![]()
As filed with the Securities and Exchange Commission on April 20, 2017
UNITED STATES
SECURITIES AND EXCHANGE COMMISSION
WASHINGTON, DC 20549
FORM 20-F
| ¨ | REGISTRATION STATEMENT PURSUANT TO SECTION 12(b) OR (g) OF THE SECURITIES EXCHANGE ACT OF 1934 |
OR
| x | ANNUAL REPORT PURSUANT TO SECTION 13 OR 15(d) OF THE SECURITIES EXCHANGE ACT OF 1934 |
For the fiscal year ended December 31, 2016
OR
| ¨ | TRANSITION REPORT PURSUANT TO SECTION 13 OR 15(d) OF THE SECURITIES EXCHANGE ACT OF 1934 |
OR
| ¨ | SHELL COMPANY REPORT PURSUANT TO SECTION 13 OR 15(d) OF THE SECURITIES EXCHANGE ACT OF 1934 |
Commission file number: 001-15276
ITAÚ UNIBANCO HOLDING S.A.
(Exact name of Registrant as specified in its charter)
Federative Republic of Brazil
(Jurisdiction of incorporation or organization)
Praça Alfredo Egydio de Souza Aranha, 100
04344-902 São Paulo, SP, Brazil
(Address of principal executive offices)
Marcelo Kopel
Investor Relations Officer
Itaú Unibanco Holding S.A.
Praça Alfredo Egydio de Souza Aranha, 100
04344-902 São Paulo, SP, Brazil
+55 11 2794 3547
drinvest@itau-unibanco.com.br
(Name, Telephone, E-mail and/or Facsimilie number and Address of Company Contact Person)
![]()
Securities registered or to be registered pursuant to Section 12(b) of the Act:
| Title of each class | Name of each exchange on which registered |
| Preferred Shares, no par value | New York Stock Exchange(*) |
| American Depositary Shares (as evidenced by American DepositaryReceipts), each representing 1 (one) Preferred Share | New York Stock Exchange |
(*) Not for trading purposes, but only in connection with the listing of American Depositary Shares pursuant to the requirements of the Securities and Exchange Commission.
Securities registered or to be registered pursuant to Section 12(g) of the Act:
None
(Title of Class)
Securities for which there is a reporting obligation pursuant to Section 15(d) of the Act:
None
(Title of Class)
Indicate the number of outstanding shares of each of the issuer’s classes of capital or common stock as of the close of the period covered by the annual report.
3,351,741,143 Common Shares, no par value
3,160,958,864 Preferred Shares, no par value
Indicate by check mark if the registrant is a well-known seasoned issuer, as defined in Rule 405 of the Securities Act.
x Yes ¨ No
If this report is an annual or transition report, indicate by check mark if the registrant is not required to file reports pursuant to Section 13 or 15(d) of the Securities Exchange Act of 1934.
¨ Yes x No
Indicate by check mark whether the registrant (1) has filed all reports required to be filed by Section 13 or 15(d) of the Securities Exchange Act of 1934 during the preceding 12 months (or for such shorter period that the registrant was required to file such reports) and (2) has been subject to such filing requirements for the past 90 days.
x Yes ¨ No
Indicate by check mark whether the registrant has submitted electronically and posted on its corporate Web site, if any, every Interactive Data File required to be submitted and posted pursuant to Rule 405 of Regulation S-T (§232405 of this chapter) during the preceding 12 months (or for such shorter period that the registrant was required to submit and post such files).
¨ Yes ¨ No
Indicate by check mark whether the registrant is a large accelerated filer, an accelerated filer, or a non-accelerated filer See definition of “accelerated filer and large accelerated filer” in Rule 12b-2 of the Exchange Act (Check one):
| x Large accelerated filer | ¨ Accelerated filer | ¨ Non-accelerated filer |
Indicate by check mark which basis of accounting the registrant has used to prepare the financial statements included in this filing:
| ¨ U.S. GAAP | x | International Financial Reporting Standards as issued by the International Accounting Standards Board | ¨ Other |
If “Other” has been checked in response to the previous question, indicate by check mark which financial statement item the registrant has elected to follow.
¨ Item 17¨ Item 18
If this is an annual report, indicate by check mark whether the registrant is a shell company (as defined in Rule 12b-2 of the Exchange Act).
¨ Yes x No
![]()
INTRODUCTION
The information presented in this annual report on Form 20-F is accurate only as of the date of this annual report and information incorporated by reference in this annual report is accurate only as of the date of the document in which such incorporated information is contained. Our business, our financial condition and results of operations, our assets and our prospects may have changed since those dates.
Information contained in or accessible through the websites referred to in this annual report on Form 20-F is not part of this annual report unless we specifically state that it is incorporated by reference and is part of this report. All references in this annual report on Form 20-F to websites are inactive textual references only.
![]()
FORM 20-F CROSS-REFERENCE INDEX
(for the purpose of filing with the United States Securities and Exchange Commission)
| 20-F item number and description | Page |
| Part I | |
| Item 1. Identity of Directors, Senior Management and Advisers | Not applicable |
| Item 2. Offer Statistics and Expected Timetable | Not applicable |
| Item 3. Key Information | |
| 3A. Selected financial data | A-15 to A-16 |
| A-165 to A-166 | |
| 3B. Capitalization and indebtedness | Not applicable |
| 3C. Reasons for the offer and use of proceeds | Not applicable |
| 3D. Risk factors | A-75 to A-83 |
| A-167 to A-168 | |
| Item 4. Information on the Company | |
| 4A. History, highlights and recents developments of the company | A-17 to A-22 |
| A-51 | |
| 4B. Business overview | A-10 to A-12 |
| A-25 | |
| A-28 to A-46 | |
| A-156 to A-164 | |
| 4C. Organizational structure | A-25 to A-28 |
| F-15 to F-16 | |
| 4D. Property, plant and equipment | A-146 to A-147 |
| Item 4A. Unresolved Staff Comments | None |
| Item 5. Operating and Financial Review and Prospects | |
| 5A. Operating results | A-3 to A-6 |
| A-120 to A-123 | |
| A-148 to A-164 | |
| 5B. Liquidity and capital resources | A-98 to A-100 |
| A-141 to A-143 | |
| A-145 to A-147 | |
| A-161 to A-164 | |
| 5C. Research and development, patents and licenses, etc. | A-25 |
| 5D. Trend information | A-163 to A-164 |
| 5E. Off-balance sheet arrangements | A-147 |
| F-146 to 147 | |
| 5F. Tabular disclosure of contractual obligations | A-145 |
| 5G. Safe Habor | Not applicable |
| Item 6. Directors, Senior Management and Employees | |
| 6A. Directors and senior management | A-54 to A-71 |
| 6B. Compensation | A-71 to A-72 |
| F-79 to F-82 | |
| 6C. Board practices | A-53 to A-70 |
| 6D. Employees | A-22 to A-25 |
| 6E. Share ownership | A-25 to A-28 |
![]()
| Item 7. Major Shareholders and Related Party Transactions | |
| 7A. Major shareholders | A-25 to A-28 |
| 7B. Related party transactions | A-57 |
| F-143 to F-144 | |
| 7C. Interests of experts and counsel | Not applicable |
| Item 8. Financial Information | |
| 8A. Consolidated Statements and Other Financial Information | A-14 to A-16 |
| F-1 to F-163 | |
| 8B. Significant Changes | None |
| Item 9. The Offer and Listing | |
| 9A. Offer and listing details | A-46 to A-47 |
| 9B. Plan of distribution | Not applicable |
| 9C. Markets | A-46 to A-50 |
| 9D. Selling shareholders | Not applicable |
| 9E. Dilution | Not applicable |
| 9F. Expenses of the issue | Not applicable |
| Item 10. Additional Information | |
| 10A. Share capital | Not applicable |
| 10B. Memorandum and articles of association | A-47 to A-51 |
| A-53 to A-74 | |
| 10C. Material contracts | None |
| 10D. Exchange controls | A-118 |
| 10E. Taxation | A-168 to A-174 |
| 10F. Dividends and paying agents | Not applicable |
| 10G. Statement by experts | Not applicable |
| 10H. Documents on display | A-13 |
| 10I. Subsidiary information | Not required |
| Item 11. Quantitative and Qualitative Disclosures About Market Risk | A-89 to A-94 |
| A-145 | |
| Item 12. Description of Securities Other Than Equity Securities | |
| 12A. Debt Securities | Not applicable |
| 12B. Warrants and Rights | Not applicable |
| 12C. Other Securities | Not applicable |
| 12D. American Depositary Shares | A-46 to A-51 |
| Part II | |
| Item 13. Defaults, Dividend Arrearages and Delinquencies | None |
| Item 14. Material Modifications to the Rights of Security Holders and Use of Proceeds | None |
| Item 15. Controls and Procedures | A-174 to A-175 |
| Item 16. [Reserved] | |
| 16A. Audit committee financial expert | A-55 |
| A-69 | |
| A-73 | |
| 16B. Code of Ethics | A-53 |
| A-73 | |
| 16C. Principal Accountant Fees and Services | A-56 |
| 16D. Exemptions from the Listing Standards for Audit Committees | A-73 |
| 16E. Purchases of Equity Securities by the Issuer and Affiliated Purchasers | A-145 to A-146 |
![]()
| 16F. Change in Registrant’s Certifying Acountant | None |
| 16G. Corporate Governance | A-72 to A-74 |
| 16H. Mine Safety Disclosure | Not applicable |
| Part III | |
| Item 17. Financial Statements | See item 18 |
| Item 18. Financial Statements | F-1 to F-163 |
| Item 19. Exhibits | B-1 |
![]()
GUIDE 3 CROSS-REFERENCE INDEX
(for the purpose of filing with the United States Securities and Exchange Commission)
| GUIDE 3 item number and description | Page |
| Part I Distribution of Assets, Liabilities and Stockholders’ Equity; Interest Rates and Interest Differential | |
| Average balance sheets | A-165 |
| Analysis of net interest earnings | A-166 |
| Volume and rate movement | A-165 to A-166 |
| Part II Investment Portfolio | |
| Book value of investments | A-124 to A-128 |
| Maturity profile | A-127 |
| Book value and market value exceeding 10% of stockholders’ equity | A-123 |
| Part III Loan Portfolio | |
| Types of Loans | A-130 |
| Maturities and Sensitivities of Loans to Changes in Interest Rates | A-130 to A-132 |
| Risk Elements | |
| Nonaccrual, Past Due and Restructured Loans | A-129 to A-140 |
| Potential Problem Loans | A-134 to A-136 |
| Foreign Outstandings | A-141 |
| Loan Concentrations | A-133 to A-134 |
| Other Interest Bearing Assets | A-165 |
| Part IV Summary of Loan Loss Experience | |
| Analysis of the Allowance for Loan Losses | A-135 to A-136 |
| Allocation of the Allowance for Loan Losses | A-136 |
| Part V Deposits | A-141 to A-143 |
| Part VI Return on Equity and Assets | A-166 |
| Part VII Short-Term Borrowings | A-141 |
Annex A – Annual Report
Index
Global context
The world economy, as well as the credit and capital markets, show signs of improvement but continue to grow at a moderate pace. Political uncertainty, however, remains.
Global GDP is expanding at a moderate pace. As noted below, U.S. real GDP grew by 1.6% in 2016 and is expected to expand at a rate of 2.3% in 2017 (according to the Federal Reserve Bank of Philadelphia’s Fourth Quarter 2016 Survey of Professional Forecasters). The Eurozone and Japan have been recovering at modest economic growth rates. Meanwhile, growth in China is stable for now, and growth in other emerging markets has been increasing.
The new U.S. administration has started to implement major changes in U.S. economic policy. A moderate fiscal expansion with the U.S. economy close to full employment will likely lead to a faster tightening of monetary policy, putting pressure on emerging market currencies and local interest rates. In addition, any protectionist policies the U.S. might pursue could negatively impact global economic growth.
In the Eurozone, the economy has been recovering at a modest pace following fiscal reforms and implementation of expansionary monetary policies by the European Central Bank (ECB), which improved both confidence and financial conditions. As such, 2016 saw a 1.7% GDP growth, and early 2017 data show no sign of a slowdown. However, the recovery is clouded by political uncertainties surrounding the Eurozone. The UK triggered Article 50 at the end of March 2017, and “Brexit” will continue as a source of uncertainty in the years to come. Additionally, France will face general elections in 2017, and there are risks that Eurosceptic factions might emerge victorious. Thus far, the political events have seen little economic spillover. Nonetheless, risks are tilted to the downside as European politicians continue to struggle to find solutions to the growing Eurosceptic movements around the continent, which is aggravated by continued problems with migration and terrorism. Please refer to section Our Risk Management, item Risk Factors, The U.K. exit from the European Union could adversely impact our business, results of operations and financial condition for further details about Brexit Risk Factor.
Given the unprecedented monetary policy measures implemented by developed countries since 2008, liquidity has been available for investment in emerging markets, supporting asset prices in those markets. As the U.S. economy has continued its recovery and its outlook remains positive, the U.S. Federal Reserve has begun to raise interest rates, as announced at the Federal Open Market Committee of the Federal Reserve’s December 2015 meeting. The United States Federal Reserve increased interest rates again in December 2016 and in March 2017, and currently anticipates it may well be appropriate to continue on a gradual path of increases of the target range for the Federal Funds rates.
Between 2013 and 2016, significant amounts of financial resources were withdrawn from investments in the emerging markets in response to weak growth in these economies and in anticipation of the gradual monetary tightening in the U.S. However, signs emerged during 2016 that these financial flows were returning to emerging markets as commodities prices stabilized and economic fundamentals improved in some emerging markets economies. Nonetheless, the global economic outlook remains uncertain with significant downside risks. These risks may still result in periods of increased volatility in asset prices in emerging markets and could also affect our operational results.
U.S. real GDP grew 1.6% in 2016, according to U.S. Bureau of Economic Analysis’ advanced estimates, compared to 2.6% in 2015. The economic expansion is expected to continue at a moderate pace in 2017 (according to the Survey of Professional Forecasters issued by the Federal Reserve Bank of Philadelphia), sustained by solid domestic demand. Domestic demand should be supported by: (i) accommodative monetary and financial conditions; (ii) consumers and business optimism, according to the January surveys data published by The Conference Board and the Institute for Supply Management, respectively; and (iii) a healthy labor market, with net job increases averaging 196,000 per month in the last twelve months until February 2017 and the U.S. unemployment rate of 4.7% in February 2017.
United States Job Creation - Nonfarm Payroll
(seasonally adjusted, thousands)

Source: Itaú Unibanco Holding and U.S. Bureau of Labor Statistics
A-3
China’s real GDP increased 6.8% year over-year in the fourth quarter of 2016, maintaining a steady growth in 2016. Chinese policymakers are trying to balance short-term growth with reforms designed to improve medium-term growth.
Latin American context
In Latin America, commodity-exporting economies continue to exhibit weak economic activity. According to recent data published by INDEC (National Institute of Statistics and Census of Argentina), Argentina, which was in a recession due to the impact of the necessary adjustment in relative prices, likely presented a positive quarter-over-quarter growth rate in the final quarter of 2016.
With exchange rates evolving more favorably than in 2013 through 2015, inflation is falling in Argentina, Colombia, Chile, Uruguay and Paraguay. In this context, central banks are reducing interest rates, which will likely support an economic recovery during 2017. On the other hand, fiscal revenues remain weak, so the fiscal consolidation process is on-going, as governments try to preserve sovereign ratings. Increases in fuel prices in Mexico and the tax reform recently approved in Colombia are examples of measures taken by Latin American sovereigns to reduce their fiscal deficit.
The following table shows the real GDP growth rates in seven Latin American countries as of and for the twelve-month period ended September 30, 2016, and as of and for the years ended December 31, 2015, 2014, 2013 and 2012, except as otherwise indicated.
| As of and for the Year Ended December 31, | ||||||||||||||||||||
| Real GDP Growth | 2016 | 2015 | 2014 | 2013 | 2012 | |||||||||||||||
| (%) | ||||||||||||||||||||
| Argentina(1) | -2.3 | 2.6 | -2.5 | 2.4 | -1.0 | |||||||||||||||
| Chile(2) | 1.6 | 2.3 | 1.9 | 4.0 | 5.3 | |||||||||||||||
| Colombia(3) | 2.0 | 3.1 | 4.4 | 4.9 | 4.0 | |||||||||||||||
| Mexico(4) | 2.1 | 2.6 | 2.3 | 1.6 | 3.8 | |||||||||||||||
| Paraguay(5) | 4.1 | 3.0 | 4.7 | 14.0 | -1.2 | |||||||||||||||
| Peru(6) | 3.9 | 3.3 | 2.5 | 5.8 | 5.9 | |||||||||||||||
| Uruguay(7) | 1.5 | 0.4 | 3.2 | 4.6 | 3.5 | |||||||||||||||
(1) Source: Instituto Nacional de Estadística y Censos
(2) Source: Banco Central de Chile.
(3) Source: Banco de la República.
(4) Source: Instituto Nacional de Estadística y Geografía.
(5) Source: Banco Central del Paraguay.
(6) Source: Banco Central de Reserva del Perú.
(7) Source: Banco Central de Uruguay.
Brazilian context
As a Brazilian bank with most of our operations in Brazil, we are significantly affected by the economic, political and social conditions in the country. From 2004 to 2011, we benefited from Brazil’s generally stable economic environment, with average annual GDP growth of approximately 4.4%, during that period, which led to increased bank lending and deposits. However, Brazil’s GDP growth rate declined to 1.9% in 2012, 3.0% in 2013 and 0.5% in 2014. In 2015, GDP decreased by 3.8% with 2016 economic slowdown partly reflecting a deceleration in potential growth. In 2016, GDP decreased by 3.6%.
GDP growth (%)

Source: IBGE.
A-4
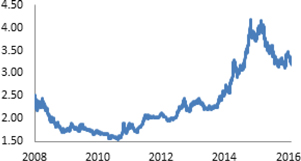
The widespread decline in inflation, due to the high level of idle capacity in the Brazilian economy and anchored inflation expectations, created an opportunity for the Central Bank to start a monetary easing cycle. After reaching 14.25% a.a. at the end of 2015, the Central Bank began to cut interest rates in October 2016. In April 2017, the Selic rate was at 11.25%. Bank lending as a proportion of GDP decreased to 49.3% in December 2016 from 53.7% in December 2015.
Selic (nominal interest rate) | Bank Lending (as % of GDP) |
 | 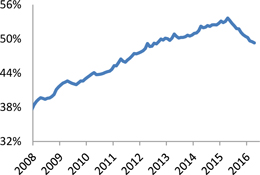 |
Source: Itaú Unibanco Holding and Central Bank
Inflation reached 6.3% in 2016, down from 10.7% in the calendar year 2015. Government-regulated prices (such as electric power prices, water and sewage tariffs and fuel prices) rose 5.5% in 2016 (down from 18.1% in 2015), while the market-set prices increased 6.6% in the same period (from 8.5% in 2015).
12-month IPCA inflation rate

Source: Itaú Unibanco Holding and IBGE
The Brazilian primary public budget result has been on a downward trend since 2014. Cuts in discretionary spending and tax hikes proved insufficient to offset the drop in tax revenues and growth in mandatory expenditures. Over 12 months, the Brazilian primary public budget balance closed December 2016 with a deficit of 2.5% of GDP, after a deficit of 1.9% of GDP in 2015 and 0.6% in 2014. To tackle the structural fiscal imbalance, the Brazilian Congress approved a spending ceiling that will limit primary public expenditure growth to the prior years inflation for at least 10 years, representing a structural reform for the Brazilian economy. The next step is the social security reform that will be discussed in the Brazilian Congress during 2017 and is primordial to ensure that the ceiling remains feasible in the years ahead. These structural reforms are an important step toward returning to primary surpluses and stabilizing public debt in the medium-term.
In addition, Brazil has implemented a large number of regulatory changes in recent years, such as changes in reserve and capital requirements for financial institutions, as well as other macro-prudential policies. Please refer to the section Our risk management, item Regulatory environment, Implementation of Basel III in Brazil and to the section Performance, item Required Reserve Deposits with the Central Bank, for further information.
Outstanding loans provided by Brazilian financial institutions continued its decreasing trend in the fourth quarter of 2016 adjusted for inflation. Year-to-year total bank loans fell by 9.2% as of December 2016 in real terms, compared with a contraction of 3.6% as of December 2015. Total new loans decreased by 15.7% as of December 2016 compared with a decrease of 11.3% in December 2015, both on an annualized basis. Non-performing household loans decreased 0.2 p.p. to 4.0% as of December 2016 when compared with the same month in 2015. Non-performing loans to non-financial corporations reached 3.5% in December 2016, compared with 2.6% in December 2015.
A-5
The Brazilian real has appreciated against the U.S. dollar, with the exchange rate reaching R$3.26 per US$1.00 as of December 30, 2016, compared with R$3.96 per US$1.00 as of December 31, 2015. This reflects the adjustments and reforms taking place in Brazil resulting in a lower risk premium.
Nominal exchange rate
(Real/US dollar)
Source: Itaú Unibanco Holding and Central Bank
Brazil’s current account deficit (the net balance from the trade of goods and services and international transfers) was 3.3% of GDP for December 2015. By December 2016, the deficit decreased to 1.3% of GDP. Brazil has maintained its external solvency, with US$372 billion in international reserves and US$ 324 billion in external debt as of December 2016.
The following table shows real GDP growth, the inflation rate, exchange rate variation and interest rates in Brazil as of and for the years ended December 31, 2016, 2015, 2014, 2013 and 2012.
| As of and for the Year Ended December 31, | ||||||||||||||||||||
| 2016 | 2015 | 2014 | 2013 | 2012 | ||||||||||||||||
| (%) | ||||||||||||||||||||
| Real GDP growth(1) | (3.6 | ) | (3.8 | ) | 0.5 | 3.0 | 1.9 | |||||||||||||
| Inflation rate - IGP-DI(2) | 7.2 | 10.7 | 3.8 | 5.5 | 8.1 | |||||||||||||||
| Inflation rate - IPCA(3) | 6.3 | 10.7 | 6.4 | 5.9 | 5.8 | |||||||||||||||
| Exchange rate variation (R$/US$)(4) | (17.8 | ) | 48.9 | 12.5 | 15.1 | 9.9 | ||||||||||||||
| TR (reference interest rate)(5) | 2.04 | 2.07 | 1.01 | 0.53 | 0.00 | |||||||||||||||
| CDI (interbank interest rate)(6) | 13.63 | 14.14 | 11.51 | 9.78 | 6.94 | |||||||||||||||
| Selic (overnight interest rate)(6) | 13.65 | 14.15 | 11.58 | 9.90 | 7.16 | |||||||||||||||
| Sovereign 5-year CDS(7) | 280.0 | 505.0 | 203.0 | 192.0 | 107.5 | |||||||||||||||
(1) Source:Instituto Brasileiro de Geografia e Estatística, or IBGE.
(2) Source: General Price Index – Internal Supply (Índice Geral de Preços–Disponibilidade Interna, or IGP-DI) published by theFundação GetulioVargas.
(3) Source: Extended National Consumer Price Index (Índice de Preços ao Consumidor Amplo, or IPCA) published by IBGE.
(4) Source: Bloomberg (cumulative rates for the period); positive numbers mean depreciation of the Brazilianreal.
(5) Source: Mortgage reference rate (Taxa Referencial, or TR) published by the Central Bank. Data presented in percentage per year. 2016 data is for November.
(6) Source: Central Bank. Data presented in percentage per year.
(7) Source: Bloomberg (period-end). Sovereign credit default swaps or CDS is a measure of country risk (and is measured using basis points).
A-6
Context of Itaú Unibanco Holding
Message from the Chairman of the Board of Directors
Dear Reader,
In 2016, Brazil faced up huge economic and political challenges that have led to uncertainties and ultimately impacted our Gross Domestic Product (GDP) for the second consecutive year. Despite this scenario, we have been able to tackle a number of hurdles and managed to generate recurring net income of R$23.3 billion1 and return on equity (ROE) of 20.1%, which means adding value to our stockholders. When it comes to our capital strength, our solidity can be seen from the 19.1% Basel ratio we reached, which is higher than the minimum of 10.5% required by the Central Bank.
Over the recent years, we have focused on enhancing credit management and have also placed an emphasis on growing insurance operations and service delivery. We pursued business expansion opportunities inside and outside Brazil, continued to invest in new technologies and disseminated the Risk Culture among our employees. As a result, in 2016, our service revenue grew 8.4% over 2015, we became holders of 100% of Itaú BMG Consignado’s capital, acquired Citibank’s retail operations in Brazil and completed the merger between Itaú Chile and CorpBanca, with our new subsidiary Itaú CorpBanca being the resulting entity.
All of these achievements are the outcome of 90 years of dedication, the engagement of highly qualified teams, the adoption of well-defined strategies and, mainly, the establishment of a culture based on ethics and transparency. As part of this, we put a great value on meritocracy, invest in people training and implement clear anti-corruption and anti-money laundering policies across all areas of the bank.
We believe that disseminating behaviors that positively influence the management of risks inherent in our business is of paramount importance. Therefore, we have adopted a Risk Culture based on the following four principles:
| · | We assume risks consciously; |
| · | We discuss our risks; |
| · | We act on our risks; and |
| · | We all are risk managers. |
Aligned with this, we understand, identify, measure, manage and mitigate risks, strengthening the individual and collective accountability of our employees so that they can make the right decision.
We recognize that our clients’ needs have changed in an increasingly fast pace. For this reason, we are always attentive to technologies having potential to transform us into a bank that is more and more digital. In 2015, we co-founded Cubo, a co-creation space now having more than 40 innovative projects being developed for Itaú. We continue to invest in data scientists who are capable of tailoring and developing new systems, as well as in information security to help ensure that the most secure products are provided to our clients. We take care of the details so that our clients do not need to worry about it.
Four years ago, we initiated a change in our structure to address the succession of Roberto Setubal. Today, we are ready to begin this new cycle, in which Candido Bracher, former Director-General of the Wholesale area of the bank, assumes as the new Executive President & CEO of the group. I am optimistic about the newly adopted structure and the new members of Itaú Unibanco’s Executive Committee, since they have all the ingredients that are necessary to continue to challenge barriers and add value to our investors, employees and clients.
I invite everyone to read the Consolidated Annual Report and learn more about the profile of our organization, businesses, strategies, and results. For us to become each day more transparent with our stockholders and the market, this annual report consolidates our 20-F form, Debt Prospectus (Medium Term Note - MTN Program) and GRI sustainability guidelines.
I wish you all a pleasant reading.
Cordially,
Pedro Moreira Salles.
Chairman of the Board of Directors.
1Net income attributable to owners of the parent company, in IFRS.
A-7
Message from the Chief Executive Officer
Dear reader,
As I noted in my message on the last Consolidated Annual Report, 2016 was expected to be challenging and we would proceed with our strategy of managing risks cautiously while keeping the capitalization level high and focusing on the efficiency of operations and client service quality. This Report describes how we executed this strategy, leading us to post positive results in 2016, even in a year marked by a severe recession in Brazil, with a contraction in GDP in excess of 7% in two years.
Despite the challenging scenario, we once again ended the year strong, with consistent results which are the outcome of a business model that balances loans and leases operations with insurance products and services. This model makes the bank less vulnerable to economic cycles, thus reducing the volatility of our income.
We closed 2016 with a net income of R$23.3 billion1 and an annualized recurring profitability to average equity of 20.1%, down 9.6% from the previous year. Under the accounting practices adopted in Brazil (BRGAAP), in 2016, 61% of Net Income2 arise from services and massive insurance products (insurance, pension plan and capitalization operations), 15% derive from treasury operations and capital surplus, and the remaining 24%, from loans and leases, the results of which have been affected by an increased default level, causing this activity to post a 9.4% return of regulatory capital, lower than the cost of capital.We believe that, with the efforts to decrease default, already initiated at the end of the year, we will be able to come back to return levels in line with the cost of capital for loans and lease operations. This expected improvement, if materialized, will be decisive to grow our results in the coming years.
Equity attributable to the owners of the company reached R$122.6 billion at the end of 2015, 9.2% up on 2016, while our Basel ratio at the end of the period was 19.1% and the average short-term liquidity ratio for 4Q16 was 212.8%, both higher than the minimum 10.5% and 70% required by the Central Bank, respectively.
The bank´s strong level of capitalization and prospects of generating results above the capital requirement in the following years allowed management to rise, for 2016, the total dividends and interest on capital to 45% of net income2 and announced that this distribution is expected to be maintained at 35% and 45% in the coming years.
The value added3 to economy by Itaú Unibanco reached R$61.6 billion, basically distributed among employees (32%), taxes (29%), reinvestment of net income (26%), and stockholders (11%). We supported several initiatives and projects throughout 2016. Our social investments totaled R$474.8 million, 67% of which through donations and sponsorships made by Itaú Unibanco and 33% through funds under law incentive. Such funds have been allocated to projects to foster education, health, culture, sports and mobility, which are areas that our organization has been prioritizing over the last year.
In 2016, we announced a series of changes in our Executive Committee. As disclosed more than two years ago, after 23 years serving as the Chief Executive Officer of Itaú Unibanco, I left the position in April 2017. Since the last General Shareholders Meeting, I have, in conjunction with Pedro Moreira Salles, served as Co-Chairman of the Board of Directors. The new Chief Executive Officer of the bank is Candido Bracher, who has more than 36 years’ experience in the financial market and, over the past 28 years, has served in several leading positions at BBA Creditanstalt, Itaú BBA and Itaú Unibanco, contributing to the evolution of these institutions.
Marco Bonomi ended his mandate as Retail General Manager and, at the last shareholders meeting, was nominated to be a member of our Board of Directors. With over four decades of experience in retail business, Marco will certainly make valuable contributions, considering his vast knowledge of banking activities.
After all changes already announced, the Executive Committee has now the following composition: Candido Bracher, Executive President & CEO, Marcio Schettini, General Retail Manager, Eduardo Vassimon, General Wholesale Manager, Caio David, Vice-President of Risks and Finance departments, André Sapoznik, Vice-President of Technology and Operations departments, and Claudia Politanski, Vice-President of Human Resources, Legal and Ombudsman, Corporate Communication and Institutional and Governmental Relations departments. We believe that this Executive Committee is ready to face with confidence the major challenges we have ahead.
In 2016, we invested over R$192 million in training our more than 94 thousand employees, focusing not only on their technical qualification but also on the dissemination of our Risk Culture, which is a critical factor in managing our organization.
Also, in 2016, our expansion occurred by means of acquisitions, with an emphasis on the consolidation of Itaú CorpBanca in Chile into our balance sheet, which represented an addition of R$71 billion to our loans and leases portfolio, the acquisition of Citibank’s retail business in Brazil, the acquisition of Recovery - a company specialized in debt collection - and the remaining 40% in Itaú BMG Consignado’s capital.
To ensure that we are able to meet our clients’ needs, we continue to expand our offerings of products and services through digital channels. If eight years ago, around 74% of our transactions were conducted from standard channels, in 2016, 73% are conducted from digital channels, which represented 10.9 billion in transactions.
We started this year expecting 2017 to be better for Brazil, with some growth for the economy and the bank´s results. We will work to continue our distinguished performance, focused on the challenges and opportunities that lie ahead.
A-8
Finally, I wish to thank for the continued trust and support I have received over the 23 years in which I led the bank. It feel privileged for having worked with so many qualified and dedicated employees, with whom I share the merits of the results reached in the period.
My warmest regards.
Roberto Setubal
Executive President & CEO
| 1 | Net income attributable to owners of the parent company, in IFRS. |
| 2 | Recurring Net Income under BRGAAP: R$22.1 billion in 2016. |
| 3 | Includes recurring net income and the reclassification of tax effects of hedging foreign investments for the financial margin, in BRGAAP |
A-9
Building a bank that’s ever more digital
We always believed in the potential of technology to make people's lives easier and continue to enhance our relationship with our customers. Based on this, we have come this far and built our company over nearly a century.
In the 1960s, when no one ever imagined that technology could change the relationship between people and companies, we were already certain that it would be essential for us to keep up with the times in an ever changing world.
Our story is proof of that. In 1970, Itaú built one of the first four main data processing centers in Brazil. It was also during that decade that Unibanco became the first Brazilian bank to start using the IBM 360 processing system. In 1983, we were the first bank to introduce ATMs in Brazil. And we didn't stop there. Because we focus on our customers’ needs, in 2013 we created the digital branches, a new way of servicing our customers with online and after-hour services, keeping a close relationship with them. Also, in September 2016, we launched an app that allows customers to open bank accounts via their cell phones. Only four months after the launch, more than 60,000 bank accounts were opened via mobile.
Today we can see that technology and mobile devices are driving significant changes in society. It is not by chance that over 73% of our transactions take place on digital channels and over 50% of those are on mobile phones.
Regardless of how much technology is available to a bank, true progress is only possible if the bank is connected to people, therefore it's more important than ever to put our customers at the center of everything we do.
We understand that this is a challenge in terms of both infrastructure and culture, and this is our task for the coming years: to build a digital bank that continues to be, in every way, personal.
Business strategy
Our Board of Directors is the body responsible for establishing the general guidelines of our business. Strategic decisions taken by our Board of Directors are supported by the Strategy Committee, which provides data and information about critical strategic matters. The Strategy Committee’s activities and responsibilities range from evaluating investment opportunities and budget guidelines to issuing opinions and recommendations in order to support the decisions of the Board of Directors. The Economic Scenarios Sub-Committee supplies macroeconomic data to the Strategy Committee, supporting its discussions. Please refer to section Our governance, item Management structure, Committees of the Board of Directors, Strategy Committee for further information.
Expand our operations in Brazil and abroad
Brazil
We continue to analyze potential business operations which would create additional value for our stockholders, in Brazil. Please refer to section Our profile, item 2016 highlights, Corporate events and partnerships for further information.
Abroad
In line with our Latin America expansion strategy, and consistent with our vision to create value and ensure sustainable performance, as from April 2016, we concluded the merger of Banco Itaú Chile with CorpBanca and now hold the control of the resulting entity – Itaú CorpBanca.
Please refer to section Our profile, item 2016 highlights, Corporate events and partnerships for further information.
Furthermore, in 2016, Moody’s assigned for the first time to Itau BBA International (based in the United Kingdom) an investment grade rating, including an A3 rating for purposes of an issuer and long term deposits rating. In its ratings release,
Moody’s recognized the strength of Itau BBA International’s balance sheet and business model.
Please refer to section Our profile, item Our business, Our international business, Itau BBA International for further details about Itau BBA International’s business.
Focus on non-interest income
We continued to focus on the offer of new products and services, which we believe add value to our customers and, at the same time, allow us to increase our fee-based income. This increase is mainly due to a higher volume of account service packages. New subscriptions to current account service packages and the adjustment of services provided to our higher-income Uniclass clients and by our Itaú Empresas business unit also contributed to this growth in fee-based income.
In addition, we continue to focus on our insurance services, which include our 30% stake in Porto Seguro, by operating under the bancassurance model, with a focus on the sale of massive personal and property insurance services, largely provided through our retail banking. As part of this strategy, in October 2014 we announced the sale of our large risks operations to the ACE group and the early termination of operating agreements between Via Varejo S.A. and our subsidiary Itaú Seguros S.A. for the offer of extended warranty insurance in “Ponto Frio” and “Casas Bahia” stores.
In September 2016, we entered into an agreement to sell our group life insurance operations with Prudential do Brasil. The transfer of shares and the financial settlement of the transaction will take place after compliance with certain conditions provided
A-10
for in the agreement, including obtaining required regulatory authorizations. This transaction reinforces our already-disclosed strategy of focusing on mass-market insurance products typically related to the Retail Banking segment.
Continue to improve efficiency
In 2010, we established an Efficiency Program aimed at identifying, implementing, and monitoring costs and revenues, in addition to promoting a strong culture of operational efficiency. In the years thereafter, we focused on increasing cost savings by reducing unnecessary costs, promoting the simplification and centralization of processes, promoting synergy gains and combining the management of certain business units.
In February 2015, we created the Technology and Operations executive area with the aim of optimizing our structure in order to sustain growth. This executive structure enabled us to organize our operations in a simpler and more efficient manner. We are committed to improve processes, to streamline operations and to be more efficient in everything we do with the clear purpose of client satisfaction.
Throughout 2015 and 2016, we increased the number of our digital branches in response to the profile of our customers, who express an increasing demand for services through digital channels. The clients of our digital branches can be in contact with their relationship managers from 7:00 am to midnight, from Monday to Friday through a variety of digital channels. This allows us to strengthen our relationship with clients and improve the efficiency and profitability of our operations.
In 2016, we launched the “Abreconta” app, which enabled, in the period of four months, the opening of approximately 60,000 new bank accounts exclusively through mobile channels.
Maintain asset quality in our loan portfolio
We are constantly seeking to improve our models for credit risk management and our economic forecasts and scenario modeling. In the last four years, we focused on the improvement of our asset quality by increasing credit selectivity, changing our loan portfolio mix, and prioritizing the offer of less risky products, such as payroll and mortgage loans, reducing the origination of higher risk portfolios, such as vehicle loans.
On January 21, 2016, we announced that our subsidiary Itaú Unibanco S.A. entered into a non-binding memorandum of understanding (MoU) with Banco Bradesco S.A., Banco do Brasil S.A., Banco Santander (Brasil) S.A. and Caixa Econômica Federal in order to create a credit intelligence bureau, or CIB. The CIB will be structured as a Brazilian corporation (sociedade por ações) and the parties to the MoU will share its control, with each of them holding a 20% equity ownership. The CIB’s technical and analytical platform will be developed and implemented through a services agreement with LexisNexis® Risk Solutions FL Inc.
The creation of CIB reaffirms the banks’ confidence in the future of Brazil and of the credit market, and allows a stronger and more sustainable market. CIB’s incorporation is subject to the execution of definitive agreements, as well as the satisfaction of certain conditions precedent.
Maintain a solid capital base
We implement a prospective approach regarding capital management. Our approach is comprised of the following phases:
(i) identification and analysis of material risks, (ii) capital planning, (iii) stress test analysis focused on the impact of severe events on our capitalization level, (iv) maintenance of a contingency plan, (v) internal capital adequacy assessment and (vi) preparation of periodic management reports.
At the end of December 2016, our Basel Ratio was 19.1%, of which: 15.9% related to Tier I Capital, which is composed of the sum of Principal Capital and Complementary Capital and 3.2% related to Tier II Capital. These indicators provide evidence of our effective loss-absorbing capacity.
Furthermore, our average Liquidity Coverage Ratio (LCR) was 212.8%. The Central Bank minimum requirement for 2016 was 70%. This ratio identifies high liquidity assets to cover outflows (net) that the institution may be subject to under a strict standard stress scenario considering a 30-day period.
In 2016, we acquired 31.4 million of our non-voting shares1 of own issue at the average price of R$30.13 per share2 aiming at: (i) maximizing the capital allocation through the efficient application of available funds, (ii) arranging for the delivery of shares to employees and management members of the company and its subsidiaries under remuneration models and long-term incentive plans; and (iii) using the shares acquired if business opportunities arise in the future.
Furthermore, in June 2016, we cancelled 100 million of our non-voting treasury shares, with no capital stock change, as the acquisition of our shares with their subsequent cancellation increases the shareholder's interest percentage in the company’s capital stock and, should the net income and the distribution of earnings percentage be maintained, it enables a higher return on dividends and interest on capital per share.
1 Quantities adjusted by the October 2016 bonus of 10%.
2 Buyback amounts includes settlement and brokerage fees. Prices are also adjusted by the October 2016 bonus of 10%.
A-11
Develop strong relationships with our clients based on client segmentation
We will continue to work on our client segmentation strategy in order to identify our clients’ needs and enhance our relationship with our client base, as well as to increase market penetration. We believe that our client segmentation tools and strategies provide us with an important competitive advantage developed over the course of more than 25 years. We aim to fulfill clients’ financial needs through a wide product portfolio by cross-selling banking and insurance products and making sales through a variety of channels. We are focused on delivering “best-in-class” client service, in order to maintain and increase client satisfaction and increase portfolio profitability.
As part of our reorganization conducted in 2015, we merged our Commercial Bank – Retail segment with our Consumer Credit – Retail segment and created the Retail Banking segment. We also migrated our Private Banking, Asset Management and Latin America Activities to our Wholesale segment. Please refer to section Performance, item Complete Financial Statements (IFRS), Note 34 – Segment Information, for further details.
Transform client experience through technology
Digital trends evolve on an exponential basis. Every day, new ways of doing business and using and exploring content emerge. At the same time, people are increasingly more open to experience the world in other ways by means of technology. We recognize that the needs of our clients are changing increasingly faster and we are attentive to technologies that have great potential to transform the three levels of clients’ relationship with the bank: experience (with new channels like mobile and internet banking), processing (big data and artificial intelligence) and infrastructure (the use of new platforms such as blockchain).We have been very active in the discussions on blockchain - the technology underlying digital and encrypted currencies – in the Latin American financial segment. We are convinced that this technology may provide solutions that bring more efficiency to our business and better experiences to our clients. In April 2016, we were the first Latin American company to enter into a partnership agreement with R3, the international innovation startup that brings together more than 70 of the largest financial institutions in the world to contribute to the international effort for the development and implementation of innovative solutions for the market based on shared ledger technologies, which are based on blockchain. We have been studying blockchain and analyzing how this technology can change the financial industry and its business models.
The manipulation, management and analysis of large volumes and varieties of data (Big Data) has been a reality for Itaú Unibanco for some time already. The bank has been improving its data processing and deepening its Data Lake, a massive repository of data capable of storing, processing and distributing with high performance, various types of information. We believe that the development of solutions that provide for integrated views of clients allows us to identify what they are going through in their lives and, for this reason, these solutions are essential for us to predict their needs and segment them in a more precise manner.
We also have new talented professionals among our employees. Data scientists, specialists in digital security and digital antifraud, people dedicated to studying and developing the client’s experience in digital channels have, in a collaborative way, joined our design, customer relationship management, technology and business teams to continue to transform the bank. The work of this team, in addition to improving the analysis of credit, risk, offer and fraud models, aims to provide mechanisms for the automation of processes and algorithms of our systems, products and channels. Therefore, the bank expects each time more to understand clients’ needs and offer them the right product at the right time.
Accordingly, Cubo Coworking Itaú has been an important ally because it allows us to be close and learn from the latest technologies and working models. In September 2016, Cubo completed one year of operation as an important technological entrepreneurship center in Brazil during this year, it promoted connections that were essential to leverage businesses, ideas and initiatives of a new generation of entrepreneurs and digital startups.
This consolidated annual report unifies the content of our major annually released reports, such as the consolidated annual report on Form 20-F, the consolidated annual report, and the Offering Memorandum for the Medium-Term Note Program, or MTN Program. The consolidated annual report on Form 20-F, filed with the U.S. Securities and Exchange Commission, or SEC, has served as the basis for the content of this report.
The consolidated annual report describes our strategy, structure, activities and operations, using plain and straightforward language to be clear to all audiences who may consult this consolidated annual report.
The information presented is aligned with Pronouncement 13 of the Market Information Disclosure Steering Committee (Comitêde Orientação para Divulgação de Informações ao Mercado, or CODIM), a Brazilian joint initiative of entities representing thecapital markets, and focused on improving transparency and information reporting in the Brazilian capital markets.
This consolidated annual report contains data from January 1, 2016 to December 31, 2016, presenting our corporate and business structure, governance and financial performance, among other matters. It also includes information on all entities subject to the significant influence or control of Itaú Unibanco Holding. Any potential changes or impacts on the data collected as a result of certain transactions, the acquisition or sale of assets, or any important change for the business are indicated throughout this report. The consolidated annual report is divided into the following sections: (i) Context, (ii) Our profile, (iii) Our governance, (iv) Our risk management, (v) Performance, and (vi) Attachments.
A-12
The audit of our financial statements in accordance with International Financial Reporting Standards (“IFRS”) as issued by the International Accounting Standards Board (“IASB”), has been conducted by PricewaterhouseCoopers Auditores Independentes, or PwC.
We are subject to informational requirements under the U.S. Securities Exchange Act of 1934, as amended, for foreign private issuers. Accordingly, we are required to file reports and other information with the SEC, including consolidated annual reports on Form 20-F and reports on Form 6-K. You may inspect and copy reports and other information filed with the SEC at the public reference facilities maintained by the SEC at 100 F Street, N.W., Washington D.C. 20549. Copies of the materials may be obtained by mail from the Public Reference Room of the SEC at 100 F Street, N.W., Washington, D.C. 20549 at prescribed rates. The public may obtain information on the operation of the SEC’s Public Reference Room by calling the SEC in the United States at 1-800-SEC-0330. In addition, the SEC maintains an Internet website atwww.sec.gov, from which you can electronically access those materials, including this consolidated annual report and the accompanying exhibits. We also file financial statements and other periodic reports with the CVM located at Rua Sete de Setembro, 111, Rio de Janeiro, Rio de Janeiro 20050-901, Brazil. The CVM maintains an Internet website atwww.cvm.gov.br.
Copies of our consolidated annual report on Form 20-F will be available for inspection upon request to the Investor Relations department at our office at Praça Alfredo Egydio de Souza Aranha 100, Torre Conceição, 9º andar – São Paulo – SP – 04344-902 – Brazil.
Investors may receive a hard copy of this consolidated annual report, including our complete audited financial statements for the last fiscal year, free of charge, by requesting a copy from our Investor Relations department, by e-mail, atinvestor.relations@itau-unibanco.com.br, indicating their contact information and their complete mailing address. Comments and suggestions regarding this report may be sent to the same e-mail.
Reading this report
In this report, the terms:
| • | “Itaú Unibanco Holding”, “Itaú Unibanco Group”, “we”, “us” or “our” refer to Itaú Unibanco Holding S.A. and all its consolidated subsidiaries and affiliates, except where specified or differently required by the context; |
| • | “Itaú Unibanco” refers to Itaú Unibanco S.A., together with its consolidated subsidiaries, except where specified or differently required by the context; |
| • | “Itaú BBA” refers to Banco Itaú BBA S.A., with its consolidated subsidiaries, except where specified or differently required by the context; |
| • | “Brazil” refers to the Federative Republic of Brazil; |
| • | “Brazilian government” refers to the federal government of the Federative Republic of Brazil; |
| • | “Central Bank” means the Central Bank of Brazil; |
| • | “CMN” means the National Monetary Council; |
| • | “CVM” means the Securities and Exchange Commission of Brazil; |
| • | “Preferred shares” and “common shares” refer to authorized and outstanding preferred and common shares with no par value; |
| • | “ADSs” refer to our American Depositary Shares (1 (one) ADS represents 1 (one) preferred share); |
| • | “R$”, “reais” or “Brazilianreal” meanreal, the Brazilian official currency; and |
| • | “US$”, “dollars” or “U.S. dollars” mean United States dollars. |
Additionally, acronyms used repeatedly, technical terms and specific market expressions in this consolidated annual report are explained or detailed in the section Attachments, item Glossary, as are the full names of our main subsidiaries and other entities referenced in this consolidated annual report.
The reference date for the quantitative information for balances found in this consolidated annual report is as of December 31, 2016 and the reference date for results is the year ended December 31, 2016, except where otherwise stated.
Our fiscal year ends on December 31 and, in this consolidated annual report, any reference to any specific fiscal year is to the 12-month period ended on December 31 of that year.
The information found in this consolidated annual report is accurate only as of the date of such information or as of the date of this consolidated annual report, as applicable. Our activities, the situation of our finances and assets, the results of transactions and our prospects may have changed since that date.
This document contains information, including statistical data, about certain markets and our competitive position. Except as otherwise indicated, this information is taken or derived from external sources. We indicate the name of the external source in each case where industry data are presented in this consolidated annual report. We cannot guarantee the accuracy of information taken from external sources, or that, in respect of internal estimates, a third party using different methods would obtain the same estimates as the estimates we present in this report.
A-13
Information contained in or accessible through the websites mentioned in this consolidated annual report does not form part of this report unless we specifically state that it is incorporated by reference and forms part of this report. All references in this report to websites are inactive textual references and are for information only.
Forward-looking information
This consolidated annual report contains statements that are or may constitute forward-looking statements within the meaning of Section 27A of the United States Securities Act of 1933, as amended, and Section 21E of the United States Securities Exchange Act of 1934, as amended. We have based these forward-looking statements largely on our current expectations and projections about future events and financial trends affecting our business. These forward-looking statements are subject to risks, uncertainties and assumptions including, among other risks:
| • | General economic, political, and business conditions in Brazil and variations in inflation indexes, interest rates, foreign exchange rates, and the performance of financial markets; |
| • | General economic and political conditions, in particular in the countries where we operate; |
| • | Government regulations and tax laws and amendments to such regulations and laws; |
| • | Developments in high-profile investigations currently in progress and their impact on customers or on our tax exposures; |
| • | Disruptions and volatility in the global financial markets; |
| • | Increases in compulsory deposits and reserve requirements; |
| • | Regulation and liquidation of our business on a consolidated basis; |
| • | Obstacles for holders of our shares and ADSs to receive dividends; |
| • | Failure or hacking of our security and operational infrastructure or systems; |
| • | Strengthening of competition and industry consolidation; |
| • | Changes in our loan portfolio and changes in the value of our securities and derivatives; |
| • | Losses associated with counterparty exposure; |
| • | Our exposure to the Brazilian public debt; |
| • | Incorrect pricing methodologies for insurance, pension plan and premium bond products and inadequate reserves; |
| • | The effectiveness of our risk management policy; |
| • | Damage to our reputation; |
| • | The capacity of our controlling stockholder to conduct our business; |
| • | Difficulties during the integration of acquired or merged businesses; |
| • | Effects from socio-environmental issues; and |
| • | Other risk factors listed in the section Our Risk Management, item Risk Factors. |
The words “believe”, “may”, “will”, “estimate”, “continue”, “anticipate”, “intend”, “expect” and similar words are intended to identify forward-looking statements, but are not the exclusive means of identifying such statements. We undertake no obligation to update publicly or revise any forward-looking statements because of new information, future events or otherwise. In light of these risks and uncertainties, the forward-looking information, events and circumstances discussed in this consolidated annual report might not occur. Our actual results and performance could differ substantially from those anticipated in such forward-looking statements.
About our financial information
Our consolidated financial statements, included elsewhere in this consolidated annual report, are prepared in accordance with the International Financial Reporting Standards, or IFRS, as issued by the IASB. All consolidated financial information related to the years 2016, 2015, 2014, 2013 and 2012 included in this report were prepared in accordance with IFRS.
We use accounting practices adopted in Brazil applicable to institutions authorized to operate by the Brazilian Central Bank (“Brazilian GAAP”) for our reports to Brazilian stockholders, filings with the CVM, and calculation of payments of dividends and tax liabilities.
The CMN establishes that financial institutions meeting certain criteria, such as Itaú Unibanco Holding, are required to present complete financial statements in accordance with IFRS as issued by IASB, in addition to financial statements under Brazilian GAAP.
Please refer to section Performance, item Complete Financial Statements in IFRS, Note 34 – Segment Information for further details about the main differences between our management reporting systems and the complete financial statements prepared according to IFRS.
Our consolidated financial statements as of December 31, 2016 and 2015 and for the three years ended December 31, 2016, 2015 and 2014 were audited by PricewaterhouseCoopers Auditores Independentes, an independent auditors, as stated in its report in section Performance, item Financial Performance in this report.
Please refer to section Performance, item Complete Financial Statements in IFRS, Note 2 – Significant Accounting Policies for further details about the significant accounting policies applied in the preparation of our complete financial statements according to IFRS.
A-14
Selected Financial Data – IFRS
The following selected financial data must be read in conjunction with the section Performance item Results and Complete Financial Statements in IFRS included in this consolidated annual report.
The data presented in the tables below have been derived from our complete financial statements for the years presented, which have been prepared in accordance with IFRS as issued by IASB, unless otherwise indicated.
| As of December 31, | Variation | |||||||||||||||||||||||||||||||||||||||||||||||||||
| Assets | 2016 | 2015 | 2014 | 2013 | 2012 | 2016-2015 | % | 2015-2014 | % | 2014-2013 | % | 2013-2012 | % | |||||||||||||||||||||||||||||||||||||||
| (In millions of R$, except percentages) | ||||||||||||||||||||||||||||||||||||||||||||||||||||
| Cash and deposits on demand | 18,542 | 18,544 | 17,527 | 16,576 | 13,967 | (2 | ) | (0.0 | ) | 1,017 | 5.8 | 951 | 5.7 | 2,609 | 18.7 | |||||||||||||||||||||||||||||||||||||
| Central Bank compulsory deposits | 85,700 | 66,556 | 63,106 | 77,010 | 63,701 | 19,144 | 28.8 | 3,450 | 5.5 | (13,904 | ) | (18.1 | ) | 13,309 | 20.9 | |||||||||||||||||||||||||||||||||||||
| Interbank deposits | 22,692 | 30,525 | 23,081 | 25,660 | 23,826 | (7,833 | ) | (25.7 | ) | 7,444 | 32.3 | (2,579 | ) | (10.1 | ) | 1,834 | 7.7 | |||||||||||||||||||||||||||||||||||
| Securities purchased under agreements to resell | 265,051 | 254,404 | 208,918 | 138,455 | 162,737 | 10,647 | 4.2 | 45,486 | 21.8 | 70,463 | 50.9 | (24,282 | ) | (14.9 | ) | |||||||||||||||||||||||||||||||||||||
| Financial assets held for trading | 204,648 | 164,311 | 132,944 | 148,860 | 145,516 | 40,337 | 24.5 | 31,367 | 23.6 | (15,916 | ) | (10.7 | ) | 3,344 | 2.3 | |||||||||||||||||||||||||||||||||||||
| Financial assets designated at fair value through profit or loss | 1,191 | 642 | 733 | 371 | 220 | 549 | 85.5 | (91 | ) | (12.4 | ) | 362 | 97.6 | 151 | 68.6 | |||||||||||||||||||||||||||||||||||||
| Derivatives | 24,231 | 26,755 | 14,156 | 11,366 | 11,597 | (2,524 | ) | (9.4 | ) | 12,599 | 89.0 | 2,790 | 24.5 | (231 | ) | (2.0 | ) | |||||||||||||||||||||||||||||||||||
| Available-for-sale financial assets | 88,277 | 86,045 | 78,360 | 96,626 | 90,869 | 2,232 | 2.6 | 7,685 | 9.8 | (18,266 | ) | (18.9 | ) | 5,757 | 6.3 | |||||||||||||||||||||||||||||||||||||
| Held-to-maturity financial assets | 40,495 | 42,185 | 34,434 | 10,116 | 3,202 | (1,690 | ) | (4.0 | ) | 7,751 | 22.5 | 24,318 | 240.4 | 6,914 | 215.9 | |||||||||||||||||||||||||||||||||||||
| Loan operations and lease operations portfolio, net | 463,394 | 447,404 | 430,039 | 389,467 | 341,271 | 15,990 | 3.6 | 17,365 | 4.0 | 40,572 | 10.4 | 48,196 | 14.1 | |||||||||||||||||||||||||||||||||||||||
| Loan operations and lease operations portfolio | 490,366 | 474,248 | 452,431 | 411,702 | 366,984 | 16,118 | 3.4 | 21,817 | 4.8 | 40,729 | 9.9 | 44,718 | 12.2 | |||||||||||||||||||||||||||||||||||||||
| (-) Allowance for loan and lease losses | (26,972 | ) | (26,844 | ) | (22,392 | ) | (22,235 | ) | (25,713 | ) | (128 | ) | 0.5 | (4,452 | ) | 19.9 | (157 | ) | 0.7 | 3,478 | (13.5 | ) | ||||||||||||||||||||||||||||||
| Other financial assets | 53,917 | 53,506 | 53,649 | 47,592 | 44,492 | 411 | 0.8 | (143 | ) | (0.3 | ) | 6,057 | 12.7 | 3,100 | 7.0 | |||||||||||||||||||||||||||||||||||||
| Investments in associates and joint ventures | 5,073 | 4,399 | 4,090 | 3,931 | 3,005 | 674 | 15.3 | 309 | 7.6 | 159 | 4.0 | 926 | 30.8 | |||||||||||||||||||||||||||||||||||||||
| Goodwill | 9,675 | 2,057 | 1,961 | 1,905 | - | 7,618 | 370.3 | 96 | 4.9 | 56 | 2.9 | 1,905 | 100.0 | |||||||||||||||||||||||||||||||||||||||
| Fixed assets, net | 8,042 | 8,541 | 8,711 | 6,564 | 5,628 | (499 | ) | (5.8 | ) | (170 | ) | (2.0 | ) | 2,147 | 32.7 | 936 | 16.6 | |||||||||||||||||||||||||||||||||||
| Intangible assets, net | 7,381 | 6,295 | 6,134 | 5,797 | 4,671 | 1,086 | 17.3 | 161 | 2.6 | 337 | 5.8 | 1,126 | 24.1 | |||||||||||||||||||||||||||||||||||||||
| Tax assets | 44,274 | 52,149 | 35,243 | 34,742 | 32,412 | (7,875 | ) | (15.1 | ) | 16,906 | 48.0 | 501 | 1.4 | 2,330 | 7.2 | |||||||||||||||||||||||||||||||||||||
| Assets held for sale | 631 | 486 | 196 | 117 | 117 | 145 | 29.8 | 290 | 148.0 | 79 | 67.5 | - | 0.0 | |||||||||||||||||||||||||||||||||||||||
| Other assets | 10,027 | 11,611 | 13,921 | 12,142 | 9,923 | (1,584 | ) | (13.6 | ) | (2,310 | ) | (16.6 | ) | 1,779 | 14.7 | 2,219 | 22.4 | |||||||||||||||||||||||||||||||||||
| Total assets | 1,353,241 | 1,276,415 | 1,127,203 | 1,027,297 | 957,154 | 76,826 | 6.0 | 149,212 | 13.2 | 99,906 | 9.7 | 70,143 | 7.3 | |||||||||||||||||||||||||||||||||||||||
| Average interest-earning assets(1) | 1,151,430 | 1,070,450 | 955,416 | 882,472 | 784,686 | 80,980 | 7.6 | 115,034 | 12.0 | 72,944 | 8.3 | 97,786 | 12.5 | |||||||||||||||||||||||||||||||||||||||
| Average non-interest-earning assets(1) | 159,779 | 115,596 | 97,526 | 83,025 | 70,758 | 44,183 | 38.2 | 18,070 | 18.5 | 14,501 | 17.5 | 12,267 | 17.3 | |||||||||||||||||||||||||||||||||||||||
| Average total assets(1) | 1,311,209 | 1,186,046 | 1,052,942 | 965,497 | 855,444 | 125,163 | 10.6 | 133,104 | 12.6 | 87,445 | 9.1 | 110,053 | 12.9 | |||||||||||||||||||||||||||||||||||||||
(1) The average balances are calculated on a monthly basis. Please refer to section Attachments – Selected Statistical Information, item Average Balance Sheet for further details.
| As of December 31, | Variation | |||||||||||||||||||||||||||||||||||||||||||||||||||
| Liabilities | 2016 | 2015 | 2014 | 2013 | 2012 | 2016-2015 | % | 2015-2014 | % | 2014-2013 | % | 2013-2012 | % | |||||||||||||||||||||||||||||||||||||||
| (In millions of R$, except percentages) | ||||||||||||||||||||||||||||||||||||||||||||||||||||
| Deposits | 329,414 | 292,610 | 294,773 | 274,383 | 243,200 | 36,804 | 12.6 | (2,163 | ) | (0.7 | ) | 20,390 | 7.4 | 31,183 | 12.8 | |||||||||||||||||||||||||||||||||||||
| Securities sold under repurchase agreements | 349,164 | 336,643 | 288,683 | 266,682 | 267,405 | 12,521 | 3.7 | 47,960 | 16.6 | 22,001 | 8.2 | (723 | ) | (0.3 | ) | |||||||||||||||||||||||||||||||||||||
| Financial liabilities held for trading | 519 | 412 | 520 | 371 | 642 | 107 | 26.0 | (108 | ) | (20.8 | ) | 149 | 40.2 | (271 | ) | (42.2 | ) | |||||||||||||||||||||||||||||||||||
| Derivatives | 24,698 | 31,071 | 17,350 | 11,405 | 11,069 | (6,373 | ) | (20.5 | ) | 13,721 | 79.1 | 5,945 | 52.1 | 336 | 3.0 | |||||||||||||||||||||||||||||||||||||
| Interbank market debt | 135,483 | 156,886 | 122,586 | 111,376 | 97,073 | (21,403 | ) | (13.6 | ) | 34,300 | 28.0 | 11,210 | 10.1 | 14,303 | 14.7 | |||||||||||||||||||||||||||||||||||||
| Institutional market debt | 96,239 | 93,918 | 73,242 | 72,055 | 72,028 | 2,321 | 2.5 | 20,676 | 28.2 | 1,187 | 1.6 | 27 | 0.0 | |||||||||||||||||||||||||||||||||||||||
| Other financial liabilities | 71,832 | 68,715 | 71,492 | 61,274 | 50,255 | 3,117 | 4.5 | (2,777 | ) | (3.9 | ) | 10,218 | 16.7 | 11,019 | 21.9 | |||||||||||||||||||||||||||||||||||||
| Reserves for insurance and private pension | 154,076 | 129,305 | 109,778 | 99,023 | 90,318 | 24,771 | 19.2 | 19,527 | 17.8 | 10,755 | 10.9 | 8,705 | 9.6 | |||||||||||||||||||||||||||||||||||||||
| Liabilities for capitalization plans | 3,147 | 3,044 | 3,010 | 3,032 | 2,892 | 103 | 3.4 | 34 | 1.1 | (22 | ) | (0.7 | ) | 140 | 4.8 | |||||||||||||||||||||||||||||||||||||
| Provisions | 20,909 | 18,994 | 17,027 | 18,862 | 19,209 | 1,915 | 10.1 | 1,967 | 11.6 | (1,835 | ) | (9.7 | ) | (347 | ) | (1.8 | ) | |||||||||||||||||||||||||||||||||||
| Tax liabilities | 5,836 | 4,971 | 4,465 | 3,794 | 7,109 | 865 | 17.4 | 506 | 11.3 | 671 | 17.7 | (3,315 | ) | (46.6 | ) | |||||||||||||||||||||||||||||||||||||
| Other liabilities | 27,110 | 25,787 | 23,660 | 20,848 | 19,956 | 1,323 | 5.1 | 2,127 | 9.0 | 2,812 | 13.5 | 892 | 4.5 | |||||||||||||||||||||||||||||||||||||||
| Total liabilities | 1,218,427 | 1,162,356 | 1,026,586 | 943,105 | 881,156 | 56,071 | 4.8 | 135,770 | 13.2 | 83,481 | 8.9 | 61,949 | 7.0 | |||||||||||||||||||||||||||||||||||||||
| Capital | 97,148 | 85,148 | 75,000 | 60,000 | 45,000 | 12,000 | 14.1 | 10,148 | 13.5 | 15,000 | 25.0 | 15,000 | 33.3 | |||||||||||||||||||||||||||||||||||||||
| Treasury shares | (1,882 | ) | (4,353 | ) | (1,328 | ) | (1,854 | ) | (1,523 | ) | 2,471 | (56.8 | ) | (3,025 | ) | 227.8 | 526 | (28.4 | ) | (331 | ) | 21.7 | ||||||||||||||||||||||||||||||
| Additional paid-in capital | 1,785 | 1,733 | 1,508 | 984 | 888 | 52 | 3.0 | 225 | 14.9 | 524 | 53.3 | 96 | 10.8 | |||||||||||||||||||||||||||||||||||||||
| Appropriated reserves | 3,443 | 10,067 | 8,210 | 13,468 | 22,423 | (6,624 | ) | (65.8 | ) | 1,857 | 22.6 | (5,258 | ) | (39.0 | ) | (8,955 | ) | (39.9 | ) | |||||||||||||||||||||||||||||||||
| Unappropriated reserves | 25,362 | 20,947 | 16,301 | 12,138 | 7,379 | 4,415 | 21.1 | 4,646 | 28.5 | 4,163 | 34.3 | 4,759 | 64.5 | |||||||||||||||||||||||||||||||||||||||
| Cumulative other comprehensive income | (3,274 | ) | (1,290 | ) | (431 | ) | (1,513 | ) | 1,735 | (1,984 | ) | 153.8 | (859 | ) | 199.3 | 1,082 | (71.5 | ) | (3,248 | ) | (187.2 | ) | ||||||||||||||||||||||||||||||
| Total stockholders’ equity attributed to the owners of the parent company | 122,582 | 112,252 | 99,260 | 83,223 | 75,902 | 10,330 | 9.2 | 12,992 | 13.1 | 16,037 | 19.3 | 7,321 | 9.6 | |||||||||||||||||||||||||||||||||||||||
| Non-controlling interests | 12,232 | 1,807 | 1,357 | 969 | 96 | 10,425 | 576.9 | 450 | 33.2 | 388 | 40.0 | 873 | 909.4 | |||||||||||||||||||||||||||||||||||||||
| Total stockholders' equity | 134,814 | 114,059 | 100,617 | 84,192 | 75,998 | 20,755 | 18.2 | 13,442 | 13.4 | 16,425 | 19.5 | 8,194 | 10.8 | |||||||||||||||||||||||||||||||||||||||
| Total liabilities and stockholders’ equity | 1,353,241 | 1,276,415 | 1,127,203 | 1,027,297 | 957,154 | 76,826 | 6.0 | 149,212 | 13.2 | 99,906 | 9.7 | 70,143 | 7.3 | |||||||||||||||||||||||||||||||||||||||
| Average interest-bearing liabilities(1) | 969,461 | 875,904 | 793,069 | 738,535 | 649,026 | 93,557 | 10.7 | 82,835 | 10.4 | 54,534 | 7.4 | 89,509 | 13.8 | |||||||||||||||||||||||||||||||||||||||
| Average non-interest-bearing liabilities(1) | 214,024 | 203,376 | 169,247 | 148,215 | 130,293 | 10,648 | 5.2 | 34,129 | 20.2 | 21,032 | 14.2 | 17,922 | 13.8 | |||||||||||||||||||||||||||||||||||||||
| Total average stockholders’ equity(1) | 127,724 | 106,766 | 90,626 | 78,747 | 76,125 | 20,958 | 19.6 | 16,140 | 17.8 | 11,879 | 15.1 | 2,622 | 3.4 | |||||||||||||||||||||||||||||||||||||||
| Total average liabilities and stockholders’ equity(1) | 1,311,209 | 1,186,046 | 1,052,942 | 965,497 | 855,444 | 125,163 | 10.6 | 133,104 | 12.6 | 87,445 | 9.1 | 110,053 | 12.9 | |||||||||||||||||||||||||||||||||||||||
(1) The average balances are calculated on a monthly basis. Please refer to section Attachments – Selected Statistical Information, item Average Balance Sheet for further details.
A-15
| For the Ended December 31, | Variation | |||||||||||||||||||||||||||||||||||||||||||||||||||
| Statement of Income | 2016 | 2015 | 2014 | 2013 | 2012 | 2016-2015 | % | 2015-2014 | % | 2014-2013 | % | 2013-2012 | % | |||||||||||||||||||||||||||||||||||||||
| (In millions of R$, except percentages) | ||||||||||||||||||||||||||||||||||||||||||||||||||||
| Banking Product | 118,661 | 92,011 | 91,657 | 79,387 | 81,172 | 26,650 | 29.0 | 354 | 0.4 | 12,270 | 15.5 | (1,785 | ) | (2.2 | ) | |||||||||||||||||||||||||||||||||||||
| Losses on Loans and Claims | (22,122 | ) | (21,335 | ) | (15,801 | ) | (14,870 | ) | (21,354 | ) | (787 | ) | 3.7 | (5,534 | ) | 35.0 | (931 | ) | 6.3 | 6,484 | (30.4 | ) | ||||||||||||||||||||||||||||||
| Banking Product Net of Losses on Loans and Claims | 96,539 | 70,676 | 75,856 | 64,517 | 59,818 | 25,863 | 36.6 | (5,180 | ) | (6.8 | ) | 11,339 | 17.6 | 4,699 | 7.9 | |||||||||||||||||||||||||||||||||||||
| General and Administrative Expenses | (50,904 | ) | (47,626 | ) | (42,550 | ) | (39,914 | ) | (38,080 | ) | (3,278 | ) | 6.9 | (5,076 | ) | 11.9 | (2,636 | ) | 6.6 | (1,834 | ) | 4.8 | ||||||||||||||||||||||||||||||
| Tax Expenses | (7,971 | ) | (5,405 | ) | (5,063 | ) | (4,341 | ) | (4,497 | ) | (2,566 | ) | 47.5 | (342 | ) | 6.8 | (722 | ) | 16.6 | 156 | (3.5 | ) | ||||||||||||||||||||||||||||||
| Share of profit or (loss) in associates and joint ventures | 528 | 620 | 565 | 603 | 175 | (92 | ) | (14.8 | ) | 55 | 9.7 | (38 | ) | (6.3 | ) | 428 | 244.6 | |||||||||||||||||||||||||||||||||||
| Current Income Tax and Social Contribution | (3,898 | ) | (8,965 | ) | (7,209 | ) | (7,503 | ) | (7,716 | ) | 5,067 | (56.5 | ) | (1,756 | ) | 24.4 | 294 | (3.9 | ) | 213 | (2.8 | ) | ||||||||||||||||||||||||||||||
| Deferred Income Tax and Social Contribution | (10,712 | ) | 16,856 | 262 | 3,160 | 3,491 | (27,568 | ) | (163.6 | ) | 16,594 | 6,333.6 | (2,898 | ) | (91.7 | ) | (331 | ) | (9.5 | ) | ||||||||||||||||||||||||||||||||
| Net Income | 23,582 | 26,156 | 21,861 | 16,522 | 13,191 | (2,574 | ) | (9.8 | ) | 4,295 | 19.6 | 5,339 | 32.3 | 3,331 | 25.3 | |||||||||||||||||||||||||||||||||||||
| Net Income Attributable to Owners of the Parent Company | 23,263 | 25,740 | 21,555 | 16,424 | 12,634 | (2,477 | ) | (9.6 | ) | 4,185 | 19.4 | 5,131 | 31.2 | 3,790 | 30.0 | |||||||||||||||||||||||||||||||||||||
| Net Income Attributable to Non-Controlling Interests | 319 | 416 | 306 | 98 | 557 | (97 | ) | (23.3 | ) | 110 | 35.9 | 208 | 212.2 | (459 | ) | (82.4 | ) | |||||||||||||||||||||||||||||||||||
| For the Year Ended December 31, | ||||||||||||||||||||
| Earnings and Dividends per Share | 2016 | 2015 | 2014 | 2013 | 2012 | |||||||||||||||
| (In R$, except number of shares) | ||||||||||||||||||||
| Basic earnings per share(1) (2) | ||||||||||||||||||||
| Common | 3.57 | 3.91 | 3.26 | 2.48 | 1.91 | |||||||||||||||
| Preferred | 3.57 | 3.91 | 3.26 | 2.48 | 1.91 | |||||||||||||||
| Diluted earnings per share(1) (2) | ||||||||||||||||||||
| Common | 3.54 | 3.89 | 3.24 | 2.47 | 1.90 | |||||||||||||||
| Preferred | 3.54 | 3.89 | 3.24 | 2.47 | 1.90 | |||||||||||||||
| Dividends and interest on stockholders’ equity per share(3) | ||||||||||||||||||||
| Common | 1.58 | 1.24 | 1.22 | 1.03 | 1.00 | |||||||||||||||
| Preferred | 1.58 | 1.24 | 1.22 | 1.03 | 1.00 | |||||||||||||||
| Weighted average number of shares outstanding - basic(1) | ||||||||||||||||||||
| Common | 3,351,741,143 | 3,351,741,143 | 3,351,741,143 | 3,351,741,143 | 3,351,741,143 | |||||||||||||||
| Preferred | 3,171,215,661 | 3,228,881,081 | 3,266,347,063 | 3,257,578,674 | 3,263,003,810 | |||||||||||||||
| Weighted average number of shares outstanding - diluted(1) | ||||||||||||||||||||
| Common | 3,351,741,143 | 3,351,741,143 | 3,351,741,143 | 3,351,741,143 | 3,351,741,143 | |||||||||||||||
| Preferred | 3,216,235,372 | 3,270,734,307 | 3,305,545,129 | 3,289,183,380 | 3,295,238,153 | |||||||||||||||
| (1) | Per share information relating to 2015, 2014, 2013 and 2012 have been retrospectively adjusted for the share bonus distribution which occurred in 2016, 2015, 2014 and 2013 as appropriate. |
| (2) | Earnings per share have been computed following the “two class method” set forth by IAS 33 Earnings Per Share. Please refer to section Our Profile, item Our shares, Information for the Investor, Stockholders' Payment for further details of our two classes of stock. Please refer to section Performance, item Consolidated Financial Statements (IFRS), Note 28 - Earnings per Share for further details of calculation of earnings per share. |
| (3) | Please refer to section Our Profile, item Our shares, Information for the Investor, Stockholders' Payment and section Our Risk Management, item Regulatory Enviroment for further details. Please refer to section Performance, item Consolidated Financial Statements (IFRS), Note 21b - Stockholders Equity - Dividends for further details. |
| For the Year Ended December 31, | ||||||||||||||||||||
| Earnings and Dividends per Share | 2016 | 2015(1) | 2014(1) | 2013(1) | 2012(1) | |||||||||||||||
| (In US$) | ||||||||||||||||||||
| Dividends and interest on stockholders’ equity per share(2) (3) | ||||||||||||||||||||
| Common | 0.48 | 0.32 | 0.46 | 0.44 | 0.49 | |||||||||||||||
| Preferred | 0.48 | 0.32 | 0.46 | 0.44 | 0.49 | |||||||||||||||
| (1) | Per share information relating to 2015, 2014, 2013 and 2012 have been retrospectively adjusted for the share bonus distribution which occurred in 2016, 2015, 2014 and 2013 as appropriate. |
| (2) | Under Brazilian Corporate Law, we are allowed to pay interest on stockholders’ equity as an alternative to paying dividends to our stockholders. Please refer to section Our Profile, item Our shares, Information for the Investor, Stockholders' Payment and section Our Risk Management, item Regulatory Enviroment for further details of interest on stockholders’ equity. |
| (3) | Converted into US$ fromreais at the selling rate established by the Central Bank at the end of the year in which dividends or interest on stockholders’ equity were paid or declared, as the case may be. |
Selected consolidated ratios
| As of the Year Ended December 31, | ||||||||||||||||||||
| Liquidity and Capital | 2016 | 2015 | 2014 | 2013 | 2012 | |||||||||||||||
| (%) | ||||||||||||||||||||
| Loans and leases as a percentage of total deposits(1) | 148.9 | 162.1 | 153.5 | 150.0 | 150.9 | |||||||||||||||
| Total stockholders' equity as a percentage of total assets(2) | 10.0 | 8.9 | 8.9 | 8.2 | 7.9 | |||||||||||||||
| (1) | Loans and leases operations as of year-end divided by total deposits as of year-end. |
| (2) | Total stockholders' equity as of year-end divided by total assets as of year-end. |
A-16
Corporate events
Changes to management
On November 9, 2016 we disclosed the succession of the current CEO, in accordance with the established transition process planned and announced to the market over two years ago. We also announced a series of changes to our Executive Committee. Please refer to section Our Governance, item Our Directors and Executive Officers for further details about the changes to our management.
10% Share bonus of Itaú Unibanco
In October 2016, our stockholders were granted one new share for each ten shares of the same class. The unit cost of R$20.05 was assigned to these shares, impacting the average price for our stockholders. For the fourth consecutive year, we granted our stockholders a 10% bonus in shares and a monthly dividend which remained at R$0.015 per share. Therefore, taking into account the last four share bonuses which we granted in the last four years, there would be a 46% increase in the monthly amounts granted to stockholders.
Share buyback program
In 2016, we acquired 31,439,000 of our non-voting shares for R$947.4 million at an average price of R$30.13 per share. The amount of shares acquired and the average price were adjusted in accordance with the 10% share bonus in October 2016. This average price also includes settlement and brokerage fees.
The share buyback process is aimed at (i) maximizing the capital allocation through the efficient application of available funds, (ii) arranging for the delivery of shares to our employees and members of our management and that of our subsidiaries under the scope of remuneration models and long-term incentive plans; and (iii) using the shares acquired if business opportunities arise in the future.
Cancellation of treasury shares
In June 2016, after obtaining regulatory approvals, we cancelled 100 million of our non-voting treasury shares, with no change to our capital stock.
The acquisition of our shares, with their subsequent cancellation increases the stockholder's interest percentage in our capital and, should the net income and the distribution of earnings percentage be maintained, it will enable a higher return on dividends and interest on capital to remaining shareholders.
The balance of treasury shares reached 69,604,462 non-voting shares in December 2016, equivalent to 2.2% of the free float of the same type. Additionally, in January 2017, we repurchased 6.35 million non-voting shares.
Payment of dividends
On August 1, 2016, our Board of Directors declared interest on capital, in the amount of R$0.39900 per share (or R$0.33915 per share, net of taxes) which was paid out on August 25, 2016 to all stockholders of record as of the close of trading on August 12, 2016.
On December 9, 2016, our Board of Directors declared interest on capital in the amount of R$0.47140 per share (or R$0.40069 per share, net of taxes) which was paid out on March 3, 2017 (as our Board of Directors declared on February 6, 2017) to all stockholders of record as of the close of trading on December 22, 2016.
On February 6, 2017, our Board of Directors changed the payment of dividends and interest on own capital of Itaú Unibanco, which will be in a range from 35% to 45% of the recurring consolidated net income in the next years. In this context, it was approved interest on capital in the amount of R$0.77540 per share (or R$0.65909 per share, net of taxes) which was paid out on March 3, 2017 to all stockholders of record as of the close of trading on February 20, 2017. It is important to note that the net payout range is subject to changes due to mergers and acquisitions, changes in tax regulation, regulatory changes and significant changes in risk-weighted assets (RWA). Events that may change the net payout described above are not exhaustive, that is, they are examples of situations that may affect payout. The net payout range is subject to changes, but always considers the minimum distribution provided for in our Bylaws.
Accordingly, the total interest on own capital paid on March 3, 2017, net of income tax, was R$ 1.05978 per share.
Adding the amounts distributed during the fiscal year 2016 to the amount that was distributed on March 3, 2017, our shareholders received R$1.5789 per share (net of income tax), totaling R$10.0 billion in dividends and interest on own capital, an amount which equals 45% of the recurring consolidated net income for 2016, an increase of 36.9% compared to the fiscal year 2015. If we consider the consolidated net income, the payout was increased from 31.3% in 2015 to 46.2% in 2016.
A-17
Mergers, acquisitions and partnerships
Credit Intelligence Bureau
In January 2016, we announced that our subsidiary Itaú Unibanco S.A. entered into a non-binding memorandum of understanding (MoU) with Banco Bradesco S.A., Banco do Brasil S.A., Banco Santander (Brasil) S.A. and Caixa Econômica Federal in order to create a credit intelligence bureau, or CIB. CIB will be structured as a Brazilian corporation (sociedade por ações) and the parties to the MoU will share its control, with each of them holding a 20% equity ownership. Its board of directors will be comprised of members appointed by the parties to the MoU and its executives will be exclusively dedicated to CIB’s businesses, preserving the independent nature of CIB’s management. CIB’s technical and analytical platform will be developed and implemented through a services agreement with LexisNexis® Risk Solutions FL Inc.
In November 2016, CADE approved CIB’s incorporation with certain restrictions. Therefore, all the required regulatory approvals have been obtained. CIB’s incorporation is subject to the execution of definitive agreements.
Acquisition of Recovery do Brasil Consultoria S.A.
In March 2016, after obtaining regulatory authorization, we consummated the acquisition of (i) 89.08% interest in the capital stock of Recovery do Brasil Consultoria S.A., of which we purchased 81.94% from Banco BTG Pactual S.A. (BTG) and 7.14% from other shareholders, as well as (ii) approximately 70% of a portfolio of R$38 billion in credit rights held by BTG.
Itaú CorpBanca
In April 2016, we closed the merger of Banco Itaú Chile with and into CorpBanca and, as a result, acquired control of the resulting entity – Itaú CorpBanca. On that same date, we entered into the Shareholders’ Agreement of Itaú CorpBanca (“Itaú CorpBanca’s Shareholders’ Agreement”), which entitles us to appoint, together with Corp Group, former controlling shareholder of CorpBanca, the majority of the members of Itaú CorpBanca’s board of directors. Such members are appointed according to the ownership interest of each of such parties, and we have the right to elect the majority of the members elected by this block. Also on that same date, Itaú Unibanco consolidated Itaú CorpBanca in its financial statements, adding approximately R$114 billion of assets to its balance sheet.
In October 2016, we acquired 10.9 billion shares of Itaú CorpBanca for approximately R$288.1 million, as set forth in Itaú CorpBanca’s Shareholders’ Agreement, and increased from 33.58% to 35.71%, without changing the governance of Itaú CorpBanca.
In January 2017, we executed an amendment to the transaction agreement, which provided for (i) the postponement of the date of acquisition of the shares held by Corp Group in Banco CorpBanca Colombia S.A. (“CorpBanca Colombia”) from January 29, 2017 to January 28, 2022, subject to receipt of applicable regulatory approvals; (ii) the modification of the previously defined structure for the combination of the operations of Itaú Unibanco and Itaú CorpBanca in Colombia, which will be implemented through a sale and purchase of assets and liabilities; and (iii) the replacement of the obligation to consummate an initial public offering (IPO) of CorpBanca Colombia for the obligation to register CorpBanca Colombia as a public company and list its shares on the Colombian stock exchange
Alliance with MasterCard in the payment solutions market in Brazil
In May 2016, the Court of CADE approved, with certain restrictions, a sevenyear term agreement between our subsidiary Itaú Unibanco S.A. and MasterCard Brasil Soluções de Pagamento Ltda., or MasterCard, to create an alliance in the payment solutions market in Brazil (the Strategic Alliance), to operate, through a company controlled by MasterCard, a new electronic payment network under a brand with domestic and international acceptance.
Sale of group life insurance business
In September 2016, we entered into an agreement for the sale of our group life insurance operations to Prudential do Brasil Seguros de Vida S.A. The transfer of shares and the financial settlement of this transaction will take place after compliance with certain conditions provided for in the agreement. This transaction reinforces our strategy, which has already been disclosed, to focus on mass-market insurance products that are typically related to retail banking.
Acquisition of Citibank retail business in Brazil
In October 2016, we entered into an Equity Interest Purchase Agreement with Citibank for the acquisition of its retail business in Brazil, including loans, deposits, credit cards, branches, on-shore wealth management and insurance brokerage, as well as the equity investments held by Citibank in TECBAN – Tecnologia Bancária S.A. and in CIBRASEC – Companhia Brasileira de Securitização.
Citibank’s retail business in Brazil (which includes 71 branches) had, as of the date of execution of the Equity InterestPurchase Agreement, approximately 315,000 retail bank clients, approximately 1.1 million credit cards and a credit portfolio
A-18
of approximately R$6 billion and, as of December 31, 2015, approximately R$35 billion in deposits and assets under management. We estimate that the impact on our principal capital (Tier I) resulting from this transaction would be approximately 40 basis points (utilizing the Basel III methodologies).
The completion of this transaction is subject to compliance with certain conditions, including obtaining approvals from the Central Bank of Brazil and CADE.
Acquisition of Itaú BMG Consignado shares
In December 2016, after obtaining the required regulatory authorizations and fulfilling conditions, we consummated the acquisition of the totality of the equity interest held by BMG in Banco Itaú BMG Consignado S.A., corresponding to 40% of Itaú BMG Consignado’s total share capital. We paid R$1.46 billion and are now the holders of 100% of the total capital.
We have maintained our position as the leading institution among privately-held banks in this segment. At December 31, 2016, our payroll loan portfolio amounted to R$44.6 billion, including Itaú BMG Consignado’s operations.
Awards and recognition
In 2016, we received a series of awards and acknowledgements helping to strengthen our reputation. A few of our most significant awards and acknowledgements are listed below:
Latin American Excellence Awards (Communication Director magazine – January 2016) -Itaú was granted this awardin the CSR Report category, with its 2014 Integrated Report. The Latin American Excellence Awards recognizes Public Relations and Communications achievements among the companies from Latin America applying for the award. It is organized by Communication Director magazine, a European quarterly publication, headquartered in Germany, targeting global decision makers in the areas of corporate communications, public relations and public affairs. Its international coverage reaches all five continents.
Company Award 2016 (Trade Finance - January 2016) -Itaú BBA won the Company Award 2016 in the category Besttrade bank in Brazil. This award is organized by Trade Finance, the financial news and operation analysis service unit of Euromoney.
IF Design Award (International Forum Design GmbH – January 2016) -The International Forum Design has over 60years of existence and is considered one of the highest acknowledgments in the world. The winners receive the IF quality seal, a symbol acknowledged globally as the apex of excellence in the market. Itaú's awarded project was Cubo, in the Communication discipline, and category 3.05 Brand Identity.
International Visual Identity Awards (Left Bank - February 2016) -Itaú won the award in the Financial Servicescategory. The International Visual Identity Awards is an independent competition, not related to any media large company or corporation. It was designed by people with a passion for good design and has a partnership with Left Bank. This was the third edition of the award.
Deals of the Year (The Banker – April 2016) -Itaú BBA was acknowledged in the 'Americas - Equities' category, with thefollow-on for Telefônica company, a transaction that raised R$16.1 billion.
2016 'Valor' Executive (Valor Econômico magazine – May 2016) -In the 16th edition of this award, Roberto Setubal wasthe executive elected in the "Banks and Financial Services" sector.
Efinance Award (Financial Executives – May 2016) -Itaú BBA was acknowledged in the Process Management category.Itaú Unibanco was acknowledged in the FinTech category, with the 'Cubo' case. Rede was acknowledged in the B2B channels category.
The Best of São Paulo – Services (Folha de S. Paulo newspaper – May 2016) -For the second consecutive year, ItaúUnibanco was the winner in the Internet Banking category.
The Most Valuable Brands (O Estado de S. Paulo – June 2016)- Itaú ranked first in the "Banks" category, second in the"Savings" category, and third in the "Insurance companies" category.
Exame's Best and Largest Companies (Exame magazine – June 2016)- In the 43rdedition of this award, Itaú Unibancowas the number one in the “200 largest groups" and “50 Largest Banks" rankings. At the “100 Largest Publicly-Held Companies" ranking, it ranked 2nd. At the "Mergers and Acquisitions" ranking, Itaú BBA/Itaú was ranked 2nd. At the “50 Largest Insurance Companies", Itaú Seguros ranked 10th; Itaú Auto e Residência ranked 17th; and Itaú Vida ranked 28th.
A-19
Valor Inovação Brasil 2016 (Valor Innovation Brazil 2016) Award (Valor Econômico magazine – July 2016)- ItaúUnibanco ranked first in the Financial Services sector.
Top 1000 World Banks 2016 (The Banker – July 2016) -Itaú Unibanco was the winner in the Top 25–Latin Americaand the Caribbean ranking.
Project & Infrastructure Finance Awards (Latin Finance - July 2016)- Itaú BBA was recognized in the BestInfrastructure Bank Brazil category.
Anuário Época Negócios 360º (Época Negócios Directory 360º) (Época Negócios magazine – August 2016)- ItaúUnibanco was presented as the winner in the Banking sector in this directory. Additionally, Itaú Seguros ranked among the 60 top companies in the global ranking of the best 300 in the 5th edition of the directory.
Mais Valor Produzido (MVP) – Bancos 2016 (More Created Value – Banks 2016) Ranking (Dom Strategy Partners – August 2016) -Itaú Unibanco was chosen as the bank with the highest perception of value by its stakeholders for the thirdconsecutive year.
As Melhores da Dinheiro 2016 (The Best of Dinheiro 2016) (Isto É Dinheiro magazine – September 2016)- In the 14thedition of this award, Itaú Unibanco was chosen as the Company of the Year and also The Best Bank.
Prêmio Ouvidorias Brasil 2016 (Brazil Ombudsman Offices Award) ABRAREC (Brazilian Association of Customer-Company Relations) and Grupo Padrão – September 2016 -Itaú Unibanco received this award with the Solução Perto deVocê (Close to you solution) case.
Empresa Pró-Ética (Companies Promoting Ethics) (Ministry of Transparency, Inspection and General Controllership of the Federal Government – November 2016) -Itaú Unibanco was among the 25 companies awarded for taking part in thepromotion of a fairer and more ethical and transparent corporate environment in Brazil.
Empresas Líderes em Transparência (Leading Companies in Transparency) (CDP Latin America – December 2016)-For the third consecutive year, Itaú Unibanco was recognized among the leading companies in terms of transparency.
Bank of the Year (The Banker – December 2016) -Itaú Unibanco was named the "Bank of the Year - Brazil" by TheBanker magazine.
As Marcas Brasileiras Mais Valiosas (Brazilian Most Valuable Brands) (Interbrands – December 2016) - For the 13thtime, Itaú Unibanco ranked top on the list of the most valuable brands in Brazil, valued at R$ 26.6 billion, up 8% compared to 2015.
Subsequent events
On April 19, 2017, the following changes in the composition of the Board of Directors were proposed and approved at the Annual and Extraordinary General Meeting:
• Candido Bracher, who becomes Chief Executive Officer replacing Roberto Setubal, is no longer a Board member but continues to attend the Board’s meeting as an invited member. In order to fulfill his vacancy in the Board of Directors, was elected Marco Bonomi, the General Retail Manager until late 2016, who has reached the limit age for performing executive functions after 22 years in the Company.
• João Moreira Salles, officer of Brasil Warrant Administração de Bens e Empresas, was elected to one of the vacancies to represent the controlling stockholders in the Board of Directors, pursuant to the provisions of the Company’s Stockholders’ Agreement, replacing Demosthenes Madureira de Pinho Neto, who leaves the Board.
• Alfredo Villela has informed the Board that he leaves his management position in the Company. Geraldo Carbone, who had been a Board member from 2006 to 2008 and Executive Vice-President from 2008 to 2011, was elected for his position for the next term of office, pursuant to the provisions of the Company’s Stockholders’ Agreement.
• Nildemar Secches has informed the Board that he leaves his management position in the Company. To fill this vacancy, Amos Genish, one of the founders and a former CEO of GVT and a former CEO of Telefônica Brasil, was elected as an independent member.
• Alfredo Setubal, Fábio Colletti Barbosa, Gustavo Loyola, José Galló, Pedro Bodin, Pedro Moreira Salles, Ricardo Villela Marino, and Roberto Setubal were reelected.
• Pedro Moreira Salles and Roberto Setubal will serve as co-chairman of the Board of Directors.
*The elections and reelections mentioned above are pending of approval by the Brazilian Central Bank.
A-20
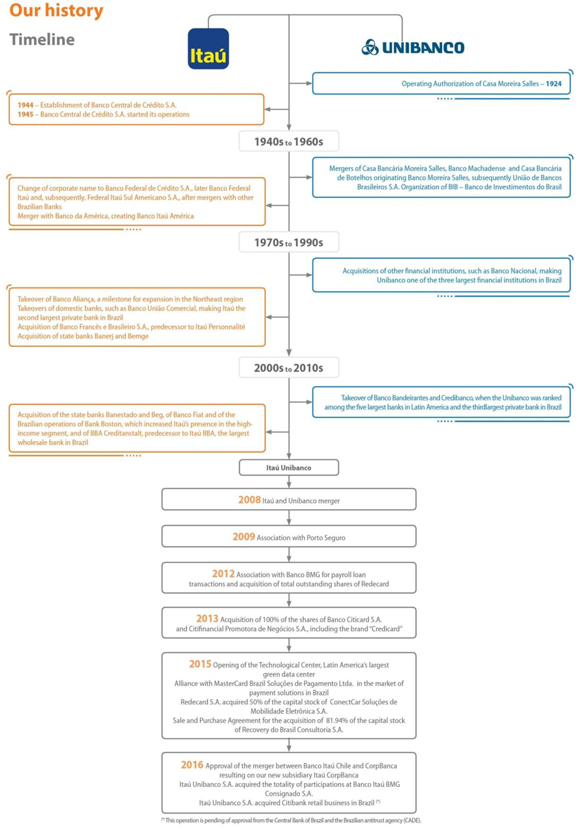
Our history begins back in 1924, when Casa Moreira Salles, founded by João Moreira Salles in Poços de Caldas, Minas Gerais, received the letter patent issued by the Brazilian Government, which allowed it to operate as a banking section, i.e., as a correspondent of the state mainstream banks. This entity eventually became Unibanco.
A-21
On the other hand, Itaú was established about two decades later, in 1945, when Alfredo Egydio de Souza Aranha, a businessman in the textile industry, and his partner Aloysio Ramalho Foz founded Banco Central de Crédito S.A., which was located in downtown São Paulo.
Gradually João Moreira Salles passed the management of Casa Moreira Salles to his son Walther Moreira Salles, who took over in 1933 while he was still a law student. In 1959, Alfredo Egydio transferred the management to his nephew Olavo Setubal, who counted on the support of the founder's son-in-law, Eudoro Villela, in this new venture.
During their separate histories, Itaú and Unibanco exhibited a number of common attributes such as their concern for ethics and transparency in doing business, adherence to the law and appreciation of their employees. The two organizations also shared the same close relationship with their clients by understanding their needs and their economic circumstances, thereby allowing the institutions to support businesses expansion by means of innovative services.
Pioneering in the dissemination of the use of technology to process banking transactions and services offered to clients, the two institutions made heavy investments in automation and support of modern operational centers. Moreover, the expansion on the basis of mergers, acquisitions and incorporations is another constant characteristic of the evolution of both banks.
Another element common to the two institutions was the support of arts and culture and the social and environmental responsibility that are manifested in Instituto Itaú Cultural and, in the social realm, in Fundação Itaú Social and Instituto Unibanco.
After nine decades of history, we continue to follow the principles and values of those who laid the foundations of what we are and, like them, we remain focused on the future to build a better world for future generations. For this reason, sustainability is a concept that permeates our organization and is widespread in our culture.
Today we are one of the largest banks in the world with international operations and deep roots in Latin America. Our commitment to Brazil leads us to serve as an agent of transformation of the society by working for great causes, such as culture, education, sports and urban mobility, continuously seeking the common good and contributing to the country's development.
Our vision, Our culture
Driven by the change in the context of our businesses, by customer requirements and the transformation in the organization, in 2015, we saw the need to underscore a series of attitudes in our culture known as Our Way (Nosso Jeito).
Since then, Our Way has evolved into seven attitudes, comprising the means whereby we intend to achieve our vision: To be the leading bank in sustainable performance and customer satisfaction.
Our Way_
1_it’s only good for us if it’s good for the client_
2_we’re passionate about performance_
3_people mean everything to us_
4_the best argument is the one that matters_
5_simple. always_
6_we think and act like owners_
7_ethics are non-negotiable_
The launch of Our Way took place at the Meeting among Leaders, which year after year constitutes one of the principal initiatives we use for reinforcing our culture.
Meeting among Leaders
Held annually since 2010, the objective of this event is to align the leadership of the organization with our strategy, ensuring the commitment and continuous engagement of our employees. In 2016, the event had an audience of 720 leaders and as its core theme, Digital Culture.
In addition to the Meeting, other initiatives were adopted for disseminating our culture:
Walther Moreira Salles Award: an annual event for enhancing the organizational culture by highlighting exceptional projects and practices on the part of Itaú Unibanco’s employees. In 2016, there were five award categories (leadership, innovation, efficiency, risk management and customer satisfaction) with 40 winners.
Alignment to Our Way Survey: a survey designed to evaluate the degree of alignment of the employees with the attitudes of our culture. In 2016, we launched the survey following the announcement of Our Way at the Meeting among Leaders. We had a total of 40,078 respondents out of the 85,622 employees invited to take part.
The number of employees within Itaú Unibanco increased from 90,320 in 2015 to 94,779 in 2016, mainly due to the consolidation of Itaú CorpBanca as from the second quarter of 2016.
A-22
The tables below show the total number of employees for the years ended December 31, 2016, 2015 and 2014, segmented by region (Brazil and abroad) and operating unit:
| Employees | As of December 31, | Variation | ||||||||||||||||||||||||||
| (Brazil and abroad) | 2016 | 2015 | 2014 | 2016-2015 | 2015-2014 | |||||||||||||||||||||||
| In Brazil | 80,871 | 83,481 | 86,192 | (2,610 | ) | (3.1 | )% | (2,711 | ) | (3.1 | )% | |||||||||||||||||
| Abroad | 13,908 | 6,839 | 6,983 | 7,069 | 103.4 | % | (144 | ) | (2.1 | )% | ||||||||||||||||||
| Argentina | 1,647 | 1,607 | 1,679 | 40 | 2.5 | % | (72 | ) | (4.3 | )% | ||||||||||||||||||
| Chile | 5,919 | 2,539 | 2,563 | 3,380 | 133.1 | % | (24 | ) | (0.9 | )% | ||||||||||||||||||
| Colombia | 3,754 | - | - | 3,754 | - | - | - | |||||||||||||||||||||
| Uruguay | 1,134 | 1,170 | 1,176 | (36 | ) | (3.1 | )% | (6 | ) | (0.5 | )% | |||||||||||||||||
| Paraguay | 806 | 799 | 789 | 7 | 0.9 | % | 10 | 1.3 | % | |||||||||||||||||||
| Europe | 200 | 216 | 233 | (16 | ) | (7.4 | )% | (17 | ) | (7.3 | )% | |||||||||||||||||
| Other | 448 | 508 | 543 | (60 | ) | (11.8 | )% | (35 | ) | (6.4 | )% | |||||||||||||||||
| Total | 94,779 | 90,320 | 93,175 | 4,459 | 4.9 | % | (2,855 | ) | (3.1 | )% | ||||||||||||||||||
| Employees | As of December 31, | Variation | ||||||||||||||||||||||||||
| (by operating unit) | 2016 | 2015 | 2014 | 2016-2015 | 2015-2014 | |||||||||||||||||||||||
| Retail banking | 71,159 | 72,815 | 75,143 | (1,656 | ) | (2.3 | )% | (2,328 | ) | (3.1 | )% | |||||||||||||||||
| Wholesale banking | 22,909 | 16,468 | 16,940 | 6,441 | 39.1 | % | (472 | ) | (2.8 | )% | ||||||||||||||||||
| Activities with the market and corporation | 711 | 1,037 | 1,092 | (326 | ) | (31.4 | )% | (55 | ) | (5.0 | )% | |||||||||||||||||
| Total | 94,779 | 90,320 | 93,175 | 4,459 | 4.9 | % | (2,855 | ) | (3.1 | )% | ||||||||||||||||||
The Turnover Rate is the ratio of employees hired to employees terminated (either voluntarily or involuntarily) in a given period. We monitor this rate on a monthly basis and submit it to the Executive Committee (the criteria used do not include employees outside of Brazil, apprentices, expatriates, disability retirees, officers and interns).
Turnover Rate¹

¹Turnover Rate = Total terminations / (Total employees at the beginning of the period + Total employees at the end of the period) / 2. The total employees at the end of the period considers employees at the beginning of the period plus the hiring of employees minus the employee terminations.
The Connecting Opportunities Program
The Connecting Opportunities Program has evolved from the revamping of the Reallocation Center. The Program’s objective is to retain employees aligned with the organization’s culture but for whom temporarily there is no room to grow in their current posts. The initial approach to such a situation is based on the reception of the employee and the mapping of the employee’s profile in readiness for future appointments to positions in Itaú Unibanco. Following discussions, the employee will participate in a career initiative process covering such aspects as preparing a résumé, interviewing postures and activating networking. In this way, the employee is given the support to ensure best performance during the process. In addition, the employee receives a guide with information, roles and responsibilities during the Connecting Opportunities Program. The selection team works jointly with the managers responsible for the vacancy in which the employee is interested. This work has produced positive results, with 56% of the nominated employees having found new positions in which to grow within the organization.
In 2016, most of the employee terminations occurred in the age group between 30 and 50 years old and the hiring of employees in the age group below 30 years old.
A-23
Compensation and benefits
We have adopted market parameters and compensation strategies, which vary according to the business area of each employee. We periodically verify these parameters through the commissioning of salary surveys conducted by specialized consultants, participation in surveys conducted by other banks, as well as participation in specialized forums on compensation matters.
Fixed compensation under our compensation strategy takes into account the complexity of an individual’s work duties and such individual’s performance with respect to such duties. Employees' fixed compensation changes according to the policy on promotion and merit, which takes into consideration the seniority of the employees and their performance when carrying out their duties.
The variable compensation, in turn, acknowledges the level of dedication, the results achieved and the short-term, medium-term and long-term sustainability of such results.
In addition, employees are entitled to receive salary adjustments and are entitled to profit sharing, pursuant to the collective bargaining agreements applicable in the relevant jurisdictions.
Our share-based profit-sharing plan, specifically designed for managers and senior managers, acknowledges those who stood out during the relevant year. The plan consists on granting preferred shares (ITUB4) or equivalent instruments, subject to the limits established by the Compensation Committee, to 10% of managers and 30% of senior managers. Of the total granted, one-third vests each year over a period of three years after the award, which is made in the coming year immediately after the performance year to which it relates. The number of preferred shares or share-based instruments granted is determined by the financial results of the organization/area as well as individual performance. The preferred shares or share-based instruments are delivered on the same date as the final portion of the profit-sharing payment, as determined in the relevant collective bargaining agreements. Compensation based on shares is not proportional to working time. The preferred share price is calculated on the seventh working day prior to the award, using the average price of ITUB4 on BM&FBOVESPA in the preceding thirty days from calculation.
We also have an institutional program called Partners Program, comprised of members of management and employees, in each case approved by our Personnel Committee, who had outstanding performance. Eligible employees are entitled to use part or their total annual variable compensation to purchase our preferred shares(Own Shares). If they hold the ownership of these Own Shares for three- and five-year terms as from the initial investment, the return on investment will be made through the receipt of our preferred shares(Partners Shares), also for three- and five-year terms. These Partners Shares will subsequently remain unavailable for five- and eight-year terms as from the initial investment in Own Shares. The Partners Program may also consider other instruments derived from shares as opposed to actual shares.
We provide several benefits established in the relevant collective bargaining agreements with unions, which represent many categories of employees. The conditions of such benefits are set forth in the relevant collective bargaining agreements (such as allowances for meals, nursery/nanny care for children, transportation, etc.). There are additional benefits, such as: (i) medical and dental care plans; (ii) private pension plans; (iii) group life insurance; (iv) psychosocial services; and (v) personalized treatment in the use of banking products and services. The granting of these benefits may vary according to the category of employees and/or market or regulatory considerations with respect to the relevant jurisdictions applicable to a particular employee.
Labor relations
We have a permanent channel for dialog with the labor unions representing all our employees in various professional categories. Respect, transparency and a direct relationship are among the principles involved in our dealings with these entities. These activities are executed with a focus on innovative and negotiated solutions to minimize possible differences and areas of conflict involving our employees.
We guarantee our employees the right of free association with labor unions and recognize the rights and privileges of those that may be elected to executive positions in labor unions in accordance with prevailing Brazilian legislation and the collective labor agreements for each professional category to which we are party. In addition, we permit labor unions to hold membership campaigns. When requested, we hold meetings between the entities, our managers and/or employees.
We maintain our commitment to prioritize collective negotiations and a permanent agenda of matters to be discussed with labor unions. Such an agenda allows us to resolve conflicts efficiently and underscores our commitment to a permanent and direct relationship with the entities representing the employees.
All our employees in Brazil enjoy the support of collective labor agreements which guarantee rights over and above those provided under the labor legislation in addition to other benefits that may be granted to our employees of a non-recurring nature and in line with our policies.
In the collective bargaining negotiations with the bank’s employees during 2016, the financial sector suffered 22 business days of strikes with an average impact on our branches of 37.7% (the same percentage as in 2015). As in previous years, these work stoppages affected Brazilian banks generally since the labor action took place across the entire domestic financial system.
During the 2015 collective bargaining negotiations with the bank employee unions, the financial sector experienced a 14-business day strike with an average impact of 37.7% on our branch network.
During the bank employee wage negotiations in 2014, strike action lasted five business days, impacting our branches on an average of 25.4% during this period.
All these labor manifestations and strikes affecting our branches have a partial impact only on our business since at least some branches are able to open during the day and the entire network is never brought to a complete halt. In this context, it
A-24
is worth pointing out that, in the past few years, we have seen a growing volume of operations which are transacted through our digital channels. This has made a significant contribution to minimizing the effects of strike action on our operations.
Brand
Our brand aims to promote positive changes in the lives of people and in society. We deliver products and services – focused on our clients’ needs – that reflect our continuous efforts to provide the best experience for everyone who interacts with us, every day. Our efforts to foster financial education permeate our entire organization and encourage people to have a more balanced relationship with their money by choosing the best type of credit and by planning their investments more efficiently. Our responsibility for the development of the nation is at the very heart of our brand, which is why, in addition to the transformation that is inherent in our core business, we also invest in projects related to education, culture, sports and urban mobility.
In 2016, we were once again ranked at the top of the Interbrand ranking of most valuable Brazilian brands with an estimated value of R$ 26.611 million. This is the 13th consecutive year in which we have been at the top of this ranking. The analysis is based on our brand’s ability to generate financial results, influence the client selection process and ensure long-term demand.
The #issomudaomundo (#thischangestheworld) platform, which guides our causes and our investments in various projects, continues to illustrate our institutional campaigns. This year, with the Leia para uma criança (Read to a child) campaign, we reached an impressive milestone: over 3 million books were offered, including braille books. This shows that we continue to mobilize clients and non-clients to make a difference in children’s lives.
Our capacity to inspire and engage people can also be seen on social media. We publish a series of articles and videos that express our point of view and tell stories that encourage people to implement positive changes in their lives. In 2016, we reached over 129 million views, which means we remain the largest Brazilian brand channel onYouTube and the largest in the world from the financial sector.
Social media is increasingly important to our strategy. This year, we achieved over 8 million fans onFacebook. We have the largestFacebook community of any bank in the world and one of the largest fan bases of any Brazilian brand, according to Socialbakers. OurTwitter profile has over 607 thousand followers, making us number one in the country’s financial sector.
We also have approximately 169 thousand followers onInstagram.
We continue to monitor all of our social media profiles 24 hours a day, seven days a week. We have a specific structure to interact with the public on all matters related to Itaú: questions, suggestions, comments and complaints. We have received more than 675 thousand mentions on social media from January 2016 to December 2016, 67% of which were positive and neutral comments, according to Gauge, a consulting agency that assists us in the analysis of social media data.
2016 was a special year for Itaú. We reinforced our positioning as a digital bank by means of the Digitau platform, highlighting in our communication and advertising campaigns the new technological solutions Itaú Unibanco presents to the market, such as apps and digital branches. Combining our innovative technology with our vision of making people’s daily lives easier we create increasingly simpler financial solutions.
Patents
We are the owners of patents and patent applications in Brazil and abroad for a method for generating a virtual keyboard for entry of a security code or user PIN number. Applications related to this patent are still pending analysis in Brazil, Uruguay and Venezuela. We are the owners of a patent for this method in Germany, Argentina, Austria, Belgium, Chile, Denmark, Spain, Finland, France, Greece, the Netherlands, Ireland, Italy, Luxembourg, Peru, Portugal, the United Kingdom, Sweden and Switzerland. Additionally, we are the owners of patent applications for a method for identifying a financial institution’s access PIN and for a method, user device and system to submit financial transaction information, which are still pending analysis in Brazil.
In Brazil, the effective term for protection of invention patents is 20 years from the date when the patent application is made. The effective terms and requirements for extension of patents outside of Brazil depend on the laws of each country or region where a patent is registered.
Main stockholders
We are controlled by IUPAR, which is jointly controlled by Itaúsa and Cia. E. Johnston. Itaúsa is controlled by members of the Egydio de Souza Aranha family, and Cia. E. Johnston is controlled by members of the Moreira Salles family.
Except for the shares indirectly owned by our controlling stockholders (through their participation in IUPAR and Itaúsa), the members of our Board of Directors and our Board of Officers, on an individual basis and as a group, beneficially owned less than 1% of our common shares and less than 1% of our preferred shares.
According to Brazilian regulation and as approved by the Central Bank, foreign investors may have a maximum of 30% of our common shares.
The following table presents information on the persons that, to our knowledge, held over 5% of our common or preferred shares as of March 31, 2017:
A-25
| Common Shares | Preferred Shares | Total | ||||||||||||||||||||||
| Total Number of | Total Number of | Total Number of | ||||||||||||||||||||||
| Stockholders | Shares | % of Total | Shares | % of Total | Shares | % of Total | ||||||||||||||||||
| IUPAR – Itaú Unibanco Participacões S.A. | 1,709,389,603 | 51.00 | - | - | 1,709,389,603 | 25.96 | ||||||||||||||||||
| Itaúsa – Investimentos Itaú S.A. | 1,295,937,718 | 38.66 | 112,882 | - | 1,296,050,600 | 19.69 | ||||||||||||||||||
| BlackRock(1) | - | - | 233,283,398 | 7.22 | 233,283,398 | 3.54 | ||||||||||||||||||
| Others | 346,413,822 | 10.34 | 2,939,466,713 | 90.99 | 3,285,880,535 | 49.93 | ||||||||||||||||||
| Subtotal | 3,351,741,143 | 100.00 | 3,172,862,993 | 98.21 | 6,524,604,136 | 99.12 | ||||||||||||||||||
| Treasury stock | 3,074 | 0.00 | 57,700,333 | 1.79 | 57,703,407 | 0.88 | ||||||||||||||||||
| Total | 3,351,744,217 | 100.00 | 3,230,563,326 | 100.00 | 6,582,307,543 | 100.00 | ||||||||||||||||||
(1) Share ownership information provided by stockholder.
Date: 03/31/2017
A-26
Ownership Structure
The following chart is an overview of the ownership structure of theItaú Unibanco group as of March 31, 2017, which includes our controlling shareholders and some of our main subsidiaries:
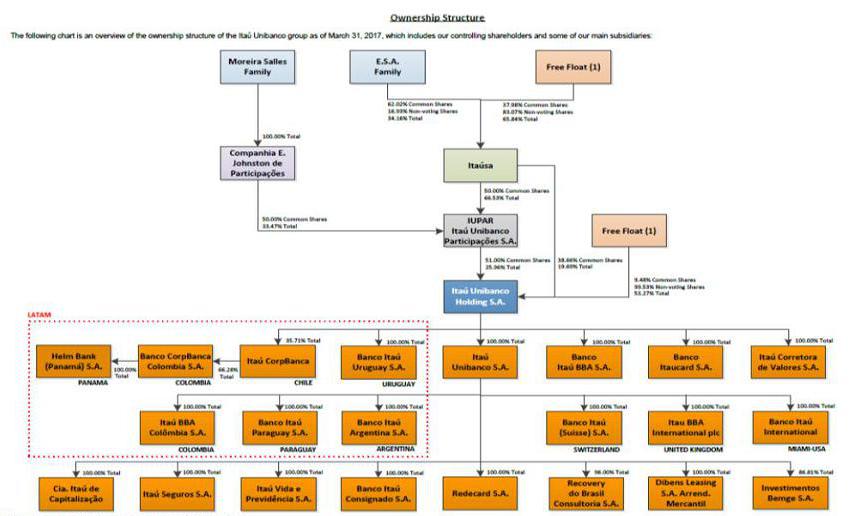
(1) Excludes shares held in treasury and by our controlling shareholders.
Please refer to section Performance, item Consolidated financial statements (IFRS), Note 2.4 a I – Summary of main accounting practices for further information about our subsidiaries.
A-27
IUPAR stockholders’ agreement
Itaúsa and Cia. E. Johnston have a stockholders’ agreement that governs their relationship as controlling stockholders of IUPAR and, indirectly, as our controlling stockholders and as controlling stockholders of our subsidiaries. Please refer towww.itau.com.br/_arquivosestaticos/RI/pdf/IUPARingles.pdf, for further details. The main terms and conditions of the agreement are described below.
The Board of Directors and the Board of Officers of IUPAR are composed of four members each: two members are nominated by Itaúsa and two members by Cia. E. Johnston for each one of these bodies. Pursuant to the IUPAR stockholders’ agreement, IUPAR shares held by Itaúsa and Cia. E. Johnston cannot be transferred to third parties until November 3, 2018. After this period, if any stockholder party to the IUPAR stockholders’ agreement decides to transfer its IUPAR shares to a third party, the other stockholders will have right of first refusal or tag-along rights. If both Itaúsa and Cia. E. Johnston decide to transfer all of their shares held in IUPAR or the total shares held by IUPAR in Itaú Unibanco Holding to third parties, Itaúsa may exercise its tag-along rights, so as to include in the sale all or part of the shares directly held by it in Itaú Unibanco Holding. All shares held directly by Itaúsa in Itaú Unibanco Holding may be freely transferred.
The IUPAR stockholders’ agreement is effective for a 20-year period from January 27, 2009, and may be automatically extended for successive 10-year periods, except if otherwise indicated.
Transfer of control and increase of interest in the share capital
Subject to the provisions of the IUPAR stockholders’ agreement, our Bylaws do not contain any provision that is intended to delay, defer or prevent a change in our shareholding control or that would operate only with respect to a merger, acquisition or corporate restructuring of our Company or its subsidiaries. However, according to Brazilian regulation all such transactions must be carried out in accordance with procedures established by CMN and be previously approved by the Central Bank.
Brazilian legislation provides that acquisition of control of a publicly held company triggers the requirement for the acquiring party to make a tender offer for all outstanding common shares, at a price equivalent to at least 80% of the price per share paid to the controlling stockholders. Additionally, our Bylaws establish the same price rule for the holders of our preferred shares.
Such legislation also requires our controlling stockholders to make a tender offer for all of our shares if they increase their interest in our share capital to a level that materially and negatively affects the liquidity of our shares.
Distribution channels
We provide integrated financial services and products to our clients through a variety of distribution channels. In addition to our traditional portfolio of banking products, we offer products such as insurance, investments, foreign exchange and brokerage. Our portfolio of corporate products suitable for large companies is managed by our wholesale banking segment. Our distribution network is divided into (i) standard channels: branches, Customer Site Branches -CBSs (banking service centers located at certain corporate clients), Automatic Teller Machines, ATMs, and telephones; and (ii) digital channels: internet, mobile and SMS banking. The volume of banking transactions carried out through internet and mobile channels has grown significantly in recent years.

Standard channels (branches, CSBs and ATMs)
Our branch network serves as a distribution network for all of the products and services we offer to our clients. As of December 31, 2016 our standard branch network reached 3,653 branches. We have 45 branches in Brazil, especially refurbished for shopping malls, with a new visual identity and service proposal. The spaces present a new concept of client service, with a differentiated layout inspired by the design of a retail store. Focusing on the relationship with the client as a way to strengthen contact with the public, these branches are open from 12 p.m. to 8 p.m. Furthermore, we have reached 135 digital branches as of December 2016, which aligns with our Digital Channels strategy.
A-28
Similarly, we also implemented changes in service hours for certain branches located in commercial hubs, which now open at 8 a.m. or 9 a.m. and close at 6 p.m. or 8 p.m. This initiative was designed to adapt our services to the routines of our clients. The range of services provided at CSBs may be the same as those provided at a full service branch, or more limited according to the size of a particular corporate client and its needs. CSBs represent a low-cost alternative to opening full service branches. In addition, we believe CSBs provide us with an opportunity to target new retail clients while servicing corporate clients and personnel.
ATMs are low-cost alternatives to employee-based services and give us points of service at significantly lower costs than branches. Our clients may conduct almost all account-related transactions through ATMs.
In addition to all our channels for serving clients (branches, CSBs and ATMs), we also have a partnership with “TecBan" ATM network, composed with more than 19,000 ATMs, which provide clients limited services – primarily cash withdrawal services.
Since 2012, we have made differentiated services available to certain registered clients. In addition to services available to our clients in general, these registered clients are able to withdraw funds and check current account balances and statements just by using biometric technology. Biometrics enables these registered clients to carry out transactions with fingerprint identification, without typing a password or using a card, providing more security and convenience for our clients. To be able to use biometrics, clients simply register with any Itaú Unibanco branch.
Digital channels (internet and mobile banking)
In a digital and wireless world, technology is now part of everyday life. With over 73% of all banking transactions in 2016 already taking place in digital channels, we, as a bank, are challenged daily with delivering an increasingly improved multi-channel and end-to-end experience to our customers.
Over 49% of all clients used a digital channel in December 2016. Mobile is the fastest growing channel, rapidly becoming the most relevant one for individuals. With respect to small and middle-market companies, desktop internet still remains the most used channel. In face of these challenges, we have continuously been transforming our customers digital experience, offering convenience through services and products to our individual and corporate clients, such as money transfers, payments, credit, investments, insurance and others.
Our focus is to provide more and more completion of services in mobile banking (just like the services we provide for internet banking) and keep improving user experience in our digital channels to make them even more intuitive and accessible to our customers.
| Branches(1) | CSBs | ATMs | ||||||||||||||||||||||||||||||||||
| Standard channels | 2016(2) | 2015 | 2014 | 2016 | 2015 | 2014 | 2016 | 2015 | 2014 | |||||||||||||||||||||||||||
| Brazil | 3,780 | 3,910 | 3,967 | 766 | 824 | 852 | 25,079 | 25,802 | 27,309 | |||||||||||||||||||||||||||
| Abroad | 531 | 228 | 229 | 26 | 23 | 22 | 1,228 | 610 | 607 | |||||||||||||||||||||||||||
| Argentina | 72 | 72 | 72 | 15 | 17 | 17 | 178 | 178 | 186 | |||||||||||||||||||||||||||
| Chile | 223 | 96 | 99 | 2 | - | - | 502 | 70 | 70 | |||||||||||||||||||||||||||
| Colombia | 174 | - | - | - | - | - | 178 | - | - | |||||||||||||||||||||||||||
| Paraguay | 31 | 32 | 30 | 8 | 5 | 4 | 311 | 307 | 297 | |||||||||||||||||||||||||||
| Uruguay | 23 | 23 | 23 | 1 | 1 | 1 | 59 | 55 | 54 | |||||||||||||||||||||||||||
| Other | 8 | 5 | 5 | - | - | - | - | - | - | |||||||||||||||||||||||||||
| Total in Brazil and abroad | 4,311 | 4,138 | 4,196 | 792 | 847 | 874 | 26,307 | 26,412 | 27,916 | |||||||||||||||||||||||||||
| (1) | Since December 31, 2014, total branches include digital branches and business branches, which are considered points of service by the CMN Resolution No. 4,072/2012. |
| (2) | 79.3% of our branches were located in the states of São Paulo, Rio de Janeiro and Minas Gerais in the southeast of Brazil, Paraná in the south of Brazil, and Goiás in the center-west of Brazil. |
Overview
We report the following segments: (i) Retail Banking, (ii) Wholesale Banking, and (iii) Activities with the Market and Corporation. Through these operational segments, we provide a broad range of banking services to a diverse client base that includes individuals and corporate clients, on an integrated basis as follows:
TheRetail Banking segment offers services to a diversified base of account holders and non-account holders, individuals and companies. The segment includes retail clients, high-income clients (Itaú Uniclass and Personnalité) and the very small and small companies. Revenues from Retail Banking come from the offer of banking products and services to retail and high-income clients and very small and small companies, in addition to financial products and services offered to our non-account holder clients, including vehicle financing and credit cards offered outside the branch network, and Itaú Consignado operations. The Retail Banking segment represents an important funding source for our operations and generates significant financial income and banking fees.
TheWholesale Banking segment is responsible for our private banking clients, the activities of Latin America units, our middle-market banking business, and the activities of Itaú BBA, which is the unit in charge of corporate and investment
A-29
banking activities. Our wholesale banking management model is based on building close relationships with our clients by obtaining an in-depth understanding of clients’ needs and offering customized solutions. Corporate activities include providing banking services to large corporations and investment banking activities include offering funding resources to the corporate sector, including fixed and variable income instruments.
TheActivities with the Market and Corporation segment manages interest income associated with our capital surplus, subordinated debt surplus and the net balance of tax credits and debits, as well as net interest income from the trading of financial instruments through proprietary positions, management of currency interest rate gaps and other risk factors, arbitrage opportunities in the foreign and Brazilian domestic markets, and mark-to-market of financial instruments. This segment also includes our interest in Porto Seguro.
We carry out a wide range of operations outside of Brazil with units strategically located in the Americas, Europe and Asia. Our international presence creates significant synergies in foreign trade finance, in the placement of Eurobonds and in the offering of more sophisticated financial transactions to our clients.
Please refer to section Performance, item Financial performance, Results, and section Performance, item Complete Financial Statements (IFRS), Note 34 – Segment information, for further information about our segments.
The diversification of our business is reflected in the changing composition of our loan portfolio over the last few years, focusing in origination on lower risk segments with increased guarantees. We are constantly seeking to implement and focus on the offer of new products and services that add value to our clients and diversify our sources of income, allowing for growth of our non-financial income arising mainly from banking service fees, income from bank charges and from insurance, pension plan and capitalization operations. Some details of our loan portfolio and services are presented as follows:
Credit cards and Commercial agreements
Itaú Unibanco is the market leader in Brazilian credit cards. Through proprietary and partnership operations with major retailers, telephone carriers, automakers and airline companies established in Brazil, we offer a wide range of credit and debit cards to more than 55.0 million account holders and non-account holders (in number of accounts in December 2016).
We are focusing our efforts to continually grow our credit cards portfolio, improve its profitability, manage our asset quality and pursue satisfaction of our clients. Accordingly, our credit card division focuses on the development of new products, the assessment of our partnerships, and the control of the credit quality of our portfolio and on a more efficient cost management. In 2012 we pioneered the launch of an alternative model in Brazil that made credit cheaper for our consumers by developing Itaucard 2.0, a similar model to the one used in the U.S. and European countries. Since its launch, we have issued more than 6.6 million cards under Itaucard 2.0.
In May 2016, we signed a partnership with Netshoes to develop the NCARD Itaucard, which is offered 100% digitally through the partner website. The sale process for the card was developed in partnership with Netshoes with instant customer evaluation technology and segmented product offering. In addition to a 100% digital experience with instant evaluation of card proposals, the process allows approved customers to immediately make their purchases on the site without having to wait for the plastic card, enabling them to take advantage of the benefits and discounts provided to cardholders.
In July 2016, we entered into an agreement with Multiplus, one of the largest companies in the rewards and loyalty programs, for the launch of a co-branded credit card, with the proposal being the best option for accumulating market points. In addition to the benefits offered by Multiplus, cardholders will also be able to use the traditional advantages of the Itaucard platform, such as payment of half the value of movie tickets, theater, shows and discounts at partner establishments.
Itaucard has made innovations in the way it interacts with its Facebook followers by using more informal language, even using references to classic “memes”.
The Itaucard application has transformed the customer experience by constantly bringing new functionalities, such as the Virtual Card, that simplifies and offers more security for online shopping. Timeline is another feature of this application, which generates a virtual card for each purchase on the internet, in which purchases and transactions can be viewed in real time.
With regard to customer service, we provide an application that can be used by our customers 24 hours a day. By December 2016 we had more than 5.7 million downloads of this application.
In 2016, maintaining the indicators of default and risk was a challenge for our credit card area in face of all the deterioration of the Brazilian economy and the high level of unemployment in Brazil. We managed to evolve the default indicator above 90 days from 8.08% in December 2015 to 6.95% in December 2016. We adopted stricter criteria to collect from our clients impacted by the crisis. To continue to grow our portfolio, we also focused on maintaining partnerships with our high-income customers and retailers.
A-30
The following table shows the market position and information about competitors for the business listed below:
| Product/Service | Market Position | Additional Information and Main Competitors | ||
| Credit Cards | We are theleaders in terms of transaction purchase volume of cards in Brazil, with a 37.1% market share in the period from January to December 2016. | The Brazilian credit card market is highly competitive, growing on average 10.0% from January to December over the last four years, according to the Brazilian Association of Credit Card Companies and Services (Associação Brasileira das Empresas de Cartões de Crédito e Serviços, or ABECS). Our main competitors in this business are Banco do Brasil S.A., Banco Bradesco S.A., Banco Santander Brasil S.A. and Caixa Econômica Federal. |
Source: Itaú Unibanco Holding and ABECS.
Payroll loans
A payroll loan is a loan with fixed installments that is directly deducted from the borrower’s payroll to the bank’s account without being recorded in the debtor’s account. Our strategy is to expand our activities in businesses with historically lower risk, achieving a leading position in the offering, distribution and sale of payroll loans in Brazil.
To expand this business and complement our strategy, on July 9, 2012 we entered into an association agreement with Banco BMG S.A. to offer, distribute and market payroll loans originated by that financial institution. Banco Itaú BMG Consignado, the entity used for purposes of this joint venture, began operations in December 2012 and is present throughout the Brazilian territory. This association was designed with the purpose of diversifying our loan portfolio, complementing our payroll loan strategy, and improving the risk profile of our portfolio of loans to individuals. Banco Itaú BMG Consignado also enables us to expand our business in the payroll loan sector in line with our values and transparency principles, following best management practices and policies.
Please refer to section Our profile, 2016 highlights, item Mergers, acquisitions and partnerships, Acquisition of Itaú BMG Consignado shares for further information.
In December 2016, after obtaining the required regulatory authorizations and meeting conditions precedent, we completed the acquisition of the total equity investment held by Banco BMG in Banco Itaú BMG Consignado. This investment corresponds to 40% of the capital of Banco Itaú BMG Consignado, meaning that we are now the holders of 100% of this institution’s total capital. This acquisition assured we kept the leadership among private banks in this segment.
Also, our strategy of higher growth in the National Social Security Institute (Instituto Nacional do Seguro Social, or INSS) beneficiaries sector, combined with certain credit policies we adopted, allowed our portfolio evolution to be followed by a decrease in delinquency levels.
The following table shows the market position and information about competitors for the business listed below:
| Product/Service | Market Position | AdditionalInformationandMain Competitors | ||
| Payroll Loans | In December 2016, we obtained a market share of 15.5% in terms of payroll loans, positioning us as thethird largestbank in this segment in Brazil. | Our main competitors in this business are Banco do Brasil S.A., Caixa Econômica Federal, Banco Bradesco S.A. and Banco Santander Brasil S.A. |
Source: Itaú Unibanco Holding and the Central Bank.
Vehicle financing
As of December 31, 2016, our portfolio of vehicle financing to individuals amounted to R$15.4 billion, a 23.1 % decrease from the same period of the previous year. The average loan to value ratio of our vehicle portfolio (the ratio of a loan to the value of an asset purchased) was 68.1% on December 31, 2016, following a downward trend since the previous year, when the loan to value ratio reached 70.8% as of December 31, 2015. Since 2012, we have reduced our risk exposure in this sector and focused on clients with better risk profiles, which has allowed us to improve the credit quality of our vehicle loan portfolio.
From January to December 2016, the average term of vehicle financing was 40 months, and half of the transactions were carried out with terms of up to 36 months.
We developed a series of new products and services that were launched in the market in 2016. Some of these products are:
Digital Platform–direct channel for origination, service and formalization of payments, bringing more agility and autonomyto the more than 10,000 participating stores and associated car dealers.
A-31
Customer Risk based pricing- an innovative solution in the Brazilian market that takes into account a customer’s creditrisk profile, as well as transaction data (term, entry and year of the vehicle) to offer lower interest rates to customers with low default risk.
Icarros- As one of the pillars of Itaú Unibanco’s digitization strategy for searching for, selecting and financing the acquisitionof new and used vehicles, iCarros, which has more than 15 million page views per month, has invested in process intelligence and automation to make customer experience even more complete and convenient. The portal uses new technology for credit simulation and pre-analysis, including presenting risk-adjusted financing rates to the customer. Currently 15% of our vehicle financing is initiated through this portal.
The following table shows the market position and information about competitors for the business listed below:
| Product/Service | Market Position | Additional Information and Main Competitors | ||
| Vehicles | In December 2016, we reached a market share of 10.3% in terms of loans to individuals among banks, positioning us as fourth in Brazil in this segment. | Our main bank competitors in this business are Banco Santander (Brasil) S.A, Banco do Brasil S.A. and Banco Bradesco S.A. |
Source: Itaú Unibanco Holding and the Central Bank.
Real estate financing and mortgages
Our mortgage business is dedicated to:
| · | creating loyalty – the relationships established in this sector are typically long-term; |
| · | contributing to the social and financial development of our clients; and |
| · | being aligned with our strategy of investing in lower risk portfolios. |
We have been leaders in mortgage loans to individuals among Brazilian private banks from 2008 to 2016, which reflects our focus on this business aligned with our strategy of migrating to lower risk portfolios.
We offer products through our network of branches and brokers, as well as through our partnership with RE/MAX and our joint venture with LPS Brasil Consultoria de Imóveis S.A. (Lopes), called “Credipronto”. These two long-term agreements provide us with exclusive real estate financing origination at a greater number of locations throughout Brazil.
One competitive advantage we have is the speed of our credit approval process and in the formalization of the relevant loan documentation. As of December 31, 2016 the average time between finalizing a financing and our receipt of the requisite documentation was 10 workdays, which we believe is a significantly shorter time period than those of our competitors.
The number of mortgages we provided directly to individuals in 2016 was 27.3 thousand, for an aggregate value of R$8.2 billion in the period, compared to R$ 10.5 billion in 2015. The average Loan to Value (LTV) ratio of the portfolio in 2016 was 41.8%, compared to 43.7% in 2015. In commercial loans, we financed 8.1 thousand new real estate units during 2016, for an aggregate value of R$ 1.4 billion.
Since 2007, real estate and mortgage transactions in the Brazilian market have been carried out mainly through a system of mortgage liens (alienação fiduciária), pursuant to which the buyer becomes the owner of the property after all payments have been made, making it easier for the bank (lender) to recover the property in case of default. This system resulted in lower legal and credit risks compared to other types of guarantees.
Another positive feature of the Brazilian market is the constant amortization system pursuant to which decreasing installments provide faster amortization of a contract, reducing our loan-to-value indicator at a faster rate than other amortization systems.
The following table shows the market position and information about competitors for the business listed below:
| Product/Service | Market Position | Additional Information and Main Competitors | ||
| Real Estate Financing and Mortgages | In the period from January to December, 2016 we were theleadersin new loans to individuals among Brazilian private banks, with 41.9% market share and,second placein terms of new loans to individuals, among all Brazilian banks, with 22.8% market share. | The main player in the Brazilian real estate market is Caixa Econômica Federal (CEF), a government owned bank. CEF is focused on real estate financing and, is the leader in this market. Other competitors include Banco do Brasil S.A., Banco Santander Brasil S.A. and Banco Bradesco S.A. |
Source: Itaú Unibanco Holding and ABECIP.
A-32
Microcredit
Our microcredit unit offers to low-income entrepreneurs who do not have the necessary attributes to participate in the traditional financial system the chance to expand and develop their businesses. Itaú Microcrédito’s loan officers solicit new and existing clients, offering loans (coupled with free loan-protection microinsurance), point of sale, or POS machines. Loan officers are also responsible for disseminating information regarding financial concepts related to the responsible use of money.
A major benefit arising from this initiative is that micro-entrepreneurs start to develop a relationship with the formal financial system. Our microcredit activities are split into two levels:
| § | 1stTier Lending: includes working capital loans, or loans for upgrades and fixed assets provided to formal and informal business people engaged in small business activities. Any granting of loans requires the presence of a trained microcredit loan officer; and |
| § | 2ndTier Lending: loans to micro-entrepreneurs through partner civil society organizations registered with the National Productive Microcredit Program. We are committed to promoting microfinance best practices and trading experiences with partner organizations. |
Our investment in microcredit consolidates our strategy to act as an agent of transformation in society. Microcredit is also important as it reinforces our vision of sustainability and increases our ability to spread our knowledge in financial education. The end goal is to create a virtuous cycle in which our bank stimulates the social and economic development of Brazil’s low-income population.
Consortia
A consortium is a self-financing system created in Brazil with a view to fostering savings for the purchase of vehicles and other assets, such as real estate. Pursuant to consortium agreements, participants are pooled according to the specific asset they elect to purchase (such as a vehicle of a particular manufacturer and model), which will be paid for in installments.
Payments made by the participants of a given consortium are used to create a “pool” of funds, which are used by one or more members of the consortium at a time to acquire the assets elected by the participants, e.g., once a month, and such members continue to make payments as scheduled. Generally, participants may receive the asset, (i) during the course of the consortium agreement (before all installments are paid), if the participant pays an amount (in addition to the regularly scheduled installment due) that is higher than such an additional amount offered by any other consortium member for that period, or (ii) during the course of the consortium agreement (before all installments are paid), if the participant is selected by random drawing, organized by the bank, to receive the asset, while continuing to pay for the remaining installments as scheduled.
As consortia are regarded as a provision of services under Brazilian law, the management of consortia does not give rise to default risk or regulatory capital requirements for us.
Since consortia do not charge interest rates, our revenues come mainly from the administration fee charged to clients. Given these characteristics, this business is strategic to us, contributing to revenue diversification and to a more complete product portfolio offering to our clients. As of December 2016, we reached the following results:
| · | 395.5 thousand in active contracts, decreasing 4.7% compared to December 2015; |
| · | R$10.7 billion in balance of installments receivables, decreasing 8.9% compared to December 2015; and |
| · | R$675.0 million in administration fees from January to December 2016, decreasing 1.3% compared to the same period of 2015. |
The following table shows the market position and information about competitors for the business listed below:
| Product/Serqvice | Market Position | Additional Information and Main Competitors | ||
| Consortia Services Fees | In the period from January to December, 2016, we had a market share of 8.4% in total consortia services fees. Considering only banks, we are thesecond largest provider of such services in terms of fees in Brazil. | Considering only banks, our main competitors in the Brazilian consortia market are Bradesco Adm. Consortia and BB Consortia. |
Source: Central Bank.
A-33
Merchant acquirer
Rede (formerly Redecard) is one of the two largest multi-brand acquirers of credit, debit and benefit card transactions in Brazil. Rede’s activities include merchant acquiring, capturing, transmission, processing and settlement of credit and debit card transactions, prepayment of receivables to merchants (resulting from sales made with credit cards), rental of POS terminals, check verification through POS terminals, and the capturing and transmission of transactions using coupons, and loyalty programs.
Our goal is to be the main partner for merchants that are seeking higher business potential with a focus on IT investments, infrastructure and POS modernization. For those partners, Rede offers a series of products that follow the market’s latest trends. Among these products we highlight Mobile Rede, which captures the transaction using a device attached to the smartphone or tablet. It allows card reading and input of purchase data for client’s signature, reinforcing our position in new payments solutions for freelancers and micro entrepreneurs. Through e-Rede we intensified and improved the quality of our electronic payments platform, offering not only the acquisition service, but also an antifraud gateway. We offer a single platform for efficient, fast and complete solutions for online payments using a robust antifraud system.
We are continuously investing in merchant loyalty by focusing on retail and offering a wide product portfolio and innovative merchant acquirer and banking solutions. In September 2016, we launched Smart Rede, a new generation of smart terminals with an innovative design and an App Store that enables merchants to choose and download solutions that assist in controlling and managing businesses. By November 2016, we made Control Rede available to merchants, a reconciliation solution that facilitates financial control of the merchant’s receivables.
In order to make banking as simple as possible for our clients, in 2016, we also developed Rede Pay, our digital wallet solution, which brings to our online merchants the chance to increase their sales by accessing thousands of customers in a simple and safe way and Preço Único (One Price), a solution that simplifies billing for the merchants by charging a single fee that includes merchant discount rate and equipment rental (POS).
In 2016, we received R$ 387 billion in transactions with respect to credit and debit cards, an increase of 1.1% compared to 2015. As of December 31, 2016, Rede was present in almost all municipalities in Brazil having electric power and telecommunications networks and had 1.5 million installed POS terminals throughout Brazil. The following table sets forth the financial volume of transactions and the amount of transactions of credit and debit cards processed by us in 2016, 2015 and 2014:
| (In billions of R$) | (In billions) | |||||||||||||||||||||||
| Financial Volume | Transactions | |||||||||||||||||||||||
| 2016 | 2015 | 2014 | 2016 | 2015 | 2014 | |||||||||||||||||||
| Credit cards | 252 | 250 | 232 | 2.0 | 2.0 | 1.9 | ||||||||||||||||||
| Debit cards | 135 | 133 | 126 | 2.0 | 2.0 | 2.0 | ||||||||||||||||||
| Total | 387 | 383 | 358 | 4.0 | 4.0 | 3.9 | ||||||||||||||||||
The following table shows the market position and information about competitors for the business listed below:
| Product/Service | Market Position | Additional Information and Main Competitors | ||
| Merchant Acquirer | In the period from January to December, 2016 we reached a market share of 34.6% in terms of total transaction volume (credit and debit) generated by the acquiring services, positioning us as thesecond largest player in this segment in Brazil. | Our main competitors in this business are Cielo S.A., Getnet Tecnologia em Captura e Processamento de Transações H.U.A.H. S.A. (GetNet) and Banco Bankpar S.A. (American Express). |
Source: Itaú Unibanco Holding and ABECS.
Other products and services portfolio
Insurance
Our insurance business provides a wide range of life and personal accident products, automobile and property insurance, credit insurance and travel insurance. Our insurance core activities, which include our 30% stake in Porto Seguro, consist of mass-market insurance products related to life, property and credit. These products are offered in synergy with retail channels – our branch network, partnership with retailers, credit card clients, real estate and vehicle financing, personal and payroll loans – and the wholesale channel. These products have characteristics such as a low loss ratio, low volatility in results and less use of capital, making them strategic and increasingly relevant in the diversification of the conglomerate’s revenues.
A-34
Other insurance activities encompass extended warranty, health insurance, our stake in IRB – Brasil Resseguros S.A. and other operations.
In May 2016, we were granted the “Consumidor Moderno de Excelência em Serviços ao Cliente” (Modern Consumer – excellence in services to clients) Award, promoted by Consumidor Moderno magazine and CIP, the Standard Intelligence Center, in the Banks and Insurance, Pension Plan and Capitalization categories. This award is granted as a recognition by the client relationship sector in Brazil.
The following table shows the market position and information about competitors for the business listed below:
| Product/Service | Market Position | Additional Information and Main Competitors | ||
| Insurance | Considering our 30% ownership interest in Porto Seguro S.A., we reached 9.9% of share in total insurance market based on earned premiums, from January to December, 2016, positioning us as thefourthlargest insurance provider in Brazil. Considering only our insurance core activities, our market share in these specific markets reached 12.6% in the same period. | The Brazilian insurance market is highly competitive. Our main competitors in this sector, excluding health insurance providers, are affiliated with large ommercial banks, such as Banco Bradesco S.A. and Banco do Brasil S. A. Although there is a great concentration of Brazilian banks, this market is still dispersed, especially with players acting in specific niches. As of December 2016 this industry consisted of approximately 154 insurance companies of various sizes, including 39 conglomerates and 47 independent companies. We believe that our alliance with Porto Seguro S.A. resulted in gains in scale and efficiency for us. |
Source: SUSEP – Superintendência de Seguros Privados. Insurance core activities include: Personal Insurance (Life, Personal Accidents, Credit Insurance, Educational, Travel, Unemployment, Funeral Allowance, Serious Diseases, Random Events), Housing, Multiple Peril and Domestic Credit – Individuals. Health Insurance and VGBL - Redeemable Life Insurance products are not included.
Private pension plans
We offer private pension plans to our clients as an option for wealth and inheritance planning and income tax purposes (these products are tax-deferred). We provide our clients with a solution to ensure the maintenance of their quality of life, as a supplement to government plans, through long-term investments.
The contributions reached R$23.4 billion from January to December 2016, mainly due to the increase in our VGBL product, and technical provisions, which increased 20.4% from January to December, totaling R$148.7 billion on December 31, 2016.
The following table shows the market position and information about competitors for the business listed below:
| Product/Service | Market Position | Additional Information and Main Competitors | ||
| Pension plans | In December 2016, our balance of provisions represented 22.8% of the market share for pension plans, positioning us as thethird largest pension provider in Brazil. | Our main competitors in private retirement plan products are controlled by large commercial banks, such as Banco Bradesco S.A. and Banco do Brasil S.A., which, like us, take advantage of their branch network to gain access to the retail market. |
Source: FENAPREVI (Balance of provisions - Pension Plans for Individuals and Companies).
Premium bonds (títulos de capitalização, or capitalization plans)
Premium bonds are fixed deposits products pursuant to which a client makes a one-time deposit or monthly deposits of a fixed sum that will be returned at the end of a designated term. Ownership of premium bonds automatically qualifies a customer to participate in periodic raffles, each time with the opportunity to win a significant cash prize. In 2016, we distributed R$58.3 million in raffle prizes for 2,361 clients.
We currently market our premium bonds portfolio of products through our branch network, electronic channels and ATMs, and we are currently developing new technologies for channel diversification. Revenues from capitalization plans increased 4.8% in 2016 compared to 2015.
A-35
Focusing on corporate responsibility principles, since August 2014 we have maintained a partnership withInstituto Ayrton Senna, a non-profit organization which focuses on promoting quality of public education in Brazil. A portion of the revenues upon purchase of PIC, our bank’s premium bonds, is provided toInstituto Ayrton Senna’s education projects.
The following table shows the market position and information about competitors for the business listed below:
| Product/Service | Market Position | Additional Information and Main Competitors | ||
| Premium Bonds | In the period from January to December, 2016, we had a market share of 13.8% in terms of revenues from sales of premium bonds, positioning us as thethird largest provider of such products in this segment in Brazil. | Our main competitors in premium bonds are controlled by large commercial banks, such as Banco Bradesco S.A. and Banco do Brasil S.A., which, like us, take advantage of their branch network to gain access to the retail market. Our profitability (measured by net profits over revenues from sales) is the highest among our main competitors. |
Source: SUSEP.
Retail Banking
We have a large and diverse portfolio of products, such as credit and investments, and services to address our clients’ needs. Our retail banking business is segregated according to customer profiles, which allows us to be closer and understand our customer’s needs, enabling us to better offer the most suitable products to meet their demands.
Itaú Retail Banking (individuals)
Our core business is retail banking and through our retail operation we offer a dedicated service structure to consumer clients throughout Brazil. Our client service structure is targeted to offer the best solutions for each client profile. We classify our retail clients as individuals with a monthly income up to R$4,000.
Our Itaú Uniclass services are available at every branch for clients who earn more than R$4,000 and below R$10,000 per month. We offer exclusive services to our Itaú Uniclass clients, including investment advisory services, exclusive cashiers, special telephone service and higher credit limits and a large team of dedicated relationship managers.
Our retail network is focused on building long term relationships with our clients.
The following table shows our market position and information about competitors for the business listed below:
| Product/Service | Market Position | Additional InformationandMain Competitors | |||
| Retail Banking (Including Itaú Personnalité) | In December 2016, we reached a market share of 11.7% based on total outstanding loan balance inreais, positioning us as thethird largest bank in this segment in Brazil. | Itaú Unibanco Holding has a leading position in many sectors of the Brazilian domestic financial market. Based on Central Bank data and publicly available financial information, our main competitors are Caixa Econômica Federal, Banco do Brasil S.A., Banco Bradesco S.A. and Banco Santander Brasil S.A. |
Source: Itaú Unibanco Holding and the Central Bank.
Itaú Personnalité (banking for high-income individuals)
We began providing customized services to high-income individuals in 1996 with the creation of Itaú Personnalité, which currently serves individuals who earn more than R$10,000 per month or have investments in excess of R$100,000.
Itaú Personnalité is focused on providing (i) financial advisory services by managers who understand the specific needs of our higher-income clients, (ii) a large portfolio of exclusive products and services and (iii) special benefits based on the type and length of relationship with the client, including discounts on various products and services. Itaú Personnalité services its clients through a dedicated network comprised of 275 branches, located in the main Brazilian cities. Itaú Personnalité clients also have access to our retail banking network of branches and ATMs throughout the country, as well as through services by internet, telephone and mobile banking. For clients who prefer remote services, Itaú Personnalité provides a “digital bank platform” where relationship managers service clients through telephone, email, SMS and videoconference from 7 a.m. to midnight on business days.
A-36
Itaú Empresas (very small and small companies)
To meet the needs of our corporate customers, we offer customized solutions and detailed advice on all products and services for:
| · | microenterprises: customer base consisting of companies with annual revenues of up to R$ 1.2 million, served by 3,617 bank branches and 2,257 relationship managers on December 31, 2016; and |
| · | small businesses: customer base consisting of companies with annual revenues between R$ 1.2 million and R$ 30 million, served by 361 offices and 1,747 relationship managers on December 31, 2016. |
The Brazilian Financial and Capital Markets Association (ANBIMA) certifies all of our relationship managers, who are trained to offer the best banking solution to each client. Our customers rely on our ability to provide products, terms and rates tailored to their needs.
Our strategy is to capture market opportunities, meeting the needs of the companies we serve and of their owners, particularly with respect to cash flow management, credit facilities, investments, and banking.
As it was the case in 2015, improving our credit portfolio and reducing the volume of non-performing loans remained our goal in 2016. During this period, we improved processes, credit policies and tools, and we intensified our collection and credit recovery efforts.
Focusing on our customers’ needs, we have launched a brand-new mobile application, offering greater ease, speed and convenience to our customers in their day-to-day interaction with the bank. We have expanded the acquiring services we offer to our clients though Rede, and increased the number of customers who have purchased our “Flex” offer, which allows merchants to receive credit card sales within two business days. We have also improved our ability to attract qualified customers with product offerings and services suitable to their needs.
Finally, we have continued our efforts to digitalize products and services, as well as develop the tools used by our sales and relationship teams. In 2017, we expect to capture the benefits of such investments, as measured by increased business productivity and greater proximity to our customers.
Public sector
Our public sector business operates in all divisions of the public sector, including the federal, state and municipal governments (in the Executive, Legislative and Judicial branches).
To service public sector clients, we use platforms that are separate from our retail banking branches, with teams of specially trained managers who offer customized solutions in tax collection, foreign exchange services, administration of public assets, payments to suppliers, payroll for civil and military servants and retirement. Based on these platforms, we have a significant amount of business with public sector clients, particularly in those Brazilian states where we acquired previously state-owned financial institutions. In December 2016, we had 5,330 public sector clients and 12 offices in Brazil.
Wholesale Banking
Wholesale Banking is the segment responsible for banking operations of large companies (those with annual revenues over R$300 million) and middle-market companies (those with annual revenues from R$30 million to R$300 million) and investment banking services. It offers a wide range of products and services to the largest economic groups of Brazil.
Our activities in this business range from typical operations of a commercial bank to capital markets operations and advisory services for mergers and acquisitions. These activities are fully integrated, which enables us to achieve a performance tailored to our clients’ needs.
One of the most important features of our Wholesale Bank is the set of initiatives linked to improving efficiency in our operations. These ongoing actions, which are expected to continue to grow in the coming years, are designed to increase revenues, improve processes and reduce costs.
Investment Banking
Our investment banking business carried out through Itaú BBA, assists companies raising capital through fixed income and equity instruments in public and private capital markets, and provides advisory services in mergers and acquisitions. We advise companies, private equity funds and investors in the structuring of variable income products and in mergers and acquisitions. From research to execution, we believe we offer a wide portfolio of investment banking services with respect to Brazilian and other Latin American companies.
In investment banking, the fixed income department acts as bookrunner or manager in the issuance of debentures, promissory notes and securitization transactions.
A-37
The following table shows the market position and information about competitors for the business listed below:
| Product/Service | Market Position | Additional Information and Main Competitors | ||
| Investment Banking | In the period from January to December 2016, Itaú BBA rankedfirst in mergers and acquisitions(1). From January to December 2016, we rankedsecondin origination and in distribution in debt capital markets transactions(2). | In investment banking, Itaú BBA’s main competitors include Banco Santander, Banco de Investimentos Credit Suisse (Brasil) S.A., Banco Merrill Lynch de Investimentos S.A., Banco Morgan Stanley S.A., Banco JP Morgan S.A., Bradesco BBI and Banco BTG Pactual S.A. |
Source: (1) Dealogic. (2) ANBIMA ranking in terms of volume
Itaú Private Bank
With a full global wealth management platform, we are the market leaders in Brazil with a market share exceeding 27% and one of the main players in Latin America. Our multidisciplinary team, which is supported by a team of investment advisers and product experts, provide comprehensive financial services to clients, understanding and addressing their needs from our eight offices in Brazil and in our offices located in Zurich, Miami, New York, Santiago, Asuncion and Nassau.
Our clients have access to a complete portfolio of products and services, ranging from investment management to wealth planning, credit and banking solutions. In addition to our in-house customized products and services, we offer our clients access to an open architecture of alternatives from third-party providers.
Aligned with our vision to be the leading bank in sustainable performance and customer satisfaction, we decided to focus our strategic priorities, and we intend to continue to do so during the next year, on the following Itaú Private Bank initiatives:
| · | being the leading private bank in terms of client satisfaction; |
| · | adding value to client and stockholders with a complete offering and long-term proactive advisory services; |
| · | continuing to invest in our international platforms to enhance Brazilian clients’ experience and expand our operations in Latin America; |
| · | increased operational efficiency of our platform through continuous investments in our IT platforms; and |
| · | maintaining a focus on risk management and regulatory considerations. |
We were recognized by the main publications of the global private bank market:
Private Wealth Management/The Banker
·Best Private Bank in Latin America (2016)
·Best Private Bank in Brazil (2016)
Private Banker International
·Outstanding Private Bank - Latin America (2016)
·Most Effective Investment Service Offering (2016)
Euromoney
· Best Private Banking Services Overall in Brazil (2016)
Global Finance
·Best Private Bank in Emerging Markets for 2017
·Best Private Bank in Brazil for 2017
Itaú Asset Management
Itaú Asset Management is responsible for managing client’s assets. With almost 60 years of experience in managing resources and 270 professionals, it has positioned itself as a leading asset manager in Brazil, and one of the leading institutions of its kind in Latin America, with assets under management of over R$527.0 billion, in December 2016 according to ANBIMA.
Furthermore, Itaú Asset Management has one of the biggest research teams in Latin America, which is composed of professionals focused on specific industries and investment strategies. The consistent investment in market research allows us to analyze investment opportunities in detail, under multiple perspectives. We offer a range of customized products and solutions, tailored to the uniqueness of each client segment, considering different investment objectives and risk profiles. We have a committed risk management team that is responsible for the support of the operation.
In July 2016, Itaú Asset Management received from Valor Investe the “Top Gestão 2016” award prepared by Standard & Poor´s as the best manager of hedge funds with three 5 star funds. In December 2016, Itaú Asset Management was elected
A-38
for the eighth time, being the fourth consecutive time the Best Manager of Funds by Exame magazine, and was the winner in eight out of nine categories of the award.
Kinea, an alternative investments management company of Itaú Unibanco, held R$11.5 billion in managed assets at the end of 2016.
The following table shows the market position and information about competitors for the business listed below:
| Product/Service | Market Position | Additional Information and Main Competitors | ||
| Asset Management | In December 2016, we had a market share of 15.1% in terms of assets under management, positioning us as thethird asset management in Brazil. | According to ANBIMA, the asset management industry in Brazil held assets totaling R$ 3,480 billion as of December 2016, with ompetition concentrated among large and well-established retail banks. Our main competitors are Banco do Brasil S.A. and Banco Bradesco S.A. |
Source: ANBIMA.
Securities Services
Itaú Securities Services business units provide:
(i) local custody and fiduciary services;
(ii) international custody services; and
(iii) corporate solutions that act as transfer agent and stockholder servicer for Brazilian companies issuing equity, debentures, promissory and bank credit notes. We also work as guarantor in transactions for project finance, escrow accounts and loan and financing contracts.
Our focus is to be a full service provider with specialized professionals and with technology as a foundation.
Pension funds, insurance companies, asset managers, international institutional investors and equity and debt issuers are our primary clients in these businesses, representing approximately 3,317 clients in 22 countries that reached R$2.6 trillion of assets under service as of December 31, 2016, which includes investment funds, underwriting, pension funds, trustee and brokerage services.
The following table shows the market position and information about competitors for the business listed below:
| Product/Service | Market Position | Additional InformationandMain Competitors | ||
| Local Custody | In December 2016, we had a market share of 27.3% based on total assets under local custody, positioning us as the second largest Local Custodian. | According to ANBIMA, the local custdy in Brazil held assets totaling R$4,035 billion as of December 2016. Our main competitors are Banco Bradesco S.A. and Banco do Brasil S.A. | ||
| International Custody | Our market share in December 2016 was 14.1% in terms of total assets under international custody, positioning us as thethird largest International Custodian. | Based on ANBIMA, the international custody srvice in Brazil totaled R$1,235 billion of assets as of December 2016. Our main competitors are Banco Citibank S.A., JP Morgan’s Securities Services and Banco Bradesco S.A. | ||
| Corporate Solutions | In December 2016, we had aleadingpositionas agent and registrar provider to 217 companies listed on BM&FBovespa, which represents 62.2% of companies listed on that exchange. Moreover, we were leader as transfer agent with 416 debentures offerings in the Brazilian market, representing 46.7% of the debentures market in Brazil. | Our main competitors in the equities market are Banco Bradesco S.A. and Banco do Brasil S.A.
Our main competitor in debentures is Banco Bradesco S.A. |
Source: Itaú Unibanco Holding, ANBIMA and BM&FBovespa.
A-39
Itaú Corretora (Brokerage)
Itaú Corretora has been providing brokerage services in BM&FBovespa since 1965. We provide retail brokerage services in Brazil to over 130 thousand clients with positions in the equity and fixed income markets, accounting for approximately R$40 billion in trading volume in 2016. The brokerage services are also provided to international clients through our broker-dealer in New York.
The following table shows the market position and information about competitors for the business listed below:
| Product/Service | Market Position | Additional InformationandMain Competitors | ||
| Retail Brokerage Services(1) | Rankedfourth in Retail Brokerage Services by trading volume in December 2016. | Main competitors: XP Investimentos, Ágora Corretora de Títulos e Valores Mobiliários S.A., Rico Corretora de Títulos e Valores Mobiliários S.A. and BB Gestão de Recursos Distribuidora de Títulos e Valores Mobiliários | ||
| Cash Equities(1) | Rankedsixth in Cash Equities by trading volume in the period between January and December 2016. | Main competitors: UBS Brasil Corretora, XP Investimentos, Morgan Stanley Corretora de Títulos e Valores Mobiliários S.A., Credit Suisse Hedging-Griffo Corretora de Valores S.A. and Merrill Lynch S.A. Corretora de Títulos e Valores Mobiliários. | ||
| Futures and Derivatives(1) | Rankedsixth in Derivatives and Futures by number of traded contracts in the period between January and December 2016. | Main competitors: UBS Brasil Corretora, BTG Pactual Corretora de Títulos e Valores Mobiliários S.A., ICAP do Brasil Corretora de Títulos e Valores Mobiliários Ltda. and Tullett Prebon Brasil S.A. Corretora de Valores e Câmbio, BGC Liquidez Distribuidora de Títulos e Valores Mobiliários Ltda. | ||
| Research(2) | Rankedfirst Research House in Latin America. | Main competitors (local and global players): J.P. Morgan Corretora de Câmbio e Valores Mobiliários S.A., BTG Pactual Corretora de Títulos e Valores Mobiliários S.A., Credit Suisse Hedging-Griffo Corretora de Valores S.A. and Bank of America Merrill Lynch S.A. Corretora de Títulos e Valores Mobiliários. |
Source: (1) CBLCnet, (2) Institutional Investor magazine.
A-40
Our International Business
Itaú Unibanco Holding’s Global Footprint
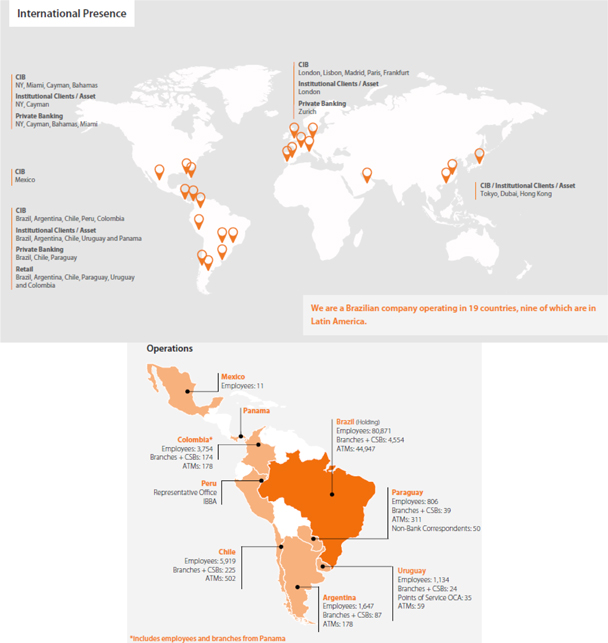
Latin America
Latin America is a priority in our international expansion strategy due to the geographic and cultural proximity to Brazil. Our purpose is to be recognized as the “Latin American Bank”, becoming a reference in the region for all financial services provided to individuals and companies.
Over the past years, we consolidated our presence in Argentina, Chile, Paraguay and Uruguay, with a principal focus on commercial banking and, with the recent merger between Banco Itaú Chile and CorpBanca, which strengthened our presence in Colombia and Panama, we further expanded even more our operations in the region. In Peru, we operate in the corporate segment through a representative office.
As of December 31, 2016 we had a network of 549 branches and client service branches (CSBs) in Latin America (excluding-Brazil). In Paraguay, we had 50 non-bank correspondent locations, which are points of service with a simplified structure, strategically located in supermarkets to provide services to our clients in that country. As of December 31, 2016, we also had 35 points of service through OCA S.A., our credit card operator in Uruguay. Please refer to section Our profile, item Distribution channels, for further details about our distribution network in Latin America.
Banco Itaú Argentina
We have operated since 1979 in Argentina, where we began with a focus on large companies with business ties to Brazil. In 1994, we initiated our retail operations in Buenos Aires. In 1998, we increased our presence through the acquisition of Buen Ayre Bank, subsequently renamed Banco Itaú Argentina.
A-41
Through Banco Itaú Argentina we offer products and services in corporate banking, small and middle-market companies and retail banking. Our corporate banking business focuses on large and institutional clients, providing lending, structured finance, investment and cash management services. Our small and middle-market operations provide credit for working capital and investments in production capacity increases. Our retail banking business focuses on middle and upper-income clients, and our services offerings include current and savings accounts, personal loans and credit cards.
The table below shows our market position and information about competitors for the business listed below:
| Product/Service | Market Position | Additional InformationandMain Competitors | ||
| Total Loan Portfolio (includes privately-owned banks only) | In December 2016, we had a market share of 2.2% in terms of total outstanding loan balance in Argentine pesos, positioning us as thethirteenth largest private bank in Argentina. | Our main competitors are Banco Santander Río S.A., Banco de Galicia y Buenos Aires S.A., BBVA Banco Frances S.A. and Banco Macro S.A. |
Source: Central Bank of Argentina.
Itaú CorpBanca
In 2015, the last pending regulatory approval required for the merger of Itaú Chile with and into CorpBanca was granted by the Superintendency of Banks and Financial Institutions, or SBIF (Superintendencia de Bancos e Instituciones Financieras), in Chile. This completed the set of regulatory approvals we required to consummate the merger in Brazil, Chile, Colombia and Panama.
The merger was consummated on April 1, 2016 and, we acquired control of the resulting bank (Itaú CorpBanca). Since the second quarter of 2016, Itaú CorpBanca’s financial results are consolidated with our results. We expect the technological and operational integration of the banks to be completed at the end of 2017 and synergies to become more evident in 2018.
In October 2016, we acquired from Corp Group 10.9 billion additional shares of Itaú CorpBanca for approximately R$288.1 million, pursuant to the terms of the shareholders’ agreement we entered into on the merger date. As a result, our interest in Itaú CorpBanca increased from 33.58% to 35.71%, without changing the governance of Itaú CorpBanca.
In January 2017, the agreement which sets out the terms and conditions of the merger was amended to reflect, among other things, changes to the terms of the transaction relating to operations in Colombia. Please refer to section Our profile, item 2016 highlights, Mergers, acquisitions and partnerships, Itaú CorpBanca.
This operation represents an important step in our strategy to expand our presence in Latin America, diversifying our operations in the region. We now rank fourth, from a previous seventh place, among the largest private banks in Chile in terms of loans and we have entered the financial retail market in Colombia through Banco CorpBanca Colombia S.A., the fifth largest bank in terms of loans, which will also operate under the Itaú brand. We now also operate in Panama.
The following table shows the market position and information about competitors for the business listed below:
| Product/Service | Market Position | Additional Information and Main Competitors | ||
| Total Loan Portfolio (includes privately-owned banks only) | In December 2016, our market share was 13.1% based on total outstanding loan balance inChileanpesos, positioning us as thefourthlargestprivate bank in Chile. | Our main competitors are Banco Santander-Chile S.A., Banco de Chile S.A., Banco de Crédito e Inversiones S.A. and Banco Bilbao Vizcaya Argentaria Chile S.A. |
Source: Superintendency of Banks and Financial Institutions.
Banco Itaú Paraguay
Our operations in Paraguay began in 1978 and comprise retail and wholesale banking, through Interbanco, which was acquired in 1995 by Unibanco. In 2010, the Itaú brand was introduced and our bank’s name was changed to Banco Itaú Paraguay. Banco Itaú Paraguay distributes products and services to small and middle market companies, agribusiness, large companies, institutional clients and consumer clients. Banco Itaú Paraguay’s main sources of income are consumer banking products, primarily credit cards. The retail segment also focuses on payroll clients. Under corporate banking, Banco Itaú Paraguay has a well-established presence in the agribusiness sector. We hold the leading position among banks in Paraguay in terms of results and deposits (data provided by the Central Bank of Paraguay, December 2016).
Banco Itaú Paraguay was the regional winner in the World’s Best Emerging Markets Banks in the Latin America 2016 category, according to Global Finance magazine. It also won in the “Best Bank in Paraguay” category of the Euromoney Awards for Excellence 2016.
A-42
The following table shows the market position and information about competitors for the business listed below:
| Product/Service | Market Position | Additional Information and Main Competitors | ||
| Total Loan Portfolio (includes privately-owned banks only) | In December 2016, we had a market share of 14.8% in terms of total outstanding loan balance in guaranis, positioning us as the third largest private bank in Paraguay. | Our main competitors are Banco Continental S.A.E.C.A., Banco Regional S.A.E.C.A. and Banco Bilbao Viscaya Argentaria Paraguay S.A. |
Source: Central Bank of Paraguay.
Banco Itaú Uruguay
Our banking operations in Uruguay include Banco Itaú Uruguay, OCA (the largest credit card issuer in Uruguay, in accordance with data from Uruguay’s Central Bank) and the pension fund management company Unión Capital. Our strategy in Uruguay is to serve a broad range of clients through customized banking solutions.
Our retail banking business is focused on individuals and small business clients. Retail products and services focus on the middle and upper-income segments, and also include current and savings accounts, payroll payment, self-service areas and ATMs in all branches, and phone and internet banking. The wholesale banking division is focused on multinational companies, financial institutions, large and middle market companies and the public sector, providing lending, cash management, treasury, trade and investment services.
The following table shows the market position and information about competitors for the business listed below:
| Product/Service | Market Position | Additional Information and Main Competitors | ||
| Total Loan Portfolio (includes privately-owned banks only) | In December 2016, we had a market share of 20.5% based on total outstanding loan balance in Uruguayan pesos, positioning us as the third largest private bank in Uruguay. | Our main competitors are Banco Santander S.A, Banco Bilbao Vizcaya Argentaria Uruguay S.A. and Scotiabank Uruguay S.A. |
Source: Central Bank of Uruguay.
Peru
In Peru, we have a representative office and we are considering to increase our activities in the corporate and investment banking segments.
Mexico
As part of a restructuring process of our activities in Latin America, the sale of our broker business in Mexico was approved by the local regulatory agency and completed on October 01, 2016. We will continue our presence in Mexico with an office dedicated to equity research with respect to Mexican issuers.
Itau BBA International
Our banking activities carried out under the corporate structure of Itau BBA International are mainly focused on two business lines:
• Corporate and Investment Banking: headquartered in the United Kingdom, but with business platforms in several cities in Europe, we meet the financial needs of companies with international presence and operations, focusing on transactions related to financing and investment relationships between companies in Latin America and Europe. The services offered include the origination of structured financing, hedging, trade financing and advisory to both European companies investing in Latin America and Latin American companies investing overseas.
• Private Banking: under the corporate structure of Itau BBA International, we manage private banking activities in Miami and Switzerland, offering specialized financial products and services to high net worth Latin American clients.
Other international operations
To support our clients in cross-border financial transactions and services, our international units are active in providing our clients with a variety of financial products, such as trade financing, loans from multilateral credit agencies, offshore loans, international cash management services, foreign exchange, letters of credit, guarantees required in international bidding processes, derivatives for hedging
A-43
or proprietary trading purposes, structured transactions and international capital markets offerings. These services are offered mainly through our branches in the Bahamas, New York and the Cayman Islands, as well as through our other international operations.
We manage proprietary portfolios and raise funds through the issuance of securities in the international market. Fund raising through the issuance of securities, certificates of deposit, commercial paper and trade notes can be conducted by our branches located in the Cayman Islands, the Bahamas and New York, as well as through Itaú Bank Ltd., a banking subsidiary incorporated in the Cayman Islands. Our proprietary portfolios are mainly held by Itaú Bank and our Nassau and Cayman Islands branches. These offices also enhance our ability to manage our international liquidity.
Through our international operations, we establish and monitor trade-related lines of credit from foreign banks, maintain correspondent banking relationships with money centers and regional banks throughout the world and oversee our other foreign currency-raising activities.
Additionally, Itaú BBA participates in the international capital markets as a dealer, as it has equity and fixed income sales and trading teams in São Paulo, New York, Santiago, London and Hong Kong. We provide extensive research coverage of over 207 listed companies in Brazil, Mexico, Chile, Colombia, Peru, Panama and Argentina. Our international fixed income and equity teams both act in offerings and trading of Brazilian and Latin American securities to institutional investors.
We believe the following strengths provide us with significant competitive advantages and distinguish us from our competitors.
Premier banking brand in Brazil
We believe that our brands are very strong and very well recognized in Brazil and that they have been associated with quality, reliability, and with our large portfolio of products, which help us maintain a low client turnover rate, especially among clients in the high-income segment. In 2016, we reinforced our positioning as a digital bank combining innovative technology with our vision of making people’s daily lives easier through increasingly simpler financial transactions. Also in 2016, our brand was elected by consulting firm Interbrand as “the most valuable brand” in Brazil for the 13th consecutive time. Please refer to section Our profile, item Brand for further information.
Large branch network in geographic areas with high economic activities
Our Brazilian branch network, while national in scope, is strategically concentrated in the southeast region of Brazil, which is the most developed and industrialized region in Brazil. Our branch network in other Latin American countries (Argentina, Chile, Colombia, Paraguay, Panama, Peru and Uruguay) is also positioned in regions with high levels of economic activity. Having our branch network in key economic areas gives us a strong presence and a competitive advantage to offer our services to a broad range of clients and benefit from selective market opportunities. Our exclusive ATM network allows us to offer a wide range of products and services to our clients, which we see as one of our competitive strengths.
Additionally, we have refurbished branches, especially in shopping malls. These branches have a new visual identity and service proposition, offering a new concept of client service and a differentiated layout inspired by the design of a retail store. Shopping mall branches have extended hours, which offers added convenience for our clients. We have an extensive network, including branches, client site branches and ATMs in Brazil and abroad. Please refer to section Our profile, item Distribution channels for further information.
Diversified line of products and services
We are a multi-service bank offering a diverse line of products and services designed to address the needs of various types of clients, including corporate clients, very small and small companies, retail clients, high-income individuals, private bank clients, non-accountholders and credit card users. We believe that this business model creates opportunities to improve our relationship with clients and thereby increases our market share and our fee-based income. We expect to maintain our leading presence by capturing a solid and increasing number of transactions across various business segments.
Technology and electronic distribution channels as drivers for sales
Our intensive use of technology and electronic distribution channels, which has contributed significantly to an increase in sales of products and services, is one of our most important competitive advantages. We invest in technology because we believe that it is how we will be able to improve the environment for our employees and clients. We focus our efforts on the development of platforms and services that use the best technology, with the purpose of streamlining and making easier the lives of everybody who relate with the bank, with a focus on mobility and convenience.
Our technology supports certain remote banking capabilities (such as call centers, mobile applications and internet banking) and offers clients the ability to buy services, verify statements and perform transactions online or over the telephone. In addition, our sales teams can access client credit scores with ease and credit proposals can be sent over the internet by any broker registered with our systems.
A-44
Through our digital branches we expanded our client relationship model offering personalized customer services from 7 a.m. to midnight, from Monday through Friday allowing our clients to manage their accounts remotely, simplifying their lives and making us more efficient. In December 2016, we had 135 digital branches, compared to 94 in 2015, an increase that is a result of good acceptance from our users. We are also investing in other digital means of communication such as Itaú Pagcontas, Itaú Tokpag, Itaucard and Itaú Empresas applications. In 2016, we developed Itaú Abreconta, an app which offers to clients the possibility to open new bank accounts from their mobile phones. Additionally, in 2015, we concluded our new data center built in the State of São Paulo, which is one of the largest in Latin America, had its construction concluded as planned and the configurations of the environmental infrastructure were successfully established. The new data center will support our growth up to 2050, ensuring high performance and availability of our operations.
Please refer to section Our profile, item Distribution channels, for further information about Personnalité Digital and other digital channels.
Technological entrepreneurship
By improving and simplifying our client’s experience, applying technology to new business models and working with agility, startups have been challenging traditional industries to review their way of working. Technology companies have also started to offer financial services, impacting the banking sector. To reinvent itself and lead this transformation, Itaú created Cubo in partnership with Redpoint to connect itself with the technological entrepreneurship universe and, consequently, find opportunities to generate competitive advantage and evolve as a digital bank.
Cubo is a non-profit organization that promotes transformation to technological entrepreneurship through a variety of initiatives. In addition to offering a co-working space for digital startups, the resident startups can count on the support mentors who are specialized in a wide range of topics and on a platform of events that includes workshops, speeches, among others, aimed at entrepreneurs and others.
By the end of 2016, Cubo had 54 resident startups that have already generated more than 650 jobs. Every day, Cubo receives investors, students, entrepreneurs and executives from big companies that come to learn about the ecosystem. Between 2015 and 2016, the startups under Cubo have received around R$ 104 million in investments from companies that believe in their business models. Employees of Itaú have already taken part in activities such as workshops, corporate events and lectures at Cubo, including employees from the international units.
Risk-based pricing model as a tool to manage risk while exploring opportunities
Our risk-based pricing model, as applied to our products, is an important competitive advantage as it gives us a more precise dimension of risk-return in various scenarios. This is an essential tool to explore commercial opportunities and simultaneously manage risk. Depending on the product, each contract is individually priced using risk adjusted return on capital models that give us a better assessment of the relevant market.
Competition
The last several years have been characterized by increased competition and consolidation in the financial services industry in Brazil. As of December 31, 2016, there were 138 conglomerates, commercial banks and multiple-service banks, development banks and Caixa Econômica Federal, among a total of 1,454 institutions in Brazil.
We, together with Banco Bradesco S.A. and Banco Santander Brasil S.A., are the leaders in the privately-owned multiple-services banking sector. As of December 31, 2016, these banks accounted for 37.8% of the Brazilian banking sector’s total assets. We also face competition from state-owned banks. As of December 31, 2016, Banco do Brasil S.A., Caixa Econômica Federal, and Banco Nacional de Desenvolvimento Econômico e Social (BNDES) accounted for 43.2% of the banking system’s total assets.
The following table sets out the total assets of the 10 main banks in Brazil, classified according to their interest in the total assets of the Brazilian banking sector:
A-45
| Position | Banks by total assets(1) | Control Type | As of December 31, | |||||||||
| 2016 | % of Total | |||||||||||
| (In billions of R$) | (%) | |||||||||||
| 1st | Banco do Brasil S.A.(2) | state-owned | 1,436.8 | 17.4 | ||||||||
| 2nd | Itaú Unibanco Holding S.A. | privately-owned | 1,331.8 | 16.2 | ||||||||
| 3rd | Caixa Econômica Federal | state-owned | 1,256.2 | 15.2 | ||||||||
| 4th | Banco Bradesco S.A.(3) | privately-owned | 1,081.4 | 13.1 | ||||||||
| 5th | Banco Nacional de Desenvolvimento Econômico e Social (BNDES) | state-owned | 867.6 | 10.5 | ||||||||
| 6th | Banco Santander Brasil S.A. | privately-owned | 705.1 | 8.6 | ||||||||
| 7th | Banco Safra S.A. | privately-owned | 148.4 | 1.8 | ||||||||
| 8th | Banco BTG Pactual S.A. | privately-owned | 132.0 | 1.6 | ||||||||
| 9th | Banco Citibank S.A. | privately-owned | 72.0 | 0.9 | ||||||||
| 10th | Banco do Estado do Rio Grande do Sul S.A. (Banrisul) | state-owned | 68.2 | 0.8 | ||||||||
| n.a. | Others | n.a. | 1,139.9 | 13.8 | ||||||||
| Total | 8,239.4 | 100.0 | ||||||||||
(1) Based on banking services, except insurance and pension funds.
(2) Includes the consolidation of 50.0% do Banco Votorantim S.A. based on Banco do Brasil’s shareholding stake and excludes these 50.0% of National Financial System.
(3) Includes the consolidation of HSBC Bank Brasil S.A.
Source: Central Bank (IF.data).
| SYMBOL | CORPORATE | ||||||
| GOVERNANCE | |||||||
| STOCK EXCHANGE | Common Share | Preferred Share | LEVEL | ||||
 | Securities, Commodities and Futures Exchange (BM&FBOVESPA) | ITUB3 | ITUB4 | Level 1 | |||
 | New York Stock Exchange (NYSE) | - | ITUB(1) | Level 2 | |||
(1) American Depositary Shares, or ADSs.
Common shares entitle the holder to one vote at our general stockholders’ meetings. The voting rights of our controlling stockholders do not differ from the voting rights of other holders of common shares.
Preferred shares are nonvoting but entitle the holder to:
• priority to receive mandatory dividends, in the amount of R$0.022 per share, non-cumulative with minimum dividend; and
• tag-along rights in the event of sale of a controlling stake, assuring a price equal to 80% of the amount paid for the controlling stockholders’ common shares.
Brazilian Corporate Law provides that preferred stockholders may vote when the company does not pay fixed or minimum dividends to which they are entitled for the period established in the company’s Bylaws, which may never exceed three consecutive fiscal years. The preferred stockholders maintain such right until the payment is made if these dividends are noncumulative or until cumulative dividends are paid.
The creation of a new class of shares with priority over preferred shares, as well as any change in preference or in rights associated with preferred shares, must be approved by at least 50% of common shares and also approved by stockholders representing the majority of preferred shares in a special general meeting. Please refer to section Our governance, item Management structure, Annual General Stockholders’ Meeting, for further information about the procedures for calling general and special stockholders meetings.
The following table sets forth the high and low market closing prices for the preferred shares for the periods indicated:
A-46
| Per Preferred Share (ITUB4)(1) | Per ADS (ITUB)(1) | |||||||||||||||
| Preferred share price | High | Low | High | Low | ||||||||||||
| (In R$) | (In R$) | (In US$) | (In US$) | |||||||||||||
| 2017 | 41.68 | 33.53 | 13.52 | 10.70 | ||||||||||||
| January | 38.25 | 33.53 | 12.15 | 10.70 | ||||||||||||
| February | 41.68 | 37.51 | 13.52 | 11.96 | ||||||||||||
| March | 40.26 | 37.77 | 12.88 | 12.07 | ||||||||||||
| April (through April 18, 2017) | 38.78 | 37.12 | 12.49 | 11.78 | ||||||||||||
| 2016 | 38.40 | 20.97 | 11.98 | 4.99 | ||||||||||||
| First quarter | 30.18 | 20.97 | 8.31 | 4.99 | ||||||||||||
| Second quarter | 30.65 | 25.44 | 8.76 | 7.28 | ||||||||||||
| Third quarter | 33.71 | 27.88 | 10.51 | 8.38 | ||||||||||||
| Fourth quarter | 38.40 | 31.01 | 11.98 | 9.12 | ||||||||||||
| 2015 | 32.34 | 23.46 | 11.18 | 5.75 | ||||||||||||
| First quarter | 30.49 | 27.07 | 11.18 | 8.59 | ||||||||||||
| Second quarter | 32.34 | 27.11 | 10.98 | 8.64 | ||||||||||||
| Third quarter | 28.95 | 23.46 | 9.26 | 5.75 | ||||||||||||
| Fourth quarter | 27.05 | 23.64 | 7.38 | 5.90 | ||||||||||||
| 2014 | 34.08 | 21.98 | 15.14 | 8.98 | ||||||||||||
| 2013 | 26.00 | 20.14 | 13.00 | 8.78 | ||||||||||||
| 2012 | 26.36 | 18.48 | 14.86 | 8.94 | ||||||||||||
Source: Economatica System.
(1) Historical prices are adjusted by corporate actions, such as 10% share bonus of Itaú Unibanco.
The following graph shows the evolution of R$100 invested from December 29, 2006 to December 28, 2016, comparing our preferred share (ITUB4) price, with and without reinvestment of dividends, to the performance of Ibovespa and CDI.

Information for the Investor
Adoption of Cumulative Voting
Under Brazilian Corporate Law and CVM’s regulation, stockholders that represent at least 5% of share capital with voting rights may demand a cumulative voting process up to 48 hours before a general stockholders’ meeting. Each share will be entitled to as many votes as the members of the board being elected, and the stockholder has the right to concentrate votes in one candidate or distribute them among several candidates. The presiding officer must inform the stockholders in advance about the number of votes required for the election of each member of the Board of Directors.
A-47
Whenever the election of the Board of Directors is held under the cumulative vote process and the common or preferred stockholders exercise their right of electing one director, the controlling stockholder will have the right to elect directors in the same number as those elected by the other stockholders plus one, regardless of the number of directors that, according to our Bylaws, compose the board.
Additionally, as our Bylaws do not provide for staggered terms, our directors may be reelected consecutively without interruption. Whenever the election has been conducted through a cumulative voting process, the removal from office of any of our directors by our stockholders, at a stockholders’ meeting will result in the removal from office of all of the remaining directors and a new election shall be arranged. In order not to affect the management of the company as a result of the removal of directors, Brazilian Corporate Law provides that despite the removal, the same directors may continue to exercise their functions until the newly elected board members take office.
Preemptive right, capital increase and payment for subscribed shares
Each stockholder has the preemptive right to subscribe for shares in any capital increase, in proportion to his equity interest, except in specific cases, in compliance with Brazilian Corporate Law.
Our Bylaws authorize the Board of Directors to increase our share capital up to a limit of 8,784,600,000 shares, of which 4,392,300,000 must be common shares and 4,392,300,000 must be preferred shares (authorized capital). Up to the limit of our authorized capital, the issuance of our shares may be made without considering our stockholders preemptive rights if (i) made for the sale on a stock exchange; (ii) by a public subscription; and (iii) exchange for our shares in a public offering for the acquisition of our control. Regardless of this provision, all increases in our share capital must be ratified by our stockholders and approved by the Central Bank.
After the approval of the capital increase by the Central Bank, a stockholder must pay the value corresponding to the subscribed shares under the terms established in the subscription documentation related to that capital increase. A stockholder that fails to make payment under the terms of the subscription documentation will be deemed to be in default, in accordance with Brazilian Corporate Law.
Brazilian legislation does not provide for liability in capital calls, therefore the ownership interest of our stockholders may be diluted if they decide not to exercise their preemptive rights to subscribe shares in cases of capital increase.
Form and Transfer
Our shares are book-entry and Itaú Corretora de Valores S.A. is our bookkeeping service provider. Therefore, the shares issued by us are to be kept in deposit accounts, under the investor’s name.
As an alternative, the investor may also deposit shares in the BM&FBovespa via a custodian institution authorized by the CVM. In such case, the BM&FBovespa, as central depositary, holds the shares under its name but controls the ownership of the securities through a structure of deposit accounts kept under the investors’ name. There is no distinction in the rights and obligations of stockholders, regardless of whether their shares are deposited with a broker-dealer or with BM&FBovespa.
Redemption and withdrawal rights
Our common shares and our preferred shares are not redeemable, except upon delisting. Pursuant to Brazilian Corporate Law, however, the approval of certain matters entitles a dissenting stockholder to withdraw from the company, such right expiring thirty days after publication of the minutes of the applicable stockholders’ meeting. This withdrawal may occur under certain conditions upon reimbursement of the value of such holder’s shares, calculated based on criteria set forth under Brazilian Corporate Law. Also, in accordance with Brazilian Corporate Law, we are entitled to reconsider any resolution that gives rise to a withdrawal within ten days following the expiration of the withdrawal period, if such exercise of withdrawal rights jeopardizes our financial stability.
Withdrawal rights are not available to stockholders whose shares have liquidity and are actively traded in the stock market in cases of merger or takeover or in case the company elects to take part in a group of companies.
Common and preferred shares should be reimbursed upon cancellation of their registration at their value, calculated based on the criteria set forth under Brazilian Corporate Law. If the resolution that gave rise to withdrawal rights was approved more than 60 days after the date when the last balance sheet was approved, the stockholder may demand that his shares be redeemed at a value based on a new balance sheet, dated up to 60 days after the date of the general meeting.
 | In the United States
Our preferred shares have been traded on the NYSE in the form of ADSs (one ADS represents one preferred share) since February 21, 2002, in compliance with NYSE and SEC requirements. These requirements include disclosure of financial statements in IFRS since 2011 and compliance with U.S. legal requirements, including the Securities Exchange Act of 1934 and the Sarbanes-Oxley Act of 2002. |
Our ADSs are issued by The Bank of New York Mellon, as depositary, under a Deposit Agreement, dated as of May 31, 2001, as amended and restated as of February 20, 2002 and as of March 30, 2009, effective as of April 3, 2009, among us, the depositary and
A-48
the owners and beneficial owners of ADSs from time to time. The depositary’s principal executive office is located at 225 Liberty Street, New York, New York 10281.
ADS holders have no stockholder rights, which are governed by Brazilian Corporate Law. The depositary is the holder of the preferred shares underlying the ADSs. Holders of ADSs have ADS holder rights.
An investor may hold the ADSs directly, registered under his or her name, or indirectly, through a broker or another financial institution. The holders of our ADSs do not have the same rights as our stockholders and the depositary and holders of corresponding shares in Brazil. The deposit agreement determines the rights and obligations of the ADS holders and is governed by New York law.
In the event of a capital increase that maintains or increases the proportion of our capital represented by preferred shares, the holders of ADSs, except as described above, have preemptive rights to subscribe only to newly issued preferred shares. In the event of a capital increase that reduces the proportion of capital represented by preferred shares, the holders of ADSs, except as described above, have preemptive rights to preferred shares in proportion to their interests and to common shares only to the extent necessary to prevent dilution of their interests.
Please refer to section Attachments, item Considerations for ADS holders for further information.
Fees and expenses
The following table summarizes the fees and expenses payable by holders of ADSs to the depositary:
| Event | Fees | |
| Issuance(1) or cancellation for the purpose of withdrawal(2) of ADSs | US$5.00 (or less) per 100 ADSs (or portion thereof) plus any additional fees charged by any governmental authorities or other institutions for the execution and delivery or surrender of ADSs. | |
| Any cash distribution | US$0.02 (or less) per ADS (or portion thereof). | |
| Depositary services | US$0.02 (or less) per ADS (or portion thereof) per calendar year (in addition to cash distribution fee of US$0.02 per ADS during the year). |
(1)Including issuances resulting from a distribution of preferred shares or rights or other property, substitution of underlying shares and transferring, splitting or grouping of receipts.
(2)Including if the deposit agreement terminates.
In addition, set below are other fees and expenses payable by holders of ADSs:
| · | registration fees: registration of transfers of preferred shares on our preferred share register to or from the name of the depositary or its agent when the holder deposit or withdraws preferred shares. |
| · | distribution of securities by the depositary to ADS holders fee: equivalent to the fee that would be payable if securities distributed to the holder thereof had been preferred shares and the shares had been deposited for issuance of ADSs. |
| · | foreign currency conversion expenses: expenses of the depositary in converting foreign currency to U.S. dollars. |
| · | depositary expenses: cable, telex and facsimile transmissions (when expressly provided in the Deposit Agreement). |
Moreover, taxes and other governmental charges which the depositary or the custodian has to pay on any ADR or preferred share underlying an ADS (for example, stock transfer taxes, stamp duty or withholding taxes) would be payable by holders of ADSs. Any other charges incurred by the depositary or its agents for servicing the deposited securities are not currently assessed in the Brazilian market.
Payment of taxes
The depositary may deduct the amount of any taxes owed from any payments to investors. It may also sell deposited securities, by public or private sale, to pay any taxes owed. Investors will remain liable if the proceeds of the sale are not sufficient to pay the taxes. If the depositary sells deposited securities, it will, if appropriate, reduce the number of ADSs to reflect the sale and pay to investors any proceeds or send to investors any property remaining after it has paid the taxes.
Reimbursement of fees
The Bank of New York Mellon, as depositary, has agreed to reimburse us for expenses we incur that are related to establishment and maintenance of the ADS program. The depositary has agreed to reimburse us for our continuing annual stock exchange listing fees. The depositary has also agreed to pay the standard out-of-pocket maintenance costs for the ADSs, which consist of the expenses of postage and envelopes for mailing annual and interim financial reports, printing and
A-49
distributing dividend checks, electronic filing of United States federal tax information, mailing required tax forms, stationery, facsimile, and telephone calls, as well as to reimburse us annually for certain investor relationship programs or special investor relations promotional activities. In certain instances, the depositary has agreed to provide additional payments to us based on applicable performance indicators relating to the ADS facility. There are limits on the amount of expenses for which the depositary will reimburse us, but the amount of reimbursement available to us is not necessarily tied to the amount of fees the depositary collects from investors.
The depositary collects its fees for delivery and surrender of ADSs directly from investors, depositing shares or surrendering ADSs in case of exercise of withdrawal rights or from intermediaries acting for them. The depositary collects fees for making distributions to investors by deducting those fees from the amounts distributed or by selling a portion of distributable property to pay the fees. The depositary may collect its annual fee for depositary services by deducting from cash distributions, by directly billing investors or by charging the book-entry system accounts of participants acting for them. The depositary may generally refuse to provide services subject to fees until its fees for those services have been paid.
In 2016, we received from the depositary US$21.9 million for promoting and encouraging the ADR program in the market, out-of-pocket maintenance costs for the ADSs (as described above), any applicable performance indicators relating to the ADS facility, underwriting fees and legal fees.
In Argentina
Until December 2016, we issued Argentine Certificates of Deposits (CEDEARs) on the Buenos Aires Stock Exchange (BCBA), which represent shares of foreign companies traded in Argentina. In 2017, we requested the Comisión Nacional de Valores (CNV) the suspention of the trading of our deposits certificates and cancellation of our CEDEARs program. On March 10, 2017 we obtained such authorization from the regulator.
Stockholders’ payment
Our Bylaws establish the distribution to stockholders of mandatory dividends equivalent to 25% of our net income calculated for each fiscal year, adjusted by the decrease or increase of amounts related to legal reserve, to reserve for contingencies and to its reversal related to prior years.
The mandatory dividend may be paid as dividends or interest on capital. The main difference between these forms of payment is tax-related. The payment of dividends is tax-free for stockholders.
The payment of interest on capital is subject to withholding income tax at a 15% rate, or 25% if the stockholder is a resident of or domiciled in a tax haven jurisdiction or a privileged tax regime.
The amount paid to stockholders as interest on capital, net of any withholding tax, may be included as part of the mandatory dividend. In such cases, we are required to distribute to stockholders an amount sufficient to ensure that the net amount received by stockholders, after the payment by us of applicable withholding taxes in respect of the distribution of interest on capital, is at least equal to the mandatory dividend. Please refer to section Attachments, item Considerations for ADS holders, Taxation for ADS holders, for further details.
Our Stockholder Remuneration Policy, approved by our Board of Directors, establishes the monthly payment of R$0.015 per share as an advance mandatory dividend. The date used in Brazil as a reference to determine which stockholders are entitled to receive the monthly dividend is determined according to the shareholding position registered on the last day of the preceding month. With respect to our ADSs, however, the date used to determine the stockholders that are entitled to receive the monthly dividend is three days after the Brazilian reference date. In both cases, monthly dividends for a given month are paid on the first business day of the next month.
Once our net income is calculated, we intend to pay the difference between the mandatory dividend, calculated as mentioned before, and the accumulated amount of advanced monthly dividends. Additionally, our Board of Directors may declare interim dividends, which will be submitted for ratification at our annual stockholders’ meeting.
A stockholder may claim payment of any dividend for a period of three years counted from the dividend payment date. After this period we have no responsibility for such payment.
Stockholders not residing in Brazil must register with the Central Bank so that dividends, interest on capital and other amounts related to their shares can be remitted abroad in a foreign currency.
Currently, we pay dividends and interest on capital equivalent to or higher than the mandatory dividends, but this may not continue to happen if our stockholders decide that such distribution is not advisable in view of our financial condition. In this case, if our Fiscal Council is constituted, it must issue an opinion about that decision, and management must present a report to CVM detailing the reasons for the suspension of the dividend payment. Profits not distributed due to a suspension of the dividend payment must be allocated to a special reserve and, if it is not absorbed by losses in subsequent years, it must be paid as dividends as soon as our financial position so permits.
Please refer to section Performance, item Complete Financial Statements (IFRS), Note 21b, and section Our risk Management, item Regulatory environment, Implementation of Basel III in Brazil.
ADS holders’ payment of dividends
A-50
Preferred shares underlying ADSs are kept in Brazil by the custodian, Itaú Unibanco, which is the owner recorded in the register service of our preferred shares. The depositary of our ADS program is The Bank of New York Mellon. The payments of dividends and distributions in cash for our preferred shares underlying the ADSs are made directly to the depositary bank abroad, which is responsible for passing them on to the stockholders within an average period of 10 days after payment is made in Brazil. The amount received by the ADS holder may be reduced if we, the custodian or the depositary are required to retain an amount related to taxes and other government charges.
Please refer to section Our profile, item 2016 highlights, Corporate events, Payment of dividends, 10% Share Bonus of Itaú Unibanco and please refer to Performance, item Complete Financial Statements (IFRS), Note 21 – Stockholders’ equity, for further information about dividends, share bonus and shares outstanding.
Further information for the investor
We are organized as a publicly held corporation for an unlimited period of time under the laws of Brazil. Our head offices are located at Praça Alfredo Egydio de Souza Aranha, 100, 04344-902, São Paulo, SP, Brazil and our telephone number is +55-11-2794-3547. We are primarily governed by Brazilian Corporate Law and our Bylaws. Our Tax Payer’s Registry (CNPJ) is 60.872.504/0001-23, and we are registered with the São Paulo Commercial Registry (Junta Comercial do Estado de São Paulo) under NIRE 35300010230. Our corporate purpose, as set forth in Article 2 of our Bylaws, is to perform banking activity in all its authorized forms, including foreign exchange transactions. Our agent for service of process in the United States is the general manager of our New York branch, which is located at 767 Fifth Avenue, 50th floor, New York, NY 10153.
| CONTACTS | |
| Shares Program | |
| Bookkeeping service | Itaú Corretora de Valores S.A. |
| Phone | 3003 9285 (capitals and metropolitan areas) or 0800 720 9285 (further areas) (Brazilian callers) or +55 11 3003 9285 (Non-Brazilian callers) |
| investfone@itau-unibanco.com.br | |
| Site | www.itaucorretora.com.br |
| Specialized branches address | www.itaucustodia.com.br/agencia_enderecos.htm |
| ADS Program | |
| Depositary bank | The Bank of New York Mellon |
| Phone | 1 888 BNY ADRS (1 888 269 2377) (U.S. callers) or |
| +1 201 680 6825 (Non-U.S. callers) | |
| shrrelations@cpushareownerservices.com | |
| Site | www.bnymellon.com/shareowner |
| Investor Relations | Itaú Unibanco Holding S.A. |
| Phone | +55 11 2794 3547 |
| investor.relations@itau-unibanco.com.br | |
| Site | www.itau.com.br/investor-relations |
| 2017 CORPORATE CALENDAR | ||
| Annual General Stockholders’ Meeting | April 19, 2017 | |
| Earnings Release – First Quarter, 2017 | May 3, 2017 | |
| Earnings Release – Second Quarter, 2017 | August 1, 2017 | |
| Earnings Release – Third Quarter, 2017 | October 31, 2017 |
Our commitment to best practices in corporate governance is directly related to our focus on stockholders and investors, transparency and accountability. We are particularly focused on platforms for communication with these groups and are continuously investing to upgrade channels and the quality of our services.
In 2016, to encourage our communications with and further strengthen our relationship with our stockholders, capital markets investors and analysts, we disclosed the organization’s results, strategies and perspectives in 16 public meetings that drew approximately 2.2 thousand attendees in several cities. The meetings were held in partnership with the Association of Capital Markets Investment Analysts and Investment Professionals (APIMEC -Associação dos Analistas e Profissionais deInvestimento do Mercado de Capitais). We also took part in 30 conferences and seven road shows in Brazil and abroad.
We held four quarterly conference calls during 2016, in each case on the day after each quarterly earnings release. The calls are conducted in Portuguese and afterwards in English and may be accessed by telephone or on the internet.
A-51
Our corporate information is posted on our Investor Relations website (www.itau.com.br/relacoes-com-investidores). In addition, our bank was the first Brazilian bank to have an IR profile on Twitter (@itauunibanco_ri) and a Facebook (facebook.com/itauunibancori) page.
Credit ratings
We subscribe to independent credit rating agency reviews by Fitch Ratings, Moody’s and Standard&Poor’s (S&P). These ratings assess our credit worthiness and are based on reviews of a broad range of business and financial attributes including risk management processes and procedures, capital strength, earnings, funding, liquidity, accounting and governance, in addition to government and/or group support.
Credit Ratings(1)
| As of December 31, 2016 | Fitch Ratings | Standard&Poor’s | Moody’s | |||
| Itaú Unibanco Holding S.A. | ||||||
| Short Term | B | B | NP | |||
| Long Term | BB+ | BB | (P) Ba3(2) | |||
| Outlook | Negative | Negative | Stable | |||
| Itaú Unibanco S.A. | ||||||
| Short Term | B | B | NP | |||
| Long Term | BB+ | BB | (P) Ba2(3) | |||
| Outlook | Negative | Negative | Stable | |||
| Itau BBA International plc(4) | ||||||
| Short Term | - | - | P-2 | |||
| Long Term | - | - | A3 | |||
| Outlook | - | - | Stable |
| (1) | International Scale Foreign Currency Ratings. |
| (2) | Refers to Itaú Unibanco Holding S.A. Senior Unsecured Debt Rating. Moody’s does not assess Deposit Ratings for Itaú Unibanco Holding. |
| (3) | Refers to Itaú Unibanco S.A. Senior Unsecured Debt Rating. Itaú Unibanco S.A. Long Term Deposit Rating is Ba3. |
| (4) | Itau BBA International plc is not rated by Fitch Ratings or Standard & Poor’s. |
In mid-February 2016, Standard & Poor’s downgraded Brazil’s ratings. As a result, the rating agency also announced reviews of the ratings of 44 Brazilian financial services institutions, including Itaú Unibanco and Itaú Unibanco Holding, which were also downgraded.
Following Moody’s downgrade of Brazil’s sovereign bond rating from Baa3 to Ba2, with a negative outlook, on February 24, 2016, Moody’s announced on February 25, 2016 that it had downgraded ratings assigned to 31 Brazilian banking entities, including Itaú Unibanco and Itaú Unibanco Holding. According to Moody’s, the affected ratings were constrained by the sovereign rating because of the relevant issuers’ close economic linkages to the government.
Following Fitch’s downgrade of Brazil’s sovereign rating from BB + to BB, with a negative outlook, on May 5, 2016, Fitch announced on May 11, 2016 that it had downgraded ratings assigned to 22 Brazilian financial institutions, including Itaú Unibanco and Itaú Unibanco Holding, which had their ratings revised to BB+ from BBB-. According to Fitch, the ratings of Itaú Unibanco and Itaú Unibanco Holding remain one notch above Brazil’s sovereign rating, due to their very strong credit profile.
In May 2016, Moody’s recalibrated the Brazilian national rating scale. As a result, Moody’s repositioned the national scale ratings of 28 Brazilian financial institutions, including Itaú Unibanco S.A. and Itaú Unibanco Holding S.A., which had their national scale ratings upgraded from Aa2.br to Aa1.br and from A2.br to A1.br, respectively, as a result of such repositioning.
On August 5, 2016, Moody’s assigned to, for the first time, Itau BBA International plc (domiciled in the United Kingdom) an investment grade, long-term deposit and issuer ratings of A3 (with a negative outlook). In assigning the ratings, Moody’s recognized the strength of Itau BBA International plc’s strong macro profile, low level of asset risk, strong capital and liquidity.
On September 1, 2016, Fitch reaffirmed the global scale long-term foreign and local currency ratings of Itaú Unibanco Holding S.A. and Itaú Unibanco S.A. at BB+ (with a negative outlook). The rating agency has emphasized that the bank has a comfortable liquidity position due to low-cost funding sources through our extensive branch network.
On October 10, 2016, Standard & Poor’s reaffirmed the global scale long-term foreign and local currency ratings of Itaú Unibanco Holding S.A. and Itaú Unibanco S.A. at BB (with a negative outlook). The rating agency also highlighted the bank’s level of capitalization.
In March, 2017, Moody’s upgraded from negative to stable the outlook of Itaú Unibanco S.A. and Itaú Unibanco Holding S.A. , aligned to the sovereign outlook review. Also in March 2017, Fitch reaffirmed the global scale long-term foreign and local currency ratings of Itaú Unibanco Holding S.A. and Itaú Unibanco S.A. at BB+ (with a negative outlook). The rating agency has emphasized that the bank has a strong liquidity, a good capitalization, a consistent profitability and comfortable levels of asset quality.
A-52
The adoption of good corporate governance practices adds value to a company, facilitates its access to capital and contributes to its longevity. Therefore, we have adopted corporate governance practices aligned with best practices adopted in the Brazilian and foreign markets. Furthermore, we comply with the corporate governance rules issued by the Central Bank and the Brazilian Securities and Exchange Commission (CVM – Comissão de Valores Mobiliários). We seek constant development of our management policies and mechanisms so as to ensure excellence in our practices and sustainable growth for our company. Please refer to www.itau.com.br/_arquivosestaticos/RI/pdf/en/ENGLISHpolitica_gc.pdf for our governance principles and practices we adopt.
In line with such principles, we voluntarily comply with the Code of Self-Regulation and Good Practices for Publicly Held Companies of the Brazilian Association of Publicly Held Companies (Associação Brasileira de Companhias Abertas, or ABRASCA), which was based on the best corporate governance practices in effect in Brazil and abroad. Our governance practices have been recognized and, as a result, we have been named to BM&FBovespa´s Corporate Sustainability Index (ISE - Índice de Sustentabilidade Empresarial) and to the Dow Jones Sustainability Index. On the latter, we were recognized as one of the top-scoring companies in the banking industry, qualified for inclusion in the 2017 Sustainability Yearbook and received the Bronze Class distinction for our sustainability performance.
In December 2016, for the third consecutive semester, we were selected for inclusion in the portfolio of the Euronext Vigeo – Emerging 70 Sustainability Index. The index is comprised of 70 companies, selected among over 850 companies listed in developing countries that showed the best performance in corporate responsibility, according to the ratings assigned by Vigeo. Inclusion in Euronext Vigeo – Emerging 70 reflects our long-term commitment to ethical business behavior, compliance with the law, corporate governance, and social, cultural and environmental responsibility. Please refer to section Our profile, item 2016 highlights for further information about our awards and recognition.
Since 2002, in line with our commitment to strengthen our position in the Brazilian capital markets, we have made a number of presentations in the regional offices of the Association of Capital Markets Investment Analysts and Investment Professionals (APIMEC - Associação dos Analistas e Profissionais de Investimento do Mercado de Capitais, or APIMEC). Beginning in 1996, we have also made presentations in the United States and Europe with respect to our governance practices. In these presentations, we have the opportunity to provide the financial community with details on our performance, strategies to add value, future perspectives and other important issues.
Our Code of Ethics was updated in August 2016 and applies to all of our employees, directors and officers. Our Code of Ethics is based on principles that support a corporate culture focused on valuing people, on strict compliance with rules and regulations and on a permanent pursuit of development. Please refer to http://www.itau.com.br/_arquivosestaticos/RI/pdf/en/codigo_de_etica_ingles.pdf?title= Itaú Unibanco's Code of Ethics for our Code of Ethics.
Additionally, we have adopted the Policy of Material Information Disclosure, which deals with the public disclosure of material information pursuant to CVM regulation. We also have adopted a Policy on Trading of Securities, which restricts the trading of securities during certain periods and requires the disclosure of all transactions carried out by the management with our securities, as permitted by CVM regulation. These policies can be found in: https://www.itau.com.br/_arquivosestaticos/RI/pdf/en/Politica_de_Divulgacao_(FOR)_INGLES.pdf?title=Corporate Policy and Procedure Disclosure of Material Information https://www.itau.com.br/_arquivosestaticos/RI/pdf/en/IHF-Politica_de_Negociacao_(FOR)_INGLES.pdf?title=Policy for Trading Itaú Unibanco Holding S.A. Securities.
Over the course of our history, as part of our corporate governance initiatives, we have made several decisions regarding the improvement of the disclosure of our information and the protection of minority stockholders rights. For example, we are listed as a publicly held company on BM&FBovespa and, in 2001, we were one of the first companies to voluntarily adhere to Corporate Governance Level 1 of the BM&FBovespa. In 2002, we listed our Level 2 ADSs on NYSE, complying with both SEC’s rules and other U.S. legal requirements, such as the Securities Exchange Act of 1934 and the Sarbanes-Oxley Act of 2002.
Public sector
In order to ensure the work of our managers and employees on an ethical and transparent basis, as well as to prevent and fight frauds and illicit acts in the relationship with the public sector, we adopt policies to clearly determine how to carry on the relationship, as well as processes and rules that determine what is allowed and what is not allowed, providing for a proper risk management.
In 2016, it is worth mentioning the launch of the ‘Relationship Policy with Public Agents and Hiring of Public Administration Bodies and Companies’, aiming at guiding governmental relations in Itaú Unibanco Conglomerate, which is construed as the institutional interests of the bank and of the financial system in general, on an organized and transparent basis with public agents. In addition to the rules established for the allowed and expected employees conduct in the relationship with any public agents, the policy also includes rules for the execution of agreements with public administration bodies and companies.
Furthermore, we revisited the Integrity and Ethics and the Bribery Prevention Corporate Policies, and the Code of Ethics, which state rules to avoid conflicts of interests in processes regarding donations and sponsorships, gifts, and in relationships
A-53
with clients, suppliers and partners, both in the public and private sectors, and which also establish guidelines and processes to prevent and fight corruption, such as training, communications, consultation and whistleblowing channels.
These policies are available at https://www.itau.com.br/investor-relations/corporate-governance/rules-and-policies
Our management is structured so as to ensure that matters are extensively discussed and decisions are made on a collective basis. The chart and text below present our management bodies, their main functions and the management members that compose them.
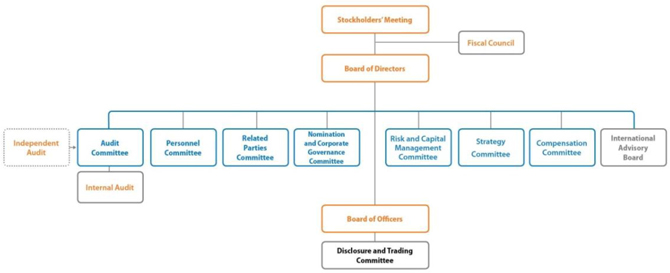
Annual General Stockholders’ Meeting and Extraordinary Stockholders’ Meeting
Our Annual General Stockholders’ Meeting is our highest decision-making body, which gathers stockholders on a regular basis before the end of April of each year and, on a special basis, whenever corporate interests so require.
It is the responsibility of our Board of Directors to call a stockholders’ meeting. The first notice of the stockholders’ meeting must be published no later than 15 days before the date of the meeting on the first call. Brazilian Corporate Law establishes that under specified circumstances, the meeting may also be convened by the fiscal council or any stockholder.
The notice of a stockholders’ meeting must be published three times, on different dates, in official newspapers widely circulated in São Paulo, our principal place of business, setting forth the place, date and time of the meeting, the meeting’s agenda and, in the event of an amendment to our Bylaws, a description of the proposed change.
In addition to the requirements of Brazilian Corporate Law, we also publish notices in two different languages (Portuguese and English) on our website and e-mail our subscribed investors and stockholders, as well as through CVM, BM&FBovespa , SEC and NYSE.
As a general rule, Brazilian Corporate Law provides that a quorum for a stockholders’ meeting consists of stockholders representing at least 25% of a company’s issued and outstanding voting share capital, on the first date the meeting is called for, and, if a quorum is not reached, any percentage of the company’s voting share capital on a second date the meeting is called for. Generally, our meetings are held with a quorum representing approximately 90% of our voting share capital.
In order to attend a stockholders’ meeting, stockholders must present an identification document. A stockholder may be represented at a stockholders’ meeting by a proxy appointed less than a year before the meeting.
Since 2012, we made available an “Online Meeting” tool. This tool is an electronic voting platform that provides stockholders with more accessibility, allowing them to exercise their voting rights in advance, from any place. In September 2016, we voluntarily made available the Remote Voting Form, an electronic document by which stockholders can convey their voting instructions directly to the Company or through service providers. According to CVM Ruling No. 561/2015, we are obligated to provide the Remote Voting Form from 2017 onwards.
Board of Directors
Our Board of Directors is the body responsible for establishing the general guidelines of our business, including our controlled companies, and is elected annually by our stockholders.
Board members must act impartially, in compliance with pre-established rules, so as to prevent conflicts of interest. Such rules include:
A-54
• not taking part in resolutions related to matters in which the director’s interests conflict with our interests. The director must inform the Board of Directors about the conflict of interest as soon as the matter giving rise to such conflict is included in the agenda or proposed by the Chairman of the Board, and in any event, before the beginning of any discussion on such matter;
• in the event the director or a company controlled or managed by the director carries out a transaction with any company of the Itaú Unibanco Group: (a) the transaction must be carried out at arm’s length; (b) if it is not a customary transaction or involves the provision of services, there must be an opinion issued by recognized financial advisors evidencing that the transaction was carried out at arm’s length; and (c) the transaction must be disclosed to and conducted under the supervision of the Related Parties Committee, the Ethics and Ombudsman Superintendence or the channels usually competent in the hierarchy of Itaú Unibanco Group, subject to the rules and conditions set forth in our Related Party Transactions Policy; and
• serving on no more than four boards of directors of companies that do not belong to the same group.
The Board of Directors’ performance is assessed yearly to ensure that board members are aligned with the organization’s values and that they represent the interests of our stockholders.
Our Board of Directors is currently composed of 12 members, nine of whom are non-executive (75%) of which five are independent (41.66%). Our board members meet on a regular basis eight times a year and on a special basis whenever necessary (in practice, on average, once a month).
According to our Bylaws, the positions of Chairman of the Board of Directors and Chief Executive Officer or principal executive officer cannot be held by the same person.
Pursuant to Brazilian law, the election or reelection of each member of our Board of Directors is subject to approval by the Central Bank. All directors are elected for a term of one year and can be reelected upon the Central Bank’s approval. Also under Brazilian law, an acting director retains his position until he is reelected or his successor takes office.
Please refer to www.itau.com.br/_arquivosestaticos/RI/pdf/InternalCharterof...pdf, for further information.
Committees of the Board of Directors
There are seven committees presented in the management organization chart above, that report directly to the Board of Directors. Committee members are elected by the Board of Directors for a term of one year, and must have proven knowledge in their respective professional fields as well as technical qualification compatible with their responsibilities.
The committees may hire outside experts but must always be careful to maintain the integrity and the confidentiality of their work.
Please refer to www.itau.com.br/investor-relations/corporate-governance/rules-and-policies, for each committee rules.
The Audit Committee is a statutory body responsible for overseeing the quality and integrity of our financial statements, the compliance with legal and regulatory requirements, the performance, independence and quality of the services provided by our independent auditors and of the work performed by our internal auditors, and of the effectiveness of our internal controls and risk management systems. It is a single body which is responsible for overseeing companies of the Itaú Unibanco Group that are authorized to operate by the Central Bank or supervised by the Superintendency of Private Insurance (Superintendência de Seguros Privados, or SUSEP).
All Audit Committee members are independent, pursuant to Brazilian banking regulation, and the Board of Directors will terminate the term of office of any member of the Audit Committee if such member’s independence is affected by any conflict or potentially conflicting situation. In order to meet the requirements of CMN, the Brazilian Council of Private Insurance (Conselho Nacional de Seguros Privados, or CNSP) as well as those of SEC and NYSE, the Board of Directors has determined that Mr Diego Fresco Gutierrez is an independent financial expert who qualifies as an “Audit Committee Financial Expert” as such term is defined in SEC rules.
The Audit Committee assessments are based on information received from management, external auditors, internal auditors, the units responsible for risk management and internal controls and on the analyses of the Audit Committee’s members resulting from direct observation. After establishing an annual schedule to comply with its duties, the Committee held 191 meetings over 58 days in the period from January to December 2016.
“Throughout 2016, the Committee held 191 meetings over 58 days. This year, in addition to following its regular agenda, the Committee made special efforts to monitor risk management and the performance of the Internal Audit in relation to information security, client relationships, and the integration process of the banks acquired in Chile and Colombia. We deeply regret to inform you of the passing of Sergio Darcy da Silva Alves, whose work on our Committee in the last years was of an invaluable contribution. On December 22, 2016, Rogério P. Calderón Peres took office as a new Committee member.”
Geraldo Travaglia Filho
President of the Audit Committee
A-55
Internal Audit
Internal Audit, under the technical supervision of the Audit Committee, provides the Board of Directors and senior management with independent, impartial and timely evaluations of the effectiveness of risk management, the adequacy of controls and compliance with the regulations and rules related to the operations of the conglomerate. Such evaluations occur periodically, with intervals from 12 to 36 months, following a methodology which is designed according to the standards of The Institute of Internal Auditors (IIA).
Internal Auditing requires the functions audited to establish action plans for the deficiencies identified, considering the deadlines which vary according to the risk rating.
Pre-approval of policies and procedures
Among the Audit Committee’s responsibilities is to establish policies and procedures regarding services that can be provided by our external auditors. On an annual basis, the Audit Committee issues (i) the list of those services which cannot be provided by our external auditors, due to the fact that such services could, eventually, affect their independence, (ii) the list of pre-approved services, and (iii) those services that need to be previously approved by the Audit Committee.
Fees and services of the principal auditor
The following table presents the total amount charged by PricewaterhouseCoopers Auditores Independentes by category for services rendered in 2016 and 2015:
| (In thousands of R$) | ||||||||||||||||
| Fees | 2016 | % Approved by the Audit Committee | 2015 | % Approved by the Audit Committee | ||||||||||||
| Audit Fees | 60,512 | 100.0 | 48,133 | 100.0 | ||||||||||||
| Audit-Related Fees | 4,755 | 100.0 | 3,728 | 100.0 | ||||||||||||
| Tax Fees | 453 | 100.0 | 423 | 100.0 | ||||||||||||
| All Other Fees | 969 | 100.0 | 1,175 | 99.0 | ||||||||||||
| Total | 66,689 | 53,459 | ||||||||||||||
| • | audit fees: corresponds to the audit of our annual financial statements, the review of our quarterly financial statements, as well as the audit and review of financial statements of our subsidiaries, services relating to issuance of comfort letters in securities offerings, issuance of reports required by regulatory bodies and audit of internal control over financial reporting in connection with the Sarbanes-Oxley Act requirements; |
| • | audit-related fees: corresponds to services provided in connection with the issuance of appraisal reports at book value, assistance related to review of documents to be filed with local and foreign regulatory bodies, including documents regarding compliance with legislation and regulations, audit of specific financial statements, compliance with greenhouse gas emissions controls and policies, due diligence activities, assurance of special purpose reports and previously agreed-upon procedures to review profit share calculation with respect to commercial partnership contracts; |
| • | tax fees: corresponds to tax consulting and advising on cross-border transactions and review of Brazilian income tax;and |
| • | other fees: corresponds to training, use of surveys and technical materials, independent review of accounting and tax matters of transactions outside Brazil, independent review of the implementation plan using the COSO 2013 framework, independent review of credit models, consultancy related to internal processes and benchmarking of a middle market transaction, review of credit card debt negociation process controls and advising on the revision of structuring sale of a credit portfolio. |
Personnel Committee
The Personnel Committee is responsible for establishing the main guidelines related to personnel. Its duties include establishing guidelines related to talent attraction and retention, recruiting and qualification, and our long term incentive programs.
“Throughout 2016 our journey took us to the consolidation of our corporate culture (“Our Way”), and we have escalated some actions for disseminating and engaging our risk management principles. We started a process to unveil the bank’s purpose, which encompassed the following steps: (1) understanding Itaú Unibanco’s history, its values and peculiarities based on its large history of mergers and acquisitions; (2) mapping its historical and potential heritage for the future; and
A-56
(3) designing the conceptual and strategic territory in which the branch will firmly anchor its purpose. We monitored the talent programs, which are aimed to attract talents from the best universities in Brazil and the world by adopting a highly rigorous selection process, and recorded a significant increase in the number of participants. Finally, we addressed significant topics, such as the executive succession planning for many careers in the bank, and diversity as a strategic value.”
Pedro Moreira Salles
Chairman of the Board of Directors and President of the Personnel Committee
Related Parties Committee
The Related Parties Committee is responsible for analyzing transactions between related parties in the circumstances specified by our Related Parties Policy in order to ensure equality and transparency in such transactions. The Committee is composed entirely of independent members.
“Throughout 2016, the Committee acted effectively on the analysis of related party transactions, having always in mind the purpose of ensuring equality among stockholders, investors, and stakeholders, as well as ensuring more transparency to the market. Approximately 30 related-party transactions of diversified types were analyzed, such as those involving real estate, supply, and technology. Another highlight was the creation of an Internal Circular Letter, aimed at improving processes related to the Transactions with Related Parties Policy, by formalizing internal responsibilities and the flows associated with the governance of transactions. Accordingly, we proceed with our commitment to keep Itaú Unibanco Holding in line with the best corporate governance practices.”
Gustavo Jorge Laboissière Loyola
Independent Director and member of the Related Parties Committee
Transactions with related parties
Our Policy for Transactions with Related Parties, or Related Parties Policy, defines the concept of related parties and establishes rules and procedures for transactions among them. It provides that such transactions must be carried out in writing, under market conditions, pursuant to our internal practices (such as the guidelines set forth in our Code of Ethics) and, subject to criteria defined by accounting standards, disclosed in our financial statements. Transactions with related parties, or sets of related transactions, that involve, in the period of one year, amounts higher than R$1.0 million are subject to additional internal governance procedures. Such transactions must be approved by our Related Parties Committee, composed entirely of independent members of our Board of Directors, and are reported to our Board of Directors on a quarterly basis. Please refer to www.itau.com.br/_arquivosestaticos/RI/pdf/en/IHF_Politica_Partes_Relacionadas_ING.pdf for our Related Parties Policy.
CVM Rulling No. 480/2009 requires that transactions with related parties that meet the conditions set forth by Schedule 30-XXXIII of such rule be disclosed within seven business days of their occurrence, in accordance with the terms defined in such rule.
Additionally, Brazilian laws and regulations provide that financial institutions are not allowed to grant loans, advances or guarantees to certain individuals and entities related to them, including:
| (i) | officers, and members of the board of directors, fiscal council, advisory councils and other statutory committees, as well as their spouses, ascendants, descendants and collateral relatives to the second degree, either blood relatives or in-laws; |
| (ii) | individuals or legal entities that directly or indirectly control the financial institution or hold more than 10% of the financial institution’s share capital; |
| (iii) | legal entities directly or indirectly controlled by the financial institution or legal entities in which the financial institution directly or indirectly holds more than 10% of the share capital; or |
| (iv) | legal entities directly or indirectly controlled by the individuals mentioned in items “i” and “ii” above or legal entities in which such individuals directly or indirectly hold more than 10% of the share capital. |
Please refer to section Performance, item Complete Financial Statements (IFRS), Note 35 – Related Parties, for further details about the related parties we do business with and the main terms of those transactions.
Nomination and Corporate Governance Committee
The Nomination and Corporate Governance Committee is composed entirely of non executive directors and is responsible for stimulating and overseeing discussions of matters related to our governance. Its duties include analyzing and issuing opinions on situations of potential conflicts of interest between the directors and companies of the Itaú Unibanco Group, periodically reviewing the criteria for nomination of our independent directors, in accordance with governance principles and applicable regulation, giving methodological and procedural support for the assessment of the Board of Directors, individual directors, committees and the chief
A-57
executive officer, and discussing and making recommendations on the succession of the directors and the chief executive officer. Please refer to section Our governance, item Management structure, for further information about changes in our Board of Officers.
“The agenda of the Nomination and Corporate Governance Committee in 2016 was highly intense, as it addressed several relevant themes for the Company’s good governance, particularly the CEO succession process.
Among other issues also addressed over the year, noteworthy issues are as follows:
| • | Discussions and recommendations on nominees to make up the Board of Directors and its Committees; |
| • | Approving the Management Nomination Policy and defining a fixed 75% minimum percentage of attendance at meetings for members of the Board of Directors and the Committees, which is in line with the best corporate governance practices; and |
| • | Discussions on the evaluation results for the Board of Directors and its members, as well as for the Chairman and CEO.” |
Fábio Colletti Barbosa
Independent Director and member of the Nomination and Corporate Governance Committee
Risk and Capital Management Committee
The Risk and Capital Management Committee is responsible for supporting the Board of Directors in performing its responsibilities related to our capital and risk management as well as submitting reports and recommendations on these topics for the approval of the Board of Directors. Its duties include establishing our risk appetite and minimum return expected on our capital, overseeing our risk control and management activities in order to assure their adequacy to the risk levels assumed and the complexity of our operations as well as the compliance with regulatory requirements. It is also responsible for promoting the improvement of our risk culture.
“In 2016, in addition to exercising its mandate of supervising risk and capital management activities, the Risk and Capital Management Committee committed a significant amount of time to revisiting our risk appetite policy. It improved its approach on governance issues and extended the scope of risks monitored in connection with this appetite, by adding aspects related to operational risk, information security and reputation to the management of risks of credit, market, and liquidity and capitalization level.”
Pedro Luiz Bodin de Moraes
Independent Director and President of the Risk and Capital Management Committee
Strategy Committee
The Strategy Committee is responsible for leading discussions of strategic matters critical to us. Its duties include proposing budgetary guidelines for the Board of Directors, and issuing opinions and recommendations on the strategic guidelines and investment opportunities in order to support the decisions of the Board of Directors.
“The Strategy Committee held five meetings during 2016, which were intended to address issues on sustainability and adequacy of guidelines to major world trends, on the suitability and its impact on current and future business, and on the profit pool of the financial system, by analyzing the strategy of inserting Itaú Unibanco Holding into the many segments of this market. In addition to these more comprehensive themes, the Committee addressed the several scenarios for both 2017 and the following years, as well as its adequacy to the strategic plan and any possible acquisition of new business. Noteworthy mentioning in 2016 was the purchase of the remaining shares of Itaú BMG Consignado, required for us to hold 100% of its capital, and the purchase of Citibank’s retail business in Brazil, which is pending approval by CADE.”
Nildemar Secches
Independent Director and member of the Strategy Committee
Compensation Committee
The Compensation Committee is composed entirely of non executive members and is responsible for leading discussions of matters related to our management compensation. Its duties include developing the Compensation Policy for our management members, proposing to our Board of Directors different methods of fixed and variable compensation, in addition to benefits and special recruiting and termination programs, discussing, analyzing and overseeing the implementation and operation of our existing compensation models, and discussing the general principles for the compensation of our employees.
“Throughout 2016 the Compensation Committee was dedicated to:
| - | defining the overall compensation for the members of the Board of Directors and Executive Board; |
| - | approving the bank’s overall bonus pool, taking into account a scenario of higher default for the wholesale banking segment; |
A-58
| - | changing the overall calculation model and the bank pool limit for the investment banking and private banking segments, therefore adjusting these segments to the institution’s other areas; |
| - | complying with the Central Bank’s request to adjust the executive compensation to the market risk, so that it refrains from having financial targets; |
| - | approving a model for a new area designed for “restructuring loan portfolios”; |
| - | approving the individual compensation for the Executive Committee members; |
| - | analyzing the comparative study on executive compensation and market research, with the conclusion that our model is consistent with market levels and our own results; and |
| - | approving rules for the so-called “good leavers”, that is, Officers who leave our organization to work with the Government, by prompting the termination of the vesting period and making them immediately dispose of their shares, to avoid any conflict of interest.” |
Alfredo Egydio Arruda Villela
Member of the Compensation Committee
Digital Advisory Board
The Board of Directors shall constitute a Digital Advisory Board which shall supply the Board with inputs, thus supporting the latter’s reflections on customer experience as impacted by the evolution of technology and world trends.
Annual evaluation of the Board of Directors and Board Committees
To assess the performance of our management and in order to comply with best corporate governance practices, we annually carry out an evaluation of our Board of Directors, its members and its Chairman, as well as the Board committees. Decisions regarding whether to propose the reelection of Board members to the Annual General Stockholders Meeting and of the members of the Board committees to the Board take into account both (i) positive performance results and high attendance at meetings during the previous term and (ii) the level of independence and industry experience.
Evaluation process
The evaluation process consists of the following stages: self-evaluation of the members of the Board, cross-evaluation of the members of the Board (Board members evaluate each other), evaluation of the Board itself by its members, evaluation of the Chairman by Board members and evaluation of the Board committees by their members.
The evaluation process is structured taking into consideration the specific responsibilities of the Board, its members, its Chairman, and each of the Board’s committees. Therefore, we aim at a high level of expertise.
The evaluation process is conducted by an independent person, responsible for distributing specific questionnaires to the Board of Directors and to each of the Board committees, as well as interviewing members of the Board and Board committees individually. The independent person is also responsible for analyzing the answers and comparing them to the results from the previous years to identify and address any findings and/or gaps relating to the Board of Directors or the Board committees that may be revealed by this process.
Methodological support and independent evaluation
The Nomination and Corporate Governance Committee provides methodological and procedural support to the evaluation process. The Committee also discusses the results of the evaluation, as well as the composition and succession plan of the Board.
Besides such support by the Nomination and Corporate Governance Committee, an independent person is responsible for carrying out the evaluation process itself.
International Advisory Board
The International Advisory Board is responsible for evaluating the prospects for the world economy and the adoption by us of internationally accepted codes and standards, especially with respect to monetary and financial policy, corporate governance, capital markets, payments systems and prevention of money laundering, in order to contribute towards strengthening our presence in the international financial community and to provide guidelines for the Board of Directors. The International Advisory Board is comprised of the following individuals, some of whom are not members of our Board of Directors or employees of the Itaú Unibanco Group: Pedro Sampaio Malan, Alessandro Profumo, André Lara Rezende, Andres Velasco, Angel Corcóstegui, Pascal Lamy, Pedro Moreira Salles, Ricardo Villela Marino, Roberto Egydio Setubal and Vikram Pandit.
A-59
Fiscal Council
The Fiscal Council is an independent body composed of three to five members elected annually by our stockholders to supervise the activities of our management, to examine our financial statements for the year ended and to issue an opinion on such financial statements, among other duties established by Brazilian law. The fiscal council must operate independently from management, our external auditors and the Audit Committee.
Although its permanent existence is not legally mandatory, we have had a Fiscal Council established and functioning continuously since 2000.
Please refer to www.itau.com.br/_arquivosestaticos/RI/pdf/en/Rules_Fiscal_Council.pdf, for each committee rules.
Board of Officers
Our Board of Officers is elected annually by the Board of Directors and its role is to implement the guidelines proposed by our Board of Directors. The officers manage our daily business activities, ensuring the best allocation and management of our funds to accomplish our established goals. The structure of our Board of Officers takes into account the segmentation of our businesses, which demands in-depth knowledge in different areas, skills and business sectors given our organization’s complexity.
Pursuant to Brazilian law, the election of each member of our Board of Officers must be approved by the Central Bank. Also under Brazilian law, an acting officer retains his or her position until he or she is reelected or a successor takes office. Our officers are subject to internal and periodic assessment, in which performance criteria such as client satisfaction, personnel and financial management are considered.
As announced on November 9, 2016, structural changes were made to the management of Itaú Unibanco Holding. The chart below presents our Board of Officers, made up of two General Managers and three Vice Presidents:
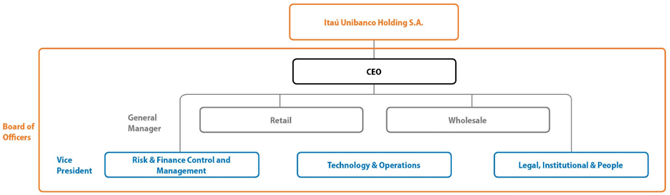
Disclosure and Trading Committee
The Disclosure and Trading Committee reports to the Board of Officers and is comprised of members of the Board of Directors and of the Board of Officers of Itaú Unibanco Holding or any company of the Itaú Unibanco Group, and professionals of proven knowledge in the capital markets area, appointed by our Investor Relations Officer, who is also a permanent member of the committee.
The committee is responsible for managing our Policy of Material Information Disclosure and our Policy on Trading of Securities. We were among the first publicly held companies in Brazil to have such a committee.
The duties of the Disclosure and Trading Committee include carrying out internal actions intended to improve the information flow and foster the ethical conduct of our management members and our employees in order to ensure transparency, quality, equality and security in the information provided to our stockholders, investors and other participants in the capital markets.
Our Directors and Executive Officers
Four of our directors, Alfredo Egydio Arruda Villela Filho, Ricardo Villela Marino, Alfredo Egydio Setubal and Roberto Egydio Setubal, are members of the Egydio de Souza Aranha family and one of our directors, Pedro Moreira Salles, is a member of the Moreira Salles family.
Our Board of Directors was elected and reelected on April 27, 2016 at our annual stockholders’ meeting. Pedro Moreira Salles, Alfredo Egydio Arruda Villela Filho, Roberto Egydio Setubal, Alfredo Egydio Setubal, Candido Botelho Bracher, Demosthenes Madureira de Pinho Neto, Fábio Colletti Barbosa, Gustavo Jorge Laboissiere Loyola, Nildemar Secches, Pedro Luiz Bodin de Moraes and Ricardo Villela Marino were reelected as members of our Board of Directors, each for a term of one year.
On the same date, José Galló was also elected as member of the Board of Directors. Henri Penchas was not reelected, having reached the age limit provided in our Bylaws.
A-60
Directors Fábio Colletti Barbosa, Gustavo Jorge Laboissière Loyola, José Galló, Nildemar Secches, and Pedro Luiz Bodin de Moraes have been deemed by us to be independent members of the Board of Directors.
With respect to our Fiscal Committee, Iran Siqueira Lima was reelected as an effective member, with José Caruso Cruz Henriques also being reelected as his alternate. Alkimar Ribeiro Moura was elected as an effective member, with João Costa also being reelected as his alternate. Current alternate Carlos Roberto de Albuquerque Sá was elected an effective member, with Eduardo Azevedo do Valle being elected on the same date as his alternate.
At the Meeting of the Board of Directors of April 28, 2016, the members of our Board of Officers were reelected for a term of office of one year. At the same meeting Atilio Luiz Magila Albiero Júnior, Fernando Barçante Tostes Malta, Gilberto Frussa and Sergio Mychkis Goldstein were elected officers. The members of the Audit Committee were also reelected for a term of office of one year with the exception of Luiz Alberto Fiore. On the same date, Ricardo Baldin was elected to the Audit Committee; however, he did not continue as a member of the Audit Committee on account of having accepted an invitation to join the Executive Board of theBanco Nacional de Desenvolvimento Econômico e Social – BNDES (the Brazilian Development Bank).
On May 3, 2016, we announced that Professor Iran Siqueira Lima, President of our Fiscal Council, reelected at the Annual General Meeting of April 27, 2016, had passed away on April 29. In light of this, José Caruso Cruz Henriques, elected as alternate member of our Fiscal Council on April 27, 2016, assumed the position as an effective member for a term of office, which shall terminate on the date of the Annual General Meeting for 2017. The position of alternate member held by Mr. José Caruso remains vacant until our next General Meeting is held.
In addition, the current members of our Audit, Strategy, Risk and Capital Management, Nomination and Governance, Personnel, Compensation and Related Parties Committees were reelected for a term of one year.
On June 7, 2016, the Central Bank approved the election and reelection (as applicable) of the members of our Board of Directors, Fiscal Council and Audit Committee.
On November 24, 2016, at the Board of Directors Meeting, Rogério Paulo Calderón was elected to the position of member of the Audit Committee and, on December 22, 2016, the Central Bank approved this election.
On December 9, 2016, at the Board of Directors Meeting, André Sapoznik and Caio Ibrahim David were elected to the position of Vice President of the Board of Officers. At the same meeting, Vice President Eduardo Mazzili de Vassimon was reassigned to the position of General Director.
On the same date, it was recorded that the General Directors will have the following specific duties:
·Candido Botelho Bracher is the Deputy CEO, responsible for supporting the CEO in his activities. This role will be performed on a temporary basis until Candido takes office as CEO, the position for which he will be elected after the next Ordinary General Stockholders’ Meeting;
·Eduardo Mazzilli de Vassimon is responsible for structuring the services and establishing internal and operational rules related to the departments of wholesale and relationship with medium-sized and large companies, including banking services, investment banking, asset and wealth management services, international business and institutional treasury;
·Márcio de Andrade Schettini is responsible for structuring services and establishing internal and operational rules related to the Retail Bank, to client relationships and offer of products and services to our client base, including individuals and companies, comprised in all retail segmentation levels, and to the insurance, pension plan, and premium bonds departments; and
·Marco Ambrogio Crespi Bonomi is responsible for supporting the process of transfer of his activities to Márcio de Andrade Schettini and this job will be performed on a temporary basis until he takes office as member of the Board of Directors, the position for which he will be appointed at the next Ordinary General Stockholders’ Meeting.
In the same way as the Vice Presidents, André Sapoznik is responsible for coordinating and organizing the technical and operational infrastructure that is necessary for the Company’s business and Caio Ibrahim David is responsible for the control and risk management department, the finance segment and the controllership department.
The elections of the members were approved by the Central Bank on January 5, 2017.
The composition of the statutory bodies as of December 31, 2016 is as follows:
A-61
| Members Name (age), position | Member since | Audit Committee | Personnel Committee | Related Parties Committee | Nomination and Corporate Governance Committee | Risk and Capital Management Committee | Strategy Committee | Compensation Committee(1) | International Advisory Council(2) | |||||||||||
| Board of Directors(3) (12 members) | ||||||||||||||||||||
| Pedro Moreira Salles (57), Chairman | 08/2009 |  | |  | | | ||||||||||||||
| Alfredo Egydio Arruda Villela Filho (47), Vice Chairman | 03/2003 | | | |||||||||||||||||
| Roberto Egydio Setubal (62), Vice Chairman | 03/2003 | | | | | |||||||||||||||
| Alfredo Egydio Setubal (58), Member | 06/2007 | | | | ||||||||||||||||
| Candido Botelho Bracher (58), Member | 02/2009 | | | |||||||||||||||||
| Demosthenes Madureira de Pinho Neto (56), Member | 05/2012 | | | |||||||||||||||||
| Fábio Colletti Barbosa (62), Independent Member |  | 07/2015 | | | | |||||||||||||||
| Gustavo Jorge Laboissière Loyola (64), Independent Member | | 07/2006 | | | | |||||||||||||||
| José Galló (65), Independent Member | | 04/2016 | | |||||||||||||||||
| Nildemar Secches (68), Independent Member | | 05/2012 | | | | |||||||||||||||
| Pedro Luiz Bodin de Moraes (60), Independent Member | | 02/2009 | | | | |||||||||||||||
| Ricardo Villela Marino (42), Member | 06/2008 | | | |||||||||||||||||
| Board of Officers (24 members) | ||||||||||||||||||||
| Roberto Egydio Setubal (62), Chief Executive Officer |  | 11/1995 | ||||||||||||||||||
| Candido Botelho Bracher (58), General Manager | | 08/2005 | ||||||||||||||||||
| Márcio de Andrade Schettini (52), General Manager | 07/2015 | |||||||||||||||||||
| Marco Ambrogio Crespi Bonomi (60), General Manager | 07/2015 | |||||||||||||||||||
| Eduardo Mazzilli de Vassimon (58), General Manager | 03/2013 | |||||||||||||||||||
| André Sapoznik (44), Vice President | 12/2016 | |||||||||||||||||||
| Caio Ibrahim David (48), Chief Financial Officer and Vice President | 12/2016 | |||||||||||||||||||
| Claudia Politanski (46), Vice President | 11/2008 | |||||||||||||||||||
| Alexsandro Broedel Lopes (42), Executive Officer | 08/2012 | |||||||||||||||||||
| Fernando Barçante Tostes Malta (48), Executive Officer | 04/2016 | |||||||||||||||||||
| Leila Cristiane Barboza Braga de Melo (45), Executive Officer | 04/2015 | |||||||||||||||||||
| Paulo Sergio Miron (50), Executive Officer | 07/2015 | |||||||||||||||||||
| Adriano Cabral Volpini (44), Officer | 02/2015 | |||||||||||||||||||
| Álvaro Felipe Rizzi Rodrigues (39), Officer | 04/2015 | |||||||||||||||||||
| Atilio Luiz Magila Albiero Junior (39), Officer | 04/2016 | |||||||||||||||||||
| Eduardo Hiroyuki Miyaki (44), Officer | 08/2011 | |||||||||||||||||||
| Emerson Macedo Bortoloto (39), Officer | 11/2011 | |||||||||||||||||||
| Gilberto Frussa (50), Officer | 04/2016 | |||||||||||||||||||
| José Virgilio Vita Neto (38), Officer | 04/2015 | |||||||||||||||||||
| Marcelo Kopel (52), Officer and Investor Relations Officer | 06/2014 | |||||||||||||||||||
| Matias Granata (42), Officer | 07/2014 | |||||||||||||||||||
| Rodrigo Luis Rosa Couto (41), Officer | 01/2012 | |||||||||||||||||||
| Sergio Mychkis Goldstein (39), Officer | 04/2016 | |||||||||||||||||||
| Wagner Bettini Sanches (45), Officer | 06/2014 | |||||||||||||||||||
| Audit Committee(3) (5 members) | ||||||||||||||||||||
| Antonio Francisco de Lima Neto (51), Independent Member | | 07/2015 | | |||||||||||||||||
| Diego Fresco Gutierrez (46), Independent Member and Financial Expert | | 04/2014 | | |||||||||||||||||
| Geraldo Travaglia Filho (65), Independent Member | | 03/2013 | | |||||||||||||||||
| Maria Helena dos Santos Fernandes de Santana (57), Independent Member | | 06/2014 | | |||||||||||||||||
| Rogério Paulo Calderón Peres (54), Independent Member | | 11/2016 | | |||||||||||||||||
| Fiscal Council(3) (3 members) | ||||||||||||||||||||
| Alkimar Ribeiro Moura (75), Independent Member | | 04/2016 | ||||||||||||||||||
| Carlos Roberto de Albuquerque Sá (66), Independent Member | | 04/2016 | ||||||||||||||||||
| José Caruso Cruz Henriques (69), Independent Member | | 04/2016 | ||||||||||||||||||
| (1) | Includes individuals that are not members of our Board of Directors: Israel Vainboim. |
| (2) | Includes individuals that are not members of our Board of Directors or employees of the Itaú Unibanco Group: Alessandro Profumo, André Lara Rezende, Andres Velasco, Angel Corcóstegui, Pascal Lamy, Pedro Sampaio Malan, Vikram Pandit. |
| (3) | Independence criteria for the members of the Board of Directors, Audit Committee and Fiscal Council are diverse, under our policies and applicable regulations in force. |
 | President |  | Member |  | Independent Member |  | also Member of the Board of Directors |
A-62
Board of Directors
Pedro Moreira Salles (Chairman)has held several positions within the Itaú Unibanco Group including Vice Chairman of the Boardof Directors (February 2010 to April 2012) of Banco Itaú BBA S.A.; Vice Chairman of the Board of Directors (March 2008 to November 2008) and CEO of Unibanco Holdings S.A. (March 2007 to November 2008); Vice Chairman of the Board of Directors and CEO at Unibanco – União de Bancos Brasileiros S.A. (September 2004 to November 2008) and Chairman of the Board of Directors of Unibanco Seguros S.A. (December 1995 to February 2009).
He has also been Member of the Board of Directors of Totvs S.A. since March 2010; Chairman and Member of the Board of Directors of Companhia E. Johnston de Participações since 2008 and CEO since 2015; Member of the Board of Directors (November 2008 to June 2015) and CEO since June 2015 at IUPAR having previously served as Chairman (November 2008 to April 2012) and Chairman of the Board of Directors of FEBRABAN since march 2017.
He also served as Vice Chairman of the Board of Directors of Porto Seguro S.A. (November 2009 to March 2012) and as Chairman of the Board of Directors of E. Johnston Representação e Participações S.A. (2001 to February 2009).
He has a Bachelor’s degree, magna cum laude, in Economics and History from the University of California, Los Angeles.
He also attended the international relations master’s program at Yale University and the OPM – Owner/President Management Program at Harvard University both in the United States.
Alfredo Egydio Arruda Villela Filho (Vice Chairman)has been Vice Chairman of the Board of Directors since March 2003.He has also served as Member of the Board of Directors since April 1997; being Vice Chairman since January 2010; and having been Chairman (April 2009 to January 2010) and Vice Chairman (April 1997 to April 2009) of Itautec S.A.; Member of the Board of Directors (April 2004 to April 2010), being the Board’s Chairman (April 2009 to November 2009) and Vice Chairman (April 2004 to April 2009 and November 2009 to April 2010) of Elekeiroz S.A.; Member of the Board of Directors since 1996, being the Board’s Vice Chairman since 2008 of Duratex S.A.; Member of the Board of Directors since August 1995, serving as Chairman since May 2015 and CEO (September 2009 to May 2015) of Itaúsa.
He has also been Member of the Itaú Unibanco Group serving as Vice Chairman of the Board of Directors of Itaú Unibanco (August 2002 to March 2003).
He has a Bachelor’s degree in Mechanical Engineering from Escola de Engenharia Mauá of Instituto Mauá de Tecnologia (IMT) and Postgraduate degree in Business Administration fromFundação Getulio Vargas (FGV) both in Brazil.
Roberto Egydio Setubal (Vice Chairman)is currently the CEO of Itaú Unibanco Holding S.A. He has overseen thecommercial operations of Banco Itaú since 1984 being appointed Chief Executive Officer (April 1994 to March 2015); General Manager (July 1990 to April 1994) and Member of the Board of Directors from May 1991 to March 2003 at Itaú Unibanco S.A. In his career at the Bank, he held several positions in the controlling, products and sales areas.
Since 1995 he is member of the International Monetary Conference and he became President of IMC in June, 2010. From 1997 up to 2000, he was the elected President of FEBRABAN (Federação Brasileira de Bancos). He is also Vice Chairman of the IIF (Institute of International Finance) and of its Steering Committee of Crisis Prevention and Capital Adequacy. In 2000 he became member of the Trilateral Commission. In 2002 he became member of the International Advisory Committee of the Federal Reserve Bank of New York. In 2003 he was appointed to the Board Member of Brazilian Economic & Social Development Council (CDES). In 2010 he became Member of the China Development Forum. He is founding member and President of the Executive Committee of Fundação Itaú Social that has developed various social programs in partnership with UNICEF and other NGOs. He is also a member of the Executive Committee of Instituto Itaú Cultural and member of the Economic and Social Development Council of the Presidency of Brazil (CDES) since November 2016.
He has a Bachelor’s degree in Production Engineering from Escola Politécnica da Universidade de São Paulo (USP) in Brazil and a Master’s degree in Science Engineering from Stanford University in the United States.
Alfredo Egydio Setubal (Member)has held several positions within the Itaú Unibanco Group including Vice President(April 1996 to March 2015); Executive Officer (May 1993 to June 1996), Managing Officer (between 1988 and 1993) and Investor Relations Officer (1995 to 2003) of Itaú Unibanco.
He has also served as Vice Chairman of the Board of Directors since September 2008; CEO and Investor Relations Officer since May 2015 of Itaúsa; Advisory Board Member of the Securities Dealers’ Association (ADEVAL) since 1993; Financial Officer for the São Paulo Museum of Modern Art (MAM) since 1992 and of ABRASCA since 1999.
He was Chairman of the Higher Committee for Guidance, Nomination and Ethics since 2009 and Member of the Board of Directors (1999 to 2009) of IBRI. He was Vice President (1994 to August 2003) and President (August 2003 to August 2008), of the National Association of Investment Banks (ANBID) (now Brazilian Financial and Capital Markets Association – ANBIMA).
He has a Bachelor’s and Postgraduate degrees in Business Administration from FGV in Brazil with specialization course at INSEAD (France).
Candido Botelho Bracher (Member)has been Vice Chairman of the Board of Directors (March 2013 to April 2015) andCEO of Banco Itaú BBA S.A. (August 2005 to December 2016). He has been the wholesale General Manager of Itaú Unibanco Holding since April 2015.
He has been Member of the Board of Directors of the São Paulo Stock Exchange – BM&FBovespa S.A. (April 2009 to June 2014); Alternate Member of the Board of Directors (September 1999 to June 2005) and Member of the Board of Directors (June 2005 to
A-63
March 2013) of Pão de Açúcar – Cia. Brasileira de Distribuição. He was Vice President of Banco Itaú BBA S.A. (February 2003 to August 2005) where he was responsible for the Commercial, Capital Markets and Human Resources Policies units. He served as Officer at Banco Itaú BBA Creditanstalt S.A. (1988 to 2003).
He has a Bachelor’s degree in Business Administration from FGV in Brazil.
Demosthenes Madureira de Pinho Neto (Member)served as Executive Officer of Itaú Unibanco (November 2008 toJanuary 2012).
He was Vice President at Banco Itaú BBA S.A. (November 2008 to April 2009); Vice President at Unibanco (December 2004 to April 2009); Executive Officer at Unibanco Asset Management (August 2002 to July 2005).
He was Vice President of the National Association of Investment Banks (ANBID) (2000 to 2003); Chief Executive Officer at Dresdner Asset Management (November 1999 to 2002); Director of Foreign Affairs at the Central Bank (1997 to March 1999) and General Monetary and Financial Policy Coordinator for the Ministry of Finance (1993).
He has a Bachelor’s and Master’s degrees in Economics fromPontifícia Universidade Católica do Rio de Janeiro (PUC-Rio) in Brazil and a Ph.D in Economics from the University of California in the United States.
Fábio Colletti Barbosa (Independent Member)was Chairman of the Board of Directors of Banco Santander (Brasil) S.A.(January 2011 to September 2011) and Chairman of the Board of Directors of Banco Santander S.A. (August 2008 to December 2010); Chief Executive Officer of Banco Real S.A. (1998 to 2008).
He was Chairman of Abril Comunicações S.A. (September 2011 to March 2014); Chairman of the Board of Directors of Fundação OSESP since 2012; Member of the Deliberative Council of Insper Institute of Education and Research since 2010; Member of the Board of UN Foundation (United Nations Foundation – USA) since 2011; Member of the Board of Instituto Empreender Endeavor since 2008; Member of the Board of ALMar Participações S.A. since 2013; Member of the Consulting Council of Vox Capital – Investments since 2012 and Member of the Investment Policies Committee of Gavea Investments since September 2015.
He has a Bachelor’s degree in Economics from Faculdade de Economia of FGV in Brazil, and Master in Business Administration from the Institute for Management and Development, Lausanne.
Gustavo Jorge Laboissière Loyola (Independent Member)was Chairman of the Fiscal Council (March 2003 to April2006) and Chairman of the Audit Committee (September 2008 to April 2014) at Itaú Unibanco Holding. He has been a Partner at Tendências Consultoria Integrada S/S Ltda. since November 2002 and Tendências Conhecimento Assessoria Econômica Ltda. since July 2003. He has also been Managing Partner at Gustavo Loyola Consultoria S/C since February 1998. He served as governor of the Central Bank (November 1992 to March 1993 and June 1995 to August 1997) and as deputy governor for Financial System Regulations and Organization of the National Financial System at the Central Bank (March 1990 to November 1992).
He has a Bachelor’s degree in Economics fromUniversidade de Brasília (UnB) and a Ph.D in Economics from FGV, both in Brazil.
José Galló (Independent Member)was Member of the Board of Directors since April 2016 and member of the PersonnelCommittee since June 2016 at Itaú Unibanco Holding.
He has been member of the Board of Directors since 1998, having held the positions of Chairman of the Board of Directors between 1999 and 2005; Chief Executive Officer since March 1999; and Managing Director (September 1991 to March 1999) at Lojas Renner S.A.
He has also been Officer since September 2005 at Renner Administradora de Cartões de Crédito Ltda. and Dromegon Participações Ltda.; Officer since August 2008 at LR Investimentos Ltda.; Officer since December 2015 at Realize Participações S.A.; Officer since March 1987 at Rumos Consultoria Empresarial Ltda.; Member of the Board of Directors between April 2007 and May 2016 at SLC Agrícola S.A.; Member of the Board of Directors since October 2010 at Localiza Rent a Car S.A. and Member of the Board of Directors since July 2004 at IDV - Instituto para Desenvolvimento do Varejo; Member of the Deliberative Council since June 2008 at Instituto Lojas Renner; Vice President since June 2004 at Store Directors Chamber (CDL) of Porto Alegre.
He has a Bachelor´s degree in Business Administration from Escola de Administração de Empresas de São Paulo - Fundação Getúlio Vargas in 1974.
Nildemar Secches (Independent Member)is Vice Chairman of the Board of Directors of Weg S.A. since 1998; ViceChairman of the Board of Directors of Iochpe-Maxion since 2004; Member of the Board of Directors of Suzano Papel e Celulose since May 2008 and of Ultrapar S.A. since April 2002.
He was CEO of Perdigão S.A. (January 1995 to October 2008); General Corporate Officer of the Iochpe-Maxion Group (1990 to 1994). He served as Director of BNDES (1987 to 1990) and Chairman of the Board of Directors of Brasil Foods - BRF S.A. (April 2007 to April 2013). He served as President of the Association of Chicken Producers and Exporters (2001 to 2003).
He has a Bachelor’s degree in Mechanical Engineering from USP, in São Carlos, a Ph.D in Economics fromUniversidadeEstadual de Campinas(UNICAMP) and a Postgraduate degree in Finance from PUC-Rio, in Brazil.
A-64
Pedro Luiz Bodin de Moraes (Independent Member)served as Member of the Board of Directors at Unibanco (July 2003to December 2008). He was Officer and Partner at Banco Icatu S.A. (1993 to 2002). He has been Partner since 2003 and Officer (2002 to 2003) at Icatu Holding S.A. He served as Monetary Policy Director of the Central Bank (1991 to 1992) and Director of BNDES (1990 to 1991).
He has a Bachelor’s and Master’s degrees in Economics from PUC-Rio in Brazil and Ph.D. in Economics from the Massachusetts Institute of Technology (MIT) in the United States.
Ricardo Villela Marino (Member)has served Itaú Unibanco Group as Vice President of Itaú Unibanco since August 2010.He served as Executive Officer (September 2006 to August 2010), Senior Managing Director (August 2005 to September 2006), Managing Director (December 2004 to August 2005) at Itaú Unibanco. He has served as Alternate Member of the Board of Directors of Itaúsa since April 2011.
He has served as Alternate Member of the Board of Directors of Duratex S.A., Elekeiroz S.A. and Itautec S.A. since April 2009. He was President of the Latin American Federation of Banks (FELABAN) (2008 to 2010).
He has a Bachelor’s degree in Mechanical Engineering from Escola Politécnica at USP in Brazil and a Master’s degree in Business Administration from MIT Sloan School of Management, Cambridge in the United States.
Board of Officers
The résumés of Mr. Roberto Egydio Setubal (Vice Chairman and Chief Executive Officer) and Mr. Candido Botelho Bracher (Member of the Board) are detailed above, in the Board of Directors item.
Eduardo Mazzilli de Vassimon (General Manager)has held several positions within the Itaú Unibanco Group includingVice President of Itaú Unibanco Holding (April 2015 to December 2016); Vice President of Itaú Unibanco since March 2013 and Member of the Board of Directors (November 2004 to April 2015) and Chief Executive Officer (since December 2016) of Banco Itaú BBA S.A.
He also served as Vice President of Banco Itaú BBA S.A. (November 2004 to December 2008), and was responsible for the international, financial institutions, products, client desk and treasury departments. He has served as General Manager of Itaú Unibanco (1980 to 1990). He has served as member of the Board of Directors at Investimentos Bemge S.A. since February 2013. He worked as Deputy Foreign Exchange Director (1990 to 1991) and as International Unit Director (1992 to 2003) of Banco BBA-Creditanstalt S.A. He has a Bachelor’s degree in Economics from Faculdade de Economia at USP (1980) and in Business Administration from FGV (1980). He also has Master’s degrees from the São Paulo Business Administration School at FGV (1982) and fromÉcole dês Hautes Études Commerciales(1982) in France.
Márcio de Andrade Schettini (General Manager)has served the Itaú Unibanco Group as General Manager since April2015 and Vice President (November 2008 to March 2015) of Itaú Unibanco.
He has served as Vice President (April 2004 to April 2009) at Unibanco.
He has a Bacharelor’s degree in Engineering and a Master’s degree in Business Administration from PUC-Rio, where he also specialized in mathematical models. He also attended the Administration program for Owners and Presidents at Harvard University.
Marco Ambrogio Crespi Bonomi (General Manager)has served Itaú Unibanco Group as a General Manager since April2015 and Vice President (April 2007 to March 2015); Executive Director (April 2004 to April 2007); Senior Managing Director (October 2000 to April 2004); Managing Director (August 1998 to October 2000) of Itaú Unibanco.
He has served as Executive Director (November 2008 to June 2014) of Unibanco; Vice President (April 2004 to April 2011) of ACREFI – National Association of Credit.
He has a Bacharelor´s degree in Economics fromFundação Armando Alvares Penteado(FAAP) (1978), Executive Financial courses at FGV (1982) and Capital Markets atNew York University (1984).
André Sapoznik (Vice President)has held several positions within the Itaú Unibanco Group including Vice President ofItaú Unibanco Holding since December 2016; Executive Officer since December 2011 and Officer from April 2009 to December 2011 at Itaú Unibanco. He joined Unibanco in 1998.
He has a Bachelor’s degree in Production Engineering from Escola Politécnica da Universidade de São Paulo and an MBA from Stanford University Graduate School of Business.
Caio Ibrahim David (Vice President and Chief Financial Officer)has held several positions within the Itaú UnibancoGroup including Vice President of Itaú Unibanco Holding since December 2016; Executive Officer from June 2010 to April 2015 and member of the Disclosure and Trading Committee since July 2010.
He has also served as Vice President since July 2013; Executive Officer from August 2010 to July 2013 and was responsible for the area of finance at Itaú Unibanco S.A. He joined the Itaú group in 1987 as a trainee, working in the areas of accounting and control of market and liquidity risks.
A-65
He is member of the Board of Directors since April 2012 and Executive Vice President from October 2010 to April 2013 at Investimentos Bemge S.A.; Member of the Board of Directors since July 2010 at Dibens Leasing S.A. - Arrendamento Mercantil; Executive Officer from April 2010 to April 2013 and Chief Executive Officer from May 2013 to March 2015 at Itauseg Participações S.A.; Vice Chairman of the Board of Directors from June 2010 to December 2012 and member of the Board of Directors from May 2010 to December 2012 at Redecard S.A.
He has a Bachelor’s degree in Engineering from Universidade Mackenzie (1986 to 1990), with Postgraduate studies in Economics and Finance (1992 to 1993) from Universidadede São Paulo and a Masters degree in Controllership from Universidade de São Paulo (1994 to 1997) and an MBA from New York University (1997 to 1999) with specialization in Finance, Accounting and International Business.
Claudia Politanski (Vice President)has held several positions within the Itaú Unibanco Group including Vice Presidentsince April 2015 at Itaú Unibanco Holding, having been Executive Officer (November 2008 to March 2015); Vice President of Itaú Unibanco since July 2013. She is currently responsible for the Legal, Institutional & People areas and serves as general legal counsel.
She joined Unibanco in 1991 and became Executive Officer (August 2007 to July 2014); Officer (February 2006 to August 2007) and Deputy Officer (July 2003 to February 2006). She was also Executive Officer of Itaú Unibanco (February 2010 to July 2013).
She has a Bachelor’s degree in Law from USP and an MBA from Fundação Dom Cabral, in Minas Gerais, both in Brazil. She also has a Master of Laws (L.L.M.) from the University of Virginia in the United States.
Alexsandro Broedel Lopes (Executive Officer)has served the Itaú Unibanco Group as Finance Executive Officer sinceMarch 2015 and Chief Accountant and Controller (May 2012 to March 2015).
He has also been Officer at Investimentos Bemge S.A. since June 2012 and Officer at Dibens Leasing S.A. – Arrendamento Mercantil since August 2012.
He is Member of the Board of Directors of CETIP (since May 2013), IRB Brasil Resseguros (since 2015) and IIRC (International Integrated Report Committee since 2014). He has also been a Member of the Accounting Standards Advisory Forum (ASAF) of the International Accounting Standards Board (IASB) since 2010. His academic activities include a part-time Professorship at Universidade de São Paulo (Accounting and Law Schools) and a visiting appointment at the London School of Economics (LSE).
Previously, he served as Commissioner at the Securities and Exchange Commission of Brazil (2010 to 2012), Member of the Audit Committee of BMF&Bovespa in 2012 and Consultant at Mattos Filho Advogados (2008 to 2009). Alexsandro is a Chartered Management Accountant (FCMA and CGMA), has a Ph.D. in Accounting and Finance from the Manchester Business School (2008) and degrees in both Accounting (BSc) and Law (LLB) at the Universidade de São Paulo.
Fernando Barçante Tostes Malta (Executive Officer)has served the Itaú Unibanco Group as Executive Officer sinceMarch 2015 and Operations Area Manager (2008 to March 2015) at Itaú Unibanco.
He served Unibanco – União de Bancos Brasileiros S.A. (1995 to 2008) in charge of managing the Channel, Branch, Institutional Portfolio areas and participated in several projects/initiatives.
He has a Bachelor´s degree in Information Technology from PUC Rio de Janeiro; MBA at Fundação D. Cabral and Advance Course in Bank Management at the Swiss Finance Institute.
Leila Cristiane Barboza Braga de Melo (Executive Officer)has held several positions in the Legal Department of ItaúUnibanco Group including the current position of Executive Officer (since April 2015 at Itaú Unibanco) and Officer (February 2010 to March 2015).
She was Deputy Officer at Unibanco (October 2008 to April 2009). She joined Unibanco in 1997 and was initially responsible for providing legal assistance on banking transactions involving banking, credit card, mortgage and vehicles, and projects related to mergers and acquisitions, corporate restructuring and capital markets, among others.
In 2000 and 2001 she worked in the Project Finance and Securities areas at Debevoise & Plimpton in NY. She is also member of W.I.L.L. – Women in Leadership in Latin America, an organization with international coverage that focuses on enhancing the individual and collective value of women in leadership positions in Latin America.
She has a Bachelor’s degree in Law from USP, and a specialization in Corporate Law with emphasis in Corporate Finance and Capital Markets from Instituto Brasileiro de Mercado deCapitais (IBMEC), and a specialization on the Fundamentals of Business Law from New York University (NYU) (2001).
Paulo Sergio Miron (Executive Officer)has held several positions within PricewaterhouseCoopers in São Paulo, he served aspartner (1996 to 2015), being responsible for the audit work for large Brazilian Financial Conglomerates, among them: Unibanco (1997 to 2000), Banco do Brasil (2001 to 2005) and Itaú Unibanco (2009 to 2013); in Brasília he served as partner (2001 to 2008), being in charge of government related services (2004 to 2008) and banking (1997 to 2008). At PricewaterhouseCoopers, he was also the training area coordinator for over 10 years and served as a University professor for a few years on matters related to the financial market.
He is Member of the Brazilian Institute of Accountants and speaker at various seminars related to financial instruments and audit.
A-66
He has a Bachelor’s degree in Accounting fromUniversidade São Judas Tadeu and in Economics from Universidade Mackenzie, both in Brazil.
Adriano Cabral Volpini (Officer)has held several positions within the Itaú Unibanco Group including Corporate SafetyOfficer since July 2012; Senior Manager of Illicit Act Prevention (August 2005 to March 2012); Manager of Illicit Act Prevention (January 2004 to July 2005); Inspection Manager (June 2003 to December 2003); Inspector (January 1998 to March 2003); Auditor (May 1996 to December 1997); Branch Operational Area (March 1991 to April 1996) of Itaú Unibanco.
He has been Officer since January 2014; Executive Officer (June 2012 to January 2014) at Dibens Leasing S.A.
He has a Bachelor’s degree in Social Communications from FAAP (1991-1995); a Postgraduate degree in Accounting and Financial Administration from FAAP (1998-2000); and an MBA in Finance from IBMEC (2000 to 2002).
Álvaro Felipe Rizzi Rodrigues (Officer)has served as Officer since October 2014 at Itaú Unibanco. Before that, he was ourLegal Superintendent (July 2008 to October 2014) and Legal Manager (March 2006 to July 2008). He has been working on the coordination and supervision of the Mergers & Acquisitions Legal Department, the Corporate and Corporate Governance Legal Department, the Corporate Affairs Paralegal Department, the Contracts, Intellectual Property and Third Sector Legal Department, as well as the International Legal Department (responsible for the matrix management of the legal teams of the Itaú Unibanco Conglomerate’s foreign units and for the monitoring and assessment of the main legal issues related to these units).
Before joining Itaú Unibanco, he practiced Corporate and Contracts Law (August 1998 to February 2005) at Tozzini Freire Advogados.
He has a Bachelor’s degree in Law from USP Law School, class of 1999, a specialization diploma in Corporate Law fromPontifícia Universidade Católica de São Paulo(PUC-SP) in 2001, and a Master´s degree in Law (LL.M). from Columbia University’s School of Law in New York (2004).
Atilio Luiz Magila Albiero Junior (Officer)has held several positions within the Itaú Unibanco Group including as anOfficer since June 2015; Senior Manager – Financial Planning (March 2011 to May 2014), having as his principal activities budget preparation, closing of the results for the month, generation of the P&L for several levels; Senior Planning Manager – Retail (May 2008 to February 2011), his principal activities being budget preparation, capacity models, AGIR for the operational and projects area; Senior Manager for Corporate Products (January 2007 to April 2008), having responsibility for the electronic channels for Corporate Entities and Cash Management; Manager for Corporate Products (May 2002 to December 2006); Company Products Analyst (January 2000 to April 2002); Intern (September 1999 to December 1999) at Itaú Unibanco S.A.
He has an undergraduate course in Electronic Engineering from Instituto Tecnológico de Aeronáutica (ITA) (1995 to 1999); Lato-Sensu postgraduate course in Business Administration from Fundação Getúlio Vargas – EAESP (2000 to 2002); MBA with Emphasis on Finance from the Massachusetts Institute of Technology (MIT) (2004 to 2006).
Eduardo Hiroyuki Miyaki (Officer)served the Itaú Unibanco Group as Officer at Itaú Unibanco (August 2010 to August2011).
He was Compliance Manager and Officer in the Money Laundering Prevention program of Itaú Unibanco (1996 to 2003). He was the manager responsible for the Internal Audit Department of our Asset Management and Treasury units (2003 to 2004). He was also the manager of our Internal Audit, Capital Markets, Insurance and Securities units (2005 to 2010).
He has a Bachelor’s degree in Civil Engineering from USP and a Postgraduate degree in Sanitation from Gunma University, in Japan. He also has a Postgraduate degree in Business Administration from FGV. He has an MBA degree in Finance and Foreign Affairs from New York University, Leonard Stern School of Business in the United States.
Emerson Macedo Bortoloto (Officer)joined Itaú Unibanco in July 2003, holding positions in the Internal Audit Department.Since November 2008, he has been responsible for evaluating processes related to market, credit and operational risks, in addition to auditing projects and continuous audit. He was also responsible for audits in the processes of information technology and retail credit analysis and granting. He also worked at Ernst & Young Auditores Independentes (May 2001 to June 2003). He worked at Banco Bandeirantes S.A. (1992 to 2001) and was responsible for performing IT and operational process audits.
He has a Bachelor’s degree in Data Processing Technology from Faculdades Integradas Tibiriça and Postgraduate degree in Audit and Consultancy in Information Security from Faculdades Associadas de São Paulo (FASP). In 2004, he obtained the CISA certification issued by ISACA. He has an MBA degree in Internal Audit fromFundação Instituto de PesquisasContábeis, Atuariais e Financeiras(FIPECAFI).
Gilberto Frussa (Officer)has held several positions within the Itaú Unibanco Group including as Officer since 2014 at ItaúUnibanco S.A. Between 1989 and 1993 he held the positions of Lawyer and Legal Manager. Since 1993 he holds the position of Legal Manager and Coordinator.
He also served as Officer (June 2006 to February 2016) at Banco Itaú BBA S.A. and is a partner of law firm Carvalho Pinto, Monteiro de Barros, Frussa e Bohlsen – Advogados.
He has a Bachelor’s degree in Law from Universidade de São Paulo in 1989.
A-67
José Virgilio Vita Neto (Officer)has served as Officer since October 2011 at Itaú Unibanco.
He joined Unibanco in January 2001, as a lawyer until June 2003, as a member of the legal team in charge of the wholesale banking legal advisory areas and real estate finance. From June 2003 to December 2005, acted as Legal Manager, leading the legal team in charge of the legal advisory services to the wholesale bank and project finance; From January 2006 to March 2011, acted as Legal Manager of retail legal advisory services. Since March 2011, as Legal Officer, he has been leading the legal team responsible for litigation, including labor, tax and civil litigation.
He has a Bachelor’s degree in Law from Universidade de São Paulo in 2000; Master´s degree in Civil Law – Contracts from Universidad de Salamanca – Spain, in 2006; and PhD in Civil Law – Contracts from Universidade de São Paulo, in 2007.
Marcelo Kopel (Officer)was an Executive Officer at Redecard S.A. (May 2010 to July 2014) and has been Officer at ItaúUnibanco since July 2014. He also worked as Officer at Banco Credicard S.A. (November 2004 to February 2010), Financial Officer at Banco Citibank S.A. (2006 to 2010) and ING Bank in Brazil (1992 to 1998) and for Latin America (1998 to 2002). At Bank of America he worked as Financial Officer accumulating the position of Operations Officer (2002 to 2003). He has served as Investor Relations Officer at Itaú Unibanco Holding S.A. since February 2015.
He has a degree in Business Administration from FAAP in Brazil.
Matias Granata (Officer)has held several positions within the Itaú Unibanco Group including as Officer since July 2014;Senior Manager for Market Risk from October 2010 to April 2014; and Senior Manager for Operational Risk from March 2009 to October 2010 at Itaú Unibanco.
He also served as Senior Treasury Trader – Proprietary Desk São Paulo (August 2007 to March 2009); Senior Treasury Trader – Proprietary Desk London (August 2004 to August 2007), Treasury Trader – Proprietary Desk, São Paulo (April 2003 to August 2004); Senior Economic Research Economist (May 2002 to April 2003).
He has a Master of Arts – International Economic Policy from the University of Warwick, UK. British Chevening Scholarship (2000-2001); a Master’s degree in Economics fromUniversidad Torcuato Di Tella (UTDT), Argentina (1998-2000) and completed a Degree Course in Economics fromUniversidad de Buenos Aires (UBA), Argentina (1992-1997).
Rodrigo Luís Rosa Couto (Officer)has held several positions within the Itaú Unibanco Group including as Officer sinceJanuary 2012 and Head of Corporate Risks (February 2008 to December 2011) at Itaú Unibanco Holding and Officer since December 2011 at Itaú Unibanco.
He has served as Officer at Dibens Leasing S.A. – Arrendamento Mercantil since January 2014. He worked as Inspector of the Direct Supervision Department – DESUP at Central Bank (1988 to 2003), Financial Stability Institute of BIS where he carried out an internship during which he participated in the preparation and lectured in a preparation course for bank supervisors of regulatory authorities worldwide (April to June 2003). He served at McKinsey & Company Associate as Consultant Member of the Risk Management Practice and Specialist in Risk and Finance subjects (September 2005 to February 2008).
He has a Bachelor’s degree in Administration, with an emphasis on Finance, from Universidade Federal do Rio Grande do Sul (UFRS) (1997) in Brazil and an MBA with honors from The Wharton School, University of Pennsylvania (2005) in the United States.
Sergio Mychkis Goldstein (Officer)has held several positions within the Itaú Unibanco Group including as an Officer sinceDecember 2015 at Itaú Unibanco.
He also served as Officer since December 2015; General Legal Manager for the General Director’s Office for Wholesale (2000 to November 2015), responsible for the Legal Department for Wholesale providing legal services for the following business areas/lines: (i) Investment Banking: coordinating services for fixed income, equity income and M&A operations, as well as structured operations; (ii) Treasury: coordinating services for treasury operations, especially funding for the retail sector, private segment and institutional investors; (iii) Wealth Management Services: coordinating services for Itaú Group’s asset management operations, Private Banking and the activities of custody, administration and management of own and third party funds; (iv) Restricted Lending Funds and On-Lending: coordinating services with respect to the demands of the corporate bank in relation to operations involving restricted resources (rural and mortgage lending) and on-lending operations with Development Bank (BNDES) funds and for lines raised abroad; (v) Debt Restructuring: coordinating services with respect to the demands of the debt restructuring area both for the major corporations area as well as the larger middle-market companies segment, operating essentially in contractual restructurings – with the exception of court enforced restructuring; (vi) Cross-border loans/F/X: coordinating services with respect to the demands for the execution of foreign loans and cross-border lending; (vii) High Volumes: coordinating services with reference to the demands involving bank lending products such as simple working capital loans, buying and selling, assignment and discount operations at Banco Itaú BBA S.A.
He has a Bachelor’s degree in Law from Pontifícia Universidade Católica (PUC), São Paulo (SP) in 2000, and a Master’s degree in Banking and Finance from the Law Faculty, Boston University, Boston (MA) in 2004.
A-68
Wagner Bettini Sanches (Officer)has been Officer of the Itaú Unibanco Group and Officer since June 2014 at Itaú UnibancoHolding and Officer since October 2011 at Itaú Unibanco and Officer (November 2012 to June/2014) at Banco Itaú BMG Consignado S.A.
He previously held a number of positions within the Itaú Unibanco Group, including Company Market Consultancy Analyst (1996 to 1999); Coordinator of the Company Market Consultancy (1999 to 2000); Manager of the Company Market Consultancy (2000 to 2001); Manager of the Corporate Credit – Company Market (2003 to 2007); Senior Manager of the Commercial Corporate Real Estate, in charge of the commercial relationship with real estate developers throughout the country (2007 and 2008); Senior Manager of Credit and Collection of Real Estate Lending Operations, in charge of the lending desk to individuals, credit analysis of companies, planning, monitoring of projects, management of collection and operational and litigation collections as from 2009 of Itaú Unibanco.
He has a Bachelor’s degree in Production Engineering from Escola Politécnica at USP in Brazil; a Post-graduate degree from the University of Michigan; an MBA with high distinction, with an emphasis on Finance and Strategy from the Ross School Business in the United States (2003).
Audit Committee
Antonio Francisco de Lima Neto (Independent Member)served as President (August 2009 to October 2013) at Banco FibraS.A.
He has worked as President (December 2006 to April 2009); Vice President of Retail and Distribution (July 2005 to December 2006); Vice President of International Business and wholesale (November 2004 to July 2005); Commercial Director (September 2001 to November 2004); Executive Superintendent of the Commercial Board (July 2000 to September 2001); Tocantins State Superintendent (May 1999 to May 2000) and Regional Superintendent of Belo Horizonte (January 1997 to May 1999) at Banco do Brasil S.A.
He has also served as Member of the Board of Directors (2007 to 2009) at Brasilprev Seguros e Previdência S.A.; Member of the Board of Directors (2006 to 2009) at FEBRABAN Brazilian Federation of Banks; Member of the Board of Directors (2004 to 2005) at BB Seguridade e Participações S.A; Member of the Board of Directors (2003 to 2005) at Brasilsaúde Companhia de Seguros; Member of the Board of Directors (2001 to 2009) at Alliance Insurance Company of Brazil; Member of the Board of Directors (2000 to 2007) at BB Securities Limited Pension Fund.
He is pursuing a Master’s degree in Economics at FGV since January 2014. He has a Course for Advisors from the Brazilian Institute of Corporate Governance (2014); a Postgraduate degree in Marketing from PUC-Rio (2001); Training for Executive MBA from Fundação Dom Cabral (1997). He has a Bachelor’s degree in Economics fromUniversidade Federal dePernambuco(UFPE), 1996.
Diego Fresco Gutierrez (Independent Member and Financial Expert)has served as an independent consultant on complexissues of financial reporting, particularly to companies doubly listed (in Brazil and in the United States) since June 2013. He was a partner at PwC – São Paulo (2000 to June 2013) in the Capital Markets and Accounting Advisory Services area and prior to that held several positions at PwC in Uruguay (1998 to 2000 and 1990 to 1997) and in the United States (1997 to 1998).
He has a Bachelor’s degree in Accounting fromUniversidad de la Republica Oriental del Uruguay in 1994. He is a Certified Public Accountant CPA registered in the State of Virginia (United States) since 2002 (Registration 27,245) and an Accountant registered with the Regional Council of Accountancy of the State of São Paulo. He has also served in the Brazilian Institute of Corporate Governance as Member of the Commission of Governance in Financial Institutions since 2013.
Geraldo Travaglia Filho (Independent Member)served as Executive Officer of Itaú Unibanco and Itaú Unibanco Holding(November 2008 to April 2009) and Executive Officer at Banco Itaú BBA S.A. (November 2008 to January 2010) and as Financial Executive Officer of Redecard S.A. (May 2009 to April 2010). He served as Vice President at Unibanco (September 2004 to April 2009).
He has a Bachelor’s degree in Business Administration from USP in Brazil and a specialization in Bank Management from The Wharton School of the University of Pennsylvania in the United States.
Maria Helena dos Santos Fernandes de Santana (Independent Member)has served as Member of the Board of Directorsand Chairman of the Corporate Governance Committee at Companhia Brasileira de Distribuição S.A. since 2013; Member of the Board of Directors and Coordinator of the Audit Committee at Totvs S.A. since 2013; Member of the Board of Directors of Bolsas y Mercados Españoles – BME since 2016 and Member of the Board of Trustees of the IFRS Foundation since January 2014. She was Member of the Board of Directors at CPFL Energia S.A. (2013 to 2015); Chairperson (July 2007 to July 2012) and Commissioner (July 2006 to July 2007) at CVM; Chairperson of the Executive Committee (2010 to 2012) at the International Organization of Securities Commissions, (IOSCO); Vice President (2004 to 2006) at the Brazilian Institute of Corporate Governance (IBGC -Instituto Brasileiro de Governança Corporativa, or IBGC). Worked for BOVESPA – São Paulo Stock Exchange (now BM&FBovespa S.A.) for 12 years, acting as Head of Listings and Issuer Relations (2000 to June 2006). She was involved, since the beginning, with the creation of the Novo Mercado and the Corporate Governance Listing Tiers, having been in charge of their implementation.
She has a Bachelor’s degree in Economics fromFaculdade de Economia, Administração e Contabilidade da Universidadede São Paulo(FEA-USP) in Brazil.
A-69
Rogério Paulo Calderón Peres (Independent Member)has served as Member of the Audit Committee since November2016; Officer from April 2011 to April 2014; Member of the Disclosure and Trading Committee from June 2009 to April 2014 at Itaú Unibanco Holding and Officer from April 2009 to April 2014 at Itaú Unibanco.
He has also served as CFO for Latin America, Member of the Financial Management Council and Member of the Administrative Committee for Latin America from July 2014 to October 2016 at HSBC Group. He served as Managing Vice-President from June 2012 to April 2013, Chairman of the Board of Directors and CEO from April 2013 to April 2014 at Investimentos Bemge S.A.; Officer from April 2013 to April 2014 at Dibens Leasing S.A. – Arrendamento Mercantil; Executive Officer from 2007 to 2009 at Unibanco – União de Bancos Brasileiros S.A.; Executive Vice President from 2003 to 2006 at Bunge Group – Bunge Brasil S.A.; Member of the Board of Directors at Fosfertil, Ultrafertil and Fertifos; Member of the Audit Committee at Bunge Foundation, Bungeprev and Fosfertil and Active partner in the divisions of Audit, Tax and Consultancy for Agribusiness and Consumer and Retail Products at PricewaterhouseCoopers from 1981 to 2003.
He has a Bachelor’s degree in Business Administration from Fundação Getúlio Vargas (State of Sao Paulo), and in Accounting from Fundação Paulo Eiró (State of São Paulo), and Postgraduate degrees and special professional courses: E-Business Education Series from the University of Virginia Darden School of Business. Executive M.B.A. from the University of Western Ontario, in Canada, Case Studies in consumer and retail companies. Center for Executive Development Faculty at Princeton University, Business Strategy and Organization. Continuing Education Management and Professional Training, Arundel, England. Executive Business Development – Finance and Investment Decision Course – Analyzes and Measures at Fundação Getúlio Vargas (State of São Paulo). Continuing Education Course at Harvard Business School, Making Corporate Boards More Effective – United States.
Fiscal Council
Alkimar Ribeiro Moura (Independent Member)has served as Member of the Fiscal Council since April 2016, being itsChairman since August 2016; Member of the Audit Committee (May 2010 to July 2015) at Itaú Unibanco Holding.
He is a retired Economics Professor at Escola de Administração de Empresas de São Paulo - Fundação Getúlio Vargas – São Paulo; Independent Member of the Supervisory Board (October 2007 to September 2010) at BM&FBovespa S.A.; Member of the Board of Directors at Banco Nossa Caixa S.A. (May 2006 to February 2007); Telemar Participações S.A. (May 2001 to January 2003); Cia. Brasil de Seguros (May 2001 to February 2003); Banco Bandeirantes S.A. (May 1999 to December 2000); President of the Investment Bank (April 2001 to January 2003) and Vice President of Finance and Capital Markets (April 2001 to January 2003) at Banco do Brasil S.A.; Officer of the National Financial System for Norms and Organization (February 1996 to September 1997), Officer of Monetary Policy (February 1994 to February 1996) and Officer of Public Debt and Open Market Operations (January 1987 to January 1988) at Central Bank of Brazil; Officer (March 1988 to March 1993) at Banco Pirelli-Fintec.
He has a Bachelor’s degree in Economics, Universidade Federal de Minas Gerais, Belo Horizonte in 1963, a Master’s degree from the University of California, Berkeley, California in 1966, PhD in Applied Economics from the University of Stanford, California in 1978.
Carlos Roberto de Albuquerque Sá (Independent Member)has served as Member of the Fiscal Council since April 2016;Alternate Member of the Fiscal Council (April 2015 to April 2016) at Itaú Unibanco Holding.
He was Alternate Fiscal Councilor (March 2011 to October 2012) at Marfrig S.A.; Officer (March 2003 to December 2010) at KPMG Auditores Independentes; Risk Officer (March 1999 to December 2002) at Net Serviços de Comunicação S.A.; Finance and Administration Officer (March 1995 to December 1998) at Sobremetal; Finance Officer (March 1991 to December 1994) at Castrol do Brasil Ltda.; Financial Controller (March 1986 to December 1988) at Schlumberger Serviços de Petróleo Ltda. and Financial Manager (March 1979 to December 1981) at Det Norske Veritas.
He graduated in Economics from Universidade Candido Mendes in 1973 and.graduated in Accounting Sciences from Faculdade Moraes Júnior in 1981. He also holds a Postgraduate degree in Finance from Pontifícia Universidade Católica - Rio de Janeiro in 1995.
José Caruso Cruz Henriques (Independent Member)has served as Alternate Member of the Fiscal Council since August2011, having been made a full Member on May 03, 2016 at Itaú Unibanco Holding.
He has also served as Executive President since 2003 at Corhen Serviços Ltda.
He was Managing Officer (1988 to August 2003) at Itaú Unibanco; Officer (1997 to July 2003) at BFB Leasing S.A. – Arrendamento Mercantil; Member of the Board of Directors (December 1994 to September 2003) at Banco Itauleasing S.A.; Officer (March 2000 to April 2003) at Banco Itaucard S.A.; Managing Officer (April 1994 to July 2003) at Intrag Distribuidora de Títulos e Valores Mobiliários Ltda.; Managing Officer (July to October 2000) at Banco Itaú Cartões S.A. and Officer (April 1993 to April 2003) at Itautec Componentes da Amazônia S.A. – Itaucam.
He holds a Bachelor´s degree in Law from Universidade de São Paulo (SP) in 1971 and a Postgraduate degree in Business Administration from Fundação Getúlio Vargas (SP) in 1979.
A-70
Directors’ and senior management’s compensation
Our Compensation Policy, applicable to directors and officers in Brazil (constituting a majority of the management of Itaú Unibanco Group), is in accordance with guidelines provided under applicable Brazilian regulation and is built upon our principles and practices and is intended to better align the interests of our stockholders and our management. Regarding variable compensation, the purpose of our Compensation Policy is to attract, retain and reward management achievements, as well as to stimulate the adoption of prudent levels of risk exposure in the short, medium and long term.
Accordingly, our Compensation Policy sets forth that of the total aggregate variable compensation paid, at least 50% must be paid in shares or share-based instruments, and at least 50% must be deferred for future payment in a minimum period of three years. If the institution or business unit records a significant decrease in the realized recurring profit or a negative result during the deferral period, the deferred and unpaid portions of the compensation will be reversed proportionally to the decrease in result (malus).
Our governance structure for the establishment of compensation sets forth clear and transparent processes, and is overseen by the Compensation Committee. Among others, its responsibilities comprise the formulation of our Compensation Policy, which must be submitted to the annual approval of the Board of Directors. Additionally, our Compensation Committee acts as an important liaison with the Central Bank, increasing the accuracy and transparency of information provided to this regulatory body. Please refer to www.itau.com.br/_arquivosestaticos/RI/pdf/CompensationCommittee.pdf for further information.
We have established a variable compensation plan pursuant to which each beneficiary is assigned annually a base amount for computation of payments. The final payment amount to an individual is calculated by the multiplication of the individual’s base amount and key performance indicators such as the consolidated results of the Itaú Unibanco Group, the results of the business unit to which the individual belongs and the individual’s performance. The performance of directors and senior management is measured by financial and non-financial metrics, with 80% linked to financial metrics and 20% linked to non-financial metrics, on a median basis within Commercial areas. Back-office areas have 25% of their metrics linked to financial results and 75% to non-financial results, also on a median basis. Commercial areas have their objectives mainly set to Managerial Operational Results (similar to net profit), banking products, costs and client satisfaction’s survey results. The objectives for back-office employees are mainly related to client satisfaction’s survey and costs.
We also have an institutional program called Partners Program, comprised of members of management and employees approved by the Personnel Committee as having provided an outstanding performance. The beneficiaries are entitled to use part or their total annual variable compensation to purchase our preferred shares (Own Shares). If they hold the ownership of these own shares for three- and five-year terms as from the initial investment, the return on investment will be through the receipt of our preferred shares (Partners Shares) also for three- and five-year terms. These partners’ shares will subsequently remain unavailable for five- and eight-year terms as from the initial investment in own shares. The Partners Program may also consider instruments derived from shares rather than actual shares.
In 2016, we recorded expenses at Itaú Unibanco Group for our management compensation, including long-term incentives plans (except Stock Option Plan) in the amount of approximately R$ 622 million. Our long-term incentive plans take into consideration amounts granted in the past but that are still being recorded. Management compensation also considers contributions to pension plans of approximately R$ 11.8 million and other benefits, such as health and dental care, of approximately R$ 2.8 million. Please refer to section Performance, item Complete Financial Statements (IFRS), Note 35 – Related Parties – (b) Compensation of the Key Management Personnel, for further details.
Brazilian legislation does not require the disclosure of individual compensation of our management, except for the highest and lowest amount received, and it is not necessary to identify those individuals. The Brazilian Institute of Finance Executives of Rio de Janeiro (Instituto Brasileiro de Executivos de Finanças, or IBEF Rio de Janeiro) filed, on behalf of its members, a lawsuit challenging the legality of this disclosure requirement, and an injunction was granted to suspend such requirement. We do not intend to make this disclosure until the matter is finally determined. Please refer to section Our risk management, item Regulatory environment, Compensation of directors and Officers of financial institutions, for further information.
Our Compensation Policy provides post-employment benefits for our management, including medical benefits such as health plan and annual medical check-up. Except for the benefits established by our Compensation Policy, we do not have service contracts with our management providing for benefits upon termination of employment.
Stock option plan
We have a stock option plan through which our employees and management receive stock options. These options enable employees and management to share the risk of price fluctuations of our preferred shares with other stockholders and is intended to integrate the beneficiaries of our Stock Option Plan into the development process of our group in the medium and long term.
Our Personnel Committee manages the Stock Option Plan, including matters such as strike prices, vesting periods and effectiveness of options, in compliance with the rules set forth in the Stock Option Plan.
Options may only be granted to beneficiaries if there is net income sufficient for the distribution of mandatory dividends. Please refer to section Our profile, item Information for the investor, Stockholders payment, for further information on the payment of dividends. Also, to avoid the dilution of stockholders, the sum of shares to be used for compensation of management and options to be granted each year will not exceed the limit of 0.5% of total shares outstanding at the closing balance sheet date of the same year. In the event the number of shares delivered and options granted is below the 0.5% limit,
A-71
the difference may be added for purposes of share-based compensation or granting of options in any one of the seven subsequent fiscal years.
In view of the effects related to Article 33 of Law No. 12,973/2014, the amounts granted under the Partners Program and not yet paid, which used to be under our Stock Option Plan, are now recognized as compensation. As a result, on April 29, 2015, our stockholders approved, among other modifications, to exclude from our Stock Option Plan the provisions on the granting of partner options (related to our prior Partners Program), so that the Stock Option Plan will provide only the granting of simple options.
In 2016, no simple options were granted pursuant to our Stock Option Plan. On December 31, 2016, we still had 38,033,506 options to be exercised by the beneficiaries. Please refer to section Performance, item Complete Financial Statements (IFRS), Note 22 – Share-based Payment, I - Stock Options Plan.
Main differences between Brazilian and U.S. corporate governance practices
In the United States, we have listed our ADSs on NYSE as a foreign private issuer and, as a result, NYSE allows us to comply with certain corporate governance requirements established by applicable Brazilian legislation in lieu of those under NYSE’s corporate governance listing standards applicable to U.S. companies with securities listed on NYSE.
Under the NYSE rules, we are required to: (i) have an audit committee or an audit board that meets certain requirements, as discussed below; (ii) provide notice by our chief executive officer to NYSE with respect to any non-compliance by us with any applicable NYSE corporate governance listing standards; (iii) provide NYSE with annual and interim written affirmations of our compliance with NYSE corporate governance listing standards; and (iv) provide a statement of the significant differences between our corporate governance practices and practices required by NYSE to be followed by U.S. listed companies. Except for those requirements, we are permitted to manage our corporate governance in accordance with applicable Brazilian legislation.
The description of the significant differences between our corporate governance practices and those required of U.S. listed companies follows below. Our main rules and policies can be found at www.itau.com.br/investor-relations/corporate-governance/rules-and-policies.
Majority of independent directors
NYSE rules require that the majority of board members be independent. Independence is defined by various criteria, including the absence of a material relationship between the director and the listed company. However, under NYSE rules, controlled listed companies (whether U.S. or foreign) of which more than 50% of the voting power is held by an individual, a group or another company, such as in our case, are not required to comply with the majority independence requirement.
Brazilian legislation does not have a similar requirement. Nevertheless, our Board of Directors has five directors considered independent pursuant to the criteria established in our Corporate Governance Policy. For further information on the composition of our Board of Directors, see section Our governance, item Management structure, Our Directors and Executive Officers.
Additionally, Brazilian Corporate Law, the Central Bank and CVM have established rules that address the duties and responsibilities of companies’ officers and directors and their professional qualification, so as to ensure the proper operation of the board.
Executive sessions
NYSE rules require that non-management directors meet at regularly scheduled executive sessions without the presence of directors who are also officers of the company.
Brazilian legislation does not have a similar requirement. However, we hold such executive sessions at least once a year. Currently, three quarters of the members of our Board of Directors are non-management directors.
Nomination and Corporate Governance Committee and Compensation Committee
NYSE rules require that listed companies have a nominating or corporate governance committee and also a compensation committee, each entirely comprised of independent directors and governed by a charter on the purposes and responsibilities of such committee. However, under NYSE rules, controlled listed companies (whether U.S. or foreign) of which more than 50% of the voting power is held by an individual, a group or another company, such as in our case, are not required to comply with such requirement.
Brazilian legislation does not require us to have a nominating or corporate governance committee. However, we have elected to form a Nomination and Corporate Governance Committee responsible for stimulating and overseeing discussions of matters related to the company’s governance. Currently, one out of five members of our Nomination and Corporate Governance Committee is considered independent under our Corporate Governance Policy. Also, one out of five members of our Compensation Committee is not a director or officer of Itaú Unibanco Holding, as required by Brazilian banking regulation.
A-72
CVM rules do not require listed companies to have a compensation committee. Nonetheless, we are required to establish a Compensation Committee pursuant to Brazilian banking regulation. In accordance with such regulation, our Compensation Committee reports to the Board of Directors and members of the Compensation Committee are not required to be independent. However, currently, three out of five members of our Compensation Committee are considered independent under our Corporate Governance Policy.
Please refer to section Our governance, item Management structure, for further information about our Nomination and Corporate Governance Committee and our Compensation Committee.
Audit Committee
NYSE rules require that listed companies have an audit committee that (i) is composed of at least three independent members who are financially literate; (ii) complies with SEC rules related to the audit committee of companies registered with NYSE; (iii) has at least one member who has accounting or financial management expertise; and (iv) is governed by a charter that expressly sets out the purposes and responsibilities of the committee and that establishes annual performance assessments.
The applicable Brazilian banking rules regulate independent audit services rendered to financial institutions and requires the establishment of an audit committee composed of at least three independent members, pursuant to the independence criteria of such rules. Our Audit Committee, formed on April 28, 2004, meets applicable Brazilian legal requirements, is elected annually by the Board of Directors and is composed of professionals with proven technical qualification compatible with the responsibilities of this committee.
Under SEC rules, we are not required to have an Audit Committee constituted or operated in accordance with NYSE rules if we meet specified SEC requirements. We believe that our Audit Committee is compliant with the requirements of Rule 10A-3(c)(3) under the Exchange Act and that it is able to act independently when performing its responsibilities. Our Audit Committee, to the extent permitted by Brazilian legislation, performs all functions required to be performed by an audit committee by Rule 10A-3 under the Exchange Act.
In line with applicable Brazilian legislation, hiring independent auditors is the responsibility of the Board of Directors, whereas the recommendation for hiring and removing independent auditors is the responsibility of the Audit Committee. Thus, our Board of Directors acts in lieu of the Audit Committee, as permitted by Rule 10A-3(c)(3)(v) under the Exchange Act, for the purpose of hiring our independent auditors.
Stockholders’ approval of management members’ compensation and stock option plans
NYSE rules require that stockholders have the opportunity to vote on all share-based compensation plans and significant changes thereto, including significant increases in the number of shares available to the plan, with a few exceptions. Brazilian legislation sets forth a comparable requirement, as it establishes the need for approval of the aggregate annual compensation of management members (including shares) and stock option plans at General Stockholders’ Meetings. Please refer to section Our governance, items Directors’ and Senior management’s compensation.
Corporate governance guidelines
NYSE rules require that listed companies adopt and disclose their corporate governance guidelines.
Brazilian legislation does not establish a similar requirement. However, we have a Corporate Governance Policy that consolidates the corporate governance principles and practices that we adopt. We believe such corporate governance principles and practices, consistent with Brazilian legislation, are compatible with the guidelines established by NYSE. We have adopted stricter rules than those required by Brazilian legislation, since we voluntarily adhere to BM&FBovespa’s Level 1 of Corporate Governance and have granted tag-along rights to all stockholders, regardless of their voting rights. Please refer to section Our governance, item Our practices, for further information.
NYSE rules require that listed companies adopt and disclose a code of business conduct and ethics for their directors, officers and employees. NYSE also requires that listed companies promptly disclose any waiver of the code provisions for directors or executive officers.
Brazilian legislation does not have a similar requirement. However, we have a Code of Ethics that, among other matters, governs the conduct of all directors, officers and employees of the Itaú Unibanco Group, detailing the principles that guide our attitudes and practices.
Internal Audit
NYSE rules require that listed companies maintain an internal audit function to provide management and the audit committee with ongoing assessments of the company’s risk management processes and internal control systems.
Brazilian banking legislation establishes a similar requirement, since it requires that financial institutions have an internal audit function. Our internal audit function is responsible for assessing the sufficiency and effectiveness of our operating and
A-73
management controls, as well as the adequacy of our risk identification and risk management processes. In addition, our internal audit function is independent from management in carrying out its activities and has access to all places, information and people deemed necessary for it to carry out its duties. The internal audit function is administratively subordinated to the Chairman of the Board of Directors, and its activities are supervised by the Audit Committee.
A-74
This section addresses the risks we consider material to our business and to investment in our securities. Should any of the events described in such risks occur, our business and financial condition, as well as the value of the investments made in our securities, may be adversely affected. Accordingly, investors should carefully assess the risk factors described below and the information disclosed in this document.
Other risks that we currently deem immaterial or we are not aware of may give rise to effects similar to those discussed below should they actually occur.
Macroeconomic risks
Changes in economic conditions may adversely affect us.
Our operations are dependent upon the performance of the Brazilian economy and, to a lesser extent, the economies of other countries in which we do business, Latin American countries in particular. The demand for credit and financial services, as well as clients’ ability to pay, is directly impacted by macroeconomic variables, such as economic growth, income, unemployment, inflation, and fluctuations in interest and foreign exchange rates. Therefore, any significant change in the Brazilian economy and, to a lesser extent, in the economies of other countries in which we do business, Latin American countries in particular, may affect our operations.
After a period of accelerated economic expansion, Brazil’s growth rates began to slow down in 2011 and by 2015 the country was in recession. In 2016, GDP decreased by 3.6%. Growth has been impacted by high interest rate, low commodities price, and high corporate leverage. In the long term, growth may be limited by a number of factors, including structural factors, such as inadequate infrastructure, which entail risks of potential energy shortages and deficiencies in the transportation sector, among others, and lack of qualified professionals, which can reduce the country’s productivity and efficiency levels. Low levels of national savings require relatively large financial flows from abroad, which may falter if political and fiscal instability is perceived by foreign investors. Depending on their intensity, these factors could lead to decreasing employment rates and to lower income and consumption levels, which could result in increased default rates on loans we grant for individuals and non-financial corporations and, therefore, have a material adverse effect on us.
Brazilian authorities exercise influence on the Brazilian economy. Changes in monetary, fiscal and foreign exchange policies may adversely affect us.
Brazilian authorities intervene from time to time in the Brazilian economy, through changes in fiscal, monetary, and foreign exchange policies, which may adversely affect us. These changes may impact variables that are crucial for our growth strategy (such as foreign exchange and interest rates, liquidity in the currency market, tax burden, and economic growth), thus limiting our operations in certain markets, affecting our liquidity and our clients’ ability to pay and, consequently, affecting us. Uncertainty regarding future economic policies may, in the future, contribute to an increase in the volatility of the Brazilian capital markets, which, in turn, may have an adverse impact on us. Other political, diplomatic, social and economic developments in Brazil and abroad that affect Brazil may also affect us.
Inflation and fluctuations in interest rates may have a material adverse effect on us.
Sudden increases in prices and long periods of high inflation may cause, among other effects, loss of purchasing power and distortions in the allocation of resources in the economy. Measures to combat high inflation rates include a tightening of monetary policy, with an increase in the SELIC interest rate, resulting in restrictions on credit and short-term liquidity, which may have a material adverse effect on us. Changes in interest rates may have a material effect on our net margins, since they impact our funding and credit granting costs.
In addition, increases in the SELIC interest rate could reduce demand for credit and increase the costs of our reserves and the risk of default by our clients. Conversely, decreases in the SELIC interest rate could reduce our gains from interest-bearing assets, as well as our net margins.
Instability of foreign exchange rates may negatively affect us.
Brazil has a floating foreign exchange rate system, pursuant to which the market establishes the value of the Brazilianreal in relation to foreign currencies. However, the Central Bank may intervene in the purchase or sale of foreign currencies for the purpose of easing variations and reducing volatility of the foreign exchange rate. In spite of those interventions, the foreign exchange rate may significantly fluctuate. In addition, in some cases, interventions made with the purpose of avoiding sharp fluctuations in the value of the Brazilianrealin relation to other currencies may have the opposite effect, leading to an increase in the volatility of the applicable foreign exchange rate.
Instability in foreign exchange rates could negatively impact our business. A potential depreciation of the Brazilianreal could result in (i) losses on our liabilities denominated in or indexed to foreign currencies; (ii) a decrease in our ability to pay for obligations denominated in or indexed to foreign currencies, as it would be more costly for us to obtain the foreign currency required to meet such obligations; (iii) a decrease in the ability of our Brazilian borrowers to pay us for debts denominated in or indexed to foreign currencies; and (iv) negative effects on the market price of our securities portfolio. On the other hand,
A-75
an appreciation of the Brazilianrealcould cause us to incur losses on assets denominated in or indexed to foreign currencies. For further information on how the effects of these variables may affect us, please see “Crises and volatility in the financial markets of countries other than Brazil may affect the global financial markets and the Brazilian economy and have a negative impact on our operations” below.
Government fiscal accounts deterioration may affect us.
If the government fiscal accounts deterioration continues, it could generate a loss of confidence by local and foreign investors. Regional governments are also facing fiscal concerns due to their high debt burden, declining revenues and inflexible expenditures. In 2017, the spotlight will remain on fiscal reforms. The Lower House of the Brazilian Congress may approve the proposed Social Security reforms, which are critical for achieving future compliance with the spending limits, by the end of the second quarter. Diminished confidence in government fiscal circumstances could lead to the downgrading of the Brazilian sovereign debt by credit rating agencies, and negatively impact the local economy, causing a depreciation of the Brazilianreal, an increase in inflation and interest rates and a deceleration of economic growth, thus adversely affecting our business, results of operations and financial condition.
Crises and volatility in the financial markets of countries other than Brazil may affect the global financial markets and the Brazilian economy and have a negative impact on our operations.
The economic and market conditions of other countries, including the United States, countries of the European Union, and emerging markets, may affect the credit availability and the volume of foreign investments in Brazil, to varying degrees.
Crises in these countries may decrease investors’ interest in Brazilian assets, which may materially and adversely affect the market price of our securities, making it more difficult for us to access capital markets and, as a result, to finance our operations in the future.
Banks that operate in countries considered to be emerging markets, including ours, may be particularly susceptible to disruptions and reductions in the availability of credit or increases in financing costs, which may have a material adverse impact on their operations. In particular, the availability of credit to financial institutions operating in emerging markets is significantly influenced by aversion to global risk. In addition, any factor impacting investors’ confidence, such as a downgrade in credit ratings, since the ratings of financial institutions, including ours, tend to be subject to a ceiling based on the sovereign credit rating, or an intervention by a government or monetary authority in one of such markets, may affect the price or availability of resources for financial institutions in any of these markets, which may affect us.
The disruptions and volatility in the global financial markets may also have significant consequences in the countries in which we operate, such as volatility in the prices of equity securities, interest rates and foreign exchange rates. Higher uncertainty and volatility may result in a slowdown in the credit market and the economy, which, in turn, could lead to higher unemployment rates and a reduction in the purchasing power of consumers. In addition, such events may significantly impair our clients’ ability to perform their obligations and increase overdue or non-performing loan operations, resulting in an increase in the risk associated with our lending activity. Thus, global financial crises, in addition to the Brazilian macroeconomic environment, may also affect in a material and adverse way the market price of securities of Brazilian issuers or lead to other negative effects in Brazil and in the countries in which we operate and have a material adverse effect on us.
The UK exit from the European Union could adversely impact our business, results of operations and financial condition.
On June 23, 2016, the U.K. electorate voted in a general referendum in favor of the U.K. exiting from the European Union (so-called “Brexit”). Brexit could adversely affect European or worldwide economic or market conditions and could contribute to instability in global financial markets and impact the operations of Itau BBA International. In addition, Brexit could lead to legal uncertainty and potentially divergent national laws and regulations as the U.K. determines which E.U. laws to replace or replicate. The effects of Brexit, and others we cannot anticipate, could have an adverse effect on our business, results of operations or financial condition.
Please refer to section Context, item Macroeconomic context, Global context and Brazilian context for further details about data and economic indicators.
Ongoing high profile anti-corruption investigations in Brazil may affect the perception of Brazil and domestic growth prospects.
Certain Brazilian companies in the energy and infrastructure sectors are facing investigations by CVM, SEC, the U.S. Department of Justice (DOJ), the Brazilian Federal Police and other Brazilian public entities which are responsible for corruption and cartel investigations, in connection with corruption allegations (so called Lava Jato investigations) and, depending on the outcome of such investigations and the time it takes to conclude them, they may face (as some of them already faced) downgrades from credit rating agencies, experience (as some of them already experienced) funding restrictions and have (as some of them already had) a reduction in revenues, among other negative effects. Such negative effects may hinder the ability of those companies to timely honor their financial obligations bringing losses to us as a number of them are our clients. The companies involved in the Lava Jato investigations, a number of which are our clients, may also be (as some of them already have been) prosecuted by investors on the grounds that they were misled by the information released to them, including their financial statements. Moreover, the current corruption investigations have contributed to reduce the value of the securities of several companies. The investment banks (including Itau BBA Securities) that acted as underwriters on
A-76
public distributions of securities of such investigated companies are also parties to certain law suits in the United States and may be parties to other legal proceedings yet to be filed. We cannot predict how long the corruption investigations may continue, or how significant the effects of the corruption investigations may be for the Brazilian economy and for the financial sector that may be investigated for the commercial relationships it may have held with companies and persons involved in Lava Jato investigations. Other high profile investigation, besides Lava Jato, ongoing in Brazil is the so called Zelotes operation. If the allegations of such investigations are confirmed they may also affect some of our clients and their credit trustworthiness. In March 2016, the Brazilian IRS (Internal Revenue Services) summoned us to account for certain tax proceedings related to BankBoston Brazil which came under investigation in relation to the Zelotes operations. We acquired BankBoston Brazil’s operation from Bank of America in 2006. On December 1, 2016, the Brazilian Federal Police conducted searches at Itaú Unibanco’s premises, to look for documents related to those proceedings, and documents related to payments made to lawyers and consultants that acted on those proceedings. We clarify that the agreement with Bank of America for the acquisition of BankBoston Brazil’s operations included a provision whereby the seller would remain liable and responsible for the conduct of BankBoston’s tax proceedings, including with regard to the retention of lawyers and consultants. Therefore, according to such agreement, any and all payments made by Itaú Unibanco to lawyers and consultants were made strictly on behalf of Bank of America. These investigations have not yet been concluded, and we remain fully available and will cooperate with the authorities should any further clarification be needed. After reviewing our control procedures and our monitoring systems, we believe we are in compliance with the existing standards, especially related to anti-money laundering standards; notwithstanding, due to the size and breadth of our operations and our commercial relationship with investigated companies or persons, and due to the several banks, both publicly and privately owned, that Itaú Unibanco acquired throughout the last 15 years, we may also come within the scope of investigations, which may ultimately result in reputational damage, civil or criminal liability. Negative effects on a number of companies may also impact the level of investments in infrastructure in Brazil, which may also lead to lower economic growth.
Legal and regulatory risks
Changes in applicable law or regulations may have a material adverse effect on our business.
Changes in the law or regulations applicable to financial institutions in Brazil may affect our ability to grant loans and collect debts in arrears, which may have an adverse effect on us. Our operations could also be adversely affected by other changes, including with respect to restrictions on remittances abroad and other exchange controls as well as by interpretations of the law by courts and agencies in a manner that differs from our legal advisors’ opinions.
In the context of economic or financial crises, the Brazilian government may also decide to implement changes to the legal framework applicable to the operation of Brazilian financial institutions. For example, in response to the global financial crisis which began in late 2007, Brazilian national and intergovernmental regulatory entities, such as the Basel Committee on Banking Supervision, proposed regulatory reforms aiming to prevent the recurrence of similar crises, which included a new requirement to increase the minimum regulatory capital (Basel III). Please refer to section Our risk management, item Regulatory environment, Basel III framework and implementation of Basel III in Brazil for further details about regulatory capital requirements. Once the implementation of the Basel III framework is completed for Brazilian banks and its effects fully evaluated, we may need to reassess our funding strategy for regulatory capital should additional regulatory capital be required to support our operations under the new standards.
Moreover, the Brazilian Congress is considering enacting new legislation that, if signed into law as currently drafted, could have an adverse effect on us. For example, a proposed law to amend the Brazilian consumer protection code would allow courts to modify terms and conditions of credit agreements in certain circumstances, imposing certain difficulties for the collection of amounts from final consumers. In addition, local or state legislatures may, from time to time consider bills intending to impose security measures and standards for customer services, such as limits in queues and accessibility requirements, that, if signed into law, could affect our operations. More recently, certain bills have passed (and others were proposed) in certain Brazilian states or municipalities that impose, or aim to impose, restrictions on the ability of creditors to include the information about insolvent debtors in the records of credit protection bureaus, which could also adversely affect our ability to collect credit outstanding.
We also have operations outside of Brazil, including, but not limited to, Argentina, Chile, Colombia, Paraguay, United Kingdom, United States, Uruguay and Switzerland. Changes in the laws or regulations applicable to our business in the countries where we operate, or the adoption of new laws, and related regulations, may have an adverse effect on us.
Increases in compulsory deposit requirements may have a material adverse effect on us.
Compulsory deposits are reserves that financial institutions are required to maintain with the Central Bank. Compulsory deposits generally do not provide the same returns as other investments and deposits because a portion of these compulsory deposits does not bear interest; instead, these funds must be held in Brazilian federal government securities and used to finance government programs, including a federal housing program and rural sector subsidies. The Central Bank has periodically changed the minimum level of compulsory deposits. Increases in such level reduce our liquidity to grant loans and make other investments and, as a result, may have a material adverse effect on us.
A-77
We are subject to regulation on a consolidated basis and may be subject to liquidation or intervention on a consolidated basis.
We operate in a number of credit and financial services related sectors through entities under our control. For regulation or supervision purposes, the Central Bank treats us and our subsidiaries and affiliates as a single financial institution. While our consolidated capital base provides financial strength and flexibility to our subsidiaries and affiliates, their individual activities could indirectly put our capital base at risk. Any investigation or intervention by the Central Bank, particularly in the activities carried out by any of our subsidiaries and affiliates, could have a material adverse impact on our other subsidiaries and affiliates and, ultimately, on us.
If we or any of our financial subsidiaries become insolvent, the Central Bank may carry out an intervention or liquidation process on a consolidated basis rather than conduct such procedures for each individual entity. In the event of an intervention or a liquidation process on a consolidated basis, our creditors would have claims on our assets and the assets of our consolidated financial subsidiaries. In this case, claims of creditors of the same nature held against us and our consolidated financial subsidiaries would rank equally in respect of payment. If the Central Bank carries out a liquidation or intervention process with respect to us or any of our financial subsidiaries on an individual basis, our creditors would not have a direct claim on the assets of such financial subsidiaries, and the creditors of such financial subsidiaries would have priority in relation to our creditors in connection with such financial subsidiaries’ assets. The Central Bank also has the authority to carry out other corporate reorganizations or transfers of control under an intervention or liquidation process.
Our insurance operation is subject to regulatory agencies.
Insurance companies are subject to SUSEP intervention and/or liquidation. In case of insufficient resources, technical reserves, or poor economic health with respect to a regulated entity, SUSEP may appoint an inspector to act within the relevant company. If such intervention does not remedy the issue, SUSEP will forward to CNSP proposal to withdraw the applicable insurance license.
In additional, insurance companies are subject to pecuniary penalties, warnings, suspension of authorization of activities and disqualification to engage in business activities as set in Law.
With respect to health insurance companies that are deemed to have financial imbalances or serious economic-financial or administrative irregularities, the Brazilian Regulatory Agency for Private Health Insurance and Plans (ANS) may order the disposal of the applicable health insurance company’s portfolio, or take other measures such as fiscal or technical direction regime for a period not exceeding 365 days, or extrajudicial liquidation.
The penalties established for violations committed by health insurance companies and their directors and officers are: (i) warnings; (ii) pecuniary penalties; (iii) suspension of company’s activities; (iv) temporary disqualification for the exercise of management positions in health insurance companies; (v) permanent disqualification for the exercise of management positions in health insurance companies as well as in open private pension funds, insurance companies, insurance brokers and financial institutions; and (vi) the cancellation of the company’s authorization to operate and sale of its portfolio.
In this sense, the risks of our insurance operation may be affected negatively by the penalties applied by SUSEP or ANS, as described above.
Holders of our shares and ADSs may not receive any dividends.
Corporations in Brazil are legally required to pay their stockholders a minimum mandatory dividend at least on a yearly basis (except in specific cases provided for in applicable law). Our Bylaws determine that we must pay our stockholders at least 25% of our annual net income calculated and adjusted pursuant to Brazilian Corporate Law. Applicable Brazilian legislation also allows corporations to consider the amount of interest on shareholders’ equity distributed to their stockholders for purposes of calculating the minimum mandatory dividends. The calculation of net income pursuant to the Brazilian Corporate Law may significantly differ from our net income calculated under IFRS.
Brazilian Corporate Law also allows the suspension of the payment of the mandatory dividends in any particular year if our Board of Directors informs our general stockholders’ meeting that such payment would be incompatible with our financial condition. Therefore, upon the occurrence of such event, the holders of our shares and ADSs may not receive any dividends. If this happens, the dividends that were not paid in the particular fiscal year shall be registered as a special reserve and, if not used to cover any losses of subsequent years, the amounts of unpaid dividends still available under such reserve shall be distributed when the financial condition of the corporation allows for such payment.
Furthermore, pursuant to its regulatory powers provided under Brazilian law and banking regulations, the Central Bank may at its sole discretion reduce the dividends or determine that no dividends will be paid by a financial institution if such restriction is necessary to mitigate relevant risks to the Brazilian financial system or the financial institution.
Please refer to section Our profile, item Our shares, Stockholders’ payment and section Our risk management, item Regulatory environment, Basel III framework, Implementation of Basel III in Brazil for further details about CMN’s capital requirements and to section Performance, item Complete Financial Statements (IFRS), Note 2.4t and Note 21, for further details about dividends and interest on capital.
Tax reforms may adversely affect our operations and profitability.
The Brazilian government regularly amends tax laws and regulations, including by creating new taxes, which can be temporary, and changing tax rates, the basis on which taxes are assessed or the manner in which taxes are calculated, including in respect
A-78
of tax rates applicable solely to the banking industry. Tax reforms may reduce the volume of our transactions, increase our costs or limit our profitability.
Decision on lawsuits due to government monetary stabilization plans may have a material adverse effect on us.
We are a defendant in lawsuits for the collection of understated inflation adjustment for savings resulting from the economic plans implemented in the 1980s and 1990s by the Brazilian Federal Government as a measure to combat inflation.
Itaú Unibanco Holding is a defendant in lawsuits filed by individuals, as well as class actions filed by: (i) consumer protection associations; and (ii) public attorneys’ office (Ministério Público) on behalf of holders of savings accounts. In connection with these class actions, Itaú Unibanco Holding establishes provisions upon service of the individual claim requiring the enforcement of a judgment handed down by the judiciary, using the same criteria used to determine the provisions of individual actions.
The Brazilian Federal Supreme Court (Supremo Tribunal Federal, or STF) has issued a number of decisions in favor of the holders of savings accounts, but has not ruled regarding the constitutionality of economic plans and their applicability to savings accounts. Currently, the appeals on this issue are suspended by order of the Supreme Court, until there is a definitive statement of this Court regarding the constitutional issue.
We are also subject to operational risks associated with the handling and conducting of a large number of lawsuits involving government monetary stabilization in case of loss.
Please refer to section Performance, item Financial performance, Liabilities, Litigation for further information.
Tax assessments may adversely affect us.
As part of the normal course of business, we are subject to inspections by federal, municipal and state tax authorities. These inspections, arising from the divergence in the understanding of the application of tax laws may generate tax assessments which, depending on their results, may have an adverse effect on our financial results.
Risks associated with our business
Market risk factor
The value of our securities and derivatives is subject to market fluctuations due to changes in Brazilian or international economic conditions and, as a result, may subject us to material losses.
The securities and derivative financial instruments in our portfolio may cause us to record gains and losses, when sold or marked to market (in the case of trading securities), and may fluctuate considerably from period to period due to domestic and international economic conditions. If, for example, we enter into derivative transactions to hedge against decreases in the value of the Brazilianrealor in interest rates and the Brazilian realappreciates or interest rates increase, we may incur financial losses and such financiallosses could have a material adverse effect on us. In addition, we may incur losses from fluctuations in the market value of positions held, including risks associated with transactions subject to variations in foreign exchange rates, interest rates, price indexes, and equity and commodity prices, along with various indexes on these risk factors.
We cannot predict the amount of realized or unrealized gains or losses for any future period. Gains or losses on our investment portfolio may not contribute to our net revenue in the future or may cease to contribute to our net revenue at levels consistent with more recent periods. We may not successfully realize the appreciation or depreciation now existing in our consolidated investment portfolio or in any assets of such portfolio.
Operational risk factor
Failures, deficiency or inadequacy of our internal processes and human error or misconduct may adversely affect us.
Although we have in place information security controls, policies and procedures designed to minimize human error, and make continuous investments in infrastructure, management of crises and operations, the operational systems related to our business may stop working properly for a limited period of time or may be temporarily unavailable due to a number of factors. These factors include events that are totally or partially beyond our control such as power outages, interruption of telecommunication services, and generalized system failures, as well as internal and external events that may affect third parties with which we do business or that are crucial to our business activities (including stock exchanges, clearing houses, financial dealers or service providers) and events resulting from wider political or social issues, such as cyber-attacks or unauthorized disclosures of personal information in our possession.
Operating failures, including those that result from human error or fraud, not only increase our costs and cause losses, but may also give rise to conflicts with our clients, lawsuits, regulatory fines, sanctions, interventions, reimbursements and other indemnity costs, all of which may have a material adverse effect on our business, reputation and results of operations.
Operational risk also includes legal risk associated with inadequacy or deficiency in contracts signed by us, as well as penalties due to noncompliance with laws and punitive damages to third parties arising from the activities undertaken by us.
Cyberattacks may cause loss of revenue and reputational harm through data security breaches that may disrupt our operations or result in the dissemination of proprietary or confidential information.
We manage and store certain proprietary information and sensitive or confidential data relating to our clients and to our operations. We may be subject to breaches of the information technology systems we use for these purposes. We are strongly
A-79
dependent on technology and thus are vulnerable to viruses, worms and other malicious software, including “bugs” and other problems that could unexpectedly interfere with the operation of our systems. We also rely in certain limited capacities on third-party data management providers whose possible security problems and security vulnerabilities may have similar effects on us.
The costs to us to eliminate or address the foregoing security problems and security vulnerabilities before or after a cyber incident could be significant and the lack of remediation may result in interruptions, delays and may affect clients and partners.
Competition risk factor
We face risks associated with the increasingly competitive environment and recent consolidations in the Brazilian banking industry
The Brazilian market for financial and banking services is highly competitive. We face significant competition from other Brazilian and international banks, in addition to other companies competing in markets we operate. Competition has increased as a result of recent consolidations among financial institutions in Brazil and of regulations that increase the ability of clients to switch business between financial institutions. Please refer to section Our risk management, item Regulatory environment, Antitrust regulation for further information about competitionin the Brazilian markets. Such increased competition may adversely affect us by, among other things, limiting our ability to retain or increase our current client base and to expand our operations, or by impacting the fees and rates we adopt, which could reduce our profit margins on banking and other services and products we offer.
We rely on third party services
We have essential services for the proper functioning of our business and technology infrastructure, such as call centers, networks, internet and systems, among others, provided by external or outsourced companies. Impacts on the provision of these services, caused by these companies due to the lack of supply or the poor quality of the contracted services, can affect the conduct of our business as well as our clients.
Credit risk factors
Changes in the profile of our business may adversely affect our loan portfolio
Our historical loan loss experience may not be indicative to our future loan losses. While the quality of our loan portfolio is associated with the default risk in the sectors in which we operate, changes in our business profile may occur due to our organic growth or merger and acquisition activity, changes in local economic conditions and, to a lesser extent, in the international economic environment, in addition to changes in the tax regimes applicable to the sectors in which we operate, among other factors. Any changes affecting any of the sectors to which we have significant lending exposure may adversely affect our loan portfolio. For example, in recent years, Brazilian banks have experienced an increase in loans to consumers, particularly in the automotive sector. However, this increased demand for vehicle loans has been followed by a significant rise in the level of consumer indebtedness, leading to high nonperforming loan rates. As a result, many financial institutions recorded higher loan losses due to an increased volume of provisions and a decrease in loans for vehicle acquisition.
Additionally, changes in the economy and in political conditions, a slowdown in customer demand, an increase in market competition, and changes in regulation and other related changes in countries in which we operate could also adversely affect the growth rate and the mix of our loan portfolio. Past performance of our loan portfolio may not be indicative of future performance.
The value of any collateral securing our loans may not be sufficient, and we may be unable to realize the full value of the collateral securing our loan portfolio
The market value of any collateral related to our loan portfolio may fluctuate, from the time we required it to the evaluation time, due to the factors related to changes in economic, political or sectorial factors beyond our control. Changes in the value of the collateral securing our loans may result in a reduction in the value we realize from collateral and may have an adverse impact on our results of operations and financial condition.
We may incur losses associated with counterparty exposure risks
We may incur losses if any of our counterparties fail to meet their contractual obligations, due to bankruptcy, lack of liquidity, operational failure or other reasons that are exclusively attributable to our counterparties. This counterparty risk may arise, for example, from our entering into reinsurance agreements or credit agreements pursuant to which counterparties have obligations to make payments to us and are unable to do so, or from our carrying out transactions in the foreign currency market (or other markets) that fail to be settled at the specified time due to non-delivery by the counterparty, clearing house or other financial intermediary. We routinely conduct transactions with counterparties in the financial services industry, including brokers and dealers, commercial banks, investment banks, mutual and hedge funds and other institutional clients, and their failure to meet their contractual obligations may adversely affect our financial performance.
We have significant exposure to Brazilian federal government debt
A-80
Like most Brazilian banks, we invest in debt securities issued by the Brazilian government. As of December 31, 2016, approximately 16.4% of all our assets and 66.7% of our securities portfolio were comprised of these debt securities. Any failure by the Brazilian government to make timely payments under the terms of these securities, or a significant decrease in their market value, could negatively affect our results of operations and financial condition.
Underwriting risk factor
Inadequate pricing methodologies for insurance, pension plan and premium bond products may adversely affect us
Our insurance and pension plan subsidiaries establish prices and calculations for our insurance and pension products based on actuarial or statistical estimates. The pricing of our insurance and pension plan products is based on models that include a number of assumptions and projections that may prove to be incorrect, since these assumptions and projections involve the exercise of judgment with respect to the levels and timing of receipt or payment of premiums, contributions, provisions, benefits, claims, expenses, interest, investment results, retirement, mortality, morbidity and persistency. We could suffer losses due to events that are contrary to our expectations directly or indirectly based on incorrect biometric and economic assumptions or faulty actuarial bases used for contribution and provision calculations.
Although the pricing of our insurance and pension plan products and the adequacy of the associated reserves are reassessed on a yearly basis, we cannot accurately determine whether our assets supporting our policy liabilities, together with future premiums and contributions, will be sufficient for the payment of benefits, claims, and expenses. Accordingly, the occurrence of significant deviations from our pricing assumptions could have an adverse effect on the profitability of our insurance and pension products. In addition, if we conclude that our reserves and future premiums are insufficient to cover future policy benefits and claims, we will be required to increase our reserves and record these effects in our financial statements, which may have a material adverse effect on us.
Management risk factors
Our policies, procedures and models related to risk control may be ineffective and our results may be adversely affected by unexpected losses
Our risk management methods, procedures and policies, including our statistical models and tools for risk measurement, such as value at risk (VaR), and default probability estimation models, may not be fully effective in mitigating our risk exposure in all economic environments or against all types of risks, including those that we fail to identify or anticipate. Some of our qualitative tools and metrics for managing risk are based on our observations of the historical market behavior. In addition, due to limitations on information available in Brazil, to assess clients’ creditworthiness, we rely largely on credit information available from our own databases, on certain publicly available consumer credit information and other sources. We apply statistical and other tools to these observations and data to quantify our risk exposure. These tools and metrics may fail to predict all types of future risk exposures. These risk exposures, for example, could arise from factors we did not anticipate or correctly evaluate in our statistical models. This would limit our ability to manage our risks. Our losses, therefore, could be significantly greater than indicated by historical measures. In addition, our quantified modeling may not take all risks into account. Our qualitative approach to managing those risks could prove insufficient, exposing us to material unexpected losses. Our results of operations and financial position depend on our ability to evaluate losses associated with risks to which we are exposed and on our ability to build these risks into our pricing policies. We recognize an allowance for loan losses aiming at ensuring an allowance level compatible with the expected loss, according to internal models credit risk measurement. The calculation also involves significant judgment on the part of our management. Those judgments may prove to be incorrect or change in the future depending on information as it becomes available. These factors may adversely affect us.
Damages to our reputation could harm our business and outlook
We are highly dependent on our image and credibility to generate business. A number of factors may tarnish our reputation and generate a negative perception of the institution by our clients, counterparties, stockholders, investors, supervisors, commercial partners and other stakeholders, such as noncompliance with legal obligations, making irregular sales to clients, dealing with suppliers with questionable ethics, unauthorized disclosure of client data, inappropriate behavior by our employees, and third-party failures in risk management, among others. In addition, certain significant actions taken by third parties, such as competitors or other market participants, may indirectly damage our reputation with clients, investors and the market in general. Damages to our reputation could have a material adverse effect on our business and prospects.
Strategy risk factors
Our controlling stockholder has the ability to direct our business
As of January 31, 2017, IUPAR, our controlling stockholder, directly owned 51.00% of our common shares and 25.96% of our total share capital, giving it the power to appoint and remove our directors and officers and determine the outcome of any action requiring stockholder approval, including transactions with related parties, corporate reorganizations and the timing and payment of dividends.
A-81
In addition, IUPAR is jointly controlled by Itaúsa, which, in turn, is controlled by the Egydio de Souza Aranha family, and by Cia. E. Johnston, which in turn is controlled by the Moreira Salles family. The interests of IUPAR, Itaúsa and the Egydio de Souza Aranha and Moreira Salles families may be different from the interests of our other stockholders.
In addition, some of our directors are affiliated with IUPAR and circumstances may arise in which the interests of IUPAR and its affiliates conflict with the interests of our other stockholders. To the extent that these and other conflicting interests exist, our stockholders will depend on our directors duly exercising their fiduciary duties as members of our Board of Directors. Notwithstanding, according to Brazilian Corporation Law the controlling stockholders should always vote in the interest of the Company. In addition, they are prohibited from voting in cases of conflict of interest in the matter to be decided.
The integration of acquired or merged businesses involves certain risks that may have a material adverse effect on us
As part of our growth strategy in the Brazilian and Latin America financial sector, we have engaged in a number of mergers, acquisitions and partnerships with other companies and financial institutions in the past and may pursue further such transactions in the future. Any such transactions involve risks, such as the possible incurrence of unanticipated costs as of result of difficulties in integrating systems, finance, accounting and personnel platforms, fail in diligence or the occurrence of unanticipated contingencies, as well as the breach of the transaction agreements by counterparties. In addition, we may not achieve the operating and financial synergies and other benefits that we expected from such transactions.
There is also the risk that antitrust and other regulatory authorities may impose restrictions or limitations on the transactions or on the businesses that arise from certain combinations or impose fines or sanctions due to the interpretation of the authorities of irregularities with respect to a corporate merger, consolidation or acquisition, even if the institution has done this legally and transparently.
If we are unable to take advantage of business growth opportunities, cost savings, operating efficiencies, revenue synergies and other benefits we anticipate from mergers and acquisitions, or if we incur greater integration costs than we have estimated, then we may be adversely affected.
Social and environmental risk factors
We may incur financial losses and damages to our reputation from environmental and social risks
Environmental and social factors are considered one of the most relevant topics for the business, since they can affect the creation of shared value in the short, medium and long terms, from the standpoint of the organization and its main stakeholders. In addition, we understand social and environmental risk as the risk of potential losses due to exposure to social and environmental events arising from the performance of our activities. For more information about our Social and environmental risk management, please refer to section Risk and capital management.
We understand that environmental and social issues may affect our activities and the revenue of our clients, causing delays in payments or default, especially in the case of significant environmental and social incidents. The way these risks may affect us becomes more evident where we finance projects in sectors with higher environmental and social impacts, such as mining, and large hydroelectric plants, which require comprehensive environmental and social due diligence as well as mitigating measures.
We recognize that climate change is one of the major challenges for us because climate events may affect our activities in our administrative buildings, network of branches and data processing centers, and are taken into consideration for all geographical regions in which we operate in Brazil.
Financial reporting risks
We make estimates and assumptions in connection with the preparation of our financial statements, and any changes to those estimates and assumptions could have a material adverse effect on our operating results
In connection with the preparation of our financial statements, we use certain estimates and assumptions based on historical experience and other factors. While we believe that these estimates and assumptions are reasonable under the circumstances, they are subject to significant uncertainties, some of which are beyond our control. Should any of these estimates and assumptions change or prove to have been incorrect, our reported operating results could be materially adversely affected.
As a result of the inherent limitations in our disclosure and accounting controls, misstatements due to error or fraud may occur and not be detected
Our disclosure controls and procedures are designed to provide reasonable assurance that information required to be disclosed by us in reports we file with or submit to SEC under the Exchange Act is accumulated and communicated to management, recorded, processed summarized and reported within the time periods specified in SEC rules and forms. We believe that any disclosure controls and procedures or internal controls and procedures, including related accounting controls, can provide only reasonable, not absolute, assurance that the objectives of the control system are met. These inherent limitations include the realities that judgments in decision-making can be faulty and that breakdowns can occur because of simple error or mistake. In addition, controls can be circumvented by the individual acts of some persons, by collusion of two or more people or by an unauthorized override of the controls.
A-82
Any failure by us to maintain effective internal control over financial reporting may adversely affect investor confidence in our company and, as a result, the value of investments in our securities
We are required under the Sarbanes-Oxley Act of 2002 to furnish a report by our management on the effectiveness of our internal control over financial reporting and to include a report by our independent auditors attesting to such effectiveness. Any failure by us to maintain effective internal control over financial reporting could adversely affect our ability to report accurately our financial condition or results of operations. If we are unable to conclude that our internal control over financial reporting is effective, or if our independent auditors determine that we have a material weakness or significant deficiency in our internal control over financial reporting, we could lose investor confidence in the accuracy and completeness of our financial reports, the market prices of our shares and ADSs could decline, and we could be subject to sanctions or investigations by SEC or other regulatory authorities. Failure to remedy any material weakness in our internal control over financial reporting, or to implement or maintain other effective control systems required of public companies subject to SEC regulation, also could restrict our future access to the capital markets.
We regard risk management as an essential instrument to optimize the use of our resources and to assist us in selecting business opportunities in order to maximize value creation to stockholders.
Our risk management process includes:
| · | identification and measurement of existing and potential risks in our operations; | |
| · | alignment of risk management and control of institutional policies, procedures and methodologies according to the guidelines of the Board of Directors and our corporate strategies; and | |
| · | management of our portfolio seeking optimal risk-return ratios. |
The risk identification process purpose is to map internal and external risk threats that may affect the business’ and support units’ strategies, keeping them from achieving their goals, potentially impacting our earnings, capital, liquidity and reputation. The risk management processes permeate the entire institution and are aligned with the Board of Directors and senior management directives, which, through the committees described below, define overall objectives by setting targets and limits for risk management .The capital management and control units support our management through monitoring and analyzing risk and capital processes. Please refer to section Our governance, item Management structure, Board of Directors and Board of Officers for further details about our Board of Directors responsibilities.
In compliance with CMN and Central Bank regulations, we have implemented a capital management structure and the Internal Capital Adequacy Assessment Process (ICAAP), taking a prospective stance in relation to capital management.
Our risk management organizational structure complies with current Brazilian and international regulation in place and is aligned with best market practices. Risk management responsibilities are structured according to the concept of three lines of defense, namely:
| · | in the first line of defense, the business and corporate support areas have the role of managing the risks they give rise to, by identifying, assessing, controlling and reporting the risks; |
| · | in the second line of defense, an independent unit provides central control, so as to ensure that our risk is managed according to the risk appetite, and established policies and procedures. This centralized control provides the Board and executives with a global overview of our exposure, in order to optimize and speed up corporate decisions;and |
| · | the role of the third line of defense, internal audit, is to provide an independent assessment of the institution’s activities, to ensure that senior management can see that risk controls are adequate, risk management is effective and internal controls and regulatory requirements are complied with. |
During the whole risk management process we apply adequate information technology (IT) systems, in accordance with Central Bank’s regulation and requirements in place. We also monitor adherence to the qualitative and quantitative regulators’ minimum capital and risk management requirements.
Risk management principles
To assume and manage risks is the essence of our activities and, for this reason, we must have well established objectives towards risk management. In this context, risk appetite defines the nature and the level of the risks that are acceptable for our organization and the culture of risks guides the necessary attitudes to manage them. We pursue sound risk management processes that permeate throughout the entire organization and are the basis of strategic decisions so as to ensure the sustainability of our business.
The principles below establish the fundamentals of risk management, risk appetite and the way our employees work on a daily basis for decision making:
1. Sustainability and customer satisfaction: We want to be a leading bank with a sustainable performance and customersatisfaction. We are concerned about creating shared value for employees, customers, stockholders and society, ensuring the longevity of our business. We will only do business that is good for the customer and the bank.
A-83
2. Risk culture:Our risk culture goes beyond policies, procedures and processes and strengthens the individual and collective responsibility of all employees so that they can do the right thing, at the right time and in the right way, respecting our ethical way of doing business. Please refer to item Risk Culture below for further information about our Risk Culture.
3. Price for risk:We operate and take risks in business that we know and understand and we avoid risks that we do not knowor in which we do not have a competitive advantage, carefully assessing risk-adjusted return.
4. Diversification:We have a low appetite for volatility in our results and, for this reason, we work with a diversified client, product and business base, seeking the diversification of the risks to which we are exposed and prioritizing lower-risk business.
5. Operational excellence:We want to be an agile bank, with a robust and stable infrastructure so as to offer a high-quality service.
6. Ethics and respect for regulation:For Itaú Unibanco, ethics are non-negotiable. We promote a fair institutional environment, guiding employees to cultivate ethics in relationships and business, and the respect for rules, taking care to protect our reputation.
In 2016, we reviewed our risk appetite policy, which was established and approved by the Board of Directors and guides our business strategy. Our risk appetite is based on the following statement of the Board of Directors:
“We are a universal bank, operating predominantly in Latin America. Supported by our risk culture, we operate based on rigorous ethical and regulatory compliance standards, seeking high and growing results, with low volatility, by means of the long-lasting relationship with clients, correctly pricing risks, well-distributed fund-raising and proper use of capital.”
Based on this statement, we have implemented five dimensions to our policy, each of them composed of a set of metrics associated with the main risks involved, combining additional forms of measurement and seeking a broad view of our exposures:
| § | Capitalization: it establishes that we must have enough capital to protect us against a severe recession or a stress event without the need to adapt our capital structure in unfavorable circumstances. This is monitored through the follow up of our capital ratios, in normal and stress situations, and of our debt issuer ratings. |
| § | Liquidity: it establishes that our liquidity must support long periods of stress. This is monitored through the follow up of our liquidity ratios. |
| § | Composition of results: it determines that our business will be focused mainly on Latin America, where we will have a diversified variety of customers and products, with low appetite for volatility of results and for high risks. This dimension comprises aspects of business and profitability, market and credit risks. Metrics monitored seek to ensure, by means of limits of exposure concentration, such as industry sectors, quality of counterparties, countries and geographical regions, and risk factors, the proper composition of our portfolios, aimed at the low volatility of our results and the sustainability of our business. |
| § | Operational risk: it focuses on the control of operational risk events that may negatively affect our business and operational strategy, and it is monitored through the follow up of the main operational risk events and losses incurred. |
| § | Reputation: it addresses risks that may affect the value of our brand and our reputation with customers, employees, regulators, investors and the general public. The risks in this dimension are monitored through the follow up of client satisfaction or dissatisfaction, our exposure in the media, in addition to the observance of our conduct. |
The Board of Directors is responsible for approving the guidelines and limits of risk appetite, performing its duties with the support of the Risk & Capital Management Committee (CGRC) and our CRO.
Risk appetite is regularly monitored, analyzed and reported to executive levels and to the Board of Directors. In case the monitoring of some metric point to a level above the risk appetite, in normal or projected situations, there is a pre-established governance with authority of reporting, including to the Board of Directors, which organizes necessary discussions and actions to be made to retake the exposures to the desirable levels of risk appetite.
A-84
Risk Culture

With the aim of strengthening our values and aligning our employees’ behavior with the guidelines established in risk management, we have adopted a number of initiatives to disseminate the risk culture. Our Risk Culture is based on four basic principles illustrated on the right side of this text.
These principles are our guidance, which aim to help our employees to understand, identify, measure, manage and mitigate risks in a conscious way.
In addition to policies, procedures and processes, risk culture strengthens the individual and collective responsibility of employees in the management of risks inherent in the activities performed individually, respecting the ethical way of managing business.
We promote a risk culture, stressing behavior which will help people at every level of the organization to consciously assume and manage risk. With these principles disseminated throughout the institution, there is an incentive for risk to be understood and openly debated, to be kept within the levels indicated by the risk appetite, and to be taken as the individual responsibility of each employee of Itaú Unibanco, irrespective of their position, area or function.
We also provide channels to report operating failures, internal or external fraud, workplace concerns or cases that may cause disorders and/or losses to us or prejudice clients. All employees or third parties have the responsibility to communicate problems timely, as soon as they taken knowledge of the situation.
Risk and capital governance
As previously mentioned, the CGRC is responsible for supporting the Board of Directors in performing its duties related to our capital and risk management. At the executive level we established subcommittees, chaired by our CEO, that are responsible for risk and capital management and report directly to the Risk and Capital Management Committee. The Board of Directors is the main authority with respect to risk and capital management decisions. The following committees are part of our risk and capital management governance structure:

Risk & Capital Management Committee (CGRC):supports the Board of Directors in performing its duties related to ourrisk and capital management by meeting, at least, four times annually, and submitting reports and recommendations to assist the Board of Directors in its decision-making with respect to:
| § | Decisions regarding the risk appetite of the institution, in terms of capital, liquidity, results, operational risk and reputation, ensuring these aspects are in alignment with our strategy and including: acceptable levels of capital and liquidity; types of risk to which we could be exposed as well as aggregate limits for each type of risk; tolerance with respect to volatility of results and risk concentrations; and general guidelines on tolerance regarding risks that may have an impact on the value of our brand (i.e., image risk); |
| § | Supervision of our risk management and control activities in order to ensure their suitability to the risk levels assumed and to the complexity of the operations as well as compliance with regulatory requirements; |
| § | Review and approval of policies and strategies for capital management, which establish mechanisms and procedures for maintaining capital compatible with the risks that are taken by us; |
| § | Establishing our minimum expected return on capital as a whole and for our lines of business as well as monitoring performance; |
| § | Supervision of our incentive structures, including compensation, seeking to ensure their alignment with risk control and value creation objectives; and | |
| § | Fostering improvement in our Risk Culture. |
A-85
Please refer to the section Our governance, item Management structure for further details about the Audit Committee responsibilities and for complementary information about the CGRC.
Superior Market Risk and Liquidity Committee (CSRML):meets on a monthly basis and is responsible for setting guidelinesand governance for investments and market and liquidity risks regarding our consolidated positions and business lines.
Superior Operational Risk Committee (CSRO):meets on a bimonthly basis and is responsible for understanding the risks of ourprocesses and business, defining guidelines for operational risks management and assessing the results achieved by our Internal Controls and Compliance System.
Superior Products Committee (CSP):meets on a weekly basis and is responsible for evaluating products, operations, servicesand processes that are beyond the authority of the Products Committees that report to it or that involve image risk to us.
Superior Credit Committee (CSC):meets on a weekly basis and is responsible for analyzing and deciding on credit proposalsthat are beyond the authority of the Credit Committees that report to it, and analyzing decisions which were not made due to a lack of consensus at the committee immediately subordinate to it or cases where, due to the relevance or characteristics of the topic or other features, these Credit Committees decide to submit to its review.
Superior Retail Credit and Collection Committee (CSCCV):meets on a monthly basis and is responsible for approving creditpolicies and assessing the performance of Retail Credit and Collection portfolios and strategies.
Superior Wholesale Credit and Collection Committee (CSCCA):meets on a monthly basis and is responsible for approvingcredit policies and assessing the performance of Wholesale Credit and Collection portfolios and strategies.
Additionally, we have subcommittees, chaired by our CRO and CFO, which are also responsible for risk and capital management. They can report directly to the Risk and Capital Management Committee or to the subcommittees mentioned above.
To support this structure, we have the Risks & Finance Control and Management Area, structured with specialized departments and subordinated to our CRO and CFO, intending to independently and in a centralized manner to ensure that the institution’s risks and capital are managed in accordance with established policies and procedures.
Risk management
Credit risk
We define credit risk as the risk of loss associated with: failure by a borrower, issuer or counterparty to fulfill their respective financial obligations as defined in the contracts; value loss of a credit agreement resulting from a deterioration of the borrower’s, issuer’s or counterparty’s credit rating; reduction of profits or income; benefits granted upon subsequent renegotiation; or debt recovery costs.
Our credit risk management is the primary responsibility of all Business Areas and is aimed at maintaining the quality of the credit portfolio at levels that are consistent with our risk appetite, for each market segment in which we operate. Our credit risk governance is managed through subcommittees, which report to the Board of Directors or to our executive structure, and act primarily by assessing the competitive market conditions, setting our credit limits, reviewing control practices and policies, and approving these actions at the respective authority levels. This includes the risk communication and reporting processes, including disclosure of institutional and supplementary policies, and other information, on credit risk management, are responsibility of this structure. We manage the credit risk to which it is exposed during the entire credit cycle, from before approval, during the monitoring process and up to the collection or recovery phase.
Our credit risk management and control structure is centralized and independent of the business units and defines operational limits, risk mitigation mechanisms and processes, and instruments to measure, monitor and control credit risk inherent to all products, portfolio concentrations and potential changes in the economic environment. Our portfolio, policies and strategies are continuously monitored so as to ensure compliance with the rules and laws in effect in each country.
The key assignments of the business areas are (i) monitoring the portfolios under their responsibility, (ii) granting credit, taking into account approval levels, market conditions, macroeconomic prospects, changes in markets and products and the effects of sector and geographical concentration, and (iii) credit risk management aimed at making the business sustainable. Our credit policy is based on internal factors, such as: client ratings, performance and evolution of our portfolio, default levels, return rates, economic capital, among others; and on external factors such as: interest rates, market default indicators, inflation and changes in consumption, among others. Policies and products’ evaluation process enables us to identify potential risks in order to ensure that credit decisions make sense from an economic and risk perspective.
With respect to our individuals, small and middle market companies, credit ratings are assigned based on two statistical models: (i) application (in the early stages of our relationship with a customer) and (ii) behavior score (used for customers with whom we already have a relationship) models. Extraordinarily, an individual analysis of specific cases may be performed, in which case credit approval follows applicable authority levels.
A-86
For large companies, classification is based on information such as the counterparty’s economic and financial situation, its cash-generating capacity, the economic group to which it belongs and the current and the prospective situation of the economic sector in which it operates. Credit proposals are analyzed on a case-by-case basis through the approval governance. We have a structured process to maintain a diversified portfolio, which is considered appropriate by our institution. The concentrations are monitored continuously for economic sectors, and largest debtors, allowing preventive measures to be taken to avoid the violation of the established limits.
We rate government securities and other debt instruments according to their credit quality parameters with the purpose of managing the exposures.
We also strictly control our credit exposure to clients and counterparties, acting to reverse occasional limit breaches. We may use contractual covenants for these purposes, such as the right to demand early payment or require additional collateral.
To measure credit risk, we take into account the probability of default by the borrower, issuer or counterparty, the estimated amount of exposure in the event of default, past losses from default and concentration of borrowers. Quantifying these risk components is part of the lending process, portfolio management and definition of limits. Models are used as tools to quantify these factors, and contribute to more exact decision-making.
The models used by us are independently validated, to ensure that the databases used in constructing the models are complete and accurate, and that the method of estimating parameters is adequate, so as to reduce the modeling risk and keep the models calibrated, to that they reflect risk parameters more accurately.
We rely on a specific structure and processes aimed at ensuring that the country is managed and controlled, including: (i) establishment of country ratings; (ii) determination of limits for countries; and (iii) monitoring of limits.
In line with the principles of CMN regulation, our credit risk management structure and institutional policy are approved by our Board of Directors and are applicable to all companies and subsidiaries in Brazil and abroad.
Please refer to section Performance, item Complete Financial Statements (IFRS), Note 36 – Management of Financial Risks for further details about credit risk.
Loan approval process
Extensions of credit are approved based on policies at the business unit level, determined in accordance with the assumptions of each department and our bank’s risk appetite. The decision to extend credit may be granted by means of a pre-approval process or the traditional approval mechanism, which is applied on a client by client basis. In both cases, the decisions are made based on principles of credit quality such as credit rating supported by statistical models, percentage of income committed by/leverage of the client and credit restrictions determined by us and the market.
The business units prepare and keep updated the policies and procedures of the credit cycle.
The credit granting process contemplates the use of credit protection services with the purpose of checking whether a client’s credit history includes information that could be considered an obstacle to granting a loan, such as assets blocked by court orders, invalid tax payer identification numbers, prior or pending debt restructuring or renegotiation processes and checks not honored due to insufficient funds.
The policy assessment process allows for the identification of potential risks and is intended to ensure that credit decisions make sense from both an economic and a risk perspective.
Individuals
Credit products offered at our branch network and through our electronic channels include, among others, overdraft protection, credit cards, personal loans, payroll loans, vehicle financing and mortgage loans.
In all cases, an internal credit score is applied and a cut-off threshold is defined for each product line. Documentation required at the moment the client decides to open an account with us or when we grant a loan includes an application form with the client’s signature, personal identification and proof of income.
In the case of pre-approved credit, if a client’s risk profile is within the cut-off threshold and parameters established under our credit policy, the credit is considered pre-approved and is automatically available to the client. In the cases where credit is not pre-approved, credit review is carried out through a traditional process under which proposals are assessed on an individual basis by a credit expert. Under this process, approvals are decided by a credit desk, since commercial managers do not have authority to approve individual applications.
Credit cards
Our credit card business is comprised of Itaucard and Hipercard credit cards as well as credit cards from associations and commercial agreements with significant retailers. Our credit cards are available to account-holding or non-account holding clients, and can be applied for by telephone, internet or points of service at our partner institutions.
The credit granting process for credit cards includes a pre-qualification phase in which internal or market restrictive filters are applied. For eligible clients, the maximum credit amount offered takes into consideration the client’s risk, based on statistical models specifically designed for credit cards (application score) and on the applicants’ income. A fixed interest rate is applied to revolving credit transactions.
Personal loans
A-87
Our decision on whether to grant loans to our account holders takes into account the client’s income level and our internal client credit rating, which is based on internally developed statistical models. Through these models, we determine which clients will receive credit offers and in which amounts, the maximum number of installments and the maximum amount for monthly installments, based on fixed interest rates.
Payroll loans
Our payroll loan products are available to account-holding or non-account holding clients. Fixed installments are directly deducted from the borrower’s payroll to the bank´s account without being recorded in the debtor’s account.
The maximum percentage of installments to income is defined by law and is limited to 35% of a payroll loan borrower’s net income (public sector employees), of which 5% should be devoted exclusively to credit cards. For private sector employees, the maximum percentage is 30%, with no additional limit for credit cards.
Documentation required to receive a payroll loan includes personal identification, proof of payroll and residence and proof of the bank account where the client receives payroll benefits. If the salary is deposited with us, this documentation is not necessary.
Vehicle financing
Vehicle financing proposals are submitted through (i) partner car dealers throughout Brazil for all types of clients (whether account holders or not) or (ii) directly at our branches or through electronic channels for account holders.
A client’s internal credit rating and the terms and conditions of the proposed transaction are taken into account before approving the proposal. If the proposed transaction meets all of our credit policy requirements, which determine maximum installment amounts, loan to value, or LTV, and maturity, and the client’s personal information is validated by credit protection services, the loan is automatically approved.
A fixed interest rate is set based on the credit rating and the characteristics of the transaction. All vehicle financing transactions are secured by the asset itself, and the maximum LTV is defined to support any possible stress periods.
Mortgage loans
In addition to real estate loans provided through our branch network, we have entered into partnerships with large real estate brokers in Brazil, which originate real estate financing, transactions for us on an exclusive basis and in different cities across the country.
The approval of real estate loans is based on assumptions involving the portion of a client’s income to be committed to loan repayments, the client rating according to our internal rating system and the maximum LTV, so that even under a stress scenario LTV is kept at adequate levels. Interest rates are fixed.
The data included in the financing proposal is analyzed, validated and confirmed by supporting documentation provided by the client. The proposal may be rejected if the information provided to us is found to be inconsistent, the proposal fails to meet our current policy requirements or any requested information fails to be provided.
Credit to very small and small companies
We offer products such as working capital financing and discount of trade receivables to very small and small companies.
Credit limits to very small and small companies are assigned according to a client’s revenues and are based on a business risk assessment, as well as on other criteria such as the financial condition of the company´s stockholders or partners, the identification of possible credit restrictions and an evaluation of the economic sector in which the company operates. Documentation required includes the company’s governing documents, proof of revenues and information on the partners or stockholders.
Similarly to our procedures for granting of loans to individuals, credit may be granted to very small and small companies pursuant to a pre-approved limit or subject to an individual analysis by a credit desk.
Much of the credit we extend to for companies in this segment requires the provision of collateral or guarantees. Transactions to finance the production of goods usually require machinery and equipment as collateral. Working capital financing may be collateralized by trade receivables, checks receivable or credit cards receivable or may be collateralized by the company’s partners or stockholders and/or third parties.
Interest rates can be fixed or variable depending on the product that is chosen by the client.
Credit to middle-market and large companies
The credit analysis process for middle-market and large companies is carried out based on the financial condition of such companies and any corporate groups to which they belong. The credit analysis takes into account the company’s history, financial capacity and adequacy of the requested transaction to the client’s needs. This analysis is based on the company’s
A-88
financial statements (balance sheet, statement of income, statement of cash flows), on-site meetings with the company, market conditions, analysis of the economic sector in which the company operates and inquiries into credit protection services.
A commensurate environmental and social assessment is undertaken for every company with whom we keep a credit relationship. As appropriate, an action plan may be created as a result of this analysis in order to bring the client into compliance with our internal policies. A recommendation for credit denial may also be issued as an outcome of such assessment.
The proposed maximum credit amount extended and the client internal rating, with a defined cut-off, are submitted to the appropriate credit authorization levels depending on the amount involved, term of the transaction and available security or guarantees, in accordance with our governance policies. Interest rates can be fixed or variable depending on the product that is chosen by the client within the credit limit approved.
Foreign units
The individual and legal entities of foreign units follow procedures similar to those applied to individuals and the corporate segments mentioned above. For the individuals segment, lending is mainly based on income level, internal credit score and internal credit rating. In the corporate segment, the granting of credit is based on the economic and financial analysis of the client.
Credit granting in our subsidiaries operating outside of Brazil follows the same corporate governance and policies described above. All subsidiaries are subject to a corporate monitoring of credit portfolios, in Brazil, as well as credit granting rules according to the characteristics of each subsidiary, including appropriate approval authority levels in Brazil, and is responsible for the corporate governance related to credit granting.
Please refer to section Performance, item Complete Financial Statements (IFRS), Note 36 – Management of financial risks, Credit risk, 3. Collateral and policies for mitigating credit risk, for further details about our risk mitigating instruments.
Market risk
Market risk is the possibility of losses resulting from fluctuations in the market value of positions held by a financial institution, including the risk subject to variations in foreign exchange rates, interest rates, price indexes, equity and commodity prices, with various indexes based on these risk factors.
Market risk management is the process by which our management monitors and controls risk of variations in the value of financial instruments due to market movements, while aiming to optimize the risk-return ratio through an adequate limits structure, alerts, effective risk management models and tools.
Our policies and general market risk management framework are in line with the principles contained in the regulation of CMN and the Central Bank. These principles guide the institution’s approach to market risk control and management across all business units and legal entities of the Itaú Unibanco Group.
Our market risk management strategy is aimed at balancing corporate business goals, taking into account, among other things:
| · | political, economic and market conditions; |
| · | the profile of our portfolio; and |
| · | capacity to act in specific markets. |
Our market risk management framework is subject to the governance and hierarchy of committees and to a structure of limits and alerts, with specific limits assigned to different levels and classes of market risk (such as interest rate risk, foreign exchange risk, among others). This structure of limits and alerts covers from aggregated risk indicators at the portfolio level, to more granular limits at the individual desk level. The market risk limits framework extends to the risk factor level, with specific limits and is aimed at improving the process of risk monitoring and understanding, as well as preventing risk concentration. Limits and alerts are calibrated based on projections of future balance sheets, stockholders’ equity, liquidity, complexity and market volatility, as well as our risk appetite. Limits are monitored on a daily basis and both breaches and potential breaches of limits are reported and discussed in accordance with the following procedure:
| · | within one business day, for management of responsible business units and executives in the risk control area and business areas; and |
| · | within one month, for the competent committees. |
Daily risk reports, used by the business and control areas, are also distributed to the executive responsible for managing the risks. In addition, our market risk management and control process is subject to periodic reviews, to ensure it reflects alignment with best market practices, and continues to improve over time.
Our structure of limits and alerts follows the guidelines provided by the Board of Directors. These are approved by the relevant committees. The process for defining limit levels and reporting violations is subject to our institutional governance policies of approval. The established information flow is intended to provide this information to various executive levels of the institution, including members of the Board of Directors through the committees responsible for risk management. This structure of limits and alerts increases control effectiveness and coverage, and is reviewed at least once a year.
The key principles underlying our market risk control structure are as follows:
A-89
| · | provide visibility and comfort for all senior management levels that market risks assumed must be in line with our risk-return objectives; |
| · | provide disciplined and informed dialogue on the overall market risk profile and its evolution over time; |
| · | increase transparency as to how the business works to optimize results; |
| · | provide early warning mechanisms to facilitate effective risk management, without obstructing the business objectives; and |
| · | monitor and avoid concentration of risks. |
Market risk is controlled by an area independent from business units, which is responsible for the daily activities: (i) measuring and assessing risk; (ii) monitoring stress scenarios, limits and alerts; (iii) applying, analyzing and testing stress scenarios; (iv) reporting risk to the executives responsible in the business units, in compliance with our governance; (v) monitoring the measures needed to adjust positions and/or levels of risk to make them viable; and (vi) supporting the secure launch of new financial products. For this, we have a structured process of communication and information flow, which provides information to our committees and ensures compliance with the requirements of Brazilian and foreign regulatory agencies.
We hedge transactions with clients and proprietary positions, including foreign investments, in order to mitigate risks arising from fluctuations in market risk factors and maintain positions on the limits. Derivatives are commonly used for these hedging activities. When these transactions are considered as hedges for accounting purposes, specific supporting documentation is provided, including ongoing follow up of the hedge effectiveness (retrospective and prospective) and other changes in the accounting process. The accounting and managerial hedging procedures are governed by our internal institutional polices.
Our market risk framework categorizes transactions as part of either part of our trading book (“Trading Book”) or banking book (“Banking Book”), in accordance with general criteria established by specific regulation.
Our Trading Book is composed of all trades with financial and commodity instruments (including derivatives) undertaken with the intention of trading.
Our Banking Book is predominantly characterized by portfolios originated from the banking business and operations related to balance sheet management. As a general rule, this book’s portfolios are intended to be either held to maturity, or sold in the medium or long term.
Market risk exposures inherent in various financial instruments, including derivatives, are composed of various risk factors that refer to a market parameter whose variation impacts a position’s valuation. The main risk factors measured by us are:
| · | Interest rates: risk of loss on transactions subject to changes in interest rate, foreign currency coupons or price-index coupons; |
| · | Currencies: risk of loss on transactions subject to currency variations; |
| · | Equities: risk of loss on transactions subject to changes in the price of equities; |
| · | Commodities: risk of loss on transactions subject to changes in commodities prices. |
CMN has regulations establishing the segregation of market risk exposure at a minimum into the following categories: interest rates, FX rates, equities and commodities. Brazilian inflation indexes are treated as a group of risk indicators and receive the same treatment of the other risk indicators, such as interest rates and FX rates, and follows the governance and risk limits framework adopted for market risk management.
Market risk is analyzed based on the following key metrics:
| · | Value at Risk (VaR): a statistical metric that quantifies the maximum potential economic loss expected in normal market conditions, considering a defined holding period and confidence level; |
| · | Losses in Stress Scenarios (Stress Testing): a simulation technique to evaluate the impact, in the assets, liabilities and derivatives of the portfolio, of various risk factors in extreme market situations (based on prospective and historic scenarios); |
| · | Stop Loss: metrics that trigger a management review of positions, if the accumulated losses in a given period reach specified levels; |
| · | Concentration: cumulative exposure of certain financial instruments or risk factors calculated at market value (mark to market); and |
| · | Stressed VaR: a statistical metric derived from VaR calculation, aimed at capturing the biggest risk in simulations of the current portfolio, taking into consideration the observable returns in historical scenarios of extreme volatility. |
In addition to the risk metrics described above, sensitivity and loss control measures are also analyzed. They include:
| · | Gap Analysis: accumulated exposure of cash flows by risk factor, which are marked-to-market and positioned by settlement dates; |
| · | Sensitivity (DV01 – Delta Variation Risk): impact on the market value of cash flows when a one basis point change is applied to current interest rates or on the index rates; and |
| · | Sensitivities to Various Risk Factors (Greek): partial derivatives of a portfolio of options on the prices of the underlying assets, implied volatilities, interest rates and time. |
A-90
Please refer to our Complete Financial Statements (IFRS), Note 36 – Management of financial risks for further details about Market risk.
VaR – Consolidated Itaú Unibanco Holding
Our consolidated VaR is calculated through the Historical Simulation methodology, which fully reflects all positions based on the historical series of asset prices.
Since the first quarter of 2016, we opted for including the exposures of each foreign unit in the calculation of the Consolidated VaR, so as to take into account the risk factors of these units, thus improving the methodology used.
As from the third quarter of 2016, we have been calculating VaR for the regulatory portfolio (exposure of the trading portfolio and exposure to foreign currency and commodities of the banking portfolio) according to internal models approved by the Central Bank. Thus, details of risk factors (shown in the VaR – Consolidated and VaR and Stressed VaR Internal Model tables – Regulatory Portfolio) have been standardized to comply with the Central Bank’s rules.
The Consolidated Total VaR table provides an analysis of our portfolio exposure to market risk.
| Global VaR (Historical Simulation approach)(1) | Average | Minimum | Maximum | December 31, 2016 | Average | Minimum | Maximum | December 31, 2015 | ||||||||||||||||||||||||
| (In millions of R$) | ||||||||||||||||||||||||||||||||
| Group of Risk Factor | ||||||||||||||||||||||||||||||||
| Interest rate | 482.5 | 323.7 | 607.4 | 607.4 | 363.5 | 314.2 | 606.4 | 347.1 | ||||||||||||||||||||||||
| FX rate | 18.4 | 6.8 | 33.2 | 17.0 | 47.1 | 11.3 | 118.6 | 12.3 | ||||||||||||||||||||||||
| Equities | 45.2 | 34.0 | 63.3 | 44.3 | 16.9 | 6.9 | 57.2 | 46.9 | ||||||||||||||||||||||||
| Commodities | 1.7 | 0.7 | 4.0 | 0.8 | 1.8 | 0.8 | 8.5 | 2.1 | ||||||||||||||||||||||||
| Diversification effect (2) | (339.7 | ) | (204.4 | ) | ||||||||||||||||||||||||||||
| Total | 236.6 | 155.1 | 341.5 | 329.8 | 207.0 | 152.3 | 340.7 | 204.0 | ||||||||||||||||||||||||
| (1) | Determined in local currency and converted into Brazilian reais at the closing price on the reporting date. |
| (2) | Reduction of risk due to the combination of all risk factors. |
On December 31, 2016, our average global VaR (Historical Simulation) was R$236.6 million, or 0.18% of our consolidated stockholders’ equity on December 31, 2016, compared to our average global VaR (Historical Simulation) of R$207.0 million on December 31, 2015, or 0.18% of our consolidated stockholders’ equity on December 31, 2015.
VaR – Trading Portfolio
The following table presents risks arising from all positions with the intention of trading, following the criteria defined above for our Trading Portfolio. Our total average Trading Portfolio VaR was R$38.6 million on December 31, 2016, compared to R$23.6 million on December 31, 2015 and to R$25.7 million on December 31, 2014.
| Trading Portfolio VaR(1) | Average | Minimum | Maximum | December 31, 2016 | Average | Minimum | Maximum | December 31, 2015 | ||||||||||||||||||||||||
| (In millions of R$) | ||||||||||||||||||||||||||||||||
| Group of Risk Factor | ||||||||||||||||||||||||||||||||
| Interest rate | 41.0 | 15.6 | 69.5 | 49.1 | 26.4 | 11.2 | 48.9 | 22.4 | ||||||||||||||||||||||||
| FX rate | 8.9 | 3.5 | 20.8 | 11.0 | 39.9 | 8.9 | 107.7 | 9.2 | ||||||||||||||||||||||||
| Equities | 7.9 | 3.3 | 23.8 | 4.0 | 4.1 | 2.3 | 7.3 | 5.0 | ||||||||||||||||||||||||
| Commodities | 1.6 | 0.5 | 5.3 | 0.8 | 1.8 | 0.8 | 6.7 | 1.5 | ||||||||||||||||||||||||
| Diversification effect (2) | (18.3 | ) | (17.3 | ) | ||||||||||||||||||||||||||||
| Total | 38.6 | 16.2 | 69.4 | 46.6 | 23.6 | 10.6 | 49.4 | 20.8 | ||||||||||||||||||||||||
| (1) | Determined in local currency and converted into Brazilian reais at the closing price on the reporting date. |
| (2) | Reduction of risk due to the combination of all risk factors. |
Sensitivity analyses (Trading and Banking Portfolios)
As required by Brazilian regulation, we conduct sensitivity analysis for market risk factors considered important. The highest resulting losses are presented below, with impact on result, by risk factor, in each such scenario and are calculated net of tax effects, providing a view of our exposure under different circumstances.
The sensitivity analyses of the Trading Portfolio and Banking Portfolio presented here are based on a static assessment of the portfolio exposure. Therefore, such analyses do not consider the dynamic response capacity of management (e.g., treasury and market risk control unit) to initiate mitigating measures, whenever a situation of high loss or risk is identified, minimizing the possibility of significant losses. In addition, the analysis is intended to assess risk exposure and the respective protective
A-91
actions, taking into account the fair value of financial instruments, regardless of whether or not financial instruments are accounted for on an accrual basis.
| Exposures | Trading Portfolio (1) December 31, 2016 | Trading and Banking Portfolios (1) December 31, 2016 | ||||||||||||||||||||||||
| Risk Factors | Risk of change | Scenario I | Scenario II | Scenario III | Scenario I | Scenario II | Scenario III | |||||||||||||||||||
| (In thousands of R$) | ||||||||||||||||||||||||||
| Interest Rate | Fixed Income Interest Rates in reais | (955 | ) | (228,625 | ) | (435,116 | ) | (7,345 | ) | (2,057,375 | ) | (3,995,498 | ) | |||||||||||||
| Foreign Exchange Linked | Foreign Exchange Linked Interest Rates | 46 | (1,951 | ) | (4,175 | ) | (2,464 | ) | (337,588 | ) | (634,962 | ) | ||||||||||||||
| Foreign Exchange Rates | Prices of Foreign Currencies | 2,914 | (17,787 | ) | (5,666 | ) | 3,013 | (45,554 | ) | (67,157 | ) | |||||||||||||||
| Price Index Linked | Prices Indexes Linked Interest Rates | (169 | ) | (22,931 | ) | (48,586 | ) | (1,450 | ) | (84,699 | ) | (341,304 | ) | |||||||||||||
| TR | TR Linked Interest Rates | - | (6 | ) | (11 | ) | 615 | (160,773 | ) | (375,571 | ) | |||||||||||||||
| Equities | Prices of Equities | (377 | ) | (30,311 | ) | (120,993 | ) | 4,056 | (139,583 | ) | (339,535 | ) | ||||||||||||||
| Other | Other relevant market rates or prices | (13 | ) | (314 | ) | 549 | (27 | ) | (523 | ) | 625 | |||||||||||||||
| Total | 1,446 | (301,925 | ) | (613,998 | ) | (3,602 | ) | (2,826,095 | ) | (5,753,402 | ) | |||||||||||||||
| (1) | Amounts net of tax effects. |
| · | Scenario I: Addition of one basis point to fixed interest rates, currency coupon, inflation and interest rate indexes and one percentage point to currency and equity prices; |
| · | Scenario II: Shocks of 25 percent in fixed interest rates, currency coupon, inflation, interest rate indexes and currency and share prices, both for growth and fall, considering the largest resulting losses per risk factor; and |
| · | Scenario III: Shocks of 50 percent in fixed interest rates, currency coupon, inflation, interest rate indexes and currency and share prices, both for growth and fall, considering the largest resulting losses per risk factor. |
Interest rate sensitivity
Interest rate sensitivity is the relationship between market interest rates and net interest income arising from the maturity or the characteristics of the renegotiation of prices of interest-bearing assets and liabilities.
Our strategy for interest rate sensitivity considers the return rates, the underlying risk level and the liquidity requirements, including our minimum regulatory cash reserves, mandatory liquidity ratios, withdrawals and maturity of deposits, capital costs and additional demand for funds.
The pricing structure is matched when equal amounts of these assets or liabilities mature or are renegotiated. Any mismatch of interest-bearing assets and liabilities is known as a gap position. The interest rate sensitivity may vary in the renegotiation periods presented due to the different renegotiation dates within the period. Also, variations among the different currencies in which the interest rate positions are denominated may arise.
These relationships are material for a particular date, and significant fluctuations may occur on a daily basis as a result of both the market forces and management decisions. Our Superior Market Risk and Liquidity Committee (CSRML) analyzes Itaú Unibanco Group’s mismatch position on a monthly basis and establishes limits for market risk exposure, interest rate positions and foreign currency positions.
Please refer to section Performance, item Complete Financial Statements in IFRS, Note 36 – Management of Financial Risks for further details about the position of our interest-bearing assets and liabilities as of December 31, 2016. Note 36 to our complete financial statements provides a snapshot view, and accordingly, does not reflect the interest rate gaps that may exist at other times, due to changing asset and liability positions, and management’s actions to manage the risk in these changing positions.
Exchange rate sensitivity
Most of our banking operations are denominated in or indexed to Brazilianreais. We also have assets and liabilities denominated in foreign currency, mainly in U.S. dollars, as well as assets and liabilities that, although denominated in Brazilianreais, are indexed to U.S. dollars and, therefore, expose us to exchange rate risk. The Central Bank regulates our foreign currency positions. Please refer to section Performance, item Complete Financial Statements (IFRS), Note 36 – Management of financial risks for further details.
The gap management policy adopted by the Superior Market Risk and Liquidity Committee (CSRML) takes into consideration the tax effects with respect to our foreign exchange positions. Since the gains from the foreign exchange rate variation on investments abroad are not taxed, we set up a hedge (a liability in foreign currency derivative instruments) in an amount sufficient so that our total foreign exchange exposure, net of tax effects, is consistent with our low risk exposure strategy.
Our foreign exchange position on the liability side is composed of various elements, including the issuance of securities in international capital markets, credit from foreign banks used to finance import and export transactions, dollar-linked on-lendings from government financial institutions and deposits in currencies from Latin America countries. The proceeds of these financial operations are usually invested in loans and in the purchase of dollar-linked securities.
The following information was prepared on a consolidated basis, eliminating transactions between related parties. Our investments abroad, which are eliminated when we consolidate the accounting information, represented R$72.4 billion as of
A-92
December 31, 2016, under the gap management policy adopted, as mentioned above. Note that we apply either economic hedges or hedge accounting to those net investments abroad.
| As of December 31, 2016 | ||||||||||||||||||||
| Exchange rate sensitivity | Brazilian currency | Denominated in foreign currency (1) | Indexed to foreign currency (1) | Total | % of amounts denominated in and indexed to foreign currency of total | |||||||||||||||
| (In millions of R$, except percentages) | ||||||||||||||||||||
| Assets | 1,049,362 | 279,132 | 24,747 | 1,353,241 | 22.5 | |||||||||||||||
| Cash and deposits on demand | 5,946 | 11,464 | 1,132 | 18,542 | 67.9 | |||||||||||||||
| Central Bank compulsory deposits | 80,331 | 5,369 | - | 85,700 | 6.3 | |||||||||||||||
| Interbank deposits | 6,044 | 16,648 | - | 22,692 | 73.4 | |||||||||||||||
| Securities purchased under agreements to resell | 264,080 | 971 | - | 265,051 | 0.4 | |||||||||||||||
| Held-for-trading financial assets | 191,250 | 10,745 | 2,653 | 204,648 | 6.5 | |||||||||||||||
| Financial assets designated at fair value through profit or loss | 1,191 | - | - | 1,191 | - | |||||||||||||||
| Derivatives | 10,710 | 8,887 | 4,634 | 24,231 | 55.8 | |||||||||||||||
| Available-for-sale financial assets | 52,859 | 34,748 | 670 | 88,277 | 40.1 | |||||||||||||||
| Held-to-maturity financial assets | 27,436 | 13,059 | - | 40,495 | 32.2 | |||||||||||||||
| Loan operations and lease operations portfolio | 318,621 | 162,006 | 9,739 | 490,366 | 35.0 | |||||||||||||||
| Allowance for loan and lease losses | (21,828 | ) | (4,654 | ) | (490 | ) | (26,972 | ) | 19.1 | |||||||||||
| Other financial assets | 41,683 | 6,003 | 6,231 | 53,917 | 22.7 | |||||||||||||||
| Investments in associates and joint ventures | 5,071 | 2 | - | 5,073 | 0.0 | |||||||||||||||
| Goodwill | 3,085 | 6,590 | - | 9,675 | 68.1 | |||||||||||||||
| Fixed assets, net | 7,285 | 757 | - | 8,042 | 9.4 | |||||||||||||||
| Intangibles assets, net | 5,510 | 1,871 | - | 7,381 | 25.3 | |||||||||||||||
| Tax assets | 42,334 | 1,940 | - | 44,274 | 4.4 | |||||||||||||||
| Assets held for sale | 547 | 84 | - | 631 | 13.3 | |||||||||||||||
| Other assets | 7,207 | 2,642 | 178 | 10,027 | 28.1 | |||||||||||||||
| Percentage of total assets | 77.6 | % | 20.6 | % | 1.8 | % | 100.0 | % | ||||||||||||
| Liabilities and Stockholders’ Equity | 1,049,276 | 286,829 | 17,136 | 1,353,241 | 22.5 | |||||||||||||||
| Deposits | 192,447 | 136,485 | 482 | 329,414 | 41.6 | |||||||||||||||
| Securities sold under repurchase agreements | 328,226 | 20,938 | - | 349,164 | 6.0 | |||||||||||||||
| Financial liabilities held for trading | - | 519 | - | 519 | 100.0 | |||||||||||||||
| Derivatives | 13,389 | 7,480 | 3,829 | 24,698 | 45.8 | |||||||||||||||
| Interbank market debt | 90,848 | 43,042 | 1,593 | 135,483 | 32.9 | |||||||||||||||
| Institutional market debt | 31,651 | 64,005 | 583 | 96,239 | 67.1 | |||||||||||||||
| Other financial liabilities | 57,426 | 7,639 | 6,767 | 71,832 | 20.1 | |||||||||||||||
| Reserves for insurance and private pension | 153,995 | 81 | - | 154,076 | 0.1 | |||||||||||||||
| Liabilities for capitalization plans | 3,147 | - | - | 3,147 | - | |||||||||||||||
| Provisions | 20,700 | 209 | - | 20,909 | 1.0 | |||||||||||||||
| Tax liabilities | 4,774 | 1,062 | - | 5,836 | 18.2 | |||||||||||||||
| Other liabilities | 17,859 | 5,369 | 3,882 | 27,110 | 34.1 | |||||||||||||||
| Non-controlling interests | 12,232 | - | - | 12,232 | - | |||||||||||||||
| Total stockholders’ equity attributed to the owners of the parent Company | 122,582 | - | - | 122,582 | - | |||||||||||||||
| Percentage of total liabilities and stockholders’ equity | 77.5 | % | 21.2 | % | 1.3 | % | 100.0 | % | ||||||||||||
(1) Predominantly U.S. dollar.
Note that the information presented in the table above is not prepared on the same basis as presented in the Consolidated Financial Statements.
Backtesting
The effectiveness of the VaR model is validated by the use of backtesting techniques, which compares hypothetical and effective daily results with the estimated daily VaR. The number of exceptions to the VaR pre-estabilished limits should be consistent, within an acceptable margin, with the hypothesis of 99% confidence level considering a period of 250 business days. Confidence levels of 97.5% and 95%, and periods of 500 and 750 business days are also considered. The backtesting analysis presented below considers the ranges suggested by the Basel Committee on banking supervision. The ranges are divided into:
| · | Green (0 to 4 exceptions): corresponds to backtesting results that do not suggest any problems with the quality or accuracy of the adopted models; |
| · | Yellow (5 to 9 exceptions): refers to an intermediate range group, which indicates an early warning and/or monitoring and may indicate the need of reviewing the model; and |
| · | Red (10 or more exceptions): demonstrate the need for an improvement action. |
According to Central Bank Circular No. 3,646, hypothetical testing consists of applying market price variations for a specific day to the portfolio balance at the end of the preceding business day. The effective test is the variation in the portfolio value up to the end of the day, including intraday transactions and excluding amounts not related to market price variations, such as fees, brokerage fees and commissions.
The Backtesting with Confidence level of 99%, and period of 250 business days, did not show failures in relation to effective and hypothetical results in the period.
A-93
Operational risk
Operational risk is defined as the possibility of losses arising from failure, deficiency or inadequacy of internal processes, people or systems or from external events that affect the achievement of strategic, tactical or operational objectives. It includes legal risk associated with inadequacy or deficiency in contracts signed by us, as well as penalties due to noncompliance with laws and punitive damages to third parties arising from the activities undertaken by us.
Internally, we classify its risks events in:
| · | Internal fraud; |
| · | External fraud; |
| · | Labor claims and deficient security in the workplace; |
| · | Inadequate practices related to clients, products and services; |
| · | Damages to our own physical assets or assets in use; |
| · | Interruption of our activities; |
| · | Failures in information technology systems; and |
| · | Failures in the performance, compliance with deadlines and management of our activities. |
In line with CMN and Central Bank regulations, we have an operational risk management structure and institutional policy, which are annually approved by the Board of Directors and are applicable to our local and foreign companies and subsidiaries. We have a governance process that is structured through forums and subcommittees composed of senior management, which, in turn, report to the Board of Directors, and by well-defined roles and responsibilities in order to reinforce the segregation of the business and management and control activities, ensuring independence between the areas and, consequently, well-balanced decisions with respect to risks. This is reflected in the risk management process carried out on a decentralized basis under the responsibility of the business areas and by a centralized control carried out by the internal control, compliance and operational risk department.
The objective of managing operational risk is to support decision-making, seeking always to identify and assess risks correctly, to create value for the shareholders and to protect our assets and our image. The managers of the executive areas use corporate methods constructed and made available by the internal control, compliance and operational risk area, so as to guarantee the quality of the control environments and comply with internal guidelines and current regulations.
Among the methodologies and tools used are the self-evaluation and the map of our prioritized risks, the approval of processes, products, and system development products and projects, the monitoring of key risk indicators that and the database of operational losses, guaranteeing a single conceptual basis for managing processes, systems, projects and new products and services.
Operational risk management includes conduct risk, which is subject to mitigating procedures to assess product design (suitability) and incentive models. The inspection area is responsible for fraud prevention. Irrespective of their origin, specific cases may be handled by risk committees and integrity and ethics committees.
Within the governance of the risk management process, the consolidated reports on risk monitoring, controls, action plans and operational losses are regularly presented to the business area executives.
It is worth noting that the dissemination of the risk and control culture to the employees by means of training is an important pillar, aimed at providing a better understanding of the matter and playing a relevant role in its mitigation.
Cyber Security
We have structured solutions in an effort to mitigate the main threats posed by cyberattacks at different levels of our organization, through the definition of policies, processes and procedures that support the entire chain of information.
We monitor and address all types of attacks and security incidents. We have a certified IT staff with knowledge of various technologies. We control the access to our systems and digital resources, while constantly updating our registry to maintain a high level of security and avoid breaches and unauthorized access. We employ state-of-the-art technology in seeking to secure our network and data, as well as other barriers such as restricted access to our servers, facilities, and virtual environments, through the use of firewalls, password-protection and encryption.
Our Corporate Security area works together with our business, IT, internal controls and internal audit teams to keep our systems always up-to-date, seeking to reduce financial losses and reputational damages in Brazil and abroad that could result from cyber attacks.
Crisis management and business continuity
The purpose of our Business Continuity Program is to protect our employees, ensure the continuity of the critical functions of our business lines, safeguard revenue and sustain both a stable financial market in which we operate and the trust of our clients and strategic partners in providing our services and products.
Our Business Continuity Program is composed of procedures for relocating and/or recovering operations in response to a variety of interruption levels and can be divided into two key elements:
A-94
| · | Crisis Management: centralized communication and response processes to manage business interruption events and any other types of threats to our image and reputation of its identity before its employees, clients, strategic partners and regulators. Our structure has a command center that constantly monitors daily operations, as well as the media channels in which we are mentioned. Our success of crisis management takes place through the focal agents, who are the representatives appointed by the business areas and that work in the monitoring of potential problems, resolution of crisis, resumption of business, improvement of processes and search for prevention actions; and |
| · | Business Continuity Plans (BCP): document with procedures and information, developed, consolidated and maintained available for use during possible incidents, allowing the resumption of critical activities in acceptable terms and conditions. For the quick and safe resumption of operations, we have established, in our BCP, corporate wide and customized actions for our lines of business by means of: |
| · | Disaster Recovery Plan: focused on the recovery of our primary data center, ensuring the continuity of the processing of critical systems within minimum pre-established periods; |
| · | Workplace Contingency Plan: employees responsible for carrying out critical business functions have alternative facilities from which to perform their activities in the event the buildings in which they usually work become unavailable. There are approximately 2,000 contingency dedicated seats that are fully equipped to meet the needs of critical business units in emergency situations; |
| · | Emergency Plan: procedures aimed at minimizing the effects of emergency situations that may impact our facilities, with a preventive focus; and |
| · | Processes Contingency Plan: alternatives (Plan B) to carry out the critical processes identified in the business areas. |
In order to keep the continuity solutions aligned with the business requirements the program applies the following tools to understand the institution:
| · | Business Impact Analysis (BIA): evaluates how critical it is to resume processes that support the delivery of products and services. Through this analysis, the business’ resumption priorities are defined; and |
| · | Threats and Vulnerabilities Analysis (AVA): identification of threats to the locations where our buildings are located. The controls’ efficiency is evaluated against potential threats in order to identify vulnerabilities so that controls are adjusted or implemented to enhance the resilience level of our critical facilities. |
Please refer to www.itau.com.br/_arquivosestaticos/RI/pdf/en/Corporate_Business_Continuity_Policy.pdf, for further details about our Corporate Business Continuity Policy.
Liquidity risk
Liquidity risk is defined as the likelihood that an institution will not being able to effectively honor its expected and unexpected obligations, current and future, including those from guarantees commitment, without affecting its daily operations or incurring significant losses.
Our liquidity risk control is carried out by an independent group of our business units that is responsible for determining the composition of our reserves, proposing assumptions for the performance of cash flows, identifying, assessing, monitoring, controlling and reporting on a daily basis the exposure to liquidity risk, in different timeframes, proposing liquidity risk limits in accordance with the group risk appetite, communicating any mismatches, considering liquidity risk on an individual basis in the countries where we operate, simulating the behavior of cash flows in stress conditions, assessing and reporting in advance the risks inherent to new products and operations, as well as reporting on the information required by the regulatory agencies. All activities are subject to assessment by our independent validation, internal controls and audit departments.
The liquidity risk measurement comprises all financial trades of our companies, as well as possible contingent and unexpected exposures, such as those derived from settlement services, provision of sureties and guarantees, and credit lines contracted and not used.
Our liquidity policies and associated limits are established based on prospective scenarios, reviewed periodically and based on definitions from senior management.
We manage and control liquidity risk on a daily basis, through governance approved at subcommittees, which provides, among other activities, the adoption of minimum liquidity limits, sufficient to absorb possible cash losses under situations of stress, measured by means of both in-house and regulatory methodologies.
Additionally, and pursuant to the requirements of CMN and Central Bank regulations, we are required to deliver on a monthly basis our Liquidity Risk Statements (DLR) to the Central Bank and the following items are regularly prepared and submitted to the senior management for monitoring and decision support:
| · | different scenarios for liquidity projections; |
| · | contingency plans for crisis situations; |
| · | reports and charts to enable monitoring risk positions; |
| · | assessment of funding costs and alternatives; and |
A-95
| · | tracking, monitoring and continuously control of funding sources considering counterparty type, maturity and other aspects. |
Please refer to section performance, item Financial Performance, Results, for further details about liquidity and capital resources.
As from the second quarter of 2016, we started to report the average of our liquidity coverage ratio (LCR) for the period, which is calculated based on the methodology defined by Central Bank regulation, which is in line with the international guidelines. In 2016, the minimum required by the Central Bank is 70%. The average ratio for the fourth quarter was 212.8%. We have diversified sources of funding, of which a significant portion comes from the retail segment. Our principal sources of funds are deposits, savings, issuance of securities and funds from acceptances.
Please refer to section performance, item Financial Performance, Liabilities, for further details about funding and results and item Complete financial statements (IFRS), Note 17 – Deposits, Note 19 – Securities sold under Repurchase agreements and Interbank and institutional market debts, and Note 36 – Management of financial risks for further details.
Please refer to section Our risk management, item Regulatory environment, for further details about the implementation of Basel III in Brazil.
Social and environmental risk
We see social and environmental risk as the risk of potential losses due to exposure to social and environmental events arising from the performance of our activities.
Mitigation actions of social and environmental risk are carried out through processes mappings, internal controls, monitoring new regulations on the subject, and recording occurrences in internal databases.
In addition, risks identified, prioritized and actions taken are reported to our management of social and environmental risk. Please refer to www.itau.com.br/_arquivosestaticos/RI/pdf/en/POLICY_FOR_SUSTAINABILITY_RI_2015__ING_.pdf, for further details about our Sustainability and Social Environmental Responsability Policy.
The social and environmental risk management is carried out by the first line of defense in its daily operations, supplemented by a technical support of our legal and risk control area, which has a team specialized in social and environmental management. Business units also have their criteria for the approval of new products, including assessing the social and environmental risks, which ensures compliance in all new products and processes employed by the institution. Governance with respect to these risks also includes the Social and Environmental Risk Committee, which is primarily responsible for emitting institutional views of social and environmental risk exposure related to our activities and operations.
Our efforts to improve the assessment of social and environmental risks have been recognized as a benchmark in Brazil and abroad, as shown by our recurring presence in the major sustainability indexes abroad, such as the Dow Jones Sustainability Index, and the Euronext Vigeo – Emerging 70. In Brazil, we are included in the Corporate Sustainability Index. We have also been awarded numerous prizes on the subject.
Reputational risk
We define reputational risk as the risk arising from internal practices, risk events and external factors that may generate a negative perception of our bank among clients, counterparties, stockholders, investors, supervisors, commercial partners, among others, which could affect the value of our brand and financial losses, in addition to adversely affecting our capability to maintain our existing commercial relations, start new businesses and continue to have access to financing sources.
We believe that our reputation is extremely important in achieving our long-term goals which is why the institution tries to align its speech with ethical and transparent practice and work, which is essential to raise the confidence of Itaú Unibanco’s stakeholders. Itaú Unibanco’s reputation depends on its strategy (vision, culture and skills) and derives from direct or indirect experience of the relationship between Itaú Unibanco and its stakeholders.
Since reputational risk directly or indirectly permeates all of our operations and processes, we have an infrastructure governance that seeks to ensure that potential reputational risks are identified, analyzed and managed while in the initial phases of its operations and the analysis of new products.
The treatment given to reputational risk is structured by means of many processes and internal initiatives, which, in turn, are supported by internal policies, which seek to provide mechanisms for the monitoring, management, control and mitigation of the main reputational risks. Among them are (i) risk appetite statement; (ii) process for the prevention and fight against the use of Itaú Unibanco in unlawful acts; (iii) crisis management processes and business continuity procedures; (iv) processes and guidelines with respect to governmental and institutional relations; (v) corporate communication processes; (vi) brand management processes; (vii) ombudsman offices initiatives and commitment to customer satisfaction; and (viii) ethics guidelines and the prevention of corruption.
Regulatory risk
We consider regulatory risk as the risk arising from losses due to fines, sanctions and other penalties applied by regulatory agencies resulting from lack of compliance with regulatory requirements. The regulatory risk is managed through a structured
A-96
process aimed at identifying changes in the regulatory environment, analyzing their impacts on the institution and monitoring the implementation of actions to comply with regulatory requirements.
We have a structure flow established in internal policies to recognize, distribute, monitor and comply with regulatory requirements. This structure involves various areas of the institution, and consists of: (i) lines of defense; (ii) monitoring draft legislation, public notices and public hearings; (iii) monitoring new rules and definition of action plans; (iv) relationship with regulators and professional organizations; (v) monitoring action plans; (vi) controlling compliance with legal decisions and TAC (conduct adjustment agreements), executed in public civil actions. In addition, the institution’s risks are classified and prioritized according to our internal control methodology.
Model risk
Our risk management already has proprietary models for risk management that are continuously monitored and reviewed whenever necessary, which aim at ensuring effective strategic and business decisions.
Model risk is defined as the risk that arises from the models used by us not correctly reflecting, on a consistent basis, the relationships of variables of interest, which can create results that systematically differ from actual results. This risk may materialize due the application of models to situations that differ from those originally modeled for or as a result of methodological inadequacies during their development.
The best market practices are used to manage the modeling risks to which the institution is exposed during the entire lifetime of each model utilized. Best market practice can be classified into four main steps: development, implementation, validation and use. The best practices used by the institution with respect to model risk control include:(i) certification of the quality of the database used; (ii) application of a check-list of essential steps to be taken during the model in question’s development; (iii) the use of conservative estimates in judgmental models; (iv) use of external benchmarks; (v) approval of results generated in model implementation; (vi) independent technical validation of models; (vii) validation of use of models; (viii) assessments of the impact in the use of models; (ix) monitoring of performance of models; and (x) monitoring of the distribution of the explanatory variables and final score with respect to a model.
Country risk
Country risk is defined as the risks of losses arising from noncompliance with the financial obligations in the terms agreed upon by borrowers, issuers, counterparties or guarantors as a result of actions taken by the government of the country where the borrower, issuer, counterparty or guarantor is located or of political, economic and social events related to the country.
We operate in many other countries in addition to Brazil. In addition to our foreign units, we have a relationship with borrowers, issuers, counterparties and guarantors from many places in the world, regardless of whether we have a foreign unit in the place where the borrower, issuer, counterparty or guarantor is located.
We have a specific structure for the management and control of country risk, consisting of commissions and committees and dedicated teams, with responsibilities defined in policies. The institution has a structured and consistent procedure for managing and controlling country risk, including: (i) the establishment of country ratings; (ii) the determination of limits for specific countries; and (iii) the monitoring of limits.
Business and strategy risk
We define the business and strategy risk as the risk of a negative impact on our financial results or capital as a consequence of a faulty strategic planning, making adverse strategic decisions, our inability to implement the proper strategic plans and/or changes in its business environment. Since business and strategic risk can directly affect the performance of our bank, we have implemented various mechanisms to ensure that both the business and the strategic decision making processes follow proper governance standards, have the active participation of officers and the Board of Directors, are based on market, macroeconomic and risk information and are aimed at optimizing the risk-return ratio. Decision-making and the establishment of business and strategy guidelines count on the full engagement of the Board of Directors, primarily through the Strategy Committee, and of the executives, through the Executive Committee. In order to handle risk adequately, we have governance and processes that involves the Risks & Finance Control and Management Area in business and strategy decisions, so as to ensure that risk is managed and decisions are sustainable in the long term. They are: (i) the qualifications and incentives of board members and executives; (ii) the budgetary process; (iii) product assessment; (iv) the evaluation and prospecting of proprietary mergers and acquisitions; and (v) a risk appetite framework which, for example, restricts the concentration of credit and exposure to specific and material risks.
Insurance products, pension plan and premium bonds risks
Products that compose portfolios of our insurance companies are related to life and elementary insurance, as well as pension plans and premium bonds. Accordingly, we understand that the main risks inherent to these products are:
A-97
| · | Underwriting risk is the possibility of losses arising from insurance products, pension plans and premium bonds that go against our expectations, directly or indirectly associated with technical and actuarial bases used for calculating premiums, contributions and technical provisions; |
| · | Market risk is the possibility of losses resulting from fluctuations in market value of assets and liabilities that comprise technical actuarial reserves; |
| · | Credit risk is the possibility of noncompliance, by a given debtor, with obligations related to the settlement of operations that involve the trading of financial assets or reinsurance; |
| · | Operational risk is the possibility of the occurrence of losses arising from the failure, deficiency or inadequacy of internal processes, people and systems, or from external events that affect the achievement of the strategic, tactical or operational objectives of the insurance, pension and premium bonds operations; and |
| · | Liquidity risk in insurance operation is the possibility of the institution not be able to timely honor its obligations to policyholders and beneficiaries due to the lack of liquidity of the assets comprising actuarial technical reserves. |
In line with good national and international practices and to ensure that risks arising from insurance products, pension plans and premium bonds are properly identified, measured, assessed, reported and approved in relevant forums, we have a risk management framework, whose guidelines are established in institutional guidelines, approved by our Board, applicable to companies and subsidiaries exposed to risk from insurance products, pension plans and premium bonds, in Brazil and abroad. The process of risk management for insurance, pensions and premium bonds plans is based on defined responsibilities distributed between the control and business areas, ensuring that they are independent of each other and focusing on the special nature of each risk, as per the guidelines established by us.
As part of the risk management process, there is a governance structure where decisions may be escalated to subcommittees, thus ensuring compliance with several regulatory and internal requirements, as well as balanced decisions relative to risks. Our objective is to ensure that assets serving as collateral for long-term products, with guaranteed minimum returns, are managed according to the characteristics of the liabilities, so that they are actuarially balanced and solvent over the long term.
Each year, liabilities for long-term products, which result in projected future benefits flows, are mapped using actuarial assumptions. This mapping enables Asset Liability Management models to be created, and these are used to define the best composition of the asset portfolio to neutralize the risk of this type of product, taking into account their economic and financial viability over the long term. Portfolios of collateral assets are rebalanced periodically according to changes in market prices, our liquidity requirements and the changes in the characteristics of the liabilities.
Capital management
The Board of Directors is the main body responsible for our capital management and is responsible for approving the institution’s capital management policies and guidelines. The Board is also responsible for approving the ICAAP report, a process which is intended to assess our capital adequacy by identifying material risks; by defining the need for additional capital for such risks and the internal means of quantifying it; by preparing a capital plan, both for normal and stress situations; and by structuring a capital contingency plan.
At the executive level, committees are responsible for approving risk assessment and capital calculation methodologies, as well as reviewing, monitoring and recommending capital-related documents and topics to the Board of Directors. As for the subcommittees, we have a dedicated structure for capital management, which consolidates information and coordinates related processes, all of which subject to verification by the independent validation, internal controls and audit areas.
In order to provide the necessary information for supporting decision making by the Executives and the Board of Directors, management reports are prepared and presented at subcommittees, informing about our capital adequacy, as well as about the projections of future capital levels in normal and stress situations.
For our annual assessment of capital adequacy, our procedure is as follows:
| · | identification of the risks to which we are exposed and analysis of their materiality; |
| · | assessment of the need for capital to cover the material risks; |
| · | development of methods for quantifying additional capital; |
| · | quantification of capital and internal capital adequacy assessment; and |
| · | submission of report on capital adequacy to the Central Bank of Brazil (BACEN). |
The ICAAP is the fundamental component of our internal capital management, and its most important element is stress testing. This process lets us assess our capital under adverse scenarios, and its purpose is to measure and confirm that, even in severe adverse conditions, we would have levels of capital adequate to ensure no restrictions on our operations or income distribution.
The result of the last ICAAP – dated as of December 2015 – showed that, in addition to having enough capital to face all material risks, we have a significant cushion, thus ensuring the soundness of its equity position.
Please refer to section Our risk management, item Regulatory environment, for further details about the implementation of Basel III in Brazil.
A-98
Minimum requirements
Our minimum capital requirements follow the set of resolutions and circulars disclosed by the Central Bank that implemented, in Brazil, the global capital requirement standards known as Basel III. These are expressed as ratios of the capital available stated by the Referential Equity (PR), or Total Capital, composed by the Tier I Capital (which comprises the Common Equity and Additional Tier I Capital) and Tier II Capital, and the risk-weighted assets, or RWA.
For purposes of calculating these minimum capital requirements, the total RWA is determined as the sum of the risk-weighted asset amounts for credit, market, and operational risks. Itaú Unibanco uses the standardized approaches to calculate credit and operational risk-weighted asset amounts.
From September 1, 2016, the Central Bank has authorized our institution to use internal market risk models to determine the total amount of regulatory capital, using the portion RWAMINT for our daily calculation, replacing the portion RWAMPAD,as set out in BACEN Central Bank Circular No. 3,646.
The standardized approach continues to be used for units which are not considered significant in calculating regulatory capital for market risk. Accordingly, use of the internal models does not apply to the following units: Argentina, Chile, Itau BBA International, Itaú BBA Colombia, Paraguay and Uruguay.
From January 1, 2016 to December 31, 2016, the minimum Total Capital ratio required was 9.875%. The required minimum Total Capital ratio was 11% between October 1, 2013, and December 31, 2015. The required minimum Total Capital ratio is scheduled for a gradual reduction to 8% on January 1, 2019.
Additionally, the Central Bank rules call for Additional Common Equity Tier I Capital (ACP), corresponding to the sum of the components ACPConservation,ACPCountercyclicaland ACPSystemic,which, in conjunction with the requirements mentioned, increase capital requirements over time. Under CMN Resolution, the values of the components ACPConservationand ACPCountercyclicalwill increase gradually from 0.625%, as from January 1, 2016, to 2.5% as from January 1, 2019. However, the countercyclical capital buffer is triggered during the credit cycle expansion phase, and currently, according to Central Bank rules, the required amount for the countercyclical capital buffer portion is zero. Further, if this portion should increase, the new percentage takes effect only 12 months after the announcement. In the case of component ACPSystemic, the current requirement applicable under Central Bank rules is 0%, increasing gradually from 0.25%, as from January 1, 2017, to 1% as from January 1, 2019.
Capital composition
The Regulatory Capital (PR), used to monitor our compliance with the operational limits imposed by the BACEN, is the sum of three items, namely:
| • | Common Equity Tier 1: sum of social capital, reserves and retained earnings, less deductions and prudential adjustments; |
| • | Additional Tier 1 Capital: consits of instruments of perpetual nature, which meet certain eligibility requirements. Together with Common Equity Tier I it makes up Tier I capital; and |
| • | Tier 2 Capital: consists of subordinated debt instruments with defined maturity dates, that meet certain eligibility requirements. Together with Common Equity Tier I and Additional Tier I Capital, it makes up Total Capital. |
In accordance with applicable Brazilian regulations, we must maintain our Regulatory Capital, Tier 1 Capital and Common Equity Tier 1 Capital ratios above the minimum regulatory requirements established at all times. The RWA used for assessing these minimum regulatory requirements can be determined by adding the following portions:
RWA = RWACPAD+ RWAMINT + RWAOPAD
RWACPAD = portion related to exposures to credit risk, calculated using standardized approach;
RWAMINT = portion related to the market risk capital requirement, calculated using internal approach, according to Central Bank rules, it includes units which are not considered significant, which follow standardized model;
RWAOPAD = portion related to the calculation of operational risk capital requirements, calculated using standardized approach.
Capital adequacy
Through our Internal Capital Adequacy Assessment Process (ICAAP), we assess the adequacy of our capital to face the incurred risks. For ICAAP, capital is composed by regulatory capital for credit, market and operational risks, and by the necessary capital to face other risks.
In order to ensure our capital soundness and availability to support business growth, we maintain Referential Equity levels above the minimum levels, according to the Common Equity Tier I, Additional Tier I Capital, and Basel ratio. On December 31, 2016, our Regulatory Capital reached R$139,477 million, an increase of R$11,012 million compared to December 31, 2015, mainly impacted by the result and the effect of foreign exchange variations during the period.
A-99
| As of December 31, | ||||||||||||||||||||
| Prudential Conglomerate | Financial Conglomerate | Variation | ||||||||||||||||||
| Capital Composition | 2016 | 2015 | 2014 | 2016-2015 | 2015-2014 | |||||||||||||||
| (In millions of R$) | (%) | |||||||||||||||||||
| Tier 1 Capital(1) | 115,940 | 101,001 | 96,232 | 14.8 | 5.0 | |||||||||||||||
| Common Equity Tier 1 Capital(2) | 115,408 | 100,955 | 96,212 | 14.3 | 4.9 | |||||||||||||||
| Additional Tier 1 Capital(3) | 532 | 46 | 20 | 1,056.5 | 130.0 | |||||||||||||||
| Tier 2 Capital(4) | 23,537 | 27,464 | 33,559 | (14.3 | ) | (18.2 | ) | |||||||||||||
| Referential Equity | 139,477 | 128,465 | 129,790 | 8.6 | (1.0 | ) | ||||||||||||||
| Minimum Referential Equity Required | 72,210 | 79,471 | 84,488 | (9.1 | ) | (5.9 | ) | |||||||||||||
| Surplus Capital in relation to the Minimum Referential Equity Required | 67,267 | 48,994 | 45,302 | 37.3 | 8.1 | |||||||||||||||
| Additional Common Equity Tier I requirement | 4,570 | |||||||||||||||||||
| Referential equity calculated for covering the interest rate risk on operations not classified in the trading portfolio (RBAN) | 2,264 | 1,275 | 1,846 | 77.6 | (30.9 | ) | ||||||||||||||
| Risk weighted assets (RWA) | 731,240 | 722,468 | 768,075 | 1.2 | (5.9 | ) | ||||||||||||||
| (1) | Comprised of the Common Equity Tier 1 Capital, as well as the Additional Tier 1 Capital. |
| (2) | Sum of social capital, reserves and retained earnings, less deductions and prudential adjustments. |
| (3) | Comprised of instruments of a perpetual nature, which meet eligibility requirements. |
| (4) | Comprised of subordinated debt instruments with defined maturity dates, which meet eligibility requirements. |
Our BIS ratio (calculated as the ratio between our Regulatory Capital and the total amount of RWA) reached 19.1%, on December 31, 2016, an increase compared to December 31, 2015, mainly explained by an increase in Regulatory Capital. Our BIS ratio on December 31, 2016 consisted of 15.9% of Tier 1 Capital and 3.2% of Tier 2 Capital.
| As of December 31, | ||||||||||||
| Prudential Conglomerate | Financial Conglomerate | |||||||||||
| Capital Composition | 2016 | 2015 | 2014 | |||||||||
| (%) | ||||||||||||
| BIS ratio | 19.1 | 17.8 | 16.9 | |||||||||
| Tier 1 Capital | 15.9 | 14.0 | 12.5 | |||||||||
| Common Equity Tier 1 Capital | 15.8 | 14.0 | 12.5 | |||||||||
| Additional Tier 1 Capital | 0.1 | - | - | |||||||||
| Tier 2 Capital | 3.2 | 3.8 | 4.4 | |||||||||
Our Regulatory Capital, Tier 1 Capital and Common Equity Tier 1 Capital ratios were calculated on a consolidated basis, applied to the financial institutions included in our Financial Conglomerate, up to December 31, 2014. From January 1, 2015, instead of calculating ratios for our Financial Conglomerate we calculated at the Prudential Conglomerate level, which is comprised of not only financial institutions but also of collective financing plans (consórcios), payment entities, factoring companies or companies that directly or indirectly assume credit risk, and investment funds in which our Itaú Unibanco Group retains substantially all risks and rewards.
Please refer to section Our risk management, item Regulatory environment, Implementation of Basel III in Brazil, for further details about minimum capital ratios.
Please refer to section Performance, item Complete Financial Statements in IFRS, Note 33 – Regulatory Capital for further details about regulatory capital.
Please refer to section Our risk management, item Regulatory environment, Basel III framework, Implementation of Basel III in Brazil.
Money laundering prevention
Financial institutions play a key role in preventing and fighting illicit acts, which includes money laundering, terrorism financing and fraud.
The challenge is to identify and prevent increasingly sophisticated operations that seek to conceal the source, ownership and transfer of goods and assets, derived from illegal activities.
Itaú Unibanco established a corporate policy to prevent its involvement in illicit activities, protecting its reputation and image among employees, customers, strategic partners, suppliers, service providers, regulators and the society, through a governance structure focused on transparency, strict compliance with the rules and regulations and cooperation with police and judicial authorities. It also continuously seeks to align itself with the local and international best practices to prevent and fight illicit acts, through investments and training its employees on ongoing basis.
In order to be compliant with the corporate policy guidelines, Itaú Unibanco established a program to prevent and fight illicit acts, which includes the following pillars:
| · | Customer Identification Process; |
| · | “Know Your Customer” Process (KYC); |
A-100
| · | “Know your Partner ” Process (KYP); |
| · | “Know Your Supplier” Process (KYS); |
| · | “Know Your Employee” Process (KYE); |
| · | Risk Assessment on New Products and Services; |
| · | Transaction Monitoring; |
| · | Reporting Suspicious Transactions to Regulators and Authorities; and |
| · | Training. |
This program is applicable to Itaú Unibanco and its controlled entities in Brazil and abroad. The oversight of prevention and detection of illegal activities is carried out by the Board of Directors, the Audit Committee, the Compliance and Operational Risk Committee, the Internal Operational Risk Committee, and the Anti-Money Laundering Committee.
Please refer to section Our risk management, item Regulatory environment for further details about money laundering regulation and to https://www.itau.com.br/_arquivosestaticos/RI/pdf/en/HF16_-_DOC_ING_RI_2016.pdf?title=Illicit Acts Prevention and Combat Corporate Policy, for more details about our Illicit Acts Prevention and Combat Corporate Policy.
Politically exposed persons
Our commitment to the compliance with applicable law and to the adoption of the best practices for prevention and detection of money laundering activity is also reflected in the identification, assessment and monitoring of Politically Exposed Persons (PEPs), whether as individuals or entities.
As per our policies related to PEPs, we apply enhanced due diligence with respect to these customers and we require a higher level of approval (at a minimum at the director level), prior to establishing any relationship with such PEPs.
Please refer to section Our risk management, item Regulatory environment for further details about politically exposed persons.
We are subject to regulation by, and supervision of, several entities, in the countries and for the segments in which we operate. The supervisory activities of these entities are essential to the structure of our business, and they directly impact our growth strategies. Below we describe the main entities that regulate and supervise our activities in Brazil:
| · | CMN: the highest authority responsible for establishing monetary and financial policies in Brazil, overall supervision of Brazilian monetary, credit, budgetary, fiscal and public debt policies, for regulating the conditions for organization, operation and inspection of financial institutions, as well as supervising the liquidity and solvency of these institutions. CMN is also responsible for the general guidelines to be followed in the organization and operation of the securities market and the regulation of foreign investments in Brazil; |
| · | Central Bank: responsible for implementing the policies established by CMN, authorizing the establishment of financial institutions and supervising financial institutions in Brazil. It establishes minimum capital requirements, limits for permanent assets, credit limits and requirements for compulsory deposits, in accordance with the policies established by CMN; |
| · | CVM: responsible for regulating, sanctioning and inspecting the Brazilian securities market (which in Brazil includes derivatives) and its participants, as well as overseeing exchange and organized over-the-counter markets; |
| · | CNSP: responsible for establishing the guidelines and directives for insurance and premium bond companies and open private pension entities; |
| · | SUSEP: responsible for regulating and supervising the insurance, open private pension funds and premium bond markets in Brazil and their participants; and |
| · | ANS: responsible for regulating and supervising the health insurance market in Brazil and its participants. |
Outside of Brazil, we have main operations subject to oversight by local regulatory authorities in the following jurisdictions: South America, in particular Argentina, Colombia, Chile, Uruguay and Paraguay; Europe, in particular, the United Kingdom and Switzerland; Central America in particular Panamá, and the Caribbean, in particular Bahamas and Cayman Islands; and the United States of America.
Financial institutions are subject to a number of regulatory requirements and restrictions, among which the following are noteworthy:
| · | prohibition against operating in Brazil without the prior approval of the Central Bank; |
| · | prohibition against acquiring real estate that are not for the financial institution’s own use, except real estate received for settlement of loan losses, in which case such real estate must be sold within one year, extendable by the Central Bank; |
| · | prohibition against acquiring interests in companies without the prior approval of the Central Bank, except for ownership interest typical of investment portfolios held by investment banks or universal banks with investment portfolios; |
A-101
| · | prohibition against granting loans that represent more than 25% of the financial institution’s regulatory capital to only one person or group; |
| · | restrictions on borrowing and lending, as well as granting advances and guarantees, to certain related individuals and legal entities. Please refer tosection Our risk management, item Regulatory environment, item Lending limits for more information about these individuals and legal entities; |
| · | obligation to deposit a portion of the deposits received from clients with the Central Bank (compulsory deposit); and |
| · | obligation to maintain sufficient capital reserves to absorb unexpected losses, pursuant to the rules proposed by the Basel Committee and implemented by the Central Bank. |
Basel III framework
The Basel III framework increases minimum capital requirements, creates new conservation and countercyclical buffers, changes risk-based capital measures, and introduces a new leverage limit and new liquidity standards in comparison to the former framework. The new rules will be phased in gradually and each country is expected to adopt such recommendations in laws or regulations applicable to local financial institutions.
The Basel III framework requires banks to maintain minimum capital levels corresponding to the following percentages of risk-weighted assets: (i) a minimum common equity capital ratio of 4.5%, composed of common shares; (ii) a minimum Tier 1 Capital ratio of 6.0%; and (iii) a minimum total capital ratio of 8.0%. In addition to the minimum capital requirements,
Basel III requires a “capital conservation buffer” of 2.5% and each national regulator is given discretion to institute a “countercyclical buffer” if it perceives a greater system-wide risk to the banking system as the result of a build-up of excess credit growth in its jurisdiction. Basel III also introduces a new leverage ratio, defined as Tier 1 Capital divided by the bank’s total exposure.
Basel III implemented a Liquidity Coverage Ratio, or LCR, and a Net Stable Funding Ratio (NSFR). The LCR requires affected banks to maintain sufficient high-quality liquid assets to cover the net cash outflows that could occur under a potential liquidity disruption scenario over a thirty-day period. The NFSR establishes a minimum amount of stable sources of funding that banks will be required to maintain based on the liquidity profile of the banks’ assets, as well as the potential for contingent liquidity needs arising from off-balance sheet commitments over a one-year period.
Additional requirements apply to non-common equity Tier 1 Capital or Tier 2 Capital instruments issued by internationally active banks. To be included in Additional Tier 1 Capital or Tier 2 Capital, an instrument must contain a provision that requires that, at the discretion of the relevant authority, such instrument be either written-off or converted into common shares upon a “trigger event.” A “trigger event” is the decision of a competent authority pursuant to which, for a bank to remain a feasible financial institution, it is necessary (i) to write-off an instrument, or (ii) to inject government funds, or equivalent support, into such bank, whichever occurs first. The requirements are applicable to all instruments issued after January 1, 2013. The instruments qualified as capital issued before that date that do not comply with these requirements will be phased out of banks’ capital over a 10-year period, beginning on January 1, 2013.
Additional regulatory capital requirements apply to Global Systemically Important Financial Institutions (G-SIFIs). The Basel Committee’s assessment methodology to determine which financial institutions are G-SIFIs is based on indicators that reflect the following aspects of G-SIFIs: (i) size; (ii) interconnectedness; (iii) lack of readily available substitute or financial institution infrastructure for the services provided; (iv) global or cross-jurisdictional activity; and (v) complexity. Each of these factors receives an equal weight of 20.0% in the assessment.
The Basel Committee has also issued a framework for the regulation of Domestic Systemically Important Banks (D-SIBs), which supplements the G-SIFI framework by focusing on the impact that the distress or failure of systemically important banks would have on the domestic economy of each country.
Implementation of Basel III in Brazil
Brazilian banks’ minimum total capital ratio is calculated as the sum of two components: Regulatory Capital (patrimônio dereferência); and Additional Core Capital (adicional de capital principal).
Brazilian banks’ Regulatory Capital is comprised of Tier 1 Capital and Tier 2 Capital. Tier 1 Capital is further divided into two elements: Common Equity Tier 1 Capital (common equity capital and profit reserves, orcapital principal) and Additional Tier 1 Capital (hybrid debt and equity instruments authorized by the Central Bank, orcapital complementar).
In order to qualify as Additional Tier 1 Capital or Tier 2 Capital, all instruments issued after October 1, 2013 by a Brazilian bank must contain loss-absorbency provisions, including a requirement that such instruments be automatically written off or converted into equity upon a “trigger event”. A “trigger event” is the earlier of: (i) Common Equity Tier 1 Capital being less than 5.125% of the risk-weighted assets for Additional Tier 1 Capital instruments and 4.5% for Tier 2 Capital instruments; (ii) the execution of a firm irrevocable written agreement for the government to inject capital in the financial institution; (iii) the Central Bank declaring the beginning of a temporary special administration regime (Regime de Administração Especial Temporária, or RAET) or intervention in the financial institution; or (iv) a decision by the Central Bank, according to criteria established by the CMN, that the write-off or conversion of the instrument is necessary to maintain the bank as a viable financial institution and to mitigate relevant risks to the Brazilian financial system. Specific procedures and criteria for the conversion of shares and the write-off of outstanding debt related to funding instruments eligible to qualify as regulatory capital are established by CMN
A-102
regulation. The legal framework applicable to financial bills (letras financeiras) was adapted to allow Brazilian financial institutions to issue Basel III-compliant debt instruments in the Brazilian market.
Existing hybrid instruments and subordinated debt previously approved by the Central Bank as eligible capital instruments may continue to qualify as Additional Tier 1 Capital or Tier 2 Capital, as the case may be, provided that they comply with the above requirements and a new authorization from the Central Bank is obtained. Instruments that do not comply with these requirements will be phased out as eligible capital instruments by deducting 10.0% of their book value per year from the amount that qualifies as Additional Tier 1 Capital or Tier 2 Capital. The first deduction occurred on October 1, 2013, and subsequent deductions will take place annually starting January 1, 2014 until January 1, 2022.
The Additional Core Capital requirement is subdivided into three elements: the capital conservation buffer (Adicional de CapitalPrincipal Conservação), the countercyclical capital buffer (Adicional de Capital Principal Contracíclico) and the higher lossabsorbency requirement for domestic systemically important banks (Adicional de Capital Principal Sistêmico). The capital conservation buffer is aimed at increasing the loss absorption ability of financial institutions. The countercyclical capital buffer can be imposed within a range by the Central Bank if it judges that credit growth is increasing systematic risk. The higher loss absorbency requirement for domestic systemically important banks seeks to address the impact that the distress or failure of Brazilian banks may have on the local economy. In the event of non-compliance with the Additional Core Capital requirement, certain restrictions will apply, including the inability of the financial institution to: (i) pay officers and directors their share of variable compensation; (ii) distribute dividends and interest on equity to stockholders; and (iii) repurchase its own shares and effect reductions in its share capital.
From October 1, 2015, a minimum LCR in a standardized liquidity stress scenario is required for banks with total assets in excess of R$100 billion, individually or at the consolidated enterprise level (conglomerado prudencial), as the case may be. The calculation of the LCR follows the methodology set forth by the Central Bank which is aligned with international guidelines. During periods of increased need for liquidity, banks may report a lower LCR than the minimum required ratio, provided that they also report to the Central Bank the causes for not meeting the minimum requirement, the contingent sources of liquidity they have available, and the measures they plan to adopt to be in compliance with the LCR requirement. Banks will also be required to effect public disclosures of their LCR on a quarterly basis after April 1, 2016.
In January 2017, the Central Bank enacted a new rule amending the provisions regarding calculation methods and procedures for the disclosure of LCR information. The new regulation establishes a new possible stress scenario and indicates that, for LCR purposes, cash and time deposits are considered retail funding components.
The following table presents the schedule for phased-in implementation by the Central Bank of the capital adequacy and liquidity coverage ratio requirements under Basel III, as applicable to Itaú Unibanco Holding. The figures presented below refer to the percentage of our risk-weighted assets.
| From January 1, | ||||||||||||||||||||
| Basel III - Schedule | 2015 | 2016 | 2017 | 2018 | 2019 | |||||||||||||||
| (%) | ||||||||||||||||||||
| Common equity Tier 1 | 4.5 | 4.5 | 4.5 | 4.5 | 4.5 | |||||||||||||||
| Tier 1 Capital | 6.0 | 6.0 | 6.0 | 6.0 | 6.0 | |||||||||||||||
| Total regulatory capital | 11.0 | 9.875 | 9.25 | 8.625 | 8.0 | |||||||||||||||
| Additional common equity Tier 1 (ACP) | - | 0.625 | 1.5 | 2.375 | 3.5 | |||||||||||||||
| Capital conservation buffer | - | 0.625 | 1.25 | 1.875 | 2.5 | |||||||||||||||
| Countercyclical capital buffer(1) | - | - | - | - | - | |||||||||||||||
| Systemic | - | - | 0.25 | 0.5 | 1.0 | |||||||||||||||
| Common equity Tier 1 + ACP | 4.5 | 5.1 | 6.0 | 6.9 | 8.0 | |||||||||||||||
| Total regulatory capital + ACP | 11.0 | 10.5 | 10.8 | 11.0 | 11.5 | |||||||||||||||
| Liquidity coverage ratio | 0.6 | 0.7 | 0.8 | 0.9 | 1.0 | |||||||||||||||
| Prudential adjustments deductions | 40 | 60 | 80 | 100 | 100 | |||||||||||||||
(1) According to Circular No 3.769 of Central Bank, the ACP countercyclical requirement is zero.
The Central Bank has also established the calculation methodology for the leverage ratio. However, it has not yet determined a minimum ratio. Banks are required to prepare public disclosures of their leverage ratios on a quarterly basis after October 1, 2015.
CMN regulation also defines the entities that compose the consolidated enterprise level (conglomerado prudencial) of a Brazilian financial institution, and establishes the requirement that a financial institution prepare and file with the Central Bank monthly complete financial statements at the consolidated enterprise level (conglomerado prudencial) pursuant to the parameters defined therein. Such financial statements should also be audited by external auditors on a semi-annual basis. As of January 1, 2015, minimum capital and ratio requirements apply at the consolidated enterprise level (conglomerado prudencial).
In addition to the rules issued in accordance with the criteria set forth in Basel III, in July, 2013, Law No. 12,838 was issued, allowing the determination of deemed credit based on deferred tax assets arising from temporary differences resulting from allowances for loan losses, which, in practice, exempts financial institutions from deducting this type of credit from its core capital. The law also changes the rules for the issue of subordinated debt, requiring the inclusion of clauses for the suspension of the stipulated compensation and the extinction of the credit right or its conversion into shares, and conditions stockholders’ remuneration to compliance with the prudential requirements established by CMN.
A-103
Brazilian financial institutions are also required to implement a capital management structure compatible with the nature of its transactions, the complexity of the products and services it offers, as well as with the extent of its exposure to risks. Capital management is defined as a process that includes: (i) monitoring and controlling the financial institution’s capital; (ii) assessing capital needs in light of the risks to which the financial institution is subject; and (iii) setting goals and conducting capital planning in order to meet capital needs due to changes in market conditions. Financial institutions should publish a report describing the structure of their capital management at least on an annual basis. Disclosure and reporting of risk management matters, risk-weighted asset calculation, and adequate compliance with regulatory capital requirements are regulated by the Central Bank and reflect the so-called “Pillar 3” of regulatory capital recommended under Basel III, aimed at improving governance and disclosure.
G-SIFI assessment in Brazil
The Central Bank has adopted the same indicators set out by the Basel Committee to determine if Brazilian financial institutions qualify as G-SIFIs. Please refer to section Our risk management, item Regulatory environment, Basel III framework, for further details. This assessment is required of banks with total exposure – the denominator for the leverage ratio – in excess of R$500 billion, individually or at the consolidated enterprise level (conglomerado prudencial), as the case may be. However, no additional loss absorbency requirements for Brazilian G-SIFIs have been established. We were not included on the latest list of G-SIFIs issued on November 21, 2016. The next update is expected in November 2017.
Recovery plans for systematically important financial institutions
On June 30, 2016, CMN enacted a rule providing stricter guidelines for recovery plans (Planos de Recuperação) for Brazil’s systemically important financial institutions. The new rule, which incorporated recommendations from the Financial Stability Board, requires financial institutions to prepare recovery plans that aim to re-establish adequate levels of capital and liquidity and to preserve the viability of such institutions under stress scenarios. The guidelines require, among other things, that subject financial institutions must identify their critical functions for the National Financial System (Sistema FinanceiroNacional) and their core business lines, monitor indicators and their critical levels, adopt stress-testing scenarios, predictrecovery strategies, assess possible risks and barriers related to the strategies and define clear and transparent governance procedures, as well as effective communication plans with key stakeholders. The rule provides for a phase-in implementation period from October 2016 to December 2017 to allow the relevant financial institutions to adapt their recovery plans to the new requirements.
Segmentation for the proportional application of the prudential regulation
On January 30, 2017, CMN enacted a resolution establishing segmentation for financial institutions, financial institution groups and other institutions authorized to operate by the Central Bank for proportional application of the prudential regulation, considering the size, international activity and risk profile of members of each segment. According to such resolution, the segments are qualified as follows:
(i) Segment 1 is composed of multiservice banks, commercial banks, investment banks, foreign exchange banks and savings banks that (a) have a size equivalent or superior to 10% of its internal gross domestic product (GDP); or (b) perform relevant international activities, independently from the magnitude of the institution;
(ii) Segment 2 is composed of multiservice banks, commercial banks, investment banks, foreign exchange banks and savings banks with (a) size below 10% of its internal GDP; and (b) other institutions of same magnitude equivalent or superior to 1% of its internal GDP;
(iii) Segment 3 is composed of institutions with a size below 1% and equivalent or superior to 0.1% of its internal GDP;
(iv) Segment 4 is composed of institutions of size below 0.1% of its internal GDP; and
(v) Segment 5 is composed of (a) institutions with a size below 0.1% of its internal GDP that applies a simplified optional method for the verification of reference equity’s minimum requirements, except for multiservice banks, commercial banks, investment banks, foreign exchange banks and savings bank; and (b) institutions not subject to the verification of reference equity.
Secured real estate bill
In January 2017, the Central Bank enacted a public consultation regarding the secured real state bill (Letra Imobiliária Garantida – LIG – Brazilian covered bond), which aims to regulate the provisions of Law No. 13,097 of January 19, 2015. The secured real state bill would provide the sector with an alternative source of funding in an attempt to expand the real estate credit market in the next few years.
A-104
Passive provision for financial guarantees
On July 28, 2016, CMN enacted a new rule, establishing specific accounting procedures for the assessment and registration of passive provisions (provisão passiva) that financial institutions must create in respect of financial guarantees. The accounting procedures established by this regulation seek to align the Brazilian standards with IFRS. Such resolution is effective since January 1, 2017.
Foreign currency transactions and exposure
Transactions involving the sale and purchase of foreign currency in Brazil may only be conducted by institutions authorized to do so by the Central Bank. There are no limits for long or short positions in foreign currency for banks authorized to carry out transactions on the foreign exchange market. The compulsory deposit requirement rate on the foreign currency short position held by financial institutions is currently 0%.
In accordance with CMN regulation, financial institutions in Brazil may raise funds abroad, either through direct loans or through the issuance of debt securities. Funds raised accordingly may be freely invested in Brazil, including but not limited to on-lending to Brazilian companies and financial institutions. Brazilian banks authorized to operate in foreign currency markets which hold regulatory capital higher than R$5 billion may also use these funds to grant loans abroad to Brazilian companies, their offshore subsidiaries and to foreign companies controlled by Brazilians or to acquire securities issued or guaranteed by such companies in the primary market. Cross-border loans, in which one party is in Brazil and the other party is abroad, require previous registration with the Central Bank, which may establish limits on the conditions of such foreign currency loan transactions. Please refer to item Taxation for further details about tax on foreign exchange transactions.
Financial institutions may also grant loans in or indexed to a foreign currency to their clients’ trade-related activities, such as by granting advances on foreign exchange contracts (Adiantamento sobre Contrato de Câmbio), advances on delivered export register (Adiantamento sobre Cambiais Entregues) or export or import prepayment agreements (Pré-Pagamento deExportação e Financiamento à Importação), all in accordance with Brazilian regulations on foreign exchange markets andinternational capital flows.
The Central Bank and the Brazilian government frequently change rules and regulations applicable to foreign currency borrowing and loans in accordance with the economic scenario and Brazilian monetary policy.
Besides that legislation sets forth that the total exposure in gold and other assets and liabilities indexed or linked to the foreign exchange rate variation undertaken by financial institutions (including their offshore branches), and their direct and indirect subsidiaries, on a consolidated basis, may not exceed 30.0% of their regulatory capital.
Liquidity and fixed assets investment regime
In accordance with CMN regulation, financial institutions may not hold, on a consolidated basis, permanent assets, including investments in unconsolidated subsidiaries, real estate, equipment and intangible assets, exceeding 50.0% of the adjusted regulatory capital.
Lending limits
Furthermore, we are legally prevented from granting loans or advances, and guarantees, including derivative transactions, underwriting or holding in our investment portfolio securities of any clients or group of affiliated clients that, in the aggregate, give rise to exposure to such client or group of affiliated clients that exceeds 25.0% of our regulatory capital.
Credit exposure limits
For the purpose of this limit, the following public sector entities are to be considered as separate customers: (i) the Brazilian government, (ii) an entity controlled directly or indirectly by the Brazilian government which is not financially dependent on another entity controlled directly or indirectly by the Brazilian government, (iii) entities controlled directly or indirectly by the Brazilian government which are financially dependent among themselves, (iv) a State or the Federal District, jointly with all entities directly or indirectly controlled by it, and (v) a municipal district, jointly with all entities directly or indirectly controlled by it.
Risk weighted asset calculation
The calculation of risk exposure is based on several factors set forth by the Central Bank regulations and impacts the capital requirements. The components take into consideration the type of risk and include the parameters and procedures for calculation of the risk weighted asset (RWA) to determine the capital requirements resulting from each risk exposure. The Central Bank has been frequently changing and updating the rules and regulations for calculation of RWA.
A-105
Financial bills
Law No. 12,838 of July 9, 2013 adapted financial bills (letras financeiras) to the Basel III framework and granted the Central Bank power to limit the payment of dividends and interest on capital by financial institutions that do not comply with CMN capital requirements. With the changes enacted by Law No. 12,838, Brazilian financial institutions will likely issue Basel III-compliant hybrid or subordinated debt instruments under the regulatory framework of financial bills. The main characteristics of financial bills changed by Law No. 12,838 are:
| • | Possibility of issuance of financial bills convertible into equity. The conversion may not be requested by the investor or the issuer financial institution; |
| • | Suspension of payment of interest in case of non-compliance with capital requirement rules in case the financial bills are part of the regulatory capital of the financial institution. Additionally, in order to preserve the regular functioning of the Brazilian financial system, the Central Bank may determine that financial bills be converted into equity or writen-off. These determinations will not be considered a default by the financial institution and will not accelerate the maturity of its other debts; and |
| • | Financial bills may include, as early maturity events, default on the payment of the interest of the financial bill or the dissolution of the financial institution. |
Principles and institutional policy
On November 24, 2016, CMNenacted a new rule establishing principles and institutional policies that must be observed by financial institutions and other institutions authorized to operate by the Central Bank with respect to their relationship with clients and users of financial products and services. In addition to ethical principles, responsibility, transparency and diligence, other measures are required such as: (i) promoting an organizational culture that incentivizes a cooperative and balanced relationship with clients and users; (ii) granting fair and equitable treatment to clients and users; and (iii) promoting legitimacy and compliance of products and services provided by financial institutions. The regulation will become effective on November 24, 2017.
Establishment of a succession policy
On November 24, 2016, CMN enacted a new resolution requiring that financial institutions and other institutions authorized to operate by the Central Bank establish a succession policy for their management. The new regulation requires that the Board of Directors of the institutions approves, supervises and controls the process of planning such policy, which must expressly assign the positions conditioned to the succession policy, taking into consideration the institution’s structure, risk profile and business model. The succession policy shall cover recruiting, promotion, election and retention processes, based on rules that regulate the identification, evaluation and training of senior management positions considering the following aspects: (i) conditions required by Brazilian law to exercise such positions; (ii) technical capacity; (iii) management capacity; (iv) interpersonal skills; (v) legislation and regulation knowledge regarding liability for their actions; and (vi) experience. The regulation provides for a phase-in implementation period from November 2016 to May 2017.
Code of Corporate Governance
In 2016, the Code of Corporate Governance for publicly-held companies (Código Brasileiro de Governança Corporativa – Companhias Abertas) was edited. It sets forth corporate governance-related principles, guidelines and actions applicable to publicly-held companies and determines that companies adopt the “apply or explain” model in respect of their principles, guidelines and actions. As a result of the edition of this Code, in December 2016 CVM submitted to public consultation the draft of a new ruling amending the current disclosure related ruling to adapt to the guidelines of the new Code. The new ruling probably will be applicable as from the end of the first semester of 2018.
Anti-corruption law
In January 2014, a new Brazilian anti-corruption law came into force which establishes that legal entities will have strict liability (regardless of fault or willful misconduct) if they are involved in any form of bribery. Although known as an anti-corruption law, it also encompasses other injurious acts contrary to the Brazilian or foreign public administration including bid rigging and obstruction of justice. The law provides for heavy penalties, both through administrative and judicial proceedings including determination of dissolution of a company, prohibition against undertaking financing with public entities and prohibition against participating in public biddings.
In addition, the law authorizes the public administrative authorities responsible for the investigation to enter into leniency agreements. The self-disclosure of violations and cooperation by legal entities may result in the reduction of fines and other sanctions as determined by the new federal regulation issued in March 2015.
The new regulation also provides parameters for the application of the anti-corruption law including with respect to penalties and compliance programs. Please refer to:
A-106
https://www.itau.com.br/_arquivosestaticos/RI/pdf/en/POLITICA_CORPORATIVA_DE_PREVENCAO_A_CORRUPCAO_ENGL.pdf where you can electronically access further details about our Anti-corruption Corporate Policy.
https://www.itau.com.br/_arquivosestaticos/RI/pdf/en/HF5_-_DOC_RI_2016_(ingles).pdf where you can electronically access further details about our Integrity and Ethics Corporate Policy and guidelines for situations of conflicts of interests.
Compensation of directors and officers of financial institutions
According to rules set forth by CMN, Brazilian financial institutions are required to have a compensation policy. If variable compensation is to be paid to management, at least 50% of the total compensation should be paid in shares or share-based instruments and at least 40% of the total compensation should be deferred for future payment for at least three years. If the institution records a significant decrease in the realized recurring profit or a negative result during the deferral period, the deferred and unpaid portions of the compensation should be reversed proportionally to the decrease in result, in order to minimize the loss incurred by the financial institutions and their stockholders.
Our compensation policy, applicable to directors and officers in Brazil (constituting the major part of the management population of the Itaú Unibanco Group), complies with CMN’s regulatory requirements. Our compensation principles and practices worldwide comply with each local regulation and seek to increase alignment between the interests of our stockholders and our management.
For further information, see section Our governance, item Corporate governance, Directors’ and senior management’s compensation.
Antitrust regulation
The Brazilian Antitrust Law requires that transactions resulting in economic concentration should be submitted for prior approval to CADE, the Brazilian antitrust authority, if the transactions meet the following criteria: (i) the economic group of any of the parties to a transaction recorded, in the fiscal year prior to that of the transaction, minimum gross revenues of R$750 million; and (ii) at least one of the other economic groups involved in the transaction recorded, for the same time period, minimum gross revenues of R$75 million. The closing of a transaction prior to CADE’s approval subjects the parties to fines ranging from R$60,000 to R$60 million, the nullity of the relevant agreement and potential administrative proceedings. In addition to submitting such transactions to CADE’s approval, financial institutions are required by Circular No. 3,590/2012 of the Central Bank (updated by Circular No. 3,800/2016) to submit to the Central Bank’s antitrust approval any concentration acts involving two or more financial institutions in the following cases: (i) acquisition of corporate control, (ii) a merger, (iii) transfer of the business to another financial institution, and (iv) other transactions which result in increased market share in the market segments they operate.
With respect to the conflict of jurisdiction to review and approve concentration acts involving financial institutions, the matter remains undefined. The uncertainty concerning whether CADE or the Central Bank should review and approve concentration acts involving financial institutions has resulted in financial institutions submitting for antitrust approval concentration acts in the banking sector not only to the Central Bank but also to CADE.
Please refer to www.itau.com.br/_arquivosestaticos/RI/pdf/en/ANTITRUST_CORPORATE_POLICY_RI_2015.pdf for further details about our Antitrust Corporate Policy.
Treatment of past due debts
Brazilian financial institutions are required to classify their credit transactions (including leasing transactions and other transactions characterized as credit advances) at different levels and recognize provisions according to the level attributed to each such transaction. The classification is based on the financial condition of the clients the terms and conditions of the transaction and the period of time during which the transaction is past due, if any. For purposes of Central Bank requirements, transactions are classified as level AA, A, B, C, D, E, F, G or H, with AA being the highest classification. Credit classifications must be reviewed on a monthly basis and, apart from additional provisions required by the Central Bank which are deemed necessary by the management of financial institutions, each level has a specific allowance percentage that is applied to it and which we use to calculate our allowance for loan losses, as specified in more detail in the following table:
| Classification (1) | AA | A | B | C | D | E | F | G | H | |||||||||||||||||||||||||||
| Allowance (%) | 0 | 0.5 | 1 | 3 | 10 | 30 | 50 | 70 | 100 | |||||||||||||||||||||||||||
| Past due (in days) | - | - | 15 to 30 | 31 to 60 | 61 to 90 | 91 to 120 | 121 to 150 | 151 to 180 | Over 180 | |||||||||||||||||||||||||||
(1) Our credit classification also takes into account the client´s credit profile, which may negatively impact the past due classification.
Under IFRS, the allowance for loan losses is based on our internally developed incurred loss models, which calculate the allowance for loan losses by multiplying the probability of default by the clients or counterparty (PD) by the potential for recovery on defaulted credits (LGD) for each transaction, as described in Note 2.4(d) X to our complete financial statements under IFRS. The risk levels are categorized as “lower risk”, “satisfactory”, “higher risk”, and “impaired” based on the probability of default, following an internal scaling, as set out in Note 36 to our complete financial statements under IFRS.
A-107
Bank insolvency
The insolvency of financial institutions is handled pursuant to applicable laws and regulations by the Central Bank, which initiates and monitors all applicable administrative proceedings. There are three types of special regimes that may be imposed to either private-sector financial institutions or state-owned (other than federal government-owned) financial institutions or similar institutions: (i) temporary special administration regime (RAET), (ii) intervention, and (iii) extrajudicial liquidation. Financial institutions may also be subject to the bankruptcy regime.
In the course of the special regimes described below, the steering committee, the intervenor, and the liquidator may, when authorized by the Central Bank: (i) dispose of assets and rights of the financial institution to third parties and (ii) proceed with corporate restructuring processes in the financial institution or its subsidiaries, among other possible measures of similar effect.
RAET
RAET is a less severe special regime which allows financial institutions to continue to operate. Its main effect is that the whole management loses its offices and is replaced by a steering committee appointed by the Central Bank with broad management powers. Its duration is limited and its main objective is the adoption of measures aimed at the resumption of the financial institution’s regular activities. If resumption is not possible, this regime may be turned into an extrajudicial liquidation.
Intervention
Under this regime, the Central Bank appoints an intervenor that takes charge of the financial institution’s management, suspending its regular activities and dismissing the financial institution’s management. In general, the intervention is aimed at preventing the continuation of certain irregularities and the aggravation of the financial situation of the financial institution, which can put assets at risk and harm the financial institution’s creditors. The intervention is also time-limited and may be followed by the resumption of the financial institution’s regular activities or the declaration of extrajudicial liquidation or bankruptcy.
The intervention suspends all actions related to payment obligations of the financial institution, prevents the early settlement or maturity of its obligations and freezes pre-existing deposits.
Extrajudicial liquidation
Extrajudicial liquidation generally corresponds to the process of dissolution of the company in cases of unrecoverable insolvency or severe violations of the rules that regulate a financial institution’s activities. The extrajudicial liquidation aims at promoting the liquidation of the existing assets for the payment of creditors, with the return of any amounts left to stockholders. Controlling stockholders may be held responsible for remaining liabilities.
The extrajudicial liquidation (i) suspends actions and executions related to the financial institution, (ii) accelerates the maturity of the financial institution’s obligations; and (iii) interrupts the statute of limitations of the financial institution’s obligations. In addition, the debt of the estate under liquidation will no longer accrue interest until all obligations to third parties are settled.
Deposit insurance
In the event of intervention, extrajudicial liquidation or liquidation of a financial institution in a bankruptcy proceeding, the Credit Insurance Fund, or FGC, a deposit insurance system, guarantees the maximum amount of R$250,000 for certain deposits and credit instruments held by an individual, a company or another legal entity with a financial institution (or financial institutions of the same economic group). The resources of the FGC come primarily from mandatory contributions from all Brazilian financial institutions that receive deposits from clients, currently at a monthly rate of 0.0125% of the amount of the balances of accounts corresponding to the financial instruments that are the subject matter of the ordinary guarantee, even if the related credits are not fully covered by FGC, and certain special contributions. Deposits and funds raised abroad are not guaranteed by the FGC. As from February 2016, credits of financial institutions and other institutions authorized to operate by the Brazilian Central Bank, complementary welfare entities, insurance companies, capitalization companies, investment clubs and investment funds, as well as those representing any interest in or financial instrument held by such entities, are not protected by the ordinary guarantee of FGC.
Payment of creditors in liquidation
In the event of extrajudicial liquidation of a financial institution or liquidation of a financial institution in a bankruptcy proceeding, the salaries of employees and the related labor claims up to a certain amount, secured credits and tax charges have priority in any claims against the entity in liquidation. The payment of unsecured credits, including deposits from regular retail clients that are not guaranteed by FGC, is subject to the prior payment of preferred credits. Additionally, upon the payment of the deposits guaranteed by FGC, FGC becomes an unsecured creditor of the estate in liquidation.
A-108
Insurance regulation
With governmental approval, insurance companies in Brazil may offer all types of insurance, except for workers’ compensation insurance, directly to clients or through qualified brokers.
Insurance companies must set aside reserves to be invested in specific types of securities. As a result, insurance companies are among the main investors in the Brazilian securities market and subject to CMN regulations regarding the investment of technical reserves.
In the event an insurance company is declared bankrupt, the insurance company will be subject to a special procedure administered by SUSEP or by ANS. If an insurance company is declared bankrupt and (i) its assets are not sufficient to guarantee at least half of the unsecured credits or (ii) procedures relating to acts that may be considered bankruptcy-related crimes are in place, the insurance company will be subject to ordinary bankruptcy procedures.
There is currently no restriction on foreign investments in insurance companies in Brazil.
Brazilian legislation establishes that insurance companies must buy reinsurance to the extent their liabilities exceed their technical limits under the rules of the regulatory body (CNSP and SUSEP), and reinsurance contracts may be entered into through a direct negotiation between the insurance and reinsurance companies or through a reinsurance broker authorized to operate in Brazil.
Insurance companies, until December 31, 2016, when transferring their risks in reinsurance, must transfer 40.0% of each facultative or automatic contract to local reinsurers (companies domiciled in Brazil).
From January 1, 2017, this percentage reduces to 30%, and will reduce annually until it reaches 15% on January 1, 2020. In addition, until December 31, 2016, risk assignment between insurers and reinsurers belonging to the same economic group is limited to 20.0% of the premiums pertaining to each facultative or automatic contract. From January 1, 2017, this percentage has increased to 30%, and annually will increase until it reaches 75% on January 1, 2020.
Anti-money laundering regulation
The Brazilian anti-money laundering law establishes the basic framework to prevent and punish money laundering as a crime. It prohibits the concealment or dissimulation of origin, location, availability, handling or ownership of assets, rights or financial resources directly or indirectly originated from crimes, subjecting the agents of these illegal practices to imprisonment, temporary disqualification from managing enterprises up to 10 years and monetary fines.
The Brazilian anti-money laundering law also created the Financial Activities Control Council, or COAF, which is the Brazilian financial intelligence unit that operates under the jurisdiction of the Ministry of Finance. COAF performs a key role in the Brazilian anti-money laundering and counter-terrorism financing system, and its legal responsibility is to coordinate the mechanisms for international cooperation and information exchange.
In compliance with the Brazilian anti-money laundering law and related regulations enacted by the Central Bank, including the rules applicable to procedures that must be adopted by financial institutions to prevent and combat money laundering and terrorism financing, as well as in response to the recommendation of the Financial Action Task Force – FATF and United Nations Security Council, financial institutions in Brazil must establish internal control and procedures aiming at:
| • | identifying and knowing their clients, which includes determining if they are PEPs, and also identifying the ultimate beneficial owners (UBO) of the transactions. These records should be kept up-to-date; |
| • | checking the compatibility between the movement of funds of a client and such client’s economic and financial capacity; |
| • | checking the origin of funds; |
| • | carrying out a prior analysis of new products and services, under the perspective of money laundering prevention; |
| • | keeping records of all transactions carried out or financial services provided on behalf of a certain client or for that client; |
| • | reporting to COAF, within one business day, any transaction deemed to be suspicious by the financial institution, as well as all transactions in cash equivalent to or higher than R$100,000, without informing the involved person or any third party; |
| • | applying special attention to (i) unusual transactions or proposed transactions with no apparent economic or legal bases; (ii) transactions involving PEPs, (iii) indication of evading client identification and transaction registering procedures; (iv) client and transactions for which the UBO cannot be identified; (v) transactions originated from or destined to countries that do not fully comply with the recommendations of the Financial Action Task Force (FATF); and (vi) situations in which it is not possible to keep the clients’ identification records duly updated; |
| • | determining criteria for hiring personnel and offering anti-money laundering training for employees; |
| • | establishing procedures to be complied with by all branches and subsidiaries of a Brazilian financial institutions located abroad with respect to anti-money laundering; |
| • | establishing that, any institutions authorized to operate in the Brazilian foreign exchange market with financial institutions located abroad must verify whether the foreign financial institution is physically located in the jurisdiction where it was organized and licensed, and that it is subject to effective supervision; |
A-109
| • | monitoring transactions and situations which could be considered suspicious for anti-money laundering purposes; |
| • | reporting to COAF the occurrence of suspicious transactions, as required under applicable regulations, and also, at least once a year, whether or not suspicious transactions are verified, in order to certify the non-occurrence of transactions subject to reporting to COAF (negative report); |
| • | requiring clients to inform the financial institution, at least one business day in advance, of their intention to withdraw amounts equal to or exceeding R$100,000; |
| • | ensuring that policies, procedures and internal controls are commensurate with the size and volume of transactions; and |
| • | unavailability of goods, values and rights of possession or ownership and all other rights, real or personal, owned, directly or indirectly, of natural or legal persons subject to sanctions by the resolutions of the United Nations Security Council. |
Non-compliance with any of the obligations above subjects the financial institution and its officers to penalties ranging from: (i) formal notice, (ii) fines (from 1.0% to 200.0% of the amount of the transaction, 200.0% of the profit generated thereby, or a fine of up to R$20,000,000), (iii) rendering executive officers ineligible for holding any management position in financial institutions, to (iv) the cancellation of the financial institution’s license to operate.
In August 2013, the Brazilian Association of Banks (Federação Brasileira de Bancos, or FEBRABAN) enacted an anti-money laundering and terrorism financing self-regulation. The purpose of the document is to improve the contribution of the Brazilian financial system to the prevention of money laundering and make consistent the practices adopted by all banks, encouraging them to reinforce their preventive procedures.
Politically exposed persons (PEPs)
PEPs are public agents who hold or have held a relevant public position, as well as their representatives, family members or other close associates, over the past five years, in Brazil or other countries, territories and foreign jurisdictions. It also includes their legal entities. Financial institutions must develop and implement internal procedures to identify PEPs and obtain special approval from a more senior staff member, such as an officer, than otherwise would be required to approve relationships prior to establishing any relationship with those individuals. They should also adopt reinforced and continuous surveillance actions regarding transactions with PEPs and report all suspicious transactions to COAF.
Portability of credit transactions
The portability of credit transactions is regulated by the Central Bank since 2013. Portability consists of the transfer of a credit transaction from the original creditor to another institution, at the request of the debtor, maintaining the same outstanding balance and payment conditions. The regulation establishes standard procedures and deadlines for the exchange of information and the mandatory use of an electronic system authorized by the Central Bank for the transfer of funds between financial institutions, prohibiting the use of any alternative procedure to produce the same effects of the portability, including so-called “debt purchases”.
Rules governing the charge of fees on banking and credit card operations
Banking fees and credit card operations are extensively regulated by the CMN and the Central Bank. According to Brazilian legislation, we must classify the services we provide to individuals under pre-determined categories and are subject to limitations on the collection of fees for such services.
Brazilian financial institutions are generally not authorized to charge fees from individuals for providing services classified as “essential” with respect to checking and saving accounts, such as supplying debit cards, check books, withdrawals, statements and transfers, among others.
Brazilian legislation also authorizes financial institutions to charge fees related to “priority services”, a standard set of services defined by Central Bank regulation. Financial institutions must offer to their individual clients “standard packages” of priority services. Clients may also choose between these or other packages offered by the financial institution, or to use and pay for services individually instead of selecting a package.
Current rules also authorize financial institutions to charge fees for specific services called “additional services” (serviços diferenciados), provided that the account holder or user is informed of the use and payment conditions relating to such services, or that fees and collection methods are defined in the contract.
CMN also establishes rules applicable to credit cards, determining the events that allow for the collection of fees by issuers, as well as the information that must be disclosed in credit card statements and in the credit card agreement. There is also a list of priority services. The rules define two types of credit cards: (i) basic credit cards, with simpler services, without rewards programs and (ii) “special credit cards”, with benefits and reward programs. A minimum of 15% of the total outstanding credit card balance must be paid monthly by credit card holders.
A minimum 30-day prior notice to the public must precede the creation or increase of a fee, whereas fees related to priority services may only be increased 180 days after the date of a previous increase (while the reduction of a fee can take place at any time). With respect to credit cards, a 45-day prior notice to the public is required for any increase or creation of fees, and
A-110
such fees may only be increased 365 days after a previous increase. The period of 365 days is also subject to changes in the rules applicable to benefit or reward programs.
At the end of 2016 and the beginning of 2017, two major changes occurred in the Brazilian payment market. In December 2016 a provisional measure was published authorizing the surcharge by payment instrument as a way to stimulate retail sales, allowing retailers to charge different prices depending on the payment method. In January 2017 the Central Bank published a new resolution establishing that debits made with credit cards cannot have a revolving credit feature for more than one payment period. Financial institutions may offer to those clients an installment credit with lower interest rates than the revolving credit line.
Leasing regulation
Although leasing transactions are not classified as credit transactions under Brazilian legislation, the Central Bank of Brazil regulates and oversees leasing transactions. The parties involved in a leasing transaction are the “lessor” (the bank) and “lessee” (our client). The leased asset, owned by the lessor, is delivered to be used by the lessee until the end of the contract, when the lessee may opt to either acquire or return it to the lessor or renew the contract for a new period.
Brazilian legislation establishes a specific methodology to account for the profits or losses in leasing transactions and all information that should be included in a lease agreement. The guaranteed residual amount paid by a lessee should correspond to a minimum return required for the transaction to be viable for the lessor, whether the purchase option is exercised or not. The laws and regulations applicable to financial institutions, such as those related to reporting requirements, capital adequacy and leverage, assets composition limits and allowance for losses, are also generally applicable to leasing companies.
Correspondent agents
We may engage other entities to provide certain services to our clients, including customer service. These entities are generally called correspondents, and our relationship with correspondents is regulated by the Central Bank. Among other requirements, the Central Bank establishes that employees of all correspondent agents must hold a technical certification authorizing them to serve customers involved in credit and leasing operations.
Banking secrecy
Brazilian financial institutions must maintain the secrecy of banking transactions and services provided to their clients. The only circumstances in which information about clients, services or transactions by Brazilian financial institutions or credit card companies may be disclosed to third parties are the following:
| • | the disclosure of information with the express consent of the interested parties; |
| • | the exchange of information between financial institutions for record purposes; |
| • | the disclosure of information to credit reference agencies based on data from the records of subscribers of checks drawn on accounts without sufficient funds and defaulting debtors; |
| • | the disclosure of information to the competent authorities relating to the actual or suspected occurrence of criminal acts or administrative wrongdoings, including the disclosure of information on transactions involving funds related to any unlawful activities; |
| • | the disclosure of some information established by law to tax authority; and |
| • | the disclosure of information in compliance with a judicial order. |
Except as permitted under the Brazilian legislation or by judicial order, a breach of bank secrecy is a criminal offense.
Digitalization of documents and record keeping
On March 31, 2016, CMN enacted a new resolution regulating the digitalization of documents with respect to transactions carried out by financial institutions and other institutions authorized to operate by the Central Bank. The regulation authorizes those institutions to maintain digital documents, instead of paper documents, for recordkeeping purposes, if certain requirements to ensure the documents authenticity, validity and protection are met. It also permits the disposal of original paper documents provided that this measure will not prejudice the institution’s ability to exercise any rights or to commence any proceeding or exercise any protective remedy related to the relevant document.
Ombudsman
In 2015, CMN and Central Bank updated the regulation about the Ombudsman’s Office for Financial Institutions subject to supervision. The Ombudsman’s Office has been mandatory since 2007 and is the main channel of customer assistance and mediation of conflicts monitored by the Central Bank.
In this update, the main duties of the Ombudsman’s Office were reinforced, to continue acting as a last resource within the company to resolve clients’ demands between clients and the institution, and to attend to complaints not resolved in our primary channels.
A-111
Every six months, the Ombudsman has to prepare a report about the most critical complaints, root cause analysis and action plans to improve customer experience. This report is submitted to upper management and audit committee, as well as to Central Bank.
The revised standard reduced SLAs from 15 to a maximum of 10 days from client’s complaints. It also demanded more transparency and highlight to contact information, telephone number for access to the Ombudsman’s Office on the internet and the need to publish a public report on the Ombudsman’s work.
Itaú Unibanco has been in compliance since the mandatory date of June 30, 2016.
Regulation of the brazilian securities market
According to the Brazilian Corporate Law, a company is considered publicly-traded or closely-held depending on whether the securities issued by it are accepted for trading in the securities market or not. All publicly-held companies, such as our company, are registered with CVM and are subject to information disclosure and reporting requirements.
Disclosure requirements
Under CVM rules, publicly-traded companies are subject to disclosure requirements and rules governing the use of material information. Any decision that may reasonably influence the price of the securities issued by a publicly-held company or the decision of investors to buy, sell, or hold these securities, is considered material.
CVM improved the quality of the information that must be presented in periodic filings by securities issuers by requiring such issuers to register a “Reference Form” in its files. This form was modeled after IOSCO’s shelf registration system in gathering all of the issuer’s information in a single document.
Asset management regulation
The Brazilian asset management regulation requires a previous registration with CVM to perform the services of portfolio management and fund administration.
Itaú Unibanco Group provides several services in the capital markets and, in particular, performs activities related to fund administration and portfolio management under CVM registration and in accordance with CVM regulation.
By providing these services, our entities engaged in the asset management business can be held civilly and administratively liable for losses arising from either intentional acts or negligence in conducting their activities.
CVM has regulatory powers to oversee these activities, including powers to impose fines and other sanctions on registered asset managers.
Funds of foreign investors
In March 2015, a new regulatory framework issued by CMN and CVM became effective regarding (i) foreign investment in the Brazilian financial and capital markets and (ii) depositary receipts.
The most significant changes in the rules applicable to foreign investment in the Brazilian financial and capital markets introduced by the new regulation are: (i) a requirement that only financial institutions authorized to operate in Brazil may act as legal representatives of non-resident investors in Brazil for purposes of any investments made within the purview of such rule; (ii) clarification of requirements regarding simultaneous foreign exchange transactions (without the effective transfer of money) related to foreign investments; and (iii) clarification about the types of investments that can be made through a foreign investor account (conta de domiciliado no exterior) maintained at a bank in Brazil.
The new regulation also amended the rules applicable to depositary receipts, by allowing the issuance of depositary receipts based on (i) any security issued by Brazilian companies registered with CVM (companhias abertas), in contrast to the previous rules which limited the issuance of depository receipts to equity securities, and (ii) credit instruments issued by financial institutions and other types of institutions registered with CVM and authorized by the Central Bank, and eligible to be included in the financial institution’s regulatory capital (Patrimônio de Referência).
Some of the changes implemented by CVM rules on registry, operations and disclosure of information related to foreign investment in the Brazilian financial and capital markets were made to detail the activities of legal representatives, to enlarge the scope of non-resident investor´s private transactions and to determine the exceptions of transfer between non-resident investors prohibited by CMN.
Internet and e-commerce regulation
Certain aspects of electronic commerce are regulated, including the validity of electronic documents in Brazil and electronic commerce transactions from the consumer protection standpoint. Current regulation on electronic commerce is intended to: (i) clearly identify the supplier and the product sold on the internet; (ii) provide an electronic service channel to clients; and (iii) guarantee cancellation and return of internet orders.
In addition, computer hacking offenses were criminalized in Brazil in 2012.
A-112
In light of the increased use of electronic channels in the Brazilian banking industry, CMN has enacted a number of resolutions over the past few years in order to provide or establish:
| • | that Brazilian residents may open deposit bank accounts by electronic means, which includes the internet, ATMs, telephone and other communication channels, provided that transfers of amounts from such accounts are allowed only between accounts of the same account holder or in the event of liquidation of investment products and funds of an account, of the same account holders who own the investment products or funds; |
| • | the requirements related to the verification of a client’s identity; |
| • | that all financial institutions that offer products and services through electronic means must guarantee the security, secrecy and reliability of all electronic transactions and disclose, in clear and precise terms, the risks and responsibilities involving the product or service acquired through these channels; and |
| • | the opening of deposit bank and savings accounts that can be used exclusively through electronic means. |
On April 25, 2016, CMN enacted a regulation on the opening and closing of banking accounts by electronic means, without the restrictions described above. Banks must adopt procedures and controls to confirm and guarantee the client’s identity and the authenticity of the information required to open an account. The regulation permits the use of digital signatures and the collection of signatures through electronic devices. The procedures and technologies used in the opening and closing of electronically deposit accounts must observe:
I - integrity, authenticity and confidentiality of the information and electronic documents used;
II - protection against access, use, modification, reproduction and unauthorized destruction of information and electronic documents;
III - backup production of information and electronic documents; and
IV - tracking and auditing procedures and technologies used in the process.
Under the new regulation, customers must be afforded the option of closing banking accounts electronically.
Federal Law No. 12,965/2014 and Federal No. Decree 8,771/2016 establish the regulatory framework for internet services in Brazil and set forth principles and rules to be observed by internet providers and users, including the protection of privacy and personal data and the preservation and safeguard of net neutrality.
FEBRABAN, the Brazilian Federation of Banks, has issued a regulation on extending credit through remote channels (such as ATMs, call centers and internet banking), setting forth minimum guidelines and procedures to ensure reliability, quality, transparency and efficiency.
Regulation on payment Agents and payment arrangements
A Brazilian law enacted in October 2013 establishes the legal framework for “payment arrangements” (i.e., the set of rules governing a payment scheme, such as a credit or debit card transaction), and “payment agents” (i.e., any agent that issues a payment instrument or acquires a merchant for payment acceptance), which became part of the Brazilian Payments System and subject to oversight by the Central Bank. Payment agents, in spite of being regulated by the Central Bank, are not deemed to be financial institutions and are prohibited from engaging in activities that are exclusive of financial institutions.
CMN and the Central Bank published rules in November 2013 regulating payment arrangements and payment agents. This regulation establishes, among other matters: (i) consumer protection and anti-money laundering compliance and loss prevention rules that should be followed by all entities supervised by the Central Bank when acting as payment agents and payment arrangers; (ii) the procedures for the incorporation, organization, authorization and operation of payment agents, as well for the transfer of control, subject to the Central Bank’s prior approval; (iii) capital requirements; (iv) definition of arrangements excluded from the Brazilian Payments System; (v) payment accounts, which are divided into prepaid and post-paid accounts; and (vi) a liquidity requirement for prepaid accounts that demands the allocation of their balance to a special account at the Central Bank or to be invested in government bonds, starting at 20% in 2014 and raising gradually up to the totality of the total account balance in 2019.
In October 2015, a regulation was published by the Central Bank regulating limitations on closed payment arrangements, the concept of domicile institution, obligation of centralized clearing and settlement for the payment arrangements, and transparency of interoperability rules within an arrangement and between arrangements.
Provision of financial services through electronic channels
On April 25, 2016, CMN enacted a new regulation, altering the exceptions to the general rule that obligates financial institutions to provide client access to traditional banking services channels, establishing that it is not required for collection and receipt services based on agreements that demand exclusively electronic channels.
A-113
Credit performance information
Brazilian law establishes rules for the organization and consultation of databases compiling positive credit history information of individuals and legal entities. The Central Bank regulates the provision of positive credit history information by financial institutions to such databases and the sharing of such information, such provision and sharing being subject to the express request or authorization of the client.
Consumer Protection Code
The Brazilian Consumer Protection Code (CDC) sets forth consumer defense and protection rules applicable to consumers’ relationships with suppliers of products or services. Brazilian higher courts understand that the CDC is also applicable to financial institutions.
The basic consumer rights dealing with financial institutions are as follows:
| • | reverse burden of proof in court; |
| • | financial institutions must ensure that proper and clear information is provided with respect to the different products and services offered, with accurate specifications for quantity, characteristics, composition, quality, and price, as well as on any risks such products pose; |
| • | financial institutions are prohibited from releasing misleading or abusive publicity or information about their contracts or services, as well as promoting overbearing or disloyal commercial practices; |
| • | financial institutions are liable for any damages caused to their consumers by misrepresentations in their publicity or information provided; |
| • | interest charged in connection with personal credit and consumer directed credit transactions must be proportionally reduced in case of early payment of debts; |
| • | collection of credits cannot expose the client to embarrassment or be performed in a threatening manner; and |
| • | amounts charged improperly may in limited circumstances have to be returned in an amount equal to twice what was paid in excess of due amounts. Such rule does not apply to cases of justifiable mistake, such as systemic failure or operational error. |
Moreover, the Brazilian Congress is considering enacting legislation that, if signed into law as currently proposed, could have an adverse effect on us. For example, a proposed law to amend the Brazilian consumer protection code would allow courts to modify terms and conditions of credit agreements in certain circumstances, imposing specified restrictions on the collection of amounts from final consumers. In addition, local or state legislatures may, from time to time, consider bills intending to impose security measures and standards for customer services, such as limits in queues and accessibility requirements, that, if signed into law, could affect our operations. More recently, certain bills have passed (and others have been proposed) in certain Brazilian states or municipalities that impose, or aim to impose, restrictions on the ability of creditors to include the information about insolvent debtors in the records of credit protection bureaus, which could also adversely affect our ability to collect credit outstanding.
Regulation of independent auditors
In accordance with CMN regulation establishing the rules that govern external audit services provided to financial institutions, the financial statements and financial information of financial institutions must be audited by independent auditors who are (i) duly registered with CVM; (ii) qualified as specialists in audit of banks by the CFC and the IBRACON; and (iii) meet the requirements that ensure auditor independence.
After issuing audit reports for five consecutive fiscal years, the responsible audit partner and audit team members with management responsibilities must rotate-off and cannot be part of the audit team of such institution for three consecutive fiscal years.
CMN regulation also prohibits the engagement and maintenance of independent auditors by financial institutions in the event that: (i) any of the circumstances of impediment or incompatibility for the provision of audit services provided for in the rules and regulations of CVM, CFC or IBRACON arise; (ii) ownership of shares of or entering into financial transactions (either asset or liability) with the audited financial institution by the audit firm or members of the audit team involved in the audit work of the financial institution; and (iii) fees payable by the institution represent 25% or more of the total annual fees of the audit firm. Additionally, the audited financial institution is prohibited from hiring partners and members of the audit team with managerial responsibilities who were involved in the audit work at the financial institution during the preceding 12 months.
In addition to the audit report, the independent auditor must prepare the following reports, as required by CMN regulation.
| • | an assessment of the internal controls and risk management procedures of the financial institution, including its electronic data processing system; |
| • | a description of non-compliance with legal and regulatory provisions that have, or may have, a significant impact on the audited financial statements or operations of the audited financial institution; and |
| • | others reports required by Central Bank. |
A-114
These reports, as well as working papers, correspondence, service agreements and other documents related to the audit work must retained and made available to the Central Bank for at least five years.
Under Brazilian law, our financial statements must be prepared in accordance with the accounting practices adopted in Brazil applicable to institutions authorized to operate by the Central Bank. We also prepare financial statements in accordance with the International Financial Reporting Standards (IFRS) as issued by IASB. Please refer to Context, item Context of this report, About our financial information for further details. Financial institutions must have their financial statements audited every six months. Quarterly financial statements filed with CVM must be reviewed by independent auditors of the financial institutions. CVM rules require publicly-held companies, including financial institutions, to disclose information related to non-audit services provided by independent auditors when they represent more than 5% of the fees for audit services. Such information should include the type of service, the amount paid and the percentage that they represent of the fees for audit of financial statements. Please refer to Our governance, item Audit Committee, for further details about fees and services of the main auditors.
Self regulators
We are signatories of self-regulation codes that establish principles, rules and recommendations of best corporate governance practices and determined activities, as applicable. The self-regulatory entities that we are subject to are: Brazilian Association of Publicly-Held Companies (ABRASCA), Brazilian Association of Credit Cards and Services Companies (ABECS), Brazilian Financial and Capital Markets Association (ANBIMA), Brazilian Federation of Banks (FEBRABAN), amongst others.
Taxation
We summarize below the main taxes levied on the transactions entered into by entities in the Itaú Unibanco Group in Brazil. This description does not represent a comprehensive analysis of all tax considerations applicable to the Itaú Unibanco Group. For a more in-depth analysis, we recommend that potential investors consult their own tax advisors. The main taxes we are subject to, with respective rates, are as follows:
| Tax | Rate | Tax calculation basis | ||
| IRPJ (Corporate Income Tax) | 15.0% plus a 10.0% surtax | Net income with adjustments (exclusions, additions, and deductions) | ||
| CSLL (Social Contribution on Net Income) | 20.0% (financial institutions, insurance companies and capitalization entities) or 9.0% (other Itaú Unibanco Group companies) | Net income with adjustments (exclusions, additions, and deductions) | ||
| COFINS (Social Security Financing Contribution) | 4.0% (financial institutions, insurance companies and capitalization entities) or 7.6% (other Itaú Unibanco Group companies) | Gross revenue minus specific deductions | ||
| PIS (Contribution on Social Integration Program) | 0.65% (financial institutions, insurance companies and capitalization entities) or 1.65% (other Itaú Unibanco Group companies) | Gross revenue minus specific deductions | ||
| ISS (Service Tax) | 2.0% to 5.0% | Price of service rendered | ||
| IOF (Tax on Financial Transactions) | Depends on the type of the transaction, as described below. | Transaction nominal value |
Corporate income tax and social contribution on net income
In accordance with applicable legislation, corporate income tax (Imposto de Renda da Pessoa Jurídica, or IRPJ), and social contribution on profits (Contribuição Social Sobre o Lucro Líquido, or CSLL) are determined by the taxable income regime. Under this regime, our taxable income, on which IRPJ and CSLL will be levied, must be adjusted by additions, deductions, and exclusions, such as nondeductible expenses, operating costs and equity accounting, respectively.
The IRPJ is levied at a basic 15.0% rate, and a 10.0% surtax is applicable when the total amount of profit for the fiscal period exceeds R$20,000 per month or R$240,000 per year. In other words, any portion of our profit exceeding this limit is taxed at an effective 25.0% rate.
A-115
CSLL is currently levied on our taxable income at a 20.0% rate, which is specific for financial institutions, insurance and similar companies. Note that this tax is generally levied at a 9.0% for non-financial legal entities. Nonetheless, the Federal Government increased such a rate initially to 15.0%, and then to 20.0%. Despite such increase, some Brazilian financial institutions, including us, are disputing the constitutionality of this higher CSLL tax rate. The amounts in dispute are accounted for as a tax liability provision in our balance sheet. In regard to this matter, it is worth mentioning that on the same rule that increased CSLL from 15.0% to 20.0% (Law 13,169), the Federal Government also determined that, as from January 1, 2019, the CSLL rate will be reduced to 15.0%.
As other Brazilian legal entities, our companies may offset the historical nominal amount of tax losses determined in prior years against results of subsequent years at any time (i.e., with no limitations with respect to time periods), provided that such offsetting does not exceed 30.0% of the annual taxable income of such future year. For purposes of IRPJ and CSLL taxation, companies should consider their income abroad as well rather than income solely from Brazilian operations. Therefore, profits, capital gains and other income earned abroad by Itaú Unibanco Group entities in Brazil, their branches, representations, affiliates or subsidiaries, will also be computed for determination of the entities net income. However, Brazilian legislation provides for our deducting the amounts paid as corporate income tax abroad against the IRPJ due in Brazil and CSLL, provided certain limits are observed.
Income tax for individuals and foreign investors
On September 22, 2015, the President of Brazil enacted Provisional Measure No. 692, or MP 692, converted into Law No. 13,259 of March 16, 2016, which aimed at increasing the flat 15% rate of the income tax levied on capital gains derived by individuals, certain corporations and foreign investors (individuals and corporations) as a result of the disposal of assets and rights in general exceeding R$5 million, by adopting a system of progressive rates that may reach a 22.5% tax rate (for positive results exceeding R$30 million). Since capital gains arising from transactions executed through a securities exchange are subject to specific tax rules, which are not included under the scope of Law No. 13,259, it is possible to sustain the position that the provisions of this rule should not apply to such transactions. This rule applies since January 1, 2017. If the stockholder is a resident of or domiciled in a tax haven jurisdiction or a privileged tax regime, the capital gains are still subject to the withholding income tax at a 25% rate.
Contribution on social integration program and social security financing contribution
In addition to IRPJ and CSLL, Brazilian legal entities are subject to the following taxes on revenue: contribution on social integration program (Contribuição Para o Programa da Integração Social, or PIS) and social security financing contribution (ContribuiçãoSocial Para o Financiamento da Seguridade Social, or COFINS).
In accordance with applicable legislation, financial institutions are subject to the cumulative regime for calculation of these taxes. Under the cumulative regime, financial institutions are required to pay PIS at a 0.65% rate and COFINS at a 4.0% rate. The cumulative regime provides for rates lower than those levied under the non-cumulative regime, which is explained below, but it prevents the use of tax credits.
Some additional deductions are legally permitted to financial institutions, and therefore the calculation basis is similar to the profit margin. Some of our subsidiaries claim that the PIS and COFINS should be levied only on their revenue from the sale of products and services, rather than on the revenues from financial and other activities. The amounts in dispute are accounted for as tax contingencies in the balance sheets of these companies.
Most non-financial companies, on the other hand, are authorized to pay PIS and COFINS contributions according to the non-cumulative regime. Under the non-cumulative regime, PIS is levied at a 1.65% rate and COFINS is levied at a 7.6% rate. The calculation basis of these taxes is the gross revenue earned by the entity; however, the taxpayer may offset credits calculated through the application of the same rates on the value paid on the purchase of certain inputs used in the entity’s production process. Currently, under such non-cumulative regime, the financial income of non-financial companies is subject to PIS and COFINS at the rate of 0.65% and 4%, respectively, except for income from interest on capital, wich is subjected to PIS and COFINS at the rate of 1.65% and 7.6%, respectively.
Service tax
The tax on services (Imposto Sobre Serviços de Qualquer Natureza, or ISS) is generally levied on the price of services rendered (e.g., banking services) and is charged by the municipality where our branch or office rendering the service is located. The tax rates vary from 2.0% up to the maximum rate of 5.0%, depending on the municipality in which the service is provided and its respective nature.
A new tax law enacted on December 30, 2016 effected a number of changes with respect to the Brazilian tax on service ISS. Among a series of modifications to the ISS, the new law introduced a minimum tax rate of 2%. The original proposed legislation approved by the Brazilian Congress provided changes related to ISS assessment on new activities such as credit card and leasing operations but the President vetoed these changes. Following the legislative procedure, there is a possibility that the Brazilian Congress overturns the presidential veto.
A-116
Tax on financial transactions
The tax on financial transactions is levied at specific rates according to the transaction in question, and may be changed by a decree from the executive branch (which may become effective as of its publication date), rather than by a law enacted by the Brazilian Congress.
The following table summarizes the main IOF rates levied on our transactions. Notwithstanding, we note that IOF is a very comprehensive tax. Therefore, for a more in-depth analysis, we recommend that tax advisors be consulted accordingly.
| Typeof transaction | Applicable Rates(Rates may be changed by a decree enacted by the Brazilian government up to amaximum rate, as described below, which may become effective as of its publicationdate) | |
| Foreign exchange transactions | IOF/FX: zero to 6.38% (depending on the transaction) Maximum rate: 25% | |
| Insurance transactions | IOF/Insurance: zero to 7.38% Maximum rate: 25% | |
| Loans and credit transactions | IOF/Credit: 0.0082% (individual) or 0.0041% (legal entities) per day, until it reaches 365 days, plus a flat 0.38% rate Maximum rate: 1.5% per day | |
| Securities | IOF/Securities: zero to 1.5% as a general rule (possible to be higher) Maximum rate: 1.5% per day | |
| Securities – Derivatives | IOF/Securities - Derivatives: zero Maximum rate: 25% |
U.S. Foreign Account Tax Compliance Act (FATCA)
FATCA attempts to minimize tax avoidance by U.S. persons investing in foreign assets both through their own accounts and through their investments in foreign entities. FATCA requires U.S. withholding agents such as Itaú to provide information to the U.S. Internal Revenue Service (IRS) regarding their U.S. account holders including substantial U.S. owners of certain Non-Financial Foreign Entities (NFFEs) and specified U.S. persons having an interest in certain professionally managed investment vehicles and trusts known as owner-documented foreign financial institutions (FFIs).
To the extent a U.S. withholding agent is not able to properly document an account, it generally will be required to deduct 30% FATCA withholding on certain payments of U.S. source income. Gross proceeds from the sale of property that would yield U.S. source dividends or interest are subject to withholding beginning January 1, 2019.
U.S. tax law has detailed rules for determining the source of income. Different rules apply for each type of income. Interest and dividends, two of the most common types of income for investors, are generally sourced by reference to the residence of the obligor. Specifically, dividends are generally treated as U.S. source income when paid by a U.S. corporation with respect to its stock, and interest is generally treated as U.S. source income when paid by a U.S. borrower of money.
The United States collaborated with other governments to develop Intergovernmental Agreements (IGAs) to implement FATCA. IGAs with partner jurisdictions facilitate the effective and efficient implementation of FATCA. The purpose of these agreements is essentially to remove domestic legal impediments to compliance with FATCA and sharing of information and to reduce burdens on FFIs located in partner jurisdictions.
More than 70 jurisdictions have signed an IGA, including Brazil, the Cayman Islands, Switzerland and United Kingdom. In addition, approximately 30 other jurisdictions are deemed as having an IGA in effect. Some countries signed a reciprocal agreement, meaning that the country (such as Brazil) and the United States will automatically exchange annually, on a reciprocal basis, specific account holder information.
There are two types of IGAs – Model 1 IGA, where local FFIs are required to implement account opening and due diligence procedures to identify U.S. accounts and report them to the local tax authority for exchange with the IRS (examples of Model 1 IGA countries are Brazil, Cayman Islands, The Bahamas, Peru and Colombia), and Model 2 IGA, where local FFIs are required to implement account opening and due diligence procedures to identify U.S. accounts, but report such information directly to the IRS (examples of Model 2 IGA countries are Switzerland, Chile, Paraguay and Japan).
The governments of Brazil and the United States entered into a Model 1 IGA on September 23, 2014, which became effective in Brazil on August 24, 2015, after the approval by the Brazilian Congress, ratification by the President and enactment of Decree 8,506 (IGA-BR).
Under the IGA-BR, Brazilian financial institutions and other entities subject to FATCA disclosure requirements are generally required to provide certain information on their U.S. account holders to the Brazilian tax authorities, which will share this information with the U.S. Internal Revenue Service.
A-117
Furthermore, Normative Ruling No. 1,680, dated December 28, 2016, was enacted to introduce the so-called Common Reporting Standard (CRS) in Brazil, which seeks to implement a system of reporting financial accounts in a manner similar to FATCA. CRS is the result of discussions on the necessity of exchanging information between tax authorities of many countries in the context of the Base Erosion and Profit Shifting (BEPS) Project, coordinated by the Organization for Economic Co-operation and Development (OECD). In connection therewith, an ancillary obligation called “e-financeira” provided by Normative Ruling No. 1,571, dated July 2, 2016, will be the mandatory report filed by financial institutions in order to fulfill FATCA and CRS obligations.
Moreover, on May 6, 2016, Brazilian tax authorities issued Normative Ruling No. 1,634, effective as of January 1, 2017, that amended the regulation applicable to the National Registry of Legal Entities (CNPJ). This regulation introduced a new rule providing an ancillary obligation by which certain entities have to indicate the “Final Beneficiary” in each CNPJ, which is defined as the natural person who ultimately, directly or indirectly, owns, controls or significantly influences a particular entity or on whose behalf a transaction is conducted.
In addition, Normative Ruling No. 1,681 was enacted in December 28, 2016 providing the obligation to annually deliver the so-called Country-by-Country Statement, an ancillary obligation also arising from the discussions under the BEPS Project, before the Brazilian Federal Revenue Service (RFB), which in its turn is also expected to exchange such information with other countries’ tax authorities.
Pursuant to FATCA, the issuer, any other financial institution or other entities subject to FATCA disclosure requirements to or through which any payment with respect to the preferred shares or ADSs is made may be required, pursuant to the IGA-BR or under applicable law, to (i) request certain information from holders or beneficial owners of our preferred shares or ADSs, which information may be provided to the U.S. Internal Revenue Service; and (ii) withhold U.S. federal tax at a 30.0% rate on some portion or all of the payments considered “pass-thru payments” made after December 31, 2018, with respect to the preferred shares or ADSs if such information is not duly provided by such a holder or beneficial owner (referred to under FATCA as a “recalcitrant account holder”). If the issuer or any other person is required to withhold amounts under or in connection with FATCA from any payments made in respect of the preferred shares or ADSs, holders and beneficial owners of the preferred shares or ADSs will not be entitled to receive any gross up or other additional amounts to compensate them for such withholding.
The above description is based on guidance issued to date by the U.S. Treasury Department, including the final U.S. Treasury regulations and IGA-BR. Future guidance may affect the application of FATCA to the preferred shares or ADSs.
Individuals or legal entities domiciled outside Brazil may own our stock through ADSs negotiated in a U.S. Exchange or through direct investments in the Brazilian Market.
However, the right to convert dividend payments and proceeds from the sale of our shares in the Brazilian Market, into foreign currency and to remit such amounts abroad is subject to restrictions under foreign investment and foreign currency legislation. This legislation generally requires, among other things, documentary evidence that establishes the validity and the economic legitimacy of the exchange operation and that the relevant investment has registered with the Central Bank and CVM, as applicable.
In case the investment in our stock is made through ADS, the ADS holders benefit from the electronic certificate of foreign capital registration obtained in Brazil by the custodian of preferred shares underlying the ADSs, which permits the depositary bank to convert dividends and other distributions with respect to the preferred shares underlying the ADSs into foreign currency and remit the proceeds abroad.
In case the investment in our stock is made directly in the Brazilian market, such investment needs to be registered with the Central Bank either as (i) a foreign direct investment, the Electronic Declaratory Registration of Foreign Direct Investment (RDE-IED), or (ii) a portfolio investment, the Electronic Declaratory Registration of Portfolio (RDE – Portfolio).
The foreign direct investment (RDE-IED) enables non-resident investors to hold stock of companies, although it, limits the ability of the investor to negotiate such stocks in the Brazilian capital markets. On the other hand, the portfolio investment (RDE – Portfolio) entitles certain foreign investors to invest not only in stocks, but also in other financial assets and securities, and to engage in a variety of transactions available in the Brazilian financial and capital markets, provided that certain requirements of the regulation are fulfilled.
Registration under RDE – Portfolio affords favorable tax treatment to non-resident investors who are not residents or domiciled in tax haven jurisdictions, as defined by Brazilian tax laws.
A-118
Message from the Chief Finance Officer
Dear reader,
At Itaú Unibanco, we work to maintain a sustainable performance for the purpose of creating value to our many stakeholders. To this end, we seek a transparent and close relationship with our clients, commercial partners, stockholders, investors and agents from the capital markets, reporting, in a timely manner, our results, risks and strategies.
In order to become increasingly more accessible to the market, we invest in many communication initiatives. Some years ago, we combined our annual report, form 20-F, sustainability report and debt prospect in this Consolidated Annual Report so as to centralize and homogenize the way we present the bank’s relevant information. In 2016, we held 16 public meetings about our results, strategies and prospects through APIMEC (Association of Capital Markets Analysts and Investment Professionals) and we participated in 30 conferences and 9 road shows, in Brazil and abroad.
This report includes the history of the bank, its strategies, main businesses, risks and results over six sections. I invite you all to get to know a little bit more about the changes in the structure of our Executive Committee and its members in the Our Governance section. In the section on risk management, you can learn more about our Risk Culture, an important instrument to ensure that all our employees take conscious risks. Together with our policies, procedures and processes, our Risk Culture strengthens the individual and collective responsibility of all employees in the management of the risks inherent to the performed activities. Also in this section, we describe our risk factors, which represent the main events that could significantly affect our business.
In the section on Performance, I invite you all to understand, in detail, the financial performance of Itaú Unibanco in 2016, which is presented in accordance with the International Financial Reporting Standards (IFRS). In it you will find the result of the application of the strategy described throughout this report by means of our main figures.
Today, we are the largest private bank in Latin America and one of the world’s 20 largest financial institutions in market value. We are present in 19 countries with a staff of more than 90,000 employees who work for the satisfaction of our clients. We have new challenges ahead of us and they encourage us to continue to build an increasingly more sustainable, transparent and technological bank.
In November 2016, we announced a number of changes to the bank’s Executive Committee, including my own appointment to the position of General Wholesale Officer. I wish Caio Ibrahim David, who takes over as CFO and CRO of Itaú Unibanco Holding, a great deal of success in his new journey.
Our team is always at the disposal of anyone interested in getting to know the bank better by means of the following communication channels: Investor Relations website (www.itau.com.br/relacoes-com-investidores) and our pages on Facebook (facebook.com/itauunibancori) and Twitter (@itauunibanco_ri). We appreciate any suggestions received in the e-mail address: relacoes.investidores@itau-unibanco.com.br.
I wish you all a good reading.
Best regards,
Eduardo Vassimon
CFO & CRO in 2016
A-119
Significant accounting policies
General information
The preparation of the consolidated financial statements included in this Consolidated Annual Report involves some assumptions that are based on our historical experience and other factors that we deem reasonable and material. Although we review these estimates and assumptions in the ordinary course of business, the presentation of our financial condition and results of operations often requires our management to make judgments regarding the effects on our financial condition and results of operations of matters that are uncertain by nature. The comments below describe those aspects that require significant judgment or involve a higher degree of complexity in the application of the accounting. Actual results may differ from those estimated under different variables, assumptions or conditions.
Use of estimates and assumptions
The preparation of complete financial statements in accordance with IFRS requires management to make estimates and assumptions that affect the reported amounts of assets and liabilities at the date of the complete financial statements, as well as the reported amounts of revenue, expenses and gains and losses during the reporting period because the actual results may differ from those determined based on such estimates and assumptions.
All estimates and assumptions made by management are in accordance with IFRS and represent our best estimates made in conformity with applicable standards. Estimates and judgments are evaluated on an ongoing basis, based on past experience and other factors.
Please refer to section Performance, item Complete Financial Statements (IFRS), Note 2.3 – Critical Accounting Estimates and Judments, for further details.
Allowance for loan and lease losses
The allowance for loan and lease losses represents our estimate of the probable losses inherent to our loan portfolio at the end of each reporting period. In order to determine the amount of the allowance for loan and lease losses, a portfolio is classified into two categories with respect to which specific methodologies are used to estimate losses. Loans and leases are analyzed on an individual or portfolio basis.
| • | Loans and leases analyzed on an individual basis (corresponding to our corporate portfolio) are individually analyzed for impairment. For those considered to be impaired, we determine the amount of the allowance based on the expected cash flows that the company that will receive from the loan. The loans analyzed on an individual basis that are not impaired are rated based on risk factors, and the inherent losses for each rating are estimated based on our historical experience, which involves judgments related to identifying risk factors and assigning a rating. |
| • | Loans analyzed on a portfolio basis (corresponding to the following portfolios: (i) Individuals, (ii) Very Small, Small and Medium Business and (iii) Foreign Units – Latin America) are further segregated into classes, when appropriate, based on their underlying risks and characteristics. The allowance for loan and lease losses is determined by portfolio based on historical experience, which also involves judgments and assumptions. |
Many factors affect the estimate of losses in each of the categories for which we estimate the allowance on a portfolio basis, such as the methodology used to measure historical delinquency and the historical period to be used. Additionally, factors affecting the specific amount of the allowances to be recorded are subjective and include economic and political conditions, credit quality trends and volume and growth observed in each portfolio. We present information on our allowance for loan and lease losses in the following table:
A-120
| Allowance for Loan and Leases Losses | 12/31/2016 | 12/31/2015 | 12/31/2014 | 12/31/2013 | 12/31/2012 | |||||||||||||||
| (In millions of R$, except percentages) | ||||||||||||||||||||
| Amount Recognized in the Balance Sheet at the beginning of period | 26,844 | 22,392 | 22,235 | 25,713 | 23,873 | |||||||||||||||
| Write-offs | (24,251 | ) | (20,065 | ) | (18,675 | ) | (21,769 | ) | (22,142 | ) | ||||||||||
| Individuals | (13,682 | ) | (11,235 | ) | (12,668 | ) | (13,541 | ) | (12,317 | ) | ||||||||||
| Credit card | (4,905 | ) | (4,055 | ) | (3,784 | ) | (3,513 | ) | (4,073 | ) | ||||||||||
| Personal loans | (6,745 | ) | (5,221 | ) | (5,150 | ) | (6,247 | ) | (4,895 | ) | ||||||||||
| Payroll loans | (1,273 | ) | (622 | ) | (429 | ) | (480 | ) | (472 | ) | ||||||||||
| Vehicles | (709 | ) | (1,294 | ) | (3,254 | ) | (3,263 | ) | (2,840 | ) | ||||||||||
| Mortgage loans | (50 | ) | (43 | ) | (51 | ) | (38 | ) | (37 | ) | ||||||||||
| Corporate | (4,985 | ) | (4,321 | ) | (672 | ) | (478 | ) | (556 | ) | ||||||||||
| Small and Medium Businesses | (4,267 | ) | (3,981 | ) | (4,992 | ) | (7,573 | ) | (9,209 | ) | ||||||||||
| Foreign Loans Latin America | (1,317 | ) | (528 | ) | (343 | ) | (177 | ) | (60 | ) | ||||||||||
| Expense Recognized in the Income Statement | 24,379 | 24,517 | 18,832 | 17,856 | 23,982 | |||||||||||||||
| Amount Recognized in the Balance Sheet at the end of period (1) | 26,972 | 26,844 | 22,392 | 22,235 | 25,713 | |||||||||||||||
| Recovery of loans written off as loss | 3,742 | 4,779 | 5,054 | 5,061 | 4,663 | |||||||||||||||
| Individuals | 1,397 | 1,886 | 2,077 | 2,058 | 1,917 | |||||||||||||||
| Credit card | 450 | 590 | 663 | 653 | 515 | |||||||||||||||
| Personal loans | 426 | 563 | 577 | 525 | 427 | |||||||||||||||
| Payroll loans | 341 | 458 | 453 | 278 | 172 | |||||||||||||||
| Vehicles | 118 | 202 | 324 | 499 | 656 | |||||||||||||||
| Mortgage loans | 62 | 73 | 60 | 103 | 147 | |||||||||||||||
| Corporate | 929 | 1,537 | 1,642 | 1,602 | 1,380 | |||||||||||||||
| Small and Medium Businesses | 450 | 666 | 769 | 891 | 976 | |||||||||||||||
| Foreign Loans Latin America | 966 | 690 | 566 | 510 | 390 | |||||||||||||||
| Net Write-offs | (20,509 | ) | (15,286 | ) | (13,621 | ) | (16,708 | ) | (17,479 | ) | ||||||||||
| Ratio of Write-offs during the period to average loans outstanding during the period (%) | 5.0 | 4.3 | 4.4 | 5.7 | 6.2 | |||||||||||||||
| Ratio of net write-offs during the period to average loans outstanding during the period (%) | 4.2 | 3.3 | 3.2 | 4.4 | 4.9 | |||||||||||||||
| Ratio of allowance for loan losses to total loans and leases (%) | 5.5 | 5.7 | 4.9 | 5.4 | 7.0 | |||||||||||||||
(1) The carrying amount of the individual loans increased by R$435 million in 2013 due to the acquisition of companies as explained in the Consolidated Financial Statements (IFRS).
During the year ended December 31, 2016, we wrote off a total amount of R$24,251 million from our loan portfolio and our ratio of the allowance for loan and lease losses to total loans and leases was 5.5%. The increase in loans written off from the prior year is due to the worsening macroeconomic scenario, mainly in Brazil.
During the year ended December 31, 2015, we wrote off a total amount of R$20,065 million from our loan portfolio and our ratio of the allowance for loan and lease losses to total loans and leases was 5.7%. The increase in loans written off from the prior year is due to the worsening macroeconomic scenario, mainly in Brazil.
During the year ended December 31, 2014, we wrote off a total amount of R$18,675 million from our loan portfolio and our ratio of the allowance for loan and lease losses to total loans and leases was 4.9%. The decrease in loans written off from the previous year from the prior year is a result of the adoption of a policy of stricter selectivity in origination, which gave rise to lower default levels compared to the previous year.
During the year ended December 31, 2013, we wrote off a total amount of R$21,769 million from our loan portfolio and our ratio of the allowance for loan and lease losses to total loans and leases was 5.4%. The decrease in loans written off is a result of the adoption of a policy of stricter selectivity in origination, which gave rise to lower default levels compared to the previous year.
During the year ended December 31, 2012, we wrote off a total amount of R$22,142 million from our loan portfolio and our ratio of the allowance for loan and lease losses to total loans and leases was 7.0%. This represents an increase in loans written off from the loans written off for the year ended December 31, 2011, when we wrote off a total amount of R$ 16,159 million. This increase is due to the increase in defaults in 2011 and beginning of 2012, associated with the increase in the volume of our portfolio of credit card, personal loans, small and medium businesses.
Fair value of financial instruments
Financial instruments recorded at fair value on our balance sheet include mainly securities classified as held-for-trading and available-for-sale as well as other trading assets, including derivatives. Securities classified as held-to-maturity are recorded at amortized historical cost on our balance sheet, and their corresponding fair values are shown in the notes to our complete financial statements. We present information on the fair value of our financial instruments in the following table as of December 31, 2016, 2015 and 2014.
A-121
| As of December 31, | ||||||||||||
| Financial instruments recorded at fair value | 2016 | 2015 | 2014 | |||||||||
| (In millions of R$, except percentages) | ||||||||||||
| Assets | ||||||||||||
| Held-for-trading | 204,648 | 164,311 | 132,944 | |||||||||
| Designated at fair value through profit or loss | 1,191 | 642 | 733 | |||||||||
| Derivatives | 24,231 | 26,755 | 14,156 | |||||||||
| Available-for-sale | 88,277 | 86,045 | 78,360 | |||||||||
| Total | 318,347 | 277,753 | 226,193 | |||||||||
| Share (derivatives / total) | 7.6 | % | 9.6 | % | 6.3 | % | ||||||
| Liabilities | ||||||||||||
| Held-for-trading | 519 | 412 | 520 | |||||||||
| Derivatives | 24,698 | 31,071 | 17,350 | |||||||||
| Total | 25,217 | 31,483 | 17,870 | |||||||||
| Share (derivatives / total) | 97.9 | % | 98.7 | % | 97.1 | % | ||||||
We determine the fair value of our financial instruments based on International Financial Reporting Standard 13 (IFRS 13), which defines fair value as the price that would be received to sell an asset or paid to transfer a liability in an orderly transaction between market participants at the measurement date.
According to IFRS 13, there are different levels of inputs that may be used to measure the fair value of financial instruments classified as levels 1, 2 and 3.
| • | Level 1: observable inputs reflect the quoted prices (unadjusted) of identical assets or liabilities in active markets; |
| • | Level 2: observable inputs reflect the information on assets and liabilities that are either directly (such as prices) or indirectly (derived from prices) observable, except for the quoted prices included in Level 1; and |
| • | Level 3: information on assets and liabilities that are not based on observable market data due to little market activity on the measurement date. We present information on our level 3 financial instruments in the following table as of December 31, 2016, 2015 and 2014. |
| As of December 31, | ||||||||||||
| Level 3 | 2016 | 2015 | 2014 | |||||||||
| (In millions of R$, except percentages) | ||||||||||||
| Held-for-trading | 1,005 | 60 | 790 | |||||||||
| Available-for-sale securities | 9,534 | 4,259 | 5,404 | |||||||||
| Net position of derivatives | 461 | 1,218 | 77 | |||||||||
| Total | 11,000 | 5,537 | 6,271 | |||||||||
| (Held-for-trading + Available-for-sale securities) / Total Level 3 | 95.8 | % | 78.0 | % | 98.8 | % | ||||||
Please refer to section Performance, item Complete Financial Statements (IFRS), Note 31 – Fair Value of Financial Instruments for further details.
Judgments are also required to determine whether there is objective evidence that a financial asset or a group of financial assets is impaired. If there is any evidence of impairment for available-for-sale or held-to-maturity financial assets, the cumulative loss, measured as the difference between the acquisition cost and current fair value, is recognized in the statement of income. The primary factors that are used by management to determine whether there is objective evidence that a financial asset is impaired include the observed period of the loss, the level of the loss, whether we were required to sell the securities before the recovery and the expectation, on the date of analysis, of the possibility of realization of the security. Please refer to section Performance, item Complete Financial Statements (IFRS), Note 2 – Significant Accounting Policies for further details about other significant accounting policies.
Contingent liabilities
Contingent liabilities arise mainly from judicial and administrative proceedings inherent to the ordinary course of our business and that are filed by third parties, including former employees and public bodies related to civil, labor, tax and social security claims.
A-122
These contingencies are assessed based on the best estimates of our management, taking into consideration the opinion of legal advisors when there is a probability that financial resources will be required to settle obligations and the amount of such obligations can be reliably measured.
Contingencies are classified as follows, based on likelihood of loss:
| • | Probable: liabilities are recognized under “provisions” on our consolidated balance sheet; |
| • | Possible: liabilities are disclosed in our complete financial statements but no provisions are recorded; and |
| • | Remote: liabilities do not require provision or disclosure. |
Contingent liabilities for which provisions are recorded and those classified as having a “possible” likelihood of loss are evaluated based on our best estimates, using models and criteria that allow for their proper evaluation despite the uncertainty that is inherent to terms and amounts.
Significant changes in accounting standards
Please refer to section Performance, item Complete Financial Statements (IFRS), Note 2.2 – New accounting standards and new accounting standards changes and interpretations for further details about information on significant changes in accounting standards.
Accounting practices adopted in Brazil
Our books and records are maintained in Brazilianreais, the official currency in Brazil, and our complete financial statements, for statutory and regulatory purposes, are prepared in accordance with accounting practices adopted in Brazil, applicable to institutions authorized to operate by the Brazilian Central Bank (BACEN) (“Brazilian GAAP”). The accounting principles and standards generally applicable under Brazilian GAAP include those established under Brazilian Corporate Law, by the Accounting Pronouncements Committee (CPC), which started issuing standards in 2007, and by the Federal Accounting Council. In the case of companies subject to regulation by the BACEN, such as Itaú Unibanco Holding, the effectiveness of the accounting pronouncements issued by entities such as the CPC depends on approval of the pronouncement by CMN, which also establishes the date of effectiveness of any pronouncements with respect to financial institutions. Additionally, CVM and other regulatory bodies, such as SUSEP and the Central Bank, provide additional industry-specific guidelines.
Regulation applicable to the presentation of the complete financial statements
Brazilian regulations establish specific rules for the consolidation of complete financial statements by financial institutions. Under current BACEN regulations, financial institutions, except for credit cooperatives, are required to prepare consolidated financial statements including investments directly or indirectly held in other companies, individually or jointly controlled, and with respect to which such financial institutions have (i) the right to appoint or designate the majority of the company’s board of directors; (ii) the right to appoint or remove the majority of the company’s executives and directors; and/or (iii) operational or shareholding control. These regulations apply to the entire group to which a financial institution belongs.
Assets
Portfolio of securities and derivative financial instruments
General information
We present below our portfolio of held-for-trading financial assets, available-for-sale financial assets, held-to-maturity financial assets and derivative financial instruments as of December 31, 2016, 2015 and 2014.
The amounts exclude our investments in securities of unconsolidated companies. For further information on our investments in unconsolidated companies, see section Performance, item complete financial statement (IFRS), Note 13 – Investments in associates and joint ventures. Held-for-trading and available-for-sale financial assets are stated at fair value and held-to-maturity financial assets are stated at amortized cost. Please refer to section Performance, item Complete Financial Statements (IFRS), Note 2 – Significant Accounting Policies for further details.
As of December 31, 2016, we held securities issued by the Brazilian federal government classified as “Government Securities – Domestic” with an aggregate book value and an aggregate market value of R$221,973 million and R$222,331 million, respectively, which represented 164.92% of our consolidated stockholders’ equity as of that date. As of December 31, 2016, we did not hold securities of any other issuer the book value of which in the aggregate represented more than 10.0% of our consolidated stockholders’ equity. This is due to our conservative asset and liabilities management and our liquidity in local currency maintained in securities issued by the Brazilian federal government. Additionally, securities issued by the Brazilian federal government are accepted as deposits in our operations in the market on BM&FBovespa.
A-123
Held-for-trading
Listed below are the assets acquired and accrued mainly for the purpose of selling in the short term or when they are part of a portfolio of financial instruments that are managed as a whole and for which there is a recent history of sales in the short term. Please refer to section Performance, item Complete Financial Statements (IFRS), Note 7 – Financial Assets Held for Trading and Designated at Fair Value Through Profit or Loss, for further details.
| As of December 31, | ||||||||||||||||||||||||
| 2016 | % of total | 2015 | % of total | 2014 | % of total | |||||||||||||||||||
| (In millions of R$, except percentages) | ||||||||||||||||||||||||
| Held-for-trading financial assets | 204,648 | 100.0 | 164,311 | 100.0 | 132,944 | 100.0 | ||||||||||||||||||
| Investment funds | 1,173 | 0.6 | 1,051 | 0.6 | 870 | 0.7 | ||||||||||||||||||
| Government securities - domestic | 165,349 | 80.8 | 121,484 | 73.9 | 88,307 | 66.4 | ||||||||||||||||||
| Brazilian government securities | 160,024 | 78.2 | 117,053 | 71.2 | 86,393 | 65.0 | ||||||||||||||||||
| Brazilian external debt bonds | 5,325 | 2.6 | 4,431 | 2.7 | 1,914 | 1.4 | ||||||||||||||||||
| Government securities - abroad | 3,735 | 1.8 | 1,149 | 0.7 | 1,540 | 1.2 | ||||||||||||||||||
| Argentina | 651 | 0.3 | 696 | 0.4 | 628 | 0.5 | ||||||||||||||||||
| United States | 78 | 0.0 | 132 | 0.1 | 448 | 0.3 | ||||||||||||||||||
| Mexico | 6 | 0.0 | 3 | 0.0 | 3 | 0.0 | ||||||||||||||||||
| Chile | 127 | 0.1 | 36 | 0.0 | 132 | 0.1 | ||||||||||||||||||
| Paraguay | 88 | 0.0 | 68 | 0.0 | 128 | 0.1 | ||||||||||||||||||
| Uruguay | 32 | 0.0 | 40 | 0.0 | 41 | 0.0 | ||||||||||||||||||
| Colombia | 2,669 | 1.3 | 72 | 0.0 | 88 | 0.1 | ||||||||||||||||||
| Other | 84 | 0.0 | 102 | 0.1 | 72 | 0.1 | ||||||||||||||||||
| Corporate securities | 34,391 | 16.8 | 40,627 | 24.7 | 42,227 | 31.8 | ||||||||||||||||||
| Shares | 2,491 | 1.2 | 2,161 | 1.3 | 2,351 | 1.8 | ||||||||||||||||||
| Securitized real estate loans | - | - | - | - | 1 | - | ||||||||||||||||||
| Bank deposit certificates | 1,824 | 0.9 | 2,583 | 1.6 | 3,281 | 2.5 | ||||||||||||||||||
| Debentures | 3,190 | 1.6 | 4,522 | 2.8 | 4,243 | 3.2 | ||||||||||||||||||
| Eurobonds and other | 662 | 0.3 | 991 | 0.6 | 1,061 | 0.8 | ||||||||||||||||||
| Financial credit bills | 25,893 | 12.6 | 30,367 | 18.5 | 30,711 | 23.1 | ||||||||||||||||||
| Promissory Notes | - | - | - | - | 577 | 0.4 | ||||||||||||||||||
| Other | 331 | 0.2 | 3 | 0.0 | 2 | 0.0 | ||||||||||||||||||
| Held-for-trading financial assets as a percentage of total assets | 15.1 | % | 12.9 | % | 11.8 | % | ||||||||||||||||||
We note that Brazilian government securities represented over 78.2% of our portfolio of held-for-trading financial assets in 2016. Brazilian government securities classified as Held-for-Trading represented 11.8% of our total assets in the same period. Please see Our risk management, item Risk factors, we have significant exposure to Brazilian federal government debt.
Available-for-sale
Listed below are financial assets that, according to management’s understanding, may be sold in response to, or before changes in, market conditions and are not classified as financial assets at fair value through profit or loss, loans and receivables or held to maturity. Please refer to section Performance, item Complete Financial Statements (IFRS), Note 10 – Available for Sale Financial Assets, for further details.
A-124
| As of December 31, | ||||||||||||||||||||||||
| 2016 | % of total | 2015 | % of total | 2014 | % of total | |||||||||||||||||||
| (In millions of R$, except percentages) | ||||||||||||||||||||||||
| Available-for-sale financial assets | 88,277 | 100.0 | 86,045 | 100.0 | 78,360 | 100.0 | ||||||||||||||||||
| Investment funds | 42 | 0.0 | 218 | 0.3 | 141 | 0.2 | ||||||||||||||||||
| Government securities - domestic | 32,003 | 36.3 | 29,108 | 33.8 | 25,625 | 32.7 | ||||||||||||||||||
| Brazilian government securities | 17,938 | 20.3 | 11,796 | 13.7 | 14,391 | 18.4 | ||||||||||||||||||
| Brazilian external debt bonds | 14,065 | 15.9 | 17,312 | 20.1 | 11,234 | 14.3 | ||||||||||||||||||
| Government securities - abroad | 14,472 | 16.4 | 9,883 | 11.5 | 8,619 | 11.0 | ||||||||||||||||||
| United States | 1,427 | 1.6 | 2,022 | 2.3 | 726 | 0.9 | ||||||||||||||||||
| Italy | - | - | - | - | 70 | 0.1 | ||||||||||||||||||
| Denmark | 819 | 0.9 | 2,548 | 3.0 | 2,699 | 3.4 | ||||||||||||||||||
| Spain | 923 | 1.0 | 1,060 | 1.2 | 783 | 1.0 | ||||||||||||||||||
| Korea | 2,673 | 3.0 | 1,626 | 1.9 | 1,782 | 2.3 | ||||||||||||||||||
| Chile | 5,844 | 6.6 | 1,407 | 1.6 | 1,119 | 1.4 | ||||||||||||||||||
| Paraguay | 1,111 | 1.3 | 912 | 1.1 | 849 | 1.1 | ||||||||||||||||||
| Uruguay | 411 | 0.5 | 178 | 0.2 | 243 | 0.3 | ||||||||||||||||||
| Colombia | 1,155 | 1.3 | - | - | - | - | ||||||||||||||||||
| Belgium | - | - | - | - | 57 | 0.1 | ||||||||||||||||||
| France | - | - | - | - | 133 | 0.2 | ||||||||||||||||||
| Netherlands | 101 | 0.1 | 122 | 0.1 | 151 | 0.2 | ||||||||||||||||||
| Other | 8 | 0.0 | 8 | 0.0 | 7 | 0.0 | ||||||||||||||||||
| Corporate securities | 41,760 | 47.3 | 46,836 | 54.4 | 43,975 | 56.1 | ||||||||||||||||||
| Shares | 1,385 | 1.6 | 928 | 1.1 | 1,999 | 2.6 | ||||||||||||||||||
| Securitized real estate loans | 2,095 | 2.4 | 2,037 | 2.4 | 2,522 | 3.2 | ||||||||||||||||||
| Bank deposit certificates | 2,641 | 3.0 | 1,573 | 1.8 | 1,281 | 1.6 | ||||||||||||||||||
| Debentures | 21,170 | 24.0 | 22,835 | 26.5 | 20,245 | 25.8 | ||||||||||||||||||
| Eurobonds and others | 7,715 | 8.7 | 10,112 | 11.8 | 6,707 | 8.6 | ||||||||||||||||||
| Promissory notes | 2,173 | 2.5 | 991 | 1.2 | 1,397 | 1.8 | ||||||||||||||||||
| Rural Product Note | 1,425 | 1.6 | 1,130 | 1.3 | 1,408 | 1.8 | ||||||||||||||||||
| Financial credit bills | 2,816 | 3.2 | 6,846 | 8.0 | 8,005 | 10.2 | ||||||||||||||||||
| Other | 340 | 0.4 | 384 | 0.4 | 411 | 0.5 | ||||||||||||||||||
| Available-for-sale financial assets as a percentage of total assets | 6.5 | % | 6.7 | % | 7.0 | % | ||||||||||||||||||
Brazilian government securities and corporate securities represented 20.3% and 47.3%, respectively, of our portfolio of available-for-sale financial assets in 2016. Brazilian government securities and corporate securities classified as available-for-sale financial assets, which are used as a hedge for our subordinated debt portfolio, represented 1.3% and 3.1%, respectively, of our total assets in the same period.
Held-to-maturity
Listed below are non-derivative financial assets that with respect to which we have the intention and financial ability to held to maturity. Please refer to section Performance, item Complete Financial Statements (IFRS), Note 11– Held to Maturity Financial Assets, for further details.
| As of December 31, | ||||||||||||||||||||||||
| 2016 | % of total | 2015 | % of total | 2014 | % of total | |||||||||||||||||||
| (In millions of R$, except percentages) | ||||||||||||||||||||||||
| Held-to-maturity financial assets | 40,495 | 100.0 | 42,185 | 100.0 | 34,434 | 100.0 | ||||||||||||||||||
| Government securities – domestic | 24,979 | 61.7 | 26,509 | 62.9 | 20,859 | 60.6 | ||||||||||||||||||
| Brazilian government securities | 12,937 | 31.9 | 11,721 | 27.8 | 10,555 | 30.7 | ||||||||||||||||||
| Brazilian external debt bonds | 12,042 | 29.7 | 14,788 | 35.1 | 10,304 | 29.9 | ||||||||||||||||||
| Government securities – abroad | 539 | 1.3 | 15 | - | 26 | 0.1 | ||||||||||||||||||
| Corporate securities | 14,977 | 37.0 | 15,661 | 37.1 | 13,549 | 39.3 | ||||||||||||||||||
| Debentures | 12 | 0.0 | - | - | - | - | ||||||||||||||||||
| Eurobonds and others | 18 | 0.0 | 4 | 0.0 | 2 | 0.0 | ||||||||||||||||||
| Securitized real estate loans | 14,487 | 35.8 | 15,657 | 37.1 | 13,547 | 39.3 | ||||||||||||||||||
| Others | 460 | 1.1 | - | - | - | - | ||||||||||||||||||
| Held-to-maturity financial assets as a percentage of total assets | 3.0 | % | 3.3 | % | 3.1 | % | ||||||||||||||||||
Derivatives
Derivatives are classified on the date of their acquisition in accordance with management’s intention to use them as a hedging instrument, as determined by Brazilian regulations. Please refer to section Performance, item Complete Financial Statements
A-125
(IFRS), Note 8 – Derivatives, for further details. Our derivatives portfolio (assets and liabilities) is composed of futures, forwards, swaps, options and credit derivatives, as stated in the following table:
| As of December 31, | ||||||||||||||||||||||||
| Derivative Financial Instruments | 2016 | % of total | 2015 | % of total | 2014 | % of total | ||||||||||||||||||
| (In millions of R$, except percentages) | ||||||||||||||||||||||||
| Assets | ||||||||||||||||||||||||
| Futures Contracts | 127 | 0.5 | 529 | 2.0 | - | - | ||||||||||||||||||
| Options premiums | 4,792 | 19.8 | 5,583 | 20.9 | 2,872 | 20.2 | ||||||||||||||||||
| Forwards (onshore) | 4,971 | 20.5 | 3,166 | 11.8 | 2,394 | 16.9 | ||||||||||||||||||
| Swaps - difference receivable | 10,542 | 43.5 | 9,147 | 34.2 | 4,816 | 34.0 | ||||||||||||||||||
| Credit derivatives - financial Institutions | 181 | 0.7 | 614 | 2.3 | 122 | 0.9 | ||||||||||||||||||
| Forwards (offshore) | 3,459 | 14.3 | 3,430 | 12.8 | 2,106 | 14.9 | ||||||||||||||||||
| Check of Swap - companies | 88 | 0.4 | 355 | 1.3 | 93 | 0.7 | ||||||||||||||||||
| Others | 71 | 0.3 | 3,931 | 14.7 | 1,753 | 12.4 | ||||||||||||||||||
| Total derivative financial instruments assets | 24,231 | 100.0 | 26,755 | 100.0 | 14,156 | 100.0 | ||||||||||||||||||
| Derivative financial instruments as percentage of total assets | 1.8 | % | 2.1 | % | 1.3 | % | ||||||||||||||||||
| Liabilities | ||||||||||||||||||||||||
| Futures Contracts | - | - | - | - | (354 | ) | 2.0 | |||||||||||||||||
| Options premiums | (4,552 | ) | 18.4 | (5,783 | ) | 18.6 | (3,057 | ) | 17.6 | |||||||||||||||
| Forwards (onshore) | (3,530 | ) | 14.3 | (833 | ) | 2.6 | (682 | ) | 3.9 | |||||||||||||||
| Swaps - difference payable | (13,221 | ) | 53.5 | (16,331 | ) | 52.6 | (9,534 | ) | 55.0 | |||||||||||||||
| Credit derivatives - financial Institutions | (147 | ) | 0.6 | (875 | ) | 2.8 | (179 | ) | 1.1 | |||||||||||||||
| Forwards (offshore) | (2,825 | ) | 11.5 | (3,142 | ) | 10.1 | (1,693 | ) | 9.8 | |||||||||||||||
| Check of swap - Companies | (353 | ) | 1.4 | (545 | ) | 1.8 | (229 | ) | 1.3 | |||||||||||||||
| Other - Companies | (70 | ) | 0.3 | (3,562 | ) | 11.5 | (1,622 | ) | 9.3 | |||||||||||||||
| Total derivative financial instruments liabilities | (24,698 | ) | 100.0 | (31,071 | ) | 100.0 | (17,350 | ) | 100.0 | |||||||||||||||
| Derivative financial instruments as percentage of total liabilities and stockholder’s equity | 1.8 | % | 2.4 | % | 1.5 | % | ||||||||||||||||||
A-126
| As of December 31, 2016 | ||||||||||||||||||||||||||||||||||||||||||||||||
| Distribution of our financial assets by maturity | No stated maturity | Due in 1 year or less | Due after 1 year to 5 years | Due after 5 years to 10 years | Due after 10 years | Total | ||||||||||||||||||||||||||||||||||||||||||
| R$ | Average yield (%) | R$ | Average yield (%) | R$ | Average yield (%) | R$ | Average yield (%) | R$ | Average yield (%) | R$ | Average yield (%) | |||||||||||||||||||||||||||||||||||||
| (In millions of R$, except percentages) | ||||||||||||||||||||||||||||||||||||||||||||||||
| Held-for-trading financial assets, at fair value | 3,206 | 31,000 | 118,050 | 42,284 | 10,108 | 204,648 | ||||||||||||||||||||||||||||||||||||||||||
| Investment funds(1) | 1,056 | - | 116 | - | - | - | - | - | - | - | 1,173 | - | ||||||||||||||||||||||||||||||||||||
| Government securities - domestic | - | 12,948 | 101,012 | 41,398 | 9,991 | 165,349 | ||||||||||||||||||||||||||||||||||||||||||
| Brazilian government securities | - | - | 12,172 | 2.6 | 97,805 | 1.9 | 40,174 | 1.4 | 9,872 | 0.5 | 160,024 | 1.8 | ||||||||||||||||||||||||||||||||||||
| Brazilian external debt bonds | - | - | 775 | 0.6 | 3,207 | 8.4 | 1,223 | 3.0 | 119 | 22.9 | 5,325 | 6.3 | ||||||||||||||||||||||||||||||||||||
| Government securities - abroad | - | 2,121 | - | 1,271 | - | 269 | - | 74 | - | 3,735 | ||||||||||||||||||||||||||||||||||||||
| Argentina | - | - | 618 | 2.2 | 30 | 5.6 | 3 | 6.3 | 0 | 6.8 | 651 | 2.3 | ||||||||||||||||||||||||||||||||||||
| United States | - | - | 78 | 0.1 | - | - | - | - | - | - | 78 | 0.1 | ||||||||||||||||||||||||||||||||||||
| Mexico | - | - | - | - | 3 | 11.0 | 1 | 5.4 | 2 | 16.8 | 6 | 12.3 | ||||||||||||||||||||||||||||||||||||
| Chile | - | - | 5 | - | 87 | 0.4 | 25 | 0.1 | 9 | - | 127 | 0.3 | ||||||||||||||||||||||||||||||||||||
| Paraguay | - | - | 88 | 0.1 | - | - | - | - | - | - | 88 | 0.1 | ||||||||||||||||||||||||||||||||||||
| Uruguay | - | - | 31 | 4.0 | - | - | 0 | 18.4 | 1 | 13.5 | 32 | 4.2 | ||||||||||||||||||||||||||||||||||||
| Colombia | - | - | 1,247 | 1.6 | 1,123 | 2.1 | 240 | 4.4 | 60 | 3.9 | 2,669 | 2.1 | ||||||||||||||||||||||||||||||||||||
| Other | - | - | 55 | - | 28 | 0.0 | - | - | 1 | 32.4 | 84 | 0.3 | ||||||||||||||||||||||||||||||||||||
| Corporate securities | 2,491 | 15,473 | - | 15,767 | - | 617 | - | 43 | - | 34,391 | ||||||||||||||||||||||||||||||||||||||
| Shares | 2,491 | - | - | - | - | - | - | - | - | - | 2,491 | 0.0 | ||||||||||||||||||||||||||||||||||||
| Bank deposit certificates | - | - | 1,806 | 1.4 | 18 | 0.1 | - | - | - | - | 1,824 | 1.4 | ||||||||||||||||||||||||||||||||||||
| Debentures | - | - | 460 | 0.3 | 2,490 | 6.8 | 240 | 19.4 | - | - | 3,190 | 6.8 | ||||||||||||||||||||||||||||||||||||
| Eurobonds and other | - | - | 299 | 1.9 | 241 | 2.9 | 79 | 2.5 | 43 | 1.1 | 662 | 2.3 | ||||||||||||||||||||||||||||||||||||
| Financial credit bills | - | - | 12,907 | 0.8 | 12,978 | 2.5 | 7 | - | - | - | 25,893 | 1.6 | ||||||||||||||||||||||||||||||||||||
| Other | - | - | - | - | 40 | 0.0 | 291 | 1.0 | - | - | 331 | 0.9 | ||||||||||||||||||||||||||||||||||||
| Financial assets designated at fair value through profit or loss - Government securities - domestic - Brazilian external debt bonds | - | 1,191 | - | - | - | 1,191 | ||||||||||||||||||||||||||||||||||||||||||
| Derivatives | - | 14,111 | 6,940 | 3,180 | 24,231 | |||||||||||||||||||||||||||||||||||||||||||
| Available-for-sale financial assets, at fair value | 1,375 | 22,261 | 38,969 | 12,329 | 13,343 | 88,277 | ||||||||||||||||||||||||||||||||||||||||||
| Investment funds(1) | 42 | - | - | - | - | - | - | - | - | - | 42 | - | ||||||||||||||||||||||||||||||||||||
| Government securities - domestic | 100 | - | 3,568 | - | 10,116 | 8,116 | 10,203 | 32,003 | - | |||||||||||||||||||||||||||||||||||||||
| Brazilian government securities | - | - | 1,708 | 11.5 | 6,686 | 5.6 | 3,668 | 13.5 | 5,876 | 17.0 | 17,938 | 11.5 | ||||||||||||||||||||||||||||||||||||
| Brazilian external debt bonds | - | - | 1,860 | 2.8 | 3,429 | 8.9 | 4,448 | 11.2 | 4,328 | 34.2 | 14,065 | 16.5 | ||||||||||||||||||||||||||||||||||||
| Government securities - abroad | - | - | 5,896 | - | 7,758 | 795 | 23 | 14,472 | ||||||||||||||||||||||||||||||||||||||||
| Argentina | - | - | 0 | 76.5 | - | - | - | - | - | - | - | - | ||||||||||||||||||||||||||||||||||||
| United States | - | - | 481 | 0.2 | 885 | 0.5 | 61 | 0.6 | - | - | 1,427 | 0.4 | ||||||||||||||||||||||||||||||||||||
| Denmark | - | - | 819 | 0.5 | - | - | - | - | - | - | 819 | 0.5 | ||||||||||||||||||||||||||||||||||||
| Spain | - | - | 682 | 1.8 | 241 | 0.2 | - | - | - | - | 923 | 1.4 | ||||||||||||||||||||||||||||||||||||
| Korea | - | - | 2,024 | 1.2 | 649 | 1.0 | - | - | - | - | 2,673 | 1.1 | ||||||||||||||||||||||||||||||||||||
| Chile | - | - | 692 | 0.4 | 4,851 | 0.4 | 278 | 0.4 | 23 | 0.5 | 5,844 | 0.4 | ||||||||||||||||||||||||||||||||||||
| Paraguay | - | - | 853 | 4.2 | 258 | 2.8 | - | - | - | - | 1,111 | 3.9 | ||||||||||||||||||||||||||||||||||||
| Uruguay | - | - | 235 | 6.6 | 119 | 0.5 | 56 | 0.8 | 1 | 0.9 | 411 | 4.0 | ||||||||||||||||||||||||||||||||||||
| Colombia | - | - | - | - | 755 | 3.9 | 400 | 3.0 | - | - | 1,155 | 3.6 | ||||||||||||||||||||||||||||||||||||
| Netherlands | - | - | 101 | - | - | - | - | - | - | - | 101 | - | ||||||||||||||||||||||||||||||||||||
| Other | - | - | 8 | 0.4 | - | - | 0 | - | - | - | 8 | 0.4 | ||||||||||||||||||||||||||||||||||||
| Corporate securities | 1,385 | - | 12,745 | - | 21,096 | 3,418 | 3,116 | 41,760 | ||||||||||||||||||||||||||||||||||||||||
| Shares | 1,385 | - | - | - | - | - | - | - | - | - | 1,385 | - | ||||||||||||||||||||||||||||||||||||
| Securitized real estate loans | - | - | - | - | - | - | - | - | 2,095 | 1.3 | 2,095 | 1.3 | ||||||||||||||||||||||||||||||||||||
| Bank deposit certificates | - | - | 2,469 | 0.3 | 152 | 1.2 | 20 | 2.0 | - | - | 2,641 | 0.3 | ||||||||||||||||||||||||||||||||||||
| Debentures | - | - | 1,960 | 10.5 | 15,152 | 4.0 | 3,218 | 3.5 | 840 | 4.3 | 21,170 | 4.6 | ||||||||||||||||||||||||||||||||||||
| Eurobonds and others | - | - | 3,659 | 1.4 | 3,876 | 0.9 | 180 | 1.0 | - | - | 7,715 | 1.1 | ||||||||||||||||||||||||||||||||||||
| Promissory notes | - | - | 1,731 | 6.8 | 442 | 1.1 | - | - | - | - | 2,173 | 5.6 | ||||||||||||||||||||||||||||||||||||
| Rural product note | - | - | 476 | 0.4 | 801 | 0.2 | - | - | 148 | 0.0 | 1,425 | 0.2 | ||||||||||||||||||||||||||||||||||||
| Financial credit bills | - | - | 2,383 | 22.1 | 433 | 5.6 | - | - | - | - | 2,816 | 19.5 | ||||||||||||||||||||||||||||||||||||
| Other | - | - | 67 | 7.6 | 240 | 1.1 | - | - | 33 | 49.8 | 340 | 7.1 | ||||||||||||||||||||||||||||||||||||
| Held-to-maturity financial assets, at amortized cost | - | 2,498 | 19,376 | 10,957 | 7,664 | 40,495 | ||||||||||||||||||||||||||||||||||||||||||
| Government securities - domestic | - | - | 1,115 | - | 16,355 | 4,599 | 2,911 | 24,979 | ||||||||||||||||||||||||||||||||||||||||
| Brazilian government securities | - | - | 276 | 47.2 | 9,750 | 19.6 | - | - | 2,911 | 39.5 | 12,937 | 24.7 | ||||||||||||||||||||||||||||||||||||
| Brazilian external debt bonds | - | - | 839 | 2.8 | 6,605 | 8.2 | 4,599 | 22.4 | - | - | 12,042 | 13.3 | ||||||||||||||||||||||||||||||||||||
| Government securities - abroad | - | - | 526 | - | - | - | 13 | 539 | - | |||||||||||||||||||||||||||||||||||||||
| Colombia | - | - | 526 | 0.6 | - | - | - | - | - | - | 526 | 0.6 | ||||||||||||||||||||||||||||||||||||
| Uruguay | - | - | - | - | - | - | - | - | 13 | - | 13 | - | ||||||||||||||||||||||||||||||||||||
| Corporate securities | - | - | 858 | - | 3,021 | 6,358 | 4,740 | 14,977 | - | |||||||||||||||||||||||||||||||||||||||
| Debentures | - | - | - | - | - | - | 12 | 84.1 | - | - | 12 | 85.8 | ||||||||||||||||||||||||||||||||||||
| Eurobonds and others | - | - | - | - | - | - | 18 | 0.1 | - | - | 18 | 0.1 | ||||||||||||||||||||||||||||||||||||
| Securitized real estate loans | - | - | 399 | 21.6 | 3,020 | 8.8 | 6,328 | 2.1 | 4,740 | 0.3 | 14,487 | 3.4 | ||||||||||||||||||||||||||||||||||||
| Other | - | - | 459 | 0.5 | 1 | - | - | - | - | - | 460 | 0.5 | ||||||||||||||||||||||||||||||||||||
(1) Average yields are not shown for these securities, as such yields are not meaningful because future yields are not quantifiable. These securities have been excluded from the calculation of the total yield.
A-127
| Fair Value | Amortized cost | |||||||||||||||||||||||
| Distribution of our financial assets by currency | Held-for-trading financial assets | Financial assets designated at fair value | Derivatives | Available-for-sale financial assets | Held-to-maturity financial assets | Total | ||||||||||||||||||
| (In millions of R$) | ||||||||||||||||||||||||
| As of December 31, 2016 | 204,648 | 1,191 | 24,231 | 88,277 | 40,495 | 358,842 | ||||||||||||||||||
| Denominated in Brazilian currency | 191,250 | 1,191 | 10,710 | 52,859 | 27,436 | 283,446 | ||||||||||||||||||
| Denominated in Brazilian currency and indexed by foreign currency(1) | 2,653 | - | 4,634 | 670 | - | 7,957 | ||||||||||||||||||
| Denominated in foreign currency(1) | 10,745 | - | 8,887 | 34,748 | 13,059 | 67,439 | ||||||||||||||||||
| As of December 31, 2015 | 164,311 | 642 | 26,755 | 86,045 | 42,185 | 319,938 | ||||||||||||||||||
| Denominated in Brazilian currency | 154,737 | 505 | 7,445 | 51,621 | 27,378 | 241,686 | ||||||||||||||||||
| Denominated in Brazilian currency and indexed by foreign currency(1) | 3,043 | - | 10,044 | 791 | - | 13,878 | ||||||||||||||||||
| Denominated in foreign currency(1) | 6,531 | 137 | 9,266 | 33,633 | 14,807 | 64,374 | ||||||||||||||||||
| As of December 31, 2014 | 132,944 | 733 | 14,156 | 78,360 | 34,434 | 260,627 | ||||||||||||||||||
| Denominated in Brazilian currency | 126,404 | 626 | 5,519 | 55,152 | 24,102 | 211,803 | ||||||||||||||||||
| Denominated in Brazilian currency and indexed by foreign currency(1) | 2,190 | - | 2,948 | 571 | - | 5,709 | ||||||||||||||||||
| Denominated in foreign currency(1) | 4,350 | 107 | 5,689 | 22,637 | 10,332 | 43,115 | ||||||||||||||||||
(1) Predominantly U.S. dollars.
For the purpose of analyzing the exposure of variations in foreign exchange rates, the following table presents the composition of our derivative financial instruments on December 31, 2016 inreais and in foreign currency, including the instruments denominated in foreign currencies. For the notional amount of derivative financial instruments, please refer to section Performance, item Complete Financial Statements (IFRS), Note 8 - Derivatives.
| As of December 31, 2016 | ||||||||||||
| Derivative financial instruments (notional amounts) | Brazilian Currency | Denominated in or linked to Foreign Currency | Total | |||||||||
| (In millions of R$) | ||||||||||||
| Swap contracts | ||||||||||||
| Buy (Sale) commitments, net | 3,128 | (7,574 | ) | (4,446 | ) | |||||||
| Forward contracts | ||||||||||||
| Buy (Sale) commitments, net | (10,990 | ) | 17,256 | 6,266 | ||||||||
| Future contracts | ||||||||||||
| Buy (Sale) commitments, net | (225,845 | ) | (39,578 | ) | (265,423 | ) | ||||||
| Option contracts | ||||||||||||
| Buy (Sale) commitments, net | 22,927 | 4,152 | 27,079 | |||||||||
| Others | ||||||||||||
| Buy (Sale) commitments, net | 410 | (624 | ) | (214 | ) | |||||||
Exposure to GIIPS
Our gross exposure to the sovereign bonds of GIIPS (Greece, Ireland, Italy, Portugal and Spain) countries, as well as to corporate clients and financial institutions domiciled in those countries as of December 31, 2016, is set forth in the following table:
| As of December 31, 2016 | ||||||||||||||||||||||||
| Segment | Credit | Co-obligation | Sovereign | Bond | Derivative | Total Exposure | ||||||||||||||||||
| (In millions of R$) | ||||||||||||||||||||||||
| Italy | ||||||||||||||||||||||||
| Corporate | 106 | - | - | - | - | 106 | ||||||||||||||||||
| Financial | - | 3 | - | - | - | 3 | ||||||||||||||||||
| Portugal | ||||||||||||||||||||||||
| Corporate | 111 | - | - | - | - | 111 | ||||||||||||||||||
| Financial | - | - | - | - | - | - | ||||||||||||||||||
| Spain | ||||||||||||||||||||||||
| Corporate | 838 | 269 | - | - | 3 | 1,110 | ||||||||||||||||||
| Financial | - | 184 | 923 | 8 | 1,115 | |||||||||||||||||||
| Total | 1,055 | 456 | 923 | - | 11 | 2,445 | ||||||||||||||||||
The total gross exposure presented above, primarily related to our exposure to corporate credits, amounted to R$1,055 million as of December 31, 2016, and with co-obligations in the amount of R$456 million. The exposure presented above has been calculated based on our estimated realizable value, which is updated depending on its nature (such as pledged amounts in current accounts used to collect customer receivables, financial investments, real estate, machinery and equipment or others), except for guarantees provided by third parties, in which case the amount corresponds to the outstanding debt. Our derivatives related to GIIPS countries amounted to R$11 million as of December 31, 2016.
A-128
Required reserve deposits with the Central Bank
The Central Bank requires reserves for deposits from Brazilian financial institutions. The reserve requirements are tools utilized by the Central Bank to control the liquidity of the Brazilian financial system, for both monetary policy and risk mitigation purposes. These requirements are applied to balances on demand deposits, saving account deposits and time deposits. See below the required reserve for each type of deposit:
| Required reserve deposits | Regulation (1) | Yield | 2016 | 2015 | 2014 | |||||||||||
| Demand Deposits | ||||||||||||||||
| Compulsory | Circular No. 3,632 | Zero | 45 | % | 45 | % | 45 | % | ||||||||
| Additional Compulsory | Circular No. 3,655 | SELIC | 0 | % | 0 | % | 0 | % | ||||||||
| Rural (2) | Resolution No. 4,096 | Zero | 34 | % | 34 | % | 34 | % | ||||||||
| Microcredit (2) | Resolution No. 4,000 | Zero | 2 | % | 2 | % | 2 | % | ||||||||
| Savings Accounts (3) | ||||||||||||||||
| Compulsory | Circular No. 3,093 | TR + 6.17% p.a. | 24.5 | % | 24.5 | % | 20 | % | ||||||||
| Additional Compulsory | Circular No. 3,655 | SELIC | 5.5 | % | 5.5 | % | 10 | % | ||||||||
| Real estate financing (2) | Resolution No. 3,932 | Zero | 65 | % | 65 | % | 65 | % | ||||||||
| Time and Interbank Deposits Received from Leasing Companies | ||||||||||||||||
| Compulsory | Circular No. 3,569 | SELIC | 25 | % | 25 | % | 20 | % | ||||||||
| Additional Compulsory | Circular No. 3,655 | SELIC | 11 | % | 11 | % | 11 | % | ||||||||
| (1) | Most recent regulation on the matter. |
| (2) | This is a compulsory investment of resources that is made in eligible transactions, that is, the funds are granted to other economic entities. |
| (3) | Remuneration on funds in savings deposits: |
For deposits made until March 5, 2012, inclusive: TR + 6.17% per annum.
For deposits made after March 5, 2012: (a) If the target of the Selic rate is higher than 8.5% per annum: TR + 6.17% per annum; (b) If the target of the Selic rate is lower than 8.5% per annum: TR + 70% of the target of the Selic rate per annum.
In 2015, the Central Bank enacted a set of rules changing the reserve requirements that Brazilian financial institutions are required to deposit with the Central Bank, as a mechanism to control the liquidity of the Brazilian financial system.
The regulations that govern the compulsory deposit rates are frequently changed by the Central Bank in accordance with the economic scenario and its monetary policy goals.
The compulsory reserve requirements imposed on time deposits (currently applicable to us at the general rate of 25.0%), demand deposits (currently at the general rate of 45.0%), and saving accounts (currently at the general rate of 24.5%, and 15.5% for rural savings deposits) represent almost the entirety of the amount that must be deposited at the Central Bank. Nonetheless, the Central Bank also determines an additional reserve requirement on deposits raised by full service banks, investment banks, commercial banks, development banks, finance, credit and investment companies, real estate credit companies and savings and loan associations, based on specific criteria.
On December 31, 2016, we recorded an amount of R$85,700 million in compulsory deposits in cash compared to R$66,556 million on December 31, 2015 and R$82,698 million in interest-bearing deposits compared to R$62,766 million on December 2015, as indicated in the following table. Please refer to section Performance, item Complete Financial Statements (IFRS), Note 5 – Central Bank Compulsory Deposits for further details.
| 2016 | 2015 | 2014 | ||||||||||||||||||||||
| Required reserve deposits | R$ | % of total required reserve deposits | R$ | % of total required reserve deposits | R$ | % of total required reserve deposits | ||||||||||||||||||
| (In millions of R$, except percentages) | ||||||||||||||||||||||||
| Non-interest bearing deposits (1) | 3,002 | 3.5 | 3,790 | 5.7 | 3,392 | 5.4 | ||||||||||||||||||
| Interest-bearing deposits (2) | 82,698 | 96.5 | 62,766 | 94.3 | 59,714 | 94.6 | ||||||||||||||||||
| Total | 85,700 | 100.0 | 66,556 | 100.0 | 63,106 | 100.0 | ||||||||||||||||||
| (1) | Mainly related to demand deposits. |
| (2) | Mainly related to time and savings deposits. |
Loan and lease operations
Most of our loans are granted to clients domiciled in Brazil and are denominated in Brazilianreais. Additionally, 47.1% of our credit portfolio consists of transactions with fixed interest rates and 52.9% of transactions with variable interest rates.
Indexation
Most of our portfolio is denominated in Brazilianreais. However, a portion of our portfolio is indexed to foreign currencies, primarily the U.S. dollar. The foreign currency portion of our portfolio consists of loans and financing for foreign trade and onlending operations. Our loans abroad represented 34.1%, 27.1% and 24.7% of our loan portfolio as of December 31, 2016, 2015 and 2014, respectively, see section Performance, item Complete Financial Statements (IFRS), Note 36 – Management of financial risks – 5. Credit risk exposure.
A-129
Loan and lease operations by type
The following table sets out the distribution of our credit portfolio according to the type of loan and lease operations, as follows:
| • | The Individuals portfolio consists primarily of credit cards, personal loans (primarily including consumer finance and overdrafts), payroll loans, vehicle financing and residential mortgage loans; |
| • | The Corporate portfolio consists primarily of loans made to large corporate clients; |
| • | The Small and Medium Businesses portfolio consists primarily of loans to small and medium-sized companies; and |
| • | The Foreign Loans – Latin America portfolio consists primarily of loans granted primarily to individuals by our operations in Argentina, Chile, Paraguay and Uruguay. |
| 2016 | 2015 | 2014 | ||||||||||||||||||||||
| Loan and Lease Operations, by type (1) | Loan | Allowance | Loan | Allowance | Loan | Allowance | ||||||||||||||||||
| (In millions of R$) | ||||||||||||||||||||||||
| Individuals | 183,147 | 14,259 | 187,220 | 14,717 | 185,953 | 13,385 | ||||||||||||||||||
| Credit card | 59,022 | 3,693 | 58,542 | 4,141 | 59,321 | 3,740 | ||||||||||||||||||
| Personal loans | 25,813 | 7,756 | 28,396 | 8,330 | 27,953 | 7,024 | ||||||||||||||||||
| Payroll Loans | 44,636 | 2,108 | 45,434 | 1,319 | 40,525 | 1,107 | ||||||||||||||||||
| Vehicles | 15,434 | 644 | 20,058 | 874 | 29,047 | 1,469 | ||||||||||||||||||
| Mortgage loans | 38,242 | 58 | 34,790 | 53 | 29,107 | 45 | ||||||||||||||||||
| Corporate | 121,754 | 5,862 | 152,527 | 6,459 | 147,002 | 3,114 | ||||||||||||||||||
| Small and Medium Businesses | 58,935 | 4,743 | 66,038 | 4,809 | 68,838 | 5,158 | ||||||||||||||||||
| Foreign Loans Latin America | 126,530 | 2,108 | 68,463 | 859 | 50,638 | 735 | ||||||||||||||||||
| Total Loan operations and lease operations portfolio | 490,366 | 26,972 | 474,248 | 26,844 | 452,431 | 22,392 | ||||||||||||||||||
(1) We classify all loans and leases more than 60 days overdue as non-accrual loans and we discontinue accruing financial income related to them. The contractual amount of non-accrual loans were R$19,942 million, R$19,458 million and R$16,514 million as of December 31, 2016, 2015 and 2014, respectively. The total of renegotiated loans in the balance of non-accrual loans reflected herein was R$4,225 million, R$3,417 million and R$3,346 million as of December 31,2016, 2015 and 2014, respectively. Non-accrual loans are presented herein in the appropriate category of loan and lease operations. The interest income foregone on our non-accrual loans net of allowance for loan losses for 2016, 2015 and 2014 was R$2,017 million, R$1,882 million and R$1,623 million, respectively.
Loan and lease operations by maturity
The following table sets out the distribution of our credit portfolio by maturity, including non-overdue and overdue installments, according to the type of loan and lease:
A-130
| Non-Overdue Installments | 12/31/2016 | |||||||||||||||||||||||||||
| Type of loan and lease | Due in 30 days or less | Due in 31-90 days | Due in 91-180 days | Due in 181-360 days | Due in one year to five years | Due after five years | Total Non-Overdue Installments | |||||||||||||||||||||
| (In millions of R$) | ||||||||||||||||||||||||||||
| Individuals | 29,843 | 22,919 | 16,934 | 18,401 | 55,700 | 30,254 | 174,051 | |||||||||||||||||||||
| Credit card | 23,093 | 16,972 | 9,185 | 4,237 | 199 | - | 53,686 | |||||||||||||||||||||
| Personal loans | 4,353 | 1,788 | 1,986 | 3,414 | 11,188 | 238 | 22,967 | |||||||||||||||||||||
| Payroll loans | 1,388 | 2,551 | 3,571 | 6,552 | 28,279 | 1,854 | 44,195 | |||||||||||||||||||||
| Vehicles | 705 | 1,236 | 1,693 | 3,113 | 8,290 | 20 | 15,057 | |||||||||||||||||||||
| Mortgage loans | 304 | 372 | 499 | 1,085 | 7,744 | 28,142 | 38,146 | |||||||||||||||||||||
| Corporate | 12,970 | 13,645 | 15,232 | 20,627 | 48,332 | 9,528 | 120,334 | |||||||||||||||||||||
| Small and Medium Businesses | 10,388 | 11,661 | 6,619 | 9,566 | 17,952 | 292 | 56,478 | |||||||||||||||||||||
| Foreign Loans Latin America | 14,144 | 14,743 | 11,903 | 13,641 | 40,798 | 27,431 | 122,660 | |||||||||||||||||||||
| Total(1) | 67,345 | 62,968 | 50,688 | 62,235 | 162,782 | 67,505 | 473,523 | |||||||||||||||||||||
(1) Includes R$9,085 million related to non-overdue installments of the non-accrual loans.
| Non-Overdue Installments | 12/31/2015 | |||||||||||||||||||||||||||
| Type of loan and lease | Due in 30 days or less | Due in 31-90 days | Due in 91-180 days | Due in 181-360 days | Due in one year to five years | Due after five years | Total Non-Overdue Installments | |||||||||||||||||||||
| (In millions of R$) | ||||||||||||||||||||||||||||
| Individuals | 29,539 | 23,792 | 18,033 | 20,223 | 57,797 | 27,682 | 177,066 | |||||||||||||||||||||
| Credit card | 21,997 | 16,998 | 9,193 | 4,174 | 161 | - | 52,523 | |||||||||||||||||||||
| Personal loans | 4,924 | 2,115 | 2,314 | 4,060 | 11,766 | 164 | 25,343 | |||||||||||||||||||||
| Payroll loans | 1,395 | 2,591 | 3,651 | 6,692 | 28,779 | 1,935 | 45,043 | |||||||||||||||||||||
| Vehicles | 978 | 1,760 | 2,414 | 4,301 | 9,974 | 21 | 19,448 | |||||||||||||||||||||
| Mortgage loans | 245 | 328 | 461 | 996 | 7,117 | 25,562 | 34,709 | |||||||||||||||||||||
| Corporate | 16,696 | 17,094 | 16,745 | 22,944 | 63,454 | 13,711 | 150,644 | |||||||||||||||||||||
| Small and Medium Businesses | 12,121 | 12,862 | 7,248 | 10,475 | 20,539 | 368 | 63,613 | |||||||||||||||||||||
| Foreign Loans Latin America | 8,611 | 7,673 | 8,045 | 7,370 | 19,304 | 16,326 | 67,329 | |||||||||||||||||||||
| Total(1) | 66,967 | 61,421 | 50,071 | 61,012 | 161,094 | 58,087 | 458,652 | |||||||||||||||||||||
(1) Includes R$8,399 million related to non-overdue installments of the non-accrual loans.
| Non-Overdue Installments | 12/31/2014 | |||||||||||||||||||||||||||
| Type of loan and lease | Due in 30 days or less | Due in 31-90 days | Due in 91-180 days | Due in 181-360 days | Due in one year to five years | Due after five years | Total Non-Overdue Installments | |||||||||||||||||||||
| (In millions of R$) | ||||||||||||||||||||||||||||
| Individuals | 29,985 | 25,941 | 20,510 | 23,392 | 54,906 | 22,651 | 177,385 | |||||||||||||||||||||
| Credit card | 21,658 | 17,658 | 9,841 | 4,740 | 217 | - | 54,114 | |||||||||||||||||||||
| Personal loans | 5,137 | 3,074 | 3,488 | 5,346 | 8,749 | 18 | 25,812 | |||||||||||||||||||||
| Payroll loans | 1,259 | 2,328 | 3,290 | 6,082 | 25,614 | 1,744 | 40,317 | |||||||||||||||||||||
| Vehicles | 1,482 | 2,516 | 3,496 | 6,348 | 14,267 | 1 | 28,110 | |||||||||||||||||||||
| Mortgage loans | 449 | 365 | 395 | 876 | 6,059 | 20,888 | 29,032 | |||||||||||||||||||||
| Corporate | 14,481 | 20,141 | 15,446 | 21,392 | 61,447 | 12,710 | 145,617 | |||||||||||||||||||||
| Small and Medium Businesses | 9,934 | 15,147 | 7,993 | 11,577 | 21,563 | 364 | 66,578 | |||||||||||||||||||||
| Foreign Loans Latin America | 7,494 | 5,703 | 5,394 | 5,388 | 14,055 | 11,743 | 49,777 | |||||||||||||||||||||
| Total(1) | 61,894 | 66,932 | 49,343 | 61,749 | 151,971 | 47,468 | 439,357 | |||||||||||||||||||||
(1) Includes R$7,533 million related to non-overdue installments of the non-accrual loans.
A-131
| Overdue Installments(1) | 12/31/2016 | |||||||||||||||||||||||||||||||||||||||
| Type of loan and lease | 01-30 days | 31-60 days | 61-90 days | 91-180 days | 181-360 days | One year or more | Total overdue installments | Total gross loans | Allowance for loan losses | Total net | ||||||||||||||||||||||||||||||
| (In millions of R$) | ||||||||||||||||||||||||||||||||||||||||
| Individuals | 1,704 | 931 | 859 | 2,318 | 3,231 | 53 | 9,096 | 183,147 | (14,259 | ) | 168,888 | |||||||||||||||||||||||||||||
| Credit card | 937 | 443 | 446 | 1,273 | 2,236 | 1 | 5,336 | 59,022 | (3,693 | ) | 55,329 | |||||||||||||||||||||||||||||
| Personal loans | 514 | 352 | 319 | 846 | 800 | 15 | 2,846 | 25,813 | (7,756 | ) | 18,057 | |||||||||||||||||||||||||||||
| Payroll loans | 71 | 53 | 48 | 116 | 123 | 30 | 441 | 44,636 | (2,108 | ) | 42,528 | |||||||||||||||||||||||||||||
| Vehicles | 145 | 64 | 37 | 69 | 60 | 2 | 377 | 15,434 | (644 | ) | 14,790 | |||||||||||||||||||||||||||||
| Mortgage loans | 37 | 19 | 9 | 14 | 12 | 5 | 96 | 38,242 | (58 | ) | 38,184 | |||||||||||||||||||||||||||||
| Corporate | 484 | 238 | 201 | 161 | 315 | 21 | 1,420 | 121,754 | (5,862 | ) | 115,892 | |||||||||||||||||||||||||||||
| Small and Medium Businesses | 481 | 301 | 223 | 619 | 799 | 34 | 2,457 | 58,935 | (4,743 | ) | 54,192 | |||||||||||||||||||||||||||||
| Foreign Loans Latin America | 2,170 | 523 | 329 | 386 | 414 | 48 | 3,870 | 126,530 | (2,108 | ) | 124,422 | |||||||||||||||||||||||||||||
| Total(2) | 4,839 | 1,993 | 1,612 | 3,484 | 4,759 | 156 | 16,843 | 490,366 | (26,972 | ) | 463,394 | |||||||||||||||||||||||||||||
(1) Defined as loans and leases contractually past due as to payment of interest or principal.
(2) Includes R$10,857 million related to overdue installments of the non-accrual loans.
| Overdue Installments(1) | 12/31/2015 | |||||||||||||||||||||||||||||||||||||||
| Type of loan and lease | 01-30 days | 31-60 days | 61-90 days | 91-180 days | 181-360 days | One year or more | Total overdue installments | Total gross loans | Allowance for loan losses | Total net | ||||||||||||||||||||||||||||||
| (In millions of R$) | ||||||||||||||||||||||||||||||||||||||||
| Individuals | 1,840 | 1,000 | 1,014 | 2,708 | 3,557 | 35 | 10,154 | 187,220 | (14,717 | ) | 172,503 | |||||||||||||||||||||||||||||
| Credit card | 979 | 418 | 551 | 1,598 | 2,466 | 7 | 6,019 | 58,542 | (4,141 | ) | 54,401 | |||||||||||||||||||||||||||||
| Personal loans | 540 | 406 | 347 | 876 | 875 | 9 | 3,053 | 28,396 | (8,330 | ) | 20,066 | |||||||||||||||||||||||||||||
| Payroll loans | 72 | 51 | 44 | 103 | 105 | 16 | 391 | 45,434 | (1,319 | ) | 44,115 | |||||||||||||||||||||||||||||
| Vehicles | 220 | 109 | 64 | 118 | 98 | 1 | 610 | 20,058 | (874 | ) | 19,184 | |||||||||||||||||||||||||||||
| Mortgage loans | 29 | 16 | 8 | 13 | 13 | 2 | 81 | 34,790 | (53 | ) | 34,737 | |||||||||||||||||||||||||||||
| Corporate | 825 | 130 | 125 | 560 | 238 | 5 | 1,883 | 152,527 | (6,459 | ) | 146,068 | |||||||||||||||||||||||||||||
| Small and Medium Businesses | 557 | 314 | 267 | 623 | 647 | 17 | 2,425 | 66,038 | (4,809 | ) | 61,229 | |||||||||||||||||||||||||||||
| Foreign Loans Latin America | 649 | 120 | 64 | 118 | 148 | 35 | 1,134 | 68,463 | (859 | ) | 67,604 | |||||||||||||||||||||||||||||
| Total(2) | 3,871 | 1,564 | 1,470 | 4,009 | 4,590 | 92 | 15,596 | 474,248 | (26,844 | ) | 447,404 | |||||||||||||||||||||||||||||
(1) Defined as loans and leases contractually past due as to payment of interest or principal.
(2) Includes R$11,059 million related to overdue installments of the non-accrual loans.
| Overdue Installments(1) | 12/31/2014 | |||||||||||||||||||||||||||||||||||||||
| Type of loan and lease | 01-30 days | 31-60 days | 61-90 days | 91-180 days | 181-360 days | One year or more | Total overdue installments | Total gross loans | Allowance for loan losses | Total net | ||||||||||||||||||||||||||||||
| (In millions of R$) | ||||||||||||||||||||||||||||||||||||||||
| Individuals | 1,844 | 910 | 791 | 1,980 | 2,972 | 71 | 8,568 | 185,953 | (13,385 | ) | 172,568 | |||||||||||||||||||||||||||||
| Credit card | 990 | 467 | 422 | 1,166 | 2,114 | 48 | 5,207 | 59,321 | (3,740 | ) | 55,581 | |||||||||||||||||||||||||||||
| Personal loans | 433 | 240 | 243 | 574 | 645 | 6 | 2,141 | 27,953 | (7,024 | ) | 20,929 | |||||||||||||||||||||||||||||
| Payroll loans | 56 | 30 | 24 | 50 | 42 | 6 | 208 | 40,525 | (1,107 | ) | 39,418 | |||||||||||||||||||||||||||||
| Vehicles | 333 | 161 | 95 | 179 | 161 | 8 | 937 | 29,047 | (1,469 | ) | 27,578 | |||||||||||||||||||||||||||||
| Mortgage loans | 32 | 12 | 7 | 11 | 10 | 3 | 75 | 29,107 | (45 | ) | 29,062 | |||||||||||||||||||||||||||||
| Corporate | 697 | 51 | 99 | 261 | 274 | 3 | 1,385 | 147,002 | (3,114 | ) | 143,888 | |||||||||||||||||||||||||||||
| Small and Medium Businesses | 488 | 249 | 243 | 559 | 681 | 40 | 2,260 | 68,838 | (5,158 | ) | 63,680 | |||||||||||||||||||||||||||||
| Foreign Loans Latin America | 449 | 86 | 56 | 126 | 103 | 41 | 861 | 50,638 | (735 | ) | 49,903 | |||||||||||||||||||||||||||||
| Total(2) | 3,478 | 1,296 | 1,189 | 2,926 | 4,030 | 155 | 13,074 | 452,431 | (22,392 | ) | 430,039 | |||||||||||||||||||||||||||||
(1) Defined as loans and leases contractually past due as to payment of interest or principal.
(2) Includes R$8,981 million related to overdue installments of the non-accrual loans.
Loan and lease operations by interest rate
The following table sets out the classification of our credit portfolio into fixed and variables rates, including non-overdue and overdue installments:
A-132
| 12/31/2016 | ||||||||||||||||||||||||||||
| Non-Overdue Installments | Due in 30 days or less | Due in 31-90 days | Due in 91-180 days | Due in 181-360 days | Due in one year to five years | Due after five years | Total Non- Overdue Installments | |||||||||||||||||||||
| (In millions of R$) | ||||||||||||||||||||||||||||
| Interest rate of loans to customers by maturity | ||||||||||||||||||||||||||||
| Variable rates | 21,082 | 28,062 | 22,294 | 28,525 | 90,341 | 64,232 | 254,536 | |||||||||||||||||||||
| Fixed rates | 46,263 | 34,906 | 28,394 | 33,710 | 72,441 | 3,273 | 218,987 | |||||||||||||||||||||
| Total (1) | 67,345 | 62,968 | 50,688 | 62,235 | 162,782 | 67,505 | 473,523 | |||||||||||||||||||||
(1) Includes R$9,085 million related to non-overdue installments of the non-accrual loans.
| 12/31/2015 | ||||||||||||||||||||||||||||
| Non-Overdue Installments | Due in 30 days or less | Due in 31-90 days | Due in 91-180 days | Due in 181-360 days | Due in one year to five years | Due after five years | Total Non- Overdue Installments | |||||||||||||||||||||
| (In millions of R$) | ||||||||||||||||||||||||||||
| Interest rate of loans to customers by maturity | ||||||||||||||||||||||||||||
| Variable rates | 17,424 | 23,010 | 19,880 | 24,869 | 79,466 | 53,659 | 218,308 | |||||||||||||||||||||
| Fixed rates | 49,543 | 38,411 | 30,191 | 36,143 | 81,628 | 4,428 | 240,344 | |||||||||||||||||||||
| Total (1) | 66,967 | 61,421 | 50,071 | 61,012 | 161,094 | 58,087 | 458,652 | |||||||||||||||||||||
(1) Includes R$8,399 million related to non-overdue installments of the non-accrual loans.
| 12/31/2014 | ||||||||||||||||||||||||||||
| Non-Overdue Installments | Due in 30 days or less | Due in 31-90 days | Due in 91-180 days | Due in 181-360 days | Due in one year to five years | Due after five years | Total Non- Overdue Installments | |||||||||||||||||||||
| (In millions of R$) | ||||||||||||||||||||||||||||
| Interest rate of loans to customers by maturity | ||||||||||||||||||||||||||||
| Variable rates | 13,506 | 23,137 | 15,346 | 21,499 | 66,894 | 42,765 | 183,147 | |||||||||||||||||||||
| Fixed rates | 48,388 | 43,795 | 33,997 | 40,250 | 85,077 | 4,703 | 256,210 | |||||||||||||||||||||
| Total (1) | 61,894 | 66,932 | 49,343 | 61,749 | 151,971 | 47,468 | 439,357 | |||||||||||||||||||||
(1) Includes R$7,533 million related to non-overdue installments of the non-accrual loans.
| 12/31/2016 | ||||||||||||||||||||||||||||||||
| Overdue Installments (1) | 01-30 days | 31-60 days | 61-90 days | 91-180 days | 181-360 days | One year or more | Total overdue installments | Total gross loans | ||||||||||||||||||||||||
| (In millions of R$) | ||||||||||||||||||||||||||||||||
| Interest rate of loans to customers by maturity | ||||||||||||||||||||||||||||||||
| Variable rates | 2,513 | 795 | 512 | 506 | 686 | 76 | 5,088 | 259,624 | ||||||||||||||||||||||||
| Fixed rates | 2,326 | 1,198 | 1,100 | 2,978 | 4,073 | 80 | 11,755 | 230,742 | ||||||||||||||||||||||||
| Total (2) | 4,839 | 1,993 | 1,612 | 3,484 | 4,759 | 156 | 16,843 | 490,366 | ||||||||||||||||||||||||
(1) Defined as loans and leases contractually past due as to payment of interest or principal.
(2) Includes R$10,857 million related to overdue installments of the non-accrual loans.
| 12/31/2015 | ||||||||||||||||||||||||||||||||
| Overdue Installments (1) | 01-30 days | 31-60 days | 61-90 days | 91-180 days | 181-360 days | One year or more | Total overdue installments | Total gross loans | ||||||||||||||||||||||||
| (In millions of R$) | ||||||||||||||||||||||||||||||||
| Interest rate of loans to customers by maturity | ||||||||||||||||||||||||||||||||
| Variable rates | 1,166 | 240 | 156 | 531 | 347 | 39 | 2,479 | 220,786 | ||||||||||||||||||||||||
| Fixed rates | 2,705 | 1,324 | 1,314 | 3,478 | 4,243 | 53 | 13,117 | 253,462 | ||||||||||||||||||||||||
| Total (2) | 3,871 | 1,564 | 1,470 | 4,009 | 4,590 | 92 | 15,596 | 474,248 | ||||||||||||||||||||||||
(1) Defined as loans and leases contractually past due as to payment of interest or principal.
(2) Includes R$11,059 million related to overdue installments of the non-accrual loans.
| 12/31/2014 | ||||||||||||||||||||||||||||||||
| Overdue Installments (1) | 01-30 days | 31-60 days | 61-90 days | 91-180 days | 181-360 days | One year or more | Total overdue installments | Total gross loans | ||||||||||||||||||||||||
| (In millions of R$) | ||||||||||||||||||||||||||||||||
| Interest rate of loans to customers by maturity | ||||||||||||||||||||||||||||||||
| Variable rates | 972 | 146 | 164 | 375 | 324 | 44 | 2,025 | 185,172 | ||||||||||||||||||||||||
| Fixed rates | 2,506 | 1,150 | 1,025 | 2,551 | 3,706 | 111 | 11,049 | 267,259 | ||||||||||||||||||||||||
| Total (2) | 3,478 | 1,296 | 1,189 | 2,926 | 4,030 | 155 | 13,074 | 452,431 | ||||||||||||||||||||||||
(1) Defined as loans and leases contractually past due as to payment of interest or principal.
(2) Includes R$8,981 million related to overdue installments of the non-accrual loans.
Loan and lease operations by economic activity
The following table sets out the composition of our credit portfolio, including non-accrual loan operations, by economic activity of the borrower:
A-133
| 12/31/2016 | 12/31/2015 | 12/31/2014 | ||||||||||||||||||||||
| Economic Activities | Loan portfolio | % of Loan portfolio | Loan portfolio | % of Loan portfolio | Loan portfolio | % of Loan portfolio | ||||||||||||||||||
| (In millions of R$, except percentages) | ||||||||||||||||||||||||
| Public sector | 3,051 | 0.6 | 3,182 | 0.7 | 4,389 | 1.0 | ||||||||||||||||||
| Industry and commerce | 112,067 | 22.8 | 125,386 | 26.5 | 116,506 | 25.7 | ||||||||||||||||||
| Services | 118,102 | 24.1 | 104,226 | 22.0 | 99,855 | 22.1 | ||||||||||||||||||
| Natural resources | 24,362 | 5.0 | 25,306 | 5.3 | 23,345 | 5.2 | ||||||||||||||||||
| Individuals | 229,945 | 46.9 | 213,622 | 45.0 | 206,094 | 45.5 | ||||||||||||||||||
| Other sectors | 2,839 | 0.6 | 2,526 | 0.5 | 2,242 | 0.5 | ||||||||||||||||||
| Total | 490,366 | 100.0 | 474,248 | 100.0 | 452,431 | 100.0 | ||||||||||||||||||
On December 31, 2016, there was no concentration of loan and lease operations exceeding 10% of the total portfolio that had not been disclosed in a category of loan and losses.
Loan and lease operations by concentration
The following table presents the composition of our credit portfolio by concentration with respect to the amounts owed by the debtors:
| 12/31/2016 | 12/31/2015 | 12/31/2014 | ||||||||||||||||||||||
| Loan | % of Loan | Loan | % of Loan | Loan | % of Loan | |||||||||||||||||||
| Concentration | portfolio | portfolio | portfolio | portfolio | portfolio | portfolio | ||||||||||||||||||
| (In millions of R$, except percentages) | ||||||||||||||||||||||||
| Largest debtor | 3,543 | 0.7 | 4,615 | 1.0 | 4,032 | 0.9 | ||||||||||||||||||
| 10 largest debtors | 21,609 | 4.4 | 27,173 | 5.7 | 23,646 | 5.2 | ||||||||||||||||||
| 20 largest debtors | 32,720 | 6.7 | 40,831 | 8.6 | 35,325 | 7.8 | ||||||||||||||||||
| 50 largest debtors | 52,992 | 10.8 | 63,797 | 13.5 | 58,180 | 12.9 | ||||||||||||||||||
| 100 largest debtors | 72,441 | 14.8 | 85,167 | 18.0 | 79,617 | 17.6 | ||||||||||||||||||
Rating of the loan and lease portfolio
The following table presents the rating of our loan and lease portfolio based on the probability of default for the periods indicated below.
A-134
| 12/31/2016 | ||||||||||||||||
| Internal Rating | Loans neither overdue nor impaired | Loans overdue not impaired (1) | Loans impaired | Total loans | ||||||||||||
| (In millions of R$, except percentages) | ||||||||||||||||
| Lower Risk | 363,954 | 5,543 | - | 369,497 | ||||||||||||
| Satisfactory | 62,883 | 6,904 | - | 69,787 | ||||||||||||
| Higher Risk | 13,767 | 6,998 | - | 20,765 | ||||||||||||
| Impaired (2) | - | - | 30,317 | 30,317 | ||||||||||||
| Total | 440,604 | 19,445 | 30,317 | 490,366 | ||||||||||||
| % | 89.8 | 4.0 | 6.2 | 100.0 | ||||||||||||
| 12/31/2015 | ||||||||||||||||
| Internal Rating | Loans neither overdue nor impaired | Loans overdue not impaired (1) | Loans impaired | Total loans | ||||||||||||
| (In millions of R$, except percentages) | ||||||||||||||||
| Lower Risk | 340,368 | 3,838 | - | 344,206 | ||||||||||||
| Satisfactory | 76,940 | 6,489 | - | 83,429 | ||||||||||||
| Higher Risk | 12,609 | 6,847 | - | 19,456 | ||||||||||||
| Impaired (2) | - | - | 27,157 | 27,157 | ||||||||||||
| Total | 429,917 | 17,174 | 27,157 | 474,248 | ||||||||||||
| % | 90.7 | 3.6 | 5.7 | 100.0 | ||||||||||||
| 12/31/2014 | ||||||||||||||||
| Internal Rating | Loans neither overdue nor impaired | Loans overdue not impaired (1) | Loans impaired | Total loans | ||||||||||||
| (In millions of R$, except percentages) | ||||||||||||||||
| Lower Risk | 324,908 | 4,042 | - | 328,950 | ||||||||||||
| Satisfactory | 81,994 | 6,989 | - | 88,983 | ||||||||||||
| Higher Risk | 11,439 | 5,853 | - | 17,292 | ||||||||||||
| Impaired (2) | - | - | 17,206 | 17,206 | ||||||||||||
| Total | 418,341 | 16,884 | 17,206 | 452,431 | ||||||||||||
| % | 92.5 | 3.7 | 3.8 | 100.0 | ||||||||||||
(1) The operations classified as Loans Overdue Not Impaired are past due between 1 day and 90 days and the balance is the total of outstanding principal amount (Overdue and Non-Overdue).
(2) We consider loans as impaired when (i) corporate transactions have a probability of default higher than 31.84%; (ii) transactions are overdue for more than 90 days; or (iii) renegotiated transactions are overdue for more than 60 days.
The credit rating in corporate transactions is based on information such as the economic and financial condition of the counterparty, its cash-generating capabilities, the economic group to which it belongs, the current and prospective situation of the economic sector in which it operates, the collateral offered and the use of proceeds. The credit proposals are analyzed on a case by case basis, through an approval-level mechanism reporting to the Superior Credit Committee.
Regarding retail transactions (those involving individuals, small and middle-market companies) the rating is assigned based on the corresponding loan application and behavior score statistical models. Decisions are made based on scoring models that are continuously updated by an independent unit. In limited instances, there may also be an individualized analysis of specific cases where approval is subject to higher credit approval levels. The risk ratings are grouped in four categories: (i) lower risk, (ii) satisfactory, (iii) higher risk and (iv) impaired. Please refer to section Performance, item Financial performance – Allowance for loan and lease losses, for further details on the individual and collective analyses.
Non-accrual loans
We consider all loans overdue for 60 days or more as non-accrual loans and, accordingly, cease the accrual of financial charges on such loans.
Write-offs
Loans and leases are written off against the allowance for loan and lease losses when the loan is not collected or is considered permanently impaired. We typically write off loans when they are overdue for 360 days, except for loans having an original maturity in excess of 36 months, which are written off when they are overdue for 540 days. However, write-offs may be recognized earlier than 360 days if we conclude that the loan is not recoverable.
Please refer to section Performance, item Assets – Loan and lease operations – Renegotiated loans for further details.
Information on the quality of loans and leases
The following table shows our non-accrual loans together with certain asset quality ratios.
A-135
| 12/31/2016 | 12/31/2015 | 12/31/2014 | 12/31/2013 | 12/31/2012 | ||||||||||||||||
| (In millions of R$, except percentages) | ||||||||||||||||||||
| Non-accrual loans | 19,942 | 19,458 | 16,514 | 18,065 | 20,791 | |||||||||||||||
| Allowance for loan losses | 26,972 | 26,844 | 22,392 | 22,235 | 25,713 | |||||||||||||||
| Total loans and leases operations portfolio | 490,366 | 474,248 | 452,431 | 411,702 | 366,984 | |||||||||||||||
| Non-accrual loans as a percentage of total loans (%) | 4.1 | 4.1 | 3.7 | 4.4 | 5.7 | |||||||||||||||
| Allowance for loan losses as a percentage of total loans (%) | 5.5 | 5.7 | 4.9 | 5.4 | 7.0 | |||||||||||||||
| Allowance for loan losses as a percentage of non-accrual loans (%) | 135.3 | 138.0 | 135.6 | 123.1 | 123.7 | |||||||||||||||
Assessment
We first assess whether there is objective evidence of loss individually allocated to individually significant loans or collectively allocated to loans that are not individually significant.
To determine the amount of the allowance for individually significant loans with objective evidence of impairment, we use methodologies that consider both the client quality and the nature of the financing, including its collateral, to estimate the cash flow expected from these loans.
If there is no objective evidence of loss for an individually assessed loan, whether significant or not, the loan is included in a group of loans with similar credit risk characteristics which are then collectively tested for impairment. Individually assessed loans for which an impairment loss is recognized are not included in the collective assessment. The amount of loss is measured as the difference between the carrying amount of the asset and the present value of the estimated future cash flows (excluding future loan losses that have not been incurred), discounted at the financial asset’s effective interest rate.
For collectively assessed loans, the calculation of the present value of the estimated future cash flows, for which collateral is received, reflects the historical performance and recovery of the fair value, considering the cash flows that may arise from the performances less costs for obtaining and selling that collateral.
For the purpose of collectively assessing impairment, loans are aggregated based on similar credit risk characteristics. These characteristics are relevant to estimate the future cash flows of these loans since they may be an indicator of the difficulty of the debtor in paying the amounts due, in accordance with the contractual conditions of the loan that is being assessed. The future cash flows of a group of loans that are collectively assessed in order to identify the need for recognizing an impairment are estimated based on the contractual cash flows of the group of loans and the historical experience of loss for loans with similar credit risk characteristics. The historical loss experience is adjusted, based on current observable data, to reflect the effects of current conditions that have not impacted the period on which the historical loss experience is based and to exclude the effects of conditions in the historical period that are not currently in place.
For individually significant loans with no objective evidence of impairment, such loans are classified into certain credit ratings based on several qualitative and quantitative factors applied to internally developed models. Considering the size and the different risk characteristics of each credit agreement, the ratings determined under internal models may be reviewed and modified by our Credit Committee, the members of which are executives and experts in corporate credit risk. We estimate the losses inherent in every rating, using the approach internally developed to low-default portfolios, which uses our historical experience to design internal models that are used to estimate the probability of default and the potential for recovery of non-performing loans.
To determine the amount of the allowance for items that are not individually significant, loans are segregated into classes based on the underlying risks and the characteristics of each group. The allowance for loan and lease losses is determined for each of these classes through a process that considers the historical delinquency and the loan loss experience in prior years.
Allocation of the allowance for loan and lease losses
The following table presents the details, by segment and class, as defined in the segmentation of our portfolio, of the allowance for loan and lease losses, of this allowance as a percentage of the total loan and lease losses for the corresponding segment or class, and the percentage of the total loan and leases in each segment and class in relation to the total loans and leases.
| 12/31/2016 | 12/31/2015 | 12/31/2014 | 12/31/2013 | 12/31/2012 | ||||||||||||||||||||||||||||||||||||||||||||||||||||||||
| Allocated allowance | Allocated allowance as a % of total loans and leases | Loans category as a % of total loans | Allocated allowance | Allocated allowance as a % of total loans and leases | Loans category as a % of total loans | Allocated allowance | Allocated allowance as a % of total loans and leases | Loans category as a % of total loans | Allocated allowance | Allocated allowance as a % of total loans and leases | Loans category as a % of total loans | Allocated allowance | Allocated allowance as a % of total loans and leases | Loans category as a % of total loans | ||||||||||||||||||||||||||||||||||||||||||||||
| (In millions of R$, except percentages) | ||||||||||||||||||||||||||||||||||||||||||||||||||||||||||||
| Individuals | 14,259 | 2.9 | 37.3 | 14,717 | 3.1 | 39.5 | 13,385 | 3.0 | 41.1 | 13,853 | 3.4 | 40.7 | 14,844 | 4.1 | 41.1 | |||||||||||||||||||||||||||||||||||||||||||||
| Credit card | 3,693 | 0.8 | 12.0 | 4,141 | 0.9 | 12.4 | 3,740 | 0.8 | 13.1 | 2,952 | 0.7 | 12.9 | 2,863 | 0.8 | 11.0 | |||||||||||||||||||||||||||||||||||||||||||||
| Personal loans | 7,756 | 1.6 | 5.3 | 8,330 | 1.7 | 6.0 | 7,024 | 1.6 | 6.2 | 6,488 | 1.6 | 6.5 | 6,841 | 1.9 | 7.3 | |||||||||||||||||||||||||||||||||||||||||||||
| Payroll loans | 2,108 | 0.4 | 9.1 | 1,319 | 0.3 | 9.6 | 1,107 | 0.2 | 9.0 | 1,133 | 0.3 | 5.5 | 867 | 0.2 | 3.7 | |||||||||||||||||||||||||||||||||||||||||||||
| Vehicles | 644 | 0.1 | 3.1 | 874 | 0.2 | 4.2 | 1,469 | 0.3 | 6.4 | 3,245 | 0.8 | 9.9 | 4,227 | 1.2 | 14.1 | |||||||||||||||||||||||||||||||||||||||||||||
| Mortgage loans | 58 | - | 7.8 | 53 | - | 7.3 | 45 | - | 6.4 | 35 | - | 5.9 | 46 | - | 5.0 | |||||||||||||||||||||||||||||||||||||||||||||
| Corporate | 5,862 | 1.2 | 24.8 | 6,459 | 1.4 | 32.2 | 3,114 | 0.7 | 32.5 | 2,006 | 0.5 | 31.6 | 1,594 | 0.4 | 29.6 | |||||||||||||||||||||||||||||||||||||||||||||
| Small and Medium Businesses | 4,743 | 1.0 | 12.1 | 4,809 | 1.0 | 13.9 | 5,158 | 1.1 | 15.2 | 5,854 | 1.4 | 17.6 | 8,853 | 2.4 | 20.9 | |||||||||||||||||||||||||||||||||||||||||||||
| Foreign Loans Latin America | 2,108 | 0.4 | 25.8 | 859 | 0.2 | 14.4 | 735 | 0.2 | 11.2 | 522 | 0.1 | 10.1 | 422 | 0.1 | 8.4 | |||||||||||||||||||||||||||||||||||||||||||||
| Total | 26,972 | 5.5 | 100.0 | 26,844 | 5.7 | 100.0 | 22,392 | 4.9 | 100.0 | 22,235 | 5.4 | 100.0 | 25,713 | 7.0 | 100.0 | |||||||||||||||||||||||||||||||||||||||||||||
A-136
Renegotiated loans
| Year Ended December 31, | ||||||||||||||||||||
| 2016 | 2015 | 2014 | 2013 | 2012 | ||||||||||||||||
| (In millions of R$, except percentages) | ||||||||||||||||||||
| Renegotiated loans (1) | 16,398 | 14,932 | 11,572 | 12,880 | 14,519 | |||||||||||||||
| Allowance for loan and lease losses | 7,341 | 6,991 | 5,459 | 6,284 | 6,767 | |||||||||||||||
| Allowance for loan and lease losses/renegotiated loans (%) | 44.8 | 46.8 | 47.2 | 48.8 | 46.6 | |||||||||||||||
(1) Includes debt consolidation, deferment or any other arrangement that modifies the periods or conditions, of operations originally overdue.
Renegotiated loans include both loans for which the corresponding credit agreement’s original terms were amended (amendments) and new loans originated in order to settle contracts or transactions with the same client (restructured loans), which were past due. Amendments and restructured loans usually reflect changes in contract terms, rates or payment conditions. In almost all cases for loan products, renegotiated loans require that at least one payment be made under the renegotiated terms in order for it to be removed from the non-performing and non-accrual status. Renegotiated loans return to non-performing and non-accrual status when they reach 60 days past due under the renegotiated terms, which typically corresponds to the borrower missing two or more payments.
The fact that a loan or lease has been renegotiated is also taken into consideration when determining the allowance for loan and lease losses after the renegotiation. The past performance and the payment history of the client and the transaction, including the probability of another default for renegotiated transactions, are considered in our risk models in order to determine the probability of default. This probability of default is generally higher than the probability assigned to similar transactions that have never been renegotiated. Another factor considered in determining the appropriate level of the allowance for loan and lease losses is the additional collateral to be offered by the debtor. The resulting allowance levels are compatible with the risk profile of each transaction.
Our renegotiated loan portfolio increased to 3.3% of our total loan portfolio as of December 31, 2016, compared to 3.1% as of December 31, 2015. At the end of 2016, the ratio of the renegotiated portfolio to the allowance for loan and lease losses was 44.8% compared to 46.8% as of December 31, 2015. This portfolio increased in 2016 due to the deteriorating macroeconomic scenario, mainly in Brazil, specifically in the corporate segment, and small and medium business segment as shown below in the table “Renegotiated loan and lease operations” where a breakdown by segment is presented.
Our renegotiated loan portfolio increased to 3.1% of our total loan portfolio as of December 31, 2015, compared to 2.6% as of December 31, 2014. At the end of 2015, the ratio of the renegotiated portfolio to the allowance for loan and lease losses was 46.8% compared to 47.2% as of December 31, 2014. This portfolio increased in 2015 due to the deteriorating macroeconomic scenario, mainly in Brazil, specifically in the corporate segment, as shown below in the table “Renegotiated loan and lease operations” where a breakdown by segment is presented.
Our renegotiated loan portfolio decreased to 2.6% of our total loan portfolio as of December 31, 2014, compared to 3.1% as of December 31, 2013. At the end of 2014, the ratio of the renegotiated portfolio to the allowance for loan and lease losses was 47.2% compared to 48.8% as of December 31, 2013. Throughout 2014, the allowance for loan and lease losses followed the evolution of the "mix" of portfolio credit risk in the renegotiated loan portfolio.
Our renegotiated loan portfolio decreased to 3.1% of our total loan portfolio as of December 31, 2013, compared to 4.0% as of December 31, 2012. At the end of 2013, the ratio of the renegotiated portfolio to the allowance for loan and lease losses was 48.8% compared to 46.6% as of December 31, 2012. Throughout 2013, the allowance for loan and lease losses followed the evolution of the "mix" of portfolio credit risk in the renegotiated loan portfolio.
Our renegotiated loan portfolio increased to 4.0% of our total loan portfolio as of December 31, 2012.At the end of 2012, the ratio of the renegotiated portfolio to the allowance for loan and lease losses was 46.6%. This ratio increased in 2012 mainly because of an increase in the renegotiated loans in default to total renegotiated loans ratio.
Since 2013, we maintained our policy for the recovery of overdue loans, including loans already written off as losses, and to reduce losses, we enhanced our collection and recovery initiatives. However, we still require that at least one installment is paid to consider the renegotiation to be valid and to treat it as a renegotiated agreement. We also adopted a policy of stricter selectivity in origination of loans, which led to lower levels of delinquency and a decreased volume of renegotiated loans.
During 2012, the Brazilian economy experienced an increase in the default levels for individuals, mainly with respect to vehicle financing and personal loan portfolios. As one of the largest banks in Brazil, our loan portfolio was impacted by this increase in defaults. In order to increase the recovery of overdue loans, including loans already written off as losses, and to reduce losses, we enhanced our collection and recovery initiatives. However, we require that at least one installment is paid to consider the renegotiation to be valid and to treat it as a renegotiated agreement.
The total amount of each type of renegotiated loan as of December 31, 2016, 2015 and 2014 is shown in the tables below.
A-137
| As of December 31, 2016 | ||||||||||||||||||||
| Type of Loan | Total Renegotiated Loans | Total Allowance for Loan Losses | Allowance for Loan Losses/ Renegotiated Loans (%) | Total Redefaulted Renegotiated Loans (1) | Redefaulted Renegotiated Loans (%) | |||||||||||||||
| (In millions of R$, except percentages) | ||||||||||||||||||||
| Restructured Loans | 14,405 | 6,740 | 46.8 | 3,930 | 27.3 | |||||||||||||||
| Agreements | 1,993 | 601 | 30.2 | 295 | 14.8 | |||||||||||||||
| Total | 16,398 | 7,341 | 44.8 | 4,225 | 25.8 | |||||||||||||||
(1) Our redefaulted renegotiated loans are renegotiated transactions 60 days or more overdue.
| As of December 31, 2015 | ||||||||||||||||||||
| Type of Loan | Total Renegotiated Loans | Total Allowance for Loan Losses | Allowance for Loan Losses/ Renegotiated Loans (%) | Total Redefaulted Renegotiated Loans (1) | Redefaulted Renegotiated Loans (%) | |||||||||||||||
| (In millions of R$, except percentages) | ||||||||||||||||||||
| Restructured Loans | 11,985 | 5,508 | 46.0 | 3,077 | 25.7 | |||||||||||||||
| Agreements | 2,947 | 1,483 | 50.3 | 340 | 11.5 | |||||||||||||||
| Total | 14,932 | 6,991 | 46.8 | 3,417 | 22.9 | |||||||||||||||
(1) Our redefaulted renegotiated loans are renegotiated transactions 60 days or more overdue.
| As of December 31, 2014 | ||||||||||||||||||||
| Type of Loan | Total Renegotiated Loans | Total Allowance for Loan Losses | Allowance for Loan Losses/ Renegotiated Loans (%) | Total Redefaulted Renegotiated Loans (1) | Redefaulted Renegotiated Loans (%) | |||||||||||||||
| (In millions of R$, except percentages) | ||||||||||||||||||||
| Restructured Loans | 10,284 | 5,051 | 49.1 | 2,744 | 26.7 | |||||||||||||||
| Agreements | 1,288 | 408 | 31.7 | 602 | 46.7 | |||||||||||||||
| Total | 11,572 | 5,459 | 47.2 | 3,346 | 28.9 | |||||||||||||||
(1) Our redefaulted renegotiated loans are renegotiated transactions 60 days or more overdue.
The tables below present an additional breakdown of renegotiated loans by portfolio, in segments and types, based on the type of modification, as of December 31, 2016, 2015 and 2014:
A-138
| As of December 31, 2016 | ||||||||||||||||
| Payment | Multiple | Multiple | ||||||||||||||
| Renegotiated loan and lease operations | extension (1) | concessions (2) | modifications (3) | Total | ||||||||||||
| (In millions of R$) | ||||||||||||||||
| Individuals | 138 | 2,470 | 5,209 | 7,817 | ||||||||||||
| Credit card | - | 333 | - | 333 | ||||||||||||
| Personal loans | - | 1,964 | 5,209 | 7,173 | ||||||||||||
| Payroll loans | - | 173 | - | 173 | ||||||||||||
| Vehicles | 68 | - | - | 68 | ||||||||||||
| Mortgage loans | 70 | - | - | 70 | ||||||||||||
| Corporate | - | - | 2,908 | 2,908 | ||||||||||||
| Small and medium businesses | 34 | 2,102 | 2,201 | 4,337 | ||||||||||||
| Foreign loans - Latin America | 188 | 1,148 | - | 1,336 | ||||||||||||
| Total renegotiated loan and lease operations | 360 | 5,720 | 10,318 | 16,398 | ||||||||||||
(1) Represents loan and lease transactions subject to an amendment of contractual terms relating exclusively to payment due dates.
(2) Represents multiple loan and lease transactions which have been restructured, i.e., all such outstanding transactions are terminated and a single new transaction consolidating the terminated loan and lease transactions is entered into.
(3) Represents individual loan and lease transactions entered into with a customer that are renegotiated for an amendment of the original contractual terms, which may include amendment of interest rates, discounts of outstanding amounts due and payment extensions.
| As of December 31, 2015 | ||||||||||||||||
| Payment | Multiple | Multiple | ||||||||||||||
| Renegotiated loan and lease operations | extension (1) | concessions (2) | modifications (3) | Total | ||||||||||||
| (In millions of R$) | ||||||||||||||||
| Individuals | 213 | 2,457 | 5,123 | 7,793 | ||||||||||||
| Credit card | - | 356 | - | 356 | ||||||||||||
| Personal loans | - | 1,965 | 5,123 | 7,088 | ||||||||||||
| Payroll loans | - | 136 | - | 136 | ||||||||||||
| Vehicles | 163 | - | - | 163 | ||||||||||||
| Mortgage loans | 50 | - | - | 50 | ||||||||||||
| Corporate | - | - | 3,181 | 3,181 | ||||||||||||
| Small and medium businesses | 53 | 2,348 | 1,357 | 3,758 | ||||||||||||
| Foreign loans - Latin America | - | 200 | - | 200 | ||||||||||||
| Total renegotiated loan and lease operations | 266 | 5,005 | 9,661 | 14,932 | ||||||||||||
(1) Represents loan and lease transactions subject to an amendment of contractual terms relating exclusively to payment due dates.
(2) Represents multiple loan and lease transactions which have been restructured, i.e., all such outstanding transactions are terminated and a single new transaction consolidating the terminated loan and lease transactions is entered into.
(3) Represents individual loan and lease transactions entered into with a customer that are renegotiated for an amendment of the original contractual terms, which may include amendment of interest rates, discounts of outstanding amounts due and payment extensions.
| As of December 31, 2014 | ||||||||||||||||
| Payment | Multiple | Multiple | ||||||||||||||
| Renegotiated loan and lease operations | extension (1) | concessions (2) | modifications (3) | Total | ||||||||||||
| (In millions of R$) | ||||||||||||||||
| Individuals | 648 | 2,352 | 4,330 | 7,330 | ||||||||||||
| Credit card | - | 403 | - | 403 | ||||||||||||
| Personal loans | - | 1,906 | 4,330 | 6,236 | ||||||||||||
| Payroll loans | - | 43 | - | 43 | ||||||||||||
| Vehicles | 577 | - | - | 577 | ||||||||||||
| Mortgage loans | 71 | - | - | 71 | ||||||||||||
| Corporate | - | - | 871 | 871 | ||||||||||||
| Small and medium businesses | 55 | 2,610 | 620 | 3,285 | ||||||||||||
| Foreign loans - Latin America | - | 86 | - | 86 | ||||||||||||
| Total renegotiated loan and lease operations | 703 | 5,048 | 5,821 | 11,572 | ||||||||||||
(1) Represents loan and lease transactions subject to an amendment of contractual terms relating exclusively to payment due dates.
(2) Represents multiple loan and lease transactions which have been restructured, i.e., all such outstanding transactions are terminated and a single new transaction consolidating the terminated loan and lease transactions is entered into.
(3) Represents individual loan and lease transactions entered into with a customer that are renegotiated for an amendment of the original contractual terms, which may include amendment of interest rates, discounts of outstanding amounts due and payment extensions.
A-139
The following tables present an additional breakdown of renegotiated loans and leases by segment and class, as of December 31, 2016, 2015 and 2014:
| As of December 31, 2016 | ||||||||||||||||||||
| Impaired | Non-impaired | Impaired non- | Non-impaired non- | |||||||||||||||||
| Renegotiated loan and lease operations | performing | performing | performing | performing | Total | |||||||||||||||
| (In millions of R$) | ||||||||||||||||||||
| Individuals | - | 4,162 | 2,162 | 1,493 | 7,817 | |||||||||||||||
| Credit card | - | 333 | - | - | 333 | |||||||||||||||
| Personal loans | - | 3,689 | 2,033 | 1,451 | 7,173 | |||||||||||||||
| Payroll loans | - | 104 | 55 | 14 | 173 | |||||||||||||||
| Vehicles | - | 32 | 29 | 7 | 68 | |||||||||||||||
| Mortgage loans | - | 4 | 45 | 21 | 70 | |||||||||||||||
| Corporate | 2,113 | 135 | 633 | 27 | 2,908 | |||||||||||||||
| Small and medium businesses | - | 2,064 | 1,293 | 980 | 4,337 | |||||||||||||||
| Foreign loans - Latin America | 22 | 733 | 292 | 289 | 1,336 | |||||||||||||||
| Total renegotiated loan and lease operations | 2,135 | 7,094 | 4,380 | 2,789 | 16,398 | |||||||||||||||
| As of December 31, 2015 | ||||||||||||||||||||
| Impaired | Non-impaired | Impaired non- | Non-impaired non- | |||||||||||||||||
| Renegotiated loan and lease operations | performing | performing | performing | performing | Total | |||||||||||||||
| (In millions of R$) | ||||||||||||||||||||
| Individuals | - | 4,133 | 2,118 | 1,542 | 7,793 | |||||||||||||||
| Credit card | - | 356 | - | - | 356 | |||||||||||||||
| Personal loans | - | 3,679 | 1,919 | 1,490 | 7,088 | |||||||||||||||
| Payroll loans | - | 83 | 28 | 25 | 136 | |||||||||||||||
| Vehicles | - | 13 | 135 | 15 | 163 | |||||||||||||||
| Mortgage loans | - | 2 | 36 | 12 | 50 | |||||||||||||||
| Corporate | 2,796 | 198 | 187 | - | 3,181 | |||||||||||||||
| Small and medium businesses | - | 1,666 | 1,207 | 885 | 3,758 | |||||||||||||||
| Foreign loans - Latin America | - | 95 | 69 | 36 | 200 | |||||||||||||||
| Total renegotiated loan and lease operations (1) | 2,796 | 6,092 | 3,581 | 2,463 | 14,932 | |||||||||||||||
| As of December 31, 2014 | ||||||||||||||||||||
| Impaired | Non-impaired | Impaired non- | Non-impaired non- | |||||||||||||||||
| Renegotiated loan and lease operations | performing | performing | performing | performing | Total | |||||||||||||||
| (In millions of R$) | ||||||||||||||||||||
| Individuals | - | 3,922 | 2,019 | 1,389 | 7,330 | |||||||||||||||
| Credit card | - | 403 | - | - | 403 | |||||||||||||||
| Personal loans | - | 3,445 | 1,486 | 1,305 | 6,236 | |||||||||||||||
| Payroll loans | - | 23 | 17 | 3 | 43 | |||||||||||||||
| Vehicles | - | 37 | 478 | 62 | 577 | |||||||||||||||
| Mortgage loans | - | 14 | 38 | 19 | 71 | |||||||||||||||
| Corporate | 236 | 408 | 227 | - | 871 | |||||||||||||||
| Small and medium businesses | - | 1,406 | 1,116 | 763 | 3,285 | |||||||||||||||
| Foreign loans - Latin America | - | 55 | 12 | 19 | 86 | |||||||||||||||
| Total renegotiated loan and lease operations | 236 | 5,791 | 3,374 | 2,171 | 11,572 | |||||||||||||||
(1) Our renegotiated loan and lease operations increased in 2015 due to the worsening macroeconomic scenario, mainly in Brazil, specifically in the segment corporate.
The following table presents the changes in our loan and lease portfolio with loss event, including the changes of the renegotiated loans and leases with loss event related to each year as of December 31, 2016, 2015 and 2014:
| Impaired loans | 2016 | 2015 | 2014 | |||||||||
| (In millions of R$) | ||||||||||||
| Balance at the beginning of the period | 27,157 | 17,206 | 16,305 | |||||||||
| (+) Loan operations added | 21,075 | 21,701 | 12,521 | |||||||||
| (+) Loan operations added due to redefault | 5,188 | 4,587 | 3,915 | |||||||||
| (-) Loans removed due to write-off | (10,737 | ) | (9,474 | ) | (10,006 | ) | ||||||
| (-) Loans removed due to renegotiation (including amendments) | (1,453 | ) | (1,160 | ) | (1,024 | ) | ||||||
| (-) Loans removed due to total or partial pay-off | (10,913 | ) | (5,703 | ) | (4,505 | ) | ||||||
| Balance at the end of the period | 30,317 | 27,157 | 17,206 | |||||||||
Please refer to section Performance, item Complete Financial Statements in IFRS Note 12 – Loan operations and lease operations portfolio for further details.
A-140
Cross border outstanding
Cross border outstanding are monetary assets which are denominated in non-local currency and exceeded 1% of our total assets in the case of transactions with foreign clients entered into by our subsidiaries in the United Kingdom (our former subsidiary in Portugal), the Cayman Islands, the Bahamas and Chile. The aggregate cross border outstanding breakdown of these subsidiaries for the periods indicated below is as follows:
| Cross border outstanding | 12/31/2016 | % | 12/31/2015 | % | 12/31/2014 | % | ||||||||||||||||||
| (In millions of R$, except percentages) | ||||||||||||||||||||||||
| Cash and deposits on demand | 41,234 | 3.1 | 52,649 | 4.1 | 4,187 | 0.4 | ||||||||||||||||||
| Interbank deposits | 97,934 | 7.2 | 139,190 | 10.9 | 64,491 | 5.7 | ||||||||||||||||||
| Securities purchased under agreements to resell | 22,267 | 1.6 | 20,187 | 1.6 | 24,606 | 2.2 | ||||||||||||||||||
| Central Bank compulsory deposits | 266 | 0.0 | 2,891 | 0.2 | 3 | 0.0 | ||||||||||||||||||
| Financial assets held for trading | 12,121 | 0.9 | 6,995 | 0.5 | 5,978 | 0.5 | ||||||||||||||||||
| Derivatives | 10,153 | 0.8 | 15,409 | 1.2 | 9,321 | 0.8 | ||||||||||||||||||
| Available for sale financial assets | 47,002 | 3.5 | 69,331 | 5.4 | 39,850 | 3.5 | ||||||||||||||||||
| Financial assets held to maturity | 12,595 | 0.9 | 15,446 | 1.2 | 10,767 | 1.0 | ||||||||||||||||||
| Loan and lease operations | 59,667 | 4.4 | 70,010 | 5.5 | 97,740 | 8.7 | ||||||||||||||||||
| Total outstanding | 303,239 | 22.4 | 392,108 | 30.7 | 256,943 | 22.8 | ||||||||||||||||||
Short-term borrowings
Short-term borrowings are included in our balance sheet under the “Securities sold under repurchase agreement” line item. The main category for short-term borrowings is “Deposits Received under Securities Repurchase Agreements with Own and Third-Party Financial Assets”. The following table shows our short-term borrowings as of December 31, 2016, 2015 and 2014:
| As of December 31, | ||||||||||||
| Securities sold under repurchase agreements | 2016 | 2015 | 2014 | |||||||||
| (In millions of R$, except percentages) | ||||||||||||
| Amount outstanding | 349,164 | 336,643 | 288,683 | |||||||||
| Maximum amount outstanding during the period | 358,781 | 336,643 | 288,683 | |||||||||
| Weighted average interest rate at period-end (%) | 12.1 | 11.7 | 10.2 | |||||||||
| Average amount outstanding during period | 339,416 | 297,509 | 266,527 | |||||||||
| Weighted average interest rate (%) | 11.9 | 12.3 | 11.1 | |||||||||
Liabilities
Funding
Main sources
Our current funding strategy is to continue to use all of our sources of funds in accordance with their costs and availability and our general asset and liability management strategy. In order to fund our operations, we intensified the use of the liquidity generated by savings deposits, interbank deposits, debt in the interbank market and debt in the institutional market during 2016, 2015 and 2014.
We also used Brazilian debentures subject to repurchase as a source of funding, reported as deposits received under securities repurchase agreements and offered to institutional clients as well as private banking, corporate banking and retail clients. This funding is designed to provide increased profitability through higher spreads in our savings deposits and higher fees earned on market funds.
Our ability to obtain funding depends on several factors, including credit ratings, general economic conditions and investors’ perception of emerging markets in general and of Brazil (particularly, current political and economic conditions in Brazil and government regulations for foreign currency funding).
Part of our long-term debt provides for the advance payment of the outstanding principal balance upon the occurrence of certain facts, as is customary for long-term financing agreements. As of December 31, 2016, none of these events, including default events and non-compliance with any financial covenant, had occurred, and we have no reason to believe that any of these events are likely to occur in 2017.
Our main sources of funding are our deposits, which are split into demand deposits, savings deposits, time deposits and interbank deposits. As of December 31, 2016, total deposits were R$329,414 million, which represented 36.3% of total funding. As of December 31, 2015, total deposits amounted to R$292,610 million, representing 33.2% of total funding. As of December 31, 2014, total deposits amounted to R$294,773 million, representing 37.8% of our total funding. Our time deposits represent one of our
A-141
major sources of funding which, as of December 31, 2016, 2015 and 2014 accounted for 17.2%, 12.0% and 13.9% of total funding, respectively.
The following table shows the breakdown of our main sources of funds as of December 31, 2016, 2015 and 2014:
| % of total | % of total | % of total | ||||||||||||||||||||||
| Breakdown of the main sources of funds | 2016 | funding | 2015 | funding | 2014 | funding | ||||||||||||||||||
| (In millions of R$, except percentages) | ||||||||||||||||||||||||
| Deposits | 329,414 | 36.3 | 292,610 | 33.2 | 294,773 | 37.8 | ||||||||||||||||||
| Demand deposits | 61,133 | 6.7 | 61,092 | 6.9 | 48,733 | 6.3 | ||||||||||||||||||
| Savings deposits | 108,250 | 12.0 | 111,319 | 12.6 | 118,449 | 15.1 | ||||||||||||||||||
| Time deposits | 156,274 | 17.2 | 105,250 | 12.0 | 108,466 | 13.9 | ||||||||||||||||||
| Interbank deposits | 3,757 | 0.4 | 14,949 | 1.7 | 19,125 | 2.5 | ||||||||||||||||||
| Securities sold under repurchase agreements | 349,164 | 38.2 | 336,643 | 38.3 | 288,683 | 37.0 | ||||||||||||||||||
| Interbank market debt | 135,483 | 14.9 | 156,886 | 17.8 | 122,586 | 15.8 | ||||||||||||||||||
| Mortgage notes | - | - | 139 | - | 143 | - | ||||||||||||||||||
| Real estate credit bills | 19,179 | 2.1 | 14,452 | 1.6 | 10,832 | 1.4 | ||||||||||||||||||
| Agribusiness credit bills | 15,442 | 1.7 | 13,775 | 1.6 | 7,811 | 1.0 | ||||||||||||||||||
| Financial credit bills | 19,566 | 2.2 | 18,496 | 2.1 | 10,645 | 1.4 | ||||||||||||||||||
| Import and export Financing | 45,633 | 5.0 | 65,566 | 7.5 | 43,381 | 5.6 | ||||||||||||||||||
| Onlending-domestic | 29,828 | 3.3 | 38,804 | 4.4 | 45,230 | 5.8 | ||||||||||||||||||
| Liabilities from transactions related to credit assignments | 5,835 | 0.6 | 5,654 | 0.6 | 4,544 | 0.6 | ||||||||||||||||||
| Institutional market debt | 96,239 | 10.6 | 93,918 | 10.7 | 73,242 | 9.4 | ||||||||||||||||||
| Subordinated debt | 57,420 | 6.3 | 65,785 | 7.5 | 55,617 | 7.1 | ||||||||||||||||||
| Foreign borrowings through securities | 33,583 | 3.7 | 24,188 | 2.7 | 15,392 | 2.0 | ||||||||||||||||||
| Structured Operations Certificates | 5,236 | 0.6 | 3,945 | 0.4 | 2,233 | 0.3 | ||||||||||||||||||
| Total | 910,300 | 100.0 | 880,057 | 100.0 | 779,284 | 100.0 | ||||||||||||||||||
Deposits by maturity
The following table shows the maturity profile of our deposits as of December 31, 2016, 2015 and 2014:
| 2016 | ||||||||||||||||||||
| Deposits by maturity | 0-30 days | 31-180 days | 181-365 days | Over 365 days | Total | |||||||||||||||
| (In millions of R$) | ||||||||||||||||||||
| Non-interest bearing deposits | 61,133 | - | - | - | 61,133 | |||||||||||||||
| Demand deposits | 61,133 | - | - | - | 61,133 | |||||||||||||||
| Interest bearing deposits | 139,982 | 30,166 | 17,734 | 80,399 | 268,281 | |||||||||||||||
| Savings deposits | 108,250 | - | - | - | 108,250 | |||||||||||||||
| Time deposits | 30,555 | 28,248 | 17,109 | 80,362 | 156,274 | |||||||||||||||
| Interbanks Deposits | 1,177 | 1,918 | 625 | 37 | 3,757 | |||||||||||||||
| Total | 201,115 | 30,166 | 17,734 | 80,399 | 329,414 | |||||||||||||||
| 2015 | ||||||||||||||||||||
| Deposits by maturity | 0-30 days | 31-180 days | 181-365 days | Over 365 days | Total | |||||||||||||||
| (In millions of R$) | ||||||||||||||||||||
| Non-interest bearing deposits | 61,092 | - | - | - | 61,092 | |||||||||||||||
| Demand deposits | 61,092 | - | - | - | 61,092 | |||||||||||||||
| Interest bearing deposits | 129,260 | 27,979 | 14,288 | 59,991 | 231,518 | |||||||||||||||
| Savings deposits | 111,319 | - | - | - | 111,319 | |||||||||||||||
| Time deposits | 13,466 | 19,252 | 13,276 | 59,256 | 105,250 | |||||||||||||||
| Interbanks Deposits | 4,475 | 8,727 | 1,012 | 735 | 14,949 | |||||||||||||||
| Total | 190,352 | 27,979 | 14,288 | 59,991 | 292,610 | |||||||||||||||
| 2014 | ||||||||||||||||||||
| Deposits by maturity | 0-30 days | 31-180 days | 181-365 days | Over 365 days | Total | |||||||||||||||
| (In millions of R$) | ||||||||||||||||||||
| Non-interest bearing deposits | 48,733 | - | - | - | 48,733 | |||||||||||||||
| Demand deposits | 48,733 | - | - | - | 48,733 | |||||||||||||||
| Interest bearing deposits | 134,841 | 36,829 | 8,537 | 65,833 | 246,040 | |||||||||||||||
| Savings deposits | 118,449 | - | - | - | 118,449 | |||||||||||||||
| Time deposits | 11,705 | 23,656 | 7,775 | 65,330 | 108,466 | |||||||||||||||
| Interbanks Deposits | 4,687 | 13,173 | 762 | 503 | 19,125 | |||||||||||||||
| Total | 183,574 | 36,829 | 8,537 | 65,833 | 294,773 | |||||||||||||||
A-142
The following table sets forth the maturity of outstanding time deposits with balances in excess of US$100,000 (or its equivalent) issued by us as of December 31, 2016, 2015 and 2014:
| 2016 | 2015 | 2014 | ||||||||||
| (In millions of R$) | ||||||||||||
| Maturity within three months | 30,560 | 26,545 | 32,549 | |||||||||
| Maturity after three months to six months | 11,124 | 10,512 | 13,782 | |||||||||
| Maturity after six months to twelve months | 12,509 | 8,925 | 6,097 | |||||||||
| Maturity after twelve months | 35,167 | 17,443 | 34,251 | |||||||||
| Total time deposits in excess of US$100,000 | 89,360 | 63,425 | 86,679 | |||||||||
The following table sets forth the mix of the individual and corporate time deposits divided among our retail, Itaú Personnalité, middle market and corporate markets (each expressed as a percentage of total time deposits) as of December 31, 2016, 2015 and 2014:
| 2016 | 2015 | 2014 | ||||||||||
| (%) | ||||||||||||
| Retail | 8.1 | 8.3 | 3.4 | |||||||||
| Itaú Personnalité | 14.3 | 17.3 | 19.4 | |||||||||
| Middle market | 39.7 | 28.5 | 26.2 | |||||||||
| Corporate | 32.5 | 44.2 | 35.6 | |||||||||
| Institutional | 5.4 | 1.7 | 15.5 | |||||||||
| Total | 100.0 | 100.0 | 100.0 | |||||||||
Other sources
We also act as a financial agent in borrowing funds from BNDES and FINAME, and lending such funds at a spread determined by the Brazilian government to targeted sectors of the economy. We obtain U.S. dollar-denominated lines of credit from our affiliates, including Itaú Unibanco Holding – Grand Cayman branch, Banco Itaú Chile and Itaú BBA S.A. – Nassau branch to provide trade finance funding for Brazilian companies. For further details on Lending domestic and import and export financing, please refer to section Performance, item Complete Financial Statements (IFRS), Note 19 – Securities Sold under Repurchase Agreements and Interbank and Institutional Market Debts.
Litigation
Overview
We are not defendants in any significant administrative proceeding before CVM, SUSEP, the Central Bank or any municipalities. As part of the ordinary course of our business, we are subject to, and we are party to various legal and administrative proceedings (including consumer complaints) filed against us with SUSEP, certain municipalities or the Central Bank.
Our complete financial statements only include reserves for probable losses that can be reasonably estimated and expenses that we may incur in connection with pending litigation or administrative proceedings, or as otherwise required by Brazilian law. Our management believes that our provisions, including interest, for legal proceedings in which we are defendants are sufficient to cover probable losses that can be reasonably estimated in the event of unfavorable court decisions. It is currently not possible to estimate the amount of all potential costs that we may incur or penalties that may be imposed on us other than those amounts for which we have reserves. We believe that any potential liabilities related to these lawsuits and administrative proceedings will not have a material adverse effect on our business, financial condition or results. There are no material proceedings in which any of our directors, any member of our senior management or any of our affiliates is either a party adverse to us or to our subsidiaries or has a material interest adverse to us or our subsidiaries.
Please refer to section Performance, item Complete Financial Statements (IFRS), Note 32 – Provisions, Contingencies and Other Commitments, for further information and details about the changes in the provisions and respective escrow deposits for tax and social security lawsuits and main types of tax disputes. The following table sets forth our provisions for such contingencies as of December 31, 2016, 2015 and 2014
| Provision | 12/31/2016 | 12/31/2015 | 12/31/2014 | |||||||||
| (In millions of R$) | ||||||||||||
| Civil | 5,172 | 5,227 | 4,643 | |||||||||
| Labor | 7,232 | 6,132 | 5,598 | |||||||||
| Tax and social security | 8,246 | 7,500 | 6,627 | |||||||||
| Other | 259 | 135 | 159 | |||||||||
| Total | 20,909 | 18,994 | 17,027 | |||||||||
No class actions alleging unfair competition, trust or monopoly practices were brought against us in 2016.
A-143
Civil litigation
Litigation arising from government monetary stabilization plans
We are a defendant in lawsuits for the collection of understated inflation adjustment for savings resulting from the economic plans implemented in the 1980s and 1990s by the Brazilian Federal Government as a measure to combat inflation. Please refer to section Our risk management, item Risk factors, Legal and regulatory risks, Decision on lawsuits due to government monetary stabilization plans may have a material adverse effect on us, for further information.
Other civil litigation
In addition to litigation arising from government monetary stabilization plans, we are defendants in numerous civil lawsuits arising from the normal course of our business. We are not able to currently predict the total amounts involved in these claims, due to the nature of the matters disputed. However, we believe that any potential liabilities related to these lawsuits will not have a material adverse effect on our financial condition or results.
Labor litigation
In 2016, we and our subsidiaries were not exposed to any labor liabilities or labor contingencies which individually significantly impacted our results. The pool of labor claims for our subsidiaries in such period comprises labor claims filed by employees, former employees and outsourced service providers.
Labor unions and former employees have filed labor claims against us, seeking compensation for alleged breaches of employment agreements or rights under the applicable labor laws. As of December 31, 2016, there were 68,386 labor claims filed against us.
The main requests in the labor claims filed by our current and former employees include:
| • | salary differences arising from the application of the 30 working hours per week limit, provided for in art. 224 of the Brazilian Labor Laws Consolidation (CLT), which is applicable to bank employees whose function does not require special trust from the employer; |
| • | salary differences arising from overtime not duly registered in the internal systems; |
| • | claims with respect to the method to establish the overtime work pay; and |
| • | salary parity. |
Labor class actions filed against us mainly relate to the continuation of health care plans, safety rules and strikes. We are also defendants in connection with labor claims filed by the labor prosecution office regarding union classification, outsourcing, occupational diseases, health and safety and compliance with the minimum quotas for disabled personnel. In the fiscal year ended December 31, 2016, we paid approximately R$ 2,453 million in direct labor expenses, mainly in settlements and convictions involving former employees, in accordance to the agreements signed and to the rulings imposed by labor courts. Regarding labor claims filed by outsourced service providers, they generally involve allegations of subsidiary liability of the companies within our group.
Please refer to section Performance, item Complete Financial Statements (IFRS), Note 32 – Provisions, Contingencies and Other Commitments, for further information about labor claims.
Tax litigation
We have certain tax disputes that arise from our ordinary business activities, mainly relating to the constitutionality or legality of certain taxes imposed on us.
We classify as legal liability tax due when we discuss the legality and / or unconstitutionality of the legislation in force. Legal liability taxes are provisioned regardless of the likelihood of loss.
Tax contingencies correspond to the principal amount of taxes involved in tax, administrative or judicial challenges, subject to tax assessment notices, plus interest and, when applicable, fines and charges. A provision is recognized whenever the chance of prevailing is less likely than not.
We took advantage of a program (Programa de Pagamento ou Parcelamento de Tributos Municipais), established by Laws: (Law No. 5,854, of April 27, 2015) Rio de Janeiro; (Law No. 8,927, of October 22, 2015 and Decree No. 26,624 of October 26, 2015) Salvador; (Law No. 18,181, of November 30, 2015 and Decree No. 29,275 of November 30, 2015) Recife; (Supplementary Law No. 95, of October 19, 2015) Curitiba for the payment of municipal tax debts with certain discounts as to penalties and interest. We settled the contested tax liabilities in question in cases with respect to which we had the lowest chances of success, according to our tax advisors.
On June 25, 2013, we received a notice of deficiency from the Brazilian tax authorities alleging that we failed to pay approximately R$11,844.7 million of IRPJ, plus accrued penalties and interest, and approximately R$6,867.0 million of CSLL, plus accrued penalties and interest, in fiscal year 2008, as a result of the corporate transaction that led to the association of Itaú Holding and Unibanco Holdings S.A. The Brazilian tax authorities allege that corporate transactions of a different kind should
A-144
have been used. However, the transaction suggested by the Brazilian tax authorities is not supported in the rules applicable to financial institutions. On January 30, 2014, we were advised that the Brazilian tax authorities confirmed the notifications in a non-unanimous ruling. On February 28, 2014 we appealed the decision at the Administrative Tax Appeals Tribunal. We continue to defend that the transactions conducted were appropriate and legitimate, having been approved by the involved companies’ management bodies and their respective stockholders, and subsequently sanctioned as well by the relevant regulatory authorities, including CVM, the Central Bank and CADE. We and our external counsel assess the risk of loss in this tax proceeding as remote. On April 10, 2017, the Administrative Board of Tax Appeals (CARF), by the Ordinary Instance, rendered a favorable decision to the Company, canceling the tax assessment notice. Currently, we are awaiting the formalization of the judgment.
Additionally, relating to the same transaction on November 14, 2013, we received a notice of tax assessment issued on behalf of Itaú Unibanco S.A., charging R$1,439.9 million of Income Tax (IRPJ) and R$502.56 million of (CSLL), plus accrued penalties and interest. We also assess the chances in prevailing in this litigation as more likely than not. We filed a voluntary appeal that was dismissed by CARF. Currently, the proceeding is pending judgment of the special appeal filed by the company with the Superior Administrative Court of Federal Tax Appeals (CSRF).
Please refer to section Performance, item Complete Financial Statements (IFRS), Note 32 – Provisions, Contingencies and Other Commitments, for further details about the changes in the provisions and respective escrow deposits for tax and social security lawsuits and main types of tax disputes.
Derivative instruments that qualify for hedge accounting
Hedging transactions may be classified into three categories: hedge of fair value, cash flows and net investment of foreign operations.
| • | Fair value hedge: is aimed at protecting us against changes in market risk due to changes in the fair value of interest subject to variable rates. |
| • | Cash flow hedge: is aimed at protecting us against future cash flows of payments of interest. |
| • | Hedge of net investment of foreign operations: it is aimed at protecting us against changes in future cash flows of foreign exchange variations in net investments of foreign operations. |
Please refer to section Our risk management item Risk and capital management, Market risk for further details about hedge. Please refer to section Performance, item Complete Financial Statements (IFRS), Note 9 – Hedge Accounting, for further details. With respect to the hedge accounting policy, please refer to section Performance, item Complete Financial Statements (IFRS), Note 2.4 d V – Summary of Main Accounting Practices.
Tabular disclosure of contractual obligations
The following table summarizes the maturity profile of our consolidated long-term debt, operating leases and other contractual commitments as of December 31, 2016:
| Payments due by period | ||||||||||||||||||||
| Contractual Obligations | Total | Less than 1 year | 1-3 years | 3-5 years | More than 5 years | |||||||||||||||
| (In millions of R$) | ||||||||||||||||||||
| Interbank market debt (1)(3) | 152,081 | 81,103 | 38,982 | 18,136 | 13,860 | |||||||||||||||
| Institutional market debt (2)(3) | 114,423 | 22,795 | 33,125 | 20,417 | 38,086 | |||||||||||||||
| Time Deposits(3) | 192,387 | 72,266 | 22,488 | 34,763 | 62,870 | |||||||||||||||
| Operating and capital (finance) lease obligations | 6,764 | 1,362 | 3,272 | 1,417 | 713 | |||||||||||||||
| Endorsements and sureties | 70,793 | 17,848 | 7,157 | 2,818 | 42,970 | |||||||||||||||
| Letters of credit to be released | 6,660 | 6,660 | - | - | - | |||||||||||||||
| Pension Obligations | 517 | 50 | 100 | 102 | 265 | |||||||||||||||
| Health Benefits | 221 | 15 | 32 | 37 | 137 | |||||||||||||||
| Total | 543,846 | 202,099 | 105,156 | 77,690 | 158,901 | |||||||||||||||
| (1) | Includes mortgage notes, real estate credit bills, agribusiness credit bills, financial credit bills, import and export financing and on-lending - domestic. |
| (2) | Includes subordinated debt, debentures and foreign borrowings through securities. |
| (3) | Includes total estimated interest payments (including for derivatives). These estimated interest payments were calculated substantially based on the interbank forward rates at the specific periods. |
Purchases of shares by the issuer and affiliated purchasers
In conformity with best corporate governance practices, on November 18, 2004, we started to voluntarily disclose our Policy for Trading Itaú Unibanco Holding S.A. Securities. Please refer to www.itau.com.br/_arquivosestaticos/RI/pdf/TreasuryStock.pdf for further details. We disclose to the market the transactions carried out with our own shares by our Treasury through an “Announcement to the Market” on a monthly basis, as well as the other disclosure requirements imposed by the Brazilian securities regulation.
The repurchase program initially effective in 2016 was approved by our Board of Directors on August 27, 2015 with limits of 50.0 million preferred shares and 10.0 million common shares.
On February 1, 2016, our Board of Directors approved the renewal of our share repurchase program through August 2, 2017, authorizing the purchase, in the aggregate with respect to all shares purchased under the program, of up to 10.0 million
A-145
common shares and 50.0 million preferred shares issued by us, without reducing our capital stock. The share acquisition process has the following potential objectives: (i) to maximize the allocation of capital through the efficient application of available funds; (ii) to provide for the delivery of shares to the employees and management of the Company and those of its subsidiaries within the scope of the compensation models and the long-term incentive plans; and (iii) to use the acquired shares in the event of business opportunities arising in the future. All purchases shall be open market purchases made through stock exchanges.
| Period(1) | (a) Total number of preferred shares purchased(2) | (b) Average price paid per preferred share(2)(3) | (c) Total number of preferred shares purchased as part of publicly announced plans or programs(2) | (d) Maximum number of preferred shares that may yet be purchased under the plans or programs | ||||||||||||
| 01/02 to 01/29/2016 | 7,990,000 | 25.06 | 49,980,000 | 20,000 | ||||||||||||
| 02/01 to 02/29/2016 | - | - | - | 50,000,000 | ||||||||||||
| 03/01 to 03/31/2016 | - | - | - | 50,000,000 | ||||||||||||
| 04/01 to 04/29/2016 | - | - | - | 50,000,000 | ||||||||||||
| 05/02 to 05/31/2016 | - | - | - | 50,000,000 | ||||||||||||
| 06/01 to 06/30/2016 | - | - | - | 50,000,000 | ||||||||||||
| 07/01 to 07/29/2016 | - | - | - | 50,000,000 | ||||||||||||
| 08/01 to 08/31/2016 | - | - | - | 50,000,000 | ||||||||||||
| 09/01 to 09/30/2016 | - | - | - | 50,000,000 | ||||||||||||
| 10/03 to 10/31/2016 | - | - | - | 50,000,000 | ||||||||||||
| 11/01 to 11/30/2016 | 1,000,000 | 35.71 | 1,000,000 | 49,000,000 | ||||||||||||
| 12/01 to 12/30/2016 | 21,650,000 | 32.86 | 22,650,000 | 27,350,000 | ||||||||||||
| 01/02 to 01/31/2017 | 6,350,000 | 35.21 | 29,000,000 | 21,000,000 | ||||||||||||
| 02/01 to 02/28/2017 | - | - | 29,000,000 | 21,000,000 | ||||||||||||
03/01 to 03/31/2017 | 1,626,000 | 38.26 | 30,626,000 | 19,374,000 | ||||||||||||
| (1) | On August 27, 2015 our Board of Directors approved the purchase of up to 11,000,000 common shares and 50,000,000 preferred shares, ending on August 26, 2016, on February 1, 2016 our Board of Directors approved the renewal of our share repurchase program through August 2, 2017, authorizing the purchase, in the aggregate with respect to all shares purchased under the program, of up to 10.0 million common shares and 50.0 million preferred shares |
| (2) | All amounts were not adjusted at the 10% bonus for our shares. Considering the 10% bonus for our shares, occurred in October 2016, we acquired (a) 31.4 million preferred shares of our own issue, in the total amount of R$947.4 million, at the average price of R$30.13 per share. |
| (3) | Includes brokerage costs. |
Capital expenditures
In accordance with our practice in the last few years, our capital expenditures in the 12-month period ended December 31, 2016 were funded with internal resources. We cannot provide assurance that we will make capital expenditures in the future and, if made, that the amounts will correspond to the current estimates. The following table show our capital expenditures as of December 31, 2016, 2015 and 2014:
| For the Year Ended December 31, | Variation | |||||||||||||||||||||||||||
| Capital Expenditures | 2016 | 2015 | 2014 | 2016-2015 | 2015-2014 | |||||||||||||||||||||||
| (In millions of R$, except percentages) | ||||||||||||||||||||||||||||
| Fixed Assets | 1,430 | 1,466 | 3,966 | (36 | ) | (2.5 | )% | (2,500 | ) | (63.0 | )% | |||||||||||||||||
| Fixed assets under construction | 341 | 198 | 1,485 | 143 | 72.2 | % | (1,287 | ) | (86.7 | )% | ||||||||||||||||||
| Land and buildings | 127 | 6 | 14 | 121 | 2016.7 | % | (8 | ) | (57.1 | )% | ||||||||||||||||||
| Leasehold improvements | 137 | 139 | 169 | (2 | ) | (1.4 | )% | (30 | ) | (17.8 | )% | |||||||||||||||||
| Furniture and data processing equipment | 602 | 1,040 | 2,236 | (438 | ) | (42.1 | )% | (1,196 | ) | (53.5 | )% | |||||||||||||||||
| Other | 223 | 83 | 62 | 140 | 168.7 | % | 21 | 33.9 | % | |||||||||||||||||||
| Intangible Assets | 2,846 | 1,062 | 1,199 | 1,784 | 168.0 | % | (137 | ) | (11.4 | )% | ||||||||||||||||||
| Acquisition of rights to credit payroll | 342 | 109 | 109 | 233 | 213.8 | % | - | 0.0 | % | |||||||||||||||||||
| Association for the promotion and offer of financial products and services | 719 | 39 | 36 | 680 | 1743.6 | % | 3 | 8.3 | % | |||||||||||||||||||
| Software developed or obtained for internal use | 1,508 | 899 | 1,044 | 609 | 67.7 | % | (145 | ) | (13.9 | )% | ||||||||||||||||||
| Other intangibles | 277 | 15 | 10 | 262 | 1746.7 | % | 5 | 50.0 | % | |||||||||||||||||||
| Total | 4,276 | 2,528 | 5,165 | 1,748 | 69.1 | % | (2,637 | ) | (51.1 | )% | ||||||||||||||||||
Please refer to section Performance, item Complete Financial Statements (IFRS), Note 15 – Fixed Assets and Note 16 – Intangible Assets for further details.
A-146
Fixed assets property, plant and equipment
As of December 31, 2016, we own and rent our principal administrative offices, which included 20 office buildings in 10 different addresses, having a total area of 445,707 square meters, located primarily in São Paulo, Brazil. These offices include our head office, and a number of other administrative buildings, where administrative functions are performed, such as commercial department, back offices, wholesale and investment bank activities, and also our data processing center.
In July 2016, we successfully completed the migration of all of Itaú Unibanco’s business processing and operation to the new datacenter in the city of Mogi Mirim. This move marks the end of the enormous investment made in and detailed implementation planning of the new technological center, which will allow for the sustainability of the business over the coming decades, as well as for innovation, competitiveness and, more importantly, the opportunity to digitalize our business and internal departments, thus creating a new experience for our employees and clients.
We also lease a portion of our administrative offices and the majority of our branches at competitive market prices from third parties and under renewable leases with terms ending from the first half of 2017 (which are in the process of being renewed under similar terms) to the fourth quarter of 2036.
As of December 31, 2016, we owned approximately 25% of our administrative offices and branches (including electronic service points, banking sites and parking lots) and leased approximately 75%.
Capitalization
The following table presents our capitalization as of December 31, 2016. The information described is derived from our consolidated financial statements as of and for the year ended December 31, 2016. As of the date of this Consolidated Annual Report, there has been no material change in our capitalization since December 31, 2016.
You should read the following table in conjunction with the information included in section Our profile, item In numbers, Selected Financial Data – IFRS, section Performance and section Attachments, item Selected Statistical Information for further details.
A-147
| As of December 31, 2016 | ||||||||
| Capitalization | R$ | US$ (1) | ||||||
| (In millions of R$, except percentages) | ||||||||
| Current liabilities | ||||||||
| Deposits | 249,015 | 76,406 | ||||||
| Securities sold under repurchase agreements | 234,569 | 71,974 | ||||||
| Financial liabilities held for trading | 134 | 41 | ||||||
| Derivatives | 10,810 | 3,317 | ||||||
| Interbank market debt | 75,352 | 23,120 | ||||||
| Institutional market debt | 19,053 | 5,846 | ||||||
| Other financial liabilities | 71,798 | 22,030 | ||||||
| Reserves for insurance and private pension | 1,450 | 445 | ||||||
| Liabilities for capitalization plans | 3,147 | 966 | ||||||
| Provisions | 4,434 | 1,360 | ||||||
| Tax liabilities | 1,741 | 534 | ||||||
| Other liabilities | 25,968 | 7,968 | ||||||
| Total | 697,471 | 214,007 | ||||||
| Long-term liabilities | ||||||||
| Deposits | 80,399 | 24,669 | ||||||
| Securities sold under repurchase agreements | 114,595 | 35,162 | ||||||
| Financial liabilities held for trading | 385 | 118 | ||||||
| Derivatives | 13,888 | 4,261 | ||||||
| Interbank market debt | 60,131 | 18,450 | ||||||
| Institutional market debt | 77,186 | 23,683 | ||||||
| Other financial liabilities | 34 | 10 | ||||||
| Reserves for insurance and private pension | 152,626 | 46,831 | ||||||
| Provisions | 16,475 | 5,055 | ||||||
| Tax liabilities | 3,452 | 1,059 | ||||||
| Other liabilities | 1,142 | 350 | ||||||
| Total | 520,313 | 159,648 | ||||||
| Income tax and social contribution - deferred | 643 | 197 | ||||||
| Non-controlling interests | 12,232 | 3,753 | ||||||
| Stockholders’ equity attributed to the owners of the parent company (2) | 122,582 | 37,612 | ||||||
| Total capitalization (3) | 1,353,241 | 415,217 | ||||||
| BIS ratio (4) | 19.1 | % | ||||||
| (1) | Convenience translation at 3.2591reais per U.S. dollar, the exchange rate in effect on December 31, 2016. |
| (2) | Itaú Unibanco Holding’s authorized and outstanding share capital consists of 3,351,744,217 common shares and 3,230,563,326 preferred shares, all of which are fully paid. For more information regarding our share capital see Note 21 to our consolidated financial statements as of and for the period ended December 31, 2016. |
| (3) | Total capitalization corresponds to the sum of total current liabilities, long-term liabilities, deferred income, minority interest in subsidiaries and stockholders’ equity. |
| (4) | Calculated by dividing total regulatory capital by risk weight assets. |
Off-balance sheet arrangements
We do not have any off-balance sheet arrangements, other than the guarantees we granted that are described in Note 36 – Management of Financial Risks, item 3 – Collateral and policies for mitigating credit risk and item 5 – Credit risk exposure of our consolidated financial statements and derivative financial instruments discussed above. Please refer to section Our Risk Management, item Risk and Capital Management, Exchange Rate Sensitivity for further details.
A-148
Results
Highlights
The highlights for the years ended December 31, 2016, December 31, 2015 and December 31, 2014 are presented below:
Net income(attributable to the owners of the parent company): decreased 9.6% in 2016 compared to 2015 and increased19.4% in 2015 compared to 2014.
For 2016, our net income attributable to the owners of the parent company was R$23,263 million and decreased by 9.6% compared to 2015, when our net income was R$25,740 million. For the year ended December 31, 2015, our net income attributable to the owners of the parent company increased by 19.4% compared to the year ended December 31, 2014, when our net income attributable to the owners of the parent company was R$21,555 million.
Our performance ratio, ROAE (return on average equity), calculated by dividing net income attributable to owners of the parent company by the quarterly average stockholders’ equity attributed to the owners of the parent company excluding quarterly average proposed dividends recorded, was 20.1% in 2016, a decrease of 470 basis points compared to 2015 when our performance ratio was 24.8%, an increase of 50 basis points compared to 2014 when our ROAE was 24.3%.
Stockholders’ equity(attributable to the owners of the parent company): increased by 9.2% as of December 31, 2016compared to December 31, 2015 and increased by 13.1% in 2015 compared to 2014.
As of December 31, 2016 our Stockholders’ equity attributed to the owners of the parent company increased by 9.2% compared to December 31, 2015, and reached R$122,582 million. As of December 31, 2015, our stockholders’ equity amounted to R$112,252 million. As of December 31, 2015 our stockholders’ equity grew 13.1% compared to stockholder equity as of December 31, 2014, which was R$99,260 million.
Loan and lease portfolio:increased by 3.4% as of December 31, 2016 compared to December 31, 2015 and increased by4.8% as of December 31, 2015 compared to December 31, 2014.
Loans and lease to individuals:
As of December 31, 2016 loans and lease to individuals totaled R$183,147 million, a decrease of 2.2% compared to December 31, 2015. The decrease primarily is a result of the decrease of 23.1% in vehicle financing as a result of our continued application of stricter requirements for granting such loans, which has led to higher down payment requirements and shorter financing terms, partially offset by the increases of (i) 9.9% in mortgage loans to R$38,242 million, mainly due to our focus on portfolios with lower delinquency rates, and (ii) 0.8% in credit card loans as we are the leading player in the Brazilian credit card market according to ABECS (Associação Brasileira das Empresas de Cartões de Crédito e Serviços), through Itaucard, Hipercard, Hiper, Credicard, joint ventures and commercial agreements with leading companies in sectors such as telecom, vehicles, retail and aviation operating in the Brazilian market.
As of December 31, 2015 loans and lease to individuals totaled R$187,220 million, an increase of 0.7% compared to December 31, 2014. The increase is primarily a result of the increases of (i) 19.5% in mortgage loans to R$34,790 million, mainly due to our focus on portfolios with lower delinquency rates, and (ii) 12.1% in payroll loans to R$45,434 million, due to a continued growth in our retail branch payroll loan operations and through Banco Itaú BMG Consignado S.A., a financial institution aimed at offering, distributing and marketing payroll loans. Vehicle financing decreased by 30.9% as of December 31, 2015 compared to December 31, 2014, totaling R$20,058 million, as a result of our continued application of stricter requirements for granting such loans, which has led to higher down payment requirements and shorter financing periods.
Loans and lease to companies:
As of December 31, 2016 loans and leases to companies, which includes corporate and small and medium business operations, totaled R$180,689 million, representing a decrease of R$37,876 million, or 17.3%, compared to December 31, 2015. Loans and leases to small and medium businesses decreased 10.8% as of December 31, 2016 compared to December 31, 2015, totaling R$58,935 million as of December 31, 2016. Loans and leases to corporate clients decreased 20.2% as of December 31, 2016 compared to December 31, 2015, totaling R$121,754 million as of December 31, 2016.
As of December 31, 2015 loans and leases to companies totaled R$218,565 million, representing an increase of R$2,725 million, or 1.3%, compared to December 31, 2014. Loans and leases to small and medium businesses decreased 4.1% as of December 31, 2015 compared to December 31, 2014, totaling R$66,038 million. Loans and leases to corporate clients increased 3.8% as of December 31, 2015 compared to December 31, 2014, totaling R$152,527 million as of December 31, 2015.
Foreign loans and leases – Latin America:
The balance of our foreign loans and leases from our operations in Latin America outside Brazil (Argentina, Chile, Colombia, Panama, Paraguay, Peru and Uruguay) totaled R$126,530 million as of December 31, 2016, an increase of 84.8% compared
A-149
to December 31, 2015 when the balance was R$68,463 million, mostly as a result of the merger between our subsidiary Banco Itaú Chile and CorpBanca in the second quarter of 2016 which represents an important step in our internationalization process.
The balance of our foreign loans and leases from our operations in Latin America outside Brazil (Argentina, Chile, Colombia, Paraguay and Uruguay) totaled R$68,463 million as of December 31, 2015, an increase of 35.2% compared to December 31, 2014 when the balance was R$50,638 million, mostly as a result of the organic growth of operations in the countries where we operate.
Credit quality (90-day NPL ratio):decreased 10 basis points as of December 31, 2016 compared to December 31, 2015and increased 40 basis points as of December 31, 2015 compared to December 31, 2014.
The 90-day non-performing loans ratio (90-day NPL ratio), is calculated by dividing 90-day’s non-performing loans by our loan portfolio.
As of December 31, 2016, our 90-day NPL ratio reached 3.4%, a reduction of 10 basis points due to a decrease in the 90-day NPL ratio for individuals. The ratio for companies as of December 31, 2016 increased by 20 basis points compared to December 31, 2015. As of December 31, 2015, our 90-day NPL ratio reached 3.5% an increase of 40 basis points compared to December 31, 2014.
The coverage ratio, calculated by dividing the provisions for allowance for loan and lease losses by 90-day non-performing loans, reflects the mechanics of our provisioning model and reached 160% as of December 31, 2016 compared to a ratio of 164% as of December 31, 2015. The coverage ratio was 160% as of December 31, 2014.
Interest and similar income:increased by 9.3% for the year ended December 31, 2016 compared to the year endedDecember 31, 2015 and increased by 23.0% for the year ended December 31, 2015 compared to the year ended December 31, 2014.
Interest and similar expenses:increased by 26.7% for the year ended December 31, 2016 compared to the year endedDecember 31, 2015 and increased by 2.9% for the year ended December 31, 2015 compared to the year ended December 31, 2014.
Banking service fees:increased by 8.4% for the year ended December 31, 2016 compared to the year ended December 31,2015 and increased by 11.8% for the year ended December 31, 2015 compared to the year ended December 31, 2014.
Income from insurance, private pension plan and capitalization operations (premium bonds) before claim and selling expenses:decreased by 11.9% for the year ended December 31, 2016 compared to the year ended December 31, 2015 anddecreased by 3.1% for the year ended December 31, 2015 compared to the year ended December 31, 2014.
General and administrative expenses:increased by 6.9% for the year ended December 31, 2016 compared to the yearended December 31, 2015 and increased by 11.9% for the year ended December 31, 2015 compared to the year ended December 31, 2014.
Expenses for allowance for loan and lease losses:decreased by 0.6% for the year ended December 31, 2016 compared tothe year ended December 31, 2015 and increased by 30.2% for the year ended December 31, 2015 compared to the year ended December 31, 2014.
Impaired loans:increased from R$27,157 million as of December 31, 2015 to R$30,317 million as of December 31, 2016, anincrease mainly with respect to impaired loans in our corporate portfolio due to a more challenging economic environment in Brazil. As of December 31, 2014 the balance of impaired loans was R$17,206 million. (For further details, refer to section Performance, item Complete Financial Statements in IFRS, Note 36.6 – Credit Quality of Financial Assets).
Loans under renegotiation:credit transactions under renegotiation, including extended, modified and deferred repayments,increased 6.1% as of December 31, 2016 compared to December 31, 2015 due to an increase in our portfolio of renegotiated corporate loans. As of December 31, 2016, loans under renegotiation represented 5.0% of the total loan portfolio.
A-150
| For the Year Ended December 31, | ||||||||||||
| Highlights | 2016 | 2015 | 2014 | |||||||||
| (In millions of R$, except percentages) | ||||||||||||
| Statement of Income | ||||||||||||
| Net Income (attributable to the owners of the parent company) | 23,263 | 25,740 | 21,555 | |||||||||
| Banking Product | 118,661 | 92,011 | 91,657 | |||||||||
| Shares (R$) | ||||||||||||
| Earnings per share - Basic (Common and Preferred) | 3.57 | 3.91 | 3.26 | |||||||||
| Weight Average Number of Outstanding Shares – Basic (in thousands) (1) | ||||||||||||
| Common | 3,351,741 | 3,351,741 | 3,351,741 | |||||||||
| Preferred | 3,171,216 | 3,228,881 | 3,266,347 | |||||||||
| Average price of preferred share on the last trading day of the period (1) | 33.68 | 23.91 | 28.69 | |||||||||
| Market Capitalization (2) | 219,348 | 155,732 | 190,161 | |||||||||
| Market Capitalization (In millions of US$) (3) | 67,303 | 39,882 | 71,592 | |||||||||
| Performance Ratios (%) | ||||||||||||
| Net income as a percentage of average stockholder’s equity – Annualized (4) | 20.1 | 24.8 | 24.3 | |||||||||
| Net income as a percentage of total assets – Annualized (5) | 1.8 | 2.2 | 2.0 | |||||||||
| Solvency Ratio (BIS Ratio) - Prudential Conglomerate (6) | 19.1 | 17.8 | 16.9 | |||||||||
| Non-performing Loans Index (NPL over 90 days) | 3.4 | 3.5 | 3.1 | |||||||||
| Non-performing Loans Index (NPL 15-90 days) | 2.5 | 2.6 | 2.5 | |||||||||
| Efficiency Ratio (ER) (7) | 46.7 | 44.0 | 47.0 | |||||||||
| Risk Adjusted Efficiency Ratio (RAER) (7) | 69.2 | 63.0 | 62.9 | |||||||||
| As of December 31, | ||||||||||||
| 2016 | 2015 | 2014 | ||||||||||
| Balance Sheet | ||||||||||||
| Total Assets | 1,353,241 | 1,276,415 | 1,127,203 | |||||||||
| Total Loan Portfolio | 490,366 | 474,248 | 452,431 | |||||||||
| Total Stockholders’ Equity | 134,814 | 114,059 | 100,617 | |||||||||
| Total Stockholders’ Equity attributed to the owners of the parent company | 122,582 | 112,252 | 99,260 | |||||||||
(1) The number of outstanding shares was adjusted to reflect the share bonus of 10% granted on June 05, 2014, July 17, 2015 and September 14, 2016.
(2) Total number of outstanding shares (common and preferred shares) multiplied by the average price of the preferred share on the last trading day in the period.
(3) The US$/R$ exchange rate was R$3.2591 as of December 31,2016, R$3.9048 as of December 31, 2015 and R$2.6562 as of December 31, 2014.
(4) Annualized Return was calculated by dividing net income attributable to owners of the parent company by the quarterly average stockholders’ equity attributed to the owners of the parent company excluding quarterly average proposed dividends recorded.
(5) Annualized Return was computed by dividing Net Income by Average Assets.
(6) Up to 2014, this ratio was calculated based on the financial conglomerate.
(7) The Efficiency Ratio and Risk Adjusted Efficiency Ratio are calculated based on managerial information (for more details on the calculation methodology of both Efficiency and Risk Adjusted Efficiency ratios, please see Basis of Segment Information Presentation).
When thereal depreciates, we incur losses on our liabilities denominated in or indexed to foreign currencies, such as our U.S. dollar-denominated long-term debt and short-term borrowings, because the cost inreais of the related interest expense increases. At the same time, we realize gains on monetary assets denominated in or indexed to foreign currencies, such as our dollar-indexed trading securities and loans, due to increased interest income from such assets when translated toreais. When thereal appreciates, the effects are the opposite of those described above. Consequently, the management of the gap in foreign currencies can have material effects on our net income. Unless otherwise indicated, the discussion in this section relates to our average interest rates and yields. Interest rates cited are measured in reais and include the effect of the variation of the real against foreign currencies.
Please refer to section Our risk management, item Risk factors, Instability of foreign exchange rates may negatively affect us and item Market risk for further details.
Net income
The following table shows the main components of our net income for the years ended December 31, 2016, 2015 and 2014:
A-151
| For the Year Ended December 31, | Variation | |||||||||||||||||||||||||||
| Consolidated Statement of Income | 2016 | 2015 | 2014 | 2016-2015 | 2015-2014 | |||||||||||||||||||||||
| (In millions of R$, except percentages) | ||||||||||||||||||||||||||||
| Banking product | 118,661 | 92,011 | 91,657 | 26,650 | 29.0 | % | 354 | 0.4 | % | |||||||||||||||||||
| Interest and similar income | 161,495 | 147,789 | 120,115 | 13,706 | 9.3 | % | 27,674 | 23.0 | % | |||||||||||||||||||
| Interest and similar expense | (95,126 | ) | (75,064 | ) | (72,977 | ) | (20,062 | ) | 26.7 | % | (2,087 | ) | 2.9 | % | ||||||||||||||
| Dividend income | 288 | 98 | 215 | 190 | 193.9 | % | (117 | ) | (54.4 | )% | ||||||||||||||||||
| Net gain (loss) from investment securities and derivatives | 7,311 | (11,862 | ) | (724 | ) | 19,173 | (161.6 | )% | (11,138 | ) | 1,538.4 | % | ||||||||||||||||
| Foreign exchange results and exchange variation on transactions | 5,513 | (6,353 | ) | 9,644 | 11,866 | (186.8 | )% | (15,997 | ) | (165.9 | )% | |||||||||||||||||
| Banking service fees | 31,918 | 29,452 | 26,342 | 2,466 | 8.4 | % | 3,110 | 11.8 | % | |||||||||||||||||||
| Income related to insurance, private pension plans and capitalization operations before claim and selling expenses | 5,880 | 6,672 | 6,888 | (792 | ) | (11.9 | )% | (216 | ) | (3.1 | )% | |||||||||||||||||
| Other income | 1,382 | 1,279 | 2,154 | 103 | 8.1 | % | (875 | ) | (40.6 | )% | ||||||||||||||||||
| Losses on loans and claims | (22,122 | ) | (21,335 | ) | (15,801 | ) | (787 | ) | 3.7 | % | (5,534 | ) | 35.0 | % | ||||||||||||||
| Expenses for allowance for loan and lease losses | (24,379 | ) | (24,517 | ) | (18,832 | ) | 138 | (0.6 | )% | (5,685 | ) | 30.2 | % | |||||||||||||||
| Recovery of loans written off as loss | 3,742 | 4,779 | 5,054 | (1,037 | ) | (21.7 | )% | (275 | ) | (5.4 | )% | |||||||||||||||||
| Expenses for claims | (1,555 | ) | (1,611 | ) | (2,430 | ) | 56 | (3.5 | )% | 819 | (33.7 | )% | ||||||||||||||||
| Recovery of claims under reinsurance | 70 | 14 | 407 | 56 | 400.0 | % | (393 | ) | (96.6 | )% | ||||||||||||||||||
| Operating margin | 96,539 | 70,676 | 75,856 | 25,863 | 36.6 | % | (5,180 | ) | (6.8 | )% | ||||||||||||||||||
| Other operating income (expenses) | (58,347 | ) | (52,411 | ) | (47,048 | ) | (5,936 | ) | 11.3 | % | (5,363 | ) | 11.4 | % | ||||||||||||||
| General and administrative expenses | (50,904 | ) | (47,626 | ) | (42,550 | ) | (3,278 | ) | 6.9 | % | (5,076 | ) | 11.9 | % | ||||||||||||||
| Tax expenses | (7,971 | ) | (5,405 | ) | (5,063 | ) | (2,566 | ) | 47.5 | % | (342 | ) | 6.8 | % | ||||||||||||||
| Share of profit or (loss) in associates and joint ventures | 528 | 620 | 565 | (92 | ) | (14.8 | )% | 55 | 9.7 | % | ||||||||||||||||||
| Income before income tax and social contribution | 38,192 | 18,265 | 28,808 | 19,927 | 109.1 | % | (10,543 | ) | (36.6 | )% | ||||||||||||||||||
| Current income tax and social contribution | (3,898 | ) | (8,965 | ) | (7,209 | ) | 5,067 | (56.5 | )% | (1,756 | ) | 24.4 | % | |||||||||||||||
| Deferred income tax and social contribution | (10,712 | ) | 16,856 | 262 | (27,568 | ) | (163.6 | )% | 16,594 | 6,333.6 | % | |||||||||||||||||
| Net income | 23,582 | 26,156 | 21,861 | (2,574 | ) | (9.8 | )% | 4,295 | 19.6 | % | ||||||||||||||||||
| Net income attributable to non-controlling interests | 319 | 416 | 306 | (97 | ) | (23.3 | )% | 110 | 35.9 | % | ||||||||||||||||||
| Net income attributable to owners of the parent company | 23,263 | 25,740 | 21,555 | (2,477 | ) | (9.6 | )% | 4,185 | 19.4 | % | ||||||||||||||||||
Banking product (operating revenues)
Banking product (operating revenues) is the sum of our operating revenues, net of funding costs, as detailed in the table above. Please refer to section Performance, item Complete Financial Statements in IFRS, Note 23 – Interest and Similar Income and Expense and Net Gain (Loss) from Investment Securities and Derivatives, Note 24 – Banking Service Fees and Note 25 – Other Income for further details.
The following table shows the main components of our interest and similar income for the years ended December 31, 2016, December 31, 2015 and December 31, 2014:
| For the Year Ended December 31, | Variation | |||||||||||||||||||||||||||
| Interest and similar income | 2016 | 2015 | 2014 | 2016-2015 | 2015 - 2014 | |||||||||||||||||||||||
| (In millions of R$, except percentages) | ||||||||||||||||||||||||||||
| Interest on Central Bank compulsory deposits | 6,920 | 5,748 | 5,904 | 1,172 | 20.4 | % | (156 | ) | (2.6 | )% | ||||||||||||||||||
| Interest on interbank deposits | 677 | 1,628 | 1,286 | (951 | ) | (58.4 | )% | 342 | 26.6 | % | ||||||||||||||||||
| Interest on securities purchased under agreements to resell | 34,162 | 27,572 | 17,929 | 6,590 | 23.9 | % | 9,643 | 53.8 | % | |||||||||||||||||||
| Interest on financial assets held for trading | 23,669 | 19,826 | 15,128 | 3,843 | 19.4 | % | 4,698 | 31.1 | % | |||||||||||||||||||
| Interest on available-for-sale financial assets | 11,160 | 8,979 | 7,272 | 2,181 | 24.3 | % | 1,707 | 23.5 | % | |||||||||||||||||||
| Interest on held-to-maturity financial assets | 3,788 | 3,758 | 2,347 | 30 | 0.8 | % | 1,411 | 60.1 | % | |||||||||||||||||||
| Interest on loans and leases operations | 80,118 | 79,392 | 69,248 | 726 | 0.9 | % | 10,144 | 14.6 | % | |||||||||||||||||||
| Other financial assets | 1,001 | 886 | 1,001 | 115 | 13.0 | % | (115 | ) | (11.5 | )% | ||||||||||||||||||
| Total interest and similar income | 161,495 | 147,789 | �� | 120,115 | 13,706 | 9.3 | % | 27,674 | 23.0 | % | ||||||||||||||||||
In the year ended December 31, 2016, the 9.3% increase in interest and similar income compared to the year ended December 31, 2015 was mainly due to increases in interest on securities purchased under agreements to resell, in interest on financial assets held for trading and in interest on available-for-sale financial assets. These increases are related to the growth in volume of these interest-earnings assets. Also, increases in the cumulative SELIC rate which increased to 14.0% in 2016 from 13.8% in 2015 contributed to the increase in interest and similar income.
In the year ended December 31, 2015, the 23.0% increase in interest and similar income compared to the year ended December 31, 2014 was mainly due to increases in interest on loans and leases, in interest on securities purchased under agreements to resell and in interest on financial assets held for trading. The increase of 14.6% in interest on loans and leases operations is mainly due to the 35.2% growth in our Latin America loan portfolio compared to the previous year. The increase in interest for trading is related to increases in the cumulative SELIC rate to 13.8% in 2015 from 10.9% in 2014.
The following table shows the composition of the carrying amount of loan and lease transactions by type which primarily account for the variation between our total loan and lease transactions as of December 31, 2016, 2015 and 2014:
A-152
| For the Year Ended December 31, | Variation | |||||||||||||||||||||||||||
| Loan and lease operations by type | 2016 | 2015 | 2014 | 2016-2015 | 2015 - 2014 | |||||||||||||||||||||||
| (In millions of R$, except percentages) | ||||||||||||||||||||||||||||
| Individuals | 183,147 | 187,220 | 185,953 | (4,073 | ) | (2.2 | )% | 1,267 | 0.7 | % | ||||||||||||||||||
| Credit card | 59,022 | 58,542 | 59,321 | 480 | 0.8 | % | (779 | ) | (1.3 | )% | ||||||||||||||||||
| Personal loans | 25,813 | 28,396 | 27,953 | (2,583 | ) | (9.1 | )% | 443 | 1.6 | % | ||||||||||||||||||
| Payroll loans | 44,636 | 45,434 | 40,525 | (798 | ) | (1.8 | )% | 4,909 | 12.1 | % | ||||||||||||||||||
| Vehicles | 15,434 | 20,058 | 29,047 | (4,624 | ) | (23.1 | )% | (8,989 | ) | (30.9 | )% | |||||||||||||||||
| Mortgage loans | 38,242 | 34,790 | 29,107 | 3,452 | 9.9 | % | 5,683 | 19.5 | % | |||||||||||||||||||
| Corporate | 121,754 | 152,527 | 147,002 | (30,773 | ) | (20.2 | )% | 5,525 | 3.8 | % | ||||||||||||||||||
| Small and medium businesses | 58,935 | 66,038 | 68,838 | (7,103 | ) | (10.8 | )% | (2,800 | ) | (4.1 | )% | |||||||||||||||||
| Foreign loans - Latin America | 126,530 | 68,463 | 50,638 | 58,067 | 84.8 | % | 17,825 | 35.2 | % | |||||||||||||||||||
| Total loan and lease operations | 490,366 | 474,248 | 452,431 | 16,118 | 3.4 | % | 21,817 | 4.8 | % | |||||||||||||||||||
As of December 31, 2016, our total loan and lease portfolio reached R$490,366 million, a 3.4% increase from the previous year mainly due to the increase in (i) the volume of loans to Latin American (not including Brazil) borrowers, due to the merger between our subsidiary Banco Itaú Chile and CorpBanca in the second quarter of 2016, and (ii) mortgage loans due to our focus on portfolios with lower delinquency rates. These increases were partially offset by decreases in loans to corporate, small and medium businesses due to a more challenging economic environment in Brazil. As of December 31, 2015, our loan portfolio reached R$474,248 million, a 4.8% increase from December 31, 2014.
Since 2011, we focused on reducing the credit risk of our loan portfolio. As a result, our mortgage, payroll and Latin America (not including Brazil) loan portfolios have grown more rapidly, while our vehicle, corporate and small companies’ portfolios have decreased. Our mortgage loan portfolio has grown in line with the market and we maintained a conservative approach regarding collateral. The portfolio LTV (Loan-to-Value: ratio between the loans and the underlying collateral) reached 41.8% in the fourth quarter of 2016. Our payroll loan portfolio has grown more than our personal loan portfolio due to a continued growth in our retail branch payroll loan operations and through Banco Itaú BMG Consignado S.A., a financial institution aimed at offering, distributing and marketing payroll loans. We maintain an association, as stated in the new commercial agreement for the distribution of payroll loans of Banco Itaú BMG Consignado and its affiliates, on an exclusive basis, through certain distribution channels linked to Banco BMG and its affiliates. In Latin America, excluding Brazil (i.e., Argentina, Chile, Colombia, Panama, Paraguay and Uruguay) our loan portfolio grew by 84.8% compared to December 31, 2015 and 35.2% in December 31, 2015 compared to December 31, 2014. In 2016, the growth in our Latin America portfolio was due to the merger between our subsidiary Banco Itaú Chile and CorpBanca in the second quarter of 2016 and represents an important step in our globalization process. For further details please refer to the table above of loan and lease operations by type.
| For the Year Ended December 31, | Variation | |||||||||||||||||||||||||||
| Interest and similar expense | 2016 | 2015 | 2014 | 2016-2015 | 2015 - 2014 | |||||||||||||||||||||||
| (In millions of R$, except percentages) | ||||||||||||||||||||||||||||
| Interest on deposits | (14,701 | ) | (13,587 | ) | (12,064 | ) | (1,114 | ) | 8.2 | % | (1,523 | ) | 12.6 | % | ||||||||||||||
| Interest on securities sold under repurchase agreements | (45,932 | ) | (32,879 | ) | (26,771 | ) | (13,053 | ) | 39.7 | % | (6,108 | ) | 22.8 | % | ||||||||||||||
| Interbank market debt | (8,348 | ) | (7,970 | ) | (14,404 | ) | (378 | ) | 4.7 | % | 6,434 | (44.7 | )% | |||||||||||||||
| Institutional market debt | (8,248 | ) | (8,030 | ) | (10,695 | ) | (218 | ) | 2.7 | % | 2,665 | (24.9 | )% | |||||||||||||||
| Financial expense from technical reserves for insurance and private pension plans | (17,790 | ) | (12,556 | ) | (8,987 | ) | (5,234 | ) | 41.7 | % | (3,569 | ) | 39.7 | % | ||||||||||||||
| Other | (107 | ) | (42 | ) | (56 | ) | (65 | ) | 154.8 | % | 14 | (25.0 | )% | |||||||||||||||
| Total interest and similar expense | (95,126 | ) | (75,064 | ) | (72,977 | ) | (20,062 | ) | 26.7 | % | (2,087 | ) | 2.9 | % | ||||||||||||||
The changes in the SELIC rate also affected our total interest expenses. In 2016, the cumulative SELIC rate increased to 14.0% as of December 31, 2016 compared to 13.8% as of December 31, 2015. As of December 31, 2014, the cumulative SELIC rate was 10.9%.
In the years ended December 31, 2016 and 2015, the increase in volume and in the SELIC rate increased our interest expenses for securities sold under repurchase agreements and reserves for insurance and private pension plans and liabilities for capitalization plans (premium bonds). Please refer to section Performance, item Financial performance, Liabilities, Funding, for further information.
Dividend income totaled R$288 million for the year ended December 31, 2016, compared to R$98 million for the year ended December 31, 2015. This increase was due to higher income from dividends on investments. Dividend income totaled R$215 million for the year ended December 31, 2014.
Net gain (loss) from investment securities and derivatives totaled a gain of R$7,311 million for the year ended December 31, 2016 compared to a loss of R$11,862 million in the same period in 2015. For the year ended December 31, 2014, net gain (loss) from investment securities and derivatives totaled a loss of R$724 million. These results were mainly due to our risk management strategies, particularly those associated with derivative instruments used to hedge our investments abroad. Foreign exchange results and exchange variation on transactions totaled a gain of R$5,513 million for the year ended December 31, 2016 compared to a loss of R$6,353 million for the year ended December 31, 2015 and a gain of R$9,644 million for the year ended December 31, 2014. The changes were due mainly to the effect from derivative financial instruments used to hedge the impact of exchange rate variations on our investments in subsidiaries abroad.
The following table shows the main components of our non-interest income for the years ended December 31, 2016, 2015 and 2014:
A-153
| For the Year Ended December 31, | Variation | |||||||||||||||||||||||||||
| Non-interest income | 2016 | 2015 | 2014 | 2016-2015 | 2015-2014 | |||||||||||||||||||||||
| (In millions of R$, except percentages) | ||||||||||||||||||||||||||||
| Banking Service Fees | 31,918 | 29,452 | 26,342 | 2,466 | 8.4 | % | 3,110 | 11.8 | % | |||||||||||||||||||
| Current account services | 9,528 | 8,815 | 7,725 | 713 | 8.1 | % | 1,090 | 14.1 | % | |||||||||||||||||||
| Asset management fees | 3,514 | 2,932 | 2,660 | 582 | 19.8 | % | 272 | 10.2 | % | |||||||||||||||||||
| Collection commissions | 1,315 | 1,250 | 1,279 | 65 | 5.2 | % | (29 | ) | (2.3 | )% | ||||||||||||||||||
| Fees from credit card services | 13,330 | 12,722 | 11,507 | 608 | 4.8 | % | 1,215 | 10.6 | % | |||||||||||||||||||
| Fees for guarantees issued and credit lines | 1,773 | 1,609 | 1,407 | 164 | 10.2 | % | 202 | 14.4 | % | |||||||||||||||||||
| Brokerage commission | 295 | 248 | 262 | 47 | 19.0 | % | (14 | ) | (5.3 | )% | ||||||||||||||||||
| Other | 2,163 | 1,876 | 1,502 | 287 | 15.3 | % | 374 | 24.9 | % | |||||||||||||||||||
| Income related to insurance, private pension plans and capitalization operations before claim and selling expenses | 5,880 | 6,672 | 6,888 | (792 | ) | (11.9 | )% | (216 | ) | (3.1 | )% | |||||||||||||||||
| Other Income | 1,382 | 1,279 | 2,154 | 103 | 8.1 | % | (875 | ) | (40.6 | )% | ||||||||||||||||||
| Total non-interest income | 39,180 | 37,403 | 35,384 | 1,777 | 4.8 | % | 2,019 | 5.7 | % | |||||||||||||||||||
In the year ended December 31, 2016, our non-interest income amounted to R$39,180 million, representing a growth of 4.8% from the year ended December 31, 2015, mainly due to the growth of 8.4% in banking service fees. In the year ended December 31, 2015, our non-interest income amounted to R$37,403 million, representing a growth of 5.7% from the year ended December 31, 2014, mainly due to the growth of 11.8% in banking service fees.
Banking service fees refer to the sum of fees from current account services, asset management, collection, credit card services, guarantees issued and credit lines, brokerage commission and other fees. In the year ended December 31, 2016, the increase in banking service fee revenues was mainly due to: (i) income from current account services, largely due to the offering of differentiated products and services, (ii) income from fees from credit card services, due to higher revenues from equipment rental and higher transaction volume during 2016 and (iii) asset management fees due to the increase in volume of assets under management. In 2015, the increase in banking service fee revenues was mainly due to: (i) income from fees from credit card services and (ii) income from current account fees. The growth in banking service fees and other fee income is in line with our strategy to diversify our income, while becoming less dependent on changes in interest rates.
In the year ended December 31, 2016, income related to insurance, private pension plans and capitalization operations (premium bonds) before claim and selling expenses decreased by R$792 million compared to the year ended December 31, 2015. The decrease was influenced by the increase of R$3,030 million in reserves for insurance and private pension plans, partially offset by the increase in income related to insurance and private pension of R$2,215 million and by the increase of R$28 million in revenues from capitalization plans. In the year ended December 31, 2015, income related to insurance, private pension and capitalization operations (premium bonds) before claim and selling expenses decreased R$216 million compared to the year ended December 31, 2014.
In the year ended December 31, 2016, other income increased R$103 million compared to the year ended December 31, 2015, due primarily to an increase in gains on the sale of assets held for sale, fixed assets and investments in associates and joint ventures. In the year ended December 31, 2015, the decrease was due primarily to a decrease in gains on the sale of assets held for sale, fixed assets and investments in associates and joint ventures where a non-recurring revenue in the amount of R$1,151 million from the sale of assets held by Itaú Seguros Soluções Corporativas S.A.(ISSC) was reflected in the year ended December 31, 2014.
The following chart shows the composition of the banking service fees for years ended December 31, 2016, 2015 and 2014:

A-154
Below is the composition of our losses on loans and claims for the years ended December 31, 2016, 2015 and 2014:
| For the Year Ended December 31, | Variation | |||||||||||||||||||||||||||
| Losses on loans and claims | 2016 | 2015 | 2014 | 2016-2015 | 2015-2014 | |||||||||||||||||||||||
| (In millions of R$, except percentages) | ||||||||||||||||||||||||||||
| Expenses for allowance for loan and lease losses | (24,379 | ) | (24,517 | ) | (18,832 | ) | 138 | (0.6 | )% | (5,685 | ) | 30.2 | % | |||||||||||||||
| Recovery of loans written-off as loss | 3,742 | 4,779 | 5,054 | (1,037 | ) | (21.7 | )% | (275 | ) | (5.4 | )% | |||||||||||||||||
| Expenses for claims | (1,555 | ) | (1,611 | ) | (2,430 | ) | 56 | (3.5 | )% | 819 | (33.7 | )% | ||||||||||||||||
| Recovery of claims under reinsurance | 70 | 14 | 407 | 56 | 400.0 | % | (393 | ) | (96.6 | )% | ||||||||||||||||||
| Total losses on loans and claims | (22,122 | ) | (21,335 | ) | (15,801 | ) | (787 | ) | 3.7 | % | (5,534 | ) | 35.0 | % | ||||||||||||||
Evolution of the expenses for allowance for loan and lease losses
The chart below shows the changes in the components making up our expenses for allowance for loan and lease losses which primarily account for the variation between expenses for allowance for loan and lease losses for the years ended December 31, 2016, 2015 and 2014:
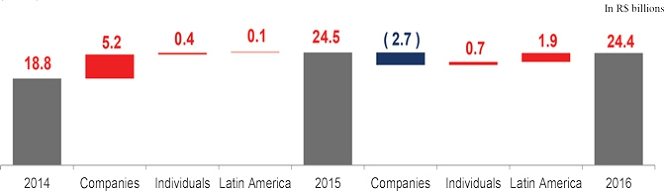
For the year ended December 31, 2016, our expenses for allowance for loan and lease losses remained relatively stable compared to the year ended December 31, 2015, primarily as a result of the decrease in our expenses for allowance loan and lease losses for companies being offset by increases in expenses for allowance and loan losses for our Latin America segment mainly as a result of the merger between Banco Itaú Chile and CorpBanca.
For the year ended December 31, 2015, our expenses for allowance for loan and lease losses increased by 30.2% compared to the year ended December 31, 2014. The growth is mainly due to a more challenging economic environment in Brazil. Please refer to section Macroeconomic context – item Brazilian context for further details.
As of December 31, 2016, the NPL ratio for operations overdue from 15 to 90 days (NPL 15-90) reached 2.5% and NPL ratio for operations overdue for over 90 days (NPL 90) reached 3.4%. The chart below shows the changes in the NPL ratios.

In the year ended December 31, 2016, the recovery of loans written off as losses reached R$3,742 million, representing a decrease of 21.7% compared to the year ended December 31, 2015 as a result of the challenging economic scenario in Brazil. In the year ended December 31, 2015, the recovery of loans written off as losses reached R$4,779 million, representing a decrease of 5.4% compared to the year ended December 31, 2014.
In 2016, expenses for claims decreased by R$56 million compared to the same period in the previous year. The reduction in expenses for claims is related to the early termination of the extended warranty agreement between Itaú Seguros S.A. and Via Varejo in the third quarter of 2014. In 2015, expenses for claims decreased by R$819 million compared to 2014, mainly due to a decrease in claims of large risk insurance operations due to the sale of the large risk portfolio, in addition to decreasing
A-155
claims in mandatory insurance for personal injury caused by motor vehicles (Seguro Obrigatório de Danos Pessoais Causadospor Veículos Automotores de Via Terrestre, or DPVAT).
In 2016, recovery of claims under reinsurance increased by R$56 million from R$14 million for the year ended December 31, 2015 reaching R$70 million, mainly due to a decrease in the recovery of claims. In 2015, recovery of claims under reinsurance decreased by R$393 million compared to the year ended December 31, 2014, mainly due to a decrease in the recovery of claims in our segment of large risk insurance products.
The following table presents the composition of our general and administrative expenses for the years ended December 31, 2016, 2015 and 2014:
| For the Year Ended December 31, | Variation | |||||||||||||||||||||||||||
| General and administrative expenses | 2016 | 2015 | 2014 | 2016-2015 | 2015-2014 | |||||||||||||||||||||||
| (In millions of R$, except percentages) | ||||||||||||||||||||||||||||
| Personnel expenses | (22,360 | ) | (19,573 | ) | (17,071 | ) | (2,787 | ) | 14.2 | % | (2,503 | ) | 14.7 | % | ||||||||||||||
| Administrative expenses | (15,959 | ) | (15,112 | ) | (14,325 | ) | (847 | ) | 5.6 | % | (787 | ) | 5.5 | % | ||||||||||||||
| Depreciation | (1,702 | ) | (1,688 | ) | (1,641 | ) | (14 | ) | 0.8 | % | (47 | ) | 2.9 | % | ||||||||||||||
| Amortization | (1,292 | ) | (910 | ) | (827 | ) | (382 | ) | 42.0 | % | (83 | ) | 10.0 | % | ||||||||||||||
| Insurance acquisition expenses | (721 | ) | (1,138 | ) | (1,214 | ) | 417 | (36.6 | )% | 76 | (6.3 | )% | ||||||||||||||||
| Other expenses | (8,870 | ) | (9,205 | ) | (7,472 | ) | 335 | (3.6 | )% | (1,733 | ) | 23.2 | % | |||||||||||||||
| Total general and administrative expenses | (50,904 | ) | (47,626 | ) | (42,550 | ) | (3,278 | ) | 6.9 | % | (5,076 | ) | 11.9 | % | ||||||||||||||
We kept a tight control on costs and have partially offset the potential rise in costs (brought by the growth of operations, the rise in salaries and benefits due to collective labor agreements and the impact of inflation on our administrative costs) with efficiency gains. Between December 31, 2015, and December 31, 2016, our number of employees increased by 4.9% to 94,779 mainly as a result of the merger between Banco Itaú Chile and CorpBanca. Between December 31, 2014 and December 31, 2015, our number of employees decreased by 3.1% to 90,320 mainly as a result of our natural turn-over.
General and administrative expenses increased by R$3,278 million, or 6.9%, in the year ended December 31, 2016 compared to the year ended December 31, 2015. In the year ended December 31, 2015, these expenses increased by 11.9% compared to the year ended December 31, 2014.
In the year ended December 31, 2016, the increase of R$2,787 million in personnel expenses compared to the year ended December 31, 2015 was mainly a result of the increase in expenses related to compensation, welfare benefits and provisions for labor claims. Also, the increase in the number of employees in Latin America as a result of the merger between Banco Itaú Chile and CorpBanca contributed to this increase in the year ended December 31, 2016 compared to the year ended December 31, 2015. The annual collective labor agreement reached in third quarter, increased compensation by 8.0% starting from September 2016 and also established the lump-sum bonus to employees, and impacted the year ended December 31, 2016 compared to the year ended December 31, 2015. In the year ended December 31, 2015, the increase of R$2,503 million in personnel expenses compared to 2014 was mainly a result of the increase in expenses related to defined contribution plan and provisions for labor claims.
In the year ended December 31, 2016, administrative expenses increased by R$847 million, or 5.6%, compared to the year ended December 31, 2015 mainly due to increases in costs related to third-party services, financial services, utilities and rent. The increase in these expenses was due to the organic growth of our operations and, the effect of inflation on most contracts and costs in the year ended December 31, 2016. In the year ended December 31, 2015, administrative expenses increased R$787 million, or 5.5%, mainly because of increases in costs related to data processing and telecommunications, advertising, promotions and publications and other expenses. In the year ended December 31, 2016, other expenses decreased R$335 million, or 3.6% compared to the year ended December 31, 2015, mainly in provisions for civil lawsuits. In 2015, other expenses grew R$1,733 million, or 23.2%, mainly due to the increases of R$724 million in selling expenses related to credit cards, R$390 million in provisions for tax and social security lawsuits and R$361 million in provisions for civil lawsuits.
In the year ended December 31, 2016, tax expenses (ISS, PIS, Cofins and other tax expenses) amounted to R$7,971 million, an increase of R$2,566 million compared to the year ended December 31, 2015, and increase of R$342 million for the year ended December 31, 2015 compared to the year ended December 31, 2014, reflecting the increase in our banking product (operating revenues).
Certain amounts of income and expenses are recognized in our income statement but do not affect our taxable basis. Conversely, certain amounts are considered taxable income or deductible expenses in the calculation of our taxes on income but do not affect our income statement. Those items are referred to as “timing differences”. Our total income tax and social contribution includes current income tax and social contribution as well as deferred income tax and social contribution. The former is the tax expense under Brazilian tax laws for the period, and the latter is the tax expense resulting from timing differences.
In the year ended December 31, 2016, income tax and social contribution amounted to an expense of R$14,610 million compared to a credit of R$7,891 million for the year ended December 31, 2015. This increase in expense was mainly due to an increase in income before tax and social contribution and due to the effect on the balance of the social contribution tax credit resulting from the rate increase from 15% to 20% as established by Provisional Measure No. 675/2015 of May 2015 (converted into Law No. 13,169/2015 in October 2015) and to the tax effect on the hedge of our equity investments abroad, as exchange rate variations on such investments are not taxable but the hedge of such investments is taxable. In the year ended December 31, 2014, income tax and social contribution amounted to an expense of R$6,947 million.
A-156
Basis of segment information presentation
Our segment information is based on reports used by senior management to assess the financial performance of our businesses and to make decisions regarding the allocation of funds for investment and other purposes.
Segment information is prepared according to accounting practices adopted in Brazil (our segment information is not prepared in accordance with IFRS) but includes the following pro forma adjustments: (i) the recognition of the impact related to allocated capital using a proprietary model; (ii) the use of funding and cost of capital, according to market prices, using certain managerial criteria; (iii) the exclusion of non-recurring events from our results and (iv) the reclassification of the tax effects from hedging transactions we enter into for our investments abroad. Please refer to section Performance, item Complete Financial Statements in IFRS, Note 34 – Segment Information for further details.
The impacts associated with capital allocation are included in the financial information. Accordingly, adjustments were made to the consolidated financial statements, based on a proprietary model. The Allocated Economic Capital (AEC) model was adopted for the consolidated financial statements by segments, and as from 2015, we changed the calculation methodology. The AEC considers, in addition to Tier l Capital, the effects of the calculation of expected loan losses, supplementary to the requirements of the Central Bank of Brazil, pursuant to CMN Circular No. 2,682/99. Accordingly, the Allocated Capital comprises the following components: Credit risk (including expected loss), operational risk, market risk and insurance underwriting risk. Based on the portion of Tier 1 Capital, we calculated the Return on Economic Allocated Capital, which corresponds to an operational performance indicator consistently adjusted to the capital required to support the risk associated to asset and liability positions assumed, in conformity with our risk appetite.
As of the first quarter of 2016, we have adopted the Basel III rules in our managerial capital allocation model.
The Efficiency Ratio and Risk Adjusted Efficiency Ratio are calculated based on managerial information, as presented below:

The Efficiency Ratio and Risk Efficiency Ratio are non-GAAP measures and we disclose them herein as we consider them to be an important measure to understand how we manage our overhead costs. We disclose this measure to the market on a quarterly basis.
Low efficiency ratios indicate a better performance, since this ratio measures the proportion of expenses over revenues. The risk-adjusted efficiency ratio includes the risk portions associated with banking transactions (result of the allowance for loan and lease losses and recovery of loans written off as losses).
We report information with respect to the following segments: (i) Retail Banking, (ii) Wholesale Banking and (iii) Activities with the Market and Corporation.
The current operational and reporting segments are described below:
| · | Retail Banking: The result of the Retail Banking segment is derived from the offer of banking products and services to a diversified client base of account holders and non-account holders, individuals and companies. The segment includes retail clients, high-income clients (Itaú Uniclass and Personnalité), and very small and small companies. This segment comprises financing and lending activities carried out in units other than the branch network, and offering of credit cards, in addition to operations with Itaú BMG Consignado; |
| · | Wholesale Banking: The result of the Wholesale Banking segment is derived from the products and services offered to middle-market companies, private banking clients, from the activities of Latin America units (excluding Brazil), including those of CorpBanca as of the second quarter of 2016 following the merger between Banco Itaú Chile and CorpBanca, and the activities of Itaú BBA, the unit in charge of commercial operations with large companies as well as performing as an investment banking unit; and |
| · | Activities with the Market and Corporation: This segment records the results derived from capital surplus, subordinated debt surplus and the net balance of tax credits and debits. It also shows the financial margin with the market, the treasury operating cost, the equity in earnings of companies not associated to each segment and the interest in Porto Seguro. |
We present below a summary of the results from our operating segments for the year ended December 31, 2016. Similar information for the years ended December 31, 2015 and 2014 is included in the consolidated financial statements, in Note 34 regarding segment information in section Performance, item Complete Financial Statements in IFRS. The following discussion should be read in conjunction with our complete financial statements, especially Note 34 regarding segment information in section Performance, item Complete Financial Statements in IFRS. The adjustments column shown in the Note 34 presents effects of the differences between the segmented results (substantially according with the accounting practices adopted in Brazil) and those calculated according to the principles adopted in our complete financial statements in IFRS.
A-157
| Consolidated Statement of Income from January 1 to December 31, 2016 | Retail Banking | Wholesale Banking | Activities with the Market + Corporation | ITAÚ UNIBANCO | Adjustments | IFRS consolidated | ||||||||||||||||||
| (In millions of R$) | ||||||||||||||||||||||||
| Banking product | 69,577 | 28,324 | 9,412 | 107,313 | 11,348 | 118,661 | ||||||||||||||||||
| Interest margin (1) | 39,154 | 19,755 | 9,264 | 68,173 | 11,308 | 79,481 | ||||||||||||||||||
| Banking service fees | 22,659 | 8,072 | 59 | 30,790 | 1,128 | 31,918 | ||||||||||||||||||
| Income related to insurance, private pension and capitalization operations before claim and selling expenses | 7,764 | 497 | 89 | 8,350 | (2,470 | ) | 5,880 | |||||||||||||||||
| Other revenues | - | - | - | - | 1,382 | 1,382 | ||||||||||||||||||
| Losses on loans and claims | (14,901 | ) | (8,471 | ) | 71 | (23,301 | ) | 1,179 | (22,122 | ) | ||||||||||||||
| Expenses for allowance for loan and lease losses | (16,717 | ) | (8,914 | ) | 71 | (25,560 | ) | 1,181 | (24,379 | ) | ||||||||||||||
| Recovery of credits written off as loss | 3,242 | 502 | - | 3,744 | (2 | ) | 3,742 | |||||||||||||||||
| Expenses for claims / recovery of claims under reinsurance | (1,426 | ) | (59 | ) | - | (1,485 | ) | - | (1,485 | ) | ||||||||||||||
| Operating margin | 54,676 | 19,853 | 9,483 | 84,012 | 12,527 | 96,539 | ||||||||||||||||||
| Other operating income (expenses) | (37,202 | ) | (13,410 | ) | (2,387 | ) | (52,999 | ) | (5,348 | ) | (58,347 | ) | ||||||||||||
| Non-interest expenses (2) | (32,883 | ) | (12,034 | ) | (1,616 | ) | (46,533 | ) | (4,371 | ) | (50,904 | ) | ||||||||||||
| Tax expenses for ISS, PIS and COFINS and other | (4,319 | ) | (1,376 | ) | (771 | ) | (6,466 | ) | (1,505 | ) | (7,971 | ) | ||||||||||||
| Share of profit or (loss) in associates and joint ventures | - | - | - | - | 528 | 528 | ||||||||||||||||||
| Net income before income tax and social contribution | 17,474 | 6,443 | 7,096 | 31,013 | 7,179 | 38,192 | ||||||||||||||||||
| Income tax and social contribution | (6,328 | ) | (1,081 | ) | (1,237 | ) | (8,646 | ) | (5,964 | ) | (14,610 | ) | ||||||||||||
| Non-controlling interest in subsidiaries | (223 | ) | 79 | (1 | ) | (145 | ) | (174 | ) | (319 | ) | |||||||||||||
| Net income | 10,923 | 5,441 | 5,858 | 22,222 | 1,041 | 23,263 | ||||||||||||||||||
| (1) | Includes net interest and similar income and expenses of R$66,369 dividend income of R$288, net gain (loss) on investment securities and derivatives of R$7,311 and results from foreign exchange results and exchange variation of transactions abroad of R$5,513. |
| (2) | Refers to general and administrative expenses including depreciation expenses of R$1,702, amortization expenses of R$1,292 and insurance acquisition expenses of R$721. |
Revenues from operations in Brazil and abroad
We conduct most of our business activities in Brazil, but we do not break down our revenues by geographic markets within Brazil. Our interest income from loans and leases, banking service fees and income from insurance, private pension plans and premium bonds transactions are divided between revenues earned in Brazil and outside of Brazil. The following information is presented in IFRS, after eliminations on consolidation.
The following table sets forth the consolidated statement of income with respect to our revenues from operations in Brazil and abroad for the years ended December 31, 2016, 2015 and 2014:
| For the Year Ended December 31, | Variation | |||||||||||||||||||||||||||
| Revenues from operations in Brazil and abroad | 2016 | 2015 | 2014 | 2016-2015 | 2015-2014 | |||||||||||||||||||||||
| (In millions of R$, except percentages) | ||||||||||||||||||||||||||||
| Income Related to Financial Operations (1) | 174,607 | 129,672 | 129,250 | 44,935 | 34.7 | % | 422 | 0.3 | % | |||||||||||||||||||
| Brazil | 154,653 | 117,140 | 118,946 | 37,513 | 32.0 | % | (1,806 | ) | (1.5 | )% | ||||||||||||||||||
| Abroad | 19,954 | 12,532 | 10,304 | 7,422 | 59.2 | % | 2,228 | 21.6 | % | |||||||||||||||||||
| Banking Service Fees | 31,918 | 29,452 | 26,342 | 2,466 | 8.4 | % | 3,110 | 11.8 | % | |||||||||||||||||||
| Brazil | 29,061 | 27,072 | 24,550 | 1,989 | 7.3 | % | 2,522 | 10.3 | % | |||||||||||||||||||
| Abroad | 2,857 | 2,380 | 1,792 | 477 | 20.0 | % | 588 | 32.8 | % | |||||||||||||||||||
| Income related to insurance, private pension and capitalization operations before claim and selling expenses | 5,880 | 6,672 | 6,888 | (792 | ) | (11.9 | )% | (216 | ) | (3.1 | )% | |||||||||||||||||
| Brazil | 5,748 | 6,570 | 6,834 | (822 | ) | (12.5 | )% | (264 | ) | (3.9 | )% | |||||||||||||||||
| Abroad | 132 | 102 | 54 | 30 | 29.4 | % | 48 | 88.9 | % | |||||||||||||||||||
| (1) | Includes interest and similar income, dividend income, net gain (loss) on investment securities and derivatives, and foreign exchange results and exchange variation on transactions. |
Retail Banking
The following table sets forth the consolidated statement of income with respect to our Retail Banking segment for the years ended December 31, 2016, 2015 and 2014:
A-158
| For the Year Ended December 31, | Variation | |||||||||||||||||||||||||||
| Consolidated Statement of Income | 2016 | 2015 | 2014 | 2016-2015 | 2015-2014 | |||||||||||||||||||||||
| (In millions of R$, except percentages) | ||||||||||||||||||||||||||||
| Banking Product | 69,577 | 70,495 | 65,516 | (918 | ) | (1.3 | )% | 4,979 | 7.6 | % | ||||||||||||||||||
| Interest margin | 39,154 | 40,997 | 37,880 | (1,843 | ) | (4.5 | )% | 3,117 | 8.2 | % | ||||||||||||||||||
| Banking service fees | 22,659 | 21,159 | 19,234 | 1,500 | 7.1 | % | 1,925 | 10.0 | % | |||||||||||||||||||
| Income from insurance, private pension and capitalization operations before claim and selling expenses | 7,764 | 8,339 | 8,402 | (575 | ) | (6.9 | )% | (63 | ) | (0.7 | )% | |||||||||||||||||
| Losses on loans and claims | (14,901 | ) | (13,893 | ) | (11,840 | ) | (1,008 | ) | 7.3 | % | (2,053 | ) | 17.3 | % | ||||||||||||||
| Expenses for allowance for loan and lease losses | (16,717 | ) | (16,232 | ) | (14,503 | ) | (485 | ) | 3.0 | % | (1,729 | ) | 11.9 | % | ||||||||||||||
| Recovery of loans written-off as losses | 3,242 | 3,886 | 4,642 | (644 | ) | (16.6 | )% | (756 | ) | (16.3 | )% | |||||||||||||||||
| Expenses for claims/Recovery of claims under reinsurance | (1,426 | ) | (1,547 | ) | (1,979 | ) | 121 | (7.8 | )% | 432 | (21.8 | )% | ||||||||||||||||
| Operating margin | 54,676 | 56,602 | 53,676 | (1,926 | ) | (3.4 | )% | 2,926 | 5.5 | % | ||||||||||||||||||
| Other operating income (expenses) | (37,202 | ) | (35,924 | ) | (34,200 | ) | (1,278 | ) | 3.6 | % | (1,724 | ) | 5.0 | % | ||||||||||||||
| Non-interest expenses | (32,883 | ) | (31,547 | ) | (30,243 | ) | (1,336 | ) | 4.2 | % | (1,304 | ) | 4.3 | % | ||||||||||||||
| Tax expenses for ISS, PIS and COFINS and other | (4,319 | ) | (4,377 | ) | (3,957 | ) | 58 | (1.3 | )% | (420 | ) | 10.6 | % | |||||||||||||||
| Income before income tax and social contribution | 17,474 | 20,678 | 19,476 | (3,204 | ) | (15.5 | )% | 1,202 | 6.2 | % | ||||||||||||||||||
| Income tax and social contribution | (6,328 | ) | (7,263 | ) | (6,761 | ) | 935 | (12.9 | )% | (502 | ) | 7.4 | % | |||||||||||||||
| Non-controlling interest in subsidiaries | (223 | ) | (342 | ) | (305 | ) | 119 | (34.8 | )% | (37 | ) | 12.1 | % | |||||||||||||||
| Net income | 10,923 | 13,073 | 12,410 | (2,150 | ) | (16.4 | )% | 663 | 5.3 | % | ||||||||||||||||||
| Performance Measures | ||||||||||||||||||||||||||||
| Efficiency Ratio | 51.1 | % | 48.0 | % | 49.8 | % | ||||||||||||||||||||||
| Risk Adjusted Efficiency Ratio | 72.4 | % | 67.4 | % | 66.7 | % | ||||||||||||||||||||||
| Balance Sheet Information | ||||||||||||||||||||||||||||
| Loan, Lease and Other Credit Transactions | 214,025 | 222,774 | 226,239 | |||||||||||||||||||||||||
| Total Assets | 909,779 | 873,202 | 811,185 | |||||||||||||||||||||||||
Net income for the Retail Banking segment decreased by 16.4% in the year ended December 31, 2016 from the year ended December 31, 2015, mainly due to the negative impact of the R$1,843 million decrease in interest margin, as a result of the challenging economic scenario in Brazil. Non-interest expenses increased by R$1,336 million, with an increase in personnel expenses, which were impacted by events related to terminations, labor claims, and lump-sum bonus payment to employees in 2016.
Banking service fees increased by 7.1% from the year ended December 31, 2015 to the year ended December 31, 2016, which had a positive impact on net income mainly due to higher revenues from current account services and credit cards.
Net income for the Retail Banking segment increased by 5.3% from the year ended December 31, 2014 to the year ended December 31, 2015, mainly due to the positive impact of the R$3,117 million increase in interest margin and of the R$1,925 million increase in banking service fees with higher revenues from current account services and credit cards. Losses on loans and claims increased by 17.3% from the year ended December 31, 2014, mainly due to higher expenses for allowance for loan and lease losses for individuals and small and very small companies due to a more challenging economic environment in Brazil. Non-interest expenses increased by 4.3%, with an increase in personnel expenses, which were affected by the collective labor agreements reached in 2014 and 2015.
Wholesale Banking
The following table sets forth the consolidated statement of income with respect to our Wholesale Banking segment for the years ended December 31, 2016, 2015 and 2014:
A-159
| For the Year Ended December 31, | Variation | |||||||||||||||||||||||||||
| Consolidated Statement of Income | 2016 | 2015 | 2014 | 2016-2015 | 2015-2014 | |||||||||||||||||||||||
| (In millions of R$, except percentages) | ||||||||||||||||||||||||||||
| Banking Product | 28,324 | 25,774 | 20,408 | 2,550 | 9.9 | % | 5,366 | 26.3 | % | |||||||||||||||||||
| Interest margin | 19,755 | 18,047 | 13,685 | 1,708 | 9.5 | % | 4,362 | 31.9 | % | |||||||||||||||||||
| Banking service fees | 8,072 | 7,282 | 6,321 | 790 | 10.8 | % | 961 | 15.2 | % | |||||||||||||||||||
| Income from insurance, private pension and capitalization operations before claim and selling expenses | 497 | 445 | 402 | 52 | 11.7 | % | 43 | 10.7 | % | |||||||||||||||||||
| Losses on loans and claims | (8,471 | ) | (5,931 | ) | (3,202 | ) | (2,540 | ) | 42.8 | % | (2,729 | ) | 85.2 | % | ||||||||||||||
| Expenses for allowance for loan and lease losses | (8,914 | ) | (6,764 | ) | (3,565 | ) | (2,150 | ) | 31.8 | % | (3,199 | ) | 89.7 | % | ||||||||||||||
| Recovery of loans written-off as losses | 502 | 883 | 407 | (381 | ) | (43.1 | )% | 476 | 117.0 | % | ||||||||||||||||||
| Expenses for claims/Recovery of claims under reinsurance | (59 | ) | (50 | ) | (44 | ) | (9 | ) | 18.0 | % | (6 | ) | 13.6 | % | ||||||||||||||
| Operating margin | 19,853 | 19,843 | 17,206 | 10 | 0.1 | % | 2,637 | 15.3 | % | |||||||||||||||||||
| Other operating income (expenses) | (13,410 | ) | (11,130 | ) | (9,150 | ) | (2,280 | ) | 20.5 | % | (1,980 | ) | 21.6 | % | ||||||||||||||
| Non-interest expenses | (12,034 | ) | (9,877 | ) | (8,158 | ) | (2,157 | ) | 21.8 | % | (1,719 | ) | 21.1 | % | ||||||||||||||
| Tax expenses for ISS, PIS and COFINS and other | (1,376 | ) | (1,253 | ) | (992 | ) | (123 | ) | 9.8 | % | (261 | ) | 26.3 | % | ||||||||||||||
| Income before income tax and social contribution | 6,443 | 8,713 | 8,056 | (2,270 | ) | (26.1 | )% | 657 | 8.2 | % | ||||||||||||||||||
| Income tax and social contribution | (1,081 | ) | (2,691 | ) | (2,591 | ) | 1,610 | (59.8 | )% | (100 | ) | 3.9 | % | |||||||||||||||
| Non-controlling interest in subsidiaries | 79 | - | - | 79 | - | - | - | |||||||||||||||||||||
| Net income | 5,441 | 6,022 | 5,465 | (581 | ) | (9.6 | )% | 557 | 10.2 | % | ||||||||||||||||||
| Performance Measures | ||||||||||||||||||||||||||||
| Efficiency Ratio | 44.8 | % | 40.4 | % | 42.1 | % | ||||||||||||||||||||||
| Risk Adjusted Efficiency Ratio | 76.0 | % | 64.4 | % | 58.4 | % | ||||||||||||||||||||||
| Balance Sheet Information | ||||||||||||||||||||||||||||
| Loan, Lease and Other Credit Transactions | 277,200 | 251,056 | 221,950 | |||||||||||||||||||||||||
| Total Assets | 585,088 | 547,236 | 436,872 | |||||||||||||||||||||||||
In the year ended December 31, 2016, net income for our Wholesale Banking segment decreased by 9.6% from the previous year. Our banking product increased by 9.9% as the interest margin and the banking service fees were 9.5% and 10.8% higher than in the year ended December 31, 2015. The increase in interest margin was due to the growth in our Latin America portfolio as a result of the merger between our subsidiary Banco Itaú Chile and CorpBanca in the second quarter of 2016.
Non-interest expenses increased by 21.8% for the year ended December 31, 2016 compared to the year ended December 31, 2015. Losses on loans and claims increased by 42.8% for the year ended December 31, 2016 compared to the year ended December 31, 2015 mainly due to the higher provision for loan losses, which totaled R$8,914 million in 2016, mainly related to higher provisions for specific economic groups due to the challenging economic scenario in Brazil. Additionally, income from recovery of loans written-off as losses decreased by 43.1% in 2016 compared to the previous year.
In the year ended December 31, 2015, net income for our Wholesale Banking segment increased by 10.2% from the previous year. Our banking product increased by 26.3% as the interest margin and the banking service fees were 31.9% and 15.2% higher than in 2014. The increase in our corporate loan portfolio during 2015 contributed to the improvement in the interest margin for the period compared to the interest margin for 2014.
Losses on loans and claims increased by 85.2%, mainly due to the increase in expenses for allowance for loan losses for companies of the corporate segment in 2015. The increase of 117.0 % in recovery of loans written-off as losses compared to 2014 was mainly driven by the restructuring with respect to amounts owed by a specific client in the corporate segment. Also, the non-interest expenses increased by 21.1%, having a negative impact on net income.
Activities with the Market and Corporation
The following table sets forth the consolidated statement of income with respect to our Activities with the Market and Corporation segment for the years ended December 31, 2016, 2015 and 2014:
A-160
| For the Year Ended December 31, | Variation | |||||||||||||||||||||||||||
| Consolidated Statement of Income | 2016 | 2015 | 2014 | 2016-2015 | 2015-2014 | |||||||||||||||||||||||
| (In millions of R$, except percentages) | ||||||||||||||||||||||||||||
| Banking Product | 9,412 | 7,641 | 3,916 | 1,771 | 23.2 | % | 3,725 | 95.1 | % | |||||||||||||||||||
| Interest margin | 9,264 | 7,513 | 3,590 | 1,751 | 23.3 | % | 3,923 | 109.3 | % | |||||||||||||||||||
| Banking service fees | 59 | 59 | 222 | - | 0.0 | % | (163 | ) | (73.4 | )% | ||||||||||||||||||
| Income from insurance, private pension and capitalization operations before claim and selling expenses | 89 | 69 | 104 | 20 | 29.0 | % | (35 | ) | (33.7 | )% | ||||||||||||||||||
| Losses on loans and claims | 71 | 98 | (3 | ) | (27 | ) | (27.6 | )% | 101 | (3366.7 | )% | |||||||||||||||||
| Expenses for allowance for loan and lease losses | 71 | 98 | (3 | ) | (27 | ) | (27.6 | )% | 101 | (3366.7 | )% | |||||||||||||||||
| Recovery of loans written-off as losses | - | - | - | - | - | - | - | |||||||||||||||||||||
| Expenses for claims/Recovery of claims under reinsurance | - | - | - | - | - | - | - | |||||||||||||||||||||
| Banking Product net of losses on loans and claims | 9,483 | 7,739 | 3,913 | 1,744 | 22.5 | % | 3,826 | 97.8 | % | |||||||||||||||||||
| Other operating income (expenses) | (2,387 | ) | (1,948 | ) | (1,089 | ) | (439 | ) | 22.5 | % | (859 | ) | 78.9 | % | ||||||||||||||
| Non-interest expenses | (1,616 | ) | (1,522 | ) | (1,182 | ) | (94 | ) | 6.2 | % | (340 | ) | 28.8 | % | ||||||||||||||
| Tax expenses for ISS, PIS and COFINS and other | (771 | ) | (426 | ) | 93 | (345 | ) | 81.0 | % | (519 | ) | (558.1 | )% | |||||||||||||||
| Income before income tax and social contribution | 7,096 | 5,791 | 2,824 | 1,305 | 22.5 | % | 2,967 | 105.1 | % | |||||||||||||||||||
| Income tax and social contribution | (1,237 | ) | (1,040 | ) | (74 | ) | (197 | ) | 18.9 | % | (966 | ) | 1305.4 | % | ||||||||||||||
| Non-controlling interest in subsidiaries | (1 | ) | (14 | ) | (6 | ) | 13 | (92.9 | )% | (8 | ) | 133.3 | % | |||||||||||||||
| Net income | 5,858 | 4,737 | 2,744 | 1,121 | 23.7 | % | 1,993 | 72.6 | % | |||||||||||||||||||
| Performance Measures | ||||||||||||||||||||||||||||
| Efficiency Ratio | 18.6 | % | 21.0 | % | 29.5 | % | ||||||||||||||||||||||
| Risk Adjusted Efficiency Ratio | 17.8 | % | 19.7 | % | 29.5 | % | ||||||||||||||||||||||
| Balance Sheet Information | ||||||||||||||||||||||||||||
| Loan, Lease and Other Credit Transactions | - | - | 3,572 | |||||||||||||||||||||||||
| Total Assets | 114,956 | 127,716 | 107,174 | |||||||||||||||||||||||||
Activities with the Market and Corporation segment includes the result from the investment of our excess capital, costs from our excess subordinated debt and the net balance of tax assets and liabilities. It also includes the financial margin on market transactions, costs of treasury operations, equity in the earnings of companies that are not linked to any segments, as well as adjustments related to minority shareholdings in subsidiaries and our interest in Porto Seguro S.A.
In 2016, net income from Activities with the Market and Corporation increased by 23.7% compared to the previous year. With positive effects on our net income, interest margin increased by R$1,751 million or 23.3%.
This increase is a result of an increase in the interest margin of R$3,923 million or 109.3%, for the year ended December 31, 2015 compared to the prior year (mainly due to higher results on our treasury transactions undertaken for purposes of asset and liability management and proprietary portfolio management). Non-interest expenses increased by 28.8% in 2015 compared to 2014.
Changes in cash flows
The following table sets forth the main variations in our cash flows for the years ended December 31, 2016, 2015 and 2014:
| For the Year Ended December 31, | ||||||||||||
| Changes in Cash Flows | 2016 | 2015 | 2014 | |||||||||
| (In millions of R$) | ||||||||||||
| Net cash from (used in) operating activities | 30,311 | (34,459 | ) | 89,726 | ||||||||
| Net cash from (used in) investing activities | 14,429 | (361 | ) | 2,676 | ||||||||
| Net cash from (used in) financing activities | (22,329 | ) | (8,529 | ) | (21,688 | ) | ||||||
| Net increase (decrease) in cash and cash equivalents | 22,411 | (43,350 | ) | 70,714 | ||||||||
In 2016, our net increase of R$22,411 million in cash and cash equivalents was provided by R$30,311 million in operating activities, by R$14,429 million in investing activities and by the use of R$22,329 million in financing activities.
Operating activities
In the year ended December 31, 2016, net cash from operating activities was R$30,311 million as a result of decreases in securities purchased under agreements to resell, in other tax assets and by the decrease in loan operations. There was also a decrease in funds from interbank markets partially compensated by an increase in deposits received under securities repurchase agreements. In 2015, net cash used in operating activities was R$34,459 million due to increases in financial assets held for trading, loan operations (as a result of the credit portfolio increases) and securities purchased under agreements to resell. In 2014, the changes in cash flows from operating activities resulted from a decrease in financial assets held for trading and an increase in deposits received under securities repurchase agreements, partially offset by increases in loan operations. Management believes cash flows from operations, available cash balances and funds from interbank markets will be sufficient to fund our operating liquidity needs.
Investing activities
In the year ended December 31, 2016 the increase in cash from investing activities was related to CorpBanca’s consolidation as a result of the merger between our subsidiary Banco Itaú Chile and CorpBanca in the second quarter of 2016 and due to the cash
A-161
received on the sale of available-for-sale financial assets. In 2015, the purchase of available-for-sale assets and purchase of held-to-maturity financial assets were the main cause for the outflows in our cash flow from investing activities. In 2014, the sale of large risk insurance operations and the sale of available-for-sale assets was the main cause for the inflows in our cash flow from investing activities, offset by cash paid for the purchase of available-for-sale assets.
Financing activities
In the years ended December 31, 2016, 2015 and 2014, the changes in cash flows from financing activities were primarily a result of an increase in redemptions of our subordinated debt in institutional markets. Further, we paid dividends and interest on capital in the amount of R$ 7,673 million, R$7,008 million and R$6,319 million in 2016, 2015 and 2014, respectively. In 2016, we purchased R$ 947 million in treasury shares compared to R$3,324 million in treasury shares in 2015, which both generated cash outflows of the same amounts.
Liquidity and capital resources
Our board of directors determines our policy regarding liquidity risk management, and establishes broad quantitative liquidity risk management limits in line with our risk appetite. CSRML, composed of members of senior management, is responsible for strategic liquidity risk management in line with the board-approved liquidity risk framework and risk appetite. In establishing our guidelines, CSRML considers the liquidity implications of each market segment and product. The institutional treasury unit of Itaú Unibanco Holding is responsible for day-to-day management of the Itaú Unibanco Group’s liquidity profile, within the parameters set by the Board of Directors and the CSRML. This includes an oversight responsibility with respect to all business units operating outside of Brazil.
We maintain separate liquidity pools at our Brazilian operations and at each of our subsidiaries in Latin America and Europe. Our Brazilian operations include the financial institutions in Brazil and the entities used by the Brazilian operations for funding and serving their clients abroad. Each subsidiary in Latin America (e.g., in Chile, Argentina, Uruguay, Colombia and Paraguay) and in Europe has its own treasury function with appropriate autonomy to manage liquidity according to local needs and regulations, while remaining in compliance with the liquidity limits established by Itaú Unibanco Holding senior management. In general, there are rarely liquidity transfers between subsidiaries or between the head office and a subsidiary, except under very specific circumstances (e.g., targeted capital increases). Brazil, Argentina, United Kingdom and Colombia are the only countries in which we operate where local regulators have established minimum liquidity levels.
CMN regulations also establish capital conservation and countercyclical buffers for Brazilian financial institutions, and determines their minimum percentages as well as which sanctions and limitations will apply in case of non-compliance with such additional requirements.
We define our consolidated group operational liquidity reserve as the total amount of assets that can be rapidly turned into cash, based on local market practices and legal restrictions. The operational liquidity reserve generally includes: cash and deposits on demand, funded positions of securities purchased under agreements to resell and unencumbered government securities.
The following table presents our operational liquidity reserve as of December 31, 2016, 2015 and 2014:
| As of December 31, | 2016 Average | |||||||||||||||
| Cash in Cash Flows | 2016 | 2015 | 2014 | Balance(1) | ||||||||||||
| (In millions of R$) | ||||||||||||||||
| Cash and deposits on demand | 18,542 | 18,544 | 17,527 | 19,500 | ||||||||||||
| Funded positions of securities purchased under agreements to resell(2) | 77,452 | 72,091 | 74,275 | 73,945 | ||||||||||||
| Unencumbered government securities | 81,458 | 65,965 | 45,587 | 64,988 | ||||||||||||
| Operational reserve | 174,627 | 156,600 | 137,389 | 158,433 | ||||||||||||
| (1) | Average calculated based on interim financial statements. |
| (2) | Net of R$4,329 (R$9,461 at 12/31/2015 and R$5,945 at 12/31/2014), which securities are restricted to guarantee transactions at BM&FBovespa and the Central Bank. |
Management controls our liquidity reserves by projecting the resources that will be available for investment by our treasury department. The technique we employ involves the statistical projection of scenarios for our assets and liabilities, considering the liquidity profiles of our counterparties.
Short-term minimum liquidity limits are defined according to guidelines set by the CSRML. These limits aim to ensure that the Itaú Unibanco Group always has sufficient liquidity available, sufficient to cover unforeseen market events. These limits are revised periodically, based on the projection of cash needs in atypical market situations (i.e., stress scenarios).
Management of liquidity makes it possible for us to simultaneously meet our operating requirements, protect our capital and exploit market opportunities. Our strategy is to maintain adequate liquidity to meet our present and future financial obligations and to capitalize on business opportunities as they arise.
We are exposed to effects of the disruptions and volatility in the global financial markets and the economies in those countries where we do business, especially Brazil. However, due to our stable sources of funding, which include a large deposit base, the large number of correspondent banks with which we have long-standing relationships, as well as facilities in place which
A-162
enable us to access further funding when required, we have not historically experienced liquidity challenges, even during periods of disruption in the international financial markets.
| For the Year Ended December 31, | ||||||||||||||||||||||||
| 2016 | 2015 | 2014 | ||||||||||||||||||||||
| Average deposits and borrowings | Average balance | % of total | Average balance | % of total | Average balance | % of total | ||||||||||||||||||
| (In millions of R$, except percentages) | ||||||||||||||||||||||||
| Interest-bearing liabilities | 969,461 | 81.9 | % | 875,904 | 81.2 | % | 793,069 | 82.4 | ||||||||||||||||
| Interest-bearing deposits | 244,121 | 20.6 | % | 236,314 | 21.9 | % | 233,999 | 24.3 | ||||||||||||||||
| Savings deposits | 106,838 | 9.0 | % | 114,500 | 10.6 | % | 111,473 | 11.6 | ||||||||||||||||
| Interbank deposits | 7,304 | 0.6 | % | 19,633 | 1.8 | % | 6,131 | 0.6 | ||||||||||||||||
| Time deposits | 129,979 | 11.0 | % | 102,182 | 9.5 | % | 116,395 | 12.1 | ||||||||||||||||
| Securities sold under repurchase agreements | 339,416 | 28.7 | % | 297,509 | 27.6 | % | 266,527 | 27.7 | ||||||||||||||||
| Interbank market debt and Institutional market debt | 240,563 | 20.4 | % | 219,463 | 20.3 | % | 183,981 | 19.1 | ||||||||||||||||
| Interbank market debt | 144,968 | 12.2 | % | 134,637 | 12.5 | % | 113,522 | 11.8 | ||||||||||||||||
| Institutional market debt | 95,595 | 8.1 | % | 84,826 | 7.9 | % | 70,459 | 7.3 | ||||||||||||||||
| Reserves for insurance private pension and liabilities for capitalization plans | 144,387 | 12.2 | % | 121,856 | 11.3 | % | 107,880 | 11.2 | ||||||||||||||||
| Other Interest-bearing liabilities | 974 | 0.1 | % | 761 | 0.1 | % | 682 | 0.1 | ||||||||||||||||
| Non-interest-bearing liabilities | 214,024 | 18.1 | % | 203,377 | 18.8 | % | 169,247 | 17.6 | ||||||||||||||||
| Non-interest bearing deposits | 61,895 | 5.2 | % | 54,148 | 5.0 | % | 43,840 | 4.6 | ||||||||||||||||
| Derivatives | 29,752 | 2.5 | % | 29,488 | 2.7 | % | 13,107 | 1.4 | ||||||||||||||||
| Other non-interest bearing liabilities | 122,377 | 10.3 | % | 119,740 | 11.1 | % | 112,300 | 11.7 | ||||||||||||||||
| Total | 1,183,485 | 100.0 | 1,079,280 | 100.0 | 962,315 | 100.0 | ||||||||||||||||||
Our main sources of funding are interest-bearing deposits, deposits received under repurchase agreements, on-lending from government financial institutions, lines of credit with foreign banks and the issuance of securities abroad. Please refer to section Performance, item Consolidated Financial Statements, Note 17 – Deposits for further details about funding.
We may from time to time seek to retire or purchase our outstanding debt, including our subordinated notes (subject to the approval of the Central Bank), and senior notes, through cash purchases in the open market purchases, privately negotiated transactions or otherwise. Such repurchases, if any, will depend on prevailing market conditions, our liquidity requirements, contractual restrictions and other factors. Notes repurchased may be held, cancelled or resold and any resale thereof will only be in compliance with applicable requirements or exemptions under the relevant securities laws.
Some of our long-term debt provides for acceleration of the outstanding principal balance upon the occurrence of specified events, which are events ordinarily found in long-term financing agreements. Up to December 31, 2016, none of these events, including any events of default or failure to satisfy financial covenants, have occurred.
Under Brazilian law, cash dividends may only be paid if the subsidiary paying such dividends has reported a profit in its financial statements. In addition, subsidiaries that are financial institutions are prohibited from making loans to Itaú Unibanco Holding, but they are allowed to make deposits in Itaú Unibanco Holding, which represent interbank certificates of deposit (Certificado de Depósito Interbancário). These restrictions have not had, and are not expected to have, a material impact on our ability to meet our cash obligations.
Seasonality
Generally our retail banking and our credit card businesses have some seasonality, with increased levels of retail and credit card transactions during the Christmas season and a subsequent decrease of these levels at the beginning of the year. In addition, there is a certain seasonality at the end of the year in our pension plan business, when the thirteenth salaries are paid. We also have some seasonality in our banking service fees related to collection services at the beginning of the year, which is when taxes and other fiscal contributions are generally paid.
Information on trends
We expect many factors to affect our future results of operations, liquidity and capital resources, including:
| • | the Brazilian economic environment (please refer to section context, item Macroeconomic Context, Brazilian Context and section Our risk management, item Risk factors, Macroeconomic risks for further details); |
| • | legal and regulatory developments (please refer to section Context, item Macroeconomic context, Brazilian context, section Our risk management, item Regulatory environment and section Our risk management, item Risk factors, Legal and regulatory risks for further details); |
| • | the effects of any ongoing international financial turmoil, including on the liquidity and capital required (please refer to section Context, item Macroeconomic context, Global context, section Our risk management, item Regulatory environment and section Our risk management, item Risk factors, Macroeconomic risks for further details); |
A-163
| • | the inflation effects on the result of our operations (please refer to section Context, item Macroeconomic context, Brazilian context and section Our risk management, item Risk factors, Macroeconomic risks, inflation and fluctuations in interest rates may have a material adverse effect on us, for further details); |
| • | the effects of the variations in the value of the Brazilianreal, foreign exchange rates and interest rates on our net interest income (please refer to section Performance, item Financial performance, Results, and section Our risk management, item Risk factors, Macroeconomic risks, for further details); and |
| • | any acquisitions we may make in the future (please refer to section Our risk management, item Risk factors, The integration of acquired or merged businesses involves certain risks that may have a material adverse effect on us for further details). |
As part of our strategy, we continue to review growth opportunities, both in Brazil and outside of Brazil. Additionally, please refer to section Our risk management, item Risk factors for comments on the risks faced in our operations and that could affect our business, results of operations or financial condition.
A-164
Complete Financial Statements (IFRS)
The following financial statements, together with the report of the independent auditor, are part of this annual report:
Management´s Report on Internal Control over Financial Reporting
The management of Itaú Unibanco Holding S.A is responsible for establishing and maintaining adequate internal control over financial reporting for the company.
The company’s internal control over financial reporting is a process designed to provide reasonable assurance regarding the reliability of financial reporting and the preparation of financial statements for external purposes in accordance with International Financial Reporting Standards (IFRSs) as issued by the International Accounting Standards Board (IASB). The company’s internal control over financial reporting includes those policies and procedures that: (i) pertain to the maintenance of records that, in reasonable detail, accurately and fairly reflect the transactions and disposals of the assets of the company; (ii) provide reasonable assurance that transactions are recorded as necessary to allow for the preparation of financial statements in accordance with generally accepted accounting principles, and that receipts and expenditures of the company are being made only in accordance with authorizations of management and directors of the company; and (iii) provide reasonable assurance regarding prevention or timely detection of unauthorized acquisition, use or disposition of the company’s assets that could have a material effect on the financial statements.
Because of its inherent limitations, internal control over financial reporting may not prevent or detect misstatements. Therefore, even those controls determined to be effective may not prevent or detect misstatements. Also, projections of any evaluation of effectiveness to future periods are subject to risk that controls may become inadequate because of changes in conditions, or a decline in the level of compliance with policies or procedures may occur.
Our management assessed the effectiveness of our internal control over financial reporting as of December 31, 2016. In making this assessment, our management used the criteria set forth in “Internal Control – Integrated Framework (2013)” issued by the Committee of Sponsoring Organizations of the Treadway Commission (COSO). Based on its evaluation and those criteria, our management has concluded that our internal control over financial reporting was effective as of December 31, 2016.
In connection with the evaluation required by the Exchange Act Rule 13a-15(d), our management, concluded that the changes that occurred during the year ended December 31, 2016 have not materially affected, or are not reasonably likely to materially affect, our internal control over financial reporting.
The effectiveness of the Company’s internal control over financial reporting as of December 31, 2016, has been audited by PricewaterhouseCoopers Auditores Independentes, an independent registered public accounting firm, as stated in their report which appears herein.
| By: | /s/ Roberto Egydio Setubal | By: | /s/ Caio Ibrahim David | |
| Name: Roberto Egydio Setubal | Name: Caio Ibrahim David | |||
| Title: Chief Executive Officer | Title: Chief Financial Officer |
A signed original copy of this report has been provided to the registrant and will be retained by the registrant and furnished to the Securities and Exchange Commission or its staff upon request.
Date: April 20, 2017
| F-1 |
Report of Independent Registered Public Accounting Firm
To the Board of Directors and Shareholders
Itaú Unibanco Holding S.A.
In our opinion, the accompanying consolidated balance sheets and the related consolidated statements of income, comprehensive income, changes in stockholders’ equity and cash flows present fairly, in all material respects, the financial position of Itaú Unibanco Holding S.A. and its subsidiaries at December 31, 2016 and December 31, 2015 and the results of their operations and their cash flows for each of the three years in the period ended December 31, 2016, in conformity with International Financial Reporting Standards as issued by the International Accounting Standards Board. Also in our opinion, the Company maintained, in all material respects, effective internal control over financial reporting as of December 31, 2016, based on criteria established inInternal Control – Integrated Framework 2013issued by the Committee of Sponsoring Organizations of the Treadway Commission (COSO). The Company’s management is responsible for these financial statements, for maintaining effective internal control over financial reporting and for its assessment of the effectiveness of internal control over financial reporting, included in the accompanying Management’s Report on Internal Control over Financial Reporting.
Our responsibility is to express opinions on these financial statements and on the Company’s internal control over financial reporting based on our integrated audits. We conducted our audits in accordance with the standards of the Public Company Accounting Oversight Board (United States). Those standards require that we plan and perform the audits to obtain reasonable assurance about whether the financial statements are free of material misstatement and whether effective internal control over financial reporting was maintained in all material respects. Our audits of the financial statements included examining, on a test basis, evidence supporting the amounts and disclosures in the financial statements, assessing the accounting principles used and significant estimates made by management, and evaluating the overall financial statement presentation. Our audit of internal control over financial reporting included obtaining an understanding of internal control over financial reporting, assessing the risk that a material weakness exists, and testing and evaluating the design and operating effectiveness of internal control based on the assessed risk. Our audits also included performing such other procedures as we considered necessary in the circumstances. We believe that our audits provide a reasonable basis for our opinions.
| F-2 |
A company’s internal control over financial reporting is a process designed to provide reasonable assurance regarding the reliability of financial reporting and the preparation of financial statements for external purposes in accordance with generally accepted accounting principles. A company’s internal control over financial reporting includes those policies and procedures that (i) pertain to the maintenance of records that, in reasonable detail, accurately and fairly reflect the transactions and dispositions of the assets of the company. (ii) provide reasonable assurance that transactions are recorded as necessary to permit preparation of financial statements in accordance with generally accepted accounting principles, and that receipts and expenditures of the company are being made only in accordance with authorizations of management and directors of the company; and (iii) provide reasonable assurance regarding prevention or timely detection of unauthorized acquisition, use, or disposition of the company’s assets that could have a material effect on the financial statements.
Because of its inherent limitations, internal control over financial reporting may not prevent or detect misstatements. Also, projections of any evaluation of effectiveness to future periods are subject to the risk that controls may become inadequate because of changes in conditions, or that the degree of compliance with the policies or procedures may deteriorate.
/s/ PricewaterhouseCoopers
PricewaterhouseCoopers Auditores Independentes
São Paulo, Brazil
April 20, 2017
| F-3 |
Consolidated Balance Sheet
(In millions of Reais)
| Note | 12/31/2016 | 12/31/2015 | ||||||||
| Assets | ||||||||||
| Cash and deposits on demand | 4 | 18,542 | 18,544 | |||||||
| Central Bank compulsory deposits | 5 | 85,700 | 66,556 | |||||||
| Interbank deposits | 6 | 22,692 | 30,525 | |||||||
| Securities purchased under agreements to resell | 6 | 265,051 | 254,404 | |||||||
| Financial assets held for trading | 7a | 204,648 | 164,311 | |||||||
| Pledged as collateral | 12,950 | 11,008 | ||||||||
| Other | 191,698 | 153,303 | ||||||||
| Financial assets designated at fair value through profit or loss | 7b | 1,191 | 642 | |||||||
| Derivatives | 8 and 9 | 24,231 | 26,755 | |||||||
| Available-for-sale financial assets | 10 | 88,277 | 86,045 | |||||||
| Pledged as collateral | 17,435 | 16,706 | ||||||||
| Other | 70,842 | 69,339 | ||||||||
| Held-to-maturity financial assets | 11 | 40,495 | 42,185 | |||||||
| Pledged as collateral | 11,778 | 9,460 | ||||||||
| Other | 28,717 | 32,725 | ||||||||
| Loan operations and lease operations portfolio, net | 12 | 463,394 | 447,404 | |||||||
| Loan operations and lease operations portfolio | 490,366 | 474,248 | ||||||||
| (-) Allowance for loan and lease losses | (26,972 | ) | (26,844 | ) | ||||||
| Other financial assets | 20a | 53,917 | 53,506 | |||||||
| Investments in associates and joint ventures | 13 | 5,073 | 4,399 | |||||||
| Goodwill | 3 | 9,675 | 2,057 | |||||||
| Fixed assets, net | 15 | 8,042 | 8,541 | |||||||
| Intangible assets, net | 16 | 7,381 | 6,295 | |||||||
| Tax assets | 44,274 | 52,149 | ||||||||
| Income tax and social contribution - current | 2,703 | 2,088 | ||||||||
| Income tax and social contribution - deferred | 27b | 37,395 | 47,453 | |||||||
| Other | 4,176 | 2,608 | ||||||||
| Assets held for sale | 36.7 | 631 | 486 | |||||||
| Other assets | 20a | 10,027 | 11,611 | |||||||
| Total assets | 1,353,241 | 1,276,415 | ||||||||
The accompanying notes are an integral part of these consolidated financial statements.
| F-4 |
ITAÚ UNIBANCO HOLDING S.A.
Consolidated Balance Sheet
(In millions of Reais)
| Note | 12/31/2016 | 12/31/2015 | ||||||||
| Liabilities and stockholders' equity | ||||||||||
| Deposits | 17 | 329,414 | 292,610 | |||||||
| Securities sold under repurchase agreements | 19a | 349,164 | 336,643 | |||||||
| Financial liabilities held for trading | 18 | 519 | 412 | |||||||
| Derivatives | 8 and 9 | 24,698 | 31,071 | |||||||
| Interbank market debt | 19a | 135,483 | 156,886 | |||||||
| Institutional market debt | 19b | 96,239 | 93,918 | |||||||
| Other financial liabilities | 20b | 71,832 | 68,715 | |||||||
| Reserves for insurance and private pension | 30c ll | 154,076 | 129,305 | |||||||
| Liabilities for capitalization plans | 3,147 | 3,044 | ||||||||
| Provisions | 32 | 20,909 | 18,994 | |||||||
| Tax liabilities | 5,836 | 4,971 | ||||||||
| Income tax and social contribution - current | 1,741 | 2,364 | ||||||||
| Income tax and social contribution - deferred | 27b II | 643 | 370 | |||||||
| Other | 3,452 | 2,237 | ||||||||
| Other liabilities | 20b | 27,110 | 25,787 | |||||||
| Total liabilities | 1,218,427 | 1,162,356 | ||||||||
| Capital | 21a | 97,148 | 85,148 | |||||||
| Treasury shares | 21a | (1,882 | ) | (4,353 | ) | |||||
| Additional paid-in capital | 21c | 1,785 | 1,733 | |||||||
| Appropriated reserves | 21d | 3,443 | 10,067 | |||||||
| Unappropriated reserves | 21e | 25,362 | 20,947 | |||||||
| Cumulative other comprehensive income | (3,274 | ) | (1,290 | ) | ||||||
| Total stockholders’ equity attributed to the owners of the parent company | 122,582 | 112,252 | ||||||||
| Non-controlling interests | 21f | 12,232 | 1,807 | |||||||
| Total stockholders’ equity | 134,814 | 114,059 | ||||||||
| Total liabilities and stockholders' equity | 1,353,241 | 1,276,415 | ||||||||
The accompanying notes are an integral part of these consolidated financial statements.
| F-5 |
Consolidated Statement of Income
Periods ended
(In millions of Reais, except for number of shares and earnings per share information)
| 01/01 to | 01/01 to | 01/01 to | ||||||||||||
| Note | 12/31/2016 | 12/31/2015 | 12/31/2014 | |||||||||||
| Banking product | 118,661 | 92,011 | 91,657 | |||||||||||
| Interest and similar income | 23a | 161,495 | 147,789 | 120,115 | ||||||||||
| Interest and similar expense | 23b | (95,126 | ) | (75,064 | ) | (72,977 | ) | |||||||
| Dividend income | 288 | 98 | 215 | |||||||||||
| Net gain (loss) on investment securities and derivatives | 23c | 7,311 | (11,862 | ) | (724 | ) | ||||||||
| Foreign exchange results and exchange variations on transactions | 5,513 | (6,353 | ) | 9,644 | ||||||||||
| Banking service fees | 24 | 31,918 | 29,452 | 26,342 | ||||||||||
| Income related to insurance, private pension and capitalization operations before claim and selling expenses | 5,880 | 6,672 | 6,888 | |||||||||||
| Income related to insurance and private pension | 30b III | 24,849 | 22,634 | 22,797 | ||||||||||
| Reinsurance Premiums | 30b III | (94 | ) | (89 | ) | (1,031 | ) | |||||||
| Change in reserves for insurance and private pension | (19,490 | ) | (16,460 | ) | (15,436 | ) | ||||||||
| Revenue from capitalization plans | 615 | 587 | 558 | |||||||||||
| Other income | 25 | 1,382 | 1,279 | 2,154 | ||||||||||
| Losses on loans and claims | (22,122 | ) | (21,335 | ) | (15,801 | ) | ||||||||
| Expenses for allowance for loan and lease losses | 12b | (24,379 | ) | (24,517 | ) | (18,832 | ) | |||||||
| Recovery of loans written-off as loss | 3,742 | 4,779 | 5,054 | |||||||||||
| Expenses for claims | (1,555 | ) | (1,611 | ) | (2,430 | ) | ||||||||
| Recovery of claims under reinsurance | 70 | 14 | 407 | |||||||||||
| Banking product net of losses on loans and claims | 96,539 | 70,676 | 75,856 | |||||||||||
| Other operating income (expenses) | (58,347 | ) | (52,411 | ) | (47,048 | ) | ||||||||
| General and administrative expenses | 26 | (50,904 | ) | (47,626 | ) | (42,550 | ) | |||||||
| Tax expenses | (7,971 | ) | (5,405 | ) | (5,063 | ) | ||||||||
| Share of profit or (loss) in associates and joint ventures | 13 | 528 | 620 | 565 | ||||||||||
| Income before income tax and social contribution | 27 | 38,192 | 18,265 | 28,808 | ||||||||||
| Current income tax and social contribution | (3,898 | ) | (8,965 | ) | (7,209 | ) | ||||||||
| Deferred income tax and social contribution | (10,712 | ) | 16,856 | 262 | ||||||||||
| Net income | 23,582 | 26,156 | 21,861 | |||||||||||
| Net income attributable to owners of the parent company | 28 | 23,263 | 25,740 | 21,555 | ||||||||||
| Net income (loss) attributable to non-controlling interests | 21f | 319 | 416 | 306 | ||||||||||
| Earnings per share - basic | 28 | |||||||||||||
| Common | 3.57 | 3.91 | 3.26 | |||||||||||
| Preferred | 3.57 | 3.91 | 3.26 | |||||||||||
| Earnings per share - diluted | 28 | |||||||||||||
| Common | 3.54 | 3.89 | 3.24 | |||||||||||
| Preferred | 3.54 | 3.89 | 3.24 | |||||||||||
| Weighted average number of shares outstanding - basic | 28 | |||||||||||||
| Common | 3,351,741,143 | 3,351,741,143 | 3,351,741,143 | |||||||||||
| Preferred | 3,171,215,661 | 3,228,881,081 | 3,266,347,063 | |||||||||||
| Weighted average number of shares outstanding - diluted | 28 | |||||||||||||
| Common | 3,351,741,143 | 3,351,741,143 | 3,351,741,143 | |||||||||||
| Preferred | 3,216,235,372 | 3,270,734,307 | 3,305,545,129 | |||||||||||
The accompanying notes are an integral part of these consolidated financial statements.
| F-6 |
Consolidated Statement of Comprehensive Income
Periods ended
(In millions of Reais)
| 01/01 to | 01/01 to | 01/01 to | ||||||||||||
| Note | 12/31/2016 | 12/31/2015 | 12/31/2014 | |||||||||||
| Net income | 23,582 | 26,156 | 21,861 | |||||||||||
| Available-for-sale financial assets | 2,040 | (2,171 | ) | 583 | ||||||||||
| Change in fair value | 2,780 | (6,518 | ) | 20 | ||||||||||
| Income tax effect | (1,251 | ) | 2,659 | 14 | ||||||||||
| (Gains) / losses transferred to income statement | 23c | 851 | 2,812 | 915 | ||||||||||
| Income tax effect | (340 | ) | (1,124 | ) | (366 | ) | ||||||||
| Hedge | (697 | ) | (1,739 | ) | (143 | ) | ||||||||
| Cash flow hedge | 9 | (2,815 | ) | 1,148 | 336 | |||||||||
| Change in fair value | (5,041 | ) | 2,104 | 644 | ||||||||||
| Income tax effect | 2,226 | (956 | ) | (308 | ) | |||||||||
| Hedge of net investment in foreign operation | 9 | 2,118 | (2,887 | ) | (479 | ) | ||||||||
| Change in fair value | 3,760 | (5,134 | ) | (830 | ) | |||||||||
| Income tax effect | (1,642 | ) | 2,247 | 351 | ||||||||||
| Remeasurements of liabilities for post-employment benefits (*) | (590 | ) | (48 | ) | 202 | |||||||||
| Remeasurements | 29 | (1,048 | ) | (68 | ) | 332 | ||||||||
| Income tax effect | 458 | 20 | (130 | ) | ||||||||||
| Foreign exchange differences on foreign investments | (2,737 | ) | 3,099 | 440 | ||||||||||
| Total comprehensive income | 21,598 | 25,297 | 22,943 | |||||||||||
| Comprehensive income attributable to non-controlling interests | 319 | 416 | 306 | |||||||||||
| Comprehensive income attributable to the owners of the parent company | 21,279 | 24,881 | 22,637 | |||||||||||
(*) Amounts that will not be subsequently reclassified to income.
The accompanying notes are an integral part of these consolidated financial statements.
| F-7 |
Consolidated Statement of Changes in Stockholders’ Equity (Notes 21 and 22)
Periods ended December 31, 2016, 2015 and 2014
(In millions of Reais)
| Attributed to owners of the parent company | ||||||||||||||||||||||||||||||||||||||||||||||||||||
| Other comprehensive income | Total | Total | ||||||||||||||||||||||||||||||||||||||||||||||||||
| Capital | Treasury shares | Additional paid-in capital | Appropriated reserves | Unappropriated reserves | Retained earnings | Available for sale(1) | Remeasurements of liabilities of post- employment benefits | Cumulative translation adjustments abroad | Gains and losses – hedge (2) | stockholders’ equity – owners of the parent company | stockholders’ equity – non- controlling interests | Total | ||||||||||||||||||||||||||||||||||||||||
| Balance at 01/01/2014 | 60,000 | (1,854 | ) | 984 | 13,468 | 12,138 | - | (1,183 | ) | (379 | ) | 1,283 | (1,234 | ) | 83,223 | 969 | 84,192 | |||||||||||||||||||||||||||||||||||
| Transactions with owners | 15,000 | 526 | 524 | (12,053 | ) | - | (7,344 | ) | - | - | - | - | (3,347 | ) | 82 | (3,265 | ) | |||||||||||||||||||||||||||||||||||
| Capital increase - Statutory Reserve | 15,000 | - | - | (15,000 | ) | - | - | - | - | - | - | - | - | - | ||||||||||||||||||||||||||||||||||||||
| Treasury shares - granting of stock options - exercised options | - | 526 | 223 | - | - | - | - | - | - | - | 749 | - | 749 | |||||||||||||||||||||||||||||||||||||||
| Granting of stock options – exercised options | - | 561 | (26 | ) | - | - | - | - | - | - | - | 535 | - | 535 | ||||||||||||||||||||||||||||||||||||||
| Acquisition of treasury shares (Note 21a) | - | (35 | ) | - | - | - | - | - | - | - | - | (35 | ) | - | (35 | ) | ||||||||||||||||||||||||||||||||||||
| Granted options recognized | - | - | 249 | - | - | - | - | - | - | - | 249 | - | 249 | |||||||||||||||||||||||||||||||||||||||
| Share-based payment – variable compensation | - | - | 301 | - | - | - | - | - | - | - | 301 | - | 301 | |||||||||||||||||||||||||||||||||||||||
| (Increase) / Reduction of interest of controlling stockholders (Note 2.4a I and 3a) | - | - | - | - | - | - | - | - | - | - | - | 167 | 167 | |||||||||||||||||||||||||||||||||||||||
| Dividends / interest on capital – Special profit reserve (Note 21b) | - | - | - | 2,947 | - | (7,344 | ) | - | - | - | - | (4,397 | ) | (85 | ) | (4,482 | ) | |||||||||||||||||||||||||||||||||||
| Dividends / Interest on capital paid in 2014 - Year 2013 - Special profit reserve | - | - | - | (2,597 | ) | - | - | - | - | - | - | (2,597 | ) | - | (2,597 | ) | ||||||||||||||||||||||||||||||||||||
| Corporate reorganizations (Note 2.4 a III) | - | - | - | (639 | ) | - | - | - | - | - | - | (639 | ) | - | (639 | ) | ||||||||||||||||||||||||||||||||||||
| Other | - | - | - | (17 | ) | - | - | - | - | - | - | (17 | ) | - | (17 | ) | ||||||||||||||||||||||||||||||||||||
| Total comprehensive income | - | - | - | - | - | 21,555 | 583 | 202 | 440 | (143 | ) | 22,637 | 306 | 22,943 | ||||||||||||||||||||||||||||||||||||||
| Net income | - | - | - | - | - | 21,555 | - | - | - | - | 21,555 | 306 | 21,861 | |||||||||||||||||||||||||||||||||||||||
| Other comprehensive income for the period | - | - | - | - | - | - | 583 | 202 | 440 | (143 | ) | 1,082 | - | 1,082 | ||||||||||||||||||||||||||||||||||||||
| Appropriations: | ||||||||||||||||||||||||||||||||||||||||||||||||||||
| Legal reserve | - | - | - | 870 | - | (870 | ) | - | - | - | - | - | - | - | ||||||||||||||||||||||||||||||||||||||
| Statutory reserve | - | - | - | 9,178 | 4,163 | (13,341 | ) | - | - | - | - | - | - | - | ||||||||||||||||||||||||||||||||||||||
| Balance at 12/31/2014 | 75,000 | (1,328 | ) | 1,508 | 8,210 | 16,301 | - | (600 | ) | (177 | ) | 1,723 | (1,377 | ) | 99,260 | 1,357 | 100,617 | |||||||||||||||||||||||||||||||||||
| Change in the period | 15,000 | 526 | 524 | (5,258 | ) | 4,163 | - | 583 | 202 | 440 | (143 | ) | 16,037 | 388 | 16,425 | |||||||||||||||||||||||||||||||||||||
| Balance at 01/01/2015 | 75,000 | (1,328 | ) | 1,508 | 8,210 | 16,301 | - | (600 | ) | (177 | ) | 1,723 | (1,377 | ) | 99,260 | 1,357 | 100,617 | |||||||||||||||||||||||||||||||||||
| Transactions with owners | 10,148 | (3,025 | ) | 225 | (7,445 | ) | - | (8,207 | ) | - | - | - | - | (8,304 | ) | 34 | (8,270 | ) | ||||||||||||||||||||||||||||||||||
| Capital increase - Statutory Reserve | 10,148 | - | - | (10,148 | ) | - | - | - | - | - | - | - | - | - | ||||||||||||||||||||||||||||||||||||||
| Treasury shares - granting of stock options | - | (3,025 | ) | 101 | - | - | - | - | - | - | - | (2,924 | ) | - | (2,924 | ) | ||||||||||||||||||||||||||||||||||||
| Granting of stock options – exercised options | - | 299 | 45 | - | - | - | - | - | - | - | 344 | - | 344 | |||||||||||||||||||||||||||||||||||||||
| Acquisition of treasury shares (Note 21a) | - | (3,324 | ) | - | - | - | - | - | - | - | - | (3,324 | ) | - | (3,324 | ) | ||||||||||||||||||||||||||||||||||||
| Granted options recognized | - | - | 56 | - | - | - | - | - | - | - | 56 | - | 56 | |||||||||||||||||||||||||||||||||||||||
| Share-based payment – variable compensation | - | - | 124 | - | - | - | - | - | - | - | 124 | - | 124 | |||||||||||||||||||||||||||||||||||||||
| (Increase) / Reduction of interest of controlling stockholders (Note 2.4a I and 3) | - | - | - | - | - | - | - | - | - | - | - | 276 | 276 | |||||||||||||||||||||||||||||||||||||||
| Dividends and interest on capital - Statutory Reserve (Note 21b) | - | - | - | 2,703 | - | (8,207 | ) | - | - | - | - | (5,504 | ) | (242 | ) | (5,746 | ) | |||||||||||||||||||||||||||||||||||
| Dividends / Interest on capital paid in 2015 - Year 2014 - Special profit reserve | - | - | - | (2,936 | ) | - | - | - | - | - | - | (2,936 | ) | - | (2,936 | ) | ||||||||||||||||||||||||||||||||||||
| Corporate reorganizations (Note 2.4 a III) | - | - | - | (639 | ) | - | - | - | - | - | - | (639 | ) | - | (639 | ) | ||||||||||||||||||||||||||||||||||||
| Other | - | - | - | - | (10 | ) | - | - | - | - | - | (10 | ) | - | (10 | ) | ||||||||||||||||||||||||||||||||||||
| Total comprehensive income | - | - | - | - | - | 25,740 | (2,171 | ) | (48 | ) | 3,099 | (1,739 | ) | 24,881 | 416 | 25,297 | ||||||||||||||||||||||||||||||||||||
| Net income | - | - | - | - | - | 25,740 | - | - | - | - | 25,740 | 416 | 26,156 | |||||||||||||||||||||||||||||||||||||||
| Other comprehensive income for the period | - | - | - | - | - | - | (2,171 | ) | (48 | ) | 3,099 | (1,739 | ) | (859 | ) | - | (859 | ) | ||||||||||||||||||||||||||||||||||
| Appropriations: | ||||||||||||||||||||||||||||||||||||||||||||||||||||
| Legal reserve | - | - | - | 1,054 | - | (1,054 | ) | - | - | - | - | - | - | - | ||||||||||||||||||||||||||||||||||||||
| Statutory reserve | - | - | - | 11,823 | 4,656 | (16,479 | ) | - | - | - | - | - | - | - | ||||||||||||||||||||||||||||||||||||||
| Balance at 12/31/2015 | 85,148 | (4,353 | ) | 1,733 | 10,067 | 20,947 | - | (2,771 | ) | (225 | ) | 4,822 | (3,116 | ) | 112,252 | 1,807 | 114,059 | |||||||||||||||||||||||||||||||||||
| Change in the period | 10,148 | (3,025 | ) | 225 | 1,857 | 4,646 | - | (2,171 | ) | (48 | ) | 3,099 | (1,739 | ) | 12,992 | 450 | 13,442 | |||||||||||||||||||||||||||||||||||
| Balance at 01/01/2016 | 85,148 | (4,353 | ) | 1,733 | 10,067 | 20,947 | - | (2,771 | ) | (225 | ) | 4,822 | (3,116 | ) | 112,252 | 1,807 | 114,059 | |||||||||||||||||||||||||||||||||||
| Transactions with owners | 12,000 | 2,471 | 52 | (9,620 | ) | - | (11,574 | ) | - | - | - | - | (6,671 | ) | 10,106 | 3,435 | ||||||||||||||||||||||||||||||||||||
| Capital increase - Statutory Reserve | 12,000 | - | - | (12,000 | ) | - | - | - | - | - | - | - | - | - | ||||||||||||||||||||||||||||||||||||||
| Treasury shares - granting of stock options | - | 2,471 | 39 | (2,670 | ) | - | - | - | - | - | - | (160 | ) | - | (160 | ) | ||||||||||||||||||||||||||||||||||||
| Granting of stock options – exercised options | - | 748 | (17 | ) | - | - | - | - | - | - | - | 731 | - | 731 | ||||||||||||||||||||||||||||||||||||||
| Acquisition of treasury shares (Note 21a) | - | (947 | ) | - | - | - | - | - | - | - | - | (947 | ) | - | (947 | ) | ||||||||||||||||||||||||||||||||||||
| Cancellation of shares - ESM of April 27, 2016 – Approved on June 7, 2016 | - | 2,670 | - | (2,670 | ) | - | - | - | - | - | - | - | - | - | ||||||||||||||||||||||||||||||||||||||
| Granted options recognized | - | - | 56 | - | - | - | - | - | - | - | 56 | - | 56 | |||||||||||||||||||||||||||||||||||||||
| Share-based payment – variable compensation | - | - | 13 | - | - | - | - | - | - | - | 13 | - | 13 | |||||||||||||||||||||||||||||||||||||||
| (Increase) / Reduction of interest of controlling stockholders (Note 2.4a I and 3) | - | - | - | - | - | - | - | - | - | - | - | 10,199 | 10,199 | |||||||||||||||||||||||||||||||||||||||
| Dividends / interest on capital – Special profit reserve (Note 21b) | - | - | - | 5,050 | - | (11,574 | ) | - | - | - | - | (6,524 | ) | (93 | ) | (6,617 | ) | |||||||||||||||||||||||||||||||||||
| Dividends / Interest on capital paid in 2016 - Year 2015 - Special profit reserve | - | - | - | (2,697 | ) | - | - | - | - | - | - | (2,697 | ) | - | (2,697 | ) | ||||||||||||||||||||||||||||||||||||
| Corporate reorganizations (Note 2.4 a III) | - | - | - | (1,586 | ) | - | - | - | - | - | - | (1,586 | ) | - | (1,586 | ) | ||||||||||||||||||||||||||||||||||||
| Other | - | - | - | - | 5 | - | - | - | - | - | 5 | - | 5 | |||||||||||||||||||||||||||||||||||||||
| Total comprehensive income | - | - | - | - | - | 23,263 | 2,040 | (590 | ) | (2,737 | ) | (697 | ) | 21,279 | 319 | 21,598 | ||||||||||||||||||||||||||||||||||||
| Net income | - | - | - | - | - | 23,263 | - | - | - | - | 23,263 | 319 | 23,582 | |||||||||||||||||||||||||||||||||||||||
| Other comprehensive income for the period | - | - | - | - | - | - | 2,040 | (590 | ) | (2,737 | ) | (697 | ) | (1,984 | ) | - | (1,984 | ) | ||||||||||||||||||||||||||||||||||
| Appropriations: | ||||||||||||||||||||||||||||||||||||||||||||||||||||
| Legal reserve | - | - | - | 943 | - | (943 | ) | - | - | - | - | - | - | - | ||||||||||||||||||||||||||||||||||||||
| Statutory reserve | - | - | - | 6,336 | 4,410 | (10,746 | ) | - | - | - | - | - | - | - | ||||||||||||||||||||||||||||||||||||||
| Balance at 12/31/2016 | 97,148 | (1,882 | ) | 1,785 | 3,443 | �� | 25,362 | - | (731 | ) | (815 | ) | 2,085 | (3,813 | ) | 122,582 | 12,232 | 134,814 | ||||||||||||||||||||||||||||||||||
| Change in the period | 12,000 | 2,471 | 52 | (6,624 | ) | 4,415 | - | 2,040 | (590 | ) | (2,737 | ) | (697 | ) | 10,330 | 10,425 | 20,755 | |||||||||||||||||||||||||||||||||||
(1) Includes Share of other comprehensive income in associates and joint ventures – Available-for-sale financial assets.
(2) Includes Cash flow hedge and hedge of net investment in foreign operation.
The accompanying notes are an integral part of these consolidated financial statements.
| F-8 |
Consolidated Statement of Cash Flows
(In millions of Reais)
| 01/01 to | 01/01 to | 01/01 to | ||||||||||||
| Note | 12/31/2016 | 12/31/2015 | 12/31/2014 | |||||||||||
| Adjusted net income | 97,507 | 56,881 | 58,231 | |||||||||||
| Net income | 23,582 | 26,156 | 21,861 | |||||||||||
| Adjustments to net income: | 73,925 | 30,725 | 36,370 | |||||||||||
| Granted options recognized and share-based payment – variable compensation | 69 | 180 | 550 | |||||||||||
| Effects of changes in exchange rates on cash and cash equivalents | 17,941 | (9,681 | ) | 1,186 | ||||||||||
| Expenses for allowance for loan and lease losses | 12b | 24,379 | 24,517 | 18,832 | ||||||||||
| Interest and foreign exchange expense from operations with subordinated debt | 942 | 15,409 | 7,879 | |||||||||||
| Change in reserves for insurance and private pension | 19,490 | 16,460 | 15,436 | |||||||||||
| Revenue from capitalization plans | (615 | ) | (587 | ) | (558 | ) | ||||||||
| Depreciation and amortization | 15 and 16 | 3,233 | 2,828 | 2,544 | ||||||||||
| Interest expense from provision for contingent and legal liabilities | 1,610 | 1,479 | 1,019 | |||||||||||
| Provision for contingent and legal liabilities | 4,246 | 3,948 | 3,380 | |||||||||||
| Interest income related to escrow deposits | (383 | ) | (285 | ) | (377 | ) | ||||||||
| Deferred taxes (excluding hedge tax effects) | 27b | 4,172 | (1,869 | ) | (262 | ) | ||||||||
| Share of profit or (loss) in associates and joint ventures | (528 | ) | (620 | ) | (565 | ) | ||||||||
| (Gain) loss on available-for-sale securities | 23c | 851 | 2,812 | 915 | ||||||||||
| Interest and foreign exchange income related to available-for-sale financial assets | (1,719 | ) | (16,941 | ) | (9,012 | ) | ||||||||
| Interest and foreign exchange income related to held-to-maturity financial assets | (185 | ) | (6,821 | ) | (3,517 | ) | ||||||||
| (Gain) loss on sale of assets held for sale | 25 and 26 | 124 | 36 | 35 | ||||||||||
| (Gain) loss on sale of investments | 25 and 26 | (69 | ) | 43 | 14 | |||||||||
| (Gain) loss on sale of fixed assets | 25 and 26 | (14 | ) | 11 | 41 | |||||||||
| (Gain) loss from sale of investment of ISSC | - | - | (1,151 | ) | ||||||||||
| Other | 381 | (194 | ) | (19 | ) | |||||||||
| Change in assets and liabilities (*) | (67,196 | ) | (91,340 | ) | 31,495 | |||||||||
| (Increase) decrease in assets | (30,405 | ) | (149,459 | ) | 8,195 | |||||||||
| Interbank deposits | 521 | 3,308 | 12,099 | |||||||||||
| Securities purchased under agreements to resell | 2,675 | (88,250 | ) | 11,327 | ||||||||||
| Compulsory deposits with the Central Bank of Brazil | (20,390 | ) | (2,762 | ) | 13,893 | |||||||||
| Financial assets held for trading | (34,950 | ) | (31,056 | ) | 26,073 | |||||||||
| Derivatives (assets / liabilities) | (4,047 | ) | 3,008 | 4,525 | ||||||||||
| Financial assets designated at fair value through profit or loss | (655 | ) | 435 | (303 | ) | |||||||||
| Loan operations | 23,416 | (28,103 | ) | (42,309 | ) | |||||||||
| Financial assets | 881 | 2,476 | (35,546 | ) | ||||||||||
| Other tax assets | 5,262 | (15,037 | ) | 1,203 | ||||||||||
| Other assets | (3,118 | ) | 6,522 | 17,233 | ||||||||||
| (Decrease) increase in liabilities | (36,791 | ) | 58,119 | 23,300 | ||||||||||
| Deposits | (18,136 | ) | (16,696 | ) | (4,353 | ) | ||||||||
| Deposits received under securities repurchase agreements | 8,534 | 47,833 | 22,013 | |||||||||||
| Financial liabilities held for trading | 206 | (434 | ) | 47 | ||||||||||
| Funds from interbank markets | (27,017 | ) | 33,199 | 3,946 | ||||||||||
| Other financial liabilities | 1,915 | (5,222 | ) | 4,711 | ||||||||||
| Technical reserve for insurance and private pension | 5,141 | 3,067 | (383 | ) | ||||||||||
| Liabilities for capitalization plans | 718 | 621 | 536 | |||||||||||
| Provisions | (2,993 | ) | (2,005 | ) | (4,852 | ) | ||||||||
| Tax liabilities | 6,359 | 6,931 | 8,119 | |||||||||||
| Other liabilities | (5,095 | ) | (2,693 | ) | 1,237 | |||||||||
| Payment of income tax and social contribution | (6,423 | ) | (6,482 | ) | (7,721 | ) | ||||||||
| Net cash from (used in) operating activities | 30,311 | (34,459 | ) | 89,726 | ||||||||||
| Interest on capital / dividends received from investments in associates and joint ventures | 287 | 243 | 213 | |||||||||||
| Cash received on sale of available-for-sale financial assets | 18,760 | 12,214 | 60,768 | |||||||||||
| Cash received from redemption of held-to-maturity financial assets | 3,473 | 3,160 | 2,667 | |||||||||||
| Cash upon sale of assets held for sale | 336 | 123 | 68 | |||||||||||
| Cash upon sale of investments in associates and joint ventures | 69 | (43 | ) | (14 | ) | |||||||||
| Cash and cash equivalents, net of assets and liabilities due from CorpBanca acquisition | 3 | 5,869 | - | - | ||||||||||
| Cash and cash equivalents, net of assets and liabilities due from Recovery acquisition | 3 | (714 | ) | - | - | |||||||||
| Cash and cash equivalents, net assets and liabilities due from BMG Seguradora acquisition | 3a | - | - | (88 | ) | |||||||||
| Cash and cash equivalents, net assets and liabilities due from ISSC sale | - | - | 1,474 | |||||||||||
| Cash upon sale of fixed assets | 15 | 109 | 104 | 62 | ||||||||||
| Cash upon sale of intangible assets | 16 | 10 | 69 | 222 | ||||||||||
| Purchase of available-for-sale financial assets | (9,959 | ) | (9,516 | ) | (46,165 | ) | ||||||||
| Purchase of held-to-maturity financial assets | (1,363 | ) | (4,090 | ) | (11,322 | ) | ||||||||
| Purchase of investments in associates and joint ventures | 13 | (381 | ) | (0 | ) | (10 | ) | |||||||
| Purchase of fixed assets | 15 | (991 | ) | (1,466 | ) | (3,966 | ) | |||||||
| (Cash upon sale) Purchase of intangible assets / Goodwill | 16 | (1,076 | ) | (1,158 | ) | (1,232 | ) | |||||||
| Net cash from (used in) investing activities | 14,429 | (361 | ) | 2,676 | ||||||||||
| Funding from institutional markets | 4,864 | 6,667 | 207 | |||||||||||
| Redemptions in institutional markets | (18,198 | ) | (5,242 | ) | (16,158 | ) | ||||||||
| (Acquisition) / Disposal of interest of non-controlling stockholders | (1,013 | ) | 276 | 167 | ||||||||||
| Granting of stock options – exercised options | 731 | 344 | 535 | |||||||||||
| Purchase of treasury shares | (947 | ) | (3,324 | ) | (35 | ) | ||||||||
| Dividends and interest on capital paid to non-controlling interests | (93 | ) | (242 | ) | (85 | ) | ||||||||
| Dividends and interest on capital paid | (7,673 | ) | (7,008 | ) | (6,319 | ) | ||||||||
| Net cash from (used in) financing activities | (22,329 | ) | (8,529 | ) | (21,688 | ) | ||||||||
| Net increase (decrease) in cash and cash equivalents | 2.4c and 4 | 22,411 | (43,350 | ) | 70,714 | |||||||||
| Cash and cash equivalents at the beginning of the period | 4 | 91,649 | 125,318 | 55,790 | ||||||||||
| Effects of changes in exchange rates on cash and cash equivalents | (17,941 | ) | 9,681 | (1,186 | ) | |||||||||
| Cash and cash equivalents at the end of the period | 4 | 96,119 | 91,649 | 125,318 | ||||||||||
| Additional information on cash flow | ||||||||||||||
| Interest received | 168,708 | 136,277 | 117,079 | |||||||||||
| Interest paid | 79,227 | 58,436 | 67,559 | |||||||||||
| Non -cash transactions | ||||||||||||||
| Loans transferred to assets held for sale | - | - | - | |||||||||||
| Dividends and interest on capital declared and not yet paid | 2,869 | 2,458 | 2,270 | |||||||||||
(*) Includes the amounts of interest received and paid as shown above.
The accompanying notes are an integral part of these consolidated financial statements.
| F-9 |
Notes to the Consolidated Financial Statements
At December 31, 2016 and December 31, 2015 for balance sheet accounts and
From January 1 to December 31, 2016, 2015 and 2014 for income statement accounts
(In millions of Reais, except information per share)
Note 1 - Overview
ITAÚ UNIBANCO HOLDING S.A. (ITAÚ UNIBANCO HOLDING) is a publicly-held company, organized and existing under the Laws of Brazil. The head office of ITAÚ UNIBANCO HOLDING is located at Praça Alfredo Egydio de Souza Aranha, n° 100, in the city of São Paulo, Brazil.
ITAÚ UNIBANCO HOLDING provides a wide range of financial products and services to individual and corporate clients in Brazil and abroad, whether these clients have Brazilian links or not through its international branches, subsidiaries and affiliates.
ITAÚ UNIBANCO HOLDING is a holding company controlled by Itaú Unibanco Participações S.A. (“IUPAR”), a holding company which owns 51% of our common shares, and which is jointly controlled by (i) Itaúsa Investimentos Itaú S.A., (“Itaúsa”), a holding company controlled by members of the Egydio de Souza Aranha family, and (ii) Companhia E. Johnston de Participações (“E. Johnston”), a holding company controlled by the Moreira Salles family. Itaúsa also directly holds 38.7% of ITAÚ UNIBANCO HOLDING common shares.
As described in Note 34, the operations of ITAÚ UNIBANCO HOLDING are divided into three operating and reportable segments: (1) Retail Banking, which comprises the retail and high net worth clients (Itaú Uniclass and Personnalité) and the corporate segment (very small and small companies); (2) Wholesale Banking, which covers the wholesale products and services for middle-market and large companies, as well as the investment banking, in addition to the activities of the Latin America unit and (3) Activities with the Market + Corporation, which mainly manages the financial results associated with capital surplus, subordinated debt, and net debt of tax credits and debits of ITAÚ UNIBANCO HOLDING.
These consolidated financial statements were approved by the Executive Board on February 6, 2017.
| F-10 |
Note 2 – Significant accounting policies
| 2.1. | Basis of preparation |
These Consolidated Financial Statements of ITAÚ UNIBANCO HOLDING were prepared taking into account the requirements and guidelines set out by the National Monetary Council (CMN), which established that as from December 31, 2010 annual Consolidated Financial Statements are to be prepared in accordance with the International Financial Reporting Standards (IFRS), as approved by the International Accounting Standards Board (IASB).
In the preparation of these consolidated financial statements, ITAÚ UNIBANCO HOLDING adopted the criteria for recognition, measurement and disclosure established in the IFRS and the interpretations of the International Financial Reporting Interpretation Committee (IFRIC).
The Consolidated Statement of Cash Flows shows the changes in cash and cash equivalents during the period, arising from operating, investing, and financing activities, and include highly-liquid investments (Note 2.4c).
Cash flows from operating activities are presented under the indirect method. Consolidated net income is adjusted for non-monetary items, such as measurement gains and losses, changes in provisions and in receivables and liabilities balances. All income and expense arising from non-monetary transactions, attributable to investing and financing activities, are eliminated. Interest received or paid are classified as operating cash flows.
Management believes that the information included in these Consolidated Financial Statements is relevant and a faithful representation of the information used in the management of the ITAÚ UNIBANCO HOLDING.
| 2.2. | New accounting standards and new accounting standards changes and interpretations |
| a) | Accounting standards applicable for period ended December 31, 2016 |
| · | IASB Annual Improvement Cycle (2012-2014) – Annually IASB makes minor amendments to a series of pronouncements to clarify the standards and avoid double interpretation. In this cycle IFRS 5 – “Non-Current Assets Held for Sale and Discontinued Operations”, IFRS 7 – “Financial Instruments: Disclosures”, IAS 19 – “Employee Benefits”, and IAS 34 – “Interim Financial Reporting” were reviewed. Effective for annual periods beginning on January 1, 2016. No material impacts arising from this change on the consolidated financial statements of ITAÚ UNIBANCO HOLDING were identified. |
| · | Amendment to IFRS 11 – “Joint Arrangement” – The change establishes criteria for recognition of acquisition of joint operations, which activity constitutes one business, according to the methodology established in IFRS 3 – Business Combinations. Effective for the years beginning on January 1, 2016 and early adoption is permitted by IASB. Impacts of this change will occur only if there is an acquisition of a joint operation that constitutes a business. |
| · | Amendment to IAS 16 – “Property, Plant and Equipment” and IAS 38 “Intangible Assets” – The amendment clarifies the base principle for depreciation and amortization as being the expected standard of consumption of future economic benefits embodied in the asset. Effective for annual periods beginning on January 1, 2016, with early adoption permitted by IASB. No material impacts arising from this amendment were identified for the consolidated financial statements of ITAÚ UNIBANCO HOLDING. |
| · | Amendment to IAS 1 – “Presentation of Financial Statements” – The amendments are aimed at encouraging companies to identify which information is sufficiently material to be disclosed in the financial statements. It also clarifies that materiality is applicable to the full set of financial statements, including the notes to the financial statements, and it is applicable to any and all disclosure requirements of the IFRS standards. Effective for periods beginning on January 1, 2016. Main effects identified are related to the disclosure of accounting policies and judgment of materiality in the notes to the financial statements. |
| · | Amendments to IAS 28, IFRS 10 and IFRS 12: “Investment Entities: Applying Consolidation Exception”: This document comprises guidance for applying the Investment Entities concept. Effective for annual periods beginning on January 1, 2016. No material impacts arising from this change on the consolidated financial statements of ITAÚ UNIBANCO HOLDING were identified. |
| F-11 |
| b) | Accounting standards recently issued and applicable in future periods |
The following pronouncements will become applicable for periods after the date of these consolidated financial statements and were not early adopted:
| · | IFRS 9 – Financial Instruments – This standard replaces IAS 39 – Financial Instruments: Recognition and Measurement. IFRS 9 applies to financial instruments and will be adopted retrospectively at its effective date, on January 1, 2018. This standard is structured to cover the pillars (I) classification and measurement of financial assets (II) impairment, and (III) hedge accounting. Among the amendments, the items below may have the most significant impacts: |
| (I) | Classification and measurement of financial assets: the classification of financial assets should depend on two criteria: the entity´s business model for managing its financial assets and the characteristics of the contractual cash flow of financial assets. |
| (II) | Impairment: The new standards introduced the expected loss approach and classification into three phases. |
| (III) | Hedge accounting: The hedge accounting requirements are closed aligned with risk management and should be applied on a prospective basis. |
IFRS 9 is in process of implementation by ITAÚ UNIBANCO HOLDING, and an evaluation of the possible impacts resulting from the adoption of this standard has been conducted and will be completed through its effective date. The adoption of the expected loss in relation to the incurred loss approach is likely to require an increase in the allowance for loan and lease losses since the recognition of losses will be anticipated. The finance, risks, and technology departments as well as Management are involved in the implementation process.
| · | IFRS 15 – “Revenue from Contracts with Customers” – The pronouncement replaces IAS 18 and IAS 11, as well as interpretations related thereto (IFRICs 13, 15 and 18). It requires that revenue is recognized in a way that shows the transfer of assets or services to the client for an amount that reflects the company’s expectation of having in consideration the rights to these assets or services. ITAU UNIBANCO HOLDING will adopt IFRS 15 retrospectively only for contracts with remaining obligations until the date this standard comes into effect. Other effects should be adjusted with a counter-entry to Retained Earnings (Losses). This standard is effective for annual periods beginning on January 1, 2018. No material impacts arising from the adoption of this standard were identified. |
| · | IFRS 16 – “Leases” – The pronouncement replaces IAS 17 - Leases, and related interpretations (IFRIC 4, SIC 15 and SIC 27). It eliminates the accounting for operating lease agreements for the lessee, presenting only one lease model, that consists of: (a) recognizing leases which terms exceeds 12 months and with substantial amounts; (b) initially recognizing lease in assets and liabilities at present value; and (c) recognizing depreciation and interest from lease separately in the result. For the lessor, accounting will continue to be segregated between operating and financial lease. This standard is effective for annual periods beginning on January 1, 2019. Possible impacts arising from the adoption of this standard are being assessed and will be completed by the date this standard is effective. |
| · | Amendment to IFRS 10 – “Consolidated Financial Statements” and IAS 28 – “Investments in Associates and Joint Ventures” – The amendments refer to an inconsistency between IFRS 10 and IAS 28 requirements, when addressing the sale or contribution of assets between an investor and its associate or joint venture. The effective date has not been defined by IASB yet. No material impacts arising from this change on the consolidated financial statements of ITAÚ UNIBANCO HOLDING were identified. |
| F-12 |
| 2.3. | Critical accounting estimates and judgments |
The preparation of consolidated financial statements in accordance with IFRS requires Management to make estimates and assumptions that affect the reported amounts of assets, liabilities, and contingent assets and liabilities at the date of the consolidated financial statements, as well as the reported amounts of revenue, expenses, gains, and losses over the reporting and subsequent periods, because actual results may differ from those determined in accordance with such estimates and assumptions.
2.3.1 Critical accounting estimates
All estimates and assumptions made by Management are in accordance with IFRS and represent the current best estimates made in compliance with the applicable standards. Estimates are evaluated continuously, considering past experience and other factors.
The Consolidated Financial Statements reflect a variety of estimates and assumptions. The critical accounting estimates and assumptions that have the most significant impact on the carrying amounts of assets and liabilities are described below:
| a) | Allowance for loan and lease losses |
ITAÚ UNIBANCO HOLDING periodically reviews its portfolio of loans and receivables to evaluate the existence of impairment.
In order to determine the amount of the allowance for loan and lease losses in the Consolidated Statements of Income with respect to certain receivables or group of receivables, ITAÚ UNIBANCO HOLDING exercises its judgment to determine whether objective evidence indicates that an event of loss has occurred. This evidence may include observable data that indicates that an adverse change has occurred in the cash flows received in relation to those expected from the counterparty or the existence of a change in local or international economic conditions that correlates with impairment. The methodology and assumptions used for estimating future cash flows are regularly reviewed by Management, considering the adequacy of models and sufficiency of provision volumes in view of the experience of incurred loss.
ITAÚ UNIBANCO HOLDING uses statistical models to calculate the Allowance for Loan and Lease Losses in the homogeneous loan portfolio. ITAÚ UNIBANCO HOLDING periodically carries out procedures to improve these estimates by aligning the required provisions to the levels of losses observed by the historical behavior (as described in Note 2.4d X). This alignment aims at ensuring that the volume of allowances reflects the current economic conditions, the composition of the loan portfolios, the quality of guarantees obtained and the profile of our clients.
Methodology and assumptions used by Management are detailed in Note 2.4d X. Allowance for loan losses is detailed in Note 12b.
| b) | Deferred income tax and social contribution |
As explained in Note 2.4k, Deferred tax assets are recognized only in relation to temporary differences and tax assets and loss for offset to the extent it is probable that ITAÚ UNIBANCO HOLDING will generate future taxable profit for its use. The expected realization of deferred tax assets is based on the projection of future taxable profits and technical studies, as disclosed in Note 27.
| c) | Fair value of financial instruments, including derivatives |
The fair value of financial instruments is measured recurrently, in conformity with the requirements of IAS 39 – Financial Instruments: Recognition and Measurement. The fair value of financial instruments, including derivatives that are not traded in active markets, is determined by using valuation techniques. This calculation is based on assumptions that take into consideration Management’s judgment based on market information and conditions in place at the balance sheet date.
ITAÚ UNIBANCO HOLDING ranks fair value measurements using a fair value hierarchy that reflects the significance of inputs used in the measurement process.
| F-13 |
The fair value of financial instruments, including Derivatives, as well as the fair value hierarchy, are detailed in Note 31.
The team in charge of the pricing of assets, in accordance with the governance defined by the committee and regulatory circulars, carries out critical analyses of the information extracted from the market and from time to time reassesses the long term of indexes. At the end of the monthly closings, the areas meet for a new round of analyses for the maintenance of the classification in connection with the fair value hierarchy. ITAÚ UNIBANCO HOLDING believes that all methodologies adopted are appropriate and consistent with market participants. Regardless of this fact, the adoption of other methodologies or use of different assumptions to estimate fair values may result in different fair value estimates.
The methodologies used to estimate the fair value of certain financial instruments are described in Note 31.
| d) | Defined benefit pension plan |
The current amount of pension plan obligations is obtained from actuarial calculations that use a set of assumptions. Among the assumptions used for estimating the net cost (income) of these plans is the discount rate. Any changes in these assumptions will affect the carrying amount of pension plan assets and liabilities.
ITAÚ UNIBANCO HOLDING determines the appropriate discount rate at the end of each year, which is used for determining the present value of estimated future cash outflows necessary for settling the pension plan liabilities. In order to determine the appropriate discount rate, ITAÚ UNIBANCO HOLDING considers the interest rates of the Brazilian federal government bonds that are denominated in Brazilian Reais, the currency in which the benefits will be paid, and that have maturity terms approximating the terms of the related liabilities.
The main assumptions on Pension plan obligations are based on, in part, current market conditions. Additional information is disclosed in Note 29.
| e) | Provisions, contingencies and other commitments |
ITAÚ UNIBANCO HOLDING periodically reviews its contingencies. These contingencies are evaluated based on Management´s best estimates, taking into account the opinion of legal counsel when there is a likelihood that financial resources will be required to settle the obligations and the amounts may be reasonably estimated.
Contingencies classified as probable losses are recognized in the Balance Sheet under Provisions.
Contingent amounts are measured using appropriate models and criteria, despite the uncertainty surrounding the ultimate timing and amounts, as detailed in Note 32.
Provisions, contingencies and other commitments are detailed in Note 32.
| f) | Technical provisions for insurance and pension plan |
Technical provisions are liabilities arising from obligations of ITAÚ UNIBANCO HOLDING to its policyholders and participants. These obligations may be short term liabilities (property and casualty insurance) or medium and long term liabilities (life insurance and pension plans).
The determination of the actuarial liability is subject to several uncertainties inherent in the coverage of insurance and pension contracts, such as assumptions of persistence, mortality, disability, life expectancy, morbidity, expenses, frequency and severity of claims, conversion of benefits into annuities, redemptions and return on assets.
The estimates for these assumptions are based on the historical experience of ITAÚ UNIBANCO HOLDING, benchmarks and experience of the actuary, in order to comply with best market practices and the continuous review of the actuarial liability. The adjustments resulting from these continuous improvements, when necessary, are recognized in the statement of income for the corresponding period.
Additional information is described in Note 30.
| F-14 |
| 2.3.2 | Critical judgments in accounting policies |
| a) | Goodwill |
The impairment test for goodwill involves estimates and significant judgments, including the identification of cash generation units and the allocation of goodwill to such units based on the expectations of which ones will benefit from the acquisition. Determining the expected cash flows and a risk-adjusted interest rate for each unit requires that management exercises judgment and estimates. Semi-annually submitted to the impairment test and, at December 31, 2016 and 2015, ITAÚ UNIBANCO HOLDING did not identify goodwill impairment losses.
| 2.4. | Summary of main accounting practices |
| a) | Consolidation |
| I. | Subsidiaries |
Before January 1, 2013, ITAÚ UNIBANCO HOLDING consolidated its subsidiaries, in accordance with IAS 27 – “Separate Financial Statements”, and its special purpose entities, in accordance with SIC 12 – “Consolidation – Special Purpose Entities”, in its Consolidated Financial Statements. Effective January 1, 2013, ITAÚ UNIBANCO HOLDING adopted IFRS 10 – “Consolidated Financial Statements”, which replaced IAS 27 and SIC 12.
In accordance with IFRS 10, subsidiaries are all entities in which ITAÚ UNIBANCO HOLDING holds control. ITAÚ UNIBANCO HOLDING controls an entity when it is exposed to, or is entitled to, its variable returns derived from its involvement with such entity, and has the capacity to impact such returns.
Subsidiaries are fully consolidated as from the date in which ITAÚ UNIBANCO HOLDING obtains control and are no longer consolidated as from the date such control is lost.
On January 1, 2013, ITAÚ UNIBANCO HOLDING assessed its investments to determine whether the conclusions of consolidation in accordance with IFRS 10 were different from those in accordance with IAS 27 and SIC 12. The application of the standard did not have significant impacts.
| F-15 |
The following table shows the main consolidated companies, which together represent over 95% of total consolidated assets, as well as the interests of ITAÚ UNIBANCO HOLDING in their voting capital at 12/31/2016 and 12/31/2015.
| Interest in voting | Interest in total | |||||||||||||||||||||
| Incorporation | capital at | capital at | ||||||||||||||||||||
| country | Activity | 12/31/2016 | 12/31/2015 | 12/31/2016 | 12/31/2015 | |||||||||||||||||
| Banco CorpBanca Colombia S.A. | (Note 3) | Colombia | Financial institution | 23.67 | % | 0.00 | % | 23.67 | % | 0.00 | % | |||||||||||
| Banco Itaú Argentina S.A. | Argentina | Financial institution | 100.00 | % | 100.00 | % | 100.00 | % | 100.00 | % | ||||||||||||
| Banco Itaú BBA S.A. | Brazil | Financial institution | 100.00 | % | 100.00 | % | 100.00 | % | 100.00 | % | ||||||||||||
| Banco Itaú Chile | (Note 3) | Chile | Financial institution | - | 99.99 | % | - | 99.99 | % | |||||||||||||
| Banco Itaú Consignado S.A(*) | Brazil | Financial institution | 100.00 | % | 60.00 | % | 100.00 | % | 60.00 | % | ||||||||||||
| Banco Itaú Paraguay S.A. | Paraguay | Financial institution | 100.00 | % | 100.00 | % | 100.00 | % | 100.00 | % | ||||||||||||
| Banco Itaú (Suisse) S.A. | Switzerland | Financial institution | 100.00 | % | 100.00 | % | 100.00 | % | 100.00 | % | ||||||||||||
| Banco Itaú Uruguay S.A. | Uruguay | Financial institution | 100.00 | % | 100.00 | % | 100.00 | % | 100.00 | % | ||||||||||||
| Banco Itaucard S.A. | Brazil | Financial institution | 100.00 | % | 100.00 | % | 100.00 | % | 100.00 | % | ||||||||||||
| Banco Itauleasing S.A. | Brazil | Financial institution | 100.00 | % | 100.00 | % | 100.00 | % | 100.00 | % | ||||||||||||
| Cia. Itaú de Capitalização | Brazil | Capitalization | 100.00 | % | 100.00 | % | 100.00 | % | 100.00 | % | ||||||||||||
| Dibens Leasing S.A. - Arrendamento Mercantil | Brazil | Leasing | 100.00 | % | 100.00 | % | 100.00 | % | 100.00 | % | ||||||||||||
| Financeira Itaú CBD S.A. Crédito, Financiamento e Investimento | Brazil | Consumer finance credit | 50.00 | % | 50.00 | % | 50.00 | % | 50.00 | % | ||||||||||||
| Hipercard Banco Múltiplo S.A. | Brazil | Financial institution | 100.00 | % | 100.00 | % | 100.00 | % | 100.00 | % | ||||||||||||
| Itau Bank, Ltd. | Cayman Islands | Financial institution | 100.00 | % | 100.00 | % | 100.00 | % | 100.00 | % | ||||||||||||
| Itau BBA Colombia S.A. Corporación Financiera | Colombia | Financial institution | 100.00 | % | 100.00 | % | 100.00 | % | 100.00 | % | ||||||||||||
| Itau BBA International plc | United Kingdom | Financial institution | 100.00 | % | 100.00 | % | 100.00 | % | 100.00 | % | ||||||||||||
| Itaú BBA USA Securities Inc. | United States | Broker | 100.00 | % | 100.00 | % | 100.00 | % | 100.00 | % | ||||||||||||
| Itaú BMG Seguradora S.A. | Brazil | Insurance | 99.99 | % | 60.00 | % | 99.99 | % | 60.00 | % | ||||||||||||
| Itaú CorpBanca | (Note 3) | Chile | Financial institution | 35.71 | % | 0.00 | % | 35.71 | % | 0.00 | % | |||||||||||
| Itaú Corretora de Valores S.A. | Brazil | Broker | 100.00 | % | 100.00 | % | 100.00 | % | 100.00 | % | ||||||||||||
| Itaú Seguros S.A. | Brazil | Insurance | 100.00 | % | 100.00 | % | 100.00 | % | 100.00 | % | ||||||||||||
| Itaú Unibanco S.A. | Brazil | Financial institution | 100.00 | % | 100.00 | % | 100.00 | % | 100.00 | % | ||||||||||||
| Itaú Vida e Previdência S.A. | Brazil | Pension plan | 100.00 | % | 100.00 | % | 100.00 | % | 100.00 | % | ||||||||||||
| Luizacred S.A. Soc. Cred. Financiamento Investimento | Brazil | Consumer finance credit | 50.00 | % | 50.00 | % | 50.00 | % | 50.00 | % | ||||||||||||
| Redecard S.A. - REDE | Brazil | Acquirer | 100.00 | % | 100.00 | % | 100.00 | % | 100.00 | % | ||||||||||||
(*) New company name of Banco Itaú BMG Consignado S.A..
ITAÚ UNIBANCO HOLDING is committed to maintaining the minimum capital required by all these joint ventures, noteworthy is that for all Financeira Itaú CBD S.A Crédito, Financiamento e Investimento (FIC) the minimum capital percentage is 25% higher than that required by the Central Bank of Brazil (Note 33).
| F-16 |
| II. | Business combinations |
Accounting for business combinations under IFRS 3 is only applicable when a business is acquired. Under IFRS 3, a business is defined as an integrated set of activities and assets that is conducted and managed for the purpose of providing a return to investors, or cost reduction or other economic benefits. In general, a business consists of inputs, processes applied to those inputs and outputs that are, or will be, used to generate income. If there is goodwill in a set of activities or transferred assets, this is presumed to be a business. For acquisitions that meet the definition of business, accounting under the purchase method is required.
The acquisition cost is measured at the fair value of the assets transferred, equity instruments issued and liabilities incurred or assumed at the exchange date, plus costs directly attributable to the acquisition. Acquired assets and assumed liabilities and contingent liabilities identifiable in a business combination are initially measured at fair value at the date of acquisition, regardless of the existence of non-controlling interests. The excess of the acquisition cost, plus non-controlling interests, if any, over the fair value of identifiable net assets acquired, is accounted for as goodwill.
The treatment of goodwill is described in Note 2.4h. If the cost of acquisition, plus non-controlling interests, if any, is lower than the fair value of identifiable net assets acquired, the difference is directly recognized in income.
For each business combination, the purchaser should measure any non-controlling interest in the acquired company at the fair value or amount proportional to its interest in net assets of the acquired company.
| III. | Transactions with non-controlling stockholders |
IFRS 10 – “Consolidated financial statements” establishes that, changes in an ownership interest in a subsidiary, which do not result in a loss of control, are accounted for as capital transactions and any difference between the amount paid and the carrying amount of non-controlling stockholders is recognized directly in consolidated stockholders' equity.
| b) | Foreign currency translation |
| I. | Functional and presentation currency |
The consolidated financial statements of ITAÚ UNIBANCO HOLDING are presented in Brazilian Reais, which is its functional and presentation currency. For each subsidiary and investment in associates and joint ventures, ITAÚ UNIBANCO HOLDING defined the functional currency, as set forth in IAS 21.
The assets and liabilities of subsidiaries with a functional currency other than the Brazilian Real are translated as follows:
| · | assets and liabilities are translated at the closing rate at the balance sheet date. |
| · | income and expenses are translated at monthly average exchange rates. |
| · | exchange differences arising from currency translation are recorded in other comprehensive income. |
| II. | Foreign currency transactions |
Foreign currency transactions are translated into the functional currency using the exchange rates prevailing at the dates of the transactions. Foreign exchange gains and losses resulting from the settlement of such transactions and from the translation at year-end exchange rates of monetary assets and liabilities denominated in foreign currencies are recognized in the consolidated statement of income as part of foreign exchange results and exchange variations on transactions.
In the case of monetary assets classified as available-for-sale, the exchange differences resulting from a change in the amortized cost of the instrument are recognized in the income statement, while those resulting from other changes in the carrying amount, except impairment losses, are recognized in other comprehensive income until derecognition or impairment.
| F-17 |
| c) | Cash and cash equivalents |
ITAÚ UNIBANCO HOLDING defines cash and cash equivalents as cash and current accounts in banks (included in the heading cash and deposits on demand on the consolidated balance sheet), interbank deposits and securities purchased under agreements to resell that have original maturities of up to 90 days or less, as shown in Note 4.
| d) | Financial Assets and Liabilities |
In accordance with IAS 39, all financial assets and liabilities, including derivative financial instruments, should be recognized in the Balance Sheet, and measured in accordance with the category in which the instrument was classified.
Financial assets and liabilities may be classified as follows:
| Categories | Recognition and Measurement | |
| · Financial assets and liabilities at fair value through profit or loss – held for trading | · Initially and subsequently recognized at fair value; · Transaction costs are directly recognized in the Consolidated Statement of Income; | |
| · Financial assets and liabilities at fair value through profit or loss – designated at fair value | · Gains and losses arising from changes in fair value are directly included in Net gain (loss) from investments in securities and derivatives. | |
| · Initially and subsequently recognized at fair value plus transaction costs; | ||
| · Available-for-sale financial assets (*) | · Unrealized gains and losses (except losses for impairment, foreign exchange differences, dividends and interest income) are recognized, net of applicable taxes, in Other comprehensive income. | |
· Held-to-maturity financial assets (*) · Loans and receivables · Financial liabilities at amortized cost | · Initially recognized at fair value plus transaction costs; · Subsequently measured at amortized cost, using the effective interest rate method. |
(*)Interest, including the amortization of premiums and discounts, is recognized in the Consolidated Statement of income under Interest and similar income.
The classification of financial assets and liabilities depends on the purpose for which financial assets were acquired or financial liabilities were assumed. Management determines the classification of financial instruments at initial recognition.
Effective interest rate–when calculating the effective interest rate, ITAÚ UNIBANCO HOLDINGestimates cash flows including all contractual terms of the financial instrument, but does not include future credit losses. The calculation includes all commissions paid or received between parties to the contract, transaction costs, and all other premiums or discounts.
Interest and similar income and expense are recognized in the Consolidated Statement of Income, in Interest and similar income and Interest and similar expense, respectively.
ITAÚ UNIBANCO HOLDING classifies as loans and receivables and financial liabilities at amortized cost the following Balance Sheet headings:
| Loans and receivables | Financial liabilities at amortized cost | |
· Central Bank compulsory deposits (Note 2.4dl and Note 5); · Interbank deposits (Note 6); · Securities purchased under agreements to resell (Note 2.4dll and Note 6); · Loan operations (Note 2.4dVIII and Note 12); and · Other financial assets (Note 20a). | · Deposits (Note 17); · Securities sold under repurchase agreements (Note 2.4dll and Note 19a); · Funds from interbank markets (Note 19a); · Funds from institutional markets (Note 19b); · Liabilities for capitalization plans; and · Other financial liabilities (Note 20b). |
| F-18 |
Regular purchases and sales of financial assets are recognized and derecognized, respectively, on the trade date.
Financial assets are derecognized when rights to receive cash flows expire or when ITAÚ UNIBANCO HOLDING transfers substantially all risks and rewards of ownership, and such transfer qualifies for write-off in accordance with IAS 39 requirements.
Otherwise, control should be assessed to determine whether the continuous involvement related to any retained control does not prevent write-off. Financial liabilities are derecognized when settled or extinguished.
Financial assets and liabilities are offset against each other and the net amount is reported in the Balance Sheet solely when there is a legally enforceable right to offset the recognized amounts and intention to settle them on a net basis, or simultaneously realize the asset and settle the liability.
| I. | Central Bank Compulsory deposits |
The Central Banks of the countries in which ITAÚ UNIBANCO HOLDING operates currently impose a number of compulsory deposit requirements on financial institutions. Such requirements are applied to a wide range of banking activities and operations, such as demand, savings, and time deposits.
| II. | Securities purchased under agreements to resell and sold under repurchase agreements |
ITAÚ UNIBANCO HOLDING has purchased securities with resale agreement (resale agreements), and sold securities with repurchase agreement (repurchase agreement) of financial assets. Resale and repurchase agreements are accounted for under Securities purchased under agreements to resell and Securities sold under repurchase agreements, respectively.
The difference between the sale and repurchase prices is treated as interest and recognized over the life of the agreements using the effective interest rate method.
The financial assets accepted as collateral in our resale agreements can be used by us, if provided for in the agreements, as collateral for our repurchase agreements or can be sold.
In Brazil, control over custody of financial assets is centralized and the ownership of investments under resale and repurchase agreements is temporarily transferred to the buyer. ITAÚ UNIBANCO HOLDING strictly monitors the fair value of financial assets received as collateral under our resale agreements and adjusts the collateral amount when appropriate.
Financial assets pledged as collateral to counterparties are also recognized in the consolidated financial statements. When the counterparty has the right to sell or re-pledge such instruments, they are presented in the balance sheet under the appropriate class of financial assets.
| III- | Financial assets and liabilities at fair value through profit or loss - held for trading |
These are financial assets and liabilities acquired or incurred principally for the purpose of selling them in the short term or when they are part of a portfolio of financial instruments that are managed together and for which there is evidence of a recent history of trading transactions.
| IV- | Financial assets and liabilities at fair value through profit or loss – designated at fair value |
These are assets and liabilities designated at fair value through profit or loss upon initial recognition (fair value option). In accordance with IAS 39, the fair value option can only be applied if it reduces or eliminates accounting mismatches in income or when the financial instruments are part of a portfolio for which risk is managed and reported to Management based on its fair value or when these instruments consist of debt instruments and embedded derivatives that should otherwise be separated.
| F-19 |
| V- | Derivatives |
All derivatives are recognized as assets when the fair value is positive, and as liabilities when negative.
Certain derivatives embedded in other financial instruments are treated as separate derivatives, when their economic characteristics and risks are not closely related to those of the host contract and the host contract is not recognized at fair value through profit or loss. These embedded derivatives are accounted for separately at fair value, with changes in fair value recognized in the consolidated statement of income in Net gain (loss) on investment securities and derivatives.
Derivatives can be designated as hedging instruments under hedge accounting and in the event they qualify, depending upon the nature of the hedged item, the method for recognizing gains or losses from changes in fair value will be different. These derivatives, which are used to hedge exposures to risk or modify the characteristics of financial assets and liabilities, and that meet IAS 39 criteria, are recognized as hedge accounting.
In accordance with IAS 39, to qualify for hedge accounting, all of the following conditions are met:
| · | at the inception of the hedge there is formal designation and documentation of the hedging relationship and the entity’s risk management objective and strategy for undertaking the hedge. |
| · | the hedge is expected to be highly effective in offsetting changes in fair value or cash flows attributable to the hedged risk, consistent with the originally documented risk management strategy for that particular hedging relationship. |
| · | for a cash flow hedge, a forecast transaction that is the subject of the hedge must be highly probable and must present an exposure to variations in cash flows that could ultimately affect profit or loss. |
| · | the effectiveness of the hedge can be reliably measured, i.e. the fair value or cash flows of the hedged item that are attributable to the hedged risk and the fair value of the hedging instrument can be reliably measured. |
| · | the hedge is assessed on an ongoing basis and it is determined that the hedge has in fact been highly effective throughout the periods for which the hedge was designated. |
IAS 39 presents three hedge accounting categories: fair value hedge, cash flow hedge, and hedge of net investments in a foreign operation.
ITAÚ UNIBANCO HOLDING uses derivatives as hedging instruments under cash flow hedge strategies, fair value hedge and hedge of net investments, as detailed in Note 9.
Fair value hedge
For derivatives that are designated and qualify as fair value hedges, the following practices are adopted:
| a) | The gain or loss arising from the new measurement of the hedge instrument at fair value should be recognized in income; and |
| b) | The gain or loss arising from the hedged item, attributable to the effective portion of the hedged risk, should adjust the book value of the hedged item and also be recognized in income. |
When the derivative expires or is sold or the hedge no longer meets the accounting hedge criteria or the entity revokes the designation, the entity should prospectively discontinue the accounting hedge. In addition, any adjustment in the book value of the hedged item should be amortized in income.
| F-20 |
Cash flow hedge
For derivatives that are designated and qualify as a cash flow hedge, the effective portion of derivative gains or losses are recognized in Other comprehensive income – Cash flow hedge, and reclassified to Income in the same period or periods in which the hedged transaction affects income. The portion of gain or loss on derivatives that represents the ineffective portion or the hedge components excluded from the assessment of effectiveness is recognized immediately in income. Amounts originally recorded in Other comprehensive income and subsequently reclassified to Income are recorded in the corresponding income or expense lines in which the related hedged item is reported.
When a hedging instrument expires or is sold, or when a hedge no longer meets the criteria for hedge accounting and also when ITAU UNIBANCO HOLDING redesignates a hedge, any cumulative gain or loss existing in Other comprehensive income is frozen and is recognized in income when the hedged item is ultimately recognized in the income statement. When a forecast transaction is no longer expected to occur, the cumulative gain or loss recognized in Other Comprehensive Income is immediately transferred to the statement of income.
Hedge of net investments in foreign operations
A hedge of a net investment in a foreign operation, including hedge of a monetary item that is accounted for as part of the net investment, is accounted for in a manner similar to a cash flow hedge:
| a) | the portion of gain or loss on the hedge instrument determined as effective is recognized in other comprehensive income. |
| b) | the ineffective portion is recognized in income. |
Gains or losses on the hedging instrument related to the effective portion of the hedge which is recognized in comprehensive income are reclassified to the income statement upon the disposal of the investment in the foreign operation.
| VI- | Available-for-sale financial assets |
In accordance with IAS 39, financial assets are classified as available-for-sale when in the Management’s judgment they can be sold in response to or in anticipation of changes in market conditions, and that were not classified into the categories of financial assets at fair value through profit or loss, loans and receivables or held to maturity.
The average cost is used to determine the realized Gains and losses on Disposal of available-for-sale financial assets, which are recorded in the consolidated statement of income under Net gain (loss) on Investments in Securities and Derivatives – Available-for-sale financial assets. Dividends on available-for-sale assets are recognized in the consolidated statement of income as Dividend income when ITAÚ UNIBANCO HOLDING is entitled to receive such dividends and inflow of economic benefits is probable.
| VII- | Held-to-maturity financial assets |
In accordance with IAS 39, the financial assets classified into the held-to-maturity category are non-derivative financial assets for which ITAÚ UNIBANCO HOLDING has the positive intention and ability to hold to maturity.
Both impairment of held-to-maturity financial assets and reversal of this loss are recorded, when applicable, in the Consolidated statement of income.
| VIII- | Loan operations |
ITAÚ UNIBANCO HOLDING classifies a loan operation as on non-accrual status if the payment of the principal or interest has been in default for 60 days or more. In this case, accrual of interest is no longer recognized.
When a financial asset or group of similar financial assets is impaired and its carrying amount is reduced through an allowance for loan losses, the subsequent interest income is recognized on
| F-21 |
the reduced carrying amount using the interest rate used to discount the future cash flows for purposes of measuring the allowance for loan losses.
Both the credit risk and the finance areas are responsible for defining the methodologies used to measure the allowance for loan losses and for assessing changes in the provision amounts on a recurring basis.
These areas monitor the trends observed in allowance for loan losses by segment level, in addition to establishing an initial understanding of the variables that may trigger changes in the allowance for loan losses, the probability of default or the loss given default.
Once the trends have been identified and an initial assessment of the variables has been made at the corporate level, the business areas are responsible for further analyzing these observed trends at a detailed level and for each portfolio, in order to understand the underlying reasons for the trends observed and for deciding whether changes are required in our credit policies.
| IX- | Lease operations (as lessor) |
When assets are subject to a finance lease, the present value of lease payments is recognized as a receivable in the consolidated balance sheet under Loan operations and Lease Operations.
Initial direct costs when incurred by ITAÚ UNIBANCO HOLDING are included in the initial measurement of the lease receivable, reducing the amount of income to be recognized over the lease period. Such initial costs usually include commissions and legal fees.
The recognition of interest income reflects a constant rate of return on the net investment of ITAÚ UNIBANCO HOLDING and is recognized in the consolidated statement of income under Interest and similar income.
| X- | Allowance for loan and lease losses |
General
ITAÚ UNIBANCO HOLDING periodically assesses whether there is any objective evidence that a receivable or group of receivables is impaired. A receivable or group of receivables is impaired and there is a need for recognizing an impairment loss if there is objective evidence of impairment as a result of one or more events that occurred after the initial recognition of the asset (a loss event) and that loss event (or events) has an impact on the estimated future cash flows that can be reliably estimated.
The allowance for loan and lease losses is recognized as probable losses inherent in the portfolio at the balance sheet date. The determination of the level of the allowance rests upon various judgments and assumptions, including current economic conditions, loan portfolio composition, prior loan and lease loss experience and evaluation of credit risk related to individual loans. Our process for determining the allowance for loan and lease losses includes Management's judgment and the use of estimates. The adequacy of the allowance is regularly analyzed by Management.
The criteria adopted by ITAÚ UNIBANCO HOLDING for determining whether there is objective evidence of impairment include the following:
| · | default in principal or interest payment. |
| · | financial difficulties of the debtor and other objective evidence that results in the deterioration of the financial position of the debtor (for example, debt-to-equity ratio, percentage of net sales or other indicators obtained through processes adopted to monitor credit, particularly for retail portfolios). |
| · | breach of loan clauses or terms. |
| · | entering into bankruptcy. |
| · | loss of competitive position of the debtor. |
| F-22 |
The estimated period between the loss event and its identification is defined by Management for each portfolio of similar receivables. Considering the representativeness of several homogeneous groups, management chose to use a twelve month period as being the most representative. For portfolios of loans that are individually evaluated for impairment this period is at most 12 months, considering the review cycle for each loan operation.
Assessment
ITAÚ UNIBANCO HOLDING first assesses whether objective evidence of impairment exists for receivables that are individually significant, and individually or collectively for receivables that are not individually significant.
To determine the amount of the allowance for individually significant receivables with objective evidence of impairment, methodologies are used that consider both the quality of the client and the nature of the transaction, including its collateral, to estimate the cash flows expected from these loans.
If no objective evidence of impairment exists for an individually assessed receivable, whether significant or not, the asset is included in a group of receivables with similar credit risk characteristics and collectively assessed for impairment. Receivables that are individually assessed for impairment and for which an impairment loss is recognized are not included in the collective assessment. The amount of loss is measured as the difference between the asset’s carrying amount and the present value of estimated future cash flows (excluding future credit losses that have not been incurred) discounted at the financial asset’s original effective interest rate.
For collectively assessed loans, the calculation of the present value of the estimated future cash flows for which there is collateral reflects the historical performance of the foreclosure and recovery of fair value, considering the cash flows that may arise from foreclosure less costs for obtaining and selling that collateral.
For the purpose of a collective evaluation of impairment, receivables are grouped on the basis of similar credit risk characteristics. The characteristics are relevant to the estimation of future cash flows for such receivables by being indicative of the debtors’ ability to pay all amounts due, according to the contractual terms of the receivables being evaluated. Future cash flows in a group of receivables that are collectively evaluated for purposes of identifying the need for recognizing impairment are estimated on the basis of the contractual cash flows of the group of receivables and historical loss experience for receivables with similar credit risk characteristics. The historical loss experience is adjusted on the basis of current observable data to reflect the effects of current conditions that did not affect the period on which the historical loss experience is based and to remove the effects of conditions in the historical period that do not exist currently.
For individually significant receivables with no objective evidence of impairment, ITAÚ UNIBANCO HOLDING classifies these loans into certain rating categories based on several qualitative and quantitative factors applied through internally developed models. Considering the size and the different risk characteristics of each contract, the rating category determined according to internal models can be reviewed and modified by our Corporate Credit Committee, the members of which are executives and officers in corporate credit risk. ITAÚ UNIBANCO HOLDING estimates inherent losses for each rating category considering an internally developed approach for low-default portfolios, that uses our historical experience for building internal models, that are used both to estimate the PD (probability of default) and to estimate the LGD (loss given default).
To determine the amount of the allowance for individually insignificant items loans are segregated into classes considering the underlying risks and characteristics of each group. The allowance for loan and lease losses is determined for each of those classes through a process that considers historical delinquency and loan loss experience over the most recent years.
Measurement
The methodology used to measure the allowance for loan and lease losses was developed internally by the credit risk and finance areas at the corporate level. In those areas and considering the different characteristics of the portfolios, different areas are responsible for defining the methodology to measure the allowance for each: Corporate (including loan
| F-23 |
operations with objective evidence of impairment and individually significant loan operations but with no objective evidence of impairment), Individuals, Small and Medium Businesses, and Foreign Units Latin America. Each of the four portfolio areas responsible for defining the methodology to measure the allowance for loan and lease losses is further divided into groups, including groups that develop the methodology and groups that validate the methodology. A centralized group in the credit risk area is responsible for measuring the allowance on a recurring basis following the methodologies developed and approved for each of the four areas.
The methodology is based on two components to determine the amount of the allowance: The probability of default by the client or counterparty (PD), and the potential economic loss that may occur in the event of default, being the debt that cannot be recovered (LGD) which are applied to the outstanding balance of the loan. Measurement and assessment of these risk components is part of the process for granting credit and for managing the portfolio. The estimated amounts of PD and LGD are measured based on statistical models that consider a significant number of variables which are different for each class and include, among others, income, equity, past loan experiences, level of indebtedness, economic sectors that affect collectability and other attributes of each counterparty and of the economic environment. These models are regularly updated for changes in economic and business conditions.
A model updating process is started when the modeling area identifies that it is not capturing significant effects of the changes of economic conditions, in the performance of the portfolio or when a change is made in the methodology for calculating the allowance for loan and lease losses. When a change in the model is made, the model is validated through back-testing and statistical methods are used to measure its performance through detailed analysis of its documentation, by describing step-by-step how the process is carried out. The models are validated by an area independent from the one developing it, by issuing a technical report on the assumptions used (integrity, consistency, and replicability of the bases) and on the mathematical methodology used. The technical report is subsequently submitted to CTAM (Model assessment technical committee), which is the highest level of approval of model reviews.
Considering the different characteristics of the loans at each of the four portfolio areas (Corporate (with no objective evidence of impairment), Individuals, Small and Medium Businesses, and Foreign Units Latin America), different areas within the corporate credit risk area are responsible for developing and approving the methodologies for loans in each of those four portfolio areas. Management believes that the fact that different areas focus on each of the four portfolios results in increased knowledge, specialization and awareness of the teams as to the factors that are more relevant for each portfolio area in measuring the loan losses. Also considering such different characteristics and other factors, different inputs and information are used to estimate the PD and LGD as further detailed below:
| · | Corporate (with no evidence of impairment) -factors considered and inputs used aremainly the history of the customer relationship with us, the results of analysis of the customer’s accounting statements and the information obtained through frequent contacts with its officers, aiming at understanding the strategy and the quality of its management. Additionally, industry and macroeconomic factors are also included in the analysis. All those factors (which are quantitative and qualitative) are used as inputs to the internal model developed to determine the corresponding rating category. This approach is also applied to the corporate credit portfolio inside and outside Brazil. |
| · | Individuals–factors considered and inputs used are mainly the history of the customerrelationship with us, and information available through credit bureaus (negative information). |
| · | Small / Medium Businesses–factors considered and inputs used include, in addition to thehistory of the customer relationship and credit bureau information about the customer’s revenues, industry expertise, and information about its shareholders and officers, among others. |
| · | Foreign Units – Latin America–considering the relative smaller size of this portfolio and itsmore recent nature, the models are simpler and use the past due status and an internal rating of the customer as main factors. |
| F-24 |
Reversal, write-off, and renegotiation
If, in a subsequent period, the amount of the impairment loss decreases and the decrease is objectively related to an event occurring after the impairment was recognized (such as an improvement in the debtor’s credit rating), the previously recognized impairment is reversed. The amount of reversal is recognized in the consolidated statement of Income under Expense for allowance for loan and lease losses.
When a loan is uncollectible, it is written-off in the balance sheet under allowance for loan and lease losses. Write-off as losses occur after 360 days of credits have matured or after 540 days for loans with maturities over 36 months.
In almost all cases for loan products, renegotiated loans require at least one payment to be made under the renegotiated terms in order for it to be removed from nonperforming and nonaccrual status. Renegotiated loans return to nonperforming and nonaccrual status when they reach 60 days past due under the renegotiated terms, which typically corresponds to the borrower missing two or more payments.
| e) | Investments in associates and joint ventures |
I – Associates
In conformity with IAS 28 - Investments in Associates and Joint Ventures, associates are companies in which the investor has a significant influence but does not hold control. Investments in these companies are initially recognized at cost of acquisition and subsequently accounted for using the equity method. Investments in associates and joint ventures include the goodwill identified upon acquisition, net of any cumulative impairment loss.
II – Joint arrangements
Before january 1, 2013, ITAÚ UNIBANCO HOLDING proportionally consolidated its interest held in joint ventures, as required by IAS 31 – Interests in Joint Ventures. From that date on, it adopted IFRS 11 – Joint arrangements, changing its accounting policy from interest in joint arrangements to the equity method.
ITAÚ UNIBANCO HOLDING has assessed the nature of its joint business and concluded that it has both joint operations and joint ventures. There was no change in the accounting treatment for joint operations. For joint ventures, ITAÚ UNIBANCO HOLDING adopted the new policy on interest in joint ventures, in accordance with the IFRS 11 transition provisions.
The effects arising from adopting IFRS 11, which gave rise to a change in the accounting policy, have not had significant impacts on the Consolidated financial statements of ITAÚ UNIBANCO HOLDING.
ITAÚ UNIBANCO HOLDING’s share in profits or losses of its associates and joint ventures after acquisition is recognized in the consolidated statement of income. Its share of the changes in the reserves of corresponding stockholders’ equity of its associates and joint ventures is recognized in its own reserves of stockholders’ equity. The cumulative changes after acquisition are adjusted against the carrying amount of the investment. When the ITAÚ UNIBANCO HOLDING share of losses of an associates and joint ventures is equal or above its interest in the associates and joint ventures, including any other receivables, ITAÚ UNIBANCO HOLDING does not recognize additional losses, unless it has incurred any obligations or made payments on behalf of the associates and joint ventures.
Unrealized profits on transactions between ITAÚ UNIBANCO HOLDING and its associates and joint ventures are eliminated to the extent of the interest of ITAÚ UNIBANCO HOLDING. Unrealized losses are also eliminated, unless the transaction provides evidence of impairment of the transferred asset. The accounting policies on associates and joint ventures are consistent with the policies adopted by ITAÚ UNIBANCO HOLDING.
| F-25 |
If the interest in the associates and joint ventures decreases, but ITAÚ UNIBANCO HOLDING retains significant influence or joint control, only the proportional amount of the previously recognized amounts in Other comprehensive income is reclassified in Income, when appropriate.
Gains and losses from dilution arising from investments in associates and joint ventures are recognized in the consolidated statement of income.
| f) | Lease commitments (as lessee) |
As a lessee, ITAÚ UNIBANCO HOLDING has finance and operating lease agreements.
ITAÚ UNIBANCO HOLDING leases certain fixed assets, and those substantially holding the risks and benefits incidental to the ownership are classified as finance leases.
Each lease installment paid is allocated part to liabilities and part to financial charges, so that a constant rate is obtained for the outstanding debt balance. Corresponding obligations, net of future financial charges, are included in Other financial liabilities. Interest expenses are recognized in the Consolidated Statement of Income over the lease term, to produce a constant periodic interest rate on the remaining liabilities balance for each period.
Expenses related to operating leases are recognized in the consolidated statement of income, on a straight-line basis, over the period of lease.
When an operating lease is terminated before the end of the lease term, any payment to be made to the lessor as a penalty is recognized as an expense in the period the termination occurs.
| g) | Fixed assets |
In accordance with IAS 16 – Property, plant and equipment, fixed assets are recognized at cost of acquisition less accumulated depreciation, which is calculated using the straight-line method and rates based on the estimated useful lives of these assets. These rates and additional details are presented in Note 15.
The residual values and useful lives of assets are reviewed and adjusted, if appropriate, at the end of each year.
ITAÚ UNIBANCO HOLDING reviews its assets in order to identify whether any indications of impairment exist. If such indications are identified, fixed assets are tested for impairment. In accordance with IAS 36 – Impairment of assets, impairment losses are recognized for the difference between the carrying and recoverable amount of an asset (or group of assets), in the consolidated statement of income. The recoverable amount of an asset is defined as the higher of its fair value less costs to sell and its value in use. For purposes of assessing impairment, assets are grouped at the lowest level for which independent cash flows can be identified (cash-generating units). The assessment may be made at an individual asset level when the fair value less the cost to sell may be reliably determined.
Gains and losses on disposals of fixed assets are recognized in the consolidated statement of income under Other income or General and administrative expenses.
| h) | Goodwill |
In accordance with IFRS 3 (R) – “Business combinations”, goodwill may arise on an acquisition and represents the excess of the consideration transferred plus non-controlling interest over the net fair value of the net identifiable assets and contingent liabilities of the acquiree. Goodwill is not amortized, but its recoverable amount is tested for impairment semi-annually or when there is any indication of impairment, using an approach that involves the identification of cash-generating units and estimates of fair value less cost to sell and/or value in use.
| F-26 |
As defined in IAS 36, a cash-generating unit is the lowest identifiable group of assets that generates cash inflows that are independent of the cash inflows from other assets or groups of assets. Goodwill is allocated to cash-generating units for the purpose of impairment testing. The allocation is made to those cash-generating units that are expected to benefit from the business combination.
IAS 36 determines that an impairment loss shall be recognized for a cash-generating unit if the recoverable amount of the cash-generating unit is less than its carrying amount. The loss shall be allocated first to reduce the carrying amount of any goodwill allocated to the cash-generating unit, and then to the other assets of the unit on a pro rata basis applied to the carrying amount of each asset. The loss cannot reduce the carrying amount of an asset below the higher of its fair value less costs to sell and its value in use. The impairment loss of goodwill cannot be reversed.
Goodwill arising from the acquisition of subsidiaries is presented in the Consolidated Balance Sheet under the line Goodwill.
Goodwill of associates and joint ventures is reported as part of investment in the consolidated balance sheet under Investments in associates and joint ventures, and the impairment test is carried out in relation to the total balance of the investments (including goodwill).
| i) | Intangible assets |
Intangible assets are non-physical assets, including software and other assets, and are initially recognized at cost. Intangible assets are recognized when they arise from legal or contractual rights, their costs can be reliably measured, and in the case of intangible assets not arising from separate acquisitions or business combinations, it is probable that future economic benefits may arise from their use. The balance of intangible assets refers to acquired assets or those internally generated.
Intangible assets may have finite or indefinite useful lives. Intangible assets with finite useful lives are amortized using the straight-line method over their estimated useful lives. Intangible assets with indefinite useful lives are not amortized, but periodically tested in order to identify any impairment.
ITAÚ UNIBANCO HOLDING semi-annually assesses its intangible assets in order to identify whether any indications of impairment exist, as well as possible reversal of previous impairment losses. If such indications are found, intangible assets are tested for impairment. In accordance with IAS 36, impairment losses are recognized as the difference between the carrying and the recoverable amount of an asset (or group of assets), and recognized in the consolidated statement of income. The recoverable amount of an asset is defined as the higher of its fair value less costs to sell and its value in use. For purposes of assessing an impairment, assets are grouped into the minimum level for which cash flows can be identified. The assessment can be made at an individual asset level when the fair value less its cost to sell can be determined reliably.
As set forth in IAS 38, ITAÚ UNIBANCO HOLDING elected the cost model to measure its intangible assets after its initial recognition.
The breakdown of intangible assets is described in Note 16.
| j) | Assets held for sale |
Assets held for sale are recognized in the balance sheet when they are actually repossessed or there is intention to sell. These assets are initially recorded at the lower of: (i) the fair value of the asset less the estimated selling expenses, or (ii) the carrying amount of the related asset held for sale.
| k) | Income tax and social contribution |
There are two components of the provision for income tax and social contribution: current and deferred.
Current income tax expense approximates taxes to be paid or recovered for the applicable period. Current assets and liabilities are recorded in the balance sheet under Tax assets – income tax and social contribution - current and tax liabilities – income tax and Social contribution – current, respectively.
Deferred income tax and social contribution represented by deferred tax assets and liabilities are obtained based on the differences between the tax bases of assets and liabilities and the amounts
| F-27 |
reported in the financial statements at each year end. The tax benefit of tax loss carryforwards is recognized as an asset. Deferred tax assets are only recognized when it is probable that future taxable income will be available for offsetting. Deferred tax assets and liabilities are recognized in the balance sheet under Tax assets – Income tax and social contribution – Deferred and Tax liabilities – Income tax and social contribution - Deferred, respectively.
Income tax and social contribution expense is recognized in the consolidated statement of income under Income tax and social contribution, except when it refers to items directly recognized in Other comprehensive income, such as: deferred tax on fair value measurement of available-for-sale financial assets, and tax on cash flow hedges. Deferred taxes of such items are initially recognized in Other comprehensive income and subsequently recognized in Income together with the recognition of the gain / loss originally deferred.
Changes in tax legislation and rates are recognized in the consolidated statement of income under Income tax and social contribution in the period in which they are enacted. Interest and fines are recognized in the consolidated statement of income under General and administrative expenses. Income tax and social contribution are calculated at the rates shown below, considering the respective taxable bases, based on the current legislation related to each tax, which in the case of the operations in Brazil are for all the reporting periods as follows:
| 12/31/2016 | ||||
| Income tax | 15.00 | % | ||
| Additional income tax | 10.00 | % | ||
| Social contribution (*) | 20.00 | % | ||
(*) On october 06, 2015, Law No. 13,169, a conversion of Provisional Measure No. 675, which increased the Social Contribution tax rate from 15.00% to 20.00% until december 31, 2018, for financial institutions, insurance companies and credit card management companies, was introduced. For the other companies, the tax rate remains at 9.00%.
To determine the proper level of provisions for taxes to be maintained for uncertain tax positions, a two-phased approach was applied, according to which a tax benefit is recognized if it is more probable than not that a position can be sustained. The benefit amount is then measured to be the highest tax benefit which probability of realization is over 50%.
| l) | Insurance contracts and private pension |
IFRS 4 – “Insurance contracts” defines insurance contracts as contracts under which the issuer accepts a significant insurance risk of the counterparty, by agreeing to compensate it if a specified uncertain future event adversely affects it. An insurance risk is significant only if the insurance event could cause an issuer to pay significant additional benefits in any scenario, except for those that do not have commercial substance. Additional benefits refer to amounts that exceed those that would be payable if no insured event occurred.
At the time of the first-time adoption of IFRS, ITAÚ UNIBANCO HOLDING decided not to change its accounting policies for insurance contracts, which follow the accounting practices generally accepted in Brazil (“BRGAAP”).
Although investment agreements with discretionary participation characteristics are financial instruments, they are treated as insurance contracts, as established by IFRS 4, as well as those transferring a significant financial risk.
These agreements may be reclassified as insurance contracts after their initial classification should the insurance risk become significant.
Once the contract is classified as an insurance contract, it remains as such until the end of its life, even if the insurance risk is significantly reduced during such period, unless all rights and obligations are extinguished or expired.
Note 30 presents a detailed description of all products classified as insurance contracts.
| F-28 |
Private pension plans
Contracts that contemplate retirement benefits after an accumulation period (known as PGBL, VGBL and FGB) assure, at the commencement date of the contract, the basis for calculating the retirement benefit (mortality table and minimum interest). The contracts specify the annuity fees and, therefore, the contract transfers the insurance risk to the issuer at the commencement date, and they are classified as insurance contracts.
Insurance premiums
Insurance premiums are recognized by issuing an insurance policy or over the period of the contracts in proportion to the amount of the insurance coverage. Insurance premiums are recognized as income in the consolidated statement of income.
If there is evidence of impairment losses with respect to receivables for insurance premiums, ITAÚ UNIBANCO HOLDING recognizes a provision, sufficient to cover this loss, based on the risk analysis of realization of insurance premiums receivable with installments overdue for over 60 days.
Reinsurance
Reinsurance premiums are recognized over the same period in which the related insurance premiums are recognized in the consolidated statement of income.
In the ordinary course of business, ITAÚ UNIBANCO HOLDING reinsures a portion of the risks underwritten, particularly property and casualty risks that exceed the maximum limits of responsibility that we determine to be appropriate for each segment and product (after a study which considers size, experience, specificities, and the necessary capital to support these limits). These reinsurance agreements allow the recovery of a portion of the losses from the reinsurer, although they do not release the insurer from the main obligation as direct insurer of the risks contemplated in the reinsurance.
Acquisition costs
Acquisition costs include direct and indirect costs related to the origination of insurance. These costs, except for the commissions paid to brokers and others, are expensed directly in income as incurred. Commissions, on the other hand, are deferred and expensed in proportion to the recognition of the premium revenue, i.e. over the period of the corresponding insurance contract.
Liabilities
Reserves for claims are established based on historical experience, claims in process of payment, estimated amounts of claims incurred but not yet reported, and other factors relevant to the required reserve levels. A liability for premium deficiencies is recognized if the estimated amount of premium deficiencies exceeds deferred acquisition costs. Expenses related to recognition of liabilities for insurance contracts are recognized in the consolidated statement of income under Change in reserves for insurance and private pension.
Embedded derivatives
We have not identified any embedded derivatives in our insurance contracts, which may be separated or measured at fair value in accordance with IFRS 4 requirements.
Liability adequacy test
IFRS 4 requires that the insurance companies analyze the adequacy of their insurance liabilities in each reporting period through a minimum adequacy test. The liability adequacy test for IFRS was conducted by adopting the current actuarial assumptions for future cash flows of all insurance contracts in force on the balance sheet date.
Should the analysis show insufficiency, any deficiency identified will be immediately accounted for in income for the period.
| F-29 |
The assumptions used to conduct the liability adequacy test are detailed in Note 30.
| m) | Capitalization plans |
For regulatory purposes in Brazil they are regulated by the insurance regulator, these plans do not meet the definition of an insurance contract under IFRS 4, and therefore they are classified as a financial liability at amortized cost under IAS 39.
Revenue from capitalization plans is recognized during the period of the contract and measured as the difference between the amount deposited by the client and the amount that ITAÚ UNIBANCO HOLDING has to reimburse.
| n) | Post-employments benefits |
ITAÚ UNIBANCO HOLDING is required to make contributions to government social security and labor indemnity plans, in Brazil and in other countries where it operates, which are expensed in the consolidated statement of income as an integral part of general and administrative expenses, when incurred.
Additionally, ITAÚ UNIBANCO HOLDING also sponsors Defined Benefit Plans and Defined Contribution Plans, accounted for in accordance with IAS 19 (R1) – “Employee benefits”.
Pension plans - Defined benefit plans
The liability (or asset, as the case may be) recognized in the Consolidated Balance Sheet with respect to the defined benefit plan corresponds to the present value of defined benefit obligations at the balance sheet date less the fair value of plan assets. The present value of defined benefit obligations is determined by discounting the estimated amount of future cash flows of benefit payments based on Brazilian government securities denominated in Reais and with maturity periods similar to the term of the pension plan liabilities. They are recognized in the Consolidated statement of income:
| · | current service cost – defined as the increase in the present value of obligations resulting from employee service in the current period. |
| · | interest on the net amount of assets (liabilities) of defined benefit plans is the change, during the period, in the net amount recognized in assets and liabilities, due to the time elapsed, which comprises the interest income on plan assets, interest expense on the obligations of the defined benefit plan and interest on the asset ceiling effects. |
Actuarial gains and losses arising from the non-adoption of the assumptions established in the latest evaluation, as compared to those effectively carried out or changes in such assumptions, are fully recognized in Other comprehensive income.
Pension plans - defined contribution
For defined contribution plans, contributions to plans made by ITAÚ UNIBANCO HOLDING, through pension plan funds, are recognized as an expense when due.
Other post-employment benefit obligations
Certain companies that merged into ITAÚ UNIBANCO HOLDING over the past few years were sponsors of post-employment healthcare benefit plans and ITAÚ UNIBANCO HOLDING is contractual committed to maintain such benefits over specific periods, as well as in relation to the benefits granted due to a judicial ruling.
These obligations are assessed annually by independent and qualified actuaries, and costs expected from these benefits are accumulated during the employment period and gains and losses arising from adjustments of practices and changes in actuarial assumptions are recognized in Stockholders’ equity, under Other comprehensive income, in the period they occurred.
| F-30 |
| o) | Share-based payment |
Share-based payment is accounted for in accordance with IFRS 2 - “Share-based payment” which requires the entity to measure the value of equity instruments granted, based on their fair value at the option grant date. This cost is recognized during the vesting period of the right to exercise the instruments.
The total amount to be expensed is determined by reference to the fair value of the options granted excluding the impact of any service and non-market performance vesting conditions (notably remaining an employee of the entity over a specified time period). The fulfillment of on-market vesting conditions is included in the assumptions about the number of options that are expected to be exercised. At the end of each period, ITAÚ UNIBANCO HOLDING revises its estimates of the number of options that are expected to be exercised based on non-market vesting conditions. It recognizes the impact of the revision of the original estimates, if any, in the consolidated statement of income, with a corresponding adjustment to stockholders’ equity.
When the options are exercised, the ITAÚ UNIBANCO HOLDING treasury shares are generally delivered to the beneficiaries.
The fair value of stock options is estimated by using option pricing models that take into account the exercise price of the option, the current stock price, the risk-free interest rate, the expected volatility of the stock price and the life of the option.
All stock based compensation plans established by ITAÚ UNIBANCO HOLDING correspond to plans that can be settled exclusively through the delivery of shares.
| p) | Financial guarantees |
ITAÚ UNIBANCO HOLDING recognizes the fair value of the guarantees issued in the consolidated balance sheet under Other liabilities. Fair value is generally represented by the fee charged to client for issuing the guarantee. This amount at the issuance date is amortized over the life of the guarantee issued and recognized in the consolidated statement of income under Banking service fees.
After issuance, if based on the best estimate ITAÚ UNIBANCO HOLDING concludes that the occurrence of a loss regarding a guarantee issued is probable, and if the loss amount is higher than the initial fair value less cumulative amortization of the guarantee, a provision is recognized for such amount.
| q) | Provisions, contingent assets and contingent liabilities |
These are assessed, recognized and disclosed in accordance with IAS 37. Contingent assets and contingent liabilities are rights and obligations arising from past events for which materialization depends on future events.
Contingent assets are not recognized in the consolidated financial statements, except when the Management of ITAÚ UNIBANCO HOLDING understands that realization is virtually certain which, generally corresponds to lawsuits with favorable rulings, in final and unappealable judgments, withdrawal from lawsuits as a result of a payment in settlement or as a result of an agreement to offset against an existing liability.
Contingent liabilities mainly arise from administrative proceedings and lawsuits, inherent in the ordinary course of business, filed by third parties, former employees and governmental bodies, in connection with civil, labor, and tax and social security claims.
These contingencies are evaluated based on Management’s best estimates, and are classified as:
| · | Probable:in which liabilities are recognized in the consolidated balance sheet under Provisions. |
| · | Possible:which are disclosed in the Consolidated Financial Statements, but no provision isrecorded. |
| · | Remote:which require neither a provision nor disclosure. |
Contingent liabilities recorded under Provisions and those disclosed as possible are measured using best estimates through the use of models and criteria which allow their appropriate measurement even if there is uncertainty as to their ultimate timing and amount, and the criteria are detailed in Note 32.
| F-31 |
The amount of court escrow deposits is adjusted in accordance with current legislation.
Contingent liabilities guaranteed by indemnity clauses provided by third parties, such as in business combinations carried out before the transition date to IFRS, are recognized when a claim is asserted, and a receivable is recognized simultaneously subject to its collectability. For business combinations carried out after the transition date, indemnification assets are recognized at the same time and measured on the same basis as the indemnified item, subject to collectability or contractual limitations on the indemnified amount.
| r) | Capital |
Common and preferred shares, which are equivalent to common shares but without voting rights are classified in Stockholders’ equity. The additional costs directly attributable to the issue of new shares are included in Stockholders’ equity as a deduction from the proceeds, net of taxes.
| s) | Treasury shares |
Common and preferred shares repurchased are recorded in Stockholders’ equity under Treasury shares at their average purchase price.
Shares that are subsequently sold, such as those sold to grantees under our share-based payment, are recorded as a reduction in treasury shares, measured at the average price of treasury stock held at such date.
The difference between the sale price and the average price of the treasury shares is recorded as a reduction or increase in Additional paid-in capital. The cancellation of treasury shares is recorded as a reduction in Treasury shares against Appropriated reserves, at the average price of treasury shares at the cancellation date.
| t) | Dividends and interest on capital |
Minimum dividend amounts established in the bylaws are recorded as liabilities at the end of each year. Any other amount above the mandatory minimum dividend is accounted for as a liability when approved by stockholders at a Stockholders´ Meeting.
Interest on capital is treated for accounting purposes as a dividend, and it is presented as a reduction of stockholders’ equity in the consolidated financial statements. The related tax benefit is recorded in the consolidated statement of income.
Dividends have been and continue to be calculated and paid based on the financial statements prepared under Brazilian accounting standards and regulations for financial institutions and not based on these consolidated financial statements prepared under IFRS.
Dividends and interest on capital are presented in Note 21.
| u) | Earnings per share |
Earnings per share are computed by dividing net income attributable to the owners of ITAÚ UNIBANCO HOLDING by the weighted average number of common and preferred shares outstanding for each reporting year. Weighted average shares are computed based on the periods for which the shares were outstanding.
ITAÚ UNIBANCO HOLDING grants stock-based compensation whose dilutive effect is reflected in diluted earnings per share, with the application of the “treasury stock method”. Under the treasury stock method, earnings per share are calculated as if shares under stock-based compensation plans had been issued and as if the assumed proceeds were used to purchase shares of ITAÚ UNIBANCO HOLDING.
Earnings per share are presented in Note 28.
| F-32 |
| v) | Revenue from services |
Services related to current accounts are offered to clients either in formal packages or individually, and their income is recognized when these services are provided.
Revenue from certain services, such as fees from funds management, performance, collection for retail clients and custody, is recognized over the life of the related contracts on a straight-line basis.
The breakdown of the banking service fees is detailed in Note 24.
| w) | Segment information |
Segment information is disclosed consistently with the internal report prepared for the Executive Committee, which makes the operational decisions of ITAÚ UNIBANCO HOLDING.
ITAÚ UNIBANCO HOLDING has three reportable segments: (i) Retail Banking (ii) Wholesale Banking and (iii) Activities with the Market + Corporation.
Segment information is presented in Note 34.
| F-33 |
Note 3 – Business development
Credit Intelligence Bureau (“CIB”)
In January 21, 2016, the ITAÚ UNIBANCO HOLDING, through its subsidiary Itaú Unibanco S.A., sidnedd a Memorandum of Understanding with Banco Bradesco S.A. Banco do Brasil S.A., Banco Santander S.A. and Caixa Econômica Federal in order to create a credit intelligence bureau (“CIB”) which will enable greater efficiency in the management and granting of credit lines at long and medium terms.
CIB will be structured as a corporation and the Parties, each of them holding a 20% equity ownership, will share its control.
CIB’s incorporation is subject to the execution of definitive documents among the Parties, as well as the satisfaction of certain conditions precedent, including the approval by applicable regulatory authorities. The transaction was approved by CADE on November 9, 2016.
Banco Itaú BMG Consignado S.A.
On September 29, 2016, ITAÚ UNIBANCO HOLDING, through its subsidiary Itaú Unibanco S.A. (Itaú Unibanco), entered into a purchase and sale agreement with Banco BMG S.A. (BMG) for acquisition of a 40% interest in the capital of Banco Itaú BMG Consignado S.A. (Itaú BMG Consignado), corresponding to BMG’s total interest in Itaú BMG Consignado, for the amount of R$ 1,460, and now holds 100% of Itaú BMG Consignado.
Itaú Unibanco and BMG will maintain an association by means of the execution of a new commercial agreement for the distribution of payroll loans of Itaú BMG Consignado and its affiliates, on an exclusive basis, through certain distribution channels linked to BMG and its affiliates.
After compliance with conditions precedent and approval by proper regulatory authorities, the transaction was completed on December 28, 2016.
Currently, Itaú BMG Consignado is controlled by ITAÚ UNIBANCO HOLDING and, therefore, this acquisition did not have accounting effects on its results on initial recognition.
ConectCarSoluções de Mobilidade Eletrônica S.A.
On October 21, 2015, ITAÚ UNIBANCO HOLDING, through its subsidiary Redecard S.A. (Rede), entered into a share purchase and sale commitment with Odebrecht Transport S.A. for the acquisition of 50% of capital stock ofConectCar Soluções de Mobilidade Eletrônica S.A. (ConectCar) for the amount of R$ 170.
ConectCar, located in Barueri, São Paulo, is an institution engaged in own payment arrangements and a provider of intermediation services for automatic payment of tolls, fuels and parking lots, ranked as the second largest company in the sector, currently operating in 12 States and in the Federal District. It was organized in 2012 as the result of a partnership between Odebrecht Transport S.A. and Ipiranga Produtos de Petróleo S.A., a company controlled by Ultrapar Participações S.A., which currently holds the remaining 50% of ConectCar’s capital stock.
After compliance with the conditions precedent and approval of proper regulatory authorities, the operation was closed on January 29, 2016. The investment acquired is measured using the equity method (Note 2.4e II).
The acquisition will not have accounting effects on the results of ITAÚ UNIBANCO HOLDING on initial recognition.
Recovery do Brasil Consultoria S.A.
At December 31, 2015, ITAÚ UNIBANCO HOLDING, through its subsidiary Itaú Unibanco S.A., entered into an agreement for purchase and sale and other covenants with Banco BTG Pactual S.A. (BTG) for acquisition of 81.94% interest in the capital of Recovery do Brasil Consultoria S.A. (Recovery), corresponding to BTG’s total interest in Recovery, for the amount of R$ 640.
| F-34 |
In the same transaction, ITAÚ UNIBANCO HOLDING agreed on the acquisition of approximately 70% of the portfolio of R$ 38 billion in credit rights related to the recovery of portfolios held by BTG, for the amount of R$ 570.
Established in 2000 in Argentina and present in Brazil since 2006, Recovery is the market leader in the management of overdue receivables portfolio. Recovery’s activities consist in prospecting and assessing portfolios, structuring and managing operations, acting in all segments, from individual to corporate loans, with financial and non-financial institutions, and offering a competitive advantage to its clients.
After the compliance with the conditions precedent and approval by regulatory authorities, the transaction was closed on March 31, 2016.
The acquisition did not have accounting effects on the results of ITAÚ UNIBANCO HOLDING on initial recognition.
On July 7, 2016, ITAÚ UNIBANCO HOLDNG, through its subsidiary Itaú Unibanco S.A., acquired, from International Finance Corporation, a 6.92% additional interest, for the amount of R$ 59, and now holds 96% of Recovery’s capital.
Itaú CorpBanca
On January 29, 2014, ITAÚ UNIBANCO HOLDING, through its subsidiary Banco Itaú Chile S.A. (BIC), entered into aTransaction Agreement with CorpBanca and its controlling stockholders (Corp Group), establishing the terms and conditions of the merger of operations of BIC and CorpBanca in Chile and in the other jurisdictions in which CorpBanca operates.
CorpBanca is a commercial bank headquartered in Chile, which also operates in Colombia and Panama, focused on individuals and large and middle-market companies. In 2015, an accordance with the Chilean Superintendence of Banks, it was one of the largest private banks in Chile, in terms of overall size of loan portfolio, with a market share of 7.1%.
This agreement represents an important step in ITAÚ UNIBANCO HOLDING’s internationalization process.
The merger was approved by the stockholders of CorpBanca and BIC and by all proper regulatory authorities in Chile, Brazil, Colombia and Panama. As set forth in the amendment to theTransactionAgreement, entered into on June 2, 2015, the parties closed the operation on April 1, 2016, when they hadfull conditions for the corporate reorganization process.
The operation was consummated by means of:
| i. | Increase in BIC’ capital in the amount of US$ 2,309 million concluded on March 22, 2016; |
| ii. | Merger of BIC into CorpBanca, with the cancellation of BIC’s shares and issue of new shares by CorpBanca, at the rate of 80,240 shares of CorpBanca for one share of BIC, so that interests resulting from the merger, named Itaú CorpBanca, are 33.58% for ITAÚ UNIBANCO HOLDING and 33.13% for Corp Group. |
The following corporate structure resulted from the transaction:
| Ownership interest | ||||
| ITAÚ UNIBANCO HOLDING | 33.58 | % | ||
| Corp Group | 33.13 | % | ||
| Other non-controlling stockholders | 33.29 | % | ||
The Itaú CorpBanca was controlled from the April 1, 2016 fur ITAÚ UNIBANCO HOLDING. On the same date, ITAU UNIBANCO HOLDING entered into a shareholders’ agreement with Corp Group, which sets forth, among others, the right of ITAÚ UNIBANCO HOLDING and Corp Group to appoint members for the Board of Directors of Itaú CorpBanca in accordance to their interests in capital stock, and this group of shareholders will have the right to appoint the majority of members of the Board of Directors of Itaú CorpBanca and ITAÚ UNIBANCO HOLDING will be entitled to appoint the majority of members elected by this block. Except for certain strategic matters of Itaú CorpBanca, on which Corp Group has the right of veto, the members of the board of directors appointed by Corp Group should vote as recommended by ITAÚ UNIBANCO HOLDING.
| F-35 |
The fair value of the consideration transferred by ITAÚ UNIBANCO HOLDING due to its interest in Itaú CorpBanca was R$ 10,517, based on the quotation of CorpBanca’s shares on the Santiago Stock Exchange.
The consideration transferred resulted in goodwill for future expected profitability of R$ 6,928. Additionally, a goodwill of R$ 692 was generated in Brazil due to the difference between the equity value of BIC and the equity value of Itaú CorpBanca resulting from the merger. This amount will not be deducted for tax purposes, except in case of disposal or merger of the investment.
The table below summarizes the main assets acquired and liabilities assumed on the acquisition date:
CorpBanca
| Assets | 04/01/2016 | |||
| Cash and deposits on demand | 5,869 | |||
| Interbank deposits | 3,712 | |||
| Securities purchased under agreements to resell | 186 | |||
| Financial assets held for trading | 5,684 | |||
| Derivatives | 6,628 | |||
| Available-for-sale financial assets | 7,164 | |||
| Held-to-maturity financial assets | 236 | |||
| Loan operations and lease operations portfolio, net | 75,222 | |||
| Other financial assets | 3,018 | |||
| Goodwill | 888 | |||
| Fixed assets, net | 494 | |||
| Intangible assets, net | 2,603 | |||
| Tax assets | 1,413 | |||
| Assets held for sale | 2 | |||
| Other assets | 1,257 | |||
| Total assets | 114,376 | |||
| Liabilities and stockholders’ equity | 04/01/2016 | |||
| Deposits | 68,387 | |||
| Securities sold under repurchase agreements | 4,052 | |||
| Derivatives | 5,749 | |||
| Interbank market debt | 6,429 | |||
| Institucional market debt | 17,025 | |||
| Other financial liabilities | 1,583 | |||
| Provisions | 140 | |||
| Tax liabilities | 1,341 | |||
| Other liabilities | 2,619 | |||
| Total liabilities | 107,325 | |||
| Plan net assets | 7,051 | |||
| Non-controlling interests | 1,515 | |||
| Net assets assumed | 5,536 | |||
| Adjustment to fair value of net assets assumed | (1,946 | ) | ||
| Net assets assumed at fair value | 3,590 | |||
Up to one year from acquisition date, adjustments to the reported amounts will be made to reflect any new information obtained about facts and circumstances that existed at the transaction completion date, as provided for in IFRS 3 – Business Combinations.
Contingent liabilities have not been recorded due to the acquisition.
Additionally, on October 26, 2016, ITAÚ UNIBANCO HOLDING, by means of its controlled subsidiary, ITB Holding Brasil Participações Ltda., it has indirectly acquired 10,908,002,836 shares of Itaú CorpBanca, for equivalent to R$ 288.1.
The possibility of implementing the acquisition of such Shares was already set forth in the shareholders’ agreement entered into on April 1st, 2016 between ITAÚ UNIBANCO HOLDING and Corp Group and certain of its affiliates. As a consequence, ITAÚ UNIBANCO HOLDING’s ownership in Itaú CorpBanca increased from approximately 33.58% to 35.71%, without altering its current governance.
| F-36 |
This transaction was implemented by means of the acquisition of 100% of the capital stock of a company named CGB II SpA, which is the current holder of the shares. All the required regulatory approvals have been obtained on October of 2016.
The acquisitions did not have accounting effects on the net income of ITAÚ UNIBANCO HOLDING on initial recognition.
MaxiPago
On September 3, 2014, ITAÚ UNIBANCO HOLDING, through its subsidiary Redecard S.A. (Rede) entered into a share purchase agreement with the controlling shareholders of MaxiPago Serviços de Internet S.A. (MaxiPago), a gateway company – network interconnection for mobile electronic payments.
On the same date, subscription and payment of 19,336 shares (33.33%) and acquisition of 24,174 shares (41.67%) were carried out, so that Rede became the holder of 43,510 common shares, representing 75% of total voting capital of MaxiPago.
After the compliance with the conditions precedent and approval by proper regulatory authorities, the operation was closed on January 8, 2015.
The difference between the amount paid and net assets at fair value resulted in the recognition of goodwill due to expected future profitability.
| Purchase price | 15 | |||
| (-) Fair value of identified assets and liabilities | (4 | ) | ||
| (=) Goodwill | 11 |
In the second semester of 2016, ITAÚ UNIBANCO HOLDING CONSOLIDATED, through its subsidiary Rede, increasead the capital of MaxiPago by 21.98 and acquired additional interest ownership of 3.02%, for the amount of R$ 2, and now holds 100% of MaxiPago’s capital stock.
| F-37 |
Note 4 - Cash and cash equivalents
For purposes of consolidated statements of cash flows, Cash and cash equivalents in this note comprises the following items:
| 12/31/2016 | 12/31/2015 | |||||||
| Cash and deposits on demand | 18,542 | 18,544 | ||||||
| Interbank deposits | 13,358 | 22,022 | ||||||
| Securities purchased under agreements to resell | 64,219 | 51,083 | ||||||
| Total | 96,119 | 91,649 | ||||||
Amounts related to interbank deposits and securities purchased under agreements to resell not included in cash equivalents are R$ 9,334 (R$ 8,503 at 12/31/2015) and R$ 200,832 (R$ 203,321 at 12/31/2015), respectively.
Note 5 - Central Bank compulsory deposits
| 12/31/2016 | 12/31/2015 | |||||||
| Non-interest bearing deposits | 3,002 | 3,790 | ||||||
| Interest-bearing deposits | 82,698 | 62,766 | ||||||
| Total | 85,700 | 66,556 | ||||||
Note 6 - Interbank deposits and securities purchased under agreements to resell
| 12/31/2016 | 12/31/2015 | |||||||||||||||||||||||
| Current | Non- current | Total | Current | Non- current | Total | |||||||||||||||||||
| Interbank deposits | 21,503 | 1,189 | 22,692 | 29,769 | 756 | 30,525 | ||||||||||||||||||
| Securities purchased under agreements to resell (*) | 264,740 | 311 | 265,051 | 254,404 | - | 254,404 | ||||||||||||||||||
| Total | 286,243 | 1,500 | 287,743 | 284,173 | 756 | 284,929 | ||||||||||||||||||
(*) The amounts of R$ 4,329 (R$ 9,461 at 12/31/2015) are pledged in guarantee of operations on BM&FBOVESPA S.A. - Bolsa de Valores, Mercadorias e Futuros and Central Bank and the amounts of R$ 178,070 (R$ 152,551 at 12/31/2015) are pledged in guarantee of repurchase agreement transactions, in conformity with the policies described in Note 2.4d.
| F-38 |
Note 7 – Financial assets held for trading and designated at fair value through profit or loss
a)Financial assets held for trading recognized at their fair value are presented in the following table:
| 12/31/2016 | 12/31/2015 | |||||||||||||||||||||||
| Accumulated gain / | Accumulated gain / | |||||||||||||||||||||||
| (loss) reflected in | (loss) reflected in | |||||||||||||||||||||||
| Cost | income | Fair value | Cost | income | Fair value | |||||||||||||||||||
| Investment funds | 1,170 | 3 | 1,173 | 1,110 | (59 | ) | 1,051 | |||||||||||||||||
| Brazilian government securities (1a) | 159,602 | 422 | 160,024 | 117,848 | (795 | ) | 117,053 | |||||||||||||||||
| Brazilian external debt bonds (1b) | 5,275 | 50 | 5,325 | 4,672 | (241 | ) | 4,431 | |||||||||||||||||
| Government securities – abroad (1c) | 3,714 | 21 | 3,735 | 1,140 | 9 | 1,149 | ||||||||||||||||||
| Argentina | 634 | 17 | 651 | 682 | 14 | 696 | ||||||||||||||||||
| Chile | 126 | 1 | 127 | 36 | - | 36 | ||||||||||||||||||
| Colombia | 2,666 | 3 | 2,669 | 77 | (5 | ) | 72 | |||||||||||||||||
| United States | 78 | - | 78 | 132 | - | 132 | ||||||||||||||||||
| Mexico | 6 | - | 6 | 3 | - | 3 | ||||||||||||||||||
| Paraguay | 88 | - | 88 | 68 | - | 68 | ||||||||||||||||||
| Uruguay | 32 | - | 32 | 40 | - | 40 | ||||||||||||||||||
| Other | 84 | - | 84 | 102 | - | 102 | ||||||||||||||||||
| Corporate securities (1d) | 34,425 | (34 | ) | 34,391 | 40,659 | (32 | ) | 40,627 | ||||||||||||||||
| Shares | 2,598 | (107 | ) | 2,491 | 2,231 | (70 | ) | 2,161 | ||||||||||||||||
| Bank deposit certificates | 1,824 | - | 1,824 | 2,583 | - | 2,583 | ||||||||||||||||||
| Debentures | 3,129 | 61 | 3,190 | 4,460 | 62 | 4,522 | ||||||||||||||||||
| Eurobonds and other | 654 | 8 | 662 | 1,015 | (24 | ) | 991 | |||||||||||||||||
| Financial credit bills | 25,893 | - | 25,893 | 30,367 | - | 30,367 | ||||||||||||||||||
| Other | 327 | 4 | 331 | 3 | - | 3 | ||||||||||||||||||
| Total (2) | 204,186 | 462 | 204,648 | 165,429 | (1,118 | ) | 164,311 | |||||||||||||||||
(1) Assets held for trading pledged as collateral of funding transactions of financial institutions and clients were: a) R$ 7,696 (R$ 7,384 at 12/31/2015), b) R$ 4,045 (R$ 3,541 at 12/31/2015), c) 1,183 (R$ 68 at 12/31/2015) and d) R$ 26 (R$ 15 at 12/31/2015), totaling R$ 12,950 (R$ 11,008 at 12/31/2015).
| (2) | In the period, there was no reclassification of held for trading financial assets to other categories of financial assets. |
| F-39 |
The cost and fair value of financial assets held for trading by maturity are as follows:
| 12/31/2016 | 12/31/2015 | |||||||||||||||
| Cost | Fair value | Cost | Fair value | |||||||||||||
| Current | 34,302 | 34,206 | 36,045 | 35,934 | ||||||||||||
| Non-stated maturity | 3,356 | 3,206 | 3,341 | 3,212 | ||||||||||||
| Up to one year | 30,946 | 31,000 | 32,704 | 32,722 | ||||||||||||
| Non-current | 169,884 | 170,442 | 129,384 | 128,377 | ||||||||||||
| From one to five years | 117,748 | 118,050 | 57,923 | 57,700 | ||||||||||||
| From five to ten years | 42,135 | 42,284 | 66,148 | 65,437 | ||||||||||||
| After ten years | 10,001 | 10,108 | 5,313 | 5,240 | ||||||||||||
| Total | 204,186 | 204,648 | 165,429 | 164,311 | ||||||||||||
Financial assets held for trading include assets with a fair value of R$ 142,081 (R$ 117,128 at 12/31/2015) that belong to investment funds wholly owned by Itaú Vida e Previdência S.A. The return of those assets (positive or negative) is fully transferred to customers of our PGBL and VGBL private pension plans whose premiums (less fees charged by us) are used by our subsidiary to purchase quotas of those investment funds.
b)Financial assets designated at fair value through profit or loss are presented in the following table:
| 12/31/2016 | ||||||||||||
| Cost | Accumulated gain / (loss) reflected in income | Fair value | ||||||||||
| Brazilian external debt bonds | 1,183 | 8 | 1,191 | |||||||||
| Total | 1,183 | 8 | 1,191 | |||||||||
| 12/31/2015 | ||||||||||||
| Cost | Accumulated gain/(loss) reflected in income | Fair value | ||||||||||
| Brazilian external debt bonds | 493 | 13 | 506 | |||||||||
| Government securities – abroad | 143 | (7 | ) | 136 | ||||||||
| Total | 636 | 6 | 642 | |||||||||
The cost and fair value by maturity of financial assets designated as fair value through profit or loss were as follows:
| 12/31/2016 | 12/31/2015 | |||||||||||||||
| Cost | Fair value | Cost | Fair value | |||||||||||||
| Current | 1,183 | 1,191 | - | - | ||||||||||||
| Up to one year | 1,183 | 1,191 | - | - | ||||||||||||
| Non-current | - | - | 636 | 642 | ||||||||||||
| From one to five years | - | 636 | 642 | |||||||||||||
| F-40 |
Note 8 – Derivatives
ITAÚ UNIBANCO HOLDING enters into derivative financial instruments with various counterparties to manage its overall exposures and to assist its customers in managing their own exposures.
Futures–Interest rate and foreign currency futures contracts are commitments to buy or sell a financialinstrument at a future date, at a contracted price or yield and may be settled in cash or through delivery. The notional amount represents the face value of the underlying instrument. Commodity futures contracts or financial instruments are commitments to buy or sell commodities (mainly gold, coffee and orange juice), at a future date, at a contracted price, which are settled in cash. The notional amount represents the quantity of such commodities multiplied by the future price at the contract date. Daily cash settlements of price movements are made for all instruments.
Forwards–Interest forward contracts are agreements to exchange payments on a specified future date, basedon a market change in interest rates from trade date to contract settlement date. Foreign exchange forward contracts represent agreements to exchange the currency of one country for the currency of another country at an agreed price, at an agreed settlement date. Financial instrument forward contracts are commitments to buy or sell a financial instrument on a future date at a contracted price and are settled in cash.
Swaps–Interest rate and foreign exchange swap contracts are commitments to settle in cash at a future dateor dates, based on differentials between specified financial indices (either two different interest rates in a single currency or two different rates each in a different currency), as applied to a notional principal amount. Swap contracts presented in Other in the table below correspond substantially to inflation rate swap contracts.
Options–Option contracts give the purchaser, for a fee, the right, but not the obligation, to buy or sell within alimited time a financial instrument including a flow of interest, foreign currencies, commodities, or financial instruments at a contracted price that may also be settled in cash, based on differentials between specific indices.
Credit Derivatives–Credit derivatives are financial instruments with value relating to the credit risk associatedto the debt issued by a third party (the reference entity), which permits that one party (the purchaser of the hedge) transfers the risk to the counterparty (the seller of the hedge). The seller of the hedge should make payments as set forth in the contract when the reference entity undergoes a credit event, such as bankruptcy, default or debt restructuring. The seller of the hedge receives a premium for the hedge, but, on the other hand, assumes the risk that the underlying asset referenced in the contract undergoes a credit event, and the seller would have to make the payment to the purchaser of the hedge, which could be the notional amount of the credit derivative.
The total value of margins pledged in guarantee by ITAÚ UNIBANCO HOLDING was R$ 12,246 (R$ 7,757 at 12/31/2015) and was basically comprised of government securities.
| F-41 |
The following table shows the composition of derivatives by index:
| Off-balance sheet notional amount | Balance sheet account receivable / (received) (payable) paid | Adjustment to market value (in results / stockholders’ equity) | Fair value | |||||||||||||
| 12/31/2016 | 12/31/2016 | 12/31/2016 | 12/31/2016 | |||||||||||||
| Futures contracts | 666,927 | 61 | 66 | 127 | ||||||||||||
| Purchase commitments | 200,752 | (237 | ) | 86 | (151 | ) | ||||||||||
| Commodities | 147 | - | - | - | ||||||||||||
| Indices | 47,295 | (213 | ) | 3 | (210 | ) | ||||||||||
| Interbank market | 109,649 | 1 | - | 1 | ||||||||||||
| Foreign currency | 31,141 | (25 | ) | 83 | 58 | |||||||||||
| Securities | 12,520 | - | - | - | ||||||||||||
| Commitments to sell | 466,175 | 298 | (20 | ) | 278 | |||||||||||
| Commodities | 284 | - | - | - | ||||||||||||
| Indices | 169,930 | 306 | (1 | ) | 305 | |||||||||||
| Interbank market | 213,991 | (11 | ) | 1 | (10 | ) | ||||||||||
| Foreign currency | 70,719 | 3 | (22 | ) | (19 | ) | ||||||||||
| Fixed rate | 941 | - | 2 | 2 | ||||||||||||
| Securities | 10,275 | - | - | - | ||||||||||||
| Other | 35 | - | - | - | ||||||||||||
| Swap contracts | (4,446 | ) | 1,767 | (2,679 | ) | |||||||||||
| Asset position | 471,221 | 6,602 | 3,940 | 10,542 | ||||||||||||
| Commodities | 5 | - | - | - | ||||||||||||
| Indices | 196,505 | 794 | 456 | 1,250 | ||||||||||||
| Interbank market | 47,210 | 1,897 | 7 | 1,904 | ||||||||||||
| Foreign currency | 13,582 | 1,136 | (1 | ) | 1,135 | |||||||||||
| Floating rate | 38,262 | (21 | ) | 1,471 | 1,450 | |||||||||||
| Fixed rate | 175,609 | 2,795 | 2,007 | 4,802 | ||||||||||||
| Securities | 12 | - | - | - | ||||||||||||
| Other | 36 | 1 | - | 1 | ||||||||||||
| Liability position | 475,667 | (11,048 | ) | (2,173 | ) | (13,221 | ) | |||||||||
| Commodities | 131 | - | - | - | ||||||||||||
| Indices | 147,560 | (2,729 | ) | (2,115 | ) | (4,844 | ) | |||||||||
| Interbank market | 36,554 | (328 | ) | (68 | ) | (396 | ) | |||||||||
| Foreign currency | 21,156 | (915 | ) | 17 | (898 | ) | ||||||||||
| Floating rate | 36,438 | (140 | ) | (1,204 | ) | (1,344 | ) | |||||||||
| Fixed rate | 233,780 | (6,926 | ) | 1,195 | (5,731 | ) | ||||||||||
| Securities | 20 | (10 | ) | 2 | (8 | ) | ||||||||||
| Other | 28 | - | - | - | ||||||||||||
| Option contracts | 583,527 | (2,108 | ) | 2,348 | 240 | |||||||||||
| Purchase commitments – long position | 163,069 | 1,490 | (625 | ) | 865 | |||||||||||
| Commodities | 404 | 16 | 1 | 17 | ||||||||||||
| Indices | 99,978 | 111 | (8 | ) | 103 | |||||||||||
| Interbank market | 1,247 | 1 | 20 | 21 | ||||||||||||
| Foreign currency | 45,106 | 1,205 | (835 | ) | 370 | |||||||||||
| Fixed rate | 11 | - | - | - | ||||||||||||
| Securities | 16,254 | 150 | 187 | 337 | ||||||||||||
| Other | 69 | 7 | 10 | 17 | ||||||||||||
| Commitments to sell – long position | 142,234 | 1,713 | 2,214 | 3,927 | ||||||||||||
| Commodities | 162 | 4 | 5 | 9 | ||||||||||||
| Indices | 92,088 | 106 | (9 | ) | 97 | |||||||||||
| Interbank market | 7,533 | 6 | (2 | ) | 4 | |||||||||||
| Foreign currency | 33,078 | 1,348 | 2,101 | 3,449 | ||||||||||||
| Fixed rate | 145 | 6 | (3 | ) | 3 | |||||||||||
| Securities | 9,211 | 243 | 122 | 365 | ||||||||||||
| Other | 17 | - | - | - | ||||||||||||
| Purchase commitments – short position | 129,392 | (2,674 | ) | 1,721 | (953 | ) | ||||||||||
| Commodities | 239 | (3 | ) | (8 | ) | (11 | ) | |||||||||
| Indices | 83,283 | (161 | ) | 29 | (132 | ) | ||||||||||
| Interbank market | 95 | - | - | - | ||||||||||||
| Foreign currency | 39,900 | (2,447 | ) | 1,875 | (572 | ) | ||||||||||
| Fixed rate | 94 | (1 | ) | - | (1 | ) | ||||||||||
| Securities | 5,599 | (54 | ) | (166 | ) | (220 | ) | |||||||||
| Other | 182 | (8 | ) | (9 | ) | (17 | ) | |||||||||
| Commitments to sell – short position | 148,832 | (2,637 | ) | (962 | ) | (3,599 | ) | |||||||||
| Commodities | 268 | (17 | ) | (3 | ) | (20 | ) | |||||||||
| Indices | 104,268 | (137 | ) | 51 | (86 | ) | ||||||||||
| Interbank market | 3,438 | (10 | ) | 2 | (8 | ) | ||||||||||
| Foreign currency | 34,132 | (2,258 | ) | (884 | ) | (3,142 | ) | |||||||||
| Fixed rate | 28 | (1 | ) | - | (1 | ) | ||||||||||
| Securities | 6,681 | (214 | ) | (128 | ) | (342 | ) | |||||||||
| Other | 17 | - | - | - | ||||||||||||
| F-42 |
| Off-balance sheet notional amount | Balance sheet account receivable / (received) (payable) paid | Adjustment to market value (in results / stockholders’ equity) | Fair value | |||||||||||||
| 12/31/2016 | 12/31/2016 | 12/31/2016 | 12/31/2016 | |||||||||||||
| Forward operations (onshore) | 13,429 | 1,446 | (5 | ) | 1,441 | |||||||||||
| Purchases receivable | 1,186 | 1,240 | (5 | ) | 1,235 | |||||||||||
| Floating rate | 546 | 545 | 1 | 546 | ||||||||||||
| Fixed rate | 395 | 450 | - | 450 | ||||||||||||
| Securities | 245 | 245 | (6 | ) | 239 | |||||||||||
| Purchases payable | - | (971 | ) | - | (971 | ) | ||||||||||
| Floating rate | - | (545 | ) | - | (545 | ) | ||||||||||
| Fixed rate | - | (421 | ) | - | (421 | ) | ||||||||||
| Securities | - | (5 | ) | - | (5 | ) | ||||||||||
| Sales receivable | 8,139 | 3,734 | 2 | 3,736 | ||||||||||||
| Interbank market | 4,396 | 8 | - | 8 | ||||||||||||
| Floating rate | 300 | 300 | - | 300 | ||||||||||||
| Fixed rate | 2,250 | 2,257 | - | 2,257 | ||||||||||||
| Securities | 1,193 | 1,169 | 2 | 1,171 | ||||||||||||
| Sales deliverable | 4,104 | (2,557 | ) | (2 | ) | (2,559 | ) | |||||||||
| Interbank market | 4,104 | - | (2 | ) | (2 | ) | ||||||||||
| Floating rate | - | (300 | ) | - | (300 | ) | ||||||||||
| Fixed rate | - | (2,257 | ) | - | (2,257 | ) | ||||||||||
| Credit derivatives | 12,100 | - | 34 | 34 | ||||||||||||
| Asset position | 5,306 | 190 | (9 | ) | 181 | |||||||||||
| Foreign currency | 3,876 | 188 | (56 | ) | 132 | |||||||||||
| Fixed rate | 114 | - | 2 | 2 | ||||||||||||
| Securities | 1,161 | 2 | 41 | 43 | ||||||||||||
| Other | 155 | - | 4 | 4 | ||||||||||||
| Liability position | 6,794 | (190 | ) | 43 | (147 | ) | ||||||||||
| Foreign currency | 5,487 | (189 | ) | 70 | (119 | ) | ||||||||||
| Fixed rate | 33 | (1 | ) | - | (1 | ) | ||||||||||
| Securities | 974 | - | (21 | ) | (21 | ) | ||||||||||
| Other | 300 | - | (6 | ) | (6 | ) | ||||||||||
| Forwards operations (offshore) | 250,775 | 472 | 162 | 634 | ||||||||||||
| Asset position | 134,049 | 3,283 | 176 | 3,459 | ||||||||||||
| Commodities | 206 | 18 | 1 | 19 | ||||||||||||
| Indices | 148 | 9 | - | 9 | ||||||||||||
| Foreign currency | 133,693 | 3,256 | 175 | 3,431 | ||||||||||||
| Securities | 2 | - | - | - | ||||||||||||
| Liability position | 116,726 | (2,811 | ) | (14 | ) | (2,825 | ) | |||||||||
| Commodities | 244 | (27 | ) | 2 | (25 | ) | ||||||||||
| Indices | 27 | - | - | - | ||||||||||||
| Foreign currency | 116,437 | (2,784 | ) | (16 | ) | (2,800 | ) | |||||||||
| Securities | 18 | - | - | - | ||||||||||||
| Check of swap | 1,493 | (326 | ) | 61 | (265 | ) | ||||||||||
| Asset position - Foreign currency | 923 | 18 | 70 | 88 | ||||||||||||
| Liability position - Interbank market | 570 | (344 | ) | (9 | ) | (353 | ) | |||||||||
| Other derivative financial instruments | 4,217 | 45 | (44 | ) | 1 | |||||||||||
| Asset position | 2,569 | 48 | 23 | 71 | ||||||||||||
| Foreign currency | 148 | (3 | ) | 8 | 5 | |||||||||||
| Fixed rate | 1,174 | 48 | (5 | ) | 43 | |||||||||||
| Securities | 940 | 3 | 14 | 17 | ||||||||||||
| Other | 307 | - | 6 | 6 | ||||||||||||
| Liability position | 1,648 | (3 | ) | (67 | ) | (70 | ) | |||||||||
| Commodities | 2 | - | - | - | ||||||||||||
| Foreign currency | 84 | - | (32 | ) | (32 | ) | ||||||||||
| Fixed rate | 81 | (1 | ) | (1 | ) | (2 | ) | |||||||||
| Securities | 1,317 | (2 | ) | (30 | ) | (32 | ) | |||||||||
| Other | 164 | - | (4 | ) | (4 | ) | ||||||||||
| Asset | 18,379 | 5,852 | 24,231 | |||||||||||||
| Liability | (23,235 | ) | (1,463 | ) | (24,698 | ) | ||||||||||
| Total | (4,856 | ) | 4,389 | (467 | ) | |||||||||||
| Derivative contracts mature as follows (in days): | ||||||||||||||||||||
| Off-balance sheet – notional amount | 0 - 30 | 31 - 180 | 181 - 365 | Over 365 | 12/31/2016 | |||||||||||||||
| Futures contractsK | 184,309 | 221,487 | 50,749 | 210,382 | 666,927 | |||||||||||||||
| Swaps contracts - difference payable | 17,588 | 67,405 | 50,000 | 329,626 | 464,619 | |||||||||||||||
| Options | 191,242 | 191,998 | 175,220 | 25,067 | 583,527 | |||||||||||||||
| Forwards (onshore) | 9,197 | 4,230 | 2 | - | 13,429 | |||||||||||||||
| Credit derivatives | - | 1,233 | 1,098 | 9,769 | 12,100 | |||||||||||||||
| Forwards (offshore) | 63,764 | 124,695 | 42,700 | 19,616 | 250,775 | |||||||||||||||
| Check of swap | - | 180 | 913 | 400 | 1,493 | |||||||||||||||
| Other derivative financial instruments | 32 | 579 | 418 | 3,188 | 4,217 | |||||||||||||||
| F-43 |
The following table shows the composition of derivatives by index:
| Off-balance sheet notional amount | Balance sheet account receivable / (received) (payable) paid | Adjustment to market value (in results / stockholders’ equity) | Fair value | |||||||||||||
| 12/31/2015 | 12/31/2015 | 12/31/2015 | 12/31/2015 | |||||||||||||
| Futures contracts | 589,451 | (71 | ) | 600 | 529 | |||||||||||
| Purchase commitments | 189,037 | 702 | 624 | 1,326 | ||||||||||||
| Commodities | 316 | - | - | - | ||||||||||||
| Indices | 60,485 | 702 | (6 | ) | 696 | |||||||||||
| Interbank market | 88,411 | (40 | ) | 1 | (39 | ) | ||||||||||
| Foreign currency | 34,228 | 40 | 629 | 669 | ||||||||||||
| Securities | 5,508 | - | - | - | ||||||||||||
| Other | 89 | - | - | - | ||||||||||||
| Commitments to sell | 400,414 | (773 | ) | (24 | ) | (797 | ) | |||||||||
| Commodities | 158 | - | - | - | ||||||||||||
| Indices | 73,466 | (754 | ) | 8 | (746 | ) | ||||||||||
| Interbank market | 190,855 | 60 | - | 60 | ||||||||||||
| Foreign currency | 129,357 | (79 | ) | (32 | ) | (111 | ) | |||||||||
| Securities | 6,260 | - | - | - | ||||||||||||
| Other | 318 | - | - | - | ||||||||||||
| Swap contracts | (8,848 | ) | 1,664 | (7,184 | ) | |||||||||||
| Asset position | 327,834 | 4,764 | 4,383 | 9,147 | ||||||||||||
| Commodities | 4 | - | - | - | ||||||||||||
| Indices | 134,426 | (18 | ) | 1,050 | 1,032 | |||||||||||
| Interbank market | 60,888 | 426 | 818 | 1,244 | ||||||||||||
| Foreign currency | 14,668 | 3,068 | 1,234 | 4,302 | ||||||||||||
| Floating rate | 11,491 | 377 | 143 | 520 | ||||||||||||
| Fixed rate | 106,316 | 911 | 1,138 | 2,049 | ||||||||||||
| Securities | 25 | - | - | - | ||||||||||||
| Other | 16 | - | - | - | ||||||||||||
| Liability position | 336,682 | (13,612 | ) | (2,719 | ) | (16,331 | ) | |||||||||
| Commodities | 15 | - | - | - | ||||||||||||
| Indices | 100,826 | (2,316 | ) | (311 | ) | (2,627 | ) | |||||||||
| Interbank market | 37,889 | (233 | ) | (1,167 | ) | (1,400 | ) | |||||||||
| Foreign currency | 33,944 | (6,084 | ) | (756 | ) | (6,840 | ) | |||||||||
| Floating rate | 11,195 | (155 | ) | (560 | ) | (715 | ) | |||||||||
| Fixed rate | 152,593 | (4,795 | ) | 70 | (4,725 | ) | ||||||||||
| Securities | 64 | (29 | ) | 5 | (24 | ) | ||||||||||
| Other | 156 | - | - | - | ||||||||||||
| Option contracts | 285,405 | 136 | (336 | ) | (200 | ) | ||||||||||
| Purchase commitments – long position | 61,880 | 2,288 | 1,661 | 3,949 | ||||||||||||
| Commodities | 481 | 25 | (11 | ) | 14 | |||||||||||
| Indices | 5,505 | 66 | (25 | ) | 41 | |||||||||||
| Interbank market | 5,116 | 15 | 6 | 21 | ||||||||||||
| Foreign currency | 44,802 | 2,073 | 1,474 | 3,547 | ||||||||||||
| Fixed rate | 6 | - | - | - | ||||||||||||
| Securities | 5,872 | 101 | 208 | 309 | ||||||||||||
| Other | 98 | 8 | 9 | 17 | ||||||||||||
| Commitments to sell – long position | 85,099 | 1,481 | 153 | 1,634 | ||||||||||||
| Commodities | 159 | 9 | 12 | 21 | ||||||||||||
| Indices | 27,824 | 133 | 16 | 149 | ||||||||||||
| Interbank market | 12,347 | 16 | (16 | ) | - | |||||||||||
| Foreign currency | 36,526 | 1,024 | (557 | ) | 467 | |||||||||||
| Fixed rate | 179 | 8 | (1 | ) | 7 | |||||||||||
| Securities | 8,015 | 291 | 698 | 989 | ||||||||||||
| Other | 49 | - | 1 | 1 | ||||||||||||
| Purchase commitments – short position | 58,929 | (2,020 | ) | (2,141 | ) | (4,161 | ) | |||||||||
| Commodities | 249 | (6 | ) | - | (6 | ) | ||||||||||
| Indices | 5,418 | (66 | ) | 21 | (45 | ) | ||||||||||
| Interbank market | 5,146 | (21 | ) | (30 | ) | (51 | ) | |||||||||
| Foreign currency | 42,750 | (1,864 | ) | (1,902 | ) | (3,766 | ) | |||||||||
| Fixed rate | 112 | - | - | - | ||||||||||||
| Securities | 5,156 | (55 | ) | (221 | ) | (276 | ) | |||||||||
| Other | 98 | (8 | ) | (9 | ) | (17 | ) | |||||||||
| Commitments to sell – short position | 79,497 | (1,613 | ) | (9 | ) | (1,622 | ) | |||||||||
| Commodities | 290 | (22 | ) | (39 | ) | (61 | ) | |||||||||
| Indices | 30,277 | (158 | ) | (23 | ) | (181 | ) | |||||||||
| Interbank market | 7,694 | (10 | ) | 10 | - | |||||||||||
| Foreign currency | 33,751 | (1,147 | ) | 740 | (407 | ) | ||||||||||
| Fixed rate | 22 | (1 | ) | - | (1 | ) | ||||||||||
| Securities | 7,414 | (275 | ) | (696 | ) | (971 | ) | |||||||||
| Other | 49 | - | (1 | ) | (1 | ) | ||||||||||
| F-44 |
| Off-balance sheet notional amount | Balance sheet account receivable / (received) (payable) paid | Adjustment to market value (in results / stockholders equity) | Fair value | |||||||||||||
| 12/31/2015 | 12/31/2015 | 12/31/2015 | 12/31/2015 | |||||||||||||
| Forwards operations (onshore) | 40,227 | 2,253 | 80 | 2,333 | ||||||||||||
| Purchases receivable | 516 | 636 | - | 636 | ||||||||||||
| Foreign currency | - | 1 | - | 1 | ||||||||||||
| Floating rate | 354 | 353 | - | 353 | ||||||||||||
| Fixed rate | 154 | 273 | - | 273 | ||||||||||||
| Securities | 8 | 9 | - | 9 | ||||||||||||
| Purchases payable | - | (508 | ) | - | (508 | ) | ||||||||||
| Floating rate | - | (353 | ) | - | (353 | ) | ||||||||||
| Fixed rate | - | (154 | ) | - | (154 | ) | ||||||||||
| Securities | - | (1 | ) | - | (1 | ) | ||||||||||
| Sales receivable | 23,208 | 2,448 | 82 | 2,530 | ||||||||||||
| Interbank market | 20,697 | - | 73 | 73 | ||||||||||||
| Floating rate | 164 | 164 | - | 164 | ||||||||||||
| Fixed rate | 153 | 157 | - | 157 | ||||||||||||
| Securities | 2,194 | 2,127 | 9 | 2,136 | ||||||||||||
| Sales deliverable | 16,503 | (323 | ) | (2 | ) | (325 | ) | |||||||||
| Interbank market | 16,503 | - | (3 | ) | (3 | ) | ||||||||||
| Foreign currency | - | (2 | ) | - | (2 | ) | ||||||||||
| Floating rate | - | (164 | ) | 1 | (163 | ) | ||||||||||
| Fixed rate | - | (157 | ) | - | (157 | ) | ||||||||||
| Credit derivatives | 12,662 | 58 | (319 | ) | (261 | ) | ||||||||||
| Asset position | 4,605 | 353 | 261 | 614 | ||||||||||||
| Foreign currency | 3,625 | 353 | 212 | 565 | ||||||||||||
| Securities | 788 | - | 45 | 45 | ||||||||||||
| Other | 192 | - | 4 | 4 | ||||||||||||
| Liability position | 8,057 | (295 | ) | (580 | ) | (875 | ) | |||||||||
| Foreign currency | 4,360 | (290 | ) | (267 | ) | (557 | ) | |||||||||
| Fixed rate | 547 | (6 | ) | (3 | ) | (9 | ) | |||||||||
| Securities | 2,763 | 1 | (275 | ) | (274 | ) | ||||||||||
| Other | 387 | - | (35 | ) | (35 | ) | ||||||||||
| Forwards operations (offshore) | 148,477 | 203 | 85 | 288 | ||||||||||||
| Asset position | 71,227 | 3,285 | 145 | 3,430 | ||||||||||||
| Commodities | 419 | 47 | - | 47 | ||||||||||||
| Indices | 22 | 1 | - | 1 | ||||||||||||
| Foreign currency | 70,786 | 3,237 | 145 | 3,382 | ||||||||||||
| Liability position | 77,250 | (3,082 | ) | (60 | ) | (3,142 | ) | |||||||||
| Commodities | 152 | (13 | ) | 2 | (11 | ) | ||||||||||
| Indices | 77 | (3 | ) | - | (3 | ) | ||||||||||
| Foreign currency | 77,020 | (3,066 | ) | (62 | ) | (3,128 | ) | |||||||||
| Securities | 1 | - | - | - | ||||||||||||
| Check of swap | 1,676 | (330 | ) | 140 | (190 | ) | ||||||||||
| Asset position - Foreign currency | 1,106 | 199 | 156 | 355 | ||||||||||||
| Liability position - Interbank market | 570 | (529 | ) | (16 | ) | (545 | ) | |||||||||
| Other derivative financial instruments | 16,651 | 117 | 252 | 369 | ||||||||||||
| Asset position | 15,508 | 2,964 | 967 | 3,931 | ||||||||||||
| Foreign currency | 10,468 | 2,883 | 588 | 3,471 | ||||||||||||
| Fixed rate | 1,464 | 71 | 63 | 134 | ||||||||||||
| Securities | 3,113 | 10 | 279 | 289 | ||||||||||||
| Other | 463 | - | 37 | 37 | ||||||||||||
| Liability position | 1,143 | (2,847 | ) | (715 | ) | (3,562 | ) | |||||||||
| Foreign currency | 283 | (2,847 | ) | (687 | ) | (3,534 | ) | |||||||||
| Securities | 743 | - | (25 | ) | (25 | ) | ||||||||||
| Other | 117 | - | (3 | ) | (3 | ) | ||||||||||
| Asset | 18,347 | 8,408 | 26,755 | |||||||||||||
| Liability | (24,829 | ) | (6,242 | ) | (31,071 | ) | ||||||||||
| Total | (6,482 | ) | 2,166 | (4,316 | ) | |||||||||||
| Derivative contracts mature as follows (in days): | ||||||||||||||||||||
| Off-balance sheet - notional amount | 0 - 30 | 31 - 180 | 181 - 365 | Over 365 | 12/31/2015 | |||||||||||||||
| Futures contracts | 152,087 | 138,545 | 74,365 | 224,454 | 589,451 | |||||||||||||||
| Swaps contracts - difference payable | 10,654 | 39,702 | 46,157 | 226,557 | 323,070 | |||||||||||||||
| Options | 93,587 | 123,391 | 40,860 | 27,567 | 285,405 | |||||||||||||||
| Forwards (onshore) | 6,591 | 22,349 | 10,118 | 1,169 | 40,227 | |||||||||||||||
| Credit derivatives | - | 1,436 | 428 | 10,798 | 12,662 | |||||||||||||||
| Forwards (offshore) | 43,651 | 70,688 | 23,365 | 10,773 | 148,477 | |||||||||||||||
| Check of swap | - | - | - | 1,676 | 1,676 | |||||||||||||||
| Other derivative financial instruments | 1,550 | 3,254 | 502 | 11,345 | 16,651 | |||||||||||||||
| F-45 |
Derivative financial instruments
See below the composition of the Derivative financial instruments portfolio (assets and liabilities) by type of instrument, stated fair value, and by maturity.
| 12/31/2016 | ||||||||||||||||||||||||||||||||
| Fair value | % | 0-30 days | 31-90 days | 91-180 days | 181-365 days | 366-720 days | Over 720 days | |||||||||||||||||||||||||
| Assets | ||||||||||||||||||||||||||||||||
| Futures contracts | 127 | 0.5 | 85 | 51 | 13 | (18 | ) | (6 | ) | 2 | ||||||||||||||||||||||
| BM&FBOVESPA | 128 | 0.5 | 85 | 52 | 13 | (18 | ) | (6 | ) | 2 | ||||||||||||||||||||||
| Financial institutions | (1 | ) | 0.0 | - | (1 | ) | - | - | - | - | ||||||||||||||||||||||
| Swaps – difference receivable | 10,542 | 43.5 | 828 | 723 | 585 | 659 | 1,497 | 6,250 | ||||||||||||||||||||||||
| BM&FBOVESPA | 1,417 | 5.8 | 178 | 156 | 218 | 58 | 206 | 601 | ||||||||||||||||||||||||
| Companies | 4,585 | 18.9 | 322 | 354 | 227 | 390 | 764 | 2,528 | ||||||||||||||||||||||||
| Financial institutions | 4,256 | 17.6 | 319 | 197 | 122 | 196 | 447 | 2,975 | ||||||||||||||||||||||||
| Individuals | 284 | 1.2 | 9 | 16 | 18 | 15 | 80 | 146 | ||||||||||||||||||||||||
| Option premiums | 4,792 | 19.7 | 354 | 582 | 759 | 1,540 | 1,397 | 160 | ||||||||||||||||||||||||
| BM&FBOVESPA | 1,679 | 6.9 | 144 | 209 | 182 | 1,075 | 41 | 28 | ||||||||||||||||||||||||
| Companies | 507 | 2.1 | 23 | 19 | 88 | 134 | 188 | 55 | ||||||||||||||||||||||||
| Financial institutions | 2,603 | 10.7 | 187 | 354 | 488 | 329 | 1,168 | 77 | ||||||||||||||||||||||||
| Individuals | 3 | 0.0 | - | - | 1 | 2 | - | - | ||||||||||||||||||||||||
| Forwards (onshore) | 4,971 | 20.6 | 3,947 | 735 | 287 | 2 | - | - | ||||||||||||||||||||||||
| BM&FBOVESPA | 1,418 | 5.9 | 427 | 703 | 286 | 2 | - | - | ||||||||||||||||||||||||
| Companies | 2,783 | 11.5 | 2,750 | 32 | 1 | - | - | - | ||||||||||||||||||||||||
| Financial institutions | 770 | 3.2 | 770 | - | - | - | - | - | ||||||||||||||||||||||||
| Credit derivatives - financial Institutions | 181 | 0.7 | - | - | 3 | 5 | 13 | 160 | ||||||||||||||||||||||||
| Forwards (offshore) | 3,459 | 14.3 | 601 | 1,252 | 444 | 579 | 245 | 338 | ||||||||||||||||||||||||
| BM&FBOVESPA | 305 | 1.3 | 82 | 123 | 56 | 44 | - | - | ||||||||||||||||||||||||
| Companies | 1,243 | 5.1 | 185 | 344 | 216 | 231 | 200 | 67 | ||||||||||||||||||||||||
| Financial institutions | 1,908 | 7.9 | 333 | 783 | 172 | 304 | 45 | 271 | ||||||||||||||||||||||||
| Individuals | 3 | 0.0 | 1 | 2 | - | - | - | - | ||||||||||||||||||||||||
| Check of swap - Companies | 88 | 0.4 | - | - | 35 | 53 | - | - | ||||||||||||||||||||||||
| Other | 71 | 0.3 | - | - | 1 | 6 | 13 | 51 | ||||||||||||||||||||||||
| Companies | 29 | 0.1 | - | - | - | 5 | 8 | 16 | ||||||||||||||||||||||||
| Financial institutions | 42 | 0.2 | - | - | 1 | 1 | 5 | 35 | ||||||||||||||||||||||||
| Total (*) | 24,231 | 100.0 | 5,815 | 3,343 | 2,127 | 2,826 | 3,159 | 6,961 | ||||||||||||||||||||||||
| % per maturity term | 24.0 | 13.8 | 8.8 | 11.7 | 13.0 | 28.7 | ||||||||||||||||||||||||||
(*) Of the total asset portfolio of Derivative Financial Instruments, R$ 14,111 refers to current and R$ 10,120 to non-current.
| F-46 |
Derivative financial instruments
See below the composition of the Derivative Financial Instruments portfolio (assets and liabilities) by type of instrument, stated fair value and by maturity.
| 12/31/2015 | ||||||||||||||||||||||||||||||||
| Fair value | % | 0-30 days | 31-90 days | 91-180 days | 181-365 days | 366-720 days | Over 720 days | |||||||||||||||||||||||||
| Assets | ||||||||||||||||||||||||||||||||
| Futures - BM&FBOVESPA | 529 | 2.0 | 639 | (155 | ) | (18 | ) | (49 | ) | 76 | 36 | |||||||||||||||||||||
| Swaps – difference receivable | 9,147 | 34.2 | 666 | 224 | 403 | 1,513 | 1,935 | 4,406 | ||||||||||||||||||||||||
| BM&FBOVESPA | 662 | 2.5 | 17 | 13 | 25 | 104 | 126 | 377 | ||||||||||||||||||||||||
| Companies | 5,127 | 19.1 | 627 | 29 | 46 | 1,037 | 838 | 2,550 | ||||||||||||||||||||||||
| Financial institutions | 2,826 | 10.6 | 21 | 177 | 325 | 329 | 657 | 1,317 | ||||||||||||||||||||||||
| Individuals | 532 | 2.0 | 1 | 5 | 7 | 43 | 314 | 162 | ||||||||||||||||||||||||
| Option premiums | 5,583 | 20.8 | 2,413 | 676 | 609 | 715 | 692 | 478 | ||||||||||||||||||||||||
| BM&FBOVESPA | 2,597 | 9.7 | 2,074 | 228 | 140 | 113 | 31 | 11 | ||||||||||||||||||||||||
| Companies | 1,278 | 4.8 | 118 | 147 | 131 | 194 | 412 | 276 | ||||||||||||||||||||||||
| Financial institutions | 1,697 | 6.3 | 221 | 300 | 337 | 399 | 249 | 191 | ||||||||||||||||||||||||
| Individuals | 11 | 0.0 | - | 1 | 1 | 9 | - | - | ||||||||||||||||||||||||
| Forwards (onshore) | 3,166 | 11.9 | 1,204 | 1,417 | 538 | 6 | 1 | - | ||||||||||||||||||||||||
| BM&FBOVESPA | 2,218 | 8.3 | 368 | 1,313 | �� | 530 | 6 | 1 | - | |||||||||||||||||||||||
| Companies | 530 | 2.0 | 418 | 104 | 8 | - | - | - | ||||||||||||||||||||||||
| Financial institutions | 418 | 1.6 | 418 | - | - | - | - | - | ||||||||||||||||||||||||
| Credit derivatives - financial institutions | 614 | 2.3 | - | - | 2 | 2 | 26 | 584 | ||||||||||||||||||||||||
| Forwards (offshore) | 3,430 | 12.8 | 1,030 | 794 | 526 | 434 | 233 | 413 | ||||||||||||||||||||||||
| BM&FBOVESPA | 47 | 0.2 | 3 | 19 | 7 | 18 | - | - | ||||||||||||||||||||||||
| Companies | 1,453 | 5.4 | 177 | 327 | 288 | 294 | 135 | 232 | ||||||||||||||||||||||||
| Financial institutions | 1,927 | 7.2 | 850 | 447 | 230 | 121 | 98 | 181 | ||||||||||||||||||||||||
| Individuals | 3 | 0.0 | - | 1 | 1 | 1 | - | - | ||||||||||||||||||||||||
| Check of swap - Companies | 355 | 1.3 | - | - | - | - | 355 | - | ||||||||||||||||||||||||
| Other | 3,931 | 14.7 | 88 | 1,269 | 867 | 32 | 112 | 1,563 | ||||||||||||||||||||||||
| Companies | 415 | 1.6 | 3 | 13 | 14 | 14 | 74 | 297 | ||||||||||||||||||||||||
| Financial institutions | 3,516 | 13.1 | 85 | 1,256 | 853 | 18 | 38 | 1,266 | ||||||||||||||||||||||||
| Total (*) | 26,755 | 100.0 | 6,040 | 4,225 | 2,927 | 2,653 | 3,430 | 7,480 | ||||||||||||||||||||||||
| % per maturity term | 22.6 | 15.8 | 10.9 | 9.9 | 12.8 | 28.0 | ||||||||||||||||||||||||||
(*) Of the total asset portfolio of Derivative Financial Instruments, R$ 15,845 refers to current and R$ 10,910 to non-current.
| F-47 |
| 12/31/2016 | ||||||||||||||||||||||||||||||||
| Fair value | % | 0 - 30 days | 31 - 90 days | 91 - 180 days | 181 - 365 days | 366 - 720 days | Over 720 days | |||||||||||||||||||||||||
| Liabilities | ||||||||||||||||||||||||||||||||
| Swaps – Difference payable | (13,221 | ) | 53.4 | (461 | ) | (228 | ) | (742 | ) | (732 | ) | (2,352 | ) | (8,706 | ) | |||||||||||||||||
| BM&FBOVESPA | (1,614 | ) | 6.5 | (304 | ) | (75 | ) | (124 | ) | (97 | ) | (125 | ) | (889 | ) | |||||||||||||||||
| Companies | (2,531 | ) | 10.2 | (67 | ) | (32 | ) | (90 | ) | (248 | ) | (573 | ) | (1,521 | ) | |||||||||||||||||
| Financial institutions | (4,106 | ) | 16.6 | (79 | ) | (103 | ) | (128 | ) | (311 | ) | (554 | ) | (2,931 | ) | |||||||||||||||||
| Individuals | (4,970 | ) | 20.1 | (11 | ) | (18 | ) | (400 | ) | (76 | ) | (1,100 | ) | (3,365 | ) | |||||||||||||||||
| Option premiums | (4,552 | ) | 18.5 | (837 | ) | (659 | ) | (516 | ) | (713 | ) | (1,116 | ) | (711 | ) | |||||||||||||||||
| BM&FBOVESPA | (1,437 | ) | 5.8 | (524 | ) | (216 | ) | (201 | ) | (455 | ) | (30 | ) | (11 | ) | |||||||||||||||||
| Companies | (631 | ) | 2.6 | (48 | ) | (28 | ) | (103 | ) | (170 | ) | (200 | ) | (82 | ) | |||||||||||||||||
| Financial institutions | (2,463 | ) | 10.0 | (265 | ) | (414 | ) | (208 | ) | (81 | ) | (882 | ) | (613 | ) | |||||||||||||||||
| Individuals | (21 | ) | 0.1 | - | (1 | ) | (4 | ) | (7 | ) | (4 | ) | (5 | ) | ||||||||||||||||||
| Forwards (onshore) | (3,530 | ) | 14.3 | (3,530 | ) | - | - | - | - | - | ||||||||||||||||||||||
| BM&FBOVESPA | (6 | ) | 0.0 | (6 | ) | - | - | - | - | - | ||||||||||||||||||||||
| Companies | (2,754 | ) | 11.2 | (2,754 | ) | - | - | - | - | - | ||||||||||||||||||||||
| Financial institutions | (770 | ) | 3.1 | (770 | ) | - | - | - | - | - | ||||||||||||||||||||||
| Credit derivatives - Financial institutions | (147 | ) | 0.6 | - | - | - | (2 | ) | (10 | ) | (135 | ) | ||||||||||||||||||||
| Forwards (offshore) | (2,825 | ) | 11.5 | (466 | ) | (881 | ) | (527 | ) | (299 | ) | (99 | ) | (553 | ) | |||||||||||||||||
| BM&FBOVESPA | (259 | ) | 1.0 | (102 | ) | (76 | ) | (41 | ) | (40 | ) | - | - | |||||||||||||||||||
| Companies | (648 | ) | 2.6 | (166 | ) | (158 | ) | (124 | ) | (129 | ) | (37 | ) | (34 | ) | |||||||||||||||||
| Financial institutions | (1,916 | ) | 7.9 | (198 | ) | (647 | ) | (360 | ) | (130 | ) | (62 | ) | (519 | ) | |||||||||||||||||
| Individuals | (2 | ) | 0.0 | - | - | (2 | ) | - | - | - | ||||||||||||||||||||||
| Check of swap - Companies | (353 | ) | 1.4 | - | - | - | (214 | ) | (139 | ) | - | |||||||||||||||||||||
| Other - Companies | (70 | ) | 0.3 | - | (1 | ) | (1 | ) | (1 | ) | (10 | ) | (57 | ) | ||||||||||||||||||
| Total (*) | (24,698 | ) | 100.0 | (5,294 | ) | (1,769 | ) | (1,786 | ) | (1,961 | ) | (3,726 | ) | (10,162 | ) | |||||||||||||||||
| % per maturity term | 21.4 | 7.2 | 7.2 | 7.9 | 15.1 | 41.2 | ||||||||||||||||||||||||||
(*) Of the total liability portfolio of Derivative Financial Instruments, R$ (10,810) refers to current and R$ (13,888) to non-current.
| F-48 |
| 12/31/2015 | ||||||||||||||||||||||||||||||||
| Fair value | % | 0 - 30 days | 31 - 90 days | 91 - 180 days | 181 - 365 days | 366 - 720 days | Over 720 days | |||||||||||||||||||||||||
| Liabilities | ||||||||||||||||||||||||||||||||
| Swaps – difference payable | (16,331 | ) | 52.6 | (783 | ) | (481 | ) | (989 | ) | (1,898 | ) | (2,618 | ) | (9,562 | ) | |||||||||||||||||
| BM&FBOVESPA | (1,107 | ) | 3.6 | (9 | ) | (10 | ) | (35 | ) | (145 | ) | (340 | ) | (568 | ) | |||||||||||||||||
| Companies | (5,912 | ) | 19.0 | (703 | ) | (422 | ) | (279 | ) | (953 | ) | (1,339 | ) | (2,216 | ) | |||||||||||||||||
| Financial institutions | (3,530 | ) | 11.4 | (60 | ) | (21 | ) | (662 | ) | (644 | ) | (284 | ) | (1,859 | ) | |||||||||||||||||
| Individuals | (5,782 | ) | 18.6 | (11 | ) | (28 | ) | (13 | ) | (156 | ) | (655 | ) | (4,919 | ) | |||||||||||||||||
| Option premiums | (5,783 | ) | 18.6 | (1,460 | ) | (1,285 | ) | (895 | ) | (845 | ) | (805 | ) | (493 | ) | |||||||||||||||||
| BM&FBOVESPA | (2,365 | ) | 7.6 | (1,112 | ) | (565 | ) | (510 | ) | (130 | ) | (40 | ) | (8 | ) | |||||||||||||||||
| Companies | (661 | ) | 2.1 | (71 | ) | (45 | ) | (63 | ) | (150 | ) | (144 | ) | (188 | ) | |||||||||||||||||
| Financial institutions | (2,748 | ) | 8.8 | (277 | ) | (674 | ) | (321 | ) | (560 | ) | (620 | ) | (296 | ) | |||||||||||||||||
| Individuals | (9 | ) | 0.1 | - | (1 | ) | (1 | ) | (5 | ) | (1 | ) | (1 | ) | ||||||||||||||||||
| Forwards (onshore) | (833 | ) | 2.6 | (828 | ) | (4 | ) | (1 | ) | - | - | - | ||||||||||||||||||||
| BM&FBOVESPA | (5 | ) | 0.0 | - | (4 | ) | (1 | ) | - | - | - | |||||||||||||||||||||
| Companies | (411 | ) | 1.3 | (411 | ) | - | - | - | - | - | ||||||||||||||||||||||
| Financial institutions | (417 | ) | 1.3 | (417 | ) | - | - | - | - | - | ||||||||||||||||||||||
| Credit derivatives - Financial institutions | (875 | ) | 2.8 | - | (9 | ) | (9 | ) | (5 | ) | (105 | ) | (747 | ) | ||||||||||||||||||
| Forwards (offshore) | (3,142 | ) | 10.1 | (692 | ) | (727 | ) | (785 | ) | (581 | ) | (233 | ) | (124 | ) | |||||||||||||||||
| BM&FBOVESPA | (41 | ) | 0.1 | (8 | ) | (10 | ) | (10 | ) | (13 | ) | - | - | |||||||||||||||||||
| Companies | (1,948 | ) | 6.3 | (260 | ) | (478 | ) | (565 | ) | (356 | ) | (179 | ) | (110 | ) | |||||||||||||||||
| Financial institutions | (1,151 | ) | 3.7 | (424 | ) | (238 | ) | (210 | ) | (211 | ) | (54 | ) | (14 | ) | |||||||||||||||||
| Individuals | (2 | ) | 0.0 | - | (1 | ) | - | (1 | ) | - | - | |||||||||||||||||||||
| Check of swap - Companies | (545 | ) | 1.8 | - | - | - | - | (335 | ) | (210 | ) | |||||||||||||||||||||
| Other | (3,562 | ) | 11.5 | (87 | ) | (1,267 | ) | (857 | ) | (19 | ) | (8 | ) | (1,324 | ) | |||||||||||||||||
| Companies | (817 | ) | 2.6 | (1 | ) | (3 | ) | (6 | ) | (4 | ) | (8 | ) | (795 | ) | |||||||||||||||||
| Financial institutions | (2,745 | ) | 8.9 | (86 | ) | (1,264 | ) | (851 | ) | (15 | ) | - | (529 | ) | ||||||||||||||||||
| Total (*) | (31,071 | ) | 100.0 | (3,850 | ) | (3,773 | ) | (3,536 | ) | (3,348 | ) | (4,104 | ) | (12,460 | ) | |||||||||||||||||
| % per maturity term | 12.4 | 12.1 | 11.4 | 10.8 | 13.2 | 40.1 | ||||||||||||||||||||||||||
(*) Of the total liability portfolio of Derivative Financial Instruments, R$ (14,507) refers to current and R$ (16,564) to non-current.
| F-49 |
a) Information on credit derivatives
ITAÚ UNIBANCO HOLDING buys and sells credit protection mainly related to securities of Brazilian listed companies in order to meet the needs of its customers. When ITAÚ UNIBANCO HOLDING sells contracts for credit protection, the exposure for a given reference entity may be partially or totally offset by a credit protection purchase contract of another counterparty for the same reference entity or similar entity. The credit derivatives for which ITAÚ UNIBANCO HOLDING is protection seller are credit default swaps, total return swaps and credit-linked notes.
Credit Default Swaps – CDS
CDS are credit derivatives in which, upon a credit event related to the reference entity pursuant to the terms of the contract, the protection buyer is entitled to receive, from the protection seller, the amount equivalent to the difference between the face value of the CDS contract and the fair value of the liability on the date the contract was settled, also known as the recovered amount. The protection buyer does not need to hold the debt instrument of the reference entity for it to receive the amounts due pursuant to the CDS contract terms when a credit event occurs.
Total Return Swap – TRS
TRS is a transaction in which a party swaps the total return of a reference entity or of a basket of assets for regular cash flows, usually interest and a guarantee against capital loss. In a TRS contract, the parties do not transfer the ownership of the assets.
The table below presents the portfolio of credit derivatives in which ITAÚ UNIBANCO HOLDING sells protection to third parties, by maturity, and the maximum potential of future payments, gross of any guarantees, as well as its classification by instrument, risk and reference entity.
| 12/31/2016 | ||||||||||||||||||||
| Maximum potential of future payments, gross | Before 1 year | From 1 to 3 years | From 3 to 5 years | Over 5 years | ||||||||||||||||
| By instrument | ||||||||||||||||||||
| CDS | 8,094 | 1,989 | 3,487 | 2,585 | 33 | |||||||||||||||
| Total by instrument | 8,094 | 1,989 | 3,487 | 2,585 | 33 | |||||||||||||||
| By risk rating | ||||||||||||||||||||
| Investment grade | 8,094 | 1,989 | 3,487 | 2,585 | 33 | |||||||||||||||
| Total by risk | 8,094 | 1,989 | 3,487 | 2,585 | 33 | |||||||||||||||
| By reference entity | ||||||||||||||||||||
| Private entities | 8,094 | 1,989 | 3,487 | 2,585 | 33 | |||||||||||||||
| Total by entity | 8,094 | 1,989 | 3,487 | 2,585 | 33 | |||||||||||||||
| 12/31/2015 | ||||||||||||||||||||
| Maximum potential of future payments, gross | Before 1 year | From 1 to 3 years | From 3 to 5 years | Over 5 years | ||||||||||||||||
| By instrument | ||||||||||||||||||||
| CDS | 8,799 | 1,781 | 3,301 | 3,717 | - | |||||||||||||||
| Total by instrument | 8,799 | 1,781 | 3,301 | 3,717 | - | |||||||||||||||
| By risk rating | ||||||||||||||||||||
| Investment grade | 8,799 | 1,781 | 3,301 | 3,717 | - | |||||||||||||||
| Total by risk | 8,799 | 1,781 | 3,301 | 3,717 | - | |||||||||||||||
| By reference entity | ||||||||||||||||||||
| Private entities | 8,799 | 1,781 | 3,301 | 3,717 | - | |||||||||||||||
| Total by entity | 8,799 | 1,781 | 3,301 | 3,717 | - | |||||||||||||||
ITAÚ UNIBANCO HOLDING assesses the risk of a credit derivative based on the credit ratings attributed to the reference entity by independent credit rating agencies. Investment grade are those entities for which credit risk is rated as Baa3 or higher, as rated by Moody's, and BBB- or higher, according to the ratings of Standard & Poor’s and Fitch Ratings. The maximum potential loss that may be incurred with the credit derivative is based on the notional amount of the derivative. ITAÚ UNIBANCO HOLDING believes, based on its historical experience, that the amount of the maximum potential loss does not represent the actual level of loss. This is so because, should there be an event of loss, the amount of maximum potential loss should be reduced from the notional amount by the recoverable amount.
| F-50 |
The credit derivatives sold are not covered by guarantees, and during this period, ITAÚ UNIBANCO HOLDING has not incurred any loss related to credit derivative contracts.
The following table presents the notional amount of purchased credit derivatives whose underlying amounts are identical to those for which ITAÚ UNIBANCO HOLDING operates as seller of the credit protection.
| 12/31/2016 | ||||||||||||
| Notional amount of credit protection sold | Notional amount of credit protection purchased with identical underlying amount | Net position | ||||||||||
| CDS | (8,094 | ) | 4,006 | (4,088 | ) | |||||||
| Total | (8,094 | ) | 4,006 | (4,088 | ) | |||||||
| 12/31/2015 | ||||||||||||
| Notional amount of credit protection sold | Notional amount of credit protection purchased with identical underlying amount | Net position | ||||||||||
| CDS | (8,799 | ) | 3,863 | (4,936 | ) | |||||||
| Total | (8,799 | ) | 3,863 | (4,936 | ) | |||||||
| F-51 |
b) Financial instruments subject to offsetting, enforceable master netting arrangements and similar agreements
The following tables set forth the financial assets and liabilities that are subject to offsetting, enforceable master netting arrangements, as well as how these financial assets and liabilities have been presented in ITAÚ UNIBANCO HOLDING's consolidated financial statements. These tables also reflect the amounts of collateral pledged or received in relation to financial assets and liabilities subject to enforceable arrangements that have not been presented on a net basis in accordance with IAS 32.
Financial assets subject to offsetting, enforceable master netting arrangements and similar agreements:
| 12/31/2016 | ||||||||||||||||||||||||
| Gross amount of recognized financial | Gross amount offset in the | Net amount of financial assets presented in the statement of | Related amounts not offset in the statement of financial position(2) | |||||||||||||||||||||
| assets(1) | statement of financial position | financial position | Financial instruments(3) | Cash collateral received | Net amount | |||||||||||||||||||
| Securities purchased under agreements to resell | 265,051 | - | 265,051 | (334 | ) | - | 264,717 | |||||||||||||||||
| Derivatives | 24,231 | - | 24,231 | (4,039 | ) | (540 | ) | 19,652 | ||||||||||||||||
| 12/31/2015 | ||||||||||||||||||||||||
| Gross amount of recognized financial | Gross amount offset in the | Net amount of financial assets presented in the statement of | Related amounts not offset in the statement of financial position(2) | |||||||||||||||||||||
| assets(1) | statement of financial position | financial position | Financial instruments(3) | Cash collateral received | Net amount | |||||||||||||||||||
| Securities purchased under agreements to resell | 254,404 | - | 254,404 | (2,569 | ) | - | 251,835 | |||||||||||||||||
| Derivatives | 26,755 | - | 26,755 | (8,150 | ) | - | 18,605 | |||||||||||||||||
Financial liabilities subject to offsetting, enforceable master netting arrangements and similar agreements:
| 12/31/2016 | ||||||||||||||||||||||||
| Gross amount of | Net amount of financial liabilities | Related amounts not offset in the | ||||||||||||||||||||||
| recognized financial | Gross amount offset in the | presented in the statement of | statement of financial position(2) | |||||||||||||||||||||
| liabilities(1) | statement of financial position | financial position | Financial instruments(3) | Cash collateral pledged | Net amount | |||||||||||||||||||
| Securities sold under repurchase agreements | 349,164 | - | 349,164 | (17,829 | ) | - | 331,335 | |||||||||||||||||
| Derivatives | 24,698 | - | 24,698 | (4,039 | ) | - | 20,659 | |||||||||||||||||
| 12/31/2015 | ||||||||||||||||||||||||
| Gross amount of | Net amount of financial liabilities | Related amounts not offset in the | ||||||||||||||||||||||
| recognized financial | Gross amount offset in the | presented in the statement of | statement of financial position(2) | |||||||||||||||||||||
| liabilities(1) | statement of financial position | financial position | Financial instruments(3) | Cash collateral pledged | Net amount | |||||||||||||||||||
| Securities sold under repurchase agreements | 336,643 | - | 336,643 | (22,158 | ) | - | 314,485 | |||||||||||||||||
| Derivatives | 31,071 | - | 31,071 | (8,150 | ) | (24 | ) | 22,897 | ||||||||||||||||
(1) Includes amounts of master offset agreements and other such agreements, both enforceable and unenforceable.
(2) Limited to amounts subject to enforceable master offset agreements and other such agreements.
(3) Includes amounts subject to enforceable master offset agreements and other such agreements, and guarantees in financial instruments.
Financial assets and financial liabilities are offset in the balance sheet only when there is a legally enforceable right to offset the recognized amounts and there is an intention to settle on a net basis, or realize the asset and settle the liability simultaneously.
Derivatives and repurchase agreements not set off in the balance sheet relate to transactions in which there are enforceable master netting agreements or similar agreements, but the offset criteria have not been met in accordance with paragraph 42 of IAS 32 mainly because ITAÚ UNIBANCO HOLDING has no intention to settle on a net basis, or realize the asset and settle the liability simultaneously.
| F-52 |
Note 9 – Hedge accounting
There are three types of hedge relations: Fair value hedge, Cash flow hedge, and Hedge of net investment in foreign operations.
| a) | Cash flow hedge |
To hedge the variation of future cash flows of interest payment and receipts and exposure to futures interest rate, ITAÚ UNIBANCO HOLDING uses futures contracts traded at BM&FBOVESPA and Chicago Stock Exchange, related to certain fixed assets and liabilities, denominated in Brazilian Reais and US Dollars, futures Euro-Dollar and interest rate swaps, related to redeemable preferred shares, denominated in US Dollars, issued by one of our subsidiaries, DDI Futures contracts, traded on BM&FBOVESPA, related to highly probable forecast transactions denominated in US Dollars and NDF (Non Deliverable Forward) and currency swap, contracts traded in the over-the-counter market, related to highly probable forecast transactions not accounted for.
Under a DI Futures contract, a net payment (receipt) is made for the difference between an amount multiplied by the CDI rate and an amount computed and multiplied by a fixed rate. Under an interest rate swap, currency and futures Euro-Dollar, a net payment (receipt) is made for the difference between an amount computed multiplied by the LIBOR rate and an amount computed and multiplied by a fixed rate. In DDI Future contracts, NDF and Forwards, the gain (loss) on exchange variation is computed as the difference between two periods of market quotation between the US Dollar and the contracted currency.
The cash flow hedge strategies of ITAÚ UNIBANCO HOLDING consist of a hedge of exposure to variations in cash flows, payment of interest and exposure to interest rate, which are attributable to changes in interest rates related to assets and liabilities recognized and changes in interest rates of unrecognized assets and liabilities.
ITAÚ UNIBANCO HOLDING has applied cash flow hedge strategies as follows:
| · | Hedge of time deposits and repurchase agreements: hedge of the variability in cash flows of interest payments resulting from changes in the CDI interest rate. |
| · | Hedge of redeemable preferred shares: hedge of the variability in cash flows of interest payments resulting from changes in the LIBOR interest rate. |
| · | Hedge of subordinated certificates of deposit (CDB): hedge of the variability in the cash flows of interest payments resulting from changes in the CDI interest rate. |
| · | Hedge of highly probable forecast transactions: Protecting the risk associated to variation in the amount of commitments, when measured in Brazilian Reais (parent company’s functional currency) arising from variations in foreign exchange rates. |
| · | Hedge of Syndicated Loan: hedge the variability in cash flow of interest payments resulting from changes in the LIBOR interest rate. |
| · | Hedge of asset transactions: to hedge the variations in cash flows of interest receipts resulting from changes in the CDI rate. |
| · | Hedge of assets denominated in UF*: to hedge the variations in cash flows of interest receipts resulting from changes in the UF*. |
| · | Hedge of Funding: to hedge the variations in cash flows of interest payments resulting from changes in the TPM* rate and foreign exchange. |
| · | Hedge of loan operations: variations in cash flows of interest receipts resulting from changes in the TPM* rate. |
| · | Hedge of asset-backed securities under repurchase agreements: changes in cash flows from interest received on changes in Selic (benchmark interest rate). |
*UF – Chilean unit of account / TPM – Monetary policy rate
To evaluate the effectiveness and to measure the ineffectiveness of such strategies, ITAÚ UNIBANCO HOLDING uses the hypothetical derivative method. The hypothetical derivative method is based on a comparison of the change in the fair value of a hypothetical derivative with terms identical to the critical terms of the variable-rate liability, and this change in the fair value of a hypothetical derivative is considered a proxy of the present value of the cumulative change in the future cash flow expected for the hedged liability.
All hedge relationships were designated between 2008 and 2016. Periods in which expected cash flows should be paid and affect the income statement are as follows:
| · | Hedge of time deposits and agreements to resell: interest paid/received daily. |
| · | Hedge of redeemable preferred shares: interest paid/received every half year. |
| · | Hedge of highly probable forecast transactions: foreign exchange amount paid / received on future dates. |
| · | Hedge of Syndicated Loan: interest paid / received daily. |
| · | Hedge of asset transactions: interest paid / received monthly. |
| F-53 |
| · | Hedge of assets denominated in UF*: interest received monthly. |
| · | Hedge of funding: interest paid monthly. |
| · | Hedge of loan operations: interest received monthly. |
Following we present gains (or losses) of the effective and ineffective of the strategies of cash flow hedge.
| 12/31/2016 | 12/31/2015 | |||||||||||||||
| Hedge instruments | Accumulated effective portion | Ineffective portion | Accumulated effective portion | Ineffective portion | ||||||||||||
| Interest rate futures | (2,051 | ) | 10 | 2,947 | 80 | |||||||||||
| NDF | - | - | 16 | - | ||||||||||||
| Interest rate swap | (27 | ) | (2 | ) | - | - | ||||||||||
| Total | (2,078 | ) | 8 | 2,963 | 80 | |||||||||||
The effective portion is recognized in the stockholders' equity, under other comprehensive income and the ineffective portion is recognized in the statement of income under net gain (loss) on investment securities and derivatives.
To hedge future cash flows of highly probable forecast transactions, arising from futures contracts in foreign currency, against the exposure to future interest rate, ITAÚ UNIBANCO HOLDING negotiated DDI Futures contracts on BM&FBOVESPA and NDF (Non Deliverable Forward) contracts traded in the over-the-counter market. During the second quarter of 2015, part of the flow of these agreements was realized, and , accordingly, Asset Valuation Adjustment was reclassified and included in the deemed cost of assets related to Hedge of Highly Probable Forecast Transaction.
At 12/31/2016, the gain (loss) on cash flow hedge expected to be reclassified from Comprehensive Income to Income in the following 12 months is R$ 130 (R$ 452 at 12/31/2015).
| F-54 |
b) Hedge of net investment in foreign operations
ITAÚ UNIBANCO HOLDING strategies of net investments in foreign operations consist of a hedge of the exposure in foreign currency arising from the functional currency of the foreign operation, with respect to the functional currency of the head office.
To hedge the changes of future cash flows of exchange variation of net investments in foreign operations, ITAÚ UNIBANCO HOLDING uses DDI Futures contracts traded at BM&FBOVESPA, Financial Assets and Forward contracts or NDF contracts entered into by our subsidiaries abroad.
In DDI Future contracts, the gain (loss) on exchange variation is computed as the difference between two periods of market quotation between the US Dollar and Brazilian Real. In the Forward or NDF contracts and Financial Assets, the gain (loss) on exchange variation is computed as the difference between two periods of market quotation between the functional currency and the US Dollar.
ITAÚ UNIBANCO HOLDING applies the hedge of net investment in foreign operations as follows:
To hedge the risk of variation in the investment amount, when measured in Brazilian Reais (the head office’s functional currency), arising from changes in exchange rates between the functional currency of the investment abroad and the Brazilian Real.
To evaluate the effectiveness and to measure the ineffectiveness of such strategies, ITAÚ UNIBANCO HOLDING uses the Dollar Offset Method. The Dollar Offset Method is based on a comparison of the change in fair value (cash flow) of the hedge instrument, attributable to changes in exchange rate and gain (loss) arising from the variation in exchange rates, on the amount of investment abroad designated as a hedged item.
Hedge relationships were designated in 2011 and 2012 and the hedge instruments will mature on the sale of investments abroad, which will be in the period when the cash flows of exchange variation are expected to occur and affect the statement of income.
Following we present gains (or losses) of the effective and ineffective of the strategies of Hedge of net investment in foreign operations.
| 12/31/2016 | 12/31/2015 | |||||||||||||||
| Hedge instrument | Accumulated effective portion | Ineffective portion | Accumulated effective portion | Ineffective portion | ||||||||||||
| DDI futures | (7,490 | ) | (51 | ) | (11,728 | ) | (6 | ) | ||||||||
| Forward | 683 | (48 | ) | 669 | 44 | |||||||||||
| NDF | 2,312 | (35 | ) | 2,801 | 76 | |||||||||||
| Financial assets | 43 | 2 | 46 | - | ||||||||||||
| Total | (4,452 | ) | (132 | ) | (8,212 | ) | 114 | |||||||||
The effective portion is recognized in the stockholders' equity, under other comprehensive income and the ineffective portion is recognized in the statement of income under net gain (loss) on investment securities and derivatives.
DDI Futures is a futures contract in which participants may trade a clean coupon for any period between the first maturity of the futures contract of foreign currency coupon (DDI) and a later maturity.
NDF (Non Deliverable Forward), or Forward Contract of Currency without Physical Delivery is a derivative traded on over-the-counter market, which has the foreign exchange rate of a given currency as its subject.
| F-55 |
c) Fair value hedge
The fair value hedge strategy of ITAÚ UNIBANCO HOLDING consists in hedging the exposure to variation in fair value, in the receipt and payment of interest related to recognized assets and liabilities.
To hedge the market risk variation in the receipt and payment of interest, ITAÚ UNIBANCO HOLDING uses interest rate swap contracts related to prefixed assets and liabilities expressed in UF (Chilean Unit of Accounts - CLF), and Euros and US Dollars, issued by subsidiaries in Chile, London and Colombia, respectively.
Under an interest rate swap contract, net receipt (payment) is made for the difference between the amount computed and multiplied by variable rate and an amount computed and multiplied by a fixed rate.
ITAÚ UNIBANCO HOLDING has applied fair value hedge as follows:
| · | To protect the risk of variation in the fair value of receipt and payment of interest resulting from variations in the fair value of variable rates involved. |
| · | To hedge the variations in cash flows of interest receipts resulting from changes in the CDI rate. |
To evaluate the effectiveness and to measure the ineffectiveness of such strategy, ITAÚ UNIBANCO HOLDING uses the percentage approach and dollar offset method:
| · | The percentage approach is based on the calculation of change in the fair value of the reviewed estimate for the hedged position (hedge item) attributable to the protected risk versus the change in the fair value of the hedged derivative instrument. |
| · | The dollar offset method is calculated based on the difference between the variation of the fair value of the hedging instrument and the variation in the fair value of the hedged item attributed to changes in the interest rate. |
Hedge relationships were designated between 2012 and 2016, and maturities of related swaps will occur between 2017 and 2030. Receipts (payments) of interest flows are expected to occur on a monthly basis, and they will affect the statement of income.
Following we present gains (or losses) of the effective and ineffective portions of the strategies of fair value hedge.
| 12/31/2016 | 12/31/2015 | |||||||||||||||
| Hedge instrument used | Accumulated effective portion | Ineffective portion | Accumulated effective portion | Ineffective portion | ||||||||||||
| Interest rate swap | (90 | ) | (6 | ) | (54 | ) | (3 | ) | ||||||||
| Total | (90 | ) | (6 | ) | (54 | ) | (3 | ) | ||||||||
The effective and ineffective portion are recognized in the statement of income under net gain (loss) on investment securities and derivatives.
| F-56 |
The tables below present, for each strategy, the notional amount and the fair value adjustments of hedge instruments and the carrying amount of the hedged item:
| 12/31/2016 | 12/31/2015 | |||||||||||||||||||||||
| Hedge instruments | Hedged item | Hedge instruments | Hedged item | |||||||||||||||||||||
| Strategies | Notional amount | Fair value adjustments | Carrying value | Notional amount | Fair value adjustments | Carrying value | ||||||||||||||||||
| Hedge of deposits and repurchase agreements | 83,068 | (8 | ) | 83,580 | 77,905 | 43 | 77,922 | |||||||||||||||||
| Hedge of syndicated loan | 6,844 | (46 | ) | 6,844 | 8,200 | (90 | ) | 8,200 | ||||||||||||||||
| Hedge of highly probable forecast transactions | - | - | - | 1,125 | 16 | 1,125 | ||||||||||||||||||
| Hedge of net investment in foreign operations(*) | 21,449 | 221 | 12,330 | 21,927 | (427 | ) | 12,815 | |||||||||||||||||
| Hedge of loan operations (Cash flow) | 1,121 | 15 | 1,121 | - | - | - | ||||||||||||||||||
| Hedge of assets transactions | 24,168 | 312 | 26,495 | 7,405 | (263 | ) | 7,876 | |||||||||||||||||
| Hedge of assets denominated in UF | 13,147 | (20 | ) | 13,147 | - | - | - | |||||||||||||||||
| Hedge of funding (Cash flow) | 4,273 | (22 | ) | 4,273 | - | - | - | |||||||||||||||||
| Hedge of Asset-backed securities under repurchase agreements | 2,546 | 24 | 2,524 | - | - | - | ||||||||||||||||||
| Hedge of loan operations (Market risk) | 2,692 | (91 | ) | 2,692 | 4,346 | 59 | 4,346 | |||||||||||||||||
| Hedge of available-for-sale securities | 472 | (14 | ) | 472 | - | - | - | |||||||||||||||||
| Hedge of funding (Market risk) | 8,659 | 9 | 8,659 | 781 | - | 781 | ||||||||||||||||||
| Total | 168,439 | 380 | 162,137 | 121,689 | (662 | ) | 113,065 | |||||||||||||||||
(*) Hedge instruments include the overhedge rate of 44.65% regarding taxes.
The table below shows the breakdown by maturity of the hedging strategies:
| 12/31/2016 | ||||||||||||||||||||||||||||||||
| Strategies | 0-1 year | 1-2 years | 2-3 years | 3-4 years | 4-5 years | 5-10 years | Over 10 years | Total | ||||||||||||||||||||||||
| Hedge of deposits and repurchase agreements | - | 32,132 | 28,616 | 10,188 | 5,646 | 6,486 | - | 83,068 | ||||||||||||||||||||||||
| Hedge of syndicated loan | 6,844 | - | - | - | - | - | - | 6,844 | ||||||||||||||||||||||||
| Hedge of highly probable forecast transactions | - | - | - | - | - | - | - | - | ||||||||||||||||||||||||
| Hedge of assets transactions | 4,627 | 13,719 | 4,890 | - | 932 | - | - | 24,168 | ||||||||||||||||||||||||
| Hedge of fixed rate loan operations (Cash flow) | 123 | - | - | 24 | 141 | 833 | - | 1,121 | ||||||||||||||||||||||||
| Hedge of net investment in foreign operations(*) | 21,449 | - | - | - | - | - | - | 21,449 | ||||||||||||||||||||||||
| Hedge of assets denominated in UF | 8,940 | 2,598 | 1,558 | - | 51 | - | - | 13,147 | ||||||||||||||||||||||||
| Hedge of funding (Cash flow) | 121 | 1,485 | 73 | 536 | 774 | 1,284 | - | 4,273 | ||||||||||||||||||||||||
| Hedge of loan operations (Market risk) | 189 | 422 | 63 | 29 | 93 | 335 | 1,561 | 2,692 | ||||||||||||||||||||||||
| Hedge of available-for-sale securities | - | - | - | 218 | - | 254 | - | 472 | ||||||||||||||||||||||||
| Hedge of funding (Market risk) | 1,266 | 2,460 | 3,433 | 701 | 72 | 488 | 239 | 8,659 | ||||||||||||||||||||||||
| Hedge of Asset-backed securities under repurchase | ||||||||||||||||||||||||||||||||
| agreements | - | - | 1,465 | 918 | 163 | - | - | 2,546 | ||||||||||||||||||||||||
| Total | 43,559 | 52,816 | 40,098 | 12,614 | 7,872 | 9,680 | 1,800 | 168,439 | ||||||||||||||||||||||||
(*) Classified as current, since instruments are frequently renewed.
| 12/31/2015 | ||||||||||||||||||||||||||||||||
| Strategies | 0-1 year | 1-2 years | 2-3 years | 3-4 years | 4-5 years | 5-10 years | Over 10 years | Total | ||||||||||||||||||||||||
| Hedge of deposits and repurchase agreements | 13,324 | 28,185 | 25,779 | 6,460 | 1,402 | 2,755 | - | 77,905 | ||||||||||||||||||||||||
| Hedge of syndicated loan | - | 8,200 | - | - | - | - | - | 8,200 | ||||||||||||||||||||||||
| Hedge of highly probable forecast transactions | 1,125 | - | - | - | - | - | - | 1,125 | ||||||||||||||||||||||||
| Hedge of assets transactions | - | 4,627 | 2,778 | - | - | - | - | 7,405 | ||||||||||||||||||||||||
| Hedge of fixed rate loan operations | 339 | 276 | 474 | 898 | 88 | 447 | 1,824 | 4,346 | ||||||||||||||||||||||||
| Hedge of structured funding (Market risk) | 781 | - | - | - | - | - | - | 781 | ||||||||||||||||||||||||
| Hedge of net investment in foreign operations(*) | 21,927 | - | - | - | - | - | - | 21,927 | ||||||||||||||||||||||||
| Total | 37,496 | 41,288 | 29,031 | 7,358 | 1,490 | 3,202 | 1,824 | 121,689 | ||||||||||||||||||||||||
(*) Classified as current, since instruments are frequently renewed.
| F-57 |
Note 10 – Available-for-sale financial assets
The fair value and corresponding cost of available-for-sale financial assets are as follows:
| 12/31/2016 | 12/31/2015 | |||||||||||||||||||||||
| Accumulated gain / | Accumulated gain / | |||||||||||||||||||||||
| (loss) reflected in other | (loss) reflected in other | |||||||||||||||||||||||
| Cost | comprehensive income | Fair value | Cost | comprehensive income | Fair value | |||||||||||||||||||
| Investment funds | 42 | - | 42 | 218 | - | 218 | ||||||||||||||||||
| Brazilian external debt bonds(1b) | 14,465 | (400 | ) | 14,065 | 19,843 | (2,531 | ) | 17,312 | ||||||||||||||||
| Brazilian government securities(1a) | 17,652 | 286 | 17,938 | 12,702 | (906 | ) | 11,796 | |||||||||||||||||
| Government securities – abroad(1c) | 14,488 | (16 | ) | 14,472 | 9,942 | (59 | ) | 9,883 | ||||||||||||||||
| Colombia | 1,105 | 50 | 1,155 | - | - | - | ||||||||||||||||||
| Chile | 5,832 | 12 | 5,844 | 1,409 | (2 | ) | 1,407 | |||||||||||||||||
| Korea | 2,673 | - | 2,673 | 1,626 | - | 1,626 | ||||||||||||||||||
| Denmark | 819 | - | 819 | 2,548 | - | 2,548 | ||||||||||||||||||
| Spain | 923 | - | 923 | 1,060 | - | 1,060 | ||||||||||||||||||
| United States | 1,446 | (19 | ) | 1,427 | 2,028 | (6 | ) | 2,022 | ||||||||||||||||
| Netherlands | 101 | - | 101 | 122 | - | 122 | ||||||||||||||||||
| Paraguay | 1,167 | (56 | ) | 1,111 | 955 | (43 | ) | 912 | ||||||||||||||||
| Uruguay | 413 | (2 | ) | 411 | 185 | (7 | ) | 178 | ||||||||||||||||
| Other | 9 | (1 | ) | 8 | 9 | (1 | ) | 8 | ||||||||||||||||
| Corporate securities(1d) | 42,176 | (416 | ) | 41,760 | 47,380 | (544 | ) | 46,836 | ||||||||||||||||
| Shares | 1,020 | 365 | 1,385 | 706 | 222 | 928 | ||||||||||||||||||
| Rural product note | 1,477 | (52 | ) | 1,425 | 1,176 | (46 | ) | 1,130 | ||||||||||||||||
| Bank deposit certificates | 2,639 | 2 | 2,641 | 1,576 | (3 | ) | 1,573 | |||||||||||||||||
| Securitized real estate loans | 2,150 | (55 | ) | 2,095 | 2,244 | (207 | ) | 2,037 | ||||||||||||||||
| Debentures | 21,863 | (693 | ) | 21,170 | 23,153 | (318 | ) | 22,835 | ||||||||||||||||
| Eurobonds and others | 7,671 | 44 | 7,715 | 10,180 | (68 | ) | 10,112 | |||||||||||||||||
| Financial bills | 2,822 | (6 | ) | 2,816 | 6,893 | (47 | ) | 6,846 | ||||||||||||||||
| Promissory notes | 2,191 | (18 | ) | 2,173 | 1,060 | (69 | ) | 991 | ||||||||||||||||
| Other | 343 | (3 | ) | 340 | 392 | (8 | ) | 384 | ||||||||||||||||
| Total(2) | 88,823 | (546 | ) | 88,277 | 90,085 | (4,040 | ) | 86,045 | ||||||||||||||||
(1) Available-for-sale assets pledged as collateral of funding of financial institutions and Clients were: a) R$ 9,120 (R$ 1,755 at 12/31/2015), b) R$ 3,240 (R$ 14,135 at 12/31/2015), c) (R$ 8 at 12/31/2015) and d) R$ 5,075 (R$ 808 at 12/31/2015), totaling R$ 17,435 (R$ 16,706 at 12/31/2015);
(2) In the period, there was no reclassification of available-for-sale financial assets to other categories of financial assets.
| F-58 |
| 12/31/2016 | 12/31/2015 | |||||||||||||||
| Cost | Fair value | Cost | Fair value | |||||||||||||
| Current | 23,516 | 23,636 | 22,754 | 22,923 | ||||||||||||
| Non-stated maturity | 1,010 | 1,375 | 923 | 1,145 | ||||||||||||
| Up to one year | 22,506 | 22,261 | 21,831 | 21,778 | ||||||||||||
| Non-current | 65,307 | 64,641 | 67,331 | 63,122 | ||||||||||||
| From one to five years | 39,149 | 38,969 | 35,739 | 35,098 | ||||||||||||
| From five to ten years | 12,521 | 12,329 | 17,041 | 15,682 | ||||||||||||
| After ten years | 13,637 | 13,343 | 14,551 | 12,342 | ||||||||||||
| Total | 88,823 | 88,277 | 90,085 | 86,045 | ||||||||||||
Note 11 - Held-to maturity financial assets
The amortized cost of held-to-maturity financial assets is as follows:
| 12/31/2016 | 12/31/2015 | |||||||
| Amortized cost | Amortized cost | |||||||
| Corporate securities | 14,977 | 15,661 | ||||||
| Brazilian external debt bonds(1b) | 12,042 | 14,788 | ||||||
| Brazilian government securities(1a) | 12,937 | 11,721 | ||||||
| Government securities – abroad | 539 | 15 | ||||||
| Total(2) | 40,495 | 42,185 | ||||||
(1) Held-to-maturity financial assets pledged as collateral of funding transactions of financial institutions and clients were a) (R$ 9,460 at 12/31/2015), b) R$ 11,778.
(2) In the period, there was no reclassification of held-to maturity financial assets to other categories of financial assets.
The interest income related to held-to-maturity financial assets was R$ 3,788 (R$ 3,758 from 01/01 to 12/31/2015).
The fair value of held-to-maturity financial assets is disclosed in Note 31.
The amortized cost of Held-to-Maturity Financial assets by maturity is as follows:
| 12/31/2016 | 12/31/2015 | |||||||
| Amortized cost | Amortized cost | |||||||
| Current | 2,498 | 661 | ||||||
| Up to one year | 2,498 | 661 | ||||||
| Non-current | 37,997 | 41,524 | ||||||
| From one to five years | 19,376 | 14,500 | ||||||
| From five to ten years | 10,957 | 18,870 | ||||||
| After ten years | 7,664 | 8,154 | ||||||
| Total | 40,495 | 42,185 | ||||||
| F-59 |
Note 12 - Loan operations and lease operations portfolio
| a) | Composition of loan operations and lease operations |
Below is the composition of the carrying amount of loan operations and lease operations by type, sector of debtor, maturity and concentration:
| Loan operations and lease operations by type | 12/31/2016 | 12/31/2015 | ||||||
| Individuals | 183,147 | 187,220 | ||||||
| Credit card | 59,022 | 58,542 | ||||||
| Personal loan | 25,813 | 28,396 | ||||||
| Payroll loans | 44,636 | 45,434 | ||||||
| Vehicles | 15,434 | 20,058 | ||||||
| Mortgage loans | 38,242 | 34,790 | ||||||
| Corporate | 121,754 | 152,527 | ||||||
| Small and medium businesses | 58,935 | 66,038 | ||||||
| Foreign loans - Latin America | 126,530 | 68,463 | ||||||
| Total loan operations and lease operations | 490,366 | 474,248 | ||||||
| Allowance for loan and lease losses | (26,972 | ) | (26,844 | ) | ||||
| Total loan operations and lease operations, net of allowance for loan and lease losses | 463,394 | 447,404 | ||||||
| By maturity | 12/31/2016 | 12/31/2015 | ||||||
| Overdue as from 1 day | 16,843 | 15,596 | ||||||
| Falling due up to 3 months | 130,313 | 128,389 | ||||||
| Falling due more than 3 months but less than 1 year | 112,923 | 111,083 | ||||||
| Falling due after 1 year | 230,287 | 219,180 | ||||||
| Total loan operations and lease operations | 490,366 | 474,248 | ||||||
| By concentration | 12/31/2016 | 12/31/2015 | ||||||
| Largest debtor | 3,543 | 4,615 | ||||||
| 10 largest debtors | 21,609 | 27,173 | ||||||
| 20 largest debtors | 32,720 | 40,831 | ||||||
| 50 largest debtors | 52,992 | 63,797 | ||||||
| 100 largest debtors | 72,441 | 85,167 | ||||||
The breakdown of the Loan and lease operations portfolio by debtor’s industry is evidenced in Note 36 item 5.1. Maximum exposure of Financial Assets segregated by business sector.
The accretion of the net present value of impaired loan operations and lease operations and the respective allowance for loan and lease losses are not presented using their gross amounts in the statement of income but on a net basis within interest and similar income. If they were presented at gross amounts, there would be an increase of R$ 2,017, R$ 1,882 and R$ 1,623 in interest and similar income as of 12/31/2016, 12/31/2015 and 12/31/2014 respectively, with the same impact on the allowance for loan and lease losses expenses.
| F-60 |
b) Allowance for loan and lease losses
The changes in the allowance for loan and lease losses are shown in the table below:
| Composition of the carrying amount by class of assets | Opening Balance 12/31/2015 | Write-offs | Net increase / (Reversal) | Closing balance 12/31/2016 | ||||||||||||
| Individuals | 14,717 | (13,682 | ) | 13,224 | 14,259 | |||||||||||
| Credit card | 4,141 | (4,905 | ) | 4,457 | 3,693 | |||||||||||
| Personal loans | 8,330 | (6,745 | ) | 6,171 | 7,756 | |||||||||||
| Payroll loans | 1,319 | (1,273 | ) | 2,062 | 2,108 | |||||||||||
| Vehicles | 874 | (709 | ) | 479 | 644 | |||||||||||
| Mortgage loans | 53 | (50 | ) | 55 | 58 | |||||||||||
| Corporate | 6,459 | (4,985 | ) | 4,388 | 5,862 | |||||||||||
| Small and medium businesses | 4,809 | (4,267 | ) | 4,201 | 4,743 | |||||||||||
| Foreign loans - Latin America | 859 | (1,317 | ) | 2,566 | 2,108 | |||||||||||
| Total | 26,844 | (24,251 | ) | 24,379 | 26,972 | |||||||||||
| Composition of the carrying amount by class of assets | Opening balance 12/31/2014 | Write-offs | Net increase / (Reversal) | Closing balance 12/31/2015 | ||||||||||||
| Individuals | 13,385 | (11,235 | ) | 12,567 | 14,717 | |||||||||||
| Credit card | 3,740 | (4,055 | ) | 4,456 | 4,141 | |||||||||||
| Personal loans | 7,024 | (5,221 | ) | 6,527 | 8,330 | |||||||||||
| Payroll loans | 1,107 | (622 | ) | 834 | 1,319 | |||||||||||
| Vehicles | 1,469 | (1,294 | ) | 699 | 874 | |||||||||||
| Mortgage loans | 45 | (43 | ) | 51 | 53 | |||||||||||
| Corporate | 3,114 | (4,321 | ) | 7,666 | 6,459 | |||||||||||
| Small and medium businesses | 5,158 | (3,981 | ) | 3,632 | 4,809 | |||||||||||
| Foreign loans - Latin America | 735 | (528 | ) | 652 | 859 | |||||||||||
| Total | 22,392 | (20,065 | ) | 24,517 | 26,844 | |||||||||||
| Composition of the carrying amount by class of assets | Opening balance 12/31/2013 | Write-offs | Net increase / (Reversal) | Closing balance 12/31/2014 | ||||||||||||
| Individuals | 13,853 | (12,668 | ) | 12,200 | 13,385 | |||||||||||
| Credit card | 2,952 | (3,784 | ) | 4,572 | 3,740 | |||||||||||
| Personal loans | 6,488 | (5,150 | ) | 5,686 | 7,024 | |||||||||||
| Payroll loans | 1,133 | (429 | ) | 403 | 1,107 | |||||||||||
| Vehicles | 3,245 | (3,254 | ) | 1,478 | 1,469 | |||||||||||
| Mortgage loans | 35 | (51 | ) | 61 | 45 | |||||||||||
| Corporate | 2,006 | (672 | ) | 1,780 | 3,114 | |||||||||||
| Small and medium businesses | 5,854 | (4,992 | ) | 4,296 | 5,158 | |||||||||||
| Foreign loans - Latin America | 522 | (343 | ) | 556 | 735 | |||||||||||
| Total | 22,235 | (18,675 | ) | 18,832 | 22,392 | |||||||||||
The composition of the allowance for loan and lease losses by customer sector is shown in the following table:
| 12/31/2016 | 12/31/2015 | |||||||
| Public sector | 5 | 2 | ||||||
| Industry and commerce | 5,253 | 4,314 | ||||||
| Services | 5,237 | 6,001 | ||||||
| Natural resources | 872 | 922 | ||||||
| Other sectors | 19 | 18 | ||||||
| Individuals | 15,586 | 15,587 | ||||||
| Total | 26,972 | 26,844 | ||||||
ITAÚ UNIBANCO HOLDING assesses the objective evidence of impairment for loan operations and lease operations on an individual basis for financial assets that are individually significant or, in aggregate, for financial assets that are not individually significant (Note 2.4d X).
| F-61 |
The composition of the allowance for loan and lease losses by type of assessment for objective evidence of impairment is shown in the following table:
| 12/31/2016 | 12/31/2015 | |||||||||||||||||||||||||||||||||||||||||||||||
| Impaired | Not impaired | Total | Impaired | Not impaired | Total | |||||||||||||||||||||||||||||||||||||||||||
| Loan | Allowance | Loan | Allowance | Loan | Allowance | Loan | Allowance | Loan | Allowance | Loan | Allowance | |||||||||||||||||||||||||||||||||||||
| I – Individually evaluated | ||||||||||||||||||||||||||||||||||||||||||||||||
| Corporate(*) | 14,138 | 5,351 | 107,616 | 511 | 121,754 | 5,862 | 11,627 | 5,716 | 140,900 | 743 | 152,527 | 6,459 | ||||||||||||||||||||||||||||||||||||
| II- Collectively evaluated | ||||||||||||||||||||||||||||||||||||||||||||||||
| Individuals | 10,763 | 6,756 | 172,384 | 7,503 | 183,147 | 14,259 | 11,579 | 6,587 | 175,641 | 8,130 | 187,220 | 14,717 | ||||||||||||||||||||||||||||||||||||
| Credit card | 3,512 | 2,150 | 55,510 | 1,543 | 59,022 | 3,693 | 4,072 | 2,436 | 54,470 | 1,705 | 58,542 | 4,141 | ||||||||||||||||||||||||||||||||||||
| Personal loans | 4,837 | 3,302 | 20,976 | 4,454 | 25,813 | 7,756 | 5,049 | 3,442 | 23,347 | 4,888 | 28,396 | 8,330 | ||||||||||||||||||||||||||||||||||||
| Payroll loans | 1,431 | 954 | 43,205 | 1,154 | 44,636 | 2,108 | 1,242 | 227 | 44,192 | 1,092 | 45,434 | 1,319 | ||||||||||||||||||||||||||||||||||||
| Vehicles | 591 | 326 | 14,843 | 318 | 15,434 | 644 | 880 | 459 | 19,178 | 415 | 20,058 | 874 | ||||||||||||||||||||||||||||||||||||
| Mortgage loans | 392 | 24 | 37,850 | 34 | 38,242 | 58 | 336 | 23 | 34,454 | 30 | 34,790 | 53 | ||||||||||||||||||||||||||||||||||||
| Small and medium businesses | 3,646 | 2,523 | 55,289 | 2,220 | 58,935 | 4,743 | 3,276 | 2,357 | 62,762 | 2,452 | 66,038 | 4,809 | ||||||||||||||||||||||||||||||||||||
| Foreign loans - Latin America | 1,770 | 727 | 124,760 | 1,381 | 126,530 | 2,108 | 675 | 313 | 67,788 | 546 | 68,463 | 859 | ||||||||||||||||||||||||||||||||||||
| Total | 30,317 | 15,357 | 460,049 | 11,615 | 490,366 | 26,972 | 27,157 | 14,973 | 447,091 | 11,871 | 474,248 | 26,844 | ||||||||||||||||||||||||||||||||||||
(*) As detailed in Note 2.4.d X, corporate loans are first evaluated on an individual basis. In the event there is no objective indication of impairment, these are subsequently evaluated on an aggregate basis in accordance with the characteristics of the operation. As a result, an allowance for loan and lease losses for corporate loans is recognized, both in the individual and the aggregate evaluation.
| F-62 |
| c) | Present value of lease operations |
Below is the analysis of the present value of minimum future payments receivable from finance leases by maturity basically composed of individual operations - vehicles:
| 12/31/2016 | ||||||||||||
| Minimum future | Future financial | Present | ||||||||||
| payments | income | value | ||||||||||
| Current | 3,572 | (1,636 | ) | 1,936 | ||||||||
| Up to 1 year | 3,572 | (1,636 | ) | 1,936 | ||||||||
| Non-current | 9,726 | (2,955 | ) | 6,771 | ||||||||
| From 1 to 5 years | 5,741 | (2,778 | ) | 2,963 | ||||||||
| Over 5 years | 3,985 | (177 | ) | 3,808 | ||||||||
| Total | 13,298 | (4,591 | ) | 8,707 | ||||||||
| 12/31/2015 | ||||||||||||
| Minimum future | Future financial | Present | ||||||||||
| payments | income | value | ||||||||||
| Current | 3,075 | (794 | ) | 2,281 | ||||||||
| Up to 1 year | 3,075 | (794 | ) | 2,281 | ||||||||
| Non-current | 3,402 | (1,050 | ) | 2,352 | ||||||||
| From 1 to 5 years | 3,172 | (1,014 | ) | 2,158 | ||||||||
| Over 5 years | 230 | (36 | ) | 194 | ||||||||
| Total | 6,477 | (1,844 | ) | 4,633 | ||||||||
The allowance for loan and lease losses related to the lease portfolio amounts to: R$ 254 (R$ 176 at 12/31/2015).
| d) | Sale or transfer of financial assets |
ITAÚ UNIBANCO HOLDING carried out operations related to the sale or transfer of financial assets in which there was the retention of credit risks of the financial assets transferred, through joint obligation clauses. Therefore, such operations remained recorded as loan operations and represent the following amounts at December 31, 2016 and December 31, 2015:
| 12/31/2016 | 12/31/2015 | |||||||||||||||||||||||||||||||
| Assets | Liabilities(1) | Assets | Liabilities(1) | |||||||||||||||||||||||||||||
| Nature of operation | Book value | Farir value | Book value | Fair value | Book value | Fair value | Book value | Fair value | ||||||||||||||||||||||||
| Companies – working capital | 2,768 | 2,768 | 2,768 | 2,768 | 2,849 | 2,849 | 2,849 | 2,849 | ||||||||||||||||||||||||
| Companies - loan(2) | - | - | 8 | 8 | - | - | - | - | ||||||||||||||||||||||||
| Individuals - vehicles(2) | - | - | 4 | 4 | - | - | - | - | ||||||||||||||||||||||||
| Individuals – mortgage loan | 3,061 | 2,960 | 3,055 | 2,944 | 2,806 | 2,763 | 2,805 | 2,752 | ||||||||||||||||||||||||
| Total | 5,829 | 5,728 | 5,835 | 5,724 | 5,655 | 5,612 | 5,654 | 5,601 | ||||||||||||||||||||||||
(1) Under Interbank Market Debt.
(2) Assignment of operations that had already been written down to losses
| F-63 |
Note 13 - Investments in associates and joint ventures
a) The following table shows the main investments of ITAÚ UNIBANCO HOLDING:
| Interest % | ||||||||||||||||||||||||||||||||
| at 12/31/2016 | 12/31/2016 | |||||||||||||||||||||||||||||||
| Total | Voting | Stockholders’ equity | Other Comprehensive Income | Net income | Investment | Equity in earnings | Market value(g) | |||||||||||||||||||||||||
| Associates | ||||||||||||||||||||||||||||||||
| Porto Seguro Itaú Unibanco Participações S.A.(a) (b) | 42.93 | 42.93 | 4,251 | 26 | 293 | �� | 2,587 | 241 | 2,644 | |||||||||||||||||||||||
| BSF Holding S.A.(c) | 49.00 | 49.00 | 2,067 | (1 | ) | 396 | 1,687 | 194 | - | |||||||||||||||||||||||
| IRB-Brasil Resseguros S.A.(a) (d) | 15.01 | 15.01 | 3,230 | (17 | ) | 745 | 478 | 109 | - | |||||||||||||||||||||||
| Other(e) | - | - | - | - | - | 114 | 13 | - | ||||||||||||||||||||||||
| Joint Ventures - Other(f) | - | - | - | - | - | 207 | (29 | ) | - | |||||||||||||||||||||||
| Total | - | - | - | - | - | 5,073 | 528 | - | ||||||||||||||||||||||||
| Interest % | ||||||||||||||||||||||||||||||||||||
| at 12/31/2015 | 12/31/2015 | 12/31/2014 | ||||||||||||||||||||||||||||||||||
| Total | Voting | Stockholders’ equity | Other comprehensive income | Net income | Investment | Equity in earnings | Market value(g) | Equity in earnings | ||||||||||||||||||||||||||||
| Associates | ||||||||||||||||||||||||||||||||||||
| Porto Seguro Itaú Unibanco Participações S.A.(a) (b) | 42.93 | 42.93 | 3,931 | (26 | ) | 708 | 2,464 | 289 | 2,830 | 196 | ||||||||||||||||||||||||||
| BSF Holding S.A.(c) | 49.00 | 49.00 | 1,561 | - | 447 | 1,348 | 219 | - | 202 | |||||||||||||||||||||||||||
| IRB-Brasil Resseguros S.A.(a) (d) | 15.01 | 15.01 | 3,213 | 12 | 674 | 475 | 102 | - | 134 | |||||||||||||||||||||||||||
| Other(e) | - | - | - | - | - | 106 | 12 | - | 36 | |||||||||||||||||||||||||||
| Joint Ventures - Other(f) | 6 | (2 | ) | (3 | ) | |||||||||||||||||||||||||||||||
| Total | - | - | - | - | - | 4,399 | 620 | - | 565 | |||||||||||||||||||||||||||
(a) For purpose of recording the participation in earnings, at 12/31/2016 the position at 11/30/2016 was used and at 12/31/2015 the position at 11/30/2015 was used, in accordance with IAS 27.
(b) For purposes of market value, the quoted share price of Porto Seguro S.A. was taken into account. The investment included the amounts of R$ 762 at 12/31/2016 and R$ 776 at 12/31/2015 that correspond to the difference between the interest in the net assets at fair value of Porto Seguro Itaú Unibanco Participações S.A. and the investment book value.
(c) In May 2012 Itaú Unibanco S.A. acquired 137,004,000 common shares of BSF Holding S.A. (parent company of Banco Carrefour) for R$ 816 which corresponds to 49% of interest in its capital. The investment amount includes R$ 582 to goodwill and R$ 92 to dividends provisioned not received on 12/31/2016.
(d) Previously accounted for as a financial instrument. As from the 4th quarter of 2013, after completing the privatization process, ITAÚ UNIBANCO HOLDING started to exercise a significant influence over IRB. Accordingly, as from this date, the investment has been accounted for under the equity method.
(e) At 12/31/2016, includes interest in total capital and voting capital of the following companies: Compañia Uruguaya de Medios de Procesamiento S.A. (39.58% total and voting capital and 38,39% on 12/31/2015), Rias Redbanc S.A. (25% total and voting capital and 25% on 12/31/2015) and Tecnologia Bancária S.A. (24.91% total capital and voting capital and 24,91% on 12/31/2015).
(f) At 12/31/2016, includes interest in total capital and voting capital of the following companies: Olimpia Promoção e Serviços S.A. (50% total and voting capital and 50% on 12/31/2015); Conectcar Soluções de Mobilidade Eletronica S.A.(50% capital total e votante) acquired at 01/29/2016 and includes income not arising from profit subsidiaries.
(g) Disclosed only for public companies.
At 12/31/2016, ITAÚ UNIBANCO HOLDING receives / recognizes dividends and interest on capital of the unconsolidated companies being the main IRB - Brasil Resseguros S.A. in the amount of R$ 104 (R$ 73 at 12/31/2015 and R$ 46 on 12/31/2014), BSF Holding S.A in the amount of R$ 62 (R$ 58 at 12/31/2015) and Porto Seguro Itaú Unibanco Participações S.A. in the amount of R$ 222 (R$ 240 at 12/31/2015 and R$ 336 on 12/31/2014).
| F-64 |
b) Other information
The table below shows the summary of the aggregate financial information of the investees under the equity method of accounting.
| 12/31/2016 | 12/31/2015 | 12/31/2014 | ||||||||||
| Total Assets (*) | 20,819 | 20,183 | 17,812 | |||||||||
| Total Liabilities (*) | 11,272 | 11,477 | 9,917 | |||||||||
| Total Income (*) | 14,868 | 22,083 | 6,907 | |||||||||
| Total Expenses (*) | (13,401 | ) | (20,255 | ) | (5,112 | ) | ||||||
(*) Represented by IRB-Brasil Resseguros S.A., in the amount of R$ 14,313 (R$ 14,690 at 12/31/2015) related to assets, R$ 11,083 (R$ 11,477 at 12/31/2015) related to liabilities, R$ 14,142 (R$ 20,928 at 12/31/2015) related to income and of R$ (13,397) (R$ (20,254) at 12/31/2015) related to expenses.
The investees do not have contingent liabilities to which ITAÚ UNIBANCO HOLDING is significantly exposed.
Note 14 – Lease commitments as lessee
| a) | Finance lease |
ITAÚ UNIBANCO HOLDING is the lessee in finance lease contracts of data processing equipment, with the option of purchase or extension, without contingent rental payments or imposed restrictions. The net carrying amount of these assets is R$ 26 (R$ 517 at 12/31/2015).
The table below shows the total future minimum payments:
| 12/31/2016 | 12/31/2015 | |||||||
| Current | 26 | 491 | ||||||
| Up to 1 year | 26 | 491 | ||||||
| Non-current | - | 26 | ||||||
| From 1 to 5 years | - | 26 | ||||||
| Total future minimum payments | 26 | 517 | ||||||
| (-) Future interest | - | - | ||||||
| Present value | 26 | 517 | ||||||
| b) | Operating leases |
ITAÚ UNIBANCO HOLDING leases many properties, for use in its operations, under standard real estate leases that normally can be cancelled at its option and include renewal options and escalations clauses. No lease agreement imposes any restriction on our ability to pay dividends, enter into further lease agreements or engage in debt or equity financing transactions, and there is no contingent payments related to the agreements.
The expenses related to operating lease agreements recognized under General and Administrative Expenses total R$ 1,145 from 01/01 to 12/31/2016 (R$ 1,102 from 01/01 to 12/31/2015 and R$ 1,018 from 01/01 to 12/31/2014).
ITAÚ UNIBANCO HOLDING has no relevant sublease contracts.
Minimum payments of initiated and remaining lease agreements with non-cancelable clauses are as follows:
| 12/31/2016 | 12/31/2015 | |||||||
| Current | 1,336 | 1,267 | ||||||
| Up to 1 year | 1,336 | 1,267 | ||||||
| Non-current | 5,402 | 5,028 | ||||||
| From 1 to 5 years | 4,689 | 4,043 | ||||||
| Over 5 years | 713 | 985 | ||||||
| Total future minimum payments | 6,738 | 6,295 | ||||||
| F-65 |
Note 15 - Fixed assets
| Real estate in use(2) | Other fixed assets(2) (3) | |||||||||||||||||||||||||||||||||||
| Fixed Assets(1) | Fixed assets under construction | Land | Buildings | Improvements | Installations | Furniture and equipment | EDP systems(3) | Other (communication, security and transportation) | Total | |||||||||||||||||||||||||||
| Annual depreciation rates | 4% | 10% | 10 a 20% | 10 a 20% | 20 a 50% | 10 a 20% | ||||||||||||||||||||||||||||||
| Cost | ||||||||||||||||||||||||||||||||||||
| Balance at 12/31/2015 | 792 | 1,008 | 3,026 | 1,673 | 1,801 | 975 | 8,217 | 858 | 18,350 | |||||||||||||||||||||||||||
| Acquisitions | 341 | 57 | 70 | 137 | 47 | 309 | 246 | 223 | 1,430 | |||||||||||||||||||||||||||
| Disposal | - | (4 | ) | (13 | ) | (56 | ) | (15 | ) | (8 | ) | (449 | ) | (6 | ) | (551 | ) | |||||||||||||||||||
| Exchange variation | (2 | ) | (15 | ) | (11 | ) | (22 | ) | (3 | ) | (67 | ) | 151 | 3 | 34 | |||||||||||||||||||||
| Transfers | (738 | ) | - | 27 | 125 | - | 1 | 515 | 4 | (66 | ) | |||||||||||||||||||||||||
| Other | (6 | ) | 1 | - | - | 71 | (5 | ) | (137 | ) | (7 | ) | (83 | ) | ||||||||||||||||||||||
| Balance at 12/31/2016 | 387 | 1,047 | 3,099 | 1,857 | 1,901 | 1,205 | 8,543 | 1,075 | 19,114 | |||||||||||||||||||||||||||
| Depreciation | ||||||||||||||||||||||||||||||||||||
| Balance at 12/31/2015 | - | - | (1,764 | ) | (930 | ) | (841 | ) | (579 | ) | (5,138 | ) | (557 | ) | (9,809 | ) | ||||||||||||||||||||
| Accumulated depreciation | - | - | (80 | ) | (245 | ) | (142 | ) | (102 | ) | (1,038 | ) | (95 | ) | (1,702 | ) | ||||||||||||||||||||
| Disposal | - | - | 11 | 53 | 6 | 5 | 377 | 4 | 456 | |||||||||||||||||||||||||||
| Exchange variation | - | - | (8 | ) | 8 | 9 | (1 | ) | (101 | ) | (8 | ) | (101 | ) | ||||||||||||||||||||||
| Other | - | - | 1 | - | (18 | ) | 3 | 96 | 2 | 84 | ||||||||||||||||||||||||||
| Balance at 12/31/2016 | - | - | (1,840 | ) | (1,114 | ) | (986 | ) | (674 | ) | (5,804 | ) | (654 | ) | (11,072 | ) | ||||||||||||||||||||
| Impairment | ||||||||||||||||||||||||||||||||||||
| Balance at 12/31/2015 | - | - | - | - | - | - | - | - | - | |||||||||||||||||||||||||||
| Additions/ assumptions | - | - | - | - | - | - | - | - | - | |||||||||||||||||||||||||||
| Reversals | - | - | - | - | - | - | - | - | - | |||||||||||||||||||||||||||
| Balance at 12/31/2016 | - | - | - | - | - | - | - | - | - | |||||||||||||||||||||||||||
| Book value | ||||||||||||||||||||||||||||||||||||
| Balance at 12/31/2016 | 387 | 1,047 | 1,259 | 743 | 915 | 531 | 2,739 | 421 | 8,042 | |||||||||||||||||||||||||||
(1) The contractual commitments for purchase of the fixed assets totaled R$ 48, achievable by 2017 (Note 36 - Off balance sheet).
(2) Includes the amount of R$ 4 related to attached real estate.
(3) Includes lease contracts, mainly related to data processing equipment, which are accounted for as lease operations. The asset and the liability are recognized in the Financial Statements.
| F-66 |
| Real estate in use(2) | Other fixed assets(2) (3) | |||||||||||||||||||||||||||||||||||
| Fixed assets(1) | Fixed assets under construction | Land | Buildings | Improvements | Installations | Furniture and equipment | EDP systems(3) | Other (communication, security and transportation) | Total | |||||||||||||||||||||||||||
| Annual depreciation rates | 4% | 10% | 10 a 20% | 10 a 20% | 20 a 50% | 10 a 20% | ||||||||||||||||||||||||||||||
| Cost | ||||||||||||||||||||||||||||||||||||
| Balance at 12/31/2014 | 2,277 | 1,011 | 2,220 | 1,468 | 1,116 | 916 | 7,419 | 773 | 17,200 | |||||||||||||||||||||||||||
| Acquisitions | 198 | - | 6 | 139 | 75 | 141 | 824 | 83 | 1,466 | |||||||||||||||||||||||||||
| Disposal | - | (6 | ) | (13 | ) | (112 | ) | 182 | (68 | ) | (533 | ) | (5 | ) | (555 | ) | ||||||||||||||||||||
| Exchange variation | - | 3 | 35 | 81 | 6 | 8 | 6 | 6 | 145 | |||||||||||||||||||||||||||
| Transfers | (1,681 | ) | - | 777 | 63 | 422 | - | 419 | - | - | ||||||||||||||||||||||||||
| Other | (2 | ) | - | 1 | 34 | - | (22 | ) | 82 | 1 | 94 | |||||||||||||||||||||||||
| Balance at 12/31/2015 | 792 | 1,008 | 3,026 | 1,673 | 1,801 | 975 | 8,217 | 858 | 18,350 | |||||||||||||||||||||||||||
| Depreciation | ||||||||||||||||||||||||||||||||||||
| Balance at 12/31/2014 | - | - | (1,695 | ) | (754 | ) | (519 | ) | (504 | ) | (4,538 | ) | (479 | ) | (8,489 | ) | ||||||||||||||||||||
| Accumulated depreciation | - | - | (74 | ) | (257 | ) | (129 | ) | (93 | ) | (1,057 | ) | (78 | ) | (1,688 | ) | ||||||||||||||||||||
| Disposal | - | - | 9 | 109 | (183 | ) | 13 | 489 | 3 | 440 | ||||||||||||||||||||||||||
| Exchange variation | - | - | (6 | ) | (27 | ) | (2 | ) | 1 | (7 | ) | (3 | ) | (44 | ) | |||||||||||||||||||||
| Other | - | - | 2 | (1 | ) | (8 | ) | 4 | (25 | ) | - | (28 | ) | |||||||||||||||||||||||
| Balance at 12/31/2015 | - | - | (1,764 | ) | (930 | ) | (841 | ) | (579 | ) | (5,138 | ) | (557 | ) | (9,809 | ) | ||||||||||||||||||||
| Impairment | ||||||||||||||||||||||||||||||||||||
| Balance at 12/31/2014 | - | - | - | - | - | - | - | - | - | |||||||||||||||||||||||||||
| Additions/ assumptions | - | - | - | - | - | - | - | - | - | |||||||||||||||||||||||||||
| Reversals | - | - | - | - | - | - | - | - | - | |||||||||||||||||||||||||||
| Balance at 12/31/2015 | - | - | - | - | - | - | - | - | - | |||||||||||||||||||||||||||
| Book value | ||||||||||||||||||||||||||||||||||||
| Balance at 12/31/2015 | 792 | 1,008 | 1,262 | 743 | 960 | 396 | 3,079 | 301 | 8,541 | |||||||||||||||||||||||||||
(1) The contractual commitments for purchase of the fixed assets totaled R$ 59, achievable by 2016 (Note 36 - Off balance sheet).
(2) Includes the amount of R$ 4 related to attached real estate.
(3) Includes lease contracts, mainly related to data processing equipment, which are accounted for as lease operations. The asset and the liability are recognized in the Financial Statements.
| F-67 |
| Real estate in use(2) | Other fixed assets | |||||||||||||||||||||||||||||||||||
| Fixed assets(1) | Fixed assets under construction | Land | Buildings | Improvements | Installations | Furniture and equipment | EDP systems(3) | Other (communication, security and transportation) | Total | |||||||||||||||||||||||||||
| Annual depreciation rates | 4% | 10% | 10 to 20% | 10 to 20% | 20 to 50% | �� | 10 to 20% | |||||||||||||||||||||||||||||
| Cost | ||||||||||||||||||||||||||||||||||||
| Balance at 12/31/2013 | 948 | 1,019 | 2,236 | 1,283 | 1,043 | 925 | 6,279 | 725 | 14,458 | |||||||||||||||||||||||||||
| Acquisitions | 1,485 | 3 | 11 | 169 | 117 | 74 | 2,045 | 62 | 3,966 | |||||||||||||||||||||||||||
| Disposal | - | (1 | ) | (6 | ) | (163 | ) | (9 | ) | (89 | ) | (829 | ) | (5 | ) | (1,102 | ) | |||||||||||||||||||
| Exchange variation | - | - | (7 | ) | 22 | 4 | (12 | ) | 4 | (11 | ) | - | ||||||||||||||||||||||||
| Transfers | (157 | ) | - | - | 157 | - | - | - | - | - | ||||||||||||||||||||||||||
| Other | 1 | (10 | ) | (14 | ) | - | (39 | ) | 18 | (80 | ) | 2 | (122 | ) | ||||||||||||||||||||||
| Balance at 12/31/2014 | 2,277 | 1,011 | 2,220 | 1,468 | 1,116 | 916 | 7,419 | 773 | 17,200 | |||||||||||||||||||||||||||
| Depreciation | ||||||||||||||||||||||||||||||||||||
| Balance at 12/31/2013 | - | - | (1,651 | ) | (667 | ) | (439 | ) | (487 | ) | (4,230 | ) | (411 | ) | (7,885 | ) | ||||||||||||||||||||
| Accumulated depreciation | - | - | (58 | ) | (247 | ) | (85 | ) | (79 | ) | (1,098 | ) | (74 | ) | (1,641 | ) | ||||||||||||||||||||
| Disposal | - | - | 3 | 162 | 2 | 60 | 768 | 4 | 999 | |||||||||||||||||||||||||||
| Exchange variation | - | - | - | 1 | 2 | 12 | (13 | ) | - | 2 | ||||||||||||||||||||||||||
| Other | - | - | 11 | (3 | ) | 1 | (10 | ) | 35 | 2 | 36 | |||||||||||||||||||||||||
| Balance at 12/31/2014 | - | - | (1,695 | ) | (754 | ) | (519 | ) | (504 | ) | (4,538 | ) | (479 | ) | (8,489 | ) | ||||||||||||||||||||
| Impairment | ||||||||||||||||||||||||||||||||||||
| Balance at 12/31/2013 | - | - | - | - | - | (9 | ) | - | - | (9 | ) | |||||||||||||||||||||||||
| Additions/ assumptions | - | - | - | - | - | - | - | - | - | |||||||||||||||||||||||||||
| Reversals | - | - | - | - | - | 9 | - | - | 9 | |||||||||||||||||||||||||||
| Balance at 12/31/2014 | - | - | - | - | - | - | - | - | - | |||||||||||||||||||||||||||
| Book value | ||||||||||||||||||||||||||||||||||||
| Balance at 12/31/2014 | 2,274 | 1,011 | 525 | 714 | 597 | 415 | 2,881 | 294 | 8,711 | |||||||||||||||||||||||||||
(1) The contractual commitments for purchase of the fixed assets totaled R$ 67, achievable by 2016 (Note 36 - Off balance sheet).
(2) Includes the amount of R$ 4 related to attached real estate.
(3) Includes lease contracts, mainly related to data processing equipment, which are accounted for as lease operations. The asset and the liability are recognized in the Financial Statements.
| F-68 |
Note 16 - Intangible assets
| Other intangible assets | ||||||||||||||||||||||||
| Intangible assets(1) | Acquisition of rights to credit payroll | Association for the promotion and offer of financial products and services | Acquisition of software | Development of software | Other intangible assets | Total | ||||||||||||||||||
| Amortization rates p.a. | 20% | 8% | 20% | 20% | 10 a 20% | |||||||||||||||||||
| Cost | ||||||||||||||||||||||||
| Balance at 12/31/2015 | 1,005 | 1,409 | 2,362 | 3,311 | 960 | 9,047 | ||||||||||||||||||
| Acquisitions | 342 | 719 | 1,293 | 215 | 277 | 2,846 | ||||||||||||||||||
| Terminated agreements/ write off | (308 | ) | (73 | ) | (3 | ) | (1 | ) | - | (385 | ) | |||||||||||||
| Exchange variation | - | (12 | ) | 120 | - | (130 | ) | (22 | ) | |||||||||||||||
| Other | 7 | (295 | ) | 68 | - | (29 | ) | (249 | ) | |||||||||||||||
| Balance at 12/31/2016 | 1,046 | 1,748 | 3,840 | 3,525 | 1,078 | 11,237 | ||||||||||||||||||
| Amortization(2) | ||||||||||||||||||||||||
| Balance at 12/31/2015 | (600 | ) | (330 | ) | (1,190 | ) | (252 | ) | (342 | ) | (2,714 | ) | ||||||||||||
| Amortization expense | (261 | ) | (263 | ) | (429 | ) | (280 | ) | (298 | ) | (1,531 | ) | ||||||||||||
| Terminated agreements/ write off | 306 | 67 | 1 | - | - | 374 | ||||||||||||||||||
| Exchange variation | - | 84 | (107 | ) | - | 110 | 87 | |||||||||||||||||
| Other | - | 66 | 24 | - | 246 | 336 | ||||||||||||||||||
| Balance at 12/31/2016 | (555 | ) | (376 | ) | (1,701 | ) | (532 | ) | (284 | ) | (3,448 | ) | ||||||||||||
| Impairment(3) | ||||||||||||||||||||||||
| Balance at 12/31/2015 | (18 | ) | (2 | ) | - | (18 | ) | - | (38 | ) | ||||||||||||||
| Additions / assumptions | (1 | ) | - | (57 | ) | (317 | ) | - | (375 | ) | ||||||||||||||
| Write off | - | 2 | 3 | - | - | 5 | ||||||||||||||||||
| Balance at 12/31/2016 | (19 | ) | - | (54 | ) | (335 | ) | - | (408 | ) | ||||||||||||||
| Book value | ||||||||||||||||||||||||
| Balance at 12/31/2016 | 472 | 1,372 | 2,085 | 2,658 | 794 | 7,381 | ||||||||||||||||||
(1) The contractual commitments for the purchase of new intangible assets totaled R$ 262, achievable by 2017 (Note 36 - Off balance sheet).
(2) All intangible assets have a defined useful life.
(3) Note 2.4i.
| F-69 |
| Other intangible assets | ||||||||||||||||||||||||
| Intangible assets (1) | Acquisition of rights to credit payroll | Association for the promotion and offer of financial products and services | Acquisition of software | Development of software | Other intangible assets | Total | ||||||||||||||||||
| Amortization rates p.a. | 20% | 8% | 20% | 20% | 10 a 20% | |||||||||||||||||||
| Cost | ||||||||||||||||||||||||
| Balance at 12/31/2014 | 1,067 | 1,582 | 1,965 | 2,836 | 791 | 8,241 | ||||||||||||||||||
| Acquisitions | 109 | 39 | 410 | 489 | 15 | 1,062 | ||||||||||||||||||
| Terminated agreements / write off | (169 | ) | (195 | ) | (134 | ) | (14 | ) | (4 | ) | (516 | ) | ||||||||||||
| Exchange variation | - | - | 109 | - | 185 | 294 | ||||||||||||||||||
| Other | (2 | ) | (17 | ) | 12 | - | (27 | ) | (34 | ) | ||||||||||||||
| Balance at 12/31/2015 | 1,005 | 1,409 | 2,362 | 3,311 | 960 | 9,047 | ||||||||||||||||||
| Amortization (2) | ||||||||||||||||||||||||
| Balance at 12/31/2014 | (556 | ) | (337 | ) | (918 | ) | (113 | ) | (149 | ) | (2,073 | ) | ||||||||||||
| Amortization expense | (213 | ) | (144 | ) | (358 | ) | (138 | ) | (287 | ) | (1,140 | ) | ||||||||||||
| Terminated agreements / write off | 169 | 144 | 134 | - | - | 447 | ||||||||||||||||||
| Exchange variation | - | - | (51 | ) | - | (150 | ) | (201 | ) | |||||||||||||||
| Other | - | 7 | 3 | (1 | ) | 244 | 253 | |||||||||||||||||
| Balance at 12/31/2015 | (600 | ) | (330 | ) | (1,190 | ) | (252 | ) | (342 | ) | (2,714 | ) | ||||||||||||
| Impairment (3) | ||||||||||||||||||||||||
| Balance at 12/31/2014 | (18 | ) | (2 | ) | - | (14 | ) | - | (34 | ) | ||||||||||||||
| Additions / assumptions | - | - | - | (4 | ) | - | (4 | ) | ||||||||||||||||
| Reversals | - | - | - | - | - | - | ||||||||||||||||||
| Balance at 12/31/2015 | (18 | ) | (2 | ) | - | (18 | ) | - | (38 | ) | ||||||||||||||
| Book value | ||||||||||||||||||||||||
| Balance at 12/31/2015 | 387 | 1,077 | 1,172 | 3,041 | 618 | 6,295 | ||||||||||||||||||
(1) The contractual commitments for the purchase of new intangible assets totaled R$ 281, achievable by 2016 (Note 36 - Off balance sheet).
(2) All intangible assets have a defined useful life.
(3) Note 2.4i.
| F-70 |
| Other intangible assets | ||||||||||||||||||||||||
| Intangible assets (1) | Acquisition of rights to credit payroll | Association for the promotion and offer of financial products and services | Acquisition of software | Development of software | Other intangible assets | Total | ||||||||||||||||||
| Amortization rates p.a. | 20% | 8% | 20% | 20% | 10 to 20% | |||||||||||||||||||
| Cost | ||||||||||||||||||||||||
| Balance at 12/31/2013 | 1,165 | 1,688 | 1,839 | 2,195 | 1,019 | 7,906 | ||||||||||||||||||
| Acquisitions | 109 | 36 | 393 | 651 | 10 | 1,199 | ||||||||||||||||||
| Terminated agreements / write off | (214 | ) | (104 | ) | (201 | ) | (10 | ) | (300 | ) | (829 | ) | ||||||||||||
| Exchange variation | - | (2 | ) | (23 | ) | - | 43 | 18 | ||||||||||||||||
| Other | 7 | (36 | ) | (43 | ) | - | 19 | (53 | ) | |||||||||||||||
| Balance at 12/31/2014 | 1,067 | 1,582 | 1,965 | 2,836 | 791 | 8,241 | ||||||||||||||||||
| Amortization (2) | ||||||||||||||||||||||||
| Balance at 12/31/2013 | (535 | ) | (256 | ) | (868 | ) | (47 | ) | (352 | ) | (2,058 | ) | ||||||||||||
| Amortization expense | (225 | ) | (157 | ) | (324 | ) | (66 | ) | (131 | ) | (903 | ) | ||||||||||||
| Terminated agreements / write off | 204 | 81 | 201 | - | 119 | 605 | ||||||||||||||||||
| Exchange variation | - | - | 10 | - | (34 | ) | (24 | ) | ||||||||||||||||
| Other | - | (5 | ) | 63 | - | 249 | 307 | |||||||||||||||||
| Balance at 12/31/2014 | (556 | ) | (337 | ) | (918 | ) | (113 | ) | (149 | ) | (2,073 | ) | ||||||||||||
| Impairment (3) | ||||||||||||||||||||||||
| Balance at 12/31/2013 | (18 | ) | (27 | ) | - | (6 | ) | - | (51 | ) | ||||||||||||||
| Additions / assumptions | - | - | - | (8 | ) | - | (8 | ) | ||||||||||||||||
| Reversals | - | 25 | - | - | - | 25 | ||||||||||||||||||
| Balance at 12/31/2014 | (18 | ) | (2 | ) | - | (14 | ) | - | (34 | ) | ||||||||||||||
| Book value | ||||||||||||||||||||||||
| Balance at 12/31/2014 | 493 | 1,243 | 1,047 | 2,709 | 642 | 6,134 | ||||||||||||||||||
(1) The contractual commitments for the purchase of new intangible assets totaled R$ 508, achievable by 2016 (Note 36 - Off balance sheet).
(2) All intangible assets have a defined useful life.
(3) Note 2.4i.
| F-71 |
Note 17 - Deposits
The table below shows the breakdown of deposits:
| 12/31/2016 | 12/31/2015 | |||||||||||||||||||||||
| Current | Non-current | Total | Current | Non-current | Total | |||||||||||||||||||
| Interest-bearing deposits | 187,882 | 80,399 | 268,281 | 171,527 | 59,991 | 231,518 | ||||||||||||||||||
| Time deposits | 75,913 | 80,361 | 156,274 | 45,994 | 59,256 | 105,250 | ||||||||||||||||||
| Interbank deposits | 3,719 | 38 | 3,757 | 14,214 | 735 | 14,949 | ||||||||||||||||||
| Savings deposits | 108,250 | - | 108,250 | 111,319 | - | 111,319 | ||||||||||||||||||
| Non-interest bearing deposits | 61,133 | - | 61,133 | 61,092 | - | 61,092 | ||||||||||||||||||
| Demand deposits | 61,133 | - | 61,133 | 61,092 | - | 61,092 | ||||||||||||||||||
| Total | 249,015 | 80,399 | 329,414 | 232,619 | 59,991 | 292,610 | ||||||||||||||||||
Note 18 – Financial liabilities held for trading
Financial liabilities held for trading are presented in the following table:
| 12/31/2016 | 12/31/2015 | |||||||
| Structured notes | ||||||||
| Shares | 49 | 57 | ||||||
| Debt securities | 470 | 355 | ||||||
| Total | 519 | 412 | ||||||
The effect of the changes in credit risk of these instruments is not significant at 12/31/2016 and 12/31/2015.
For shares, in view of the characteristics of the instrument, there is no definite value to be paid at the maturity date. For debt securities, the amount to be paid at maturity comprises several exchange rates and indices, and there is no contractual amount for settlement.
The fair value of financial liabilities held for trading by maturity is as follows:
| 12/31/2016 | 12/31/2015 | |||||||
| Cost / Fair value | Cost / Fair value | |||||||
| Current - up to one year | 134 | 34 | ||||||
| Non-current | 385 | 378 | ||||||
| From one to five years | 295 | 364 | ||||||
| From five to ten years | 52 | 5 | ||||||
| After ten years | 38 | 9 | ||||||
| Total | 519 | 412 | ||||||
| F-72 |
Note 19 – Securities sold under repurchase agreements and interbank and institutional market debts
a) Securities sold under repurchase agreements and interbank market debt
The table below shows the breakdown of funds:
| 12/31/2016 | 12/31/2015 | |||||||||||||||||||||||
| Current | Non- current | Total | Current | Non- current | Total | |||||||||||||||||||
| Securities sold under repurchase agreements | 234,569 | 114,595 | 349,164 | 181,198 | 155,445 | 336,643 | ||||||||||||||||||
| Transactions backed by own financial assets (*) | 101,400 | 114,595 | 215,995 | 64,955 | 155,445 | 220,400 | ||||||||||||||||||
| Transactions backed by third party financial assets | 133,169 | - | 133,169 | 116,243 | - | 116,243 | ||||||||||||||||||
| Interbank market debt | 75,352 | 60,131 | 135,483 | 80,547 | 76,339 | 156,886 | ||||||||||||||||||
| Mortgage notes | - | - | - | 31 | 108 | 139 | ||||||||||||||||||
| Real estate credit bills | 12,830 | 6,349 | 19,179 | 12,441 | 2,011 | 14,452 | ||||||||||||||||||
| Agribusiness credit bills | 9,158 | 6,284 | 15,442 | 6,695 | 7,080 | 13,775 | ||||||||||||||||||
| Financial credit bills | 5,976 | 13,590 | 19,566 | 3,860 | 14,636 | 18,496 | ||||||||||||||||||
| Import and export financing | 38,123 | 7,510 | 45,633 | 45,633 | 19,933 | 65,566 | ||||||||||||||||||
| On-lending - domestic | 9,205 | 20,623 | 29,828 | 11,884 | 26,920 | 38,804 | ||||||||||||||||||
| Liabilities from transactions related to credit assignments (Note 12d) | 60 | 5,775 | 5,835 | 3 | 5,651 | 5,654 | ||||||||||||||||||
(*) It includes R$ 132,149 (R$ 152,215 at 12/31/2015) related to Debentures of own issue.
Funding for import and export financing represents credit facilities available for financing of imports and exports of Brazilian companies, in general denominated in foreign currency. The interest rate for each one of the operations (p.a.) is presented in the table below:
| Brazil | Foreign | |||
| Securities sold under repurchase agreements(*) | 8,5% of CDI to 17.36% | 0.63% to 1.85% | ||
| Mortgage notes | - | 2.5% to 8% | ||
| Real estate credit bills | 83% to 100% of CDI | - | ||
| Financial credit bills | IGPM to 113% | - | ||
| Agribusiness credit bills | 83% to 98% of CDI | - | ||
| Import and export financing | 1.1% to 6.0% | 0.4% to 9.5% | ||
| On-lending - domestic | 2.5% to 14.5% | - | ||
| Liabilities from transactions related to credit assignments | 6.38% to 13.17% | - |
(*)Note 2,4d presents the operations comprising Deposits received under securities repurchased agreements.Final repurchase dates are set until December 2032.
| b) | Institutional market debt |
The table below presents the breakdown of funds obtained in Institutional markets:
| 12/31/2016 | 12/31/2015 | |||||||||||||||||||||||
| Current | Non- current | Total | Current | Non- current | Total | |||||||||||||||||||
| Subordinated debt (1) | 11,056 | 46,364 | 57,420 | 10,209 | 55,576 | 65,785 | ||||||||||||||||||
| Foreign borrowing through securities | 5,947 | 27,636 | 33,583 | 4,757 | 19,431 | 24,188 | ||||||||||||||||||
| Structured Operations Certificates (2) | 2,050 | 3,186 | 5,236 | 893 | 3,052 | 3,945 | ||||||||||||||||||
| Total | 19,053 | 77,186 | 96,239 | 15,859 | 78,059 | 93,918 | ||||||||||||||||||
(1) At 12/31/2016, the amount of R$ 51,875 (R$ 64,861 at 12/31/2015) is included in the Reference Equity, under the proportion defined by CMN Resolution No. 3,444, of February 28, 2007, as amended by CMN Resolution No. 3,532, of January 31, 2008.
(2) As at December 31, 2016, the market value of the funding from Structured Operations Certificates issued is R$ 5,816.
The interest rate for each one of the operations (p.a.) is presented in the table below.
| Brazil | Foreign | |||
| Subordinated debt | CDI+ 1% to IGPM + 7.6% | 3.5% to 10.79% | ||
| Foreign borrowing through securities | 0.89% to 12.73% | 0.63% to 25.04% | ||
| Structured Operations Certificates | IPA + 3.28% to 16.54% | - |
| F-73 |
Note 20 - Other assets and liabilities
a) Other assets
| 12/31/2016 | 12/31/2015 | |||||||||||||||||||||||
| Current | Non- current | Total | Current | Non- current | Total | |||||||||||||||||||
| Financial (1) | 41,648 | 12,269 | 53,917 | 41,546 | 11,960 | 53,506 | ||||||||||||||||||
| Receivables from credit card issuers | 26,124 | - | 26,124 | 25,191 | - | 25,191 | ||||||||||||||||||
| Insurance and reinsurance operations | 1,306 | 14 | 1,320 | 1,367 | - | 1,367 | ||||||||||||||||||
| Deposits in guarantee for contingent liabilities (Note 32) | 2,118 | 11,144 | 13,262 | 2,131 | 10,502 | 12,633 | ||||||||||||||||||
| Deposits in guarantee for foreign borrowing program | 893 | - | 893 | 409 | - | 409 | ||||||||||||||||||
| Negotiation and intermediation of securities | 6,770 | - | 6,770 | 7,725 | - | 7,725 | ||||||||||||||||||
| Receivables from reimbursement of contingent liabilities (Note 32c) | 258 | 870 | 1,128 | 335 | 758 | 1,093 | ||||||||||||||||||
| Receivables from services provided | 2,510 | - | 2,510 | 2,333 | 149 | 2,482 | ||||||||||||||||||
| Amounts receivable from FCVS – Salary Variations Compensation Fund (2) | 7 | 234 | 241 | - | 551 | 551 | ||||||||||||||||||
| Foreign exchange portfolio | - | - | - | 444 | - | 444 | ||||||||||||||||||
| Operations without credit granting characteristics | 1,662 | 7 | 1,669 | 1,611 | - | 1,611 | ||||||||||||||||||
| Non-financial | 7,804 | 2,223 | 10,027 | 7,005 | 4,606 | 11,611 | ||||||||||||||||||
| Prepaid expenses | 2,101 | 687 | 2,788 | 2,196 | 1,012 | 3,208 | ||||||||||||||||||
| Retirement plan assets (Notes 29c and d) | - | 1,113 | 1,113 | - | 2,183 | 2,183 | ||||||||||||||||||
| Sundry domestic | 1,634 | 32 | 1,666 | 602 | - | 602 | ||||||||||||||||||
| Premiums from loan operations | 531 | 319 | 850 | 814 | 850 | 1,664 | ||||||||||||||||||
| Sundry foreign | 1,776 | 65 | 1,841 | 1,542 | 550 | 2,092 | ||||||||||||||||||
| Other | 1,762 | 7 | 1,769 | 1,851 | 11 | 1,862 | ||||||||||||||||||
(1) There were no impairment losses for other financial assets in these periods.
(2) The Salary Variation Compensation Fund – FCVS was established through Resolution No. 25, of June 16, 1967, of the Board of the former BNH (National Housing Bank), and its purpose is to settle balances remaining after the end of real estate financing contracted up to March 1990, relating to agreements financed under the SFH (National Housing System), and provided that they are covered by FCVS.
| b) | Other liabilities |
| 12/31/2016 | 12/31/2015 | |||||||||||||||||||||||
| Current | Non- current | Total | Current | Non- current | Total | |||||||||||||||||||
| Financial | 71,798 | 34 | 71,832 | 68,478 | 237 | 68,715 | ||||||||||||||||||
| Credit card operations | 58,920 | - | 58,920 | 56,143 | - | 56,143 | ||||||||||||||||||
| Foreign exchange portfolio | 620 | - | 620 | - | - | - | ||||||||||||||||||
| Negotiation and intermediation of securities | 10,538 | - | 10,538 | 10,920 | 177 | 11,097 | ||||||||||||||||||
| Finance leases (Note 14a) | 26 | - | 26 | 491 | 26 | 517 | ||||||||||||||||||
| Funds from consortia participants | 84 | - | 84 | 45 | - | 45 | ||||||||||||||||||
| Other | 1,610 | 34 | 1,644 | 879 | 34 | 913 | ||||||||||||||||||
| Non-financial | 25,968 | 1,142 | 27,110 | 24,975 | 812 | 25,787 | ||||||||||||||||||
| Collection and payment of taxes and contributions | 297 | - | 297 | 239 | - | 239 | ||||||||||||||||||
| Sundry creditors - domestic | 2,488 | 117 | 2,605 | 1,681 | 75 | 1,756 | ||||||||||||||||||
| Funds in transit | 10,214 | 190 | 10,404 | 10,893 | - | 10,893 | ||||||||||||||||||
| Provision for sundry payments | 2,007 | 203 | 2,210 | 1,944 | 199 | 2,143 | ||||||||||||||||||
| Social and statutory | 5,541 | 35 | 5,576 | 5,110 | - | 5,110 | ||||||||||||||||||
| Related to insurance operations | 224 | - | 224 | 253 | - | 253 | ||||||||||||||||||
| Liabilities for official agreements and rendering of payment services | 864 | - | 864 | 808 | - | 808 | ||||||||||||||||||
| Provision for retirement plan benefits (Note 29c and e) | 201 | 548 | 749 | - | 491 | 491 | ||||||||||||||||||
| Personnel provision | 1,352 | 49 | 1,401 | 1,336 | 47 | 1,383 | ||||||||||||||||||
| Provision for health insurance | 742 | - | 742 | 716 | - | 716 | ||||||||||||||||||
| Deferred income | 1,975 | - | 1,975 | 1,909 | - | 1,909 | ||||||||||||||||||
| Other | 63 | - | 63 | 86 | - | 86 | ||||||||||||||||||
| F-74 |
Note 21 – Stockholders’ equity
| a) | Capital |
The Extraordinary Stockholders’ Meeting held on September 14, 2016 approved the increase of subscribed and paid-up capital by R$ 12,000, with the capitalization of the amounts recorded in Revenue Reserve – Statutory Reserve, with a 10% bonus shares. Bonus shares started being traded on October 21,2016 and the process was approved by the Central Bank on September 23,2016. Accordingly, capital stock was increased by 598,391,594 shares.
The Extraordinary Stockholders` Meeting of April 27, 2016 approved the cancellation of 100,000,000 preferred shares of own issue held in treasury, without change to the capital stock, through the capitalization of amounts recorded in Revenue Reserves – Statutory Reserve. This process was approved by the Central Bank of Brazil on June 7, 2016.
Capital comprises 6,582,307,543 book-entry shares with no par value, of which 3,351,744,217 are common and 3,230,563,326 are preferred shares without voting rights, but with tag-along rights, in the event of the public offer of common shares, at a price equal to 80% of the amount paid per share with voting rights in the controlling stake, as well as a dividend at least equal to that of the common shares. Capital stock amounts to R$ 97,148 (85,148 at 12/31/2015), of which R$ 65,534 (58,284 at 12/31/2015) refers to stockholders domiciled in the country and R$ 31,614 (R$ 26,864 at 12/31/2015) refers to stockholders domiciled abroad.
The table below shows the breakdown of and change in shares of paid-in capital and the reconciliation of balances at the beginning and end of the period:
| 12/31/2016 | ||||||||||||||||
| Number | ||||||||||||||||
| Common | Preferred | Total | Amount | |||||||||||||
| Residents in Brazil at 12/31/2015 | 3,033,657,386 | 1,130,776,196 | 4,164,433,582 | |||||||||||||
| Residents abroad at 12/31/2015 | 13,382,812 | 1,906,099,555 | 1,919,482,367 | |||||||||||||
| Shares of capital stock at 12/31/2015 | 3,047,040,198 | 3,036,875,751 | 6,083,915,949 | |||||||||||||
| (-) Cancellation of shares - ESM of April 27, 2016 – Approved on June 7, 2016 | - | (100,000,000 | ) | (100,000,000 | ) | |||||||||||
| Bonus Shares - ESM of 09/14/2016 - Carried out at 09/23/2016 | 304,704,019 | 293,687,575 | 598,391,594 | |||||||||||||
| Shares of capital stock at 12/31/2016 | 3,351,744,217 | 3,230,563,326 | 6,582,307,543 | |||||||||||||
| Residents in Brazil at 12/31/2016 | 3,335,350,311 | 1,104,963,731 | 4,440,314,042 | |||||||||||||
| Residents abroad at 12/31/2016 | 16,393,906 | 2,125,599,595 | 2,141,993,501 | |||||||||||||
| Treasury shares at 12/31/2015 (1) | 2,795 | 162,562,650 | 162,565,445 | (4,353 | ) | |||||||||||
| Purchase of shares | - | 30,640,000 | 30,640,000 | (947 | ) | |||||||||||
| Exercised options – granting of stock options | - | (19,931,626 | ) | (19,931,626 | ) | 315 | ||||||||||
| Disposals – stock option plan | - | (8,293,957 | ) | (8,293,957 | ) | 433 | ||||||||||
| (-) Cancellation of shares - ESM of April 27, 2016 – Approved on June 7, 2016 | - | (100,000,000 | ) | (100,000,000 | ) | 2,670 | ||||||||||
| Bonus Shares - ESM of 09/14/2016 | 279 | 4,627,395 | 4,627,674 | - | ||||||||||||
| Treasury shares at 12/31/2016 (1) | 3,074 | 69,604,462 | 69,607,536 | (1,882 | ) | |||||||||||
| Outstanding shares at 12/31/2016 | 3,351,741,143 | 3,160,958,864 | 6,512,700,007 | |||||||||||||
| Outstanding shares at 12/31/2015 (2) | 3,351,741,143 | 3,161,744,411 | 6,513,485,554 | |||||||||||||
| 12/31/2015 | ||||||||||||||||
| Number | ||||||||||||||||
| Common | Preferred | Total | Amount | |||||||||||||
| Residents in Brazil at 12/31/2014 | 3,034,554,303 | 1,148,179,276 | 4,182,733,579 | |||||||||||||
| Residents abroad at 12/31/2014 | 12,485,895 | 1,888,696,475 | 1,901,182,370 | |||||||||||||
| Shares of capital stock at 12/31/2014 | 3,047,040,198 | 3,036,875,751 | 6,083,915,949 | |||||||||||||
| Bonus shares - ESM of 04/29/2015 – made effective on 06/25/2015 | 304,704,019 | 303,687,575 | 608,391,594 | |||||||||||||
| Shares of capital stock at 12/31/2015 | 3,351,744,217 | 3,340,563,326 | 6,692,307,543 | |||||||||||||
| Residents in Brazil at 12/31/2015 | 3,337,023,124 | 1,243,853,815 | 4,580,876,939 | |||||||||||||
| Residents abroad at 12/31/2015 | 14,721,093 | 2,096,709,511 | 2,111,430,604 | |||||||||||||
| Treasury shares at 12/31/2014 (1) | 2,795 | 59,211,406 | 59,214,201 | (1,328 | ) | |||||||||||
| Purchase of shares | - | 122,677,280 | 122,677,280 | (3,324 | ) | |||||||||||
| Exercised options - granting of stock options | - | (6,461,115 | ) | (6,461,115 | ) | 4 | ||||||||||
| Disposals – stock option plan | - | (5,877,161 | ) | (5,877,161 | ) | 295 | ||||||||||
| Bonus shares - ESM of 04/29/2015 | 279 | 9,268,505 | 9,268,784 | - | ||||||||||||
| Treasury shares at 12/31/2015 (1) | 3,074 | 178,818,915 | 178,821,989 | (4,353 | ) | |||||||||||
| Outstanding shares at 12/31/2015 (2) | 3,351,741,143 | 3,161,744,411 | 6,513,485,554 | |||||||||||||
| Outstanding shares at 12/31/2014 (2) | 3,351,741,143 | 3,275,430,780 | 6,627,171,923 | |||||||||||||
(1) Own shares, purchased based on authorization of the Board of Directors, to be held in Treasury for subsequent cancellation of replacement in the market.
(2) For better comparability, outstanding shares were adjusted to reflect the bonuses of 09/23/2016.
| F-75 |
We detail below of the cost of shares purchased in the period, as well the average cost of treasury shares and their market price (in Brazilian Reais per share):
| 01/01 to 12/31/2016 | ||||||||
| Cost / market value | Common | Preferred | ||||||
| Minimum | - | 23.79 | ||||||
| Weighted average | - | 30.13 | ||||||
| Maximum | - | 36.05 | ||||||
| Treasury shares | ||||||||
| Average cost | 6.59 | 27.04 | ||||||
| Market value at 12/31/2016 | 30.00 | 33.85 | ||||||
| 01/01 to 12/31/2015 | ||||||||
| Cost / market value | Common | Preferred | ||||||
| Minimum | - | 24.96 | ||||||
| Weighted average | - | 28.80 | ||||||
| Maximum | - | 31.86 | ||||||
| Treasury shares | ||||||||
| Average cost | 7.25 | 26.78 | ||||||
| Market value at 12/31/2015 | 24.58 | 26.33 | ||||||
| F-76 |
| b) | Dividends |
Stockholders are entitled to an annual mandatory dividend of not less than 25% of adjusted profit, pursuant to the provisions of the Brazilian Corporate Law. Both common and preferred shares participate equally, after common shares have received dividends equal to the annual minimum priority dividend of R$ 0.022 per share non-cumulative to be paid to preferred shares.
The calculation of the monthly advance of the mandatory minimum dividend is based on the share position on the last day of the prior month, with payment being made on the first business day of the subsequent month, amounting to R$ 0.015 per share.
Calculation of dividends and interest on capital
| 12/31/2016 | 12/31/2015 | 12/31/2014 | ||||||||||
| Statutory net income | 18,853 | 21,084 | 17,392 | |||||||||
| Adjustments: | ||||||||||||
| (-) Legal reserve | (943 | ) | (1,054 | ) | (870 | ) | ||||||
| Dividend calculation basis | 17,910 | 20,030 | 16,522 | |||||||||
| Mandatory dividend - 25% | 4,478 | 5,007 | 4,130 | |||||||||
| Dividends and interest on capital – paid / provisioned for | 10,000 | 7,305 | 6,635 | |||||||||
Payments / provision for interest on capital and dividends
| 12/31/2016 | ||||||||||||
| Gross | WHT | Net | ||||||||||
| Paid / prepaid | 3,355 | (355 | ) | 3,000 | ||||||||
| Dividends - 11 monthly installments of R$ 0.015 per share paid from February to December 2016 | 987 | - | 987 | |||||||||
| Interest on capital - R$ 0.3990 per share paid on 08/25/2016 | 2,368 | (355 | ) | 2,013 | ||||||||
| Declared until 12/31/2016 (recorded in other liabilities) | 3,169 | (461 | ) | 2,708 | ||||||||
| Dividends - 1 monthly installment of R$ 0.015 per share paid on 01/02/2017 | 98 | - | 98 | |||||||||
| Interest on capital - R$ 0.4714 per share, credited on 12/30/2016, paid by 04/28/2017 | 3,071 | (461 | ) | 2,610 | ||||||||
| Declared after 12/31/2016 (Recorded in Revenue Reserves - Dividends equalization) | 5,050 | (758 | ) | 4,292 | ||||||||
| Interest on capital - R$ 0.7754 per share | 5,050 | (758 | ) | 4,292 | ||||||||
| Total from 01/01 to 12/31/2016 - R$ 1.5789 net per share | 11,574 | (1,574 | ) | 10,000 | ||||||||
| 12/31/2015 | ||||||||||||
| Gross | WHT | Net | ||||||||||
| Paid / prepaid | 3,002 | (311 | ) | 2,691 | ||||||||
| Dividends - 11 monthly installments of R$ 0.015 per share paid from February to December 2015 | 932 | - | 932 | |||||||||
| Interest on capital - R$ 0.3460 per share paid on 08/25/2015 | 2,070 | (311 | ) | 1,759 | ||||||||
| Declared until 12/31/2015 (recorded in other liabilities) | 2,502 | (186 | ) | 2,316 | ||||||||
| Dividends - 1 monthly installment of R$ 0.015 per share paid on 01/04/2016 | 89 | - | 89 | |||||||||
| Dividends provision - R$ 0.1980 per share | 1,173 | 1,173 | ||||||||||
| Interest on capital - R$ 0.2090 per share, credited on 12/30/2015, paid by 04/30/2016 | 1,240 | (186 | ) | 1,054 | ||||||||
| Declared after 12/31/2015 (Recorded in Revenue Reserves - Unrealized Profits Reserve) | �� | 2,703 | (405 | ) | 2,298 | |||||||
| Interest on capital - R$ 0.4564 per share | 2,703 | (405 | ) | 2,298 | ||||||||
| Total from 01/01 to 12/31/2015 - R$ 1.2376 net per share | 8,207 | (902 | ) | 7,305 | ||||||||
Payments / provision for interest on capital and dividends
| 12/31/2014 | ||||||||||||
| Gross | WHT | Net | ||||||||||
| Paid / prepaid | 2,637 | (267 | ) | 2,370 | ||||||||
| Dividends - 11 monthly installments of R$ 0.015 per share paid from February to December 2014 | 857 | - | 857 | |||||||||
| Interest on capital - R$ 0.3256 per share paid on 08/25/2014 | 1,780 | (267 | ) | 1,513 | ||||||||
| Declared until 12/31/2014 (recorded in other liabilities) | 1,760 | - | 1,760 | |||||||||
| Dividends - 1 monthly installment of R$ 0.015 per share paid on 01/02/2015 | 82 | - | 82 | |||||||||
| Interest on capital - R$ 0.3063 per share | 1,678 | - | 1,678 | |||||||||
| Declared after 12/31/2014 (Recorded in Revenue Reserves - Unrealized Profits Reserve) | 2,947 | (442 | ) | 2,505 | ||||||||
| Interest on capital - R$ 0.5380 per share | 2,947 | (442 | ) | 2,505 | ||||||||
| Total from 01/01 to 12/31/2014 - R$ 1.2204 net per share | 7,344 | (709 | ) | 6,635 | ||||||||
| F-77 |
c) Additional paid-in capital
Additional paid-in capital corresponds to: (i) the difference between the proceeds from the sale of treasury shares and the average cost of such shares, and (ii) the compensation expenses recognized in accordance with the stock option plan and variable compensation.
d) Appropriated reserves
| 12/31/2016 | 12/31/2015 | 12/31/2014 | ||||||||||
| Capital reserves (1) | 285 | 285 | 285 | |||||||||
| Premium on subscription of shares | 284 | 284 | 284 | |||||||||
| Reserves from tax incentives, restatement of equity securities and other | 1 | 1 | 1 | |||||||||
| Revenue reserves | 3,158 | 9,782 | 7,925 | |||||||||
| Legal (2) | 7,838 | 6,895 | 5,841 | |||||||||
| Statutory | 1,132 | 9,461 | 7,775 | |||||||||
| Dividends equalization (3) | 337 | 3,355 | 2,885 | |||||||||
| Working capital increase (4) | - | 1,655 | 1,162 | |||||||||
| Increase in capital of investees (5) | 795 | 4,451 | 3,728 | |||||||||
| Corporate reorganizations (Note 2.4 a III) | (10,862 | ) | (9,277 | ) | (8,638 | ) | ||||||
| Unrealized profits (6) | 5,050 | 2,703 | 2,947 | |||||||||
| Total reserves at parent company | 3,443 | 10,067 | 8,210 | |||||||||
| (1) | Refers to amounts received by Itaú Unibanco Holding that were not included in the statement of income, since they do not refer to compensation for the provision of goods or services. |
| (2) | Legal reserve - may be used to increase capital or to absorb losses, but it cannot be distributed as dividends. |
| (3) | Reserve for dividends equalization - its purpose is to reserve funds for the payment or advances on dividends, including interest on capital, to maintain the flow of the stockholders' compensation. |
| (4) | Reserve for working capital - its purpose is to guarantee funds for operations. |
| (5) | Reserve for increase in capital of investees - its purpose is to guarantee the preemptive right in the capital increases of investees. |
| (6) | Refers to interest on capital declared after December 31 of each period. |
| e) | Unappropriated reserves |
Refers to balance of profit remaining after the distribution of dividends and appropriations to statutory reserves in the statutory accounts of ITAÚ UNIBANCO HOLDING.
f) Non-controlling interests
| Stockholders’ equity | Net Income | |||||||||||||||
| 01/01 to | 01/01 to | |||||||||||||||
| 12/31/2016 | 12/31/2015 | 12/31/2016 | 12/31/2015 | |||||||||||||
| Itaú CorpBanca (Note 3) | 10,117 | - | 119 | - | ||||||||||||
| Banco CorpBanca Colômbia S.A. (Note 3) | 1,231 | - | 22 | - | ||||||||||||
| Financeira Itaú CBD S.A. Crédito, Financiamento e Investimento | 519 | 428 | 119 | 118 | ||||||||||||
| Banco Itaú Consignado S.A. | - | 983 | (20 | ) | 217 | |||||||||||
| Luizacred S.A. Soc. Cred. Financiamento Investimento | 275 | 282 | 51 | 62 | ||||||||||||
| Others | 90 | 114 | 28 | 19 | ||||||||||||
| Total | 12,232 | 1,807 | 319 | 416 | ||||||||||||
| F-78 |
Note 22 – Share-based payment
ITAÚ UNIBANCO HOLDING and its subsidiaries have share-based payment programs aimed at involving its management members and employees in the medium and long term corporate development process.
These payments are only made in years where there are sufficient profits to enable the distribution of mandatory dividends, in order to limit the maximum dilutive effect to which stockholders are subject, and at a quantity that does not exceed the limit of 0.5% of the total shares held by the controlling and minority stockholders at the balance sheet date.
These programs are settled through the delivery of ITUB4 treasury shares to stockholders.
At the ESM of September 14, 2016 a capital increase with 10% share bonus was approved and ratified by BACEN on September 23, 2016. The new shares will be included in the share position on October 21, 2016. Therefore, for better comparability, the number of shares shown in this note consider the bonus shares.
From 01/01 to 12/31/2016, the accounting effect of the share-based payment in income was R$ (591) (R$ (734) from 01/01 to 12/31/2015 and R$ (441) from 01/01 to 12/31/2014)).
I – Stock Option Plan (Simple Options)
ITAÚ UNIBANCO HOLDING has a Stock Option Plan (“Simple Options”) aimed at involving management members and employees in the medium and long term corporate development program of ITAÚ UNIBANCO HOLDING and its subsidiaries, offering them the opportunity benefit from the appreciation that their work and dedication bring to the shares.
In addition to the grants provided under the Plan, ITAÚ UNIBANCO HOLDING also maintains control over the rights and obligations in connection with the options granted under the plans approved at the Extraordinary Stockholders’ Meetings held on April 24, 2009 and April 19, 2013 related to the Unibanco – União de Bancos Brasileiros S.A. and to Unibanco Holdings S.A., and to Redecard S.A. (“Rede”) stock option plans, respectively. Accordingly, the exchange of shares for ITUB4 did not have a relevant financial impact.
Simple options have the following characteristics:
| a) | Exercise price:calculated based on the average prices of shares in the three months of the year priorto the grant date. The prices determined will be restated to the last business day of the month prior to the option exercise date based on IGP-M or, in its absence, on an index to be determined internally, and should be paid within the period in force for the settlement of operations on BM&FBOVESPA. |
| b) | Vesting period:determined upon issue, from one to seven years, counted from the grant date. Thevesting period is normally determined at five years. |
| c) | Fair value and economic assumptions for cost recognition:the fair value of Simple Options iscalculated on the grant date based on the Binominal model. Economic assumptions used are as follows: |
| (i) | Exercise price: exercise price previously agreed upon the option issue, adjusted by the IGP-M variation; |
| (ii) | Price of the underlying asset (ITUB4 shares): closing price on BM&FBOVESPA on the calculation base date. |
| (iii) | Expected dividends: the average annual return rate for the last three years of dividends paid plus interest on capital of the ITUB4 share; |
| (iv) | Risk-free interest rate: IGP-M coupon rate at the expiration date of the Simple Option; |
| (v) | Expected volatility: calculated based on the standard deviation from the history of the last 84 monthly returns of the ITUB4 share closing prices, disclosed by BM&FBOVESPA, adjusted by the IGP-M variation. |
| F-79 |
Summary of changes in the plan
| Simple options | ||||||||||||
| Weighted average | Weighted average | |||||||||||
| Quantity | exercise price | market value | ||||||||||
| Opening balance 12/31/2015 | 50,543,148 | 31.89 | ||||||||||
| Options exercisable at the end of the period | 35,647,958 | 33.40 | ||||||||||
| Options outstanding but not exercisable | 14,895,190 | 28.29 | ||||||||||
| Options: | ||||||||||||
| Granted | - | - | ||||||||||
| Canceled / Forfeited(*) | (127,798 | ) | 35.91 | |||||||||
| Exercised | (12,381,844 | ) | 26.92 | 35.15 | ||||||||
| Balance at 12/31/2016 | 38,033,506 | 36.94 | ||||||||||
| Options exercisable at the end of the period | 23,440,177 | 40.98 | ||||||||||
| Options outstanding but not exercisable | 14,593,329 | 30.45 | ||||||||||
| Range of exercise prices | ||||||||||||
| Granting 2009-2010 | 25,66 - 41,69 | |||||||||||
| Granting 2011-2012 | 30,45 - 40,72 | |||||||||||
| Weighted average of the remaining contractual life (in years) | 2.63 | |||||||||||
(*) Refers to non-exercise based on the beneficiary’s decision.
| Simple options | ||||||||||||
| Weighted average | Weighted average | |||||||||||
| Quantity | exercise price | market value | ||||||||||
| Opening balance 12/31/2014 | 60,678,323 | 29.48 | ||||||||||
| Options exercisable at the end of the period | 31,759,519 | 29.23 | ||||||||||
| Options outstanding but not exercisable | 28,918,804 | 29.75 | ||||||||||
| Options: | ||||||||||||
| Granted | - | - | ||||||||||
| Canceled / Forfeited(*) | (9,968,681 | ) | 36.44 | |||||||||
| Exercised | (166,494 | ) | 22.11 | 31.24 | ||||||||
| Opening balance 12/31/2015 | 50,543,148 | 31.89 | ||||||||||
| Options exercisable at the end of the period | 35,647,958 | 33.40 | ||||||||||
| Options outstanding but not exercisable | 14,895,190 | 28.29 | ||||||||||
| Range of exercise prices | ||||||||||||
| Granting 2008-2009 | 23,95 - 36,62 | |||||||||||
| Granting 2010-2012 | 21,71 - 38,90 | |||||||||||
| Weighted average of the remaining contractual life (in years) | 2.60 | |||||||||||
(*) Refers to non-exercise based on the beneficiary’s decision.
| Simple options | ||||||||||||
| Weighted average | Weighted average | |||||||||||
| Quantity | exercise price | market value | ||||||||||
| Opening balance 12/31/2013 | 79,033,384 | 27.15 | ||||||||||
| Options exercisable at the end of the period | 39,609,101 | 25.14 | ||||||||||
| Options outstanding but not exercisable | 39,424,283 | 29.96 | ||||||||||
| Options: | ||||||||||||
| Granted | - | - | ||||||||||
| Canceled / Forfeited(*) | (1,684,588 | ) | 28.91 | |||||||||
| Exercised | (16,670,473 | ) | 24.80 | 33.39 | ||||||||
| Opening balance 12/31/2014 | 60,678,323 | 29.48 | ||||||||||
| Options exercisable at the end of the period | 31,759,519 | 29.23 | ||||||||||
| Options outstanding but not exercisable | 28,918,804 | 29.75 | ||||||||||
| Range of exercise prices | ||||||||||||
| Granting 2006-2009 | 21,64 - 36,25 | |||||||||||
| Granting 2010-2012 | 21,71 - 35,15 | |||||||||||
| Weighted average of the remaining contractual life (in years) | 2.56 | |||||||||||
(*) Refers to non-exercise based on the beneficiary’s decision.
| F-80 |
ll – Partner Plan
The employees and management members of ITAÚ UNIBANCO HOLDING and its subsidiaries may be selected to participate in the program investing a percentage of their bonus to acquire ITUB4 shares and share-based instruments. Accordingly, the ownership of these shares should be held by the beneficiaries for a period from three to five years, counted from the initial investment, and are thus subject to market price variations. After complying with the suspensive conditions set forth in the program, beneficiaries will be entitled to receive ITUB4 as consideration, in accordance with the numbers of shares provided for in the program regulations.
The acquisition prices of own shares and Share-Based Instruments are established every six months and is equivalent to the average of the ITUB4 quotation in the 30 days prior to the determination of the acquisition price.
The fair value of the ITUB4 as consideration is the market price at the grant date, less expected dividends.
The weighted average of the fair value of the ITUB4 shares as consideration was estimated at R$ 19.45 per share at 12/31/2016 (R$ 26.56 per share at 12/31/2015 and R$ 26.95 per share at 12/31/2014).
Law No. 12,973/14, which adjusted the tax legislation to the international accounting standards and terminated the Transitional Tax Regime (RTT), set up a new legal framework for payments made in shares. We made changes to the Partner Plan, and adjusted its tax effects, to conform to this new legislation.
Changes in the Partner Program
| Quantity | ||||
| Balance at 12/31/2015 | 33,666,355 | |||
| New granted | 12,392,845 | |||
| Cancelled | (370,039 | ) | ||
| Exercised | (10,226,782 | ) | ||
| Balance at 12/31/2016 | 35,462,379 | |||
| Weighted average of remaining contractual life (years) | 2.73 | |||
| Quantity | ||||
| Balance at 12/31/2014 | 29,407,871 | |||
| New granted | 11,442,795 | |||
| Cancelled | (889,690 | ) | ||
| Exercised | (6,294,621 | ) | ||
| Balance at 12/31/2015 | 33,666,355 | |||
| Weighted average of remaining contractual life (years) | 2.02 | |||
| Quantity | ||||
| Balance at 12/31/2013 | 22,205,702 | |||
| New granted | 13,318,700 | |||
| Cancelled | (1,883,243 | ) | ||
| Exercised | (4,233,288 | ) | ||
| Balance at 12/31/2014 | 29,407,871 | |||
| Weighted average of remaining contractual life (years) | 2.05 | |||
| F-81 |
III- Variable compensation
The policy established in compliance with CMN Resolution No. 3,921/10 sets forth that fifty percent (50%) of the management’s variable compensation should be paid in cash and fifty percent (50%) should be paid in shares for a period of three years. Shares are delivered on a deferred basis, of which one-third (1/3) per year, will be contingent upon the executive’s remaining with the institution. The deferred unpaid portions may be reversed proportionally to the significant reduction of the recurring income realized or the negative income for the period.
The fair value of the ITUB4 share is the market price at its grant date.
The weighted average of the fair value of ITUB4 shares was estimated at R$ 21.96 per share at 12/31/2016 (R$ 28.40 per share at 12/31/2015 and R$ 23.03 per share at 12/31/2014).
Change in variable compensation in shares
| Quantity | ||||
| Opening balance 12/31/2015 | 22,325,573 | |||
| New | 13,422,462 | |||
| Delivered | (11,136,079 | ) | ||
| Cancelled | (72,550 | ) | ||
| Balance at 12/31/2016 | 24,539,406 | |||
Change in variable compensation in shares
| Quantity | ||||
| Opening balance 12/31/2014 | 17,492,005 | |||
| New | 13,792,517 | |||
| Delivered | (8,306,134 | ) | ||
| Cancelled | (652,815 | ) | ||
| Balance at 12/31/2015 | 22,325,573 | |||
Change in variable compensation in shares
| Quantity | ||||
| Opening balance 12/31/2013 | 9,119,826 | |||
| New | 12,102,893 | |||
| Delivered | (3,250,234 | ) | ||
| Cancelled | (480,480 | ) | ||
| Balance at 12/31/2014 | 17,492,005 | |||
| F-82 |
Note 23 - Interest and similar income and expense and net gain (loss) on investment securities and derivatives
a) Interest and similar income
| 01/01 to | 01/01 to | 01/01 to | ||||||||||
| 12/31/2016 | 12/31/2015 | 12/31/2014 | ||||||||||
| Central Bank compulsory deposits | 6,920 | 5,748 | 5,904 | |||||||||
| Interbank deposits | 677 | 1,628 | 1,286 | |||||||||
| Securities purchased under agreements to resell | 34,162 | 27,572 | 17,929 | |||||||||
| Financial assets held for trading | 23,669 | 19,826 | 15,128 | |||||||||
| Available-for-sale financial assets | 11,160 | 8,979 | 7,272 | |||||||||
| Held-to-maturity financial assets | 3,788 | 3,758 | 2,347 | |||||||||
| Loan and lease operations | 80,118 | 79,392 | 69,248 | |||||||||
| Other financial assets | 1,001 | 886 | 1,001 | |||||||||
| Total | 161,495 | 147,789 | 120,115 | |||||||||
b) Interest and similar expense
| 01/01 to | 01/01 to | 01/01 to | ||||||||||
| 12/31/2016 | 12/31/2015 | 12/31/2014 | ||||||||||
| Deposits | (14,701 | ) | (13,587 | ) | (12,064 | ) | ||||||
| Securities sold under repurchase agreements | (45,932 | ) | (32,879 | ) | (26,771 | ) | ||||||
| Interbank market debt | (8,348 | ) | (7,970 | ) | (14,404 | ) | ||||||
| Institutional market debt | (8,248 | ) | (8,030 | ) | (10,695 | ) | ||||||
| Financial expense from technical reserves for insurance and private pension | (17,790 | ) | (12,556 | ) | (8,987 | ) | ||||||
| Other | (107 | ) | (42 | ) | (56 | ) | ||||||
| Total | (95,126 | ) | (75,064 | ) | (72,977 | ) | ||||||
c) Net gain (loss) on investment securities and derivatives
| 01/01 to | 01/01 to | 01/01 to | ||||||||||
| 12/31/2016 | 12/31/2015 | 12/31/2014 | ||||||||||
| Financial assets held for trading | 2,514 | (1,625 | ) | 215 | ||||||||
| Derivatives(*) | 7,320 | (6,071 | ) | 119 | ||||||||
| Financial assets designated at fair value through profit or loss | 49 | 51 | 32 | |||||||||
| Available-for-sale financial assets | (1,685 | ) | (4,345 | ) | (1,089 | ) | ||||||
| Held-to-Maturity Financial Assets (Permanent Loss) | (740 | ) | - | - | ||||||||
| Finacial liabilities held for trading | (147 | ) | 128 | (1 | ) | |||||||
| Total | 7,311 | (11,862 | ) | (724 | ) | |||||||
(*) Includes the ineffective derivatives portion related to hedge accounting.
During the period ended 12/31/2016, ITAÚ UNIBANCO HOLDING recognized impairment expenses in the amount of R$ 1,882, out of which R$ 1,142 on Available-for-Sale Financial Assets and R$ 740 on Held-to-Maturity Financial Assets. Total loss, net of reversals, amounted to R$ 1,522 and was recorded in the statement of income in line item Net gain (loss) on securities and derivatives.
| F-83 |
Note 24 - Banking service fees
| 01/01 to | 01/01 to | 01/01 to | ||||||||||
| 12/31/2016 | 12/31/2015 | 12/31/2014 | ||||||||||
| Current account services | 9,528 | 8,815 | 7,725 | |||||||||
| Asset management fees | 3,514 | 2,932 | 2,660 | |||||||||
| Collection commissions | 1,315 | 1,250 | 1,279 | |||||||||
| Fees from credit card services | 13,330 | 12,722 | 11,507 | |||||||||
| Fees for guarantees issued and credit lines | 1,773 | 1,609 | 1,407 | |||||||||
| Brokerage commission | 295 | 248 | 262 | |||||||||
| Other | 2,163 | 1,876 | 1,502 | |||||||||
| Total | 31,918 | 29,452 | 26,342 | |||||||||
Note 25 - Other income
| 01/01 to | 01/01 to | 01/01 to | ||||||||||
| 12/31/2016 | 12/31/2015 | 12/31/2014 | ||||||||||
| Gains on sale of assets held for sale, fixed assets and investments in associates and joint ventures | 233 | 97 | 1,194 | |||||||||
| Recovery of expenses | 331 | 210 | 207 | |||||||||
| Reversal of provisions | 156 | 455 | 179 | |||||||||
| Program for Cash or Installment Payment of Federal Taxes | 13 | 65 | 158 | |||||||||
| Other | 649 | 452 | 416 | |||||||||
| Total | 1,382 | 1,279 | 2,154 | |||||||||
| F-84 |
Note 26 - General and administrative expenses
| 01/01 to | 01/01 to | 01/01 to | ||||||||||
| 12/31/2016 | 12/31/2015 | 12/31/2014 | ||||||||||
| Personnel expenses | (22,360 | ) | (19,573 | ) | (17,071 | ) | ||||||
| Compensation | (8,752 | ) | (7,982 | ) | (7,046 | ) | ||||||
| Payroll taxes | (2,567 | ) | (2,540 | ) | (2,364 | ) | ||||||
| Welfare benefits | (3,070 | ) | (2,472 | ) | (2,133 | ) | ||||||
| Retirement plans and post-employment benefits (Note 29) | 279 | (240 | ) | 33 | ||||||||
| Defined benefit | (81 | ) | (78 | ) | (30 | ) | ||||||
| Defined contribution | 360 | (162 | ) | 63 | ||||||||
| Stock option plan (Note 22d) | (306 | ) | (214 | ) | (231 | ) | ||||||
| Training | (192 | ) | (202 | ) | (186 | ) | ||||||
| Employee profit sharing | (3,610 | ) | (3,387 | ) | (3,324 | ) | ||||||
| Dismissals | (571 | ) | (351 | ) | (377 | ) | ||||||
| Provision for labor claims (Note 32) | (3,571 | ) | (2,185 | ) | (1,443 | ) | ||||||
| Administrative expenses | (15,959 | ) | (15,112 | ) | (14,325 | ) | ||||||
| Data processing and telecommunications | (3,966 | ) | (4,052 | ) | (3,870 | ) | ||||||
| Third party services | (4,340 | ) | (4,044 | ) | (4,189 | ) | ||||||
| Installations | (1,161 | ) | (1,022 | ) | (924 | ) | ||||||
| Advertising, promotions and publications | (1,036 | ) | (1,095 | ) | (972 | ) | ||||||
| Rent | (1,480 | ) | (1,289 | ) | (1,216 | ) | ||||||
| Transportation | (391 | ) | (411 | ) | (432 | ) | ||||||
| Materials | (313 | ) | (380 | ) | (365 | ) | ||||||
| Financial services | (731 | ) | (614 | ) | (544 | ) | ||||||
| Security | (716 | ) | (675 | ) | (627 | ) | ||||||
| Utilities | (425 | ) | (418 | ) | (289 | ) | ||||||
| Travel | (199 | ) | (212 | ) | (204 | ) | ||||||
| Other | (1,201 | ) | (900 | ) | (693 | ) | ||||||
| Depreciation | (1,702 | ) | (1,688 | ) | (1,641 | ) | ||||||
| Amortization | (1,292 | ) | (910 | ) | (827 | ) | ||||||
| Insurance acquisition expenses | (721 | ) | (1,138 | ) | (1,214 | ) | ||||||
| Other expenses | (8,870 | ) | (9,205 | ) | (7,472 | ) | ||||||
| Expenses related to credit cards | (3,165 | ) | (3,415 | ) | (2,691 | ) | ||||||
| Losses with third party frauds | (571 | ) | (468 | ) | (472 | ) | ||||||
| Loss on sale of assets held for sale, fixed assets and investments in associates and joint ventures | (274 | ) | (187 | ) | (133 | ) | ||||||
| Provision for civil lawsuits (Note 32) | (1,489 | ) | (2,069 | ) | (1,708 | ) | ||||||
| Provision for tax and social security lawsuits | (915 | ) | (1,361 | ) | (971 | ) | ||||||
| Refund of interbank costs | (294 | ) | (262 | ) | (229 | ) | ||||||
| Other | (2,162 | ) | (1,443 | ) | (1,268 | ) | ||||||
| Total | (50,904 | ) | �� | (47,626 | ) | (42,550 | ) | |||||
| F-85 |
Note 27 – Income tax and social contribution
ITAÚ UNIBANCO HOLDING and each of its subsidiaries file separate, for each fiscal year, corporate income tax returns and social contribution on net income.
| a) | Composition of income tax and social contribution expenses |
Demonstration of Income tax and social contribution expense calculation:
| 01/01 to | 01/01 to | 01/01 to | ||||||||||
| Due on operations for the period | 12/31/2016 | 12/31/2015 | 12/31/2014 | |||||||||
| Income before income tax and social contribution | 38,192 | 18,265 | 28,808 | |||||||||
| Charges (income tax and social contribution) at the rates in effect (Note 2.4 k) | (17,187 | ) | (7,611 | ) | (11,523 | ) | ||||||
| Increase / decrease in income tax and social contribution charges arising from: | ||||||||||||
| Share of profit or (loss) of associates and joint ventures net | 165 | 176 | 109 | |||||||||
| Foreign exchange variation on assets and liabilities abroad | (4,313 | ) | 8,329 | 1,471 | ||||||||
| Interest on capital | 3,617 | 2,585 | 1,738 | |||||||||
| Corporate reorganizations (Note 2.4 a III) | 628 | 631 | 639 | |||||||||
| Dividends and interest on external debt bonds | 365 | 271 | 311 | |||||||||
| Other nondeductible expenses net of non taxable income(*) | 12,827 | (13,346 | ) | 46 | ||||||||
| Income tax and social contribution expenses | (3,898 | ) | (8,965 | ) | (7,209 | ) | ||||||
| Related to temporary differences | ||||||||||||
| Increase (reversal) for the period | (10,774 | ) | 13,006 | 1,341 | ||||||||
| Increase (reversal) of prior periods | 62 | (71 | ) | (1,079 | ) | |||||||
| Increase in the social contribution tax rate (Note 27b III) | - | 3,921 | - | |||||||||
| (Expenses)/Income related to deferred taxes | (10,712 | ) | 16,856 | 262 | ||||||||
| Total income tax and social contribution expenses | (14,610 | ) | 7,891 | (6,947 | ) | |||||||
(*) Includes temporary (additions) and exclusions.
| F-86 |
b) Deferred taxes
I - The deferred tax asset balance and respective changes are as follows:
| 12/31/2015 | Realization / reversal | Increase(1) | 12/31/2016 | |||||||||||||
| Reflected in income | 48,911 | (16,508 | ) | 15,480 | 47,883 | |||||||||||
| Allowance for loan and lease losses | 25,572 | (6,337 | ) | 7,740 | 26,975 | |||||||||||
| Related to income tax and social contribution tax carryforwards | 6,655 | (288 | ) | 561 | 6,928 | |||||||||||
| Provision for contingent liabilities | 5,385 | (1,784 | ) | 2,106 | 5,707 | |||||||||||
| Civil lawsuits | 2,149 | (701 | ) | 507 | 1,955 | |||||||||||
| Labor claims | 1,812 | (1,010 | ) | 1,366 | 2,168 | |||||||||||
| Tax and social security | 1,420 | (71 | ) | 233 | 1,582 | |||||||||||
| Other | 4 | (2 | ) | - | 2 | |||||||||||
| Goodwill on purchase of investments | 511 | (346 | ) | - | 165 | |||||||||||
| Legal liabilities – tax and social security | 508 | (200 | ) | 79 | 387 | |||||||||||
| Adjustments of operations carried out on the futures settlement market | 1,253 | (797 | ) | 29 | 485 | |||||||||||
| Adjustment to market value of financial assets held for trading and derivatives | 4,951 | (4,951 | ) | 145 | 145 | |||||||||||
| Provision related to health insurance operations | 322 | (22 | ) | - | 300 | |||||||||||
| Other | 3,754 | (1,783 | ) | 4,820 | 6,791 | |||||||||||
| Reflected in stockholders’ equity | 4,253 | (1,970 | ) | 711 | 2,994 | |||||||||||
| Corporate reorganizations (Note 2.4 a III) | 1,883 | (627 | ) | - | 1,256 | |||||||||||
| Adjustment to market value of available-for-sale securities | 1,980 | (1,338 | ) | - | 642 | |||||||||||
| Cash flow hedge | 137 | - | 706 | 843 | ||||||||||||
| Other | 253 | (5 | ) | 5 | 253 | |||||||||||
| Total (2)(3) | 53,164 | (18,478 | ) | 16,191 | 50,877 | |||||||||||
(1)Includes balance arising from the Corpbanca acquisition R$ 1,221 and Recovery acquisition R$ 45 (Note 3).
(2)Deferred income tax and social contribution assets and liabilities are recorded in the balance sheet offset by a taxable entity and total R$ 37,395 and R$ 643.
(3)The accounting records of deferred tax assets on income tax losses and/or social contribution loss carryforwards, as well as those arising from temporary differences, are based on technical feasibility studies which consider the expected generation of future taxable income, considering the history of profitability for each subsidiary individually, and for the consolidated taken as a whole. For the subsidiaries, Itaú Unibanco S.A. and Banco Itaucard S.A., a petition has been sent to Central Bank of Brazil, in compliance with paragraph 7 of article 1 of Resolution No. 4,441/15 and pursuant to Circular 3,776/15.
| 12/31/2014 | Realization / reversal | Increase | 12/31/2015 | |||||||||||||
| Reflected in income | 32,513 | (7,009 | ) | 23,407 | 48,911 | |||||||||||
| Allowance for loan and lease losses | 18,909 | (2,319 | ) | 8,982 | 25,572 | |||||||||||
| Related to income tax and social contribution tax carryforwards | 5,430 | (239 | ) | 1,464 | 6,655 | |||||||||||
| Provision for contingent liabilities | 4,298 | (1,364 | ) | 2,451 | 5,385 | |||||||||||
| Civil lawsuits | 1,818 | (624 | ) | 955 | 2,149 | |||||||||||
| Labor claims | 1,460 | (382 | ) | 734 | 1,812 | |||||||||||
| Tax and social security | 1,009 | (351 | ) | 762 | 1,420 | |||||||||||
| Other | 11 | (7 | ) | - | 4 | |||||||||||
| Goodwill on purchase of investments | 721 | (210 | ) | - | 511 | |||||||||||
| Legal liabilities – tax and social security | 394 | (698 | ) | 812 | 508 | |||||||||||
| Adjustments of operations carried out in futures settlement market | 3 | (4 | ) | 1,254 | 1,253 | |||||||||||
| Adjustment to market value of financial assets held for trading and derivatives | 109 | (109 | ) | 4,951 | 4,951 | |||||||||||
| Provision related to health insurance operations | 274 | - | 48 | 322 | ||||||||||||
| Other | 2,375 | (2,066 | ) | 3,445 | 3,754 | |||||||||||
| Reflected in stockholders’ equity | 4,106 | (1,527 | ) | 1,674 | 4,253 | |||||||||||
| Corporate reorganizations (Note 2.4 a III) | 2,514 | (631 | ) | - | 1,883 | |||||||||||
| Adjustment to market value of available-for-sale securities | 539 | (142 | ) | 1,583 | 1,980 | |||||||||||
| Cash flow hedge | 50 | - | 87 | 137 | ||||||||||||
| Other | 1,003 | (754 | ) | 4 | 253 | |||||||||||
| Total(*) | 36,619 | (8,536 | ) | 25,081 | 53,164 | |||||||||||
(*) Deferred income tax and social contribution assets and liabilities are recorded in the balance sheet offset by a taxable entity and total R$ 47,453 and R$ 370.
| F-87 |
II- The provision for deferred tax liability balance and respective changes are as follows:
| Realization / | ||||||||||||||||
| 12/31/2015 | reversal | Increase(1) | 12/31/2016 | |||||||||||||
| Reflected in income | 4,277 | (2,283 | ) | 11,513 | 13,507 | |||||||||||
| Depreciation in excess – finance lease | 1,487 | (551 | ) | - | 936 | |||||||||||
| Adjustment of escrow deposits and contingent liabilities | 1,130 | (168 | ) | 231 | 1,193 | |||||||||||
| Pension plans | 336 | (143 | ) | 40 | 233 | |||||||||||
| Adjustments of operations carried out on the futures settlement market | 51 | (100 | ) | 1,144 | 1,095 | |||||||||||
| Adjustment to market value of financial assets held for trading and derivatives | 198 | (198 | ) | 7,293 | 7,293 | |||||||||||
| Taxation of results abroad – capital gains | 286 | - | 1,216 | 1,502 | ||||||||||||
| Other | 789 | (1,123 | ) | 1,589 | 1,255 | |||||||||||
| Reflected in stockholders’ equity accounts | 1,804 | (1,639 | ) | 453 | 618 | |||||||||||
| Adjustment to market value of available-for-sale securities | 53 | - | 433 | 486 | ||||||||||||
| Cash flow hedge | 1,313 | (1,250 | ) | - | 63 | |||||||||||
| Provision for pension plan benefits | 424 | (389 | ) | - | 35 | |||||||||||
| Other | 14 | - | 20 | 34 | ||||||||||||
| Total(2) | 6,081 | (3,922 | ) | 11,966 | 14,125 | |||||||||||
(1)Includes balance arising from the Corpbanca acquisition R$ 994 (Note 3).
(2)Deferred income tax and social contribution asset and liabilities are recorded in the balance sheet offset by a taxable entity and total R$ 37,395 and R$ 643.
| 12/31/2014 | Realization / reversal | Increase | 12/31/2015 | |||||||||||||
| Reflected in income | 4,735 | (1,801 | ) | 1,343 | 4,277 | |||||||||||
| Depreciation in excess – finance lease | 2,508 | (1,021 | ) | - | 1,487 | |||||||||||
| Adjustment of escrow deposits and contingent liabilities | 876 | (425 | ) | 679 | 1,130 | |||||||||||
| Pension plans | 336 | (34 | ) | 34 | 336 | |||||||||||
| Adjustments of operations carried out on the futures settlement market | 4 | (12 | ) | 59 | 51 | |||||||||||
| Adjustment to market value of financial assets held for trading and derivatives | 6 | (6 | ) | 198 | 198 | |||||||||||
| Taxation of results abroad – capital gains | 563 | (277 | ) | - | 286 | |||||||||||
| Other | 442 | (26 | ) | 373 | 789 | |||||||||||
| Reflected in stockholders’ equity accounts | 956 | (97 | ) | 945 | 1,804 | |||||||||||
| Adjustment to market value of available-for-sale securities | 132 | (79 | ) | - | 53 | |||||||||||
| Cash flow hedge | 373 | - | 940 | 1,313 | ||||||||||||
| Provision for pension plan benefits | 442 | (18 | ) | - | 424 | |||||||||||
| Other | 9 | - | 5 | 14 | ||||||||||||
| Total(*) | 5,691 | (1,898 | ) | 2,288 | 6,081 | |||||||||||
(*) Deferred income tax and social contribution asset and liabilities are recorded in the balance sheet offset by a taxable entity and total R$ 47,453 and R$ 370.
| III | - The estimate of realization and present value of tax credits and from the Provision for Deferred Income Tax and Social Contribution existing at 12/31/2016, are: |
| Deferred tax assets | ||||||||||||||||||||||||||||||||||||||||
| Temporary differences | % | Tax loss / social contribution loss carryforwards | % | Total | % | Deferred tax liabilities | % | Net deferred taxes | % | |||||||||||||||||||||||||||||||
| 2017 | 21,863 | 50 | % | 37 | 1 | % | 21,900 | 43 | % | (1,260 | ) | 8 | % | 20,640 | 56 | % | ||||||||||||||||||||||||
| 2018 | 10,363 | 23 | % | 151 | 2 | % | 10,514 | 21 | % | (646 | ) | 5 | % | 9,868 | 27 | % | ||||||||||||||||||||||||
| 2019 | 4,682 | 11 | % | 2,060 | 30 | % | 6,742 | 13 | % | (2,372 | ) | 17 | % | 4,370 | 12 | % | ||||||||||||||||||||||||
| 2020 | 1,130 | 3 | % | 2,416 | 35 | % | 3,546 | 7 | % | (1,363 | ) | 10 | % | 2,183 | 6 | % | ||||||||||||||||||||||||
| 2021 | 598 | 1 | % | 1,775 | 25 | % | 2,373 | 5 | % | (366 | ) | 3 | % | 2,007 | 5 | % | ||||||||||||||||||||||||
| After 2021 | 5,313 | 12 | % | 489 | 7 | % | 5,802 | 11 | % | (8,118 | ) | 57 | % | (2,316 | ) | -6 | % | |||||||||||||||||||||||
| Total | 43,949 | 100 | % | 6,928 | 100 | % | 50,877 | 100 | % | (14,125 | ) | 100 | % | 36,752 | 100 | % | ||||||||||||||||||||||||
| Present value(*) | 40,415 | 5,937 | 46,352 | (11,370 | ) | 34,982 | ||||||||||||||||||||||||||||||||||
(*) The average funding rate, net of tax effects, was used to determine the present value.
The projections of future taxable income include estimates related to macroeconomic variables, exchange rates, interest rates, volume of financial operations and services fees and others, which can vary in relation to actual data and amounts.
Net income in the financial statements is not directly related to the taxable income, due to differences between the accounting criteria and tax legislation, in addition to corporate aspects. Accordingly, it is recommended that the trends for the realization of deferred tax assets arising from temporary differences, and tax loss carry forwards should not be used as an indication of future net income.
Considering the temporary effects of Law 13,169/15, which increases the Social Contribution tax rate to 20% until December 31, 2018, tax credits were accounted for based on their expected realization. At 12/31/2015 the effect on the consolidated statement of income was R$ 3,921. There are no unrecorded deferred tax assets at 12/31/2016 and 12/31/2015.
| F-88 |
Note 28 – Earnings per share
Basic and diluted earnings per share were computed as shown in the table below for the periods indicated. Basic earnings per share are computed by dividing the net income attributable to the stockholder of ITAÚ UNIBANCO HOLDING by the average number of shares for the period, and by excluding the number of shares purchased and held as treasury shares by the company. Diluted earnings per share are computed on a similar way, but with the adjustment made in the denominator when assuming the conversion of all shares that may be diluted.
| Net income attributable to owners of the parent company – basic earnings per | 01/01 to | 01/01 to | 01/01 to | |||||||||
| share | 12/31/2016 | 12/31/2015 | 12/31/2014 | |||||||||
| Net income | 23,263 | 25,740 | 21,555 | |||||||||
| Minimum non-cumulative dividend on preferred shares in accordance with our | ||||||||||||
| bylaws | (70 | ) | (71 | ) | (72 | ) | ||||||
| Subtotal | 23,193 | 25,669 | 21,483 | |||||||||
| Retained earnings to be distributed to common equity owners in an amount per | ||||||||||||
| share equal to the minimum dividend payable to preferred equity owners | (73 | ) | (74 | ) | (74 | ) | ||||||
| Subtotal | 23,120 | 25,595 | 21,409 | |||||||||
| Retained earnings to be distributed to common and preferred equity owners on a pro-rata basis | ||||||||||||
| To common equity owners | 11,880 | 13,036 | 10,843 | |||||||||
| To preferred equity owners | 11,240 | 12,559 | 10,566 | |||||||||
| Total net income available to common equity owners | 11,953 | 13,110 | 10,917 | |||||||||
| Total net income available to preferred equity owners | 11,310 | 12,630 | 10,638 | |||||||||
| Weighted average number of shares outstanding (Note 21a) | ||||||||||||
| Common shares | 3,351,741,143 | 3,351,741,143 | 3,351,741,143 | |||||||||
| Preferred shares | 3,171,215,661 | 3,228,881,081 | 3,266,347,063 | |||||||||
| Earnings per share - basic – R$ | ||||||||||||
| Common shares | 3.57 | 3.91 | 3.26 | |||||||||
| Preferred shares | 3.57 | 3.91 | 3.26 | |||||||||
| Net income attributable to owners of the parent company – diluted earnings per | 01/01 to | 01/01 to | 01/01 to | |||||||||
| share | 12/31/2016 | 12/31/2015 | 12/31/2014 | |||||||||
| Total net income available to preferred equity owners | 11,310 | 12,630 | 10,638 | |||||||||
| Dividend on preferred shares after dilution effects | 82 | 83 | 64 | |||||||||
| Net income available to preferred equity owners considering preferred shares after the dilution effect | ||||||||||||
| 11,392 | 12,713 | 10,702 | ||||||||||
| Total net income available to ordinary equity owners | 11,953 | 13,110 | 10,917 | |||||||||
| Dividend on preferred shares after dilution effects | (82 | ) | (83 | ) | (64 | ) | ||||||
| Net income available to ordinary equity owners considering preferred shares after the dilution effect | ||||||||||||
| 11,871 | 13,027 | 10,853 | ||||||||||
| Adjusted weighted average of shares (Note 21a) | ||||||||||||
| Common shares | 3,351,741,143 | 3,351,741,143 | 3,351,741,143 | |||||||||
| Preferred shares | 3,216,235,372 | 3,270,734,307 | 3,305,545,129 | |||||||||
| Preferred shares | 3,171,215,661 | 3,228,881,081 | 3,266,347,063 | |||||||||
| Incremental shares from stock options granted under our share-based payment | 45,019,711 | 41,853,226 | 39,198,066 | |||||||||
| Earnings per share - diluted – R$ | ||||||||||||
| Common shares | 3.54 | 3.89 | 3.24 | |||||||||
| Preferred shares | 3.54 | 3.89 | 3.24 | |||||||||
Potential anti-dilution effects of shares under our share-based payment, which were excluded from the calculation of diluted earnings per share, totaled 6,901,686 preferred shares at 12/31/2016, 4,805,473 preferred shares at 12/31/2015 and 3,494,779 preferred shares at 12/31/2014.
| F-89 |
Note 29 – Post-employment benefits
The accounting policies and procedures adopted by ITAÚ UNIBANCO HOLDING CONSOLIDATED for employee benefits are summarized below:
The total amounts recognized in Income for the Period and Stockholders’ Equity – Other comprehensive income were as follows:
Total amounts recognized in Income for the period
| Defined benefit | Defined contribution(*) | Other benefits | Total | |||||||||||||||||||||||||||||||||||||||||||||
| 01/01 to | 01/01 to | 01/01 to | 01/01 to | 01/01 to | 01/01 to | 01/01 to | 01/01 to | 01/01 to | 01/01 to | 01/01 to | 01/01 to | |||||||||||||||||||||||||||||||||||||
| 12/31/2016 | 12/31/2015 | 12/31/2014 | 12/31/2016 | 12/31/2015 | 12/31/2014 | 12/31/2016 | 12/31/2015 | 12/31/2014 | 12/31/2016 | 12/31/2015 | 12/31/2014 | |||||||||||||||||||||||||||||||||||||
| Cost of current service | (62 | ) | (68 | ) | (74 | ) | - | - | - | - | - | - | (62 | ) | (68 | ) | (74 | ) | ||||||||||||||||||||||||||||||
| Net interest | (13 | ) | (6 | ) | (32 | ) | 239 | 219 | 196 | (19 | ) | (17 | ) | (14 | ) | 207 | 196 | 150 | ||||||||||||||||||||||||||||||
| Contribution | - | - | - | 121 | (381 | ) | (133 | ) | - | - | - | 121 | (381 | ) | (133 | ) | ||||||||||||||||||||||||||||||||
| Benefits paid | - | - | - | - | - | - | 13 | 13 | 9 | 13 | 13 | 9 | ||||||||||||||||||||||||||||||||||||
| Total Amounts Recognized | (75 | ) | (74 | ) | (106 | ) | 360 | (162 | ) | 63 | (6 | ) | (4 | ) | (5 | ) | 279 | (240 | ) | (48 | ) | |||||||||||||||||||||||||||
(*) In the period, contributions to the defined contributions plan, including PGBL, totaled R$ 339 (R$ 207 from 01/01 to 12/31/2015 and R$ 190 from 01/01 to 12/31/2014), of which R$ 115 (R$ 144 from 01/01 to 12/31/2015 and R$ 133 from 01/01 to 12/31/2014) arising from social security funds.
Total amounts recognized in Stockholders’ Equity – Other comprehensive income
| Defined benefit | Defined contribution | Other benefits | Total | |||||||||||||||||||||||||||||||||||||||||||||
| 12/31/2016 | 12/31/2015 | 12/31/2014 | 12/31/2016 | 12/31/2015 | 12/31/2014 | 12/31/2016 | 12/31/2015 | 12/31/2014 | 12/31/2016 | 12/31/2015 | 12/31/2014 | |||||||||||||||||||||||||||||||||||||
| At the beginning of the period | (45 | ) | (75 | ) | (354 | ) | (314 | ) | (221 | ) | (286 | ) | (13 | ) | (8 | ) | 7 | (372 | ) | (304 | ) | (633 | ) | |||||||||||||||||||||||||
| Effects on asset ceiling (*) | (633 | ) | (103 | ) | (453 | ) | (1,244 | ) | (38 | ) | 77 | - | - | - | (1,877 | ) | (141 | ) | (376 | ) | ||||||||||||||||||||||||||||
| Remeasurements | 608 | 133 | 732 | 236 | (55 | ) | (12 | ) | (36 | ) | (5 | ) | (15 | ) | 808 | 73 | 705 | |||||||||||||||||||||||||||||||
| Total Amounts Recognized | (70 | ) | (45 | ) | (75 | ) | (1,322 | ) | (314 | ) | (221 | ) | (49 | ) | (13 | ) | (8 | ) | (1,441 | ) | (372 | ) | (304 | ) | ||||||||||||||||||||||||
(*) The revision of the estimate for recognition of the social security fund resulted in the reversal of future contributions by R$ 1,053.
| F-90 |
a) Retirement plans
ITAÚ UNIBANCO HOLDING and some of its subsidiaries sponsor defined benefit plans, including variable contribution plans, whose basic purpose of which is to provide benefits that, in general, represent a life annuity benefit, and may be converted into survivorship annuities, according to the plan's regulations. They also sponsor defined contribution plans, the benefit of which is calculated based on the accumulated balance of individual accounts at the eligibility date, according to the plan’s regulations, which does not require actuarial calculation, except as described in Note 29c.
Employees hired prior to July 31, 2002, for those who came from Itaú, and prior to February 27, 2009 for those who came from Unibanco, are beneficiaries of the above-mentioned plans. As regards the new employees hired after these dates, they have the option to voluntarily participate in a variable contribution plan (PGBL), managed by Itaú Vida e Previdência S.A.
Retirement plans are managed by closed-end private pension entities (EFPC), with independent legal structures, as detailed below:
| Entity | Benefit plan | |
| Fundação Itau Unibanco - Previdência Complementar | Supplementary retirement plan – PAC(1) | |
| Franprev benefit plan - PBF(1) | ||
| 002 benefit plan - PB002(1) | ||
| Itaulam basic plan - PBI(1) | ||
| Itaulam Supplementary Plan - PSI(2) | ||
| Itaubanco Defined Contribution Plan(3) | ||
| Itaubank Retirement Plan(3) | ||
| Itaú Defined Benefit Plan(1) | ||
| Itaú Defined Contribution Plan(2) | ||
| Unibanco Pension Plan(3) | ||
| Prebeg benefit plan(1) | ||
| UBB PREV defined benefit plan(1) | ||
| Benefit plan II (1) | ||
| Supplementary Retirement Plan – Flexible Premium Annuity (ACMV)(1) | ||
| REDECARD Basic Retirement Plan(1) | ||
| REDECARD Supplementary Retirement Plan(2) | ||
| REDECARD Pension Plan(3) | ||
| ITAUCARD Defined Benefit Retirement Plan(1) | ||
| ITAUCARD Supplementary Retirement Plan(2) | ||
| Funbep Fundo de Pensão Multipatrocinado | Funbep I Benefit Plan(1) | |
| Funbep II Benefit Plan(2) |
(1)Defined benefit plan;
(2)Variable contribution plan;
(3)Defined contribution plan.
b) Governance
The closed-end private pension entities (EFPC) and the benefit plans they manage are regulated in conformity with the related specific legislation. The EFPC are managed by the Executive Board, Advisory Council and Fiscal Council, with some members appointed by the sponsors and others appointed as representatives of active and other participants, pursuant to the respective Entity’s by laws. The main purpose of the EFPC is to pay benefits to eligible participants, pursuant to the Plan Regulations, maintaining the plans assets invested separately and independently from ITAÚ UNIBANCO HOLDING.
| F-91 |
c) Defined benefit plans
I - Main assumptions used in actuarial valuation of retirement plans
| 12/31/2016 | 12/31/2015 | 12/31/2014 | |||
| Discount rate(1) | 10.24% p.a. | 11.28% p.a. | 10.24% p.a. | ||
| Mortality table(2) | AT-2000 | AT-2000 | AT-2000 | ||
| Turnover(3) | Exp.Itaú 2008/2010 | Exp.Itaú 2008/2010 | Exp.Itaú 2008/2010 | ||
| Future salary growth | 5.04% to 7.12% p.a. | 5.04% to 7.12% p.a. | 5.04 to 7.12% p.a. | ||
| Growth of the pension fund and social security benefits | 4.00% p.a. | 4.00% p.a. | 4.00% p.a. | ||
| Inflation | 4.00% p.a. | 4.00% p.a. | 4.00% p.a. | ||
| Actuarial method(4) | Projected Unit Credit | Projected Unit Credit | Projected Unit Credit |
(1) The adoption of this assumption is based on interest rates obtained from the actual interest curve in IPCA, for medium term liabilities of retirement plans sponsored by ITAÚ UNIBANCO HOLDING. At 12/31/2016 assumptions were adopted consistently with the economic scenario at the balance sheet date rate, considering the volatility of the interest markets and the models adopted.
(2) The mortality tables adopted correspond to those disclosed by Society of Actuaries (SOA), the North-American entity which corresponds to Brazilian Institute of Actuarial Science (IBA), which reflects a 10% increase in the probabilities of survival compared to the respective basic tables.The life expectancy in years per the AT-2000 mortality table for participants aged 55 years is 27 and 31 years for men and women, respectively.
(3) The turnover assumption is based on the effective experience of active participants linked to ITAÚ UNIBANCO HOLDING, resulting in the average of 2.4 % p.a. based on the 2008/2010 experience.
(4) Using the Projected Unit Credit method, the mathematical reserve is determined based on the current projected benefit amount multiplied by the ratio between the length of service at the assessment date and the length of service that will be reached at the date when the benefit is granted. The cost is determined taking into account the current projected benefit amount distributed over the years that each participant is employed.
In case of benefits sponsored by foreign subsidiaries, actuarial assumptions adequate to the group of participants and the country's economic scenario are adopted.
Biometric/demographic assumptions adopted are consistent with the group of participants of each benefit plan, pursuant to the studies carried out by an independent external actuarial consulting company.
II- Risk Exposure -Through its defined benefit plans, ITAÚ UNIBANCO HOLDING is exposed to a number of risks, the most significant onesare:
-Volatility of Assets -The actuarial liability is calculated by adopting a discount rate defined on the income related to securities issued bythe Brazilian treasury (government securities). If the actual income related to plan assets is lower than expected, this may give rise to a deficit. The plans have a significant percentage of fixed-income securities pegged to the plan commitments, aimed at minimizing volatility and short and medium term risk.
-Changes in Investment Income -A decrease in income related to public securities will imply a decrease in the discount rate and,therefore, will increase the plan's actuarial liability. The effect will be partially offset by the recognition of these securities at market value.
-Inflation Risk -Most of the employee benefit plans are pegged to the inflation rates, and a higher inflation will lead to higher obligations.The effect will also be partially offset because a significant portion of the plan assets is pegged to government securities restated at the inflation rate.
-Life Expectancy -Most of the plan obligations are to provide life benefits, and therefore an increase in life expectancy will result inincreased plan liabilities.
| III | - Management of defined benefit plan assets |
The general purpose of managing EFPCs funds is to search for a long term balance between assets and obligations to pay retirement benefits, by exceeding the actuarial targets (discount rate plus benefit adjustment index, established in the plan regulations).
Regarding the assets guaranteeing the actuarial liability reserves, management should ensure the payment capacity of retirement benefits in the long term by avoiding the risk of mismatching assets and liabilities in each pension plan.
| F-92 |
The allocation of plan assets and the allocation target by type of asset are as follows:
| Fair Value | % Allocation | |||||||||||||||||||||||||||
| Types | 12/31/2016 | 12/31/2015 | 12/31/2014 | 12/31/2016 | 12/31/2015 | 12/31/2014 | Meta 2017 | |||||||||||||||||||||
| Fixed income securities | 15,134 | 12,369 | 12,250 | 91.61 | % | 90.73 | % | 91.16 | % | 53% to 100% | ||||||||||||||||||
| Variable income securities | 685 | 537 | 641 | 4.15 | % | 3.94 | % | 4.77 | % | 0% to 20% | ||||||||||||||||||
| Structured investments | 9 | 27 | 22 | 0.05 | % | 0.20 | % | 0.17 | % | 0% to 10% | ||||||||||||||||||
| Real estate | 623 | 633 | 488 | 3.77 | % | 4.64 | % | 3.63 | % | 0% to 7% | ||||||||||||||||||
| Loans to participants | 69 | 67 | 37 | 0.42 | % | 0.49 | % | 0.27 | % | 0% to 5% | ||||||||||||||||||
| Total | 16,520 | 13,633 | 13,438 | 100.00 | % | 100.00 | % | 100.00 | % | |||||||||||||||||||
The defined benefit plan assets include shares of ITAÚ UNIBANCO HOLDING, its main parent company (ITAÚSA) and of subsidiaries of the latter, with a fair value of R$ 575 (R$ 452 at 12/31/2015 and R$ 554 at 12/31/2014), and real estate rented to Group companies, with a fair value of R$ 597 (R$ 606 at 12/31/2015 and R$ 455 at 12/31/2014).
Fair Value
The fair value of the plan assets is adjusted up to the Balance Sheet date, as follows:
Fixed-Income Securities and Structured Investments–accounted for at market value, considering the average trading price on the calculationdate, net realizable value obtained upon the technical addition of pricing, considering, at least, the payment terms and maturity, credit risk and the indexing unit.
Variable income securities–accounted for at market value, taken to be the share average quotation at the last day of the month or at the closestdate on the stock exchange on which the share has posted the highest liquidity rate.
Real Estate–stated at acquisition or construction cost, adjusted to market value based on reappraisals made in 2015, supported by technicalappraisal reports. Depreciation is calculated under the straight line method, considering the useful life of the real estate.
Loans to participants– adjusted up to the report date, in compliance with the respective agreements.
Fund Allocation Target
The fund allocation target is based on Investment Policies that are currently revised and approved by the Advisory Council of each EFPC, considering a five-year period, which establishes guidelines for investing funds guaranteeing Actuarial Liability and for classifying securities.
IV- Net amount recognized in the balance sheet
Following is the calculation of the net amount recognized in the balance sheet, corresponding to the defined benefit plan:
| 12/31/2016 | 12/31/2015 | 12/31/2014 | ||||||||||
| 1 - Net assets of the plans | 16,520 | 13,633 | 13,438 | |||||||||
| 2- Actuarial liabilities | (13,723 | ) | (11,587 | ) | (11,695 | ) | ||||||
| 3- Surplus (1-2) | 2,797 | 2,046 | 1,743 | |||||||||
| 4- Asset ceiling(*) | (3,008 | ) | (2,134 | ) | (1,847 | ) | ||||||
| 5- Net amount recognized in the balance sheet (3-4) | (211 | ) | (88 | ) | (104 | ) | ||||||
| Amount recognized in assets (Note 20a) | 317 | 224 | 242 | |||||||||
| Amount recognized in liabilities (Note 20b) | (528 | ) | (312 | ) | (346 | ) | ||||||
(*) Corresponds to the excess of the present value of the available economic benefit, in conformity with paragraph 58 of IAS 19.
| F-93 |
V- Changes in the net amount recognized in the balance sheet:
| 12/31/2016 | ||||||||||||||||||||
| Plan net assets | Actuarial liabilities | Surplus | Asset ceiling | Recognized amount | ||||||||||||||||
| Value at the beginning of the period | 13,633 | (11,587 | ) | 2,046 | (2,134 | ) | (88 | ) | ||||||||||||
| Cost of current service | - | (62 | ) | (62 | ) | - | (62 | ) | ||||||||||||
| Net interest(1) | 1,483 | (1,255 | ) | 228 | (241 | ) | (13 | ) | ||||||||||||
| Benefits paid | (1,060 | ) | 1,060 | - | - | - | ||||||||||||||
| Contributions of sponsors | 149 | - | 149 | - | 149 | |||||||||||||||
| Contributions of participants | 15 | - | 15 | - | 15 | |||||||||||||||
| Effects on asset ceiling | - | - | - | (633 | ) | (633 | ) | |||||||||||||
| Balance arising from the CoprBanca acquisition (Note 3) | - | (207 | ) | (207 | ) | - | (207 | ) | ||||||||||||
| Exchange Variation | (8 | ) | 43 | 35 | - | 35 | ||||||||||||||
| Remeasurements(2) (3) | 2,308 | (1,715 | ) | 593 | - | 593 | ||||||||||||||
| Value end of the period | 16,520 | (13,723 | ) | 2,797 | (3,008 | ) | (211 | ) | ||||||||||||
| 12/31/2015 | ||||||||||||||||||||
| Plan net assets | Actuarial liabilities | Surplus | Asset ceiling | Recognized amount | ||||||||||||||||
| Value at the beginning of the period | 13,438 | (11,695 | ) | 1,743 | (1,847 | ) | (104 | ) | ||||||||||||
| Cost of current service | - | (68 | ) | (68 | ) | - | (68 | ) | ||||||||||||
| Net interest(1) | 1,334 | (1,151 | ) | 183 | (189 | ) | (6 | ) | ||||||||||||
| Benefits paid | (908 | ) | 908 | - | - | - | ||||||||||||||
| Contributions of sponsors | 60 | - | 60 | - | 60 | |||||||||||||||
| Contributions of participants | 15 | - | 15 | - | 15 | |||||||||||||||
| Effects on asset ceiling | - | - | - | (103 | ) | (103 | ) | |||||||||||||
| Remeasurements(2) (3) | (306 | ) | 419 | 113 | 5 | 118 | ||||||||||||||
| Value end of the period | 13,633 | (11,587 | ) | 2,046 | (2,134 | ) | (88 | ) | ||||||||||||
| 12/31/2014 | ||||||||||||||||||||
| Plan net assets | Actuarial liabilities | Surplus | Asset ceiling | Recognized amount | ||||||||||||||||
| Value beginning of the period | 12,512 | (11,577 | ) | 935 | (1,293 | ) | (358 | ) | ||||||||||||
| Cost of current service | - | (74 | ) | (74 | ) | - | (74 | ) | ||||||||||||
| Net interest(1) | 1,178 | (1,087 | ) | 91 | (123 | ) | (32 | ) | ||||||||||||
| Benefits paid | (780 | ) | 780 | - | - | - | ||||||||||||||
| Contributions of sponsors | 81 | - | 81 | - | 81 | |||||||||||||||
| Contributions of participants | 15 | - | 15 | - | 15 | |||||||||||||||
| Effects on asset ceiling | - | - | - | (453 | ) | (453 | ) | |||||||||||||
| Remeasurements(2) (3) | 432 | 263 | 695 | 22 | 717 | |||||||||||||||
| Value end of the period | 13,438 | (11,695 | ) | 1,743 | (1,847 | ) | (104 | ) | ||||||||||||
(1) Corresponds to the amount calculated on 01/01/2016 based on the beginning amount (Net Assets, Actuarial Liabilities and Asset ceiling), taking into account the estimated amount of payments/ receipts of benefits/ contributions, multiplied by the discount rate of 11.28% p.a. (At 01/01/2015 used by the discount rate of 10.24% p.a.)
(2) Remeasurements recorded in net assets and asset ceiling correspond to the income earned above/below the expected return rate.
(3) The actual return on assets amounted to R$ 3,791 (R$ 1,028 at 12/31/2015 and R$ 1,610 at 12/31/2014 ).
| F-94 |
During the period, the contributions made totaled R$ 149 (R$ 60 from 01/01 to 12/31/2015 and R$ 81 from 01/01 to 12/31/2014). The contribution rate increases based on the beneficiary’s salary.
In 2017, contribution to the retirement plans sponsored by ITAÚ UNIBANCO HOLDING is expected to amount to R$ 71.
The estimate for payment of benefits for the next 10 years is as follows:
| Period | Payment estimate | |||
| 2017 | 1,071 | |||
| 2018 | 1,112 | |||
| 2019 | 1,160 | |||
| 2020 | 1,212 | |||
| 2021 | 1,266 | |||
| 2022 to 2026 | 7,098 | |||
VI- Sensitivity of defined benefit obligation
The impact, due to the change in the assumption – discount rate by 0.5%, which would be recognized in Actuarial liabilities of the plans, as well as in Stockholders’ Equity – Other Comprehensive Income of the sponsor (before taxes) would amount to:
| Effect which would be | ||||||||||||
| Effects on actuarial | recognized in | |||||||||||
| Change in Assumption | liabilities of the plan | Stockholders’ Equity(*) | ||||||||||
| Percentage of | ||||||||||||
| actuarial | ||||||||||||
| Value | liabilities | Value | ||||||||||
| - Decrease by 0.5% | 703 | 5.13 | % | (271 | ) | |||||||
| - Increase by 0.5% | (644 | ) | (4.70 | )% | 235 | |||||||
(*) Net of effects of asset ceiling
| F-95 |
d) Defined contribution plans
The defined contribution plans have assets relating to sponsors’ contributions not yet included in the participant’s account balance due to loss of eligibility to a plan benefit, as well as resources from the migration from the defined benefit plans. The fund will be used for future contributions to the individual participants' accounts, according to the rules of the respective benefit plan regulation.
I - Change in the net amount recognized in the Balance sheet:
| 12/31/2016 | 12/31/2015 | 12/31/2014 | ||||||||||||||||||||||||||||||||||
| Pension plan | Recognized | Pension plan | Recognized | Pension plan | Recognized | |||||||||||||||||||||||||||||||
| fund | Asset ceiling | amount | fund | Asset ceiling | amount | fund | Asset ceiling | amount | ||||||||||||||||||||||||||||
| Value beginning of the period | 2,229 | (270 | ) | 1,959 | 2,438 | (224 | ) | 2,214 | 2,361 | (275 | ) | 2,086 | ||||||||||||||||||||||||
| Net interest | 269 | (30 | ) | 239 | 239 | (20 | ) | 219 | 223 | (27 | ) | 196 | ||||||||||||||||||||||||
| Contribution (Note 29) | 121 | - | 121 | (381 | ) | - | (381 | ) | (133 | ) | - | (133 | ) | |||||||||||||||||||||||
| Receivables – allocation of funds (*) | (515 | ) | - | (515 | ) | - | - | - | - | - | - | |||||||||||||||||||||||||
| Effects on asset ceiling (Note 29) | (1,053 | ) | (191 | ) | (1,244 | ) | - | (38 | ) | (38 | ) | - | 77 | 77 | ||||||||||||||||||||||
| Remeasurements | 236 | - | 236 | (67 | ) | 12 | (55 | ) | (13 | ) | 1 | (12 | ) | |||||||||||||||||||||||
| Value end of the period (Note 20a) | 1,287 | (491 | ) | 796 | 2,229 | (270 | ) | 1,959 | 2438 | -224 | 2214 | |||||||||||||||||||||||||
| (*) | Refers to the allocation of the surplus of Plano Itaubanco CD’s social security fund. |
| e) | Other post-employment benefits |
ITAÚ UNIBANCO HOLDING and its subsidiaries do not offer other post-employment benefits, except in those cases arising from obligations under acquisition agreements signed by ITAÚ UNIBANCO HOLDING, as well as in relation to the benefits granted due to a judicial sentence, in accordance with the terms and conditions established, in which health plans are totally or partially sponsored for specific groups of former workers and beneficiaries.
Based on the report prepared by an independent actuary, the changes in obligations for these other projected benefits and the amounts recognized in the balance sheet, under liabilities, of ITAÚ UNIBANCO HOLDING are as follows:
I- Change in the net amount recognized in the balance sheet:
| 12/31/2016 | 12/31/2015 | 12/31/2014 | ||||||||||
| At the beginning of the period | (179 | ) | (170 | ) | (146 | ) | ||||||
| Interest cost | (19 | ) | (17 | ) | (14 | ) | ||||||
| Benefits paid | 13 | 13 | 9 | |||||||||
| Remeasurements | (36 | ) | (5 | ) | (19 | ) | ||||||
| At the end of the period (Note 20b) | (221 | ) | (179 | ) | (170 | ) | ||||||
The estimate for payment of benefits for the next 10 years is as follows:
| Period | Payment estimate | |||
| 2017 | 13 | |||
| 2018 | 14 | |||
| 2019 | 15 | |||
| 2020 | 16 | |||
| 2021 | 17 | |||
| 2022 to 2026 | 103 | |||
II- Assumptions and sensitivity - medical care cost
For calculation of projected benefits obligations in addition to the assumptions used for the defined benefit plans (Note 29c I), an 8.16% p.a. increase in medical costs assumption is assumed.
Assumptions about medical care cost trends have a significant impact on the amounts recognized in income. A change of one percentage point in the medical care cost rates would have the following effects:
| Recognition | 1% increase | 1% decrease | ||||||||
| Service cost and interest cost | Income | 3 | (2 | ) | ||||||
| Present value of obligation | Other comprehensive income | 26 | (22 | ) | ||||||
| F-96 |
Note 30 – Insurance contracts
| a) | Insurance contracts |
ITAÚ UNIBANCO HOLDING, through its subsidiaries, offers to the market insurance and private pension products, with the purpose of assuming risks and restoring the economic balance of the assets of the policyholder if damaged. Products are offered through insurance brokers (third parties operating in the market and its own brokers), Itaú Unibanco branches and electronic channels, according to their characteristics and regulatory requirements.
| b) | Main products |
I - Insurance
The contract entered into between the parties aims at guaranteeing the protection of the client's assets. Upon payment of a premium, the policyholder is protected through previously-agreed replacement or indemnification clauses for damages. ITAÚ UNIBANCO HOLDING insurance companies then recognize technical reserves administered by themselves, through specialized areas within the conglomerate, with the objective of indemnifying the policyholder's loss in the event of claims of insured risks.
The insurance risks sold by insurance companies of ITAÚ UNIBANCO HOLDING are divided into property and casualty, that covers losses, damages or liabilities for assets or persons, and life insurance, that includes coverage for death and personal accidents.
| Loss ratio | Sales ratio | |||||||||||||||
| % | % | |||||||||||||||
| Main insurance lines | 01/01 to | 01/01 to | 01/01 to | 01/01 to | ||||||||||||
| 12/31/2016 | 12/31/2015 | 12/31/2016 | 12/31/2015 | |||||||||||||
| Group accident insurance | 5.0 | 5.8 | 42.1 | 42.0 | ||||||||||||
| Individual accident | 19.5 | 19.5 | 12.4 | 11.4 | ||||||||||||
| Commercial multiple peril | 63.3 | 44.6 | 21.1 | 20.9 | ||||||||||||
| Internal credit | 221.7 | 113.7 | 3.9 | 18.3 | ||||||||||||
| Mandatory insurance for personal injury caused by motor vehicles | ||||||||||||||||
| (DPVAT) | 85.7 | 86.7 | 1.4 | 1.4 | ||||||||||||
| Serious or terminal diseases | 22.1 | 16.1 | 10.7 | 10.7 | ||||||||||||
| Extended warranty - assets | 17.1 | 16.8 | 63.8 | 64.6 | ||||||||||||
| Credit Life | 18.7 | 15.6 | 19.0 | 21.8 | ||||||||||||
| Multiple risks | 7.8 | 7.4 | 62.1 | 62.2 | ||||||||||||
| Home insurance in market policies – Credit Life | 14.7 | 15.0 | (0.3 | ) | (2.8 | ) | ||||||||||
| Group life | 46.8 | 46.7 | 13.6 | 13.0 | ||||||||||||
II - Private pension
Developed as a solution to ensure the maintenance of the quality of life of participants, as a supplement to the government plans, through long term investments, private pension products are divided into three major groups:
| · | PGBL - Plan Generator of Benefits:The main objective of this plan is the accumulation of financialresources, but it can be purchased with additional risk coverage. Recommended for clients that file the full version of income tax return, because they can deduct contributions paid for tax purposes up to 12% of the annual taxable gross income. |
| · | VGBL - Redeemable Life Insurance:This is an insurance structured as a pension plan. Its taxationdiffers from the PGBL; in this case, the tax basis is the earned income. |
| · | FGB - Fund Generator of Benefits:This is a pension plan with minimum income guarantee, andpossibility of receiving earnings from asset performance. Once recognized the distribution of earnings at a certain percentage, as established by the FGB policy, it is not at management's discretion, but instead represents an obligation to ITAÚ UNIBANCO HOLDING. Although there are plans still in existence, they are no longer sold. |
| F-97 |
III – Income related to insurance and private pension
The revenue from the main insurance and private pension products is as follows:
| Premiums and contributions issued | Reinsurance | Retained premiums and contributions | ||||||||||||||||||||||||||||||||||
| 01/01 to | 01/01 to | 01/01 to | 01/01 to | 01/01 to | 01/01 to | 01/01 to | 01/01 to | 01/01 to | ||||||||||||||||||||||||||||
| 12/31/2016 | 12/31/2015 | 12/31/2014 | 12/31/2016 | 12/31/2015 | 12/31/2014 | 12/31/2016 | 12/31/2015 | 12/31/2014 | ||||||||||||||||||||||||||||
| Group accident insurance | 780 | 862 | 796 | (4 | ) | (2 | ) | (2 | ) | 776 | 860 | 794 | ||||||||||||||||||||||||
| Individual accident | 224 | 214 | 186 | (12 | ) | (11 | ) | (2 | ) | 212 | 203 | 184 | ||||||||||||||||||||||||
| Commercial multiple peril | 56 | 57 | 139 | - | - | (25 | ) | 56 | 57 | 114 | ||||||||||||||||||||||||||
| Internal Credit | 63 | 151 | 105 | - | - | - | 63 | 151 | 105 | |||||||||||||||||||||||||||
| Mandatory insurance for personal injury caused by motor vehicles (DPVAT) | 37 | 37 | 243 | - | - | - | 37 | 37 | 243 | |||||||||||||||||||||||||||
| Serious or terminal diseases | 167 | 169 | 159 | (1 | ) | (2 | ) | (1 | ) | 166 | 167 | 158 | ||||||||||||||||||||||||
| Warranty extension - assets | 112 | 252 | 1,202 | - | 112 | 252 | 1,202 | |||||||||||||||||||||||||||||
| Disability Savings Pension | 298 | 256 | 194 | (3 | ) | (6 | ) | (5 | ) | 295 | 250 | 189 | ||||||||||||||||||||||||
| PGBL | 1,955 | 1,840 | 1,665 | - | 1,955 | 1,840 | 1,665 | |||||||||||||||||||||||||||||
| Credit Life | 570 | 726 | 802 | - | (1 | ) | 570 | 725 | 802 | |||||||||||||||||||||||||||
| Petroleum risks | - | - | 284 | - | - | (252 | ) | - | - | 32 | ||||||||||||||||||||||||||
| Multiple risks | 162 | 172 | 223 | - | - | (53 | ) | 162 | 172 | 170 | ||||||||||||||||||||||||||
| Specified and all risks | - | - | 501 | - | - | (393 | ) | - | - | 108 | ||||||||||||||||||||||||||
| Home Insurance in Market Policies – Credit Life | 261 | 224 | 187 | (18 | ) | (19 | ) | (19 | ) | 243 | 205 | 168 | ||||||||||||||||||||||||
| Traditional | 142 | 159 | 174 | - | - | - | 142 | 159 | 174 | |||||||||||||||||||||||||||
| VGBL | 18,153 | 15,501 | 13,532 | - | 18,153 | 15,501 | 13,532 | |||||||||||||||||||||||||||||
| Group life | 1,278 | 1,453 | 1,414 | (44 | ) | (37 | ) | (28 | ) | 1,234 | 1,416 | 1,386 | ||||||||||||||||||||||||
| Other lines | 591 | 561 | 991 | (12 | ) | (11 | ) | (251 | ) | 579 | 550 | 740 | ||||||||||||||||||||||||
| Total | 24,849 | 22,634 | 22,797 | (94 | ) | (89 | ) | (1,031 | ) | 24,755 | 22,545 | 21,766 | ||||||||||||||||||||||||
| F-98 |
| c) | Technical reserves for insurance and private pension |
The technical provisions of insurance and pension plan are recognized according to the technical notes approved by SUSEP and criteria established by current legislation.
I - Insurance and private pension:
| · | Provision for unearned premiums –this provision is recognized, based on insurance premiums, forthe coverage of amounts payable related to claims and expenses to be incurred, throughout their terms maturity, in connection with the risks assumed at the calculation base date. The calculation is performed on the level of policies or endorsement of agreements in force, on apro rata-die basis.The provision includes an estimate for effective and not issued risks (PPNG-RVNE). |
| · | Provision for unsettled claims –this provision is recognized for the coverage of amounts payablerelated to lump-sum payments and income overdue from claims reported up to the calculation base date, but not yet paid. The provision covers administrative and legal claims, gross of accepted coinsurance operations and reinsurance operations and net of ceded coinsurance operations. The provision should include, whenever required, IBNER (claims incurred but not sufficiently reported) for the aggregate development of claims reported but not paid, which amounts may be changed throughout the process up to final settlement. |
| · | Provision for claims incurred and not reported–this provision is recognized for the coverage ofexpected unsettled amounts related to claims incurred but not reported up to the calculation base date, gross of accepted coinsurance operations and reinsurance operations, and net of ceded coinsurance operations. |
| · | Mathematical provisions for benefits to be granted -recognized for the coverage of commitmentsassumed to participants or policyholders, based on the assumptions set forth in the contract, while the event that gave rise to the benefit and/or indemnity has not occurred. The provision is calculated in accordance with the methodology approved in the actuarial technical note to the product. |
| · | Mathematical provisions for granted benefits -recognized after the event triggering the benefit occurs,for the coverage of the commitments assumed to the participants or insured parties, based on the assumptions established in the agreement. The provision is calculated in accordance with the methodologies approved in the technical actuarial note on the product. |
| · | Provision for financial surplus –it is recognized to ensure the amounts intended for distribution of financialsurplus, if the event is stated in the agreement. Corresponds to the financial income exceeding the minimum return guaranteed in the product. |
| · | Other technical provisions –it is recognized when insufficiency of premiums or contributions are identifiedrelated to payments of benefits and indemnities. |
| · | Provision for redemptions and other amounts to regularize –it comprises the amounts related toredemptions to regularize, returns of premiums or funds, portability requested but, for any reason, not yet transferred to the insurance company or open private pension entity beneficiary, and premiums received but not quoted. |
| · | Provision for related expenses -It is recognized for the coverage of expected amounts related to expenseswith benefits and indemnities, due to events incurred and to be incurred. |
II - Change in reserves for insurance and private pension
The details about the changes in balances of reserves for insurance and private pension operations are as follows:
| F-99 |
II.I - Change in technical provisions
| 12/31/2016 | 12/31/2015 | |||||||||||||||||||||||||||||||
| Property, individuals and life insurance | Private pension | Life with survivor benefits | Total | Property, individuals and life insurance | Private pension | Life with survivor benefits | Total | |||||||||||||||||||||||||
| Opening balance | 4,755 | 32,688 | 91,862 | 129,305 | 5,872 | 28,228 | 75,678 | 109,778 | ||||||||||||||||||||||||
| (+) Additions arising from premiums / contribution | 4,302 | 2,395 | 18,153 | 24,850 | 4,825 | 2,255 | 15,501 | 22,581 | ||||||||||||||||||||||||
| (-) Deferral of risk | (5,124 | ) | (297 | ) | - | (5,421 | ) | (5,780 | ) | (253 | ) | - | (6,033 | ) | ||||||||||||||||||
| (-) Payment of claims / benefits | (1,623 | ) | (370 | ) | (39 | ) | (2,032 | ) | (1,553 | ) | (337 | ) | (19 | ) | (1,909 | ) | ||||||||||||||||
| (+) Reported claims | 1,620 | - | - | 1,620 | 1,712 | - | - | 1,712 | ||||||||||||||||||||||||
| (-) Redemptions | (1 | ) | (1,939 | ) | (13,277 | ) | (15,217 | ) | (2 | ) | (1,479 | ) | (8,720 | ) | (10,201 | ) | ||||||||||||||||
| (+/-) Net portability | - | 380 | 709 | 1,089 | - | 886 | 504 | 1,390 | ||||||||||||||||||||||||
| (+) Adjustment of reserves and financial surplus | 20 | 4,371 | 13,171 | 17,562 | 9 | 3,244 | 9,052 | 12,305 | ||||||||||||||||||||||||
| (+/-) Other (recognition / reversal) | (23 | ) | 451 | 1,892 | 2,320 | (328 | ) | 144 | (134 | ) | (318 | ) | ||||||||||||||||||||
| Reserves for insurance and private pension | 3,926 | 37,679 | 112,471 | 154,076 | 4,755 | 32,688 | 91,862 | 129,305 | ||||||||||||||||||||||||
II.II - Technical provisions balances
| Insurance | Private pension | Total | ||||||||||||||||||||||
| 12/31/2016 | 12/31/2015 | 12/31/2016 | 12/31/2015 | 12/31/2016 | 12/31/2015 | |||||||||||||||||||
| Unearned premiums | 2,204 | 3,027 | 17 | 15 | 2,221 | 3,042 | ||||||||||||||||||
| Mathematical reserve for benefits to be granted and benefits granted | 24 | 24 | 148,341 | 122,914 | 148,365 | 122,938 | ||||||||||||||||||
| Redemptions and Other Unsettled Amounts | 11 | 23 | 210 | 166 | 221 | 189 | ||||||||||||||||||
| Financial surplus | 2 | 1 | 581 | 547 | 583 | 548 | ||||||||||||||||||
| Unsettled claims(1) | 769 | 783 | 23 | 18 | 792 | 801 | ||||||||||||||||||
| IBNR | 435 | 424 | 27 | 24 | 462 | 448 | ||||||||||||||||||
| Administrative and Related Expenses | 39 | 42 | 71 | 50 | 110 | 92 | ||||||||||||||||||
| Other | 442 | 431 | 880 | 816 | 1,322 | 1,247 | ||||||||||||||||||
| Total(2) | 3,926 | 4,755 | 150,150 | 124,550 | 154,076 | 129,305 | ||||||||||||||||||
(1) The provision for unsettled claims is detailed in Note 30e.
(2)This table covers the amendments established by Susep Circular No. 517, de 07/30/2015, also for comparison purposes.
| F-100 |
| d) | Deferred selling expenses |
Deferred acquisition costs of insurance are direct and indirect costs incurred to sell, underwrite and originate a new insurance contract.
Direct costs are basically commissions paid for brokerage services, agency and prospecting efforts and are deferred for amortization in proportion to the recognition of revenue from earned premiums, that is, over the coverage period, for the term of effectiveness of contracts, according to the calculation rules in force.
Balances are recorded under gross reinsurance assets and changes are shown in the table below:
| Balance at 01/01/2016 | 901 | |||
| Increase | 902 | |||
| Amortization | (1,374 | ) | ||
| Balance at 12/31/2016 | 429 | |||
| Balance to be amortized in up to 12 months | 335 | |||
| Balance to be amortized after 12 months | 94 | |||
| Balance at 01/01/2015 | 1,647 | |||
| Increase | 1,133 | |||
| Amortization | (1,879 | ) | ||
| Balance at 12/31/2015 | 901 | |||
| Balance to be amortized in up to 12 months | 644 | |||
| Balance to be amortized after 12 months | 257 |
The amounts of deferred selling expenses from reinsurance are stated in Note 30I.
| F-101 |
| e) | Table of loss development |
Changes in the amount of obligations of the ITAÚ UNIBANCO HOLDING may occur at the end of each annual reporting period. The table below shows the development by the claims incurred method. The first part of the table shows how the final loss estimate changes through time. The second part of the table reconciles the amounts pending payment and the liability disclosed in the balance sheet.
I – Gross of reinsurance
| Reserve for unsettled claims(*) | 792 | |||
| (-) DPVAT operations | 19 | |||
| (-) IBNER (claims incurred but not sufficiently reported) | 240 | |||
| (-) Retrocession and other estimates | 3 | |||
| Liability claims presented in the development table (Ia + Ib) | 530 |
(*) Provision for unsettled claims stated in Note 30c II.II of 12/30/2016, gross of reinsurance
Ia - Administratives claims - gross of reinsurance
| Occurrence date | 12/31/2012 | 12/31/2013 | 12/31/2014 | 12/31/2015 | 12/31/2016 | Total | ||||||||||||||||||
| At the end of reporting period | 1,230 | 1,168 | 1,142 | 1,243 | 1,310 | |||||||||||||||||||
| After 1 year | 1,221 | 1,166 | 1,130 | 1,286 | ||||||||||||||||||||
| After 2 years | 1,227 | 1,172 | 1,150 | |||||||||||||||||||||
| After 3 years | 1,227 | 1,177 | ||||||||||||||||||||||
| After 4 years | 1,229 | |||||||||||||||||||||||
| Current estimate | 1,229 | 1,177 | 1,150 | 1,286 | 1,310 | |||||||||||||||||||
| Accumulated payments through base date | 1,226 | 1,173 | 1,142 | 1,262 | 1,098 | 5,901 | ||||||||||||||||||
| Liabilities recognized in the balance sheet | 3 | 4 | 8 | 24 | 212 | 251 | ||||||||||||||||||
| Liabilities in relation to prior years | 27 | |||||||||||||||||||||||
| Total administratives claims included in balance sheet | 278 | |||||||||||||||||||||||
Ib - Judicial claims - gross of reinsurance
| Occurrence date | 12/31/2012 | 12/31/2013 | 12/31/2014 | 12/31/2015 | 12/31/2016 | Total | ||||||||||||||||||
| At the end of reporting period | 54 | 32 | 32 | 35 | 34 | |||||||||||||||||||
| After 1 year | 64 | 49 | 44 | 48 | ||||||||||||||||||||
| After 2 years | 72 | 59 | 56 | |||||||||||||||||||||
| After 3 years | 78 | 70 | ||||||||||||||||||||||
| After 4 years | 85 | |||||||||||||||||||||||
| Current estimate | 85 | 70 | 56 | 48 | 34 | |||||||||||||||||||
| Accumulated payments through base date | 65 | 50 | 40 | 33 | 24 | 212 | ||||||||||||||||||
| Liabilities recognized in the balance sheet | 20 | 20 | 17 | 15 | 10 | 82 | ||||||||||||||||||
| Liabilities in relation to prior years | 170 | |||||||||||||||||||||||
| Total judicial claims included in balance sheet | 252 | |||||||||||||||||||||||
| F-102 |
II - Net of reinsurance
| Reserve for unsettled claims(1) | 792 | |||
| (-) DPVAT operations | 19 | |||
| (-) IBNER | 240 | |||
| (-) Reinsurance(2) | 31 | |||
| (-) Retrocession and other estimates | 3 | |||
| Liability claims presented in the development table (IIa + IIb) | 499 |
| (1) | Provision refers to provision for unsettled claims stated in Note 30c II.II of 12/31/2016. |
| (2) | Reinsurance operations stated in Note 30l III of 12/31/2016. |
IIa - Administratives claims - net of reinsurance
| Occurrence date | 12/31/2012 | 12/31/2013 | 12/31/2014 | 12/31/2015 | 12/31/2016 | Total | ||||||||||||||||||
| At the end of reporting period | 1,186 | 1,144 | 1,129 | 1,221 | 1,298 | |||||||||||||||||||
| After 1 year | 1,175 | 1,142 | 1,116 | 1,253 | ||||||||||||||||||||
| After 2 years | 1,181 | 1,148 | 1,131 | |||||||||||||||||||||
| After 3 years | 1,182 | 1,152 | ||||||||||||||||||||||
| After 4 years | 1,183 | |||||||||||||||||||||||
| Current estimate | 1,183 | 1,152 | 1,131 | 1,253 | 1,298 | |||||||||||||||||||
| Accumulated payments through base date | 1,180 | 1,149 | 1,123 | 1,229 | 1,092 | 5,773 | ||||||||||||||||||
| Liabilities recognized in the balance sheet | 3 | 4 | 8 | 24 | 206 | 245 | ||||||||||||||||||
| Liabilities in relation to prior years | 18 | |||||||||||||||||||||||
| Total administratives claims included in balance sheet | 263 | |||||||||||||||||||||||
IIb - Judicial claims - net of reinsurance
| Occurrence date | 12/31/2012 | 12/31/2013 | 12/31/2014 | 12/31/2015 | 12/31/2016 | Total | ||||||||||||||||||
| At the end of reporting period | 54 | 32 | 32 | 35 | 31 | |||||||||||||||||||
| After 1 year | 64 | 49 | 44 | 47 | ||||||||||||||||||||
| After 2 years | 72 | 59 | 56 | |||||||||||||||||||||
| After 3 years | 77 | 70 | ||||||||||||||||||||||
| After 4 years | 84 | |||||||||||||||||||||||
| Current estimate | 84 | 70 | 56 | 47 | 31 | |||||||||||||||||||
| Accumulated payments through base date | 64 | 50 | 40 | 33 | 21 | 208 | ||||||||||||||||||
| Liabilities recognized in the balance sheet | 20 | 20 | 17 | 14 | 10 | 81 | ||||||||||||||||||
| Liabilities in relation to prior years | 155 | |||||||||||||||||||||||
| Total judicial claims included in balance sheet | 236 | |||||||||||||||||||||||
The breakdown of the table development of claims between administrative and legal evidences the reallocation of claims up to a certain base date and that become legal ones afterwards, which may give the wrong impression of need for adjusting the provisions in each breakdown.
| F-103 |
| f) | Liability adequacy test |
As established in IFRS 4 – “Insurance contracts”, an insurance company must carry out the Liability Adequacy Test, comparing the amount recognized for its technical reserves with the current estimate of cash flow of its future obligations. The estimate should consider all cash flows related to the business, which is the minimum requirement for carrying out the adequacy test.
The Liability adequacy test did not show any deficiency for periods ended 2016, 2015 and 2014.
The assumptions used in the test are periodically reviewed and are based on the best practices and the analysis of subsidiaries’ experience, therefore representing the best estimates for cash flow projections.
Methodology and Test Grouping
The methodology for testing all products is based on the projection of cash flows. Specifically for insurance products, cash flows were projected using the method known as run-off triangle of quarterly frequency. Cash flows for the deferral and the assignment phases are tested on a separate basis for social security products.
The risk grouping criterion considers groups subject to similar risks that are jointly managed as a single portfolio.
Biometric Tables
Biometric tables are instruments to measure the biometric risk represented by the probability of death, survival or disability of a participant.
For death and survival estimates, the Brazilian Market Insurer Experience (BR-EMS) tables in effect are used, adjusted according to life expectancy development of Scale G, and the Álvaro Vindas table is adopted to estimate benefit requests for disability
Risk-free Interest Rate
The relevant risk-free forward interest-rate structure is an indicator of the pure time value of money used to price the set of projected cash flows.
The relevant structure of risk-free interest rate was obtained from the curve of securities deemed to be credit risk free, available in the Brazilian financial market and determined pursuant to an internal policy of ITAÚ UNIBANCO HOLDING, considering the addition of spread, which took into account the impact of the market result of held-to-maturity securities of the guarantee assets portfolio.
Income conversion rate
The income conversion rate represents the expected conversion of balances accumulated by participants in retirement benefits. The decision of conversion into income by participants is influenced by behavioral, economic and tax factors.
Other Assumptions
Related expenses, cancellations and partial redemptions, future increases and contributions, among others, are assumptions that affect the estimate of projected cash flows since they represent expenses and income arising from insurance agreements assumed.
| F-104 |
| g) | Insurance risk – effect of changes on actuarial assumptions |
Property insurance is a short-lived insurance, and the main actuarial assumptions involved in the management and pricing of the associated risks are claims frequency and severity. Volatility above the expected number of claims and/or amount of claim indemnities may result in unexpected losses.
Life insurance and pension plans are, in general, medium or long-lived products and the main risks involved in the business may be classified as biometric risk, financial risk and behavioral risk.
Biometric risk relates to: i) more than expected increase in life expectancies for products with survivorship coverage (mostly pension plans); ii) more than expected decrease in mortality rates for products with survivorship coverage (mostly life insurance).
Products offering financial guarantee predetermined under contract involve financial risk inherent in the underwriting risk, with such risk being considered insurance risk.
Behavioral risk relates to a more than expected increase in the rates of conversion into annuity income, resulting in increased payments of retirement benefits.
The estimated actuarial assumptions are based on the historical evaluation of ITAÚ UNIBANCO HOLDING, on benchmarks and the experience of the actuaries.
To measure the effects of changes in the key actuarial assumptions, sensitivity tests were conducted in the amounts of current estimates of future liability cash flows. The sensitivity analysis considers a vision of the impacts caused by changes in assumptions, which could affect the income for the period and stockholders’ equity at the balance sheet date. This type of analysis is usually conducted under theceteris paribus condition, in which the sensitivity of a system is measured when one variable of interest is changed and all the others remain unchanged. The results obtained are shown in the table below:
| F-105 |
The sensitivity analysis considers a vision of the impacts caused by changes in assumptions, which could affect the income for the period and stockholders’ equity at the balance sheet date. Results were as follows:
| Impact in Results and Stockholders’ Equity(1) | ||||||||||||||||||||||||
| 12/31/2016 | 12/31/2015 | |||||||||||||||||||||||
| Supplementary | Insurance | Supplementary | Insurance | |||||||||||||||||||||
| Retirement Plans and | Gross of | Net of | Retirement Plans and | Gross of | Net of | |||||||||||||||||||
| Sensitivity analysis | Life with Living Benefits | reinsurance | reinsurance | Life with Living Benefits | reinsurance | reinsurance | ||||||||||||||||||
| 5% increase in mortality rates | 21 | (3 | ) | (3 | ) | 8 | (4 | ) | (3 | ) | ||||||||||||||
| 5% decrease in mortality rates | (23 | ) | 3 | 3 | (8 | ) | 3 | 3 | ||||||||||||||||
| 0.1% increase in risk-free interest rates | 49 | 6 | 6 | 38 | 7 | 7 | ||||||||||||||||||
| 0.1% decrease in risk-free interest rates | (50 | ) | (6 | ) | (6 | ) | (39 | ) | (7 | ) | (7 | ) | ||||||||||||
| 5% increase in conversion in income rates | (6 | ) | - | - | (12 | ) | - | - | ||||||||||||||||
| 5% decrease in conversion in income rates | 6 | - | - | 12 | - | - | ||||||||||||||||||
| 5% increase in claims | 0 | (50 | ) | (48 | ) | - | (62 | ) | (60 | ) | ||||||||||||||
| 5% decrease in claims | 0 | 50 | 48 | - | 63 | 60 | ||||||||||||||||||
(1) Amounts net of tax effects.
| h) | Risks of insurance and private pension |
ITAÚ UNIBANCO HOLDING has specific committees to define the management of funds from the technical reserves for insurance and private pension, issue guidelines for managing these funds with the objective of achieving long term return, and define evaluation models, risk limits and strategies on allocation of funds to defined financial assets. Such committees are comprised not only of executives and those directly responsible for the business management process, but also for an equal number of professionals that head up or coordinate the commercial and financial areas.
The extended warranty product, this is marketed by the retail company that sells to consumer. The DPVAT production results from the participation that the insurance companies of ITAÚ UNIBANCO HOLDING have in the Leading Insurance Company of the DPVAT consortium.
| F-106 |
There is no product concentration in relation to insurance premiums, reducing the concentration risk of products and distribution channels.
| 01/01 to 12/31/2016 | 01/01 to 12/31/2015 | 01/01 to 12/31/2014 | ||||||||||||||||||||||||||||||||||
| Insurance | Retained | Retention | Insurance | Retained | Retention | Insurance | Retained | Retention | ||||||||||||||||||||||||||||
| premiums | premium | (%) | premiums | premium | (%) | premiums | premium | (%) | ||||||||||||||||||||||||||||
| Property and casualty | ||||||||||||||||||||||||||||||||||||
| Mandatory personal injury caused by motor vehicle (DPVAT) | 37 | 37 | 100.0 | 37 | 37 | 100.0 | 243 | 243 | 100.0 | |||||||||||||||||||||||||||
| Extended warranty | 112 | 112 | 100.0 | 252 | 252 | 100.0 | 1,202 | 1,202 | 100.0 | |||||||||||||||||||||||||||
| Individuals | ||||||||||||||||||||||||||||||||||||
| Group accident insurance | 780 | 776 | 99.5 | 862 | 860 | 99.7 | 796 | 794 | 99.8 | |||||||||||||||||||||||||||
| Individual accident | 224 | 212 | 94.8 | 214 | 203 | 94.8 | 186 | 184 | 98.9 | |||||||||||||||||||||||||||
| Credit life | 570 | 570 | 100.0 | 726 | 725 | 99.9 | 802 | 802 | 100.0 | |||||||||||||||||||||||||||
| Group life | 1,278 | 1,234 | 96.5 | 1,453 | 1,416 | 97.5 | 1,414 | 1,386 | 98.2 | |||||||||||||||||||||||||||
| Large risks | ||||||||||||||||||||||||||||||||||||
| Engineering | - | - | - | - | - | - | 46 | 8 | 17.4 | |||||||||||||||||||||||||||
| Petroleum risks | - | - | - | - | - | - | 284 | 32 | 11.3 | |||||||||||||||||||||||||||
| Specified and operational risks | - | - | - | - | - | - | 501 | 108 | 21.6 | |||||||||||||||||||||||||||
| i) | Insurance, pension plan and capitalization management structure |
The products that make up the portfolios of ITAÚ UNIBANCO HOLDING’s insurance companies are related to the life insurance and elementary, pension plan and capitalization lines. Therefore, we understand that the major risks inherent in these products are as follows:
| · | Underwriting risk is the possibility of losses arising from operations of insurance, pension plan and capitalization that go against the organization’s expectations, directly or indirectly associated with the technical and actuarial bases adopted to calculate premiums, contributions and provisions. |
| · | Market risk is the possibility of incurring losses due to fluctuations in the market values of assets and liabilities comprising the actuarial technical reserves. |
| · | Credit risk is the possibility of a certain debtor failing to meet any obligations in connection with the settlement of operations involving the trade of financial assets or reinsurance. |
| · | Operational risk is the possibility of incurring losses arising from the failure, deficiency or inadequacy or internal processes, personnel and systems, or external events impacting the achievement of strategic, tactical or operational purposes of the insurance, pension plan and capitalization operations. |
| · | Liquidity risk in insurance operations is the possibility of the institution being unable to honor its obligations on a timely basis before policyholders and beneficiaries due to lack of liquidity of assets that make up their actuarial technical reserves. |
| j) | Duties and responsibilities |
In line with good national and international practices and to ensure that the risks arising from insurance, pension plan and capitalization products are properly identified, measured, assesses, reported and approved in proper bodies, the ITAÚ UNIBANCO HOLDING has a risk management structure which guidelines are established in an internal policy, approved by its Board of Directors, applicable to the companies and subsidiaries exposed to insurance, pension plan and capitalization risks in Brazil and abroad.
The management process of insurance, pension plan and capitalization risks is based on responsibilities established and distributed between the control and business areas, assuring independence among them and focusing on the specificities of each risk, in accordance with the guidelines established by ITAÚ UNIBANCO HOLDING.
Also, as part of the risk management process, there is a governance structure where decisions may be escalated to panels, ensuring compliance with a number of internal and regulatory requirements, as well as balanced decisions regarding risks.
The purpose of ITAÚ UNIBANCO HOLDING is to ensure that assets backing long-term products, with guaranteed minimum returns, are managed according to the characteristics of the liabilities aiming at actuarial balance and long-term solvency.
Considering actuarial assumptions, a detailed mapping of the liabilities of long-term products that result in payment flows of projected future benefits is performed annually. Based on this mapping, Asset Liability Management models are used to find the best asset portfolio composition that enables the neutralize the risks entailed in this type of product, considering its long-term economic and financial feasibility. The portfolios of backing assets are periodically rebalanced based on the fluctuations in market prices of assets, the company’s liquidity needs, and changes in characteristics of liabilities.
| F-107 |
| k) | Market, credit and liquidity risk |
| I) | Market risk |
Market risk is analyzed, in relation to insurance operations, based on the following metrics and sensitivity and loss control measures: Value at Risk (VaR), Losses in Stress Scenarios (Stress Test), Sensitivity (DV01- Delta Variation) and Concentration. For a detailed description of metrics, see Note 36 – Market risk. In the table, the sensitivity analysis (DV01 – Delta Variation) is presented in relation to insurance operations that demonstrate the impact on the cash flows market value when submitted to a 1 annual basis point increase in the current interest rates or index rate and 1 percentage point in the share price and currency.
| 12/31/2016 | 12/31/2015 | |||||||||||||||
| Class | Account balance | DV01 | Account balance | DV01 | ||||||||||||
| Government securities | ||||||||||||||||
| NTN-C | 5,141 | (3.03 | ) | 4,821 | (3.20 | ) | ||||||||||
| NTN-B | 2,969 | (3.53 | ) | 2,055 | (1.95 | ) | ||||||||||
| LTN | - | - | - | - | ||||||||||||
| DI Future | - | - | - | - | ||||||||||||
| Private securities | ||||||||||||||||
| Indexed to IPCA | 307 | (0.14 | ) | 209 | (0.09 | ) | ||||||||||
| Indexed to PRE | 240 | (0.00 | ) | 77 | (0.00 | ) | ||||||||||
| Shares | 0 | 0.00 | 1 | 0.01 | ||||||||||||
| Floating assets | 5,852 | - | 4,998 | - | ||||||||||||
| Under agreements to resell | 6,266 | - | 4,977 | - | ||||||||||||
| F-108 |
| II) | Liquidity Risk |
Liquidity risk is the risk that ITAÚ UNIBANCO HOLDING may have insufficient net funds available to honor its current obligations at a given moment. The liquidity risk is managed, for insurance operation, continuously based on the monitoring of payment flows related to its liabilities vis a vis the inflows generated by its operations and financial assets portfolio.
Financial assets are managed in order to optimize the risk-return ratio of investments, considering, on a careful basis, the characteristics of their liabilities. The risk integrated control considers the concentration limits by issuer and credit risk, sensitivities and market risk limits and control over asset liquidity risk. Thus, investments are concentrated in government and private securities with good credit quality in active and liquid markets, keeping a considerable amount invested in short-term assets, available on demand, to cover regular needs and any liquidity contingencies. Additionally, ITAÚ UNIBANCO HOLDING constantly monitors the solvency conditions of its insurance operations.
| Liabilities | Assets | 12/31/2016 | 12/31/2015 | |||||||||||||||||||||||
| Liabilities | Liabilities | Assets | Liabilities | Liabilities | Assets | |||||||||||||||||||||
| amounts(1) | DU(2) | DU(2) | amounts(1) | DU(2) | DU(2) | |||||||||||||||||||||
| Insurance operations | Backing asset | |||||||||||||||||||||||||
| Unearned premiums | LFT, repurchase agreements, NTN-B, CDB, LF and debentures | 2,202 | 13.5 | 3,025 | 15.8 | 13.8 | ||||||||||||||||||||
| IBNR, PDR e PSL | LFT, repurchase agreements, NTN-B, CDB, LF and debentures | 1,242 | 13.8 | 1,243 | 15.7 | 16.9 | ||||||||||||||||||||
| Other provisions | LFT, repurchase agreements, NTN-B, CDB, LF and debentures | 446 | 119.0 | 434 | 104.6 | 22.7 | ||||||||||||||||||||
| Subtotal | Subtotal | 3,890 | 4,702 | |||||||||||||||||||||||
| Pension plan, VGBL and individual life operations | ||||||||||||||||||||||||||
| Related expenses | LFT, repurchase agreements, NTN-B, CDB, LF and debentures | 71 | 107.4 | 80.9 | 50 | 102.7 | 85.7 | |||||||||||||||||||
| Unearned premiums | LFT, repurchase agreements, NTN-B, CDB and debentures | 19 | - | 14.1 | 17 | - | 12.2 | |||||||||||||||||||
| Unsettled claims | LFT, repurchase agreements, NTN-B, CDB and debentures | 25 | - | 13.9 | 20 | - | 12.3 | |||||||||||||||||||
| IBNR | LFT, repurchase agreements, NTN-B, CDB and debentures | 27 | 11.4 | 14.1 | 28 | 9.8 | 10.5 | |||||||||||||||||||
| Redemptions and Other Unsettled Amounts | LFT, repurchase agreements, NTN-B, CDB and debentures | 221 | - | 14.0 | 190 | - | 12.3 | |||||||||||||||||||
| Mathematical reserve for benefits granted | LFT, repurchase agreements, LTN, NTN-B, NTN-C, NTN-F, CDB, LF and debentures | 1,737 | 107.4 | 81.1 | 1,540 | 102.7 | 85.8 | |||||||||||||||||||
| Mathematical reserve for benefits to be granted – PGBL/ VGBL | LFT, repurchase agreements, LTN, NTN-B, NTN-C, NTN-F, CDB, LF and debentures(3) | 142,039 | 169.9 | 39.4 | 117,073 | 160.6 | 23.9 | |||||||||||||||||||
| Mathematical reserve for benefits to be granted – traditional | LFT, repurchase agreements, NTN-B, NTN-C, Debentures | 4,584 | 210.9 | 92.0 | 4,321 | 208.1 | 79.4 | |||||||||||||||||||
| Other provisions | LFT, repurchase agreements, NTN-B, NTN-C, CDB, LF and debentures | 880 | 210.9 | 92.0 | 816 | 208.1 | 79.4 | |||||||||||||||||||
| Financial surplus | LFT, repurchase agreements, NTN-B, NTN-C, CDB, LF and debentures | 583 | 210.6 | 91.8 | 548 | 207.8 | 79.2 | |||||||||||||||||||
| Subtotal | Subtotal | 150,186 | 124,603 | |||||||||||||||||||||||
| Total technical reserves | Total backing assets | 154,076 | 129,305 | |||||||||||||||||||||||
| (1) | Gross amounts of Credit Rights, Escrow Deposits and Reinsurance. |
| (2) | DU = Duration in months |
| (3) | Excluding PGBL / VGBL reserves allocated in variable income. |
| F-109 |
| III) | Credit Risk |
Reinsurers – Breakdown
We present below the division of risks granted by the ITAÚ UNIBANCO HOLDING’s insurance companies to reinsurance companies:
| - | Insurance Operations:reinsurance premiums operations are basically represented by: IRB BrasilResseguros with 56.14% (66.67% at 12/31/2015) and Munich Re do Brasil with 43.33% (32.94% at 12/31/2015). |
| - | Social Security Operations:social security operations related to reinsurance premiums are entirelyrepresented by Munich Re do Brasil with 70% (50% at 12/31/2015) and General Reinsurance AG with 30% (50% at 12/31/2015). |
| F-110 |
IV) Risk level of financial assets
The table below shows insurance financial assets, individually evaluated, classified by rating:
| 12/31/2016 | ||||||||||||||||||||||||
| Internal rating (*) | Interbank deposits and securities purchased under agreements to resell | Held-for-trading financial assets | Derivatives assets | Available-for- sale financial assets | Held-to- maturity financial assets | Total | ||||||||||||||||||
| Lower risk | 7,859 | 125,944 | 284 | 3,558 | 4,629 | 142,274 | ||||||||||||||||||
| Satisfactory | - | 13 | - | - | - | 13 | ||||||||||||||||||
| Higher Risk | - | - | - | - | - | - | ||||||||||||||||||
| Total | 7,859 | 125,957 | 284 | 3,558 | 4,629 | 142,287 | ||||||||||||||||||
| % | 5.5 | 88.5 | 0.2 | 2.5 | 3.3 | 100.0 | ||||||||||||||||||
(*) Internal risk level ratings, with due associated probability of default, are detailed in Note 36.
| 12/31/2015 | ||||||||||||||||||||||||
| Internal rating (*) | Interbank deposits and securities purchased under agreements to resell | Held-for-trading financial assets | Derivatives assets | Available-for- sale financial assets | Held-to- maturity financial assets | Total | ||||||||||||||||||
| Lower risk | 5,667 | 94,709 | 126 | 2,732 | 4,320 | 107,554 | ||||||||||||||||||
| Satisfactory | - | 16 | - | - | - | 16 | ||||||||||||||||||
| Higher Risk | - | - | - | - | - | - | ||||||||||||||||||
| Total | 5,667 | 94,725 | 126 | 2,732 | 4,320 | 107,570 | ||||||||||||||||||
| % | 5.3 | 88.1 | 0.1 | 2.5 | 4.0 | 100.0 | ||||||||||||||||||
(*) Internal risk level ratings, with due associated probability of default, are detailed in Note 36.
| F-111 |
| l) | Reinsurance |
Expenses and revenues from reinsurance premiums ceded are recognized in the period when they occur, according to the accrual basis, with no offset of assets and liabilities related to reinsurance except in the event there is a contractual provision for the offset of accounts between the parties. Analyses of reinsurance required are made to meet the current needs of ITAÚ UNIBANCO HOLDING, maintaining the necessary flexibility to comply with changes in management strategy in response to the various scenarios to which it may exposed.
Reinsurance assets
Reinsurance assets are valued according to consistent basis of risk assignment contracts, and in the event of losses effectively paid, as from December 2015; they are revalued after 180 days have elapsed in relation to the possibility of non-recovery. For previous periods, revaluation term is 365 days. This amendment was for compliance with the SUSEP Circular in force. In case of doubt, these assets are reduced based on the provision recognized for credit risk associated to reinsurance.
Reinsurance transferred
ITAÚ UNIBANCO HOLDING transfers, in the normal course of its businesses, reinsurance premiums to cover losses on underwriting risks to its policy holders and is in compliance with the operational limits established by the regulating authority. In addition to proportional contracts, non-proportional contracts are also entered into in order to transfer a portion of the responsibility to the reinsurance company for losses that exceed a certain level of losses in the portfolio. Non-proportional reinsurance premiums are included in Other assets - prepaid expenses and amortized to Other operating expenses over the effectiveness period of the contract on a daily accrual basis.
| F-112 |
I- Changes in balances of transactions with reinsurance companies
| Credits | Debits | |||||||||||||||
| 12/31/2016 | 12/31/2015 | 12/31/2016 | 12/31/2015 | |||||||||||||
| Opening balance | 18 | 262 | 103 | 610 | ||||||||||||
| Issued contracts | - | - | 79 | 75 | ||||||||||||
| Recoverable claims | 32 | - | - | - | ||||||||||||
| Prepayments / payments to reinsurer | (3 | ) | 12 | (108 | ) | (36 | ) | |||||||||
| Other increase / reversal | (1 | ) | (256 | ) | - | (546 | ) | |||||||||
| Closing balance | 46 | 18 | 74 | 103 | ||||||||||||
II – Balances of technical reserves with reinsurance assets
| 12/31/2016 | 12/31/2015 | |||||||
| Reinsurance claims | 52 | 52 | ||||||
| Reinsurance premiums | 15 | 24 | ||||||
| Closing balance | 67 | 76 | ||||||
III – Changes in balances of technical reserves for reinsurance claims
| 12/31/2016 | 12/31/2015 | |||||||
| Opening balance | 52 | 2,456 | ||||||
| Reported claims | 70 | 32 | ||||||
| Paid claims | (99 | ) | (25 | ) | ||||
| Other increase / reversal | 2 | (2,412 | ) | |||||
| Monetary adjustment and interest of claims | 27 | 1 | ||||||
| Closing balance (*) | 52 | 52 | ||||||
(*) Includes Reserve for unsettled claims, IBNER (Reserve for claims not sufficiently warned), IBNR (Reserve for claims incurred but not reported), not covered by the table of loss development net of reinsurance Note 30 eII.
IV – Changes in balances of technical reserves for reinsurance premiums
| 12/31/2016 | 12/31/2015 | |||||||
| Opening balance | 24 | 949 | ||||||
| Receipts | 65 | 61 | ||||||
| Payments | (74 | ) | (45 | ) | ||||
| Other increase / reversal | - | (941 | ) | |||||
| Closing balance | 15 | 24 | ||||||
V – Changes in balances of technical reserves for reinsurance commission
| 12/31/2016 | 12/31/2015 | |||||||
| Opening balance | - | (37 | ) | |||||
| Receipts | 6 | 4 | ||||||
| Payments | (6 | ) | (4 | ) | ||||
| Other increase / reversal | 37 | |||||||
| Closing balance | - | - | ||||||
| F-113 |
| m) | Regulatory authorities |
Insurance and private pension operations are regulated by the National Council of Private Insurance (CNSP) and the Superintendence of Private Insurance (SUSEP). These authorities are responsible for regulating the market, and consequently for assisting in the mitigation of risks inherent in the business.
The CNSP is the regulatory authority of insurance activities in Brazil, created by Decree-Law N° 73, of November 21, 1966. The main attribution of CNSP, at the time of its creation, was to set out the guidelines and rules of government policy on private insurance segments, and with the enactment of Law N° 6,435, of July 15, 1977, its attributions included private pension of public companies.
The Superintendence of Private Insurance (SUSEP) is the authority responsible for controlling and overseeing the insurance, and reinsurance markets. An agency of the Ministry of Finance, it was created by the Decree-Law N° 73, of November 21, 1966, which also created the National System of Private Insurance, comprising the National Council of Private Insurance (CNSP), IRB Brasil Resseguros S.A. – IRB Brasil Re, the companies authorized to have plans and the open-ended private pension companies.
| F-114 |
Note 31 – Fair value of financial instruments
In cases where market prices are not available, fair values are based on estimates using discounted cash flows or other valuation techniques. These techniques are significantly affected by the assumptions adopted, including the discount rate and estimate of future cash flows. The estimated fair value achieved through these techniques cannot be substantiated by comparison with independent markets and, in many cases, it cannot be realized in the immediate settlement of the instrument.
The following table summarizes the carrying and estimated fair values for financial instruments:
| 12/31/2016 | 12/31/2015 | |||||||||||||||
| Carrying value | Estimated fair value | Carrying value | Estimated fair value | |||||||||||||
| Financial assets | ||||||||||||||||
| Cash and deposits on demand and Central Bank compulsory deposits | 104,242 | 104,242 | 85,100 | 85,100 | ||||||||||||
| Interbank deposits | 22,692 | 22,731 | 30,525 | 30,525 | ||||||||||||
| Securities purchased under agreements to resell | 265,051 | 265,051 | 254,404 | 254,404 | ||||||||||||
| Financial assets held for trading(*) | 204,648 | 204,648 | 164,311 | 164,311 | ||||||||||||
| Financial assets designated at fair value through profit or loss(*) | 1,191 | 1,191 | 642 | 642 | ||||||||||||
| Derivatives(*) | 24,231 | 24,231 | 26,755 | 26,755 | ||||||||||||
| Available-for-sale financial assets(*) | 88,277 | 88,277 | 86,045 | �� | 86,045 | |||||||||||
| Held-to-maturity financial assets | 40,495 | 40,749 | 42,185 | 38,892 | ||||||||||||
| Loan operations and lease operations | 463,394 | 472,704 | 447,404 | 446,787 | ||||||||||||
| Other financial assets | 53,917 | 53,917 | 53,506 | 53,506 | ||||||||||||
| Financial liabilities | ||||||||||||||||
| Deposits | 329,414 | 329,371 | 292,610 | 292,775 | ||||||||||||
| Securities sold under repurchase agreements | 349,164 | 349,164 | 336,643 | 336,643 | ||||||||||||
| Financial liabilities held for trading(*) | 519 | 519 | 412 | 412 | ||||||||||||
| Derivatives(*) | 24,698 | 24,698 | 31,071 | 31,071 | ||||||||||||
| Interbank market debt | 135,483 | 134,730 | 156,886 | 156,174 | ||||||||||||
| Institutional market debt | 96,239 | 95,012 | 93,918 | 95,461 | ||||||||||||
| Liabilities for capitalization plans | 3,147 | 3,147 | 3,044 | 3,044 | ||||||||||||
| Other financial liabilities | 71,832 | 71,832 | 68,715 | 68,715 | ||||||||||||
(*) These assets and liabilities are recorded in the balance sheet at their fair value.
Financial instruments not included in the Balance Sheet (Note 36) are represented by Standby letters of credit and guarantees provided, which amount to R$ 77,453 (R$ 81,180 at 12/31/2015) with an estimated fair value of R$ 1,066 (R$ 1,143 at 12/31/2015).
The methods and assumptions adopted to estimate the fair value are defined below:
| a) | Cash and deposits on demand, Central Bank compulsory deposits, Securities purchased under agreements to resell, Securities sold under repurchase agreements and liabilities for capitalization plans –The carrying amounts for these instruments approximate their fair values. |
| b) | Interbank deposits, deposits, Interbank market debt and Institutional market debt–ITAÚ UNIBANCOHOLDING estimates the fair values by discounting the estimated cash flows and adopting the market interest rates. |
| c) | Financial assets held for trading, including Derivatives (assets and liabilities), Financial assets designated at fair value through profit or loss, Available-for-sale financial assets, Held-to-maturity financial assets and Financial liabilities held for trading –Under normal conditions, market prices arethe best indicators of the fair values of financial instruments. However, not all instruments have liquidity or quoted market prices and, in such cases, the adoption of present value estimates and other pricing techniques are required. In the absence of quoted prices from National Association of Financial Market Institutions (ANBIMA), the fair values of bonds are calculated based on the interest rates provided by others on the market (brokers). The fair values of corporate debt securities are computed by adopting criteria similar to those applied to interbank deposits, as described above. The fair values of shares are computed based on their prices quoted in the market. The fair values of derivative financial instruments were determined as follows: |
| · | Swaps:The cash flows are discounted to present value based on yield curves that reflect theappropriate risk factors. These yield curves may be drawn mainly based on the exchange price of derivatives at BM&FBOVESPA, of Brazilian government securities in the secondary market or derivatives and securities traded abroad. These yield curves may be used to obtain the fair value of currency swaps, interest rate swaps and swaps based on other risk factors (commodities, stock exchange indices, etc.). |
| F-115 |
| · | Futures and forwards:Quotations on exchanges or criteria identical to those applied to swaps. |
| · | Options:The fair values are determined based on mathematical models (such as Black&Scholes) thatare fed with implicit volatility data, interest rate yield curve and fair value of the underlying asset. Current market prices of options are used to compute the implicit volatilities. All these data are obtained from different sources (usually Bloomberg). |
| · | Credit:Inversely related to the probability of default (PD) in a financial instrument subject to credit risk.The process of adjusting the market price of these spreads is based on the differences between the yield curves with no risk and the yield curves adjusted for credit risk. |
| d) | Loan operations and lease operations –Fair value is estimated based on groups of loans with similarfinancial and risk characteristics, using valuation models. The fair value of fixed-rate loans was determined by discounting estimated cash flows, applying current interest rates for similar loans. For the majority of loans at floating rate, the carrying amount was considered close to their fair value. The fair value of loan and lease operations not overdue was calculated by discounting the expected payments of principal and interest through maturity, at the aforementioned rates. The fair value of overdue loan and lease transactions was based on the discount of estimated cash flows, using a rate proportional to the risk associated with the estimated cash flows, or on the underlying collateral. The assumptions related to cash flows and discount rates are determined using information available in the market and the borrower’s specific information of the debtor. |
| e) | Deposits–The fair value of fixed-rate loans with maturity dates was determined by discounting estimatedcash flows, applying current interest rates for similar funding operations. Cash deposits are not considered in the fair value estimate. The assumptions related to cash flows and discount rates are determined based on information available in the market and information specific for each operation. |
| f) | Other financial assets / liabilities–primarily composed of receivables from credit card issuers, deposits inguarantee for contingent liabilities and trading and intermediation of securities. The carrying amounts for these assets/liabilities substantially approximate their fair values, since they principally represent amounts to be received in the short term from credit card holders and to be paid to credit card acquirers, judicially required deposits (indexed to market rates) made by ITAÚ UNIBANCO HOLDING as guarantees for lawsuits or very short-term receivables (generally with a maturity of approximately 5 (five) business days). All of these items represent assets / liabilities without significant associated market, credit and liquidity risks. |
In accordance with IFRS, ITAÚ UNIBANCO HOLDING classifies fair value measurements in a fair value hierarchy that reflects the significance of inputs adopted in the measurement process.
Level 1:Observable inputs that reflect quoted prices (unadjusted) for identical assets or liabilities in activemarkets. An active market is a market in which transactions for the asset or liability being measured occur often enough and with sufficient volume to provide pricing information on an ongoing basis.
Level 2:Inputs other than quoted prices included in Level 1 that are observable for the asset or liability eitherdirectly or indirectly. Level 2 generally includes: (i) quoted prices for similar assets or liabilities in active markets; (ii) quoted prices for identical or similar assets or liabilities in markets that are not active, that is, markets in which there are few transactions for the asset or liability, the prices are not current, or quoted prices vary substantially either over time or among market makers, or in which little information is released publicly; (iii) inputs other than quoted prices that are observable for the asset or liability (for example, interest rates and yield curves observable at commonly quoted intervals, volatilities, etc.); (iv) inputs that are mainly derived from or corroborated by observable market data through correlation or by other means.
Level 3:Inputs are unobservable for the asset or liability. Unobservable information shall be used to measurefair value to the extent that observable information is not available, thus allowing for situations in which there is little, if any, market activity for the asset or liability at the measurement date.
| F-116 |
Financial assets for trading, Available for sale, and Designated at fair value through profit or loss:
Level 1:Highly-liquid securities with prices available in an active market are classified in Level 1 of the fairvalue hierarchy. This classification level includes most of the Brazilian Government Securities, securities of foreign governments, shares and debentures traded on stock exchanges and other securities traded in an active market.
Level 2:When the pricing information is not available for a specific security, the assessment is usually based onprices quoted in the market for similar instruments, pricing information obtained for pricing services, such as Bloomberg, Reuters and brokers (only when the prices represent actual transactions) or discounted cash flows, which use information for assets actively traded in an active market. These securities are classified into Level 2 of the fair value hierarchy and are comprised of certain Brazilian government securities, debentures, some government securities quoted in a less-liquid market in relation to those classified into Level 1, and some share prices in investment funds. ITAÚ UNIBANCO HOLDING does not hold positions in alternative investment funds or private equity funds.
Level 3:When no pricing information in an active market, ITAÚ UNIBANCO HOLDING uses internallydeveloped models, from curves generated according to the proprietary model. The Level 3 classification includes some Brazilian government and private securities falling due after 2025 and securities that are not usually traded in an active market.
Derivatives:
Level 1:Derivatives traded on stock exchanges are classified in Level 1 of the hierarchy.
Level 2:For derivatives not traded on stock exchanges, ITAÚ UNIBANCO HOLDING estimates the fair value byadopting a variety of techniques, such as Black&Scholes, Garman & Kohlhagen, Monte Carlo or even the discounted cash flow models usually adopted in the financial market. Derivatives included in Level 2 are credit default swaps, cross currency swaps, interest rate swaps, plain vanilla options, certain forwards and generally all swaps. All models adopted by ITAÚ UNIBANCO HOLDING are widely accepted in the financial services industry and reflect all derivative contractual terms. Considering that many of these models do not require a high level of subjectivity, since the methodologies adopted in the models do not require major decisions and information for the model are readily observed in the actively quotation markets, these products were classified in Level 2 of the measurement hierarchy.
Level 3:The derivatives with fair values based on non-observable information in an active market wereclassified into Level 3 of the fair value hierarchy, and are comprised of non-standard options, certain swaps indexed to non-observable information, and swaps with other products, such as swap with option and USD Check, credit derivatives and futures of certain commodities. These operations have their pricing derived from a range of volatility using the basis of historical volatility.
All aforementioned valuation methodologies may result in a fair value that may not be indicative of the net realizable value or future fair values. However, ITAÚ UNIBANCO HOLDING believes that all methodologies used are appropriate and consistent with the other market participants. However, the adoption of other methodologies or assumptions different than those used to estimate fair value may result in different fair value estimates at the balance sheet date.
| F-117 |
Distribution by level
The following table presents the breakdown of risk levels at 12/31/2016 and 12/31/2015 for financial assets held for trading and available-for-sale financial assets.
| 12/31/2016 | 12/31/2015 | |||||||||||||||||||||||||||||||
| Level 1 | Level 2 | Level 3 | Total | Level 1 | Level 2 | Level 3 | Total | |||||||||||||||||||||||||
| Financial assets held for trading | 165,883 | 37,760 | 1,005 | 204,648 | 123,948 | 40,303 | 60 | 164,311 | ||||||||||||||||||||||||
| Investment funds | 14 | 1,159 | - | 1,173 | 19 | 1,032 | - | 1,051 | ||||||||||||||||||||||||
| Brazilian government securities | 157,369 | 2,654 | 1 | 160,024 | 114,007 | 3,043 | 3 | 117,053 | ||||||||||||||||||||||||
| Brazilian external debt bonds | 5,325 | - | - | 5,325 | 4,431 | - | - | 4,431 | ||||||||||||||||||||||||
| Government securities – other countries | 819 | 2,916 | - | 3,735 | 933 | 216 | - | 1,149 | ||||||||||||||||||||||||
| Argentina | 651 | - | - | 651 | 696 | - | - | 696 | ||||||||||||||||||||||||
| Chile | - | 127 | - | 127 | - | 36 | - | 36 | ||||||||||||||||||||||||
| Colombia | - | 2,669 | - | 2,669 | - | 72 | - | 72 | ||||||||||||||||||||||||
| United States | 78 | - | - | 78 | 132 | - | - | 132 | ||||||||||||||||||||||||
| Mexico | 6 | - | - | 6 | 3 | - | - | 3 | ||||||||||||||||||||||||
| Paraguay | - | 88 | - | 88 | - | 68 | - | 68 | ||||||||||||||||||||||||
| Uruguay | - | 32 | - | 32 | - | 40 | - | 40 | ||||||||||||||||||||||||
| Other | 84 | - | - | 84 | 102 | - | - | 102 | ||||||||||||||||||||||||
| Corporate securities | 2,356 | 31,031 | 1,004 | 34,391 | 4,558 | 36,012 | 57 | 40,627 | ||||||||||||||||||||||||
| Shares | 1,533 | - | 958 | 2,491 | 2,161 | - | - | 2,161 | ||||||||||||||||||||||||
| Bank deposit certificates | 12 | 1,812 | - | 1,824 | 19 | 2,564 | - | 2,583 | ||||||||||||||||||||||||
| Debentures | 216 | 2,949 | 25 | 3,190 | 2,333 | 2,141 | 48 | 4,522 | ||||||||||||||||||||||||
| Eurobonds and others | 595 | 49 | 18 | 662 | 45 | 940 | 6 | 991 | ||||||||||||||||||||||||
| Financial credit bills | - | 25,893 | - | 25,893 | - | 30,367 | - | 30,367 | ||||||||||||||||||||||||
| Other | - | 328 | 3 | 331 | - | - | 3 | 3 | ||||||||||||||||||||||||
| Available-for-sale financial assets | 34,840 | 43,903 | 9,534 | 88,277 | 32,439 | 49,347 | 4,259 | 86,045 | ||||||||||||||||||||||||
| Investment funds | - | 42 | - | 42 | 6 | 98 | 114 | 218 | ||||||||||||||||||||||||
| Brazilian government securities | 17,039 | 671 | 228 | 17,938 | 10,793 | 791 | 212 | 11,796 | ||||||||||||||||||||||||
| Brazilian external debt bonds | 14,065 | - | - | 14,065 | 17,312 | - | - | 17,312 | ||||||||||||||||||||||||
| Government securities – other countries | 1,536 | 12,850 | 86 | 14,472 | 2,152 | 7,702 | 29 | 9,883 | ||||||||||||||||||||||||
| Chile | - | 5,758 | 86 | 5,844 | - | 1,378 | 29 | 1,407 | ||||||||||||||||||||||||
| Colombia | - | 1,155 | - | 1,155 | - | - | - | - | ||||||||||||||||||||||||
| Korea | - | 2,673 | - | 2,673 | - | 1,626 | - | 1,626 | ||||||||||||||||||||||||
| Denmark | - | 819 | - | 819 | - | 2,548 | - | 2,548 | ||||||||||||||||||||||||
| Spain | - | 923 | - | 923 | - | 1,060 | - | 1,060 | ||||||||||||||||||||||||
| United States | 1,427 | - | - | 1,427 | 2,022 | - | - | 2,022 | ||||||||||||||||||||||||
| Netherlands | 101 | - | - | 101 | 122 | - | - | 122 | ||||||||||||||||||||||||
| Paraguay | - | 1,111 | - | 1,111 | - | 912 | - | 912 | ||||||||||||||||||||||||
| Uruguay | - | 411 | - | 411 | - | 178 | - | 178 | ||||||||||||||||||||||||
| Other | 8 | - | - | 8 | 8 | - | - | 8 | ||||||||||||||||||||||||
| Corporate securities | 2,200 | 30,340 | 9,220 | 41,760 | 2,176 | 40,756 | 3,904 | 46,836 | ||||||||||||||||||||||||
| Shares | 817 | - | 568 | 1,385 | 661 | - | 267 | 928 | ||||||||||||||||||||||||
| Rural Product Note | - | 876 | 549 | 1,425 | - | 1,078 | 52 | 1,130 | ||||||||||||||||||||||||
| Bank deposit certificates | - | 2,527 | 114 | 2,641 | - | 1,443 | 130 | 1,573 | ||||||||||||||||||||||||
| Securitized real estate loans | - | - | 2,095 | 2,095 | - | - | 2,037 | 2,037 | ||||||||||||||||||||||||
| Debentures | 277 | 16,007 | 4,886 | 21,170 | 410 | 21,581 | 844 | 22,835 | ||||||||||||||||||||||||
| Eurobonds and others | 1,105 | 5,615 | 995 | 7,715 | 1,105 | 8,981 | 26 | 10,112 | ||||||||||||||||||||||||
| Financial credit bills | - | 2,816 | - | 2,816 | - | 6,479 | 367 | 6,846 | ||||||||||||||||||||||||
| Promissory notes | 1 | 2,172 | - | 2,173 | - | 937 | 54 | 991 | ||||||||||||||||||||||||
| Other | - | 327 | 13 | 340 | - | 257 | 127 | 384 | ||||||||||||||||||||||||
| Financial assets designated at fair value through profit or loss | 1,191 | - | - | 1,191 | 642 | - | - | 642 | ||||||||||||||||||||||||
| Brazilian government securities | 1,191 | - | - | 1,191 | 506 | - | - | 506 | ||||||||||||||||||||||||
| Government securities – other countries | - | - | - | - | 136 | - | - | 136 | ||||||||||||||||||||||||
| Financial liabilities held for trading | - | 519 | - | 519 | - | 412 | - | 412 | ||||||||||||||||||||||||
| Structured notes | - | 519 | - | 519 | - | 412 | - | 412 | ||||||||||||||||||||||||
The following table presents the breakdown of risk levels at 12/31/2016 and 12/31/2015 for our derivative assets and liabilities.
| 12/31/2016 | 12/31/2015 | |||||||||||||||||||||||||||||||
| Level 1 | Level 2 | Level 3 | Total | Level 1 | Level 2 | Level 3 | Total | |||||||||||||||||||||||||
| Derivatives - assets | 127 | 23,583 | 521 | 24,231 | 529 | 24,975 | 1,251 | 26,755 | ||||||||||||||||||||||||
| Futures | 127 | - | - | 127 | 529 | - | - | 529 | ||||||||||||||||||||||||
| Swap – differential receivable | - | 10,074 | 468 | 10,542 | - | 7,958 | 1,189 | 9,147 | ||||||||||||||||||||||||
| Options | - | 4,745 | 47 | 4,792 | - | 5,550 | 33 | 5,583 | ||||||||||||||||||||||||
| Forwards (onshore) | - | 4,971 | - | 4,971 | - | 3,166 | - | 3,166 | ||||||||||||||||||||||||
| Credit derivatives | - | 181 | - | 181 | - | 614 | - | 614 | ||||||||||||||||||||||||
| Forwards (offshore) | - | 3,459 | - | 3,459 | - | 3,430 | - | 3,430 | ||||||||||||||||||||||||
| Check of swap | - | 88 | - | 88 | - | 355 | - | 355 | ||||||||||||||||||||||||
| Other derivatives | - | 65 | 6 | 71 | - | 3,902 | 29 | 3,931 | ||||||||||||||||||||||||
| Derivatives - liabilities | - | (24,638 | ) | (60 | ) | (24,698 | ) | - | (31,038 | ) | (33 | ) | (31,071 | ) | ||||||||||||||||||
| Swap – differential payable | - | (13,165 | ) | (56 | ) | (13,221 | ) | - | (16,310 | ) | (21 | ) | (16,331 | ) | ||||||||||||||||||
| Options | - | (4,548 | ) | (4 | ) | (4,552 | ) | - | (5,771 | ) | (12 | ) | (5,783 | ) | ||||||||||||||||||
| Forwards (onshore) | - | (3,530 | ) | - | (3,530 | ) | - | (833 | ) | - | (833 | ) | ||||||||||||||||||||
| Credit derivatives | - | (147 | ) | - | (147 | ) | - | (875 | ) | - | (875 | ) | ||||||||||||||||||||
| Forwards (offshore) | - | (2,825 | ) | - | (2,825 | ) | - | (3,142 | ) | - | (3,142 | ) | ||||||||||||||||||||
| Check of swap | - | (353 | ) | - | (353 | ) | - | (545 | ) | - | (545 | ) | ||||||||||||||||||||
| Other derivatives | - | (70 | ) | - | (70 | ) | - | (3,562 | ) | - | (3,562 | ) | ||||||||||||||||||||
There were no significant transfer between Level 1 and Level 2 during the period from December 31, 2016 and December 31, 2015. Transfers to and from Level 3 are presented in movements of Level 3.
| F-118 |
Measurement of fair value Level 2 based on pricing services and brokers
When pricing information is not available for securities classified as Level 2, pricing services, such as Bloomberg or brokers, are used to value such instruments.
In all cases, to assure that the fair value of these instruments is properly classified as Level 2, internal analysis of the information received are conducted, so as to understand the nature of the input used in the establishment of such values by the service provider.
Prices provided by pricing services that meet the following requirements are considered Level 2: input is immediately available, regularly distributed, provided by sources actively involved in significant markets and it is not proprietary.
Of the total of R$ 81,633 million in financial instruments classified as Level 2, at December 31, 2016, pricing service or brokers were used to evaluate securities at the fair value of R$ 40,388 million, substantially represented by:
| · | Debentures:When available, we use price information for transactions recorded in the Brazilian DebentureSystem (SND), an electronic platform operated by CETIP, which provides multiple services for transactions involving debentures in the secondary market. Alternatively, prices of debentures provided by ANBIMA are used. Its methodology includes obtaining, on a daily basis, illustration and non-binding prices from a group of market players deemed to be significant. Such information is subject to statistical filters established in the methodology, with the purpose of eliminating outliers. |
| · | Global and corporate securities:The pricing process for these securities consists in capturing from 2 to 8quotes from Bloomberg, depending on the asset. The methodology consists in comparing the highest purchase prices and the lowest sale prices of trades provided by Bloomberg for the last day of the month. Such prices are compared with information from purchase orders that the Institutional Treasury of ITAÚ UNIBANCO HOLDING provides for Bloomberg. Should the difference between them be lower than 0.5%, the average price of Bloomberg is used. Should it be higher than 0.5% or if the Institutional Treasury does not provide information on this specific security, the average price gathered directly from other banks is used. The price of the Institutional Treasury is used as a reference only and never in the computation of the final price. |
Level 3 recurring fair value measurements
The departments in charge of defining and applying the pricing models are segregated from the business areas. The models are documented, submitted to validation by an independent area and approved by a specific committee. The daily process of price capture, calculation and disclosure are periodically checked according to formally defined testing and criteria and the information is stored in a single and corporate history data base.
The most recurring cases of assets classified as Level 3 are justified by the discount factors used. Factors such as the fixed interest curve in Brazilian Reais and the TR coupon curve – and, as a result, its related factors – have inputs with terms shorter than the maturities of these fixed-income assets. For swaps, the analysis is carried out by index for both parties. There are some cases in which the inputs periods are shorter than the maturity of the derivative.
| F-119 |
Level 3 recurring fair value changes
The tables below show the changes in balance sheet for financial instruments classified by ITAÚ UNIBANCO HOLDING in Level 3 of the fair value hierarchy. Derivative financial instruments classified in Level 3 mainly correspond to other derivatives linked to shares.
| Fair value at 12/31/2015 | Total gains or losses (realized / unrealized) | Purchases | Settlements | Transfers in and / or out of Level 3 | Fair value at 12/31/2016 | Total gains (losses) related to assets and liabilities still held at 12/31/2016 | ||||||||||||||||||||||
| Financial assets held for trading | 60 | (151 | ) | 87 | (344 | ) | 1,353 | 1,005 | (154 | ) | ||||||||||||||||||
| Brazilian government securities | 3 | - | - | (2 | ) | - | 1 | - | ||||||||||||||||||||
| Corporate securities | 57 | (151 | ) | 87 | (342 | ) | 1,353 | 1,004 | (154 | ) | ||||||||||||||||||
| Shares | - | (114 | ) | - | - | 1,072 | 958 | (152 | ) | |||||||||||||||||||
| Debentures | 48 | (37 | ) | 33 | (306 | ) | 287 | 25 | (2 | ) | ||||||||||||||||||
| Eurobonds and others | 6 | - | 54 | (36 | ) | (6 | ) | 18 | - | |||||||||||||||||||
| Other | 3 | - | - | - | - | 3 | - | |||||||||||||||||||||
| Available-for-sale financial assets | 4,259 | (677 | ) | 4,626 | (4,380 | ) | 5,706 | 9,534 | (685 | ) | ||||||||||||||||||
| Investment funds | 114 | 313 | - | (427 | ) | - | - | - | ||||||||||||||||||||
| Brazilian government securities | 212 | (208 | ) | - | 220 | 4 | 228 | 11 | ||||||||||||||||||||
| Government securities – abroad - Chile | 29 | (44 | ) | 321 | (220 | ) | - | 86 | - | |||||||||||||||||||
| Corporate securities | 3,904 | (738 | ) | 4,305 | (3,953 | ) | 5,702 | 9,220 | (696 | ) | ||||||||||||||||||
| Shares | 267 | 119 | - | (227 | ) | 409 | 568 | 76 | ||||||||||||||||||||
| Rural Product Note | 52 | (54 | ) | 1,205 | (851 | ) | 197 | 549 | (57 | ) | ||||||||||||||||||
| Bank deposit certificates | 130 | 2 | 483 | (501 | ) | - | 114 | - | ||||||||||||||||||||
| Securitized real estate loans | 2,037 | 58 | 11 | (10 | ) | (1 | ) | 2,095 | (55 | ) | ||||||||||||||||||
| Debentures | 844 | (739 | ) | 2,111 | (994 | ) | 3,664 | 4,886 | (653 | ) | ||||||||||||||||||
| Eurobonds and others | 26 | (130 | ) | 446 | (837 | ) | 1,490 | 995 | (7 | ) | ||||||||||||||||||
| Financial credit bills | 367 | 14 | - | (301 | ) | (80 | ) | - | - | |||||||||||||||||||
| Promissory notes | 54 | - | - | (54 | ) | - | - | - | ||||||||||||||||||||
| Other | 127 | (8 | ) | 49 | (178 | ) | 23 | 13 | - | |||||||||||||||||||
| Fair value at 12/31/2015 | Total gains or losses (realized / unrealized) | Purchases | Settlements | Transfers in and / or out of Level 3 | Fair value at 12/31/2016 | Total gains (losses) related to assets and liabilities still held at 12/31/2016 | ||||||||||||||||||||||
| Derivatives - assets | 1,251 | (713 | ) | 254 | (728 | ) | 457 | 521 | (7 | ) | ||||||||||||||||||
| Swap – differential receivable | 1,189 | (731 | ) | 8 | (455 | ) | 457 | 468 | 21 | |||||||||||||||||||
| Options | 33 | 36 | 246 | (268 | ) | - | 47 | (28 | ) | |||||||||||||||||||
| Other derivatives | 29 | (18 | ) | - | (5 | ) | - | 6 | - | |||||||||||||||||||
| Derivatives - liabilities | (33 | ) | 18 | (35 | ) | 96 | (106 | ) | (60 | ) | (2 | ) | ||||||||||||||||
| Swap – differential payable | (21 | ) | 9 | (5 | ) | 67 | (106 | ) | (56 | ) | (8 | ) | ||||||||||||||||
| Options | (12 | ) | 9 | (30 | ) | 29 | - | (4 | ) | 6 | ||||||||||||||||||
| Fair value at 12/31/2014 | Total gains or losses (realized / unrealized) | Purchases | Settlements | Transfers in and / or out of Level 3 | Fair value at 12/31/2015 | Total gains (losses) related to assets and liabilities still held at 12/31/2015 | ||||||||||||||||||||||
| Financial assets held for trading | 790 | 33 | 102 | (865 | ) | - | 60 | - | ||||||||||||||||||||
| Brazilian government securities | - | 4 | - | (1 | ) | - | 3 | - | ||||||||||||||||||||
| Corporate securities | 790 | 29 | 102 | (864 | ) | - | 57 | - | ||||||||||||||||||||
| Securitized real estate loans | 1 | - | - | (1 | ) | - | - | - | ||||||||||||||||||||
| Debêntures | 210 | (13 | ) | 66 | (215 | ) | - | 48 | - | |||||||||||||||||||
| Promissory notes | 577 | 54 | - | (631 | ) | - | - | - | ||||||||||||||||||||
| Eurobonds and others | 2 | (6 | ) | 27 | (17 | ) | - | 6 | - | |||||||||||||||||||
| Other | - | (6 | ) | 9 | - | - | 3 | |||||||||||||||||||||
| Available-for-sale financial assets | 5,404 | (1,241 | ) | 4,453 | (4,624 | ) | 267 | 4,259 | (451 | ) | ||||||||||||||||||
| Investment funds | - | (1,128 | ) | 1,242 | - | - | 114 | - | ||||||||||||||||||||
| Brazilian government securities | 249 | (116 | ) | 85 | (6 | ) | - | 212 | (22 | ) | ||||||||||||||||||
| Government securities – abroad - Chile | 13 | (1 | ) | 101 | (84 | ) | - | 29 | - | |||||||||||||||||||
| Corporate securities | 5,142 | 4 | 3,025 | (4,534 | ) | 267 | 3,904 | (429 | ) | |||||||||||||||||||
| Shares | - | - | - | - | 267 | 267 | - | |||||||||||||||||||||
| Rural Product Note | 51 | 1 | 9 | (9 | ) | - | 52 | - | ||||||||||||||||||||
| Bank deposit certificates | 58 | 7 | 201 | (136 | ) | - | 130 | - | ||||||||||||||||||||
| Securitized real estate loans | 2,522 | (142 | ) | 68 | (411 | ) | - | 2,037 | (207 | ) | ||||||||||||||||||
| Debêntures | 706 | (12 | ) | 915 | (765 | ) | - | 844 | (222 | ) | ||||||||||||||||||
| Eurobonds and others | 53 | (8 | ) | 94 | (113 | ) | - | 26 | 2 | |||||||||||||||||||
| Financial credit bills | 270 | 48 | 49 | - | - | 367 | (2 | ) | ||||||||||||||||||||
| Promissory notes | 1,397 | 72 | 1,574 | (2,989 | ) | - | 54 | - | ||||||||||||||||||||
| Other | 85 | 38 | 115 | (111 | ) | - | 127 | - | ||||||||||||||||||||
| Fair value at 12/31/2014 | Total gains or losses (realized / unrealized) | Purchases | Settlements | Transfers in and / or out of Level 3 | Fair value at 12/31/2015 | Total gains (losses) related to assets and liabilities still held at 12/31/2015 | ||||||||||||||||||||||
| Derivatives - Assets | 121 | 369 | 316 | (219 | ) | 664 | 1,251 | 31 | ||||||||||||||||||||
| Swaps - differential receivable | 33 | 318 | 192 | (18 | ) | 664 | 1,189 | - | ||||||||||||||||||||
| Options | 16 | (29 | ) | 124 | (78 | ) | - | 33 | (10 | ) | ||||||||||||||||||
| Other derivatives | 72 | 80 | - | (123 | ) | - | 29 | 41 | ||||||||||||||||||||
| Derivatives - Liabilities | (44 | ) | (40 | ) | (95 | ) | 148 | (2 | ) | (33 | ) | - | ||||||||||||||||
| Swaps - differential payable | (38 | ) | (38 | ) | (11 | ) | 68 | (2 | ) | (21 | ) | - | ||||||||||||||||
| Options | (6 | ) | (2 | ) | (84 | ) | 80 | - | (12 | ) | - | |||||||||||||||||
| F-120 |
Sensitivity analyses operations of Level 3
The fair value of financial instruments classified in Level 3 (in which prices negotiated are not easily noticeable in active markets) is measured through assessment techniques based on correlations and associated products traded in active markets, internal estimates and internal models.
Significant unverifiable inputs used for measurement of the fair value of instruments classified in Level 3 are: interest rates, underlying asset prices and volatility. Significant variations in any of these inputs separately may give rise to significant changes in the fair value.
The table below shows the sensitivity of these fair values in scenarios of changes of interest rates, asset prices, or in scenarios vary in prices with shocks and the volatility for non-linear assets:
| Sensitivity – Level 3 Operations | 12/31/2016 | |||||||||
| Impact | ||||||||||
| Risk factor groups | Scenarios | Result | Stockholders' equity | |||||||
| I | (2.3 | ) | (1.8 | ) | ||||||
| Interest rates | II | (57.6 | ) | (44.2 | ) | |||||
| III | (115.2 | ) | (87.9 | ) | ||||||
| Currency, commodities, and ratios | I | (76.3 | ) | - | ||||||
| II | (152.6 | ) | - | |||||||
| Nonlinear | I | (13.5 | ) | - | ||||||
| II | (19.8 | ) | - | |||||||
The following scenarios are used to measure the sensitivity:
Interest rate
Shocks at 1, 25 and 50 basis points (scenarios I, II and III respectively) in the interest curves, both for increase and decrease, considering the largest losses resulting in each scenario.
Currencies, commodities and ratios
Shocks at 5 and 10 percentage points (scenarios I and II respectively) in prices of currencies, commodities and ratios, both for increase and decrease, considering the largest losses resulting in each scenario.
Non linear
Scenario I:Shocks at 5 percentage points in prices and 25 percentage points the level in volatility, both forincrease and decrease, considering the largest losses resulting in each scenario.
Scenario II:Shocks at 10 percentage points in prices and 25 percentage points the level in volatility, both forincrease and decrease, considering the largest losses resulting in each scenario.
| F-121 |
Note 32 – Provisions, contingencies and other commitments
| Provision | 12/31/2016 | 12/31/2015 | ||||||
| Civil | 5,172 | 5,227 | ||||||
| Labor | 7,232 | 6,132 | ||||||
| Tax and social security | 8,246 | 7,500 | ||||||
| Other | 259 | 135 | ||||||
| Total | 20,909 | 18,994 | ||||||
| Current | 4,434 | 3,848 | ||||||
| Non-current | 16,475 | 15,146 | ||||||
ITAÚ UNIBANCO HOLDING, as a result of the ordinary course of its business, may be a party to legal lawsuits of labor, civil and tax nature. The contingencies related to these lawsuits are classified as follows:
| a) | Contingent assets:there are no contingent assets recorded. |
| b) | Provisions and contingencies:The criteria to quantify contingencies are adequate in relation to the specificcharacteristics of civil, labor and tax lawsuits portfolios, as well as other risks, taking into consideration the opinion of its legal advisors, the nature of the lawsuits, the similarity with previous lawsuits and the prevailing previous court decisions. |
| - | Civil lawsuits |
In general, contingencies arise from claims related to the revision of contracts and compensation for damages and pain and suffering and the lawsuits are classified as follows:
Collective lawsuits(related to claims of a similar nature and with individual amounts that are not consideredsignificant): contingencies are determined on a monthly basis and the expected amount of losses is accrued according to statistical references that take into account the nature of the lawsuit and the characteristics of the court (Small Claims Court or Regular Court). Contingencies and provisions are adjusted to reflect the amounts deposited as guarantee for their execution when realized.
Individual lawsuits(related to claims with unusual characteristics or involving significant amounts): Theseare periodically calculated based on the calculation of the amount claimed. Probability of loss, which is estimated based on the characteristics of the lawsuit. The amounts considered as probable losses are recorded as provisions.
It should be mentioned that ITAÚ UNIBANCO HOLDING is a party to specific lawsuits related to the collection of understated inflation adjustments to savings accounts resulting from economic plans implemented in the 80’s and 90’s as a measure to combat inflation.
Although ITAÚ UNIBANCO HOLDING complied with the rules in effect at the time, the company is a defendant in lawsuits filed by individuals that address this topic, as well as in class actions filed by: (i) consumer protection associations; and (ii) the Public Prosecution Office on behalf of savings account holders. With respect to these lawsuits, ITAÚ UNIBANCO HOLDING records provisions when it is served and when the individuals apply to enforce the decision rendered by the Judicial Branch, using the same criteria adopted to determine provisions for individual lawsuits.
The Federal Supreme Court (STF) has issued some decisions favorable to savings account holders, but it has not established its understanding with respect to the constitutionality of the economic plans and their applicability to savings accounts. Currently, the appeals involving these matters are suspended, as determined by the STF, until it pronounces a final decision.
No amount is recorded as a provision in relation to Civil lawsuits which likelihood of loss is considered possible, which total estimated risk is R$ 3,388 (R$ 2,460 at 12/31/2015), in this amount there are no values resulting from interests in joint ventures.
| F-122 |
| - | Labor claims |
Contingencies arise from lawsuits in which labor rights provided for in labor legislation specific to the related profession are discussed, such as: overtime, salary equalization, reinstatement, transfer allowance, pension plan supplement, among others, are discussed. These lawsuits are classified as follows:
Collective lawsuits(related to claims considered similar and with individual amounts that are notconsidered relevant): The expected amount of loss is determined and accrued on a monthly basis in accordance with a statistical share pricing model and is reassessed taking into account the court rulings. These contingencies are adjusted to the amounts deposited as guarantee for their execution when realized.
Individual lawsuits(related to claims with unusual characteristics or involving significant amounts): Theseare periodically calculated based on the calculation of the amount claimed. Probability of loss which, in turn, is estimated in accordance with the actual and legal characteristics related to that lawsuit.
No amount is recorded as a provision for labor claims for which the likelihood of loss is considered possible, and for which the total estimated risk is R$ 79 (R$ 829 of 12/31/2015).
| - | Other risks |
These are quantified and recorded as provisions mainly based on the evaluation of agribusiness credit transactions with joint obligation and FCVS (Salary Variations Compensation Fund) credits transferred to Banco Nacional.
| F-123 |
The table below shows the changes in the balances of provisions for civil, labor and other provision and the respective escrow deposit balances:
| 01/01 to 12/31/2016 | ||||||||||||||||
| Civil | Labor | Other | Total | |||||||||||||
| Opening balance | 5,227 | 6,132 | 135 | 11,494 | ||||||||||||
| Balance arising from Corpbanca acquisition (Note 3) | 2 | 5 | 133 | 140 | ||||||||||||
| (-) Contingencies guaranteed by indemnity clause (Note 2.4.t) | (236 | ) | (1,089 | ) | - | (1,325 | ) | |||||||||
| Subtotal | 4,993 | 5,048 | 268 | 10,309 | ||||||||||||
| Interest (Note 26) | 248 | 625 | - | 873 | ||||||||||||
| Changes in the period reflected in results (Note 26) | 1,241 | 2,946 | (9 | ) | 4,178 | |||||||||||
| Increase(*) | 1,901 | 3,149 | (7 | ) | 5,043 | |||||||||||
| Reversal | (660 | ) | (203 | ) | (2 | ) | (865 | ) | ||||||||
| Payment | (1,566 | ) | (2,453 | ) | - | (4,019 | ) | |||||||||
| Subtotal | 4,916 | 6,166 | 259 | 11,341 | ||||||||||||
| (+) Contingencies guaranteed by indemnity clause (Note 2.4.t) | 256 | 1,066 | - | 1,322 | ||||||||||||
| Closing balance | 5,172 | 7,232 | 259 | 12,663 | ||||||||||||
| Escrow deposits at 12/31/2016 (Note 20a) | 1,541 | 2,337 | - | 3,878 | ||||||||||||
| (*) Civil provisions include the provision for economic plans amounting to R$ 408. | ||||||||||||||||
| 01/01 to 12/31/2015 | ||||||||||||||||
| Civil | Labor | Other | Total | |||||||||||||
| Opening balance | 4,643 | 5,598 | 159 | 10,400 | ||||||||||||
| (-) Contingencies guaranteed by indemnity clause (Note 2.4.t) | (132 | ) | (1,029 | ) | - | (1,161 | ) | |||||||||
| Subtotal | 4,511 | 4,569 | 159 | 9,239 | ||||||||||||
| Interest (Note 26) | 322 | 548 | - | 870 | ||||||||||||
| Changes in the period reflected in results (Note 26) | 1,747 | 1,637 | (24 | ) | 3,360 | |||||||||||
| Increase(*) | 2,698 | 1,795 | (21 | ) | 4,472 | |||||||||||
| Reversal | (951 | ) | (158 | ) | (3 | ) | (1,112 | ) | ||||||||
| Payment | (1,589 | ) | (1,711 | ) | - | (3,300 | ) | |||||||||
| Subtotal | 4,991 | 5,043 | 135 | 10,169 | ||||||||||||
| (+) Contingencies guaranteed by indemnity clause (Note 2.4.t) | 236 | 1,089 | - | 1,325 | ||||||||||||
| Closing balance | 5,227 | 6,132 | 135 | 11,494 | ||||||||||||
| Escrow deposits at 12/31/2015 (Note 20a) | 1,741 | 2,218 | - | 3,959 | ||||||||||||
| (*) Civil provisions include the provision for economic plans amounting to R$ 233. | ||||||||||||||||
| 01/01 to 12/31/2014 | ||||||||||||||||
| Civil | Labor | Other | Total | |||||||||||||
| Opening balance | 4,473 | 5,192 | 223 | 9,888 | ||||||||||||
| (-) Contingencies guaranteed by indemnity clause (Note 2.4.t) | (134 | ) | (811 | ) | - | (945 | ) | |||||||||
| Subtotal | 4,339 | 4,381 | 223 | 8,943 | ||||||||||||
| Interest (Note 26) | 184 | 320 | - | 504 | ||||||||||||
| Changes in the period reflected in results (Note 26) | 1,524 | 1,123 | (64 | ) | 2,583 | |||||||||||
| Increase(*) | 2,100 | 1,459 | 23 | 3,582 | ||||||||||||
| Reversal | (576 | ) | (336 | ) | (87 | ) | (999 | ) | ||||||||
| Payment | (1,536 | ) | (1,255 | ) | - | (2,791 | ) | |||||||||
| Subtotal | 4,511 | 4,569 | 159 | 9,239 | ||||||||||||
| (+) Contingencies guaranteed by indemnity clause (Note 2.4.t) | 132 | 1,029 | - | 1,161 | ||||||||||||
| Closing balance | 4,643 | 5,598 | 159 | 10,400 | ||||||||||||
| Escrow deposits at 12/31/2014 (Note 20a) | 2,073 | 2,567 | - | 4,640 | ||||||||||||
(*)Civil provisions include the provision for economic plans amounting to R$ 210.
| - | Tax and social security lawsuits |
ITAÚ UNIBANCO HOLDING classify as legal liability the lawsuits filed to discuss the legality and unconstitutionality of the legislation in force, which are the subject matter of a provision, regardless of the probability of loss.
Tax contingencies correspond to the principal amount of taxes involved in tax, administrative or judicial challenges, subject to tax assessment notices, plus interest and, when applicable, fines and charges. A provision is recognized whenever the likelihood of loss is probable.
| F-124 |
The table below shows the changes in the balances of provisions and respective balance of escrow deposits for tax and social security lawsuits:
| Provision | 01/01 to 12/31/2016 | 01/01 to 12/31/2015 | 01/01 to 12/31/2014 | |||||||||
| Opening balance | 7,500 | 6,627 | 8,974 | |||||||||
| (-) Contingencies guaranteed by indemnity clause | (65 | ) | (61 | ) | (57 | ) | ||||||
| Subtotal | 7,435 | 6,566 | 8,917 | |||||||||
| Interest(*) | 737 | 609 | 515 | |||||||||
| Changes in the period reflected in results | 68 | 588 | 797 | |||||||||
| Increase(*) | 287 | 1,170 | 1,156 | |||||||||
| Reversal(*) | (219 | ) | (582 | ) | (359 | ) | ||||||
| Payment | (63 | ) | (328 | ) | (3,663 | ) | ||||||
| Subtotal | 8,177 | 7,435 | 6,566 | |||||||||
| (+) Contingencies guaranteed by indemnity clause | 69 | 65 | 61 | |||||||||
| Closing balance | 8,246 | 7,500 | 6,627 | |||||||||
(*) The amounts are included in the headings Tax Expenses, General and Administrative Expenses and Current Income Tax and Social Contribution.
| Escrow deposits | 01/01 to 12/31/2016 | 01/01 to 12/31/2015 | 01/01 to 12/31/2014 | |||||||||
| Opening balance | 4,339 | 4,736 | 5,658 | |||||||||
| Appropriation of interest | 383 | 285 | 377 | |||||||||
| Changes in the period | 125 | (682 | ) | (1,299 | ) | |||||||
| Deposits made | 217 | 355 | 193 | |||||||||
| Withdrawals | (66 | ) | (944 | ) | (5 | ) | ||||||
| Deposits released | (26 | ) | (93 | ) | (1,487 | ) | ||||||
| Closing balance (Note 20a) | 4,847 | 4,339 | 4,736 | |||||||||
| F-125 |
Main discussions related to the provisions recognized for Tax and Social Securities Lawsuits are described as follows:
| · | CSLL – Isonomy – R$ 1,207: the company is discussing the lack of constitutional support for the increase, establishes by law nº 11,727/08, of the CSLL rate for financial and insurance companies from 9% to 15%. The balance of the deposit in court totals R$ 1,191; |
| · | INSS – Accident Prevention Factor (FAP) – R$ 1,004: the company is discussing the legality of FAP and inconsistent calculations made by the INSS. The balance of the deposit in court totals R$ 110; |
| · | PIS and COFINS – Calculation basis – R$ 650: the company is defending the levy of PIS and COFINS on revenue, which should be understood as revenue from the sales of assets and services. The balance of the deposit in court totals R$ 571; |
| · | IRPJ and CSLL – Profits abroad– R$ 599: the company is discussing the calculation bases with respect to profits earned abroad and defending the inapplicability of the SRF Regulatory Instruction No. 213/02, which exceeds the corresponding legal provision. The balance of the deposit in court totals R$ 229. |
Off-balance sheet contingencies
The amounts involved in tax and social security lawsuits for which the likelihood of loss is possible are not recognized in a provision. The estimated amounts at risk in the main tax and social security lawsuits with a likelihood of loss deemed possible, which total R$ 18,106, are described below:
| · | INSS – Non-compensatory amounts – R$ 4,770: the company defends the non-levy of this contribution on these amounts, among which are profit sharing, stock options, transportation vouchers and sole bonuses; |
| · | IRPJ and CSLL – Goodwill – Deduction – R$ 3,122: the deductibility of goodwill with future expected profitability on the acquisition of investments, and R$ 665 of this amount is guaranteed in purchase agreements; |
| · | IRPJ, CSLL, PIS and COFINS – Requests for offsetting dismissed - R$ 1,613: cases in which the liquidity and the ability of offset credits are discussed; |
| · | IRPJ and CSLL – Interest on capital – R$ 1,406: the company is defending the deductibility of interest on capital declared to stockholders based on the Brazilian long term interest rate (TJLP) on the stockholders’ equity for the year and for prior years; |
| · | ISS – Banking Institutions – R$ 930: these are banking operations, revenue from which may not be interpreted as prices for services rendered, and/or which arises from activities not listed under Supplementary Law No. 116/03 or Decree Law No. 406/68. |
| · | IRPJ and CSLL – Disallowance of Tax Losses – R$ 606: Discussion on the amount of tax loss carryforwards, which may reduce the calculation basis of such taxes. |
| · | IRPJ/ CSLL – Deductibility of Losses in Credit Operations – R$ 601 – Assessments drawn up to require the payment of IRPJ and CSLL due to the alleged non-observance of the legal criteria for the deduction of losses upon the receipt of credits. |
| c) | Receivables - Reimbursement of contingencies |
The Receivables balance arising from reimbursements of contingencies totals R$ 1,128 (R$ 1,093 at 12/31/2015) (Note 20a). This value is derived from basically the guarantee in the privatization process of the Banco Banerj S.A. which occurred 1997, where the State of Rio de Janeiro created a fund to guarantee civil, labor and tax contingencies.
| F-126 |
| d) | Assets pledged as collateral for contingencies |
Assets pledged as collateral for lawsuits involving contingent liabilities are restricted or deposited as shown below:
| 12/31/2016 | 12/31/2015 | |||||||
| Financial assets held for trading and Available-for-sale financial assets | ||||||||
| (basically financial treasury bills) | 950 | 793 | ||||||
| Escrow deposits (Note 20a) | 4,537 | 4,335 | ||||||
Deposits related to lawsuits must be made in court and can be withdrawn by the winning party in the lawsuit, with the respective additions provided for by law, according to the court decision.
In general, the provisions related to the lawsuits of ITAÚ UNIBANCO HOLDING are long term, considering the time required for the termination of these lawsuits in the Brazilian judicial system. For this reason, no estimate of the specific year in which these lawsuits will be terminated has been disclosed.
According to the opinion of its legal advisors, ITAÚ UNIBANCO HOLDING CONSOLIDATED is not involved in any other administrative or judicial proceedings that may significantly impact the results of their operations.
e) Programs for Cash or Installment Payment of Municipal Taxes
ITAÚ UNIBANCO HOLDING adhere to PPIs – Installment Payment Incentive Programs substantially related to the local level, established the following by laws: Law No. 5,854, of April 27, 2015 - Rio de Janeiro; Law No. 8,927, of October 22, 2015 and Decree-Law No. 26,624, of October 26, 2015 - Salvador; Law No. 18,181, of November 30, 2015 and Decree Law No. 29,275, of November 30, 2015 - Recife; Supplementary Law No. 95, of October 19, 2015 - Curitiba; Law No. 3,546, of December 18, 2015 – Salto; Law No. 12,457, of October 03,2016 – Londrina.
The PPIs promote the regularization of debts mentioned in these laws, arising from tax and non-tax credits, either recognized or not, including those that are part of the Enforceable Debt, either filed or to be filed in court.
The net effect of the PPIs in result was R$ 14, and it is recorded in Other Operating Income.
| F-127 |
Note 33 – Regulatory capital
ITAÚ UNIBANCO HOLDING is subject to regulation by the Central Bank of Brazil (BACEN), which issues rules and instructions regarding currency and credit policies for financial institutions operating in Brazil. BACEN also determines minimum capital requirements, procedures for verification of information for assessment of the global systemic importance of financial institutions, limits for fixed assets, limits for loans, accounting practices and requirements of compulsory deposits, requiring banks to comply with the regulation based on the Basel Accord on capital adequacy. Additionally, the National Council of Private Insurance (CNSP) and SUSEP issue regulations on capital requirement, which affect our insurance, pension plan and capitalization operations.
a) Capital Requirements in Place and In Progress
ITAÚ UNIBANCO HOLDING’s minimum capital requirements comply with the set of BACEN resolutions and circulars which established in Brazil the global capital requirement standards known as Basel III. These are expressed as indices obtained from the ratio between capital - represented by the Referential Equity (PR), or Total Capital, composed by the Tier I Capital (which comprises the Common Equity and Additional Tier I Capital) and Tier II Capital, and the risk-weighted assets (RWA).
The Total Capital, Tier 1 Capital and Common Equity Tier I Capital ratios are calculated on a consolidated basis, applied to entities that are part of Prudential Conglomerate, which comprises not only financial institutions but also collective financing plans (“consórcios”), payment entities, factoring companies or companies that directly or indirectly assume credit risk, and investment funds in which ITAÚ UNIBANCO HOLDING retains substantially all risks and rewards.
For purposes of calculating these minimum capital requirements, the total RWA is determined as the sum of the risk weighted asset amounts for credit, market, and operational risks. ITAÚ UNIBANCO HOLDING uses the standardized approaches to calculate credit and operational risk-weighted asset amounts.
From September 1, 2016, BACEN authorized ITAÚ UNIBANCO HOLDING to use internal market risk models to determine the total amount of regulatory capital, using for its daily calculation the portion of RWAmint, replacing the portion RWAmpad, as set out in BACEN Circular 3,646.
For units which are not considered significant in calculating regulatory capital for market risk, the standardized approach is used. Therefore, the internal models are not used for Argentina, Chile, Itaú BBAInternational, Itaú BBA Colombia, Paraguay, and Uruguay units.
From January 1, 2016 to December 31, 2016, the minimum Total Capital ratio required is 9.875%. The required minimum Total Capital ratio between October 1, 2013 and December 31, 2015 was 11%, reducing gradually to 8% on January 1, 2019.
In addition to the minimum regulatory capital requirements, BACEN rules calls for Additional Common Equity Tier I Capital (ACP), corresponding to the sum of the components ACPConservation, ACPCountercyclical and ACPSystemic, which, in conjunction with the requirements mentioned, increase capital requirements over time. Under CMN Resolution 4,193, the value of each of the components ACPConservation and ACPCountercyclicalwill increase gradually from 0.625%, as from January 1, 2016, to 2.5%, as from January 1, 2019. However, component ACPCountercyclicalis triggered during the phase of expansion of the credit cycle and, in accordance with BACEN Circular 3,769, the value currently required for component ACPCountercyclical is equal to zero. Also, if this component increases, the new percentage rate will take effect only twelve months after the announcement. In the case of component ACPSystemic, under BACEN Circular 3,768, the current requirement applicable to ITAÚ UNIBANCO HOLDING is 0%, increasing gradually from 0.25%, as from January 2017, to 1%, as from January 1, 2019.
The Basel III regulatory reform also redefined the requirements for the qualification of instruments eligible for Tier I or Tier II Capital, as regulated by CMN Resolution 4,192, including a gradual reduction calendar for instruments already considered in the capital, issued prior to the effective date of the standard, which do not fully meet the new requirements.
The table below shows Basel III implementation calendar for Brazil, as defined by BACEN, in which the figures refer to the percentage of ITAÚ UNIBANCO HOLDING’s risk-weighted assets.
| F-128 |
| From January 1, | ||||||||||||||||||||
| Basel III Implentation Calendar | 2015 | 2016 | 2017 | 2018 | 2019 | |||||||||||||||
| Common Equity Tier I | ||||||||||||||||||||
| Tier I | 6.0 | % | 6.0 | % | 6.0 | % | 6.0 | % | 6.0 | % | ||||||||||
| Total Capital | 11 | % | 9.875 | % | 9.25 | % | 8.625 | % | 8.0 | % | ||||||||||
| Additional Common Equity Tier I (ACP) | 0.0 | % | 0.625 | % | 1.50 | % | 2.375 | % | 3.5 | % | ||||||||||
| Conservation | 0 | % | 0.625 | % | 1.25 | % | 1.875 | % | 2.5 | % | ||||||||||
| Countercyclical(1) | 0 | % | 0 | % | 0 | % | 0 | % | 0 | % | ||||||||||
| Systemic | 0 | % | 0 | % | 0.25 | % | 0.5 | % | 1.0 | % | ||||||||||
| Common Equity Tier I + ACP | 4.5 | % | 5.125 | % | 6.0 | % | 6.875 | % | 8.0 | % | ||||||||||
| Total Capital + ACP | 11.0 | % | 10.5 | % | 10.75 | % | 11.0 | % | 11.5 | % | ||||||||||
| Prudential Adjustments Deductions | 40 | % | 60 | % | 80 | % | 100 | % | 100 | % | ||||||||||
(1) According to BACEN Circular 3,769, the current requirement for component ACPcountercyclical is equal to zero.
Additionally, in March 2015, Circular BACEN 3,751 came into force, It provides for the calculation of the relevant indicators for assessing the Global Systemically Important Banks (G-SIBs) of financial institutions in Brazil. Information on the values of the G-SIBs indicators, which are not part of its financial statements, can be found at www.itau.com.br/investor-relations, “Corporate Governance” section, “Global Systemically Important Banks”.
The Leverage Ratio is defined as the ratio between the Tier I Capital and Total Exposure, calculated as prescribed by BACEN Circular 3,748. The objective of this ratio is to be a simple, risk-insensitive leverage measure. Therefore, it does not take into consideration risk-weighting or mitigation factors. In line with the instructions set out in BACEN Circular 3,706, since October 2015, ITAÚ UNIBANCO HOLDING has reported its Leverage Ratio to BACEN on a monthly basis. However, according to recommendations in Basel III Accord, a minimum Leverage Ratio should be required in 2018, which will be defined based on the period over which the ratio’s behavior was monitored, since its implementation in 2011 up to 2017.
More information on the composition of the Leverage Ratio, which are not part of its financial statements, is available atwww.itau.com.br/investors-relations, “Governança Corporate Governance section/Risk and Capital Management – Pillar 3.
b) Capital Management
The Board of Directors is the main body in the management of ITAÚ UNIBANCO HOLDING’s capital and it is responsible for approving the institutional capital management policy and guidelines regarding the institution’s capitalization level. The Board is also responsible for fully approving the ICAAP report, a process which is intended to assess the adequacy of ITAÚ UNIBANCO HOLDING’s capital by identifying material risks; defining the need for additional capital for such risks and the internal capital quantification methodologies; preparing a capital plan, both for normal and stress situations; and structuring a capital contingency plan.
At the executive level, corporate bodies are responsible for approving risk assessment and capital calculation methodologies, as well as revising, monitoring and recommending capital-related documents and topics to the Board of Directors. To support the governance of its management bodies, ITAÚ UNIBANCO HOLDING has a dedicated capital management structure, which coordinates and consolidates information and related processes, all of which subject to verification by independent validation, internal control and audit areas.
In order to provide Executives and the Board of Directors with necessary information to support the decision-making process, management reportS are prepared and presented at corporate bodies, keeping them informed of ITAÚ UNIBANCO HOLDING as well as of projections of future capital levels under normal and stress situations.
The “Public Access Report – Capital Management“, which are not part of its financial statements, which provides the guidelines established in the institutional capital management policy can be accessed at www.itau.com.br/investor-relations, under Corporate Governance, Regulations and Policies.
c) Risk appetite
ITAÚ UNIBANCO HOLDING’s risk appetite is a set of guidelines and limits defining acceptable levels of risk for ITAÚ UNIBANCO HOLDING, aligned with the institution’s strategy. Divided into four dimensions consisting of a set of metrics of the key risks involved, risk appetite combines complementary forms of risk measurement, in order to give a comprehensive overview of the institution’s exposure.
The capitalization dimension reflects the level of protection of the bank against significant losses. This dimension establishes the minimum capitalization guidelines of ITAÚ UNIBANCO HOLDING in relation to its
| F-129 |
risks, according to which management uses ITAÚ UNIBANCO HOLDING’s capital in accordance with acceptable leverage levels and funding costs.
The liquidity dimension reflects the level of protection against a long period of funding stress, which could lead to a lack of liquidity. This dimension establishes the guidelines regarding the minimum liquidity levels, acceptable levels of mismatch of terms and funding structure.
The business composition dimension, in turn, seeks to ensure, by means of concentration limits, proper portfolio composition, aiming at low volatility and sustainability of the businesses.
Whereas, the franchise dimension addresses risks that may impact the value of the brand and reputation of ITAÚ UNIBANCO HOLDING with stakeholders.
The Board of Directors holds the highest approval authority for risk appetite guidelines and limits, carrying out its responsibilities with the support of its Risk and Capital Management Committee, which submits reports and recommendations on the issue for the Board’s approval. The acceptable risk levels should be in line with the risk appetite limits approved by the Board of Directors.
Executive and operational functions are the responsibility of the Executive Board and the risk commissions, whose members include the Chief Risk Officer (CRO) and the CEO of the institution. In addition to regularly monitoring and supervising the metrics, the risk commissions are also responsible for implementing the risk appetite framework. Also, the Audit Committee monitors the evolution of the risk appetite and helps in its management.
d) Composição do Capital
The Referential Equity (PR) used to monitor compliance with the operational limits imposed by BACEN is the sum of three items, namely:
| - | Common Equity Tier I: the sum of capital, reserves and retained earnings, less deductions and prudential adjustments. |
| - | Additional Tier I Capital: consists of instruments of a perpetual nature, which meet eligibility requirements. Together with Common Equity |
Tier I it makes up Tier I.
- Tier II: consists of subordinated debt instruments with defined maturity dates that meet eligibility requirements. Together with Common Equity Tier I and Additional Tier I Capital, makes up Total Capital.
The table below presents the composition of the referential equity segregated into Common Equity Tier I, Additional Tier I Capital and Tier II Capital, taking into consideration their respective prudential adjustments, as required by current regulations.
| Composition of Referential Equity | 12/31/2016 | 12/31/2015 | ||||||
| Stockholders’ equity Itaú Unibanco Holding S.A. (Consolidated) | 115,590 | 106,462 | ||||||
| Non-controlling Interests | 11,568 | 916 | ||||||
| Changes in Subsidiaries´ Interests in Capital Transactions | 2,777 | 3,683 | ||||||
| Consolidated Stockholders’ Equity (BACEN) | 129,935 | 111,061 | ||||||
| Common Equity Tier I Prudential Adjustments | (14,527 | ) | (10,107 | ) | ||||
| Common Equity Tier I | 115,408 | 100,955 | ||||||
| Additional Tier I Prudential Adjustments | 532 | 46 | ||||||
| Additional Tier I Capital | 532 | 46 | ||||||
| Tier I (Common Equity Tier I + Additional Tier I Capital) | 115,940 | 101,001 | ||||||
| Instruments Eligible to Comprise Tier II | 23,488 | 27,403 | ||||||
| Tier II Prudential Adjustments | 49 | 61 | ||||||
| Tier II | 23,537 | 27,464 | ||||||
| Referential Equity (Tier I + Tier II) | 139,477 | 128,465 | ||||||
| F-130 |
The table below shows the most significant Prudential Adjustments for ITAÚ UNIBANCO HOLDING. Together, they correspond to more than 90% of the prudential adjustments as at December 31, 2016.
| Composition of Prudential Adjustments | 12/31/2016 | 12/31/2015 | ||||||
| Goodwill paid on the acquisition of investments | 7,408 | 2,926 | ||||||
| Intangible assets | 3,254 | 1,078 | ||||||
| Tax credits | 3,678 | 2,389 | ||||||
| Surplus of Common Equity Tier I Capital - Noncontrolling interests | 909 | 152 | ||||||
| Adjustments relating to the fair value of derivatives used as cash flow | ||||||||
| hedge, for hedged items that do not have their mark-to-market | (1,254 | ) | - | |||||
| adjustments accounted for | ||||||||
| Other | 532 | 3,562 | ||||||
| Total | 14,527 | 10,107 | ||||||
During 2016, ITAÚ UNIBANCO HOLDING bought back shares in the amount of R$ 947. These shares are recorded in line item “Treasury Shares”, which totaled R$ (1,882) as at December 31, 2016. Treasury shares reduce the institution´s Equity, causing its capital base to be decreased.
In this period, the amount of dividends and interest on capital paid / accrued that affected the base of the institution’s capital totaled R$ 9,221. Dividends are deducted from the institution´s Equity, thus reducing the base of its capital. Whereas, interest on capital, which is accounted for as an expense directly in profit (loss), reduces the institution´s net income and, consequently, the base of its capital.
For details on capital requirements, which are not part of its financial statements, are available at www.itau.com.br/investors-relations, Corporate Governance section / Risk and Capital Management – Pillar 3.
| F-131 |
The funds obtained through the issuance of subordinated debt securities are considered Tier II capital for the purpose of capital to risk-weighted assets ratio, as follows. According to current legislation, the accounting balance of subordinated debt as of December 2012 was used for the calculation of reference equity as of December 2016, considering instruments approved after the closing date to compose Tier II, totaling R$ 51,134.
| Name of security / currency | Principal amount (original currency) | Issue | Maturity | Return p.a. | Saldo Contábil 12/31/2016 | |||||||||||||
| Subordinated CDB - BRL | ||||||||||||||||||
| 367 | 2010 | 2017 | IPCA + 7,21% to 7,33% | 929 | ||||||||||||||
| 367 | Total | 929 | ||||||||||||||||
| Subordinated financial bills - BRL | ||||||||||||||||||
| 206 | 2010 | 2017 | IPCA + 6,95% to 7,2% | 337 | ||||||||||||||
| 3,224 | 2011 | 2017 | 108% to 112% of CDI | 3,565 | ||||||||||||||
| 3,650 | 100% of CDI + 1,29% to 1,52% | 3,802 | ||||||||||||||||
| 352 | IPCA + 6,15% to 7,8% | 647 | ||||||||||||||||
| 138 | IGPM + 6,55% to 7,6% | 276 | ||||||||||||||||
| 500 | 2012 | 2017 | 100% of CDI + 1,12% | 506 | ||||||||||||||
| 42 | 2011 | 2018 | IGPM + 7% | 65 | ||||||||||||||
| 30 | IPCA + 7,53% to 7,7% | 48 | ||||||||||||||||
| 6,373 | 2012 | 2018 | 108% to 113% of CDI | 7,250 | ||||||||||||||
| 461 | IPCA + 4,4% to 6,58% | 760 | ||||||||||||||||
| 3,782 | 100% of CDI + 1,01% to 1,32% | 3,904 | ||||||||||||||||
| 112 | 9,95% to 11,95% | 174 | ||||||||||||||||
| 2 | 2011 | 2019 | 109% to 109,7% of CDI | 4 | ||||||||||||||
| 1 | 2012 | 2019 | 110% of CDI | 2 | ||||||||||||||
| 12 | 11.96% | 21 | ||||||||||||||||
| 101 | IPCA + 4,7% to 6,3% | 163 | ||||||||||||||||
| 1 | 2012 | 2020 | 111% of CDI | 2 | ||||||||||||||
| 20 | IPCA + 6% to 6,17% | 37 | ||||||||||||||||
| 6 | 2011 | 2021 | 109,25% to 110,5% of CDI | 11 | ||||||||||||||
| 2,307 | 2012 | 2022 | IPCA + 5,15% to 5,83% | 3,885 | ||||||||||||||
| 20 | IGPM + 4,63% | 27 | ||||||||||||||||
| 21,340 | Total | 25,486 | ||||||||||||||||
| Subordinated euronotes - USD | ||||||||||||||||||
| 990 | 2010 | 2020 | 6.20% | 3,264 | ||||||||||||||
| 1,000 | 2010 | 2021 | 5.75% | 3,352 | ||||||||||||||
| 730 | 2011 | 2021 | 5,75% to 6,20% | 2,396 | ||||||||||||||
| 550 | 2012 | 2021 | 6.20% | 1,793 | ||||||||||||||
| 2,600 | 2012 | 2022 | 5,50% to 5,65% | 8,580 | ||||||||||||||
| 1,851 | 2012 | 2023 | 5.13% | 6,075 | ||||||||||||||
| 7,721 | Total | 25,460 | ||||||||||||||||
| Total | 51,875 | |||||||||||||||||
(*) Subordinated CDBs may be redeemed from November 2011.
| F-132 |
e) Risk-weighted Assets (RWA)
According to CMN Resolution 4,193, and subsequent amendments, for assessing the minimum capital requirements, the RWA must be calculated by adding the following portions:
RWA = RWACPAD + RWAMINT+ RWAOPAD
RWACPAD = portion related to exposures to credit risk calculated using standardized approach;
RWAMINT = portion related to the market risk capital requirement, using internal approach, according to BACEN Circular 3,646;
RWAOPAD = portion related to the operational risk capital requirement, calculated using standardized approach.
The table below shows the amounts of risk weighted assets for Credit Risk (RWACPAD):
| 12/31/2016 | 12/31/2015 | |||||||
| Risk exposures | ||||||||
| Exposure Weighted by Credit Risk (RWACPAD) | 669,284 | 679,593 | ||||||
| a) Per Weighting Factor (FPR): | ||||||||
| FPR at 2% | 105 | 179 | ||||||
| FPR at 20% | 8,011 | 7,000 | ||||||
| FPR at 35% | 12,056 | 11,695 | ||||||
| FPR at 50% | 44,251 | 46,025 | ||||||
| FPR at 75% | 142,194 | 136,104 | ||||||
| FPR at 85% | 82,494 | 129,884 | ||||||
| FPR at 100% | 325,890 | 288,057 | ||||||
| FPR at 250% | 33,213 | 37,858 | ||||||
| FPR at 300% | 7,357 | 10,751 | ||||||
| FPR up to 1250%(*) | 1,608 | 1,990 | ||||||
| Derivatives - Changes in the Counterparty Credit Quality | 6,168 | 4,924 | ||||||
| Derivatives - Future Potential Gain | 5,937 | 5,126 | ||||||
| b) Per Type: | ||||||||
| Securities | 45,741 | 51,085 | ||||||
| Loan Operations - Retail | 114,481 | 109,882 | ||||||
| Loan Operations - Non-Retail | 247,911 | 237,365 | ||||||
| Joint Liabilities - Retail | 205 | 242 | ||||||
| Joint Liabilities - Non-Retail | 47,108 | 46,655 | ||||||
| Loan Commitments - Retail | 27,504 | 25,972 | ||||||
| Loan Commitments - Non-Retail | 10,234 | 12,924 | ||||||
| Other Exposures | 176,100 | 195,468 | ||||||
(*) Taking into consideration the application of the “F” factor required by Article 29 of BACEN Circular 3,644.
| F-133 |
We present below the breakdown of Risk-weighted assets of market risk (RWAMINT), as follows:
| 12/31/2016(1) | 12/31/2015(2) | |||||||
| Risk-weighted assets of market risk (RWAMINT) | 24,130 | 14,252 | ||||||
| Operations subject to interest rate variations | 24,919 | 11,291 | ||||||
| Fixed rate denominated in Real | 4,952 | 2,127 | ||||||
| Foreign currency coupon | 15,497 | 6,700 | ||||||
| Price index coupon | 4,470 | 2,464 | ||||||
| Operations subject to commodity price variation | 353 | 473 | ||||||
| Operations subject to stock price variation | 401 | 952 | ||||||
| Operations subject to risk exposures in gold, foreign currency and foreign | 1,138 | 1,536 | ||||||
| Capital benefit – Internal models | (2,681 | ) | ||||||
(1) | Market risk-weighted assets calculated based on internal models. |
| (2) | Market risk-weighted assets calculated based on standard models. |
The capital requirement for the market risk portion is the maximum of the internal model and 90% of the standardized model. As at December 31, 2016, RWAMPAD was R$ 26,811; hence, the regulatory capital for market risk (RWAMINT amounted to R$ 24,130, or 90% of the standardized model.
The table below shows the amounts of risk weighted assets for Operational Risk (RWAOPAD):
| 12/31/2016 | 12/31/2015 | |||||||
| Risk-weighted assets of operational risk (RWAOPAD) | 37,826 | 28,623 | ||||||
| Retail | 10,887 | 7,470 | ||||||
| Commercial | 24,166 | 16,491 | ||||||
| Corporate finance | 2,789 | 1,380 | ||||||
| Negotiation and sales | (11,026 | ) | (4,927 | ) | ||||
| Payments and settlement | 3,418 | 3,074 | ||||||
| Financial agent services | 3,471 | 2,873 | ||||||
| Asset management | 4,109 | 2,145 | ||||||
| Retail brokerage | 12 | 118 | ||||||
f) Capital Adequacy Assessment
In annually assessing its capital adequacy, ITAÚ UNIBANCO HOLDING adopts the following flow:
| - | Identification of risks to which the institution is exposed and analysis of their materiality; |
| - | Evaluation of capital requirements for material risks; |
| - | Development of methodologies for quantifying additional capital; |
| - | Quantification and internal capital adequacy evaluation; |
| - | Sending the capital adequacy report to BACEN. |
Under ICAAP, a fundamental component for ITAÚ UNIBANCO HOLDING's internal capital management, noteworthy is the stress testing, a most significant element. This process provides for assessing capital by way of adverse scenarios, approved on a yearly basis by the Board of Directors, and whose purpose is measuring and assessing whether, even in severe adverse scenarios, the institution would have adequate capital levels that would not generate restrictions to the development of its activities.
The result of the last ICAAP – conducted as of December 2015 – indicated that, in addition to capital to face all material risks, ITAÚ UNIBANCO HOLDING has significant capital surplus, thus assuring the institution’s equity soundness.
| F-134 |
g) Capital Adequacy
ITAÚ UNIBANCO HOLDING, through the ICAAP, assesses the adequacy of its capital to face the incurred risks. For ICAAP,
capital is composed by regulatory capital for credit, market and operational risks and by the necessary capital to face other risks.
In order to ensure the soundness of ITAÚ UNIBANCO HOLDING and the availability of capital to support business growth, ITAÚ UNIBANCO HOLDING maintains PR levels above the minimum level required to face risks, as evidenced by the Common Equity, Tier I Capital and Basel ratios.
| Composition of Referential Equity (PR) | 12/31/2016 | 09/30/2016 | 12/31/2015 | |||||||||
| Tier I | 115,940 | 115,936 | 101,001 | |||||||||
| Common Equity Tier I | 115,408 | 115,364 | 100,955 | |||||||||
| Additional Tier I Capital | 532 | 572 | 46 | |||||||||
| Tier II | 23,537 | 23,622 | 27,464 | |||||||||
| Referential Equity | 139,477 | 139,557 | 128,465 | |||||||||
| Minimum Referential Equity Required | 72,210 | 72,672 | 79,471 | |||||||||
| Surplus Capital in relation to the Minimum Referential Equity Required | 67,267 | 66,885 | 48,994 | |||||||||
| Additional Common Equity Tier I Required (ACPRequired) | 4,570 | 4,600 | ||||||||||
| Referential equity calculated for covering the interest rate risk on operations not classified in the trading portfolio (RBAN) | 2,264 | 2,332 | 1,275 | |||||||||
The table below shows the Basel and Fixed Asset Ratios:
| 12/31/2016 | 09/30/2016 | 12/31/2015 | ||||||||||
| Basel Ratio | 19.1 | % | 19.0 | % | 17.8 | % | ||||||
| Tier I | 15.9 | % | 15.8 | % | 14.0 | % | ||||||
| Common Equity Tier I | 15.8 | % | 15.7 | % | 14.0 | % | ||||||
| Additional Tier I Capital | 0.1 | % | 0.1 | % | 0.0 | % | ||||||
| Tier II | 3.2 | % | 3.2 | % | 3.8 | % | ||||||
| Fixed Asset Ratio | 25.4 | % | 23.6 | % | 27.7 | % | ||||||
| Surplus Capital in Relation to Fixed Assets | 34,298 | 36,837 | 28,616 | |||||||||
Considering our current capital base at December 31, 2016, should the Basel III rules established by BACEN be immediately and fully applied, the principal capital ratio would be 14.0% (13.6% at 12/31/2015 considering the use of tax credit), taking into consideration the payment of additional interest on capital expected for March 2017, the merger of Citibank and the use of tax credit.
h) Stress testing
Stress testing is performed by Itaú Unibanco to evaluate the institution’s solvency in hypothetical, however, plausible, situations of systemic crisis and identify areas most susceptible to the impact of the stress that may require risk mitigation.
Since 2010, Itaú Unibanco has performed a process that simulates the impact of extreme economic and market conditions on the results and capital of the institution.
To perform the test, macroeconomic variables for each stress scenario are estimated by the economic research department. The scenarios are defined based on their relevance for the bank´s results and likelihood to occur and are submitted to the Board of Directors for approval.
Projections of macroeconomic variables (GDP, benchmark interest rate and inflation) and of the credit market (fundraising, loans, default rate, spread and fees) for these scenarios are generated based on exogenous shocks or by using models validated by an independent area.
The projections calculated sensitize the budgeted results and balance sheet and, consequently, affect the risk weighted assets and the capital and liquidity ratios.
| F-135 |
This information allows to identify potential factors of risks on businesses, supporting the Board of Directors’ strategic decisions, the budgetary process and discussions on credit granting policies, in addition to being used as input for risk appetite metrics.
| F-136 |
Note 34 – Segment Information
ITAÚ UNIBANCO HOLDING is a banking institution that offers its customers a wide range of financial products and services.
The current operational and reporting segments of ITAÚ UNIBANCO HOLDING are described below:
| · | Retail Banking |
The result of the Retail Banking segment arises from the offer of banking products and services to a diversified client base of account holders and non-account holders, individuals and companies. The segment includes retail clients, high net worth clients (Itaú Uniclass and Personnalité), and the corporate segment (very small and small companies). This segment comprises financing and lending activities carried out in units other than the branch network, and offering of credit cards, in addition to operations with Itaú Consignado.
| · | Wholesale Banking |
The result of the Wholesale Banking segment arises from the products and services offered to middle-market companies, private banking clients, from the activities of Latin America units, and the activities of Itaú BBA, the unit in charge of commercial operations with large companies and performing as an investment banking unit.
| · | Activities with the Market + Corporation |
This segment records the result arising from capital surplus, subordinated debt surplus and the net balance of tax credits and debits. It also shows the financial margin with the market, the Treasury operating cost, the equity in earnings of companies not associated to each segment and the interest in Porto Seguro.
Basis of presentation of segment information
Segment information is prepared based on the reports used by top management (Executive Committee) to assess the performance and to make decisions regarding the allocation of funds for investment and other purposes.
The top management (Executive Committee) of ITAÚ UNIBANCO HOLDING uses a variety of information for such purposes including financial and non-financial information that is measured on different bases as well as information prepared based on accounting practices adopted in Brazil. The main index used to monitor the business performance is the Recurring Net Income and the Economic Capital allocated to each segment.
The segment information has been prepared following accounting practices adopted in Brazil modified for the adjustments described below:
· Allocated capital and income tax rate
Based on the managerial income statement, the segment information considers the application of the following criteria:
Allocated capital:The impacts associated to capital allocation are included in the financial information.Accordingly, adjustments were made to the financial statements, based on a proprietary model. The Allocated Economic Capital (AEC) model was adopted for the financial statements by segments, and as from 2015, we changed the calculation methodology. The AEC considers, in addition to Tier l allocated capital, the effects of the calculation of expected loan losses, supplementary to the requirements of the Central Bank of Brazil, pursuant to CMN Circular No. 2.682/99. Accordingly, the Allocated Capital comprises the following components: Credit risk (including expected loss), operational risk, market risk and insurance underwriting risk. Based on the portion of allocated capital tier I, we calculated the Return on Allocated Economic Capital, which corresponds to an operational performance indicator consistently adjusted to the capital required to support the risk associated to asset and liability positions assumed, in conformity with our risk appetite.
Income tax rate:We consider the total income tax rate, net of the tax effect from the payment of interest oncapital, for the Retail Banking, Wholesale Bank and Activities with the Market segments. The difference between the income tax amount calculated by segment and the effective income tax amount, as stated in the consolidated financial statements, is allocated to the Activities with the Market + Corporation column.
| F-137 |
| · | Reclassification and application of managerial criteria |
The managerial statement of income was used to prepare information per segment. These statements were obtained based on the statement of income adjusted by the impact of non-recurring events and the managerial reclassifications in income.
We describe below the main reclassifications between the accounting and managerial results:
Banking product:The banking product considers the opportunity cost for each operation. The financialstatements were adjusted so that the stockholders' equity was replaced by funding at market price. Subsequently, the financial statements were adjusted to include revenues related to capital allocated to each segment. The cost of subordinated debt and the respective remuneration at market price were proportionally allocated to the segments, based on the economic allocated capital.
Hedge tax effects:The tax effects of the hedge of investments abroad were adjusted–these wereoriginally recorded in the tax expenses (PIS and COFINS) and Income Tax and Social Contribution on net income lines – and are now reclassified to the margin. The strategy to manage the foreign exchange risk associated to the capital invested abroad aims at preventing the effects of the exchange rates variation on income. In order to achieve this objective, we used derivative instruments to hedge against such foreign currency risk, with investments remunerated in Brazilian Reais. The hedge strategy for foreign investments also considers the impact of all tax effects levied.
Insurance:Insurance business revenues and expenses were concentrated in Income related to Insurance,pension plan and capitalization operations. The main reclassifications of revenues refer to the financial margins obtained with the technical provisions of insurance, pension plan and capitalization, in addition to revenue from management of pension plan funds.
Other reclassifications:Other Income, Share of Income of Associates, Non-Operating Income, ProfitSharing of Management Members and Expenses for Credit Card Reward Program were reclassified to those lines representing the way the institution manages its business, enabling greater understanding for performance analysis. Accordingly, equity in earnings of investment in Banco CSF S.A. (“Banco Carrefour”) was reclassified to the financial margin line.
The adjustments and reclassifications column shows the effects of the differences between the accounting principles followed for the presentation of segment information, which are substantially in line with the accounting practices adopted for financial institutions in Brazil, except as described above, and the policies used in the preparation of these consolidated financial statements according to IFRS. Main adjustments are as follows:
| · | Allowance for Loan Losses, which, under IFRS (IAS 39), should be recognized upon objective evidence that loan operations are impaired (incurred loss), and the Expected Loss concept is adopted according to Brazilian accounting standards; |
| · | Shares and units classified as permanent investments were stated at fair value under IFRS (IAS 39 and 32), and their gains and losses were directly recorded to Stockholders’ Equity, not passing through income for the period; |
| · | Effective interest rates, financial assets and liabilities stated at amortized cost, are recognized by the effective interest rate method, allocating revenues and costs directly attributable to acquisition, issue or disposal for the transaction period of the operation; according to Brazilian standards, fee expenses and income are recognized as these transactions are engaged. |
| · | Business combinations are accounted for under the acquisition method in IFRS (IFRS 3), in which the purchase price is allocated among assets and liabilities of the acquired company, and the amount not subject to allocation, if any, is recognized as goodwill. Such amount is not amortized, but is subject to an impairment test. |
| F-138 |
ITAÚ UNIBANCO HOLDING S.A.
From January 1 to December 31, 2016
(In millions of Reais, except for share information)
| Consolidated Statement of Income | Retail Banking | Wholesale Banking | Activities with the Market + Corporation | ITAÚ UNIBANCO | Adjustments | IFRS consolidated | ||||||||||||||||||
| Banking product | 69,577 | 28,324 | 9,412 | 107,313 | 11,348 | 118,661 | ||||||||||||||||||
| Interest margin(1) | 39,154 | 19,755 | 9,264 | 68,173 | 11,308 | 79,481 | ||||||||||||||||||
| Banking service fees | 22,659 | 8,072 | 59 | 30,790 | 1,128 | 31,918 | ||||||||||||||||||
| Income related to insurance, private pension, and capitalization | ||||||||||||||||||||||||
| operations before claim and selling expenses | 7,764 | 497 | 89 | 8,350 | (2,470 | ) | 5,880 | |||||||||||||||||
| Other income | - | - | - | - | 1,382 | 1,382 | ||||||||||||||||||
| Losses on loans and claims | (14,901 | ) | (8,471 | ) | 71 | (23,301 | ) | 1,179 | (22,122 | ) | ||||||||||||||
| Expenses for allowance for loan and lease losses | (16,717 | ) | (8,914 | ) | 71 | (25,560 | ) | 1,181 | (24,379 | ) | ||||||||||||||
| Recovery of loans written off as loss | 3,242 | 502 | - | 3,744 | (2 | ) | 3,742 | |||||||||||||||||
| Expenses for claims / recovery of claims under reinsurance | (1,426 | ) | (59 | ) | - | (1,485 | ) | - | (1,485 | ) | ||||||||||||||
| Operating margin | 54,676 | 19,853 | 9,483 | 84,012 | 12,527 | 96,539 | ||||||||||||||||||
| Other operating income (expenses) | (37,202 | ) | (13,410 | ) | (2,387 | ) | (52,999 | ) | (5,348 | ) | (58,347 | ) | ||||||||||||
| Non-interest expenses(2) | (32,883 | ) | (12,034 | ) | (1,616 | ) | (46,533 | ) | (4,371 | ) | (50,904 | ) | ||||||||||||
| Tax expenses for ISS, PIS and COFINS and Other | (4,319 | ) | (1,376 | ) | (771 | ) | (6,466 | ) | (1,505 | ) | (7,971 | ) | ||||||||||||
| Share of profit or (loss) in associates and joint ventures | - | - | - | - | 528 | 528 | ||||||||||||||||||
| Net income before income tax and social contribution | 17,474 | 6,443 | 7,096 | 31,013 | 7,179 | 38,192 | ||||||||||||||||||
| Income tax and social contribution | (6,328 | ) | (1,081 | ) | (1,237 | ) | (8,646 | ) | (5,964 | ) | (14,610 | ) | ||||||||||||
| Non-controlling interest in subsidiaries | (223 | ) | 79 | (1 | ) | (145 | ) | (174 | ) | (319 | ) | |||||||||||||
| Net income | 10,923 | 5,441 | 5,858 | 22,222 | 1,041 | 23,263 | ||||||||||||||||||
(1) Includes net interest and similar income and expenses of R$ 66,369 dividend income of R$ 288, net gain (loss) on investment securities and derivatives of R$ 7,311 and results from foreign exchange results and exchange variation of transactions abroad of R$ 5,513.
(2) Refers to general and administrative expenses including depreciation expenses of R$ 1,702, amortization expenses of R$ 1,292 and insurance acquisition expenses of R$ 721.
| Total assets (1) - 12/31/2016 | 909,779 | 585,088 | 114,956 | 1,425,639 | (72,398 | ) | 1,353,241 | |||||||||||||||||
| Total liabilities - 12/31/2016 | 877,792 | 525,390 | 79,365 | 1,298,423 | (79,996 | ) | 1,218,427 | |||||||||||||||||
| (1) Includes: | ||||||||||||||||||||||||
| Investments in associates and joint ventures | 1,325 | - | 3,106 | 4,431 | 642 | 5,073 | ||||||||||||||||||
| Goodwill | 1,398 | 6,171 | - | 7,569 | 2,106 | 9,675 | ||||||||||||||||||
| Fixed assets, net | 5,635 | 1,177 | - | 6,812 | 1,230 | 8,042 | ||||||||||||||||||
| Intangible assets, net | 6,559 | 1,105 | - | 7,664 | (283 | ) | 7,381 |
The consolidated figures do not represent the sum of the segments because there are intercompany transactions that were eliminated only in the consolidated financial statements. Segments are assessed by top management, net of income and expenses between related parties.
| F-139 |
ITAÚ UNIBANCO HOLDING S.A.
From January 1 to December 31, 2015
(In millions of Reais except per share information)
| Consolidated Statement of Income | Retail Banking | Wholesale Banking | Actitivities with the Market + Corporation | ITAÚ UNIBANCO | Adjustments | IFRS consolidated | ||||||||||||||||||
| Banking product | 70,495 | 25,774 | 7,641 | 103,910 | (11,899 | ) | 92,011 | |||||||||||||||||
| Interest margin(1) | 40,997 | 18,047 | 7,513 | 66,557 | (11,949 | ) | 54,608 | |||||||||||||||||
| Banking service fees | 21,159 | 7,282 | 59 | 28,500 | 952 | 29,452 | ||||||||||||||||||
| Income related to insurance, private pension, and capitalization operations before claim and selling expenses | 8,339 | 445 | 69 | 8,853 | (2,181 | ) | 6,672 | |||||||||||||||||
| Other income | - | - | - | - | 1,279 | 1,279 | ||||||||||||||||||
| Losses on loans and claims | (13,893 | ) | (5,931 | ) | 98 | (19,726 | ) | (1,609 | ) | (21,335 | ) | |||||||||||||
| Expenses for allowance for loan and lease losses | (16,232 | ) | (6,764 | ) | 98 | (22,898 | ) | (1,619 | ) | (24,517 | ) | |||||||||||||
| Recovery of loans written off as loss | 3,886 | 883 | - | 4,769 | 10 | 4,779 | ||||||||||||||||||
| Expenses for claims / recovery of claims under reinsurance | (1,547 | ) | (50 | ) | - | (1,597 | ) | - | (1,597 | ) | ||||||||||||||
| Operating margin | 56,602 | 19,843 | 7,739 | 84,184 | (13,508 | ) | 70,676 | |||||||||||||||||
| Other operating income (expenses) | (35,924 | ) | (11,130 | ) | (1,948 | ) | (49,002 | ) | (3,409 | ) | (52,411 | ) | ||||||||||||
| Non-interest expenses(2) | (31,547 | ) | (9,877 | ) | (1,522 | ) | (42,946 | ) | (4,680 | ) | (47,626 | ) | ||||||||||||
| Tax expenses for ISS, PIS and COFINS and Other | (4,377 | ) | (1,253 | ) | (426 | ) | (6,056 | ) | 651 | (5,405 | ) | |||||||||||||
| Share of profit or (loss) in associates and joint ventures | - | - | - | - | 620 | 620 | ||||||||||||||||||
| Net income before income tax and social contribution | 20,678 | 8,713 | 5,791 | 35,182 | (16,917 | ) | 18,265 | |||||||||||||||||
| Income tax and social contribution | (7,263 | ) | (2,691 | ) | (1,040 | ) | (10,994 | ) | 18,885 | 7,891 | ||||||||||||||
| Non-controlling interest in subsidiaries | (342 | ) | - | (14 | ) | (356 | ) | (60 | ) | (416 | ) | |||||||||||||
| Net income | 13,073 | 6,022 | 4,737 | 23,832 | 1,908 | 25,740 | ||||||||||||||||||
(1) Includes net interest and similar income and expenses of R$ 72,725, dividend income of R$ 98, net gain (loss) on investment securities and derivatives of R$ (11,862) and foreign exchange results and exchange variation on transactions of abroad R$ (6,353).
(2) Refers to general and administrative expenses including depreciation expenses of R$ 1,688, amortization expenses of R$ 910 and insurance acquisition expenses of R$ 1,138.
| Total assets(1) - 12/31/2015 | 873,202 | 547,236 | 127,716 | 1,359,172 | (82,757 | ) | 1,276,415 | |||||||||||||||||
| Total liabilities - 12/31/2015 | 840,033 | 502,887 | 97,017 | 1,250,955 | (88,599 | ) | 1,162,356 | |||||||||||||||||
| (1) Includes: | ||||||||||||||||||||||||
| Investments in associates and joint ventures | 1,064 | - | 2,436 | 3,500 | 899 | 4,399 | ||||||||||||||||||
| Goodwill | 232 | - | - | 232 | 1,825 | 2,057 | ||||||||||||||||||
| Fixed assets, net | 5,781 | 1,274 | - | 7,055 | 1,486 | 8,541 | ||||||||||||||||||
| Intangible assets, net | 6,606 | 857 | - | 7,463 | (1,168 | ) | 6,295 |
The Consolidated figures do not represent the sum of the segments because there are intercompany transactions that were eliminated only in the consolidated financial statements. Segments are assessed by top management, net of income and expenses between related parties.
| F-140 |
ITAÚ UNIBANCO HOLDING S.A.
From January 1 to December 31, 2014
(In millions of Reais except per share information)
| Consolidated Statement of Income | Retail Banking | Wholesale Banking | Actitivities with the Market + Corporation | ITAÚ UNIBANCO | Adjustments | IFRS consolidated | ||||||||||||||||||
| Banking product | 65,516 | 20,408 | 3,916 | 89,840 | 1,817 | 91,657 | ||||||||||||||||||
| Interest margin(1) | 37,880 | 13,685 | 3,590 | 55,155 | 1,118 | 56,273 | ||||||||||||||||||
| Banking service fees | 19,234 | 6,321 | 222 | 25,777 | 565 | 26,342 | ||||||||||||||||||
| Income related to insurance, private pension, and capitalization operations before claim and selling expenses | 8,402 | 402 | 104 | 8,908 | (2,020 | ) | 6,888 | |||||||||||||||||
| Other income | - | - | - | - | 2,154 | 2,154 | ||||||||||||||||||
| Losses on loans and claims | (11,840 | ) | (3,202 | ) | (3 | ) | (15,045 | ) | (756 | ) | (15,801 | ) | ||||||||||||
| Expenses for allowance for loan and lease losses | (14,503 | ) | (3,565 | ) | (3 | ) | (18,071 | ) | (761 | ) | (18,832 | ) | ||||||||||||
| Recovery of loans written off as loss | 4,642 | 407 | - | 5,049 | 5 | 5,054 | ||||||||||||||||||
| Expenses for claims / recovery of claims under reinsurance | (1,979 | ) | (44 | ) | - | (2,023 | ) | - | (2,023 | ) | ||||||||||||||
| Operating margin | 53,676 | 17,206 | 3,913 | 74,795 | 1,061 | 75,856 | ||||||||||||||||||
| Other operating income (expenses) | (34,200 | ) | (9,150 | ) | (1,089 | ) | (44,439 | ) | (2,609 | ) | (47,048 | ) | ||||||||||||
| Non-interest expenses(2) | (30,243 | ) | (8,158 | ) | (1,182 | ) | (39,583 | ) | (2,967 | ) | (42,550 | ) | ||||||||||||
| Tax expenses for ISS, PIS and COFINS and Other | (3,957 | ) | (992 | ) | 93 | (4,856 | ) | (207 | ) | (5,063 | ) | |||||||||||||
| Share of profit or (loss) in associates and joint ventures | - | - | - | - | 565 | 565 | ||||||||||||||||||
| Net income before income tax and social contribution | 19,476 | 8,056 | 2,824 | 30,356 | (1,548 | ) | 28,808 | |||||||||||||||||
| Income tax and social contribution | (6,761 | ) | (2,591 | ) | (74 | ) | (9,426 | ) | 2,479 | (6,947 | ) | |||||||||||||
| Non-controlling interest in subsidiaries | (305 | ) | - | (6 | ) | (311 | ) | 5 | (306 | ) | ||||||||||||||
| Net income | 12,410 | 5,465 | 2,744 | 20,619 | 936 | 21,555 | ||||||||||||||||||
(1) Includes net interest and similar income and expenses of R$ 47,138, dividend income of R$ 215, net gain (loss) on investment securities and derivatives of R$ (724) and foreign exchange results and exchange variation on transactions of abroad R$ 9,644.
(2) Refers to general and administrative expenses including depreciation expenses of R$ 1,641, amortization expenses of R$ 827 and insurance acquisition expenses of R$ 1,214.
| Total assets(1) - 12/31/2014 | 811,185 | 436,872 | 107,174 | 1,208,702 | (81,499 | ) | 1,127,203 | |||||||||||||||||
| Total liabilities - 12/31/2014 | 770,528 | 399,544 | 86,897 | 1,110,439 | (83,853 | ) | 1,026,586 | |||||||||||||||||
| (1) Includes: | ||||||||||||||||||||||||
| Investments in associates and joint ventures | 982 | - | 2,117 | 3,099 | 991 | 4,090 | ||||||||||||||||||
| Goodwill | 204 | - | - | 204 | 1,757 | 1,961 | ||||||||||||||||||
| Fixed assets, net | 6,693 | 868 | - | 7,561 | 1,150 | 8,711 | ||||||||||||||||||
| Intangible assets, net | 7,841 | 791 | - | 8,632 | (2,498 | ) | 6,134 |
The Consolidated figures do not represent the sum of the segments because there are intercompany transactions that were eliminated only in the consolidated financial statements. Segments are assessed by top management, net of income and expenses between related parties.
| F-141 |
Information on the result of main services and products and noncurrent assets by geographic area are as follows:
| 01/01 to 12/31/2016 | 01/01 to 12/31/2015 | 01/01 to 12/31/2014 | ||||||||||||||||||||||||||||||||||
| Brazil | Abroad | Total | Brazil | Abroad | Total | Brazil | Abroad | Total | ||||||||||||||||||||||||||||
| Income related to financial operations(1) (2) | 154,653 | 19,954 | 174,607 | 117,140 | 12,532 | 129,672 | 118,946 | 10,304 | 129,250 | |||||||||||||||||||||||||||
| Income related to insurance, private pension and capitalization operations before claim and selling expenses | 5,748 | 132 | 5,880 | 6,570 | 102 | 6,672 | 6,834 | 54 | 6,888 | |||||||||||||||||||||||||||
| Banking service fees | 29,061 | 2,857 | 31,918 | 27,072 | 2,380 | 29,452 | 24,550 | 1,792 | 26,342 | |||||||||||||||||||||||||||
| Non-current assets | 13,299 | 2,124 | 15,423 | 13,841 | 995 | 14,836 | 14,038 | 807 | 14,845 | |||||||||||||||||||||||||||
| (1) | Includes interest and similar income, dividend income, net gain (loss) on investment securities and derivatives, foreign exchange results, and exchange variation on transactions. |
| (2) | ITAÚ UNIBANCO HOLDING does not have clients representing 10% or higher of its revenues. |
| F-142 |
Note 35 – Related parties
| a) | Transactions between related parties are carried out at amounts, terms and average rates in accordance with normal market practices during the period, as well as under reciprocal conditions. |
Transactions between companies included in consolidation (Note 2.4a) were eliminated from the consolidated financial statements and the absence of risk is taken into consideration.
The unconsolidated related parties are as follows:
| · | Itaú Unibanco Participações S.A. (IUPAR), Companhia E. Johnston de Participações S.A. (shareholder of IUPAR) and ITAÚSA, direct and indirect shareholders of ITAÚ UNIBANCO HOLDING; |
| · | The non-financial subsidiaries of ITAÚSA, especially: Itautec S.A., Duratex S.A., Elekeiroz S.A., ITH Zux Cayman Company Ltd and Itaúsa Empreendimentos S.A.; |
| · | Fundação Itaú Unibanco - Previdência Complementar and FUNBEP – Fundo de Pensão Multipatrocinado, closed-end supplementary pension entities, that administer retirement plans sponsored by ITAÚ UNIBANCO HOLDING and / or its subsidiaries; |
| · | Fundação Itaú Social, Instituto Itaú Cultural, Instituto Unibanco, Instituto Assistencial Pedro Di Perna, Instituto Unibanco de Cinema, Associação Itaú Viver Mais and Associação Cubo Coworking Itaú, entities sponsored by ITAÚ UNIBANCO HOLDING and subsidiaries to act in their respective areas of interest; and |
| · | Investments in Porto Seguro Itaú Unibanco Participações S.A. and BSF Holding S.A. |
The transactions with these related parties are mainly as follows:
| F-143 |
| ITAÚ UNIBANCO HOLDING CONSOLIDATED | ||||||||||||||||||||||
| Assets / (liabilities) | Revenue / (expenses) | |||||||||||||||||||||
| Annual rate | 12/31/2016 | 12/31/2015 | 01/01 to 12/31/2016 | 01/01 to 12/31/2015 | 01/01 a 31/12/2014 | |||||||||||||||||
| Securities sold under repurchase agreements | (77 | ) | (249 | ) | (19 | ) | (20 | ) | (13 | ) | ||||||||||||
| Duratex S.A. | 97.5% to 100% CDI | (18 | ) | (41 | ) | (4 | ) | (9 | ) | (10 | ) | |||||||||||
| Elekeiroz S.A. | 97.5% to 100% CDI | (3 | ) | (8 | ) | (1 | ) | (1 | ) | (2 | ) | |||||||||||
| Itautec S.A. | 96.5% to 100.1% CDI | (1 | ) | (110 | ) | (3 | ) | - | - | |||||||||||||
| Itaúsa Empreendimentos S.A. | - | (64 | ) | (7 | ) | (7 | ) | - | ||||||||||||||
| Olimpia Promoção e Serviços S.A. | (14 | ) | (11 | ) | (2 | ) | (1 | ) | - | |||||||||||||
| Conectcar Soluções de Mobilidade Eletrônica S.A. | (24 | ) | - | - | - | - | ||||||||||||||||
| Other | (17 | ) | (15 | ) | (2 | ) | (2 | ) | (1 | ) | ||||||||||||
| Amounts receivable from (payable to) related companies / Banking service fees (expenses) | (129 | ) | (116 | ) | 28 | 20 | 8 | |||||||||||||||
| Olimpia Promoção e Serviços S.A. | (2 | ) | (2 | ) | (25 | ) | (28 | ) | - | |||||||||||||
| Fundação Itaú Unibanco - Previdência Complementar | (127 | ) | (114 | ) | 44 | 39 | 35 | |||||||||||||||
| FUNBEP - Fundo de Pensão Multipatrocinado | - | - | 6 | 5 | 5 | |||||||||||||||||
| Other | - | - | - | 2 | (32 | ) | ||||||||||||||||
| Rental revenues (expenses) | - | - | (59 | ) | (56 | ) | (51 | ) | ||||||||||||||
| Itaúsa Investimentos Itaú S.A. | - | - | (2 | ) | (2 | ) | - | |||||||||||||||
| Fundação Itaú Unibanco - Previdência Complementar | - | - | (44 | ) | (42 | ) | (38 | ) | ||||||||||||||
| FUNBEP - Fundo de Pensão Multipatrocinado | - | - | (13 | ) | (12 | ) | (13 | ) | ||||||||||||||
| Donation expenses | - | - | (88 | ) | (84 | ) | (78 | ) | ||||||||||||||
| Instituto Itaú Cultural | - | - | (87 | ) | (83 | ) | (77 | ) | ||||||||||||||
| Associação Itaú Viver Mais | - | - | (1 | ) | (1 | ) | (1 | ) | ||||||||||||||
Pursuant to the current rules, financial institutions cannot grant loans or advances to the following:
a) any individuals or companies that control the Institution or any entity under common control with the institution, or any executive officer, director, member of the fiscal council, or the immediate family members of these individuals;
| b) | any entity controlled by the institution; or |
| c) | any entity in which the bank directly or indirectly holds more than 10% of the capital stock. |
Therefore, no loans or advances were granted to any subsidiary, executive officer, director or family members.
| b) | Compensation of the key management personnel |
Compensation for the period paid to key management members of ITAÚ UNIBANCO HOLDING consisted of:
| 01/01 to | 01/01 to | 01/01 to | ||||||||||
| 12/31/2016 | 12/31/2015 | 12/31/2014 | ||||||||||
| Compensation | 360 | 459 | 343 | |||||||||
| Board of directors | 32 | 27 | 14 | |||||||||
| Executives | 328 | 432 | 329 | |||||||||
| Profit sharing | 251 | 239 | 261 | |||||||||
| Board of directors | 2 | 1 | 12 | |||||||||
| Executives | 249 | 238 | 249 | |||||||||
| Contributions to pension plans - executives | 12 | 9 | 7 | |||||||||
| Stock option plan – executives | 263 | 200 | 234 | |||||||||
| Total | 885 | 907 | 845 | |||||||||
| F-144 |
Note 36 – Management of financial risks
Credit risk
1. Credit risk measurement
ITAÚ UNIBANCO HOLDING understands credit risk is the possibility of losses arising from the breach by the borrower, issuer or counterparty of the respective agreed-upon financial obligations, the devaluation of loan agreement due to downgrading of the borrower’s, the issuer’s, the counterparty’s risk rating, the reduction in gains or compensation, the advantages given upon posterior renegotiation and the recovery costs.
The credit risk management of ITAÚ UNIBANCO HOLDING’s is the primary responsibility of all business units and aims to keep the quality of loan portfolios in levels consistent with the institution’s risk appetite for each market segment in which it operates.
ITAÚ UNIBANCO HOLDING establishes its credit policy based on internal factors, such as the client rating criteria, performance of and changes in portfolio, default levels, return rates, and the allocated economic capital; among others, and external factors, such as interest rates, market default indicators, inflation, changes in consumption, among others. The assessment process of policies and products enables ITAÚ UNIBANCO HOLDING to identify potential risks, so as to make sure that credit decisions make sense from an economic and risk perspective.
ITAÚ UNIBANCO HOLDING has a structured process to keep a diversified portfolio deemed as adequate by the institution. The ongoing monitoring on the concentration level of portfolios, by assessing the economic activity sectors and major debtors, enables it to take preventive measures, to prevent that defined limits are breached.
The table below shows the correspondence between risk levels attributed by all segments of ITAÚ UNIBANCO HOLDING internal models (lower risk, satisfactory, higher risk and impaired) and the probability of default associated with each of these levels, and the risk levels assigned by the respective market models.
| External rating | |||||||||
| Internal rating | PD | Moody's | S&P | Fitch | |||||
| Lower risk | Lower or equal than 4.44% | Aaa to B2 | AAA to B | AAA to B- | |||||
| Satisfactory | From 4.44% up to 25.95% | B3 to Caa3 | B- to CCC- | CCC+ to CCC- | |||||
| Higher risk | Higher than 25.95% | Ca1 to D | CC+ to D | CC+ to D | |||||
| Impairment | Corporate operations with a PD higher than 31.84% Operations past due for over 90 days Renegotiated operations past due for over 60 days | Ca1 to D | CC+ to D | CC+ to D | |||||
For individual, small and middle-market companies, credit rating is attributed based on application statistical models (in the early phases of ITAÚ UNIBANCO HOLDING’s relationship with the client) and behavior score (used for clients with which ITAÚ UNIBANCO HOLDING already has a relationship). Decisions are made based on these models, which are continuously monitored by an independent framework. Exceptionally, there can be an individual analysis of specific cases, in which credit approval is submitted to proper levels.
For large companies, the rating is based on information such as economic and financial condition of the counterparty, their cash-generating capability, the economic group to which they belong, and the current and prospective situation of the economic sector in which they operate. The credit proposals are analyzed on a case by case basis, through an approval-level mechanism.
Government securities and other debt instruments are classified by ITAÚ UNIBANCO HOLDING according to their credit quality aiming at managing their exposures.
In line with the principles of CMN Resolution N° 3,721, of April 30, 2009, ITAÚ UNIBANCO HOLDING has structure and corporate guidelines on credit risk management, approved by its Board of Directors, applicable to companies and subsidiaries in Brazil and abroad.
| F-145 |
| 2. | Credit risk management |
ITAÚ UNIBANCO HOLDING strictly controls the credit exposure of clients and counterparties, taking action to address situations in which the actual exposure exceeds the desired one. For this purpose, contractually provided actions can be taken, such as early settlement or requirement of additional collateral.
| 3. | Collateral and policies for mitigating credit risk |
ITAÚ UNIBANCO HOLDING uses guarantees to increase its recovery capacity in transactions involving credit risk. The guarantees used may be personal guarantees, collateral, legal structures with mitigation power and offset agreements.
For management purposes, for collaterals to be considered instruments that mitigate credit risk, they must comply with the requirements and standards of the rules that regulate them domestic or not, and be legally valid (effective), enforceable and assessed on a regular basis.
ITAÚ UNIBANCO HOLDING also uses credit derivatives, such as single name CDS, to mitigate credit risk of its portfolios of loans and securities. These instruments are priced based on models that use the fair value of market inputs, such as credit spreads, recovery rates, correlations and interest rates.
| 4. | Policy on the provision |
The policies on the provision adopted by ITAÚ UNIBANCO HOLDING are aligned with the guidelines of IFRS and the Basel Accord. As a result, an allowance for loan losses is recognized when there are indications of the impairment of the portfolio and takes into account a horizon of loss appropriate for each type of transaction. We consider asimpaired loans overdue for more than 90 days, renegotiated loans overdue by more than 60 days and Corporate loans below a specific internal rating. Loans are written-down 360 days after such loans become past due or 540 days of being past due in the case of loans with original maturities over 36 months.
| 5. | Credit risk exposure |
| 12/31/2016 | 12/31/2015 | |||||||||||||||||||||||
| Brazil | Abroad | Total | Brazil | Abroad | Total | |||||||||||||||||||
| Interbank deposits | 6,044 | 16,648 | 22,692 | 7,502 | 23,023 | 30,525 | ||||||||||||||||||
| Securities purchased under agreements to resell | 264,080 | 971 | 265,051 | 252,295 | 2,109 | 254,404 | ||||||||||||||||||
| Financial assets held for trading | 193,903 | 10,745 | 204,648 | 157,206 | 7,105 | 164,311 | ||||||||||||||||||
| Financial assets designated at fair value through profit or loss | - | 1,191 | 1,191 | - | 642 | 642 | ||||||||||||||||||
| Derivatives | 13,593 | 10,638 | 24,231 | 15,858 | 10,897 | 26,755 | ||||||||||||||||||
| Available-for-sale financial assets | 53,529 | 34,748 | 88,277 | 52,221 | 33,824 | 86,045 | ||||||||||||||||||
| Held-to-maturity financial assets | 27,436 | 13,059 | 40,495 | 27,378 | 14,807 | 42,185 | ||||||||||||||||||
| Loan operations and lease operations | 305,394 | 158,000 | 463,394 | 326,241 | 121,163 | 447,404 | ||||||||||||||||||
| Other financial assets | 47,914 | 6,003 | 53,917 | 47,665 | 5,841 | 53,506 | ||||||||||||||||||
| Off balance sheet | 259,854 | 39,973 | 299,827 | 272,274 | 30,246 | 302,520 | ||||||||||||||||||
| Endorsements and sureties | 62,172 | 8,621 | 70,793 | 68,897 | 5,347 | 74,244 | ||||||||||||||||||
| Letters of credit to be released | 6,660 | - | 6,660 | 6,936 | - | 6,936 | ||||||||||||||||||
| Commitments to be released | 191,022 | 31,352 | 222,374 | 196,441 | 24,899 | 221,340 | ||||||||||||||||||
| Mortgage loans | 4,389 | - | 4,389 | 6,812 | - | 6,812 | ||||||||||||||||||
| Overdraft accounts | 87,239 | - | 87,239 | 81,151 | - | 81,151 | ||||||||||||||||||
| Credit cards | 96,497 | 1,273 | 97,770 | 102,721 | 1,211 | 103,932 | ||||||||||||||||||
| Other pre-approved limits | 2,897 | 30,079 | 32,976 | 5,757 | 23,688 | 29,445 | ||||||||||||||||||
| Total | 1,171,747 | 291,976 | 1,463,723 | 1,158,640 | 249,657 | 1,408,297 | ||||||||||||||||||
| F-146 |
The table above presents the maximum exposure at December 31, 2016 and December 31, 2015, without considering any collateral received or other additional credit improvements.
For assets recognized in the balance sheet, the exposures presented are based on net carrying amounts. This analysis includes only financial assets subject to credit risk and excludes non-financial assets.
The contractual amounts of endorsements and sureties and letters of credit represent the maximum potential of credit risk in the event the counterparty does not meet the terms of the agreement. The vast majority of commitments (real estate loans, overdraft accounts and other pre-approved limits) mature without being drawn, since they are renewed monthly and we have the power to cancel them at any time. As a result, the total contractual amount does not represent our effective future exposure to credit risk or the liquidity needs arising from such commitments.
As shown in the table, the most significant exposures correspond to loan operations, financial assets held for trading, and securities purchased under agreements to resell, in addition to sureties, endorsements and other commitments.
The maximum exposure to the quality of the financial assets presented highlights that:
| · | 88.8% of loan operations and other financial assets exposure (Table 6.1 and 6.1.2) are categorized as low probability of default in accordance with our internal rating; |
| · | only 4.0% of the total loans exposure (Table 6.1) is represented by overdue credits not impaired; |
| · | 6.2% of the total loans exposure (Table 6.1) corresponds to overdue loans impaired. |
| 5.1 | Maximum exposure of financial assets segregated by business sector |
| a) | Loan operations and lease operations portfolio |
| 12/31/2016 | % | 12/31/2015 | % | |||||||||||||
| Public sector | 3,051 | 0.6 | 3,182 | 0.7 | ||||||||||||
| Industry and commerce | 112,067 | 22.8 | 125,386 | 26.5 | ||||||||||||
| Services | 118,102 | 24.1 | 104,226 | 22.0 | ||||||||||||
| Natural resources | 24,362 | 5.0 | 25,306 | 5.3 | ||||||||||||
| Other sectors | 2,839 | 0.6 | 2,526 | 0.5 | ||||||||||||
| Individuals | 229,945 | 46.9 | 213,622 | 45.0 | ||||||||||||
| Total | 490,366 | 100.0 | 474,248 | 100.0 | ||||||||||||
| b) | Other financial assets(*) |
| 12/31/2016 | % | 12/31/2015 | % | |||||||||||||
| Natural resources | 2,466 | 0.4 | 4,313 | 0.7 | ||||||||||||
| Public sector | 249,745 | 38.7 | 197,871 | 32.7 | ||||||||||||
| Industry and commerce | 10,435 | 1.6 | 11,856 | 2.0 | ||||||||||||
| Services | 2,741 | 0.4 | 89,932 | 14.9 | ||||||||||||
| Other sectors | 93,165 | 14.4 | 15,420 | 2.5 | ||||||||||||
| Individuals | 290 | 0.0 | 546 | 0.1 | ||||||||||||
| Financial | 287,743 | 44.5 | 284,929 | 47.1 | ||||||||||||
| Total | 646,585 | 100.0 | 604,867 | 100.0 | ||||||||||||
(*) Includes financial assets held for trading, derivatives, assets designated at fair value through profit or loss, available-for-sale financial assets, held-to-maturity financial assets, interbank deposits and securities purchased under agreements to resell.
| c) | The credit risks of off balance sheet items (endorsements and sureties, letters of credit and commitments to be released) are not categorized or managed by business sector. |
| F-147 |
| 6. | Credit quality of financial assets |
| 6.1 | The following table shows the breakdown of loans operations and lease operations portfolio considering: loans not overdue and loans overdue either impaired or not impaired: |
| 12/31/2016 | 12/31/2015 | |||||||||||||||||||||||||||||||
| Internal rating | Loans not overdue and not impaired | Loans overdue not impaired | Loans overdue and impaired | Total loans | Loans not overdue and not impaired | Loans overdue and not impaired | Loans overdue and impaired | Total loans | ||||||||||||||||||||||||
| Lower risk | 363,954 | 5,543 | - | 369,497 | 340,368 | 3,838 | - | 344,206 | ||||||||||||||||||||||||
| Satisfactory | 62,883 | 6,904 | - | 69,787 | 76,940 | 6,489 | - | 83,429 | ||||||||||||||||||||||||
| Higher risk | 13,767 | 6,998 | - | 20,765 | 12,609 | 6,847 | - | 19,456 | ||||||||||||||||||||||||
| Impairment | - | - | 30,317 | 30,317 | - | - | 27,157 | 27,157 | ||||||||||||||||||||||||
| Total | 440,604 | 19,445 | 30,317 | 490,366 | 429,917 | 17,174 | 27,157 | 474,248 | ||||||||||||||||||||||||
| % | 89.8 | % | 4.0 | % | 6.2 | % | 100.0 | % | 90.7 | % | 3.6 | % | 5.7 | % | 100.0 | % | ||||||||||||||||
The following table shows the breakdown of loans operations and lease operations by portfolios of areas and classes, based on indicators of credit quality:
| 12/31/2016 | 12/31/2015 | |||||||||||||||||||||||||||||||||||||||
| Lower risk | Satisfactory | Higher risk | Impaired | Total | Lower risk | Satisfactory | Higher risk | Impaired | Total | |||||||||||||||||||||||||||||||
| Individuals | 122,112 | 38,910 | 11,362 | 10,763 | 183,147 | 102,479 | 60,132 | 13,030 | 11,579 | 187,220 | ||||||||||||||||||||||||||||||
| Credit cards | 42,432 | 11,212 | 1,866 | 3,512 | 59,022 | 40,297 | 11,887 | 2,286 | 4,072 | 58,542 | ||||||||||||||||||||||||||||||
| Personal | 6,414 | 6,298 | 8,264 | 4,837 | 25,813 | 6,234 | 8,014 | 9,099 | 5,049 | 28,396 | ||||||||||||||||||||||||||||||
| Payroll loans | 26,624 | 15,972 | 609 | 1,431 | 44,636 | 9,582 | 33,766 | 844 | 1,242 | 45,434 | ||||||||||||||||||||||||||||||
| Vehicles | 11,378 | 2,911 | 554 | 591 | 15,434 | 14,149 | 4,292 | 737 | 880 | 20,058 | ||||||||||||||||||||||||||||||
| Mortgage loans | 35,264 | 2,517 | 69 | 392 | 38,242 | 32,217 | 2,173 | 64 | 336 | 34,790 | ||||||||||||||||||||||||||||||
| Corporate | 102,162 | 5,447 | 7 | 14,138 | 121,754 | 133,779 | 6,915 | 206 | 11,627 | 152,527 | ||||||||||||||||||||||||||||||
| Small and medium businesses | 40,534 | 10,084 | 4,671 | 3,646 | 58,935 | 45,202 | 12,567 | 4,993 | 3,276 | 66,038 | ||||||||||||||||||||||||||||||
| Foreign loans - Latin America | 104,689 | 15,346 | 4,725 | 1,770 | 126,530 | 62,746 | 3,815 | 1,227 | 675 | 68,463 | ||||||||||||||||||||||||||||||
| Total | 369,497 | 69,787 | 20,765 | 30,317 | 490,366 | 344,206 | 83,429 | 19,456 | 27,157 | 474,248 | ||||||||||||||||||||||||||||||
| % | 75.4 | % | 14.2 | % | 4.2 | % | 6.2 | % | 100.0 | % | 72.6 | % | 17.6 | % | 4.1 | % | 5.7 | % | 100.0 | % | ||||||||||||||||||||
| F-148 |
The table below shows the breakdown of loans operations and lease operations portfolio not overdue and not impaired, by portfolio of segments and classes, based on indicators of credit quality.
| 12/31/2016 | 12/31/2015 | |||||||||||||||||||||||||||||||
| Lower risk | Satisfactory | Higher risk | Total | Lower risk | Satisfactory | Higher risk | Total | |||||||||||||||||||||||||
| I – Individually evaluated Corporate | ||||||||||||||||||||||||||||||||
| Large companies | 101,612 | 5,076 | 7 | 106,695 | 133,251 | 6,721 | 114 | 140,086 | ||||||||||||||||||||||||
| II- Collectively-evaluated | ||||||||||||||||||||||||||||||||
| Individuals | 120,221 | 34,851 | 7,155 | 162,227 | 100,819 | 55,625 | 8,269 | 164,713 | ||||||||||||||||||||||||
| Credit card | 42,158 | 10,445 | 1,083 | 53,686 | 39,945 | 11,086 | 1,492 | 52,523 | ||||||||||||||||||||||||
| Personal | 6,317 | 5,864 | 5,538 | 17,719 | 6,166 | 7,527 | 6,030 | 19,723 | ||||||||||||||||||||||||
| Payroll loans | 26,383 | 15,606 | 447 | 42,436 | 9,501 | 33,116 | 642 | 43,259 | ||||||||||||||||||||||||
| Vehicles | 10,821 | 1,947 | 68 | 12,836 | 13,584 | 2,918 | 84 | 16,586 | ||||||||||||||||||||||||
| Mortgage loans | 34,542 | 989 | 19 | 35,550 | 31,623 | 978 | 21 | 32,622 | ||||||||||||||||||||||||
| Small and medium businesses | 39,983 | 9,011 | 3,235 | 52,229 | 44,582 | 11,181 | 3,456 | 59,219 | ||||||||||||||||||||||||
| Foreign loans and Latin America | 102,138 | 13,945 | 3,370 | 119,453 | 61,716 | 3,413 | 770 | 65,899 | ||||||||||||||||||||||||
| Total | 363,954 | 62,883 | 13,767 | 440,604 | 340,368 | 76,940 | 12,609 | 429,917 | ||||||||||||||||||||||||
6.1.1 Loan operations and lease operations by portfolios of areas and classes, are classified by maturity as follows (loans overdue not impaired):
| 12/31/2016 | 12/31/2015 | |||||||||||||||||||||||||||||||
| Overdue by up to 30 days | Overdue from 31 to 60 days | Overdue from 61 to 90 days | Total | Overdue by up to 30 days | Overdue from 31 to 60 days | Overdue from 61 to 90 days | Total | |||||||||||||||||||||||||
| Individuals | 5,976 | 2,772 | 1,410 | 10,158 | 6,306 | 2,973 | 1,650 | 10,929 | ||||||||||||||||||||||||
| Credit card | 937 | 442 | 446 | 1,825 | 978 | 417 | 551 | 1,946 | ||||||||||||||||||||||||
| Personal | 1,850 | 993 | 414 | 3,257 | 1,992 | 1,127 | 505 | 3,624 | ||||||||||||||||||||||||
| Payroll loans | 439 | 168 | 161 | 768 | 532 | 248 | 153 | 933 | ||||||||||||||||||||||||
| Vehicles | 1,382 | 448 | 177 | 2,007 | 1,706 | 642 | 245 | 2,593 | ||||||||||||||||||||||||
| Mortgage loans | 1,368 | 721 | 212 | 2,301 | 1,098 | 539 | 196 | 1,833 | ||||||||||||||||||||||||
| Corporate | 790 | 72 | 58 | 920 | 571 | 168 | 73 | 812 | ||||||||||||||||||||||||
| Small and medium businesses | 1,928 | 816 | 316 | 3,060 | 2,128 | 987 | 429 | 3,544 | ||||||||||||||||||||||||
| Foreign loans - Latin America | 3,965 | 899 | 443 | 5,307 | 1,506 | 274 | 109 | 1,889 | ||||||||||||||||||||||||
| Total | 12,659 | 4,559 | 2,227 | 19,445 | 10,511 | 4,402 | 2,261 | 17,174 | ||||||||||||||||||||||||
| F-149 |
6.1.2 The table below shows other financial assets, individually evaluated, classified by rating:
| 12/31/2016 | ||||||||||||||||||||||||||||
| Internal rating | Interbank deposits and securities purchased under agreements to resell | Held-for-trading financial assets | Financial assets designated at fair value through profit or loss | Derivatives assets | Available-for- sale financial assets | Held-to- maturity financial assets | Total | |||||||||||||||||||||
| Lower risk | 287,743 | 204,621 | 1,191 | 23,943 | 83,974 | 39,008 | 640,480 | |||||||||||||||||||||
| Satisfactory | - | 19 | - | 87 | 980 | 294 | 1,380 | |||||||||||||||||||||
| Higher risk | - | 8 | - | 201 | 1,227 | - | 1,436 | |||||||||||||||||||||
| Impairment | - | - | - | - | 2,096 | 1,193 | 3,289 | |||||||||||||||||||||
| Total | 287,743 | 204,648 | 1,191 | 24,231 | 88,277 | 40,495 | 646,585 | |||||||||||||||||||||
| % | 44.4 | 31.7 | 0.2 | 3.7 | 13.7 | 6.3 | 100.0 | |||||||||||||||||||||
| 12/31/2015 | ||||||||||||||||||||||||||||
| Internal rating | Interbank deposits and securities purchased under agreements to resell | Held-for-trading financial assets | Financial assets designated at fair value through profit or loss | Derivatives assets | Available-for- sale financial assets | Held-to- maturity financial assets | Total | |||||||||||||||||||||
| Lower risk | 284,929 | 164,283 | 642 | 26,251 | 84,284 | 41,843 | 602,232 | |||||||||||||||||||||
| Satisfactory | - | 26 | - | 130 | 889 | 342 | 1,387 | |||||||||||||||||||||
| Higher Risk | - | 2 | - | 374 | 308 | - | 684 | |||||||||||||||||||||
| Impairment | - | - | - | - | 564 | - | 564 | |||||||||||||||||||||
| Total | 284,929 | 164,311 | 642 | 26,755 | 86,045 | 42,185 | 604,867 | |||||||||||||||||||||
| % | 47.1 | 27.2 | 0.1 | 4.4 | 14.2 | 7.0 | 100.0 | |||||||||||||||||||||
| F-150 |
6.1.3 Collateral held for loan and lease operations portfolio
| 12/31/2016 | 12/31/2015 | |||||||||||||||||||||||||||||||
| (l) Over-collateralized assets | (II) Under-collateralized assets | (l) Over-collateralized assets | (II) Under-collateralized assets | |||||||||||||||||||||||||||||
| Financial effect of collateral | Carrying value of the assets | Fair value of collateral | Carrying value of the assets | Fair value of collateral | Carrying value of the assets | Fair value of collateral | Carrying value of the assets | Fair value of collateral | ||||||||||||||||||||||||
| Individuals | 51,587 | 128,555 | 790 | 743 | 54,640 | 135,202 | 639 | 572 | ||||||||||||||||||||||||
| Personal | 443 | 1,297 | 682 | 652 | 495 | 1,204 | 448 | 419 | ||||||||||||||||||||||||
| Vehicles | 13,039 | 35,995 | 107 | 90 | 19,390 | 50,662 | 189 | 152 | ||||||||||||||||||||||||
| Mortgage loans | 38,105 | 91,263 | 1 | 1 | 34,755 | 83,336 | 2 | 1 | ||||||||||||||||||||||||
| Small, medium businesses and corporate | 122,353 | 368,937 | 12,324 | 6,729 | 169,560 | 481,916 | 7,968 | 2,932 | ||||||||||||||||||||||||
| Foreign loans - Latin America | 97,374 | 155,923 | 9,420 | 4,803 | 57,680 | 89,531 | 7,715 | 6,042 | ||||||||||||||||||||||||
| Total | 271,314 | 653,415 | 22,534 | 12,275 | 281,880 | 706,649 | 16,322 | 9,546 | ||||||||||||||||||||||||
The difference between the total loan portfolio and collateralized loan portfolio is generated by non-collateralized loans amounting to R$ 196,518 (R$ 176,046 at 12/31/2015).
ITAÚ UNIBANCO HOLDING uses collateral to reduce the occurrence of losses in operations with credit risk and manages and regularly reviews its collateral with the objective that collateral held is sufficient, legally exercisable (effective) and feasible. Thus, collateral is used to maximize the recoverability potential of impaired loans and not to reduce the exposure value of customers and counterparties.
Individuals
Personal– This category of credit products usually requires collateral, focusing on endorsements and sureties.
Vehicles– For this type of operation, clients' assets serve as collateral, which are also the leased assets in leasing operations.
Mortgage loans– Regards buildings themselves given in guarantee.
Small, Medium Businesses and Corporate –For these operations, any collateral can be used within the credit policy of ITAÚ UNIBANCO HOLDING (chattel mortgage, assignmenttrust, surety / joint debtor, Mortgage and others).
Foreign loans – Latin America–For these operations, any collateral can be used within the credit policy of ITAÚ UNIBANCO HOLDING (chattel mortgage, assignment trust, surety/jointdebtor, Mortgage and others).
| F-151 |
7.Repossessed assets
Repossessed assets are recognized as assets when possession is effectively obtained.
Assets received from the foreclosure of loans, including real estate, are initially recorded at the lower of: (i) the fair value of the asset less the estimated selling expenses, or (ii) the carrying amount of the loan.
Further impairment of assets is recorded as a provision, with a corresponding charge to income. The maintenance costs of these assets are expensed as incurred.
The policy for sales of these assets (assets not for use) includes periodic auctions that are announced in advance and considers that the assets cannot be held for more than one year as stipulated by the BACEN. This period may be extended at the discretion of BACEN.
The amounts below represent total assets repossessed in the period:
| 01/01 to | 01/01 to | |||||||
| 12/31/2016 | 12/31/2015 | |||||||
| Real estate not for own use | 13 | 133 | ||||||
| Residential properties - mortgage loans | 411 | 256 | ||||||
| Vehicles - linked to loan operations | 14 | 18 | ||||||
| Other (vehicles / furniture / equipments) - dation | 172 | 37 | ||||||
| Total | 610 | 444 | ||||||
| F-152 |
Market risk
Market risk is the possibility of incurring financial losses arising from the changes in the market value of positions held by a financial institution, including the risks of transactions subject to foreign exchange variation, interest rates, share prices, price indexes and commodity prices, among other indices related to risk factors.
Market risk management is the process through which the ITAÚ UNIBANCO HOLDING monitors and controls the risks of variations in financial instruments market values due market changes, aimed at optimizing the risk-return ratio, by using an appropriate structure of limits, alerts, models and adequate management tools.
The policy of risk management the ITAÚ UNIBANCO HOLDING is in line with the principles of CMN Resolution No. 3,464 of June 26, 2007, and posterior amendments, comprising a set of principles that drive the institution’s strategy of control and management of market risks in all business units and legal entities of ITAÚ UNIBANCO HOLDING.
The document set forth by the corporate guidelines on market risk management, that is not part of the financial statements, may be viewed on the websitewww.itau.com.br/relacoes-com-investidores, in the section Corporate Governance / Rules and Policies / Public Access Report - Market Risk.
The risk management strategy of ITAÚ UNIBANCO HOLDING tries to achieve a balance between business objectives, considering among others:
| · | Political, economic and market context; |
| · | Portfolio profile of ITAÚ UNIBANCO HOLDING; |
| · | Capacity to operate in specific markets. |
The process for managing the market risk of ITAÚ UNIBANCO HOLDING is conducted within the governance and hierarchy of committees and a framework of limits and warnings approved specifically for this purpose, covering different levels and classes of market risk (such as interest rate, and exchange variation risk, among others). This framework of limits and warnings covers from the monitoring of risk aggregate indicators (portfolio level) to granular limits (individual desk level). The framework of market risk ranges from the risk factor level, with specific limits aiming at improving the risk monitoring and understanding process, and at avoiding risk concentration. These limits are quantified by assessing the forecasted results of the balance sheet, size of stockholders’ equity, liquidity, markets complexity and volatility and the institution’s appetite for risk. Limits are monitored daily and excesses and potential violations are reported and discussed for each established limit:
| · | Within one business day, for management of business units in charge and executives of the risk control area and business areas; and |
| · | Within one month, for proper committees. |
Daily risk reports, used by the business and control departments, are issued for senior management. Additionally, the risk control and management process is submitted to periodic reviews for the purpose of keeping it in line with the best market practices and adherent to the ongoing improvement processes at ITAÚ UNIBANCO HOLDING.
The structure of limits and alerts follows the Board of Directors' guidelines and is approved by panels. The process to definite limit levels and violation reports follow the governance to approve the internal policies of ITAÚ UNIBANCO HOLDING. The information flow established aims at disseminating information to the several levels of executives of the institution, including the members of the Executive Board, by means of the Committees in charge of risk management. This limit and warning framework increases effectiveness and the control coverage is reviewed at least on an annual basis.
The purpose of market risk of ITAÚ UNIBANCO HOLDING structure is:
| · | Providing visibility and assurance to all executive levels that the assumption of market risks is in line with ITAÚ UNIBANCO HOLDING and the risk-return objective; |
| · | Promoting disciplined and educated discussion on the global risk profile and its evolution over time; |
| · | Increasing transparency on the way the business seeks to optimize results; |
| · | Providing early warning mechanisms in order to make the effective risk management easier, without jeopardizing the business purposes; and |
| F-153 |
| · | Monitoring and avoiding risk concentration. |
The market risk is controlled by an area independent from the business areas, which is responsible for the daily activities of: (i) risk measurement and assessment, (ii) monitoring of stress scenarios, limits and warnings, (iii) application, analysis and tests of stress scenarios, (iv) risk reporting for individuals responsible within the business areas, in compliance with governance of ITAÚ UNIBANCO HOLDING, (v) monitoring of actions required for adjustment of positions and/or risk levels to make them feasible, and (vi) support to the launch of new financial products with security. For that purpose, ITAÚ UNIBANCO HOLDING has a structured reporting and information process and an information flow that provides input for the follow-up by committees and complies with the requirements of Brazilian and foreign regulatory agencies.
ITAÚ UNIBANCO HOLDING hedges transactions with clients and proprietary positions, including foreign investments, aiming at mitigating risks arising from fluctuations in market factors and maintaining the classification the transactions into the current exposure limits. Derivatives are the most frequently used instruments for these hedges. When these transactions are designed for as hedge accounting, specific supporting documentation is prepared, including continuous review of the hedge effectiveness (retrospective and prospective) and other changes in the accounting process. Accounting and managerial hedge are governed by corporate guidelines of ITAÚ UNIBANCO HOLDING.
For a detailed vision of the accounting hedge topic, see Note 9 – Hedge accounting.
The market risk structure categorizes transactions as part of either the banking portfolio or the trading portfolio, in accordance with general criteria established by the National Monetary Council Resolution No. 3,464 and BACEN Circular No. 3,354 of July 27, 2007.
The trading portfolio consists of all transactions involving financial instruments and goods, including derivatives, which are carried out with the intention of trading.
The banking portfolio is basically characterized by transactions from the banking business and transactions related to the management of the balance sheet of the institution. It has the no-intention of resale and medium and long term time horizons as general guidelines.
Exposures to market risks inherent in the many different financial instruments, including derivatives, are broken down into a number of risk factors, primary market components for pricing. The main risk factors measured by ITAÚ UNIBANCO HOLDING are:
| · | Interest rates: the risk of losses from transactions subject to interest rate variations, foreign-currency coupons and price-index coupons; |
| · | Currencies: the risk of losses from transactions subject to foreign exchange rate variation; |
| · | Shares: the risk of losses from transactions subject to share price variations; |
| · | Commodities: the risk of losses from transactions subject to commodity price variations. |
The CMN has regulations that establish the segregation of exposure to market risk at least in the following categories: interest rate, exchange rate, shares and commodities. Inflation rates are addressed as a group of risk factors and received the same treatment as the other risk factors, such as interest rates, exchange rates, etc., and follow the structure of risk and limits governance adopted by ITAÚ UNIBANCO HOLDING to manage market risk.
Market risk is analyzed based on the following metrics:
| · | Value at risk (VaR): statistical metric that estimates the expected maximum potential economic loss under normal market conditions, taking into consideration a certain time horizon and confidence level; |
| · | Losses in stress scenarios (Stress test): simulation technique to assess the behavior of assets, liabilities and derivatives of a portfolio when several risk factors are taken to extreme market situations (based on prospective and historical scenarios) in the portfolio; |
| · | Stop loss: metrics which purpose is to review positions, should losses accumulated in a certain period reach a certain amount; |
| · | Concentration: cumulative exposure of a certain financial instruments or risk factor calculated at market value (“MtM – Mark to Market”); and |
| · | Stressed VaR: statistical metric resulting from the VaR calculation, with the purpose of capturing the highest risk in simulations for the current portfolio, considering the returns that can be observed in historic scenarios of extreme volatility. |
| F-154 |
In addition to the risk measures, sensitivity and loss control measures are also analyzed. They comprise:
| · | Gap analysis: accumulated exposure, by risk factor, of cash flows expressed at market value, allocated at the maturity dates; |
| · | Sensitivity (DV01 – Delta Variation): the impact on the cash flows market value when submitted to an one annual basis point increase in the current interest rates or index rate; |
| · | Sensitivity to the Several Risk Factors (Greeks): partial derivatives of an options portfolio in relation to the underlying assets price, implicit volatility, interest rate and timing. |
ITAÚ UNIBANCO HOLDING uses proprietary systems to measure the consolidated market risk. The processing of these systems occur, in an access-controlled environment, being highly available, which has data safekeeping and recovery processes, and counts on such an infrastructure to ensure the continuity of business in contingency (disaster recovery) situations.
VaR - Consolidated ITAÚ UNIBANCO HOLDING
Consolidated VaR of ITAÚ UNIBANCO HOLDING is calculated through the Historical Simulation methodology, which fully reflects all its positions based on the historical series of asset prices. In the first quarter of 2016, o ITAÚ UNIBANCO HOLDING opted for including the exposures of each foreign unit in the calculation of ITAÚ UNIBANCO HOLDING’s Consolidated VaR, so as to take into account the risk factors of these units, thus improving the methodology used.
The Consolidated Total VaR table provides an analysis of the exposure to market risk of ITAÚ UNIBANCO HOLDING portfolios.
ITAÚ UNIBANCO HOLDING maintaining its conservative management and portfolio diversification, continued with its policy of operating within low limits in relation to its capital in the period. In this quarter, the Total Average VaR remained lower than 1% of ITAÚ UNIBANCO HOLDING`s stockholders` equity, in line with that recorded in the previous quarter.
From January 1st to December 31, 2016, the average total VaR in Historical Simulation was R$ 236.6, or 0.18% of total stockholders’ equity (throughout 2015 it was R$ 207.0 or 0.18% of total stockholders’ equity).
| (in R$ million) | ||||||||||||||||||||||||||||||||
| VaR Total - Historical Simulation | ||||||||||||||||||||||||||||||||
| 12/31/2016(1) | 12/31/2015(2) | |||||||||||||||||||||||||||||||
| Average | Minimum | Maximum | Var Total | Average | Minimum | Maximum | Var Total | |||||||||||||||||||||||||
| Risk factor group | ||||||||||||||||||||||||||||||||
| Interest rates | 482.5 | 323.7 | 607.4 | 607.4 | 363.5 | 314.2 | 606.4 | 347.1 | ||||||||||||||||||||||||
| Currencies | 18.4 | 6.8 | 33.2 | 17.0 | 47.1 | 11.3 | 118.6 | 12.3 | ||||||||||||||||||||||||
| Shares | 45.2 | 34.0 | 63.3 | 44.3 | 16.9 | 6.9 | 57.2 | 46.9 | ||||||||||||||||||||||||
| Commodities | 1.7 | 0.7 | 4.0 | 0.8 | 1.8 | 0.8 | 8.5 | 2.1 | ||||||||||||||||||||||||
| Effect of diversification | (339.7 | ) | (204.4 | ) | ||||||||||||||||||||||||||||
| Total risk | 236.6 | 155.1 | 341.5 | 329.8 | 207.0 | 152.3 | 340.7 | 204.0 | ||||||||||||||||||||||||
| (1) | VaR by Risk factor group includes information from foreign units. |
| (2) | VaR by Risk factor group does not include information from foreign units. |
| F-155 |
Interest rate
The table on the position of accounts subject to interest rate risk group them by products, book value of accounts distributed by maturity. This table is not used directly to manage interest rate risks; it is mostly used to enable the assessment of mismatching between accounts and products associated thereto and to identify possible risk concentration.
The following table sets forth our interest-earning assets and interest-bearing liabilities and therefore does not reflect interest rate gap positions that may exist as of any given date. In addition, variations in interest rate sensitivity may exist within the repricing periods presented due to differing repricing dates within the period.
Position of accounts subject to interest rate risk(1)
| 12/31/2016 | 12/31/2015 | |||||||||||||||||||||||||||||||||||||||||||||||
| 0-30 days | 31-180 days | 181-365 days | 1-5 years | Over 5 years | Total | 0-30 days | 31-180 days | 181-365 days | 1-5 years | Over 5 years | Total | |||||||||||||||||||||||||||||||||||||
| Interest-bearing assets | 389,843 | 219,332 | 95,331 | 347,743 | 167,400 | 1,219,649 | 376,617 | 203,639 | 97,021 | 277,995 | 186,609 | 1,141,881 | ||||||||||||||||||||||||||||||||||||
| Interbank deposits | 13,286 | 4,676 | 3,541 | 1,189 | - | 22,692 | 23,454 | 3,436 | 2,879 | 753 | 3 | 30,525 | ||||||||||||||||||||||||||||||||||||
| Securities purchased under agreements to resell | 201,525 | 63,180 | 35 | 281 | 30 | 265,051 | 196,402 | 57,997 | 5 | - | - | 254,404 | ||||||||||||||||||||||||||||||||||||
| Central Bank compulsory deposits | 82,698 | - | - | - | - | 82,698 | 62,766 | - | - | - | - | 62,766 | ||||||||||||||||||||||||||||||||||||
| Held-for-trading financial assets | 6,971 | 14,194 | 13,041 | 118,050 | 52,392 | 204,648 | 12,872 | 9,413 | 13,649 | 57,700 | 70,677 | 164,311 | ||||||||||||||||||||||||||||||||||||
| Financial assets held for trading and designated at fair value through profit or loss | - | - | 1,191 | - | - | 1,191 | - | - | - | 642 | - | 642 | ||||||||||||||||||||||||||||||||||||
| Available-for-sale financial assets | 5,994 | 10,539 | 7,103 | 38,969 | 25,672 | 88,277 | 3,903 | 7,106 | 11,914 | 35,098 | 28,024 | 86,045 | ||||||||||||||||||||||||||||||||||||
| Held-to-maturity financial assets | 1,370 | 528 | 600 | 19,376 | 18,621 | 40,495 | 342 | - | 319 | 14,500 | 27,024 | 42,185 | ||||||||||||||||||||||||||||||||||||
| Derivatives | 5,815 | 5,470 | 2,826 | 6,940 | 3,180 | 24,231 | 6,040 | 7,152 | 2,653 | 8,116 | 2,794 | 26,755 | ||||||||||||||||||||||||||||||||||||
| Loan and lease operations portfolio | 72,184 | 120,745 | 66,994 | 162,938 | 67,505 | 490,366 | 70,838 | 118,535 | 65,602 | 161,186 | 58,087 | 474,248 | ||||||||||||||||||||||||||||||||||||
| Interest-bearing liabilities | 325,241 | 90,652 | 111,907 | 287,433 | 62,298 | 877,531 | 290,908 | 98,129 | 74,635 | 316,852 | 72,968 | 853,492 | ||||||||||||||||||||||||||||||||||||
| Savings deposits | 108,250 | - | - | - | - | 108,250 | 111,319 | - | - | - | - | 111,319 | ||||||||||||||||||||||||||||||||||||
| Time deposits | 30,555 | 28,248 | 17,110 | 78,032 | 2,329 | 156,274 | 13,465 | 19,252 | 13,277 | 57,694 | 1,562 | 105,250 | ||||||||||||||||||||||||||||||||||||
| Interbank deposits | 1,176 | 1,918 | 625 | 36 | 2 | 3,757 | 4,475 | 8,727 | 1,012 | 735 | - | 14,949 | ||||||||||||||||||||||||||||||||||||
| Deposits received under repurchase agreements | 172,411 | 6,844 | 55,314 | 97,056 | 17,539 | 349,164 | 144,750 | 15,186 | 21,262 | 134,708 | 20,737 | 336,643 | ||||||||||||||||||||||||||||||||||||
| Interbank market | 6,535 | 38,590 | 30,227 | 50,590 | 9,541 | 135,483 | 8,056 | 42,525 | 29,966 | 62,654 | 13,685 | 156,886 | ||||||||||||||||||||||||||||||||||||
| Institutional market | 951 | 11,490 | 6,612 | 46,883 | 30,303 | 96,239 | 4,988 | 5,123 | 5,748 | 42,938 | 35,121 | 93,918 | ||||||||||||||||||||||||||||||||||||
| Derivatives | 5,294 | 3,555 | 1,961 | 11,394 | 2,494 | 24,698 | 3,850 | 7,309 | 3,348 | 14,715 | 1,849 | 31,071 | ||||||||||||||||||||||||||||||||||||
| Financial liabilities held for trading | 69 | 7 | 58 | 295 | 90 | 519 | 5 | 7 | 22 | 364 | 14 | 412 | ||||||||||||||||||||||||||||||||||||
| Liabilities for capitalization plans | - | - | - | 3,147 | - | 3,147 | - | - | - | 3,044 | - | 3,044 | ||||||||||||||||||||||||||||||||||||
| Difference asset / liability(2) | 64,602 | 128,680 | (16,576 | ) | 60,310 | 105,102 | 342,118 | 85,709 | 105,510 | 22,386 | (38,857 | ) | 113,641 | 288,389 | ||||||||||||||||||||||||||||||||||
| Cumulative difference | 64,602 | 193,282 | 176,706 | 237,016 | 342,118 | 85,709 | 191,219 | 213,605 | 174,748 | 288,389 | ||||||||||||||||||||||||||||||||||||||
| Ratio of cumulative difference to total interest-bearing assets | 5.3 | % | 15.8 | % | 14.5 | % | 19.4 | % | 28.1 | % | 7.5 | % | 16.7 | % | 18.7 | % | 15.3 | % | 25.3 | % | ||||||||||||||||||||||||||||
| (1) | Remaining contractual terms. |
| (2) | The difference arises from the mismatch between the maturities of all remunerated assets and liabilities, at the respective period-end date, considering the contractually agreed terms. |
| F-156 |
Position of accounts subject to currency risk
| 12/31/2016 | ||||||||||||||||
| Assets | Dollar | Chilean Peso | Other | Total | ||||||||||||
| Cash and deposits on demand | 6,719 | 1,581 | 3,164 | 11,464 | ||||||||||||
| Central Bank compulsory deposits | 81 | - | 5,288 | 5,369 | ||||||||||||
| Interbank deposits | 8,860 | 1,007 | 6,781 | 16,648 | ||||||||||||
| Securities purchased under agreements to resell | 199 | 112 | 660 | 971 | ||||||||||||
| Financial assets held for trading | 6,833 | 305 | 3,607 | 10,745 | ||||||||||||
| Financial assets designated at fair value through profit or loss | 1,191 | - | - | 1,191 | ||||||||||||
| Derivatives | 5,313 | 4,873 | 452 | 10,638 | ||||||||||||
| Available-for-sale financial assets | 22,513 | 8,337 | 3,898 | 34,748 | ||||||||||||
| Held-to-maturity financial assets | 12,519 | - | 540 | 13,059 | ||||||||||||
| Loan operations and lease operations portfolio, net | 43,641 | 73,325 | 41,034 | 158,000 | ||||||||||||
| Total assets | 107,869 | 89,540 | 65,424 | 262,833 | ||||||||||||
| 12/31/2016 | ||||||||||||||||
| Liabilities | Dollar | Chilean Peso | Other | Total | ||||||||||||
| Deposits | 37,824 | 51,330 | 47,331 | 136,485 | ||||||||||||
| Securities sold under repurchase agreements | 18,353 | 27 | 2,558 | 20,938 | ||||||||||||
| Financial liabilities held for trading | 519 | - | - | 519 | ||||||||||||
| Derivatives | 4,783 | 4,105 | 282 | 9,170 | ||||||||||||
| Interbank market debt | 34,659 | 5,932 | 2,451 | 43,042 | ||||||||||||
| Institutional market debt | 37,077 | 23,643 | 3,284 | 64,004 | ||||||||||||
| Total liabilities | 133,215 | 85,037 | 55,906 | 274,158 | ||||||||||||
| Net position | (25,346 | ) | 4,503 | 9,518 | (11,325 | ) | ||||||||||
| 12/31/2015 | ||||||||||||||||
| Assets | Dollar | Chilean Peso | Other | Total | ||||||||||||
| Cash and deposits on demand | 6,060 | 779 | 4,611 | 11,450 | ||||||||||||
| Central Bank compulsory deposits | 234 | 503 | 6,435 | 7,172 | ||||||||||||
| Interbank deposits | 16,281 | 2,093 | 4,649 | 23,023 | ||||||||||||
| Securities purchased under agreements to resell | 1,966 | 56 | 87 | 2,109 | ||||||||||||
| Financial assets held for trading | 6,125 | 73 | 907 | 7,105 | ||||||||||||
| Financial assets designated at fair value through profit or loss | 642 | - | - | 642 | ||||||||||||
| Derivatives | 9,581 | 1,279 | 37 | 10,897 | ||||||||||||
| Available-for-sale financial assets | 28,833 | 3,063 | 1,928 | 33,824 | ||||||||||||
| Held-to-maturity financial assets | 14,807 | - | - | 14,807 | ||||||||||||
| Loan operations and lease operations portfolio, net | 63,456 | 36,776 | 20,931 | 121,163 | ||||||||||||
| Total assets | 147,985 | 44,622 | 39,585 | 232,192 | ||||||||||||
| 12/31/2015 | ||||||||||||||||
| Liabilities | Dollar | Chilean Peso | Other | Total | ||||||||||||
| Deposits | 55,539 | 25,811 | 30,657 | 112,007 | ||||||||||||
| Securities sold under securities repurchase agreements | 23,405 | 240 | 142 | 23,787 | ||||||||||||
| Financial liabilities held for trading | 412 | - | - | 412 | ||||||||||||
| Derivatives | 9,179 | 1,396 | 429 | 11,004 | ||||||||||||
| Interbank market debt | 59,203 | 3,796 | 821 | 63,820 | ||||||||||||
| Institutional market debt | 44,901 | 8,112 | 334 | 53,347 | ||||||||||||
| Total liabilities | 192,639 | 39,355 | 32,383 | 264,377 | ||||||||||||
| Net position | (44,654 | ) | 5,267 | 7,202 | (32,185 | ) | ||||||||||
The exposure to share price risk is disclosed in Note 7 related to financial assets held for trading and Note 10, related to available-for-sale financial assets.
| F-157 |
Liquidity risk
Liquidity risk is defined as the existence of imbalances between marketable assets and liabilities due – mismatching between payments and receipts - which may affect payment capacity of ITAÚ UNIBANCO HOLDING, taking into consideration the different currencies and payment terms and their respective rights and obligations.
Policies and procedures
The management of liquidity risks seeks to guarantee liquidity sufficient to support possible outflows in market stress situations, as well as the compatibility between funding and the terms and liquidity of assets.
ITAÚ UNIBANCO HOLDING has a structure dedicated to improve the monitoring, control and analysis, through models of projections of the variables that affect cash flows and the level of reserves in local and foreign currencies.
The document that details the guidelines established by the internal policy on liquidity risk management, that is not part of the financial statements, may be viewed on the websitewww.itau.com.br/relacoes-com-investidores, in the section Corporate Governance/Rules and Policies / Public Access Report – Liquidity Risk.
The liquidity risk measurement process makes use of corporate and own in-house developed application systems. ITAÚ UNIBANCO HOLDING manages proprietary IT systems to support the liquidity risk measurement process.
Additionally, ITAÚ UNIBANCO HOLDING establishes guidelines and limits. Compliance with these guidelines and limits is periodically analyzed in technical committees, and their purpose is to provide an additional safety margin to the minimum projected needs. The liquidity management policies and the respective limits are established based on prospective scenarios periodically reviewed and on the definitions of the top management.
These scenarios may be reviewed in view of cash requirements resulting from atypical market situations or arising from strategic decisions of ITAÚ UNIBANCO HOLDING.
In compliance with the requirements of CMN Resolution No. 4,090 of May 24, 2012 and BACEN Circular N° 3,749 of March 5, 2015 , the Statement of Liquidity Risk (DRL) is sent to BACEN on a monthly basis, and the following items for monitoring and supporting decisions are periodically prepared and submitted to top management:
| · | Different scenarios projected for changes in liquidity; | |
| · | Contingency plans for crisis situations; | |
| · | Reports and charts that describe the risk positions; | |
| · | Assessment of funding costs and alternative sources of funding; |
| · | Monitoring of changes in funding through a constant control over sources of funding, considering the type of investor and maturities, among other factors; |
In compliance with Circular nº 3.724 of BACEN, banks holding total assets over R$ 100 billion are required, since October 2015, to report a standardized Liquidity Coverage Ratio (LCR) ratio to the Central Bank of Brazil. This ratio is calculated based on a methodology defined by the Central Bank of Brazil itself, and is in line with international of Basileia.
The summarized calculation of the indicator is as follows. In 2016, the minimum indicator requirement is 70%. For more detail on the short-term liquidity indicator, that is not part of the financial statements, visitinvestor- relations,sectionCorporate Governance / Risk and Capital Management – Pillar 3.
| F-158 |
| Information on the Liquidity Coverage Ratio (LCR) | 4th quarter 2016 | |||
| Total Adjusted Amount(1) | ||||
| Total high-quality liquid assets (2) | 180,957 | |||
| Total potential cash outflows (3) | 85,018 | |||
| Liquidity Coverage Ratio (%) | 212.8 | % | ||
(1) Corresponds to the amount calculated after the application of weighting factors and limits established by BACEN Circular No. 3,749.
(2) HQLA - High quality liquid assets: balance in the stock, which in certain cases weighted by a discount factor, of assets that remain liquid in the markets during a stress period, which can be easily converted into cash and that pose low risk.
(3) Potential cash outflows calculated in standardized stress, determined by Circular No. 3.749 (outflows), subtracted from (i) potential cash inflows calculated under standardized stress, set forth by Circular No. 3,749 and (ii) 75% x Outflows, whichever is lower.
Primary sources of funding
ITAÚ UNIBANCO HOLDING has different sources of funding, of which a significant portion is from the retail segment. Total funding from clients reached R$ 612.7 billion (R$ 586.2 billion at 12/31/2015), particularly funding from time deposits. A considerable portion of these funds – 34.0% of total, or R$ 207.4 billion – is available on demand to the client. However, the historical behavior of the accumulated balance of the two largest items in this group – demand and savings deposits - is relatively consistent with the balances increasing over time and inflows exceeding outflows for monthly average amounts.
| 12/31/2016 | 12/31/2015 | |||||||||||||||||||||||
| Funding from clients | 0-30 days | Total | % | 0-30 days | Total | % | ||||||||||||||||||
| Deposits | 201,113 | 329,414 | 190,352 | 292,610 | ||||||||||||||||||||
| Demand deposits | 61,133 | 61,133 | 10.0 | 61,092 | 61,092 | 10.4 | ||||||||||||||||||
| Savings deposits | 108,250 | 108,250 | 17.7 | 111,319 | 111,319 | 19.0 | ||||||||||||||||||
| Time deposits | 30,554 | 156,274 | 25.5 | 13,465 | 105,250 | 18.0 | ||||||||||||||||||
| Other | 1,176 | 3,757 | 0.6 | 4,476 | 14,949 | 2.6 | ||||||||||||||||||
| Funds from acceptances and issuance of securities (1) | 3,091 | 93,711 | 15.3 | 4,128 | 75,590 | 12.9 | ||||||||||||||||||
| Funds from own issue (2) | 2,561 | 132,149 | 21.6 | 2,863 | 152,215 | 25.9 | ||||||||||||||||||
| Subordinated debt | 628 | 57,420 | 9.4 | 4,722 | 65,785 | 11.2 | ||||||||||||||||||
| Total | 207,393 | 612,694 | 100.0 | 202,065 | 586,200 | 100 | ||||||||||||||||||
(1) Includes mortgage notes, real estate credit bills, agribusiness, financial and structured operations certificates recorded in interbank market and debts and liabilities for issuance of debentures and foreign borrowing and securities recorded in funds from institutional markets.
(2) Refer to deposits received under securities repurchase agreements with securities from own issue.
Control over liquidity
ITAÚ UNIBANCO HOLDING manages its liquidity reserves based on estimates of funds that will be available for investment, considering the continuity of business in normal conditions.
During the period of 2016, ITAÚ UNIBANCO HOLDING maintained appropriate levels of liquidity in Brazil and abroad. Liquid assets (cash and deposits on demand, securities purchased under agreements to resell - funded position and government securities – available, detailed in the table Undiscounted future flows – Financial assets) totaled R$ 177.5 billion and accounted for 84.2% of the short term redeemable obligations, 28.5% of total funding, and 19.0% of total assets.
The table below shows the indicators used by ITAÚ UNIBANCO HOLDING in the management of liquidity risk:
| Liquidity indicators | 12/31/2016 % | 12/31/2015 % | ||||||
| Net assets (1) / funds within 30 days (2) | 84.2 | 77.5 | ||||||
| Net assets (1) / total funds (3) | 28.5 | 26.7 | ||||||
| Net assets (1) / total assets (4) | 19.0 | 18.1 | ||||||
(1) Net assets: Cash and deposits on demand, Securities purchased under agreements to resell – Funded position and Government securities - available. Detailed in the table Undiscounted future flows – Financial assets.
(2) Table Funding from clients (Total Funding from clients 0-30 days).
(3) Table funding from clients (Total funding from clients).
(4) Detailed in the table Undiscounted future flows – Financial assets, total present value regards R$ 918,080 (R$ 863,180 at 12/31/2015).
| F-159 |
The following table presents assets and liabilities according to their remaining contractual maturities, considering their undiscounted flows.
| Undiscounted future flows except for derivatives | 12/31/2016 | 12/31/2015 | ||||||||||||||||||||||||||||||||||||||
| Financial assets(1) | 0 - 30 days | 31 - 365 days | 366 - 720 days | Over 720 days | Total | 0 - 30 days | 31 - 365 days | 366 - 720 days | Over 720 days | Total | ||||||||||||||||||||||||||||||
| Cash and deposits on demand | 18,542 | - | - | - | 18,542 | 18,544 | - | - | - | 18,544 | ||||||||||||||||||||||||||||||
| Interbank investments | 219,066 | 58,275 | 1,171 | 292 | 278,804 | 229,295 | 40,016 | 696 | 239 | 270,246 | ||||||||||||||||||||||||||||||
| Securities purchased under agreements to resell – Funded position(2) | 77,452 | - | - | - | 77,452 | 72,091 | - | - | - | 72,091 | ||||||||||||||||||||||||||||||
| Securities purchased under agreements to resell – Financed position | 128,303 | 49,749 | - | - | 178,052 | 133,315 | 33,742 | - | - | 167,057 | ||||||||||||||||||||||||||||||
| Interbank deposits | 13,311 | 8,526 | 1,171 | 292 | 23,300 | 23,889 | 6,274 | 696 | 239 | 31,098 | ||||||||||||||||||||||||||||||
| Securities | 82,163 | 16,757 | 12,415 | 74,479 | 185,814 | 71,124 | 15,485 | 11,017 | 78,774 | 176,400 | ||||||||||||||||||||||||||||||
| Government securities - available | 75,310 | 20 | 40 | 6,088 | 81,458 | 65,965 | - | - | - | 65,965 | ||||||||||||||||||||||||||||||
| Government securities – subject to repurchase commitments | 556 | 4,732 | 5,990 | 14,808 | 26,086 | 68 | 2,675 | 712 | 6,866 | 10,321 | ||||||||||||||||||||||||||||||
| Private securities - available | 6,297 | 11,728 | 5,424 | 47,866 | 71,315 | 5,091 | 12,681 | 10,305 | 71,908 | 99,985 | ||||||||||||||||||||||||||||||
| Private securities – subject to repurchase commitments | - | 277 | 961 | 5,717 | 6,955 | - | 129 | - | - | 129 | ||||||||||||||||||||||||||||||
| Derivative financial instruments | 5,815 | 8,296 | 3,159 | 6,961 | 24,231 | 5,955 | 7,685 | 3,430 | 6,289 | 23,359 | ||||||||||||||||||||||||||||||
| Gross position | - | - | - | - | - | - | 1 | - | 20 | 21 | ||||||||||||||||||||||||||||||
| Cross Currency Swap Deliverable - Asset position | - | - | - | - | - | - | 852 | - | 975 | 1,827 | ||||||||||||||||||||||||||||||
| Cross Currency Swap Deliverable - Liability position | - | - | - | - | - | - | (851 | ) | - | (955 | ) | (1,806 | ) | |||||||||||||||||||||||||||
| Net position | 5,815 | 8,296 | 3,159 | 6,961 | 24,231 | 5,955 | 7,684 | 3,430 | 6,269 | 23,338 | ||||||||||||||||||||||||||||||
| Swaps | 828 | 1,967 | 1,497 | 6,250 | 10,542 | 666 | 2,140 | 1,935 | 4,406 | 9,147 | ||||||||||||||||||||||||||||||
| Option | 354 | 2,881 | 1,397 | 160 | 4,792 | 2,413 | 2,000 | 692 | 478 | 5,583 | ||||||||||||||||||||||||||||||
| Forward (onshore) | 3,947 | 1,024 | - | - | 4,971 | 1,204 | 1,961 | 1 | - | 3,166 | ||||||||||||||||||||||||||||||
| Other derivative financial instruments | 686 | 2,424 | 265 | 551 | 3,926 | 1,672 | 1,583 | 802 | 1,385 | 5,442 | ||||||||||||||||||||||||||||||
| Loan and lease operations portfolio(3) | 61,602 | 176,002 | 81,224 | 211,908 | 530,736 | 63,263 | 171,813 | 86,118 | 187,619 | 508,813 | ||||||||||||||||||||||||||||||
| Total financial assets | 387,188 | 259,330 | 97,969 | 293,640 | 1,038,127 | 388,181 | 234,999 | 101,261 | 272,921 | 997,362 | ||||||||||||||||||||||||||||||
(1) The assets portfolio does not take into consideration the balance of compulsory deposits in Central Bank, amounting to R$ 85,700 (R$ 66,556 at 12/31/2015), which release of funds is linked to the maturity of the liability portfolios. The amounts of PGBL and VGBL are not considered in the assets portfolio because they are covered in Note 30.
(2) Net of R$ 4,329 (R$ 9,461 at 12/31/2015) which securities are restricted to guarantee transactions at BM&FBOVESPA S.A. and the Central Bank of Brazil.
(3) Net of payment to merchants of R$ 43,837 (R$ 38,978 at 12/31/2015) and the amount of liabilities from transactions related to credit assignments R$ 5,711 (R$ 5,495 at 12/31/2015) .
| F-160 |
| Undiscounted future flows except for derivatives | 12/31/2016 | 12/31/2015 | ||||||||||||||||||||||||||||||||||||||
| Financial liabilities | 0 – 30 days | 31 – 365 days | 366 – 720 days | Over 720 days | Total | 0 – 30 days | 31 – 365 days | 366 – 720 days | Over 720 days | Total | ||||||||||||||||||||||||||||||
| Deposits | 201,167 | 44,545 | 13,106 | 107,055 | 365,873 | 190,890 | 45,133 | 8,331 | 64,843 | 309,197 | ||||||||||||||||||||||||||||||
| Demand deposits | 61,133 | - | - | - | 61,133 | 61,092 | - | - | - | 61,092 | ||||||||||||||||||||||||||||||
| Savings deposits | 108,250 | - | - | - | 108,250 | 111,319 | - | - | - | 111,319 | ||||||||||||||||||||||||||||||
| Time deposit | 30,295 | 41,971 | 13,088 | 107,033 | 192,387 | 13,873 | 34,660 | 8,326 | 64,819 | 121,678 | ||||||||||||||||||||||||||||||
| Interbank deposits | 1,489 | 2,574 | 18 | 22 | 4,103 | 4,606 | 10,473 | 5 | 24 | 15,108 | ||||||||||||||||||||||||||||||
| Compulsory deposits | (42,314 | ) | (13,885 | ) | (3,985 | ) | (25,516 | ) | (85,700 | ) | (40,807 | ) | (9,021 | ) | (2,043 | ) | (14,685 | ) | (66,556 | ) | ||||||||||||||||||||
| Demand deposits | (8,092 | ) | - | - | - | (8,092 | ) | (10,224 | ) | - | - | - | (10,224 | ) | ||||||||||||||||||||||||||
| Savings deposits | (24,791 | ) | - | - | - | (24,791 | ) | (26,838 | ) | - | - | - | (26,838 | ) | ||||||||||||||||||||||||||
| Time deposit | (9,431 | ) | (13,885 | ) | (3,985 | ) | (25,516 | ) | (52,817 | ) | (3,745 | ) | (9,021 | ) | (2,043 | ) | (14,685 | ) | (29,494 | ) | ||||||||||||||||||||
| Securities sold under repurchase agreements(1) | 209,521 | 59,771 | 42,410 | 87,069 | 398,771 | 167,363 | 39,464 | 63,773 | 111,189 | 381,789 | ||||||||||||||||||||||||||||||
| Government securities | 168,301 | 5,600 | 5,764 | 33,812 | 213,477 | 139,530 | 5,315 | 2,588 | 29,937 | 177,370 | ||||||||||||||||||||||||||||||
| Private securities | 13,753 | 54,171 | 36,646 | 53,257 | 157,827 | 8,043 | 30,146 | 61,185 | 81,252 | 180,626 | ||||||||||||||||||||||||||||||
| Foreign | 27,467 | - | - | - | 27,467 | 19,790 | 4,003 | - | - | 23,793 | ||||||||||||||||||||||||||||||
| Funds from acceptances and issuance of securities(2) | 3,003 | 35,659 | 28,974 | 36,858 | 104,494 | 4,188 | 24,186 | 19,178 | 40,612 | 88,164 | ||||||||||||||||||||||||||||||
| Borrowing and onlending(3) | 5,077 | 46,527 | 11,000 | 20,943 | 83,547 | 5,902 | 58,159 | 24,116 | 25,672 | 113,849 | ||||||||||||||||||||||||||||||
| Subordinated debt(4) | 271 | 13,501 | 16,621 | 41,043 | 71,436 | 4,775 | 10,115 | 13,764 | 56,006 | 84,660 | ||||||||||||||||||||||||||||||
| Derivative financial instruments | 5,294 | 5,516 | 3,726 | 10,162 | 24,698 | 3,765 | 8,537 | 4,104 | 11,269 | 27,675 | ||||||||||||||||||||||||||||||
| Gross position | - | - | - | - | - | 1 | 11 | - | 4 | 16 | ||||||||||||||||||||||||||||||
| Cross Currency Swap Deliverable - Asset position | - | - | - | - | - | (85 | ) | (1,269 | ) | - | (236 | ) | (1,590 | ) | ||||||||||||||||||||||||||
| Cross Currency Swap Deliverable - Liability position | - | - | - | - | - | 86 | 1,280 | - | 240 | 1,606 | ||||||||||||||||||||||||||||||
| Net position | 5,294 | 5,516 | 3,726 | 10,162 | 24,698 | 3,764 | 8,526 | 4,104 | 11,265 | 27,659 | ||||||||||||||||||||||||||||||
| Swaps | 461 | 1,702 | 2,352 | 8,706 | 13,221 | 783 | 3,368 | 2,618 | 9,562 | 16,331 | ||||||||||||||||||||||||||||||
| Option | 837 | 1,888 | 1,116 | 711 | 4,552 | 1,460 | 3,025 | 805 | 493 | 5,783 | ||||||||||||||||||||||||||||||
| Forward (onshore) | 3,530 | - | - | - | 3,530 | 828 | 5 | - | - | 833 | ||||||||||||||||||||||||||||||
| Other derivative financial instruments | 466 | 1,926 | 258 | 745 | 3,395 | 693 | 2,128 | 681 | 1,210 | 4,712 | ||||||||||||||||||||||||||||||
| Total financial liabilities | 382,019 | 191,634 | 111,852 | 277,614 | 963,119 | 336,076 | 176,573 | 131,223 | 294,906 | 938,778 | ||||||||||||||||||||||||||||||
(1) Includes own and third parties’ portfolios.
(2) Includes mortgage notes, real estate credit bills, agribusiness, financial bills and structured operations certificates recorded in interbank market funds and liabilities for issuance of debentures and foreign securities recorded in funds from institutional markets.
(3) Recorded in funds from interbank markets.
(4) Recorded in funds from institutional markets.
| F-161 |
| 12/31/2016 | 12/31/2015 | |||||||||||||||||||||||||||||||||||||||
| Off balance sheet | 0 – 30 days | 31 – 365 days | 366 – 720 days | Over 720 days | Total | 0 – 30 days | 31 – 365 days | 366 – 720 days | Over 720 days | Total | ||||||||||||||||||||||||||||||
| Endorsements and sureties | 1,645 | 16,203 | 5,603 | 47,342 | 70,793 | 2,018 | 13,819 | 5,477 | 52,930 | 74,244 | ||||||||||||||||||||||||||||||
| Commitments to be released | 90,279 | 42,522 | 11,657 | 77,916 | 222,374 | 84,641 | 28,808 | 28,404 | 79,487 | 221,340 | ||||||||||||||||||||||||||||||
| Letters of credit to be released | 6,660 | - | - | - | 6,660 | 6,936 | - | - | - | 6,936 | ||||||||||||||||||||||||||||||
| Contractual commitments - Fixed assets and Intangible (Notes 15 and 16) | - | 310 | - | - | 310 | - | 340 | - | - | 340 | ||||||||||||||||||||||||||||||
| Total | 98,584 | 59,035 | 17,260 | 125,258 | 300,137 | 93,595 | 42,967 | 33,881 | 132,417 | 302,860 | ||||||||||||||||||||||||||||||
| F-162 |
Note 37 – Supplementary information
Citibank’s retail operations
On October 8, 2016, ITAÚ UNIBANCO HOLDING S.A. entered, by means of its subsidiaries, into a share purchase and sale agreement with Banco Citibank S.A. and with other companies of its conglomerate (Citibank) for the acquisition of the retail activities carried out by Citibank in Brazil, including loans, deposits, credit cards, branches, assets under management and insurance brokerage, as well as the equity investments held by Citibank in TECBAN – Tecnologia Bancária S.A. (representing 5.64% of its capital) and in Cibrasec – Companhia Brasileira de Securitização (representing 3.60% of its capital), for R$ 710 million.
This operation will involve the corporate restructuring of some companies of the Citibank conglomerate so that the retail business in Brazil is spun off and transferred to the companies that will be the subject matter of the acquisition.
The effective acquisitions and financial settlements will take place after compliance with some contractual conditions and the obtainments of the necessary regulatory authorizations.
This acquisition will not have accounting impacts on ITAÚ UNIBANCO HOLDING's results.
| F-163 |
Selected statistical information
The following information is included for analytical purposes and should be read in together with our section Performance, item Financial Performance, Significant Accounting Policies, Assets and Liabilities and Item Consolidated Financial Statements (IFRS).
The data included or referenced in this section are presented in accordance with IFRS, unless otherwise indicated.
Average balance sheet and interest rate data
The following table presents the average balances of our interest-earning assets and interest-bearing liabilities, other assets and liabilities accounts, the related interest income and expense amounts and the average real yield/rate for each period.
We calculated the average balances using monthly book balances as we believe such balances are representative of our operations and it would be too costly to produce average balances using daily book balances in IFRS.
The majority of our business is comprised by operations with individuals and corporates, which have grown organically and without significant fluctuations over short periods. Non-accrual loans and leases are disclosed as a non-interest earning asset for the periods indicated in the following table:
| 2016 | 2015 | 2014 | ||||||||||||||||||||||||||||||||||
| Assets | Average balance | Interest | Average yield/rate | Average balance | Interest | Average yield/rate | Average balance | Interest | Average yield/rate | |||||||||||||||||||||||||||
| (In millions of R$, except percentages) | ||||||||||||||||||||||||||||||||||||
| Interest-earning assets(1) | 1,151,430 | 161,495 | 14.0 | 1,070,450 | 147,789 | 13.8 | 955,416 | 120,115 | 12.6 | |||||||||||||||||||||||||||
| Interbank deposits | 26,914 | 678 | 2.5 | 29,489 | 1,628 | 5.5 | 24,019 | 1,286 | 5.4 | |||||||||||||||||||||||||||
| Securities purchased under agreements to resell | 252,737 | 34,162 | 13.5 | 204,362 | 27,572 | 13.5 | 170,327 | 17,929 | 10.5 | |||||||||||||||||||||||||||
| Central Bank compulsory deposits | 72,031 | 6,920 | 9.6 | 63,418 | 5,748 | 9.1 | 69,882 | 5,904 | 8.4 | |||||||||||||||||||||||||||
| Financial assets held for trading | 179,035 | 23,669 | 13.2 | 152,687 | 19,826 | 13.0 | 134,695 | 15,128 | 11.2 | |||||||||||||||||||||||||||
| Available-for-sale financial assets | 87,678 | 11,160 | 12.7 | 82,744 | 8,979 | 10.9 | 78,559 | 7,272 | 9.3 | |||||||||||||||||||||||||||
| Held-to-maturity financial assets | 41,384 | 3,788 | 9.2 | 38,295 | 3,758 | 9.8 | 24,317 | 2,347 | 9.7 | |||||||||||||||||||||||||||
| Loan operations and lease operations (accrual) | 438,081 | 80,118 | 18.3 | 445,583 | 79,392 | 17.8 | 403,447 | 69,248 | 17.2 | |||||||||||||||||||||||||||
| Other Financial Assets | 53,570 | 1,000 | 1.9 | 53,871 | 886 | 1.6 | 50,170 | 1,001 | 2.0 | |||||||||||||||||||||||||||
| Non-interest-earning assets | 159,779 | 115,596 | 97,526 | |||||||||||||||||||||||||||||||||
| Cash and deposits on demand | 21,204 | 19,159 | 17,038 | |||||||||||||||||||||||||||||||||
| Central Bank compulsory deposits | 3,782 | 3,797 | 4,025 | |||||||||||||||||||||||||||||||||
| Derivatives | 28,904 | 24,276 | 12,647 | |||||||||||||||||||||||||||||||||
| Non-accrual loans | 21,487 | 18,559 | 17,040 | |||||||||||||||||||||||||||||||||
| Allowance for loan and lease losses | (28,902 | ) | (24,526 | ) | (21,655 | ) | ||||||||||||||||||||||||||||||
| Fixed assets, net | 8,176 | 8,618 | 7,145 | |||||||||||||||||||||||||||||||||
| Investments in unconsolidated companies | 4,790 | 4,219 | 3,964 | |||||||||||||||||||||||||||||||||
| Goodwill | 6,286 | 2,011 | 1,798 | |||||||||||||||||||||||||||||||||
| Intangible assets, net | 8,336 | 6,225 | 6,019 | |||||||||||||||||||||||||||||||||
| Tax assets | 47,265 | 43,212 | 35,000 | |||||||||||||||||||||||||||||||||
| Assets held for sale | 570 | 341 | 137 | |||||||||||||||||||||||||||||||||
| Other assets | 37,881 | 9,706 | 14,369 | |||||||||||||||||||||||||||||||||
| Total | 1,311,209 | 1,186,046 | 1,052,942 | |||||||||||||||||||||||||||||||||
(1) For the net yield on total average interest-earning assets, see "Net Interest Margin and Spread".
| 2016 | 2015 | 2014 | ||||||||||||||||||||||||||||||||||
| Liabilities | Average balance | Interest | Average yield/rate | Average balance | Interest | Average yield/rate | Average balance | Interest | Average yield/rate | |||||||||||||||||||||||||||
| (In millions of R$, except percentages) | ||||||||||||||||||||||||||||||||||||
| Interest-bearing liabilities | 969,461 | 95,125 | 9.8 | 875,904 | 75,064 | 8.6 | 793,069 | 72,977 | 9.2 | |||||||||||||||||||||||||||
| Interest-bearing deposits | 244,121 | 14,701 | 6.0 | 236,315 | 13,587 | 5.7 | 233,999 | 12,064 | 5.2 | |||||||||||||||||||||||||||
| Savings deposits | 106,838 | 7,501 | 7.0 | 114,500 | 7,720 | 6.7 | 111,473 | 6,905 | 6.2 | |||||||||||||||||||||||||||
| Deposits from banks and time deposits | 137,283 | 7,200 | 5.2 | 121,815 | 5,867 | 4.8 | 122,527 | 5,159 | 4.2 | |||||||||||||||||||||||||||
| Securities sold under repurchase agreements | 339,416 | 45,932 | 13.5 | 297,509 | 32,879 | 11.1 | 266,527 | 26,771 | 10.0 | |||||||||||||||||||||||||||
| Interbank market debt and Institutional market debt | 240,563 | 16,596 | 6.9 | 219,463 | 15,999 | 7.3 | 183,981 | 25,099 | 13.6 | |||||||||||||||||||||||||||
| Interbank market debt | 144,968 | 8,347 | 5.8 | 134,637 | 7,970 | 5.9 | 113,522 | 14,404 | 12.7 | |||||||||||||||||||||||||||
| Institutional market debt | 95,595 | 8,249 | 8.6 | 84,826 | 8,030 | 9.5 | 70,459 | 10,695 | 15.2 | |||||||||||||||||||||||||||
| Reserves for insurance and private pension and Liabilities for capitalization plans | 144,387 | 17,790 | 12.3 | 121,856 | 12,557 | 10.3 | 107,880 | 8,987 | 8.3 | |||||||||||||||||||||||||||
| Other interest-bearing liabilities | 974 | 106 | 10.9 | 761 | 42 | 5.5 | 682 | 56 | 8.2 | |||||||||||||||||||||||||||
| Non-interest bearing liabilities | 214,024 | 203,376 | 169,247 | |||||||||||||||||||||||||||||||||
| Non-interest bearing deposits | 61,895 | 54,148 | 43,840 | |||||||||||||||||||||||||||||||||
| Derivatives | 29,752 | 29,488 | 13,107 | |||||||||||||||||||||||||||||||||
| Other non-interest-bearing liabilities | 122,377 | 119,740 | 112,300 | |||||||||||||||||||||||||||||||||
| Total stockholders’ equity attributed to the owners of the parent company | 117,844 | 105,034 | 89,458 | |||||||||||||||||||||||||||||||||
| Non-controlling interests | 9,880 | 1,732 | 1,168 | |||||||||||||||||||||||||||||||||
| Total | 1,311,209 | 1,186,046 | 1,052,942 | |||||||||||||||||||||||||||||||||
Changes in interest income and expenses – volume and rate analysis
The following table sets forth the allocation of the changes in our interest income and expense in terms of average volume and changes in the average yields/rates for the periods indicated below. Volume balance and rate variations have been
| A-165 |
calculated based on variations of average balances over the period and changes in average interest yield/rates on interest earning assets and interest-bearing liabilities from one period to the other.
| Increase/(decrease) due to changes in: | ||||||||||||||||||||||||||||||||||||
| 2016-2015 | 2015-2014 | 2014-2013 | ||||||||||||||||||||||||||||||||||
| Volume(1) | Yield/rate(2) | Net change (3) | Volume(1) | Yield/rate(2) | Net change (3) | Volume(1) | Yield/rate(2) | Net change (3) | ||||||||||||||||||||||||||||
| (In millions of R$, except percentages) | ||||||||||||||||||||||||||||||||||||
| Interest-earning assets | 10,158 | 3,547 | 13,706 | 15,027 | 12,647 | 27,674 | 9,533 | 16,455 | 25,988 | |||||||||||||||||||||||||||
| Interbank deposits | (131 | ) | (819 | ) | (950 | ) | 301 | 41 | 342 | 142 | 561 | 703 | ||||||||||||||||||||||||
| Securities purchased under agreements to resell | 6,539 | 52 | 6,591 | 4,001 | 5,641 | 9,642 | 602 | 4,697 | 5,299 | |||||||||||||||||||||||||||
| Central Bank compulsory deposits | 813 | 358 | 1,171 | (733 | ) | 578 | (156 | ) | 550 | 1,041 | 1,590 | |||||||||||||||||||||||||
| Financial assets held for trading | 3,477 | 366 | 3,843 | 2,166 | 2,532 | 4,698 | (302 | ) | 4,570 | 4,268 | ||||||||||||||||||||||||||
| Available-for-sale financial assets | 559 | 1,622 | 2,181 | 403 | 1,303 | 1,707 | (417 | ) | 2,623 | 2,206 | ||||||||||||||||||||||||||
| Held-to-maturity financial assets | 181 | (151 | ) | 30 | 1,371 | 40 | 1,411 | 1,909 | (48 | ) | 1,861 | |||||||||||||||||||||||||
| Loan and lease operations (accrual) | (1,275 | ) | 2,000 | 726 | 7,434 | 2,710 | 10,144 | 6,973 | 2,729 | 9,702 | ||||||||||||||||||||||||||
| Other Financial Assets | (5 | ) | 119 | 114 | 83 | (198 | ) | (115 | ) | 77 | 282 | 359 | ||||||||||||||||||||||||
| Interest-bearing liabilities | 9,342 | 10,719 | 20,060 | 11,420 | (9,333 | ) | 2,087 | 2,717 | 23,898 | 26,615 | ||||||||||||||||||||||||||
| Interest-bearing deposits | 446 | 669 | 1,114 | 276 | 1,247 | 1,523 | 1,030 | 1,231 | 2,261 | |||||||||||||||||||||||||||
| Saving deposits | (572 | ) | 354 | (219 | ) | 191 | 624 | 815 | 1,083 | 807 | 1,890 | |||||||||||||||||||||||||
| Interbank deposits | (138 | ) | 659 | 521 | 485 | (115 | ) | 370 | (43 | ) | 435 | 392 | ||||||||||||||||||||||||
| Time deposits | 1,156 | (344 | ) | 812 | (400 | ) | 738 | 338 | (11 | ) | (11 | ) | (21 | ) | ||||||||||||||||||||||
| Securities sold under repurchase agreements | 5,032 | 8,020 | 13,053 | 3,279 | 2,829 | 6,109 | 718 | 9,188 | 9,906 | |||||||||||||||||||||||||||
| Interbank market debt and Institutional market debt | 1,308 | (711 | ) | 596 | 6,595 | (15,695 | ) | (9,100 | ) | 568 | 8,315 | 8,883 | ||||||||||||||||||||||||
| Interbank market debt | 586 | (208 | ) | 377 | 3,444 | (9,878 | ) | (6,434 | ) | 620 | 7,539 | 8,159 | ||||||||||||||||||||||||
| Institutional market debt | 722 | (503 | ) | 219 | 3,151 | (5,816 | ) | (2,666 | ) | (52 | ) | 777 | 724 | |||||||||||||||||||||||
| Reserves for insurance and private pension and Liabilities for capitalization | 2,542 | 2,691 | 5,233 | 1,262 | 2,307 | 3,569 | 387 | 5,163 | 5,551 | |||||||||||||||||||||||||||
| Other Interest-bearing liabilities | 14 | 50 | 64 | 8 | (22 | ) | (14 | ) | 14 | - | 14 | |||||||||||||||||||||||||
(1) Volume change has been computed as the change in the average interest-earning assets or interest-bearing liabilities from one period to the other multiplied by the average yield/rate in the earlier period.
(2) Yield/rate change has been computed as the change in the yield/rate in the period multiplied by the average interest-earning assets or interest-bearing liabilities in the earlier period.
(3) We allocated the net change from the combined effects of volume and yield/rate proportionately to volume change and yield/rate change, in absolute terms, without considering positive and negative effects.
Net interest margin and spread
The following table sets forth our average interest-earning assets, total average interest bearing liabilities, net interest income and the comparative net interest margin and net interest spread for the periods indicated below.
| 2016 | 2015 | 2014 | ||||||||||
| (In millions of R$, except percentages) | ||||||||||||
| Total average interest-earning assets | 1,151,430 | 1,070,450 | 955,416 | |||||||||
| Total average interest-bearing liabilities | 969,461 | 875,904 | 793,069 | |||||||||
| Net interest income (1) | 66,370 | 72,725 | 47,139 | |||||||||
| Average yield on average interest-earning assets (2) | 14.0 | % | 13.8 | % | 12.6 | % | ||||||
| Average rate on average interest-bearing liabilities (3) | 9.8 | % | 8.6 | % | 9.2 | % | ||||||
| Net interest spread (4) | 4.2 | % | 5.2 | % | 3.4 | % | ||||||
| Net interest margin (5) | 5.8 | % | 6.8 | % | 4.9 | % | ||||||
(1) Is the sum of total interest income less total interest expense.
(2) Total interest income divided by total average interest-earning assets.
(3) Total interest expense divided by total average interest-bearing liabilities.
(4) Difference between the average yield on interest-earning assets and the average rate on interest-bearing liabilities.
(5) Net interest income divided by total average interest-earning assets.
Return on equity and assets
The following table sets forth certain data with respect to return on equity and assets for the periods indicated below.
| 2016 | 2015 | 2014 | ||||||||||
| (In millions of R$, except percentages) | ||||||||||||
| Net income attributable to owners of the parent company | 23,263 | 25,740 | 21,555 | |||||||||
| Average total assets | 1,311,210 | 1,186,046 | 1,052,942 | |||||||||
| Average stockholders' equity | 117,844 | 105,034 | 89,458 | |||||||||
| Net income as a percentage of average total assets (1) | 1.8 | % | 2.2 | % | 2.0 | % | ||||||
| Net income as a percentage of average stockholder's equity (1) | 20.1 | % | 24.8 | % | 24.3 | % | ||||||
| Average stockholder's equity as a percentage of average total assets | 9.0 | % | 8.9 | % | 8.5 | % | ||||||
| Dividend payout ratio per share (2) | 44.6 | % | 28.9 | % | 31.1 | % | ||||||
(1) Attributable to owners of the parent company.
(2) Dividend and interest on stockholders’ equity per share divided by basic earnings per share. Please refer to section Our profile, item In numbers, Selected Financial Data for additional information on the computation of both dividend and interest on shareholders’ equity and basic earnings per share.
Currently, the Brazilian foreign exchange system allows the purchase and sale of foreign currency and the performance of international transfers inreais by any individual or legal entity, subject to certain regulatory procedures.
| A-166 |
The Brazilian government may impose temporary restrictions on the conversion of Brazilian currency into foreign currencies and on the remittance to foreign investors of proceeds from their investments in Brazil. Brazilian law allows the government to impose these restrictions whenever there is a serious imbalance in Brazil’s balance of payments or there are reasons to foresee a serious imbalance. We cannot predict whether the Brazilian government will impose remittance restrictions in the future. Thereal may depreciate or appreciate substantially against the U.S. dollar in the future.
Please refer to section Our risk management, item Risk factors, Macroeconomic risks, item Instability of foreign exchange rates may negatively affect us, for further details.
As of April 18, 2017, the U.S. dollar-real exchange rate (PTAX) was R$3.0958 to U$1.00.
The following table sets forth information on the selling rate for U.S. dollars and euro as reported by the Central Bank for the periods and dates indicated.
| Exchange Rate of Brazilian Currency per US$1.00 | Exchange Rate of Brazilian Currency per €1.00 | |||||||||||||||||||||||||||||||
| Year | Low | High | Average(1) | Year-End | Low | High | Average(1) | Year-End | ||||||||||||||||||||||||
| 2012 | 1.7024 | 2.1121 | 1.9588 | 2.0435 | 2.2465 | 2.7633 | 2.5277 | 2.6954 | ||||||||||||||||||||||||
| 2013 | 1.9528 | 2.4457 | 2.1741 | 2.3426 | 2.5347 | 3.2682 | 2.8947 | 3.2265 | ||||||||||||||||||||||||
| 2014 | 2.1974 | 2.7403 | 2.3599 | 2.6562 | 2.8900 | 3.4320 | 3.1113 | 3.2270 | ||||||||||||||||||||||||
| 2015 | 2.5754 | 4.1949 | 3.3876 | 3.9048 | 2.9080 | 4.7209 | 3.7358 | 4.2504 | ||||||||||||||||||||||||
| 2016 | 3.1193 | 4.1558 | 3.4500 | 3.2591 | 3.3879 | 4.5032 | 3.8043 | 3.4384 | ||||||||||||||||||||||||
| 2017 (through April 18, 2017) | 3.0510 | 3.2729 | 3.1226 | 3.0958 | 3.2455 | 3.4424 | 3.3388 | 3.3144 | ||||||||||||||||||||||||
Source: Economatica System.
| (1) | Represents the average of the exchange rates on the last day of each month during the relevant period. |
| Exchange Rate of Brazilian Currency per US$1.00 | Exchange Rate of Brazilian Currency per €1.00 | |||||||||||||||||||||||||||||||
| Month | Low | High | Average(1) | Month-End | Low | High | Average(1) | Month-End | ||||||||||||||||||||||||
| October 2016 | 3.1193 | 3.2359 | 3.1858 | 3.1811 | 3.3879 | 3.6251 | 3.5106 | 3.4811 | ||||||||||||||||||||||||
| November 2016 | 3.2024 | 3.4446 | 3.3420 | 3.3967 | 3.5326 | 3.7392 | 3.6000 | 3.6002 | ||||||||||||||||||||||||
| December 2016 | 3.2591 | 3.4650 | 3.3523 | 3.2591 | 3.4042 | 3.7127 | 3.5333 | 3.4384 | ||||||||||||||||||||||||
| January 2017 | 3.1270 | 3.2729 | 3.1966 | 3.1270 | 3.3383 | 3.4424 | 3.3944 | 3.3759 | ||||||||||||||||||||||||
| February 2017 | 3.0510 | 3.1479 | 3.1042 | 3.0993 | 3.2455 | 3.3846 | 3.3060 | 3.2753 | ||||||||||||||||||||||||
| March 2017 | 3.0765 | 3.1735 | 3.1279 | 3.1684 | 3.2723 | 3.4013 | 3.3447 | 3.3896 | ||||||||||||||||||||||||
| April 2017 (through April 18, 2017) | 3.0923 | 3.1463 | 3.1213 | 3.0958 | 3.2967 | 3.3392 | 3.3222 | 3.3144 | ||||||||||||||||||||||||
Source: Economatica System.
| (1) | Represents the average of the closing exchange rates of each day during the relevant period. |
Considerations for ADS holders
Risks related to our ADSs
Before investing in our shares and ADSs, it is important for the investor to know that, in addition to the risks related to our business, which may impact the value of our securities and our ability to perform certain obligations, including the payment of dividends and interest in equity, the investor will be exposed to additional risks, as described below. Additional risks and uncertainties that we are unaware of, or that we currently deem to be immaterial, may also become important factors that affect us and/or ADS holders.
The relative price volatility and limited liquidity of the Brazilian capital markets may significantly limit the ability of our investors to sell the preferred shares underlying our ADSs, at the price and time they desire
The investment in securities traded in emerging markets frequently involves a risk higher than an investment in securities of issuers from the United States or other developed countries, and these investments are generally considered more speculative. The Brazilian securities market is smaller, less liquid, more concentrated and can be more volatile than markets in the United States and other countries. Thus, an investor’s ability to sell preferred shares underlying ADSs at the price and time the investor desires may be substantially limited.
The preferred shares underlying our ADSs do not have voting rights, except in specific circumstances.
Pursuant to our Bylaws, the holders of preferred shares and therefore of our ADSs are not entitled to vote in our general stockholders’ meetings, except in specific circumstances. Even in such circumstances, ADS holders may be subject to practical restrictions on their ability to exercise their voting rights due to additional operational steps involved in communicating with these stockholders, as mentioned below.
According to the provisions of the ADSs deposit agreement, in the event of a general stockholders’ meeting, we will provide notice to the depositary bank, which will, to the extent practicable, send such notice to ADS holders and instructions on how such holders can participate in such general stockholders’ meeting, and ADS holders should instruct the depositary bank on how to vote in order to exercise their voting rights. This additional step of instructing the ADS depositary bank may make the process for exercising voting rights longer for ADS holders.
| A-167 |
Holders of ADSs may be unable to exercise preemptive rights with respect to our preferred shares
We may not be able to offer the U.S. holders of our ADSs preemptive rights granted to holders of our preferred shares in the event of an increase of our share capital by issuing preferred shares unless a registration statement relating to such preemptive rights and our preferred shares is effective or an exemption from such registration requirements of the Securities Act is available. As we are not obligated to file a registration statement relating to preemptive rights with respect to our preferred shares, we cannot assure that preemptive rights will be offered to you. In the event such registration statement is not filed or if the exemption from registration is not available, the U.S. holders of our ADSs may not receive any value from the granting of such preemptive rights.
The surrender of ADSs may cause the loss of the ability to remit foreign currency abroad and of certain Brazilian tax advantages
While ADS holders benefit from the electronic certificate of foreign capital registration obtained in Brazil by the custodian for our preferred shares underlying the ADSs, which permits the depositary bank to convert dividends and other distributions with respect to the preferred shares underlying the ADSs into foreign currency and remit the proceeds abroad, the availability and requirements of such electronic certificate may be adversely affected by future legislative changes.
If an ADS holder surrenders the ADSs and, consequently, receives preferred shares underlying the ADSs, such holder will have to register its investment in the preferred shares with the Central Bank of Brazil either as (i) a Foreign Direct Investment, subject to Law No. 4131/62, which will require an electronic certificate of foreign capital registration, the Electronic Declaratory Registration of Foreign Direct Investment (RDE-IED), or (ii) as a Foreign Investment in Portfolio, subject to Resolution CMN No. 4373/14, which among other requirements, requires the appointment of a financial institution in Brazil as the custodian of the preferred shares and legal representative of the foreign investor in the Electronic Declaratory Registration of Portfolio (RDE – Portfolio). The failure to register the investment in the preferred shares as foreign investment under one of the regimes mentioned above (Eg. RDE – IED or RDE – Portfolio) will impact the ability of the holder to dispose of the preferred shares and to receive dividends. Moreover, upon receipt of the preferred shares underlying the ADSs, Brazilian regulations require the investor to enter into corresponding exchange rate transactions and pay taxes on these exchange rate transactions, as applicable. The tax treatment for the remittance of dividends and distributions on, and the proceeds from any sale of, our preferred shares is less favorable in case a holder of preferred shares obtains the RDE-IED instead of the RDE-Portfolio. In addition, if a holder of preferred shares attempts to obtain an electronic certificate of foreign capital registration, such holder may incur expenses or suffer delays in the application process, which could impact the investor’s ability to receive dividends or distributions relating to our preferred shares or the return of capital on a timely manner.
The holders of ADSs have rights that differ from those of stockholders of companies organized under the laws of the United States or other countries
Our corporate affairs are governed by our Bylaws and Brazilian Corporate Law, which may have legal principles that differ from those that would apply if we were incorporated in the United States or in another country. Under Brazilian Corporate Law, the holders of ADSs and the holders of our preferred shares may have different rights with respect to the protection of investor interests, including remedies available to investors in relation to any actions taken by our Board of Directors or the holders of our common shares, which may be different from what is provided in U.S. law or the law of another country.
Taxation for ADS holders
This summary is based upon tax laws of Brazil and the United States in effect as of the date hereof, and contains a description of the main Brazilian and U.S. federal income tax considerations regarding the acquisition, ownership and disposition of our preferred shares or ADSs, but it does not purport to be a comprehensive description of all the tax considerations that may be relevant to these matters, considering that laws are subject to change and to differing interpretations (possibly with retroactive effect). Although there is no income tax treaty between Brazil and the United States in place, the tax authorities of the two countries have agreed in applicable provisions of reciprocal tax treatment as to compensation of tax withheld at the source country in the residence country. No assurance can be given, however, as to whether or when a treaty will enter into force or how it will affect a U.S. Holder (as defined below) of our preferred shares or ADSs.
Prospective purchasers of our preferred shares or ADSs should consult their own tax advisors as to the tax consequences of the acquisition, ownership and disposition of our preferred shares and ADSs, including, in particular, the effect of any non-U.S., non-resident, state or local tax laws.
Brazilian tax considerations
The following discussion summarizes the main Brazilian tax consequences related to the acquisition, ownership and disposition by Non-Resident Holders of our ADSs.
Non-resident holders resident or domiciled in tax haven jurisdictions
In accordance with Brazilian law, as regulated by Article 1 of Normative Rulling No. 1,037 of June 4th, 2010, as amended, a “tax haven” is defined as a country or location: (a) that does not impose any income tax or where the maximum income tax rate is 20% , or 17% as further detailed below; or (b) where the local legislation imposes restrictions on disclosure regarding
| A-168 |
shareholder composition or investment ownership. A list of current tax haven jurisdictions has been published per such Normative Rulling. Non-Resident Holders resident or domiciled in tax haven jurisdictions may be subject to withholding tax in Brazil at higher rates than Non-Resident Holders not resident or domiciled in tax havens, as described below.
Additionally, on June 24, 2008, Law No. 11,727 introduced the concept of “privileged tax regime,” which is defined as a tax regime that (i) does not tax income or taxes it at a maximum rate lower than 20%; (ii) grants tax benefits to non-resident entities or individuals (a) without the requirement to carry out substantial economic activity in the country or dependency or (b) contingent to the non-exercise of substantial economic activity in the country or dependency; (iii) does not tax or that taxes income generated abroad at a maximum rate of lower than 20%; or (iv) does not provide access to information related to shareholding composition, ownership of assets and rights or economic transactions carried out.
On November 28, 2014, the Brazilian tax authorities issued Ordinance No. 488, which decreased these minimum thresholds from 20% to 17% in certain cases. Under Ordinance No. 488, the 17% threshold applies only to countries and regimes aligned with international standards of fiscal transparency, in accordance with rules to be established by the Brazilian tax authorities.
Notwithstanding the above, we recommend that you consult your own tax advisors regarding the consequences of the implementation of Law No. 11,727, Normative Ruling No. 1,037 and of any related Brazilian tax law or regulation concerning tax havens and privileged tax regimes.
Taxation of dividends
Payment of dividends derived from profits generated after January 1, 1996, including dividends paid in kind, are not subject to withholding tax in Brazil. Payment of dividends derived from profits generated before January 1st, 1996 may be subject to Brazilian withholding tax at varying rates, according to the year when the profits have been generated.
Taxation of interest on net equity
Law No. 9,249, dated December 26, 1995, as amended, allows a Brazilian corporation, such as ourselves, to also make payments of interest on net equity in addition to dividend distributions. Please refer tosection Our risk management, itemRegulatory environment, Taxationfor further information. Currently, payments of interest on net equity are subject towithholding tax at a general rate of 15%, or 25% in the case of a Non-Resident Holder that is resident or domiciled in a tax haven jurisdiction.
Taxation of gains
(a) Sales or other dispositions of ADSs
Arguably, gains realized outside Brazil by a Non-Resident Holder from the sale or other disposition of ADSs to another Non-Resident Holder are not subject to Brazilian taxation. However, according to Law No. 10,833, dated December 29, 2003, as amended, the disposition of assets located in Brazil by a Non-Resident Holder may be subject to Brazilian withholding tax at a 15% flat rate or progressive rate may vary from 15% to 22.5% depending on the kind of investment made into Brazil and the location where the Non-Resident Holder is resident or domiciled (also, a 25% rate may apply if the foreign beneficiary is resident or domiciled in a jurisdiction deemed to be a tax haven for Brazilian tax purposes).
Although the referred Law is not completely clear with respect to what is considered to be an asset located in Brazil, ADSs generally should not be considered to be assets located in Brazil for purposes of such Law because they represent securities issued and negotiated in an offshore exchange market. It is important to note that even if ADSs were considered to be assets located in Brazil, Non-Resident Holders not resident or domiciled in tax haven jurisdictions may still apply for exemption from capital gains tax according to Article 81 of Law No. 8,981, dated January 20, 1995, as amended.
(b) Conversion of our preferred shares into ADSs
The deposit by a Non-Resident Holder of our preferred shares with the depositary for conversion into ADSs may be subject to Brazilian capital gains tax, if such Non-Resident Holder is resident or domiciled in a tax haven jurisdiction or if such preferred shares have not been registered under the Central Bank according to CMN Resolution No. 4.373, dated September 29, 2014, effective as of March 30, 2015 (former CMN Resolution No. 2,689, dated January 26, 2000, and CMN Resolution No. 1,927, dated May 18, 1992), as amended. In those cases, the difference between the acquisition cost of such preferred shares or the amount otherwise previously registered under the Central Bank and the average price of such preferred shares, according to the mentioned CMN Resolution No. 4,373/14), may be considered taxable capital gain, and may be subject to income tax. Please refer to section Our risk management, item Regulatory environment, Funds of foreign investors, for further details. Non-Resident Holders that are resident or domiciled in tax haven jurisdictions may be subject to capital gain tax at a 25% rate on sale or transfer of shares out of the financial markets upon such a conversion. On the other hand, when Non-Resident Holders that are not resident or domiciled in tax haven jurisdictions deposit preferred shares registered according to CMN Resolution No. 4,373/14 in exchange for ADSs, such deposit should not be subject to capital gain tax.
(c) Sales or other dispositions of our preferred shares
| A-169 |
Non-Resident Holders not resident or domiciled in tax haven jurisdictions that register their portfolio according to CMN Resolution No. 4,373/14 benefit from a special tax treatment according to which any capital gain arising from the sale of securities within Brazilian stock exchanges is exempt from income tax. On the other hand, sale of shares not registered according to CMN Resolution No. 4,373/14 or made outside of Brazilian stock exchanges is generally subject to 15% capital gain tax.
Such special treatment is not applicable to Non-Resident Holders resident or domiciled in tax haven jurisdictions, who are subject to general taxation rules applicable to Brazilian residents on the sale of their investments in the financial markets, including stock exchanges and over-the-counter markets. The taxation rate is then generally of 15%. If such Non-Resident Holders sell shares outside of the financial markets, the income taxation rate will instead be of 25%. Any exercise of preemptive rights related to our preferred shares (and in connection with the ADS program) will not be subject to Brazilian taxation. The gains from the sale or assignment of preemptive rights will be subject to the Brazilian income tax according to the same rules applicable to disposition of shares or ADSs.
Tax on financial transactions IOF/Exchange (IOF/FX) and IOF/Securities
According to Decree No. 6,306/2007, and further amendments, Tax on Financial Transactions may levy some foreign exchange transactions. Please refer tosection Our risk management, item Regulatory environment, Taxation, for further details about Tax on financial transactions.
The acquisition of ADSs is not subject to IOF tax. As of December 24, 2013, pursuant to Decree No. 8,165, the IOF/Securities tax levied on the assignment of shares traded in the Brazilian stock exchange market in order to permit the issuance of depositary receipts to be negotiated overseas has been reduced to 0% rate.
Other Brazilian taxes
There are no Brazilian inheritance, gift or succession taxes applicable to the transfer of ownership or title (ownership without beneficial interest) of our preferred shares or ADSs or the vesting of free beneficial interest of such shares or ADSs outside Brazil by a Non-Resident Holder, except for gift, inheritance and legacy taxes that are levied by some states of Brazil if bestowed in such states of Brazil or abroad when the receiver is resident or domiciled in these states of Brazil. There are no Brazilian stamp, issue, registration, or similar taxes or duties payable to Non-Resident Holders of our preferred shares or ADSs.
INVESTORS ARE STRONGLY ADVISED TO CONSULT THEIR OWN TAX ADVISORS AS TO BRAZILIAN. FEDERAL, STATE AND LOCAL TAX CONSIDERATIONS RELATING TO THE PURCHASE, OWNERSHIP AND DISPOSITION OF OUR PREFERRED SHARES OR ADSs IN LIGHT OF THEIR PARTICULAR CIRCUMSTANCES, AS WELL AS THE EFFECT OF ANY NON-BRAZILIAN TAX LAWS.
U.S. federal income tax considerations
The following is a general discussion of certain U.S. federal income tax considerations relating to the purchase, ownership and disposition of our preferred shares or ADSs by U.S. Holders (as defined below) who hold such preferred shares or ADSs as capital assets within the meaning of section 1221 of the U.S. Internal Revenue Code of 1986, as amended (the “Code”). This discussion does not address all of the U.S. federal income tax considerations that may be relevant to specific U.S. Holders in light of their particular circumstances or to U.S. Holders subject to special treatment under U.S. federal income tax law, such as banks, insurance companies, retirement plans, regulated investment companies, real estate investment trusts, dealers in securities, brokers, tax-exempt entities, certain former citizens or residents of the United States, U.S. Holders that hold our preferred shares or ADSs as part of a “straddle,” “hedging,” “conversion” or other integrated transaction, U.S. Holders that mark their securities to market for U.S. federal income tax purposes, U.S. Holders that have a functional currency other than the U.S. dollar, U.S. Holders that own (or are deemed to own) 10% or more (by voting power) of our shares or U.S. Holders that receive our preferred shares or ADSs as compensation. In addition, this discussion does not address the effect of any U.S. state, local or non-U.S. tax considerations or any U.S. estate, gift or alternative minimum tax considerations. This discussion is based on the Code, U.S. Treasury regulations promulgated or proposed thereunder and administrative and judicial interpretations thereof, all as in effect on the date hereof, and all of which are subject to change, possibly with retroactive effect, or subject to differing interpretations. This discussion also assumes that each obligation in the deposit agreement and any related agreement will be performed in accordance with its terms.
For purposes of this discussion, the term “U.S. Holder” means a beneficial owner of our preferred shares or ADSs that is, for U.S. federal income tax purposes, (i) an individual who is a citizen or resident of the United States, (ii) a corporation created or organized in or under the laws of the United States, any state thereof, or the District of Columbia, (iii) an estate the income of which is subject to U.S. federal income tax regardless of its source, or (iv) a trust (x) with respect to which a court within the United States is able to exercise primary supervision over its administration and one or more U.S. persons have the authority to control all of its substantial decisions or (y) that has in effect a valid election under applicable U.S. Treasury regulations to be treated as a U.S. person.
| A-170 |
If an entity treated as a partnership for U.S. federal income tax purposes invests in our preferred shares or ADSs, the U.S. federal income tax considerations relating to such investment will depend in part upon the status and activities of such entity and the particular partner. Any such entity should consult its own tax advisor regarding the U.S. federal income tax considerations applicable to it and its partners relating to the purchase, ownership and disposition of such preferred shares or ADSs.
INVESTORS ARE STRONGLY ADVISED TO CONSULT THEIR OWN TAX ADVISORS AS TO THE U.S. FEDERAL, STATE AND LOCAL TAX CONSIDERATIONS RELATING TO THE PURCHASE, OWNERSHIP AND DISPOSITION OF OUR PREFERRED SHARES OR ADSs IN LIGHT OF THEIR PARTICULAR CIRCUMSTANCES, AS WELL AS THE EFFECT OF ANY NON-U.S. TAX LAWS.
Except where specifically described below, this discussion assumes that we are not and will not be a passive foreign investment company (a PFIC), for U.S. federal income tax purposes. Please see the discussion under “Passive Foreign Investment Company Considerations” below.
Treatment of ADSs
A U.S. Holder of ADSs generally will be treated for U.S. federal income tax purposes as the owner of such U.S. Holder’s proportionate interest in our preferred shares held by the depositary (or its custodian) that are represented and evidenced by such ADSs. Accordingly, any deposit or withdrawal of our preferred shares in exchange for ADSs generally will not result in the realization of gain or loss to such U.S. Holder for U.S. federal income tax purposes.
Distributions
A U.S. Holder that receives a distribution with respect to our preferred shares (whether held through ADSs or directly), including payments of interest on net equity as described above under “– Brazilian Tax Considerations – Taxation of Interest on Net Equity,” generally will be required to include the amount of such distribution (without reduction for any Brazilian withholding tax with respect thereto) in gross income as a dividend to the extent of our current or accumulated earnings and profits (as determined for U.S. federal income tax purposes) on the date such U.S. Holder (or the depositary, in the case of ADSs) actually or constructively receives such distribution, and will not be eligible for the dividends received deduction allowed to corporations. A distribution on our preferred shares (whether held through ADSs or directly) in excess of current and accumulated earnings and profits generally will be treated first as a non-taxable return of capital to the extent of such U.S. Holder’s basis in such preferred shares or ADSs, as the case may be, and thereafter as gain from the sale or exchange of such preferred shares or ADSs (which will be treated in the same manner described below under “Sale, Exchange or Other Disposition of Preferred Shares or ADSs”). We have not maintained and do not plan to maintain calculations of earnings and profits for U.S. federal income tax purposes. As a result, a U.S. Holder may need to include the entire amount of any such distribution in income as a dividend.
The U.S. dollar value of any distribution on our preferred shares made in Brazilianreais generally should be calculated by reference to the exchange rate between the U.S. dollar and the Brazilianreal in effect on the date of receipt of such distribution by the U.S. Holder (or the depositary, in the case of ADSs), regardless of whether thereais so received are in fact converted into U.S. dollars. Such U.S. Holder generally will have a basis in suchreais equal to the U.S. dollar value of suchreais on the date of receipt. Any gain or loss on a subsequent conversion or other disposition of suchreais by such U.S. Holder generally will be treated as ordinary income or loss and generally will be income or loss from sources within the United States.
Distributions treated as dividends that are received by certain non-corporate U.S. persons (including individuals) in respect of shares of a non-U.S. corporation (other than a corporation that is, in the taxable year during which the distributions are made or the preceding taxable year, a PFIC) that is readily tradable on an established securities market in the United States generally qualify for a 20% reduced maximum tax rate (and potentially additional tax discussed below under “Medicare Tax”) so long as certain holding period and other requirements are met. Since the ADSs will be listed on the NYSE, unless we are treated as a PFIC with respect to a U.S. Holder, dividends received by such a U.S. Holder in respect of the ADSs should qualify for the reduced rate. Based on existing guidance, it is not entirely clear whether dividends received by such a U.S. Holder of our preferred shares in respect of such shares will qualify for the reduced rate, because our preferred shares are not themselves listed on a United States exchange. Special rules apply for purposes of determining the recipient’s investment income (which may limit deductions for investment interest) and foreign income (which may affect the amount of U.S. foreign tax credit) and to certain extraordinary dividends. Each U.S. Holder that is a non-corporate taxpayer should consult its own tax advisor regarding the possible applicability of the reduced tax rate and the related restrictions and special rules.
Sale, exchange or other Disposition of Preferred Shares or ADSs
Upon a sale, exchange or other disposition of our preferred shares or ADSs, a U.S. Holder generally will recognize gain or loss for U.S. federal income tax purposes in an amount equal to the difference, if any, between the amount realized on such sale, exchange or other disposition and such U.S. Holder’s adjusted tax basis in such preferred shares or ADSs. Any gain or loss so recognized generally will be long-term capital gain or loss if such U.S. Holder has held such preferred shares or ADSs for more than one year at the time of such sale, exchange or other disposition. Certain non-corporate U.S. Holders are entitled to
| A-171 |
preferential treatment for net long-term capital gains. The ability of a U.S. Holder to offset capital losses against ordinary income is limited.
A U.S. Holder that receives Brazilianreais from the sale, exchange or other disposition of our preferred shares generally will realize an amount equal to the U.S. dollar value of suchreais on the settlement date of such sale, exchange or other disposition if (i) such U.S. Holder is a cash basis or electing accrual basis taxpayer and our preferred shares are treated as being “traded on an established securities market” or (ii) such settlement date is also the date of such sale, exchange or other disposition. Such U.S. Holder generally will have a basis in suchreais equal to the U.S. dollar value of suchreais on the settlement date. Any gain or loss on a subsequent conversion or other disposition of suchreais by such U.S. Holder generally will be treated as ordinary income or loss and generally will be income or loss from sources within the United States. Each U.S. Holder should consult its own tax advisor regarding the U.S. federal income tax consequences of receivingreais from the sale, exchange or other disposition of our preferred shares in cases not described in the first sentence of this paragraph.
Foreign tax credit considerations
Distributions on our preferred shares (whether held through ADSs or directly), including payments of interest on net equity as described above under “– Brazilian Tax Considerations – Taxation of Interest on Net Equity,” that are treated as dividends, before reduction for any Brazilian withholding taxes with respect thereto, will generally be included in the gross income of a U.S. Holder. Thus, such U.S. Holder may be required to report income for such purposes in an amount greater than the actual amount such U.S. Holder receives in cash. Distributions treated as dividends generally will constitute income from sources outside the United States and generally will be categorized for U.S. foreign tax credit purposes as “passive category income” or, in the case of some U.S. Holders, as “general category income.” Subject to applicable limitations and holding period requirements, a U.S. Holder may be eligible to elect to claim a U.S. foreign tax credit against its U.S. federal income tax liability for any such Brazilian withholding taxes. Under current law, gain resulting from a sale or other disposal of our preferred shares or ADSs may be subject to Brazilian income or withholding taxes. A U.S. Holder’s use of a foreign tax credit with respect to any such Brazilian income or withholding taxes could be limited, as such gain generally will constitute income from sources within the United States. A U.S. Holder that does not claim a U.S. foreign tax credit generally may instead claim a deduction for any such Brazilian taxes, but only for a taxable year in which such U.S. Holder elects to do so with respect to all non-U.S. income taxes paid or accrued by such U.S. Holder in such taxable year. Foreign currency exchange gain or loss generally will constitute income from sources within the United States. The rules relating to foreign tax credits are complex, and each U.S. Holder should consult its own tax advisor regarding the application of such rules.
Passive foreign investment company considerations
Special U.S. federal income tax rules apply to U.S. persons owning shares of a PFIC. A non-U.S. corporation generally will be classified as a PFIC for U.S. federal income tax purposes in any taxable year in which, after applying relevant look-through rules with respect to the income and assets of certain subsidiaries, either: at least 75% of its gross income is “passive income”, or on average at least 50% of the gross value of its assets is attributable to assets that produce passive income or are held for the production of passive income.
For this purpose, passive income generally includes, among other things, dividends, interest, rents, royalties, gains from the disposition of passive assets and gains from commodities transactions.
The application of the PFIC rules to banks is unclear under present U.S. federal income tax law. Banks generally derive a substantial part of their income from assets that are interest bearing or that otherwise could be considered passive under the PFIC rules. The United States Internal Revenue Service ( IRS), has issued a notice, and has proposed regulations, that exclude from passive income any income derived in the active conduct of a banking business by a qualifying foreign bank, also known as the Active Bank Exception. The IRS notice and proposed regulations have different requirements for qualifying as a foreign bank, and for determining the banking income that may be excluded from passive income under the Active Bank Exception. Moreover, the proposed regulations have been outstanding since 1994 and will not be effective unless finalized.
Based on estimates of our current and projected gross income and gross assets, we do not believe that we will be classified as a PFIC for our current or future taxable years. The determination of whether we are a PFIC, however, is made annually and is based upon the composition of our income and assets (including income and assets of entities in which we hold at least a 25% interest), and the nature of our activities (including our ability to qualify for the Active Bank Exception).
Because final regulations have not been issued and because the notice and the proposed regulations are inconsistent, our status under the PFIC rules is subject to considerable uncertainty. While we conduct, and intend to continue to conduct, a significant banking business, there can be no assurance that we will satisfy the specific requirements for the Active Bank Exception under either the IRS notice or the proposed regulations. Accordingly, U.S. Holders could be subject to U.S. federal income tax under the rules described below.
If we are treated as a PFIC for any taxable year during which a U.S. Holder owns our preferred shares or ADSs, any gain realized on a sale or other taxable disposition of such preferred shares or ADSs and certain “excess distributions” (generally distributions in excess of 125% of the average distribution over the prior three-year period, or if shorter, the holding period for such preferred shares or ADSs) will be treated as ordinary income and will be subject to tax as if (i) the excess distribution or gain had been realized ratably over the U.S. Holder’s holding period for such preferred shares or ADSs, (ii) the amount deemed realized in each year had been subject to tax in each such year at the highest marginal rate for such year (other than
| A-172 |
income allocated to the current period or any taxable period before we became a PFIC, which would be subject to tax at such U.S. Holder’s regular ordinary income rate for the current year and would not be subject to the interest charge discussed below), and (iii) the interest charge generally applicable to underpayments of tax had been imposed on the taxes deemed to have been payable in those years.
We do not expect to provide information that would allow U.S. Holders to avoid the foregoing consequences by making a “qualified electing fund” election.
If we are treated as a PFIC and, at any time, we invest in non-U.S. corporations that are classified as PFICs (“Subsidiary PFICs”), U.S. Holders generally will be deemed to own, and also would be subject to the PFIC rules with respect to, their indirect ownership interest in any such Subsidiary PFIC. If we are treated as a PFIC, a U.S. Holder could incur liability for the deferred tax and interest charge described above if either (i) we receive a distribution from, or dispose of all or part of our interest in, any such Subsidiary PFIC or (ii) such U.S. Holder disposes of all or part of our preferred shares or ADSs.
A U.S. holder of shares in a PFIC (but possibly not a Subsidiary PFIC, as discussed below) may make a “mark-to-market” election, provided the PFIC shares are “marketable stock” as defined under applicable Treasury regulations (i.e., “regularly traded” on a “qualified exchange or other market”). Under applicable Treasury regulations, a “qualified exchange or other market” includes (i) a national securities exchange that is registered with the U.S. Securities and Exchange Commission or the national market system established under the Securities Exchange Act of 1934, as amended (the “Exchange Act”), or (ii) a foreign securities exchange that is regulated or supervised by a governmental authority of the country in which the market is located and meets certain trading, listing, financial disclosure and other requirements set forth in applicable Treasury regulations. The ADSs are traded on the NYSE and the preferred shares are traded on the BM&FBovespa. The NYSE constitutes a qualified exchange or other market. Although the IRS has not addressed whether the BM&FBovespa meets the requirements to be treated as a qualified exchange or other market, we believe that the BM&FBovespa should be so treated. PFIC shares traded on a qualified exchange or other market are regularly traded on such exchange or other market for any calendar year during which such shares are traded, other than inde minimis quantities, on at least 15 days during each calendar quarter. We cannot assure U.S. Holders that our preferred shares or ADSs will be treated as “marketable stock” for any taxable year.
The tax consequences that would apply if we were a PFIC would be different from those described above if a “mark-to-market” election is available and a U.S. Holder validly makes such an election as of the beginning of such U.S. Holder’s holding period. If such an election were made, such U.S. Holder generally would (i) include in gross income, entirely as ordinary income, an amount equal to the excess, if any, of the fair market value of our preferred shares or ADSs as of the close of each taxable year and such U.S. Holder’s adjusted tax basis in such preferred shares or ADSs, and (ii) deduct as an ordinary loss the excess, if any, of such U.S. Holder’s adjusted tax basis in such preferred shares or ADSs over the fair market value of such preferred shares or ADSs at the end of the taxable year, but only to the extent of the net amount previously included in gross income as a result of the mark-to-market election. Any gain from a sale, exchange or other disposition of our preferred shares or ADSs in a taxable year in which we were a PFIC would be treated as ordinary income, and any loss from such sale, exchange or other disposition would be treated first as ordinary loss (to the extent of any net mark-to-market gains previously included in income) and thereafter as capital loss. A U.S. Holder’s adjusted tax basis in such preferred shares or ADSs would increase or decrease by the amount of the gain or loss taken into account under the mark-to-market regime. Even if a U.S. Holder is eligible to make a mark-to-market election with respect to our preferred shares or ADSs, however, it is not clear whether or how such election would apply with respect to the shares of any Subsidiary PFIC that such U.S. Holder is treated as owning, because such Subsidiary PFIC shares might not be marketable stock. The mark-to-market election is made with respect to marketable stock in a PFIC on a shareholder-by-shareholder basis and, once made, can only be revoked with the consent of the IRS. Special rules would apply if the mark-to-market election is not made for the first taxable year in which a U.S. Holder owns any equity interest in us while we are a PFIC.
A U.S. Holder who owns our preferred shares or ADSs during any taxable year that we are treated as a PFIC generally would be required to file an information return with respect to us and any Subsidiary PFIC in which the U.S. Holder holds a direct or indirect interest. U.S. Holders should consult their own tax advisors regarding the application of the PFIC rules to our preferred shares or ADSs and the availability and advisability of making a mark-to-market election should we be considered a PFIC for any taxable year.
Medicare tax
In addition to regular U.S. federal income tax, certain U.S. Holders that are individuals, estates or trusts are subject to a 3.8% tax on all or a portion of their “net investment income,” which may include all or a portion of their income arising from a distribution with respect to a preferred share or ADS and net gain from the sale, exchange or other disposition of a preferred share or ADS.
Backup withholding and information reporting
Backup withholding and information reporting requirements generally apply to certain U.S. Holders with respect to payments made on or proceeds from the sale, exchange or other disposition of our preferred shares or ADSs. A U.S. Holder not otherwise exempt from backup withholding generally can avoid backup withholding by providing a properly executed IRS Form W-9. Backup withholding is not an additional tax. Any amounts withheld under the backup withholding rules generally will be allowed as a
| A-173 |
refund or a credit against the U.S. Holder’s U.S. federal income tax liability, provided the required information is timely furnished by the U.S. Holder to the IRS.
Disclosure requirements for specified foreign financial assets
Individual U.S. Holders (and certain U.S. entities specified in U.S. Treasury Department guidance) who, during any taxable year, hold any interest in any “specified foreign financial asset” generally will be required to file with their U.S. federal income tax returns certain information on IRS Form 8938 if the aggregate value of all such assets exceeds certain specified amounts. “Specified foreign financial asset” generally includes any financial account maintained with a non-U.S. financial institution and may also include our preferred shares or ADSs if they are not held in an account maintained with a financial institution. Substantial penalties may be imposed, and the period of limitations on assessment and collection of U.S. federal income taxes may be extended, in the event of a failure to comply. U.S. Holders should consult their own tax advisors as to the possible application to them of this filing requirement.
Disclosure requirements for certain U.S. holders recognizing significant losses
A U.S. Holder that claims significant losses in respect of our preferred shares or ADSs for U.S. federal income tax purposes (generally (i) US$10 million or more in a taxable year or US$20 million or more in any combination of taxable years for corporations or partnerships all of whose partners are corporations, (ii) US$2 million or more in a taxable year or US$4 million or more in any combination of taxable years for all other taxpayers, or (iii) US$50,000 or more in a taxable year for individuals or trusts with respect to a foreign currency transaction) may be required to file Form 8886 for “reportable transactions.” U.S. Holders should consult their own tax advisors concerning any possible disclosure obligation with respect to our preferred shares or ADSs.
US Foreign Account Tax Compliance Act (FATCA)
Please refer to section Our Risk Management, item Regulatory Environment, Taxation, U.S. Foreign Account Tax Compliance Act (FATCA) for more clarification on FATCA.
(a) Disclosure Controls and Procedures
We carried out an evaluation, under the supervision and with the participation of our management, including our chief executive officer (“CEO”), and our chief financial officer (“CFO”), of the effectiveness of our “disclosure controls and procedures” (as defined in the Exchange Act Rules 13a-15(e) and 15d-15(e)) as required by paragraph (b) of the Exchange Act Rules 13a-15 or 15d-15, as of December 31, 2016.
A control system, no matter how well designed and operated, can provide only reasonable, not absolute, assurance that the control system’s objectives will be met. Therefore, our management does not expect that the controls will prevent all errors and all fraud.
Based upon the evaluation performed, our CEO and CFO have concluded that as of December 31, 2016, our disclosure controls and procedures were effective to provide reasonable assurance that material information relating to us and our consolidated subsidiaries is (i) recorded, processed, summarized and reported within the time periods specified in the SEC’s rules and forms and (ii) accumulated and communicated to our management, including our principal executive officers and principal financial officers, to allow timely decisions regarding required disclosure.
(b) Management’s Annual Report on Internal Control Over Financial Reporting
Our management is responsible for establishing and maintaining adequate internal control over financial reporting as defined in Rules 13a-15(f) and 15d-15(f) under the Exchange Act. Our internal control was designed to provide reasonable assurance regarding the reliability of financial reporting and the preparation of consolidated financial statements for external purposes, in accordance with the International Financial Reporting Standards (IFRS) issued by the International Accounting Standards Board (IASB).
All internal control systems, no matter how well designed, have inherent limitations. Therefore, even those systems determined to be effective may not prevent or detect misstatements. Also, projections of any evaluation of effectiveness to future periods are subject to risk that controls may become inadequate because of changes in conditions, or a decline in the level of compliance with policies or procedures may occur.
Our management assessed the effectiveness of our internal control over financial reporting as of December 31, 2016. In making this assessment, our management used the criteria set forth in “Internal Control – Integrated Framework (2013)” issued by the Committee of Sponsoring Organizations of the Treadway Commission (COSO). Based on its evaluation and those criteria, our management has concluded that our internal control over financial reporting was effective as of December 31, 2016.
The effectiveness of the Company’s internal control over financial reporting as of December 31, 2016, has been audited by PricewaterhouseCoopers Auditores Independentes, an independent registered public accounting firm.
| A-174 |
(c) Attestation Report of the Independent Registered Public Accounting Firm
The report of PricewaterhouseCoopers Auditores Independentes, our independent registered public accounting firm, dated April 20, 2017, on the effectiveness of our internal control over financial reporting as of December 31, 2016 is presented with our consolidated financial statements.
Please refer to Performance, item Consolidated Financial Statements (IFRS) for further details about our independent registered public accounting firm.
(d) Changes in Internal Control Over Financial Reporting
In connection with the evaluation required by the Exchange Act Rule 13a-15(d), our management, including our CEO and CFO, concluded that the changes that occurred during the year ended December 31, 2016 have not materially affected, and are not reasonably likely to materially affect, our internal control over financial reporting.
Sustainability is incorporated into our corporate strategy through a consolidated governance structure that is integrated into our business, which allows us to incorporate social and environmental issues into daily activities and processes throughout the Itaú Unibanco Group. Long-term strategic decisions on sustainability are discussed on an annual basis by our Board of Directors, at an annual meeting of the Strategy Committee (composed of Board of Directors members) and twice a year at meetings of our Executive Committee. Since 2011, our sustainability activities have been based on three strategic focuses: (i) social and environmental risks and opportunities, (ii) financial education and (iii) dialogue and transparency.
Our management of social and environmental risk is based on the identification, measurement, mitigation and monitoring of risks. We know that the increasing societal consciousness of the environmental and social challenges we face makes these issues more material to our operations, products and services. By integrating social and environmental risks and opportunities into our strategy, governance, processes, management policies, products and services, we are creating a virtuous circle that can help society to prosper. In the last 15 years, we developed and participated in various initiatives to reduce environmental and social risks and seize opportunities to address those risks. Over that period, we have created strategies, routines, processes and products, adopted specific policies and adhered to voluntary commitments such as PRI (Principles for Responsible Investments), EP (Equator Principles), CDP (Carbon Disclosure Project), Principles for Sustainable Insurance (PSI) and Global Compact that guide our business and institutional practices. We have developed specific social and environmental guidelines applicable to our lending processes (lending and financing), insurance, investments and suppliers. Our main social and environmental guidelines include: (i) a list of restricted activities (firearms, ammunition and explosives; extraction and production of wood and the production of firewood and charcoal extracted from native forests; fishing activities; extraction and industrialization of asbestos; and abattoirs and beef packaging plants), (ii) a list of prohibited activities (prostitution; illegal use of child labor; and work under conditions similar to slavery), (iii) compliance with environmental licensing, (iv) the inclusion of social and environmental contractual clauses, and (v) specific rules for providing real estate collateral.
In 2015, we published a paper on our Social and Environmental Risks and Opportunities strategy that discusses our practices and the challenges we see for enhancing sustainability. We regularly monitor the development of our goals for 2020, published in this document. You can access it at <https://www.itau.com.br/_arquivosestaticos/Itau/PDF/Sustentabilidade/Posicionamento-Itau-ROSA_english.pdf>
Further, in 2016, we carried out a study on financial regulatory risks associated with climate change issues and improved our performance on human rights by structuring a multidisciplinary working group and governance on diversity, sponsored by the People Area, which reports to the People Committee and the Sustainability Committee.
As part of Financial Education initiative, in 2015, we issued a study called “Choices and Money” to answer the questions “How to help people make better use of their money? How to help people accomplish their goal”. The study traces the influences of economic and social past on our financial behavior and discusses how they shape the choices we make when it comes to money. To access the study in Portuguese click on <http://itau.com.br/_arquivosestaticos/Itau/PDF/Sustentabilidade/Escolhas_e_Dinheiro_Educacao_Financeira.pdf>
Based on the outcomes of this study, we have decided to adopt an approach to generate a broader identification and, in 2016, we launched the “Real Life” campaign, a webseries telling real histories and sharing financial knowledge applied to day-to-day life. The four episodes show people and families in different moments of life, exploring their dilemmas and how they deal with money, providing financial guidance to help them achieve their goals. This series had over 42 million views.
In 2016, we signed up to a partnership with the Family School program of the State of São Paulo, which opens the state schools during the weekends for activities guided by four pillars: culture, work, sports and health. Through the end of 2016, we trained the vice-principals of 751 schools in Greater São Paulo, who trained 73 volunteers, impacting 12,468 people.
Our dialogue and transparency efforts focused on developing our reporting processes with the goal of consolidating the integration of communications. Since 2004, sustainability information has been disclosed based on the Global Reporting Initiative criteria, and is integrated into our annual report, which includes both financial and sustainability information. Additionally, in 2013, we entered into a partnership with the International Integrated Reporting Council (IIRC),to prepare a concise piece of communication focused on our ability to create value for stakeholders over time. Visit our 2016 Integrated Report at www.itau.com.br/annual-report.
| A-175 |
The management of sustainability issues has contributed to our access to funding through development agencies, and to our presence in sustainability indexes. We are the only Latin American bank to be included in the Dow Jones Sustainability Index since the inception of the index in 1999, and we also integrate the Business Sustainability Index and the Carbon Efficient Index, both of the São Paulo stock exchange. Also noteworthy are our partnerships with the Inter-American Development Bank (IDB), the Inter-American Investment Corporation (IIC), and the Brazilian Development Bank (BNDES) , which participate with us in lending or joint performance on specific projects.
A
| • | ABEL –Associação Brasileira de Empresas de Leasing (Brazilian Association of Leasing Companies) | |
| • | Aberje –Associação Brasileira de Comunicação Empresarial (Brazilian Association of Corporate Communication) |
| • | ABRASCA –Associação Brasileira de Companhias Abertas (Brazilian Association of Public Companies) | |
| • | ADS –American Depositary Shares | |
| • | ANBIMA –Associação Brasileira das Entidades dos Mercados Financeiros e de Capitais (Brazilian Association of Stock and Financial Markets Entities) | |
| • | APIMEC –Associação dos Analistas e Profissionais de Investimento do Mercado de Capitais (Association of Capital Markets Analysts and Investment Professionals) | |
| • | ATM – Automatic Teller Machine |
B
| • | Banco Itaú Argentina – Banco Itaú Argentina S.A |
| • | Banco Itaú Chile – Banco Itaú Chile S.A. | |
| • | Banco Itaú Paraguay – Banco Itaú Paraguay S.A | |
| • | Banco Itaú Uruguay – Banco Itaú Uruguay S.A |
| • | BCBA – Buenos Aires Stock Exchange | |
| • | BCBS – Basel Committee on Banking Supervision | |
| • | BIS – Bank for International Settlements | |
| • | BM&FBovespa –Bolsa de Valores, Mercadorias e Futuros S.A. (Securities, Commodities and Futures Exchange) | |
| • | BNDES –Banco Nacional de Desenvolvimento Econômico e Social (Brazilian Social and Economic Development Bank) | |
| • | BNY Mellon – The Bank of New York Mellon | |
| • | Brazilian Corporate Law – Law No. 6,404, of December 15, 1976, as amended (including by Law No. 11,638) | |
| • | Brazilian Payment System – encompasses the institutions, the systems and the procedures related to the transfer of funds and of other financial assets, among the diverse economic agents of the Brazilian market, or that involve the processing, the clearing and settlement of payments in any of its forms. |
C
| • | CADE –Conselho Administrativo de Defesa Econômica (Administrative Council for Economic Defense) |
| • | CCR – Counterparty Credit Risk | |
| • | CDC –Código de Defesa do Consumidor (Consumer Protection Code) | |
| • | CDI –Certificado de Depósito Interbancário (Interbank Deposit Certificate) | |
| • | CEDEAR – Argentine Certificates of Deposits |
| • | Central Bank –Banco Central do Brasil (Brazilian Central Bank) | |
| • | CFC –Conselho Federal de Contabilidade (Federal Accounting Council) | |
| • | CGRC – Risk and Capital Management Committee | |
| • | Cia E. Johnston – Companhia E. Johnston de Participações | |
| • | CMN –Conselho Monetário Nacional (National Monetary Council) |
| • | NRF – Risk and Financial Policies Committee | |
| • | CNSP –Conselho Nacional de Seguros Privados (National Council of Private Insurance) | |
| • | COAF –Conselho de Controle de Atividades Financeiras (Financial Activities Control Council) | |
| • | COSO –Committee of Sponsoring Organizations of the Treadway Commission | |
| • | COFINS –Contribuição Para o Financiamento da Seguridade Social (Social Security Financing Contribution) |
| • | CONSIF –Confederação Nacional do Sistema Financeiro (National Association of the Financial System) | |
| • | CSB – Corporate Site Branch | |
| • | CSC – Superior Credit Committee | |
| • | CSCCA – Superior Wholesale Credit and Collection Committee |
| • | CSCCV – Superior Retail Credit and Collection Committee | |
| • | CSLL –Contribuição Social Sobre o Lucro Líquido (Social Contribution on Profits) |
| • | CSP – Superior Products Committee | |
| • | CSRML – Superior Market Risk and Liquidity Committee |
| A-176 |
| • | CSRO – Superior Operational Risk Management Committee | |
| • | CTAM – Model Assessment Technical Committee | |
| • | CVM –Comissão de Valores Mobiliários (Brazilian Securities and Exchange Comission) |
D
| • | DJSI – Dow Jones Sustainability Index |
F
| • | FATF – Financial Action Task Force |
| • | FEBRABAN –Federação Brasileira de Bancos (Brazilian Federation of Banks) |
| • | Fed – U.S. Federal Reserve System | |
| • | FGC –Fundo Garantidor de Crédito (Credit Insurance Fund) |
I
| • | IASB – International Accounting Standards Board |
| • | IBEF –Instituto Brasileiro de Executivos de Finanças (Brazilian Institute of Finance Executives) | |
| • | IBRACON –Instituto de Auditores Independentes do Brasil (Institute od Independent Auditors of Brazil) |
| • | IBRI –Instituto Brasileiro de Relações com Investidores (Brazilian Investor Relations Institute) | |
| • | ICAAP – Internal Capital Adequacy Assessment Process | |
| • | IFRS – International Financial Reporting Standards | |
| • | IOF –Imposto Sobre Operações Financeiras (Tax on Financial Transactions) | |
| • | IRPJ –Imposto de Renda da Pessoa Jurídica (Corporate Income Tax) | |
| • | IRS – U.S. Internal Revenue Service |
| • | ISE –Índice de Sustentabilidade Empresarial (Corporate Sustainability Index) |
| • | ISSQN –Imposto sobre Serviços de Qualquer Natureza (Service Tax) | |
| • | Itaú BBA Colombia – Itaú BBA Colombia S.A. Corporación Financiera | |
| • | Itau BBA International – Itau BBA International plc | |
| • | Itaucard – Banco Itaucard S.A. | |
| • | Itaú Holding Financeira – Itaú Holding Financeira S.A. |
| • | Itaú Unibanco Group – Itaú Unibanco Holding S.A. and all its subsidiaries and affiliates | |
| • | Itaúsa – Itaú Investimentos S.A. | |
| • | IUPAR – Itaú Unibanco Participações S.A. |
L
| • | LCR – Liquidity Coverage Ratio |
N
| • | NSFR – Net Stable Funding Ratio |
| • | NYSE – New York Stock Exchange |
P
| • | PEP – Politically Exposed Person | |
| • | PFIC – Passive Foreign Investment Company |
| • | PIS –Programa de Integração Social (Social Integration Program) |
R
| • | RAET –Regime Especial de Administração Temporária (Temporary Special Administration Regime) | |
| • | RMCCI –Regulamento de Mercado de Câmbio e Capitais Internacionais (Regulation of Exchange and Capital Markets) |
S
| • | SEC – U.S. Securities and Exchange Commission | |
| • | SELIC –Sistema Especial de Liquidação e de Custódia (Special Clearing and Settlement System) | |
| • | SISBACEN –Sistema do Banco Central do Brasil (the Brazilian Central Bank System): a database that collects information provided by financial institutions to the Central Bank | |
| • | SOX – The Sarbanes-Oxley Act of 2002 | |
| • | STF –Superior Tribunal Federal (Brazilian Federal Supreme Court) |
| • | STJ –Superior Tribunal de Justiça (Brazilian Superior Court of Justice) | |
| • | SUSEP –Superintendência de Seguros Privados (Superintendency of Private Insurance) |
T
| • | TR –Taxa Referencial (Brazilian benchmark interest rate) |
U
| • | Unibanco – União de Bancos Brasileiros S.A. |
V
| • | VaR – Value at Risk |
| A-177 |
List of Foreign Subsidiaries (as of December 31, 2016)
| Company | Country | |
| Banco Itaú Argentina S.A. | Argentina | |
| FC Recovery S.A.U. | Argentina | |
| Itaú Asset Management S.A. Sociedad Gerente de Fondos Comunes de Inversión | Argentina | |
| Itaú Valores | Argentina | |
| Itrust Servicios Inmobiliarios S.A.C.I. | Argentina | |
| Itaú Bahamas Directors Ltd | Bahamas | |
| Itaú Bahamas Nominees Ltd | Bahamas | |
| Itaú Bank & Trust Bahamas Ltd | Bahamas | |
| Itaú Unibanco S.A. Nassau Branch | Bahamas | |
| Karen International Limited | Bahamas | |
| Bicsa Holdings Ltd | Cayman Islands | |
| Bie Cayman, Ltd. | Cayman Islands | |
| Itaú Bank & Trust Cayman Ltd. | Cayman Islands | |
| Itau Bank, Ltd. | Cayman Islands | |
| Itaú BBA International (Cayman) Ltd | Cayman Islands | |
| Itau Cayman Directors Ltd. | Cayman Islands | |
| Itau Cayman Nominees Ltd. | Cayman Islands | |
| Itau Global Asset Management | Cayman Islands | |
| Itaú Unibanco Holding Cayman Branch | Cayman Islands | |
| Itaú Unibanco S.A. Cayman Branch | Cayman Islands | |
| ITB Holding Ltd | Cayman Islands | |
| MCC Securities Inc. | Cayman Islands | |
| Topaz Holding Ltd. | Cayman Islands | |
| Uni-Investiment International Corp. | Cayman Islands | |
| CGB II SpA | Chile | |
| Corpbanca Administradora General de Fondos | Chile | |
| Corpbanca Corredora de Seguros S.A. | Chile | |
| Corpbanca Corredores de Bolsa S.A. | Chile | |
| Corplegal S.A. | Chile | |
| Itaú Asesorías Financieras S.A. | Chile | |
| Itaú BBA Corredor de Bolsa Limitada | Chile | |
| Itaú Chile Administradora General de Fondos S.A. | Chile | |
| Itaú Chile Compañia de Seguros de Vida S.A. | Chile | |
| Itaú Chile Corredora de Seguros Limitada | Chile | |
| Itaú Chile Inversiones, Servicios y Administracion S.A. | Chile | |
| Itaú Corpbanca S.A. | Chile | |
| MCC Asesorías Ltda. | Chile | |
| MCC S.A. Corredores de Bolsa | Chile | |
| Recaudaciones y Cobranzas S.A. | Chile | |
| Recuperadora de Creditos Ltda | Chile | |
| SMU Corp S.A. | Chile | |
| Banco Corpbanca Colombia | Colombia | |
| Corpbanca Investment Trust | Colombia | |
| Helm Comisionista | Colombia | |
| Helm Corredor de Seguros | Colombia |
| A-178 |
| Helm Fiduciaria S.A. | Colombia | |
| Itau BBA Colombia S.A. Corporación Financiera | Colombia | |
| Itaú Asia Securities Ltd | Hong Kong | |
| Itaú Japan Asset Management Limited | Japan | |
| Itaú Unibanco S.A. Tokyo Branch | Japan | |
| Itaú Europa Luxembourg S.A. | Luxembourg | |
| Itaú BBA México, S.A. de C.V. | Mexico | |
| Proserv – Promociones y Servicios S.A. de C.V. | Mexico | |
| CIFI* | Panamá | |
| Helm Bank | Panamá | |
| Helm Casa de Valores | Panamá | |
| Albarus S.A. | Paraguay | |
| Bancard Sociedad Anonima | Paraguay | |
| Banco del Paraná S.A. | Paraguay | |
| Banco Itaú Paraguay S.A. | Paraguay | |
| Afinco Americas Madeira, Sgps, Soc. Unipessoal Ltda | Portugal | |
| IPI – Itaúsa Portugal Investimentos, SGPS Ltda. | Portugal | |
| Itaúsa Europa – Investimentos, SGPS, Ltda. | Portugal | |
| Banco Itau (Suisse) S.A. | Swiss | |
| Banco Itau International | U.S.A. | |
| Corpbanca New York Branch | U.S.A. | |
| Corpbanca Securities Inc. | U.S.A. | |
| Itaú BBA USA Securities, Inc. | U.S.A. | |
| Itau International Investiment Llc | U.S.A. | |
| Itaú International Securities Inc | U.S.A. | |
| Itaú Unibanco S.A. New York Branch | U.S.A. | |
| Itau USA Asset Management Inc. | U.S.A. | |
| Jasper International Investiment Llc | U.S.A. | |
| Itaú BBA International Plc. | UK | |
| Itaú UK Asset Management Ltd | UK | |
| Itaú Middle East Limited | United Arab Emirates | |
| Aco Ltda | Uruguay | |
| Banco Itau Uruguay S.A. | Uruguay | |
| C.U.M.P.S.A.* | Uruguay | |
| Mundostar S.A. | Uruguay | |
| Nevada Woods S.A. | Uruguay | |
| Oca Casa Financiera S.A. | Uruguay | |
| Oca S.A. | Uruguay | |
| Rias Redbanc* | Uruguay | |
| Unión Capital AFAP S.A. | Uruguay |
* Minority shareholder.
| A-179 |
![]()
| Number | Description | |
| 1 | Bylaws of Itaú Unibanco Holding S.A. (unofficial English translation)(1). | |
| 2.(a) | Amended and Restated Deposit Agreement among the Registrant, The Bank of New York, as depositary, and the Holders from time to time of American Depositary Shares issued thereunder, including the form of American Depositary Receipts(2). | |
| 2.(b)(i) | The total amount of long-term debt securities of Itaú Unibanco Holding S.A. and our subsidiaries under any one instrument does not exceed 10.0% of our total assets on a consolidated basis. We agree to furnish copies of instruments defining the rights of certain holders of long-term debt to the Securities and Exchange Commission upon request. | |
| 4.(a) | Shareholders’ Agreement, dated as of January 27, 2009, between Itaúsa - Investimentos Itaú S.A. and the Moreira Salles family (unofficial English translation)(3). | |
| 4.(c) | Plan for Granting Stock Options(4) | |
| 6 | Statement explaining calculation of earnings per share(5). | |
| 7 | Statement explaining calculation of dividend and interest on capital per share(6). | |
| 8.1 | List of subsidiaries (7). | |
| 11.1 | Code of Ethics (unofficial English translation)(8). | |
| 12.1 | Chief Executive Officer Certification pursuant to Section 302 of the Sarbanes-Oxley Act of 2002(9). | |
| 12.2 | Chief Financial Officer Certification pursuant to Section 302 of the Sarbanes-Oxley Act of 2002(9). | |
| 13 | Chief Executive Officer and Chief Financial Officer Certification pursuant to 18 U.S.C. Section 1350 as Enacted Pursuant to Section 906 of the Sarbanes-Oxley Act of 2002(9). | |
| 15 | Transaction Agreement, dated as of January 29, 2014, and amended on June 2, 2015 and on January 20, 2017, between Banco Itaú Chile and CorpBanca(10). |
| (1) | Incorporated herein by reference to our Report on Form 6-K filed with the Commission on September 23, 2016 (Commission File No. 001-15276). |
| (2) | Incorporated herein by reference to the Registration Statement on Form F-6 filed with the Commission on October 16, 2013 (Commission File No. 333-191758). |
| (3) | Incorporated herein by reference to our Annual Report on Form 20-F/A filed with the Commission on May 17, 2010 (Commission File No. 001-15276). |
| (4) | Incorporated by reference herein to our Report on Form 6-K filed with the Commission on May 12, 2015 (Commission File No.: 001-15276). |
| (5) | Incorporated by reference herein to “Note 2.4 – Summary of main accounting policies, item u) Earnings per share” to Complete Financial Statements included in this Annual Report on Form 20-F. |
| (6) | Incorporated by reference herein to “Note 21 – Stockholders’ equity, item b) Dividends” to Complete Financial Statements included in this Annual Report on Form 20-F. |
| (7) | Incorporated by reference herein to “Note 2.4 – Summary of main accounting policies, item a) Consolidation, I. Subsidiaries” to Complete Financial Statements included in this Annual Report on Form 20-F. |
| (8) | Incorporated by reference herein to our Report on Form 6-K filed with the Commission on August 29, 2016 (Commission File No.: 001-15276). |
| (9) | Filed herewith. |
| (10) | Incorporated by reference here in to our Report on Form SC 13D filed with the Commission on July 07, 2014 and its amendments filed with the Commission on June 26, 2015 and on January 27, 2017 (Commission File No. 001-15276). |
| B-1 |
![]()
SIGNATURES
The registrant hereby certifies that it meets all of the requirements for filing on Form 20-F and that it has duly caused and authorized the undersigned to sign this annual report on its behalf.
| ITAÚ UNIBANCO HOLDING S.A. |
| By: | /s/ Roberto Egydio Setubal | |
| Name: Roberto Egydio Setubal | ||
| Title: Chief Executive Officer |
| By: | /s/ Caio Ibrahim David | |
| Name: Caio Ibrahim David | ||
| Title: Chief Financial Officer |
Dated: April 20, 2017
| B-2 |