 Maple Tree Board of Directors Presentation to Regarding Project Maple Tree February 24, 2007 Exhibit (c)(4) |
 Table of Contents Presentation to Maple Tree Board of Directors Project Maple Tree 1. Overview of the Proposed Offer 2. Public Market Trading Perspective 3. Valuation Analysis Appendix |
 Overview of the Proposed Offer |
 1 Summary of Proposed Terms Acquirors Certain funds affiliated with Apax Partners Worldwide LLP and Apax Partners, L.P. (collectively “Apax”) Certain funds affiliated with Morgan Stanley, through Morgan Stanley Strategic Investments Inc. Transaction Structure Acquisition by Maple Tree Acquisition Corporation, a British Columbia corporation (“Parent”), of 100% of the outstanding common shares of Maple Tree Limited (the “Company”), pursuant to a Canadian court approved plan of arrangement Offer Values Fully diluted equity value = $1,692 million Enterprise value = $1,759 million Purchase Price US$40.00 per share in an all cash transaction Financing Total equity contribution of $715 million Apax - $390 million as the lead investor (60% of non-management contribution) Morgan Stanley - $260 million (40% of non-management contribution) Certain executives (“Rollover Investors”) are expected to roll-over equity/options equal to $65 million Committed Debt financing of $1,185 million (6.8x 3/31/07E LTM Adjusted EBITDA) Term Loan B ($595 million), Senior Notes ($340 million) and Senior Sub Notes ($250 million) Key conditions: Company MAC, current with SEC public filings Management Arrangements Management requested to roll-over an average of at least 50% of existing equity/options into acquisition Aggregate option pool representing 10% of the fully-diluted equity of the Company (strike price equal to the acquisition price) Representations & Warranties Customary public company representations and warranties Definition of “Material Adverse Effect on the Company” (“MAE”) excludes: (a) changes in economic conditions or markets; (b) changes in the insurance brokerage industry and laws other than any change in law relating to contingent commissions or adverse developments in regulatory investigations relating to contingent commissions (whether or not involving the Company); (c) changes in the Company’s share price; (d) the Company’s failure to meet internal or external projections; (e) effects from the announcement of the Agreement or its consummation; (f) acts of war or terrorism; and (g) changes in GAAP Lock-up Fairfax Financial Holdings, which controls 26% of the Company, will enter into a Voting agreement in favor of the Transaction Voting Agreement terminates if the Company accepts a Superior Proposal Overview of the Proposed Offer |
 2 Summary of Proposed Terms (cont’d) “Go-shop” Period / Termination “Go-shop” period for 43.5 days post announcement (including announcement date) in two stages: Solicitation period for 22 days post announcement (including announcement date) to contact potential buyers and receive initial proposals Tail period for an additional 21.5 days following solicitation period to negotiate with parties who submitted bona fide proposals during the solicitation period with a comparable level of consideration, regardless of its form Break-up fee $21.1 million or $0.50 per share (1.25% of fully diluted equity value) to accept a Superior Proposal during the 44 day go-shop period In order to terminate the agreement or change its recommendation because of a Superior Proposal, the Company must provide details of the Superior Proposal and 3 days notice to Buyer Break-up fee of approximately $50.8 million or $1.20 per share (3.00% of fully diluted equity value) to accept a Superior Proposal following the go-shop period No right to match for Buyer with respect to a Superior Proposal Maple Tree to pay Buyer expenses up to $6 million in the event of a negative shareholder vote or if the Company does not meet the closing conditions Buyer to pay the Company a reverse break-up fee of $50.8 million due to Apax’s inability to close financing Drop-dead date of September 7, 2007 Treatment of Options and Restricted Shares Except for options held by Rollover Investors, Company options (all of which are vested) will be cancelled cashed- out at the effective time (with holders receiving any positive spread between the acquisition price and strike price for each cancelled option) Approximately 79% of the Company’s restricted stock units will be accelerated at the effective time, with holders receiving $40 per cancelled share Closing Conditions Mutual conditions: (i) Company shareholder approval (66 2/3% of all votes cast and 50% of all votes cast excluding votes representing shares held by senior officers of the Company); (ii) approval of the plan of arrangement by the Ontario Superior Court of Justice; (iii) applicable regulatory approvals; and (iv) absence of restraints Other customary conditions Overview of the Proposed Offer |
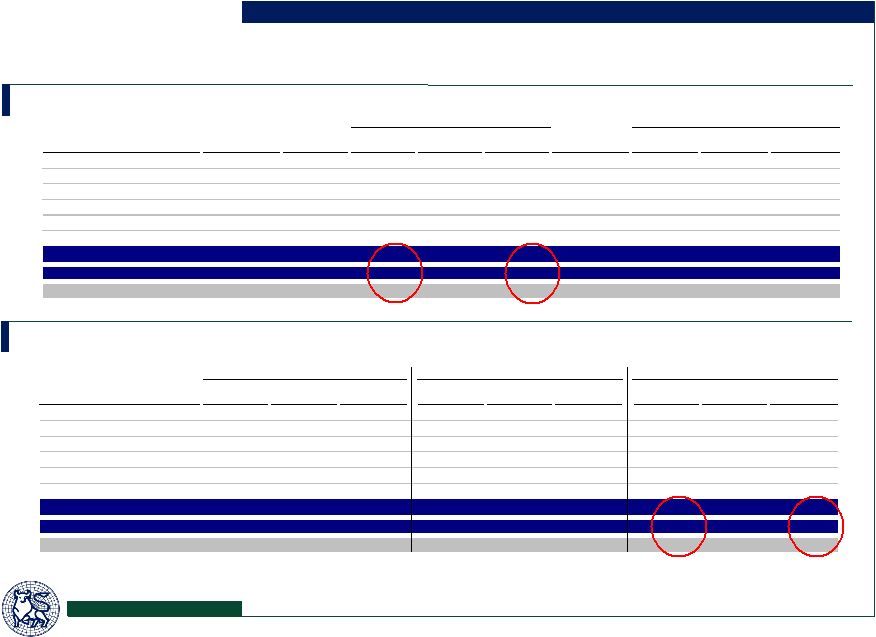
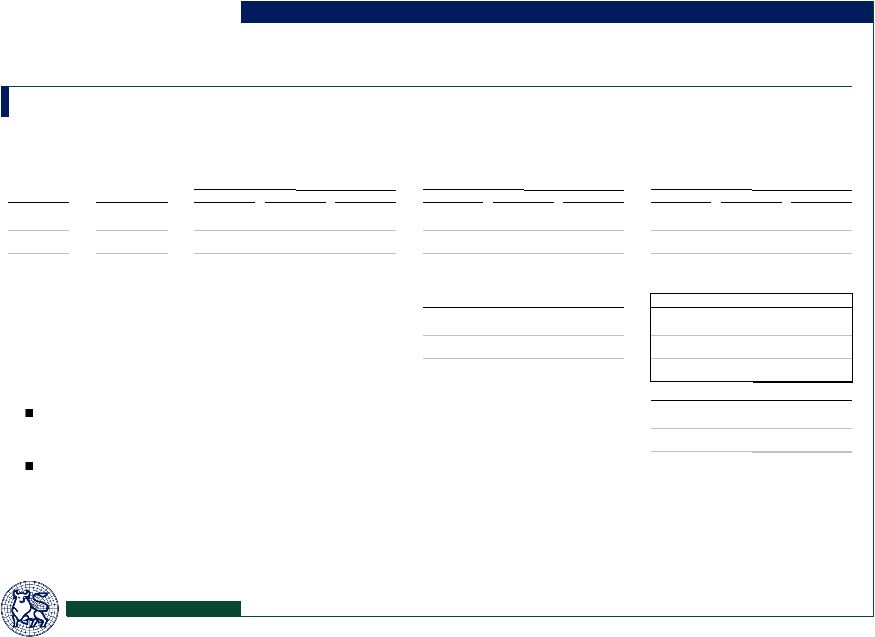
 3 Overview of the Proposed Offer Transaction Values and Multiples Transaction Values ($ in millions) Implied Offer Premiums Transaction Multiples ($ in millions) ____________________ Note: US dollars in millions, except per share data. (1) Based on 39.714 million basic shares outstanding (2) Based on 2.015 million restricted share units, 0.814 million options with an exercise price of $15.67 and 0.106 million options with an exercise price of $13.79. (3) Includes $144.6 million of debt at 12/31/06 and $21.8 million liability to fund the remaining portion of the Talbot earnout. Excludes an undiscounted value of $61.5 million in potential contingent payments, which are based on future performance metrics. (4) Source: Maple Tree Management, which includes acquisitions. Amounts exclude non-cash stock based compensation, expense for Talbot earnout and investment income on unrestricted cash, where applicable. (5) Average of MMC, AOC, WSH, BRO, AJG and HRH, subject to certain adjustments. (6) Includes $35.5 million in revenue and $15.0 million in EBITDA related to the 2006 time period prior to completion of acquisitions closed in 2006. Offer price per share US$40.00 Equity value (1) $1,588.5 Plus: Net effect of dilutive securities (2) 103.2 Fully diluted equity value $1,691.7 Plus: Debt at 12/31/06 (3) 166.4 Less: Unrestricted cash at 12/31/06 (99.2) Enterprise value $1,758.9 Implied Price Premium Current (2/20/07) $33.45 19.6% 1 week prior (2/13/07) $33.20 20.5% 3 months prior (11/20/06) $29.95 33.6% 6 months prior (8/18/06) $27.82 43.8% 52 week intraday high (2/12/07) $33.75 18.5% 3 month average (11/20/06) $31.61 26.5% 6 month average (8/18/06) $30.61 30.7% 1 year average (2/17/06) $28.67 39.5% Public Maple Offer Comparables (5) Tree (4) $40.00 (Average) Enterprise value as a multiple of: 2006E Revenue $543.9 3.2x 2.5x 2006E Adjusted revenue (6) 579.4 3.0x 2.5x 2006E EBITDA 142.7 12.3x 11.0x 2006E Adjusted EBITDA (6) 157.7 11.2x 11.0x 2007E EBITDA 185.2 9.5x 9.9x Equity value as a multiple of: 2006E Net income $61.7 27.4x 19.9x 2007E Net income 84.2 20.1x 16.8x 2006E Cash net income 78.5 21.6x 16.6x 2007E Cash net income 104.4 16.2x 14.0x |
 4 Overview of Financing Commitment Apax has obtained a debt commitment letter from Merrill Lynch and Morgan Stanley for $1,185 million $795 million of senior credit facilities $340 million of senior unsecured bridge loan $250 million of senior subordinated bridge loan Bridge loan commitments expected to be refinanced with senior and senior subordinated notes offerings in advance of closing Financing commitments are not subject to the successful syndication of the credit facilities Bridge loan facility available in the event the bonds are not placed prior to closing Funding of bridge conditioned upon delivery of offering memorandum no less than 20 days prior to funding Company to use commercially reasonable efforts to ensure underwriter has 20 consecutive days to market the bonds after receipt of offering memorandum The commitment letters generally have the same conditionality as in the Arrangement Agreement Material Adverse Effect definition conformed Reps follow the Arrangement Agreement Termination date to be consistent with Arrangement Agreement End Date Equity requirement equal to a minimum of 25% of pro forma capitalization Current sources and uses implies equity equal to 36% of pro forma capitalization Equity commitment letters totaling $650 million delivered by Apax and Morgan Stanley Apax's commitment letters are generally reflective of the current market standard in going private transactions and have fairly limited conditionality Overview of the Proposed Offer |
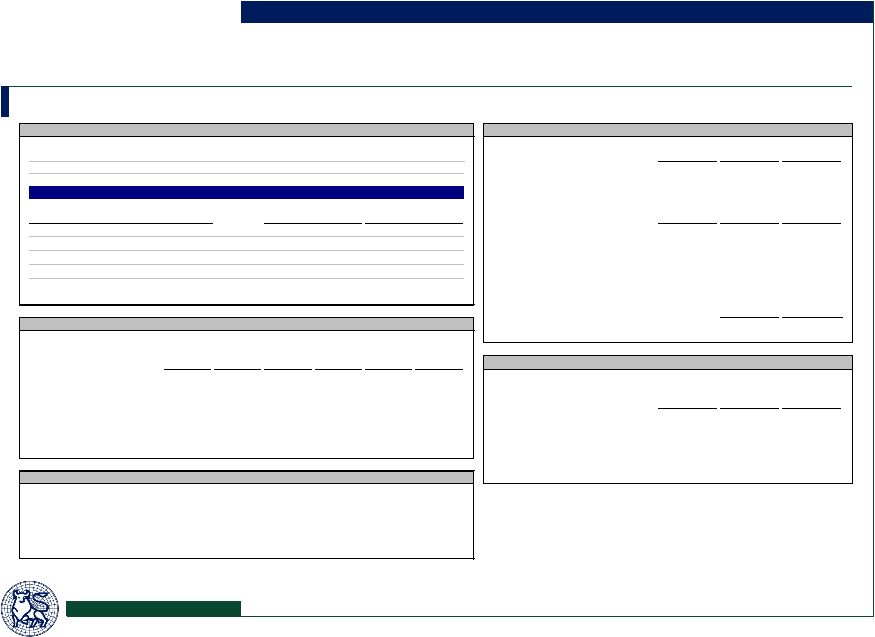
 5 Summary of Proposed Financing Terms and Conditions Other Material Terms Capitalization ($ in millions) Expected Ratings Facility / Security Amount ($mm) Tenor Pricing Outcome Senior Secured Credit Facility Revolver $100.0 6 years L+250 bps B2/B Term Loan B 595.0 7 years L+250 bps B2/B Senior Notes/Interim Loan Senior Notes $340.0 8 years 9.25% Area B3/B- Senior Sub. Notes/Interim Loan Senior Subordinated Note $250.0 10 years 10.75% Area Caa1/CCC+ Bridge Commitment Terms Senior Notes Senior Sub. Notes Initial Pricing L + 425 bps L + 575 bps Step-ups (after 6 months) +50 bps per quarter Cash Caps 10.75% 12.25% Total Financing $1,285.0 Covenants: Net Senior Leverage maintenance covenant for Revolver No maintenance covenant for Term Loan B Net Senior Leverage and Fixed Charge Coverage Ratio incurrence covenants for Term Loan B Ability to syndicate up to 49% of Bridge pre-close Commitment increases for acquisitions prior to closing, with limitations on amounts and subject to providing S-X compliant statements Delivery of financial statements (audited, quarterly and pro forma) Satisfactory documentation and regulatory approval ____________________ (1) Revolving credit facility commitment of $100 million; unfunded at close. (2) Includes impact related to the 2006 time period prior to completion of acquisitions which were closed in 2006 and the full year pro forma impact of acquisitions announced in 2007. Reduced by earnings on $42.2 million of cash to be used in the acquisition. Excludes non-cash stock based compensation and expense for Talbot earnout. Overview of the Proposed Offer Amount Multiple Revolving credit facility (1) $0.0 0.0x Term loan B 595.0 3.4x Total bank debt $595.0 3.4x Senior unsecured notes 340.0 1.9x Total senior debt $935.0 5.3x Senior subordinated notes 250.0 1.4x Total debt $1,185.0 6.8x 3/31/07E LTM Adjusted EBITDA (2) $175.1 |
 6 Sources and Uses of Cash ____________________ (1) In addition, there will be $57.0 million of unrestricted cash remaining at the Company as of 12/31/06 to fund future acquisitions and ongoing operating needs. (2) Revolving credit facility commitment of $100 million; unfunded at close. (3) Based on 39.714 million basic shares outstanding, 2.015 million restricted share units, 0.814 million options with an exercise price of $15.67 and 0.106 million options with an exercise price of $13.79. (4) Final payment relating to the earnout of Talbot, which is due March 31. 2007. Uses ($ in millions) Sources ($ in millions) Overview of the Proposed Offer Amount Percent Unrestricted cash at 12/31/06 (1) $42.2 2.2% Revolving credit facility (2) 0.0 0.0% Term loan B 595.0 30.6% Senior unsecured notes 340.0 17.5% Senior subordinated notes 250.0 12.9% Total debt $1,185.0 61.0% Management roll-over equity 65.0 3.3% Apax equity 390.0 20.1% MSSIG equity 260.0 13.4% Total equity $715.0 36.8% Total sources $1,942.2 100.0% Amount Percent Equity value $1,588.5 81.8% Net value of options 22.6 1.2% Value of restricted share units 80.6 4.1% Fully diluted equity purchase price (3) $1,691.7 87.1% Refinance debt at 12/31/06 144.6 7.4% Earnout to be settled in cash (4) 21.8 1.1% Transaction fees and expenses 84.1 4.3% Total uses $1,942.2 100.0% |
 7 Timeline: Summary of Key Events Date Event December 18, 2006 Merrill Lynch meets with the Maple Tree at its offices in Chicago for an overview of a going private transaction December 20, 2006 Maple Tree is approached, unsolicited, by Stephens Inc. (a privately owned investment bank headquartered in Little Rock, Arkansas) expressing the interest of Apax Partners, L.P. (“Apax”) to consider a leveraged buyout of the Company January 2 – 3, 2007 Maple Tree and Apax meet in Chicago for an introductory meeting; Apax expressed interest in taking the Company private, suggestin a 20% premium to market (implied a value of approximately US$37.67 per share at that time) January 12, 2007 Maple Tree indicates willingness to Apax to host a meeting with senior management team January 15 - 17, 2007 Maple Tree and Apax, along with their financial advisors and debt financing sources, meet in Chicago for preliminary due diligence. Maple Tree verbally agrees not to solicit other parties until January 23, 2007, as an inducement for Apax to develop a higher proposal Week of January 15, 2007 Maple Tree provides Apax with additional confidential information and access to management January 23, 2007 Maple Tree and Apax, along with their financial advisors, meet in Boston. Apax submits a proposal to acquire Maple Tree for US$40.00 per share. Apax’s offer is supported by debt commitment letters from both Merrill Lynch and Morgan Stanley. January 25, 2007 Maple Tree’s Board of Directors meets and is informed of Apax’s offer and reviews its proposal. Maple Tree’s Board requests that Merrill Lynch negotiate certain process-related terms, including the “go-shop” provision, with Apax before proceeding. January 29, 2007 Maple Tree’s Board of Directors meets and forms a Special Committee of the Board of Directors. The Special Committee authorizes Apax to proceed with confirmatory due diligence, subject to a fully financed offer of at least US$40.00 per share with a suitable “go-shop” provision Maple Tree and Apax enter into a Non Solicitation Letter through February 23, 2007, subject to certain conditions January 30 – February 1, 2007 Maple Tree and Apax, along with their respective advisors and debt financing sources, meet in Chicago for confirmatory due diligence February 2, 2007 Maple Tree’s Special Committee of the Board selects Scotia Capital as its financial advisor February 6-7, 2007 Maple Tree and Apax, along with Apax’s accounting advisor and Maple Tree’s financial advisor, meet in Chicago for confirmatory due diligence February 16, 2007 and February 20, 2007 Merrill Lynch and Scotia Capital meet with Maple Tree’s Special Committee to provide an update on process and timing and other transaction matters Overview of the Proposed Offer |
 Public Market Trading Perspective |
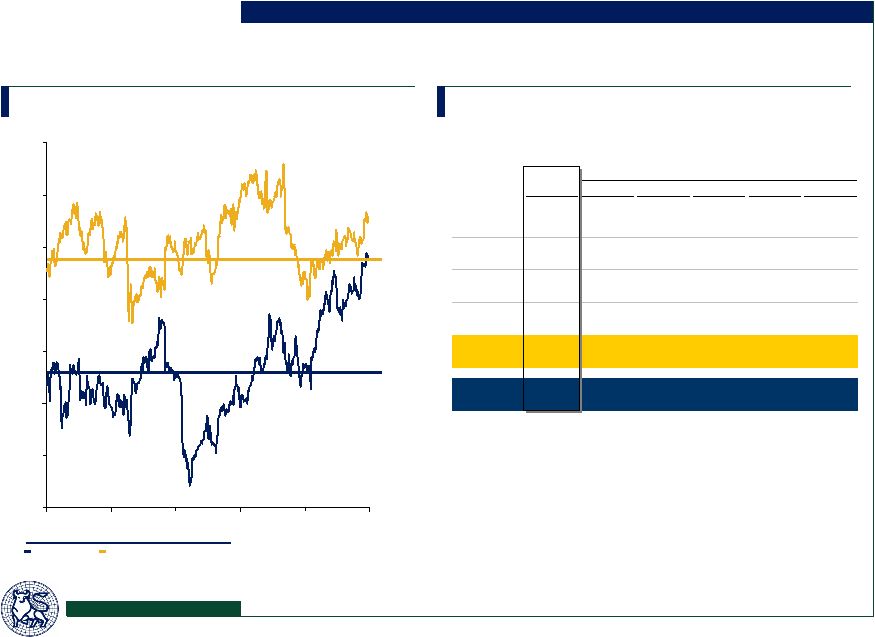
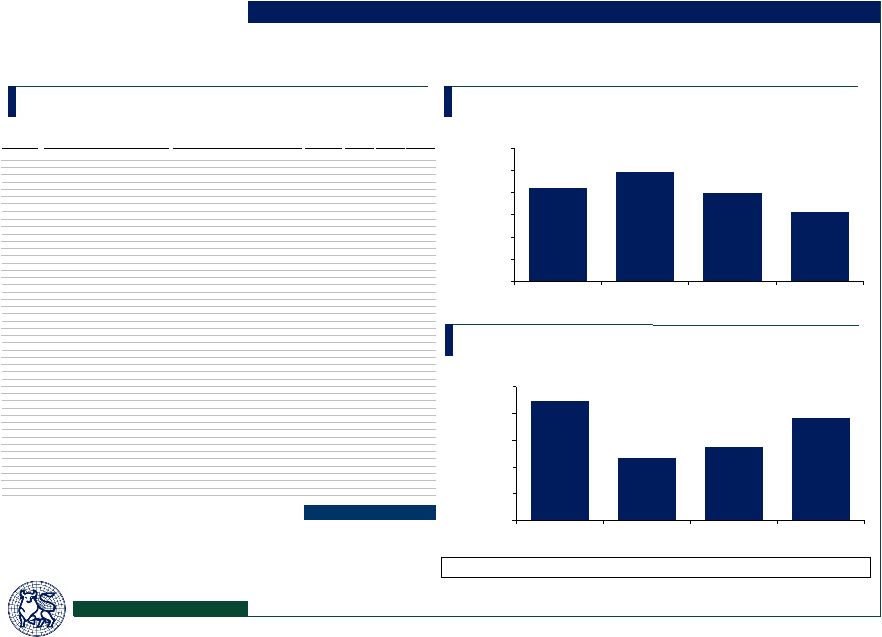
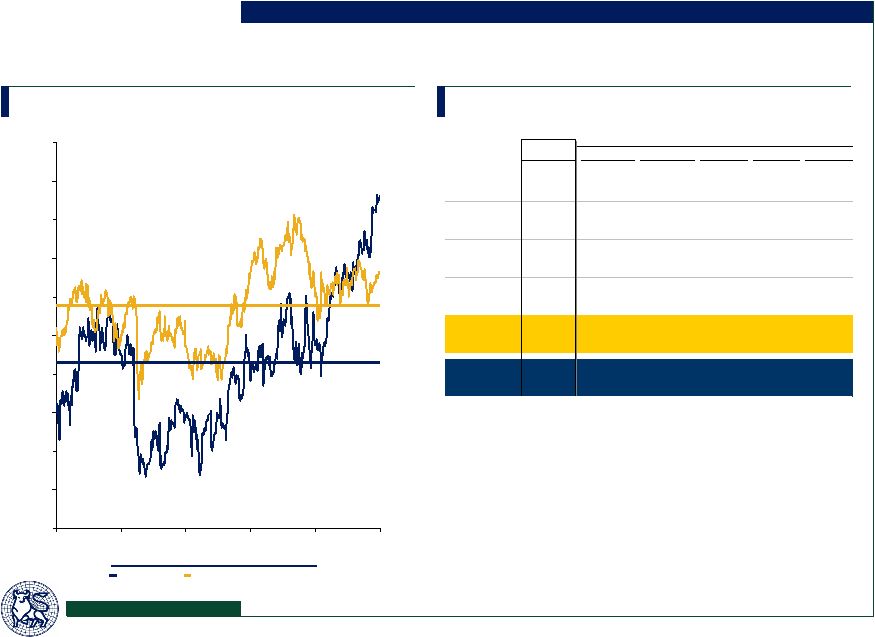
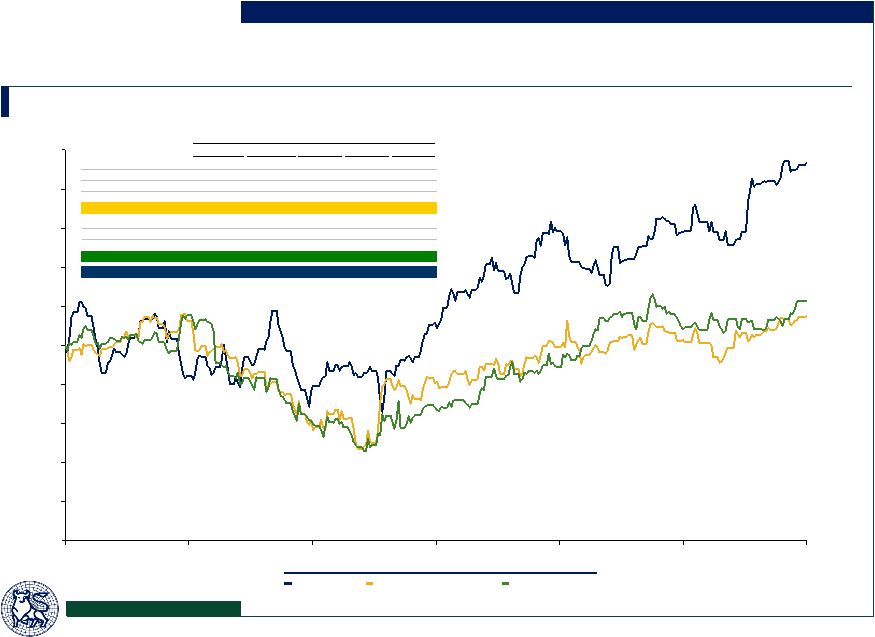 8 Relative Stock Price Performance (1 Year) ____________________ Source: FactSet. Public Market Trading Perspective 75% 80% 85% 90% 95% 100% 105% 110% 115% 120% 125% 2/20/2006 4/21/2006 6/21/2006 8/21/2006 10/21/2006 12/21/2006 2/20/2007 Middle- Market Brokers Maple Tree Global Brokers Global Brokers Middle-Market Brokers Maple Tree Price Performance YTD 2007 3 Months 6 Months 1 Year 3 Years BRO 0.8% (3.8%) (6.8%) (9.5%) 53.2% AJG (1.0%) 0.3% 7.8% (1.5%) (12.1%) HRH 4.2% 4.2% 4.6% 9.9% 17.3% USIH 8.9% 8.5% 29.5% 16.2% 24.9% Middle Market Brokers 3.2% 2.3% 8.8% 3.8% 20.8% MMC (1.7%) (6.2%) 17.7% 1.1% (37.8%) AOC 10.6% 9.6% 15.0% 0.1% 48.6% WSH 2.8% 1.8% 11.1% 15.8% 6.7% Global Brokers 3.9% 1.7% 14.6% 5.7% 5.8% Maple Tree 6.6% 11.7% 20.2% 23.4% 104.6% |
 9 Public Market Trading Perspective Trading Analysis Over the Last 12 Months ____________________ Source: FactSet. Based on volume traded from 2/17/06 to 2/20/07. (1) Price range data for TSX in Canadian dollars. 951 1,036 1,699 2,069 2,454 1,720 1,760 4,804 1,502 324 0 1,000 2,000 3,000 4,000 5,000 6,000 24-25 25-26 26-27 27-28 28-29 29-30 30-31 31-32 32-33 33-34 Volume Traded by Price Range - NYSE Volume Traded by Price Range (1) - TSX Cumulative Volume - NYSE Cumulative Volume - TSX 100.0% 94.8% 89.2% 79.9% 68.6% 55.2% 45.8% 36.2% 10.0% 1.8% 0% 20% 40% 60% 80% 100% 120% 24-25 24-26 24-27 24-28 24-29 24-30 24-31 24-32 24-33 24-34 % 1.8% 8.2% 26.2% 9.6% 9.4% 13.4% 11.3% 9.3% 5.7% 5.2% 36 53 8 54 65 23 146 118 107 98 122 91 0 20 40 60 80 100 120 140 160 28-29 29-30 30-31 31-32 32-33 33-34 34-35 35-36 36-37 37-38 38-39 39-40 100.0% 96.1% 90.4% 89.5% 83.6% 76.6% 74.1% 58.2% 45.4% 33.8% 23.1% 9.9% 0% 20% 40% 60% 80% 100% 120% 28-29 29-30 30-31 31-32 32-33 33-34 34-35 35-36 36-37 37-38 38-39 39-40 Total Volume = 18,319 shares Total Volume = 920 shares % 9.9% 13.3% 10.6% 11.6% 12.8% 15.9% 2.5% 7.0% 5.9% 0.9% 5.8% 3.9% (000’s of shares) (000’s of shares) Weighted Average Price = US$28.80 Weighted Average Price = C$32.75 |
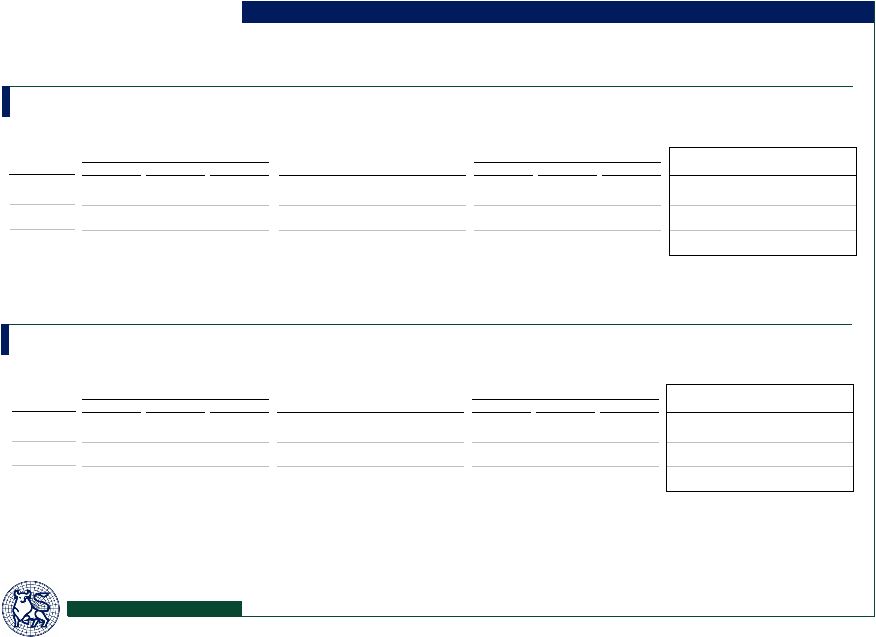
 EPS Net Income Price Q4 2007E Q4 Firm Rating Target 2006E 2006E 2007E % change 2006E 2006E 2007E Cochran Caronia Outperform $34.00 $0.33 $1.60 $1.91 19.4% $14.9 $54.7 $90.1 Ferris Baker Watts Buy 36.00 0.30 1.38 1.79 29.7% 12.3 52.1 74.9 Keefe, Bruyette & Woods Outperform 36.00 0.37 1.65 2.05 24.2% NA NA NA Stephens Overweight 36.00 0.34 1.59 1.87 17.6% 14.2 62.6 78.0 TD Newcrest Buy 35.00 0.35 1.61 1.91 18.6% NA NA NA Wachovia Outperform NA 0.35 1.60 2.00 25.0% 14.3 62.9 82.1 Average $35.40 $0.34 $1.57 $1.92 22.4% $13.9 $58.1 $81.3 FirstCall Average $0.34 $1.61 $1.92 22.4% $13.9 $58.1 $82.1 Maple Tree Management (1) $0.32 $1.60 $2.01 25.5% $13.1 $61.7 $84.2 10 Public Market Trading Perspective Equity Research Summary Net Income Estimates ($ in millions) ____________________ Source: FirstCall as of 2/20/07. (1) Includes the impact of acquisitions. Net income excludes expenses associated with Talbot earnout. Revenue and EBITDA Estimates ($ in millions) Revenue EBITDA EBITDA Margin Q4 Q4 Q4 Firm 2006E 2006E 2007E 2006E 2006E 2007E 2006E 2006E 2007E Cochran Caronia $141.3 $547.9 $649.5 $34.9 $145.8 $175.4 24.7% 26.6% 27.0% Ferris Baker Watts 139.0 545.6 631.5 35.5 148.0 175.0 25.5% 27.1% 27.7% Keefe, Bruyette & Woods NA 550.0 646.0 NA 149.0 179.0 NA 27.1% 27.7% Stephens 140.1 546.7 622.4 34.6 147.2 171.5 24.7% 26.9% 27.6% TD Newcrest NA 550.5 641.0 NA 147.8 178.6 NA 26.8% 27.9% Wachovia 143.1 549.7 651.5 35.2 147.7 179.8 24.6% 26.9% 27.6% Average $140.9 $548.4 $640.3 $35.0 $147.6 $176.5 24.9% 26.9% 27.6% FirstCall Average $140.9 $548.4 $651.5 $35.0 $147.6 $179.8 24.9% 26.9% 27.6% Maple Tree Management (1) $137.3 $543.9 $658.1 $34.3 $146.9 $189.2 25.0% 27.0% 28.8% |
 11 Public Market Trading Perspective Selected Equity Research Commentary Highlights Considerations Maple Tree will ultimately increase its internal growth, expand its margins, and, most importantly, beat EPS expectations through M&A. As a result, we expect Maple Tree to be our fastest growing broker through 2007. Stephens, 10/27/06 We continue to be impressed with the progress the company is making toward building a national platform and creating a long-term differentiated franchise. Ferris, Baker Watts, 10/26/06 Maple Tree is the only brokerage stock we are recommending to buy. Revenue growth was 3x to 4x more than growth being produced by other regional brokers. Management’s ability to attract deals in a competitive environment gives us comfort that Maple Tree will produce a materially higher growth rate going forward. Cochran Caronia Waller, 10/27/06 Organic growth at Maple Tree should benefit from actions being taken to strengthen the sales culture. We believe Maple Tree can sustain organic growth in the low to mid-single digit range in 2007 and beyond, even in a declining rate environment. Wachovia, 11/21/06 Maple Tree believes prices are down an average of 5% to 10% across its main markets and believes this headwind is probably a bit worse than some of its peers. We note that the strongest pricing markets are the Gulf Coast and California, where Maple Tree has comparatively a smaller presence. By contrast, Midwest markets, where Maple Tree’s presence is strongest, report the softest pricing. Ferris, Baker Watts, 10/26/06 The commercial insurance market should experience a heightened level of rate pressure in subsequent quarters. This pressure should result in lower organic growth for Maple Tree (we estimate 3%), but growth from acquisitions will more than compensate for this potential decline. Cochran Caronia Waller, 10/27/06 Downward pressure on rates expected to continue in 2007. Maple Tree expects further softening of rates given its geographic footprint concentrated in non-catastrophe exposed areas. Wachovia, 10/26/06 Maple Tree delivered organic growth on core commissions of 1.0%, excluding FX gains, compared to an average of 4.5% for its main competitors…we could see further pressure on Maple Tree’s organic growth and margins. This is a concern, and we’ll be watching developments closely. TD Newcrest, 10/27/06 |
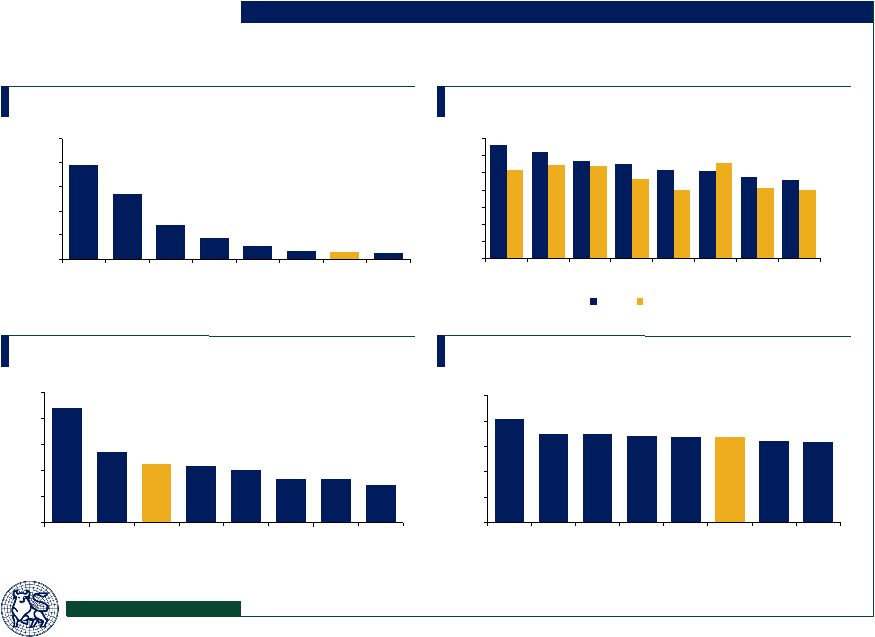 12 Public Market Trading Perspective Selected Trading Multiples and Metrics ____________________ Source: Wall Street research, company filings, and FactSet. Market data as of 2/20/07. (1) Enterprise value includes impact of dilutive securities. 2007E Revenue Multiple 2007E Cash P/E Multiple Enterprise Value (1) ($ in billions) EBITDA Multiple 12.7x 12.8x 13.4x 13.5x 13.7x 14.0x 14.0x 16.3x 0.0x 4.0x 8.0x 12.0x 16.0x 20.0x BRO AJG MMC HRH WSH Maple Tree USIH AOC 1.5x 1.7x 1.7x 2.0x 2.2x 2.2x 2.7x 4.4x 0.0x 1.0x 2.0x 3.0x 4.0x 5.0x BRO WSH Maple Tree HRH USIH MMC AJG AOC 13.3x 12.5x 11.4x 11.0x 10.4x 10.2x 9.5x 9.2x 8.0x 10.4x 11.0x 8.0x 8.2x 11.1x 9.3x 10.8x 0.0x 2.0x 4.0x 6.0x 8.0x 10.0x 12.0x 14.0x WSH BRO AJG USIH Maple Tree MMC AOC HRH 2006E 2007E $1.3 $1.5 $1.7 $2.8 $4.3 $7.1 $13.6 $19.6 $0.0 $5.0 $10.0 $15.0 $20.0 $25.0 MMC AOC WSH BRO AJG HRH Maple Tree USIH |
 13 Historical EBITDA Trading Multiples (Middle Market Brokers) Enterprise Value / LTM EBITDA Valuation Statistics Public Market Trading Perspective ____________________ Source: Company filings and FactSet. Note: LTM EBITDA, diluted shares, and net debt figures effective as of earnings release dates. Financial data based on 12/31/06 for BRO, AJG and Maple Tree and 9/30/06 for HRH and USIH. Market value based on diluted share count calculated using treasury stock method. Net debt includes unrestricted cash and liquid investments. EBITDA excludes non-cash compensation expense and non-recurring charges. 5.5x 6.5x 7.5x 8.5x 9.5x 10.5x 11.5x 12.5x 01/01/04 08/17/04 04/03/05 11/18/05 07/05/06 02/20/07 Middle Market Brokers Maple Tree Middle Market Brokers Maple Tree Average Current 3 Month 6 Month 1 Year 2 Years 3 Years BRO 12.5x 12.9x 13.3x 14.1x 13.9x 13.8x AJG 11.4 10.5 9.9 9.3 9.0 9.3 HRH 9.0 8.6 8.6 8.5 8.2 8.2 USIH 11.5 11.0 10.5 10.6 11.9 11.3 Average 11.0x 10.6x 10.6x 10.6x 10.4x 10.4x Maple Tree 10.4x 9.8x 9.6x 9.1x 8.2x 8.1x |
 $30.7 $56.4 $73.4 $87.4 $113.5 $146.9 $0.0 $20.0 $40.0 $60.0 $80.0 $100.0 $120.0 $140.0 $160.0 2001 2002 2003 2004 2005 2006E 14 Revenue has been Growing with Strong Margins Revenue ($ in millions) EBITDA (1) ($ in millions) Margin 25.6% 24.6% 25.6% 25.6% 19.9% 27.0% Commissions 20.7% 25.2% 28.4% 40.5% 65.6% 23.9% Other Contingents Commissions Average (‘02-’06): 25.7% Contingents 86.4% 17.1% 61.6% 94.3% 20.2% 10.6% Other 19.3% 5.1% 29.4% 49.5% 28.3% 30.7% ____________________ Note: 2006E figures based on draft results provided by the Company. (1) Excludes impact of non-cash stock based compensation and Talbot earnout compensation. Total 24.6% 24.0% 30.2% 42.8% 61.7% 22.9% Public Market Trading Perspective $0.0 $100.0 $200.0 $300.0 $400.0 $500.0 $600.0 2001 2002 2003 2004 2005 2006E $154.0 $220.0 $286.4 $355.1 $442.6 $543.9 |
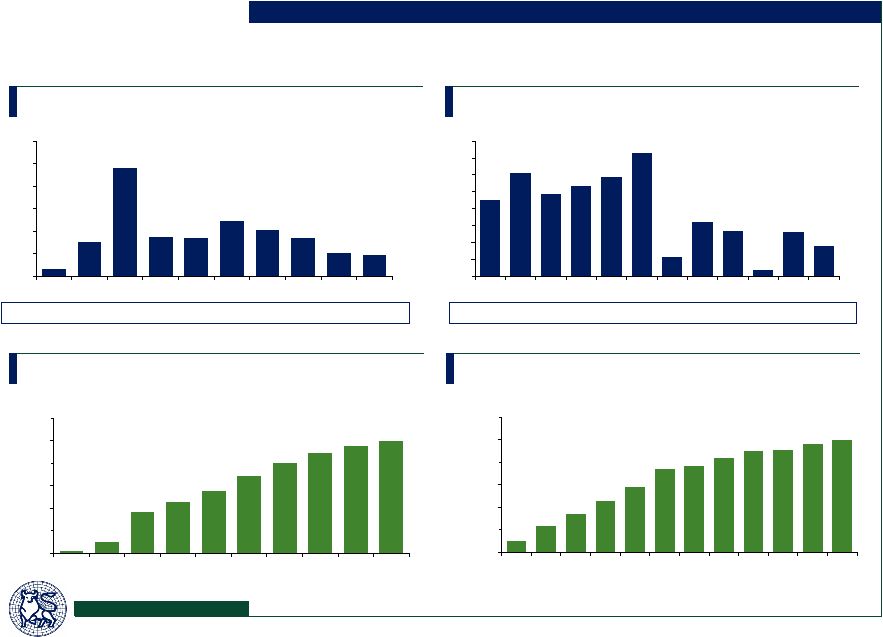
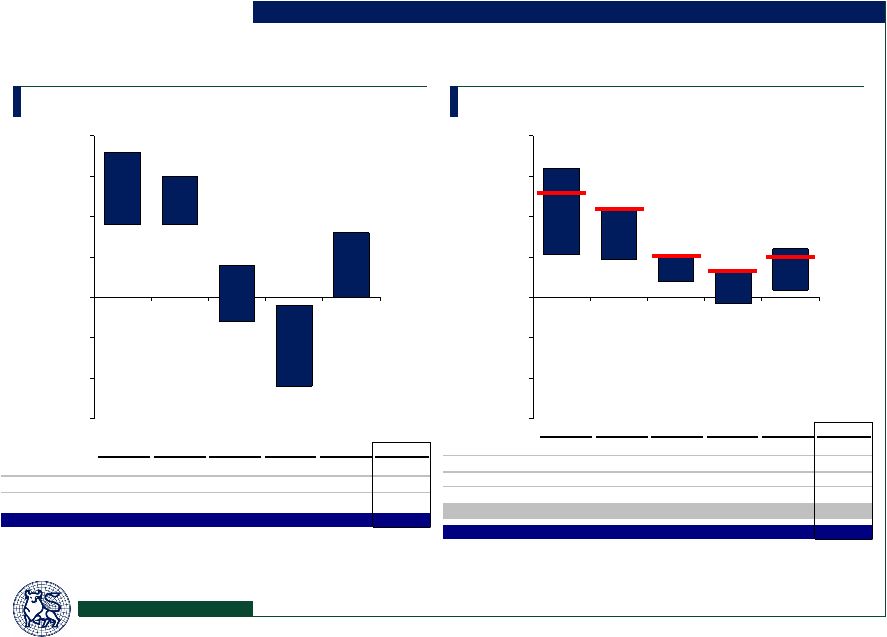
 15 Public Market Trading Perspective Comparative Reported Total Revenue Growth ____________________ Source: Company filings. Note: Financial data based on 12/31/06 for MMC, AOC, WSH, BRO, AJG, HRH and Maple Tree and 9/30/06 for USIH. (1) Excludes revenue from financial services segment. Middle Market Brokers Global Brokers 2.3% (0.9%) 4.9% 10.8% 5.3% 7.1% (0.4%) 9.6% 19.7% 21.8% (10.0%) 0.0% 10.0% 20.0% 30.0% 40.0% 50.0% 5.0% 8.4% 9.9% 7.8% 5.7% 23.8% 26.1% 24.0% 30.2% 42.8% (10.0%) 0.0% 10.0% 20.0% 30.0% 40.0% 50.0% 2002 2003 2004 2005 2006 Average MMC 5.3% 10.8% 5.0% (0.9%) 2.3% 4.5% AOC 14.1% 11.7% 4.9% (0.9%) 5.4% 7.0% WSH 21.8% 19.7% 9.6% (0.4%) 7.1% 11.6% Mean 13.7% 14.1% 6.5% (0.7%) 4.9% 7.7% 2002 2003 2004 2005 2006 Average BRO 24.9% 20.9% 17.4% 21.5% 11.7% 19.3% AJG (1) 22.2% 15.4% 11.8% 8.4% 7.3% 13.0% HRH 37.1% 24.5% 9.9% 8.8% 5.5% 17.1% USIH 5.7% 7.8% 18.2% 26.1% 8.2% 13.2% Maple Tree 42.8% 30.2% 24.0% 24.6% 22.9% 28.9% Mean 26.5% 19.8% 16.3% 17.9% 11.1% 18.3% |
 16 Comparative Organic Revenue Growth Middle Market Brokers Global Brokers 0% (11%) (3%) 9% 9% 8% (1%) 4% 15% 18% (15%) (10%) (5%) 0% 5% 10% 15% 20% 1% (1%) 2% 5% 5% 6% 3% 5% 11% 16% (15%) (10%) (5%) 0% 5% 10% 15% 20% ____________________ Source: Company filings. Note: Organic growth on commissions and fees, including the impact of foreign exchange, where applicable. (1) Based on total revenue for brokerage segment only. (2) Based on brokerage segment only. (3) 2006 organic growth based on September 30, 2006 year to date. (4) Includes the impact foreign exchange. 2002 2003 2004 2005 2006 Average MMC (1) 15% 13% (3%) (11%) 0% 3% AOC (1) 9% 9% 0% (1%) 2% 4% WSH 18% 15% 4% (1%) 8% 9% Mean 14% 12% 0% (4%) 3% 5% 2002 2003 2004 2005 2006 Average BRO (3) 12% 6% 4% 3% 5% 6% AJG (2) 16% 10% 2% 2% 6% 7% HRH 9% 6% 2% (1%) 4% 4% USIH (3) 5% 5% 4% (1%) 1% 3% Maple Tree (4) 13% 11% 5% 3% 5% 7% Mean 11% 7% 3% 1% 4% 5% Public Market Trading Perspective |
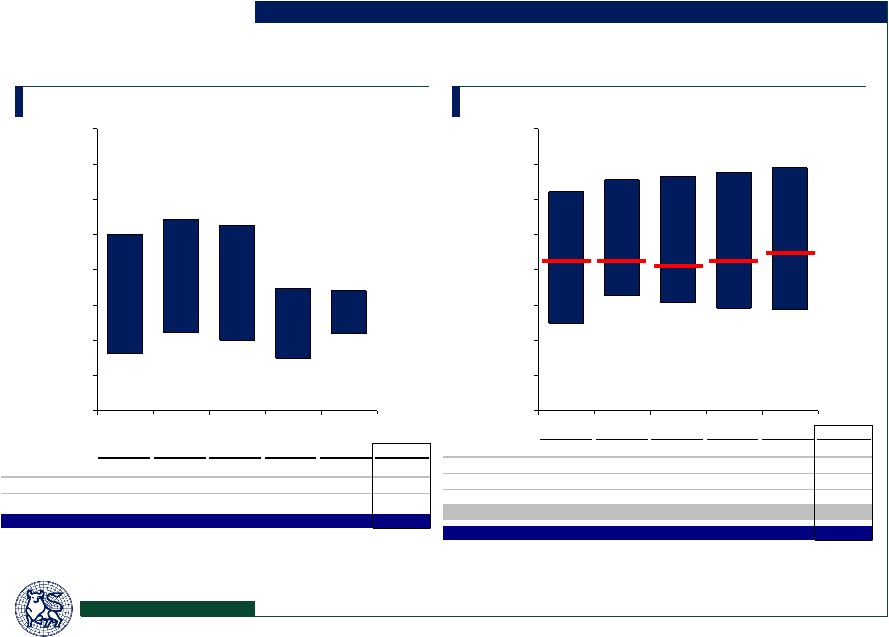 17 Comparative EBITDA Margin Middle Market Brokers Global Brokers 15.9% 12.4% 15.0% 16.0% 13.0% 22.0% 22.3% 31.3% 32.2% 30.0% 5.0% 10.0% 15.0% 20.0% 25.0% 30.0% 35.0% 40.0% 45.0% 19.3% 19.5% 20.3% 21.4% 17.4% 39.5% 38.8% 38.3% 37.8% 36.1% 5.0% 10.0% 15.0% 20.0% 25.0% 30.0% 35.0% 40.0% 45.0% ____________________ Source: Company filings. Note: Financial data based on 12/31/06 for MMC, AOC, WSH, BRO, AJG, HRH and Maple Tree and 9/30/06 for USIH. Excludes non-cash stock based compensation. (1) 2006 EBITDA margin based on depreciation and amortization for the last twelve months ended 9/30/06 and includes non-cash stock based compensation. (2) 2006 EBITDA margin based on non-cash stock based compensation for the last twelve months ended 9/30/06. (3) Excludes revenue and expenses from financial services segment. (4) Excludes Talbot earnout. 2002 2003 2004 2005 2006 Average MMC (1) 25.7% 25.4% 17.2% 12.4% 16.0% 19.4% AOC (2) 13.0% 16.0% 15.0% 14.6% 15.9% 14.9% WSH 30.0% 32.2% 31.3% 22.3% 22.0% 27.6% Mean 22.9% 24.5% 21.2% 16.5% 18.0% 20.6% 2002 2003 2004 2005 2006 Average BRO 36.1% 37.8% 38.3% 38.8% 39.5% 38.1% AJG (3) 20.5% 21.6% 22.8% 19.5% 19.3% 20.8% HRH (2) 28.1% 29.0% 28.1% 26.8% 27.5% 27.9% USIH 17.4% 21.4% 20.3% 20.6% 22.0% 20.3% Maple Tree (4) 25.6% 25.6% 24.6% 25.6% 27.0% 25.7% Mean 25.5% 27.1% 26.8% 26.3% 27.1% 26.6% Public Market Trading Perspective |
 Valuation Analysis |
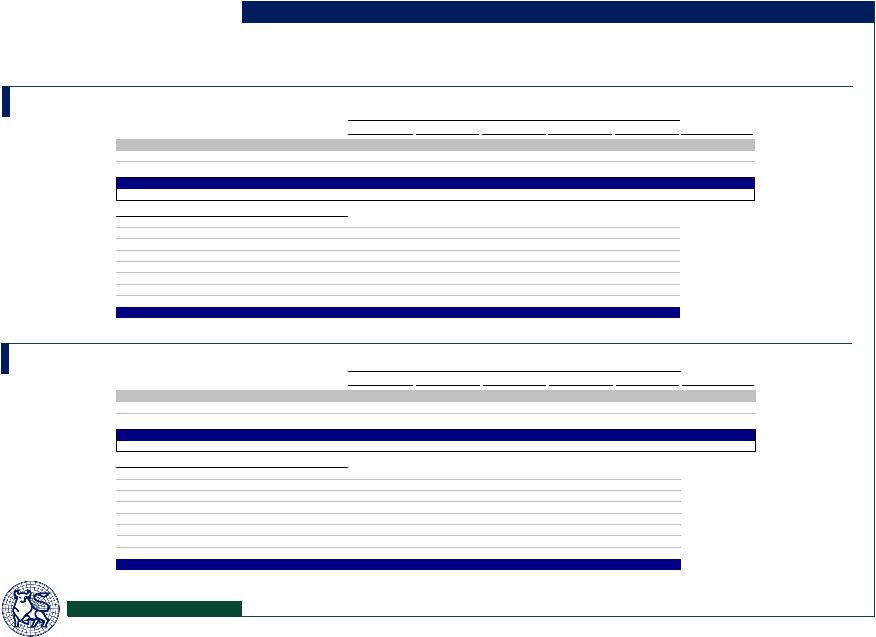
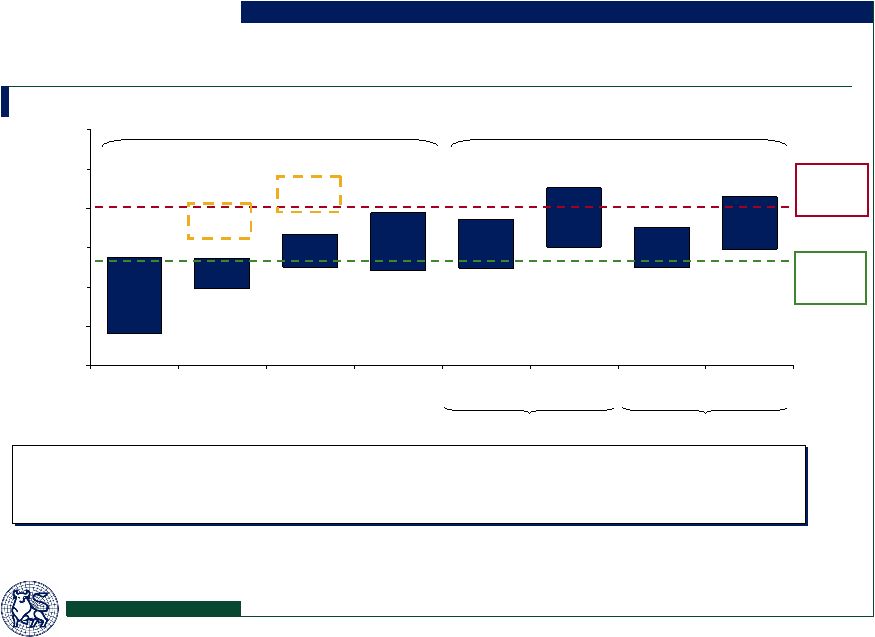 $34.82 $32.41 $35.07 $32.40 $32.04 $32.48 $29.79 $24.08 $41.46 $37.56 $42.63 $38.65 $39.44 $36.70 $33.63 $33.75 $20.00 $25.00 $30.00 $35.00 $40.00 $45.00 $50.00 52 Week High / Low Public Trading Comparables P/E Public Trading Comparables EV/ EBITDA Acquisition Comparables No Acquisition Case With Acquisitions (Mgmt. Case) No Acquisition Case With Acquisitions (Mgmt. Case) Valuation Analysis Valuation Summary (US$) Equity Value Per Share ____________________ Note: Market data as of 2/20/07. (1) Dotted box indicates a 20% change of control premium to publicly traded comparables. (2) FirstCall estimate. (3) Includes impact related to the 2006 time period prior to completion of acquisitions which were closed in 2006. Excludes non-cash stock based compensation, expense for Talbot earnout and investment income on unrestricted cash. (4) Based on 39.714 million basic shares outstanding, 2.015 million restricted share units, 0.814 million options with an exercise price of $15.67 and 0.106 million options with an exercise price of $13.79. Assumes net debt of $67.2 million. (5) Includes full year pro forma impact of acquisitions announced in 2007. Reduced by earnings on $42.2 million of cash to be used in the acquisition. Discount Rate: 10% – 12% Terminal Value: 8.5x – 9.5x (4) Leverage of 6.77x 3/31/07E LTM Adjusted EBITDA (5) 2011 Exit EBITDA Multiple Range of 9.0x – 11.0x 22%-25% Equity Returns (3)(4) 9.0x – 11.0x 2006 Adj. EBITDA of $157.7mm (3)(4) 2007E GAAP EPS 15.5x – 17.5x of $1.92 (2) Metric / Multiples / Methodology Discounted Cash Flow Analysis Leveraged Buyout Analysis 18 Current Price: $33.45 Offer: $40.00 Discount Rate: 11% – 13% Terminal Value: 8.5x – 9.5x (4) 20% premium (1) 8.0x – 9.0x 2007E EBITDA of $179.8mm (2) Based on Actual Results and Wall Street Estimates Based on Management Projections |
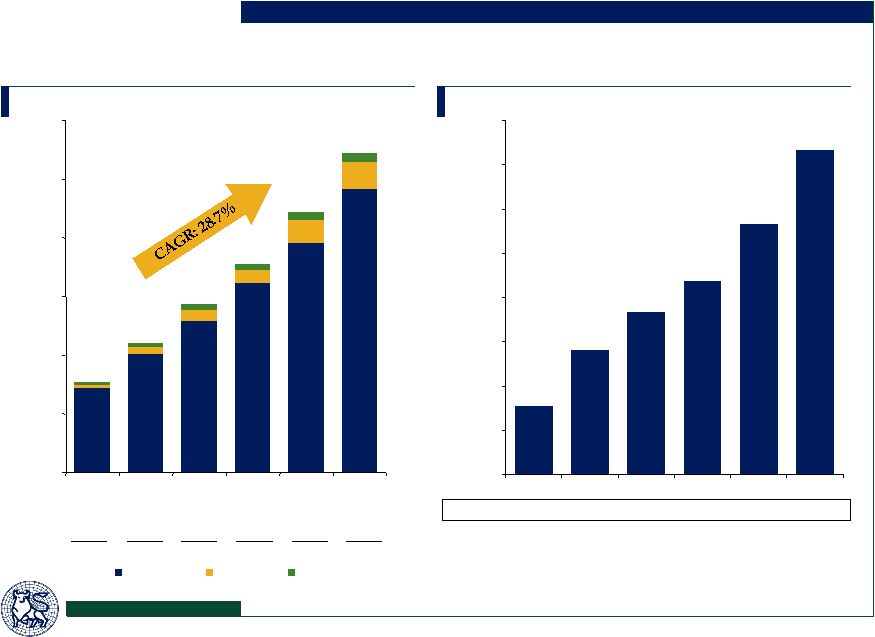
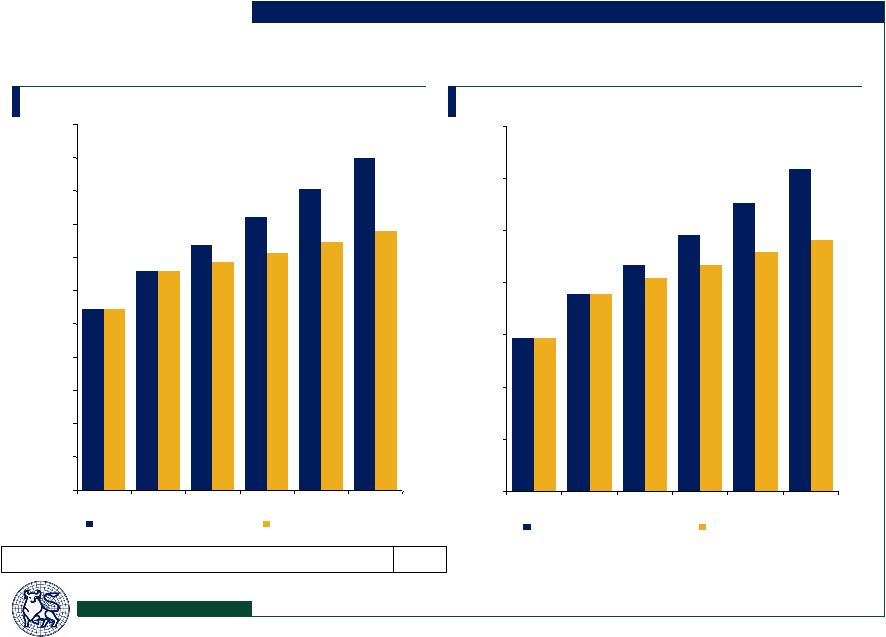 19 Financial Projections Revenue ($ in millions) EBITDA (1) ($ in millions) Valuation Analysis ____________________ Note: 2006E figures based on draft results provided by the Company. (1) Excludes impact of non-cash stock based compensation and expense for Talbot earnout. $309 $276 $246 $217 $189 $147 $241 $230 $217 $204 $0 $50 $100 $150 $200 $250 $300 $350 2006E 2007E 2008E 2009E 2010E 2011E With Acquisitions (Mgmt. Case) No Acquisition Case Annual Percent Change CAGR Acq. Case 22.9% 21.0% 11.9% 11.2% 10.5% 10.1% 12.9% No Acq. Case 22.9% 21.0% 4.0% 4.3% 4.3% 4.4% 7.4% $997 $905 $819 $737 $658 $544 $777 $744 $713 $684 $0 $100 $200 $300 $400 $500 $600 $700 $800 $900 $1,000 $1,100 2006E 2007E 2008E 2009E 2010E 2011E With Acquisitions (Mgmt. Case) No Acquisition Case |
 20 Financial Projections – With Acquisitions (Management Case) ($ in millions, except per share amounts) ____________________ Source: Maple Tree management estimates. (1) Includes expense relating to Talbot earnout and other non-recurring items. Projected CAGR / Avg. 2006E 2007E 2008E 2009E 2010E 2011E 07E-'11E Commission income $437.1 $537.0 $610.4 $686.9 $766.3 $849.0 12.1% Contingent commissions and volume overrides 41.7 51.1 54.8 58.9 62.9 67.4 7.2% Other 14.1 20.0 21.4 23.3 26.1 30.2 10.8% Acquired revenue 51.0 50.0 50.0 50.0 50.0 50.0 - - Total revenue $543.9 $658.1 $736.7 $819.1 $905.3 $996.6 10.9% Total growth 22.9% 21.0% 11.9% 11.2% 10.5% 10.1% 12.9% Organic growth 4.9% 5.4% 4.0% 4.0% 4.0% 4.0% 4.3% EBITDA $146.9 $189.2 $217.3 $245.7 $276.1 $308.9 13.0% EBITDA margin 27.0% 28.8% 29.5% 30.0% 30.5% 31.0% 30.0% Net income $50.9 $82.1 $97.0 $112.3 $128.7 $146.5 Net income adjustments (1) 10.8 2.1 0.0 0.0 0.0 0.0 Adjusted net income $61.7 $84.2 $97.0 $112.3 $128.7 $146.5 14.8% Weighted average diluted shares (mm) 38.5 41.9 42.1 42.5 42.9 43.2 Adjusted EPS $1.60 $2.01 $2.31 $2.64 $3.00 $3.39 14.0% Cash net income $74.4 $100.1 $114.5 $130.4 $147.3 $165.6 Expense margins (% of revenue) Compensation 54.4% 54.3% 53.6% 53.2% 52.8% 52.5% Selling 4.0% 3.8% 3.7% 3.6% 3.5% 3.4% Occupancy 4.7% 4.5% 4.6% 4.7% 4.8% 4.9% Administration 9.9% 8.6% 8.5% 8.4% 8.3% 8.2% Total 73.0% 71.2% 70.5% 70.0% 69.5% 69.0% Valuation Analysis |
 21 Financial Projections – No Acquisition Case ($ in millions, except per share amounts) ____________________ Source: Maple Tree management estimates, excluding the impact of projected acquisitions in 2008 and thereafter. (1) Includes expense relating to Talbot earnout and other non-recurring items. Projected CAGR / Avg. 2006E 2007E 2008E 2009E 2010E 2011E 07E-'11E Commission income $437.1 $537.0 $610.4 $634.9 $660.2 $686.7 6.3% Contingent commissions and volume overrides 41.7 51.1 50.7 50.8 50.8 51.5 0.2% Other 14.1 20.0 23.0 27.8 33.0 39.0 18.2% Acquired revenue 51.0 50.0 0.0 0.0 0.0 0.0 - - Total revenue $543.9 $658.1 $684.1 $713.4 $744.1 $777.1 4.2% Total growth 22.9% 21.0% 4.0% 4.3% 4.3% 4.4% 7.6% Organic growth 4.9% 5.4% 4.0% 4.0% 4.0% 4.0% 4.3% EBITDA $146.9 $189.2 $204.3 $216.6 $229.6 $240.9 6.2% EBITDA margin 27.0% 28.8% 29.9% 30.4% 30.9% 31.0% 30.2% Net income $50.9 $82.1 $92.0 $99.9 $108.1 $114.9 Net income adjustments (1) 10.8 2.1 0.0 0.0 0.0 0.0 Adjusted net income $61.7 $84.2 $92.0 $99.9 $108.1 $114.9 8.1% Weighted average diluted shares (mm) 38.5 41.9 42.1 42.4 42.8 43.1 Adjusted EPS $1.60 $2.01 $2.19 $2.36 $2.53 $2.67 7.3% Cash net income $74.4 $100.1 $106.8 $113.2 $119.9 $125.5 Expense margins (% of revenue) Compensation 54.4% 54.3% 53.4% 53.0% 52.6% 52.6% Selling 4.0% 3.8% 3.7% 3.6% 3.5% 3.4% Occupancy 4.7% 4.5% 4.6% 4.7% 4.8% 4.9% Administration 9.9% 8.6% 8.4% 8.3% 8.2% 8.1% Total 73.0% 71.2% 70.1% 69.6% 69.1% 69.0% Difference to acquisition case Revenue $0.0 ($52.6) ($105.7) ($161.2) ($219.4) Cumulative revenue 0.0 (52.6) (158.3) (319.5) (538.9) EBITDA 0.0 (13.0) (29.2) (46.5) (68.0) Cumulative EBITDA 0.0 (13.0) (42.2) (88.7) (156.7) Valuation Analysis |
 22 Valuation Analysis Potential Projection “Opportunities” and “Threats” Projection Opportunities Projection Threats Acquisition pipeline remains robust, with approximately $30 million of revenue acquired to date in 2007 The Company has announced 3 acquisitions in 2007, representing revenue of approximately $30 million Terms have been agreed for an additional acquisition, representing revenue of approximately $18 million There is approximately $150 million of revenue in the acquisition pipeline Pricing improvements in the insurance market will lead to higher organic growth rates Build out of producer informational tools and training to increase sales productivity Ability to driver higher organic revenue growth Ability to expand foot print in selected geographic regions (southwest and southeast) Expand reinsurance brokerage business Opportunity to further accelerate EBITDA margin expansion through fold-in acquisitions Pricing environment across property & casualty industry is softening Will require a higher level of new business sales to maintain expected organic revenue growth of 4% Increased pressure on contingent commissions which are based on underwriting performance Regulatory hangover from previous industry investigations into illegal sales practices Future structure and levels of contingent commissions as part of broker compensation Future margin expansion very dependent on overall revenue growth to gain greater efficiencies Availability of acquisition opportunities to support acquired revenue assumptions Ability to continue to price acquisitions at 5x-7x pro forma EBITDA |
 |
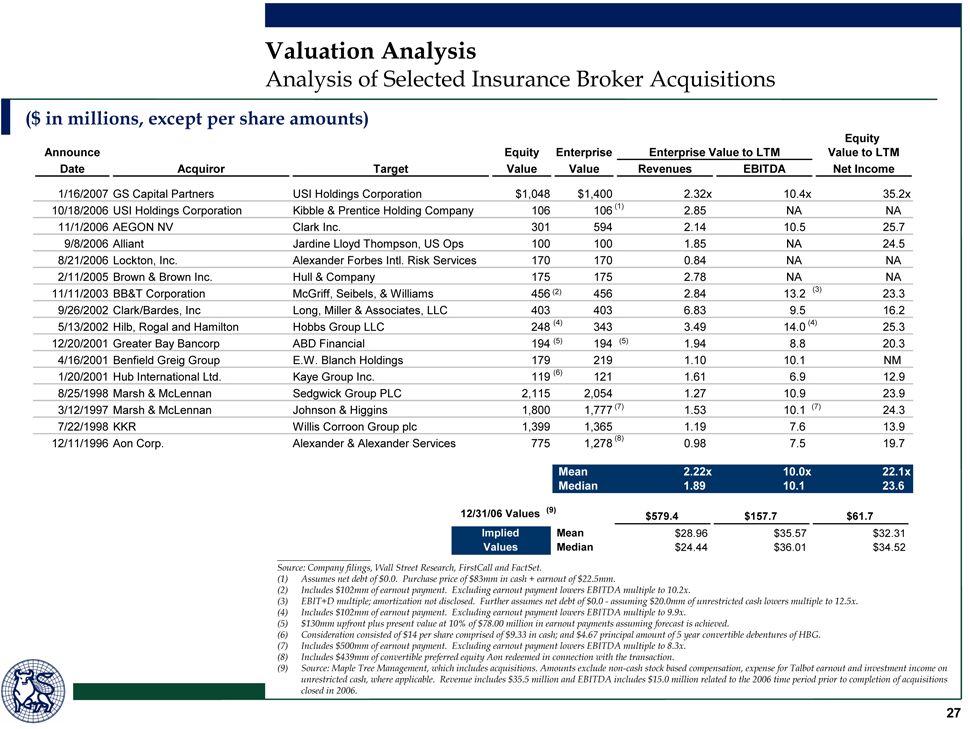
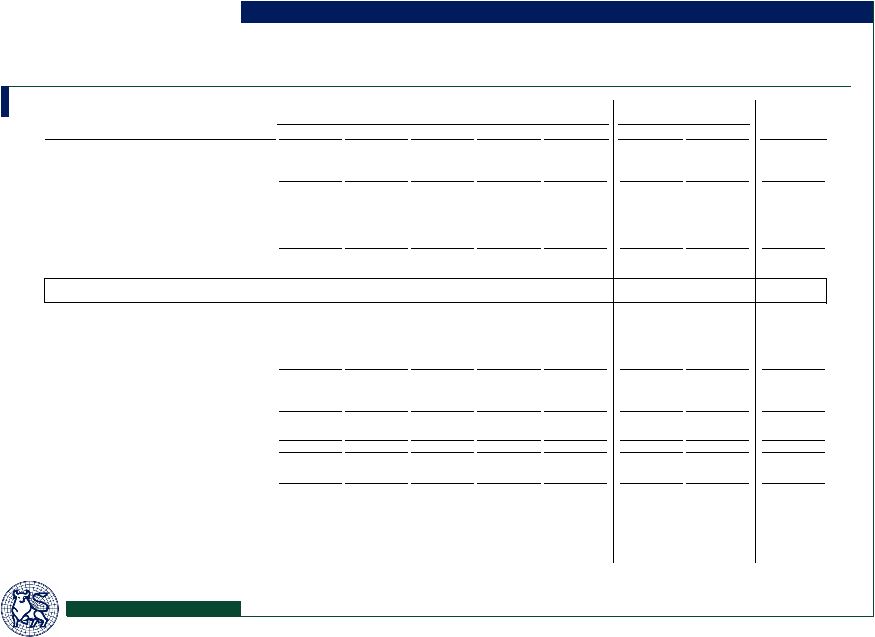
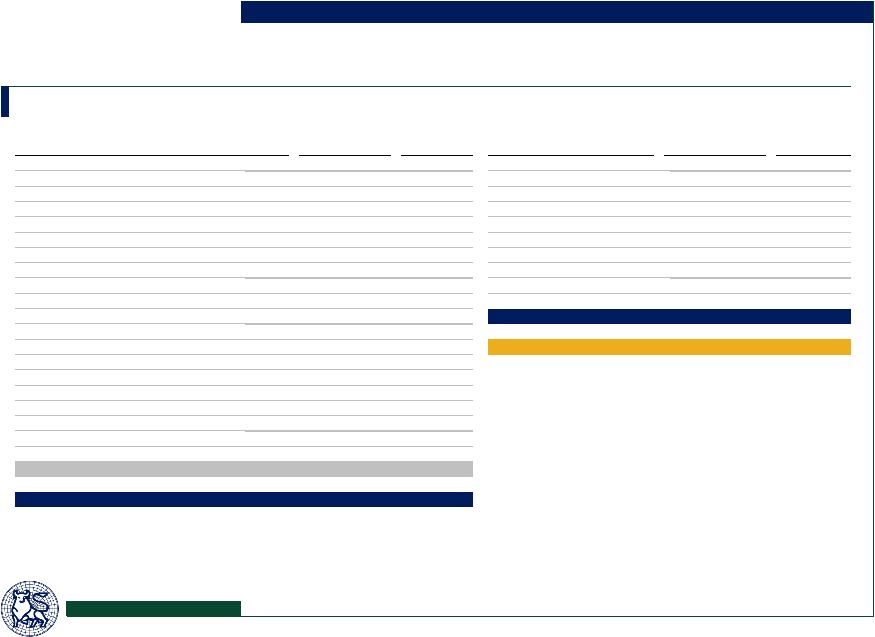
 24 Valuation Analysis Public U.S. Market Premiums Paid in All-Cash Transactions Premiums between $1.5bn – $2.5bn (since January 1, 2002) 1-Day Prior Median Premiums Date Transaction Premium (%) Announced Target Name Acquiror Name Value 1 Day 1 Week 1 Month 2/20/07 New River Pharmaceuticals Inc Shire plc $2,350 9.7% 17.0% 15.0% 1/29/07 First Republic Bank Merrill Lynch Bank & Trust 1,700 43.6 42.7 40.7 1/16/07 Genesis HealthCare Corp JER Partners; Formation Capital LLC (IBO) 1,741 19.2 33.5 31.5 1/8/07 United Surgical Partners International Inc UNCN Acquisition Corp 1,672 13.4 9.5 13.7 12/20/06 John H Harland Co M&F Worldwide Corp 1,629 18.6 19.5 22.3 12/19/06 Redback Networks Inc Telefonaktiebolaget LM Ericsson 1,731 20.7 42.0 51.5 11/20/06 Oregon Steel Mills Inc Evraz Group SA 2,398 7.3 9.9 20.6 11/16/06 Reader's Digest Association Inc Ripplewood Holdings LLC 2,438 9.6 10.2 28.3 11/6/06 Per-Se Technologies Inc McKesson Corp 1,870 14.5 17.8 18.2 10/31/06 Trammell Crow Co CB Richard Ellis Group Inc 2,218 26.6 30.0 35.6 10/25/06 Yankee Candle Co Inc Madison Dearborn Partners LLC 1,761 21.0 19.0 22.1 10/17/06 ICOS Corp Eli Lilly & Co 2,391 18.0 21.0 30.9 10/2/06 Myogen Inc Gilead Sciences Inc 2,242 49.7 49.2 54.4 8/21/06 Glenborough Realty Trust Inc Morgan Stanley Real Estate Funds 1,781 8.1 11.4 20.4 8/10/06 FileNET Corp International Business Machines Corp - IBM 1,514 1.0 4.0 28.1 7/14/06 Petco Animal Supplies Inc Leonard Green & Partners LP; TPG 1,795 49.1 48.3 52.9 6/29/06 RSA Security Inc EMC Corp 2,113 44.6 49.2 80.5 6/12/06 Texas Regional Bancshares Inc Banco Bilbao Vizcaya Argentaria SA - BBVA 2,131 13.7 23.4 38.9 5/1/06 Aviall Inc Boeing Co 2,028 27.3 27.6 27.2 4/26/06 Diagnostic Products Corp Siemens AG 1,763 20.7 20.4 25.5 4/25/06 Northwestern Corp Babcock & Brown Infrastructure Group 2,288 16.1 21.9 15.6 4/12/06 Sybron Dental Specialties Inc Danaher Corp 2,103 12.6 9.7 24.4 3/13/06 Andrx Corp Watson Pharmaceuticals Inc 1,841 15.8 22.8 40.1 3/6/06 Longview Fibre Co Investor Group 1,876 35.1 36.6 34.9 1/18/06 Burlington Coat Factory Warehouse Corp Bain Capital Inc 2,045 1.4 3.5 12.3 12/23/05 Tommy Hilfiger Corp Apax Partners LP 1,548 5.0 1.1 (6.7) 12/14/05 Anteon International Corp General Dynamics Corp 2,157 36.1 32.7 21.7 10/24/05 AMLI Residential Properties Trust Morgan Stanley 2,100 20.7 21.4 19.0 9/19/05 Spinnaker Exploration Co Norsk Hydro ASA 2,409 34.4 44.3 54.6 9/15/05 UICI Management Group 1,747 19.0 17.1 15.0 8/4/05 Metris Companies Inc HSBC Holdings plc 1,555 1.1 0.5 4.5 6/17/05 CRT Properties Inc Investor Group 1,697 15.4 17.2 21.2 6/16/05 Vicuron Pharmaceuticals Inc Pfizer Inc 1,771 84.2 78.6 69.2 4/21/05 Transkaryotic Therapies Inc Shire Pharmaceuticals Group plc 1,554 21.6 38.1 65.6 1/31/05 Pulitzer Inc Lee Enterprises Inc 1,507 1.7 (1.5) (1.3) 11/3/04 Argosy Gaming Co Penn National Gaming Inc 2,199 16.4 11.1 20.6 10/18/04 Select Medical Corp EGL Acquisition Corp 2,300 26.6 27.8 39.4 7/22/04 AMC Entertainment Inc Marquee Holdings Inc 2,020 13.6 35.9 26.7 6/3/04 NeighborCare Inc Omnicare Inc 1,626 69.8 67.8 25.8 5/19/04 Alaris Medical Systems Inc Cardinal Health Inc 2,034 18.4 11.6 20.7 5/18/04 Kroll Inc Marsh & McLennan Companies Inc 1,741 32.4 32.9 29.8 5/3/04 Keystone Property Trust ProLogis 1,536 17.0 14.2 (2.5) 6/9/03 Veridian Corp General Dynamics Corp 1,501 28.0 30.8 46.0 5/29/03 Chateau Communities Inc Hometown America LLC 2,081 16.3 16.7 37.3 4/1/03 Clayton Homes Inc Berkshire Hathaway Inc 1,711 13.2 9.9 11.0 10/14/02 Quintiles Transnational Corp Pharma Services Co 1,650 35.4 39.1 14.8 4/13/02 Nortek Inc Kelso & Co LP 1,613 (3.1) 6.9 6.3 1/21/02 Gaylord Container Corp Temple-Inland Inc 1,798 33.0 46.3 30.0 Mean 22.4% 25.0% 28.2% Median 18.5 21.2 25.7 1-Week Prior Median Premiums Average (all years): 22.4% Average (all years): 25.0% ____________________ Source: Securities Data Corporation, as of 1/22/07. 18.4% 19.9% 18.0% 16.3% 10.0% 12.0% 14.0% 16.0% 18.0% 20.0% 22.0% 2004 2005 2006 YTD 2007 7 10 21 4 25.3% 21.0% 19.3% 27.8% 10.0% 14.0% 18.0% 22.0% 26.0% 30.0% 2004 2005 2006 YTD 2007 # of Transactions: |
 Valuation Analysis Comparison to Leveraged Buyout of USI Holdings 25 ____________________ Note: USIH EBITDA and net income estimates based on Wallstreet research. (1) Based on 58.404 million basic shares outstanding. (2) Based on 1.214 million non-vested share awards and 5.813 million options with a weighted average exercise price of $11.15. (3) Stated transaction value from press release dated 1/16/07. (4) 2006 organic growth based on September 30, 2006 year to date. (5) Includes the impact of foreign exchange. (6) Excludes non-cash stock based compensation. (7) Excludes Talbot earnout and investment income on unrestricted cash, where applicable. (8) Includes impact related to the 2006 time period prior to completion of acquisitions which were closed in 2006 based on public disclosure; excludes non-cash compensation. (9) Includes $15.0 million in EBITDA related to the 2006 time period prior to completion of acquisitions closed in 2006. (10) 10/24/06 used as date for 1-day prior premium, and 9/25/06 used as date for 1-month prior premium. (11) 2/20/07 used as date for 1-day prior premium, and 1/20/07 used as date for 1-month prior premium. Multiples ($ in millions) Summary ($ in millions, except per share amts) Comparative Operating Metrics On October 24th, 2006 at close of business USI announced that it had received an indication of interest from an unnamed private equity firm to acquire the company USI formed a special committee of the Board and ran an auction process On January 16th, 2007, USI announced it had entered into a definitive merger agreement to be acquired by Goldman Sachs Capital Partners for $17.00 per share Equity value at $17.00 per share (1) $992.9 Plus: Net effect of dilutive securities (2) 54.6 Fully diluted equity value $1,047.5 Plus: Implied net debt 352.5 Enterprise value (3) $1,400.0 2002 2003 2004 2005 2006 Average Total Revenue Growth USIH 5.7% 7.8% 18.2% 26.1% 8.2% 13.2% Maple Tree 42.8% 30.2% 24.0% 24.6% 22.9% 28.9% Organic Revenue Growth USIH (4) 5% 5% 4% (1%) 1% 3% Maple Tree (5) 13% 11% 5% 3% 5% 7% EBITDA Margin (6) USIH 17.4% 21.4% 20.3% 20.6% 22.0% 20.3% Maple Tree (7) 25.6% 25.6% 24.6% 25.6% 27.0% 25.7% USI Maple Tree Multiple Multiple Implied Amount (6) at $17.00 Amount (6)(7) at $40.00 Price by USI 2006E EBITDA $119.5 11.7x $142.7 12.3x $37.97 2006E Adjusted EBITDA 134.3 10.4 157.7 11.2 37.30 2007E EBITDA 138.9 10.1 185.2 9.5 42.51 2006E Net Income $32.0 32.8x $61.7 27.4x 47.71 2007E Net Income 40.9 25.6 84.2 20.1 50.86 % Premium 1-Day Prior 15.0% 19.6% 38.47 1-Month Prior 23.7% 28.9% 41.39 (8) (9) (10) (11) |
 26 Valuation Analysis With Acquisitions (Management Case) ($ in millions, except per share amounts) Discounted Cash Flows Analysis No Acquisition Case ($ in millions, except per share amounts) ____________________ (1) Includes $15.0 million in EBITDA related to the 2006 time period prior to completion of acquisitions closed in 2006. Excludes non-cash stock based compensation, expense for Talbot earnout and investment income on unrestricted cash. (2) Based on net debt of $67.2 million as of 12/31/06 ($166.4 million of debt less $99.2 million of cash). (3) Based on 39.714 million basic shares outstanding, 2.015 million restricted share units, 0.814 million options with an exercise price of $15.67 and 0.106 million options with an exercise price of $13.79. Enterprise Value 8.5x 9.0x 9.5x $1,689.7 $1,780.3 $1,870.9 1,617.2 1,703.8 1,790.5 1,548.5 1,631.3 1,714.2 Enterprise Value as a Multiple of 2006E Adjusted EBITDA (1) 10.7x 11.3x 11.9x 10.3x 10.8x 11.4x 9.8x 10.3x 10.9x Equity Value Per Diluted Share (3) $38.38 $40.50 $42.63 36.68 38.71 40.74 35.07 37.01 38.95 Total Diluted Equity Value (2) 8.5x 9.0x 9.5x $1,622.5 $1,713.1 $1,803.7 1,550.0 1,636.6 1,723.2 1,481.3 1,564.1 1,647.0 WACC 11.0% 12.0% 13.0% Enterprise Value 8.5x 9.0x 9.5x $1,559.9 $1,630.7 $1,701.5 1,495.8 1,563.5 1,631.2 1,435.0 1,499.7 1,564.4 Enterprise Value as a Multiple of 2006E Adjusted EBITDA (1) 9.9x 10.3x 10.8x 9.5x 9.9x 10.3x 9.1x 9.5x 9.9x Equity Value Per Diluted Share (3) $35.33 $36.99 $38.65 33.83 35.42 37.00 32.40 33.92 35.44 Total Diluted Equity Value (2) 8.5x 9.0x 9.5x $1,492.7 $1,563.5 $1,634.3 1,428.6 1,496.3 1,563.9 1,367.8 1,432.5 1,497.2 WACC 10.0% 11.0% 12.0% |
 |
 Appendix |
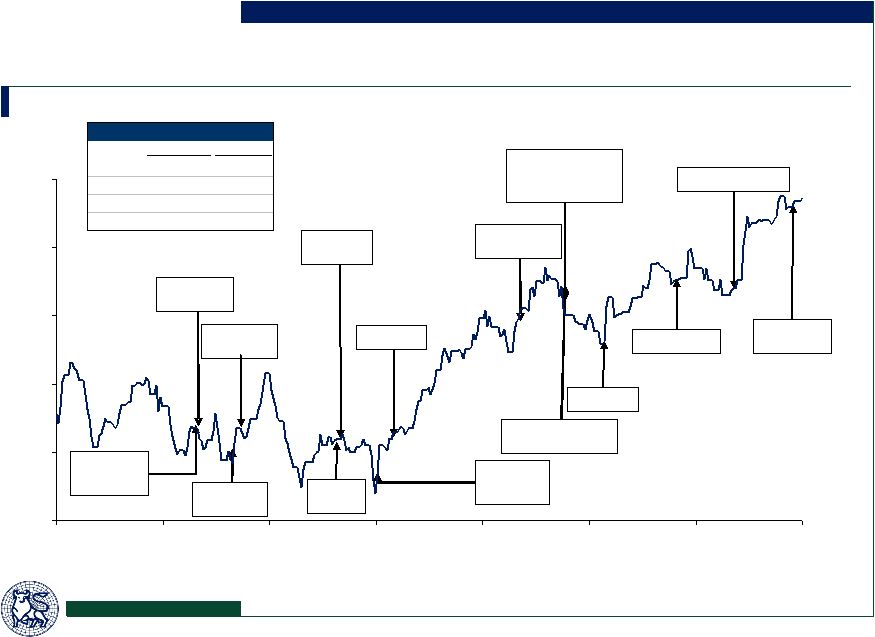 4/28/06: Acquires assets of Hirsch Wolf & Co. 4/27/06: Beats 1Q’06 earnings estimates by $0.04 cents 28 Appendix Historical Stock Price Performance (US$) ____________________ Source: FactSet and news releases. 5/15/06: Acquires Westar Insurance Managers 5/19/06: Prices secondary offering at $26.25 7/5/06: Acquires AssurConseil 7/7/06: Acquires Fortun Insurance Agency 7/27/06: Misses 2Q’06 earning estimates by $0.01 cent 8/2/06: Acquires Post & Kurtz 10/3/06: Acquires Kaufman & Kaufman Insurance 10/26/06: CEO discloses new responsibilities among executive management team Misses 3Q’06 earning estimates by $0.02 cents 11/13/06: Names new CFO 12/19/06: Acquires Bart Proud Insurance 2/14/07: Acquires Hibernia Insurance Agency 10/25/06: USI receives bid from private equity firm. Special Committee is formed 1/16/07: USI to be acquired by GS Capital Partners % change Maple Tree S&P 500 1 week 0.8% 1.1% 1 month 7.8% 2.0% YTD 2007 6.6% 2.9% 1 year 23.4% 13.4% $24.00 $26.00 $28.00 $30.00 $32.00 $34.00 2/20/06 4/13/06 6/4/06 7/26/06 9/16/06 11/7/06 12/29/06 2/20/07 |
 29 Historical Price/Forward EPS Multiples (Middle Market Brokers) Price / Forward EPS ____________________ Source: FactSet. Middle Market Brokers Maple Tree 10.0x 11.0x 12.0x 13.0x 14.0x 15.0x 16.0x 17.0x 18.0x 19.0x 20.0x 1/1/04 8/17/04 4/3/05 11/18/05 7/5/06 2/20/07 Valuation Statistics Appendix Average Current 3 Month 6 Month 1 Year 2 Years 3 Years BRO 20.1x 20.2x 21.0x 22.5x 21.9x 21.7x AJG 16.4 16.8 16.4 16.5 15.5 15.3 HRH 17.1 16.4 16.4 16.2 15.5 14.7 USIH 13.2 12.5 11.8 11.6 11.3 11.4 Average 16.7x 16.5x 16.4x 16.7x 16.0x 15.8x Maple Tree 18.6x 17.5x 17.0x 16.0x 14.7x 14.3x Middle Market Brokers Maple Tree |
 30 Historical Financial Performance ____________________ (1) Based on draft results provided by the Company. (2) Excludes Talbot earnout compensation and non-cash stock based compensation. ($ in millions) Nine Months Year Ending December 31, Ending September 30, 2001 2002 2003 2004 2005 2005 2006 2006E (1) Commission income $143.1 $201.0 $258.1 $323.2 $389.9 $283.3 $353.6 $483.2 Contingent commissions and volume overrides 5.9 11.5 18.5 21.7 40.5 35.8 41.5 44.7 Other 5.0 7.5 9.7 10.2 12.2 9.4 11.5 15.9 Total revenue $154.0 $220.0 $286.4 $355.1 $442.6 $328.5 $406.6 $543.9 % change 61.7% 42.8% 30.2% 24.0% 24.6% 29.5% 23.8% 22.9% Operating expenses Compensation (2) $88.0 $118.7 $156.3 $195.7 $246.3 $181.2 $220.4 $296.0 Selling, occupancy and administration 35.3 44.9 56.6 71.9 82.8 60.3 73.7 101.1 Total expenses $123.3 $163.6 $212.9 $267.7 $329.1 $241.5 $294.0 $397.0 % change 61.2% 32.7% 30.2% 25.7% 23.0% 28.0% 21.8% 20.6% EBITDA $30.7 $56.4 $73.4 $87.4 $113.5 $87.0 $112.6 $146.9 EBITDA margin 19.9% 25.6% 25.6% 24.6% 25.6% 26.5% 27.7% 27.0% Depreciation and amortization $8.9 $7.2 $9.5 $12.7 $17.1 $12.0 $20.9 $30.0 Interest expense 7.4 7.3 5.2 7.4 10.7 7.6 9.7 12.3 Talbot earnout 0.0 0.0 0.0 14.4 28.7 23.5 9.9 12.2 Non-cash compensation 0.0 1.1 4.8 6.5 7.2 5.3 4.9 6.6 Other expense (income) (0.9) (2.9) (1.4) 0.7 (6.9) (6.6) (0.9) (0.6) Total other expenses $15.4 $12.7 $18.1 $41.7 $56.7 $41.9 $44.5 $60.3 Earnings before tax $15.3 $43.7 $55.4 $45.8 $56.7 $45.1 $68.0 $86.6 Income taxes 5.3 14.3 18.8 20.0 31.0 25.0 28.2 35.7 Net income from continuing operations $10.0 $29.4 $36.5 $25.8 $25.7 $20.1 $39.8 $50.9 Net earnings (loss) from discontinued operations -- -- -- 0.5 (0.0) (0.1) 0.1 -- Net earnings $10.0 $29.4 $36.5 $26.2 $25.7 $20.0 $39.9 $50.9 Weighted average diluted shares 20.1 30.2 33.8 35.3 36.6 36.7 38.3 38.5 Diluted EPS (total operations) $0.49 $0.96 $1.14 $0.80 $0.76 $0.59 $1.07 $1.35 Balance Sheet Items Cash and equivalents (unrestricted) $27.0 $40.6 $82.1 $98.2 $70.1 $122.4 $109.7 $99.2 Trust cash (restricted) 50.4 53.6 54.5 71.7 113.3 64.1 85.5 112.2 Corporate debt 80.3 72.0 78.8 151.8 140.3 149.9 147.9 144.6 Convertible debentures 61.6 35.0 35.0 35.0 35.0 35.0 -- -- Shareholders' equity 135.3 284.3 342.8 381.8 419.9 411.3 647.2 659.2 Appendix |
 31 Summary Financial Projections – Free Cash Flow With Acquisitions (Management Case) ($ in millions) No Acquisition Case ($ in millions) Projected CAGR / Avg. 2007E 2008E 2009E 2010E 2011E 07E-'11E Total revenue (including inv. Income) $658.1 $736.7 $818.7 $904.0 $992.9 10.8% Total growth 13.9% 12.0% 11.1% 10.4% 9.8% 11.5% Organic growth (incl. in total) 5.4% 4.0% 4.0% 4.0% 4.0% 4.3% EBITDA $189.2 $217.4 $245.3 $274.8 $305.3 12.7% EBITDA margin 28.8% 29.5% 30.0% 30.4% 30.7% 29.9% Free cash flow Pre-tax income $131.4 $155.2 $179.2 $204.5 $230.7 Less: Income taxes (cash) (49.3) (58.2) (67.2) (76.7) (86.5) Plus: Depreciation and amortization 37.0 41.6 44.6 47.7 51.0 Plus: Non-cash compensation and Talbot earnout 8.9 8.7 9.6 10.7 11.7 Plus: Change in working capital (2.7) (2.0) (2.1) (2.2) (2.3) Less: Capital expenditures (14.5) (15.5) (16.4) (18.1) (19.9) Less: Cash earnout payments (18.2) (11.0) (18.3) (1.8) (0.3) Less: Cash used in acquisitions (82.7) (96.1) (95.9) (95.7) (95.8) Free cash flow $10.0 $22.7 $33.6 $68.5 $88.7 Cumulative free cash flow $10.0 $32.7 $66.3 $134.8 $223.4 Projected CAGR / Avg. 2007E 2008E 2009E 2010E 2011E 07E-'11E Total revenue (including inv. Income) $658.1 $684.1 $709.4 $736.1 $764.3 3.8% Total growth 13.9% 4.0% 3.7% 3.8% 3.8% 5.8% Organic growth (incl. in total) 5.4% 4.0% 4.0% 4.0% 4.0% 4.3% EBITDA $189.2 $204.3 $212.6 $221.6 $228.1 4.8% EBITDA margin 28.8% 29.9% 30.0% 30.1% 29.8% 29.7% Free cash flow Pre-tax income $131.4 $147.3 $155.9 $165.0 $171.0 Less: Income taxes (cash) (49.3) (55.2) (58.5) (61.9) (64.1) Plus: Depreciation and amortization 37.0 37.1 36.4 36.0 36.1 Plus: Non-cash compensation and Talbot earnout 8.9 8.1 8.4 8.8 9.1 Plus: Change in working capital (2.7) (0.6) (0.7) (0.7) (0.7) Less: Capital expenditures (14.5) (14.4) (14.3) (14.9) (15.5) Less: Cash earnout payments (18.2) (11.0) (18.3) (1.8) (0.3) Less: Cash used in acquisitions (82.7) 0.0 0.0 0.0 0.0 Free cash flow $10.0 $111.2 $109.0 $130.5 $135.5 Cumulative free cash flow $10.0 $121.2 $230.2 $360.7 $496.3 Appendix |
 32 Discounted Cash Flows Analysis – With Acquisitions (Management Case) ($ in millions) Appendix ____________________ (1) Present value calculated as of 12/31/06. (2) Discounted 5 years based on 2011E EBITDA of $305.3 million. (3) Based on net debt of $67.2 million as of 12/31/06 ($166.4 million of debt less $99.2 million of cash). (4) Includes $15.0 million in EBITDA related to the 2006 time period prior to completion of acquisitions closed in 2006. Excludes non-cash stock based compensation, expense for Talbot earnout and investment income on unrestricted cash. (5) Based on 39.714 million basic shares outstanding, 2.015 million restricted share units, 0.814 million options with an exercise price of $15.67 and 0.106 million options with an exercise price of $13.79. (6) Excludes expense for Talbot earnout. Every 1 point annual change in organic growth has a value of approximately $1.23 to $1.48 per diluted share Every 1 point annual change in EBITDA margin has a value of approximately $1.40 to $1.66 per diluted share Discounted (1) PV of Terminal Value as a Cash Flows Multiple of 2011E EBITDA (2) Enterprise Value Total Diluted Equity Value (3) WACC (2007E-2011E) 8.5x 9.0x 9.5x 8.5x 9.0x 9.5x 8.5x 9.0x 9.5x 11.0% $149.7 $1,540.0 $1,630.6 $1,721.2 $1,689.7 $1,780.3 $1,870.9 $1,622.5 $1,713.1 $1,803.7 12.0% 144.8 + 1,472.5 1,559.1 1,645.7 = 1,617.2 1,703.8 1,790.5 1,550.0 1,636.6 1,723.2 13.0% 140.0 1,408.4 1,491.3 1,574.1 1,548.5 1,631.3 1,714.2 1,481.3 1,564.1 1,647.0 Enterprise Value as a Multiple of 2006E EBITDA (4) Equity Value Per Diluted Share (5) 10.7x 11.3x 11.9x $38.38 $40.50 $42.63 10.3x 10.8x 11.4x 36.68 38.71 40.74 9.8x 10.3x 10.9x 35.07 37.01 38.95 Price/2007E EPS (6) 19.3x 20.3x 21.4x 18.4x 19.4x 20.5x 17.6x 18.6x 19.6x |
 33 Discounted Cash Flows Analysis – No Acquisition Case Appendix ($ in millions) Every 1 point annual change in organic growth has a value of approximately $1.14 to $1.37 per diluted share Every 1 point annual change in EBITDA margin has a value of approximately $1.14 to $1.35 per diluted share ____________________ (1) Present value calculated as of 12/31/06. (2) Discounted 5 years based on 2011E EBITDA of $228.1 million. (3) Based on net debt of $67.2 million as of 12/31/06 ($166.4 million of debt less $99.2 million of cash). (4) Includes $15.0 million in EBITDA related to the 2006 time period prior to completion of acquisitions closed in 2006. Excludes non-cash stock based compensation, expense for Talbot earnout and investment income on unrestricted cash. (5) Based on 39.714 million basic shares outstanding, 2.015 million restricted share units, 0.814 million options with an exercise price of $15.67 and 0.106 million options with an exercise price of $13.79. (6) Excludes expense for Talbot earnout. Discounted (1) PV of Terminal Value as a Cash Flows Multiple of 2011E EBITDA (2) Enterprise Value Total Diluted Equity Value (3) WACC (2007E-2011E) 8.5x 9.0x 9.5x 8.5x 9.0x 9.5x 8.5x 9.0x 9.5x 10.0% $356.2 $1,203.7 $1,274.5 $1,345.3 $1,559.9 $1,630.7 $1,701.5 $1,492.7 $1,563.5 $1,634.3 11.0% 345.4 + 1,150.4 1,218.1 1,285.8 = 1,495.8 1,563.5 1,631.2 1,428.6 1,496.3 1,563.9 12.0% 335.0 1,100.0 1,164.7 1,229.4 1,435.0 1,499.7 1,564.4 1,367.8 1,432.5 1,497.2 Enterprise Value as a Multiple of 2006E EBITDA (4) Equity Value Per Diluted Share (5) 9.9x 10.3x 10.8x $35.33 $36.99 $38.65 9.5x 9.9x 10.3x 33.83 35.42 37.00 9.1x 9.5x 9.9x 32.40 33.92 35.44 Price/2007E EPS (6) 17.7x 18.6x 19.4x 17.0x 17.8x 18.6x 16.2x 17.0x 17.8x |
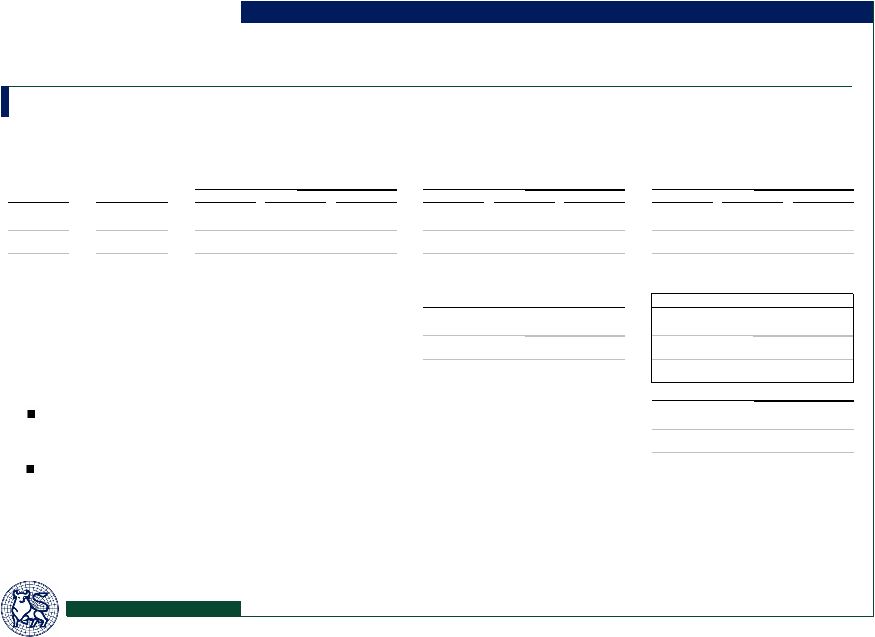
 34 Leveraged Buyout Analysis – With Acquisitions (Management Case) ($ in millions) ____________________ (1) Includes $35.5 million in revenue and $15.0 million in EBITDA related to the 2006 time period prior to completion of acquisitions closed in 2006. (2) Excludes non-cash stock based compensation, expense for Talbot earnout and investment income on unrestricted cash. (3) 2006E EBITDA reduced by earnings on $42.2 million of cash to be used in the acquisition. (4) Includes impact of 10% management warrants. Enterprise Value and Multiple Analysis Sources and Uses Offer price per share Sources Lvg. $ % Premium to current price ($33.45) Unrestricted cash $42.2 2.2% Fully diluted equity value Term loan B 3.4x 595.0 30.6% Enterprise value Senior unsecured notes 2.0x 340.0 17.5% Senior subordinated notes 1.4x 250.0 12.9% Enterprise value as a multiple of: Sponsor/mgmt. equity 715.0 36.8% 2006E Revenue Total sources 6.8x $1,942.2 100.0% 2006E Adjusted revenue (1) 2006E EBITDA (2) Uses 2006E Adjusted EBITDA (1)(2) Fully diluted equity purchase price $1,691.7 87.1% 2007E EBITDA (2) Refinance debt 144.6 7.4% Talbot earnout 21.8 1.1% Fees 84.1 4.3% Credit Statistics Total uses $1,942.2 100.0% PF 2006E 2007E 2008E 2009E 2010E 2011E Returns on Equity (EOY 5) (4) EBITDA (1)(2)(3) $160.2 $188.7 $216.8 $244.9 $274.8 $306.8 EBITDA/interest 1.5x 1.8x 2.0x 2.3x 2.5x 2.9x Exit Multiple (EV/EBITDA) 9.0x 10.0x 11.0x Total debt/EBITDA 7.4x 6.5x 5.7x 5.1x 4.5x 3.9x Enterprise value $2,760.9 $3,067.6 $3,374.4 Bank debt/EBITDA 3.7x 3.1x 2.6x 2.2x 1.7x 1.2x Diluted equity value 1,710.5 2,017.3 2,324.1 Cum. Bank debt paydown - - 0.9% 5.1% 11.0% 22.9% 38.7% Net value of equity 1,539.5 1,815.6 2,091.7 Equity return 16.6% 20.5% 23.9% Multiple of initial investment 2.2x 2.5x 2.9x Borrowing Rates Revolving credit facility L+ 2.50% Term loan B L+ 2.50% Senior unsecured notes 9.25% Senior subordinated notes 10.75% $40.00 Multiple $1,758.9 $1,691.7 19.6% 157.7 185.2 3.2x 3.0x 12.3x 11.2x 9.5x Value $543.9 579.4 142.7 Appendix |
 35 Leveraged Buyout Analysis – No Acquisition Case ($ in millions) ____________________ (1) Includes $35.5 million in revenue and $15.0 million in EBITDA related to the 2006 time period prior to completion of acquisitions closed in 2006. (2) Excludes non-cash stock based compensation, expense for Talbot earnout and investment income on unrestricted cash. (3) 2006E EBITDA reduced by earnings on $42.2 million of cash to be used in the acquisition. (4) Includes impact of 10% management warrants. Enterprise Value and Multiple Analysis Sources and Uses Offer price per share Sources Lvg. $ % Premium to current price ($33.45) Unrestricted cash $42.2 2.2% Fully diluted equity value Term loan B 3.4x 595.0 30.6% Enterprise value Senior unsecured notes 2.0x 340.0 17.5% Senior subordinated notes 1.4x 250.0 12.9% Enterprise value as a multiple of: Sponsor/mgmt. equity 715.0 36.8% 2006E Revenue Total sources 6.8x $1,942.2 100.0% 2006E Adjusted revenue (1) 2006E EBITDA (2) Uses 2006E Adjusted EBITDA (1)(2) Fully diluted equity purchase price $1,691.7 87.1% 2007E EBITDA (2) Refinance debt 144.6 7.4% Talbot earnout 21.8 1.1% Fees 84.1 4.3% Credit Statistics Total uses $1,942.2 100.0% PF 2006E 2007E 2008E 2009E 2010E 2011E Returns on Equity (EOY 5) (4) EBITDA (1)(2)(3) $160.2 $188.7 $203.2 $214.2 $225.8 $235.5 EBITDA/interest 1.5x 1.8x 2.0x 2.2x 2.4x 2.8x Exit Multiple (EV/EBITDA) 9.0x 10.0x 11.0x Total debt/EBITDA 7.4x 6.5x 5.7x 5.1x 4.4x 3.7x Enterprise value $2,119.2 $2,354.7 $2,590.1 Bank debt/EBITDA 3.7x 3.1x 2.6x 2.1x 1.6x 1.0x Diluted equity value 1,380.2 1,615.7 1,851.2 Cum. Bank debt paydown - - 0.9% 12.2% 24.0% 40.4% 59.0% Net value of equity 1,242.2 1,454.1 1,666.1 Equity return 11.7% 15.3% 18.4% Multiple of initial investment 1.7x 2.0x 2.3x Borrowing Rates Revolving credit facility L+ 2.50% Term loan B L+ 2.50% Senior unsecured notes 9.25% Senior subordinated notes 10.75% $40.00 Multiple $1,758.9 $1,691.7 19.6% 157.7 185.2 3.2x 3.0x 12.3x 11.2x 9.5x Value $543.9 579.4 142.7 Appendix |
 36 Ownership Profile ____________________ Source: FactSet and Maple Tree. (1) Includes all restricted stock units and options granted, regardless if exercisable. (2) Reflects total shares owned by Fairfax controlled entities. Appendix % of Diluted % of Diluted Institutional Ownership Shares Shares Insider Ownership Shares Shares (1) Lord Abbett & Co. LLC 2,195,377 5.2% Fairfax Financial Holdings Ltd. 10,325,428 24.5% Wasatch Advisors, Inc. 2,156,940 5.1 Martin Hughes 641,689 1.5 Artisan Partners LP 1,370,000 3.2 Bruce Guthart 479,161 1.1 T. Rowe Price Associates, Inc. (MD) 1,272,800 3.0 Richard Gulliver 443,903 1.1 Trusco Capital Management, Inc. 800,187 1.9 Harles Burnham 302,471 0.7 Eagle Asset Management, Inc. 756,870 1.8 Lawrence Lineker 218,407 0.5 Munder Capital Management/World Asset Management 722,455 1.7 Craig Barton 195,907 0.5 Investment Counselors of Maryland LLC 684,900 1.6 Chad Robertson 201,175 0.5 TCW Asset Management Co. 640,647 1.5 Dale Kaufman 215,434 0.5 Cardinal Capital Management LLC 640,270 1.5 Other 3,850,587 9.1 Pzena Investment Management LLC 506,189 1.2 Total Insiders 16,874,161 40.0% Putnam Investment Management, Inc. 462,260 1.1 Other/Retail 5,990,702 14.2 Amber Capital LP 440,200 1.0 Total Shares 42,223,108 100.0% Royce & Associates LLC 410,600 1.0 Endeavour Capital Advisors, Inc. 377,217 0.9 Friess Associates LLC 369,300 0.9 Kalmar Investments, Inc. 366,560 0.9 F&C Asset Management Plc (Investment) 340,870 0.8 Silvercrest Asset Management Group LLC 335,464 0.8 Turner Investment Partners, Inc. 315,250 0.7 Total - Top 20 Institutions 15,164,356 35.9% Other Institutional Holders 4,193,889 9.9 Total Institutional 19,358,245 45.8% Institutional 45.8% Other/Retail 16.4% Fairfax/ Insiders 40.0% (2) |
 37 Disclaimers Merrill Lynch prohibits (a) employees from, directly or indirectly, offering a favorable research rating or specific price target, or offering to change such rating or price target, as consideration or inducement for the receipt of business or for compensation, and (b) Research Analysts from being compensated for involvement in investment banking transactions except to the extent that such participation is intended to benefit investor clients. This proposal is confidential, for your private use only, and may not be shared with others (other than your advisors) without Merrill Lynch's written permission, except that you (and each of your employees, representatives or other agents) may disclose to any and all persons, without limitation of any kind, the tax treatment and tax structure of the proposal and all materials of any kind (including opinions or other tax analyses) that are provided to you relating to such tax treatment and tax structure. For purposes of the preceding sentence, tax refers to U.S. federal and state tax. This proposal is for discussion purposes only. Merrill Lynch is not an expert on, and does not render opinions regarding, legal, accounting, regulatory or tax matters. You should consult with your advisors concerning these matters before undertaking the proposed transaction. |