Exhibit (c)(9)
Confidential Draft
Project Maple Tree
Presentation to the Special Committee
February 16, 2007
1
Confidential Draft
Table of Contents
Sections
1. Situation Overview
2. Scotia Capital.s Process
3. Preliminary Financial Analysis
4. Fairness Considerations
Appendix
1. Overview of Hub International
Confidential Draft
Situation Overview
3
Confidential Draft
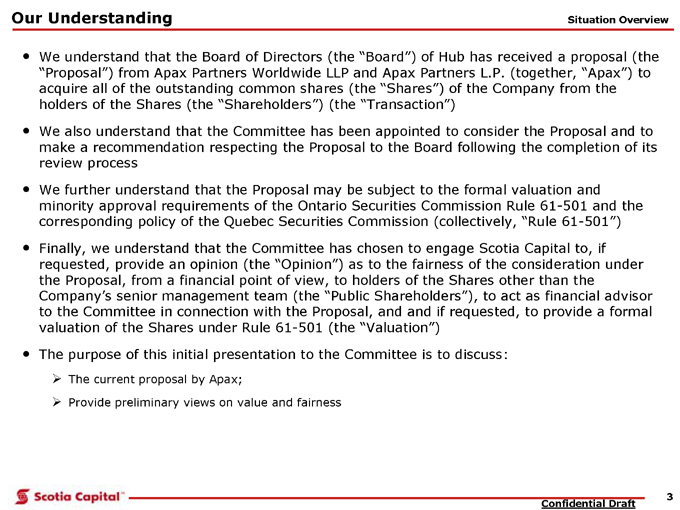
Our Understanding. We understand that the Board of Directors (the .Board.) of Hub has received a proposal (the .Proposal.) from Apax Partners Worldwide LLP and Apax Partners L.P. (together, .Apax.) to acquire all of the outstanding common shares (the .Shares.) of the Company from the holders of the Shares (the .Shareholders.) (the .Transaction.). We also understand that the Committee has been appointed to consider the Proposal and to make a recommendation respecting the Proposal to the Board following the completion of its review process. We further understand that the Proposal may be subject to the formal valuation and minority approval requirements of the Ontario Securities Commission Rule 61-501 and the corresponding policy of the Quebec Securities Commission (collectively, .Rule 61-501.). Finally, we understand that the Committee has chosen to engage Scotia Capital to, if requested, provide an opinion (the .Opinion.) as to the fairness of the consideration under the Proposal, from a financial point of view, to holders of the Shares other than the Company.s senior management team (the .Public Shareholders.), to act as financial advisor to the Committee in connection with the Proposal, and and if requested, to provide a formal valuation of the Shares under Rule 61-501 (the .Valuation.). The purpose of this initial presentation to the Committee is to discuss:
The current proposal by Apax;
Provide preliminary views on value and fairness Situation Overview
4
Confidential Draft
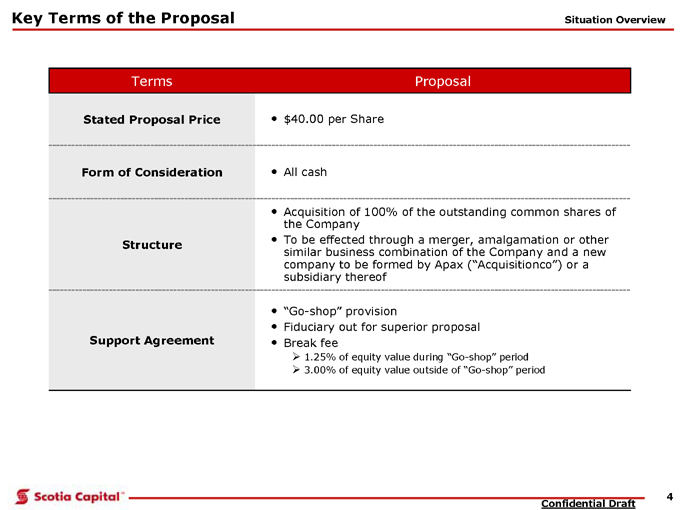
Key Terms of the Proposal Situation Overview. Go-shop. provision. Fiduciary out for superior proposal. Break fee
1.25% of equity value during .Go-shop. period 3.00% of equity value outside of .Go-shop. period
Support Agreement. Acquisition of 100% of the outstanding common shares of the Company. To be effected through a merger, amalgamation or other similar business combination of the Company and a new company to be formed by Apax (.Acquisitionco.) or a subsidiary thereof All cash. $40.00 per Share
Proposal
Stated Proposal Price
Form of Consideration
Structure
Terms
5
Confidential Draft
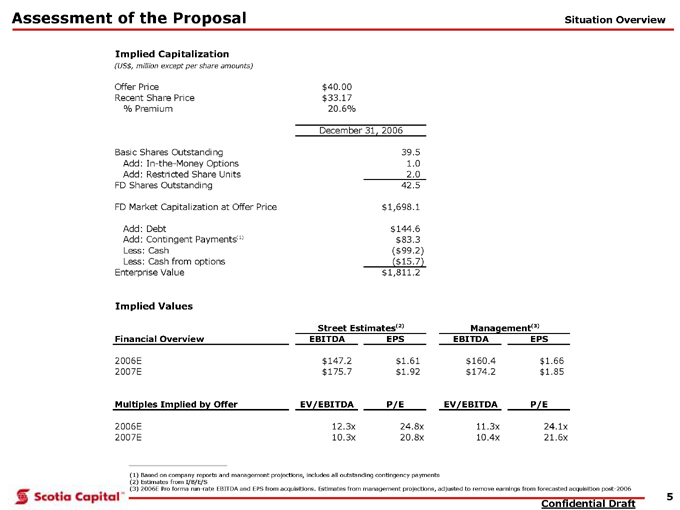
Assessment of the Proposal
(1) Based on company reports and management projections, includes all outstanding contingency payments
(2) Estimates from I/B/E/S
(3) 2006E Pro forma run-rate EBITDA and EPS from acquisitions. Estimates from management projections, adjusted to remove earnings from forecasted acquisition post-2006 Situation Overview Implied Capitalization (US$, million except per share amounts) Offer Price $40.00
Recent Share Price $33.17
% Premium 20.6%
Basic Shares Outstanding 39.5
Add: In-the-Money Options 1.0
Add: Restricted Share Units 2.0
FD Shares Outstanding 42.5
FD Market Capitalization at Offer Price $1,698.1 Add: Debt $144.6 Add: Contingent Payments(1) $83.3 Less: Cash ($99.2) Less: Cash from options ($15.7) Enterprise Value $1,811.2 Implied Values Financial Overview EBITDA EPS EBITDA EPS 2006E $147.2 $1.61 $160.4 $1.66 2007E $175.7 $1.92 $174.2 $1.85 Multiples Implied by Offer EV/EBITDA P/E EV/EBITDA P/E 2006E 12.3x 24.8x 11.3x 24.1x 2007E 10.3x 20.8x 10.4x 21.6x December 31, 2006 Street Estimates(2) Management(3)
Confidential Draft
Scotia Capital.s Process
7
Confidential Draft
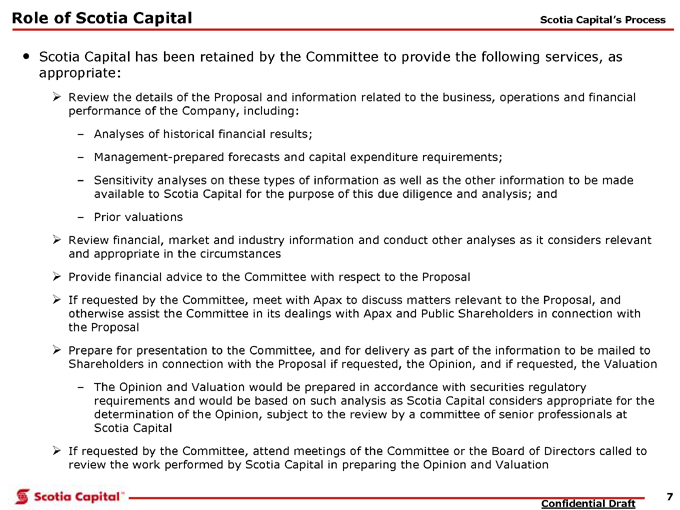
Role of Scotia Capital Scotia Capital has been retained by the Committee to provide the following services, as appropriate:
Review the details of the Proposal and information related to the business, operations and financial performance of the Company, including: Analyses of historical financial results;. Management-prepared forecasts and capital expenditure requirements;. Sensitivity analyses on these types of information as well as the other information to be made available to Scotia Capital for the purpose of this due diligence and analysis; and. Prior valuations Review financial, market and industry information and conduct other analyses as it considers relevant and appropriate in the circumstances Provide financial advice to the Committee with respect to the Proposal If requested by the Committee, meet with Apax to discuss matters relevant to the Proposal, and otherwise assist the Committee in its dealings with Apax and Public Shareholders in connection with the Proposal Prepare for presentation to the Committee, and for delivery as part of the information to be mailed to Shareholders in connection with the Proposal if requested, the Opinion, and if requested, the Valuation. The Opinion and Valuation would be prepared in accordance with securities regulatory requirements and would be based on such analysis as Scotia Capital considers appropriate for the determination of the Opinion, subject to the review by a committee of senior professionals at Scotia Capital If requested by the Committee, attend meetings of the Committee or the Board of Directors called to review the work performed by Scotia Capital in preparing the Opinion and Valuation Scotia Capital.s Process
8
Confidential Draft
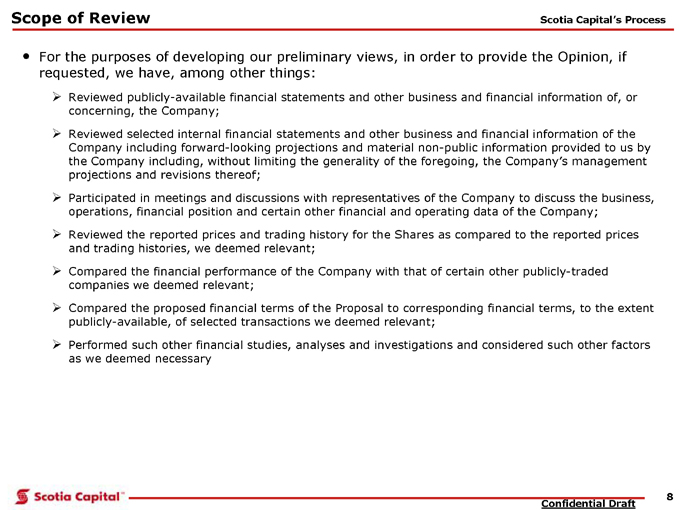
Scope of Review. For the purposes of developing our preliminary views, in order to provide the Opinion, if requested, we have, among other things:
Reviewed publicly-available financial statements and other business and financial information of, or concerning, the Company;
Reviewed selected internal financial statements and other business and financial information of the Company including forward-looking projections and material non-public information provided to us by the Company including, without limiting the generality of the foregoing, the Company.s management projections and revisions thereof;
Participated in meetings and discussions with representatives of the Company to discuss the business, operations, financial position and certain other financial and operating data of the Company;
Reviewed the reported prices and trading history for the Shares as compared to the reported prices and trading histories, we deemed relevant;
Compared the financial performance of the Company with that of certain other publicly-traded companies we deemed relevant;
Compared the proposed financial terms of the Proposal to corresponding financial terms, to the extent publicly-available, of selected transactions we deemed relevant; Performed such other financial studies, analyses and investigations and considered such other factors as we deemed necessary Scotia Capital.s Process
9
Confidential Draft
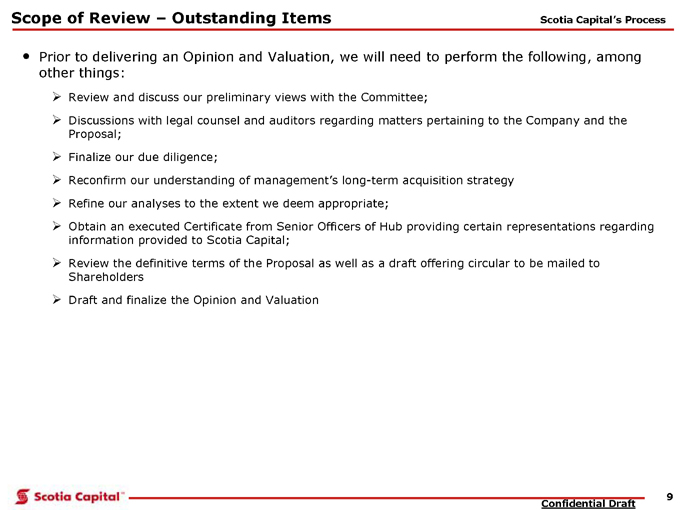
Scope of Review . Outstanding Items. Prior to delivering an Opinion and Valuation, we will need to perform the following, among other things:
Review and discuss our preliminary views with the Committee;
Discussions with legal counsel and auditors regarding matters pertaining to the Company and the
Proposal;
Finalize our due diligence;
Reconfirm our understanding of management.s long-term acquisition strategy
Refine our analyses to the extent we deem appropriate;
Obtain an executed Certificate from Senior Officers of Hub providing certain representations regarding information provided to Scotia Capital; Review the definitive terms of the Proposal as well as a draft offering circular to be mailed to Shareholders Draft and finalize the Opinion and Valuation Scotia Capital.s Process
Confidential Draft
Preliminary Financial Analysis
11
Confidential Draft
Methodology
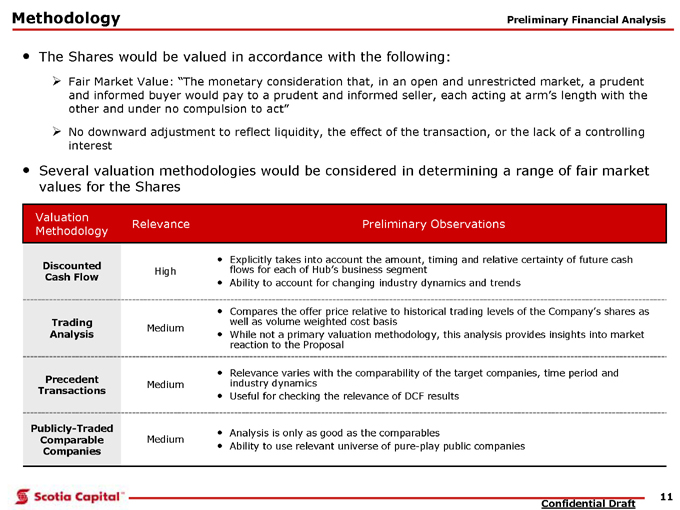
. The Shares would be valued in accordance with the following: Fair Market Value: .The monetary consideration that, in an open and unrestricted market, a prudent and informed buyer would pay to a prudent and informed seller, each acting at arm.s length with the other and under no compulsion to act.
No downward adjustment to reflect liquidity, the effect of the transaction, or the lack of a controlling interest Several valuation methodologies would be considered in determining a range of fair market values for the Shares Preliminary Financial Analysis Explicitly takes into account the amount, timing and relative certainty of future cash flows for each of Hub.s business segment Ability to account for changing industry dynamics and trends High Discounted Cash Flow Compares the offer price relative to historical trading levels of the Company.s shares as well as volume weighted cost basis While not a primary valuation methodology, this analysis provides insights into market reaction to the Proposal
Medium Trading
Analysis
Medium
Medium
Relevance Analysis is only as good as the comparables Ability to use relevant universe of pure-play public companies Relevance varies with the comparability of the target companies, time period and industry dynamics Useful for checking the relevance of DCF results Preliminary Observations Precedent Transactions Publicly-Traded Comparable Companies Valuation Methodology
12
Confidential Draft
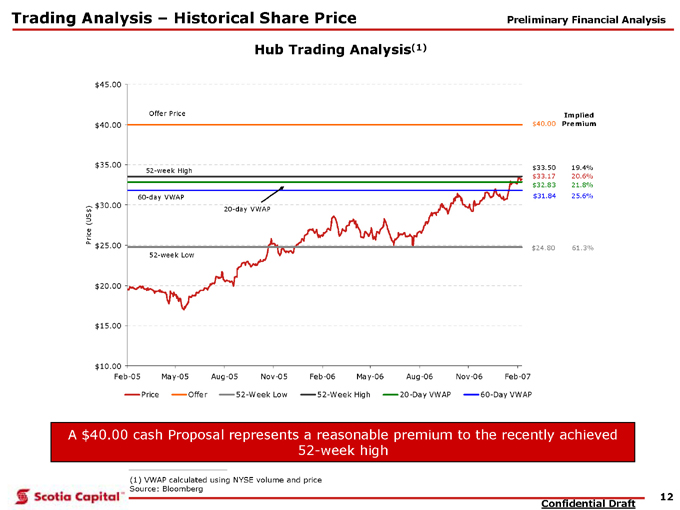
Trading Analysis . Historical Share Price
A $40.00 cash Proposal represents a reasonable premium to the recently achieved
52-week high
Hub Trading Analysis(1)
(1) VWAP calculated using NYSE volume and price
Source: Bloomberg $10.00 $15.00 $20.00 $25.00 $30.00 $35.00 $40.00 $45.00
Feb-05 May-05 Aug-05 Nov-05 Feb-06 May-06 Aug-06 Nov-06 Feb-07
Price (US$)
Price Offer 52-Week Low 52-Week High 20-Day VWAP 60-Day VWAP
Implied
Premium $40.00 $24.80 $33.50 $32.83 $31.84 $33.17 20.6% 61.3% 19.4% 21.8% 25.6% 52-week High 60-day VWAP 52-week Low 20-day VWAP Offer Price Preliminary Financial Analysis
13
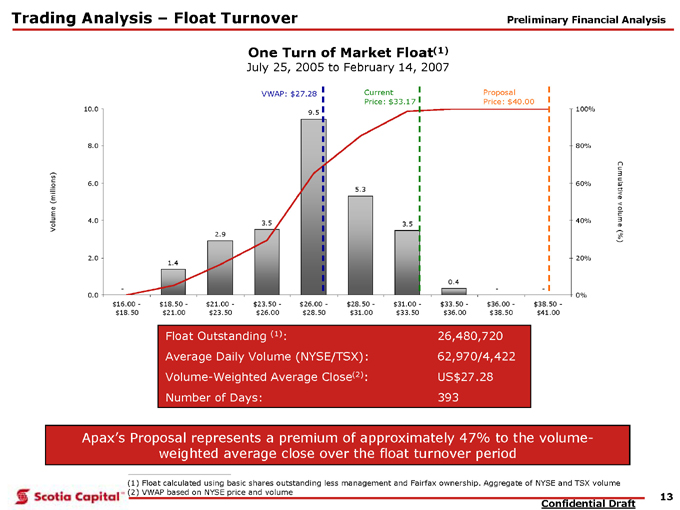
Confidential Draft 1.4 2.9 3.5 9.5 5.3 3.5 — 0.4 0.0 2.0 4.0 6.0 8.0 10.0 $16.00 - $18.50 $18.50 - $21.00 $21.00 - $23.50 $23.50 - $26.00 $26.00 - $28.50 $28.50 - $31.00 $31.00 - $33.50 $33.50 - $36.00 $36.00 - $38.50 $38.50 - $41.00
Volume (millions) 0% 20% 40% 60% 80% 100%
Cumulative volume (%)
Trading Analysis . Float Turnover
One Turn of Market Float(1)
July 25, 2005 to February 14, 2007
Float Outstanding (1): 26,480,720
Average Daily Volume (NYSE/TSX): 62,970/4,422
Volume-Weighted Average Close(2): US$27.28
Number of Days: 393
(1) Float calculated using basic shares outstanding less management and Fairfax ownership. Aggregate of NYSE and TSX volume
(2) VWAP based on NYSE price and volume Apax.s Proposal represents a premium of approximately 47% to the volumeweighted average close over the float turnover period VWAP: $27.28 Current Price: $33.17 Proposal Price: $40.00 Preliminary Financial Analysis
14
Confidential Draft
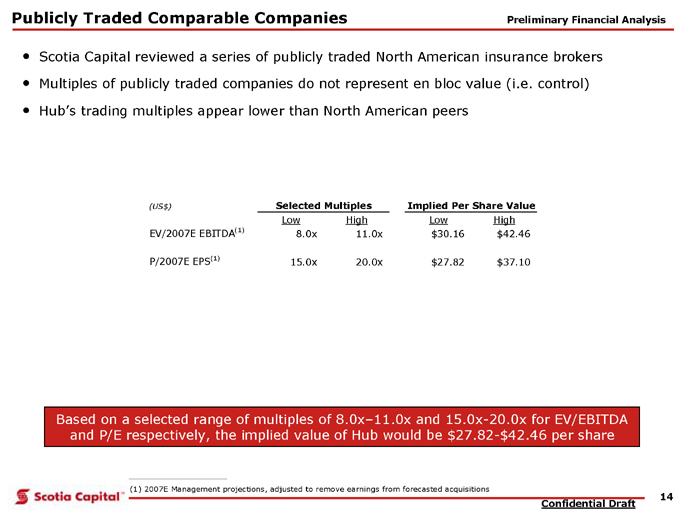
Publicly Traded Comparable Companies
Scotia Capital reviewed a series of publicly traded North American insurance brokers
Multiples of publicly traded companies do not represent en bloc value (i.e. control)
Hub.s trading multiples appear lower than North American peers
Based on a selected range of multiples of 8.0x.11.0x and 15.0x-20.0x for EV/EBITDA and P/E respectively, the implied value of Hub would be $27.82-$42.46 per share
(1) 2007E Management projections, adjusted to remove earnings from forecasted acquisitions
Preliminary Financial Analysis
(US$) Selected Multiples Implied Per Share Value
Low High Low High
EV/2007E EBITDA(1) 8.0x 11.0x $30.16 $42.46
P/2007E EPS(1) 15.0x 20.0x $27.82 $37.10
15
Confidential Draft
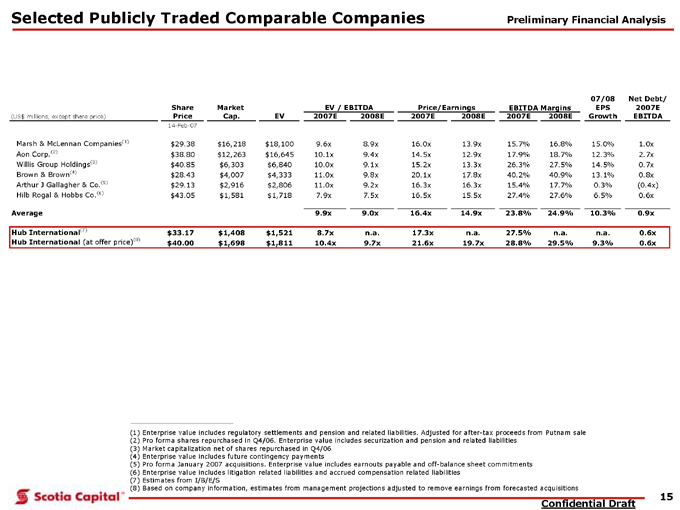
Selected Publicly Traded Comparable Companies
(1) Enterprise value includes regulatory settlements and pension and related liabilities. Adjusted for after-tax proceeds from Putnam sale
(2) Pro forma shares repurchased in Q4/06. Enterprise value includes securization and pension and related liabilities
(3) Market capitalization net of shares repurchased in Q4/06
(4) Enterprise value includes future contingency payments
(5) Pro forma January 2007 acquisitions. Enterprise value includes earnouts payable and off-balance sheet commitments
(6) Enterprise value includes litigation related liabilities and accrued compensation related liabilities
(7) Estimates from I/B/E/S
(8) Based on company information, estimates from management projections adjusted to remove earnings from forecasted acquisitions
Preliminary Financial Analysis
07/08 Net Debt/
Share Market EBITDA Margins EPS 2007E
(US$ millions, except share price) Price Cap. EV 2007E 2008E 2007E 2008E 2007E 2008E Growth EBITDA 14-Feb-07 Marsh & McLennan Companies(1) $29.38 $16,218 $18,100 9.6x 8.9x 16.0x 13.9x 15.7% 16.8% 15.0% 1.0x Aon Corp.(2) $38.80 $12,263 $16,645 10.1x 9.4x 14.5x 12.9x 17.9% 18.7% 12.3% 2.7x Willis Group Holdings(3) $40.85 $6,303 $6,840 10.0x 9.1x 15.2x 13.3x 26.3% 27.5% 14.5% 0.7x Brown & Brown(4) $28.43 $4,007 $4,333 11.0x 9.8x 20.1x 17.8x 40.2% 40.9% 13.1% 0.8x Arthur J Gallagher & Co.(5) $29.13 $2,916 $2,806 11.0x 9.2x 16.3x 16.3x 15.4% 17.7% 0.3% (0.4x) Hilb Rogal & Hobbs Co.(6) $43.05 $1,581 $1,718 7.9x 7.5x 16.5x 15.5x 27.4% 27.6% 6.5% 0.6xAverage 9.9x 9.0x 16.4x 14.9x 23.8% 24.9% 10.3% 0.9x
Hub International(7) $33.17 $1,408 $1,521 8.7x n.a. 17.3x n.a. 27.5% n.a. n.a. 0.6x
Hub International (at offer price)(8) $40.00 $1,698 $1,811 10.4x 9.7x 21.6x 19.7x 28.8% 29.5% 9.3% 0.6x
EV / EBITDA Price/Earnings
16
Confidential Draft
Selected Precedent Transactions Analysis
. Precedent transactions analysis is based upon the multiples implied by prior transactions in the North American insurance broker sector
Prior transactions by Hub were also reviewed
Scotia Capital reviewed certain public information regarding industry transactions and considered a range of multiples that are appropriate for assessing Hub
Such multiples implicitly reflect a premium for control In identifying appropriate transactions, Scotia Capital considered, among other things, size, nature of the business model, margins and recent and future growth prospects Scotia Capital is of the view that there are relatively few truly meaningful and recent comparable transactions based on the aforementioned criteria
We have nonetheless observed transaction multiples of approximately 10.0x .. 11.0x LTM EBITDA
Preliminary Financial Analysis
17
Confidential Draft
Selected Precedent Transactions Analysis
(1) LTM financial results adjusted for one-time charges and pro forma acquisitions made during the LTM period. Forward for year-end 2007. 1-day prior premium based on October 24,
2006 share price when USIH announced formation of special committee. Includes mid-point of estimated contingent payments
(2) Financial results adjusted for one-time charges. Transaction value includes preferred shares
(3) Consortium included Actis Capital, Caisse de Depot et Placement and Ontario Teachers Pension Plan. Financials shown in US$. Premiums to prices prior to June 7, 2006, date on which
the company announced sale process
(4) Transaction value and multiples from street research
(5) Financials from company press release and street research. Forward for year-end 2002
(6) Forward multiples based on 2001 estimates from street research. Premium to 1-day prior share price though review of strategic alternative announced November 2000
(7) C$, forward for year-end 2000
(8) Transaction value from press release. Financials are historical from Willis Group Holdings initial public offering documents, June, 2001. Premium based on ADR.
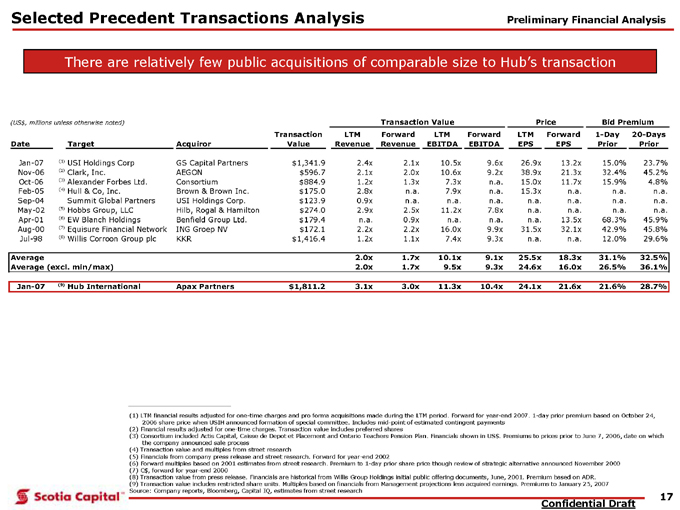
(9) Transaction value includes restricted share units. Multiples based on financials from Management projections less acquired earnings. Premiums to January 25, 2007 Source: Company reports, Bloomberg, Capital IQ, estimates from street research There are relatively few public acquisitions of comparable size to Hub.s transaction (US$, millions unless otherwise noted) Date Target Acquiror Transaction Value LTM Revenue Forward Revenue LTM EBITDA Forward EBITDA LTM EPS Forward EPS 1-Day Prior 20-Days Prior
Jan-07 (1) USI Holdings Corp GS Capital Partners $1,341.9 2.4x 2.1x 10.5x 9.6x 26.9x 13.2x 15.0% 23.7% Nov-06 (2) Clark, Inc. AEGON $596.7 2.1x 2.0x 10.6x 9.2x 38.9x 21.3x 32.4% 45.2% Oct-06 (3) Alexander Forbes Ltd. Consortium $884.9 1.2x 1.3x 7.3x n.a. 15.0x 11.7x 15.9% 4.8% Feb-05 (4) Hull & Co, Inc. Brown & Brown Inc. $175.0 2.8x n.a. 7.9x n.a. 15.3x n.a. n.a. n.a.Sep-04 Summit Global Partners USI Holdings Corp. $123.9 0.9x n.a. n.a. n.a. n.a. n.a. n.a. n.a. May-02 (5) Hobbs Group, LLC Hilb, Rogal & Hamilton $274.0 2.9x 2.5x 11.2x 7.8x n.a. n.a. n.a. n.a. Apr-01 (6) EW Blanch Holdings Benfield Group Ltd. $179.4 n.a. 0.9x n.a. n.a. n.a. 13.5x 68.3% 45.9% Aug-00 (7) Equisure Financial Network ING Groep NV $172.1 2.2x 2.2x 16.0x 9.9x 31.5x 32.1x 42.9% 45.8% Jul-98 (8) Willis Corroon Group plc KKR $1,416.4 1.2x 1.1x 7.4x 9.3x n.a. n.a. 12.0% 29.6% Average 2.0x 1.7x 10.1x 9.1x 25.5x 18.3x 31.1% 32.5% Average (excl. min/max) 2.0x 1.7x 9.5x 9.3x 24.6x 16.0x 26.5% 36.1% Jan-07 (9) Hub International Apax Partners $1,811.2 3.1x 3.0x 11.3x 10.4x 24.1x 21.6x 21.6% 28.7% Price Transaction Value Bid Premium Preliminary Financial Analysis
18
Confidential Draft
USI Holdings Implied Valuation
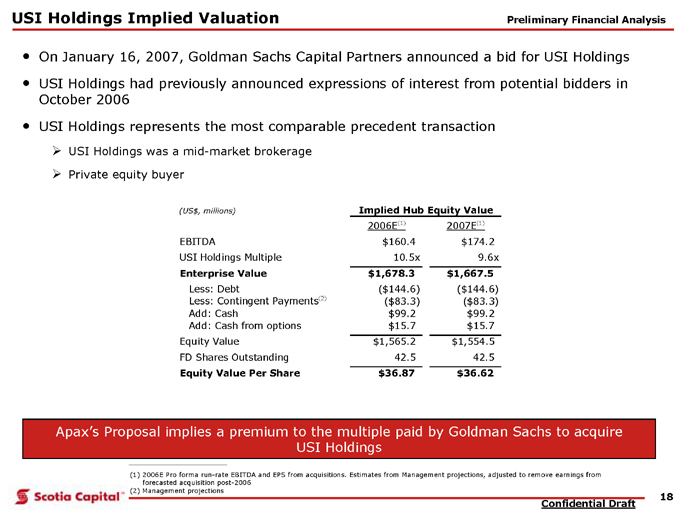
. On January 16, 2007, Goldman Sachs Capital Partners announced a bid for USI Holdings
. USI Holdings had previously announced expressions of interest from potential bidders in
October 2006
. USI Holdings represents the most comparable precedent transaction
USI Holdings was a mid-market brokerage
Private equity buyer
(1) 2006E Pro forma run-rate EBITDA and EPS from acquisitions. Estimates from Management projections, adjusted to remove earnings from forecasted acquisition post-2006
(2) Management projections (US$, millions) 2006E(1) 2007E(1) EBITDA $160.4 $174.2 USI Holdings Multiple 10.5x 9.6x
Enterprise Value $1,678.3 $1,667.5 Less: Debt ($144.6) ($144.6) Less: Contingent Payments(2) ($83.3) ($83.3) Add: Cash $99.2 $99.2 Add: Cash from options $15.7 $15.7 Equity Value $1,565.2 $1,554.5 FD Shares Outstanding 42.5 42.5 Equity Value Per Share $36.87 $36.62 Implied Hub Equity Value Preliminary Financial Analysis Apax.s Proposal implies a premium to the multiple paid by Goldman Sachs to acquire USI Holdings
19
Confidential Draft
DCF Analysis
. The DCF approach takes into account the amount, timing and relative certainty of projected scash flows
The analysis involves several steps:
Developing a long-term forecast of the unlevered free cash flows (.UFCF.) of the business;
Calculating a terminal value to capture value beyond the forecast period; and
Discounting the cash flows and terminal value at the weighted average cost of capital (.WACC.) to arrive at an enterprise value in current dollars at December 31, 2006 In developing its 15-year forecast for the fiscal period going from December 31, 2006E to 2021E, Scotia Capital based its analysis on information and forecasts provided by Hub management 2007 Budget and Summary Management Projections (2007-2011)
Actual results for year ending December 31, 2006
Hub business plans
Other internal documents and spreadsheets
. In addition to this, we met with senior management of Hub to discuss the Company.s business model, its strategic plan and prospects for each business segment . Projections were also developed through discussions on key assumptions with management and vetted for reasonableness Insurance sector pricing trends Continued strategy for acquisitions of hub brokerages and fold-in brokerages Preliminary Financial Analysis
20
Confidential Draft
DCF Analysis . Segmented Business Model
For the purpose of our analysis, UFCFs are defined as after-tax operating cash flows adjusted for working capital requirements, capital expenditures and future acquisition costs
After-tax operating cash flows exclude all interest payments and assume a long-term corporate tax rate of 37.5%
Forecasts of sales and earnings before interest, taxes, depreciation and amortization (.EBITDA.) were modeled for each individual hub based on the following drivers: Commissions & Fees revenue growth rates by product line
Contingent Commissions, Interest Income and Other Income grown as per management forecast
Expense margins grown as a percentage of total revenue and in line with management projections
Future acquisitions as per management forecast Other key considerations included:
Review of Hub.s competitive positioning within each of its segments
Pool of potential acquisition/consolidation targets
Preliminary Financial Analysis
21
Confidential Draft
DCF Analysis . Consolidated Business Model Consolidated forecasts were obtained by combining results from each hub and adjusting for corporate expenses
Additional considerations included:
Potential outcome of class action litigation concerning contingent commissions
Related party transactions with Fairfax
From the information gathered during our due diligence process, neither of the additional considerations necessitated adjustments to value
Preliminary Financial Analysis
22
Confidential Draft
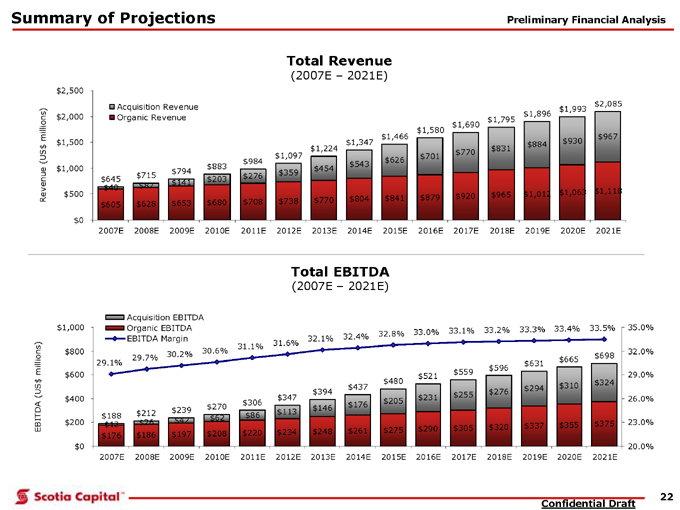
Summary of Projections
Total Revenue
(2007E . 2021E)
Preliminary Financial Analysis
Total EBITDA
(2007E . 2021E)
$605 $628 $653 $680 $708 $738 $770 $804 $841 $879 $920 $965 $1,012 $1,063 $1,118 $40 $87 $141 $203 $276 $359 $454 $543 $626 $701 $770 $831 $884 $930 $967
$645 $715 $794
$883
$984 s$1,097 $1,224 $1,347 $1,466 $1,580 $1,690 $1,795 $1,896 $1,993 $2,085 $0 $500 $1,000 $1,500 $2,000 $2,500 2007E 2008E 2009E 2010E 2011E 2012E 2013E 2014E 2015E 2016E 2017E 2018E 2019E 2020E 2021E
Revenue (US$ millions)
Acquisition Revenue
Organic Revenue $176 $186 $197 $208 $220 $234 $248 $261 $275 $290 $305 $320 $337 $355 $375 $12 $26 $42 $62 $86 $113 $146 $176 $205 $231 $255 $276 $294 $310 $324 $188 $212 $239 $270 $306 $347 $394 $437 $480 $521 $559 $596 $631 $665 $698 29.1% 29.7% 30.2% 30.6% 31.1% 31.6% 32.1% 32.4% 32.8% 33.0% 33.1% 33.2% 33.3% 33.4% 33.5% $0 $200 $400 $600 $800 $1,000 2007E 2008E 2009E 2010E 2011E 2012E 2013E 2014E 2015E 2016E 2017E 2018E 2019E 2020E 2021E EBITDA (US$ millions) 20.0% 23.0% 26.0% 29.0% 32.0% 35.0% Acquisition EBITDA Organic EBITDA EBITDA Margin
23
Confidential Draft
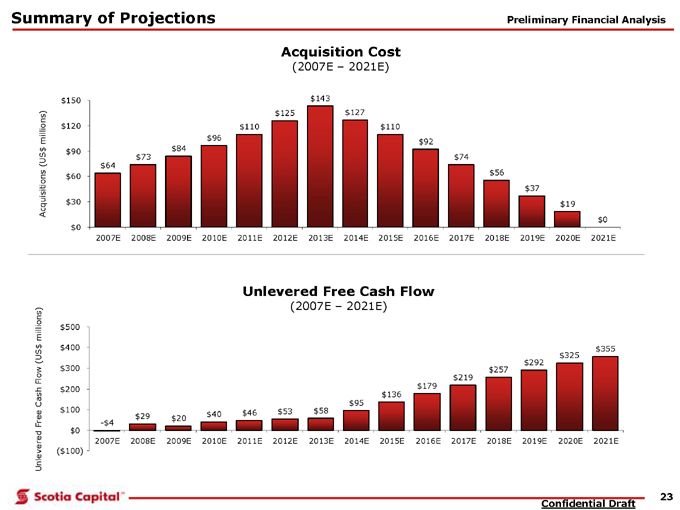
Summary of Projections
Unlevered Free Cash Flow
(2007E . 2021E)
Preliminary Financial Analysis
Acquisition Cost
(2007E . 2021E)
$64 $73 $84 $96 $110 $125 $143 $127 $110 $92 $74 $56 $37 $19 $0 $0 $30 $60 $90 $120 $150 2007E 2008E 2009E 2010E 2011E 2012E 2013E 2014E 2015E 2016E 2017E 2018E 2019E 2020E 2021E Acquisitions (US$ millions) -$4 $29 $20 $40 $46 $53 $58 $95 $136 $179 $219 $257 $292 $325 $355 ($100) $0 $100 $200 $300 $400 $500 2007E 2008E 2009E 2010E 2011E 2012E 2013E 2014E 2015E 2016E 2017E 2018E 2019E 2020E 2021E Unlevered Free Cash Flow (US$ millions)
24
Confidential Draft
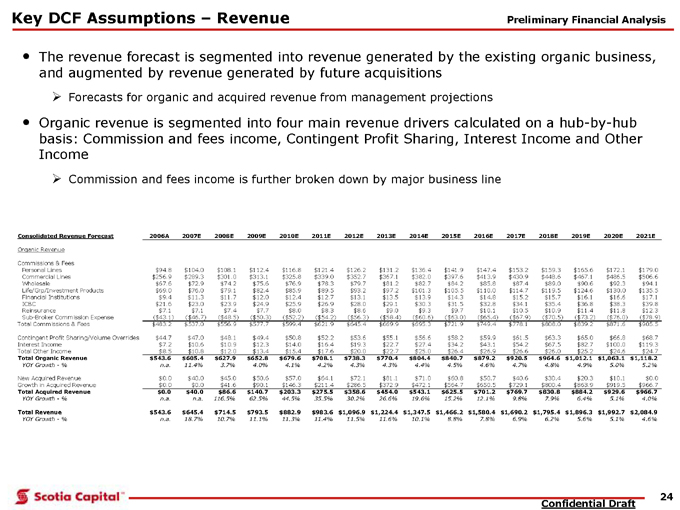
Key DCF Assumptions - Revenue
The revenue forecast is segmented into revenue generated by the existing organic business,
and augmented by revenue generated by future acquisitions
Forecasts for organic and acquired revenue from management projections
Organic revenue is segmented into four main revenue drivers calculated on a hub-by-hub
basis: Commission and fees income, Contingent Profit Sharing, Interest Income and Other
Income
Commission and fees income is further broken down by major business line
Preliminary Financial Analysis
Consolidated Revenue Forecast 2006A 2007E 2008E 2009E 2010E 2011E 2012E 2013E 2014E 2015E 2016E 2017E 2018E 2019E 2020E 2021E
Organic Revenue
Commissions & Fees
Personal Lines $94.8 $104.0 $108.1 $112.4 $116.8 $121.4 $126.2 $131.2 $136.4 $141.9 $147.4 $153.2 $159.3 $165.6 $172.1 $179.0
Commercial Lines $256.9 $289.3 $301.0 $313.1 $325.8 $339.0 $352.7 $367.1 $382.0 $397.6 $413.9 $430.9 $448.6 $467.1 $486.5 $506.6
Wholesale $67.6 $72.9 $74.2 $75.6 $76.9 $78.3 $79.7 $81.2 $82.7 $84.2 $85.8 $87.4 $89.0 $90.6 $92.3 $94.1
Life/Grp/Investment Products $69.0 $76.0 $79.1 $82.4 $85.9 $89.5 $93.2 $97.2 $101.3 $105.5 $110.0 $114.7 $119.5 $124.6 $130.0 $135.5
Financial Institutions $9.4 $11.3 $11.7 $12.0 $12.4 $12.7 $13.1 $13.5 $13.9 $14.3 $14.8 $15.2 $15.7 $16.1 $16.6 $17.1
ICBC $21.6 $23.0 $23.9 $24.9 $25.9 $26.9 $28.0 $29.1 $30.3 $31.5 $32.8 $34.1 $35.4 $36.8 $38.3 $39.8
Reinsurance $7.1 $7.1 $7.4 $7.7 $8.0 $8.3 $8.6 $9.0 $9.3 $9.7 $10.1 $10.5 $10.9 $11.4 $11.8 $12.3
Sub-Broker Commission Expense ($43.1) ($46.7) ($48.5) ($50.3) ($52.2) ($54.2) ($56.3) ($58.4) ($60.6) ($63.0) ($65.4) ($67.9) ($70.5) ($73.2) ($76.0) ($78.9)
Total Commissions & Fees $483.2 $537.0 $556.9 $577.7 $599.4 $621.9 $645.4 $669.9 $695.3 $721.9 $749.4 $778.1 $808.0 $839.2 $871.6 $905.5
Contingent Profit Sharing/Volume Overrides $44.7 $47.0 $48.1 $49.4 $50.8 $52.2 $53.6 $55.1 $56.6 $58.2 $59.9 $61.5 $63.3 $65.0 $66.8 $68.7
Interest Income $7.2 $10.6 $10.9 $12.3 $14.0 $16.4 $19.3 $22.7 $27.4 $34.2 $43.1 $54.2 $67.5 $82.7 $100.0 $119.3
Total Other Income $8.5 $10.8 $12.0 $13.4 $15.4 $17.6 $20.0 $22.7 $25.0 $26.4 $26.9 $26.6 $26.0 $25.2 $24.6 $24.7
Total Organic Revenue $543.6 $605.4 $627.9 $652.8 $679.6 $708.1 $738.3 $770.4 $804.4 $840.7 $879.2 $920.5 $964.6 $1,012.1 $1,063.1 $1,118.2
YOY Growth—% n.a. 11.4% 3.7% 4.0% 4.1% 4.2% 4.3% 4.3% 4.4% 4.5% 4.6% 4.7% 4.8% 4.9% 5.0% 5.2%
New Acquired Revenue $0.0 $40.0 $45.0 $50.6 $57.0 $64.1 $72.1 $81.1 $71.0 $60.8 $50.7 $40.6 $30.4 $20.3 $10.1 $0.0
Growth in Acquired Revenue $0.0 $0.0 $41.6 $90.1 $146.3 $211.4 $286.5 $372.9 $472.1 $564.7 $650.5 $729.1 $800.4 $863.9 $919.5 $966.7
Total Acquired Revenue $0.0 $40.0 $86.6 $140.7 $203.3 $275.5 $358.6 $454.0 $543.1 $625.5 $701.2 $769.7 $830.8 $884.2 $929.6 $966.7
YOY Growth—% n.a. n.a. 116.5% 62.5% 44.5% 35.5% 30.2% 26.6% 19.6% 15.2% 12.1% 9.8% 7.9% 6.4% 5.1% 4.0%
Total Revenue $543.6 $645.4 $714.5 $793.5 $882.9 $983.6 $1,096.9 $1,224.4 $1,347.5 $1,466.2 $1,580.4 $1,690.2 $1,795.4 $1,896.3 $1,992.7 $2,084.9
YOY Growth—% n.a. 18.7% 10.7% 11.1% 11.3% 11.4% 11.5% 11.6% 10.1% 8.8% 7.8% 6.9% 6.2% 5.6% 5.1% 4.6%
25
Confidential Draft
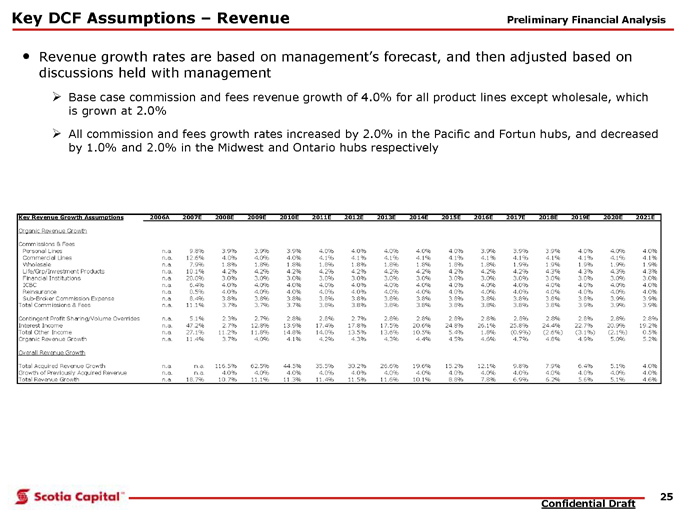
Key DCF Assumptions - Revenue
Revenue growth rates are based on management.s forecast, and then adjusted based on
discussions held with management
Base case commission and fees revenue growth of 4.0% for all product lines except wholesale, which is grown at 2.0%
All commission and fees growth rates increased by 2.0% in the Pacific and Fortun hubs, and decreased by 1.0% and 2.0% in the Midwest and Ontario hubs respectively
Preliminary Financial Analysis
Key Revenue Growth Assumptions 2006A 2007E 2008E 2009E 2010E 2011E 2012E 2013E 2014E 2015E 2016E 2017E 2018E 2019E 2020E 2021E
Organic Revenue Growth
Commissions & Fees
Personal Lines n.a. 9.8% 3.9% 3.9% 3.9% 4.0% 4.0% 4.0% 4.0% 4.0% 3.9% 3.9% 3.9% 4.0% 4.0% 4.0%
Commercial Lines n.a. 12.6% 4.0% 4.0% 4.0% 4.1% 4.1% 4.1% 4.1% 4.1% 4.1% 4.1% 4.1% 4.1% 4.1% 4.1%
Wholesale n.a. 7.9% 1.8% 1.8% 1.8% 1.8% 1.8% 1.8% 1.8% 1.8% 1.8% 1.9% 1.9% 1.9% 1.9% 1.9%
Life/Grp/Investment Products n.a. 10.1% 4.2% 4.2% 4.2% 4.2% 4.2% 4.2% 4.2% 4.2% 4.2% 4.2% 4.3% 4.3% 4.3% 4.3%
Financial Institutions n.a. 20.0% 3.0% 3.0% 3.0% 3.0% 3.0% 3.0% 3.0% 3.0% 3.0% 3.0% 3.0% 3.0% 3.0% 3.0%
ICBC n.a. 6.4% 4.0% 4.0% 4.0% 4.0% 4.0% 4.0% 4.0% 4.0% 4.0% 4.0% 4.0% 4.0% 4.0% 4.0%
Reinsurance n.a. 0.5% 4.0% 4.0% 4.0% 4.0% 4.0% 4.0% 4.0% 4.0% 4.0% 4.0% 4.0% 4.0% 4.0% 4.0%
Sub-Broker Commission Expense n.a. 8.4% 3.8% 3.8% 3.8% 3.8% 3.8% 3.8% 3.8% 3.8% 3.8% 3.8% 3.8% 3.8% 3.9% 3.9%
Total Commissions & Fees n.a. 11.1% 3.7% 3.7% 3.7% 3.8% 3.8% 3.8% 3.8% 3.8% 3.8% 3.8% 3.8% 3.9% 3.9% 3.9%
Contingent Profit Sharing/Volume Overrides n.a. 5.1% 2.3% 2.7% 2.8% 2.8% 2.7% 2.8% 2.8% 2.8% 2.8% 2.8% 2.8% 2.8% 2.8% 2.8%
Interest Income n.a. 47.2% 2.7% 12.8% 13.9% 17.4% 17.8% 17.5% 20.6% 24.8% 26.1% 25.8% 24.4% 22.7% 20.9% 19.2%
Total Other Income n.a. 27.1% 11.2% 11.8% 14.8% 14.0% 13.5% 13.6% 10.5% 5.4% 1.8% (0.9%) (2.6%) (3.1%) (2.1%) 0.5%
Organic Revenue Growth n.a. 11.4% 3.7% 4.0% 4.1% 4.2% 4.3% 4.3% 4.4% 4.5% 4.6% 4.7% 4.8% 4.9% 5.0% 5.2%
Overall Revenue Growth
Total Acquired Revenue Growth n.a. n.a. 116.5% 62.5% 44.5% 35.5% 30.2% 26.6% 19.6% 15.2% 12.1% 9.8% 7.9% 6.4% 5.1% 4.0%
Growth of Previously Acquired Revenue n.a. n.a. 4.0% 4.0% 4.0% 4.0% 4.0% 4.0% 4.0% 4.0% 4.0% 4.0% 4.0% 4.0% 4.0% 4.0%
Total Revenue Growth n.a. 18.7% 10.7% 11.1% 11.3% 11.4% 11.5% 11.6% 10.1% 8.8% 7.8% 6.9% 6.2% 5.6% 5.1% 4.6%
26
Confidential Draft
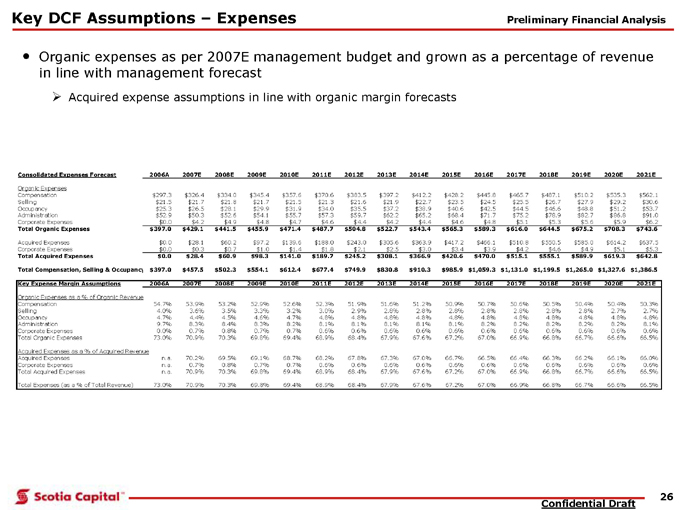
Key DCF Assumptions - Expenses
Organic expenses as per 2007E management budget and grown as a percentage of revenue in line with management forecast
??Acquired expense assumptions in line with organic margin forecasts
Preliminary Financial Analysis
Consolidated Expenses Forecast 2006A 2007E 2008E 2009E 2010E 2011E 2012E 2013E 2014E 2015E 2016E 2017E 2018E 2019E 2020E 2021E
Organic Expenses
Compensation $297.3 $326.4 $334.0 $345.4 $357.6 $370.6 $383.5 $397.2 $412.2 $428.2 $445.8 $465.7 $487.1 $510.2 $535.3 $562.1
Selling $21.5 $21.7 $21.8 $21.7 $21.5 $21.3 $21.6 $21.9 $22.7 $23.5 $24.5 $25.5 $26.7 $27.9 $29.2 $30.6
Occupancy $25.3 $26.5 $28.1 $29.9 $31.9 $34.0 $35.5 $37.2 $38.9 $40.6 $42.5 $44.5 $46.6 $48.8 $51.2 $53.7
Administration $52.9 $50.3 $52.6 $54.1 $55.7 $57.3 $59.7 $62.2 $65.2 $68.4 $71.7 $75.2 $78.9 $82.7 $86.8 $91.0
Corporate Expenses $0.0 $4.2 $4.9 $4.8 $4.7 $4.6 $4.4 $4.2 $4.4 $4.6 $4.8 $5.1 $5.3 $5.6 $5.9 $6.2
Total Organic Expenses $397.0 $429.1 $441.5 $455.9 $471.4 $487.7 $504.8 $522.7 $543.4 $565.3 $589.3 $616.0 $644.5 $675.2 $708.3 $743.6
Acquired Expenses $0.0 $28.1 $60.2 $97.2 $139.6 $188.0 $243.0 $305.6 $363.9 $417.2 $466.1 $510.8 $550.5 $585.0 $614.2 $637.5
Corporate Expenses $0.0 $0.3 $0.7 $1.0 $1.4 $1.8 $2.1 $2.5 $3.0 $3.4 $3.9 $4.2 $4.6 $4.9 $5.1 $5.3
Total Acquired Expenses $0.0 $28.4 $60.9 $98.3 $141.0 $189.7 $245.2 $308.1 $366.9 $420.6 $470.0 $515.1 $555.1 $589.9 $619.3 $642.8
Total Compensation, Selling & Occupancy $397.0 $457.5 $502.3 $554.1 $612.4 $677.4 $749.9 $830.8 $910.3 $985.9 $1,059.3 $1,131.0 $1,199.5 $1,265.0 $1,327.6 $1,386.5
Key Expense Margin Assumptions 2006A 2007E 2008E 2009E 2010E 2011E 2012E 2013E 2014E 2015E 2016E 2017E 2018E 2019E 2020E 2021E
Organic Expenses as a % of Organic Revenue
Compensation 54.7% 53.9% 53.2% 52.9% 52.6% 52.3% 51.9% 51.6% 51.2% 50.9% 50.7% 50.6% 50.5% 50.4% 50.4% 50.3%
Selling 4.0% 3.6% 3.5% 3.3% 3.2% 3.0% 2.9% 2.8% 2.8% 2.8% 2.8% 2.8% 2.8% 2.8% 2.7% 2.7%
Occupancy 4.7% 4.4% 4.5% 4.6% 4.7% 4.8% 4.8% 4.8% 4.8% 4.8% 4.8% 4.8% 4.8% 4.8% 4.8% 4.8%
Administration 9.7% 8.3% 8.4% 8.3% 8.2% 8.1% 8.1% 8.1% 8.1% 8.1% 8.2% 8.2% 8.2% 8.2% 8.2% 8.1%
Corporate Expenses 0.0% 0.7% 0.8% 0.7% 0.7% 0.6% 0.6% 0.6% 0.6% 0.6% 0.6% 0.6% 0.6% 0.6% 0.6% 0.6%
Total Organic Expenses 73.0% 70.9% 70.3% 69.8% 69.4% 68.9% 68.4% 67.9% 67.6% 67.2% 67.0% 66.9% 66.8% 66.7% 66.6% 66.5%
Acquired Expenses as a % of Acquired Revenue
Acquired Expenses n.a. 70.2% 69.5% 69.1% 68.7% 68.2% 67.8% 67.3% 67.0% 66.7% 66.5% 66.4% 66.3% 66.2% 66.1% 66.0%
Corporate Expenses n.a. 0.7% 0.8% 0.7% 0.7% 0.6% 0.6% 0.6% 0.6% 0.6% 0.6% 0.6% 0.6% 0.6% 0.6% 0.6%
Total Acquired Expenses n.a. 70.9% 70.3% 69.8% 69.4% 68.9% 68.4% 67.9% 67.6% 67.2% 67.0% 66.9% 66.8% 66.7% 66.6% 66.5%
Total Expenses (as a % of Total Revenue) 73.0% 70.9% 70.3% 69.8% 69.4% 68.9% 68.4% 67.9% 67.6% 67.2% 67.0% 66.9% 66.8% 66.7% 66.6% 66.5%
27
Confidential Draft
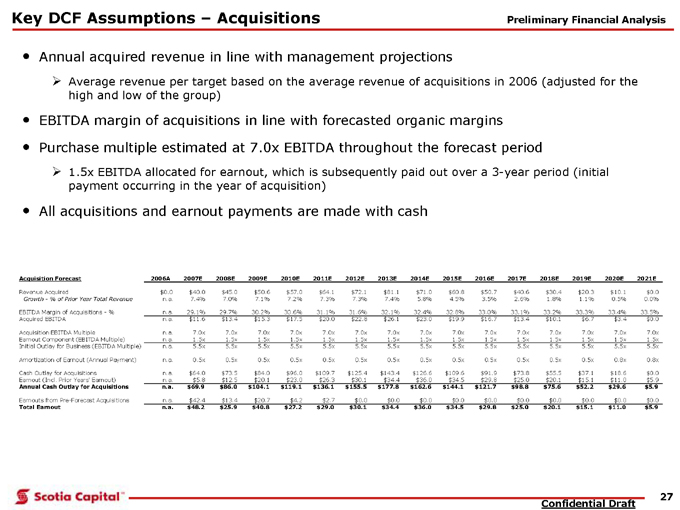
Key DCF Assumptions - Acquisitions
Annual acquired revenue in line with management projections
??Average revenue per target based on the average revenue of acquisitions in 2006 (adjusted for the
high and low of the group)
EBITDA margin of acquisitions in line with forecasted organic margins
Purchase multiple estimated at 7.0x EBITDA throughout the forecast period
??1.5x EBITDA allocated for earnout, which is subsequently paid out over a 3-year period (initial
payment occurring in the year of acquisition)
All acquisitions and earnout payments are made with cash
Preliminary Financial Analysis
Acquisition Forecast 2006A 2007E 2008E 2009E 2010E 2011E 2012E 2013E 2014E 2015E 2016E 2017E 2018E 2019E 2020E 2021E
Revenue Acquired $0.0 $40.0 $45.0 $50.6 $57.0 $64.1 $72.1 $81.1 $71.0 $60.8 $50.7 $40.6 $30.4 $20.3 $10.1 $0.0
Growth—% of Prior Year Total Revenue n.a. 7.4% 7.0% 7.1% 7.2% 7.3% 7.3% 7.4% 5.8% 4.5% 3.5% 2.6% 1.8% 1.1% 0.5% 0.0%
EBITDA Margin of Acquisitions—% n.a. 29.1% 29.7% 30.2% 30.6% 31.1% 31.6% 32.1% 32.4% 32.8% 33.0% 33.1% 33.2% 33.3% 33.4% 33.5%
Acquired EBITDA n.a. $11.6 $13.4 $15.3 $17.5 $20.0 $22.8 $26.1 $23.0 $19.9 $16.7 $13.4 $10.1 $6.7 $3.4 $0.0
Acquisition EBITDA Multiple n.a. 7.0x 7.0x 7.0x 7.0x 7.0x 7.0x 7.0x 7.0x 7.0x 7.0x 7.0x 7.0x 7.0x 7.0x 7.0x
Earnout Component (EBITDA Multiple) n.a. 1.5x 1.5x 1.5x 1.5x 1.5x 1.5x 1.5x 1.5x 1.5x 1.5x 1.5x 1.5x 1.5x 1.5x 1.5x
Initial Outlay for Business (EBITDA Multiple) n.a. 5.5x 5.5x 5.5x 5.5x 5.5x 5.5x 5.5x 5.5x 5.5x 5.5x 5.5x 5.5x 5.5x 5.5x 5.5x
Amortization of Earnout (Annual Payment) n.a. 0.5x 0.5x 0.5x 0.5x 0.5x 0.5x 0.5x 0.5x 0.5x 0.5x 0.5x 0.5x 0.5x 0.8x 0.8x
Cash Outlay for Acquisitions n.a. $64.0 $73.5 $84.0 $96.0 $109.7 $125.4 $143.4 $126.6 $109.6 $91.9 $73.8 $55.5 $37.1 $18.6 $0.0
Earnout (Incl. Prior Years’ Earnout) n.a. $5.8 $12.5 $20.1 $23.0 $26.3 $30.1 $34.4 $36.0 $34.5 $29.8 $25.0 $20.1 $15.1 $11.0 $5.9
Annual Cash Outlay for Acquisitions n.a. $69.9 $86.0 $104.1 $119.1 $136.1 $155.5 $177.8 $162.6 $144.1 $121.7 $98.8 $75.6 $52.2 $29.6 $5.9
Earnouts from Pre-Forecast Acquisitions n.a. $42.4 $13.4 $20.7 $4.2 $2.7 $0.0 $0.0 $0.0 $0.0 $0.0 $0.0 $0.0 $0.0 $0.0 $0.0
Total Earnout n.a. $48.2 $25.9 $40.8 $27.2 $29.0 $30.1 $34.4 $36.0 $34.5 $29.8 $25.0 $20.1 $15.1 $11.0 $5.9
28
Confidential Draft
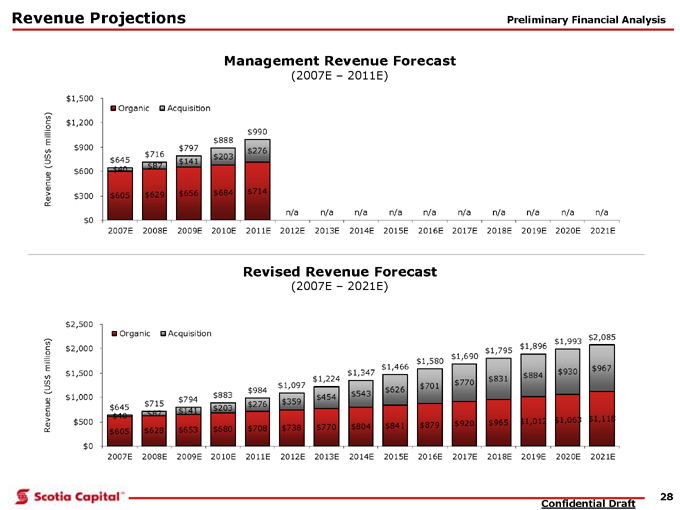
Revenue Projections
Management Revenue Forecast
(2007E . 2011E)
Preliminary Financial Analysis
Revised Revenue Forecast
(2007E . 2021E)
$605 $628 $653 $680 $708 $738 $770 $804 $841 $879 $920 $965 $1,012 $1,063 $1,118 $40 $87 $141 $203 $276 $359 $454 $543 $626 $701 $770 $831 $884 $930 $967
$645 $715 $794 $883
$984
$1,097
$1,224
$1,347
$1,466
$1,580
$1,690
$1,795 $1,896
$1,993 $2,085
$0
$500
$1,000
$1,500
$2,000
$2,500
2007E 2008E 2009E 2010E 2011E 2012E 2013E 2014E 2015E 2016E 2017E 2018E 2019E 2020E 2021E
Revenue (US$ millions)
Organic Acquisition
$605 $629 $656 $684 $714
$40 $87 $141
$203
$276
$645
$716
$797
$888
$990
n/a n/a n/a n/a n/a n/a n/a n/a n/a n/a
$0
$300
$600
$900
$1,200
$1,500
2007E 2008E 2009E 2010E 2011E 2012E 2013E 2014E 2015E 2016E 2017E 2018E 2019E 2020E 2021E
Revenue (US$ millions)
Organic Acquisition
29
Confidential Draft
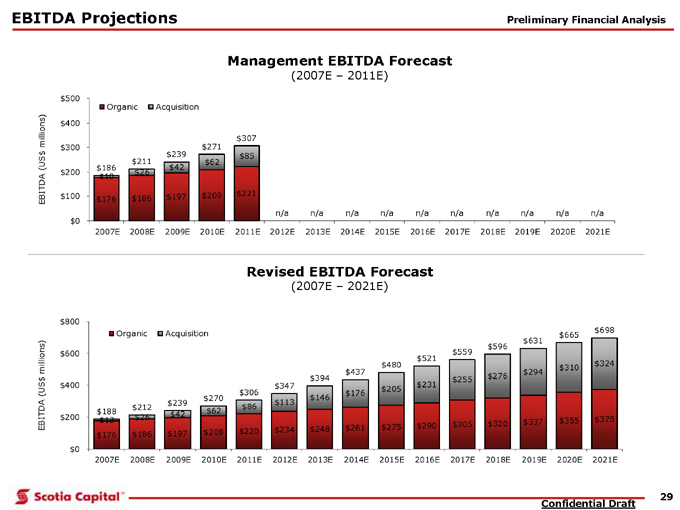
EBITDA Projections
Management EBITDA Forecast
(2007E - 2011E)
Preliminary Financial Analysis
Revised EBITDA Forecast
(2007E - 2021E)
$176 $186 $197 $208 $220 $234 $248 $261 $275 $290 $305 $320 $337 $355 $375 $12 $26 $42 $62 $86 $113
$146 $176 $205 $231
$255 $276 $294 $310 $324
$188 $212 $239
$270
$306
$347
$394
$437
$480
$521
$559
$596
$631
$665
$698
$0
$200
$400
$600
$800
2007E 2008E 2009E 2010E 2011E 2012E 2013E 2014E 2015E 2016E 2017E 2018E 2019E 2020E 2021E
EBITDA (US$ millions)
Organic Acquisition
$176 $186 $197 $209 $221
$10 $26
$42
$62
$85
$186
$211
$239
$271
$307
n/a n/a n/a n/a n/a n/a n/a n/a n/a n/a
$0
$100
$200
$300
$400
$500
2007E 2008E 2009E 2010E 2011E 2012E 2013E 2014E 2015E 2016E 2017E 2018E 2019E 2020E 2021E
EBITDA (US$ millions)
Organic Acquisition
30
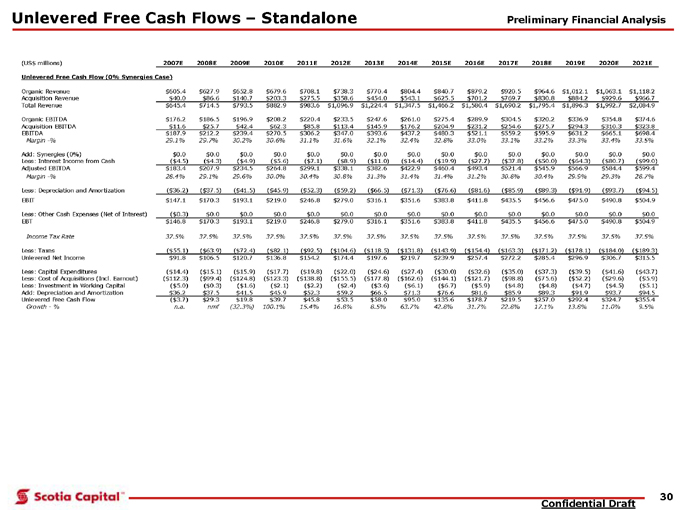
Confidential Draft
Unlevered Free Cash Flows - Standalone Preliminary Financial Analysis
(US$ millions) 2007E 2008E 2009E 2010E 2011E 2012E 2013E 2014E 2015E 2016E 2017E 2018E 2019E 2020E 2021E
Unlevered Free Cash Flow (0% Synergies Case)
Organic Revenue $605.4 $627.9 $652.8 $679.6 $708.1 $738.3 $770.4 $804.4 $840.7 $879.2 $920.5 $964.6 $1,012.1 $1,063.1 $1,118.2
Acquisition Revenue $40.0 $86.6 $140.7 $203.3 $275.5 $358.6 $454.0 $543.1 $625.5 $701.2 $769.7 $830.8 $884.2 $929.6 $966.7
Total Revenue $645.4 $714.5 $793.5 $882.9 $983.6 $1,096.9 $1,224.4 $1,347.5 $1,466.2 $1,580.4 $1,690.2 $1,795.4 $1,896.3 $1,992.7 $2,084.9
Organic EBITDA $176.2 $186.5 $196.9 $208.2 $220.4 $233.5 $247.6 $261.0 $275.4 $289.9 $304.5 $320.2 $336.9 $354.8 $374.6
Acquisition EBITDA $11.6 $25.7 $42.4 $62.3 $85.8 $113.4 $145.9 $176.2 $204.9 $231.2 $254.6 $275.7 $294.3 $310.3 $323.8
EBITDA $187.9 $212.2 $239.4 $270.5 $306.2 $347.0 $393.6 $437.2 $480.3 $521.1 $559.2 $595.9 $631.2 $665.1 $698.4
Margin -% 29.1% 29.7% 30.2% 30.6% 31.1% 31.6% 32.1% 32.4% 32.8% 33.0% 33.1% 33.2% 33.3% 33.4% 33.5%
Add: Synergies (0%) $0.0 $0.0 $0.0 $0.0 $0.0 $0.0 $0.0 $0.0 $0.0 $0.0 $0.0 $0.0 $0.0 $0.0 $0.0
Less: Interest Income from Cash ($4.5) ($4.3) ($4.9) ($5.6) ($7.1) ($8.9) ($11.0) ($14.4) ($19.9) ($27.7) ($37.8) ($50.0) ($64.3) ($80.7) ($99.0)
Adjusted EBITDA $183.4 $207.9 $234.5 $264.8 $299.1 $338.1 $382.6 $422.9 $460.4 $493.4 $521.4 $545.9 $566.9 $584.4 $599.4
Margin -% 28.4% 29.1% 29.6% 30.0% 30.4% 30.8% 31.3% 31.4% 31.4% 31.2% 30.8% 30.4% 29.9% 29.3% 28.7%
Less: Depreciation and Amortization ($36.2) ($37.5) ($41.5) ($45.9) ($52.3) ($59.2) ($66.5) ($71.3) ($76.6) ($81.6) ($85.9) ($89.3) ($91.9) ($93.7) ($94.5)
EBIT $147.1 $170.3 $193.1 $219.0 $246.8 $279.0 $316.1 $351.6 $383.8 $411.8 $435.5 $456.6 $475.0 $490.8 $504.9
Less: Other Cash Expenses (Net of Interest) ($0.3) $0.0 $0.0 $0.0 $0.0 $0.0 $0.0 $0.0 $0.0 $0.0 $0.0 $0.0 $0.0 $0.0 $0.0
EBT $146.8 $170.3 $193.1 $219.0 $246.8 $279.0 $316.1 $351.6 $383.8 $411.8 $435.5 $456.6 $475.0 $490.8 $504.9
Income Tax Rate 37.5% 37.5% 37.5% 37.5% 37.5% 37.5% 37.5% 37.5% 37.5% 37.5% 37.5% 37.5% 37.5% 37.5% 37.5%
Less: Taxes ($55.1) ($63.9) ($72.4) ($82.1) ($92.5) ($104.6) ($118.5) ($131.8) ($143.9) ($154.4) ($163.3) ($171.2) ($178.1) ($184.0) ($189.3)
Unlevered Net Income $91.8 $106.5 $120.7 $136.8 $154.2 $174.4 $197.6 $219.7 $239.9 $257.4 $272.2 $285.4 $296.9 $306.7 $315.5
Less: Capital Expenditures ($14.4) ($15.1) ($15.9) ($17.7) ($19.8) ($22.0) ($24.6) ($27.4) ($30.0) ($32.6) ($35.0) ($37.3) ($39.5) ($41.6) ($43.7)
Less: Cost of Acquisitions (Incl. Earnout) ($112.3) ($99.4) ($124.8) ($123.3) ($138.8) ($155.5) ($177.8) ($162.6) ($144.1) ($121.7) ($98.8) ($75.6) ($52.2) ($29.6) ($5.9)
Less: Investment in Working Capital ($5.0) ($0.3) ($1.6) ($2.1) ($2.2) ($2.4) ($3.6) ($6.1) ($6.7) ($5.9) ($4.8) ($4.8) ($4.7) ($4.5) ($5.1)
Add: Depreciation and Amortization $36.2 $37.5 $41.5 $45.9 $52.3 $59.2 $66.5 $71.3 $76.6 $81.6 $85.9 $89.3 $91.9 $93.7 $94.5
Unlevered Free Cash Flow ($3.7) $29.3 $19.8 $39.7 $45.8 $53.5 $58.0 $95.0 $135.6 $178.7 $219.5 $257.0 $292.4 $324.7 $355.4
Growth—% n.a. nmf (32.3%) 100.1% 15.4% 16.8% 8.5% 63.7% 42.8% 31.7% 22.8% 17.1% 13.8% 11.0% 9.5%
31
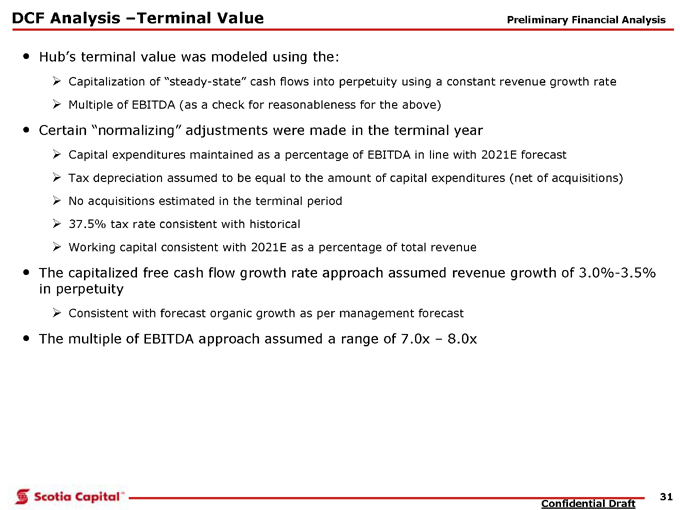
Confidential Draft
DCF Analysis .Terminal Value Hubs terminal value was modeled using the:
Capitalization of .steady-state. cash flows into perpetuity using a constant revenue growth rate
Multiple of EBITDA (as a check for reasonableness for the above)
Certain .normalizing. adjustments were made in the terminal year
Capital expenditures maintained as a percentage of EBITDA in line with 2021E forecast
Tax depreciation assumed to be equal to the amount of capital expenditures (net of acquisitions)
No acquisitions estimated in the terminal period
37.5% tax rate consistent with historical
Working capital consistent with 2021E as a percentage of total revenue
The capitalized free cash flow growth rate approach assumed revenue growth of 3.0%-3.5% in perpetuity
Consistent with forecast organic growth as per management forecast
The multiple of EBITDA approach assumed a range of 7.0x . 8.0x
Preliminary Financial Analysis
32
Confidential Draft
DCF Analysis - WACC
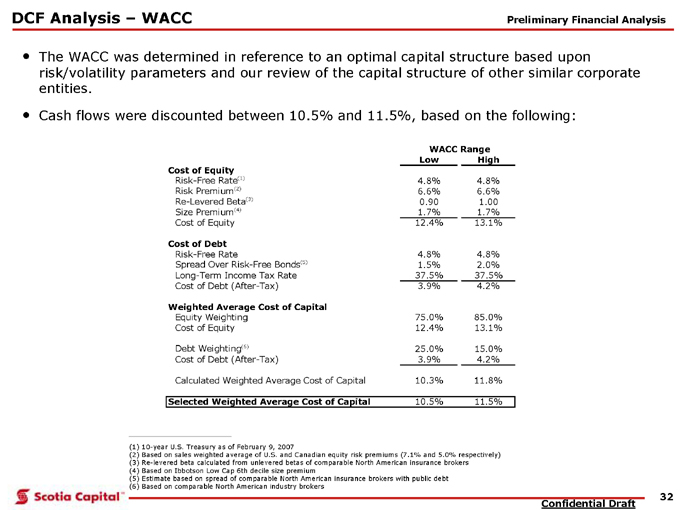
The WACC was determined in reference to an optimal capital structure based upon
risk/volatility parameters and our review of the capital structure of other similar corporate
entities.
Cash flows were discounted between 10.5% and 11.5%, based on the following:
(1) 10-year U.S. Treasury as of February 9, 2007
(2) Based on sales weighted average of U.S. and Canadian equity risk premiums (7.1% and 5.0% respectively)
(3) Re-levered beta calculated from unlevered betas of comparable North American insurance brokers
(4) Based on Ibbotson Low Cap 6th decile size premium
(5) Estimate based on spread of comparable North American insurance brokers with public debt
(6) Based on comparable North American industry brokers
Preliminary Financial Analysis
WACC Range
Low High
Cost of Equity
Risk-Free Rate(1) 4.8% 4.8%
Risk Premium(2) 6.6% 6.6%
Re-Levered Beta(3) 0.90 1.00
Size Premium(4) 1.7% 1.7%
Cost of Equity 12.4% 13.1%
Cost of Debt
Risk-Free Rate 4.8% 4.8%
Spread Over Risk-Free Bonds(5) 1.5% 2.0%
Long-Term Income Tax Rate 37.5% 37.5%
Cost of Debt (After-Tax) 3.9% 4.2%
Weighted Average Cost of Capital
Equity Weighting 75.0% 85.0%
Cost of Equity 12.4% 13.1%
Debt Weighting(6) 25.0% 15.0%
Cost of Debt (After-Tax) 3.9% 4.2%
Calculated Weighted Average Cost of Capital 10.3% 11.8%
Selected Weighted Average Cost of Capital 10.5% 11.5%
33
Confidential Draft
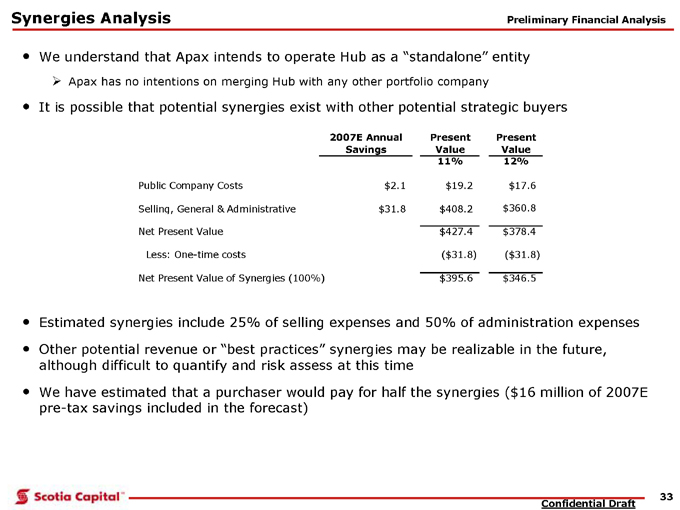
Synergies Analysis . We understand that Apax intends to operate Hub as a .standalone. entity
Apax has no intentions on merging Hub with any other portfolio company. It is possible that potential synergies exist with other potential strategic buyers
Estimated synergies include 25% of selling expenses and 50% of administration expenses
Other potential revenue or .best practices. synergies may be realizable in the future, although difficult to quantify and risk assess at this time
We have estimated that a purchaser would pay for half the synergies ($16 million of 2007E
pre-tax savings included in the forecast)
Preliminary Financial Analysis
2007E Annual
Savings
Present
Value
Present
Value
11% 12%
Public Company Costs $2.1 $19.2 $17.6
Selling, General & Administrative $31.8 $408.2 $360.8
Net Present Value $427.4 $378.4
Less: One-time costs ($31.8) ($31.8)
Net Present Value of Synergies (100%) $395.6 $346.5
34
Confidential Draft
Synergies Analysis—Contingent Commissions
As Hub generates a significant level of contingent commission revenue, it is possible that
certain strategic buyers may suffer dis-synergies in effecting an acquisition of Hub
In 2004/2005, in response to actions commenced by the New York State Attorney General and the
Superintendent of the New York State Insurance Department, Marsh & McLennan Cos., Aon Corp.,
Willis Group Holdings, and Arthur J. Gallagher & Co., agreed to forego contingent commissions
Furthermore, a number of insurance carriers, including St. Paul Travelers, Zurich Financial, Chubb
Corp., and Metropolitan Life have agreed to no longer pay some or all contingent fees
Recent initiatives by those in the industry directly affected by the loss of contingent
commissions may have created a solution to partially replace the losses of contingent commission revenue
Industry participants, including Chubb and St. Paul Travelers have effectively developed a .fixed
commission. structure tied to producer performance, which is similar in nature to contingent
commissions, and has received the approval of the New York State Attorney General
According to a recent Chubb agreement, a fixed commission paid to a producer, set prior to the sale of
a particular insurance product, and that may be based on, among other things, the prior year’s
performance of the producer” is not considered contingent compensation and thus is permitted. Notwithstanding the foregoing, the remaining uncertainty around contingent commissions may suggest the most logical strategic buyers (Marsh & McLennan Cos., Aon Corp., Willis
Group Holdings, and Arthur J. Gallagher & Co.,) may be hesitant to acquire any insurance
brokerage that currently earns contingent commission revenue
Preliminary Financial Analysis
35
Confidential Draft
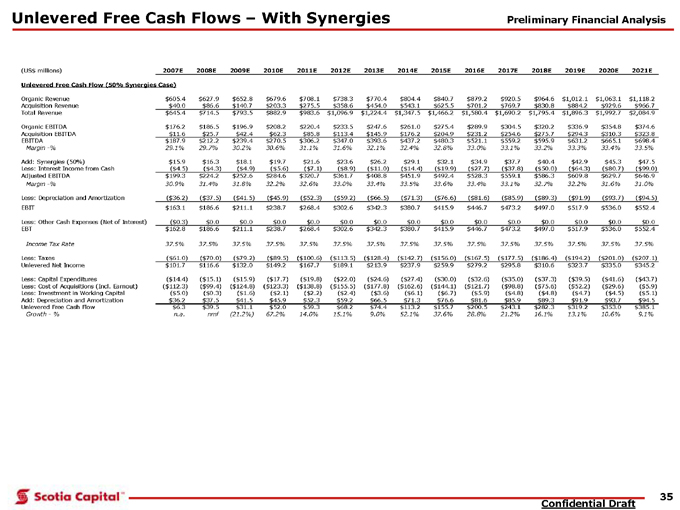
Unlevered Free Cash Flows - With Synergies Preliminary Financial Analysis
(US$ millions) 2007E 2008E 2009E 2010E 2011E 2012E 2013E 2014E 2015E 2016E 2017E 2018E 2019E 2020E 2021E
Unlevered Free Cash Flow (50% Synergies Case)
Organic Revenue $605.4 $627.9 $652.8 $679.6 $708.1 $738.3 $770.4 $804.4 $840.7 $879.2 $920.5 $964.6 $1,012.1 $1,063.1 $1,118.2
Acquisition Revenue $40.0 $86.6 $140.7 $203.3 $275.5 $358.6 $454.0 $543.1 $625.5 $701.2 $769.7 $830.8 $884.2 $929.6 $966.7
Total Revenue $645.4 $714.5 $793.5 $882.9 $983.6 $1,096.9 $1,224.4 $1,347.5 $1,466.2 $1,580.4 $1,690.2 $1,795.4 $1,896.3 $1,992.7 $2,084.9
Organic EBITDA $176.2 $186.5 $196.9 $208.2 $220.4 $233.5 $247.6 $261.0 $275.4 $289.9 $304.5 $320.2 $336.9 $354.8 $374.6
Acquisition EBITDA $11.6 $25.7 $42.4 $62.3 $85.8 $113.4 $145.9 $176.2 $204.9 $231.2 $254.6 $275.7 $294.3 $310.3 $323.8
EBITDA $187.9 $212.2 $239.4 $270.5 $306.2 $347.0 $393.6 $437.2 $480.3 $521.1 $559.2 $595.9 $631.2 $665.1 $698.4
Margin -% 29.1% 29.7% 30.2% 30.6% 31.1% 31.6% 32.1% 32.4% 32.8% 33.0% 33.1% 33.2% 33.3% 33.4% 33.5%
Add: Synergies (50%) $15.9 $16.3 $18.1 $19.7 $21.6 $23.6 $26.2 $29.1 $32.1 $34.9 $37.7 $40.4 $42.9 $45.3 $47.5
Less: Interest Income from Cash ($4.5) ($4.3) ($4.9) ($5.6) ($7.1) ($8.9) ($11.0) ($14.4) ($19.9) ($27.7) ($37.8) ($50.0) ($64.3) ($80.7) ($99.0)
Adjusted EBITDA $199.3 $224.2 $252.6 $284.6 $320.7 $361.7 $408.8 $451.9 $492.4 $528.3 $559.1 $586.3 $609.8 $629.7 $646.9
Margin -% 30.9% 31.4% 31.8% 32.2% 32.6% 33.0% 33.4% 33.5% 33.6% 33.4% 33.1% 32.7% 32.2% 31.6% 31.0%
Less: Depreciation and Amortization ($36.2) ($37.5) ($41.5) ($45.9) ($52.3) ($59.2) ($66.5) ($71.3) ($76.6) ($81.6) ($85.9) ($89.3) ($91.9) ($93.7) ($94.5)
EBIT $163.1 $186.6 $211.1 $238.7 $268.4 $302.6 $342.3 $380.7 $415.9 $446.7 $473.2 $497.0 $517.9 $536.0 $552.4
Less: Other Cash Expenses (Net of Interest) ($0.3) $0.0 $0.0 $0.0 $0.0 $0.0 $0.0 $0.0 $0.0 $0.0 $0.0 $0.0 $0.0 $0.0 $0.0
EBT $162.8 $186.6 $211.1 $238.7 $268.4 $302.6 $342.3 $380.7 $415.9 $446.7 $473.2 $497.0 $517.9 $536.0 $552.4
Income Tax Rate 37.5% 37.5% 37.5% 37.5% 37.5% 37.5% 37.5% 37.5% 37.5% 37.5% 37.5% 37.5% 37.5% 37.5% 37.5%
Less: Taxes ($61.0) ($70.0) ($79.2) ($89.5) ($100.6) ($113.5) ($128.4) ($142.7) ($156.0) ($167.5) ($177.5) ($186.4) ($194.2) ($201.0) ($207.1)
Unlevered Net Income $101.7 $116.6 $132.0 $149.2 $167.7 $189.1 $213.9 $237.9 $259.9 $279.2 $295.8 $310.6 $323.7 $335.0 $345.2
Less: Capital Expenditures ($14.4) ($15.1) ($15.9) ($17.7) ($19.8) ($22.0) ($24.6) ($27.4) ($30.0) ($32.6) ($35.0) ($37.3) ($39.5) ($41.6) ($43.7)
Less: Cost of Acquisitions (Incl. Earnout) ($112.3) ($99.4) ($124.8) ($123.3) ($138.8) ($155.5) ($177.8) ($162.6) ($144.1) ($121.7) ($98.8) ($75.6) ($52.2) ($29.6) ($5.9)
Less: Investment in Working Capital ($5.0) ($0.3) ($1.6) ($2.1) ($2.2) ($2.4) ($3.6) ($6.1) ($6.7) ($5.9) ($4.8) ($4.8) ($4.7) ($4.5) ($5.1)
Add: Depreciation and Amortization $36.2 $37.5 $41.5 $45.9 $52.3 $59.2 $66.5 $71.3 $76.6 $81.6 $85.9 $89.3 $91.9 $93.7 $94.5
Unlevered Free Cash Flow $6.3 $39.5 $31.1 $52.0 $59.3 $68.2 $74.4 $113.2 $155.7 $200.5 $243.1 $282.3 $319.2 $353.0 $385.1
Growth—% n.a. nmf (21.2%) 67.2% 14.0% 15.1% 9.0% 52.1% 37.6% 28.8% 21.2% 16.1% 13.1% 10.6% 9.1%
Confidential Draft
Fairness Considerations
37
Confidential Draft
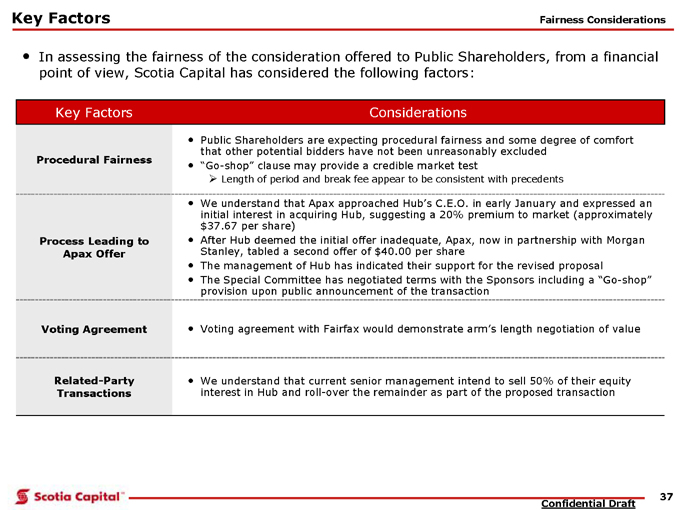
Key Factors. Voting agreement with Fairfax would demonstrate arm.s length negotiation of value Voting Agreement
Public Shareholders are expecting procedural fairness and some degree of comfort
that other potential bidders have not been unreasonably excluded
Go-shop. clause may provide a credible market test
Length of period and break fee appear to be consistent with precedents
Procedural Fairness
We understand that current senior management intend to sell 50% of their equity
interest in Hub and roll-over the remainder as part of the proposed transaction
Related-Party
Transactions
We understand that Apax approached Hub.s C.E.O. in early January and expressed an
initial interest in acquiring Hub, suggesting a 20% premium to market (approximately
$37.67 per share)
After Hub deemed the initial offer inadequate, Apax, now in partnership with Morgan
Stanley, tabled a second offer of $40.00 per share
The management of Hub has indicated their support for the revised proposal
The Special Committee has negotiated terms with the Sponsors including a .Go-shop.
provision upon public announcement of the transaction
Considerations
Process Leading to
Apax Offer
Key Factors
In assessing the fairness of the consideration offered to Public Shareholders, from a financial
point of view, Scotia Capital has considered the following factors:
Fairness Considerations
Confidential Draft
Overview of Hub International
Appendix 1

39
Confidential Draft
Market Profile
Trading Performance Capitalization and Implied Value
(1) Excludes trust cash
(2) Management projection including contingent payments
(3) Estimates from I/B/E/S
Overview of Hub International
$10.00
$15.00
$20.00
$25.00
$30.00
$35.00
Feb-04 Aug-04 Feb-05 Aug-05 Feb-06 Aug-06 Feb-07
Price (US$)
0
500
1,000
1,500
2,000
2,500
3,000
Volume (thousands)
Volume Price
Jul. 27, 2006
Reports strong Q2 06
results indicating a
38% increase in net
revenue year over year
Dec. 13, 2005
Hub, in partnership with
Wellpoint Health Services,
announces launch of new
healthcare program
M ay 12, 2006
Announces that it will offer
4,000,000 common shares
in a public offering
Oct. 26, 2006
Reports Q3 06 results with
$0.17/sh vs. ($0.01)/sh in
the prior year
Sep. 1, 2005
Announces the fold-
in acquisition o f The
Innovators Insurance
Agencies
M ay 3, 2005
Announces acquisition
of THB Intermediaries
Inc.
Oct. 26, 2005
Reports Q3 05 results
indicating 7% revenue
growth of which 5% is
organic
Jul. 29, 2004
Reports Q2 06 results
demonstrating an 11%
increase in revenues
year over year
(US$, million except share price)
Recent Share Price $33.17
Basic Shares Outstanding 39.5
Add: In-the-Money Options 1.0
Add: Restricted Share Units 2.0
FD Shares Outstanding 42.5
Market Capitalization $1,408.2
Add: Debt(1) $144.6
Add: Contingent Payments(2) $83.3
Less: Cash ($99.2)
Less: Cash from options ($15.7)
Enterprise Value $1,521.2
Base(3) Multiple
Revenue
2006E $548.1 2.8x
2007E $639.5 2.4x
EV/EBITDA
2006E $147.2 10.3x
2007E $175.7 8.7x
P/E
2006E $1.61 20.6x
2007E $1.92 17.3x
40
Confidential Draft
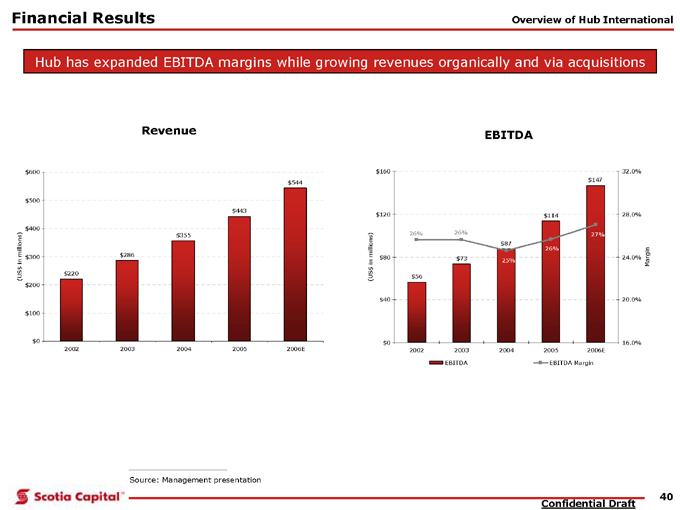
Financial Results
Revenue EBITDA
Hub has expanded EBITDA margins while growing revenues organically and via acquisitions
Source: Management presentation
Overview of Hub International
$56
$73
$87
$114
$147
26% 26%
25%
26%
27%
$0
$40
$80
$120
$160
2002 2003 2004 2005 2006E
(US$ in millions)
16.0%
20.0%
24.0%
28.0%
32.0%
Margin
EBITDA EBITDA Margin
$220
$286
$355
$443
$544
$0
$100
$200
$300
$400
$500
$600
2002 2003 2004 2005 2006E
(US$ in millions)
41
Confidential Draft
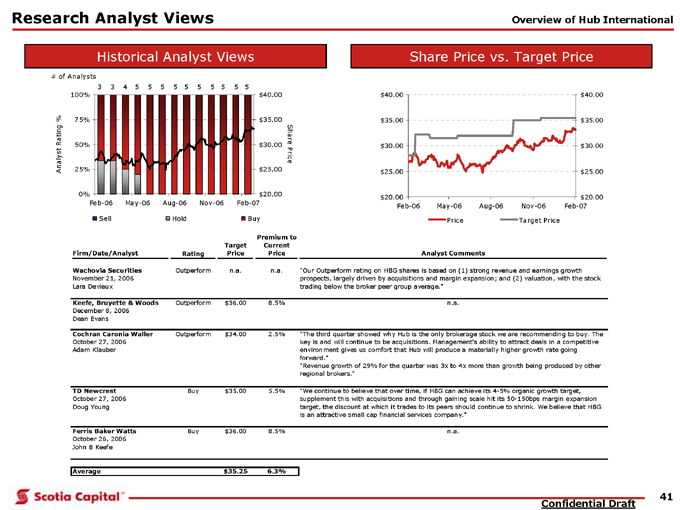
Research Analyst Views
Historical Analyst Views Share Price vs. Target Price
Overview of Hub International
0%
25%
50%
75%
100%
Feb-06 May-06 Aug-06 Nov-06 Feb-07
Analyst Rating %
$20.00
$25.00
$30.00
$35.00
$40.00
Share Price
Sell Hold Buy
# of Analysts
3 3 5 5 5 5 5 5 5 5 5 5 4
$20.00
$25.00
$30.00
$35.00
$40.00
Feb-06 May-06 Aug-06 Nov-06 Feb-07
$20.00
$25.00
$30.00
$35.00
$40.00
Price Target Price
Firm/Date/Analyst Rating
Target
Price
Premium to
Current
Price Analyst Comments
Wachovia Securities Outperform n.a. n.a.
November 21, 2006
Lara Devieux
Keefe, Bruyette & Woods Outperform $36.00 8.5%
December 8, 2006
Dean Evans
Cochran Caronia Waller Outperform $34.00 2.5%
October 27, 2006
Adam Klauber
TD Newcrest Buy $35.00 5.5%
October 27, 2006
Doug Young
Ferris Baker Watts Buy $36.00 8.5%
October 26, 2006
John B Keefe
Average $35.25 6.3%
"We continue to believe that over time, if HBG can achieve its 4-5% organic growth target,
supplement this with acquisitions and through gaining scale hit its 50-150bps margin expansion
target, the discount at which it trades to its peers should continue to shrink. We believe that HBG
is an attractive small cap financial services company."
n.a.
"Our Outperform rating on HBG shares is based on (1) strong revenue and earnings growth
prospects, largely driven by acquisitions and margin expansion; and (2) valuation, with the stock
trading below the broker peer group average."
n.a.
"The third quarter showed why Hub is the only brokerage stock we are recommending to buy. The
key is and will continue to be acquisitions. Management’s ability to attract deals in a competitive
environment gives us comfort that Hub will produce a materially higher growth rate going
forward."
"Revenue growth of 29% for the quarter was 3x to 4x more than growth being produced by other
regional brokers."
42
Confidential Draft
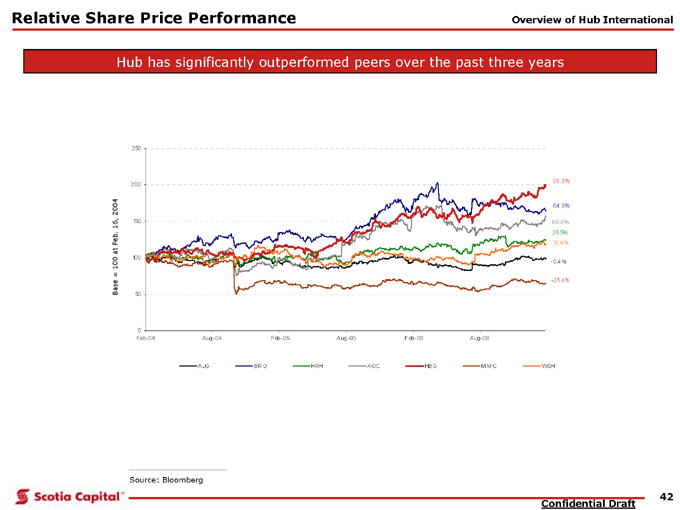
Relative Share Price Performance
Hub has significantly outperformed peers over the past three years
Overview of Hub International
Source: Bloomberg
0
50
100
150
200
250
Feb-04 Aug-04 Feb-05 Aug-05 Feb-06 Aug-06
AJG BRO HRH AOC HBG MMC WSH
-0.4%
64.8%
25.5%
60.8%
98.3%
-35.4%
19.4%
Base = 100 at Feb. 16, 2004
43
Confidential Draft
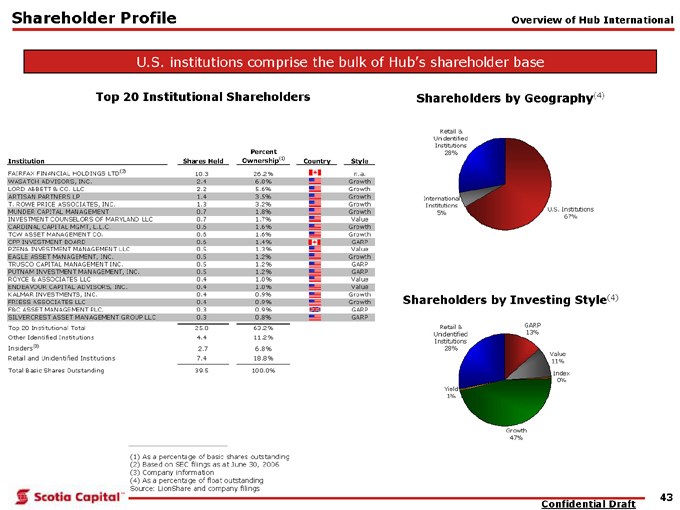
Shareholder Profile
Shareholders by Geography(4) Top 20 Institutional Shareholders
(1) As a percentage of basic shares outstanding
(2) Based on SEC filings as at June 30, 2006
(3) Company information
(4) As a percentage of float outstanding
Source: LionShare and company filings
U.S. institutions comprise the bulk of Hub.s shareholder base
Shareholders by Investing Style(4)
Overview of Hub International
Institution Shares Held
Percent
Ownership(1) Country Style
FAIRFAX FINANCIAL HOLDINGS LTD(2) 10.3 26.2% n.a.
WASATCH ADVISORS, INC. 2.4 6.0% Growth
LORD ABBETT & CO. LLC 2.2 5.6% Growth
ARTISAN PARTNERS LP 1.4 3.5% Growth
T. ROWE PRICE ASSOCIATES, INC. 1.3 3.2% Growth
MUNDER CAPITAL MANAGEMENT 0.7 1.8% Growth
INVESTMENT COUNSELORS OF MARYLAND LLC 0.7 1.7% Value
CARDINAL CAPITAL MGMT, L.L.C. 0.6 1.6% Growth
TCW ASSET MANAGEMENT CO. 0.6 1.6% Growth
CPP INVESTMENT BOARD 0.6 1.4% GARP
PZENA INVESTMENT MANAGEMENT LLC 0.5 1.3% Value
EAGLE ASSET MANAGEMENT, INC. 0.5 1.2% Growth
TRUSCO CAPITAL MANAGEMENT INC. 0.5 1.2% GARP
PUTNAM INVESTMENT MANAGEMENT, INC. 0.5 1.2% GARP
ROYCE & ASSOCIATES LLC 0.4 1.0% Value
ENDEAVOUR CAPITAL ADVISORS, INC. 0.4 1.0% Value
KALMAR INVESTMENTS, INC. 0.4 0.9% Growth
FRIESS ASSOCIATES LLC 0.4 0.9% Growth
F&C ASSET MANAGEMENT PLC. 0.3 0.9% GARP
SILVERCREST ASSET MANAGEMENT GROUP LLC 0.3 0.8% GARP
Top 20 Institutional Total 25.0 63.2%
Other Identified Institutions 4.4 11.2%
Insiders(3) 2.7 6.8%
Retail and Unidentified Institutions 7.4 18.8%
Total Basic Shares Outstanding 39.5 100.0%
U.S. Institutions
67%
International
Institutions
5%
Retail &
Unidentified
Institutions
28%
GARP
30
13%
Value
11%
Index
0%
Growth
47%
Yield
1%
Retail &
Unidentified
Institutions
30
30
28%