Exhibit 96.1
 | International Tower Hill Mines Ltd. S-K 1300 – Technical Report Summary Livengood Gold Project Pre-feasibility Study |  |
DATE AND SIGNATURE PAGE
This report is effective as of the 29th day of October 2021.
| “Original signed on file” | | October 13, 2023 |
| BBA USA Inc. | | Date |
| | | |
| | | |
| | | |
| | | |
| “Original signed on file” | | October 13, 2023 |
| NewFields Mining & Design & Technical Services, LLC | | Date |
| | | |
| | | |
| | | |
| | | |
| “Original signed on file” | | October 13, 2023 |
| JDS Energy & Mining Inc. | | Date |
| | | |
| | | |
| | | |
| | | |
| “Original signed on file” | | October 13, 2023 |
| Resource Development Associates Inc. | | Date |
| OCTOBER 2023 | | BBA Document No.: 3661013-000000-40-ERA-0001-R00 |
| International Tower Hill Mines Ltd. S-K 1300 – Technical Report Summary Livengood Gold Project Pre-feasibility Study | |
TABLE OF CONTENTS
| 1.1.1 | 2023 TRS Amendments | 1-2 |
| 1.3 | Key Project Outcomes | 1-3 |
| 1.4 | Property Description, Location and Access | 1-4 |
| 1.8 | Mineral Processing and Metallurgical Testing | 1-8 |
| 1.9 | Mineral Resource Estimate | 1-9 |
| 1.10 | Mineral Reserve Estimate | 1-11 |
| 1.13 | Local Resources and Project Infrastructure | 1-17 |
| 1.13.1 | Local Resources | 1-17 |
| 1.13.2 | Project Infrastructure | 1-18 |
| 1.14 | Environmental and Permitting | 1-20 |
| 1.15 | Socioeconomic Conditions | 1-21 |
| 1.16 | Capital Cost and Operating Cost Estimates | 1-22 |
| 1.16.2 | Operating Costs | 1-23 |
| 1.17 | Project Economics | 1-24 |
| 1.19 | Interpretations and Conclusions | 1-28 |
| 2.1.1 | 2023 TRS Amendments | 2-1 |
| 2.2 | Basis of the Technical Report Summary | 2-1 |
| 2.4 | Report Responsibility | 2-2 |
| 2.5 | Personal Inspection of the Livengood Property | 2-3 |
| International Tower Hill Mines Ltd. S-K 1300 – Technical Report Summary Livengood Gold Project Pre-feasibility Study | |
| 2.6 | Effective Dates and Declaration | 2-3 |
| 2.7 | Sources of Information | 2-4 |
| 2.8 | Currency, Units of Measure, and Calculations | 2-6 |
| 3. | Property Description and Location | 3-1 |
| 3.1 | Property Description | 3-1 |
| 3.1.1 | 100% Owned Patented Mining Claims | 3-1 |
| 3.1.2 | 100% Owned State of Alaska Mining Claims | 3-1 |
| 3.1.3 | 100% Owned Federal Unpatented Placer Mining Claims | 3-1 |
| 3.1.4 | 100% Owned by Livengood Placers, Inc. | 3-2 |
| 3.1.6 | Patented Mining Claims (Undivided Interests Less Than 100%) | 3-4 |
| 3.1.7 | Other Land Obligations | 3-5 |
| 3.1.9 | Environmental Liabilities | 3-6 |
| 4. | Accessibility, Climate, Local Resources, Infrastructure and Physiography | 4-1 |
| 4.3 | Local Resources and Infrastructure | 4-1 |
| 6. | Geological Setting and Mineralization and Deposit | 6-1 |
| 6.1 | Geological Setting and Mineralization | 6-1 |
| 6.1.2 | Mineralization and Alteration | 6-4 |
| International Tower Hill Mines Ltd. S-K 1300 – Technical Report Summary Livengood Gold Project Pre-feasibility Study | |
| 6.1.3 | Massive Stibnite Veins | 6-5 |
| 6.1.4 | Antimony Mineralization Halo | 6-7 |
| 7.1 | Exploration History | 7-1 |
| 7.2.1 | Reverse Circulation vs Core Drilling | 7-3 |
| 7.2.2 | Resource Verification Drilling | 7-7 |
| 8. | Sample Preparation, Assaying and Security | 8-1 |
| 8.1 | Sample Collection, Procedures and Security | 8-1 |
| 8.3 | QA/QC Procedures and Results | 8-2 |
| 8.4 | Data Collection, Entry and Maintenance | 8-2 |
| 10. | Mineral Processing and Metallurgical Testing | 10-1 |
| 10.2 | FS – Sample Selection and Preparation | 10-2 |
| 10.3 | FS – Mineralogy and Gold Deportment Study | 10-5 |
| 10.4 | Comminution Testing | 10-6 |
| 10.4.1 | FS – Comminution Testing | 10-6 |
| 10.4.2 | 2017 PFS – Comminution Testing | 10-8 |
| 10.4.3 | Testwork Summary for Crushing and Grinding Circuit Design | 10-9 |
| 10.4.4 | Project Throughput Estimation | 10-12 |
| 10.4.5 | Comminution Circuit Simulations and Design Summary | 10-16 |
| 10.5 | Metallurgical Testwork | 10-20 |
| 10.5.1 | 2013 FS – Metallurgical Testwork | 10-20 |
| 10.5.2 | 2013 FS – Optimization Test Program | 10-20 |
| 10.5.3 | 2013 FS – Variability Test Program | 10-29 |
| 10.5.4 | 2013 FS – Solid / Liquid Separation Testwork | 10-33 |
| 10.5.5 | 2013 FS – Cyanide Detoxification Tests | 10-33 |
| 10.5.6 | 2017 PFS – Metallurgical Testwork | 10-34 |
| 10.5.7 | 2017 PFS – Continuous Testwork | 10-35 |
| 10.5.8 | 2017 PFS – Phase 7 - Assay Procedures and Water Source Testing | 10-35 |
| 10.5.9 | 2017 PFS – Phase 8 - Grind, Recovery, Gravity, Flotation Testing | 10-35 |
| 10.5.10 | 2017 PFS – Phase 9 - SGS and FLS-Curtin University Test Program | 10-37 |
| International Tower Hill Mines Ltd. S-K 1300 – Technical Report Summary Livengood Gold Project Pre-feasibility Study | |
| 10.5.11 | 2017 PFS – Phase 10 - Stirred Tank Reactor (STR) Leach Tests | 10-50 |
| 10.5.12 | 2021 PFS – Metallurgical Testwork | 10-53 |
| 10.5.13 | 2021 PFS – Phase 9a - Cyanide Leach Testing | 10-53 |
| 10.5.14 | 2021 PFS – Phase 9b - Gravity, Grind, Leaching, STR and Flotation Testing | 10-61 |
| 10.5.15 | 2021 PFS – Phase 11 | 10-76 |
| 10.5.16 | 2021 PFS – Phase 12 | 10-86 |
| 10.5.17 | 2021 PFS – Phase 13 | 10-102 |
| 10.6 | Recovery Equations | 10-105 |
| 10.6.1 | 2017 PFS Recovery Equations – Grind Sizes of 90 µm and 180 µm | 10-105 |
| 10.6.2 | 2021 PFS Recovery Equations – Grind Size of 50-250 µm | 10-108 |
| 10.7 | Flowsheet Development | 10-112 |
| 10.7.1 | 2017 PFS Comparative Studies | 10-112 |
| 10.7.2 | 2021 PFS Comparative Study | 10-118 |
| 10.7.3 | Flowsheet Development Summary | 10-120 |
| 10.8 | Opportunities for Further Investigation | 10-121 |
| 11. | Mineral Resource Estimates | 11-1 |
| 11.1 | Mineral Resource Estimation Methodology | 11-1 |
| 11.4 | Grade Capping – Handling of Outliers | 11-5 |
| 11.7 | Contact Profile Analysis | 11-8 |
| 11.10 | Grade Estimation | 11-16 |
| 11.11 | Model Validation | 11-18 |
| 11.12 | Resource Classification | 11-21 |
| 11.13 | Qualified Person Opinion – Further Work | 11-23 |
| 11.14 | Mineral Resource Summary | 11-24 |
| 11.15 | Grade Sensitivity Analysis | 11-26 |
| 11.16 | Sensitivity of Mineralization to Gold Price | 11-28 |
| 12. | Mineral Reserve Estimates | 12-1 |
| 12.2 | General Parameters Used to Estimate the Mineral Reserves | 12-3 |
| International Tower Hill Mines Ltd. S-K 1300 – Technical Report Summary Livengood Gold Project Pre-feasibility Study | |
| 12.2.1 | Topographical Data | 12-3 |
| 12.2.2 | Mineral Resource Block Model | 12-3 |
| 12.2.4 | Moisture Content | 12-6 |
| 12.3 | Modifying Factors That Affect the Mineral Reserves | 12-6 |
| 12.3.2 | Open Pit Optimization | 12-7 |
| 12.3.3 | Open Pit Design | 12-14 |
| 13.1.1 | Geotechnical Pit Slope Parameters | 13-1 |
| 13.2.2 | Phase Design Results | 13-2 |
| 13.3 | Waste Rock Storage Facility and Stockpile Designs | 13-7 |
| 13.3.1 | Growth Media Stockpiles | 13-7 |
| 13.3.2 | Overburden Stockpile | 13-7 |
| 13.3.3 | Waste Rock Storage Facility | 13-7 |
| 13.3.4 | Low Grade Ore Stockpile | 13-8 |
| 13.3.5 | Emergency Ore Stockpile | 13-8 |
| 13.3.6 | Acid Rock Drainage | 13-9 |
| 13.4 | Mine Production Plan | 13-9 |
| 13.5 | Mine Equipment Fleet | 13-18 |
| 13.5.1 | Operating Schedule | 13-19 |
| 13.5.2 | Equipment Utilization Model | 13-19 |
| 13.5.3 | Drilling and Blasting | 13-21 |
| 13.5.6 | Auxiliary Equipment | 13-23 |
| 13.5.7 | Mine Dispatch System | 13-24 |
| 13.5.8 | Mine Dewatering | 13-24 |
| International Tower Hill Mines Ltd. S-K 1300 – Technical Report Summary Livengood Gold Project Pre-feasibility Study | |
| 14.2 | Process Plant Production Schedule | 14-1 |
| 14.3 | Conceptual Process Flow Diagram | 14-1 |
| 14.4 | Plant Operating Design Parameters | 14-2 |
| 14.5 | Process Plant Facilities Description | 14-5 |
| 14.5.1 | Primary Crushing | 14-7 |
| 14.5.2 | Crushed Ore Stockpile | 14-7 |
| 14.5.3 | Secondary Crushing (Pre-Crushing) | 14-7 |
| 14.5.4 | Grinding and Pebble Crushing | 14-7 |
| 14.5.5 | Gravity and Intensive Leaching | 14-8 |
| 14.5.6 | Carbon in Leach | 14-8 |
| 14.5.7 | Adsorption, Desorption and Recovery (ADR) | 14-9 |
| 14.5.8 | Pre-Detox Thickening and Cyanide Detoxification | 14-9 |
| 14.7 | Ancillary Facilities | 14-12 |
| 14.8 | Process Plant Controls | 14-12 |
| 14.10 | Energy Requirements | 14-13 |
| 14.11 | Process Plant Arrangement | 14-13 |
| 14.12 | Process Plant Personnel | 14-15 |
| 15. | Project Infrastructure | 15-1 |
| 15.2 | General Site Arrangement | 15-2 |
| 15.4.1 | O’Connor Creek Substation | 15-3 |
| 15.4.2 | GVEA Transmission System Upgrades | 15-4 |
| 15.4.3 | 230 kV Transmission Line | 15-4 |
| 15.5 | Site Electrical Distribution | 15-5 |
| 15.5.1 | Emergency Power | 15-5 |
| 15.7.1 | Light Vehicle Roads | 15-6 |
| 15.7.2 | Mine Haul Roads | 15-6 |
| International Tower Hill Mines Ltd. S-K 1300 – Technical Report Summary Livengood Gold Project Pre-feasibility Study | |
| 15.8 | Explosives Storage Facilities | 15-6 |
| 15.10 | Administration and Mine Services Facility | 15-7 |
| 15.10.1 | Lube Storage and Distribution | 15-7 |
| 15.10.2 | Warehouse and Storage | 15-7 |
| 15.10.3 | Mechanical Workshop | 15-8 |
| 15.10.4 | Administration Offices | 15-8 |
| 15.11 | Other Structures | 15-8 |
| 15.12 | Communications / Information Technology (IT) | 15-9 |
| 15.13 | Fire Protection | 15-10 |
| 15.15 | Construction Camp | 15-10 |
| 15.16 | Personnel Transportation | 15-10 |
| 15.17 | Fairbanks Infrastructure | 15-10 |
| 15.17.1 | Integrated Remote Operation Centre (IROC) | 15-11 |
| 15.18 | Waste Rock Storage Facility (WRSF) and Stockpiles | 15-11 |
| 15.18.1 | Growth Media Stockpiles | 15-11 |
| 15.18.2 | Overburden Stockpile | 15-11 |
| 15.18.3 | Waste Rock Storage Facility (WRSF) | 15-12 |
| 15.18.4 | Low Grade Ore Stockpile | 15-12 |
| 15.18.5 | Emergency Ore Stockpile | 15-12 |
| 15.19 | TMF and Water Management | 15-13 |
| 15.19.1 | Tailings Management Facility | 15-13 |
| 15.19.2 | Water Management | 15-14 |
| 16. | Market Studies and Contracts | 16-1 |
| 16.3 | Gold Price Projections | 16-1 |
| 17. | Environmental Studies, Permitting, and Plans, Negotiations, or Agreements with Local Individuals or Groups | 17-1 |
| 17.1.1 | Historical Project Activities and Permitting | 17-1 |
| International Tower Hill Mines Ltd. S-K 1300 – Technical Report Summary Livengood Gold Project Pre-feasibility Study | |
| 17.1.2 | Baseline Studies | 17-1 |
| 17.1.3 | Environmental Management Strategies | 17-5 |
| 17.2.1 | Closure Activities | 17-6 |
| 17.2.2 | Post Closure Activities | 17-7 |
| 17.3.1 | Project Permitting Requirements | 17-7 |
| 17.3.2 | Status of Permit Applications | 17-9 |
| 17.4 | Requirements for Performance or Reclamation Bonds | 17-10 |
| 17.5 | Mine Closure Requirements and Costs | 17-10 |
| 17.6 | Socioeconomic Conditions | 17-10 |
| 17.6.1 | Regional Economy | 17-11 |
| 17.6.2 | Recreational and Subsistence Resources | 17-11 |
| 17.6.3 | Socioeconomic and Project Consequences | 17-11 |
| 17.6.4 | Support Services | 17-12 |
| 17.6.5 | Employment and Training | 17-12 |
| 17.7 | Adequacy of Current Plans | 17-12 |
| 18. | Capital and Operating Costs | 18-1 |
| 18.1 | Capital Cost Summary and Basis | 18-1 |
| 18.2 | Initial Capital Costs | 18-3 |
| 18.2.2 | Mine Development | 18-4 |
| 18.2.3 | Mining Equipment | 18-4 |
| 18.2.6 | Infrastructure Facilities | 18-6 |
| 18.2.7 | Indirect and Owner’s Costs | 18-7 |
| 18.3 | Sustaining Capital Costs | 18-9 |
| 18.4 | Operating Cost Summary and Basis | 18-10 |
| 18.4.1 | Electricity, Diesel and LNG | 18-12 |
| 18.4.2 | Project Personnel | 18-12 |
| International Tower Hill Mines Ltd. S-K 1300 – Technical Report Summary Livengood Gold Project Pre-feasibility Study | |
| 18.4.5 | General and Administration (G&A) | 18-18 |
| 18.6 | Transportation and Refining | 18-20 |
| 19.2 | Assumptions and Basis | 19-1 |
| 19.4 | Third Party Smelting, Refining and Transportation | 19-3 |
| 19.9 | Operating, All-in Sustaining, and All-in Costs | 19-6 |
| 19.10 | Financial Analysis | 19-6 |
| 19.11 | Sensitivity Analysis | 19-9 |
| 20. | Adjacent Properties | 20-1 |
| 20.1 | Producing Properties | 20-1 |
| 20.2 | Exploration Projects | 20-1 |
| 21. | Other Relevant Data and Information | 21-1 |
| 21.1 | Execution Plan and Schedule | 21-1 |
| 21.2 | Logistics and Transportation | 21-4 |
| 21.2.2 | Freight Options Considered | 21-4 |
| 21.2.3 | Recommended Base Routes | 21-5 |
| 22. | Interpretation and Conclusions | 22-1 |
| 22.4 | Indicative Economics | 22-3 |
| 22.5 | Project Risks and Opportunities | 22-3 |
| International Tower Hill Mines Ltd. S-K 1300 – Technical Report Summary Livengood Gold Project Pre-feasibility Study | |
| 23.2 | Sampling Program to Obtain Fresh Core | 23-2 |
| 23.3 | Metallurgical Testwork | 23-2 |
| 23.4 | Feasibility Study | 23-2 |
| 24.2 | Geology and Resources | 24-1 |
| 24.4 | Mineral Processing and Metallurgy | 24-3 |
| 24.6 | TMF and Water Management | 24-6 |
| 25. | Reliance on Information Provided by Registrant | 25-1 |
APPENDICES
Appendix A: Properties and Claims
| International Tower Hill Mines Ltd. S-K 1300 – Technical Report Summary Livengood Gold Project Pre-feasibility Study | |
LIST OF TABLES
| Table 1-1: PFS contributors | 1-2 |
| Table 1-2: Average gold recovery (Gravity+CIL) estimated for each rock type | 1-9 |
| Table 1-3: Constraining parameters used for the Livengood Gold Project | 1-10 |
| Table 1-4: Livengood Gold Project mineral resource estimate (exclusive of mineral reserves) | 1-10 |
| Table 1-5: Livengood Gold Project mineral resource estimate (inclusive of mineral reserves) | 1-11 |
| Table 1-6: Livengood Gold Project Mineral Reserves, October 22, 2021 – BBA USA Inc. | 1-12 |
| Table 1-7: Environmental baseline studies (2008-2021) | 1-20 |
| Table 1-8: Initial capital and sustaining capital costs by major area | 1-23 |
| Table 1-9: Total operating cost breakdown (LOM average) | 1-24 |
| Table 1-10: Financial model inputs | 1-25 |
| Table 1-11: Summary of pre-feasibility study results | 1-25 |
| Table 1-12: Key project activities (preliminary) | 1-28 |
| Table 2-1: Primary PFS contributors | 2-2 |
| Table 2-2: Chapter/Section responsibility by Consulting Firm | 2-3 |
| Table 7-1: Comparison of modeled gold grades between core and RC drilling by stratigraphic unit | 7-4 |
| Table 7-2: Calculated resources for Area 50 by drill sample type | 7-6 |
| Table 7-3: Calculated resources for the Core Cross, Sunshine Cross and Area 50 | 7-7 |
| Table 10-1: Livengood gold ore sample selection weights (kg) used in the FS test programs | 10-2 |
| Table 10-2: Definition of Livengood rock types (FS) | 10-3 |
| Table 10-3: Comminution data (FS) | 10-6 |
| Table 10-4: Average JK drop weight parameters by rock type (FS) | 10-7 |
| Table 10-5: SMC testwork statistical analysis (2017 PFS) | 10-9 |
| Table 10-6: Comminution test statistical analysis by rock type | 10-9 |
| Table 10-7: Comminution test statistics using all 2013 FS and 2017 PFS testwork data | 10-10 |
| Table 10-8: Grinding circuit design values | 10-10 |
| Table 10-9: SAG and ball mill design criteria for simulations | 10-13 |
| Table 10-10: Throughput estimations for each scenario in metric tons per day (mt/d) | 10-14 |
| Table 10-11: Specific energy calculations for each scenario at design (80th percentile) A×b | 10-15 |
| Table 10-12: Comminution simulations summary | 10-18 |
| Table 10-13: Optimization composites used for testwork | 10-20 |
| Table 10-14: Comparison of gravity test results | 10-21 |
| International Tower Hill Mines Ltd. S-K 1300 – Technical Report Summary Livengood Gold Project Pre-feasibility Study | |
| Table 10-15: Gold recovery resulting from the combination of gravity, flotation and CIL (FS) | 10-25 |
| Table 10-16: Gold recovery resulting from whole ore leaching (FS) | 10-28 |
| Table 10-17: Overall gold recovery of optimization samples for both process options (FS) | 10-28 |
| Table 10-18: Variability sample gold recovery (FS) | 10-30 |
| Table 10-19: Gold head assay | 10-38 |
| Table 10-20: Composite naming and weights for Phase 9 (2017 PFS) test program. | 10-38 |
| Table 10-21: ICP Analysis of the CIL feed from the continuous testwork for each rock type | 10-40 |
| Table 10-22: Comparison of cyanide addition in Phase 9 versus Continuous | 10-40 |
| Table 10-23: Intensive leach results | 10-45 |
| Table 10-24: Kinetic results from Phase 9 | 10-48 |
| Table 10-25: Phase 10 results (2017 PFS) | 10-51 |
| Table 10-26: Reproducibility of cyanidation tests on the Livengood Gold Project | 10-52 |
| Table 10-27: Test conditions (2021 PFS – Phase 9a) | 10-55 |
| Table 10-28: Test results for all Rock Types (2021 PFS – Phase 9a) | 10-55 |
| Table 10-29: Average gold gravity recovery results for each rock type | 10-63 |
| Table 10-30: Phase 9 and Phase 9b recovery results comparison | 10-63 |
| Table 10-31: Result summary of the second pass gravity test at 180 µm | 10-67 |
| Table 10-32: Result summary of the second pass gravity test at 135 µm | 10-67 |
| Table 10-33: Result summary of the second pass gravity test at 90 µm | 10-68 |
| Table 10-34: Flotation testwork results | 10-69 |
| Table 10-35: Overall recovery comparison | 10-69 |
| Table 10-36: Composition of blend composites | 10-70 |
| Table 10-37: Effect of ore blend on CIL recovery, leach residue, flotation recovery and mass pull | 10-70 |
| Table 10-38: STR leach matrix conditions | 10-73 |
| Table 10-39: Average STR testwork results | 10-74 |
| Table 10-40: Knelson concentrate intensive leach results | 10-75 |
| Table 10-41: Knelson tailings CIL results | 10-76 |
| Table 10-42: Composites characteristics | 10-77 |
| Table 10-43: Gravity separation results | 10-79 |
| Table 10-44: 10 kg Bulk results from Phase 11 | 10-86 |
| Table 10-45: Composites characteristics | 10-87 |
| Table 10-46: Gravity separation results | 10-88 |
| Table 10-47: Average CIL testwork results | 10-95 |
| Table 10-48: Flotation testwork results | 10-96 |
| International Tower Hill Mines Ltd. S-K 1300 – Technical Report Summary Livengood Gold Project Pre-feasibility Study | |
| Table 10-49: Flotation concentrate leach results | 10-97 |
| Table 10-50: Overall recovery comparison when using POX | 10-98 |
| Table 10-51: Enhanced gravity followed by POX/CIL results | 10-98 |
| Table 10-52: Index and Strength testing results (all samples) | 10-100 |
| Table 10-53: Permeability testing (select samples) | 10-101 |
| Table 10-54: Massive Stibnite shell recovery estimation | 10-104 |
| Table 10-55: Average gold recovery estimated for each rock type | 10-105 |
| Table 10-56: Average gold recovery estimated for each rock type (2021 PFS) | 10-111 |
| Table 10-57: Summary of recovery results from different testwork programs | 10-114 |
| Table 10-58: Simulated gold recoveries for the WOL vs Flotation trade-off | 10-115 |
| Table 10-59: Annual operating cost comparison | 10-117 |
| Table 11-1: Historical drilling and sampling | 11-2 |
| Table 11-2: THM resource drilling and sampling | 11-3 |
| Table 11-3: Density determinations | 11-3 |
| Table 11-4: Au assay statistics for Livengood | 11-4 |
| Table 11-5: Capping statistics | 11-5 |
| Table 11-6: Model extents | 11-12 |
| Table 11-7: ID3 Estimation Parameters | 11-16 |
| Table 11-8: Livengood deposit massive stibnite grade estimates | 11-17 |
| Table 11-9: Comparison of ID3 to NN estimates to evaluate for biases in the 2021 MRE | 11-18 |
| Table 11-10: Sources and Degree of Uncertainty | 11-22 |
| Table 11-11: Pit constraining parameters used for the Livengood Gold Project | 11-24 |
| Table 11-12: Livengood Gold Project mineral resource estimate (exclusive of mineral reserves) | 11-25 |
| Table 11-13: Livengood Gold Project mineral resource estimate (inclusive of mineral reserves) | 11-26 |
| Table 11-14: Sensitivity of block model to cut-off grade | 11-27 |
| Table 11-15: Sensitivity of mineralization inventory contained in pit shells | 11-28 |
| Table 12-1: Livengood Project mineral reserves (October 22, 2021- BBA USA Inc.) | 12-2 |
| Table 12-2: Lowest grades processed | 12-3 |
| Table 12-3: Block model specifications | 12-4 |
| Table 12-4: Block model item list | 12-4 |
| Table 12-5: Rock type numbering | 12-5 |
| Table 12-6: Bulk dry densities | 12-6 |
| Table 12-7: Processing throughput capacities by rock type | 12-8 |
| Table 12-8: Fixed costs by area | 12-8 |
| International Tower Hill Mines Ltd. S-K 1300 – Technical Report Summary Livengood Gold Project Pre-feasibility Study | |
| Table 12-9: Pit optimization cost inputs ($/mt) | 12-9 |
| Table 12-10: Revenue parameters | 12-9 |
| Table 12-11: Mill recoveries (OSX = 1) | 12-10 |
| Table 12-12: Mill recoveries (OSX = 2) | 12-10 |
| Table 12-13: Mill recoveries (OSX = 3) | 12-10 |
| Table 12-14: Average mill recoveries by rock type (%) (1) | 12-11 |
| Table 12-15: Pit optimization results | 12-13 |
| Table 12-16: Distributions of RMR (Bienawski, 1989) per engineering unit | 12-16 |
| Table 12-17: Distributions of UCS per engineering unit | 12-16 |
| Table 12-18: Overall slope stability analysis results for the ultimate pit | 12-18 |
| Table 12-19: Pit slope design recommendations for ultimate pit | 12-18 |
| Table 12-20: Pit wall configuration | 12-20 |
| Table 13-1: Mineral reserves by phase | 13-2 |
| Table 13-2: WRSF slope configuration | 13-8 |
| Table 13-3: Mine production schedule | 13-11 |
| Table 13-4: Mill feed by rock type | 13-12 |
| Table 13-5: Mine equipment fleet | 13-18 |
| Table 13-6: Mine equipment KPIs | 13-20 |
| Table 13-7: Fixed drilling time per hole | 13-21 |
| Table 13-8: Blast patterns (ore) | 13-22 |
| Table 13-9: Blast patterns (waste) | 13-22 |
| Table 13-10: Mine workforce | 13-25 |
| Table 14-1: General process design criteria | 14-3 |
| Table 14-2: Reagents and area of use | 14-10 |
| Table 14-3: Grinding media and area of use | 14-11 |
| Table 14-4: Process plant power demand by area | 14-13 |
| Table 14-5: Process plant salaried manpower | 14-15 |
| Table 14-6: Process plant hourly manpower | 14-16 |
| Table 15-1: Estimated total project power demand | 15-3 |
| Table 16-1: Refining and pricing assumptions | 16-2 |
| Table 17-1: Environmental baseline studies (2008-2016) | 17-1 |
| Table 17-2: Summary of environmental baseline studies | 17-2 |
| Table 17-3: Project permit requirements | 17-7 |
| Table 18-1: Capital cost estimate contributors | 18-1 |
| International Tower Hill Mines Ltd. S-K 1300 – Technical Report Summary Livengood Gold Project Pre-feasibility Study | |
| Table 18-2: Initial capital and sustaining capital costs by major area | 18-2 |
| Table 18-3: Open pit mine initial capital costs | 18-3 |
| Table 18-4: Mining equipment initial capital costs | 18-4 |
| Table 18-5: Power supply capital costs by major area | 18-5 |
| Table 18-6: Process plant capital costs by major area | 18-5 |
| Table 18-7: Infrastructure capital costs by area | 18-7 |
| Table 18-8: Indirect and Owner’s costs by area | 18-8 |
| Table 18-9: Contingency by major area | 18-9 |
| Table 18-10: Sustaining capital costs by major area | 18-9 |
| Table 18-11: Operating cost estimate contributors | 18-10 |
| Table 18-12: Total operating cost breakdown (LOM average) | 18-11 |
| Table 18-13: Project peak personnel (Year 6) | 18-13 |
| Table 18-14: Average annual and life of mine operating costs – by activity | 18-14 |
| Table 18-15: Average annual and life of mine operating costs – by consumable | 18-14 |
| Table 18-16: Average annual and life of mine operating costs – process plant | 18-16 |
| Table 18-17: Average LOM media wear and consumption rates | 18-16 |
| Table 18-18: Average annual and life of mine operating costs – general and administration | 18-19 |
| Table 18-19: G&A employee list | 18-20 |
| Table 19-1: Financial model criteria | 19-2 |
| Table 19-2: Operating, All-in Sustaining, and All-in costs (pre-tax) | 19-6 |
| Table 19-3: Financial analysis summary (pre-tax and after-tax) | 19-7 |
| Table 19-4: Simplified cash flow table | 19-8 |
| Table 19-5: Project sensitivity analysis – after-tax IRR and NPV | 19-10 |
| Table 21-1: Key project activities (preliminary) | 21-1 |
| Table 21-2: Preferred base route legs and distances | 21-5 |
| Table 22-1: Project risks (preliminary risk assessment) | 22-4 |
| Table 22-2: Project opportunities (preliminary opportunity assessment) | 22-7 |
| Table 23-1: Cost estimate for feasibility study recommendations | 23-1 |
| International Tower Hill Mines Ltd. S-K 1300 – Technical Report Summary Livengood Gold Project Pre-feasibility Study | |
LIST OF FIGURES
| Figure 1-1: Project location map | 1-5 |
| Figure 1-2: Map illustrating the company’s Livengood Gold Project land holdings | 1-6 |
| Figure 1-3: Simplified process flow diagram | 1-16 |
| Figure 1-4: Gold production schedule (oz/year) | 1-17 |
| Figure 1-5: After-tax sensitivity analysis for project net present value (NPV @ 5% discount rate) | 1-27 |
| Figure 1-6: After-tax sensitivity analysis for project internal rate of return (IRR %) | 1-27 |
| Figure 3-1: Map illustrating the company’s Livengood Gold Project land holdings | 3-3 |
| Figure 3-2: Project location map | 3-7 |
| Figure 6-1: Terrane map of Alaska showing Livengood Terrane (LG: red arrow) | 6-2 |
| Figure 6-2: Diagrammatic thrust/stratigraphic column in the Livengood area | 6-3 |
| Figure 6-3: Generalized geologic map of the Money Knob area based on geologic work by THM | 6-4 |
| Figure 6-4: Cross section through the deposit | 6-5 |
| Figure 6-5: Caption 3D view of MSV and >2,500 ppm Sb assays | 6-6 |
| Figure 6-6: Caption 3D view of MSV and >2,500 ppm Sb assays | 6-6 |
| Figure 6-7: 3D view of the Sb_100ppm grade shell generated from preferential linear alignments | 6-7 |
| Figure 6-8: 3D view of the Sb_100 ppm grade shell | 6-8 |
| Figure 6-9: Cross section view of the Sb_100 ppm grade shell (meshed solid) | 6-9 |
| Figure 7-1: Plot of gold values in soil samples | 7-1 |
| Figure 7-2: Distribution of resource / delineation drill holes in Money Knob area over time | 7-2 |
| Figure 7-3: Map showing location of areas of detailed drilling | 7-5 |
| Figure 7-4: Models for RC, Whole PQ, and Sawn HQ from Area 50 | 7-6 |
| Figure 10-1: FS Design comminution sample preparation flowsheet (SGS report) | 10-4 |
| Figure 10-2: FS Variability comminution sample preparation flowsheet | 10-4 |
| Figure 10-3: Cumulative A × b (DWT + SMC) results for the Livengood Gold Project | 10-11 |
| Figure 10-4: Cumulative BWi results for the Livengood Gold Project | 10-11 |
| Figure 10-5: SABC with pre-crushing (secondary crusher) circuit configuration | 10-12 |
| Figure 10-6: Gold gravity concentration grind-recovery relationships | 10-21 |
| Figure 10-7: Effect of primary grind on gold rougher flotation test Kinetics | 10-23 |
| Figure 10-8: Flotation concentrates CIL test gold leach kinetics for different rock types (FS) | 10-24 |
| Figure 10-9: Effect of grind on gold extraction kinetics for RT4, RT5, RT6 and RT9 (FS) | 10-26 |
| Figure 10-10: Mozley gravity tailings CIL test kinetics for different rock types (FS) | 10-27 |
| International Tower Hill Mines Ltd. S-K 1300 – Technical Report Summary Livengood Gold Project Pre-feasibility Study | |
| Figure 10-11: Gold gravity recovery box plots (FS) | 10-31 |
| Figure 10-12: Gold in Residues from CIL testwork vs P80 for each rock type (FS) | 10-32 |
| Figure 10-13: 2017 PFS (Phase 9) testwork outline | 10-39 |
| Figure 10-14: 2017 PFS (Phase 9) gravity recovery for all tock types | 10-41 |
| Figure 10-15: Livengood GRG results vs FLS/Curtin database (source Curtin report) | 10-42 |
| Figure 10-16: Livengood GRG results vs FLS/Curtin database (source Curtin report) | 10-43 |
| Figure 10-17: Livengood GRG results vs FLS/Curtin database (source Curtin report) | 10-43 |
| Figure 10-18: Livengood GRG results vs FLS/Curtin database (source Curtin report) | 10-44 |
| Figure 10-19: Livengood GRG results vs FLS/Curtin database (source Curtin report) | 10-44 |
| Figure 10-20: Intensive leach of Mozley concentrate | 10-46 |
| Figure 10-21: 2017 PFS (Phase 9) - Leach kinetics analyses according to rock type | 10-49 |
| Figure 10-22: 2021 PFS (Phase 9a) testwork outline | 10-54 |
| Figure 10-23: RT4 Average CIL and CIP residue grades at a P80 of 112 µm | 10-56 |
| Figure 10-24: RT5 Average CIL and CIP residue grades at a P80 of 111 µm | 10-57 |
| Figure 10-25: RT6 Average CIL and CIP residue grades at a P80 of 99 µm | 10-57 |
| Figure 10-26: RT7 Average CIL and CIP residue grades at a P80 of 120 µm | 10-58 |
| Figure 10-27: RT9 Average CIL and CIP residue grades at a P80 of 113 µm | 10-58 |
| Figure 10-28: Leach kinetics results for RT4, RT5, RT6, RT7 and RT9 | 10-59 |
| Figure 10-29: % Au gain preg-robbing level | 10-60 |
| Figure 10-30: 2021 PFS (Phase 9b) testwork outline | 10-62 |
| Figure 10-31: Leach kinetics of the Knelson concentrate | 10-64 |
| Figure 10-32: CIL residue grade according to grind size | 10-66 |
| Figure 10-33: Deportment of gold by leach form and carrier | 10-71 |
| Figure 10-34: Diagnostic leach result distribution | 10-72 |
| Figure 10-35: Leach kinetics 16 vs 24 hours | 10-75 |
| Figure 10-36: 2021 PFS (Phase 11) testwork outline | 10-78 |
| Figure 10-37: Gravity recovery vs calculated head by rock type | 10-80 |
| Figure 10-38: Overall gold recovery according to location inside or outside the 100 ppm Sb shell | 10-83 |
| Figure 10-39: Overall gold recovery according to grind size | 10-85 |
| Figure 10-40: Gravity recovery vs calculated head by rock type | 10-89 |
| Figure 10-41: Overall gold recovery according to location inside or outside the 100 ppm Sb shell | 10-92 |
| Figure 10-42: Overall gold recovery according to calculated head grade | 10-94 |
| Figure 10-43: 2021 PFS (Phase 13) testwork outline | 10-103 |
| Figure 10-44: Overall recovery related to the antimony concentration | 10-104 |
| International Tower Hill Mines Ltd. S-K 1300 – Technical Report Summary Livengood Gold Project Pre-feasibility Study | |
| Figure 10-45: 2017 PFS (Phase 9) - RT7 gold recovery vs head grade | 10-106 |
| Figure 10-46: 2017 PFS (Phase 9) - RT9 gold recovery vs head grade | 10-107 |
| Figure 10-47: 3D representation of the overall Au recovery versus Au grade and P80 (2021 PFS) | 10-111 |
| Figure 11-1: Uncapped gold grade distribution by stratigraphic unit | 11-4 |
| Figure 11-2: Capped quartile statistics | 11-6 |
| Figure 11-3: Capped composite statistics | 11-7 |
| Figure 11-4: Cell declustering chart demonstrates sample clustering is not a factor for the deposit | 11-8 |
| Figure 11-5: Contact profile of RT6 and RT7. Grades converge at the contact. Soft boundary | 11-9 |
| Figure 11-6: RT6 and RT9. Grades converge at contact. Soft boundary | 11-9 |
| Figure 11-7: RT7 and RT9 Grades converge at the contact. Soft boundary | 11-10 |
| Figure 11-8: Cambrian stratigraphy search ellipse | 11-11 |
| Figure 11-9: Upper Sediments North search ellipse | 11-11 |
| Figure 11-10: Type 679 search ellipse | 11-12 |
| Figure 11-11: Section A-B looking west. Geologic models used to flag the Livengood block model | 11-13 |
| Figure 11-12: Intersection of massive stibnite veins on cross section A-B | 11-14 |
| Figure 11-13: Cross section A-B showing the 100 ppm antimony halo for Livengood | 11-15 |
| Figure 11-14: Visual comparison of composite database with estimated Au grades for Section A-B | 11-19 |
| Figure 11-15: Scattergram comparing global estimated Au grade to composite database Au values | 11-20 |
| Figure 11-16: Swath plot through Section A-B | 11-21 |
| Figure 11-17: Livengood grade vs tonnage relationship | 11-28 |
| Figure 12-1: Pit optimization results | 12-12 |
| Figure 12-2: Location of geotechnical drill holes | 12-15 |
| Figure 12-3: Critical slope stability sections for the (2013) ultimate pit | 12-17 |
| Figure 12-4: Pit Slope Design Sectors for the Ultimate Pit | 12-19 |
| Figure 12-5: Haul road configuration | 12-21 |
| Figure 12-6: Final bench access | 12-22 |
| Figure 12-7: Open pit design | 12-23 |
| Figure 13-1: Phase designs | 13-3 |
| Figure 13-2: Phase 1 design | 13-4 |
| Figure 13-3: Phase 2 design | 13-4 |
| Figure 13-4: Phase 3 design | 13-5 |
| Figure 13-5: Phase 4 design | 13-5 |
| Figure 13-6: Phase 5 design | 13-6 |
| Figure 13-7: Phase 6 design | 13-6 |
| International Tower Hill Mines Ltd. S-K 1300 – Technical Report Summary Livengood Gold Project Pre-feasibility Study | |
| Figure 13-8: Gold production | 13-13 |
| Figure 13-9: Mill feed | 13-13 |
| Figure 13-10: Material mined (ROM) | 13-14 |
| Figure 13-11: Low grade ore stockpile balance | 13-14 |
| Figure 13-12: Massive stibnite tonnages milled | 13-15 |
| Figure 13-13: End of preproduction | 13-16 |
| Figure 13-14: End of Year 05 | 13-16 |
| Figure 13-15: End of Year 10 | 13-17 |
| Figure 13-16: End of Year 15 | 13-17 |
| Figure 13-17: Equipment utilization model | 13-19 |
| Figure 14-1: Conceptual process block flow diagram | 14-2 |
| Figure 14-2: Conceptual process flowsheet | 14-6 |
| Figure 14-3: Process plant general arrangement | 14-14 |
| Figure 15-1: Livengood property – conceptual infrastructure arrangement drawing | 15-1 |
| Figure 16-1: Gold spot price on a monthly basis since November 2018 | 16-2 |
| Figure 18-1: Annual operating cash costs ($/oz) | 18-11 |
| Figure 18-2: Operations Personnel | 18-12 |
| Figure 19-1: Annual gold production schedule | 19-5 |
| Figure 19-2: Life-of-mine cash flow projection (pre-tax and after-tax, discount rate: 5%) | 19-9 |
| Figure 19-3: After-tax sensitivity analysis for project net present value (NPV @ 5% discount rate) | 19-10 |
| Figure 19-4: After-tax sensitivity analysis for project internal rate of return (IRR %) | 19-10 |
| Figure 21-1: Summary project execution schedule | 21-3 |
| Figure 21-2: Primary route, Livengood logistics plan (Google Earth) | 21-6 |
| International Tower Hill Mines Ltd. S-K 1300 – Technical Report Summary Livengood Gold Project Pre-feasibility Study | |
| LIST OF ABBREVIATIONS |
| Abbreviation | Description |
| AARL | Anglo American Research Laboratories |
| ADR | Adsorption, desorption and reactivation |
| Ag | Silver |
| AGA | AngloGold Ashanti |
| Ai | Abrasion index |
| AISC | all-in sustaining costs |
| AMHT | Alaska Mental Health Trust |
| amsl | above mean sea level |
| ANFO | Ammonium Nitrate Fuel Oil |
| APDES | Alaska Pollution Discharge Elimination System |
| APR | Annual Percentage Rate |
| ARD | Acid Rock Drainage |
| Au | Gold |
| B | Billion |
| BBA | BBA Inc. |
| BWi | Bond Work index |
| C | Carbon |
| CaO | Calcium oxide (quicklime) |
| CCTV | closed-circuit television |
| CEQ | Council of Environmental Quality |
| CIL | Carbon in leach |
| CIM | Canadian Institute of Mining |
| CIP | Carbon in pulp |
| CN | Cyanide |
| CND | Cyanide detoxification |
| CNT | Cyanide (total) |
| CNWAD | Cyanide (weak acid dissociable) |
| CSS | Contact Support Services |
| Cu | Copper |
| CuSO4 | Copper sulphate |
| CWi | Crusher Work index |
| DEF | Diesel exhaust fluid |
| DOT | Department of Transportation |
| DTH | down-the-hole |
| DWT | JK Drop Weight Test |
| EC | Engineer’s compliance |
| EIS | Environmental Impact Study |
| International Tower Hill Mines Ltd. S-K 1300 – Technical Report Summary Livengood Gold Project Pre-feasibility Study | |
| LIST OF ABBREVIATIONS |
| Abbreviation | Description |
| EO | Enterprise Optimization |
| EPA | United States Environmental Protection Agency |
| EPCM | Engineering, Procurement, Construction Management |
| EPS | Electric Power Systems, Inc. |
| et al. | and others |
| FNSB | Fairbanks North Star Borough |
| FOB | Freight on board |
| FS | Feasibility Study |
| G&A | General and Administration |
| GCL | Geosynthetic clay liner |
| GOH | Gross operating hours |
| GRG | Gravity recoverable gold |
| GVEA | Golden Valley Electrical Association |
| HCI | Hydrochloric acid |
| Hg | mercury |
| ICP | Inductively coupled plasma |
| ID2 | Inverse Distance square |
| ID3 | Inverse Distance cube |
| IDW | Inverse Distance Weighting |
| ILR | Intensive Leach Reactor |
| IROC | Integrated remote operating center |
| IRR | Internal Rate of Return |
| IT | Information Technology |
| ITH | International Tower Hill Mines, Ltd. |
| JDS | JDS Energy and Mining Inc. |
| K | Thousand |
| KPI(s) | Key performance indictors |
| LLC | Limited Liability Company |
| LLDPE | Linear low density polyethylene |
| LNG | Liquefied natural gas |
| LOM | Life of mine |
| LPI | Livengood Placers, Inc. |
| M | Million |
| MACRS | Modified Accelerated Cost Recovery System |
| ML | Metal leaching |
| MMBTU | Metric Million British thermal units |
| MPSO | MinePlan Schedule Optimizer |
| International Tower Hill Mines Ltd. S-K 1300 – Technical Report Summary Livengood Gold Project Pre-feasibility Study | |
| LIST OF ABBREVIATIONS |
| Abbreviation | Description |
| MS | Mineral survey |
| MSV | massive stibnite veins |
| MWMP | Meteoric Water Mobility Potential |
| Na2S2O5 | Sodium Metabisulfite |
| NaCN | Sodium cyanide |
| NAD | North American Datum (Topographical Surveying) |
| NaOH | Sodium hydroxide |
| NEPA | National Environmental Policy Act |
| NewFields | NewFields Mining Design & Technical Services, LLC |
| NHPA | National Historic Preservation Act |
| NN | Nearest neighbor |
| no. | Number |
| NOH | Net operating hours |
| NPI | Net Profits Interest |
| NPV | Net Present Value |
| NSR | Net Smelter Return |
| O2 | Oxygen |
| OCS | O’Connor Creek Substation |
| OK | Ordinary Kriging |
| PAG | Potentially Acid Generating |
| PbNO3 | Lead nitrate |
| PEP | Project execution plan |
| PFS | Pre-feasibility Study |
| PLT(s) | Point load test(s) |
| POF | Probability of failure |
| QA/QC | Quality Assurance/Quality Control |
| QP(s) | Qualified Person(s) |
| QSV | Quartz-stibnite-vein |
| RC | Reverse Circulation |
| RCM | Reliability-Centred Maintenance |
| RCRA | Resource Conservation and Recovery Act |
| RDA | Resource Development Associates Inc. |
| RMR | Rock Mass Rating |
| ROM | Run of mine |
| ROW | Right of way |
| RT | Rock type |
| RWi | Rod Work index |
| International Tower Hill Mines Ltd. S-K 1300 – Technical Report Summary Livengood Gold Project Pre-feasibility Study | |
| LIST OF ABBREVIATIONS |
| Abbreviation | Description |
| S | Sulfur |
| SABC | Comminution circuit consisting of a SAG mill, ball mill and pebble crusher |
| SAG | Semi-Autogenous Grinding |
| Sb | Antimony |
| sg | Specific gravity |
| SHPO | State Historic Preservation Office |
| SMC | SAG Mill Comminution |
| SO2 | Sulfur dioxide |
| SPCC | Spill Prevention, Control and Countermeasure Plan |
| SPI | SAG Power Index |
| SRIL | SR International Logistics |
| SRK | SRK Consulting (Canada and US) Inc. |
| SVC | Static VAR Compensator |
| SWPPP | Storm Water Pollution Protection Plan |
| TAPS | Trans-Alaska Pipeline |
| TBC | To be confirmed |
| THM | Tower Hill Mines, Inc. |
| TMF | Tailings management facility |
| TRS | Technical Report Summary |
| TSF | Tailing storage facility |
| UCS | Uniaxial Compressive Strength |
| US | United States |
| USD | United States dollars |
| USGS | United States Geological Survey |
| UTM | Universal Transverse Mercator Coordinate System |
| VPSA | Vacuum pressure swing adsorption |
| WOL | Whole ore leach |
| WRSF | Waste rock storage facility |
| XRF | X-ray Fluorescence |
| YT | Yukon-Tanana |
| International Tower Hill Mines Ltd. S-K 1300 – Technical Report Summary Livengood Gold Project Pre-feasibility Study | |
| LIST OF ABBREVIATIONS – UNITS OF MEASUREMENT |
| Unit | Description |
| $ or USD | United States dollar |
| $/mt | Dollars per metric ton |
| $/t | Dollars per ton |
| % | Percent |
| a | Annum (year) |
| A | Ampere |
| ˚C | Degrees Celsius |
| ˚F | Degrees Fahrenheit |
| µm | micron |
| cm | centimeter |
| cm3 | cubic centimeter |
| d | day (24 hours) |
| deg or o | angular degree |
| F80 | 80% passing - Feed |
| ft | feet (12 inches) |
| ft2 | square feet |
| g | gram |
| g/g | grams per gram |
| g/L | gram per Liter |
| g/mt | grams per metric ton |
| gal | gallon |
| gpm | (US) gallons per minute |
| h | hour (60 minutes) |
| ha | hectare |
| hp | horsepower |
| Hz | Hertz |
| in | inch |
| k | kips (1,000 pounds) |
| kg | kilogram |
| kg/m2 | kilograms per square meter |
| kg/mt | kilograms per metric ton |
| km | kilometer |
| km/h | kilometers per hour |
| kW | kilowatt |
| kWh/mt | kilowatt hour per metric ton |
| kWh/t | kilowatt hour per ton |
| International Tower Hill Mines Ltd. S-K 1300 – Technical Report Summary Livengood Gold Project Pre-feasibility Study | |
| LIST OF ABBREVIATIONS – UNITS OF MEASUREMENT |
| Unit | Description |
| L | liter |
| L/m | liters per minute |
| lb | pound |
| lb/ft | pounds per foot |
| lb/t | pounds per ton |
| m | meter |
| m2 | square meter |
| m3 | cubic meter |
| m3 | cubic meter |
| m3/h | cubic meters per hour |
| mesh | US Mesh |
| mi | mile |
| mil | one thousandth of an inch |
| min | minute (60 seconds) |
| mm | millimeter |
| mm | millimeter |
| Mmt | Million metric ton |
| mph | miles per hour |
| mt | metric ton (1,000 kg) |
| Mt | Million ton |
| mt/d | metric ton per day |
| mt/h | metric ton per hour |
| MW | Megawatt |
| oz | Troy ounce |
| oz/y | Troy ounces per year |
| P100 | 100% passing - Product |
| P80 | 80% passing - Product |
| ppm | parts per million |
| t | ton (2,000 lbs) |
| t/d | (short) ton per day |
| t/h | (short) ton per hour |
| V | Volt |
| wt% | weight percent |
| y | year (365 days) |
| yd | yard (36 inches) |
| yd3 | cubic yard |
| International Tower Hill Mines Ltd. S-K 1300 – Technical Report Summary Livengood Gold Project Pre-feasibility Study | |
The Livengood Gold Project (herein also referred to as “the Project”) is a gold exploration project located 70 mi (113 km) northwest of Fairbanks, Alaska, USA. The Project is in an active mining district that has been mined for gold since 1914.
This amended Technical Report Summary (the “TRS”) was prepared and compiled by BBA USA Inc. at the request of International Tower Hill Mines Ltd. (ITH) through its wholly owned subsidiary Tower Hill Mines, Inc. (THM). The purpose of the TRS is to summarize the results of the Pre-feasibility Study (PFS) for the Livengood gold deposit on the THM property. This TRS, as amended, has been prepared in accordance with §§229.1300 through 229.1305 (subpart 229.1300 of Regulation S-K). The TRS supports the ITH November 4, 2021 news release “International Tower Hill Mines Announces Pre-Feasibility Study Results on 13.6 Million Ounce Gold Resource” announcing the results of the study. This TRS also supports the mineral resource, mineral reserve and property disclosures in ITH’s Annual Report on Form 10-K for the fiscal years ended December 31, 2021 and December 31, 2022, in addition to the November 4, 2021 release.
The PFS and this TRS are based on an updated resource estimate, effective as of August 20, 2021, and has an optimized Project configuration of 65,000 t/d. The Project configuration in this TRS remains a conventional, owner-operated surface mine that will utilize large-scale mining equipment in a blast/load/haul operation. Mill feed would be processed in a 65,000 t/d (59,000 mt/d) comminution circuit consisting of primary and secondary crushing, wet grinding in a single semi-autogenous (SAG) mill and single ball mill, followed by a gravity gold circuit and a conventional carbon in leach (CIL) circuit. As a result of the changes to the Project as summarized in this TRS, including differences in the mineral resource estimation methodology and changes to the economic parameters applied to the geologic block model (gold price, recovery, CAPEX, and OPEX), all of which resulted in a change in the mineral resources, the Project as evaluated in the 2017 PFS is no longer considered current and the 2017 PFS should therefore not be relied upon by investors.
This TRS assumes that the Livengood Gold Project will be constructed using imperial units. Therefore, to the maximum extent practicable, all design work and equipment descriptions were completed and reported in imperial units, with metric units shown in parentheses. Every effort has been made to clearly display the appropriate units being used throughout this TRS. However, it is important to note that both the Livengood Gold Project drill hole database and the block model were originally created in metric units and have been consistently maintained in metric units. Therefore, some tables and figures in this TRS may be presented in metric units only to minimize the risk of data unit conversion errors.
For financial modeling, ore tonnage is reported in short tons (t), with all costs reported in $/t.
Certain other testwork, such as comminution results and unconfined compressive strength tests, are reported in metric units.
| International Tower Hill Mines Ltd. S-K 1300 – Technical Report Summary Livengood Gold Project Pre-feasibility Study | |
All monetary units are in United States dollars ($), unless otherwise specified. Costs are based on third quarter (Q3) 2021 dollars.
On October 13, 2023, this TRS was amended by adding a stratigraphic column to Section 6.1.1 and an opinion of the QPs to Sections 10.8, 12.3, and 17.7 as prescribed by Item 601(b)(96) of Regulation S-K.
The independent PFS was prepared through the collaboration of a number of industry-recognized consulting firms “Contributors”, including BBA USA Inc. (“BBA”, Montreal, Quebec, Canada), NewFields Mining Design & Technical Services, LLC (“NewFields”, Lone Tree, Colorado, USA), JDS Energy and Mining Inc. (“JDS”, Denver, Colorado, USA), and Resource Development Associates Inc. (“RDA”, Highlands Ranch, Colorado, USA). Qualified Persons as defined in S-K 1300 guidelines from these firms provided resource estimates, design parameters and cost estimates for mine operations, process facilities, major equipment selection, waste and tailings storage, reclamation, permitting, operating and capital expenditures. A summary of contributors to the PFS is included in Table 1-1.
Table 1-1: PFS contributors
| Consulting Firm | General Overview of Responsibilities |
| BBA USA Inc. | § Mineral reserve estimation § Mine engineering § Mine CAPEX and OPEX § Mineral processing and metallurgical testing § Process engineering and process plant OPEX § Process plant and infrastructure CAPEX § G&A OPEX § Environmental Studies and Permitting § Financial model § Overall PFS TRS integration |
| NewFields Mining Design & Technical Services, LLC | § Geotechnical engineering § Waste rock and water management § Tailings Management Facility (TMF) engineering and CAPEX |
| JDS Energy and Mining Inc. | § Mine pit wall slope stability |
| Resource Development Associates Inc. | § Geology § Drilling § Resource estimation. |
| International Tower Hill Mines Ltd. S-K 1300 – Technical Report Summary Livengood Gold Project Pre-feasibility Study | |
The reader is advised that the results of the PFS summarized in this TRS are intended to provide an initial, high-level review of the proposed optimized project configuration and revised design options. The PFS mine plan, execution plan and economic model include numerous assumptions. There is no guarantee that the Project economics described herein will be achieved.
The key outcomes of this PFS are the following:
| § | The Livengood Gold Project Mineral Resource (exclusive of reserves) is estimated at 234.5 M Measured metric tons at an average grade of 0.53 g/mt (3.99 Moz) and 40.01 M Indicated metric tons at an average grade of 0.49 g/mt (0.63 Moz), for a total (Measured and Indicated) of 274.5 M metric tons at an average grade of 0.52 g/mt (4.62 Moz). Inferred Mineral resources total 16.0 M metric tons at an average grade of 0.40 g/mt (0.21 Moz). |
| § | The Livengood Gold Project Mineral Resource (inclusive of reserves) is estimated at 646.0 M Measured metric tons at an average grade of 0.60 g/mt (12.48 Moz) and 58.5 M Indicated metric tons at an average grade of 0.61 g/mt (1.14 Moz), for a total (Measured and Indicated) of 704.5 M metric tons at an average grade of 0.60 g/mt. Inferred Mineral resources total 16.0 M metric tons at an average grade of 0.40 g/mt (0.21 Moz). |
| § | Defined and estimated Proven Mineral Reserves of 411.5 M metric tons at an average grade of 0.64 g/mt (8.5 Moz contained) and Probable Mineral Reserves of 18.5 M metric tons at an average grade of 0.86 g/mt (0.5 Moz contained), for a total of 430.1 M metric tons at an average grade of 0.65 g/mt (9.0 Moz contained). To access these mineral reserves, 496.1 M metric tons of overburden and waste rock must be mined, resulting in a strip ratio of 1.15:1 |
| § | The mine plan developed for the PFS provides sufficient ore to support an annual production rate of approximately 317,000 oz/y over an estimated 20.3-year mine life, producing a total of approximately 6.4 Moz of gold. |
| § | The material mined from the open pit peaks at 66 Mt (60 Mmt) per year and averages 57 Mt (52 Mmt). A total of 105 Mt (95 Mmt) of ore is sent to the low-grade ore stockpile over the life of the mine, with an average gold grade of 0.38 g/mt. The maximum size of the low-grade ore stockpile is 88 Mt (88 Mmt). |
| § | The peak mine fleet requirements have been estimated at 18 x 320 t haul trucks, 2 x 40 yd3 hydraulic shovels, 2 x 40 yd3 wheel loaders and 5-production drills. |
| § | Metallurgical testwork has confirmed the preferred flowsheet consisting of primary crushing, secondary crushing, and a comminution circuit (SABC configuration) producing a final grind size of 250 µm (P80), with gravity recovery followed by whole ore leaching of the gravity tailings. LOM gold recovery is estimated to be 71.4% based on the rock types tested and mine plan. |
| § | The initial capital cost (-20% / +25% accuracy) of the open pit mine, 65,000 t/d (59,000 mt/d) process plant and general site infrastructure is estimated at $1.93B, including a contingency of $220M. |
| § | LOM project sustaining capital costs total $658M, excluding reclamation costs of $317M. |
| International Tower Hill Mines Ltd. S-K 1300 – Technical Report Summary Livengood Gold Project Pre-feasibility Study | |
| § | The mining cost is estimated at $2.05/t mined, process plant operating cost is estimated at an average of $7.72/t ore processed, and general and administrative costs of $1.35/t ore processed. |
| § | All-in sustaining cost of production of 1,171 $/oz over LOM, including sustaining capital and before reclamation expenses, royalties, mining, and income taxes. |
| § | Base case ($1,680/oz) positive Project NPV of $45M at a 5% discount rate and an IRR of 5.3% after mining and income taxes. Payback period is 10.4 years. |
| 1.4 | Property Description, Location and Access |
The Livengood property is located approximately 70 mi (113 km) by road (47 mi (75 km) by air) northwest of Fairbanks, Alaska in the Tolovana Mining District within the Tintina Gold Belt. The deposit area is centered near Money Knob, a local topographic high point. This feature and the adjoining ridge lines are the probable lode gold source for the Livengood placer deposits that lie in the adjacent valleys. These placer deposits have been actively mined since 1914 and have produced more than 500,000 oz of gold.
The property lies in numerous sections of Fairbanks Meridian Township 8N and Ranges 4W and 5W. Money Knob, the principal geographic feature within the known deposit, is located at 65 ̊30’16’’N, 148 ̊31’33’’W.
The property straddles Highway 2 (also known as the Elliott Highway), a paved, all-weather highway linking the North Slope oil fields to Fairbanks, and adjoins the Trans-Alaska Pipeline (TAPS) corridor, which transports crude oil from the North Slope south and contains the fiber optic communications cable that may be used at the Project site (see Figure 1-1). Locally, a number of unpaved roads lead from the Elliott Highway into and across the deposit. A 3,000 ft (914 m) runway is located 3.73 mi (6 km) to the southwest of the Project and is suitable for light aircraft.
The site is approximately 40 mi (64 km) south of the Arctic Circle. The climate in this part of Alaska is continental with temperate and mild conditions in summer with average lows and highs in the range of 44°F to 72°F (7°C to 22°C). Winter is cold with average lows and highs for December through March in the range of -17°F to 23°F (-27°C to -5°C). The lowest temperatures are about – 40°F (-40°C). Annual precipitation is approximately 15.7 in (400 mm) water equivalent. Winter snow pack depth is approximately 26 in (66 cm).
| International Tower Hill Mines Ltd. S-K 1300 – Technical Report Summary Livengood Gold Project Pre-feasibility Study | |
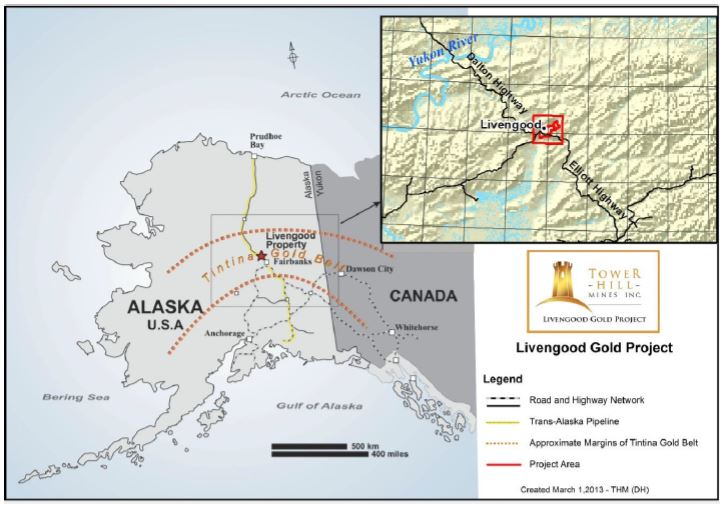
Figure 1-1: Project location map
The Livengood Gold Project property covers approximately 48,300 acres (19,546 hectares), all of which is controlled by ITH through its wholly-owned subsidiaries, THM and Livengood Placers, Inc. (LPI). The Livengood Gold Project is comprised of multiple land parcels: 100% owned patented mining claims, 100% owned State of Alaska mining claims, and 100% owned federal unpatented placer claims, land leased from the Alaska Mental Health Trust (AMHT), land leased from holders of state and federal patented and unpatented lode and placer mining claims, and undivided interests in patented mining claims. The property and claims controlled through ownership, leases or agreements are shown in Figure 1-2.
| International Tower Hill Mines Ltd. S-K 1300 – Technical Report Summary Livengood Gold Project Pre-feasibility Study | |
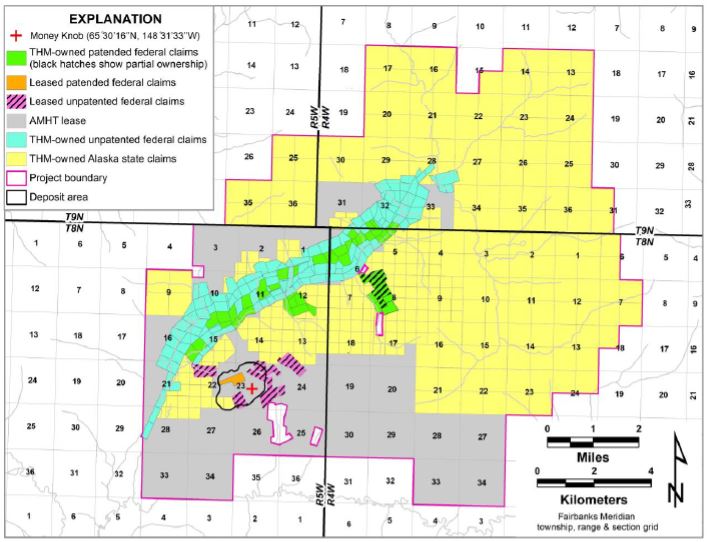
Figure 1-2: Map illustrating the company’s Livengood Gold Project land holdings
(As at September 30, 2021, by tenure type, referenced to the Fairbanks Meridian Township, range and section grid.)
Gold was first discovered in the gravels of Livengood Creek in 1914 (Brooks, 1916) and led to the founding of the Town of Livengood. Subsequently, more than 500,000 oz of placer gold has been produced. From 1914 through the 1970s, the primary focus of prospecting activity was placer deposits. Historically, prospectors considered Money Knob and the associated ridgeline the source of the placer gold. Prospecting, primarily in the 1950s and in the form of dozer trenches, was carried out for lode type mineralization in the vicinity of Money Knob. However, no significant lode production has occurred to date.
| International Tower Hill Mines Ltd. S-K 1300 – Technical Report Summary Livengood Gold Project Pre-feasibility Study | |
Since the 1970s, the property has been prospected and explored by several companies. Geochemical surveys by Cambior Inc. in 2000 and AngloGold Ashanti (U.S.A.) Exploration Inc. (AGA) in 2003 and 2004, outlined a 1.0 × 0.5 mi2 (1.6 × 0.8 km2) area with anomalous gold in soil. Scattered anomalous samples continue along strike for an additional 1.2 mi (2 km) to the northeast and 1 mi (1.6 km) to the southwest. Eight reverse circulation (RC) holes were drilled by AGA in 2003 and a further four diamond core holes were drilled in 2004 to evaluate this anomaly. Favorable results from these holes revealed wide intervals of gold mineralization (BAF-7: 455 ft (138.7 m) @ 1.07 g/mt Au; MK-04-03: 181.4 ft (55.3 m) @ 0.51 g/mt Au) along with lesser intervals over a broad area. In 2006, AGA sold the Livengood Gold Project to ITH. In the same year, THM drilled a 4,026 ft (1,227 m), seven-hole core program. The success of that program led to the drilling of an additional 14,432 ft (4,400 m) in 15 diamond core holes in 2007 to test surface anomalies, expand the area of previously intersected mineralization, and advance geologic and structural understanding of the deposit. Subsequent programs have continued to expand the resource, leading to consideration of development of the deposit. Concomitant programs have included geotechnical, engineering, and metallurgical work, along with the collection of environmental baseline data. As of the end of 2014, completed exploration and delineation drilling totals 574,599 ft (175,138 m) in 621 RC holes and 140.854 ft (42,932 m) in 151 core drill holes.
Beginning in 2009, technical studies were performed to generate preliminary surface mine designs, to generate metallurgical data for process definition, and to develop pre-conceptual information on the location and capacities of potential tailings management, overburden management, water reservoir and mill process facilities. A pre-feasibility study was begun in 2011, but was not completed, as advancing technical studies indicated major changes to the flowsheet and project configuration warranted a shift to the feasibility study, which was completed in August 2013.
From 2013 through 2016, additional metallurgical testwork was performed, along with various techno-economic trade-off studies, to form the basis for the project configuration that was presented in the 2017 PFS.
The 2017 PFS work indicated that the project economics are sensitive to recovery, grind size, reagent consumption and test conditions. Further testwork was executed from 2017 through 2021, along with an Enterprise Optimization (EO) study (the “Whittle and BBA Study’’) to confirm the project configuration as well as the process conditions that are presented in this PFS.
Gold mineralization is associated with disseminated arsenopyrite and pyrite in volcanic, sedimentary, and intrusive rocks, and in quartz veins cutting the more competent lithologies, primarily volcanic rocks, sandstones, and to a lesser degree, ultramafic rocks. Three principal stages of alteration are currently recognized. In order from oldest to youngest, these are characterized by biotite, albite, and sericite. Carbonate was introduced with and subsequent to these stages. Arsenopyrite and pyrite were introduced primarily during the albite and sericite stages. Gold correlates strongly with arsenic and occurs primarily within and on the margins of arsenopyrite and pyrite.
| International Tower Hill Mines Ltd. S-K 1300 – Technical Report Summary Livengood Gold Project Pre-feasibility Study | |
Mineralization is interpreted to be intrusion-related, consistent with other gold deposits of the Tintina Gold Belt and has a similar arsenic-antimony (As-Sb) geochemical association. Mineralization is controlled partly by stratigraphic units, but thrust-fold architecture is apparently key to providing pathways for magma (dikes and sills) and hydrothermal fluid.
| 1.8 | Mineral Processing and Metallurgical Testing |
Several phases of testwork, along with an enterprise optimization study (the “Whittle and BBA Study’’), have been completed since the 2017 PFS was issued.
A new round of simulations was completed at different grind sizes to determine the maximum achievable throughput using the recommended 2017 PFS configuration, which is a single line SABC circuit with pre-crushing, generating data that was used in the Whittle and BBA Study. The result of the work was a maximum throughput of 65,000 t/d (59,000 mt/d), operating to a target grind size of 250 µm (P80). The design relies upon an optimized drill & blast strategy to achieve the rated throughput with a SAG mill (D × L) 36 ft × 20 ft with 15 MW of installed power and a ball mill (26 ft × 40.5 ft) with 15 MW of installed power. The SAG mill is operated in closed circuit with a pebble crusher and the ball mill is operated in closed circuit with hydrocyclones.
The back end of the plant, all that follows comminution, was optimized as a result of this PFS work, which included a detailed analysis of previous work, completed by BBA, as well as the completion of five new rounds of testwork, completed since the issue of the 2017 PFS. The various test programs (Phases 9a, 9b, 11-13) were conducted to expand on knowledge developed through the course of the FS optimization, FS variability and 2017 PFS test programs. In the process of completing the five rounds of this PFS testwork, several key conclusions were drawn:
| § | Carbon in leach (CIL) methodology was retained over the carbon in pulp (CIP) of whole gravity tails (WOL). This decision was based on the 2017 PFS comparative study and on testwork results from this PFS, showing that better recoveries were obtained on RT6 and RT7 with CIL, while the other rock types appeared insensitive to CIL vs CIP. |
| § | There are no significant adverse recovery issues introduced by mixing the chemical and physical properties of the ore types. |
| § | Increasing the target particle size from a P80 of 180 to 250 µm resulted in a decrease in gold recovery of between 1% and 7%, depending upon rock type and head grades. The benefit of the coarser grind, which outweighs the recovery loss, is the higher throughput that facilitates a higher daily gold production. |
| § | The effectiveness of gravity recovery was further confirmed because of this PFS testwork, using samples generated from both drill core and RC rig drill chips. |
| § | Depending upon rock type, gold recovery is slightly related to location, either inside or outside the 100 ppm antimony shell. |
| § | The overall gold recovery does not appear to be highly sensitive to either lead nitrate (0-200 ppm) or cyanide (0.4-0.8 kg/t) concentration. |
| International Tower Hill Mines Ltd. S-K 1300 – Technical Report Summary Livengood Gold Project Pre-feasibility Study | |
After the 2017 PFS, a focused effort was made to better understand the gold recovery implications of antimony concentration in the orebody. The data collected during Phases 11, 12 and 13 were used to develop linear recovery equations for each of the five rock types, both inside and outside the 100 ppm antimony shell, and as a function of antimony concentration, grind size and gold grade. A linear equation was developed for the composites having an antimony grade above 200 ppm, regardless of whether they were in or out of the 100 ppm antimony shell. Gold recoveries (Gravity+CIL) were established for each of the Livengood ore rock types at a grind size of 250 µm (P80) and are presented in Table 1-2.
Table 1-2: Average gold recovery (Gravity+CIL) estimated for each rock type
| Rock Type | Au Recovery (%) |
| RT4 | 83.3 |
| RT5 | 79.8 |
| RT6 | 73.5 |
| RT7 | 66.4 |
| RT9 | 57.1 |
The Whittle and BBA Study reviewed various technologies and project configurations with the objective of recommending an optimum configuration for this PFS. This study determined that the gravity/CIL plant at a grind size of 250 µm (P80) with conventional tailings provided the highest NPV.
| 1.9 | Mineral Resource Estimate |
The Livengood mineral resource (Effective date August 20, 2021) was estimated using Inverse Distance Weighting (IDW) interpolation techniques. A database comprising 776 drill holes containing 125,450 assays was the basis of the estimate. Assays were composited to nominal 10-meter lengths, yielding 20,806 individual samples that were used for the estimation of mineralization.
Three sources of volumetric determination were used for the resource model. One was a three-dimensional (3D) stratigraphic model used to assign rock type codes to the block model. The second was an implicit model that interpolated a 100-ppm antimony halo or “shell” for the mineral deposit, with blocks flagged as either inside or outside this halo. The third was 54 individually interpreted massive stibnite veins that were used to determine the volume percentage and grade of veins within each model block that is intersected by the veins. Gold contained within each block was estimated using Inverse Distance cubed (ID3) parameters.
Mineral resources must demonstrate reasonable prospects for eventual economic extraction. The deposit gold is amenable for open pit extraction. To determine the quantities of material meeting the “reasonable prospects” test by an open pit, the author used the Lerchs-Grossman © economic algorithm to determine economic pit limits.
| International Tower Hill Mines Ltd. S-K 1300 – Technical Report Summary Livengood Gold Project Pre-feasibility Study | |
Economic parameters used in the analysis are based on the average gold price ($1,650/oz) at effective date of August 20, 2021. Pit optimization parameters are shown in Table 1-3. Gold recoveries are tonnage-weighted and include the recovery from massive stibnite of 22%.
Table 1-3: Constraining parameters used for the Livengood Gold Project
| Parameter | Unit | Rock
type 4 | Rock
type 5 | Rock
type 6 | Rock
type 7 | Rock
Type 8 | Rock
Type 9 |
| Mining Cost | $/total mt | 1.76 | 1.74 | 1.74 | 1.68 | 1.76 | 1.76 |
| Gold Cut-off | g/mt | 0.21 | 0.20 | 0.25 | 0.25 | 0.33 | 0.33 |
| Processing Cost | $/process mt | 9.27 | 9.15 | 9.17 | 9.50 | 9.71 | 9.71 |
| Gold Recovery | % | 84 | 80 | 71 | 67 | 55 | 56 |
| Administrative Cost | $/process mt | 1.55 | 1.55 | 1.55 | 1.55 | 1.55 | 1.55 |
| Royalty | % | 3 | 3 | 3 | 3 | 3 | 3 |
| Gold Selling Price | $/oz | 1,650 | 1,650 | 1,650 | 1,650 | 1,650 | 1,650 |
| Overall Slope Angle | Degrees | 45 | 45 | 45 | 45 | 45 | 45 |
The mineral resource estimate for the Livengood Gold project is shown in Table 1-4 (Exclusive of Reserves) and Table 1-5 (Inclusive of Reserves).
Table 1-4: Livengood Gold Project mineral resource estimate (exclusive of mineral reserves)
(2021 MRE), August 20, 2021 – Resource Development Associates Inc.
| Classification | Ore
Metric tons (Mmt) | Au Grade
(g/mt) | Contained Au
(Koz) |
| Measured | 234.50 | 0.53 | 3,990.49 |
| Indicated | 40.01 | 0.49 | 629.61 |
| Total Measured and Indicated (M & I) | 274.51 | 0.52 | 4,620.10 |
| Inferred | 15.98 | 0.40 | 206.98 |
| 1. | The effective date of the estimate is August 20, 2021. |
| 2. | Mineral resources for the Project are enumerated as per §229.1302(d)(1)(iii)(A) (Item 1302(d)(1)(iii)(A) of Regulation S-K). |
| 3. | Mineral resources are not mineral reserves and do not meet the threshold for reserve modifying factors, such as economic viability, that would allow for conversion to mineral reserves. There is no certainty that any part of the mineral resources estimated will be converted into mineral reserves. |
| 4. | Open pit resources stated as contained within a potentially economically mineable open pit; pit optimization was based on an assumed price for gold of US$1,650/oz., variable mining and recoveries, general and administrative costs of US$1.55/t and a pit slope angle of 45 degrees. |
| 5. | Numbers in the table have been rounded to reflect the accuracy of the estimate and may not sum due to rounding. |
| 6. | Mineral resources are reported exclusive of mineral reserves. The reserves disclosed in the TRS represent measured mineral resources and indicated mineral resources that were evaluated with modifying factors related to open pit mining. |
| International Tower Hill Mines Ltd. S-K 1300 – Technical Report Summary Livengood Gold Project Pre-feasibility Study | |
Table 1-5: Livengood Gold Project mineral resource estimate (inclusive of mineral reserves)
(2021 MRE), August 20, 2021 – Resource Development Associates Inc.
| Classification | Ore
Metric tons (Mmt) | Au Grade
(g/mt) | Contained Au
(Koz) |
| Measured | 646.00 | 0.60 | 12,482.49 |
| Indicated | 58.51 | 0.61 | 1,141.61 |
| Total Measured and Indicated (M & I) | 704.51 | 0.60 | 13,624.10 |
| Inferred | 15.98 | 0.40 | 206.98 |
| 1. | The effective date of the estimate is August 20, 2021. |
| 2. | Mineral resources for the Project are enumerated as per §229.1302(d)(1)(iii)(A) (Item 1302(d)(1)(iii)(A) of Regulation S-K). |
| 3. | Mineral resources are not mineral reserves and do not meet the threshold for reserve modifying factors, such as economic viability, that would allow for conversion to mineral reserves. There is no certainty that any part of the mineral resources estimated will be converted into mineral reserves. |
| 4. | Open pit resources stated as contained within a potentially economically mineable open pit; pit optimization was based on an assumed price for gold of US$1,650/oz., variable mining and recoveries, general and administrative costs of US$1.55/t and a pit slope angle of 45 degrees. |
| 5. | Numbers in the table have been rounded to reflect the accuracy of the estimate and may not sum due to rounding. |
| 6. | Mineral resources are reported inclusive of mineral reserves. The reserves disclosed in the TRS represent measured mineral resources and indicated mineral resources that were evaluated with modifying factors related to open pit mining. |
| 1.10 | Mineral Reserve Estimate |
Mineral reserves have been estimated for the Project by BBA USA Inc., using a gold price of $1,680/oz. The mine design and mineral reserve estimate have been completed to a level appropriate for a PFS. The mineral reserve estimate stated herein is consistent with the S-K 1300 requirements and is suitable for public reporting. As such, the mineral reserves are based on Measured and Indicated Mineral Resources, and do not include any Inferred Mineral Resources.
Development of the mine production plan included pit optimization, pit and phase designs, mine scheduling and the application of modifying factors to the Measured and Indicated Mineral Resources. The Qualified Person is not aware of any legal, political, or other risks that could materially affect the development of the mineral reserve.
Table 1-6 presents the mineral reserves for the Project, which include 411.5 Mmt of Proven Mineral Reserves at an average gold grade of 0.64 g/mt, and 18.5 Mmt of Probable Mineral Reserves at an average gold grade of 0.86 g/mt for a total of 430.1 Mmt of Proven and Probable Mineral Reserves at an average gold grade of 0.65 g/mt. To access these mineral reserves, 496.1 Mmt of overburden and waste rock must be mined, resulting in a strip ratio of 1.15:1.
| International Tower Hill Mines Ltd. S-K 1300 – Technical Report Summary Livengood Gold Project Pre-feasibility Study | |
Table 1-6: Livengood Gold Project Mineral Reserves, October 22, 2021 – BBA USA Inc.
| Classification | Ore
Metric tons (Mmt) | Au Grade
(g/mt) | Contained Au
Koz |
| Proven | 411.5 | 0.64 | 8,492 |
| Probable | 18.5 | 0.86 | 512 |
| Proven and Probable Totals | 430.1 | 0.65 | 9,004 |
| 1. | The effective date of the estimate is October 22, 2021. |
| 2. | Mineral reserves are estimated using a gold price of US$1,680 per ounce, and consider a 3% royalty, 1.80/oz for smelting, refining, and transportation costs, and a gold payable of 99.9%. |
| 3. | Metallurgical recovery curves were developed for each rock type, with the Mineral Reserves having the following tonnage weighted averages: 83.3% for RT4, 79.8% for RT5, 73.5% for RT6, 66.4% for RT7, 58.7% for RT8 and 57.1% for RT9, including 22% for massive stibnite mineralization. |
| 4. | As a result of the complex metallurgical recovery equations, it is difficult to determine specific cut-off grades. The following presents the lowest gold grades for each rock type that are processed in the life of mine plan: 0.26 g/t for RT4, 0.28 g/t for RT5, 0.31 g/t for RT6, 0.31 g/t for RT7, 0.42 g/t for RT8 and 0.42 g/t for RT9. |
| 5. | The strip ratio for the open pit is 1.15 to 1. |
| 6. | The mineral reserves are inclusive of mining dilution and ore loss. |
| 7. | The reference point for the mineral reserves is the primary crusher. |
| 8. | Totals may not add due to rounding. |
The Livengood deposit will be mined using conventional open pit mining methods consisting of drilling, blasting, loading, and hauling with large-scale mining equipment. Vegetation, topsoil, and overburden will be stripped and stockpiled for future reclamation use. The ore and waste rock will be drilled and blasted with 32.8 ft (10 m) high benches and loaded into haul trucks with a fleet of diesel-powered hydraulic excavators and front-end wheel loaders.
The processing flowsheet consists of primary crushing, secondary crushing, and a comminution circuit (SABC configuration) producing a final grind size of 250 μm (P80), with gravity recovery followed by whole ore leaching (CIL) of the gravity tailings. The mill has been designed with a nominal throughput of 65,000 t/d (59,000 mt/d). Tailings will be stored in a conventional slurry tailings facility.
Material mined from the open pit that is not directly hauled to the primary crusher will be placed in several storage facilities across the Livengood site. These facilities include growth media stockpiles, an overburden stockpile, a waste rock storage facility (WRSF), and a low-grade ore stockpile. Waste rock will also be used as construction material both during preproduction and to raise the height of the TMF dike as the mine life progresses.
| International Tower Hill Mines Ltd. S-K 1300 – Technical Report Summary Livengood Gold Project Pre-feasibility Study | |
To maximize the NPV of the Project, a total of six mining phases (pushbacks) have been designed and incorporated into the mining sequence to bring higher grade material forward and to defer waste rock stripping. The mining phases include a starter pit that will be mined during the three years of preproduction, during which a total of 89 Mt (81 Mmt) of waste rock has been estimated to be required for the construction of certain infrastructure such as the TMF starter dike, mine haul roads, site access roads, and platforms for the processing facilities and other buildings. Ore mined during preproduction will be stockpiled and processed after mill start-up.
A mine production plan has been prepared using the MinePlan Schedule Optimizer (MPSO) tool in the Hexagon MinePlan 3D software. Provided with economic input parameters and operational constraints such as phase sequencing, maximum bench sink rates, and mining and milling capacities, the software determines the optimal mining sequence and low-grade ore stockpiling strategy, which maximizes the NPV of the mine production plan. The mine plan has been prepared quarterly for the first two years of production and annually thereafter.
The mine production plan resulted in a 20.3-year mine life plus 3 years of preproduction development. A contractor will operate the pit during the first year of preproduction to develop the first benches in the Phase 1 starter pit and construct the network of mine haul roads. By the second year, the owner’s fleet of equipment will be on-site and assembled and will take over from the contractor.
The total material mined from the open pit peaks at 66 Mt (60 Mmt) from Year 2 to Year 5 and averages 55 Mt/y (50 Mmt/y) between Year 1 and Year 17. A total of 105 Mt (95 Mmt) of ore is sent to the low-grade ore stockpile over the life of the mine, with an average gold grade of 0.38 g/mt. A total of 84% of the low-grade ore is rehandled and sent to the mill during the final five years of production, with smaller amounts rehandled in earlier years.
During the life of mine (LOM), a total of 271 Mt (246 Mmt) is hauled to the TMF for dike construction, representing 52% of the total waste rock.
The average gold grade for ore to the mill is fairly consistent on a year to year basis, ranging from 0.58 g/mt to 0.93 g/mt when the open pit is in operation, and drops to 0.36 g/mt during stockpile rehandling at the end of the mine life.
A peak gold production of 482 koz is achieved in Year 3, when higher grades will be fed to mill, which also coincides with higher mill recoveries. Gold production averages 342 koz per year between Year 1 and Year 17 and 154 koz per year during stockpile rehandling.
The mine will be operated with an owner fleet, 365 days per year, 24 hours per day, running two 12-hour shifts per day. For equipment calculations, a total of five days of lost production time has been considered for poor weather conditions.
| International Tower Hill Mines Ltd. S-K 1300 – Technical Report Summary Livengood Gold Project Pre-feasibility Study | |
Production drilling will be done with a fleet of autonomous diesel-powered down-the-hole (DTH) drills that will drill 9.8 inch (251 mm) diameter holes on 32.8 ft (10 m) high benches with drill patterns varying for ore and waste and by rock type. Blasting will be done using primarily Ammonium Nitrate Fuel Oil (ANFO) and with bulk emulsion during wet conditions. A total of five production drills and one secondary drill for pre-splitting and secondary blasting are required during most of the mine life.
Loading will be done using a mix of diesel-powered hydraulic shovels and frontend wheel loaders, both equipped with 40 yd3 (31 m3) buckets. During peak production, the fleet will include two shovels and two wheel loaders.
Hauling will be done with 320 t (291 mt) rigid frame haul trucks and the fleet requirements were estimated for each period of the mine production plan using a haulage network developed and loaded into the MS Haulage tool of MinePlan 3D. The truck fleet peaks at a total of 18 trucks.
The mine workforce has been estimated for each period of the mine plan, which includes management and supervisory personnel, mine technical services, mine operations, and mine maintenance personnel. The mine workforce peaks at 221 employees.
The recovery methods for the Project were established based on previously noted laboratory-scale testwork programs, information from equipment suppliers and on BBA’s experience on similar projects. Many of the significant process plant configuration changes implemented within the 2017 PFS were retained, including the addition of secondary crushing ahead of the SAG mill for more efficient use of power, inclusion of a single line SAG/ball mill configuration, and simplification of the mill foundation and pebble re-grind circuit. Recent metallurgical testwork completed has also resulted in the grind size being further coarsened from 180 to 250 µm (P80) with a design leach retention time of 24 hours. With relatively minor changes to equipment selection, this has permitted a significant increase in the nominal throughput.
The nominal Livengood process plant capacity at 93% is 65,000 t/d (59,000 mt/d) resulting in an annual capacity of 23.7 Mt/y (21.5 Mmt/y). Run of mine ore is transported to the primary gyratory (60×89) crusher, where it is crushed and stockpiled in a covered pile, then conveyed to the secondary crushing (1,250 hp) building. Crushed product (1.65 in (42 mm)) will then be conveyed and processed in a comminution circuit (SABC) consisting of wet grinding in a single semi-autogenous (SAG) mill ((D×L) 36 ft × 20 ft /20,115 hp) in closed circuit with a pebble crusher (932 hp) and a single ball mill (25.4 ft × 40 ft / 20,115 hp). The ball mill is in closed circuit with hydrocyclones. A pulp stream will be bled from a portion of the ball mill discharge and treated with a bank of eight centrifugal gravity gold separators. The gravity tails will be pre-treated with oxygen and lead nitrate, and then leached in a conventional CIL circuit (2 rows of 7 tanks). The gravity gold will be intensively leached from the gravity concentrate with two intensive leach reactor (ILR) systems.
| International Tower Hill Mines Ltd. S-K 1300 – Technical Report Summary Livengood Gold Project Pre-feasibility Study | |
Gold from the leach circuit will be recovered by an adsorption-desorption-recovery (ADR) circuit, where the final product will be doré. Two thickeners (213 ft / 65 m diameter) (Pre-leach and Pre-Detox) will be used to maximize water and cyanide recovery. The Inco SO2/air cyanide detoxification method will be used to reduce the cyanide content of the process tailings to acceptable concentrations prior to being discharged to the tailings management facility (TMF). A preliminary water balance indicates that approximately 233 gpm (53 m3/hr) of fresh water will be required during operations.
The gyratory crushing, secondary crushing and main process plant will operate 24 hours per day and 7 days per week. The operating teams will work on a schedule of two 12-hour shifts. The main process plant will be stopped periodically to perform preventive maintenance on equipment for which there is no standby unit. The process plant is designed to operate with an availability of 93%.
Process plant reagents, including cyanide, lime, elemental sulfur, hydrochloric acid, lead nitrate, carbon, and flocculants, will be delivered to site by transport truck as required and stored in the process facility.
Figure 1-3, a simplified process flow diagram, describes the conceptual process flow from the ore delivery to the crusher through to doré production and tailings management. The average gold head grade for plant feed will be 0.65 g/mt with an overall gold recovery of 71.4% based on the LOM plan.
| International Tower Hill Mines Ltd. S-K 1300 – Technical Report Summary Livengood Gold Project Pre-feasibility Study | |
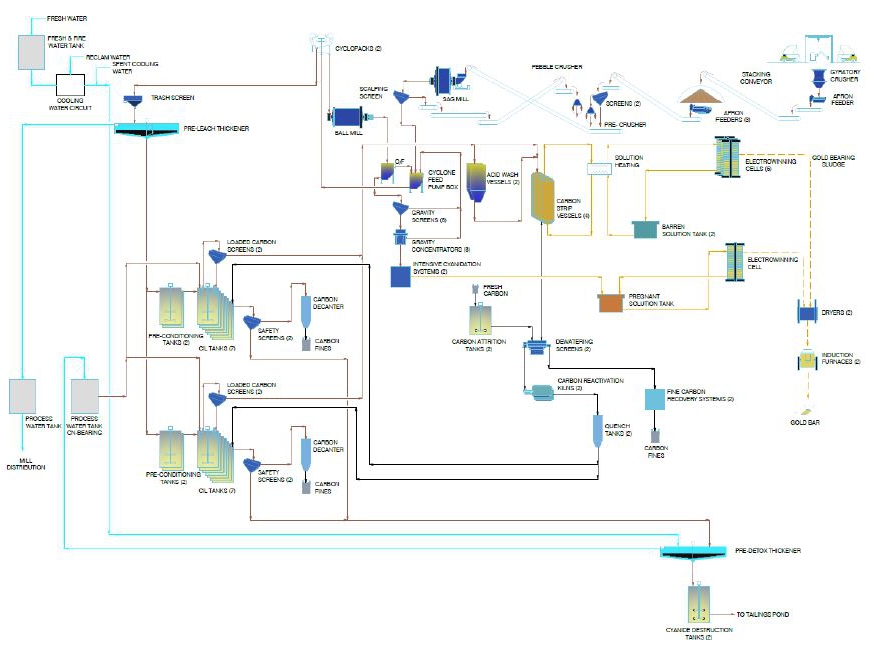
Figure 1-3: Simplified process flow diagram
| International Tower Hill Mines Ltd. S-K 1300 – Technical Report Summary Livengood Gold Project Pre-feasibility Study | |
The following Figure 1-4 shows the process plant feed grade and gold production per year based on the LOM mine plan. Annual gold production will average 317,000 oz/y over the LOM.
Figure 1-4: Gold production schedule (oz/year)
The process plant facilities include a wet laboratory, mill offices, a mill dry and maintenance shops. A total of 140 employees are required in the process plant, including 26 salaried staff and 114 hourly workers.
| 1.13 | Local Resources and Project Infrastructure |
The Fairbanks North Star Borough (FNSB), which has a population of approximately 100,000 people, has a hospital, government offices, businesses, military bases and the University of Alaska, Fairbanks. Fairbanks is linked to southern Alaska by a north-south transportation and utility corridor that includes two paved highways, a railroad, an interlinked electrical grid and communications infrastructure. The city has an international airport serviced by up to three major airlines and has demonstrated capacity to serve as the primary employment and service base for the Project.
The paved, all weather State Highway 2 (Elliott Highway) runs north from Fairbanks to the North Slope oilfields at Prudhoe Bay, and passes within one mile of the Money Knob deposit. Communications infrastructure (fiber optic) has been extended to the North Slope along the TAPS, which parallels the Elliott Highway and passes just west of the Livengood Project site.
| International Tower Hill Mines Ltd. S-K 1300 – Technical Report Summary Livengood Gold Project Pre-feasibility Study | |
| 1.13.2 | Project Infrastructure |
To the extent practicable, the infrastructure facilities for the Project have been designed for optimum construction access and operational efficiency as well as to take advantage of the existing roads and infrastructure.
Surface Infrastructure
The Project envisions construction of the following key infrastructure facilities:
| § | O’Connor Creek substation and 50 miles (80 km) of new 230 kV transmission line; |
| § | Access light vehicle and mine haulage roads; |
| § | Process plant and ancillary buildings; |
| § | Administration, dry, maintenance, and warehouse complex; |
| § | Mine truck wash and fueling facilities; |
| § | Bulk fuel storage and delivery system; |
| § | Water and sewage treatment; |
| § | Fresh water pumping and distribution system; |
| § | Waste rock, ore and growth media stockpiles; |
| § | Surface water management diversion ditches; |
| § | Tailings and Waste Rock Management Facilities; |
| § | Temporary construction camp; |
| § | Fairbanks Integrated Remote Operations Center (IROC); |
| § | Fairbanks employee parking area. |
Site Power
The total power demand of the Project (LOM average) is estimated to be approximately 57.8 MW, including network losses of 3% and represents the LOM average. An electrical load list was created based on a detailed mechanical equipment list that included the major power draw contributors. Minor power consumers and power for auxiliary systems were benchmarked based on BBA’s past project experience. The projected annual electrical energy use is estimated to be approximately 450.9 GWh including the network losses.
A study completed by Electric Power Systems has determined that the local utility in Fairbanks (Golden Valley Electric Association) can provide the power required for the Project. The Project would be connected to the local grid by building a 50-mi (80 km) 230-kVa transmission line along the pipeline corridor. A new 138/230 kV substation at O’Connor Creek (OCS) will be required to connect the transmission line to the GVEA system.
Emergency power systems (4.16 kV and 600 V) are planned for the purpose of supplying the critical installations when the main power is lost. Critical loads will be grouped into different categories, where some will be attended to automatically and others controlled manually.
| International Tower Hill Mines Ltd. S-K 1300 – Technical Report Summary Livengood Gold Project Pre-feasibility Study | |
Communications and IT
A site-wide telecommunication infrastructure will be installed to provide internet access, an IP phone system, a security access system, interconnection of the fire detection system, surveillance and process video cameras, as well as a mobile radio system for personnel and site vehicles.
Tailings, Mine Waste Rock and Water Management Facility
The tailings management facility (TMF) has been designed to provide safe and secure storage of approximately 486 Mt (441 Mmt) of mill tailings along with a supernatant pond. The TMF has sufficient area to expand up to 529 Mt (480 Mmt) capacity, dependent on future modifications that would be required at the freshwater reservoir.
The TMF is situated within Livengood Valley and is formed by two cross-valley embankments, the west embankment and the east embankment. Both TMF embankments and the impoundment area in between are geomembrane-lined and designed to be constructed in phases. The TMF embankments require the removal of some native materials within the embankment footprints to improve stability characteristics of the foundation. These materials will be excavated and transported to growth media stockpiles in the general area, for use during reclamation of the Project site. The impoundment area will be covered with a layer of mine waste rock to provide a stable foundation for the installation of the geomembrane.
Solution management systems at the TMF include a groundwater drainage system and a tailings underdrain system. The groundwater drainage system will be located below the impoundment geomembrane and positioned within the main drainages. This drain system will capture near surface groundwater flow and convey it to sumps located downstream of the TMF west embankment. The collected water will be pumped into the TMF impoundment and used in the processing of ore at the mill. The tailings underdrain system is located above the impoundment geomembrane and will collect process solutions draining from the deposited tailings mass. This system will return the collected solutions to the supernatant pond for recycling back to the mill.
The TMF east embankment will also form an embankment for the fresh water reservoir. This reservoir will be used as a make-up water supply for the project. Excess water captured by the reservoir will be conveyed, via gravity through a flow-through drain, to Livengood Creek downstream of the TMF west embankment. The flow-through drain consists of multiple large diameter pipes positioned below the impoundment geomembrane and near the main groundwater drainage system.
Non-economic mine waste rock, produced by mining activities at the Livengood site, will either be incorporated into the construction of site facilities, such as the TMF, or hauled and stockpiled in Gertrude Creek valley. The current design of the waste rock storage facility is for 105 Myd3 (80 Mm3). An embankment constructed at the mouth of the Gertrude Creek valley will serve as a buttress for the waste rock storage facility in addition to providing containment for tailings within the TMF.
| International Tower Hill Mines Ltd. S-K 1300 – Technical Report Summary Livengood Gold Project Pre-feasibility Study | |
Low grade ore will also be stockpiled within the upper reaches of the Gertrude Creek valley. The current design of the stockpile is sufficient to store 45 Myd3 (34 Mm3) of material. The stockpile can be expanded, as needed, by modifying the design of the waste rock storage facility.
The surface water management structures required to support the project primarily include minor stormwater diversion channels and roadside ditches.
| 1.14 | Environmental and Permitting |
THM has been conducting environmental baseline studies at the Project since 2008, as part of their overall goal of providing environmentally relevant and supportable data for environmental permitting, engineering design and a basis for permit-required monitoring during construction, mining and closure of the Project. These studies include surface water, hydrology, hydrogeology, wetlands & vegetation, meteorology & air quality, aquatic resources, rock characterization, wildlife, cultural resources and noise studies.
Table 1-7: Environmental baseline studies (2008-2021)
| Baseline Study | 2008 | 2009 | 2010 | 2011 | 2012 | 2013 | 2014 | 2015 | 2016 | 2017-
2021 |
| Surface Water | | | | | | | | | | |
| Surface Water Quality | | ● | ● | ● | ● | ● | ● | ● | ● | ● |
| Sediment Quality | | | | | | ● | ● | ● | ● | |
| Hydrology | | | | | | | | | | |
| Surface Water Flow and Snow | | | ● | ● | ● | ● | ● | ● | ● | ● |
| Hydrogeology | | | ● | ● | ● | ● | ● | ● | ● | ● |
| Groundwater Quality | | | ● | ● | ● | ● | ● | ● | ● | ● |
| Hydrogeological Modeling | | | ● | ● | ● | ● | ● | ● | ● | ● |
| Permafrost Studies | | | ● | ● | ● | ● | ● | ● | ● | ● |
| Wetlands & Vegetation | | | | | | | | | | |
| Wetlands Delineations | | ● | ● | ● | ● | ● | ● | | | |
| Meteorology & Air Quality | | | | | | | | | | |
| Meteorological Data | | | ● | ● | ● | ● | ● | ● | ● | ● |
| Precipitation | | | ● | ● | ● | ● | ● | ● | ● | ● |
| Ambient Air | | | | ● | | | | | | |
| Aquatic Resources | | | | | | | | | | |
| Bio-monitoring | | ● | ● | ● | ● | ● | ● | ● | ● | ● |
| Resident Fish Surveys | | ● | ● | ● | ● | ● | ● | | | |
| Rock Characterization | | | | | | | | | | |
| Static ML/ARD Testing | | | ● | ● | ● | ● | ● | ● | | |
| Kinetic ML/ARD Testing | | | | ● | ● | ● | ● | ● | ● | ● |
| On-Site Kinetic Testing | | | | | ● | ● | ● | ● | ● | ● |
| International Tower Hill Mines Ltd. S-K 1300 – Technical Report Summary Livengood Gold Project Pre-feasibility Study | |
| Baseline Study | 2008 | 2009 | 2010 | 2011 | 2012 | 2013 | 2014 | 2015 | 2016 | 2017-
2021 |
| Wildlife Studies | | | | | | | | | | |
| Habitat Mapping | | | | ● | | | | | | |
| Mammal Surveys | | | | ● | | | | | | |
| Avian Surveys | | | | ● | ● | | | | | |
| Cultural Resources | | | | | | | | | | |
| Cultural Site Surveys | ● | ● | ● | ● | ● | | | | | |
| Socioeconomics (Section 17.6) | | | | ● | ● | ● | | | | |
| Noise Studies | | | | | | | | | | |
| Noise Surveys | | | | | ● | ● | | | | |
In early 2011, project engineers identified a 50 mi (80 km) power transmission corridor with a terminus at Livengood. Baseline investigations along this corridor have included: surface water quality, wetlands & vegetation, wildlife, aquatic resources, and cultural resources. The results of these programs have been used, in part, to select the transmission alignment.
Based on a review of the studies completed to date, there are no known environmental issues that are anticipated to materially impact the Project’s ability to extract the gold resource.
Since development of the Project will require several federal permits, the National Environmental Policy Act (NEPA) and Council of Environmental Quality (CEQ) Regulations will govern the federal permitting portion of the Project. The NEPA process requires that all elements of a project and their direct, indirect and cumulative impacts be considered. A reasonable range of alternatives are evaluated to assess their comparative environmental impacts, including consideration of feasibility and practicality. In fulfillment of the NEPA requirements, it is anticipated that the Project will be required to prepare an Environmental Impact Statement (EIS). Upon completion of the EIS and the associated Record of Decision by the lead federal agency, the federal and state agencies will then complete their own permitting actions and decisions. The State of Alaska is expected to take a cooperating role to coordinate the NEPA review with the state permitting process. Actual permitting timelines are controlled by the federal NEPA review and federal and state agency decisions.
Actual permitting timelines are controlled by the Federal NEPA review and federal and state agency decisions. There have been no permit applications submitted for project construction.
| 1.15 | Socioeconomic Conditions |
Livengood lies within the Yukon-Koyukuk Census Area, which encompasses a nearly 150,000 square mile (mi2) (388,000 km2) swath of Interior Alaska from the Canadian border to the lower Yukon River. In 2020, the Census Area held a total population of 5,343 widely dispersed residents in 38 communities, of which approximately 70% were Alaska Natives. Both Minto, which is approximately 40 mi (64 km) from Livengood, and Manley Hot Springs, approximately 80 mi (129 km) away from the Project, have road access to Fairbanks.
| International Tower Hill Mines Ltd. S-K 1300 – Technical Report Summary Livengood Gold Project Pre-feasibility Study | |
The Fairbanks area is the service and supply hub for Interior and Northern Alaska. Construction of the Trans-Alaska Pipeline System (TAPS) resulted in an economic boom in Fairbanks from 1975 to 1977. The oil industry remains an important part of the local economy, with Fairbanks providing logistical support for the North Slope activity, operation of a local refinery and the operation and maintenance of TAPS. Today, the University of Alaska, the Fairbanks Memorial Hospital, and the Fort Knox and Pogo gold mines are some of the Fairbanks area’s largest employers. The Fairbanks North Star Borough (FNSB) economy included 37,400 non-agricultural wage and salary jobs in 2019, accounting for $2.24B in annual payroll.
Most of the small communities in rural interior Alaska are largely dependent on subsistence. Seventy-five percent (75%) of the Native families in Alaska’s smaller villages acquire 50% of their food through subsistence activities (Federal Subsistence Board, 1992). For families that do not participate in a cash economy, subsistence can be the primary direct means of support; for others, it contributes indirectly to income by replacing household food purchases.
The PFS estimates a total of 3.8 M man-hours during Project construction at Livengood, with a peak construction workforce of 800. The average wage of those workers is estimated at $50.00/hr. During the three years of preproduction mine development, the Owner’s crew will be approximately 170 employees on average. During operations, the average number of employees is estimated at 331 peaking in year 6 at 430. Total annual wages paid during operations is estimated to be $38M based on an annual average wage of approximately $115,000/y.
The labor force in the communities nearest the mine is very small. The total population of Minto, Manley Hot Springs and Livengood combined is 312 residents in 2020. Skilled and unskilled labor to support mine development and operations will come primarily from the Fairbanks area, with a total labor force of nearly 40,000 workers. The training plan for the Project will be designed to promote safety, environmental stewardship, efficient production, and local hire.
| 1.16 | Capital Cost and Operating Cost Estimates |
The total estimated preproduction capital cost (-20% / +25%) to design, procure, construct and commission the Livengood Gold Project facilities, including funding of reclamation activities, is estimated to be $1.93B. The estimated sustaining capital cost required by the Project is $658M. This estimate includes the addition of certain contingencies and indirect costs. The cumulative LOM capital expenditure (preproduction and sustaining capital) is estimated to be $2.852B. Table 1-8 summarizes the initial capital and sustaining capital costs by major area.
| International Tower Hill Mines Ltd. S-K 1300 – Technical Report Summary Livengood Gold Project Pre-feasibility Study | |
Table 1-8 summarizes the initial capital and sustaining capital costs by major area.
Table 1-8: Initial capital and sustaining capital costs by major area
($ Millions)
| Cost Item/Area | Initial ($M) | Sustaining ($M) |
| Mine Equipment | 200 | 139 |
| Mine Development | 230 | |
| Process Facilities | 433 | |
| Infrastructure Facilities | 459 | 514 |
| Power Supply | 87 | |
| Owners Costs | 296 | 5 |
| Contingency | 220 | |
| Sub-total before Reclamation | 1,925 | 658 |
| Spare parts, consumables, and initial fills (1) | 40 | |
| Funding of Reclamation Trust Fund (2) | 23 | 245 |
| Total | $1,989M | $903M |
Note: Rounding of some figures may lead to minor discrepancies in totals.
| (1) | The $40M spent on spare parts, consumables and initial fills in preproduction are recaptured in the final year of operations (Year 21). |
| (2) | Includes initial funding, total $317M estimated costs. The difference of $49M is projected trust fund earnings. |
The operating cost estimate for the Livengood Gold Project includes all expenses incurred to operate the mine and process plant from the start of Year 1 through Year 21 at a daily average production rate of 65,000 t/d (59,000 mt/d). The expected accuracy for the operating cost estimate is that of a pre-feasibility study level (+/- 20%) and does not contain any allowances for contingency or escalation beyond Q3 2021. Any ore excavated during the preproduction period is considered as a capital expense. The average operating cost including royalties and smelting/refining fees over the life of mine is estimated to be $13.82/t ($15.23/mt). The average total number of personnel over the LOM will be approximately 331.
The total and unit operating cost estimate summaries are shown below in Table 1-9 for the three major operating cost areas: mining, processing, and general and administrative (G&A). The unit costs areas are shown in terms of total cost LOM per ore ton milled and total cost per troy ounce of gold produced.
| International Tower Hill Mines Ltd. S-K 1300 – Technical Report Summary Livengood Gold Project Pre-feasibility Study | |
Table 1-9: Total operating cost breakdown (LOM average)
| Cost Item / Area | Total ($M) | Average ($/t mined) | Average ($/t milled) | Average ($/oz) | OPEX (%) |
| Mining (including stockpile reclaim) | 1,910 | 2.05 | 4.03 | 297 | 29 |
| Processing | 3,659 | - | 7.72 | 569 | 56 |
| General and Administration | 639 | - | 1.35 | 99 | 10 |
| On-site Mine Operating Costs | 6,208 | - | 13.09 | 965 | 95 |
| Royalties | 323 | - | 0.68 | 50 | 5 |
| Smelting, Refining and Transport | 22 | - | 0.05 | 3 | 0.3 |
| Sub-total before Reclamation | 6,553 | - | 13.82 | 1,019 | 100 |
| Funding of Reclamation Trust Fund | 317 | - | 0.67 | 49 | 0 |
| Total | $6,893M | - | $14.50$/t | $1,068/oz | 100% |
A financial analysis for the Project was carried out using a discounted cash flow approach. The internal rate of return (IRR) on total investment was calculated based on 100% equity financing even though THM may decide in the future to finance part of the Project using alternative sources of capital. The net present value (NPV) was calculated from the cash flow generated by the Project based on a discount rate of 5%. The payback period based on the undiscounted annual cash flow of the Project was also indicated as a financial measure.
No inflation or escalation exists in the economic model. THM compiled the taxation calculations for the Project with assistance from third-party taxation experts. The Livengood Gold Project is subject to three levels of taxation, including federal income tax, Alaska State income tax, and an Alaska State mining license tax. The model calculates pre-tax and after-tax returns, and is based on the current US tax system applicable to mineral resource income. The model applies 3% royalties on net smelter returns over the life of the Project, based on an average royalty calculation. The model includes provisions for doré transportation, insurance, refining and payable charges. The major inputs and assumptions used for the development of the financial model are listed in Table 1-10.
| International Tower Hill Mines Ltd. S-K 1300 – Technical Report Summary Livengood Gold Project Pre-feasibility Study | |
Table 1-10: Financial model inputs
| Execution Plan | |
| Construction Period | 36 months |
| Mine Life (after preproduction) | 20.3 years |
| LOM Ore Tons (millions) | 430.1 |
| LOM Gold Grade (g/mt Au) | 0.65 |
| Average Annual Process Gold Production Rate (oz) | 317,000 |
| Metal Pricing | |
| Gold Price ($/oz) | 1,680 |
| Cost and Tax Criteria | |
| Estimate Basis | Q3 2021 |
| Inflation/Currency Fluctuation | None |
| Leverage | 100% Equity |
| Income Tax | AK State, Federal |
| Royalties | |
| Royalty on Net Smelter Return (NSR) | 3% |
| Gold Transportation and Insurance, Refining, and Payable Charges | |
| Gold ($/oz) | 3.48 |
| Payable Terms | |
| Gold | 99.90% |
Table 1-11 below presents the results of the pre-feasibility study.
Table 1-11: Summary of pre-feasibility study results
| | Value | Unit |
| Production Metrics | | |
| Mill Throughput | 65,000 | Dry tons/day |
| Head Grade – LOM | 0.65 | g/mt |
| Gold Recovery | 71.4 | % |
| Mine Life | 20.3 | Years |
| Total oz Produced | 6,430,178 | oz |
| Average Annual Production – LOM | 317,000 | oz |
| Total Ore Processed | 474 | Million tons |
| Total Waste Rock (not including preproduction) | 463 | Million tons |
| Annual Mining Rate | 52 | Million tons |
| Low grade stockpile size (maximum) | 88 | Million tons |
| International Tower Hill Mines Ltd. S-K 1300 – Technical Report Summary Livengood Gold Project Pre-feasibility Study | |
| | Value | Unit |
| Capital and Operating Costs | | |
| CAPEX – Initial | 1.93 | $Billion |
| CAPEX – Sustaining | 658 | $Million |
| Reclamation & Closure | 317 | $Million |
| OPEX – Mining - LOM | 2.05 | $/t mined |
| OPEX – Processing - LOM | 7.72 | $/t ore |
| OPEX – G&A - LOM | 1.35 | $/t ore |
| OPEX – Operating Cost – LOM | 1,068 | $/oz |
| All-In Cost Pre-Tax (CAPEX+OPEX) – LOM | 1,512 | $/oz |
| Pre-Tax Financial Metrics | | |
| Pre-Tax NPV (@ 5%) | 168 | $M |
| Pre-Tax IRR | 6.1 | % |
| Pre-Tax Payback | 9.8 | Years |
| After-Tax Financial Metrics | | |
| After-Tax NPV (@ 5%) | 45 | $M |
| After-Tax IRR | 5.3 | % |
| After-Tax Payback | 10.4 | Years |
The pre-tax internal rate of return (IRR) is 6.1% and the pre-tax net present value (NPV) using a 5% discount rate over the life of mine is $168M. The after-tax IRR is 5.3% and the pre-tax NPV using a 5% discount rate over the life of mine is $45M.
The results of the after-tax sensitivity analysis performed are summarized in Figure 1-5 and Figure 1-6. This sensitivity analysis shows that both gold price and recovery variations cause the greatest and almost equivalent impact on project value. A 30% increase in the gold price to $2,184/oz would yield an IRR of 14.1% and a NPV of $1,493M. A 30% decrease in the gold price to $1,176/oz would yield a reduced IRR of -22.5% and NPV of $-1,647M. The impact of variations in operating and capital cost on both financial metrics is similar with the operating cost changes resulting in marginally larger project returns than capital cost changes, meaning reducing operating expenses would benefit the Project more than reducing capital costs by the same percentage.
| International Tower Hill Mines Ltd. S-K 1300 – Technical Report Summary Livengood Gold Project Pre-feasibility Study | |
Figure 1-5: After-tax sensitivity analysis for project net present value (NPV @ 5% discount rate)
Figure 1-6: After-tax sensitivity analysis for project internal rate of return (IRR %)
| International Tower Hill Mines Ltd. S-K 1300 – Technical Report Summary Livengood Gold Project Pre-feasibility Study | |
A hypothetical execution schedule for permitting, engineering, pre-development and construction of the Project was developed as part of the pre-feasibility study. The plan is conceptual in nature and contingent on the eventual completion of the positive feasibility study, during which it will be adjusted and refined. The major project activity milestones are presented in Table 1-12.
Table 1-12: Key project activities (preliminary)
| Activity | Start Date | Completion Date | Duration (months) |
| Environmental Impact Statement and Permitting | Q1 Year -7 | Q3 Year -3 | 48 |
| Engineering Studies in Support of Permitting | Q1 Year -7 | Q3 Year -3 | 48 |
| Process Plant Detailed Engineering | Q1 Year -3 | Q3 Year -2 | 21 |
| Project Authorization | | Q3 Year -3 | |
| Pit Pre-Stripping / Waste Rock Supply for Construction | Q3 Year -3 | Q4 Year -1 | 30 |
| Tailings Management Embankment Construction | Q3 Year -3 | Q4 Year -1 | 30 |
| Process Plant Construction | Q4 Year -3 | Q4 Year -1 | 27 |
| Process Plant Dry Commissioning Completed | | Q1 Year 1 | |
| Start Process Plant Ramp-up to Commercial Production | Q1 Year 1 | | |
| 1.19 | Interpretations and Conclusions |
This TRS was prepared to demonstrate the economic viability of an open pit mine and process plant complex based on the reserves estimated for the Livengood Gold Project. The process plant capacity is planned to be 65,000 t/d (59,000 mt/d).
This TRS provides a summary of the results and findings from each major area of investigation to a level that is equivalent and normally expected for a PFS of a resource development project. Standard industry practices, equipment and processes were used in this study. The Project contributors, on the date of publication, are not aware of any unusual or significant risks or uncertainties that could materially affect the reliability or confidence in the Project or development of the mineral reserves based on the information available.
The results of the PFS indicate that the proposed Project is technically feasible and marginally viable at the base case gold price of $1,680/oz. It is recommended to advance the Project to the feasibility study level including the completion of additional metallurgical testwork and various confirmatory studies to improve the Project’s economics, study potential opportunities and reduce overall implementation risk. The decision and timeline to pursue the feasibility study is at the discretion of THM.
An analysis of the results of the investigations has identified a series of risks and opportunities associated with each of the technical aspects considered for the development of the Project.
| International Tower Hill Mines Ltd. S-K 1300 – Technical Report Summary Livengood Gold Project Pre-feasibility Study | |
The key risks include:
| § | Large earthwork quantities required to construct the Project; |
| § | Management of waste rock could be more expensive than assumed; |
| § | Impact of climate change on project design, |
| § | Evolving ESG practices and governmental regulations. |
The key opportunities include:
| § | Conducting grind/recovery metallurgical testing at coarser than 250 µm (P80). |
Based on the full list of recommendations presented in Chapter 23, it is estimated that the full feasibility study, including the recommended field activities, metallurgical testwork and environmental studies, would cost approximately $10.2M, including a 20% contingency.
| International Tower Hill Mines Ltd. S-K 1300 – Technical Report Summary Livengood Gold Project Pre-feasibility Study | |
This amended Technical Report Summary (the “TRS”) was prepared and compiled by BBA USA Inc. in cooperation with a number of consulting firms at the request of International Tower Hill Mines Ltd. (ITH) through its wholly owned subsidiary Tower Hill Mines, Inc. (THM). BBA USA Inc. is an independent engineering consulting firm headquartered in Montreal, Quebec, Canada.
The purpose of the TRS is to summarize the results of the Pre-feasibility Study (PFS) for the Livengood gold deposit on the THM property. This TRS has been amended and prepared in accordance with §§229.1300 through 229.1305 (subpart 229.1300 of Regulation S-K).
The TRS supports the ITH November 4, 2021 news release “International Tower Hill Mines Announces Pre-Feasibility Study Results on 13.6 million ounce Gold Resource”. This TRS also supports the mineral resource, mineral reserve and property disclosures in ITH’s Annual Report on Form 10-K for the fiscal years ended December 31, 2021 and December 31, 2022, in addition to the November 4, 2021 release.
This TRS was prepared based on contributions from BBA USA Inc., JDS Energy and Mining Inc., NewFields Mining Design & Technical Services, LLC, and Resource Development Associates Inc.
The Livengood property (65 ̊30’16’’N, 148 ̊31’33’’W) is located approximately 70 mi (113 km) northwest of Fairbanks, Alaska in the Tolovana Mining District within the Tintina Gold Belt. The property straddles Highway 2 (also known as the Elliott Highway), a paved, all-weather highway linking the North Slope oil fields to Fairbanks, and adjoins the Trans-Alaska Pipeline System (TAPS) corridor, which transports crude oil from the North Slope south.
On October 13, 2023, this TRS was amended by adding a stratigraphic column to Section 6.1.1 and an opinion of the QPs to Sections 10.8, 12.3, and 17.7 as prescribed by Item 601(b)(96) of Regulation S-K.
| 2.2 | Basis of the Technical Report Summary |
This TRS is based on an updated resource estimate effective, as of August 20, 2021, and has an optimized Project configuration of 65,000 t/d (59,000 mt/d).
This TRS presents a summary of the results of the PFS for the development of the Livengood Gold Project. THM requested engineering consulting group BBA USA Inc. (BBA) to lead and perform the PFS, including contributions from a number of independent consulting firms including JDS Energy and Mining Inc. (JDS), NewFields Mining Design & Technical Services, LLC (NewFields), and Resource Development Associates Inc. (RDA).
| International Tower Hill Mines Ltd. S-K 1300 – Technical Report Summary Livengood Gold Project Pre-feasibility Study | |
This TRS was prepared at the request of Mr. Karl Hanneman, Chief Executive Officer of Tower Hill Mines, Inc. As of the date of this TRS, ITH is an exploration and development company trading on the Toronto Stock Exchange (TSX) under the trading symbol (ITH) and the New York Stock Exchange (NYSE.MKT) under the trading symbol (THM).
The THM corporate office is situated at:
| | Address: | 506 Gaffney Road, Suite 200 |
| | | Fairbanks, AK, USA 99701 |
| | Telephone: | (907) 328-2800 |
| | Fax: | (907) 328-2832 |
A summary of the PFS contributors and their general areas of input is presented in Table 2-1.
Table 2-1: Primary PFS contributors
| Consulting Firm | Scope of Services |
| BBA USA Inc. | § Mine engineering § Mine capital and operating costs § Mineral reserve estimation § Surface infrastructure design and capital costs § Metallurgical testwork analysis and process plant design § Process plant capital and operating costs § Environmental studies and permitting § General and administration operating costs § Financial analysis § Overall TRS integration |
| JDS Energy & Mining Inc. | § Rock mechanics and open pit slope stability |
| NewFields Mining Design & Technical Services, LLC | § Geotechnical engineering § Waste rock and water management § Tailings management facility (TMF) design and capital costs § Closure plan and costs |
| Resource Development Associates Inc. | § Geological modeling and mineral resource estimation § Mineral resource classification |
The consulting firms listed in Table 2-2, are responsible for the TRS and are independent of ITH and THM. These firms have employees which are considered to be Qualified Persons (QPs) by virtue of their employee’s education, experience and memberships in good standing with professional associations.
| International Tower Hill Mines Ltd. S-K 1300 – Technical Report Summary Livengood Gold Project Pre-feasibility Study | |
The consulting firms have supervised the preparation of this TRS and take responsibility for the contents of the TRS as set out in Table 2-2. Each consulting firm has also contributed relevant figures, tables and portions of Chapters 1 (Summary), 22 (Interpretation and Conclusions), 23 (Recommendations), 24 (References) and 25 (Reliance on Information provided by the Registrant).
Table 2-2: Chapter/Section responsibility by Consulting Firm
| Consulting Firm | Site Visit | Chapter/Section Responsibility |
| BBA USA Inc. | August 15, 2016 | Chapters 2, 3, 10 (except Section 10.5.16.7), 12 (except Section 12.3.3.1), 13, 14, 15 (except Sections 15.14, and 15.19), 16, 17, 18, 19, 21, and the relevant portions of Chapters 1, 22, 23, 24 and 25. |
| NewFields Mining Design & Technical Services, LLC | March 1-2, 2012 | Sections 10.5.16.7, 15.14, 15.19, and the relevant portions of Chapters 1, 18, 22, 23, 24 and 25. |
| JDS Energy & Mining Inc. | June 20-22, 2012 | Section 12.3.3.1, and the relevant portions of Chapters 1, 22, 23, 24 and 25. |
| Resource Development Associates Inc. | August 2, 2011 | Chapters 4, 5, 6 ,7 ,8, 9, 11 and 20, and the relevant portions of Chapters 1, 22, 23, 24 and 25. |
| 2.5 | Personal Inspection of the Livengood Property |
The Consulting firm’s QPs inspected the Livengood Property on the dates shown in Table 2-2 above.
| 2.6 | Effective Dates and Declaration |
This TRS supports the ITH news release “International Tower Hill Mines Announces Pre-Feasibility Study Results on 13.6 million ounce Gold Resource” dated November 4, 2021 announcing the results of the PFS. This TRS also supports the mineral resource, mineral reserve and property disclosures in ITH’s Annual Report on Form 10-K for the fiscal year ended December 31, 2021, in addition to the November 4, 2021 release. The TRS has a number of effective dates as follows:
| § | Date of metallurgical testwork completion: April 15, 2021; |
| § | Date of the Mineral Resource Estimate: August 20, 2021; |
| § | Date of the Mineral Reserve Estimate: October 21, 2021; |
| § | Date of Financial Analysis: October 29, 2021. |
The overall effective date of the TRS is taken to be the date of the financial analysis and is October 29, 2021.
| International Tower Hill Mines Ltd. S-K 1300 – Technical Report Summary Livengood Gold Project Pre-feasibility Study | |
As of the effective date of this TRS, the Consulting firms are not aware of any known litigation potentially affecting the Livengood Gold Project. The Consulting firms did not verify the legality or terms of any underlying agreement(s) that may exist concerning the permits, royalties or other agreement(s) between third parties.
The results of this TRS are not dependent upon any prior agreements concerning the conclusions to be reached, nor are there any undisclosed understandings concerning any future business dealings between THM and the consulting firms. The consulting firms are being paid a fee for their work in accordance with the normal professional consulting practice.
The opinions contained herein are based on information collected throughout the course of the investigations by the consulting firms, which in turn reflect various technical and economic conditions at the time of writing. Given the nature of the mining business, these conditions can change significantly over relatively short periods of time. Consequently, actual results can be significantly more or less favorable.
| 2.7 | Sources of Information |
The reports and documentation listed in Chapter 24 (References) and Chapter 25 (Reliance on Information Provided by Registrant) of this TRS were used to support the preparation of this TRS. Additional information was sought from THM personnel where required. Sections from reports authored by other consultants may have been directly quoted or summarized in this TRS and are so indicated, where appropriate.
This TRS has been completed using the aforementioned sources of information, as well as available information contained in, but not limited to, the following reports, documents and discussions:
| § | Technical discussions with THM personnel; |
| § | QPs’ personal inspections of the Livengood gold property; |
| § | Reports detailing mineralogical, metallurgical and grindability characteristics of the Livengood deposit, conducted by industry recognized metallurgical testing laboratories on behalf of THM; |
| § | Geological block model received on June 4, 2021 with the file name: 210526_rda_model.bmf; |
| § | A conceptual process flowsheet developed by BBA based on the specific Project testwork and similar operations; |
| § | Internal and commercially available databases and cost models; |
| § | Various reports covering site hydrology, hydrogeology, geotechnical and geochemistry; |
| § | Internal unpublished reports received from THM; and |
| § | Additional information from public domain sources. |
| International Tower Hill Mines Ltd. S-K 1300 – Technical Report Summary Livengood Gold Project Pre-feasibility Study | |
The following individuals provided specialist input to BBA:
| § | Jorge Torrealba, PhD (BBA), André Allaire, PhD, P. Eng. (BBA) and Derek Blais (BBA) provided input to the comminution and metallurgical data interpretations as summarized in the TRS (Chapters 10 and 14). |
| § | Denise Herzog, ITH Manager of Environmental Affairs provided input on recent environmental activities and current permitting status as summarized in the TRS (Chapter 17). |
| § | Christopher Chung (BBA) provided input to the civil and geotechnical design of the general site infrastructure (Chapter 15). |
| § | Guillaume Richer-Rochon (BBA) provided electrical designs for the site and process plant (Chapters 14 and 15). |
| § | Bertrand Fortin (BBA) and Steven Perron (BBA) provided the designs for the process plant (Chapter 14). |
| § | Jean-Francois Beaulieu and Laura Mottola (BBA) provided the operating philosophies, designs and costs for the Integrated Remote Operations Centre (IROC) as described in Chapter 15. |
| § | Jocelyn Marcoux (BBA) provided input on the process plant and infrastructure capital costs (Chapter 18) as well as input on the Project construction strategies as summarized in the TRS (Chapter 21). |
| § | Claude Catudal (BBA) provided input on the Project execution strategy and schedule as summarized in the TRS (Chapter 21). |
These specialists are not considered as QPs for the purposes of this S-K 1300 TRS.
The following specialist reports were used by JDS:
| § | Knight Piesold Consulting, Technical Memorandum No. 3: Preliminary Seismic Hazard Assessment, May 5, 2011. |
| § | SRK Consulting Inc., 2010 and 2012 Hydrogeological Investigations and Modeling Results, Livengood Project dated February 2011 and April 2013, respectively. |
| § | Carew, T.J, Pennstrom, M.A., Bell, R.J., Klerk, Q., November 2010 Summary Report on the Livengood Project, Tolovana District, Alaska. November 1, 2010 provided geologic background information for the site. |
These specialists are not considered as QPs for the purposes of this S-K 1300 TRS.
| International Tower Hill Mines Ltd. S-K 1300 – Technical Report Summary Livengood Gold Project Pre-feasibility Study | |
The following individuals provided specialist input to NewFields:
| § | Joseph Compton (NewFields) provided input to the civil and geotechnical design of the TMF as well as input on the capital costs (Chapter 18). |
| § | Joseph Hickey (NewFields) provided input on the TMF capital costs (Chapter 18). |
| § | Troy Thompson (Ecological Resource Consultants) provided input to the water balance and water management design (Chapter 15). |
These specialists are not considered as QPs for the purposes of this S-K 1300 TRS.
| 2.8 | Currency, Units of Measure, and Calculations |
This TRS assumes that the Livengood Gold Project will be constructed using imperial units. Therefore, to the maximum extent practicable, all design work and equipment descriptions were completed and reported in imperial units, with metric units shown in parentheses. Every effort has been made to clearly display the appropriate units being used throughout this TRS.
However, it is important to note that both the Livengood Gold Project drill hole database and the block model were originally created in metric units and have been consistently maintained in metric units. Therefore, some tables and figures in this TRS may be presented in metric units only to minimize the risk of data unit conversion errors.
Unless otherwise specified or noted, this TRS uses the following assumptions and units:
| § | Currency is in US dollars (USD or $); |
| § | All ounce units are reported in troy ounces, unless otherwise stated: 1 oz (troy) = 31.1 g; |
| § | All metal prices are expressed in US dollars (USD or $); |
| § | For financial modeling, ore tonnage is reported in short tons (t), with all costs reported in $/t; |
| § | All cost estimates have a base date of the third quarter (Q3) of 2021. |
This TRS includes technical information that required subsequent calculations to derive subtotals, totals and weighted averages. Such calculations inherently involve a degree of rounding and consequently introduce a margin of error. Where these occur, the QPs consider them immaterial.
This TRS is intended to be used by International Tower Hill Mines Ltd. subject to the terms and conditions of its agreements with BBA USA Inc. and the relevant consulting firms. Such agreements permit International Tower Hill Mines Ltd. to file this TRS as a Technical Report Summary with the SEC’s new mining rules under subpart 1300 and item 601 (96)(B)(iii) of the Regulation S-K (SK-1300). Any other use of this TRS by any third party is at that party’s sole risk. The user of this document should ensure that this is the most recent TRS for the property as it is not valid if a new TRS has been issued.
| International Tower Hill Mines Ltd. S-K 1300 – Technical Report Summary Livengood Gold Project Pre-feasibility Study | |
The authors would like to acknowledge the general support provided by the THM management and Alaska development team personnel during this assignment. The TRS benefitted from the knowledge and specific input of the following individuals:
| § | Karl L. Hanneman – Chief Executive Officer |
| § | Debbie L. Evans – Corporate Controller |
| § | Denise A. Herzog – Environmental Affairs Manager |
Their commitment, contributions and teamwork are gratefully acknowledged and appreciated.
| International Tower Hill Mines Ltd. S-K 1300 – Technical Report Summary Livengood Gold Project Pre-feasibility Study | |
| 3. | Property Description and Location |
The Livengood Gold Project covers approximately 48,300 acres (19,546 hectares), all of which is controlled by the Company through its wholly-owned subsidiary, Tower Hill Mines, Inc. (THM) (Figure 3-1). The Livengood Gold Project is comprised of multiple land parcels: 100% owned patented mining claims, 100% owned State of Alaska mining claims, 100% owned federal unpatented placer mining claims; land leased from the Alaska Mental Health Trust (AMHT); land leased from holders of State of Alaska mining claims, patented claims, federal unpatented lode and placer mining claims, and undivided interests in patented mining claims. The property and claims controlled through ownership, leases or agreements are summarized below. All of the agreements are in good standing and are transferable. THM has taken reasonable steps to verify title to mineral properties in which it has an interest. Except for the patented mining claims and the federal unpatented mining claims of the Hudson/Geraghty lease, none of the properties have been surveyed.
| 3.1.1 | 100% Owned Patented Mining Claims |
| § | U.S. Mineral Survey 2447, located on lower Livengood Creek, subject to an agreement to allow Larry Nelson, as agent for Nelson Mining Company, to operate a placer mine on MS 2447 through February 2, 2023. |
| § | U.S. Mineral Survey 1956, located on lower Gertrude Creek, subject to a reserved royalty of 5% of gross value held by Key Trust Company on behalf of the Luther Hess Trust. With respect to portions of U.S. Mineral Survey 1626, located on lower Amy Creek: |
| - | 100% of No. 2 Above Discovery Amy Creek, |
| - | 100% of No. 3 Above Discovery Amy Creek, and |
| - | 100% of Up Grade Association Bench. |
| 3.1.2 | 100% Owned State of Alaska Mining Claims |
| § | 169 State of Alaska mining claims acquired by purchase. (Appendix A, Table A1); |
| § | 153 State of Alaska mining claims acquired by location. (Appendix A, Table A2). |
| 3.1.3 | 100% Owned Federal Unpatented Placer Mining Claims |
| § | 29 federal unpatented placer mining claims. (Appendix A, Table A3). |
| International Tower Hill Mines Ltd. S-K 1300 – Technical Report Summary Livengood Gold Project Pre-feasibility Study | |
| 3.1.4 | 100% Owned by Livengood Placers, Inc. |
Livengood Placers, Inc. (LPI), a private Nevada corporation that is 100% owned by THM, is the record owner of the following:
| § | 29 patented mining claims. (Appendix A, Table A4); |
| § | 108 federal unpatented placer mining claims. (Appendix A, Table A5); |
| § | 24 State of Alaska mining claims. (Appendix A, Table A6). |
Alaska Mental Health Trust Lease. A lease of the AMHT mineral rights having a term commencing July 1, 2004, and extending 19 years until June 30, 2023, subject to further extensions beyond June 30, 2023, by either commercial production or payment of an advance minimum royalty equal to 125% of the amount paid in Year 19 and diligent pursuit of development. The lease requires minimum work expenditures and advance minimum royalties, which escalate annually with inflation. A net smelter return (NSR) production royalty of between 2.5% and 5.0% (depending upon the price of gold) is payable to the lessor with respect to the lands subject to this lease. In addition, an NSR production royalty of 1% is payable to the lessor with respect to the unpatented federal mining claims subject to the lease described in the Hudson/Geraghty Lease below and an NSR production royalty of between 0.5% and 1.0% (depending upon the price of gold) is payable to the lessor with respect to the lands acquired by THM as a result of the purchase of LPI. in December 2011. As of December 31, 2020, there were 9,970 acres (4.035 hectares) included in the AMHT lease.
| International Tower Hill Mines Ltd. S-K 1300 – Technical Report Summary Livengood Gold Project Pre-feasibility Study | |
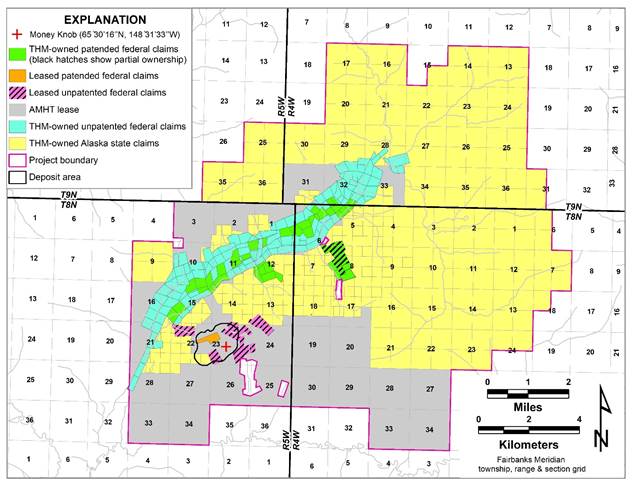
Figure 3-1: Map illustrating the company’s Livengood Gold Project land holdings
(As at September 30, 2021, by tenure type, referenced to the Fairbanks Meridian Township, range and section grid.)
| § | Hudson/Geraghty Lease. A lease of 20 federal unpatented lode mining claims having an initial term of ten years commencing on April 21, 2003, and continuing for so long thereafter as advance minimum royalties are paid and mining-related activities, including exploration, continue on the property or on adjacent properties controlled by THM. The lease requires an advance minimum royalty of $50,000 on or before each anniversary date (all of which minimum royalties are recoverable from production royalties). An NSR production royalty of between 2% and 3% (depending on the price of gold) is payable to the lessors. THM may purchase 1% of the royalty for $1,000,000. (Appendix A, Table A7). |
| International Tower Hill Mines Ltd. S-K 1300 – Technical Report Summary Livengood Gold Project Pre-feasibility Study | |
| § | Griffin Lease. A lease of U.S. Mineral Survey 1990 having an initial term of ten years commencing January 18, 2007, and continuing for so long thereafter as advance minimum royalties are paid. The lease requires an advance minimum royalty of $20,000 on or before each anniversary date through January 18, 2017, and $25,000 on or before each subsequent anniversary (all of which minimum royalties are recoverable from production royalties). An NSR production royalty of 3% is payable to the lessors. THM may purchase all interests of the lessors in the leased property (including the production royalty) for $1,000,000 (less all minimum and production royalties paid to the date of purchase), of which $500,000 is payable in cash over four years following the closing of the purchase and the balance of $500,000 is payable by way of the 3% NSR production royalty. |
| § | Tucker Lease. A lease of two unpatented federal lode mining claims and four federal unpatented placer mining claims having an initial term of 10 years commencing on March 28, 2007, and continuing for so long thereafter as advance minimum royalties are paid and mining-related activities, including exploration, continue on the property or on adjacent properties controlled by THM. The lease requires an advance minimum royalty of $15,000 on or before each anniversary date (all of which minimum royalties are recoverable from production royalties). THM is required to pay the lessor the sum of $250,000 upon making a positive production decision, $125,000 payable within 120 days of the decision and $125,000 within a year of the decision (all of which are recoverable from production royalties). An NSR production royalty of 2% is payable to the lessor. THM may purchase all of the interest of the lessor in the leased property (including the production royalty) for $1,000,000. (Appendix A, Table A8). |
| 3.1.6 | Patented Mining Claims (Undivided Interests Less Than 100%) |
| § | An undivided 5/6th interest in that certain patented placer mining claim known as the “Kinney Bench” claim, included within U.S. Mineral Survey No. 1626 on lower Amy Creek. |
| § | An undivided 5/9th interest in that certain patented placer mining claim known as the “Union Bench Association” claim, included within U.S. Mineral Survey No. 1626 on lower Amy Creek. |
| § | An undivided 1/6th interest in that certain patented placer mining claim known as the “Bessie Bench” claim, included within U.S. Mineral Survey No. 1626 on lower Amy Creek. |
| § | An undivided 1/3rd interest in those certain patented placer mining claims known as the “War Association” claim, the “Mutual Association” claim, and the “O.K. Fraction” claim, all included within U.S. Mineral Survey No. 2033 on lower Amy Creek. |
| § | An undivided 2/5th interest in those certain patented lode mining claims known as the “Yukon” claim, the “Mastodon” claim, and the “Piedmont” claim, all included within U.S. Mineral Survey No. 1990. |
| International Tower Hill Mines Ltd. S-K 1300 – Technical Report Summary Livengood Gold Project Pre-feasibility Study | |
| 3.1.7 | Other Land Obligations |
State of Alaska Mining Claims
On State of Alaska lands, the state holds both the surface and the subsurface rights. State of Alaska 40-acre mining claims require an annual rental payment of $40 per claim to be paid to the state (by November 30th of each year) for the first five years, $85 per year for the second five years, and $205 per year thereafter. These rental rates are multiplied by four for each 160-acre claim. As a consequence of the annual rentals due, all State of Alaska mining claims have an expiry date of November 30th each year. In addition, there is a minimum annual work expenditure requirement of $100 per 40-acre claim and $400 per 160-acre claim (due on or before noon on September 1st each year) or cash in lieu of labor. An affidavit evidencing that such work has been performed is required to be filed on or before November 30th each year. Excess work can be carried forward for up to four years. If the rental is paid and the work requirements are met, the mining claims can be held indefinitely. The work completed by THM during the 2021 field season was filed as assessment work, and the value of that work is sufficient to meet the assessment work requirements through September 1, 2025, on all State of Alaska mining claims.
Holders of State of Alaska mining claims are also required to pay a production royalty on all revenue received from minerals produced on state land during each calendar year. The production royalty rate is 3% of net income.
Federal Unpatented Mining Claims
Holders of federal unpatented mining claims are required to pay an annual claim maintenance fee of $165 per 20 acres payable in advance on or before August 31 of each year.
Water and Land Use Considerations
Holders of State of Alaska and federal unpatented mining claims have the right to use the land and water included within mining claims only when necessary for mineral prospecting, development, extraction, or basic processing, or for storage of mining equipment. However, the exercise of such rights is subject to the appropriate permits being obtained.
THM has all of the necessary permits for exploration, geotechnical, and baseline data collection activities at the Project. These permits are active and include Alaska Department of Natural Resources (hard rock exploration, temporary water use), U.S. Bureau of Land Management (plan of operations), U.S. Corps of Engineers (Section��404 and nationwide wetlands), Alaska Department of Environmental Conservation (Section 401, storm water), and Alaska Department of Fish and Game (fish habitat) authorizations. Permits required to support project development are discussed in Chapter 17.
| International Tower Hill Mines Ltd. S-K 1300 – Technical Report Summary Livengood Gold Project Pre-feasibility Study | |
| 3.1.9 | Environmental Liabilities |
With over 100 years of placer mining activity and sporadic prospecting and exploration in the region, there is moderate to considerable historic disturbance on the property. Some of the historic placer workings are now overgrown with willow and alder. The old mining town of Livengood is now abandoned except for more modern road maintenance buildings at the town site. THM does not anticipate any significant obligations for recovery and reclamation of historic disturbance and there are no known significant existing environmental liabilities.
The Livengood property is located approximately 70 mi (113 km) northwest of Fairbanks, Alaska in the Tolovana Mining District within the Tintina Gold Belt. The deposit area is centered near Money Knob, a local topographic high point. This feature and the adjoining ridge lines are the probable lode gold source for the Livengood placer deposits that lie in the adjacent valleys that have been actively mined since 1914 and produced more than 500,000 oz of gold.
The property lies in numerous sections of Fairbanks Meridian Township 8N and Ranges 4W and 5W. Money Knob, the principal geographic feature within the known deposit, is located at 65 ̊30’16’’N, 148 ̊31’33’’W.
The property straddles Highway 2 (also known as the Elliott Highway), a paved, all-weather highway linking the North Slope oil fields to Fairbanks, and adjoins the TAPS corridor, which transports crude oil from the North Slope south and contains the fiber-optic communications cable that may be used at the Livengood site (see Figure 3-2).
| International Tower Hill Mines Ltd. S-K 1300 – Technical Report Summary Livengood Gold Project Pre-feasibility Study | |

Figure 3-2: Project location map
| International Tower Hill Mines Ltd. S-K 1300 – Technical Report Summary Livengood Gold Project Pre-feasibility Study | |
| 4. | Accessibility, Climate, Local Resources, Infrastructure and Physiography |
The Livengood property is located approximately 70 mi (113 km) northwest of Fairbanks, Alaska in the Tolovana Mining District, within the Tintina Gold Belt. The property straddles Highway 2, a paved, all-weather highway linking the North Slope oil fields to Fairbanks, and adjoins the TAPS corridor. Locally, a number of unpaved roads lead from the highway into and across the deposit. A 3,000-ft (914 m) runway is located 3.7 mi (6 km) to the southwest near the former TAPS Livengood Camp and is suitable for light aircraft.
The site is approximately 40 mi (64 km) south of the Arctic Circle. The climate in this part of Alaska is continental with temperate and mild conditions in summer with average lows and highs in the range of 44°F to 72°F (7°C to 22°C). Winter is cold with average lows and highs for December through March in the range of -17°F to 23°F (-27°C to -5°C). The lowest lows are in the -40°F (-40°C) range. Annual precipitation is in the order of 15.7 in (400 mm) water equivalent. Winter snowpack depth is approximately 26 in (660 mm).
| 4.3 | Local Resources and Infrastructure |
The community of Minto (2012 population 223) is approximately 40 mi (64 km) southwest of the Project, and Manley Hot Springs (2012 population 116) is approximately 80 mi (129 km) southwest of the Project area at the western terminus of the Elliott Highway. The Fairbanks North Star Borough has a population of approximately 100,000 people, and comprises the regional center with hospitals, government offices, businesses, and the University of Alaska - Fairbanks. The city is linked to southern Alaska by a north-south transportation and utility corridor that includes two paved highways, a railroad, an interlinked electrical grid, and communications infrastructures. The city has an international airport serviced by major airlines. Fairbanks services both the Fort Knox and Pogo gold mines, which operate year round. Skilled and unskilled labor to support mine development and operations will come primarily from the Fairbanks area, with a total labor force of over 40,000 workers.
| International Tower Hill Mines Ltd. S-K 1300 – Technical Report Summary Livengood Gold Project Pre-feasibility Study | |
A study completed by Electric Power Systems has determined that the local utility in Fairbanks (Golden Valley Electric Association) can provide the 55 MW of power required for the Project. The Project would be connected to the local grid by building a 50-mi (80 km) 230 kVa transmission line along the pipeline corridor.
SRK Consulting completed a regional hydrology study and determined that the average annual precipitation at the Livengood site, at project elevation of 1,400 ft (427 m) amsl, is 15.7 in (400 mm). A water balance study was completed by Ecological Resource Consultants (ERC) based on available and collected data. The study indicates that the site has an adequate water supply for the Project as designed.
Two independent fiber optic communication cables currently extend from Fairbanks to the North Slope, one along the TAPS, the other parallel to the Elliott Highway, both of which pass less than 2 mi (3.2 km) west of the Project.
The 48,300 acres (19,500 hectares) of the Livengood Gold Project property has sufficient area to support the required Project facilities, including tailings, waste rock storage facilities and processing plant sites.
The Project area consists of rolling terrain of the Yukon-Tanana Uplands with a maximum elevation of 2,622 ft (800 m) at Livengood Dome. Upper and mid slopes are occupied by mature black spruce (Picea mariana), white spruce (P. glauca), paper birch (Betula neoalaskana), and quaking aspen (Populus tremuloides) forests. Low-lying areas and floodplains are dominated by poorly drained shrub and black spruce woodland communities often underlain by permafrost. Few lakes or ponds occur in the Project area. Land disturbance from previous mining activity is conspicuous, particularly in Livengood Creek and lower Goldstream Creek.
| International Tower Hill Mines Ltd. S-K 1300 – Technical Report Summary Livengood Gold Project Pre-feasibility Study | |
Gold was first discovered in the gravels of Livengood Creek in 1914 (Brooks, 1916) and led to the founding of the town of Livengood. Subsequently, over 500,000 oz of placer gold were produced. From 1914 through the 1970s, the primary focus of prospecting activity was placer deposits. Historically, prospectors considered Money Knob, a topographic high within the currently known gold deposit, and the associated ridgeline to be the source of placer gold. Prospecting, primarily in the 1950s and in the form of dozer trenches, was carried out for lode mineralization in the vicinity of Money Knob. However, no significant lode production has occurred to date.
Modern corporate exploration for lode gold mineralization in the vicinity of Money Knob and the Livengood placer deposits was initiated in 1976, continued intermittently though 1999, and included extensive soil sampling, trenching and 25 shallow drill holes. The most recent round of exploration of the Money Knob area began when AngloGold Ashanti (AGA) acquired property in 2003 and undertook an 8-hole RC program. The results from this program were encouraging and AGA followed up with an expanded soil geochemical survey, which identified gold-anomalous zones in the Money Knob area. Based on these results, prior soil surveys, and geological concepts, four diamond core holes were drilled in late 2004. The two drill programs intersected broad and extensive zones of gold mineralization, but no further work was executed due to financial constraints and a shift in corporate strategy. In 2006, AGA sold the Livengood Gold Project to ITH. In the same year, THM drilled a 4,026 ft (1,227 m), 7-hole core program. The success of that program led to the drilling of an additional 14,436 ft (4,400 m) in 15 core holes in 2007 to test surface anomalies, expand the area of previously intersected mineralization, and advance geologic and structural understanding of the deposit. Subsequent programs have continued to expand the resource, leading to consideration of development of the deposit. Concomitant programs have included geotechnical, engineering and metallurgical work, along with the collection of environmental baseline data. As of the end of 2014, AGA and THM completed exploration and delineation drilling totaling 575,078 ft (175,284 m) in 604 RC holes and 138,726 ft (42,284 m) in 149 core drill holes.
| International Tower Hill Mines Ltd. S-K 1300 – Technical Report Summary Livengood Gold Project Pre-feasibility Study | |
| 6. | Geological Setting and Mineralization and Deposit |
| 6.1 | Geological Setting and Mineralization |
The Livengood deposit is hosted by rocks of the Livengood Terrane (Figure 6-1), an east–west belt, approximately 150 mi (240 km) long, consisting of tectonically interleaved assemblages, which include: i) the Amy Creek assemblage, a sequence of latest Proterozoic and/or early Paleozoic basalt, mudstone, chert, dolomite, and limestone; ii) a Cambrian ophiolite sequence of mafic and ultramafic sea floor rocks thrust over the Amy Creek Assemblage, in turn overthrust by; iii) a sequence of Devonian clastic sedimentary, volcanic, and volcaniclastic rocks (Athey et al., 2004). The Devonian rocks are the dominant host to the mineralization at Livengood and have been informally subdivided into “Upper Sediments” and “Lower Sediments” stratigraphic units, separated by volcanic rocks (“Volcanics” or “Main Volcanics”, Figure 6-2 and Figure 6-3). The Devonian assemblage was overthrust by a second klippe of Cambrian ophiolite and structurally intercalated cherty sedimentary rocks (“Money Knob”, Figure 6-3). All of these rocks are intruded by post-thrusting, Cretaceous (91.7-93.2 My; Athey, Layer, and Drake, 2004) multiphase monzonitic and syenitic dikes; gold mineralization is spatially and temporally associated with these intrusive rocks.
| International Tower Hill Mines Ltd. S-K 1300 – Technical Report Summary Livengood Gold Project Pre-feasibility Study | |
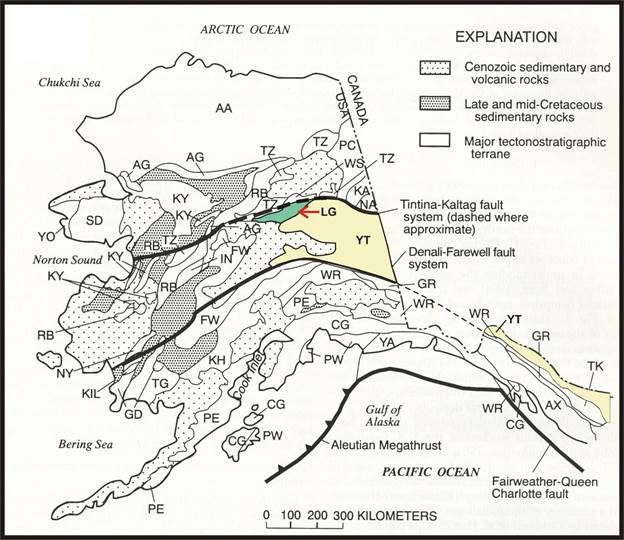
Figure 6-1: Terrane map of Alaska showing Livengood Terrane (LG: red arrow)
The heavy black line north of the Livengood Terrane is the Tintina Fault. The heavy black line to the south of the Livengood and Yukon-Tanana Terrane (YT) is the Denali Fault. The Tintina Gold Belt lies between these two faults (after Goldfarb, 1997)
| International Tower Hill Mines Ltd. S-K 1300 – Technical Report Summary Livengood Gold Project Pre-feasibility Study | |
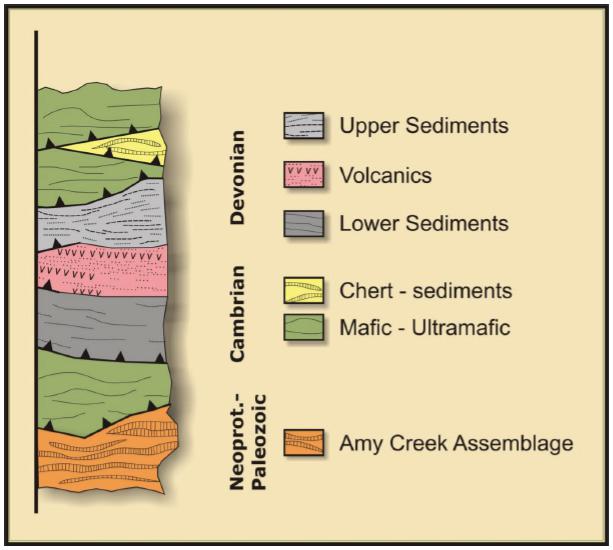
Figure 6-2: Diagrammatic thrust/stratigraphic column in the Livengood area
| International Tower Hill Mines Ltd. S-K 1300 – Technical Report Summary Livengood Gold Project Pre-feasibility Study | |
| 6.1.2 | Mineralization and Alteration |
Gold mineralization is associated with disseminated arsenopyrite and pyrite in volcanic, sedimentary and intrusive rocks, and in quartz veins cutting the more competent lithologies, primarily volcanic rocks, sandstones, and to a lesser degree, ultramafic rocks. Mineralization appears to be contiguous over a map area approximately 2.5 km2 (Figure 6-3); a 0.1 g/mt grade shell averages 920 ft (280 m) thick and drilling has not closed off the deposit at depth. The stronger zones of mineralization are associated with areas of more abundant dikes. South of the Lillian Fault (Figure 6-3 and Figure 6-4) individual mineralized envelopes are tabular and follow stratigraphic units, particularly the Devonian volcanics, or lie in envelopes that dip up to 45° to the south, mimicking the structural architecture and attitude of the diking. On the north side of the Lillian fault, mineralization is similar in style and orientation and hosted primarily in steeply dipping Upper Sediments. Three principal stages of alteration are currently recognized; in order from oldest to youngest, these are characterized by biotite, albite, and sericite. Arsenopyrite and pyrite were introduced primarily during the albite and sericite stages. Gold correlates strongly with arsenic and occurs primarily within and on the margins of arsenopyrite and pyrite grains. Carbonate was introduced with and subsequent to these stages. Dating of the sericite alteration (Athey, Layer, and Drake, 2004) indicates that mineralization and alteration were contemporaneous with the emplacement of the dikes.
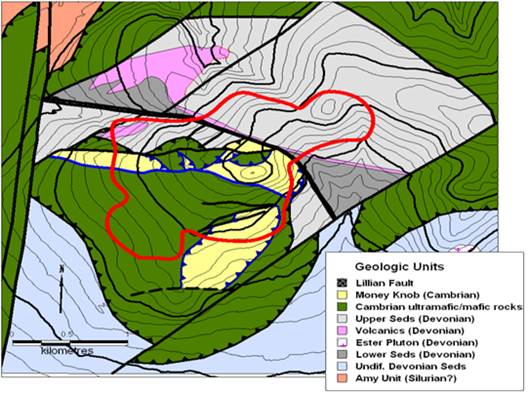
Figure 6-3: Generalized geologic map of the Money Knob area based on geologic work by THM
(Red outline is the surface projection of the gold deposit)
| International Tower Hill Mines Ltd. S-K 1300 – Technical Report Summary Livengood Gold Project Pre-feasibility Study | |
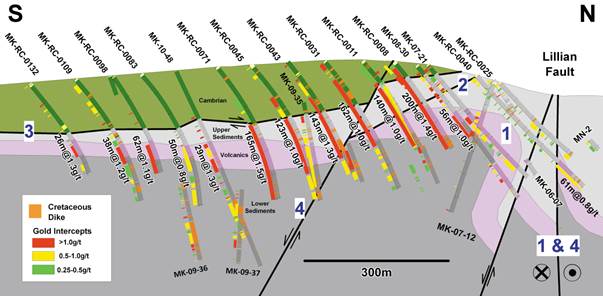
Figure 6-4: Cross section through the deposit
(Blue numbers indicate possible sequence of structural events: 1) Fold thrust development in the Permian (?); 2) NE-trending cross faults; 3) Thrust emplacement of Cambrian sheet; 4) Extensional collapse, all of which pre-date dike emplacement and coeval mineralization.)
| 6.1.3 | Massive Stibnite Veins |
Interpretations of the occurrence of massive stibnite veins (MSV) was interpreted using Leapfrog software. MSV host high concentrations of the element antimony (Sb). Sb is known to have an inverse relationship to Au metallurgical recoveries. Fifty-four individual occurrences of MSV have been identified within a corridor of Sb mineralization within the Livengood deposit. Figure 6-5 and Figure 6-6 display oblique view of the interpreted veins in relation to drill holes. Drilling shows other high grade Sb intercepts in the deposit.
| International Tower Hill Mines Ltd. S-K 1300 – Technical Report Summary Livengood Gold Project Pre-feasibility Study | |

Figure 6-5: Caption 3D view of MSV and >2,500 ppm Sb assays
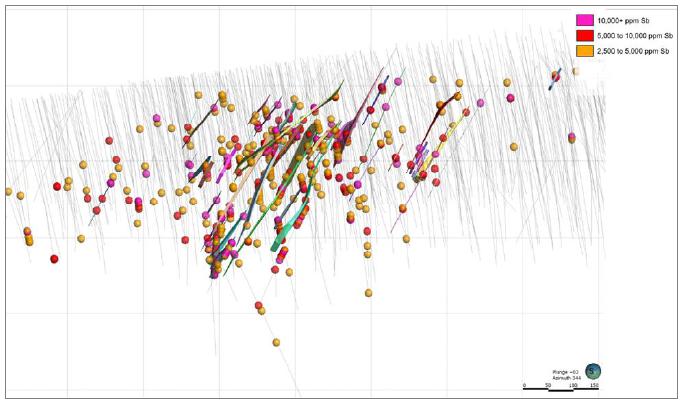
Figure 6-6: Caption 3D view of MSV and >2,500 ppm Sb assays
| International Tower Hill Mines Ltd. S-K 1300 – Technical Report Summary Livengood Gold Project Pre-feasibility Study | |
| 6.1.4 | Antimony Mineralization Halo |
Model iterations were evaluated to estimate the Sb distribution within the Livengood deposit.
Implicit models of the Sb distribution were generated in late 2017 using the overall Sb assay data available. The implicit contouring was conditioned by “vectors”, reflecting visual trends of continuity, and detected preferential alignments that guided the construction of the resulting Sb grade shells at a cut-off grade of 100 ppm.
The 100 ppm Sb shell volumetrics approximately reflect the proportion of Sb material reported to be above 100 ppm in the assay database, which suggests that about 20% of the overall mineral resources at Livengood are appreciably tainted by Sb.
It is to be noted that the modeling of the overall Sb distribution was not constrained by any of the rock units/ solids stratigraphic interpretation. Instead, the Sb distribution appears to be linked to structurally controlled domains, either some massive stibnite vein occurrences or zones of quartz-stibine veinlets reflecting, it is thought, some preferential vectors of continuity that could be related to post-mineralization structural features.
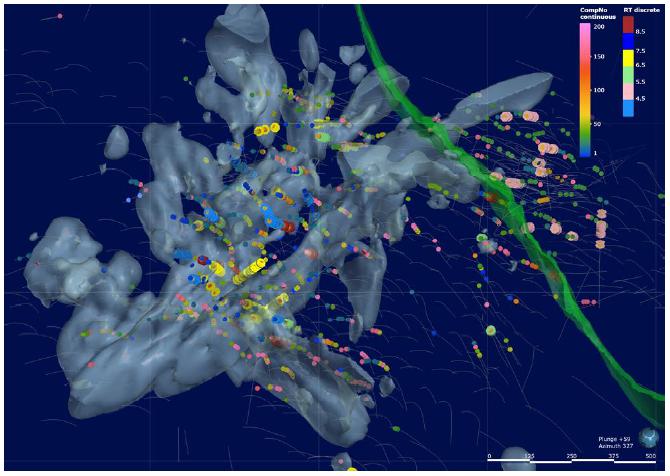
Figure 6-7: 3D view of the Sb_100ppm grade shell generated from preferential linear alignments
and chosen metallurgical composite samples spatial distribution
Note the green RT8 volcanic cross-cutting unit, for reference
| International Tower Hill Mines Ltd. S-K 1300 – Technical Report Summary Livengood Gold Project Pre-feasibility Study | |
Detailed review of the structural data and measurements specifically related to the Quartz-Stibnite-Vein (QSV) domain, as recorded over time, suggest the prevalence of structural trends within that particular QSV domain, which were modeled as structural form interpolants using Leapfrog.
The so-called “form interpolants”, shown as flowing sheets/ribbons (Figure 6-8), in return were used to guide the construction of grade shells while implicitly interpolating the Sb distribution. The resulting 100 ppm Sb shell appears as the meshed blue solid, truncated in Figure 6-9.
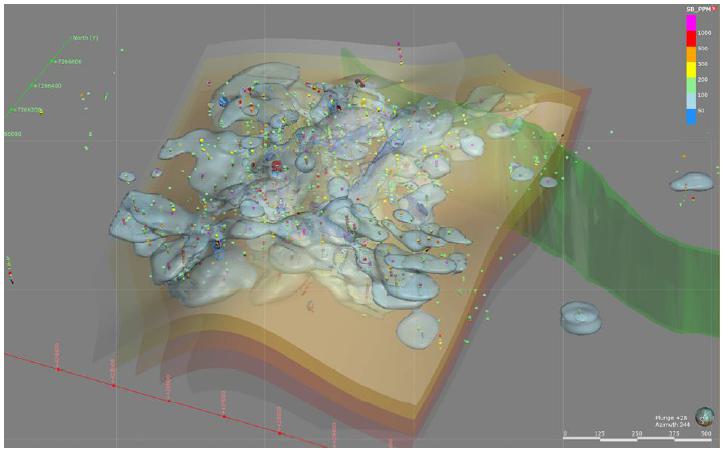
Figure 6-8: 3D view of the Sb_100 ppm grade shell
derived from structurally controlled “form interpolant/sheets” guiding the implicit modeling with Leapfrog
Note the green RT8 volcanic dike unit, for reference
| International Tower Hill Mines Ltd. S-K 1300 – Technical Report Summary Livengood Gold Project Pre-feasibility Study | |
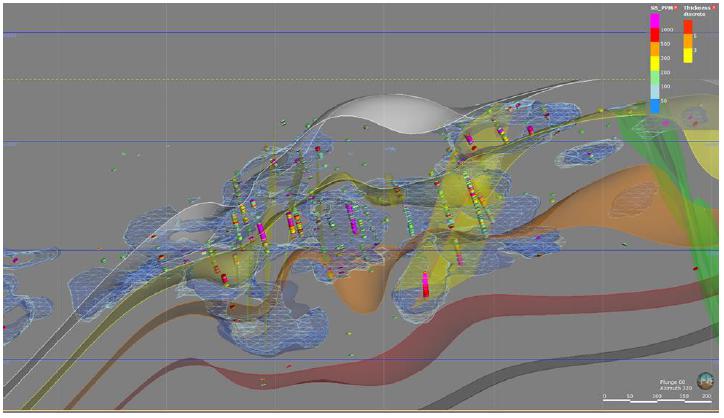
Figure 6-9: Cross section view of the Sb_100 ppm grade shell (meshed solid)
derived from structurally controlled “form interpolant/sheets” shown as ribbons
To the right, note the green RT8 volcanic cross-cutting unit, for reference
Among gold deposits of the Tintina Gold Belt, Livengood mineralization is most similar to the dike and sill-hosted mineralization of the Donlin Creek deposit, where gold occurs in narrow quartz veins associated with dikes of similar composition (Ebert, et al., 2000). The age of the intrusions and the coincidence of mineralization and intrusive rocks are typical of those of other nearby gold deposits of the Tintina Gold Belt, which have been characterized as intrusion-related gold systems (Newberry et al., 1995; McCoy et. al., 1997). For these reasons Livengood is best classified with these deposits.
| International Tower Hill Mines Ltd. S-K 1300 – Technical Report Summary Livengood Gold Project Pre-feasibility Study | |
Multiple companies have explored the Livengood area as outlined in Chapter 6. Among them, Cambior Inc. was chiefly responsible for outlining the sizeable area of anomalous gold in soil samples, which THM expanded between 2006 and 2010 (Figure 7-1) by collecting an additional 843 surface samples. These samples helped improve definition of anomalous gold in soil on the southwest side of Money Knob and to the northeast from Money Knob. The THM and Cambior samples were collected where C horizon material was available; the -80 mesh fraction was analyzed for gold and a multi-element package. The currently known deposit is defined by the most coherent and strongest gold anomaly, but represents detailed evaluation of only about 25% of the total gold-anomalous area.
During 2011, THM completed an IP/Resistivity survey covering the deposit and gold-anomalous soil geochemistry to the northeast, where loess and frozen ground have prevented complete geochemical coverage. The objective of the survey was to establish the geophysical signature of the deposit and identify similar signatures elsewhere in the district to prioritize exploration drilling.
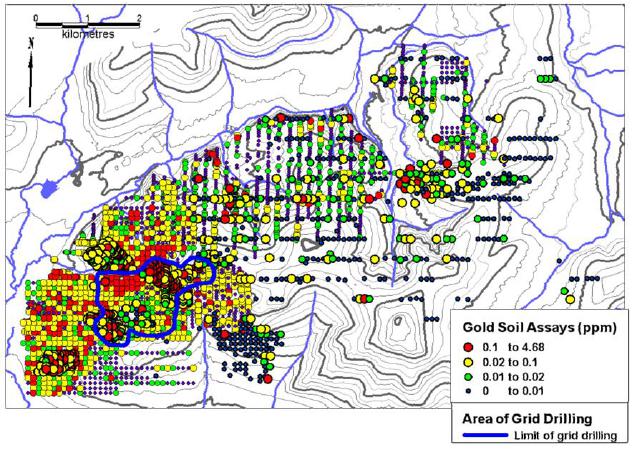
Figure 7-1: Plot of gold values in soil samples
(The surface projection of the known deposit is outlined in blue in the lower left corner of the figure)
| International Tower Hill Mines Ltd. S-K 1300 – Technical Report Summary Livengood Gold Project Pre-feasibility Study | |
THM conducted drilling programs on the Livengood property from 2006 through 2012 (Figure 7-2) utilizing both core and reverse circulation (RC) drilling. These programs initially outlined mineralization in the Core Zone south of the Lillian fault in 2006 and subsequently in the Sunshine Zone area north of the fault, beginning in 2009, through step-out drilling and drill testing of areas with anomalous values in surface soil samples. Through completion of the delineation drilling at the end of the 2012 season, THM and others have completed a total of 717,435 ft (218,674 m) of exploration and delineation drilling, of which 574,599 ft (175,138 m) was RC drilling and 140,854 ft (42,932 m) was core drilling.
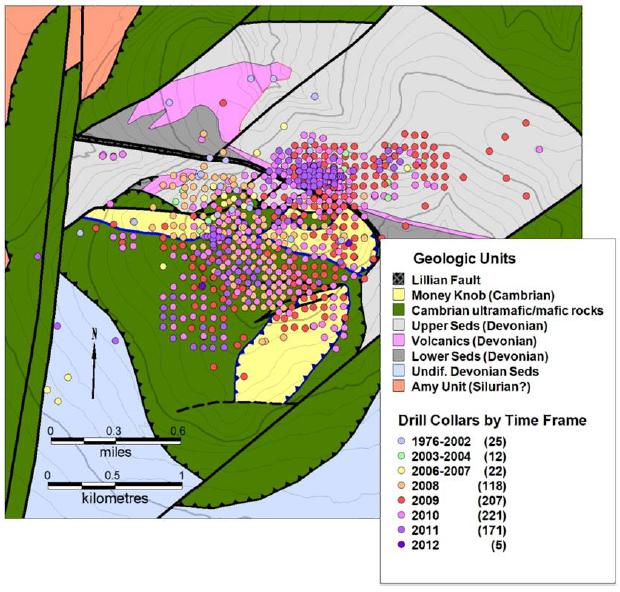
Figure 7-2: Distribution of resource / delineation drill holes in Money Knob area over time
(All holes completed after 2004 were drilled by THM. Drilling illustrated through 2011 dedicated to exploration and delineation; 2012 holes shown are geotechnical.)
| International Tower Hill Mines Ltd. S-K 1300 – Technical Report Summary Livengood Gold Project Pre-feasibility Study | |
Nearly all resource drill holes at Livengood have been drilled in a northerly direction at an inclination of -50° (RC) and -60° (core), to best intercept the south-dipping structures and mineralized zones as close to perpendicular as possible. A few holes have been drilled in other directions to test other features and aspects of mineralization. Initial grid drill holes were spaced at 246 ft (75 m) along lines and 246 ft (75 m) apart; subsequent infill drilling in the center of the 246 ft (75 m) square brings the nominal drill spacing to 164 ft (50 m) for a significant portion of the deposit.
Reverse circulation holes are bored and cased for the upper 0-100 ft (0-30 m) to prevent downhole contamination and to help keep the hole open for ease of drilling at greater depths. Recovery of sample material from RC holes is done via a cyclone and a dry or wet splitter, according to conditions. Drill cuttings are collected over the course of each 5 ft (1.52 m) interval and captured for a primary sample, an equivalent secondary sample (“met” sample) and a third batch of chips for logging purposes.
Diamond core holes represent 24% of the footage (meterage) drilled. Core is recovered using triple tube techniques to ensure good recovery (>92%) and confidence in core orientation. The core is oriented using either the ACTTM or the EZMarkTM tools.
Below the surface, drill hole locations are determined by sub-meter differential GPS surveys at the drill collar. The initial azimuth of drill holes is measured using a tripod mounted transit compass in conjunction with a laser alignment device mounted on the hole of the collar. Downhole surveys of RC drill holes and most core holes are completed using a gyroscopic survey instrument manufactured by Icefield Tools Corporation. Some core holes have been surveyed using the Reflex EZ ShotTM system. Results of surveys and duplicate tests show normal minor deviation in azimuth and inclination for drill holes (Brechtel, et al., 2011).
| 7.2.1 | Reverse Circulation vs Core Drilling |
On other projects, the use of reverse circulation (RC) drilling beneath the water table has resulted in inaccurate assay data, due to cyclicity and/or downhole contamination. As THM has used both RC and core drilling above and below the water table, THM has conducted a detailed evaluation of the RC data and comparison of the gold data for the two drilling techniques to check the accuracy of the RC data and evaluate any potential bias between the two drilling methods.
During RC drilling, cyclic contamination can occur if the driller fails to clean the drill hole prior to the addition of drill rods, which can be detected by grade spikes that occur with the addition of rods. Examination of the RC database indicated potential cyclic contamination in portions of six holes and one entire drill hole (Brechtel et al., 2011). The data for the affected intervals have been removed from the database used for resource calculation.
Detectable migration of mineralized material downhole, when drilling beneath the water table, can occur following penetration of a high-grade intersection and is manifested by a monotonic grade decrease for samples below the intersection. The frequency of monotonic decreases beneath high-grade intersections in both core and RC drill holes is statistically comparable; significant downhole contamination is not indicated for the RC drilling (Brechtel, et al., 2011).
| International Tower Hill Mines Ltd. S-K 1300 – Technical Report Summary Livengood Gold Project Pre-feasibility Study | |
Early in 2011, THM modeled the distribution and mean of gold grades for both types of drilling (Brechtel, et al., 2011). Table 7-1 compares the mean values by stratigraphic unit. The data suggests that, on average for the deposit, core gold grades (split HQ) are 4% lower than RC grades. The most notable contrast occurs in the Sunshine Zone above the water table, where the core grade is 20% lower than the RC grade.
Table 7-1: Comparison of modeled gold grades between core and RC drilling by stratigraphic unit
| Unit | Core vs RC Difference |
| Kint (dikes) | -6% |
| Cambrian | -3% |
| Main Volcanics | -3% |
| Sunshine Zone Upper Sediments above water table | -20% |
| Sunshine Zone Upper Sediments below water table | +6% |
| All Data | -4% |
Based on this work, an area in the Sunshine Zone (Area 50, Figure 7-3) and above the water table was selected for detailed drilling to further evaluate the relationship between core and RC results, where the discrepancy was the greatest. Area 50 was drilled out to nominal 123 ft (37.5 m) spacing to the water table (approximately 492 ft (150 m) below surface). The drilling included a mix of HQ core (7 drill holes sawn in half for sampling), PQ core (23 holes sampled whole), and RC drilling (28 holes), providing the opportunity to re-examine the difference between core and RC samples. All Area 50 samples were composited to 16.4 ft (5 m) lengths and grades modeled. The results are illustrated in Figure 7-4. For Area 50, the modeled mean PQ grade is 92% of that calculated for RC drilling, and the modeled HQ grade is 71% of the RC grade and 77% of the PQ grade, indicating that sawn HQ core recovers significantly less gold than either whole PQ core or RC sampling; PQ sampling is closer to RC sampling, but still lower. Ordinary kriging of the resource within the Area 50 volume by sample type bears out this relative relationship (contained gold based on PQ core is 94% of that based on RC; for HQ the contained gold is 80% of that calculated using RC) (Table 7-2).
Because the gold at Livengood is relatively coarse, the relative sample volume (e.g. RC with a 5-in (127 mm) diameter, whole PQ core with a 3.3 in (83 mm) diameter, and HQ core with a 2.4-in (61 mm) diameter that has been halved) is likely the root cause of the grade discrepancies between core and RC, due to the nugget effect. Split HQ core comprised 13% of the composites used to calculate the August 2011 resource. Based on the results above, it can be concluded that the resource is not significantly overstated and may be slightly understated.
| International Tower Hill Mines Ltd. S-K 1300 – Technical Report Summary Livengood Gold Project Pre-feasibility Study | |
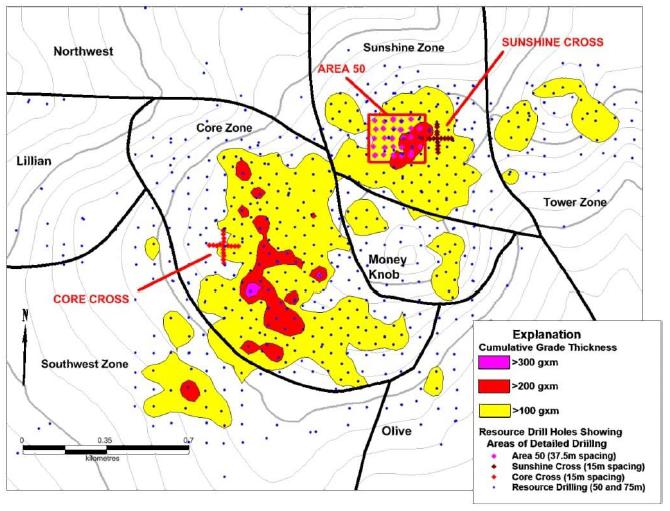
Figure 7-3: Map showing location of areas of detailed drilling
(Area 50, Sunshine Cross and Core Cross)
In addition, the mineralization in the Sunshine Zone (Area 50) is characterized by quartz-carbonate-sulfide veinlets that have a significantly higher proportion of associated coarse gold relative to the remainder of the deposit. Where the mineralized material is partially oxidized, the carbonate and sulfide are leached out, rendering the veinlets friable with the core often breaking along them. The most probable explanations for the greater discrepancies in grade in the Sunshine Zone above the water table are: i) loss of gold due to less than 100% core recovery (average 92%), and ii) progressive loss of gold with increased handling of the sample material, e.g. the HQ core was boxed, then taken from the boxes and sawn in half lengthwise then bagged (most handling), the PQ core was boxed, then transferred whole directly into sample bags (less handling), and the RC samples were bagged directly on the rig (no handling). This effect would be most pronounced in oxidized zones of the deposit, but could also occur in unoxidized rocks if they are badly broken and core recovery is less than 100%.
| International Tower Hill Mines Ltd. S-K 1300 – Technical Report Summary Livengood Gold Project Pre-feasibility Study | |
Table 7-2: Calculated resources for Area 50 by drill sample type
(Ordinary kriging of 32.8 ft (10 m) composites, 0.25 g/mt cut-off)
| Drill Sample Type | Metric Tons (Mmt) | Tonnage Ratio | Au Grade (g/mt) | Grade Ratio | Au (oz) | Au Ratio |
| RC drilling | 16.73 | | 0.575 | | 309,114 | |
| PQ drilling, PQ/RC ratios | 15.95 | 0.953 | 0.566 | 0.984 | 289,981 | 0.938 |
| HQ drilling, HQ/RC ratios | 15.14 | 0.905 | 0.510 | 0.887 | 248,061 | 0.802 |
| HQ/PQ ratios | | 0.949 | | 0.901 | | 0.855 |
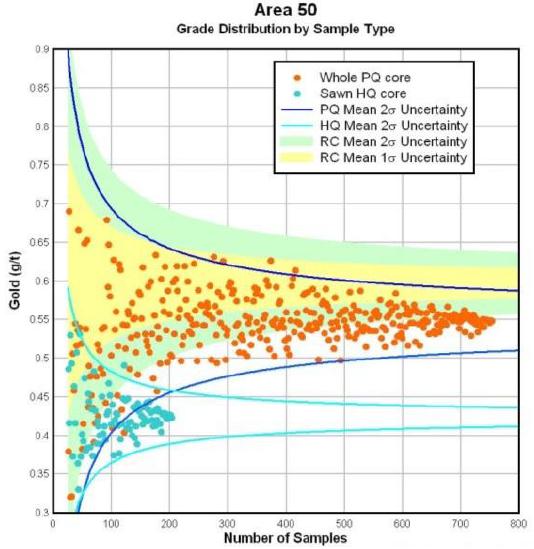
Figure 7-4: Models for RC, Whole PQ, and Sawn HQ from Area 50
(Based on 869 RC Composites, 753 PQ Core Composites, and 203 HQ Core Composites (all composited to 16.4 ft (5 m)). The modeled grade means for the RC, PQ and HQ composites in Area 50 are 0.597, 0.549 and 0.424 g/mt gold, respectively.)
| International Tower Hill Mines Ltd. S-K 1300 – Technical Report Summary Livengood Gold Project Pre-feasibility Study | |
| 7.2.2 | Resource Verification Drilling |
Two areas of the deposit, the Core and Sunshine crosses, were selected for 49 ft (15 m) spaced reverse circulation (RC) in-fill drilling on crosses with north-south and east-west legs 492 ft (150 m) in length (Table 7-3) to demonstrate continuity of grade and, thereby, confidence in the resource based on the wider spaced grid drilling defining the resource. A third area, Area 50, measuring 640 ft (195 m) by 787 ft (240 m) at the surface, was drilled on a 123 ft (37.5 m) grid with alternating core and RC drilling. Two resources were generated for each volume using ordinary kriging on samples composited to 33 ft (10 m) lengths: the first including those portions of the 164 ft (50 m) grid drilling (May 2011 resource) within the volume; and a second using both the grid and close-spaced drilling within the same volume. On average, the effect of the increased drilling density on tonnage, grade, and contained ounces of gold is negligible (less than 1%; see Table 123), indicating that current grid spacing adequately defines the resource.
Table 7-3: Calculated resources for the Core Cross, Sunshine Cross and Area 50
(Ordinary kriging, 0.25 g/mt cut-off)
| Area, Drill Hole Spacing (1) | Metric
Tons (Mmt) | Tonnage Ratio (all/grid) | Au Grade (g/mt) | Grade Ratio | Au (oz) | Au Ratio (all/grid) |
| Core Cross, 50 m grid & 15 m infill | 15.67 | | 0.481 | | 242,401 | |
| Core Cross, 50 m grid drilling only | 15.37 | 1.020 | 0.477 | 1.008 | 235,715 | 1.028 |
| Sunshine Cross, 50 m grid & 15 m infill | 9.82 | | 0.553 | | 174,647 | |
| Sunshine Cross, 50 m grid drilling only | 9.81 | 1.001 | 0.566 | 0.977 | 178,556 | 0.978 |
| Area 50, all drilling (37.5 m) | 16.04 | | 0.562 | | 289,685 | |
| Area 50, 50 m grid drilling only | 16.13 | 0.994 | 0.550 | 1.022 | 285,136 | 1.016 |
| All areas (averages) | | 1.005 | | 1.002 | | 1.007 |
Note: 1 m = 3.28 ft
The author is unaware of any sampling or recovery factors that could materially impact the accuracy and reliability of the drilling results for the Livengood Gold Project.
| International Tower Hill Mines Ltd. S-K 1300 – Technical Report Summary Livengood Gold Project Pre-feasibility Study | |
| 8. | Sample Preparation, Assaying and Security |
| 8.1 | Sample Collection, Procedures and Security |
THM samples all holes from surface to total depth. Since 2009, core from the deposit is quick-logged in the split tube at the drill site, then boxed and transported by the geologist to the core logging facility in camp for detailed logging and sample markup. Samples lengths, based on geologic criteria, range from 1 ft (0.3 m) to 5 ft (1.52 m). After logging, the core is sawn in half longitudinally and sampled on the specified intervals into bags. Past procedures, largely similar, are documented in Brechtel et al. (2011).
RC samples (an “original” and a duplicate) are collected at the rig, as described in Chapter 10, directly into bar-coded bags, which are printed and coded with the hole number and sample interval. The samples are transported by project personnel from the drill site to camp, where they are logged in using a bar code reader slaved to a portable Thermo Fisher Scientific NITONTM XRF analyzer (used to collect geochemical data on all the RC samples).
When all samples for a drill hole are accounted for, a sample shipment is assembled by adding control samples for quality assurance and quality control (QA/QC). One standard (certified gold content) purchased from RockLabs or Geostats and one blank (below detection limit for gold) are added for every 18 drill samples in the shipment. Shipment paperwork is prepared for the lab and includes instructions for the preparation of prep duplicates (1 per 20 drill samples). All core samples are weighed and the weights recorded. The shipment is bagged in sealed containers and the seal numbers are recorded on the sample submittal form. The shipments are picked up at the Project site by ALS USA, Inc. (ALS) lab personnel, who acknowledge receipt and custody of the samples by signing a copy of the submittal form, which is retained in the Project files.
Drill samples were weighed upon receipt at the ALS prep lab in Fairbanks. RC samples are then dried and re-weighed. The samples are crushed (-10 mesh) and a 1 kg fraction is pulverized. Aliquots for analysis and the coarse rejects are also weighed. The tracking of weights from the field through the sample preparation process permits the detection of sample switches and/or number transcription errors. ALS forwards pulps from the Fairbanks prep lab to Vancouver or Nevada for analysis. Samples are analyzed by standard 50 g fire assay/AA finish for the gold determinations. All core samples and select RC drilling samples are also submitted for multi-element ICP-MS analyses using a 4-acid digestion technique. These are standard analyses for the exploration industry and are performed to a high standard. ALS is accredited by the Standards Council of Canada, NATA (Australia) and also has ISO 17025 and 9001 accreditations.
| International Tower Hill Mines Ltd. S-K 1300 – Technical Report Summary Livengood Gold Project Pre-feasibility Study | |
| 8.3 | QA/QC Procedures and Results |
ALS analytical reports are reviewed when received to: i) verify shipped vs received weights for core and dry weights against coarse rejects plus sample aliquots for all samples to check for weight loss or gain that indicates sample mixing, switches or transcription errors; and ii) blanks and standards with “out-of-range” values (±10% for standards and 3x detection limit for blanks). Errors are flagged and reported to ALS for resolution. If required, samples with questioned results and the surrounding 10 samples are re-analyzed. Upon satisfactory resolution of any discrepancies, new analytical certificates are issued by ALS.
In addition, duplicate gold pulp analyses and check assays with a second lab are requested on an annual basis. These analyses, and those for field duplicates and prep duplicates, are examined to evaluate the laboratory prep and analytical process. These data indicate no systematic bias introduced in the sample prep or gold assaying procedures, but do show scatter in the gold data, particularly at higher grades, which is interpreted as the product of nugget effect, typical for deposits with free gold. Results and detailed analysis of the data for 5,466 prep duplicates, 5,173 pulp duplicates, standard materials, and check assays are reported in Brechtel, et al., 2011.
As a further check on the integrity of gold assaying, 2,096 samples were selected for 1 kg screen fire assays for comparison to the standard 50 g fire assay/AA finish results routinely used by THM (Brechtel, et al., 2011). The mean gold grade for the samples is very similar for both data sets (within 0.1%). In detail, the data suggest that the standard fire assays are lower or equal to the screen fires at gold grades up to 9 g/mt. At grades over 9 g/mt, the 50 g assays may over-represent the gold grade, but at Livengood the number of samples at these grades is very small (<0.2% of the sample population).
| 8.4 | Data Collection, Entry and Maintenance |
Two master Project databases are maintained in Microsoft™ Access by THM: i) a drill hole database containing all the data collected in the field, including drill hole locations, downhole surveys, geologic logging, NITON™XRF geochemistry and sample interval data; and ii) an assay database that is the repository of all laboratory generated analytical data.
Data gathered electronically in the field is uploaded daily to the drill hole database utilizing custom queries. These data include RC drill logs and NITON™XRF geochemistry, collar locations and gyroscopic downhole survey data. Core logging and sampling information is collected on paper and hand entered. Once data is entered, database internal subroutines check the data for errors (i.e. gaps and overlaps in logging or sampling intervals) and data format consistency. Analytical data from ALS is received electronically, uploaded to the assay database and merged with the sample interval data read from the drill hole database. Customized queries check blank and standard analyses and flag out of range values.
The databases and all raw data are stored on a hard drive in the field office, which is copied automatically daily to the server in the Fairbanks office, where tape backup of the server is conducted nightly with rotation of tapes into offsite storage.
In the opinion of the author, the sample preparation, sample security and analytical procedures are adequate for the Livengood Gold Project.
| International Tower Hill Mines Ltd. S-K 1300 – Technical Report Summary Livengood Gold Project Pre-feasibility Study | |
When the QP from RDA visited the Project, they were given unfettered access to the core logging facility and witnessed firsthand the procedures that were in place. No limitations were placed on the QP for any reason. In the opinion of the QP, the data at Livengood is adequate for the purposes of grade estimation for the Project.
The QP examined core during the site visit. Observations were that drill logs, cross sections and maps were done to a high quality. From 2006 through 2009, Dr. Paul Klipfel annually, and independently, collected a total of 80 samples from outcrops (2006), and both RC and core drill holes for gold analysis. Comparison of the results to THM’s original gold assays indicates a scatter due to the nugget effect, but no systematic bias in the data (detailed discussion in Brechtel, et al., 2011). The QP reviewed the results of the 2009 verification sampling and agrees with the conclusions regarding accuracy, precision and lack of bias. Additionally, in 2010, 39 drill samples were collected for verification. The 2010 samples show a good overall correlation with the results reported by THM, with precision similar to or better than the analyses reported by the author in 2011 (Brechtel, et al., 2011). The QP has not verified all sample types or material reported, but to the best of their knowledge, THM has been diligent in their sampling procedures and efforts to maintain accurate and reliable results.
| International Tower Hill Mines Ltd. S-K 1300 – Technical Report Summary Livengood Gold Project Pre-feasibility Study | |
| 10. | Mineral Processing and Metallurgical Testing |
This chapter presents the pertinent results from the testwork leading up to the 2013 feasibility study (FS), the post-FS test results that were obtained leading up to the 2017 pre-feasibility study (2017 PFS), as well as the post-2017 PFS test results that were obtained leading up to the 2021 PFS. The chapter begins with an outline of sample selection and preparation for the FS test programs (Section 10.2). This is followed by a discussion on the mineralogy and gold deportment of the Livengood gold ore rock types (Section 10.3), work that had been completed for the FS. Design work and equipment descriptions in this Chapter are reported in imperial units, with metric units shown in parentheses. Every effort has been made to clearly display the appropriate units being used throughout this TRS, certain tables show results in metric units only.
Comminution testing and the results of grinding simulations as they relate to mill circuit design and throughput estimation are covered in Section 10.4. Comminution testing was conducted in the following test programs:
| § | FS – Design Comminution Test Program; |
| § | FS – Variability Comminution Test Program; |
| § | PFS – SMC Testwork (2015-2016). |
Metallurgical testing results and how these relate to back-end (post-comminution) plant design are discussed in Section 10.5. Metallurgical testing was performed in the following test programs:
| § | FS – Optimization Test Program; |
| § | FS – Variability Test Program; |
| § | 2017 PFS – Continuous Test Program; |
| § | 2017 PFS Phase 7 – Assay procedures and water source testing; |
| § | 2017 PFS Phase 8 – Grind, leach recovery, gravity, flotation testing; |
| § | 2017 PFS Phase 9 – SGS and FLS / Curtin University test program, grind, leach recovery, gravity testing; |
| § | 2017 PFS Phase 10 – Stirred tank reactor (STR) testing of rock types RT7 and RT9. |
| § | 2021 PFS Phase 9a – Cyanide leach testing; |
| § | 2021 PFS Phase 9b – Gravity recovery, stirred tank reactor (STR), gold deportment, diagnostic leach and flotation testing; |
| § | 2021 PFS Phases 11 and 12 – Gold grade/recovery and grind size/recovery relationships both inside and outside the 100 ppm antimony shell. |
| § | 2021 PFS Phase 13 – antimony concentration/gold recovery relationships. |
| International Tower Hill Mines Ltd. S-K 1300 – Technical Report Summary Livengood Gold Project Pre-feasibility Study | |
The metallurgical testwork chapter includes discussion on gravity recovery, flotation, leach pre-conditioning, CIL, intensive leach (IL) testing, settling, cyanide detoxification and other topics as they relate to plant design. Phases 9, 9a, 9b and 11 and portions of Phase 13 represent the test programs that used RC rig duplicate rock chips in composite samples. All other test programs were based on drill core composite samples.
The chapter closes with a discussion on recovery equations (Section 10.6) and consolidates all testwork conclusions and a number of trade-offs as they relate to process flowsheet development (Section 10.7); potential opportunities for future testwork are then given (Section 10.8).
| 10.2 | FS – Sample Selection and Preparation |
As part of the work leading up to the FS, samples were selected by THM and RPA (Altman, K. 2013) and submitted to SGS for design and variability comminution composite preparation (Tajadod, J. and Lang, J., 2013).
Sample selection focused on the preparation of large bulk composite samples, which were used for flowsheet optimization testing and comminution testing. A number of variability samples were selected to test the variation in the orebody and to examine how the metallurgical response changes based on the feed grade for each of the rock types.
A mine production schedule that was developed prior to the 2013 FS was used to establish average gold grade targets to help guide the sample selection.
SGS Vancouver received two shipments in February and March 2012, originating from the Livengood property and submitted by THM. The material that was shipped was composed of approximately 3,000 individual samples, which were used for the optimization, design comminution and variability testing (Table 10-1).
Table 10-1: Livengood gold ore sample selection weights (kg) used in the FS test programs
| FS Test Program | Sample Weight (kg) |
| Optimization | 4,800 |
| Design comminution | 2,700 |
| Variability | 3,000 |
The Livengood rock types were identified on the basis of their lithology. The six rock types identified in Table 10-2 below accounted for 100% of the reserve at that time.
| International Tower Hill Mines Ltd. S-K 1300 – Technical Report Summary Livengood Gold Project Pre-feasibility Study | |
Table 10-2: Definition of Livengood rock types (FS)
| Rock Type | Description | % Ounces (of P&P) (1) | % Tons |
| RT4 | Cambrian | 13.1 | 13.9 |
| RT5 | Upper Sediments – Sunshine Zone | 23.5 | 28.2 |
| RT6 | Upper Sediments | 19.5 | 18.4 |
RT7 Bleached | Lower Sediments – South of Lillian Fault | 13.5 | 12.1 |
| RT8 | Volcanics – North of Lillian Fault | 1.9 | 2.0 |
| RT9 | Volcanics – South of Lillian Fault | 28.5 | 25.4 |
During the FS, rock type RT7 was further designated as “bleached” or “unbleached” material to account for the differences in the alteration and other factors of the samples. RT7 unbleached was not included in potential ore. The sample compositing instructions did contain some errors, so some of the RT7 samples were mixed up and in other cases bleached and unbleached material was combined.
For the design comminution test program, each sample interval was selected and added to the composite, blended, and homogenized. From each composite, 20 rocks (-3 /+2 in) were selected for the Bond low-energy impact (CWi) test. Each composite was then crushed to 100% minus 2½ in and 65 kg was split for the JK Drop Weight (DWT) test. The remaining sample was crushed to nominal 1¼ in and 5 kg was split for the Bond abrasion (Ai) test. The remaining sample was stage-crushed to ½ in and 15 kg was split for the Bond rod mill grindability (RWi) test. Finally, the remaining sample was stage-crushed to 6 mesh and 10 kg was split for the Bond ball mill grindability (BWi) test. The FS Design comminution sample preparation flowsheet is illustrated in Figure 10-1.
| International Tower Hill Mines Ltd. S-K 1300 – Technical Report Summary Livengood Gold Project Pre-feasibility Study | |
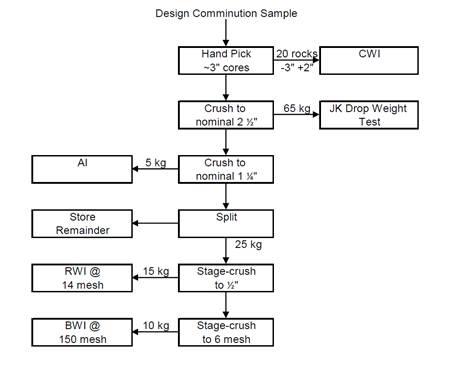
Figure 10-1: FS Design comminution sample preparation flowsheet (SGS report)
For the comminution portion of variability testing, each sample interval was selected and added to the composite, blended and homogenized. Every sample was crushed to nominal 2½ in and 10 kg was split for the SPI test. The remaining sample was stage-crushed to nominal 6 mesh, blended, and a 10 kg portion was split for the BWi test. The comminution variability sample preparation flowsheet is illustrated in Figure 10-2.
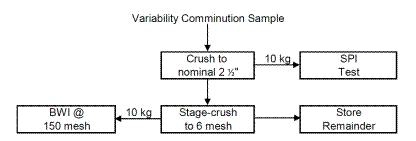
Figure 10-2: FS Variability comminution sample preparation flowsheet
| International Tower Hill Mines Ltd. S-K 1300 – Technical Report Summary Livengood Gold Project Pre-feasibility Study | |
Both the design comminution and variability samples were selected from the major rock types (RT4, RT5, RT6 and RT9). Rock types RT7-Bleached, RT7-Unbleached and Stibnite were also tested in the comminution variability test program. RT8 was not tested in any of the test programs. RT7-Bleached and RT7-Unbleached labels were later removed and sample results were combined and renamed RT7.
| 10.3 | FS – Mineralogy and Gold Deportment Study |
SGS (Wang, Z. and Prout, S., (2013)) undertook a high definition mineralogical examination of the Livengood samples that were used for the FS metallurgical testwork. Examination of four samples, which were identified as RT4, RT5, RT6, and RT9, was carried out using X-ray diffraction (XRD), QEMSCAN, Electron Microprobe Analysis (EMPA), optical microscopy, and chemical analysis. The purpose of this test program was to determine the overall mineral assemblage, the liberation/association of the iron sulfides and gold-bearing minerals, as well as to complete a mass balance of microscopic gold.
The RT4 sample consisted of carbonates (22.5%), talc (18.6%), quartz (16.0%), feldspars (13.1%), chlorite (11.0%), micas (6.4%), and other silicates (mainly amphibole, pyroxene, garnet and epidote) (4.7%), clays (2.5%), oxides (1.8%), along with trace (<1%) apatite and other minerals. Arsenopyrite accounted for 1.9% and pyrite for 0.9%. Gold minerals were tentatively quantified in the sample at less than 0.001%.
The RT5, RT6 and RT9 samples consisted of quartz (33.0-40.2%), micas (11.8-16.9%) feldspars (21.7%-27.7%), carbonates (3.7-7.2%), and oxides (1.5-2.1%), along with trace (<1%) talc, apatite and other minerals. Pyrite accounted for 2.9-10.5%, arsenopyrite (1.0-1.4%). Gold minerals were tentatively quantified in the samples at less than 0.001%.
In the four samples, gold occurred mainly in its native form (defined as Au 75-100%), and carried an average of 90.8-93.5 wt% Au, while all other elements were less than 1.0 wt%.
The results of the gold deportment characterization demonstrated that RT5, RT6 and RT9 all exhibited broadly similar characteristics. Rock types RT6 and RT9 demonstrated poor correlation with chemical assays, suggesting that the contribution of finer gold populations may be more significant in these ore domains. Rock type RT4 showed significant variation in both mineralogical composition and identified gold populations. It would be anticipated that RT4 may cause difficulties in recovery for a process tailored to the other ore domains.
Rock types RT5 and RT6 had pyrite as the dominant sulfide mineral over arsenopyrite. Rock type RT9 maintained this trend, but with <10% arsenopyrite (relative to pyrite) present. Generally, solid solution gold could be expected to be hosted with arsenopyrite and consequently the potential contribution of solid solution gold to the overall gold balance should not be expected to be significant in these rock types.
Rock type RT4 showed arsenopyrite to be the dominant sulfide mineral. However, the abundance of sulfide minerals was generally lower in this rock type, once again suggesting that solid solution gold should not be a major factor in process development.
| International Tower Hill Mines Ltd. S-K 1300 – Technical Report Summary Livengood Gold Project Pre-feasibility Study | |
Comparison of the four rock types examined for the Project demonstrated a consistent trend for the majority of gold to be present as free gold within the gravity concentration size range. The majority of gold grains that were not within the gravity recoverable range were identified as fine exposed gold grains and should be readily amenable to recovery by CIL leaching of the gravity tailings.
Comminution testwork programs were completed as part of the 2013 FS and the 2017 PFS. In both cases, the objective was to generate the information needed to size the crushing and grinding circuits for the Project.
| 10.4.1 | FS – Comminution Testing |
Comminution testing was performed on samples that comprised part of the optimization samples, as well as the variability samples. Samples were selected based on the potential mill supplier’s recommendations
Design comminution samples were prepared in accordance with Figure 10-1. A total of 12 DWTs were performed on rock types RT4, RT5, RT6, RT7-Bleached, RT7-Unbleached and RT9. Priority was given to the DWT, due to limitations in the availability of PQ core.
A total of 36 samples were prepared for comminution testing, including: Bond Work index (BWi), Rod Work index (RWi), Crusher Work index (CWi) and Abrasion index (Ai). These indexes were applied in the crusher and mill sizing calculations as well as for determination of consumables, such as balls and liners.
Additional SAG power index (SPI) and BWi tests were completed using variability samples. The total number of BWi tests was 136.
The average BWi, RWi, CWi and Ai for each of the above rock types are presented in Table 10-3.
Table 10-3: Comminution data (FS)
| Rock Type | Work Index Metric (kWh/mt) |
| BWi | RWi | CWi | Ai |
| RT4 | 12.3 | 13.1 | 13.3 | 0.14 |
| RT5 | 11.9 | 15.7 | 14.1 | 0.15 |
| RT6 | 14.4 | 17.3 | 14.4 | 0.12 |
| RT7 | 14.1 | 14.5 | 7.7 | 0.17 |
| RT9 | 14.3 | 16.3 | 7.4 | 0.35 |
| Total Number of Tests | 136 | 26 | 48 | 48 |
| International Tower Hill Mines Ltd. S-K 1300 – Technical Report Summary Livengood Gold Project Pre-feasibility Study | |
JK Drop Weight (DWT) tests were performed on selected rock type samples. The data obtained was analyzed to determine the JKSimMet comminution parameters. These parameters were combined with equipment details and operating conditions to analyze and/or predict grinding circuit performance. While the A and b values of the DWT are not independent and cannot be used for direct comparison between ore types, their product (A×b) provides a good parameter for comparison. Lower A×b values indicate a higher resistance to abrasion breakage and also a greater resistance to impact breakage. Table 10-4 below, shows the average A and b values for each rock type. The results indicated that RT4 and RT7 would require less comminution energy than the other rock types. The numbers are indicative of a medium hard rock type.
Table 10-4: Average JK drop weight parameters by rock type (FS)
| Rock Type | Number of Tests | A | b | A×b |
| RT4 | 2 | 62.1 | 0.83 | 51.5 |
| RT5 | 2 | 67.6 | 0.50 | 33.8 |
| RT6 | 2 | 50.7 | 0.64 | 32.5 |
| RT7 | 4 | 55.4 | 0.89 | 49.3 |
| RT9 | 2 | 60.5 | 0.58 | 35.4 |
| Total Tests | 12 | |
| 10.4.1.1 | FS – JKSimMet Simulations |
Analysis of the JK Drop Weight parameters was performed by Mark Richardson of CSS using JKSimMet, a software package used to analyze the grinding circuit, which was comprised of a single (D×L) 40 ft × 25 ft SAG mill, followed by two (D×L) 28 ft × 45 ft ball mills, with a pebble crusher operated in closed circuit with the SAG mill. Following optimization, the JKSimMet results led to the conclusion that the selected circuit would process about 92,600 t/d (84,000 mt/d).
It should be noted that one vendor recommended the use of a (D) 42 ft. SAG mill to achieve the target throughput. Consideration was given to this size of mill, but it was decided that a “first of its kind” (D) 42 ft SAG was not warranted, due to a lack of reference sites with proven track record in the industry at the time of the FS.
After further consultation, the JKSimMet model was rerun using the following new parameters:
| § | Circuit target grind of 90 µm (P80); |
| § | Daily throughput of 100,000 t/d (90,718 mt/d); |
| § | BWi (14.3 kWh/mt) corresponding to the 75th percentile of LOM hardness. |
The simulation resulted in a circulating load of 15% through the pebble crusher and a circulating load of 350% running through the ball mill circuit. The proposed circuit used a single (D × L) 40 ft × 26 ft SAG mill with 27 MW of installed power and two 28 ft × 46 ft ball mills with 29.5 MW of installed power each.
| International Tower Hill Mines Ltd. S-K 1300 – Technical Report Summary Livengood Gold Project Pre-feasibility Study | |
The decision was made to accept the vendor recommendation, but to also install a bypass after the pebble crusher, to allow the option to shift some of the SAG load downstream to the ball mill circuit as a way to balance the power draw in the circuits.
| 10.4.2 | 2017 PFS – Comminution Testing |
BBA completed a review of the FS comminution testwork (“Comminution testing of samples from the Livengood Property”. SGS report 50223-001-Phase III, com Report 3. February 26, 2013). Based on the review, BBA made the recommendation to carry out additional comminution testwork (SMC testing) to increase the level of confidence in the parameters used to design the grinding circuit and gain further insights into the variability of the Livengood gold ore’s comminution properties.
| 10.4.2.1 | 2017 PFS – SMC Testwork Program (2015-2016) |
SMC testwork was performed in January 2016 at SGS Vancouver to increase understanding of the ore variability by rock type in support of the grinding circuit development.
Ten composites were prepared for each rock type. Each composite was made up of several drill core intervals. The composite weights ranged from 12 to 26 kg. The samples making up a composite were all properly bagged and labeled according to the rock type (e.g. RT4) and composite number (1-10), i.e. RT4-1, RT4-2, up to RT4-10. The samples that made up the composites were bagged and labelled according to drill hole number and sample number. All samples within a composite came from a single drill hole.
BBA requested that Stephen Morrell (SMC Testing®) be engaged to assist in calibrating the SMC test results using the DWT data from the 2013 FS. This procedure is a required step in BBA’s practices to ensure that the calibration of the SMC results is performed using data from DWT tests from the same deposit and ore types as opposed to using generic databases available through JKTech (owners of JKSimMet). The calibration of the SMC results for each of the rock types (RT4, RT5, RT6, RT7, and RT9) was completed using the DWT data that corresponded to each specific rock type.
Table 10-5 shows the average as well as the 50th and 80th percentile results of the SMC testwork. Based on BBA’s experience and internal database, the RT5 and RT9 ore could be classified as hard, as the 50th percentile (50th) of the A×b data is in the low 30s. On this same basis, rock types RT6 and RT7 would be considered medium hard (50th in the 40s), and RT4 would be considered the softest of the rock types present in the Livengood deposit (50th = 73).
It is important to note that for most of the rock types there is only a small difference between the 50th and 80th A×b values. With the exception of RT4, the results suggest that there will not be significant grinding throughput variability from one rock type to another. In the case of RT4, ore blending with other rock types should be considered to moderate this issue.
| International Tower Hill Mines Ltd. S-K 1300 – Technical Report Summary Livengood Gold Project Pre-feasibility Study | |
When comparing the comminution results from the 2017 PFS to the 2013 FS, the 50th A×b results for the RT4 rock type was lower (the ore was softer) than the average of the DWT results from the FS. The 50th A×b results for rock types RT5, RT6, and RT9 were of the same order as the average of the DWT results from the FS. In the case of RT7, the 50th was slightly harder than the average of the DWT results from the FS.
Table 10-5: SMC testwork statistical analysis (2017 PFS)
| RT | Number of
Tests | Samples ID | A×b Average | A×b 50th percentile | A×b 80th percentile |
| 4 | 10 | RT4-1 to 10 | 75.0 | 73.1 | 57.1 |
| 5 | 10 | RT5-1 to 10 | 36.7 | 33.4 | 29.3 |
| 6 | 10 | RT6-1 to 10 | 44.4 | 38.5 | 31.3 |
| 7 | 10 | RT7-1 to 10 | 47.9 | 40.1 | 33.8 |
| 9 | 10 | RT9-1 to 10 | 37.9 | 36.7 | 31.8 |
| Total | 50 | | | | |
| 10.4.3 | Testwork Summary for Crushing and Grinding Circuit Design |
A database was prepared with all available results from both the FS and 2017 PFS comminution testwork. Table 10-6 and Table 10-7 present the results of a statistical analysis by rock type using the results from the FS and 2017 PFS programs.
Table 10-6: Comminution test statistical analysis by rock type
| Percentile | Rock Type | SG (g/cm3) | JK Drop Weight Parameters
(DWT and SMC test) | CWi | RWi | BWi | Ai |
| A × b | ta | kWh/
mt | kWh/
mt | kWh/
mt | g |
| 50th | RT4 | 2.73 | 65.2 | 0.72 | 14.5 | 13.4 | 12.0 | 0.13 |
| RT5 | 2.68 | 33.4 | 0.36 | 14.2 | 15.7 | 12.0 | 0.15 |
| RT6 | 2.73 | 36.7 | 0.41 | 15.1 | 17.6 | 13.0 | 0.10 |
| RT7 | 2.71 | 42.7 | 0.41 | 7.9 | 14.2 | 12.1 | 0.15 |
| RT9 | 2.74 | 36.0 | 0.38 | 6.9 | 16.3 | 13.7 | 0.29 |
| 80th | ALL | 2.77 | 32.0 | 0.61 | 15.5 | 17.1 | 13.7 | 0.25 |
| International Tower Hill Mines Ltd. S-K 1300 – Technical Report Summary Livengood Gold Project Pre-feasibility Study | |
Table 10-7: Comminution test statistics using all 2013 FS and 2017 PFS testwork data
| Statistic | SG (g/cm3) | JK Drop Weight Parameters | CWi | RWi | BWi | Ai |
| A × b | ta | kWh/mt | kWh/mt | kWh/mt | g |
| Max | 2.87 | 23.8 | 1.26 | 19.7 | 19.1 | 14.9 | 0.59 |
| 90% | 2.79 | 28.9 | 0.79 | 17.0 | 17.9 | 14.3 | 0.33 |
| 80% | 2.77 | 32.0 | 0.61 | 15.5 | 17.1 | 13.7 | 0.25 |
| 75% | 2.76 | 33.0 | 0.58 | 14.3 | 16.4 | 13.4 | 0.20 |
| 50% | 2.71 | 41.0 | 0.41 | 9.4 | 14.9 | 12.6 | 0.16 |
| 25% | 2.66 | 52.9 | 0.32 | 7.2 | 13.1 | 11.7 | 0.10 |
| 10% | 2.57 | 78.6 | 0.28 | 5.8 | 11.6 | 11.1 | 0.08 |
| Min | 2.39 | 121.0 | 0.23 | 4.8 | 11.2 | 10.2 | 0.05 |
| Average | 2.70 | 47.1 | 0.49 | 10.8 | 14.8 | 12.6 | 0.18 |
Crushing circuit simulations used the 80th percentile of the Crusher Work index (CWi) (Table 10-7).
Originally, the 80th percentiles of the DWT and BWi of the hardest ores (RT5 and RT9) were used by BBA to estimate the initial grinding circuit design parameters. This was because SMC data was not available at the time. The final grinding circuit design parameters (Table 10-8) were taken from the data point (RT6 sample ID DC5) that was closest to the 80th percentile of the A×b values of rock types RT5 and RT9. For design purposes, those results were considered the 80th percentile. Note that this same test sample’s BWi value was also used for design purposes (13.1 kWh/mt).
Figure 10-3 (A×b for DWT and SMC) and Figure 10-4 (BWi) show the cumulative distributions from the comminution testwork programs. Figure 10-3 indicates the preliminary A×b design point as (Design_RT5&RT9_DWT). Similarly, Figure 10-4 indicates the preliminary BWi design point as (Design_RT5&RT9_DWT).
Table 10-6 shows the 50th percentile of the Abrasion index (Ai) for each rock type. The Ai values are classified as medium-low in abrasiveness and were used to calculate media consumption
Table 10-8: Grinding circuit design values
| Percentile | Rock Type | A × b | ta | RWi | BWi |
| kWh/mt |
| 80th | RT5+RT9 | 29.6 | - | | 11.9 |
| Design Value DWT | RT6 | 29.3 | 0.58 | 17.1 | 13.1 |
| International Tower Hill Mines Ltd. S-K 1300 – Technical Report Summary Livengood Gold Project Pre-feasibility Study | |
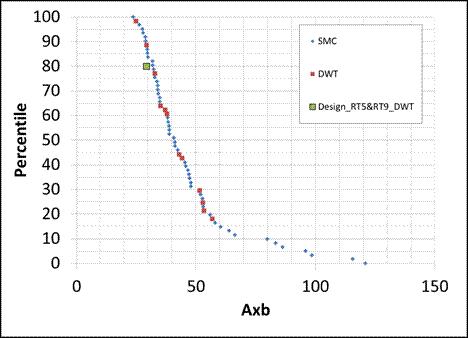
Figure 10-3: Cumulative A × b (DWT + SMC) results for the Livengood Gold Project
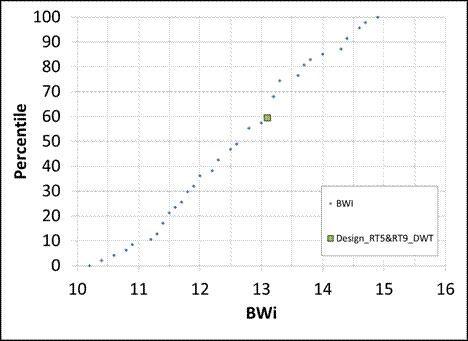
Figure 10-4: Cumulative BWi results for the Livengood Gold Project
| International Tower Hill Mines Ltd. S-K 1300 – Technical Report Summary Livengood Gold Project Pre-feasibility Study | |
| 10.4.4 | Project Throughput Estimation |
Three scenarios were simulated for the 2017 PFS:
| 1. | Scenario A was a circuit based on two lines (SABC, Figure 10-5) with pre-crushing and a final product of 90 µm (P80). SABC stands for a comminution circuit consisting of a semi-autogenous grinding mill (SAG), ball mill and pebble crusher. |
| 2. | Scenario B was a circuit based on one line of the same configuration as Scenario A, but with a final product of 180 µm (P80). |
| 3. | Scenario C was based on the same circuit configuration as Scenario B, but with optimized blasting, resulting in a finer (F80) feed. |
The grind of 90 µm (P80) that was used in Scenario A was based on the FS design criteria. The selection of 180 µm (P80) in Scenarios B and C was the result of integrating the gold leaching results, which indicated at most a 2% difference in leaching recovery between 90 µm and 180 µm.
The grindability results from historical testwork contained in the BBA database were used to benchmark grinding circuit configurations. Crusher and mill specifications were extracted from recent projects from the BBA database.
Bruno (version 3.62) modeling software was used for the crushing simulations and JKSimMet (version 5.3) was used for the grinding simulations.
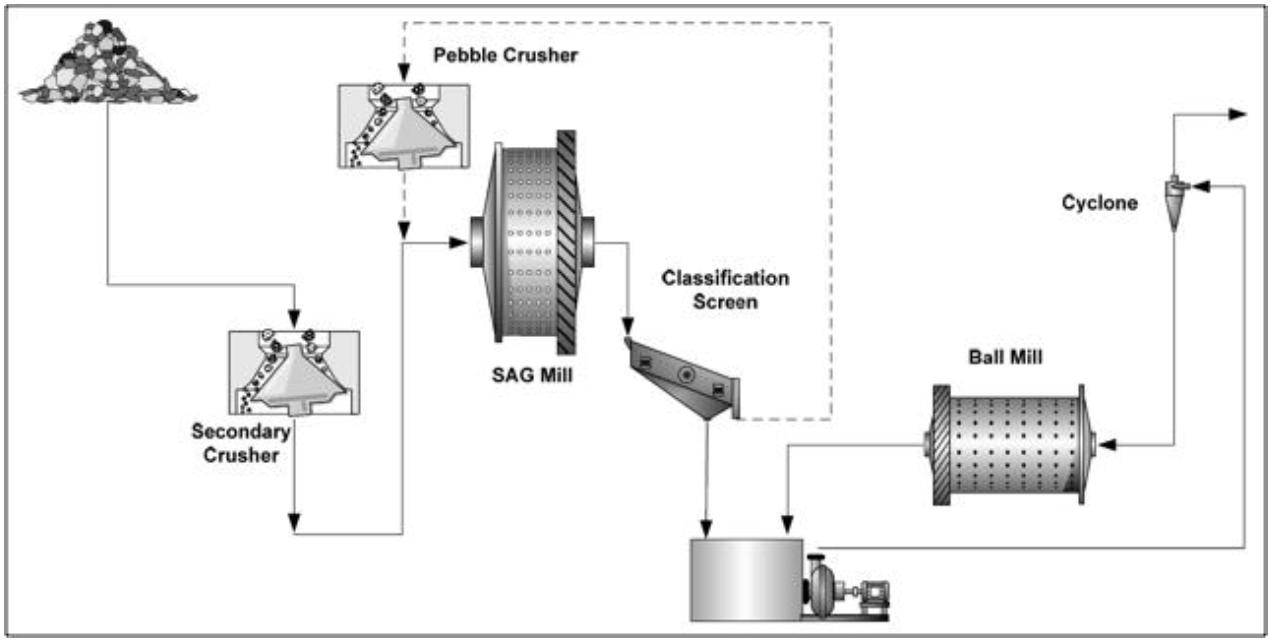
Figure 10-5: SABC with pre-crushing (secondary crusher) circuit configuration
| International Tower Hill Mines Ltd. S-K 1300 – Technical Report Summary Livengood Gold Project Pre-feasibility Study | |
| 10.4.4.1 | Specific Energy and Throughput Estimations |
Preliminary power calculations were completed using Moly-Cop Tools (Moly-Cop v3) and JKMRC Estimator (Power Draw Estimation Spreadsheet tools for JKSimMet V5.3). The input parameters used by the two software packages are presented in Table 10-9.
Table 10-9: SAG and ball mill design criteria for simulations
| | Unit | SAG Mill | Ball Mill |
| Nominal Dimensions (D×L) | ft × ft | 36 × 20 | 26 × 40.5 |
| Effective Diameter | ft | 35.3 | 25.5 |
| Effective Length | ft | 17.5 | 39.5 |
| Mill Critical Speed | % | 74.5 | 74.8 |
| Charge Filling | % | 28 | 30 |
| Balls Filling | % | 15 | 30 |
| Percent Solids in Mill | % | 75 | 76.4 |
| Ore Density | mt/m3 | 2.72 | 2.72 |
| Losses | % | 5 | 5 |
| Ball Density | mt/m3 | 7.75 | 7.75 |
| Feed Cone Angle | (°) | 15 | 24.3 |
| Discharge Cone Angle | (°) | 15 | 24.3 |
| Trunnion Diameter | ft | 8.2 | 6.6 |
The design tonnage is estimated by an iterative process using Excel’s “goal and seek” function, where the installed power is the target of the function and is based on known mill specifications. The mill tonnage is varied until the estimated power consumption matches the installed power. The result is the design tonnage of the grinding circuit.
Table 10-10 presents the results of the simulations, completed using the 80th percentile of the grindability results, which are used for calculating the grinding equipment design throughput. The table also presents the 50th percentile of the grindability results for each rock type, which is used for calculating the average throughput used to design the back end (post-comminution) portion of the plant. The average plant throughput was calculated as a weighted average of the throughput for each rock type multiplied by the percentage of each rock type in the deposit, based on the latest LOM summary by rock type, reference “160614 LVG 355k Prod 45M TPA Max Unlimited Stockpile RT9 67%.xlsx”.
| International Tower Hill Mines Ltd. S-K 1300 – Technical Report Summary Livengood Gold Project Pre-feasibility Study | |
Table 10-10: Throughput estimations for each scenario in metric tons per day (mt/d)
| | 50th Percentile | 80th Percentile |
| | Throughput, mt/d |
| Scenario A – SABC × 2 + Pre-crusher 90 µm (P80) |
| RT4 | 78,163 | - |
| RT5 | 72,952 | - |
| RT6 | 69,331 | - |
| RT7 | 74,189 | - |
| RT9 | 66,814 | - |
| Weighted average of each rock type | 71,801 | - |
| All rock types combined | - | 66,284 |
| Scenario B – SABC × 1 + Pre-crusher 180 µm (P80) |
| RT4 | 47,914 | - |
| RT5 | 46,059 | - |
| RT6 | 43,498 | - |
| RT7 | 46,721 | - |
| RT9 | 41,510 | - |
| Weighted average of each rock type | 44,877 | - |
| All rock types combined | - | 41,577 |
| Scenario C – SABC × 1 + Pre-crusher (Optimized Blasting)180 µm (P80) |
| RT4 | 51,181 | - |
| RT5 | 49,128 | - |
| RT6 | 46,081 | - |
| RT7 | 49,570 | - |
| RT9 | 44,160 | - |
| Weighted average of each rock type | 47,745 | - |
| All rock types combined | - | 44,756 |
The estimated throughputs highlighted in bold were the values used for trade-off analysis and for design purposes for the 2017 PFS. The 80th percentile A×b parameter taken from the cumulative plot of all rock types (combined) was used to generate the 80th percentile throughput. This value represents the achievable throughput when the feed to the mill ranks in the 80th percentile (A×b) of all rock types. The 80th throughput value is used to design the comminution circuit.
The 50th percentile throughputs for each scenario are based on a weighted average throughput of the estimated throughputs for each rock type, which were generated through simulation using the 50th percentile A×b values that are associated with each rock type. The weighted average (50th) value is used to design the back end of the plant, which encompasses all elements of the process that follow comminution.
| International Tower Hill Mines Ltd. S-K 1300 – Technical Report Summary Livengood Gold Project Pre-feasibility Study | |
Table 10-11: Specific energy calculations for each scenario at design (80th percentile) A×b
| Series | Parameter | Unit | Scenario A (90 µm) | Scenario B (180 µm) | Scenario C (180 µm + Opt. D&B) |
| SAG Mill | Ball Mill | SAG Mill | Ball Mill | SAG Mill | Ball Mill |
| Number of grinding lines / Number of units per line | | 2/1 | 2/1 | 1/1 | 1/1 | 1/1 | 1/1 |
| Mill Characteristics | Nominal dimension (D × L) | ft × ft | 36.0 × 20.0 | 26.0 × 40.5 | 36.0 × 20.0 | 26.0 × 40.5 | 36.0 × 20.0 | 26.0 × 40.5 |
| Inside liner dimension (D × L) | m × m | 10.77 × 5.33 | 7.77 × 12.04 | 10.77 × 5.33 | 7.77 × 12.04 | 10.77 × 5.33 | 7.77 × 12.04 |
| % of critical speed | % | 74.5 | 74.7 | 75 | 74.6 | 75 | 74.6 |
| Cone angle | degree | 15.0 | 24.3 | 15 | 24.3 | 15 | 24.3 |
| Grinding Steel | Ball charge | % volume | 15.0 | 30.0 | 14.7 | 30 | 14.7 | 30 |
| Mill Power per Line | Required power | kW | 13,846 | 14,960 | 13,846 | 14,949 | 13,846 | 14,950 |
| HP | 18,568 | 20,061 | 18,568 | 20,046 | 18,568 | 20,048 |
| Installed power | kW | 14,000 | 15,000 | 14,000 | 15,000 | 14,000 | 15,000 |
| HP | 18,774 | 20,115 | 18,774 | 20,115 | 18,774 | 20,115 |
| Total Circuit Power | Required power | kW | 27,797 | 29,446 | 13,846 | 14,949 | 13,846 | 14,950 |
| HP | 37,276 | 39,488 | 18,568 | 20,046 | 18,568 | 20,048 |
| Installed power | kW | 28,000 | 30,000 | 14,000 | 15,000 | 14,000 | 15,000 |
| HP | 37,549 | 40,231 | 18,774 | 20,115 | 18,774 | 20,115 |
| Specific Energy | Motor output | kWh/t | 8.4 | 9.5 | 6.7 | 7.6 | 6.2 | 7.0 |
| Total kWh/mt | 17.9 | 14.3 | 13.2 |
| International Tower Hill Mines Ltd. S-K 1300 – Technical Report Summary Livengood Gold Project Pre-feasibility Study | |
| 10.4.5 | Comminution Circuit Simulations and Design Summary |
| 10.4.5.1 | 2017 PFS Simulations |
The simulations for Scenarios A, B and C were completed by BBA using the same SAG and ball mill design criteria described in Table 10-9. The SAG and ball mill specifications are based on an operation with a slightly higher ore hardness, where BBA has previously conducted design, commissioning, as well as technical support over the course of several years.
As part of BBA best practices, simulations were performed to balance the power draw in the SAG and ball mills to avoid mill throughput bottlenecks. The estimated power consumptions in Table 10-11 include adjustments for motor/drive efficiency (96%) and also ore variability factors, for which a value of 90% was assumed for the SAG mill and 95% for the ball mill.
Scenario A simulations concluded that the selected circuit (two lines SABC + pre-crusher) would process approximately 79,145 t/d (71,800 mt/d), which is based on each line having a throughput of 39,573 t/d (35,900 mt/d) (P80 of 90 µm).
New leaching results became available at the time that the comminution work was being conducted. The new results indicated that approximately an average 2% improvement in leaching recovery was realized at (P80) 90 versus 180 µm. A new scenario was modeled (Scenario B) to explore the throughput gain by relaxing the grind size. The Scenario B simulations led BBA to conclude that the selected circuit, based on a single line, would have a weighted average throughput of 49,470 t/d (44,877 mt/d) at the coarser target grind size of 180 µm.
The final optimization simulations were run by BBA using the following parameters:
| § | Circuit target grind of 180 µm (P80); |
| § | Finer feed (F80) assumed as a result of optimized blasting. |
The simulation resulted in a 27% circulating load through the pebble crusher and the ball mill circuit running at 250% circulating load, generating a 180 µm (P80) product.
| 10.4.5.2 | 2017 PFS Design Recommendations |
| § | The recommended configuration for the Project is a single line SABC circuit with pre-crushing, and considers that the crushing and grinding plant will be fed by ore that has been treated with optimized blasting techniques. The conclusion is based on analysis of simulation results as well as CAPEX and OPEX calculations. The circuit that was selected was based on the configuration with the lowest specific energy consumption. |
| § | The proposed circuit uses a single (D × L) 36 ft × 20 ft SAG mill with 14 MW of installed power and one 26 ft × 40.5 ft ball mill with 15 MW of installed power. |
| International Tower Hill Mines Ltd. S-K 1300 – Technical Report Summary Livengood Gold Project Pre-feasibility Study | |
| § | Based on the information analyzed, the grinding circuit is designed to process 49,334 t/d (44,756 mt/d) when the ore is at the 80th percentile of all grindability results. |
| § | Based on the information analyzed, the grinding circuit is designed to process 52,630 t/d (47,745 mt/d) when a weighted average of the 50th percentile grindability results for each rock type are assumed as the mill feed. This is the throughput used for sizing the back-end circuit. |
| § | Coarsening of the grind from 90 to 180 µm (P80), coupled with optimized blasting, which generates a finer (F80) feed material, explains the increase in per line throughput between Scenarios A and C. For a single line, Scenario C is 33% higher (52,630 t/d (47,745 mt/d) vs 39,572 t/d (35,900 mt/d)), which has a direct impact on daily gold production. |
| § | Similarly, the coarser grind and optimized blasting are also the basis for the reduction in specific energy between Scenarios A and C. Scenario C is 26% lower (13.2 vs 17.9 kWh/t), which translates into a lower per metric ton operating cost for electricity. |
| 10.4.5.3 | 2021 PFS Simulations and design recommendations |
Five simulations using the 2017 PFS recommended configuration, which is a single line SABC circuit with pre-crushing, were modeled by BBA. The Bruno simulation software (crushing) and the JKSimMet (SAG and ball milling) were used applying the SAG and ball mill design criteria shown in Table 10-9 to determine the maximum achievable throughput at different grind sizes including 50, 90, 180, 215 and 250 µm (P80). The simulations were performed to balance the power draw in the SAG and ball mills to avoid mill throughput bottlenecks. The results of these simulations were used to support the Whittle optimization study that is discussed in Section 10.7.2.1.
A summary of the simulations is presented in Table 10-12. The weighted averages were calculated by multiplying the throughput by the percentage of each rock type in the deposit, based on the latest mine production plan. The following are the major conclusions:
| § | Coarsening the grind from 180 to 250 µm (P80) allowed to achieve a higher throughput (64,265 t/d (58,300 mt/d) vs 59,360 t/d (53,850 mt/d)). |
| § | The finer grinds, 50 and 90 µm (P80), required more milling capacity such as ball mills. |
| International Tower Hill Mines Ltd. S-K 1300 – Technical Report Summary Livengood Gold Project Pre-feasibility Study | |
Table 10-12: Comminution simulations summary
(2021 PFS)
| Rock Type | Grind Size - P80 (µm) | Throughput (mt/d) | Primary
Crusher Power
Demand (kW) | Secondary
Crusher Power
Demand (kW) | Pebble Crusher
Power Demand (Kw) | SAG Mill Power
Demand (kW) | Ball Mill Power
Demand (kW) | Total Power
Demand (MW) |
| RT4 | 250 | 64,253 | 432 | 1,160 | 400 | 12,828 | 14,709 | 29.5 |
| RT5 | 57,408 | 378 | 1,023 | 477 | 14,059 | 13,707 | 29.6 |
| RT6 | 57,850 | 405 | 1,071 | 500 | 14,036 | 14,796 | 30.8 |
| RT9 | 57,408 | 209 | 739 | 447 | 14,038 | 13,823 | 29.3 |
| RT7 | 54,979 | 176 | 664 | 486 | 14,028 | 14,813 | 30.2 |
| Weighted average | 58,300 | 320 | 918 | 513 | 14,019 | 14,782 | 30.6 |
| RT4 | | 57,960 | 390 | 1,069 | 330 | 13,300 | 14,875 | 30.0 |
| RT5 | 54,096 | 357 | 985 | 437 | 14,037 | 14,238 | 30.1 |
| RT6 | 215 | 52,109 | 365 | 987 | 436 | 13,944 | 14,815 | 30.5 |
| RT9 | 55,752 | 203 | 733 | 426 | 14,024 | 14,818 | 30.2 |
| RT7 | 49,901 | 160 | 616 | 432 | 13,879 | 14,860 | 29.9 |
| Weighted average | 53,848 | 295 | 859 | 451 | 14,048 | 14,824 | 30.5 |
| RT4 | 180 | 52,550 | 354 | 1,104 | 304 | 12,377 | 14,835 | 29.0 |
| RT5 | 50,232 | 331 | 1,041 | 412 | 13,084 | 14,814 | 29.7 |
| RT6 | 47,141 | 330 | 1,016 | 401 | 12,939 | 14,807 | 29.5 |
| RT9 | 50,563 | 184 | 756 | 387 | 13,200 | 14,867 | 29.4 |
| RT7 | 45,816 | 147 | 643 | 438 | 12,162 | 14,754 | 28.1 |
| Weighted average | 49,224 | 269 | 885 | 381 | 13,755 | 14,795 | 30.1 |
| International Tower Hill Mines Ltd. S-K 1300 – Technical Report Summary Livengood Gold Project Pre-feasibility Study | |
| Rock Type | Grind Size - P80 (µm) | Throughput (mt/d) | Primary
Crusher Power
Demand (kW) | Secondary
Crusher Power
Demand (kW) | Pebble Crusher
Power Demand (Kw) | SAG Mill Power
Demand (kW) | Ball Mill Power
Demand (kW) | Total Power
Demand (MW) |
| RT4 | 90 | 52,550 | 354 | 1,104 | 304 | 12,377 | 22,610 | 36.7 |
| RT5 | 50,232 | 331 | 1,041 | 412 | 13,084 | 22,610 | 37.5 |
| RT6 | 47,141 | 330 | 1,016 | 401 | 12,939 | 22,610 | 37.3 |
| RT9 | 50,563 | 184 | 756 | 387 | 13,200 | 22,610 | 37.1 |
| RT7 | 45,816 | 147 | 643 | 438 | 12,162 | 22,610 | 36.0 |
| Weighted average | 49,224 | 269 | 885 | 381 | 13,755 | 22,610 | 37.9 |
| RT4 | 50 | 52,550 | 354 | 1,104 | 304 | 12,377 | 31,986 | 46.1 |
| RT5 | 50,232 | 331 | 1,041 | 412 | 13,084 | 31,986 | 46.9 |
| RT6 | 47,141 | 330 | 1,016 | 401 | 12,939 | 31,986 | 46.7 |
| RT9 | 50,563 | 184 | 756 | 387 | 13,200 | 31,986 | 46.5 |
| RT7 | 45,816 | 147 | 643 | 438 | 12,162 | 31,986 | 45.4 |
| Weighted average | 49,224 | 269 | 885 | 381 | 13,755 | 31,986 | 47.3 |
| International Tower Hill Mines Ltd. S-K 1300 – Technical Report Summary Livengood Gold Project Pre-feasibility Study | |
| 10.5 | Metallurgical Testwork |
| 10.5.1 | 2013 FS – Metallurgical Testwork |
As part of the 2013 FS, metallurgical testwork was completed to evaluate the appropriate gold recovery process. Standard recovery trade-offs, such as; whole ore leach vs flotation and CIL vs CIP were explored. The initial work was carried out to establish reagent consumption, leach residence time, and to determine the optimum leach feed particle size (P80). The phases of testwork are outlined as follows:
| § | Optimization testing to establish preliminary ore design parameters; |
| § | Variability testing to assess leaching response on selected gold grades and rock types; |
The nature of the testwork and resulting conclusions are presented in the sections below.
| 10.5.2 | 2013 FS – Optimization Test Program |
Composites of the major rock types were prepared as indicated in Table 10-13. The assayed direct gold head grades for each of these samples are also summarized.
Table 10-13: Optimization composites used for testwork
| Rock Type | Composite | Au (g/mt) |
| RT4 | Optimization Composite 2 (RT4) | 1.21 |
| RT5 | Optimization Composite 1 (RT5) | 0.89 |
| RT6 | Optimization Composite 3 (RT6) | 0.98 |
| RT9 | Optimization Composite 4 (RT9) | 1.09 |
| RT7 | Mini optimization composite (RT7) | 1.43 |
Various grinds, from 100 to 225 µm (F80), were tested to optimize the grind for gravity recovery from each ore type (Figure 10-6). Analysis of the results indicated that a primary grind of 180 µm (P80) was suitable for all of the ore types tested. Figure 10-6 also presents the results of GRG testwork conducted for each rock type. The GRG results are greater than 60% for RT4, RT5 and RT6 and greater than 55% for RT9. Typical gold operations recover 50% to 65% of the gold associated as GRG. It is observed in Figure 10-6 that the results of the batch gravity tests are in all cases greater than 50% of the GRG.
| International Tower Hill Mines Ltd. S-K 1300 – Technical Report Summary Livengood Gold Project Pre-feasibility Study | |
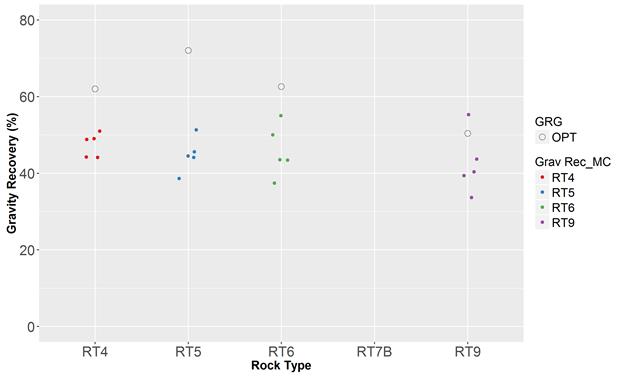
Figure 10-6: Gold gravity concentration grind-recovery relationships
for RT4, RT5, RT6 and RT9 (FS)
Note from Figure 10-6, “Grav Rec_MC” is the gravity recovery to Mozley concentrate and GRG refers to the gravity recoverable gold of the optimization testwork.
Table 10-14: Comparison of gravity test results
for different rock types (FS)
| Test | Rock Type | Optimization
Composite | Product | Mass | Grade
g/mt | Rec.
% | Gravity
Tail K80 |
| % | Au | Au | µm |
G 1 10 kg | RT5 Sunshine Upper Sediments | Opt Comp 1 | Mozley Concentrate Final Tails | 0.04 99.96 | 860 0.48 | 44.1 55.9 | 193 |
Calculated Head Direct Head | - | 0.86 0.89 | - |
G 4 10 kg | RT9 Volcanics | Opt Comp 4 | Mozley Concentrate Final Tails | 0.04 99.96 | 1816 0.61 | 55.3 44.7 | 190 |
Calculated Head Direct Head | - | 1.36 1.09 | - |
| International Tower Hill Mines Ltd. S-K 1300 – Technical Report Summary Livengood Gold Project Pre-feasibility Study | |
| Test | Rock Type | Optimization
Composite | Product | Mass | Grade
g/mt | Rec.
% | Gravity
Tail K80 |
| % | Au | Au | µm |
G 7 10 kg | RT6 Upper Sediments | Opt Comp 3 | Mozley Concentrate Final Tails | 0.06 99.94 | 710 0.52 | 43.5 56.5 | 202 |
Calculated Head Direct Head | - | 0.92 0.98 | - |
G 10 10 kg | RT4 Cambrian | Opt Comp 2 | Mozley Concentrate Final Tails | 0.06 99.94 | 745 0.46 | 49.0 51.0 | 185 |
Calculated Head Direct Head | - | 0.90 1.21 | - |
One of the options tested was to generate a flotation concentrate from the gravity tailings and leach only the concentrate. This would be compared to a second option of direct leaching of the gravity tailings.
Flotation testing examined the effect of grind, reagent dosage, and reagent selection. Optimization of the cyanidation of the flotation concentrate and of the gravity tailings required that the effects of grind, cyanide concentration, and residence time be considered.
The RT4 rock type contained significant quantities of talc, which was difficult to separate and would increase the bulk of the potential flotation concentrate. Talc flotation cells were considered as a process option, but the decision to go to direct cyanidation leaching of the gravity tails, on the basis of the complete test results for the other three rock types, rendered this option moot.
Various grinds were tested to optimize the grind for rougher recovery from each ore type. The grind recovery data, represented below in Figure 10-7, indicated that a grind of 90 µm (P80) was suitable for all of the ore types tested. The RT4 rock type did not respond well to flotation. At 12% rougher flotation mass pull, the projected rougher gold recoveries were 78%, 74%, 75% and 50% for RT5, RT9, RT6 and RT4, respectively.
| International Tower Hill Mines Ltd. S-K 1300 – Technical Report Summary Livengood Gold Project Pre-feasibility Study | |
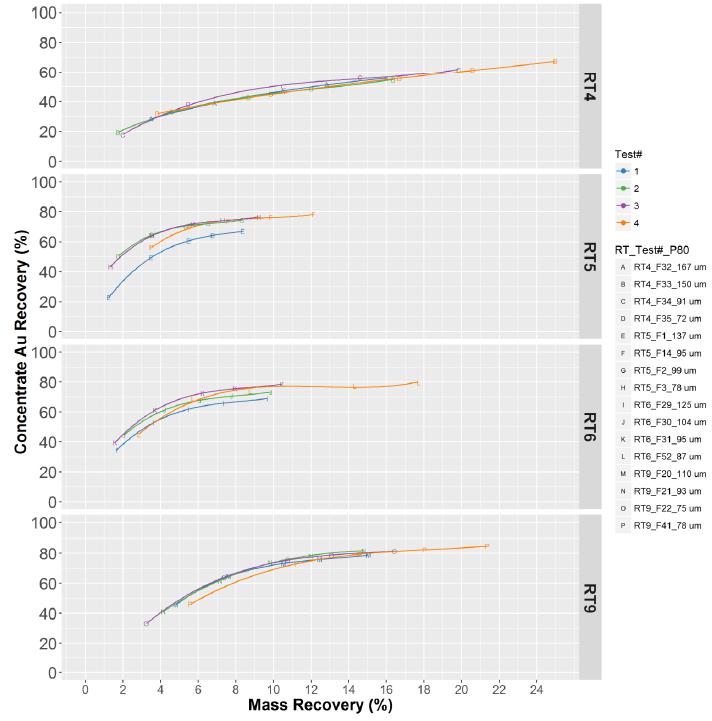
Figure 10-7: Effect of primary grind on gold rougher flotation test Kinetics
for RT4, RT5, RT6 and RT9 (FS)
| International Tower Hill Mines Ltd. S-K 1300 – Technical Report Summary Livengood Gold Project Pre-feasibility Study | |
Flotation concentrates from RT5, RT6 and RT9 were subsequently leached (CIL) to determine recoveries. Figure 10-8 shows the gold recovery relative to time for these three rock types. Based on an analysis of the results, it became evident that the recovery of gold would be higher by applying CIL on the entirety of the gravity tails. Therefore, it was decided not to conduct any further flotation testing and CIL tests on flotation concentrate for RT4 were dropped.
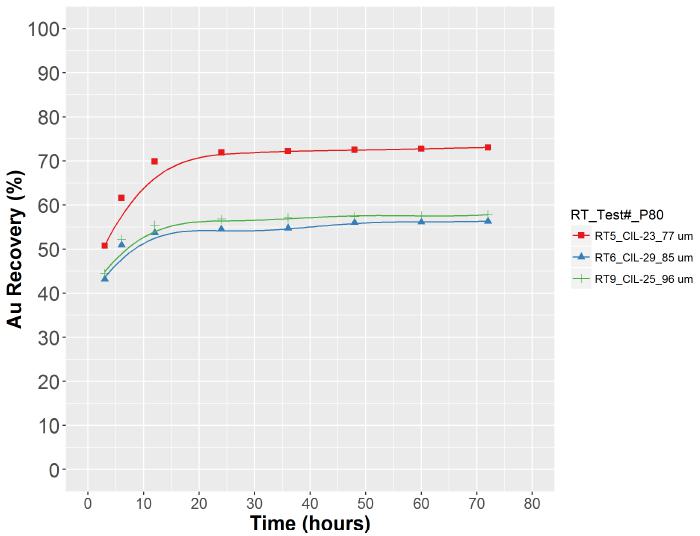
Figure 10-8: Flotation concentrates CIL test gold leach kinetics for different rock types (FS)
| International Tower Hill Mines Ltd. S-K 1300 – Technical Report Summary Livengood Gold Project Pre-feasibility Study | |
| 10.5.2.3 | Flotation Option Recovery Summary |
The results derived for each rock type in this test series are summarized in Table 10-15.
Table 10-15: Gold recovery resulting from the combination of gravity, flotation and CIL (FS)
| | Au Recovery (%) |
| Rock Type | Gravity | Flotation | CIL | Total |
| RT4 | 49.0% | 50% | - | - |
| RT5 | 44.1% | 78.3% | 73.0% | 76.1% |
| RT6 | 43.5% | 75.0% | 56.3% | 67.4% |
| RT9 | 55.3% | 74.0% | 57.8% | 74.4% |
| Arithmetic AVG | 47.7% | 69.8% | 62.4% | 70.5% |
| 10.5.2.4 | Whole Ore Leach (WOL) Option |
The WOL option was also investigated, in which the Livengood process would consist of gravity and CIL leach of the gravity tails. Various grinds were tested to optimize the grind for the CIL leach recovery from each ore type. The grind recovery data, represented below in Figure 10-9, indicated that a grind of 90-100 µm (P80) was suitable for CIL leaching of all of the rock types.
The observations regarding Figure 10-9 are as follows:
| § | The incremental gold recovery at 72 hours (vs 24 hours) for RT5 and RT6 is less than 2.5%. For RT4 and RT9, it is less than 1%; |
| § | There were no samples collected between 5 and 24 hours; |
| § | The gold recovery variation (for each rock type) at the particle size range from 60 to 180 µm (P80) was inconclusive given the single test at each grind size. |
These observations were taken into consideration in the course of developing the optimized leaching conditions during the PFS.
| International Tower Hill Mines Ltd. S-K 1300 – Technical Report Summary Livengood Gold Project Pre-feasibility Study | |
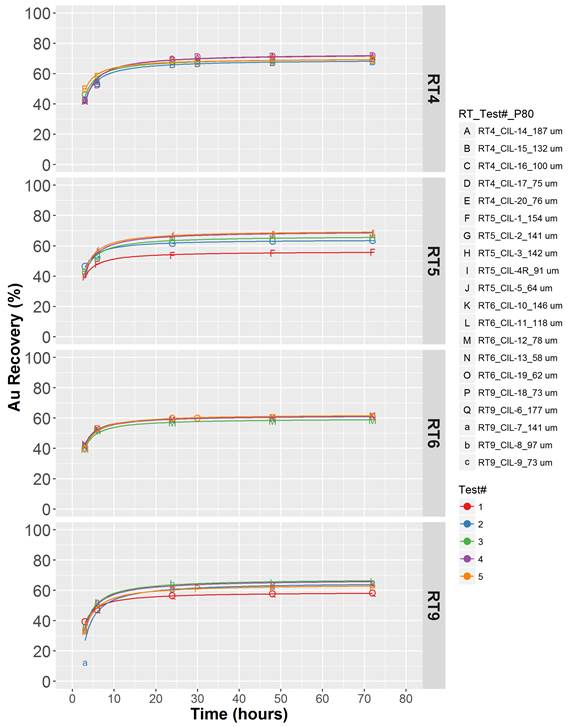
Figure 10-9: Effect of grind on gold extraction kinetics for RT4, RT5, RT6 and RT9 (FS)
| International Tower Hill Mines Ltd. S-K 1300 – Technical Report Summary Livengood Gold Project Pre-feasibility Study | |
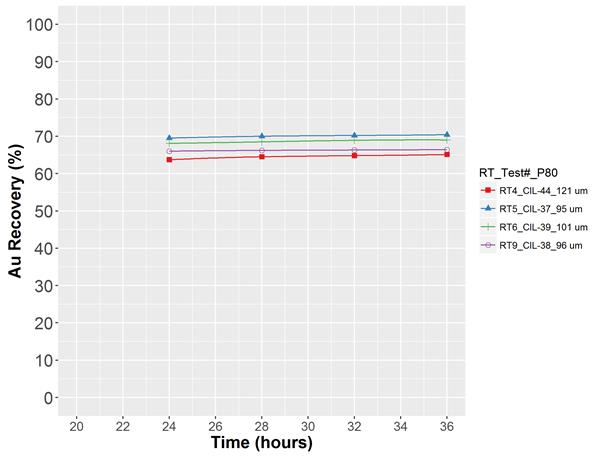
Figure 10-10: Mozley gravity tailings CIL test kinetics for different rock types (FS)
The above graph illustrates the very flat leach recovery curves for the gravity tail leach, indicating little (if any) increased extraction beyond 24 hours of leach time. Similar to the observation made for Figure 10-9, the leaching rate after 24 hours was very slow and it was decided to explore shorter leaching retention times in future testwork.
| 10.5.2.5 | WOL Option Recovery Summary |
The analysis that was completed with the optimization samples led to the conclusion that the preferred flowsheet was gravity followed by CIL of the gravity tails. The gravity plus CIL leaching of the gravity tails produced a 9-12% improved gold recovery for all rock types compared to gravity plus flotation with CIL of flotation concentrate. The overall results of whole ore leaching can be seen below in Table 10-16.
| International Tower Hill Mines Ltd. S-K 1300 – Technical Report Summary Livengood Gold Project Pre-feasibility Study | |
Table 10-16: Gold recovery resulting from whole ore leaching (FS)
| | Au Recovery (%) |
| Rock Type | Gravity | CIL | Total |
| RT4 | 49.0% | 69.0% | 84.2% |
| RT5 | 44.1% | 78.0% | 87.7% |
| RT6 | 43.5% | 58.7% | 76.7% |
| RT9 | 55.3% | 66.0% | 84.8% |
| Arth. AVG (RT4 to RT9 only) | 48.0% | 67.9% | 83.3% |
| RT7 (bleached) (1) | 24.3% | 44.8% | 58.2% |
(1) RT7 (bleached) was tested in a mini-program after the other rock types.
The CIL testwork demonstrated that cyanide consumption is not overly sensitive to grind. On a weighted average basis by rock type over the life of mine, the ore required 5.75 lb/t (2.88 kg/mt) of lime and 1.74 lb/t (0.87kg/mt) of sodium cyanide in the gold leach.
The overall gold recoveries achieved by both process options are summarized in Table 10-17 below.
Table 10-17: Overall gold recovery of optimization samples for both process options (FS)
| Rock Type | Gravity + CIL | Gravity + Flotation + CIL |
| RT4 | 84.2% | - |
| RT5 | 87.7% | 76.1% |
| RT6 | 76.7% | 67.4% |
| RT9 | 84.8% | 74.4% |
| RT7 | 58.2% | - |
The important conclusions that are drawn from the FS optimization testing include:
| § | All rock types responded well to gravity separation, with 44 to 55% of the gold recoverable in the gravity circuit. At a grind of approximately (P80) 180 µm, these gravity recoveries were achieved at a 1% mass pull; |
| § | Rougher flotation works reasonably well for RT5, RT6 and RT9, although the mass recovery was variable. Rougher flotation does not work well for RT4, due to the noted significant presence of talc; |
| § | Rock type RT4 is quite different from the other rock types. It is softer, contains significantly more talc than the other samples, and contains more total carbon, Total Organic Carbon (TOC), and carbonate; |
| § | Overall gold extraction was increased 9 to 12% by the leaching the gravity tails as compared to the leaching flotation concentrate. |
| International Tower Hill Mines Ltd. S-K 1300 – Technical Report Summary Livengood Gold Project Pre-feasibility Study | |
A detailed analysis of the testwork results post FS by BBA indicated that there were additional opportunities to explore, such as reducing the leach retention time and targeting a coarser grind.
| 10.5.3 | 2013 FS – Variability Test Program |
Following on the optimization testing, the FS test program moved into a variability testing phase. The goal was to determine the variation that existed in the ore and to test the geological extremes of each rock type. In addition to the samples tested in the optimization phase, rock type RT7 and a rock type known as Stibnite was included in the variability testing program. The RT7 rock type, which contains varying levels of antimony (Sb) in the form of stibnite and jamesonite, was not evaluated in the initial optimization testing as it did not have a large presence in the early period of the mine life and only represented 12.1% by weight of the LOM reserve. The RT7 rock type was originally split into two sub-types, RT7-Bleached and RT7-Unbleached, as these sub-types exhibited different metallurgical responses. The Stibnite rock type represented a very small fraction of the mine’s ore, but had multiple g/mt head grades.
The most favorable process conditions that were established in the optimization phase were used for variability testing. The variability test results showed an overall lower average gold recovery than what was achieved in the optimization phase, which is reflective of the extremes of the deposit, rather than the more representative optimization samples. The average overall gold recovery resulting from multiple tests for each rock type is summarized below in Table 10-18.
| International Tower Hill Mines Ltd. S-K 1300 – Technical Report Summary Livengood Gold Project Pre-feasibility Study | |
Table 10-18: Variability sample gold recovery (FS)
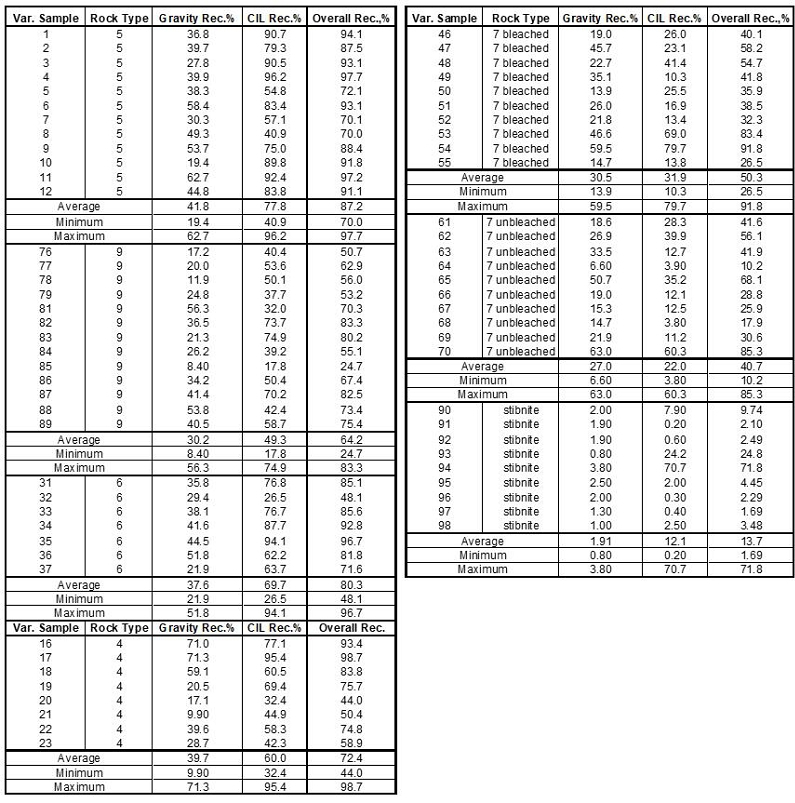
| International Tower Hill Mines Ltd. S-K 1300 – Technical Report Summary Livengood Gold Project Pre-feasibility Study | |
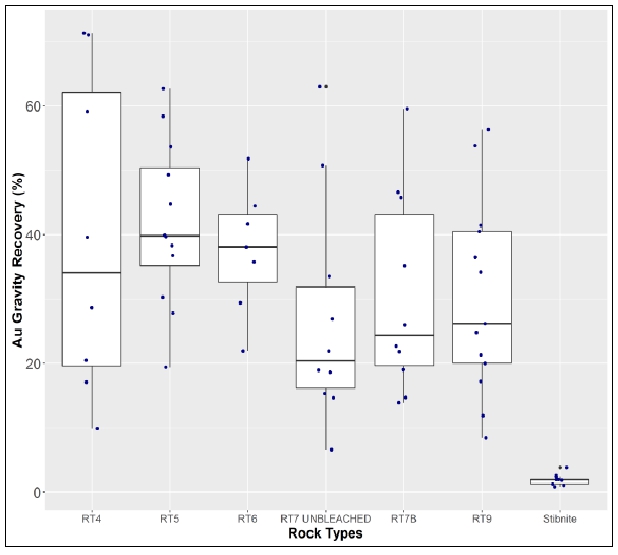
Figure 10-11: Gold gravity recovery box plots (FS)
| International Tower Hill Mines Ltd. S-K 1300 – Technical Report Summary Livengood Gold Project Pre-feasibility Study | |

Figure 10-12: Gold in Residues from CIL testwork vs P80 for each rock type (FS)
The columns in Figure 10-12 represent the gold grade ranges in g/mt and the rows correspond to the different rock types.
Analysis of the results suggested that the RT4, RT5 and RT6 rock types did not show a correlation with grade, RT9 showed a weak correlation with grade, while RT7 presented a strong correlation to stibnite content and grade.
| International Tower Hill Mines Ltd. S-K 1300 – Technical Report Summary Livengood Gold Project Pre-feasibility Study | |
A post FS analysis led to the conclusion that the RT5 results suggested opportunities to increase gold recovery with finer grind. The red boxes associated with RT5 in Figure 10-12 highlight the lower gold in residues at the finer P80(s). Similar observations have been made for RT4 and RT6. This was not observed for RT7 and RT9. BBA analyzed the information on testwork methodology that was available and a lack of consistency was observed in the residence time as well as the level of monitoring of dissolved oxygen (DO) levels during testwork preconditioning and leaching. This result was critical, because low dissolved oxygen levels during the initial hours of a leaching test will have an important and detrimental effect on the gold leaching performance. This observation was used during Phase 9 PFS testwork to standardize the O2preconditioning (4 hours) as well as monitoring and maintaining the DO levels (8 ppm).
Important follow-up observations from the analysis of the variability testwork include:
| § | The opportunity to lower the gold in residues by using finer grind (P80) (RT5, Figure 10-11). |
| § | The need to monitor and control preconditioning and DO levels more closely as these will have an impact on CN consumption. |
| 10.5.4 | 2013 FS – Solid / Liquid Separation Testwork |
As part of the FS, Livengood gold ore samples were submitted to Pocock Industrial, Inc. for solid liquid separation (SLS) testing. Pre-leached and leached samples from the optimized testwork were submitted to Pocock for each of the primary rock types (RT4, RT5, RT6, RT7 Bleached, and RT9). The current flowsheet contains a total of two thickeners; one pre-leach thickener, and one tailings (pre-detox) thickener.
The Project design criteria use a high rate thickening rise rate of 1.64 gpm/ft² (4.0 m3/m²h) for both the pre-leach thickener and the tailings thickener at a design P80 of 90 µm. Additional savings on reagents (flocculant) are expected for the present scenario, where the P80 is 180 µm, but further settling testwork will be required for confirmation.
| 10.5.5 | 2013 FS – Cyanide Detoxification Tests |
| 10.5.5.1 | FS – Cyanide Detoxification Testwork |
The CIL tailings generated from the leaching testwork was used for cyanide detoxification testing. The INCO SO2/air process was used to remove cyanide and base metal complexes from the CIL tailings generated from each rock type. The objective of this phase of testing was to optimize cyanide detoxification (CND) of the CIL tailings. The “Interim Test Program” used a 10 kg sample of each rock type (RT4, RT5, RT6, RT7 and RT9).
| International Tower Hill Mines Ltd. S-K 1300 – Technical Report Summary Livengood Gold Project Pre-feasibility Study | |
The feed pulp density to cyanide detoxification was between 31-39%. The results showed that it was possible to treat the CIL tailings using the INCO process to bring both weak acid dissociable cyanide (CNWAD) and total cyanide (CNT) levels below 1 mg/L. The test conditions indicate that a pH of 8.5-8.6 coupled with a retention time of 94-147 minutes is ideal. The reagent consumptions from the Phase 1 testing are 8.2-14.7 g/g CNWAD of equivalent SO2, 4.9-8.9 g/g CNWAD of lime, and 0.27-0.57 g/g CNWAD of Cu.
The design application rates were assumed to be:
| § | Copper sulfate = 0.08 lb/t; |
| § | Sodium metabisulfite = 1.65 lb/t. |
| 10.5.5.2 | Observations Made Regarding Cyanide detoxification |
In the lead-up to the PFS, BBA reviewed the design of the cyanide detoxification system that was presented in the 2013 FS. The objective was to look for gaps and opportunities. The following are the major conclusions:
| § | The use of a sulfur burner to generate SO2 instead of sodium metabisulfite was identified as an opportunity to lower the OPEX. Details are presented in the flowsheet development in Section 10.7. |
| § | A model was developed to estimate the amount of cyanide that is recirculated to the leaching process via the pre-detox thickener. The result is less cyanide reporting to cyanide detoxification. |
| 10.5.6 | 2017 PFS – Metallurgical Testwork |
Five additional phases (Continuous, 7, 8, 9 and 10) of testwork were completed after the FS for the 2017 PFS. Testwork was conducted to explore possible opportunities established through BBA’s analysis of the FS testwork and/or to clarify certain questions regarding gold leach performance and reagent consumptions. The phases of testwork are outlined as follows:
| § | Continuous: Processing FS Optimization composites using recycled process solutions; |
| § | Phase 7: Assay procedures and water source testing; |
| § | Phase 8: Exploratory testing on selected rock types; |
| § | Phase 9: SGS / FLS Curtin University testwork: Exploratory testing on selected rock types using reverse circulation (RC) drill chip composites; |
| § | Phase 10: Stirred tank reactor (STR) controlled leach testwork, with focus on two problematic rock types (RT7 and RT9). |
The nature of the testwork and resulting conclusions are discussed below.
| International Tower Hill Mines Ltd. S-K 1300 – Technical Report Summary Livengood Gold Project Pre-feasibility Study | |
| 10.5.7 | 2017 PFS – Continuous Testwork |
Continuous testwork was conducted using 60 kg composites taken from the optimization master composites prepared for the FS. The objective of the continuous testwork was to evaluate the impact of recirculating streams as well as generating leach residues (CIL tailings) for the cyanide detoxification testwork. The continuous testwork conditions were developed from the optimization and variability testwork.
One of the important conclusions to be drawn from the continuous testwork is that the results indicated that using lower CN additions had a minimal impact on gold leaching performance, except on RT9, where cyanide starvation conditions were observed. The continuous results were used to estimate the addition of lead nitrate and cyanide for the Phase 9 test program (see Section 10.5.10).
| 10.5.8 | 2017 PFS – Phase 7 - Assay Procedures and Water Source Testing |
The Phase 7 testwork was conducted on 20 kg composites of RT4, RT5, and RT9. The objective of the Phase 7 testwork was to remove uncertainty related to the water source used for testing: SGS Vancouver water versus water that was sourced from the mine and to confirm the procedures necessary for improving assay repeatability. To improve assay repeatability, all samples had gravity recoverable gold removed prior to leaching by a combination of a centrifugal concentrator followed by gravity table, leaching was performed in triplicate, and all pulps were fire screen assayed in triplicate.
CIL testing with air sparging using both Vancouver and mine-sourced water was performed on Mozley gravity tails to compare the extractable gold using similar reagent conditions.
Gravity tail leach recoveries for duplicate samples were within 2% of each other for all three rock types using Vancouver and mine-sourced water and likely within the precision of the testwork. Cyanide consumption increased 0.3% with mine water and lime consumption decreased 8%.
Important conclusions from the Phase 7 testwork include:
| § | The results indicated that the gold recovery was not particularly sensitive to water source; |
| § | Phase 7 results confirmed that performing triplicate screen metallic assays on gravity tail leach residue was the protocol required for precise work. |
| 10.5.9 | 2017 PFS – Phase 8 - Grind, Recovery, Gravity, Flotation Testing |
The Phase 8 testwork program was comprised of several sub-phases and all work was conducted on 75 kg core samples. The objectives of the program were to explore CIL gold recovery sensitivity to particle size.
The sub-phases are described as follows:
| § | Gravity testing on 180 and 250 µm (P80) samples; |
| § | CIL sensitivity testwork on 90, 180 and 250 µm (P80) samples; |
| International Tower Hill Mines Ltd. S-K 1300 – Technical Report Summary Livengood Gold Project Pre-feasibility Study | |
| § | At 90 µm (P80), CIL of gravity tails was compared to CIL of only a flotation concentrate generated from the gravity tails. |
Phase 8a
| § | CIL testing was extended down to 60 and 75 µm (P80): |
| - | Knelson and Mozley tails 250 µm (P80) samples from the Phase 8 testwork program were combined and reground to 60 and 75 µm (P80). |
| § | Carbon handling protocols were compared: |
| - | The carbon handling protocol was explored. No significant difference was found between adding new carbon and retaining the original carbon for the duration of the testwork. |
| § | Dissolved oxygen (DO) and CN consumption were evaluated: |
| - | Phase 8a was the first attempt to normalize the DO levels and CN additions between different tests. There had been indications of inconsistent preconditioning in previous testwork. |
Phase 8b
| § | Evaluated gravity and leach sensitivity at 90, 180 and 250 µm (P80); |
| § | At 90 µm (P80), CIL of gravity tails was compared to CIL leaching of only a flotation concentrate generated from the gravity tails. |
Phase 8c
| § | Completed intensive leach (IL) of flotation concentrate. |
Phase 8d
| § | Tested flotation with sulfidization at 180 µm (P80). |
| - | Phase 8d was designed to study the response of flotation to sulfidization at a grind of 180 µm (P80). Only two rock types were tested. |
The important conclusions to be drawn from the Phase 8 test program include the following:
| § | Flotation gold recoveries did not improve with slurry sulfidization; |
| § | Gold recovery did not improve with a grind of 60 µm (P80); |
| § | CN consumption was reduced by the pre-oxidation; |
| § | The carbon handling protocol did not affect the gold recovery performance. |
| International Tower Hill Mines Ltd. S-K 1300 – Technical Report Summary Livengood Gold Project Pre-feasibility Study | |
| 10.5.10 | 2017 PFS – Phase 9 - SGS and FLS-Curtin University Test Program |
The Phase 9 SGS / FLS-Curtin University test program was conducted on 500 kg composites made according to rock type. It was the first work conducted using reverse circulation (RC) drill chips.
The objectives of the Phase 9 test program were:
| § | To compare the performance of gravity recovery at 180 and 250 µm (P80); |
| § | To study the impact of lead nitrate addition on intensive leach and CIL; |
| § | To confirm and/or revise the cyanide addition to CIL; |
| § | To study the impact of particle size on gold leaching at 75, 90, 135, 180 and 250 µm (P80). |
The Phase 9 program processed a large quantity of mass for each sample to confirm the process flowsheet developed in Phase 8, and to avoid having nugget effects influence the metallurgical recoveries.
The objectives of the FLS/Curtin University testwork were:
| § | To conduct gravity recoverable gold (GRG) testing and to perform an Integrated Liberation and Leaching Model (ILLM) characterization on the Livengood gold ore types. |
Rock type splits of 100 kg each were sent to FLSmidth/AMIRA (Curtin University, Australia).
| 10.5.10.1 | Phase 9 Metallurgical Composite Sample Selection Methodology |
The Project resource has been defined by approximately 800 drill holes, about 80% of which are reverse circulation (RC) and 20% are core. Prior to the Phase 9 test program for the PFS, all of the metallurgical testwork had been completed using individual core samples or core sample composites. The Phase 9 samples were the first to be composited from RC rig duplicate rock chips. The Phase 9 samples are bulk composites prepared for each of the five major rock types to represent the average grade and approximate grade distribution of the 2013 FS Reserve.
The RC rig duplicates (rock chips), which originated from an earlier phase reported under SGS project CAVM-50223-006, were received at SGS in June 2015. The gold head assays, determined by screened metallics, are presented in Table 10-19.
| International Tower Hill Mines Ltd. S-K 1300 – Technical Report Summary Livengood Gold Project Pre-feasibility Study | |
Table 10-19: Gold head assay
| Rock Type Composite | Au, g/mt |
| RT4 | 0.64 |
| RT5 | 0.72 |
| RT6 | 0.81 |
| RT7B | 0.89 |
| RT9 | 0.68 |
Composites were prepared from samples received in super sacks that had been sorted according to their rock type. The composites were labelled as follows with the following weights (Table 10-20):
Table 10-20: Composite naming and weights for Phase 9 (2017 PFS) test program.
| Composite Name | Mass (kg) |
| RT4 June 2015 Composite | 453.6 |
| RT5 June 2015 Composite | 468.0 |
| RT6 June 2015 Composite | 472.8 |
| RT7B June 2015 Composite | 475.0 |
| RT9 June 2015 Composite | 477.5 |
Each composite was stage crushed to 100% minus 10 mesh, blended, and split to obtain two 100 kg splits and one bulk split as identified below:
| § | 100 kg forwarded to FLSmidth for GRG tests and leach tests performed at Curtin University; |
| § | 100 kg stored in a freezer at SGS; |
| § | Bulk split retained at SGS for use in the current testwork program. |
Figure 10-13 illustrates the testwork that was conducted.
| International Tower Hill Mines Ltd. S-K 1300 – Technical Report Summary Livengood Gold Project Pre-feasibility Study | |
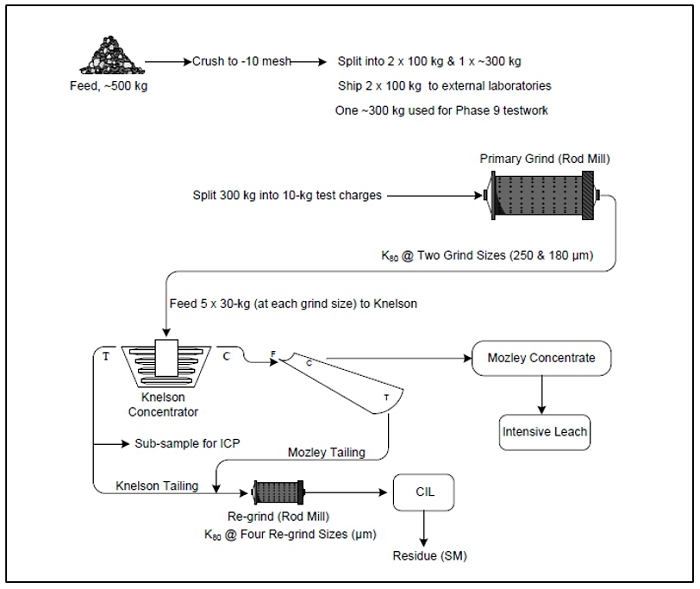
Figure 10-13: 2017 PFS (Phase 9) testwork outline
In an effort to minimize the differences found between calculated and direct head grades (possibly due to nugget effect), Phase 9 testwork was conducted following a different approach using larger samples (30 kg) versus the normal 2 kg samples used in the previous testwork.
| 10.5.10.2 | Phase 9 – Cyanide and Lead Nitrate Addition |
The ICP analysis of the leach feed composites had not been available at the time that the leaching testwork was being completed. Instead of waiting for this information, BBA recommended that the lead nitrate addition be based on the Sb content from the ICP analysis of each rock type from the continuous testwork program (Table 10-21).
| International Tower Hill Mines Ltd. S-K 1300 – Technical Report Summary Livengood Gold Project Pre-feasibility Study | |
Table 10-21: ICP Analysis of the CIL feed from the continuous testwork for each rock type
(2017 PFS)
| Rock Type | Au | Ag | Cu | Fe | Ni | S | As | Pb | Sb | Te | Hg | Proposed Lead
Nitrate addition, g/mt |
| RT4 | 0.5 | | 45.1 | 5.29 | 1008 | 0.60 | 4748 | 21.6 | 64.0 | 0.18 | 4.3 | 150 |
| RT5 | 0.4 | 0.4 | 51.5 | 4.2 | 121 | 0.97 | 2800 | 14.4 | 19.9 | 0.1 | 0.4 | 100 |
| RT6 | 0.5 | 0.4 | 75.3 | 3.87 | 146 | 1.25 | 3360 | 29.4 | 62.3 | 0.17 | 1.4 | 150 |
| RT7 | 0.6 | 0.5 | 62.8 | 4.12 | 206 | 1.98 | 3973 | 15.4 | 176.5 | 0.20 | 0.7 | 250 |
| RT9 | 0.7 | 0.5 | 36.6 | 4.60 | 69 | 2.54 | 3995 | 24.1 | 101.8 | 0.13 | 3.1 | 250 |
Table 10-22: Comparison of cyanide addition in Phase 9 versus Continuous
(2017 PFS)
| Rock Type | CN Addition used during
Continuous Testwork kg/t | Proposed CN Addition for
Phase 9, kg/mt |
| RT4 | 0.52 | 0.71 |
| RT5 | 0.71 | 0.71 |
| RT6 | 0.51 | 0.8 |
| RT7 | 0.67 | 1 |
| RT9 | 0.57 | 1 |
| 10.5.10.3 | Phase 9 – Gravity / Intensive Leach Testwork |
Phase 9 gravity testwork was performed on two particle sizes, 180 and 250 µm (P80), at SGS Vancouver. It was observed that similar average results were realized for RT7 and RT9. On the other hand, RT4 and RT5 show higher gravity results at 180 µm (P80), and RT6 shows higher gravity recovery at the coarser grind size. In general, however, the gravity results were lower than those obtained in previous work.
Figure 10-14 summarizes the gravity testwork results of Phase 9 (180 and 250 µm); the GRG results by FLS/Curtin University, along with the results obtained from the FS optimization test program.
| International Tower Hill Mines Ltd. S-K 1300 – Technical Report Summary Livengood Gold Project Pre-feasibility Study | |
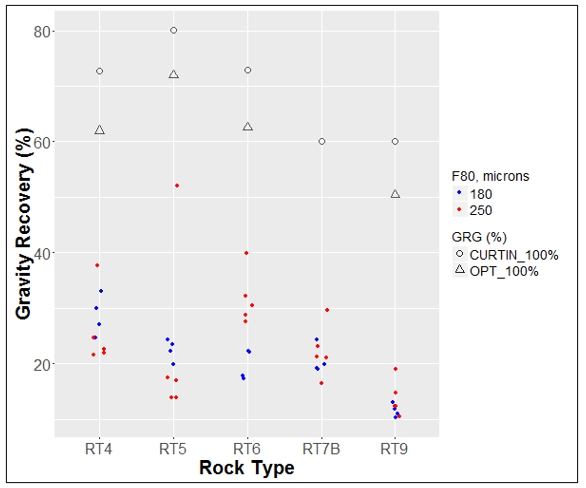
Figure 10-14: 2017 PFS (Phase 9) gravity recovery for all tock types
(GRG presented as the 3rd stage of GRG)
The GRG results from the FLS/Curtin University testwork are comparable to the results of the optimization GRG testwork, presented earlier in Figure 10-6, which is an important conclusion for a few reasons:
| § | The rock types tested represent 98.2% of the ore body; |
| § | Two independent labs have produced these complementary results; |
| § | The FS optimization testwork made use of drill core composites, whereas the FLS/Curtin testwork used RC drill chip composites, implying that two independent sample batches have been tested. |
The gravity gold recovery in Phase 9, which followed the Knelson+Mozley table methodology, was lower compared to previous testwork; compare these results, for example, to those of Figure 10-11. BBA is placing less emphasis on these particular results. In future testwork, this method of testing will be applied. However, BBA recommends that a systematic review of the testing protocols be performed.
| International Tower Hill Mines Ltd. S-K 1300 – Technical Report Summary Livengood Gold Project Pre-feasibility Study | |
A series of benchmark graphs (Figure 10-15 to Figure 10-19) were prepared by FLS/Curtin University that compare the results of Livengood gold ores to the Curtin gravity testwork database. Figure 10-15 shows the high percentage of GRG of Livengood gold ore (60 to 80%) compared to the FLS/Curtin University database (15 to 55% for the same gold head grade).
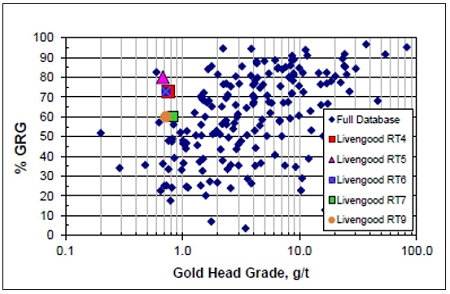
Figure 10-15: Livengood GRG results vs FLS/Curtin database (source Curtin report)
(2017 PFS)
Figure 10-16 plots the % GRG vs the gold recovered in stage 1 (of 3 stages) (P80 = 850 µm) of gravity testwork, showing that the results fall within the range of data contained in the full FLS/Curtin University database. This observation supports the good gravity recoverable potential of the Livengood gold ore.
A good agreement was also found between the % GRG and the gold recovery of stage 1 vs feed size (F80) of the gold particles and the FLS/Curtin University database (Figure 10-17 and Figure 10-18).
| International Tower Hill Mines Ltd. S-K 1300 – Technical Report Summary Livengood Gold Project Pre-feasibility Study | |
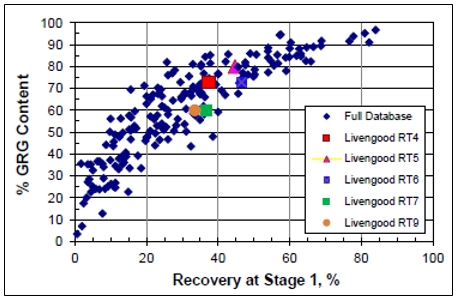
Figure 10-16: Livengood GRG results vs FLS/Curtin database (source Curtin report)
(2017 PFS)
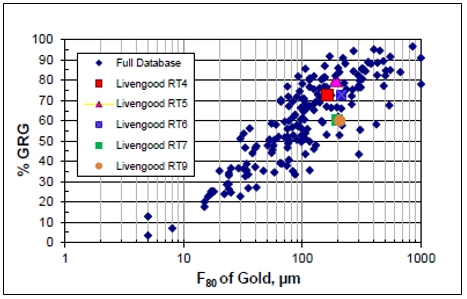
Figure 10-17: Livengood GRG results vs FLS/Curtin database (source Curtin report)
(2017 PFS)
| International Tower Hill Mines Ltd. S-K 1300 – Technical Report Summary Livengood Gold Project Pre-feasibility Study | |
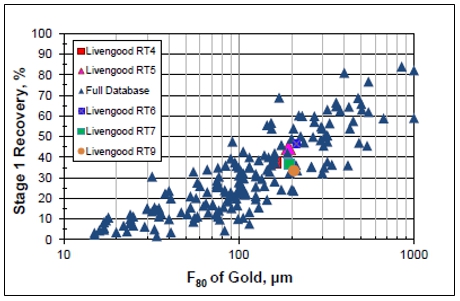
Figure 10-18: Livengood GRG results vs FLS/Curtin database (source Curtin report)
(2017 PFS)
Figure 10-19 shows the benchmarking of the results of Livengood versus two operations with similar % GRG. The operations processing ores “sample B” and “sample D” typically recover gravity gold in the order of 45 to 55%. FLS/Curtin University indicates that operations typically should achieve recoveries in the order of 50 to 66% of the plant feed GRG.
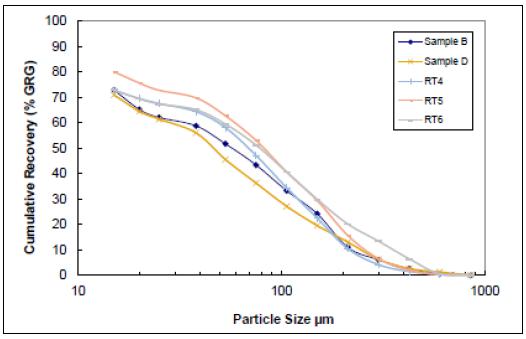
Figure 10-19: Livengood GRG results vs FLS/Curtin database (source Curtin report)
(2017 PFS)
| International Tower Hill Mines Ltd. S-K 1300 – Technical Report Summary Livengood Gold Project Pre-feasibility Study | |
| 10.5.10.4 | Phase 9 – Intensive Leach Kinetic Testwork |
Intensive leach testwork was conducted on Mozley concentrates. Table 10-23 presents the results of the testwork.
Table 10-23: Intensive leach results
(2017 PFS)
| Test ID | Gravity K80 | Intensive Leach K80 | NaCN | CaO | Au in
Residue | Calc
Head | Au
Recovery |
| µm | µm | Add
kg/mt | Cons
kg/mt | kg/mt | kg/mt | g/mt | g/mt | % |
| IL-1 | 180 | 180 | 72.5 | 31.5 | 2.29 | 0.81 | 8.20 | 477 | 98.3 |
| IL-2 | 250 | 250 | 61.7 | 25.2 | 1.84 | <1 | 10.1 | 369 | 97.3 |
| IL-3 | 180 | 180 | 74.0 | 30.5 | 1.84 | 0.65 | 9.64 | 369 | 97.4 |
| IL-4 | 250 | 250 | 66.8 | 35.0 | 1.51 | 0.59 | 10.9 | 295 | 96.3 |
| IL-5 | 180 | 180 | 73.6 | 30.7 | 0.74 | <1 | 9.16 | 393 | 97.7 |
| IL-6 | 250 | 250 | 80.2 | 29.9 | 0.88 | <1 | 13.2 | 536 | 97.5 |
| IL-7 | 180 | 180 | 72.5 | 30.3 | 1.36 | 0.28 | 8.68 | 389 | 97.8 |
| IL-8 | 250 | 250 | 78.2 | 27.8 | 1.66 | 0.24 | 9.01 | 331 | 97.3 |
| IL-9 | 180 | 180 | 74.7 | 31.6 | 1.18 | <1 | 7.53 | 190 | 96.0 |
| IL-10 | 250 | 250 | 74.4 | 35.4 | 0.80 | 0.8 | 7.32 | 215 | 96.6 |
| International Tower Hill Mines Ltd. S-K 1300 – Technical Report Summary Livengood Gold Project Pre-feasibility Study | |
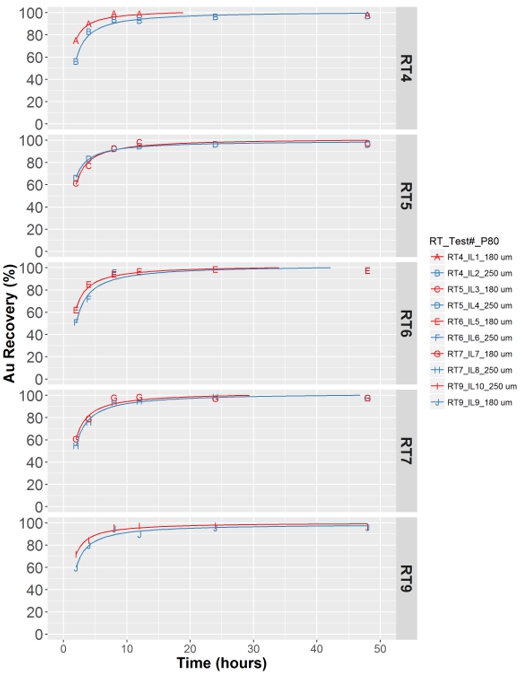
Figure 10-20: Intensive leach of Mozley concentrate
| International Tower Hill Mines Ltd. S-K 1300 – Technical Report Summary Livengood Gold Project Pre-feasibility Study | |
| 10.5.10.5 | Phase 9 – Leach Kinetic Testwork |
Following observations from the FS optimization test program, the decision was taken to add extra sampling times (12 and 18 hours) to the leach testwork to better characterize the gold leaching kinetics for each rock type. Figure 10-21 shows the results of kinetics tests from gravity tails at 180 µm (P80). Results using 250 µm (P80) gravity tails presented similar trends.
The leaching kinetics results were analyzed and it was found that for each rock type, after 18 hours of leach time, there was no extra recovery or the increment was not sufficient to justify the addition of an extra leach tank.
The latter observation was used to reduce the leaching retention time from 32 to 21 hours. The reduction in the leaching retention time translates into lower cyanide and lime consumption. An example of the analysis is presented on Table 10-24.
The important conclusions to be drawn from the Phase 9 and the FLS/Curtin testwork include:
| § | A high gravity recoverable gold content was confirmed; |
| § | Improved leach results were obtained from Curtin on all samples (pH 10); |
| § | The first intensive leach of gravity concentrates achieved excellent gold recoveries on gravity concentrates from all rock types ranging from 96 to 98%; |
| § | Pre-conditioning and lead nitrate led to a reduction in leaching time; |
| § | A reduction in CN consumption and required leach time were realized. |
| International Tower Hill Mines Ltd. S-K 1300 – Technical Report Summary Livengood Gold Project Pre-feasibility Study | |
Table 10-24: Kinetic results from Phase 9
(2017 PFS)
| | | Phase 9 |
Rock
Type | Item | 90 µm | 180 µm |
| Leaching time, hours | Leaching time, hours |
| 18 | 24 | 32 | 18 | 24 | 32 |
| RT4 | Au head grade, g/mt | 0.44 | 0.52 |
| Au residue, g/mt | 0.07 | 0.07 | 0.07 | 0.08 | 0.08 | 0.08 |
| Au Recovery, % | 83.0 | 83.2 | 83.2 | 83.9 | 84.5 | 84.6 |
| CN consumption, kg/mt | 0.26 | 0.28 | 0.34 | 0.19 | 0.23 | 0.32 |
| CaO consumption, kg/mt | 2.29 | 2.56 | 2.51 | 2.14 | 2.35 | 2.30 |
| RT5 | Au head grade, g/mt | 0.50 | 0.65 |
| Au residue, g/mt | 0.09 | 0.09 | 0.09 | 0.12 | 0.11 | 0.11 |
| Au Recovery, % | 81.1 | 81.8 | 82.0 | 81.6 | 82.7 | 83.0 |
| CN consumption, kg/mt | 0.20 | 0.24 | 0.31 | 0.19 | 0.24 | 0.31 |
| CaO consumption, kg/mt | 1.75 | 1.77 | 1.75 | 1.77 | 1.78 | 1.74 |
| RT6 | Au head grade, g/mt | 0.55 | 0.57 |
| Au residue, g/mt | 0.18 | 0.18 | 0.18 | 0.20 | 0.20 | 0.20 |
| Au Recovery, % | 67.5 | 67.5 | 67.5 | 64.9 | 65.1 | 65.2 |
| CN consumption, kg/mt | 0.29 | 0.32 | 0.38 | 0.27 | 0.31 | 0.35 |
| CaO consumption, kg/mt | 1.59 | 1.68 | 1.62 | 1.46 | 1.55 | 1.52 |
| RT7B | Au head grade, g/mt | 0.53 | 0.75 |
| Au residue, g/mt | 0.28 | 0.28 | 0.28 | 0.35 | 0.34 | 0.33 |
| Au Recovery, % | 47.0 | 47.2 | 47.2 | 53.8 | 55.2 | 55.7 |
| CN consumption, kg/mt | 0.48 | 0.51 | 0.53 | 0.36 | 0.41 | 0.51 |
| CaO consumption, kg/mt | 1.86 | 2.17 | 2.14 | 1.73 | 2.05 | 2.02 |
| RT9 | Au head grade, g/mt | 0.62 | 0.55 |
| Au residue, g/mt | 0.29 | 0.29 | 0.29 | 0.31 | 0.30 | 0.30 |
| Au Recovery, % | 53.0 | 53.1 | 53.1 | 43.5 | 44.9 | 45.5 |
| CN consumption, kg/mt | 0.39 | 0.40 | 0.47 | 0.27 | 0.36 | 0.43 |
| CaO consumption, kg/mt | 1.58 | 1.70 | 1.67 | 1.32 | 1.34 | 1.30 |
| International Tower Hill Mines Ltd. S-K 1300 – Technical Report Summary Livengood Gold Project Pre-feasibility Study | |

Figure 10-21: 2017 PFS (Phase 9) - Leach kinetics analyses according to rock type
| International Tower Hill Mines Ltd. S-K 1300 – Technical Report Summary Livengood Gold Project Pre-feasibility Study | |
| 10.5.11 | 2017 PFS – Phase 10 - Stirred Tank Reactor (STR) Leach Tests |
Phase 10 was conducted under the direction of Guy Deschênes (former BBA employee), owing to his expertise on leaching gold ores containing antimony (Sb). The test program included the use of lead nitrate and control of dissolved oxygen levels under controlled leach conditions. This approach had previously been demonstrated effective at the Fort Knox Mine to control the adverse effects of antimony.
The objective of the Phase 10 test program was to determine whether antimony minerals were responsible for some low gold extractions experienced by rock types (RT7 and RT9). The antimony content of the RT7 sample tested (590 ppm) is an order of magnitude higher than that of RT9 (60 ppm or less).
Phase 10 included testing using 20 kg composites of RT7 and RT9.
The gold content in samples RT7-GR11, RT9-GR14 and RT9-V86, V89 were 0.46 g/t, 0.72 g/t and 0.50 g/t respectively. The RT7 sample contained 0.016% Cu, 4.7% Fe, 0.026% Zn and 2.0% S (STot), whereas RT9 contained 0.014% Cu, 5.3% Fe, 0.013% Zn and 2.0% S (STot).
Tests were conducted in stirred tank reactors (STR) under controlled conditions of the following variables; agitation, temperature, pH, free cyanide and dissolved oxygen (DO). The leaching conditions that were applied were those used for processing orebodies containing antimony minerals.
The results were compared to baseline conditions (0.5 h pre-treatment, pH 10.7, DO 4 ppm; 32 h leaching, 200 ppm NaCN, pH 10.7, DO 8 ppm). Test results for the RT7 and RT9 composite samples indicated only a modest improvement in gold extraction of 2-5%, when calculated on the basis of gold balance developed around the leach solution and residues, i.e. gold recovery based on leach testwork results. This improvement resulted from a pre-treatment of four hours, with the addition of 100 g/mt lead nitrate and oxygen. However, if the interpretation is based upon the gold content of the leach residues only, which may be valid because the assayed (direct) head grades are the same for each rock type, it suggests no improvement.
The leaching profiles of the baseline conditions and new conditions using lead nitrate are comparable, which would indicate no sign of passivation of antimony minerals. The lack of interference by antimony minerals might be explained by no or insufficient liberation during grinding, or that surface passivation had already taken place in the prior treatment of the samples. Other explanations for a lack of improvement may be that the gold is not liberated at the particle size selected, or that the gold is refractory, i.e. gold is in solid solution with the mineral. Seven tests with repeats indicated good reproducibility of the results.
| International Tower Hill Mines Ltd. S-K 1300 – Technical Report Summary Livengood Gold Project Pre-feasibility Study | |
Table 10-25: Phase 10 results (2017 PFS)
| Sample | Feed | CN | | Pre-aeration | | Leach | Reagent Cons. | Residual | Au Extraction (%) | Residue
Grade | Head Grade
(g/mt Au) |
| Size | Test
No. | Time
(h) | pH | DO
(ppm) | Pb(NO3)2
(g/mt) | pH | D. O.
mg/L | NaCN
(kg/mt) | CaO
(kg/mt) | NaCN
g | | | Calc | Direct |
P80,
µm | 2h | 5h | 24h | 32h | Au, g/mt |
| GR11:1-3,7-9:RT7 RT7B:repeats | 90 | 1 | 0.5 | 10.7 | 4 | - | 10.7 | 8 | 0.67 | 0.9 | 0.11 | 14 | 20 | 35 | 21.5 | 0.40 | 0.51 | |
| 2 | 4 | 9.8 | 8 | - | 9.9 | 8 | 0.68 | 0.6 | 0.22 | 8 | 8 | 14 | 26.5 | 0.36 | 0.49 | 0.46 |
| 3 | 4 | 9.8 | 6 | 100 | 9.9 | 8 | 0.71 | 0.5 | 0.20 | 7 | 28 | 28 | 27.1 | 0.39 | 0.54 |
| 7 | 2 | 10.0 | 9 | 100 | 10.2 | 8 | 0.74 | 0.3 | 0.13 | 14 | 20 | 30 | 23.5 | 0.38 | 0.50 |
| 7R | 2 | 10.0 | 6 | 100 | 10.3 | 8 | 0.65 | 0.4 | 0.15 | 11 | 20 | 47 | 28.3 | 0.39 | 0.55 |
| 8 | 4 | 10.1 | 8 | 100 | 10.2 | 16 | 0.65 | 0.2 | 0.13 | 15 | 23 | 25 | 23.9 | 0.39 | 0.52 |
| 8R | 4 | 10.1 | 16 | 100 | 10.2 | 19 | 0.61 | 0.3 | 0.17 | 19 | 21 | 30 | 25.7 | 0.38 | 0.52 |
| 9 | 4 | 10.1 | 6 | 200 | 10.2 | 8 | 0.63 | 0.1 | 0.18 | 15 | 21 | 27 | 25.4 | 0.40 | 0.53 |
| 9R | 4 | 10.0 | 7 | 200 | 10.2 | 7 | 0.53 | 0.4 | 0.19 | 18 | 22 | 28 | 21.5 | 0.40 | 0.50 |
| GR14 RT9 | 86 | 4 | 0.5 | 10.2 | 4 | - | 10.6 | 8 | 0.47 | 0.7 | 0.16 | 37 | 55 | 58 | 44.8 | 0.34 | 0.62 | |
| 5 | 4 | 10.2 | 8 | - | 9.9 | 8 | 0.62 | 0.4 | 0.20 | 38 | 40 | 52 | 46.3 | 0.32 | 0.60 | 0.72 |
| 6 | 4 | 10.2 | 7 | 100 | 9.9 | 8 | 0.60 | 0.3 | 0.21 | 41 | 49 | 50 | 50.2 | 0.32 | 0.64 |
| GR14 RT9 (V86 & V89) | 62 | 10 | 2 | 10.2 | 9 | 100 | 10.2 | 8 | 0.76 | 0.1 | 0.12 | 53 | 55 | 59 | 54.7 | 0.21 | 0.46 | |
| 10R | 2 | 10.0 | 8 | 100 | 10.0 | 7 | 0.63 | 0.4 | 0.16 | 52 | 49 | 37 | 42.0 | 0.29 | 0.49 | 0.50 |
| 11 | 4 | 10.1 | 12 | 100 | 10.2 | 16 | 0.59 | 0.1 | 0.16 | 55 | 57 | 57 | 53.9 | 0.22 | 0.48 |
| 11R | 4 | 10.2 | 16 | 100 | 10.2 | 15 | 0.47 | 0.3 | 0.16 | 54 | 56 | 52 | 55.5 | 0.20 | 0.46 |
| 12 | 4 | 9.9 | 8 | 200 | 10.1 | 8 | 0.52 | 0.2 | 0.15 | 50 | 52 | 54 | 54.0 | 0.22 | 0.48 |
| 12R | 4 | 10.0 | 9 | 200 | 10.1 | 8 | 0.52 | 0.4 | 0.20 | 49 | 51 | 53 | 55.4 | 0.21 | 0.47 |
| International Tower Hill Mines Ltd. S-K 1300 – Technical Report Summary Livengood Gold Project Pre-feasibility Study | |
Table 10-26: Reproducibility of cyanidation tests on the Livengood Gold Project
(2017 PFS)
Sample
number | CN | Reagent Cons. | Gravity
Tail Leach
Extraction
(% Au) | Residue
Grade Au,
g/mt | Head grade
(g/mt Au) |
| Test No. | NaCN
(kg/mt) | CaO
(kg/mt) | Calc |
| RT 7 and RT7B | 7 | 0.74 | 0.3 | 23.5 | 0.38 | 0.50 |
| 7R | 0.65 | 0.4 | 28.3 | 0.39 | 0.55 |
| 8 | 0.65 | 0.2 | 23.9 | 0.39 | 0.52 |
| 8R | 0.61 | 0.3 | 25.7 | 0.38 | 0.52 |
| 9 | 0.63 | 0.1 | 25.4 | 0.40 | 0.53 |
| 9R | 0.53 | 0.4 | 21.5 | 0.40 | 0.50 |
| RT9 | 10 | 0.76 | 0.1 | 54.7 | 0.21 | 0.46 |
| 10R | 0.63 | 0.4 | 42.0 | 0.29 | 0.49 |
| 11 | 0.59 | 0.1 | 53.9 | 0.22 | 0.48 |
| 11r | 0.47 | 0.3 | 55.5 | 0.20 | 0.46 |
| 12 | 0.52 | 0.2 | 54.0 | 0.22 | 0.48 |
| 12R | 0.52 | 0.4 | 55.4 | 0.21 | 0.47 |
Important conclusions that can be drawn from the Phase 10 test program include:
| § | For the samples tested, there was no clear evidence of passivation in the leaching profiles using conditions that are efficient for ores containing antimony minerals; |
| § | Given the level of antimony and arsenic minerals that are present, this is a very unusual response. Either these minerals did not interfere, perhaps because they were not liberated, or the samples tested were altered by the previous grinding/gravity tests that were performed on them. Ageing may have also been a contributing factor; |
| § | The response runs counter to the good recovery results of RT9 in the FS optimization, where the average gravity tail leach extraction was 62.9%. It also runs counter to the RT7 mini-optimization testwork that resulted in an average gold recovery of 53.6%. Both of these sets of tests were run on fresh core, where the impact of antimony should have been quite pronounced, but yet gold recoveries were higher than the Phase 10 testwork. Particle size cannot be used to explain the differences in the Phase 10 tests, because the P80 of 60-90 µm was similar to that used in the FS optimization tests; |
| § | The results reinforce the need to consider detailed gold deportment analysis of gravity and leaching products in the next phase of testwork; |
| § | Seven tests with repeats indicated a good reproducibility of the results; |
| § | Lead nitrate addition may have increased the gold leaching kinetics. |
| International Tower Hill Mines Ltd. S-K 1300 – Technical Report Summary Livengood Gold Project Pre-feasibility Study | |
| 10.5.12 | 2021 PFS – Metallurgical Testwork |
Five additional phases (9a, 9b, 11, 12, with addenda 1-5, and 13) of testwork have been completed since the 2017 PFS. These testwork were conducted to explore possible opportunities established through BBA’s analysis of the FS and 2017 PFS testwork, to clarify certain questions regarding gold leach performance and reagent consumptions and to confirm the process flowsheet. Phase descriptors with a common numeric identifier mean that those programs were completed on replicate splits of the same large composites for each of the different rock types. For example, all the work for Phases 9, 9a, and 9b was completed on replicates of the same RC chip composites. Similarly, all the work for Phase 12, including addenda 1-5, was completed on replicates of the same core composites. The new phases are outlined as follows:
| § | Phase 9a: Cyanide leach testing on all rock types using reverse circulation (RC) drill chip composites; |
| § | Phase 9b: Gravity recovery improvement, flowsheet optimization, STR testwork, ore blends testing, gold deportment, diagnostic leaching on two problematic rock types (RT7 and RT9) and flotation testing; |
| § | Phase 11: Testing using RC rig duplicates to assess impact of the ore body location in relation with the 100 ppm antimony shell on the gold recovery and improvement of the understanding of the gold grade/recovery and grind size/recovery relationships; |
| § | Phase 12: Original objectives are the same as Phase 11 but using core samples rather than RC rig duplicates; followed by Phase 12, Addenda 1-5 as described below; |
| § | Phase 13: Testing using a blend of core and RC rig duplicates to assess impact of the ore body location and antimony concentrations of 200 ppm and above on gold recovery. |
The nature of the testwork and resulting conclusions are discussed below.
| 10.5.13 | 2021 PFS – Phase 9a - Cyanide Leach Testing |
The Phase 9a was conducted by SGS Vancouver on approximately 50 kg of product rejects from the Phase 9 composites processed by FLSmidth/AMIRA and returned to SGS in 2015 where each sample had previously been prepared from reverse circulation rig duplicates (rock chips).
The objectives were to confirm the process flowsheet developed in Phase 8, to avoid nugget effects from influencing the projected metallurgical recoveries and to determine the effect of leach conditions using samples taken from a homogenous feed composite.
The Phase 9a testwork were completed in triplicate on 1 kg splits to compare different leach tests conditions:
| § | Lead nitrate addition at PFS concentration vs no lead nitrate; |
| § | Sodium cyanide concentration at 0.4 kg/t vs 0.8 kg/t; |
| International Tower Hill Mines Ltd. S-K 1300 – Technical Report Summary Livengood Gold Project Pre-feasibility Study | |
The composite sample selection was described previously in the section 10.5.10.1. Figure 10-22 illustrates the testwork that was conducted.

Figure 10-22: 2021 PFS (Phase 9a) testwork outline
Table 10-27 presents the test conditions and Table 10-28 present the gold recoveries obtained for each rock type. The average gold recovery were similar when using CIL or CIP methodologies for Rock Types 4, 5 and 9 while better gold recovery was obtained when using CIL methodology for Rock Types 6 and 7.
| International Tower Hill Mines Ltd. S-K 1300 – Technical Report Summary Livengood Gold Project Pre-feasibility Study | |
Table 10-27: Test conditions (2021 PFS – Phase 9a)
| Test ID | Lead Nitrate Concentration (g/mt) | Sodium Cyanide Dosage (kg/mt) | Test pH |
| CIL-1 | 100 | 0.4 | 10 |
| CIL-2 | 100 | 0.8 | 10 |
| CIL-3 | 100 | 0.4 | 10.5 |
| CIL-4 | 100 | 0.8 | 10.5 |
| CIL-5 | 0 | 0.4 | 10 |
| CIL-6 | 0 | 0.8 | 10 |
| CIL-7 | 0 | 0.4 | 10.5 |
| CIL-8 | 0 | 0.8 | 10.5 |
| CIP-1 | 100 | 0.4 | 10 |
| CIP-2 | 100 | 0.8 | 10 |
| CIP-3 | 100 | 0.4 | 10.5 |
| CIP-4 | 100 | 0.8 | 10.5 |
| CIP-5 | 0 | 0.4 | 10 |
| CIP-6 | 0 | 0.8 | 10 |
| CIP-7 | 0 | 0.4 | 10.5 |
| CIP-8 | 0 | 0.8 | 10.5 |
Table 10-28: Test results for all Rock Types (2021 PFS – Phase 9a)
| Test ID | RT4
Au Recovery
(%) | RT5
Au Recovery
(%) | RT6
Au Recovery
(%) | RT7
Au Recovery
(%) | RT9
Au Recovery
(%) |
| CIL-1 | 78.1 | 72.2 | 58.8 | 43.9 | 46.7 |
| CIL-2 | 77.4 | 72.8 | 64.3 | 40.6 | 47.9 |
| CIL-3 | 73.7 | 73.9 | 64.1 | 36.8 | 49.1 |
| CIL-4 | 75.3 | 72.0 | 62.9 | 43.9 | 47.6 |
| CIL-5 | 76.8 | 68.9 | 61.3 | 41.3 | 46.6 |
| CIL-6 | 75.3 | 72.5 | 56.3 | 38.1 | 46.8 |
| CIL-7 | 74.2 | 56.9 | 57.8 | 35.6 | 43.8 |
| CIL-8 | 78.4 | 65.7 | 56.5 | 39.6 | 45.6 |
| International Tower Hill Mines Ltd. S-K 1300 – Technical Report Summary Livengood Gold Project Pre-feasibility Study | |
| Test ID | RT4
Au Recovery
(%) | RT5
Au Recovery
(%) | RT6
Au Recovery
(%) | RT7
Au Recovery
(%) | RT9
Au Recovery
(%) |
| CIP-1 | 75.6 | 71.8 | 56.0 | 32.4 | 50.2 |
| CIP-2 | 75.5 | 69.3 | 55.5 | 34.4 | 51.6 |
| CIP-3 | 73.9 | 71.8 | 58.8 | 33.8 | 45.5 |
| CIP-4 | 75.6 | 74.3 | 53.7 | 35.3 | 46.7 |
| CIP-5 | 78.9 | 66.5 | 52.8 | 31.0 | 46.8 |
| CIP-6 | 74.9 | 70.2 | 52.0 | 35.3 | 49.7 |
| CIP-7 | 73.9 | 59.6 | 43.8 | 32.1 | 44.4 |
| CIP-8 | 76.1 | 66.4 | 54.2 | 33.7 | 45.8 |
Figure 10-23 to Figure 10-27 show the residue averages of three replicates at each test condition. These conditions are identified in the legend of each figure with the four variables being CIL or CIP, concentration of lead nitrate added (ppm), initial cyanide concentration (kg/t) and pH.
The residue grades were the same in the CIL and CIP for Rock Types 4, 5 and 9. Lower residual gold grades were obtained for Rock Types 6 and 7 when using the CIL. These results confirm that CIL seems to be the better methodology compared to CIP.
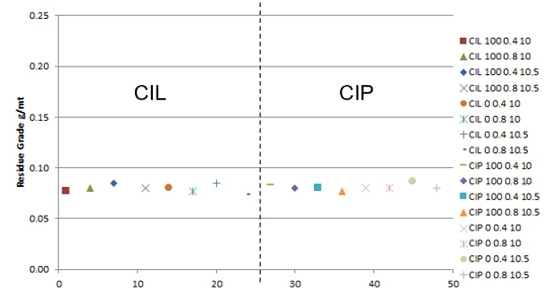
Figure 10-23: RT4 Average CIL and CIP residue grades at a P80 of 112 µm
(2021 PFS – Phase 9a)
| International Tower Hill Mines Ltd. S-K 1300 – Technical Report Summary Livengood Gold Project Pre-feasibility Study | |
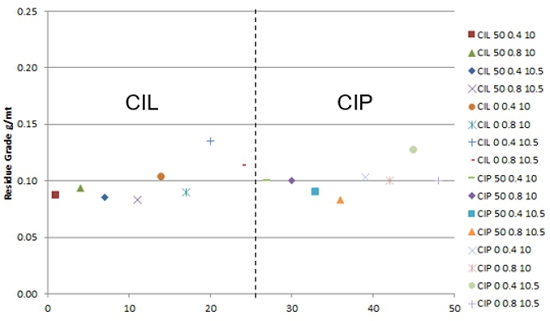
Figure 10-24: RT5 Average CIL and CIP residue grades at a P80 of 111 µm
(2021 PFS – Phase 9a)
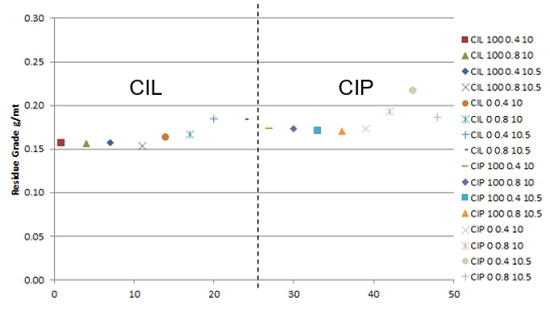
Figure 10-25: RT6 Average CIL and CIP residue grades at a P80 of 99 µm
(2021 PFS – Phase 9a)
| International Tower Hill Mines Ltd. S-K 1300 – Technical Report Summary Livengood Gold Project Pre-feasibility Study | |
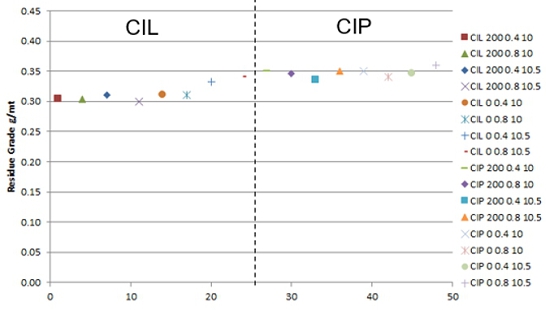
Figure 10-26: RT7 Average CIL and CIP residue grades at a P80 of 120 µm
(2021 PFS – Phase 9a)
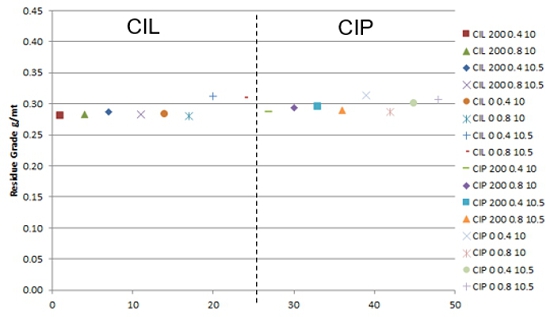
Figure 10-27: RT9 Average CIL and CIP residue grades at a P80 of 113 µm
(2021 PFS – Phase 9a)
The gold leach kinetic profiles of the CIP test replicates are presented in Figure 10-28 for each condition listed in Table 10-27 and for each rock type. The plots suggest that gold recovery plateaued after 18 hours of leaching for all rock types. RT4, RT7 and RT9 appeared to reach maximum gold dissolution by 12 hours.
| International Tower Hill Mines Ltd. S-K 1300 – Technical Report Summary Livengood Gold Project Pre-feasibility Study | |
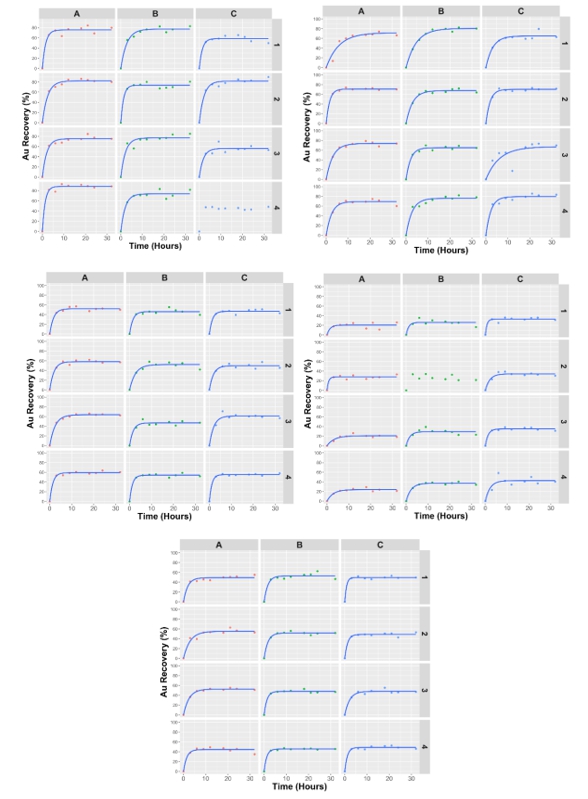
Figure 10-28: Leach kinetics results for RT4, RT5, RT6, RT7 and RT9
(2021 PFS – Phase 9a)
| International Tower Hill Mines Ltd. S-K 1300 – Technical Report Summary Livengood Gold Project Pre-feasibility Study | |
The potential preg-robbing level of each rock type was determined by the analysis Au31 and Au31a performed in quadruplicate. The preg-robbing levels for each rock type are shown in Figure 10-29. Values approaching 0% have low potential for preg-robbing while negative values near -40% have a significant potential for preg-robbing.
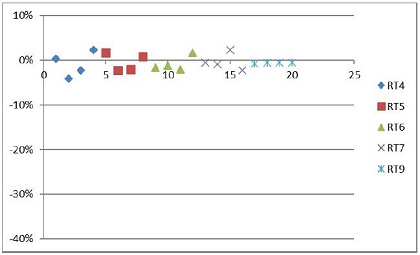
Figure 10-29: % Au gain preg-robbing level
(2021 PFS – Phase 9a)
The important conclusions to be drawn from the leach residue assay interpretation of Phase 9a are as follow:
| § | RT7 and RT6 showed better recovery both with CIL. The other rock types appeared insensitive to CIL vs CIP; |
| § | Leach residue grades were consistently as low as what was obtained during previous testwork at SGS for all rock types; |
| § | None of the five rock types (RT4, RT5, RT6, RT7 and RT9) were sensitive to the addition of lead nitrate at PFS concentration at the test condition at pH 10; |
| § | None of the five rock types were sensitive to the leach variable of cyanide concentration at either 0.4 kg/t vs 0.8 kg/t; |
| § | RT5, RT6, RT7 and RT9 showed better results at pH 10 without lead nitrate. However, the variance is slightly above 0.02 g/t of the method detection limit, which indicates that this is not significant; |
| § | RT4 appeared insensitive to either pH 10 or pH 10.5 or with and without lead nitrate addition; |
| § | Geochemical analysis of the samples showed all rock types with low preg-robbing levels of 5% or less. |
| International Tower Hill Mines Ltd. S-K 1300 – Technical Report Summary Livengood Gold Project Pre-feasibility Study | |
| 10.5.14 | 2021 PFS – Phase 9b - Gravity, Grind, Leaching, STR and Flotation Testing |
The Phase 9b was conducted by SGS Vancouver on the remaining 100 kg of the 500 kg June 2015 reverse circulation Phase 9 composites from each rock type. The key objectives of this phase were to:
| § | Attempt to demonstrate improved gravity recovery on a bulk sample to the level predicted by previous E-GRG testwork; |
| § | Develop reliable grind and recovery data by completing five data points at six grind sizes between 90 and 250 microns; |
| § | Complete additional screening flotation work; |
| § | Develop additional kinetic and reagent consumption data to optimize the flowsheet; |
| § | Test representative ore blends to assess impact on recovery and reagents; |
| § | Complete additional gold deportment and diagnostic leach work on RT7 and RT9 leach residues; |
| § | Complete stirred reactor testing in attempt to assess and reduce antimony impacts on recovery. |
The composite sample selection was described previously in the Section 10.5.10.1. Figure 10-30 illustrates the testwork that were conducted.
| International Tower Hill Mines Ltd. S-K 1300 – Technical Report Summary Livengood Gold Project Pre-feasibility Study | |
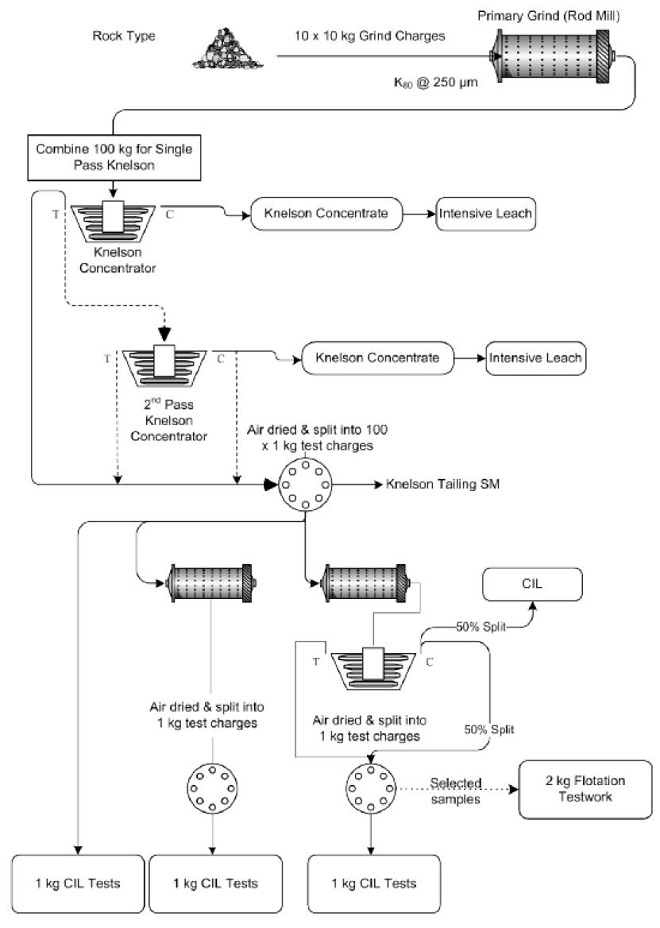
Figure 10-30: 2021 PFS (Phase 9b) testwork outline
| International Tower Hill Mines Ltd. S-K 1300 – Technical Report Summary Livengood Gold Project Pre-feasibility Study | |
| 10.5.14.1 | Phase 9b – Gravity / Intensive Leach Testwork |
Phase 9b gravity testwork was performed at a grind of 250 µm (P80). One 100 kg composite by rock type was processed in a single pass through a Knelson concentrator at 40% solids. The entire gravity concentrate was intensive leached, and the tailings were assayed to determine the gold deportment of the gravity products. The results presented in the Table 10-29 demonstrates that the gravity recovery modeled by FLSmidth/AMIRA and the Feasibility Study E-GRG work can be achieved.
Table 10-29: Average gold gravity recovery results for each rock type
(2021 PFS – Phase 9b)
| Rock Type | Phase 9 | Phase 9b |
Calc. Head (Au g/mt) | FLSmidth/AMIRA Stage 1 % GRG Recovery P100– 850 µm | SGS Vancouver Gravity Recovery
with Mozley P80– 250 µm | Calc. head (Au g/mt) | SGS Vancouver Gravity Recovery without Mozley P80– 250 µm |
| RT4 | 0.70 | 38% | 24% | 0.68 | 49% |
| RT5 | 0.63 | 44% | 16% | 0.63 | 64% |
| RT6 | 0.71 | 46% | 25% | 0.76 | 53% |
| RT7 | 0.78 | 35% | 16% | 0.81 | 38% |
| RT9 | 0.69 | 33% | 10% | 0.73 | 36% |
Table 10-30 shows higher gravity recovery of each rock type obtained during Phase 9b testwork leading to an improvement in the overall recovery as compared to splits from the same composites in Phase 9. The gravity recovery improvement in Phase 9b appears to have removed leachable gold from the pulp and resulted in lower CIL recovery than Phase 9. The early gravity recovery of otherwise leachable gold could result in reductions in CAPEX and OPEX in the leach circuit.
Table 10-30: Phase 9 and Phase 9b recovery results comparison
(2021 PFS – Phase 9b)
Rock
Type | Phase 9 | Phase 9b |
Average
Gravity
Recovery | Average
CIL
Recovery | Overall
Recovery | Average
Tails (Au g/mt) | Average
Gravity
Recovery | Average CIL Recovery | Overall Recovery | Average Tails (Au g/mt) |
| RT4 | 24% | 78% | 83% | 0.10 | 49% | 69% | 84% | 0.11 |
| RT5 | 16% | 77% | 80% | 0.11 | 64% | 62% | 86% | 0.10 |
| RT6 | 25% | 64% | 72% | 0.18 | 53% | 51% | 77% | 0.17 |
| RT7 | 16% | 43% | 52% | 0.31 | 38% | 37% | 61% | 0.31 |
| RT9 | 10% | 48% | 53% | 0.29 | 36% | 41% | 62% | 0.32 |
| International Tower Hill Mines Ltd. S-K 1300 – Technical Report Summary Livengood Gold Project Pre-feasibility Study | |
The Knelson concentrate from each rock type was intensive leached to determine the recoverable gold. Gold recoveries exceeding 98% were achieved for all rock types. The leach rates of the Knelson concentrates are shown in Figure 10-31. The leach kinetics of all rock types were substantially completed after 8 hours of leaching and reached 99% by 24 hours.
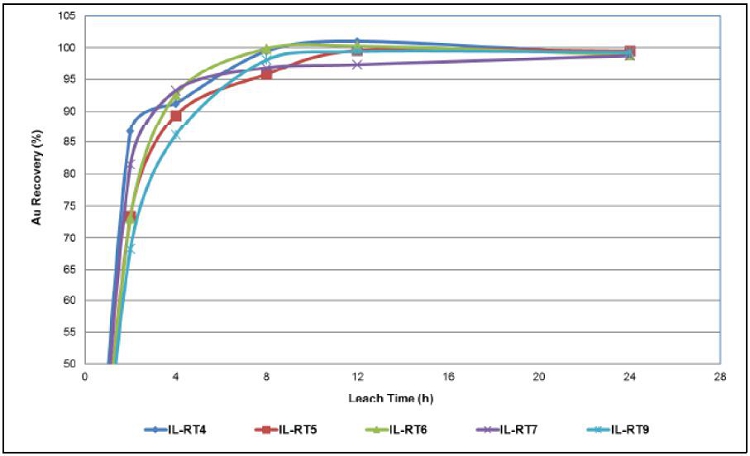
Figure 10-31: Leach kinetics of the Knelson concentrate
(2021 PFS – Phase 9b)
| 10.5.14.2 | Phase 9b – CIL Tests on Knelson Tailings |
A total of 345 standard bottle roll tests were performed on Knelson tailings to determine the extractable gold for each rock type as a function of different parameters: grind size, preconditioning, pH, and cyanide dosage.
Figure 10-32 shows the CIL residue grades for each rock type at different grind sizes, between 90 µm and 250 µm. Between five and seven data points are represented at each grind size for the single pass gravity results and ten data points for the double pass gravity results.
Some observations that can be drawn from this testwork are the following:
| § | Slightly better recoveries were obtained with the double pass gravity; |
| § | Some of the residues have the same assay and plot on top of each other. The well clustered data are interpreted to reflect an improvement in the test protocol as a consequence of gravity recoverable gold not reporting to conventional leaching and potentially impacting the repeatability of leach residue assays; |
| International Tower Hill Mines Ltd. S-K 1300 – Technical Report Summary Livengood Gold Project Pre-feasibility Study | |
| § | The results of overall recovery versus grind size do not show any inflection point neither for single pass gravity nor for the second pass gravity, which can suggest that there is an opportunity to conduct testwork on coarser sizes in the future; |
| § | There was no correlation shown between cyanide consumption and grind size. |
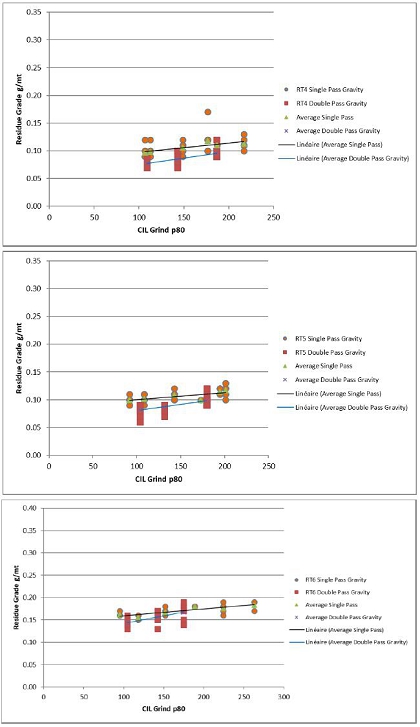
| International Tower Hill Mines Ltd. S-K 1300 – Technical Report Summary Livengood Gold Project Pre-feasibility Study | |
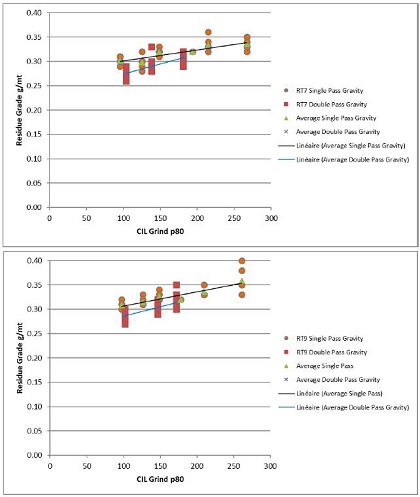
Figure 10-32: CIL residue grade according to grind size
(2021 PFS – Phase 9b)
| 10.5.14.3 | Phase 9b – Regrind and Gravity Separation Testing |
A total of 46 regrinds were performed at six different grind sizes, including 215, 180, 150, 135, 120 and 90 µm (P80) for all rock types and blend composites. After regrinding, a total of 15 gravity tests were carried out on each rock type at 180, 135 and 90 µm (P80). The Knelson concentrates were split in half; one half was forwarded to intensive leach and the other was returned with the Knelson tailings. The second pass gravity as well as the intensive leach results are presented in Table 10-31 to Table 10-33.
The results show that regrinding followed by gravity separation and intensive leach can recover more gold than a single pass in gravity followed by CIL. The increased amount gain average from 0.02 to 0.04 g/t. These results reflect the same opportunity identified in the gold deportment and diagnostic leach work that is discussed in Section 10.5.14.6. Enhanced gold recovery is possible by intensive leaching, but improved grinding and/or gravity, or even whole ore intensive leach may be required.
| International Tower Hill Mines Ltd. S-K 1300 – Technical Report Summary Livengood Gold Project Pre-feasibility Study | |
Table 10-31: Result summary of the second pass gravity test at 180 µm
(2021 PFS – Phase 9b)
Rock
type | 2nd pass grav. con. calc. head (Au g/mt) | Residue
after IL (Au g/mt) | Au
recovery
from con. (%) | 2nd pass grav. Au into con. (Au g/mt) | Net Au
possible 2nd pass grav. (Au g/mt) | 1st pass grav. CIL tail (Au g/mt) | 2nd pass grav. CIL tail (Au g/mt) | Difference 1st to 2nd pass (Au g/mt) | Gravity
intensive
leach gain (Au g/mt) |
| RT4 | 7.29 | 2.82 | 61.3 | 0.07 | 0.04 | 0.11 | 0.10 | 0.01 | 0.03 |
| RT5 | 6.04 | 2.29 | 62.1 | 0.05 | 0.03 | 0.11 | 0.10 | 0.01 | 0.02 |
| RT6 | 9.62 | 3.53 | 63.3 | 0.09 | 0.06 | 0.18 | 0.17 | 0.01 | 0.05 |
| RT7 | 6.11 | 3.56 | 41.7 | 0.05 | 0.02 | 0.32 | 0.31 | 0.01 | 0.01 |
| RT9 | 6.24 | 2.42 | 61.2 | 0.05 | 0.03 | 0.33 | 0.30 | 0.03 | 0.00 |
Table 10-32: Result summary of the second pass gravity test at 135 µm
(2021 PFS – Phase 9b)
Rock
type | 2nd pass grav. con. calc. head (Au g/mt) | Residue
after IL (Au g/mt) | Au
recovery
from con. (%) | 2nd pass grav. Au into con. (Au g/mt) | Net Au
possible 2nd pass grav. (Au g/mt) | 1st pass grav. CIL tail (Au g/mt) | 2nd pass grav. CIL tail (Au g/mt) | Difference 1st to 2nd pass (Au g/mt) | Gravity
intensive
leach gain (Au g/mt) |
| RT4 | 11.4 | 3.58 | 68.7 | 0.11 | 0.08 | 0.10 | 0.08 | 0.02 | 0.06 |
| RT5 | 7.81 | 2.75 | 64.8 | 0.07 | 0.05 | 0.10 | 0.09 | 0.01 | 0.04 |
| RT6 | 8.23 | 4.01 | 51.3 | 0.08 | 0.04 | 0.16 | 0.16 | 0.00 | 0.04 |
| RT7 | 7.40 | 3.73 | 49.6 | 0.07 | 0.04 | 0.30 | 0.29 | 0.01 | 0.03 |
| RT9 | 5.69 | 3.41 | 40.1 | 0.05 | 0.02 | 0.31 | 0.30 | 0.01 | 0.01 |
| International Tower Hill Mines Ltd. S-K 1300 – Technical Report Summary Livengood Gold Project Pre-feasibility Study | |
Table 10-33: Result summary of the second pass gravity test at 90 µm
(2021 PFS – Phase 9b)
Rock
type | 2nd pass grav. con. calc. head (Au g/mt) | Residue
after IL (Au g/mt) | Au
recovery
from con. (%) | 2nd pass grav. Au into con. (Au g/mt) | Net Au
possible 2nd pass grav. (Au g/mt) | 1st pass grav. CIL tail (Au g/mt) | 2nd pass grav. CIL tail (Au g/mt) | Difference 1st to 2nd pass (Au g/mt) | Gravity
intensive
leach gain (Au g/mt) |
| RT4 | 10.3 | 3.06 | 70.3 | 0.09 | 0.07 | 0.10 | 0.08 | 0.02 | 0.05 |
| RT5 | 7.44 | 3.04 | 59.1 | 0.07 | 0.04 | 0.10 | 0.08 | 0.02 | 0.02 |
| RT6 | 12.0 | 4.91 | 59.1 | 0.13 | 0.07 | 0.16 | 0.14 | 0.02 | 0.05 |
| RT7 | 10.3 | 3.61 | 64.8 | 0.11 | 0.07 | 0.30 | 0.27 | 0.03 | 0.04 |
| RT9 | 8.36 | 3.58 | 57.2 | 0.09 | 0.05 | 0.31 | 0.29 | 0.02 | 0.03 |
| International Tower Hill Mines Ltd. S-K 1300 – Technical Report Summary Livengood Gold Project Pre-feasibility Study | |
| 10.5.14.4 | Phase 9b – Flotation Testwork |
Flotation testwork was completed on three replicates of each rock type and on three replicates from ore blends representative of Year 1, Year 2, Year 4 and LOM at a grind size of 180 µm (P80). The test conditions for all rock types were based on previously optimized flotation conditions for RT7 and RT9. The intent was to achieve a 15% mass pull. Table 10-34 shows the averages of the replicate results for each sample. Table 10-35 presents the comparison of the overall recovery by test condition. As shown in this table, overall recovery for gravity followed by flotation was 3% to 12% lower compared to recovery for gravity followed by CIL. These poor results eliminated the flotation in the selected process flowsheet.
Table 10-34: Flotation testwork results
(2021 PFS – Phase 9b)
| Sample | Mass Pull | Flotation recovery |
| RT4 | 27% | 46% |
| RT5 | 12% | 44% |
| RT6 | 15% | 34% |
| RT7 | 16% | 32% |
| RT9 | 16% | 30% |
| Y1 | 16% | 38% |
| Y2 | 12% | 32% |
| Y4 | 12% | 42% |
| LOM 180 | 18% | 36% |
| LOM 135 | 18% | 38% |
| LOM 90 | 17% | 38% |
Table 10-35: Overall recovery comparison
(2021 PFS – Phase 9b)
Rock
Type | Gravity
Recovery | CIL
Recovery | Gravity CIL
Recovery | Flotation
Recovery | Gravity
Flotation
Recovery | Difference |
| RT4 | 49% | 69% | 84% | 46% | 72% | 12% |
| RT5 | 64% | 62% | 86% | 44% | 77% | 8% |
| RT6 | 53% | 51% | 77% | 34% | 67% | 9% |
| RT7 | 38% | 37% | 61% | 32% | 58% | 3% |
| RT9 | 36% | 41% | 62% | 30% | 53% | 8% |
| International Tower Hill Mines Ltd. S-K 1300 – Technical Report Summary Livengood Gold Project Pre-feasibility Study | |
| 10.5.14.5 | Phase 9b – Effect of Ore Blend |
A series of blend composites was prepared for the first time to evaluate potential impacts of mixing the chemical and physical properties of the ore types on recovery and reagent consumptions. The composition of the blends is presented in Table 10-36.
Table 10-36: Composition of blend composites
(2021 PFS – Phase 9b)
| Rock Type | RT4 | RT5 | RT6 | RT7 | RT9 |
| Blend Year 1 | 40% | 27% | 27% | 0% | 7% |
| Blend Year 2 | 9% | 9% | 45% | 0% | 36% |
| Blend Year 3 | 9% | 82% | 9% | 0% | 0% |
| Blend LOM | 15% | 23% | 23% | 15% | 23% |
The effect of ore blend on recoveries and mass pull are presented in the Table 10-37. The results show that there are no significant adverse recovery issues introduced by mixing ore types. The difference between measured and projected data were varying between -7% to 1% for the CIL recovery, flotation recovery and mass pull. There was no statistically significant difference in measured CIL residue grades as compared to predicted grades.
Table 10-37: Effect of ore blend on CIL recovery, leach residue, flotation recovery and mass pull
(2021 PFS – Phase 9b)
| Rock Type | Year 1
Blend | Year 2
Blend | Year 4
Blend | LOM
Blend |
| Projected tails (Au g/mt) | 0.14 | 0.21 | 0.11 | 0.20 |
| Measured tails (Au g/mt) | 0.13 | 0.21 | 0.11 | 0.19 |
| Difference (measured-projected) | -0.01 | 0.00 | 0.00 | -0.01 |
| Projected CIL recovery | 61% | 50% | 61% | 52% |
| Measured CIL recovery | 56% | 44% | 59% | 45% |
| Difference (measured-projected) | -5% | -6% | -3% | -7% |
| Projected float recovery | 41% | 34% | 43% | 37% |
| Measured float recovery | 38% | 32% | 42% | 37% |
| Difference (measured-projected) | -3% | -2% | -1% | 0% |
| Projected mass pull | 19% | 16% | 14% | 17% |
| Measured mass pull | 16% | 12% | 12% | 18% |
| Difference (measured-projected) | -3% | -4% | -2% | 1% |
| International Tower Hill Mines Ltd. S-K 1300 – Technical Report Summary Livengood Gold Project Pre-feasibility Study | |
| 10.5.14.6 | Phase 9b – Residue Characterization |
AMTEL completed a gold deportment study on three replicate samples selected from the Phase 9b RT7 and RT9 gravity/CIL leach residues from the 105 µm metallic screen undersize. The gold deportment study demonstrated that approximately 17% of gold in these samples was recoverable from both rock types by intensive leaching. Some of the gold in the tailings was observed to have developed a coating, interpreted as silver and silver oxide developed in part by gold depletion during leaching. Figure 10-33 shows the gold deportment.
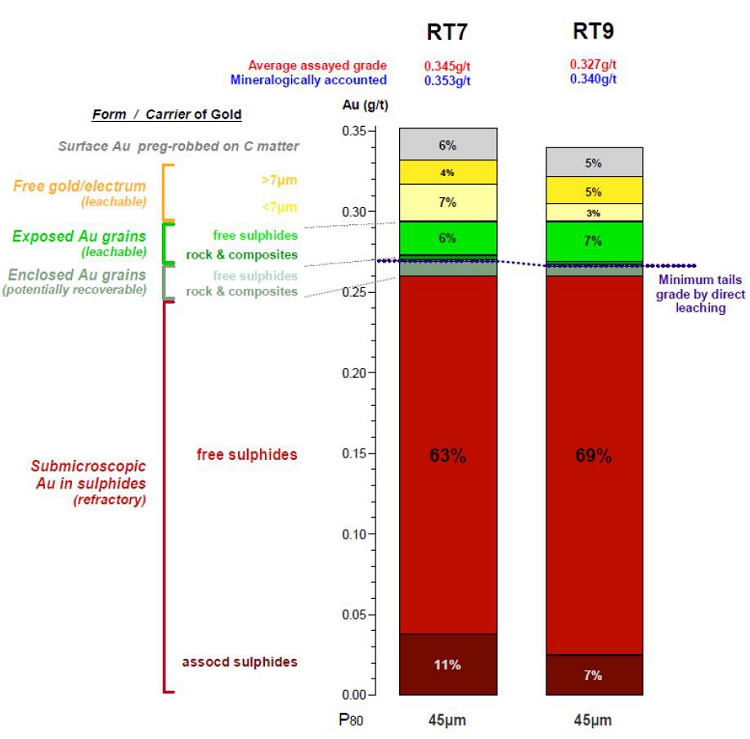
Figure 10-33: Deportment of gold by leach form and carrier
(2021 PFS – Phase 9b)
| International Tower Hill Mines Ltd. S-K 1300 – Technical Report Summary Livengood Gold Project Pre-feasibility Study | |
SGS completed six diagnostic leach tests on triplicates of both RT7 and RT9 gravity/CIL residues at a grind size of 120 µm from the 105 µm metallic screen undersize to diagnose the presence of gold encapsulated by other minerals. The diagnostic leach work indicates that 14.7% of the gold in RT7 residues and 18.1% of the gold in the RT9 residues is recoverable by intensive leach at this particle size. This result corroborates the AMTEL gold deportment work shown previously. Figure 10-34 shows the average diagnostic leach results for RT7 and RT9.
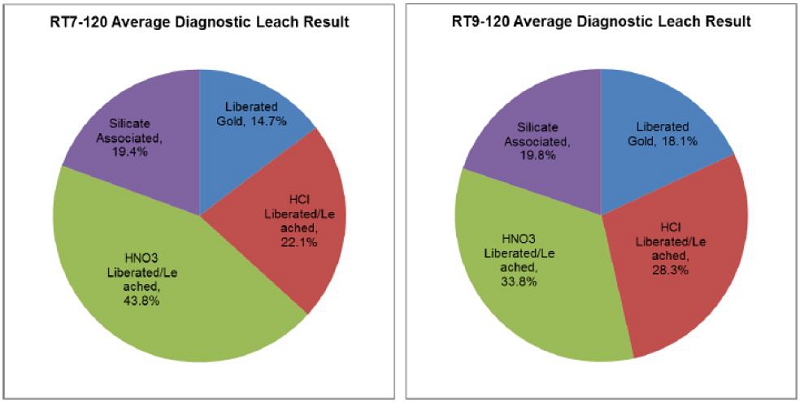
Figure 10-34: Diagnostic leach result distribution
(2021 PFS – Phase 9b)
| 10.5.14.7 | Phase 9b – Stirred Tank Reactor (STR) Leach Tests |
A stirred tank reactor testwork program was completed under the direction of BBA. The program was initiated at SGS Vancouver in British Columbia. Samples were shipped to BBA laboratory in Hamilton, Ontario. Leaching products were assayed at SGS Lakefield in Ontario. The test program included the use of lead nitrate to study the influence of passivation of the gold surfaces during grinding and leach sample preparation. Phase 9b included testing of six aliquots, all weighing approximately 1 kg from each rock type (RT4, RT5, RT6, RT7 and RT9).
The objectives of the testwork program were to:
| § | Compare the leaching performance at 16 and 24 hours; |
| § | Assess whether controlled leaching conditions could improve Au recovery; |
| § | Search opportunities to reduce the leaching time and reagent consumptions. |
| International Tower Hill Mines Ltd. S-K 1300 – Technical Report Summary Livengood Gold Project Pre-feasibility Study | |
The test program was conducted on Knelson gravity tails at a grind size of 180 µm (P80). Tests were conducted in stirred tank reactor (STR) under controlled conditions of the following variables: temperature, agitation, pH, oxidation reduction potential (ORP), free cyanide, and dissolved oxygen (DO). Table 10-38 shows the matrix conditions. To study possible passivation of the Au surface during the leaching testwork, the use of DO in the 12-14 ppm range instead of 6-8 ppm was used for one of the aliquots for each rock type.
Table 10-38: STR leach matrix conditions
(2021 PFS – Phase 9b)
Rock
Type | Lead Nitrate | pH | DO pre-
cond. (ppm) | DO during
leaching (ppm) | Initial NaCN
dosage (kg/mt) | NaCN during
leach (kg/mt) | Leaching
time |
During re-
grinding (g/mt) | During
pre-cond. (g/mt) |
| RT4 | 100 | 25 | 10.2 | 6 - 8 | 6 - 8 | 0.4 | 0.2 | 16 & 24 |
| RT5 | 50 | 18 |
| RT6 | 100 | 25 |
| RT7 | 200 | 50 |
| RT9 | 200 | 50 |
Table 10-39 presents a summary of the average results of the STR testwork program. Some observations that can be drawn from this table are listed below:
| § | The Au residue was similar (within the experimental error of 0.02 g/t) for the 16 and 24-hour tests, for all rock types; |
| § | The Au recovery based on the carbon adsorption was higher in all cases at 16-hour vs 24-hour tests, except RT7; |
| § | The Au recovery based on the residue was higher in RT4, RT6 and RT9 at 16-hour vs 24-hour, except RT5 and RT7. |
| § | Higher DO (range 12 to 14 ppm O2 instead of 6 to 8 ppm O2) did not have an impact on Au leaching; |
| § | The NaCN consumptions were between 0.25 and 0.40 kg/t with an average of 0.33 kg/t. Since the STR testwork are closer to the reality than the bottle roll tests, it can be expected that the NaCN consumption will be lower than what was used in the testwork of the other phases; |
| § | The NaCN consumptions were lower for all rock types at 16-hour vs 24-hour, except for RT5. It could be explained by the lower lead nitrate addition for this rock type; |
| § | The CaO consumptions were between 0.74 to 1.09 kg/t with an average of 0.87 kg/t. Since the STR testwork are closer to the reality than the bottle roll tests, it can be expected that the CaO consumption will be lower than what was used in the testwork of the other phases; |
| § | The CaO consumptions were higher for all rock types at 16 hours, except RT5; |
| § | These controlled leach tests were not able to reduce leach residue assays below the bottle roll results from SGS shown previously in Figure 10-32 at a grind size of 180 µm. |
| International Tower Hill Mines Ltd. S-K 1300 – Technical Report Summary Livengood Gold Project Pre-feasibility Study | |
Table 10-39: Average STR testwork results
(2021 PFS – Phase 9b)
Rock
Type | Leach
Time (hours) | Reagent
Consumption | Residue
Grade (Au g/mt) | Head Grade | Au Recovery |
NaCN (kg/mt) | CaO (kg/mt) | Calculated (Au g/mt) | Direct (Au g/mt) | Carbon ads (%) | Residue (%) |
| RT4 | 24 | 0.40 | 0.91 | 0.12 | 0.36 | 0.35 | 67.7 | 66.3 |
| 16 | 0.32 | 1.05 | 0.11 | 0.37 | 71.2 | 70.0 |
| RT5 | 24 | 0.25 | 0.82 | 0.09 | 0.25 | 0.23 | 60.7 | 62.5 |
| 16 | 0.33 | 0.77 | 0.11 | 0.28 | 61.3 | 61.2 |
| RT6 | 24 | 0.37 | 0.74 | 0.19 | 0.34 | 0.36 | 43.3 | 42.4 |
| 16 | 0.27 | 0.84 | 0.21 | 0.38 | 46.8 | 43.5 |
| RT7 | 24 | 0.36 | 0.88 | 0.31 | 0.51 | 0.47 | 42.2 | 38.7 |
| 16 | 0.34 | 1.09 | 0.32 | 0.49 | 37.7 | 35.2 |
| RT9 | 24 | 0.34 | 0.76 | 0.33 | 0.50 | 0.47 | 36.5 | 34.6 |
| 16 | 0.29 | 0.81 | 0.32 | 0.52 | 39.4 | 37.6 |
Figure 10-35 shows kinetic plots of Au leaching residue vs time. Similar kinetic rates can be observed in both the 16-hour and 24-hour. These tests confirm Phase 9a work showing that the leach kinetics appeared to reach maximum gold dissolution by 12 hours as shown previously in Figure 10-28.
The addition of lead nitrate during regrind and pre-conditioning did not improve Au leaching kinetics or Au leaching tails. A lead nitrate optimization program is suggested to study the impact of the addition of lead nitrate in Au leach kinetics and cyanide consumption.
| International Tower Hill Mines Ltd. S-K 1300 – Technical Report Summary Livengood Gold Project Pre-feasibility Study | |
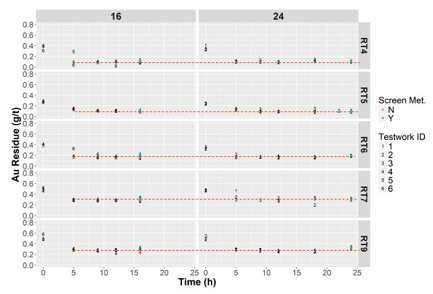
Figure 10-35: Leach kinetics 16 vs 24 hours
(2021 PFS – Phase 9b)
| 10.5.14.8 | Phase 9b – Reprocessing of CIL Residues |
Various CIL tailing metallic screen undersize residues, after being pulverized to approximately 50 µm (P80) from different particle sizes, were reconstituted to make up a sample for each rock type. These samples were reprocessed through a gravity concentrator in a single pass. The concentrates were forwarded to intensive leaching and the gravity tails were sent to CIL to determine if the liberated gold identified by AMTEL and SGS diagnostic leach can be recovered significatively.
Table 10-40 presents the results of the concentrate regrinding followed by intensive leaching. Modest improvement in tail residue grades and recoveries were obtained. The 3.5% and 3.0% values for RT7 and RT9 (as a percentage of gold in the CIL tails) compares to the 15%-17% obtained by AMTEL and SGS diagnostic leach, which means that the liberated gold appears to be too small to be recovered by gravity circuit.
Table 10-40: Knelson concentrate intensive leach results
(2021 PFS – Phase 9b)
| Sample ID | Residue Grade (Au g/mt) | Au Recovery (%) |
| KnelCon of RT4 Residues | 0.09 | 14.9 |
| KnelCon of RT5 Residues | 0.10 | 8.14 |
| KnelCon of RT6 Residues | 0.17 | 5.35 |
| KnelCon of RT7 Residues | 0.33 | 3.52 |
| KnelCon of RT9 Residues | 0.30 | 3.05 |
| International Tower Hill Mines Ltd. S-K 1300 – Technical Report Summary Livengood Gold Project Pre-feasibility Study | |
Reprocessing the Knelson tailings by the CIL methodology liberated additional leachable gold and obtained tail residue grades and recovery shown in Table 10-41. The 16.9% and 23.8% recovery improvement for RT7 and RT9 (as a percentage of gold in the CIL tails) compares favorably to the 15%-17% obtained by AMTEL and SGS diagnostic leach. The overall recovery increase by rock type is shown in the right column. These data warranted a re-examination of the grind/recovery characteristics, which was completed in Phases 11 and 12, following the success at improving the gravity circuit test protocols.
Table 10-41: Knelson tailings CIL results
(2021 PFS – Phase 9b)
| Sample ID | Residue Grade (Au g/mt) | Au Recovery in
CIL Tails (%) | Au Overall Recovery
Increase (%) |
| RT4 Knelson Tail of CIL residues | 0.06 | 29.1 | 4.9 |
| RT5 Knelson Tail of CIL residues | 0.06 | 35.8 | 3.4 |
| RT6 Knelson Tail of CIL residues | 0.13 | 16.9 | 4.0 |
| RT7 Knelson Tail of CIL residues | 0.24 | 16.9 | 6.4 |
| RT9 Knelson Tail of CIL residues | 0.23 | 23.8 | 12.4 |
| 10.5.15 | 2021 PFS – Phase 11 |
The Phase 11 was conducted by SGS Vancouver on 100 kg composites prepared from the RC rig duplicates store at Livengood site since 2012 drilling from each of the five rock types. The objectives of this phase were to:
| § | Assess whether gold recovery is dependent upon orebody location in relation to the 100 ppm antimony shell; |
| § | Improve the understanding of the gold grade/recovery and grind size/recovery relationships. |
The samples were based on rock type, oxide/sulfide zone type, gold concentration, antimony concentration and location with respect to the antimony 100 ppm shell. The samples were composited to achieve three targeted grades; resource average grade (RTXX-1), average grade plus cut-off (RTXX-2) and average grade plus two times cut-off (RTXX-3). When adequate samples were available for compositing, three composites for each targeted grade were prepared from outside the 100 ppm antimony shell (RTXO-X) and three composites from inside the 100 ppm antimony shell (RTXS-X). The antimony shell is a complex 3D solid modeled to include the areas of highest antimony concentration in the orebody. All composites were selected to have less than 100 ppm antimony so as to determine whether mere proximity to generally higher antimony levels resulted in an impact on gold recovery, even at approximately similar antimony concentrations of the composites themselves. Rock types RT4 and RT5 did not have sufficient samples to prepare the “inside the 100 ppm antimony shell” composites. Table 10-42 presents some characteristics of the composites.
| International Tower Hill Mines Ltd. S-K 1300 – Technical Report Summary Livengood Gold Project Pre-feasibility Study | |
Samples were ground to a grind size of 250 µm (P80), processed twice in a gravity concentrator, the tailings were split and reground to grind sizes of 180 µm and 50 µm (P80). The gravity concentrates from both passes for a given rock type were combined and intensive leached while the gravity tailings were CIL leached according to the same protocol as Phase 9b. Figure 10-36 illustrates the metallurgical test procedures that were conducted.
Table 10-42: Composites characteristics
(2021 PFS – Phase 11)
| Sample ID | Drill Assay Head Grade (Au g/mt) | Arsenic Concentration (As ppm) | Antimony Concentration (Sb ppm) |
| RT4O-1 | 0.64 | 5 159 | 28 |
| RT4O-2 | 0.99 | 3 227 | 28 |
| RT4O-3 | 1.38 | 1 800 | 27 |
| RT5O-1 | 0.59 | 1 944 | 24 |
| RT5O-2 | 0.93 | 3 301 | 27 |
| RT5O-3 | 1.31 | 4 286 | 27 |
| RT6S-1 | 0.72 | 4 327 | 55 |
| RT6S-2 | 0.97 | 2 271 | 48 |
| RT6S-3 | 2.48 | 2 730 | 76 |
| RT6O-1 | 0.70 | 2 447 | 26 |
| RT6O-2 | 1.05 | 3 171 | 32 |
| RT6O-3 | 1.41 | 3 772 | 30 |
| RT7S-1 | 0.80 | 5 418 | 58 |
| RT7S-2 | 1.45 | 4 776 | 57 |
| RT7S-3 | 1.84 | 4 677 | 59 |
| RT7O-1 | 0.77 | 3 077 | 37 |
| RT7O-2 | 1.20 | 3 144 | 40 |
| RT7O-3 | 1.69 | 3 440 | 31 |
| RT9S-1 | 0.84 | 4 859 | 51 |
| RT9S-2 | 1.20 | 12 001 | 71 |
| RT9S-3 | 1.69 | 6 871 | 57 |
| RT9O-1 | 0.83 | 6 446 | 47 |
| RT9O-2 | 1.21 | 7 855 | 43 |
| RT9O-3 | 1.61 | 8 642 | 43 |
| International Tower Hill Mines Ltd. S-K 1300 – Technical Report Summary Livengood Gold Project Pre-feasibility Study | |
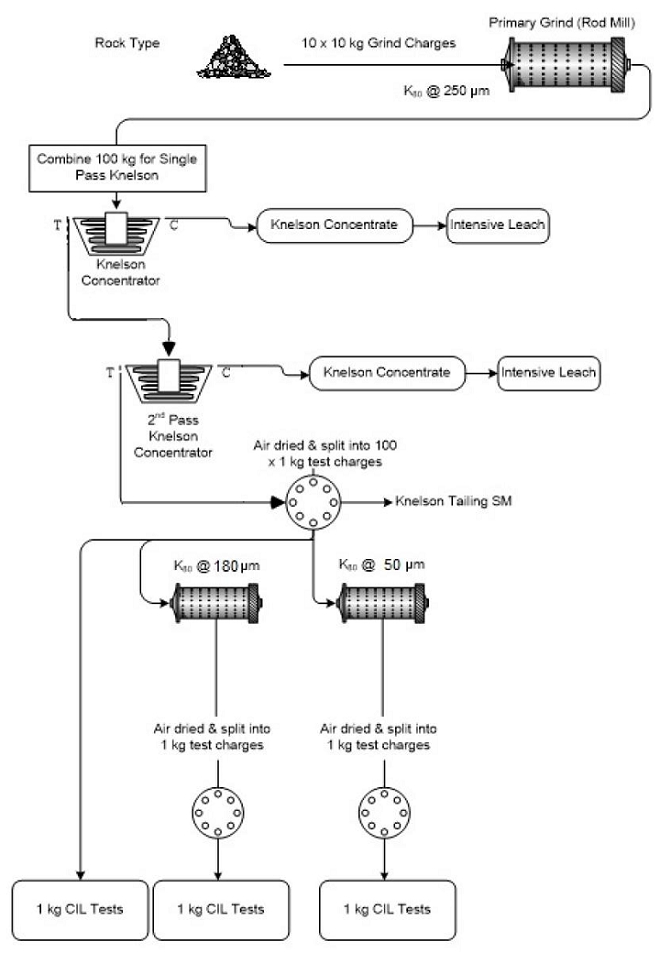
Figure 10-36: 2021 PFS (Phase 11) testwork outline
| International Tower Hill Mines Ltd. S-K 1300 – Technical Report Summary Livengood Gold Project Pre-feasibility Study | |
| 10.5.15.1 | Phase 11 – Gravity / Intensive Leach Testwork |
Phase 11 gravity testwork was performed at a grind of 250 µm (P80). The results obtained from the two-stage gravity test are presented in the Table 10-42. Phase 9b and Phase 11 make two consecutive test programs with gravity results near those predicted by AMIRA for the Phase 9 composites. These results confirm the gravity circuit performance and demonstrate the need for a robust gravity circuit. As shown in Figure 10-37, gravity recovery does not appear to be a function of head grade.
Table 10-43: Gravity separation results
(2021 PFS – Phase 11)
Composite
Name | Calculated Head (Au g/mt) | 1st Pass Gravity
Recovery (%) | 2nd Pass Gravity
Recovery (%) | Total Gravity
Recovery (%) | Gravity Tail (Au g/mt) |
| RT4O-1 | 0.54 | 47.9 | 3.9 | 51.8 | 0.26 |
| RT4O-2 | 1.02 | 53.0 | 8.8 | 61.8 | 0.39 |
| RT4O-3 | 0.75 | 44.0 | 13.3 | 57.3 | 0.32 |
| RT5O-1 | 0.63 | 45.7 | 5.3 | 51.0 | 0.31 |
| RT5O-2 | 1.03 | 49.7 | 7.6 | 57.3 | 0.44 |
| RT5O-3 | 1.23 | 33.3 | 7.6 | 40.9 | 0.73 |
| RT6S-1 | 0.95 | 54.1 | 4.2 | 58.3 | 0.40 |
| RT6S-2 | 0.74 | 46.0 | 9.3 | 55.3 | 0.33 |
| RT6S-3 | 1.74 | 50.6 | 21.4 | 72.0 | 0.49 |
| RT6O-1 | 0.74 | 42.7 | 3.4 | 46.1 | 0.40 |
| RT6O-2 | 0.91 | 40.9 | 11.9 | 52.8 | 0.43 |
| RT6O-3 | 0.99 | 38.9 | 6.8 | 45.7 | 0.54 |
| RT7S-1 | 1.12 | 54.5 | 5.3 | 59.8 | 0.45 |
| RT7S-2 | 1.24 | 51.2 | 8.7 | 59.9 | 0.50 |
| RT7S-3 | 1.04 | 44.4 | 3.8 | 48.2 | 0.54 |
| RT7O-1 | 0.91 | 57.0 | 5.7 | 62.7 | 0.34 |
| RT7O-2 | 1.01 | 58.6 | 4.0 | 62.6 | 0.38 |
| RT7O-3 | 1.12 | 70.7 | 3.4 | 74.1 | 0.29 |
| RT9S-1 | 0.92 | 46.0 | 3.0 | 49.0 | 0.47 |
| RT9S-2 | 1.27 | 31.0 | 3.5 | 34.5 | 0.83 |
| RT9S-3 | 1.16 | 44.8 | 5.5 | 50.3 | 0.58 |
| RT9O-1 | 1.09 | 41.0 | 2.4 | 43.4 | 0.62 |
| RT9O-2 | 1.44 | 42.0 | 4.8 | 46.8 | 0.77 |
| RT9O-3 | 1.18 | 29.3 | 7.1 | 36.4 | 0.75 |
| International Tower Hill Mines Ltd. S-K 1300 – Technical Report Summary Livengood Gold Project Pre-feasibility Study | |
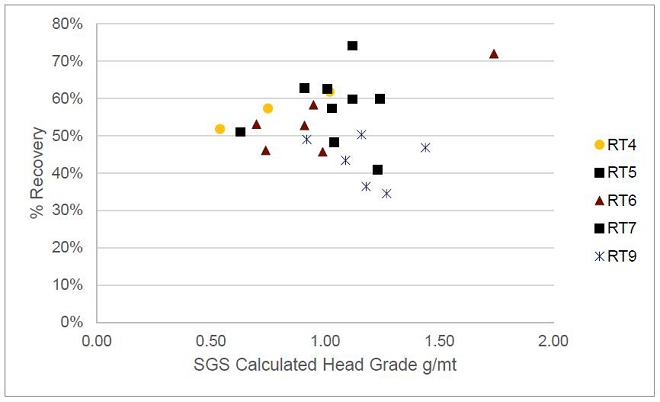
Figure 10-37: Gravity recovery vs calculated head by rock type
(2021 PFS – Phase 11)
The 1st pass Knelson concentrate and the 2nd pass Knelson concentrate were forwarded separately for intensive leach cyanidation. High gold recoveries exceeding 94% to 99% were achieved by 1st pass concentrates and gold recoveries of 73% to 98% were achieved by 2nd pass concentrates.
| 10.5.15.2 | Phase 11 – CIL Tests on Knelson Tailing Leach Testwork and Overall Recovery |
A total of 720 bottle roll tests on the 24 variability samples were conducted to determine the extractable gold from the Knelson tailing as a function of grind size. For each variability sample, ten replicate bottle roll tests were performed at three different grind sizes, 250, 180 and 50 µm (P80).
Figure 10-38 presents the overall recovery related to the antimony concentration. The results show that, if related to only one parameter, RT6 and RT7 recoveries seem to be not dependent on the sample location being inside or outside the 100 ppm antimony shell. RT9 has one composite that showed reduced recovery that could be related to location, antimony concentration or other factors. RT4 and RT5 did not have composites from within the antimony shell. However, a statistical analysis that is discussed in Section 10.6.2, demonstrated in a 3D model that gold recoveries appear to be slightly dependent on the sample location being inside or outside the 100 ppm antimony shell when they are related to grind size and head grades.
| International Tower Hill Mines Ltd. S-K 1300 – Technical Report Summary Livengood Gold Project Pre-feasibility Study | |
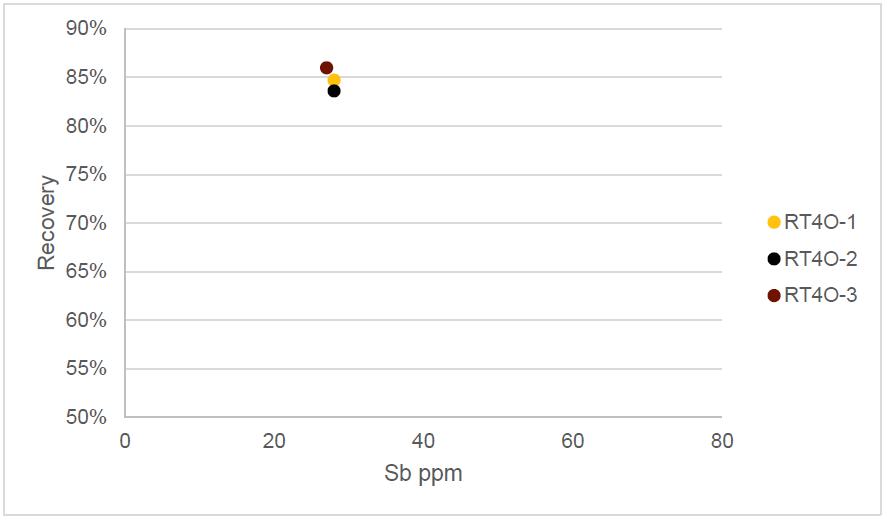
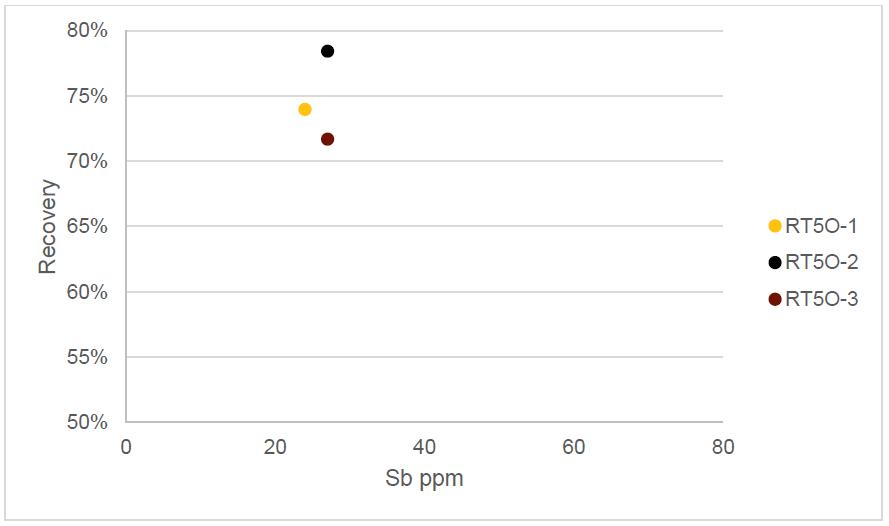
| International Tower Hill Mines Ltd. S-K 1300 – Technical Report Summary Livengood Gold Project Pre-feasibility Study | |
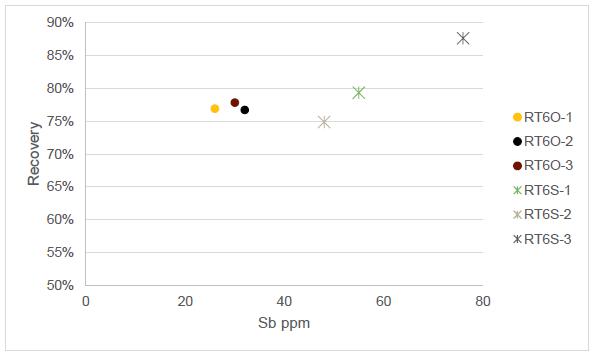
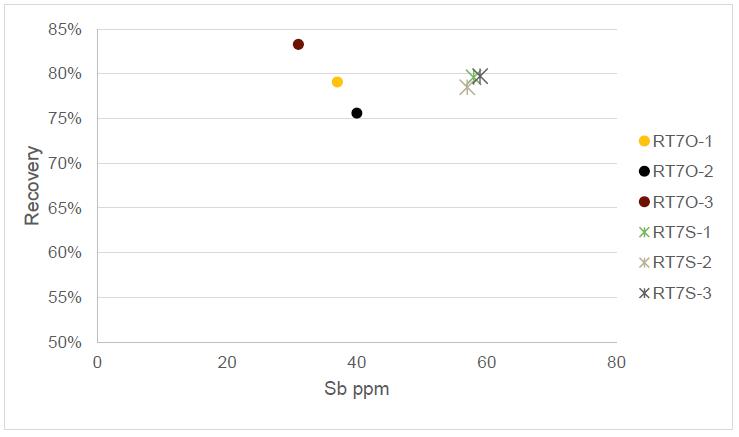
| International Tower Hill Mines Ltd. S-K 1300 – Technical Report Summary Livengood Gold Project Pre-feasibility Study | |
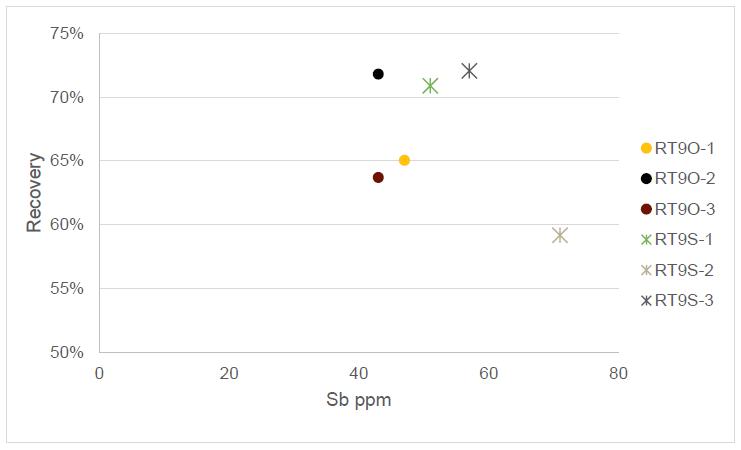
Figure 10-38: Overall gold recovery according to location inside or outside the 100 ppm Sb shell
(2021 PFS – Phase 11)
Figure 10-39 shows the overall gold recovery according to the grind size. Coarsening the grind to 250 µm (P80) results in gold recovery losses between 1% and 4% depending on the rock type. However, similar to the results of Phase 9b, these results do not show any inflection point between 250 and 180 µm, which can suggest that there is an opportunity to conduct testwork on coarser sizes in the future.
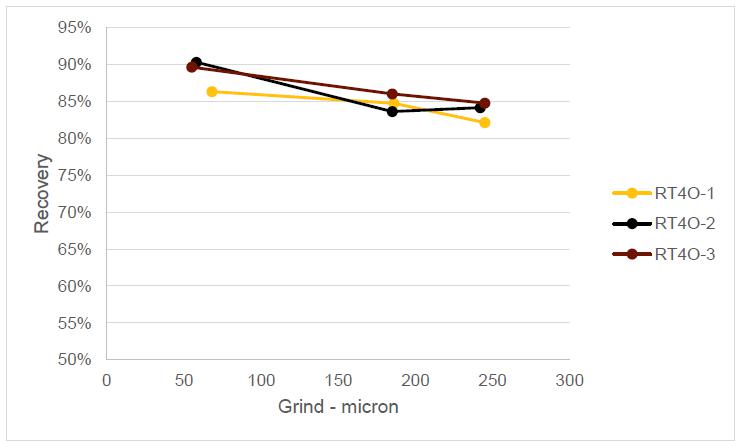
| International Tower Hill Mines Ltd. S-K 1300 – Technical Report Summary Livengood Gold Project Pre-feasibility Study | |
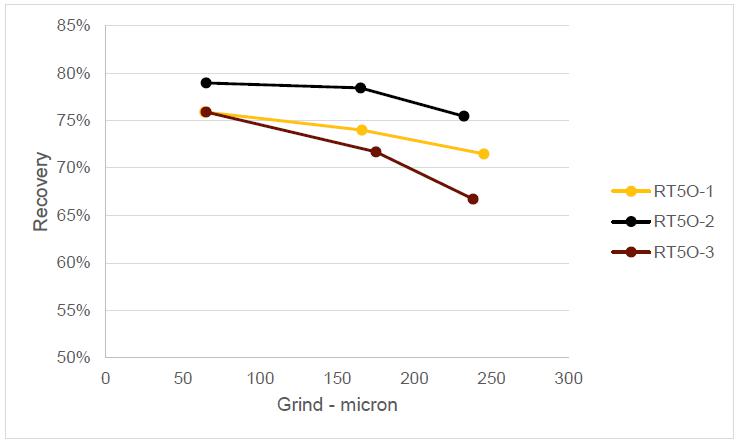
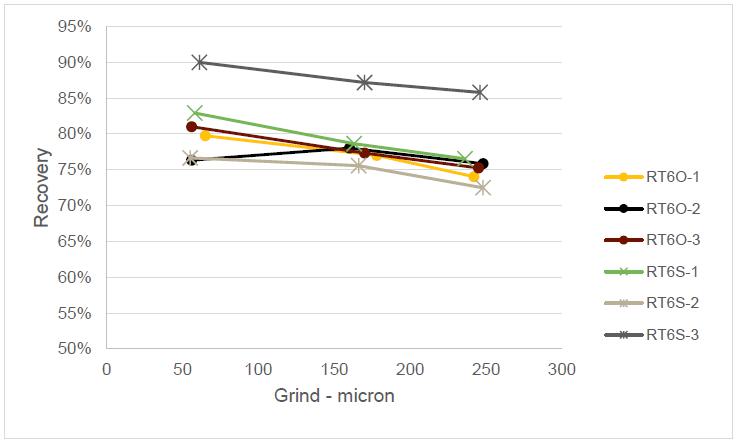
| International Tower Hill Mines Ltd. S-K 1300 – Technical Report Summary Livengood Gold Project Pre-feasibility Study | |
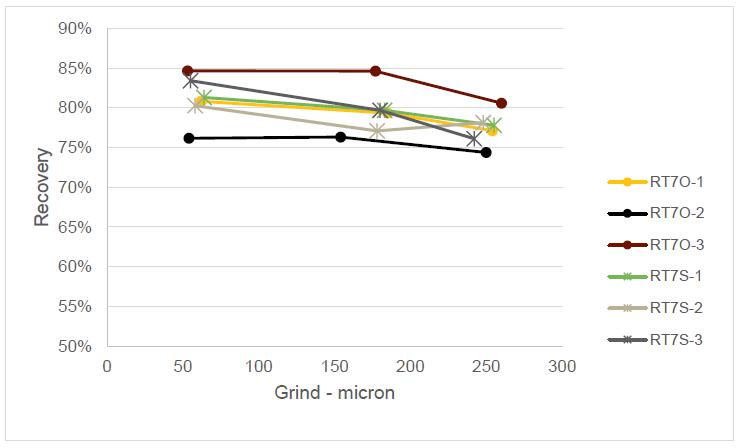
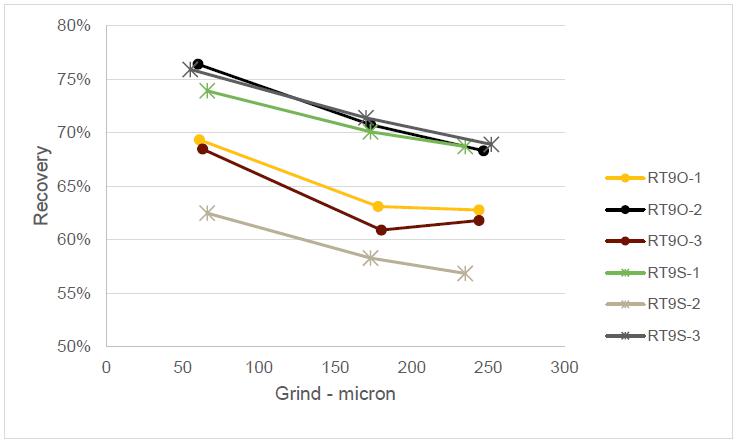
Figure 10-39: Overall gold recovery according to grind size
(2021 PFS – Phase 11)
| International Tower Hill Mines Ltd. S-K 1300 – Technical Report Summary Livengood Gold Project Pre-feasibility Study | |
| 10.5.15.3 | Bulk CIP Tailings Production |
A series of six bulk regrind and cyanidation leach tests were performed to produce fresh leach tailings slurry for off-site geotechnical testing. Three leach feed composites, RT4O, RT5O, and RT9S, were prepared in duplicate by blending 1 kg of Knelson tailings and grinding to a target P80 of 50 µm or 180 µm. The entire ground slurry was then forwarded for carbon-in-pulp (CIP) testing. Table 10-44 shows the obtained results, which yielded similar gold recovery to the 1 kg CIL bottle roll tests; however, a slight increase in residual gold grade may be evident in the CIP tests. The geotechnical characteristics of these leach residues are discussed in Section 10.5.16.7.
Table 10-44: 10 kg Bulk results from Phase 11
(2021 PFS)
| Rock type | Target Leach
P80 (µm) | Au Grade (Au g/mt) | Au Leach
Recovery (%) |
| RT4O | 50 | 0.32 | 73.7% |
| 180 | 0.32 | 64.6% |
| RT5O | 50 | 0.49 | 53.3% |
| 180 | 0.49 | 49.2% |
| RT9S | 50 | 0.63 | 47.7% |
| 180 | 0.63 | 40.1% |
Important conclusions that can be drawn from the Phase 11 test program include:
| § | The good results obtained with the gravity testwork confirm the gravity circuit performance and demonstrate the need for a robust gravity circuit; |
| § | Depending on the rock type, gold recovery is slightly related to the location either inside or outside the 100 ppm antimony shell. |
| 10.5.16 | 2021 PFS – Phase 12 |
The Phase 12 was completed by SGS Vancouver on 100 kg composites prepared from split core from each of the five major rock types. Two new composites with higher antimony concentration were added during this phase. The objectives were the same as Phase 11:
| § | To assess whether gold recovery is dependent upon orebody location in relation to the 100 ppm antimony shell; |
| § | To improve the understanding of the gold grade/recovery and grind size/recovery relationships. |
| International Tower Hill Mines Ltd. S-K 1300 – Technical Report Summary Livengood Gold Project Pre-feasibility Study | |
The main differences were that Phase 12 was completed on core samples rather than RC rig duplicates and the availability of core allowed for a more specific selection of sample location and grade distribution. The samples were based on rock type, gold concentration, antimony concentration and location with respect to the antimony 100 ppm shell. The samples were composited to achieve three targeted grades, same as described in Section 10.5.15 and were processed as shown in Figure 10-36 from this same section. Table 10-45 presents some characteristics of the composites.
Table 10-45: Composites characteristics
(2021 PFS – Phase 12)
| Sample ID | Drill Assay Head Grade (Au g/mt) | Arsenic Concentration (As ppm) | Antimony Concentration (Sb ppm) |
| CRT4O-1 | 0.61 | 3,682 | 37 |
| CRT4O-3 | 2.46 | 11 | 35 |
| CRT5O-1 | 0.61 | 2,513 | 18 |
| CRT5O-2 | 0.93 | 3,723 | 19 |
| CRT5O-3 | 1.25 | 2,744 | 17 |
| CRT6S-1 | 0.45 | 2,285 | 58 |
| CRT6O-1 | 0.69 | 3,699 | 33 |
| CRT6O-2 | 1.03 | 3,934 | 33 |
| CRT6O-3 | 1.40 | 2,649 | 21 |
| CRT7S-1 | 0.75 | 3,310 | 55 |
| CRT7S-2 | 1.18 | 3,934 | 45 |
| CRT7S-3 | 1.94 | 4,129 | 45 |
| CRT7O-1 | 0.77 | 2,393 | 28 |
| CRT7O-2 | 1.19 | 2,302 | 25 |
| CRT7O-3 | 1.60 | 3,503 | 38 |
| CRT9S-1 | 0.83 | 5,831 | 60 |
| CRT9S-2 | 1.17 | 6,672 | 67 |
| CRT9S-3 | 2.03 | 8,484 | 61 |
| CRT9O-1 | 0.84 | 6,231 | 44 |
| CRT9O-2 | 1.21 | 6,743 | 42 |
| CRT9O-3 | 1.60 | 4,729 | 35 |
| CRT6 300 | 0.84 | 4,859 | 51 |
| CRT6 Kin300 | 1.20 | 12,001 | 71 |
| International Tower Hill Mines Ltd. S-K 1300 – Technical Report Summary Livengood Gold Project Pre-feasibility Study | |
| 10.5.16.1 | Phase 12 – Gravity / Intensive Leach Testwork |
Phase 12 gravity testwork was performed at a grind of 250 µm (P80). The results obtained from the two-stage gravity test are presented in the Table 10-46. Phase 12 confirmed the robust gravity recovery of Phases 9b and 11. As shown in Figure 10-40, gravity recovery increased as a function of head grade for all rock types. This may be explained by the larger spread in grades tested.
Table 10-46: Gravity separation results
(2021 PFS – Phase 12)
Composite
Name | Calculated Head (Au g/mt) | 1st Pass Gravity
Recovery (%) | 2nd Pass Gravity
Recovery (%) | Total Gravity
Recovery (%) | Gravity Tail (Au g/mt) |
| CRT4O-1 | 0.76 | 34.7 | 4.0 | 38.7 | 0.47 |
| CRT4O-3 | 3.20 | 38.8 | 5.7 | 44.5 | 1.78 |
| CRT5O-1 | 0.77 | 46.8 | 2.6 | 49.4 | 0.39 |
| CRT5O-2 | 0.99 | 40.7 | 4.9 | 45.6 | 0.54 |
| CRT5O-3 | 1.38 | 54.7 | 4.0 | 58.7 | 0.57 |
| CRT6S-1 | 0.49 | 25.6 | 4.6 | 30.2 | 0.34 |
| CRT6O-1 | 0.76 | 31.3 | 13.3 | 44.6 | 0.34 |
| CRT6O-2 | 1.03 | 42.2 | 5.5 | 47.7 | 0.54 |
| CRT6O-3 | 2.70 | 74.6 | 3.2 | 77.8 | 0.60 |
| CRT7S-1 | 0.78 | 25.3 | 11.7 | 37.0 | 0.49 |
| CRT7S-2 | 1.06 | 42.0 | 5.6 | 47.6 | 0.56 |
| CRT7S-3 | 2.36 | 60.0 | 5.3 | 65.3 | 0.82 |
| CRT7O-1 | 0.90 | 38.7 | 8.2 | 46.9 | 0.48 |
| CRT7O-2 | 0.82 | 37.4 | 7.7 | 45.1 | 0.45 |
| CRT7O-3 | 1.55 | 58.0 | 5.3 | 63.3 | 0.57 |
| CRT9S-1 | 0.98 | 17.2 | 1.5 | 18.7 | 0.80 |
| CRT9S-2 | 1.11 | 15.1 | 1.9 | 17.0 | 0.92 |
| CRT9S-3 | 2.25 | 42.9 | 4.3 | 47.2 | 1.19 |
| CRT9O-1 | 1.03 | 25.0 | 2.6 | 27.6 | 0.75 |
| CRT9O-2 | 1.44 | 27.7 | 2.8 | 30.5 | 1.00 |
| CRT9O-3 | 2.03 | 45.0 | 2.4 | 47.4 | 1.07 |
| CRT6 300 | 0.67 | 18.6 | 5.0 | 23.6 | 0.52 |
| CRT6 Kin300 | 0.89 | 23.5 | 4.3 | 27.8 | 0.65 |
| International Tower Hill Mines Ltd. S-K 1300 – Technical Report Summary Livengood Gold Project Pre-feasibility Study | |
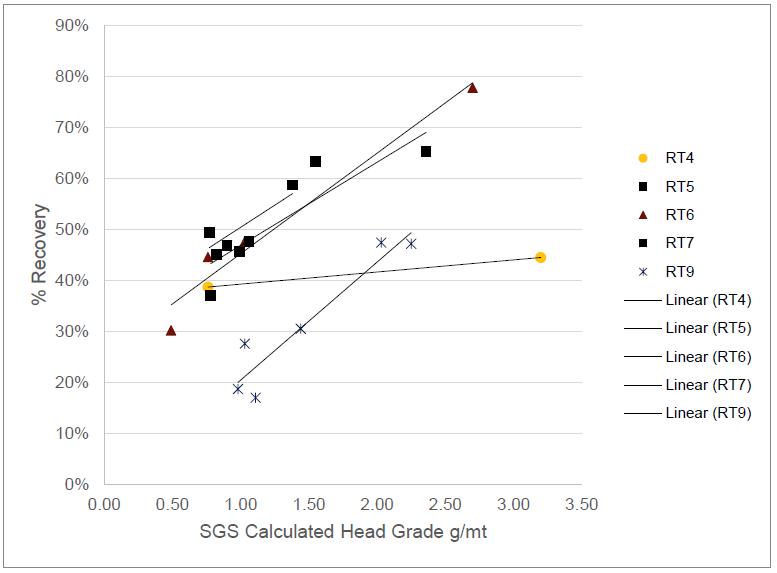
Figure 10-40: Gravity recovery vs calculated head by rock type
(2021 PFS – Phase 12)
The 1st pass Knelson concentrate and the 2nd pass Knelson concentrate were forwarded separately for intensive leach cyanidation. High gold recoveries exceeding 70% to 99.6% were achieved by the 1st pass concentrates and gold recoveries of 36% to 97% were achieved by the 2nd pass concentrates.
| 10.5.16.2 | Phase 12 – CIL Tests on Knelson Tailing Leach Testwork and Overall Recovery |
A total of 665 bottle roll tests on the 23 variability samples were conducted to determine the extractable gold from the Knelson tailing as a function of grind size. For each variability sample, ten replicate bottle roll tests were performed at three different grind sizes, 250, 180 and 50 µm (P80).
Figure 10-41 presents the overall recovery related to the antimony concentration. The results show that, if related to only one parameter, recoveries seem to be not dependent on the sample location being inside or outside the 100 ppm antimony shell. RT4 and RT5 did not have composites from within the antimony shell. However, a statistical analysis that is discussed in Section 10.6.2, demonstrated in a 3D model that gold recoveries appear to be slightly dependent on the sample location being inside or outside the 100 ppm antimony shell when they are related to grind size and head grades.
| International Tower Hill Mines Ltd. S-K 1300 – Technical Report Summary Livengood Gold Project Pre-feasibility Study | |
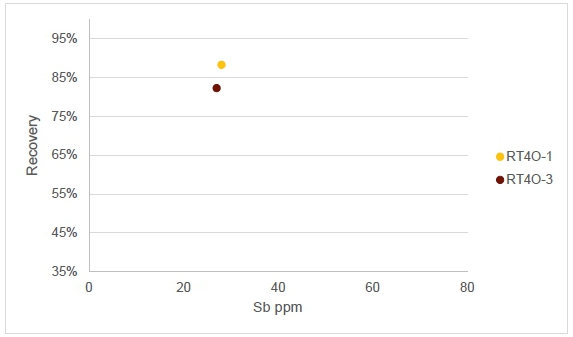
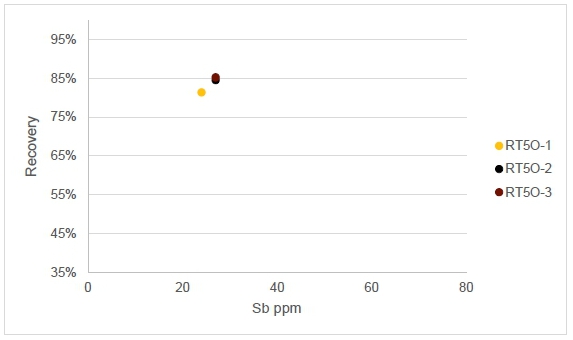
| International Tower Hill Mines Ltd. S-K 1300 – Technical Report Summary Livengood Gold Project Pre-feasibility Study | |
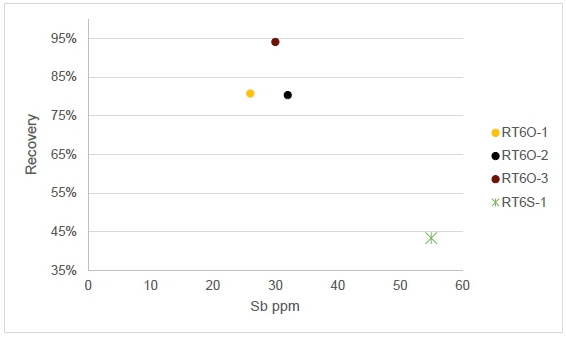
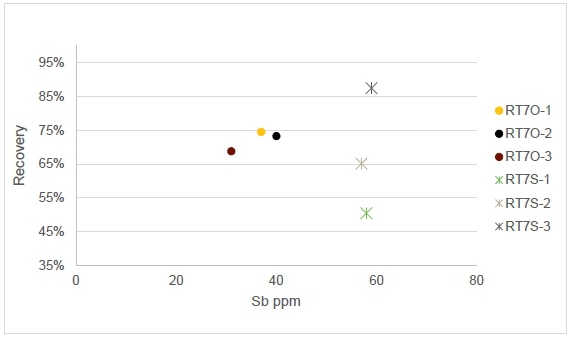
| International Tower Hill Mines Ltd. S-K 1300 – Technical Report Summary Livengood Gold Project Pre-feasibility Study | |
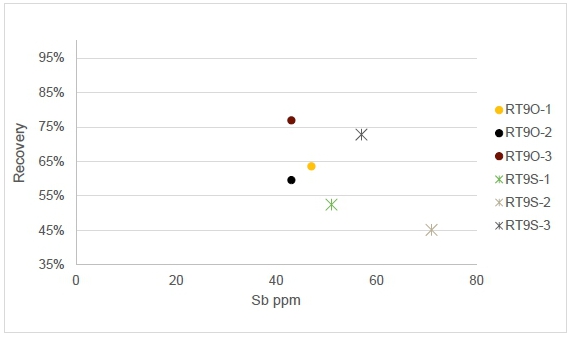
Figure 10-41: Overall gold recovery according to location inside or outside the 100 ppm Sb shell
(2021 PFS – Phase 12)
Figure 10-42 shows that RT5O, RT6(O&S), RT7S and RT9(O&S) revealed a positive gold recovery according to calculated head grade relationship, while RT4O and RT7O revealed a negative relationship.

| International Tower Hill Mines Ltd. S-K 1300 – Technical Report Summary Livengood Gold Project Pre-feasibility Study | |
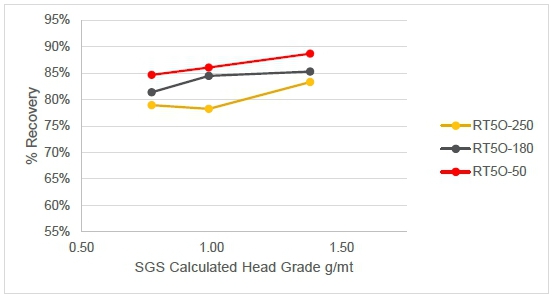
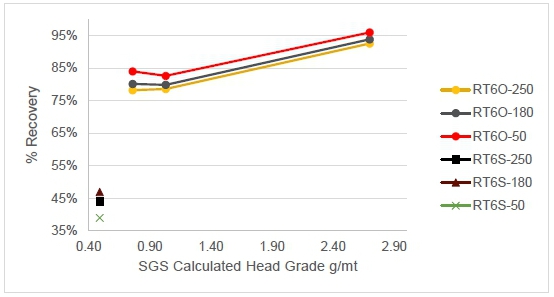
| International Tower Hill Mines Ltd. S-K 1300 – Technical Report Summary Livengood Gold Project Pre-feasibility Study | |
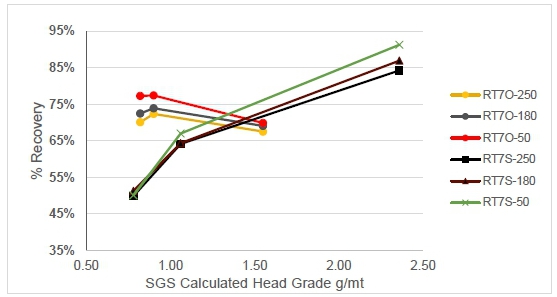
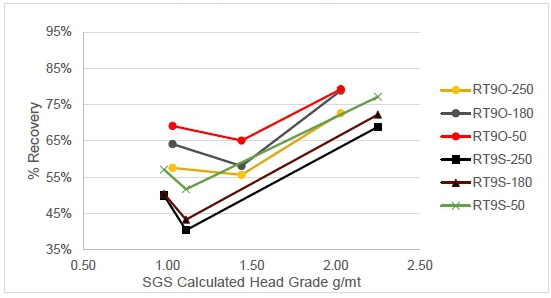
Figure 10-42: Overall gold recovery according to calculated head grade
(2021 PFS – Phase 12
| 10.5.16.3 | Phase 12 – Solid-Liquid Separation |
Solid-liquid separation and geotechnical testing was conducted by SGS Canada, Burnaby laboratory on all five rock types at three grind sizes, 50 µm, 180 µm and 250 µm (P80). A total of 15 charges were prepared representing five composites in triplicate to perform flocculant scoping, static and dynamic thickening, underflow rheology, pressure filtration and geotechnical testing. The objective was to obtain the solid-liquid separation and pressure filtration data from different grind sizes necessary to evaluate the trade-off between thickener/slurry tailings and thickener/pressure filtration/dry stack tailings. This trade-off was part of the Whittle optimization study and is discussed in Section 10.7.2.1 while the geotechnical results are discussed in Section 10.5.16.7.
| International Tower Hill Mines Ltd. S-K 1300 – Technical Report Summary Livengood Gold Project Pre-feasibility Study | |
| 10.5.16.4 | Phase 12 – Impact of Lead Nitrate on Gold Recovery |
A total of 80 cyanide bottle roll leach tests on Knelson tailings were performed to evaluate the impact of lead nitrate and cyanide concentrations in the CIL circuit on overall gold recovery of the five rock types at a grind size of 180 µm (P80), at resource average grade and based on the source location, i.e., outside or inside the Sb 100 ppm shell.
The results shown in Table 10-47 confirmed earlier testwork which indicated that the overall gold recovery does not appear to be highly sensitive to either lead nitrate (0-200 ppm) or cyanide (0.4-0.8 kg/t) concentrations. These data were used to support the Whittle optimization study that is discussed in Section 10.7.2.1.
Table 10-47: Average CIL testwork results
(2021 PFS – Phase 12)
| Sample ID | Lead Nitrate
Conc. (g/mt) | NaCN
Dosage (kg/mt) | NaCN
Cons. (kg/mt) | CaO
Cons. (kg/mt) | Au Residue
Grade (Au g/mt) | Au Calc.
Head (Au g/mt) | Au
Recovery (%) |
| CRT4O | 0 | 0.80 | 0.20 | 1.82 | 0.08 | 0.44 | 79.9 |
| CRT4O | 50 | 0.60 | 0.32 | 1.85 | 0.08 | 0.43 | 80.7 |
| CRT5O | 0 | 0.80 | 0.21 | 0.77 | 0.13 | 0.36 | 59.8 |
| CRT5O | 100 | 0.60 | 0.17 | 0.81 | 0.14 | 0.38 | 60.8 |
| CRT6O | 0 - 50 | 0.60 – 0.80 | 0.18 | 0.89 | 0.20 | 0.48 | 59.1 |
| CRT6O | 100 | 0.40 | 0.15 | 0.94 | 0.20 | 0.51 | 61.3 |
| CRT6S | 0 - 50 | 0.60 – 0.80 | 0.20 | 0.53 | 0.25 | 0.32 | 23.6 |
| CRT6S | 100 | 0.40 | 0.18 | 0.58 | 0.26 | 0.34 | 24.9 |
| CRT7O | 0 - 100 | 0.60 – 0.80 | 0.19 | 0.85 | 0.21 | 0.43 | 50.7 |
| CRT7O | 200 | 0.40 | 0.19 | 1.17 | 0.47 | 0.54 | 12.8 |
| CRT7S | 0 - 100 | 0.60 – 0.80 | 0.22 | 0.88 | 0.39 | 0.47 | 18.3 |
| CRT7S | 200 | 0.40 | 0.15 | 0.81 | 0.33 | 0.80 | 59.1 |
| CRT9O | 0 - 100 | 0.60 – 0.80 | 0.20 | 0.73 | 0.38 | 0.71 | 45.9 |
| CRT9O | 200 | 0.40 | 0.16 | 1.16 | 0.63 | 1.02 | 38.6 |
| CRT9S | 0 - 100 | 0.60 – 0.80 | 0.21 | 1.16 | 0.47 | 0.77 | 39.6 |
| CRT9S | 200 | 0.40 | 0.17 | 1.18 | 0.62 | 0.94 | 34.0 |
| 10.5.16.5 | Phase 12 – Flotation Testwork |
Flotation concentrates were prepared from unprocessed gravity tails for two rock types, RT7 and RT9, that had previously been ground to 250 µm (P80). These gravity tails were reground to a grind size of 90 µm (P80) and processed through five stages of flotation using optimal flotation condition from Phases 8 and 8b. The concentrates were then reground to 9 µm prior to be split into four equal parts. One part was processed by CIL, one part by hot alkaline leach (HAL), one by pressure oxidation (POX) and the last one was preserved.
| International Tower Hill Mines Ltd. S-K 1300 – Technical Report Summary Livengood Gold Project Pre-feasibility Study | |
The results from five stages of flotation presented in Table 10-48 shows that 20% to 25% mass pull can be achieved and that 88% to 91% of the gold contained in the gravity tailings reported to the flotation concentrate.
Table 10-48: Flotation testwork results
(2021 PFS – Phase 12)
| Sample ID | Calculated
Head (Au g/mt) | Mass Pull (%) | Au from Gravity Tails
Into Concentrate (%) | Concentrate
Grade (Au g/mt) | Flotation
Tails Grade (Au g/mt) |
| RT7S-1 | 0.38 | 22 | 90 | 1.56 | 0.05 |
| RT7S-2 | 0.43 | 21 | 91 | 1.88 | 0.05 |
| RT9S-1 | 0.75 | 25 | 88 | 2.67 | 0.12 |
| RT9S-2 | 0.88 | 20 | 88 | 3.87 | 0.13 |
The results presented in Table 10-49 show that ultra-fine grinding (UFG) followed by CIL recovered 38% to 49% of the gold from the flotation concentrate, while UFG followed by POX recovered 86% to 92% and UFG followed by HAL recovered 39% to 72%.
| International Tower Hill Mines Ltd. S-K 1300 – Technical Report Summary Livengood Gold Project Pre-feasibility Study | |
Table 10-49: Flotation concentrate leach results
(2021 PFS – Phase 12)
| Sample ID | NaCN add’n (kg/mt) | NaCN cons. (kg/mt) | CaO add’n (kg/mt) | CaO cons. (kg/mt) | S2- residue
grade (%) | Au residue
grade (g/mt) | Au calc.
Head
(g/mt) | Au recovery –
carbon
adsorption
(%) | Au recovery – leached from residue (%) |
| RT7S-1-CIL-UFG | 1.18 | 0.95 | 1.0 | 1.0 | 5.8 | 1.00 | 1.63 | 37.6 | 38.6 |
| RT7S-1-CIL-POX | 1.09 | 0.74 | 7.4 | 7.4 | 0.2 | 0.16 | 1.95 | 90.9 | 91.6 |
| RT7S-1-CIL-HAL | 1.08 | 0.71 | 0.8 | 0.8 | 3.3 | 0.72 | 1.18 | 37.5 | 38.7 |
| RT7S-2-CIL-UFG | 1.31 | 1.07 | 1.3 | 1.3 | 5.3 | 1.11 | 1.92 | 42.0 | 42.4 |
| RT7S-2-CIL-POX | 1.04 | 0.57 | 3.4 | 3.3 | 0.7 | 0.18 | 2.60 | 92.3 | 92.9 |
| RT7S-2-CIL-HAL | 1.02 | 1.02 | 0.7 | 0.7 | 2.6 | 0.40 | 1.18 | 58.1 | 65.8 |
| RT9S-1-CIL-UFG | 1.10 | 1.05 | 1.3 | 1.3 | 11.9 | 1.27 | 2.52 | 49.4 | 49.7 |
| RT9S-1-CIL-POX | 1.48 | 1.25 | 21.9 | 21.9 | 1.9 | 0.32 | 2.39 | 85.7 | 86.8 |
| RT9S-1-CIL-HAL | 1.46 | 1.20 | 2.3 | 2.3 | 10.4 | 0.72 | 2.60 | 71.8 | 72.3 |
| RT9S-2-CIL-UFG | 1.28 | 1.23 | 1.4 | 1.4 | 14.9 | 2.10 | 3.40 | 38.0 | 38.2 |
| RT9S-2-CIL-POX | 2.10 | 1.77 | 43.0 | 42.7 | 1.0 | 0.28 | 3.70 | 92.0 | 92.3 |
| RT9S-2-CIL-HAL | 1.33 | 1.11 | 2.7 | 2.7 | 13.6 | 1.66 | 3.74 | 55.2 | 55.6 |
| International Tower Hill Mines Ltd. S-K 1300 – Technical Report Summary Livengood Gold Project Pre-feasibility Study | |
Table 10-50 shows overall recoveries when the flotation concentrate is reground, then POX/CIL on the reground concentrates and CIL on the flotation tails compared to the same flowsheet without POX. The results show that an average increase of 32% can be achieved on the overall recovery when using POX.
Table 10-50: Overall recovery comparison when using POX
(2021 PFS – Phase 12)
| Sample ID | Gravity/Flotation/UFG/POX/CIL + CIL float tails
overall recovery (%) | Gravity/Flotation/UFG/CIL + CIL float tails
overall recovery (%) | Difference (%) |
| RT7S-1 | 89.9 | 58.0 | 31.9 |
| RT7S-2 | 92.8 | 65.4 | 27.4 |
| RT9S-1 | 87.7 | 59.7 | 28.0 |
| RT9S-2 | 88.7 | 46.9 | 41.8 |
| Average | | 32.3 |
| 10.5.16.6 | Phase 12 – Enhanced Gravity and POX/CIL Testwork |
Enhanced gravity concentrates were prepared from Phase 12 unprocessed gravity tails for two rock types, RT7 and RT9, that had previously been ground to 250 µm (P80), processed twice through a Knelson gravity concentrator, split into 1 kg aliquots, processed through CIL leach and pulverized to pass a 105-micron screen for metallic screen assay of the CIL residues. These residues were processed four times through a Knelson concentrator to obtain a 5% mass pull. This concentrate was then ground at a grind size of 9 µm (P80) and then POX/CIL leached.
Table 10-51 presents the obtain results. These enhanced gravities and POX/CIL recoveries resulted in overall recoveries varying between 66% to 86% representing an increase of 24% compared to the previous Phase 12 recoveries presented in Section 10.5.16.2.
Table 10-51: Enhanced gravity followed by POX/CIL results
(2021 PFS – Phase 12)
| Sample ID | Calculated
Head Grade (Au g/mt) | Mass Pull (%) | Au from Gravity
Tails into
Concentrate (%) | Concentrate Grade (Au g/mt) | Four Pass
Gravity Tails (Au g/mt) | POX
Recovery (%) |
| RT7S-1 | 0.44 | 4.1 | 45.7 | 4.92 | 0.25 | 87.9 |
| RT7S-2 | 0.41 | 4.1 | 44.3 | 4.43 | 0.24 | 91.5 |
| RT9S-1 | 0.49 | 5.3 | 43.6 | 3.98 | 0.29 | 92.8 |
| RT9S-2 | 0.63 | 5.6 | 35.4 | 4.00 | 0.43 | 98.3 |
| International Tower Hill Mines Ltd. S-K 1300 – Technical Report Summary Livengood Gold Project Pre-feasibility Study | |
| 10.5.16.7 | Phase 12 – Geotechnical Testwork |
Geotechnical testing was conducted by SGS Canada, Burnaby laboratory and by Knight Piésold, Denver, Colorado laboratory on all five rock types at two grind sizes, 50 µm and 250 µm (P80). Testing included particle size analysis, Atterberg limits, laboratory compaction (Proctor), strength (consolidated-undrained triaxial compression), and permeability on a total of 10 samples. The objective was to obtain data from different grind sizes necessary to evaluate the trade-off between thickener/slurry tailings and filtration/dry stack tailings. This trade-off was part of the Whittle optimization study and is discussed in Section 10.7.2.1. Table 10-52 and Table 10-53 present the results of the testing completed.
Index and strength testing show that material properties change with grind size. The finer grind (50 µm) results in tailings with a lower sand content and a higher clay content, as expected. This difference in particle size results in tailings material that achieves a lower compacted density and a slightly lower effective stress. When evaluating the dry stack tailings facility alternative, it was determined that the coarser grind tailings (250 µm) provided a better product for compaction, stability and overall capacity efficiency.
| International Tower Hill Mines Ltd. S-K 1300 – Technical Report Summary Livengood Gold Project Pre-feasibility Study | |
Table 10-52: Index and Strength testing results (all samples)
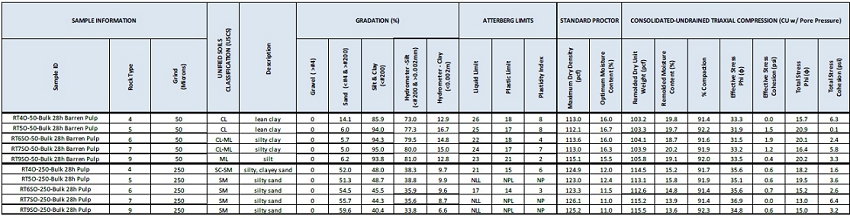
| International Tower Hill Mines Ltd. S-K 1300 – Technical Report Summary Livengood Gold Project Pre-feasibility Study | |
Table 10-53: Permeability testing (select samples)
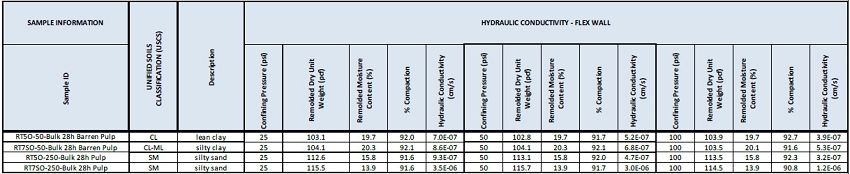
| International Tower Hill Mines Ltd. S-K 1300 – Technical Report Summary Livengood Gold Project Pre-feasibility Study | |
Hydraulic conductivity (permeability) testing was performed on two rock types (RT5 and RT7) at the two grinds (50 µm and 250 µm) to determine if grind size effected the permeability characteristics of the samples. It was determined that when the samples were compacted to similar criteria (3% over optimum moisture and 92% compaction) there was minimal difference. Therefore, it was determined that when considering seepage and draindown of the dry stack tailings, grind size was not a critical factor.
Important conclusions that can be drawn from the Phase 12 test program include:
| § | The good results obtained with the gravity testwork confirm the gravity circuit performance and demonstrate the need for a robust gravity circuit; |
| § | Coarsening the grind to 250 µm (P80) results in gold recovery losses between 1% and 7% depending on the rock type and head grades. However, similar to the results of Phases 9b and 11, these results do not show any inflection point between 250 and 180 µm, which can suggest that there is an opportunity to conduct testwork on coarser sizes in the future; |
| § | Depending on the rock type, gold recovery is slightly related to the location either inside or outside the 100 ppm antimony shell; |
| § | Overall gold recovery does not appear to be highly sensitive to either lead nitrate (0-200 ppm) or cyanide (0.4-0.8 kg/t) concentrations; |
| § | The good results obtained with the POX and enhanced gravity testwork demonstrate that there is an opportunity to increase recovery. However, the Whittle optimization work did not demonstrate this would add value. Additional enhanced gravity testwork could be conducted. |
| 10.5.17 | 2021 PFS – Phase 13 |
The Phase 13 was conducted by SGS Vancouver on approximately 100 kg composites (a total of 1,940 kg), prepared from a blend of core and RC rig duplicates. The objective was to obtain overall gold recovery data from all five rock types at antimony concentrations of approximately 250, 750, and +1,000 ppm. Figure 10-43 illustrates the testwork that was conducted.
| International Tower Hill Mines Ltd. S-K 1300 – Technical Report Summary Livengood Gold Project Pre-feasibility Study | |
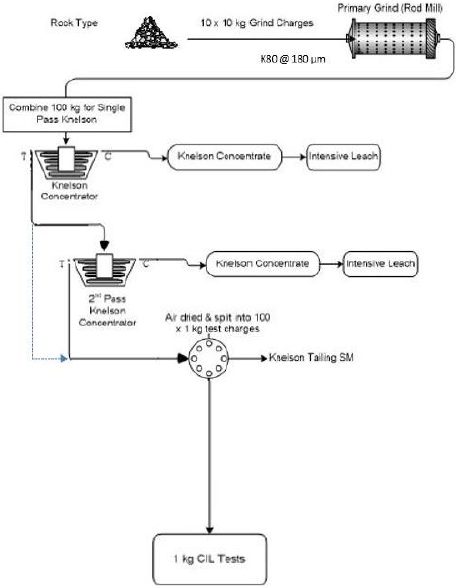
Figure 10-43: 2021 PFS (Phase 13) testwork outline
Figure 10-44 shows that composites having an antimony grade above 200 ppm, regardless of whether they are in or out of the 100 ppm antimony shell, achieved an overall recovery as shown by the linear equation presenting on the chart.
| International Tower Hill Mines Ltd. S-K 1300 – Technical Report Summary Livengood Gold Project Pre-feasibility Study | |
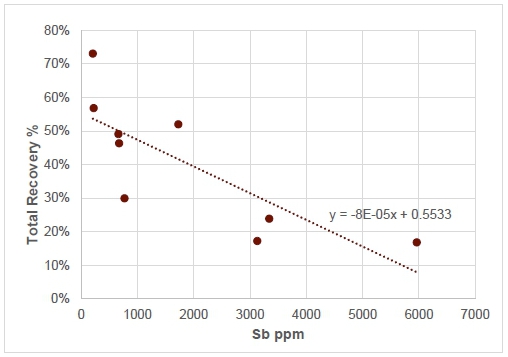
Figure 10-44: Overall recovery related to the antimony concentration
(2021 PFS – Phase 13)
As explained in Chapter 15, massive stibnite will not be separated from the host country rock during mining. An average recovery for the diluted massive stibnite tonnage was estimated based on the 2013 feasibility study stibnite recovery results as shown in Table 10-54. The results presented in Figure 10-44 support the equations that are discussed in Section 10.6.2, which will be applied if antimony is above 200 ppm.
Table 10-54: Massive Stibnite shell recovery estimation
| Sample | Au Grade (g/mt) | Sb Grade (ppm) | Estimated Average Recovery in
Massive Stibnite Shell (%) |
| Pure massive stibnite | 8.07 | 18,000 | 22 |
| Country rock | 0.90 | 4,000 |
| International Tower Hill Mines Ltd. S-K 1300 – Technical Report Summary Livengood Gold Project Pre-feasibility Study | |
| 10.6.1 | 2017 PFS Recovery Equations – Grind Sizes of 90 µm and 180 µm |
Recovery equations for the 2017 PFS were developed using the results of the optimization, variability, continuous, and Phase 9 and Phase 10 test programs.
Table 10-55 presents the average recovery estimated for each of the five rock types within the Livengood gold deposit. With the exception of RT9, the gold recovery results include a 2% reduction for coarser grind at 180 µm (P80)
Table 10-55: Average gold recovery estimated for each rock type
| Rock Type | Au Recovery (%) |
| RT4 | 78.4 |
| RT5 | 84.5 |
| RT6 | 76.3 |
| RT7 | 62.0(1) |
| RT9 | 69.2(2) |
| (1) | Weighted average based on recovery correlation to quartz – stibnite + jamesonite |
| (2) | Weighted average based on grade/frequency distribution of the 15 × 15 ×10 meter block model. |
The data from all of the testwork programs was analyzed using several criteria to discard possible testwork with less-than ideal or erroneous conditions (i.e. tests with low DO or low CN level, wrong particle size, etc.). The filtered data (“qualified data”) of tests including all grind sizes was used to develop a recovery estimates for all rock types based on calculated head grade. For example, the optimization and Phase 9 results were averaged and each testwork program contributed one point to the data set. It was understood that this was the most appropriate treatment, especially considering that both optimization and Phase 9 testwork was conducted on a master composite of each rock type.
Rock Types: RT4, RT5 and RT6
The results from the entire body of testwork were analyzed with the objective of developing relationships to characterize the gold leaching performance of rock types RT4, RT5 and RT6. It was not possible to develop a gold grade vs gold recovery model(s), based on the available data for these rock types.
An average gold recovery for each rock type was estimated from the results of the different testwork programs. A 2% recovery reduction was applied when converting leach test results from 90 to 180 µm (F80).
The cyanide and lime consumptions were estimated as an average of the reagent consumptions observed from both the continuous and Phase 9 testwork programs. Variability or optimization results were not used, because when comparing testwork results, it was found that the higher cyanide additions did not improve the gold recovery results.
| International Tower Hill Mines Ltd. S-K 1300 – Technical Report Summary Livengood Gold Project Pre-feasibility Study | |
Rock Types: RT7 and RT9
Testwork results were analyzed to characterize the most important gold recovery drivers for the RT7 and RT9 rock types. A strong relationship between quartz - stibnite + jamesonite and grade was found for RT7, which is depicted in Figure 10-45. Stibnite and jamesonite are antimony-bearing minerals.
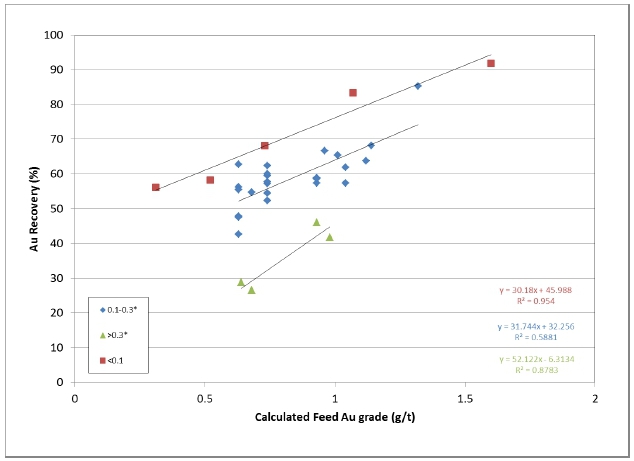
Figure 10-45: 2017 PFS (Phase 9) - RT7 gold recovery vs head grade
at different Quartz-Stibnite+Jamesonite levels
The RT9 testwork results were examined using advanced statistical techniques (R/ggplot2 software) in a number of ways in an attempt to establish the most defensible relationship to estimate gold recovery.
| International Tower Hill Mines Ltd. S-K 1300 – Technical Report Summary Livengood Gold Project Pre-feasibility Study | |
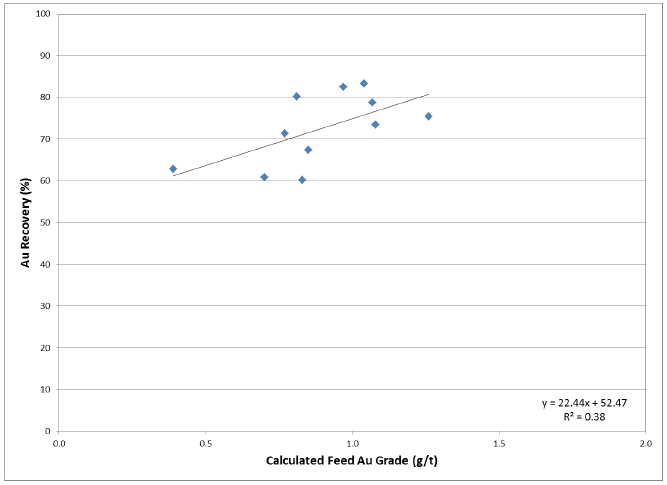
Figure 10-46: 2017 PFS (Phase 9) - RT9 gold recovery vs head grade
In the case of rock type RT9, a head grade/recovery relationship was found (Figure 10-46), but it is probable that there is a quartz - stibnite + jamesonite or antimony relationship as well. However, the current available data suggests that the quartz - stibnite + jamesonite index is under 0.1 and it is not possible to establish a strong relation showing any detrimental effect on gold leaching.
Given that the curve for rock type RT9 was developed using all qualified data, including grinds of between (P80) 80 and 250 µm, it was decided not to apply a deduction in gold recovery to compensate for a coarser grind of product (P80 of 180 µm). For the other rock types, a 2.5% reduction was considered appropriate.
| International Tower Hill Mines Ltd. S-K 1300 – Technical Report Summary Livengood Gold Project Pre-feasibility Study | |
| 10.6.2 | 2021 PFS Recovery Equations – Grind Size of 50-250 µm |
Subsequent to the 2017 PFS, a focused effort to better understand the implications of antimony concentrations in the orebody on gold recovery was performed. BBA constructed a Leapfrog geologic model with antimony shells at different antimony concentrations. The antimony shell of 100 ppm was selected to test a metallurgical recovery hypothesis based on approximately 25% of the orebody being within this shell. Phases 11 and 12 composites were selected based on the 100 ppm antimony shell location, being inside or outside, and tested for metallurgical recovery based on different grind sizes and gold grades. Phase 13 composites were selected to test the implication of high antimony at approximate levels of 250, 750, and +1,000 ppm on gold recovery and to develop a specific recovery equation, which is presented on Figure 10-44 and that will be applied to the proportion of the projected blocks that are massive stibnite.
The data collected during Phases 11, 12 and 13 were processed using R/RStudio to estimate linear recovery equations for each of the five rock types, both inside and outside the 100 ppm antimony shell, as a function of antimony concentration, grind sizes and gold grade as well as to develop 3D representations that are presented in Figure 10-47. These recovery equations were incorporated into the block model by the BBA mining team using a grind size of 250 µm (P80) and were used for the Whittle optimization that is discussed in Section 10.7.2.1.The linear recovery equations are shown below and the methodology to apply these equations into the block model and the coefficient values are described in Section 12.3.2.
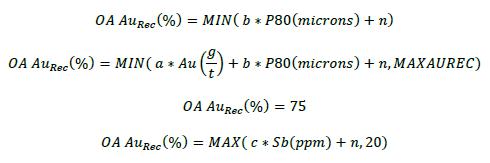
| International Tower Hill Mines Ltd. S-K 1300 – Technical Report Summary Livengood Gold Project Pre-feasibility Study | |
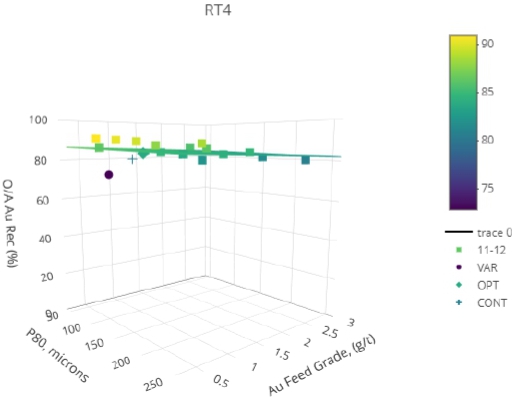
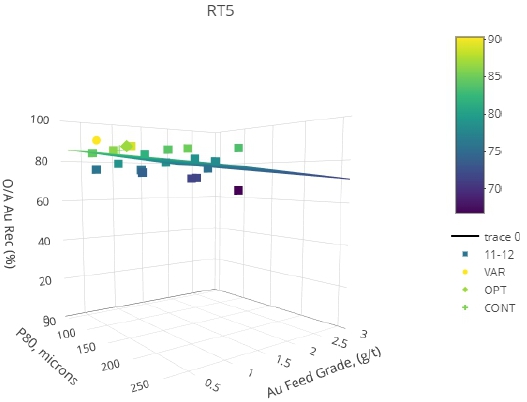
| International Tower Hill Mines Ltd. S-K 1300 – Technical Report Summary Livengood Gold Project Pre-feasibility Study | |
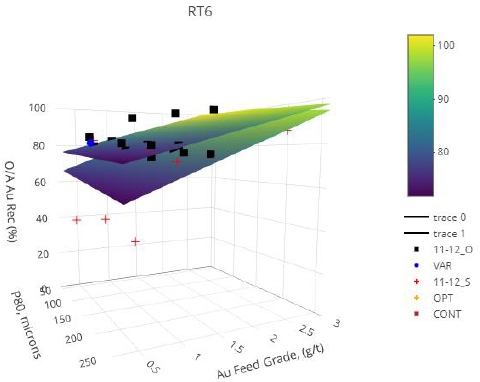
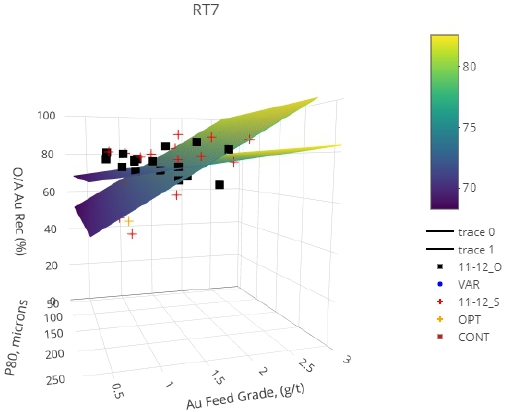
| International Tower Hill Mines Ltd. S-K 1300 – Technical Report Summary Livengood Gold Project Pre-feasibility Study | |
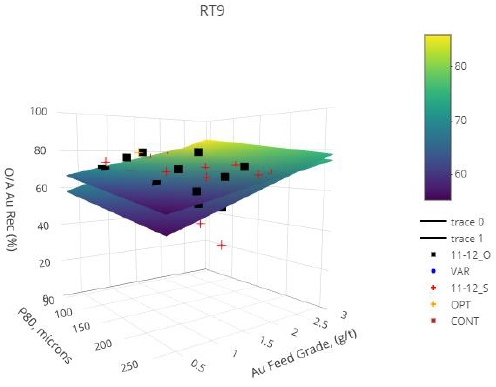
Figure 10-47: 3D representation of the overall Au recovery versus Au grade and P80 (2021 PFS)
Table 10-56 presents the average gold recoveries per rock type as well as the blended overall recovery when applying the 2021 PFS recovery equations at a grind size of 250 µm and the methodology described in Section 12.3.2 into the block model.
Table 10-56: Average gold recovery estimated for each rock type (2021 PFS)
| Rock type | Au Recovery -
Outside the 100
ppm antimony shell (%) | Au Recovery -
Inside the 100 ppm
antimony shell (%) | Au recovery -
Antimony grade
above 200 ppm (%) | Average Au
recovery (%) |
| RT4 | 83.4 | - | 74.0 | 83.3 |
| RT5 | 79.9 | - | 74.8 | 79.8 |
| RT6 | 76.4 | 63.9 | 48.9 | 73.5 |
| RT7 | 72.8 | 64.0 | 48.5 | 66.4 |
| RT8 | 59.3 | 52.0 | 43.5 | 58.7 |
| RT9 | 60.0 | 55.1 | 48.9 | 57.1 |
| Tonnage weighted average mill recovery (%) | 75.1 | 60.4 | 50.1 | 71.4 |
| International Tower Hill Mines Ltd. S-K 1300 – Technical Report Summary Livengood Gold Project Pre-feasibility Study | |
In summary, the models were developed for each rock type and location, being inside or outside the 100 ppm antimony shell, based on the results of the metallurgical testwork of Phases 11 and 12. A specific recovery equation was developed for the massive stibnite, higher than 200 ppm, based on the Phase 13 testwork results.
| § | The models indicate that the overall gold recovery is a function of gold head grade and grind size (P80); |
| § | No equation was developed for RT4 and RT5 for the inside 100 ppm antimony shell since very little antimony is present in these zones; |
| § | In general, for rock types with samples outside and inside of the 100 ppm antimony shell: |
| - | The difference in gold recovery between outside and inside the shell is bigger at lower Au head grades; |
| - | At higher Au head grades the Au recovery is in the same order for samples outside and inside the shell. |
| 10.7 | Flowsheet Development |
| 10.7.1 | 2017 PFS Comparative Studies |
| 10.7.1.1 | Comminution Optimization with Drilling and Blasting (D&B) |
Establishing Run-of-Mine (ROM) particle size distribution (PSD) estimates represents an important step for developing a baseline for mineral processing costs. Given that the drilling and blasting process is typically regarded as the first stage of comminution, its efficiency will directly impact the subsequent activities, namely crushing and grinding. To assess and quantify these impacts for the Project, various blast design scenarios were compiled and simulated for each ore-bearing geological domain, namely RT4 (Cambrian), RT5 and RT6 (Upper and Lower Seds), and RT9 (Volcanics).
The first step towards generating ROM PSD curve estimates consists of compiling all available geological and geo-mechanical parameters. These parameters were then imported into a break radius modeling software (AEGIS), which estimated the degree of breakage and area of influence of a typical blast hole charge. Based on the resultant break radii, preliminary burden and spacing values were then determined for each rock type and/or explosive charge.
After determining burden and spacing values, the remaining blast design and geo-mechanical parameters were compiled and integrated in a JKMRC Fragmentation (software) model. The software will use the inputs to generate PSD curves for the ROM material produced by various blast designs, in the different geological domains. This is referred to as a drill & blast (D&B) analysis.
The results of the D&B exercise were used in conjunction with comminution design software (Bruno and JKSimMet) to study the impact of the PSD on throughput and specific energy.
The impact of the D&B in the 2017 PFS was an increase of 6.4% in the average throughput of the Project from 49,468 to 52,630 t/d (or 44,877 to 47,745 mt/d).
| International Tower Hill Mines Ltd. S-K 1300 – Technical Report Summary Livengood Gold Project Pre-feasibility Study | |
Future work
With regards to the Volcanics domain, it must be noted that geo-mechanical test results were not available and were therefore assumed. To confirm the resulting ROM PSD values obtained for the Volcanics (RT9) domain, a re-iteration of the simulation work is recommended once geo-mechanical testing is completed.
| 10.7.1.2 | Comminution Optimization with Pre-crushing |
Simulations were conducted during the 2017 PFS to study the opportunities to increase throughput by adding a pre-crusher. The simulations indicate that a 25% to 30% increase in tonnage can be achieved by including a pre-crushing step.
| 10.7.1.3 | Throughput Studies |
The higher tonnage comminution circuit from the 2013 FS was challenged during the development of the 2017 PFS via an extensive throughput rationalization study. The 2017 PFS investigated the impact of grinding circuit configuration, ROM particle size, pre-crushing and target particle size would have on equipment size, power efficiency, overall throughput, OPEX and CAPEX. The scenarios that were investigated include the following:
| § | Pre crushing + single line SABC Circuit; |
| § | Dual line pre crushing + SABC Circuit; |
| § | SAG mill motor type (Twin Pinon versus wrap around); |
| § | Grinding circuit product size target of 90 µm vs 180 µm; |
| § | Impact of drill and blast (Finer ROM) on throughput. |
Analysis of the leaching testwork conducted in parallel to the throughput studies, indicated that the gold recovery was relatively insensitive to grind in the range of 90 to 180 µm (P80). Based on this observation, it was decided to coarsen the grind to 180 µm (P80), which resulted in a significant throughput increase of 25%, which more than compensated for the gold losses of 2%.
Due to the significantly reduced capital cost and lower Project execution risk, a single line (SABC + pre-crushing) circuit was adopted for further development and use as the base case for the 2017 PFS even though its throughput capability would be lower than the circuit proposed by the 2013 FS study. The final configuration also assumes additional throughput by applying optimized drill and blast techniques to produce a finer ROM product for the primary crusher.
| 10.7.1.4 | Leach Time, Lead Nitrate, and Pre-oxidation |
Testwork evidence also indicates that the gold recovery kinetics slow down significantly after 21 hours of leaching time. The gain/loss in gold recovery (estimate = +/- 1% Au recovery) does not justify the addition of extra leaching tanks (21 to 32 hours represent an addition of 6 leach tanks).
| International Tower Hill Mines Ltd. S-K 1300 – Technical Report Summary Livengood Gold Project Pre-feasibility Study | |
Pre-oxidation was normalized to four hours in the course of completing Phases 8 and 9 testwork from the 2017 PFS and it showed that by combining lead nitrate and O2 during the pre-conditioning stage, it was possible to reduce the leaching time and also reduce the cyanide consumption as a result of reducing leach time and by oxidizing any sulfides that could consume cyanide.
| 10.7.1.5 | 2017 PFS WOL vs Flotation |
A trade-off study was conducted during the 2017 PFS between a whole gravity tails CIL configuration (WOL) and a flotation configuration (Flotation or FLOT), where gravity tails float concentrates undergo CIL.
The result of the trade-off study supported the decision to select gravity, followed by CIL of the gravity tailings as the design process.
Recovery – WOL vs Flotation
The summarized results of WOL and Flotation testing from both the 2013 FS and Phase 8 (2017 PFS) are presented in Table 10-57. At the bottom of the table the differences in recovery between the WOL and Flotation options are also presented. Due to different composites being used in the FS as compared to the Phase 8 testwork, the differences calculated for the Phase 8b and Phase 8d results were calculated not against the WOL recovery results from the FS, but against corresponding WOL results from the same samples of Phase 8 test program. Some results suggested slightly higher recoveries for the Flotation option, but generally, the WOL option resulted in a significantly higher recovery.
Table 10-57: Summary of recovery results from different testwork programs
| Testwork Program | FS | Phase 8a | Phase 8b | Phase 8b | Phase 8d |
| Configuration | WOL | FLOT | WOL | FLOT | FLOT | FLOT |
| P80(µm) | 90 | 90 | 60/75 | 90 | 180 | 180 |
| Rock Types | Au Recovery (%) |
| RT4 | 84.2 | - | - | - | - | - |
| RT5 | 87.7 | 76.1 | 82 | 81 | 68 | 72.6 |
| RT6 | 76.7 | 67.4 | - | - | - | - |
| RT7 | 58.2 | - | - | - | - | - |
| RT9 | 78.1 | 66.8 | 62 | 68 | 65 | 67.4 |
| Rock Types | Au Recovery difference compared to WOL (%) |
| RT4 | - | - | - | - | - | - |
| RT5 | - | -11.6 | - | -1 | -14 | -9.4 |
| RT6 | - | -9.3 | - | - | - | - |
| RT7 | - | - | - | - | - | - |
| RT9 | - | -11.3 | - | 5 | 2 | 4.4 |
| International Tower Hill Mines Ltd. S-K 1300 – Technical Report Summary Livengood Gold Project Pre-feasibility Study | |
In the absence of consistent comparable between WOL and Flotation between the different composites, the decision was taken to assume a recovery difference (Flotation – WOL) for each rock type that was likely to be favorable to the Flotation option. In the case of rock types RT4, RT5, and RT6, a relative difference of -5% was assumed, which was generally less than what had been observed, at least for RT5 and RT6. In the case of RT7 and RT9, the recovery difference was assumed to be +5%, implying a higher recovery for the Flotation option as compared to the WOL option. These assumptions were developed as a means of evaluating the Flotation option in the best light for the purpose of conducting the trade-off (Table 10-58). If the WOL option delivered higher NPV than the Flotation option, even under these assumptions, it would validate the selection of the WOL flowsheet. Using these assumed recovery differences, weighted average recoveries were calculated for both options, with the results of 76 wt% avg. gold recovery for WOL and 74 wt% avg. gold recovery for flotation.
Table 10-58: Simulated gold recoveries for the WOL vs Flotation trade-off
| Rock types | Relative difference | WOL | FLOT |
| RT4 | -5% | 78% | 73% |
| RT5 | -5% | 85% | 80% |
| RT6 | -5% | 76% | 71% |
| RT7 | 5% | 62% | 67% |
| RT9 | 5% | 69% | 74% |
| Wt. Avg. | 76% | 74% |
Capital Cost Estimate
The 2017 PFS crushing and grinding configuration produces a particle size (P80) of 180 µm that is fed to each of the configurations (WOL or FLOT). Both process configurations are equipped with the same gravity circuit.
In the FLOT configuration, a flotation concentrate (12% mass pull) is produced and is fed to a CIL circuit that is substantially smaller than the CIL circuit in the WOL configuration. Additionally, the equipment required for cyanidation detoxification is smaller.
In the WOL configuration, a greater volume of slurry would need to go through thickening and detoxification prior to going to the tailings management facility (TMF). The cyanide detoxification tanks are smaller in the FLOT than WOL configurations due to the smaller volumetric flow of CIL tails in the FLOT configuration. On the other hand, the CN concentration in the FLOT configuration is higher than WOL, meaning that the unit requirements of SO2 are higher in the Detox system of the FLOT configuration.
All equipment costs for the WOL and FLOT configurations were estimated using equipment cost information from BBA’s projects database. Total CAPEX indicates an increase of $11.7M by adopting the WOL option.
| International Tower Hill Mines Ltd. S-K 1300 – Technical Report Summary Livengood Gold Project Pre-feasibility Study | |
Operating Cost Estimate
Operating cost estimates were prepared for both alternatives. The WOL option indicated a slight increase in operating cost over the Flotation option $7.44/t ($8.21/mt) vs $7.13/t ($7.86/mt).
Cash flow analysis
Discounted cash flow models (5% discount rate and $1,250/oz gold) where developed to determine the Net Present Value (NPV) for each alternative based on the revenues, capital costs and operating costs. The weighted average distribution of rock types from the 2017 PFS LOM plan was used to determine the overall gold recovery for each alternative.
The NPV values were very similar for both configurations: $5,322M for WOL and $5,200M for Flotation with the WOL alternative being slightly more profitable (+$120M). Since the WOL and Flotation alternatives have similar capital costs, this result could be explained by the WOL having a better gold recovery while the Flotation alterative having lower operating costs.
The review of the underlying geology has allowed for a better understanding of the preg-robbing nature and distribution of the deposit. Using the preg-robbing index, the main observation is that the volcanics typically present very low preg-robbing values, while both sediment rock types (upper and lower) present a higher level of preg-robbing. This can be classified as a very systematic behavior. On that basis, the Livengood resources are probably best processed using carbon in leach (CIL), instead of Carbon in Pulp (CIP). Furthermore, the sediment rock types are important contributors to the gold resource and will likely have to be mined concurrently to the main volcanics. As well, in some cases there is the inclusion of sediments cutting through the volcanics that will induce preg-robbing.
In the 2013 FS, sodium metabisulfite (SMBS) was used to supply SO2 to the cyanide detoxification process at a rate of 1.63 lb/t (0.82 kg/mt). At 100,000 t/d (90,718 mt/d) and based on a price of $0.37/lb, the total annual operating cost for producing SO2 with SMBS was approximately $22.0M. Upon review of the SMBS consumption estimate, BBA concluded that an opportunity to reduce the cost of SO2 was highly probable.
A trade-off was conducted by BBA comparing the available options on the basis of their operating and capital costs. This comparative study evaluated three possible options for the production or supply of SO2: 1) mixing of sodium metabisulfite (base case); 2) burning of elemental sulfur using a sulfur burner; and 3) direct injection of liquid SO2.
| International Tower Hill Mines Ltd. S-K 1300 – Technical Report Summary Livengood Gold Project Pre-feasibility Study | |
Key Assumptions
The following list contains the assumptions used in conducting this study:
| § | The throughput of the process plant for all options was 100,000 t/d (90,718 mt/d) or the plant throughput of the 2013 FS; |
| § | SO2 to CN ratio was determined by testwork (SGS post feasibility testwork program - Project report 50223-002 – December 2013); |
| § | This trade-off study covers only the cost (capital and operating) for the supply of SO2 for the cyanide detoxification process. Any other costs outside of this scope are not covered, including mining, front-end process, infrastructure, tailings pond and tailings management. These other costs are neglected in the analysis, since they would not impact the selection of the SO2 supply; |
| § | Equipment pricing was determined through updated budget quotes for the major equipment or historical prices. The other equipment costs were determined using BBA’s equipment cost database and were based on the required equipment size; |
| § | A quotation has been recently obtained from the supplier for elemental sulfur and sodium metabisulfite. The cost of liquid SO2 was estimated based on BBA’s pricing database; |
| § | When using a sulfur burner with less than 100% availability, SMBS is used as a back-up during operation downtime. |
Feasibility Study Versus Trade-Off Cost Comparison
Table 10-59 presents the annual operating cost and the cost of the reagent.
Table 10-59: Annual operating cost comparison
| | Annual Cost
(M$/y) | Reagent Cost
($/t) | Reagent Reference |
| Sodium metabisulfite | 22.0 | 820 | 2013 Feasibility Study |
| Elemental sulfur | 5.4 | 552 | 2016 Supplier Quote |
| Liquid SO2 | 34.0 | 1,830 | BBA Estimate |
Even using the 2013 FS consumption numbers, burning of elemental sulfur to produce SO2 would have been advantageous. The yearly operating cost for the Project would have been approximately $17.0M less.
Conclusions and Recommendations
Based on the cash flow analysis, the liquid SO2 option is the costliest followed by the SMBS option. Although the highest initial capital cost expenditure is required, burning of elemental sulfur in a sulfur burner presents the lowest cost method to produce SO2 over the LOM. Even at 50% sulfur burner availability and SMBS compensating for the difference, the sulfur option is the most economical with over $100M in savings over the LOM.
| International Tower Hill Mines Ltd. S-K 1300 – Technical Report Summary Livengood Gold Project Pre-feasibility Study | |
The sensitivity analysis on the price of sulfur also demonstrates that the sulfur burner option is the most attractive. Payback of the equipment is within one year even at double the sulfur price.
The QP recommends that THM pursue the sulfur burner option for the Livengood Gold Project.
| 10.7.2 | 2021 PFS Comparative Study |
| 10.7.2.1 | Whittle Enterprise Optimization |
At the onset of the 2021 PFS, ITH retained Whittle Consulting and BBA to collaborate on an enterprise optimization study (the “Whittle and BBA Study”) to review various technologies and project configurations with the objective of recommending an optimum configuration for the 2021 PFS. The Whittle and BBA Study compared different scenarios such as secondary crushing with SAG and ball mill, tertiary crushing with ball mill, gravity/CIL at a grind size of 90 µm to 250 µm (P80), a stand-alone and an auxiliary heap leach configuration, gravity only gold recovery, gravity/flotation with pressure oxidation and CIL of flotation concentrate. These configurations were evaluated at various combinations of project ramp up strategies, annual throughput, primary, secondary, and tertiary grind size, as well as mining fleet size and ore stockpile management strategies. Several tailings technologies were reviewed including conventional tailings and pressure filtered tailings.
The starting base case was the 2017 PFS mine plan and flowsheet that was input into the optimizer to verify that it was properly calibrated. The base case was then re-run with a new ID3 block model and all CAPEX and OPEX costs were updated from 2017 to reflect Q4 2020 pricing. Mill recovery equations were also adjusted using the latest metallurgical testwork results. A gold price of $2,000 US per ounce was used for the financial optimization.
Grind Size Scenarios
A grind size throughput recovery model was generated from comminution power data and grind recovery curves for each rock type. The model incorporated five grind sizes from 90 µm to 250 µm (P80) to obtain the best financials for the base case flowsheet of two stage crushing, SABC circuit and CIL process. It was observed that the IRR and NPV increases with the grind size due to increased throughput albeit a slight drop in gold recovery. Increasing the grind size from 180 µm (2017 PFS) to 250 µm increases the throughput of the grinding circuit from 55,000 mt/d to 62,000 mt/d. The additional CAPEX required to debottleneck the rest of the installations and the mine was included in the analysis. The operating costs were recalculated for each of the grinding sizes. It was concluded that 250 µm was the financially best grind size and was therefore recommended for the 2021 PFS.
| International Tower Hill Mines Ltd. S-K 1300 – Technical Report Summary Livengood Gold Project Pre-feasibility Study | |
Heap Leach Scenario
Since the Livengood deposit has 50 million metric tons of oxidized gold mineralization close to surface that is amenable to heap leaching, an option for heap leaching as a first phase of the Project was investigated. The capital costs for the three-stage crushing as well as the operating costs and recovery equations were developed as inputs to the Whittle optimization software. The simulations showed that it was not economic to include a first phase of heap leaching due to the lower gold recoveries and relatively high operating costs.
Flotation, Ultra-fine Grinding, and Pressure Oxidation Scenarios
Several flotation cases were developed, and the POX option was run as a final case. None of the cases improved the Project financials. Although the POX option showed improved gold recoveries, this option was not favorable due to the increase in capital and operating costs of the grinding and the POX reagents including oxygen. Sensitivity analyses were done assuming improved flotation conditions (lower mass pull of flotation concentrate and correspondingly higher gold grade); however, the results did not add value.
Gravity Only Scenario
A case was developed for a gravity only circuit at a grind size of 90 µm (P80). This option had lower CAPEX and OPEX, but due to the lower gold recoveries this scenario did not improve the financials of the Project.
Dry Stack Tailings/Commingled Waste Facility
A dry stack tailings option, commingled in a single facility with waste rock, was developed. This included a pressure filtration plant for the tailings and new phasing due to the reduced tailings impoundment construction material requirements. This case has a lower NPV than the slurry tailings case and would be conceivable only if near pit co-disposal areas with waste rock were available. This scenario should be evaluated further since it potentially reduces the environmental footprint of the Project.
Observations and Recommendations from the Study:
| § | The Whittle and BBA Study determined that the gravity/CIL plant at a grind size of 250 µm (P80) with conventional tailings provided the highest NPV, which is the configuration recommended and detailed in the 2021 PFS. |
| § | Grinding above 250 µm should be investigated, since it is possible to separate the activated carbon from the pulp at coarser grind sizes. |
| § | Many options were identified as being unfavorable and should not be further pursued. These options include; heap leaching of near surface mineralization, flotation, ultra-fine grinding, and pressure oxidation. |
| 10.7.2.2 | Gravity Concentration |
A gravity recovery modeling was performed by FLSmidth during the 2021 PFS to confirm the number and size of Knelson concentrators and Acacia. The modeling included the results of E-GRG testing by Curtin
| International Tower Hill Mines Ltd. S-K 1300 – Technical Report Summary Livengood Gold Project Pre-feasibility Study | |
University on five ore samples corresponding to RT4, RT5, RT6, RT7 and RT9 and the results from SGS on RT4, RT5, RT6 and RT9.
The gravity modeling confirmed that the Livengood ores tested are highly amenable to gravity recovery. The GRG is “coarse to very coarse” on the AMIRA classification scale, which is highly favorable for gravity recovery. To achieve the better recovery, a gravity circuit with two parallel lines, each with four Knelson concentrators (KC-QC70) with one Acacia (CS10000) per line is recommended.
| 10.7.3 | Flowsheet Development Summary |
Livengood gold ore has demonstrated that it is very amenable to gravity concentration as a substantial proportion of the gold is free and liberated at a reasonably coarse grind. GRG results confirmed the great potential for gravity recoverable gold.
The fact that Livengood gold ores contain coarser gold particles makes analytical measurement of samples more difficult. Ultimately, on the basis of mineralogical observation and of practical assaying knowledge, larger sample sizes were chosen (1 kg) and the coarser gold particles screened out and weight averaged back into the undersize assays to smooth the effect of the erratic gold dispersion in the low grade deposit.
The effect of these erratic assays made initial metallurgical results difficult to interpret, in part because the mass balances were often further apart than the effect of the test changes. Under these circumstances, it was difficult to determine whether test condition changes were making improvements to the process. The program at SGS in Vancouver made the initial choice to go with screen fire assays, allowing better gold averages for samples and improving gold mass balances.
Gold deportment studies indicated that a substantial amount of the finer gold had at least a 25% or greater exposure, allowing it to be recovered by cyanidation.
However, some of the exposed gold was not contained in sulfide aggregates and was therefore less amenable to sulfide flotation. A considerable amount of testing of flotation with cyanidation of the flotation concentrate compared to direct cyanidation verified the mineralogical observations.
On the basis of the substantial testwork conducted on the major rock types and trade-off study (WOL vs Flotation), the results warranted the selection of directly leaching the gravity tails versus the leaching of the flotation concentrate.
The incorporation of activated carbon in the cyanide leach was utilized to obviate the gold robbing presence of some organics in the ore at Livengood. The activated carbon removes solubilized gold before the naturally occurring organics can rob it from solution. The daily tonnage proposed for milling at Livengood is large and the resulting amount of carbon in the leach circuit will also be large.
The mineralogical studies indicating that silver is only a minor contributor to the precious metals at Livengood further justified the choice of carbon. Livengood gold ore contains some soluble copper minerals. The copper that does solubilize will load onto carbon in the CIL leach and as a result will increase the
| International Tower Hill Mines Ltd. S-K 1300 – Technical Report Summary Livengood Gold Project Pre-feasibility Study | |
required amount and advance frequency of carbon. The copper is removed from the carbon in a desorption process by using a cold strip prior to stripping the gold from the carbon. The stripped copper will be used to reduce the copper requirements for the cyanide destruction process.
Analysis of leaching (CIL) kinetic tests with preconditioning with O2 (4h) and lead nitrate has shown that the gold is leached within 24 hours of retention time. The reduction of leaching time from 32 hours in the 2013 FS to 24 hours impacts the CAPEX (fewer leach tanks) and OPEX (lower CN consumption).
The incorporation of pre-crushing was recommended by BBA to enhance the operation of the SAG mill, by providing a narrower feed particle size, thereby reducing variability, which will translate into increased efficiency. The estimated increase in throughput from the addition of pre-crushing is 25% to 30%.
Grinding simulations of a single line SABC + pre-crushing circuit has shown that there is a 19% increase in throughput if the grind size is relaxed from 180 µm to 250 µm (P80) and by using optimized drill and blast techniques.
Sulfur dioxide (SO2) produced by a sulfur burner will significantly reduce the OPEX costs for cyanide detoxification.
Based on the metallurgical testwork results from SGS and Pocock, BBA developed a Process Design Criteria and Process Flow Diagrams as described in Chapter 14.
| 10.8 | Opportunities for Further Investigation |
Opinion on Data Adequacy
A comprehensive amount of testwork has been completed on the Project. In the opinion of the QPs, the metallurgical testwork data support the declaration of mineral resources and mineral reserves.
The QPs recommend further testwork as discussed below.
Product Grind Size (P80)
The QPs recommend performing new testwork using the optimized conditions of Phases 12 and 13 but at a grind size (P80) higher than 250 µm. The recoveries obtained during Phases 9b, 11 and 12 did not show any inflection point between 250 µm and 180 µm, which may suggest that there is an opportunity for testwork on coarser sizes to add value.
Solid / Liquid Separation Testwork
Flocculant testwork on tailings were performed at a product size of 250 µm (P80) for the Project before the samples went for geotechnical testing. The QPs recommend performing further settling testwork: static as well as dynamic settling testwork. The static work can be used to screen potential flocculant suppliers for the Livengood mill feed. Dynamic settling testwork by vendors is recommended as part as the equipment sizing and bidding process.
| International Tower Hill Mines Ltd. S-K 1300 – Technical Report Summary Livengood Gold Project Pre-feasibility Study | |
Cyanide Detoxification Testwork
For cyanide detoxification, the following reagent consumptions were assumed for the 2021 PFS:
| § | Lime = 0.62 lb/t (0.28 kg/mt); |
| § | Copper sulfate = 0.09 lb/t (0.045 kg/mt); |
| § | S (elemental) = 0.52 lb/t (0.26 kg/mt); |
| § | Sodium metabisulfite = 0.38 lb/t (0.19 kg/mt). |
Confirmatory detoxification testwork with a particle size distribution target of 250 µm (P80) is recommended. Potential reagent savings are expected as a result of lower liberation of detrimental metals that could otherwise consume cyanide reagents.
Stirred Tank Reactor (STR) Optimization
Further stirred tank reactor (STR) testwork should be conducted with fresh drill cores with and without lead nitrate to optimize the lead nitrate, sodium cyanide and lime consumptions.
Carbon Loading Testwork and Simulation (CIL)
Both a qualified laboratory and equipment vendor(s) should be approached to undertake carbon loading testwork and simulation work of the proposed CIL carbon handling system to confirm the assumptions made in this study. This work will lead to the selection of the most appropriate carbon elution system (high pressure ZADRA vs AARL).
Oxygen Uptake Tests
The QPs recommend that oxygen uptake tests be performed by more than one service supplier to confirm the oxygen consumption for the Livengood Gold Project.
| International Tower Hill Mines Ltd. S-K 1300 – Technical Report Summary Livengood Gold Project Pre-feasibility Study | |
| 11. | Mineral Resource Estimates |
| 11.1 | Mineral Resource Estimation Methodology |
The global mineral resource estimate was prepared based on a resource model constructed using Vulcan Geomodeller ® and Whittle ® scientific software programs. The Livengood mineral resource was estimated using Inverse Distance Weighting (IDW) interpolation techniques.
Three sources of volumetric determination were used for the resource model. One was a three-dimensional (3D) stratigraphic model used to assign rock type codes to the block model. The second was an implicit model that interpolated a 100-ppm antimony halo or “shell” for the mineral deposit, with blocks flagged as either inside or outside this halo. The third was 54 individually interpreted massive stibnite veins that were used to determine the volume percentage and grade of veins within each model block that is intersected by the veins.
Gold contained within each block was estimated using Inverse Distance cubed (ID3). The block model was flagged with the stratigraphic models using a block majority coding method except for blocks that intersected the combination of bedrock and overburden or blocks that intersected the combination of bedrock and massive stibnite veins. This was necessary to better calculate individual block densities due to significantly variable specific gravity measurements in those rock types. Grade discontinuities at stratigraphic contacts were evaluated to determine hard and soft boundaries for the estimation of mineralization within the stratigraphic domains of the mineral deposit.
Note that the resource modeling work described and the analytical measures reported in this chapter are done using metric units. Where it is deemed pertinent (i.e. to support summary production statistics), the equivalent measure in imperial units have been provided.
The estimates of mineral resources may be materially affected if mining, metallurgical, or infrastructure factors change from those currently assumed at Livengood. Estimates of inferred mineral resources have significant geological uncertainty and it should not be assumed that all or any part of an inferred mineral resource will be converted to the measured or indicated categories. Mineral resources that are not mineral reserves do not meet the threshold for reserve modifying factors, such as estimated economic viability, that would allow for conversion to mineral reserves.
The total Livengood drilling and sampling datasets are shown in Table 11-1. Drilling performed by THM is shown in Table 11-2. Of the 797 listed sampling locations, 776 are directly related to the 2021 mineral resource estimate (2021 MRE). The historical data (pre-2006) represent approximately 2% of the total information used. The use of historical data is based on its statistical consistency with current data and the small portion of the total data represented as shown in past technical reports (Klipfel and Giroux, 2008a, 2008b, and 2009; Klipfel et al., 2009a and 2009b). For data validation purposes, in 2011, SRK checked the
| International Tower Hill Mines Ltd. S-K 1300 – Technical Report Summary Livengood Gold Project Pre-feasibility Study | |
assay data on a representative subset of drill holes (10%) used for the resource estimate against the original assay certificates (Carew, 2011). An error rate of less than 1% was identified and is well within acceptable standards for accuracy and use in mineral resource estimates. These minor errors have been addressed in the mineral estimation procedures. Lechner (2017) and Carew (2011) identified minor assaying concerns related to potential assay value cyclicity in RC drilling. These have been addressed in the 2021 MRE such that there is not a material impact on the estimation of gold throughout the Livengood mineral deposit.
The topographic surface used is based on a 4 m Digital Elevation Model derived from 2008 aerial photography.
Densities used in the resource are based on 98 determinations from core and RC chip samples, and are shown in Table 11-3. Based on empirical observations, massive stibnite vein density was estimated at 2.86, country rock density was estimated at 2.7 and overburden density was estimated at 2.
Table 11-1: Historical drilling and sampling
| Year | Company | Method | Number of Sites | Feet | Meters |
| 1976 | Homestake | Percussion | 5 | 994 | 303 |
| 1981 | Occidental | Percussion | 6 | 988 | 301 |
| 1989 | AMAX | Trench | 2 | 525 | 160 |
| 1990 | AMAX | RC | 3 | 1,050 | 320 |
| 1997 | Placer Dome | Core | 8 | 3,467 | 1,057 |
| 2003 | AngloGold | RC | 8 | 4,968 | 1,514 |
| 2004 | AngloGold | Trench | 8 | 892 | 272 |
| 2004 | AngloGold | Core | 4 | 2,500 | 762 |
| Total | 44 | 15,384 | 4,689 |
| International Tower Hill Mines Ltd. S-K 1300 – Technical Report Summary Livengood Gold Project Pre-feasibility Study | |
Table 11-2: THM resource drilling and sampling
| Year | Company | Method | Number of Sites | Feet | Meters |
| 2006 | THM | Core | 7 | 4,027 | 1,227 |
| 2007 | THM | Core | 15 | 14,471 | 4,411 |
| 2008 | THM | Core | 9 | 7,185 | 2,190 |
| 2008 | THM | Trench | 4 | 261 | 80 |
| 2008 | THM | RC | 109 | 93,402 | 28,469 |
| 2009 | THM | Core | 12 | 15,003 | 4,573 |
| 2009 | THM | RC | 195 | 196,243 | 59,815 |
| 2010 | THM | Core | 38 | 43,472 | 13,250 |
| 2010 | THM | RC | 195 | 184,717 | 56,302 |
| 2011 | THM | RC | 111 | 94,219 | 28,718 |
| 2011 | THM | Core | 53 | 44,260 | 13,490 |
| 2012 | THM | Core | 5 | 6,469 | 1,972 |
| Total | 753 | 703,730 | 214,497 |
| | | | | | |
Table 11-3: Density determinations
| Lithology Unit | Density |
| Money Knob Rock type 2 (RT2) | 2.67 |
| Cambrian Rock type 4 (RT4) | 2.82 |
| Upper Sediments North Rock type 5 (RT5) | 2.68 |
| Upper Sediments South Rock type 6 (RT6) | 2.68 |
| Lower Sediments Rock type 7 (RT7) | 2.74 |
| Main Volcanics Rock type 8 (RT8) | 2.72 |
| Main Volcanics Rock type 9 (RT9) | 2.72 |
| Country Rock | 2.70 |
| Overburden | 2.00 |
A statistical summary of Au and Sb above detection limit is shown in Table 11-4. The elements of concern for the 2021 mineral resource are gold and antimony distributions. These elements are of major interest and drive the mining, metallurgical and economic considerations for the Livengood mineral deposit, with gold adding positive value and antimony having a negative correlation with gold recovery.
| International Tower Hill Mines Ltd. S-K 1300 – Technical Report Summary Livengood Gold Project Pre-feasibility Study | |
Table 11-4: Au assay statistics for Livengood
| Element | Unit | N | Mean | Maximum | Std. Dev. | C.V. |
| Au | ppm | 147,658 | 0.36 | 76.5 | 1.12 | 3.07 |
| Sb | ppm | 90,090 | 122 | 174,000 | 1,821 | 15 |
Each of the database assay intervals were logged for lithology, stratigraphy, alteration and mineralization. Disseminated mineralization displays varying average grades of gold controlled by the stratigraphy of the deposit (Figure 11-1). Sampled assay values have high coefficients of variation due to high grade outliers, which skew the mean average grades above the third quartile. Evaluation of the following graph suggests that capping the gold grades by stratigraphy is required to estimate the contained metal content of the deposit. A coefficient of variation (C.V.) below 2.00 is desirable to assist in estimating the recoverable ounces for the mineral deposit.
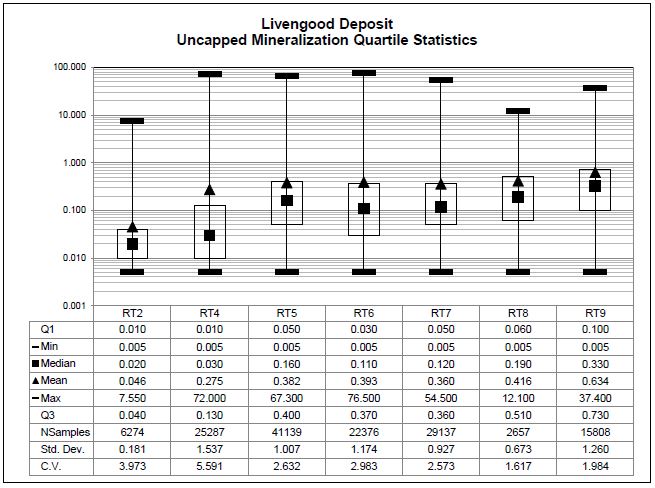
Figure 11-1: Uncapped gold grade distribution by stratigraphic unit
| International Tower Hill Mines Ltd. S-K 1300 – Technical Report Summary Livengood Gold Project Pre-feasibility Study | |
| 11.4 | Grade Capping – Handling of Outliers |
Treatment of outliers is generally a perplexing problem. There is no generally accepted solution of handing outliers; however, diligence needs to be exerted with the assay database to ensure the ability to estimate the true average grade of the mineral deposit. Therefore, a generally accepted practice of capping grades at the 90th through 99th percentile has been employed to limit the impact of high-grade outliers for the deposit.
Table 11-5 summarizes the capping statistics. Figure 11-2 shows the resulting box plot quartile statistics after subsequent capping with the extreme outliers reduced to the capping levels listed in Table 11-1.
Antimony grades were not capped. Antimony is a deleterious element in which it is industry standard practice not to perform grade capping.
Table 11-5: Capping statistics
| Stratigraphy | Uncapped
Grade | Number of
Capped Assays | Capped
Grade | Number Samples
Capped |
| RT 2 | 0.05 | 6,266 | 0.04 | 8 |
| RT 4 | 0.28 | 25,220 | 0.21 | 67 |
| RT 5 | 0.38 | 41,119 | 0.37 | 20 |
| RT 6 | 0.39 | 22,367 | 0.38 | 9 |
| RT 7 | 0.36 | 29,125 | 0.35 | 12 |
| RT 8 | 0.42 | 2,649 | 0.40 | 8 |
| RT 9 | 0.63 | 15,789 | 0.61 | 19 |
| International Tower Hill Mines Ltd. S-K 1300 – Technical Report Summary Livengood Gold Project Pre-feasibility Study | |
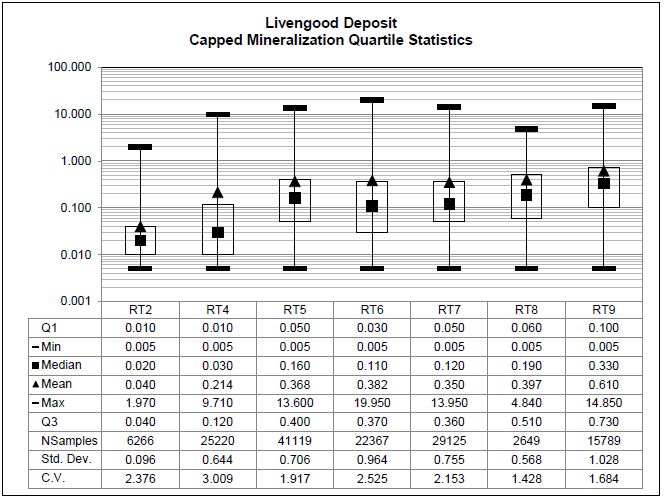
Figure 11-2: Capped quartile statistics
Compositing reduces the impact of short assay intervals and helps to better estimate the average grade of the deposit. Compositing incorporates a certain amount of dilution into the raw assay data prior to estimation. The open pit mining operation envisioned for the Project will be at a larger scale than the assays intervals sampled for the deposit. The selective mining unit for the Project is expected to be 10 m, therefore, the assays for the database have been composited to 10 m. Composites are length weighted down hole composites of the capped Au assay values.
Figure 11-3 details the final composite statistics, by stratigraphy, that have been used for the mineral resource estimate; C.V.(s) are within acceptable ranges, high grade outliers have been accounted for. and average Au values are within acceptable ranges. The manipulation from assays to composites has been carried out using industry accepted practices and RDA recommends that the final composite database can be used for mineral resource estimation of the Livengood deposit.
| International Tower Hill Mines Ltd. S-K 1300 – Technical Report Summary Livengood Gold Project Pre-feasibility Study | |
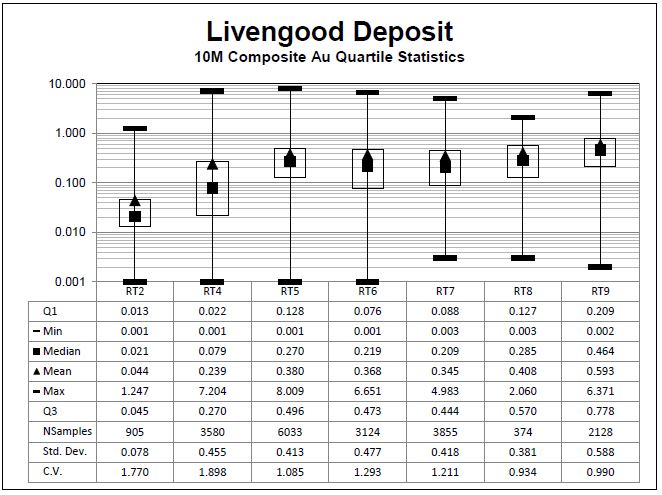
Figure 11-3: Capped composite statistics
Cell declustering was evaluated to ensure more densely drilled out portions of the deposit that are not biased by a large sample set of high grades localized to one area. Figure 11-4 demonstrates that the mean values do not show a minimum, followed by a maximum, as the cell size increases. Therefore, cell declustering was not used in the 2021 MRE.
| International Tower Hill Mines Ltd. S-K 1300 – Technical Report Summary Livengood Gold Project Pre-feasibility Study | |
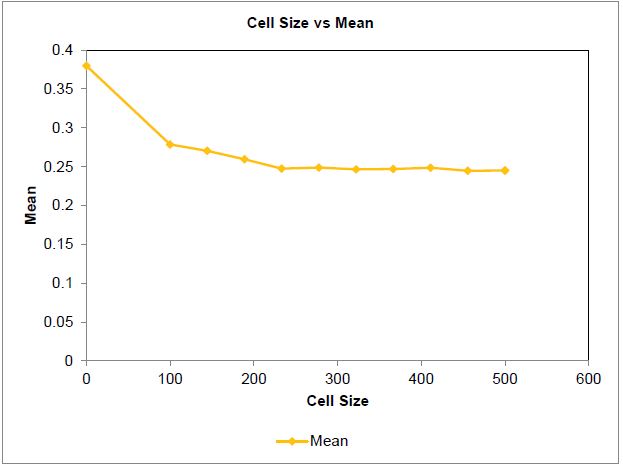
Figure 11-4: Cell declustering chart demonstrates sample clustering is not a factor for the deposit
| 11.7 | Contact Profile Analysis |
The Au values of the individual stratigraphic units of the deposit were evaluated to determine whether the mineralization of the units is separate and distinct from every other unit. If mineralization is continuous or convergent across stratigraphic contacts, then it is possible to estimate mineralization from both assay populations. The average grades of the units do not need to be similar. If the grades appeared graphically to converge at the contact, then these units were to be estimated as one unit. The upper sediments (RT6), lower sediments (RT7), and the main volcanics (RT9) show convergence at the boundaries and were estimated as one domain. All other stratigraphic units were estimated as separated domains, using no assay values from other domains.
| International Tower Hill Mines Ltd. S-K 1300 – Technical Report Summary Livengood Gold Project Pre-feasibility Study | |
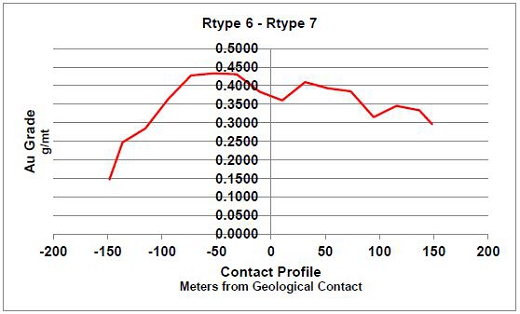
Figure 11-5: Contact profile of RT6 and RT7. Grades converge at the contact. Soft boundary
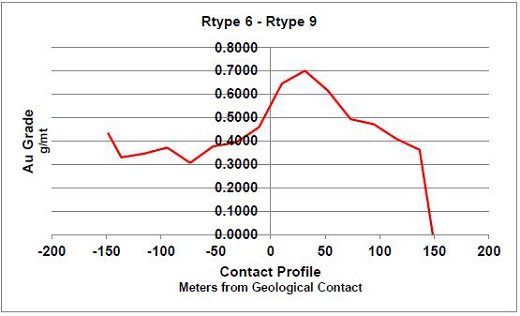
Figure 11-6: RT6 and RT9. Grades converge at contact. Soft boundary
| International Tower Hill Mines Ltd. S-K 1300 – Technical Report Summary Livengood Gold Project Pre-feasibility Study | |
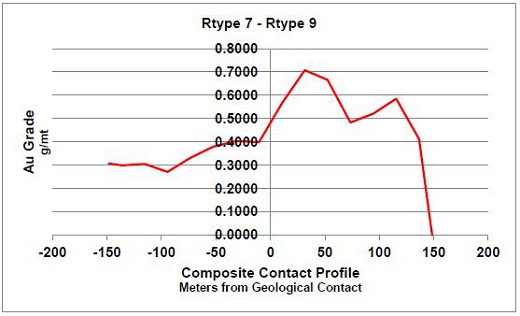
Figure 11-7: RT7 and RT9 Grades converge at the contact. Soft boundary
Anisotropy of mineralization was evaluated with Sage spatial modeling software to determine appropriate search ellipses for grade estimation. Mineralization at Livengood can be considered fairly homogeneous across the extents of the deposit, which is typical of many of the large disseminated deposits throughout the world. Drilling across the deposit has been developed on a fairly regular grid in many cases due to the large size of the mineral footprint. Evaluations with spatial modeling software yield fairly large search ellipses, which suggest low variances of gold grades across large distances. Search ellipses were developed for the Cambrian RT4, Upper Sediments North of the Lillian Fault RT5, Upper Sediments South of the Lillian Fault RT6, Lower Sediments RT7, Devonian Volcanics RT8 Main Volcanics RT9. RT6, RT7 and RT9 use the same anisotropic search distances.
Search ellipse regions are displayed in Figure 11-8, Figure 11-9 and Figure 11-10.
| International Tower Hill Mines Ltd. S-K 1300 – Technical Report Summary Livengood Gold Project Pre-feasibility Study | |
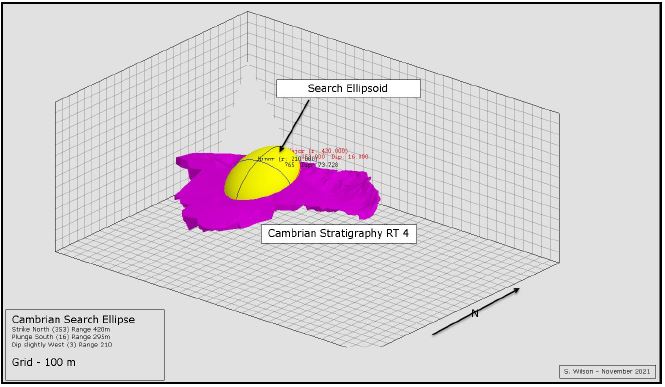
Figure 11-8: Cambrian stratigraphy search ellipse
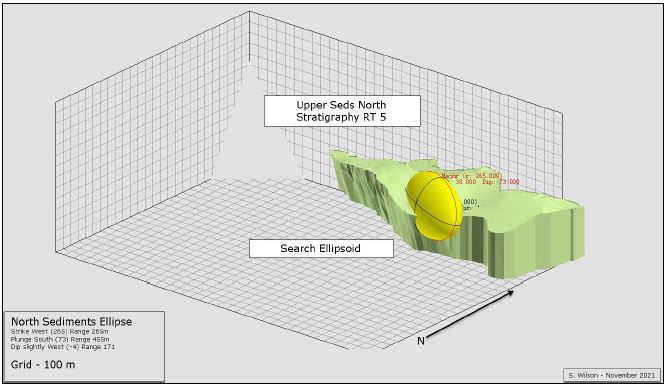
Figure 11-9: Upper Sediments North search ellipse
| International Tower Hill Mines Ltd. S-K 1300 – Technical Report Summary Livengood Gold Project Pre-feasibility Study | |

Figure 11-10: Type 679 search ellipse
All other sedimentary and rock types within the deposit were estimated using the 679 search parameters. Massive stibnite vein grades are modeled explicitly as explained later in this chapter.
A 3D block model was constructed to encompass the drilling data and the interpreted geologic models for the Project. Block model dimensions are shown in Table 11-6. All coordinates are in the UTM NAD27 Alaska coordinate system. All units are metric.
Table 11-6: Model extents
| | Minimum (m) | Maximum (m) | Extent (m) | Block Size (m) | No. of Blocks |
| East | 427,600 | 430,850 | 3,250 | 10 | 325 |
| North | 7,264,310 | 7,266,710 | 2,400 | 10 | 240 |
| Elevation | -290 | 610 | 510 | 900 | 90 |
The Livengood block model has been coded with several interpreted shapes that are representative of the deposit. These include topography, stratigraphy, massive stibnite veins and the implicit 100 ppm antimony shell. Figure 11-11 to Figure 11-13 show a representative view, south to north looking west. These show the physical attributes of the model on a representative section of the geology of the mineral deposit.
| International Tower Hill Mines Ltd. S-K 1300 – Technical Report Summary Livengood Gold Project Pre-feasibility Study | |
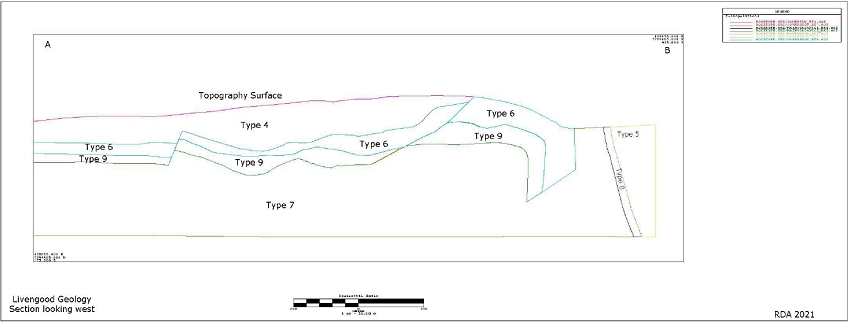
Figure 11-11: Section A-B looking west. Geologic models used to flag the Livengood block model
| International Tower Hill Mines Ltd. S-K 1300 – Technical Report Summary Livengood Gold Project Pre-feasibility Study | |
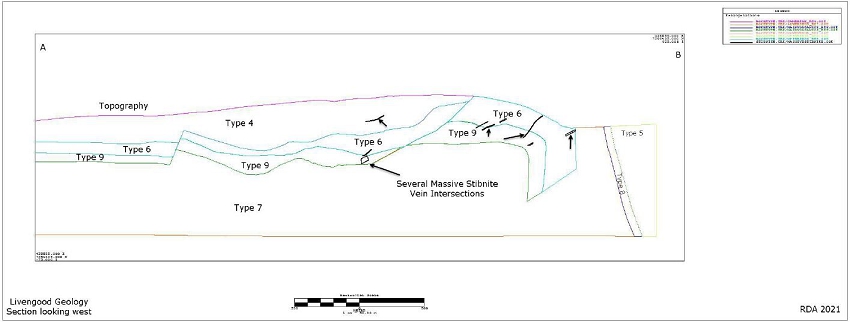
Figure 11-12: Intersection of massive stibnite veins on cross section A-B
| International Tower Hill Mines Ltd. S-K 1300 – Technical Report Summary Livengood Gold Project Pre-feasibility Study | |
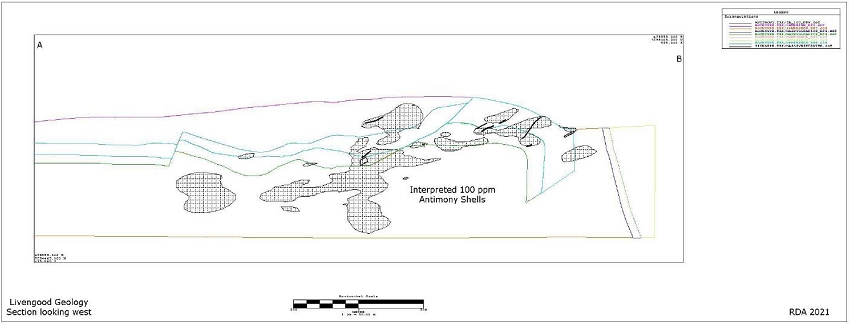
Figure 11-13: Cross section A-B showing the 100 ppm antimony halo for Livengood
| International Tower Hill Mines Ltd. S-K 1300 – Technical Report Summary Livengood Gold Project Pre-feasibility Study | |
Gold grades for the mineral resource are estimated using Inverse Distance Weighting. Inverse distance methods are a suite of weighted average estimation methods. These result in estimates that are smoothed versions of the original sample data. Inverse distance methods are based on calculating weights for the samples based on the distance from the samples to the centroid of a model block. This is essentially a linear estimate where sample weights are assigned to composite values for all composites used in the estimate. The calculation of the weights is based on the inverse of the distance between the composite and the center of the block being estimated. Sample weights are standardized to a sum of 1 to ensure there is not a globally biased estimate. In the mining industry there are two common exponents used, Inverse Distance squared (ID2) and Inverse Distance cubed (ID3). ID3 is used when large weights are desired for the closest composites. This is applicable when the variable being estimated is erratic and the current data spacing is large relative to the data that would be available for mineral boundary decision making. Such as with open pit gold grade distributions. ID3 methodologies are widely used in the mining industry and have proven through the decades to be an acceptable and reliable methodology for the estimation of gold distributions in large scale low grade disseminated gold deposits.
Gold grades have been interpolated throughout the block model. They are stored as a grade in each model block based on the estimation parameters associated with each stratigraphic unit. Five individual estimation domains were run on the model; Type 2, Type 4, Type 5, Type 8 and Type 679. Only samples and blocks matching the stratigraphic criteria were used in each of the five estimation runs. This honors the hard and soft boundaries identified by the contact profile analysis. Antimony (Sb) grades have been interpolated using the same parameters as gold. Antimony grades within the veins were not used in the determination of the block interpolated grades.
Table 11-7: ID3 Estimation Parameters
Estimation
ID | Minimum
Samples | Max
Samples | Max Samples
Allowed per Hole | Sample
Rock Type | Block Rock
Type | Number of
Blocks Estimated |
| 2 | 5 | 8 | 2 | 2 | 2 | 43,618 |
| 4 | 5 | 8 | 2 | 4 | 4 | 106,552 |
| 5 | 5 | 8 | 2 | 5 | 5 | 361,056 |
| 8 | 5 | 8 | 2 | 8 | 8 | 2,466 |
| 679 | 5 | 8 | 2 | 6, 7 or 9 | 6, 7 or 9 | 682,830 |
Gold grades for the massive stibnite veins have been explicitly modeled based on the average gold grade of the composites that are intersected by the veins. Gold and antimony grades for each of the 54 interpreted grades are identified in Table 11-8. These values have been directly applied to their respective percentages of the associated model blocks.
| International Tower Hill Mines Ltd. S-K 1300 – Technical Report Summary Livengood Gold Project Pre-feasibility Study | |
Table 11-8: Livengood deposit massive stibnite grade estimates
| Vein | Au Grade (ppm) | Sb Grade (ppm) | Vein | Au Grade (ppm) | Sb Grade (ppm) |
| 1 | 1.520 | 49,340 | 28 | 1.835 | 10,440 |
| 2 | 2.025 | 6,840 | 29 | 1.259 | 20,869 |
| 3 | 1.038 | 7,323 | 30 | 1.100 | 10,700 |
| 4 | 7.397 | 10,210 | 31 | 1.100 | 3,378 |
| 5 | 1.608 | 12,247 | 32 | 4.430 | 53,750 |
| 6 | 4.223 | 18,250 | 33 | 0.965 | 7,995 |
| 7 | 2.533 | 15,167 | 34 | 3.740 | 10,580 |
| 8 | 1.767 | 7,428 | 35 | 3.020 | 1,467 |
| 9 | 1.685 | 9,065 | 36 | 13.925 | 69,550 |
| 10 | 1.409 | 6,679 | 37 | 1.778 | 18,362 |
| 11 | 1.682 | 2,977 | 38 | 1.614 | 10,914 |
| 12 | 4.806 | 16,746 | 39 | 1.280 | 16,220 |
| 13 | 3.392 | 4,583 | 40 | 0.516 | 4,769 |
| 14 | 1.749 | 15,362 | 41 | 0.153 | 79 |
| 15 | 1.165 | 5,339 | 42 | 1.200 | 0 |
| 16 | 1.495 | 9,865 | 43 | 2.804 | 10,276 |
| 17 | 0.196 | 26 | 44 | 1.180 | 117 |
| 18 | 1.168 | 2,547 | 45 | 1.380 | 3,737 |
| 19 | 1.875 | 6,410 | 46 | 3.853 | 16,476 |
| 20 | 2.317 | 20,349 | 47 | 1.000 | 16,700 |
| 21 | 0.960 | 7,325 | 48 | 1.480 | 40,800 |
| 22 | 2.270 | 2,190 | 49 | 1.250 | 13,350 |
| 23 | 0.570 | 53,473 | 50 | 9.530 | 19,667 |
| 24 | 3.432 | 10,731 | 51 | 1.000 | 5,480 |
| 25 | 7.180 | 46,537 | 52 | 1.040 | 5,940 |
| 26 | 3.924 | 11,885 | 23 | 4.495 | 24,900 |
| 27 | 8.278 | 51,332 | 54 | 1.000 | 3,607 |
| International Tower Hill Mines Ltd. S-K 1300 – Technical Report Summary Livengood Gold Project Pre-feasibility Study | |
Block model validation can be quantified numerically in certain aspects and in many cases is visual and sometimes subjective. Many locations throughout the mineral deposit have been checked for biased estimates. One such validation is to compare the ID3 estimate against the nearest neighbor (NN) estimation. A NN estimate should have a globally higher grade and higher variance than the NN estimation. Bias can be surmised visually if high grades of mineralization have been estimated over known low grade areas of the deposit. A comparison of estimated mineralization should mimic the same visual characteristics as seen against an overlay of the composites used for the estimation as in Figure 11-14. Another visual characteristic to ensure no bias is that there are no obvious streaks of high grade, which can be an indicator of high-grade bias in the estimate. The blocks on Section A-B demonstrate that the estimate of mineralization compares well with the Livengood exploration drilling data.
Table 11-9 compares the global ID3 estimate against the global NN estimate at a 0.00 g/t Au cut-off grade. The same conditions and criteria used for the ID3 interpolation were used for the NN interpolation. Variance, standard deviation and coefficient of variance should display the same behavior, i.e. higher than the ID3 estimation. Model Au grade variance, standard deviations and coefficients of variation are also presented in the Table 11-9. These comparisons satisfy the QP that there is no global bias in the 2021 MRE. An acceptable smoothing of the original assayed grades of the deposit has been achieved.
Table 11-9: Comparison of ID3 to NN estimates to evaluate for biases in the 2021 MRE
| ID3 Model Grade vs. NN Model Grade | Unit | Au | Au Variance | Std. Dev. | C.V. |
| ID3 Global Resource Estimate | (g/t) | 0.254 | 0.017 | 0.266 | 1.047 |
| NN Global Resource Estimate | (g/t) | 0.255 | 0.204 | 0.452 | 1.775 |
| Variance | % | 0.393 | -91 | -41 | -41 |
| International Tower Hill Mines Ltd. S-K 1300 – Technical Report Summary Livengood Gold Project Pre-feasibility Study | |

Figure 11-14: Visual comparison of composite database with estimated Au grades for Section A-B
| International Tower Hill Mines Ltd. S-K 1300 – Technical Report Summary Livengood Gold Project Pre-feasibility Study | |
A scattergram comparing the composite Au grades to the modeled Au grades is shown in Figure 11-15. The highest grade is in the composite data, which is expected. The highest variance is in the composites as expected. The mean average grade is identical as expected. The QP is confident that there are no biases in the 2021 MRE for the Livengood Gold Project. The Livengood 2021 MRE can be relied upon for economic analyses.
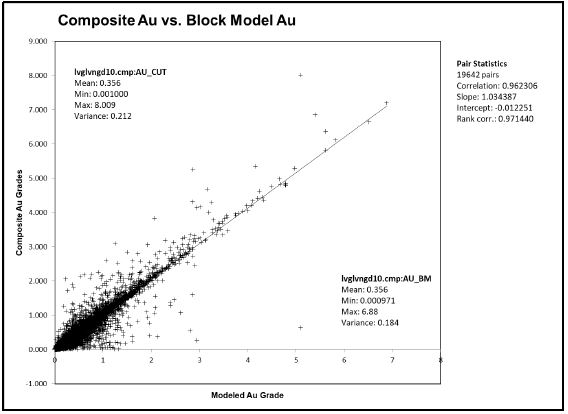
Figure 11-15: Scattergram comparing global estimated Au grade to composite database Au values
One final validation of the model is summarized in Figure 11-16. Here is displayed the grades from south to north on 10-meter increments. This chart is a swath plot; often referred to as a drift analysis. This is used to verify that there is no local bias to the estimation of gold grades. The light dotted line represents the nearest composite grades that were used to estimate the block grades. A visual check shows that the sample grades are most erratic, which is indicative of the highest variance. The blue solid line represents the NN estimate, which is smoother than the sample grades yet less smooth than the ID3, which is represented by the solid red line. These results indicate that there is no bias in the local estimation of grades for Livengood.
| International Tower Hill Mines Ltd. S-K 1300 – Technical Report Summary Livengood Gold Project Pre-feasibility Study | |
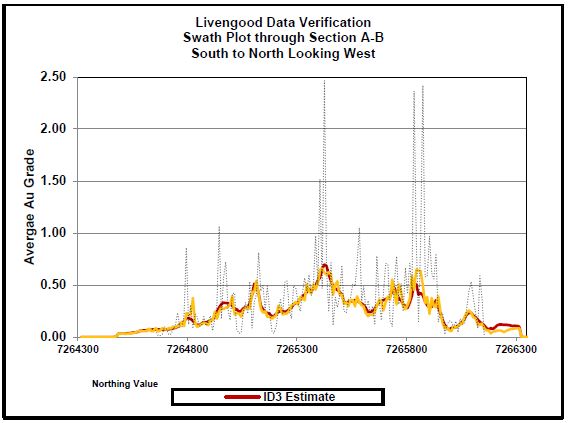
Figure 11-16: Swath plot through Section A-B
| 11.12 | Resource Classification |
Mineral resources are classified in accordance with §229.1302(d)(1)(iii)(A) (Item 1302(d)(1)(iii)(A) of Regulation S-K). Mineralization at Livengood has been categorized as Inferred mineral resources, indicated mineral resources and measured mineral resources, based upon increasing levels of confidence in various physical characteristics of the deposit. Drill hole spacing, search neighborhoods, metallurgical characterization, geological confidence and many other factors were used to give the QP confidence in the mineral resource estimate for the Project (2021 MRE). RDA is satisfied that the geological modeling for Livengood honors the geological information and knowledge of the mineral deposit. The location of the samples and the assay data are sufficiently reliable to support resource evaluation.
Classification of mineral resources for Livengood are based on the distance to the nearest samples used to derive the gold grade for each individual block in the deposit. Massive stibnite veins are classified as Indicated mineral resources. No massive stibnite veins have been classified as Measured mineral resources. RDA has classified the mineral resources according to Table 11-10 which summarizes the sources and degree of uncertainty considered by RDA.
| International Tower Hill Mines Ltd. S-K 1300 – Technical Report Summary Livengood Gold Project Pre-feasibility Study | |
In reference to Table 11-10, sources and degree of uncertainty in the categories and are defined as follows:
| § | Measured Resources – Measured mineral resources are limited to areas where in opinion of RDA the quality and quantity of the grade and tonnage are based on low levels of uncertainty. Only areas within the model where the criteria and uncertainty correspond to the Low Degree of Uncertainty column in Table 11-10 have been used to classify this category of resource. |
| § | Indicated Resources - RDA has limited the Indicated part of a mineral resource for which in RDA’s opinion the quantity and grade are estimated on the basis of adequate geological evidence and sampling. This includes all the sources of data used in under the Measured category. The main controlling feature on the uncertainty is considered to be the drill spacing with a minimum of 2 holes within 60m – 120m used within different domains, to determine an adequate level of grade uncertainty. The criteria and uncertainty correspond to the Medium Degree of Uncertainty column in Table 11-10. |
| § | Inferred Resources - RDA has limited the Inferred part of a mineral resource for areas in the geological model where the quantity and grade are estimated on the basis of limited geological evidence and sampling. RDA considers this to have the highest levels of uncertainty with limited drilling information resulting in grades not being able to be estimated with adequate confidence between drill holes for the application of modifying factors for mining. These areas of the model represent the lowest drilling density (wide spaced), which are beyond the ranges where valid estimates can be assigned with confidence. RDA considers these areas of the mineral resource will require additional exploration drilling prior to mining. The criteria and uncertainty correspond to the High Degree of Uncertainty column in Table 11-10. |
Table 11-10: Sources and Degree of Uncertainty
| | Degree of Uncertainty |
| Source | Low | Medium | High |
| Drilling | Exploration - no significant issues identified. Protocols consistent with industry standards. | | |
| Sampling | Industry standard sampling utilized for core and RC drilling | | |
| Sample Preparation/ Assay | Sample handling, preparation and analysis methods at accredited, independent laboratories meet current industry standards. | | |
| QA-QC | Sample preparation and analysis procedures for Livengood meet current industry standards, assay results suitable for use in resource estimation. | | |
| International Tower Hill Mines Ltd. S-K 1300 – Technical Report Summary Livengood Gold Project Pre-feasibility Study | |
| | Degree of Uncertainty |
| Source | Low | Medium | High |
| Data Verification | Density and clustering of drilling has been demonstrated to have little-to-no impact on estimates mineralization volumes. | | |
| Database | Location, analytical and geological data in the database were verified to the QP's satisfaction. | | |
| Geologic Modeling | Geologic models have been reviewed and conform with the geological interpretations of the deposit | | |
| Bulk Density | | Measurements based on only 98 determinations. Massive stibnite veining based on empirical observations. | |
| Grade Estimation | Grade model verification in terms of visual verification, comparative statistics and swath plots indicate that estimated grades are largely visually representative, unbiased and within acceptable tolerances. | | |
| Drill Spacing and Estimation Criteria | Model blocks estimated with a minimum of five samples and a minimum of three drillholes. Limit of two samples per hole. Distance within 60m of nearest drill hole. | Model blocks estimated with a minimum of five samples and a minimum of three drillholes. Limit of two samples per hole. Distance to nearest hole > 60m and <= 120m. | Model blocks estimated with a minimum of five samples and a minimum of three drillholes. Limit of two samples per hole. Distance to nearest hole > 120m. |
| Continuity of Classification Volumes | Smoothing applied to re-classify isolated volumes (groups of blocks) to ensure reasonable continuity of Measured and Indicated categories, using implicit modeling techniques. Also adjusted for depth consistent with high confidence drill density near surface. | Massive stibnite vein mineral estimates classified only as indicated mineralization even in very close proximity to geological drilling intercepts. | |
| | | | |
| 11.13 | Qualified Person Opinion – Further Work |
The qualified person is of the opinion that, with consideration of the recommendations listed in Section 23.1, that any issues relating to all applicable technical and economic factors likely to influence the prospect of economic extraction can be resolved with further work.
| International Tower Hill Mines Ltd. S-K 1300 – Technical Report Summary Livengood Gold Project Pre-feasibility Study | |
| 11.14 | Mineral Resource Summary |
Mineral resources must demonstrate reasonable prospects for eventual economic extraction. The “reasonable prospects” test generally implies that the quantity and grade estimates meet certain economic thresholds and modifying factors that that take into account extraction scenarios and processing recoveries. The deposit gold mineralization is amenable for open pit extraction. To determine the quantities of material meeting the reasonable prospects of eventual economic extraction by an open pit, RDA used the Lerchs-Grossman © economic algorithm, which constructs lists of related blocks that should or should not be mined. The final list defines a surface pit shell that has the highest possible total value, while honoring the required surface mine slope and economic parameters.
Economic parameters used in the analysis are based on an average gold price of $1,650/oz on the date of August 20, 2021. Pit optimization parameters are shown in Table 11-11. Gold recoveries are tonnage-weighted and include the recovery from massive stibnite of 22%.
Table 11-11: Pit constraining parameters used for the Livengood Gold Project
| Parameter | Unit | Rock
Type
4 | Rock
Type 5 | Rock
Type 6 | Rock
Type 7 | Rock
Type 8 | Rock
Type 9 |
| Mining Cost | $/total mt | 1.76 | 1.74 | 1.74 | 1.68 | 1.76 | 1.76 |
| Au Cut-off | g/mt | 0.21 | 0.20 | 0.25 | 0.25 | 0.33 | 0.33 |
| Processing Cost | $/process mt | 9.27 | 9.15 | 9.17 | 9.50 | 9.71 | 9.71 |
| Au Recovery | % | 84 | 80 | 71 | 67 | 55 | 56 |
| Administrative Cost | $/process mt | 1.55 | 1.55 | 1.55 | 1.55 | 1.55 | 1.55 |
| Royalty | % | 3 | 3 | 3 | 3 | 3 | 3 |
| Au Selling Price | $/oz | 1,650 | 1,650 | 1,650 | 1,650 | 1,650 | 1,650 |
| Overall Slope Angle | Degrees | 45 | 45 | 45 | 45 | 45 | 45 |
The parameters listed in Table 11-11 above define a realistic basis to estimate the mineral resource for the Livengood Gold Project and are representative of similar mining operations throughout North America. The mineral resource has been limited to mineralized material that occurs within the pit shells and that could be scheduled to be processed based on the defined cut-off grade by rock type. All other material within the defined pit shells, other than the six predominant mineralized sedimentary units, was characterized as non-mineralized material. The QP used the gold selling price of $1,650/oz, which is based a 5% premium on the three-year trailing average gold selling price of $1,585/oz at August 2021. The QP applied the premium to the gold price to recognize the continued upward trend of metal prices entering in to the fourth quarter of 2021.
| International Tower Hill Mines Ltd. S-K 1300 – Technical Report Summary Livengood Gold Project Pre-feasibility Study | |
The reader is cautioned that the results from the pit optimization are used solely for reporting the reasonable prospects for eventual economic extraction by an open pit and do not represent an economic study, using modifying factors that could convert mineral resources to mineral reserves. RDA considers that blocks located within a conceptual pit shell are amenable for open pit extraction and can be reported as the mineral resource for the Project.
The mineral resource estimate for the Project (2021 MRE) is summarized in Table 11-12. Mineral resources are reported at various cut-off grades to reflect the throughput factors and varying costs by rock type for processing at Livengood as shown in Table 11-11. Mineral resources are not mineral reserves and do not meet the threshold for reserve modifying factors, such as estimated economic viability, that would allow for conversion to mineral reserves.
This TRS discloses mineral reserves in Chapter 12. The mineral resources disclosed in Table 11-12 are exclusive of the mineral reserves disclosed in Chapter 12. Table 11-13 discloses the Livengood mineral resource estimate inclusive of mineral reserves.
Table 11-12: Livengood Gold Project mineral resource estimate (exclusive of mineral reserves)
(2021 MRE), August 20, 2021 – Resource Development Associates Inc.
| Classification | Metric tons (Mmt) | Au (g/mt) | Contained Au (Koz) |
| Measured | 234.50 | 0.53 | 3,990.49 |
| Indicated | 40.01 | 0.49 | 629.61 |
| Total M & I | 274.51 | 0.52 | 4,620.10 |
| Inferred | 15.98 | 0.40 | 206.98 |
| 1. | The effective date of the estimate is August 20, 2021. |
| 2. | Mineral resources for the Project are enumerated as per §229.1302(d)(1)(iii)(A) (Item 1302(d)(1)(iii)(A) of Regulation S-K). |
| 3. | Mineral resources are not mineral reserves and do not meet the threshold for reserve modifying factors, such as estimated economic viability, that would allow for conversion to mineral reserves. There is no certainty that any part of the mineral resources estimated will be converted into mineral reserves; |
| 4. | Open pit resources stated as contained within a potentially economically minable open pit; pit optimization was based on an assumed price for gold of US$1,650/oz, variable mining and recoveries as described in Table 11-11, and G&A cost of US$1.55/t, and a pit slope of 45 degrees; |
| 5. | Numbers in the table have been rounded to reflect the accuracy of the estimate and may not sum due to rounding; |
| 6. | Mineral resources are reported exclusive of mineral reserves. The reserves reported in Chapter 12 represent measured mineral resources and indicated mineral resources that were evaluated with modifying factors related to open pit mining. |
| International Tower Hill Mines Ltd. S-K 1300 – Technical Report Summary Livengood Gold Project Pre-feasibility Study | |
Table 11-13: Livengood Gold Project mineral resource estimate (inclusive of mineral reserves)
(2021 MRE), August 20, 2021 – Resource Development Associates Inc.
| Classification | Metric tons (Mmt) | Au (g/mt) | Contained Au (Koz) |
| Measured | 646.00 | 060 | 12,482.49 |
| Indicated | 58.51 | 0.61 | 1,141.61 |
| Total M & I | 704.51 | 0.60 | 13,624.10 |
| Inferred | 15.98 | 0.40 | 206.98 |
| 1. | The effective date of the estimate is August 20, 2021. |
| 2. | Mineral resources are not mineral reserves and do not meet the threshold for reserve modifying factors, such as estimated economic viability, that would allow for conversion to mineral reserves. There is no certainty that any part of the mineral resources estimated will be converted into mineral reserves; |
| 3. | Open pit resources stated as contained within a potentially economically minable open pit; pit optimization was based on an assumed price for gold of US$1,650/oz, variable mining and recoveries as described in Table 11-11, and G&A cost of US$1.55/t, and a pit slope of 45 degrees; |
| 4. | Numbers in the table have been rounded to reflect the accuracy of the estimate and may not sum due to rounding; |
| 5. | Mineral resources are reported inclusive of mineral reserves. The reserves reported in Chapter 12 represent measured mineral resources and indicated mineral resources that were evaluated with modifying factors related to open pit mining. |
| 11.15 | Grade Sensitivity Analysis |
Mineralization at Livengood is sensitive to the selection of the reporting cut-off grade. To illustrate this sensitivity, the block model quantities and grade estimates within the constraining pit are presented in Table 11-14 at linear increases in the cut-off grades for Measured, Indicated and Inferred mineral mineralization at Livengood. The same results are presented graphically in Figure 11-17. The reader is cautioned that Table 11-14 should not be misconstrued as a mineral resource. The reported quantities and grades are only presented as a sensitivity of the resource model to the selection of cut-off grade. Mineral resources are not mineral reserves and do not meet the threshold for reserve modifying factors, such as economic viability, that would allow for conversion to mineral reserves.
| International Tower Hill Mines Ltd. S-K 1300 – Technical Report Summary Livengood Gold Project Pre-feasibility Study | |
Table 11-14: Sensitivity of block model to cut-off grade
Cut-off
Au g/mt | Measured | Indicated | Measured & Indicated | Inferred |
Metric
Tons (000) | Grade Au
g/mt | Au oz
(000) | Metric Tons
(000) | Grade Au
g/mt | Au oz
(000) | Metric Tons
(000) | Grade Au
g/mt | Au oz
(000) | Metric Tons
(000) | Grade Au
g/mt | Au oz
(000) |
| 0.2 | 816,569 | 0.53 | 13,914 | 73,263 | 0.53 | 1,248 | 889,832 | 0.53 | 15,162 | 20,423 | 0.37 | 243 |
| 0.3 | 626,843 | 0.61 | 12,293 | 55,069 | 0.63 | 1,115 | 681,912 | 0.61 | 13,409 | 13,359 | 0.43 | 185 |
| 0.4 | 464,710 | 0.71 | 10,608 | 37,347 | 0.76 | 913 | 502,057 | 0.71 | 11,520 | 6,017 | 0.52 | 101 |
| 0.5 | 332,891 | 0.81 | 8,669 | 25,437 | 0.91 | 744 | 358,328 | 0.82 | 9,413 | 2,142 | 0.65 | 45 |
| 0.6 | 234,524 | 0.92 | 6,937 | 17,976 | 1.06 | 613 | 252,500 | 0.93 | 7,549 | 1,079 | 0.75 | 26 |
| 0.7 | 164,938 | 1.03 | 5,462 | 13,645 | 1.19 | 522 | 178,583 | 1.04 | 5,984 | 614 | 0.84 | 17 |
| 0.8 | 117,098 | 1.15 | 4,329 | 10,648 | 1.31 | 448 | 127,746 | 1.16 | 4,778 | 335 | 0.92 | 10 |
| 0.9 | 83,825 | 1.26 | 3,396 | 8,372 | 1.44 | 388 | 92,197 | 1.28 | 3,783 | 180 | 0.98 | 6 |
| 1.0 | 61,474 | 1.38 | 2,727 | 6,479 | 1.58 | 329 | 67,953 | 1.40 | 3,057 | 59 | 1.04 | 2 |
| International Tower Hill Mines Ltd. S-K 1300 – Technical Report Summary Livengood Gold Project Pre-feasibility Study | |
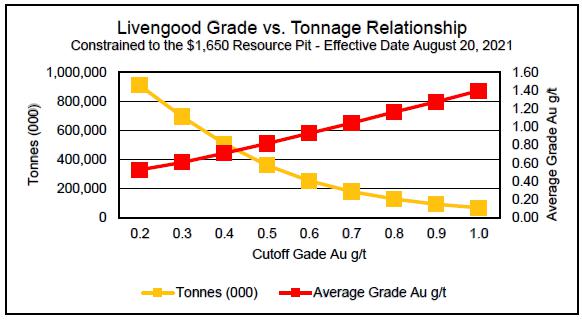
Figure 11-17: Livengood grade vs tonnage relationship
| 11.16 | Sensitivity of Mineralization to Gold Price |
The sensitivity of mineralization defined by the evaluation of the mineralization inventory at different gold prices was performed for gold prices of $984/oz (-20%), $1,320/oz (resource base case) and $1,980/oz (+20%). The input parameters defined in Table 11-11 above were used in the analysis. Table 11-15 lists the amount of the mineralization contained within the pit shells that could be scheduled to process.
Table 11-15: Sensitivity of mineralization inventory contained in pit shells
defined by WhittleTM Analyses at different gold prices within pit shells
| WhittleTM Pit Gold Price | Classification | Metric Tons (Mmt) | Au (g/t) | Contained Au (Koz) |
| $1,320 | Measured | 423.84 | 0.70 | 9,496.30 |
| Indicated | 24.35 | 0.85 | 666.13 |
| Total M & I | 448.19 | 0.71 | 10,162.43 |
| Inferred | 2.02 | 0.55 | 35.93 |
| $1,650 | Measured | 646.00 | 0.60 | 12,482.49 |
| Indicated | 58.51 | 0.61 | 1,141.61 |
| Total M & I | 704.51 | 0.60 | 13,624.10 |
| Inferred | 15.98 | 0.40 | 206.98 |
| $1,980 | Measured | 845.60 | 0.54 | 14,668.81 |
| Indicated | 108.98 | 0.49 | 1,717.27 |
| Total M & I | 954.58 | 0.53 | 16,386.08 |
| Inferred | 31.97 | 0.37 | 377.99 |
| International Tower Hill Mines Ltd. S-K 1300 – Technical Report Summary Livengood Gold Project Pre-feasibility Study | |
| 12. | Mineral Reserve Estimates |
The Livengood deposit will be mined using conventional open pit mining methods consisting of drilling, blasting, loading, and hauling with large-scale mining equipment. The processing flowsheet consists of primary crushing, secondary crushing, and a comminution circuit (SABC configuration) producing a final grind size of 250 μm (P80), with gravity recovery followed by whole ore leaching (CIL) of the gravity tailings. The mill has been designed with a nominal throughput of 65,000 t/d (59,000 mt/d). Tailings will be stored in a conventional slurry tailings facility.
The mine production plan and subsequent mineral reserves are based on a gold price of $1,680/oz. The mineral reserves for the Livengood Project were prepared by BBA USA Inc. and have an effective date of October 22, 2021.
Development of the mine production plan included pit optimization, pit and phase designs, mine scheduling and the application of modifying factors to the Measured and Indicated Mineral Resources. The reference point for the mineral reserves is the feed to the primary crusher. The tonnages and grades reported are inclusive of mining dilution and operational mining losses.
The mine design and mineral reserve estimates have been completed to a level appropriate for a PFS. The mineral reserve estimate stated herein is consistent with the S-K 1300 requirements and is suitable for public reporting. As such, the mineral reserves are based on Measured and Indicated Mineral Resources, and do not include any Inferred Mineral Resources. The Qualified Person is not aware of any legal, political, or other risks that could materially affect the development of the mineral reserve.
Table 12-1 presents the mineral reserves for the Project, which include 411.5 Mmt of Proven Mineral Reserves at an average gold grade of 0.64 g/mt, and 18.5 Mmt of Probable Mineral Reserves at an average gold grade of 0.86 g/mt for a total of 430.1 Mmt of Proven and Probable Mineral Reserves at an average gold grade of 0.65 g/mt. To access these mineral reserves, 496.1 Mmt of overburden and waste rock must be mined, resulting in a strip ratio of 1.15:1.
The mill recoveries developed for the Project, discussed in further detail in Section 12.3.2, depend on the rock type and are calculated using linear equations that are a function of antimony concentration, grind size and gold grade. As a result, it is not possible to calculate a cut-off grade for the mineral reserves that can be uniformly applied across each resource block. The determination of ore and waste was done by evaluating the recovery and economics of each block. For Measured and Indicated blocks within the open pit, if the revenue less the processing and general and administration cost is positive, the block is considered as ore. Table 12-2 presents the lowest grades processed by rock type in the LOM.
| International Tower Hill Mines Ltd. S-K 1300 – Technical Report Summary Livengood Gold Project Pre-feasibility Study | |
Table 12-1: Livengood Project mineral reserves (October 22, 2021- BBA USA Inc.)
| Classification | Ore
Metric tons (Mmt) | Au Grade
(g/mt) | Contained Au
Koz |
| Proven | | | |
| RT4 | 75.4 | 0.54 | 1,314 |
| RT5 | 110.5 | 0.55 | 1,972 |
| RT6 | 91.7 | 0.65 | 1,922 |
| RT7 | 61.0 | 0.70 | 1,367 |
| RT8 | 2.4 | 0.73 | 56 |
| RT9 | 70.5 | 0.82 | 1,861 |
| Total Proven | 411.5 | 0.64 | 8,492 |
| Probable | | | |
| RT4 | 2.5 | 0.48 | 39 |
| RT5 | 4.0 | 0.47 | 62 |
| RT6 | 3.0 | 0.99 | 94 |
| RT7 | 4.8 | 0.98 | 152 |
| RT8 | 0.3 | 0.76 | 6 |
| RT9 | 3.9 | 1.26 | 159 |
| Total Probable | 18.5 | 0.86 | 512 |
| Proven and Probable Totals | 430.1 | 0.65 | 9,004 |
| 1. | The effective date of the estimate is October 22, 2021. |
| 2. | Mineral reserves for the Project are enumerated as per added §229.1302(e)(2)(iii)(A) (Item 1302(e)(2)(iii)(A) of Regulation S-K). |
| 3. | Mineral reserves are estimated using a gold price of US$1,680 per ounce, and consider a 3% royalty, 1.80/oz for smelting, refining, and transportation costs, and a gold payable of 99.9%. |
| 4. | Metallurgical recovery curves were developed for each rock type, with the Mineral Reserves having the following tonnage weighted averages: 83.3% for RT4, 79.8% for RT5, 73.5% for RT6, 66.4% for RT7, 58.7% for RT8 and 57.1% for RT9, including 22% for massive stibnite mineralization. |
| 5. | As a result of the complex metallurgical recovery equations, it is difficult to determine specific cut-off grades. The following presents the lowest gold grades for each rock type that are processed in the life of mine plan: 0.26 g/t for RT4, 0.28 g/t for RT5, 0.31 g/t for RT6, 0.31 g/t for RT7, 0.42 g/t for RT8 and 0.42 g/t for RT9. |
| 6. | The strip ratio for the open pit is 1.15 to 1. |
| 7. | The mineral reserves are inclusive of mining dilution and ore loss. |
| 8. | The reference point for the mineral reserves is the primary crusher. |
| 9. | Totals may not add due to rounding. |
| International Tower Hill Mines Ltd. S-K 1300 – Technical Report Summary Livengood Gold Project Pre-feasibility Study | |
Table 12-2: Lowest grades processed
| Rock Type | Au Grade
g/mt |
| RT4 | 0.26 |
| RT5 | 0.28 |
| RT6 | 0.31 |
| RT7 | 0.31 |
| RT8 | 0.42 |
| RT9 | 0.42 |
| 12.2 | General Parameters Used to Estimate the Mineral Reserves |
The following section discusses the geological information that was used for the mine design and mineral reserve estimate. This information includes the topographic surface, the geological block model and the material properties for ore, waste rock and overburden.
The mine design and mine planning were done using Hexagon’s MinePlan 3D software Version 15.8 (formerly known as MineSight). The mine design work was completed using the UTM NAD27 coordinate system, in metric units, to be aligned with the geology and mineral resource work.
The topographic information used for the Project originates from a file called “Aero_Elev_Contours_2m_NAD27.dwg”. These contours contain an adequate resolution deemed appropriate for a PFS level.
There are no lakes or rivers in the Project area that are of importance for the mine design. The creeks are easily identifiable using the topographic information available.
| 12.2.2 | Mineral Resource Block Model |
The mineral resource block model was provided to BBA by Resource Development Associates Inc. on June 4, 2021, in a Vulcan format block model file called “210526_rda_model.bmf”, which BBA then imported into the MinePlan 3D. Table 12-3 presents the block model specifications and Table 12-4 presents the items that were provided with the block model. The block model does not have a rotation applied.
| International Tower Hill Mines Ltd. S-K 1300 – Technical Report Summary Livengood Gold Project Pre-feasibility Study | |
Table 12-3: Block model specifications
| Item | Unit | X | Y | Z |
| Model Origin (min) | m | 427,600 | 7,264,310 | -290 |
| Model Extent (max) | m | 430,850 | 7,266,710 | 610 |
| Block Dimension | m | 10 | 10 | 10 |
| Number of Blocks | | 325 | 240 | 90 |
Table 12-4: Block model item list
| Item | Description |
| CRAU | Au grade of country rock before combination with Massive Stibnite (g/mt) |
| CRSB | Sb grade of country rock before combination with Massive Stibnite (ppm) |
| MSVAU | Au grade of Massive Stibnite before combination with country rock (g/mt) |
| MSVSB | Sb grade of Massive Stibnite before combination with country rock (ppm) |
| AU | Average Au grade considering country rock and Massive Stibnite (g/mt) |
| SB | Average Sb grade considering country rock and Massive Stibnite (ppm) |
| CLASS | Resource Classification (1 = Measured, 2= Indicated, 3 = Inferred) |
| MSVP | Massive Stibnite percentage in block |
| DENS | Block density based on rock type |
| RTYPE | Rock type (see Table 12-5) |
A surface representing the overburden/bedrock contact was provided by the BBA geology team as a triangulated surface called “OVB__F200917.dxf”. Overburden is classified as loess, colluivum, and weathered bedrock that lies above the bedrock. Blocks have been coded as overburden if a majority of the block is above this surface. The QP is of the opinion that no further precision is required for the overburden quantities and is comfortable using this “whole block” approach for the PFS.
The overburden thickness within the open pit area for the Project averages 30 ft (9 m), ranging from 6 ft to 80 ft (2 m to 24 m). The majority of the pit area has less than 16 ft (5 m) of overburden, while the only area that has considerable thickness is in the northeast corner of the pit.
Table 12-6 presents the rock code numbering system that was used. It is important to note that only the Cambrian, Upper and Lower Sediments as well as the Volcanics contain potentially economic mineralization.
| International Tower Hill Mines Ltd. S-K 1300 – Technical Report Summary Livengood Gold Project Pre-feasibility Study | |
An average topsoil thickness of 12 inches (30 cm) was assumed for mine design purposes. This material will be stripped and placed separately in growth media stockpiles to be used for closure and reclamation activities.
Table 12-5: Rock type numbering
| Rock Type | Rock Code |
| Overburden | 1 |
| Money Knob | 2 |
| Cambrian | 4 |
| Upper Sediments North of the Lilian Fault | 5 |
| Upper Sediments South of the Lilian Fault | 6 |
| Lower Sediments | 7 |
| Volcanics North of the Lilian Fault | 8 |
| Volcanics South of the Lilian Fault | 9 |
| Background (outside of modeled areas) | 99 |
The Livengood deposit contains a rock type called Massive Stibnite that has very high head grades but a very low gold recovery in the mill. A DXF file containing solids that represent the Massive Stibnite zones was provided by the BBA geology team in a file called “GM_InterpretationSb_20200824.dxf”. The value “MSVP” was coded in the block model to represent the percentage of Massive Stibnite for each block. It is important to note that the Massive Stibnite represents approximately 0.3% of the mineralized material in the deposit. Gold and antimony grades have been interpolated separately for the Massive Stibnite and country rock portions of each block containing Massive Stibnite. The block densities, however, represent a combination of the country rock and Massive Stibnite densities. Densities are discussed in Section 12.2.3.
A DXF file called “SB_ PPM QtzStibVns Trended_NO MSV_100 ppm.dxf” was provided by the BBA geology team containing a series of triangulated solids representing areas of the deposit where the antimony grades are generally above 100 ppm. These solids were used to calculate mill recoveries, which is discussed in further detail in Section 12.3.2.
Bulk density is an important measurement that converts volumes modeled by the geologists into tonnages and contained ounces of gold. It is also used to estimate mine equipment requirements. The densities used for the PFS have been measured using 98 different samples from diamond drill cores and reverse circulation (RC) chip samples and are presented by rock type in Table 12-6.
| International Tower Hill Mines Ltd. S-K 1300 – Technical Report Summary Livengood Gold Project Pre-feasibility Study | |
Table 12-6: Bulk dry densities
| Rock Type | Bulk Dry Density
(mt/m3) |
| RT1 | 2.00 |
| RT2 | 2.67 |
| RT4 | 2.82 |
| RT5 / RT6 | 2.68 |
| RT7 | 2.74 |
| RT8 / RT9 | 2.72 |
| Massive Stibnite | 2.86 |
Mineral resources and mineral reserves are reported as in situ dry metric tons. The mill process reports wet metric tons, which include the moisture content. The moisture content reflects the amount of water present within the rock formation. It affects the estimation of haul truck requirements and must be considered during the payload calculations. The moisture content is also a contributing factor for the process water balance. A moisture content of 4% has been used for all rock types, which is based on crushing simulation work completed for the Project. A moisture content of 10% has been used for overburden.
The swell factor reflects the increase in volume of the material from its in situ state to its state after it has been blasted and loaded into the haul trucks. The swell factor is an important parameter that is used to determine the loading and hauling equipment requirements, as well as the rock pile and stockpile designs. A swell factor of 30% was used for all rock types and 20% overburden, which are typical values for these material types. Once the rock is placed on the rock pile, the swell factor is reduced by 10% due to compaction.
| 12.3 | Modifying Factors That Affect the Mineral Reserves |
The following section presents the modifying factors that were applied to convert mineral resources into mineral reserves for the Project, as well as the pit optimization analysis and open pit design. In the opinion of the QPs, the mineral reserves for the Livengood Project could be materially affected by changes to the modifying factors such as the following:
| § | Changes in the metallurgical recovery assumptions; |
| § | Changes in the long-term gold price and exchange rate assumptions; |
| § | Changes to operating and capital cost assumptions; |
| International Tower Hill Mines Ltd. S-K 1300 – Technical Report Summary Livengood Gold Project Pre-feasibility Study | |
| § | Changes to the input assumptions used to derive the conceptual open pit outlines used to constrain the estimate; |
| § | Changes to the forecast dilution and mining recovery assumptions; |
| § | Variations in geotechnical, hydrogeological and mining method assumptions; |
| § | Changes to the assumed permitting and regulatory environment under which the mine plan was developed; |
| § | Changes to environmental and social license assumptions. |
In every mining operation, it is impossible to perfectly separate the ore and waste due to the large scale of the mining equipment and the use of drilling and blasting. For the Livengood Project, a diluted grade was calculated for every block by considering an amount of 5% from each of the four neighboring blocks in plan view. The value of 5% represents a width of 1.6 ft (0.5 m), which is considered reasonable considering the size of the loading equipment and nature of the deposit. Only the grades have been diluted, the tonnages remain intact since it is just a transfer of tons from one block to another. After calculation of dilution, the in situ grade within the ultimate pit design drops from 0.653 g/mt to 0.649 g/mt.
Considering the nature of the deposit and the methodology used to estimate mining dilution, the mining recovery has been set at 100% for the PFS.
| 12.3.2 | Open Pit Optimization |
A pit optimization analysis has been completed to determine the extent of the deposit that can be mined and processed economically. The pit optimization was done using the pseudo-flow algorithm in the Project Evaluator module of MinePlan 3D. The algorithm determines the economic limits of the open pit at a range of selling prices based on input of mining and processing costs, revenue per block, and operational parameters such as the mill recovery, pit slopes and other imposed physical constraints. The pseudo-flow algorithm provides similar results as the Lerch-Grossman algorithm with the benefit of shorter computing times. Since this study is at a PFS level, Inferred Mineral Resources have been considered as waste rock in the pit optimization and mine plan.
The pit optimization considered the activity-based costing methodology that distinguishes fixed costs from variable costs. Fixed costs are time related with no direct production drivers while variable costs are directly related to a production driver in the system. The total fixed costs per year are then allocated to the system bottleneck, which, for the Project, is the SAG mill processing capacity. Table 12-7 presents the hourly processing throughputs by rock type that were developed for the Project by the BBA process team.
| International Tower Hill Mines Ltd. S-K 1300 – Technical Report Summary Livengood Gold Project Pre-feasibility Study | |
Table 12-7: Processing throughput capacities by rock type
| Rock Type | Processing Throughput
Capacities
(t/h) |
| RT4 | 3,208 |
| RT5 | 2,866 |
| RT6 | 2,888 |
| RT7 | 2,866 |
| RT8 / RT9 | 2,745 |
Table 12-8 presents the fixed costs for the operation that were developed by BBA at the start of the PFS, representing those of a 65,000 t/d (59,000 mt/d) milling operation and a 61 Mt/y (55 Mmt/y) mining operation.
Table 12-8: Fixed costs by area
| Area | Fixed Costs
(M$/y) |
| Mine | 24.2 |
| Process Plant | 33.5 |
| General & Administration | 27.0 |
| Total Fixed Costs | 84.7 |
The fixed costs are then divided by the SAG mill hours of operation, which are estimated to be 7,949 hours per year, resulting in a bottleneck cost of $10,655 applied to every hour of milling.
The variable cost parameters for the pit optimization analysis were developed at the start of the PFS and are based on previous studies on the Project and BBA’s relevant experience. These costs are presented in Table 12-9. The mining cost represents drilling, blasting, loading and hauling at a reference elevation of 420 m (bottom of bench). The mining cost is incremented by $0.02/mt for every 10 m drop in elevation to account for longer haulage times. Benches above the 420 m reference elevation are assigned the base mining costs. The costs vary by rock type due to the different hardness and rock characteristics. The processing costs consider the power cost, consumable cost and tailings cost and are based on an electricity cost of $0.16/kWh. The table also includes the bottleneck cost for each rock type, which is equal to the annual bottleneck cost of $10,655/h divided by the processing throughput (Table 12-7).
| International Tower Hill Mines Ltd. S-K 1300 – Technical Report Summary Livengood Gold Project Pre-feasibility Study | |
Table 12-9: Pit optimization cost inputs ($/mt)
| Rock Type | Mining Cost
(ore) | Mining Cost
(waste) | Processing
Cost | Bottleneck
Cost |
| RT1 | n/a | 0.86 | n/a | n/a |
| RT2 | n/a | 1.34 | n/a | n/a |
| RT4 | 1.32 | 1.34 | 7.34 | 3.66 |
| RT5 | 1.30 | 1.32 | 7.22 | 4.10 |
| RT6 | 1.30 | 1.32 | 7.24 | 4.07 |
| RT7 | 1.24 | 1.26 | 7.57 | 4.10 |
| RT8 / RT9 | 1.32 | 1.34 | 7.78 | 4.28 |
Table 12-10 presents the revenue parameters that were used for the pit optimization. A gold price of $1,650/oz was used, in line with the 3-year trailing average. Note that the financial analysis for the PFS was completed at a slightly higher gold price of $1,680/oz.
Table 12-10: Revenue parameters
| Item | Unit | Value |
| Selling Price | $/oz | 1,650 |
| Conversion Factor | | 31.1035 |
| Smelting, refining and transport | $/oz | 1.80 |
| Gold Payable | % | 99.50 |
| Royalty | % | 3.00 |
| Net Gold Price | $/oz | 1,591 |
Table 12-11, Table 12-12, and Table 12-13 present the mill recovery formulas developed by the BBA process team at the start of the PFS. The recoveries depend on the rock type and are calculated using linear equations, which are a function of antimony concentration, grind size and gold grade. The blocks have been flagged with an item called “OSX” according to the following rules:
| § | Blocks that are outside of the 100 ppm antimony shell are coded as “1”; |
| § | Blocks that are inside the 100 ppm antimony shell are coded as “2”; |
| § | Blocks that have an antimony grade above 200 ppm, regardless of whether they are in or out of the 100 ppm antimony shell are coded as “3”. |
The tables present the formulas and also include either a minimum recovery (floor) or maximum recovery (ceiling) where applicable. Note that all calculated recoveries including the floor and ceiling are multiplied by 0.997 to reflect a carbon efficiency factor.
| International Tower Hill Mines Ltd. S-K 1300 – Technical Report Summary Livengood Gold Project Pre-feasibility Study | |
Also note that the Cambrian (Rock Type 4) and Upper Sediments North of the Lilian Fault (Rock Type 5) were only coded with an OSX value of either “1” or “3” since no recovery formula was developed for these rock types if the antimony grade was above 100 ppm. This was deemed acceptable since there are very few of these occurrences in the block model.
Table 12-11: Mill recoveries (OSX = 1)
| Rock Code | Formula (1) | a | b | n | Ceiling |
| 4 | b x 250 + n | | -0.011 | 86.65 | n/a |
| 5 | b x 250 x n | | -0.038 | 89.56 | n/a |
| 6 | a x Au + b x 250 + n | 8.04 | -0.024 | 76.15 | 96.12 |
| 7 | a x Au + b x 250 + n | 0.53 | -0.020 | 77.98 | 84.67 |
| 8 / 9 | a x Au + b x 250 + n | 5.73 | -0.049 | 67.27 | 79.39 |
(1) The gold (Au) grade is in g/mt
Table 12-12: Mill recoveries (OSX = 2)
| Rock Code | Formula (1) | a | b | n | Ceiling |
| 4 / 5 | n/a | | | | n/a |
| 6 | a x Au + b x 250 + n | 15.05 | -0.017 | 56.27 | 89.98 |
| 7 | a x Au + b x 250 + n | 19.55 | -0.007 | 48.01 | 91.33 |
| 8 / 9 | a x Au + b x 250 + n | 13.00 | -0.035 | 50.84 | 77.12 |
(1) The gold (Au) grade is in g/mt
Table 12-13: Mill recoveries (OSX = 3)
| Rock Code | Formula (1) | c | b | n | Floor |
| 4 / 5 | n | | | 75.00 | n/a |
| 6 / 7 / 8 / 9 | c x Sb + b x 250 + n | -0.008 | | 55.33 | 20.00 |
(1) The antimony (Sb) grade is in ppm
For blocks that contain Massive Stibnite, due to the large size of the mining equipment and general narrow thickness of the Massive Stibnite veins, it was decided that the Massive Stibnite will not be separated from the host country rock during mining. An average mill recovery was therefore calculated for each block in the model, which considers the mill recovery of the country rock and a mill recovery of 22% for the Massive Stibnite portion. The average mill recovery for the block is mass weighted.
| International Tower Hill Mines Ltd. S-K 1300 – Technical Report Summary Livengood Gold Project Pre-feasibility Study | |
Table 12-14 presents the average mill recoveries for each rock type within the ultimate pit design.
Table 12-14: Average mill recoveries by rock type (%) (1)
| Rock type | OSX | Average (2) |
| 1 | 2 | 3 |
| RT4 | 83.4 | | 74.0 | 83.3 |
| RT5 | 79.9 | | 74.8 | 79.8 |
| RT6 | 76.4 | 63.9 | 48.9 | 73.5 |
| RT7 | 72.8 | 64.0 | 48.5 | 66.4 |
| RT8 | 59.3 | 52.0 | 43.5 | 58.7 |
| RT9 | 60.0 | 55.1 | 48.9 | 57.1 |
| Tonnage Weighted Average Mill Recovery | 75.1 | 60.4 | 50.1 | 71.4 |
| (1) | Including massive stibnite at 22% mill recovery. |
An overall pit slope of 37 degrees was considered in the pit optimization. The slope is shallower than the 42 degree inter-ramp angle that has been recommended in the geotechnical study, discussed in Section 12.3.3.1, since it accounts for the future addition of access ramps and geotechnical berms during the pit design process.
A minimum offset of 25 m has been considered from the Livengood property limit.
Using the cost, revenue, and operating parameters, a series of nested pit shells was generated by varying the gold price (revenue factor). The software then generated best-case and worst-case mining sequences using the series of shells and produced two net present values (NPV) for each revenue factor. The best-case scenario considered that mining will be sequenced using each of the nested shells while the worst-case scenario considered that mining will be done without phasing. The NPVs have been generated using a discount rate of 5%.
Figure 12-1 and Table 12-15 present the results for each of the revenue factor pit shells along with their associated best-case and worst-case NPVs. The 0.7 revenue factor pit shell was selected as a guide for the ultimate pit design. This pit contains 439 Mmt of resources at an average diluted grade of 0.66 g/mt and has a strip ratio of 1.3:1.
| International Tower Hill Mines Ltd. S-K 1300 – Technical Report Summary Livengood Gold Project Pre-feasibility Study | |
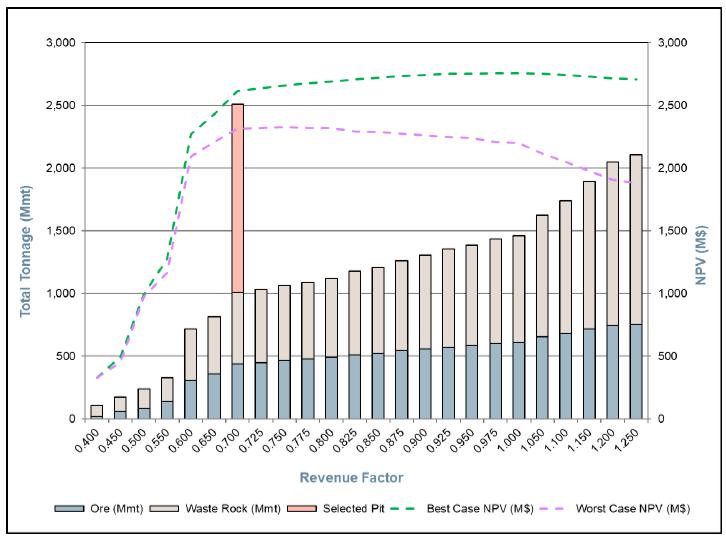
Figure 12-1: Pit optimization results
| International Tower Hill Mines Ltd. S-K 1300 – Technical Report Summary Livengood Gold Project Pre-feasibility Study | |
Table 12-15: Pit optimization results
Revenue
Factor | Mineral
Resources (Mmt) | Au Grade (g/mt) | Recovered
Ounces (oz) | Waste Rock (Mmt) | Strip Ratio | Incremental
Strip Ratio | Mine Life (yrs) | Best-Case
NPV (M$) | Worst-Case
NPV (M$) |
| 0.400 | 18.8 | 0.79 | 368,293 | 90.7 | 4.83 | 4.83 | 0.9 | 330 | 330 |
| 0.450 | 58.9 | 0.72 | 1,032,340 | 115.3 | 1.96 | 0.61 | 2.9 | 499 | 453 |
| 0.500 | 86.5 | 0.73 | 1,508,170 | 151.3 | 1.75 | 1.30 | 4.3 | 994 | 974 |
| 0.550 | 136.6 | 0.70 | 2,240,991 | 190.6 | 1.40 | 0.78 | 6.8 | 1,273 | 1,164 |
| 0.600 | 306.8 | 0.68 | 4,746,964 | 411.5 | 1.34 | 1.30 | 15.3 | 2,270 | 2,095 |
| 0.650 | 358.4 | 0.67 | 5,434,880 | 455.2 | 1.27 | 0.85 | 17.9 | 2,431 | 2,209 |
| 0.700 | 438.6 | 0.66 | 6,508,236 | 570.7 | 1.30 | 1.44 | 21.9 | 2,616 | 2,312 |
| 0.725 | 449.1 | 0.66 | 6,638,791 | 581.3 | 1.29 | 1.02 | 22.5 | 2,635 | 2,320 |
| 0.750 | 464.5 | 0.66 | 6,825,639 | 598.3 | 1.29 | 1.10 | 23.2 | 2,658 | 2,326 |
| 0.775 | 477.1 | 0.65 | 6,972,121 | 613.0 | 1.28 | 1.17 | 23.9 | 2,675 | 2,319 |
| 0.800 | 490.2 | 0.65 | 7,126,148 | 629.7 | 1.28 | 1.27 | 24.5 | 2,690 | 2,317 |
| 0.825 | 510.1 | 0.64 | 7,359,540 | 666.5 | 1.31 | 1.85 | 25.5 | 2,709 | 2,293 |
| 0.850 | 521.5 | 0.64 | 7,492,819 | 686.1 | 1.32 | 1.73 | 26.1 | 2,719 | 2,289 |
| 0.875 | 543.1 | 0.64 | 7,734,885 | 720.0 | 1.33 | 1.57 | 27.2 | 2,734 | 2,275 |
| 0.900 | 558.3 | 0.63 | 7,902,338 | 745.8 | 1.34 | 1.70 | 27.9 | 2,743 | 2,261 |
| 0.925 | 573.6 | 0.63 | 8,079,758 | 782.6 | 1.36 | 2.40 | 28.7 | 2,750 | 2,246 |
| 0.950 | 583.5 | 0.63 | 8,185,086 | 800.0 | 1.37 | 1.76 | 29.2 | 2,753 | 2,237 |
| 0.975 | 600.4 | 0.62 | 8,361,830 | 832.9 | 1.39 | 1.94 | 30.0 | 2,756 | 2,209 |
| 1.000 | 609.8 | 0.62 | 8,457,497 | 850.2 | 1.39 | 1.85 | 30.5 | 2,757 | 2,197 |
| 1.050 | 654.2 | 0.61 | 8,923,982 | 970.8 | 1.48 | 2.71 | 32.7 | 2,752 | 2,115 |
| 1.100 | 682.8 | 0.61 | 9,218,524 | 1,058.0 | 1.55 | 3.06 | 34.1 | 2,745 | 2,050 |
| 1.150 | 716.1 | 0.60 | 9,565,917 | 1,177.0 | 1.64 | 3.57 | 35.8 | 2,730 | 1,977 |
| 1.200 | 742.9 | 0.59 | 9,861,747 | 1,306.0 | 1.76 | 4.80 | 37.1 | 2,716 | 1,909 |
| 1.250 | 754.3 | 0.59 | 9,972,314 | 1,350.7 | 1.79 | 3.95 | 37.7 | 2,708 | 1,883 |
| International Tower Hill Mines Ltd. S-K 1300 – Technical Report Summary Livengood Gold Project Pre-feasibility Study | |
Using the results of the pit optimization analysis, an operational pit was designed, which is the basis of the LOM. This pit design uses the selected pit shell as a guide and includes smoothing the pit wall, adding ramps to access the pit bottom and ensures that the pit can be mined safely and efficiently. The following section provides the parameters that were used for the open pit design and presents the results.
| 12.3.3.1 | Pit Slope Geotechnical Evaluation |
The following information summarizes the findings of the SRK (2013a) feasibility pit slope evaluation as well as supplemental stability analyses completed for the interim pit phase designs by SRK (2016).
Data Collection
A field data collection program was designed and carried out for the Project with the primary objective of rock mass characterization and defining the dominant discontinuity orientations. Field data collection consisted of geotechnical core logging and discontinuity orientation, point load testing and laboratory strength testing. The Livengood site has very minimal outcrop exposure and, consequently, geotechnical mapping could not be carried out to a significant degree.
Tower Hill Mines (THM) technicians logged geotechnical data for all of the 2010 resource drill holes providing the first geotechnical data for mine design; 17 of the 2010 holes (totaling 22,227 ft (6,470 m)) were located within the proposed open pit area and were considered in the development of the geotechnical model. Based on the 2010 information, two supplemental geotechnical specific drilling campaigns were undertaken in 2011 (three holes totaling 2,700 ft (823 m)) and in 2012 (four holes totaling 4,508 ft (1,374 m)). Core from these geotechnical specific holes was logged by SRK personnel at the drill rig on a 24-hour basis. The locations of the 24 combined geotechnical drill holes are shown on Figure 12-2.
A total of 107 core samples were selected from the geotechnical core for laboratory testing including 68 uniaxial compressive strength, 15 triaxial compressive strength, 19 Brazilian tensile strength, and 29 direct shear tests.
| International Tower Hill Mines Ltd. S-K 1300 – Technical Report Summary Livengood Gold Project Pre-feasibility Study | |
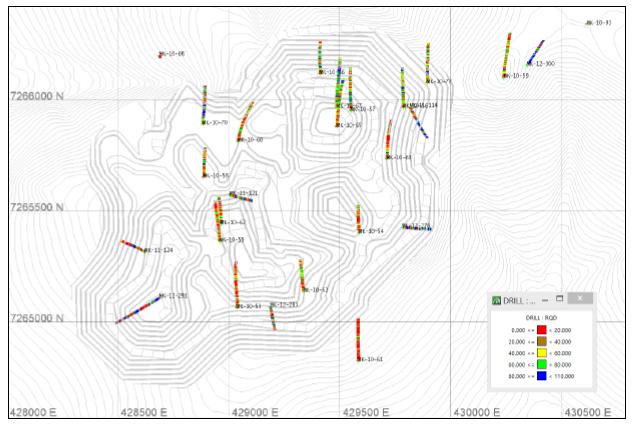
Figure 12-2: Location of geotechnical drill holes
Geotechnical Model
The Project is located within a geologically complex environment composed of interlayered sediments and volcanics that have undergone intense thrusting and faulting. Results of the data collection programs support this, showing heavily fractured, weak to moderate strength rock with various types of alteration.
The field and laboratory data were used to calculate rock mass rating (RMR) values according to the Bieniawski (1989) system for each core run or shorter intervals where conditions varied within a run. This data was used as the primary means of evaluating the overall quality of the various rock types and stratigraphies encountered.
It was determined from data analysis that the materials within each of the main lithologies (i.e. Money Knob Sequence, Upper Sediments, Main Volcanics, Lower Sediments (including the Lower Sand) and Cambrian units) are geotechnically similar and that the data within each could be grouped to form individual engineering units for pit slope analysis. Given that nearly all of the Sunshine area geologic materials are believed to be within the Upper Sediments unit and demonstrated similar geotechnical characteristics, the materials were classified together as one engineering unit, i.e., Sunshine Upper Sediments. RMR statistics for each engineering unit are summarized in Table 12-16.
| International Tower Hill Mines Ltd. S-K 1300 – Technical Report Summary Livengood Gold Project Pre-feasibility Study | |
Table 12-16: Distributions of RMR (Bienawski, 1989) per engineering unit
| Engineering Unit | No. | Mean | Std. Dev. |
| Money Knob | 106 | 54 | 10 |
| Cambrian | 166 | 55 | 14 |
| Main Volcanics | 64 | 52 | 13 |
| Upper Seds (Core Zone) | 211 | 56 | 14 |
| Lower Seds | 190 | 53 | 13 |
| Upper Seds (Sunshine) | 193 | 62 | 14 |
In order to develop a large population of uniaxial compressive strength (UCS) data for statistical analysis, a total of 1,923 valid point load tests (PLTs) were multiplied by correlation factors to estimate a UCS value for each PLT. A correlation factor was developed for each individual engineering unit according to ASTM standards by pairing each laboratory UCS test with adjacent PLTs, which generally resulted in linear relationships between the two variables. Table 12-17 contains a statistical summary of the overall UCS data per engineering unit.
Table 12-17: Distributions of UCS per engineering unit
| Engineering Unit | No. | Mean | Std. Dev. |
| Money Knob | 65 | 20 | 15 |
| Cambrian | 227 | 88 | 172 |
| Main Volcanics | 106 | 69 | 47 |
| Upper Sediments (Core Zone) | 249 | 32 | 34 |
| Lower Sediments | 290 | 36 | 26 |
| Upper Sediments (Sunshine) | 808 | 59 | 42 |
Slope Stability Analyses
SRK evaluated both inter-ramp/overall and bench scale stability using probabilistic methods of analysis. Representative inter-ramp/overall slope models were analyzed for a total of six critical design sections as shown on Figure 12-3 to confirm stability of ultimate pit slopes. The critical sections were selected to represent the anticipated most adverse stability conditions such as where the slope height is at its maximum, pit wall materials are low strength and/or pore water pressures may be the highest. The 2012 Livengood three-dimensional stratigraphic and structural models were used to generate the two–dimensional cross sections for modeling. The analyses were conducted using limit equilibrium methods using the Hoek-Brown (2002) rock mass shear strength criteria and the end of mining groundwater surface was developed as part of the SRK (2013b) hydrogeologic model.
| International Tower Hill Mines Ltd. S-K 1300 – Technical Report Summary Livengood Gold Project Pre-feasibility Study | |
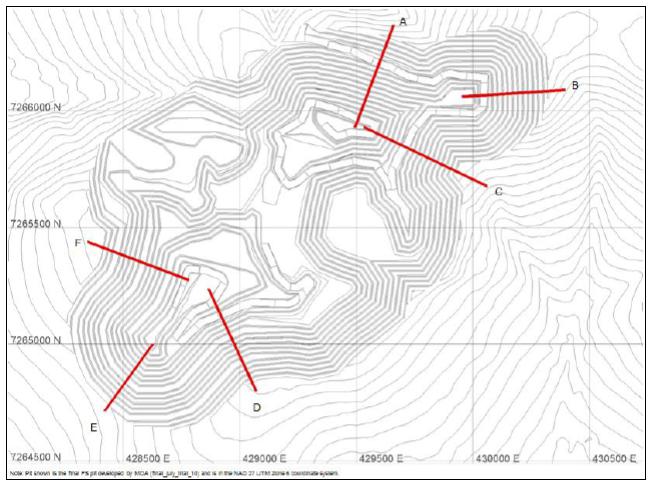
Figure 12-3: Critical slope stability sections for the (2013) ultimate pit
Based on accepted engineering experience, inter-ramp/overall slope designs subject to probabilities of failure (POF) ranging from 20% to 30% for slopes with low failure consequences and approximately 5% to 10% for high failure consequences are considered appropriate by SRK for most open pit mines. Slopes of high failure consequence are generally those slopes that are critical to mine operations, such as those on which major haul roads are established, those providing ingress or egress points to the pit, or those underlying infrastructure such as processing facilities or structures. Given the relatively high variability in rock quality and groundwater levels, a maximum POF of 20% was considered acceptable for the non-critical slopes. Results of the analyses are summarized in Table 12-18. While Section C demonstrates a slightly higher POF than targeted, it was considered acceptable due to the short slope length and the flexibility to re-design the ramp should an instability occur.
| International Tower Hill Mines Ltd. S-K 1300 – Technical Report Summary Livengood Gold Project Pre-feasibility Study | |
Table 12-18: Overall slope stability analysis results for the ultimate pit
| Section | Probability
of Failure | Mean Factor
of Safety | Recommended Geotechnical Berm Elevations |
| A | 3% | 1.7 | NA |
| B | 3% | 1.9 | NA |
| C | 22% | 1.2 | NA |
| D | 8% | 1.4 | Elev. 220, 320 |
| E | 14% | 1.3 | Elev. 220 |
| F | 18% | 1.3 | Elev. 120, 220, 320 |
Geotechnical berms were incorporated into the design to reduce the overall slope angles, where necessary, to achieve acceptable POF. The geotechnical berms are designed at a total width of 82 ft (25 m).
Pit Slope Design Recommendations for the Ultimate Pit
The final pit slope design recommendations for the ultimate pit are summarized in Table 12-19 with corresponding sectors shown on Figure 12-4.
Table 12-19: Pit slope design recommendations for ultimate pit
| Pit Sector | Max. Overall Slope Angle | Max. Inter-ramp Slope Angle | 25 m Geotech. Berms (Approx. Elev.) | Bench Height (m) | Bench (1) Width (m) | Bench (1) Face Angle |
| A | 40 | 42 | 220, 320 | 20 | 12/14.9 | 63/70 |
| B | 41 | 42 | 220, 320 | 20 | 12/14.9 | 63/70 |
| Remaining Areas | 42 | 42 | N/A | 20 | 12/14.9 | 63/70 |
| (1) | The 42° inter-ramp may be achieved by either 14.9 m width with 70° bench face angles or 12 m width with 63° bench face angles. |
| International Tower Hill Mines Ltd. S-K 1300 – Technical Report Summary Livengood Gold Project Pre-feasibility Study | |
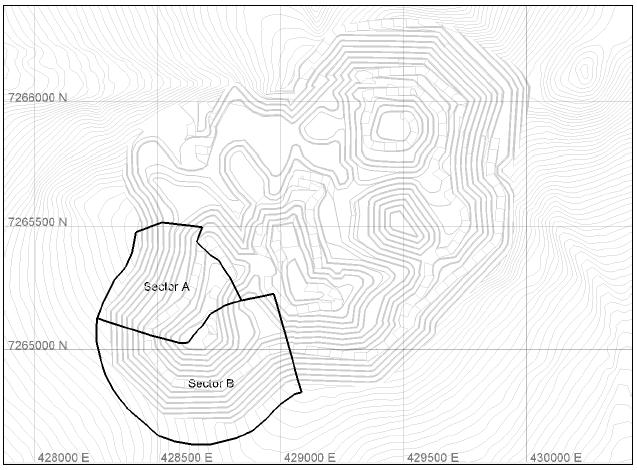
Figure 12-4: Pit Slope Design Sectors for the Ultimate Pit
Recommendations were provided for both 63º and 70º bench faces angle configurations. The 63º bench face angle represents the lowest risk of local bench instabilities, particularly for the Sunshine pit north wall, where bedding will dip shallowly into the pit; however, depending on the mining equipment selected and on operational considerations, excavation of 70º bench face angles may be more practical. Considering the relatively wide catch benches (14.9 m) that would be required to achieve the 42º inter-ramp angle, localized bench sloughing that may occur with the 70º bench face angles is expected to be retained by the catch bench beneath. Regardless of which bench configuration is selected, inter-ramp slope angles should not be increased over 42°.
Pit Slope Design Recommendations for Early Mine Phase Interim Pit Walls
Subsequent to the initial SRK (2013a) feasibility pit slope study, additional analyses were completed by SRK (2016) to optimize interim pit wall angles, minimizing waste handling during the critical payback period. A total of six critical slope stability sections were analyzed for the interim slopes with the maximum inter-ramp slope heights ranging between 120 m and 160 m.
| International Tower Hill Mines Ltd. S-K 1300 – Technical Report Summary Livengood Gold Project Pre-feasibility Study | |
The average properties were used for the deterministic analyses to represent the rock mass strength inputs for each of the primary rock types (Table 12-16 and Table 12-17). Groundwater surfaces were estimated for each model based on the SRK (2013b) hydrogeologic model. Acceptability criteria for the work included a 1.3 safety factor and a 5% to 10% maximum POF (high failure consequence slopes) due to the proximity of the haul roads to the interim slopes analyzed. The analyses indicated safety factors between 1.5 and 2.4 for the optimized slopes with probabilities of failure ranging between 1 % and 10 %.
The results of the interim slope stability analyses indicated that stability of lower, interim slope heights will be controlled primarily by achievable bench face angles and, to a lesser extent, the stability of high inter-ramp and overall slopes. Calculated safety factors could be considered relatively high for typical open pit slope designs. However, steepening of the inter-ramp slope angles beyond 47° would require steeper bench face angles or reducing the design catch bench width, which is not recommended at the feasibility level due to the lack of rock exposure and actual geologic structural information. With detailed geotechnical bench face mapping and good quality wall control blasting practices, opportunity may exist to steepen the inter-ramp angles based on more accurate information acquired during pit development.
Based on the (SRK, 2013a) feasibility study geotechnical characterization and subsequent slope stability analyses (SRK, 2016) described above, SRK recommends that a maximum inter-ramp slope angle of 47° be used for inter-ramp slope heights of less than 160 m.
| 12.3.3.2 | Pit Wall Configuration |
Table 12-20 presents the pit wall configurations that were used by BBA for the PFS pit and phase designs.
Table 12-20: Pit wall configuration
| Description | Unit | Initial Phases | Later Phases |
| Bench Height | ft | 65.6 | 65.6 |
| Bench Configuration | | Double | Double |
| Bench Face Angle | deg | 70 | 70 |
| Catch Bench Width | ft | 37.4 | 48.9 |
| Inter-ramp Angle | deg | 47 | 42 |
The pit design includes an 82 ft (25 m) wide berm at the 250 m elevation in the southwest part of the pit, as per the geotechnical recommendation.
| International Tower Hill Mines Ltd. S-K 1300 – Technical Report Summary Livengood Gold Project Pre-feasibility Study | |
With respect to the pit wall configuration in the overburden, the pit slope report states the following: “At Livengood, overburden soil cover is generally thin, thereby limiting permafrost melting and flowing to a mostly operational issue. In response, extra-wide berms or access points should be left within or at the base of overburden materials to provide catchment and to permit clean-up of sloughing areas if necessary”. Since the overburden thickness in the pit area is very limited, as discussed in Section 12.2.2, especially along the final pit walls, the QP has not considered a modified pit wall configuration in the overburden nor a catchment berm since this was deemed to have a very small overall impact on the stripping ratio. The next level of study would warrant more detail in the pit design related to the overburden slopes.
The haul ramps within the pit have been designed for haulage with 320 t (291 mt) sized rigid frame mining trucks, with an overall width of 112 ft (34 m). For double lane traffic, industry practice indicates the running surface width to be a minimum of three times the width of the largest truck.
The overall width of a 320 t rigid frame mining truck is 30 ft (9.1 m), resulting in a running surface of 89.6 ft (27.3 m). The allowance for berms and ditches increases the overall haul road width to 112 ft (34 m). Single-lane traffic has been considered for the final 4 benches (40 m in elevation), reducing the overall ramp width to 85 ft (26 m). Figure 12-5 presents the haul road configuration for 2-way traffic. A maximum ramp grade of 10% has been considered.
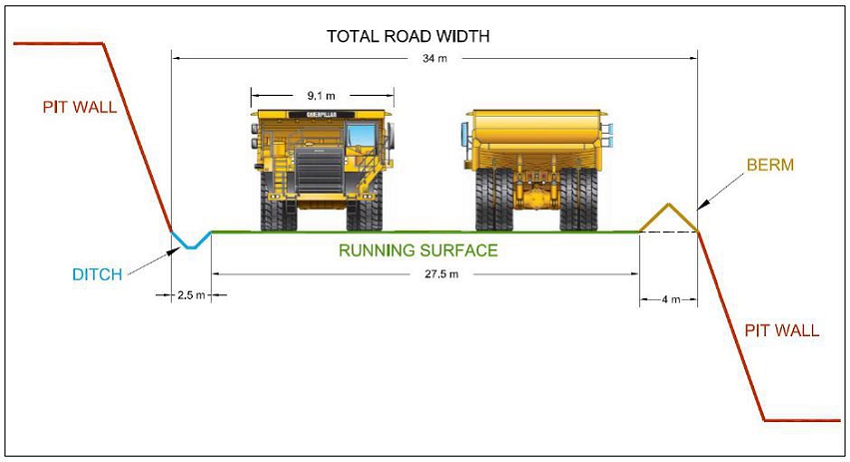
Figure 12-5: Haul road configuration
| International Tower Hill Mines Ltd. S-K 1300 – Technical Report Summary Livengood Gold Project Pre-feasibility Study | |
| 12.3.3.4 | Minimum Mining Width |
A minimum mining width of 165 ft (50 m) has been considered for the pit design. This width must be respected to ensure that a 320 t haul truck, which has a turning radius of 105 ft (32 m), can safely enter the mining area and make a 180° turn to be positioned for loading.
| 12.3.3.5 | Final Bench Access |
In order to reduce the stripping ratio as much as is feasibly safe and efficient, the access ramp has not been designed to the bottom of the lowest benches. When mining the final bench, the haul trucks will be positioned on the bench crest rather than on the bench toe. Figure 12-6 illustrates this operating scenario, commonly referred to in the industry as a good-bye cut. This final bench has been designed at a height of 16.4 ft (5 m) high.
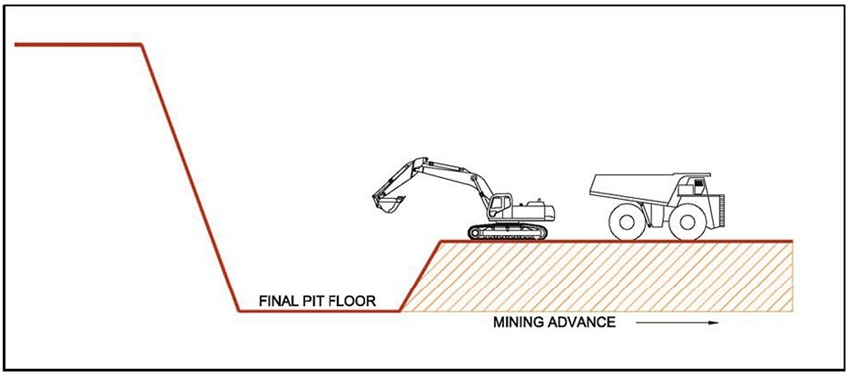
Figure 12-6: Final bench access
| 12.3.3.6 | Open Pit Design Results |
The open pit that has been designed for the Project is approximately 7,500 ft (2,300 m) long and 3,900 ft (1,200 m) wide at surface. The total surface area of the pit is roughly 220 ha. The pit ramp on the final wall enters at the 380 m elevation on the north east side. The ramp branches off into two segments at the 370 m elevation, a first one to access a small area on the far east side of the pit, and a second one that runs along the north wall towards the west. At the 290 m elevation, the main ramp branches off again into two segments, a first one to access the central part of the pit and a second one that accesses the west part of the pit. The deepest part of the pit is at the 85 m elevation, 985 ft (300 m) below surface.
| International Tower Hill Mines Ltd. S-K 1300 – Technical Report Summary Livengood Gold Project Pre-feasibility Study | |
Accounting for mining dilution, the open pit includes 453.6 Mt (411.5 Mmt) of Proven Mineral Reserves at an average gold grade of 0.64 g/mt and 20.4 Mt (18.5 Mmt) of Probable Mineral Reserves at an average gold grade of 0.86 g/mt for a total of 474.1 Mt (430.1 Mmt) of Proven and Probable Mineral Reserves at an average gold grade of 0.65 g/mt. In order to access these mineral reserves, 546.9 Mt (496.1 Mmt) of overburden and waste rock must be mined, resulting in a strip ratio of 1.15:1. There are only a few hundred thousand metric tons of Inferred Mineral Resources in the open pit. The pit contains 1.2 Mt (1.1 Mmt) of Massive Stibnite at an average gold grade of 2.93 g/mt.
Figure 12-7 presents an isometric view of the open pit design.
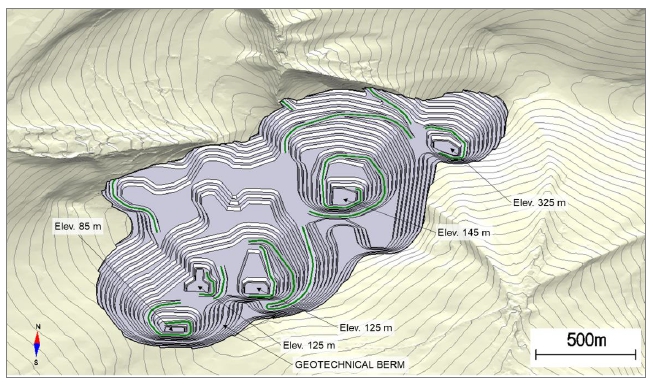
Figure 12-7: Open pit design
| International Tower Hill Mines Ltd. S-K 1300 – Technical Report Summary Livengood Gold Project Pre-feasibility Study | |
The Livengood deposit will be mined using conventional open pit mining methods consisting of drilling, blasting, loading, and hauling with large-scale mining equipment. Vegetation, topsoil, and overburden will be stripped and stockpiled for future reclamation use. The ore and waste rock will be drilled and blasted with 32.8 ft (10 m) high benches and loaded into haul trucks with a fleet of diesel-powered hydraulic excavators and front-end wheel loaders.
| 13.1.1 | Geotechnical Pit Slope Parameters |
The geotechnical pit slope parameters were presented in Section 12.3.3.1.
A hydrogeological investigation was completed by SRK on the Livengood Project in 2012, and summarized in a report titled, “2012 Hydrogeological Investigations and Modeling Results – Draft 3” (SRK, 2013b). The study included numerical groundwater flow modeling to evaluate pit water inflows during mining operations and to understand the formation of the pit lake after mining ceases. The results of the study showed that the maximum amount of groundwater expected to enter the pit will be in the range of 2,406 m3/d. This quantity of water is manageable with dewatering pumps, which are discussed in Section 13.5.8.
To maximize the NPV of the Project, mining phases (pushbacks) have been designed and incorporated into the mining sequence to bring higher-grade material forward and to defer waste rock stripping.
During the preproduction phase of the Project, a total of 89 Mt (81 Mmt) of waste rock has been estimated to be required for the construction of certain infrastructure such as the tailings management facility (TMF) starter dike, mine haul roads, site access roads, and platforms for the processing facilities and other buildings. It has been assumed that all waste rock types will be acceptable as construction material except for overburden.
A starter pit, also referred to as Phase 1, was designed on the eastern side of the open pit, which targets the waste rock requirements and minimizes the amount of ore that would have to be stockpiled during preproduction. A trade-off study was carried out early in the Project, which evaluated a starter pit on the westside of the open pit. The western starter pit targeted an area that would expose ore quicker but was not used in the PFS due to the longer haul distances relative to the eastern starter pit.
| International Tower Hill Mines Ltd. S-K 1300 – Technical Report Summary Livengood Gold Project Pre-feasibility Study | |
The Phase 1 starter pit contains 5.6 Mt (5.1 Mmt) of overburden, 91.4 Mt (82.9 Mmt) of waste rock and 5.4 Mt (4.9 Mmt) of ore. The bottom of the starter pit is at the 385 m elevation, and the total depth of the starter pit is 328 ft (100 m).
| 13.2.2 | Phase Design Results |
The phase designs were guided by the lower revenue factor pit shells from the pit optimization analysis. A total of five phases have been designed in addition to the starter pit. To ensure the phases can be mined safely and efficiently with the selected fleet of mining equipment, a minimum width of 400 ft (122 m) has been considered between each phase. Narrower widths down to 130 ft (40 m) have been allowed for short segments.
For all phases, the haul ramp exits have been located on the northside of the pit to avoid haul road construction requirements on the south side, which would negatively impact the visual effects of the Project.
Table 13-1 presents the mineral reserves for each phase and Figure 13-1 presents a plan view showing the limits of each phase.
Table 13-1: Mineral reserves by phase
| Phase | Ore
(Mt) | Au Grade
(g/mt) | Overburden
(Mt) | Waste Rock
(Mt) | Strip
Ratio |
| Phase 1 | 5.6 | 0.45 | 5.6 | 91.3 | 17.3 |
| Phase 2 | 35.8 | 0.60 | 2.2 | 7.8 | 0.3 |
| Phase 3 | 76.5 | 0.75 | 4.4 | 68.0 | 0.9 |
| Phase 4 | 45.1 | 0.57 | 1.1 | 31.4 | 0.7 |
| Phase 5 | 118.3 | 0.60 | 3.1 | 106.5 | 0.9 |
| Phase 6 | 192.7 | 0.68 | 6.9 | 218.7 | 1.2 |
| Total (1) | 474.0 | 0.65 | 23.4 | 523.7 | 1.2 |
| (1) | Numbers may not add up due to rounding. |
| International Tower Hill Mines Ltd. S-K 1300 – Technical Report Summary Livengood Gold Project Pre-feasibility Study | |
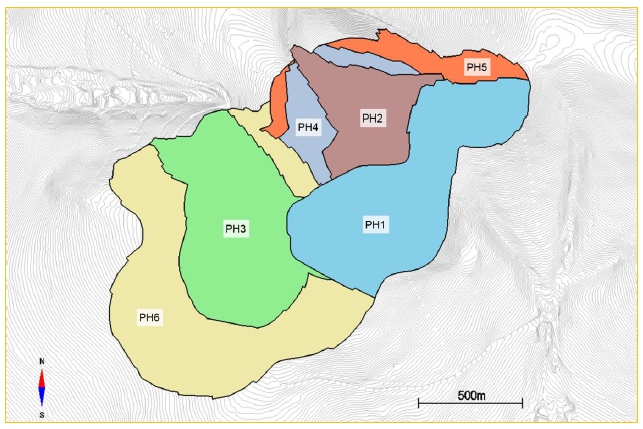
Figure 13-1: Phase designs
Phase 2 targets an area on the east side of the pit with a very low strip ratio of 0.3 to 1. The bottom of Phase 2 is at the 305 m elevation, and the total depth of Phase 2 is 540 ft (165 m).
Phase 3 targets a high grade area on the west side of the pit with an average grade of 0.75 g/mt. The stripping ratio is relatively low at 0.9 to 1.0. The bottom of Phase 3 is at the 210 m elevation, and the total depth of Phase 3 is 920 ft (280 m). Both Phase 2 and Phase 3 will be mined at the same time to separate the equipment fleet, which will allow for higher productivities.
Phase 4 is an expansion of Phase 2. The bottom of Phase 4 is at the 245 m elevation, and the total depth of Phase 4 is 820 feet (250 m).
Phase 5 mines the pit to its final limits on the east side and Phase 6 mines the pit to its final limits on the west side. Since the Phase 5 ramp cuts off access to the remaining benches above the 350 m elevation, a ramp has been included in the northwest corner of the pit in Phase 6 to access this material.
Figure 13-2 to Figure 13-7 present the designs for each phase.
| International Tower Hill Mines Ltd. S-K 1300 – Technical Report Summary Livengood Gold Project Pre-feasibility Study | |
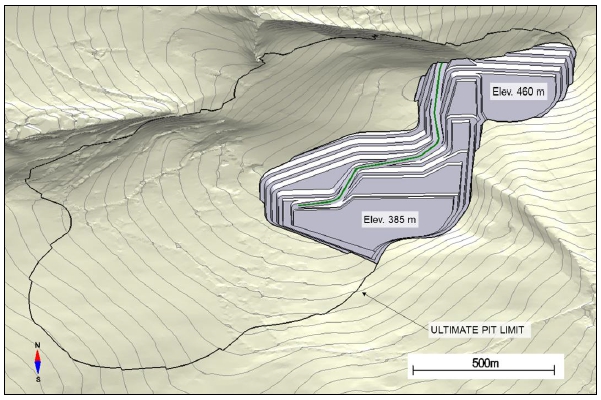
Figure 13-2: Phase 1 design
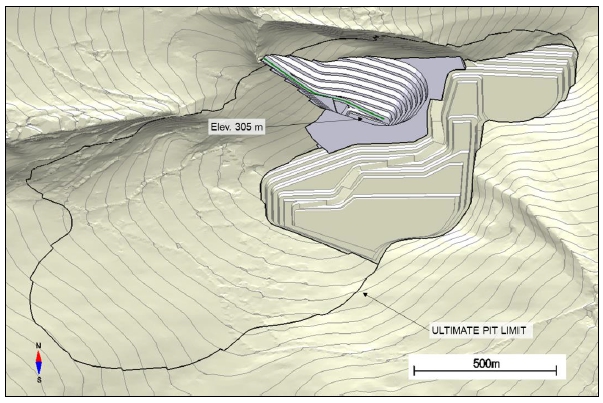
Figure 13-3: Phase 2 design
| International Tower Hill Mines Ltd. S-K 1300 – Technical Report Summary Livengood Gold Project Pre-feasibility Study | |
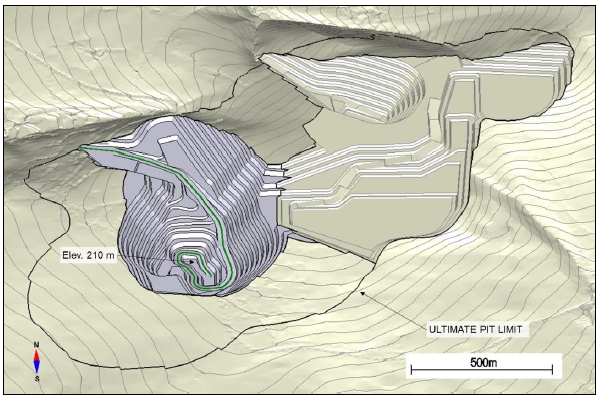
Figure 13-4: Phase 3 design
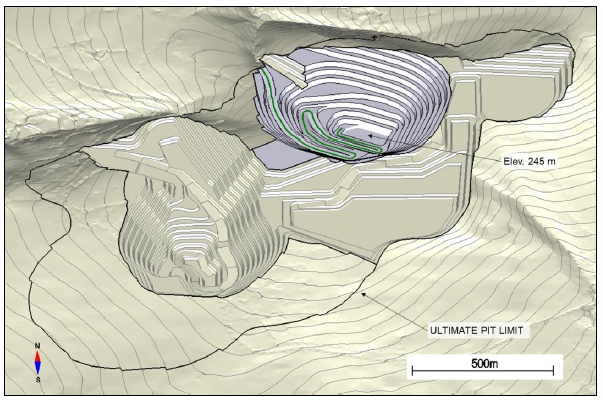
Figure 13-5: Phase 4 design
| International Tower Hill Mines Ltd. S-K 1300 – Technical Report Summary Livengood Gold Project Pre-feasibility Study | |
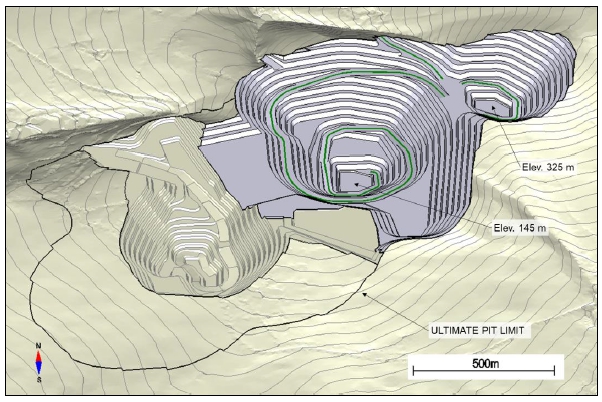
Figure 13-6: Phase 5 design
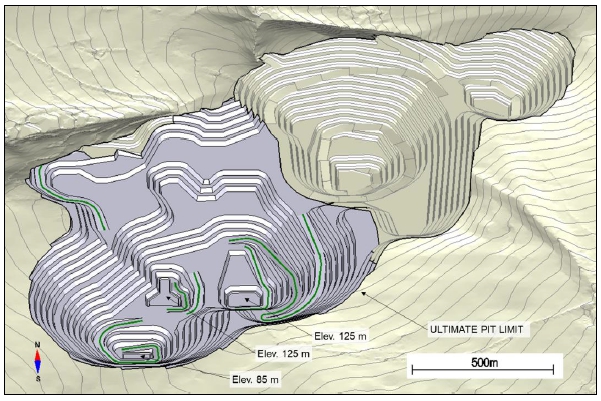
Figure 13-7: Phase 6 design
| International Tower Hill Mines Ltd. S-K 1300 – Technical Report Summary Livengood Gold Project Pre-feasibility Study | |
| 13.3 | Waste Rock Storage Facility and Stockpile Designs |
Material mined from the open pit that is not directly hauled to the primary crusher will be placed in several storage facilities across the Livengood site. These facilities, discussed in further detail below, include growth media stockpiles, the overburden stockpile, the waste rock storage facility (WRSF), the low grade ore stockpile, and an emergency ore stockpile. Waste rock will also be used as construction material both during preproduction, as discussed in Section 13.2.1, and to raise the height of the TMF dike as the mine life progresses. Note that trees will be cleared prior to placing material in these piles.
| 13.3.1 | Growth Media Stockpiles |
As discussed in Section 12.2.2, a topsoil thickness of 12 inches (30 cm) has been assumed for mine design purposes. This material will be stripped and placed separately in growth media stockpiles to be used for closure and reclamation activities. Several growth media stockpiles will be strategically located around the site. Depending on the mining sequence and closure activities, topsoil may be hauled directly to certain areas if they are available for reclamation, thus reducing costs by limiting re-handling activities.
| 13.3.2 | Overburden Stockpile |
Overburden will be stripped and hauled to the overburden stockpile located in the Gertrude Creek Valley to the east of the plant site. The overburden stockpile will be built on the side of the hill, has a footprint area of 67 ha and a capacity of 15.7 Myd3 (12 Mm3). The bottom of the overburden stockpile is at the 420 m elevation and the top is at the 540 m elevation for a total height of 395 feet (120 m). The overburden stockpile has been designed with 150 ft (45 m) wide catch benches every 100 ft (30 m) in elevation and has an overall slope of 18.4 degrees.
| 13.3.3 | Waste Rock Storage Facility |
Waste rock not used for construction will be hauled to the WRSF located in the Gertrude Creek Valley to the east of the plant site, below the overburden stockpile. The PFS considers the same design parameters for the WRSF that were prepared by AMEC for the 2013 FS and presented in the report titled “Geotechnical Design Report August 6, 2013.pdf” (AMEC, 2013).
Since the WRSF will be built along the side of a hill, a buttress called the “Gertrude Creek Embankment” will be built at the base of the WRSF to provide additional stability. The buttress will separate the TMF and the WRSF. Stacking of the waste rock will begin at the base of the pile, against the Gertrude Creek Embankment, and advance up the slope in a “bottom-up” sequence. Access to each lift will be from the haul road that will be built to the east of the plant site to access the TMF. Table 13-2 presents the slope configuration for the WRSF.
| International Tower Hill Mines Ltd. S-K 1300 – Technical Report Summary Livengood Gold Project Pre-feasibility Study | |
Table 13-2: WRSF slope configuration
| Description | Unit | Value |
| Lift Height | ft | 100 |
| Overall Slope | deg | 18.4 (3H:1V) |
| Bench Face Angle | deg | 33.7 |
| Berm Width | ft | 150 |
The WRSF was designed with a footprint area of 215 ha and a capacity of 163 Myd3 (125 Mm3). The bottom of the WRSF is at the 330 m elevation and the top is at the 420 m elevation for a total height of 295 ft (90 m). The PFS requires 105 Myd3 (80 Mm3) of storage capacity in the WRSF and will be built to the 390 m elevation.
A trade-off study was completed to evaluate the merits of placing waste rock in mined-out areas of the pit. Although the mine sequencing does allow for in-pit dumping, it was determined that too much potential mineralization would be sterilized by in-pit dumping.
| 13.3.4 | Low Grade Ore Stockpile |
To maximize the NPV of the Project, lower grade ore will be placed in a stockpile so that higher grade ore can be accessed and sent to the process plant earlier in the mine life. The lower grade ore is then reclaimed at the end of the life of the mine. The low grade ore stockpile is located to the east of the open pit on the ridge above Gertrude Creek. Material placed in the stockpile will be classified into low grade (< 0.5 g/mt), medium grade (> 0.5 g/mt and < 0.7 g/mt) and high grade (> 0.7 g/tm), with each category being placed in a different part of the pile.
The peak low grade ore stockpile balance from the mine plan, presented in Section 13.4, is 87.7 Mt (79.6 Mt), resulting in a capacity requirement of 45 Myd3 (34 Mm3). The low grade stockpile will also be built on the side of the hill and has a footprint area of 100 ha. The bottom of the low grade stockpile is at the 300 m elevation and the top is at the 570 m elevation for a total height of 886 ft (270 m) at its highest point. The low grade stockpile has been designed with 150 ft (45 m) wide catch benches every 100 ft (30 m) in elevation and has an overall slope of 18.4 degrees.
| 13.3.5 | Emergency Ore Stockpile |
To ensure the primary crusher can be fed when the mine will be shut down during extreme weather events, an emergency ore stockpile has been located on the run of mine (ROM) pad. The emergency ore stockpile has a 65,000 t (58,967 mt) capacity to provide 24 hours of crusher feed. The emergency ore stockpile has a height of 16 ft (5 m) and a surface area of 65,000 ft2 (6,040 m2). Ore from this stockpile will be rehandled with wheel loaders that will either dump directly into the hopper of the primary crusher or load haul trucks that will haul and dump into the hopper.
| International Tower Hill Mines Ltd. S-K 1300 – Technical Report Summary Livengood Gold Project Pre-feasibility Study | |
SRK previously completed a report on the acid rock drainage (ARD) potential of the Livengood waste rock, titled “Metal Leaching and Acid Rock Drainage Assessment, Livengood Project, Alaska. Progress Report 3 - Final” (SRK, 2012)., The SRK study concluded that the Volcanic and Lower Sediment rock types have the greatest potential to produce ARD. These rock types represent approximately 15% of the waste rock within the open pit and should easily be mixed with the non-potentially ARD rock types when placed in the WRSF. The QP recommends that the design and sequencing of placement of ARD material into the WRSF be updated for the next phase of study.
The mine production plan has been prepared using the MinePlan Schedule Optimizer (MPSO) tool in the Hexagon MinePlan 3D software. Provided with economic input parameters and operational constraints such as phase sequencing, maximum bench sink rates, and mining and milling capacities, the software determines the optimal mining sequence and low grade ore stockpiling strategy, which maximizes the NPV of the mine production plan.
The mine plan has been prepared quarterly for the first 2 years of production and annually thereafter. The mine plan also includes a period of preproduction that has been scheduled annually over 3 years. The purpose of the preproduction period is for the mine to provide waste rock for construction material and to prepare the pit for mining operations.
The mine plan has been prepared using cuts that are 200 m x 200 m x 10 m high. Partial mining was not allowed so cuts are mined in their entirety within a given period.
The mine plan considers a maximum bench sink rate of eight benches per year per phase, for a maximum vertical sink of 262 ft (80 m) per year per phase.
For low grade stockpile rehandling, since the low grade ore stockpile will be quite large and can be reclaimed from many sides, the mine plan considers “average grade” reclaim strategy.
The mine plan targets the nominal mill throughput capacity of 65,000 t/d (58,967 mt/d) and varies based on the blend of ore by rock type. Table 15-7 in Section 12.3.2 presenting the mill throughput rates in t/h for each rock type have been considered in the mine plan. The mine plan also considers an overall mill utilization of 93%, which results in 8,147 hours per year of operation.
The mine plan accounts for the following process plant utilization ramp-up prior to achieving 93%, at the start of Year 2. This results in an average plant utilization of 75% for the first year of operation, which falls between Class 1 and Class 2 of the McNulty start-up benchmarking curves.
| International Tower Hill Mines Ltd. S-K 1300 – Technical Report Summary Livengood Gold Project Pre-feasibility Study | |
The Livengood Project has a 20.3-year mine life plus 3 years of preproduction development. A contractor will operate the pit during the first year of preproduction to develop the first benches in the Phase 1 starter pit and construct the network of mine haul roads. By the second year, the owner’s fleet of equipment will be on-site and assembled and will take over from the contractor.
Mining of Phases 2 to 6 is planned as follows:
| § | Phase 2 – Mined between Year 1 and Year 2; |
| § | Phase 3 – Mined between Year 1 and Year 4; |
| § | Phase 4 – Stripping begins in Year 3 and will be completely mined out in Year 7; |
| § | Phase 5 – Mining begins in Year 4 and completes in Year 10; |
| § | Phase 6 – Mining begins in Year 6 and completes in Year 17. |
The total material mined from the open pit peaks at 66 Mt (60 Mmt) from Year 2 to Year 5 and averages 55 Mt/y (50 Mmt/y) between Year 1 and Year 17. A total of 105 Mt (95 Mmt) of ore is sent to the low grade ore stockpile over the life of the mine, with an average gold grade of 0.38 g/mt. A total of 84% of the low grade ore is rehandled and sent to the mill during the final five years of production, with smaller amounts rehandled in earlier years.
During the life of mine, a total of 271 Mt (246 Mmt) is hauled to the TMF for dike construction, representing 52% of the total waste rock.
The average gold grade for ore to the mill is fairly consistent on a year to year basis, ranging from 0.58 g/mt to 0.93 g/mt when the open pit is in operation, and drops to 0.36 g/mt during stockpile rehandling at the end of the mine life.
A peak gold production of 482 koz is achieved in Year 3, when higher grades will be fed to mill, which also coincides with higher mill recoveries. Gold production averages 342 koz per year between Year 1 and Year 17 and 154 koz per year during stockpile rehandling.
Table 13-3 presents the mine production schedule (summarized by year) and Table 13-4 presents the mill feed by rock type (summarized by year). Figure 13-8 to Figure 13-12 present various charts which display the mine production schedule and Figure 13-13 to Figure 13-16 present the pit advances for at the end of Preproduction, Year 05, Year 10, and Year 15.
| International Tower Hill Mines Ltd. S-K 1300 – Technical Report Summary Livengood Gold Project Pre-feasibility Study | |
Table 13-3: Mine production schedule
| Year | Unit | -3 | -2 | -1 | 1 | 2 | 3 | 4 | 5 | 6 | 7 | 8 | 9 | 10 | 11 | 12 | 13 | 14 | 15 | 16 | 17 | 18 | 19 | 20 | 21 | Total |
| Mill Feed | Mt | 0.0 | 0.0 | 0.0 | 18.0 | 24.4 | 24.3 | 23.2 | 23.6 | 23.6 | 23.6 | 23.4 | 23.5 | 24.2 | 23.9 | 23.8 | 23.4 | 23.1 | 23.2 | 23.2 | 23.4 | 23.8 | 23.8 | 23.8 | 6.8 | 474.0 |
| Gold Grade | g/mt | 0.00 | 0.00 | 0.00 | 0.76 | 0.69 | 0.93 | 0.93 | 0.61 | 0.61 | 0.64 | 0.64 | 0.69 | 0.58 | 0.61 | 0.72 | 0.77 | 0.77 | 0.71 | 0.73 | 0.65 | 0.36 | 0.36 | 0.36 | 0.37 | 0.65 |
| Ounces Rec. | koz | 0 | 0 | 0 | 321 | 388 | 482 | 437 | 314 | 328 | 340 | 329 | 357 | 306 | 296 | 336 | 339 | 322 | 308 | 316 | 293 | 188 | 188 | 188 | 54 | 6,430 |
| Mill Recovery | % | 0% | 0% | 0% | 80% | 79% | 73% | 69% | 74% | 78% | 77% | 75% | 76% | 75% | 70% | 67% | 65% | 62% | 64% | 64% | 66% | 75% | 75% | 75% | 74% | 71% |
| ROM to Mill | Mt | 0.0 | 0.0 | 0.0 | 16.7 | 23.3 | 24.3 | 22.9 | 22.4 | 23.6 | 23.6 | 23.4 | 23.5 | 15.8 | 19.6 | 23.8 | 23.4 | 23.1 | 23.2 | 23.2 | 13.4 | 0.0 | 0.0 | 0.0 | 0.0 | 369.2 |
| Gold Grade | g/mt | 0.00 | 0.00 | 0.00 | 0.76 | 0.70 | 0.93 | 0.94 | 0.61 | 0.61 | 0.64 | 0.64 | 0.69 | 0.67 | 0.66 | 0.72 | 0.77 | 0.77 | 0.71 | 0.73 | 0.86 | 0.00 | 0.00 | 0.00 | 0.00 | 0.73 |
| ROM to Stkp | Mt | 1.2 | 2.7 | 1.1 | 16.1 | 8.1 | 12.1 | 17.0 | 6.6 | 6.6 | 3.3 | 3.3 | 3.3 | 3.3 | 3.3 | 3.3 | 3.3 | 3.3 | 3.3 | 3.3 | 0.3 | 0.0 | 0.0 | 0.0 | 0.0 | 104.8 |
| Gold Grade | Mt | 0.47 | 0.45 | 0.44 | 0.38 | 0.34 | 0.40 | 0.40 | 0.33 | 0.34 | 0.35 | 0.36 | 0.35 | 0.33 | 0.35 | 0.44 | 0.38 | 0.41 | 0.40 | 0.38 | 0.40 | 0.00 | 0.00 | 0.00 | 0.00 | 0.38 |
| Stkp to Mill | Mt | 0.0 | 0.0 | 0.0 | 1.3 | 1.1 | 0.0 | 0.3 | 1.3 | 0.0 | 0.0 | 0.0 | 0.0 | 8.4 | 4.3 | 0.0 | 0.0 | 0.0 | 0.0 | 0.0 | 10.0 | 23.8 | 23.8 | 23.8 | 6.8 | 104.8 |
| Gold Grade | g/mt | 0.00 | 0.00 | 0.00 | 0.73 | 0.45 | 0.62 | 0.75 | 0.59 | 0.00 | 0.00 | 0.00 | 0.00 | 0.42 | 0.36 | 0.00 | 0.00 | 0.00 | 0.00 | 0.00 | 0.38 | 0.36 | 0.36 | 0.36 | 0.37 | 0.38 |
| OB to Stkp | Mt | 3.9 | 1.5 | 0.2 | 4.7 | 1.6 | 0.8 | 1.6 | 2.0 | 0.6 | 1.5 | 1.4 | 1.4 | 1.7 | 0.5 | 0.0 | 0.0 | 0.0 | 0.0 | 0.0 | 0.0 | 0.0 | 0.0 | 0.0 | 0.0 | 23.3 |
| Waste to WRSF | Mt | 11.2 | 3.2 | 2.6 | 2.5 | 8.7 | 15.2 | 10.9 | 21.4 | 20.4 | 22.8 | 23.1 | 23.0 | 31.5 | 31.1 | 9.6 | 8.0 | 3.1 | 3.0 | 1.0 | 0.0 | 0.0 | 0.0 | 0.0 | 0.0 | 252.5 |
| Waste to TMF | Mt | 2.4 | 27.8 | 31.5 | 24.4 | 24.4 | 13.8 | 13.8 | 13.8 | 9.4 | 9.4 | 9.4 | 9.4 | 11.6 | 11.6 | 11.6 | 11.6 | 10.7 | 10.7 | 10.7 | 3.0 | 0.0 | 0.0 | 0.0 | 0.0 | 271.1 |
| Total Material Moved | Mt | 18.8 | 35.2 | 35.3 | 65.6 | 67.3 | 66.1 | 66.5 | 67.4 | 60.6 | 60.6 | 60.6 | 60.6 | 72.3 | 70.4 | 48.4 | 46.3 | 40.2 | 40.3 | 38.3 | 26.6 | 23.8 | 23.8 | 23.8 | 6.8 | 1,125.7 |
| Total Material Mined (ROM) | Mt | 18.8 | 35.2 | 35.3 | 64.3 | 66.1 | 66.1 | 66.1 | 66.1 | 60.6 | 60.6 | 60.6 | 60.6 | 63.9 | 66.1 | 48.4 | 46.3 | 40.2 | 40.3 | 38.3 | 16.6 | 0.0 | 0.0 | 0.0 | 0.0 | 1,020.9 |
| Strip Ratio | | 14.8 | 12.3 | 31.8 | 1.0 | 1.1 | 0.8 | 0.7 | 1.3 | 1.0 | 1.2 | 1.3 | 1.3 | 2.4 | 1.9 | 0.8 | 0.7 | 0.5 | 0.5 | 0.4 | 0.2 | 0.0 | 0.0 | 0.0 | 0.0 | 1.2 |
| International Tower Hill Mines Ltd. S-K 1300 – Technical Report Summary Livengood Gold Project Pre-feasibility Study | |
Table 13-4: Mill feed by rock type
| Year | Unit | 1 | 2 | 3 | 4 | 5 | 6 | 7 | 8 | 9 | 10 | 11 | 12 | 13 | 14 | 15 | 16 | 17 | 18 | 19 | 20 | 21 | Total |
| Tonnes | Mt | 18.0 | 24.4 | 24.3 | 23.2 | 23.6 | 23.6 | 23.6 | 23.4 | 23.5 | 24.2 | 23.9 | 23.8 | 23.4 | 23.1 | 23.2 | 23.2 | 23.4 | 23.8 | 23.8 | 23.8 | 6.8 | 474.0 |
| RT4 | Mt | 4.0 | 9.3 | 9.7 | 0.6 | 2.9 | 2.8 | 2.8 | 2.0 | 2.8 | 8.2 | 7.7 | 8.0 | 4.7 | 2.3 | 0.7 | 0.0 | 1.8 | 4.7 | 4.7 | 4.7 | 1.3 | 85.8 |
| RT5 | Mt | 12.9 | 9.3 | 0.4 | 5.9 | 10.8 | 14.8 | 11.1 | 11.2 | 12.3 | 3.8 | 2.0 | 0.0 | 0.0 | 0.0 | 0.0 | 0.0 | 3.3 | 8.7 | 8.7 | 8.7 | 2.5 | 126.3 |
| RT6 | Mt | 1.0 | 5.6 | 9.7 | 7.7 | 7.4 | 4.5 | 7.7 | 3.9 | 0.5 | 5.7 | 7.0 | 5.6 | 5.9 | 4.0 | 4.7 | 3.2 | 3.0 | 5.2 | 5.2 | 5.2 | 1.5 | 104.4 |
| RT7 | Mt | 0.1 | 0.0 | 0.0 | 2.3 | 0.9 | 0.7 | 0.8 | 2.9 | 5.2 | 3.9 | 0.4 | 0.8 | 2.2 | 4.2 | 12.8 | 16.8 | 10.8 | 2.3 | 2.3 | 2.3 | 0.7 | 72.6 |
| RT8 | Mt | 0.0 | 0.1 | 0.0 | 0.3 | 0.3 | 0.4 | 0.1 | 0.2 | 0.6 | 0.3 | 0.0 | 0.0 | 0.0 | 0.0 | 0.0 | 0.0 | 0.1 | 0.1 | 0.1 | 0.1 | 0.0 | 2.9 |
| RT9 | Mt | 0.0 | 0.0 | 4.5 | 6.3 | 1.4 | 0.4 | 1.2 | 3.3 | 2.2 | 2.2 | 6.6 | 9.5 | 10.7 | 12.5 | 5.0 | 3.2 | 4.4 | 2.7 | 2.7 | 2.7 | 0.8 | 82.1 |
| Gold Grade | g/mt | 0.76 | 0.69 | 0.93 | 0.93 | 0.61 | 0.61 | 0.64 | 0.64 | 0.69 | 0.58 | 0.61 | 0.72 | 0.77 | 0.77 | 0.71 | 0.73 | 0.65 | 0.36 | 0.36 | 0.36 | 0.37 | 0.65 |
| RT4 | g/mt | 0.78 | 0.58 | 0.73 | 0.58 | 0.58 | 0.79 | 0.51 | 0.53 | 0.58 | 0.50 | 0.55 | 0.51 | 0.64 | 0.49 | 0.61 | 0.00 | 0.31 | 0.31 | 0.31 | 0.31 | 0.31 | 0.54 |
| RT5 | g/mt | 0.75 | 0.73 | 0.65 | 0.68 | 0.52 | 0.54 | 0.63 | 0.59 | 0.66 | 0.45 | 0.36 | 0.48 | 0.00 | 0.00 | 0.00 | 0.00 | 0.36 | 0.36 | 0.36 | 0.36 | 0.36 | 0.55 |
| RT6 | g/mt | 0.78 | 0.82 | 1.05 | 0.90 | 0.73 | 0.67 | 0.70 | 0.67 | 0.58 | 0.55 | 0.54 | 0.72 | 0.67 | 0.69 | 0.59 | 0.60 | 0.43 | 0.37 | 0.37 | 0.37 | 0.37 | 0.66 |
| RT7 | g/mt | 0.71 | 0.54 | 0.64 | 0.89 | 0.76 | 0.54 | 0.55 | 0.63 | 0.75 | 0.88 | 0.49 | 0.86 | 0.80 | 0.78 | 0.73 | 0.73 | 0.82 | 0.36 | 0.36 | 0.36 | 0.36 | 0.72 |
| RT8 | g/mt | 0.78 | 0.58 | 0.77 | 0.88 | 0.72 | 0.75 | 0.85 | 0.65 | 0.97 | 0.63 | 0.45 | 0.53 | 0.00 | 0.00 | 0.00 | 0.00 | 0.45 | 0.45 | 0.45 | 0.45 | 0.45 | 0.73 |
| RT9 | g/mt | 0.00 | 0.00 | 1.15 | 1.26 | 0.68 | 1.00 | 0.69 | 0.89 | 0.78 | 0.64 | 0.84 | 0.90 | 0.87 | 0.85 | 0.79 | 0.85 | 0.76 | 0.46 | 0.46 | 0.46 | 0.46 | 0.84 |
| International Tower Hill Mines Ltd. S-K 1300 – Technical Report Summary Livengood Gold Project Pre-feasibility Study | |
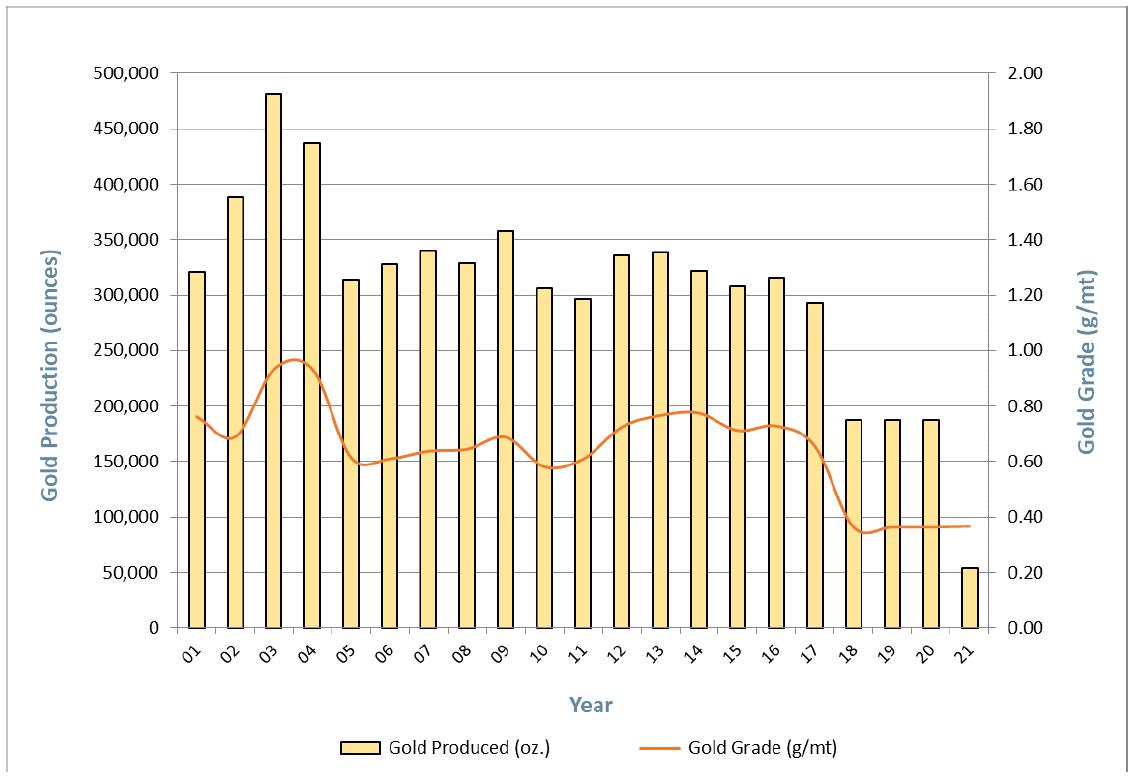
Figure 13-8: Gold production
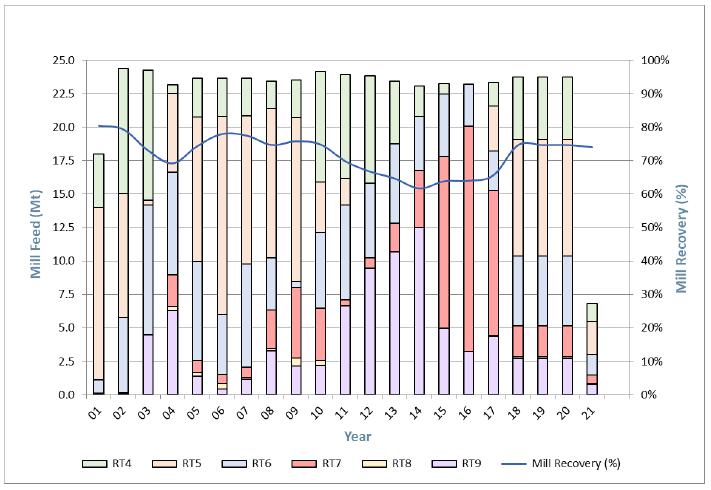
Figure 13-9: Mill feed
| International Tower Hill Mines Ltd. S-K 1300 – Technical Report Summary Livengood Gold Project Pre-feasibility Study | |
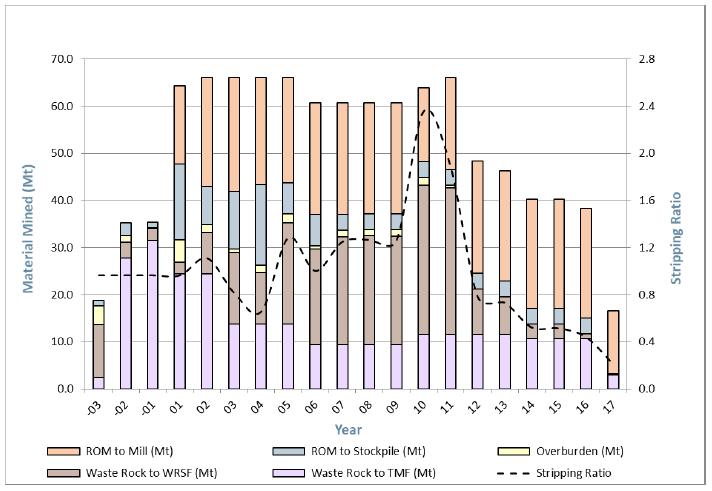
Figure 13-10: Material mined (ROM)
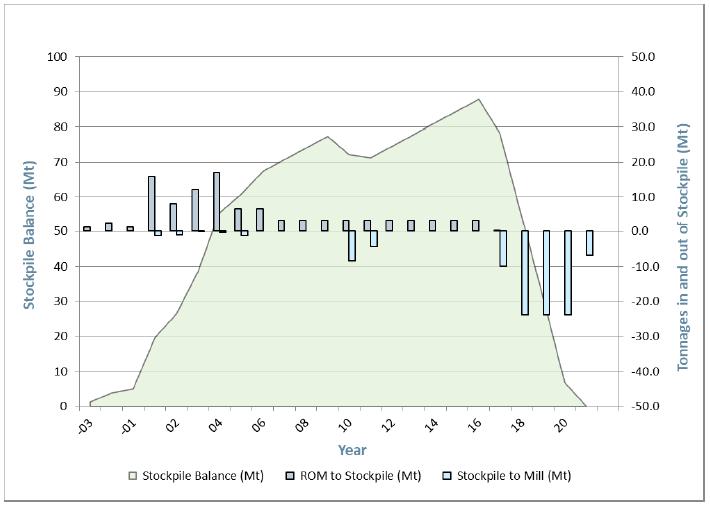
Figure 13-11: Low grade ore stockpile balance
| International Tower Hill Mines Ltd. S-K 1300 – Technical Report Summary Livengood Gold Project Pre-feasibility Study | |
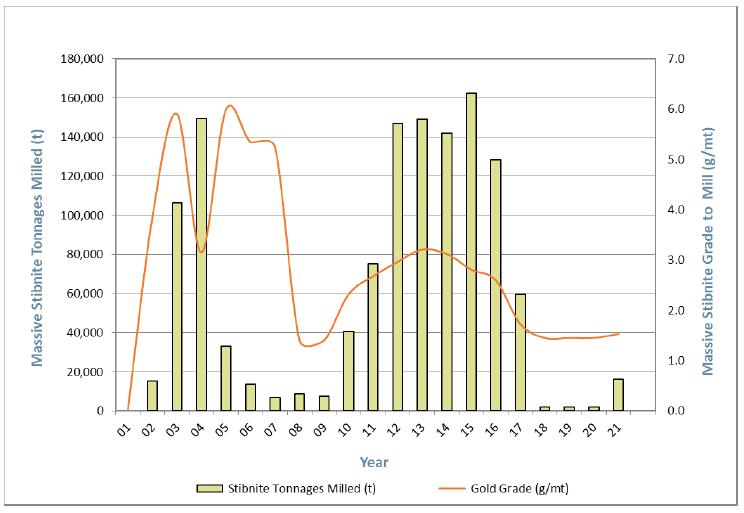
Figure 13-12: Massive stibnite tonnages milled
| International Tower Hill Mines Ltd. S-K 1300 – Technical Report Summary Livengood Gold Project Pre-feasibility Study | |
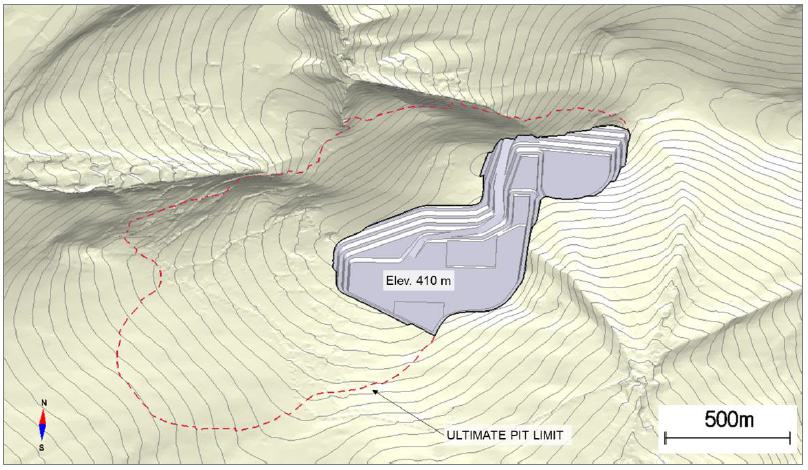
Figure 13-13: End of preproduction
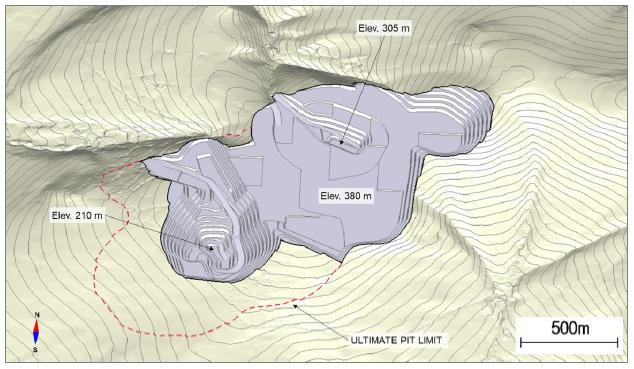
Figure 13-14: End of Year 05
| International Tower Hill Mines Ltd. S-K 1300 – Technical Report Summary Livengood Gold Project Pre-feasibility Study | |

Figure 13-15: End of Year 10
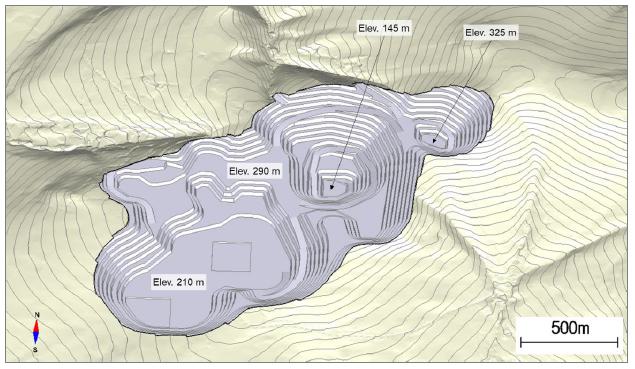
Figure 13-16: End of Year 15
| International Tower Hill Mines Ltd. S-K 1300 – Technical Report Summary Livengood Gold Project Pre-feasibility Study | |
The following section discusses equipment selection and fleet requirements to carry out the mine plan. The mine will be operated by an owner fleet with the peak requirements presented in Table 13-5. The table identifies the Komatsu trucks, shovel, loader, and support equipment as well as the Epiroc drill to give the reader an appreciation for the equipment size. It is important to note that the specific equipment selection will be done during the procurement phase of the Project.
Table 13-5: Mine equipment fleet
| Equipment | Model | Description | Units |
| Haul Truck | Komatsu 930E-5 | Payload – 320 t | 18 |
| Hydraulic Excavator | Komatsu PC5500-11 | Bucket Payload – 40 yd3 | 2 |
| Wheel Loader | Komatsu L1850 | Bucket Payload – 40 yd3 | 2 |
| Production Drill | Epiroc PV-231 | n/a | 5 |
| Secondary Drill | Epiroc D65 | n/a | 1 |
| Track Dozer (Small) | Komatsu D375A-8 | Net Power – 609 hp | 3 |
| Track Dozer (Large) | Komatsu D475A-8 | Net Power – 890 hp | 3 |
| Road Grader | CAT 16M3 | Net Power – 259 hp | 4 |
| Water Truck | Komatsu HD1500-8 | Capacity – 37,000 gal | 2 |
| Utility Excavator (Small) | Komatsu PC490LC-11 | Net Power – 359 hp | 2 |
| Utility Excavator (Large) | Komatsu PC800LC-8 | Net Power – 363 hp | 2 |
| Small Loader (Stemming) | CAT430 | n/a | 1 |
| Lighting Plant | n/a | n/a | 12 |
| Explosives Truck | n/a | n/a | 2 |
| Fuel & Lube Truck | CAT 740 | n/a | 2 |
| Mechanic Service Truck | n/a | n/a | 3 |
| Welding Truck | n/a | n/a | 2 |
| Flatbed with Crane | n/a | n/a | 2 |
| Lowboy | n/a | n/a | 2 |
| Tire Handler | n/a | n/a | 1 |
| Mobile Crane (Small) | n/a | n/a | 1 |
| Mobile Crane (Medium) | n/a | n/a | 1 |
| Mobile Crane (Large) | n/a | n/a | 1 |
| Pickup Truck | n/a | n/a | 20 |
| Transport Bus | n/a | n/a | 4 |
| Dewatering Pump | Godwin HL260 | Net Power – 600 hp | 4 |
| International Tower Hill Mines Ltd. S-K 1300 – Technical Report Summary Livengood Gold Project Pre-feasibility Study | |
The mine will be operated with an owner fleet, 365 days per year, 24 hours per day, running 2-12-hour shifts per day. For equipment calculations, a total of five days of lost production time has been considered for poor weather conditions.
| 13.5.2 | Equipment Utilization Model |
Figure 13-17 presents the equipment utilization model that is used to understand the key performance indictors (KPI) that govern the fleet requirements. The definitions for each time component are presented below using haul trucks as an example.
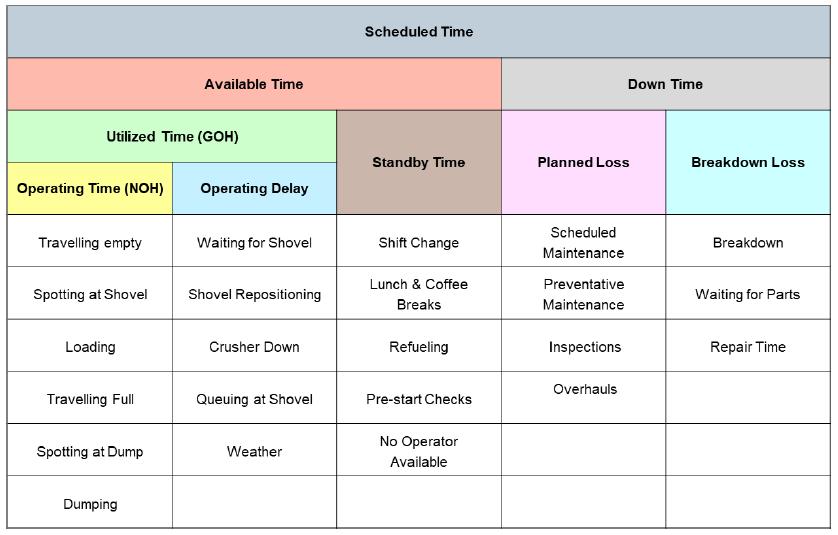
Figure 13-17: Equipment utilization model
| International Tower Hill Mines Ltd. S-K 1300 – Technical Report Summary Livengood Gold Project Pre-feasibility Study | |
| § | Scheduled Time – full calendar year less unplanned shutdowns; |
| § | Down Time – the unit is inoperable due to either a scheduled maintenance or an unplanned breakdown; |
| § | Available Time – scheduled time less down time; |
| § | Standby Time – the unit is available mechanically but not being used (the engine will typically be shut off while the unit is on standby); |
| § | Utilized Time – available time less standby time. This time is also referred to as the Gross Operating Hours (GOH); |
| § | Operating Delays – the unit is available and not on standby but not effectively producing (the engine will be running during the operating delays); |
| § | Operating Time – utilized time minus operating delays. This time is also referred to as the Net Operating Hours (NOH). |
The following KPIs can be calculated from the different time components using the formulas below:
| § | Availability – (NOH + Op. Delays + Standby) / (NOH + Op. Delays + Standby + Down); |
| § | Use of Availability – (NOH + Op. Delays) / (NOH + Op. Delays + Standby); |
| § | Machine Utilization – (NOH + Op. Delays) / (Scheduled Time); |
| § | Operating Efficiency – (NOH) / (NOH + Op. Delays); |
| § | Effective Utilization – (NOH) / (Scheduled Time). |
Table 13-6 presents the KPIs and time assumptions that were used for the fleet of trucks, shovels, loaders, and drills.
Table 13-6: Mine equipment KPIs
| Description | Units | Trucks | Shovels / Loaders | Drills |
| Availability | % | 85.0 | 85.0 | 80.0 |
| Use of Availability | % | 86.3 | 86.3 | 96.2 |
| Machine Utilization | % | 73.3 | 73.3 | 77.0 |
| Operating Efficiency | % | 85.6 | 85.6 | 91.4 |
| Effective Utilization | % | 62.8 | 62.8 | 70.4 |
| Scheduled Time | h/y | 8,760 | 8,760 | 8,760 |
| Down Time | h/y | 1,314 | 1,314 | 1,752 |
| Standby Time | h/y | 1,024 | 1,024 | 264 |
| Operating Delays | h/y | 922 | 922 | 581 |
| Utilized Time (GOH) | h/y | 6,422 | 6,422 | 6,745 |
| Operating Time (NOH) | h/y | 5,500 | 5,500 | 6,163 |
| International Tower Hill Mines Ltd. S-K 1300 – Technical Report Summary Livengood Gold Project Pre-feasibility Study | |
| 13.5.3 | Drilling and Blasting |
Production drilling will be done with a fleet of autonomous diesel-powered down-the-hole (DTH) drills that will drill 9.8 inch (251 mm) diameter holes on 32.8 ft (10 m) high benches. Drilling productivities have been calculated per rock type based on an instantaneous drill penetration rate of 82 ft/h (25 m/h) and the fixed time drilling components presented in Table 13-7.
Table 13-7: Fixed drilling time per hole
| Description | Unit | Value |
| Steel Retract | min | 0.40 |
| Jack Up | min | 0.30 |
| Tramming | min | 2.50 |
| Jack Down | min | 0.50 |
| Collar | min | 3.00 |
| Bit Change | min | 0.30 |
| Total | min | 7.00 |
The drill productivities have been applied to the number of holes drilled per year to determine the annual hours of drilling and number of units required. In addition to the number of holes, which is based on the blast patterns presented in Table 13-8 and Table 13-9, an additional 2% will be considered for holes that will require re-drilling.
Blasting will be carried out using Ammonium Nitrate Fuel Oil (ANFO). Although ANFO has a lower explosive density than emulsion products, which therefore requires a tighter drill pattern to achieve the same fragmentation, a trade-off study was carried out and demonstrates that the lower cost for ANFO in the region outweighs the additional drilling requirements. The ANFO used will have a density of 0.031 lb/in3 (0.85 g/cm3). Table 13-8 and Table 13-9 present the blast patterns for ore and waste rock for each rock type that were developed in order to achieve the desired fragmentation. Blasting will be done using electric detonation and drill holes will be double primed (two detonators and two boosters per hole). Emulsion was considered for 10% of the holes to account for wet conditions.
| International Tower Hill Mines Ltd. S-K 1300 – Technical Report Summary Livengood Gold Project Pre-feasibility Study | |
Table 13-8: Blast patterns (ore)
| Description | Unit | RT4 | RT5 / RT6 | RT7 | RT8 / RT9 |
| Burden | ft | 19.4 | 20.0 | 21.3 | 19.4 |
| Spacing | ft | 19.4 | 20.1 | 21.3 | 19.4 |
| Subdrilling | ft | 3.3 | 3.3 | 3.3 | 3.3 |
| Stemming | ft | 11.5 | 11.5 | 11.5 | 11.5 |
| Powder Factor | lb/ft | 0.68 | 0.66 | 0.58 | 0.68 |
Table 13-9: Blast patterns (waste)
| Description | Unit | RT2 / RT4 | RT5 / RT6 | RT7 | RT8 / RT9 |
| Burden | ft | 21.7 | 22.3 | 24.6 | 21.7 |
| Spacing | ft | 21.7 | 22.3 | 24.6 | 21.7 |
| Subdrilling | ft | 3.3 | 3.3 | 3.3 | 3.3 |
| Stemming | ft | 11.5 | 11.5 | 11.5 | 11.5 |
| Powder Factor | lb/ft | 0.50 | 0.48 | 0.42 | 0.50 |
Pre-split blasting will be done on the final pit walls using 45 mm diameter packaged emulsion with explosive densities of 0.043 lb/in3 (1.20 g/cm3). Pre-split blasting will be double benched (65.6 ft) using 5 in (127 mm) diameter holes, with 3.3 ft (1 m) of sub-drilling. The pre-split holes will be spaced 5 ft (1.5 m) apart, resulting in a power factor of 0.24 lb/ft2 (1.16 kg/m2).
A total of five production drills and one secondary drill for pre-splitting and secondary blasting are required during most of the mine life.
Explosives products and accessories will be delivered to site by a local explosives supplier and stored in a facility that will be located to the east of the pit, south of the low grade ore stockpile. The facility will include two, 100-t ammonium nitrate silos as well as a smaller silo for emulsion. The explosives products will be mixed with diesel fuel at this facility to produce the explosives that will be transported to the blast patterns and loaded into the holes by the Livengood blasting team. Approximately 15,430 t (14 million kg) of explosives will be used every year.
Loading will be done on 32.8 ft (10 m) benches using a mix of diesel-powered hydraulic shovels and frontend wheel loaders, both equipped with 40 yd3 (31 m3) buckets. Productivities have been calculated considering shovel bucket swing times of 35 seconds and loader cycle times of 50 seconds. A 90% fill factor has been considered for both machines.
| International Tower Hill Mines Ltd. S-K 1300 – Technical Report Summary Livengood Gold Project Pre-feasibility Study | |
During peak production, the fleet will include two shovels and two wheel loaders.
Hauling will be done with 320 t (291 mt) rigid frame haul trucks. Haul productivities have been calculated considering effective payloads of 317 t (288 mt), which have been reduced from the nominal payloads to account for a carryback of 1%.
A haulage network was established in MPSO that considers the hauls for each mining cut to each potential dumping destination. Using rimpull curves provided by the truck manufacturers, MPSO calculated the travel times for each haul. The travel times were then added to the fixed haulage cycle times to arrive at the total cycle times. The fixed cycle times consider 55 seconds for truck spotting, 35 seconds for each shovel bucket (50 seconds for the front-end loaders), and 90 seconds for spotting and dumping at the destination. It is assumed that the shovel/loader will be waiting for a truck with a loaded bucket 50% of the time, resulting in a 5-second first bucket pass in those instances. A total of five buckets is required to load each truck, resulting in an average total fixed cycle time of 305 seconds. In addition to these haulage parameters, the truck productivity calculations consider a 3% rolling resistance, a maximum speed of 25 mph (40 km/h) and a downhill maximum speed of 15 mph (25 km/h).
A total of 12 trucks are required in preproduction, ramping up to 18 in Year 1. Truck requirements remain constant between 15 and 18 for most of the mine life, ramping down when the operation is limited to stockpile rehandle.
The following are the average one-way haul distances for the open pit over the life of mine:
| § | Ore to the crusher: 1.6 miles (2.6 km); |
| § | Ore to the low grade stockpile: 2.1 miles (3.4 km); |
| § | Overburden to the overburden stockpile: 3.4 miles (5.4 km); |
| § | Waste rock to the WRSF: 3.1 miles (5.0 km); |
| § | Waste rock to the TMF: 4.4 miles (7.1 km); |
| § | Stockpile rehandle: 0.9 miles (1.4 km). |
| 13.5.6 | Auxiliary Equipment |
A fleet of support equipment has been included for haul road maintenance, drill pad preparation, material placement on the WRSF, and cleaning around the loading face. Material spreading on the tailings dike has been accounted for in the TMF construction costs. The fleet of support equipment includes dozers, graders, water trucks, and utility loaders and excavators.
A fleet of service equipment such as fuel and lube trucks, lowboys to transport the tracked equipment, personnel buses, maintenance vehicles, and pick-up trucks is also included.
| International Tower Hill Mines Ltd. S-K 1300 – Technical Report Summary Livengood Gold Project Pre-feasibility Study | |
| 13.5.7 | Mine Dispatch System |
A mine dispatch system has been included to optimize the use of the loading and hauling fleets.
Mine water will be collected in in-pit sumps that will be strategically located on the lower benches of the pit. Water collected in the sumps will be pumped to surface using electrically powered pumps and will be discharged into the site drainage network for treatment and clarification prior to discharge into the environment. A total of four pumps have been included in the equipment fleet during peak production.
The mine workforce has been estimated for each period of the mine plan, which includes management and supervisory personnel, mine technical services, mine operations, and mine maintenance personnel.
All workers will be bussed to site from Fairbanks daily. Mine operations and mine maintenance personnel who will work on shift will be part of a 4-crew system to provide 24 h/d coverage and staff workers will be on site 5 days per week.
The mine workforce during peak production totals 221 employees, comprising 165 in mine operations, 42 in mine maintenance, and 14 in mine technical services. The workforce for the mine has been categorized into Mine Operations. Table 13-10 presents the workforce requirements for the open pit during peak production.
| International Tower Hill Mines Ltd. S-K 1300 – Technical Report Summary Livengood Gold Project Pre-feasibility Study | |
Table 13-10: Mine workforce
| Description | Number |
| Mine Operations | |
| Mine Manager | 1 |
| Mine Operations Superintendent | 1 |
| Mine Operations Foreman | 8 |
| Mine Clerk | 1 |
| Mine Trainer | 4 |
| Shovel Operator | 7 |
| Loader Operator | 7 |
| Truck Operator | 62 |
| Blaster | 2 |
| Blast Helper | 2 |
| Driller | 6 |
| Dozer Operator | 24 |
| Grader Operator | 16 |
| Water Truck Driver | 8 |
| Utility Operator | 16 |
| Mine Maintenance | |
| Maintenance Superintendent | 1 |
| Maintenance Foreman | 12 |
| Maintenance Planner | 2 |
| Mechanics | 27 |
| Mine Technical Services | |
| Mine Technical Superintendent | 1 |
| Mining Engineer | 4 |
| Geologist | 2 |
| Surveyor | 2 |
| Sampler | 4 |
| Geotechnical Engineer | 1 |
| Total | 221 |
| International Tower Hill Mines Ltd. S-K 1300 – Technical Report Summary Livengood Gold Project Pre-feasibility Study | |
The recovery methods for the Livengood Gold Project were established on the basis of laboratory-scale testwork as described in Chapter 10, equipment information from suppliers, and BBA’s experience on similar projects. The resulting flowsheet reflects the results of this testwork and forms the basis for the plant design, capital costs and operating costs developed in this study. Design work and equipment descriptions in this Chapter are reported in imperial units, with metric units shown in parentheses. Every effort has been made to clearly display the appropriate units being used throughout this TRS, certain tables show results in metric units only.
| 14.2 | Process Plant Production Schedule |
The mine is scheduled to deliver an average tonnage of approximately 65,000 t/d (59,000 mt/d) of ore to the primary crusher and process plant on a 365-day-per-year basis. The process plant is designed to operate with an availability of 93%. The primary crusher and main process plant will operate 24 hours per day and 7 days per week. The operating teams will work on a schedule of two 12-hour shifts. The main process plant will be stopped periodically to perform preventive maintenance on equipment, for which there is no standby unit. The operations and maintenance teams will be supported by an Integrated Remote Operating Control Center (IROC) to be located in Fairbanks. More information on the IROC is given in Chapter 15.
The overall gold recovery of the proposed circuit is estimated at 71.4% based on the rock types to be processed according to the LOM plan. Average annual gold production is estimated to be 388,600 oz/year for the first 5-years and approximately 317,000 oz/year life of mine.
| 14.3 | Conceptual Process Flow Diagram |
The processing plant consists of primary crushing, ore reclaiming, pre-crushing, grinding, gravity recovery, carbon in leach (CIL) with adsorption, desorption and reactivation (ADR) circuits, cyanide detoxification, water and tailings management, and reagent preparation circuits geared to produce gold doré for delivery to the refinery. Figure 14-1 describes the conceptual process flow from the ore delivery to the crusher to doré production and tailings and water management.
| International Tower Hill Mines Ltd. S-K 1300 – Technical Report Summary Livengood Gold Project Pre-feasibility Study | |
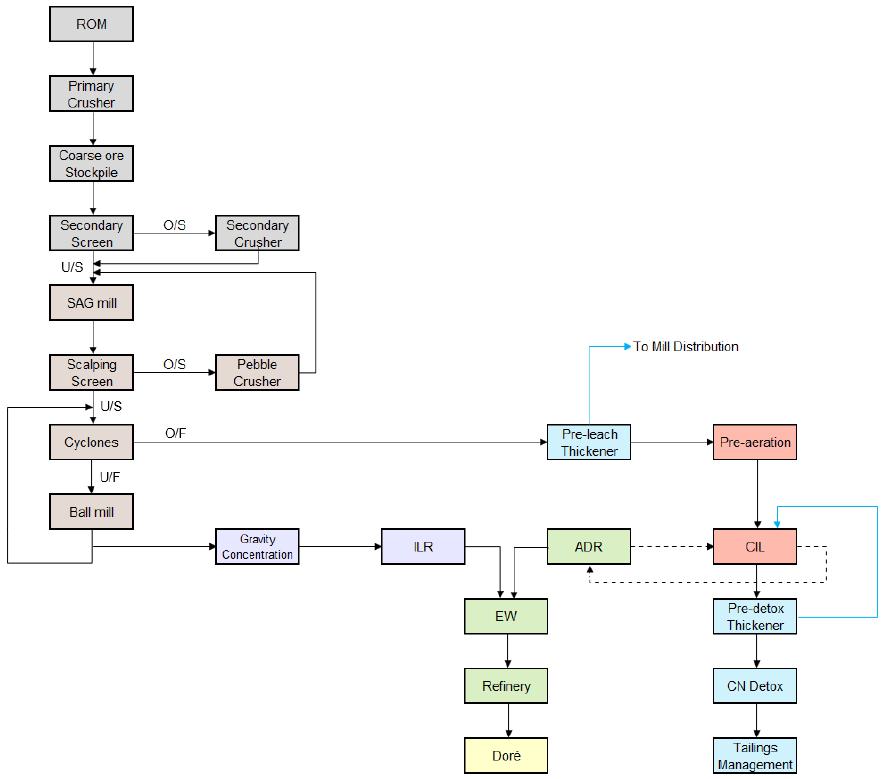
Figure 14-1: Conceptual process block flow diagram
| 14.4 | Plant Operating Design Parameters |
The design criteria to determine sizing of the equipment is based on a nominal daily processing plant throughput capability of 65,000 t/d (59,000 mt/d) with a 93% availability factor. A design factor of 1.15 was typically considered for areas where flow rates are not affected by the feed grades of the ore processed. Table 14-1 presents an overview of the main design criteria factors employed and sizes of the most significant process equipment.
| International Tower Hill Mines Ltd. S-K 1300 – Technical Report Summary Livengood Gold Project Pre-feasibility Study | |
Table 14-1: General process design criteria
| Criterion | Unit | Value |
| General Design Data | | |
| Process Plant Operating Life | y | 21 |
| Overall Process Plant Availability | % | 93 |
| Operating Hours Per Year | h | 8,147 |
| Design Factor | | 1.15 |
| Production Rates | | |
| Life of Mine | Mt (Mmt) | 474 (430) |
| Annual | Mt/y (Mmt/y) | 23.7 (21.5) |
| Daily | t/d (mt/d) | 65,000 (59,000) |
| Process Plant Feed | | |
| Gold Grade (LOM Average) | g/mt | 0.65 |
| Feed Size (ROM, F80) | in (mm) | 31.5 (800) |
| Primary Crushing | | |
| Crusher Type / Size - (Gyratory (60' × 89')) | hp (kW) | 1,000 (746) |
| Utilization | % | 65 |
| Product Size (P80) | in (mm) | 5.4 (138) |
| Hourly Throughput (nominal) | t/h (mt/h) | 4,167 (3,780) |
| Stockpile Retention Time (Live) | h | 12 |
| Secondary Crushing (Pre-crushing) | | |
| Crusher Type / Size - Cone | hp (kW) | 1,250 (932) |
| Number of Secondary Crushers | no. | 1 |
| Utilization | % | 90.8 |
| Product Size (P80) | in (mm) | 1.65 (42) |
| Hourly Throughput (nominal) | t/h (mt/h) | 1,612 (1,463) |
| Grinding and Pebble Crushing | | |
| Hourly Throughput | t/h (mt/h) | 2,912 (2,642) |
| Number of SAG Mills | no. | 1 |
| SAG Mill Size | D × L, ft | 36 x 20 |
| Scalping Screen Transfer Size (T80) | in, (µm) | 0.11 (2,800) |
| SAG Circuit Product Size (P80) | in (µm) | 0.06 (1,500) |
| SAG Mill Specific Energy (motor output) | kWh/t (kWh/mt) | 4.74 (5.22) |
| SAG Mill (Installed Power) | hp (kW) | 20,115 (15,000) |
| Pebble Crusher Type / Size - Cone | hp (kW) | (1,250) 932 |
| Pebble Crusher Product Size (P80) | in (mm) | 0.55-0.63 (14-16) |
| International Tower Hill Mines Ltd. S-K 1300 – Technical Report Summary Livengood Gold Project Pre-feasibility Study | |
| Number of Ball Mills | no. | 1 |
| Ball Mill Size | D × L, ft | 26.0 × 40.5 |
| Ball Mill (Installed Power) | hp (kW) | 20,115 (15,000) |
| Ball Mill Specific Energy (motor output) | kWh/t (kWh/mt) | 4.9 (5.4) |
| Ball Mill Product Size (P80) | in (µm) | 0.01 (250) |
| Ball Mill Circulating Load | % | 300 |
| Gravity Circuit | | |
| Screens | no. | 8 (1 / gravity concentrator) |
| Gravity Concentrator Size (Diameter) | in | 127 |
| Number of Gravity Concentrators | no. | 8 (2 lines x 4 units) |
| Intensive Leach Reactor (ILR) | no. | 2 |
| Cyanide Leaching and ADR | | |
| Pre-Leach Thickener diameter | ft (m) | 213 (65) |
| Pre-Conditioning Tank Dimension | D x H, ft | 47 x 61 |
| Number of Pre-Conditioning Tanks | no. | 4 (2 lines x 2 tanks) |
| Pre-Conditioning Retention Time | h | 4.04 |
| CIL Slurry Volume – per line | m3 (yd3) | 57,939 (75,784) |
| CIL Tank Dimension | D x H, ft | 63 x 79 |
| Number of CIL Tanks | no. | 14 (2 lines × 7 tanks) |
| CIL Retention Time | h | 24 |
| pH | - | 10.5 |
| Carbon Concentration | g/L (lb/gallon) | 20 (0.17) |
| Carbon Tonnage per tank | t (mt) | 157 (143) |
| Carbon Transfers per Day | no. | 1 |
| Average Carbon Loading | g/mt (lb/t) | 500 (1.02) |
| Carbon Stripping Capacity | t/day (mt/day) | 79 (72) |
| Cyanide Detoxification | | |
| Pre-Detox Thickener Diameter | ft (m) | 213 (65) |
| CIL Discharge Cyanide Concentration | ppm (mg/L) | 150 |
| Detoxification Tank Dimension | D x H, ft | 47 x 58 |
| Detoxification Circuit Retention Time | h | 1.5 |
| Sulfur Burner Capacity | mt SO2/d | 40 |
| Detox Circuit Discharge Target (WAD Cyanide) | ppm | 22 |
| Tailings Slurry Density | % | 50 |
| International Tower Hill Mines Ltd. S-K 1300 – Technical Report Summary Livengood Gold Project Pre-feasibility Study | |
| 14.5 | Process Plant Facilities Description |
The Livengood process facilities will consist of a comminution circuit (one SAG and one ball mill) followed by a gravity concentration circuit. The tailings from the gravity concentration circuit will be fed to a CIL circuit. Gold will be recovered by an adsorption, desorption and recovery (ADR) circuit, where the final product will be doré. Process tailings will be thickened, treated to detoxify cyanide, and discharged to the tailings management facility (TMF). The gravity gold will be intensively leached from the gravity concentrate. Figure 14-2 presents a schematic process flow diagram while the following subsections describe the selected flowsheet in more detail.
| International Tower Hill Mines Ltd. S-K 1300 – Technical Report Summary Livengood Gold Project Pre-feasibility Study | |
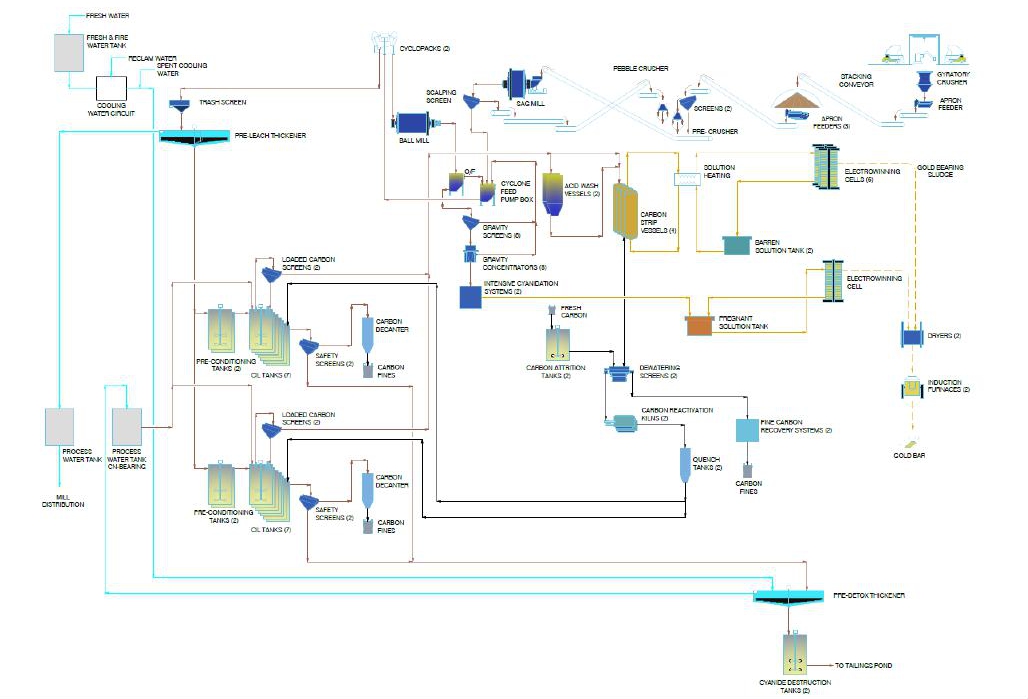
Figure 14-2: Conceptual process flowsheet
| International Tower Hill Mines Ltd. S-K 1300 – Technical Report Summary Livengood Gold Project Pre-feasibility Study | |
The primary crushing system is a single stage open circuit (60 × 89) gyratory crusher (1,000 hp, 746 kW). The crusher selection is based upon a feed (F80) size of 31.5 in (800 mm) and a product (P80) of 5.4 in (138 mm), with an expected utilization of 65% at 65,000 t/d (59,000 mt/d). The live capacity of the feed and discharge hoppers to the gyratory crusher are designed for slightly over two truckloads, assuming a nominal payload of 320 t (291 mt). The gyratory crusher’s instantaneous throughput is 4,167 t/h (3,780 mt/h) and the system is equipped with a sacrificial conveyor.
| 14.5.2 | Crushed Ore Stockpile |
The crushed ore storage pile is designed for a live capacity corresponding to approximately 12 hours of crushing or 34,946 t (31,703 mt). The total capacity of the storage pile (live + dead) is 113,961 t (103,384 mt). The coarse ore stockpile is covered by a dome.
| 14.5.3 | Secondary Crushing (Pre-Crushing) |
Ore reclaim from the stockpile is fed from a reclaim tunnel. The reclaim tunnel is equipped with three apron feeders that feed a secondary cone crusher installed in an open circuit. Two screens 12 ft × 27 ft (3.7 m × 8.2 m) receive the gyratory crusher product, which directs oversize material to a cone crusher (1,250 hp, 932 kW) that crushes the oversize to a P80 of 1.65 in (42 mm). The screen undersize and secondary crusher product is subsequently fed to the SAG mill. The secondary crusher is equipped with a by-pass chute to maintain high plant availability.
| 14.5.4 | Grinding and Pebble Crushing |
A SAG mill / ball mill, in a SABC configuration has been selected (Figure 13-5) for the Livengood Gold Project; this configuration provides increased efficiency for competent to medium hard ores. In a SABC circuit, the SAG mill operates in closed circuit with a pebble crusher. The SAG mill is equipped with pebble ports, which evacuate the hard, critical size pebbles that are then conveyed to the pebble crusher, before being returned to the SAG mill. The ball mill operates in closed circuit with hydrocyclones. The required SAG mill power is estimated at 4.7 kWh/t (5.2 kWh/mt), while the required ball mill power is estimated at 4.9 kWh/t (5.4 kWh/mt), for a combined total of 9.6 kWh/t (10.6 kWh/mt) at the pinion, excluding the pebble crusher and secondary crusher power. The grinding circuit product used to design the mill power is 250 µm (P80). The total power required to grind from primary crusher to final ball mill product is 10.2 kWh/t (11.3 kWh/mt). Note that all estimated power values cited are based on the motor output.
The grinding circuit is based on one grinding line, which is comprised of a SAG mill (D×L: 36 ft × 20 ft,) with installed power of 20,115 hp (15,000 kW) and a ball mill (26 ft × 40.5 ft) with installed power of 20,115 hp, (15,000 kW).
| International Tower Hill Mines Ltd. S-K 1300 – Technical Report Summary Livengood Gold Project Pre-feasibility Study | |
The product from the SAG mill will fall onto a classification screen. The oversize from the scalping screen will be conveyed to a single cone (pebble) crusher (1,250 hp (932 kW)), the product of which is returned to the SAG mill. A scalping screen undersize product of 2,800 µm (P80) is discharged into the cyclone feed pumpbox, from which the slurry is pumped to two hydrocyclone clusters. The cyclone underflow is fed to the ball mill. The product is discharged into the gravity feed pumpbox which feeds the gravity circuit. The overflow of the gravity feed pumpbox is returned to the cyclone feed pumpbox along with the tails of the gravity circuit. The feed to the gravity circuit (93,600 t/d (84,910 mt/d)) goes to a distributor that feeds eight gravity screens (four per line), each of which feeds its own gravity concentrator (127 in). The gravity screen oversize and gravity concentrator tails are returned to the cyclone feed pumpbox. The gravity concentrate, amounting to approximately 0.05 wt% mass pull, is sent to the intensive cyanidation (ILR) system.
Pebble lime will be added continuously at the ball mill to maintain ball mill discharge pH above 9.0 to promote sodium cyanide leaching downstream and limit the amount of conditioning required prior to CIL.
| 14.5.5 | Gravity and Intensive Leaching |
The Livengood gold ore contains significant amounts of free gold, which responds well to gravity concentration. The gravity circuit consists of two parallel lines composed of four Knelson concentrators each fed by a portion of the ball mill discharge. Based on testwork and simulations conducted by FLSmidth, the design gold recovery of the gravity circuit is estimated to be 30% for an average feed blend.
A batch intensive cyanidation system composed of two units will be used to process the gravity concentrate. The extraction performance of gold from the gravity concentrate by the intensive cyanidation system is designed at 98%. The pregnant solution will be pumped to a tank in the gold room, followed by electrowinning in a dedicated cell.
The hydrocyclone overflow product will be pumped to a trash screen, before discharging into the pre-leach high rate thickener with a diameter of 213 ft (65 m). This thickener will thicken the slurry to 60 wt% in the thickener underflow stream. The thickener overflow will report to the process water tanks. The underflow from the thickener will feed CIL lines 1 and 2 at the pre-conditioning stage.
Pre-conditioning with oxygen and lead nitrate will be conducted in four large tanks. The designed retention time is four hours when the plant operates at 65,000 t/d (59,000 mt/d). Lead nitrate will be added to the pre-conditioning tank based on the concentration of antimony in the feed. When the concentration is sufficiently low, no lead nitrate will be added to the pre-conditioning circuit.
The CIL circuit is comprised of two lines of seven large CIL tanks each and all within their own concrete containment areas. Overflow from the pre-detox thickener is added to the first CIL tanks of each line to adjust the slurry percent solids to 50%. The designed retention time is 24 hours when the plant operates at 65,000 t/d (59,000 mt/d). The design carbon loading is 800 g/mt, but is to be confirmed by additional CIL testwork and simulation.
| International Tower Hill Mines Ltd. S-K 1300 – Technical Report Summary Livengood Gold Project Pre-feasibility Study | |
The slurry will flow counter-currently to the carbon from tank 1 through to tank 7. Fresh carbon will be added to tank 7 and flow to tank 1, by way of the carbon advance pumps located in each CIL tank. Slurry will exit tank 7 over the carbon safety screens, before heading to the pre-detox thickener. Loaded carbon exiting tank 1 will report to the carbon stripping system (ADR) for recovery of the adsorbed metals.
| 14.5.7 | Adsorption, Desorption and Recovery (ADR) |
Loaded carbon from the CIL tanks reports to the loaded carbon stripping circuit, where gold will be stripped, and the carbon reactivated for recycle to the CIL circuit. Based on the information available, it is assumed that one strip per day will be sufficient to recover the gold loaded onto the carbon.
The ADR circuit includes an acid wash stage (two vessels) and High Pressure “modified” Zadra process for gold stripping from the loaded carbon. The Zadra stripping circuit (four vessels) is considered “modified”, as the electrowinning is done in-line, with no pregnant tank between stripping and electrowinning. The barren solution is collected in two 20,236 gal (76.6 m3) barren tanks. The stripping cycle will be two stages, in which copper is stripped first, followed by gold. The stripped copper is converted to copper sulfate for use in the cyanide detoxification circuit downstream.
The stripped carbon will flow to the carbon regeneration kilns (2) possessing the same carbon capacities and conservatively include provision for 100% regeneration of the carbon. The regenerated carbon will be combined with fresh carbon, making up for carbon losses that occur through the process. This regenerated/fresh carbon mixture will maintain an adequate supply to the CIL circuits.
The flow of pregnant solution from the Zadra circuit and the gravity ILR is split to feed a total of seven electrowinning cells. The refining equipment is designed to handle both the gold from the stripping circuit and from the gravity recovery system. The electrowinning sludge is filtered, dried, and mixed with fluxes, before being smelted in an induction furnace.
| 14.5.8 | Pre-Detox Thickening and Cyanide Detoxification |
Thickener overflow reports to the process water tank and will be used for water needs upstream and to dilute the slurry prior to cyanide detoxification. The underflow of the pre-detox thickener (213 ft (65 m) diameter) is diluted to 50% from 60%.
The selected cyanide detoxification process is the Inco SO2/air process. A sulfur burner will be used to produce SO2. Cyanide detoxification was designed with 1.5 hours of retention time in two tanks. The tailings slurry will be pumped at 50 wt% solids coming out of the cyanide detoxification unit.
Water recovered by the reclaim barge pumps from the settled tailings will be returned upstream to meet process water requirements.
All cyanide process tanks are provided with appropriately sized secondary containments and all process solution pipelines are contained within the mill complex (mill building, CIL/leach tank farm, and detoxification plant) and are provided with secondary containment in association with the major tanks that they serve.
| International Tower Hill Mines Ltd. S-K 1300 – Technical Report Summary Livengood Gold Project Pre-feasibility Study | |
The main consumables for the processing plant are represented by the grinding media and liners for the SAG and ball mills, as well as the reagents used in the leaching, gold recovery and cyanide detoxification circuits.
All process reagents are contained in a separate area within the process plant building to prevent any contamination of any surrounding areas in case of a spill. Safety showers are provided in the different reagent mixing and utilization areas for safety, in case of contact with the reagents. HCN monitors will be installed in appropriate locations to ensure the safety of the employees. Grinding media will be in pits located indoors, close to usage points.
The primary reagents used in the process include sodium cyanide (NaCN), lime (CaO), oxygen (O2), elemental sulfur (S), sodium hydroxide (NaOH), hydrochloric acid (HCl), carbon, copper sulphate (CuSO4), lead nitrate (Pb(NO3)2) and flocculant. Consumption rates are mostly based on results from bench-scale testwork, with reductions as deemed applicable to recycle streams and implementation of control strategies at industrial scale.
Table 14-2 and Table 14-3 list all reagents, media, areas of usage and their purpose.
Table 14-2: Reagents and area of use
| Reagent | Area | Use | Consumption
(mt/y) |
| Lead nitrate (PbNO3) | Pre-treatment ahead of carbon in
leach and intensive leach | Surface passivation | 1,028 |
| Sodium cyanide (NaCN) | Carbon in leach and carbon
elution | Dissolution of gold and elution | 7,357 |
| Oxygen (O2) | Carbon in leach | Dissolution of gold | 54,913 |
| Carbon (C) | Carbon in leach | Gold adsorption | 526 |
| Quicklime (CaO) | Ball mills Carbon in leach
Cyanide detoxification | pH control | 30,410 |
| Sodium hydroxide (NaOH) | Acid wash and Carbon elution | Neutralization of acid and elution | 1,250 |
| Hydrochloric acid (HCl) | Carbon elution | Acid wash | 696 |
| Elemental sulfur (S) | Cyanide detoxification | Cyanide detoxification | 5,127 |
| SMBS (Na2S2O5) | Cyanide detoxification | Cyanide detoxification (backup) | 399 |
| Copper sulphate (CuSO4) | Cyanide detoxification | Catalyst cyanide detoxification
reaction | 965 |
| Flocculant | Pre-leach thickener
Pre-detox thickener | Flocculate solids to assist in
solid/liquid separation | 1,287 |
| International Tower Hill Mines Ltd. S-K 1300 – Technical Report Summary Livengood Gold Project Pre-feasibility Study | |
Table 14-3: Grinding media and area of use
| Media | Area | Consumption (mt/y) |
| 5-in forged steel ball | SAG mill | 3,472 |
| 3-in forged steel ball | Ball Mill | 7,304 |
Carbon is consumed regularly through abrasion in the CIL tanks and in transfer pumps, and by thermal disintegration from regeneration, etc. Carbon will be delivered by truck in 1,100 lb (500 kg) bulk super sacks. Before it can be used in the process, fresh carbon must be wetted and abraded in an attrition tank.
Caustic soda (50%) and hydrochloric acid (31.5%) will be used in the carbon stripping process. Caustic soda will be supplied by bulk tanker and the acid will be delivered in rubber-lined ISO containers. The individual feed lines will be equipped with flow meters and control valves to ensure that the appropriate dosages are achieved.
Sodium cyanide (NaCN), used in the cyanide leaching (CIL and ILR) and carbon stripping processes, will be delivered in briquette form in ISO tanks. The briquettes will be dissolved in water and the solution will be stored in a tank, from which it will be distributed by pumps to the appropriate process areas.
Oxygen is fundamental for gold leaching. Based on the previous trade-off studies by BBA, the implementation of a vacuum pressure swing adsorption (VPSA) oxygen production plant was selected to meet the oxygen requirements of the Project. Oxygen will then be bottom-sparged to the pre-treatment tank and CIL tanks. A liquid oxygen back-up system will be available when the VPSA plant is not in operation.
Flocculant will be required for the pre-leach and pre-detox thickeners. It will be delivered in solid form and dissolved in batches in a mixing tank using process water. The batch will then be pumped to a storage tank, from where the reagent will be continuously metered into the thickener feed slurry.
Copper sulphate (CuSO4) will be delivered in solid form in 2,756 lb (1,250 kg) super sacks and dissolved in batches in a mixing tank using fresh water. The batch will then be pumped to a storage tank, from which the reagent will be continuously pumped to the cyanide detoxification tank.
Quicklime (CaO) is used in the cyanide detoxification and cyanide leaching processes (pre-aeration and CIL tanks). It will be delivered by truck in bulk containers and transferred pneumatically to a lime storage silo. A screw conveyor will transfer the quicklime from the silo to the lime slaker, where it will be wetted with water. The slaked lime will pass through grit separators and into the quicklime mixing tank, to which more water will be added to create slurry of the appropriate density. Grit will be removed from the separator and disposed of using a screw conveyor. The hydrated lime slurry will be pumped continuously from the mixing tank to the appropriate process areas.
Lead nitrate (PbNO3), used in cyanide leaching, will be delivered in 2,200 lb (1,000 kg) bulk super sacks. Lead nitrate is dissolved in batches in a mixing tank. The solution will then be pumped to a holding tank, from which the reagent will be continuously pumped to the pre-conditioning tanks.
| International Tower Hill Mines Ltd. S-K 1300 – Technical Report Summary Livengood Gold Project Pre-feasibility Study | |
The Inco SO2/air process will be used for cyanide detoxification. The sulfur dioxide (SO2) will be generated using a sulfur burner that will burn elemental sulfur delivered to site in 2,200 lb (1,000 kg) bulk super sacks, which will be transferred to a storage silo. The SO2 will be produced on demand and will be delivered to the cyanide detoxification tanks.
Sodium Metabisulfite (Na2S2O5) will be the back-up source of SO2 when the sulfur burner plant is under maintenance. Sodium metabisulfite will be received in 2,200 lb (1,000 kg) super sacks. Each sack will be emptied into the sodium metabisulfite mix tank and mixed with fresh water to 20 wt% and then transferred to the sodium metabisulfite solution holding tank. Sodium metabisulfite solution will be pumped by the sodium metabisulfite distribution pump to the cyanide detox reactor tanks.
Copper sulphate (CuSO4) and quicklime (CaO) will be added to control the chemical reaction at the cyanide detoxification reactors. The detoxified slurry will then be pumped to the TMF.
Refining flux will be delivered to site in bags or buckets. Pre-mixed fluxes are mixed with the dried electrowinning sludge to adjust the chemistry of the material for refining. The proper flux mix and quantity, based on the electrowinning sludge chemistry, will be established by the smelting flux supplier during the first months of operation.
The process plant building will house various maintenance facilities including shops for mechanical, electrical and instrumentation repairs. Equipment requiring specialized maintenance or major rebuilds will either be dispatched to shops in the Fairbanks area or back to their suppliers.
Other facilities within the process plant building include a centralized control room located near the grinding area, metallurgical and sample preparation laboratory, change-rooms (dry), lunchroom, as well as offices, conference and training rooms.
| 14.8 | Process Plant Controls |
A plant control system with open architecture and a unique platform will be used. The main communication backbone will be provided by redundant Ethernet fiber optic cables. Where equipment is supplied as a packaged unit, the vendor packages will have standardized controllers that will communicate with and be controlled by the plant network.
The control system will include operator workstations with historian software to enable reporting of plant data, calculations, statistical analysis of process data, and to allow for metallurgical optimization of the plant operations.
An information system and an information management system will allow certain staff to monitor the process and the variables from their PCs, connected to the management information platform.
Monitors will be installed for a closed-circuit television (CCTV) system, a calling and searching system, fire protection systems, centralized panels, and other dedicated systems that require monitoring or controlling by the operator.
| International Tower Hill Mines Ltd. S-K 1300 – Technical Report Summary Livengood Gold Project Pre-feasibility Study | |
Process water is distributed throughout the processing facility to dilute streams to the necessary solids pulp density that is required in each unit operation. The majority of the process water is reclaimed from the CIL thickener overflow stream and from the tailings pond via the reclaim pumps. The fresh water required for the process is taken from the wells located on the north side of Livengood Valley. Based on the mass and water balance, fresh make-up requirements will be approximately 233 gpm (53 m3/h)
The total operating power demand for the process plant will be approximately 54 MW. The crushing and grinding circuit represent approximately 57% of the total operating power used by the plant. The processing power demand is shown in Table 14-4.
Table 14-4: Process plant power demand by area
| Area | Power Demand (MW) |
| Primary Crushing | 1.8 |
| Stockpile | 2.0 |
| SAG Mill | 18.4 |
| Secondary Crushing and Pebble Crushing | 0.6 |
| Ball Mill | 15.8 |
| Gravity and ILR | 2.2 |
| Leaching | 5.3 |
| ADR and Gold Room | 0.7 |
| Detox and Plant Tailings | 3.1 |
| Reagents | 2.4 |
| Plant Services | 1.3 |
| Total Power Demand | 53.5 |
Liquefied natural gas will be used for heating within the process plant building.
| 14.11 | Process Plant Arrangement |
The proposed Livengood process plant and ancillary facilities will be located approximately midway between the open pit mine to the south-east and the TMF to the north. The process plant comprises four main buildings: the primary crushing building, the covered stockpile area, the secondary/pebble crushing building and the main process plant building. Secondary process facilities such as the thickeners, reagent silos, oxygen plant and sulfur burner are in proximity to the main process building. A general arrangement of the process plant area is presented in Figure 14-3.
| International Tower Hill Mines Ltd. S-K 1300 – Technical Report Summary Livengood Gold Project Pre-feasibility Study | |
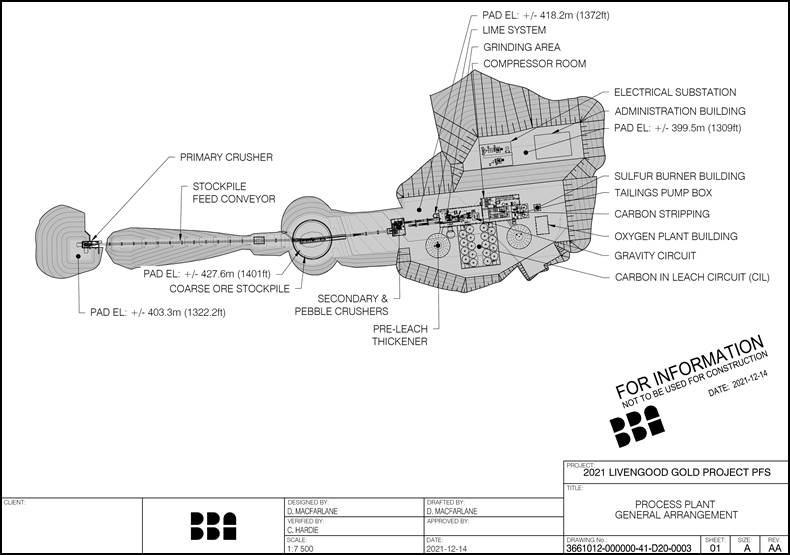
Figure 14-3: Process plant general arrangement
| International Tower Hill Mines Ltd. S-K 1300 – Technical Report Summary Livengood Gold Project Pre-feasibility Study | |
| 14.12 | Process Plant Personnel |
A total of 140 employees are required in the process plant, including 26 salaried staff and 114 hourly workers divided into management and technical services, operations and maintenance departments.
Table 14-5 and Table 14-6 present the salaried and the hourly manpower requirements, respectively, for the processing plant.
Table 14-5: Process plant salaried manpower
| Position | Number of Employees |
| Mill manager | 1 |
| Mill secretary / clerk | 1 |
| Mill operations supervisor | 4 |
| Safety trainer & coordinator | 1 |
| Chief metallurgist | 1 |
| Metallurgist | 2 |
| Chief assayer | 1 |
| DCS engineer | 1 |
| Process data analyst | 1 |
| Mill maintenance superintendent | 1 |
| Electrical superintendent | 1 |
| E&I supervisor | 2 |
| Electrical engineer | 1 |
| Electrical maintenance planner | 1 |
| Mechanical engineer | 1 |
| Mill maintenance supervisor | 2 |
| Mill maintenance planner | 2 |
| Crusher supervisor | 1 |
| Tailings supervisor | 1 |
| Total – Salaried | 26 |
| International Tower Hill Mines Ltd. S-K 1300 – Technical Report Summary Livengood Gold Project Pre-feasibility Study | |
Table 14-6: Process plant hourly manpower
| Position | Number of Employees |
| Mill Operations |
| Primary crushing operator | 4 |
| Crusher / conveyor helper | 4 |
| Mill control room operator | 4 |
| Grinding operator | 4 |
| Grinding helper | 4 |
| Gravity operator | 4 |
| Gravity helper | 4 |
| Leach / CIL operator | 8 |
| Stripping operator | 4 |
| Refiner | 4 |
| Detox operator | 4 |
| Tailing operator | 4 |
| Reagents operator | 4 |
| Metallurgical technician | 2 |
| Assayer | 4 |
| Sampler | 4 |
| Sub-total | 66 |
| Mill Maintenance |
| Millwright | 20 |
| Mechanic / welder | 16 |
| Elect. / Inst. | 4 |
| Electrician | 4 |
| Instrument technician | 4 |
| Sub-total | 48 |
| Total – Hourly | 114 |
| International Tower Hill Mines Ltd. S-K 1300 – Technical Report Summary Livengood Gold Project Pre-feasibility Study | |
| 15. | Project Infrastructure |
The Livengood Gold Project area is located approximately 70 mi (113 km) by road (47 mi (75 km) by air) northwest of Fairbanks and is accessed by state Highway 2 (Elliott Highway), which provides paved, year-round access from Fairbanks. The property is adjacent to the Trans-Alaska Pipeline System (TAPS) corridor, which transports crude oil from the North Slope south and contains a fiber optic communications cable. A second fiber optic cable runs parallel to the Elliott Highway. Locally, a number of unpaved roads lead from the Elliott Highway into and across the deposit. A 3,000 ft (914 m) runway is located 3.7 mi (6 km) to the southwest of the Project and is suitable for light aircraft (see Figure 15-1).
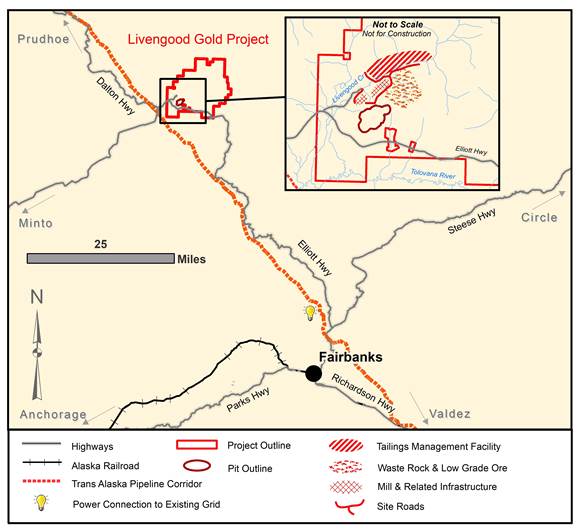
Figure 15-1: Livengood property – conceptual infrastructure arrangement drawing
| International Tower Hill Mines Ltd. S-K 1300 – Technical Report Summary Livengood Gold Project Pre-feasibility Study | |
| 15.2 | General Site Arrangement |
To the extent practicable, the infrastructure facilities for the Project have been designed to avoid or minimize impacts to wetlands by avoiding direct use of the Tolovana River watershed and by establishing a footprint as compact as possible within the historically mined Livengood Creek basin. The Project site has been configured for optimum construction access and operational efficiency as well as to take advantage of the existing roads and infrastructure.
The Project envisions construction of the following key infrastructure items:
| § | Temporary construction camp; |
| § | Light vehicle access and mine haulage roads; |
| § | O’Connor Creek substation and 50 miles of new 230 kV transmission line; |
| § | Process plant and ancillary buildings; |
| § | Administration and mine dry building |
| § | Maintenance garage, truck wash, warehousing and explosive storage facilities; |
| § | Bulk fuel storage and refueling station; |
| § | Water and sewage treatment; |
| § | Site wide electrical distribution and emergency power generators; |
| § | Fresh water pumping and distribution system; |
| § | Waste rock, overburden, ore and growth media stockpiles; |
| § | Communications and information technology networks; |
| § | Mine tailings and water management facilities; |
| § | Fairbanks Integrated Remote Operations Center (IROC); |
| § | Fairbanks employee parking area. |
The total power demand of the Project is estimated to be approximately 57.8 MW, including network losses of 3%. An electrical load list was created based on a detailed mechanical equipment list that included the major power draw contributors. Minor power consumers and power for auxiliary systems were benchmarked based on BBA’s past project experience. Based on this load list, the power demand was calculated taking into account the nominal operating loads (load factor), efficiency factors and a diversity factor. Table 15-1 shows the estimated power demand breakdown by area. The power demand presented represents the LOM average. The yearly nominal power demand will vary based on the rock type blend as the specific grinding energy varies per rock type. The projected annual electrical energy use is estimated to be approximately 450.9 GWh including the network losses of 3%.
| International Tower Hill Mines Ltd. S-K 1300 – Technical Report Summary Livengood Gold Project Pre-feasibility Study | |
Table 15-1: Estimated total project power demand
| Area | Power Demand
(MW) | % Site |
| Open Pit Mine and Mine Garage | 0.3 | 1 |
| Process Plant | 53.5 | 93 |
| Administration Building and General Infrastructure | 0.3 | 1 |
| Tailings and Water Management | 2.0 | 3 |
| Network Losses | 1.7 | 3 |
| Site total | 57.8 | 100 |
Golden Valley Electric Association (GVEA), a member-owned cooperative, provides the only regulated electrical service to customers connected to the rail belt power grid north of the Alaska Range. Historic peak winter demand on the GVEA system is approximately 210 MW. GVEA is connected to South Central Alaska via a single 138 kV transmission line that has a capacity to import approximately 75 MW into the GVEA service area.
In 2012/2013, to support the 2013 FS, Electric Power Systems, Inc. (EPS) conducted a power supply study and determined that the GVEA system, with modifications, is capable of providing the Project with up to 100 MW of power, if required. To supply the 58 MW required for the PFS configuration, the additions and modifications to the electrical system that will be required include:
| § | A new substation at O’Connor Creek; |
| § | GVEA transmission system upgrades; |
| § | 50 mi (80 km) 230 kV transmission line up to the Livengood Project substation. |
| 15.4.1 | O’Connor Creek Substation |
A new 138/230 kV substation at O’Connor Creek (OCS) will be required to connect the Livengood transmission line to the GVEA system. The OCS will contain two 100/150 MVAR transformers, each of which will be capable of transmitting the Livengood load. GVEA has obtained a lease from the Fairbanks North Star Borough for the land parcel required for the substation. The substation will be a 3-ring bus configuration and will step up the voltage from 138 kV to 230 kV for transmission to Livengood. The network stability study performed by Dryden & LaRue in 2013 determined that a 10 Mvar Static Var Compensator (SVC) will be required at the O’Connor Creek substation.
| International Tower Hill Mines Ltd. S-K 1300 – Technical Report Summary Livengood Gold Project Pre-feasibility Study | |
| 15.4.2 | GVEA Transmission System Upgrades |
GVEA currently provides 138 kV service to the Fort Knox mine through the Fort Knox transmission line that connects to the grid at the Gold Hill substation. The OCS will be built adjacent to and connect to the Fort Knox transmission line. Since a large part of the GVEA generation will be coming from their facilities near North Pole, Alaska, located approximately 15 mi (24 km) southeast of Fairbanks, upgrades to the GVEA transmission system will be required. Upgrades to the GVEA transmission system include double circuiting approximately 15 mi (24 km) of existing line and replacing 18 mi (29 km) of various sections of 69 kV and 138 kV lines with new 138 kV transmission line.
| 15.4.3 | 230 kV Transmission Line |
Dryden & LaRue completed the design for the 50 mi (80 km) 230 kV transmission line. The route generally consists of flat to gently rolling terrain. It follows the Trans-Alaska Pipeline (TAPS) for the first 42.5 mi (68.4 km) from O’Conner Creek substation, crossing it three times. The route then traverses north and east away from the TAPS corridor for 7.25 mi (11.7 km) to the Livengood mine site substation.
The preliminary design is based on constructing the 230 kV transmission line with wood H-frame structures with guyed angle and dead-end structures. Wood poles will be directly embedded with native backfill where favorable soils exist. Where ice-rich permafrost or swampy conditions exist, driven pile foundations will be used to support the wood poles. The transmission line would be permitted in conjunction with the Project, would be constructed by THM, and operated by GVEA. EPS determined that a 25 MVAR SVC is required at the Livengood mine site substation to modulate the transient effects of the Project to GVEA specifications.
In the current study, the 25 Mvar SVC has been replaced by two Synchronous Condensers, which will provide the same benefit and will also contribute to the short-circuit capacity at the Livengood interconnection.
| International Tower Hill Mines Ltd. S-K 1300 – Technical Report Summary Livengood Gold Project Pre-feasibility Study | |
| 15.5 | Site Electrical Distribution |
The main substation at the plant site will consist of one 230 kV incoming circuit breaker and two 230 – 13.8 kV, 450/65/80 MVA, outdoor transformers, each with a 230 kV disconnect switch and a 230 kV circuit breaker on the primary side. The substation will distribute power to the plant at 13.8 kV, 60 Hz from a main switchgear installed in a pre-fabricated building located in the main substation. The main loads, each at 13.8 kV, are dedicated to the SAG and ball mills. This equipment will be driven by low-speed synchronous motors that will be run by a variable frequency drives complete with their own dedicated transformers. Two remote substations will be required. One 13.8-4.16 kV, 3 MVA substation at the tailing pond will feed the fresh water pumping station and one 13.8-4.16 kV, 1.5 MVA substation near the mining pit will feed the mine dewatering pumps. The electrical distribution to the site infrastructure (security gate, mine garage/administration complex and other facilities) will consist of a dedicated 13.8 kV overhead line distribution network. Approximately 3.7 mi (6 km) of aerial lines will supply all the infrastructure loads around the site.
Two 2,000 kW diesel engine driven generators will serve as the emergency electrical power source for the whole plant. The generator sets will provide backup power to the plant for selected process loads that need emergency power to allow an orderly shutdown of the process in case of a main power failure or to simply maintain them in operation if they are critical. They will also provide backup power to the plant control system, critical remote 480 V loads and the security system. One of these generators will provide power at 4.16 kV while the other will provide power at 480 V.
Other smaller generators (480 V) may be considered for remote consumers when using the main generators is not practical.
Generators purchased for the construction camp will be used as backup generators for the infrastructure area once the operations phase commences. No emergency power capacity is planned for the open pit mine area.
The main road and security gate to access the site will be located near the existing Alaska Department of Transportation facilities. Site access will be controlled with a guard/security house located at the entrance to the site on the main access road. The guard house will be a modular, pre-fabricated wood-frame building, with separate entrance and exit doors, potable water cooler (bottled), and a small toilet and sink connected to a pumpable holding tank. Visitor car, and bus and truck parking bays will be provided after passing the guard house. The security gate will be manned full time and is equipped with a weigh scale to monitor delivery of all bulk items required by the operation.
| International Tower Hill Mines Ltd. S-K 1300 – Technical Report Summary Livengood Gold Project Pre-feasibility Study | |
The Project site is very well situated and will make use of existing roads when possible. Project site roads will consist of both light vehicle access roads and mine truck haul roads. These roads will be constructed during the initial construction of the Project with adjustments to the alignments and profiles during the operational years as facilities change in size and shape. The on-site roads will be constructed of crushed waste rock available from site and other available materials. A dedicated mobile aggregate crushing plant will be utilized for the entire life of Project, including the period post ex-pit operation, when stockpiles are being reclaimed, to provide aggregate for continually resurfacing haul roads.
| 15.7.1 | Light Vehicle Roads |
Site roads are light vehicle access roads located throughout the Project site. Approximately 5 mi (8 km) of new site roads are planned to be constructed. These roads are designed to provide access to the administration complex, mine equipment assembly and truck shop/wash area, substation, diesel and LNG storage area, fresh water wells, process plant facilities, and the explosives storage facilities. These site roads have been designed with a two-way travel width of 26 ft (8 m) and 3 ft (1 m) high safety berms along each road shoulder. If necessary, transit of these roads by large vehicles will be by controlled one-way traffic.
Mine haul roads will be built to connect the open pit to the primary crusher, emergency ore stockpile pad, mine truck shop/wash area, mine equipment assembly area, refueling station, tailings management facility, overburden stockpile, waste rock storage facility, and low grade ore stockpile. The haul roads have been designed for a two-way travel width of 105 ft (32 m) and 6.5 ft (2.0 m) high safety berms along each road shoulder, which is suitable for the 320 t (291 mt) class trucks planned for Project use. Over the life of the mine, approximately 13.7 mi (22 km) of haul roads (ex-pit) will be built, of which 1.25 mi (2.3 km) will be built over the planned waste rock stockpile.
| 15.8 | Explosives Storage Facilities |
The explosives storage facilities have been located roughly 0.4 mi (700 m) to the east of the open pit and directly south of the low grade ore stockpile. Minimum distance requirements to mining activity and infrastructure have been respected. The explosives storage facilities include silos to store Emulsion and ANFO, as well as magazines to store the explosives accessories.
| International Tower Hill Mines Ltd. S-K 1300 – Technical Report Summary Livengood Gold Project Pre-feasibility Study | |
The process plant area consists of the primary crushing facility, covered stockpile, secondary/pebble crushing and main process plant building. The main process plant enclosed structure is approximately 165 ft (50 m) wide by 656 ft (200 m) long, and will house the grinding area (SAG and ball mills), carbon stripping, electrowinning, refining and reagent preparation areas as well as tailings pumps, mechanical services, maintenance areas, offices and the metallurgical laboratory. The pre-leach thickeners, CIL leach tanks, pre-detox, detox cyanide destruction tanks, and lime and sulfur burner facility are to be located outside, around the process building. The process building will be heated with liquefied natural gas (LNG).
| 15.10 | Administration and Mine Services Facility |
The administration offices and mine dry will be in a building with approximate dimensions of 295 ft (90 m) long by 197 ft (60 m) wide and will be located on the same pad as the substation north of the process plant. However, the mine fleet shop will be located on the same pad as the mine equipment assembly area.
The mine fleet shop will be designed as a permanent building with an expandable maintenance bay structure that will accommodate the addition of mining vehicles over time. A symmetrical design allows for repair bays to be added in pairs. The fleet bay dimensions, bay door sizing and overhead crane lifting capacities (70 t / 63 mt) are all based on a fleet of 320 t (291 mt) class mining trucks. All vehicle bays will have the same dimensions to allow for operations flexibility. As with the process facilities, this building will be heated with LNG.
| 15.10.1 | Lube Storage and Distribution |
The mine fleet shop will be equipped with an enclosed lube storage and distribution system for mine fleet maintenance. The storage area will consist of multiple vertical steel tanks sized according to their consumption rate and located within a containment dike. The storage area will be placed alongside the mine garage facility, and the large used oil and coolant tanks will be located outdoors for ease of access and servicing. A long-range overhead dispensing and evacuation system for transfer of oil, grease, transmission fluids, cooling fluids, windshield washer, service water and compressed air is planned for the mine fleet shop.
| 15.10.2 | Warehouse and Storage |
The warehouse storage facility is located adjacent to the mine fleet shop, with direct access between the sections, to facilitate heavy component transfer and increased productivity. Warehouse storage requirements will be defined according to the type of storage required. The assumption is made that only one set of major components will be housed at the site and sufficient “rolling” storage will be provided. Moreover, an exterior cold storage area has been allocated adjacent to the building.
| International Tower Hill Mines Ltd. S-K 1300 – Technical Report Summary Livengood Gold Project Pre-feasibility Study | |
| 15.10.3 | Mechanical Workshop |
The mechanical workshop will also serve as a light vehicle maintenance bay, and be equipped with a 10 t (9 mt) overhead crane and small bay doors. An allowance for equipment has been included in the capital cost estimate.
| 15.10.4 | Administration Offices |
The mine offices will include sufficient closed offices and workstations to accommodate the mining operations, mine maintenance, and environmental and technical services. Additional offices are foreseen in the warehouse as well as in the concentrator building for process personnel, maintenance group and administration groups.
The mine dry facilities will consist of locker rooms and shower facilities for both men and women. Each mine employee will be assigned two distinct lockers. The shower facilities will be sufficient to handle the shift crossover.
The following additional surface infrastructure facilities are located at various locations on site and are described below. The mine services facilities will be positioned on the pad to ensure free and safe movement of the heavy vehicles and will include a “ready line” parking area for the mine haul trucks. These additional facilities include the following:
| - | The truck wash facility will accommodate the mine trucks and auxiliary vehicles. This facility will have a specialized truck wash system, which will include a mud settling basin, oil separator, and water filtration and recirculation system to reduce overall water consumption. The truck wash facility will be located adjacent to the truck shop in the open pit mine area. |
| - | Diesel storage will consist of ten 13,000 gal (50,000 L) tanks located along the eastern edge of the process plant pad, providing up to an average of seven-day storage capacity, based on 24 hrs/d operation for the LOM. The tanks are double-walled and self-contained with leak detectors. |
| International Tower Hill Mines Ltd. S-K 1300 – Technical Report Summary Livengood Gold Project Pre-feasibility Study | |
| - | The fuel dispensing system for mine fleet vehicles will be located near the fuel storage area and will consist of an open-ended pre-engineered building with high speed dispensers and hose reels. A concrete pad will be installed under the enclosure and will be equipped with a spill catchment. The fuel dispensing area will also serve as a top-off area for engine coolant, oil, grease and windshield washer fluid. For safety and practical reasons, a separate fuel dispensing station for light vehicles will be located nearby. Gasoline usage is minor and will be satisfied by purchase from local retail suppliers. The mine’s light vehicle fleet is expected to consist primarily of diesel pickup trucks. |
| - | A skid mounted sewage treatment plant will treat sewage from the administration building and process plant. Sludge from the sewage treatment plant will be collected by a vacuum truck and may be transported off site for disposal. The sewage treatment plant will be located adjacent to the administration building. |
| § | Potable Water Treatment Plant: |
| - | A skid mounted potable water treatment plant is planned to supply water to the administration building, mine services facility and process plant. The treatment process consists of filtration, chlorination and UV sterilization units to produce potable quality water. The potable water treatment plant will be located adjacent to the administration building. |
| § | Emergency services building: |
| - | The emergency services building will be connected to the administration building and is a modular and pre-fabricated wood-frame building. It contains two offices, an examination room, a treatment room, and a waiting room. Within the same complex, a covered garage houses the ambulance and fire truck. |
| 15.12 | Communications / Information Technology (IT) |
The internet and phones services will be provided for the Project by a regional internet service provider, utilizing one of the existing networks currently installed near the TAPS corridor. A redundant fiber optic network will interconnect critical site areas including the gate house, administration and mine services facility and the process plant. Telecommunication services for non-critical remote locations will be provided by a wireless network. A hand-held radio system will be used for voice communication between personnel in the field. The site-wide fiber optic network will be utilized by the following systems:
| § | Process plant control system (process control network and electrical systems); |
| § | Corporate IT (phone and data); |
| § | Operations, maintenance and warehouse management systems; |
| § | Video surveillance and access control systems. |
| International Tower Hill Mines Ltd. S-K 1300 – Technical Report Summary Livengood Gold Project Pre-feasibility Study | |
The mining operation plans to use mobile mine radios with base stations to communicate between equipment operators and the mine staff. Some equipment will also be equipped with GPS technology to provide accurate location information through Wi-Fi communication.
An underground fire water distribution network of 14-in pipe, feeding sprinkler systems, with 6-in hydrants will be installed around the process plant and the administration and mine services facility. The network will be supplied by a combined fresh/fire water tank and a dedicated fire water pump with sufficient water to meet demand for two hours.
Each facility will also be protected by manual fire alarm systems and will have portable fire extinguishers located at strategic points throughout.
Fresh water for potable and process plant use will be sourced from an aquifer system located on the north side of the Livengood valley. Pumping tests and hydrological studies conducted in 2015 (Cope, L., SRK 2016) of the Amy Carbonate unit indicate that the aquifer could support five to ten water supply wells each, producing 500 to 1,000 gpm (1,900 to 3,800 L/m). It has been assumed that eight wells will be able to support the process plant start-up and operations requirements. Water from the wells and the fresh water reservoir will be pumped via a heat traced pipeline to the process plant pad for further distribution to other areas as required.
A temporary 800 person construction camp will be mobilized for the construction phase of the Project. The camp would have single occupancy rooms in a common bathroom arrangement. The construction camp is planned to include a kitchen, dining complex, offices, recreation room, and laundry and gym facilities. Once construction activities are completed, the construction camp will be removed and sold.
| 15.16 | Personnel Transportation |
As a permanent camp is not planned for the operations phase of the Project, all personnel will be transported between Fairbanks and the mine site by charter buses. Multiple buses will be required to operate on different schedules to accommodate varying work schedules. All costs related to personnel transportation are covered by the General & Administration operating cost estimate.
| 15.17 | Fairbanks Infrastructure |
A prefabricated guard house, bus waiting building, small receiving area and parking lot for 300 vehicles are planned to be located in the city of Fairbanks.
| International Tower Hill Mines Ltd. S-K 1300 – Technical Report Summary Livengood Gold Project Pre-feasibility Study | |
| 15.17.1 | Integrated Remote Operation Centre (IROC) |
An IROC is planned to be established in the city of Fairbanks on a leased basis in an existing commercial building. The integration of operations is an essential addition in the implementation of new projects and offers an approach for reconciling people (culture), process and technology in the development of an efficient operating model in production mode. Outlined below are some of the programs that are planned to be established as part of the overall integrated operations strategy for the Livengood Gold Project:
| § | Operational Excellence (OE) and Lean Mining® Program; |
| § | Asset Management Program; |
| § | Reliability-Centred Maintenance (RCM) Program; |
| § | Supply Chain Management; |
| § | Human Factors Engineering; |
| 15.18 | Waste Rock Storage Facility (WRSF) and Stockpiles |
Material mined from the open pit that is not directly hauled to the primary crusher will be placed in several storage facilities across the Livengood site. These facilities, discussed in more details below, include growth media stockpiles, overburden stockpile, WRSF, low grade ore stockpile, and an emergency ore stockpile.
| 15.18.1 | Growth Media Stockpiles |
Growth media (topsoil) material will be stripped and placed separately in growth media stockpiles to be used for closure and reclamation activities. Several growth media stockpiles will be strategically located around the site. Depending on the mining sequence and closure activities, topsoil may be hauled directly to certain areas if they are available for reclamation, thus reducing costs by limiting re-handling activities.
| 15.18.2 | Overburden Stockpile |
Overburden will be stripped and hauled to the overburden stockpile located in the Gertrude Creek Valley to the east of the plant site. The overburden stockpile will be built on the side of the hill, has a footprint area of 67 ha and a capacity of 15.7 Myd3 (12 Mm3). The bottom of the overburden stockpile is at the 1,378 ft (420 m) elevation and the top is at the 1,772 ft (540 m) elevation for a total height of 395 feet (120 m). The overburden stockpile has been designed with 150 ft (45 m) wide catch benches every 100 ft (30 m) in elevation and has an overall slope of 18.4 degrees.
| International Tower Hill Mines Ltd. S-K 1300 – Technical Report Summary Livengood Gold Project Pre-feasibility Study | |
| 15.18.3 | Waste Rock Storage Facility (WRSF) |
Waste rock not used for construction will be hauled to the WRSF located in the Gertrude Creek Valley to the east of the plant site, below the overburden stockpile. The PFS considers the same design parameters for the WRSF that were prepared by AMEC for the 2013 FS and presented in the report titled “Geotechnical Design Report August 6, 2013.pdf” (AMEC, 2013).
Since the WRSF will be built along the side of a hill, a buttress called the “Gertrude Creek Embankment” will be built at the base of the WRSF to provide additional stability. The buttress will separate the TMF and the WRSF. Stacking of the waste rock will begin at the base of the pile, against the Gertrude Creek Embankment, and advance up the slope in a “bottom-up” sequence. Access to each lift will be from the haul road that will be built to the east of the plant site to access the TMF. The WRSF has been designed with an overall slope of 18.4 degree (3H:1V).
The WRSF was designed with a footprint area of 215 ha and a capacity of 163 Myd3 (125 Mm3). The bottom of the WRSF is at the 1,083 ft (330 m) elevation and the top is at the 1,378 ft (420 m) elevation for a total height of 295 ft (90 m). The PFS requires 105 Myd3 (80 Mm3) of storage capacity in the WRSF and will be built to the 1,280 ft (390 m) elevation.
| 15.18.4 | Low Grade Ore Stockpile |
To maximize the NPV of the Project, lower grade ore will be placed in a stockpile so that higher grade ore can be accessed and sent to the process plant earlier in the mine life. The lower grade ore is then reclaimed at the end of the life of the mine. The low grade ore stockpile is located to the east of the open pit on the ridge above Gertrude Creek. Material placed in the stockpile will be classified into low grade (< 0.5 g/mt), medium grade (> 0.5 g/mt and < 0.7 g/mt) and high grade (> 0.7 g/mt), with each category being placed in a different part of the pile.
The peak low grade ore stockpile balance from the mine plan is 87.7 Mt (79.6 Mt), resulting in a capacity requirement of 45 Myd3 (34 Mm3). The low grade stockpile will also be built on the side of the hill and has a footprint area of 100 ha. The bottom of the low grade stockpile is at the 984 ft (300 m) elevation and the top is at the 1,870 ft (570 m) elevation for a total height of 886 ft (270 m) at its highest point.
The low grade stockpile has been designed with an overall slope of 18.4 degrees. Runoff from the low grade ore stockpile will be collected and discharged into the TMF.
| 15.18.5 | Emergency Ore Stockpile |
To ensure the primary crusher can be fed when the mine will be shut down during extreme weather events, an emergency ore stockpile has been located on the run of mine (ROM) pad. The emergency ore stockpile has a 65,000 t (58,967 mt) capacity to provide 24 hours of crusher feed. The emergency ore stockpile has a height of 16 ft (5 m) and a surface area of 65,000 ft2 (6,040 m2). Ore from this stockpile will be rehandled with wheel loaders that will either dump directly into the hopper of the primary crusher or load haul trucks that will haul and dump into the hopper.
| International Tower Hill Mines Ltd. S-K 1300 – Technical Report Summary Livengood Gold Project Pre-feasibility Study | |
| 15.19 | TMF and Water Management |
| 15.19.1 | Tailings Management Facility |
The TMF has been designed as a fully lined facility to provide safe and secure storage of approximately 486 Mt (441 Mmt) of mill tailings along with a supernatant pond for ore processing solutions. The TMF has expansion potential up to 529 Mt (480 Mmt). Expansions would require evaluations and design modifications to the Gertrude Creek embankment and fresh water reservoir.
The TMF is situated across the Livengood Creek valley and is formed by two cross-valley embankments, the west embankment and the east embankment. Both TMF embankments and the impoundment area between them are geomembrane lined. The TMF embankments require the removal of some native materials within the embankment footprints to improve stability characteristics of the foundation. These materials will be excavated and transported to growth media stockpiles in the general area for use during reclamation of the Project site. The embankments will then be constructed in phases beginning with starter dams, followed by a succession of five raises (six phases in total) to the final crest elevation. In addition to the phased embankment expansions, the basin of the TMF will also be expanded in phases. The embankment and basin expansions will be constructed concurrently, with the first expansion being constructed during the first two years of operation. The remaining five expansions will take approximately three years each to construct and will be completed every four years. After completion of the six TMF phases, the west embankment will have an ultimate height of approximately 450 ft (137 m) and the east embankment will have an ultimate height of 220 ft (67m).
The TMF embankments will be constructed with earth and rock fill materials generated from the open pit mine or borrowed from within the Project limits. The design of the embankments includes a 60 mil linear low-density polyethylene (LLDPE) geomembrane on the interior slope, underlain with Transition Zones, Select Rockfill and Rockfill material zones. The starter embankments also include a geosynthetic clay liner (GCL) below the LLDPE geomembrane. The GCL will further reduce the potential for seepage through the embankments during the initial years of operation when the supernatant pond will be located adjacent to the west embankment. The interior slope of the embankments is proposed to be 3H:1V (horizontal:vertical). Reclaim pipe benches are provided at each raise crest elevation. The downstream (exterior) slope of the west embankment is designed at a 2.5H:1V for the initial phases and steepening to a 1.8H:1V by Phase 6. The exterior slope of the east embankment is designed at a 2.5H:1V for all embankment phases.
A TMF groundwater drainage system will be installed within the major drainages in the Livengood Creek valley and will be located below the 60-mil LLDPE TMF impoundment geomembrane. These drains are designed to capture near surface groundwater flow and seepage from the fresh water reservoir and convey it to the underdrain collection sumps located immediately downstream of the TMF west embankment. Toe drains located along the downstream toe of the TMF west embankment will also be incorporated into this drain system. Water collected in the TMF groundwater drainage system sumps will be pumped into the TMF impoundment for reclaim.
| International Tower Hill Mines Ltd. S-K 1300 – Technical Report Summary Livengood Gold Project Pre-feasibility Study | |
A tailings underdrain collection system will be provided above the impoundment geomembrane to reduce the hydraulic head on the geomembrane and improve consolidation of the tailings. This underdrain system will collect solution that drains from the tailings and convey it to a collection sump located near the TMF west embankment south abutment. The collected solution will then be pumped into the TMF impoundment for reclaim. Mill tailings will flow by gravity to the TMF. The tailings pipeline will follow the road on the south side of the valley (road to access Gertrude Creek embankment) and along the two embankments to spigot tailings along the face of the embankments to minimize seepage potential. A reclaim barge will be utilized to recycle reclaim water to the mill. The barge will operate on the north side of the Livengood valley, keeping the deepest portions of the supernatant pond away from the TMF embankments.
| 15.19.2.1 | Contact Water Management |
All contact water flowing on the mine site will be directed to the TMF via a series of ditches and culverts. Ditches will generally follow the roads until discharging to the TMF. The channels are sized to convey the storm events.
| 15.19.2.2 | Management of Non-Contact Water to TMF |
Non-contact surface water management consists of a fresh water reservoir located immediately east of the TMF. It is formed by the TMF east embankment. In addition to being used to manage non-contact water, this reservoir will be used as a fresh water supply facility. Excess water captured by the reservoir will be conveyed via a gravity flow-through drain to a discharge location in Livengood Creek located downstream of the TMF west embankment. The flow-through drain consists of dual 48-inch pipes to convey the flow and a vertical inlet structure. Similar to the TMF embankment, the freshwater reservoir embankment requires the removal of some native materials within the embankment footprint to improve stability characteristics of the foundation. These materials will be excavated and transported to growth media stockpiles in the general area for use during reclamation of the Project site. An injection grout curtain will then be installed along the embankment upstream toe to reduce seepage from the reservoir. The embankment will be constructed with earth and rock fill materials generated from the open pit mine or borrowed from within the Project limits. The design of the embankment includes a 60 mil LLDPE geomembrane on the upstream slope, underlain by a GCL, filter, drainage, and transition zones. Above the LLDPE, the geomembrane is composed of an overliner layer, geotextile, and riprap materials to protect the geomembrane and GCL liner system. At the upstream toe of the embankment, the LLDEP and GCL are connected to the grout curtain with a concrete plinth.
| International Tower Hill Mines Ltd. S-K 1300 – Technical Report Summary Livengood Gold Project Pre-feasibility Study | |
| 16. | Market Studies and Contracts |
It was assumed in this PFS and TRS that the Livengood Gold Project will produce gold in the form of doré bars. The market for doré is well established and accessible to new producers. The doré bars will be refined in a certified North American refinery—of which there are many in the United States and Canada—and the gold will be sold on the spot market.
No market studies have been conducted by Tower Hill Mines (THM) nor its consultants on the gold doré that will be produced at Livengood. Gold is a freely traded commodity on the world market for which there is a steady demand from numerous buyers. The gold market is very liquid with many buyers and sellers active at any given time. Gold production is expected to be sold on the spot market.
Due to its widely traded nature, it is not difficult to determine the market value of gold at any particular time. Gold doré bullion is typically sold through commercial banks and metals traders with sales price obtained from the World Spot or London fixes. These contracts are easily transacted, and standard terms apply. BBA expects that the terms of any sales contracts would be typical of, and consistent with, standard industry practices and would be similar to contracts for the supply of doré elsewhere in the world.
| 16.3 | Gold Price Projections |
Figure 16-1 shows the gold spot price on a monthly basis since November 2018. As of October 29, 2021, the trailing three-year gold price average was US$1,630/oz and the trailing two-year gold price average was US$1,760/oz.
| International Tower Hill Mines Ltd. S-K 1300 – Technical Report Summary Livengood Gold Project Pre-feasibility Study | |
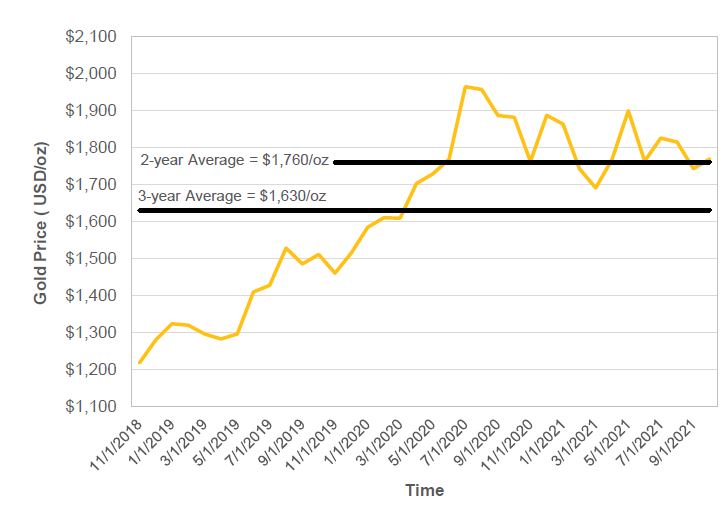
Figure 16-1: Gold spot price on a monthly basis since November 2018
For this TRS, a gold price of US$1,680/oz (base case) was assumed within the financial model (Chapter 19) to estimate revenue from the Project. The forecasted gold price is kept constant and is meant to reflect the average metal price expectation over the life of the Project. It should be noted that metal prices can be volatile and that there is the potential for deviation from the LOM forecasts. Refining and pricing assumptions are presented in Table 16-1.
Table 16-1: Refining and pricing assumptions
| Assumption | Unit | Value |
| Gold Payable | % | 99.9 |
| Gold Refining Charge (including Insurance and Transport)(1) | $/oz | 1.80 |
| Gold Price | $/oz | 1,680 |
| (1) | Gold refining charge including insurance, transport and gold payability = $3.48/oz |
| International Tower Hill Mines Ltd. S-K 1300 – Technical Report Summary Livengood Gold Project Pre-feasibility Study | |
There are no refining agreements or sales contracts currently in place for the Project that are relevant to this TRS. It is expected that terms contained within any sales contract that could be entered into would be typical of and consistent with standard industry practices and be similar to contracts for the supply of gold elsewhere in the world.
There are several large 3rd party gold refineries with well-established industry relationships in North America. Among the more notable ones are:
| § | Metalor Technologies USA; North Attleboro, Massachusetts; |
| § | Johnson Matthey; Salt Lake City, Utah; |
| § | Canadian Mint; Ottawa, Ontario. |
None of the aforementioned companies have been contacted by THM to provide a competitive treatment bid.
| International Tower Hill Mines Ltd. S-K 1300 – Technical Report Summary Livengood Gold Project Pre-feasibility Study | |
| 17. | Environmental Studies, Permitting, and Plans, Negotiations, or Agreements with Local Individuals or Groups |
| 17.1.1 | Historical Project Activities and Permitting |
Livengood Creek and the creeks draining Money Knob are mineralized and have been placer mined for over 100 years. Portions of the resource area on Money Knob have also hosted intermittent hard rock mineral exploration activities. The Project area contains federal mining claims (Bureau of Land Management), state mining claims (Department of Natural Resources), state leases (Alaska Mental Health Trust Land), and private land (as described in Chapter 3). THM has received all appropriate authorizations required to conduct exploration, geotechnical and baseline data collection activities.
THM has been conducting environmental baseline studies at the Livengood Gold Project since 2008 as part of THM’s overall goal of providing environmentally relevant and supportable data for environmental permitting, engineering design and a basis for permit-required monitoring during construction, mining and closure of the Project. These investigations are summarized in Table 17-1 and Table 17-2.
Table 17-1: Environmental baseline studies (2008-2016)
| Baseline Study | 2008 | 2009 | 2010 | 2011 | 2012 | 2013 | 2014 | 2015 | 2016 | 2017-
2021 |
| Surface Water | | | | | | | | | | |
| Surface Water Quality | | ● | ● | ● | ● | ● | ● | ● | ● | ● |
| Sediment Quality | | | | | | ● | ● | ● | ● | |
| Hydrology | | | | | | | | | | |
| Surface Water Flow and Snow | | | ● | ● | ● | ● | ● | ● | ● | ● |
| Hydrogeology | | | ● | ● | ● | ● | ● | ● | ● | ● |
| Groundwater Quality | | | ● | ● | ● | ● | ● | ● | ● | ● |
| Hydrogeological Modeling | | | ● | ● | ● | ● | ● | ● | ● | ● |
| Permafrost Studies | | | ● | ● | ● | ● | ● | ● | ● | ● |
| Wetlands & Vegetation | | | | | | | | | | |
| Wetlands Delineations | | ● | ● | ● | ● | ● | ● | | | |
| Meteorology & Air Quality | | | | | | | | | | |
| Meteorological Data | | | ● | ● | ● | ● | ● | ● | ● | ● |
| Precipitation | | | ● | ● | ● | ● | ● | ● | ● | ● |
| Ambient Air | | | | ● | | | | | | |
| International Tower Hill Mines Ltd. S-K 1300 – Technical Report Summary Livengood Gold Project Pre-feasibility Study | |
| Baseline Study | 2008 | 2009 | 2010 | 2011 | 2012 | 2013 | 2014 | 2015 | 2016 | 2017-
2021 |
| Aquatic Resources | | | | | | | | | | |
| Bio-monitoring | | ● | ● | ● | ● | ● | ● | ● | ● | ● |
| Resident Fish Surveys | | ● | ● | ● | ● | ● | ● | | | |
| Rock Characterization | | | | | | | | | | |
| Static ML/ARD Testing | | | ● | ● | ● | ● | ● | ● | | |
| Kinetic ML/ARD Testing | | | | ● | ● | ● | ● | ● | ● | ● |
| On-Site Kinetic Testing | | | | | ● | ● | ● | ● | ● | ● |
| Wildlife Studies | | | | | | | | | | |
| Habitat Mapping | | | | ● | | | | | | |
| Mammal Surveys | | | | ● | | | | | | |
| Avian Surveys | | | | ● | ● | | | | | |
| Cultural Resources | | | | | | | | | | |
| Cultural Site Surveys | ● | ● | ● | ● | ● | | | | | |
| Socioeconomics (Section 17.6) | | | | ● | ● | ● | | | | |
| Noise Studies | | | | | | | | | | |
| Noise Surveys | | | | | ● | ● | | | | |
Table 17-2: Summary of environmental baseline studies
| Baseline Study | Program Summary |
| Surface Water Quality | Surface water quality samples have been collected since 2009 over a wide range of hydrologic conditions. The network includes 20 stations in and around the Project area and 4 stations along the power line corridor. All samples have been analyzed for a comprehensive suite of analytes and include QC sample collection. Monitoring continued 2013-2017 at three stations located on the Tolovana River and the West Fork of the Tolovana River. While there are apparent local and seasonal spikes among some analytes, these are deemed to be mostly natural and, in part, a reflection of placer mining activity and regional mineralization. |
| Hydrology | The Project region is characterized by large areas of permafrost that limit groundwater recharge into local streams. As a result, many streams are ephemeral during periods of low precipitation. The USGS has maintained stream gauges in the Project area since 2010. Snow surveys have been completed in a variety of aspects, elevations, and vegetation types in late spring 2010-2021. Three years of surface flow data have been collected from Lower Amy Creek and the fifth year of data collection from Livengood Creek in the vicinity of the ADOT maintenance facility is underway. Regional data sources were used to characterize average, extreme drought, and flood conditions at the Project site, enabling the development of a long-term synthetic record of estimated monthly precipitation at the Project site, which forms the basis of the water balance model. |
| Groundwater Quality | THM has sampled 54 groundwater wells throughout the Project area. Water chemistry data indicates that groundwater varies locally and is controlled by geology and permafrost. Groundwater is most mineralized in the vicinity of the deposit; groundwater distal to the deposit has the least mineralization. |
| International Tower Hill Mines Ltd. S-K 1300 – Technical Report Summary Livengood Gold Project Pre-feasibility Study | |
| Baseline Study | Program Summary |
Hydrogeological Modeling | Compilation of average static water levels collected from the site piezometer network and pump tests indicates that the groundwater surface generally follows topography, indicating groundwater flows from higher elevations to lower elevation areas. Groundwater recharge to the deposit area is from the ridge to the northeast of the resource area. The hydraulic conductivities observed down-gradient from the proposed pit and in the rocks of the Livengood Valley are relatively high. The lowest hydraulic conductivity values were observed to the north and east of the resource area. Groundwater is confined under permafrost. Predictive numerical simulations for project groundwater have been conducted for passive pit inflow conditions and indicate that the pit will take several hundred years to fill. |
| Permafrost Studies | Thermal analysis has been performed to provide a site-wide understanding of permafrost conditions and a basis for engineering design. In general, the permafrost beneath the Livengood Gold Project area is extensive, but relatively warm (>-2ºC) and discontinuous. Permafrost depths at the Project have been measured to reach nearly 600 ft (183 m) below ground surface. |
| Wetlands and Vegetation | A 62,000-acre (25,090 ha) wetlands map of the Project area and power line corridor was completed in December 2013. This mapping will form the basis for wetlands minimization, avoidance, and mitigation during mine design and permit application preparation. Approximately half of the mapped area has been delineated as wetlands, the majority of which are dominated by black spruce forests and near-surface permafrost. Despite the fairly wide distribution of 13 invasive species found within the study area, most of the populations are relatively small. The control and containment of these species will be considered during the development of project management and reclamation plans. |
| Meteorology & Air Quality | Two meteorological stations were installed in late 2010 for use in dispersion modeling, air quality permitting, facility design, and other baseline studies. One station is located on Gertrude Ridge, northeast of the resource area, and has collected data including temperature, year-round precipitation, wind direction and speed, and relative humidity. The other station is located to the southwest of the resource area at a lower elevation and has collected the same meteorological parameters as well as seasonal evaporation data. Two fine particulate matter (PM2.5) meters were co-located with this station to monitor ambient air quality in 2011. In 2013, an all-season precipitation gauge was installed at the ADOT maintenance facility in the Livengood Creek Valley. |
| Resident Fish Surveys | As the most populous fish in the Project area, young of the year Arctic Grayling were targeted for full-body tissue analysis. Fish tissue sampling was conducted from 2009-2012. Tissues of the resident fish in the area contain detectable metals concentrations, as do many regional streams in naturally mineralized areas. The 2010 program included a summer fish presence/absence survey, a May Arctic Grayling spawning survey, a May Northern pike metals analysis, and a fall Whitefish otolith study. In 2011, a fish overwintering investigation was completed as well as a data gap analysis along the power line corridor. Survey results indicate that there are grayling overwintering in the West Fork of the Tolovana River and the old placer pond located in the Livengood Creek Valley. No salmon species have been found in the Project area. The three major drainages (Chatanika, Tatalina, and Tolovana Rivers) and their tributaries along the power line corridor are identified as fish-bearing. |
| Bio-monitoring | Macro-invertebrate sampling was conducted in 2009-2012; periphyton sampling was conducted in 2009-2017. The Project area supports a robust benthic population of less sensitive species, as would be expected in streams that have hosted long-term placer mining. |
| International Tower Hill Mines Ltd. S-K 1300 – Technical Report Summary Livengood Gold Project Pre-feasibility Study | |
| Baseline Study | Program Summary |
| Rock Characterization | In 2010, composites of various resource rock types, alterations, and oxidation were created and tested for metal content, sulfur speciation and acid rock drainage (ARD) potential. This work has since been expanded to include static and kinetic testing on selected samples obtained from the entire resource area data package, the resource dataset screened for gold grades less than 0.3 g/mt, ore composites, tailing samples, regional rock types, and overburden. The sample selection process included screening for rock type as well as sulfur, arsenic, mercury, selenium, and antimony content. Seventy-five humidity cell tests have undergone multi-year testing. Samples from the datasets have also been tested for meteoric water mobility potential (MWMP) and sequential MWMP. Twenty-eight 550 lb (250 kg) barrels of resource and regional materials are also undergoing on-site multi-year testing to establish scalability factors. The data indicates that certain stratigraphic units are potentially acid generating (PAG), while other rock types are non-PAG. Several rock types have metal leaching (ML) potential, with arsenic, antimony, and selenium being of primary interest. Mineral content and ARD potential tend to decrease outside the resource area. Management of these materials is discussed in Section 17.1.3. |
| Habitat Mapping | Wildlife studies were initiated in 2011 and included a review and synthesis of existing data in the Project area, GIS mapping of wildlife habitats and field surveys for key wildlife species. There are currently no threatened and endangered wildlife species known in the Project area. The majority of the wildlife habitats in the study area comprise black-spruce dominated upland open needle leaf forests. |
| Mammal Surveys | Aerial surveys of moose were conducted in the Project area to determine the population density and late winter distribution. During the survey, a total of 51 moose within 13 surveyed sample units were sighted. |
| Avian Surveys | In the Project area and the power line corridor, less than a third of the raptor nests were found to be occupied. Eight species of land birds that are considered high priority species for conservation were recorded in the Project area in 2012, although none of these species were confirmed to be nesting. |
| Cultural Resources | Cultural resource surveys have been completed on nearly 16,000 acres (6,475 ha) of the Project area and 5,000 acres (2,023 ha) of the power line corridor. To date, 124 historic features and 21 prehistoric sites have been identified. The majority of these historic features are remains of historic placer camps and workings. The majority of prehistoric sites contain surface and subsurface lithic materials. During the Project permitting process, all features will be reviewed by the State Historic Preservation Office (SHPO) and federal agencies working under Section 106 of the National Historic Preservation Act (NHPA). Mitigation plans will be developed as needed. |
| Noise Studies | Winter and summer noise monitoring was completed in March 2013 and July 2013, respectively. Seven locations were monitored employing two different techniques (short term and 24 hour). |
| International Tower Hill Mines Ltd. S-K 1300 – Technical Report Summary Livengood Gold Project Pre-feasibility Study | |
| 17.1.3 | Environmental Management Strategies |
Tailings Management Facility – The TMF has been designed to safely contain process plant tailings and fluids through the use of a geosynthetic liner and a cross-valley embankment on the west end of the Livengood Valley. A rock fill underdrain system will be constructed in the basin to collect near surface groundwater and any seepage that may occur from the overlying liner system. During operations, seepage from the underdrain will be collected and pumped into the TMF. Modeling and pump tests suggest that permafrost underlying the basin isolates the TMF and restricts communication with the deep groundwater.
Mine Waste Rock Facility – To minimize ARD potential and achieve an ideal blend of PAG and non-PAG materials, the facility will be constructed in lifts to facilitate blending. If needed, rocks demonstrating high relative levels of ARD or metal leaching (ML) will be specifically managed within the waste rock facility. Underdrains will collect meteoric water that infiltrates the waste rock and carry it to a lined sump at the up-gradient base of the embankment constructed along the bottom of the Gertrude Creek basin. From there, the collected water will be pumped into the TMF. The Gertrude Creek basin is underlain by permafrost that restricts communication with the deep groundwater.
A key to the successful closure of the Project is to incorporate as many environmental considerations into the initial design process as possible. These considerations are reflected in the PFS design and include the characterization studies of the mine waste rock and overburden, process plant tailings and water that have been underway since 2009.
The closure plan presented is conceptual and may not represent the executed closure plan should this Project advance to an operational facility. The plan will extend over a 36-year period, starting in production Year 17 with the construction of a water treatment plant, and ending in Year 52 with the decommissioning of the water treatment plant. The facility closure plan is divided into two main phases: closure and post-closure.
A reclamation and closure plan will be submitted to the relevant government agencies during the permitting process and will discuss the final outcome of the Project, including a final land use plan, re-grading, long-term water quality monitoring and management, test vegetation plots, the closure design, removal of facility components and financial assurances. In addition, the Project will need to prepare a U.S. Army Corps of Engineers Compensatory Mitigation Plan for mitigating unavoidable wetlands impacts that will include input from many reclamation and mitigation banking experts. It may require the setting up of mitigation banks with third parties.
| International Tower Hill Mines Ltd. S-K 1300 – Technical Report Summary Livengood Gold Project Pre-feasibility Study | |
Closure will involve initial reclamation and salvage activities and will take approximately five years to complete.
Water Treatment Plant
A 5,500 gpm (1,249 m3/h) water treatment plant will be constructed during Mine Year 20 and 21 to treat water removed from the TMF supernatant pond and seepage from the TMF underdrain system and the mine waste rock stockpile sump. Geochemistry and groundwater sampling suggest that the arsenic, selenium and antimony contained in pond, seepage and sump water will be treatable. The water treatment plant will be of modular construction, consisting of 500 gpm (114 m3/h) units, so that over time, as the treatment requirements reduce, modules can be taken out of service.
Tailings Management Facility
A dry closure of the TMF has been incorporated into its design. The supernatant pond will be removed and treated. Four years will be required to place a 3 ft (0.92 m) thick layer of mine waste rock over the entire tailings surface. A 1.5 ft (0.46 m) layer of growth media will then be placed over the rock. The capped tailings surface will be seeded and fertilized. Diversion channels will be constructed along the perimeter of the tails basin; the flow will be diverted past the embankment through drop structures.
Surface Mine
At the end of mine life, active dewatering of the surface mine will cease and the pit will be allowed to naturally fill with groundwater. Groundwater modeling indicates that the pit will take several hundred years to fill.
Mine Waste Rock and Ore Stockpiles
The mine waste rock stockpile has been designed to minimize the impacts from potentially acid-generating waste rock. During closure, the waste rock will be contoured, covered with 1.5 ft (0.46 m) of growth media, seeded and fertilized. The ore stockpile area will be ripped prior to placement of growth media, seed, and fertilizer. The interface area between the graded stockpile toe and the natural ground will be riprapped to prevent erosion of the stockpile toe in areas where there will be concentrated runoff flows. Any runoff flow will be directed to the TMF diversion channels. Once flows to the sump have decreased, the pumps and other equipment will be salvaged.
Roads, Foundations, Buildings, and Equipment
During closure, buildings will be removed from their foundations, with the exception of the water treatment plant and other closure support buildings. All work pads and roads not needed for site access will be dozer ripped, covered with growth media, seeded and fertilized. Pre-construction drainage patterns will be restored or enhanced to minimize storm water impacts. Safety berms will be dozed over the road slope or into road ditches to further enhance drainage.
| International Tower Hill Mines Ltd. S-K 1300 – Technical Report Summary Livengood Gold Project Pre-feasibility Study | |
| 17.2.2 | Post Closure Activities |
The post closure period includes six years of site stabilization and maintenance after closure is complete, and a subsequent 20 years of water treatment and monitoring.
| 17.3.1 | Project Permitting Requirements |
The Project will require numerous federal and state permits and authorizations. Table 17-3 lists the permits likely to be required based on the conditions at the time of this TRS. This list is based on government agency guidance and past Alaskan mining project development experience.
Since development of the Project will require a number of federal permits, the National Environmental Policy Act (NEPA) and Council of Environmental Quality (CEQ) Regulations will govern the federal permitting portion of the Project. The NEPA process requires that all elements of a project and their direct, indirect and cumulative impacts be considered. A reasonable range of alternatives are evaluated to assess their comparative environmental impacts, including consideration of feasibility and practicality. In fulfillment of the NEPA requirements, it is anticipated that the Project will be required to prepare an Environmental Impact Statement (EIS). Upon completion of the EIS and the associated Record of Decision by the lead federal agency, the federal and state agencies will then complete their own permitting actions and decisions. The State of Alaska is expected to take a cooperating role to coordinate the NEPA review with the state permitting process. Actual permitting timelines are controlled by the federal NEPA review and federal and state agency decisions.
Table 17-3: Project permit requirements
| Agency | Authorization |
| Federal | |
| U.S. Army Corps of Engineers | CWA Section 404 Permit (wetlands dredge and fill) |
| Section 106 Historical and Cultural Resources Protection |
| U.S. Environmental Protection Agency | Spill Prevention, Control and Countermeasure Plan (SPCC) |
| EPA Air Quality Permit Review |
| EPA Hazardous Waste Generator ID Resource Conservation and Recovery Act (RCRA) |
| National Marine Fisheries Service | Threatened and Endangered Species Act Applicability Consultation |
| U.S. Fish and Wildlife Service | Section 7 Threatened and Endangered Species Act Consultation |
| Bald Eagle Protection Act Clearance |
| Migratory Bird Protection |
| Fish and Wildlife Coordination Act |
| International Tower Hill Mines Ltd. S-K 1300 – Technical Report Summary Livengood Gold Project Pre-feasibility Study | |
| Agency | Authorization |
| U.S. Bureau of Land Management | Plan of Operations Approval |
| Decision Record |
| Bond Approvals |
| U.S. Bureau of Alcohol, Tobacco & Firearms | Permit & License for Use of Explosives |
| License to Transport Explosives |
| Mine Safety and Health Administration | Notification of Legal Identity |
| Training of Miners Plan |
| Federal Aviation Administration | Notice of Controlled Firing Area (Blasting) |
| Structure Warning Lights |
| Federal Communication Commission | Radio Station License |
| U.S. Department of Transportation | Approval to Transport Hazardous Materials |
| U.S. Regulatory Commission | Material License for Geotechnical Studies |
| State | |
Alaska Department of Natural Resources Division of Mining, Land & Water | Miscellaneous Land Use Permits |
| Plan of Operations |
| Reclamation Plan Approval |
| Reclamation Bond |
| Mining License |
| Land Use Permits and Leases |
| Certificate of Approval to Construct a Dam |
| Certificate of Approval to Operate a Dam |
| Dam Safety Certification |
| Material Sale (for construction material borrow areas) |
| Temporary Water Use Permit (if not acquiring water rights) |
| Water Appropriation Permits |
| Road Right of Way/Access |
| Power Line Right of Way |
| Cultural Resource Protection |
| Archeology Study Permits |
| International Tower Hill Mines Ltd. S-K 1300 – Technical Report Summary Livengood Gold Project Pre-feasibility Study | |
| Agency | Authorization |
| Alaska Department of Environmental Conservation | Alaska Pollution Discharge Elimination System (APDES) |
| Section 401 Water Quality Certification (SWA 404 Permit) |
| Storm Water Pollution Prevention Plan (SWPPP) Review Approval |
| Oil Discharge Prevention and Contingency Plan Review Approval |
| Plan Review and Approvals to Construct and Operate a Public Water Supply System |
| Plan Review and Construction Approval for Domestic Wastewater System |
| Solid Waste Management Permit |
| Food Establishment Permit |
| Air Quality Construction Permit (first 12 months) |
| Air Quality PSD Permit |
| Air Quality Title V Operating Permit |
| Alaska Department of Fish & Game | Fish Collection, Habitat, and Passage permits |
| Alaska Department of Transportation & Public Facilities | Notification of Blasting for Road Closure |
| Controlled Firing Area for Blasting |
| Right of Way/Access/Driveway |
| Alaska Department of Public Safety-FP | Fire Marshal Plan Review |
| Alaska Department of Labor and Workforce Development | Certificate of Inspection for Fired & Unfired Pressure Vessels |
| Employer Registration |
| Alaska Department of Health and Social Services | Health Impact Assessment |
| Other Entities | |
| Alyeska Pipeline | Trans- Alaskan Pipeline System (TAPS) Right of Way (ROW) access/crossing approvals |
The proposed preliminary project execution plan for the development and construction of the Livengood Gold Project summarized in Chapter 21 incorporates the permits previously noted in Table 17-3.
| 17.3.2 | Status of Permit Applications |
There have been no permit applications submitted for project construction.
| International Tower Hill Mines Ltd. S-K 1300 – Technical Report Summary Livengood Gold Project Pre-feasibility Study | |
| 17.4 | Requirements for Performance or Reclamation Bonds |
There are two State of Alaska agencies that require financial assurance in conjunction with approval and issuance of large mine permits. The Department of Natural Resources Division of Mining, Land and Water and the Department of Environmental Conservation require financial assurance, both during and after operations, and to cover short and long-term water treatment, if necessary, as well as reclamation and closure costs, monitoring and maintenance needs. The financial assurance amounts will be estimated in conjunction with development of the Reclamation and Closure Plan.
| 17.5 | Mine Closure Requirements and Costs |
A mine closure plan featuring dry closure of the tailings management facility has been developed. Closure costs track reclamation and closure expenses from Year 17 through Year 52. The reclamation and stabilization effort occurs from Year 22 through Year 28 and includes deconstruction of the facilities and closure of the tailings management facility, mine waste rock facility, roads and water storage reservoirs as described in Section 17.2. These costs total $226.4M, including contractor indirect costs. Subsequent post-closure costs incurred during Year 29 through Year 52 include pumping, water treatment, maintenance and post-closure monitoring. These costs total $76.7M. Year 52 is the last year with planned closure expenses.
The total closure cost is $316.9M, which is applied to the cash flow in Year 21. This cost, which includes indirect costs, includes closure of the mine waste rock stockpile, tailings management facility, solid waste landfill and ancillary facilities.
Closure cost funding will flow from a closure trust fund financed by mine cash flow. Annual contributions to the closure trust fund are included in the cash flow model. The annual contribution is $11.7M during Year 2 through Year 21. The model includes trust fund earnings at 3.0% annual percentage rate (APR), applied to the fund balance until closure is complete in Year 52.
| 17.6 | Socioeconomic Conditions |
The Livengood Mining District has a history of cyclical employment and development dating back to 1914, when placer gold mining became the primary economic activity in the area. The district has produced over 500,000 oz of placer gold, with two-thirds of that production coming prior to World War II. In 2021, there were two placer operations active in the Livengood area. Today, there are no year-round residents in the town-site, with only a handful of abandoned structures still standing.
| International Tower Hill Mines Ltd. S-K 1300 – Technical Report Summary Livengood Gold Project Pre-feasibility Study | |
Livengood lies within the Yukon-Koyukuk Census Area, which encompasses a nearly 150,000 -square mile (m2) (388,000-km2) swath of Interior Alaska from the Canadian border to the lower Yukon River. In 2020, the Census Area held a total population of 5,343 widely dispersed residents in 38 communities, of which approximately 70% were Alaska Natives. Both Minto, which is approximately 40 mi (64 km) from Livengood, and Manley Hot Springs, approximately 80 mi (129 km) away from the Project, have road access to Fairbanks.
The Fairbanks area is the service and supply hub for Interior and Northern Alaska. Construction of the Trans-Alaska Pipeline System (TAPS) resulted in an economic boom in Fairbanks from 1975 to 1977. The oil industry remains an important part of the local economy, with Fairbanks providing logistical support for the North Slope activity, operation of a local refinery and the operation and maintenance of TAPS. Today, the University of Alaska, the Fairbanks Memorial Hospital, and the Fort Knox and Pogo gold mines are some of the Fairbanks area’s largest employers. The Fairbanks North Star Borough (FNSB) economy included 37,400 non-agricultural wage and salary jobs in 2019, accounting for $2.24B in annual payroll.
| 17.6.2 | Recreational and Subsistence Resources |
The State of Alaska Tanana Area Basin plan designates mining as the primary land use for the Project area. The plan identifies recreation as a secondary use in the Project area. It will be important to consider both the present and likely future recreational uses of the area and how mining projects can cohabitate successfully.
Most of the small communities in rural interior Alaska are largely dependent on subsistence. Seventy-five percent of the Native families in Alaska’s smaller villages acquire 50% of their food through subsistence activities (Federal Subsistence Board, 1992). For families who do not participate in a cash economy, subsistence can be the primary direct means of support; for others, it contributes indirectly to income by replacing household food purchases.
| 17.6.3 | Socioeconomic and Project Consequences |
Developing the Livengood Gold Project into a mine would offer residents and families from the surrounding communities the opportunity of year-round stable wage paying jobs. Continuing local hire efforts by THM will be a key focus of the Project. Training programs such as the Drill Helper Training Program conducted in May of 2011, a partnership with the State Department of Labor, will be used to attract, train and retain an Alaskan workforce for the various construction and operating jobs available.
| International Tower Hill Mines Ltd. S-K 1300 – Technical Report Summary Livengood Gold Project Pre-feasibility Study | |
The PFS estimates a total of 3.8 M man-hours during Project construction at Livengood, with a peak construction workforce of 800. The average wage of those workers is estimated at $50.00/hr. During the three years of preproduction mine development, the Owner’s crew will be approximately 170 employees on average. During operations, the average number of employees is estimated at 331 peaking in year 6 at 430. Total annual wages paid during operations is estimated to be $38M based on an annual average wage of approximately $115,000/y.
A 2011 study of the economic impact of the Fort Knox Mine on the Fairbanks North Star Borough determined that 62% of the mine’s goods and services spending were with businesses located in the FNSB. For purposes of this TRS, we have assumed a local purchase volume of 50% for the Project. Using that assumption, the result would be an annual local expenditure of approximately $200M on consumables, supplies and purchases.
| 17.6.5 | Employment and Training |
The labor force in the communities nearest the mine is very small. The total population of Minto, Manley Hot Springs and Livengood combined is 312 residents in 2020. Skilled and unskilled labor to support mine development and operations will come primarily from the Fairbanks area, with a total labor force of nearly 40,000 workers. The training plan for the Project will be designed to promote safety, environmental stewardship, efficient production, and local hire.
| 17.7 | Adequacy of Current Plans |
Based on the information referenced in Sections 17.1 to 17.6, in the opinion of the QPs, the Company’s current plans to address environmental compliance, permitting, and local or individual groups are adequate.
| International Tower Hill Mines Ltd. S-K 1300 – Technical Report Summary Livengood Gold Project Pre-feasibility Study | |
| 18. | Capital and Operating Costs |
The capital and operating cost estimates presented in this study are based on the development, construction and start-up of an open pit mine, process plant and tailings management facility capable of processing on average 65,000 t/d (59,000 mt/d) of gold bearing material. All capital and operating cost estimates cited in this TRS are referenced in nominal third quarter 2021 United States dollars. No provisions have been included to offset future escalation. Units presented in this chapter are presented as imperial unless otherwise stated.
| 18.1 | Capital Cost Summary and Basis |
THM engaged various consultants to provide estimate support for various cost portions of the Project that fall within their specialized scope of work (see Table 18-1). BBA consolidated the cost information from all sources to determine the overall project capital cost.
Table 18-1: Capital cost estimate contributors
| Scope / Responsibility | Contributor(s) |
| Mine Equipment and Development | BBA |
| Process Plant & Ancillary Facilities | BBA |
| Surface Infrastructure and Buildings | BBA |
| Waste Rock and Tailings Management Facility | NewFields |
| Electrical Line and Substations | BBA |
| Indirect Cost | BBA |
| Owner's Cost | BBA |
| Reclamation and Remediation | Newfields |
| Contingency | All |
The total estimated preproduction capital cost (-20% / +25%) to design, procure, construct and commission the Livengood Gold Project facilities is $1.93B including $220M in contingency funds. When spare parts/consumables/initial fills ($40M) and funding of the closure trust fund is included ($23M), the overall cost is estimated to be $1.99B. The estimated sustaining capital cost required by the Project is $658M not including reclamation trust funding, which totals $245M. The sustaining capital estimate includes the addition of certain contingencies and indirect costs. The cumulative life of mine (LOM) capital expenditure (preproduction and sustaining capital) is estimated to be $2.85B. Table 1-8 summarizes the initial capital and sustaining capital costs by major area.
| International Tower Hill Mines Ltd. S-K 1300 – Technical Report Summary Livengood Gold Project Pre-feasibility Study | |
Table 18-2: Initial capital and sustaining capital costs by major area
($ Millions)
| Cost Item/Area | Initial ($M) | Sustaining ($M) |
| Mine Equipment | 200 | 139 |
| Mine Development | 230 | |
| Process Facilities | 433 | |
| Infrastructure Facilities | 459 | 514 |
| Power Supply | 87 | |
| Owners Costs | 296 | 5 |
| Contingency | 220 | |
| Sub-total before Reclamation | 1,925 | 658 |
| Spare parts, consumables, and initial fills(1) | 40 | |
| Funding of Reclamation Trust Fund(2) | 23 | 245 |
| Total | $1,989M | $903M |
| Note: | Rounding of some figures may lead to minor discrepancies in totals. |
| (1) | The $40M spent on spare parts, consumables and initial fills in preproduction are recaptured in the final year of operations (Year 21). |
| (2) | Includes initial funding, total $317M estimated costs. The difference of $49M is projected trust fund earnings. |
The overall capital cost estimate developed in this study generally meets the AACE Class 4 requirements and has an accuracy range of -20% and +25%. Estimate accuracy ranges are projections based upon cost estimating methods and are not a guarantee of actual project costs. The capital cost estimate of this pre-feasibility study (PFS) forms the basis for the approval of further development of the Project by means of a feasibility study (FS).
The capital cost estimate is based on the following assumptions:
| § | Reflects general accepted practices in the cost engineering profession; |
| § | Assumes contracts will be awarded to reputable contractors on a lump sum basis; |
| § | Craft all-in rates are trade union rates calculated based on an assumed 60-hour work week with 10-hour shifts worked daily. Rotation for craft and supervision personnel is 20 days on and 10 days off; |
| § | Waste rock generated during the mine pre-stripping will be of suitable quality and quantity to be used as backfill material to construct the tailings management facility and other infrastructure facilities; |
| International Tower Hill Mines Ltd. S-K 1300 – Technical Report Summary Livengood Gold Project Pre-feasibility Study | |
| § | Construction will consist of a mixture of contracted work and work performed by mine personnel; |
| § | The following activities will be performed by the THM owners team (mine personnel) to support the construction of the tailings management facility and other geotechnical facilities: |
| - | Crushing and screening of waste rock for construction aggregate; |
| - | Load, haul and placement (spreading and compaction) of rock fill from mine; |
| § | Soil conditions will not require special foundation designs such as piling; |
| § | All excavated material will be disposed of on site; |
| § | Project will adhere to the schedule in construction execution plan as detailed in Chapter 21; |
| § | The estimate assumes that the contingency will be spent. |
General exclusions from the capital estimate are as follows:
| § | Sunk costs (costs prior to a production decision); |
| § | Land acquisition, permitting, licensing costs; |
| § | Allowance for special incentives (schedule, safety, etc.); |
| § | Interest and financing costs; |
| § | Escalation beyond Q3 2021; |
| § | Taxes and import duties; |
| § | Salvage value, except for sale of construction camp; |
| § | Risk due to labor disputes, permitting delays, weather delays or any other force majeure occurrences; |
| § | Issues beyond the control of the Owner. |
| 18.2 | Initial Capital Costs |
The initial capital cost for mine development activities and the acquisition of mining equipment is $430M and summarized in Table 18-3.
Table 18-3: Open pit mine initial capital costs
($ Millions)
| Cost Item/Area | Initial ($M) |
| Mine Development | 230 |
| Mine Equipment | 200 |
| Total | $430M |
| International Tower Hill Mines Ltd. S-K 1300 – Technical Report Summary Livengood Gold Project Pre-feasibility Study | |
Mine development for the open pit will be carried out over a 3-year period. A contractor will be used during the first year of mine development, which will include tree clearing, pioneering work as well as haul road construction. The total cost for the contractor has been estimated to be $68M, which considers a unit rate of $3.62/t. Years 2 and 3 of mine development will be carried out using the owner’s fleet of mining equipment and personnel. The owner’s cost for mine development, plant road construction and temporary facilities has been estimated to be $162M, which considers workforce salaries, consumables, and the cost to operate the equipment fleet. The overall initial cost for mine development is estimated to be $230M.
Open pit mining mobile and ancillary equipment costs were estimated based on recent supplier quotations and BBA’s in-house database. The initial mine equipment requirements are based on operating hours and production needs as described in Chapter 13. The mobile support equipment consists of dozers, graders, water trucks, fuel trucks and cranes required to support the mining operation. The initial mine equipment requirements along with the capital costs, which total $200M, are detailed in Table 18-4.
Table 18-4: Mining equipment initial capital costs
($ Millions)
| Cost Item / Area | No. | Initial ($M) |
| Haul Truck (Payload - 291 mt) | 18 | 113 |
| Hydraulic Excavator (Bucket Payload – 31 m3) | 2 | 22 |
| Wheel Loader (Bucket Payload – 31 m3) | 1 | 10 |
| Production Drill | 5 | 14 |
| Secondary Drill | 1 | 1 |
| Mobile Support Equipment | - | 38 |
| GPS and Dispatch System | 1 | 2 |
| Total | | $200M |
The capital costs related to the electrical transmission line, O’Connor Creek substation and the Golden Valley Electrical Association (GVEA) system upgrade were estimated by specialized local firms (Dryden & LaRue, and Electric Power Systems) in 2013, escalated to 2021 and integrated into the estimate by BBA. The main on-site substation was estimated by BBA based on other recent projects of similar size, power rating and layout. Table 18-5 summarizes the initial capital cost estimate for the off-site and on-site electrical facilities.
| International Tower Hill Mines Ltd. S-K 1300 – Technical Report Summary Livengood Gold Project Pre-feasibility Study | |
Table 18-5: Power supply capital costs by major area
($ Millions)
| Cost Item / Area | Initial ($M) |
| 230 KV Transmission Line | 32 |
| O’Connor Creek Substation | 11 |
| GVEA Transmission System Upgrades | 23 |
| Primary Substation and Site Distribution | 21 |
| Total | $87M |
The design and capital costs of the crusher area, the crushed ore stockpile area and the process plant has largely been based on BBA’s experience on recent projects. To estimate the capital cost of the process plant, BBA used its project cost database, which includes as-built capital costs for a number of similar large gold processing facilities. Based on the proposed plant capacity, preliminary general arrangement layouts and project location, the capital costs were adjusted to match the requirements of the Project. For the major process and mechanical equipment packages, equipment datasheets and summary specifications were prepared, and budget pricing obtained from qualified suppliers. Regional data from Northern Canada and Alaska was compared to assess and adjust the labor and crew rates and productivity factors for Alaska based on BBA’s standard estimating spreadsheet. The process plant preproduction capital costs are detailed by area in Table 18-6:
Table 18-6: Process plant capital costs by major area
($ Millions)
| Cost Item / Area | Initial ($M) |
| Process Building | 52 |
| Primary Crushing | 46 |
| Stockpile, Pre-Crushing and Pebble Crushing | 67 |
| Primary and Secondary Grinding | 121 |
| Gravity Separation | 9 |
| Leaching | 88 |
| Carbon Stripping and Gold Room | 16 |
| Cyanide Destruction and Tailings | 25 |
| Reagents | 5 |
| Common Services | 4 |
| Total(1) | $433M |
| (1) | Spare parts, consumables and initial fills are not included. |
| International Tower Hill Mines Ltd. S-K 1300 – Technical Report Summary Livengood Gold Project Pre-feasibility Study | |
| 18.2.6 | Infrastructure Facilities |
The capital cost of infrastructure facilities required by the Project was estimated by BBA and NewFields. BBA estimated the initial capital costs based on the site/building layout drawings, specific project requirements and its in-house database for the following site infrastructure facilities:
| § | Site preparation and common underground services; |
| § | Site security and main access gate; |
| § | Mine haul and site access roads; |
| § | Mine garage, dry, warehouse and administration complex; |
| § | Mine truck wash and fuel/lubrication facility; |
| § | Office, garage and warehouse equipment; |
| § | Site communications and emergency power; |
| § | Water and sewage treatment; |
| § | Fresh water wells, pumping station and piping; |
| § | Process plant tailings and water reclaim systems; |
| § | Fairbanks Integrated Operations Center (IROC) equipment; |
| § | Fairbanks guardhouse, storage and employee parking area (off-site). |
NewFields developed the preliminary designs and estimated material quantities for the tailings management facility, fresh water reservoir and related infrastructure such as:
| § | Livengood Valley and Gertrude Creek TMF starter embankments (lined facility with 47.7 Mt (43.3 Mmt) storage capacity equivalent to approximately two years of production); |
| § | Water reservoir flow through drain system; |
| § | TMF North access road and pipe corridor; |
| § | Surface water diversion ditches; |
| § | Ground water collection systems; |
| § | Growth media, waste rock and ore stockpiles. |
The general approach of utilizing mine waste rock from the surface mine delivered by the mine operations to satisfy the major fill requirements for the TMF was employed to maximize savings in construction costs. Based on recent project experience in Northern Canada, BBA assisted NewFields in developing earthwork unit costs and overhead costs using a mixture of contracted work and work performed by mine personnel. To support the TMF cost estimate, budgetary quotes for the supply of the principal purchased materials, such as geosynthetics and piping, was obtained from potential vendors. Table 18-7 summarizes the initial infrastructure capital costs by area.
| International Tower Hill Mines Ltd. S-K 1300 – Technical Report Summary Livengood Gold Project Pre-feasibility Study | |
Table 18-7: Infrastructure capital costs by area
($ Millions)
| Cost Item / Area | Initial ($M) |
| Site Preparation and Common Services | 13 |
| Main Control Gate and Access Roads | 24 |
| Truck Shop and Administration Building | 47 |
| Mine Truck Wash | 9 |
| General Infrastructure Buildings and Temporary Facilities | 12 |
| Fuel and Explosives Facilities | 2 |
| Tailings, Waste Rock and Water Management Infrastructure | 305 |
| Site Communications | 13 |
| Electrical Substation | 33 |
| Total | $459M |
| 18.2.7 | Indirect and Owner’s Costs |
For the Project, indirect costs included within the preproduction capital cost estimate, an itemized list of elements has been used to generate factored estimates. The Owner’s costs were calculated using BBA’s database, data from the 2013 Feasibility Study, THM requirements and adjusted to meet the requirements of the Project. The following costs have been covered within the estimate:
| - | Construction camp (800 rooms) procurement (including resale) and operations; |
| - | Engineering, procurement and construction management (EPCM); |
| - | Construction quality assurance, third party testing and surveying; |
| - | Construction of temporary facilities, erection and operation; |
| - | Pre-operational verifications, commissioning and start-up support; |
| - | Relocation costs to move the Alaska Department of Transport (DOT) Garage Facilities; |
| - | Vendor representatives during construction. |
| - | Preproduction employment and training; |
| - | Corporate services and site support operations; |
| - | Environmental monitoring and community development; |
| - | Right of Way (ROW) and land acquisition; |
| International Tower Hill Mines Ltd. S-K 1300 – Technical Report Summary Livengood Gold Project Pre-feasibility Study | |
Table 18-8 provides a breakdown of the indirect and Owner’s costs by area:
Table 18-8: Indirect and Owner’s costs by area
($ Millions)
| Cost Item / Area | Initial ($M) |
| Construction Camp (including resale) | 40 |
| Construction Operations Costs | 52 |
| Alaska DOT Garage Relocation Costs | 20 |
| EPCM Services | 70 |
| Sub-Consultants and Third-Party Services | 5 |
| Land and Ocean Freight | 37 |
| Vendor Representatives | 3 |
| Construction Mobile Equipment | 6 |
| Owner's Costs | 55 |
| Offsite and Other | 8 |
| Total | $296M |
It should be noted that costs related to mine and mill initial fills, commissioning spares, start-up and capital spares totaling $40M, normally shown as indirect costs, are not included.
Contingency provides an allowance to the capital cost estimate for undeveloped details within the scope of work covered by the estimate. Contingency is not intended to take into account items such as labor disruptions, weather-related impediments, changes to the scope of the Project from what is defined in the study, nor does contingency take into account price escalation or currency fluctuations.
To establish an adequate contingency estimate, BBA along with the other contributors, reviewed the overall capital cost estimate and categorized the major project work items in terms of level of definition and the nature of how the costs were established for labor, materials and equipment. Depending on the level of confidence, contingencies were allocated to each of the work items. Table 18-9 provides a summary of the contingency by major work area. The total contingency cost for the Livengood Gold Project is estimated to be $220M or approximately 12% of the Project’s overall direct and indirect costs.
| International Tower Hill Mines Ltd. S-K 1300 – Technical Report Summary Livengood Gold Project Pre-feasibility Study | |
Table 18-9: Contingency by major area
($ Millions)
| Cost Item / Area | Initial ($M) |
| Mine Equipment and Preproduction Work | 10 |
| Process Plant, Surface Facilities and Project Indirect Costs | 157 |
| Tailings, Waste Rock and Water Management Facilities | 53 |
| Total | $220M |
| 18.3 | Sustaining Capital Costs |
The total estimated sustaining capital cost for the Livengood Gold Project is $658M (not including reclamation trust funding) and was developed by BBA and NewFields. This is the estimated expense required to maintain operations over the proposed 20.3-year mine life. Including the reclamation trust fund payments of $245M, the sustaining capital costs total $903M. Sustaining capital costs included are as follows:
| § | Open pit mining equipment (new and replacements), equipment rebuilds and spare parts; |
| § | Phased (2 through 6) tailings management facility and water management system upgrades to achieve their ultimate capacity based on the design provided by NewFields; |
| § | Lengthening and relocation of the process plant tailings pumping and pipeline systems; |
| § | Purchase of site mobile equipment and light vehicles; |
| § | Contingency related to the previously listed activities; |
| § | Annual funding of the reclamation trust fund for eventual site closure beginning in Year 21. |
Table 18-10 summarizes the sustaining capital requirements over life of mine.
Table 18-10: Sustaining capital costs by major area
($ Millions)
| Cost Item / Area | Sustaining ($M) |
| Infrastructure Facilities | 514 |
| Mine Equipment | 139 |
| Mobile Equipment and Light Vehicles | 5 |
| Sub-total before Reclamation | 658 |
| Funding of Reclamation Trust Fund | 245 |
| Total | $903M |
| International Tower Hill Mines Ltd. S-K 1300 – Technical Report Summary Livengood Gold Project Pre-feasibility Study | |
| 18.4 | Operating Cost Summary and Basis |
The operating cost estimate for the Livengood Gold Project includes all expenses incurred to operate the mine and process plant from the start of Year 1 through Year 21 at a daily average production rate of 65,000 t/d (59,000 mt/d). Units presented in this chapter are presented as imperial unless otherwise stated. The expected accuracy for the operating cost estimate is that of a pre-feasibility study level (+-/ 20%) and does not contain any allowances for contingency or escalation beyond Q3 2021. Any ore excavated during the preproduction period is considered as a capital expense. Life of mine averages presented in this section take into account all years of production, including the year of ramp-up and stockpile reclaim years at the end of the LOM.
Table 18-11: Operating cost estimate contributors
| Scope / Responsibility | Contributor(s) |
| Mine Operations | BBA USA Inc. |
| Process Plant Operations | BBA USA Inc. |
| General and Administration (G&A) | THM and BBA USA Inc. |
THM engaged various consultants to provide estimation support for various operating cost areas of the Project that fall within their specialized scope of work (see Table 18-11). Operating costs were estimated using cost models, laboratory testwork, budgetary quotations from suppliers, general knowledge and recent experience on similar projects. THM, in consultation with BBA, provided a list of personnel, based on mining, process plant and administrative requirements, along with the salaries benefits and bonuses associated with each position.
The three major operating costs (on-site) areas are mining, processing, and general and administration (G&A). Table 1-9 provides the breakdown of the projected operating costs for the Project. The unit cost areas including royalties and smelting, refining and transport costs are shown in terms of total cost LOM per ton mined, per ore ton processed and total cost per ounce of gold produced. The average operating cost, including royalties and smelting/refining fees (but not including reclamation fund payments), over the LOM is estimated to be $13.82/t ($15.23/mt) milled.
| International Tower Hill Mines Ltd. S-K 1300 – Technical Report Summary Livengood Gold Project Pre-feasibility Study | |
Table 18-12: Total operating cost breakdown (LOM average)
| Cost Item / Area | Total ($M) | Average ($/t mined) | Average ($/t milled) | Average ($/oz) | OPEX (%) |
| Mining (including stockpile reclaim) | 1,910 | 2.05 | 4.03 | 297 | 29 |
| Processing | 3,659 | - | 7.72 | 569 | 56 |
| General and Administration | 639 | - | 1.35 | 99 | 10 |
| Onsite Mine Operating Costs | 6,208 | - | 13.09 | 965 | 95 |
| Royalties | 323 | - | 0.68 | 50 | 5 |
| Smelting, Refining and Transport | 22 | - | 0.05 | 3 | 0.3 |
| Sub-total before Reclamation | 6,553 | - | 13.82 | 1,019 | 100 |
| Funding of Reclamation Trust Fund | 317 | - | 0.67 | 49 | 0 |
| Total | $6,893M | - | $14.50/t | $1,068/oz | 100% |
The operating cash costs per ounce of gold vary significantly, depending on the mill feed grade, rock type composition, mine strip ratio and stockpiling activities. The annual variation in operating costs per ounce of gold produced can be seen in Figure 18-1. It should be noted that due to the processing of lower grade stockpile material (between 0.3 and 0.4 g/t), the overall operating costs per ounce increase significantly during the later years.
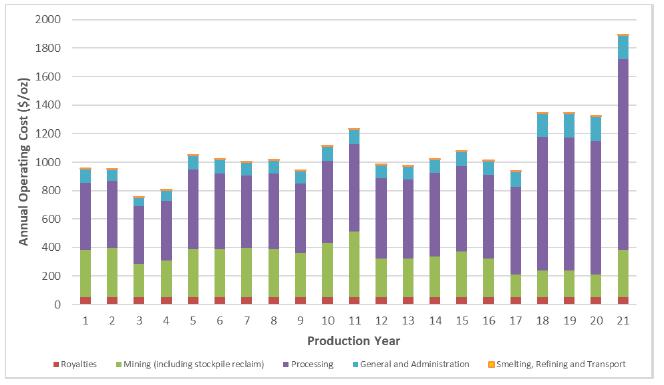
Figure 18-1: Annual operating cash costs ($/oz)
| International Tower Hill Mines Ltd. S-K 1300 – Technical Report Summary Livengood Gold Project Pre-feasibility Study | |
| 18.4.1 | Electricity, Diesel and LNG |
The cost of electrical power for the Project was estimated based on the GVEA 2-year trailing average industrial rate of $0.16 / kWh provided by THM. A diesel fuel unit cost of $2.40 / gal was used for estimating the operating costs of the mine and infrastructure mobile equipment. Liquefied natural gas (LNG) is planned to be used as the heat source for the process and ancillary facilities. At present, LNG is being supplied to Fairbanks and it is assumed that LNG will be available in sufficient quantities at the time mine operations commence. A supply unit rate of $21 / MMBTU has been used for LNG in this estimate.
The mine and mill are planned to operate 365 days per year, primarily with two 12-hour shifts per day. Various crew schedules will be employed, including crews with 4 days on, 4 days off rotation, crews with 14 days on, 14 days off rotation, and staff with 4 days on, 3 days off. Most General and Administration personnel will work 12-hour day shifts with 4 days on, 3 days off rotation. Personnel will be transported to site from Fairbanks on a daily basis by third party contract highway coach.
The number of employees required by the Project during the production phase (Years 1 to 21) consists of personnel from the open pit mine, process plant and site administration (G&A). On average, over the life of mine, the total number of personnel will be approximately 355. As shown in Figure 18-2, the process plant and general and administrative employees remain fairly constant throughout the mine life, while the mine employees vary on an annual basis due to changes in operations and maintenance personnel requirements. The mine personnel requirements drop significantly in Year 17, due to the end of open pit mining and all process plant feed requirements being met with 100% stockpile material.
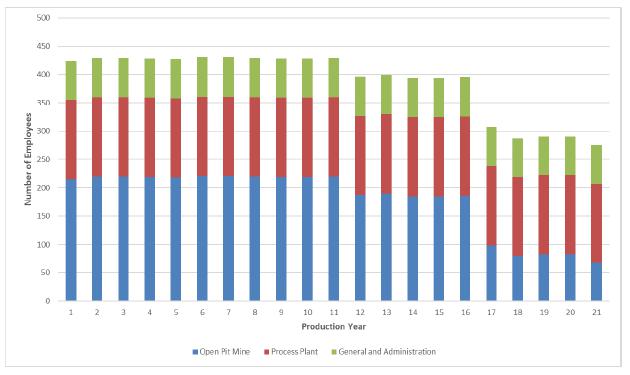
Figure 18-2: Operations Personnel
| International Tower Hill Mines Ltd. S-K 1300 – Technical Report Summary Livengood Gold Project Pre-feasibility Study | |
The total personnel for the Livengood Gold Project peaks in Year 6 at 430 employees as shown in Table 18-13.
Table 18-13: Project peak personnel (Year 6)
| Area | No. of
Employees |
| Open Pit Mine | 221 |
| Process Plant | 140 |
| General and Administration | 69 |
| Total | 430 |
| 18.4.3.1 | Mine Operating Costs |
Mine operating costs have been estimated for each period of the mine plan using supplier pricing, in-house databases, and outside sources particularly for materials, services, and consumables. The mine operating costs are based on operating the mining equipment, the labor associated with operating the mine, the cost for explosives as well as pit dewatering, road maintenance, stockpile rehandle, and other activities.
The mine operating cost was estimated to average $2.05/t mined for 20.3-year life of mine. Table 18-14 presents the mine operating cost by activity and Table 18-15 presents the mine operating cost by consumable.
Over the life of the mine, the mine operating costs have been calculated to total $1.91B. This amount includes $152M dedicated to rehandling of the low grade ore stockpile. When excluding the low grade ore stockpile rehandling costs, the mine operating costs, based purely on mining run of mine material from the pit equate to $1.89/t.
| International Tower Hill Mines Ltd. S-K 1300 – Technical Report Summary Livengood Gold Project Pre-feasibility Study | |
Table 18-14: Average annual and life of mine operating costs – by activity
| Cost Item / Activity | LOM Cost ($M) | Average
Annual Cost ($M/y) | Cost per Ton ($/t mined) | Cost per Ton ($/t milled) | OPEX (%) |
| Production Loading | 187 | 8.9 | 0.20 | 0.39 | 10 |
| Hauling | 802 | 38.2 | 0.86 | 1.69 | 42 |
| Drilling | 168 | 8.0 | 0.18 | 0.36 | 9 |
| Blasting | 275 | 13.1 | 0.30 | 0.58 | 14 |
| Support & Services | 305 | 14.5 | 0.33 | 0.64 | 16 |
| Mine Supervision & Technical Services | 133 | 6.3 | 0.14 | 0.28 | 7 |
| Other | 39 | 1.9 | 0.04 | 0.08 | 2 |
| Total | $1,910M | $90.9M/y | $2.05/t | $4.03/t | 100% |
Table 18-15: Average annual and life of mine operating costs – by consumable
| Cost Item / Activity | LOM Cost ($M) | Average
Annual Cost ($M/y) | Cost per Ton ($/t mined) | Cost per Ton ($/t milled) | OPEX (%) |
| Labor | 573 | 27.3 | 0.61 | 1.21 | 30 |
| Fuel | 366 | 17.4 | 0.39 | 0.77 | 19 |
| Lube | 31 | 1.5 | 0.03 | 0.06 | 2 |
| Tires | 148 | 7.1 | 0.16 | 0.31 | 8 |
| PM & Repair Parts | 389 | 18.5 | 0.42 | 0.82 | 20 |
| Ground Engaging Tools | 99 | 4.7 | 0.11 | 0.21 | 5 |
| Electricity | 13 | 0.6 | 0.01 | 0.03 | 1 |
| Explosives | 266 | 12.7 | 0.29 | 0.56 | 14 |
| Other | 24 | 1.2 | 0.03 | 0.05 | 1 |
| Total | $1,910 | $90.9M/y | $2.05/t | $4.03/t | 100% |
The cost to operate the fleet of mining equipment considers fuel consumption, consumables such as tires, wear parts and ground engaging tools, preventative maintenance, and repair parts. For the major equipment such as haul trucks, shovels, wheel loaders, production drills, track dozers, and road graders, the maintenance costs have been calculated as a function of the hour intervals for each machine throughout the life of mine, while an average cost per hour was considered for the support and service equipment.
| International Tower Hill Mines Ltd. S-K 1300 – Technical Report Summary Livengood Gold Project Pre-feasibility Study | |
An extended life of up to 140,000 hours has been considered for the fleet of haul trucks and shovels with additional maintenance costs having been provided by the equipment suppliers. Costs related to engine rebuilds and truck reframes have been treated as sustaining capital costs.
It is important to note that the fuel costs consider the addition of diesel exhaust fluid (DEF) for the Tier 4 equipment. A cost of $5.11/gallon has been used for DEF which has been applied to 3% of the fuel burn. A cost of $15.14/gallon has been used for lubes and greases.
| 18.4.3.3 | Explosives and Accessories |
Explosives costs of $0.29/lb for ANFO and $0.69/lb for emulsion have been used, which are based on budgetary pricing from local explosive suppliers. The suppliers also provided pricing for explosive accessories such as detonators, boosters, connectors, and surface wire, as well as a cost for delivery to site.
| 18.4.3.4 | Other Miscellaneous Costs |
The mine operating costs include an additional $1.2M/y which consider the costs for ore grade control, dewatering costs that are in addition to the operation of the pumps, as well as other miscellaneous costs.
The workforce cost for the mining operations averages approximately $27.3M per year, which has been calculated based on the number of employees and their annual salaries. The salaries include 45% for fringe benefits and 5% overtime for non-supervisory positions.
Process plant operating costs over the 20.3-year mine life were calculated based on the metallurgical testwork program, the mine schedule, salary cost tables (THM), comparable projects, literature reviews and recent supplier quotations. Operating costs for each rock type were developed and then combined, based on the mine schedule, to calculate the overall operating cost on a per ton weighted average basis. The process plant operating costs including the tailings management area are estimated to be $7.72/t over the life of mine.
The average operating cost includes reagents, consumables, grinding media, personnel (Salaried and Labor), electrical power, liquefied natural gas and maintenance/operations parts. The consumables include spare parts, grinding media, liners and screen components. A breakdown of the process plant operating costs is shown in Table 18-16. The main cost areas for the process plant are electrical power, crushing and grinding steel, and reagents and chemicals. The majority of the reagent costs are associated with sodium cyanide and lime required for leaching.
| International Tower Hill Mines Ltd. S-K 1300 – Technical Report Summary Livengood Gold Project Pre-feasibility Study | |
Table 18-16: Average annual and life of mine operating costs – process plant
| Cost Item / Activity | LOM Cost ($M) | Average
Annual Cost ($M/y) | Cost per Ton ($/t milled) | OPEX (%) |
| Labor (incl. tailings management) | 277 | 13 | 0.58 | 8 |
| Power (incl. tailings management) | 1,415 | 67 | 2.98 | 39 |
| Grinding Steel | 497 | 24 | 1.05 | 14 |
| Reagents | 1,136 | 54 | 2.40 | 31 |
| Fuel | 129 | 6 | 0.27 | 4 |
| Maintenance and Operations (incl. tailings management) | 186 | 9 | 0.39 | 5 |
| Crushing Steel | 19 | 1 | 0.04 | 1 |
| Total | $3,659M | $174M/y | $7.72/t | 100% |
| 18.4.4.1 | Crushing and Grinding Steel |
The replacement costs of major equipment consumables, such as the primary crusher liners, pre-crusher/pebble crusher mantles and bowls, SAG and ball mill liners, and screen decks, were calculated based on recommended change-out schedules, recent budgetary quotations and BBA’s internal database.
The Livengood process flowsheet includes two types of grinding media for the SAG and ball mills. The consumption rates for the 5-inch SAG mill and 3-inch ball mill media were calculated using MolyCop (V 3.0) tools and the abrasion index (Ai) distribution measured at the 50th percentile for the five rock types to be processed over the LOM. The input data considered the average operating conditions for the SAG and ball mills, in terms of power draw, rotational speed, pulp density and media loading. The wear and annual media consumption rates for each type are presented in Table 18-17. Crushing and grinding steel represents approximately 15% of the total process operating cost at $1.09/t milled.
Table 18-17: Average LOM media wear and consumption rates
| Media Type | Wear Rate (lb/kWh) | Annual Consumption
(t) |
| SAG mill – 5-in steel media | 0.081 | 3,161 |
| Ball mill – 3-in steel media | 0.110 | 6,734 |
| International Tower Hill Mines Ltd. S-K 1300 – Technical Report Summary Livengood Gold Project Pre-feasibility Study | |
| 18.4.4.2 | Reagents and Chemicals |
The reagent and chemical consumptions were estimated based on testwork, industrial references, literature and assumed operational practice. Sodium cyanide and lime have a higher consumption variability depending on rock type and, therefore, have been estimated based on an analysis of the various testwork campaigns performed to date, as well as adjusted using scale-up factors and assumed process water recirculation rates within the process plant.
The reagent unit costs ($/t reagent) were established through recent vendor quotations and comparison to prices at reference sites and include delivery to site. The Reagents and chemicals category represents approximately 31% of the total process operating cost at $2.40/t milled.
The largest power consumers within the process plant are the SAG and ball mills. The respective power required for the SAG mill and ball mill were calculated based on the comminution testwork program, which provided the material hardness indices (A x b value) for the SAG mill and the BWi of the ball mill for the five rock types expected to be processed during the LOM.
The SAG mill specific energy (kWh/t) was estimated from the analyzed relationships derived from testwork between the A x b value and the SAG motor input specific energy as determined by JKSimMet. The ball mill specific energy (kWh/t) was calculated from the BWi and the Bond formula, assuming the ball mill will grind the rock from 2,900 µm (F80) to 250 µm (P80).
The overall process plant energy consumption was estimated based on the SAG and ball mill grinding energy requirements and factored balance of plant equipment running loads. Various factors (efficiency, load, diversity, and annual factors) were applied to adjust for equipment motor efficiency, the power used versus installed, the synchronous operation of equipment and average plant operating availability. The electrical power of the process plant represents approximately 39% of the total process operating costs at $2.98/t milled.
| 18.4.4.4 | Liquefied Natural Gas |
Liquefied natural gas (LNG) is planned to be used for heating of the primary and secondary crusher buildings, the main process plant building and surface ancillary facilities. LNG will also be used for process heat in the ADR circuit. LNG requirements have been estimated based on the building requirements and similar sized installations. LNG represents approximately 4% of the total process operating costs at $0.27/t milled.
| 18.4.4.5 | Maintenance and Operations Supplies |
Maintenance supplies and materials are intended to cover the costs of maintaining the process facilities. Operations supplies are intended to cover the cost of personnel protection wear, minor tools, oil and other consumables. The costs of maintenance and operations supplies were derived using a percentage of the capital cost of plant mechanical equipment. Combined maintenance and operations supplies represent approximately 5% of the total process operating costs at $0.39/t milled.
| International Tower Hill Mines Ltd. S-K 1300 – Technical Report Summary Livengood Gold Project Pre-feasibility Study | |
A total of 140 employees (26 salaried and 114 hourly) divided into management and technical services, operations and maintenance departments are required to operate and maintain the process plant and tailings management facility. No allowance for contractors has been allocated. The list of personnel (Chapter 14), along with the salaries and benefits, was provided by THM. The estimated personnel cost (salaried and hourly combined) represents approximately 8% of the total process operating cost at $0.58/t milled.
| 18.4.5 | General and Administration (G&A) |
General and Administration (G&A) costs are expenses not directly related to the production of goods and encompass items not included in the mining and processing sectors of the Project. These costs were developed based on THM’s past project experience, similar sized operations and BBA’s in-house database.
The General and Administration area includes the following items:
| § | Site administration, accounting and payroll labor; |
| § | Human Resources, Information Technology (IT) and Health Services labor; |
| § | Computer hardware and software costs/license fees; |
| § | Electricity and LNG requirements for the Project’s surface infrastructure, such as the mine garage, administration building and the freshwater pumping system; |
| § | Health and Safety supplies; |
| § | Insurance (Earthquake, Physical Plant, and Rolling Stock including loss of production); |
| § | Security, maintenance, laundry, snow removal and janitorial service contracts; |
| § | Warehouse administration and supplies; |
| § | Waste collection and recycling services; |
| § | Environmental testwork and permitting fees; |
| § | Mobile equipment and building maintenance; |
| § | Fairbanks Integrated Operations Centre (IROC) operating costs; |
| § | Telecommunications and data service fees; |
| § | Staff and labor training; |
| § | Employee transportation fees. |
The total G&A operating cost equals $1.35/t milled. Table 18-18 shows life of mine and average annual operating costs for G&A expenses. The largest costs within the G&A category is employee transport, representing approximately 15%, while insurance is the second largest cost, accounting for approximately 13%. Electricity and heating, followed by costs related to the integrated operations center, environmental, and health and safety departments are also significant contributors.
| International Tower Hill Mines Ltd. S-K 1300 – Technical Report Summary Livengood Gold Project Pre-feasibility Study | |
Table 18-18: Average annual and life of mine operating costs – general and administration
| Cost Item / Activity | LOM Cost
($M) | Average
Annual Cost
($M/y) | Cost per
Ton ($/t
milled) | OPEX (%) |
| General Management and Administration Labor | 21 | 1.0 | 0.04 | 3% |
| Environmental | 51 | 2.4 | 0.11 | 8% |
| Community Relations | 19 | 0.9 | 0.04 | 3% |
| Human Resources | 24 | 1.2 | 0.05 | 4% |
| Health, Safety & Security | 53 | 2.5 | 0.11 | 8% |
| Accounting | 31 | 1.5 | 0.06 | 5% |
| Information Technology and Communications | 24 | 1.1 | 0.05 | 4% |
| Warehouse | 25 | 1.2 | 0.05 | 4% |
| Purchasing | 13 | 0.6 | 0.03 | 2% |
| Integrated Operations Personnel | 58 | 2.8 | 0.12 | 9% |
| Employee Transport | 97 | 4.6 | 0.20 | 15% |
| Land | 11 | 0.5 | 0.02 | 2% |
| Electricity and Heating | 75 | 3.6 | 0.16 | 12% |
| Fuel, Tires and Maintenance for Mobile Equipment and Process Plant Vehicles | 40 | 1.9 | 0.08 | 6% |
| Insurance | 82 | 3.9 | 0.17 | 13% |
| Integrated Operations - Collaborative Work, Building Lease and Overhead | 14 | 0.7 | 0.03 | 2% |
| Total | $639M | $30.4M/y | $1.35/t | 100% |
| International Tower Hill Mines Ltd. S-K 1300 – Technical Report Summary Livengood Gold Project Pre-feasibility Study | |
A total of 69 employees are required by the general and administration group. The number of employees allocated to each administration department is shown in Table 18-19.
Table 18-19: G&A employee list
| Department | No. of Employees |
| General Management and Administration | 2 |
| Environmental | 10 |
| Community Relations | 1 |
| Human Resources | 5 |
| Health, Safety & Security | 13 |
| Accounting | 8 |
| Information Technology and Communications | 3 |
| Warehouse | 7 |
| Purchasing | 4 |
| Integrated Operations (IROC) Personnel | 16 |
| Total | 69 |
The annual royalty costs are based on the PFS mine design and production profile, along with the terms of the individual royalty agreements. Over the life of the Project, based on an assumed 3.0% average royalty fee, approximately $323M in royalties is expected to be paid.
| 18.6 | Transportation and Refining |
A weekly shipment of doré bars will be transported to a refinery. A flat rate transportation cost will be incurred by the refinery in addition to a cost by weight and a variable liability fee. A treatment cost per troy ounce of material shipped to the refinery will also be charged. THM will be paid for a set recovery of the assayed gold content, which is assumed to be 99.9% based on typical contract terms. Over the LOM, a transport and refining cost including the payability discount of $22M ($3.48/oz) is estimated based on typical terms and pricing.
| International Tower Hill Mines Ltd. S-K 1300 – Technical Report Summary Livengood Gold Project Pre-feasibility Study | |
The economic/financial assessment of the Livengood Gold Project is based on a financial model developed by Tower Hill Mines (THM) and BBA USA Inc. (BBA). The model calculates revenues based on the recovered ounces determined by the mining plan and a gold price of $1,680/oz (base case). The model then subtracts costs to generate the Project cash flow. The financial model provides the means to evaluate the Project’s discounted cash flow and can guide future development decisions for the Project. The economic evaluation was carried out using a discounted cash flow approach on a pre-tax and after-tax basis, based on Q4 2021 metal price projections. No provision was made for the effects of inflation. Current tax regulations were applied to assess the federal income tax liabilities, while the most recent state regulations were applied to assess the Alaska income and mining tax liabilities.
The internal rate of return (IRR) on total investment was calculated based on 100% equity financing, even though THM may decide in the future to finance part of the Project with debt financing. The net present value (NPV) was calculated from the cash flow generated by the Project, based on a discount rate of 5%. The payback period based on the undiscounted annual cash flow of the Project is also indicated as a financial measure. Furthermore, a sensitivity analysis has been performed for the after-tax base case to assess the impact of the following variations on the Project economics: capital costs, operating costs, and price of gold.
The economic analysis presented in this section contains forward-looking information with regard to the mineral reserve estimates, commodity prices, proposed mine production plan, projected recovery rates, operating costs, construction costs and Project schedule. The results of the economic analysis are subject to a number of known and unknown risks, uncertainties and other factors that may cause actual results to differ materially from those presented here. The reader is cautioned that this PFS is preliminary in nature and there is no certainty that the PFS economics will be realized.
| 19.2 | Assumptions and Basis |
The economic analysis was performed using the following assumptions and basis:
| § | The conceptual mine plan developed in Chapter 13 provided the following inputs to the financial model: mine life, annual ore and waste tons mined, and annual mill tons and head grade, annual ounces recovered based on recovery algorithms internal to the block model; |
| § | The preproduction period and construction period financial inputs flow from the Project execution schedule developed in Chapter 21, taking into consideration key Project milestones; |
| § | The financial model applies metal pricing of $1,680/oz, which was estimated on the basis of historical trailing averages and consensus analyst estimates that were deemed to be credible. The forecasts used are meant to reflect the average metal price expectation over the life of the Project. It is understood that metal prices can be volatile and that there is the potential for deviation from the LOM forecasts; |
| International Tower Hill Mines Ltd. S-K 1300 – Technical Report Summary Livengood Gold Project Pre-feasibility Study | |
| § | All cost and sales estimates are in constant Q3 2021 United States dollars with no inflation or escalation factors taken into account; |
| § | All metal products are assumed sold in the same year that they are produced; |
| § | Class specific capital cost depreciation rates for tangible property under the Modified Accelerated Cost Recovery System (MACRS) are used for the purpose of determining the allowable taxable income; |
| § | All project related payment and disbursements incurred prior to the effective date of this TRS are considered as sunk costs. Disbursements that may occur after the effective date of this TRS, but before the start of construction, are considered as sunk costs; |
| § | Net present value (NPV) was calculated using the middle of period approach; |
| § | The after-tax model includes Alaska state taxes and Federal taxes according to 2021 guidelines; |
| § | The model applies 3% royalties on net smelter returns across the life of mine based on an average royalty calculation; |
| § | Project revenue is derived from the sale of gold doré into the international marketplace. No contractual arrangements for doré smelting or refining exist at this time. Provisions for gold transportation, insurance, refining and payable charges have been included in the financial model; |
| § | Final rehabilitation and closure costs will be incurred after production Year 21. |
This financial analysis was performed on both a pre-tax basis and after-tax basis with the assistance of an external tax consultant hired by THM. The general assumptions used for this financial model and the LOM plan tonnage and grade estimates are summarized in Table 19-1, and outlined in Table 19-3.
Table 19-1: Financial model criteria
| Description | Value | Unit |
| Construction/Preproduction Period | 36 | Months |
| Mine Life (after preproduction) | 20.3 | Years |
| Total Ore Processed | 474 | Mt |
| Total Waste Mined (including 84Mt during preproduction) | 547 | Mt |
| Gold Head Grade (LOM) | 0.65 | g/mt |
| Gold Head Grade (Year 1-5) | 0.79 | g/mt |
| Gold Recovery (LOM) | 71.4 | % |
| Gold Production (LOM) | 6,430,178 | Troy oz |
| Average Annual Process Gold Production Rate (LOM) | 317,000 | Troy oz |
| Average Annual Process Gold Production Rate (Year 1-5) | 388,600 | Troy oz |
| Daily Milling Rate | 65,000 | t/d |
| Open Pit Mining Operating Cost (LOM Avg.) | 2.05 | $/t mined |
| International Tower Hill Mines Ltd. S-K 1300 – Technical Report Summary Livengood Gold Project Pre-feasibility Study | |
| Description | Value | Unit |
| Processing Operating Cost (LOM Avg.) | 7.72 | $/t milled |
| General and Administration Operating Cost (LOM Avg.) | 1.35 | $/t milled |
| Gold Transportation and Insurance, Refining, and Payable Charges | 3.48 | $/oz |
| Doré Gold Payable Terms | 99.90 | % |
| Royalty on Net Smelter Return (NSR) | 3.00 | % |
| Base Case Gold Price | 1,680 | $/oz |
| Discount Rate | 5 | % |
| Initial Capital Cost | 1.93 | $B |
| Sustaining Capital Cost | 658 | $M |
| Reclamation and Closure Cost | 317 | $M |
The annual royalty costs are based on the conceptual open pit mine design and production profiles described in Chapter 13. Due to the fact that there are numerous individual royalty agreements, for the purposes of this financial evaluation, a fixed 3.0% NSR has been assumed. Over the life of the Project, approximately $323M in royalties is expected to be paid based on the base case metal prices and Project assumptions.
| 19.4 | Third Party Smelting, Refining and Transportation |
A weekly shipment of doré bars will be transported to a refinery. A flat rate transportation cost will be incurred by the refinery in addition to a cost by weight and a variable liability fee. A treatment cost per troy ounce of material shipped to the refinery will also be charged. THM will be paid for a set recovery (99.9%) of the assayed gold content. Over the life of the mine, the transport and refining cost including payable charges are estimated to be $3.48/oz.
The Livengood Gold Project is subject to three levels of taxation, including federal income tax, Alaska State income tax, and an Alaska State mining license tax. THM compiled the taxation calculations for the Project with assistance from third party taxation experts. This information was not verified by BBA.
The current US tax system applicable to mineral resource income was used to assess the annual tax liabilities for the Project. The US Federal corporate income tax, Alaska State corporate income tax and Alaska State license mining tax rates currently applicable over the operating life of the Project are 21.0%, 9.40% and 7.0% of taxable income, respectively.
| International Tower Hill Mines Ltd. S-K 1300 – Technical Report Summary Livengood Gold Project Pre-feasibility Study | |
The tax calculations are underpinned by the following key assumptions:
| § | The Project is held 100% by a corporate entity and the after-tax analysis does not attempt to reflect any future changes in corporate structure or property ownership; |
| § | Assumes 100% equity financing and therefore does not consider interest and financing expenses; |
| § | Projected payments relating to Net Smelter Return (NSR) or Net Profits Interest (NPI) royalties, as applicable, are allowed as a deduction for federal and state income tax purposes, but are added back for state mining tax purposes; and |
| § | Actual taxes payable will be affected by corporate activities, and current and future tax benefits have not been considered. |
The combined effect on the Project of the three levels of taxation, including the elements described above, is a cumulative effective tax rate of 38%, based on the Project’s LOM Operating Income (gross income less operating costs and depreciation). It is anticipated, based on the Project assumptions, that THM will make tax payments of approximately $280M over the life of the Project.
NewFields developed a dry closure plan for the tailings management facility. Closure costs track reclamation and closure expenses over a period of 36 years (Year 17 through 52), including costs to build and operate a water treatment plant in Years 17-21, prior to the termination of operations. The main closure construction effort occurs from Year 22 through 31, accounting for 96% of the overall closure costs. Costs for pumping and management operations are included in Years 23 through 52. Year 52 is the last year with planned closure expenses.
The total closure cost is $317M. This total closure cost is applied to the cash flow in Year 21. This cost includes closure of the overburden stockpile, tailings management facility, solid waste landfill, and ancillary facilities, including indirect costs.
Closure cost funding will flow from a closure trust fund financed by mine cash flow. Annual contributions to the closure trust fund are included in the cash flow model. The annual contribution is $11.7M during Years -2 through 21. The model includes trust fund earnings at a 3.0% annual percentage rate (APR), applied to the fund balance until closure is complete.
Working capital is the maximum funding required during the initial operating period to offset expenses prior to the cumulative revenue offsetting the cumulative expenses; that is, when the operation becomes self-sustaining in its cash flow. Working capital is recovered at the end of the Project.
The revenue was calculated on a weekly basis using the amount and price of the saleable product produced, allowing for the following ramp-up, which corresponds to the mine production schedule:
| Quarter 1: | 15.3% of 1st year production |
| Quarter 2: | 25.4% of 1st year production |
| Quarter 3: | 27.1% of 1st year production |
| Quarter 4: | 32.2% of 1st year production |
| Total: | 100% of 1st year production (75% of design capacity) |
| International Tower Hill Mines Ltd. S-K 1300 – Technical Report Summary Livengood Gold Project Pre-feasibility Study | |
Revenue receipt was projected based on shipping and receipt of 85% of funds four weeks after the shipping date, with the balance of 15% of funds received eight weeks after shipping doré.
Average weekly expenditure rates were calculated from the operating costs for Year 1. The average weekly expenditure of funds starts immediately in week one of Year 1.
The maximum cash flow deficiency would occur in week 12, totaling $46.1M. The model contains this working capital cost in Year 1 and recovers the equivalent amount in Year 21.
Figure 19-1 highlights the anticipated gold production schedule for the Livengood Gold Project. Total life of mine production is anticipated to be 6,430,178 oz or approximately 317,000 oz/y based on the PFS mine plan, estimated feed grade and recovery estimates. The average feed grade is expected to be 0.65 g/mt and process plant recovery is estimated to be 71.4% over the life of mine. Over the first five years, the operation is expected to produce approximately 388,600 oz/y due to higher grade material being preferentially sent to the process plant. Low grade material will be stockpiled in these early years to be used for future process plant feed. During Years 18 through 21, the process plant feed will consist entirely of reclaimed ore from the low-grade stockpile.
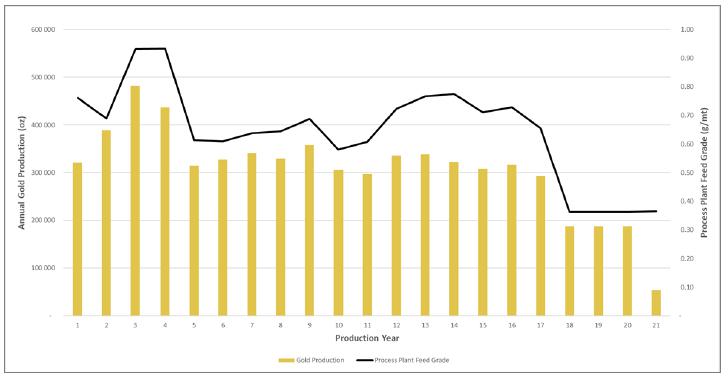
Figure 19-1: Annual gold production schedule
| International Tower Hill Mines Ltd. S-K 1300 – Technical Report Summary Livengood Gold Project Pre-feasibility Study | |
| 19.9 | Operating, All-in Sustaining, and All-in Costs |
The operating costs over the LOM to produce gold at Livengood total $6.87B or $1,068/oz. The all-in sustaining costs (AISC) including sustaining capital total $7.53B or $1,171/oz. All-in costs including operating, capital (initial and sustaining) and reclamation funding are estimated to be $9.72B or $1,512/oz. Table 19-2 highlights the all-in sustaining costs (AISC) and all-in cost of production over the first 5 years and the life of the Project.
Table 19-2: Operating, All-in Sustaining, and All-in costs (pre-tax)
| | Years 1-5 | LOM |
| | $/oz | $Million | $/oz | $Million |
| Operating Costs | 887 | 1,724 | 1,068 | 6,870 |
| Sustaining Capital Expenditures (1) | 151 | 292 | 102 | 658 |
| All-In Sustaining Costs (AISC) | 1,038 | 2,016 | 1,171 | 7,529 |
| Initial Capital Expenditures (2) (3) | 0 | 0 | 299 | 1,925 |
| Funding of Reclamation Trust Fund (4) | 30 | 58 | 42 | 268 |
| All-In Costs | 1,068 | 2,075 | 1,512 | 9,722 |
Notes:
Rounding of some figures may lead to minor discrepancies in totals.
| (1) | Excludes $18M upfront funding included in reclamation and remediation above and $37M of recoverable initial stores inventory. |
| (2) | Includes initial capital expenditures only under LOM. |
| (3) | Excludes $40 million of recoverable initial stores inventories. |
| (4) | Total $317 million estimated costs. |
A 5% discount rate was applied to the cash flow to derive the NPV for the Project on a pre-tax and after-tax basis. The summary of the financial evaluation results for the Project base case, at a gold price of $1,680/oz, is presented in Table 19-3.
| International Tower Hill Mines Ltd. S-K 1300 – Technical Report Summary Livengood Gold Project Pre-feasibility Study | |
Table 19-3: Financial analysis summary (pre-tax and after-tax)
| Description | Base Case | Unit |
| Pre-Tax | Net Present Value (0% disc) | 1,397.1 | $M |
| Net Present Value (5% disc) | 168.5 | $M |
| Internal Rate of Return | 6.1% | % |
| Simple Payback Period | 9.8 | Year |
| After-Tax | Net Present Value (0% disc) | 1,137.1 | $M |
| Net Present Value (5% disc) | 44.6 | $M |
| Internal Rate of Return | 5.3% | % |
| Simple Payback Period | 10.4 | Year |
The pre-tax base case financial model resulted in an IRR of 6.1% and an NPV of $ 168.5M using a discount rate of 5%. The simple pre-tax payback period is 9.8 years. On an after-tax basis, the base case financial model resulted in an IRR of 5.3% and an NPV of $ 44.6M with a discount rate of 5%. The simple after-tax payback period is 10.4 years.
The summary of the Livengood Gold Project discounted cash flow financial model (pre-tax and after-tax) is presented in Table 19-4.
| International Tower Hill Mines Ltd. S-K 1300 – Technical Report Summary Livengood Gold Project Pre-feasibility Study | |
Table 19-4: Simplified cash flow table
| Year | -3 | -2 | -1 | 1 | 2 | 3 | 4 | 5 | 6 | 7 | 8 | 9 | 10 | 11 | 12 | 13 | 14 | 15 | 16 | 17 | 18 | 19 | 20 | 21 | Total/Average |
| Period | Preproduction | | | | | | | | | | Production | | | | | | | | | | |
| Production Summary | | | | | | | | | | | | | | | | | | | | | | | | | |
| Total Ore Mined (Mt) | 1 | 3 | 1 | 33 | 31 | 36 | 40 | 29 | 30 | 27 | 27 | 27 | 19 | 23 | 27 | 27 | 26 | 27 | 27 | 14 | 0 | 0 | 0 | 0 | 474 |
| Total Waste Mined (Mt) | 18 | 33 | 34 | 32 | 35 | 30 | 26 | 37 | 30 | 34 | 34 | 34 | 45 | 43 | 21 | 20 | 14 | 14 | 12 | 3 | 0 | 0 | 0 | 0 | 547 |
| Total Milled (Mt) | 0 | 0 | 0 | 18 | 24 | 24 | 23 | 24 | 24 | 24 | 23 | 24 | 24 | 24 | 24 | 23 | 23 | 23 | 23 | 23 | 24 | 24 | 24 | 7 | 474 |
| Mill Head Grade Au (g/mt) | 0 | 0 | 0 | 0.76 | 0.69 | 0.93 | 0.93 | 0.61 | 0.61 | 0.64 | 0.64 | 0.69 | 0.58 | 0.61 | 0.72 | 0.77 | 0.77 | 0.71 | 0.73 | 0.65 | 0.36 | 0.36 | 0.36 | 0.37 | 0.65 |
| Gold Recovery (%) | 0% | 0% | 0% | 80% | 79% | 73% | 69% | 74% | 78% | 77% | 75% | 76% | 75% | 70% | 67% | 65% | 62% | 64% | 64% | 66% | 75% | 75% | 75% | 74% | 71% |
| Revenue | | | | | | | | | | | | | | | | | | | | | | | | | |
| Gross Revenue ($M) | 0 | 0 | 0 | 540 | 653 | 810 | 734 | 528 | 550 | 572 | 553 | 601 | 514 | 498 | 564 | 569 | 540 | 518 | 531 | 492 | 315 | 315 | 315 | 90 | 10,803 |
| Operating Expenditures | | | | | | | | | | | | | | | | | | | | | | | | | |
| Mining ($M) | 0 | 0 | 0 | -106 | -134 | -115 | -114 | -107 | -111 | -117 | -111 | -112 | -117 | -136 | -92 | -93 | -93 | -99 | -86 | -47 | -36 | -36 | -31 | -18 | -1,910 |
| Processing ($M) | 0 | 0 | 0 | -153 | -184 | -193 | -182 | -174 | -174 | -174 | -175 | -175 | -178 | -182 | -188 | -187 | -188 | -186 | -186 | -180 | -176 | -176 | -176 | -72 | -3,659 |
| General and Administration ($M) | 0 | 0 | 0 | -31 | -31 | -31 | -31 | -31 | -31 | -31 | -31 | -31 | -31 | -31 | -31 | -31 | -31 | -31 | -31 | -31 | -31 | -31 | -31 | -9 | -639 |
| Smelting, Refining and Transport Costs ($M) | 0 | 0 | 0 | -1 | -1 | -2 | -2 | -1 | -1 | -1 | -1 | -1 | -1 | -1 | -1 | -1 | -1 | -1 | -1 | -1 | -1 | -1 | -1 | 0 | -22 |
| Royalty Payments ($M) | 0 | 0 | 0 | -16 | -20 | -24 | -22 | -16 | -16 | -17 | -17 | -18 | -15 | -15 | -17 | -17 | -16 | -16 | -16 | -15 | -9 | -9 | -9 | -3 | -323 |
| Capital Expenditures | | | | | | | | | | | | | | | | | | | | | | | | | |
| Preproduction ($M) (1) | -58 | -982 | -926 | 0 | 0 | 0 | 0 | 0 | 0 | 0 | 0 | 0 | 0 | 0 | 0 | 0 | 0 | 0 | 0 | 0 | 0 | 0 | 0 | 40 | -1,925 |
| Sustaining ($M) | 0 | 0 | 0 | -81 | -94 | -41 | -37 | -38 | -34 | -38 | -26 | -29 | -41 | -37 | -38 | -23 | -35 | -17 | -15 | -18 | -15 | 0 | 0 | 0 | -658 |
| Reclamation and Closure ($M) | 0 | -12 | -12 | -12 | -12 | -12 | -12 | -12 | -12 | -12 | -12 | -12 | -12 | -12 | -12 | -12 | -12 | -12 | -12 | -12 | -12 | -12 | -12 | -12 | -268 |
| Working Capital ($M) | 0 | 0 | 0 | -46 | 0 | 0 | 0 | 0 | 0 | 0 | 0 | 0 | 0 | 0 | 0 | 0 | 0 | 0 | 0 | 0 | 0 | 0 | 0 | 46 | 0 |
| Pre-Tax Cash Flow | | | | | | | | | | | | | | | | | | | | | |
| Annual Pre-Tax Cash Flow ($M) | -58 | -994 | -937 | 93 | 177 | 392 | 334 | 148 | 171 | 181 | 180 | 223 | 119 | 84 | 185 | 203 | 164 | 156 | 184 | 188 | 36 | 51 | 56 | 63 | 1,397 |
| Cumulative Pre-Tax Cash Flow ($M) | -58 | -1,051 | -1,989 | -1,896 | -1,719 | -1,327 | -993 | -846 | -675 | -494 | -314 | -92 | 27 | 111 | 296 | 499 | 664 | 820 | 1,003 | 1,192 | 1,228 | 1,279 | 1,334 | 1,397 | 1,397 |
| Taxes | | | | | | | | | | | | | | | | | | | | | |
| Alaska State Income and Mining Taxes ($M) | 0 | 0 | 0 | -5 | 0 | -7 | -10 | -0.5 | -3 | -5 | -7 | -13 | -6 | -4 | -15 | -16 | -13 | -11 | -14 | -18 | -3 | -3 | -4 | 0 | -157 |
| Federal Income Tax ($M) | 0 | 0 | 0 | -2 | 0 | -3 | -3 | -0.1 | -1 | -1 | -2 | -3 | -4 | -4 | -15 | -16 | -13 | -11 | -15 | -19 | -3 | -3 | -4 | 0 | -123 |
| After-Tax Cash Flow | | | | | | | | | | | | | | | | | | | | | |
| Annual After-Tax Cash Flow ($M) | -58 | -994 | -937 | 89 | 177 | 386 | 326 | 147 | 168 | 177 | 175 | 207 | 109 | 76 | 155 | 171 | 138 | 134 | 154 | 151 | 30 | 45 | 48 | 63 | 1,137 |
| Cumulative After-Tax Cash Flow ($M) | -58 | -1,051 | -1,989 | -1,900 | -1,723 | -1,338 | -1,012 | -864 | -696 | -519 | -344 | -137 | -28 | 48 | 203 | 374 | 512 | 646 | 800 | 951 | 982 | 1,026 | 1,074 | 1,137 | 1,137 |
| Summary | | | | | | | | | | | | | | | | | | | | | | | | |
| Pre-Tax NPV @ 5% ($M) | 168 | | | | | | | | | | | | | | | | | | | | | | | |
| Pre-Tax IRR (%) | 6.1% | | | | | | | | | | | | | | | | | | | | | | | | |
| After-Tax NPV @ 5% ($M) | 45 | | | | | | | | | | | | | | | | | | | | | | | | |
| After-Tax IRR (%) | 5.3% | | | | | | | | | | | | | | | | | | | | | | | | |
| | | | | | | | | | | | | | | | | | | | | | | | | | |
(1) $40M of recoverable initial stores inventory in Year 21.
| International Tower Hill Mines Ltd. S-K 1300 – Technical Report Summary Livengood Gold Project Pre-feasibility Study | |
Figure 19-2 shows the cumulative cash flows for the Project projected for the life of the mine on a pre-tax and after-tax basis.
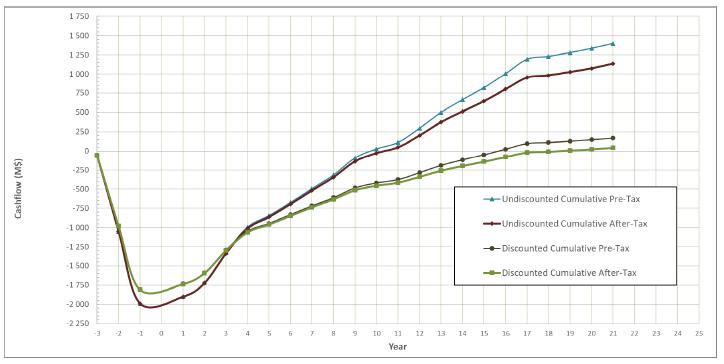
Figure 19-2: Life-of-mine cash flow projection (pre-tax and after-tax, discount rate: 5%)
| 19.11 | Sensitivity Analysis |
The economic evaluation includes an analysis of the Project sensitivity to key financial parameters compared to the base case. Sensitivity measures how much impact a change in a given parameter has on the base Project value, all other factors remaining constant. Table 19-5 presents the after-tax IRR and NPV (@ 5% discount rate) sensitivity results for varying gold recovery, gold price, total operating cost and total capital cost. Figure 19-3 and Figure 19-4 present each sensitivity analysis graphically, steeper curves represent greater sensitivity.
This sensitivity analysis shows that both gold price and recovery variations cause the greatest and almost equivalent impact on the Project value. A 30% increase in gold price to $2,184/oz would yield an IRR of 14.1% and a NPV of $1,493. A 30% decrease in gold price to $1,176/oz would yield a reduced IRR of -22.5% and NPV of -$1,647M. The impact of variations in operating and capital cost on both financial metrics is fairly similar, with the operating cost changes resulting in marginally larger Project returns than capital cost changes, meaning that reducing operating expenses would benefit the Project more than reducing capital costs by the same percentage.
| International Tower Hill Mines Ltd. S-K 1300 – Technical Report Summary Livengood Gold Project Pre-feasibility Study | |
Table 19-5: Project sensitivity analysis – after-tax IRR and NPV
| Base Case Variance | -30% | -20% | -15% | -10% | -5% | Base Case | 5% | 10% | 15% | 20% | 30% |
| Gold Recovery (%) | 50% | 57% | 61% | 64% | 68% | 71.4% | 75% | 78% | 82% | 86% | 93% |
| After Tax IRR (%) | -16.2% | -4.2% | -1.1% | 1.4% | 3.5% | 5.3% | 7.0% | 8.6% | 10.1% | 11.5% | 14.1% |
| After Tax NPV @ 5% ($M) | -1,637 | -1,044 | -753 | -469 | -209 | 45 | 293 | 536 | 776 | 1,014 | 1,483 |
| Gold Price ($/oz) | 1,176 | 1,344 | 1,428 | 1,512 | 1,596 | 1,680 | 1,764 | 1,848 | 1,932 | 2,016 | 2,184 |
| After Tax IRR (%) | -22.5% | -4.5% | -1.2% | 1.4% | 3.5% | 5.3% | 7.0% | 8.6% | 10.1% | 11.5% | 14.1% |
| After Tax NPV @ 5% ($M) | -1,647 | -1,051 | -758 | -472 | -$210 | 45 | 295 | 540 | 781 | 1,020 | 1,493 |
| Operating Cost ($M) | 4,345 | 4,966 | 5,276 | 5,587 | 5,897 | 6,208 | 6,518 | $6,828 | 7,139 | 7,449 | 8,070 |
| After Tax IRR (%) | 10.6% | 9.0% | 8.1% | 7.3% | 6.3% | 5.3% | 4.3% | 3.1% | 1.9% | 0.5% | -3.1% |
| After Tax NPV @ 5% ($M) | 877 | 609 | 470 | 330 | 189 | 45 | -$103 | -$251 | -403 | -567 | -906 |
| Initial Capital Cost ($M) | 1,391 | 1,589 | 1,689 | 1,789 | 1,889 | 1,989 | 2,089 | 2,190 | 2,290 M | $2,391 M | 2,594 |
| After Tax IRR (%) | 10.4% | 8.4% | 7.5% | 6.7% | 6.0% | 5.3% | 4.7% | 4.1% | 3.6% | 3.1% | 2.2% |
| After Tax NPV @ 5% ($M) | 580 | 402 | 312 | 223 | 134 | 45 | -$45 | -$134 | -223 | -312 | -491 |
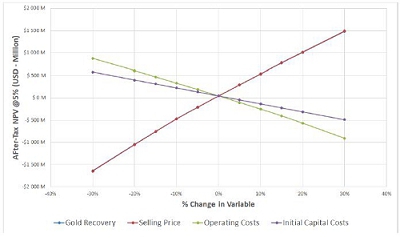 | 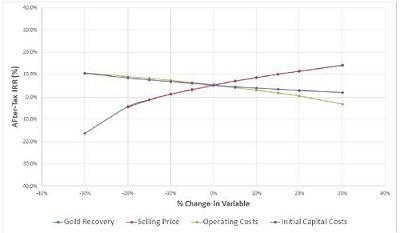 |
| | |
| Figure 19-3: After-tax sensitivity analysis for project net present value (NPV @ 5% discount rate) | Figure 19-4: After-tax sensitivity analysis for project internal rate of return (IRR %) |
| International Tower Hill Mines Ltd. S-K 1300 – Technical Report Summary Livengood Gold Project Pre-feasibility Study | |
This chapter provides public source information on producing and exploration properties adjacent to the Livengood Gold Project. The information related to adjacent properties is not necessarily indicative of the mineralization on the Livengood Gold property.
The Fort Knox Gold Mine is an open pit mine owned and operated by Toronto-based Kinross Gold (TSX:K). A conventional gravity/carbon-in-pulp (CIP) mill processes up to 50,000 t/d (45,000 mt/d) of higher grade ore (0.6 g/mt), with a heap leach for lower grade ore (0.3 g/mt). The mine is located 26 mi (42 km) northeast from the city of Fairbanks via a combination of paved and unpaved roads. In production since 1996 and surpassing production of 8 Moz, Fort Knox is the single largest producer of gold in the history of the State of Alaska and is the largest single property taxpayer in the Fairbanks North Star Borough. This information has no relation to Livengood.
The Pogo Gold Mine is an underground mine owned and operated by Northern Star Resources. A conventional gravity/flotation/flotation concentrate CIP leach processes up to 3,000 t/d (2,722 mt/d) of ore generally 7-10 g/mt. The mine is located 85 mi (137 km) southeast from the city of Fairbanks via a combination of paved and unpaved roads. In production since 2006 and surpassing production of 4 Moz, Pogo is the largest underground gold mine in Alaska. This information has no relationship to Livengood.
In 2014, Freegold Ventures Limited (FVL:TSX) acquired control of the Shorty Creek property comprising 27,000 acres (10,800 hectares) of State of Alaska mining claims directly adjacent to and south of the Livengood Gold Project. During 2015, the company released a technical report on the property (Abrams, Mark J., “Technical Report for the Shorty Creek Project, Livengood-Tolovana Mining District, Alaska”, March 31, 2015), completed a geophysical program and conducted limited drilling.
In 2016, Freegold released an updated technical report on the property (Abrams, Mark J., “Updated Technical Report for the Shorty Creek Project, Livengood-Tolovana Mining District, Alaska”, March 25, 2016), and conducted additional drilling. Hole SC 16-01 intersected 434.5 m grading 0.57% copper equivalent from the base of oxidation at 86.1 m to EOH at 520.6 m. Within this broad intercept, a higher grade interval of 207 m grading 0.73% copper equivalent from 138.6 m to 345 m was also intersected. Mineralization remains open to depth with the last 12 m grading 0.82% copper equivalent (Cu 0.55%, Au 0.145 g/t and Ag 9.67 g/t). (Freegold Ventures Limited press release September 8, 2016).
In March 2019, Freegold announced that it had entered into an Agreement with a wholly owned subsidiary of South32 Limited (South32) whereby South32 has the option to earn a 70% interest in the Shorty Creek property. Drilling was conducted during 2019 and 2021.
The QP has been unable to verify the information related to Shorty Creek and the information is not necessarily indicative of the mineralization at Livengood. Shorty Creek has no relationship to Livengood.
| International Tower Hill Mines Ltd. S-K 1300 – Technical Report Summary Livengood Gold Project Pre-feasibility Study | |
| 21. | Other Relevant Data and Information |
| 21.1 | Execution Plan and Schedule |
The execution plan is conceptual in nature and will be adjusted and refined during a future phase of the Project. The plan covers the period from the initiation of the Environmental Impact Study (EIS) process to commercial production in Q2 Year 1. It is based on a recommended Project configuration that includes an open pit mine, a processing plant with a capacity of 65,000 t/d (59,000 mt/d), surface infrastructure and a tailings management facility (TMF) with storage capacity for 21 years of production. The durations and milestones for the major Project activities are shown in Table 1-12 and Figure 21-1.
Table 21-1: Key project activities (preliminary)
| Activity | Start date | Completion
date | Duration (months) |
| Environmental Impact Statement and Permitting | Q1 YR -7 | Q3 YR -3 | 48 |
| Engineering Studies in Support of Permitting | Q1 YR -7 | Q3 YR -3 | 48 |
| Process Plant Detailed Engineering | Q1 YR -3 | Q3 YR -2 | 21 |
| Project Authorization | | Q3 YR -3 | |
| Pit Pre-Stripping / Waste Rock Supply for Construction | Q3 YR -3 | Q4 YR -1 | 30 |
| Tailings Management Embankment Construction | Q3 YR -3 | Q4 YR -1 | 30 |
| Process Plant Construction | Q4 YR -3 | Q4 YR -1 | 27 |
| Process Plant Dry Commissioning Completed | | Q1 YR 1 | |
| Start Process Plant Ramp-up to Commercial Production | Q1 YR 1 | | |
After the PFS, the next step for the Project would be a full feasibility study and detailed engineering necessary to support permit applications. In parallel, environmental studies will be continued.
The Project schedule includes consideration of early work requirements, the permitting process, stakeholder engagement, engineering studies, the procurement of long lead items and critical equipment, construction, and facility commissioning, including the power line and main substation, processing plant, tailings management facility, and site infrastructure.
Off-site construction of a sub-station and a transmission line for the Project will need to be permitted, constructed, and operational by Q2 Year -1 to allow for commissioning of the processing facilities.
| International Tower Hill Mines Ltd. S-K 1300 – Technical Report Summary Livengood Gold Project Pre-feasibility Study | |
On-site construction at the Livengood site is planned to start with a major civil contractor preparing the site access roads, while contractor equipment and crews begin preproduction stripping and site work in Q3 Year -3. THM mining equipment and crews will assume preproduction stripping and site work in Q3 Year -2. The overall construction period from start of the access road construction to completion of the process plant is expected to last 32 months. The civil contractor will begin the TMF embankment foundations in Q4 Year -3, while the ground is frozen. Waste rock excavated from the pit by the mining team will be used for the construction of the embankment, haul roads, and other facilities. Waste rock fill will be delivered, placed and compacted by the THM mining operations team. The civil contractor will be responsible for the installation of liners and smaller volume excavations and backfills. Once road foundations and embankment foundations are completed, work will be maximized in warmer weather and scaled back during the coldest winter months. The preproduction TMF embankment will be raised by the end of Q3 Year -1 to a height sufficient to accumulate process water required for start-up and operations.
The construction of other surface facilities, including the main substation, process plant and surface fleet maintenance shop will begin in Q4 Year -3 with the aim of completing construction and commissioning in Q1 Year 1. This schedule is in line with recent projects of similar scope and size.
An analysis of the construction schedule developed during the PFS facilitated the development of a preliminary site workforce plan, which is expected to peak at approximately 800 workers during construction. The total estimated workforce takes into account the development of the open pit, direct and indirect construction labor for the tailings and water management facilities, process plant construction, and the construction of other site facilities. The estimate also incorporates commissioning crews and an allowance for THM operating and supervision personnel. A construction camp will be built to lodge the labor force.
Figure 21-1 shows the summary schedule for the Project.
| International Tower Hill Mines Ltd. S-K 1300 – Technical Report Summary Livengood Gold Project Pre-feasibility Study | |

Figure 21-1: Summary project execution schedule
| International Tower Hill Mines Ltd. S-K 1300 – Technical Report Summary Livengood Gold Project Pre-feasibility Study | |
| 21.2 | Logistics and Transportation |
In 2012, SR International Logistics (SRIL) completed a logistics and transportation study to support the FS. SRIL reviewed and compiled extensive data to plan a seamless and uninterrupted flow of materials and equipment from global suppliers to the Project site. SRIL, with input from shippers Lynden Transport and Totem Ocean Express, created a comprehensive report detailing the logistics and transportation needs of the Project. This study will need to be updated as part of a future FS, including pricing details for ocean freight, inland freight, air freight, heavy haul requirements, rail freight, consolidation and marshaling points, and warehousing.
| 21.2.2 | Freight Options Considered |
The construction and commissioning of the Project will require effective frontend planning and a complete, schedule-driven transportation and logistics plan. All freight forwarding activities will feature identification of critical path items. Expediting and inspection personnel will control, verify and facilitate the movement of goods to the Project site.
Key Project personnel and/or agents acting on behalf of the Project will be located at strategic points to ensure that ocean freight and inland freight schedules are met and that freight inspections/inventories and import customs documentation are compliant with US government requirements.
Foreign shipments will be pre-inspected to verify quantities, purchase order engineer’s compliance (EC) certification, customs documentation and completeness. The B-Harmonization classification number will be incorporated in all import documents to expedite customs clearance and delivery of goods to the Project site; duties and taxes will also be based on this number.
Designated key equipment will require pre-inspections to verify quality and quantities, EC certification and packing/handling compliance.
THM will set up a primary receiving yard to hold and consolidate freight near the Project site. It is assumed that the primary receiving yard would be located on the northern outskirts of Fairbanks, near Highway 2. Alternatively, THM may decide to place the primary receiving yard closer to site, near the current Alaska DOT station.
Ocean freight will be the dominant mode of transporting materials and equipment not readily available in Alaska. All methods of ocean freight may be utilized. Ships may take five days and barges ten days duration from Puget Sound (Seattle, WA) to Anchorage.
| International Tower Hill Mines Ltd. S-K 1300 – Technical Report Summary Livengood Gold Project Pre-feasibility Study | |
Trucking will be the primary method to move materials and equipment to the Project yards from Alaskan arrival ports. Freight will be consolidated at a primary receiving yard assumed to be located near Fairbanks. The distances and drive time elements between Alaska ports and the prospective Fairbanks yard are given below:
| § | Anchorage Port to Fairbanks yard: 360 mi (576 km) (6 hours) via State Highways 1 and 3. The road has year-round state maintenance and regulations. |
| § | Valdez Port to Fairbanks yard: 365 mi (584 km) (7 hours) via State Highway 4 with year-round state maintenance and regulations. |
| § | Seward Port to Fairbanks yard: 485 mi (776 km) (8 hours 30 min) via State Highways 1 and 3 with year-round state maintenance and regulations. This route holds little benefit and should be avoided, but ocean shipping situations may dictate its use. |
| § | Whittier Port to Fairbanks yard: 417 mi (667 km) (7 hours 30 min) via State Highways 1 and 3 with year-round state maintenance and regulations. The primary size restriction is the Anton Anderson Tunnel, which all road and rail must use. This is not a desirable location for on-forwarding freight by road. The port is primarily used for rail. Ocean alternatives may dictate this route. |
Railroads have very detailed size-weight restrictions but are, pound for pound, the most cost-effective method to move materials and equipment to Fairbanks. Regularly scheduled rail service connects with US and Canadian lines via hydro-train barges.
Caterpillar, Komatsu and other mining and construction equipment dealers use rail as their primary method to move equipment to the Alaskan market. Rail should be considered for any producer with national rail contracts selling FOB Fairbanks. Also, any mining contractor moving equipment from the lower 48 states to Alaska should consider rail.
| 21.2.3 | Recommended Base Routes |
The preferred base route for most project equipment and materials contains four legs and is shown in Figure 21-2. The legs are listed below with the approximate distances:
Table 21-2: Preferred base route legs and distances
| Number | Leg | Distance (miles) |
| 1 | EX-works to Puget Sound | - |
| 2 | Puget Sound to Anchorage | 1,726 |
| 3 | Anchorage to Fairbanks | 352 |
| 4 | Fairbanks to Livengood | 71 |
| Total | Puget Sound to Livengood | 2,109 |
| International Tower Hill Mines Ltd. S-K 1300 – Technical Report Summary Livengood Gold Project Pre-feasibility Study | |
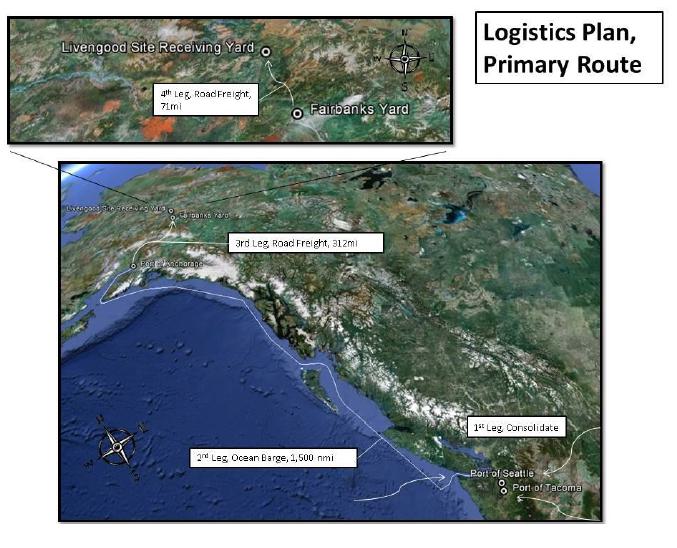
Figure 21-2: Primary route, Livengood logistics plan (Google Earth)
| International Tower Hill Mines Ltd. S-K 1300 – Technical Report Summary Livengood Gold Project Pre-feasibility Study | |
| 22. | Interpretation and Conclusions |
This TRS was prepared by a group of independent consultants (QPs) to demonstrate the economic viability of an open pit mine and process plant complex based on the reserves estimated for the Livengood Gold Project. This TRS provides a summary of the results and findings from each major area of investigation to a level that is equivalent and normally expected for a PFS of a resource development project. Standard industry practices, equipment and processes were used in this study.
This TRS is based on an updated resource estimate effective as of August 20, 2021, and has an optimized Project configuration with a throughput of 65,000 t/d (59,000 mt/d) compared to the 52,600 t/d (47,700 mt/d) Project evaluated in the 2017 PFS.
The Project configuration evaluated in the PFS remains a conventional, owner operated surface mine that will utilize large-scale mining equipment in a blast/load/haul operation. Mill feed would be processed in a 65,000 t/d (59,000 mt/d) comminution circuit consisting of primary and secondary crushing (pre-crushing), wet grinding in a single semi-autogenous (SAG) mill and single ball mill, a gravity gold circuit, two parallel conventional carbon in leach (CIL) circuits, followed by an ADR system and dewatering.
This configuration is estimated to have an initial capital cost of $1.93B, process operating costs of $7.72 per ton, and sustaining costs of $658M, excluding a $317M reclamation and closure cost.
The slightly higher initial capital cost as compared to the 2017 PFS ($1.84B) can mostly be attributed to higher mine equipment and mine development costs and escalation offset by cost savings forecast from design modifications and project execution strategy. Only minor changes were made to the process equipment selection, which, in combination with a decision based on the Whittle EO project led to coarsen the grind, resulting in a higher throughput and overall annual gold production.
A slightly higher OPEX was estimated in this PFS as compared to the 2017 PFS. This can largely be attributed to escalation in mining, process and G&A costs. However, cost escalation was also mitigated by such developments as incorporating autonomous drilling and an integrated remote operations center, as examples. One of the most significant developments reflected in this study was the decision to increase the grind size from 180 µm to 250 µm (P80), which allowed a higher throughput, effectively distributing many fixed OPEX costs to more tons, e.g. operating personnel, and lowering the power consumption per ton milled. Reagent costs were also further optimized as a result of the testwork leading up to this PFS.
The total G&A costs, developed on a similar basis to the 2017 PFS, went up due to escalation, but were also offset somewhat on a unit basis due to the higher throughput.
| International Tower Hill Mines Ltd. S-K 1300 – Technical Report Summary Livengood Gold Project Pre-feasibility Study | |
The key outcomes of this PFS study are:
| § | The Livengood Gold Project mineral resource is estimated at 646.0 M measured metric tons at an average grade of 0.60 g/mt (12.48 Moz) and 58.5 M indicated metric tons at an average grade of 0.61 g/mt (1.14 Moz), for a total of 704.5 M metric tons at an average grade of 0.60 g/mt (13.6 Moz). Mineral resources are inclusive of mineral reserves. |
| § | This PFS has converted a portion of these mineral resources into proven mineral reserves of 411.5 Mmt at an average grade of 0.64 g/mt (8.5 Moz contained) and probable mineral reserves of 18.5 Mmt at an average grade of 0.86 g/mt (0.5 Moz contained), for a total of 430.1 Mmt at an average grade of 0.65 g/mt (9.0 Moz contained). To access these mineral reserves, 496.1 Mmt of overburden and waste rock must be mined, resulting in a strip ratio of 1.15:1 |
| § | The mine plan developed for the PFS provides sufficient ore to support an annual production rate of approximately 317,000 oz/y over an estimated 20.3 year mine life, producing a total of approximately 6.4 Moz of gold. |
| § | The material mined from the open pit peaks at 66 Mt (60 Mmt) per year and averages 57 Mt (52 Mmt). A total of 105 Mt (95 Mmt) of ore is sent to the low grade ore stockpile over the life of the mine, with an average gold grade of 0.38 g/mt. The maximum size of the low grade ore stockpile is 88 Mt (80 Mmt). |
| § | The peak mine fleet requirements have been estimated at 18 -320 t haul trucks, 2 -40 yd3 hydraulic shovels, 2 -40 yd3 wheel loaders and 5-production drills. |
| § | Metallurgical testwork has confirmed the preferred flowsheet consisting of primary crushing, secondary crushing and a comminution circuit (SABC configuration) producing a final grind size of 250 µm (P80), with gravity recovery followed by whole ore leaching of the gravity tailings (CIL). LOM gold recovery is estimated to be 71.4% based on the rock types tested. |
| § | Important Project surface infrastructure include: |
| - | O’Connor Creek Substation and 50 mi (81 km) of new 230 kV transmission line; |
| - | Administration, dry, maintenance, and warehouse complex; |
| - | Fresh water wells, pumping and distribution system; |
| - | Process plant including mechanical workshop, offices, cafeteria, HVAC, electrical rooms within the complex. The oxygen plant and sulfur burner are stand-alone buildings found near the process plant; |
| - | Waste rock, low grade ore and growth media stockpiles; |
| - | Tailings management facility with capacity for approximately 486 Mt (441 Mmt) of mill tailings along with a supernatant pond. Design incorporates best practices, including lined rock fill embankments with a lined tailings basin; |
| - | Off-site Integrated Remote Operations Center (IROC) located in Fairbanks. |
| International Tower Hill Mines Ltd. S-K 1300 – Technical Report Summary Livengood Gold Project Pre-feasibility Study | |
| § | The initial capital cost (-20% / +25% accuracy) of the open pit mine, 65,000 t/d (59,000 mt/d) process plant and general site infrastructure is estimated at $1.93B, including a contingency of $220M. Additional pre-production costs include $40M for spare parts and initial fills (the costs are recovered during the last year of operations) and $23M for funding of the reclamation trust fund. |
| § | LOM Project sustaining capital costs total $658M, which include mine equipment, tailings management facility construction and mobile equipment in the mill. Additional sustaining costs of $317M are required for the reclamation and closure. |
| § | The mining cost is estimated at $2.05/t mined, process plant operating cost is estimated at an average of $7.72/t ore processed, and general and administrative costs of $1.35/t ore processed. |
| § | The total power demand is estimated to be approximately 57.8 MW, including network losses. |
| § | Over the life of mine, the total number of personnel averages 355, including mining, processing and G&A. The total personnel numbers peak in Year 6 at 430 employees. |
| § | Based on review of the studies completed to date, there are no known environmental issues that are anticipated to materially impact the Project’s ability to extract the gold resource. |
The financial analysis performed as part of this PFS using the base case assumptions results in an after-tax net present value (NPV) of $44.6M at a 5% discount rate and an internal rate of return (IRR) of 5.3% after mining and income taxes. The payback period is 10.4 years. The all-in sustaining costs (AISC), including sustaining capital, total $7.53B or $1,171/oz. All-in costs including operating, capital (initial and sustaining) and reclamation funding are estimated to be $9.72B or $1,512 /oz.
The results of the PFS indicate that the proposed Livengood Gold Project is technically feasible, and has marginally positive economics at the base case gold price of ($1,680/oz). However, development of the Project could have the potential to generate improved results with additional efforts as detailed by the opportunities in Table 22-2. The Project QPs recommend advancing the Project to the feasibility study level including the completion of additional metallurgical testwork and various confirmatory studies to improve the Project’s economics, study potential opportunities and reduce overall implementation risk. The decision and timeline to pursue the feasibility study is at the discretion of THM.
| 22.5 | Project Risks and Opportunities |
As with most mining projects, there are risks that could affect the economic viability of the Project. Many of these risks are based on a lack of detailed knowledge and can be managed as more sampling, testing, design, and engineering are conducted at the next study stages. Table 22-1 identifies what are currently deemed to be the most significant internal Project risks, potential impacts, and possible mitigation approaches that could affect the technical feasibility and economic outcome of the Project.
| International Tower Hill Mines Ltd. S-K 1300 – Technical Report Summary Livengood Gold Project Pre-feasibility Study | |
External risks are, to a certain extent, beyond the control of the Project proponents and are much more difficult to anticipate and mitigate. Although, in many instances, some risk reduction can be achieved. External risks are things such as the political situation in the Project region, metal prices, exchange rates and government legislation. These external risks are generally applicable to all mining projects. Negative variance to these items from the assumptions made in the economic model would reduce the profitability of the mine and the mineral resource estimates.
There are opportunities that could improve the economics, timing, and/or permitting potential of the Project. The major opportunities that have been identified at this time are summarized in Table 22-2 excluding those typical to all mining projects, such as changes in metal prices, exchange rates, etc. Further information and assessments are needed before these opportunities should be included in the Project economics.
Table 22-1: Project risks (preliminary risk assessment)
| Area | Risk and Potential Impact | Possible Mitigation Approach |
| Geology and Resource Estimation | 1. Use of Reverse Circulation drilling. TMH has used both core and reverse circulation (RC) drilling above and below the water table. The use of RC drilling beneath the water table can result in inaccurate assay data, due to cyclicity and/or downhole contamination. | 1. Detailed analysis of drilling data indicated the potential for cyclicity contamination in portions of 12 holes. The data for the suspect intervals was removed from the database used for resource calculation. Similar analyses for downhole migration of mineralized material indicated that significant downhole contamination is not an issue. |
| Open Pit Mining | 1. Unable to provide sufficient construction material from the open pit during pre-production. This may result in delays to the start of operations and potential cost overruns. 2. Construction material sourced from mine waste. Uncertain what proportion of mine waste can be used for construction purposes. | 1. Develop a detailed Project Execution Plan (PEP) to determine appropriate productivities and ensure adequate fleet sizing. Develop a more detailed earthworks mass balance. 2. Testwork supports PFS construction plan but future regulatory changes will need to be monitored. |
| International Tower Hill Mines Ltd. S-K 1300 – Technical Report Summary Livengood Gold Project Pre-feasibility Study | |
| Area | Risk and Potential Impact | Possible Mitigation Approach |
| | | |
| Metallurgy and Process Plant | 1. Local utility short-circuit capacity too low for motor mill starting. Local utility short-circuit capacity might cause issues to start the mill motors. 2. Electrical availability and network studies date back to 2013. 3. Foundation design. Foundation quantities were estimated according to available preliminary geotechnical investigation report that does not provide details for all areas. The actual soil/rock conditions encountered during construction may differ from what is currently understood. The result could have negative implications to both the execution schedule and CAPEX. 4. Circuit design. The thickener design was based on best practice as recent sedimentation testwork results were inconsistent. 5. Circuit design. Cold stripping design was based on best practice as no testwork was performed. | 1. Instead of a STATCOM compensation for the 230 kV power line, the design has been done using two 15 MVAR synchronous condensers at the Livengood substation. The synchronous condensers will contribute positively to the short-circuit capacity available. A mill motor starting study should also be performed during the next development phase of the Project. 2. Update all required electrical and network studies before or in parallel to a future feasibility study. 3. Additional geotechnical investigations should be performed in the next engineering stage to improve the confidence in the design parameters for foundation works for the selected locations for crushing and processing areas. 4. Perform additional thickening and sedimentation tests to confirm thickener sizing and flocculant dosages for the next study phase. 5. Cold stripping should be investigated and modeled in the next study phase. |
| Environment | 1. Impact of climate change on site conditions. Climate change could have impacts on weather and soil conditions. 2. Evolving ESG and government guidelines. Over time, social acceptance of the Project could be a risk as ESG becomes a more critical deciding factor in project advancement. | 1. Review Project designs to take into consideration the impact of climate change on site conditions. 2. Ensure that permitting guidelines are carefully monitored and ESG trade-offs are performed. |
| Water Management | 1. Operation of flow-through drain. The flow-through drain conveys stormwater from upstream to downstream, under the TMF. The integrity of the flow-through drain system in perpetuity is critical to the permitting and long-term stability of the TMF. | 1. Further the refinement of hydrological modeling and flow-through drain system design focusing on system redundancy, integrity and cost. |
| International Tower Hill Mines Ltd. S-K 1300 – Technical Report Summary Livengood Gold Project Pre-feasibility Study | |
| Area | Risk and Potential Impact | Possible Mitigation Approach |
| | | |
| Waste and Tailings Management | 1. Deleterious waste rock. Some waste rock proposed to be used as construction material may have acid generating or arsenic leaching potential. 2. Large area of liner installation.
The Project will require the surface preparation and placement of approximately 24 Mft2 (2.2 Mm2) of LLDPE liner at the TMF during the construction of the starter facility and prior to production. There is a risk that the contractor may not be able to place the quantity of liner required in the time available. The result could have significant negative implications to both the execution schedule and cost. | 1. Identify additional testing, incorporate the results into the geological block model. Include TMF construction material requirements in the waste rock management plan. 2. A detailed PEP should be developed, which will identify required milestones for the earthworks and production rates for the liner installation. |
| Execution Plan | 1. Less than optimum Project start date. The PFS execution plan assumes a July 1st mobilization date for construction activities. The actual Project release date is uncertain given the combination of market variables and the multi-year permitting process that must be completed prior to a construction decision. There is a risk that a Project release date that is substantially different than July 1st could have negative implications to both the execution schedule and Project cost. | 1. A detailed PEP should be developed, which will identify alternative approaches to minimize the construction timeline and Project cost. |
| International Tower Hill Mines Ltd. S-K 1300 – Technical Report Summary Livengood Gold Project Pre-feasibility Study | |
Table 22-2: Project opportunities (preliminary opportunity assessment)
| Area | Opportunity Explanation | Benefit |
| Open Pit Mining | 1. In-Pit backfilling of waste rock. Waste rock can be placed back in the pit once the eastern portion is mined to final design. | 1. Reduction in hauling distances and provide a cost savings. However, future potential resources may be sterilized. |
| Metallurgy and Process Plant | 1. Revision of the local utility network modification study. The latest study available stating the required local utility modifications was completed in 2013 and is based on a plant power demand of 90 MW. Some decisions, such as the selection of 230 kV for power transmission, could prove not to be the most cost-effective solution. 2. Reagent optimization. The impact of lead nitrate is not fully developed and shows minor improvements to gold recovery considering the high OPEX associated to the reagent. 3. Product grind size. No testwork has been conducted to investigate a grind size above 250 µm (P80). 4. ADR circuit design is adequate; however, value engineering could lead to reduction of equipment and building space. 5. Reagent optimization. Perform leaching tests in stirred leach reactor test to further optimize lime and cyanide consumption. | 1. Potentially reducing the Project CAPEX if electrical power transmission is proved to be more cost-effective at 138 kV. In general, the CAPEX will benefit from a lower voltage. However, the cost of energy for the OPEX may increase. It is mainly a matter of validating if 230 kV is still the best decision for the Project in 2021 and moving forward. 2. Perform additional testwork with and without lead nitrate using CIL methodology and optimized reagent conditions (O2, NaCN, CaO and pH) to determine whether and how to incorporate the addition of lead nitrate into the circuit. 3. Coarser grinds would allow for higher throughput, which could be achieved, and it is possible to separate the activated carbon from the pulp at coarser grind sizes. 4. Potential reduction in required equipment and building space thus leading to CAPEX savings. 5. Lower reagent consumption would lead to a lower OPEX |
| Water and tailings management | 1. Reduce earthworks quantities. Continue to refine the TMF design through a detailed grading and layer definition in the basin of the Livengood Valley. | 1. This opportunity could reduce the volume of waste rock required during construction and reduce the volume of processed gravels required. Potential CAPEX reduction |
| Execution Plan | 1. Alternative construction techniques. Investigate the application of the following concepts to the Project: - Pre-assembly of leach tank bridges, structural steel, and pipe racks; - Pre-welding of tanks and piping off-site; - Use of pre-cast foundations; - Use of prefabricated buildings for offices and non-industrial use facilities. | 1. These concepts could compress the construction schedule and reduce pre-production CAPEX. |
| International Tower Hill Mines Ltd. S-K 1300 – Technical Report Summary Livengood Gold Project Pre-feasibility Study | |
This Technical Report Summary on Tower Hill Mines Livengood Gold Project was prepared by experienced and competent independent consultants using accepted engineering methodologies and standards. It provides a summary of the results and findings from each major area of investigation including exploration, geological modelling, mineral resource, mine design, metallurgy, process design, infrastructure, environmental management, tailings and water management, capital and operating costs, and economic analysis. The level of investigation for each of these areas is considered to meet or exceed what is normally expected of a preliminary feasibility study (PFS).
The 2021 PFS details a project which will process 65,000 tons per day and produce 6.4 million ounces of gold over 21 years at an all-in-sustaining cost of $1,171/oz. Based on the results of the PFS, the QPs recommend that Tower Hill Mines proceed with a feasibility study (FS) as part of the Livengood Mine development plan. Timing for the proposed FS and associated data collection activities is at the discretion of Tower Hill Mines. Recommendations and associated budgets are provided by the QPs to ensure sufficient information is available going forward. It is also recommended that the ongoing environmental work continue to support project development and maintain continuity of baseline information.
It is estimated that the full feasibility study including the recommended field activities, metallurgical testwork and environmental studies would cost approximately $10.2M including a 20% contingency. A breakdown of the key components of this study is summarized in Table 23-1
Table 23-1: Cost estimate for feasibility study recommendations
| Activities | Estimated Cost
($M) |
| Sampling Program (5,000 ft) | 2.5 |
| Metallurgical Studies and Testwork | 1.0 |
| Feasibility Study | 4.0 |
| Environmental Baseline | 1.0 |
| Sub-total | 8.5 |
| Contingency (20%) | 1.7 |
| Total | $10.2M |
Sections 23.2 to 23.5 summarize the key recommendations arising from this study.
| International Tower Hill Mines Ltd. S-K 1300 – Technical Report Summary Livengood Gold Project Pre-feasibility Study | |
| 23.2 | Sampling Program to Obtain Fresh Core |
Metallurgical testwork completed in Phases 7 to 13 between 2013 and 2021 were conducted on core and RC chips obtained by drilling programs completed between 2008 and 2012. There has been a considerable evolution and improvement in the laboratory protocols and testwork flowsheet applied to the composite samples during this period of time. As a recommended best practice, the final laboratory protocols and the final flowsheet recommended in the PFS should be applied to recently obtained fresh core and the recovery estimates confirmed.
It is estimated that approximately 5,000 feet (1,500 m) of PQ core should be drilled targeting all 5 major rock types of the Livengood deposit.
| 23.3 | Metallurgical Testwork |
Additional metallurgical testwork using the fresh rock samples gathered above should be performed and include the following:
| § | PFS recovery equations and reagent consumptions by rock type should be validated. |
| § | The PFS work has indicated that net operating income increases as the grind size (P80) is increased up to the limits of existing testwork at 250 µm. Additional testwork should be completed to establish the upper economic boundary of a coarser grind size (above 250 µm) |
| § | Sedimentation and filtration testwork at a P80 of 250 µm and coarser. |
| § | Column leach results of 12.5 mm show a negative sloping linear grade/recovery relationship over the grade ranges tested (approximately 0.5 to 1.0 g/mt). When evaluating the potential economics of an auxiliary heap leach that might process material with gold grades below mill cut-off (approximately 0.25 to 0.5 g/mt). extrapolation of the negative sloping linear relationship into the lower grade ranges resulted in low recovery and unfavorable economics. If the grade/recovery relationship is not linear into the lower grade ranges, it could alter the economics of the auxiliary heap leach. Additional column leach testwork should be completed on 12.5 mm crush to assess gold recovery at 0.25 to 0.5 g/mt. |
A feasibility study that includes the additional metallurgical testwork results, as detailed in Section 23.3, should be completed to detail out designs to a feasibility level of engineering, including the open pit, stockpiles, mine haul and site roads, mine maintenance facilities, electrical supply & distribution, process plant, infrastructure, and reclamation and closure. These designs will be required to estimate the initial capital cost, sustaining capital cost and operating costs at the feasibility study level (+/- 15%), which will be in turn used to support a financial analysis and a potential development decision. Additional studies as listed below should be undertaken as part of the FS or prior to the start of the FS as internal studies:
| International Tower Hill Mines Ltd. S-K 1300 – Technical Report Summary Livengood Gold Project Pre-feasibility Study | |
| § | Additional tailings studies are recommended to confirm the selected approach for the FS. These studies should be completed in coordination with the mining team to optimize the use of in-pit material to construct portions of the facilities to save costs, but also understand the overall cost to the mine with different configurations; |
| § | Update the 2013 detailed hydrologic/hydrogeological analysis and water balance to determine water intake, storage and discharge requirements; |
| § | Evaluate proposed and alternative designs for the flow-through drain system of the TMF for cost reductions and operational improvements; |
| § | Update of the geotechnical study to support the most recent designs for the mine, process plant, TMF and general site infrastructure is recommended to verify foundation conditions for consideration in the FS design work. |
Environmental baseline studies and geochemistry studies should continue to be progressed to support a timely environmental approvals process, as well as to support the feasibility study engineering design.
| International Tower Hill Mines Ltd. S-K 1300 – Technical Report Summary Livengood Gold Project Pre-feasibility Study | |
Kunter, R., Carew, T., Rehn, C., Levy, M., Prenn, N., 2013, Livengood Gold Project: Feasibility Study: Livengood, Alaska, Samuel Engineering 43-101 Technical Report, Effective: September 4, 2013, 189 p.
Census Area: Data Source: https://live.laborstats.alaska.gov/cen/2020/downloads.
Federal Subsistence Board, 1992.
FNSB: Data Source: https://www.co.fairbanks.ak.us/ArchiveCenter/ViewFile/Item/311.
Hardie, C., Baker, R., Levy, M., Carew, T., Wilson, S., George, T. April 10, 2017: NI 43-101 Technical Report on the Livengood Gold Project – Pre-feasibility Study, Livengood, Alaska: Technical report prepared by BBA for International Tower Hill Mines Ltd., effective date March 8, 2017.
| 24.2 | Geology and Resources |
Abrams, Mark J., 2015. “Technical Report for the Shorty Creek Project, Livengood-Tolovana Mining District, Alaska”, March 31, 2015.
Abrams, Mark J., 2016. “Updated Technical Report for the Shorty Creek Project, Livengood-Tolovana Mining District, Alaska”, March 25, 2016.
Athey, J.E., Layer, P.W., and Drake, J., 2004, 40Ar/39Ar ages of rocks collected in the Livengood C-3, C-4, and B-5 quadranges, Alaska: Alaska Division of Geological and Geophysical Surveys Raw-Data File 2004-1, 12 p.
Athey, J.E., Szumigala, D.J., Newberry, R.J., Werdon, M.B., and Hicks, S.A., 2004, Bedrock geologic map of the Livengood SW C-3 and SE C-4 Quadrangles, Tolovana mining district, Alaska, Preliminary Interpretive report 2004-3, Division of Geological and Geophysical Surveys.
Bieniawski Z.T., Engineering Rock Mass Classifications, John Wiley & Sons, New York, 1989.
Brechtel, C.E., Carew, T.J., Myers, R., Pennstrom, W., Puchner, C., and Wilson, S., 2011, August 2011 Summary report on the Livengood Project, Tolovana District, Alaska, 275 pp.
Brooks, A. H., 1916, Preliminary report on the Tolovana district: U.S. Geological Survey Bulletin 642, p. 201-209.
| International Tower Hill Mines Ltd. S-K 1300 – Technical Report Summary Livengood Gold Project Pre-feasibility Study | |
Carew, T., Pennstrom, W., and Bell, R.J., 2010, November 2010 Summary report on the Livengood Project, Tolovana District, Alaska, 210 p.
Carew, T., 2011. Internal report analyzing drill sampling cyclicity.
D.L., 1997, Plutonic related gold deposits of interior Alaska, Society of Economic Geologists, Economic Geology Monograph 9, pp. 91-241.
Ebert, S., Dodd, S., Miller, L., and Petsel, S., 2000, The Donlin Creek Au-As-Sb-Hg deposit, southwestern Alaska, in Geology and Ore Deposits 2000, The Great Basin and Beyond, Symposium Proceedings, Geological Society of Nevada, ed., Cluer, J.K., Price, J.G., Struhsacker, E.M., Hardyman, R.F., and Morris, C.L., p. 1069-1081.
Freegold Ventures Limited press release September 8, 2016.
Giroux Consultants Ltd, 2007, Livengood resource evaluation, Consultants report to THM, 22 p.
Giroux Consultants Ltd, 2008, Livengood resource evaluation, Consultants report to THM, 35 p.
Giroux Consultants Ltd, 2009, Livengood resource evaluation, January 2009, Consultants report to THM, 36 p.
Goldfarb, 1997, Metallogenic evolution of Alaska: Economic Geology Monograph 9, Society of Economic Geologists, pp. 4-34.
Goldfarb, R., Hart, C., Miller, M., Miller, L., Farmer, G.L., Groves, D., 2000, The Tintina gold belt – a global perspective, in The Tintina Gold Belt: Concepts, Exploration, and Discoveries, British Columbia and Yukon Chamber of Mines, Cordilleran Roundup Special Volume 2, pp. 5-31
Hoek E., Carranza-Torres CT, Corkum B., Hoek-Brown Failure Criterion, 2002 Edition. In: Proceedings of the Fifth International North American Rock Mechanics Symposium, Toronto, Canada, Vol. 1, 2002. pp. 267-273.
Klipfel, P., 2006, Summary report on the Livengood Project, Tolovana District, Alaska, consultants report to THM, 37 p.
Klipfel, P. and Giroux, G., 2008a, Summary report on the Livengood Project, Tolovana District, Alaska; Consultants report to THM, 62 p.
Klipfel, P. and Giroux, G., 2008b, October 2008 Summary report on the Livengood Project, Tolovana District, Alaska; Consultants report to THM, 90 p.
Klipfel, P. and Giroux, G., 2009, January 2009 Summary report on the Livengood Project, Tolovana District, Alaska: consultant’s technical report to THM, 99 p.
| International Tower Hill Mines Ltd. S-K 1300 – Technical Report Summary Livengood Gold Project Pre-feasibility Study | |
Klipfel, P., Barnes, T., and Pennstrom, 2009a, July 2009 summary report on the Livengood Project, Tolovana District, Alaska: consultant’s technical report to ITH, 120 p.
Klipfel, P., Carew, T., and Pennstrom, W., 2009b, October 2009 summary report on the Livengood Project, Tolovana District, Alaska: consultant’s technical report to ITH, 144 p.
Lechner, M., 2017, Internal report, Summary or RMI’s August 2017 Block Model.
McCoy, D., Newberry, R.J., Layer, P., DiMarchi, J.J., Bakke, A., Masterman, J.S., and Minehane, D.L., 1997, Plutonic related gold deposits of interior Alaska, Society of Economic Geologists, Economic Geology Monograph 9, pp. 91-241.
Newberry, R.J., McCoy, D.T., and Brew, D.A., 1995, Plutonic-hosted gold ores in Alaska: Igneous vs. metamorphic origins: Resource Geology special issue, N0 18, pp. 57-100.
AMEC, 2013. “Livengood Gold Project, Feasibility Study Geotechnical Design Report, August 6, 2013” prepared by AMEC Environment & Infrastructure, Inc. 625 pgs.
SRK Consulting (U.S.), 2012. Report on acid rock drainage potential of the Livengood waste rock, titled “Metal Leaching and Acid Rock Drainage Assessment, Livengood Project, Alaska. Progress Report 3 - Final. September 2012. 853 pgs.
SRK Consulting (U.S.), Inc., 2013a, Feasibility Pit Slope Evaluation, Livengood Project. Report prepared for Tower Hill Mines Inc. dated July 2013. 213 pgs.
SRK Consulting (U.S.), Inc., 2013b. Report titled “2012 Hydrogeologic Investigations and Modeling Results - Draft 3, Livengood Project”. Prepared for Tower Hill Mines Inc. dated July 13, 2013. 286 pgs.
SRK Consulting (U.S.), Inc., 2016, Geotechnical Slope Optimization of Years 1 and 3 Pit Designs, Livengood Gold Project. Letter report prepared by Michael Levy and John Tinucci for Tower Hill Mines Inc. dated March 14, 2016. 37 pgs.
| 24.4 | Mineral Processing and Metallurgy |
Altman, K., 2013. Report on the Metallurgical Sample Selection Livengood Project, for Tower Hill Mines, Inc., Alaska, USA. RPA Report.
Anon. 2013. “Sample Characterization particle Size Analysis Flocculant Screening Gravity Sedimentation and Pulp Rheology Studies”. Pocock Industrial, Inc. Report conducted for Samuel Eng. (on behalf of Livengood Project).
| International Tower Hill Mines Ltd. S-K 1300 – Technical Report Summary Livengood Gold Project Pre-feasibility Study | |
Del Bosco, R., 2016, Blasting Review & PSD Estimation, International Tower Hill – Livengood Project, BBA consultant’s presentation to THM, 8 p.
Deschênes, G, 2016, Optimisation of Leaching Parameters to Extract Gold from a Sample for the Livengood Project Containing Antimony Minerals: Scoping Study. BBA report (3661003-010001-49-ERA-0001/R00.doc), June 7, 2016.
Ding, L., Gajo, M. and Lascelles, D., 2018. “Phase 9B Metallurgical Test Program on Material from Livengood Deposit”. SGS Project 50223-014 – Final report. May 29, 2018.
Fullam, M., 2021. “Gravity Modeling Report Livengood Gold Project”. FLSmidth report prepared for Torrealba, J. on behalf of THM. June 15, 2021.
Fullam, M., 2013. “Gravity Modeling Report Livengood Gold Project”. FLSmidth report prepared for Altman, K. on behalf of THM. February 15, 2013.
Gajo, M. and Lang, J., 2016. “Phase 8 Metallurgical Test Program on Material from Livengood Deposit”. SGS Project 50223-005 – Final Report February 23, 2016.
Gajo, M. and Lascelles, D., 2017. “Phase 9A Metallurgical Test Program on Material from Livengood Deposit”. SGS Project 50223-013 – Final report. December 6, 2017.
Gajo, M. and Prout, S., 2019. “Phase 11 Metallurgical Test Program on Material from Livengood Deposit”. SGS Project 50223-015 – Final report. March 22, 2019.
Gajo, M. and Prout, S., 2019. “Phase 12 Metallurgical Test Program on Material from Livengood Deposit”. SGS Project 50223-16M – Final report. September 18, 2019.
Hall , A. and Prout, S., 2016. “Phase 8a Metallurgical Test Program”. SGS Project 50223-007 – Final Report June 21, 2016.
Hall , A. and Lang, J., 2016. “Phase 9 Metallurgical Test Program”. SGS Project 50223-012 – Final Report May 27, 2016.
Lascelles, D. and Imeson, D., 2016. “Phase 8d Metallurgical Test Program on Material from the Livengood Deposit”. SGS Project 50223-011 – Final Report June 17, 2016.
McClelland., 2011. “161020 Preg-Rob Test Data Summary slides.pptx”. Power point presentation provided by THM.
McMullen, J., 2015. Geological Section Review. BBA report (3661001-000000-40-ERA-0002-R01.docx), October 28, 2015.
Peevers, R., Pan, J. and Whittle, G., 2021. “Enterprise Optimization Report for the Livengood Gold Project by: Whittle Consulting”. June 2021.
| International Tower Hill Mines Ltd. S-K 1300 – Technical Report Summary Livengood Gold Project Pre-feasibility Study | |
Pocock Industrial Inc., (August 2011). Sample Characterization & PSA Flocculant Screening Gravity sedimentation and Pulp Rheology Studies Conducted for Talon Gold Alaska Inc., Livengood Project.
Pocock Industrial Inc. (February 2013). Sample Characterization Particle Size Analysis Flocculant Screening Gravity Sedimentation and Pulp Rheology Studies Conducted for Samuel Engineering, Livengood Project.
Richardson, M., JKSimMet Raw Simulation files: Livengood v5.3, Version.jksm5, Livengood w Revised Conditions.jksmx, and Livengood.jksmx.
SGS Canada Inc. Phase 13 Metallurgical Test Program Data.
SGS Canada Inc. (February 2013). Comminution Testing of Samples from the Livengood Property.
SGS Canada Inc. (February 2013). Metallurgical Development Testing on Four Rock Types from the Livengood Property - Phase 1 Optimization.
SGS Canada Inc. (March 2013). Cyanide Detoxification of CIL Tailings.
SGS Canada Inc. (March 2013). Metallurgical Variability Testing of the Livengood Property.
Tajadod, J. and Lang, J., 2013. “Metallurgical Development Testing on Four Rock Types from The Livengood Property”. SGS Project 50223-001 – Report 1. February 13, 2013. Phase 1 Optimization.
Tajadod, J. and Lang, J., 2013. “Metallurgical Variability Testing of the Livengood Property”. SGS Project 50223-001 – Report 4. October 7, 2013. Phase II, Variability.
Tajadod, J. and Lang, J., 2013. Preparation of Final Tailing Samples Using Mine Water” SGS Project 50223-002 – Final Report. December 17, 2013
Tajadod, J. and Lang, J., 2015. “Phase 7 Metallurgical Test Program on Material from Livengood Deposit”. SGS Project 50223-003 – Final report. April 6, 2015.
Tajadod, J. and Lang, J., 2016. “Phase 8b Metallurgical Test Program on Material from Livengood Deposit”. SGS Project 50223-008 – Final Report. February 12, 2016.
Tajadod, J. and Lang, J., 2016. “Phase 8c Intensive Cyanide Leach Test Program”. SGS Project 50223-010 – Final Report. February 26, 2016.
Tajadod, J. and Lang, J., 2013, Comminution Testing of Samples from the Livengood Property. SGS Project 50223-001 ��� Phase III, Comminution Report 3. February 26, 2013. SGS Report.
| International Tower Hill Mines Ltd. S-K 1300 – Technical Report Summary Livengood Gold Project Pre-feasibility Study | |
Wang, Z. and Prout, S., 2013, An Investigation by High Definitional Mineralogy into the Mineralogical Characteristics of Four Samples from the Livengood Project. SGS Project 50223-001, MI5083-APR12, MI5101-MAY12, MI5004-MAY12, MI5005-MAY12. Revised May 3, 2013.
Weir, M., SMC Test Report for Tower Hill Mines, JKTech Job No 16007/P1. Testing date January 2016.
Cope, L., Mayer, J., (February 2016), Analysis of 2015 PW-03 Pumping Test – Livengood Project, SRK Consulting, February 19, 2016, project 193800.050.
Electric Power Systems INC (EPS), (August 14, 2013). McCoy, D., Newberry, R.J., Layer, P., DiMarchi, J.J., Bakke, A., Masterman, J.S., and Minehane.
Huffman, G.D, 2011 Power cost evaluation for the Livengood mine, Dryden & LaRue, Inc., October 6, 2011.
Meyer, D.A., Burlingame, D.W., International Tower Hill Mines, Ltd., Livengood Gold Project Power Supply Study, Project # 13-0126.
| 24.6 | TMF and Water Management |
AMEC, 2013. Feasibility Study report titled “Geotechnical Design Report August 6, 2013.
Ecological Resource Consultants, Inc., 2016, Livengood Water Balance for Pre-Feasibility Study, Technical Memorandum, dated September 2, 2016.
Knight Piésold and Co. 2012, Report on Pre-Feasibility Design of Geotechnical Infrastructure, Livengood Gold Project, dated May 11, 2012.
Samuel Engineering, Inc., 2013, Livengood Gold Project Feasibility Study, Volumes I and VII, dated August 25, 2013.
SRK Consulting (U.S.), Inc., 2016, Analysis of 2015 PW-03 Pumping Test – Livengood Project, Memorandum to Tower Hill Mines Inc. dated February 19, 2016.
| International Tower Hill Mines Ltd. S-K 1300 – Technical Report Summary Livengood Gold Project Pre-feasibility Study | |
| 25. | Reliance on Information Provided by Registrant |
The consulting firm’s and their Qualified Persons (QPs) have relied upon written reports and statements of other individuals and companies with whom they do business. It is believed that the basic assumptions are factual and accurate, and that the interpretations are reasonable. This data has been relied upon in the prefeasibility study and there is no reason to believe that any material facts have been withheld or misstated. The QPs have taken all appropriate steps, in their professional judgment, to ensure that the work, information, or advice from the below listed employees of THM or others, is sound and the QPs do not disclaim any responsibility for the Technical Report Summary. THM personnel who have been instrumental in supporting this study are as follows:
| § | Karl L. Hanneman – Chief Executive Officer |
| § | Debbie L. Evans – Corporate Controller |
| § | Denise A. Herzog – Environmental Affairs Manager |
All of these individuals have had a longstanding affiliation with the Project.
For the specific purpose of this Technical Report Summary, the QPs relied upon legal, environmental, and tax matters provided by the registrant as follows:
| § | Ownership and legal status of the mineral tenures comprising the Livengood Gold Project provided by THM as of September 30, 2021 as set forth in Section 3.1, Appendix A, and the relevant portions of Chapter 1. The various agreements under which THM holds title to the mineral claims for this Project have not been reviewed by the QPs, and the QPs offer no legal opinion as to the validity of the mineral title claimed. |
| § | Environmental status of the LIvengood Gold Project, the required permits for project development and the socioeconomic conditions in the Project area as provided by THM, as of November 13, 2021, as set forth in Chapter 17 and in the relevant portions of Chapter 1. |
| § | Taxes, royalties, and other government levies or interests applicable to revenue or income from the Livengood Gold Project, relevant to and incorporated into the financial model developed as summarized in Chapter 19 and the relevant portions of Chapter 1. |
| International Tower Hill Mines Ltd. S-K 1300 – Technical Report Summary Livengood Gold Project Pre-feasibility Study | |
Appendix A: Properties and Claims
| International Tower Hill Mines Ltd. S-K 1300 – Technical Report Summary Livengood Gold Project Pre-feasibility Study | |
Table A1: State of Alaska Claims – 100% Owned
| Claim Owner | ADL Number | Parcel Name | Meridian Township Range and Section | Acres | Count |
| Tower Hill Mines, Inc. | 330936 | LUCKY 55 | F009N004W33 | 40 | 1 |
| Tower Hill Mines, Inc. | 330937 | LUCKY 56 | F009N004W33 | 40 | 2 |
| Tower Hill Mines, Inc. | 330938 | LUCKY 64 | F009N004W32 F009N004W33 | 40 | 3 |
| Tower Hill Mines, Inc. | 330939 | LUCKY 65 | F009N004W33 | 40 | 4 |
| Tower Hill Mines, Inc. | 330940 | LUCKY 66 | F009N004W33 | 40 | 5 |
| Tower Hill Mines, Inc. | 330941 | LUCKY 72 | F008N004W05 | 40 | 6 |
| Tower Hill Mines, Inc. | 330942 | LUCKY 73 | F008N004W05 | 40 | 7 |
| Tower Hill Mines, Inc. | 330943 | LUCKY 74 | F008N004W05 | 40 | 8 |
| Tower Hill Mines, Inc. | 330944 | LUCKY 75 | F008N004W04 | 40 | 9 |
| Tower Hill Mines, Inc. | 330945 | LUCKY 76 | F008N004W04 | 40 | 10 |
| Tower Hill Mines, Inc. | 330946 | LUCKY 82 | F008N004W05 | 40 | 11 |
| Tower Hill Mines, Inc. | 330947 | LUCKY 83 | F008N004W05 | 40 | 12 |
| Tower Hill Mines, Inc. | 330948 | LUCKY 84 | F008N004W05 | 40 | 13 |
| Tower Hill Mines, Inc. | 330949 | LUCKY 85 | F008N004W04 | 40 | 14 |
| Tower Hill Mines, Inc. | 330950 | LUCKY 86 | F008N004W04 | 40 | 15 |
| Tower Hill Mines, Inc. | 330951 | LUCKY 91 | F008N004W05 | 40 | 16 |
| Tower Hill Mines, Inc. | 330952 | LUCKY 92 | F008N004W05 | 40 | 17 |
| Tower Hill Mines, Inc. | 330953 | LUCKY 93 | F008N004W05 | 40 | 18 |
| Tower Hill Mines, Inc. | 330954 | LUCKY 94 | F008N004W05 | 40 | 19 |
| Tower Hill Mines, Inc. | 330955 | LUCKY 95 | F008N004W04 | 40 | 20 |
| Tower Hill Mines, Inc. | 330956 | LUCKY 96 | F008N004W04 | 40 | 21 |
| Tower Hill Mines, Inc. | 330957 | LUCKY 101 | F008N004W05 | 40 | 22 |
| Tower Hill Mines, Inc. | 330958 | LUCKY 102 | F008N004W05 | 40 | 23 |
| Tower Hill Mines, Inc. | 330959 | LUCKY 103 | F008N004W05 | 40 | 24 |
| Tower Hill Mines, Inc. | 330960 | LUCKY 104 | F008N004W05 | 40 | 25 |
| Tower Hill Mines, Inc. | 330961 | LUCKY 105 | F008N004W04 | 40 | 26 |
| Tower Hill Mines, Inc. | 330962 | LUCKY 106 | F008N004W04 | 40 | 27 |
| Tower Hill Mines, Inc. | 330963 | LUCKY 202 | F008N004W08 | 40 | 28 |
| Tower Hill Mines, Inc. | 330964 | LUCKY 203 | F008N004W08 | 40 | 29 |
| Tower Hill Mines, Inc. | 330965 | LUCKY 204 | F008N004W08 | 40 | 30 |
| Tower Hill Mines, Inc. | 330966 | LUCKY 205 | F008N004W09 | 40 | 31 |
| Tower Hill Mines, Inc. | 330967 | LUCKY 206 | F008N004W09 | 40 | 32 |
| Tower Hill Mines, Inc. | 330968 | LUCKY 207 | F008N004W09 | 40 | 33 |
| Tower Hill Mines, Inc. | 330969 | LUCKY 208 | F008N004W09 | 40 | 34 |
| International Tower Hill Mines Ltd. S-K 1300 – Technical Report Summary Livengood Gold Project Pre-feasibility Study | |
| Claim Owner | ADL Number | Parcel Name | Meridian Township Range and Section | Acres | Count |
| Tower Hill Mines, Inc. | 330970 | LUCKY 302 | F008N004W08 | 40 | 35 |
| Tower Hill Mines, Inc. | 330971 | LUCKY 303 | F008N004W08 | 40 | 36 |
| Tower Hill Mines, Inc. | 330972 | LUCKY 304 | F008N004W08 | 40 | 37 |
| Tower Hill Mines, Inc. | 330973 | LUCKY 305 | F008N004W09 | 40 | 38 |
| Tower Hill Mines, Inc. | 330974 | LUCKY 306 | F008N004W09 | 40 | 39 |
| Tower Hill Mines, Inc. | 330975 | LUCKY 307 | F008N004W09 | 40 | 40 |
| Tower Hill Mines, Inc. | 330976 | LUCKY 308 | F008N004W09 | 40 | 41 |
| Tower Hill Mines, Inc. | 330977 | LUCKY 404 | F008N004W08 | 40 | 42 |
| Tower Hill Mines, Inc. | 330978 | LUCKY 405 | F008N004W09 | 40 | 43 |
| Tower Hill Mines, Inc. | 330979 | LUCKY 406 | F008N004W09 | 40 | 44 |
| Tower Hill Mines, Inc. | 338477 | LUCKY 198 | F008N004W07 | 40 | 45 |
| Tower Hill Mines, Inc. | 338478 | LUCKY 199 | F008N004W07 | 40 | 46 |
| Tower Hill Mines, Inc. | 338479 | LUCKY 295 | F008N005W12 | 40 | 47 |
| Tower Hill Mines, Inc. | 338480 | LUCKY 296 | F008N005W12 | 40 | 48 |
| Tower Hill Mines, Inc. | 338481 | LUCKY 297 | F008N004W07 | 40 | 49 |
| Tower Hill Mines, Inc. | 338482 | LUCKY 298 | F008N004W07 | 40 | 50 |
| Tower Hill Mines, Inc. | 338483 | LUCKY 299 | F008N004W07 | 40 | 51 |
| Tower Hill Mines, Inc. | 338484 | LUCKY 392 | F008N005W11 | 40 | 52 |
| Tower Hill Mines, Inc. | 338485 | LUCKY 395 | F008N005W12 | 40 | 53 |
| Tower Hill Mines, Inc. | 338486 | LUCKY 396 | F008N005W12 | 40 | 54 |
| Tower Hill Mines, Inc. | 338487 | LUCKY 397 | F008N004W07 | 40 | 55 |
| Tower Hill Mines, Inc. | 338488 | LUCKY 398 | F008N004W07 | 40 | 56 |
| Tower Hill Mines, Inc. | 338489 | LUCKY 399 | F008N004W07 | 40 | 57 |
| Tower Hill Mines, Inc. | 338490 | LUCKY 400 | F008N004W07 F008N004W08 | 40 | 58 |
| Tower Hill Mines, Inc. | 338491 | LUCKY 491 | F008N005W11 | 40 | 59 |
| Tower Hill Mines, Inc. | 338492 | LUCKY 492 | F008N005W11 | 40 | 60 |
| Tower Hill Mines, Inc. | 338493 | LUCKY 493 | F008N005W12 | 40 | 61 |
| Tower Hill Mines, Inc. | 338494 | LUCKY 494 | F008N005W12 | 40 | 62 |
| Tower Hill Mines, Inc. | 338495 | LUCKY 495 | F008N005W12 | 40 | 63 |
| Tower Hill Mines, Inc. | 338496 | LUCKY 496 | F008N005W12 | 40 | 64 |
| Tower Hill Mines, Inc. | 338497 | LUCKY 497 | F008N004W07 | 40 | 65 |
| Tower Hill Mines, Inc. | 338498 | LUCKY 498 | F008N004W07 | 40 | 66 |
| Tower Hill Mines, Inc. | 338499 | LUCKY 499 | F008N004W07 | 40 | 67 |
| Tower Hill Mines, Inc. | 338500 | LUCKY 500 | F008N004W07 F008N004W08 | 40 | 68 |
| Tower Hill Mines, Inc. | 338501 | LUCKY 504 | F008N004W08 | 40 | 69 |
| International Tower Hill Mines Ltd. S-K 1300 – Technical Report Summary Livengood Gold Project Pre-feasibility Study | |
| Claim Owner | ADL Number | Parcel Name | Meridian Township Range and Section | Acres | Count |
| Tower Hill Mines, Inc. | 338502 | LUCKY 505 | F008N004W09 | 40 | 70 |
| Tower Hill Mines, Inc. | 338503 | LUCKY 589 | F008N005W14 | 40 | 71 |
| Tower Hill Mines, Inc. | 338504 | LUCKY 590 | F008N005W14 | 40 | 72 |
| Tower Hill Mines, Inc. | 338505 | LUCKY 591 | F008N005W14 | 40 | 73 |
| Tower Hill Mines, Inc. | 338506 | LUCKY 592 | F008N005W14 | 40 | 74 |
| Tower Hill Mines, Inc. | 338507 | LUCKY 593 | F008N005W13 | 40 | 75 |
| Tower Hill Mines, Inc. | 338508 | LUCKY 594 | F008N005W13 | 40 | 76 |
| Tower Hill Mines, Inc. | 338509 | LUCKY 595 | F008N005W13 | 40 | 77 |
| Tower Hill Mines, Inc. | 338510 | LUCKY 596 | F008N005W13 | 40 | 78 |
| Tower Hill Mines, Inc. | 338511 | LUCKY 597 | F008N004W18 | 40 | 79 |
| Tower Hill Mines, Inc. | 338512 | LUCKY 598 | F008N004W18 | 40 | 80 |
| Tower Hill Mines, Inc. | 338513 | LUCKY 599 | F008N004W18 | 40 | 81 |
| Tower Hill Mines, Inc. | 338514 | LUCKY 689 | F008N005W14 | 40 | 82 |
| Tower Hill Mines, Inc. | 338515 | LUCKY 690 | F008N005W14 | 40 | 83 |
| Tower Hill Mines, Inc. | 338516 | LUCKY 691 | F008N005W14 | 40 | 84 |
| Tower Hill Mines, Inc. | 338517 | LUCKY 692 | F008N005W14 | 40 | 85 |
| Tower Hill Mines, Inc. | 338518 | LUCKY 693 | F008N005W13 | 40 | 86 |
| Tower Hill Mines, Inc. | 338519 | LUCKY 694 | F008N005W13 | 40 | 87 |
| Tower Hill Mines, Inc. | 338520 | LUCKY 697 | F008N004W18 | 40 | 88 |
| Tower Hill Mines, Inc. | 338521 | LUCKY 698 | F008N004W18 | 40 | 89 |
| Tower Hill Mines, Inc. | 338522 | LUCKY 699 | F008N004W18 | 40 | 90 |
| Tower Hill Mines, Inc. | 347943 | LC 407 | F008N004W09 | 40 | 91 |
| Tower Hill Mines, Inc. | 347944 | LC 408 | F008N004W09 | 40 | 92 |
| Tower Hill Mines, Inc. | 347945 | LC 502 | F008N004W08 | 40 | 93 |
| Tower Hill Mines, Inc. | 347946 | LC 503 | F008N004W08 | 40 | 94 |
| Tower Hill Mines, Inc. | 347947 | LC 506 | F008N004W09 | 40 | 95 |
| Tower Hill Mines, Inc. | 347948 | LC 507 | F008N004W09 | 40 | 96 |
| Tower Hill Mines, Inc. | 347949 | LC 600 | F008N004W17 F008N004W18 | 40 | 97 |
| Tower Hill Mines, Inc. | 347950 | LC 601 | F008N004W17 | 40 | 98 |
| Tower Hill Mines, Inc. | 347951 | LC 602 | F008N004W17 | 40 | 99 |
| Tower Hill Mines, Inc. | 347952 | LC 603 | F008N004W17 | 40 | 100 |
| Tower Hill Mines, Inc. | 347953 | LC 604 | F008N004W17 | 40 | 101 |
| Tower Hill Mines, Inc. | 347954 | LC 605 | F008N004W16 | 40 | 102 |
| Tower Hill Mines, Inc. | 347955 | LC 695 | F008N005W13 | 40 | 103 |
| Tower Hill Mines, Inc. | 347956 | LC 696 | F008N005W13 | 40 | 104 |
| International Tower Hill Mines Ltd. S-K 1300 – Technical Report Summary Livengood Gold Project Pre-feasibility Study | |
| Claim Owner | ADL Number | Parcel Name | Meridian Township Range and Section | Acres | Count |
| Tower Hill Mines, Inc. | 347957 | LC 700 | F008N004W17 F008N004W18 | 40 | 105 |
| Tower Hill Mines, Inc. | 347958 | LC 701 | F008N004W17 | 40 | 106 |
| Tower Hill Mines, Inc. | 347959 | LC 702 | F008N004W17 | 40 | 107 |
| Tower Hill Mines, Inc. | 347960 | LC 703 | F008N004W17 | 40 | 108 |
| Tower Hill Mines, Inc. | 347961 | LC 704 | F008N004W17 | 40 | 109 |
| Tower Hill Mines, Inc. | 347962 | LC 790 | F008N005W14 | 40 | 110 |
| Tower Hill Mines, Inc. | 347963 | LC 791 | F008N005W14 | 40 | 111 |
| Tower Hill Mines, Inc. | 347964 | LC 792 | F008N005W14 | 40 | 112 |
| Tower Hill Mines, Inc. | 347965 | LC 793 | F008N005W13 | 40 | 113 |
| Tower Hill Mines, Inc. | 347966 | LC 794 | F008N005W13 | 40 | 114 |
| Tower Hill Mines, Inc. | 347967 | LC 795 | F008N005W13 | 40 | 115 |
| Tower Hill Mines, Inc. | 347968 | LC 796 | F008N005W13 | 40 | 116 |
| Tower Hill Mines, Inc. | 347969 | LC 797 | F008N004W18 | 40 | 117 |
| Tower Hill Mines, Inc. | 347970 | LC 798 | F008N004W18 | 40 | 118 |
| Tower Hill Mines, Inc. | 347971 | LC 799 | F008N004W18 | 40 | 119 |
| Tower Hill Mines, Inc. | 347972 | LC 800 | F008N004W17 F008N004W18 | 40 | 120 |
| Tower Hill Mines, Inc. | 347973 | LC 801 | F008N004W17 | 40 | 121 |
| Tower Hill Mines, Inc. | 347974 | LC 802 | F008N004W17 | 40 | 122 |
| Tower Hill Mines, Inc. | 347975 | LC 803 | F008N004W17 | 40 | 123 |
| Tower Hill Mines, Inc. | 347976 | LC 891 | F008N005W14 | 40 | 124 |
| Tower Hill Mines, Inc. | 347977 | LC 892 | F008N005W14 | 40 | 125 |
| Tower Hill Mines, Inc. | 347978 | LC 893 | F008N005W13 | 40 | 126 |
| Tower Hill Mines, Inc. | 347979 | LC 894 | F008N005W13 | 40 | 127 |
| Tower Hill Mines, Inc. | 347980 | LC 895 | F008N005W13 | 40 | 128 |
| Tower Hill Mines, Inc. | 348802 | LC 688 | F008N005W15 | 40 | 129 |
| Tower Hill Mines, Inc. | 348803 | LC 787 | F008N005W15 | 40 | 130 |
| Tower Hill Mines, Inc. | 348804 | LC 788 | F008N005W15 | 40 | 131 |
| Tower Hill Mines, Inc. | 348805 | LC 884 | F008N005W16 | 40 | 132 |
| Tower Hill Mines, Inc. | 348806 | LC 885 | F008N005W15 | 40 | 133 |
| Tower Hill Mines, Inc. | 348807 | LC 886 | F008N005W15 | 40 | 134 |
| Tower Hill Mines, Inc. | 348808 | LC 887 | F008N005W15 | 40 | 135 |
| Tower Hill Mines, Inc. | 348809 | LC 888 | F008N005W15 | 40 | 136 |
| Tower Hill Mines, Inc. | 348810 | LC 984 | F008N005W21 | 40 | 137 |
| Tower Hill Mines, Inc. | 348811 | LC 985 | F008N005W22 | 40 | 138 |
| Tower Hill Mines, Inc. | 348812 | LC 986 | F008N005W22 | 40 | 139 |
| International Tower Hill Mines Ltd. S-K 1300 – Technical Report Summary Livengood Gold Project Pre-feasibility Study | |
| Claim Owner | ADL Number | Parcel Name | Meridian Township Range and Section | Acres | Count |
| Tower Hill Mines, Inc. | 348813 | LC 987 | F008N005W22 | 40 | 140 |
| Tower Hill Mines, Inc. | 348814 | LC 1083 | F008N005W21 | 40 | 141 |
| Tower Hill Mines, Inc. | 348815 | LC 1084 | F008N005W21 | 40 | 142 |
| Tower Hill Mines, Inc. | 348816 | LC 1085 | F008N005W22 | 40 | 143 |
| Tower Hill Mines, Inc. | 348817 | LC 1086 | F008N005W22 | 40 | 144 |
| Tower Hill Mines, Inc. | 348818 | LC 1183 | F008N005W21 | 40 | 145 |
| Tower Hill Mines, Inc. | 348819 | LC 1184 | F008N005W21 | 40 | 146 |
| Tower Hill Mines, Inc. | 348820 | LC 1185 | F008N005W22 | 40 | 147 |
| Tower Hill Mines, Inc. | 348821 | LC 1186 | F008N005W22 | 40 | 148 |
| Tower Hill Mines, Inc. | 348822 | LC 1282 | F008N005W21 | 40 | 149 |
| Tower Hill Mines, Inc. | 348823 | LC 1283 | F008N005W21 | 40 | 150 |
| Tower Hill Mines, Inc. | 348824 | LC 1284 | F008N005W21 | 40 | 151 |
| Tower Hill Mines, Inc. | 348825 | LC 1285 | F008N005W22 | 40 | 152 |
| Tower Hill Mines, Inc. | 348826 | LC 1286 | F008N005W22 | 40 | 153 |
| Tower Hill Mines, Inc. | 348827 | LC 1287 | F008N005W22 | 40 | 154 |
| Tower Hill Mines, Inc. | 348828 | LC 1288 | F008N005W22 | 40 | 155 |
| Tower Hill Mines, Inc. | 348829 | LC 1382 | F008N005W28 | 40 | 156 |
| Tower Hill Mines, Inc. | 348830 | LC 1383 | F008N005W28 | 40 | 157 |
| Tower Hill Mines, Inc. | 348831 | LC 1384 | F008N005W28 | 40 | 158 |
| Tower Hill Mines, Inc. | 348832 | LC 1385 | F008N005W27 | 40 | 159 |
| Tower Hill Mines, Inc. | 361326 | LUCKY 90 | F008N004W06 | 40 | 160 |
| Tower Hill Mines, Inc. | 361327 | LUCKY 100 | F008N004W06 | 40 | 161 |
| Tower Hill Mines, Inc. | 361328 | LUCKY 200 | F008N004W07 | 40 | 162 |
| Tower Hill Mines, Inc. | 361329 | LUCKY 294 | F008N005W12 | 40 | 163 |
| Tower Hill Mines, Inc. | 361330 | LUCKY 300 | F008N004W07 | 40 | 164 |
| Tower Hill Mines, Inc. | 361331 | LUCKY 394 | F008N005W12 | 40 | 165 |
| Tower Hill Mines, Inc. | 361332 | LUCKY 401 | F008N004W08 | 40 | 166 |
| Tower Hill Mines, Inc. | 361333 | LUCKY 402 | F008N004W08 | 40 | 167 |
| Tower Hill Mines, Inc. | 361334 | LUCKY 403 | F008N004W08 | 40 | 168 |
| Tower Hill Mines, Inc. | 361335 | LUCKY 501 | F008N004W08 | 40 | 169 |
| International Tower Hill Mines Ltd. S-K 1300 – Technical Report Summary Livengood Gold Project Pre-feasibility Study | |
Table A2: State of Alaska Claims – 100% Owned
| Claim Owner | ADL Number | Parcel Name | Meridian Township Range and Section | Acres | Count |
| Tower Hill Mines, Inc. | 669377 | LVG 1 | F008N004W09 | 40 | 170 |
| Tower Hill Mines, Inc. | 669378 | LVG 2 | F008N004W16 | 40 | 171 |
| Tower Hill Mines, Inc. | 669379 | LVG 3 | F008N004W16 | 40 | 172 |
| Tower Hill Mines, Inc. | 669380 | LVG 4 | F008N004W16 | 40 | 173 |
| Tower Hill Mines, Inc. | 669381 | LVG 5 | F009N004W20 | 160 | 174 |
| Tower Hill Mines, Inc. | 669382 | LVG 6 | F009N004W20 | 160 | 175 |
| Tower Hill Mines, Inc. | 669383 | LVG 7 | F009N004W21 | 160 | 176 |
| Tower Hill Mines, Inc. | 669384 | LVG 8 | F009N004W21 | 160 | 177 |
| Tower Hill Mines, Inc. | 669385 | LVG 9 | F009N004W22 | 160 | 178 |
| Tower Hill Mines, Inc. | 669386 | LVG 10 | F009N004W22 | 160 | 179 |
| Tower Hill Mines, Inc. | 669387 | LVG 11 | F009N004W20 | 160 | 180 |
| Tower Hill Mines, Inc. | 669388 | LVG 12 | F009N004W20 | 160 | 181 |
| Tower Hill Mines, Inc. | 669389 | LVG 13 | F009N004W21 | 160 | 182 |
| Tower Hill Mines, Inc. | 669390 | LVG 14 | F009N004W21 | 160 | 183 |
| Tower Hill Mines, Inc. | 669391 | LVG 15 | F009N004W22 | 160 | 184 |
| Tower Hill Mines, Inc. | 669392 | LVG 16 | F009N004W22 | 160 | 185 |
| Tower Hill Mines, Inc. | 669393 | LVG 17 | F009N005W25 | 160 | 186 |
| Tower Hill Mines, Inc. | 669394 | LVG 18 | F009N005W25 | 160 | 187 |
| Tower Hill Mines, Inc. | 669395 | LVG 19 | F009N004W30 | 160 | 188 |
| Tower Hill Mines, Inc. | 669396 | LVG 20 | F009N004W30 | 160 | 189 |
| Tower Hill Mines, Inc. | 669397 | LVG 21 | F009N004W29 | 160 | 190 |
| Tower Hill Mines, Inc. | 669398 | LVG 22 | F009N004W29 | 160 | 191 |
| Tower Hill Mines, Inc. | 669399 | LVG 23 | F009N005W25 | 160 | 192 |
| Tower Hill Mines, Inc. | 669400 | LVG 24 | F009N005W25 | 160 | 193 |
| Tower Hill Mines, Inc. | 669401 | LVG 25 | F009N004W30 | 160 | 194 |
| Tower Hill Mines, Inc. | 669402 | LVG 26 | F009N004W30 | 160 | 195 |
| Tower Hill Mines, Inc. | 669403 | LVG 27 | F009N004W29 | 160 | 196 |
| Tower Hill Mines, Inc. | 669404 | LVG 28 | F009N004W29 | 160 | 197 |
| Tower Hill Mines, Inc. | 669405 | LVG 29 | F009N005W35 | 160 | 198 |
| Tower Hill Mines, Inc. | 669406 | LVG 30 | F009N005W35 | 160 | 199 |
| Tower Hill Mines, Inc. | 669407 | LVG 31 | F009N005W36 | 160 | 200 |
| Tower Hill Mines, Inc. | 669408 | LVG 32 | F009N005W36 | 160 | 201 |
| Tower Hill Mines, Inc. | 669409 | LVG 33 | F009N005W35 | 160 | 202 |
| Tower Hill Mines, Inc. | 669410 | LVG 34 | F009N005W35 | 160 | 203 |
| Tower Hill Mines, Inc. | 669411 | LVG 35 | F009N005W36 | 160 | 204 |
| International Tower Hill Mines Ltd. S-K 1300 – Technical Report Summary Livengood Gold Project Pre-feasibility Study | |
| Claim Owner | ADL Number | Parcel Name | Meridian Township Range and Section | Acres | Count |
| Tower Hill Mines, Inc. | 669412 | LVG 36 | F009N005W36 | 160 | 205 |
| Tower Hill Mines, Inc. | 669413 | LVG 37 | F008N005W03 | 160 | 206 |
| Tower Hill Mines, Inc. | 669414 | LVG 38 | F008N005W03 | 160 | 207 |
| Tower Hill Mines, Inc. | 669415 | LVG 39 | F008N005W03 | 160 | 208 |
| Tower Hill Mines, Inc. | 669416 | LVG 40 | F008N005W03 | 160 | 209 |
| Tower Hill Mines, Inc. | 669417 | LVG 41 | F009N004W27 | 160 | 210 |
| Tower Hill Mines, Inc. | 669418 | LVG 42 | F009N004W27 | 160 | 211 |
| Tower Hill Mines, Inc. | 669419 | LVG 43 | F009N004W27 | 160 | 212 |
| Tower Hill Mines, Inc. | 669420 | LVG 44 | F009N004W27 | 160 | 213 |
| Tower Hill Mines, Inc. | 669421 | LVG 45 | F009N004W34 | 160 | 214 |
| Tower Hill Mines, Inc. | 669422 | LVG 46 | F009N004W34 | 160 | 215 |
| Tower Hill Mines, Inc. | 669423 | LVG 47 | F009N004W34 | 160 | 216 |
| Tower Hill Mines, Inc. | 669424 | LVG 48 | F009N004W34 | 160 | 217 |
| Tower Hill Mines, Inc. | 669425 | LVG 49 | F008N004W04 | 160 | 218 |
| Tower Hill Mines, Inc. | 669426 | LVG 50 | F008N004W03 | 160 | 219 |
| Tower Hill Mines, Inc. | 669427 | LVG 51 | F008N004W03 | 160 | 220 |
| Tower Hill Mines, Inc. | 669428 | LVG 52 | F008N004W02 | 160 | 221 |
| Tower Hill Mines, Inc. | 669429 | LVG 53 | F008N004W02 | 160 | 222 |
| Tower Hill Mines, Inc. | 669430 | LVG 54 | F008N004W04 | 160 | 223 |
| Tower Hill Mines, Inc. | 669431 | LVG 55 | F008N004W03 | 160 | 224 |
| Tower Hill Mines, Inc. | 669432 | LVG 56 | F008N004W03 | 160 | 225 |
| Tower Hill Mines, Inc. | 669433 | LVG 57 | F008N004W02 | 160 | 226 |
| Tower Hill Mines, Inc. | 669434 | LVG 58 | F008N004W02 | 160 | 227 |
| Tower Hill Mines, Inc. | 669435 | LVG 59 | F008N004W10 | 160 | 228 |
| Tower Hill Mines, Inc. | 669436 | LVG 60 | F008N004W10 | 160 | 229 |
| Tower Hill Mines, Inc. | 669437 | LVG 61 | F008N004W11 | 160 | 230 |
| Tower Hill Mines, Inc. | 669438 | LVG 62 | F008N004W11 | 160 | 231 |
| Tower Hill Mines, Inc. | 669439 | LVG 63 | F008N004W10 | 160 | 232 |
| Tower Hill Mines, Inc. | 669440 | LVG 64 | F008N004W10 | 160 | 233 |
| Tower Hill Mines, Inc. | 669441 | LVG 65 | F008N004W11 | 160 | 234 |
| Tower Hill Mines, Inc. | 669442 | LVG 66 | F008N004W11 | 160 | 235 |
| Tower Hill Mines, Inc. | 669443 | LVG 67 | F008N004W16 | 160 | 236 |
| Tower Hill Mines, Inc. | 669444 | LVG 68 | F008N004W15 | 160 | 237 |
| Tower Hill Mines, Inc. | 669445 | LVG 69 | F008N004W15 | 160 | 238 |
| Tower Hill Mines, Inc. | 669446 | LVG 70 | F008N004W14 | 160 | 239 |
| Tower Hill Mines, Inc. | 669447 | LVG 71 | F008N004W14 | 160 | 240 |
| Tower Hill Mines, Inc. | 669448 | LVG 72 | F008N004W16 | 160 | 241 |
| International Tower Hill Mines Ltd. S-K 1300 – Technical Report Summary Livengood Gold Project Pre-feasibility Study | |
| Claim Owner | ADL Number | Parcel Name | Meridian Township Range and Section | Acres | Count |
| Tower Hill Mines, Inc. | 669449 | LVG 73 | F008N004W16 | 160 | 242 |
| Tower Hill Mines, Inc. | 669450 | LVG 74 | F008N004W15 | 160 | 243 |
| Tower Hill Mines, Inc. | 669451 | LVG 75 | F008N004W15 | 160 | 244 |
| Tower Hill Mines, Inc. | 669452 | LVG 76 | F008N004W14 | 160 | 245 |
| Tower Hill Mines, Inc. | 669453 | LVG 77 | F008N004W14 | 160 | 246 |
| Tower Hill Mines, Inc. | 669454 | LVG 78 | F008N004W21 | 160 | 247 |
| Tower Hill Mines, Inc. | 669455 | LVG 79 | F008N004W21 | 160 | 248 |
| Tower Hill Mines, Inc. | 669456 | LVG 80 | F008N004W22 | 160 | 249 |
| Tower Hill Mines, Inc. | 669457 | LVG 81 | F008N004W22 | 160 | 250 |
| Tower Hill Mines, Inc. | 669458 | LVG 82 | F008N004W23 | 160 | 251 |
| Tower Hill Mines, Inc. | 669459 | LVG 83 | F008N004W23 | 160 | 252 |
| Tower Hill Mines, Inc. | 669460 | LVG 84 | F008N004W21 | 160 | 253 |
| Tower Hill Mines, Inc. | 669461 | LVG 85 | F008N004W21 | 160 | 254 |
| Tower Hill Mines, Inc. | 669462 | LVG 86 | F008N004W22 | 160 | 255 |
| Tower Hill Mines, Inc. | 669463 | LVG 87 | F008N004W22 | 160 | 256 |
| Tower Hill Mines, Inc. | 669464 | LVG 88 | F008N004W23 | 160 | 257 |
| Tower Hill Mines, Inc. | 669465 | LVG 89 | F008N004W23 | 160 | 258 |
| Tower Hill Mines, Inc. | 700008 | LVG 90 | F009N004W17 | 160 | 259 |
| Tower Hill Mines, Inc. | 700009 | LVG 91 | F009N004W17 | 160 | 260 |
| Tower Hill Mines, Inc. | 700010 | LVG 92 | F009N004W16 | 160 | 261 |
| Tower Hill Mines, Inc. | 700011 | LVG 93 | F009N004W16 | 160 | 262 |
| Tower Hill Mines, Inc. | 700012 | LVG 94 | F009N004W17 | 160 | 263 |
| Tower Hill Mines, Inc. | 700013 | LVG 95 | F009N004W17 | 160 | 264 |
| Tower Hill Mines, Inc. | 700014 | LVG 96 | F009N004W16 | 160 | 265 |
| Tower Hill Mines, Inc. | 700015 | LVG 97 | F009N004W16 | 160 | 266 |
| Tower Hill Mines, Inc. | 700016 | LVG 98 | F008N005W09 | 160 | 267 |
| Tower Hill Mines, Inc. | 700017 | LVG 99 | F008N005W09 | 160 | 268 |
| Tower Hill Mines, Inc. | 700018 | LVG 100 | F008N005W09 | 160 | 269 |
| Tower Hill Mines, Inc. | 700019 | LVG 101 | F008N005W09 | 160 | 270 |
| Tower Hill Mines, Inc. | 703377 | LVG 116 | F009N004W14 | 160 | 271 |
| Tower Hill Mines, Inc. | 703378 | LVG 117 | F009N004W14 | 160 | 272 |
| Tower Hill Mines, Inc. | 703379 | LVG 118 | F009N004W13 | 160 | 273 |
| Tower Hill Mines, Inc. | 703380 | LVG 119 | F009N004W13 | 160 | 274 |
| Tower Hill Mines, Inc. | 703381 | LVG 120 | F009N004W15 | 160 | 275 |
| Tower Hill Mines, Inc. | 703382 | LVG 121 | F009N004W14 | 160 | 276 |
| Tower Hill Mines, Inc. | 703383 | LVG 122 | F009N004W14 | 160 | 277 |
| Tower Hill Mines, Inc. | 703384 | LVG 123 | F009N004W13 | 160 | 278 |
| International Tower Hill Mines Ltd. S-K 1300 – Technical Report Summary Livengood Gold Project Pre-feasibility Study | |
| Claim Owner | ADL Number | Parcel Name | Meridian Township Range and Section | Acres | Count |
| Tower Hill Mines, Inc. | 703385 | LVG 124 | F009N004W13 | 160 | 279 |
| Tower Hill Mines, Inc. | 703386 | LVG 125 | F009N004W23 | 160 | 280 |
| Tower Hill Mines, Inc. | 703387 | LVG 126 | F009N004W23 | 160 | 281 |
| Tower Hill Mines, Inc. | 703388 | LVG 127 | F009N004W24 | 160 | 282 |
| Tower Hill Mines, Inc. | 703389 | LVG 128 | F009N004W24 | 160 | 283 |
| Tower Hill Mines, Inc. | 703390 | LVG 129 | F009N004W23 | 160 | 284 |
| Tower Hill Mines, Inc. | 703391 | LVG 130 | F009N004W23 | 160 | 285 |
| Tower Hill Mines, Inc. | 703392 | LVG 131 | F009N004W24 | 160 | 286 |
| Tower Hill Mines, Inc. | 703393 | LVG 132 | F009N004W24 | 160 | 287 |
| Tower Hill Mines, Inc. | 703394 | LVG 133 | F009N004W26 | 160 | 288 |
| Tower Hill Mines, Inc. | 703395 | LVG 134 | F009N004W26 | 160 | 289 |
| Tower Hill Mines, Inc. | 703396 | LVG 135 | F009N004W25 | 160 | 290 |
| Tower Hill Mines, Inc. | 703397 | LVG 136 | F009N004W25 | 160 | 291 |
| Tower Hill Mines, Inc. | 703398 | LVG 137 | F009N004W26 | 160 | 292 |
| Tower Hill Mines, Inc. | 703399 | LVG 138 | F009N004W26 | 160 | 293 |
| Tower Hill Mines, Inc. | 703400 | LVG 139 | F009N004W25 | 160 | 294 |
| Tower Hill Mines, Inc. | 703401 | LVG 140 | F009N004W25 | 160 | 295 |
| Tower Hill Mines, Inc. | 703402 | LVG 141 | F009N004W35 | 160 | 296 |
| Tower Hill Mines, Inc. | 703403 | LVG 142 | F009N004W35 | 160 | 297 |
| Tower Hill Mines, Inc. | 703404 | LVG 143 | F009N004W36 | 160 | 298 |
| Tower Hill Mines, Inc. | 703405 | LVG 144 | F009N004W36 | 160 | 299 |
| Tower Hill Mines, Inc. | 703406 | LVG 145 | F009N003W31 | 160 | 300 |
| Tower Hill Mines, Inc. | 703407 | LVG 146 | F009N004W35 | 160 | 301 |
| Tower Hill Mines, Inc. | 703408 | LVG 147 | F009N004W35 | 160 | 302 |
| Tower Hill Mines, Inc. | 703409 | LVG 148 | F009N004W36 | 160 | 303 |
| Tower Hill Mines, Inc. | 703410 | LVG 149 | F009N004W36 | 160 | 304 |
| Tower Hill Mines, Inc. | 703411 | LVG 150 | F009N003W31 | 160 | 305 |
| Tower Hill Mines, Inc. | 703412 | LVG 151 | F008N004W01 | 160 | 306 |
| Tower Hill Mines, Inc. | 703413 | LVG 152 | F008N004W01 | 160 | 307 |
| Tower Hill Mines, Inc. | 703414 | LVG 153 | F008N003W06 | 160 | 308 |
| Tower Hill Mines, Inc. | 703415 | LVG 154 | F008N004W01 | 160 | 309 |
| Tower Hill Mines, Inc. | 703416 | LVG 155 | F008N004W01 | 160 | 310 |
| Tower Hill Mines, Inc. | 703417 | LVG 156 | F008N003W06 | 160 | 311 |
| Tower Hill Mines, Inc. | 703418 | LVG 157 | F008N004W12 | 160 | 312 |
| Tower Hill Mines, Inc. | 703419 | LVG 158 | F008N004W12 | 160 | 313 |
| Tower Hill Mines, Inc. | 703420 | LVG 159 | F008N003W07 | 160 | 314 |
| Tower Hill Mines, Inc. | 703421 | LVG 160 | F008N003W07 | 160 | 315 |
| International Tower Hill Mines Ltd. S-K 1300 – Technical Report Summary Livengood Gold Project Pre-feasibility Study | |
| Claim Owner | ADL Number | Parcel Name | Meridian Township Range and Section | Acres | Count |
| Tower Hill Mines, Inc. | 703422 | LVG 161 | F008N004W12 | 160 | 316 |
| Tower Hill Mines, Inc. | 703423 | LVG 162 | F008N004W12 | 160 | 317 |
| Tower Hill Mines, Inc. | 703424 | LVG 163 | F008N003W07 | 160 | 318 |
| Tower Hill Mines, Inc. | 703425 | LVG 164 | F008N003W07 | 160 | 319 |
| Tower Hill Mines, Inc. | 703426 | LVG 165 | F008N004W13 | 160 | 320 |
| Tower Hill Mines, Inc. | 703427 | LVG 166 | F008N004W13 | 160 | 321 |
| Tower Hill Mines, Inc. | 703428 | LVG 167 | F008N003W18 | 160 | 322 |
| Tower Hill Mines, Inc. | 703429 | LVG 168 | F008N004W13 | 160 | 323 |
| Tower Hill Mines, Inc. | 703430 | LVG 169 | F008N004W13 | 160 | 324 |
| Tower Hill Mines, Inc. | 703431 | LVG 170 | F008N004W24 | 160 | 325 |
| Tower Hill Mines, Inc. | 703432 | LVG 171 | F008N004W24 | 160 | 326 |
| International Tower Hill Mines Ltd. S-K 1300 – Technical Report Summary Livengood Gold Project Pre-feasibility Study | |
Table A3: Federal Unpatented Placer Claims – 100% Owned
| Township | Range | Section | BLM Claim # | Claim Name |
| 8 North | 5 West | 15NW | 61477 | Patsy Bench |
| 9 North | 4 West | 31SE | 61478 | Black Bench |
| 9 North | 4 West | 32SW | 61479 | Little Ben Bench |
| 9 North | 4 West | 32SW | 61480 | Oregon |
| 9 North | 4 West | 32SW | 61481 | Moonshine |
| 9 North | 4 West | 32SW | 61482 | Blue Bird |
| 9 North | 4 West | 32SW | 61483 | Nerma Fisko |
| 9 North | 4 West | 32NE | 61484 | Prosper |
| 9 North | 4 West | 32NE | 61485 | #2 Below Heine Creek |
| 9 North | 4 West | 32NE | 61486 | Windy Association |
| 9 North | 4 West | 32NE | 61487 | Triangle |
| 9 North | 4 West | 32NE | 61488 | Black Dimond |
| 9 North | 4 West | 29SE | 61489 | Robin |
| 9 North | 4 West | 28SW | 61490 | Dimond Ski Association |
| 9 North | 4 West | 28SW | 61491 | Hoover Devide |
| 9 North | 4 West | 29SE | 61492 | Mellon |
| 8 North | 5 West | 6SW | 61498 | #9 Above Discovery Association |
| 8 North | 4 West | 6NE | 61499 | #10 Above Bench |
| 8 North | 4 West | 5NW | 61500 | Gem Association |
| 9 North | 4 West | 32SW | 61501 | #18 Above Discovery Association |
| 9 North | 4 West | 32SE | 61502 | Sunshine |
| 9 North | 4 West | 32SE | 61503 | Last Chance Fraction |
| 9 North | 4 West | 32SE | 61504 | #23 above Discovery Association |
| 9 North | 4 West | 32SE | 61505 | Star Association |
| 9 North | 4 West | 32SE | 61506 | May Association |
| 9 North | 4 West | 32SE | 61507 | Hot Air Association |
| 9 North | 4 West | 32SE | 61508 | Option Association |
| 9 North | 4 West | 32NE | 61493 | Tomtit Association |
| 9 North | 4 West | 1SE | 61494 | LaFrance Association |
| International Tower Hill Mines Ltd. S-K 1300 – Technical Report Summary Livengood Gold Project Pre-feasibility Study | |
Table A4: Patented Claims – 100% Owned
Mineral Survey | Patent Number | Claim Names | LPI Ownership |
| 832 | 743623 | Wagner Association Bench | 100% |
| 1604 | 1041577 | Snow Bird Bench | 100% |
| 1604 | 1041577 | Mint Bench | 100% |
| 1604 | 1041577 | Black Jack | 100% |
| 1609 | 1043895 | Navada Bench Placer | 100% |
| 1609 | 1043895 | Gold Brick Fraction Placer | 100% |
| 1623 | 1073686 | Italy | 100% |
| 1624 | 1073687 | Trustworthy Association | 100% |
| 1624 | 1073687 | Imperial Association | 100% |
| 1625 | 1075872 | Etna-Sunnyside Association | 15/16 |
| 1625 | 1075872 | Sunny Bench Association | 100% |
| 1640 | 1069069 | Duncan | 100% |
| 1641 | 1069097 | Eureka or No. 22 Creek Above on Livengood | 100% |
| 1641 | 1069097 | Placer Mining Claim No. 21 Above Discovery on Livengood Creek | 100% |
| 1641 | 1069097 | Placer Mining Claim No. 20 Above Discovery on Livengood Creek | 3/4 |
| 1641 | 1069097 | Placer Mining Claim No. 19 Above Discovery on Livengood Creek | 100% |
| 1641 | 1069097 | Last Chance | 100% |
| 1641 | 1069097 | Tolovana Bench | 100% |
| 1960 | 1036259 | No.1 Above Discovery on Livengood Creek | 100% |
| 1960 | 1036259 | The Tolovana Placer Mining Bench Claim on Right Limit of Livengood Creek | 100% |
| 1960 | 1036259 | No.1 Above Discovery Bench | 100% |
| 1960 | 1036259 | No. One Bench Fraction Above Discovery Right Limit Livengood Creek | 100% |
| 1960 | 1036259 | Ready Bullion Placer Mining Bench Claim on Right Limit of Livengood Creek | 100% |
| 1963 | 1045457 | Deep Channel Association | 100% |
| 1966 | 1031406 | Golden Rod Association | 100% |
| 2060 | 1117204 | Eldorado Bench | 100% |
| 2071 | 1117929 | Marietta Association | 100% |
| 2152 | 1127946 | Hidden Treasure | 100% |
| 2152 | 1127946 | Hot Day | 100% |
| International Tower Hill Mines Ltd. S-K 1300 – Technical Report Summary Livengood Gold Project Pre-feasibility Study | |
Table A5: Federal Unpatented Placer Claims – 100% Owned
| Township | Range | Section | BLM Claim # | Claim Name |
| 8 North | 5 West | 11SE | 61249 | #5 above Discovery |
| 8 North | 5 West | 11SE | 61250 | Star fraction |
| 8 North | 5 West | 11SW | 61256 | #3 above discovery |
| 8 North | 5 West | 11SE | 61257 | #4 above discovery |
| 8 North | 5 West | 11NE | 61258 | Dickey-fraction |
| 8 North | 5 West | 11SE | 61259 | #4-a above discovery |
| 8 North | 5 West | 11NE | 61260 | #5 above discovery bench |
| 8 North | 5 West | 11NE | 61261 | #5 bench fraction, 1st tier |
| 8 North | 5 West | 11NE | 61262 | Leitrim a/k/a letruim, letrium, letram association |
| 8 North | 5 West | 12NW | 61263 | #7 bench right limit 1st tier above discovery |
| 8 North | 5 West | 12NW | 61264 | #7 above discovery |
| 8 North | 5 West | 12NW | 61265 | Rosalind fraction |
| 8 North | 5 West | 12NW | 61266 | #8 above discovery |
| 8 North | 5 West | 1SW | 61267 | Chatham bench association |
| 8 North | 5 West | 1SW | 61268 | Gold dollar association claim |
| 8 North | 4 West | 7NW | 61269 | Basin association claim |
| 8 North | 4 West | 6SW | 61270 | Dorothy association bench claim |
| 8 North | 4 West | 6SW | 61271 | Riffle association claim |
| 8 North | 4 West | 6SE | 61272 | Montana association |
| 8 North | 5 West | 11NE | 61273 | High grade fraction |
| 8 North | 5 West | 11NE | 61274 | Triangle fraction |
| 8 North | 5 West | 12NW | 61275 | #6 above discovery |
| 8 North | 5 West | 12NW | 61276 | o.k. fraction |
| 8 North | 5 West | 12NW | 61277 | #1 frank (franklin) gulch |
| 8 North | 5 West | 1SW | 61278 | #2 franklin gulch |
| 9 North | 4 West | 33SW | 61292 | Cloud association |
| 9 North | 4 West | 33SW | 61293 | Ruby bench |
| 8 North | 5 West | 28SW | 61322 | Pete |
| 8 North | 5 West | 28NW | 61323 | Mike |
| 8 North | 5 West | 21SE | 61324 | Ike |
| 8 North | 5 West | 21NE | 61325 | Carolyn |
| 8 North | 5 West | 21SE | 61326 | Sunshine Fraction |
| 8 North | 5 West | 16SE | 61327 | Frio |
| 8 North | 5 West | 16SW | 61328 | Ring |
| 8 North | 5 West | 16SW | 61329 | Pilot |
| 8 North | 5 West | 16SE | 61330 | Dan |
| International Tower Hill Mines Ltd. S-K 1300 – Technical Report Summary Livengood Gold Project Pre-feasibility Study | |
| Township | Range | Section | BLM Claim # | Claim Name |
| 8 North | 5 West | 16SE | 61331 | Nyuk |
| 8 North | 5 West | 16SE | 61332 | Sweede Association |
| 8 North | 5 West | 15SW | 61333 | Eureka Banch claim |
| 8 North | 5 West | 15SW | 61334 | Bessie Bench |
| 8 North | 5 West | 15NW | 61335 | Jeanne |
| 8 North | 5 West | 16NE | 61336 | Hawk |
| 8 North | 5 West | 16NE | 61337 | Gypsy |
| 8 North | 5 West | 15NW | 61338 | Reef Association |
| 8 North | 5 West | 15NW | 61339 | California Fraction |
| 8 North | 5 West | 15NW | 61340 | No. 1 Below Discovery |
| 8 North | 5 West | 9SE | 61341 | Horse |
| 8 North | 5 West | 9SE | 61342 | Close |
| 8 North | 5 West | 10SW | 61343 | No. 2 Below Myrtle Creek |
| 8 North | 5 West | 15NW | 61344 | No. 1 Bench Right Limit |
| 8 North | 5 West | 15NW | 61345 | No. 1 Bench Fraction |
| 8 North | 5 West | 15NE | 61346 | Discovery Livengood Cr. Association |
| 8 North | 5 West | 10SW | 61347 | Placer Mining Claim No. 1 Below Discovery |
| 8 North | 5 West | 9SE | 61348 | Destiny |
| 8 North | 5 West | 9NE | 61349 | Jackpot |
| 8 North | 5 West | 10NW | 61350 | Nancy |
| 8 North | 5 West | 10NW | 61351 | Paystreak Bench Claim |
| 8 North | 5 West | 10NW | 61352 | Eureka Bench Claim on Left Limit |
| 8 North | 5 West | 10SW | 61353 | Deep Channel Fraction |
| 8 North | 5 West | 10NW | 61354 | Colorado Association |
| 8 North | 5 West | 10SE | 61355 | George Association, 2nd Tier |
| 8 North | 5 West | 10SE | 61356 | Gan Fraction, 2nd Tier right limit |
| 8 North | 5 West | 10NE | 61357 | Colorado Fraction, 3rd tier right limit |
| 8 North | 5 West | 10NE | 61358 | Sacramento Bench |
| 8 North | 5 West | 10NE | 61359 | Three Star Association |
| 8 North | 5 West | 10SE | 61360 | Toni Placer Mining Claim |
| 8 North | 5 West | 10NE | 61361 | Little Butch |
| 8 North | 5 West | 10NE | 61362 | Horseshoe claim |
| 8 North | 5 West | 10NE | 61363 | Carryall |
| 8 North | 5 West | 10NE | 61364 | Fish Association |
| 8 North | 5 West | 11NW | 61365 | Homesite Bench |
| 8 North | 5 West | 11NW | 61366 | Virgina Association |
| 8 North | 5 West | 10NW | 61367 | Eagle Bench Association |
| 8 North | 5 West | 11NE | 61368 | Birch Fraction |
| International Tower Hill Mines Ltd. S-K 1300 – Technical Report Summary Livengood Gold Project Pre-feasibility Study | |
| Township | Range | Section | BLM Claim # | Claim Name |
| 8 North | 5 West | 2SE | 61369 | Brendan or Brandon Bench |
| 8 North | 5 West | 2SW | 61370 | Xmas |
| 8 North | 5 West | 2SE | 61371 | Blanche |
| 8 North | 5 West | 1SW | 61372 | Audrey Fraction |
| 8 North | 5 West | 1SW | 61373 | Gold Dollar Fraction |
| 8 North | 5 West | 1SW | 61374 | Livengood Bench Right Limit |
| 8 North | 5 West | 1NW | 61375 | Snow |
| 8 North | 5 West | 1NE | 61376 | Ice |
| 8 North | 5 West | 1SE | 61377 | Harding (Pearson) |
| 8 North | 5 West | 1SE | 61378 | Mayflower Claim |
| 8 North | 5 West | 1SE | 61379 | Golden Gusher Bench Claim |
| 8 North | 4 West | 6SW | 61380 | Bonznza Bench |
| 8 North | 4 West | 6NW | 61381 | North Star Association |
| 8 North | 4 West | 6NW | 61382 | Black Bear Association |
| 8 North | 4 West | 6NW | 61383 | Tom Cat Bench |
| 8 North | 4 West | 6NW | 61385 | Flat Association |
| 8 North | 4 West | 6SW | 61386 | Magnus Opus |
| 8 North | 4 West | 6NE | 61387 | Banner Bench claim |
| 8 North | 4 West | 6NE | 61388 | Jewel Bench |
| 8 North | 4 West | 6NW | 61389 | Wild Cat bench |
| 9 North | 4 West | 31SE | 61391 | Hum Dinger |
| 8 North | 4 West | 6NE | 61392 | Red Claim |
| 9 North | 4 West | 31SE | 61393 | Jerry Association |
| 9 North | 4 West | 32SW | 61394 | Alaska |
| 9 North | 4 West | 32NW | 61395 | California Association claim |
| 9 North | 4 West | 32NW | 61396 | Gol Run Bench, 2nd Tier |
| 9 North | 4 West | 29SE | 61399 | Spring Association |
| 9 North | 4 West | 28SE | 61406 | Wedge Claim |
| 9 North | 4 West | 28SE | 61407 | Bulldozer |
| 9 North | 4 West | 28SE | 61408 | Eve |
| 9 North | 4 West | 27SW | 61409 | Resavoir Association |
| 9 North | 4 West | 28SW | 61420 | Alabam on the divide |
| 9 North | 4 West | 29SW | 63462 | Dome a/k/a Dome Association |
| 9 North | 4 West | 1SW | 63466 | Marjorie Bench |
| International Tower Hill Mines Ltd. S-K 1300 – Technical Report Summary Livengood Gold Project Pre-feasibility Study | |
Table A6: State of Alaska Claims – 100% Owned
| Claim Owner | ADL Number | Parcel Name | Meridian Township Range and Section | Acres | Count |
| Livengood Placers, Inc. | 361349 | Galaxy 1 | F008N005W10 | 40 | 327 |
| Livengood Placers, Inc. | 361350 | Galaxy 2 | F008N005W10 | 40 | 328 |
| Livengood Placers, Inc. | 361351 | Galaxy 3 | F008N005W02 | 40 | 329 |
| Livengood Placers, Inc. | 361352 | Galaxy 4 | F008N005W02 F008N005W03 F008N005W10 F008N005W11 | 40 | 330 |
| Livengood Placers, Inc. | 361353 | Galaxy 5 | F008N005W10 F008N005W11 | 40 | 331 |
| Livengood Placers, Inc. | 361354 | Galaxy 6 | F008N005W02 | 40 | 332 |
| Livengood Placers, Inc. | 361355 | Galaxy 7 | F008N005W02 F008N005W11 | 40 | 333 |
| Livengood Placers, Inc. | 361356 | Galaxy 8 | F008N005W11 | 40 | 334 |
| Livengood Placers, Inc. | 361357 | Galaxy 9 | F008N005W02 | 40 | 335 |
| Livengood Placers, Inc. | 361358 | Galaxy 10 | F008N005W02 F008N005W11 | 40 | 336 |
| Livengood Placers, Inc. | 361359 | Galaxy 11 | F008N005W01 F008N005W02 | 40 | 337 |
| Livengood Placers, Inc. | 361360 | Galaxy 12 | F008N005W01 F008N005W02 | 40 | 338 |
| Livengood Placers, Inc. | 361361 | Galaxy 13 | F008N005W01 F008N005W02 | 40 | 339 |
| Livengood Placers, Inc. | 361362 | Galaxy 14 | F008N005W01 | 40 | 340 |
| Livengood Placers, Inc. | 361363 | Galaxy 15 | F008N005W01 | 40 | 341 |
| Livengood Placers, Inc. | 361364 | Galaxy 16 | F008N005W01 | 40 | 342 |
| Livengood Placers, Inc. | 361365 | Galaxy 17 | F008N004W06 F008N004W07 F009N004W31 | 40 | 343 |
| Livengood Placers, Inc. | 361366 | Galaxy 18 | F008N004W06 F009N004W31 | 40 | 344 |
| Livengood Placers, Inc. | 361367 | Galaxy 19 | F009N004W31 | 40 | 345 |
| Livengood Placers, Inc. | 361368 | Galaxy 20 | F009N004W31 | 40 | 346 |
| Livengood Placers, Inc. | 603474 | FM9N4W28SW | F009N004W28 | 160 | 347 |
| Livengood Placers, Inc. | 603475 | FM9N4W28SE | F009N004W28 | 160 | 348 |
| Livengood Placers, Inc. | 603476 | FM9N4W28NE | F009N004W28 | 160 | 349 |
| Livengood Placers, Inc. | 603477 | FM9N4W28NW | F009N004W28 | 160 | 350 |
| International Tower Hill Mines Ltd. S-K 1300 – Technical Report Summary Livengood Gold Project Pre-feasibility Study | |
Table A7: Hudson/Geraghty Lease - Federal Unpatented Lode Claims
BLM File Number | Parcel Name | Owner |
| 55452 | SHARON | HUDSON |
| 55453 | DOROTHEA | HUDSON |
| 55454 | LENORA | HUDSON |
| 55455 | FOSTER | HUDSON |
| 55456 | VANCE | HUDSON |
| 55457 | TWERPIT | HUDSON |
| 55458 | SAUNDERS | HUDSON |
| 55459 | NICKIE | HUDSON |
| 55460 | PATRICK | HUDSON |
| 55461 | WHITE ROCK | HUDSON |
| 55462 | SUNSHINE #1 | GERAGHTY |
| 55463 | SUNSHINE #2 | GERAGHTY |
| 55464 | OLD SMOKY | HUDSON |
| 55465 | WITTROCK | HUDSON |
| 55466 | BLACK ROCK | HUDSON |
| 55467 | TRAPLINE | HUDSON |
| 55468 | PATRICIA | HUDSON |
| 55469 | ANNE | HUDSON |
| 55470 | EILEEN | HUDSON |
| 55471 | BRIDGET | HUDSON |
| International Tower Hill Mines Ltd. S-K 1300 – Technical Report Summary Livengood Gold Project Pre-feasibility Study | |
The Property consists of the following six (6) unpatented Federal Lode and Placer claims:
Table A8: Tucker Lease – Federal Unpatented Lode and Placer Claims
| File Number | Parcel Name | Date Acquired | Acres | Type |
| 37580 | Lillian No. 1 | 30-Sep-1968 | 21 | Lode Claim |
| 37581 | Satellite | 30-Sep-1968 | 20 | Lode Claim |
| 37582 | Nickel Bench R.L. | 30-Jun-1972 | 20 | Placer Claim |
| 37583 | The Nickel | 12-Aug-1965 | 19 | Placer Claim |
| 37584 | Overlooked | 6-Sep-1975 | 18 | Placer Claim |
| 37585 | The Lad | 12-Aug-1965 | 20 | Placer Claim |