UNITED STATES
SECURITIES AND EXCHANGE COMMISSION
Washington, D.C. 20549
SCHEDULE l4A
PROXY STATEMENT PURSUANT TO SECTION 14(A) OF THE SECURITIES
EXCHANGE ACT OF 1934
Filed by the Registrant þ
Filed by a Party other than the Registrant ¨
Check the appropriate box:
| ¨ | Preliminary Proxy Statement |
| ¨ | Confidential, for Use of the Commission Only (as permitted by Rule 14a-6(e)(2)) |
| ¨ | Definitive Proxy Statement |
| þ | Definitive Additional Materials |
| ¨ | Soliciting Material Under Rule l4a-l2 |
ATLAS AIR WORLDWIDE HOLDINGS, INC. | ||||
| (Name of Registrant As Specified In Its Charter) | ||||
N/A | ||||
| (Name of Person(s) Filing Proxy statement, if Other Than the Registrant) | ||||
| Payment of Filing Fee (Check the appropriate box): | ||||
| þ | No fee required. | |||
| ¨ | Fee computed on table below per Exchange Act Rules l4a-6(i)(4) and 0-11 | |||
| (1) | Title of each class of securities to which transaction applies:
| |||
| ||||
| (2) | Aggregatenumber of securities to which transaction applies:
| |||
| ||||
| (3) | Per unit price or other underlying value of transaction computed pursuant to Exchange Act Rule 0-11 (set forth in the amount on which the filing fee is calculated and state how it was determined):
| |||
| ||||
| (4) | Proposed maximum aggregate value of transaction:
| |||
| ||||
| (5) | Total fee paid:
| |||
| ||||
| ¨ | Fee paid previously with preliminary materials. | |||
| ¨ | Check box if any part of the fee is offset as provided by Exchange Act Rule 0-11(a) (2) and identify the filing for which the offsetting fee was paid previously. Identify the previous filing by registration statement number, or the form or schedule and the date of its filing. | |||
| (1) | Amount Previously Paid:
| |||
| ||||
| (2) | Form, Schedule or Registration Statement No.:
| |||
| ||||
| (3) | Filing Party:
| |||
| ||||
| (4) | Date Filed:
| |||
| ||||
 May 16, 2013 Adam R. Kokas SVP, GC, CHRO and Secretary Spencer Schwartz SVP and CFO |
 Dear Stockholders, The proxy advisory firms ISS and Glass Lewis have recently recommended to their clients that they vote against our proposal to approve, on an advisory basis, the compensation of our named executive officers. As we explain, we strongly disagree with their recommendations and urge you to vote in favor of the advisory proposal to approve the compensation of our executives. Sincerely, The AAWW Compensation Committee Frederick McCorkle, Chairman Eugene I. Davis Carol B. Hallett |
 3 OUR MANAGEMENT IS FOCUSED ON CONTINUING TO BUILD A STRONGER COMPANY THAT DELIVERS INTRINSIC VALUE FOR OUR STOCKHOLDERS October 2009 – announced plans to commence CMI passenger charter service for SonAir September 2011 – placed two 747-8F aircraft with Panalpina January 2012 – arranged Ex-Im guaranteed financing for remaining six 747-8F aircraft September 2012 – placed two 747-8F aircraft with DHL July 2010 – commenced CMI Dreamlifter service for Boeing May 2011 – U.S. Military passenger service commenced December 2011 – delivery completed for first three 747-8F aircraft placed with British Airways March 2012 – began 767 CMI service for DHL July 2007 – Atlas creates express network with DHL September 2006 – announced major order for Boeing’s new 747-8 Freighter February 2011 – secured financing for first three 747-8F aircraft January 2012 – received military approval for 767-300 airlift service February 2013 – announced 747- 400F ACMI for new customer Chapman Freeborn; implemented stock repurchase program March 2013 – acquired first 777F for Titan Dry Leasing platform June 2012 – began 747-400F ACMI for new customer Etihad Cargo |
 4 WE HAD MANY MAJOR ACHIEVEMENTS IN 2012 In Fiscal 2012, we: Grew our revenues 18% to $1.65 billion. Achieved pretax income of $205 million, reflecting the second-best operating results in our history. Our reported operating income and margin increased to $226 million and 14% in 2012 from $151 million and 11% in 2011. Our free cash flow* increased to $209 million in 2012 from $78 million in 2011. Secured Ex-Im Bank financing at extremely attractive terms for up to six of our 747-8F aircraft. Secured attractive placement with customers for the four 747-8F aircraft deliveries that occurred in 2012. Developed and implemented a comprehensive, long-term strategic plan to provide new earnings streams and create competitive advantages. Obtained Civil Aviation Review Board approval from the U.S. military to perform AMC B767 passenger service. Executed a start-up plan for B767-200 express cargo operations for DHL. Delivered numerous customer service quality metrics at or close to maximum levels. Received IATA Operational Safety Audit re-certification for cargo and passenger operations without any negative findings. *Information related to this non-GAAP financial measure, including reconciliation to the corresponding GAAP financial measure, is set forth in Exhibit 99 of our Form 8-K, furnished to the SEC on February 13, 2013. |
 5 HEADWINDS IN 2012 These numerous accomplishments were achieved despite the following headwinds: • Continued sluggish global economic conditions. • Muted “peak” season. • Commercial charter volumes and rates materially impacted by: - Increased air cargo capacity. - Softer demand. - Significantly reduced military flying levels. |
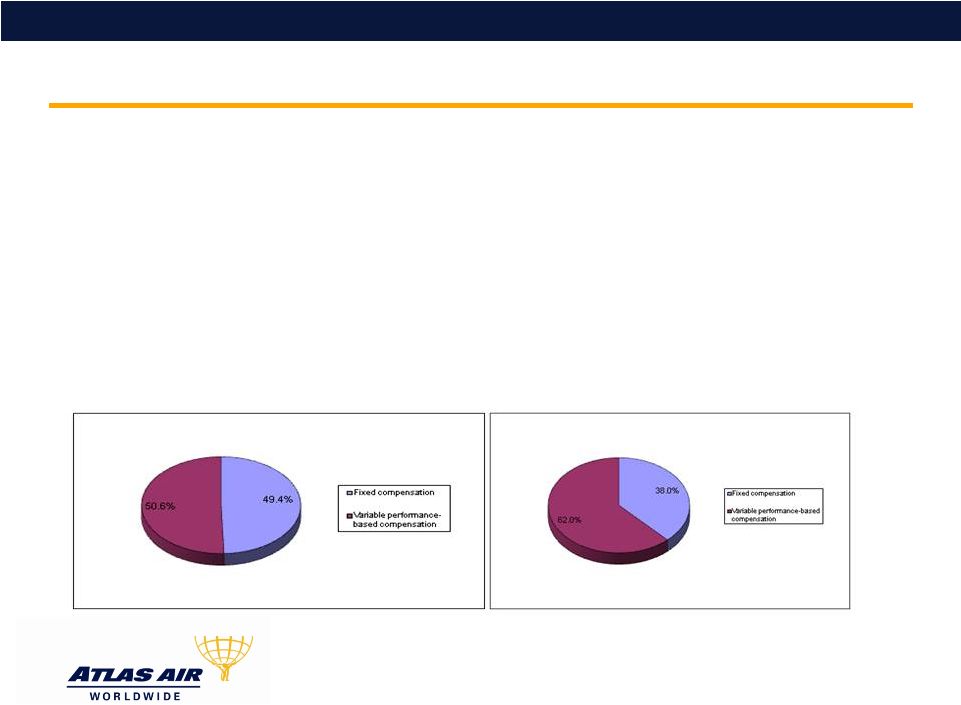 6 WE PAY FOR PERFORMANCE We believe that ISS’s policy of basing its say on pay recommendation on an analysis of CEO pay compared to 1 and 3 year TSR fails to acknowledge the contributions of all of our executive officers to the long-term prospects of the company. The chart appearing below on the left is based on our 2012 Summary Compensation Table and shows the percentage of our total compensation (as reflected in such table) that consisted of fixed compensation and variable or performance-based compensation (long-term performance units are assumed to be earned at the target level for purposes of our Summary Compensation Table). The chart appearing below on the right is based on the same information, except the percentages valuing long-term performance units granted in 2012 are assumed to be earned at the maximum level. For purposes of these charts, we have taken the percentages applicable to our five NEOs. A significant portion of our compensation is performance based. |
 7 ANNUAL INCENTIVE PLAN TARGET SETTING Financial targets reward superior performance; financial targets used to determine annual cash bonus were adjusted upward each year. |
 8 AAWW 2012 STOCK PERFORMANCE Percent Change Dow Jones Transportation Average Index: ALK, CHRW, CNW, CSX, DAL, EXPD, FDX, GMT, JBHT, JBLU, KEX, KSU, LSTR, LUV, MATX, NSC, R, LUV, UAL, UNP, UPS |
 9 A substantial majority (over 67%) of our shareholders voting on our 2012 Say-on-Pay proposal voted in favor of that proposal notwithstanding a recommendation against it by ISS. We believe that our shareholders support our compensation practices because: • They recognize our compensation best practices and excellent pay for performance results. • We manage our business for the long-term and for future growth. • As previously indicated, AAWW’s financial performance for the year was solid and filled with numerous financial and operational achievements, despite a challenging macro-economic and freight environment. This strong performance was reflected in a 15% increase in our share price performance. • We grew our revenues in 2012 by 18% to $1.65 billion. • We achieved pretax income of $205 million, reflecting the second-best operating results in our history. • Our reported operating income and margin increased to $226 million and 14% in 2012 from $151 million and 11% in 2011. • Our free cash flow * increased to $209 million in 2012 from $78 million in 2011. STRONG SHAREHOLDER SUPPORT FOR OUR COMPENSATION PRACTICES *Information related to this non-GAAP financial measure, including reconciliation to the corresponding GAAP financial measure, is set forth in Exhibit 99 of our Form 8-K, furnished to the SEC on February 13, 2013. |
 10 WE ARE RESPONSIVE TO OUR SHAREHOLDERS Prior to our 2012 annual meeting, we reached out to holders of approximately 85% of outstanding shares to discuss their views on our executive compensation program. We held conversations and/or exchanged emails with stockholders holding approximately 82% of our outstanding shares. The AAWW Compensation Committee considered the feedback from stockholders and made the following changes to our compensation program beginning in 2013: • Reduced the weighting of the individual management business objective metric in the annual cash incentive plan from 40% to 30%. • Revised the financial performance metric in the annual cash incentive plan from one based on pretax income to one based on earnings per common share. • Changed the earnings before taxes performance metric used for long-term incentive awards to one based on earnings before interest, taxes, depreciation and amortization (EBITDA). |
 11 AAWW MAINTAINS A TOP OF CLASS MANAGEMENT TEAM IN A COMPETITIVE MARKETPLACE Our executives’ skills are valuable to us and they are highly transferrable and desirable to our competitors, as well as to companies in other industries. We have designed our compensation policy so that we maintain our current executive team and remain an attractive employer as we invest in our future growth, continue to execute our strategic transformation and endure challenging economic environments. KEY COMPONENTS OF OUR COMPENSATION POLICY INCLUDE: Benchmarking our executives’ compensation at competitive levels • We target base salary, performance-based annual incentive cash compensation and performance- based and time-based equity compensation between the 50 th and 75 th percentiles of our compensation peers for our CEO and at the 75 th percentile for our other senior executives. This is nationwide data even though AAWW executives are based in one of the highest cost locations in the country. • While ISS criticizes the Company for using peers “with significantly higher revenue than” AAWW, ISS’ report on our executive compensation fails to consider that the information on our peers is scaled to provide an “apples- to-apples” comparison of compensation in the markets in which we compete for executive talent. Reward strong individual performance by aligning incentive-based compensation to individuals’ annual performance objectives • We incentivize management’s long-term investment in the company by rewarding what they can control, and decline to reward risky behavior targeted at artificially inflating stockholder return at the expense of our future growth. • Our Annual incentive program performance targets include personal metrics that are specifically tailored to each individual’s job responsibilities to incentivize the achievement of job specific goals. |
 12 Robust performance of our high quality, experience executive team. Productivity and commitment of our lean management team. High proportion of incentive compensation that is only paid if earned by superior performance. Express Board policy to provide strong incentives to retain current management team. - Significant competition for high-performing talent. WHERE DID ISS GET IT WRONG? BENCHMARKING We target to 50 th to 75 th percentile because of: Management team has successfully executed numerous strategic initiatives notwithstanding challenging market conditions. Over 60% of compensation is performance-based (assuming a maximum payout of long-term equity awards. - AAWW executives are based in one of the highest cost locations in the country. |
 13 WHERE DID ISS GET IT WRONG? EXPRESSES CONCERN WITH SUCCESSIVE ABOVE-TARGET PAYOUTS ISS: Concerned that goals under the long-term incentive plan are “not particularly rigorous.” • Long term incentive payouts are determined based on operating performance (measured by average growth in earnings before taxes (EBT) and return on invested capital (ROIC)) compared against a peer group of approximately 20 similar “asset heavy” companies. The only way to earn above-target payouts is to outperform the peer group. We believe that objectively comparing performance to a set of 20 peer companies, by its nature, is certainly a rigorous process. AAWW achieved top quartile ROIC and 56-75 th percentile EBT growth from 2010-2012 as compared to the peer group. What did ISS get wrong? • While some of these peers have larger revenue bases than AAWW, this group of peers is used only for performance comparisons and is not used to benchmark AAWW compensation levels. |
 14 ISS: The service quality metric under the company’s annual incentive plan is “relatively more subjective.” • 60% of the annual incentive payout is based on objective metrics (50% financial performance and 10% service quality (20% in the case of our operating personnel)).This was increased to 70% in 2013 based on shareholder feedback. The financial metric was changed from adjusted pre-tax income to adjusted earnings per share in 2013 to continue to ensure alignment of management and shareholder interests. • The service quality metrics are measured against AAWW’s ability to meet or exceed aggressive service level agreements (SLAs) specified in contracts with our key customers. AAWW either meets or exceeds these standards or it doesn’t. • As permitted under the SEC rules, AAWW does not provide the reliability targets in its proxy statement as it has determined that such disclosure would result in competitive harm. WHERE DID ISS GET IT WRONG? EXPRESSES CONCERN WITH SUCCESSIVE ABOVE-TARGET PAYOUTS • What did ISS get wrong? |
 15 • What did ISS get wrong? • Individual business objectives (IBOs) consist of many detailed, job specific goals that are specifically tailored to incentivize executives to drive achievement of the business plan and financial goals approved by the Board. IBOs are described in detail on page 31 of the Proxy Statement. • We establish challenging targets which represent a high level of operating performance. 2012 financial targets represent a meaningful increase over the targets for 2011. WHERE DID ISS GET IT WRONG? EXPRESSES CONCERN WITH SUCCESSIVE ABOVE-TARGET PAYOUTS |
 16 AAWW MAINTAINS COMPENSATION BEST PRACTICES We offer no excise tax gross ups or modified gross ups. We believe these gross ups are antithetical to fair compensation practices. Payments in event of change of control do not exceed 3x for all executives. We believe change of control payments at this level protect our executives, yet are not prohibitive to a potential strategic partner. No share recycling. Policy of not reusing shares forfeited for tax withholding or cancelled awards. Minimum stock ownership requirements are in place for officers and directors, and we provide robust disclosure on such compliance. We believe our directors and officers act in our stockholders’ best interests when they themselves are stockholders. There is 100% compliance with the stock ownership requirements, and actual ownership levels far exceed the minimum requirements in most instances. Substantial levels of variable compensation. As indicated on page 6, a majority of our compensation is “at risk” whether earned on a target basis or at the maximum level. |
 1Q13 HIGHLIGHTS Reflected business mix, productivity gains, efficiency initiatives Adjusted EPS - $0.22* Street consensus - $0.14 Full-year outlook affirmed Adjusted EPS ~ $4.80* Operating revenue up 5% Operating income up 10% ACMI Direct Contribution up 65% Free cash flow of $42 million* *Information related to these non-GAAP financial measures, including reconciliations to the corresponding GAAP financial measures, is contained on page 21 of our Form 10-Q for the quarterly period ended March 31, 2013, filed with the SEC on May 2, 2013 and in Exhibit 99 of our Form 8-K, furnished to the SEC on May 2, 2013. 17 |