QuickLinks -- Click here to rapidly navigate through this document
A-i
AmerenEnergy Generating Company Assets
CONFIDENTIAL
May 24, 2002
Final Report
Supplement to October 25, 2000 Final Report
A-ii
This report was prepared by Stone & Webster Consultants, Inc. and its affiliated company, Stone & Webster, Inc., both hereafter referred to as Stone & Webster, expressly for Lehman Brothers Inc. ("Lehman Brothers") and the AmerenEnergy Generating Company ("Genco"). Neither Stone & Webster, nor Lehman Brothers, nor any person acting in their behalf, (a) makes any warranty, express or implied, with respect to the use of any information or methods disclosed in this report; or (b) assumes any liability with respect to the use of any information or methods disclosed in this report. Any recipient of this report, by their reliance on, acceptance or use of this report, releases Stone & Webster and its affiliates from any liability for any direct, indirect, consequential or special loss or damage whether arising in contract, tort (including negligence) or otherwise. Nothing expressed in this report should be construed as a legal opinion as to compliance with law or regulation. Accordingly, no statement by Stone & Webster should be construed to contain such an opinion.
Electronic mail copies of this report are not official unless authenticated and signed by Stone & Webster and are not to be modified in any manner without Stone & Webster's express written consent.
A-iii
Independent Technical Review for Financing: AmerenEnergy Generating Company Assets
Table of Contents
| 1 | EXECUTIVE SUMMARY | A-1 | |||||
| 1.1 | COAL-FIRED STATIONS | A-3 | |||||
| 1.1.1 | Condition Assessment | A-3 | |||||
| 1.1.2 | Performance | A-6 | |||||
| 1.1.3 | O&M | A-7 | |||||
| 1.2 | GAS-FIRED STATIONS | A-7 | |||||
| 1.2.1 | Performance | A-8 | |||||
| 1.2.2 | O&M | A-8 | |||||
| 1.3 | CONCLUSIONS | A-9 | |||||
| 1.3.1 | Coal-fired Stations | A-9 | |||||
| 1.3.2 | Gas-fired Stations | A-9 | |||||
| 1.3.3 | Financial Model Forecast | A-10 | |||||
| 2 | INTRODUCTION | A-11 | |||||
| 2.1 | SCOPE OF SERVICES | A-11 | |||||
| 3 | COAL-FIRED STATIONS | A-14 | |||||
| 3.1 | CONDITION ASSESSMENT | A-14 | |||||
| 3.1.1 | Newton | A-14 | |||||
| 3.1.2 | Coffeen | A-20 | |||||
| 3.1.3 | Meredosia | A-25 | |||||
| 3.1.4 | Hutsonville | A-31 | |||||
| 3.2 | PERFORMANCE | A-34 | |||||
| 3.2.1 | Newton | A-35 | |||||
| 3.2.2 | Coffeen | A-36 | |||||
| 3.2.3 | Meredosia | A-37 | |||||
| 3.2.4 | Hutsonville | A-38 | |||||
| 3.3 | OPERATION & MAINTENANCE | A-39 | |||||
| 3.3.1 | Newton | A-40 | |||||
| 3.3.2 | Coffeen | A-41 | |||||
| 3.3.3 | Meredosia | A-42 | |||||
| 3.3.4 | Hutsonville | A-43 | |||||
| 3.4 | ENVIRONMENTAL COMPLIANCE AND PERMITTING | A-44 | |||||
| 3.4.1 | System-wide Air Emissions Compliance Programs | A-44 | |||||
| 3.4.2 | Generating Station Environmental Compliance | A-49 | |||||
| 4 | GAS-FIRED STATIONS | A-55 | |||||
| 4.1 | DESIGN AND CONSTRUCTION | A-55 | |||||
| 4.1.1 | Grand Tower | A-55 | |||||
| 4.1.2 | Pinckneyville Phase II | A-57 | |||||
| 4.1.3 | Columbia | A-60 | |||||
| 4.2 | PERFORMANCE | A-61 | |||||
| 4.2.1 | Grand Tower | A-61 | |||||
| 4.2.2 | Gibson City | A-63 | |||||
| 4.2.3 | Pinckneyville | A-65 | |||||
| 4.2.4 | Kinmundy | A-67 | |||||
| 4.2.5 | Columbia | A-69 | |||||
| 4.3 | OPERATION AND MAINTENANCE | A-70 | |||||
| 4.3.1 | Grand Tower | A-70 | |||||
| 4.3.2 | CT Stations (Gibson City, Kinmundy, Pinckneyville and Columbia) | A-71 | |||||
A-iv
| 4.4 | ENVIRONMENTAL COMPLIANCE AND PERMITTING | A-74 | |||||
| 4.4.1 | Grand Tower | A-74 | |||||
| 4.4.2 | Gibson City | A-75 | |||||
| 4.4.3 | Pinckneyville | A-75 | |||||
| 4.4.4 | Kinmundy | A-77 | |||||
| 4.4.5 | Columbia | A-79 | |||||
| 5 | FINANCIAL MODEL FORECAST | A-81 | |||||
| 5.1 | TECHNICAL ASSUMPTIONS | A-82 | |||||
| 5.2 | FINANCING ASSUMPTIONS | A-82 | |||||
| 5.3 | REVENUES | A-83 | |||||
| 5.4 | EXPENSES | A-84 | |||||
| 5.4.1 | Fuel Cost | A-84 | |||||
| 5.4.2 | O&M Costs | A-84 | |||||
| 5.4.3 | Capital Expenditures | A-86 | |||||
| 5.5 | BASE CASE RESULTS | A-86 | |||||
| 5.6 | SENSITIVITY ANALYSIS | A-87 | |||||
| 5.7 | CONCLUSIONS | A-88 | |||||
| 5.8 | RESULTS SUMMARY TABLES | A-88 | |||||
| APPENDIX A: ACRONYMS | A-97 | ||||||
A-v
| TABLE 1.1-1. | SUMMARY OF ASSET CHARACTERISTICS: COAL-FIRED STATIONS | A-1 | ||
| TABLE 1.1-2. | SUMMARY OF ASSET CHARACTERISTICS: GAS-FIRED STATIONS | A-2 | ||
| TABLE 1.1-1. | STATION PERFORMANCE SUMMARY | A-6 | ||
| TABLE 1.2-1. | STATION PERFORMANCE SUMMARY | A-8 | ||
| TABLE 2.1-1. | SITE VISIT DATES | A-12 | ||
| TABLE 3.1-1. | NEWTON CHARACTERISTICS | A-15 | ||
| TABLE 3.1-2. | COFFEEN CHARACTERISTICS | A-21 | ||
| TABLE 3.1-3. | MEREDOSIA CHARACTERISTICS | A-26 | ||
| TABLE 3.1-4. | HUTSONVILLE CHARACTERISTICS | A-32 | ||
| TABLE 3.2-1. | NEWTON PERFORMANCE | A-35 | ||
| TABLE 3.2-2. | COFFEEN PERFORMANCE | A-36 | ||
| TABLE 3.2-3. | MEREDOSIA PERFORMANCE | A-37 | ||
| TABLE 3.2-4. | HUTSONVILLE PERFORMANCE | A-38 | ||
| TABLE 3.3-1. | COST OF PLANT IMPROVEMENT INITIATIVES PROGRAM | A-39 | ||
| TABLE 3.3-2. | NEWTON O&M EXPENSES | A-40 | ||
| TABLE 3.3-3. | NEWTON OVERHAUL SCHEDULE | A-40 | ||
| TABLE 3.3-4. | CAPITAL PROJECTS: NEWTON UNIT 1 | A-41 | ||
| TABLE 3.3-5. | CAPITAL PROJECTS: NEWTON UNIT 2 | A-41 | ||
| TABLE 3.3-6. | COFFEEN O&M EXPENDITURES | A-41 | ||
| TABLE 3.3-7. | CAPITAL PROJECTS: COFFEEN UNIT 1 | A-42 | ||
| TABLE 3.3-8. | CAPITAL PROJECTS: COFFEEN UNIT 2 | A-42 | ||
| TABLE 3.3-9. | MEREDOSIA O&M EXPENSES | A-42 | ||
| TABLE 3.3-10. | CAPITAL PROJECTS: MEREDOSIA UNITS 1 AND 2 | A-43 | ||
| TABLE 3.3-11. | CAPITAL PROJECTS: MEREDOSIA UNIT 3 | A-43 | ||
| TABLE 3.3-12. | CAPITAL PROJECTS: MEREDOSIA UNIT 4 | A-43 | ||
| TABLE 3.3-13. | HUTSONVILLE O&M EXPENSES | A-44 | ||
| TABLE 3.3-14. | CAPITAL PROJECTS: HUTSONVILLE UNITS 3 AND 4 | A-44 | ||
| TABLE 3.4-1. | PHASE II SO2 ALLOCATIONS: COAL-FIRED STATIONS | A-45 | ||
| TABLE 3.4-2. | SO2 EMISSIONS | A-45 | ||
| TABLE 3.4-3. | NOX EMISSIONS PROJECTIONS | A-46 | ||
| TABLE 3.4-4. | HISTORICAL NOX EMISSIONS SUMMARY | A-47 | ||
| TABLE 3.4-5. | 2001 NOX EMISSIONS | A-48 | ||
| TABLE 3.4-6. | NOX REDUCTION OPTIONS | A-48 | ||
| TABLE 3.4-7. | OZONE SEASON NOX EMISSIONS | A-49 | ||
| TABLE 3.4-8. | NEWTON EMISSIONS LIMITATIONS | A-49 | ||
| TABLE 3.4-9. | COFFEEN EMISSIONS LIMITATIONS | A-51 | ||
| TABLE 3.4-10. | MEREDOSIA EMISSIONS LIMITATIONS | A-52 | ||
| TABLE 3.4-11. | HUTSONVILLE EMISSIONS LIMITATIONS | A-53 | ||
| TABLE 4.2-1. | GRAND TOWER PERFORMANCE SUMMARY | A-62 | ||
| TABLE 4.2-2. | GIBSON CITY PERFORMANCE TEST RESULTS | A-64 | ||
| TABLE 4.2-3. | GIBSON CITY PERFORMANCE SUMMARY | A-64 | ||
| TABLE 4.2-4. | PINCKNEYVILLE UNITS 5 - 8 PERFORMANCE TEST RESULTS | A-66 | ||
| TABLE 4.2-5. | PINCKNEYVILLE PERFORMANCE SUMMARY | A-66 | ||
| TABLE 4.2-6. | KINMUNDY PERFORMANCE TEST RESULTS | A-68 | ||
| TABLE 4.2-7. | KINMUNDY PERFORMANCE SUMMARY | A-68 | ||
| TABLE 4.2-8. | COLUMBIA UNITS 1 - 4 PERFORMANCE TEST RESULTS | A-69 | ||
| TABLE 4.2-9. | COLUMBIA PERFORMANCE SUMMARY | A-70 | ||
| TABLE 4.3-1. | GRAND TOWER O&M BUDGET FORECAST | A-70 | ||
| TABLE 4.3-2. | CAPITAL PROJECTS: GRAND TOWER | A-71 |
A-vi
| TABLE 4.3-3. | FIXED OPERATING FEE FOR CT PLANTS | A-72 | ||
| TABLE 4.3-4. | GIBSON CITY 2001 O&M COSTS | A-72 | ||
| TABLE 4.3-5. | PINCKNEYVILLE 2000 AND 2001 O&M COSTS | A-73 | ||
| TABLE 4.3-6. | KINMUNDY 2001 O&M COSTS | A-73 | ||
| TABLE 4.3-7. | COLUMBIA 2001 O&M COSTS | A-73 | ||
| TABLE 5.3-1. | GENCO PROJECTED REVENUES, 2003 | A-83 | ||
| TABLE 5.3-2. | TOTAL ANNUAL GENERATION (GWH) | A-84 | ||
| TABLE 5.4-1. | GENCO OPERATING EXPENSES, 2003 | A-84 | ||
| TABLE 5.4-2. | O&M BUDGET FORECAST SUMMARY ($MILLION) | A-85 | ||
| TABLE 5.4-3. | SO2 COMPLIANCE COST EXPENDITURES SUMMARY | A-85 | ||
| TABLE 5.4-4. | CAPITAL EXPENDITURES BY YEAR ($MILLION) | A-86 | ||
| TABLE 5.4-5. | STATION CAPITAL EXPENDITURES SUMMARY ($MILLION) | A-86 | ||
| TABLE 5.6-1. | SENSITIVITY ANALYSIS—SENIOR DSCR (2002 - 2011) | A-87 | ||
| TABLE 5.8-1. | BASE CASE RESULTS | A-89 | ||
| TABLE 5.8-2. | SENSITIVITY CASE 1: OVERBUILD | A-90 | ||
| TABLE 5.8-3. | SENSITIVITY CASE 2: LOW FUEL | A-93 | ||
| TABLE 5.8-4. | SENSITIVITY CASE 3: HIGH FUEL | A-95 |
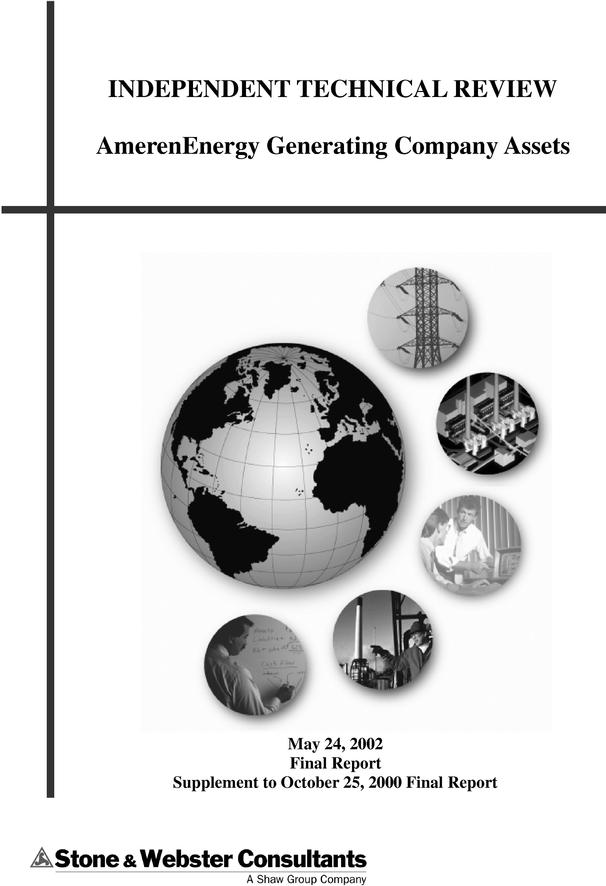
| Figure 5.1-1. | Projected Capacity Factors (Coal-fired Stations) | A-82 | ||
| Figure 5.3-1. | Genco Revenues 2002 - 2011 ($000) | A-83 | ||
| Figure 5.6-1. | Senior Debt Service Coverage Ratio Summary, Base Case and Sensitivity Analyses | A-87 |
A-vii
Stone & Webster was retained by Ameren Corporation ("Ameren", which shall also refer to one or more of its subsidiaries) on behalf of Lehman Brothers, Initial Purchaser for a Rule 144A Bond issuance by Genco, to perform a lenders' independent technical review of the portfolio of generating assets owned by Genco. The generating assets ("the Assets") include the existing predominantly coal-fired stations ("Coal-fired Stations") shown in Table 1.1-1.
Table 1.1-1. Summary of Asset Characteristics: Coal-fired Stations
| Station/Unit | Type | Date Commissioned | Fuel | Capacity (MW) Summer net | |||||
|---|---|---|---|---|---|---|---|---|---|
| Newton Power Station ("Newton") | |||||||||
| Unit 1 | Steam-Electric | 1977 | Coal | 557 | |||||
| Unit 2 | Steam-Electric | 1982 | Coal | 575 | |||||
| Total | 1132 | ||||||||
| Coffeen Power Station ("Coffeen") | |||||||||
| Unit 1 | Steam-Electric | 1965 | Coal | 340 | |||||
| Unit 2 | Steam-Electric | 1972 | Coal | 560 | |||||
| Total | 900 | ||||||||
| Meredosia Power Station ("Meredosia") | |||||||||
| Unit 1 | Steam-Electric | 1948 | Coal | 62 | |||||
| Unit 2 | Steam-Electric | 1949 | Coal | 62 | |||||
| Unit 3 | Steam-Electric | 1960 | Coal | 215 | |||||
| Unit 4 | Steam-Electric | 1975 | Oil | 168 | |||||
| Total | 507 | ||||||||
| Hutsonville Power Station ("Hutsonville")* | |||||||||
| Unit 3 | Steam-Electric | 1953 | Coal | 76 | |||||
| Unit 4 | Steam-Electric | 1954 | Coal | 77 | |||||
| Total | 153 | ||||||||
| Totals | 2692 | ||||||||
- *
- Hutsonville also has a 3 MW diesel generator which was not included in this review.
A-1
The Assets also include natural gas-fired combined cycle and combustion turbine ("CT") stations ("Gas-fired Stations") as shown on Table 1.1-2.
Table 1.1-2. Summary of Asset Characteristics: Gas-fired Stations
| Station/Unit | Type | Commercial Operation Date | Fuel | Capacity (MW) Summer net | |||||
|---|---|---|---|---|---|---|---|---|---|
| Grand Tower Power Station ("Grand Tower") | |||||||||
| Unit 1/3 | Combined cycle | 06/01 | Natural gas | 249 | |||||
| Unit 2/4 | Combined cycle | 12/01 | Natural gas | 270 | |||||
| Total | 519 | ||||||||
| Gibson City Power Station ("Gibson City") | |||||||||
| Unit 1 | CT | 06/00 | Gas or oil | 116 | |||||
| Unit 2 | CT | 07/00 | Gas or oil | 116 | |||||
| Total | 232 | ||||||||
| Pinckneyville Power Station ("Pinckneyville") | |||||||||
| Unit 1 | CT | 06/00 | Natural gas | 44 | |||||
| Unit 2 | CT | 06/00 | Natural gas | 44 | |||||
| Unit 3 | CT | 06/00 | Natural gas | 44 | |||||
| Unit 4 | CT | 06/00 | Natural gas | 44 | |||||
| Unit 5 | CT | 06/01 | Natural gas | 36 | |||||
| Unit 6 | CT | 06/01 | Natural gas | 36 | |||||
| Unit 7 | CT | 06/01 | Natural gas | 36 | |||||
| Unit 8 | CT | 07/01 | Natural gas | 36 | |||||
| Total | 320 | ||||||||
| Kinmundy Power Station ("Kinmundy") | |||||||||
| Unit 1 | CT | 04/01 | Gas or oil | 117 | |||||
| Unit 2 | CT | 05/01 | Gas or oil | 117 | |||||
| Total | 234 | ||||||||
| Columbia Power Station ("Columbia") | |||||||||
| Unit 1 | CT | 07/01 | Natural gas | 36 | |||||
| Unit 2 | CT | 07/01 | Natural gas | 36 | |||||
| Unit 3 | CT | 06/01 | Natural gas | 36 | |||||
| Unit 4 | CT | 07/01 | Natural gas | 36 | |||||
| Total | 144 | ||||||||
| Joppa Power Station ("Joppa") | |||||||||
| Unit 1 | CT | 09/00 | Natural gas | 62 | |||||
| Unit 2 | CT | 09/00 | Natural gas | 62 | |||||
| Unit 3 | CT | 09/00 | Natural gas | 62 | |||||
| Total | 186 | ||||||||
| Totals | 1635 | ||||||||
The Assets have a combined electric generating capacity of approximately 4327 MW (net), and are all fossil-fuel fired. The Assets are located in Illinois, with the exception of Columbia, which is located in Missouri.
A-2
Previously, Stone & Webster prepared an independent technical review report dated October 25, 2000 summarizing the condition assessment, performance, operations and maintenance ("O&M"), environmental compliance and financial projections associated with Genco's assets at that time. This Independent Technical Review Report ("Report"), including the observations and conclusions presented herein, is based on, among other things, our review of the available technical, performance and cost data, visits to selected facilities and interviews with Ameren personnel. This Report is intended to supplement Stone & Webster's October 2000 report and presents our updated findings and conclusions regarding the following:
- •
- Operations, maintenance, performance and environmental compliance of the Assets during the interim period (October 2000 to May 2002, as availability of data permitted);
- •
- The design, operations, maintenance, performance and environmental compliance of the Columbia power station and Pinckneyville Units 4-8, which were not considered under the previous review; and
- •
- The pro forma financial model ("Financial Model"), including Genco's projected cash flows and debt service coverages.
1.1 Coal-fired Stations
The Coal-fired Stations include Newton, Coffeen, Meredosia and Hutsonville. Stone & Webster's conclusions regarding condition assessment, performance, O&M, and environmental compliance of each station are presented in the following sections. The costs for planned projects and improvements discussed below are reflected in the Financial Model.
1.1.1 Condition Assessment
TheNewton station consists of two essentially identical steam-electric generating units. Units 1 and 2 are balanced draft, reheat, coal-fired units rated 557 and 575 MW net, respectively. The units were placed in operation in 1977 and 1982. Cooling water to supply the once-through cooling system for the units is taken from a man-made lake and discharged to either the lake or a new supplemental cooling pond. Both Units 1 and 2 use low-NOx burners for NOx control. SO2 is controlled by firing low sulfur coal, currently Powder River Basin ("PRB") coal. The units are equipped with electrostatic precipitators ("ESPs") for control of particulate emissions. Newton is currently operated in intermediate mode at relatively high average capacity factors, and is forecast to provide baseload service in the future.
Newton has made several improvements since the previous Stone & Webster inspection in February 2000, including:
- •
- A new supplemental cooling pond was completed in order to eliminate derates due to discharge temperature limitations during the summer months.
- •
- Digital burner management and combustion control systems were installed on both units, and a new digital boiler control system was installed for Unit 2.
- •
- New low-NOx burners were installed on Unit 2.
- •
- Unit 1 fans were tipped to increase fan capacity.
- •
- Improvements and automation of coal handling and grinding equipment were implemented to enhance reliability.
- •
- A structural integrity survey, including inspections of all of the major structures throughout the plant, was conducted.
A-3
- •
- Operational tuning has continued on both units.
In addition, both units are now operating more frequently at the 5% design throttle overpressure of 2,520 psig. This, coupled with the other improvements, has resulted in capacity increases for both units (2 MW for Unit 1, 20 MW for Unit 2, summer net). The higher capacities are within permitted values.
The recent boiler inspection reports indicated both boilers were in good condition. The capital budget for boiler improvements reflects expected replacements due to normal aging. Inspections are performed during each scheduled major outage, including non-destructive testing, to determine the condition of and maintenance / replacement requirements for major plant components. Provided that these inspections are maintained and areas of concern are inspected at appropriate intervals, with corresponding repair and/or replacement/upgrade of major equipment, many years of additional reliable operation can be expected.
The Newton turbine generators are of a class of General Electric ("GE") units which have a well documented class history. There is some evidence of low pressure ("LP") inner shell distortion which will require eventual major repairs along with high pressure ("HP") and intermediate pressure ("IP") stationary nozzle repairs. There has been some HP/IP turbine erosion that has required component replacement with erosion resistant coated parts. Additional blade replacements are to be expected and have been budgeted for. The rotor bores have been inspected with no evidence of defects to date. As with the boilers, the turbine capital budget reflects industry experience with this class.
Both Newton units are fully capable of reliable operation for 20 additional years provided that a comprehensive non-destructive examination and testing ("NDE/NDT") program, consistent with Genco's operating plan, is followed. The units are currently in very good condition and appear to be well maintained.
TheCoffeen station consists of two steam-electric generating units. Units 1 and 2 are balanced draft, reheat, coal-fired units rated at 340 MW and 560 MW net, respectively. The units were placed in operation in 1965 and 1972. Cooling water for the main condensers is taken from a man-made lake and discharged to either the lake or a supplemental cooling pond. Both units presently employ cyclone burners with over-fire air ("OFA") systems for NOx control, however, selective catalytic reduction systems ("SCRs") are under construction in order to achieve reduced NOx emissions. The units have no special provisions for SO2 control. Both units are equipped with electrostatic precipitators for particulate control. Coffeen is currently operated in intermediate mode, and is forecast to operate in baseload mode in the future.
Coffeen has made several significant improvements since the previous Stone & Webster inspection in February 2000, including:
- •
- A new supplemental cooling pond has been installed, which helps ensure compliance with discharge temperature requirements.
- •
- Many improvements have been made to reduce fugitive coal dust throughout the plant. Posimetric feeders have been installed in place of the former coal feeders. New ventilation and fogging has been added at coal transfer points. A new baghouse was installed to collect dust from the coal silos.
- •
- Large fine-grind coal crushers have been installed. They will improve the reliability of crusher operation and are expected to require reduced maintenance costs.
- •
- A new SO3 injection system was installed to improve the precipitator performance.
- •
- A structural integrity survey, including inspections of all of the major structures throughout the plant, was conducted.
A-4
The recent boiler inspection reports indicated that both boilers are in good overall condition and could be operated for many more years provided timely maintenance is performed and replacements are made. Superheater and reheater tube replacements will be implemented as testing and inspection results indicate the need. A comprehensive non-destructive testing and inspection program has been mandated and will be used to schedule major maintenance and replacements. Sufficient funds have been budgeted for high energy piping inspection for both units for the next twenty years. The projected Coffeen capital budget reflects normal replacements due to aging.
As with Newton, the Coffeen turbine generators each have a well documented class history. HP/IP inlet stage erosion has been addressed by periodic replacements with erosion-resistant coatings. Gradual shell distortion will require straightening. The rotor bores have been inspected with no potential end of life defects detected.
The station appeared to be well maintained and in good condition. Both Coffeen units should be fully capable of reliable operation for 20 additional years provided that a comprehensive non-destructive testing and inspection program is followed and used to schedule major maintenance and replacements.
TheMeredosia station consists of four steam-electric generating units. Units 1 and 2 are essentially identical, balanced draft, nonreheat, coal-fired units rated at 62 MW net. These units were placed in service in 1948 and 1949. Unit 3 is a twin furnace design balanced draft, reheat, coal-fired unit rated at 215 MW net. Unit 3 was placed in service in 1960. Unit 4 is a pressurized, reheat, oil-fired unit rated at 168 MW net. Unit 4 was placed in service in 1975. The station appeared to be well maintained and in good condition, considering the age of Units 1 and 2 and the historically infrequent operation of Unit 4.
Meredosia Units 1 and 2 are older, less efficient units that have been utilized as intermediate service units in recent years. The last report indicated the need to perform more intensive nondestructive testing in order to fully determine the technical requirements of keeping the Unit 1 and 2 boilers operating well into the future. Towards that end, Genco plans inspection and testing to determine the condition of the boilers. The services of a consulting engineer are to be utilized in 2002 to support these activities.
The existing Unit 1 and 2 turbines could be operated for an additional 20 years with expenditures as reflected in the maintenance and capital forecasts. Intermediate service with a large number of starts has a detrimental effect on turbines and their auxiliaries, and eventual HP shell and steam path replacements would be likely for continued service beyond 20 years. The Unit 1 and 2 precipitators could be expected to require precipitator rebuilds if longer-term operation is envisioned.
The current condition of Meredosia Unit 3 would permit an additional 20 years of operation. NOx levels were brought into compliance with the addition of low-NOx burners and over-fire air. The Unit 3 primary superheater may require rebuilding in the future, and Genco has planned testing and inspection to support evaluation of the need and timing for replacement. The Unit 3 turbine has inner shell distortion and significant steam path erosion. Major HP inner shell repairs could be expected as early as 2005, and costs for those repairs are included in the budget forecast.
Meredosia Unit 4 can continue in operation as a peaking unit for 20 years. The Unit 4 boiler NDT program is adequate given the light usage of the unit. The next scheduled turbine overhaul (initiated subsequent to Stone & Webster's site visit) was to include a complete turbine dismantling to establish the baseline condition of shells, rotor and steam path components. With respect to emissions control, although not anticipated at present, a precipitator may eventually be required for particulate control for continued oil firing.
TheHutsonville station currently consists of two steam-electric generating units. Units 3 and 4 are identical balanced draft, reheat, coal-fired steam-electric generating units rated at 76 and 77 MW net,
A-5
respectively. The units were placed in service in 1953 and 1954. Water for the station's once-through cooling system is taken from and discharged back to the Wabash River. The units are equipped with electrostatic precipitators for control of particulate emissions. The units have no special provisions for NOx or SO2 control.
Hutsonville Units 3 and 4, although found to be in apparent good condition for their age, have operated in recent years at low capacity factors. Both units are nearly 50 years old and the recent history of NDE and metallurgical testing is quite limited. A reasonable budget has been allocated for steam turbine repairs. With appropriate maintenance including a resumption of NDE, the Hutsonville units can be operated reliably in intermediate service for another 20 years. It is likely that some additional impacts of the low capacity factor cyclic operation will be detected in both boilers. It will be necessary to perform tube, header and piping inspections to identify other component replacements in order to operate until 2021.
1.1.2 Performance
Stone & Webster reviewed the technical inputs to Resource Data International's ("Market Consultant") dispatch simulation model for the Coal-fired Stations. The key input data, such as claimed capacity, scheduled and forced outage rates and heat rates were reasonable and consistent with recent historical experience. The five-year historical averages (1997-2001) and the Market Consultant's projected performance forecasts are summarized in Table 1.1-1 below. Projected values are averaged over 20 years.
Table 1.1-1. Station Performance Summary
| | Newton | Coffeen | Meredosia | Hutsonville | ||||||||||||||
|---|---|---|---|---|---|---|---|---|---|---|---|---|---|---|---|---|---|---|
| | Historical (5-yr avg.) | Forecast (20-yr avg.) | Historical (5-yr avg.) | Forecast (20-yr avg.) | Historical (5-yr avg.) | Forecast (20-yr avg.) | Historical (5-yr avg.) | Forecast (20-yr avg.) | ||||||||||
| Capacity Factor | ||||||||||||||||||
| Unit 1 | 64.7 | % | 88.5 | % | 45.8 | % | 75.1 | % | 26.7 | % | 35.3 | % | — | — | ||||
| Unit 2 | 58.9 | % | 85.0 | % | 50.8 | % | 75.5 | % | 26.7 | % | 37.5 | % | — | — | ||||
| Unit 3 | — | — | — | — | 44.3 | % | 66.4 | % | 38.7 | % | 53.6 | % | ||||||
| Unit 4 | — | — | — | — | 4.0 | % | 0.2 | % | 41.4 | % | 53.4 | % | ||||||
| Equivalent Availability Factor | ||||||||||||||||||
| Unit 1 | 85.6 | % | 90.8 | % | 72.3 | % | 80.2 | % | 86.2 | % | 83.1 | % | — | — | ||||
| Unit 2 | 79.2 | % | 88.7 | % | 75.1 | % | 80.3 | % | 81.8 | % | 84.4 | % | — | — | ||||
| Unit 3 | — | — | — | — | 73.9 | % | 86.6 | % | 83.1 | % | 87.9 | % | ||||||
| Unit 4 | — | — | — | — | 75.5 | % | 65.6 | % | 83.5 | % | 87.6 | % | ||||||
| Equivalent Forced Outage Rate | ||||||||||||||||||
| Unit 1 | 5.1 | % | 5.5 | % | 9.6 | % | 11.7 | % | 17.3 | % | 8.8 | % | — | — | ||||
| Unit 2 | 5.7 | % | 5.5 | % | 10.3 | % | 11.9 | % | 5.0 | % | 8.8 | % | — | — | ||||
| Unit 3 | — | — | — | — | 10.6 | % | 5.8 | % | 7.3 | % | 6.5 | % | ||||||
| Unit 4 | — | — | — | — | 49.3 | % | 22.2 | % | 7.1 | % | 6.5 | % | ||||||
| Heat Rate (Btu/kWh) | ||||||||||||||||||
| Unit 1 | 10,480 | 10,103 | 10,743 | 10,209 | 13,275 | 13,290 | — | — | ||||||||||
| Unit 2 | 10,167 | 10,099 | 10,475 | 10,086 | 13,275 | 13,290 | — | — | ||||||||||
| Unit 3 | — | — | — | — | 10,720 | 9,955 | 11,015 | 10,811 | ||||||||||
| Unit 4 | — | — | — | — | 15,500 | 10,821 | 10,927 | 10,680 | ||||||||||
The higher-than-historical capacity factors forecast for Newton, Coffeen, and Meredosia are attributable to reductions in the delivered price of coal due to recent fuel contract re-negotiations, a switch to PRB coal at Newton, and the Market Consultant's coal pricing projections relative to natural gas pricing. These stations were designed for base load service and should be able to safely and reliably meet these capacity factor projections, assuming that appropriate operations and maintenance practices are followed and budgeted capital projects implemented (as reflected in the budget forecasts).
A-6
The projected increases in equivalent availability for some units are due to decreased planned outage durations and potential to decrease forced outages. Projected heat rates were based on recent performance. Stone & Webster finds these assumptions reasonable.
1.1.3 O&M
Stone & Webster reviewed detailed capital and overhaul expense forecasts provided by Genco for the Assets. These budgeted expenses were reviewed and found to be adequate to support the continued operation of the Assets at the level (i.e., capacity factor) projected through 2021. Based on Stone & Webster's review, there are no known existing conditions that would preclude operation of the Coal-Fired Stations through 2021, assuming enhancement of condition assessment programs (including NDE/NDT), maintenance and capital improvement programs as reflected in the Financial Model and as appropriate considering the age(s) of the assets.
In fact, a series of new initiatives is planned as part of Genco's strategy to extend the reliability and viability of its coal based assets. As part of its Plant Improvement Initiatives program, increased short-term capital and operating expenditures are allocated to enhance the long-term performance of its coal-based generation portfolio. These expenditures will fund development of a centralized technical service infrastructure as well as continued study of the mechanical, electrical and structural integrity of the plants.
1.2 Gas-fired Stations
TheGrand Tower station is located on the Mississippi River outside the town of Grand Tower, Illinois. The repowered combined cycle station is comprised of two natural gas fired Siemens Westinghouse ("SWPC") 501FD combustion turbine generators ("CTGs"), new heat recovery steam generators ("HRSGs"), and the existing steam turbines. Nomenclature for the two combined cycle systems is Unit 1/3 (249 MW net) and Unit 2/4 (270 MW net); the net plant output is 519 MW. Access to the site is by highway. Repowering of the station has been completed and commercial operation was achieved in June 2001 for Unit 1/3 and December 2001 for Unit 2/4. These units provide intermediate service.
TheGibson City station is a nominal 232 MW (net) peaking station consisting of two SWPC 501D5A CTGs operating in simple cycle. The primary fuel is natural gas, but the units have oil firing capability. The CTs are equipped with dry low-NOx burners for NOx control while firing gas and utilize water injection for NOx control while firing oil.
ThePinckneyville station is a 320 MW (net) simple cycle plant comprised of two phases, Phase I of four GE LM6000PC CTGs (176 MW) and Phase II of four GE PG6581B CTGs (144 MW). The Phase I CTs use water injection for NOx control; the Phase II CTs are equipped with dry low-NOxcombustors. The units fire natural gas fuel (only).
TheKinmundy station consists of two SWPC W501D5A CTGs operating in simple cycle. Net station capacity is 234 MW. The CTs are equipped with dual fuel combustors (i.e., will run on either gas or oil) and have water injection for NOx control (oil firing). The primary fuel for the CTs is natural gas.
TheColumbia station is a 144 MW (net) station consisting of four GE PG6581B CTGs. The simple cycle CTs are equipped with dry low-NOx combustors for NOx control, and fire natural gas fuel (only).
The Gibson City, Pinckneyville, Kinmundy and Columbia stations are all projected to operate in peaking mode.
A-7
TheJoppa station consists of three GE Frame 7B gas-fired simple cycle CTGs, which have been operational since 1974 and were recently refurbished and relocated to the Joppa site. These three units have a combined capacity of 186 MW. Genco has entered into a lease agreement with Ameren Energy Development Company ("Development") wherein these CTs are leased to Development for a minimum term of 15 years. Under the lease agreement, Genco has no operational or performance obligations, e.g., capacity, heat rate or availability, for these machines. The project is now in commercial operation and is not discussed further in this Report.
1.2.1 Performance
Performance characteristics are summarized on the following table. Note that Genco combines performance statistics for units at each station.
Table 1.2-1. Station Performance Summary
| | Gibson City | Pinckneyville | Kinmundy | Columbia | ||||||||||||
|---|---|---|---|---|---|---|---|---|---|---|---|---|---|---|---|---|
| Item | 2001 | Projected* | 2001 | Projected* | 2001 April - Dec | Projected* | 2001 June - Dec | Projected* | ||||||||
| Capacity Factor (%) | ||||||||||||||||
| 4.5 | 0.6 | 6.0 | 5.3 | 5.6 | 0.7 | 2.1 | 0.4 | |||||||||
| Equivalent Availability Factor (%) | ||||||||||||||||
| 82.6 | 86.2 | 88.8 | 96.2 | 97.3 | 96.2 | 91.7 | 96.2 | |||||||||
| Heat Rate (Btu/kWh) | ||||||||||||||||
| 12,621 | 11,479 | 11,538 | Units 1-4: 9,784 Units 5-8: 12,338 | 12,576 | 12,338 | 14,277 | 12,338 | |||||||||
- *
- As projected by the Market Consultant
2001 performance data for Grand Tower is limited due to the relatively recent in-service dates, particularly of Unit2/4. Capacity factor forecasts for Grand Tower average 34.5% through 2021. The baseload heat rate forecasts are 7,801 Btu/kWh and 7,328 Btu/kWh for Units 1/3 and 2/4, respectively. Equivalent availability factors are expected to average 90% for both units.
The simple cycle units have met the suppliers' performance guarantees (or were otherwise accepted by Genco despite minor shortfalls) and have performed satisfactorily. The combined cycle units at Grand Tower have experienced operational problems associated with the HRSGs. The HRSG vendor has recently completed warranty repairs and the units have returned to service.
1.2.2 O&M
Genco operates and maintains Grand Tower. Stone & Webster reviewed Genco's detailed capital and overhaul expense forecasts, which were found to be adequate to support the continued operation of the project at the capacity factors projected through 2021.
Operation and maintenance for the Gibson City, Kinmundy, Pinckneyville, and Columbia power plants are provided for under a single contract with Siemens Westinghouse Operating Service Company ("SW"). Stone & Webster reviewed the Operations and Maintenance Agreement (amended and restated) between Genco and SW. The term of the contract is to May 31, 2010 unless otherwise extended or terminated. The agreement is reasonable and associated costs are reflected in the Financial Model. Costs after 2010 are forecast to be consistent with the costs of previous years.
A-8
1.3 Conclusions
1.3.1 Coal-fired Stations
- •
- The Newton, Coffeen, Meredosia and Hutsonville power stations were found to be well maintained and generally in good condition as compared to similar facilities of the same age. With the implementation of enhanced condition monitoring programs and the forecast capital improvements, these electric generating facilities should continue to provide reliable power generation through the term of the Financial Model (2002 - 2021).
- •
- Stone & Webster reviewed the technical inputs to the Market Consultant's dispatch simulation model. The key input data, such as claimed capacity, availability, scheduled and forced outage rates and heat rates were reasonable and consistent with recent historical experience. Recent enhancements at Newton and Coffeen, coupled with Genco's Plant Improvement Initiatives program, support improved performance projections for the coal plants as compared to the October 25, 2000 report.
- •
- The assets are technically capable of performing at the capacity factors projected by the Market Consultant.
- •
- Genco's forecast O&M expenses are consistent with Ameren's historical expenditures and with those of other similar projects with which Stone & Webster is familiar. The O&M expenses appear reasonable and adequate to meet Genco's maintenance and performance objectives.
- •
- The overhaul schedules developed by Genco are prudent and consistent with current operations. The overhaul and capital expenses forecast in the Financial Model are considered adequate to support the continued operation of the Coal-fired Stations through 2021, assuming implementation and continuation of condition assessment programs.
- •
- The generating stations are operated in compliance with current permit requirements.
- •
- Genco plans to comply with current NOx and SO2 emissions limitations through the transfer of emissions credits and through capital expenditures, e.g., SCR systems. These plans appear to be reasonable and adequate, based on the currently available information.
1.3.2 Gas-fired Stations
- •
- The key input data to the Market Consultant's dispatch model, such as capacities, availabilities and heat rates, were reasonable and consistent with industry norms.
- •
- Performance with respect to projected capacity factors is considered achievable.
- •
- The simple cycle CT technologies (W501D5A, GE LM6000, GE PG6581B) are commercially proven and widely used in the market.
- •
- SWPC has identified operational issues affecting the new 501FD combustion turbines and are implementing corrective measures. These issues should have minimal impact on the operation of the Grand Tower units.
- •
- If operated and maintained in accordance with the O&M agreement and established operating plans and budgets, which are considered adequate, the useful lives of the units are expected to exceed the term of the Financial Model (2002 - 2021).
- •
- With minor exceptions, all of the CTs achieved guaranteed performance. Actual operation of the units has been satisfactory.
- •
- A majority of the Gas-fired Stations' required permits have been acquired and the permit acquisition plan for those permits not yet obtained is reasonable.
A-9
1.3.3 Financial Model Forecast
- •
- The availability, capacity and heat rate inputs used by the Market Consultant to develop its projections of market prices and energy generation are consistent with the values Stone & Webster has reviewed and found reasonable.
- •
- The projected heat rate and capacity assumptions have been developed based on historical data as modified to account for improvements that have been made or are planned to be made to these facilities. With continued capital investment, it is reasonable to expect that the heat rates and capacities can be maintained over the period shown in the Financial Model.
- •
- Genco's maintenance and capital budgets, reflected in the Financial Model, appear reasonable and adequate to meet the performance objectives safely and reliably.
- •
- Stone & Webster reviewed the calculation methodology of the Financial Model. The Financial Model fairly presents, in Stone & Webster's opinion, projected revenues and expenses under the base case assumptions.
- •
- Stone & Webster reviewed the technical aspects of Genco's Electric Power Sales Agreement as well as additional wholesale and retail contracts to which Genco affiliates are parties. Stone & Webster confirmed that the demand capacity, length of engagement (term) and capacity and energy pricing are consistent with those reflected in the Financial Model.
- •
- The forecast revenues from the sale of capacity and energy, as projected by the Market Consultant and Ameren, are more than adequate to pay the annual operating and maintenance expenses (including provisions for major maintenance), other operating expenses, and debt service. Under the base case assumptions, the average senior debt service coverage ratio ("DSCR") (before capital expenditures) is calculated to be 6.4x from 2002 through 2011. The minimum DSCR is 4.0x and occurs in 2003.
- •
- Three sensitivity cases were prepared to test the impact of different market forces on the energy and capacity prices forecast by the Market Consultant and the associated impact on the DSCR. The market energy and capacity prices were forecast assuming (i) the overbuilding of generation facilities in the region, (ii) lower fuel prices and (iii) higher fuel prices. The average senior DSCR was most sensitive to the overbuild sensitivity case. The 10-year average senior DSCR (before capital expenditures) in this case fell to 6.0x with a minimum of 3.7x in 2003, 2004 and 2005.
A-10
2 INTRODUCTION
Stone & Webster has prepared this Report of the Genco Assets for Lehman Brothers, as Initial Purchaser for a Rule 144A bond offering by Genco. This Report is intended to supplement Stone & Webster's October 25, 2000 report and reflects an update of the results of an independent engineering assessment of these Assets:
- •
- Newton Power Station
- •
- Coffeen Power Station
- •
- Meredosia Power Station
- •
- Hutsonville Power Station
- •
- Grand Tower Power Station
- •
- Gibson City Power Station
- •
- Kinmundy Power Station
- •
- Pinckneyville Power Station
- •
- Columbia Power Station
The Assets have a combined electric generating capacity of approximately 4,327 MW (net), and are all fossil-fuel fired.
The principal considerations and assumptions used in completing this review include:
- •
- Stone & Webster has used data and information provided to us, that we assume to be accurate and reliable.
- •
- Stone & Webster has assumed that the contracts, agreements, rules and regulations associated with the transaction will be fully enforceable in accordance with their terms and that all parties will comply with the provisions of their respective agreements.
- •
- Stone & Webster reviewed the operating plans and associated capital and operating budgets summarized herein. We assume that Genco will operate the assets in accordance with the operating plans.
2.1 Scope of Services
Stone & Webster was retained to update its Independent Technical Review Report dated October 25, 2000. Stone & Webster's role as the independent technical consultant is to review the principal aspects of the Assets. In general, Stone & Webster reviews work prepared by others, and does not prepare original engineering design products or condition assessment reports as part of the due diligence process.
A-11
Stone & Webster's review included visit(s) to each site as summarized below:
| Station | Initial Site Visit(s) | Follow-up Site Visit | ||
|---|---|---|---|---|
| Newton | 2/14-15/2000 | 11/8/2001 | ||
| Coffeen | 2/16-17/2000 | 11/6/2001 | ||
| Meredosia | 2/10-11/2000 | 11/5/2001 | ||
| Hutsonville | 2/9/2000 | 11/7/2001 | ||
| Grand Tower | 2/17-18/2000 9/25/2000 | 11/15/2001 | ||
| Gibson City | 2/16/2000 | — | ||
| Pinckneyville | 2/16/2000 | 11/1/2001 | ||
| Kinmundy | 2/16/2000 9/25/2000 | 11/1/2001 | ||
| Columbia | — | 10/31/2001 |
During the course of each site visit, Stone & Webster interviewed Ameren personnel, reviewed available documentation and participated in a tour and brief visual inspection of each facility. Except where otherwise noted, site visit references in this Report refer to the "Follow-up Site Visits" in the table above.
The review by Stone & Webster is limited to technical issues and the possible impact of those issues on commercial terms and conditions. A description of activities performed under each task area follows.
Review of Condition Assessment1
Stone & Webster reviewed available documentation related to the condition and performance of the major components, e.g., outage and overhaul reports, reflecting the period between October 2000 and the date of issuance of this Report. Stone & Webster evaluated the adequacy of the proposed O&M plans and remaining life, considering the current condition and expected service duty.
- 1
- Note that "condition assessment", in this context, refers to review of existing documentation, e.g., overhaul and condition reports and life extension studies, coupled with the visual inspections and interviews conducted during the site visits, and the conclusions drawn therefrom.
Design Review for "New" Gas-fired Stations
Stone & Webster reviewed the design of major equipment and systems for the new additions to Genco's generating portfolio, Columbia station and Pinckneyville Units 5-8. Design documentation was reviewed with regard to:
- •
- Compatibility of design with operating requirements, site characteristics, feedstock characteristics and quantities, and off-site transport requirements;
- •
- Ability of design to perform as required and projected in anticipated operating modes;
- •
- Capability of design to fulfill anticipated service life and meet availability, reliability and performance requirements and projections; and
- •
- Conformance of design with "good engineering practice" (i.e., industry standards).
A-12
Historical and Projected Performance
Stone & Webster reviewed the recent historical performance (capacity, heat rate, availability, capacity factor) of the units to evaluate the reasonableness of the projected performance of the units. The effects of capital and operational improvements were incorporated into the evaluation of the projected performance.
Review of O&M Plans and Budgets
Stone & Webster assessed the ability of the Assets to meet the projected performance given the operation and maintenance plans and practices developed by Genco. We reviewed the planned outage schedule and commented on the reasonableness of the projected availability figures. We reviewed the operating and maintenance budgets, including the planned maintenance and capital projects plans.
Review of Environmental Compliance and Permitting Issues
Stone & Webster reviewed the technical requirements of operating permits and discussed historical compliance with plant personnel. We determined whether there were any significant non-compliance notifications during the October 2000 to October 2001 period. We reviewed and commented on the plans (including future emissions control upgrades) for maintaining the Assets in compliance with their permits and the cost associated with maintaining environmental compliance over the term of the Financial Model (2002-2021).
Review of Financial Model
Stone & Webster conducted a detailed review of the Financial Model prepared by Genco and provided an opinion on the reasonableness of the operating costs, capital expenditures, and availability assumptions over the term of the financing. We commented on the adequacy of the Financial Model to accurately reflect the expected revenues and expenses. Stone & Webster also reviewed capacity, heat rate, availability and variable operating cost inputs to the Market Consultant's dispatch model.
A-13
3 COAL-FIRED STATIONS
These assets, Newton, Coffeen, Meredosia and Hutsonville stations, are all coal-fired facilities except for Meredosia Unit 4, which is oil fired. The combined electric generating capacity is 2692 MW (net).
This section summarizes Stone & Webster's findings with respect to condition assessment, remaining life, performance, O&M and environmental aspects of these assets. Generally, only those items requiring an update since Stone & Webster's October 2000 report are summarized herein.
3.1 Condition Assessment
3.1.1 Newton
The Newton station consists of two essentially identical steam-electric generating units. Units 1 and 2 are balanced draft, reheat, coal-fired units rated 557 and 575 MW net, respectively. The units were placed in operation in 1977 and 1982. Cooling water to supply the once-through cooling system for the units is taken from a man-made lake and discharged to either the lake or a new supplemental cooling pond. The units are equipped with electrostatic precipitators for control of particulate emissions. Both Units 1 and 2 use low-NOx burners for NOx control; the Unit 2 system is new in 2001. SO2 is controlled by firing low sulfur coal, currently PRB coal. Newton currently provides intermediate service at relatively high capacity factors.
Newton has made several improvements since Stone & Webster's first inspection in February 2000, including:
- •
- A supplemental cooling pond was completed so that the units can operate during the summer months with no load restrictions due to discharge temperature limitations.
- •
- Digital burner management and combustion control was installed on both units, and a new digital boiler control system was installed for Unit 2.
- •
- New low-NOx burners for Unit 2 allow for greater efficiency in fuel consumption.
- •
- Mill internals were standardized for improved coal grinding.
- •
- Automated coal handling equipment was installed that allows more accurate blending of PRB coals.
- •
- Improved boiler tuning has been performed on both units.
- •
- A Structural Integrity Survey was conducted by FRU-CON Engineering, Inc., as part of Genco's Plant Improvement Initiatives program. All of the major structures throughout the plant were inspected. Issues were identified and prioritized for corrective action during the survey.
Table 3.1-1 provides a summary of the major characteristics of Units 1 and 2. The sections that follow provide a summary update of our condition assessment findings since October 2000.
A-14
Table 3.1-1. Newton Characteristics
| ITEM | UNIT 1 | UNIT 2 | ||
|---|---|---|---|---|
| PERFORMANCE | ||||
| Normal Summer Capacity (MW Net) | 557 | 575 | ||
| Minimum Load (MW) | 250 | 250 | ||
| Full Load Heat Rate, HHV (Btu/kWh) | 10,103 | 10,099 | ||
| PRIME MOVER | ||||
| Manufacturer | GE | GE | ||
| Type | Tandem Compound Four Flow | Tandem Compound Four Flow | ||
| Commissioned (Year) | 1977 | 1982 | ||
| HP Turbine Inlet Pressure/Temp (psig/oF) | 2400/1000 | 2400/1000 | ||
| Design Overpressure Rating (psig) | 2520 | 2520 | ||
| Reheat Turbine Inlet Temp (oF) | 1000 | 1000 | ||
| ELECTRIC GENERATOR | ||||
| Manufacturer | GE | GE | ||
| Cooling | Hydrogen | Hydrogen | ||
| MVA | 686 | 686 | ||
| STEAM GENERATOR | ||||
| Manufacturer | CE | CE | ||
| No. of Boilers | 1 | 1 | ||
| Circulation | Forced | Forced | ||
| Draft Condition | Balanced | Balanced | ||
| Cycle Type | Reheat | Reheat | ||
| Primary Fuel | Coal | Coal | ||
| OTHER | ||||
| Cooling Water Source | Lake | Lake | ||
| Fuel Delivery | Rail | Rail |
3.1.1.1 Boilers
Both boilers at Newton continue to operate on PRB coal in intermediate service mode. There are no design limitations on either boiler. However, after the supplemental cooling pond was installed, the Unit 1 boiler output was noted as the limiting factor in unit generation, i.e., the Unit 1 boiler is limited by the induced draft ("ID") fan capacity, particularly in warm weather. Genco is attempting to increase fan output by spraying a fine mist of water into the flue gas to cool the gas. The cooler flue gas is denser and should result in slightly higher fan capacity. Tips have been added to the fan blades to increase the flow rate of the gas and air conditioners have been installed to provide additional cooling to the fan motors. Unit 1 is equipped with two 7000 hp Westinghouse Sturtevant centrifugal ID fans and Unit 2 is equipped with three 5000 hp American Standard centrifugal flow fans. The horsepower of the Unit 2 fans is 7% greater than the Unit 1 fans, allowing a higher generating capacity than Unit 1. Turndown is still approximately 3 to 1, with a minimum of 200 MW at 3 mill operation. The plant is continuing to improve its capability to burn PRB coal.
As of November 1, 2001, the Unit 1 boiler had experienced a total of 340 start-ups. Of these, 108 were classified as cold and 232 as hot (less than 48 hours off line). The boiler has operated a total of 162,501 hours since startup, averaging 7,400 to 7,500 hours on line per year.
Major overhaul (Genco terms these outages "inspections") of the Unit 1 boiler was last performed in the spring of 2000. The next major overhaul is scheduled for the spring of 2003. Major work
A-15
performed during the last overhaul consisted of installation of long retractable sootblowers at the superheater pendant assemblies, replacement of transition welds, installation of shields on the front reheater, rear wall hanger tubes, screenwall tubes, front superheater pendants, and front steam cooled wall, and other general repairs.
Overall, the Unit 1 boiler appeared clean and in good condition. The unit was running at 590 MW gross during the site visit. Previously it was stated that transition welds (dissimilar welds) in the final SH pendants required replacement by 2002. However, Genco now plans these replacements as condition warrants rather than on a calendar basis. This is reasonable assuming careful condition monitoring. The finishing reheat superheater may be redesigned or replaced if future conditions deteriorate. The furnace waterwalls have shown no signs of wastage due to low-NOx burner operation. However, the furnace lower slope is subject to ash erosion. Finally, it should be noted that while the Unit 1 boiler ductwork from the air preheater to the precipitator is generally in good condition, the ductwork from the precipitator to the ID fans and from the ID fans to the stack has deteriorated and will require partial or total replacement.
As previously noted, there have been high metal temperatures in the reheater (1122°F) and the reheat outlet leads are seamwelded. Inspection of these leads was done in 1998 and another inspection is planned in 2003. Previous comments regarding the superheater and economizer still apply.
Past problems regarding burning PRB coal have been reduced. Plant operating and maintenance experience is continuing to reduce the effects of slagging PRB coal ash. Planned near-term boiler modifications include four new sootblowers, and installation of pulverizer air duct heaters will be evaluated.
As of November 1, 2001 the Unit 2 boiler had experienced 211 cold starts and 145 hot starts. At that time, the boiler had accumulated 104,019 hours of operation.
Outage and inspection of the Unit 2 boiler was last performed in the spring of 2001. The next major outage and inspection is scheduled for spring 2004. Major work performed during the last overhaul consisted of installation of ABB TFS2000R low-NOx burners with two levels of over-fire air, WRTE air-cooled combined warm up and ignition oil guns, DFS flame sensing system, spark tip conversion kit, ignition flame monitoring and an oil flow control upgrade. In addition, over 4000 shields were replaced in the superheat and reheat sections, air heater seals were replaced, superheat girdle loops were replaced with several flex-ties, and pulverizers received major overhauls. As with the Unit 1 boiler, the output can be limited due to pluggage of the economizer and resultant ID fan runout.
Overall, the Unit 2 boiler is clean and in good condition. The boiler was not running during the site visit due to a generator fault. The boiler normally burns Antelope and North Antelope PRB coal. As noted during the 2000 review, the pendant/finishing sections are in fair condition, and replacement has been included in the budget forecast. This area is subject to sootblower erosion and flyash plugging/erosion. Shielding, weld overlay and tube replacements are required at every scheduled outage. However, according to plant personnel, current conditions and operating experience do not warrant replacement in the near term. It was also noted during the previous review that the economizer was to be redesigned. However, operational improvements have since precluded the need for any near term modifications or replacements.
Each boiler has 6 Combustion Engineering ("CE") Raymond pulverizers (886's on Unit 1 and 923's on Unit 2), which have now been standardized such that all 12 mills are essentially identical. Major work on the recent Unit 2 mill overhaul included complete journal and roll rebuilds, air seal housing replacements, inner cone tile replacement, body liner replacement, bull ring weld overlay, scraper replacement and opening up of clearances to better accommodate PRB coal. A comprehensive pulverizer maintenance program is carried out on both units, with major overhauls on a 36 month basis and minor overhauls done yearly. The condition of the mills is considered excellent.
A-16
3.1.1.2 Steam Turbine—Generators
The Newton Unit 1 recent major outage history includes inspection and maintenance of the HP/IP turbine in 2000, which included the main stop valve. Boresonic inspection detected no reportable indications, with re-inspection recommended at the next major outage scheduled for 2009. The next scheduled major LP outage is planned for 2006. Outage intervals are based on operating time and the number of start/stop and load change cycles. GE has been used for technical direction in the past, and as lead contractor for major turbine and generator outages. The plant plans to compete this outage work in the future. There have been no major reliability problems with the turbine generator. Maintenance activity has included blending of HP/IP blading due to foreign object damage and coating of several IP diaphragms for solid particle erosion ("SPE") control. There has been a need to replace control stage and first reheat blading, nozzle plate and nozzle box because of SPE. The two LP rotors have received normal repairs since commissioning in order to maintain efficiency and mechanical reliability. Rotor bore inspections have been completed on all rotors with no reportable findings. The HP/IP casing has not required major weld repairs and should not require major repairs or replacement if the current operating mode is maintained. The main generator was converted to 18-18 retaining rings in 1994. The HP/IP turbine was converted to retractable packing and the unit was resealed with replacement in-kind spill strips and interstage seals during the major outage in 1994.
Planned major capital projects for Unit 1 include:
- •
- installation of a GE "Dense Pack" HP/IP steam path design at the next scheduled outage in 2009, involving replacement of the HP rotor, diaphragms and nozzle plate for efficiency improvement;
- •
- upgrade of the turbine control system in 2006;
- •
- upgrade of boiler feed pump control system in 2003;
- •
- rewind of the generator stator in 2006; and
- •
- replacement of the L-0 low-pressure turbine blades at the outage in 2015.
Newton Unit 2 recent major outage history includes inspection and maintenance of the HP/IP turbine in 1995. Boresonic inspection of the HP/IP rotor detected no reportable indications, with re-inspection recommended at the next major outage scheduled for 2004. The most recent Unit 2 LP turbine major overhaul was in 1997. Boresonic inspections of the LP rotor detected no reportable indications. Excessive inner shell horizontal joint warpage and erosion was reported, along with some alignment difficulties. Weld repair and machining was recommended at the next outage, planned for 2010. Outage intervals are based on operating time and the number of start/stop and load change cycles. There have been no major reliability problems with the turbine generator. Maintenance activity has included blending of HP/IP blading due to foreign object damage and coating of several IP diaphragms for SPE control. There has been a need to replace control stage and first reheat blading, nozzle plate and nozzle box because of SPE. The two LP rotors have received normal repairs since commissioning. The HP/IP casing has not required major weld repairs and should not require major repairs or replacement if the current operating mode is maintained. The main generator was converted to 18-18 retaining rings in 1999. The HP/IP turbine was converted to retractable packing and the unit was resealed with replacement in-kind spill strips and interstage seals during the major outage in 1995.
Planned major capital projects for Unit 2 include:
- •
- installation of a GE "Dense Pack" HP/IP steam path design at the scheduled outage in 2010;
- •
- upgrade of the turbine control system in 2016;
- •
- upgrade of boiler feed pump control system in 2007;
A-17
- •
- rewind of the generator stator in 2007; and
- •
- replacement of the L-0 low-pressure turbine blades at the outage in 2016.
During the site visit, Newton Unit 2 was out of service due to a generator failure. On November 5, the unit had tripped when the generator vibration went over the high vibration limit of bearing No. 8, and there was also some overheating due to lack of cooling water flow to the hydrogen coolers. The generator was being disassembled for inspection at the time of Stone & Webster's visit.
An inspection report was subsequently prepared following the generator repair, with a copy provided to Stone & Webster. A piece of the rotor pole block had been found lying on the armature and the turbine end pole block was also split. High megger readings had led to the suspicion that windings had been damaged, however after cleaning, megger readings were restored. The bad readings may be attributed to carbon, solder flux or some other contaminant that was removed during the cleaning. Some burn damage was found on the outboard collector ring. This area was wrapped with glass tape and epoxy resin. Also, the two generator bearings were rebabbitted.
The generator repairs were completed and the unit was returned to service November 29 and there have been no further problems with this generator. During the outage, several other repairs were completed to effectively utilize the time off line, including boiler shielding, pulverizer repair and precipitator cleaning.
These units are well maintained and have had no load limiting failures or design defects. The turbine deck area and all lower levels with turbine generator support equipment are well maintained and well lighted. Accessibility is tight around the boiler feed pumps and turbines. The projected capital expenditures for this turbine generator appear to be reasonable. Plant staff is diligent in maintaining this equipment.
3.1.1.3 Balance of Plant
Generally, only those issues changed or relevant since the previous review are addressed.
As stated previously, the condenser cooling water is taken from and ultimately discharged to an onsite man-made lake. The lake has been supplemented by a new 260 acre cooling pond in order to prevent the plant circulating water system from exceeding thermal discharge limitations. The circulating water system consists of a common, unenclosed screenwell structure for Units 1 and 2. Replacement of Unit 1 and 2 traveling screens with stainless mesh screen, as well as new frames, is scheduled in the next three years (Genco indicated that work has already commenced). Re-inspection of Unit 1 and 2 circulating water piping was done in 2000 and 2001, respectively, and the conclusion was that no appreciable change has occurred in these lines and the overall condition is good.
The Unit 1 condenser, supplied by Southwestern, was retubed in 2000 with stainless steel tubes. The Unit 2 condenser, supplied by Westinghouse, was characterized by station personnel as being in good condition. There are plans to retube the Unit 2 condenser in 2007. The boiler feed pump turbines each exhaust to an auxiliary condenser. The Unit 1 auxiliary condensers were recently retubed with 90-10 and 70-30 cu-ni tubes. The Unit 2 auxiliary condensers will be retubed in 2004.
The last stage Unit 2 HP heater was replaced in the spring of 2001. Retubing of the 2B LP feedwater heater is planned in 2004. Additional Unit 1 and Unit 2 heater replacement has been scheduled and budgeted appropriately over the life of the unit.
The boiler feed pump turbines have received normal maintenance since commissioning. Stone & Webster observed high vibration and turbine-pumps operating in alarm mode. Oil leakage was also observed. According to Genco, the high vibration was subsequently reduced. The Unit 1 bearings were replaced on both pumps, which resulted in decreasing the vibration by over 30%. On Unit 2, the pump
A-18
that had high vibration has since had a hot realignment which reduced the vibration by 45%. All these pumps are now being closely monitored and are scheduled for overhauls in the future.
It should be noted that a spare rotating element for the identical Unit 1 and 2 boiler feed pumps is on site, and condition based maintenance is performed as necessary.
During the last review it was noted that, in 1996, ABB strongly recommended that the remainder of the reheat piping be inspected at the next scheduled outage. A follow-up inspection of Unit 1 was completed in 1998 and indicated the suitability of the pipe for further service. Unit 2, five years younger than Unit 1, is to be inspected in 2004.
In the coal handling system, a new Svedala stacker reclaimer capable of 3000 tons per hour stackout and 2500 tons per hour reclaim capacity was installed in the fall of 2000. Future plans call for replacement of coal handling belts, rail repair, rotary dumper repair and replacement, structural repair, and stacker reclaimer inspection. This will ensure the continued good condition and operability of the coal handling system.
The bottom ash generated in the coal-fired boilers is water-sluiced to an on-site unlined settling pond. This is an Allen Sherman Hoff wet bottom sluicing system which has two clinker grinders per hopper, six per unit. The bottom ash collection and transport systems are overhauled at each major boiler outage.
Sargent & Lundy inspected the Unit 1 stack in April, 2000. The findings indicated that the stack is structurally sound with no major structural deficiencies, and it is scheduled for re-inspection in 2003. Maintenance of the Unit 1 liner is scheduled in 2003. The Unit 2 stack is in good condition with no significant structural defects, and it is scheduled for re-inspection in 2004.
Unit 1 and 2 ESP controls were replaced in 2000. In 2001, Unit 1 rapper weights were increased and the SO3 injection system was changed from a pellet system to a molten sulfur system. Anti-sway assemblies and collecting plate spacer bars were installed on Unit 2.
3.1.1.4 Remaining Life
The recent boiler inspection reports indicated both boilers were in good condition. The capital budget for boiler improvements reflects expected replacements due to normal aging. Economizer repair and secondary superheater and pendant finishing reheater replacements will be done on an as-needed basis as operation and condition of the equipment warrant. Inspections are performed during each scheduled major outage, including non-destructive testing, to determine the condition of major plant components. Provided that these inspections are maintained and areas of concern are inspected at appropriate intervals, with corresponding repair and/or replacement/upgrade of major equipment, many years of reliable base load operation can be expected.
The Newton turbine generators are of a class of GE units which have a well documented class history. There is some evidence of LP inner shell distortion which will require eventual major repairs along with HP and IP stationary nozzle repairs during major overhauls. There has been some HP and IP turbine erosion that has required nozzle and blade replacement with erosion resistant coated parts. Additional blade replacements would be expected. The rotor bores have been inspected with no evidence of defects to date. As with the boilers, the turbine capital budget reflects industry experience with this class.
Both Newton units are fully capable of reliable operation for 20 additional years provided that a comprehensive NDE/NDT program is followed. The units are currently in very good condition and appear to be well maintained.
A-19
3.1.2 Coffeen
The Coffeen station is located just outside the town of Coffeen, Illinois. The station consists of two steam-electric generating units. Units 1 and 2 are balanced draft, reheat, coal-fired units rated at 340 MW and 560 MW net, respectively. The units were placed in operation in 1965 and 1972. Cooling water for the main condensers is taken from a man-made lake and discharged to either the lake or a supplemental cooling pond. Units 1 and 2 are equipped with electrostatic precipitators for particulate control, and presently employ cyclone burners with OFA systems for NOx control. SCRs are under construction for both units. The units have no special provisions for SO2 control. Coffeen currently operates in intermediate mode.
Coffeen has made several significant improvements since the previous Stone & Webster inspection in February 2000:
- •
- A 79-acre supplemental cooling pond has been installed in order to reduce the temperature of the circulating water entering the cooling lake. A second phase of the enhanced cooling system is the installation of 12 modules of auxiliary cooling towers, commissioning for which is nearly complete. The expenditure for this system is reflected in the Financial Model. Genco anticipates that the two projects together will preclude load restrictions associated with discharge temperature regulations.
- •
- Many improvements have been made to reduce fugitive coal dust throughout the plant. This not only improves the cleanliness, it also reduces the potential for coal dust explosions and improves the reliability of the whole plant as the dust can contaminate many components. Posimetric feeders have been installed in place of the former coal feeders. This is a popular alternative feeder that is becoming accepted throughout the industry. New ventilation and fogging has been added at coal transfer points. A new bag house has been installed to collect dust from the coal silos.
- •
- Larger coal crushers have been installed. This will improve the reliability of this component and reduce maintenance costs.
- •
- A new system was installed to improve the precipitator performance. Sulfur trioxide is being injected with a system designed by Chemithon. This sulfur fluxation will reduce the load restrictions caused by opacity exceedances.
- •
- A Structural Integrity Survey was conducted by FRU-CON Engineering, Inc. All of the major structures throughout the plant were inspected. Issues were identified and prioritized for corrective action during the survey.
The general overall condition of the plant is enhanced by all of these recent improvements.
Table 3.1-2 provides a summary of major station characteristics. The sections that follow provide a summary update of our condition assessment findings since October 2000.
A-20
Table 3.1-2. Coffeen Characteristics
| ITEM | UNIT 1 | UNIT 2 | ||
|---|---|---|---|---|
| PERFORMANCE | ||||
| Normal Summer Capacity (MW Net) | 340 | 560 | ||
| Minimum Load (MW Gross) | 150 | 250 | ||
| Full Load Heat Rate, HHV (Btu/kWh) | 10,209 | 10,086 | ||
| PRIME MOVER | ||||
| Manufacturer | GE | GE | ||
| Type | Tandem Compound Four Flow | Tandem Compound Four Flow | ||
| Commissioned (Year) | 1965 | 1972 | ||
| HP Turbine Inlet Pressure/Temp (psig/oF) | 2620/1005 | 2500/1005 | ||
| Reheat Turbine Inlet Temp (oF) | 1005 | 1005 | ||
| ELECTRIC GENERATOR | ||||
| Manufacturer | GE | GE | ||
| Cooling | Hydrogen | Hydrogen | ||
| MVA | 457.6 | 685 | ||
| STEAM GENERATOR | ||||
| Manufacturer | B&W | B&W | ||
| No. of Boilers | 1 | 1 | ||
| Circulation | Once Through | Once Through | ||
| Draft Condition | Balanced | Balanced | ||
| Cycle Type | Reheat | Reheat | ||
| Primary Fuel | Coal | Coal | ||
| OTHER | ||||
| Cooling Water Source | Lake | Lake | ||
| Fuel Delivery | Rail | Rail |
3.1.2.1 Boilers
A major outage and inspection of the Unit 1 boiler was last performed in the fall of 2000. The boiler was also inspected in the fall of 2001. The next major outage and inspection is scheduled for fall 2002, during which cyclone stud upgrades and furnace ultrasonic testing ("UT") and weld overlays are scheduled. In 2000, work performed included cyclone repairs, casing repairs, refractory repairs, realignment of superheater pendants, tube shield installation, duct repairs, sootblower piping repairs, and replacement/repair of cracked wall tubes. Work in 2001 was basically maintenance plus NDT of the critical headers.
Overall, the Unit 1 boiler is in good condition. The boiler area was fairly clean during the site visit. In 2000, the boiler furnace and cyclones were fully inspected. In 2001, the boiler and cyclones were inspected in the spring, prior to the scheduled fall outage. Recent boiler inspection reports for 2000 and 2001 were reviewed. The primary superheater tubes are scheduled for replacement in 2008. The primary superheater inlet and outlet headers are considered in good condition following the latest inspection. The reheater is in good condition; the tubes were replaced in 1997. The economizer is in good condition. However, plans call for replacement in 2008. Boiler ductwork is in good condition.
As previously stated, a test burn of PRB coal in the Unit 1 boiler showed it would result in a derating from 389 gross MW to 340 gross MW. Future plans do not now call for switching to PRB coal, but more test burns are planned. Major maintenance intervals have increased from 24 months to 36 months.
A-21
NOx control is accomplished with OFA, which was installed in the fall of 2000. Inspection of the lower furnace will be done in 2002 since OFA has been known to cause lower furnace reducing zones. Front and rear wall replacement has been budgeted for 2002 as well as partial replacement of the sidewalls. An SCR system is now being installed. At this point, there are no limitations on boiler output due to boiler related issues.
Inspections of the Unit 2 boiler were performed in the spring and fall of 2001. The next outage and inspection is scheduled for fall 2003. New 2A and 2B gas recirculation fan rotors were installed in 2000. Major work performed during the recent outages consisted of installation of OFA, finishing superheater outlet pendant replacement, cyclone repairs, furnace repairs, casing repairs, replacement of the 2C gas recirculation fan rotor, furnace floor repairs, slag neck repairs, SCR related work, and boiler hydro testing.
Overall the Unit 2 boiler is clean and in good condition. Chemical cleaning was last done in 1996 and is planned again in 2003. The inlet and intermediate secondary superheater pendants are scheduled for replacement in 2003. The primary superheater tubes are original and are considered in fair condition. The primary superheater inlet and outlet headers are considered in good condition. Sootblower erosion is present in the upper primary superheater bank. Erosion shields are installed/repaired at each scheduled outage. The reheater is in fair condition. Upper portions of outlet pendants suffer from flyash plugging and have moderate to severe sootblower erosion, which is cured by pad welding. Replacement of the primary superheater is scheduled for 2009. Tube replacements are planned and performed during scheduled outages based on prior inspections. The Unit 2 reheater pendant tubes are scheduled for replacement in 2003. The economizer is in good condition, however, replacement is planned within the next ten years. Boiler ductwork is still in good condition.
NOx control is accomplished with an OFA system installed in the fall of 1999, and an SCR system is currently being installed.
3.1.2.2 Steam Turbine—Generators
The Coffeen Unit 1 recent major outage history includes inspection and maintenance of the HP/IP in 1995. No significant defects were reported from boresonic inspection of the rotor. Stages 1, 8 and 9 rotor blades were replaced due to SPE. The 7th stage shrouding was also replaced. The 8th stage diaphragm was replaced and incorporated a setback modification for control of SPE. The nozzle box was replaced to improve SPE resistance. Minor shell cracks were weld repaired and the inner casing was extensively remachined to correct distortion. It is expected that the HP/IP rotor will require replacement of some blading during the next scheduled outage. The most recent LP outage was in 1997. The last stage buckets (blades) and diaphragms were replaced to improve efficiency and to replace blades damaged due to moisture erosion. The LP inner casings are distorted and had cracked supports that were weld repaired. It is expected that several additional stages of LP blades in both LP turbines will require replacement at the next scheduled outage in 2002. Boresonic inspection detected no reportable indications, with re-inspection recommended at the next major outage.
Outage intervals are based on operating time and the number of start/stop and load change cycles. GE has been used occasionally for technical direction in the past; the plant now bids out outage support. There have been no major reliability problems with the turbine generator. There has been a need to replace control stage and first reheat blading, nozzle plate and nozzle box because of SPE as described above. The two LP rotors have received normal repairs since commissioning. Rotor bore inspections have been completed on all rotors with no reportable findings. The HP/IP casing has only required minor weld repairs and should not require major repairs or replacement if the current operating mode is maintained. The main generator was converted to 18-18 retaining rings in the 1990's and the generator stator was rewedged in 1997.
A-22
Through December 2001, Unit 1 has experienced 659 starts and accumulated 195,874 hours of operation.
A major capital project planned for Unit 1 is installation of a GE "Dense Pack" HP/IP steam path design at the next scheduled outage in 2008. Upgrade of the turbine control system is also budgeted for 2008.
The Coffeen Unit 2 recent major outage history includes inspection and maintenance of the HP/IP that was in process during our visit. The Genco turbine engineer stated that there were no major issues reported during this outage and no significant defects were reported from boresonic inspection of the rotor. Stages 1 and 7 thru 10 blades were replaced with coated blades for control of SPE in 1995. The 6th and 11th stage shrouding was also replaced at that time. It is expected that these blade and diaphragm improvements for SPE reduced the amount of subsequent repairs required. The nozzle box was also replaced to improve SPE resistance. Minor shell cracks were weld repaired and the inner casing was extensively remachined to correct distortion. Turbine valves and the generator were last maintained in 1999. The most recent LP outage was in 1996/1997. The last stage buckets (blades) and diaphragms, damaged due to moisture erosion, were replaced in 1993 with blades that improved efficiency. The LP inner casings are distorted and had cracked supports that were weld repaired. It is expected that several additional stages of LP blades in both LP turbines will require replacement at the next scheduled outage in 2003. Boresonic inspection detected no reportable indications, with re-inspection recommended at the next major outage.
There have been no major reliability problems with the turbine generator. There has been a need to replace control stage and first reheat blading, nozzle plate and nozzle box because of SPE. The two LP rotors have received normal repairs since commissioning. Rotor bore inspections have been completed on all rotors with no reportable findings. The HP/IP casing has not required major weld repairs and should not require major repairs or replacement if the current operating mode is maintained. The main generator was converted to 18-18 retaining rings in the 1990's and the generator stator was rewedged in 1997.
Through December 2001, Unit 2 has experienced 476 starts and accumulated 184,481 hours of operation.
Major planned capital projects include installation of a GE "Dense Pack" HP/IP steam path design at the next scheduled outage in 2015. Upgrade of the turbine control system has also been budgeted for that outage.
These units are well maintained and have had no load limiting failures or design defects. The need for SPE and moisture erosion maintenance has been identified and maintenance and capital budgets reflect this. The turbine deck area and all lower levels with turbine generator support equipment are well maintained and well lighted. Plant staff is diligent in maintaining this equipment. The age of these units, coupled with operating history, warrants evaluation of remaining life of high temperature components such as the HP/IP rotor, inner cylinders and valve bodies, at appropriate intervals.
A-23
3.1.2.3 Balance of Plant
Additional cathodic protection cells were added to the circulating water inlet piping in 2000. Following inspection in 2001, a new shotcrete lining was installed in approximately1/4 mile of the discharge piping.
A 79 acre supplemental cooling pond was installed in 2000, including 7 transfer pumps, pump house and electrical controls. In 2002, a 12 module Trane counter-flow cooling tower will be added to ensure that discharge cooling water to the cooling lake meets environmental regulations. Three of the seven pumps will be dedicated to the cooling tower.
Since Unit 1 condenser tube leaks have stabilized, retubing of the Unit 1 condenser is not planned until 2008. The Unit 2 condenser leakage has also stabilized and there are no plans for replacement at this time.
Feedwater heater replacements and/or retubings have been scheduled and budgeted appropriately for both units. Recent feedwater heater replacements included the 2G high pressure feedwater heater in 2001.
Unit 1 boiler feed pumps are scheduled for overhaul in 2005 and 2011. The Unit 2C startup pump was overhauled this year and the main pumps scheduled for overhaul in 2003 and 2006. There have been blade failures and repairs in one of the boiler feed pump turbines.
Re-inspection of Unit 1 hot reheat piping was repeated in 2000. No significant issues were noted. As is the case for Unit 1, replacement of some piping may be required in the next 20 years as the damaging effects of high temperature/pressure exposure and metal fatigue manifest themselves. The need for formal inspection will be evaluated as additional hours are accumulated, and provisions have been made in the budget for continued assessments and repairs.
In 2001, Sargent and Lundy did a cold walkdown of pipe supports and hangers for both units including main steam, hot reheat, cold reheat, and feedwater piping. A hot walkdown was to have been done following restart of the units in late 2001, but no further information was available as of the issuance of this Report. Genco expects the contractor's inspection report to be issued later in 2002.
Major work recently done on the coal handling system included upgrading of the controls to distributed control system ("DCS") controlled from the main control room, replacement of existing 30° conveyor belt idlers with 45° idlers, replacement of four hammermill crushers with three Penn Crusher fine grind hammermills, upgrading of lighting to Class II, Division 1 explosion proof lighting, addition of a water fogging system in the feeder area for dust control, and addition of new ventilation and fire detection in the feeder area. Additional work included belt replacement and extension in the tripper gallery, raising the belts to accommodate a new surge bin which will feed four new posimetric coal feeders, raising belts to allow better cleaning, replacing and upgrading the tripper gallery lighting, fire protection upgrades in the tripper gallery, electrical upgrades to explosion proof levels in the tripper gallery area, a new silo baghouse (22 bags) for ventilation dust removal, and new floor drains for improved wash down capability. With these upgrades, there are now no major chronic problems associated with the coal receipt and handling systems.
The common stack was re-inspected in 2001, and is still structurally sound with no major deficiencies. No significant issues were noted.
3.1.2.4 Emissions Control Equipment
SCRs are under construction at Coffeen. The SCR process uses an ammonia reagent and a vanadium/titanium based catalyst to convert NOx to elemental nitrogen and water. The SCR reactor is initially loaded with two layers of catalyst to achieve 90% NOx removal. A third layer of catalyst will be added to the SCR reactor in the future to compensate for deactivation of the initial layers. The SCR
A-24
reactor is also equipped with a full flow bypass duct to allow for full load operation of the boiler without passing the flue gas through the SCR.
The SCR gas flow path includes knockout baffles above the economizer hoppers to remove large particle fly ash. After passing over the economizer hoppers, the flue gas turns up through static mixers and the ammonia injection grid then makes a one hundred eighty degree turn down into the SCR reactor. Each catalyst layer is equipped with sootblowers and screens to prevent fly ash from plugging the catalyst. After passing through the SCR reactor, the flue gas travels to the inlet of the tubular air heater.
The SCR process requires anhydrous ammonia for a reagent. The ammonia storage facility consists of 2 tanks each designed to store 45,000 gallons of anhydrous ammonia for Units 1 and 2. The tanks are capable of accepting truck deliveries of ammonia and have a seven-day storage capacity. Onsite storage of this quantity of ammonia will require Genco to prepare a Risk Management Plan per US Environmental Protection Agency ("USEPA" or "EPA") regulations for this facility.
3.1.2.5 Remaining Life
The recent boiler inspection reports indicated that both boilers are in good overall condition and could be operated for many more years provided timely maintenance is performed and replacements are made. Superheater and reheater tube replacements will be implemented as testing and inspection results indicate the need. Comprehensive non-destructive testing and inspection has been mandated as part of the Plant Improvement Initiatives program, and results will be used to schedule major maintenance and replacements. Sufficient funds have been budgeted for high energy piping inspection for both units for the next twenty years. The current loading of the units has contributed to prolonging the useful life of boiler components. The projected Coffeen capital budget reflects normal replacements due to aging.
As with Newton, the Coffeen turbine generators each have a well documented class history. HP and IP inlet stage erosion has been addressed by periodic replacements with erosion resistant coatings. Replacement of the first three HP and IP stages is expected between 2013 and 2019. Gradual shell distortion will require straightening. The rotor bores have been inspected with no potential end of life defects detected. All four Unit 1 inner casings are distorted and major repair welding and rework is expected around 2008. Severe SPE is occurring and repair welding of stationary nozzles and blading can be expected. Unit 2 is also experiencing inner casing distortion and severe SPE. Major inner casing repair welding will be required in the period between 2007 and 2017.
Both Coffeen units are in good condition and should be fully capable of reliable operation for 20 additional years, provided that a comprehensive non-destructive testing and inspection program is followed and used to schedule major maintenance and replacements.
3.1.3 Meredosia
The Meredosia station is located on the Illinois River, near the town of Meredosia, Illinois. The station consists of four steam-electric generating units. Units 1 and 2 are essentially identical, balanced draft, nonreheat, coal-fired units with capacity of 62 MW net. These units were placed in service in 1948 and 1949. Unit 3 is a balanced draft, reheat, coal-fired unit with a capacity of 215 MW net. Unit 3 is a twin furnace design utilizing a common steam drum, with the superheat furnace performing the final superheating and the reheat furnace performing the reheating along with one half of the primary superheating. Unit 3 was placed in service in 1960. Unit 4 is a pressurized, reheat, oil-fired unit, 168 MW net and placed in service in 1975. The major power generation equipment is located indoors, with the exception of the Unit 4 boiler, which is located outdoors. Condenser cooling water for Units 1 - 3 is taken from and discharged back to the Illinois River. Unit 4 utilizes a mechanical draft cooling tower and closed-loop system for condenser cooling.
A-25
Units 1 and 2 have no special provisions for NOx control. Unit 3 has ABB-CE level 1 low-NOx burners installed. The Unit 4 boiler is equipped with over-fire air and gas recirculation to allow NOx control. None of the units have provisions for control of SO2emissions. Units 1, 2, and 3 are equipped with electrostatic precipitators for control of particulates; Unit 4 has no precipitator.
Table 3.1-3 provides a summary of major characteristics of Units 1 through 4. The sections that follow provide a summary update of our condition assessment findings since October 2000.
Table 3.1-3. Meredosia Characteristics
| | UNITS 1 & 2 (Boilers 1 - 4) | UNIT 3 | UNIT 4 | |||
|---|---|---|---|---|---|---|
| PERFORMANCE | ||||||
| Normal Summer Capacity (MW Net) | 2x62 | 215 | 168 | |||
| Minimum Load (net MW) | 23 per unit | 80 | 45 | |||
| Full Load Heat Rate, HHV (Btu/kWh) | 13,290 | 9,955 | 10,821 | |||
| PRIME MOVER | 2 | |||||
| Manufacturer | GE | Allis-Chalmers | Westinghouse | |||
| Type | Tandem Compound Two Flow | Tandem Compound Triple Flow | Tandem Compound Two Flow | |||
| Commissioned (Year) | 1948, 1949 | 1960 | 1975 | |||
| HP Turbine Inlet Pressure/Temp (psig/oF) | 850/900 | 2000/1050 | 2400/1000 | |||
| Reheat Turbine Inlet Temp (oF) | N/A | 1000 | 1000 | |||
| ELECTRIC GENERATOR | 2 | |||||
| Manufacturer | GE | Allis-Chalmers | Westinghouse | |||
| Cooling | Hydrogen | Hydrogen | Hydrogen | |||
| MVA | 81.25 | 281.6 | 233.0 | |||
| STEAM GENERATOR | ||||||
| Manufacturer | CE | CE | Foster Wheeler | |||
| No. of Boilers | 4 | 1 (twin) | 1 | |||
| Circulation | Natural | Forced | Natural | |||
| Draft Condition | Balanced | Balanced | Pressurized | |||
| Cycle Type | Non-Reheat | Reheat | Reheat | |||
| Primary Fuel | Coal | Coal | Oil | |||
| OTHER | ||||||
| Cooling Water | Illinois River | Illinois River | Cooling Tower, make up from III River | |||
| Fuel Delivery | Truck or Barge | Truck or Barge | Truck or Barge |
3.1.3.1 Boilers
The Unit 1 and 2 boilers (2 per unit) operate with no limitations on output or steam conditions and are projected to continue to provide intermediate service. Overall, the Unit 1 and 2 boilers are clean and in good condition considering their age. Both units were on economic standby during the site visit. NDT of critical boiler parts has rarely been done in the past. However, funds have been budgeted for future NDT of critical boiler and high energy piping systems.
A-26
Boiler operation is conservative with no temperature limits being exceeded. There are no specific NOx control provisions for Units 1 and 2 other than combustion tuning. New low-NOx burners (Level II type) are planned for installation in boilers 1 - 4 in 2002 and 2003. A new DCS system is being studied for boilers 1 - 4. New ID fan rotors were installed in the spring of 2001 and burners were overhauled with tips replaced at the same time. Cold end tubular air heater tubes were replaced as necessary on all four boilers in 2001. No limitations on boiler operation were noted other than turbine seasonal limitations (back pressure). Most Unit 1-2 boiler tube leaks are in the superheaters and in boiler 1, followed by boiler 3. Boilers 2 and 4 have experienced fewer tube leaks. Other than the previously mentioned casing and ductwork air in-leakage and fly ash erosion, which one would expect from boilers of this vintage, there are no major issues. Primary and secondary superheater elements are scheduled for replacement as necessary.
Each of the four boilers is equipped with two CE Raymond 573 coal pulverizers. Each mill was overhauled in 2001 including hard surfacing of all bullrings and replacement of hot air damper and primary air exhauster drives. In 2002, boilers 1 and 2 will be equipped with ceramic exhauster wheels and new upper and throat steel liners. Boilers 3 and 4 have already had this modification installed. There are no issues with the Unit 1 and 2 pulverizers. All 8 pulverizer bowls will be replaced starting with the first 2 in 2002 and continuing two per year until all are replaced.
The Unit 3 boiler still operates as an intermediate service unit, and is projected to continue in that mode, with no limitations on output or steam conditions. It was learned during the recent visit that the original equipment manufacturer ("OEM") has not been used in the past for maintenance, as in-house expertise is sufficient to maintain the boiler. However, Genco plans to use Alstom, the current owner of the OEM technology, to support its enhanced inspection program.
Overhaul of the Unit 3 boiler was last performed in the spring of 2001. The corporate boiler engineer last inspected the boiler in the spring of 2001. The resultant recommendations included maintenance items that were completed during the subsequent outage. Overall, the Unit 3 boiler was still found to be clean and in good condition considering its age. The boiler was running at 1,600,000 lbs./hr (225 MW) during the site visit. Chemical cleaning was last done in 2000 and is tentatively scheduled again in 2005. Tube leaks attributed to the recent chemical cleaning were addressed and future modifications and tube replacements will be made to mitigate the problem. Boiler ductwork is considered to be in good condition. The final pendant section of the secondary superheater was replaced in the fall of 2000. According to recent inspection reports all other sections of the secondary superheater are in good condition, requiring only minor maintenance. Condition of the secondary superheater outlet header is suspect and continuous monitoring is required. NDT is scheduled for this in 2002. In 1991, the final superheater outlet header was assessed and it was determined that the header had experienced temperature excursions and should be inspected every three years. This header will be inspected at the next outage in 2002. Aside from the outlet superheater tube replacement, future boiler items will include chemical cleaning, superheater outlet header inspection, tube shielding, pad welding and burner tip replacement.
The primary superheater is in good condition. Soot blower erosion is controlled by shielding and removing sootblowers from service. A rebuild of the primary superheater may be likely in less than five years; however, this will be determined by tube sampling and frequency of leaks. Funding has been projected for this item in 2005. Waterwalls were replaced in the 1970's and 1980's due to hydrogen embrittlement. Pad welding is planned for the lower water walls to reduce erosion and falling ash effects. Also, weak tubes in the economizer have been identified and will be replaced in 2003. According to plant personnel, no recent NDT inspections had been performed; however NDT inspection is budgeted for the future.
A-27
The boiler is equipped with eight CE Raymond 633 pulverizers which were overhauled in 2001, including hard surfacing of wear surfaces and replacement of internal cones for expected PRB coal use. Four pulverizers also had ceramic exhauster wheels replaced in 2001.
Replacement of the secondary superheater outlet tubes in the fall of 2000 eliminated the previously mentioned temperature and ramp rate restrictions. Currently there is an issue regarding superheat temperature sagging due to insufficient slagging of the waterwalls and subsequent loss of radiant heat to the furnace area superheat tubes. The plant is working with Alstom to cure the problem. No other limitations on output or temperature exist. Other than superheater temperature, sootblower erosion, fly ash erosion, and refractory deterioration, which one would expect from a boiler of this vintage, there are no ongoing issues.
The Unit 4 boiler still primarily operates as a peaking unit from early spring to late fall due to the cost of fuel oil. Over its life, the boiler has now run only 18,731 hours and has been started 748 times. Major overhaul of the Unit 4 boiler was last performed in the winter of 2000 to 2001. Overall, the Unit 4 boiler and auxiliaries were still in good condition. The plant has continued to address ductwork, expansion joints and other housekeeping issues. Both hot and cold side baskets have been replaced. Boiler insulation and lagging is still in fair condition. The boiler was not running during the site visit. Pressure parts were characterized by station personnel as still being in excellent condition. The last inspection was done in January 2001. No NDT was performed during this inspection.
3.1.3.2 Steam Turbine—Generators
Unit 1 and 2 maintenance overhauls are scheduled every twelve years. The most recent Unit 1 major turbine overhaul was in 1994, as reported previously. The most recent Unit 2 major turbine overhaul was in 2001. Turbo Parts Inc. upgraded parts of the N1 and N2 packing to Guardian and five rows of interstage packing were replaced in-kind. The LP exhaust hood ledges, struts and horizontal joints were reported to be deteriorating due to continued water erosion. The LP inner shell exhibited erosion throughout on the shell fits. The horizontal joint had several locations of steam cutting, which were weld repaired and re-machined. This type of repair has been successful in the past and is necessary maintenance for a turbine of this age. Erosion shields were added to the L-1 blades and 105 L-0 blades were reconditioned with new erosion shields. The turbine end L-0 shrouds were undershroud soldered to address shroud lifting, a common and accepted repair. The HP/IP and LP rotors were boresonic inspected with no reportable indications. Bearing #1 and the active thrust bearing were upgraded to tilting pad design to address past problems with poor bearing fit. The generator rotor was rewound with new copper during the 2000 outage. Boresonic inspection of the generator rotor resulted in no reportable indications.
Valves are typically inspected and repaired with every major turbine generator outage unless problems are indicated. The next scheduled major outage is in 2006 for Unit 1 and 2013 for Unit 2. Outages are conducted using a combination of plant personnel, contractors and Ameren engineering for support. There have been no major reliability problems with the turbine generators, although these units have received major repairs since commissioning. Major maintenance activity has included replacement of HP/IP steam paths and inner shell (HP only) in 1976.
These units are well maintained and have had no load limiting failures or design defects. The turbine deck area and all lower levels with turbine generator support equipment are well maintained, accessible and well lighted. Several major repairs/replacements are anticipated, and have been budgeted for over the next two outages, based on the history of steam erosion. Plant staff is diligent in maintaining and operating this equipment.
Meredosia Unit 3 overhauls will be performed at eight-year intervals as a full unit, including the generator. The most recent Unit 3 major turbine overhaul was in 1997. The plant does plan to replace the three rows of L-0 blades at the next outage in 2005. There have been L-0 blade failures attributed
A-28
to the looseness of the connectors (footballs) between the blades. These connectors are inspected annually and repaired if loose or if there are indications of weld cracks. This unit did have a loss of oil incident in 2001. The unit required extensive repairs to the bearings, seals and bearing journals on the rotor. It was noted by the SWPC representative that there is remaining work to be completed at the next outage, but that it is not considered critical to reliable operation of the unit until 2005. The total time lost resulting from this forced outage was 33 days. The cause of the incident has since been corrected.
The plant has also identified a capital project to rewind the stator in 2005.
This unit is well maintained and has had no load limiting failures or design defects. It is expected that major repair of HP inner cylinder will be necessary to correct distortion. SPE does not appear to be a major problem at this plant. The age of this unit requires that the condition of the high temperature areas of the rotors and pressure boundary such as steam chests and valve bodies be assessed for remaining life/creep damage. Generator insulation should also be monitored for integrity. The stator rewind scheduled for 2005 will present a good opportunity to inspect this generator in detail. Oil/hydrogen leaks should be corrected at the next opportunity. The plant has invested in an updated control system. The turbine deck area and all lower levels with turbine generator support equipment are well maintained and well lighted. Plant staff is diligent in maintaining this equipment.
Due to limited operating time on Meredosia Unit 4, this unit had only received one major turbine-generator maintenance overhaul in 1984 for the HP/IP section. A major outage was scheduled subsequent to Stone & Webster's site visit and was to include a significant amount of inspection and repair work including internal/external alignment, seal replacement, rotor boresonic inspection, and replacement of generator retaining rings. Major repairs to or replacement of the first 3 or 4 stages of HP blading and the first 1 or 2 stages of IP blading were anticipated due to SPE. The planned mechanical and electrical inspection of the generator should result in a better assessment of work necessary for future reliable generator operation.
This unit runs on oil and is used for peaking service only. There are no known load limiting design defects with this unit. The turbine deck area and all lower levels with turbine generator support equipment are well maintained, accessible and well lighted. Plant staff is diligent in maintaining this equipment.
3.1.3.3 Electrical and Controls
Genco plans to add Iris PD sensors to the Unit 1 generator in 2005. The Unit 4 generator will have Iris PD sensors installed in 2002. Units 2 and 3 already have PD sensors installed, and Unit 3 also has a stator vibration probe that provides continuous reading of stator vibration level. The Unit 3 generator stator will be rewound in 2005.
The Unit 1 transformer is scheduled for an external (not major) overhaul in 2002 (gaskets, cooling fans, protective trip devices). Gas analysis does not indicate significant internal problems with the transformer.
As previously mentioned, there are a number of control panels required to operate Unit 1 and 2 boilers and turbines. Genco's current plan is to initiate an engineering study in 2002 to evaluate automating the manual control system on boilers 1 - 4.
3.1.3.4 Balance of Plant
The Unit 1 and 2 circulating water pumps are overhauled on an as-needed basis and are characterized as being in good condition with high reliability. The next overhaul period for two of these pumps is 2006 - 2008. The Unit 3 circulating water pumps have required periodic overhauls (typically every four years). The next overhaul period for these pumps is 2005-2006 (one per year). There are no
A-29
issues with these pumps. Regarding the Unit 1-3 circulating water system, it was confirmed that plant personnel did not have any records of internal inspection of the discharge tunnels.
As noted in Stone & Webster's October 2000 report, Unit 4 is equipped with a Marley mechanical draft four-cell cooling tower for condenser cooling. The cooling tower was characterized as being in good condition but marginally sized, as the limiting factor of the unit is condenser back pressure. Replacement of the fill of the first three cells with PVC fill will be done in 2003. A consultant studied the design in 2001 and stated that no practical modifications exist, other than possible fan improvements, to improve the tower's capacity. Also relative to the Unit 4 circulating water system is an issue with calcium carbonate plaque in the condenser tubes, affecting heat transfer. A tube cleaning is planned for early 2002. Despite the good condition of the condensers, it is probable that each will have to be retubed once more in the next twenty years.
It should be noted further to the last report that the Unit 1 HP heaters (2 each) were replaced approximately 12 years ago and the Unit 2 HP heaters (2 each) were replaced approximately 4 years ago. All the Unit 3 heaters were reported to be original with no HP heater tubes plugged. The Unit 3 LP heaters have had some leakage and very few plugged tubes.
It was noted that the Unit 1-2 boiler feed pump overhaul for each pump will be based on predictive maintenance analysis. For budgeting purposes, the next scheduled overhauls for the Unit 3 boiler feed pumps is one pump each in 2003, 2005 and 2007. The Unit 4-1 pump was overhauled approximately ten years ago and 4-2 pump was overhauled five years ago. They are considered in good condition.
Regarding high energy piping, it was further learned that the Unit 1 and 2 main steam piping replaced in the mid 1980's was from the boiler superheater outlet headers to the turbine main steam stop valves. Future high energy piping examinations have been planned for 2003-2006 to fully characterize and detect any ongoing material degradation. This will depend on the number of accumulated operating hours. Future Unit 3 seam welded and other high energy piping examinations have been budgeted for 2003-2005 to fully characterize and detect any ongoing material degradation. To date, Unit 4 had not accumulated sufficient operating hours to necessarily justify inspections, but inspections have been budgeted for high energy steam piping in 2004. It was stated in the last report that some piping replacements may be required in the next 20 years as the damaging effects of high temperature/pressure exposure and metal fatigue manifest themselves. Towards that end, follow-on inspections have been budgeted for each unit commencing 8 - 12 years after the near term inspections.
Regarding coal handling issues, it was noted in the last report that the center steel-encased concrete pylons at the dock were badly worn from the continuous scraping against the barge. Repairs were made in 2001 which included new ballast rock. The station has budgeted for complete coal handling system refurbishment in 2002, including bunker level devices, automation of the tripper, replacement of conveyor belts, new idlers and troughing rollers, replacement of the Bradford breaker, tripper gallery fire protection upgrades, new washdown systems, new chutes and other repairs as required. Subsequent major maintenance is planned for 2003 and in eight year intervals thereafter. Presently, the coal handling system is still characterized as being in fair condition, largely due to its age and the corrosion effects of medium to high sulfur coal.
During the recent visit it was noted that the demineralized water systems are fed from (3) deepwells on plant property. Water used to be passed through greensand filters to remove iron and manganese, but tests showed that these elements were not present in sufficient quantity to cause a problem and the filters were removed from service. In 1975, an analog controlled Cochrane demineralizer was added to supplement the original Graver demineralizer. The Graver demineralizer was removed and the Cochrane demineralizer upgraded to soft programmable logic control ("PLC") in October 2001. Plant staff characterized the demineralizer system operation as excellent.
A-30
In 2000, a 285,000 gallon waste storage tank was converted to a condensate storage tank to increase condensate back-up capacity. A new roof was added to the tank during the conversion. The plant has recently completed erection of a 500,000 condensate storage tank, which reduces labor requirements and bring the total condensate storage capacity up to 935,000 usable gallons.
3.1.3.5 Remaining Life
Meredosia Units 1 and 2 are older, less efficient units that have been utilized as peaking units in recent years. The last report indicated the need to perform more intensive nondestructive testing in order to fully determine the scope of keeping the Unit 1 and 2 boilers operating well into the future. Towards that end, Genco plans inspection and testing to determine the condition of the boilers. Genco indicated that the services of a consulting engineer had been obtained to support these activities.
The existing Unit 1 and Unit 2 turbines could be operated for an additional 20 years with expenditures as reflected in the maintenance and capital forecasts. Peaking service has a detrimental effect on turbines and their auxiliaries, and eventual HP shell and steam path replacements would be likely for continued service beyond 20 years. The Unit 1 and 2 precipitators could be expected to require precipitator rebuilds if longer-term operation is envisioned.
The current condition of Meredosia Unit 3 would permit an additional 20 years of operation. NOx levels were lowered to meet regulatory requirements with the addition of low-NOx burners and over-fire air. The Unit 3 primary superheater may require rebuilding in the future, and Genco has planned testing and inspection to support evaluation of the need and timing for replacement. The Unit 3 turbine has inner shell distortion and significant steam path erosion, which could necessitate major repairs as early as 2005.
Meredosia Unit 4 can continue in operation as a peaking unit for 20 years. The Unit 4 boiler NDT program is adequate given the light usage of the unit. The next scheduled overhaul (presently under way) will include a more complete turbine dismantling to establish a baseline condition of shells, rotor and steam path components. Although not anticipated at present, if the unit remains on oil, a precipitator may eventually be required for particulate control.
3.1.4 Hutsonville
Hutsonville station is located along the Wabash River, outside of Hutsonville, Illinois. The station currently consists of two steam-electric generating units, Units 3 and 4, with nominal capacities of 76 and 77 MW net, respectively. The units were placed in service in 1953 and 1954. The units have no special provisions for NOx or SO2 control. The units are equipped with electrostatic precipitators for control of particulate emissions.
Table 3.1-4 provides a summary of the characteristics of Units 3 and 4. The sections that follow provide a summary update of our condition assessment findings since October 2000.
A-31
Table 3.1-4. Hutsonville Characteristics
| ITEM | UNIT 3 | UNIT 4 | ||
|---|---|---|---|---|
| PERFORMANCE | ||||
| Normal Summer Capacity (MW Net) | 76 | 77 | ||
| Minimum Load (MW) | 29 | 29 | ||
| Full Load Heat Rate, HHV (Btu/kWh) | 10,811 | 10,680 | ||
| PRIME MOVER | ||||
| Manufacturer | GE | GE | ||
| Type | Tandem Compound Two Flow | Tandem Compound Two Flow | ||
| Commissioned (Year) | 1953 | 1954 | ||
| HP Turbine Inlet Pressure/Temp (psig/oF) | 1450/1000 | 1450/1000 | ||
| Reheat Turbine Inlet Temp (oF) | 1000 | 1000 | ||
| ELECTRIC GENERATOR | ||||
| Manufacturer | GE | GE | ||
| Cooling | Hydrogen | Hydrogen | ||
| MVA | 75.0 | 75.0 | ||
| STEAM GENERATOR | ||||
| Manufacturer | CE | CE | ||
| No. of Boilers | 1 | 1 | ||
| Circulation | Natural | Natural | ||
| Draft Condition | Balanced | Balanced | ||
| Cycle Type | Reheat | Reheat | ||
| Primary Fuel | Coal | Coal | ||
| OTHER | ||||
| Cooling Water Source | Wabash River | Wabash River | ||
| Fuel Delivery | Truck | Truck |
3.1.4.1 Boilers
Additional information regarding past boiler history was obtained. Supplementing previously reported maintenance and upgrades, Ameren also:
- •
- replaced Unit 3 hot and intermediate air heater baskets in 1988;
- •
- chemically cleaned Unit 3 and Unit 4 boilers in 1992;
- •
- installed continuous emissions monitoring systems ("CEMS") on both units in 1993 and 1994;
- •
- installed high efficiency exhauster wheels on Unit 3 and Unit 4 mills in 1997;
- •
- rebladed Unit 3 and Unit 4 forced draft fans in 2000;
- •
- replaced Unit 4 cold end baskets on both air heaters in 2000;
- •
- rebuilt Unit 3 drum internals in 1997; and
- •
- rebuilt Unit 4 drum internals in 1998.
Inspection and major overhaul of the Unit 3 boiler was last performed in the spring of 2000. Major work performed during the last overhaul included header inspections, screen tube shields, penthouse air inleakage repair, air preheater cold end basket replacement, pulverizer maintenance, and forced draft ("FD") fan reblading. In August of 1998, Storm Engineering performed an on-line test of
A-32
the Unit 3 and 4 pulverizers to evaluate opportunities for combustion optimization. The resultant recommendations from past inspections are being addressed. In 1997, Unit 3 mill exhausters were replaced with high efficiency fans. New liners were installed on these mills in 1998.
Major overhaul of the Unit 4 boiler was last performed in the spring of 2001 and included an inspection by the company boiler engineer. Major work included superheater shields, air preheater seal repairs, waterwall UT, superheater leak repairs, reheater pendant repairs, reheater shield replacements, economizer and superheater flyash erosion pads, and pulverizer inspection and minor repairs. Pad welding for flyash erosion was done in late 2001. In 1997, Unit 4 mill exhausters were replaced with high efficiency fans. New liners were installed on these mills in 1998.
Both boilers are expected to have NDT performed by the OEM on critical headers in the near future. In 2003 and 2004, both units will have OFA ports and ductwork installed on the boilers. Boiler controls will be updated for this modification as well. Other future boiler items include reheat inlet pendant replacement, miscellaneous header replacement and economizer replacement. According to plant personnel, coal bunker lining condition should be monitored.
3.1.4.2 Steam Turbine—Generators
Unit 3 and 4 major maintenance overhauls are scheduled every ten years. The most recent major outage was in 1997 for Unit 3 and in 1998 for Unit 4. Both units were converted to retractable packing during these outages. The HP/IP and LP rotors were also boresonic inspected during these outages with no reportable indications found.
During the last Unit 3 overhaul, the HP/IP and LP sections and all admission valves were fully dismantled. The rotors were found fit for continued service but re-inspection was recommended within 2,000 starts or 10 to 12 years. It was recommended that the HP inner shell alignment problems and 10th stage diaphragm distortion be further investigated at the next outage. Cracks around the HP lower inner shell first stage pressure tap should be monitored for changes.
The most recent Unit 4 major overhaul was in March 1998. The rotors were found fit for continued service with re-inspection recommended within 2,000 starts or 10 to 12 years.
The most recent major outage on Unit 3 generator was in 2000. The generator was disassembled and bore copper was replaced. Several rotor wedges had migrated and were repositioned. GE recommended replacement of the hydrogen and air seals. A contractor performed electrical tests on the insulation and found it acceptable.
Major outages for the HP/IP, LP and generators are planned for Units 3 and 4 in 2007 and 2008, respectively. Valve inspection and repairs will be included. It is expected that some blade and shell repairs will be necessary, but this is not unusual for units of this age. It is recommended that the HP/IP rotor and HP/IP steam chest and valve bodies subjected to 1000°F steam be inspected for remaining life. No major capital expenditures are planned at this time. Turbine electro-hydraulic controls upgrades should be considered for continued operation of these units to improve load control for automatic dispatch and to reduce the maintenance costs for this mature control system. Fire protection for the plant will be reviewed by Ameren's fire protection task force and will include the area around the turbine, generator and lube oil reservoir.
These units are well maintained and have had no load limiting failures or design defects. The turbine deck area and all lower levels with turbine generator support equipment are well maintained, accessible and well lighted. These units should provide reliable generation for the next twenty-year period if the current maintenance and operating mode continues. It is expected that the recommended remaining life assessment will demonstrate a need to repair and/or replace some major components such as HP/IP rotor or inner/outer shells for longer term operation. Plant staff is diligent in maintaining and operating this equipment.
A-33
3.1.4.3 Balance of Plant
The Unit 3 and 4 circulating water intake traveling screens were replaced in September and November of 2001. Gearboxes and drives on both screens were replaced in 1999. The screens are in excellent condition. The 3A, 3B and 4A circulating water pumps were replaced in 1989 and 1990. The 4B pump was rebuilt in 1988.
The Unit 3 condenser is scheduled to be retubed in 2003 and the Unit 4 condenser is scheduled to be retubed in 2004. The condensate pumps were last overhauled as follows: 3A in 1997, 3B in 1991, 4A in 2000 and 4B in 1988. The pumps appear to be in good condition.
Feedwater heaters replaced in the past included 2 Unit 3 HP heaters in 1988 and 1989, and 2 Unit 4 HP heaters in 1982 and 1984. Also, a Unit 4 LP heater was retubed in 1981. Funds have been budgeted for future feed water heater replacement.
It was previously reported that the boiler feed pump common spare was scheduled to be rebuilt in 2000. In fact, it was rebuilt in 1999.
Future inspections of high energy piping are planned, most likely in 2003 and 2004 or 2007 and 2008.
A mechanical inspection of the coal handling facilities was done in 1999 by Fairfield engineering. Currently there is a 50-80 day coal supply, which is up from the previously reported 45 - 60 day supply.
The next stack inspections are scheduled for the 2003 and 2004 outages. No change in stack condition was noted.
Fire protection systems are inspected yearly by Ameren's risk management group. A special task force has been reviewing fire protection issues. Future plans call for upgrading of the fire protection system as the task force recommendations are completed.
3.1.4.4 Remaining Life
Hutsonville Units 3 and 4, although found to be in apparent good condition for their age, have operated in recent years at low capacity factors. Both units are nearly 50 years old and the recent history of NDE and metallurgical testing is quite limited. A reasonable budget has been allocated for steam turbine repairs. With appropriate maintenance including a resumption of NDE, the Hutsonville units can be operated reliably in intermediate service for another 20 years. It is likely that some additional impacts of the low capacity factor cyclic operation will be detected in both boilers. It will be necessary to perform tube, header and piping inspections to identify other component replacements in order to operate until 2021.
3.2 Performance
This section summarizes the historical and projected performance of the Genco Coal-fired Stations. The projected performance is shown for the period 2002 through 2021 and is a combination of assumptions and outputs of the Market Consultant's dispatch simulation model.
The following definitions of terms were used to define the performance data summarized in this section:
Capacity Factor—The ratio of the actual net generation to the normal claimed capacity operating for the entire 8,760 hours in a year.
Equivalent Availability Factor ("EAF")—The fraction of maximum generation that could be provided if limited only by outages, overhauls, and deratings. It is the ratio of available generation to maximum possible generation.
A-34
Equivalent Forced Outage Rate ("EFOR")—The ratio of forced outages and restrictions to service hours. The fundamental difference between availability and forced outage rate is that availability includes outages and planned overhauls while forced outage rate is not affected by planned overhauls.
Heat Rate (Btu/kWh)—The ratio of the fuel energy input to the net unit electric energy output.
In reviewing the historical and projected performance of electric generating units, the reliability of the units are generally evaluated by looking at the EAF and EFOR values. The EAF is an indication of the ability of a unit to generate electricity regardless of whether it is dispatched. The EFOR is an indication of the degree to which the unit was limited during operation by forced outages and restrictions.
3.2.1 Newton
A summary of the historical and projected performance for Newton is shown in Table 3.2-1.
Table 3.2-1. Newton Performance
| | Historical Performance (1995 - 1999) | Updated Performance | ||||||||||||
|---|---|---|---|---|---|---|---|---|---|---|---|---|---|---|
| | | | Projected (2002 - 2021) | |||||||||||
| | As previously reported | | | |||||||||||
| | Average | Maximum | Minimum | 2000 | 2001 | Average | ||||||||
| Capacity Factor | ||||||||||||||
| Unit 1 | 62.1 | % | 69.8 | % | 51.0 | % | 60.8 | % | 72.6 | % | 88.5 | |||
| Unit 2 | 56.8 | % | 61.7 | % | 50.0 | % | 68.2 | % | 53.1 | % | 85.0 | |||
| Net Generation (GWh) | ||||||||||||||
| Units 1 and 2 | 5,885 | 6,296 | 5,462 | 6,296 | 6,097 | 8,600 | ||||||||
| EAF | ||||||||||||||
| Unit 1 | 82.6 | % | 93.8 | % | 68.4 | % | 81.1 | % | 92.6 | % | 90.8 | % | ||
| Unit 2 | 82.5 | % | 92.0 | % | 72.7 | % | 87.8 | % | 68.0 | % | 88.7 | % | ||
| EFOR | ||||||||||||||
| Unit 1 | 6.2 | % | 10.8 | % | 3.1 | % | 5.5 | % | 2.8 | % | 5.5 | % | ||
| Unit 2 | 5.2 | % | 7.3 | % | 3.4 | % | 4.8 | % | 15.0 | % | 5.5 | % | ||
| Heat Rate (Btu/kWh) | ||||||||||||||
| Unit 1 | 10,107 | 10,385 | 9,706 | 10,677 | 10,897 | 10,103 | ||||||||
| Unit 2 | 10,306 | 10,732 | 9,963 | 9,885 | 10,319 | 10,099 | ||||||||
Newton performance has continued to improve slightly since the previous assessment by Stone & Webster. The year 2000 EFOR was lower than the previous 5-year average. Unit 1 decreased from 6.2% to 5.5% and Unit 2 decreased from 5.2% to 4.8%. The 2001 EFOR was 2.8% on Unit 1 and 15.0% on Unit 2. The major events on Unit 2 in 2001 were furnace tube leaks resulting in 170 outage hours in January, and boiler tube leaks causing 66 outage hours in April. Boiler tube leaks are the major cause of outages throughout the industry. One of these incidents was random tube leaks and the other incident was caused by a slag fall. The boiler ash built up in an accumulation of molten slag that hardened and fell, rupturing several tubes in the bottom of the furnace. Slag buildup can be monitored and shed prior to large buildups, and closer attention will be given to these slag build-ups in the future. In addition and as described earlier, there was a forced outage on Unit 2 due to a generator overheating incident.
One key performance parameter change is an increase in capacity at Newton. More frequent operation at design throttle overpressure, coupled with new equipment installation and operational tuning, has resulted in increased generating capability of both units. The plant plans to realize an additional 2 MW capacity on Unit 1 in the summer and an additional 7 MW during the remainder of
A-35
the year. The Unit 1 generating capacity is now generally limited by the ID fan capability as described earlier. Unit 2 is expected to generate an additional 20 MW in the summer and an additional 27 MW in the remainder of the year. Stone & Webster agrees that it is reasonable that Newton can achieve these additional generating capacities based on the available information presented.
With regard to projected performance, the future capacity factors increase over the historic primarily as a result of the recent switch to PRB coal and associated fuel pricing forecasts by the Market Consultant. It will be technically feasible to achieve this level of baseload operation based on the projected EAF and EFOR. Recent performance enhancements coupled with the Performance Improvement Initiatives program will contribute to increased reliability at Newton. The future O&M and capital budgets have allocated funding for necessary repairs and equipment replacements consistent with the projected performance.
Stone & Webster notes that the Market Consultant capacity factor forecasts in 2002, 2003 and 2004 exceed the projected EAFs. The reason for this apparent discrepancy relates to the summer and winter capacity ratings for the units. The winter capacity ratings for these units are slightly higher than their summer ratings, and the Market Consultant projected full dispatch for the units during the period in question. Because the capacity factor is calculated on the basis of the summer rating, additional generation during the non-summer months from the incremental capacity at the units appears to boost their generation above achievable levels. Put another way, if the annual capacity factor were calculated on the basis of winter capacity, the resulting capacity factors would be consistent with the stipulated EAFs for Newton 1 and Newton 2. Stone & Webster agrees that the performance projections are reasonable.
3.2.2 Coffeen
A summary of the historical and projected performance for Coffeen is shown in Table 3.2-2.
Table 3.2-2. Coffeen Performance
| | Historical Performance (1995 - 1999) | Updated Performance | ||||||||||||
|---|---|---|---|---|---|---|---|---|---|---|---|---|---|---|
| | | | Projected (2002 - 2021) | |||||||||||
| | As previously reported | | | |||||||||||
| | Average | Maximum | Minimum | 2000 | 2001 | Average | ||||||||
| Capacity Factor | ||||||||||||||
| Unit 1 | 39.1 | % | 51.2 | % | 26.4 | % | 54.3 | % | 51.3 | % | 75.1 | % | ||
| Unit 2 | 51.0 | % | 54.3 | % | 48.1 | % | 56.1 | % | 45.4 | % | 75.5 | % | ||
| Net Generation (GWh) | ||||||||||||||
| Units 1 and 2 | 3,912 | 4,384 | 3,440 | 4,384 | 3,665 | 5,941 | ||||||||
| EAF | ||||||||||||||
| Unit 1 | 67.8 | % | 81.8 | % | 51.7 | % | 79.1 | % | 73.1 | % | 80.2 | % | ||
| Unit 2 | 71.6 | % | 80.0 | % | 62.5 | % | 77.1 | % | 70.3 | % | 80.3 | % | ||
| EFOR | ||||||||||||||
| Unit 1 | 13.3 | % | 18.2 | % | 6.5 | % | 7.2 | % | 10.5 | % | 11.7 | % | ||
| Unit 2 | 12.5 | % | 16.7 | % | 7.2 | % | 7.3 | % | 11.3 | % | 11.9 | % | ||
| Heat Rate (Btu/kWh) | ||||||||||||||
| Unit 1 | 10,871 | 11,146 | 10,664 | 10,498 | 10,547 | 10,209 | ||||||||
| Unit 2 | 10,407 | 10,702 | 10,251 | 10,379 | 10,476 | 10,086 | ||||||||
The projected average EAF for Coffeen is 80.2% for Unit 1 and 80.3% for Unit 2. The projected average EFOR is 11.7% on Unit 1 and 11.9% on Unit 2. The year 2000 EFOR was significantly better than the forecast average at 7.2% on Unit 1 and 7.3% on Unit 2, and the 2001 EFOR was slightly better than the forecast by 1.2% on Unit 1 and 0.6% on Unit 2.
A-36
With regard to projected performance, even though the future capacity factors increase compared to the historic capacity factors, they are considered achievable. The projected EFOR and EAF are achievable and are consistent with the O&M and capital budgets. These budgets allow for adequate repairs and equipment replacement to maintain the projected level of availability.
3.2.3 Meredosia
A summary of the historical and projected performance for Meredosia is shown in Table 3.2-3.
Table 3.2-3. Meredosia Performance
| | Historical Performance (1995 - 1999) | Updated Performance | ||||||||||||
|---|---|---|---|---|---|---|---|---|---|---|---|---|---|---|
| | | | Projected (2002 - 2021) | |||||||||||
| | As previously reported | | | |||||||||||
| | Average | Maximum | Minimum | 2000 | 2001 | Average | ||||||||
| Capacity Factor | ||||||||||||||
| Unit 1 | 24.1 | % | 36.3 | % | 11.6 | % | 33.0 | % | 23.4 | % | 35.3 | % | ||
| Unit 2 | 21.6 | % | 31.9 | % | 12.8 | % | 33.0 | % | 23.4 | % | 37.5 | % | ||
| Unit 3 | 46.7 | % | 54.3 | % | 35.4 | % | 44.8 | % | 47.0 | % | 66.4 | % | ||
| Unit 4 | 2.5 | % | 5.7 | % | 0.2 | % | 4.9 | % | 3.8 | % | 0.2 | % | ||
| Net Generation (GWh) | ||||||||||||||
| Units 1, 2, 3 and 4 | 1,207 | 1,285 | 1,104 | 1,251 | 1,151 | 1,650 | ||||||||
| EAF | ||||||||||||||
| Unit 1 | 84.2 | % | 97.0 | % | 74.9 | % | 90.6 | % | 88.6 | % | 83.1 | % | ||
| Unit 2 | 84.7 | % | 98.8 | % | 69.6 | % | 80.4 | % | 78.7 | % | 84.4 | % | ||
| Unit 3 | 73.7 | % | 87.3 | % | 60.1 | % | 77.2 | % | 80.5 | % | 86.6 | % | ||
| Unit 4 | 57.8 | % | 70.4 | % | 36.5 | % | 77.1 | % | 96.3 | % | 65.6 | % | ||
| EFOR | ||||||||||||||
| Unit 1 | 22.3 | % | 51.1 | % | 0.7 | % | 15.5 | % | 11.8 | % | 8.8 | % | ||
| Unit 2 | 11.1 | % | 33.9 | % | 1.4 | % | 2.3 | % | 2.6 | % | 8.8 | % | ||
| Unit 3 | 8.9 | % | 11.2 | % | 5.3 | % | 3.9 | % | 21.5 | % | 5.8 | % | ||
| Unit 4 | 68.3 | % | 96.1 | % | 54.8 | % | 54.0 | % | 15.1 | % | 22.2 | % | ||
| Heat Rate (Btu/kWh) | ||||||||||||||
| Unit 1&2 | 13,209 | 13,729 | 12,068 | 13,973 | 13,304 | 13,290 | ||||||||
| Unit 3 | 10,461 | 11,293 | 10,103 | 11,153 | 10,692 | 9,955 | ||||||||
| Unit 4 | 25,502 | 59,681 | 14,560 | 14,580 | 17,676 | 10,821 | ||||||||
The performance of Meredosia has improved somewhat since the previous assessment. Units 1 and 2 consist of four boilers connected to a common header supplying either turbine unit, typical of old power plants and adding to the reliability since any boiler can supply either turbine. The Unit 1 equivalent availability in 2000 and 2001 showed improvement over the previous 5-year average. Unit 3 was 3.5% higher in 2000 and 6.8% higher in 2001 than the previous 5-year averages.
The Unit 4 capacity factor continued to be low at 4.9% in 2000 and 3.8% in 2001. This unit is not dispatched often because the fuel is higher priced oil and the thermal efficiency is relatively low.
Investments have been made in Units 1 and 2 to ensure their reliability. The turbines and generators have been overhauled, air heater tubes have been replaced as necessary, and new ID fans have been installed. During the peak summer season of 2001, the equivalent availability for Units 1 and 2 was greater than 99%. In 2002, burner replacement has been budgeted.
With regard to projected performance, the future capacity factors are consistent with the historic capacity factors, and considered achievable. The projected EFOR and EAF are consistent with
A-37
historical, and the O&M and capital budgets are considered reasonable. These budgets allow for adequate repairs and equipment replacement to maintain this level of reliability.
3.2.4 Hutsonville
A summary of the historical and projected performance for Hutsonville is shown in Table 3.2-4.
Table 3.2-4. Hutsonville Performance
| | Historical Performance (1995 - 1999) | Updated Performance | ||||||||||||
|---|---|---|---|---|---|---|---|---|---|---|---|---|---|---|
| | | | Projected (2002 - 2021) | |||||||||||
| | As previously reported | | | |||||||||||
| | Average | Maximum | Minimum | 2000 | 2001 | Average | ||||||||
| Capacity Factor | ||||||||||||||
| Unit 3 | 40.4 | % | 64.0 | % | 25.7 | % | 34.4 | % | 47.0 | % | 53.6 | % | ||
| Unit 4 | 37.8 | % | 63.3 | % | 18.6 | % | 42.6 | % | 42.6 | % | 53.4 | % | ||
| Net Generation (GWh) | ||||||||||||||
| Units 3 and 4 | 576 | 785 | 402 | 525 | 592 | 717 | ||||||||
| EAF | ||||||||||||||
| Unit 3 | 82.2 | % | 95.0 | % | 67.8 | % | 82.8 | % | 97.2 | % | 87.9 | % | ||
| Unit 4 | 82.0 | % | 90.7 | % | 56.4 | % | 97.0 | % | 92.1 | % | 87.6 | % | ||
| EFOR | ||||||||||||||
| Unit 3 | 7.9 | % | 23.9 | % | 1.8 | % | 2.0 | % | 2.6 | % | 6.5 | % | ||
| Unit 4 | 8.0 | % | 17.1 | % | 2.1 | % | 2.0 | % | 1.0 | % | 6.5 | % | ||
| Heat Rate (Btu/kWh) | ||||||||||||||
| Unit 3 | 11,006 | 11,634 | 11,497 | 11,402 | 10,776 | 10,811 | ||||||||
| Unit 4 | 10,921 | 11,396 | 10,365 | 11,151 | 10,637 | 10,680 | ||||||||
Hutsonville has performed very well since the previous Stone & Webster assessment. The EFOR in 2000 was 2.0% on Unit 3 and 2.0% on Unit 4, which is significantly lower than the previous 5 year average of 7.9% and 8.0%, respectively. The 2001 EFOR was also lower at 2.6% at Unit 3 and 1.0% on Unit 4. In February of 2001, there were load restrictions for fuel quality of 109 equivalent outage hours on both Units 3 and 4. The sulfur content of the coal must stay below the regulatory limit, but if the sulfur goes too low it affects precipitator performance and results in increased opacity. Once this low sulfur fuel was burned out of the bunkers, the remaining fuel was segregated and slowly blended in until it was all used.
A program has been initiated (part of the Plant Improvement Initiatives program) for examining the major boiler components and determining the remaining life. This program will identify components that need to be replaced prior to their failure, which will prevent forced outages. The high-energy piping that will eventually be susceptible to creep damage will also be inspected to prevent maintenance problems and to avert potential safety issues.
Hutsonville appeared to be very clean and well maintained, especially for an older coal-fired plant. Since the capacity factors are lower than the other Genco coal plants, there are periods of time in the spring and fall when the units are out of service for economy. During these outages, operators are reassigned for cleaning, painting and routine maintenance tasks that don't require special skills.
With regard to projected performance, the future capacity factors decrease somewhat compared to the historic capacity factors. The projected EFOR and EAF are consistent with historical and the O&M and capital budgets are considered reasonable. These budgets allow for adequate repairs and equipment replacement to maintain the projected level of availability.
A-38
3.3 Operation & Maintenance
Where updated or modified since the October 2000 report, Stone & Webster reviewed the projected station staffing, O&M budgets, overhaul schedules, and capital and overhaul expenses provided by Genco. In addition, we reviewed the station maintenance management practices for effectiveness and adequacy.
The projected operation and maintenance costs are generally consistent with the projections summarized in Stone & Webster's October 2000 report. One difference is the cost of Genco's recently developed Plant Improvement Initiatives program. This program includes:
- •
- Development of a resource center in Effingham, Illinois that will provide technical services for all of the plants. These services will include support for design control, project management and centralized record keeping.
- •
- A remote control center that will monitor plant critical control systems in real-time with a state-of-the-art communication system.
- •
- Continuous study of the mechanical, electrical and structural integrity of the plants.
- •
- Standardization of work practices that include sharing of effective maintenance procedures between the plants.
- •
- Cross-training of maintenance employees on all aspects of power plant support. A technical library and laboratory will be included.
The majority of costs to implement the Plant Improvement Initiatives program are allocated for the next 5 years; the costs then taper off once the new program is established.
Table 3.3-1. Cost of Plant Improvement Initiatives Program
| Year | Cost $(000) | |
|---|---|---|
| 2002 | 15,930 | |
| 2003 | 7,500 | |
| 2004 | 13,000 | |
| 2005 | 8,000 | |
| 2006 | 8,000 | |
| 2007 | 2,000 | |
| 2008 | 1,000 | |
| 2009 | 500 | |
| 2010 | 500 | |
| 2011 | 500 | |
| 2012 | 500 |
Outside consultants will support implementation of these initiatives. A reliability-based maintenance program will be set up, which consists of establishing maintenance schedules based on system conditions and reliability goals rather than the historical practice of performing corrective maintenance and scheduled (calendar basis) maintenance. There will be more preventive and predictive maintenance utilized, using techniques such as vibration monitoring, lubricating oil analysis and infrared photography, to predict maintenance problems before they result in equipment failures. Potential availability and forced outage rate improvements resulting from implementation of these programs have been incorporated into the Financial Model.
In the sections that follow, projected costs generally appear to be higher than historical costs. However, when considering the additional cost of the above programs, the projected costs are reasonably consistent with historical. These levels of future costs assures that there will be sufficient resources for the appropriate maintenance activities.
A-39
3.3.1 Newton
3.3.1.1 Operation and Maintenance Expenses
Recent historical as well as projected O&M expenses are summarized in the following table:
Table 3.3-2. Newton O&M Expenses
| Year | (2002 $000) | |
|---|---|---|
| 1994 - 2000 (avg) | 29,411 | |
| 2001 | 26,529 | |
| 2002 - 2021 (avg) | 32,010 |
Note: excludes SO2 allowances
Except as noted previously, the future budget for operation and maintenance is generally consistent with the historic costs. These budgeted costs should be sufficient to maintain safe and reliable operation as projected.
3.3.1.2 Overhaul Schedule
Stone & Webster reviewed Genco's planned overhaul and maintenance schedule, summarized below. The most recent overhauls for the Units 1 and 2 HP turbines were in 2001 and 1995, respectively. The next HP turbine overhauls are scheduled in 2009 and 2004, respectively. This is consistent with the industry average time between turbine overhauls.
Table 3.3-3. Newton Overhaul Schedule
| Year | Unit 1 Weeks | Unit 2 Weeks | ||
|---|---|---|---|---|
| 2003 | 4 | |||
| 2004 | 5 | |||
| 2006 | 4 | |||
| 2007 | 4 | |||
| 2009 | 5 | |||
| 2010 | 4 |
3.3.1.3 Capital Expenditures
The future capital budget includes the selected items shown below. The justification for each of these projects is to maintain reliability, except for the environmental projects. The low-NOx burners and precipitator work are to assure compliance with the environmental regulations for emissions of NOx and particulate. Common projects include a railroad upgrade ($1.4 million in 2004) and fire protection equipment ($3 million in 2002 through 2006).
A-40
Table 3.3-4. Capital Projects: Newton Unit 1
| Description | $(000) | Year | ||
|---|---|---|---|---|
| Generator Stator Rewind | 6,000 | 2006 | ||
| Low NOx Conversion | 4,389 | 2004 | ||
| Replace Economizer | 5,000 | 2009 | ||
| Fans and duct work | 14,700 | 2006 | ||
| Convert Boiler Controls | 1,925 | 2009 | ||
| Reheater Replacement | 5,000 | 2009 | ||
| Turbine Controls | 1,700 | 2006 | ||
| Turbine Dense Pak | 8,500 | 2009 |
Table 3.3-5. Capital Projects: Newton Unit 2
| Description | $(000) | Year | ||
|---|---|---|---|---|
| Turbine Controls | 1,722 | 2004 | ||
| Generator Stator Rewind | 7,500 | 2007 | ||
| Retube Condenser | 3,500 | 2007 | ||
| Secondary Superheater | 5,000 | 2010 | ||
| Turbine Dense Pak | 8,500 | 2010 | ||
| Replace Boiler Water Walls | 2,000 | 2010 |
3.3.2 Coffeen
3.3.2.1 Operation and Maintenance Expenses
Recent historical as well as projected O&M expenses are summarized in the following table.
Table 3.3-6. Coffeen O&M Expenditures
| YEAR | (2002 $000) | |
|---|---|---|
| 1994 - 2000 (avg) | 28,889 | |
| 2001 | 36,919 | |
| 2002 - 2021 (avg) | 34,817 |
Note: excludes SO2 allowances
Except as previously noted, the future budget for operation and maintenance is generally consistent with the historical costs. These budgeted costs should be sufficient to maintain safe and reliable operation as projected.
3.3.2.2 Overhaul Schedule
Stone & Webster reviewed Genco's planned overhaul and maintenance schedule. The most recent overhauls for the Unit 1 and 2 HP turbines were in 1995 and 2001, respectively. The next HP turbine overhauls are scheduled in 2002 and 2006, respectively. This is consistent with the industry average time between turbine overhauls. The units are scheduled to have a regular boiler overhaul every third year. During the alternate years there are short two-week boiler inspections. The regular boiler overhaul takes 8 weeks because of the cyclone burners, which must have all the refractory removed followed by extensive repairs to the cyclone internal tubing, due to the high temperatures and erosive condition in these burners.
A-41
3.3.2.3 Capital Expenditures
The future capital budget includes the selected items shown below. The justification for each of these projects is to maintain reliability, except for the environmental projects. The SCR system for NOx reduction is to assure compliance with the environmental regulations. Common projects include the cooling towers ($6.3 million in 2002), fire protection equipment ($1.8 million in 2002 through 2004) and fuel system and rail yard upgrade ($19 million in 2004).
Table 3.3-7. Capital Projects: Coffeen Unit 1
| Description | $(000) | Year | ||
|---|---|---|---|---|
| SCR for NOx reduction | 42,420 | 2003 | ||
| Boiler waterwall replacement | 9,232 | 2002 | ||
| Drag Feeder | 4,000 | 2005 | ||
| Upper superheater | 5,674 | 2008 | ||
| Condenser tube replacement | 3,000 | 2008 | ||
| Turbine dense pak | 8,500 | 2008 | ||
| Economizer and primary superheater | 11,000 | 2008 |
Table 3.3-8. Capital Projects: Coffeen Unit 2
| Description | $(000) | Year | ||
|---|---|---|---|---|
| SCR for NOx reduction | 18,292 | (1) | 2002 | |
| Turbine controls | 1,700 | 2003 | ||
| Retube condenser | 2,000 | 2003 | ||
| Upgrade Unit controls | 3,000 | 2003 | ||
| Replace reheater | 9,208 | 2003 | ||
| Replace superheater pendants | 5,727 | 2003 | ||
| ID Fan upgrade | 12,000 | 2006 | ||
| Generator stator bar replacement | 8,500 | 2006 | ||
| Replace drag feeders | 7,000 | 2006 | ||
| Boiler controls | 6,000 | 2006 | ||
| Primary superheater, reheater and economizer | 15,000 | 2009 |
Note (1) The total cost of the SCR is $65 million, of this $46.7 million was paid in 2001.
3.3.3 Meredosia
3.3.3.1 Operation and Maintenance Expenses
Recent historical as well as projected O&M expenses are summarized in the following table.
Table 3.3-9. Meredosia O&M Expenses
| Year | (2002 $000) | |
|---|---|---|
| 1994 - 2000 (avg) | 11,710 | |
| 2001 | 15,602 | |
| 2002 - 2021 (avg) | 19,551 |
Note: excludes SO2 allowances
A-42
Except as noted previously, the future budget for operation and maintenance is generally consistent with the historic costs. These budgeted costs should be sufficient to maintain safe and reliable operation as projected.
3.3.3.2 Overhaul Schedule
Stone & Webster reviewed Genco's planned overhaul and maintenance schedule. The most recent overhauls for the Unit 1, 2, 3 and 4 HP turbines were in 1994, 2001, 1997 and 1986, respectively. The next HP turbine overhauls for Units 1, 2, 3 and 4 are scheduled in 2006, 2013, 2005 and 2002 respectively. All of the units have a boiler outage every other year.
3.3.3.3 Capital Expenditures
The future capital budget includes the selected items shown below. The justification for each of these projects is to maintain reliability, except for the environmental projects. Common projects are coal handling modifications ($2.6 million in 2002), fire protection equipment ($5.4 million in 2002 through 2010) and combined boiler controls for boilers 1-4 ($8 million in 2004).
Table 3.3-10. Capital Projects: Meredosia Units 1 and 2
| Description | $(000) | Unit 1 Year | Unit 2 Year | |||
|---|---|---|---|---|---|---|
| Boiler component replacement | 9,000 | 2006 | 2008, 2009 | |||
| Low-NOx burners | 12,420 | 2002 | 2003 | |||
| Replace superheaters | 8,000 | 2006, 2007 | 2008, 2009 | |||
| Replace boiler waterwalls | 3,000 | 2008 | 2009 |
Table 3.3-11. Capital Projects: Meredosia Unit 3
| Description | $(000) | Year | ||
|---|---|---|---|---|
| Install SCR for NOx reduction | 51,321 | 2003, 2004 | ||
| Replace economizer | 2,500 | 2003 | ||
| Generator stator rewind | 4,500 | 2005 | ||
| Replace intermediate pendants | 1,800 | 2005 | ||
| Replace boiler waterwalls | 1,900 | 2007 |
Table 3.3-12. Capital Projects: Meredosia Unit 4
| Description | $(000) | Year | ||
|---|---|---|---|---|
| Replace and consolidate controls | 780 | 2004 | ||
| Replace boiler waterwalls | 1,800 | 2011 |
3.3.4 Hutsonville
3.3.4.1 Operation and Maintenance Expenses
Recent historical as well as projected O&M expenses are summarized in the following table.
A-43
Table 3.3-13. Hutsonville O&M Expenses
| Year | (2002 $000) | |
|---|---|---|
| 1994 - 2000 (avg) | 6,869 | |
| 2001 | 7,983 | |
| 2002 - 2021 (avg) | 9,764 |
Note: excludes SO2 allowances
The future budget for operation and maintenance is generally consistent with the historic costs. These budgeted costs should be sufficient to maintain safe and reliable operation as projected.
3.3.4.2 Overhaul Schedule
Stone & Webster reviewed Genco's planned overhaul and maintenance schedule. The units are scheduled to have a boiler overhaul every other year and the alternate year there is a short one-week boiler inspection. The turbine overhauls are scheduled at 10-year intervals. The next turbine overhauls are scheduled for 2007 and 2008 at Units 3 and 4, respectively.
3.3.4.3 Capital Expenditures
The future capital budget includes the items shown below. The justification for each of these projects is to maintain reliability, except for the environmental projects. The common projects are replacing and upgrading the control system for $2.5 million in 2003, fire protection equipment for $1,845,000 in 2002 through 2006 and sealing the ash pond for $4.5 million in 2002 and 2003.
Table 3.3-14. Capital Projects: Hutsonville Units 3 and 4
| Description | $(000) | Unit 3 Year | Unit 4 Year | |||
|---|---|---|---|---|---|---|
| Install OFA for NOx control | 11,702 | 2003 | 2003 | |||
| Refractory, insulation and casing | 11,392 | 2003 | 2004 | |||
| Refurbish precipitator | 4,400 | 2007 | 2008 | |||
| Boiler component replacement | 1,000 | 2007 | 2008 | |||
| Replace boiler headers | 9,000 | 2007 | 2008 |
3.4 Environmental Compliance and Permitting
Relevant regulatory, permitting, emissions compliance, hazardous waste handling and site contamination issues are addressed. Only those items updated or modified since the October 2000 report are included herein.
3.4.1 System-wide Air Emissions Compliance Programs
3.4.1.1 SO2 Compliance Plans
The Genco Coal-Fired Stations are affected by Title IV SO2 requirements. The annual Phase II SO2 allocations for these stations are summarized in the following table.
A-44
Table 3.4-1. Phase II SO2 Allocations: Coal-fired Stations
| Generating Station | SO2 Allocations (2000-2009) | SO2 Allocations (2010-2021) | ||
|---|---|---|---|---|
| Coffeen | 20,466 | 20,500 | ||
| Hutsonville(1,2) | 4,525 | 4,533 | ||
| Meredosia | 7,192 | 7,203 | ||
| Newton(3,4) | 29,557 | 29,608 | ||
| Grand Tower | 3,030 | 3,035 | ||
| Total | 64,770 | 64,879 |
Notes:
- (1)
- For the year 2000, Hutsonville's allocation is 5,829.
- (2)
- For the years 2010 and 2020, Hutsonville's allocation is 3,881.
- (3)
- For the year 2000, Newton's allocation is 30,117.
- (4)
- For the years 2010 and 2020, Newton's allocation is 29,328.
The average annual SO2 emission rates for the Genco generating units for the years 1997 through 2001 are summarized below.
Table 3.4-2. SO2 Emissions
| | | Average Annual SO2 Emission Rate (lb/MMBtu) | ||||||||||
|---|---|---|---|---|---|---|---|---|---|---|---|---|
| Generating Unit | Boiler Number | |||||||||||
| 1997 | 1998 | 1999 | 2000 | 2001 | ||||||||
| Coffeen 1 | 1 | 2.30 | 2.42 | 1.97 | 1.63 | 1.90 | ||||||
| Coffeen 2 | 2 | 2.08 | 2.39 | 2.23 | 1.66 | 1.92 | ||||||
| Grand Tower 3(1) | 7 | 5.10 | 4.68 | 4.07 | 4.24 | na | ||||||
| Grand Tower 3(1) | 8 | 4.94 | 4.60 | 4.02 | 4.03 | na | ||||||
| Grand Tower 4(2) | 9 | 5.16 | 4.65 | 4.29 | 4.05 | na | ||||||
| Hutsonville 3 | 5 | 4.36 | 4.28 | 4.35 | 4.44 | 4.62 | ||||||
| Hutsonville 4 | 6 | 4.46 | 4.58 | 4.36 | 4.36 | 4.58 | ||||||
| Meredosia 1 and 2 | 1 | 4.54 | 4.82 | 3.92 | 4.03 | 4.99 | ||||||
| Meredosia 1 and 2 | 2 | 4.54 | 4.75 | 3.95 | 3.99 | 4.98 | ||||||
| Meredosia 1 and 2 | 3 | 4.56 | 4.77 | 3.81 | 3.97 | 4.94 | ||||||
| Meredosia 1 and 2 | 4 | 4.64 | 4.79 | 3.79 | 3.99 | 4.95 | ||||||
| Meredosia 3 | 5 | 3.18 | 2.70 | 2.28 | 2.41 | 2.60 | ||||||
| Meredosia 4 | 6 | 0.62 | 0.57 | 0.59 | 0.58 | 0.47 | ||||||
| Newton 1 | 1 | 0.92 | 0.49 | 0.48 | 0.45 | 0.45 | ||||||
| Newton 2 | 2 | 0.90 | 0.90 | 0.62 | 0.47 | 0.49 | ||||||
Notes:
- (1)
- Grand Tower Unit 3, Boilers 7 and 8 repowered with combined cycle unit in 2001.
- (2)
- Grand Tower Unit 4, Boiler 9 repowered with combined cycle unit in 2001.
A-45
There are no operating flue gas desulfurization ("FGD") systems at these generating units. However, an FGD system was operated at Newton Unit 1 until December 1996. Newton Units 1 and 2 switched from Illinois Basin coal to PRB coal in 1998 and 1999, respectively. Although PRB coal test burns have been performed at Coffeen, there are no short term plans to switch to PRB coal at Coffeen. The repowering of Grand Tower has lowered SO2 emissions from this station beginning in 2001.
Ameren, together with the Market Consultant, provided projections of annual SO2 emissions from the Genco units for the period 2002 through 2021. The projected annual SO2 emissions for these units exceed the SO2 allowance allocations for each year of the forecast. However, Ameren has "banked" a significant amount of unused SO2 allocations from the years 1995 through 2001. In addition, Ameren has separately forecast an annual surplus of SO2 allowances for the Union Electric (Genco affiliate, d/b/a AmerenUE) generating units for the period of 2000 through 2004. Ameren plans to utilize surplus SO2 allowances from the AmerenUE generating units to offset excessive SO2 emissions at Genco for the years 2002 through 2005. Accordingly, Genco has not included capital expenditures for future FGD systems or fuel switching in the Financial Model. For the years 2006 through 2021, Genco plans to purchase SO2 allowances on the open market and the costs for these purchases have been included in the Financial Model.
3.4.1.2 NOx Compliance Plans
Title IV NOx Control Requirements
The Genco Coal-fired Stations are subject to the Title IV NOx control requirements. Ameren is utilizing an averaging plan for compliance with the Acid Rain Phase II NOx reduction requirements. Ameren submitted its revised Phase II NOx Compliance and Averaging Plans to the Illinois Environmental Protection Agency ("IEPA") on June 28, 2001. The table below summarizes the Phase II annual NOx emission rate limits and Ameren's projected annual NOx emission rates for each of the coal-fired units.
Table 3.4-3. NOx Emissions Projections
| | | Average Annual NOx Emission Rate (lb/MMBtu) | ||||
|---|---|---|---|---|---|---|
| Generating Unit | Boiler Number | Phase II Limit | Projected | |||
| Newton 1(1) | 1 | na | na | |||
| Newton 2 | 2 | 0.45 | 0.30 | |||
| Coffeen 1 | 1 | 0.86 | 0.85 | |||
| Coffeen 2 | 2 | 0.86 | 0.85 | |||
| Grand Tower 3(2) | 7 | na | na | |||
| Grand Tower 3(2) | 8 | na | na | |||
| Grand Tower 4(2) | 9 | na | na | |||
| Meredosia 1 and 2 | 1 | 0.45 | 0.60 | |||
| Meredosia 1 and 2 | 2 | 0.45 | 0.60 | |||
| Meredosia 1 and 2 | 3 | 0.45 | 0.60 | |||
| Meredosia 1 and 2 | 4 | 0.45 | 0.60 | |||
| Meredosia 3 | 5 | 0.45 | 0.60 | |||
| Hutsonville 3 | 5 | 0.45 | 0.60 | |||
| Hutsonville 4 | 6 | 0.45 | 0.60 | |||
Notes:
- (1)
- Newton Unit 1 was removed from the averaging plan in 2001 (it is still required to meet a 0.45 lb/MMBtu NOx limit).
A-46
- (2)
- Grand Tower Units 3 and 4 are not included in the averaging plan due to repowering to gas-fired combined cycle.
The historical annual NOx emission rates for the Genco Coal-fired Stations are summarized in the following table.
Table 3.4-4. Historical NOx Emissions Summary
| | | Average Annual NOx Emission Rate (lb/MMBtu) | ||||||||||
|---|---|---|---|---|---|---|---|---|---|---|---|---|
| Generating Unit | Boiler Number | |||||||||||
| 1997 | 1998 | 1999 | 2000 | 2001 | ||||||||
| Newton 1 | 1 | 0.29 | 0.21 | 0.17 | 0.17 | 0.15 | ||||||
| Newton 2 | 2 | 0.38 | 0.36 | 0.29 | 0.22 | 0.15 | ||||||
| Coffeen 1 | 1 | 1.28 | 1.17 | 1.19 | 1.05 | 0.77 | ||||||
| Coffeen 2 | 2 | 1.28 | 1.17 | 1.19 | 1.05 | 0.77 | ||||||
| Grand Tower 3(1) | 7 | 0.73 | 0.70 | 0.72 | 0.76 | 0.10 | ||||||
| Grand Tower 3(1) | 8 | 0.76 | 0.72 | 0.80 | 0.75 | 0.10 | ||||||
| Grand Tower 4(1) | 9 | 0.61 | 0.56 | 0.65 | 0.71 | 0.10 | ||||||
| Meredosia 1 and 2 | 1 | 0.50 | 0.47 | 0.53 | 0.50 | 0.45 | ||||||
| Meredosia 1 and 2 | 2 | 0.50 | 0.47 | 0.53 | 0.50 | 0.45 | ||||||
| Meredosia 1 and 2 | 3 | 0.50 | 0.47 | 0.53 | 0.50 | 0.45 | ||||||
| Meredosia 1 and 2 | 4 | 0.50 | 0.47 | 0.53 | 0.50 | 0.45 | ||||||
| Meredosia 3 | 5 | 0.69 | 0.52 | 0.55 | 0.52 | 0.51 | ||||||
| Meredosia 4 | 6 | 0.21 | 0.19 | 0.19 | 0.20 | 0.17 | ||||||
| Hutsonville 3 | 5 | 0.53 | 0.53 | 0.56 | 0.55 | 0.55 | ||||||
| Hutsonville 4 | 6 | 0.54 | 0.49 | 0.60 | 0.52 | 0.53 | ||||||
Notes:
- (1)
- Grand Tower Units 3 and 4 repowered with gas-fired combined cycle units in 2001.
The table above indicates that the projected NOx emission rates in the Title IV NOx averaging plan were attained by each of the Genco generating units. Coffeen Units 1 and 2 have been retrofit with OFA ports since the 2000 site visit. In 1998, Meredosia Unit 3 (boiler 5) was retrofit with a Level I low NOx concentric firing system ("LNCFS"). Newton Unit 1 was retrofit with a Level III LNCFS NOx control system in 1994. The retrofit of a TFS 2000 system at Newton Unit 2 was completed in the spring of 2001. The additional combustion NOx control systems that are planned for these Genco units will provide additional compliance margin for meeting the NOx reduction requirements of Title IV of the Clean Air Act Amendments of 1990 ("CAAA").
Ameren reports that its Year 2000 Phase II NOx Plan weighted average NOx emission rate was 0.41 lb/MMBtu, compared to a weighted average NOx emission rate limit of 0.578 lb/MMBtu. Stone & Webster noted that Ameren's 2000 plan included Newton Unit 1.
Actual NOx emission rates for 2001 for the coal-fired units included in Ameren's revised NOx compliance/averaging plan(s) are listed in the following table. Stone & Webster noted that Newton Unit 1 is not included in Ameren's 2001 plans.
A-47
Table 3.4-5. 2001 NOx Emissions
| Station | Emission Unit | 2001 NOx Emission Rate (lb/MMBtu) | NOx Emission Rate Limit (lb/MMBtu) | |||
|---|---|---|---|---|---|---|
| Newton | 2 | 0.15 | 0.45 | |||
| Coffeen | 1 | 0.77 | 0.86 | |||
| Coffeen | 2 | 0.77 | 0.86 | |||
| Meredosia | 1 | 0.45 | 0.45 | |||
| Meredosia | 2 | 0.45 | 0.45 | |||
| Meredosia | 3 | 0.45 | 0.45 | |||
| Meredosia | 4 | 0.45 | 0.45 | |||
| Meredosia | 5 | 0.51 | 0.45 | |||
| Hutsonville | 5 | 0.55 | 0.45 | |||
| Hutsonville | 6 | 0.53 | 0.45 | |||
Year 2001 Weighted Average | 0.511 | 0.634 | ||||
Future NOx Control Programs
The Genco generating units are affected by the EPA state implementation plan ("SIP") call rule. Ameren has developed plans to comply with the requirements of the final SIP call rule submitted by the Illinois EPA ("IEPA") and approved by the USEPA on December 10, 2000. Ameren's NOx allowance allocations for these generating units equal 4,584 allowances for the years 2004 through 2006. Beginning in 2007, the rule includes flexible mechanisms to determine NOx allowance allocations. The allocations for the years 2007 and beyond depend upon a number of factors, including the operating characteristics of other generating facilities in the state of Illinois. Based on the final rule, IEPA will determine the number of allocations for 2007 by April 1 of 2004. At this point in time, considerable uncertainty remains concerning the number of allocations available after 2006.
Ameren's compliance strategy is based on the initial allocations for the 2004, 2005 and 2006 ozone seasons. The strategy will be adjusted as necessary in the later years to accommodate both future allocations and changes in technology for NOx control. Ameren has identified the following NOxreduction options, many of which have been implemented or are now under construction, as a means of meeting the requirements of the final NOx SIP call rule.
Table 3.4-6. NOx Reduction Options
| Generating Unit | NOx Reduction Option | Controlled NOx Emission Rate (lb/MMBtu) | ||
|---|---|---|---|---|
| Coffeen 1 | SCR Retrofit | 0.08 | ||
| Coffeen 2 | SCR Retrofit | 0.08 | ||
| Grand Tower 3 | Natural Gas Combined Cycle Repowering | 0.094 | ||
| Grand Tower 4 | Natural Gas Combined Cycle Repowering | 0.094 | ||
| Hutsonville 3 | LNCFS Level II plus Combustion Optimization | 0.22 | ||
| Hutsonville 4 | LNCFS Level II plus Combustion Optimization | 0.22 | ||
| Meredosia 3 | SCR Retrofit | 0.05 | ||
| Newton 1 | TFS 2000 plus Combustion Optimization | 0.12 | ||
| Newton 2 | TFS 2000 plus Combustion Optimization | 0.15 |
Ameren developed a forecast of ozone season NOx emissions based on ozone season heat input projections provided by the Market Consultant and assuming the above NOx compliance plan is in
A-48
place. This forecast is compared with Ameren's estimated NOx allowance allocations for the years 2004 through 2006 in the following table.
Table 3.4-7. Ozone Season NOx Emissions
| | 2004 | 2005 | 2006 | |||
|---|---|---|---|---|---|---|
| NOx Emissions (tons/ozone season)(1) | 4,180 | 3,778 | 3,844 | |||
| NOx Allowance Allocation(2) | 4,584 | 4,584 | 4,584 | |||
| Surplus (Shortage) of NOx Allowances | 404 | 806 | 740 |
Notes:
- (1)
- NOx emissions based on Market Consultant's power generation forecasts.
- (2)
- Allocations based on IEPA final rules with 5% deducted for new source set-aside.
If the allocations for the years 2007 through 2021 continue at the level for the years 2004 through 2006, the Genco units will continue to generate surplus NOx allowances each year. If Genco receives fewer allocations, Ameren could need to purchase additional NOx allowances or install additional NOx control equipment some point in the 2008 to 2021 time frame. However, it is unknown at present what Genco's future allocations will be.
Refer also to the station-specific NOx compliance plans in the following sections.
3.4.2 Generating Station Environmental Compliance
Stone & Webster reviewed current air and water permit requirements, environmental limitations on current or future operations, environmental compliance, and other significant environmental issues affecting each of the Genco generating stations. Only those items changed or modified since the October 2000 report are highlighted in the following sections.
3.4.2.1 Newton
Air Pollution Control Compliance
Emission limitations for each of the Newton generating units are summarized in the following table.
Table 3.4-8. Newton Emissions Limitations
| Pollutant | Unit 1 | Unit 2 | ||
|---|---|---|---|---|
| SO2 (lb/MMBtu) | 1.2 | 1.2 | ||
| NOx (lb/MMBtu) | 0.7 | 0.7 | ||
| CO (ppmvd @ 50% excess air) | 200 | 200 | ||
| TSP (lb/MMBtu) | 0.10 | 0.10 | ||
| Opacity (%, 6-minute avg.) | 20 | 20 |
Newton Unit 1 was retrofit with a Level III Low-NOx Concentric Firing System ("LNCFS") in 1994. Recent and planned emissions control improvements at Newton include the following:
- •
- Install low-NOx burners and controls on Unit 2 (2001)
- •
- Install low-NOx optimization program on Units 1 and 2 (2002)
- •
- Modify Unit 1 boiler to TSF2000 low-NOx (2003-2004)
A-49
Opacity monitoring reports for the first three quarters of 2001 indicate excess emissions for only 0.06 and 0.64 percent of the operating time for Units 1 and 2, respectively. These percentages do not include excess opacity emissions during start-up, shutdown, malfunctions, and breakdowns; however, these events are excluded relative to opacity standards compliance.
Wastewater Discharge Compliance
Ameren has completed construction of a supplemental cooling pond, as described earlier, in order to reduce discharge temperatures to acceptable levels. According to Ameren, implementation of this supplemental cooling pond will not result in any increase in station generating capacities or life-cycle extension beyond current permitted values.
Ash Disposal
Newton has a 420-acre bottom ash settling pond, which is projected by Ameren to serve the life of the station. The PRB coal that is used at Newton produces a high quality Class C flyash. Currently, approximately 100% of the fly ash is sent to secondary markets. Fly ash can be disposed of at an on-site, 40-acre landfill. Continued success in marketing the fly ash will extend the useful life of the landfill. The amounts budgeted for future ash disposal costs should be adequate.
Site Contamination
Stone & Webster notes that Central Illinois Public Service Company ("AmerenCIPS", a Genco affiliate) has retained responsibility and indemnified Genco with regard to all environmental damages or violation of any environmental requirements attributable to or resulting from any action prior to the earlier transfer of generating assets to Genco.
The Phase I environmental site assessment ("ESA") report of February 2000 identified certain issues common to all of the existing generating facilities, as well as issues specific to Newton. Accordingly, Stone & Webster recommended additional ESA activities at each station, e.g., soil and groundwater sampling and analysis, in order to baseline and document the extent of any current contamination. Stone & Webster's recommendation was for the commercial benefit of Genco, and not meant to be based on current regulatory requirements, as Genco is not under regulatory obligation to perform additional characterization. As of this date, Ameren reports that it has not conducted any supplemental site contamination investigations at Newton.
3.4.2.2 Coffeen
Air Emissions Compliance
The annual SO2 emissions for Coffeen Units 1 and 2 are projected to exceed the SO2 allowance allocations for these units by more than a factor of two. Current SO2 compliance plans for Coffeen are to transfer SO2 allowances from other Ameren units. Coffeen Units 1 and 2 are included in the planned Title IV averaging plan for the Genco generating units for the year 2000.
A-50
Emission limitations for each of the Coffeen generating units are summarized below:
Table 3.4-9. Coffeen Emissions Limitations
| Pollutant | Unit 1 | Unit 2 | Aux. Boiler | |||
|---|---|---|---|---|---|---|
| SO2 (lb/hour) | 55,555 for Units 1&2 | 0.3 | ||||
| NOx (lb/MMBtu) | 0.8 | 0.8 | None | |||
| CO (ppmvd @ 50% excess air) | 200 | 200 | 200 | |||
| TSP (lb/MMBtu) | 0.19 | 0.15 | 0.10 | |||
| Opacity (%, 6-minute avg) | 30 | 30 | 20 | |||
Units 1 and 2 use continuous CEMS which measure and record opacity, CO2, NOx, SO2, and flue gas flow rate. Units 1 and 2 burn local Illinois coal and have no SO2 emissions controls. Coffeen Unit 2 has been retrofit with OFA ports. Test results provided by Ameren indicate that Unit 2 is capable of meeting the above NOx emissions limitations with the new OFA system. OFA ports were installed on Coffeen Unit 1 in the fall of 2000. Units 1 and 2 control particulate emissions with an ESP. Sulfur fluxation (SO3 injection) has been installed on both units to improve ESP performance. Recent and planned emissions control improvements at Coffeen include the following:
- •
- Unit 1 SCR retrofit (2001-2004)
- •
- Unit 2 SCR retrofit (2001-2002)
- •
- Unit 1 furnace side wall replacement (2002)
- •
- Unit 2 boiler controls replacement (2003)
- •
- Units 1 and 2 boiler optimization software (2003)
- •
- Units 1 and 2 "Smart" software package installation (2004)
Opacity monitoring reports for the first three quarters of 2001 indicate excess emissions for approximately 2.78 percent of the operating time for Units 1 and 2. These percentages do not include excess opacity emissions during start-up, shutdown, malfunctions, and breakdowns; however, these events are excluded relative to opacity standards compliance.
Wastewater Discharge Compliance
Ameren has constructed a supplemental cooling pond, as described earlier, in order to reduce discharge temperatures to acceptable levels. According to Ameren, implementation of this supplemental cooling pond will not result in any increase in station generating capacities or life-cycle extension beyond current permitted values.
Ash Disposal
Fly ash that is produced at Coffeen is typically handled dry and sent off-site, currently to a landfill. Another option involves mine back filling, at a mine located approximately 40 miles from the station. Ameren has received a permit from the IEPA for underground injection control ("UIC") of a fly ash and mine water slurry. The life of the UIC project is not known. In addition, Coffeen also has a permit in place to build a 20-acre on-site landfill. Coffeen's ash disposal plan and budget should be adequate.
A-51
3.4.2.3 Meredosia
Air Pollution Control Compliance
The annual SO2 emissions for Meredosia boilers 1-6 are projected to exceed the SO2 allowance allocations for these units by more than a factor of two. Current SO2 compliance plans for Meredosia are to transfer SO2 allowances from other Ameren units. Units 1-6 are included in the planned Title IV averaging plan for the Genco generating units for the year 2000. Additional details concerning Ameren's system-wide SO2 and NOx compliance plans were provided earlier. Emission limitations for each of the Meredosia generating units are summarized below:
Table 3.4-10. Meredosia Emissions Limitations
| Pollutant | Boilers 1-4 (Units 1 and 2) | Boiler 5 (Unit 3) | Boiler 6 (Unit 4) | |||
|---|---|---|---|---|---|---|
| SO2 (lb/hour) | 23,000 lb/hr plant limit | 23,000 lb/hr plant limit | 0.8 lb/MMBtu | |||
| NOx (lb/MMBtu) | None | None | 0.3 | |||
| CO (ppmvd @ 50% excess air) | 200 | 200 | 200 | |||
| TSP (lb/MMBtu) | 0.20 | 0.10 | 0.10 | |||
| Opacity (%, 6-minute avg) | 30 | 30 | 20 |
Boilers 1 - 6 use CEMS which measure and record opacity, CO2, NOx, SO2, and flue gas flow rate. Boilers 1 - 4 burn high sulfur coal and have no SO2 emissions controls. Boiler 5 burns intermediate sulfur (~1%) coal to generate some SO2 credits and boiler 6 fires low sulfur #4 oil (~0.4%). In 1998, Meredosia Unit 3 (boiler 5) was retrofitted with ABB-CE Level I LNCFS. Boilers 1 - 5 control particulate emissions with an ESP. Boiler 6 has no particulate control. Recent and planned emissions control improvements at Meredosia include the following:
- •
- SCR on Unit 3, boiler 5 (2002-2004)
- •
- Level II low-NOx burners on Unit 1, boilers 1 and 2 (2002)
- •
- Boiler optimization software (2003)
- •
- Level II low-NOx burners on Unit 2, boilers 3 and 4 (2003)
- •
- Consolidate controls on Unit 4, boiler 6 (2004)
Opacity monitoring reports for 2001 to date indicate excess emissions for approximately 2.66 percent of the operating time for boilers 1-4, 0.14 percent for boiler 5, and 4.26 for boiler 6. These percentages do not include excess opacity emissions during start-up, shutdown, malfunctions, and breakdowns; however, these events are excluded relative to opacity standards compliance.
Wastewater Discharge Compliance
The National Pollutant Discharge Elimination System ("NPDES") permit governs discharges at nine outfalls. NPDES sampling data for all discharge points are reported to indicate general compliance with permit requirements. Information provided to Stone & Webster by Ameren for 2000-2001 listed the following NPDES Permit exceedances at Meredosia:
- •
- One exceedance for total suspended solids ("TSS") at the fly ash pond outfall
- •
- Two exceedances for TSS at the bottom ash pond outfall
- •
- Two exceedances for total copper (one at each of two cooling tower outfalls)
A-52
- •
- Five exceedances for boron at the fly ash pond outfall
However, none of these exceedances resulted in a Notice of Violation ("NOV") from IEPA. At this time, there are no outstanding water pollution control violations, enforcement issues or consent orders for the station with IEPA or USEPA, nor reported public complaints regarding water pollution from Meredosia or its operational activities.
Site Contamination
One of the issues identified in the Phase I ESA is that the former fly and bottom ash ponds were closed as landfills; i.e., with wastes in place. Although impermeable caps were placed upon these ponds at closure, the potential exists for residual migration of waste constituents to groundwater. As of this date, Ameren reports that it has not conducted any supplemental site contamination investigations at Meredosia.
3.4.2.4 Hutsonville
Air Pollution Control Compliance
The annual SO2 emissions for Hutsonville Units 3 and 4 are projected to exceed the SO2 allowance allocations for these units by more than a factor of two. Current SO2 compliance plans for Hutsonville are to transfer SO2 allowances from other Ameren units. Units 3 and 4 are included in the planned Title IV averaging plan for the Genco generating units. Emission limitations for each of the Hutsonville generating units are summarized below:
Table 3.4-11. Hutsonville Emissions Limitations
| Pollutant | Units 3&4 | |
|---|---|---|
| SO2 (lb/hour) | 8,536 | |
| NOx (lb/MMBtu) | None | |
| CO (ppmvd @ 50% excess air) | 200 | |
| TSP (lb/MMBtu) | 0.18 | |
| Opacity (%, 6-minute avg) | 30 |
Units 3 and 4 use CEMS which measure and record opacity, CO2, NOx, SO2, and flue gas flow rate. Units 3 and 4 burn local high sulfur (~2.5%) coal and have no SO2 emissions controls. Units 3 and 4 control particulate emissions with an ESP. Recent and planned emissions control improvements at Hutsonville include the following:
- •
- OFA system for Unit 3 (2002-2003)
- •
- Boiler furnace casing for Unit 3 (2002-2003)
- •
- OFA system for Unit 4 (2002-2004)
- •
- Boiler furnace casing for Unit 4 (2003-2004)
- •
- WDPF controls (2003-2004)
- •
- Boiler air ductwork on Unit 3 (2003-2004)
- •
- Boiler air heater on Unit 3 (2003)
- •
- Boiler air heater on Unit 4 (2004)
- •
- Boiler air ductwork on Unit 3 (2003)
- •
- Boiler air ductwork on Unit 4 (2004)
A-53
Recent opacity monitoring reports indicate that excess emissions are not a problem at Unit 3 and Unit 4.
Wastewater Discharge Compliance
The IEPA has authority to issue NPDES permits for the USEPA in Illinois. Hutsonville has a NPDES permit effective through April 30, 2004 to discharge to the Wabash River in Crawford County Illinois. The NPDES permit governs discharges at six outfalls. NPDES sampling data for all discharge points are reported to indicate general compliance with permit requirements, with the exception of one TSS exceedance during 2000 at the fly ash pond discharge. Ameren has resolved an enforcement action with the IEPA in regard to ground water contamination from the ash pond. Fines were paid and Ameren is implementing correction actions pursuant to a compliance consent agreement with the IEPA on this issue.
Site Contamination
The Phase I ESA identified the following issues of concern at Hutsonville:
- •
- Stone & Webster noted that the wells used to obtain fresh water for potable purposes at the station are located downgradient from the fly ash pond Trace metals from historic ash disposal practices have been detected and are being monitored in shallow groundwater at the site perimeter, including the area in which the potable water wells are located. Ameren stated that the aquifer from which the potable water wells draw is not affected by the ash ponds. In any case, Ameren intends to close the ash pond of concern in accordance with the State-approved closure plan. This plan will include an ongoing groundwater monitoring program. Stone & Webster further noted that sampling and analysis for organic contaminants is not conducted on potable well water. Although organic contaminants are not typically associated with coal combustion wastes, Stone & Webster recommended that these potable water wells should be sampled and analyzed for organic as well as inorganic contaminants.
- •
- Genco indicated that the agricultural property located to the southwest of the Hutsonville power station was formerly used by the farm bureau cooperative to fill and rinse herbicide and pesticide tankers. However, Ameren stated that groundwater monitoring wells along these plant boundaries are already in place and that data on groundwater conditions does not indicate any problems. Accordingly, Stone & Webster does not believe that this potential condition poses a significant risk to this station.
3.4.2.5 Grand Tower
The coal-fired units at Grand Tower have been decommissioned and await dismantling and removal in concert with the repowering of this station. However, the existing steam turbines (Units 3 and 4) have been reused in the repowered configuration. For environmental discussion of Grand Tower, refer to Section 4.4.1.
A-54
4 GAS-FIRED STATIONS
Genco's Gas-fired Stations include the following:
- •
- Grand Tower Power Station (repowered)
- •
- Gibson City Power Station
- •
- Pinckneyville Power Station, Phases I and II
- •
- Kinmundy Power Plant
- •
- Columbia Power Station
These assets are all natural gas fired facilities, and have a combined electric generating capacity of approximately 1635 MW (net). The Gibson City and Kinmundy turbines are equipped with dual fuel capability (natural gas and fuel oil).
This section summarizes Stone & Webster's findings with respect to design and construction, performance, O&M, and environmental aspects of these assets. Only updates or modifications since the October 2000 report are provided.
4.1 Design and Construction
Projects addressed in this section include Grand Tower (design update), Pinckneyville Units 5-8 (Phase II) and Columbia.
4.1.1 Grand Tower
The Grand Tower station is located on the Mississippi River outside the town of Grand Tower, Illinois. Access to the site is by highway. The station now consists of two gas-fired combined cycle generating units. Repowering of the station is complete and commercial operation has been achieved. The previously existing Unit 3 and 4 steam turbines were repowered with two SWPC 501FD CTs (Units 1 and 2). Nomenclature for the two combined cycle systems is Unit 1/3 (249 MW net, with duct firing) and Unit 2/4 (270 MW net, with duct firing). These units provide intermediate service.
4.1.1.1 Combustion Turbine Generators
Stone & Webster views the SWPC 501FD technology as a refinement on the W501F technology, typical of normal design improvements by manufacturers. However, SWPC has identified operational issues affecting all units in the F fleet, and issued technical advisories to ensure that until the present problems are solved, they do not cause damage to operating units.
The issue previously reported as relevant to the Grand Tower units is potential cracking of the row 2 turbine blade. As noted in the October 2000 report, SWPC issued a technical advisory ("TA") and has developed a new row 2 blade design to correct this problem. Grand Tower Unit 1/3 has the new row 2 design. Unit 2/4 has the blades with the potential to crack. Ameren plans to monitor the blade condition in order to prevent a failure.
SWPC has issued another technical advisory for these CTs that relates to spin cooling and hot restart. Spin cooling is the practice of running the CT rotor with the starter motor at a speed of approximately 625 rpm when the CT is out of service. In years past, the SWPC instruction manuals actually required spin cooling after a unit trip. SWPC expected the spin cooling to uniformly cool the cylinder (outer casing) to help maintain compressor blade tip clearances following shutdown. Spin cooling is also used after a shutdown to rapidly cool the CT so that maintenance activities can be performed sooner. On a combined cycle plant, the requirement for purging the HRSG and ductwork is met by running the CT with the starter motor for a period of time to pump clean air through the
A-55
HRSG and duct. For the CT, this purge procedure is equivalent to spin cooling the CT when done during a warm or hot start.
SWPC upgraded the 501F line from "C" to "D" in approximately 1998. Part of the upgrade was a redesigned compressor. This compressor has proven to be sensitive to spin cooling. SWPC has attributed several incidences of serious seal rubbing in 501FD machines to spin cooling and has limited this practice with these machines. Also, the number of times a 501FD CT can be used to purge a HRSG after a shutdown has been restricted.
The related TA more recently issued to Ameren includes operational limitations that can be summarized as follows:
- 1.
- After a trip, the operator has one chance to get the engine back into service within 20 minutes. Failing this, he must wait 5 hours or until compressor temperature falls to 250°F.
- 2.
- For cycling plants, the CT must be out of service for 5 hours or until compressor temperature falls below 250°F before it can be restarted.
The limitation represented by Item 1 above is somewhat mitigated by the fact that the forced outage rate for these machines is very low. Also, the time required to repair the cause of the forced outage is probably longer than 5 hours. If the cause of a trip can be repaired in 20 minutes or less, the chance of a successful restart is very high. The starting reliability of these machines is greater than 90%.
The limitation on cycling resulting from Item 2 above is probably not significant (an earlier limitation of 12 hours effectively precluded two-shift cycling). If a unit is to be shut down in the evening and restarted in the morning, it will probably be down for more than 5 hours anyway.
4.1.1.2 Steam Turbine-Generators
The 1999 Unit 1/3 outage inspection report was reviewed, along with a 1993 Unit 1/3 steam path audit, a 1997 Unit 1/3 outage report, a 1999 Unit 2/4 steam path audit, a 1999-2000 Unit 2/4 inspection outage report, a Unit 2/4 fluorescent magnetic particle inspection report, and a 1999 governor valve chest repair report. Unit 1/3 exhibited some evidence of HP turbine cylinder distortion and horizontal joint leakage along with heavy LP turbine erosion. Modifications and laser alignment of the blade ring/cylinder appear to have corrected the problem based on outage data and observations. The crossover piping from the HP to the LP turbine had heavy erosion. Reports indicated that repairs have not been done, but monitoring of this situation continues. Steam chest distortion seems to be a problem and some chest cracks were detected. It was decided to monitor the cracks rather than repair them at this time. Unit 2/4 exhibited HP inner cylinder cracking and IP inner cylinder distortion, which were repaired during the 1999-2000 outage. The HP and IP blading showed some damage from casing rubs and some LP blade erosion. Repairs were made and included replacement of HP blade rows 12 and 13. Nozzle blocks and a number of seals were replaced. During the 2001 overhaul, the shaft journals for the HP/IP rotor were drawn to correct a rotor bow problem. Several recommendations regarding the Unit 2/4 turbine were either performed or verified. Additionally, a laser alignment was performed to correct and verify the Unit 2/4 internal component alignment to the LP rotor. Based on report recommendations, the LP and HP rotor should have an inspection within the next ten years. This has been budgeted for 2008.
As previously reported, the rotor bores of both units were inspected between 1997 and 1999 and some reportable indications were detected. All rotors inspected were deemed fit for return to service. It was also previously mentioned that the LP turbines are water rather than steam sealed. Water seals are considered obsolete and create potential for rotor damage with cyclic operation. It is reasonable to expect to be able to operate these turbines for another overhaul cycle, at which time inspection and repairs will be made to ensure continued reliable operation. Based on the data provided by Ameren
A-56
and the "industry" data that is available for this design, the steam turbines are in reasonably good condition. However, with 49 and 42 years of service, respectively, some components of these units are near the end of their design lives and repairs / replacements have been included in the expense forecasts. The budget includes $2,005,000 in 2008 and $1,845,000 in 2009 for overhauls for Units 2/4 and 1/3, respectively. Additional major overhauls are budgeted for 2017 and 2018. Replacement of the Unit 1/3 HP casing is budgeted for 2011 and replacement of the 2/4 HP inner cylinder is budgeted for 2012.
4.1.1.3 Construction Status
The Grand Tower units went into commercial operation as follows:
Unit 1/3 June 29, 2001
Unit 2/4 December 6, 2001
However, the punch list for Grand Tower is still open. One significant item involves leaking combustion turbine horizontal joints. SWPC has a recommended repair procedure which will be implemented at the next major outage. None of the other punch list items appear to be significant.
4.1.2 Pinckneyville Phase II
Pinckneyville Phase II, a nominal 144 MW simple cycle plant, is located approximately three miles northeast of Pinckneyville, Illinois on White Walnut Road. The site consists of approximately 70 acres, and is accessible from White Walnut Road and Illinois Highway 154 east of Pinckneyville.
The plant consists of four single fuel GE Energy Products Europe Model PG6581B CTs operating in simple cycle. Each CT is rated at approximately 36 MW output at 95°F. The CTs are equipped with dry low-NOx burners for NOx control. The GE scope of supply includes the air-cooled generators, diesel starting engine, lube oil system, closed loop auxiliary cooling system air intake filters, and the digital control system.
Additional major equipment at the site includes one demineralized water storage tank (Phase I), electric switchyard, electrical support building, municipal water supply system, and associated balance of plant equipment and systems. Miscellaneous drains, including turbine water wash, are held in separate storage tanks and hauled off site. Storm runoff will be discharged into the environment.
Station perimeter fence and switchyard perimeter fence is provided. Natural gas metering and pressure regulation is located within the fenced area.
4.1.2.1 Combustion Turbine Generators
The August 21, 2000 executed contract with GE for the supply of eight PG 6581B CTs (four for Columbia and four for Pinckneyville) is complete and typical in its scope of supply, division of responsibility, and supply and service specifications. In addition to supplying the CTs, GE also provided technical field assistance for the installation, start-up, check-up, and thermal performance testing of the CTs and operator training. This is a typical arrangement. The design standards and codes referenced in the contract encompass major US codes such as API, ASME, ASTM, AWS, NFPA and BOCA. Other national and international codes are referenced. This is acceptable and typical practice.
The four GE "Frame 6" packages consist of one single shaft industrial gas turbine connected through a gear drive to a single Alstom 60 Hz air cooled generator rated at 50.875 MVA. The packages also include a brushless exciter assembly, diesel starting motor, inlet air system, lube oil system, turbine control compartment ("TCC") and natural gas skids. CO2 fire protection equipment is provided in the CT enclosure, the accessory compartment and the TCC. The TCC includes the CT controls, generator
A-57
controls, motor control centers, batteries, battery charger and fire protection cubicle. Remote human/machine interface ("HMI") stations are also provided in the control room.
The major components of each gas turbine engine are a 17 stage compressor section, a combustion section, and a three stage power turbine. The engines are equipped with GE's proprietary combustion system of the reverse flow type which includes 10 combustion chambers equipped with liners, flow sleeves, transition pieces, and crossfire tubes. The Pinckneyville engines are equipped with dry low-NOx combustors for natural gas firing. The engines are not equipped for fuel oil firing. The system operation is automatically controlled by GE's "Mark 5" electronic control system. This control system is typical for this type of gas turbine.
The gas turbine requires periodic washing of its aerodynamic components that accumulate deposits which could affect performance. A water wash system is provided.
The PG6581B is the latest upgrade of the 6001B family that was first introduced in 1978. GE has produced approximately 850 6001B-type machines that have accumulated over 4,500,000 operating hours. Stone & Webster expects that these machines will operate satisfactorily in the peaking service planned. GE warrants that the PG6581B CTs are designed for the purpose of generating electric power, and that they will be free from defects in workmanship and material for 12 months after initial synchronization or 24 months after the delivery date whichever first occurs. This warranty is reasonable and typical. Further, any repaired or replacement parts supplied under the warranty will carry warranties on the same terms set forth above except that the warranty period shall be for one year from such repair or replacement.
4.1.2.2 Interconnections
Natural gas for the Pinckneyville plant is supplied to the site by two 30-inch pipelines operated by Natural Gas Pipeline of America. The two pipes supply all eight units. The maximum supply pressure is approximately 860 psig. For the Phase II units, the pressure regulator station is sized for four CT units operating at peak load. Two 50 percent dew point fuel gas heaters are provided for the site. This gas supply system is considered adequate.
Plant water is supplied to the site by the City of Pinckneyville municipal water authority through an underground line. The single fuel GE PG581B engines do not require process water for operation. Raw water piping is installed and capped near the air inlet of each machine. This piping is for the possible future addition of evaporative coolers.
Demineralized water is required for periodic turbine water washes. The site has a 550,000 demineralized water storage tank installed with the Phase I units. Demineralized water from this tank is used to supply the small amount of water needed by the Phase II units for turbine water washes. This arrangement is adequate because of the small water requirement of the GE engines.
Miscellaneous equipment drains and turbine water wash drains are collected in a storage tank and hauled off site. Water collected in transformer pit drains is inspected for oil and, if clean, released to the environment. Contaminated transformer pit drains are pumped out and hauled off site for proper disposal. Storm water runoff is directed to the environment.
4.1.2.3 Auxiliary Power Systems
The electrical system consists of the 230 kV switchyard, 480V distribution systems and other systems including lighting, uninterruptable power ("UPS"), DC system, etc. The generator output from Units 5 and 6 are bused together in the 15 kV switchgear and feed a single 13.8/230 kV main step-up transformer. Units 7 and 8 are arranged in a similar manner. Each unit is provided with a 13,800/480V unit auxiliary transformer to feed CT loads. For common loads and CT startup loads a double-ended 480V load center is provided. Each end of this load center is fed from a 13,800/480V station service
A-58
transformer. The design also includes provisions for connecting to offsite backup power through automatic transfer of sources. The backup power source can be connected to each end of the 480V load center. This arrangement of the auxiliary electrical power system is usual and should be adequate. The GE CT units (Phase II) at Pinckneyville are equipped with diesel engines for starting and are capable of starting without any off site power (black start capable).
4.1.2.4 Plant Controls
A central digital control system is provided for the CTs and balance of plant equipment. The CTs are each provided with a GE "Mark 5" digital system tailored specifically for the PG6581B machine. A central digital control system of PLC type is provided for the balance of plant equipment and switchyard operation. The primary turbine control communications for operation and diagnostics will be through the SCADA interface located in the service building and the local panel located in the CT electrical enclosure. Remote operation capability will be provided to the Ameren dispatching office located in St. Louis.
4.1.2.5 Fire Protection System
The fire protection system for the Phase II units was extended from the Phase I system. Water from the city is stored in two storage tanks with 550,000-gallon capacity each. One tank is dedicated to raw water service and the other has a volume dedicated to fire water. Hydrants and fire monitors are connected to an underground firewater piping loop protecting the plant. Two 100% capacity motor driven main firewater pumps, a pressure maintenance jockey pump, and a two-hour fire water supply are provided in accordance with NFPA 850. One main pump operates on electricity generated by the plant. The other main pump operates on electricity from an independent source supplied to the facility.
The GE-supplied CT enclosure compartment is equipped with a CO2 fire protection system. A total of 14 heat detectors are provided arranged in three zones. The system can also be actuated manually at the CO2 bottle rack. The fire protection panel is located in the TCC. The design of these systems is the usual and accepted practice for simple cycle power plants.
4.1.2.6 Construction Status
The Pinckneyville Phase II Units went into commercial operation as follows:
Unit 5 June 26, 2001
Unit 6 June 18, 2001
Unit 7 June 27, 2001
Unit 8 July 28, 2001
Stone & Webster representatives visited the site on November 1, 2001. At that time, all construction contractors had left the site and the units were completely turned over to the operating contractor, SW. Genco is maintaining a punchlist of open issues left over from construction. Specific people are assigned the responsibility of resolving open items and the list is updated frequently. One significant item on the list was failure of the UPS that GE provided for their electrical/control unit. Apparently GE has had similar problems with a large number of UPS units from the same supplier. GE has accepted this as a warranty issue and has replaced the units. None of the items on the list, including the UPS failures, has any long-term implications for plant operations.
Another item on the punchlist was off-site upgrades to two substations. Under the unusual condition of having the Cahokia to Pinckneyville line out of service, the West Frankfort substation can limit total plant output (Phase I&II) to 319 MW. Ameren has indicated that upgrades to these substations, which will eliminate this constraint, will be completed by summer 2002.
A-59
4.1.3 Columbia
Columbia, a nominal 144 MW simple cycle plant, is located within the city limits of Columbia, Missouri north of highway 63 and east of State Route B. Road access is Route B. The plant site is owned by the City of Columbia and leased by Ameren.
The plant consists of four single fuel GE Energy Products Europe Model PG6581B CTs operating in simple cycle. Each CT is rated at approximately 36 MW output at 95°F. The CTs are equipped with dry low-NOx burners for NOx control. The GE scope of supply includes the air-cooled generators, diesel starting engine, lube oil system, closed loop auxiliary cooling system air intake filters, and the digital control system.
Additional major equipment at the site includes one demineralized water storage tank, electric switchyard, service building, municipal water supply system, and associated balance of plant equipment and systems. Demineralized water is hauled in for the turbine washes and potable water is supplied from the Columbia municipal water authority. Miscellaneous drains including turbine water wash drains and sanitary waste are directed to the Municipal sewer. Storm runoff is allowed to drain naturally.
Station perimeter fence and switchyard perimeter fence is provided. Natural gas metering and pressure regulation is located within the fenced area.
4.1.3.1 Combustion Turbine Generators
The August 21, 2000 executed contract with GE for the supply of eight (four for Columbia and four for Pinckneyville) PG 6581B CTs is complete and typical in its scope of supply, division of responsibility, and supply and service specifications. Details are provided in Section 4.1.2.1.
4.1.3.2 Interconnections
Natural gas for the Columbia plant is supplied to the site by a pipeline operated by AmerenUE. The maximum supply pressure is approximately 720 psig. The AmerenUE pressure regulator station is sized for four CT units operating at peak load. Two 50 percent dew point fuel gas heaters are provided for the site. This gas supply system is considered adequate.
Potable water is supplied to the site by the City of Columbia municipal water authority through an underground line. The single fuel GE PG581B engines do not require process water for operation. Raw water piping is installed and capped near the air inlet of each machine. This piping is for the possible future addition of evaporative coolers.
Demineralized water is required for periodic turbine water washes. The site has a demineralized water storage tank to store water for this purpose. Because of the small requirement for demineralized water, Genco does not intend to produce the water on site. Instead, the water will be purchased and delivered to the site by tanker truck. This arrangement is adequate because of the small water requirement of the GE engines.
Miscellaneous equipment drains, turbine water wash drains and sanitary waste are all directed to the City of Columbia municipal sewer which has been extended to the site. Water collected in transformer pit drains is inspected for oil and, if clean, released to the environment. Contaminated transformer pit drains are pumped out and hauled off site for proper disposal.
4.1.3.3 Auxiliary Power Systems
The electrical system consists of the 69 kV switchyard, 480V distribution systems and other systems including lighting, UPS, DC, etc. The generator output from Units 1 and 2 are bused together in the 15 kV switchgear and feed a single 13.8/69 kV main step-up transformer. Units 3 and 4 are arranged in a similar manner. Each unit is provided with a 13,800/480V unit auxiliary transformer to feed CT loads.
A-60
For common loads and CT startup loads, a double-ended 480 V load center is provided. Each end of this load center is fed from a 13,800/480V station service transformer. The design also includes provisions for connecting to offsite backup power through automatic transfer of sources. Backup power is the 13.8 kV line from the City of Columbia switchyard. The backup power source can be connected to each end of the 480V load center. This arrangement of the auxiliary electrical power system is usual and should be adequate. The GE CT units at Columbia are equipped with diesel engines for starting and are capable of starting without any off-site power (black start capable).
4.1.3.4 Plant Controls
A central digital control system is provided for the CTs and balance of plant equipment. The CTs are each provided with a GE "Mark 5" digital control system identical to those described previously.
4.1.3.5 Fire Protection System
The fire protection system is designed in accordance with all applicable fire protection codes. Firewater is supplied from a pipe connection to the City of Columbia water system. A fire protection pipe loop is provided around the perimeter of the site and supplies fire hydrants at appropriate locations.
The GE-supplied CT enclosure compartment is equipped with a CO2 fire protection system. A total of 14 heat detectors are provided and arranged in three zones. The system can also be actuated manually at the CO2 bottle rack. The fire protection panel is located in the TCC. The design of these systems is the usual and accepted practice for simple cycle power plants.
4.1.3.6 Construction Status
The Columbia units went into commercial operation as follows:
Unit 1 July 28, 2001
Unit 2 July 10, 2001
Unit 3 June 18, 2001
Unit 4 July 14, 2001
Stone & Webster representatives visited the site on October 31, 2001. At that time, all but one construction contractor had left the site and the units were completely turned over to the operating contractor, SW. The remaining construction contractor demobilized in November 2001. Genco is maintaining a punchlist of open issues left over from construction. Specific people are assigned the responsibility of resolving open items and the list is updated frequently. The only significant items on the list were a problem with loss of fuel pressure to the diesel and failure of the UPS that GE provided for their electrical/control unit. GE has accepted the latter as a warranty issue and has replaced the units.
4.2 Performance
4.2.1 Grand Tower
Performance Guarantees and Testing
Plant performance, based on Genco's documentation, is summarized in the following table. Note that there was no single contractor point of responsibility for performance guarantees in terms of net unit heat rate and net plant output for the repowered combined cycle plant. However, performance guarantees were provided for major new components (e.g., CTs and HRSGs).
A-61
Table 4.2-1. Grand Tower Performance Summary
| Item | Design / Projection | ||
|---|---|---|---|
| Base Load Capacity (net MW) | |||
| Unit 1/3 | 222 | ||
| Unit 2/4 | 235 | ||
| Base Load Heat Rate (Btu/kWh) | |||
| Unit 1/3 | 7,801 | ||
| Unit 2/4 | 7,328 | ||
| Maximum Capacity (fired HRSG, net MW) | |||
| Unit 1/3 | 249 | ||
| Unit 2/4 | 270 | ||
| Full Load Heat Rate (Btu/kWh) | |||
| Unit 1/3 | 8,190 | ||
| Unit 2/4 | 7,734 | ||
| Capacity Factor (%), avg 2002 - 2021 | |||
| Unit 1/3 | 31.6 | ||
| Unit 2/4 | 37.3 | ||
The Base Load Capacity in this table is the rating without duct burners and is more efficient and has a lower heat rate. Dispatch is normally based on the base load data and the duct burners will be used when demand increases sufficiently to justify adding less efficient capacity.
The repowered Unit 1/3 combined cycle was completed and in service for the summer peak season. The acceptance test was conducted on July 2 and the capacity demonstrated was 3% higher than the guarantee of 176,450 kW net, and the heat rate was 0.1% better than its guarantee of 9,326 Btu/kWh.
Unit 2/4 had its acceptance test on October 28, 2001 and its capacity exceeded guarantee by 3.3% and the heat rate was better than guarantee by 1.5%. During our visit, the unit was out of service to remove the fine mesh screen, which protects the steam turbine from weld spatter created during construction. Commercial operation was declared on December 6.
Actual Performance
Genco reported the following operating data for the partial year operation in 2001:
| • | Station gross generation: | Unit 1: 313,819 kWh, Unit 2: 95,410 kWh |
The availability of Unit 1 improved from 66% in July during the initial operation phase to 86% in August and the starting reliability improved from 56% in July to 100% in September. The overall performance of Unit 1 appears to be satisfactory. During our site visit, Unit 1 was operating successfully without any unusual alarms being annunciated in the control room. Genco reported that in November there was a four day forced outage caused by a fire system discharge into the CT enclosure, and in December there was a three day forced outage caused by a turbine cooling system flange leak. These should be one-time events that do not result in continuing problems.
A-62
An additional performance-related issue concerns the internal HRSG structural supports. After only a few hundred hours of operation, Genco observed that the supports were wearing, cracking, and in some cases failing. The failures were associated with supports for a gas distribution plate located at the inlet to the HRSG. Some warping of the distribution plate was also observed. The HRSG vendor, Nooter Corporation, has accepted responsibility for correcting the problem as a warranty repair. Nooter has upgraded the design of the supports as follows:
- •
- The plate thickness of all supports has been increased;
- •
- All the restraint pipes were replaced to ensure proper welding;
- •
- A total of six additional supports were added to each plate; and
- •
- Two horizontal stiffener bars were added to each plate.
These modifications were completed on April 24, 2002 and May 11, 2002 on Units1/3 and2/4, respectively, and are considered permanent repairs. Both units are now in service.
Another issue that arose during early operation was high gas mass flow exiting the CTs. Performance tests indicated that while CT performance guarantees were achieved, the gas flow was 12% higher than expected for Unit 1 and 7% higher for Unit 2. Normally, this increased flow would result in increased steam generation from the HRSGs and raise issues of associated design adequacy. This is not a concern at Grand Tower because the design incorporates supplemental duct burner firing, and at full unit output the duct burner firing rate can be reduced slightly to maintain steam flow at design conditions. The increased flow will also increase gas pressure in the HRSG, but Nooter has confirmed that the casing is structurally adequate for the increase. Lastly and although not presently planned, if an SCR is added to the HRSG in the future, the SCR design should reflect the increased gas flow. Nooter has not advised Genco of any additional concerns associated with the increased gas mass flow.
4.2.2 Gibson City
Performance Guarantees and Testing
SWPC guaranteed the following thermal performance for each of the two 501D5A CTs supplied to the Gibson City station:
| On natural gas: | ||||||
a. Net output | 113,075 kW | |||||
| b. Net heat rate | 10,061 Btu/kWh LHV | |||||
On fuel oil: | ||||||
a. Net output | 113,780 kW | |||||
| b. Net heat rate | 10,321 Btu/kWh LHV | |||||
These guarantees are based on the following conditions; ambient temperature 59°F, relative humidity 60%, barometric pressure 14.302 psia, evaporative cooler off, and wet compression off. Plant output can be increased by approximately 17% to 18% using the wet compression system combined with evaporative cooling.
Thermal performance tests have been conducted on both units for both natural gas and oil firing. Unit 1 was tested July 25, 2000 on gas and February 12, 2001 on oil. Unit 2 was tested August 3, 2000 on gas and January 11, 2001 on oil. The testing was done in accordance with SWPC document number 22T2380 "Specification for a Simple Cycle Thermal Performance Test on Four W501D5A Gas Turbines at the Ameren Gibson City & Kinmundy Projects". This procedure is based on the requirements of
A-63
ASME PTC-22. The results of the tests, corrected to the guarantee conditions, are summarized in the table below.
Table 4.2-2. Gibson City Performance Test Results
| Parameter | Unit 1 Gas | Unit 1 Oil | Unit 2 Gas | Unit 2 Oil | |||||
|---|---|---|---|---|---|---|---|---|---|
| Corrected Results Net Power (kW) Net Heat Rate (Btu/kWh) | 119,673 9,775 | 116,008 10,156 | 114,467 9,940 | 115,234 10,233 | |||||
| Guarantee Net Power (kW) Net Heat Rate (Btu/kWh) | 113,075 10,061 | 113,780 10,321 | 113,075 10,061 | 113,780 10,321 | |||||
| Difference Net Power (kW) Net Heat Rate (Btu/kWh) | +5.84 - -2.84 | % % | +2.0 - -1.6 | % % | +1.23 - -1.2 | % % | +1.3 - -0.9 | % % |
The results indicate that Unit 1 and Unit 2 met all the contractual thermal performance guarantees for both oil and gas firing.
Actual Performance
Genco reported the following operating data for the year 2001:
| • Station gross generation: | 92,097,000 kWh | |||||
| • Station net generation: | 89,456,000 kWh | |||||
| • Station capacity factor: | 4.48% |
Table 4.2-3. Gibson City Performance Summary
| Unit | Operating Hours | Net Heat Rate Btu/kWh | EAF % | |||
|---|---|---|---|---|---|---|
| 1 | 562 | 12,621 | 72.47 | |||
| 2 | 524 | 12,621 | 92.64 |
Market-Consultant-projected operating hours for 2001 for Units 1 and 2 were 263. As can be seen, the units operated more than these projections.
The heat rate shown above is a blended rate for the entire station that is calculated by dividing total fuel consumed by total net station generation. In some cases the calculation also includes power consumed at the station when the units are not in service. In addition, the actual heat rate is based on the higher heating value of the fuel whereas the guaranteed heat rate is based on the lower heating value. Because of these factors, the actual heat rate reported above will always be higher than the guaranteed heat rate. Stone & Webster has no information to indicate that the units are operating at other than their expected heat rate.
Stone & Webster expects the EAF for simple cycle CTs to exceed 90%. Gibson City Unit 2 exceeds this criterion. Unit 1 was out of service for a period of time for a combustor inspection. This accounts for the low availability of this unit.
A-64
4.2.3 Pinckneyville
Performance Guarantees and Testing
GE S&S Energy Products guaranteed the following thermal performance for each of the four LM6000PC Phase I CTs (Units 1-4) supplied to the Pinckneyville station:
| a. Output at generator terminal | 44,446 kW | |||||
| b. Heat rate | 8,811 Btu/kWh LHV |
Performance testing for Units 1 through 4 has been successfully completed, as reported earlier.
GE guarantees the following thermal performance for each of the four Phase II PG6581B CTs supplied to the station:
| On natural gas: | ||||||
a. Net output | 36,496 kW | |||||
| b. Net heat rate | 11,115 Btu/kWh LHV | |||||
The performance guarantee is based primarily on the following conditions:
- 1.
- Steady state continuous full load of the CTs,
- 2.
- Ambient temperature of 95°F, relative humidity 85%.
- 3.
- Barometric pressure 1.002 bar.
- 4.
- Generator power factor 0.80, lagging.
- 5.
- Generator frequency 60 Hz.
A-65
Thermal performance tests have been conducted on all units with natural gas firing. The tests were conducted from October 13 through 27, 2001. Testing was done in accordance with GE's test procedure GEK-28166A/GEI41067D. This procedure is based on the requirements of ASME PTC-22. The results of the tests, corrected to the guarantee conditions, are summarized in the table below.
Table 4.2-4. Pinckneyville Units 5-8 Performance Test Results
| Parameter | Averaged Results Units 5-8 | ||
|---|---|---|---|
| Corrected Results Net Power (kW) Net Heat Rate (Btu/kWh) | 36,178 10,663 | ||
| Guarantee Net Power (kW) Net Heat Rate (Btu/kWh) | 36,496 11,115 | ||
| Difference Net Power (kW) Net Heat Rate (Btu/kWh) | -0.87 - -4.06 | % % | |
| Uncertainty Allowance Net Power (kW) Net Heat Rate (Btu/kWh) | +/-3.01 +/-2.32 | % % |
The contract with GE for Units 5-8 stipulates that the tested performance of the four units be averaged and then compared to the performance guarantees. Also, the test procedure allows for a test uncertainty allowance. Based on these conditions, Units 5-8 met all the contractual thermal performance guarantees with gas firing.
Actual Performance
Genco reported the following operating data for the year 2001:
| • Station gross generation: | 118,938,000 kWh | |||||
| • Station net generation: | 109,486,857 kWh | |||||
| • Station capacity factor: | 5.98% |
Table 4.2-5. Pinckneyville Performance Summary
| Unit | Operating Hours | Net Heat Rate Btu/kWh | EAF % | |||
|---|---|---|---|---|---|---|
| 1 | 575 | 11,583 | 80.29 | |||
| 2 | 618 | 11,583 | 81.31 | |||
| 3 | 603 | 11,583 | 81.40 | |||
| 4 | 616 | 11,583 | 81.04 | |||
| 5 | 256 | 11,583 | 97.95 | |||
| 6 | 229 | 11,583 | 98.17 | |||
| 7 | 178 | 11,583 | 97.76 | |||
| 8 | 162 | 11,583 | 99.39 |
A-66
Market-Consultant-projected operating hours for Units 1 through 4 for 2001 were 832. Units 5, 6, and 7 were projected to operate for 88 hours and Unit 8 for 44 hours. As can be seen, Units 1 through 4 operated less than projected and Units 5 through 8 more than projected.
The heat rate shown above is a blended rate for the entire station that is calculated by dividing total fuel consumed by total net station generation. In the case of Pinckneyville, the heat rates for Units 1-4 are blended with the heat rates for Units 5-8. In some cases the calculation also includes power consumed at the station when the units are not in service. In addition, the actual heat rate is based on the higher heating value of the fuel whereas the guaranteed heat rate is based on the lower heating value. Because of these factors, the actual heat rate reported above will always be higher than the guaranteed heat rate. Stone & Webster has no information to indicate that the units are operating at other than their expected heat rate.
Stone & Webster expects the EAF for simple cycle CTs to exceed 90%. Pinckneyville Units 5 through 8 exceed this criterion. Units 1 through 4 are not equipped with anti-icing heaters in the air inlet ducts. Therefore, these units cannot be dispatched during icing conditions in winter. This time is counted as unavailable, which is the reason for the low availability numbers.
4.2.4 Kinmundy
Performance Guarantees and Testing
SWPC guarantees the following thermal performance for each of the two 501D5A CTs supplied to the Kinmundy station:
| On natural gas: | ||||||
a. Net output | 113,655 kW | |||||
| b. Net heat rate | 10,071 Btu/kWh LHV | |||||
On fuel oil: | ||||||
a. Net output | 114,360 kW | |||||
| b. Net heat rate | 10,335 Btu/kWh LHV | |||||
These guarantees are based on the following conditions; ambient temperature 59°F, relative humidity 60%, barometric pressure 14.406 psia, evaporative cooler off, and wet compression off. Plant output can be increased by approximately 17% to 18% using the wet compression system combined with evaporative cooling.
Thermal performance tests have been conducted on both units for both natural gas and oil firing. Unit 1 was tested April 9, 2001 on gas and May 4, 2001 on oil. Unit 2 was tested May 24, 2001 on gas and June 2, 2001 on oil. The testing was done in accordance with SWPC document number 22T2380 "Specification for a Simple Cycle Thermal Performance Test on Four W501D5A Gas Turbines at the Ameren Gibson City & Kinmundy Projects". This procedure is based on the requirements of ASME
A-67
PTC-22. The results of the tests, corrected to the guarantee conditions, are summarized in the table below.
Table 4.2-6. Kinmundy Performance Test Results
| Parameter | Unit 1 Gas | Unit 1 Oil | Unit 2 Gas | Unit 2 Oil | |||||
|---|---|---|---|---|---|---|---|---|---|
| Corrected Results Net Power (kW) Net Heat Rate (Btu/kWh) | 114,524 9,898 | 114,263 10,218 | 115,868 9,750 | 115,568 10,040 | |||||
| Guarantee Net Power (kW) Net Heat Rate (Btu/kWh) | 113,655 10,071 | 114,360 10,335 | 113,655 10,071 | 114,360 10,335 | |||||
| Difference Net Power (kW) Net Heat Rate (Btu/kWh) | +0.76 - -1.72 | % % | -0.08 - -1.13 | % % | +1.95 - -3.19 | % % | +1.06 - -2.85 | % % |
The results indicate that Unit 1 and Unit 2 met all the contractual thermal performance guarantees with the exception of Unit 1 net power on oil. This small deficiency has not prevented Genco from accepting the Unit.
Actual Performance
Genco reported the following operating data for the year 2001:
| Station gross generation: | 82,433,000kWh | |||||
| Station net generation: | 78,559,000kWh | |||||
| Station capacity factor: | 5.63% |
Table 4.2-7. Kinmundy Performance Summary
| Unit | Operating Hours | Net Heat Rate Btu/kWh | EAF % | |||
|---|---|---|---|---|---|---|
| 1 | 473 | 12,576 | 96.89 | |||
| 2 | 397 | 12,576 | 97.64 |
Market-Consultant-projected operating hours for 2001 for Units 1 and 2 were 219. As can be seen, the units operated more than projected.
The heat rate shown above is a blended rate for the entire station that is calculated by dividing total fuel consumed by total net station generation. In the case of Kinmundy, this procedure blends gas and oil firing data together. In some cases the calculation also includes power consumed at the station when the units are not in service. In addition, the actual heat rate is based on the higher heating value of the fuel whereas the guaranteed heat rate is based on the lower heating value. Because of these factors, the actual heat rate reported above will always be higher than the guaranteed heat rate. Stone & Webster has no information to indicate that the units are operating at other than their expected heat rate.
Stone & Webster expects the EAF for simple cycle CTs to exceed 90%. The Kinmundy units exceed this criterion.
A-68
4.2.5 Columbia
Performance Guarantees and Testing
GE guarantees the following thermal performance for each of the four PG6581B CTs supplied to the Columbia station:
On natural gas:
| a. Net output | 36,496 kW | |||
| b. Net heat rate | 11,115 Btu/kWh LHV |
The performance guarantee is based primarily on the following conditions:
- 1.
- Steady state continuous full load of the CTs,
- 2.
- Ambient temperature of 95°F, relative humidity 85%.
- 3.
- Barometric pressure 1.002 bar.
- 4.
- Generator power factor 0.80, lagging.
- 5.
- Generator frequency 60 Hz.
Thermal performance tests have been conducted on all units with natural gas firing. The tests were conducted from October 13 through 27, 2001. Testing was done in accordance with GE's test procedure GEK-28166A/GEI41067D. This procedure is based on the requirements of ASME PTC-22. The results of the tests, corrected to the guarantee conditions are summarized in the table below.
Table 4.2-8. Columbia Units 1-4 Performance Test Results
| Parameter | Averaged Results Units 1-4 | ||
|---|---|---|---|
| Corrected Results | |||
| Net Power (kW) | 36,410 | ||
| Net Heat Rate (Btu/kWh) | 10,775 | ||
| Guarantee | |||
| Net Power (kW) | 36,496 | ||
| Net Heat Rate (Btu/kWh) | 11,115 | ||
| Difference | |||
| Net Power (kW) | -0.24 | % | |
| Net Heat Rate (Btu/kWh) | -3.06 | % | |
| Uncertainty Allowance | |||
| Net Power (kW) | +/-3.01 | % | |
| Net Heat Rate (Btu/kWh) | +/-2.32 | % |
The contract with GE for the Columbia units stipulates that the tested performance of the four units be averaged and then compared to the performance guarantees. Also, the test procedure allows for a test uncertainty allowance. Based on these conditions, Units 1-4 met all the contractual thermal performance guarantees with gas firing.
A-69
Actual Performance
Genco reported the following operating data for the year 2001:
| • | Station gross generation: | 13,924,000 kWh | ||
| • | Station net generation: | 13,869,000 kWh | ||
| • | Station capacity factor | 2.05% |
Table 4.2-9. Columbia Performance Summary
| Unit | Operating Hours | Net Heat Rate Btu/kWh | EAF % | |||
|---|---|---|---|---|---|---|
| 1 | 102 | 14,277 | 91.89 | |||
| 2 | 127 | 14,277 | 91.29 | |||
| 3 | 113 | 14,277 | 87.98 | |||
| 4 | 121 | 14,277 | 95.78 |
The heat rate shown above is a blended rate for the entire station as described earlier. In some cases the calculation also includes power consumed at the station when the units are not in service. In addition, the actual heat rate is based on the higher heating value of the fuel whereas the guaranteed heat rate is based on the lower heating value. Because of these factors, the actual heat rate reported above will always be higher than the guaranteed heat rate. Stone & Webster has no information to indicate that the units are operating at other than their expected heat rate.
Stone & Webster expects the EAF for simple cycle CTs to exceed 90%. The Columbia units exceed this criterion, except for Unit 3.
4.3 Operation and Maintenance
4.3.1 Grand Tower
4.3.1.1 Station Staffing Levels
The Grand Tower staff is divided into three areas: production, technical services and administration. The production includes operations and maintenance. There are 4 operating shifts with 4 operators per shift, except for the day shift, which has 5 operators. The maintenance staff includes 9 mechanics, 3 electricians and 2 instrument and control technicians. There are a total of 51 employees.
Contract personnel will be used for some maintenance work, including major overhauls. The projected staffing level is adequate for the planned mode of operation. The numbers are typical of those found in similarly configured plants that Stone & Webster has reviewed.
4.3.1.2 Operation and Maintenance Expenses
The projected O&M expenses for 2002 through 2021 are summarized in the following table.
Table 4.3-1. Grand Tower O&M Budget Forecast
| Year | ($000) | |
|---|---|---|
| 2002 | $7,071 | |
| 2003 | $7,843 | |
| 2004 | $5,271 | |
| 2002-2021 (avg) | $8,451 |
A-70
The future budget for operation and maintenance is considered reasonable and is consistent with similar plants that Stone & Webster has reviewed. These budgeted costs should be sufficient to maintain safe and reliable operation as projected.
4.3.1.3 Overhaul Schedule
Stone & Webster reviewed Genco's planned overhaul and maintenance schedule. The CT combustor overhaul will occur on an interval of every 8,000 equivalent operating hours. Considering the capacity factor projections, these combustor overhauls are expected about every two to three years. The turbine hot path inspections will be every 24,000 equivalent operating hours, and the major CT overhauls will be scheduled every 48,000 equivalent hours. These intervals reflect the recommendations of the turbine manufacturer. The steam turbine overhauls are scheduled for the years 2009 and 2018 at Unit 1/3 and the years 2008 and 2017 at Unit 2/4.
4.3.1.4 Capital Expenditures
The future capital budget includes the selected items shown below. Common projects include fire protection facilities ($950,000), retirement of coal handling structures ($1,650,000 over the 2003-2013 period) and controls upgrade ($2,000,000).
Table 4.3-2. Capital Projects: Grand Tower
| Description | Year | $(000) | |||
|---|---|---|---|---|---|
| Fire Protection Facilities | 2002 - 2004 | $ | 950 | ||
| Rewind Stator—Unit 2 | 2017 | $ | 900 | ||
| Oil Circuit Breaker—Unit 1 | 2006 | $ | 1,000 | ||
| Retube Condenser—Unit 2 | 2006 | $ | 1,600 | ||
| Retirement of Coal Handling Structures | 2003 - 2013 | $ | 1,650 | ||
| Controls Upgrade | 2012 | $ | 2,000 | ||
| Replace HP inner cylinder—Unit 2 | 2017 | $ | 3,000 | ||
| Replace HP casing—Unit 1 | 2011 | $ | 4,260 | ||
4.3.2 CT Stations (Gibson City, Kinmundy, Pinckneyville and Columbia)
Operation and maintenance for Gibson City, Kinmundy, Pinckneyville, Elgin(2) and Columbia power plants are provided for under a single contract with Siemens Westinghouse Operating Service Company. All of the plants are simple cycle combustion turbine peaking facilities. Stone & Webster reviewed the Operations and Maintenance Agreement (amended and restated) between AmerenEnergy Generating Company ("Owner") and SW (also "Operator"). The amended and restated agreement is dated May 12, 2001. The term of the contract is from October 11, 1999 to May 31, 2010 unless extended by the parties or terminated earlier as allowed in the agreement. Most of the terms and conditions are consistent with those described in Stone & Webster's October 2000 report.
- (2)
- Elgin is a peaking plant under construction in northern Illinois that is not part of this financing. Its capacity and generation have not been included in the Financial Model.
One area of difference is that Gibson City and Kinmundy have SWPC CTs while Pinckneyville and Columbia have GE CTs. The division of responsibility between the Owner and Operator are somewhat different for the plants with GE CTs versus the plants with SWPC CTs (i.e., where Operator's affiliate
A-71
supplied the turbines). The following highlights terms and conditions that apply to Pinckneyville and Columbia, the GE facilities:
- •
- The contract requires seven technicians at Pinckneyville and four at Columbia. For Pinckneyville and Columbia this staff is in place. This is sufficient to perform the duties of the Operator.
- •
- The Operator is responsible for training the personnel to operate the plant except that the Owner will pay for training specific to the GE CTs.
- •
- For the GE plants, the owner may purchase the parts from GE.
- •
- For Pinckneyville and Columbia (GE plants) the owner is responsible for many of the routine O&M costs that are the Operator's responsibility at Gibson City and Kinmundy (SWPC plants). Examples include training, CT and BOP spare parts, consumables, software, travel, vendor representatives, etc.
- •
- The fixed operating fee for the plants will be paid on a monthly basis and escalated each year. The monthly fee is to be paid as follows:
Table 4.3-3. Fixed Operating Fee for CT Plants
| Amount | Dates | Description | |||
|---|---|---|---|---|---|
| $ | 66,366/month | May 1, 2000—May 31, 2001 | Pinckneyville Phase I | ||
| $ | 94,355/month | June 1, 2001—May 31, 2010 | Pinckneyville Phase I & II | ||
| $ | 54,334 | June 1, 2001—May 31, 2010 | Columbia | ||
We believe the agreement is reasonable. Stone & Webster's observations during the site visit and discussions with the Owner and Operator were favorable. The contract appears to be working well. The plants appeared to be properly staffed and the personnel appeared to be experienced and motivated, and the operating personnel took pride in their respective plants.
4.3.2.1 Gibson City
The following actual O&M costs have been incurred at Gibson City for the year 2001:
Table 4.3-4. Gibson City 2001 O&M Costs
| Description | Value | ||
|---|---|---|---|
| Natural Gas Cost | $ | 5,766,118 | |
| Fuel Oil Cost | $ | 1,030,647 | |
| Operation Cost | $ | 753,107 | |
| Maintenance Cost | $ | 866,092 | |
| Total Cost | $ | 8,415,963 | |
The operation and maintenance costs (less fuel) shown above and Genco's projected O&M cost for 2002 (and escalated out to 2021) of approximately $2,544,000 ($10.9/kW) is consistent with other similar units.
An order for spare parts was issued with a total order value of $3,103,284. All parts are now on hand, in inventory. Stone & Webster considers this inventory to be adequate.
A-72
4.3.2.2 Pinckneyville
The following actual O&M costs have been incurred at Pinckneyville for the year 2001:
Table 4.3-5. Pinckneyville 2000 and 2001 O&M Costs
| Description | Value (2000) | Value (2001) | ||||
|---|---|---|---|---|---|---|
| Natural Gas Cost | $ | 2,433,639 | $ | 6,911,672 | ||
| Operation Cost | $ | 516,799 | $ | 950,012 | ||
| Maintenance Cost | $ | 588,889 | $ | 842,164 | ||
| Total Cost | $ | 3,539,327 | $ | 8,703,848 | ||
The operation and maintenance costs (less fuel) shown above and Genco's projected O&M cost for 2002 (and escalated out to 2021) of approximately $3,287,000 ($10.3/kW) is consistent with other similar units.
An order for Phase I spare parts was issued with a total order value of $800,633 and a Phase II order was issued with a total value of $487,452. All parts are now on hand, in inventory. Stone & Webster considers this inventory to be adequate.
4.3.2.3 Kinmundy
The following actual O&M costs have been incurred at Kinmundy for the year 2001:
Table 4.3-6. Kinmundy 2001 O&M Costs
| Description | Value | ||
|---|---|---|---|
| Natural Gas Cost | $ | 4,750,853 | |
| Fuel Oil Cost | $ | 709,393 | |
| Operation Cost | $ | 633,344 | |
| Maintenance Cost | $ | 686,143 | |
| Total Cost | $ | 6,779,732 | |
The operation and maintenance costs (less fuel) shown above are low for simple cycle units. However, Genco's projected O&M cost for 2002 (and escalated out to 2021) of approximately $2,185,000 ($9.3/kW) is consistent with other similar units.
An order for spare parts was issued with a total order value of $3,103,284. All parts are now on hand, in inventory. Stone & Webster considers this inventory to be adequate.
4.3.2.4 Columbia
The following actual O&M costs have been incurred at Columbia for the year 2001:
Table 4.3-7. Columbia 2001 O&M Costs
| Description | Value | ||
|---|---|---|---|
| Natural Gas Cost | $ | 962,188 | |
| Operation Cost | $ | 249,650 | |
| Maintenance Cost | $ | 295,263 | |
| Total Cost | $ | 1,507,101 | |
A-73
The operation and maintenance costs (less fuel) shown above are low for simple cycle units. However, Genco's projected O&M cost for 2002 (and escalated out to 2021) of approximately $4,498,000 ($0.4/kW) is consistent with other similar units.
An order for spare parts was issued with a total order value of $487,451. All parts are now on hand, in inventory. Stone & Webster considers this inventory to be adequate.
4.4 Environmental Compliance and Permitting
The Gibson City, Kinmundy and Pinckneyville sites are "greenfield" sites. Although the Columbia site is located within an area that has been designated for industrial development, this site is also considered to be a greenfield site in that there is no documented previous usage as an industrial site. Stone & Webster did not document any significant environmental conditions with regard to these sites that could preclude their development and usage for power generation. The Grand Tower site is a "brownfield" site in that a generating station was operating at the site prior to the conversion to combined cycle. Items which have been changed or modified since Stone & Webster's October 2000 report are summarized in the following sections.
With regard to permitting status, all environmental construction permits for the Gas-fired Stations were acquired previously. Applications for the Title V (operating) permits, including documentation of initial compliance with atmospheric emission limits, have been submitted to the appropriate regulatory agencies for each station except Grand Tower. Submittal of the Title V permit application for Grand Tower is expected within the prescribed time frame. Genco is authorized to operate under the terms of the construction permits until such time as the Title V permits are issued.
Specific issues are addressed in the following sections.
4.4.1 Grand Tower
The repowered Grand Tower is currently in commercial operation. Units 1 and 2 (combustion turbines) commenced commercial operation in June and December 2001, respectively. Stone & Webster reviewed the October 2001 emission test results for the new units at Grand Tower. These test results indicated that Grand Tower is capable of complying with its new air permit conditions.
Emissions, effluents or solid waste generation reports are not yet available for Grand Tower. To Stone & Webster's knowledge (based on interviews with Ameren personnel), this station has operated in compliance with all of its environmental permits and authorizations, with the following exceptions. With regard to the NPDES Permit, there were four exceedances at Outfall 002 (ash pond) for boron during operation of the former coal-fired units, and three exceedances at Outfall 003A (sewage treatment plant) for BOD5. According to Ameren, IEPA has not issued any NOVs to Ameren for these exceedances.
A-74
Gibson City is currently in commercial operation. Units 1 and 2 (combustion turbines) commenced first operation in June and July 2000, respectively. Stone & Webster reviewed the results of emission testing for these units that was conducted in accordance with the air permits. These test results demonstrated compliance with permit conditions.
To Stone & Webster's knowledge, based on interviews with Ameren personnel, this station has operated in compliance with all of its environmental permits and authorizations, with one exception. The one exception was a relatively insignificant exceedance of the hourly NOx emission rate (156 vs. 136 lb/hr). To Stone & Webster's knowledge, there has been no recurrence of this event, nor did the IEPA issue a NOV for this exceedance.
4.4.3 Pinckneyville
Pinckneyville is currently in commercial operation. Air Construction Permit No. 99090035 was issued on November 9, 1999 by the IEPA to Ameren Intermediate Holding Company, Inc. for Phase I to include four simple-cycle combustion turbines with associated emission controls and other equipment. Stone & Webster reviewed a copy of this permit and has the following observations:
- •
- Each of the four combustion turbines (Units 1 - 4) is permitted for a nominal generating capacity of 48.5 MWe and a rated (maximum) heat input of 444 MMBtu/hr.
- •
- The combustion turbines are subject to new source performance standards ("NSPS"). Each combustion turbine is equipped with inlet chillers for power augmentation and water injection for NOx control. However, SCR units were not required.
- •
- The owner has further committed to a maximum of less than 200 tons per year of any regulated air pollutant in order to avoid prevention of significant deterioration ("PSD") permitting and the requirement for public notice.
- •
- The facility is required to install CEMS for NOx emissions.
- •
- The facility is required to install CEMS or conduct fuel monitoring for SO2 emissions.
- •
- The facility is required to conduct environmental performance testing during the initial six months of operation to demonstrate compliance with permit conditions.
Air Construction Permit No. 00090076 was issued on February 9, 2001 by the IEPA to AmerenEnergy Generating Company for Phase II to include four simple-cycle combustion turbines with associated emissions control and other equipment. Stone & Webster reviewed a copy of this permit and has the following observations:
- •
- The facility is permitted for the combustion of pipeline natural gas, only.
- •
- Each of the four combustion turbines (Units 5 - 8) is permitted for a nominal generating capacity of 48 MWe and a rated (maximum) heat input of 552.5 MMBtu/hr.
- •
- The combustion turbines are subject to NSPS. Each combustion turbine is equipped with dry low-NOx combustors for NOx control. However, SCR units were not required.
- •
- The owner has further committed to a maximum of less than 250 tons per year of any regulated air pollutant in order to avoid PSD permitting and the requirement for public notice (NOx at 230 tons per year is the governing air pollutant). Significantly, Phase II was considered to be a separate project from Phase I for PSD purposes.
- •
- The permit includes lb/hr and lb/MMBtu emission limits for NOx CO, volatile organic matter ("VOM"), particulate matter ("PM/PM10") and SO2 during "normal" operations. The permit
A-75
- •
- The permit includes NOx, CO and VOM emission limits for the two indirect gas heaters.
- •
- The permit includes NOx, CO, SO2 and VOM emission limits for the four reciprocating startup engines. These engines are permitted to fire either diesel fuel or natural gas.
- •
- The facility is required to install CEMS for combustion turbine NOx emissions.
- •
- The facility is required to conduct fuel monitoring for SO2 emissions.
- •
- The facility is required to conduct environmental performance testing during the initial six months of operation to demonstrate compliance with permit conditions.
also includes lb/hr and lb/MMBtu emissions limits for CO and VOM emissions at reduced load (less than 60%) conditions.
Stone & Webster noted that the Phase II air permit does not specifically address the evaporative coolers used for power augmentation on these combustion turbines. Evaporative coolers are not installed at this time, however, supply and drain piping for future coolers has been installed and capped. No decision has been made to install coolers at this time.
Ameren negotiated a contract with the City of Pinckneyville effective June 12, 2000 for supply of municipal (potable) water during Phase I in amounts of 320 gpm maximum, 215 gpm 24-hour average during Phase I, and "minimally treated raw water" in amounts of 830 gpm maximum, 500 gpm 24-hour average during Phase II. Phase I of this agreement was originally in effect for one year only. This agreement was amended on May 15, 2001 to extend the period for furnishing potable water until such time as "minimally treated raw water" will be available. During Phase I, potable water would be supplied through a new eight-inch water line to be constructed by Ameren and ceded to the City. In preparation for Phase II, Ameren is to refurbish existing and construct new water supply equipment to pump raw water from Beaucoup Creek to City Lake. This raw water will then be treated (settling, stabilization and, possibly, disinfection) in refurbished/new units prior to being pumped to the Pinckneyville station for industrial usage to supplement the potable water supplied to this station during Phase II.
This two-phase mode of water supply is predicated upon two site constraints. First, the City of Pinckneyville was initially unable to make a long-term commitment to supply potable water at a rate sufficient to meet this power station's predicted site needs. Second, since the City adds fluoride as part of its potable water treatment system, Ameren was concerned that the concentrating effect of the station's cooling towers would result in blowdown fluoride concentrations that would be too high for direct discharge.
On January 11, 2002, Ameren signed an amended agreement with the City of Pinckneyville for the supply of city water to this station. This amended agreement provides the Pinckneyville station with up to 354 gpm of potable water until March 31, 2002, after which the City agrees to supply 354 gpm of minimally treated water (i.e., water free of fluorides) to the Pinckneyville station for industrial use. Stone & Webster notes that this quantity of water is more than what was originally provided during the initial phase of the previous agreement. This amount of water should be sufficient for both Phases I and II, unless Ameren decides to install evaporative coolers for the Phase II power generating units in the future (an option not considered in the performance projections).
Ameren obtained Water Pollution Control ("WPC") Permit No. 2000-EE-0708 from IEPA for the pretreatment and hauling of industrial and sanitary wastewaters (but not stormwater) generated at the Pinckneyville station to the City of Pinckneyville Sewage Treatment Plant ("STP") No. 1 (old plant). This permit was issued by IEPA on May 24, 2000 and revised on June 2, 2000. This permit expires on April 30, 2005.
A-76
Separately, Ameren submitted an application to IEPA on October 12, 2001 for a NPDES Permit authorizing the direct discharge of treated industrial wastewaters from the Pinckneyville station to White Walnut Creek, a tributary of Beaucoup Creek. Outfall 001 will be composed predominately of blowdown from the Phase I cooling towers, which utilize chemical additives. Outfall 001 will also include wastewater drained from miscellaneous equipment and turbine cleaning wash water, both of which will be treated in the Phase I oily water separator prior to being mixed with cooling tower blowdown for combined discharge. Outfall 002 will be composed entirely of blowdown from the Phase II evaporative coolers, which do not utilize any chemical additives. Separately, Ameren plans to install dechlorination equipment on the outfall in the near future.
Sanitary wastewaters and other "special" wastewaters will continue to be hauled to the City of Pinckneyville STP No. 1 for treatment and discharge under the permit discussed previously. According to Ameren, trailer-mounted equipment is used for generation of demineralized water and there are no regeneration wastes generated at this site.
Ameren submitted a Notice of Intent ("NOI") to IEPA for coverage under NPDES General Storm Water Permit No. ILR105094 during Phase I construction. This NOI was amended to cover site construction for Phase II as well.
According to Ameren, a permit for the discharge of stormwater from non-process areas during operations in not required by local, State or Federal regulations. Separately, the spill prevention, countermeasure and control ("SPCC") plan for this site is currently being updated to include Phase II.
Pinckneyville is currently in commercial operation. Units 1 through 4 (Phase I) commenced operation in June and July 2000 and Units 5 through 8 (Phase II) commenced operation in June and July 2001. Stone & Webster received copies of the environmental performance test results for Units 1 through 4 and Units 5 through 8, which indicated that these units met their permit limits.
To Stone & Webster's knowledge, based on interviews with Ameren personnel, this station has operated in compliance with all of its environmental permits and authorizations, with one exception. The one exception was a relatively insignificant exceedance of the hourly NOx emission rate. To Stone & Webster's knowledge, there has been no recurrence of this event, nor did the IEPA issue a NOV for this exceedance.
Since there will not be any onsite treatment, storage or disposal ("TSD") facilities for the management of hazardous waste, a Resource Conservation and Recovery Act ("RCRA") permit for this site is not required. Since construction personnel were not on site, material safety data sheet ("MSDS") collections could not be reviewed. All solid wastes from construction activities were being properly managed for offsite disposal.
4.4.4 Kinmundy
Kinmundy is now in commercial operation. Air Construction Permit No. 99020027 was issued on June 28, 1999 by the IEPA to Union Electric Development Corporation for Kinmundy. Stone & Webster reviewed a copy of this permit and has the following observations:
- •
- The facility is permitted for the combustion of pipeline natural gas and distillate fuel oil.
- •
- The combustion turbines are subject to NSPS. Each combustion turbine is equipped with water injection for NOx control (oil firing).
- •
- The permit includes separate lb/hr emission limits for NOx CO, VOM, PM/PM10 and SO2 during gas and oil-firing operations. However, the permit only includes one (combined) ton per year emission limit for each of these air pollutants.
A-77
- •
- The owner has further committed to a maximum of less than 250 tons per year of any regulated air pollutant in order to avoid PSD permitting.
- •
- The facility is required to install CEMS for combustion turbine NOx emissions.
- •
- The facility is required to conduct fuel monitoring for SO2 emissions.
- •
- The facility is required to conduct environmental performance testing during the initial six months of operation to demonstrate compliance with permit conditions. Separate tests must be conducted for burning of natural gas and fuel oil.
Ameren has also received the Acid Rain Program Phase II Permit for this station.
Stone & Webster received and reviewed a copy of the following water supply agreements:
- •
- Water Supply Contract dated May 15, 2000 between Ameren and the City of Salem
- •
- Water Supply Contract dated May 4, 2000 between Northeast Marion County Water Company and FMC Water Company
- •
- Amended Water Purchase Contract dated May 15, 2000 between the City of Salem and Northeast Marion County Water Company
According to these agreements, the City of Salem agrees to supply FMC with up to 50,000 gallons per day of potable water to supplement FMC's existing supplies of water to supply water to Kinmundy station.
NPDES Permit No. IL0075001 was issued on May 3, 2001 by IEPA to Genco for the Kinmundy station. This NPDES permit expires on April 30, 2006. Stone & Webster reviewed a copy of this permit and noted that it authorizes the discharge of station wastewaters through one outfall (001) to surface receiving water(s). Outfall 001 is limited to miscellaneous equipment and floor drain wastewater, including floor drain wastewater from the transformer and fuel oil containment areas and fuel oil unloading area. At Ameren's request, all references to "evaporative cooler" blowdown as part of the discharge at Outfall 001 were removed. Since Outfall 001 does not include evaporative cooler blowdown, monitoring and reporting requirements and limitations for temperature, total residual chlorine, copper and fluoride were removed.
In addition to the NPDES Permit, IEPA issued WPC Permit No. 2001-EE-1724 to Genco on May 16, 2001. This permit expires on April 30, 2006. The WPC permit includes a description of the wastewater streams and authorization to construct the treatment equipment listed in the NPDES permit discussed above. In addition, the WPC Permit authorizes hauling of collected turbine cleaning wastewater to the Village of Patoka STP in the amount of 130 gallons per day on an intermittent basis. This wastewater must be sampled and analyzed once per month prior to discharge to the STP for pH, oil & grease and total dissolved solids.
Stone & Webster noted that neither the NPDES nor the WPC Permit addressed sanitary wastes, although the 8/15/2000 permit application described the storage and management of sanitary waste. It noted a variance from Monroe County for the installation of a 1500 gallon sanitary waste storage tank. At the time of the application, a location to receive the hauled waste had not been determined.
IEPA approved coverage of construction activities for Kinmundy under NPDES Storm Water Permit No. ILR104978. This permit required preparation of a stormwater pollution prevention plan ("SWPPP") to address construction activities.
Stone & Webster received copies of the stormwater discharge permit(s) for operation of Kinmundy and the SPCC Plan for this station. No issues were noted.
A-78
Units 1 and 2 commenced operation in April and May 2000, respectively. As noted previously, separate environmental performance tests for gas and oil firing are required for each of these units. Stone & Webster received copies of environmental performance testing for Kinmundy which documented compliance with NSPS emission limits for NOx, CO and PM.
Stone & Webster did not receive copies of emissions, effluents or solid waste generation reports for Kinmundy. To our knowledge, however, this station has operated in compliance with all of its environmental permits and authorizations, with the following exception. Stone & Webster reviewed a copy of a letter dated October 2, 2001 from Ameren to IEPA. On August 27, 2001 an exceedance of the hourly NOx emission limit of 136 lb/hr as stated in Special Condition No. 3b of the construction permit for natural gas firing occurred at Kinmundy. The daily CEMS summary report indicated that the duration of this excursion lasted approximately four hours. This exceedance was due to an incorrect fuel parameter in the control system for Unit 1. The incorrect fuel parameter caused more fuel to be supplied to the burners than was necessary and resulted in abnormally high NOx concentrations in the exhaust gas. After the incident occurred, SWPC personnel with control system expertise were called to investigate. They discovered that an incorrect fuel parameter had been inadvertently entered into the control system logic (the fuel parameter was off by a factor of 10). The correct fuel parameter was entered into the control system logic and the unit was returned to service. To Stone & Webster's knowledge, there has been no recurrence of this event, nor did the IEPA issue a NOV for this exceedance.
4.4.5 Columbia
Columbia is currently in commercial operation. The Columbia site is located within an area zoned by the city for industrial development. This site is in Boone County, which is an attainment area for all criteria air pollutants.
Air Construction Permit No. 012001-25 was (re)issued by the Missouri Department of Natural Resources ("MDNR") to Genco for Columbia on May 29, 2001. This permit includes four 48 MW simple-cycle combustion turbines with associated emission controls, two 5.77 MMBtu/hr fuel heaters and four 5.2 MMBtu/hr startup engines. Stone & Webster reviewed a copy of this permit and has the following observations:
- •
- The combustion turbines and the fuel heaters are permitted to fire pipeline natural gas, only.
- •
- The startup engines are permitted to fire diesel fuel, only.
- •
- The combustion turbines are subject to NSPS. Each combustion turbine is equipped with dry low-NOx combustors for NOx control. SCR units were not required.
- •
- The owner has further committed to a maximum of less than 100 tons per year of any regulated air pollutant in order to avoid PSD permitting.
- •
- The facility is required to install CEMS for NOx emissions.
- •
- The facility is required to install CEMS or conduct fuel monitoring for SO2 emissions.
- •
- The facility is required to conduct environmental performance testing during the initial six months of operation to demonstrate compliance with permit conditions; specifically, NOx for one of the fuel heaters, CO for one of the combustion turbines, PM10 for one of the startup engines (if the total operational time of the four startup engines exceeds 250 minutes during any consecutive 24 hour period).
Potable water will be supplied by the City of Columbia. This station will not require city water for industrial usage on a normal basis. Demineralized water will be delivered by truck for turbine washing.
A-79
All drains at Columbia station drain to sumps that are equipped to capture floating oils. Oil-free wastewaters are discharged to the Columbia city sewer along with sanitary wastewater from this station.
Stormwater is not discharged to the city sewer. Since this facility is located within the city limits, a permit for discharge of stormwater during construction was not required. According to Ameren, a permit for the discharge of stormwater from non-process areas during operations in not required by local, State or Federal regulations. Stone & Webster did receive a copy of the authorization issued by MDNR for discharge of wastewaters resulting from hydrostatic testing of petroleum-related oil and gas pipelines and storage tanks at Columbia.
According to Ameren, the SPCC plan for this site is currently being certified.
Since there will not be any onsite TSD facilities for the management of hazardous waste, a RCRA permit for this site is not required. Since construction personnel were not on site, MSDS collections could not be reviewed. All solid wastes from construction activities were being properly managed for offsite disposal.
Columbia is currently in commercial operation. Units 1 through 4 commenced operation in June and July 2001. Stone & Webster reviewed the results of emissions testing for these units that was conducted in accordance with the air permits. These test results demonstrated compliance with permit conditions.
Stone & Webster did not receive copies of emissions, effluents or solid waste generation reports for Columbia. To our knowledge, however, this station has operated in compliance with all of its environmental permits and authorizations.
Stone & Webster reviewed a copy of the Ground Lease Agreement dated February 5, 2001 between the City of Columbia and Ameren Energy Development Company for the Columbia Power Station. This agreement has a term of forty years, plus four successive five year renewal options. This agreement includes a clause wherein Ameren indemnifies the City for any property damages associated with Ameren's activities at this site and stipulates that Ameren shall be responsible for any mitigation costs associated with contamination of this property that occurs subsequent to the effective date of this agreement. In return, the City stated that, to the best of its knowledge, this property has not been affected by the presence of any hazardous, toxic or other polluting materials, nor are there any flood prone areas, wetlands or habitat for endangered species at this site, nor are there now or has there ever been any underground storage tanks at this site. However, Ameren did not exercise its right under this agreement to conduct a Phase I ESA or otherwise independently confirm the environmental condition of this site prior to construction.
A-80
FINANCIAL PROJECTIONS
Stone & Webster reviewed the Financial Model developed by Ameren. Stone & Webster has reviewed the assumptions, data, and calculations necessary to support the projections of cash flow available for debt service. We have verified that the underlying model assumptions are consistent with the current condition and expected performance of the generating units. Stone & Webster has validated key calculations to ensure that the resulting revenues, expenses, cash flow, and DSCRs were correctly calculated. Stone & Webster has not reviewed the tax and depreciation assumptions, which were provided by Ameren, nor the financing assumptions, which were provided by Lehman Brothers.
In the review of the Financial Model, Stone & Webster made certain assumptions with respect to conditions that may exist or events that may occur in the future. In addition, Stone & Webster has used data and information, provided to us, which we believe to be reliable. We believe that the use of these assumptions and data are reasonable for the purpose of our Report. However, some assumptions may differ significantly from actual future conditions due to unanticipated events and circumstances. To the extent that actual future conditions differ from those assumed herein, the actual results will vary from those forecast. Principal considerations and assumptions used by Stone & Webster in reviewing the Financial Model include the following:
- •
- Stone & Webster has assumed that all contracts, agreements, rules and regulations will be fully enforceable in accordance with their terms and that all parties will comply with the provisions of their respective agreements.
- •
- The market revenue projections were prepared by the Market Consultant as outputs of its market pricing model. Contract revenue projections were prepared by Ameren. Stone & Webster has reviewed the technical inputs to the market pricing model. In addition, Stone & Webster reviewed the technical aspects of the wholesale and retail contracts associated with the Genco revenue projections through 2014 and finds the demand capacity, term and pricing of the contracts consistent with that reflected in the Financial Model.
- •
- The Financial Model assumes that only the Coal-fired Stations and Gas-fired Stations described throughout this Report are included in the projections.
- •
- Stone & Webster reviewed the 20-year operating plans prepared by Genco. We assume that Genco will operate the Assets in accordance with the operating plans. Stone & Webster did not review cost or performance projections beyond the twenty-year period reflected in the Financial Model.
- •
- Stone & Webster has assumed that all licenses, permits and approvals will be obtained and/or renewed on a timely basis.
- •
- We have relied on the fuel cost projections developed by the Market Consultant. The price of fuel purchased is an output of the market pricing model.
- •
- Stone & Webster has assumed that Genco will be able to purchase SO2 emissions credits in order to comply with its emission limits for SO2. We have assumed that emissions offsets will be available for transfer from an affiliate and/or for purchase by Genco and that sufficient demand exists for the sale of certain emission credits by Genco at the prices forecast in the Financial Model (allowance pricing was provided by Market Consultant).
- •
- The non-operating expenses projected for the Assets are developed by Ameren. These expenses include, for example, property taxes and insurance.
The following sections describe the key technical assumptions reflected in the Financial Model followed by a discussion of project revenues and expenses, presentation of the base case results and discussion of sensitivity analyses.
A-81
4.5 Technical Assumptions
Stone & Webster reviewed Genco's inputs to the Market Consultant's dispatch simulation model. These technical assumptions included capacity, equivalent availability, forced outage rate and heat rate. The values we reviewed, presented earlier in this Report, accurately reflect the condition and capability of the Assets.
The Base Case Financial Model capacity factors, provided as outputs of the Market Consultant's model, were previously summarized in terms of 20-year averages. The actual capacity factor profiles vary during that period, particularly for the Coal-fired Stations, as shown in the following figure.
Figure 4.5-1. Projected Capacity Factors (Coal-fired Stations)
Coffeen Capacity Factors, %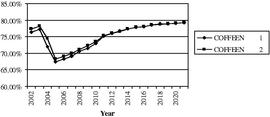 | Hutsonville Capacity Factors, %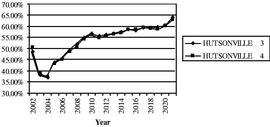 | |
Meredosia Capcity Factors, %  | Newton Capacity Factors, % 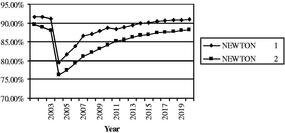 |
The higher-than-historical capacity factors forecast for the Coal-fired Stations are attributable to reductions in the delivered price of coal due to recent fuel contract re-negotiations, a switch to PRB coal at Newton, and the Market Consultant's coal pricing projections relative to natural gas pricing. Newton additionally benefits from the switch to PRB coal, which has lower associated environmental compliance costs. These stations were designed for base load service and should be able to safely and reliably meet these capacity factor projections assuming that appropriate operations and maintenance practices are followed and budgeted capital projects implemented.
4.6 Financing Assumptions
Lehman Brothers provided the financing assumptions. The $425 million debt issuance in 2000 consists of $225 million Series A senior notes due 2005 and $200 million Series B senior notes due 2010. The subject $275 million debt issuance in 2002 matures in 2032 (the Financial Model reflects the period from 2002 through 2021). The year 2000 debt issuances are assumed to be refinanced at maturity on substantially similar terms and conditions throughout the term of the Financial Model. The year 2000 and 2002 issuances constitute the "Senior Debt". The interest payments on the Senior Debt average $56.8 million per annum during the 2002-2011 period.
A-82
4.7 Revenues
Revenue projections were provided by Ameren and the Market Consultant. The projections include contract sales, "spot market" energy and capacity sales and lease revenues. The contract sales include sales under the Electric Power Supply Agreements ("EPSAs") between Genco and AmerenEnergy Marketing Company ("Marketing") and between Marketing and AmerenCIPS. Stone & Webster reviewed the technical aspects of these EPSAs as well as thirty-four "back-stopping" wholesale and retail contracts to which Genco affiliates, rather than Genco itself, are parties. Stone & Webster confirmed that the demand capacity, length of engagement (term) and capacity and energy pricing are consistent with those reflected in the Financial Model. Load factor forecasts associated with these contracts were provided by Genco and not reviewed by Stone & Webster.
Full-year Asset revenues (rounded) for 2003 are shown in the following table:
Table 4.7-1. Genco Projected Revenues, 2003
| Revenue Source | Amount ($ million) | % of Total | ||||
|---|---|---|---|---|---|---|
| Total Contracts Sales | 605.3 | 92.8 | % | |||
| Spot Market | ||||||
| Energy Sales | 30.8 | |||||
| Capacity Sales | 17.6 | |||||
| Purchases | -11.8 | |||||
| Total Spot Market (Net) | 36.6 | 5.6 | % | |||
| Lease Revenues | 10.1 | 1.6 | % | |||
| TOTAL REVENUES | 652 | 100 | % | |||
Revenues average $832 million per year from 2002 through 2011, and increase from $673 million in 2002 to $1002 million in 2011. The contribution to total revenues of contract sales, net spot market sales and lease revenues are shown in Figure 5.3-1.
Figure 4.7-1. Genco Revenues 2002-2011 ($000)
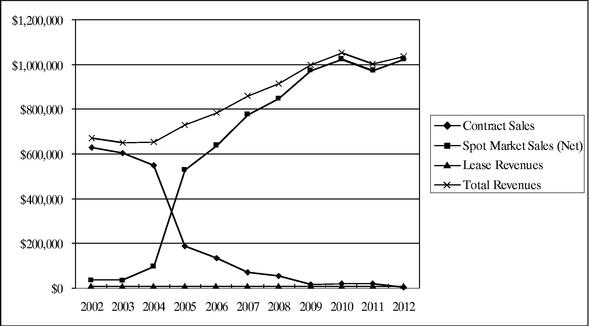
A-83
Total generation for each year is provided in the following table:
Table 4.7-2. Total Annual Generation (GWh)
| Year | Generation (GWh) | Year | Generation (GWh) | Year | Generation (GWh) | |||||
|---|---|---|---|---|---|---|---|---|---|---|
| 2002 | 18,774 | 2006 | 16,736 | 2010 | 18,614 | |||||
| 2003 | 18,182 | 2007 | 17,256 | 2011 | 18,988 | |||||
| 2004 | 17,574 | 2008 | 17,884 | |||||||
| 2005 | 16,285 | 2009 | 18,289 |
4.8 Expenses
The major operating expenses shown in the Financial Model include fuel cost, variable O&M, fixed O&M, G&A and property taxes. The projected operating expenses and capital costs for 2003 are summarized in the following table:
Table 4.8-1. Genco Operating Expenses, 2003
| Cost Item | Amount ($ million) | ||
|---|---|---|---|
| Fuel Costs | $ | 258.0 | |
| Variable O & M | $ | 48.4 | |
| Fixed O & M | $ | 76.6 | |
| SO2 Cost | $ | 0.0 | |
| G&A Costs (net Property Taxes) | $ | 24.8 | |
| Property Taxes and Other | $ | 16.8 | |
| Total Operating Expenses | $ | 424.6 | |
Total operating expenses average $469.6 million per year from 2002 to 2011. The average reflects SO2 credit purchases beginning in 2006.
4.8.1 Fuel Cost
Fuel cost projections were developed by the Market Consultant. Stone & Webster was not asked to review these forecasts. Coal is assumed to be purchased through an existing long-term coal supply contract for Coffeen and Meredosia, and on the spot market for Newton and Hutsonville. Natural gas and oil pricing projections are based on spot market purchases. Fuel costs average $276 million per year during the 2002-2011 periods, and vary from a low of $244 million in 2005 to a high of $315 million in 2011.
4.8.2 O&M Costs
O&M costs include fixed and variable components. Stone & Webster reviewed the variable cost inputs as developed by Genco, which were considered reasonable and consistent with those of similar projects that we have evaluated. Variable O&M costs (non-fuel) average approximately $2.47/MWh for the Coal-fired Stations in 2002, and escalate at 3% per year thereafter for inflation. Non-fuel variable O&M costs average approximately $7.53/MWh for the Gas-fired Stations in 2002, and escalate at 3% per year thereafter for inflation. In nominal dollars, total non-fuel variable O&M costs (all stations) average approximately $52.7 million per year during the 2002-2011 period.
Total fixed O&M costs for the Genco Assets average $73.0 million during that same period, and range from a low of $61.2 million in 2010 to a high of $81.7 million in 2009. This broad range is
A-84
attributable to the variability of major maintenance requirements coupled with the 3% inflation escalation factor.
As described earlier, Genco will operate and maintain the Newton, Coffeen, Meredosia, Hutsonville, and Grand Tower stations. The detailed O&M budgets developed by Genco include operations expenses (labor and materials), routine maintenance (labor and materials), major maintenance and SO2 compliance costs. These projections are summarized in the following table.
Table 4.8-2. O&M Budget Projections Summary ($ million)
| Item | Average (2002-2011) | ||
|---|---|---|---|
| Non-Project O&M Expenditures | |||
| Operations Labor | 31.0 | ||
| Ameren Energy Expenses | 12.0 | ||
| Subtotal | 43.0 | ||
| Operations Other | 9.2 | ||
| Transmission Services | 0.0 | ||
| Subtotal | 9.2 | ||
| Maintenance Labor | 17.9 | ||
| Maintenance Other | 10.4 | ||
| Subtotal | 28.3 | ||
Project Expenditures | |||
| Maintenance Projects | 33.8 | ||
| Plant Improvement Initiatives | 4.2 | ||
| Subtotal | 38.0 | ||
| SO2 Compliance Costs | 10.9 | ||
Genco provided these forecasts on an all-in basis, i.e., operations and maintenance expenses reflect both fixed and variable components, which is a typical utility accounting practice. Major maintenance ranges from $25.3 million in 2010 to $46.1 million in 2009. Major maintenance varies considerably from year to year due to the cyclical nature of major maintenance projects.
The cost of SO2 compliance, i.e., SO2 allowance requirements and costs, was provided by the Market Consultant. Annual costs, in millions of dollars, are summarized in the following table.
Table 4.8-3. SO2 Compliance Cost Expenditures Summary
| Year | SO2 Compliance | Year | SO2 Compliance | Year | SO2 Compliance | |||||
|---|---|---|---|---|---|---|---|---|---|---|
| 2002 | 0 | 2006 | 13.8 | 2010 | 24.3 | |||||
| 2003 | 0 | 2007 | 16.0 | 2011 | 21.8 | |||||
| 2004 | 0 | 2008 | 18.4 | |||||||
| 2005 | 0 | 2009 | 14.9 |
As described earlier, Genco has outsourced operation and maintenance of the Gibson City, Kinmundy, Columbia and Pinckneyville stations. O&M costs are comprised of the contract fee with SW, major maintenance, other Owner costs (e.g., initial spares, utilities, etc.). There are no capital expenditure requirements for these units, given the projected peaking service and new construction. Total operating expenses for these units average $14.3 million per annum during the period 2002-2011. Non-fuel variable O&M averages approximately 8% of this amount.
A-85
Further discussion of O&M costs is provided in Sections 3.3 and 4.3. As previously stated, Stone & Webster considers these O&M budget forecasts, coupled with the planned capital expenditures budgets, to be adequate for continued safe and reliable operation of the Assets.
4.8.3 Capital Expenditures
Total costs for capital expenditures average $63 million per annum during the 2002-2011 period. This ranges from a low of $26 million in 2005 to a high of $128 million in 2003. The Genco total capital expenditures by year through 2021 are shown below.
Table 4.8-4. Capital Expenditures by Year ($ million)
| Year | Capital | Year | Capital | |||||
|---|---|---|---|---|---|---|---|---|
| 2002 | $ | 81,648 | 2012 | $ | 49,983 | |||
| 2003 | $ | 128,261 | 2013 | $ | 5,941 | |||
| 2004 | $ | 74,009 | 2014 | $ | 11,637 | |||
| 2005 | $ | 26,314 | 2015 | $ | 122,170 | |||
| 2006 | $ | 79,679 | 2016 | $ | 48,421 | |||
| 2007 | $ | 35,895 | 2017 | $ | 20,864 | |||
| 2008 | $ | 59,668 | 2018 | $ | 18,891 | |||
| 2009 | $ | 60,315 | 2019 | $ | 11,391 | |||
| 2010 | $ | 32,697 | 2020 | $ | 9,912 | |||
| 2011 | $ | 52,794 | 2021 | $ | 6,747 | |||
| Total | $ | 937,238 | ||||||
Average costs over this same period are shown in the table below for the Newton, Coffeen, Meredosia, Hutsonville and Grand Tower (combined cycle) stations.
Table 4.8-5. Station Capital Expenditures Summary ($ million)
| Station | Average (2002-2011) | |
|---|---|---|
| Newton | 12.6 | |
| Coffeen | 28.3 | |
| Meredosia | 14.0 | |
| Hutsonville | 5.8 | |
| Grand Tower | 2.5 | |
| Total | 63.2 |
Capital expenditures generally include such projects as precipitator refurbishment, condenser retubing, low-NOx burner upgrades, economizer replacements, waterwall replacements, control systems upgrades, superheater tube replacement, economizer tubes, turbine component replacements, generator rewinds, ash disposal ponds and landfills, and high energy piping inspections. Station-specific capital expenditures include the supplemental cooling towers at Coffeen and SCRs at Coffeen. Capital expenditures are also covered in detail in Section 3.3.
4.9 Base Case Results
The base case Financial Model summary, included as Table 5.8-1, contains the major operating revenue and expense projections that support the cash forecasted to be used for debt service payments. Values in the year 2002 are presented on an annualized basis. The DSCR is defined as the cash flow available for debt service ("CFADS") to Senior Debt interest expense. CFADS is calculated after major maintenance expenditures, but prior to capital expenditures. The senior DSCR is shown for each year
A-86
of the Financial Model. For interest payments on the Senior Debt, the average DSCR during the period 2002-2011 for the base case is calculated as 6.4x, with a minimum DSCR of 4.0x in 2003.
4.10 Sensitivity Analysis
Stone & Webster reviewed the results of the following sensitivity analyses, defined by and with inputs provided by the Market Consultant. Independent sensitivity analyses were not conducted by Stone & Webster.
- •
- Case 1: Overbuild—represents the possibility of capacity additions well in excess of historical reserve margins. 4000 MW of new capacity are assumed to come on line in the Mid-American Interconnected Network ("MAIN") and 2,300 MW of new capacity are assumed to come on-line in the East-Central Area Reliability ("ECAR") region, over and above base case levels.
- •
- Case 2: Low Fuel Price—reflects the potential volatility of fuel markets. Natural gas and fuel oil prices were decreased in each year by 15% relative to base case levels.
- •
- Case 3: High Fuel Price—reflects the potential volatility of fuel markets. Natural gas and fuel oil prices were increased in each year by 15% relative to base case levels.
Debt service coverage ratios on Senior Debt interest payments are summarized for these sensitivity cases in the following table:
Table 4.10-1. Sensitivity Analysis—Senior DSCR (2002-2011)
| Case | First 5yr Avg | Second 5yr Avg | 10Yr Avg | Minimum | ||||
|---|---|---|---|---|---|---|---|---|
| Base Case | 4.7x | 8.0x | 6.4x | 4.0x | ||||
| 1: Overbuild | 3.9x | 8.1x | 6.0x | 3.7x | ||||
| 2: Low Fuel Price | 4.5x | 6.9x | 5.7x | 3.9x | ||||
| 2: High Fuel Price | 5.3x | 9.4x | 7.3x | 4.1x |
The senior DSCRs for the base case and sensitivity cases, 2002 - 2011, are summarized as Figure 5.6-1.
Figure 4.10-1. Senior Debt Service Coverage Ratio Summary, Base Case and Sensitivity Analyses
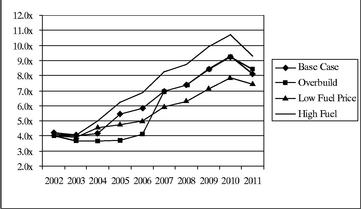
The respective Financial Model summaries are provided as Tables 5.8-2 through 5.8-4.
A-87
4.11 Conclusions
On the basis of our review and the assumptions set forth in the Report, Stone & Webster is of the opinion that:
- •
- The availability, capacity and heat rate inputs used by the Market Consultant to develop its projections of market prices and energy generation are consistent with the values Stone & Webster has reviewed and found reasonable.
- •
- The projected heat rate and capacity assumptions have been developed based on historical data as modified to account for improvements that have been made or are planned to be made to these facilities. With continued capital investment, it is reasonable to expect that the heat rates and capacities can be maintained over the period shown in the Financial Model.
- •
- Genco's maintenance and capital budgets, reflected in the Financial Model, appear reasonable and adequate to meet the performance objectives safely and reliably in the ordinary course of business.
- •
- Stone & Webster reviewed the technical and commercial assumptions and the calculation methodology of the Financial Model. The technical assumptions assumed in the Financial Model are reasonable and consistent with the contracts reviewed. The Financial Model fairly presents, in Stone & Webster's opinion, projected revenues and expenses under the base case assumptions.
- •
- The projected revenues from the sale of capacity and energy are more than adequate to pay the annual operating and maintenance expenses (including provisions for major maintenance), other operating expenses, and debt service. Under the base case assumptions, the average senior DSCR (before capital expenditures) is calculated to be 6.4x from 2002 through 2011. The minimum senior DSCR is 4.0x and occurs in 2003.
- •
- Three sensitivity cases were prepared to test the impact of different market forces on the energy and capacity prices forecast by the Market Consultant and the associated impact on the DSCR. The market energy and capacity prices were forecast assuming (i) the overbuilding of generation facilities in the region, (ii) lower fuel prices and (iii) higher fuel prices. The average senior DSCR was most sensitive to the overbuild sensitivity case. The 10-year average senior DSCR (before capital expenditures) in this case fell to 6.0x with a minimum of 3.7x in 2003, 2004 and 2005.
4.12 Results Summary Tables
Financial Model results are summarized in the following tables.
A-88
Table 4.12-1. Base Case Results
AmerenEnergy Generating Company
Cash Flow Summary
Base Case page 1 of 2
(all values are $000's unless otherwise noted)
| year ending December 31, | 2002 | 2003 | 2004 | 2005 | 2006 | 2007 | 2008 | 2009 | 2010 | 2011 | 2012 | |||||||||||||||||||||||||
|---|---|---|---|---|---|---|---|---|---|---|---|---|---|---|---|---|---|---|---|---|---|---|---|---|---|---|---|---|---|---|---|---|---|---|---|---|
| Annual Generation (GWh) | 18,774 | 18,182 | 17,574 | 16,285 | 16,736 | 17,256 | 17,884 | 18,289 | 18,614 | 18,988 | 19,122 | |||||||||||||||||||||||||
Operating Revenues | ||||||||||||||||||||||||||||||||||||
| Contract Revenues | $ | 627,424 | $ | 605,308 | $ | 550,766 | $ | 190,313 | $ | 134,065 | $ | 71,948 | $ | 54,242 | $ | 18,565 | $ | 19,424 | $ | 19,661 | $ | 2,976 | ||||||||||||||
| Market Sales (Net) | $ | 35,748 | $ | 36,586 | $ | 94,601 | $ | 528,628 | $ | 639,219 | $ | 777,127 | $ | 849,160 | $ | 971,889 | $ | 1,024,337 | $ | 971,844 | $ | 1,025,124 | ||||||||||||||
| Energy Sales | $ | 31,831 | $ | 30,820 | $ | 68,110 | $ | 339,849 | $ | 424,284 | $ | 524,076 | $ | 584,702 | $ | 680,951 | $ | 727,534 | $ | 723,061 | $ | 766,318 | ||||||||||||||
| Capacity Sales | $ | 18,372 | $ | 17,598 | $ | 37,270 | $ | 188,779 | $ | 214,935 | $ | 253,051 | $ | 264,458 | $ | 290,938 | $ | 296,803 | $ | 248,782 | $ | 258,807 | ||||||||||||||
| Purchases | $ | (14,455 | ) | $ | (11,833 | ) | $ | (10,778 | ) | $ | 0 | $ | 0 | $ | 0 | $ | 0 | $ | 0 | $ | 0 | $ | 0 | $ | 0 | |||||||||||
| Lease Revenue | $ | 10,093 | $ | 10,093 | $ | 10,093 | $ | 10,093 | $ | 10,093 | $ | 10,093 | $ | 10,093 | $ | 10,093 | $ | 10,093 | $ | 10,093 | $ | 10,093 | ||||||||||||||
| Total Operating Revenues | $ | 673,265 | $ | 651,987 | $ | 655,459 | $ | 729,034 | $ | 783,377 | $ | 859,167 | $ | 913,494 | $ | 1,000,547 | $ | 1,053,854 | $ | 1,001,597 | $ | 1,038,193 | ||||||||||||||
Operating Expenses | ||||||||||||||||||||||||||||||||||||
| Fuel Costs | $ | 261,734 | $ | 258,037 | $ | 252,666 | $ | 244,110 | $ | 255,636 | $ | 269,673 | $ | 285,980 | $ | 300,859 | $ | 312,305 | $ | 315,179 | $ | 320,791 | ||||||||||||||
| Variable O & M | $ | 42,540 | $ | 48,367 | $ | 47,853 | $ | 46,415 | $ | 49,094 | $ | 52,122 | $ | 55,563 | $ | 58,634 | $ | 61,439 | $ | 64,754 | $ | 67,193 | ||||||||||||||
| Fixed O & M | $ | 80,516 | $ | 76,609 | $ | 67,720 | $ | 76,136 | $ | 76,962 | $ | 64,717 | $ | 71,816 | $ | 81,743 | $ | 61,204 | $ | 73,016 | $ | 80,370 | ||||||||||||||
| G&A Costs (net Property Taxes) | $ | 37,360 | $ | 24,809 | $ | 30,514 | $ | 29,594 | $ | 30,315 | $ | 31,224 | $ | 32,161 | $ | 33,126 | $ | 34,119 | $ | 35,143 | $ | 36,197 | ||||||||||||||
| Property Taxes | $ | 16,800 | $ | 16,800 | $ | 20,725 | $ | 22,850 | $ | 25,175 | $ | 28,700 | $ | 29,561 | $ | 30,448 | $ | 31,361 | $ | 32,302 | $ | 33,271 | ||||||||||||||
| SO2 Cost | $ | 0 | $ | 0 | $ | 0 | $ | 0 | $ | 13,848 | $ | 15,951 | $ | 18,403 | $ | 14,852 | $ | 24,311 | $ | 21,812 | $ | 20,759 | ||||||||||||||
| Total Operating Expenses | $ | 438,950 | $ | 424,622 | $ | 419,478 | $ | 419,104 | $ | 451,030 | $ | 462,387 | $ | 493,483 | $ | 519,661 | $ | 524,739 | $ | 542,206 | $ | 558,581 | ||||||||||||||
CFADS | $ | 234,315 | $ | 227,365 | $ | 235,981 | $ | 309,929 | $ | 332,347 | $ | 396,780 | $ | 420,011 | $ | 480,885 | $ | 529,114 | $ | 459,391 | $ | 479,612 | ||||||||||||||
Senior Debt Service | $ | 56,825 | $ | 56,825 | $ | 56,825 | $ | 56,825 | $ | 56,825 | $ | 56,825 | $ | 56,825 | $ | 56,825 | $ | 56,825 | $ | 56,825 | $ | 56,825 | ||||||||||||||
Senior DSCR | 4.1 | x | 4.0 | x | 4.2 | x | 5.5 | x | 5.8 | x | 7.0 | x | 7.4 | x | 8.5 | x | 9.3 | x | 8.1 | x | 8.4 | x | ||||||||||||||
| Average, 2002-2011 | 6.4 | x | ||||||||||||||||||||||||||||||||||
| Minimum, 2002-2011 | 4.0 | x | ||||||||||||||||||||||||||||||||||
| Average, 2002-2006 | 4.7 | x | ||||||||||||||||||||||||||||||||||
| Average, 2007-2011 | 8.0 | x | ||||||||||||||||||||||||||||||||||
Senior Debt / Capitalization | 46 | % | 46 | % | 46 | % | 44 | % | 43 | % | 40 | % | 37 | % | 34 | % | 30 | % | 27 | % | 25 | % | ||||||||||||||
| Average, 2002-2011 | 39 | % | ||||||||||||||||||||||||||||||||||
A-89
Figure 5.8-1 Base Case Results (Continued)
AmerenEnergy Generating Company
Cash Flow Summary
Base Case page 2 of 2
(all values are $000's unless otherwise noted)
| year ending December 31, | 2013 | 2014 | 2015 | 2016 | 2017 | 2018 | 2019 | 2020 | 2021 | |||||||||||||||||||||
|---|---|---|---|---|---|---|---|---|---|---|---|---|---|---|---|---|---|---|---|---|---|---|---|---|---|---|---|---|---|---|
| Annual Generation (GWh) | 19,125 | 19,264 | 19,364 | 19,361 | 19,543 | 19,667 | 19,659 | 19,789 | 19,853 | |||||||||||||||||||||
Operating Revenues | ||||||||||||||||||||||||||||||
| Contract Revenues | $ | 3,050 | $ | 3,126 | $ | 0 | $ | 0 | $ | 0 | $ | 0 | $ | 0 | $ | 0 | $ | 0 | ||||||||||||
| Market Sales (Net) | $ | 1,051,452 | $ | 1,093,374 | $ | 1,140,576 | $ | 1,182,507 | $ | 1,238,042 | $ | 1,301,268 | $ | 1,363,271 | $ | 1,435,839 | $ | 1,507,243 | ||||||||||||
| Energy Sales | $ | 778,213 | $ | 817,813 | $ | 851,764 | $ | 874,364 | $ | 931,054 | $ | 991,071 | $ | 1,041,356 | $ | 1,114,396 | $ | 1,181,895 | ||||||||||||
| Capacity Sales | $ | 273,239 | $ | 275,561 | $ | 288,812 | $ | 308,143 | $ | 306,988 | $ | 310,197 | $ | 321,915 | $ | 321,443 | $ | 325,348 | ||||||||||||
| Purchases | $ | 0 | $ | 0 | $ | 0 | $ | 0 | $ | 0 | $ | 0 | $ | 0 | $ | 0 | $ | 0 | ||||||||||||
| Lease Revenue | $ | 10,093 | $ | 10,093 | $ | 10,093 | $ | 10,093 | $ | 10,093 | $ | 10,093 | $ | 10,093 | $ | 10,093 | $ | 10,093 | ||||||||||||
| Total Operating Revenues | $ | 1,064,595 | $ | 1,106,593 | $ | 1,150,669 | $ | 1,192,599 | $ | 1,248,134 | $ | 1,311,361 | $ | 1,373,364 | $ | 1,445,931 | $ | 1,517,336 | ||||||||||||
Operating Expenses | ||||||||||||||||||||||||||||||
| Fuel Costs | �� | |||||||||||||||||||||||||||||
| Variable O & M | $ | 69,171 | $ | 71,770 | $ | 74,298 | $ | 76,467 | $ | 79,574 | $ | 82,430 | $ | 84,731 | $ | 87,861 | $ | 90,944 | ||||||||||||
| Fixed O & M | $ | 78,482 | $ | 86,620 | $ | 89,046 | $ | 71,528 | $ | 93,198 | $ | 105,408 | $ | 78,046 | $ | 92,040 | $ | 115,286 | ||||||||||||
| G&A Costs (net Property Taxes) | $ | 37,283 | $ | 38,402 | $ | 39,554 | $ | 40,740 | $ | 41,962 | $ | 43,221 | $ | 44,518 | $ | 45,853 | $ | 47,229 | ||||||||||||
| Property Taxes | $ | 34,269 | $ | 35,297 | $ | 36,356 | $ | 37,447 | $ | 38,570 | $ | 39,728 | $ | 40,919 | $ | 42,147 | $ | 43,411 | ||||||||||||
| SO2 Costs | $ | 15,539 | $ | 16,449 | $ | 17,458 | $ | 18,139 | $ | 19,447 | $ | 20,835 | $ | 21,792 | $ | 23,200 | $ | 24,633 | ||||||||||||
| Total Operating Expenses | $ | 558,932 | $ | 580,391 | $ | 595,433 | $ | 587,195 | $ | 628,085 | $ | 659,181 | $ | 645,687 | $ | 680,385 | $ | 721,839 | ||||||||||||
CFADS | $ | 505,663 | $ | 526,202 | $ | 555,235 | $ | 605,404 | $ | 620,050 | $ | 652,180 | $ | 727,677 | $ | 765,546 | $ | 795,497 | ||||||||||||
Senior Debt Service | $ | 56,825 | $ | 56,825 | $ | 56,825 | $ | 56,825 | $ | 56,825 | $ | 56,825 | $ | 56,825 | $ | 56,825 | $ | 56,825 | ||||||||||||
Senior DSCR | 8.9 | x | 9.3 | x | 9.8 | x | 10.7 | x | 10.9 | x | 11.5 | x | 12.8 | x | 13.5 | x | 14.0 | x | ||||||||||||
Senior Debt / Capitalization | 23 | % | 21 | % | 19 | % | 18 | % | 16 | % | 15 | % | 14 | % | 13 | % | 12 | % | ||||||||||||
A-90
Table 4.12-2. Sensitivity Case 1: Overbuild
AmerenEnergy Generating Company
Cash Flow Summary
Overbuild page 1 of 2
(all values are $000's unless otherwise noted)
| year ending December 31, | 2002 | 2003 | 2004 | 2005 | 2006 | 2007 | 2008 | 2009 | 2010 | 2011 | 2012 | |||||||||||||||||||||||||
|---|---|---|---|---|---|---|---|---|---|---|---|---|---|---|---|---|---|---|---|---|---|---|---|---|---|---|---|---|---|---|---|---|---|---|---|---|
| Annual Generation (GWh) | 18,753 | 18,073 | 17,471 | 16,194 | 16,673 | 17,218 | 17,803 | 18,195 | 18,485 | 18,863 | 19,025 | |||||||||||||||||||||||||
Operating Revenues | ||||||||||||||||||||||||||||||||||||
| Contract Revenues | $ | 620,596 | $ | 596,424 | $ | 541,154 | $ | 190,313 | $ | 134,065 | $ | 71,948 | $ | 54,242 | $ | 18,565 | $ | 19,424 | $ | 19,661 | $ | 2,976 | ||||||||||||||
| Market Sales (Net) | $ | 35,979 | $ | 25,979 | $ | 74,763 | $ | 429,001 | $ | 541,060 | $ | 775,286 | $ | 845,382 | $ | 965,787 | $ | 1,016,194 | $ | 988,282 | $ | 1,037,965 | ||||||||||||||
| Energy Sales | $ | 31,513 | $ | 27,155 | $ | 64,252 | $ | 334,796 | $ | 420,874 | $ | 521,501 | $ | 580,549 | $ | 674,849 | $ | 718,179 | $ | 715,260 | $ | 758,633 | ||||||||||||||
| Capacity Sales | $ | 18,383 | $ | 9,948 | $ | 20,641 | $ | 94,205 | $ | 120,186 | $ | 253,785 | $ | 264,834 | $ | 290,938 | $ | 298,015 | $ | 273,022 | $ | 279,332 | ||||||||||||||
| Purchases | $ | (13,916 | ) | $ | (11,124 | ) | $ | (10,130 | ) | $ | 0 | $ | 0 | $ | 0 | $ | 0 | $ | 0 | $ | 0 | $ | 0 | $ | 0 | |||||||||||
| Lease Revenue | $ | 10,093 | $ | 10,093 | $ | 10,093 | $ | 10,093 | $ | 10,093 | $ | 10,093 | $ | 10,093 | $ | 10,093 | $ | 10,093 | $ | 10,093 | $ | 10,093 | ||||||||||||||
| Total Operating Revenues | $ | 666,668 | $ | 632,495 | $ | 626,009 | $ | 629,407 | $ | 685,218 | $ | 857,326 | $ | 909,716 | $ | 994,445 | $ | 1,045,710 | $ | 1,018,036 | $ | 1,051,033 | ||||||||||||||
Operating Expenses | ||||||||||||||||||||||||||||||||||||
| Fuel Costs | $ | 261,727 | $ | 255,846 | $ | 250,630 | $ | 242,145 | $ | 254,409 | $ | 268,774 | $ | 284,277 | $ | 298,550 | $ | 309,265 | $ | 312,439 | $ | 318,590 | ||||||||||||||
| Variable O & M | $ | 42,536 | $ | 48,068 | $ | 47,530 | $ | 46,086 | $ | 48,922 | $ | 51,994 | $ | 55,306 | $ | 58,313 | $ | 60,960 | $ | 64,347 | $ | 66,873 | ||||||||||||||
| Fixed O & M | $ | 80,519 | $ | 76,908 | $ | 68,043 | $ | 76,464 | $ | 77,134 | $ | 64,845 | $ | 72,073 | $ | 82,064 | $ | 61,683 | $ | 73,423 | $ | 80,690 | ||||||||||||||
| G&A Costs (net Property Taxes) | $ | 37,360 | $ | 24,809 | $ | 30,514 | $ | 29,594 | $ | 30,315 | $ | 31,224 | $ | 32,161 | $ | 33,126 | $ | 34,119 | $ | 35,143 | $ | 36,197 | ||||||||||||||
| Property Taxes | $ | 16,800 | $ | 16,800 | $ | 20,725 | $ | 22,850 | $ | 25,175 | $ | 28,700 | $ | 29,561 | $ | 30,448 | $ | 31,361 | $ | 32,302 | $ | 33,271 | ||||||||||||||
| SO2 Cost | $ | 0 | $ | 0 | $ | 0 | $ | 0 | $ | 13,848 | $ | 15,951 | $ | 18,403 | $ | 14,852 | $ | 24,311 | $ | 21,812 | $ | 20,759 | ||||||||||||||
| Total Operating Expenses | $ | 438,942 | $ | 422,431 | $ | 417,442 | $ | 417,140 | $ | 449,802 | $ | 461,488 | $ | 491,781 | $ | 517,352 | $ | 521,699 | $ | 539,466 | $ | 556,380 | ||||||||||||||
CFADS | $ | 227,726 | $ | 210,064 | $ | 208,567 | $ | 212,267 | $ | 235,415 | $ | 395,837 | $ | 417,935 | $ | 477,092 | $ | 524,011 | $ | 478,570 | $ | 494,653 | ||||||||||||||
Senior Debt Service | $ | 56,825 | $ | 56,825 | $ | 56,825 | $ | 56,825 | $ | 56,825 | $ | 56,825 | $ | 56,825 | $ | 56,825 | $ | 56,825 | $ | 56,825 | $ | 56,825 | ||||||||||||||
Senior DSCR | 4.0x | 3.7x | 3.7x | 3.7x | 4.1x | 7.0x | 7.4x | 8.4x | 9.2x | 8.4x | 8.7x | |||||||||||||||||||||||||
| Average, 2002-2011 | 6.0x | |||||||||||||||||||||||||||||||||||
| Minimum, 2002-2011 | 3.7x | |||||||||||||||||||||||||||||||||||
| Average, 2002-2006 | 3.9x | |||||||||||||||||||||||||||||||||||
| Average, 2007-2011 | 8.1x | |||||||||||||||||||||||||||||||||||
| Senior Debt / Capitalization | 47 | % | 47 | % | 47 | % | 47 | % | 47 | % | 44 | % | 41 | % | 36 | % | 32 | % | 29 | % | 26 | % | ||||||||||||||
| Average, 2002-2011 | 42 | % | ||||||||||||||||||||||||||||||||||
A-91
Figure 5.8-2. Sensitivity Case 1: Overbuild (Continued)
AmerenEnergy Generating Company
Cash Flow Summary
Overbuild page 2 of 2
(all values are $000's unless otherwise noted)
| year ending December 31, | 2013 | 2014 | 2015 | 2016 | 2017 | 2018 | 2019 | 2020 | 2021 | |||||||||||||||||||||
|---|---|---|---|---|---|---|---|---|---|---|---|---|---|---|---|---|---|---|---|---|---|---|---|---|---|---|---|---|---|---|
| Annual Generation (GWh) | 19,021 | 19,179 | 19,290 | 19,288 | 19,462 | 19,581 | 19,600 | 19,712 | 19,780 | |||||||||||||||||||||
Operating Revenues | ||||||||||||||||||||||||||||||
| Contract Revenues | $ | 3,050 | $ | 3,126 | $ | 0 | $ | 0 | $ | 0 | $ | 0 | $ | 0 | $ | 0 | $ | 0 | ||||||||||||
| Market Sales (Net) | $ | 1,067,541 | $ | 1,106,847 | $ | 1,154,578 | $ | 1,200,465 | $ | 1,250,400 | $ | 1,313,533 | $ | 1,376,550 | $ | 1,443,551 | $ | 1,519,410 | ||||||||||||
| Energy Sales | $ | 769,672 | $ | 810,762 | $ | 845,061 | $ | 867,476 | $ | 922,708 | $ | 982,631 | $ | 1,033,930 | $ | 1,105,544 | $ | 1,173,357 | ||||||||||||
| Capacity Sales | $ | 297,869 | $ | 296,086 | $ | 309,517 | $ | 332,989 | $ | 327,693 | $ | 330,902 | $ | 342,620 | $ | 338,007 | $ | 346,053 | ||||||||||||
| Purchases | $ | 0 | $ | 0 | $ | 0 | $ | 0 | $ | 0 | $ | 0 | $ | 0 | $ | 0 | $ | 0 | ||||||||||||
| Lease Revenue | $ | 10,093 | $ | 10,093 | $ | 10,093 | $ | 10,093 | $ | 10,093 | $ | 10,093 | $ | 10,093 | $ | 10,093 | $ | 10,093 | ||||||||||||
| Total Operating Revenues | $ | 1,080,684 | $ | 1,120,066 | $ | 1,164,671 | $ | 1,210,557 | $ | 1,260,493 | $ | 1,323,625 | $ | 1,386,643 | $ | 1,453,644 | $ | 1,529,503 | ||||||||||||
Operating Expenses | ||||||||||||||||||||||||||||||
| Fuel Costs | ||||||||||||||||||||||||||||||
| Variable O & M | $ | 68,795 | $ | 71,457 | $ | 74,046 | $ | 76,162 | $ | 79,183 | $ | 82,005 | $ | 84,497 | $ | 87,511 | $ | 90,579 | ||||||||||||
| Fixed O & M | $ | 78,858 | $ | 86,932 | $ | 89,298 | $ | 71,834 | $ | 93,589 | $ | 105,833 | $ | 78,281 | $ | 92,389 | $ | 115,651 | ||||||||||||
| G&A Costs (net Property Taxes) | $ | 37,283 | $ | 38,402 | $ | 39,554 | $ | 40,740 | $ | 41,962 | $ | 43,221 | $ | 44,518 | $ | 45,853 | $ | 47,229 | ||||||||||||
| Property Taxes | $ | 34,269 | $ | 35,297 | $ | 36,356 | $ | 37,447 | $ | 38,570 | $ | 39,728 | $ | 40,919 | $ | 42,147 | $ | 43,411 | ||||||||||||
| SO2 Costs | $ | 15,539 | $ | 16,449 | $ | 17,458 | $ | 18,139 | $ | 19,447 | $ | 20,835 | $ | 21,792 | $ | 23,200 | $ | 24,633 | ||||||||||||
| Total Operating Expenses | $ | 556,317 | $ | 578,206 | $ | 593,449 | $ | 585,168 | $ | 625,712 | $ | 656,597 | $ | 643,832 | $ | 677,823 | $ | 719,301 | ||||||||||||
CFADS | $ | 524,366 | $ | 541,860 | $ | 571,222 | $ | 625,389 | $ | 634,781 | $ | 667,029 | $ | 742,811 | $ | 775,821 | $ | 810,202 | ||||||||||||
Senior Debt Service | $ | 56,825 | $ | 56,825 | $ | 56,825 | $ | 56,825 | $ | 56,825 | $ | 56,825 | $ | 56,825 | $ | 56,825 | $ | 56,825 | ||||||||||||
Senior DSCR | 9.2x | 9.5x | 10.1x | 11.0x | 11.2x | 11.7x | 13.1x | 13.7x | 14.3x | |||||||||||||||||||||
Senior Debt / Capitalization | 24 | % | 22 | % | 20 | % | 18 | % | 17 | % | 15 | % | 14 | % | 13 | % | 12 | % | ||||||||||||
A-92
Table 4.12-3. Sensitivity Case 2: Low Fuel
AmerenEnergy Generating Company
Cash Flow Summary
Low Fuel page 1 of 2
(all values are $000's unless otherwise noted)
| year ending December 31, | 2002 | 2003 | 2004 | 2005 | 2006 | 2007 | 2008 | 2009 | 2010 | 2011 | 2012 | |||||||||||||||||||||||||
|---|---|---|---|---|---|---|---|---|---|---|---|---|---|---|---|---|---|---|---|---|---|---|---|---|---|---|---|---|---|---|---|---|---|---|---|---|
| Annual Generation (GWh) | 18,527 | 17,853 | 17,144 | 15,474 | 15,948 | 16,527 | 17,233 | 17,655 | 18,080 | 18,207 | 18,463 | |||||||||||||||||||||||||
| Operating Revenues | ||||||||||||||||||||||||||||||||||||
| Contract Revenues | $ | 620,575 | $ | 600,134 | $ | 551,523 | $ | 190,313 | $ | 134,065 | $ | 71,948 | $ | 54,242 | $ | 18,565 | $ | 19,424 | $ | 19,661 | $ | 2,976 | ||||||||||||||
| Market Sales (Net) | $ | 27,564 | $ | 28,858 | $ | 105,323 | $ | 470,128 | $ | 572,267 | $ | 699,549 | $ | 766,295 | $ | 875,731 | $ | 923,582 | $ | 908,561 | $ | 956,589 | ||||||||||||||
| Energy Sales | $ | 23,857 | $ | 20,470 | $ | 51,578 | $ | 280,211 | $ | 356,059 | $ | 445,396 | $ | 500,334 | $ | 583,985 | $ | 625,567 | $ | 615,338 | $ | 656,732 | ||||||||||||||
| Capacity Sales | $ | 18,443 | $ | 20,407 | $ | 65,016 | $ | 189,917 | $ | 216,208 | $ | 254,152 | $ | 265,961 | $ | 291,746 | $ | 298,015 | $ | 293,222 | $ | 299,857 | ||||||||||||||
| Purchases | ($ | 14,737 | ) | ($ | 12,019 | ) | ($ | 11,270 | ) | $ | 0 | $ | 0 | $ | 0 | $ | 0 | $ | 0 | $ | 0 | $ | 0 | $ | 0 | |||||||||||
| Lease Revenue | $ | 10,093 | $ | 10,093 | $ | 10,093 | $ | 10,093 | $ | 10,093 | $ | 10,093 | $ | 10,093 | $ | 10,093 | $ | 10,093 | $ | 10,093 | $ | 10,093 | ||||||||||||||
| Total Operating Revenues | $ | 658,231 | $ | 639,084 | $ | 666,939 | $ | 670,534 | $ | 716,425 | $ | 781,589 | $ | 830,629 | $ | 904,388 | $ | 953,098 | $ | 938,314 | $ | 969,657 | ||||||||||||||
| Operating Expenses | ||||||||||||||||||||||||||||||||||||
| Fuel Costs | $ | 252,153 | $ | 248,702 | $ | 241,393 | $ | 225,514 | $ | 236,719 | $ | 250,246 | $ | 266,648 | $ | 279,826 | $ | 292,733 | $ | 290,551 | $ | 298,024 | ||||||||||||||
| Variable O & M | $ | 41,892 | $ | 47,454 | $ | 46,520 | $ | 44,010 | $ | 46,665 | $ | 49,719 | $ | 53,236 | $ | 56,269 | $ | 59,369 | $ | 61,776 | $ | 64,568 | ||||||||||||||
| Fixed O & M | $ | 81,163 | $ | 77,522 | $ | 69,053 | $ | 78,540 | $ | 79,392 | $ | 67,120 | $ | 74,142 | $ | 84,108 | $ | 63,273 | $ | 75,995 | $ | 82,995 | ||||||||||||||
| G&A Costs (net Property Taxes) | $ | 37,360 | $ | 24,809 | $ | 30,514 | $ | 29,594 | $ | 30,315 | $ | 31,224 | $ | 32,161 | $ | 33,126 | $ | 34,119 | $ | 35,143 | $ | 36,197 | ||||||||||||||
| Property Taxes | $ | 16,800 | $ | 16,800 | $ | 20,725 | $ | 22,850 | $ | 25,175 | $ | 28,700 | $ | 29,561 | $ | 30,448 | $ | 31,361 | $ | 32,302 | $ | 33,271 | ||||||||||||||
| SO2 Cost | $ | 0 | $ | 0 | $ | 0 | $ | 0 | $ | 13,848 | $ | 15,951 | $ | 18,403 | $ | 14,852 | $ | 24,311 | $ | 21,812 | $ | 20,759 | ||||||||||||||
| Total Operating Expenses | $ | 429,368 | $ | 415,287 | $ | 408,205 | $ | 400,508 | $ | 432,113 | $ | 442,960 | $ | 474,151 | $ | 498,628 | $ | 505,167 | $ | 517,578 | $ | 535,814 | ||||||||||||||
| CFADS | $ | 228,863 | $ | 223,797 | $ | 258,734 | $ | 270,025 | $ | 284,312 | $ | 338,629 | $ | 356,478 | $ | 405,760 | $ | 447,931 | $ | 420,736 | $ | 433,843 | ||||||||||||||
| Senior Debt Service | $ | 56,825 | $ | 56,825 | $ | 56,825 | $ | 56,825 | $ | 56,825 | $ | 56,825 | $ | 56,825 | $ | 56,825 | $ | 56,825 | $ | 56,825 | $ | 56,825 | ||||||||||||||
| Senior DSCR | 4.0x | 3.9x | 4.6x | 4.8x | 5.0x | 6.0x | 6.3x | 7.1x | 7.9x | 7.4x | 7.6x | |||||||||||||||||||||||||
| Average, 2002 - 2011 | 5.7x | |||||||||||||||||||||||||||||||||||
| Minimum, 2002 - 2011 | 3.9x | |||||||||||||||||||||||||||||||||||
| Average, 2002 - 2006 | 4.5x | |||||||||||||||||||||||||||||||||||
| Average, 2007 - 2011 | 6.9x | |||||||||||||||||||||||||||||||||||
| Senior Debt / Capitalization | 46 | % | 46 | % | 46 | % | 45 | % | 44 | % | 42 | % | 40 | % | 37 | % | 33 | % | 30 | % | 27 | % | ||||||||||||||
| Average, 2002-2011 | 41 | % | ||||||||||||||||||||||||||||||||||
A-93
Table 5.8-3. Sensitivity Case 2: Low Fuel (Continued)
AmerenEnergy Generating Company
Cash Flow Summary
Low Fuel page 2 of 2
(all values are $000's unless otherwise noted)
| year ending December 31, | 2013 | 2014 | 2015 | 2016 | 2017 | 2018 | 2019 | 2020 | 2021 | | ||||||||||||||||||||||
|---|---|---|---|---|---|---|---|---|---|---|---|---|---|---|---|---|---|---|---|---|---|---|---|---|---|---|---|---|---|---|---|---|
| Annual Generation (GWh) | 18,486 | 18,718 | 18,895 | 18,898 | 19,084 | 19,160 | 19,211 | 19,394 | 19,560 | |||||||||||||||||||||||
| Operating Revenues | ||||||||||||||||||||||||||||||||
| Contract Revenues | $ | 3,050 | $ | 3,126 | $ | 0 | $ | 0 | $ | 0 | $ | 0 | $ | 0 | $ | 0 | $ | 0 | ||||||||||||||
| Market Sales (Net) | $ | 981,003 | $ | 1,021,562 | $ | 1,062,245 | $ | 1,090,455 | $ | 1,142,761 | $ | 1,198,025 | $ | 1,249,696 | $ | 1,320,952 | $ | 1,389,502 | ||||||||||||||
| Energy Sales | $ | 665,755 | $ | 701,099 | $ | 731,513 | $ | 750,477 | $ | 795,886 | $ | 844,531 | $ | 889,030 | $ | 952,144 | $ | 1,014,462 | ||||||||||||||
| Capacity Sales | $ | 315,248 | $ | 320,462 | $ | 330,732 | $ | 339,979 | $ | 346,875 | $ | 353,494 | $ | 360,666 | $ | 368,808 | $ | 375,040 | ||||||||||||||
| Purchases | $ | 0 | $ | 0 | $ | 0 | $ | 0 | $ | 0 | $ | 0 | $ | 0 | $ | 0 | $ | 0 | ||||||||||||||
| Lease Revenue | $ | 10,093 | $ | 10,093 | $ | 10,093 | $ | 10,093 | $ | 10,093 | $ | 10,093 | $ | 10,093 | $ | 10,093 | $ | 10,093 | ||||||||||||||
| Total Operating Revenues | $ | 994,146 | $ | 1,034,781 | $ | 1,072,337 | $ | 1,100,548 | $ | 1,152,854 | $ | 1,208,118 | $ | 1,259,789 | $ | 1,331,045 | $ | 1,399,595 | ||||||||||||||
| Operating Expenses | ||||||||||||||||||||||||||||||||
| Fuel Costs | ||||||||||||||||||||||||||||||||
| Variable O & M | $ | 66,599 | $ | 69,529 | $ | 72,389 | $ | 74,487 | $ | 77,602 | $ | 80,278 | $ | 82,774 | $ | 86,114 | $ | 89,470 | ||||||||||||||
| Fixed O & M | $ | 81,054 | $ | 88,861 | $ | 90,955 | $ | 73,509 | $ | 95,170 | $ | 107,561 | $ | 80,004 | $ | 93,786 | $ | 116,760 | ||||||||||||||
| G&A Costs (net Property Taxes) | $ | 37,283 | $ | 38,402 | $ | 39,554 | $ | 40,740 | $ | 41,962 | $ | 43,221 | $ | 44,518 | $ | 45,853 | $ | 47,229 | ||||||||||||||
| Property Taxes | $ | 34,269 | $ | 35,297 | $ | 36,356 | $ | 37,447 | $ | 38,570 | $ | 39,728 | $ | 40,919 | $ | 42,147 | $ | 43,411 | ||||||||||||||
| SO2 Costs | $ | 15,539 | $ | 16,449 | $ | 17,458 | $ | 18,139 | $ | 19,447 | $ | 20,835 | $ | 21,792 | $ | 23,200 | $ | 24,633 | ||||||||||||||
| Total Operating Expenses | $ | 536,515 | $ | 558,873 | $ | 574,821 | $ | 565,972 | $ | 605,748 | $ | 635,025 | $ | 622,471 | $ | 657,038 | $ | 700,143 | ||||||||||||||
| CFADS | $ | 457,631 | $ | 475,908 | $ | 497,517 | $ | 534,576 | $ | 547,106 | $ | 573,093 | $ | 637,317 | $ | 674,006 | $ | 699,452 | ||||||||||||||
| Senior Debt Service | $ | 56,825 | $ | 56,825 | $ | 56,825 | $ | 56,825 | $ | 56,825 | $ | 56,825 | $ | 56,825 | $ | 56,825 | $ | 56,825 | ||||||||||||||
| Senior DSCR | 8.1x | 8.4x | 8.8x | 9.4x | 9.6x | 10.1x | 11.2x | 11.9x | 12.3x | |||||||||||||||||||||||
| Senior Debt/Capitalization | 25 | % | 23 | % | 21 | % | 20 | % | 18 | % | 17 | % | 16 | % | 14 | % | 13 | % | ||||||||||||||
A-94
Table 4.12-4. Sensitivity Case 3: High Fuel
AmerenEnergy Generating Company
Cash Flow Summary
High Fuel page 1 of 2
(all values are $000's unless otherwise noted)
| year ending December 31, | 2002 | 2003 | 2004 | 2005 | 2006 | 2007 | 2008 | 2009 | 2010 | 2011 | 2012 | |||||||||||||||||||||||||
|---|---|---|---|---|---|---|---|---|---|---|---|---|---|---|---|---|---|---|---|---|---|---|---|---|---|---|---|---|---|---|---|---|---|---|---|---|
| Annual Generation (GWh) | 18,792 | 18,290 | 17,768 | 16,516 | 17,043 | 17,620 | 18,148 | 18,572 | 18,878 | 19,282 | 19,455 | |||||||||||||||||||||||||
Operating Revenues | ||||||||||||||||||||||||||||||||||||
| Contract Revenues | $ | 632,807 | $ | 609,981 | $ | 563,507 | $ | 190,313 | $ | 134,065 | $ | 71,948 | $ | 54,242 | $ | 18,565 | $ | 19,424 | $ | 19,661 | $ | 2,976 | ||||||||||||||
| Market Sales (Net) | $ | 41,219 | $ | 43,717 | $ | 138,933 | $ | 584,376 | $ | 709,413 | $ | 864,692 | $ | 942,018 | $ | 1,071,580 | $ | 1,120,499 | $ | 1,057,820 | $ | 1,115,541 | ||||||||||||||
| Energy Sales | $ | 40,346 | $ | 41,563 | $ | 87,187 | $ | 396,166 | $ | 494,478 | $ | 612,377 | $ | 678,312 | $ | 789,634 | $ | 841,090 | $ | 837,317 | $ | 889,574 | ||||||||||||||
| Capacity Sales | $ | 17,566 | $ | 15,993 | $ | 64,620 | $ | 188,210 | $ | 214,935 | $ | 252,316 | $ | 263,707 | $ | 281,947 | $ | 279,410 | $ | 220,502 | $ | 225,967 | ||||||||||||||
| Purchases | $ | (16,694 | ) | $ | (13,839 | ) | $ | (12,874 | ) | $ | 0 | $ | 0 | $ | 0 | $ | 0 | $ | 0 | $ | 0 | $ | 0 | $ | 0 | |||||||||||
| Lease Revenue | $ | 10,093 | $ | 10,093 | $ | 10,093 | $ | 10,093 | $ | 10,093 | $ | 10,093 | $ | 10,093 | $ | 10,093 | $ | 10,093 | $ | 10,093 | $ | 10,093 | ||||||||||||||
| Total Operating Revenues | $ | 684,118 | $ | 663,791 | $ | 712,533 | $ | 784,782 | $ | 853,571 | $ | 946,733 | $ | 1,006,352 | $ | 1,100,238 | $ | 1,150,016 | $ | 1,087,573 | $ | 1,128,609 | ||||||||||||||
Operating Expenses | ||||||||||||||||||||||||||||||||||||
| Fuel Costs | $ | 268,311 | $ | 265,277 | $ | 261,671 | $ | 254,388 | $ | 267,959 | $ | 284,123 | $ | 299,583 | $ | 315,602 | $ | 327,395 | $ | 331,660 | $ | 338,621 | ||||||||||||||
| Variable O & M | $ | 42,655 | $ | 48,874 | $ | 48,582 | $ | 47,103 | $ | 50,013 | $ | 53,253 | $ | 56,445 | $ | 59,553 | $ | 62,375 | $ | 65,830 | $ | 68,458 | ||||||||||||||
| Fixed O & M | $ | 80,400 | $ | 76,102 | $ | 66,991 | $ | 75,448 | $ | 76,044 | $ | 63,586 | $ | 70,934 | $ | 80,824 | $ | 60,268 | $ | 71,940 | $ | 79,105 | ||||||||||||||
| G&A Costs (net Property Taxes) | $ | 37,360 | $ | 24,809 | $ | 30,514 | $ | 29,594 | $ | 30,315 | $ | 31,224 | $ | 32,161 | $ | 33,126 | $ | 34,119 | $ | 35,143 | $ | 36,197 | ||||||||||||||
| Property Taxes | $ | 16,800 | $ | 16,800 | $ | 20,725 | $ | 22,850 | $ | 25,175 | $ | 28,700 | $ | 29,561 | $ | 30,448 | $ | 31,361 | $ | 32,302 | $ | 33,271 | ||||||||||||||
| SO2 Cost | $ | 0 | $ | 0 | $ | 0 | $ | 0 | $ | 14,518 | $ | 16,909 | $ | 19,375 | $ | 16,187 | $ | 26,249 | $ | 23,857 | $ | 22,974 | ||||||||||||||
| Total Operating Expenses | $ | 445,527 | $ | 431,862 | $ | 428,484 | $ | 429,383 | $ | 464,023 | $ | 477,795 | $ | 508,058 | $ | 535,739 | $ | 541,768 | $ | 560,732 | $ | 578,626 | ||||||||||||||
CFADS | $ | 238,592 | $ | 231,929 | $ | 284,049 | $ | 355,399 | $ | 389,547 | $ | 468,938 | $ | 498,294 | $ | 564,499 | $ | 608,247 | $ | 526,841 | $ | 549,983 | ||||||||||||||
Senior Debt Service | $ | 56,825 | $ | 56,825 | $ | 56,825 | $ | 56,825 | $ | 56,825 | $ | 56,825 | $ | 56,825 | $ | 56,825 | $ | 56,825 | $ | 56,825 | $ | 56,825 | ||||||||||||||
Senior DSCR | 4.2x | 4.1x | 5.0x | 6.3x | 6.9x | 8.3x | 8.8x | 9.9x | 10.7x | 9.3x | 9.7x | |||||||||||||||||||||||||
| Average, 2002-2011 | 7.3x | |||||||||||||||||||||||||||||||||||
| Minimum, 2002-2011 | 4.1x | |||||||||||||||||||||||||||||||||||
| Average, 2002-2006 | 5.3x | |||||||||||||||||||||||||||||||||||
| Average, 2007-2011 | 9.4x | |||||||||||||||||||||||||||||||||||
Senior Debt / Capitalization | 46 | % | 46 | % | 46 | % | 44 | % | 43 | % | 40 | % | 37 | % | 34 | % | 30 | % | 27 | % | 25 | % | ||||||||||||||
| Average, 2002-2011 | 39 | % | ||||||||||||||||||||||||||||||||||
A-95
Table 5.8-4. Sensitivity Case 3: High Fuel (Continued)
AmerenEnergy Generating Company
Cash Flow Summary
High Fuel page 2 of 2
(all values are $000's unless otherwise noted)
| year ending December 31, | 2013 | 2014 | 2015 | 2016 | 2017 | 2018 | 2019 | 2020 | 2021 | |||||||||||||||||||||
|---|---|---|---|---|---|---|---|---|---|---|---|---|---|---|---|---|---|---|---|---|---|---|---|---|---|---|---|---|---|---|
| Annual Generation (GWh) | 19,439 | 19,587 | 19,701 | 19,690 | 19,823 | 19,910 | 19,926 | 20,030 | 20,047 | |||||||||||||||||||||
Operating Revenues | ||||||||||||||||||||||||||||||
| Contract Revenues | $ | 3,050 | $ | 3,126 | $ | 0 | $ | 0 | $ | 0 | $ | 0 | $ | 0 | $ | 0 | $ | 0 | ||||||||||||
| Market Sales (Net) | $ | 1,147,655 | $ | 1,193,559 | $ | 1,245,742 | $ | 1,296,305 | $ | 1,354,598 | $ | 1,420,539 | $ | 1,495,077 | $ | 1,572,932 | $ | 1,654,368 | ||||||||||||
| Energy Sales | $ | 903,151 | $ | 950,838 | $ | 990,058 | $ | 1,017,149 | $ | 1,080,738 | $ | 1,147,611 | $ | 1,210,431 | $ | 1,292,899 | $ | 1,370,430 | ||||||||||||
| Capacity Sales | $ | 244,504 | $ | 242,721 | $ | 255,684 | $ | 279,156 | $ | 273,860 | $ | 272,928 | $ | 284,646 | $ | 280,033 | $ | 283,938 | ||||||||||||
| Purchases | $ | 0 | $ | 0 | $ | 0 | $ | 0 | $ | 0 | $ | 0 | $ | 0 | $ | 0 | $ | 0 | ||||||||||||
| Lease Revenue | $ | 10,093 | $ | 10,093 | $ | 10,093 | $ | 10,093 | $ | 10,093 | $ | 10,093 | $ | 10,093 | $ | 10,093 | $ | 10,093 | ||||||||||||
| Total Operating Revenues | $ | 1,160,798 | $ | 1,206,778 | $ | 1,255,835 | $ | 1,306,398 | $ | 1,364,690 | $ | 1,430,631 | $ | 1,505,170 | $ | 1,583,024 | $ | 1,664,460 | ||||||||||||
Operating Expenses | ||||||||||||||||||||||||||||||
| Fuel Costs | ||||||||||||||||||||||||||||||
| Variable O & M | $ | 70,378 | $ | 73,040 | $ | 75,673 | $ | 77,771 | $ | 80,723 | $ | 83,593 | $ | 86,223 | $ | 89,370 | $ | 92,148 | ||||||||||||
| Fixed O & M | $ | 77,276 | $ | 85,349 | $ | 87,671 | $ | 70,225 | $ | 92,049 | $ | 104,246 | $ | 76,555 | $ | 90,530 | $ | 114,082 | ||||||||||||
| G&A Costs (net Property Taxes) | $ | 37,283 | $ | 38,402 | $ | 39,554 | $ | 40,740 | $ | 41,962 | $ | 43,221 | $ | 44,518 | $ | 45,853 | $ | 47,229 | ||||||||||||
| Property Taxes | $ | 34,269 | $ | 35,297 | $ | 36,356 | $ | 37,447 | $ | 38,570 | $ | 39,728 | $ | 40,919 | $ | 42,147 | $ | 43,411 | ||||||||||||
| SO2 Costs | $ | 17,226 | $ | 18,256 | $ | 19,182 | $ | 19,944 | $ | 21,059 | $ | 22,127 | $ | 23,304 | $ | 24,763 | $ | 25,982 | ||||||||||||
| Total Operating Expenses | $ | 577,653 | $ | 600,127 | $ | 615,974 | $ | 607,289 | $ | 647,791 | $ | 679,213 | $ | 666,861 | $ | 701,094 | $ | 742,416 | ||||||||||||
CFADS | $ | 583,145 | $ | 606,651 | $ | 639,861 | $ | 699,109 | $ | 716,900 | $ | 751,418 | $ | 838,309 | $ | 881,930 | $ | 922,044 | ||||||||||||
Senior Debt Service | $ | 56,825 | $ | 56,825 | $ | 56,825 | $ | 56,825 | $ | 56,825 | $ | 56,825 | $ | 56,825 | $ | 56,825 | $ | 56,825 | ||||||||||||
Senior DSCR | 10.3x | 10.7x | 11.3x | 12.3x | 12.6x | 13.2x | 14.8x | 15.5x | 16.2x | |||||||||||||||||||||
Senior Debt / Capitalization | 23 | % | 21 | % | 19 | % | 18 | % | 16 | % | 15 | % | 14 | % | 13 | % | 12 | % | ||||||||||||
A-96
| Acronym | Definition | |
|---|---|---|
| API | American Petroleum Institute | |
| ASME | American Society of Mechanical Engineers | |
| ASTM | American Society of Testing and Materials | |
| AWS | American Welding Society | |
| B&W | Babcock & Wilcox | |
| BOCA | Building Officials and Code Administrators | |
| CAAA | Clean Air Act Amendments Of 1990 | |
| CE | Combustion Engineering | |
| CEMS | Continuous Emissions Monitoring Systems | |
| CFADS | Cash Flow Available For Debt Service | |
| CIPS | Central Illinois Public Service Company | |
| CT/CTG | Combustion Turbine / Combustion Turbine Generator | |
| DCS | Distributed Control System | |
| DSCR | Debt Service Coverage Ratio | |
| EAF | Equivalent Availability Factor | |
| ECAR | East-Central Area Reliability | |
| EFOR | Equivalent Forced Outage Rate | |
| ESA | Environmental Site Assessment | |
| EPA | US Environmental Protection Agency | |
| ESP | Electrostatic Precipitator | |
| FD | Forced Draft | |
| FGD | Flue Gas Desulfurization | |
| GE | General Electric | |
| HMI | Human-Machine Interface | |
| HP | High Pressure | |
| HRSG | Heat Recovery Steam Generator | |
| ID | Induced Draft | |
| IP | Intermediate Pressure | |
| IEPA | Illinois Environmental Protection Agency | |
| LP | Low Pressure | |
| MAIN | Mid-American Interconnected Network | |
| MDNR | Missouri Department of Natural Resources | |
| MSDS | Material Safety Data Sheet | |
| NDE/NDT | Non-Destructive Examination / Testing | |
| NFPA | National Fire Protection Association | |
| NOI | Notice of Intent | |
| NOV | Notice of Violation | |
| NPDES | National Pollutant Discharge Elimination System | |
| NSPS | New Source Performance Standard | |
| OFA | Over-fire Air | |
| O&M | Operations and Maintenance | |
| OEM | Original Equipment Manufacturer | |
| PD | Partial Discharge | |
| PLC | Programmable Logic Control | |
| PM | Particulate Matter | |
| PRB | Powder River Basin | |
| PSD | Prevention Of Significant Deterioration | |
| RCRA | Resource Conservation And Recovery Act |
A-97
| SCR | Selective Catalytic Reduction | |
| SIP | State Implementation Plan | |
| SPCC | Spill Prevention, Countermeasure And Control | |
| SPE | Solid Particle Erosion | |
| STP | Sewage Treatment Plant | |
| SW | Siemens Westinghouse Operating Services | |
| SWPC | Siemens Westinghouse Power Corporation | |
| SWPPP | Stormwater Pollution Prevention Plan | |
| TA | Technical Advisory | |
| TCC | Turbine Control Compartment | |
| TSD | Treatment, Storage Or Disposal | |
| TSS | Total Suspended Solids | |
| UIC | Underground Injection Control | |
| UPS | Uninterruptible Power System | |
| USEPA | United States Environmental Protection Agency | |
| UT | Ultrasonic Testing | |
| VOM | Volatile Organic Matter | |
| WPC | Water Pollution Control |
A-98
Independent Technical Review
LEGAL NOTICE
ELECTRONIC MAIL NOTICE
Independent Technical Review for Financing: AmerenEnergy Generating Company Assets Table of Contents
List of Tables
List of Figures
Table 2.1-1. Site Visit Dates
Table 3.1-1. Newton Characteristics
Table 3.1-2. Coffeen Characteristics
Table 3.1-4. Hutsonville Characteristics
Table 3.2-1. Newton Performance
Table 3.2-2. Coffeen Performance
Table 3.2-3. Meredosia Performance
Table 3.2-4. Hutsonville Performance
Table 3.3-1. Cost of Plant Improvement Initiatives Program
Table 3.3-2. Newton O&M Expenses
Table 3.4-1. Phase II SO2 Allocations: Coal-fired Stations
Table 3.4-3. NOx Emissions Projections
Table 3.4-4. Historical NOx Emissions Summary
Table 3.4-5. 2001 NOx Emissions
Table 3.4-6. NOx Reduction Options
Table 3.4-7. Ozone Season NOx Emissions
Table 3.4-8. Newton Emissions Limitations
Table 3.4-9. Coffeen Emissions Limitations
Table 3.4-10. Meredosia Emissions Limitations
Table 3.4-11. Hutsonville Emissions Limitations
Table 4.2-1. Grand Tower Performance Summary
Table 4.2-2. Gibson City Performance Test Results
Table 4.2-3. Gibson City Performance Summary
Table 4.2-4. Pinckneyville Units 5-8 Performance Test Results
Table 4.2-5. Pinckneyville Performance Summary
Table 4.2-6. Kinmundy Performance Test Results
Table 4.2-7. Kinmundy Performance Summary
Table 4.2-8. Columbia Units 1-4 Performance Test Results
Table 4.2-9. Columbia Performance Summary
Table 4.3-1. Grand Tower O&M Budget Forecast
Table 4.3-2. Capital Projects: Grand Tower
Table 4.3-3. Fixed Operating Fee for CT Plants
Table 4.3-4. Gibson City 2001 O&M Costs
Table 4.3-5. Pinckneyville 2000 and 2001 O&M Costs
Table 4.3-6. Kinmundy 2001 O&M Costs
Table 4.3-7. Columbia 2001 O&M Costs
Figure 4.5-1. Projected Capacity Factors (Coal-fired Stations)
Table 4.12-1. Base Case Results
Figure 5.8-1 Base Case Results (Continued)
Table 4.12-2. Sensitivity Case 1: Overbuild
Figure 5.8-2. Sensitivity Case 1: Overbuild (Continued)
Table 4.12-3. Sensitivity Case 2: Low Fuel
Table 5.8-3. Sensitivity Case 2: Low Fuel (Continued)
Table 4.12-4. Sensitivity Case 3: High Fuel
Table 5.8-4. Sensitivity Case 3: High Fuel (Continued)