QuickLinks -- Click here to rapidly navigate through this document
Independent Market Consultant's Report
Electricity Market Analysis of the
Midwest and Forecast of Electricity
Revenues for AmerenEnergy Generating
May 24, 2002
Prepared For:
Lehman Brothers
745 7th Avenue 25th Floor
New York, NY 10019
Prepared By:
Platts/RDI Consulting, A McGraw-Hill Company.
3333 Walnut Street
Boulder, CO 80301-2515
Tel: (720) 548-5000
| Executive summary | B-3 | ||
| Summary of Results and Conclusions | B-3 | ||
| Introduction | B-10 | ||
| Midwest Market Overview | B-11 | ||
| Midwest Supply | B-11 | ||
| Future Supply | B-13 | ||
| Demand Forecast | B-13 | ||
| Transmission Capacity and Pricing | B-15 | ||
| Industry Restructuring in MAIN and ECAR | B-16 | ||
| Historic Pricing In Midwest U.S. Markets | B-18 | ||
| Base Case Assumptions | B-19 | ||
| Existing Supply | B-19 | ||
| New Generation | B-21 | ||
| Cost of New Generation Technologies | B-25 | ||
| Nuclear Generation | B-26 | ||
| Demand Forecast | B-26 | ||
| Reserve Requirements | B-27 | ||
| Coal Price Forecast | B-28 | ||
| Environmental Regulation | B-29 | ||
| NOx Regulations | B-30 | ||
| Gas Price Forecast | B-32 | ||
| AEG Contractual Obligations | B-34 | ||
| Methodology Overview | B-35 | ||
| Reserve Requirement Model | B-35 | ||
| Explicit Capacity Adder Model | B-35 | ||
| Energy Only Model | B-36 | ||
| RDI's Energy Market Methodology | B-36 | ||
| Capacity Market Methodology | B-37 | ||
| Base Case Results | B-39 | ||
| Energy Price Forecast | B-40 | ||
| ECAR/MAIN Supply and Demand Balance | B-41 | ||
| Projected Operations and Market Sales Revenue for AEG's Units | B-43 | ||
| Sensitivity Case Results | B-48 | ||
| Sensitivity Case Results | B-48 | ||
B-2
AmerenEnergy Generating (AEG), the non-regulated generating subsidiary of Ameren Corporation, retained Platts/RDI Consulting (RDI) to prepare this independent electricity market study of the Midwest United States, including the Mid-American Interconnected Network (MAIN) and the East Central Area Reliability council (ECAR). The purpose of this study is to assess the dispatch and potential market sales revenue of AEG's power plant portfolio in support of its existing generating capacity. AEG was created in May 2000 when Ameren Corp spun off its Illinois generating assets into a new power generation subsidiary. This report provides a forecast of market clearing prices for Southern Illinois, where most of AEG's assets are located, and also describes the key assumptions and the methodologies used in developing this forecast.
The base analytical tools utilized for this study were the Inter-Regional Electric Market Model (IREMM) and an integrated capacity price model. IREMM is a sophisticated production simulation model that simulates the Eastern Interconnection on an hourly basis for each year within the time horizon of the forecast. The capacity price model is integrated with IREMM and calculates the additional revenue required for maintenance of adequate capacity reserves. Using these models, RDI forecasts the market clearing price of energy and capacity to assess the economics of selling power in the Midwest U.S.
Summary of Results and Conclusions
The following represents the conclusions and key findings of RDI's market assessment and electricity price forecast.
- i.
- While MAIN and ECAR represent distinct reliability councils, because of strong interconnections between them, as well as implementation of the Midwest Independent System Operator, they are viewed as a combined region for capacity and reserve purposes. Key characteristics of these regions include the following:
- a.
- Strong interconnections between ECAR and MAIN. The North American Electric Reliability Council's (NERC)2001 Summer Assessmentindicates peak season transfer capability from MAIN to ECAR of 4,000 MW. On a net basis, MAIN tends to import power from ECAR during intermediate load hours and export power to ECAR during peak hours.
- b.
- A Memorandum of Cooperation was signed on May 9, 2002 to expand MISO to include PJM, SPP, and TRANSLink Transmission Company's participants to create a single wholesale energy market. The union should be finalized later in 2002 and will serve customers in ECAR, MAIN, MAPP, SPP, PJM, the Canadian province of Manitoba, and service territory held by Public Service Company of Colorado. By eliminating pancaking of wheeling tariffs across multiple control areas, MISO should provide AEG with greater access to higher priced on-peak markets to the east.
- c.
- Annual energy and peak demand growth of 2.5% and 2.0% (weather normalized) from 1995-1999 for MAIN and ECAR, respectively. RDI projects that slowing population growth will restrain future energy and peak demand growth to 1.5% and 1.3%, respectively, in the two regions, below the U.S. forecast average of 1.7%.
- d.
- An abundance of baseload generation. The Midwest markets of MAIN and ECAR have the largest proportions of coal and nuclear generation of any region in the country. This makes the region very competitive with regard to off-peak generation.
- e.
- Significant wholesale and retail deregulation in Ohio, Illinois and Michigan. In the Midwest, deregulation appears to be partly responsible for large amounts of new capacity development.
- ii.
- MAIN and ECAR have experienced high levels of new capacity development in the last two years.
B-3
- a.
- RDI estimates that in ECAR and MAIN, over 29,000 MW of new capacity will come on-line between 2000 and 2005. This amount of new capacity represents 19% of ECAR/MAIN's 2001 peak demand.
- b.
- RDI projects that ECAR/MAIN reserve margins will approach 19% by 2003 before declining to 16% in 2005.
- iii.
- RDI's base case electricity price forecast (including both energy and capacity prices) for Southern Illinois, drop to a low of $27.37 in 2004 (in 2001 dollars) before returning to equilibrium pricing. The results of the forecast are summarized in Table 1. Key findings of the forecast include:
- a.
- RDI's base case forecast reflects a long market in 2002-2004. ECAR/MAIN is forecast to be in supply/demand balance by 2005.
- b.
- The primary drivers of the price forecast in Southern Illinois are high levels of baseload nuclear and coal generation setting off-peak prices, and natural gas units setting on-peak prices. As loads grow and a greater number of gas-fired power plants enter the capacity mix, natural gas prices exert greater influence over the region's price trends.
- c.
- Table 3 and Table 4 summarize RDI's key assumptions used in developing the forecast. The assumptions shown in Table 3 primarily influence the capacity market forecast with secondary influences on the energy market forecast.
- d.
- Table 4 summarizes the factors that primarily influence the energy market forecast, with secondary influences on the capacity market forecasts.
- iv.
- RDI's findings regarding AEG's assets are as follows:
- a.
- Ameren Corporation, which controls regulated generation in Missouri and AEG's unregulated assets, is the second largest generator in ECAR/MAIN, after AEP. FirstEnergy in Ohio and Edison Mission Energy in Illinois each operate comparable amounts of generation to Ameren.
- b.
- Figure 1 shows the regional peak season dispatch curve for power plants in the MAIN region. The region features high levels of nuclear and coal-fired capacity with a dispatch price below $20/MWh. AEG's generation portfolio, as indicated, includes coal- and gas-fired power plants in all portions of the dispatch curve.
- c.
- Through 2004, AEG's principal revenue source will be derived from its term wholesale contracts. After the contracts currently in place expire, RDI's analysis assumes that AEG will receive, on average, the wholesale market rate for subsequent contracts. Table 2 shows RDI's base projection of revenues from AEG's market sales. Average revenues fall from 2001-2004 as natural gas prices decline and reserve margins increase. After 2004, AEG's average market revenues show nominal growth of 3.4% per year.
- v.
- RDI conducted sensitivity analysis on key market variables; including natural gas prices and the possibility of regional overbuild. RDI's findings include the following:
- a.
- Because of the large number of new plants proposed for the Midwest, the risk of overbuild may be considered to be higher than in the past. RDI evaluated an overbuild scenario in which a higher proportion of projects were built, pushing reserve margins for ECAR and MAIN to 23% by 2003. This level of capacity addition results in the region being oversupplied through 2006.
- b.
- To capture the effect of volatile fuel prices on market sales revenues, RDI modeled low and high fuel scenarios in which natural gas and oil prices trended 15% below the base case and 15% above the base case.
B-4
- c.
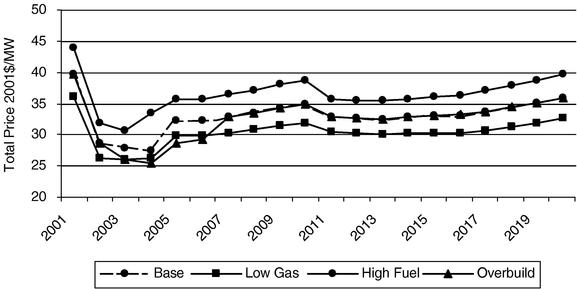
- Figure 2 shows the market price outcome of each of these sensitivity cases for Southern Illinois. The overbuild case results in an 11% reduction in annual prices from 2003-2006, while the low natural gas price case results in an 8% reduction in annual prices over the study period. The high fuel scenario results in an 11% increase in annual prices over the study period. In terms of revenue effects, the overbuild case results in a 19% reduction in annual market sales revenues during the years of surplus capacity. The low natural gas case reduces annual revenues by 8% and the high natural gas increases annual revenues 9%.
- d.
- It is important to note that while two of the sensitivity cases RDI investigated represent downside risks to AEG's market sales revenues, RDI believes the potential for strong markets due to higher fuel prices and tight generation conditions are likely to occur during the forecast period. While today's natural gas prices are low and reserve margins are at historic highs, gas prices can certainly rise to high levels, as they did during the latter half of 2000, and tight generation conditions can occur, as they did during the summers of 1998-1999.
TABLE 1
FORECAST PRICE RESULTS: 2001-2020 (NOMINAL$)
| | ENERGY PRICE ($/MWh) | | | | | ||||||||||||||
|---|---|---|---|---|---|---|---|---|---|---|---|---|---|---|---|---|---|---|---|
| YEAR | ON-PEAK | MID-PEAK | OFF-PEAK | YEAR ROUND | ANNUAL GROWTH % | CAPACITY PRICE $/kW-yr | TOTAL PRICE $/MWh | TOTAL PRICE 2001$/MWh | REAL ANNUAL GROWTH % | ||||||||||
| 2001 | 45.67 | 26.14 | 17.98 | 32.71 | — | 60.77 | 39.65 | 39.65 | — | ||||||||||
| 2002 | 32.80 | 22.44 | 17.46 | 25.71 | -21 | % | 33.53 | 29.54 | 28.68 | -28 | % | ||||||||
| 2003 | 31.73 | 23.03 | 18.89 | 25.79 | 0 | % | 33.02 | 29.56 | 27.86 | -3 | % | ||||||||
| 2004 | 31.77 | 22.81 | 18.39 | 25.60 | -1 | % | 37.70 | 29.91 | 27.37 | -2 | % | ||||||||
| 2005 | 35.92 | 25.67 | 20.26 | 28.75 | 12 | % | 66.58 | 36.35 | 32.29 | 18 | % | ||||||||
| 2006 | 37.15 | 26.79 | 20.99 | 29.79 | 4 | % | 67.83 | 37.53 | 32.37 | 0 | % | ||||||||
| 2007 | 38.99 | 28.22 | 21.97 | 31.26 | 5 | % | 69.09 | 39.15 | 32.79 | 1 | % | ||||||||
| 2008 | 41.09 | 30.14 | 23.35 | 33.09 | 6 | % | 70.69 | 41.16 | 33.47 | 2 | % | ||||||||
| 2009 | 43.93 | 32.31 | 24.74 | 35.32 | 7 | % | 72.11 | 43.55 | 34.38 | 3 | % | ||||||||
| 2010 | 46.19 | 34.14 | 26.11 | 37.20 | 5 | % | 73.67 | 45.61 | 34.96 | 2 | % | ||||||||
| 2011 | 45.08 | 33.43 | 26.30 | 36.60 | -2 | % | 66.58 | 44.20 | 32.89 | -6 | % | ||||||||
| 2012 | 46.22 | 34.37 | 27.11 | 37.59 | 3 | % | 67.05 | 45.25 | 32.69 | -1 | % | ||||||||
| 2013 | 46.63 | 34.88 | 27.92 | 38.15 | 1 | % | 70.56 | 46.21 | 32.41 | -1 | % | ||||||||
| 2014 | 48.81 | 36.58 | 29.53 | 40.05 | 5 | % | 71.13 | 48.17 | 32.80 | 1 | % | ||||||||
| 2015 | 50.48 | 38.07 | 30.87 | 41.57 | 4 | % | 73.74 | 49.99 | 33.05 | 1 | % | ||||||||
| 2016 | 51.59 | 39.14 | 31.94 | 42.66 | 3 | % | 78.41 | 51.61 | 33.13 | 0 | % | ||||||||
| 2017 | 54.42 | 41.45 | 34.17 | 45.19 | 6 | % | 78.13 | 54.11 | 33.72 | 2 | % | ||||||||
| 2018 | 57.60 | 44.03 | 36.34 | 47.92 | 6 | % | 77.91 | 56.81 | 34.37 | 2 | % | ||||||||
| 2019 | 60.33 | 46.46 | 38.42 | 50.37 | 5 | % | 81.74 | 59.70 | 35.07 | 2 | % | ||||||||
| 2020 | 64.27 | 49.51 | 41.29 | 53.78 | 7 | % | 80.62 | 62.98 | 35.92 | 2 | % | ||||||||
B-5
FIGURE 1
MAIN SUPPLY CURVE 2002
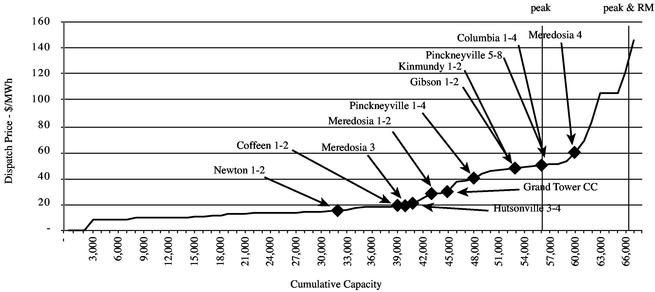
TABLE 2
WHOLESALE MARKET REVENUES FOR AEG, 2001-2020 ($NOMINAL)
| YEAR | AVAILABLE CAPACITY (MW) | ENERGY SALES (GWH) | TOTAL REVENUES ($000) | AVERAGE REVENUES $/MWh | ||||
|---|---|---|---|---|---|---|---|---|
| 2001 | 138 | 601 | 31,525 | 52.48 | ||||
| 2002 | 546 | 1,060 | 50,203 | 47.38 | ||||
| 2003 | 551 | 1,041 | 48,418 | 46.52 | ||||
| 2004 | 989 | 2,306 | 105,379 | 45.69 | ||||
| 2005 | 2,844 | 10,457 | 528,628 | 50.55 | ||||
| 2006 | 3,183 | 12,728 | 639,219 | 50.22 | ||||
| 2007 | 3,673 | 15,099 | 777,127 | 51.47 | ||||
| 2008 | 3,757 | 16,148 | 849,160 | 52.59 | ||||
| 2009 | 4,040 | 17,719 | 971,889 | 54.85 | ||||
| 2010 | 4,040 | 18,044 | 1,024,337 | 56.77 | ||||
| 2011 | 4,040 | 18,418 | 971,844 | 52.77 | ||||
| 2012 | 4,105 | 19,122 | 1,025,124 | 53.61 | ||||
| 2013 | 4,105 | 19,125 | 1,051,452 | 54.98 | ||||
| 2014 | 4,105 | 19,264 | 1,093,374 | 56.76 | ||||
| 2015 | 4,141 | 19,364 | 1,140,576 | 58.90 | ||||
| 2016 | 4,141 | 19,361 | 1,182,507 | 61.08 | ||||
| 2017 | 4,141 | 19,543 | 1,238,042 | 63.35 | ||||
| 2018 | 4,141 | 19,667 | 1,301,268 | 66.16 | ||||
| 2019 | 4,141 | 19,659 | 1,363,271 | 69.35 | ||||
| 2020 | 4,141 | 19,789 | 1,435,839 | 72.56 |
B-6
FIGURE 2
COMPARISON OF BASE AND SENSITIVITY CASE RESULTS, TOTAL PRICE ($2001/MWH)
B-7
TABLE 3
KEY INPUT VALUES AND ASSUMPTIONS FOR THE CAPACITY MARKET FORECAST—ECAR/MAIN
| Parameter | Input Values | | ||||||||||
|---|---|---|---|---|---|---|---|---|---|---|---|---|
| Demand | Base Case | |||||||||||
| 2001 Net Peak Projection (MW) | 157,382 | |||||||||||
| Annual Peak Growth 2001-2010 | 1.7% | |||||||||||
| Annual Peak Growth 2011-2020 | 1.1% | |||||||||||
| Planning Reserve Margin (%) | ||||||||||||
| 2001-2010 | 16.0% | |||||||||||
| 2011-2015 | 15.0% | |||||||||||
| 2016-2020 | 15.0% | |||||||||||
| New Power Plant Builds | ||||||||||||
| Capital Costs ($2001/kW) | CT | CC | ||||||||||
| and Heat Rate (Btu/kWh) | Cost | Heat Rate | Cost | Heat Rate | ||||||||
| 2001 | 450.0 | 10,900 | 600.0 | 7,000 | ||||||||
| 2005 | 350.0 | 10,900 | 500.0 | 7,000 | ||||||||
| 2011 | 350.0 | 10,200 | 500.0 | 6,500 | ||||||||
| 2015 | 350.0 | 10,200 | 500.0 | 6,500 | ||||||||
| 2020 | 350.0 | 10,200 | 500.0 | 6,500 | ||||||||
| Fixed O&M ($2001/kW/yr) | 5.0 | 15.0 | ||||||||||
| Variable O&M ($2001/MWh) | 5.0 | 2.2 | ||||||||||
| Equivalent Availability Factor (%) | 95.0 | 92.0 | ||||||||||
| Equivalent Forced Outage Rate (%) | 3.0 | 5.0 | ||||||||||
| Financial Costs for New Builds | ||||||||||||
| Debt/Equity Ratio (%) | 50/50 | |||||||||||
| Nominal Cost of Debt (%) | 8.5% | |||||||||||
| Nominal After Tax ROE (%) | 15.0% | |||||||||||
| Marginal Income Tax Rate (%) | 40.7% | |||||||||||
| Depreciation Schedule | MACRS | |||||||||||
| General Inflation Rate | 2.5% | |||||||||||
| New Capacity Additions | Projected Firm Capacity Additions Plus Additional Capacity Required to Achieve Reserve Margin | |||||||||||
| Firmly Planned Capacity Additions (MW) | ECAR | MAIN | ||||||||||
| 2000 | 3,944 | 2,830 | ||||||||||
| 2001 | 4,943 | 4,974 | ||||||||||
| 2002 | 3,425 | 2,566 | ||||||||||
| 2003 | 1,657 | 1,744 | ||||||||||
| 2004 | 0 | 76 | ||||||||||
| Total Firmly Planned Additions | 13,969 | 12,190 | ||||||||||
B-8
TABLE 4
KEY INPUT VALUES AND ASSSUMPTIONS FOR THE ENERGY MARKET FORECAST
| | Input Values * | |||||||||||||||
|---|---|---|---|---|---|---|---|---|---|---|---|---|---|---|---|---|
| | 2001 | 2005 | 2010 | 2015 | 2020 | |||||||||||
| So. IL Delivered Natural Gas Prices ($/MMbtu) | $ | 5.89 | $ | 3.26 | $ | 3.34 | $ | 3.09 | $ | 3.57 | ||||||
ECAR Delivered Natural Gas Prices ($/MMbtu) | $ | 6.01 | $ | 3.38 | $ | 3.48 | $ | 3.25 | $ | 3.82 | ||||||
Henry Hub Delivered Natural Gas Prices ($/MMbtu) | $ | 5.65 | $ | 3.17 | $ | 3.18 | $ | 2.96 | $ | 3.45 | ||||||
Delivered Oil Prices ($/MMbtu) | $ | 4.25 | $ | 3.22 | $ | 2.55 | $ | 2.87 | $ | 3.38 | ||||||
Typical FOB Coal Prices ($/MMbtu) | ||||||||||||||||
Central Appalachia | $ | 1.57 | $ | 1.06 | $ | 1.06 | $ | 1.03 | $ | 1.01 | ||||||
Illinois Basin | $ | 1.16 | $ | 0.83 | $ | 0.80 | $ | 0.78 | $ | 0.77 | ||||||
Southern Powder River Basin | $ | 0.50 | $ | 0.32 | $ | 0.31 | $ | 0.30 | $ | 0.30 | ||||||
Nuclear Retirements | Projected 772MW in 2010; 3,709 between 2010 - 2020 due to retirement or license expiration | |||||||||||||||
Fossil Retirements | As indicated by Form 411 submissions | |||||||||||||||
- *
- All prices expressed in constant 2001 dollars
B-9
AmerenEnergy Generating (AEG), the non-regulated generating subsidiary of Ameren Corporation, retained Platts/RDI Consulting (RDI) to prepare this independent electricity market study of the Midwest United States, including the Mid-American Interconnected Network (MAIN) and the East Central Area Reliability council (ECAR). The purpose of this study is to assess the dispatch and potential market sales revenue of AEG's power plant portfolio in support of its generating capacity. AEG was created in May 2000 when Ameren Corp spun off its Illinois generating assets into a new power generation subsidiary. This report provides a forecast of market clearing prices for Southern Illinois, where AEG's assets are located, and also describes the key assumptions and the methodologies used in developing this forecast.
The first section of this report provides an overview of the ECAR/MAIN electricity market. The next section details the base case assumptions employed for the forecast. The third section discusses RDI's forecasting methodology. The final section summarizes the results of the study including regional price results and forecasts of unit generation and market purchases and sales.
B-10
This section provides an overview of the midwestern markets of MAIN and ECAR. AEG's generation is located in the MAIN region, with plants in central and southern Illinois and Missouri, close to the juncture of ECAR and the Southeast Electric Reliability Council. Because of historically heavy interconnections, power exchange, and high pricing correlation, RDI considers ECAR and MAIN to be a common market for reserve sharing purposes. The common membership of ECAR and MAIN generators and transmission owners in the Midwest Independent System Operator (MISO) further underscores the common basis of the two regions.
Midwest Supply
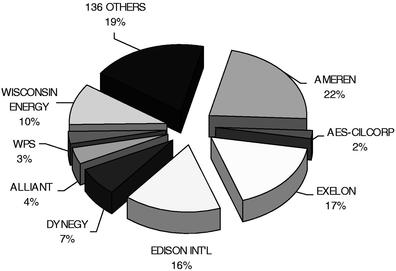
Within the MAIN region, Ameren Corp. is the largest generation provider (Figure 3). The generation assets of the former Commonwealth Edison are now split between Exelon (principally nuclear generation) and Edison Mission (most of the fossil generation). Overall, the market concentration of assets in MAIN is not high enough to permit the exercise of market power.
FIGURE 3
MAIN MARKET SHARE, 2001 (% OF TOTAL CAPACITY)
When considered together, ECAR and MAIN have several generation providers, including integrated investor-owned utilities, exempt wholesale generation companies, and nuclear generating companies (Figure 4). American Electric Power (AEP), with generation and retail operations in Ohio, West Virginia, Kentucky, Indiana, and Michigan, is the largest holder of generating assets. After AEP, 39% of the generation ownership is spread evenly among the next six owners, reflecting a low concentration of ownership for the region. The remainder is spread amongst numerous market participants.
B-11
FIGURE 4
ECAR/MAIN MARKET SHARE, 2001 (% OF TOTAL CAPACITY)

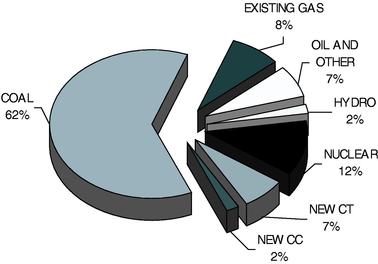
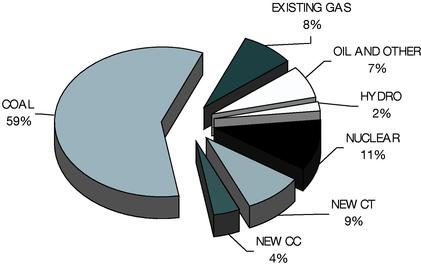
Figure 5 shows the break down of capacity by fuel type as of the summer of 2001. The "New CC" and "New CT" categories include units that came on-line in 1999 and 2000, while the "Existing Gas" category includes gas-fired generation on-line before January 1999. As illustrated in Figure 5, the total share of capacity in gas-fired generation has doubled since 1999, with much of the new capacity in peaking combustion turbines.
An important characteristic of this region is the low proportion of peaking resources, compared to other regions. Baseload and intermediate generating resources (coal, nuclear, combined cycle, and hydro) make up 78% of the region's generating mix, with peakers representing the remaining 22%.
FIGURE 5
ECAR/MAIN CAPACITY SHARE BY PLANT TYPE—2001
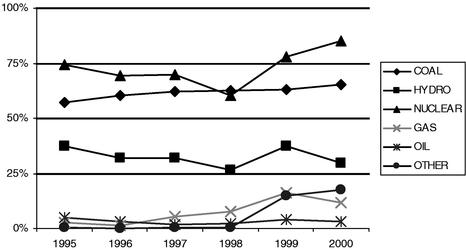
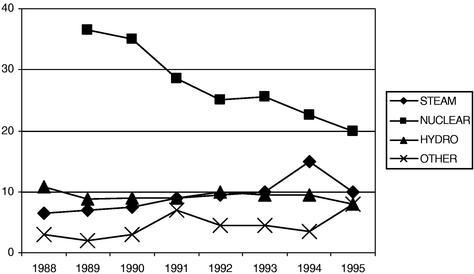
Capacity factors for plants in the Midwest have shown gradual growth over the last several years. A larger than usual amount of nuclear capacity was out of service in 1998, but nuclear utilization has increased steadily since then. Load growth has increased capacity factors of the region's coal and gas-fired generation as well. Figure 6 shows historic capacity factors for generation by fuel type.
B-12
FIGURE 6
MIDWEST CAPACITY FACTORS (1995-2000)
Future Supply
Between 2002 and 2004, RDI projects that more than 9,000 MW of capacity will be placed in service in ECAR and MAIN, including a mix of gas-fired combined cycle plants and combustion turbines. This infusion of capacity is expected to change the dispatch profile in the region for intermediate and peaking resources. Figure 7 shows the breakdown of capacity by fuel type in 2003. From 2001-2003, new capacity is projected to expand at a slower pace than in 1999-2001, and the new capacity is split more evenly between new combined cycle plants and combustion turbines. Overall, new gas-fired capacity is expected to expand its share from 9% of the generation mix to 13% between 2001 and 2003. The majority of the new peaking capacity is located in ECAR, while the majority of the new combined-cycle capacity is located in MAIN.
FIGURE 7
ECAR/MAIN CAPACITY SHARE BY PLANT TYPE—2003
Demand Forecast
Load growth forecasts for this study were developed from RDI's own demand forecast and the 1999 FERC Form 714. The FERC 714 report contains hourly load information. This information is utilized to simulate hourly chronological demand in IREMM.
B-13
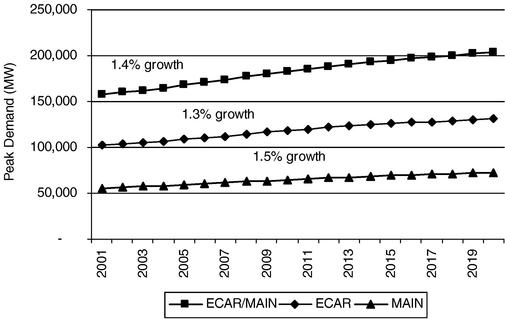
Historic and forecast regional demand growth is driven by economic and demographic factors. Figure 8 shows RDI's peak demand forecast for ECAR and MAIN combined. Factors affecting historic and forecast demand are discussed below.
States in the ECAR region made a strong recovery from the 1989-1991 recession, reflecting the recovery of the industrial base in the region, which resulted in strong growth in electricity sales. Sales grew rapidly through 1995 and slowed down somewhat through 1998. Between 1992 and 1998, Gross State Product (GSP) growth averaged 3.8% per year, equal to the national average. Population growth in ECAR has averaged 0.5% per year, roughly half the national average. Electric load growth averaged 2.4% per year (2.1% on a weather-normalized basis) during this period.
RDI forecasts electricity sales and peak demand to grow at 1.6% annually from 2001 through 2005, slightly below RDI's national average forecast of 1.8%. After 2005, sales growth is projected to moderate to 1.3% annually.
The states in the MAIN region experienced sustained economic growth in the 90s, driven primarily by continued expansion of manufacturing in Illinois and Wisconsin. Economic production, measured in terms of real dollar GSP, expanded by 3.8% annually from 1992 to 1998—slightly faster than the national average. During the same period, population growth averaged 0.7% per year, below the national average.
Between 1992 and 1998, electricity sales increased at a 3.2% annualized rate, although much of this was attributable to higher than average summer temperatures. On a weather-normalized basis, electricity sales in MAIN are estimated to have grown 2.6% on an annualized basis, close to the national average.
A projected slowdown in economic growth for the MAIN region drives electricity sales projections to slightly below U.S. averages over the forecast period. Electricity sales are projected to grow at 1.5% through the forecast period.
A small amount of the demand in each region is interruptible. RDI includes this demand in its forecast of peak demand. RDI models interruptible demand as an expensive peaking resource. That is, we represent it as actual capacity with a very high marginal cost so that this resource would be dispatched only during the highest peak demand conditions to reflect the manner in which interruptible resources are used and how they contribute to regional reserves.
B-14
FIGURE 8
ECAR/MAIN FORECAST PEAK DEMAND GROWTH (2000-2015)
Transmission Capacity and Pricing
The transmission system of MAIN and ECAR is centrally located amongst many interconnection points with other reliability councils, owing to AEP's efforts to interconnect its five-state system of generation and loads. ECAR is the only region in the U.S. with significant transmission mileage at 765 kV.
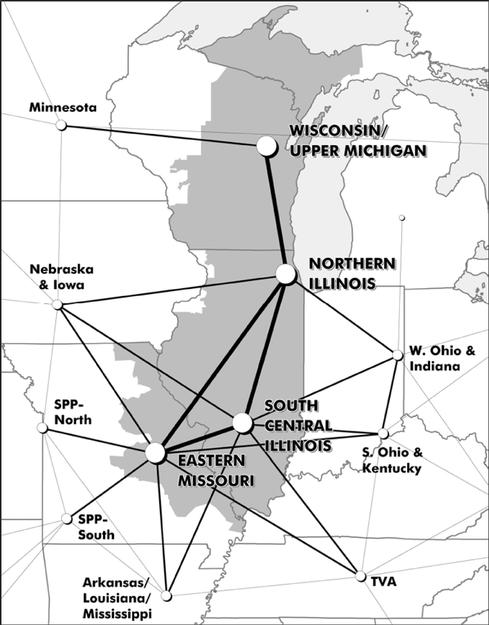
Figure 9 shows a general schematic of transmission paths between MAIN and surrounding areas. As shown in Figure 9, MAIN has strong interconnections with ECAR to the east and SERC (Entergy and TVA to the south, with lesser interconnections going west.(1) Transmission transfer capabilities directly affecting the MAIN region include the following:
- •
- MAIN to ECAR: 4,000 MW (Reverse 3,800 MW)
- •
- MAIN to Entergy: 3,000 MW (Reverse 650 MW)
- •
- MAIN to SPP: 900 MW (Reverse 2,300 MW)
- •
- MAIN to TVA: 2,300 MW (Reverse 1,800 MW)
- (1)
- Figure 9 does not reflect the recent switch in membership of Alliant-West from the MAPP reliability council to the MAIN reliability council. Load and capacity balances presented in this study account for the change in membership.
B-15
FIGURE 9
MAIN TRANSMISSION INTERCONNECTIONS
Based on analysis of Open Access Same-time Information System (OASIS) data, RDI assumes that transmission tariffs for spot transactions will be set at $2.50 per MWh. This amount is assigned to each utility market area to reflect the cost of transferring power over multiple systems during those times when power cost differentials make such transfers attractive.
The presence of transmission system coordination via a Regional Transmission Organization (RTO) or an Independent System Operator (ISO) could change the dynamics of transmission wheeling charges by eliminating system-by-system wheeling.
Industry Restructuring in MAIN and ECAR
Industry restructuring is proceeding on several fronts in both the federal and state arenas. This section first discusses restructuring initiatives at the state level, and then discusses key federal initiatives.
B-16
State Restructuring Initiatives
Several states in the Midwest U.S. have actively restructured their electricity markets. Major restructuring initiatives include the following:
- •
- Michigan enacted restructuring legislation in June 2000 after several years of controversy. The Michigan Public Service Commission (PSC) had previously attempted to order restructuring, but was determined by the state Supreme Court in June 1999 to lack authority in this area. Detroit Edison and Consumers Power then began to phase in retail competition on a voluntary basis. Legislation called for IOUs and cooperatives with peak loads of 1 MW or more to offer retail choice starting January 2002. Nine regulatory orders took effect January 1, 2002 to protect customers, adopt reliability and accounting standards, protects and determine net stranded costs unilaterally, in addition to other related regulatory issues.
- •
- Ohio has moved ahead with plans to begin retail competition for all IOU customers in January 2001, pursuant to legislation enacted in 1999. In October 2000 the Public Utility Commission of Ohio (PUCO) completed its process of reviewing utilities' transition plans and approving settlements in their transition cases. Utilities are supposed to ensure that at least 20 percent of their distribution-service customers are served by competitive suppliers (including utility affiliates) by the end of the transition period ending in 2005.
- •
- West Virginia is reconsidering its prior support of electric restructuring. In March 2000 the legislature adopted a resolution accepting a restructuring plan proposed by the West Virginia Public Service Commission (PSC). The plan incorporates a four-year rate freeze. Details are being worked out in PSC rulemakings. Higher prices in other restructured states, particularly California and Montana, have given lawmakers misgivings about moving ahead with restructuring. The legislature must pass a resolution giving final approval to any restructuring plan adopted by the PSC. The details of the plan have not been finalized, and the legislature has not yet voted on it, meaning the advent of restructured deregulation in West Virginia will be delayed or possibly negated.
- •
- Illinois enacted restructuring legislation in late 1997. The phase-in of retail competition among IOUs started with large commercial and industrial customers in October 1999, and runs until May 2002, when competition extends to residential customers. Municipals and cooperatives can opt-in to competition. Early data indicate that statewide, a little over 3% of industrial customers have switched away from their traditional retail suppliers.
- •
- Wisconsin has taken some steps to restructure the electric industry, but so far has not elected to pursue retail competition. In 1997 the state's Public Service Commission determined that action on retail competition should be deferred in favor of concentrating on transmission and reliability issues. The state's budget bill, passed in October 1999, included several electric industry provisions, including a requirement that utility transmission assets be transferred to an independent transmission company, and funding for a study of market power issues.
Federal Restructuring Initiatives
Several transmission-owning utilities within ECAR and MAIN are members of the Midwest Independent System Operator (ISO), formed in 1996. The Midwest ISO is expected to be the nation's largest ISO. Market trials of its systems began in August 2001.
Also pertinent to ECAR is the proposed Alliance Regional Transmission Organization (RTO), a for-profit group being formed by Consumers Energy, Detroit Edison, FirstEnergy, Illinois Power (which has been a member of the Midwest ISO), and Virginia Power. RDI expects that a unified Midwest market will broaden the reach of low-cost generators such as AEG's coal-fired plants. Reduced costs of
B-17
electricity transfers may also favor gas-fired generation in Illinois, which has historically enjoyed lower delivered gas costs than similar plants in Indiana, Michigan, and Ohio.
Historic Pricing In Midwest U.S. Markets
Table 5 shows monthly average on-peak prices for two regional electricity hubs nearest AEG. Table 5 illustrates the convergence in pricing between the two hubs that has occurred. The summer time price spikes experienced at Cinergy in 1998-1999 reflected abnormal weather, generation outages, and fragmented transmission system operation. Prices into Ameren, while affected by the spike, were significantly lower than Cinergy. Summertime prices in 2000 in Cinergy moderated significantly because of new capacity construction cited previously. An uptick in natural gas prices toward the end of the year drove up on-peak power prices to the point where annual average prices finished higher than the previous year. From 1999 through 2001, prices into Ameren were very similar to prices at Cinergy.
TABLE 5
MONTHLY WHOLESALE ON-PEAK ELECTRICITY PRICES IN ECAR AND MAIN ($/MWH):
1998-PRESENT
| | AMEREN | CINERGY | ||||||||||||||
|---|---|---|---|---|---|---|---|---|---|---|---|---|---|---|---|---|
| MONTH | ||||||||||||||||
| 1998 | 1999 | 2000 | 2001 | 1998 | 1999 | 2000 | 2001 | |||||||||
| JAN | N/A | 22.63 | 25.65 | 46.44 | 17.02 | 21.02 | 26.33 | 46.49 | ||||||||
| FEB | 17.00 | 18.69 | 24.85 | 36.65 | 16.20 | 17.62 | 22.78 | 36.19 | ||||||||
| MAR | 25.68 | 20.44 | 25.67 | 39.15 | 23.21 | 20.14 | 23.62 | 40.03 | ||||||||
| APR | 23.75 | 29.00 | 30.09 | 46.61 | 20.98 | 24.67 | 27.06 | 47.98 | ||||||||
| MAY | N/A | 24.60 | 45.87 | 35.69 | 43.67 | 22.70 | 40.38 | 35.17 | ||||||||
| JUN | 127.11 | 42.22 | 37.84 | 33.42 | 243.73 | 51.12 | 37.65 | 36.56 | ||||||||
| JUL | 53.67 | 245.51 | 44.55 | 41.37 | 114.66 | 245.37 | 37.45 | 40.85 | ||||||||
| AUG | 33.00 | 73.25 | 57.76 | 48.04 | 36.24 | 63.73 | 43.35 | 46.83 | ||||||||
| SEP | 35.73 | 21.36 | 31.20 | 22.59 | 31.10 | 19.58 | 23.10 | 22.92 | ||||||||
| OCT | 20.00 | 21.26 | 34.84 | 23.14 | 19.54 | 20.98 | 30.67 | 22.57 | ||||||||
| NOV | 21.73 | 21.71 | 40.44 | 21.43 | 19.39 | 19.42 | 47.15 | 22.72 | ||||||||
| DEC | 21.17 | 21.84 | 69.29 | 19.08 | 18.91 | 19.28 | 68.78 | 19.00 | ||||||||
| DAILY AVERAGE | 32.08 | 46.85 | 59.26 | 34.49 | 51.88 | 45.58 | 58.89 | 33.86 | ||||||||
B-18
This section provides a detailed accounting of the factors driving the base case forecast. While RDI models the entire Eastern Interconnect, this section will focus on assumptions relating to the ECAR/MAIN regions.
Existing Supply
The supply curves constructed by RDI for this analysis were built on a unit-by-unit basis. The unit data used are based on the annual EIA-411 reports supplied to the Department of Energy via the regional councils of the North American Electric Reliability Council (NERC), and from RDI's proprietary databases. RDI also verified the EIA-411 report by utilizing integrated resource plans and RDI's internal databases. Key assumptions relating to generating units were as follows:
Unit Ratings The EIA-411 report was used to determine the summer and winter capacity ratings of each unit on the grid.
Primary and Alternate Fuel Types For non-coal burning plants, RDI determined each type of fuel that can be used at a generating unit from EIA-411 reports. Each month the relative price of alternate fuels is compared to the primary fuel and the least expensive fuel is selected. Coal fired plants are treated separately and are discussed later in the report.
Availability The availability statistics for all non-nuclear units were obtained from aggregate NERC/GADS statistics by prime mover type. The equivalent availability factor (EAF)(2) and the equivalent forced outage rate (EFOR)(3) were used to calculate the scheduled outage factor (SOF) to determine the maintenance period for each unit. Regional average availability factors and forced outage rates are shown in Table 6 for 1995-1999. Availability statistics for nuclear units are based on an engineering and statistical analysis performed by RDI.
- (2)
- EAF is the percentage of hours in the year that a unit is available to operate whether or not it is actually dispatched.
- (3)
- EFOR is the percentage of hours in the year in which a plant will incur an unplanned outage.
TABLE 6
FIVE YEAR AVERAGE AVAILABILITY STATISTICS (1995-1999)
| TECHNOLOGY | EAF | EFOR | |||
|---|---|---|---|---|---|
| STEAM TURBINES | 82 | % | 8 | % | |
| GAS TURBINES | 85 | % | 10 | % |
Heat Rates Heat rate information was obtained from RDI's POWERdat information system, based on a combination of EIA-411 and EIA-860 information.
Non-Fuel Variable O&M Variable O&M costs affect the dispatch price of individual units. Variable O&M calculations vary across utilities. It is RDI's opinion that this variation occurs primarily because utilities have never had profit incentives that motivate them to fully understand their cost structure. A few utilities do not include a variable O&M adder in dispatch decisions. One RDI client assumes that 20% of its total non-fuel O&M is variable. Another client uses a variable O&M of $1/MWh at one coal-fired power plant and $2/MWh at another coal fired power plant because the second plant must pay the local water utility for its water supplies. This same client dispatches its gas turbine assuming a variable O&M of $3/MWh.
RDI assumed that a $1.80/MWh variable O&M dispatch cost for coal-fired capacity. For other existing plants, RDI assumed that 20% of each unit's historical operating costs—less land leasing costs
B-19
and allowances—were variable. A two-year average for 1998 to 1999 was employed to determine historical operating costs. For existing peaking units, RDI assumed an additional $5.00/MWh charge to capture start-up costs upon dispatch.
For new units, RDI assumed a variable O&M of $1.80/MWh for new coal-fired plants, $2.20/MWh for all new combined cycle units, and $5.00/MWh for all new simple-cycle peaking turbines. The higher O&M cost for peaking turbines is intended to reflect the additional start-up costs such units typically incur. Units with scrubbers are assigned an additional $1/MWh charge based on information reported in the EIA-767 form by utilities.
Fixed O&M Fixed O&M calculations for individual plants were based on data filed with the Energy Information Administration. For each plant and prime mover type, the fixed O&M was calculated as follows:
Fixed O&M = Total Non-Fuel O&M less (Assumed Variable O&M ($/MWh) × Generation (MWh))
If power plant land leasing costs were greater than 20% of total non-fuel O&M, then power plant rents were subtracted from total non-fuel O&M for purposes of calculating fixed O&M. In many instances, sale-leaseback expenses are reported as an operating cost associated with the plant. Because these expenses would have to be paid whether or not the plant is shutdown, it is not appropriate to consider these expenses when analyzing a plant's cash costs. Also, since there can be significant year to year swings in O&M expenses due to major overhauls or other major non-recurring costs, RDI averaged fixed O&M expenses from 1998 and 1999.
The above approach was used to estimate fixed O&M expenses for all utility owned generation. However, actual power plant O&M cost information is not publicly available for non-utility owned plants. For non-utility coal units, it is assumed that fixed O&M expenses equal $20/kW-year. For non-utility gas plants, it is assumed that fixed O&M expenses equal $5/kW-year for peaking plants and $15/kW-yr for combined-cycle plants. These assumptions are based on RDI's prior engagements with power plant developers. For non-utility units that have contracts guaranteeing a fixed price for their output, it was not necessary to make any assumptions regarding fixed O&M.
Replacement Capital Costs Since generating assets are assumed to maintain operations over the forecast horizon (unless it is uneconomic to do so), it is also assumed that replacement capital would have to be invested to keep the plant in service. It is also necessary to include replacement capital costs in the model because many utilities account for operating expenses as capital expenses to increase their rate base. The cost of replacement capital in this analysis is based on the historic information and trends shown in Figure 10. It is largely consistent with replacement cost information presented in numerous utility Integrated Resource Plans as well.
B-20
FIGURE 10
UTILITY ANNUAL CAPITAL ADDITIONS ($/KW-YR)
New Generation
In the past two years, MAIN and ECAR have seen a significant number of new capacity projects announced. Except for those announced new power projects that RDI considers very likely to be seen to completion, IREMM adds new capacity only as it is economically justified.(4) For this analysis RDI explicitly modeled projects which were under construction as of the start of the study, or if there were other strong indications that a project was likely to come on line by June of 2004. Such indicators may include the existence of fuel supply, or a power off-take contract; an announcement that the project has been financed; or an assessment of the developer's track record for seeing projects to fruition.
- (4)
- Given the regional capacity balances, the first year of automatic additions in ECAR/MAIN is 2005.
Table 7 through Table 10 shows the list of projects explicitly modeled by RDI in the base case analysis in ECAR and MAIN. Negative capacity amounts shown in these tables reflect conversions from simple cycle to combined cycle facilities. Essentially, the CT is "retired" and the "new" combined cycle is simultaneously brought on-line. The capacity listed for the combined cycle phase of the project represents the total capacity at the plant after the conversion. Altogether, RDI projects that over 26,000 MW of new capacity will be placed in service in ECAR/MAIN between 2000-2004.
As discussed above, the projects listed in Table 7 through Table 10 represent the projects that as of July 2001 were deemed likely to be brought on-line. An additional 82,000 MW of capacity has been proposed for construction in ECAR and MAIN. However, it is implicit in this analysis that developers will recognize the potential for over-supply in the region and will curtail project development unless the regional supply/demand mix indicates new capacity will be required and developers can earn an adequate return on investment. Over the course of the forecast (2001-2020), RDI projects that over 66,000 MW will be required in ECAR and MAIN.
B-21
TABLE 7
ASSUMED NEW CAPACITY ADDITIONS IN ECAR (RECENTLY OPERATING)—1999-2001
| NAME | ST | PRIME MOVER | CAPACITY MW | RDI ONLINE DATE | NEWGen PROJECT STATUS | |||||
|---|---|---|---|---|---|---|---|---|---|---|
| AES Warrior Run | MD | Coal Boiler/Cogen | 180 | Feb-00 | Operating | |||||
| Allegheny Energy Supply/Springdale | PA | Combust Turb | 88 | Dec-99 | Operating | |||||
| American Municipal Power/Belleville | WV | Hydro | 42 | Jul-99 | Operating | |||||
| American Municipal Power/Bowling Green | OH | Combust Turb | 32 | Jul-00 | Operating | |||||
| American Municipal Power/Hamilton | OH | Combust Turb | 32 | Jul-00 | Operating | |||||
| American Municipal Power/Ohio | OH | Combust Turb | 38 | Jul-00 | Operating | |||||
| Appalachian Power/Smith Mountain | VA | Hydro | 36 | Jan-00 | Operating | |||||
| APS/Fayette | PA | Combust Turb | 88 | Aug-00 | Operating | |||||
| Catamount Energy/Gauley River | WV | Hydro | 80 | Apr-01 | Operating | |||||
| Cinergy/Madison | OH | Combust Turb | 640 | Jun-00 | Operating | |||||
| Cinergy/Vermillion | IN | Combust Turb | 640 | Jun-00 | Operating | |||||
| CMS Generation Co. | MI | Combust Turb | 136 | Jun-99 | Operating | |||||
| CMS Generation/Kalamazoo River | MI | Combust Turb | 63 | Jun-99 | Operating | |||||
| CMS/Dearborn | MI | Combust Turb | 38 | Jun-02 | Operating | |||||
| CMS/Zilwaukee | MI | Combust Turb | 41 | May-00 | Operating | |||||
| Constellation Power/Wayne County | WV | Combust Turb | 300 | May-01 | Operating | |||||
| Constellation Power/Wolf Hills | VA | Combust Turb | 250 | Jun-01 | Operating | |||||
| Dearborn Industrial Generation | MI | CT/Cogen | 160 | Jul-99 | Operating | |||||
| Detroit Edison/Belle River | MI | Combust Turb | 216 | Jul-99 | Operating | |||||
| Detroit Edison/Greenwood | MI | Combust Turb | 226 | Jun-99 | Operating | |||||
| Detroit Edison/River Rouge | MI | CT/Cogen | 260 | Jun-00 | Operating | |||||
| DPL Energy/Chester Township | IN | Combust Turb | 200 | Jun-01 | Operating | |||||
| DPL Energy/Darby | OH | Combust Turb | 320 | Jun-01 | Operating | |||||
| DPL Energy/Greenville | OH | Combust Turb | 200 | Jul-00 | Operating | |||||
| Energy Developments/Model Landfill | OH | Combust Turb | 4 | Jun-01 | Operating | |||||
| Energy Developments/Ottawa Landfill | OH | Combust Turb | 3 | Jun-01 | Operating | |||||
| Enron/West Fork | IN | Combust Turb | 540 | Jul-00 | Operating | |||||
| FirstEnergy/Perry | OH | Nuclear | 35 | Jul-00 | Operating | |||||
| FirstEnergy/Perry | OH | Nuclear | 25 | Mar-01 | Operating | |||||
| Holland/491 E. 48th Steet | MI | Combust Turb | 80 | Jun-00 | Operating | |||||
| Indianapolis Power & Light/Georgetown | IN | Combust Turb | 264 | Jun-00 | Operating | |||||
| Indianapolis Power & Light/Georgetown | IN | Combust Turb | 80 | Jun-01 | Operating | |||||
| Kentucky Utilities Co. | KY | Combust Turb | 75 | Jun-00 | Operating | |||||
| Kentucky Utilities Co./Brown | KY | Combust Turb | 133 | Jul-01 | Operating | |||||
| Kentucky Utilities/Brown | KY | Combust Turb | 328 | Aug-99 | Operating | |||||
| Mirant/Zeeland | MI | Combust Turb | 300 | Jun-01 | Operating | |||||
| Ohio Edison/Burger | OH | Coal Boiler | 94 | May-99 | Operating | |||||
| Ohio Edison/West Lorain | OH | Combust Turb | 120 | May-99 | Operating | |||||
| Ohio Edison/West Lorain | OH | Combust Turb | 425 | Jun-01 | Operating | |||||
| Orion Power/Ceredo | WV | Combust Turb | 510 | Jun-01 | Operating | |||||
| PG&E Generating/Bowling Green | OH | Combust Turb | 50 | Nov-00 | Operating | |||||
| PG&E Generating/Galion | OH | Combust Turb | 50 | Nov-00 | Operating | |||||
| PG&E Generating/Napoleon | OH | Combust Turb | 50 | Aug-00 | Operating | |||||
| PG&E Generating/Napoleon | OH | Combust Turb | 45 | Nov-00 | Operating | |||||
| Riverside Generating/Riverside | KY | Combust Turb | 560 | Aug-01 | Operating | |||||
| Toledo Edison/Richland Peaking | OH | Combust Turb | 390 | Nov-00 | Operating | |||||
| Trigen-Cinergy/Ashtabula | OH | CT/Cogen | 28 | Feb-01 | Operating | |||||
| Trigen-Cinergy/Lafarge Gypsum | KY | CT/Cogen | 5 | Apr-01 | Operating | |||||
| Williams Energy/Worthington | IN | Combust Turb | 180 | Jun-00 | Operating | |||||
| RECENTLY OPERATING CAPACITY (MW): | 8,678 | |||||||||
B-22
TABLE 8
ASSUMED NEW CAPACITY ADDITIONS IN ECAR (UNDER CONSTRUCTION AND ADV. DEVELOPMENT)—2001-2004
| NAME | ST | PRIME MOVER | CAPACITY MW | RDI ONLINE DATE | NEWGen PROJECT STATUS | |||||
|---|---|---|---|---|---|---|---|---|---|---|
| Atlantic Renewable Energy/Tucker County Wind | WV | Wind Turb | 21 | Jan-02 | Advan Develop | |||||
| Dayton Power & Light/Tait | OH | Combust Turb | 320 | Dec-01 | Advan Develop | |||||
| Decker Energy/Carson City | MI | Combust Turb | 510 | Jun-02 | Advan Develop | |||||
| Decker Energy/St. Clair County | MI | Comb Cycle | 510 | Jan-03 | Advan Develop | |||||
| AEP/Van Wert County | OH | Combust Turb | 510 | Jun-02 | Under Constr | |||||
| Allegheny Energy Supply/Springdale | PA | Comb Cycle | 540 | Jan-03 | Under Constr | |||||
| Dearborn Industrial Generation | MI | CC/Cogen | 550 | Jun-01 | Under Constr | |||||
| Dominion Energy/Pleasants County | WV | Combust Turb | 340 | Jun-02 | Under Constr | |||||
| DPL Energy/Darby | OH | Combust Turb | 160 | Jun-01 | Under Constr | |||||
| Dresden Energy/Muskingum County | OH | Comb Cycle | 607 | Jun-03 | Under Constr | |||||
| Duke Energy Washington, L.L.C. | OH | Comb Cycle | 620 | Jun-02 | Under Constr | |||||
| Dynegy/Bluegrass | KY | Combust Turb | 372 | Jun-02 | Under Constr | |||||
| East Kentucky Power/J.K. Smith | KY | Combust Turb | 80 | Jun-01 | Under Constr | |||||
| Kinder Morgan Power/Jackson | MI | CC/Duct | 414 | Jun-02 | Under Constr | |||||
| Mill Run Windpower | PA | Wind Turb | 15 | Sep-01 | Under Constr | |||||
| Primary Energy/Indiana Harbor | IN | CT/Cogen | 50 | Sep-01 | Under Constr | |||||
| Primary Energy/Whiting Refinery | IN | CC/Cogen | 545 | Jun-01 | Under Constr | |||||
| Troy Energy/Wood County | OH | Combust Turb | 600 | Jun-02 | Under Constr | |||||
| ADVANCED DEVELOPMENT AND UNDER CONSTRUCTION: | 6,764 | |||||||||
B-23
TABLE 9
ASSUMED NEW CAPACITY ADDITIONS IN MAIN (RECENTLY OPERATING)—1999-2001
| NAME | ST | PRIME MOVER | CAPACITY MW | RDI ONLINE DATE | NEWGen PROJECT STATUS | |||||
|---|---|---|---|---|---|---|---|---|---|---|
| Ameren/Gibson | IL | Combust Turb | 113 | Jun-00 | Operating | |||||
| Ameren/Gibson | IL | Combust Turb | 113 | Jul-00 | Operating | |||||
| Ameren/Grand Tower | IL | CC/Duct | 519 | Jul-01 | Operating | |||||
| Ameren/Grand Tower | IL | Coal Boiler | -190 | Jan-01 | Operating | |||||
| Ameren/Kinmundy | IL | Combust Turb | 117 | May-01 | Operating | |||||
| Ameren/Kinmundy | IL | Combust Turb | 117 | Jun-01 | Operating | |||||
| Ameren/Pinckneyville | IL | Combust Turb | 89 | Jun-00 | Operating | |||||
| Ameren/Pinckneyville | IL | Combust Turb | 89 | Jun-00 | Operating | |||||
| Ameren/Pinckneyville | IL | Combust Turb | 108 | Jul-01 | Operating | |||||
| Ameren/Pinckneyville | IL | Combust Turb | 36 | Jul-01 | Operating | |||||
| AmerenUE/Meramec | MO | Combust Turb | 48 | Jun-00 | Operating | |||||
| Calpine/De Pere Energy | WI | Combust Turb | 179 | Jun-99 | Operating | |||||
| CILCO/AES Medina Valley | IL | CC/Duct/Cogen | 45 | Jun-01 | Operating | |||||
| CogenAmerica/Morris | IL | CC/Cogen | 155 | Mar-00 | Operating | |||||
| Commonwealth Edison/La Salle | IL | Nuclear | 50 | Jun-00 | Operating | |||||
| Duke Energy/Audrain | MO | Combust Turb | 640 | Jun-01 | Operating | |||||
| Duke Energy/Lee | IL | Combust Turb | 640 | Jun-01 | Operating | |||||
| Dynegy/Rocky Road Power | IL | Combust Turb | 250 | Jun-99 | Operating | |||||
| Dynegy/Rocky Road Power | IL | Combust Turb | 100 | Jul-00 | Operating | |||||
| Electric Energy/Joppa | IL | Combust Turb | 155 | Aug-00 | Operating | |||||
| Elwood Energy | IL | Combust Turb | 750 | Jun-01 | Operating | |||||
| Elwood Energy | IL | Combust Turb | 600 | Jul-99 | Operating | |||||
| Enron/Lincoln Energy Center | IL | Combust Turb | 664 | Jun-00 | Operating | |||||
| Illinova/Havana | IL | Other Boiler | 238 | Jun-99 | Operating | |||||
| Illinova/Tilton | IL | Combust Turb | 176 | Jun-99 | Operating | |||||
| Indeck/Rockford | IL | Combust Turb | 300 | Jun-00 | Operating | |||||
| Madison Gas & Electric/Rosiere Wind | WI | Wind Turb | 3 | Jun-99 | Operating | |||||
| Madison Gas & Electric/West Marinette | WI | Combust Turb | 83 | Jun-00 | Operating | |||||
| MidAmerican Energy/Cordova | IL | Comb Cycle | 537 | Jun-01 | Operating | |||||
| Mirant/SEI Wisconsin | WI | Combust Turb | 300 | May-00 | Operating | |||||
| Reliant/Shelby County | IL | Combust Turb | 340 | Jul-00 | Operating | |||||
| SkyGen/Rockgen Energy | WI | Combust Turb | 510 | Jun-01 | Operating | |||||
| Southwestern Electric/St. Elmo | IL | Combust Turb | 45 | Jun-00 | Operating | |||||
| Soyland/Alsey | IL | Combust Turb | 92 | Aug-99 | Operating | |||||
| Soyland/Alsey | IL | Combust Turb | 21 | Jun-00 | Operating | |||||
| Trigen-Cinergy/Tuscola | IL | Coal Boiler/Cogen | 6 | Dec-99 | Operating | |||||
| Trigen-St. Louis Energy/St. Louis Cogen | MO | CT/Cogen | 15 | Jun-99 | Operating | |||||
| Unicom/McDonalds | IL | Combust Turb | 0 | Jun-99 | Operating | |||||
| University Park/Chicago (Conpow) | IL | Combust Turb | 300 | Jun-01 | Operating | |||||
| Wisconsin Electric/Fond Du Lac Wind | WI | Wind Turb | 0.3 | Jun-99 | Operating | |||||
| Wisconsin Electric/Germantown | WI | Combust Turb | 85 | May-00 | Operating | |||||
| Wisconsin Electric/Germantown | WI | Other | 50 | Aug-00 | Operating | |||||
| WPS/Kewaunee | WI | Nuclear | 30 | Jan-00 | Operating | |||||
| WPS/Lincoln Turbines | WI | Wind Turb | 3 | Jun-99 | Operating | |||||
| RECENTLY OPERATING CAPACITY (MW): | 8,521 | |||||||||
B-24
TABLE 10
ASSUMED NEW CAPACITY ADDITIONS IN MAIN (UNDER CONSTRUCTION AND ADV. DEVELOPMENT)—2001-2004
| NAME | ST | PRIME MOVER | CAPACITY MW | RDI ONLINE DATE | NEWGen PROJECT STATUS | |||||
|---|---|---|---|---|---|---|---|---|---|---|
| Alliant/Amerhest Digester | WI | Combust Turb | 0.2 | Jun-01 | Under Constr | |||||
| Ameren/Grand Tower | IL | CC/Duct | 290 | Jun-01 | Under Constr | |||||
| Ameren/Grand Tower | IL | Coal Boiler | -100 | Jun-01 | Under Constr | |||||
| Calumet/Cook County | IL | Combust Turb | 300 | Jun-01 | Under Constr | |||||
| FPL Energy/Iowa Co. Wind Farm | WI | Wind Turb | 9 | Apr-01 | Under Constr | |||||
| Holland Energy | IL | CC/Duct | 665 | Jun-02 | Under Constr | |||||
| NRG Energy/Kendall County | IL | Comb Cycle | 1,100 | May-02 | Under Constr | |||||
| Reliant/Aurora | IL | Combust Turb | 270 | Jun-01 | Under Constr | |||||
| University of Missouri | MO | Combust Turb | 26 | Dec-01 | Under Constr | |||||
| Badger Generating | WI | Comb Cycle | 1,080 | Jan-03 | Advan Develop | |||||
| Calpine/De Pere Energy | WI | Combust Turb | -179 | Jan-04 | Advan Develop | |||||
| Calpine/De Pere Energy | WI | CC/Cogen | 255 | Jan-04 | Advan Develop | |||||
| Commonwealth Edison/La Salle | IL | Nuclear | 50 | Jun-01 | Advan Develop | |||||
| Enron/Great Plains | IL | Combust Turb | 664 | Apr-03 | Advan Develop | |||||
| Microgy Cogeneration/Shawano | WI | Waste | 1 | Mar-02 | Advan Develop | |||||
| Zion Energy | IL | Combust Turb | 800 | Jun-02 | Advan Develop | |||||
| ADVANCED DEVELOPMENT AND UNDER CONSTRUCTION: | 5,231 | |||||||||
Cost of New Generation Technologies
Assumptions for the cost and operating parameters of new generation technologies have been developed throughout RDI's work with other developers and through the review of publicly available documents related to new power plant construction. These assumptions are shown in Table 11.
Table 11 shows declining costs for gas turbines from 2001-2005. This reflects a shortage of turbines and peak delivery of new turbines during 2001-2002. Developers currently looking to build should see prices similar to 1999-2000 levels. This is substantiated by the unwillingness of General Electric or Siemens Westinghouse to expand their turbine manufacturing capacity despite current shortages. Both expect an easing of orders and perceive excess capacity as a greater risk than lost sales opportunities.
Turbine technology has made substantial technological progress in the last five years—increasing efficiencies for both simple cycle combustion turbines (CT) and combined cycle (CC) facilities. However, because turbine technology is already highly sophisticated, RDI does not expect major improvements in heat rates or efficiencies in the future. Still, RDI's base case assumes that by 2011 new vintage turbines will be available. These turbines are assumed to have a 6.5% efficiency improvement over current vintage CT's, and 7.2% improvement over current vintage CC's.
RDI also assumes the cost of building new capacity remains constant in real terms during each year of the forecast.
B-25
TABLE 11
COST OF NEW TECHNOLOGIES ($2001)
| ASSUMPTION | COMBINED CYCLE | COMBUSTION TURBINE | ADVANCED CC | ADVANCED CT | ||||
|---|---|---|---|---|---|---|---|---|
| Initial Capital Cost $/kW | 600 - 500 (2005 | ) | 450 - 350 (2005 | ) | 500 | 350 | ||
| Construction Period | 2 Years | 1.5 Years | 2 Years | 1.5 Years | ||||
| Availability Factor | 92% | 95% | 92% | 95% | ||||
| Heat Rate | 7,000 | 10,900 | 6,500 | 10,200 | ||||
| Variable O&M | 2.20 | 5.00 | 1.20 | 5.00 | ||||
| Fixed O&M $/kW-yr | 15.00 | 5.00 | 20.00 | 5.00 |
- *
- Variable O&M for combustion turbines consists primarily of start-up costs.
Other financial assumptions are as follows:
- •
- Debt Financing: 50%
- •
- Pre-Tax Cost of Debt: 8.5%
- •
- Cost of Equity: 15%
- •
- General Inflation: 2.5%
- •
- Marginal Income Tax Rate: 40.7%
- •
- Depreciation Schedule (20 years): MACRS
Nuclear Generation
Operating licenses for nuclear plants in the U.S. will begin to expire in 2010. The Nuclear Regulatory Commission (NRC) will have to consider whether or not to extend the 40-year operating licenses of its reactors. Constellation Energy—formerly Baltimore Gas and Electric—was the first nuclear operator to be granted a license extension, for its Calvert Cliffs nuclear station.7 Other nuclear operators are carefully watching the re-licensing process. It is estimated that for as little as $10-50/kW a nuclear plant can be upgraded to operate 20 years beyond its current 40-year licensing period. In fact, Constellation estimated the final cost of the Calvert Cliffs re-licensing at $11/kW. The construction of new baseload capacity could not even be conceived at this price. RDI therefore expects that there will be substantial pressure on the NRC to re-license nuclear plants in the coming years. In ECAR, two nuclear plants have announced their intention to seek license extensions: Beaver Valley and Donald C. Cook. RDI believes 20-year extensions will be granted in each case, pushing their potential retirement dates beyond 2030.
Ontario Power Generation (OPG) has embarked on a program to restart its operationally troubled CANDU nuclear reactors at the Bruce and Pickering stations. The restart process for Pickering is underway, with the first 514 MW unit scheduled for December 2001. OPG intends to bring up the remaining 3 units in six-month stages thereafter, beginning August 2002. RDI's forecast assumes the Bruce restart will be delayed until 2004-2005.
Demand Forecast
The previous section of the report summarizes the primary drivers of demand growth for the region. Table 12 shows historic and forecast peak demand for ECAR/MAIN.
- (5)
- Energy Insight, "20,000 MW of Nuke Capacity Likely to Seek License Extensions", December 1, 1999.
B-26
TABLE 12
ECAR/MAIN SUMMER AND WINTER PEAK DEMAND FORECAST
| YEAR | Summer Peak MW | Annual % Growth | Winter Peak MW | Annual % Growth | |||||
|---|---|---|---|---|---|---|---|---|---|
| 1996 | 137,200 | 121,696 | |||||||
| 1997 | 139,379 | 1.6 | % | 110,643 | -9.1 | % | |||
| 1998 | 141,293 | 1.4 | % | 121,811 | 10.1 | % | |||
| 1999 | 150,774 | 6.7 | % | 125,320 | 2.9 | % | |||
| 2000 | 144,585 | -4.1 | % | 126,489 | 0.9 | % | |||
| 4-YR AVG | 1.3 | % | 1.0 | % | |||||
| 2001 | 157,382 | 128,289 | |||||||
| 2002 | 159,990 | 1.7 | % | 130,405 | 1.6 | % | |||
| 2003 | 162,323 | 1.5 | % | 132,303 | 1.5 | % | |||
| 2004 | 164,919 | 1.6 | % | 134,418 | 1.6 | % | |||
| 2005 | 168,103 | 1.9 | % | 136,991 | 1.9 | % | |||
| 2006 | 170,737 | 1.6 | % | 139,134 | 1.6 | % | |||
| 2007 | 173,850 | 1.8 | % | 141,657 | 1.8 | % | |||
| 2008 | 177,031 | 1.8 | % | 144,235 | 1.8 | % | |||
| 2009 | 180,270 | 1.8 | % | 146,853 | 1.8 | % | |||
| 2010 | 183,110 | 1.6 | % | 149,157 | 1.6 | % | |||
| 2011 | 185,833 | 1.5 | % | 151,365 | 1.5 | % | |||
| 2012 | 188,533 | 1.5 | % | 153,552 | 1.4 | % | |||
| 2013 | 190,923 | 1.3 | % | 155,492 | 1.3 | % | |||
| 2014 | 193,034 | 1.1 | % | 157,205 | 1.1 | % | |||
| 2015 | 195,006 | 1.0 | % | 158,809 | 1.0 | % |
Note that historic values represent actual peak demand, while the forecast assumes normal weather. Year-to-year swings in historic peak demand often reflect transitions from hotter to milder summers.
Reserve Requirements
RDI developed assumed reserve equilibrium levels for ECAR/MAIN based on historical requirements and an analysis of loss-of-load expectation (LOLE). The loss-of-load expectation represents the probability of curtailing demand owing to generation shortfall. This probability is multiplied by the value of lost load (VOLL), expressed in $/MWh, which represents the economic cost to buyers of interruptions in supply. For its analysis, RDI assumed that VOLL is $10,000/MWh; the reliability required reserve margin is relatively insensitive to this value. The VOLL multiplied by hourly LOLE is an hourly capacity value; that is, it represents the value of having an additional megawatt of generating capacity in the region. The sum of this hourly capacity value over all hours of the year is the annual capacity value, in $/MW-yr.
For the purpose of determining equilibrium reserves, RDI used iterative IREMM runs to estimate the annual capacity value for each region varying reserve margins from 9% to 21%. The reserve margin yielding a capacity value equal to the annual cost of new combustion turbine capacity was used as the target reserve margin for these regions.
The result of this process was used to determine the minimum reserve margin required for reliability purposes through 2010. The reserve equilibrium after 2010 was set 1% below this target, assuming a moderate improvement in availability factors for existing generation. In ECAR/MAIN, the resulting target reserve margins were 16% through 2009 and 15% thereafter.
B-27
Coal Price Forecast
For this analysis, RDI developed plant specific coal price forecasts for coal burning plants in the East Central U.S. These forecasts reflect RDI's analysis of such factors as existing coal supply contracts, Clean Air Act Compliance strategies, trends in transportation costs and regional coal supply and demand balances.
Existing Coal Supply Contracts RDI maintains a detailed database on fuel supply agreements at U.S. coal-fired facilities—including delivered costs and the minemouth and transportation components of that cost, as well as contract expirations. Existing coal supply contracts are forecast to continue at historic volumes through the contract expiration date. Future delivered costs of contracted coal are projected using historical price trends. Upon the expiration of the contract, contract volumes are replaced by the least expensive delivered spot-market coal available.
Clean Air Act Compliance Costs Each coal type has a sulfur emission cost calculated based on the sulfur content, scrubber efficiency at each plant (if any), and the forecast cost of SO2 emission allowances. This approach increases the effective cost of higher sulfur coal relative to coals with lower sulfur content. Allowance prices and the sulfur content of a coal play a role in determining the dispatch of individual plants.
Transportation Transportation costs for various coal source regions are developed for each coal plant. Actual transportation rates are used where known for existing movements, and others are modeled where no prior transactions have been reported. The transportation cost model takes into account such factors as the coal source region, distance to the plant, delivery options at the plant, and transportation productivity improvement. Transportation rates in real terms decline annually at various rates that range between 1.6% and 0.4%. Western rail shipments decline at an average rate of 1.25% per year while eastern rail rates average a 1.05% decline per year.
Mine Prices FOB mine prices for each major supply region were obtained from RDI'sCoal Market Research Service. Spot coal prices have increased dramatically in the past year, reversing a steady long-term trend of declining prices and margins to coal producers. Several factors contributed to the surge in prices, including the following:
- •
- Powder River Basin (PRB) curtailed production when prices reached historic lows dipping below $5/ton in 1999;
- •
- Over the past two years, coal plants around the country had reduced stockpiles as a competitive effort to cut costs. Higher loads due to warmer weather pushed plant owners back into spot markets at the same time to rebuild plant inventories;
- •
- Problems developed at several eastern mines as they moved to comply with new regulations regarding mining practices and waste disposal, further constraining supply.
In some cases, PRB prices jumped to $15/ton on the spot market. RDI believes the coal industry will respond to increased prices with additional investment. However, a lagging cycle for investment and historically low returns to production may create a period of 3 - 4 years in which spot prices may exceed marginal costs of production. RDI believes several additional factors will push average coal prices lower in real terms:
- •
- Average coal mine productivity in the West will increase as longwall mining technology is improved in Colorado and Utah, and as surface mining operations in Wyoming install larger scale haulage, more efficient overburden coal stripping equipment, and improve mine planning and maintenance efficiency.
- •
- The current application of the synfuels tax credit allows synfuel producers to sell premium quality coals for less than they bought it for in some cases. This tax credit will tend to distort
B-28
- •
- Numerous coal contracts will expire or "rollover" during the next ten years. As these contracts are replaced or renegotiated, coal consumers will likely receive price reductions resulting from productivity improvements and general oversupply conditions. New contracts are of substantially shorter duration, almost always less than five years. The elimination of long-term contracts will result in a more volatile, commodity-like pricing environment where the primary factor determining sales success is price.
- •
- Premium quality, eastern low-sulfur coal will see supply constraints in the forecast period due to reserve depletion and additional mining regulations. However, declining demand for this product due to eroding export coal markets, and the continued encroachment of lower cost western coals will prevent run-ups in the price of eastern coal.
eastern markets to end users, keeping end user prices low and delaying further penetration of PRB coals to eastern markets. The tax credit will expire in 2007, and some possibility exists that the IRS will nullify its use earlier.
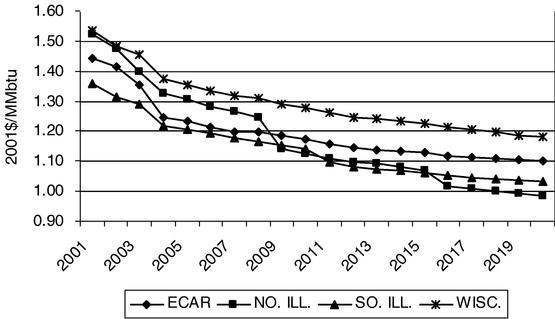
Overall, RDI expects that regional coal-fired power plants will experience declining real prices as shown in Figure 11. RDI projects these prices to fall in the near term, as new suppliers enter the spot market. In the longer term, prices are projected to fall at 0.7% annually in real terms. Figure 11 shows RDI's average delivered spot coal price for plants in ECAR and in neighboring regions.
FIGURE 11
DELIVERED COAL PRICES FOR ECAR AND NEIGHBORING REGIONS ($2001/MMBTU)
Environmental Regulation
Future SO2 Compliance Requirements Phase II of EPA's Acid Rain Program began on January 1, 2000. Provisions for SO2 control are divided into two phases. Phase I ran from January 1, 1995 through December 31, 1999 and affected 263 coal units and oil units in the U.S. Phase II of the Acid Rain program applies to all coal and oil plants greater than 25 MW. Once affected, units must comply with emission tonnage caps on an annual basis for January through December. These caps are determined by calculating a unit's imputed emissions based on a rate of 2.5 pounds SO2/mmBtu (lbs. SO2/mmBtu) for Phase I and 1.2 lbs. SO2/mmBtu for Phase II multiplied by the unit's actual heat input during the base period 1985-1987 (the "Baseline"). EPA makes adjustments that reduce the final target by about 3% in Phase I and 10% in Phase II.
B-29
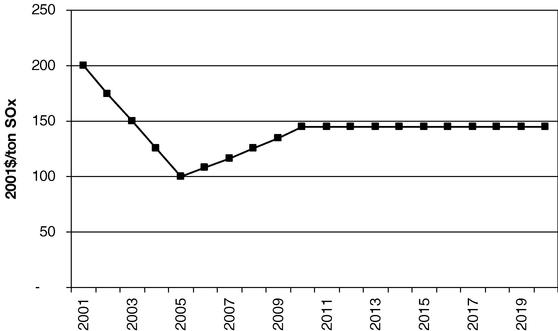
RDI's modeling establishes a baseline for SO2 emissions. RDI then constructs a marginal cost curve for additional SO2 removal, including a plant-by-plant analysis of scrubbing and fuel switching options. An SO2 allowance forecast is established by calculating the additional SO2 emissions to be removed beyond the baseline and applying that amount against the marginal cost of removing emissions. This also provides a forecast of capital expenditures for SO2 compliance at specific power plants. RDI assumes FGD capital costs of $125/kW for units greater than 450 MW. FGD O&M costs are estimated at $0.50/MWh for new installations. Based on this analysis and the current size of the bank for SO2 allowances, RDI forecasts allowance prices starting at $200 in the 2001 and declining to $100 per ton in 2005. At this point, RDI projects the bank will be drawn down and the market will move upward in response to the final ratchet in 2010, gradually increasing to just under $150 in 2013 in $2001 dollars. RDI's SO2 allowance price forecast is shown in Figure 12.
FIGURE 12
SULFUR DIOXIDE ALLOWANCE FORECAST ($2001/TON)
NOx Regulations
RDI independently forecasts nitrogen oxide (NOX) controls to electric generating units affected by future NOX requirements. The key inputs to RDI's model include forecast generation levels developed by the IREMM model, historic NOX emission rates collected by the U.S. Environmental Protection Agency, and estimated NOX control costs. The model evaluates multiple control options per unit including selective catalytic reduction (SCR), selective non-catalytic reduction (SNCR) and gas reburn.
RDI assumes a two-phase allowance trading program for controlling summertime NOX emissions for the 11 states (and the District of Columbia) included in the northeast OTC NOX Budget Program. The first phase of the trading program is currently in effect and runs through the summer of 2002. Starting in May 2003, RDI assumes EPA's NOX SIP Call regional trading program will go into effect—impacting 11 additional states.(6) This phase establishes an emission cap set at 0.15 lbs./mmBtu. Additional emission controls that are necessary to comply with the second phase of the program are forecast based on RDI's estimate of the most economic NOX control options available at affected units
B-30
under the regional trading program. Table 13 shows the jurisdictions included in both the OTC Budget and the NOX SIP Call programs.
- (6)
- EPA has since announced its intention to delay implementation of a state budget limitation for NOx until 2004, effectively delaying the implementation of a cap and trade program by a year.
TABLE 13
OTC NOX BUDGET AND EPA NOX SIP CALL JURISDICTIONS
| OTC | EPA NOX SIP CALL | |
|---|---|---|
| Connecticutt | Alabama | |
| Delaware | Indiana | |
| Maine | Illinois | |
| Maryland | Kentucky | |
| Massachusetts | Michigan | |
| New Hampshire | North Carolina | |
| New Jersey | Ohio | |
| New York | South Carolina | |
| Pennsylvania | Tennessee | |
| Rhode Island | Virginia | |
| Vermont | West Virginia | |
| District of Columbia |
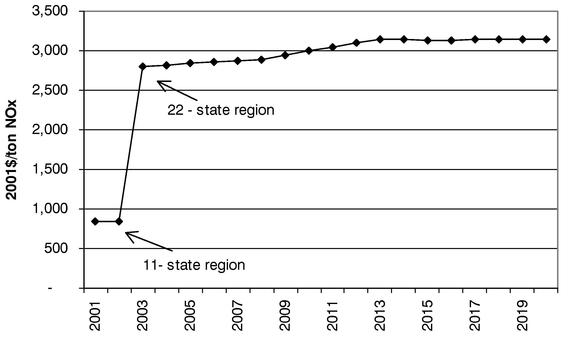
To ascertain the cost associated with NOx emission allowances, IREMM first determines whether a unit is in a market participating in a regional allowance trading market. If the unit is in an allowance trading market, the corresponding dispatch cost is determined by evaluating the NOx emission rate of the unit—taking into account any emission control technologies—and the cost of purchasing an allowance for those emissions. Forecast NOx allowance prices are shown in Figure 13.
B-31
FIGURE 13
FORECAST NOX ALLOWANCE PRICES FOR NOX SIP CALL TRADING PROGRAM
($2001/TON)
Gas Price Forecast
Key national level assumptions and results driving RDI's forecast of natural gas prices include the following:
- •
- U.S. gas supply including imports reaches about 79 Bcfd or 28.9 Tcf by 2010. Gulf offshore gas production grows at 3.4% per year.
- •
- Gas consumption by electric generators grows to 7.5 Tcf (20.5 Bcfd) by 2010, up from the 1999 level of 4.1 Tcf (11.4 Bcfd).
- •
- 200,000 MW of cumulative gas-fired additions by 2010 drive demand growth. 61% of these additions are combined cycle. The regional generation additions are the same as those reported in RDI's power market analysis.
- •
- Average annual U.S. GDP growth from 1999 to 2010 is assumed to be 3.0% per year. U.S. population is expected to grow at 0.8% per year.
- •
- West Texas Intermediate (WTI) oil prices decline in real terms from current levels to about $23/bbl by 2005 and then decrease to $20/bbl by 2010.
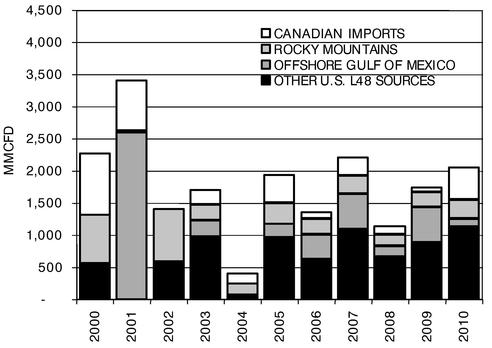
In the Base Case projection, the Rocky Mountain, Gulf Offshore and Canadian imports account for almost 60% of the incremental gas supplies in any given year. However, in the near-term the price effect associated with the current market should also stimulate incremental production from other U.S. onshore basins primarily in Texas. Increasing demand growth from electric generation is expected to keep the pressure on incremental supplies. Near term pressure will come from the need to refill depleted storage fields and meet new generation demands. Table 14 shows North American supply projections, and Figure 14 summarizes sources of incremental supply growth.
B-32
TABLE 14
NATURAL GAS SUPPLY PROJECTIONS—BILLIONS OF CUBIC FEET PER DAY (BCFD)
| YEAR | US ONSHORE | ROCKY MOUNTAIN | GULF OFFSHORE | CANADIAN IMPORT | LNG | TOTAL U.S. GAS SUPPLY | |||||||
|---|---|---|---|---|---|---|---|---|---|---|---|---|---|
| 1996 | 33.69 | 3.09 | 14.75 | 7.76 | 0.15 | 59.43 | |||||||
| 1997 | 33.91 | 3.36 | 14.95 | 7.91 | 0.18 | 60.32 | |||||||
| 1998 | 32.66 | 3.72 | 15.36 | 8.46 | 0.24 | 60.44 | |||||||
| 1999 | 30.54 | 5.11 | 15.49 | 9.24 | 0.23 | 60.61 | |||||||
| 2000 | 31.29 | 5.09 | 13.27 | 11.03 | 0.51 | 61.19 | |||||||
| 2001 | 31.83 | 5.15 | 14.53 | 11.54 | 0.63 | 63.68 | |||||||
| 2002 | 32.62 | 5.33 | 15.33 | 10.84 | 0.62 | 64.73 | |||||||
| 2003 | 34.28 | 5.60 | 15.49 | 11.45 | 0.66 | 67.48 | |||||||
| 2004 | 34.61 | 5.87 | 15.59 | 11.95 | 0.66 | 68.69 | |||||||
| 2005 | 35.48 | 6.19 | 15.62 | 12.67 | 0.70 | 70.65 | |||||||
| 2006 | 36.08 | 6.43 | 16.74 | 12.78 | 0.72 | 72.76 | |||||||
| 2007 | 36.78 | 6.77 | 18.14 | 12.87 | 0.76 | 75.32 | |||||||
| 2008 | 37.73 | 7.02 | 18.60 | 13.05 | 0.83 | 77.23 | |||||||
| 2009 | 38.70 | 7.26 | 18.94 | 13.26 | 0.93 | 79.09 | |||||||
| 2010 | 39.27 | 7.54 | 19.85 | 13.65 | 1.02 | 81.34 | |||||||
| % CHG 2000 to 2010 | 2.5 | % | 4.8 | % | 5.0 | % | 2.4 | % | 10.0 | % | 3.3 | % |
FIGURE 14
SOURCES OF INCREMENTAL GAS SUPPLY MMCFD
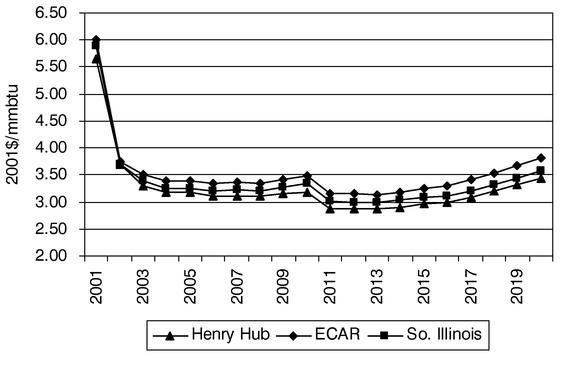
As shown in Figure 15, natural gas delivers into PJM at a premium to ECAR (approximately $0.19/mmBtu).
B-33
FIGURE 15
REGIONAL DELIVERED NATURAL GAS PRICE FORECAST ($2001/MMBTU)
AEG Contractual Obligations
RDI assumed that AEG would need to supply all of its contract obligations in each hour before it could sell its excess capacity and energy in regional wholesale markets. Additionally, AEG is allowed to supply its contract obligations with lower-cost energy available to it from its Joint Dispatch Agreement (JDA) with AmerenUE and with economy purchases from the wholesale markets. Under the JDA, each of AEG and AmerenUE has a first call on excess energy available from the other company in order to meet load requirements. This system energy transfer is priced at marginal cost. AmerenEnergy Marketing, as AEG's agent, can also make economy purchases from the wholesale markets to supplement AEG's own generating capacity. RDI's estimates of wholesale market transactions for AEG assumed dispatch of AmerenUE's plants at projected market prices but did not attempt to model the positive or negative effects that the JDA may have on AEG's future revenues.
B-34
RDI employed two integrated market models to perform this analysis. The primary analytical model is the Inter-Regional Electric Market Model (IREMM). IREMM is a sophisticated production simulation model that simulates the Eastern Interconnection on an hourly basis for each forecast year. RDI also employed a proprietary capacity price model, which uses outputs from IREMM to calculate additional revenues required to maintain adequate capacity reserves. Using these models, RDI forecasts electricity prices and unit dispatch.
RDI forecasts market clearing prices in two components—the cost of incremental energy and the value of capacity. The incremental energy cost represents the price of non-firm economy energy on an hour-ahead or day-ahead market. The capacity premium represents the additional premium that must be paid to make the energy firm. The cost of firm power is the sum of these two components.
Incremental energy costs are projected in terms of $/MWh. Capacity prices are projected first in $/kW-yr, then allocated over the hours in a year to obtain values in $/MWh. For example, a capacity price of $52/kW-yr, when allocated over 100% of the 8,760 hours in a year, is equivalent to $5.94/MWh. If the average incremental energy cost over the year is $20.00/MWh, then the average price of firm power over the year is $25.94/MWh. This is the value of firm baseload power.
However, on an hourly basis, capacity has a value of zero in the vast majority of hours. These include all hours in non-peak months, weekends, off-peak hours of every day, and most weekdays of peak months. Capacity typically has a non-zero value in less than 5% of the hours of the year. A capacity price of $52/kW-yr, when allocated over 5% of the hours in a year, is equivalent to $118.72/MWh. If incremental energy costs are, say, $45.00/MWh on average during peaking hours, then the total price of firm peaking power is $163.72/MWh (25.00 + 118.72). Standard on-peak products are typically defined in terms of 5x16 blocks, representing 48% of the hours in a month or year. Thus, an annual capacity price of $52/kW-yr becomes $12.37/MWh when applied to 5x16 standard on-peak products.
In general, there are three different pricing models that are prominently used to describe competitive wholesale markets. These models are as follows:
Reserve Requirement Model
In the reserve requirement model, a specified level of reserve is assigned to each load serving entity (LSE) in proportion to its load. To meet this requirement, the load serving entity must enter into contracts with generators or procure its obligation through a "capacity exchange" that is operated by a central clearing house, such as an Independent System Operator (ISO). In such a model, a generator will receive two separate payment streams. The first stream is an energy price that is determined by the hourly interaction of supply and demand in the spot market. The second stream is the capacity price that is determined by the separately run capacity auction. This stream could be determined on a monthly, seasonal, or annual basis. Such a market is currently operating in the PJM, NYISO, and ISO-NE.
Explicit Capacity Adder Model
The explicit capacity adder model is similar to the reserve requirement model in that market rules dictate that capacity will be priced separately. One difference between these models is that, in an explicit capacity adder model, retail suppliers do not have an obligation to secure capacity. Also, the "capacity premium" is calculated on an hourly basis rather than on a monthly or annual basis. The explicit capacity adder model was employed in the United Kingdom (U.K.) electricity market through March 2001, but is now discontinued. In this model, all generators submit bids to a central clearing exchange, specifying how much power they are willing to commit at a given price during the next
B-35
24 hours. Generators have the potential to earn revenues from two different payment streams. The first payment stream is received for actual kilowatt-hour sales into a central power exchange (or spot market). This price is determined by the bid of the highest cost unit selected to supply power during each hour. This price is commonly referred to as the system marginal price. The second payment stream is commonly referred to as the capacity payment. This additional payment is equal to the value of lost load multiplied by the loss of load probability. It is paid to all generators available during the hour. The value of lost load is determined administratively by the central pool. The loss of load probability is a function of the forecast demand and the amount of generation available to meet that demand.
Energy Only Model
The energy only model, the hourly price of electricity is determined purely through the interaction of supply and demand without the interference of administratively determined installed reserve requirements or a separate capacity payment. In the other two model structures, the hourly price in the spot market is always set by the highest cost unit (on a variable cost basis) dispatched to meet demand (assuming no participant can exert market power). The key distinction of the energy only model is that during some peak hours of demand, the price would instead be set by the marginal cost of an outage to customers. If regulators could estimate precisely the value of lost load on an hourly basis and customers could curtail demand, the energy only model market would result in pricing that is very similar to the explicit capacity adder model. Moreover, if a regulator precisely predicted the reserve requirement found in the energy only model, the reserve requirement and energy only models would achieve similar annual prices for electricity.
It should be noted that, in theory, each of these model structures should produce similar prices on an annual basis. Also, a mix of these market structures can exist. For instance, in an energy-only market bilateral transactions will exist between generators and marketers where capacity and energy may be priced separately.
RDI's Energy Market Methodology
RDI employs an analytical approach that is based on the reserve requirement model. First, RDI simulates the interaction of the energy market using IREMM. This model performs many of the functions typically associated with electric power production simulation programs such as marginal cost dispatching and maintenance scheduling.
IREMM's methodology relies on the following concepts:
Incremental Production Cost The incremental cost of production is the cost of producing an additional MWh of energy. To minimize costs, an efficient dispatch center will dispatch its lowest cost generating units first. In the bulk power market, a profit-maximizing company will produce energy as long as its incremental cost of production is less than the additional revenue obtained from the sale of that energy. Thus, if it can sell energy externally for more than its incremental cost of production, the company will continue to produce after its own load has been met. On the other hand, if the company can buy the energy it needs to meet its load for less than the cost of its own generation, the company will maximize profit by making the purchase.
Supply and Demand Initially, units are dispatched to meet each individual company's internal load. Once these loads are served with their available resources, the quantities of surplus energy available for sale and the quantities of displaceable energy can be calculated at various price levels. From these prices and quantities, IREMM develops supply and demand curves for each company. Energy supply and demand is balanced on an hourly basis.
B-36
Market Clearing Prices IREMM's basic premise is that market forces exist and determine prevailing bulk power prices. Together with the cost of transmitting energy between any two companies, the interactions of the supply and demand functions determine the market clearing prices. These market prices represent a spatial equilibrium where supply and demand is satisfied simultaneously. Market clearing prices emerge as each system attempts to maximize its "gains," defined as the sum of profits on sales and savings on purchases.
Important outputs from the IREMM model that are used in this analysis include:
- •
- Hourly energy market prices for Southern Illinois, where AEG's generation is located,
- •
- Unit specific capacity factors for AEG's power plants,
- •
- Calculations of reserve margins for ECAR/MAIN, and
- •
- Calculations of the amount of new capacity added to the grid in each year.
Capacity Market Methodology
During the next step of the modeling process, RDI incorporates the results from IREMM into a capacity price-forecasting model. In a competitive wholesale power market, generation assets receive a revenue stream from providing buyers with a secure, reliable supply of energy. The capacity payment may be explicit, or it may be an implied component of market prices. The revenue derived from providing firm capacity depends on the following four factors:
- •
- The value a buyer derives from having a secure power supply or, conversely, the economic cost of interruptions to a buyer;
- •
- The amount of generating capacity available to the market;
- •
- The cost of keeping existing capacity available; and
- •
- The cost of building and operating new capacity.
When actual reserve margins are below required reserve margins (i.e. supply is short), the region requires new capacity. Customers at the wholesale and retail levels perceive a significant risk of interruptions resulting from inadequate generating capacity, and are willing to pay for firm capacity to mitigate that risk. At higher reserve margins (approaching supply/demand equilibrium), the risk of interruptions is less and customers are not willing to pay as much to secure firm capacity. At very high reserve margins, the region has surplus capacity. Customers do not perceive that there is any substantial risk of an outage owing to inadequate generating capacity and place a very low value on securing firm supply.
RDI's capacity model accounts for each of these market conditions (supply shortage, supply near equilibrium, excess supply). When excess supply exists, the capacity price is calculated as: the amount of additional revenue required to keep enough generation available to meet demand plus the reserve requirement. Each power plant in a region is ranked according to the plant's operating profit—taking into account only spot market revenues and variable operating costs.
Consider a hypothetical, low cost coal plant. Such a plant is likely to achieve a contribution margin as high as $50/kW-yr (energy market revenues less variable fuel and O&M). Accordingly, this plant covers its cash operating costs from energy market revenues alone. Assuming perfect competitive conditions, its bid into the capacity market will be close to zero.
Next, consider a peaking unit. This plant will achieve only a small contribution margin in the energy market since it is designed to only run economically a few hours of the year when demand is high. When it does run, it is normally the price setting unit, receiving only enough revenue to cover its short-run marginal costs. Therefore, if it is going to continue to be financially viable, it must recover
B-37
the rest of its cash costs from the capacity market. It is this break-even figure that determines the bid price of each generator in the capacity market.
Some customers are willing to pay for firm supply even when excess capacity exists in the market. This occurs when the customer perceives that she will incur a loss if she was to suffer an outage, and the likelihood of an outage is significant to that customer. This capacity payment provides a marginal producer who may never operate with coverage of their fixed costs plus return on their investment. Such a payment typically occurs when the actual market reserve margin is slightly higher than the required or equilibrium reserve margin.
In each year, RDI's capacity price model evaluates the risk that a customer would suffer an outage given the projected reserve margin and the equilibrium reserve margin in that year. Based on previous loss of load valuation studies the model determines the value that customers would be willing to pay to avoid outages in that year. Typically, this value represents a discount from the cost of building new firm capacity. If that value is greater than the capacity price determined by the break-even analysis described above, then that becomes the capacity price in that year.
When new capacity is required, the model calculates the break-even cost (including annualized investment costs and return on equity) for new generating technologies. The model then adds enough new capacity to the grid to meet target reserve margins. The type of capacity added in each year is determined by the relative profitability of competing generation technologies.
The capacity price model also determines which plants cannot recover their cash costs from the market. If the break-even price for a new plant is lower than the break-even price for existing units, the unprofitable plants are retired—typically after two or three years. Any new retirements or capacity additions resulting from the capacity price model are put back into the IREMM model, and the model is re-run. This process is continued until a converged solution is reached.
Both IREMM and the capacity price model are used in this study to analyze the period from 2001 to 2020.
To summarize, the overall modeling approach accounts for the factors that affect all markets: supply, demand, transport capability, and ownership concentration. Ultimately, the model ensures that prices reach a level that enables all generators within the required reserve margin to recover their cash operating costs.(7) New capacity is built only if and when it is profitable to do so. Selecting the mix of capacity additions that result in the lowest overall prices while still maintaining generator profitability minimizes overall costs.
- (7)
- After a power plant is built, cash operating costs include fuel, operation and maintenance expenses, and capital replacement costs that are required to keep the plant operating and available. Before a power plant is built, cash costs include these costs as well as investment costs and a return on capital.
B-38
Table 15 shows RDI's base case annual electricity price forecast for the Southern Illinois market—where the AEG project will sell its electrical output.
TABLE 15
BASE CASE ELECTRICITY PRICE FORECAST (NOMINAL $)
| ENERGY PRICE ($/MWh) | | | | | |||||||||||||||
|---|---|---|---|---|---|---|---|---|---|---|---|---|---|---|---|---|---|---|---|
| YEAR | ON-PEAK | MID-PEAK | OFF-PEAK | YEAR ROUND | ANNUAL GROWTH % | CAPACITY PRICE $/kW-yr | TOTAL PRICE $/MWh | TOTAL PRICE 2001$/MWh | REAL ANNUAL GROWTH % | ||||||||||
| 2001 | 45.67 | 26.14 | 17.98 | 32.71 | — | 60.77 | 39.65 | 39.65 | — | ||||||||||
| 2002 | 32.80 | 22.44 | 17.46 | 25.71 | -21 | % | 33.53 | 29.54 | 28.68 | -28 | % | ||||||||
| 2003 | 31.73 | 23.03 | 18.89 | 25.79 | 0 | % | 33.02 | 29.56 | 27.86 | -3 | % | ||||||||
| 2004 | 31.77 | 22.81 | 18.39 | 25.60 | -1 | % | 37.70 | 29.91 | 27.37 | -2 | % | ||||||||
| 2005 | 35.92 | 25.67 | 20.26 | 28.75 | 12 | % | 66.58 | 36.35 | 32.29 | 18 | % | ||||||||
| 2006 | 37.15 | 26.79 | 20.99 | 29.79 | 4 | % | 67.83 | 37.53 | 32.37 | 0 | % | ||||||||
| 2007 | 38.99 | 28.22 | 21.97 | 31.26 | 5 | % | 69.09 | 39.15 | 32.79 | 1 | % | ||||||||
| 2008 | 41.09 | 30.14 | 23.35 | 33.09 | 6 | % | 70.69 | 41.16 | 33.47 | 2 | % | ||||||||
| 2009 | 43.93 | 32.31 | 24.74 | 35.32 | 7 | % | 72.11 | 43.55 | 34.38 | 3 | % | ||||||||
| 2010 | 46.19 | 34.14 | 26.11 | 37.20 | 5 | % | 73.67 | 45.61 | 34.96 | 2 | % | ||||||||
| 2011 | 45.08 | 33.43 | 26.30 | 36.60 | -2 | % | 66.58 | 44.20 | 32.89 | -6 | % | ||||||||
| 2012 | 46.22 | 34.37 | 27.11 | 37.59 | 3 | % | 67.05 | 45.25 | 32.69 | -1 | % | ||||||||
| 2013 | 46.63 | 34.88 | 27.92 | 38.15 | 1 | % | 70.56 | 46.21 | 32.41 | -1 | % | ||||||||
| 2014 | 48.81 | 36.58 | 29.53 | 40.05 | 5 | % | 71.13 | 48.17 | 32.80 | 1 | % | ||||||||
| 2015 | 50.48 | 38.07 | 30.87 | 41.57 | 4 | % | 73.74 | 49.99 | 33.05 | 1 | % | ||||||||
| 2016 | 51.59 | 39.14 | 31.94 | 42.66 | 3 | % | 78.41 | 51.61 | 33.13 | 0 | % | ||||||||
| 2017 | 54.42 | 41.45 | 34.17 | 45.19 | 6 | % | 78.13 | 54.11 | 33.72 | 2 | % | ||||||||
| 2018 | 57.60 | 44.03 | 36.34 | 47.92 | 6 | % | 77.91 | 56.81 | 34.37 | 2 | % | ||||||||
| 2019 | 60.33 | 46.46 | 38.42 | 50.37 | 5 | % | 81.74 | 59.70 | 35.07 | 2 | % | ||||||||
| 2020 | 64.27 | 49.51 | 41.29 | 53.78 | 7 | % | 80.62 | 62.98 | 35.92 | 2 | % | ||||||||
The base case forecast is driven by two primary factors. The first factor is the capacity balance in ECAR/MAIN, which changes over the forecast period. The second factor is natural gas prices.
In 2001, the first year of the forecast period, ECAR/MAIN is slightly short on capacity during the summer, contributing to higher on-peak prices. Capacity additions over the next year alleviate the shortage, moving the region into a three-year surplus, putting downward pressure on prices. The surplus disappears in 2005, and the region comes into supply demand balance.
As discussed in the Base Case Assumptions section, RDI projects natural gas prices to fall substantially from the historic highs of winter 2000 and the first quarter of 2001, as new supplies are brought to market. Actual prices at Henry Hub fell below $3.00/mmBtu, a more rapid decline than RDI projected. More moderate weather through 2001 allowed the natural gas industry to fill storage to higher levels than the previous year, putting downward pressure on the market. RDI expects regional gas prices to average approximately $3.46/mmBtu (constant dollars) through 2010. In the longer term, a price drop is projected to occur after 2010, as Alaskan natural gas supplies come on-stream, but overall upward price pressure is expected to remain.
Figure 16 illustrates the regional supply curve given falling gas prices and new capacity additions. The AEG portfolio is indicated on the supply curve.
B-39
FIGURE 16
ECAR/MAIN SUPPLY CURVE 2002
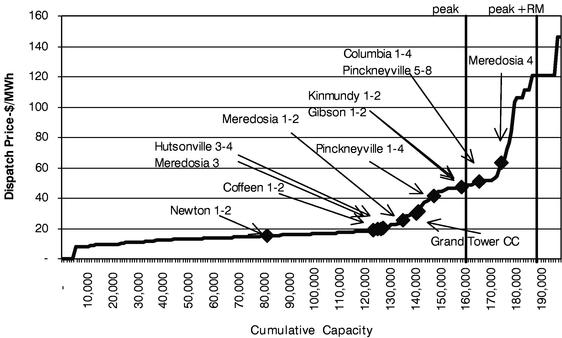
The presence of large amounts of coal-fired generation in the region can be seen in dispatch prices below $20/MWh. Above this level is existing and new gas-fired capacity, whose dispatch price declines in response to falling gas prices. Because AEG receives favorably priced natural gas relative to gas plants in ECAR, its portfolio of gas plants captures additional generation when the spread between gas prices in both regions increases. Conversely, coal pricing in ECAR tends to be lower than in MAIN, creating more competition in baseload generation for AEG's baseload generation.
The last factor driving long run marginal prices is the cost of building new capacity. The base case forecast assumes that new construction costs remain constant in real terms throughout the forecast—even when advanced turbines are introduced in 2010.(8) Increased penetration of advanced turbines in the later years of the forecast puts downward pressure on energy prices. In the long run (after 2005), annual real price growth is projected to be 1.1%.
- (8)
- As discussed in the Assumptions section, near term construction costs for new capacity are higher, reflecting cyclical shortages in the market for new turbines. RDI assumes that higher costs for turbine acquisition will moderate after 2005.
Energy Price Forecast
Figure 17 summarizes forecast energy prices by time of day.
B-40
FIGURE 17
AVERAGE ANNUAL ENERGY PRICES BY TIME PERIOD ($2001/MWH)

Over the forecast, energy prices move in conjunction with natural gas prices. Electric energy prices move down through 2004 as the gas market returns to equilibrium. Off-peak energy prices reflect high levels of coal-fired capacity on the margin during those hours. After 2015, gas-fired capacity increasingly becomes marginal generation for off-peak hours as well, putting upward pressure on energy prices.
ECAR/MAIN Supply and Demand Balance
RDI's base case reflects a moderate oversupply condition through 2004. A high level of capacity additions between 2001 - 2003 pushes reserve margins to a peak of 19% in 2003. RDI expects ECAR/MAIN to require new capacity starting in 2005 (Table 16).
B-41
TABLE 16
FORECAST LOAD AND RESOURCES—ECAR/MAIN (2001-2020)
| | SEASONAL PEAK | INSTALLED CAP | | RESERVE MARGIN | | |||||||||||
|---|---|---|---|---|---|---|---|---|---|---|---|---|---|---|---|---|
| YEAR | INCREMENTAL ADDITIONS | CAPACITY PRICE ($2001/kW) | ||||||||||||||
| SUMMER | WINTER | SUMMER | WINTER | SUMMER | WINTER | |||||||||||
| 2001 | 157,382 | 128,290 | 172,716 | 166,251 | 9,917 | 16 | % | 37 | % | 60.77 | ||||||
| 2002 | 159,990 | 130,405 | 183,122 | 179,202 | 5,991 | 18 | % | 42 | % | 32.55 | ||||||
| 2003 | 162,324 | 132,304 | 189,015 | 189,892 | 3,401 | 19 | % | 46 | % | 31.12 | ||||||
| 2004 | 164,920 | 134,417 | 192,375 | 194,358 | 76 | 17 | % | 45 | % | 34.50 | ||||||
| 2005 | 168,104 | 136,992 | 188,758 | 190,740 | 3,121 | 16 | % | 44 | % | 59.16 | ||||||
| 2006 | 170,737 | 139,135 | 191,960 | 193,923 | 3,049 | 16 | % | 44 | % | 58.51 | ||||||
| 2007 | 173,850 | 141,657 | 194,397 | 196,378 | 3,634 | 16 | % | 44 | % | 57.87 | ||||||
| 2008 | 177,031 | 144,235 | 197,956 | 199,937 | 3,700 | 16 | % | 44 | % | 57.48 | ||||||
| 2009 | 180,270 | 146,853 | 201,413 | 203,394 | 3,850 | 16 | % | 44 | % | 56.93 | ||||||
| 2010 | 183,110 | 149,157 | 204,252 | 206,211 | 4,078 | 16 | % | 44 | % | 56.46 | ||||||
| 2011 | 185,833 | 151,365 | 209,536 | 211,474 | 2,086 | 15 | % | 42 | % | 49.54 | ||||||
| 2012 | 188,533 | 153,552 | 210,567 | 212,505 | 3,123 | 15 | % | 42 | % | 48.44 | ||||||
| 2013 | 190,923 | 155,492 | 211,725 | 213,634 | 3,918 | 15 | % | 42 | % | 49.49 | ||||||
| 2014 | 193,034 | 157,205 | 216,047 | 217,956 | 2,971 | 15 | % | 42 | % | 48.43 | ||||||
| 2015 | 195,006 | 158,809 | 219,697 | 221,605 | 2,280 | 15 | % | 42 | % | 48.75 | ||||||
| 2016 | 196,914 | 160,355 | 222,025 | 223,933 | 2,213 | 15 | % | 42 | % | 50.33 | ||||||
| 2017 | 198,755 | 161,853 | 222,559 | 225,340 | 3,005 | 15 | % | 43 | % | 48.69 | ||||||
| 2018 | 200,511 | 163,277 | 226,524 | 228,422 | 2,032 | 15 | % | 42 | % | 47.14 | ||||||
| 2019 | 202,422 | 164,829 | 228,358 | 230,256 | 2,214 | 15 | % | 42 | % | 48.01 | ||||||
| 2020 | 204,152 | 166,230 | 230,771 | 232,669 | 2,002 | 15 | % | 42 | % | 45.98 | ||||||
Table 17 contains a summary of new capacity additions for the forecast period by technology type. These additions include the new capacity explicitly added by RDI shown in Table 7 through Table 10, and incremental capacity added by IREMM as needed to meet reserve requirements in the later years of the forecast shown in Table 16. RDI projects that Additions made after 2010 are expected to consist of advanced turbines with improved heat rates as shown in Table 11. "Other" capacity shown after 2009 consists of a relatively small increment of coal-fired capacity that may be able to economically develop in ECAR/MAIN in the long-term.
Table 17 illustrates how the value of peaking versus intermediate capacity shifts over time. In 2001 peaking capacity is being added in response to the near-term capacity shortage, but over the next three years the mix tilts toward mid-merit and baseload combined cycle capacity. After 2005, the need for peaking capacity re-asserts itself. After 2010, economics tend to favor the improved efficiency of combined cycle gas generation.
B-42
TABLE 17
BREAKDOWN OF FORECAST CAPACITY ADDITIONS IN ECAR/MAIN (MW)
| YEAR | OTHER | CURRENT VINTAGE CTs | CURRENT VINTAGE CCs | ADVANCED CTs | ADVANCED CCs | TOTAL ADDITIONS | CAP PRICE $2001/kW-yr | |||||||
|---|---|---|---|---|---|---|---|---|---|---|---|---|---|---|
| 2001 | (111 | ) | 7,458 | 2,569 | — | — | 9,917 | 60.57 | ||||||
| 2002 | 22 | 3,170 | 2,799 | — | — | 5,991 | 32.67 | |||||||
| 2003 | — | 664 | 2,737 | — | — | 3,401 | 30.13 | |||||||
| 2004 | — | (179 | ) | 255 | — | — | 76 | 34.50 | ||||||
| 2005 | — | 2,965 | 156 | — | — | 3,121 | 58.98 | |||||||
| 2006 | — | 2,897 | 152 | — | — | 3,049 | 58.25 | |||||||
| 2007 | — | 3,452 | 182 | — | — | 3,634 | 57.70 | |||||||
| 2008 | — | 3,515 | 185 | — | — | 3,700 | 57.23 | |||||||
| 2009 | — | 3,658 | 193 | — | — | 3,850 | 56.85 | |||||||
| 2010 | — | 3,874 | 204 | — | — | 4,078 | 56.31 | |||||||
| 2011 | 104 | — | — | 313 | 1,669 | 2,086 | 45.82 | |||||||
| 2012 | 156 | — | — | 468 | 2,498 | 3,123 | 45.55 | |||||||
| 2013 | 196 | — | — | 588 | 3,134 | 3,918 | 46.69 | |||||||
| 2014 | 149 | — | — | 446 | 2,377 | 2,971 | 45.71 | |||||||
| 2015 | 114 | — | — | 342 | 1,824 | 2,280 | 46.11 | |||||||
| 2016 | 111 | — | — | 332 | 1,770 | 2,213 | 47.76 | |||||||
| 2017 | 150 | — | — | 451 | 2,404 | 3,005 | 46.20 | |||||||
| 2018 | 102 | — | — | 305 | 1,626 | 2,032 | 45.32 | |||||||
| 2019 | 111 | — | — | 332 | 1,771 | 2,214 | 45.66 | |||||||
| 2020 | 100 | — | — | 300 | 1,602 | 2,002 | 44.27 | |||||||
| Total: | 1,203 | 31,474 | 9,432 | 3,877 | 20,675 | 66,661 |
Projected Operations and Market Sales Revenue for AEG's Units
AEG's generation is influenced by market conditions and the relative dispatch price of its generating units. As an unregulated subsidiary with a trading affiliate, AmerenEnergy Marketing (AEM), AEG can sell its output in wholesale spot markets when it has surplus capacity, and buy from the market when the market price is lower than its marginal cost of generation. As a low cost supplier, AEG relies on purchases to meet its contracts less than 1% of the time, more often selling into the wholesale markets. As current contracts expire, the amount available to sell into the market, and therefore subject to wholesale spot prices, increases.
Portfolio Utilization—Figure 18 shows trends in baseload generation (AEG's coal-fired generating plants) and intermediate generation (Grand Tower combined cycle plant). As natural gas prices fall and new combined cycle generation enters the market through 2004, small amounts of AEG's baseload generation is displaced. Load growth after 2004 results in increased generation from these facilities. AEG's combined cycle plant shows low generation initially due to the influx of competitive gas-fired generation, but has stronger generation growth, as loads grow, similar to the coal plants. After 2010, the penetration of new combined cycle plants tends to erode Grand Tower's generation share. Finally, Figure 19 shows trends in AEG's peaking generation, which consists of GE LM6000, Westinghouse 501D, and GE 6B combustion turbines. Increased gas-fired competition in the region dampens peaking generation from these turbines through 2004. As with AEG's other units, increased loads and other reserve margins boost peaking generation after that time. Figure 19 shows the average capacity factor from peaking generation, which is made up of higher capacity factors from the more efficient LM6000 turbines (5%), and lower capacity factors from the less efficient GE 6B turbines (1 - 2%).
B-43
FIGURE 18
AVERAGE ANNUAL CAPACITY FACTORS FOR AEG BASELOAD AND INTERMEDIATE GENERATION, 2001 - 2020
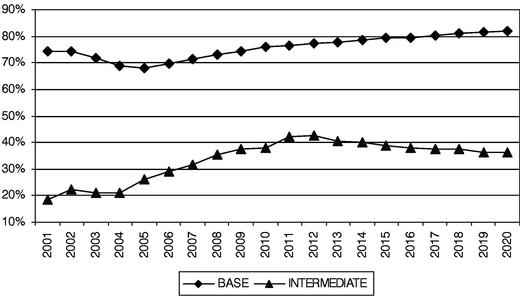
FIGURE 19
AVERAGE ANNUAL CAPACITY FACTORS FOR AEG PEAKING GENERATION, 2001-2020
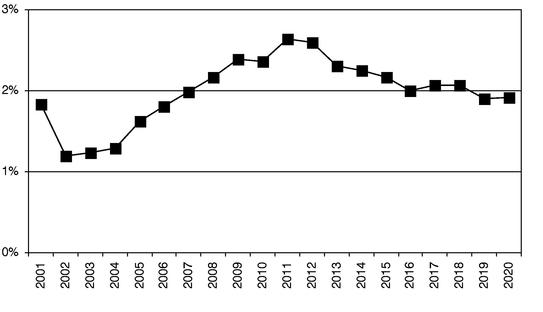
SO2 Emission Projections—While trading of electric power is the predominant component of AEG's operations, AEG also participates actively in current and forward SO2 allowance markets created by Title IV of the Clean Air Act. As with other coal plant operators across the country, AEG's trading basis is derived from SO2 emission allowances allocated to its coal-fired generation. Table 18 shows the net result of AEG's allowance allocation and trading activities, compared with RDI's projection of emissions from AEG's plants. On balance, AEG has sold its SO2 allowances, leaving it with potential deficits in every year of the study after 2002. AEG therefore expects it will need to acquire allowances in order to maintain compliance with the Clean Air Act.
B-44
TABLE 18
AEG'S CURRENT SO2 BANK AND PROJECTED SO2 EMISSIONS
| Year | AEG Allowance Bank | RDI Emissions Projection | Allowance Surplus (Deficit) | ||||
|---|---|---|---|---|---|---|---|
| 2002 | 127,534 | 144,277 | (16,743 | ) | |||
| 2003 | 64,770 | 129,326 | (64,556 | ) | |||
| 2004 | 64,770 | 121,875 | (57,105 | ) | |||
| 2005 | 64,770 | 118,156 | (53,386 | ) | |||
| 2006 | 10,490 | 121,281 | (110,791 | ) | |||
| 2007 | 10,490 | 125,246 | (114,756 | ) | |||
| 2008 | 10,490 | 129,991 | (119,501 | ) | |||
| 2009 | 64,770 | 133,937 | (69,167 | ) | |||
| 2010 | 63,947 | 137,973 | (74,026 | ) | |||
| 2011 | 64,879 | 136,548 | (71,669 | ) | |||
| 2012 | 64,879 | 138,824 | (73,945 | ) | |||
| 2013 | 64,879 | 139,948 | (75,069 | ) | |||
| 2014 | 64,879 | 142,105 | (77,226 | ) | |||
| 2015 | 64,879 | 144,595 | (79,716 | ) |
While AEG faces deficits in its allowance position, its affiliate AmerenUE carries significant surpluses due to aggressive emission reductions and comparatively little trading of its allowance positions. AEG therefore intends to engage in a dollar-for-dollar swap of its future SO2 allowances for current allowances held by AmerenUE. While this swap will have equal monetary value, it defers AEG's cash obligation to purchase SO2 allowances to later years of its operations. Table 19 illustrates the effect of the swap on AEG's net SO2 balance through 2015, given RDI's emissions projections. AEG's intent with respect to using this trading mechanism is to create a near-zero net position in SO2 allowances in 2002 - 2005, with obligations to acquire additional allowances occurring after 2005. To maintain the dollar-for-dollar value of the swap, AEG will exchange its later year SO2 allowances for AmerenUE's current year allowances at current market prices. At RDI's current forecast for SO2 allowances, AEG acquires $20.5 million in current year SO2 allowances in 2003 - 2005, and simultaneously credits AmerenUE with allowances equal to the same dollar amount in 2009 - 2011. While Table 19 shows the allowance amounts associated with the trade based on RDI's projections of emissions and prices, the actual tonnage associated with the swap (and monetary value) will depend on AEG's allowance balance and prices available in forward markets at the time of the swap.
B-45
TABLE 19
EFFECT OF EMISSION SWAP ON AEG'S COMPLIANCE REQUIREMENTS
| Year | AEG Allowance Bank | RDI Emissions Projection | Swapped with AmerenUE | End of Year Balance | |||||
|---|---|---|---|---|---|---|---|---|---|
| 2002 | 127,534 | 144,277 | 16,800 | 57 | |||||
| 2003 | 64,770 | 129,326 | 64,500 | 0 | |||||
| 2004 | 64,770 | 121,875 | 57,200 | 95 | |||||
| 2005 | 64,770 | 118,156 | 53,300 | 9 | |||||
| 2006 | 10,490 | 121,281 | 0 | (110,782 | ) | ||||
| 2007 | 10,490 | 125,246 | 0 | (114,756 | ) | ||||
| 2008 | 10,490 | 129,991 | 0 | (119,501 | ) | ||||
| 2009 | 64,770 | 133,937 | (17,684 | ) | (86,851 | ) | |||
| 2010 | 63,947 | 137,973 | (54,603 | ) | (128,629 | ) | |||
| 2011 | 64,879 | 136,548 | (40,187 | ) | (111,856 | ) | |||
| 2012 | 64,879 | 138,824 | (29,848 | ) | (103,793 | ) | |||
| 2013 | 64,879 | 139,948 | 0 | (75,069 | ) | ||||
| 2014 | 64,879 | 142,105 | 0 | (77,226 | ) | ||||
| 2015 | 64,879 | 144,595 | 0 | (79,716 | ) |
Wholesale Market Sales Revenue—Table 20 summarizes total market sales revenue for AEG. Spot capacity and corresponding sales of energy increase as existing contracts roll off, with the bulk of AEG's contracts expiring by 2005. Average revenues fall in the first year due to declining natural gas prices, and are constrained somewhat by regional surplus capacity through 2004. Market prices recover by 2005, and revenue growth after that time averages 3% annually.
B-46
TABLE 20
AEG WHOLESALE REVENUE FORECAST ($NOMINAL)
| YEAR | AVAILABLE CAPACITY (MW) | ENERGY SALES (GWH) | TOTAL REVENUES ($000) | AVERAGE REVENUES $/MWh | ||||
|---|---|---|---|---|---|---|---|---|
| 2001 | 138 | 601 | 31,525 | 52.48 | ||||
| 2002 | 546 | 1,060 | 50,203 | 47.38 | ||||
| 2003 | 551 | 1,041 | 48,418 | 46.52 | ||||
| 2004 | 989 | 2,306 | 105,379 | 45.69 | ||||
| 2005 | 2,844 | 10,457 | 528,628 | 50.55 | ||||
| 2006 | 3,183 | 12,728 | 639,219 | 50.22 | ||||
| 2007 | 3,673 | 15,099 | 777,127 | 51.47 | ||||
| 2008 | 3,757 | 16,148 | 849,160 | 52.59 | ||||
| 2009 | 4,040 | 17,719 | 971,889 | 54.85 | ||||
| 2010 | 4,040 | 18,044 | 1,024,337 | 56.77 | ||||
| 2011 | 4,040 | 18,418 | 971,844 | 52.77 | ||||
| 2012 | 4,105 | 19,122 | 1,025,124 | 53.61 | ||||
| 2013 | 4,105 | 19,125 | 1,051,452 | 54.98 | ||||
| 2014 | 4,105 | 19,264 | 1,093,374 | 56.76 | ||||
| 2015 | 4,141 | 19,364 | 1,140,576 | 58.90 | ||||
| 2016 | 4,141 | 19,361 | 1,182,507 | 61.08 | ||||
| 2017 | 4,141 | 19,543 | 1,238,042 | 63.35 | ||||
| 2018 | 4,141 | 19,667 | 1,301,268 | 66.16 | ||||
| 2019 | 4,141 | 19,659 | 1,363,271 | 69.35 | ||||
| 2020 | 4,141 | 19,789 | 1,435,839 | 72.56 |
B-47
To understand the elements of risk facing AEG better, RDI evaluated three sensitivity cases designed to affect forecast market prices and dispatch for AEG's units. Specifically, RDI evaluated the following:
- •
- Low and high natural gas/fuel oil prices to all generators
- •
- Overbuild of generating capacity in the Midwestern U.S.
For natural gas and fuel oil, prices were increased and decreased by 15% relative to the base case. In the overbuild scenario, a higher proportion of proposed capacity was assumed to be built, pushing reserve margins to 23% by 2003.
Sensitivity Case Results
Figure 20 compares the annual average price of electricity across each of the sensitivity cases RDI evaluated.
FIGURE 20
PROJECTED ECAR/MAIN MARKET PRICES UNDER BASE AND SENSITIVITY CASES ($2001/MWH)
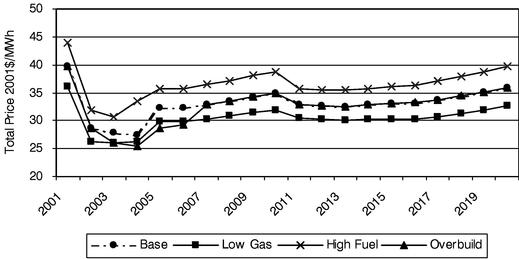
Table 21 shows the nominal price forecast for each case, separating the energy and capacity price components. As illustrated above, the low fuel and overbuild cases exert the greatest downward pressure on prices, with the low fuel case principally reducing energy prices and the overbuild case principally reducing capacity prices.
B-48
TABLE 21
SENSITIVITY CASE ENERGY AND CAPACITY PRICE FORECASTS ($NOMINAL/MWH)
| | Base $/MWh | Low Fuel $/MWh | High Fuel $/MWh | Overbuild $/MWh | ||||||||||||
|---|---|---|---|---|---|---|---|---|---|---|---|---|---|---|---|---|
| Year | Avg Energy | Capacity | Avg Energy | Capacity | Avg Energy | Capacity | Avg Energy | Capacity | ||||||||
| 2001 | 32.71 | 60.77 | 29.07 | 61.07 | 37.11 | 60.17 | 32.71 | 60.77 | ||||||||
| 2002 | 25.71 | 33.53 | 23.13 | 33.78 | 29.23 | 32.18 | 25.70 | 33.67 | ||||||||
| 2003 | 25.79 | 33.02 | 23.43 | 37.06 | 29.25 | 29.04 | 25.59 | 18.07 | ||||||||
| 2004 | 25.60 | 37.70 | 23.22 | 47.35 | 29.09 | 65.37 | 25.42 | 20.88 | ||||||||
| 2005 | 28.75 | 66.58 | 25.94 | 66.78 | 32.52 | 66.18 | 28.56 | 33.13 | ||||||||
| 2006 | 29.79 | 67.83 | 26.81 | 67.93 | 33.76 | 67.53 | 29.67 | 37.76 | ||||||||
| 2007 | 31.26 | 69.09 | 28.25 | 69.19 | 35.68 | 68.69 | 31.31 | 69.09 | ||||||||
| 2008 | 33.09 | 70.69 | 29.79 | 70.79 | 37.76 | 70.19 | 33.11 | 70.49 | ||||||||
| 2009 | 35.32 | 72.11 | 31.63 | 72.21 | 40.40 | 69.79 | 35.26 | 72.01 | ||||||||
| 2010 | 37.20 | 73.67 | 33.24 | 73.77 | 42.51 | 69.16 | 37.08 | 73.77 | ||||||||
| 2011 | 36.60 | 66.58 | 32.71 | 72.58 | 41.79 | 54.58 | 36.51 | 67.58 | ||||||||
| 2012 | 37.59 | 67.05 | 33.52 | 73.05 | 42.97 | 55.05 | 37.46 | 68.05 | ||||||||
| 2013 | 38.15 | 70.56 | 33.99 | 76.80 | 43.72 | 59.56 | 38.02 | 72.56 | ||||||||
| 2014 | 40.05 | 71.13 | 35.56 | 78.07 | 45.83 | 59.13 | 39.94 | 72.13 | ||||||||
| 2015 | 41.57 | 73.74 | 36.79 | 79.87 | 47.65 | 61.74 | 41.44 | 74.74 | ||||||||
| 2016 | 42.66 | 78.41 | 37.73 | 82.10 | 48.95 | 67.41 | 42.55 | 80.41 | ||||||||
| 2017 | 45.19 | 78.13 | 39.80 | 83.77 | 51.91 | 66.13 | 45.08 | 79.13 | ||||||||
| 2018 | 47.92 | 77.91 | 42.09 | 85.36 | 55.03 | 65.91 | 47.78 | 79.91 | ||||||||
| 2019 | 50.37 | 81.74 | 44.17 | 87.10 | 57.95 | 68.74 | 50.27 | 82.74 | ||||||||
| 2020 | 53.78 | 80.62 | 47.02 | 89.06 | 61.81 | 67.62 | 53.65 | 81.62 | ||||||||
Table 22 illustrates the annual real price impact of each sensitivity case.
B-49
TABLE 22
PERCENT CHANGE OF SENSITIVITY CASES FROM BASE CASE
| | | % Change from Base Case | |||||||
|---|---|---|---|---|---|---|---|---|---|
| Year | Base Case 2001$/MWh | Low Fuel | High Fuel | Overbuild | |||||
| 2001 | 39.65 | -9 | % | 11 | % | 0 | % | ||
| 2002 | 28.68 | -9 | % | 11 | % | 0 | % | ||
| 2003 | 27.86 | -6 | % | 10 | % | -6 | % | ||
| 2004 | 27.37 | -4 | % | 22 | % | -7 | % | ||
| 2005 | 32.29 | -8 | % | 10 | % | -11 | % | ||
| 2006 | 32.37 | -8 | % | 10 | % | -9 | % | ||
| 2007 | 32.79 | -8 | % | 11 | % | 0 | % | ||
| 2008 | 33.47 | -8 | % | 11 | % | 0 | % | ||
| 2009 | 34.38 | -8 | % | 11 | % | 0 | % | ||
| 2010 | 34.96 | -9 | % | 11 | % | 0 | % | ||
| 2011 | 32.89 | -7 | % | 9 | % | 0 | % | ||
| 2012 | 32.69 | -7 | % | 9 | % | 0 | % | ||
| 2013 | 32.41 | -7 | % | 9 | % | 0 | % | ||
| 2014 | 32.80 | -8 | % | 9 | % | 0 | % | ||
| 2015 | 33.05 | -8 | % | 9 | % | 0 | % | ||
| 2016 | 33.13 | -9 | % | 10 | % | 0 | % | ||
| 2017 | 33.72 | -9 | % | 10 | % | 0 | % | ||
| 2018 | 34.37 | -9 | % | 10 | % | 0 | % | ||
| 2019 | 35.07 | -9 | % | 10 | % | 0 | % | ||
| 2020 | 35.92 | -9 | % | 10 | % | 0 | % | ||
Table 23 shows the effect of each case on the market sales revenue results for AEG. During the oversupply period (2002 - 2009), AEG's revenues are reduced by an average of 17% annually. In the low gas price case, AEG's revenues are reduced by an average of 10% annually. In the long run, the overbuild scenario results in a slight increase in AEG's revenues. This is because high reserve margins tend to delay the penetration of more efficient expansion capacity, providing greater support for long-term prices.
B-50
TABLE 23
COMPARISON OF MARKET SALES REVENUE UNDER BASE AND SENSITIVITY CASES
| TOTAL REVENUES (millions$) | ||||||||
|---|---|---|---|---|---|---|---|---|
| YEAR | BASE | LOW FUEL | HIGH FUEL | OVERBUILD | ||||
| 2001 | 32 | 28 | 36 | 32 | ||||
| 2002 | 50 | 42 | 58 | 50 | ||||
| 2003 | 48 | 41 | 58 | 37 | ||||
| 2004 | 105 | 117 | 152 | 85 | ||||
| 2005 | 529 | 470 | 584 | 429 | ||||
| 2006 | 639 | 572 | 709 | 541 | ||||
| 2007 | 777 | 700 | 865 | 775 | ||||
| 2008 | 849 | 766 | 942 | 845 | ||||
| 2009 | 972 | 876 | 1,072 | 966 | ||||
| 2010 | 1,024 | 924 | 1,120 | 1,016 | ||||
| 2011 | 972 | 909 | 1,058 | 988 | ||||
| 2012 | 1,025 | 957 | 1,116 | 1,038 | ||||
| 2013 | 1,051 | 981 | 1,148 | 1,068 | ||||
| 2014 | 1,093 | 1,022 | 1,194 | 1,107 | ||||
| 2015 | 1,141 | 1,062 | 1,246 | 1,155 | ||||
| 2016 | 1,183 | 1,090 | 1,296 | 1,200 | ||||
| 2017 | 1,238 | 1,143 | 1,355 | 1,250 | ||||
| 2018 | 1,301 | 1,198 | 1,421 | 1,314 | ||||
| 2019 | 1,363 | 1,250 | 1,495 | 1,377 | ||||
| 2020 | 1,436 | 1,321 | 1,573 | 1,444 | ||||
| 2021 | 1,576 | 1,390 | 1,654 | 1,519 | ||||
Two factors can account for reduced market sakes revenue in the low fuel and overbuild sensitivity cases. First, lower prices reduce average revenues from market sales, and second, reduced volume of sales can reduce revenues. In the low fuel case, cost differentials between gas-fired generation in Illinois, Michigan, and Ohio are reduced, reducing the cost advantage of Illinois generation. In the high fuel scenario, AEG's coal-fired generation earns greater revenues and margins on the difference between its coal costs and market prices pushed up by higher gas costs. Higher market sales revenues are offset by higher gas costs at AEG's own gas-fired generation. The higher fuel costs have a greater impact in the early years of the forecast, when prices for AEG's generation are fixed by its term contracts. After 2003 - 2004, higher spot prices in the high fuel case provide a significant boost to AEG's revenues.
Each case has noteworthy dispatch effects as well. In the low fuel case, efficient gas plants are more often able to compete with marginal coal units such as AEG's Hutsonville and Meredosia 1-2. This reduces sales from Illinois units to markets in neighboring eastern states, resulting in lower generation from AEG's plants. This effect is most pronounced in comparing AEG's coal-fired generation (Figure 21), but can be seen to a lesser extent in AEG's intermediate generation (Figure 22) and peaking generation (Figure 23).
B-51
FIGURE 21
UTILIZATION OF AEG COAL-FIRED GENERATION UNDER BASE AND SENSITIVITY CASES
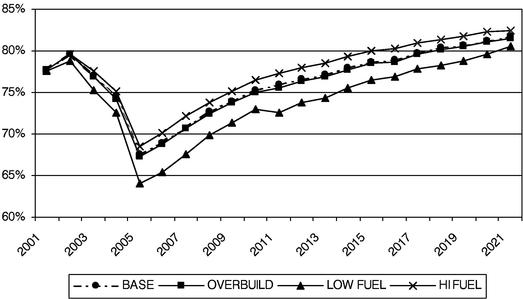
FIGURE 22
UTILIZATION OF AEG COMBINED CYCLE GENERATION UNDER BASE AND SENSITIVITY CASES
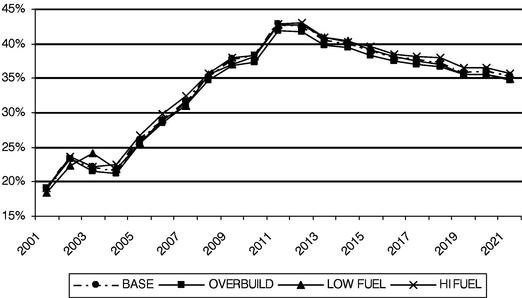
B-52
FIGURE 23
UTILIZATION OF AEG PEAKING GENERATION UNDER BASE AND SENSITIVITY CASES
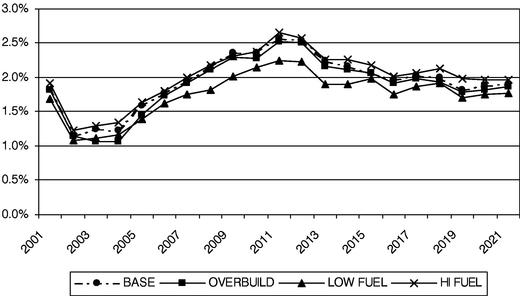
Because fuel costs are held constant, the impact of the overbuild case on AEG's utilization is minimal. In the overbuild case, AEG realizes much the same sales opportunities, but lower prices on those opportunities due to higher reserve margins and increased system efficiency.
B-53
Independent Market Consultant's Report
Table of Contents
Executive Summary
Introduction
Midwest Market Overview
Base Case Assumptions
Methodology Overview
Base Case Results
Sensitivity Case Results