UNITED STATES
SECURITIES AND EXCHANGE COMMISSION
Washington, D.C. 20549
FORM N-CSR
CERTIFIED SHAREHOLDER REPORT OF REGISTERED MANAGEMENT
INVESTMENT COMPANIES
Investment Company Act file number 811-10325
VANECK VECTORS ETF TRUST
(Exact name of registrant as specified in charter)
666 Third Avenue, New York, NY 10017
(Address of principal executive offices) (Zip code)
Van Eck Associates Corporation
666 Third Avenue, New York, NY 10017
(Name and address of agent for service)
Registrant’s telephone number, including area code: (212) 293-2000
Date of fiscal year end: DECEMBER 31
Date of reporting period: DECEMBER 31, 2020
| Item 1. | REPORTS TO SHAREHOLDERS. |
| ANNUAL REPORT December 31, 2020 |
| VANECK VECTORS® | |
| Africa Index ETF | AFK® |
| Brazil Small-Cap ETF | BRF® |
| China Growth Leaders ETF | GLCN |
| ChinaAMC SME-ChiNext ETF | CNXT® |
| Egypt Index ETF | EGPT® |
| India Growth Leaders ETF | GLIN |
| Indonesia Index ETF | IDX® |
| Israel ETF | ISRA® |
| Russia ETF | RSX® |
| Russia Small-Cap ETF | RSXJ® |
| Vietnam ETF | VNM® |
| 800.826.2333 | vaneck.com |
Certain information contained in this report represents the opinion of the investment adviser which may change at any time. This information is not intended to be a forecast of future events, a guarantee of future results or investment advice. Current market conditions may not continue. The information contained herein regarding each index has been provided by the relevant index provider. Also, unless otherwise specifically noted, any discussion of the Funds’ holdings, the Funds’ performance, and the views of the investment adviser are as of December 31, 2020.
VANECK VECTORS ETFs
December 31, 2020 (unaudited)
Dear Fellow Shareholders:
The level of stimulus from the U.S. Federal Reserve (Fed) in 2020 was almost unprecedented and had investment consequences that endure into the new year of 2021. Financial markets benefited from the Fed stimulus and the case for gold investing solidified further.
As 2020 ends, the global economy continues to grow surprisingly well, supporting the markets, despite the social distancing that we all continue to feel in our personal lives. Important commodities like copper regained and passed pre-COVID-19 highs. In addition, in China, not only are higher real policy interest rates a sign of economic strength, but the country’s industrial recovery also points to all-time highs in activity, even though consumer activity lags a little.
We do, however, see two risks to markets in 2021: 1) an unforeseen rise in interest rates in the U.S. triggered by higher global growth or other factors; and 2) a bump in the return to full employment. As to the first risk, several assets like gold, commodities and bitcoin may not be fully reflecting inflationary risks which could be a consequence of the huge stimulus of 2020.
An incredible number of people have been laid off in the U.S. and, regardless of GDP numbers, people are unlikely to return quickly to work at pre-COVID-19 levels. Despite signature into law on December 27, 2020 of the Consolidated Appropriations Act, 2021, concern may remain high enough for policy makers to take additional steps (any of which, however, are, as yet, uncertain) that may impact the financial recovery.
The investing outlook sometimes does change suddenly, as it certainly did in 2020. To get our quarterly investment outlooks, please subscribe to “VanEck News & Insights”. Should you have any questions regarding fund performance, please contact us at 800.826.2333 or visit our website.
We sincerely thank you for investing in VanEck’s investment strategies. On the following pages, you will find a performance discussion and financial statements for each of the funds for the twelve month period ended December 31, 2020. As always, we value your continued confidence in us and look forward to helping you meet your investment goals in the future.

Jan F. van Eck
CEO and President
VanEck Vectors ETF Trust
January 15, 2021
Investing involves substantial risk and high volatility, including possible loss of principal. An investor should consider the investment objective, risks, charges and expenses of the Funds carefully before investing. To obtain a prospectus and summary prospectus, which contain this and other information, call 800.826.2333 or visit vaneck.com. Please read the prospectus and summary prospectus carefully before investing.
| 1 |
VANECK VECTORS ETFs
December 31, 2020 (unaudited)
Market Review
All funds were to some extent affected by both the wide market sell off beginning in late-February and ensuing market volatility, sparked by the COVID-19 pandemic as it evolved globally. However, remedial measures, both financial and fiscal, taken by central governments around the world in response to the crisis (including the asset purchasing program of the U.S. Federal Reserve), resulted in a positive “bounce back” in markets starting in April. By the end of 2020, the extent of the recovery varied considerably country by country and region by region.
Africa
The materials sector, was by far the greatest positive contributor to the performance of VanEck Vectors Africa Index ETF, which returned 2.29% for the 12 month period. The financial and energy sectors were the two greatest detractors from performance. Geographically, four Canada-domiciled mining companies (gold, precious metals and copper) operating in Africa made the country the top contributor to Fund returns. It was followed by Nigeria. By country, the greatest detractor from performance, by country, was Ghana with two companies operating in the energy sector.
Brazil
Supported by robust third1 and fourth quarter2 2019 figures, Brazil went into 2020 with its economy on an apparently steady footing. However, having hit a high on January 23, 2020, as turmoil hit the world’s markets, small-cap Brazilian stocks proceeded to plummet by approximately 59% over the following two months, hitting a low on March 23. Unable to claw back their losses as the year unfolded, the VanEck Vectors Brazil Small-Cap ETF lost 20.75% over the 12 month period under review.
Six sectors contributed positively to performance, with the industrial, materials and consumer staples sectors contributing the most. However, together, the negative contributions just from the utilities and consumer discretionary sectors, with two of the three largest average sector weightings during the year, significantly exceeded all positive contributions to performance.
China
Despite having been the original epicenter of the COVID-19 pandemic, China’s rapid and robust recovery therefrom was reflected in the strong positive performances of both VanEck Vectors China Growth Leaders ETF (formerly the VanEck Vectors ChinaAMC CSI 300 ETF) and VanEck Vectors ChinaAMC SME-ChiNext ETF which returned 25.95% and 64.23%, respectively.
VanEck Vectors ChinaAMC SME-ChiNext ETF, by seeking to track its index of companies on the SME and ChiNext boards, offers exposure to more consumer, new economy sector names, many of which have also tended to be non-state owned enterprises. While the information technology sector, with the largest average sector weighting during the year, was the greatest contributor to performance, comparable positive contributions were also made by the healthcare and industrial sectors. Only the utilities and real estate sectors detracted from performance and then only minimally. While most sectors contributed positively to the performance of VanEck Vectors China Growth Leaders ETF, consumer staples companies contributed by far the most to returns. The financial sector detracted by far the most.
Effective May 1, 2020, the Fund changed its name from VanEck Vectors® ChinaAMC CSI 300 ETF to VanEck Vectors China Growth Leaders ETF and has traded thereafter under a new ticker, GLCN. As of the same date, Fund now seeks to track, before fees and expenses, the MarketGrader China All-Cap Growth Leaders Index.
Egypt
Egypt went into 2020 with a strong economy: GDP had grown by 5.6% in its 2019 fiscal year (the 12 months to end-June)3 and GDP growth in the last two calendar quarters of the year was also strong.4 Having hit a high on February 26, however, Egyptian stocks fell approximately 39% to a low on March 18. Unable fully to recoup its losses thereafter, the VanEck Vectors Egypt Index ETF lost 10.09% in 2020.
| 2 |
The top three performing sectors were consumer services, materials and consumer discretionary. The financial and healthcare sectors detracted most from performance. Large-cap companies, with the smallest average weighting during the period under review, detracted the most from performance.
India
The VanEck Vectors India Growth Leaders ETF (formerly the VanEck Vectors India Small-Cap Index ETF) posted a slight gain for the year of 0.80%. The Fund’s portfolio was hit hard by the downturn in the market at the end of March. Having recorded a high on January 17, between then and the low recorded on March 23, the Fund lost approximately 50%. However, it was able to claw back its most of its losses to end the year a little higher than it started it.
While the information technology sector contributed the most positively to performance, companies in the industrial sector were the greatest detractors from performance.
Effective May 1, 2020, the Fund changed its name from VanEck Vectors® India Small-Cap Index ETF to VanEck Vectors India Growth Leaders ETF and has traded thereafter under the ticker GLIN. As of the same date, the Fund now seeks to track, before fees and expenses, the MarketGrader India All-Cap Growth Leaders Index.
Indonesia
Like so many other countries, 2020 was particularly challenging for Indonesia and, compared with other Asian emerging markets countries, it was relatively hard hit by COVID-19.5 This was reflected in the returns for the VanEck Vectors Indonesia Index ETF, which lost 8.20% in 2020. The country had gone into the year with a stable and growing economy and, while GDP growth of 5.02% in 2019 may have been its weakest since 2015,6 Indonesian stocks were able to recoup many of their losses between the lows they hit toward the end of March and December 31, 2020.
Positive contributions to returns came from three sectors: materials, energy and healthcare. The greatest negative contribution to returns came from the financial sector, with the largest average weighting during the period under review, which, alone, exceeded all positive contributions to performance.
Israel
Israel is one country that, despite both the market downturn at the start of 2020 and the continuing ravages of COVID-19, managed successfully economically. While figures from the country Central Bureau of Statistics showed that its economy shrank by 2.8% in the first three quarters of 20207 compared with the corresponding period of 2019, most other developed countries suffered far greater damage from the crisis.8 The country was helped by strong exports, particularly from the tech sector.9
The VanEck Vectors Israel ETF gained 28.14% for the 12 months period under review. Over the period under review, the performance of the information technology sector, with the largest average weighting during 2020 made by far the greatest positive contribution to returns. Three sectors detracted most from performance: financial, real estate and energy. Large-cap companies, followed by small- then mid-cap companies, made the greatest positive contribution to returns.
Russia
Despite the effects of the COVID-19 crisis on Russia’s economy being quite serious resulting in the country experiencing its deepest recession since World War II,10 2020 could have been considerably worse for both the VanEck Vectors Russia Small-Cap ETF and its peer investing in larger-cap Russian stocks, the VanEck Vectors Russia ETF. The former ETF gained 5.23% for the year, while the latter lost 1.38% over the same period.
The materials sector was by far the most significant contributor to performance of the VanEck Vectors Russia ETF and the energy sector detracted the most. For the VanEck Vectors Russia Small-Cap ETF, the materials sector were the most significant contributors to positive returns. The industrial, information technology and utilities sectors were the greatest detractors from performance.
| 3 |
VANECK VECTORS ETFs
MANAGEMENT DISCUSSION
(unaudited) (continued)
Vietnam
VanEck Vectors Vietnam ETF gained 9.72% in 2020. Despite the country’s economic growth having fallen to a 30-year low as a result of COVID-19, it was still forecast to expand by 2.91% in 2020.11 Even at this level, according to the country’s General Statistics Office, the rate is “among the world’s highest.”12
Small-and mid-cap companies contributed the most to performance over the reporting period, each category alone outperforming the positive returns of large-cap companies. Four sectors contributed the majority of positive returns: information technology, materials, consumer staples and financial. The industrial, energy and real estate sectors were the greatest detractors from performance.
| * | Returns based on the funds’ net asset values (NAVs). |
| All indices are unmanaged and include the reinvestment of all dividends, but do not reflect the payment of transaction costs, advisory fees or expenses that are associated with an investment in the fund. An index’s performance is not illustrative of the fund’s performance. Indices are not securities in which investments can be made. Results reflect past performance and do not guarantee future results. |
| 1 | The Wall Street Journal: Brazil’s Economy Expands at Fastest Pace in Six Quarters, December 3, 2019, https://www.wsj.com/articles/brazils-economy-expands-at-fastest-pace-in-six-quarters-11575377914 |
| 2 | Reuters: Brazil GDP +0.5% in Q4, bringing total 2019 growth to 1.1% - IBGE, March 4, 2020, https://www.reuters.com/article/brazil-economy-idUSAQN027YC4 |
| 3 | Focus Economics: GDP in Egypt, https://www.focus-economics.com/country-indicator/egypt/gdp |
| 4 | The GlobalEconomy.com: Egypt: Economic growth, quarterly, https://www.theglobaleconomy.com/Egypt/gdp_growth/ |
| 5 | Rabo Research: Indonesia: Uncertainties hinder quick economic recovery, November 2, 2020, https://economics.rabobank.com/publications/2020/november/indonesia-uncertainties-hinder-quick-economic-recovery/ |
| 6 | The Jakarta Post: Indonesia’s GDP growth stagnated at 5.02 percent last year, weakest since 2015, February 5, 2020, https://www.thejakartapost.com/news/2020/02/05/indonesias-gdp-stagnated-at-5-02-percent-last-year-weakest-since-2015.html |
| 7 | Globes: Israel’s economy shrank 2.8% in first 9 months of 2020, December 16, 2020, https://en.globes.co.il/en/article-israels-economy-shrank-28-in-first-9-months-of-2020-1001353369 |
| 8 | Ibid. |
| 9 | Ibid. |
| 10 | World Bank: Russia Economic Report, December 16, 2020, https://www.worldbank.org/en/country/russia/publication/rer#:~:text=Russian%20economic%20growth%20is%20projected,than%20the%20forecast%20of%20September.&text=In%20such%20a%20case%2C%20GDP,by%202.8%20percent%20in%202022 |
| 11 | Reuters: Vietnam’s 2020 economic growth slips to 30-year low due to COVID-19, December 27, 2020, https://www.reuters.com/article/us-vietnam-economy-gdp-idUSKBN29107M |
| 12 | Ibid. |
| 4 |
VANECK VECTORS AFRICA INDEX ETF
PERFORMANCE COMPARISON
December 31, 2020 (unaudited)
| Average Annual Total Returns | |||||||||
| Share Price | NAV | MVAFKTR1 | SPTR2 | ||||||
| One Year | 4.42% | 2.29% | 4.20% | 18.40% | |||||
| Five Year | 6.20% | 5.58% | 7.07% | 15.22% | |||||
| Ten Year | (2.31)% | (2.29)% | (1.07)% | 13.88% | |||||
| 1 | MVIS® GDP Africa (MVAFKTR) Index is a rules-based, modified-capitalization-weighted, float-adjusted index and is intended to give investors a means of tracking the overall performance of the publicly traded companies in Africa. |
| Index data prior to June 21, 2013 reflects that of the Dow Jones Africa Titans 50 IndexSM. From June 21, 2013, forward, the index data reflects that of the MVIS® GDP Africa Index (MVAFKTR). All Index history reflects a blend of the performance of the aforementioned Indexes. | |
| 2 | The S&P 500 Index (SPTR) is a market-value weighted index consisting of 500 stocks chosen for market size, liquidity, and industry group representation, with each stock’s weight in the index proportionate to its market value. |
| Hypothetical Growth of $10,000 | ||
| This chart shows the value of a hypothetical $10,000 investment in the Fund at NAV over the past 10 years. The result is compared with the Fund’s benchmark and a broad-based index. |  |
Past performance is no guarantee of future results. Performance results do not reflect the deduction of taxes that a shareholder would pay on fund distributions or on the redemption or sale of fund shares.
See “About Fund Performance” on page 16 for more information.
| 5 |
VANECK VECTORS BRAZIL SMALL-CAP ETF
PERFORMANCE COMPARISON
December 31, 2020 (unaudited)
| Average Annual Total Returns | |||||||||
| Share Price | NAV | MVBRFTR1 | SPTR2 | ||||||
| One Year | (21.04)% | (20.75)% | (20.11)% | 18.40% | |||||
| Five Year | 19.18% | 19.20% | 19.88% | 15.22% | |||||
| Ten Year | (5.76)% | (5.62)% | (4.91)% | 13.88% | |||||
| 1 | MVIS® Brazil Small-Cap Index (MVBRFTR) is a rules based, modified capitalization weighted, float adjusted index intended to give investors a means of tracking the overall performance of publicly traded small-capitalization companies that are incorporated in or doing substantial business in Brazil. |
| 2 | The S&P 500 Index (SPTR) is a market-value weighted index consisting of 500 stocks chosen for market size, liquidity, and industry group representation, with each stock’s weight in the index proportionate to its market value. |
| Hypothetical Growth of $10,000 | ||
| This chart shows the value of a hypothetical $10,000 investment in the Fund at NAV over the past 10 years. The result is compared with the Fund’s benchmark and a broad-based index. | 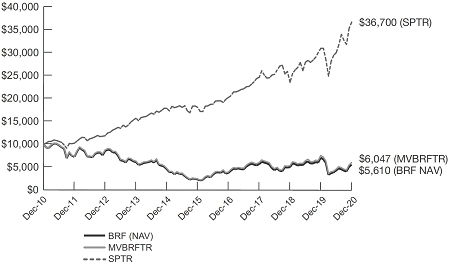 |
Past performance is no guarantee of future results. Performance results do not reflect the deduction of taxes that a shareholder would pay on fund distributions or on the redemption or sale of fund shares.
See “About Fund Performance” on page 16 for more information.
| 6 |
VANECK VECTORS CHINA GROWTH LEADERS ETF
PERFORMANCE COMPARISON
December 31, 2020 (unaudited)
| Average Annual Total Returns | |||||||||||
| Share Price | NAV | MGCNGRNR1 | CSIH07492 | SPTR3 | |||||||
| One Year | 25.73% | 25.95% | 37.85% | 39.03% | 18.40% | ||||||
| Five Year | 6.21% | 6.07% | 9.32% | 9.51% | 15.22% | ||||||
| Ten Year | 3.39% | 5.03% | 7.50% | 7.59% | 13.88% | ||||||
| 1 | The MarketGrader China All-Cap Growth Leaders Index (MGCNGRNR) is a modified market capitalization weighted, float adjusted index designed to track Chinese companies that the index provider has determined exhibit favorable fundamental characteristics according to the index provider’s proprietary scoring methodology. |
| 2 | CSI 300 Index (CSIH0749) is a modified free-float market capitalization weighted index comprised of the largest and most liquid stocks in the Chinese A-share market. Constituent stocks for the CSI 300 Index must have been listed for more than three months (unless the stock’s average daily A-share market capitalization since its initial listing ranks among the top 30 of all A-shares) and must not be experiencing what the index provider believes to be obvious abnormal fluctuations or market manipulation. |
| Index data as of October 31, 2018 for all periods presented reflect the CSIH0749 stream of the Index which is denominated in USD and converted by the index provider using the “offshore” Renminbi (CNH) exchange rate. | |
| Effective May 1, 2020, MGCNGRNR replaced CSIH0749 as the Fund’s benchmark index. All index history reflects a blend of the performance of the aforementioned Indexes. | |
| 3 | The S&P 500 Index (SPTR) is a market-value weighted index consisting of 500 stocks chosen for market size, liquidity, and industry group representation, with each stock’s weight in the index proportionate to its market value. |
| Hypothetical Growth of $10,000 | ||
| This chart shows the value of a hypothetical $10,000 investment in the Fund at NAV over the past 10 years. The result is compared with the Fund’s benchmark and a broad-based index. | 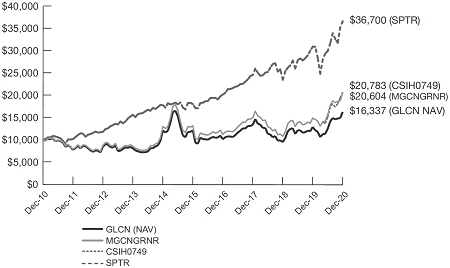 |
Past performance is no guarantee of future results. Performance results do not reflect the deduction of taxes that a shareholder would pay on fund distributions or on the redemption or sale of fund shares.
See “About Fund Performance” on page 16 for more information.
| 7 |
VANECK VECTORS CHINAAMC SME-CHINEXT ETF
PERFORMANCE COMPARISON
December 31, 2020 (unaudited)
| Average Annual Total Returns | |||||||||
| Share Price | NAV | CNI61091 | SPTR2 | ||||||
| One Year | 63.30% | 64.23% | 71.71% | 18.40% | |||||
| Five Year | 3.43% | 3.37% | 6.15% | 15.22% | |||||
| Life* | 11.19% | 11.33% | 14.35% | 12.64% | |||||
| * | Commencement of Fund: 7/23/14; First Day of Secondary Market Trading: 7/24/14 |
| 1 | The SME-ChiNext Index (CNI6109) is a modified, free-float adjusted index intended to track the performance of the 100 largest and most liquid stocks listed and trading on the Small and Medium Enterprise (“SME”) Board and the ChiNext Board of the Shenzhen Stock Exchange. The SME-ChiNext Index is comprised of A-shares. |
| Index data as of October 1, 2015 for all periods presented reflect the CNI6109 stream of the Index which is denominated in USD and converted by the index provider using the “offshore” Renminbi (CNH) exchange rate. | |
| 2 | The S&P 500 Index (SPTR) is a market-value weighted index consisting of 500 stocks chosen for market size, liquidity, and industry group representation, with each stock’s weight in the index proportionate to its market value. |
| Hypothetical Growth of $10,000 (Since Inception) | ||
| This chart shows the value of a hypothetical $10,000 investment in the Fund at NAV since inception. The result is compared with the Fund’s benchmark and a broad-based index. |  |
Past performance is no guarantee of future results. Performance results do not reflect the deduction of taxes that a shareholder would pay on fund distributions or on the redemption or sale of fund shares.
See “About Fund Performance” on page 16 for more information.
| 8 |
VANECK VECTORS EGYPT INDEX ETF
PERFORMANCE COMPARISON
December 31, 2020 (unaudited)
| Average Annual Total Returns | |||||||||
| Share Price | NAV | MVEGPTTR1 | SPTR2 | ||||||
| One Year | (11.53)% | (10.09)% | (8.59)% | 18.40% | |||||
| Five Year | (6.83)% | (6.77)% | (2.18)% | 15.22% | |||||
| Ten Year | (8.80)% | (8.42)% | (6.22)% | 13.88% | |||||
| 1 | MVIS® Egypt Index (MVEGPTTR) is a rules based, modified capitalization weighted, float adjusted index intended to give investors a means of tracking the overall performance of publicly traded companies that are incorporated in or doing substantial business in Egypt. |
| 2 | The S&P 500 Index (SPTR) is a market-value weighted index consisting of 500 stocks chosen for market size, liquidity, and industry group representation, with each stock’s weight in the index proportionate to its market value. |
| Hypothetical Growth of $10,000 | ||
| This chart shows the value of a hypothetical $10,000 investment in the Fund at NAV over the past 10 years. The result is compared with the Fund’s benchmark and a broad-based index. |
Past performance is no guarantee of future results. Performance results do not reflect the deduction of taxes that a shareholder would pay on fund distributions or on the redemption or sale of fund shares.
See “About Fund Performance” on page 16 for more information.
| 9 |
VANECK VECTORS INDIA GROWTH LEADERS ETF
PERFORMANCE COMPARISON
December 31, 2020 (unaudited)
| Average Annual Total Returns | |||||||||
| Share Price | NAV | MGINGRNR1 | SPTR2 | ||||||
| One Year | (0.31)% | 0.80% | 5.92% | 18.40% | |||||
| Five Year | (4.89)% | (4.88)% | (4.26)% | 15.22% | |||||
| Ten Year | (7.74)% | (7.72)% | (7.04)% | 13.88% | |||||
| 1 | The MarketGrader India All-Cap Growth Leaders Index (MGINGRNR) is a modified market capitalization weighted, float adjusted index designed to track Indian companies that the index provider has determined exhibit favorable fundamental characteristics according to the index provider’s proprietary scoring methodology. |
| Effective May 1, 2020, MGINGRNR replaced MVIS® India Small-Cap Index (MVSCIFTR) as the Fund’s benchmark index. MVSCIFTR ceased operations on June 30, 2020, and is therefore excluded from the Fund’s Performance Comparison as of December 31, 2020. Index history prior to June 30, 2020 reflects a blend of the performance of the aforementioned Indexes. | |
| 2 | The S&P 500 Index (SPTR) is a market-value weighted index consisting of 500 stocks chosen for market size, liquidity, and industry group representation, with each stock’s weight in the index proportionate to its market value. |
| Hypothetical Growth of $10,000 | ||
| This chart shows the value of a hypothetical $10,000 investment in the Fund at NAV over the past 10 years. The result is compared with the Fund’s benchmark and a broad-based index. |  |
Past performance is no guarantee of future results. Performance results do not reflect the deduction of taxes that a shareholder would pay on fund distributions or on the redemption or sale of fund shares.
See “About Fund Performance” on page 16 for more information.
| 10 |
VANECK VECTORS INDONESIA INDEX ETF
PERFORMANCE COMPARISON
December 31, 2020 (unaudited)
| Average Annual Total Returns | |||||||||
| Share Price | NAV | MVIDXTR1 | SPTR2 | ||||||
| One Year | (7.44)% | (8.20)% | (8.15)% | 18.40% | |||||
| Five Year | 4.12% | 4.06% | 4.41% | 15.22% | |||||
| Ten Year | (1.43)% | (1.41)% | (0.87)% | 13.88% | |||||
| 1 | MVIS® Indonesia Index (MVIDXTR) is a rules based, modified capitalization weighted, float adjusted index intended to give investors a means of tracking the overall performance of publicly traded companies that are incorporated in or doing substantial business in Indonesia. |
| 2 | The S&P 500 Index (SPTR) is a market-value weighted index consisting of 500 stocks chosen for market size, liquidity, and industry group representation, with each stock’s weight in the index proportionate to its market value. |
| Hypothetical Growth of $10,000 | ||
| This chart shows the value of a hypothetical $10,000 investment in the Fund at NAV over the past 10 years. The result is compared with the Fund’s benchmark and a broad-based index. | 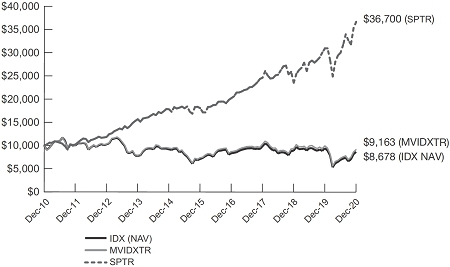 |
Past performance is no guarantee of future results. Performance results do not reflect the deduction of taxes that a shareholder would pay on fund distributions or on the redemption or sale of fund shares.
See “About Fund Performance” on page 16 for more information.
| 11 |
PERFORMANCE COMPARISON
December 31, 2020 (unaudited)
| Average Annual Total Returns | |||||||||
| Share Price | NAV | BLSNTR1 | SPTR2 | ||||||
| One Year | 28.21% | 28.14% | 28.16% | 18.40% | |||||
| Five Year | 10.50% | 10.45% | 10.81% | 15.22% | |||||
| Life* | 9.33% | 9.32% | 9.75% | 14.43% | |||||
| * | Commencement of Fund: 6/25/13; First Day of Secondary Market Trading: 6/26/13 |
| 1 | Bluestar Israel Global Index® (BLSNTR) is a rules based, modified capitalization, float adjusted weighted index comprised of equity securities, which may include depositary receipts, of publicly traded companies that are generally considered by the index provider to be Israeli companies. |
| 2 | The S&P 500 Index (SPTR) is a market-value weighted index consisting of 500 stocks chosen for market size, liquidity, and industry group representation, with each stock’s weight in the index proportionate to its market value. |
| Hypothetical Growth of $10,000 (Since Inception) | ||
| This chart shows the value of a hypothetical $10,000 investment in the Fund at NAV since inception. The result is compared with the Fund’s benchmark and a broad-based index. |  |
Past performance is no guarantee of future results. Performance results do not reflect the deduction of taxes that a shareholder would pay on fund distributions or on the redemption or sale of fund shares.
See “About Fund Performance” on page 16 for more information.
| 12 |
PERFORMANCE COMPARISON
December 31, 2020 (unaudited)
| Average Annual Total Returns | |||||||||
| Share Price | NAV | MVRSXTR1 | SPTR2 | ||||||
| One Year | (0.09)% | (1.38)% | (0.76)% | 18.40% | |||||
| Five Year | 14.97% | 14.60% | 15.24% | 15.22% | |||||
| Ten Year | (1.02)% | (1.06)% | (1.01)% | 13.88% | |||||
| 1 | MVIS® Russia Index (MVRSXTR) is a rules based, modified capitalization weighted, float adjusted index intended to give investors a means of tracking the overall performance of publicly traded companies that are incorporated in or doing substantial business in Russia. |
| 2 | The S&P 500 Index (SPTR) is a market-value weighted index consisting of 500 stocks chosen for market size, liquidity, and industry group representation, with each stock’s weight in the index proportionate to its market value. |
| Hypothetical Growth of $10,000 | ||
| This chart shows the value of a hypothetical $10,000 investment in the Fund at NAV over the past 10 years. The result is compared with the Fund’s benchmark and a broad-based index. |  |
Past performance is no guarantee of future results. Performance results do not reflect the deduction of taxes that a shareholder would pay on fund distributions or on the redemption or sale of fund shares.
See “About Fund Performance” on page 16 for more information.
| 13 |
VANECK VECTORS RUSSIA SMALL-CAP ETF
PERFORMANCE COMPARISON
December 31, 2020 (unaudited)
| Average Annual Total Returns | |||||||||
| Share Price | NAV | MVRSXJTR1 | SPTR2 | ||||||
| One Year | 4.27% | 5.23% | 5.51% | 18.40% | |||||
| Five Year | 17.92% | 17.80% | 18.72% | 15.22% | |||||
| Life* | (4.52)% | (4.46)% | (4.09)% | 13.73% | |||||
| * | Commencement of Fund: 4/13/11; First Day of Secondary Market Trading: 4/14/11 |
| 1 | MVIS® Russia Small-Cap Index (MVRSXJTR) is a rules based, modified capitalization weighted, float adjusted index intended to give investors a means of tracking the overall performance of publicly traded small-capitalization companies that are incorporated in or doing substantial business in Russia. |
| 2 | The S&P 500 Index (SPTR) is a market-value weighted index consisting of 500 stocks chosen for market size, liquidity, and industry group representation, with each stock’s weight in the index proportionate to its market value. |
| Hypothetical Growth of $10,000 (Since Inception) | ||
| This chart shows the value of a hypothetical $10,000 investment in the Fund at NAV since inception. The result is compared with the Fund’s benchmark and a broad-based index. |  |
Past performance is no guarantee of future results. Performance results do not reflect the deduction of taxes that a shareholder would pay on fund distributions or on the redemption or sale of fund shares.
See “About Fund Performance” on page 16 for more information.
| 14 |
PERFORMANCE COMPARISON
December 31, 2020 (unaudited)
| Average Annual Total Returns | |||||||||
| Share Price | NAV | MVVNMTR1 | SPTR2 | ||||||
| One Year | 9.94% | 9.72% | 10.44% | 18.40% | |||||
| Five Year | 4.61% | 4.66% | 5.33% | 15.22% | |||||
| Ten Year | (2.19)% | (1.84)% | (1.08)% | 13.88% | |||||
| 1 | MVIS® Vietnam Index (MVVNMTR) is a rules based, modified capitalization weighted, float adjusted index intended to give investors a means of tracking the overall performance of publicly traded companies that are incorporated in or doing substantial business in Vietnam. |
| 2 | The S&P 500 Index (SPTR) is a market-value weighted index consisting of 500 stocks chosen for market size, liquidity, and industry group representation, with each stock’s weight in the index proportionate to its market value. |
| Hypothetical Growth of $10,000 | ||
| This chart shows the value of a hypothetical $10,000 investment in the Fund at NAV over the past 10 years. The result is compared with the Fund’s benchmark and a broad-based index. | 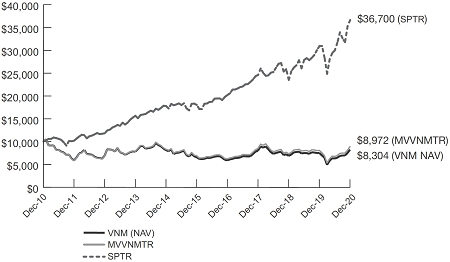 |
Past performance is no guarantee of future results. Performance results do not reflect the deduction of taxes that a shareholder would pay on fund distributions or on the redemption or sale of fund shares.
See “About Fund Performance” on page 16 for more information.
| 15 |
ABOUT FUND PERFORMANCE
(unaudited)
The price used to calculate market return (Share Price) is determined by using the closing price listed on its primary listing exchange. Since the shares of each Fund did not trade in the secondary market until after each Fund’s commencement, for the period from commencement to the first day of secondary market trading in shares of each Fund, the NAV of each Fund is used as a proxy for the secondary market trading price to calculate market returns.
The performance data quoted represents past performance. Past performance is not a guarantee of future results. Performance information for each Fund may reflect temporary waivers of expenses and/or fees. Had each Fund incurred all expenses, investment returns would have been reduced. These returns do not reflect the deduction of taxes that a shareholder would pay on Fund dividends and distributions or the sale of Fund shares.
Investment return and value of the shares of each Fund will fluctuate so that an investor’s shares, when sold, may be worth more or less than their original cost. Performance may be lower or higher than performance data quoted. Fund returns reflect reinvestment of dividends and capital gains distributions. Performance current to the most recent month-end is available by calling 800.826.2333 or by visiting vaneck.com.
Index returns assume the reinvestment of all income and do not reflect any management fees or brokerage expenses associated with Fund returns. Certain indices may take into account withholding taxes. Investors cannot invest directly in the Index. Returns for actual Fund investors may differ from what is shown because of differences in timing, the amount invested and fees and expenses.
The Africa Index, Brazil Small-Cap Index, Egypt Index, Indonesia Index, Russia Index, Russia Small-Cap Index, and Vietnam Index are published by MV Index Solutions GmbH (MVIS®), which is a wholly owned subsidiary of the Adviser, Van Eck Associates Corporation. The China Index and India Index are published by MarketGrader.com Corp. (MarketGrader). The SME-ChiNext Index is published by the Shenzhen Securities Information Co., Ltd. (Shenzhen Securities), which is a subsidiary of the Shenzhen Stock Exchange. The Israel Index is published by BlueStar Global Investors, LLC (BlueStar).
BlueStar, MarketGrader MVIS, and Shenzhen Securities are “Index Providers.” The Index Providers do not sponsor, endorse, or promote the Funds and bear no liability with respect to the Funds or any security.
| 16 |
EXPLANATION OF EXPENSES
(unaudited)
Hypothetical $1,000 investment at beginning of period
As a shareholder of a Fund, you incur operating expenses, including management fees and other Fund expenses. This disclosure is intended to help you understand the ongoing costs (in dollars) of investing in your Fund and to compare these costs with the ongoing costs of investing in other mutual funds.
The disclosure is based on an investment of $1,000 invested at the beginning of the period and held for the entire period, July 1, 2020 to December 31, 2020.
Actual Expenses
The first line in the table below provides information about account values and actual expenses. You may use the information in this line, together with the amount you invested, to estimate the expenses that you paid over the period. Simply divide your account value by $1,000 (for example, an $8,600 account value divided by $1,000 = 8.6), then multiply the result by the number in the first line under the heading entitled “Expenses Paid During the Period.”
Hypothetical Example for Comparison Purposes
The second line in the table below provides information about hypothetical account values and hypothetical expenses based on the Fund’s actual expense ratio and an assumed rate of return of 5% per year before expenses, which is not the Fund’s actual return. The hypothetical account values and expenses may not be used to estimate the actual ending account balance or expenses you paid for the period. You may use this information to compare the ongoing costs of investing in your Fund and other funds. To do so, compare this 5% hypothetical example with the 5% hypothetical examples that appear in the shareholder reports of other funds.
Please note that the expenses shown in the table are meant to highlight your ongoing costs only and do not reflect any transactional costs, such as brokerage commissions paid on purchases and sales. Therefore, the second line of the table is useful in comparing ongoing costs only, and will not help you determine the relative costs of owning different funds. In addition, if these transactional costs were included, your costs would have been higher.
| 17 |
VANECK VECTORS ETF TRUST
EXPLANATION OF EXPENSES
(unaudited) (continued)
| Beginning Account Value July 1, 2020 | Ending Account Value December 31, 2020 | Annualized Expense Ratio During Period | Expenses Paid During the Period* July 1, 2020 – December 31, 2020 | |||||||||||||
| Africa Index ETF | ||||||||||||||||
| Actual | $ | 1,000.00 | $ | 1,270.10 | 0.79 | % | $ | 4.51 | ||||||||
| Hypothetical** | $ | 1,000.00 | $ | 1,021.17 | 0.79 | % | $ | 4.01 | ||||||||
| Brazil Small-Cap ETF | ||||||||||||||||
| Actual | $ | 1,000.00 | $ | 1,304.30 | 0.61 | % | $ | 3.53 | ||||||||
| Hypothetical** | $ | 1,000.00 | $ | 1,022.07 | 0.61 | % | $ | 3.10 | ||||||||
| China Growth Leaders ETF | ||||||||||||||||
| Actual | $ | 1,000.00 | $ | 1,303.00 | 0.60 | % | $ | 3.47 | ||||||||
| Hypothetical** | $ | 1,000.00 | $ | 1,022.13 | 0.60 | % | $ | 3.05 | ||||||||
| ChinaAMC SME-ChiNext ETF | ||||||||||||||||
| Actual | $ | 1,000.00 | $ | 1,359.40 | 0.65 | % | $ | 3.85 | ||||||||
| Hypothetical** | $ | 1,000.00 | $ | 1,021.87 | 0.65 | % | $ | 3.30 | ||||||||
| Egypt Index ETF | ||||||||||||||||
| Actual | $ | 1,000.00 | $ | 1,093.80 | 1.00 | % | $ | 5.26 | ||||||||
| Hypothetical** | $ | 1,000.00 | $ | 1,020.11 | 1.00 | % | $ | 5.08 | ||||||||
| India Growth Leaders ETF | ||||||||||||||||
| Actual | $ | 1,000.00 | $ | 1,361.60 | 1.20 | % | $ | 7.12 | ||||||||
| Hypothetical** | $ | 1,000.00 | $ | 1,019.10 | 1.20 | % | $ | 6.09 | ||||||||
| Indonesia Index ETF | ||||||||||||||||
| Actual | $ | 1,000.00 | $ | 1,248.80 | 0.57 | % | $ | 3.22 | ||||||||
| Hypothetical** | $ | 1,000.00 | $ | 1,022.27 | 0.57 | % | $ | 2.90 | ||||||||
| Israel ETF | ||||||||||||||||
| Actual | $ | 1,000.00 | $ | 1,364.40 | 0.60 | % | $ | 3.57 | ||||||||
| Hypothetical** | $ | 1,000.00 | $ | 1,022.12 | 0.60 | % | $ | 3.05 | ||||||||
| Russia ETF | ||||||||||||||||
| Actual | $ | 1,000.00 | $ | 1,182.50 | 0.56 | % | $ | 3.07 | ||||||||
| Hypothetical** | $ | 1,000.00 | $ | 1,022.32 | 0.56 | % | $ | 2.85 | ||||||||
| Russia Small-Cap ETF | ||||||||||||||||
| Actual | $ | 1,000.00 | $ | 1,211.80 | 0.76 | % | $ | 4.23 | ||||||||
| Hypothetical** | $ | 1,000.00 | $ | 1,021.32 | 0.76 | % | $ | 3.86 | ||||||||
| Vietnam ETF | ||||||||||||||||
| Actual | $ | 1,000.00 | $ | 1,304.30 | 0.56 | % | $ | 3.24 | ||||||||
| Hypothetical** | $ | 1,000.00 | $ | 1,022.32 | 0.56 | % | $ | 2.85 | ||||||||
| * | Expenses are equal to the Fund’s annualized expense ratio (for the six months ended December 31, 2020) multiplied by the average account value over the period, multiplied by the number of days in the most recent fiscal half year divided by the number of days in the fiscal year (to reflect the one-half year period). | |
| ** | Assumes annual return of 5% before expenses |
| 18 |
VANECK VECTORS AFRICA INDEX ETF
SCHEDULE OF INVESTMENTS
December 31, 2020
| Number of Shares | Value | |||||||
| COMMON STOCKS: 100.1% | ||||||||
| Burkina Faso: 1.9% | ||||||||
| 277,917 | IAMGOLD Corp. (USD) * | $ | 1,019,955 | |||||
| Canada: 6.0% | ||||||||
| 21,713 | B2Gold Corp. (USD) | 121,593 | ||||||
| 45,574 | Barrick Gold Corp. (USD) | 1,038,176 | ||||||
| 372,811 | Ivanhoe Mines Ltd. * † | 2,007,444 | ||||||
| 3,167,213 | ||||||||
| China / Hong Kong: 2.1% | ||||||||
| 1,665,000 | China Molybdenum Co. Ltd. # | 1,089,208 | ||||||
| Egypt: 4.7% | ||||||||
| 313,434 | Centamin Plc (GBP) # | 530,344 | ||||||
| 518,515 | Commercial International Bank Egypt SAE Reg S (GDR) # | 1,945,018 | ||||||
| 2,475,362 | ||||||||
| Germany: 4.3% | ||||||||
| 55,345 | Jumia Technologies AG (ADR) * | 2,233,171 | ||||||
| India: 1.3% | ||||||||
| 22,187 | MakeMyTrip Ltd. (USD) * † | 655,182 | ||||||
| Indonesia: 0.8% | ||||||||
| 3,655,100 | Golden Agri-Resources Ltd. (SGD) # | 439,671 | ||||||
| Ivory Coast: 2.4% | ||||||||
| 54,292 | Endeavour Mining Corp. (CAD) * | 1,262,268 | ||||||
| Kenya: 8.9% | ||||||||
| 3,653,400 | Equity Group Holdings Plc * # | 1,223,864 | ||||||
| 11,019,500 | Safaricom Plc # | 3,455,990 | ||||||
| 4,679,854 | ||||||||
| Morocco: 11.2% | ||||||||
| 53,218 | Attijariwafa Bank | 2,529,665 | ||||||
| 50,343 | Bank of Africa | 881,723 | ||||||
| 58,364 | Banque Centrale Populaire | 1,636,708 | ||||||
| 35,529 | Cosumar # | 838,425 | ||||||
| 5,886,521 | ||||||||
| Nigeria: 7.0% | ||||||||
| 28,699,036 | Guaranty Trust Bank Plc # | 2,122,144 | ||||||
| 27,247,760 | Zenith Bank Ltd. # | 1,546,679 | ||||||
| 3,668,823 | ||||||||
| Norway: 0.6% | ||||||||
| 7,941 | Scatec ASA Reg S 144A # | 316,700 | ||||||
| South Africa: 35.9% | ||||||||
| 54,246 | Absa Group Ltd. # | 443,657 | ||||||
| 5,277 | Anglo American Platinum Ltd. # | 519,487 | ||||||
| 68,441 | Anglo American Plc (GBP) # | 2,259,163 | ||||||
| 20,523 | Aspen Pharmacare Holdings Ltd. * # | 175,559 | ||||||
| 20,077 | AVI Ltd. # | 100,239 | ||||||
| 16,821 | Bid Corp. Ltd. # | 302,410 | ||||||
| 19,419 | Bidvest Group Ltd. # | 208,014 | ||||||
| 2,099 | Capitec Bank Holdings Ltd. † # | 205,360 | ||||||
| 15,052 | Clicks Group Ltd. | 258,918 | ||||||
| 20,568 | Coronation Fund Managers Ltd. # | 60,418 | ||||||
| 32,239 | Discovery Ltd. # | 337,178 | ||||||
| 13,027 | Exxaro Resources Ltd. # | 123,657 | ||||||
| 257,076 | FirstRand Ltd. # | 896,139 | ||||||
| Number of Shares | Value | |||||||
| South Africa: (continued) | ||||||||
| 64,914 | Fortress REIT Ltd. | $ | 60,323 | |||||
| 12,309 | Foschini Group Ltd. * † # | 86,070 | ||||||
| 52,703 | Gold Fields Ltd. (USD) | 488,557 | ||||||
| 225,461 | Growthpoint Properties Ltd. # | 193,220 | ||||||
| 34,422 | Harmony Gold Mining Co. Ltd. (ADR) * | 161,095 | ||||||
| 47,320 | Impala Platinum Holdings Ltd. # | 651,595 | ||||||
| 45,143 | Investec Plc (GBP) # | 115,968 | ||||||
| 4,735 | Kumba Iron Ore Ltd. # | 201,511 | ||||||
| 81,204 | Life Healthcare Group Holdings Ltd. * # | 92,746 | ||||||
| 64,743 | Momentum Metropolitan Holdings | 69,465 | ||||||
| 15,922 | Mr Price Group Ltd. # | 184,855 | ||||||
| 101,018 | MTN Group Ltd. † # | 417,096 | ||||||
| 4,763,560 | MTN Nigeria Communications Plc # | 1,844,288 | ||||||
| 23,342 | MultiChoice Group Ltd. # | 213,164 | ||||||
| 19,368 | Naspers Ltd. # | 3,967,762 | ||||||
| 20,839 | Nedbank Group Ltd. # | 184,108 | ||||||
| 73,418 | Netcare Ltd. | 62,478 | ||||||
| 16,310 | Northam Platinum Ltd. * # | 233,417 | ||||||
| 256,503 | Old Mutual Ltd. † # | 208,254 | ||||||
| 24,320 | Pick n Pay Stores Ltd. # | 83,028 | ||||||
| 52,983 | Rand Merchant Investment Holdings Ltd. | 115,606 | ||||||
| 36,610 | Remgro Ltd. # | 240,594 | ||||||
| 23,180 | Resilient REIT Ltd. † # | 66,972 | ||||||
| 144,424 | Sanlam Ltd. # | 576,694 | ||||||
| 37,985 | Sasol Ltd. (ADR) * | 336,547 | ||||||
| 34,771 | Shoprite Holdings Ltd. # | 330,826 | ||||||
| 33,513 | Sibanye Stillwater Ltd. (ADR) * | 532,522 | ||||||
| 10,326 | Spar Group Ltd. # | 133,022 | ||||||
| 93,851 | Standard Bank Group Ltd. # | 813,185 | ||||||
| 9,191 | Tiger Brands Ltd. # | 130,708 | ||||||
| 49,016 | Woolworths Holdings Ltd. # | 132,033 | ||||||
| 18,817,908 | ||||||||
| Switzerland: 1.9% | ||||||||
| 26,138 | Mediclinic International Plc (GBP) * # | 100,944 | ||||||
| 262,799 | Nestle Nigeria Plc # | 901,289 | ||||||
| 1,002,233 | ||||||||
| Tanzania: 1.1% | ||||||||
| 26,314 | AngloGold Ashanti Ltd. (ADR) | 595,223 | ||||||
| United Arab Emirates: 4.9% | ||||||||
| 156,556 | Maroc Telecom # | 2,544,425 | ||||||
| United Kingdom: 1.9% | ||||||||
| 495,800 | East African Breweries Ltd. | 700,340 | ||||||
| 31,749 | Vodacom Group Ltd. (ZAR)# | 268,268 | ||||||
| 968,608 | ||||||||
| United States: 0.4% | ||||||||
| 2,600 | Royal Caribbean Cruises Ltd. | 194,194 | ||||||
| Zambia: 2.8% | ||||||||
| 81,751 | First Quantum Minerals Ltd. (CAD) | 1,466,256 | ||||||
| Zimbabwe: 0.0% | ||||||||
| 32,900 | Cassava Smartech Zimbabwe Ltd. * # | 1,796 | ||||||
| 15,980 | Delta Corp. Ltd. # | 3,063 | ||||||
| 4,859 | ||||||||
| Total Common Stocks (Cost: $42,362,204) | 52,487,634 | |||||||
See Notes to Financial Statements
| 19 |
VANECK VECTORS AFRICA INDEX ETF
SCHEDULE OF INVESTMENTS
(continued)
| Number of Shares | Value | |||||||
| SHORT-TERM INVESTMENT HELD AS COLLATERAL FOR SECURITIES ON LOAN: 0.5% (Cost: $283,655) | ||||||||
| Money Market Fund: 0.5% | ||||||||
| 283,655 | State Street Navigator Securities Lending Government Money Market Portfolio | $ | 283,655 | |||||
| Total Investments: 100.6% (Cost: $42,645,859) | 52,771,289 | |||||||
| Liabilities in excess of other assets: (0.6)% | (339,654 | ) | ||||||
| NET ASSETS: 100.0% | $ | 52,431,635 | ||||||
Definitions:
| ADR | American Depositary Receipt |
| CAD | Canadian Dollar |
| GBP | British Pound |
| GDR | Global Depositary Receipt |
| SGD | Singapore Dollar |
| USD | United States Dollar |
| ZAR | South African Rand |
Footnotes
| * | Non-income producing |
| † | Security fully or partially on loan. Total market value of securities on loan is $1,969,822. |
| # | Security has been valued in good faith pursuant to guidelines established by the Board of Trustees. The aggregate value of fair valued securities is $34,060,225 which represents 65.0% of net assets. |
| Reg S | Security was purchased pursuant to Regulation S under the Securities Act of 1933, which exempts from registration securities offered and sold outside of the United States. Such a security cannot be sold in the United States without either an effective registration statement filed pursuant to the Securities Act of 1933, or pursuant to an exemption from registration. |
| 144A | Security exempt from registration under Rule 144A of the Securities Act of 1933, as amended, or otherwise restricted. These securities may be resold in transactions exempt from registration, unless otherwise noted, and the value amounted to $316,700, or 0.6% of net assets. |
| Summary of Investments by Sector Excluding Collateral for Securities Loaned | % of Investments | Value | ||||||
| Communication Services | 16.7 | % | $ | 8,743,231 | ||||
| Consumer Discretionary | 14.2 | 7,453,267 | ||||||
| Consumer Staples | 8.0 | 4,221,939 | ||||||
| Energy | 0.2 | 123,657 | ||||||
| Financials | 30.8 | 16,154,223 | ||||||
| Health Care | 0.8 | 431,727 | ||||||
| Industrials | 0.4 | 208,014 | ||||||
| Materials | 27.7 | 14,514,361 | ||||||
| Real Estate | 0.6 | 320,515 | ||||||
| Utilities | 0.6 | 316,700 | ||||||
| 100.0 | % | $ | 52,487,634 | |||||
See Notes to Financial Statements
| 20 |
The summary of inputs used to value the Fund’s investments as of December 31, 2020 is as follows:
| Level 1 Quoted Prices | Level 2 Significant Observable Inputs | Level 3 Significant Unobservable Inputs | Value | ||||||||||||||
| Common Stocks | |||||||||||||||||
| Burkina Faso | $ | 1,019,955 | $ | — | $ | — | $ | 1,019,955 | |||||||||
| Canada | 3,167,213 | — | — | 3,167,213 | |||||||||||||
| China / Hong Kong | — | 1,089,208 | — | 1,089,208 | |||||||||||||
| Egypt | — | 2,475,362 | — | 2,475,362 | |||||||||||||
| Germany | 2,233,171 | — | — | 2,233,171 | |||||||||||||
| India | 655,182 | — | — | 655,182 | |||||||||||||
| Indonesia | — | 439,671 | — | 439,671 | |||||||||||||
| Ivory Coast | 1,262,268 | — | — | 1,262,268 | |||||||||||||
| Kenya | — | 4,679,854 | — | 4,679,854 | |||||||||||||
| Morocco | 5,048,096 | 838,425 | — | 5,886,521 | |||||||||||||
| Nigeria | — | 3,668,823 | — | 3,668,823 | |||||||||||||
| Norway | — | 316,700 | — | 316,700 | |||||||||||||
| South Africa | 2,085,511 | 16,732,397 | — | 18,817,908 | |||||||||||||
| Switzerland | — | 1,002,233 | — | 1,002,233 | |||||||||||||
| Tanzania | 595,223 | — | — | 595,223 | |||||||||||||
| United Arab Emirates | — | 2,544,425 | — | 2,544,425 | |||||||||||||
| United Kingdom | 700,340 | 268,268 | — | 968,608 | |||||||||||||
| United States | 194,194 | — | — | 194,194 | |||||||||||||
| Zambia | 1,466,256 | — | — | 1,466,256 | |||||||||||||
| Zimbabwe | — | 4,859 | — | 4,859 | |||||||||||||
| Money Market Fund | 283,655 | — | — | 283,655 | |||||||||||||
| Total | $ | 18,711,064 | $ | 34,060,225 | $ | — | $ | 52,771,289 | |||||||||
See Notes to Financial Statements
| 21 |
VANECK VECTORS BRAZIL SMALL-CAP ETF
SCHEDULE OF INVESTMENTS
December 31, 2020
| Number of Shares | Value | |||||||
| COMMON STOCKS: 91.6% | ||||||||
| Automobiles & Components: 0.8% | ||||||||
| 40,000 | Mahle-Metal Leve SA Industria e Comercio # | $ | 162,083 | |||||
| 68,950 | Tupy SA # | 279,242 | ||||||
| 441,325 | ||||||||
| Capital Goods: 2.4% | ||||||||
| 152,114 | Embraer SA (ADR) † | 1,035,896 | ||||||
| 95,902 | Iochpe Maxion SA # | 287,185 | ||||||
| 1,323,081 | ||||||||
| Commercial & Professional Services: 0.4% | ||||||||
| 38,800 | Ambipar Participacoes e Empreendimentos SA * # | 197,572 | ||||||
| Consumer Durables & Apparel: 13.4% | ||||||||
| 47,350 | Arezzo Industria e Comercio SA # | 623,091 | ||||||
| 107,900 | Cia Hering SA # | 357,680 | ||||||
| 61,850 | Construtora Tenda SA # | 360,671 | ||||||
| 295,200 | Cyrela Brazil Realty SA Empreendimentos e Participacoes # | 1,683,469 | ||||||
| 84,600 | Direcional Engenharia SA # | 213,853 | ||||||
| 143,350 | Even Construtora e Incorporadora SA # | 333,587 | ||||||
| 158,152 | EZ Tec Empreendimentos e Participacoes SA # | 1,313,769 | ||||||
| 215,800 | Grendene SA # | 348,930 | ||||||
| 268,050 | Grupo de Moda Soma SA * # | 686,129 | ||||||
| 235,600 | MRV Engenharia e Participacoes SA # | 862,715 | ||||||
| 95,850 | Vivara Participacoes SA # | 542,744 | ||||||
| 7,326,638 | ||||||||
| Consumer Services: 4.2% | ||||||||
| 99,282 | Arcos Dorados Holdings, Inc. (USD) * | 499,388 | ||||||
| 146,050 | BK Brasil Operacao e Assessoria # | 306,556 | ||||||
| 156,376 | CVC Brasil Operadora e Agencia de Viagens SA # | 619,222 | ||||||
| 66,000 | GAEC Educacao SA # | 457,852 | ||||||
| 57,575 | Ser Educacional SA Reg S 144A # | 173,622 | ||||||
| 16,037 | Vasta Platform Ltd. (USD) * † | 232,537 | ||||||
| 2,289,177 | ||||||||
| Energy: 3.1% | ||||||||
| 82,900 | Enauta Participacoes SA # | 188,548 | ||||||
| 20,500 | Modec, Inc. † # | 372,771 | ||||||
| 82,750 | Petro Rio SA * # | 1,111,697 | ||||||
| 1,673,016 | ||||||||
| Food, Beverage & Tobacco: 4.3% | ||||||||
| 52,694 | Adecoagro SA (USD) * | 358,319 | ||||||
| 73,150 | Camil Alimentos SA # | 155,674 | ||||||
| 279,500 | Minerva SA # | 547,370 | ||||||
| 169,400 | Sao Martinho SA # | 895,199 | ||||||
| 75,300 | SLC Agricola SA # | 398,398 | ||||||
| 2,354,960 | ||||||||
| Health Care Equipment & Services: 6.9% | ||||||||
| 257,450 | Fleury SA # | 1,343,454 | ||||||
| 47,700 | Instituto Hermes Pardini SA # | 208,166 | ||||||
| 248,650 | Odontoprev SA # | 697,417 | ||||||
| 224,550 | Qualicorp SA # | 1,520,311 | ||||||
| 3,769,348 | ||||||||
| Number of Shares | Value | |||||||
| Insurance: 2.8% | ||||||||
| 896,800 | IRB Brasil Resseguros SA # | $ | 1,411,885 | |||||
| 68,200 | Wiz Solucoes e Corretagem de Seguros SA # | 105,775 | ||||||
| 1,517,660 | ||||||||
| Materials: 6.7% | ||||||||
| 266,275 | Duratex SA # | 985,223 | ||||||
| 46,972 | ERO Copper Corp. (CAD) * | 753,530 | ||||||
| 282,739 | Largo Resources Ltd. (CAD) * † | 306,528 | ||||||
| 33,692 | RHI Magnesita NV (GBP) # | 1,614,719 | ||||||
| 3,660,000 | ||||||||
| Media & Entertainment: 0.5% | ||||||||
| 60,700 | Smiles Fidelidade SA # | 275,931 | ||||||
| Real Estate: 8.4% | ||||||||
| 146,538 | Aliansce Sonae Shopping Centers SA * # | 826,408 | ||||||
| 717,500 | BR Malls Participacoes SA # | 1,372,695 | ||||||
| 214,750 | BR Properties SA # | 410,322 | ||||||
| 24,937 | FII BTG Pactual Corporate Office Fund # | 426,014 | ||||||
| 90,050 | Iguatemi Empresa de Shopping Centers SA # | 646,634 | ||||||
| 41,100 | Jereissati Participacoes SA # | 208,250 | ||||||
| 271,750 | JHSF Participacoes SA # | 410,079 | ||||||
| 45,700 | Log Commercial Properties e Participacoes # | 302,771 | ||||||
| 4,603,173 | ||||||||
| Retailing: 1.5% | ||||||||
| 60,900 | C&A Modas Ltda # | 150,953 | ||||||
| 95,650 | Grupo SBF SA * # | 546,659 | ||||||
| 111,550 | Marisa Lojas SA * # | 146,582 | ||||||
| 844,194 | ||||||||
| Semiconductors & Semiconductor Equipment: 0.7% | ||||||||
| 9,652 | SMART Global Holdings, Inc. (USD) * | 363,205 | ||||||
| Software & Services: 3.7% | ||||||||
| 110,328 | Linx SA (ADR) † | 783,329 | ||||||
| 64,200 | Locaweb Servicos de Internet SA Reg S 144A * # | 998,742 | ||||||
| 416,776 | Sonda SA # | 256,400 | ||||||
| 2,038,471 | ||||||||
| Technology Hardware & Equipment: 0.3% | ||||||||
| 9,767 | Ituran Location and Control Ltd. (USD) | 186,061 | ||||||
| Telecommunication Services: 4.0% | ||||||||
| 1,073,205 | Oi SA (ADR) * † | 2,178,606 | ||||||
| Transportation: 13.2% | ||||||||
| 99,514 | Azul SA (ADR) * † | 2,270,910 | ||||||
| 317,450 | Cia de Locacao das Americas # | 1,792,440 | ||||||
| 96,400 | Cosan Logistica SA # | 343,315 | ||||||
| 180,190 | EcoRodovias Infraestrutura e Logistica SA * # | 466,058 | ||||||
| 71,628 | Gol Linhas Aereas Inteligentes SA (ADR) * † | 703,387 | ||||||
| 139,950 | Movida Participacoes SA # | 556,603 | ||||||
| 627,950 | Santos Brasil Participacoes SA # | 636,151 | ||||||
| 64,350 | Simpar SA # | 440,570 | ||||||
| 7,209,434 | ||||||||
See Notes to Financial Statements
| 22 |
| Number of Shares | Value | |||||||
| Utilities: 14.3% | ||||||||
| 215,840 | AES Tiete Energia SA # | $ | 685,913 | |||||
| 179,787 | Alupar Investimento SA # | 938,895 | ||||||
| 197,738 | Cia de Saneamento de Minas Gerais SA # | 626,951 | ||||||
| 314,400 | Cia de Saneamento do Parana # | 1,581,136 | ||||||
| 180,200 | Light SA # | 853,852 | ||||||
| 106,000 | Omega Geracao SA * # | 826,851 | ||||||
| 358,300 | Transmissora Alianca de Energia Eletrica SA # | 2,304,335 | ||||||
| 7,817,933 | ||||||||
| Total Common Stocks (Cost: $42,702,576) | 50,069,785 | |||||||
| PREFERRED STOCKS: 8.2% | ||||||||
| Banks: 0.7% | ||||||||
| 80,364 | Banco ABC Brasil SA, 3.04% # | 243,451 | ||||||
| 105,600 | Banco BMG SA Reg S 144A, 2.87% # | 126,703 | ||||||
| 370,154 | ||||||||
| Capital Goods: 1.6% | ||||||||
| 491,059 | Marcopolo SA, 2.23% # | 271,995 | ||||||
| 188,350 | Randon Implementos e Participacoes SA, 1.50% # | 585,976 | ||||||
| 857,971 | ||||||||
| Financials: 1.0% | ||||||||
| 200,100 | Banco do Estado do Rio Grande do Sul SA, 4.08% # | 564,426 | ||||||
| Number of Shares | Value | |||||||
| Materials: 3.3% | ||||||||
| 638,500 | Metalurgica Gerdau SA, 1.54% # | $ | 1,380,438 | |||||
| 43,477 | Unipar Carbocloro SA, 1.89% # | 429,617 | ||||||
| 1,810,055 | ||||||||
| Utilities: 1.6% | ||||||||
| 155,800 | Cia Energetica de Sao Paulo, 3.60% # | 872,254 | ||||||
| Total Preferred Stocks (Cost: $2,625,346) | 4,474,860 | |||||||
| WARRANTS: 0.1% (Cost: $0) | ||||||||
| Consumer Services: 0.1% | ||||||||
| 32,726 | CVC Brasil Operadora e Agencia de Viagens SA (BRL 12.84, expiring 01/29/21) * | 60,485 | ||||||
| Total Investments Before Collateral for Securities Loaned: 99.9% (Cost: $45,327,922) | 54,605,130 | |||||||
| SHORT-TERM INVESTMENT HELD AS COLLATERAL FOR SECURITIES ON LOAN: 6.0% (Cost: $3,283,495) | ||||||||
| Money Market Fund: 6.0% | ||||||||
| 3,283,495 | State Street Navigator Securities Lending Government Money Market Portfolio | 3,283,495 | ||||||
| Total Investments: 105.9% (Cost: $48,611,417) | 57,888,625 | |||||||
| Liabilities in excess of other assets: (5.9)% | (3,226,734 | ) | ||||||
| NET ASSETS: 100.0% | $ | 54,661,891 | ||||||
Definitions:
| ADR | American Depositary Receipt |
| BRL | Brazilian Real |
| CAD | Canadian Dollar |
| GBP | British Pound |
| USD | United States Dollar |
Footnotes:
| * | Non-income producing |
| † | Security fully or partially on loan. Total market value of securities on loan is $4,062,877. |
| # | Security has been valued in good faith pursuant to guidelines established by the Board of Trustees. The aggregate value of fair valued securities is $44,872,949 which represents 82.1% of net assets. |
| Reg S | Security was purchased pursuant to Regulation S under the Securities Act of 1933, which exempts from registration securities offered and sold outside of the United States. Such a security cannot be sold in the United States without either an effective registration statement filed pursuant to the Securities Act of 1933, or pursuant to an exemption from registration. |
| 144A | Security exempt from registration under Rule 144A of the Securities Act of 1933, as amended, or otherwise restricted. These securities may be resold in transactions exempt from registration, unless otherwise noted, and the value amounted to $1,299,067, or 2.4% of net assets. |
See Notes to Financial Statements
| 23 |
VANECK VECTORS BRAZIL SMALL-CAP ETF
SCHEDULE OF INVESTMENTS
(continued)
| Summary of Investments by Sector Excluding Collateral for Securities Loaned | % of Investments | Value | ||||||
| Communication Services | 4.5 | % | $ | 2,454,537 | ||||
| Consumer Discretionary | 20.1 | 10,961,819 | ||||||
| Consumer Staples | 4.3 | 2,354,960 | ||||||
| Energy | 3.1 | 1,673,016 | ||||||
| Financials | 5.3 | 2,878,254 | ||||||
| Health Care | 6.9 | 3,769,348 | ||||||
| Industrials | 17.6 | 9,588,058 | ||||||
| Information Technology | 4.7 | 2,587,737 | ||||||
| Materials | 10.0 | 5,470,055 | ||||||
| Real Estate | 7.6 | 4,177,159 | ||||||
| Utilities | 15.9 | 8,690,187 | ||||||
| 100.0 | % | $ | 54,605,130 | |||||
The summary of inputs used to value the Fund’s investments as of December 31, 2020 is as follows:
| Level 1 Quoted Prices | Level 2 Significant Observable Inputs | Level 3 Significant Unobservable Inputs | Value | ||||||||||||||
| Common Stocks | |||||||||||||||||
| Automobiles & Components | $ | — | $ | 441,325 | $ | — | $ | 441,325 | |||||||||
| Capital Goods | 1,035,896 | 287,185 | — | 1,323,081 | |||||||||||||
| Commercial & Professional Services | — | 197,572 | — | 197,572 | |||||||||||||
| Consumer Durables & Apparel | — | 7,326,638 | — | 7,326,638 | |||||||||||||
| Consumer Services | 731,925 | 1,557,252 | — | 2,289,177 | |||||||||||||
| Energy | — | 1,673,016 | — | 1,673,016 | |||||||||||||
| Food, Beverage & Tobacco | 358,319 | 1,996,641 | — | 2,354,960 | |||||||||||||
| Health Care Equipment & Services | — | 3,769,348 | — | 3,769,348 | |||||||||||||
| Insurance | — | 1,517,660 | — | 1,517,660 | |||||||||||||
| Materials | 1,060,058 | 2,599,942 | — | 3,660,000 | |||||||||||||
| Media & Entertainment | — | 275,931 | — | 275,931 | |||||||||||||
| Real Estate | — | 4,603,173 | — | 4,603,173 | |||||||||||||
| Retailing | — | 844,194 | — | 844,194 | |||||||||||||
| Semiconductors & Semiconductor Equipment | 363,205 | — | — | 363,205 | |||||||||||||
| Software & Services | 783,329 | 1,255,142 | — | 2,038,471 | |||||||||||||
| Technology Hardware & Equipment | 186,061 | — | — | 186,061 | |||||||||||||
| Telecommunication Services | 2,178,606 | — | — | 2,178,606 | |||||||||||||
| Transportation | 2,974,297 | 4,235,137 | — | 7,209,434 | |||||||||||||
| Utilities | — | 7,817,933 | — | 7,817,933 | |||||||||||||
| Preferred Stocks* | — | 4,474,860 | — | 4,474,860 | |||||||||||||
| Warrants* | 60,485 | — | — | 60,485 | |||||||||||||
| Money Market Fund | 3,283,495 | — | — | 3,283,495 | |||||||||||||
| Total | $ | 13,015,676 | $ | 44,872,949 | $ | — | $ | 57,888,625 | |||||||||
| * | See Schedule of Investments for industry sector breakouts. |
See Notes to Financial Statements
| 24 |
VANECK VECTORS CHINA GROWTH LEADERS ETF
SCHEDULE OF INVESTMENTS
December 31, 2020
| Number of Shares | Value | |||||||
| COMMON STOCKS: 99.6% | ||||||||
| Automobiles & Components: 0.4% | ||||||||
| 5,978 | Changzhou Xingyu Automotive Lighting Systems Co. Ltd. # | $ | 184,754 | |||||
| Capital Goods: 6.6% | ||||||||
| 25,400 | Anhui Heli Co. Ltd. # | 55,603 | ||||||
| 15,300 | Beijing Aerospace Changfeng Co. Ltd. # | 35,914 | ||||||
| 9,100 | Guangdong Kinlong Hardware Products Co. Ltd. # | 201,876 | ||||||
| 8,700 | Hangzhou Boiler Group Co. Ltd. # | 12,338 | ||||||
| 28,000 | Harbin Boshi Automation Co. Ltd. # | 52,300 | ||||||
| 18,716 | Jiangsu Hengli Hydraulic Co. Ltd. # | 325,968 | ||||||
| 8,900 | Jinlei Technology Co. Ltd. # | 45,602 | ||||||
| 6,700 | Nanxing Machinery Co. Ltd. # | 16,030 | ||||||
| 6,300 | Neway Valve Suzhou Co. Ltd. # | 12,125 | ||||||
| 19,200 | Ningbo Donly Co. Ltd. # | 17,798 | ||||||
| 16,400 | Ningbo Orient Wires & Cables Co. Ltd. # | 63,062 | ||||||
| 17,500 | Ocean’s King Lighting Science & Technology Co. Ltd. # | 19,959 | ||||||
| 13,400 | Qingdao Tianneng Heavy Industries Co. Ltd. # | 33,088 | ||||||
| 6,300 | Riyue Heavy Industry Co. Ltd. # | 29,399 | ||||||
| 282,000 | Sany Heavy Industry Co. Ltd. # | 1,521,565 | ||||||
| 5,200 | SEC Electric Machinery Co. Ltd. # | 9,898 | ||||||
| 17,400 | Shanghai Chuangli Group Co. Ltd. # | 17,269 | ||||||
| 11,200 | Shanghai Hanbell Precise Machinery Co. Ltd. # | 25,994 | ||||||
| 9,900 | Shanghai Huaming Intelligent Terminal Equipment Co. Ltd. # | 30,720 | ||||||
| 31,300 | Shanghai Liangxin Electrical Co. Ltd. | 147,619 | ||||||
| 31,000 | Shanghai Taisheng Wind Power Equipment Co. Ltd. # | 36,348 | ||||||
| 24,000 | Shanghai Tongji Science & Technology Industrial Co. Ltd. # | 30,504 | ||||||
| 12,200 | Shenzhen FRD Science & Technology Co. Ltd. # | 37,904 | ||||||
| 28,500 | Sieyuan Electric Co. Ltd. # | 88,167 | ||||||
| 33,326 | Yantai Eddie Precision Machinery Co. Ltd. # | 354,259 | ||||||
| 9,502 | Zhejiang Dingli Machinery Co. Ltd. # | 148,294 | ||||||
| 15,200 | Zhejiang Jianfeng Group Co. Ltd. # | 32,749 | ||||||
| 3,402,352 | ||||||||
| Commercial & Professional Services: 1.5% | ||||||||
| 23,250 | A-Living Services Co. Ltd. Reg S 144A # | 103,178 | ||||||
| 3,000 | Binjiang Service Group Co. Ltd. Reg S # | 5,546 | ||||||
| 72,000 | Country Garden Services Holdings Co. Ltd. # | 487,033 | ||||||
| 40,000 | Ever Sunshine Lifestyle Services Group Ltd. Reg S # | 87,831 | ||||||
| 12,000 | S-Enjoy Service Group Co. Ltd. # | 27,497 | ||||||
| 16,956 | Zhejiang Weiming Environment Protection Co. Ltd. # | 49,413 | ||||||
| 760,498 | ||||||||
| Consumer Durables & Apparel: 0.8% | ||||||||
| 15,000 | Biem.l.fdlkk Garment Co. Ltd. # | 37,556 | ||||||
| 14,000 | Guangdong Xinbao Electrical Appliances Holdings Co. Ltd. # | 91,132 | ||||||
| Number of Shares | Value | |||||||
| Consumer Durables & Apparel: (continued) | ||||||||
| 7,100 | Healthcare Co. Ltd. * # | $ | 35,473 | |||||
| 5,900 | Ningbo Peacebird Fashion Co. Ltd. # | 27,260 | ||||||
| 10,800 | Shanghai Yaoji Technology Co. Ltd. # | 40,788 | ||||||
| 28,100 | Suzhou TA&A Ultra Clean Technology Co. Ltd. # | 106,601 | ||||||
| 26,900 | Xinlong Holding Group Co. Ltd. * # | 33,273 | ||||||
| 23,500 | Zhejiang Meida Industrial Co. Ltd. # | 57,717 | ||||||
| 429,800 | ||||||||
| Consumer Services: 0.0% | ||||||||
| 24,000 | China Kepei Education Group Ltd. Reg S # | 16,728 | ||||||
| Diversified Financials: 0.1% | ||||||||
| 5,626 | 360 DigiTech, Inc. (ADR) * | 66,331 | ||||||
| Energy: 0.8% | ||||||||
| 123,100 | Shaanxi Coal Industry Co. Ltd. # | 177,188 | ||||||
| 39,000 | Yantai Jereh Oilfield Services Group Co. Ltd. # | 210,531 | ||||||
| 21,900 | Zhejiang Kingland Pipeline & Technologies Co. Ltd. # | 21,396 | ||||||
| 409,115 | ||||||||
| Food, Beverage & Tobacco: 25.5% | ||||||||
| 24,600 | Angel Yeast Co. Ltd. # | 193,497 | ||||||
| 8,300 | Chongqing Brewery Co. Ltd. # | 152,164 | ||||||
| 23,800 | Chongqing Fuling Zhacai Group Co. Ltd. # | 155,225 | ||||||
| 36,440 | Foshan Haitian Flavouring and Food Co. Ltd. # | 1,126,332 | ||||||
| 24,700 | Fujian Sunner Development Co. Ltd. # | 101,029 | ||||||
| 13,900 | Guangdong Guanghong Holdings Co. Ltd. # | 14,528 | ||||||
| 166,693 | Henan Shuanghui Investment & Development Co. Ltd. # | 1,205,954 | ||||||
| 267,216 | Inner Mongolia Yili Industrial Group Co. Ltd. # | 1,825,363 | ||||||
| 83,600 | Jiangxi Zhengbang Technology Co. Ltd. # | 219,487 | ||||||
| 11,300 | Jiugui Liquor Co. Ltd. # | 272,591 | ||||||
| 9,700 | Kemen Noodle Manufacturing Co. Ltd. # | 26,611 | ||||||
| 19,300 | Liaoning Wellhope Agri-Tech JSC Ltd. # | 35,157 | ||||||
| 36,828 | Luzhou Laojiao Co. Ltd. # | 1,282,613 | ||||||
| 65,280 | Muyuan Foodstuff Co. Ltd. # | 774,959 | ||||||
| 11,300 | Nanning Sugar Industry Co. Ltd. * # | 13,381 | ||||||
| 16,940 | Qianhe Condiment and Food Co. Ltd. # | 97,542 | ||||||
| 21,100 | Sanquan Food Co. Ltd. # | 84,379 | ||||||
| 16,800 | Shandong Xiantan Co. Ltd. # | 29,920 | ||||||
| 48,300 | Shandong Yisheng Livestock & Poultry Breeding Co. Ltd. # | 82,970 | ||||||
| 17,600 | Shanghai Bairun Investment Holding Group Co. Ltd. # | 282,935 | ||||||
| 13,011 | Shanxi Xinghuacun Fen Wine Factory Co. Ltd. # | 752,411 | ||||||
| 59,800 | Tech-Bank Food Co. Ltd. * # | 134,444 | ||||||
| 289,791 | Wens Foodstuffs Group Co. Ltd. # | 814,022 | ||||||
| 68,330 | Wuliangye Yibin Co. Ltd. # | 3,071,910 | ||||||
| 25,000 | Yihai International Holding Ltd. # | 371,203 | ||||||
| 13,120,627 | ||||||||
See Notes to Financial Statements
| 25 |
VANECK VECTORS CHINA GROWTH LEADERS ETF
SCHEDULE OF INVESTMENTS
(continued)
| Number of Shares | Value | |||||||
| Health Care Equipment & Services: 4.3% | ||||||||
| 26,000 | AK Medical Holdings Ltd. Reg S 144A # | $ | 45,065 | |||||
| 15,300 | Andon Health Co. Ltd. * # | 21,759 | ||||||
| 16,950 | Beijing Chunlizhengda Medical Instruments Co. Ltd. # | 47,738 | ||||||
| 14,100 | Beijing Wandong Medical Technology Co. Ltd. # | 21,967 | ||||||
| 26,100 | Blue Sail Medical Co. Ltd. # | 84,665 | ||||||
| 28,800 | Dian Diagnostics Group Co. Ltd. # | 151,893 | ||||||
| 24,100 | Edan Instruments, Inc. # | 67,774 | ||||||
| 6,300 | Guangdong Biolight Meditech Co. Ltd. # | 25,148 | ||||||
| 10,900 | Guangzhou Wondfo Biotech Co. Ltd. # | 149,956 | ||||||
| 36,150 | Jafron Biomedical Co. Ltd. # | 378,067 | ||||||
| 12,000 | Jiang Xi Sanxin Medtec Co. Ltd. # | 32,472 | ||||||
| 37,100 | Jiangsu Yuyue Medical Equipment & Supply Co. Ltd. # | 161,151 | ||||||
| 65,770 | Lepu Medical Technology Beijing Co. Ltd. # | 275,194 | ||||||
| 3,000 | Ningbo David Medical Device Co. Ltd. # | 7,573 | ||||||
| 19,250 | Ovctek China, Inc. # | 242,948 | ||||||
| 13,100 | Shanghai Kindly Enterprise Development Group Co. Ltd. # | 31,640 | ||||||
| 10,300 | Topchoice Medical Corp. * # | 438,948 | ||||||
| 12,280 | Well Lead Medical Co. Ltd. # | 23,674 | ||||||
| 2,207,632 | ||||||||
| Household & Personal Products: 0.2% | ||||||||
| 34,600 | C&S Paper Co. Ltd. # | 111,262 | ||||||
| Insurance: 4.2% | ||||||||
| 983,000 | China Life Insurance Co. Ltd. # | 2,163,661 | ||||||
| Materials: 6.8% | ||||||||
| 20,100 | ABA Chemicals Corp. # | 17,968 | ||||||
| 125,767 | Anhui Conch Cement Co. Ltd. # | 1,000,762 | ||||||
| 11,200 | Anhui Guangxin Agrochemical Co. Ltd. * # | 41,408 | ||||||
| 45,100 | Beijing Lier High-Temperature Materials Co. Ltd. # | 31,215 | ||||||
| 4,500 | Chengdu Guibao Science & Technology Co. Ltd. # | 11,990 | ||||||
| 18,200 | Chongqing Zaisheng Technology Corp. Ltd. # | 38,292 | ||||||
| 112,570 | Citic Pacific Special Steel Group Co. Ltd. # | 378,233 | ||||||
| 19,600 | Fujian Green Pine Co. Ltd. # | 56,706 | ||||||
| 31,100 | Gansu Qilianshan Cement Group Co. Ltd. # | 65,112 | ||||||
| 16,400 | Gansu Shangfeng Cement Co. Ltd. # | 49,335 | ||||||
| 34,700 | Guangdong Tapai Group Co. Ltd. # | 68,101 | ||||||
| 3,940 | Hailir Pesticides and Chemicals Group Co. Ltd. # | 12,383 | ||||||
| 8,300 | Huangshan Novel Co. Ltd. # | 12,548 | ||||||
| 71,600 | Huaxin Cement Co. Ltd. # | 227,852 | ||||||
| 16,200 | Hunan Haili Chemical Industry Co. Ltd. * # | 20,399 | ||||||
| 34,500 | Jiangsu Changbao Steeltube Co. Ltd. # | 23,337 | ||||||
| 10,000 | Jiangsu Wujin Stainless Steel Pipe Group Co. Ltd. # | 11,744 | ||||||
| 9,700 | Jiangsu Yangnong Chemical Co. Ltd. # | 197,260 | ||||||
| 23,000 | Jiangxi Wannianqing Cement Co. Ltd. # | 47,153 | ||||||
| 83,500 | Kingfa Sci & Tech Co. Ltd. # | 220,645 | ||||||
| 16,500 | Liaoning Fu-An Heavy Industry Co. Ltd. # | 29,292 | ||||||
| Number of Shares | Value | |||||||
| Materials: (continued) | ||||||||
| 11,700 | Limin Group Co. Ltd. # | $ | 22,923 | |||||
| 7,800 | Nantong Acetic Acid Chemical Co. Ltd. # | 20,075 | ||||||
| 13,100 | Ningxia Building Materials Group Co. Ltd. # | 26,770 | ||||||
| 7,200 | Puyang Huicheng Electronic Material Co. Ltd. # | 22,509 | ||||||
| 9,500 | Qingdao Gon Technology Co. Ltd. # | 45,869 | ||||||
| 7,900 | Shandong Dawn Polymer Co. Ltd. # | 31,317 | ||||||
| 7,900 | Shandong Head Co. Ltd. # | 41,886 | ||||||
| 16,900 | Shangdong Lubei Chemical Co. Ltd. * # | 18,243 | ||||||
| 32,500 | Shenzhen Beauty Star Co. Ltd. # | 54,911 | ||||||
| 128,000 | West China Cement Ltd. # | 19,009 | ||||||
| 12,900 | Xiamen Jihong Technology Co. Ltd. # | 64,163 | ||||||
| 34,600 | Xinjiang Tianshan Cement Co. Ltd. # | 80,560 | ||||||
| 91,660 | Yintai Gold Co. Ltd. # | 121,699 | ||||||
| 21,500 | Yonggao Co. Ltd. # | 21,116 | ||||||
| 20,800 | Zhejiang Double Arrow Rubber Co. Ltd. # | 26,711 | ||||||
| 175,800 | Zhejiang Huafeng Spandex Co. Ltd. # | 273,199 | ||||||
| 25,800 | Zhejiang JIULI Hi-Tech Metals Co. Ltd. # | 43,350 | ||||||
| 3,496,045 | ||||||||
| Media & Entertainment: 10.7% | ||||||||
| 32,400 | Beijing Kunlun Tech Co. Ltd. # | 99,595 | ||||||
| 4,400 | Hangzhou Electronic Soul Network Technology Co. Ltd. # | 21,336 | ||||||
| 91,100 | NanJi E-Commerce Co. Ltd. # | 192,057 | ||||||
| 24,818 | NetEase, Inc. (ADR) | 2,376,820 | ||||||
| 144,400 | Ourpalm Co. Ltd. * # | 113,654 | ||||||
| 4,900 | Shenzhen Bingchuan Network Co. Ltd. # | 18,646 | ||||||
| 33,800 | Tencent Holdings Ltd. # | 2,431,598 | ||||||
| 2,424 | WiMi Hologram Cloud, Inc. (ADR) * | 13,962 | ||||||
| 56,400 | Wuhu Shunrong Sanqi Interactive Entertainment Network Technology Co. Ltd. # | 271,369 | ||||||
| 5,539,037 | ||||||||
| Pharmaceuticals, Biotechnology & Life Sciences: 11.6% | ||||||||
| 6,500 | Anhui Sunhere Pharmaceutical Excipients Co. Ltd. # | 17,303 | ||||||
| 33,200 | Apeloa Pharmaceutical Co. Ltd. # | 119,035 | ||||||
| 18,600 | Changchun High & New Technology Industry Group, Inc. # | 1,285,378 | ||||||
| 66,000 | China Medical System Holdings Ltd. # | 73,721 | ||||||
| 52,800 | Chongqing Zhifei Biological Products Co. Ltd. # | 1,201,360 | ||||||
| 33,000 | Da An Gene Co. Ltd. of Sun Yat-Sen University # | 174,483 | ||||||
| 127,675 | Jiangsu Hengrui Medicine Co. Ltd. # | 2,189,692 | ||||||
| 23,400 | Jiangxi Fushine Pharmaceutical Co. Ltd. # | 51,463 | ||||||
| 49,516 | Joincare Pharmaceutical Group Industry Co. Ltd. # | 106,009 | ||||||
| 14,100 | Shandong Wohua Pharmaceutical Co. Ltd. # | 17,470 | ||||||
| 20,900 | Shanghai Kehua Bio-Engineering Co. Ltd. # | 49,637 | ||||||
| 30,100 | Shijiazhuang Yiling Pharmaceutical Co. Ltd. # | 118,401 | ||||||
| 17,700 | Tianjin Ringpu Bio-Technology Co. Ltd. # | 51,490 | ||||||
See Notes to Financial Statements
| 26 |
| Number of Shares | Value | |||||||
| Pharmaceuticals, Biotechnology & Life Sciences: (continued) | ||||||||
| 3,400 | Tibet Cheezheng Tibetan Medicine Co. Ltd. # | $ | 13,561 | |||||
| 25,400 | YiChang HEC ChangJiang Pharmaceutical Co. Ltd. Reg S 144A † # | 28,954 | ||||||
| 56,000 | Yifan Pharmaceutical Co. Ltd. # | 163,346 | ||||||
| 57,800 | Zhejiang NHU Co. Ltd. # | 300,125 | ||||||
| 5,961,428 | ||||||||
| Real Estate: 1.6% | ||||||||
| 75,000 | Central China New Life Ltd. Reg S # | 63,842 | ||||||
| 3,750 | Kaisa Prosperity Holdings Ltd. Reg S † # | 9,231 | ||||||
| 71,000 | Logan Group Co. Ltd. # | 116,290 | ||||||
| 12,800 | Midea Real Estate Holding Ltd. Reg S 144A † # | 28,549 | ||||||
| 74,000 | Powerlong Real Estate Holdings Ltd. # | 51,156 | ||||||
| 28,600 | Rongan Property Co. Ltd. # | 12,773 | ||||||
| 37,400 | Seazen Holdings Co. Ltd. # | 200,398 | ||||||
| 20,200 | Shenzhen Changhong Technology Co. Ltd. * # | 85,396 | ||||||
| 11,200 | Shenzhen Properties & Resources Development Group Ltd. # | 21,004 | ||||||
| 5,100 | Sichuan Languang Justbon Services Group Co. Ltd. Reg S # | 23,182 | ||||||
| 65,700 | Tianjin Jinbin Development Co. Ltd. * # | 25,170 | ||||||
| 148,300 | Youngor Group Co. Ltd. # | 164,259 | ||||||
| 801,250 | ||||||||
| Retailing: 9.4% | ||||||||
| 8,429 | Alibaba Group Holding Ltd. (ADR) * | 1,961,681 | ||||||
| 189,800 | Easyhome New Retail Group Co. Ltd. # | 245,280 | ||||||
| 30,159 | JD.com, Inc. (ADR) * | 2,650,976 | ||||||
| 4,857,937 | ||||||||
| Semiconductors & Semiconductor Equipment: 4.6% | ||||||||
| 35,900 | JA Solar Technology Co. Ltd. * # | 225,857 | ||||||
| 106,383 | LONGi Green Energy Technology Co. Ltd. # | 1,511,993 | ||||||
| 202,000 | Xinyi Solar Holdings Ltd. # | 529,590 | ||||||
| 27,700 | Zhejiang Jingsheng Mechanical & Electrical Co. Ltd. # | 128,284 | ||||||
| 2,395,724 | ||||||||
| Software & Services: 2.0% | ||||||||
| 120,000 | Chinasoft International Ltd.† # | 134,089 | ||||||
| 16,600 | Global Infotech Co. Ltd. # | 30,944 | ||||||
| 41,870 | Hundsun Technologies, Inc. # | 676,798 | ||||||
| 18,600 | Shanghai Baosight Software Co. Ltd. # | 197,751 | ||||||
| 1,039,582 | ||||||||
| Number of Shares | Value | |||||||
| Technology Hardware & Equipment: 8.2% | ||||||||
| 79,900 | Addsino Co. Ltd. # | $ | 338,777 | |||||
| 6,300 | Beijing Wanji Technology Co. Ltd. # | 44,369 | ||||||
| 32,500 | BYD Electronic International Co. Ltd. † # | 170,474 | ||||||
| 14,300 | Eoptolink Technology, Inc. Ltd. # | 122,395 | ||||||
| 14,000 | Fujian Torch Electron Technology Co. Ltd. # | 155,975 | ||||||
| 13,600 | Goldcard Smart Group Co. Ltd. # | 26,519 | ||||||
| 202,005 | Luxshare Precision Industry Co. Ltd. # | 1,747,623 | ||||||
| 5,850 | Nanhua Instruments Co. Ltd. # | 12,084 | ||||||
| 48,100 | Shenzhen Sunway Communication Co. Ltd. # | 266,081 | ||||||
| 34,200 | Sunny Optical Technology Group Co. Ltd. # | 747,083 | ||||||
| 5,400 | Tangshan Huizhong Instrumentation Co. Ltd. # | 11,084 | ||||||
| 34,700 | Wuhan Guide Infrared Co. Ltd. # | 223,433 | ||||||
| 67,200 | WUS Printed Circuit Kunshan Co. Ltd. # | 194,706 | ||||||
| 3,400 | Wuxi Xinje Electric Co. Ltd. # | 47,590 | ||||||
| 22,800 | ZheJiang Dali Technology Co. Ltd. | 96,581 | ||||||
| 4,204,774 | ||||||||
| Utilities: 0.3% | ||||||||
| 52,900 | GCL Energy Technology Co. Ltd. * # | 50,780 | ||||||
| 85,800 | Guangdong Baolihua New Energy Stock Co. Ltd. # | 96,455 | ||||||
| 18,900 | Luenmei Quantum Co. Ltd. # | 33,022 | ||||||
| 180,257 | ||||||||
| Total Common Stocks (Cost: $41,167,962) | 51,348,794 | |||||||
| SHORT-TERM INVESTMENT HELD AS COLLATERAL FOR SECURITIES ON LOAN: 0.1% (Cost: $38,384) | ||||||||
| Money Market Fund: 0.1% | ||||||||
| 38,384 | State Street Navigator Securities Lending Government Money Market Portfolio | 38,384 | ||||||
| Total Investments: 99.7% (Cost: $41,206,346) | 51,387,178 | |||||||
| Other assets less liabilities: 0.3% | 130,777 | |||||||
| NET ASSETS: 100.0% | $ | 51,517,955 | ||||||
See Notes to Financial Statements
| 27 |
VANECK VECTORS CHINA GROWTH LEADERS ETF
SCHEDULE OF INVESTMENTS
(continued)
Definitions:
| ADR | American Depositary Receipt |
Footnotes:
| * | Non-income producing |
| † | Security fully or partially on loan. Total market value of securities on loan is $169,979. |
| # | Security has been valued in good faith pursuant to guidelines established by the Board of Trustees. The aggregate value of fair valued securities is $44,034,824 which represents 85.5% of net assets. |
| Reg S | Security was purchased pursuant to Regulation S under the Securities Act of 1933, which exempts from registration securities offered and sold outside of the United States. Such a security cannot be sold in the United States without either an effective registration statement filed pursuant to the Securities Act of 1933, or pursuant to an exemption from registration. |
| 144A | Security exempt from registration under Rule 144A of the Securities Act of 1933, as amended, or otherwise restricted. These securities may be resold in transactions exempt from registration, unless otherwise noted, and the value amounted to $205,746, or 0.4% of net assets. |
| Summary of Investments by Sector Excluding Collateral for Securities Loaned | % of Investments | Value | ||||||
| Communication Services | 10.8 | % | $ | 5,539,037 | ||||
| Consumer Discretionary | 10.7 | 5,489,219 | ||||||
| Consumer Staples | 25.8 | 13,231,889 | ||||||
| Energy | 0.8 | 409,115 | ||||||
| Financials | 4.3 | 2,229,992 | ||||||
| Health Care | 15.9 | 8,169,060 | ||||||
| Industrials | 8.1 | 4,162,850 | ||||||
| Information Technology | 14.9 | 7,640,080 | ||||||
| Materials | 6.8 | 3,496,045 | ||||||
| Real Estate | 1.6 | 801,250 | ||||||
| Utilities | 0.3 | 180,257 | ||||||
| 100.0 | % | $ | 51,348,794 | |||||
The summary of inputs used to value the Fund’s investments as of December 31, 2020 is as follows:
| Level 1 Quoted Prices | Level 2 Significant Observable Inputs | Level 3 Significant Unobservable Inputs | Value | ||||||||||||||
| Common Stocks | |||||||||||||||||
| Automobiles & Components | $ | — | $ | 184,754 | $ | — | $ | 184,754 | |||||||||
| Capital Goods | 147,619 | 3,254,733 | — | 3,402,352 | |||||||||||||
| Commercial & Professional Services | — | 760,498 | — | 760,498 | |||||||||||||
| Consumer Durables & Apparel | — | 429,800 | — | 429,800 | |||||||||||||
| Consumer Services | — | 16,728 | — | 16,728 | |||||||||||||
| Diversified Financials | 66,331 | — | — | 66,331 | |||||||||||||
| Energy | — | 409,115 | — | 409,115 | |||||||||||||
| Food, Beverage & Tobacco | — | 13,120,627 | — | 13,120,627 | |||||||||||||
| Health Care Equipment & Services | — | 2,207,632 | — | 2,207,632 | |||||||||||||
| Household & Personal Products | — | 111,262 | — | 111,262 | |||||||||||||
| Insurance | — | 2,163,661 | — | 2,163,661 | |||||||||||||
| Materials | — | 3,496,045 | — | 3,496,045 | |||||||||||||
| Media & Entertainment | 2,390,782 | 3,148,255 | — | 5,539,037 | |||||||||||||
| Pharmaceuticals, Biotechnology & Life Sciences | — | 5,961,428 | — | 5,961,428 | |||||||||||||
| Real Estate | — | 801,250 | — | 801,250 | |||||||||||||
| Retailing | 4,612,657 | 245,280 | — | 4,857,937 | |||||||||||||
| Semiconductors & Semiconductor Equipment | — | 2,395,724 | — | 2,395,724 | |||||||||||||
| Software & Services | — | 1,039,582 | — | 1,039,582 | |||||||||||||
| Technology Hardware & Equipment | 96,581 | 4,108,193 | — | 4,204,774 | |||||||||||||
| Utilities | — | 180,257 | — | 180,257 | |||||||||||||
| Money Market Fund | 38,384 | — | — | 38,384 | |||||||||||||
| Total | $ | 7,352,354 | $ | 44,034,824 | $ | — | $ | 51,387,178 | |||||||||
See Notes to Financial Statements
| 28 |
VANECK VECTORS CHINAAMC SME-CHINEXT ETF
SCHEDULE OF INVESTMENTS
December 31, 2020
| Number of Shares | Value | |||||||
| COMMON STOCKS: 100.0% | ||||||||
| Automobiles & Components: 3.2% | ||||||||
| 52,122 | Byd Co. Ltd. # | $ | 1,562,874 | |||||
| Banks: 2.3% | ||||||||
| 210,832 | Bank of Ningbo Co. Ltd. # | 1,147,407 | ||||||
| Capital Goods: 13.8% | ||||||||
| 127,600 | AVIC Electromechanical Systems Co. Ltd. # | 225,110 | ||||||
| 64,600 | Contemporary Amperex Technology Co. Ltd. # | 3,500,209 | ||||||
| 69,496 | Eve Energy Co. Ltd. # | 873,079 | ||||||
| 53,970 | Han’s Laser Technology Co. Ltd. # | 355,701 | ||||||
| 70,490 | Shenzhen Inovance Technology Co. Ltd. # | 1,013,359 | ||||||
| 158,230 | Xinjiang Goldwind Science and Technology Co. Ltd. # | 347,744 | ||||||
| 114,024 | Zhejiang Sanhua Intelligent Controls Co. Ltd. # | 432,852 | ||||||
| 6,748,054 | ||||||||
| Consumer Durables & Apparel: 1.1% | ||||||||
| 29,480 | Hangzhou Robam Appliances Co. Ltd. # | 185,193 | ||||||
| 103,576 | NavInfo Co. Ltd. # | 227,850 | ||||||
| 10,123 | Zhejiang Supor Co. Ltd. # | 121,674 | ||||||
| 534,717 | ||||||||
| Consumer Services: 1.1% | ||||||||
| 47,100 | Offcn Education Technology Co. Ltd. # | 254,942 | ||||||
| 94,221 | Songcheng Performance Development Co. Ltd. # | 257,193 | ||||||
| 512,135 | ||||||||
| Diversified Financials: 6.4% | ||||||||
| 59,300 | China Great Wall Securities Co. Ltd. # | 117,436 | ||||||
| 424,298 | East Money Information Co. Ltd. # | 2,023,720 | ||||||
| 181,380 | First Capital Securities Co. Ltd. # | 277,646 | ||||||
| 137,943 | Guoyuan Securities Co. Ltd. # | 289,588 | ||||||
| 13,000 | Hithink RoyalFlush Information Network Co. Ltd. # | 248,455 | ||||||
| 116,254 | Western Securities Co. Ltd. # | 181,530 | ||||||
| 3,138,375 | ||||||||
| Food, Beverage & Tobacco: 10.1% | ||||||||
| 187,100 | Beijing Dabeinong Technology Group Co. Ltd. # | 278,275 | ||||||
| 35,300 | Fujian Sunner Development Co. Ltd. # | 144,386 | ||||||
| 46,000 | Guangdong Haid Group Co. Ltd. # | 463,846 | ||||||
| 308,260 | Guangdong Wens Foodstuffs Group Co. Ltd. # | 865,768 | ||||||
| 35,938 | Jiangsu Yanghe Brewery Joint-Stock Co. Ltd. # | 1,306,298 | ||||||
| 85,600 | Jiangxi Zhengbang Technology Co. Ltd. # | 224,738 | ||||||
| 106,400 | Muyuan Foodstuff Co. Ltd. # | 1,263,107 | ||||||
| 23,900 | Yihai Kerry Arawana Holdings Co. Ltd. * | 398,490 | ||||||
| 4,944,908 | ||||||||
| Number of Shares | Value | |||||||
| Health Care Equipment & Services: 8.8% | ||||||||
| 111,211 | Aier Eye Hospital Group Co. Ltd. # | $ | 1,282,780 | |||||
| 25,000 | Jafron Biomedical Co. Ltd. # | 261,458 | ||||||
| 38,520 | Jiangsu Yuyue Medical Equipment & Supply Co. Ltd. # | 167,319 | ||||||
| 73,813 | Lepu Medical Technology Beijing Co. Ltd. # | 308,848 | ||||||
| 164,116 | Meinian Onehealth Healthcare Holdings Co. Ltd. * # | 286,589 | ||||||
| 26,200 | Shenzhen Mindray Bio-Medical Electronics Co. Ltd. # | 1,715,686 | ||||||
| 107,966 | Winning Health Technology Group Co. Ltd. # | 291,142 | ||||||
| 4,313,822 | ||||||||
| Household & Personal Products: 0.4% | ||||||||
| 47,800 | By-health Co. Ltd. # | 177,865 | ||||||
| Materials: 5.4% | ||||||||
| 103,303 | Beijing Oriental Yuhong Waterproof Technology Co. Ltd. # | 617,375 | ||||||
| 47,400 | Jiangxi Ganfeng Lithium Co. Ltd. # | 739,462 | ||||||
| 72,300 | Lomon Billions Group Co. Ltd. # | 342,471 | ||||||
| 103,000 | Rongsheng Petrochemical Co. Ltd. # | 438,510 | ||||||
| 22,900 | Yunnan Energy New Material Co. Ltd. # | 500,287 | ||||||
| 2,638,105 | ||||||||
| Media & Entertainment: 5.9% | ||||||||
| 66,742 | Beijing Enlight Media Co. Ltd. # | 124,209 | ||||||
| 666,484 | Focus Media Information Technology Co. Ltd. # | 1,013,740 | ||||||
| 44,180 | Giant Network Group Co. Ltd. # | 118,588 | ||||||
| 42,570 | Mango Excellent Media Co. Ltd. # | 475,561 | ||||||
| 110,200 | NanJi E-Commerce Co. Ltd. # | 232,323 | ||||||
| 77,250 | Perfect World Co. Ltd. # | 351,062 | ||||||
| 71,900 | Wuhu Shunrong Sanqi Interactive Entertainment Network Technology Co. Ltd. # | 345,948 | ||||||
| 223,260 | Zhejiang Century Huatong Group Co. Ltd. * # | 244,643 | ||||||
| 2,906,074 | ||||||||
| Pharmaceuticals, Biotechnology & Life Sciences: 10.6% | ||||||||
| 8,600 | Asymchem Laboratories Tianjin Co. Ltd. # | 396,270 | ||||||
| 14,800 | Betta Pharmaceuticals Co. Ltd. # | 244,480 | ||||||
| 11,500 | BGI Genomics Co. Ltd. # | 227,347 | ||||||
| 21,400 | Chengdu Kanghong Pharmaceutical Group Co. Ltd. # | 158,664 | ||||||
| 38,846 | Chongqing Zhifei Biological Products Co. Ltd. # | 883,864 | ||||||
| 32,600 | Hangzhou Tigermed Consulting Co. Ltd. # | 810,310 | ||||||
| 64,937 | Hualan Biological Engineering, Inc. # | 422,630 | ||||||
| 13,100 | Pharmaron Beijing Co. Ltd. # | 243,054 | ||||||
| 154,263 | Shanghai RAAS Blood Products Co. Ltd. # | 175,681 | ||||||
| 18,900 | Shenzhen Kangtai Biological Products Co. Ltd. # | 507,530 | ||||||
| 57,898 | Sichuan Kelun Pharmaceutical Co. Ltd. # | 173,265 | ||||||
| 99,200 | Walvax Biotechnology Co. Ltd. # | 588,015 | ||||||
| 71,770 | Zhejiang NHU Co. Ltd. # | 372,664 | ||||||
| 5,203,774 | ||||||||
See Notes to Financial Statements
| 29 |
VANECK VECTORS CHINAAMC SME-CHINEXT ETF
SCHEDULE OF INVESTMENTS
(continued)
| Number of Shares | Value | |||||||
| Real Estate: 0.2% | ||||||||
| 114,100 | RiseSun Real Estate Development Co. Ltd. # | $ | 114,798 | |||||
| Retailing: 0.5% | ||||||||
| 217,538 | Suning Commerce Group Co. Ltd. # | 258,500 | ||||||
| Semiconductors & Semiconductor Equipment: 3.0% | ||||||||
| 7,600 | Ingenic Semiconductor Co. Ltd. * # | 107,121 | ||||||
| 14,000 | NAURA Technology Group Co. Ltd. # | 389,604 | ||||||
| 5,800 | SG Micro Corp. # | 235,665 | ||||||
| 113,220 | Tianjin Zhonghuan Semiconductor Joint-Stock Co. Ltd. # | 444,875 | ||||||
| 136,600 | Tianshui Huatian Technology Co. Ltd. # | 286,686 | ||||||
| 1,463,951 | ||||||||
| Software & Services: 5.1% | ||||||||
| 108,550 | Anhui USTC iFlytek Co. Ltd. # | 683,632 | ||||||
| 20,290 | Beijing Shiji Information Technology Co. Ltd. # | 97,290 | ||||||
| 69,500 | Beijing Sinnet Technology Co. Ltd. # | 183,947 | ||||||
| 119,558 | DHC Software Co. Ltd. # | 152,968 | ||||||
| 59,575 | Glodon Software Co. Ltd. # | 722,968 | ||||||
| 11,800 | Sangfor Technologies, Inc. # | 450,507 | ||||||
| 43,515 | Venustech Group, Inc. # | 195,938 | ||||||
| 2,487,250 | ||||||||
| Technology Hardware & Equipment: 18.5% | ||||||||
| 32,100 | Avary Holding Shenzhen Co. Ltd. # | 245,486 | ||||||
| 34,761 | AVIC Jonhon Optronic Technology Co. Ltd. # | 419,618 | ||||||
| 66,700 | Chaozhou Three-Circle Group Co. Ltd. # | 383,055 | ||||||
| 137,916 | GoerTek, Inc. # | 793,424 | ||||||
| 126,400 | Guangdong LY Intelligent Manufacturing Co. Ltd. # | 233,697 | ||||||
| Number of Shares | Value | |||||||
| Technology Hardware & Equipment: (continued) | ||||||||
| 21,300 | Guangzhou Shiyuan Electronic Technology Co. Ltd. # | $ | 377,490 | |||||
| 85,368 | Lens Technology Co. Ltd. # | 401,957 | ||||||
| 274,482 | Luxshare Precision Industry Co. Ltd. # | 2,374,649 | ||||||
| 6,160 | Maxscend Microelectronics Co. Ltd. # | 541,574 | ||||||
| 126,162 | OFILM Group Co. Ltd. # | 256,023 | ||||||
| 10,220 | Shennan Circuits Co. Ltd. # | 170,295 | ||||||
| 51,601 | Shenzhen Sunway Communication Co. Ltd. # | 285,448 | ||||||
| 75,000 | Suzhou Dongshan Precision Manufacturing Co. Ltd. # | 300,298 | ||||||
| 27,200 | Unigroup Guoxin Microelectronics Co. Ltd. # | 560,084 | ||||||
| 35,000 | Wuhan Guide Infrared Co. Ltd. # | 225,365 | ||||||
| 75,400 | WUS Printed Circuit Kunshan Co. Ltd. # | 218,465 | ||||||
| 37,000 | Wuxi Lead Intelligent Equipment Co. Ltd. # | 478,780 | ||||||
| 16,600 | Yealink Network Technology Corp. Ltd. # | 187,091 | ||||||
| 107,405 | Zhejiang Dahua Technology Co. Ltd. # | 328,996 | ||||||
| 31,500 | Zhongji Innolight Co. Ltd. # | 246,944 | ||||||
| 9,028,739 | ||||||||
| Transportation: 3.2% | ||||||||
| 101,700 | SF Holding Co. Ltd. # | 1,381,353 | ||||||
| 74,024 | Yunda Holding Co. Ltd. # | 179,171 | ||||||
| 1,560,524 | ||||||||
| Utilities: 0.4% | ||||||||
| 421,900 | CGN Power Co. Ltd. # | 183,138 | ||||||
| Total Common Stocks (Cost: $25,110,945) | 48,925,010 | |||||||
| Other assets less liabilities: 0.0% | 24,008 | |||||||
| NET ASSETS: 100.0% | $ | 48,949,018 | ||||||
Footnotes:
| * | Non-income producing |
| # | Security has been valued in good faith pursuant to guidelines established by the Board of Trustees. The aggregate value of fair valued securities is $48,526,520 which represents 99.1% of net assets. |
| Summary of Investments by Sector | % of Investments | Value | ||||||
| Communication Services | 5.9 | % | $ | 2,906,074 | ||||
| Consumer Discretionary | 5.9 | 2,868,226 | ||||||
| Consumer Staples | 10.5 | 5,122,773 | ||||||
| Financials | 8.8 | 4,285,782 | ||||||
| Health Care | 19.4 | 9,517,596 | ||||||
| Industrials | 17.0 | 8,308,578 | ||||||
| Information Technology | 26.5 | 12,979,940 | ||||||
| Materials | 5.4 | 2,638,105 | ||||||
| Real Estate | 0.2 | 114,798 | ||||||
| Utilities | 0.4 | 183,138 | ||||||
| 100.0 | % | $ | 48,925,010 | |||||
See Notes to Financial Statements
| 30 |
The summary of inputs used to value the Fund’s investments as of December 31, 2020 is as follows:
| Level 1 Quoted Prices | Level 2 Significant Observable Inputs | Level 3 Significant Unobservable Inputs | Value | ||||||||||||||||
| Common Stocks | |||||||||||||||||||
| Automobiles & Components | $ | — | $ | 1,562,874 | $ | — | $ | 1,562,874 | |||||||||||
| Banks | — | 1,147,407 | — | 1,147,407 | |||||||||||||||
| Capital Goods | — | 6,748,054 | — | 6,748,054 | |||||||||||||||
| Consumer Durables & Apparel | — | 534,717 | — | 534,717 | |||||||||||||||
| Consumer Services | — | 512,135 | — | 512,135 | |||||||||||||||
| Diversified Financials | — | 3,138,375 | — | 3,138,375 | |||||||||||||||
| Food, Beverage & Tobacco | 398,490 | 4,546,418 | — | 4,944,908 | |||||||||||||||
| Health Care Equipment & Services | — | 4,313,822 | — | 4,313,822 | |||||||||||||||
| Household & Personal Products | — | 177,865 | — | 177,865 | |||||||||||||||
| Materials | — | 2,638,105 | — | 2,638,105 | |||||||||||||||
| Media & Entertainment | — | 2,906,074 | — | 2,906,074 | |||||||||||||||
| Pharmaceuticals, Biotechnology & Life Sciences | — | 5,203,774 | — | 5,203,774 | |||||||||||||||
| Real Estate | — | 114,798 | — | 114,798 | |||||||||||||||
| Retailing | — | 258,500 | — | 258,500 | |||||||||||||||
| Semiconductors & Semiconductor Equipment | — | 1,463,951 | — | 1,463,951 | |||||||||||||||
| Software & Services | — | 2,487,250 | — | 2,487,250 | |||||||||||||||
| Technology Hardware & Equipment | — | 9,028,739 | — | 9,028,739 | |||||||||||||||
| Transportation | — | 1,560,524 | — | 1,560,524 | |||||||||||||||
| Utilities | — | 183,138 | — | 183,138 | |||||||||||||||
| Total | $ | 398,490 | $ | 48,526,520 | $ | — | $ | 48,925,010 | |||||||||||
See Notes to Financial Statements
| 31 |
VANECK VECTORS EGYPT INDEX ETF
SCHEDULE OF INVESTMENTS
December 31, 2020
| Number of Shares | Value | |||||||
| COMMON STOCKS: 100.1% | ||||||||
| Banks: 7.7% | ||||||||
| 393,839 | Commercial International Bank Egypt SAE Reg S (GDR) # | $ | 1,477,342 | |||||
| Capital Goods: 5.9% | ||||||||
| 1,811,954 | El Sewedy Electric Co. # | 1,129,326 | ||||||
| Consumer Durables & Apparel: 3.1% | ||||||||
| 1,365,683 | Oriental Weavers # | 595,560 | ||||||
| Consumer Services: 4.5% | ||||||||
| 940,981 | Cairo Investment & Real Estate Development Co. SAE # | 875,331 | ||||||
| Diversified Financials: 13.4% | ||||||||
| 2,258,660 | CI Capital Holding for Financial Investments * # | 573,466 | ||||||
| 257,595 | Egyptian Financial Group-Hermes Holding Co. Reg S (GDR) | 409,576 | ||||||
| 847,743 | Egyptian Financial Group-Hermes Holding SAE * # | 790,720 | ||||||
| 1,905,957 | Pioneers Holding * # | 487,946 | ||||||
| 3,319,855 | Qalaa Holdings SAE * # | 304,902 | ||||||
| 2,566,610 | ||||||||
| Food, Beverage & Tobacco: 10.2% | ||||||||
| 1,684,890 | Eastern Co. SAE # | 1,395,910 | ||||||
| 1,507,749 | Juhayna Food Industries | 568,401 | ||||||
| 1,964,311 | ||||||||
| Health Care Equipment & Services: 8.3% | ||||||||
| 3,345,709 | Cleopatra Hospital * | 1,012,433 | ||||||
| 1,813,499 | Ibnsina Pharma SAE # | 587,077 | ||||||
| 1,599,510 | ||||||||
| Number of Shares | Value | |||||||
| Materials: 18.8% | ||||||||
| 1,591,122 | Alexandria Mineral Oils Co. * # | $ | 315,978 | |||||
| 517,204 | Centamin Plc (GBP) # | 875,132 | ||||||
| 1,503,737 | Egyptian Kuwaiti Holding Co. (USD) # | 1,525,132 | ||||||
| 780,850 | Ezz Steel Co. SAE * | 532,646 | ||||||
| 603,678 | Sidi Kerir Petrochemcials Co. # | 358,268 | ||||||
| 3,607,156 | ||||||||
| Real Estate: 22.2% | ||||||||
| 2,418,054 | Emaar Misr for Development SAE * # | 365,072 | ||||||
| 1,535,165 | Heliopolis Housing # | 596,198 | ||||||
| 3,374,730 | Medinet Nasr Housing # | 822,205 | ||||||
| 6,145,392 | Palm Hills Developments SAE # | 534,195 | ||||||
| 788,675 | Six of October Development & Investment Co. # | 745,668 | ||||||
| 2,874,067 | Talaat Moustafa Group # | 1,200,554 | ||||||
| 4,263,892 | ||||||||
| Telecommunication Services: 6.0% | ||||||||
| 9,263,160 | Orascom Telecom Media and Technology Holding SAE * # | 327,890 | ||||||
| 1,082,278 | Telecom Egypt | 820,825 | ||||||
| 1,148,715 | ||||||||
| Total Common Stocks (Cost: $17,717,970) | 19,227,753 | |||||||
| Liabilities in excess of other assets: (0.1)% | (15,040 | ) | ||||||
| NET ASSETS: 100.0% | $ | 19,212,713 | ||||||
Definitions:
| GBP | British Pound |
| GDR | Global Depositary Receipt |
| USD | United States Dollar |
Footnotes:
| * | Non-income producing |
| # | Security has been valued in good faith pursuant to guidelines established by the Board of Trustees. The aggregate value of fair valued securities is $15,883,872 which represents 82.7% of net assets. |
| Reg S | Security was purchased pursuant to Regulation S under the Securities Act of 1933, which exempts from registration securities offered and sold outside of the United States. Such a security cannot be sold in the United States without either an effective registration statement filed pursuant to the Securities Act of 1933, or pursuant to an exemption from registration. |
See Notes to Financial Statements
| 32 |
| Summary of Investments by Sector | % of Investments | Value | ||||||
| Communication Services | 6.0 | % | $ | 1,148,715 | ||||
| Consumer Discretionary | 7.6 | 1,470,891 | ||||||
| Consumer Staples | 10.2 | 1,964,311 | ||||||
| Financials | 21.0 | 4,043,952 | ||||||
| Health Care | 8.3 | 1,599,510 | ||||||
| Industrials | 5.9 | 1,129,326 | ||||||
| Materials | 18.8 | 3,607,156 | ||||||
| Real Estate | 22.2 | 4,263,892 | ||||||
| 100.0 | % | $ | 19,227,753 | |||||
The summary of inputs used to value the Fund’s investments as of December 31, 2020 is as follows:
| Level 1 Quoted Prices | Level 2 Significant Observable Inputs | Level 3 Significant Unobservable Inputs | Value | ||||||||||||||||
| Common Stocks | |||||||||||||||||||
| Banks | $ | — | $ | 1,477,342 | $ | — | $ | 1,477,342 | |||||||||||
| Capital Goods | — | 1,129,326 | — | 1,129,326 | |||||||||||||||
| Consumer Durables & Apparel | — | 595,560 | — | 595,560 | |||||||||||||||
| Consumer Services | — | 875,331 | — | 875,331 | |||||||||||||||
| Diversified Financials | 409,576 | 2,157,034 | — | 2,566,610 | |||||||||||||||
| Food, Beverage & Tobacco | 568,401 | 1,395,910 | — | 1,964,311 | |||||||||||||||
| Health Care Equipment & Services | 1,012,433 | 587,077 | — | 1,599,510 | |||||||||||||||
| Materials | 532,646 | 3,074,510 | — | 3,607,156 | |||||||||||||||
| Real Estate | — | 4,263,892 | — | 4,263,892 | |||||||||||||||
| Telecommunication Services | 820,825 | 327,890 | — | 1,148,715 | |||||||||||||||
| Total | $ | 3,343,881 | $ | 15,883,872 | $ | — | $ | 19,227,753 | |||||||||||
See Notes to Financial Statements
| 33 |
VANECK VECTORS INDIA GROWTH LEADERS ETF
SCHEDULE OF INVESTMENTS(a)
December 31, 2020
| Number of Shares | Value | |||||||
| COMMON STOCKS: 99.8% | ||||||||
| Banks: 11.9% | ||||||||
| 198,336 | HDFC Bank Ltd. # | $ | 3,906,521 | |||||
| 120,729 | Housing Development Finance Corp. Ltd. # | 4,229,853 | ||||||
| 8,136,374 | ||||||||
| Capital Goods: 2.1% | ||||||||
| 44,919 | Amara Raja Batteries Ltd. # | 568,922 | ||||||
| 39,206 | Hindustan Aeronautics Ltd. Reg S # | 455,068 | ||||||
| 2,674 | IndiaMart InterMesh Ltd. Reg S 144A * # | 235,226 | ||||||
| 10,700 | Polycab India Ltd. # | 152,240 | ||||||
| 112,906 | Rail Vikas Nigam Ltd. Reg S # | 37,131 | ||||||
| 1,448,587 | ||||||||
| Commercial & Professional Services: 0.7% | ||||||||
| 10,639 | L&T Technology Services Ltd. Reg S 144A # | 341,171 | ||||||
| 29,725 | RITES Ltd. # | 110,674 | ||||||
| 451,845 | ||||||||
| Consumer Services: 0.5% | ||||||||
| 1,298,085 | Chennai Super Kings Cricket Ltd. * # ø¥ | 344,208 | ||||||
| Diversified Financials: 5.2% | ||||||||
| 38,294 | Central Depository Services India Ltd. Reg S # | 279,561 | ||||||
| 32,637 | ICICI Securities Ltd. Reg S 144A # | 206,836 | ||||||
| 166,401 | Manappuram Finance Ltd. # | 377,378 | ||||||
| 16,280 | Multi Commodity Exchange of India Ltd. # | 385,831 | ||||||
| 45,832 | Muthoot Finance Ltd. # | 759,712 | ||||||
| 119,359 | SBI Cards & Payment Services Ltd. # | 1,391,361 | ||||||
| 34,407 | Ujjivan Financial Services Ltd. # | 130,029 | ||||||
| 3,530,708 | ||||||||
| Food, Beverage & Tobacco: 13.9% | ||||||||
| 52,312 | Balrampur Chini Mills Ltd. # | 123,502 | ||||||
| 5,846 | Bombay Burmah Trading Co. # | 103,961 | ||||||
| 52,371 | Britannia Industries Ltd. # | 2,568,080 | ||||||
| 1,144,413 | ITC Ltd. # | 3,277,404 | ||||||
| 12,667 | Kaveri Seed Co. Ltd. # | 90,446 | ||||||
| 13,045 | Nestle India Ltd. # | 3,287,676 | ||||||
| 100 | Radico Khaitan Ltd. # | 627 | ||||||
| 31,297 | Tata Coffee Ltd. # | 44,978 | ||||||
| 9,496,674 | ||||||||
| Health Care Equipment & Services: 1.9% | ||||||||
| 39,889 | Apollo Hospitals Enterprise Ltd. # | 1,316,210 | ||||||
| Materials: 6.9% | ||||||||
| 2,113 | Alkyl Amines Chemicals # | 111,016 | ||||||
| 1,677 | Astec Lifesciences Ltd. # | 29,713 | ||||||
| 6,287 | Atul Ltd. # | 553,881 | ||||||
| 4,528 | Bayer CropScience Ltd. # | 337,341 | ||||||
| 203,316 | Castrol India Ltd. # | 342,940 | ||||||
| 65,948 | Chambal Fertilizers & Chemicals Ltd. # | 205,943 | ||||||
| 45,550 | Coromandel International Ltd. # | 508,462 | ||||||
| 29,435 | Deepak Nitrite Ltd. # | 380,468 | ||||||
| 30,415 | EID Parry India Ltd. * # | 143,126 | ||||||
| 9,406 | Huhtamaki PPL Ltd. # | 40,366 | ||||||
| 36,195 | JK Paper Ltd. # | 52,789 | ||||||
| 14,040 | Navin Fluorine International Ltd. # | 502,918 | ||||||
| Number of Shares | Value | |||||||
| Materials: (continued) | ||||||||
| 34,654 | PI Industries Ltd. # | $ | 1,042,029 | |||||
| 32,201 | Rallis India Ltd. # | 124,223 | ||||||
| 5,850 | Rossari Biotech Ltd. * # | 75,431 | ||||||
| 10,451 | Vinati Organics Ltd. # | 173,186 | ||||||
| 53,145 | Welspun Corp. Ltd. # | 97,149 | ||||||
| 4,720,981 | ||||||||
| Media & Entertainment: 0.2% | ||||||||
| 16,542 | Just Dial Ltd. # | 143,607 | ||||||
| Pharmaceuticals, Biotechnology & Life Sciences: 21.3% | ||||||||
| 13,332 | Aarti Drugs Ltd. # | 128,767 | ||||||
| 11,359 | Ajanta Pharma Ltd. # | 254,080 | ||||||
| 22,496 | Alembic Pharmaceuticals Ltd. # | 318,047 | ||||||
| 10,758 | Alkem Laboratories Ltd. # | 431,189 | ||||||
| 123,500 | Aurobindo Pharma Ltd. # | 1,555,195 | ||||||
| 6,974 | Caplin Point Laboratories Ltd. # | 48,341 | ||||||
| 230,555 | Cipla Ltd. # | 2,589,502 | ||||||
| 56,854 | Divi’s Laboratories Ltd. # | 2,990,076 | ||||||
| 48,081 | Dr Reddy’s Laboratories Ltd. # | 3,423,242 | ||||||
| 19,808 | FDC Ltd. # | 90,113 | ||||||
| 60,272 | Granules India Ltd. # | 290,430 | ||||||
| 8,870 | IOL Chemicals and Pharmaceuticals Ltd. # | 90,060 | ||||||
| 27,367 | Ipca Laboratories Ltd. # | 819,641 | ||||||
| 15,807 | JB Chemicals & Pharmaceuticals Ltd. # | 219,792 | ||||||
| 23,290 | Jubilant Life Sciences Ltd. # | 269,708 | ||||||
| 108,725 | Laurus Labs Ltd. Reg S 144A # | 526,380 | ||||||
| 3,948 | Sanofi India Ltd. # | 449,769 | ||||||
| 33,044 | Sequent Scientific Ltd. # | 76,571 | ||||||
| 14,570,903 | ||||||||
| Software & Services: 26.7% | ||||||||
| 50,218 | Birlasoft Ltd. # | 170,286 | ||||||
| 5,908 | eClerx Services Ltd. # | 71,618 | ||||||
| 263,951 | HCL Technologies Ltd. # | 3,425,793 | ||||||
| 17,043 | Larsen & Toubro Infotech Ltd. Reg S 144A # | 854,751 | ||||||
| 4,688 | Mastek Ltd. # | 72,867 | ||||||
| 16,576 | MindTree Ltd. # | 377,472 | ||||||
| 32,962 | Mphasis Ltd. # | 695,961 | ||||||
| 5,187 | NIIT Technologies Ltd. # | 192,505 | ||||||
| 10,013 | Oracle Financial Services Software Ltd. # | 440,923 | ||||||
| 18,764 | Persistent Systems Ltd. # | 389,986 | ||||||
| 84,220 | Tata Consultancy Services Ltd. # | 3,306,910 | ||||||
| 13,782 | Tata Elxsi Ltd. # | 347,230 | ||||||
| 255,624 | Tech Mahindra Ltd. # | 3,416,540 | ||||||
| 591,242 | Wipro Ltd. # | 3,131,770 | ||||||
| 19,236 | WNS Holdings Ltd. (ADR) * | 1,385,954 | ||||||
| 18,280,566 | ||||||||
| Technology Hardware & Equipment: 6.0% | ||||||||
| 898 | Honeywell Automation India Ltd. # | 456,062 | ||||||
| 215,910 | Infosys Ltd. (ADR) | 3,659,674 | ||||||
| 4,115,736 | ||||||||
| Telecommunication Services: 1.6% | ||||||||
| 348,782 | Bharti Infratel Ltd. # | 1,100,479 | ||||||
See Notes to Financial Statements
| 34 |
| Number of Shares | Value | |||||||
| Utilities: 0.9% | ||||||||
| 27,422 | CESC Ltd. # | $ | 230,586 | |||||
| 115,255 | Gujarat State Petronet Ltd. # | 350,030 | ||||||
| 580,616 | ||||||||
| Total Common Stocks (Cost: $49,878,670) | 68,237,494 | |||||||
| Other assets less liabilities: 0.2% | 120,889 | |||||||
| NET ASSETS: 100.0% | $ | 68,358,383 | ||||||
| Definitions: | |
| ADR | American Depositary Receipt |
| Footnotes: | |
| (a) | Represents Consolidated Schedule of Investments. |
| * | Non-income producing |
| # | Security has been valued in good faith pursuant to guidelines established by the Board of Trustees. The aggregate value of fair valued securities is $63,191,866 which represents 92.4% of net assets. |
| ø | Restricted Security - the aggregate value of restricted securities is $344,208, or 0.5% of net assets. |
| ∞ | Security is valued using significant unobservable inputs that factor in discount for lack of marketability and is classified as Level 3 in the fair value hierarchy |
| Reg S | Security was purchased pursuant to Regulation S under the Securities Act of 1933, which exempts from registration securities offered and sold outside of the United States. Such a security cannot be sold in the United States without either an effective registration statement filed pursuant to the Securities Act of 1933, or pursuant to an exemption from registration. |
| 144A | Security exempt from registration under Rule 144A of the Securities Act of 1933, as amended, or otherwise restricted. These securities may be resold in transactions exempt from registration, unless otherwise noted, and the value amounted to $2,164,364, or 3.2% of net assets. |
Restricted securities held by the Fund as of December 31, 2020 are as follows:
| Security | Acquisition Date | Number of Shares | Acquisition Cost | Value | % of Net Assets | |||||
| Chennai Super Kings Cricket Ltd. | 10/08/15 | 1,298,085 | $35,108 | $344,208 | 0.5% |
| Summary of Investments by Sector | % of Investments | Value | ||||||
| Communication Services | 2.3 | % | $ | 1,588,294 | ||||
| Consumer Staples | 13.9 | 9,496,674 | ||||||
| Financials | 17.1 | 11,667,082 | ||||||
| Health Care | 23.3 | 15,887,113 | ||||||
| Industrials | 2.8 | 1,900,432 | ||||||
| Information Technology | 32.8 | 22,396,302 | ||||||
| Materials | 6.9 | 4,720,981 | ||||||
| Utilities | 0.9 | 580,616 | ||||||
| 100.0 | % | $ | 68,237,494 | |||||
See Notes to Financial Statements
| 35 |
VANECK VECTORS INDIA GROWTH LEADERS ETF
SCHEDULE OF INVESTMENTS(a)
(continued)
The summary of inputs used to value the Fund’s investments as of December 31, 2020 is as follows:
| Level 1 Quoted Prices | Level 2 Significant Observable Inputs | Level 3 Significant Unobservable Inputs | Value | ||||||||||||||
| Common Stocks | |||||||||||||||||
| Banks | $ | — | $ | 8,136,374 | $ | — | $ | 8,136,374 | |||||||||
| Capital Goods | — | 1,448,587 | — | 1,448,587 | |||||||||||||
| Commercial & Professional Services | — | 451,845 | — | 451,845 | |||||||||||||
| Consumer Services | — | — | 344,208 | 344,208 | |||||||||||||
| Diversified Financials | — | 3,530,708 | — | 3,530,708 | |||||||||||||
| Food, Beverage & Tobacco | — | 9,496,674 | — | 9,496,674 | |||||||||||||
| Health Care Equipment & Services | — | 1,316,210 | — | 1,316,210 | |||||||||||||
| Materials | — | 4,720,981 | — | 4,720,981 | |||||||||||||
| Media & Entertainment | — | 143,607 | — | 143,607 | |||||||||||||
| Pharmaceuticals, Biotechnology & Life Sciences | — | 14,570,903 | — | 14,570,903 | |||||||||||||
| Software & Services | 1,385,954 | 16,894,612 | — | 18,280,566 | |||||||||||||
| Technology Hardware & Equipment | 3,659,674 | 456,062 | — | 4,115,736 | |||||||||||||
| Telecommunication Services | — | 1,100,479 | — | 1,100,479 | |||||||||||||
| Utilities | — | 580,616 | — | 580,616 | |||||||||||||
| Total | $ | 5,045,628 | $ | 62,847,658 | $ | 344,208 | $ | 68,237,494 | |||||||||
See Notes to Financial Statements
| 36 |
VANECK VECTORS INDONESIA INDEX ETF
SCHEDULE OF INVESTMENTS
December 31, 2020
| Number of Shares | Value | |||||||
| COMMON STOCKS: 100.0% | ||||||||
| Automobiles & Components: 6.4% | ||||||||
| 5,305,300 | Astra International Tbk PT # | $ | 2,280,329 | |||||
| Banks: 26.5% | ||||||||
| 1,242,500 | Bank Central Asia Tbk PT # | 2,995,083 | ||||||
| 4,907,902 | Bank Mandiri Persero Tbk PT # | 2,214,686 | ||||||
| 3,522,532 | Bank Negara Indonesia Persero Tbk PT # | 1,551,099 | ||||||
| 9,163,700 | Bank Rakyat Indonesia Tbk PT # | 2,724,397 | ||||||
| 9,485,265 | ||||||||
| Diversified Financials: 0.8% | ||||||||
| 883,250 | First Pacific Company Ltd. (HKD) # | 283,937 | ||||||
| Energy: 9.3% | ||||||||
| 7,552,200 | Adaro Energy Tbk PT # | 769,648 | ||||||
| 2,252,497 | Banpu PCL (NVDR) (THB)# | 827,574 | ||||||
| 1,849,700 | Tambang Batubara Bukit Asam Tbk PT # | 370,522 | ||||||
| 722,169 | United Tractors Tbk PT # | 1,368,724 | ||||||
| 3,336,468 | ||||||||
| Food, Beverage & Tobacco: 12.1% | ||||||||
| 3,407,100 | Charoen Pokphand Indonesia Tbk PT # | 1,584,521 | ||||||
| 3,116,600 | Golden Agri-Resources Ltd. (SGD) # | 374,895 | ||||||
| 218,100 | Gudang Garam Tbk PT * # | 636,622 | ||||||
| 1,046,300 | Indofood Cbp Sukses Makmur Tbk PT # | 713,341 | ||||||
| 2,073,100 | Indofood Sukses Makmur Tbk PT # | 1,011,143 | ||||||
| 4,320,522 | ||||||||
| Health Care Equipment & Services: 1.4% | ||||||||
| 2,556,397 | Mitra Keluarga Karyasehat Tbk PT Reg S # | 496,971 | ||||||
| Household & Personal Products: 3.9% | ||||||||
| 2,702,300 | Unilever Indonesia Tbk PT # | 1,414,397 | ||||||
| Materials: 16.4% | ||||||||
| 12,348,000 | Barito Pacific Tbk PT # | 967,728 | ||||||
| 1,010,600 | Chandra Asri Petrochemical Tbk PT # | 652,739 | ||||||
| 1,214,200 | Indah Kiat Pulp and Paper Corp. Tbk PT # | 902,215 | ||||||
| 851,800 | Indocement Tunggal Prakarsa Tbk PT # | 878,243 | ||||||
| 4,963,400 | Merdeka Copper Gold Tbk PT # | 859,097 | ||||||
| 588,000 | Pabrik Kertas Tjiwi Kimia Tbk PT # | 413,033 | ||||||
| 1,372,500 | Semen Gresik Persero Tbk PT # | 1,214,889 | ||||||
| 5,887,944 | ||||||||
| Number of Shares | Value | |||||||
| Pharmaceuticals, Biotechnology & Life Sciences: 2.8% | ||||||||
| 9,518,200 | Kalbe Farma Tbk PT # | $ | 1,002,801 | |||||
| Real Estate: 3.2% | ||||||||
| 4,298,900 | Bumi Serpong Damai Tbk PT * # | 375,692 | ||||||
| 4,119,295 | Ciputra Development Tbk PT # | 289,119 | ||||||
| 15,065,700 | Lippo Karawaci Tbk PT * # | 229,770 | ||||||
| 7,050,000 | Pakuwon Jati Tbk PT # | 255,940 | ||||||
| 1,150,521 | ||||||||
| Retailing: 3.0% | ||||||||
| 3,239,400 | Ace Hardware Indonesia Tbk PT # | 395,930 | ||||||
| 46,688 | Jardine Cycle & Carriage Ltd. (SGD) # | 691,652 | ||||||
| 1,087,582 | ||||||||
| Telecommunication Services: 11.6% | ||||||||
| 11,563,200 | Sarana Menara Nusantara Tbk PT # | 790,538 | ||||||
| 108,194 | Telkom Indonesia Persero Tbk PT (ADR) † | 2,544,723 | ||||||
| 4,279,600 | Tower Bersama Infrastructure Tbk PT # | 497,429 | ||||||
| 1,718,875 | XL Axiata Tbk PT # | 334,307 | ||||||
| 4,166,997 | ||||||||
| Transportation: 1.0% | ||||||||
| 1,028,150 | Jasa Marga Persero Tbk PT # | 338,995 | ||||||
| Utilities: 1.6% | ||||||||
| 4,922,300 | Perusahaan Gas Negara Tbk PT # | 580,614 | ||||||
| Total Common Stocks (Cost: $46,239,312) | 35,833,343 | |||||||
| SHORT-TERM INVESTMENT HELD AS COLLATERAL FOR SECURITIES ON LOAN: 0.2% (Cost: $89,746) | ||||||||
| Money Market Fund: 0.2% | ||||||||
| 89,746 | State Street Navigator Securities Lending Government Money Market Portfolio | 89,746 | ||||||
| Total Investments: 100.2% (Cost: $46,329,058) | 35,923,089 | |||||||
| Liabilities in excess of other assets: (0.2)% | (74,068 | ) | ||||||
| NET ASSETS: 100.0% | $ | 35,849,021 | ||||||
| Definitions: | |
| ADR | American Depositary Receipt |
| HKD | Hong Kong Dollar |
| NVDR | Non-Voting Depositary Receipt |
| SGD | Singapore Dollar |
| THB | Thai Baht |
| Footnotes: | |
| * | Non-income producing |
| † | Security fully or partially on loan. Total market value of securities on loan is $1,798,904. |
| # | Security has been valued in good faith pursuant to guidelines established by the Board of Trustees. The aggregate value of fair valued securities is $33,288,620 which represents 92.9% of net assets. |
| Reg S | Security was purchased pursuant to Regulation S under the Securities Act of 1933, which exempts from registration securities offered and sold outside of the United States. Such a security cannot be sold in the United States without either an effective registration statement filed pursuant to the Securities Act of 1933, or pursuant to an exemption from registration. |
See Notes to Financial Statements
| 37 |
VANECK VECTORS INDONESIA INDEX ETF
SCHEDULE OF INVESTMENTS
(continued)
| Summary of Investments by Sector Excluding Collateral for Securities Loaned | % of Investments | Value | ||||||
| Communication Services | 11.6 | % | $ | 4,166,997 | ||||
| Consumer Discretionary | 9.4 | 3,367,911 | ||||||
| Consumer Staples | 16.0 | 5,734,919 | ||||||
| Energy | 9.3 | 3,336,468 | ||||||
| Financials | 27.3 | 9,769,202 | ||||||
| Health Care | 4.2 | 1,499,772 | ||||||
| Industrials | 1.0 | 338,995 | ||||||
| Materials | 16.4 | 5,887,944 | ||||||
| Real Estate | 3.2 | 1,150,521 | ||||||
| Utilities | 1.6 | 580,614 | ||||||
| 100.0 | % | $ | 35,833,343 | |||||
The summary of inputs used to value the Fund’s investments as of December 31, 2020 is as follows:
| Level 1 Quoted Prices | Level 2 Significant Observable Inputs | Level 3 Significant Unobservable Inputs | Value | ||||||||||||||
| Common Stocks | |||||||||||||||||
| Automobiles & Components | $ | — | $ | 2,280,329 | $ | — | $ | 2,280,329 | |||||||||
| Banks | — | 9,485,265 | — | 9,485,265 | |||||||||||||
| Diversified Financials | — | 283,937 | — | 283,937 | |||||||||||||
| Energy | — | 3,336,468 | — | 3,336,468 | |||||||||||||
| Food, Beverage & Tobacco | — | 4,320,522 | — | 4,320,522 | |||||||||||||
| Health Care Equipment & Services | — | 496,971 | — | 496,971 | |||||||||||||
| Household & Personal Products | — | 1,414,397 | — | 1,414,397 | |||||||||||||
| Materials | — | 5,887,944 | — | 5,887,944 | |||||||||||||
| Pharmaceuticals, Biotechnology & Life Sciences | — | 1,002,801 | — | 1,002,801 | |||||||||||||
| Real Estate | — | 1,150,521 | — | 1,150,521 | |||||||||||||
| Retailing | — | 1,087,582 | — | 1,087,582 | |||||||||||||
| Telecommunication Services | 2,544,723 | 1,622,274 | — | 4,166,997 | |||||||||||||
| Transportation | — | 338,995 | — | 338,995 | |||||||||||||
| Utilities | — | 580,614 | — | 580,614 | |||||||||||||
| Money Market Fund | 89,746 | — | — | 89,746 | |||||||||||||
| Total | $ | 2,634,469 | $ | 33,288,620 | $ | — | $ | 35,923,089 | |||||||||
See Notes to Financial Statements
| 38 |
SCHEDULE OF INVESTMENTS
December 31, 2020
| Number of Shares | Value | |||||||
| COMMON STOCKS: 100.1% | ||||||||
| Banks: 12.0% | ||||||||
| 390,004 | Bank Hapoalim BM # | $ | 2,680,852 | |||||
| 507,734 | Bank Leumi Le-Israel BM # | 2,999,503 | ||||||
| 19,497 | First International Bank of Israel Ltd. # | 518,528 | ||||||
| 381,610 | Israel Discount Bank Ltd. # | 1,474,635 | ||||||
| 56,076 | Mizrahi Tefahot Bank Ltd. # | 1,301,897 | ||||||
| 8,975,415 | ||||||||
| Capital Goods: 5.3% | ||||||||
| 8,551 | Ashtrom Group Ltd. # | 169,359 | ||||||
| 6,439 | Caesarstone Ltd. (USD) † | 82,999 | ||||||
| 9,925 | Elbit Systems Ltd. # | 1,309,429 | ||||||
| 3,632 | Elco Holdings Ltd. # | 184,205 | ||||||
| 449 | Electra Ltd. # | 246,107 | ||||||
| 19,668 | Inrom Construction Industries Ltd. # | 95,964 | ||||||
| 13,687 | Kornit Digital Ltd. (USD) * | 1,219,922 | ||||||
| 9,355 | RADA Electronic Industries Ltd. (USD) * | 91,211 | ||||||
| 35,158 | Shapir Engineering and Industry Ltd. # | 267,578 | ||||||
| 55,250 | Shikun & Binui Ltd. # | 323,374 | ||||||
| 3,990,148 | ||||||||
| Commercial & Professional Services: 0.3% | ||||||||
| 1,258 | Danel Adir Yeoshua Ltd. # | 207,817 | ||||||
| Consumer Durables & Apparel: 0.5% | ||||||||
| 3,261 | Delta-Galil Industries Ltd. # | 82,748 | ||||||
| 2,837 | Electra Consumer Products Ltd. # | 98,447 | ||||||
| 13,894 | Maytronics Ltd. # | 209,371 | ||||||
| 390,566 | ||||||||
| Consumer Services: 0.6% | ||||||||
| 77,462 | 888 Holdings Plc (GBP) # | 303,054 | ||||||
| 1,705 | Fattal Holdings Ltd. # | 184,609 | ||||||
| 487,663 | ||||||||
| Diversified Financials: 1.5% | ||||||||
| 21,455 | Altshuler Shaham Provident Funds & Pension Ltd. # | 112,732 | ||||||
| 71,230 | Isracard Ltd. # | 241,182 | ||||||
| 32,447 | Plus500 Ltd. (GBP) # | 642,564 | ||||||
| 29,859 | Tel Aviv Stock Exchange Ltd. # | 152,476 | ||||||
| 1,148,954 | ||||||||
| Energy: 0.9% | ||||||||
| 3,013 | Delek Group Ltd. # | 94,165 | ||||||
| 24,517 | Energean Oil & Gas Plc (GBP) * # | 240,931 | ||||||
| 656,051 | Oil Refineries Ltd. # | 148,839 | ||||||
| 1,919 | Paz Oil Co. Ltd. # | 206,068 | ||||||
| 690,003 | ||||||||
| Food & Staples Retailing: 0.7% | ||||||||
| 2,500 | Rami Levi Chain Stores Hashikma Marketing Ltd. # | 175,293 | ||||||
| 49,011 | Shufersal Ltd. # | 378,914 | ||||||
| 554,207 | ||||||||
| Food, Beverage & Tobacco: 0.6% | ||||||||
| 15,682 | Strauss Group Ltd. # | 470,796 | ||||||
| Number of Shares | Value | |||||||
| Health Care Equipment & Services: 5.7% | ||||||||
| 6,535 | Inmode Ltd. (USD) * | $ | 310,282 | |||||
| 28,886 | Mediterranean Towers Ltd. # | 81,635 | ||||||
| 13,136 | Nano-X Imaging Ltd. (USD) * † | 599,790 | ||||||
| 18,802 | Novocure Ltd. (USD) * | 3,253,498 | ||||||
| 4,245,205 | ||||||||
| Insurance: 3.7% | ||||||||
| 23,447 | Clal Insurance Enterprises Holdings Ltd. * # | 368,302 | ||||||
| 42,801 | Harel Insurance Investments & Financial Services Ltd. # | 395,510 | ||||||
| 2,829 | IDI Insurance Co. Ltd. # | 85,871 | ||||||
| 9,868 | Lemonade, Inc. (USD) * | 1,208,830 | ||||||
| 9,189 | Menorah Mivtachim Holdings Ltd. # | 172,689 | ||||||
| 119,455 | Migdal Insurance & Financial Holdings Ltd. # | 138,461 | ||||||
| 52,767 | Phoenix Holdings Ltd. * # | 402,239 | ||||||
| 2,771,902 | ||||||||
| Materials: 2.3% | ||||||||
| 269,934 | Israel Chemicals Ltd. # | 1,379,068 | ||||||
| 1,621 | Israel Corp. Ltd. * # | 310,293 | ||||||
| 1,689,361 | ||||||||
| Media & Entertainment: 0.1% | ||||||||
| 17,966 | Tremor International Ltd. (GBP) * † | 96,270 | ||||||
| Pharmaceuticals, Biotechnology & Life Sciences: 6.5% | ||||||||
| 3,266 | 89bio, Inc. (USD) * | 79,592 | ||||||
| 10,290 | Brainstorm Cell Therapeutics, Inc. (USD) * | 46,562 | ||||||
| 21,457 | Compugen Ltd. (USD) * † | 259,844 | ||||||
| 12,100 | Kamada Ltd. * # | 77,956 | ||||||
| 7,733 | Pluristem Therapeutics, Inc. (USD) * † | 54,672 | ||||||
| 7,984 | Redhill Biopharma Ltd. (ADR) * † | 64,511 | ||||||
| 3,283 | Taro Pharmaceutical Industries Ltd. (USD) * | 241,038 | ||||||
| 407,548 | Teva Pharmaceutical Industries Ltd. * # | 3,940,619 | ||||||
| 4,758 | UroGen Pharma Ltd. (USD) * † | 85,739 | ||||||
| 4,850,533 | ||||||||
| Real Estate: 6.1% | ||||||||
| 4,845 | Africa Israel Properties Ltd. * # | 198,575 | ||||||
| 15,962 | Airport City Ltd. * # | 242,582 | ||||||
| 41,199 | Alony Hetz Properties & Investments Ltd. # | 577,206 | ||||||
| 58,930 | Amot Investments Ltd. # | 330,545 | ||||||
| 21,980 | Azorim Investment Development & Construction Co. Ltd. * # | 75,807 | ||||||
| 14,057 | Azrieli Group Ltd. # | 894,159 | ||||||
| 30,450 | Bayside Land Corp. # | 248,658 | ||||||
| 2,381 | Big Shopping Centers Ltd. # | 265,400 | ||||||
| 1,217 | Blue Square Real Estate Ltd. # | 78,488 | ||||||
| 718 | Brack Capital Properties NV * # | 66,628 | ||||||
| 18,849 | Gazit-Globe Ltd. # | 123,436 | ||||||
| 170,005 | Industrial Buildings Corp. # | 438,550 | ||||||
| 34,632 | Israel Canada T.R Ltd. # | 103,055 | ||||||
| 405 | Isras Investment Co. Ltd. # | 85,004 | ||||||
| 5,965 | Mega Or Holdings Ltd. # | 182,300 | ||||||
| 6,389 | Melisron Ltd. # | 347,627 | ||||||
| 2,222 | Prashkovsky Investments and Construction Ltd. # | 60,221 | ||||||
See Notes to Financial Statements
| 39 |
VANECK VECTORS ISRAEL ETF
SCHEDULE OF INVESTMENTS
(continued)
| Number of Shares | Value | |||||||
| Real Estate: (continued) | ||||||||
| 612 | Property & Building Corp. # | $ | 60,430 | |||||
| 8,357 | Summit Real Estate Holdings Ltd. # | 124,924 | ||||||
| 1,668 | YH Dimri Construction & Development Ltd. # | 77,964 | ||||||
| 4,581,559 | ||||||||
| Retailing: 2.3% | ||||||||
| �� | 13,081 | Delek Automotive Systems Ltd. # | 123,044 | |||||
| 6,620 | Fiverr International Ltd. (USD) * | 1,291,562 | ||||||
| 2,018 | Fox Wizel Ltd. # | 203,112 | ||||||
| 1,033 | Tadiran Holdings Ltd. # | 76,327 | ||||||
| 1,694,045 | ||||||||
| Semiconductors & Semiconductor Equipment: 8.9% | ||||||||
| 7,581 | Camtek Ltd. (USD) * | 166,100 | ||||||
| 6,185 | Ceva, Inc. (USD) * | 281,417 | ||||||
| 5,796 | DSP Group, Inc. (USD) * | 96,156 | ||||||
| 6,904 | Nova Measuring Instruments Ltd. * # | 487,809 | ||||||
| 14,686 | SolarEdge Technologies, Inc. (USD) * | 4,686,596 | ||||||
| 37,519 | Tower Semiconductor Ltd. (USD) * | 968,741 | ||||||
| 6,686,819 | ||||||||
| Software & Services: 36.0% | ||||||||
| 41,397 | Amdocs Ltd. (USD) | 2,936,289 | ||||||
| 39,219 | Check Point Software Technologies Ltd. (USD) * | 5,212,597 | ||||||
| 13,828 | CyberArk Software Ltd. (USD) * | 2,234,467 | ||||||
| 2,514 | Formula Systems Ltd. # | 217,527 | ||||||
| 3,836 | Hilan Ltd. # | 182,316 | ||||||
| 22,900 | JFrog Ltd. (USD) * | 1,438,807 | ||||||
| 13,942 | LivePerson, Inc. (USD) * † | 867,611 | ||||||
| 7,113 | Magic Software Enterprises Ltd. (USD) | 111,318 | ||||||
| 9,452 | Matrix IT Ltd. # | 214,401 | ||||||
| 21,819 | NICE Systems Ltd. * # | 6,178,072 | ||||||
| 786 | One Software Technologies Ltd. # | 104,122 | ||||||
| 11,430 | Sapiens International Corp. NV (USD) | 349,872 | ||||||
| 8,040 | Varonis Systems, Inc. (USD) * † | 1,315,424 | ||||||
| 19,173 | Verint Systems, Inc. (USD) * | 1,288,042 | ||||||
| 17,435 | Wix.com Ltd. (USD) * | 4,358,053 | ||||||
| 27,008,918 | ||||||||
| Number of Shares | Value | |||||||
| Technology Hardware & Equipment: 1.6% | ||||||||
| 8,470 | AudioCodes Ltd. (USD) † | $ | 233,348 | |||||
| 76,655 | BATM Advanced Communications Ltd. (GBP) * † # | 97,262 | ||||||
| 21,132 | Ceragon Networks Ltd. (USD) * | 58,747 | ||||||
| 10,645 | Gilat Satellite Networks Ltd. # | 69,559 | ||||||
| 3,620 | Ituran Location and Control Ltd. (USD) | 68,961 | ||||||
| 9,367 | Powerfleet, Inc. (USD) * | 69,597 | ||||||
| 12,503 | Radware Ltd. (USD) * | 346,958 | ||||||
| 12,236 | Stratasys Ltd. (USD) * † | 253,530 | ||||||
| 1,197,962 | ||||||||
| Telecommunication Services: 1.5% | ||||||||
| 730,445 | Bezeq The Israeli Telecommunication Corp. Ltd. * # | 726,702 | ||||||
| 31,776 | Cellcom Israel Ltd. * # | 157,246 | ||||||
| 31,589 | Partner Communications Co. Ltd. * | 174,336 | ||||||
| 6,623 | Perion Network Ltd. (USD) * | 84,311 | ||||||
| 1,142,595 | ||||||||
| Utilities: 3.0% | ||||||||
| 70,018 | Energix-Renewable Energies Ltd. # | 320,159 | ||||||
| 189,796 | Enlight Renewable Energy Ltd. * # | 396,755 | ||||||
| 6,644 | Kenon Holdings Ltd. # | 195,906 | ||||||
| 21,225 | OPC Energy Ltd. # | 221,496 | ||||||
| 12,331 | Ormat Technologies, Inc. (USD) † | 1,113,243 | ||||||
| 2,247,559 | ||||||||
| Total Common Stocks (Cost: $48,872,983) | 75,128,297 | |||||||
| SHORT-TERM INVESTMENT HELD AS COLLATERAL FOR SECURITIES ON LOAN: 1.4% (Cost: $1,102,074) | ||||||||
| Money Market Fund: 1.4% | ||||||||
| 1,102,074 | State Street Navigator Securities Lending Government Money Market Portfolio | 1,102,074 | ||||||
| Total Investments: 101.5% (Cost: $49,975,057) | 76,230,371 | |||||||
| Liabilities in excess of other assets: (1.5)% | (1,163,162 | ) | ||||||
| NET ASSETS: 100.0% | $ | 75,067,209 | ||||||
Definitions:
| ADR | American Depositary Receipt |
| GBP | British Pound |
| USD | United States Dollar |
Footnotes:
| * | Non-income producing |
| † | Security fully or partially on loan. Total market value of securities on loan is $4,361,345. |
| # | Security has been valued in good faith pursuant to guidelines established by the Board of Trustees. The aggregate value of fair valued securities is $37,427,454 which represents 49.9% of net assets. |
See Notes to Financial Statements
| 40 |
| Summary of Investments by Sector Excluding Collateral for Securities Loaned | % of Investments | Value | ||||||
| Communication Services | 1.7 | % | $ | 1,238,865 | ||||
| Consumer Discretionary | 3.4 | 2,572,274 | ||||||
| Consumer Staples | 1.4 | 1,025,003 | ||||||
| Energy | 0.9 | 690,003 | ||||||
| Financials | 17.2 | 12,896,271 | ||||||
| Health Care | 12.1 | 9,095,738 | ||||||
| Industrials | 5.6 | 4,197,965 | ||||||
| Information Technology | 46.4 | 34,893,699 | ||||||
| Materials | 2.2 | 1,689,361 | ||||||
| Real Estate | 6.1 | 4,581,559 | ||||||
| Utilities | 3.0 | 2,247,559 | ||||||
| 100.0 | % | $ | 75,128,297 | |||||
The summary of inputs used to value the Fund’s investments as of December 31, 2020 is as follows:
| Level 1 Quoted Prices | Level 2 Significant Observable Inputs | Level 3 Significant Unobservable Inputs | Value | ||||||||||||||
| Common Stocks | |||||||||||||||||
| Banks | $ | — | $ | 8,975,415 | $ | — | $ | 8,975,415 | |||||||||
| Capital Goods | 1,394,132 | 2,596,016 | — | 3,990,148 | |||||||||||||
| Commercial & Professional Services | — | 207,817 | — | 207,817 | |||||||||||||
| Consumer Durables & Apparel | — | 390,566 | — | 390,566 | |||||||||||||
| Consumer Services | — | 487,663 | — | 487,663 | |||||||||||||
| Diversified Financials | — | 1,148,954 | — | 1,148,954 | |||||||||||||
| Energy | — | 690,003 | — | 690,003 | |||||||||||||
| Food & Staples Retailing | — | 554,207 | — | 554,207 | |||||||||||||
| Food, Beverage & Tobacco | — | 470,796 | — | 470,796 | |||||||||||||
| Health Care Equipment & Services | 4,163,570 | 81,635 | — | 4,245,205 | |||||||||||||
| Insurance | 1,208,830 | 1,563,072 | — | 2,771,902 | |||||||||||||
| Materials | — | 1,689,361 | — | 1,689,361 | |||||||||||||
| Media & Entertainment | 96,270 | — | — | 96,270 | |||||||||||||
| Pharmaceuticals, Biotechnology & Life Sciences | 831,958 | 4,018,575 | — | 4,850,533 | |||||||||||||
| Real Estate | — | 4,581,559 | — | 4,581,559 | |||||||||||||
| Retailing | 1,291,562 | 402,483 | — | 1,694,045 | |||||||||||||
| Semiconductors & Semiconductor Equipment | 6,199,010 | 487,809 | — | 6,686,819 | |||||||||||||
| Software & Services | 20,112,480 | 6,896,438 | — | 27,008,918 | |||||||||||||
| Technology Hardware & Equipment | 1,031,141 | 166,821 | — | 1,197,962 | |||||||||||||
| Telecommunication Services | 258,647 | 883,948 | — | 1,142,595 | |||||||||||||
| Utilities | 1,113,243 | 1,134,316 | — | 2,247,559 | |||||||||||||
| Money Market Fund | 1,102,074 | — | — | 1,102,074 | |||||||||||||
| Total | $ | 38,802,917 | $ | 37,427,454 | $ | — | $ | 76,230,371 | |||||||||
See Notes to Financial Statements
| 41 |
SCHEDULE OF INVESTMENTS
December 31, 2020
| Number of Shares | Value | |||||||
| COMMON STOCKS: 97.6% | ||||||||
| Banks: 11.6% | ||||||||
| 8,373,366 | Sberbank of Russia PJSC (ADR) # | $ | 121,063,943 | |||||
| 1,490,670 | TCS Group Holding Plc Reg S (GDR) # | 49,045,200 | ||||||
| 19,359,614 | VTB Bank PJSC Reg S (GDR) # | 18,471,298 | ||||||
| 188,580,441 | ||||||||
| Diversified Financials: 2.2% | ||||||||
| 16,434,952 | Moscow Exchange MICEX-RTS PJSC # | 35,509,277 | ||||||
| Energy: 35.6% | ||||||||
| 25,200,633 | Gazprom PJSC (ADR) † # | 140,698,561 | ||||||
| 1,650,225 | Lukoil PJSC (ADR) # | 112,236,745 | ||||||
| 656,375 | Novatek PJSC Reg S (GDR) # | 106,889,057 | ||||||
| 13,520,068 | Rosneft Oil Co. PJSC Reg S (GDR) # | 76,234,877 | ||||||
| 11,117,738 | Surgutneftegas PJSC (ADR) † # | 51,358,446 | ||||||
| 2,213,528 | Tatneft PJSC (ADR) † # | 90,142,244 | ||||||
| 577,559,930 | ||||||||
| Food & Staples Retailing: 7.6% | ||||||||
| 4,208,797 | Magnit OJSC Reg S (GDR) # | 73,962,233 | ||||||
| 1,385,944 | X5 Retail Group NV Reg S (GDR) # | 50,045,228 | ||||||
| 124,007,461 | ||||||||
| Materials: 26.8% | ||||||||
| 31,170,360 | Alrosa PJSC # | 41,635,064 | ||||||
| 6,709,901 | Evraz Plc (GBP) # | 42,865,171 | ||||||
| 3,070,866 | MMC Norilsk Nickel PJSC (ADR) # | 95,714,536 | ||||||
| 1,566,666 | Novolipetskiy Metallurgicheskiy Kombinat PAO Reg S (GDR) # | 43,346,885 | ||||||
| 1,450,936 | PhosAgro PJSC Reg S (GDR) # | 19,786,986 | ||||||
| 3,260,559 | Polymetal International Plc (GBP) # | 75,028,482 | ||||||
| 733,593 | Polyus PJSC Reg S (GDR) # | 73,940,036 | ||||||
| 2,398,375 | Severstal PAO Reg S (GDR) # | 42,153,143 | ||||||
| 434,470,303 | ||||||||
| Media & Entertainment: 6.8% | ||||||||
| 1,418,271 | Mail.ru Group Ltd. Reg S (GDR) * # | 37,169,415 | ||||||
| 1,045,647 | Yandex NV (USD) * † | 72,756,118 | ||||||
| 109,925,533 | ||||||||
| Number of Shares | Value | |||||||
| Telecommunication Services: 5.0% | ||||||||
| 5,472,600 | Mobile TeleSystems PJSC (ADR) | $ | 48,979,770 | |||||
| 13,077,159 | Rostelecom PJSC # | 17,151,689 | ||||||
| 9,621,666 | VEON Ltd. (ADR) † | 14,528,716 | ||||||
| 80,660,175 | ||||||||
| Utilities: 2.0% | ||||||||
| 441,849,410 | Inter Rao Ues PJSC # | 31,856,057 | ||||||
| 7,410,870 | Irkutsk Electronetwork Co. JSC (USD) * # ¥ | 38,322 | ||||||
| 31,894,379 | ||||||||
| Total Common Stocks (Cost: $1,582,508,242) | 1,582,607,499 | |||||||
| PREFERRED STOCK: 2.3% (Cost: $46,059,374) | ||||||||
| Energy: 2.3% | ||||||||
| 19,347 | AK Transneft OAO, 8.26% # | 36,860,318 | ||||||
| Total Investments Before Collateral for Securities Loaned: 99.9% (Cost: $1,628,567,616) | 1,619,467,817 | |||||||
| SHORT-TERM INVESTMENT HELD AS COLLATERAL FOR SECURITIES ON LOAN: 0.0% (Cost: $495,767) | ||||||||
| Money Market Fund: 0.0% | ||||||||
| 495,767 | State Street Navigator Securities Lending Government Money Market Portfolio | 495,767 | ||||||
| Total Investments: 99.9% (Cost: $1,629,063,383) | 1,619,963,584 | |||||||
| Other assets less liabilities: 0.1% | 1,220,882 | |||||||
| NET ASSETS: 100.0% | $ | 1,621,184,466 | ||||||
Definitions:
| ADR | American Depositary Receipt |
| GBP | British Pound |
| GDR | Global Depositary Receipt |
| USD | United States Dollar |
Footnotes:
| * | Non-income producing |
| † | Security fully or partially on loan. Total market value of securities on loan is $7,039,403. |
| # | Security has been valued in good faith pursuant to guidelines established by the Board of Trustees. The aggregate value of fair valued securities is $1,483,203,213 which represents 91.5% of net assets. |
| ∞ | Security is valued using significant unobservable inputs that factor in discount for lack of marketability and is classified as Level 3 in the fair value hierarchy. |
| Reg S | Security was purchased pursuant to Regulation S under the Securities Act of 1933, which exempts from registration securities offered and sold outside of the United States. Such a security cannot be sold in the United States without either an effective registration statement filed pursuant to the Securities Act of 1933, or pursuant to an exemption from registration. |
See Notes to Financial Statements
| 42 |
| Summary of Investments by Sector Excluding Collateral for Securities Loaned | % of Investments | Value | ||||||
| Communication Services | 11.8 | % | $ | 190,585,708 | ||||
| Consumer Staples | 7.7 | 124,007,461 | ||||||
| Energy | 37.9 | 614,420,248 | ||||||
| Financials | 13.8 | 224,089,718 | ||||||
| Materials | 26.8 | 434,470,303 | ||||||
| Utilities | 2.0 | 31,894,379 | ||||||
| 100.0 | % | $ | 1,619,467,817 | |||||
The summary of inputs used to value the Fund’s investments as of December 31, 2020 is as follows:
| Level 1 Quoted Prices | Level 2 Significant Observable Inputs | Level 3 Significant Unobservable Inputs | Value | ||||||||||||||
| Common Stocks | |||||||||||||||||
| Banks | $ | — | $ | 188,580,441 | $ | — | $ | 188,580,441 | |||||||||
| Diversified Financials | — | 35,509,277 | — | 35,509,277 | |||||||||||||
| Energy | — | 577,559,930 | — | 577,559,930 | |||||||||||||
| Food & Staples Retailing | — | 124,007,461 | — | 124,007,461 | |||||||||||||
| Materials | — | 434,470,303 | — | 434,470,303 | |||||||||||||
| Media & Entertainment | 72,756,118 | 37,169,415 | — | 109,925,533 | |||||||||||||
| Telecommunication Services | 63,508,486 | 17,151,689 | — | 80,660,175 | |||||||||||||
| Utilities | — | 31,856,057 | 38,322 | 31,894,379 | |||||||||||||
| Preferred Stock* | — | 36,860,318 | — | 36,860,318 | |||||||||||||
| Money Market Fund | 495,767 | — | — | 495,767 | |||||||||||||
| Total | $ | 136,760,371 | $ | 1,483,164,891 | $ | 38,322 | $ | 1,619,963,584 | |||||||||
| * | See Schedule of Investments for industry sector breakouts. |
See Notes to Financial Statements
| 43 |
VANECK VECTORS RUSSIA SMALL-CAP ETF
SCHEDULE OF INVESTMENTS
December 31, 2020
| Number of Shares | Value | |||||||
| COMMON STOCKS: 98.0% | ||||||||
| Banks: 6.5% | ||||||||
| 24,836,600 | Credit Bank of Moscow PJSC * # | $ | 2,066,272 | |||||
| Commercial & Professional Services: 10.1% | ||||||||
| 53,144 | HeadHunter Group Plc (ADR) † | 1,607,606 | ||||||
| 14,872,500 | Novorossiysk Commercial Sea Port PJSC # | 1,631,861 | ||||||
| 3,239,467 | ||||||||
| Diversified Financials: 6.7% | ||||||||
| 49,913 | Safmar Financial Investment * # | 333,364 | ||||||
| 126,328 | VNV Global AB (SEK) * # | 1,801,771 | ||||||
| 2,135,135 | ||||||||
| Energy: 1.4% | ||||||||
| 545,856 | TMK PJSC # | 452,634 | ||||||
| Food & Staples Retailing: 4.6% | ||||||||
| 412,556 | Lenta Plc (GDR) * # | 1,467,242 | ||||||
| Materials: 13.3% | ||||||||
| 2,503,697 | Eurasia Mining Plc (GBP) † | 1,155,069 | ||||||
| 812,073 | Mechel PJSC * # | 871,555 | ||||||
| 3,460,394 | Petropavlovsk Plc (GBP) * # | 1,534,358 | ||||||
| 333,035 | Raspadskaya OJSC # | 701,310 | ||||||
| 4,262,292 | ||||||||
| Real Estate: 10.3% | ||||||||
| 827,155 | Etalon Group Plc Reg S (GDR) # | 1,430,089 | ||||||
| 158,887 | LSR Group PJSC # | 1,867,378 | ||||||
| 3,297,467 | ||||||||
| Retailing: 10.0% | ||||||||
| 1,314,668 | Detsky Mir PJSC Reg S 144A # | 2,412,138 | ||||||
| 80,368 | M.Video PJSC # | 773,912 | ||||||
| 3,186,050 | ||||||||
| Software & Services: 3.4% | ||||||||
| 104,880 | QIWI Plc (ADR) † | 1,080,264 | ||||||
| Number of Shares | Value | |||||||
| Telecommunication Services: 7.7% | ||||||||
| 328,652 | Sistema PJSFC Reg S (GDR) # | $ | 2,457,636 | |||||
| Transportation: 11.3% | ||||||||
| 2,271,272 | Aeroflot PJSC * # | 2,193,621 | ||||||
| 239,953 | Globaltrans Investment Plc Reg S (GDR) # | 1,432,353 | ||||||
| 3,625,974 | ||||||||
| Utilities: 12.7% | ||||||||
| 32,309,800 | Mosenergo PJSC # | 903,666 | ||||||
| 121,191,600 | OGK-2 PJSC # | 1,198,052 | ||||||
| 2,819,700,000 | TGC-1 PJSC # | 428,153 | ||||||
| 40,999,000 | Unipro PJSC # | 1,549,608 | ||||||
| 4,079,479 | ||||||||
| Total Common Stocks (Cost: $29,376,296) | 31,349,912 | |||||||
| PREFERRED STOCK: 1.8% (Cost: $581,537) | ||||||||
| Utilities: 1.8% | ||||||||
| 288,076 | Rosseti Lenenergo PJSC, 8.92% | 595,124 | ||||||
| Total Investments Before Collateral for Securities Loaned: 99.8% (Cost: $29,957,833) | 31,945,036 | |||||||
| SHORT-TERM INVESTMENT HELD AS COLLATERAL FOR SECURITIES ON LOAN: 8.2% (Cost: $2,620,748) | ||||||||
| Money Market Fund: 8.2% | ||||||||
| 2,620,748 | State Street Navigator Securities Lending Government Money Market Portfolio | 2,620,748 | ||||||
| Total Investments: 108.0% (Cost: $32,578,581) | 34,565,784 | |||||||
| Liabilities in excess of other assets: (8.0)% | (2,568,028 | ) | ||||||
| NET ASSETS: 100.0% | $ | 31,997,756 | ||||||
Definitions:
| ADR | American Depositary Receipt |
| GBP | British Pound |
| GDR | Global Depositary Receipt |
| SEK | Swedish Krona |
Footnotes:
| * | Non-income producing |
| † | Security fully or partially on loan. Total market value of securities on loan is $2,655,770. |
| # | Security has been valued in good faith pursuant to guidelines established by the Board of Trustees. The aggregate value of fair valued securities is $27,506,973 which represents 86.0% of net assets. |
| Reg S | Security was purchased pursuant to Regulation S under the Securities Act of 1933, which exempts from registration securities offered and sold outside of the United States. Such a security cannot be sold in the United States without either an effective registration statement filed pursuant to the Securities Act of 1933, or pursuant to an exemption from registration. |
| 144A | Security exempt from registration under Rule 144A of the Securities Act of 1933, as amended, or otherwise restricted. These securities may be resold in transactions exempt from registration, unless otherwise noted, and the value amounted to $2,412,138, or 7.5% of net assets. |
See Notes to Financial Statements
| 44 |
| Summary of Investments by Sector Excluding Collateral for Securities Loaned | % of Investments | Value | ||||||
| Communication Services | 7.7 | % | $ | 2,457,636 | ||||
| Consumer Discretionary | 10.0 | 3,186,050 | ||||||
| Consumer Staples | 4.6 | 1,467,242 | ||||||
| Energy | 1.4 | 452,634 | ||||||
| Financials | 13.2 | 4,201,407 | ||||||
| Industrials | 21.5 | 6,865,441 | ||||||
| Information Technology | 3.4 | 1,080,264 | ||||||
| Materials | 13.3 | 4,262,292 | ||||||
| Real Estate | 10.3 | 3,297,467 | ||||||
| Utilities | 14.6 | 4,674,603 | ||||||
| 100.0 | % | $ | 31,945,036 | |||||
The summary of inputs used to value the Fund’s investments as of December 31, 2020 is as follows:
| Level 1 Quoted Prices | Level 2 Significant Observable Inputs | Level 3 Significant Unobservable Inputs | Value | ||||||||||||||
| Common Stocks | |||||||||||||||||
| Banks | $ | — | $ | 2,066,272 | $ | — | $ | 2,066,272 | |||||||||
| Commercial & Professional Services | 1,607,606 | 1,631,861 | — | 3,239,467 | |||||||||||||
| Diversified Financials | — | 2,135,135 | — | 2,135,135 | |||||||||||||
| Energy | — | 452,634 | — | 452,634 | |||||||||||||
| Food & Staples Retailing | — | 1,467,242 | — | 1,467,242 | |||||||||||||
| Materials | 1,155,069 | 3,107,223 | — | 4,262,292 | |||||||||||||
| Real Estate | — | 3,297,467 | — | 3,297,467 | |||||||||||||
| Retailing | — | 3,186,050 | — | 3,186,050 | |||||||||||||
| Software & Services | 1,080,264 | — | — | 1,080,264 | |||||||||||||
| Telecommunication Services | — | 2,457,636 | — | 2,457,636 | |||||||||||||
| Transportation | — | 3,625,974 | — | 3,625,974 | |||||||||||||
| Utilities | — | 4,079,479 | — | 4,079,479 | |||||||||||||
| Preferred Stock* | 595,124 | — | — | 595,124 | |||||||||||||
| Money Market Fund | 2,620,748 | — | — | 2,620,748 | |||||||||||||
| Total | $ | 7,058,811 | $ | 27,506,973 | $ | — | $ | 34,565,784 | |||||||||
| * | See Schedule of Investments for industry sector breakouts. |
See Notes to Financial Statements
| 45 |
SCHEDULE OF INVESTMENTS
December 31, 2020
| Number of Shares | Value | |||||||
| COMMON STOCKS: 99.8% | ||||||||
| Banks: 6.2% | ||||||||
| 6,688,632 | Bank for Foreign Trade of Vietnam JSC # | $ | 28,423,813 | |||||
| Capital Goods: 2.5% | ||||||||
| 5,828,580 | Hoang Huy Investment Financial Services JSC # | 5,033,157 | ||||||
| 6,374,425 | Vietnam Electrical Equipment * # | 6,222,889 | ||||||
| 11,256,046 | ||||||||
| Consumer Durables & Apparel: 10.3% | ||||||||
| 1,373,160 | Eclat Textile Co. Ltd. # | 20,682,693 | ||||||
| 2,871,000 | Feng TAY Enterprise Co. Ltd. # | 20,423,158 | ||||||
| 366,655 | Hansae Co. Ltd. (KRW) # | 5,917,304 | ||||||
| 47,023,155 | ||||||||
| Diversified Financials: 3.6% | ||||||||
| 11,456,515 | Saigon Securities, Inc. # | 16,468,757 | ||||||
| Food, Beverage & Tobacco: 14.3% | ||||||||
| 5,813,130 | Masan Group Corp. # | 22,400,838 | ||||||
| 9,464,981 | Thanh Thanh Cong Tay Ninh JSC # | 8,586,761 | ||||||
| 7,241,341 | Vietnam Dairy Products JSC # | 34,164,857 | ||||||
| 65,152,456 | ||||||||
| Health Care Equipment & Services: 4.6% | ||||||||
| 768,800 | MANI, Inc. # | 20,973,001 | ||||||
| Insurance: 2.2% | ||||||||
| 3,537,996 | Bao Viet Holdings # | 10,126,745 | ||||||
| Materials: 5.6% | ||||||||
| 14,194,302 | Hoa Phat Group JSC # | 25,555,113 | ||||||
| Number of Shares | Value | |||||||
| Real Estate: 25.2% | ||||||||
| 9,487,306 | No Va Land Investment Group Corp. * # | $ | 27,110,538 | |||||
| 15,738,022 | Vincom Retail JSC * # | 21,445,530 | ||||||
| 7,495,522 | Vingroup JSC * # | 35,187,865 | ||||||
| 8,177,652 | Vinhomes JSC Reg S 144A * # | 31,706,951 | ||||||
| 115,450,884 | ||||||||
| Technology Hardware & Equipment: 20.4% | ||||||||
| 797,672 | BH Co. Ltd. (KRW) # | 16,169,017 | ||||||
| 954,512 | Dreamtech Co. Ltd. (KRW) # | 10,299,842 | ||||||
| 668,200 | KH Vatec Co. Ltd. (KRW) * # | 12,581,447 | ||||||
| 478,083 | MCNEX Co. Ltd. (KRW) † # | 17,818,444 | ||||||
| 417,940 | Seojin System Co. Ltd. (KRW) # | 19,487,247 | ||||||
| 2,470,390 | Synopex, Inc. (KRW) * # | 9,612,959 | ||||||
| 445,632 | UTI, Inc. (KRW) # | 7,506,628 | ||||||
| 93,475,584 | ||||||||
| Transportation: 2.7% | ||||||||
| 2,305,040 | Vietjet Aviation JSC # | 12,491,305 | ||||||
| Utilities: 2.2% | ||||||||
| 17,171,710 | PetroVietnam Power Corp. * # | 10,135,111 | ||||||
| Total Common Stocks (Cost: $321,060,213) | 456,531,970 | |||||||
| EXCHANGE TRADED FUND: 0.0% (Cost: $42,158) | ||||||||
| 62,610 | VFMVN Diamond ETF * | 46,654 | ||||||
| Total Investments: 99.8% (Cost: $321,102,371) | 456,578,624 | |||||||
| Other assets less liabilities: 0.2% | 710,802 | |||||||
| NET ASSETS: 100.0% | $ | 457,289,426 | ||||||
Definitions:
| KRW | Korean Won |
Footnotes:
| * | Non-income producing |
| † | Security fully or partially on loan. Total market value of securities on loan is $2,236,236. |
| # | Security has been valued in good faith pursuant to guidelines established by the Board of Trustees. The aggregate value of fair valued securities is $456,531,970 which represents 99.8% of net assets. |
| Reg S | Security was purchased pursuant to Regulation S under the Securities Act of 1933, which exempts from registration securities offered and sold outside of the United States. Such a security cannot be sold in the United States without either an effective registration statement filed pursuant to the Securities Act of 1933, or pursuant to an exemption from registration. |
| 144A | Security exempt from registration under Rule 144A of the Securities Act of 1933, as amended, or otherwise restricted. These securities may be resold in transactions exempt from registration, unless otherwise noted, and the value amounted to $31,706,951, or 6.9% of net assets. |
See Notes to Financial Statements
| 46 |
| Summary of Investments by Sector | % of Investments | Value | ||||||
| Consumer Discretionary | 10.3 | % | $ | 47,023,155 | ||||
| Consumer Staples | 14.3 | 65,152,456 | ||||||
| Exchange Traded Fund | 0.0 | 46,654 | ||||||
| Financials | 12.0 | 55,019,315 | ||||||
| Health Care | 4.6 | 20,973,001 | ||||||
| Industrials | 5.2 | 23,747,351 | ||||||
| Information Technology | 20.5 | 93,475,584 | ||||||
| Materials | 5.6 | 25,555,113 | ||||||
| Real Estate | 25.3 | 115,450,884 | ||||||
| Utilities | 2.2 | 10,135,111 | ||||||
| 100.0 | % | $ | 456,578,624 | |||||
The summary of inputs used to value the Fund’s investments as of December 31, 2020 is as follows:
| Level 1 Quoted Prices | Level 2 Observable | Level 3 Significant Unobservable Inputs | Value | ||||||||||||||
| Common Stocks* | $ | — | $ | 456,531,970 | $ | — | $ | 456,531,970 | |||||||||
| Exchange Traded Fund | 46,654 | — | — | 46,654 | |||||||||||||
| Total | $ | 46,654 | $ | 456,531,970 | $ | — | $ | 456,578,624 | |||||||||
| * | See Schedule of Investments for industry sector breakouts. |
See Notes to Financial Statements
| 47 |
VANECK VECTORS ETF TRUST
STATEMENTS OF ASSETS AND LIABILITIES
December 31, 2020
| Africa Index ETF | Brazil Small-Cap ETF | China Growth Leaders ETF | ChinaAMC SME-ChiNext ETF | Egypt Index ETF | |||||||||||||||||||||
| Assets: | |||||||||||||||||||||||||
| Investments, at value Unaffiliated issuers (1) (2) | $ | 52,487,634 | $ | 54,605,130 | $ | 51,348,794 | $ | 48,925,010 | $ | 19,227,753 | |||||||||||||||
| Short-term investments held as collateral for securities loaned (3) | 283,655 | 3,283,495 | 38,384 | — | — | ||||||||||||||||||||
| Cash | 47,766 | 88,044 | 304,427 | — | 541,490 | ||||||||||||||||||||
| Cash denominated in foreign currency, at value (4) | 1,778 | 5,020 | 1,402,354 | 439,536 | (b) | 133,722 | |||||||||||||||||||
| Receivables: | |||||||||||||||||||||||||
| Investment securities sold | — | 631 | — | — | — | ||||||||||||||||||||
| Shares of beneficial interest sold | 4,578 | 15 | — | — | — | ||||||||||||||||||||
| Dividends and interest | 39,022 | 122,223 | 264 | — | 88,735 | ||||||||||||||||||||
| Due from custodian | — | — | — | — | 562,782 | ||||||||||||||||||||
| Prepaid expenses | 879 | 879 | 875 | 876 | 873 | ||||||||||||||||||||
| Total assets | 52,865,312 | 58,105,437 | 53,095,098 | 49,365,422 | 20,555,355 | ||||||||||||||||||||
| Liabilities: | |||||||||||||||||||||||||
| Payables: | |||||||||||||||||||||||||
| Investment securities purchased | — | 631 | — | — | — | ||||||||||||||||||||
| Collateral for securities loaned | 283,655 | 3,283,495 | 38,384 | — | — | ||||||||||||||||||||
| Line of credit | — | — | 1,406,843 | 278,314 | 1,232,892 | ||||||||||||||||||||
| Due to Adviser | 32,464 | 19,693 | 59,929 | 20,387 | 23,776 | ||||||||||||||||||||
| Due to custodian | — | — | — | 4,663 | — | ||||||||||||||||||||
| Deferred Trustee fees | 12,522 | 37,570 | 5,247 | 702 | 5,690 | ||||||||||||||||||||
| Accrued expenses | 105,036 | 102,157 | 66,740 | 112,338 | 80,284 | ||||||||||||||||||||
| Total liabilities | 433,677 | 3,443,546 | 1,577,143 | 416,404 | 1,342,642 | ||||||||||||||||||||
| NET ASSETS | $ | 52,431,635 | $ | 54,661,891 | $ | 51,517,955 | $ | 48,949,018 | $ | 19,212,713 | |||||||||||||||
| Shares outstanding | 2,600,000 | 2,550,000 | 1,100,000 | 1,000,000 | 749,974 | ||||||||||||||||||||
| Net asset value, redemption and offering price per share | $ | 20.17 | $ | 21.44 | $ | 46.83 | $ | 48.95 | $ | 25.62 | |||||||||||||||
| Net Assets consist of: | |||||||||||||||||||||||||
| Aggregate paid in capital | $ | 107,588,533 | $ | 209,571,389 | $ | 41,263,427 | $ | 37,776,742 | $ | 55,375,933 | |||||||||||||||
| Total distributable earnings (loss) | (55,156,898 | ) | (154,909,498 | ) | 10,254,528 | 11,172,276 | (36,163,220 | ) | |||||||||||||||||
| NET ASSETS | $ | 52,431,635 | $ | 54,661,891 | $ | 51,517,955 | $ | 48,949,018 | $ | 19,212,713 | |||||||||||||||
| (1) Value of securities on loan | $ | 1,969,822 | $ | 4,062,877 | $ | 169,979 | $ | — | $ | — | |||||||||||||||
| (2) Cost of investments | $ | 42,362,204 | $ | 45,327,922 | $ | 41,167,962 | $ | 25,110,945 | $ | 17,717,970 | |||||||||||||||
| (3) Cost of short-term investments held as collateral for securities loaned | $ | 283,655 | $ | 3,283,495 | $ | 38,384 | $ | — | $ | — | |||||||||||||||
| (4) Cost of cash denominated in foreign currency | $ | 1,646 | $ | 5,014 | $ | 1,324,596 | $ | 436,409 | $ | 133,867 | |||||||||||||||
| (a) | Represents Consolidated Statement of Assets and Liabilities. |
| (b) | Includes $9,464 on foreign investor minimum settlement reserve funds (See Note 2H). |
See Notes to Financial Statements
| 48 |
| India Growth Leaders ETF (a) | Indonesia Index ETF | Israel ETF | Russia ETF | Russia Small-Cap ETF | Vietnam ETF | ||||||||||||||||||||||||
| $ | 68,237,494 | $ | 35,833,343 | $ | 75,128,297 | $ | 1,619,467,817 | $ | 31,945,036 | $ | 456,578,624 | ||||||||||||||||||
| — | 89,746 | 1,102,074 | 495,767 | 2,620,748 | — | ||||||||||||||||||||||||
| 6 | 181,268 | — | 188,416 | 359,629 | 34 | ||||||||||||||||||||||||
| 1,681,218 | — | — | 747,957 | 33,491 | 1,241,414 | ||||||||||||||||||||||||
| — | — | — | 308,884 | — | — | ||||||||||||||||||||||||
| — | — | — | — | — | — | ||||||||||||||||||||||||
| 13,559 | 230 | 92,563 | 7,351,867 | 85,282 | 875,011 | ||||||||||||||||||||||||
| — | — | — | — | — | — | ||||||||||||||||||||||||
| 1,742 | 878 | 1,743 | 4,348 | 879 | 4,343 | ||||||||||||||||||||||||
| 69,934,019 | 36,105,465 | 76,324,677 | 1,628,565,056 | 35,045,065 | 458,699,426 | ||||||||||||||||||||||||
| — | — | — | 5,087,431 | 159,404 | — | ||||||||||||||||||||||||
| — | 89,746 | 1,102,074 | 495,767 | 2,620,748 | — | ||||||||||||||||||||||||
| 1,324,498 | — | — | — | — | 980,608 | ||||||||||||||||||||||||
| 62,148 | 17,922 | 47,345 | 666,821 | 55,401 | 182,496 | ||||||||||||||||||||||||
| — | — | 31,364 | — | — | — | ||||||||||||||||||||||||
| 14,539 | 31,525 | 3,493 | 178,562 | 3,153 | 47,397 | ||||||||||||||||||||||||
| 174,451 | 117,251 | 73,192 | 952,009 | 208,603 | 199,499 | ||||||||||||||||||||||||
| 1,575,636 | 256,444 | 1,257,468 | 7,380,590 | 3,047,309 | 1,410,000 | ||||||||||||||||||||||||
| $ | 68,358,383 | $ | 35,849,021 | $ | 75,067,209 | $ | 1,621,184,466 | $ | 31,997,756 | $ | 457,289,426 | ||||||||||||||||||
| 2,074,967 | 1,750,000 | 1,675,000 | 68,050,000 | 883,318 | 26,100,000 | ||||||||||||||||||||||||
| $ | 32.94 | $ | 20.49 | $ | 44.82 | $ | 23.82 | $ | 36.22 | $ | 17.52 | ||||||||||||||||||
| $ | 147,431,765 | $ | 153,032,394 | $ | 57,924,027 | $ | 3,171,635,578 | $ | 44,217,000 | $ | 663,518,311 | ||||||||||||||||||
| (79,073,382 | ) | (117,183,373 | ) | 17,143,182 | (1,550,451,112 | ) | (12,219,244 | ) | (206,228,885 | ) | |||||||||||||||||||
| $ | 68,358,383 | $ | 35,849,021 | $ | 75,067,209 | $ | 1,621,184,466 | $ | 31,997,756 | $ | 457,289,426 | ||||||||||||||||||
| $ | — | $ | 1,798,904 | $ | 4,361,345 | $ | 7,039,403 | $ | 2,655,770 | $ | 2,236,236 | ||||||||||||||||||
| $ | 49,878,670 | $ | 46,239,312 | $ | 48,872,983 | $ | 1,628,567,616 | $ | 29,957,833 | $ | 321,102,371 | ||||||||||||||||||
| $ | — | $ | 89,746 | $ | 1,102,074 | $ | 495,767 | $ | 2,620,748 | $ | — | ||||||||||||||||||
| $ | 1,680,238 | $ | — | $ | — | $ | 728,669 | $ | 33,475 | $ | 1,238,977 | ||||||||||||||||||
See Notes to Financial Statements
| 49 |
VANECK VECTORS ETF TRUST
For the Year Ended December 31, 2020
| Africa Index ETF | Brazil Small-Cap ETF | China Growth Leaders ETF | ChinaAMC SME-ChiNext ETF | Egypt Index ETF | |||||||||||||||||||||
| Income: | |||||||||||||||||||||||||
| Dividends | $ | 1,733,782 | $ | 1,339,542 | $ | 701,018 | $ | 287,985 | $ | 854,372 | |||||||||||||||
| Interest | 92 | 537 | 39,210 | 6,367 | 528 | ||||||||||||||||||||
| Securities lending income | 20,775 | 53,620 | 2,772 | — | — | ||||||||||||||||||||
| Foreign taxes withheld | (151,328 | ) | (79,084 | ) | (61,584 | ) | (29,132 | ) | (68,829 | ) | |||||||||||||||
| Total income | 1,603,321 | 1,314,615 | 681,416 | 265,220 | 786,071 | ||||||||||||||||||||
| Expenses: | |||||||||||||||||||||||||
| Management fees | 211,779 | 282,104 | 227,466 | 184,554 | 115,230 | ||||||||||||||||||||
| Professional fees | 72,643 | 74,000 | 61,570 | 76,423 | 72,301 | ||||||||||||||||||||
| Custody and accounting fees | 66,370 | 72,380 | 151,814 | 92,837 | 30,082 | ||||||||||||||||||||
| Reports to shareholders | 19,765 | 17,516 | 16,643 | 16,770 | 12,391 | ||||||||||||||||||||
| IOPV fees | 5,882 | 5,038 | 5,882 | 4,277 | 5,038 | ||||||||||||||||||||
| Trustees’ fees and expenses | 1,719 | 2,956 | 2,880 | 1,269 | 1,166 | ||||||||||||||||||||
| Registration fees | 5,995 | 5,995 | 5,996 | 5,995 | 5,995 | ||||||||||||||||||||
| Insurance | 2,710 | 2,872 | 2,789 | 1,765 | 2,606 | ||||||||||||||||||||
| Interest | 2,334 | 8,248 | 99,407 | 38,663 | 9,296 | ||||||||||||||||||||
| Mauritius income taxes | — | — | — | — | — | ||||||||||||||||||||
| Other | 1,161 | 1,142 | 645 | 653 | 561 | ||||||||||||||||||||
| Total expenses | 390,358 | 472,251 | 575,092 | 423,206 | 254,666 | ||||||||||||||||||||
| Waiver of management fees | (57,606 | ) | (131,494 | ) | (227,466 | ) | (183,092 | ) | (28,822 | ) | |||||||||||||||
| Expenses assumed by the Adviser | — | — | (75,361 | ) | — | — | |||||||||||||||||||
| Net expenses | 332,752 | 340,757 | 272,265 | 240,114 | 225,844 | ||||||||||||||||||||
| Net investment income | 1,270,569 | 973,858 | 409,151 | 25,106 | 560,227 | ||||||||||||||||||||
| Net realized gain (loss) on: | |||||||||||||||||||||||||
| Investments | (3,425,281 | ) | (2,455,273 | )(b) | 14,017,344 | 2,914,744 | (4,089,240 | ) | |||||||||||||||||
| Increase from payment from Adviser (see Note 3) | — | — | 57,732 | 17,518 | — | ||||||||||||||||||||
| In-kind redemptions | 147,851 | (471,949 | ) | 360,869 | — | 99,624 | |||||||||||||||||||
| Foreign currency transactions and foreign denominated assets and liabilities | (40,656 | ) | (76,002 | ) | (303,561 | ) | (98,592 | ) | (45,787 | ) | |||||||||||||||
| Net realized gain (loss) | (3,318,086 | ) | (3,003,224 | ) | 14,132,384 | 2,833,670 | (4,035,403 | ) | |||||||||||||||||
| Net change in unrealized appreciation (depreciation) on: | |||||||||||||||||||||||||
| Investments | 2,864,252 | (20,823,348 | ) | (7,395,891 | ) | 15,524,369 | (769,001 | ) | |||||||||||||||||
| Foreign currency transactions and foreign denominated assets and liabilities | 55 | (3,687 | ) | 69,609 | 3,106 | (923 | ) | ||||||||||||||||||
| Net change in unrealized appreciation (depreciation) | 2,864,307 | (20,827,035 | ) | (7,326,282 | ) | 15,527,475 | (769,924 | ) | |||||||||||||||||
| Net Increase (Decrease) in Net Assets Resulting from Operations | $ | 816,790 | $ | (22,856,401 | ) | $ | 7,215,253 | $ | 18,386,251 | $ | (4,245,100 | ) | |||||||||||||
| (a) | Represents Consolidated Statement of Operations. |
| (b) | Net of foreign taxes $1,880. |
See Notes to Financial Statements
| 50 |
| India Growth Leaders ETF (a) | Indonesia Index ETF | Israel ETF | Russia ETF | Russia Small-Cap ETF | Vietnam ETF | ||||||||||||||||||||||||
| $ | 1,421,862 | $ | 1,026,086 | $ | 515,734 | $ | 62,599,069 | $ | 1,285,710 | $ | 4,470,346 | ||||||||||||||||||
| 888 | 501 | 247 | 4,979 | 479 | 290 | ||||||||||||||||||||||||
| — | 1,250 | 86,600 | 28,466 | 74,315 | 71,399 | ||||||||||||||||||||||||
| (145,259 | ) | (162,063 | ) | (99,207 | ) | (7,823,819 | ) | (79,930 | ) | (256,683 | ) | ||||||||||||||||||
| 1,277,491 | 865,774 | 503,374 | 54,808,695 | 1,280,574 | 4,285,352 | ||||||||||||||||||||||||
| 401,208 | 166,361 | 298,647 | 5,412,011 | 152,411 | 1,852,953 | ||||||||||||||||||||||||
| 192,018 | 71,508 | 75,340 | 74,950 | 71,304 | 71,554 | ||||||||||||||||||||||||
| 130,598 | 52,515 | 64,375 | 886,686 | 147,366 | 210,060 | ||||||||||||||||||||||||
| 24,357 | 14,300 | 13,577 | 63,823 | 12,046 | 42,514 | ||||||||||||||||||||||||
| 5,882 | 5,882 | 5,038 | 10,591 | 5,882 | 6,354 | ||||||||||||||||||||||||
| 30,793 | 2,580 | 1,802 | 39,410 | 1,438 | 13,023 | ||||||||||||||||||||||||
| 5,995 | 5,995 | 5,995 | 10,250 | 4,984 | 4,984 | ||||||||||||||||||||||||
| 5,002 | 1,891 | 3,503 | 20,011 | 1,828 | 10,315 | ||||||||||||||||||||||||
| 43,426 | — | 6,616 | 43,782 | 986 | 40,638 | ||||||||||||||||||||||||
| 114,361 | — | — | — | — | — | ||||||||||||||||||||||||
| 40,114 | 591 | 1,065 | 22,674 | 525 | 2,482 | ||||||||||||||||||||||||
| 993,754 | 321,623 | 475,958 | 6,584,188 | 398,770 | 2,254,877 | ||||||||||||||||||||||||
| (155,333 | ) | (132,060 | ) | (116,929 | ) | — | (152,411 | ) | — | ||||||||||||||||||||
| — | — | — | — | (16,820 | ) | — | |||||||||||||||||||||||
| 838,421 | 189,563 | 359,029 | 6,584,188 | 229,539 | 2,254,877 | ||||||||||||||||||||||||
| 439,070 | 676,211 | 144,345 | 48,224,507 | 1,051,035 | 2,030,475 | ||||||||||||||||||||||||
| (36,669,063 | ) | (4,549,419 | ) | 1,010,946 | (110,746,736 | ) | (4,103,756 | ) | (53,026,878 | ) | |||||||||||||||||||
| — | — | — | — | — | — | ||||||||||||||||||||||||
| 580,194 | 2,766,221 | 2,184,913 | 75,822,816 | 653,642 | 798,939 | ||||||||||||||||||||||||
| (418,797 | ) | (23,878 | ) | (4,491 | ) | (23,197 | ) | (9,946 | ) | (400,541 | ) | ||||||||||||||||||
| (36,507,666 | ) | (1,807,076 | ) | 3,191,368 | (34,947,117 | ) | (3,460,060 | ) | (52,628,480 | ) | |||||||||||||||||||
| 26,438,252 | (2,555,558 | ) | 13,431,785 | (7,605,000 | ) | 3,556,167 | 78,553,928 | ||||||||||||||||||||||
| 2,688 | (12 | ) | (188 | ) | 3,765 | (489 | ) | 2,915 | |||||||||||||||||||||
| 26,440,940 | (2,555,570 | ) | 13,431,597 | (7,601,235 | ) | 3,555,678 | 78,556,843 | ||||||||||||||||||||||
| $ | (9,627,656 | ) | $ | (3,686,435 | ) | $ | 16,767,310 | $ | 5,676,155 | $ | 1,146,653 | $ | 27,958,838 | ||||||||||||||||
See Notes to Financial Statements
| 51 |
VANECK VECTORS ETF TRUST
STATEMENTS OF CHANGES IN NET ASSETS
| Africa Index ETF | Brazil Small-Cap ETF | |||||||||||||||||||
| Year Ended December 31, 2020 | Year Ended December 31, 2019 | Year Ended December 31, 2020 | Year Ended December 31, 2019 | |||||||||||||||||
| Operations: | ||||||||||||||||||||
| Net investment income | $ | 1,270,569 | $ | 2,868,210 | $ | 973,858 | $ | 2,257,232 | ||||||||||||
| Net realized gain (loss) | (3,318,086 | ) | (2,433,758 | ) | (3,003,224 | ) | 9,890,910 | |||||||||||||
| Increase from payment from Adviser (see Note 3) | — | — | — | 372,975 | ||||||||||||||||
| Net change in unrealized appreciation (depreciation) | 2,864,307 | 3,995,501 | (20,827,035 | ) | 18,136,058 | |||||||||||||||
| Net increase (decrease) in net assets resulting from operations | 816,790 | 4,429,953 | (22,856,401 | ) | 30,657,175 | |||||||||||||||
| Distributions to shareholders: | ||||||||||||||||||||
| From distributable earnings | (1,990,000 | ) | (3,150,210 | ) | (899,895 | ) | (2,475,060 | ) | ||||||||||||
| Share transactions:* | ||||||||||||||||||||
| Proceeds from sale of shares | 4,077,573 | — | — | — | ||||||||||||||||
| Cost of shares redeemed | (696,293 | ) | (6,279,035 | ) | (19,205,846 | ) | (18,955,215 | ) | ||||||||||||
| Increase (decrease) in net assets resulting from share transactions | 3,381,280 | (6,279,035 | ) | (19,205,846 | ) | (18,955,215 | ) | |||||||||||||
| Total increase (decrease) in net assets | 2,208,070 | (4,999,292 | ) | (42,962,142 | ) | 9,226,900 | ||||||||||||||
| Net Assets, beginning of year | 50,223,565 | 55,222,857 | 97,624,033 | 88,397,133 | ||||||||||||||||
| Net Assets, end of year | $ | 52,431,635 | $ | 50,223,565 | $ | 54,661,891 | $ | 97,624,033 | ||||||||||||
| * Shares of Common Stock Issued (no par value) | ||||||||||||||||||||
| Shares sold | 200,000 | — | — | — | ||||||||||||||||
| Shares redeemed | (50,000 | ) | (300,000 | ) | (1,000,000 | ) | (850,000 | ) | ||||||||||||
| Net increase (decrease) | 150,000 | (300,000 | ) | (1,000,000 | ) | (850,000 | ) | |||||||||||||
See Notes to Financial Statements
| 52 |
| China Growth Leaders ETF | ChinaAMC SME-ChiNext ETF | Egypt Index ETF | ||||||||||||||||||||||||||
| Year Ended December 31, 2020 | Year Ended December 31, 2019 | Year Ended December 31, 2020 | Year Ended December 31, 2019 | Year Ended December 31, 2020 | Year Ended December 31, 2019 | |||||||||||||||||||||||
| $ | 409,151 | $ | 1,138,595 | $ | 25,106 | $ | 105,891 | $ | 560,227 | $ | 740,019 | |||||||||||||||||
| 14,074,652 | (3,500,097 | ) | 2,816,152 | (3,224,352 | ) | (4,035,403 | ) | (2,645,772 | ) | |||||||||||||||||||
| 57,732 | — | 17,518 | — | — | — | |||||||||||||||||||||||
| (7,326,282 | ) | 19,454,132 | 15,527,475 | 9,178,141 | (769,924 | ) | 1,577,163 | |||||||||||||||||||||
| 7,215,253 | 17,092,630 | 18,386,251 | 6,059,680 | (4,245,100 | ) | (328,590 | ) | |||||||||||||||||||||
| (6,633,990 | ) | (985,120 | ) | (3,800 | ) | (135,000 | ) | (499,984 | ) | (650,037 | ) | |||||||||||||||||
| 47,623,122 | 20,798,155 | 30,434,278 | 14,409,463 | 2,595,503 | 23,237,784 | |||||||||||||||||||||||
| (64,107,257 | ) | (23,178,285 | ) | (29,674,046 | ) | (6,258,128 | ) | (10,031,819 | ) | (24,088,922 | ) | |||||||||||||||||
| (16,484,135 | ) | (2,380,130 | ) | 760,232 | 8,151,335 | (7,436,316 | ) | (851,138 | ) | |||||||||||||||||||
| (15,902,872 | ) | 13,727,380 | 19,142,683 | 14,076,015 | (12,181,400 | ) | (1,829,765 | ) | ||||||||||||||||||||
| 67,420,827 | 53,693,447 | 29,806,335 | 15,730,320 | 31,394,113 | 33,223,878 | |||||||||||||||||||||||
| $ | 51,517,955 | $ | 67,420,827 | $ | 48,949,018 | $ | 29,806,335 | $ | 19,212,713 | $ | 31,394,113 | |||||||||||||||||
| 1,150,000 | 500,000 | 900,000 | 500,000 | 100,000 | 700,000 | |||||||||||||||||||||||
| (1,650,000 | ) | (600,000 | ) | (900,000 | ) | (250,000 | ) | (425,000 | ) | (800,000 | ) | |||||||||||||||||
| (500,000 | ) | (100,000 | ) | — | 250,000 | (325,000 | ) | (100,000 | ) | |||||||||||||||||||
See Notes to Financial Statements
| 53 |
VANECK VECTORS ETF TRUST
STATEMENTS OF CHANGES IN NET ASSETS
(continued)
| India Growth Leaders ETF (a) | Indonesia Index ETF | |||||||||||||||||||
| Year Ended December 31, 2020 | Year Ended December 31, 2019 | Year Ended December 31, 2020 | Year Ended December 31, 2019 | |||||||||||||||||
| Operations: | ||||||||||||||||||||
| Net investment income | $ | 439,070 | $ | 2,054,079 | $ | 676,211 | $ | 764,133 | ||||||||||||
| Net realized gain (loss) | (36,507,666 | ) | (39,335,646 | ) | (1,807,076 | ) | (617,672 | ) | ||||||||||||
| Net change in unrealized appreciation (depreciation) | 26,440,940 | (585,632 | ) | (2,555,570 | ) | 2,357,875 | ||||||||||||||
| Net increase (decrease) in net assets resulting from operations | (9,627,656 | ) | (37,867,199 | ) | (3,686,435 | ) | 2,504,336 | |||||||||||||
| Distributions to shareholders: | ||||||||||||||||||||
| From distributable earnings | (178,129 | ) | (1,600,209 | ) | (600,075 | ) | (850,140 | ) | ||||||||||||
| Return of capital | — | — | — | — | ||||||||||||||||
| Total distributions | (178,129 | ) | (1,600,209 | ) | (600,075 | ) | (850,140 | ) | ||||||||||||
| Share transactions:* | ||||||||||||||||||||
| Proceeds from sale of shares | — | 9,562,351 | 27,619,482 | 1,105,121 | ||||||||||||||||
| Cost of shares redeemed | (43,873,347 | ) | (35,496,590 | ) | (28,309,693 | ) | (6,734,141 | ) | ||||||||||||
| Increase (decrease) in net assets resulting from share transactions | (43,873,347 | ) | (25,934,239 | ) | (690,211 | ) | (5,629,020 | ) | ||||||||||||
| Total increase (decrease) in net assets | (53,679,132 | ) | (65,401,647 | ) | (4,976,721 | ) | (3,974,824 | ) | ||||||||||||
| Net Assets, beginning of year | 122,037,515 | 187,439,162 | 40,825,742 | 44,800,566 | ||||||||||||||||
| Net Assets, end of year | $ | 68,358,383 | $ | 122,037,515 | $ | 35,849,021 | $ | 40,825,742 | ||||||||||||
| * Shares of Common Stock Issued (no par value) | ||||||||||||||||||||
| Shares sold | — | 250,000 | 1,600,000 | 50,000 | ||||||||||||||||
| Shares redeemed | (1,650,000 | ) | (950,000 | ) | (1,650,000 | ) | (300,000 | ) | ||||||||||||
| Net increase (decrease) | (1,650,000 | ) | (700,000 | ) | (50,000 | ) | (250,000 | ) | ||||||||||||
| (a) | Represents Consolidated Statement of Changes in Net Assets. |
See Notes to Financial Statements
| 54 |
| Israel ETF | Russia ETF | Russia Small-Cap ETF | ||||||||||||||||||||||||||
| Year Ended December 31, 2020 | Year Ended December 31, 2019 | Year Ended December 31, 2020 | Year Ended December 31, 2019 | Year Ended December 31, 2020 | Year Ended December 31, 2019 | |||||||||||||||||||||||
| $ | 144,345 | $ | 320,572 | $ | 48,224,507 | $ | 71,398,887 | $ | 1,051,035 | $ | 1,646,695 | |||||||||||||||||
| 3,191,368 | 118,469 | (34,947,117 | ) | 78,531,516 | (3,460,060 | ) | (1,890,792 | ) | ||||||||||||||||||||
| 13,431,597 | 11,883,788 | (7,601,235 | ) | 300,156,557 | 3,555,678 | 11,025,005 | ||||||||||||||||||||||
| 16,767,310 | 12,322,829 | 5,676,155 | 450,086,960 | 1,146,653 | 10,780,908 | |||||||||||||||||||||||
| (127,803 | ) | (800,085 | ) | (52,666,239 | ) | (73,500,780 | ) | (1,399,971 | ) | (1,625,031 | ) | |||||||||||||||||
| — | — | (334,141 | ) | — | — | — | ||||||||||||||||||||||
| (127,803 | ) | (800,085 | ) | (53,000,380 | ) | (73,500,780 | ) | (1,399,971 | ) | (1,625,031 | ) | |||||||||||||||||
| 4,500,656 | — | 878,463,560 | 373,210,325 | — | — | |||||||||||||||||||||||
| (3,880,690 | ) | — | (491,881,611 | ) | (793,491,106 | ) | (3,085,140 | ) | (6,496,725 | ) | ||||||||||||||||||
| 619,966 | — | 386,581,949 | (420,280,781 | ) | (3,085,140 | ) | (6,496,725 | ) | ||||||||||||||||||||
| 17,259,473 | 11,522,744 | 339,257,724 | (43,694,601 | ) | (3,338,458 | ) | 2,659,152 | |||||||||||||||||||||
| 57,807,736 | 46,284,992 | 1,281,926,742 | 1,325,621,343 | 35,336,214 | 32,677,062 | |||||||||||||||||||||||
| $ | 75,067,209 | $ | 57,807,736 | $ | 1,621,184,466 | $ | 1,281,926,742 | $ | 31,997,756 | $ | 35,336,214 | |||||||||||||||||
| 125,000 | — | 39,500,000 | 17,000,000 | — | — | |||||||||||||||||||||||
| (100,000 | ) | — | (22,800,000 | ) | (36,200,000 | ) | (100,000 | ) | (200,000 | ) | ||||||||||||||||||
| 25,000 | — | 16,700,000 | (19,200,000 | ) | (100,000 | ) | (200,000 | ) | ||||||||||||||||||||
See Notes to Financial Statements
| 55 |
VANECK VECTORS ETF TRUST
STATEMENTS OF CHANGES IN NET ASSETS
(continued)
| Vietnam ETF | ||||||||||
| Year Ended December 31, 2020 | Year Ended December 31, 2019 | |||||||||
| Operations: | ||||||||||
| Net investment income | $ | 2,030,475 | $ | 3,804,531 | ||||||
| Net realized loss | (52,628,480 | ) | (21,262,075 | ) | ||||||
| Net change in unrealized appreciation (depreciation) | 78,556,843 | 44,556,208 | ||||||||
| Net increase in net assets resulting from operations | 27,958,838 | 27,098,664 | ||||||||
| Distributions to shareholders: | ||||||||||
| From distributable earnings | (1,644,751 | ) | (3,336,840 | ) | ||||||
| Return of capital | (182,249 | ) | — | |||||||
| Total distributions | (1,827,000 | ) | (3,336,840 | ) | ||||||
| Share transactions:* | ||||||||||
| Proceeds from sale of shares | 35,837,932 | 133,626,985 | ||||||||
| Cost of shares redeemed | (47,640,582 | ) | (32,097,680 | ) | ||||||
| Increase (decrease) in net assets resulting from share transactions | (11,802,650 | ) | 101,529,305 | |||||||
| Total increase in net assets | 14,329,188 | 125,291,129 | ||||||||
| Net Assets, beginning of year | 442,960,238 | 317,669,109 | ||||||||
| Net Assets, end of year | $ | 457,289,426 | $ | 442,960,238 | ||||||
| * Shares of Common Stock Issued (no par value) | ||||||||||
| Shares sold | 2,450,000 | 8,200,000 | ||||||||
| Shares redeemed | (3,950,000 | ) | (2,000,000 | ) | ||||||
| Net increase (decrease) | (1,500,000 | ) | 6,200,000 | |||||||
See Notes to Financial Statements
| 56 |
VANECK VECTORS ETF TRUST
FINANCIAL HIGHLIGHTS
For a share outstanding throughout each year:
| (a) | Calculated based upon average shares outstanding |
| (b) | Total return is calculated assuming an initial investment made at the net asset value at the beginning of the year, reinvestment of any dividends and distributions at net asset value on the dividend/distributions payment date and a redemption at the net asset value on the last day of the year. The return includes adjustments in accordance with U.S. generally accepted accounting principles and as such, the net asset values for financial reporting purposes and the returns based upon those net asset values may differ from the net asset values and returns for shareholder transactions. The return does not reflect the deduction of taxes that a shareholder would pay on Fund dividends/distributions or the redemption of Fund shares. |
| (c) | Portfolio turnover rates exclude securities received or delivered as a result of processing in-kind capital share transactions. |
| (d) | Excludes reimbursement from prior year custodial charge of 0.01%. |
| (e) | For the year ended December 31, 2019, 0.55% of total return, representing $0.11 per share, consisted of a payment from the Adviser in connection with a reimbursement for an investment loss (See Note 3). |
See Notes to Financial Statements
| 57 |
VANECK VECTORS ETF TRUST
FINANCIAL HIGHLIGHTS
For a share outstanding throughout each year:
| (a) | Calculated based upon average shares outstanding |
| (b) | Total return is calculated assuming an initial investment made at the net asset value at the beginning of the year, reinvestment of any dividends and distributions at net asset value on the dividend/distributions payment date and a redemption at the net asset value on the last day of the year. The return includes adjustments in accordance with U.S. generally accepted accounting principles and as such, the net asset values for financial reporting purposes and the returns based upon those net asset values may differ from the net asset values and returns for shareholder transactions. The return does not reflect the deduction of taxes that a shareholder would pay on Fund dividends/distributions or the redemption of Fund shares. |
| (c) | Portfolio turnover rates exclude securities received or delivered as a result of processing in-kind capital share transactions. |
| (d) | Excludes reimbursement from prior year custodial charge of 0.02%. |
| (e) | Effective January 10, 2019, the Fund includes interest expense in the calculation of the expense limitation. The ratio only excludes interest expense accrued prior to January 10, 2019 and not waived under the expense limit agreement. |
| (f) | Amount represents less than $0.005 per share. |
| (g) | For the year ended December 31, 2020, 0.12% of total return, representing $0.05 per share, consisted of a payment by the Adviser (See Note 3). |
| (h) | For the year ended December 31, 2020, 0.07% of total return, representing $0.02 per share, consisted of a payment by the Adviser (See Note 3). |
See Notes to Financial Statements
| 58 |
FINANCIAL HIGHLIGHTS
For a share outstanding throughout each year:
| (a) | Calculated based upon average shares outstanding |
| (b) | Total return is calculated assuming an initial investment made at the net asset value at the beginning of the year, reinvestment of any dividends and distributions at net asset value on the dividend/distributions payment date and a redemption at the net asset value on the last day of the year. The return includes adjustments in accordance with U.S. generally accepted accounting principles and as such, the net asset values for financial reporting purposes and the returns based upon those net asset values may differ from the net asset values and returns for shareholder transactions. The return does not reflect the deduction of taxes that a shareholder would pay on Fund dividends/distributions or the redemption of Fund shares. |
| (c) | Portfolio turnover rates exclude securities received or delivered as a result of processing in-kind capital share transactions. |
| (d) | Represents Consolidated Financial Highlights |
| (e) | Excludes reimbursement from prior year custodial charge of 0.01% |
| (f) | The amount shown for a share outstanding does not correspond with the aggregate net gain (loss) on investments for the period due to the timing of sales and repurchases of shares in relation to fluctuating market values of the investments of the Fund. |
See Notes to Financial Statements
| 59 |
VANECK VECTORS ETF TRUST
FINANCIAL HIGHLIGHTS
For a share outstanding throughout each year:
| (a) | Calculated based upon average shares outstanding |
| (b) | Total return is calculated assuming an initial investment made at the net asset value at the beginning of the year, reinvestment of any dividends and distributions at net asset value on the dividend/distributions payment date and a redemption at the net asset value on the last day of the year. The return includes adjustments in accordance with U.S. generally accepted accounting principles and as such, the net asset values for financial reporting purposes and the returns based upon those net asset values may differ from the net asset values and returns for shareholder transactions. The return does not reflect the deduction of taxes that a shareholder would pay on Fund dividends/distributions or the redemption of Fund shares. |
| (c) | Portfolio turnover rates exclude securities received or delivered as a result of processing in-kind capital share transactions. |
See Notes to Financial Statements
| 60 |
FINANCIAL HIGHLIGHTS
For a share outstanding throughout each year:
| (a) | Calculated based upon average shares outstanding |
| (b) | Total return is calculated assuming an initial investment made at the net asset value at the beginning of the year, reinvestment of any dividends and distributions at net asset value on the dividend/distributions payment date and a redemption at the net asset value on the last day of the year. The return includes adjustments in accordance with U.S. generally accepted accounting principles and as such, the net asset values for financial reporting purposes and the returns based upon those net asset values may differ from the net asset values and returns for shareholder transactions. The return does not reflect the deduction of taxes that a shareholder would pay on Fund dividends/distributions or the redemption of Fund shares. |
| (c) | Portfolio turnover rates exclude securities received or delivered as a result of processing in-kind capital share transactions. |
| (d) | Effective May 1, 2016, the ratio excludes depositary receipt fees in excess of 0.10% of average daily net assets (See Note 3). |
| (e) | Effective May 1, 2016, the ratio excludes depositary receipt fees in excess of 0.08% of average daily net assets (See Note 3). |
See Notes to Financial Statements
| 61 |
VANECK VECTORS ETF TRUST
FINANCIAL HIGHLIGHTS
For a share outstanding throughout each year:
| (a) | Calculated based upon average shares outstanding |
| (b) | Total return is calculated assuming an initial investment made at the net asset value at the beginning of the year, reinvestment of any dividends and distributions at net asset value on the dividend/distributions payment date and a redemption at the net asset value on the last day of the year. The return includes adjustments in accordance with U.S. generally accepted accounting principles and as such, the net asset values for financial reporting purposes and the returns based upon those net asset values may differ from the net asset values and returns for shareholder transactions. The return does not reflect the deduction of taxes that a shareholder would pay on Fund dividends/distributions or the redemption of Fund shares. |
| (c) | Portfolio turnover rates exclude securities received or delivered as a result of processing in-kind capital share transactions. |
| (d) | Amount represents less than $0.005 per share. |
See Notes to Financial Statements
| 62 |
VANECK VECTORS ETF TRUST
December 31, 2020
Note 1—Fund Organization—VanEck Vectors ETF Trust (the “Trust”) is registered under the Investment Company Act of 1940, as amended, as an open-end management investment company. The Trust was incorporated in Delaware as a statutory trust on March 15, 2001. The Trust operates as a series fund, and offers multiple investment portfolios, each of which represents a separate series of the Trust. These financial statements relate only to the investment portfolios listed in the diversification table below (each a “Fund” and, collectively, the “Funds”).
| Fund | Diversification Classification |
| Africa Index ETF | Diversified |
| Brazil Small-Cap ETF | Diversified |
| China Growth Leaders ETF | Diversified |
| ChinaAMC SME-ChiNext ETF | Diversified |
| Egypt Index ETF | Non-Diversified |
| India Growth Leaders ETF | Diversified |
| Indonesia Index ETF | Non-Diversified |
| Israel ETF | Non-Diversified |
| Russia ETF | Non-Diversified |
| Russia Small-Cap ETF | Non-Diversified |
| Vietnam ETF | Non-Diversified |
Each Fund was created to provide investors with the opportunity to purchase a security representing a proportionate undivided interest in a portfolio of securities consisting of substantially all of the common stocks in approximately the same weighting as their index. China Asset Management (Hong Kong) Limited (the “Sub-Adviser”) is the sub-adviser to China Growth Leaders ETF (formerly known as ChinaAMC CSI 300 ETF) and ChinaAMC SME-ChiNext ETF. China Growth Leaders ETF and ChinaAMC SME-ChiNext ETF seek to achieve their investment objectives by primarily investing directly in A-shares through the Hong Kong-Shanghai Stock Connect program and via the A-share quota granted to the Sub-Adviser. India Growth Leaders ETF (formerly known as India Small-Cap Index ETF) makes its investments through MV SCIF Mauritius (the “Subsidiary”), a wholly owned subsidiary organized in the Republic of Mauritius.
Note 2—Significant Accounting Policies—The preparation of financial statements in conformity with U.S. generally accepted accounting principles (“GAAP”) requires management to make estimates and assumptions that affect the reported amounts and disclosures in the financial statements. Actual results could differ from those estimates.
The Funds are investment companies and follow accounting and reporting requirements of Accounting Standards Codification (“ASC”) 946 Financial Services—Investment Companies.
The following summarizes the Funds’ significant accounting policies.
| A. | Security Valuation—The Funds value their investments in securities and other assets and liabilities at fair value daily. Fair value is the price that would be received to sell an asset or paid to transfer a liability in an orderly transaction between market participants on the measurement date. Securities traded on national exchanges are valued at the closing price on the markets in which the securities trade. Securities traded on the NASDAQ Stock Market LLC (“NASDAQ”) are valued at the NASDAQ official closing price. Over-the-counter securities not included on NASDAQ and listed securities for which no sale was reported are valued at the mean of the bid and ask prices. To the extent these securities are actively traded they are categorized as Level 1 in the fair value hierarchy (described below). Certain foreign securities, whose values may be affected by market direction or events occurring before the Funds’ pricing time (4:00 p.m. Eastern Time) but after the last close of the securities’ primary market, are fair valued using a pricing service and are categorized as Level 2 in the fair value hierarchy. The pricing service, using methods approved by the Board of Trustees, considers the correlation of the trading patterns of the foreign security to intraday trading in the U.S. markets, based on indices of domestic securities and other appropriate indicators such as prices of relevant ADR’s and futures contracts. The Funds may also fair value securities in other situations, such as when a particular foreign market is closed but the Fund is open. Short-term debt securities with sixty days or less to maturity are valued at amortized cost, which with accrued interest approximates fair value. Money market fund investments are valued at net asset value and are considered as Level 1 in the fair value hierarchy. The Pricing Committee of Van Eck Associates Corporation (“the Adviser”) provides oversight of the Funds’ valuation policies and procedures, which are approved by the Funds’ Board of Trustees. Among other things, these procedures allow the Funds to utilize independent pricing services, quotations from securities dealers, and other market sources to |
| 63 |
VANECK VECTORS ETF TRUST
NOTES TO FINANCIAL STATEMENTS
(continued)
| determine fair value. The Pricing Committee convenes regularly to review the fair value of financial instruments or other assets. If market quotations for a security or other asset are not readily available, or if the Adviser believes they do not otherwise reflect the fair value of a security or asset, the security or asset will be fair valued by the Pricing Committee in accordance with the Funds’ valuation policies and procedures. The Pricing Committee employs various methods for calibrating the valuation approaches utilized to determine fair value, including a regular review of key inputs and assumptions, periodic comparisons to valuations provided by other independent pricing services, transactional back-testing and disposition analysis. | |
| Certain factors such as economic conditions, political events, market trends, the nature of and duration of any restrictions on disposition, trading in similar securities of the issuer or comparable issuers and other security specific information are used to determine the fair value of these securities. Depending on the relative significance of valuation inputs, these securities may be classified either as Level 2 or Level 3 in the fair value hierarchy. The price which the Funds may realize upon sale of an investment may differ materially from the value presented in the Schedules of Investments. | |
| The Funds utilize various methods to measure the fair value of their investments on a recurring basis, which includes a hierarchy that prioritizes inputs to valuation methods used to measure fair value. The fair value hierarchy gives highest priority to unadjusted quoted prices in active markets for identical assets and liabilities (Level 1 measurements) and the lowest priority to unobservable inputs (Level 3 measurements). The inputs or methodologies used for valuing securities are not necessarily an indication of the risk associated with investing in those securities. The three levels of the fair value hierarchy are described below: | |
| Level 1 — Quoted prices in active markets for identical securities. | |
| Level 2 — Significant observable inputs (including quoted prices for similar securities, interest rates, prepayment speeds, credit risk, etc.). | |
| Level 3 — Significant unobservable inputs (including each Fund’s own assumptions in determining the fair value of investments). | |
| A summary of the inputs and the levels used to value the Funds’ investments are located in the Schedules of Investments. Additionally, tables that reconcile the valuation of the Funds’ Level 3 investments and that present additional information about valuation methodologies and unobservable inputs, if applicable, are located in the Schedules of Investments. | |
| B. | Basis for Consolidation—The Subsidiary, an Indian exempted company, was incorporated on February 25, 2010 and acts as an investment vehicle for the India Growth Leaders ETF (the “Fund”) in order to effect certain investments on behalf of the Fund. The Fund is the sole shareholder of the Subsidiary, and it is intended that the Fund will remain the sole shareholder and will continue to control the Subsidiary. The consolidated financial statements of the Fund include the financial results of its wholly owned subsidiary. All material interfund account balances and transactions have been eliminated in consolidation. |
| C. | Federal Income Taxes—It is each Fund’s policy to comply with the provisions of the Internal Revenue Code applicable to regulated investment companies and to distribute all of its taxable income to its shareholders. Therefore, no federal income tax provision is required. |
| D. | Distributions to Shareholders—Dividends to shareholders from net investment income and distributions from net realized capital gains, if any, are declared and paid annually by each Fund. Income dividends and capital gain distributions are determined in accordance with U.S. income tax regulations, which may differ from such amounts determined in accordance with GAAP. |
| E. | Currency Translation—Assets and liabilities denominated in foreign currencies and commitments under foreign currency contracts are translated into U.S. dollars at the closing prices of such currencies each business day as quoted by one or more sources. Purchases and sales of investments are translated at the exchange rates prevailing when such investments are acquired or sold. Foreign denominated income and expenses are translated at the exchange rates prevailing when accrued. The portion of realized and unrealized gains and losses on investments that result from fluctuations in foreign currency exchange rates is not separately disclosed in the financial statements. Such amounts are included with the net realized and unrealized gains and losses on investment |
| 64 |
| securities in the Statements of Operations. Recognized gains or losses attributable to foreign currency fluctuations on foreign currency denominated assets, other than investments, and liabilities are recorded as net realized gain (loss) and net change in unrealized appreciation (depreciation) on foreign currency transactions and foreign denominated assets and liabilities in the Statements of Operations. | |
| F. | Restricted Securities—The Funds may invest in securities that are subject to legal or contractual restrictions on resale. These securities generally may be resold in transactions exempt from registration or to the public if the securities are registered. Disposal of these securities may involve time-consuming negotiations and expense, and prompt sale at an acceptable price may be difficult. Information regarding restricted securities, if any, is included at the end of each Fund’s Schedule of Investments. |
| G. | Offsetting Assets and Liabilities—In the ordinary course of business, the Funds enter into transactions subject to enforceable master netting or other similar agreements. Generally, the right of offset in those agreements allows the Funds to offset any exposure to a specific counterparty with any collateral received or delivered to that counterparty based on the terms of the agreements. The Funds may pledge or receive cash and or securities as collateral for securities lending. For financial reporting purposes, the Funds present securities lending assets and liabilities on a gross basis in the Statements of Assets and Liabilities. Cash collateral received for securities lending in the form of money market fund investments, if any, at December 31, 2020 is presented in the Schedules of Investments and in the Statements of Assets and Liabilities. Non-cash collateral is disclosed in Note 9 (Securities Lending). |
| H. | Other—Security transactions are accounted for on trade date. Realized gains and losses are determined based on the specific identification method. Dividend income is recorded on the ex-dividend date except that certain dividends from foreign securities are recognized upon notification of the ex-dividend date. Interest income, including amortization of premiums and discounts, is accrued as earned. |
| The Funds earn interest income on uninvested cash balances held at the custodian bank. Such amounts, if any, are presented as interest income in the Statements of Operations. | |
| The character of distributions received from certain investments may be comprised of net investment income, capital gains, and return of capital. It is the Funds’ policy to estimate the character of distributions received from these investments based on historical data if actual amounts are not available. After each calendar year end, these investments report the actual tax character of these distributions. Differences between the estimated and actual amounts are reflected in the Funds’ records in the year in which they are reported by adjusting the related cost basis of investments, capital gains and income, as necessary. | |
| In the normal course of business, the Funds enter into contracts that contain a variety of general indemnifications. The Funds’ maximum exposure under these agreements is unknown as this would involve future claims that may be made against the Funds that have not yet occurred. However, the Adviser believes the risk of loss under these arrangements to be remote. | |
| At December 31, 2020, ChinaAMC SME-ChiNext included $9,464 in cash, at value on the Statements of Assets and Liabilities, which represents foreign investor minimum settlement reserve funds required by China Securities Depository and Clearing Corporation Limited. |
Note 3—Investment Management and Other Agreements—The Adviser is the investment adviser to the Funds. The Adviser receives a management fee, calculated daily and payable monthly based on an annual rate of 0.50% of each Fund’s average daily net assets. The Adviser has agreed, until at least May 1, 2021, to waive management fees and assume expenses to prevent each Fund’s total annual operating expenses (excluding acquired fund fees and expenses, interest expense, trading expenses, taxes and extraordinary expenses; and for Russia ETF and Russia Small-Cap ETF, depositary receipt fees up to 0.10% and 0.08% of average daily net assets, respectively) from exceeding the expense limitations listed in the table below. Effective January 10, 2019, China Growth Leaders ETF and ChinaAMC SME-ChiNext ETF no longer exclude interest expense from their expense limitations. Refer to the Statements of Operations for the amounts waived/assumed by the Adviser for the period ended June 30, 2020.
| 65 |
VANECK VECTORS ETF TRUST
NOTES TO FINANCIAL STATEMENTS
(continued)
| Fund | Expense Limitations | |||
| Africa Index ETF | 0.78 | % | ||
| Brazil Small-Cap ETF | 0.59 | |||
| China Growth Leaders ETF | 0.60 | |||
| ChinaAMC SME-ChiNext ETF | 0.65 | |||
| Egypt Index ETF | 0.94 | |||
| India Growth Leaders ETF | 0.85 | |||
| Indonesia Index ETF | 0.57 | |||
| Israel ETF | 0.59 | |||
| Russia ETF | 0.62 | |||
| Russia Small-Cap ETF | 0.67 | |||
| Vietnam ETF | 0.76 | |||
During the year ended December 31, 2019, the Adviser reimbursed the Brazil Small-Cap ETF $372,975 for an investment loss. This reimbursement is reflected in the Statements of Changes in Net Assets as a net increase from payment from Adviser. The per share and total return impact to the Fund is reflected in the Financial Highlights.
During the year ended December 31, 2020, the Adviser reimbursed the China Growth Leaders ETF and ChinaAMC SME-ChiNext ETF $57,732 and $17,518, respectively, for transactional losses. These reimbursements are reflected in the Statements of Operations and Statements of Changes in Net Assets as a net increase from payment from Adviser. The per share and total return impacts to the Funds are reflected in the Financial Highlights.
In addition, Van Eck Securities Corporation (the “Distributor”), an affiliate of the Adviser, acts as the Funds’ distributor. Certain officers and a Trustee of the Trust are officers, directors or stockholders of the Adviser and Distributor.
At December 31, 2020, the Adviser owned approximately 27% of China Growth Leaders ETF.
Note 4—Capital Share Transactions – As of December 31, 2020, there were an unlimited number of capital shares of beneficial interest authorized by the Trust with no par value. Fund shares are not individually redeemable and are issued and redeemed at their net asset value per share only through certain authorized broker-dealers (“Authorized Participants”) in blocks of shares (“Creation Units”).
The consideration for the purchase or redemption of Creation Units of the Funds generally consists of the in-kind contribution or distribution of securities constituting the Funds’ underlying index (“Deposit Securities”) plus a balancing cash component to equate the transaction to the net asset value per share of the Fund on the transaction date. Cash may also be substituted in an amount equivalent to the value of certain Deposit Securities, generally as a result of market circumstances, or when the securities are not available in sufficient quantity for delivery, or are not eligible for trading by the Authorized Participant. The Funds may issue Creation Units in advance of receipt of Deposit Securities subject to various conditions, including, for the benefit of the Funds, a requirement to maintain cash collateral on deposit at the custodian equal to at least 115% of the daily marked to market value of the missing Deposit Securities.
Authorized Participants purchasing and redeeming Creation Units may pay transaction fees directly to the transfer agent. In addition, the Funds may impose variable fees on the purchase or redemption of Creation Units for cash, or on transactions effected outside the clearing process, to defray certain transaction costs. These variable fees, if any, are reflected in share transactions in the Statements of Changes in Net Assets.
| 66 |
Note 5—Investments—For the year ended December 31, 2020, purchases and sales of investments (excluding short-term investments and in-kind capital share transactions) and the purchases and sales of investments resulting from in-kind capital share transactions (excluding short-term investments) were as follows:
| In-kind Capital Share Transactions | ||||||||||||||||
| Fund | Purchases | Sales | Purchases | Sales | ||||||||||||
| Africa Index ETF | $ | 15,928,680 | $ | 16,337,256 | $ | 2,540,931 | $ | 450,014 | ||||||||
| Brazil Small-Cap ETF | 17,916,582 | 33,995,055 | — | 3,102,077 | ||||||||||||
| China Growth Leaders ETF | 92,348,317 | 117,095,190 | 4,528,999 | 2,868,907 | ||||||||||||
| ChinaAMC SME-ChiNext ETF | 36,062,022 | 35,410,229 | — | — | ||||||||||||
| Egypt Index ETF | 6,322,242 | 11,916,161 | 303,816 | 1,415,751 | ||||||||||||
| India Growth Leaders ETF | 108,871,826 | 149,477,978 | — | 3,358,873 | ||||||||||||
| Indonesia Index ETF | 4,293,278 | 4,250,438 | 27,629,000 | 28,320,267 | ||||||||||||
| Israel ETF | 13,617,387 | 13,555,454 | 4,500,199 | 3,880,695 | ||||||||||||
| Russia ETF | 267,633,700 | 273,849,569 | 878,121,389 | 491,641,795 | ||||||||||||
| Russia Small-Cap ETF | 14,319,206 | 15,036,811 | — | 3,085,203 | ||||||||||||
| Vietnam ETF | 121,986,997 | 132,576,831 | 1,763,709 | 2,811,353 | ||||||||||||
Note 6—Income Taxes—As of December 31, 2020, for Federal income tax purposes, the identified cost, gross unrealized appreciation, gross unrealized depreciation, and net unrealized appreciation (depreciation) of investments owned were as follows:
| Fund | Tax Cost of Investments | Gross Unrealized Appreciation | Gross Unrealized (Depreciation) | Net Unrealized Appreciation (Depreciation) | ||||||||||||
| Africa Index ETF | $ | 44,462,545 | $ | 12,860,277 | $ | (4,551,533 | ) | $ | 8,308,744 | |||||||
| Brazil Small-Cap ETF | 53,295,400 | 11,230,001 | (6,636,776 | ) | 4,593,225 | |||||||||||
| China Growth Leaders ETF | 41,223,363 | 11,588,438 | (1,424,623 | ) | 10,163,815 | |||||||||||
| ChinaAMC SME-ChiNext ETF | 26,384,698 | 24,464,521 | (1,924,209 | ) | 22,540,312 | |||||||||||
| Egypt Index ETF | 21,700,699 | 2,362,743 | (4,835,689 | ) | (2,472,946 | ) | ||||||||||
| India Growth Leaders ETF | 50,176,765 | 18,684,781 | (624,052 | ) | 18,060,729 | |||||||||||
| Indonesia Index ETF | 46,372,076 | 2,805,086 | (13,254,073 | ) | (10,448,987 | ) | ||||||||||
| Israel ETF | 51,320,347 | 31,795,172 | (6,885,148 | ) | 24,910,024 | |||||||||||
| Russia ETF | 1,634,885,843 | 156,943,020 | (171,865,279 | ) | (14,922,259 | ) | ||||||||||
| Russia Small-Cap ETF | 34,190,672 | 5,294,420 | (4,919,308 | ) | 375,112 | |||||||||||
| Vietnam ETF | 338,715,682 | 147,219,576 | (29,356,634 | ) | 117,862,942 | |||||||||||
At December 31, 2020, the components of total distributable earnings (losses) on a tax basis, for each Fund, were as follows:
| Fund | Undistributed Ordinary Income | Accumulated Capital Losses | Qualified Late-Year Losses* | Other Temporary Differences | Unrealized Appreciation (Depreciation) | Total Distributable Earnings (Losses) | ||||||||||||||||||
| Africa Index ETF | $ | 533,561 | $ | (63,986,897 | ) | $ | — | $ | (12,522 | ) | $ | 8,308,960 | $ | (55,156,898 | ) | |||||||||
| Brazil Small-Cap ETF | 40,437 | (159,506,417 | ) | — | (37,570 | ) | 4,594,052 | (154,909,498 | ) | |||||||||||||||
| China Growth Leaders ETF | 18,202 | — | — | (5,247 | ) | 10,241,573 | 10,254,528 | |||||||||||||||||
| ChinaAMC SME-ChiNext ETF | — | (11,370,462 | ) | — | (701 | ) | 22,543,439 | 11,172,276 | ||||||||||||||||
| Egypt Index ETF | 174,954 | (33,858,940 | ) | — | (5,689 | ) | (2,473,545 | ) | (36,163,220 | ) | ||||||||||||||
| India Growth Leaders ETF | — | (97,120,820 | ) | — | (14,540 | ) | 18,061,978 | (79,073,382 | ) | |||||||||||||||
| Indonesia Index ETF | 53,861 | (106,756,722 | ) | — | (31,525 | ) | (10,448,987 | ) | (117,183,373 | ) | ||||||||||||||
| Israel ETF | 241,318 | (8,004,713 | ) | — | (3,492 | ) | 24,910,069 | 17,143,182 | ||||||||||||||||
| Russia ETF | — | (1,535,358,932 | ) | — | (178,562 | ) | (14,913,618 | ) | (1,550,451,112 | ) | ||||||||||||||
| Russia Small-Cap ETF | 750,578 | (13,341,844 | ) | — | (3,153 | ) | 375,175 | (12,219,244 | ) | |||||||||||||||
| Vietnam ETF | — | (324,044,989 | ) | (5,301 | ) | (47,398 | ) | 117,868,803 | (206,228,885 | ) | ||||||||||||||
| * | Qualified late year losses incurred after October 31, 2020 are deemed to arise on the January 1, 2021. |
| 67 |
VANECK VECTORS ETF TRUST
NOTES TO FINANCIAL STATEMENTS
(continued)
The tax character of dividends paid to shareholders was as follows:
| 2020 Dividends | 2019 Dividends | |||||||||||||||
| Ordinary | Return of | Long-Term | Ordinary | |||||||||||||
| Fund | Income** | Capital | Capital Gains | Income ** | ||||||||||||
| Africa Index ETF | $ | 1,990,000 | $ | — | $ | — | $ | 3,150,210 | ||||||||
| Brazil Small-Cap ETF | 899,895 | — | — | 2,475,060 | ||||||||||||
| China Growth Leaders ETF | 1,442,540 | — | 5,191,450 | 985,120 | ||||||||||||
| ChinaAMC SME-ChiNext ETF | 3,800 | — | — | 135,000 | ||||||||||||
| Egypt Index ETF | 499,984 | — | — | 650,037 | ||||||||||||
| India Growth Leaders ETF | 178,129 | — | — | 1,600,209 | ||||||||||||
| Indonesia Index ETF | 600,075 | — | — | 850,140 | ||||||||||||
| Israel ETF | 127,803 | — | — | 800,085 | ||||||||||||
| Russia ETF | 52,666,238 | 334,142 | — | 73,500,780 | ||||||||||||
| Russia Small-Cap ETF | 1,399,971 | — | — | 1,625,031 | ||||||||||||
| Vietnam ETF | 1,644,751 | 182,249 | — | 3,336,840 | ||||||||||||
| ** | Includes short-term capital gains (if any) |
At December 31, 2020, the Funds had capital loss carryforwards available to offset future capital gains, as follows:
| Fund | Short-Term Capital Losses with No Expiration | Long-Term Capital Losses with No Expiration | Total | |||||||||
| Africa Index ETF | $ | (10,938,807 | ) | $ | (53,048,090 | ) | $ | (63,986,897 | ) | |||
| Brazil Small-Cap ETF | (23,062,481 | ) | (136,443,936 | ) | (159,506,417 | ) | ||||||
| ChinaAMC SME-ChiNext ETF | (7,874,850 | ) | (3,495,612 | ) | (11,370,462 | ) | ||||||
| Egypt Index ETF | (12,917,767 | ) | (20,941,173 | ) | (33,858,940 | ) | ||||||
| India Growth Leaders ETF | (20,892,662 | ) | (76,228,158 | ) | (97,120,820 | ) | ||||||
| Indonesia Index ETF | (37,346,421 | ) | (69,410,301 | ) | (106,756,722 | ) | ||||||
| Israel ETF | (181,378 | ) | (7,823,335 | ) | (8,004,713 | ) | ||||||
| Russia ETF | (234,740,709 | ) | (1,300,618,223 | ) | (1,535,358,932 | ) | ||||||
| Russia Small-Cap ETF | (3,818,481 | ) | (9,523,363 | ) | (13,341,844 | ) | ||||||
| Vietnam ETF | (73,661,992 | ) | (250,382,997 | ) | (324,044,989 | ) | ||||||
During the year ended December 31, 2020, China Growth Leaders ETF, ChinaAMC SME-ChiNext ETF and Israel ETF utilized $6,045,903, $2,884,515 and $955,946 of their capital loss carryovers available from prior years.
During the year ended December 31, 2020, as a result of permanent book to tax differences, primarily due to earnings attributable to the redemption of shares, tax net operating losses and the tax treatment of gains/losses from securities redeemed in-kind, the Funds incurred differences that affected distributable earnings and aggregate paid in capital by the amounts in the table below. Net assets were not affected by these reclassifications.
| Fund | Increase (Decrease) in Distributable Earnings | Increase (Decrease) in Aggregate Paid in Capital | ||||||
| Africa Index ETF | $ | (142,303 | ) | $ | 142,303 | |||
| Brazil Small-Cap ETF | 525,642 | (525,642 | ) | |||||
| China Growth Leaders ETF | (748,341 | ) | 748,341 | |||||
| ChinaAMC SME-ChiNext ETF | 67,834 | (67,834 | ) | |||||
| Egypt Index ETF | (99,625 | ) | 99,625 | |||||
| India Growth Leaders ETF | (193,447 | ) | 193,447 | |||||
| Indonesia Index ETF | (2,647,921 | ) | 2,647,921 | |||||
| Israel ETF | (2,117,734 | ) | 2,117,734 | |||||
| Russia ETF | (70,199,214 | ) | 70,199,214 | |||||
| Russia Small-Cap ETF | (194,697 | ) | 194,697 | |||||
| Vietnam ETF | (729,413 | ) | 729,413 | |||||
| 68 |
The Funds recognize the tax benefits of uncertain tax positions only where the position is “more-likely-than-not” to be sustained assuming examination by applicable tax authorities. Management has analyzed the Funds’ tax positions, and has concluded that no liability for unrecognized tax benefits should be recorded related to uncertain tax positions taken on return filings for all open tax years. The Funds do not have exposure for additional years that might still be open in certain foreign jurisdictions. Therefore, no provision for income tax is required in the Funds’ financial statements. However, the Funds are subject to foreign taxes on the appreciation in value of certain investments. The Funds provide for such taxes on both realized and unrealized appreciation.
The Funds recognize interest and penalties, if any, related to uncertain tax positions as income tax expense in the Statements of Operations. During the year ended December 31, 2020, the Funds did not incur any interest or penalties.
Investments in China: Uncertainties in the Chinese tax rules governing taxation of income and gains from investments in A-Shares could result in unexpected tax liabilities for the China Growth Leaders ETF and ChinaAMC SME-ChiNext ETF (the “Funds”). China generally imposes withholding income tax (“WHT”) at a rate of 10% on dividends derived by non-PRC resident enterprises (including a Qualified Foreign Institutional Investor (“QFII”) and a Renminbi Qualified Foreign Institutional Investor (“RQFII”)) from issuers resident in China. China imposes WHT at a rate of 10% on capital gains derived by non-PRC resident enterprises from the disposal in shares of PRC enterprises. Effective November 17, 2014, investments through the Hong Kong-Shanghai Stock Connect program, QFIIs and RQFIIs, which includes these Funds, were exempted temporarily from WHT with respect to gains derived from the trading of equity investments (including A-shares). However, uncertainties remain regarding the taxation of capital gains in China. PRC rules for taxation of RQFIIs (and QFIIs) and the PRC tax regulations to be issued by the PRC State Administration of Taxation and/or PRC MOF to clarify the subject matter may apply retrospectively, even if such rules are adverse to the nonresident investors. If the PRC tax authorities were to issue differing formal guidance or tax rules regarding the taxation of capital gains derived by QFIIs, RQFIIs and other nonresident investors WHT on gains from such investments the Funds could be subject to additional tax liabilities.
Investments in India: As a result of renegotiation of the India Mauritius Tax treaty, India commenced taxation on capital gains arising from disposition of shares acquired on or after April 1, 2017 in a company resident in India, with shares acquired on or before March 31, 2017 being grandfathered as exempt from capital gains taxation subject to treaty relief. India currently assesses a capital gains tax on shares sold on the exchange of 15% on short term capital gains and 10% on long term capital gains (plus applicable surcharge and cess). Further, long-term capital gains on certain shares that were held as of January 31, 2018, may be eligible for a step up in cost basis which may reduce realized taxable gains. Existing Indian capital loss carryforwards may be utilized to offset capital gains realized on securities sold.
Note 7—Principal Risks—Non-diversified funds generally hold securities of fewer issuers than diversified funds (See Note 1) and may be more susceptible to the risks associated with these particular issuers, or to a single economic, political or regulatory occurrence affecting these issuers. The Funds may purchase securities on foreign exchanges. Securities of foreign issuers involve special risks and considerations not typically associated with investing in U.S. issuers. These risks include devaluation of currencies, currency controls, less reliable information about issuers, different securities transaction clearance and settlement practices, future adverse economic developments and political conflicts, or natural or other disasters, such as the recent coronavirus outbreak. Additionally, certain Funds may invest in securities of emerging market issuers, which are exposed to a number of risks that may make these investments volatile in price or difficult to trade. Political risks may include unstable governments, nationalization, restrictions on foreign ownership, laws that prevent investors from getting their money out of a country, sanctions and investment restrictions and legal systems that do not protect property risks as well as the laws of the United States. These and other factors can make emerging market securities more volatile and potentially less liquid than securities issued in more developed markets. Certain securities of Chinese issuers are, or may in the future become restricted, and the Funds may be forced to sell such restricted securities and incur a loss as a result.
Should the Chinese government impose restrictions on the ability of China Growth Leaders ETF and ChinaAMC SME-ChiNext ETF to repatriate funds associated with direct investment in A-Shares, the Funds may be unable to satisfy distribution requirements applicable to regulated investment companies (“RICs”) under the Internal Revenue Code of 1986, as amended, and the Funds may therefore be subject to Fund-level U.S. federal taxes.
| 69 |
VANECK VECTORS ETF TRUST
NOTES TO FINANCIAL STATEMENTS
(continued)
The respiratory disease caused by a novel coronavirus, which has spread internationally and declared as a pandemic by the World Health Organization, has resulted in closing borders, quarantines, disruptions to supply chains and customer activity, loss of life, as well as general concern and uncertainty. The coronavirus has already negatively impacted the economies of many nations, individual companies, and the market. This pandemic is expected to have a continued impact in ways that cannot necessarily be foreseen presently.
A more complete description of risks is included in each Fund’s Prospectus and Statement of Additional Information.
Note 8—Trustee Deferred Compensation Plan—The Trust has a Deferred Compensation Plan (the “Plan”) for Trustees under which the Trustees can elect to defer receipt of their trustee fees until retirement, disability or termination from the Board of Trustees. The fees otherwise payable to the participating Trustees are deemed invested in shares of the Funds as directed by the Trustees.
The expense for the Plan is included in “Trustees’ fees and expenses” in the Statements of Operations. The liability for the Plan is shown as “Deferred Trustee fees” in the Statements of Assets and Liabilities.
Note 9—Securities Lending—To generate additional income, each of the Funds may lend its securities pursuant to a securities lending agreement with the securities lending agent. Each Fund may lend up to 33% of its investments requiring that the loan be continuously collateralized by cash, cash equivalents, U.S. government securities, or any combination of cash and such securities at all times equal to at least 102% (105% for foreign securities) of the market value of securities loaned. Daily market fluctuations could cause the value of loaned securities to be more or less than the value of the collateral received. When this occurs, the collateral is adjusted and settled on the next business day. During the term of the loan, the Funds will continue to receive any dividends, interest or amounts equivalent thereto, on the securities loaned while receiving a fee from the borrower and or earning interest on the investment of the cash collateral. Such fees and interest are shared with the securities lending agent under the terms of the securities lending agreement. Securities lending income is disclosed as such in the Statements of Operations. Cash collateral is maintained on the Funds’ behalf by the lending agent and is invested in the State Street Navigator Securities Lending Government Money Market Portfolio. Non-cash collateral consists of U.S. Treasuries and U.S. Government Agency securities, and is not disclosed in the Funds’ Schedules of Investments or Statements of Assets and Liabilities as it is held by the agent on behalf of the Funds. The Funds do not have the ability to re-hypothecate those securities. Loans are subject to termination at the option of the borrower or the Funds. Upon termination of the loan, the borrower will return to the Fund securities identical to the securities loaned. The Funds bear the risk of delay in recovery of, or even loss of rights in, the securities loaned should the borrower of the securities fail financially. The value of loaned securities and related cash collateral, if any, at December 31, 2020 is presented on a gross basis in the Schedules of Investments and Statements of Assets and Liabilities. The following is a summary of the Funds’ securities on loan and related collateral as of December 31, 2020:
| Fund | Market Value of Securities on Loan | Cash Collateral | Non-Cash Collateral | Total Collateral | ||||||||||||
| Africa Index ETF | $ | 1,969,822 | $ | 283,655 | $ | 1,779,588 | $ | 2,063,243 | ||||||||
| Brazil Small-Cap ETF | 4,062,877 | 3,283,495 | 1,102,339 | 4,385,834 | ||||||||||||
| China Growth Leaders ETF | 169,979 | 38,384 | 140,879 | 179,263 | ||||||||||||
| Indonesia Index ETF | 1,798,904 | 89,746 | 1,754,807 | 1,844,553 | ||||||||||||
| Israel ETF | 4,361,345 | 1,102,074 | 3,460,210 | 4,562,284 | ||||||||||||
| Russia ETF | 7,039,403 | 495,767 | 6,941,451 | 7,437,218 | ||||||||||||
| Russia Small-Cap ETF | 2,655,770 | 2,620,748 | 165,323 | 2,786,071 | ||||||||||||
| Vietnam ETF | 2,236,236 | — | 2,587,736 | 2,587,736 | ||||||||||||
The following table presents money market fund investments held as collateral by type of security on loan as of December 31, 2020:
| 70 |
| Gross Amount of Recognized Liabilities for Securities Lending Transactions* in the Statements of Assets and Liabilities | ||||
| Fund | Equity Securities | |||
| Africa Index ETF | $ | 283,655 | ||
| Brazil Small-Cap ETF | 3,283,495 | |||
| China Growth Leaders ETF | 38,384 | |||
| Indonesia Index ETF | 89,746 | |||
| Israel ETF | 1,102,074 | |||
| Russia ETF | 495,767 | |||
| Russia Small-Cap ETF | 2,620,748 | |||
| * | Remaining contractual maturity: overnight and continuous |
Note 10—Bank Line of Credit—The Funds may participate in a $200 million committed credit facility (the “Facility”) to be utilized for temporary financing until the settlement of sales or purchases of portfolio securities, the repurchase or redemption of shares of the Funds at the request of the shareholders and other temporary or emergency purposes. The Funds have agreed to pay commitment fees, pro rata, based on the unused but available balance. Interest is charged to the Funds based on prevailing market rates in effect at the time of borrowings. During the year ended December 31, 2020, the following Funds borrowed under this Facility:
| Fund | Days Outstanding | Average Daily Loan Balance | Average Interest Rate | |||||||||
| Africa Index ETF | 108 | $ | 313,904 | 1.64 | % | |||||||
| Brazil Small-Cap ETF | 196 | 211,827 | 1.81 | |||||||||
| China Growth Leaders ETF | 164 | 1,649,477 | 1.62 | |||||||||
| ChinaAMC SME-ChiNext ETF | 139 | 1,823,924 | 1.86 | |||||||||
| Egypt Index ETF | 284 | 590,229 | 1.65 | |||||||||
| India Growth Leaders ETF | 135 | 1,212,485 | 1.96 | |||||||||
| Israel ETF | 71 | 1,442,035 | 1.44 | |||||||||
| Russia ETF | 150 | 4,068,107 | 1.68 | |||||||||
| Russia Small-Cap ETF | 5 | 226,814 | 2.24 | |||||||||
| Vietnam ETF | 275 | 1,777,377 | 1.71 | |||||||||
Outstanding loan balances as of December 31, 2020, if any, are reflected in the Statements of Assets and Liabilities.
Note 11—Recent Accounting Pronouncements—The Funds adopted all provisions of the Accounting Standards Update No. 2018-13, Disclosure Framework—Changes to the Disclosure Requirements for Fair Value Measurement (“ASU 2018-13”) that eliminate and modify certain disclosure requirements for fair value measurements. Based on management’s evaluation, the adoption of the ASU 2018-13 had no material impact on the financial statements and related disclosures.
Note 12—Subsequent Event Review—The Funds have evaluated subsequent events and transactions for potential recognition or disclosure through the date the financial statements were issued.
| 71 |
REPORT OF INDEPENDENT REGISTERED PUBLIC ACCOUNTING FIRM
To the Shareholders of VanEck Vectors Africa Index ETF, VanEck Vectors Brazil Small-Cap ETF, VanEck Vectors China Growth Leaders ETF, VanEck Vectors ChinaAMC SME-ChiNext ETF, VanEck Vectors Egypt Index ETF, VanEck Vectors India Growth Leaders ETF, VanEck Vectors Indonesia Index ETF, VanEck Vectors Israel ETF, VanEck Vectors Russia ETF, VanEck Vectors Russia Small-Cap ETF and VanEck Vectors Vietnam ETF and the Board of Trustees of VanEck Vectors ETF Trust
Opinion on the Financial Statements
We have audited the accompanying statements of assets and liabilities (consolidated as it relates to VanEck Vectors India Growth Leaders ETF) of VanEck Vectors Africa Index ETF, VanEck Vectors Brazil Small-Cap ETF, VanEck Vectors China Growth Leaders ETF, VanEck Vectors ChinaAMC SME-ChiNext ETF, VanEck Vectors Egypt Index ETF, VanEck Vectors India Growth Leaders ETF, VanEck Vectors Indonesia Index ETF, VanEck Vectors Israel ETF, VanEck Vectors Russia ETF, VanEck Vectors Russia Small-Cap ETF and VanEck Vectors Vietnam ETF (collectively referred to as the “Funds”) (eleven of the series constituting VanEck Vectors ETF Trust (the “Trust”)), including the schedules of investments (consolidated as it relates to VanEck Vectors India Growth Leaders ETF), as of December 31, 2020, and the related statements of operations (consolidated as it relates to VanEck Vectors India Growth Leaders ETF) for the year then ended, the statements of changes in net assets (consolidated as it relates to VanEck Vectors India Growth Leaders ETF) for each of the two years in the period then ended, the financial highlights (consolidated as it relates to VanEck Vectors India Growth Leaders ETF) for each of the five years in the period then ended and the related notes (collectively referred to as the “financial statements”). In our opinion, the financial statements present fairly, in all material respects, the financial position (consolidated as it relates to VanEck Vectors India Growth Leaders ETF) of each of the Funds (eleven of the series constituting VanEck Vectors ETF Trust) at December 31, 2020, the results of their operations (consolidated as it relates to VanEck Vectors India Growth Leaders ETF) for the year then ended, the changes in their net assets (consolidated as it relates to VanEck Vectors India Growth Leaders ETF) for each of the two years in the period then ended and their financial highlights (consolidated as it relates to VanEck Vectors India Growth Leaders ETF) for each of the five years in the period then ended, in conformity with U.S. generally accepted accounting principles.
Basis for Opinion
These financial statements are the responsibility of the Trust’s management. Our responsibility is to express an opinion on each of the Funds’ financial statements based on our audits. We are a public accounting firm registered with the Public Company Accounting Oversight Board (United States) (“PCAOB”) and are required to be independent with respect to the Trust in accordance with the U.S. federal securities laws and the applicable rules and regulations of the Securities and Exchange Commission and the PCAOB.
We conducted our audits in accordance with the standards of the PCAOB. Those standards require that we plan and perform the audit to obtain reasonable assurance about whether the financial statements are free of material misstatement, whether due to error or fraud. The Trust is not required to have, nor were we engaged to perform, an audit of the Trust’s internal control over financial reporting. As part of our audits, we are required to obtain an understanding of internal control over financial reporting, but not for the purpose of expressing an opinion on the effectiveness of the Trust’s internal control over financial reporting. Accordingly, we express no such opinion.
Our audits included performing procedures to assess the risks of material misstatement of the financial statements, whether due to error or fraud, and performing procedures that respond to those risks. Such procedures included examining, on a test basis, evidence regarding the amounts and disclosures in the financial statements. Our procedures included confirmation of securities owned as of December 31, 2020, by correspondence with the custodian and brokers or by other appropriate auditing procedures where replies from broker were not received. Our audits also included evaluating the accounting principles used and significant estimates made by management, as well as evaluating the overall presentation of the financial statements. We believe that our audits provide a reasonable basis for our opinion.

We have served as the auditor of one or more of the VanEck investment companies since 1999.
New York, New York
February 25, 2021
| 72 |
VANECK VECTORS ETF TRUST
(unaudited)
The following information is provided with respect to the distributions paid during the taxable year ended December 31, 2020:
| Record Date | 12/22/2020 |
| Ex Date | 12/21/2020 |
| Payable Date | 12/28/2020 |
| Africa Index ETF | Brazil Small-Cap ETF | China Growth Leaders ETF | ChinaAMC SME-ChiNext ETF | Egypt Index ETF | India Growth Leaders Index ETF | |||||||||||||||||||||||||||
| Total Distribution Paid Per Share | $ | 0.796000 | $ | 0.352900 | $ | 6.030900 | $ | 0.003800 | $ | 0.625000 | $ | 0.078300 | ||||||||||||||||||||
| Ordinary Income Per Share | $ | 0.796000 | $ | 0.352900 | $ | 1.311400 | $ | 0.003800 | $ | 0.625000 | $ | 0.078300 | ||||||||||||||||||||
| Return of Capital Per Share | $ | — | $ | — | $ | — | $ | — | $ | — | $ | — | ||||||||||||||||||||
| Long-Term Capital Gain Per Share | $ | — | $ | — | $ | 4.719500 | $ | — | $ | — | $ | — | ||||||||||||||||||||
| Ordinary Income: | ||||||||||||||||||||||||||||||||
| Qualified Dividend Income for Individuals | 31.82 | %* | 3.57 | %* | 38.79 | %* | 100.00 | % | 97.41 | %* | 100.00 | % | ||||||||||||||||||||
| Dividends Qualifying for the Dividends Received Deduction for Corporations | 0.31 | %* | — | — | — | — | — | |||||||||||||||||||||||||
| Foreign Source Income | 54.24 | %* | 99.54 | %* | 39.13 | %* | 100.00 | % | 88.13 | %* | 100.00 | % | ||||||||||||||||||||
| Foreign Taxes Paid Per Share | $ | 0.046864 | ** | $ | 0.031211 | ** | $ | 0.055624 | ** | $ | — | $ | 0.084797 | ** | $ | — | ||||||||||||||||
| Qualified Short-Term Capital Gains | $ | — | $ | — | $ | 0.482179 | *** | $ | — | $ | — | $ | — | |||||||||||||||||||
| Indonesia Index ETF | Israel ETF | Russia ETF | Russia Small-Cap ETF | Vietnam ETF | ||||||||||||||||||||||||||||
| Total Distribution Paid Per Share | $ | 0.342900 | $ | 0.076300 | $ | 0.798800 | $ | 1.584900 | $ | 0.070000 | ||||||||||||||||||||||
| Ordinary Income Per Share | $ | 0.342900 | $ | 0.076300 | $ | 0.793764 | $ | 1.584900 | $ | 0.063017 | ||||||||||||||||||||||
| Return of Capital Per Share | $ | — | $ | — | $ | 0.005036 | (a) | $ | — | $ | 0.006983 | (a) | ||||||||||||||||||||
| Long-Term Capital Gain Per Share | $ | — | $ | — | $ | — | $ | — | $ | — | ||||||||||||||||||||||
| Ordinary Income: | ||||||||||||||||||||||||||||||||
| Qualified Dividend Income for Individuals | 100.00 | %* | 2.47 | % | 100.00 | %* | 49.78 | %* | 41.80 | %* | ||||||||||||||||||||||
| Dividends Qualifying for the Dividends Received Deduction for Corporations | — | 0.09 | % | — | — | — | ||||||||||||||||||||||||||
| Foreign Source Income | 100.00 | %* | 17.08 | %* | 81.74 | %* | 53.25 | %* | 100.00 | %* | ||||||||||||||||||||||
| Foreign Taxes Paid Per Share | $ | 0.082761 | ** | $ | — | $ | 0.087724 | ** | $ | 0.088371 | ** | $ | 0.009390 | ** | ||||||||||||||||||
| Qualified Short-Term Capital Gains | $ | — | $ | — | $ | — | $ | — | $ | — | ||||||||||||||||||||||
| * | Expressed as a percentage of the ordinary income distribution grossed up for foreign taxes. |
| ** | The foreign taxes paid represent taxes incurred by the Fund on income received by the Fund from foreign sources. Foreign taxes paid may be included in taxable income with an offsetting deduction from gross income or may be taken as a credit for taxes paid to foreign governments. |
| *** | This distribution represents Qualified Short-Term Capital Gains (“QSTG”) which may be exempt from United States withholding tax when distributed to non-U.S. shareholders with proper documentation. |
| (a) | A return of capital is not considered taxable income to shareholders. The portion of a distribution which is a dividend is includable in gross income while the portion of the distribution which is not a dividend shall be applied against and reduces the adjusted basis of the stock. Accordingly, shareholders who received these distributions should not include these amounts in taxable income, but instead should treat them as a reduction of the cost basis of the applicable shares upon which these distributions were paid. |
Please consult your tax advisor for proper treatment of this information.
| 73 |
VANECK VECTORS ETF TRUST
BOARD OF TRUSTEES AND OFFICERS
December 31, 2020 (unaudited)
| Name, Address1 and Year of Birth | Position(s) Held with the Trust | Term of Office2 and Length of Time Served | Principal Occupation(s) During Past Five Years | Number of Portfolios in Fund Complex3 Overseen | Other Directorships Held Outside the Fund Complex3 During Past Five Years | |||||
| Independent Trustees | ||||||||||
| David H. Chow, 1957*† | Chairman Trustee | Since 2008 Since 2006 | Founder and CEO, DanCourt Management LLC (financial/ strategy consulting firm and Registered Investment Adviser), March 1999 to present. | 56 | Trustee, Berea College of Kentucky, May 2009 to present and currently Chairman of the Investment Committee; Member of the Governing Council of the Independent Directors Council, October 2012 to September 2020; Trustee, MainStay Fund Complex4, January 2016 to present and currently Chairman of the Risk and Compliance Committee. | |||||
| Laurie A. Hesslein, 1959*† | Trustee | Since 2019 | Citigroup, Managing Director, and Business Head, Local Consumer Lending North America, and CEO and President, CitiFinancial Servicing LLC (2013 - 2017). | 56 | Trustee, First Eagle Senior Loan Fund. Formerly, Trustee, Eagle Growth and Income Opportunities Fund, March 2017 to December 2020. | |||||
| R. Alastair Short, 1953*† | Trustee | Since 2006 | President, Apex Capital Corporation (personal investment vehicle). | 67 | Chairman and Independent Director, EULAV Asset Management; Trustee, Kenyon Review; Trustee, Children’s Village. Formerly, Independent Director, Tremont offshore funds. | |||||
| Peter J. Sidebottom, 1962*† | Trustee | Since 2012 | Lead Partner, North America Banking and Capital Markets Strategy, Accenture, May 2017 to present; Partner, PWC/Strategy & Financial Services Advisory, February 2015 to March 2017; Founder and Board Member, AspenWoods Risk Solutions, September 2013 to February 2016; Independent consultant, June 2013 to February 2015; Partner, Bain & Company (management consulting firm), April 2012 to December 2013; Executive Vice President and Senior Operating Committee Member, TD Ameritrade (on-line brokerage firm), February 2009 to January 2012. | 56 | Board Member, Special Olympics, New Jersey, November 2011 to September 2013; Director, The Charlotte Research Institute, December 2000 to 2009; Board Member, Social Capital Institute, University of North Carolina Charlotte, November 2004 to January 2012; Board Member, NJ-CAN, July 2014 to 2016. | |||||
| Richard D. Stamberger, 1959*† | Trustee | Since 2006 | Senior Vice President, B2B, Future Plc (global media company), July 2020 to present; President, CEO and co-founder, SmartBrief, Inc., 1999 to 2019. | 67 | Director, Food and Friends, Inc. | |||||
| Interested Trustee | ||||||||||
| Jan F. van Eck, 19635 | Trustee, Chief Executive Officer and President | Trustee (Since 2006); Chief Executive Officer and President (Since 2009) | Director, President and Chief Executive Officer of Van Eck Associates Corporation (VEAC), Van Eck Absolute Return Advisers Corporation (VEARA) and Van Eck Securities Corporation (VESC); Officer and/or Director of other companies affiliated with VEAC and/or the Trust | 67 | Director, National Committee on US- China Relations. | |||||
| 1 | The address for each Trustee and officer is 666 Third Avenue, 9th Floor, New York, New York 10017. |
| 2 | Each Trustee serves until resignation, death, retirement or removal. Officers are elected yearly by the Trustees. |
| 3 | The Fund Complex consists of the VanEck Funds, VanEck VIP Trust and the Trust. |
| 4 | The MainStay Fund Complex consists of MainStay Funds, MainStay Funds Trust, MainStay VP Funds Trust and MainStay MacKay Defined Term Municipal Opportunities Fund. |
| 5 | “Interested person” of the Trust within the meaning of the 1940 Act. Mr. van Eck is an officer of VEAC, VEARA and VESC. |
| * | Member of the Audit Committee. |
| † | Member of the Nominating and Corporate Governance Committee. |
| 74 |
| Officer’s Name, Address1 and Year of Birth | Position(s) Held with the Trust | Term of Office2 and Length of Time Served | Principal Occupation(s) During Past Five Years | |||
| Officer Information | ||||||
| Matthew A. Babinsky, 1983 | Assistant Vice President and Assistant Secretary | Since 2016 | Assistant Vice President, Assistant General Counsel and Assistant Secretary of VEAC, VEARA and VESC; Officer of other investment companies advised by VEAC and VEARA. Formerly, Associate, Clifford Chance US LLP. | |||
| Russell G. Brennan, 1964 | Assistant Vice President and Assistant Treasurer | Since 2008 | Assistant Vice President of VEAC; Officer of other investment companies advised by VEAC and VEARA. | |||
| Charles T. Cameron, 1960 | Vice President | Since 2006 | Portfolio Manager of VEAC; Officer and/or Portfolio Manager of other investment companies advised by VEAC and VEARA. Formerly, Director of Trading of VEAC. | |||
| John J. Crimmins, 1957 | Vice President, Treasurer, Chief Financial Officer and Principal Accounting Officer | Vice President, Chief Financial Officer and Principal Accounting Officer (Since 2012); Treasurer (Since 2009) | Vice President of VEAC and VEARA; Officer of other investment companies advised by VEAC and VEARA. Formerly, Vice President of VESC. | |||
| Eduardo Escario, 1975 | Vice President | Since 2012 | Regional Director, Business Development/Sales for Southern Europe and South America of VEAC. | |||
| Henry Glynn, 1983 | Assistant Vice President | Since 2018 | Head of ETF Capital Markets Europe of Van Eck Switzerland AG. Formerly, Member of the Capital Markets team at Vanguard Group. | |||
| F. Michael Gozzillo, 1965 | Chief Compliance Officer | Since 2018 | Vice President and Chief Compliance Officer of VEAC and VEARA; Chief Compliance Officer of VESC; Officer of other investment companies advised by VEAC and VEARA. Formerly, Chief Compliance Officer of City National Rochdale, LLC and City National Rochdale Funds. | |||
| Laura Hamilton, 1977 | Vice President | Since 2019 | Assistant Vice President of VEAC and VESC; Officer of other investment companies advised by VEAC and VEARA. Formerly, Operations Manager of Royce & Associates. | |||
| Nicholas Jackson, 1974 | Assistant Vice President | Since 2018 | Director, Business Development of VanEck Australia Pty Ltd. Formerly, Vice President, Business Development of VanEck Australia Pty Ltd. | |||
| Laura I. Martínez, 1980 | Vice President and Assistant Secretary | Vice President (Since 2016); Assistant Secretary (Since 2008) | Vice President, Associate General Counsel and Assistant Secretary of VEAC, VEARA and VESC; Officer of other investment companies advised by VEAC and VEARA. Formerly, Assistant Vice President of VEAC, VEARA and VESC. | |||
| Matthew McKinnon, 1970 | Assistant Vice President | Since 2018 | Head of Business Development of Asia Pacific of VanEck Australia Pty Ltd. Formerly, Director, Intermediaries and Institutions of VanEck Australia Pty Ltd. | |||
| Arian Neiron, 1979 | Vice President | Since 2018 | Managing Director and Head of Asia Pacific of VanEck Australia Pty Ltd.; Officer and/or Director of other companies affiliated with VEAC and/or the Trust. | |||
| James Parker, 1969 | Assistant Treasurer | Since 2014 | Assistant Vice President of VEAC; Manager, Portfolio Administration of VEAC and VEARA. Officer of other investment companies advised by VEAC and VEARA. | |||
| Adam Phillips, 1970 | Vice President | Since 2018 | ETF Chief Operating Officer of VEAC; Director of other companies affiliated with VEAC. | |||
| Philipp Schlegel, 1974 | Vice President | Since 2016 | Managing Director of Van Eck Switzerland AG. | |||
| Jonathan R. Simon, 1974 | Senior Vice President, Secretary and Chief Legal Officer | Senior Vice President (Since 2016); Secretary and Chief Legal Officer (Since 2014) | Senior Vice President, General Counsel and Secretary of VEAC, VEARA and VESC; Officer and/or Director of other companies affiliated with VEAC and/or the Trust. Formerly, Vice President of VEAC, VEARA and VESC. | |||
| 1 | The address for each Officer is 666 Third Avenue, 9th Floor, New York, New York 10017. |
| 2 | Officers are elected yearly by the Trustees. |
| 75 |
This report is intended for the Funds’ shareholders. It may not be distributed to prospective investors unless it is preceded or accompanied by a VanEck Vectors ETF Trust (the “Trust”) prospectus and summary prospectus, which includes more complete information. Investing involves substantial risk and high volatility, including possible loss of principal. An investor should consider the investment objective, risks, charges and expenses of the Fund carefully before investing. To obtain a prospectus and summary prospectus, which contains this and other information, call 800.826.2333 or visit vaneck.com. Please read the prospectus and summary prospectus carefully before investing.
Additional information about the Trust’s Board of Trustees/Officers and a description of the policies and procedures the Trust uses to determine how to vote proxies relating to portfolio securities are provided in the Statement of Additional Information. The Statement of Additional Information and information regarding how the Trust voted proxies relating to portfolio securities during the most recent twelve month period ending June 30 is available, without charge, by calling 800.826.2333, or by visiting vaneck.com, or on the Securities and Exchange Commission’s website at http://www.sec.gov.
The Trust files its complete schedule of portfolio holdings with the Securities and Exchange Commission for the first and third quarters of each fiscal year on Form N-PORT. The Trust’s Form N-PORT filings are available on the Commission’s website at http://www.sec.gov and may be reviewed and copied at the Commission’s Public Reference Room in Washington, D.C. Information on the operation of the Public Reference Room may be obtained by calling 202.942.8090. The Funds’ complete schedules of portfolio holdings are also available by calling 800.826.2333 or by visiting vaneck.com.

| Investment Adviser: | Van Eck Associates Corporation | |
| Distributor: | Van Eck Securities Corporation | |
| 666 Third Avenue, New York, NY 10017 | ||
| vaneck.com | ||
| Account Assistance: | 800.826.2333 | INTLAR |
| ANNUAL REPORT December 31, 2020 |
| VANECK VECTORS® | |
| Agribusiness ETF | MOO® |
| Gold Miners ETF | GDX® |
| Junior Gold Miners ETF | GDXJ® |
| Low Carbon Energy ETF | SMOG® |
| Natural Resources ETF | HAP® |
| Oil Refiners ETF | CRAK® |
| Oil Services ETF | OIH® |
| Rare Earth/Strategic Metals ETF | REMX® |
| Steel ETF | SLX® |
| Unconventional Oil & Gas ETF | FRAK® |
| Uranium+Nuclear Energy ETF | NLR® |
| 800.826.2333 | vaneck.com |
Certain information contained in this report represents the opinion of the investment adviser which may change at any time. This information is not intended to be a forecast of future events, a guarantee of future results or investment advice. Current market conditions may not continue. The information contained herein regarding each index has been provided by the relevant index provider. Also, unless otherwise specifically noted, any discussion of the Funds’ holdings, the Funds’ performance, and the views of the investment adviser are as of December 31, 2020.
VANECK VECTORS ETFs
December 31, 2020 (unaudited)
Dear Fellow Shareholders:
The level of stimulus from the U.S. Federal Reserve (Fed) in 2020 was almost unprecedented and had investment consequences that endure into the new year of 2021. Financial markets benefited from the Fed stimulus and the case for gold investing solidified further.
As 2020 ends, the global economy continues to grow surprisingly well, supporting the markets, despite the social distancing that we all continue to feel in our personal lives. Important commodities like copper regained and passed pre-COVID-19 highs. In addition, in China, not only are higher real policy interest rates a sign of economic strength, but the country’s industrial recovery also points to all-time highs in activity, even though consumer activity lags a little.
We do, however, see two risks to markets in 2021: 1) an unforeseen rise in interest rates in the U.S. triggered by higher global growth or other factors; and 2) a bump in the return to full employment. As to the first risk, several assets like gold, commodities and bitcoin may not be fully reflecting inflationary risks which could be a consequence of the huge stimulus of 2020.
An incredible number of people have been laid off in the U.S. and, regardless of GDP numbers, people are unlikely to return quickly to work at pre-COVID-19 levels. Despite signature into law on December 27, 2020 of the Consolidated Appropriations Act, 2021, concern may remain high enough for policy makers to take additional steps (any of which, however, are, as yet, uncertain) that may impact the financial recovery.
The investing outlook sometimes does change suddenly, as it certainly did in 2020. To get our quarterly investment outlooks, please subscribe to “VanEck News & Insights”. Should you have any questions regarding fund performance, please contact us at 800.826.2333 or visit our website.
We sincerely thank you for investing in VanEck’s investment strategies. On the following pages, you will find a performance discussion and financial statements for each of the funds for the twelve month period ended December 31, 2020. As always, we value your continued confidence in us and look forward to helping you meet your investment goals in the future.

Jan F. van Eck
CEO and President
VanEck Vectors ETF Trust
January 15, 2021
Investing involves substantial risk and high volatility, including possible loss of principal. An investor should consider the investment objective, risks, charges and expenses of the Funds carefully before investing. To obtain a prospectus and summary prospectus, which contain this and other information, call 800.826.2333 or visit vaneck.com. Please read the prospectus and summary prospectus carefully before investing.
| 1 |
VANECK VECTORS ETFs
December 31, 2020 (unaudited)
Market Review
All funds were to some extent affected not only by both the wide market sell off beginning in late-February and ensuing market volatility, sparked by the COVID-19 pandemic as it evolved globally, but also by the resulting destruction of the demand for many hard assets. However, remedial measures, both financial and fiscal, taken by central governments around the world in response to the crisis (including the asset purchasing program of the U.S. Federal Reserve), resulted in a positive “bounce back” in markets starting in April. By the end of 2020, the extent of the recovery, not least in demand for hard assets, varied considerably sector by sector and geographically.
Agribusiness
From highs at the very start of the year, the Fund plummeted in March, along with the market, to hit a low toward the end of the month. Thereafter, agribusiness stocks moved upward through the rest of the year. The Fund gained 14.73% for the 12 month period. All sectors contributed to the Fund’s positive performance, with the primary drivers being companies in the industrial and healthcare sectors. In the former, they were, in particular, those in the machinery segment. In the latter, they were those in the healthcare equipment and supplies segment involved in the wellbeing, health and safety of livestock, pets and also people. Companies in the consumer staples sector contributed the least. By far the greatest positive returns came from companies in the U.S., while the greatest negative returns came from those in Germany and Australia.
Gold Miners
The stocks of both major gold miners and their junior peers hit lows in mid-March. However, thereafter, on the back of falling U.S. interest rates, the many uncertainties that abounded in the market and a rise in the price of gold, they rose, albeit fitfully, over the rest of 2020. The larger gold miners (VanEck Vectors Gold Miners ETF) posted a gain of 23.30% and junior gold miners (VanEck Vectors Junior Gold Miners ETF) posted a gain of 30.07% for the 12 month period.
Among the larger mining stocks, Canadian companies, with the largest average country weighting, contributed by far the most to performance. Companies in Australia detracted the most from performance.
The situation was similar among the juniors, with Canada the strongest contributor, followed by Australia. Peru detracted the most from performance.
Low Carbon Energy
The performance of low carbon energy stocks during the 12 month period was very encouraging, with the Fund recording a gain of 118.65%. Companies in the consumer discretionary, information technology and industrial sectors contributed by far the most to performance. Only the energy sector detracted from performance and then only minimally. The U.S. was by far the best performing country. Only Singapore and Brazil detracted from performance and then only minimally.
Natural Resources
Having plummeted in mid-March, natural resources stocks staged a rally over the remainder of 2020 and the Fund gained 6.73% over the 12 months period under review. The materials and industrial sectors contributed most to performance and the energy sector was by far the greatest detractor from performance. Australian companies contributed the most to performance, while UK companies detracted the most.
| 2 |
Oil Refiners
Along with so many others, oil refining stocks hit low in March. Although they recovered somewhat thereafter, ending down from their highs at the start of 2020. The Fund recorded a loss of 11.50% over the 12 month period. Increasing prices for crude oil and continuing concerns around demand both contributed to a challenging environment for refiners.
Exposure to refiners in the U.S. contributed by far the most negatively to Fund’s total return. The only significant positive contributors were: Finland, India and South Korea.
Oil Services
From a high on January 6, oil services stocks fell precipitously over the next two months to hit a low on March 18. Thereafter, however, with drilling activity having slowed substantially, the Baker Hughes U.S. rig count fell over 56% from 805 at the end of 2019 to 351 at the close of 2020,1 they failed to make any significant recovery and the Fund ended the full 12 month period down 41.31%.
The oil service stocks in the U.S., with the largest average country weighting, detracted the most from performance and the Netherlands detracted the least.
Rare Earth and Strategic Metals
The Fund had a firm year in 2020, gaining 63.22%. Having hit a low on February 23, the Fund recovered steadily through the third quarter and then experienced a particularly strong final quarter for the year. The majority of the companies in Fund’s portfolio contributed positively to returns. Of the companies contributing positively, those involved in the mining of lithium and/or production of lithium contributed the most. The greatest detractors from performance were three companies with mining operations and/or production involving either titanium, or lithium or molybdenum. Small-cap companies performed much better than either their large- or mid-cap peers during the period under review.
Steel
Having hit lows toward the end of March, as demand recovered for steel recovered, steel stocks climbed during the rest of the year, ending it with a noticeable surge in the last two months. The Fund ended the year under review recording a gain of 20.57%. Australia and Brazil were the greatest contributors to performance. While no country detracted from performance, India contributed the least.
Unconventional Oil & Gas
From a peak for the year at the end of its first week, unconventional oil and gas stocks hit a trough on March 18, having fallen a little over 70%. Thereafter, as oil prices firmed from their significant (negative) low at the end of April, stocks benefited from a fitful, if partial, recovery over the remainder of the year, with a surge in the last two months. The Fund lost 30.65% over the period under review. Having started 2020 at $61.18 a barrel, and hit a low of -$37.63 on April 20, by the end of the year the front month2 West Texas Intermediate (WTI) crude oil price stood at $48.52. Consequently, unconventional oil and gas, particularly shale oil, companies had a challenging year. Both U.S. companies (on average approximately 86% of the Fund by weight during the period under review) and Canadian contributed negatively to performance.
| 3 |
VANECK VECTORS ETFs
MANAGEMENT DISCUSSION
(unaudited) (continued)
Uranium+Nuclear Energy
Having hit a high on February 21, stocks in the Fund plummeted nearly 35% over the next two months to hit a low on March 23. Thereafter, it clawed its way back up, but still ended the 12 month period only slightly up with a gain of 3.59%. Energy companies were the greatest contributors to the Fund’s positive total return, with only the industrial and utilities sectors detracting from performance. Geographically, companies in the Canada contributed the most to performance, while those in Japan and the U.S. were the greatest detractors from performance. According to the World Nuclear Association figures, in December 2020, there were some 441 operable nuclear power reactors in 32 countries and 54 power reactors currently under construction in 19 countries, notably China, India, South Korea and the UAE.3
| 1 | Baker Hughes: Baker Hughes Rig Count, https://rigcount.bakerhughes.com/static-files/1686adeb-62c7-431d-91c0-f0ee02134bf9 |
| 2 | Front month: “Used in the context of options and futures, the term Front Month means the month closest to delivery (futures) or expiration (options)—which is often in the same month.” www.wikinvest.com/wiki/Front_Month |
| 3 | World Nuclear Association: World Nuclear Power Reactors & Uranium Requirements, December 2020, https://www.world-nuclear.org/information-library/facts-and-figures/world-nuclear-power-reactors-and-uranium-requireme.aspx |
| 4 |
VANECK VECTORS AGRIBUSINESS ETF
PERFORMANCE COMPARISON
December 31, 2020 (unaudited)
| Average Annual Total Returns | |||||||||
| Share Price | NAV | MVMOOTR1 | SPTR2 | ||||||
| One Year | 14.59% | 14.73% | 14.70% | 18.40% | |||||
| Five Year | 12.59% | 12.54% | 12.47% | 15.22% | |||||
| Ten Year | 5.70% | 5.72% | 5.90% | 13.88% | |||||
| 1 | MVIS® Global Agribusiness Index (MVMOOTR) is a rules based index intended to give investors a means of tracking the overall performance of the companies in the global agribusiness segment which includes: agri-chemicals, animal health and fertilizers, seeds and traits, from farm/irrigation equipment and farm machinery, aquaculture and fishing, livestock, cultivation and plantations (including grain, oil palms, sugar cane, tobacco leafs, grapevines etc.) and trading of agricultural products. |
| Index data prior to March 18, 2013 reflects that of the DAXglobal Agribusiness Index (DXAG). From March 18, 2013, forward, the index data reflects that of the MVIS® Global Agribusiness Index (MVMOOTR). All Index history reflects a blend of the performance of the aforementioned Indexes. | |
| 2 | The S&P 500 Index (SPTR) is a market-value weighted index consisting of 500 stocks chosen for market size, liquidity, and industry group representation, with each stock’s weight in the index proportionate to its market value. |
| Hypothetical Growth of $10,000 | ||
| This chart shows the value of a hypothetical $10,000 investment in the Fund at NAV over the past 10 years. The result is compared with the Fund’s benchmark and a broad-based index. |  |
Past performance is no guarantee of future results. Performance results do not reflect the deduction of taxes that a shareholder would pay on fund distributions or on the redemption or sale of fund shares.
See “About Fund Performance” on page 16 for more information.
| 5 |
VANECK VECTORS GOLD MINERS ETF
PERFORMANCE COMPARISON
December 31, 2020 (unaudited)
| Average Annual Total Returns | |||||||||
| Share Price | NAV | GDMNTR1 | SPTR2 | ||||||
| One Year | 23.67% | 23.30% | 23.69% | 18.40% | |||||
| Five Year | 21.96% | 21.93% | 22.45% | 15.22% | |||||
| Ten Year | (4.59)% | (4.60)% | (4.17)% | 13.88% | |||||
| 1 | NYSE Arca Gold Miners Index (GDMNTR) is a modified market capitalization weighted index primarily comprised of publicly traded companies involved in the mining for gold and silver. |
| 2 | The S&P 500 Index (SPTR) is a market-value weighted index consisting of 500 stocks chosen for market size, liquidity, and industry group representation, with each stock’s weight in the index proportionate to its market value. |
| Hypothetical Growth of $10,000 | ||
| This chart shows the value of a hypothetical $10,000 investment in the Fund at NAV over the past 10 years. The result is compared with the Fund’s benchmark and a broad-based index. |  |
Past performance is no guarantee of future results. Performance results do not reflect the deduction of taxes that a shareholder would pay on fund distributions or on the redemption or sale of fund shares.
See “About Fund Performance” on page 16 for more information.
| 6 |
VANECK VECTORS JUNIOR GOLD MINERS ETF
PERFORMANCE COMPARISON
December 31, 2020 (unaudited)
| Average Annual Total Returns | |||||||||
| Share Price | NAV | MVGDXJTR1 | SPTR2 | ||||||
| One Year | 30.41% | 30.07% | 30.89% | 18.40% | |||||
| Five Year | 24.96% | 24.96% | 25.16% | 15.22% | |||||
| Ten Year | (8.50)% | (8.48)% | (8.10)% | 13.88% | |||||
| 1 | MVIS® Global Junior Gold Miners Index (MVGDXJTR) is a rules based, modified capitalization weighted, float adjusted index intended to give investors a means of tracking the overall performance of small-capitalization companies that are involved primarily in the mining for gold and/or silver. |
| 2 | The S&P 500 Index (SPTR) is a market-value weighted index consisting of 500 stocks chosen for market size, liquidity, and industry group representation, with each stock’s weight in the index proportionate to its market value. |
| Hypothetical Growth of $10,000 | ||
| This chart shows the value of a hypothetical $10,000 investment in the Fund at NAV over the past 10 years. The result is compared with the Fund’s benchmark and a broad-based index. | 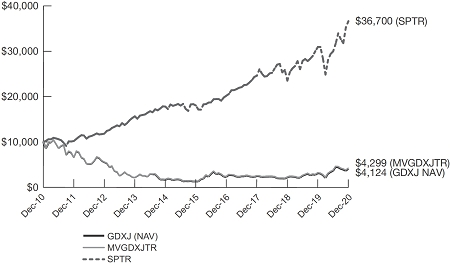 |
Past performance is no guarantee of future results. Performance results do not reflect the deduction of taxes that a shareholder would pay on fund distributions or on the redemption or sale of fund shares.
See “About Fund Performance” on page 16 for more information.
| 7 |
VANECK VECTORS LOW CARBON ENERGY ETF
PERFORMANCE COMPARISON
December 31, 2020 (unaudited)
| Average Annual Total Returns | |||||||||
| Share Price | NAV | AGIXLT1 | SPTR2 | ||||||
| One Year | 118.38% | 118.65% | 120.34% | 18.40% | |||||
| Five Year | 25.74% | 25.84% | 26.21% | 15.22% | |||||
| Ten Year | 11.87% | 11.83% | 11.71% | 13.88% | |||||
| 1 | Ardour Global IndexSM (Extra Liquid) (AGIXLT) is a rules based, modified capitalization weighted, float adjusted index intended to give investors a means of tracking the overall performance of a global universe of listed companies engaged in the alternative energy industry. |
| 2 | The S&P 500 Index (SPTR) is a market-value weighted index consisting of 500 stocks chosen for market size, liquidity, and industry group representation, with each stock’s weight in the index proportionate to its market value. |
| Hypothetical Growth of $10,000 | ||
| This chart shows the value of a hypothetical $10,000 investment in the Fund at NAV over the past 10 years. The result is compared with the Fund’s benchmark and a broad-based index. |  |
Past performance is no guarantee of future results. Performance results do not reflect the deduction of taxes that a shareholder would pay on fund distributions or on the redemption or sale of fund shares.
See “About Fund Performance” on page 16 for more information.
| 8 |
VANECK VECTORS NATURAL RESOURCES ETF
PERFORMANCE COMPARISON
December 31, 2020 (unaudited)
| Average Annual Total Returns | |||||||||
| Share Price | NAV | RVEIT1 | SPTR2 | ||||||
| One Year | 6.32% | 6.73% | 6.35% | 18.40% | |||||
| Five Year | 10.53% | 10.55% | 10.64% | 15.22% | |||||
| Ten Year | 2.31% | 2.36% | 2.50% | 13.88% | |||||
| 1 | VanEck® Natural Resources Index (RVEIT) is a rules based, modified capitalization weighted, float adjusted index intended to give investors a means of tracking the overall performance of a global universe of listed companies engaged in the production and distribution of commodities and commodity-related products and services. |
| 2 | The S&P 500 Index (SPTR) is a market-value weighted index consisting of 500 stocks chosen for market size, liquidity, and industry group representation, with each stock’s weight in the index proportionate to its market value. |
| Hypothetical Growth of $10,000 | ||
| This chart shows the value of a hypothetical $10,000 investment in the Fund at NAV over the past 10 years. The result is compared with the Fund’s benchmark and a broad-based index. |
Past performance is no guarantee of future results. Performance results do not reflect the deduction of taxes that a shareholder would pay on fund distributions or on the redemption or sale of fund shares.
See “About Fund Performance” on page 16 for more information.
| 9 |
VANECK VECTORS OIL REFINERS ETF
PERFORMANCE COMPARISON
December 31, 2020 (unaudited)
| Average Annual Total Returns | |||||||||
| Share Price | NAV | MVCRAKTR1 | SPTR2 | ||||||
| One Year | (11.20)% | (11.50)% | (11.90)% | 18.40% | |||||
| Five Year | 7.20% | 7.29% | 7.19% | 15.22% | |||||
| Life* | 6.77% | 6.80% | 6.79% | 13.72% | |||||
| * | Commencement of Fund: 8/18/15; First Day of Secondary Market Trading: 8/19/15 |
| 1 | MVIS® Global Oil Refiners Index (MVCRAKTR) is a rules based, modified capitalization weighted, float adjusted index intended to give investors a means of tracking the overall performance of companies involved in crude oil refining which may include: gasoline, diesel, jet fuel, fuel oil, naphtha, and other petrochemicals. |
| 2 | The S&P 500 Index (SPTR) is a market-value weighted index consisting of 500 stocks chosen for market size, liquidity, and industry group representation, with each stock’s weight in the index proportionate to its market value. |
| Hypothetical Growth of $10,000 (Since Inception) | ||
| This chart shows the value of a hypothetical $10,000 investment in the Fund at NAV since inception. The result is compared with the Fund’s benchmark and a broad-based index. |  |
Past performance is no guarantee of future results. Performance results do not reflect the deduction of taxes that a shareholder would pay on fund distributions or on the redemption or sale of fund shares.
See “About Fund Performance” on page 16 for more information.
| 10 |
VANECK VECTORS OIL SERVICES ETF
PERFORMANCE COMPARISON
December 31, 2020 (unaudited)
| Average Annual Total Returns | |||||||||
| Share Price | NAV | MVOIHTR1 | SPTR2 | ||||||
| One Year | (41.17)% | (41.31)% | (41.99)% | 18.40% | |||||
| Five Year | (20.38)% | (20.38)% | (20.62)% | 15.22% | |||||
| Life* | (14.61)% | (14.70)% | (14.87)% | 15.39% | |||||
| * | Commencement of Fund: 12/20/11; First Day of Secondary Market Trading: 12/21/11 |
| 1 | MVIS® US Listed Oil Services 25 Index (MVOIHTR) is a rules based, modified capitalization weighted, float adjusted index intended to give investors a means of tracking the overall performance of the largest and the most liquid common stocks and depositary receipts of U.S. exchange-listed companies involved in oil services to the upstream oil sector. |
| 2 | The S&P 500 Index (SPTR) is a market-value weighted index consisting of 500 stocks chosen for market size, liquidity, and industry group representation, with each stock’s weight in the index proportionate to its market value. |
| Hypothetical Growth of $10,000 (Since Inception) | ||
| This chart shows the value of a hypothetical $10,000 investment in the Fund at NAV since inception. The result is compared with the Fund’s benchmark and a broad-based index. | 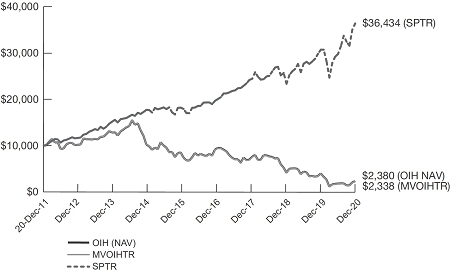 |
Past performance is no guarantee of future results. Performance results do not reflect the deduction of taxes that a shareholder would pay on fund distributions or on the redemption or sale of fund shares.
See “About Fund Performance” on page 16 for more information.
| 11 |
VANECK VECTORS RARE EARTH/STRATEGIC METALS ETF
PERFORMANCE COMPARISON
December 31, 2020 (unaudited)
| Average Annual Total Returns | |||||||||
| Share Price | NAV | MVREMXTR1 | SPTR2 | ||||||
| One Year | 64.70% | 63.22% | 61.53% | 18.40% | |||||
| Five Year | 14.71% | 14.14% | 13.19% | 15.22% | |||||
| Ten Year | (10.76)% | (10.70)% | (11.22)% | 13.88% | |||||
| 1 | MVIS® Global Rare Earth/Strategic Metals Index (MVREMXTR) is a rules based, modified capitalization weighted, float adjusted index intended to give investors a means of tracking the overall performance of companies involved in the rare earth and strategic metals segment. |
| 2 | The S&P 500 Index (SPTR) is a market-value weighted index consisting of 500 stocks chosen for market size, liquidity, and industry group representation, with each stock’s weight in the index proportionate to its market value. |
| Hypothetical Growth of $10,000 | ||
| This chart shows the value of a hypothetical $10,000 investment in the Fund at NAV over the past 10 years. The result is compared with the Fund’s benchmark and a broad-based index. |  |
Past performance is no guarantee of future results. Performance results do not reflect the deduction of taxes that a shareholder would pay on fund distributions or on the redemption or sale of fund shares.
See “About Fund Performance” on page 16 for more information.
| 12 |
PERFORMANCE COMPARISON
December 31, 2020 (unaudited)
| Average Annual Total Returns | |||||||||
| Share Price | NAV | STEEL1 | SPTR2 | ||||||
| One Year | 20.82% | 20.57% | 21.29% | 18.40% | |||||
| Five Year | 21.40% | 21.35% | 21.74% | 15.22% | |||||
| Ten Year | (1.94)% | (1.94)% | (1.68)% | 13.88% | |||||
| 1 | NYSE Arca Steel Index (STEEL) is a modified market capitalization weighted index comprised of common stocks and ADRs of selected companies that are primarily involved in a variety of activities that are related to steel production. |
| 2 | The S&P 500 Index (SPTR) is a market-value weighted index consisting of 500 stocks chosen for market size, liquidity, and industry group representation, with each stock’s weight in the index proportionate to its market value. |
| Hypothetical Growth of $10,000 | ||
| This chart shows the value of a hypothetical $10,000 investment in the Fund at NAV over the past 10 years. The result is compared with the Fund’s benchmark and a broad-based index. |  |
Past performance is no guarantee of future results. Performance results do not reflect the deduction of taxes that a shareholder would pay on fund distributions or on the redemption or sale of fund shares.
See “About Fund Performance” on page 16 for more information.
| 13 |
VANECK VECTORS UNCONVENTIONAL OIL & GAS ETF
PERFORMANCE COMPARISON
December 31, 2020 (unaudited)
| Average Annual Total Returns | |||||||||
| Share Price | NAV | MVFRAKTR1 | SPTR2 | ||||||
| One Year | (30.42)% | (30.65)% | (30.98)% | 18.40% | |||||
| Five Year | (9.50)% | (9.46)% | (9.37)% | 15.22% | |||||
| Life* | (11.45)% | (11.45)% | (11.36)% | 14.54% | |||||
| * | Commencement of Fund: 2/14/12; First Day of Secondary Market Trading: 2/15/12 |
| 1 | MVIS® Global Unconventional Oil & Gas Index (MVFRAKTR) is a rules based, modified capitalization weighted, float adjusted index intended to give investors a means of tracking the overall performance of companies involved in the exploration, development, extraction and/or production of unconventional oil and natural gas. |
| 2 | The S&P 500 Index (SPTR) is a market-value weighted index consisting of 500 stocks chosen for market size, liquidity, and industry group representation, with each stock’s weight in the index proportionate to its market value. |
| Hypothetical Growth of $10,000 (Since Inception) | ||
| This chart shows the value of a hypothetical $10,000 investment in the Fund at NAV since inception. The result is compared with the Fund’s benchmark and a broad-based index. | 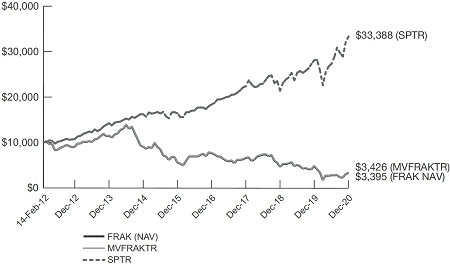 |
Past performance is no guarantee of future results. Performance results do not reflect the deduction of taxes that a shareholder would pay on fund distributions or on the redemption or sale of fund shares.
See “About Fund Performance” on page 16 for more information.
| 14 |
VANECK VECTORS URANIUM+NUCLEAR ENERGY ETF
PERFORMANCE COMPARISON
December 31, 2020 (unaudited)
| Average Annual Total Returns | |||||||||
| Share Price | NAV | MVNLRTR1 | SPTR2 | ||||||
| One Year | 3.49% | 3.59% | 3.19% | 18.40% | |||||
| Five Year | 5.24% | 5.22% | 4.79% | 15.22% | |||||
| Ten Year | (0.38)% | (0.33)% | (0.76)% | 13.88% | |||||
| 1 | MVIS® Global Uranium & Nuclear Energy Index (MVNLRTR) is a rules based, modified capitalization weighted, float adjusted index intended to give investors a means of tracking the overall performance of companies involved in uranium and nuclear energy. |
| Index data prior to March 24, 2014 reflects that of the DAXglobal® Nuclear Energy Index (DXNE). From March 24, 2014, forward, the index data reflects that of the MVIS® Global Uranium & Nuclear Energy Index (MVNLRTR). All index history reflects a blend of the performance of the aforementioned Indexes. | |
| 2 | The S&P 500 Index (SPTR) is a market-value weighted index consisting of 500 stocks chosen for market size, liquidity, and industry group representation, with each stock’s weight in the index proportionate to its market value. |
| Hypothetical Growth of $10,000 | ||
| This chart shows the value of a hypothetical $10,000 investment in the Fund at NAV over the past 10 years. The result is compared with the Fund’s benchmark and a broad-based index. | 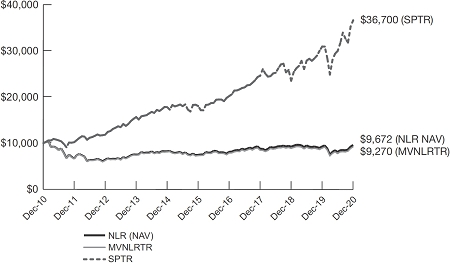 |
Past performance is no guarantee of future results. Performance results do not reflect the deduction of taxes that a shareholder would pay on fund distributions or on the redemption or sale of fund shares.
See “About Fund Performance” on page 16 for more information.
| 15 |
VANECK VECTORS ETF TRUST
(unaudited)
The price used to calculate market return (Share Price) is determined by using the closing price listed on its primary listing exchange. Since the shares of each Fund did not trade in the secondary market until after each Fund’s commencement, for the period from commencement to the first day of secondary market trading in shares of each Fund, the NAV of each Fund is used as a proxy for the secondary market trading price to calculate market returns.
The performance data quoted represents past performance. Past performance is not a guarantee of future results. Performance information for certain Funds reflect temporary waivers of expenses and/or fees. Had these Funds incurred all expenses, investment returns would have been reduced. These returns do not reflect the deduction of taxes that a shareholder would pay on Fund dividends and distributions or the sale of Fund shares.
Investment return and value of the shares of each Fund will fluctuate so that an investor’s shares, when sold, may be worth more or less than their original cost. Performance may be lower or higher than performance data quoted. Fund returns reflect reinvestment of dividends and capital gains distributions. Performance current to the most recent month-end is available by calling 800.826.2333 or by visiting vaneck.com.
All indices are unmanaged and include the reinvestment of all dividends, but do not reflect the payment of transaction costs, advisory fees or expenses that are associated with an investment in the Fund. Certain indices may take into account withholding taxes. An index’s performance is not illustrative of the Fund’s performance. Indices are not securities in which investments can be made.
The Gold Miners Index and Steel Index are published by ICE Data Indices, LLC (ICE Data). The Agribusiness Index, Junior Gold Miners Index, Oil & Gas Index, Oil Refiners Index, Oil Services Index, Rare Earth/Strategic Metals Index and Uranium & Nuclear Energy Index are published by MV Index Solutions GmbH (MVIS®), which is a wholly owned subsidiary of the Adviser, Van Eck Associates Corporation. The Natural Resources Index and the Ardour Global Index are published by S-Network Global Indexes, LLC (S-Network).
ICE Data, MVIS, S-Network, and Ardour are referred to herein as the “Index Providers”. The Index Providers do not sponsor, endorse, or promote the Funds and bear no liability with respect to the Funds or any security.
| 16 |
VANECK VECTORS ETF TRUST
(unaudited)
Hypothetical $1,000 investment at beginning of period
As a shareholder of a Fund, you incur operating expenses, including management fees and other Fund expenses. This disclosure is intended to help you understand the ongoing costs (in dollars) of investing in your Fund and to compare these costs with the ongoing costs of investing in other mutual funds.
The disclosure is based on an investment of $1,000 invested at the beginning of the period and held for the entire period, July 1, 2020 to December 31, 2020.
Actual Expenses
The first line in the table below provides information about account values and actual expenses. You may use the information in this line, together with the amount you invested, to estimate the expenses that you paid over the period. Simply divide your account value by $1,000 (for example, an $8,600 account value divided by $1,000 = 8.6), then multiply the result by the number in the first line under the heading entitled “Expenses Paid During the Period.”
Hypothetical Example for Comparison Purposes
The second line in the table below provides information about hypothetical account values and hypothetical expenses based on the Fund’s actual expense ratio and an assumed rate of return of 5% per year before expenses, which is not the Fund’s actual return. The hypothetical account values and expenses may not be used to estimate the actual ending account balance or expenses you paid for the period. You may use this information to compare the ongoing costs of investing in your Fund and other funds. To do so, compare this 5% hypothetical example with the 5% hypothetical examples that appear in the shareholder reports of other funds.
Please note that the expenses shown in the table are meant to highlight your ongoing costs only and do not reflect any transactional costs, such as brokerage commissions paid on purchases and sales. Therefore, the second line of the table is useful in comparing ongoing costs only, and will not help you determine the relative costs of owning different funds. In addition, if these transactional costs were included, your costs would have been higher.
| 17 |
VANECK VECTORS ETF TRUST
EXPLANATION OF EXPENSES
(unaudited) (continued)
| Beginning Account Value July 1, 2020 | Ending Account Value December 31, 2020 | Annualized Expense Ratio During Period | Expenses Paid During the Period* July 1, 2020 - December 31, 2020 | |||||||||||||
| Agribusiness ETF | ||||||||||||||||
| Actual | $ | 1,000.00 | $ | 1,306.30 | 0.54 | % | $ | 3.13 | ||||||||
| Hypothetical** | $ | 1,000.00 | $ | 1,022.42 | 0.54 | % | $ | 2.75 | ||||||||
| Gold Miners ETF | ||||||||||||||||
| Actual | $ | 1,000.00 | $ | 988.00 | 0.51 | % | $ | 2.55 | ||||||||
| Hypothetical** | $ | 1,000.00 | $ | 1,022.57 | 0.51 | % | $ | 2.59 | ||||||||
| Junior Gold Miners ETF | ||||||||||||||||
| Actual | $ | 1,000.00 | $ | 1,113.60 | 0.51 | % | $ | 2.71 | ||||||||
| Hypothetical** | $ | 1,000.00 | $ | 1,022.57 | 0.51 | % | $ | 2.59 | ||||||||
| Low Carbon Energy ETF | ||||||||||||||||
| Actual | $ | 1,000.00 | $ | 2,026.30 | 0.62 | % | $ | 4.72 | ||||||||
| Hypothetical** | $ | 1,000.00 | $ | 1,022.02 | 0.62 | % | $ | 3.15 | ||||||||
| Natural Resources ETF | ||||||||||||||||
| Actual | $ | 1,000.00 | $ | 1,302.90 | 0.50 | % | $ | 2.89 | ||||||||
| Hypothetical** | $ | 1,000.00 | $ | 1,022.62 | 0.50 | % | $ | 2.54 | ||||||||
| Oil Refiners ETF | ||||||||||||||||
| Actual | $ | 1,000.00 | $ | 1,173.60 | 0.60 | % | $ | 3.28 | ||||||||
| Hypothetical** | $ | 1,000.00 | $ | 1,022.12 | 0.60 | % | $ | 3.05 | ||||||||
| Oil Services ETF | ||||||||||||||||
| Actual | $ | 1,000.00 | $ | 1,279.30 | 0.35 | % | $ | 2.01 | ||||||||
| Hypothetical** | $ | 1,000.00 | $ | 1,023.38 | 0.35 | % | $ | 1.78 | ||||||||
| Rare Earth/Strategic Metals ETF | ||||||||||||||||
| Actual | $ | 1,000.00 | $ | 1,923.60 | 0.59 | % | $ | 4.34 | ||||||||
| Hypothetical** | $ | 1,000.00 | $ | 1,022.17 | 0.59 | % | $ | 3.00 | ||||||||
| Steel ETF | ||||||||||||||||
| Actual | $ | 1,000.00 | $ | 1,647.80 | 0.56 | % | $ | 3.73 | ||||||||
| Hypothetical** | $ | 1,000.00 | $ | 1,022.32 | 0.56 | % | $ | 2.85 | ||||||||
| Unconventional Oil & Gas ETF | ||||||||||||||||
| Actual | $ | 1,000.00 | $ | 1,180.50 | 0.54 | % | $ | 2.96 | ||||||||
| Hypothetical** | $ | 1,000.00 | $ | 1,022.42 | 0.54 | % | $ | 2.75 | ||||||||
| Uranium+Nuclear Energy ETF | ||||||||||||||||
| Actual | $ | 1,000.00 | $ | 1,187.90 | 0.60 | % | $ | 3.30 | ||||||||
| Hypothetical** | $ | 1,000.00 | $ | 1,022.12 | 0.60 | % | $ | 3.05 | ||||||||
| * | Expenses are equal to the Fund’s annualized expense ratio (for the six months ended December 31, 2020) multiplied by the average account value over the period, multiplied by the number of days in the most recent fiscal half year divided by the number of days in the fiscal year (to reflect the one-half year period). |
| ** | Assumes annual return of 5% before expenses |
| 18 |
VANECK VECTORS AGRIBUSINESS ETF
December 31, 2020
| Number of Shares | Value | |||||||
| COMMON STOCKS: 99.9% | ||||||||
| Australia: 1.6% | ||||||||
| 2,678,469 | Incitec Pivot Ltd. * # | $ | 4,715,643 | |||||
| 1,153,528 | Treasury Wine Estates Ltd. † # | 8,352,017 | ||||||
| 13,067,660 | ||||||||
| Brazil: 2.8% | ||||||||
| 2,668,300 | Rumo SA * # | 9,868,315 | ||||||
| 305,465 | Yara International ASA (NOK) # | 12,690,585 | ||||||
| 22,558,900 | ||||||||
| Canada: 5.6% | ||||||||
| 917,369 | Nutrien Ltd. (USD) | 44,180,491 | ||||||
| Chile: 1.1% | ||||||||
| 182,851 | Sociedad Quimica y Minera de Chile SA (ADR) | 8,976,156 | ||||||
| China / Hong Kong: 5.0% | ||||||||
| 3,077,000 | China Mengniu Dairy Co. Ltd. # | 18,548,334 | ||||||
| 6,064,351 | Wilmar International Ltd. (SGD) # | 21,350,719 | ||||||
| 39,899,053 | ||||||||
| Denmark: 1.2% | ||||||||
| 92,202 | Bakkafrost P/F (NOK) # | 6,592,274 | ||||||
| 25,992 | Schouw & Co. AB # | 2,631,869 | ||||||
| 9,224,143 | ||||||||
| Germany: 7.4% | ||||||||
| 935,728 | Bayer AG # | 55,210,543 | ||||||
| 359,589 | K+S AG # | 3,454,507 | ||||||
| 58,665,050 | ||||||||
| Indonesia: 0.2% | ||||||||
| 13,190,845 | Golden Agri-Resources Ltd. (SGD) # | 1,586,724 | ||||||
| Israel: 0.9% | ||||||||
| 1,382,066 | ICL Group Ltd. (USD) † | 6,979,433 | ||||||
| Japan: 5.8% | ||||||||
| 1,654,430 | Kubota Corp. † # | 36,148,853 | ||||||
| 74,800 | Maruha Nichiro Corp. # | 1,610,731 | ||||||
| 152,200 | Nippon Meat Packers, Inc. # | 6,704,213 | ||||||
| 443,400 | Nippon Suisan Kaisha Ltd. # | 1,832,983 | ||||||
| 46,296,780 | ||||||||
| Malaysia: 2.3% | ||||||||
| 4,884,355 | IOI Corp. Bhd # | 5,307,132 | ||||||
| 625,170 | Kuala Lumpur Kepong Bhd # | 3,682,502 | ||||||
| 1,052,080 | PPB Group Bhd # | 4,846,518 | ||||||
| 3,852,800 | Sime Darby Plantation Bhd # | 4,788,966 | ||||||
| 18,625,118 | ||||||||
| Netherlands: 0.4% | ||||||||
| 147,116 | OCI NV * † # | 2,834,775 | ||||||
| Norway: 3.4% | ||||||||
| 500,114 | Leroy Seafood Group ASA # | 3,533,606 | ||||||
| 795,815 | Mowi ASA # | 17,793,804 | ||||||
| 92,844 | Salmar ASA # | 5,447,609 | ||||||
| 26,775,019 | ||||||||
| Russia: 0.4% | ||||||||
| 232,966 | PhosAgro PJSC Reg S (GDR) # | 3,177,049 | ||||||
| Number of Shares | Value | |||||||
| Singapore: 0.8% | ||||||||
| 14,420,500 | Charoen Pokphand Indonesia Tbk PT # | $ | 6,706,461 | |||||
| Switzerland: 0.8% | ||||||||
| 13,316 | Bucher Industries AG # | 6,116,871 | ||||||
| Taiwan: 0.4% | ||||||||
| 1,488,000 | Taiwan Fertilizer Co. Ltd. # | 2,874,579 | ||||||
| Thailand: 1.1% | ||||||||
| 9,638,136 | Charoen Pokphand Foods (NVDR) # | 8,605,100 | ||||||
| United Kingdom: 3.6% | ||||||||
| 1,772,527 | CNH Industrial NV (USD) * | 22,759,247 | ||||||
| 104,406 | Genus Plc # | 5,971,697 | ||||||
| 28,730,944 | ||||||||
| United States: 55.1% | ||||||||
| 86,824 | AGCO Corp. | 8,950,686 | ||||||
| 768,615 | Archer-Daniels-Midland Co. | 38,745,882 | ||||||
| 43,967 | Balchem Corp. | 5,065,878 | ||||||
| 200,975 | Bunge Ltd. | 13,179,940 | ||||||
| 252,252 | CF Industries Holdings, Inc. | 9,764,675 | ||||||
| 1,080,198 | Corteva, Inc. | 41,825,267 | ||||||
| 207,307 | Darling Ingredients, Inc. * | 11,957,468 | ||||||
| 240,522 | Deere & Co. | 64,712,444 | ||||||
| 311,255 | Elanco Animal Health, Inc. * | 9,546,191 | ||||||
| 181,537 | FMC Corp. | 20,864,047 | ||||||
| 110,696 | IDEXX Laboratories, Inc. * | 55,333,610 | ||||||
| 65,727 | Neogen Corp. * | 5,212,151 | ||||||
| 97,356 | Pilgrim’s Pride Corp. * | 1,909,151 | ||||||
| 28,003 | Sanderson Farms, Inc. | 3,701,997 | ||||||
| 575,830 | The Mosaic Co. | 13,249,848 | ||||||
| 158,693 | Toro Co. | 15,050,444 | ||||||
| 188,599 | Tractor Supply Co. | 26,513,247 | ||||||
| 435,014 | Tyson Foods, Inc. | 28,032,302 | ||||||
| 386,216 | Zoetis, Inc. | 63,918,748 | ||||||
| 437,533,976 | ||||||||
| Total Common Stocks (Cost: $653,814,085) | 793,414,282 | |||||||
| SHORT-TERM INVESTMENT HELD AS COLLATERAL FOR SECURITIES ON LOAN: 0.1% (Cost: $434,046) | ||||||||
| Money Market Fund: 0.1% | ||||||||
| 434,046 | State Street Navigator Securities Lending Government Money Market Portfolio | 434,046 | ||||||
| Total Investments: 100.0% (Cost: $654,248,131) | 793,848,328 | |||||||
| Liabilities in excess of other assets: (0.0)% | (47,854 | ) | ||||||
| NET ASSETS: 100.0% | $ | 793,800,474 | ||||||
See Notes to Financial Statements
| 19 |
VANECK VECTORS AGRIBUSINESS ETF
SCHEDULE OF INVESTMENTS
(continued)
Definitions:
| ADR | American Depositary Receipt |
| GDR | Global Depositary Receipt |
| NOK | Norwegian Krone |
| NVDR | Non-Voting Depositary Receipt |
| USD | United States Dollar |
Footnotes:
| * | Non-income producing |
| † | Security fully or partially on loan. Total market value of securities on loan is $35,130,908. |
| # | Security has been valued in good faith pursuant to guidelines established by the Board of Trustees. The aggregate value of fair valued securities is $272,984,979 which represents 34.4% of net assets. |
| Reg S | Security was purchased pursuant to Regulation S under the Securities Act of 1933, which exempts from registration securities offered and sold outside of the United States. Such a security cannot be sold in the United States without either an effective registration statement filed pursuant to the Securities Act of 1933, or pursuant to an exemption from registration. |
| Summary of Investments by Sector Excluding Collateral for Securities Loaned | % of Investments | Value | ||||||
| Consumer Discretionary | 3.3 | % | $ | 26,513,247 | ||||
| Consumer Staples | 29.4 | 233,419,999 | ||||||
| Health Care | 23.9 | 189,221,243 | ||||||
| Industrials | 20.6 | 163,606,860 | ||||||
| Materials | 22.8 | 180,652,933 | ||||||
| 100.0 | % | $ | 793,414,282 | |||||
The summary of inputs used to value the Fund’s investments as of December 31, 2020 is as follows:
| Level 1 Quoted Prices | Level 2 Significant Observable Inputs | Level 3 Significant Unobservable Inputs | Value | ||||||||||||||
| Common Stocks | |||||||||||||||||
| Australia | $ | — | $ | 13,067,660 | $ | — | $ | 13,067,660 | |||||||||
| Brazil | — | 22,558,900 | — | 22,558,900 | |||||||||||||
| Canada | 44,180,491 | — | — | 44,180,491 | |||||||||||||
| Chile | 8,976,156 | — | — | 8,976,156 | |||||||||||||
| China / Hong Kong | — | 39,899,053 | — | 39,899,053 | |||||||||||||
| Denmark | — | 9,224,143 | — | 9,224,143 | |||||||||||||
| Germany | — | 58,665,050 | — | 58,665,050 | |||||||||||||
| Indonesia | — | 1,586,724 | — | 1,586,724 | |||||||||||||
| Israel | 6,979,433 | — | — | 6,979,433 | |||||||||||||
| Japan | — | 46,296,780 | — | 46,296,780 | |||||||||||||
| Malaysia | — | 18,625,118 | — | 18,625,118 | |||||||||||||
| Netherlands | — | 2,834,775 | — | 2,834,775 | |||||||||||||
| Norway | — | 26,775,019 | — | 26,775,019 | |||||||||||||
| Russia | — | 3,177,049 | — | 3,177,049 | |||||||||||||
| Singapore | — | 6,706,461 | — | 6,706,461 | |||||||||||||
| Switzerland | — | 6,116,871 | — | 6,116,871 | |||||||||||||
| Taiwan | — | 2,874,579 | — | 2,874,579 | |||||||||||||
| Thailand | — | 8,605,100 | — | 8,605,100 | |||||||||||||
| United Kingdom | 22,759,247 | 5,971,697 | — | 28,730,944 | |||||||||||||
| United States | 437,533,976 | — | — | 437,533,976 | |||||||||||||
| Money Market Fund | 434,046 | — | — | 434,046 | |||||||||||||
| Total | $ | 520,863,349 | $ | 272,984,979 | $ | — | $ | 793,848,328 | |||||||||
See Notes to Financial Statements
| 20 |
VANECK VECTORS GOLD MINERS ETF
SCHEDULE OF INVESTMENTS
December 31, 2020
| Number of Shares | Value | |||||||
| COMMON STOCKS: 99.9% | ||||||||
| Australia: 14.7% | ||||||||
| 100,622,799 | Evolution Mining Ltd. ‡ # | $ | 387,584,793 | |||||
| 51,818,427 | Gold Road Resources Ltd. ‡ * # | 52,987,929 | ||||||
| 39,230,743 | Newcrest Mining Ltd. † # | 783,668,514 | ||||||
| 43,635,019 | Northern Star Resources Ltd. ‡ † # | 426,875,246 | ||||||
| 41,436,303 | OceanaGold Corp. (CAD) ‡ * | 80,010,444 | ||||||
| 72,189,343 | Perseus Mining Ltd. ‡ * † # | 72,435,336 | ||||||
| 47,642,610 | Ramelius Resources Ltd. ‡ # | 62,075,381 | ||||||
| 30,121,307 | Regis Resources Ltd. ‡ † # | 87,000,503 | ||||||
| 65,007,914 | Resolute Mining Ltd. ‡ * † # | 39,928,687 | ||||||
| 65,228,373 | Saracen Mineral Holdings Ltd. ‡ * # | 239,553,823 | ||||||
| 51,915,555 | Silver Lake Resources Ltd. ‡ * † # | 71,711,925 | ||||||
| 41,537,810 | St. Barbara Ltd. ‡ # | 75,627,992 | ||||||
| 24,849,018 | Westgold Resources Ltd. ‡ * † # | 50,723,137 | ||||||
| 2,430,183,710 | ||||||||
| Brazil: 4.9% | ||||||||
| 19,480,509 | Wheaton Precious Metals Corp. (USD) | 813,116,446 | ||||||
| Burkina Faso: 0.6% | ||||||||
| 27,901,949 | IAMGOLD Corp. (USD) ‡ * | 102,400,153 | ||||||
| Canada: 46.4% | ||||||||
| 11,394,470 | Agnico-Eagle Mines Ltd. (USD) | 803,424,080 | ||||||
| 23,125,489 | Alamos Gold, Inc. (USD) ‡ | 202,348,029 | ||||||
| 61,867,571 | B2Gold Corp. (USD) ‡ † | 346,458,398 | ||||||
| 75,436,658 | Barrick Gold Corp. (USD) | 1,718,447,069 | ||||||
| 10,653,498 | Dundee Precious Metals, Inc. ‡ | 76,514,526 | ||||||
| 14,251,485 | Equinox Gold Corp. (USD) ‡ * † | 147,360,355 | ||||||
| 13,026,815 | First Majestic Silver Corp. (USD) ‡ * † | 175,080,394 | ||||||
| 10,847,127 | Fortuna Silver Mines, Inc. (USD) ‡ * † | 89,380,326 | ||||||
| 8,095,944 | Franco-Nevada Corp. (USD) † | 1,014,664,661 | ||||||
| 12,904,095 | K92 Mining, Inc. ‡ * † | 77,080,191 | ||||||
| 74,100,822 | Kinross Gold Corp. (USD) ‡ | 543,900,033 | ||||||
| 17,156,335 | Kirkland Lake Gold Ltd. ‡ † | 708,338,478 | ||||||
| 39,832,868 | New Gold, Inc. (USD) ‡ * † | 87,233,981 | ||||||
| 9,827,973 | Osisko Gold Royalties Ltd. (USD) ‡ † | 124,618,698 | ||||||
| 12,377,060 | Pan American Silver Corp. (USD) ‡ † | 427,132,341 | ||||||
| 11,027,161 | Pretium Resources, Inc. (USD) ‡ * | 126,591,808 | ||||||
| 11,327,735 | Sandstorm Gold Ltd. (USD) ‡ * † | 81,219,860 | ||||||
| 10,317,303 | Silvercorp Metals, Inc. (USD) ‡ | 69,022,757 | ||||||
| 12,924,478 | SSR Mining, Inc. (USD) ‡ * † | 259,911,253 | ||||||
| 9,869,176 | Teranga Gold Corp. ‡ * | 105,818,637 | ||||||
| 5,036,836 | Torex Gold Resources, Inc. ‡ * | 75,473,469 | ||||||
| 8,193,067 | Wesdome Gold Mines Ltd. ‡ | 68,296,995 | ||||||
| 56,099,290 | Yamana Gold, Inc. (USD) ‡ † | 320,326,946 | ||||||
| 7,648,643,285 | ||||||||
| China / Hong Kong: 3.4% | ||||||||
| 153,690,000 | Zhaojin Mining Industry Co. Ltd. ‡ † # | 183,114,692 | ||||||
| 337,882,000 | Zijin Mining Group Ltd. ‡ # | 382,742,128 | ||||||
| 565,856,820 | ||||||||
| Egypt: 0.7% | ||||||||
| 68,073,818 | Centamin Plc (GBP) ‡ # | 115,183,901 | ||||||
| Ivory Coast: 1.4% | ||||||||
| 9,601,162 | Endeavour Mining Corp. (CAD) ‡ * † | 223,223,248 | ||||||
| Number of Shares | Value | |||||||
| Kyrgyzstan: 1.2% | ||||||||
| 17,418,122 | Centerra Gold, Inc. (CAD) ‡ | $ | 201,525,211 | |||||
| Peru: 1.1% | ||||||||
| 14,941,172 | Cia de Minas Buenaventura SAA (ADR) ‡ | 182,132,887 | ||||||
| South Africa: 4.3% | ||||||||
| 5,091,512 | DRDGOLD Ltd. (ADR) † | 59,723,436 | ||||||
| 52,019,222 | Gold Fields Ltd. (ADR) ‡ | 482,218,188 | ||||||
| 36,275,670 | Harmony Gold Mining Co. Ltd. (ADR) ‡ * † | 169,770,136 | ||||||
| 711,711,760 | ||||||||
| Tanzania: 3.4% | ||||||||
| 24,549,819 | AngloGold Ashanti Ltd. (ADR) ‡ | 555,316,906 | ||||||
| Turkey: 0.8% | ||||||||
| 10,293,691 | Eldorado Gold Corp. (USD) ‡ * | 136,597,279 | ||||||
| United States: 17.0% | ||||||||
| 14,353,458 | Coeur Mining, Inc. ‡ * | 148,558,290 | ||||||
| 31,271,109 | Hecla Mining Co. ‡ | 202,636,786 | ||||||
| 34,082,270 | Newmont Mining Corp. | 2,041,187,150 | ||||||
| 3,863,433 | Royal Gold, Inc. ‡ | 410,914,734 | ||||||
| 2,803,296,960 | ||||||||
| Total Common Stocks (Cost: $12,735,548,205) | 16,489,188,566 | |||||||
| SHORT-TERM INVESTMENT HELD AS COLLATERAL FOR SECURITIES ON LOAN: 0.8% (Cost: $124,038,217) | ||||||||
| Money Market Fund: 0.8% | ||||||||
| 124,038,217 | State Street Navigator Securities Lending Government Money Market Portfolio | 124,038,217 | ||||||
| Total Investments: 100.7% (Cost: $12,859,586,422) | 16,613,226,783 | |||||||
| Liabilities in excess of other assets: (0.7)% | (109,708,141 | ) | ||||||
| NET ASSETS: 100.0% | $ | 16,503,518,642 | ||||||
See Notes to Financial Statements
| 21 |
VANECK VECTORS GOLD MINERS ETF
SCHEDULE OF INVESTMENTS
(continued)
Definitions:
| ADR | American Depositary Receipt |
| CAD | Canadian Dollar |
| GBP | British Pound |
| USD | United States Dollar |
Footnotes:
| ‡ | Affiliated issuer – as defined under the Investment Company Act of 1940. |
| * | Non-income producing |
| † | Security fully or partially on loan. Total market value of securities on loan is $277,024,023. |
| # | Security has been valued in good faith pursuant to guidelines established by the Board of Trustees. The aggregate value of fair valued securities is $3,031,213,987 which represents 18.4% of net assets. |
| Summary of Investments by Sector Excluding Collateral for Securities Loaned | % of Investments | Value | ||||||
| Gold | 94.2 | % | $ | 15,525,935,962 | ||||
| Silver Mining | 5.8 | 963,252,604 | ||||||
| 100.0 | % | $ | 16,489,188,566 | |||||
A summary of the Fund’s transactions in securities of affiliates for the period ended December 31, 2020 is set forth below:
| Affiliates | Value 12/31/19 | Purchases | Sales Proceeds | Realized Gain (Loss) | Dividend Income | Net Change in Unrealized Appreciation (Depreciation) | Value 12/31/20 | |||||||||||||||||||||
| Alacer Gold Corp. | $ | 98,668,191 | $ | 23,479,339 | $ | (87,443,819 | ) | $ | 6,398,663 | $ | — | $ | (41,102,374 | ) | $ | — | ||||||||||||
| Alamos Gold, Inc. | 148,183,745 | 69,824,462 | (70,228,876 | ) | 13,566,564 | 1,462,198 | 41,002,134 | 202,348,029 | ||||||||||||||||||||
| AngloGold Ashanti Ltd. | 583,793,728 | 223,915,137 | (236,599,782 | ) | 68,458,792 | 2,428,226 | (84,250,969 | ) | 555,316,906 | |||||||||||||||||||
| B2Gold Corp. | 258,816,788 | 124,654,659 | (117,606,011 | ) | 31,255,292 | 6,582,406 | 49,337,670 | 346,458,398 | ||||||||||||||||||||
| Centamin Plc | 122,016,193 | 50,360,399 | (53,172,665 | ) | 455,652 | 7,304,490 | (4,475,678 | ) | 115,183,901 | |||||||||||||||||||
| Centerra Gold, Inc. | 147,155,926 | 62,533,448 | (60,276,152 | ) | 11,065,204 | 2,182,200 | 41,046,785 | 201,525,211 | ||||||||||||||||||||
| Cia de Minas Buenaventura SAA | 241,158,385 | 60,805,301 | (61,521,693 | ) | (22,570,992 | ) | — | (35,738,114 | ) | 182,132,887 | ||||||||||||||||||
| Coeur Mining, Inc. | 122,252,687 | 33,750,847 | (30,587,676 | ) | (8,250,160 | ) | — | 31,392,592 | 148,558,290 | |||||||||||||||||||
| Detour Gold Corp. | 216,419,234 | 7,651,600 | (146,064,807 | ) | 1,175,124 | — | (79,181,151 | ) | — | |||||||||||||||||||
| Dundee Precious Metals, Inc. | 48,403,977 | 22,336,899 | (21,525,331 | ) | 1,279,615 | 934,164 | 26,019,366 | 76,514,526 | ||||||||||||||||||||
| Eldorado Gold Corp. | 80,070,037 | 41,217,438 | (32,685,138 | ) | (7,294,498 | ) | — | 55,289,440 | 136,597,279 | |||||||||||||||||||
| Endeavour Mining Corp. | 130,838,546 | 136,017,029 | (62,413,798 | ) | 2,553,193 | — | 16,228,278 | 223,223,248 | ||||||||||||||||||||
| Equinox Gold Corp. | — | 130,486,130 | (16,211,552 | ) | 4,389,466 | — | 28,696,311 | 147,360,355 | ||||||||||||||||||||
| Evolution Mining Ltd. | 285,107,900 | 135,794,379 | (138,179,480 | ) | 27,420,513 | 10,923,459 | 77,441,481 | 387,584,793 | ||||||||||||||||||||
| First Majestic Silver Corp. | 157,985,327 | 49,981,032 | (39,240,752 | ) | 648,219 | — | 5,706,568 | 175,080,394 | ||||||||||||||||||||
| Fortuna Silver Mines, Inc. | — | 54,887,457 | (6,660,564 | ) | 1,554,958 | — | 39,598,475 | 89,380,326 | ||||||||||||||||||||
| Gold Fields Ltd. | 344,138,678 | 192,542,200 | (159,587,145 | ) | 46,078,756 | 7,705,749 | 59,045,699 | 482,218,188 | ||||||||||||||||||||
| Gold Road Resources Ltd. | — | 62,115,502 | (6,343,025 | ) | 197,089 | — | (2,981,637 | ) | 52,987,929 | |||||||||||||||||||
| Harmony Gold Mining Co. Ltd. | 123,865,219 | 70,470,139 | (46,171,900 | ) | 11,935,413 | — | 9,671,265 | 169,770,136 | ||||||||||||||||||||
| Hecla Mining Co. | 105,703,007 | 46,327,453 | (35,294,921 | ) | (1,679,938 | ) | 482,111 | 87,581,185 | 202,636,786 | |||||||||||||||||||
| Highland Gold Mining Ltd. | 59,183,929 | 19,549,524 | (103,115,165 | ) | 28,379,340 | 790,295 | (3,997,628 | ) | — | |||||||||||||||||||
| IAMGOLD Corp. | 109,845,516 | 37,814,744 | (38,157,475 | ) | (11,967,362 | ) | — | 4,864,730 | 102,400,153 | |||||||||||||||||||
| K92 Mining, Inc. | — | 78,030,784 | (1,235,816 | ) | 38,701 | — | 246,522 | 77,080,191 | ||||||||||||||||||||
| Kinross Gold Corp. | 373,867,149 | 194,941,877 | (194,676,600 | ) | 44,149,511 | 4,349,142 | 125,618,096 | 543,900,033 | ||||||||||||||||||||
| Kirkland Lake Gold Ltd. | 563,145,549 | 407,473,090 | (252,417,777 | ) | 71,977,919 | 9,078,199 | (81,840,303 | ) | 708,338,478 | |||||||||||||||||||
| New Gold, Inc. | 37,261,514 | 57,414,015 | (39,381,845 | ) | (19,704,784 | ) | — | 51,645,081 | 87,233,981 | |||||||||||||||||||
| Northern Star Resources Ltd. | 322,344,397 | 151,189,155 | (117,837,924 | ) | 44,394,127 | 7,662,572 | 26,785,491 | 426,875,246 | ||||||||||||||||||||
| OceanaGold Corp. | 77,002,870 | 31,837,853 | (23,029,405 | ) | (11,512,591 | ) | — | 5,711,717 | 80,010,444 | |||||||||||||||||||
| Osisko Gold Royalties Ltd. | 96,177,657 | 41,679,568 | (36,993,180 | ) | (5,772,774 | ) | 1,406,620 | 29,527,427 | 124,618,698 | |||||||||||||||||||
| Pan American Silver Corp. | 312,466,101 | 125,082,835 | (120,997,320 | ) | 23,757,416 | 2,625,373 | 86,823,309 | 427,132,341 | ||||||||||||||||||||
| Perseus Mining Ltd. | 59,258,632 | 23,165,105 | (20,224,386 | ) | 549,755 | — | 9,686,230 | 72,435,336 | ||||||||||||||||||||
| Pretium Resources, Inc. | 129,804,682 | 42,655,984 | (39,023,308 | ) | (5,473,459 | ) | — | (1,372,091 | ) | 126,591,808 | ||||||||||||||||||
| Ramelius Resources Ltd. | — | 66,080,967 | (6,411,602 | ) | 344,405 | 638,874 | 2,061,611 | 62,075,381 | ||||||||||||||||||||
| Regis Resources Ltd. | 96,922,314 | 36,442,451 | (37,429,290 | ) | (4,913,546 | ) | 3,278,010 | (4,021,426 | ) | 87,000,503 | ||||||||||||||||||
| Resolute Mining Ltd. | 50,094,493 | 18,369,613 | (12,473,628 | ) | (2,451,272 | ) | — | (13,610,519 | ) | 39,928,687 | ||||||||||||||||||
| Royal Gold, Inc. | 504,581,618 | 170,503,257 | (182,916,455 | ) | 18,155,155 | 4,301,967 | (99,408,841 | ) | 410,914,734 | |||||||||||||||||||
See Notes to Financial Statements
| 22 |
| Affiliates (continued) | Value 12/31/19 | Purchases | Sales Proceeds | Realized Gain (Loss) | Dividend Income | Net Change in Unrealized Appreciation (Depreciation) | Value 12/31/20 | |||||||||||||||||||||
| Sandstorm Gold Ltd. | $ | 81,945,776 | $ | 38,782,215 | $ | (30,800,854 | ) | $ | 5,272,822 | $ | — | $ | (13,980,099 | ) | $ | 81,219,860 | ||||||||||||
| Saracen Mineral Holdings Ltd. | 161,141,752 | 80,632,557 | (82,863,350 | ) | 28,142,859 | — | 52,500,005 | 239,553,823 | ||||||||||||||||||||
| Semafo, Inc. | 43,820,064 | 10,812,106 | (76,410,482 | ) | (3,943,726 | ) | — | 25,722,038 | — | |||||||||||||||||||
| Silver Lake Resources Ltd. | — | 70,369,242 | (8,736,062 | ) | 1,413,164 | — | 8,665,581 | 71,711,925 | ||||||||||||||||||||
| Silvercorp Metals, Inc. | 61,254,547 | 21,676,270 | (18,652,966 | ) | (3,239,802 | ) | 246,768 | 7,984,708 | 69,022,757 | |||||||||||||||||||
| SSR Mining, Inc. | 149,124,556 | 121,948,394 | (57,206,383 | ) | 8,224,944 | — | 37,819,742 | 259,911,253 | ||||||||||||||||||||
| St. Barbara Ltd. | 83,729,671 | 30,261,229 | (30,686,751 | ) | (10,224,900 | ) | 2,265,680 | 2,548,743 | 75,627,992 | |||||||||||||||||||
| Teranga Gold Corp. | — | 82,517,522 | (11,096,724 | ) | 2,530,353 | — | 31,867,486 | 105,818,637 | ||||||||||||||||||||
| Torex Gold Resources, Inc. | 84,910,581 | 27,326,872 | (27,669,854 | ) | (1,437,911 | ) | — | (7,656,219 | ) | 75,473,469 | ||||||||||||||||||
| Wesdome Gold Mines Ltd. | 67,489,359 | 25,805,788 | (25,134,107 | ) | (646,817 | ) | — | 782,772 | 68,296,995 | |||||||||||||||||||
| Westgold Resources Ltd. | — | 50,339,121 | — | — | — | 384,016 | 50,723,137 | |||||||||||||||||||||
| Yamana Gold, Inc. | 236,234,921 | 105,437,178 | (106,257,372 | ) | 16,512,464 | 3,961,281 | 68,399,755 | 320,326,946 | ||||||||||||||||||||
| Zhaojin Mining Industry Co. Ltd. | 72,449,148 | 157,014,167 | (36,598,920 | ) | 3,599,979 | 322,863 | (13,349,682 | ) | 183,114,692 | |||||||||||||||||||
| Zijin Mining Group Ltd. | 179,209,244 | 76,610,011 | (74,272,776 | ) | 9,633,663 | 4,448,329 | 191,561,986 | 382,742,128 | ||||||||||||||||||||
| $ | 7,227,843,608 | $ | 4,000,914,344 | $ | (3,240,522,864 | ) | $ | 414,424,558 | $ | 85,380,976 | $ | 852,297,564 | $ | 9,254,957,210 | ||||||||||||||
The summary of inputs used to value the Fund’s investments as of December 31, 2020 is as follows:
| Level 1 Quoted Prices | Level 2 Significant Observable Inputs | Level 3 Significant Unobservable Inputs | Value | ||||||||||||||
| Common Stocks | |||||||||||||||||
| Australia | $ | 80,010,444 | $ | 2,350,173,266 | $ | — | $ | 2,430,183,710 | |||||||||
| Brazil | 813,116,446 | — | — | 813,116,446 | |||||||||||||
| Burkina Faso | 102,400,153 | — | — | 102,400,153 | |||||||||||||
| Canada | 7,648,643,285 | — | — | 7,648,643,285 | |||||||||||||
| China / Hong Kong | — | 565,856,820 | — | 565,856,820 | |||||||||||||
| Egypt | — | 115,183,901 | — | 115,183,901 | |||||||||||||
| Ivory Coast | 223,223,248 | — | — | 223,223,248 | |||||||||||||
| Kyrgyzstan | 201,525,211 | — | — | 201,525,211 | |||||||||||||
| Peru | 182,132,887 | — | — | 182,132,887 | |||||||||||||
| South Africa | 711,711,760 | — | — | 711,711,760 | |||||||||||||
| Tanzania | 555,316,906 | — | — | 555,316,906 | |||||||||||||
| Turkey | 136,597,279 | — | — | 136,597,279 | |||||||||||||
| United States | 2,803,296,960 | — | — | 2,803,296,960 | |||||||||||||
| Money Market Fund | 124,038,217 | — | — | 124,038,217 | |||||||||||||
| Total | $ | 13,582,012,796 | $ | 3,031,213,987 | $ | — | $ | 16,613,226,783 | |||||||||
See Notes to Financial Statements
| 23 |
VANECK VECTORS JUNIOR GOLD MINERS ETF
SCHEDULE OF INVESTMENTS
December 31, 2020
| Number of Shares | Value | |||||||
| COMMON STOCKS: 99.8% | ||||||||
| Australia: 21.2% | ||||||||
| 23,356,793 | Alkane Resources Ltd. * † # | $ | 17,275,921 | |||||
| 58,963,102 | Aurelia Metals Ltd. † # | 19,605,835 | ||||||
| 1 | Australian Strategic Materials Ltd. * # | 5 | ||||||
| 34,802,941 | Bellevue Gold Ltd. * # | 30,195,551 | ||||||
| 27,526,714 | Dacian Gold Ltd. * # | 8,710,018 | ||||||
| 54,219,080 | De Grey Mining Ltd. * # | 42,710,029 | ||||||
| 60,229,981 | Evolution Mining Ltd. # | 231,997,370 | ||||||
| 41,522,835 | Gold Road Resources Ltd. * # | 42,459,973 | ||||||
| 32,016,457 | Northern Star Resources Ltd. # | 313,212,490 | ||||||
| 32,019,967 | OceanaGold Corp. (CAD) * | 61,828,194 | ||||||
| 57,856,499 | Perseus Mining Ltd. * # | 58,053,651 | ||||||
| 35,876,981 | Ramelius Resources Ltd. # | 46,745,492 | ||||||
| 79,558,808 | Red 5 Ltd. * † # | 15,915,335 | ||||||
| 22,973,657 | Regis Resources Ltd. # | 66,355,677 | ||||||
| 40,794,699 | Resolute Mining Ltd. * # | 25,056,623 | ||||||
| 45,970,993 | Saracen Mineral Holdings Ltd. * # | 168,830,320 | ||||||
| 39,094,661 | Silver Lake Resources Ltd. * # | 54,002,185 | ||||||
| 33,686,229 | St. Barbara Ltd. # | 61,332,600 | ||||||
| 42,463,373 | West African Resources Ltd. * # | 34,236,366 | ||||||
| 19,037,415 | Westgold Resources Ltd. * # | 38,860,184 | ||||||
| 1,337,383,819 | ||||||||
| Burkina Faso: 1.2% | ||||||||
| 20,537,733 | IAMGOLD Corp. (USD) * | 75,373,480 | ||||||
| Canada: 48.9% | ||||||||
| 16,298,396 | Alamos Gold, Inc. (USD) | 142,610,965 | ||||||
| 7,402,796 | Alexco Resource Corp. (USD) ‡ * | 23,466,863 | ||||||
| 5,221,283 | Americas Gold & Silver Corp. (USD) * † | 16,864,744 | ||||||
| 42,383,605 | B2Gold Corp. (USD) † | 237,348,188 | ||||||
| 7,322,012 | Dundee Precious Metals, Inc. | 52,587,449 | ||||||
| 8,952,980 | Endeavour Silver Corp. (USD) ‡ * † | 45,123,019 | ||||||
| 11,282,484 | Equinox Gold Corp. (USD) * † | 116,660,885 | ||||||
| 9,559,533 | First Majestic Silver Corp. (USD) * † | 128,480,124 | ||||||
| 9,320,368 | Fortuna Silver Mines, Inc. (USD) ‡ * † | 76,799,832 | ||||||
| 13,427,417 | Freegold Ventures Ltd. ‡ * † | 8,326,263 | ||||||
| 11,967,553 | Gold Standard Ventures Corp. (USD) * † | 8,662,115 | ||||||
| 8,440,556 | GoldMining, Inc. ‡ * † | 18,351,915 | ||||||
| 2,719,333 | Gran Colombia Gold Corp. † | 17,203,943 | ||||||
| 2,465,592 | Great Bear Resources Ltd. * † | 32,784,245 | ||||||
| 20,065,005 | Great Panther Silver Ltd. (USD) ‡ * | 17,099,397 | ||||||
| 10,343,848 | K92 Mining, Inc. * | 61,787,036 | ||||||
| 6,486,591 | Karora Resources, Inc. * † | 19,195,014 | ||||||
| 4,446,478 | Lundin Gold, Inc. * † | 38,147,570 | ||||||
| 4,033,083 | MAG Silver Corp. (USD) * † | 82,758,863 | ||||||
| 18,363,101 | McEwen Mining, Inc. (USD) * † | 18,087,655 | ||||||
| 2,132,699 | Metalla Royalty & Streaming Ltd. (USD) ‡ * † | 26,786,699 | ||||||
| 3,267,522 | New Found Gold Corp. * | 10,438,630 | ||||||
| 30,364,540 | New Gold, Inc. (USD) * | 66,498,343 | ||||||
| 4,781,596 | New Pacific Metals Corp. * † | 30,138,317 | ||||||
| 11,254,286 | NovaGold Resources, Inc. (USD) * | 108,828,946 | ||||||
| 7,877,443 | Novo Resources Corp. * † | 14,716,102 | ||||||
| 7,159,746 | Orla Mining Ltd. * † | 38,552,478 | ||||||
| 5,312,731 | Osisko Gold Royalties Ltd. (USD) † | 67,365,429 | ||||||
| 13,598,365 | Osisko Mining, Inc. * | 39,492,897 | ||||||
| Number of Shares | Value | |||||||
| Canada: (continued) | ||||||||
| 10,754,374 | Pan American Silver Corp. (USD) ‡ † | $ | 371,133,447 | |||||
| 8,368,111 | Premier Gold Mines Ltd. * † | 19,770,812 | ||||||
| 8,091,109 | Pretium Resources, Inc. (USD) * | 92,885,931 | ||||||
| 16,094,526 | Pure Gold Mining, Inc. * | 32,593,310 | ||||||
| 15,272,479 | Roxgold, Inc. * | 19,300,386 | ||||||
| 16,872,120 | Sabina Gold and Silver Corp. ‡ * | 43,570,859 | ||||||
| 9,854,175 | Sandstorm Gold Ltd. (USD) ‡ * † | 70,654,435 | ||||||
| 3,285,125 | Seabridge Gold, Inc. (USD) * † | 69,217,584 | ||||||
| 8,964,873 | Silvercorp Metals, Inc. (USD) ‡ | 59,975,000 | ||||||
| 6,386,423 | SilverCrest Metals, Inc. (USD) * † | 71,400,209 | ||||||
| 10,102,173 | SSR Mining, Inc. (USD) * † | 203,154,699 | ||||||
| 1,694,754 | Sulliden Mining Capital, Inc. * | 93,118 | ||||||
| 5,431,004 | Teranga Gold Corp. * | 58,231,958 | ||||||
| 3,209,456 | Torex Gold Resources, Inc. * | 48,091,456 | ||||||
| 1,481,553 | Victoria Gold Corp. * † | 14,175,927 | ||||||
| 32,282,560 | Wallbridge Mining Co. Ltd. * † | 19,764,833 | ||||||
| 6,721,354 | Wesdome Gold Mines Ltd. | 56,028,869 | ||||||
| 48,209,422 | Yamana Gold, Inc. (USD) ‡ | 275,275,800 | ||||||
| 3,090,482,559 | ||||||||
| China / Hong Kong: 0.9% | ||||||||
| 19,287,400 | Real Gold Mining Ltd. * # ∞ | 2 | ||||||
| 50,441,500 | Zhaojin Mining Industry Co. Ltd. # | 60,098,769 | ||||||
| 60,098,771 | ||||||||
| Egypt: 1.2% | ||||||||
| 44,690,311 | Centamin Plc (GBP) # | 75,617,976 | ||||||
| Indonesia: 1.6% | ||||||||
| 597,587,900 | Merdeka Copper Gold Tbk PT # | 103,434,334 | ||||||
| Ivory Coast: 2.0% | ||||||||
| 5,376,220 | Endeavour Mining Corp. (CAD) * | 124,995,005 | ||||||
| Kyrgyzstan: 1.5% | ||||||||
| 8,071,906 | Centerra Gold, Inc. (CAD) | 93,390,812 | ||||||
| Mexico: 1.9% | ||||||||
| 7,005,456 | Industrias Penoles, SAB de CV | 118,405,936 | ||||||
| Peru: 2.5% | ||||||||
| 9,533,508 | Cia de Minas Buenaventura SAA (ADR) | 116,213,463 | ||||||
| 14,608,022 | Hochschild Mining Plc (GBP) # | 41,615,298 | ||||||
| 157,828,761 | ||||||||
| Russia: 0.9% | ||||||||
| 128,243,111 | Petropavlovsk Plc (GBP) * † # | 56,863,709 | ||||||
| South Africa: 7.1% | ||||||||
| 1,529,673 | DRDGOLD Ltd. (ADR) | 17,943,064 | ||||||
| 5,348,490 | DRDGOLD Ltd. # | 6,450,794 | ||||||
| 34,652,715 | Gold Fields Ltd. (ADR) | 321,230,668 | ||||||
| 22,632,344 | Harmony Gold Mining Co. Ltd. (ADR) * † | 105,919,370 | ||||||
| 451,543,896 | ||||||||
| Turkey: 2.3% | ||||||||
| 8,447,356 | Eldorado Gold Corp. (USD) * | 112,096,414 | ||||||
| 2,601,074 | Koza Altin Isletmeleri AS # | 33,820,474 | ||||||
| 145,916,888 | ||||||||
| United Kingdom: 1.8% | ||||||||
| 220,197,941 | Greatland Gold Plc ‡ * † # | 111,017,621 | ||||||
See Notes to Financial Statements
| 24 |
| Number of Shares | Value | |||||||
| United States: 4.8% | ||||||||
| 15,053,862 | Argonaut Gold, Inc. (CAD) ‡ * † | $ | 32,376,438 | |||||
| 9,422,988 | Coeur Mining, Inc. * | 97,527,926 | ||||||
| 1,031,283 | Fortitude Gold Corp. * # ∞ | 1,082,847 | ||||||
| 1,144,033 | Gatos Silver, Inc. * | 14,906,750 | ||||||
| 3,595,560 | Gold Resource Corp. ‡ † | 10,463,080 | ||||||
| 3,162,831 | Golden Star Resources Ltd. * † | 11,734,103 | ||||||
| 20,529,833 | Hecla Mining Co. | 133,033,318 | ||||||
| 301,124,462 | ||||||||
| Total Common Stocks (Cost: $4,965,909,156) | 6,303,478,029 | |||||||
| SHORT-TERM INVESTMENT HELD AS COLLATERAL FOR SECURITIES ON LOAN: 3.0% (Cost: $187,646,529) | ||||||||
| Money Market Fund: 3.0% | ||||||||
| 187,646,529 | State Street Navigator Securities Lending Government Money Market Portfolio | 187,646,529 | ||||||
| Total Investments: 102.8% (Cost: $5,153,555,685) | 6,491,124,558 | |||||||
| Liabilities in excess of other assets: (2.8)% | (176,156,886 | ) | ||||||
| NET ASSETS: 100.0% | $ | 6,314,967,672 | ||||||
See Notes to Financial Statements
| 25 |
VANECK VECTORS JUNIOR GOLD MINERS ETF
SCHEDULE OF INVESTMENTS
(continued)
| Definitions: | |
| ADR | American Depositary Receipt |
| CAD | Canadian Dollar |
| GBP | British Pound |
| USD | United States Dollar |
| Footnotes: | |
| ‡ | Affiliated issuer – as defined under the Investment Company Act of 1940. |
| * | Non-income producing |
| † | Security fully or partially on loan. Total market value of securities on loan is $281,119,293. |
| # | Security has been valued in good faith pursuant to guidelines established by the Board of Trustees. The aggregate value of fair valued securities is $1,765,557,449 which represents 28.0% of net assets. |
| ∞ | Security is valued using significant unobservable inputs that factor in discount for lack of marketability and is classified as Level 3 in the fair value hierarchy. |
| Summary of Investments by Sector Excluding Collateral for Securities Loaned | % of Investments | Value | ||||||
| Diversified Metals & Mining | 3.5 | % | $ | 220,103,401 | ||||
| Environmental & Facilities Services | 0.4 | 23,466,863 | ||||||
| Gold | 76.9 | 4,849,903,255 | ||||||
| Precious Metals & Minerals | 4.1 | 256,178,859 | ||||||
| Silver | 15.1 | 953,825,651 | ||||||
| 100.0 | % | $ | 6,303,478,029 | |||||
A summary of the Fund’s transactions in securities of affiliates for the period ended December 31, 2020 is set forth below:
| Affiliates | Value 12/31/19 | Purchases | Sales Proceeds | Realized Gain (Loss) | Dividend Income | Net Change in Unrealized Appreciation (Depreciation) | Value 12/31/20 | |||||||||||||||||||||
| Alexco Resource Corp. | $ | — | $ | 16,129,139 | $ | (3,577,284 | ) | $ | 633,547 | $ | — | $ | 10,281,461 | $ | 23,466,863 | |||||||||||||
| Argonaut Gold, Inc. | 14,435,644 | 20,728,712 | (6,297,537 | ) | (2,334,980 | ) | — | 5,844,599 | 32,376,438 | |||||||||||||||||||
| Dacian Gold Ltd. | 13,018,355 | 10,334,100 | (4,010,317 | ) | (1,068,499 | ) | — | (9,563,621 | ) | — | (a) | |||||||||||||||||
| Detour Gold Corp. | 181,734,099 | 1,177,961 | (165,579,677 | ) | 42,521,899 | — | (59,854,282 | ) | — | |||||||||||||||||||
| Eldorado Gold Corp. | 73,147,045 | 45,938,637 | (45,375,757 | ) | (2,226,663 | ) | — | 40,613,152 | — | (a) | ||||||||||||||||||
| Endeavour Silver Corp. | 20,422,974 | 14,975,675 | (8,509,370 | ) | (3,449,756 | ) | — | 21,683,496 | 45,123,019 | |||||||||||||||||||
| First Majestic Silver Corp. | 124,793,167 | 55,686,413 | (51,401,503 | ) | (1,232,860 | ) | — | 634,907 | — | (a) | ||||||||||||||||||
| Fortuna Silver Mines, Inc. | 34,976,747 | 24,569,297 | (17,955,894 | ) | (660,728 | ) | — | 35,870,410 | 76,799,832 | |||||||||||||||||||
| Freegold Ventures Ltd. | — | 9,086,656 | (32,099 | ) | (2,895 | ) | — | (725,399 | ) | 8,326,263 | ||||||||||||||||||
| Gold Resource Corp. | 19,463,815 | 8,023,749 | (8,472,762 | ) | (216,885 | ) | 130,902 | (8,334,837 | ) | 10,463,080 | ||||||||||||||||||
| GoldMining, Inc. | — | 19,631,802 | (71,012 | ) | 566 | — | (1,209,441 | ) | 18,351,915 | |||||||||||||||||||
| Great Panther Silver Ltd. | 9,618,682 | 7,443,222 | (4,856,423 | ) | (2,541,441 | ) | — | 7,435,357 | 17,099,397 | |||||||||||||||||||
| Greatland Gold Plc | — | 87,893,909 | (1,072,482 | ) | 237,518 | — | 23,958,676 | 111,017,621 | ||||||||||||||||||||
| Harmony Gold Mining Co. Ltd. | 109,086,669 | 65,368,350 | (79,397,614 | ) | 7,617,436 | — | 3,244,529 | — | (a) | |||||||||||||||||||
| IAMGOLD Corp. | 89,982,908 | 38,122,757 | (43,986,475 | ) | (13,906,734 | ) | — | 5,161,024 | — | (a) | ||||||||||||||||||
| Metalla Royalty & Streaming Ltd. | — | 24,901,225 | (90,634 | ) | (3,801 | ) | — | 1,979,909 | 26,786,699 | |||||||||||||||||||
| Pan American Silver Corp. | 281,572,897 | 163,095,144 | (152,642,674 | ) | 1,994,814 | 2,198,573 | 77,113,266 | 371,133,447 | ||||||||||||||||||||
| Perseus Mining Ltd. | 52,403,324 | 33,458,496 | (30,287,226 | ) | 8,114,862 | — | (5,635,805 | ) | — | (a) | ||||||||||||||||||
| Ramelius Resources Ltd. | 31,267,811 | 24,858,473 | (18,690,672 | ) | 4,711,301 | 474,979 | 4,598,579 | — | (a) | |||||||||||||||||||
| Regis Resources Ltd. | 81,384,318 | 41,346,935 | (47,340,668 | ) | (6,424,673 | ) | 2,723,608 | (2,610,235 | ) | — | (a) | |||||||||||||||||
| Roxgold, Inc. | 15,552,339 | 8,840,398 | (10,676,149 | ) | (680,776 | ) | — | 6,264,574 | — | (a) | ||||||||||||||||||
| Royal Nickel Corp. | 12,503,299 | 3,343,590 | (16,223,163 | ) | (2,290,301 | ) | — | 2,666,575 | — | |||||||||||||||||||
| Sabina Gold and Silver Corp. | — | 38,306,735 | (160,325 | ) | 12,600 | — | 5,411,849 | 43,570,859 | ||||||||||||||||||||
| Sandstorm Gold Ltd. | 69,904,229 | 43,322,880 | (34,679,270 | ) | 6,168,139 | — | (14,061,543 | ) | 70,654,435 | |||||||||||||||||||
| Silver Lake Resources Ltd. | 41,916,219 | 28,549,661 | (31,317,377 | ) | 9,449,666 | — | 5,404,016 | — | (a) | |||||||||||||||||||
| Silvercorp Metals, Inc. | 58,986,781 | 55,617,823 | (56,751,025 | ) | 3,825,341 | 212,387 | (1,703,920 | ) | 59,975,000 | |||||||||||||||||||
| SSR Mining, Inc. | 134,317,641 | 104,321,573 | (66,565,667 | ) | 13,119,532 | — | 17,961,620 | — | (a) | |||||||||||||||||||
| St. Barbara Ltd. | 71,165,348 | 34,335,463 | (35,135,098 | ) | (9,540,963 | ) | 1,934,029 | 507,850 | — | (a) | ||||||||||||||||||
| Wesdome Gold Mines Ltd. | 65,233,780 | 31,869,288 | (35,575,731 | ) | 7,524,663 | — | (13,023,131 | ) | — | (a) | ||||||||||||||||||
| Yamana Gold, Inc. | 212,879,242 | 132,680,289 | (134,994,911 | ) | 21,130,601 | 3,268,571 | 43,580,579 | 275,275,800 | ||||||||||||||||||||
| $ | 1,819,767,333 | $ | 1,193,958,352 | $ | (1,111,726,796 | ) | $ | 80,480,530 | $ | 10,943,049 | $ | 203,494,214 | $ | 1,190,420,668 | ||||||||||||||
| (a) | Security held by the Fund, however not classified as an affiliate at the end of the reporting period. |
See Notes to Financial Statements
| 26 |
The summary of inputs used to value the Fund’s investments as of December 31, 2020 is as follows:
| Level 1 Quoted Prices | Level 2 Significant Observable Inputs | Level 3 Significant Unobservable Inputs | Value | ||||||||||||||
| Common Stocks | |||||||||||||||||
| Australia | $ | 61,828,194 | $ | 1,275,555,625 | $ | — | $ | 1,337,383,819 | |||||||||
| Burkina Faso | 75,373,480 | — | — | 75,373,480 | |||||||||||||
| Canada | 3,090,482,559 | — | — | 3,090,482,559 | |||||||||||||
| China / Hong Kong | — | 60,098,769 | 2 | 60,098,771 | |||||||||||||
| Egypt | — | 75,617,976 | — | 75,617,976 | |||||||||||||
| Indonesia | — | 103,434,334 | — | 103,434,334 | |||||||||||||
| Ivory Coast | 124,995,005 | — | — | 124,995,005 | |||||||||||||
| Kyrgyzstan | 93,390,812 | — | — | 93,390,812 | |||||||||||||
| Mexico | 118,405,936 | — | — | 118,405,936 | |||||||||||||
| Peru | 116,213,463 | 41,615,298 | — | 157,828,761 | |||||||||||||
| Russia | — | 56,863,709 | — | 56,863,709 | |||||||||||||
| South Africa | 445,093,102 | 6,450,794 | — | 451,543,896 | |||||||||||||
| Turkey | 112,096,414 | 33,820,474 | — | 145,916,888 | |||||||||||||
| United Kingdom | — | 111,017,621 | — | 111,017,621 | |||||||||||||
| United States | 300,041,615 | — | 1,082,847 | 301,124,462 | |||||||||||||
| Money Market Fund | 187,646,529 | — | — | 187,646,529 | |||||||||||||
| Total | $ | 4,725,567,109 | $ | 1,764,474,600 | $ | 1,082,849 | $ | 6,491,124,558 | |||||||||
See Notes to Financial Statements
| 27 |
VANECK VECTORS LOW CARBON ENERGY ETF
SCHEDULE OF INVESTMENTS
December 31, 2020
| Number of Shares | Value | |||||||
| COMMON STOCKS: 100.0% | ||||||||
| Canada: 3.2% | ||||||||
| 295,995 | Algonquin Power & Utilities Corp. † | $ | 4,867,422 | |||||
| 107,405 | Northland Power, Inc. † | 3,850,225 | ||||||
| 8,717,647 | ||||||||
| China / Hong Kong: 18.2% | ||||||||
| 526,000 | Byd Co. Ltd. † | 13,846,150 | ||||||
| 455,000 | Flat Glass Group Co. Ltd. † | 1,918,988 | ||||||
| 34,439 | JinkoSolar Holding Co. Ltd. (ADR) * † | 2,130,741 | ||||||
| 478,042 | NIO, Inc. (ADR) * † | 23,299,767 | ||||||
| 1,045,380 | Xinjiang Goldwind Science & Technology Co. Ltd. † # | 2,106,154 | ||||||
| 2,278,000 | Xinyi Solar Holdings Ltd. # | 5,972,309 | ||||||
| 49,274,109 | ||||||||
| Denmark: 14.7% | ||||||||
| 67,943 | Orsted AS Reg S 144A | 13,921,827 | ||||||
| 108,438 | Vestas Wind Systems A/S # | 25,653,710 | ||||||
| 39,575,537 | ||||||||
| France: 0.9% | ||||||||
| 91,521 | SunPower Corp. (USD) * † | 2,346,598 | ||||||
| Germany: 2.0% | ||||||||
| 134,340 | Siemens Gamesa Renewable Energy SA † # | 5,463,535 | ||||||
| South Korea: 4.0% | ||||||||
| 18,828 | Samsung SDI Co. Ltd. # | 10,911,720 | ||||||
| Sweden: 2.5% | ||||||||
| 206,282 | Nibe Industrier AB † # | 6,777,163 | ||||||
| United States: 54.5% | ||||||||
| 27,968 | Acuity Brands, Inc. | 3,386,645 | ||||||
| 63,148 | Albemarle Corp. | 9,315,593 | ||||||
| 87,685 | Array Technologies, Inc. * | 3,782,731 | ||||||
| 116,098 | Bloom Energy Corp. * † | 3,327,369 | ||||||
| 52,271 | Cree, Inc. * † | 5,535,499 | ||||||
| 187,730 | Eaton Corp. Plc | 22,553,882 | ||||||
| 61,323 | Enphase Energy, Inc. * † | 10,760,347 | ||||||
| 48,491 | First Solar, Inc. * | 4,796,730 | ||||||
| 154,507 | Microchip Technology, Inc. | 21,338,962 | ||||||
| 228,197 | ON Semiconductor Corp. * | 7,468,888 | ||||||
| 30,835 | Ormat Technologies, Inc. † | 2,783,784 | ||||||
| 235,088 | Plug Power, Inc. * | 7,971,834 | ||||||
| 27,578 | SolarEdge Technologies, Inc. * | 8,800,691 | ||||||
| 89,776 | Sunrun, Inc. * | 6,228,659 | ||||||
| 34,473 | Tesla, Inc. * | 24,326,562 | ||||||
| 20,556 | Universal Display Corp. | 4,723,769 | ||||||
| 147,101,945 | ||||||||
| Total Common Stocks (Cost: $146,142,026) | 270,168,254 | |||||||
| Number of Shares | Value | |||||||
| SHORT-TERM INVESTMENT HELD AS COLLATERAL FOR SECURITIES ON LOAN: 5.2% (Cost: $13,994,705) | ||||||||
| Money Market Fund: 5.2% | ||||||||
| 13,994,705 | State Street Navigator Securities Lending Government Money Market Portfolio | $ | 13,994,705 | |||||
| Total Investments: 105.2% (Cost: $160,136,731) | 284,162,959 | |||||||
| Liabilities in excess of other assets: (5.2)% | (14,004,428 | ) | ||||||
| NET ASSETS: 100.0% | $ | 270,158,531 | ||||||
See Notes to Financial Statements
| 28 |
| Definitions: | |
| ADR | American Depositary Receipt |
| USD | United States Dollar |
| Footnotes: | |
| * | Non-income producing |
| † | Security fully or partially on loan. Total market value of securities on loan is $56,269,478. |
| # | Security has been valued in good faith pursuant to guidelines established by the Board of Trustees. The aggregate value of fair valued securities is $86,571,556 which represents 32.0% of net assets. |
| Reg S | Security was purchased pursuant to Regulation S under the Securities Act of 1933, which exempts from registration securities offered and sold outside of the United States. Such a security cannot be sold in the United States without either an effective registration statement filed pursuant to the Securities Act of 1933, or pursuant to an exemption from registration. |
| 144A | Security exempt from registration under Rule 144A of the Securities Act of 1933, as amended, or otherwise restricted. These securities may be resold in transactions exempt from registration, unless otherwise noted, and the value amounted to $13,921,827, or 5.2% of net assets. |
| Summary of Investments by Sector Excluding Collateral for Securities Loaned | % of Investments | Value | ||||||
| Consumer Discretionary | 22.8 | % | $ | 61,472,479 | ||||
| Energy | 3.0 | 7,971,834 | ||||||
| Industrials | 29.3 | 79,279,848 | ||||||
| Information Technology | 32.1 | 86,705,242 | ||||||
| Materials | 3.4 | 9,315,593 | ||||||
| Utilities | 9.4 | 25,423,258 | ||||||
| 100.0 | % | $ | 270,168,254 | |||||
The summary of inputs used to value the Fund’s investments as of December 31, 2020 is as follows:
| Level 1 Quoted Prices | Level 2 Significant Observable Inputs | Level 3 Significant Unobservable Inputs | Value | ||||||||||||||
| Common Stocks | |||||||||||||||||
| Canada | $ | 8,717,647 | $ | — | $ | — | $ | 8,717,647 | |||||||||
| China / Hong Kong | 25,430,508 | 23,843,601 | — | 49,274,109 | |||||||||||||
| Denmark | — | 39,575,537 | — | 39,575,537 | |||||||||||||
| France | 2,346,598 | — | — | 2,346,598 | |||||||||||||
| Germany | — | 5,463,535 | — | 5,463,535 | |||||||||||||
| South Korea | — | 10,911,720 | — | 10,911,720 | |||||||||||||
| Sweden | — | 6,777,163 | — | 6,777,163 | |||||||||||||
| United States | 147,101,945 | — | — | 147,101,945 | |||||||||||||
| Money Market Fund | 13,994,705 | — | — | 13,994,705 | |||||||||||||
| Total | $ | 197,591,403 | $ | 86,571,556 | $ | — | $ | 284,162,959 | |||||||||
See Notes to Financial Statements
| 29 |
VANECK VECTORS NATURAL RESOURCES ETF
SCHEDULE OF INVESTMENTS
December 31, 2020
| Number of Shares | Value | |||||||
| COMMON STOCKS: 99.8% | ||||||||
| Argentina: 0.0% | ||||||||
| 1,549 | YPF SA (ADR) | $ | 7,280 | |||||
| Australia: 7.6% | ||||||||
| 4,757 | AGL Energy Ltd. # | 43,949 | ||||||
| 26,306 | Alumina Ltd. # | 37,331 | ||||||
| 2,007 | Ampol Ltd. # | 44,051 | ||||||
| 9,543 | APA Group # (s) | 71,069 | ||||||
| 13,916 | Bega Cheese Ltd. † # | 54,910 | ||||||
| 33,221 | BHP Group Ltd. # | 1,086,467 | ||||||
| 5,668 | BlueScope Steel Ltd. # | 76,615 | ||||||
| 22,498 | Costa Group Holdings Ltd. † # | 70,895 | ||||||
| 4,746 | Deterra Royalties Ltd. * † | 17,579 | ||||||
| 8,305 | Elders Ltd. # | 63,236 | ||||||
| 19,300 | Evolution Mining Ltd. # | 74,341 | ||||||
| 18,750 | Fortescue Metals Group Ltd. # | 338,978 | ||||||
| 87,807 | Glencore Plc (GBP) # | 278,744 | ||||||
| 12,846 | GrainCorp Ltd. * # | 41,548 | ||||||
| 9,219 | Newcrest Mining Ltd. # | 184,158 | ||||||
| 17,902 | Nufarm Ltd. * † # | 56,663 | ||||||
| 14,862 | Oil Search Ltd. # | 42,632 | ||||||
| 14,154 | Origin Energy Ltd. # | 52,012 | ||||||
| 3,662 | OZ Minerals Ltd. # | 53,545 | ||||||
| 12,179 | Rio Tinto Plc (GBP) # | 916,381 | ||||||
| 14,230 | Santos Ltd. # | 68,974 | ||||||
| 12,513 | Saracen Mineral Holdings Ltd. * # | 45,955 | ||||||
| 54,186 | South32 Ltd. # | 103,652 | ||||||
| 7,670 | Woodside Petroleum Ltd. # | 134,697 | ||||||
| 3,958,382 | ||||||||
| Austria: 0.3% | ||||||||
| 95 | Mayr-Melnhof Karton AG # | 19,149 | ||||||
| 1,157 | OMV AG # | 46,286 | ||||||
| 731 | Verbund - Oesterreichische Elektrizis AG # | 62,200 | ||||||
| 1,409 | Voestalpine AG # | 50,366 | ||||||
| 178,001 | ||||||||
| Brazil: 3.4% | ||||||||
| 5,203 | Adecoagro SA (USD) * | 35,380 | ||||||
| 2,097 | Cia de Saneamento Basico do Estado de Sao Paulo (ADR) | 18,013 | ||||||
| 7,198 | Cia Siderurgica Nacional SA (ADR) † | 42,828 | ||||||
| 1,100 | Cosan S.A. Industria e Comercio # | 16,066 | ||||||
| 11,890 | Gerdau SA (ADR) | 55,526 | ||||||
| 12,200 | Klabin SA # (a) | 62,012 | ||||||
| 13,400 | Minerva SA # | 26,242 | ||||||
| 14,953 | Petroleo Brasileiro S.A. (ADR) | 167,922 | ||||||
| 4,850 | SLC Agricola SA # | 25,660 | ||||||
| 7,750 | Suzano SA # | 87,033 | ||||||
| 38,736 | Vale SA (ADR) | 649,215 | ||||||
| 5,072 | Wheaton Precious Metals Corp. (USD) | 211,705 | ||||||
| 9,632 | Yara International ASA (NOK) # | 400,163 | ||||||
| 1,797,765 | ||||||||
| British Virgin Islands: 0.1% | ||||||||
| 32,200 | Japfa Ltd. (SGD) # | 22,567 | ||||||
| 13,600 | Lee & Man Paper Manufacturing Ltd. (HKD) # | 11,158 | ||||||
| 18,857 | Nine Dragons Paper Holdings Ltd. (HKD) # | 26,801 | ||||||
| 60,526 | ||||||||
| Number of Shares | Value | |||||||
| Burkina Faso: 0.0% | ||||||||
| 5,345 | IAMGOLD Corp. (CAD) * † | $ | 19,593 | |||||
| Canada: 9.4% | ||||||||
| 2,739 | Agnico-Eagle Mines Ltd. (USD) | 193,127 | ||||||
| 4,422 | Alamos Gold, Inc. | 38,597 | ||||||
| 3,596 | Algonquin Power & Utilities Corp. † | 59,134 | ||||||
| 11,785 | B2Gold Corp. | 65,955 | ||||||
| 20,085 | Barrick Gold Corp. (USD) | 457,536 | ||||||
| 506 | Boralex, Inc. | 18,763 | ||||||
| 9,491 | Canadian Natural Resources Ltd. (USD) † | 228,259 | ||||||
| 277 | Canadian Solar, Inc. (USD) * † | 14,193 | ||||||
| 8,197 | Cenovus Energy, Inc. * † | 49,864 | ||||||
| 16,275 | Enbridge, Inc. (USD) † | 520,637 | ||||||
| 2,423 | Equinox Gold Corp. * | 25,048 | ||||||
| 2,093 | First Majestic Silver Corp. * † | 28,060 | ||||||
| 2,153 | Franco-Nevada Corp. | 269,717 | ||||||
| 728 | Innergex Renewable Energy, Inc. † | 15,640 | ||||||
| 6,236 | Ivanhoe Mines Ltd. * | 33,578 | ||||||
| 14,212 | Kinross Gold Corp. (USD) | 104,316 | ||||||
| 3,132 | Kirkland Lake Gold Ltd. | 129,312 | ||||||
| 727 | Lundin Gold, Inc. * | 6,237 | ||||||
| 374 | Methanex Corp. † | 17,171 | ||||||
| 2,718 | NovaGold Resources, Inc. (USD) * | 26,283 | ||||||
| 31,946 | Nutrien Ltd. (USD) | 1,538,519 | ||||||
| 1,676 | Osisko Gold Royalties Ltd. † | 21,220 | ||||||
| 2,374 | Pan American Silver Corp. (USD) | 81,927 | ||||||
| 4,419 | Pembina Pipeline Corp. † | 104,405 | ||||||
| 2,094 | Pretium Resources, Inc. * | 23,981 | ||||||
| 2,474 | SSR Mining, Inc. (USD) * | 49,752 | ||||||
| 748 | Stella-Jones, Inc. | 27,172 | ||||||
| 12,257 | Suncor Energy, Inc. (USD) | 205,672 | ||||||
| 7,553 | TC Energy Corp. (USD) | 307,558 | ||||||
| 5,252 | Teck Resources Ltd. (USD) | 95,324 | ||||||
| 654 | TransAlta Renewables, Inc. † | 11,170 | ||||||
| 2,581 | Village Farms International, Inc. * † | 26,114 | ||||||
| 577 | West Fraser Timber Co. Ltd. | 37,039 | ||||||
| 10,762 | Yamana Gold, Inc. (USD) | 61,451 | ||||||
| 4,892,731 | ||||||||
| Chile: 0.8% | ||||||||
| 12,108 | Empresas CMPC SA | 31,868 | ||||||
| 7,204 | Lundin Mining Corp. (CAD) | 63,897 | ||||||
| 6,757 | Sociedad Quimica y Minera de Chile SA (ADR) | 331,701 | ||||||
| 427,466 | ||||||||
| China / Hong Kong: 2.6% | ||||||||
| 41,400 | Aluminum Corp. of China Ltd. * # | 14,573 | ||||||
| 16,640 | Angang Steel Co. Ltd. † # | 6,791 | ||||||
| 21,600 | Astra Agro Lestari Tbk PT # | 18,974 | ||||||
| 28,000 | Beijing Enterprises Water Group Ltd. # | 11,263 | ||||||
| 17,100 | China Coal Energy Co. Ltd. # | 5,146 | ||||||
| 19,700 | China Gas Holdings Ltd. # | 78,051 | ||||||
| 18,400 | China Hongqiao Group Ltd. # | 16,866 | ||||||
| 20,929 | China Longyuan Power Group Corp. Ltd. # | 21,040 | ||||||
| 39,700 | China Molybdenum Co. Ltd. # | 25,971 | ||||||
| 205,427 | China Petroleum & Chemical Corp. # | 91,468 | ||||||
| 27,391 | China Shenhua Energy Co. Ltd. # | 51,622 | ||||||
| 27,000 | Fosun International Ltd. # | 42,397 | ||||||
| 18,000 | Guangdong Investment Ltd. # | 32,443 | ||||||
| 83,000 | Hong Kong & China Gas Co. Ltd. # | 124,154 | ||||||
See Notes to Financial Statements
| 30 |
| Number of Shares | Value | |||||||
| China / Hong Kong: (continued) | ||||||||
| 11,800 | Jiangxi Copper Co. Ltd. (Class H) # | $ | 18,571 | |||||
| 32,500 | Kunlun Energy Co. Ltd. # | 28,162 | ||||||
| 9,300 | Maanshan Iron and Steel Co. Ltd. (Class H) # | 2,569 | ||||||
| 168,740 | PetroChina Co. Ltd. (Class-H) # | 52,240 | ||||||
| 4,000 | Shandong Chenming Paper Holdings Ltd. # | 1,926 | ||||||
| 7,000 | Shandong Gold Mining Co. Ltd. Reg S 144A # | 16,165 | ||||||
| 12,000 | United Tractors Tbk PT # | 22,744 | ||||||
| 159,764 | Wilmar International Ltd. (SGD) # | 562,480 | ||||||
| 11,600 | Yanzhou Coal Mining Co. Ltd. # | 9,295 | ||||||
| 12,900 | Zhaojin Mining Industry Co. Ltd. # | 15,370 | ||||||
| 64,361 | Zijin Mining Group Ltd. # | 72,906 | ||||||
| 1,343,187 | ||||||||
| Cyprus: 0.1% | ||||||||
| 1,284 | Novolipetskiy Metallurgicheskiy | |||||||
| Kombinat PAO Reg S (GDR) # | 35,526 | |||||||
| Denmark: 1.4% | ||||||||
| 2,789 | Bakkafrost P/F (NOK) # | 199,408 | ||||||
| 1,109 | Orsted AS Reg S 144A # | 227,239 | ||||||
| 1,209 | Vestas Wind Systems A/S # | 286,019 | ||||||
| 712,666 | ||||||||
| Egypt: 0.1% | ||||||||
| 14,489 | Abou Kir Fertilizers & Chemical Industries # | 19,114 | ||||||
| 13,059 | Centamin Plc (GBP) # | 22,096 | ||||||
| 41,210 | ||||||||
| Finland: 0.8% | ||||||||
| 1,935 | Metsa Board Oyj # | 20,408 | ||||||
| 3,462 | Neste Oil Oyj # | 251,745 | ||||||
| 6,741 | Stora Enso Oyj (R Shares) # | 129,275 | ||||||
| 401,428 | ||||||||
| France: 2.0% | ||||||||
| 16,761 | Aguas Andinas SA (CLP) # | 5,397 | ||||||
| 209 | Neoen SA Reg S 144A * † # | 16,073 | ||||||
| 2,487 | Suez # | 49,367 | ||||||
| 501 | SunPower Corp. (USD) * † | 12,846 | ||||||
| 20,256 | Total SA # | 875,653 | ||||||
| 3,244 | Veolia Environnement SA # | 80,113 | ||||||
| 171 | Voltalia SA * # | 5,391 | ||||||
| 1,044,840 | ||||||||
| Germany: 0.6% | ||||||||
| 13,778 | E.ON SE # | 152,804 | ||||||
| 578 | Encavis AG # | 15,106 | ||||||
| 483 | Nordex SE * # | 13,226 | ||||||
| 1,379 | Siemens Gamesa Renewable Energy SA † # | 56,083 | ||||||
| 3,553 | Suedzucker AG # | 50,824 | ||||||
| 4,282 | ThyssenKrupp AG * # | 42,497 | ||||||
| 189 | VERBIO Vereinigte BioEnergie AG | 7,099 | ||||||
| 337,639 | ||||||||
| Greece: 0.0% | ||||||||
| 259 | Terna Energy SA | 4,183 | ||||||
| Hungary: 0.1% | ||||||||
| 4,017 | MOL Hungarian Oil & Gas Plc * # | 29,659 | ||||||
| Number of Shares | Value | |||||||
| India: 1.4% | ||||||||
| 12,978 | Reliance Industries Ltd. 144A (GDR) † # | $ | 707,565 | |||||
| Indonesia: 0.1% | ||||||||
| 300,219 | Golden Agri-Resources Ltd. (SGD) # | 36,113 | ||||||
| 28,300 | Indah Kiat Pulp and Paper Corp. Tbk PT # | 21,028 | ||||||
| 110,600 | Merdeka Copper Gold Tbk PT # | 19,143 | ||||||
| 76,284 | ||||||||
| Ireland: 0.3% | ||||||||
| 7,095 | Origin Enterprises Plc # | 26,873 | ||||||
| 2,815 | Smurfit Kappa Group Plc (GBP) # | 131,933 | ||||||
| 158,806 | ||||||||
| Israel: 0.5% | ||||||||
| 1,345 | Energix-Renewable Energies Ltd. * # | 6,150 | ||||||
| 39,061 | Israel Chemicals Ltd. # | 199,559 | ||||||
| 230 | Israel Corp. Ltd. * # | 44,027 | ||||||
| 249,736 | ||||||||
| Italy: 0.6% | ||||||||
| 20,152 | ENI S.p.A. # | 210,708 | ||||||
| 17,016 | Snam SpA # | 96,249 | ||||||
| 306,957 | ||||||||
| Ivory Coast: 0.1% | ||||||||
| 1,382 | Endeavour Mining Corp. (CAD) * | 32,131 | ||||||
| Japan: 5.3% | ||||||||
| 1,300 | Daio Paper Corp. # | 25,242 | ||||||
| 2,317 | Hitachi Metals Ltd. † # | 35,231 | ||||||
| 1,400 | Hokuto Corp. # | 28,331 | ||||||
| 2,000 | Idemitsu Kosan Co. Ltd. † # | 44,038 | ||||||
| 8,700 | Inpex Corp. † # | 46,918 | ||||||
| 6,464 | JFE Holdings, Inc. * # | 62,069 | ||||||
| 24,700 | JXTG Holdings, Inc. # | 88,724 | ||||||
| 65,100 | Kubota Corp. † # | 1,422,418 | ||||||
| 5,500 | Kumiai Chemical Industry Co. Ltd. † # | 49,584 | ||||||
| 665 | Kurita Water Industries Ltd. # | 25,422 | ||||||
| 2,536 | Maruha Nichiro Corp. # | 54,610 | ||||||
| 1,500 | Mitsubishi Materials Corp. # | 31,602 | ||||||
| 1,100 | Nippon Paper Industries Co. Ltd. # | 12,740 | ||||||
| 10,700 | Nippon Steel Corp. * # | 138,013 | ||||||
| 15,614 | Nippon Suisan Kaisha Ltd. # | 64,547 | ||||||
| 14,050 | Nisshin Seifun Group, Inc. # | 223,834 | ||||||
| 10,476 | Oji Holdings Corp. # | 59,647 | ||||||
| 2,670 | Rengo Co. Ltd. # | 22,382 | ||||||
| 2,100 | Sakata Seed Corp. # | 72,833 | ||||||
| 1,883 | Sumitomo Forestry Co. Ltd. # | 39,397 | ||||||
| 3,100 | Sumitomo Metal Mining Ltd. # | 137,904 | ||||||
| 500 | Taki Chemical Co. Ltd. † # | 31,636 | ||||||
| 3,100 | Tokyo Gas Co. Ltd. # | 71,757 | ||||||
| 2,788,879 | ||||||||
| Kazakhstan: 0.1% | ||||||||
| 4,611 | KAZ Minerals Plc (GBP) # | 41,369 | ||||||
| Kyrgyzstan: 0.1% | ||||||||
| 2,461 | Centerra Gold, Inc. (CAD) | 28,473 | ||||||
| Liechtenstein: 0.1% | ||||||||
| 3,891 | Antofagasta Plc (GBP) # | 76,307 | ||||||
| Luxembourg: 0.3% | ||||||||
| 7,297 | Arcelormittal * # | 167,142 | ||||||
See Notes to Financial Statements
| 31 |
VANECK VECTORS NATURAL RESOURCES ETF
SCHEDULE OF INVESTMENTS
(continued)
| Number of Shares | Value | |||||||
| Malaysia: 0.9% | ||||||||
| 86,039 | Felda Global Ventures Holdings Bhd # $ | 27,432 | ||||||
| 13,551 | Genting Plantation Bhd # | 33,215 | ||||||
| 102,294 | IOI Corp. Bhd # | 111,148 | ||||||
| 17,578 | Kuala Lumpur Kepong Bhd # | 103,541 | ||||||
| 1,400 | Petronas Dagangan Bhd # | 7,459 | ||||||
| 30,300 | PPB Group Bhd # | 139,580 | ||||||
| 18,700 | Press Metal Aluminium Holdings Bhd # | 39,068 | ||||||
| 461,443 | ||||||||
| Mexico: 0.8% | ||||||||
| 2,081 | Fresnillo Plc (GBP) # | 32,129 | ||||||
| 11,940 | Gruma, SAB de CV | 141,976 | ||||||
| 35,964 | Grupo Mexico, SAB de CV | 151,830 | ||||||
| 1,382 | Industrias Penoles, SAB de CV | 23,359 | ||||||
| 959 | Southern Copper Corp. (USD) | 62,450 | ||||||
| 411,744 | ||||||||
| Netherlands: 1.3% | ||||||||
| 3,903 | OCI NV * † # | 75,207 | ||||||
| 29,785 | Royal Dutch Shell Plc (GBP) # | 504,614 | ||||||
| 1,897 | Tenaris SA (ADR) | 30,257 | ||||||
| 2,214 | Ternium SA (ADR) | 64,383 | ||||||
| 674,461 | ||||||||
| Norway: 1.5% | ||||||||
| 8,640 | Equinor ASA # | 146,022 | ||||||
| 25,252 | Mowi ASA # | 564,615 | ||||||
| 15,399 | Norsk Hydro ASA # | 71,771 | ||||||
| 782,408 | ||||||||
| Peru: 0.1% | ||||||||
| 2,178 | Cia de Minas Buenaventura SAA (ADR) | 26,550 | ||||||
| Poland: 0.3% | ||||||||
| 1,534 | KGHM Polska Miedz SA * # | 75,762 | ||||||
| 2,337 | Polski Koncern Naftowy Orlen SA # | 36,274 | ||||||
| 13,003 | Polskie Gornictwo Naftowe I | |||||||
| Gazownictwo SA # | 19,467 | |||||||
| 131,503 | ||||||||
| Portugal: 0.1% | ||||||||
| 910 | EDP Renovaveis SA # | 25,245 | ||||||
| 3,471 | Galp Energia, SGPS, SA # | 36,837 | ||||||
| 2,448 | Navigator Co. SA # | 7,444 | ||||||
| 69,526 | ||||||||
| Russia: 2.8% | ||||||||
| 5,915 | Evraz Plc (GBP) # | 37,787 | ||||||
| 48,515 | Gazprom PJSC (ADR) # | 270,866 | ||||||
| 3,063 | Lukoil PJSC (ADR) # | 208,324 | ||||||
| 6,781 | MMC Norilsk Nickel PJSC (ADR) # | 211,354 | ||||||
| 1,523 | Novatek PJSC Reg S (GDR) # | 248,017 | ||||||
| 7,633 | PhosAgro PJSC Reg S (GDR) # | 104,094 | ||||||
| 4,242 | Polymetal International Plc (GBP) # | 97,612 | ||||||
| 5,110 | Rosneft Oil Co. PJSC Reg S (GDR) # | 28,813 | ||||||
| 2,139 | Severstal PAO Reg S (GDR) # | 37,594 | ||||||
| 28,711 | Surgutneftegas PJSC (ADR) # | 132,631 | ||||||
| 2,072 | Tatneft PJSC (ADR) # | 84,379 | ||||||
| 1,461,471 | ||||||||
| Number of Shares | Value | |||||||
| Saudi Arabia: 0.0% | ||||||||
| 335 | S-Oil Corp. (KRW) # | $ | 21,358 | |||||
| South Africa: 1.7% | ||||||||
| 640 | Anglo American Platinum Ltd. # | 63,004 | ||||||
| 13,220 | Anglo American Plc (GBP) # | 436,378 | ||||||
| 9,361 | Gold Fields Ltd. (ADR) | 86,776 | ||||||
| 5,996 | Harmony Gold Mining Co. Ltd. (ADR) | 28,061 | ||||||
| 8,832 | Impala Platinum Holdings Ltd. # | 121,616 | ||||||
| 617 | Kumba Iron Ore Ltd. # | 26,258 | ||||||
| 3,205 | Northam Platinum Ltd. * # | 45,868 | ||||||
| 24,957 | Sibanye Stillwater Ltd. * # | 100,627 | ||||||
| 908,588 | ||||||||
| South Korea: 0.9% | ||||||||
| 963 | Hyundai Steel Co. # | 35,196 | ||||||
| 143 | Korea Zinc Co. Ltd. # | 52,956 | ||||||
| 905 | POSCO # | 226,141 | ||||||
| 424 | SK Energy Co. Ltd. # | 74,370 | ||||||
| 379 | SK Holdings Co. Ltd. # | 84,085 | ||||||
| 195 | Woongjin Coway Co. Ltd. # | 13,068 | ||||||
| 485,816 | ||||||||
| Spain: 0.3% | ||||||||
| 349 | Atlantica Sustainable Infrastructure Plc (USD) | 13,255 | ||||||
| 1,801 | Enagas SA # | 39,683 | ||||||
| 12,439 | Repsol SA † # | 125,507 | ||||||
| 178,445 | ||||||||
| Sweden: 0.7% | ||||||||
| 2,017 | Billerudkorsnas AB # | 35,562 | ||||||
| 3,084 | Boliden AB # | 109,613 | ||||||
| 1,020 | Holmen AB # | 49,004 | ||||||
| 1,540 | Lundin Energy AB # | 41,815 | ||||||
| 7,038 | SSAB AB (B Shares) * # | 22,349 | ||||||
| 6,598 | Svenska Cellulosa AB * # | 115,572 | ||||||
| 373,915 | ||||||||
| Taiwan: 0.5% | ||||||||
| 141,472 | China Steel Corp. # | 124,719 | ||||||
| 13,920 | Formosa Petrochemical Corp. # | 49,508 | ||||||
| 42,200 | Taiwan Fertilizer Co. Ltd. # | 81,524 | ||||||
| 255,751 | ||||||||
| Tanzania: 0.2% | ||||||||
| 4,690 | AngloGold Ashanti Ltd. (ADR) | 106,088 | ||||||
| Thailand: 0.4% | ||||||||
| 11,200 | Energy Absolute Plc (NVDR) # | 18,324 | ||||||
| 11,200 | PTT Exploration & Production PCL (NVDR) # | 36,730 | ||||||
| 84,900 | PTT PCL (NVDR) # | 120,534 | ||||||
| 122,800 | Thaifoods Group PCL (NVDR) # | 19,921 | ||||||
| 195,509 | ||||||||
| Turkey: 0.2% | ||||||||
| 1,967 | Eldorado Gold Corp. (USD) * | 26,102 | ||||||
| 15,393 | Eregli Demir ve Celik Fabrikalari TAS # | 30,894 | ||||||
| 2,830 | Gubre Fabrikalari TAS * # | 32,740 | ||||||
| 89,736 | ||||||||
See Notes to Financial Statements
| 32 |
| Number of Shares | Value | |||||||
| United Kingdom: 3.1% | ||||||||
| 153,154 | BP Plc # | $ | 528,282 | |||||
| 688 | Ceres Power Holdings Plc * # | 12,417 | ||||||
| 55,771 | CNH Industrial NV (USD) * | 716,100 | ||||||
| 15,110 | DS Smith Plc * # | 77,207 | ||||||
| 2,850 | ITM Power Plc * # | 20,069 | ||||||
| 5,345 | Mondi Plc # | 125,193 | ||||||
| 2,583 | Pennon Group Plc # | 33,418 | ||||||
| 1,466 | Severn Trent Plc # | 45,747 | ||||||
| 4,185 | United Utilities Group Plc # | 51,166 | ||||||
| 1,609,599 | ||||||||
| United States: 45.6% | ||||||||
| 301 | Advanced Drainage Systems, Inc. | 25,158 | ||||||
| 3,447 | AGCO Corp. | 355,351 | ||||||
| 226 | American States Water Co. | 17,969 | ||||||
| 836 | AO Smith Corp. | 45,830 | ||||||
| 3,033 | Apache Corp. | 43,038 | ||||||
| 31,230 | Archer-Daniels-Midland Co. | 1,574,304 | ||||||
| 1,018 | Atmos Energy Corp. | 97,148 | ||||||
| 5,275 | Baker Hughes Co. | 109,984 | ||||||
| 7,838 | Bunge Ltd. | 514,016 | ||||||
| 3,203 | Cabot Oil & Gas Corp. | 52,145 | ||||||
| 303 | California Water Service Group | 16,371 | ||||||
| 2,085 | Cal-Maine Foods, Inc. | 78,271 | ||||||
| 12,005 | CF Industries Holdings, Inc. | 464,714 | ||||||
| 1,926 | Cheniere Energy, Inc. * | 115,618 | ||||||
| 15,471 | Chevron Corp. | 1,306,526 | ||||||
| 465 | Clearway Energy, Inc. | 14,847 | ||||||
| 4,530 | Cleveland-Cliffs, Inc. * | 65,957 | ||||||
| 1,581 | Concho Resources, Inc. | 92,251 | ||||||
| 8,620 | ConocoPhillips | 344,714 | ||||||
| 499 | Continental Resources, Inc. * † | 8,134 | ||||||
| 42,285 | Corteva, Inc. | 1,637,275 | ||||||
| 673 | Cree, Inc. * † | 71,271 | ||||||
| 9,091 | Darling Ingredients, Inc. * | 524,369 | ||||||
| 17,590 | Deere & Co. | 4,732,590 | ||||||
| 3,076 | Devon Energy Corp. | 48,632 | ||||||
| 1,268 | Diamondback Energy, Inc. | 61,371 | ||||||
| 608 | Domtar Corp. * | 19,243 | ||||||
| 4,679 | EOG Resources, Inc. | 233,342 | ||||||
| 1,369 | Essential Utilities, Inc. | 64,740 | ||||||
| 644 | Evoqua Water Technologies Corp. * | 17,375 | ||||||
| 33,980 | Exxon Mobil Corp. | 1,400,656 | ||||||
| 520 | First Solar, Inc. * | 51,438 | ||||||
| 7,272 | FMC Corp. | 835,771 | ||||||
| 237 | Franklin Electric Co., Inc. | 16,403 | ||||||
| 16,377 | Freeport-McMoRan, Inc. * | 426,130 | ||||||
| 1,701 | Fresh Del Monte Produce, Inc. | 40,943 | ||||||
| 1,279 | FuelCell Energy, Inc. * † | 14,286 | ||||||
| 3,069 | Graphic Packaging Holding Co. | 51,989 | ||||||
| 7,060 | Halliburton Co. | 133,434 | ||||||
| 5,973 | Hecla Mining Co. | 38,705 | ||||||
| 2,197 | Hess Corp. | 115,980 | ||||||
| 1,198 | HollyFrontier Corp. | 30,968 | ||||||
| 4,401 | Howmet Aerospace, Inc. * | 125,605 | ||||||
| 1,711 | Imperial Oil Ltd. † | 32,560 | ||||||
| 3,760 | Ingredion, Inc. | 295,799 | ||||||
| 4,327 | International Paper Co. | 215,138 | ||||||
| 248 | Itron, Inc. * | 23,783 | ||||||
| 15,644 | Kinder Morgan, Inc. | 213,853 | ||||||
| Number of Shares | Value | |||||||
| United States: (continued) | ||||||||
| 608 | Lindsay Corp. | $ | 78,104 | |||||
| 1,236 | Louisiana-Pacific Corp. | 45,942 | ||||||
| 6,344 | Marathon Oil Corp. | 42,314 | ||||||
| 5,229 | Marathon Petroleum Corp. | 216,271 | ||||||
| 3,120 | National Oilwell Varco, Inc. | 42,838 | ||||||
| 287 | New Fortress Energy, Inc. | 15,380 | ||||||
| 9,072 | Newmont Mining Corp. | 543,322 | ||||||
| 3,098 | NiSource, Inc. | 71,068 | ||||||
| 3,404 | Nucor Corp. | 181,059 | ||||||
| 7,475 | Occidental Petroleum Corp. | 129,392 | ||||||
| 3,570 | ONEOK, Inc. | 137,017 | ||||||
| 271 | Ormat Technologies, Inc. † | 24,466 | ||||||
| 1,044 | Packaging Corp. of America | 143,978 | ||||||
| 1,025 | Pentair Plc | 54,417 | ||||||
| 3,510 | Phillips 66 | 245,489 | ||||||
| 2,739 | Pilgrim’s Pride Corp. * | 53,712 | ||||||
| 1,320 | Pioneer Natural Resources Co. | 150,335 | ||||||
| 2,716 | Plug Power, Inc. * | 92,100 | ||||||
| 741 | Potlatch Corp. | 37,065 | ||||||
| 1,512 | Rayonier, Inc. | 44,423 | ||||||
| 719 | Reliance Steel & Aluminum Co. | 86,100 | ||||||
| 243 | Renewable Energy Group, Inc. * | 17,209 | ||||||
| 740 | Royal Gold, Inc. | 78,706 | ||||||
| 11,156 | Schlumberger Ltd. | 243,535 | ||||||
| 14 | Seaboard Corp. | 42,434 | ||||||
| 161 | SJW Group | 11,167 | ||||||
| 308 | SolarEdge Technologies, Inc. * | 98,289 | ||||||
| 8,488 | Southern Co. | 521,418 | ||||||
| 2,254 | Steel Dynamics, Inc. | 83,105 | ||||||
| 1,874 | Targa Resources Corp. | 49,436 | ||||||
| 1,723 | The Andersons, Inc. | 42,231 | ||||||
| 19,363 | The Mosaic Co. | 445,543 | ||||||
| 6,524 | Tractor Supply Co. | 917,144 | ||||||
| 16,516 | Tyson Foods, Inc. | 1,064,291 | ||||||
| 3,277 | Valero Energy Corp. | 185,380 | ||||||
| 170 | Watts Water Technologies, Inc. | 20,689 | ||||||
| 2,858 | Westrock Co. | 124,409 | ||||||
| 8,214 | Weyerhaeuser Co. | 275,415 | ||||||
| 9,753 | Williams Cos, Inc. | 195,548 | ||||||
| 1,113 | Xylem, Inc. | 113,292 | ||||||
| 23,780,028 | ||||||||
| Zambia: 0.2% | ||||||||
| 6,220 | First Quantum Minerals Ltd. (CAD) | 111,560 | ||||||
| Total Common Stocks (Cost: $48,885,301) | 52,061,230 | |||||||
| SHORT-TERM INVESTMENT HELD AS COLLATERAL FOR SECURITIES ON LOAN: 0.6% (Cost: $340,095) | ||||||||
| Money Market Fund: 0.6% | ||||||||
| 340,095 | State Street Navigator Securities Lending Government Money Market Portfolio | 340,095 | ||||||
| Total Investments: 100.4% (Cost: $49,225,396) | 52,401,325 | |||||||
| Liabilities in excess of other assets: (0.4)% | (226,056 | ) | ||||||
| NET ASSETS: 100.0% | $ | 52,175,269 | ||||||
See Notes to Financial Statements
| 33 |
VANECK VECTORS NATURAL RESOURCES ETF
SCHEDULE OF INVESTMENTS
(continued)
Definitions:
| ADR | American Depositary Receipt |
| CAD | Canadian Dollar |
| CLP | Chilean Peso |
| GBP | British Pound |
| GDR | Global Depositary Receipt |
| HKD | Hong Kong Dollar |
| KRW | Korean Won |
| NOK | Norwegian Krone |
| NVDR | Non-Voting Depositary Receipt |
| SGD | Singapore Dollar |
| USD | United States Dollar |
Footnotes:
| (a) | Units, each consists of one ordinary share and four preferred shares. |
| (s) | Stapled security, each share consists of one unit of Australian Pipeline Trust and one unit of APT Investment Trust. |
| * | Non-income producing |
| † | Security fully or partially on loan. Total market value of securities on loan is $2,644,227. |
| # | Security has been valued in good faith pursuant to guidelines established by the Board of Trustees. The aggregate value of fair valued securities is $20,062,485 which represents 38.5% of net assets. |
| Reg S | Security was purchased pursuant to Regulation S under the Securities Act of 1933, which exempts from registration securities offered and sold outside of the United States. Such a security cannot be sold in the United States without either an effective registration statement filed pursuant to the Securities Act of 1933, or pursuant to an exemption from registration. |
| 144A | Security exempt from registration under Rule 144A of the Securities Act of 1933, as amended, or otherwise restricted. These securities may be resold in transactions exempt from registration, unless otherwise noted, and the value amounted to $967,042, or 1.9% of net assets. |
| Summary of Investments by Sector Excluding Collateral for Securities Loaned | % of Investments | Value | ||||||
| Consumer Discretionary | 1.9 | % | $ | 969,609 | ||||
| Consumer Staples | 13.6 | 7,077,177 | ||||||
| Energy | 25.5 | 13,276,422 | ||||||
| Industrials | 16.0 | 8,349,367 | ||||||
| Information Technology | 0.5 | 271,820 | ||||||
| Materials | 37.2 | 19,369,020 | ||||||
| Real Estate | 0.7 | 356,903 | ||||||
| Utilities | 4.6 | 2,390,912 | ||||||
| 100.0 | % | $ | 52,061,230 | |||||
See Notes to Financial Statements
| 34 |
The summary of inputs used to value the Fund’s investments as of December 31, 2020 is as follows:
| Level 2 | Level 3 | ||||||||||||||||
| Level 1 | Significant | Significant | |||||||||||||||
| Quoted | Observable | Unobservable | |||||||||||||||
| Prices | Inputs | Inputs | Value | ||||||||||||||
| Common Stocks | |||||||||||||||||
| Argentina | $ | 7,280 | $ | — | $ | — | $ | 7,280 | |||||||||
| Australia | 17,579 | 3,940,803 | — | 3,958,382 | |||||||||||||
| Austria | — | 178,001 | — | 178,001 | |||||||||||||
| Brazil | 1,180,589 | 617,176 | — | 1,797,765 | |||||||||||||
| British Virgin Islands | — | 60,526 | — | 60,526 | |||||||||||||
| Burkina Faso | 19,593 | — | — | 19,593 | |||||||||||||
| Canada | 4,892,731 | — | — | 4,892,731 | |||||||||||||
| Chile | 427,466 | — | — | 427,466 | |||||||||||||
| China / Hong Kong | — | 1,343,187 | — | 1,343,187 | |||||||||||||
| Cyprus | — | 35,526 | — | 35,526 | |||||||||||||
| Denmark | — | 712,666 | — | 712,666 | |||||||||||||
| Egypt | — | 41,210 | — | 41,210 | |||||||||||||
| Finland | — | 401,428 | — | 401,428 | |||||||||||||
| France | 12,846 | 1,031,994 | — | 1,044,840 | |||||||||||||
| Germany | 7,099 | 330,540 | — | 337,639 | |||||||||||||
| Greece | 4,183 | — | — | 4,183 | |||||||||||||
| Hungary | — | 29,659 | — | 29,659 | |||||||||||||
| India | — | 707,565 | — | 707,565 | |||||||||||||
| Indonesia | — | 76,284 | — | 76,284 | |||||||||||||
| Ireland | — | 158,806 | — | 158,806 | |||||||||||||
| Israel | — | 249,736 | — | 249,736 | |||||||||||||
| Italy | — | 306,957 | — | 306,957 | |||||||||||||
| Ivory Coast | 32,131 | — | — | 32,131 | |||||||||||||
| Japan | — | 2,788,879 | — | 2,788,879 | |||||||||||||
| Kazakhstan | — | 41,369 | — | 41,369 | |||||||||||||
| Kyrgyzstan | 28,473 | — | — | 28,473 | |||||||||||||
| Liechtenstein | — | 76,307 | — | 76,307 | |||||||||||||
| Luxembourg | — | 167,142 | — | 167,142 | |||||||||||||
| Malaysia | — | 461,443 | — | 461,443 | |||||||||||||
| Mexico | 379,615 | 32,129 | — | 411,744 | |||||||||||||
| Netherlands | 94,640 | 579,821 | — | 674,461 | |||||||||||||
| Norway | — | 782,408 | — | 782,408 | |||||||||||||
| Peru | 26,550 | — | — | 26,550 | |||||||||||||
| Poland | — | 131,503 | — | 131,503 | |||||||||||||
| Portugal | — | 69,526 | — | 69,526 | |||||||||||||
| Russia | — | 1,461,471 | — | 1,461,471 | |||||||||||||
| Saudi Arabia | — | 21,358 | — | 21,358 | |||||||||||||
| South Africa | 114,837 | 793,751 | — | 908,588 | |||||||||||||
| South Korea | — | 485,816 | — | 485,816 | |||||||||||||
| Spain | 13,255 | 165,190 | — | 178,445 | |||||||||||||
| Sweden | — | 373,915 | — | 373,915 | |||||||||||||
| Taiwan | — | 255,751 | — | 255,751 | |||||||||||||
| Tanzania | 106,088 | — | — | 106,088 | |||||||||||||
| Thailand | — | 195,509 | — | 195,509 | |||||||||||||
| Turkey | 26,102 | 63,634 | — | 89,736 | |||||||||||||
| United Kingdom | 716,100 | 893,499 | — | 1,609,599 | |||||||||||||
| United States | 23,780,028 | — | — | 23,780,028 | |||||||||||||
| Zambia | 111,560 | — | — | 111,560 | |||||||||||||
| Money Market Fund | 340,095 | — | — | 340,095 | |||||||||||||
| Total | $ | 32,338,840 | $ | 20,062,485 | $ | — | $ | 52,401,325 | |||||||||
See Notes to Financial Statements
| 35 |
VANECK VECTORS OIL REFINERS ETF
SCHEDULE OF INVESTMENTS
December 31, 2020
| Number of Shares | Value | |||||||
| COMMON STOCKS: 100.1% | ||||||||
| Australia: 4.3% | ||||||||
| 34,659 | Ampol Ltd. # | $ | 760,715 | |||||
| Austria: 4.5% | ||||||||
| 19,817 | OMV AG # | 792,783 | ||||||
| Finland: 8.3% | ||||||||
| 19,982 | Neste Oil Oyj # | 1,453,024 | ||||||
| Greece: 1.2% | ||||||||
| 14,400 | Motor Oil Hellas Corinth Refineries SA # | 207,359 | ||||||
| Hungary: 4.6% | ||||||||
| 108,482 | MOL Hungarian Oil & Gas Plc * # | 800,952 | ||||||
| India: 7.8% | ||||||||
| 25,140 | Reliance Industries Ltd. 144A (GDR) # | 1,370,642 | ||||||
| Japan: 11.9% | ||||||||
| 13,900 | Cosmo Energy Holdings Co. Ltd. # | 247,697 | ||||||
| 37,268 | Idemitsu Kosan Co. Ltd. † # | 820,605 | ||||||
| 283,800 | JXTG Holdings, Inc. # | 1,019,424 | ||||||
| 2,087,726 | ||||||||
| New Zealand: 1.4% | ||||||||
| 106,420 | Z Energy Ltd. * # | 245,640 | ||||||
| Poland: 5.5% | ||||||||
| 20,915 | Grupa Lotos SA # | 232,796 | ||||||
| 46,748 | Polski Koncern Naftowy Orlen SA # | 725,607 | ||||||
| 958,403 | ||||||||
| Portugal: 4.3% | ||||||||
| 71,033 | Galp Energia, SGPS, SA # | 753,864 | ||||||
| Number of Shares | Value | |||||||
| Saudi Arabia: 3.0% | ||||||||
| 8,130 | S-Oil Corp. (KRW) # | $ | 518,335 | |||||
| South Korea: 7.8% | ||||||||
| 1,787 | Hyundai Heavy Industries Holdings Co. Ltd. # | 467,235 | ||||||
| 5,122 | SK Energy Co. Ltd. # | 898,401 | ||||||
| 1,365,636 | ||||||||
| Taiwan: 4.8% | ||||||||
| 235,000 | Formosa Petrochemical Corp. # | 835,800 | ||||||
| Thailand: 5.3% | ||||||||
| 199,300 | Bangchak Corp. PCL (NVDR) # | 137,055 | ||||||
| 2,557,700 | IRPC PCL (NVDR) # | 317,699 | ||||||
| 270,100 | Thai Oil PCL (NVDR) # | 468,401 | ||||||
| 923,155 | ||||||||
| Turkey: 2.4% | ||||||||
| 29,536 | Tupras-Turkiye Petrol Rafinerileri AS * # | 428,733 | ||||||
| United States: 23.0% | ||||||||
| 25,739 | HollyFrontier Corp. | 665,353 | ||||||
| 26,635 | Marathon Petroleum Corp. | 1,101,624 | ||||||
| 17,785 | Phillips 66 | 1,243,883 | ||||||
| 17,829 | Valero Energy Corp. | 1,008,587 | ||||||
| 4,019,447 | ||||||||
| Total Common Stocks: 100.1% (Cost: $19,398,107) | 17,522,214 | |||||||
| Liabilities in excess of other assets: (0.1)% | (16,110 | ) | ||||||
| NET ASSETS: 100.0% | $ | 17,506,104 | ||||||
Definitions:
| GDR | Global Depositary Receipt |
| KRW | Korean Won |
| NVDR | Non-Voting Depositary Receipt |
Footnotes:
| * | Non-income producing |
| † | Security fully or partially on loan. Total market value of securities on loan is $634,148. |
| # | Security has been valued in good faith pursuant to guidelines established by the Board of Trustees. The aggregate value of fair valued securities is $13,502,767 which represents 77.1% of net assets. |
| 144A | Security exempt from registration under Rule 144A of the Securities Act of 1933, as amended, or otherwise restricted. These securities may be resold in transactions exempt from registration, unless otherwise noted, and the value amounted to $1,370,642, or 7.8% of net assets. |
| Summary of Investments by Sector | % of Investments | Value | ||||||
| Energy | 97.3 | % | $ | 17,054,979 | ||||
| Industrials | 2.7 | 467,235 | ||||||
| 100.0 | % | $ | 17,522,214 | |||||
See Notes to Financial Statements
| 36 |
The summary of inputs used to value the Fund’s investments as of December 31, 2020 is as follows:
| Level 2 | Level 3 | ||||||||||||||||
| Level 1 | Significant | Significant | |||||||||||||||
| Quoted | Observable | Unobservable | |||||||||||||||
| Prices | Inputs | Inputs | Value | ||||||||||||||
| Common Stocks | |||||||||||||||||
| Australia | $ | — | $ | 760,715 | $ | — | $ | 760,715 | |||||||||
| Austria | — | 792,783 | — | 792,783 | |||||||||||||
| Finland | — | 1,453,024 | — | 1,453,024 | |||||||||||||
| Greece | — | 207,359 | — | 207,359 | |||||||||||||
| Hungary | — | 800,952 | — | 800,952 | |||||||||||||
| India | — | 1,370,642 | — | 1,370,642 | |||||||||||||
| Japan | — | 2,087,726 | — | 2,087,726 | |||||||||||||
| New Zealand | — | 245,640 | — | 245,640 | |||||||||||||
| Poland | — | 958,403 | — | 958,403 | |||||||||||||
| Portugal | — | 753,864 | — | 753,864 | |||||||||||||
| Saudi Arabia | — | 518,335 | — | 518,335 | |||||||||||||
| South Korea | — | 1,365,636 | — | 1,365,636 | |||||||||||||
| Taiwan | — | 835,800 | — | 835,800 | |||||||||||||
| Thailand | — | 923,155 | — | 923,155 | |||||||||||||
| Turkey | — | 428,733 | — | 428,733 | |||||||||||||
| United States | 4,019,447 | — | — | 4,019,447 | |||||||||||||
| Total | $ | 4,019,447 | $ | 13,502,767 | $ | — | $ | 17,522,214 | |||||||||
See Notes to Financial Statements
| 37 |
VANECK VECTORS OIL SERVICES ETF
SCHEDULE OF INVESTMENTS
December 31, 2020
| Number of Shares | Value | |||||||
| COMMON STOCKS: 100.0% | ||||||||
| Netherlands: 5.0% | ||||||||
| 2,266,020 | Tenaris SA (ADR) † | $ | 36,143,019 | |||||
| United Kingdom: 4.9% | ||||||||
| 3,825,357 | TechnipFMC Plc (USD) | 35,958,356 | ||||||
| United States: 90.1% | ||||||||
| 2,290,449 | Baker Hughes Co. | 47,755,862 | ||||||
| 1,253,296 | Cactus, Inc. | 32,673,427 | ||||||
| 2,499,688 | ChampionX Corp. * | 38,245,226 | ||||||
| 1,047,685 | Core Laboratories NV | 27,774,129 | ||||||
| 244,026 | DMC Global, Inc. * † | 10,554,124 | ||||||
| 567,362 | Dril-Quip, Inc. * | 16,805,262 | ||||||
| 4,215,450 | Frank’s International NV * | 11,550,333 | ||||||
| 5,001,848 | Halliburton Co. | 94,534,927 | ||||||
| 3,377,410 | Helix Energy Solutions Group, Inc. * † | 14,185,122 | ||||||
| 1,366,509 | Helmerich & Payne, Inc. | 31,648,348 | ||||||
| 1,862,701 | Liberty Oilfield Services, Inc. * | 19,204,447 | ||||||
| 166,620 | Nabors Industries Ltd. * | 9,702,283 | ||||||
| 2,331,772 | National Oilwell Varco, Inc. | 32,015,230 | ||||||
| 2,787,429 | NexTier Oilfield Solutions, Inc. * † | 9,588,756 | ||||||
| 1,954,362 | Oceaneering International, Inc. | 15,537,178 | ||||||
| 1,136,775 | Oil States International, Inc. * | 5,706,611 | ||||||
| 3,951,687 | Patterson-UTI Energy, Inc. | 20,785,874 | ||||||
| Number of Shares | Value | |||||||
| United States: (continued) | ||||||||
| 1,808,689 | ProPetro Holding Corp. * | $ | 13,366,212 | |||||
| 3,250,057 | RPC, Inc. † | 10,237,680 | ||||||
| 6,403,422 | Schlumberger Ltd. | 139,786,702 | ||||||
| 2,135,925 | Select Energy Services, Inc. * | 8,757,292 | ||||||
| 14,051,217 | Transocean Ltd. * † | 32,458,311 | ||||||
| 1,247,461 | US Silica Holdings, Inc. | 8,757,176 | ||||||
| 651,630,512 | ||||||||
| Total Common Stocks (Cost: $926,029,173) | 723,731,887 | |||||||
| SHORT-TERM INVESTMENT HELD AS COLLATERAL FOR SECURITIES ON LOAN: 3.1% (Cost: $22,425,566) | ||||||||
| Money Market Fund: 3.1% | ||||||||
| 22,425,566 | State Street Navigator Securities Lending Government Money Market Portfolio | 22,425,566 | ||||||
| Total Investments: 103.1% (Cost: $948,454,739) | 746,157,453 | |||||||
| Liabilities in excess of other assets: (3.1)% | (22,736,644 | ) | ||||||
| NET ASSETS: 100.0% | $ | 723,420,809 | ||||||
Definitions:
| ADR | American Depositary Receipt |
| USD | United States Dollar |
Footnotes:
| * | Non-income producing |
| † | Security fully or partially on loan. Total market value of securities on loan is $40,399,525. |
| Summary of Investments by Sector Excluding Collateral for Securities Loaned | % of Investments | Value | ||||||
| Oil & Gas Drilling | 13.1 | % | $ | 94,594,816 | ||||
| Oil & Gas Equipment & Services | 86.9 | 629,137,071 | ||||||
| 100.0 | % | $ | 723,731,887 | |||||
The summary of inputs used to value the Fund’s investments as of December 31, 2020 is as follows:
| Level 2 | Level 3 | ||||||||||||||||
| Level 1 | Significant | Significant | |||||||||||||||
| Quoted | Observable | Unobservable | |||||||||||||||
| Prices | Inputs | Inputs | Value | ||||||||||||||
| Common Stocks* | $ | 723,731,887 | $ | — | $ | — | $ | 723,731,887 | |||||||||
| Money Market Fund | 22,425,566 | — | — | 22,425,566 | |||||||||||||
| Total | $ | 746,157,453 | $ | — | $ | — | $ | 746,157,453 | |||||||||
* See Schedule of Investments for geographic sector breakouts.
See Notes to Financial Statements
| 38 |
VANECK VECTORS RARE EARTH/STRATEGIC METALS ETF
SCHEDULE OF INVESTMENTS
December 31, 2020
| Number of Shares | Value | |||||||
| COMMON STOCKS: 100.1% | ||||||||
| Australia: 26.1% | ||||||||
| 8,218,236 | Galaxy Resources Ltd. * # | $ | 14,199,104 | |||||
| 2,879,222 | Iluka Resources Ltd. # | 14,471,036 | ||||||
| 34,749,573 | Jupiter Mines Ltd. † # | 8,186,954 | ||||||
| 5,784,425 | Lynas Rare Earths Ltd. * † # | 17,838,910 | ||||||
| 4,205,363 | Orocobre Ltd. * † # | 14,524,125 | ||||||
| 21,865,286 | Pilbara Minerals Ltd. * † # | 14,781,125 | ||||||
| 84,001,254 | ||||||||
| Canada: 4.9% | ||||||||
| 1,254,078 | Lithium Americas Corp. (USD) * † | 15,738,679 | ||||||
| China / Hong Kong: 46.2% | ||||||||
| 32,254,952 | China Molybdenum Co. Ltd. # | 31,092,614 | ||||||
| 10,122,510 | China Northern Rare Earth Group High-Tech Co. Ltd. * # | 20,426,752 | ||||||
| 1,480,400 | Ganfeng Lithium Co. Ltd. Reg S 144A † # | 17,727,610 | ||||||
| 13,813,401 | Jinduicheng Molybdenum Co. Ltd. # | 13,220,143 | ||||||
| 11,559,714 | Shenghe Resources Holding Co. Ltd. * # | 15,841,725 | ||||||
| 7,414,549 | Xiamen Tungsten Co. Ltd. # | 19,267,953 | ||||||
| 2,540,961 | Zhejiang Huayou Cobalt Co. Ltd. * # | 31,051,935 | ||||||
| 148,628,732 | ||||||||
| France: 4.2% | ||||||||
| 257,539 | Eramet SA * † # | 13,507,815 | ||||||
| Number of Shares | Value | |||||||
| Japan: 3.1% | ||||||||
| 1,152,647 | Toho Titanium Co. Ltd. † # | $ | 9,922,049 | |||||
| Netherlands: 4.0% | ||||||||
| 435,142 | AMG Advanced Metallurgical † # | 13,013,293 | ||||||
| United States: 11.6% | ||||||||
| 1,017,928 | AXT, Inc. * | 9,741,571 | ||||||
| 774,944 | Livent Corp. * † | 14,599,945 | ||||||
| 893,192 | Tronox Holdings Plc | 13,058,467 | ||||||
| 37,399,983 | ||||||||
| Total Common Stocks (Cost: $230,846,528) | 322,211,805 | |||||||
| SHORT-TERM INVESTMENT HELD AS COLLATERAL FOR SECURITIES ON LOAN: 2.9% (Cost: $9,421,120) | ||||||||
| Money Market Fund: 2.9% | ||||||||
| 9,421,120 | State Street Navigator Securities Lending Government Money Market Portfolio | 9,421,120 | ||||||
| Total Investments: 103.0% (Cost: $240,267,648) | 331,632,925 | |||||||
| Liabilities in excess of other assets: (3.0)% | (9,510,365 | ) | ||||||
| NET ASSETS: 100.0% | $ | 322,122,560 | ||||||
| Definitions: | |
| USD | United States Dollar |
Footnotes:
| * | Non-income producing |
| † | Security fully or partially on loan. Total market value of securities on loan is $49,851,637. |
| # | Security has been valued in good faith pursuant to guidelines established by the Board of Trustees. The aggregate value of fair valued securities is $269,073,143 which represents 83.5% of net assets. |
| Reg S | Security was purchased pursuant to Regulation S under the Securities Act of 1933, which exempts from registration securities offered and sold outside of the United States. Such a security cannot be sold in the United States without either an effective registration statement filed pursuant to the Securities Act of 1933, or pursuant to an exemption from registration. |
| 144A | Security exempt from registration under Rule 144A of the Securities Act of 1933, as amended, or otherwise restricted. These securities may be resold in transactions exempt from registration, unless otherwise noted, and the value amounted to $17,727,610, or 5.5% of net assets. |
| Summary of Investments by Sector Excluding Collateral for Securities Loaned | % of Investments | Value | ||||||
| Information Technology | 3.0 | % | $ | 9,741,571 | ||||
| Materials | 97.0 | 312,470,234 | ||||||
| 100.0 | % | $ | 322,211,805 | |||||
See Notes to Financial Statements
| 39 |
VANECK VECTORS RARE EARTH/STRATEGIC METALS ETF
SCHEDULE OF INVESTMENTS
(continued)
The summary of inputs used to value the Fund’s investments as of December 31, 2020 is as follows:
| Level 1 Quoted Prices | Level 2 Significant Observable Inputs | Level 3 Significant Unobservable Inputs | Value | ||||||||||||||
| Common Stocks | |||||||||||||||||
| Australia | $ | — | $ | 84,001,254 | $ | — | $ | 84,001,254 | |||||||||
| Canada | 15,738,679 | — | — | 15,738,679 | |||||||||||||
| China / Hong Kong | — | 148,628,732 | — | 148,628,732 | |||||||||||||
| France | — | 13,507,815 | — | 13,507,815 | |||||||||||||
| Japan | — | 9,922,049 | — | 9,922,049 | |||||||||||||
| Netherlands | — | 13,013,293 | — | 13,013,293 | |||||||||||||
| United States | 37,399,983 | — | — | 37,399,983 | |||||||||||||
| Money Market Fund | 9,421,120 | — | — | 9,421,120 | |||||||||||||
| Total | $ | 62,559,782 | $ | 269,073,143 | $ | — | $ | 331,632,925 | |||||||||
See Notes to Financial Statements
| 40 |
SCHEDULE OF INVESTMENTS
December 31, 2020
| Number of Shares | Value | |||||||
| COMMON STOCKS: 99.9% | ||||||||
| Australia: 14.8% | ||||||||
| 151,430 | Rio Tinto Plc (ADR) † | $ | 11,390,565 | |||||
| Brazil: 23.8% | ||||||||
| 608,187 | Cia Siderurgica Nacional SA (ADR) † | 3,618,713 | ||||||
| 728,679 | Gerdau SA (ADR) | 3,402,931 | ||||||
| 673,219 | Vale SA (ADR) † | 11,283,150 | ||||||
| 18,304,794 | ||||||||
| India: 4.9% | ||||||||
| 432,054 | Vedanta Ltd. (ADR) † | 3,793,434 | ||||||
| Luxembourg: 7.7% | ||||||||
| 257,291 | ArcelorMittal SA (USD) † | 5,891,964 | ||||||
| Netherlands: 8.6% | ||||||||
| 209,669 | Tenaris SA (ADR) | 3,344,220 | ||||||
| 113,270 | Ternium SA (ADR) | 3,293,892 | ||||||
| 6,638,112 | ||||||||
| South Korea: 7.1% | ||||||||
| 87,806 | POSCO (ADR) | 5,471,192 | ||||||
| United States: 33.0% | ||||||||
| 76,319 | Allegheny Technologies, Inc. * | 1,279,870 | ||||||
| 28,898 | Carpenter Technology Corp. | 841,510 | ||||||
| 250,790 | Cleveland-Cliffs, Inc. * † | 3,651,502 | ||||||
| 72,258 | Commercial Metals Co. | 1,484,179 | ||||||
| 19,572 | Gibraltar Industries, Inc. * | 1,408,010 | ||||||
| 76,019 | Nucor Corp. | 4,043,451 | ||||||
| 29,206 | Reliance Steel & Aluminum Co. | 3,497,418 | ||||||
| 22,939 | Ryerson Holding Corp. * | 312,888 | ||||||
| Number of Shares | Value | |||||||
| United States: (continued) | ||||||||
| 16,522 | Schnitzer Steel Industries, Inc. | $ | 527,217 | |||||
| 93,048 | Steel Dynamics, Inc. | 3,430,680 | ||||||
| 49,803 | SunCoke Energy, Inc. | 216,643 | ||||||
| 27,173 | TimkenSteel Corp. * | 126,898 | ||||||
| 132,641 | United States Steel Corp. † | 2,224,389 | ||||||
| 30,804 | Warrior Met Coal, Inc. | 656,741 | ||||||
| 31,748 | Worthington Industries, Inc. | 1,629,942 | ||||||
| 25,331,338 | ||||||||
| Total Common Stocks (Cost: $71,825,201) | 76,821,399 | |||||||
| SHORT-TERM INVESTMENT HELD AS COLLATERAL FOR SECURITIES ON LOAN: 1.9% (Cost: $1,467,173) | ||||||||
| Money Market Fund: 1.9% | ||||||||
| 1,467,173 | State Street Navigator Securities Lending Government Money Market Portfolio | 1,467,173 | ||||||
| Total Investments: 101.8% (Cost: $73,292,374) | 78,288,572 | |||||||
| Liabilities in excess of other assets: (1.8)% | (1,398,479 | ) | ||||||
| NET ASSETS: 100.0% | $ | 76,890,093 | ||||||
| Definitions: | |
| ADR | American Depositary Receipt |
| USD | United States Dollar |
| Footnotes: | |
| * | Non-income producing |
| † | Security fully or partially on loan. Total market value of securities on loan is $14,911,116. |
| Summary of Investments by Sector Excluding Collateral for Securities Loaned | % of Investments | Value | ||||||
| Energy | 4.4 | % | $ | 3,344,220 | ||||
| Industrials | 1.8 | 1,408,010 | ||||||
| Materials | 93.8 | 72,069,169 | ||||||
| 100.0 | % | $ | 76,821,399 | |||||
The summary of inputs used to value the Fund’s investments as of December 31, 2020 is as follows:
| Level 1 Quoted Prices | Level 2 Significant Observable Inputs | Level 3 Significant Unobservable Inputs | Value | ||||||||||||||
| Common Stocks* | $ | 76,821,399 | $ | — | $ | — | $ | 76,821,399 | |||||||||
| Money Market Fund | 1,467,173 | — | — | 1,467,173 | |||||||||||||
| Total | $ | 78,288,572 | $ | — | $ | — | $ | 78,288,572 | |||||||||
| * | See Schedule of Investments for geographic sector breakouts. |
See Notes to Financial Statements
| 41 |
VANECK VECTORS UNCONVENTIONAL OIL & GAS ETF
SCHEDULE OF INVESTMENTS
December 31, 2020
| Number of Shares | Value | |||||||
| COMMON STOCKS: 100.0% | ||||||||
| Canada: 15.3% | ||||||||
| 34,141 | ARC Resources Ltd. | $ | 160,790 | |||||
| 77,561 | Cenovus Energy, Inc. (USD) * | 468,468 | ||||||
| 56,571 | Crescent Point Energy Corp. (USD) | 132,376 | ||||||
| 21,454 | Enerplus Corp. (USD) † | 67,151 | ||||||
| 34,605 | Husky Energy, Inc. † | 171,124 | ||||||
| 9,482 | PrairieSky Royalty Ltd. † | 75,097 | ||||||
| 24,483 | Seven Generations Energy Ltd. * | 127,027 | ||||||
| 26,248 | Tourmaline Oil Corp. | 353,544 | ||||||
| 35,609 | Whitecap Resources, Inc. † | 135,840 | ||||||
| 1,691,417 | ||||||||
| United States: 84.7% | ||||||||
| 17,884 | Antero Resources Corp. * | 97,468 | ||||||
| 26,859 | Apache Corp. | 381,129 | ||||||
| 27,903 | Cabot Oil & Gas Corp. | 454,261 | ||||||
| 8,893 | Cimarex Energy Co. | 333,576 | ||||||
| 14,172 | CNX Resources Corp. * | 153,058 | ||||||
| 10,052 | Concho Resources, Inc. | 586,534 | ||||||
| 21,275 | ConocoPhillips | 850,787 | ||||||
| 7,964 | Continental Resources, Inc. * † | 129,813 | ||||||
| 29,852 | Devon Energy Corp. | 471,960 | ||||||
| 9,427 | Diamondback Energy, Inc. | 456,267 | ||||||
| 17,153 | EOG Resources, Inc. | 855,420 | ||||||
| 20,783 | EQT Corp. * | 264,152 | ||||||
| 12,596 | Hess Corp. | 664,943 | ||||||
| 61,604 | Marathon Oil Corp. | 410,899 | ||||||
| 8,447 | Matador Resources Co. * | 101,871 | ||||||
| Number of Shares | Value | |||||||
| United States: (continued) | ||||||||
| 9,695 | Murphy Oil Corp. | $ | 117,309 | |||||
| 5,845 | National Fuel Gas Co. | 240,405 | ||||||
| 38,066 | Occidental Petroleum Corp. | 658,922 | ||||||
| 21,771 | Ovintiv, Inc. | 312,632 | ||||||
| 33,293 | Parsley Energy, Inc. | 472,761 | ||||||
| 7,661 | PDC Energy, Inc. * | 157,280 | ||||||
| 6,946 | Pioneer Natural Resources Co. | 791,080 | ||||||
| 17,062 | Range Resources Corp. * | 114,315 | ||||||
| 38,632 | WPX Energy, Inc. * | 314,851 | ||||||
| 9,391,693 | ||||||||
| Total Common Stocks (Cost: $22,269,724) | 11,083,110 | |||||||
| SHORT-TERM INVESTMENT HELD AS COLLATERAL FOR SECURITIES ON LOAN: 2.3% (Cost: $253,074) | ||||||||
| Money Market Fund: 2.3% | ||||||||
| 253,074 | State Street Navigator Securities Lending Government Money Market Portfolio | 253,074 | ||||||
| Total Investments: 102.3% (Cost: $22,522,798) | 11,336,184 | |||||||
| Liabilities in excess of other assets: (2.3)% | (251,882 | ) | ||||||
| NET ASSETS: 100.0% | $ | 11,084,302 | ||||||
| Definitions: | |
| USD | United States Dollar |
| Footnotes: | |
| * | Non-income producing |
| † | Security fully or partially on loan. Total market value of securities on loan is $523,899. |
| Summary of Investments by Sector Excluding Collateral for Securities Loaned | % of Investments | Value | ||||||
| Gas Utilities | 2.2 | % | $ | 240,405 | ||||
| Integrated Oil & Gas | 11.7 | 1,298,514 | ||||||
| Oil & Gas Exploration & Production | 86.1 | 9,544,191 | ||||||
| 100.0 | % | $ | 11,083,110 | |||||
The summary of inputs used to value the Fund’s investments as of December 31, 2020 is as follows:
| Level 1 Quoted Prices | Level 2 Significant Observable Inputs | Level 3 Significant Unobservable Inputs | Value | ||||||||||||||
| Common Stocks* | $ | 11,083,110 | $ | — | $ | — | $ | 11,083,110 | |||||||||
| Money Market Fund | 253,074 | — | — | 253,074 | |||||||||||||
| Total | $ | 11,336,184 | $ | — | $ | — | $ | 11,336,184 | |||||||||
| * | See Schedule of Investments for geographic sector breakouts. |
See Notes to Financial Statements
| 42 |
VANECK VECTORS URANIUM+NUCLEAR ENERGY ETF
SCHEDULE OF INVESTMENTS
December 31, 2020
| Number of Shares | Value | |||||||
| COMMON STOCKS: 99.9% | ||||||||
| Canada: 6.8% | ||||||||
| 67,341 | Cameco Corp. (USD) | $ | 902,369 | |||||
| 86,135 | NexGen Energy Ltd. * † | 237,311 | ||||||
| 24,786 | Uranium Participation Corp. * | 95,525 | ||||||
| 1,235,205 | ||||||||
| Czech Republic: 4.8% | ||||||||
| 36,322 | CEZ AS # | 871,708 | ||||||
| Finland: 5.2% | ||||||||
| 38,825 | Fortum Oyj # | 939,476 | ||||||
| France: 4.4% | ||||||||
| 50,379 | Electricite de France SA # | 798,454 | ||||||
| Italy: 4.4% | ||||||||
| 28,564 | Endesa SA † # | 784,698 | ||||||
| Japan: 15.1% | ||||||||
| 44,400 | Hokuriku Electric Power Co. # | 289,699 | ||||||
| 87,800 | Kansai Electric Power Co., Inc. # | 830,499 | ||||||
| 95,900 | Kyushu Electric Power Co., Inc. # | 827,395 | ||||||
| 295,000 | Tokyo Electric Power Co., Inc. * # | 779,287 | ||||||
| 2,726,880 | ||||||||
| Kazakhstan: 1.6% | ||||||||
| 15,604 | NAC Kazatomprom JSC Reg S (GDR) | 280,872 | ||||||
| South Korea: 5.8% | ||||||||
| 3,673 | KEPCO Plant Service & Engineering Co. Ltd. # | 100,545 | ||||||
| 77,614 | Korea Electric Power Corp. (ADR) * | 952,324 | ||||||
| 1,052,869 | ||||||||
| Number of Shares | Value | |||||||
| United States: 51.8% | ||||||||
| 10,780 | BWX Technologies, Inc. | $ | 649,818 | |||||
| 18,670 | Dominion Energy, Inc. | 1,403,984 | ||||||
| 15,143 | Duke Energy Corp. | 1,386,493 | ||||||
| 30,521 | Energy Fuels, Inc. * † | 130,019 | ||||||
| 9,108 | Entergy Corp. | 909,343 | ||||||
| 29,471 | Exelon Corp. | 1,244,266 | ||||||
| 83,774 | PG&E Corp. * | 1,043,824 | ||||||
| 9,572 | Pinnacle West Capital Corp. | 765,281 | ||||||
| 12,651 | PNM Resources, Inc. | 613,953 | ||||||
| 19,765 | Public Service Enterprise Group, Inc. | 1,152,300 | ||||||
| 44,649 | Uranium Energy Corp. * | 78,582 | ||||||
| 9,377,863 | ||||||||
| Total Common Stocks (Cost: $16,609,800) | 18,068,025 | |||||||
| SHORT-TERM INVESTMENT HELD AS COLLATERAL FOR SECURITIES ON LOAN: 5.7% (Cost: $1,037,199) | ||||||||
| Money Market Fund: 5.7% | ||||||||
| 1,037,199 | State Street Navigator Securities Lending Government Money Market Portfolio | 1,037,199 | ||||||
| Total Investments: 105.6% (Cost: $17,646,999) | 19,105,224 | |||||||
| Liabilities in excess of other assets: (5.6)% | (1,011,988 | ) | ||||||
| NET ASSETS: 100.0% | $ | 18,093,236 | ||||||
| Definitions: | |
| ADR | American Depositary Receipt |
| GDR | Global Depositary Receipt |
| USD | United States Dollar |
Footnotes:
| * | Non-income producing |
| † | Security fully or partially on loan. Total market value of securities on loan is $975,422. |
| # | Security has been valued in good faith pursuant to guidelines established by the Board of Trustees. The aggregate value of fair valued securities is $6,221,761 which represents 34.4% of net assets. |
| Reg S | Security was purchased pursuant to Regulation S under the Securities Act of 1933, which exempts from registration securities offered and sold outside of the United States. Such a security cannot be sold in the United States without either an effective registration statement filed pursuant to the Securities Act of 1933, or pursuant to an exemption from registration. |
See Notes to Financial Statements
| 43 |
VANECK VECTORS URANIUM+NUCLEAR ENERGY ETF
SCHEDULE OF INVESTMENTS
(continued)
| Summary of Investments by Sector Excluding Collateral for Securities Loaned | % of Investments | Value | ||||||
| Energy | 9.0 | % | $ | 1,629,153 | ||||
| Financials | 0.5 | 95,525 | ||||||
| Industrials | 4.2 | 750,363 | ||||||
| Utilities | 86.3 | 15,592,984 | ||||||
| 100.0 | % | $ | 18,068,025 | |||||
The summary of inputs used to value the Fund’s investments as of December 31, 2020 is as follows:
| Level 1 Quoted Prices | Level 2 Significant Observable Inputs | Level 3 Significant Unobservable Inputs | Value | ||||||||||||||
| Common Stocks | |||||||||||||||||
| Canada | $ | 1,235,205 | $ | — | $ | — | $ | 1,235,205 | |||||||||
| Czech Republic | — | 871,708 | — | 871,708 | |||||||||||||
| Finland | — | 939,476 | — | 939,476 | |||||||||||||
| France | — | 798,454 | — | 798,454 | |||||||||||||
| Italy | — | 784,698 | — | 784,698 | |||||||||||||
| Japan | — | 2,726,880 | — | 2,726,880 | |||||||||||||
| Kazakhstan | 280,872 | — | — | 280,872 | |||||||||||||
| South Korea | 952,324 | 100,545 | — | 1,052,869 | |||||||||||||
| United States | 9,377,863 | — | — | 9,377,863 | |||||||||||||
| Money Market Fund | 1,037,199 | — | — | 1,037,199 | |||||||||||||
| Total | $ | 12,883,463 | $ | 6,221,761 | $ | — | $ | 19,105,224 | |||||||||
See Notes to Financial Statements
| 44 |
[This Page Intentionally Left Blank.]
| 45 |
VANECK VECTORS ETF TRUST
STATEMENTS OF ASSETS AND LIABILITIES
December 31, 2020
| Agribusiness ETF | Gold Miners ETF | Junior Gold Miners ETF | Low Carbon Energy ETF | Natural Resources ETF | |||||||||||||||||||||
| Assets: | |||||||||||||||||||||||||
| Investments, at value (1) | |||||||||||||||||||||||||
| Unaffiliated issuers (2) | $ | 793,414,282 | $ | 7,234,231,356 | $ | 5,113,057,361 | $ | 270,168,254 | $ | 52,061,230 | |||||||||||||||
| Affiliated issuers (3) | — | 9,254,957,210 | 1,190,420,668 | — | — | ||||||||||||||||||||
| Short-term investments held as collateral for securities loaned (4) | 434,046 | 124,038,217 | 187,646,529 | 13,994,705 | 340,095 | ||||||||||||||||||||
| Cash | 145 | 17,877,003 | 11,276,108 | 57,187 | — | ||||||||||||||||||||
| Cash denominated in foreign currency, at value (5) | 437,475 | 470 | 15,693 | — | 110,061 | ||||||||||||||||||||
| Receivables: | |||||||||||||||||||||||||
| Investment securities sold | — | — | 2,042,220 | — | 308,231 | ||||||||||||||||||||
| Shares of beneficial interest sold | — | 18,990 | — | — | — | ||||||||||||||||||||
| Due from Adviser | — | — | — | — | — | ||||||||||||||||||||
| Dividends and interest | 1,233,234 | 4,746,728 | 2,454,903 | 160,857 | 108,605 | ||||||||||||||||||||
| Prepaid expenses | 4,352 | 21,625 | 17,344 | 1,751 | 879 | ||||||||||||||||||||
| Total assets | 795,523,534 | 16,635,891,599 | 6,506,930,826 | 284,382,754 | 52,929,101 | ||||||||||||||||||||
| Liabilities: | |||||||||||||||||||||||||
| Payables: | |||||||||||||||||||||||||
| Investment securities purchased | — | — | 1,021,110 | — | 198,584 | ||||||||||||||||||||
| Collateral for securities loaned | 434,046 | 124,038,217 | 187,646,529 | 13,994,705 | 340,095 | ||||||||||||||||||||
| Line of credit | 189,688 | — | — | — | — | ||||||||||||||||||||
| Shares of beneficial interest redeemed | — | 9,495 | — | — | — | ||||||||||||||||||||
| Due to Adviser | 322,166 | 6,826,609 | 2,576,709 | 127,148 | 37,109 | ||||||||||||||||||||
| Due to custodian | — | — | — | — | 77,185 | ||||||||||||||||||||
| Deferred Trustee fees | 531,981 | 1,097,032 | 270,591 | 13,364 | 13,734 | ||||||||||||||||||||
| Accrued expenses | 245,179 | 401,604 | 448,215 | 89,006 | 87,125 | ||||||||||||||||||||
| Total liabilities | 1,723,060 | 132,372,957 | 191,963,154 | 14,224,223 | 753,832 | ||||||||||||||||||||
| NET ASSETS | $ | 793,800,474 | $ | 16,503,518,642 | $ | 6,314,967,672 | $ | 270,158,531 | $ | 52,175,269 | |||||||||||||||
| Shares outstanding | 10,200,000 | 458,652,500 | 116,387,446 | 1,633,298 | 1,350,000 | ||||||||||||||||||||
| Net asset value, redemption and offering price per share | $ | 77.82 | $ | 35.98 | $ | 54.26 | $ | 165.41 | $ | 38.65 | |||||||||||||||
| Net Assets consist of: | |||||||||||||||||||||||||
| Aggregate paid in capital | $ | 1,379,239,567 | $ | 23,318,263,919 | $ | 9,487,517,646 | $ | 200,109,723 | $ | 92,958,351 | |||||||||||||||
| Total distributable earnings (loss) | (585,439,093 | ) | (6,814,745,277 | ) | (3,172,549,974 | ) | 70,048,808 | (40,783,082 | ) | ||||||||||||||||
| NET ASSETS | $ | 793,800,474 | $ | 16,503,518,642 | $ | 6,314,967,672 | $ | 270,158,531 | $ | 52,175,269 | |||||||||||||||
| (1) Value of securities on loan | $ | 35,130,908 | $ | 277,024,023 | $ | 281,119,293 | $ | 56,269,478 | $ | 2,644,227 | |||||||||||||||
| (2) Cost of investments — Unaffiliated issuers | $ | 653,814,085 | $ | 5,512,949,139 | $ | 4,141,418,620 | $ | 146,142,026 | $ | 48,885,301 | |||||||||||||||
| (3) Cost of investments — Affiliated issuers | $ | — | $ | 7,222,599,066 | $ | 824,490,536 | $ | — | $ | — | |||||||||||||||
| (4) Cost of short-term investments held as collateral for securities loaned | $ | 434,046 | $ | 124,038,217 | $ | 187,646,529 | $ | 13,994,705 | $ | 340,095 | |||||||||||||||
| (5) Cost of cash denominated in foreign currency | $ | 420,786 | $ | 458 | $ | 15,549 | $ | — | $ | 110,141 | |||||||||||||||
See Notes to Financial Statements
| 46 |
| Oil Refiners ETF | Oil Services ETF | Rare Earth/ Strategic Metals ETF | Steel ETF | Unconventional Oil & Gas ETF | Uranium+Nuclear Energy ETF | ||||||||||||||||||||||||
| $ | 17,522,214 | $ | 723,731,887 | $ | 322,211,805 | $ | 76,821,399 | $ | 11,083,110 | $ | 18,068,025 | ||||||||||||||||||
| — | — | — | — | — | — | ||||||||||||||||||||||||
| — | 22,425,566 | 9,421,120 | 1,467,173 | 253,074 | 1,037,199 | ||||||||||||||||||||||||
| 15,795 | 109 | 149 | 173,192 | 101,105 | 388,195 | ||||||||||||||||||||||||
| — | — | 1,070,882 | — | 2,546 | — | ||||||||||||||||||||||||
| — | — | — | 19,228,632 | 2,534 | 2,597 | ||||||||||||||||||||||||
| — | — | 26,740 | 20,833 | — | — | ||||||||||||||||||||||||
| — | — | — | — | 184 | — | ||||||||||||||||||||||||
| 43,207 | 698,185 | 100,074 | 90,179 | 9,704 | 22,362 | ||||||||||||||||||||||||
| 875 | 4,343 | 1,748 | 879 | 870 | 873 | ||||||||||||||||||||||||
| 17,582,091 | 746,860,090 | 332,832,518 | 97,802,287 | 11,453,127 | 19,519,251 | ||||||||||||||||||||||||
| — | — | — | 8,047,909 | 2,540 | 285,131 | ||||||||||||||||||||||||
| — | 22,425,566 | 9,421,120 | 1,467,173 | 253,074 | 1,037,199 | ||||||||||||||||||||||||
| — | 499,706 | 1,020,606 | — | — | — | ||||||||||||||||||||||||
| — | — | — | 11,220,642 | — | — | ||||||||||||||||||||||||
| 7,259 | 206,527 | 116,138 | 1,031 | — | 5,664 | ||||||||||||||||||||||||
| — | — | — | — | — | — | ||||||||||||||||||||||||
| 641 | 182,952 | 17,273 | 18,069 | 4,285 | 11,932 | ||||||||||||||||||||||||
| 68,087 | 124,530 | 134,821 | 157,370 | 108,926 | 86,089 | ||||||||||||||||||||||||
| 75,987 | 23,439,281 | 10,709,958 | 20,912,194 | 368,825 | 1,426,015 | ||||||||||||||||||||||||
| $ | 17,506,104 | $ | 723,420,809 | $ | 322,122,560 | $ | 76,890,093 | $ | 11,084,302 | $ | 18,093,236 | ||||||||||||||||||
| 700,000 | 4,700,543 | 4,924,987 | 1,725,000 | 145,000 | 366,632 | ||||||||||||||||||||||||
| $ | 25.01 | $ | 153.90 | $ | 65.41 | $ | 44.57 | $ | 76.44 | $ | 49.35 | ||||||||||||||||||
| $ | 26,017,265 | $ | 2,514,280,861 | $ | 555,834,382 | $ | 222,845,794 | $ | 74,007,492 | $ | 100,672,591 | ||||||||||||||||||
| (8,511,161 | ) | (1,790,860,052 | ) | (233,711,822 | ) | (145,955,701 | ) | (62,923,190 | ) | (82,579,355 | ) | ||||||||||||||||||
| $ | 17,506,104 | $ | 723,420,809 | $ | 322,122,560 | $ | 76,890,093 | $ | 11,084,302 | $ | 18,093,236 | ||||||||||||||||||
| $ | 634,148 | $ | 40,399,525 | $ | 49,851,637 | $ | 14,911,116 | $ | 523,899 | $ | 975,422 | ||||||||||||||||||
| $ | 19,398,107 | $ | 926,029,173 | $ | 230,846,528 | $ | 71,825,201 | $ | 22,269,724 | $ | 16,609,800 | ||||||||||||||||||
| $ | — | $ | — | $ | — | $ | — | $ | — | $ | — | ||||||||||||||||||
| $ | — | $ | 22,425,566 | $ | 9,421,120 | $ | 1,467,173 | $ | 253,074 | $ | 1,037,199 | ||||||||||||||||||
| $ | — | $ | — | $ | 1,064,853 | $ | — | $ | 2,542 | $ | — | ||||||||||||||||||
See Notes to Financial Statements
| 47 |
STATEMENTS OF OPERATIONS
For the Year Ended December 31, 2020
| Agribusiness ETF | Gold Miners ETF | Junior Gold Miners ETF | Low Carbon Energy ETF | Natural Resources ETF | |||||||||||||||||||||
| Income: | |||||||||||||||||||||||||
| Dividends – unaffiliated issuers | $ | 12,920,590 | $ | 96,427,085 | $ | 42,667,193 | $ | 1,111,727 | $ | 1,613,231 | |||||||||||||||
| Dividends – affiliated issuers | — | 85,380,976 | 10,943,049 | — | — | ||||||||||||||||||||
| Interest | 938 | 10,563 | 33,990 | 140 | 77 | ||||||||||||||||||||
| Securities lending income | 213,338 | 1,016,015 | 3,520,954 | 32,133 | 15,914 | ||||||||||||||||||||
| Foreign taxes withheld | (1,203,369 | ) | (15,207,817 | ) | (4,128,866 | ) | (65,065 | ) | (94,921 | ) | |||||||||||||||
| Total income | 11,931,497 | 167,626,822 | 53,036,320 | 1,078,935 | 1,534,301 | ||||||||||||||||||||
| Expenses: | |||||||||||||||||||||||||
| Management fees | 3,045,901 | 74,909,513 | 26,972,600 | 685,772 | 248,945 | ||||||||||||||||||||
| Professional fees | 70,261 | 101,525 | 139,982 | 83,426 | 82,403 | ||||||||||||||||||||
| Custody and accounting fees | 108,267 | 197,154 | 225,898 | 48,802 | 81,511 | ||||||||||||||||||||
| Reports to shareholders | 57,692 | 437,380 | 148,834 | 38,717 | 15,548 | ||||||||||||||||||||
| IOPV fees | — | — | 5,038 | 5,038 | 5,882 | ||||||||||||||||||||
| Trustees’ fees and expenses | 24,660 | 337,383 | 175,279 | 4,646 | 2,589 | ||||||||||||||||||||
| Registration fees | 5,995 | 6,680 | 20,426 | 8,518 | 5,995 | ||||||||||||||||||||
| Insurance | 12,532 | 98,695 | 52,789 | 3,725 | 2,837 | ||||||||||||||||||||
| Interest | 8,036 | 45,475 | 82,295 | 2,962 | 2,099 | ||||||||||||||||||||
| Other | 13,854 | 312,254 | 221,929 | 2,225 | 1,668 | ||||||||||||||||||||
| Total expenses | 3,347,198 | 76,446,059 | 28,045,070 | 883,831 | 449,477 | ||||||||||||||||||||
| Waiver of management fees | — | — | — | (29,968 | ) | (203,578 | ) | ||||||||||||||||||
| Expenses assumed by the Adviser | — | — | — | — | — | ||||||||||||||||||||
| Net expenses | 3,347,198 | 76,446,059 | 28,045,070 | 853,863 | 245,899 | ||||||||||||||||||||
| Net investment income | 8,584,299 | 91,180,763 | 24,991,250 | 225,072 | 1,288,402 | ||||||||||||||||||||
| Net realized gain (loss) on: | |||||||||||||||||||||||||
| Investments – unaffiliated issuers | (6,563,399 | ) | (14,510,776 | ) | 187,710,247 | 42,036,606 | (2,939,573 | ) | |||||||||||||||||
| Investments – affiliated issuers | — | (180,425,783 | ) | (74,347,989 | ) | — | — | ||||||||||||||||||
| In-kind redemptions – unaffiliated issuers | 18,100,504 | 637,443,205 | 390,659,972 | — | 951,638 | ||||||||||||||||||||
| In-kind redemptions – affiliated issuers | — | 594,850,341 | 154,828,519 | — | — | ||||||||||||||||||||
| Foreign currency transactions and foreign denominated assets and liabilities | 61,014 | (521,686 | ) | 2,589,212 | (26,457 | ) | (9,939 | ) | |||||||||||||||||
| Net realized gain (loss) | 11,598,119 | 1,036,835,301 | 661,439,961 | 42,010,149 | (1,997,874 | ) | |||||||||||||||||||
| Net change in unrealized appreciation (depreciation) on: | |||||||||||||||||||||||||
| Investments – unaffiliated issuers | 60,964,379 | 656,241,857 | 329,409,136 | 91,337,333 | (1,679,909 | ) | |||||||||||||||||||
| Investments – affiliated issuers | — | 852,297,564 | 203,494,214 | — | — | ||||||||||||||||||||
| Foreign currency transactions and foreign denominated assets and liabilities | 17,995 | (25,702 | ) | (3,411 | ) | 8,294 | 1,035 | ||||||||||||||||||
| Net change in unrealized appreciation (depreciation) | 60,982,374 | 1,508,513,719 | 532,899,939 | 91,345,627 | (1,678,874 | ) | |||||||||||||||||||
| Net Increase (Decrease) in Net Assets Resulting from Operations | $ | 81,164,792 | $ | 2,636,529,783 | $ | 1,219,331,150 | $ | 133,580,848 | $ | (2,388,346 | ) | ||||||||||||||
See Notes to Financial Statements
| 48 |
| Oil Refiners ETF | Oil Services ETF | Rare Earth/ Strategic Metals ETF | Steel ETF | Unconventional Oil & Gas ETF | Uranium+Nuclear Energy ETF | ||||||||||||||||||||||||
| $ | 620,448 | $ | 9,053,159 | $ | 1,507,888 | $ | 1,347,382 | $ | 268,507 | $ | 518,768 | ||||||||||||||||||
| — | — | — | — | — | — | ||||||||||||||||||||||||
| — | 1,481 | 1,367 | 41 | 177 | 175 | ||||||||||||||||||||||||
| 1,254 | 1,315,176 | 1,964,089 | 38,425 | 3,578 | 9,819 | ||||||||||||||||||||||||
| (50,939 | ) | (29,467 | ) | (96,280 | ) | (39,848 | ) | (5,913 | ) | (38,137 | ) | ||||||||||||||||||
| 570,763 | 10,340,349 | 3,377,064 | 1,346,000 | 266,349 | 490,625 | ||||||||||||||||||||||||
| 90,743 | 1,781,434 | 831,684 | 234,556 | 51,070 | 95,610 | ||||||||||||||||||||||||
| 67,700 | 73,700 | 71,589 | 71,250 | 71,631 | 72,404 | ||||||||||||||||||||||||
| 47,128 | 40,041 | 60,797 | 110,404 | 41,136 | 42,385 | ||||||||||||||||||||||||
| 12,267 | 68,936 | 29,768 | 13,970 | 13,080 | 9,895 | ||||||||||||||||||||||||
| 5,038 | 5,038 | 5,882 | 3,983 | 5,354 | 5,882 | ||||||||||||||||||||||||
| 1,614 | 34,840 | 7,200 | 2,887 | 3,022 | 962 | ||||||||||||||||||||||||
| 5,862 | 12,250 | 5,997 | 1,221 | 5,995 | 5,995 | ||||||||||||||||||||||||
| 1,839 | 13,931 | 4,116 | 2,789 | 1,854 | 1,762 | ||||||||||||||||||||||||
| 900 | 8,135 | 25,011 | 2,975 | — | 330 | ||||||||||||||||||||||||
| 343 | 2,394 | 3,418 | 937 | 620 | 3,259 | ||||||||||||||||||||||||
| 233,434 | 2,040,699 | 1,045,462 | 444,972 | 193,762 | 238,484 | ||||||||||||||||||||||||
| (90,743 | ) | (254,131 | ) | (71,288 | ) | (183,792 | ) | (51,070 | ) | (95,610 | ) | ||||||||||||||||||
| (35,035 | ) | — | — | — | (87,584 | ) | (27,894 | ) | |||||||||||||||||||||
| 107,656 | 1,786,568 | 974,174 | 261,180 | 55,108 | 114,980 | ||||||||||||||||||||||||
| 463,107 | 8,553,781 | 2,402,890 | 1,084,820 | 211,241 | 375,645 | ||||||||||||||||||||||||
| (3,830,307 | ) | (656,826,956 | ) | (17,445,558 | ) | (11,516,503 | ) | (6,195,297 | ) | (1,889,604 | ) | ||||||||||||||||||
| — | — | — | — | — | — | ||||||||||||||||||||||||
| (206,773 | ) | 56,271,904 | 1,853,141 | 3,752,088 | (248,917 | ) | 1,216,426 | ||||||||||||||||||||||
| — | — | — | — | — | — | ||||||||||||||||||||||||
| (12,671 | ) | — | (41,236 | ) | — | 5 | 3,555 | ||||||||||||||||||||||
| (4,049,751 | ) | (600,555,052 | ) | (15,633,653 | ) | (7,764,415 | ) | (6,444,209 | ) | (669,623 | ) | ||||||||||||||||||
| 1,113,021 | 363,927,111 | 112,751,242 | 12,848,203 | 1,113,009 | 1,096,615 | ||||||||||||||||||||||||
| — | — | — | — | — | — | ||||||||||||||||||||||||
| 2,587 | — | 3,043 | — | (173 | ) | (114 | ) | ||||||||||||||||||||||
| 1,115,608 | 363,927,111 | 112,754,285 | 12,848,203 | 1,112,836 | 1,096,501 | ||||||||||||||||||||||||
| $ | (2,471,036 | ) | $ | (228,074,160 | ) | $ | 99,523,522 | $ | 6,168,608 | $ | (5,120,132 | ) | $ | 802,523 | |||||||||||||||
See Notes to Financial Statements
| 49 |
VANECK VECTORS ETF TRUST
STATEMENTS OF CHANGES IN NET ASSETS
| Agribusiness ETF | Gold Miners ETF | |||||||||||||||||||
| Year Ended December 31, 2020 | Year Ended December 31, 2019 | Year Ended December 31, 2020 | Year Ended December 31, 2019 | |||||||||||||||||
| Operations: | ||||||||||||||||||||
| Net investment income | $ | 8,584,299 | $ | 9,325,082 | $ | 91,180,763 | $ | 81,818,784 | ||||||||||||
| Net realized gain (loss) | 11,598,119 | 44,797,316 | 1,036,835,301 | 379,314,111 | ||||||||||||||||
| Net change in unrealized appreciation (depreciation) | 60,982,374 | 90,494,954 | 1,508,513,719 | 3,098,738,866 | ||||||||||||||||
| Net increase (decrease) in net assets resulting from operations | 81,164,792 | 144,617,352 | 2,636,529,783 | 3,559,871,761 | ||||||||||||||||
| Distributions to shareholders: | ||||||||||||||||||||
| From distributable earnings | (8,649,640 | ) | (9,500,095 | ) | (85,977,700 | ) | (83,020,376 | ) | ||||||||||||
| Share transactions:** | ||||||||||||||||||||
| Proceeds from sale of shares | 106,178,252 | 105,326,430 | 4,987,854,222 | 3,041,614,263 | ||||||||||||||||
| Cost of shares redeemed | (101,652,572 | ) | (280,400,157 | ) | (4,033,614,138 | ) | (4,095,425,966 | ) | ||||||||||||
| Increase (decrease) in net assets resulting from share transactions | 4,525,680 | (175,073,727 | ) | 954,240,084 | (1,053,811,703 | ) | ||||||||||||||
| Total increase (decrease) in net assets | 77,040,832 | (39,956,470 | ) | 3,504,792,167 | 2,423,039,682 | |||||||||||||||
| Net Assets, beginning of year | 716,759,642 | 756,716,112 | 12,998,726,475 | 10,575,686,793 | ||||||||||||||||
| Net Assets, end of year | $ | 793,800,474 | $ | 716,759,642 | $ | 16,503,518,642 | $ | 12,998,726,475 | ||||||||||||
| ** Shares of Common Stock Issued (no par value) | ||||||||||||||||||||
| Shares sold | 1,450,000 | 1,600,000 | 154,150,000 | 110,700,000 | ||||||||||||||||
| Shares redeemed | (1,700,000 | ) | (4,400,000 | ) | (138,550,000 | ) | (169,500,000 | ) | ||||||||||||
| Net increase (decrease) | (250,000 | ) | (2,800,000 | ) | 15,600,000 | (58,800,000 | ) | |||||||||||||
See Notes to Financial Statements
| 50 |
| Junior Gold Miners ETF | Low Carbon Energy ETF | Natural Resources ETF | ||||||||||||||||||||||||||
| Year Ended December 31, 2020 | Year Ended December 31, 2019 | Year Ended December 31, 2020 | Year Ended December 31, 2019 | Year Ended December 31, 2020 | Year Ended December 31, 2019 | |||||||||||||||||||||||
| $ | 24,991,250 | $ | 10,138,692 | $ | 225,072 | $ | 70,269 | $ | 1,288,402 | $ | 1,907,303 | |||||||||||||||||
| 661,439,961 | 389,351,781 | 42,010,149 | 3,957,336 | (1,997,874 | ) | 1,861,690 | ||||||||||||||||||||||
| 532,899,939 | 1,159,349,428 | 91,345,627 | 24,995,612 | (1,678,874 | ) | 8,604,689 | ||||||||||||||||||||||
| 1,219,331,150 | 1,558,839,901 | 133,580,848 | 29,023,217 | (2,388,346 | ) | 12,373,682 | ||||||||||||||||||||||
| (99,001,811 | ) | (19,760,414 | ) | (149,937 | ) | — | (1,274,940 | ) | (1,900,000 | ) | ||||||||||||||||||
| 2,296,605,753 | 1,571,000,381 | 32,017,566 | 3,279,996 | 11,167,537 | 3,749,265 | |||||||||||||||||||||||
| (2,321,187,674 | ) | (2,164,254,798 | ) | — | (6,568,905 | ) | (25,822,931 | ) | (21,011,129 | ) | ||||||||||||||||||
| (24,581,921 | ) | (593,254,417 | ) | 32,017,566 | (3,288,909 | ) | (14,655,394 | ) | (17,261,864 | ) | ||||||||||||||||||
| 1,095,747,418 | 945,825,070 | 165,448,477 | 25,734,308 | (18,318,680 | ) | (6,788,182 | ) | |||||||||||||||||||||
| 5,219,220,254 | 4,273,395,184 | 104,710,054 | 78,975,746 | 70,493,949 | 77,282,131 | |||||||||||||||||||||||
| $ | 6,314,967,672 | $ | 5,219,220,254 | $ | 270,158,531 | $ | 104,710,054 | $ | 52,175,269 | $ | 70,493,949 | |||||||||||||||||
| 58,350,000 | 44,500,000 | 250,000 | 50,000 | 300,000 | 100,000 | |||||||||||||||||||||||
| (65,100,000 | ) | (63,300,000 | ) | — | (100,000 | ) | (850,000 | ) | (600,000 | ) | ||||||||||||||||||
| (6,750,000 | ) | (18,800,000 | ) | 250,000 | (50,000 | ) | (550,000 | ) | (500,000 | ) | ||||||||||||||||||
See Notes to Financial Statements
| 51 |
VANECK VECTORS ETF TRUST
STATEMENTS OF CHANGES IN NET ASSETS
(continued)
| Oil Refiners ETF | Oil Services ETF (a) | |||||||||||||||||||
| Year Ended December 31, 2020 | Year Ended December 31, 2019 | Year Ended December 31, 2020 | Year Ended December 31, 2019 | |||||||||||||||||
| Operations: | ||||||||||||||||||||
| Net investment income | $ | 463,107 | $ | 472,933 | $ | 8,553,781 | $ | 17,732,991 | ||||||||||||
| Net realized loss | (4,049,751 | ) | (4,102,029 | ) | (600,555,052 | ) | (732,283,769 | ) | ||||||||||||
| Net change in unrealized appreciation (depreciation) | 1,115,608 | 6,240,728 | 363,927,111 | 792,379,286 | ||||||||||||||||
| Net increase (decrease) in net assets resulting from operations | (2,471,036 | ) | 2,611,632 | (228,074,160 | ) | 77,828,508 | ||||||||||||||
| Distributions to shareholders: | ||||||||||||||||||||
| From distributable earnings | (450,520 | ) | (496,080 | ) | (8,700,087 | ) | (17,651,031 | ) | ||||||||||||
| Return of capital | (11,480 | ) | — | — | — | |||||||||||||||
| Total distributions | (462,000 | ) | (496,080 | ) | (8,700,087 | ) | (17,651,031 | ) | ||||||||||||
| Share transactions:** | ||||||||||||||||||||
| Proceeds from sale of shares | 10,352,663 | 21,310,441 | 1,565,472,841 | 1,831,589,993 | ||||||||||||||||
| Cost of shares redeemed | (24,728,022 | ) | (37,120,710 | ) | (1,378,601,348 | ) | (2,163,278,689 | ) | ||||||||||||
| Increase (decrease) in net assets resulting from share transactions | (14,375,359 | ) | (15,810,269 | ) | 186,871,493 | (331,688,696 | ) | |||||||||||||
| Total increase (decrease) in net assets | (17,308,395 | ) | (13,694,717 | ) | (49,902,754 | ) | (271,511,219 | ) | ||||||||||||
| Net Assets, beginning of year | 34,814,499 | 48,509,216 | 773,323,563 | 1,044,834,782 | ||||||||||||||||
| Net Assets, end of year | $ | 17,506,104 | $ | 34,814,499 | $ | 723,420,809 | $ | 773,323,563 | ||||||||||||
| ** Shares of Common Stock Issued (no par value) | ||||||||||||||||||||
| Shares sold | 525,000 | 700,000 | 11,320,000 | 6,570,000 | ||||||||||||||||
| Shares redeemed | (1,025,000 | ) | (1,300,000 | ) | (9,532,500 | ) | (7,380,000 | ) | ||||||||||||
| Net increase (decrease) | (500,000 | ) | (600,000 | ) | 1,787,500 | (810,000 | ) | |||||||||||||
| (a) | Share activity has been adjusted to reflect the 1 for 20 reverse share split which took place on April 15, 2020 (See Note 11). |
| (b) | Share activity has been adjusted to reflect the 1 for 3 reverse share split which took place on April 15, 2020 (See Note 11). |
| (c) | Share activity has been adjusted to reflect the 1 for 10 reverse share split which took place on April 15, 2020 (See Note 11). |
See Notes to Financial Statements
| 52 |
| Rare Earth/Strategic Metals ETF (b) | Steel ETF | Unconventional Oil & Gas ETF (c) | ||||||||||||||||||||||||||
| Year Ended December 31, 2020 | Year Ended December 31, 2019 | Year Ended December 31, 2020 | Year Ended December 31, 2019 | Year Ended December 31, 2020 | Year Ended December 31, 2019 | |||||||||||||||||||||||
| $ | 2,402,890 | $ | 3,627,666 | $ | 1,084,820 | $ | 1,819,995 | $ | 211,241 | $ | 286,559 | |||||||||||||||||
| (15,633,653 | ) | (34,444,235 | ) | (7,764,415 | ) | (4,736,577 | ) | (6,444,209 | ) | (6,395,006 | ) | |||||||||||||||||
| 112,754,285 | 20,064,586 | 12,848,203 | 9,706,290 | 1,112,836 | 8,707,027 | |||||||||||||||||||||||
| 99,523,522 | (10,751,983 | ) | 6,168,608 | 6,789,708 | (5,120,132 | ) | 2,598,580 | |||||||||||||||||||||
| (2,500,183 | ) | (3,000,424 | ) | (1,160,720 | ) | (1,830,265 | ) | (175,001 | ) | (350,000 | ) | |||||||||||||||||
| — | — | (89,230 | ) | — | — | — | ||||||||||||||||||||||
| (2,500,183 | ) | (3,000,424 | ) | (1,249,950 | ) | (1,830,265 | ) | (175,001 | ) | (350,000 | ) | |||||||||||||||||
| 133,894,168 | 179,145,791 | 32,148,724 | 22,421,304 | — | 1,675,305 | |||||||||||||||||||||||
| (101,731,782 | ) | (64,994,094 | ) | (26,219,056 | ) | (18,873,013 | ) | (3,221,221 | ) | (14,385,844 | ) | |||||||||||||||||
| 32,162,386 | 114,151,697 | 5,929,668 | 3,548,291 | (3,221,221 | ) | (12,710,539 | ) | |||||||||||||||||||||
| 129,185,725 | 100,399,290 | 10,848,326 | 8,507,734 | (8,516,354 | ) | (10,461,959 | ) | |||||||||||||||||||||
| 192,936,835 | 92,537,545 | 66,041,767 | 57,534,033 | 19,600,656 | 30,062,615 | |||||||||||||||||||||||
| $ | 322,122,560 | $ | 192,936,835 | $ | 76,890,093 | $ | 66,041,767 | $ | 11,084,302 | $ | 19,600,656 | |||||||||||||||||
| 2,933,333 | 4,033,333 | 800,000 | 600,000 | — | 15,000 | |||||||||||||||||||||||
| (2,783,333 | ) | (1,533,333 | ) | (825,000 | ) | (500,000 | ) | (30,000 | ) | (115,000 | ) | |||||||||||||||||
| 150,000 | 2,500,000 | (25,000 | ) | 100,000 | (30,000 | ) | (100,000 | ) | ||||||||||||||||||||
See Notes to Financial Statements
| 53 |
VANECK VECTORS ETF TRUST
STATEMENTS OF CHANGES IN NET ASSETS
(continued)
| Uranium+Nuclear Energy ETF | ||||||||||
| Year Ended | Year Ended | |||||||||
| December 31, | December 31, | |||||||||
| 2020 | 2019 | |||||||||
| Operations: | ||||||||||
| Net investment income | $ | 375,645 | $ | 516,417 | ||||||
| Net realized loss | (669,623 | ) | (123,124 | ) | ||||||
| Net change in unrealized appreciation (depreciation) | 1,096,501 | (269,910 | ) | |||||||
| Net increase in net assets resulting from operations | 802,523 | 123,383 | ||||||||
| Distributions to shareholders: | ||||||||||
| From distributable earnings | (401,975 | ) | (550,019 | ) | ||||||
| Share transactions:** | ||||||||||
| Cost of shares redeemed | (5,037,717 | ) | (2,503,957 | ) | ||||||
| Decrease in net assets resulting from share transactions | (5,037,717 | ) | (2,503,957 | ) | ||||||
| Total decrease in net assets | (4,637,169 | ) | (2,930,593 | ) | ||||||
| Net Assets, beginning of year | 22,730,405 | 25,660,998 | ||||||||
| Net Assets, end of year | $ | 18,093,236 | $ | 22,730,405 | ||||||
| ** Shares of Common Stock Issued (no par value) | ||||||||||
| Shares redeemed | (100,000 | ) | (50,000 | ) | ||||||
| Net decrease | (100,000 | ) | (50,000 | ) | ||||||
See Notes to Financial Statements
| 54 |
VANECK VECTORS ETF TRUST
For a share outstanding throughout each year:
| (a) | Calculated based upon average shares outstanding |
| (b) | Total return is calculated assuming an initial investment made at the net asset value at the beginning of year, reinvestment of any dividends and distributions at net asset value on the dividend/distributions payment date and a redemption at the net asset value on the last day of the year. The return includes adjustments in accordance with U.S. generally accepted accounting principles and as such, the net asset values for financial reporting purposes and the returns based upon those net asset values may differ from the net asset values and returns for shareholder transactions. The return does not reflect the deduction of taxes that a shareholder would pay on Fund dividends/distributions or the redemption of Fund shares. |
| (c) | Portfolio turnover rates exclude securities received or delivered as a result of processing in-kind capital share transactions. |
See Notes to Financial Statements
| 55 |
VANECK VECTORS ETF TRUST
FINANCIAL HIGHLIGHTS
For a share outstanding throughout each year:
| (a) | Calculated based upon average shares outstanding |
| (b) | Total return is calculated assuming an initial investment made at the net asset value at the beginning of year, reinvestment of any dividends and distributions at net asset value on the dividend/distributions payment date and a redemption at the net asset value on the last day of the year. The return includes adjustments in accordance with U.S. generally accepted accounting principles and as such, the net asset values for financial reporting purposes and the returns based upon those net asset values may differ from the net asset values and returns for shareholder transactions. The return does not reflect the deduction of taxes that a shareholder would pay on Fund dividends/distributions or the redemption of Fund shares. |
| (c) | Portfolio turnover rates exclude securities received or delivered as a result of processing in-kind capital share transactions. |
| (d) | The ratios presented do not reflect the Fund’s proportionate share of income and expenses from the Fund’s investment in underlying funds. |
See Notes to Financial Statements
| 56 |
FINANCIAL HIGHLIGHTS
For a share outstanding throughout each year:
| (a) | Calculated based upon average shares outstanding |
| (b) | Total return is calculated assuming an initial investment made at the net asset value at the beginning of year, reinvestment of any dividends and distributions at net asset value on the dividend/distributions payment date and a redemption at the net asset value on the last day of the year. The return includes adjustments in accordance with U.S. generally accepted accounting principles and as such, the net asset values for financial reporting purposes and the returns based upon those net asset values may differ from the net asset values and returns for shareholder transactions. The return does not reflect the deduction of taxes that a shareholder would pay on Fund dividends/distributions or the redemption of Fund shares. |
| (c) | Portfolio turnover rates exclude securities received or delivered as a result of processing in-kind capital share transactions. |
| (d) | The amount shown for a share outstanding does not correspond with the aggregate net gain (loss) on investments for the year due to the timing of sales and repurchases of shares in relation to fluctuating market values of the investments of the Fund. |
See Notes to Financial Statements
| 57 |
VANECK VECTORS ETF TRUST
FINANCIAL HIGHLIGHTS
For a share outstanding throughout each year:
| (a) | Calculated based upon average shares outstanding |
| (b) | Total return is calculated assuming an initial investment made at the net asset value at the beginning of year, reinvestment of any dividends and distributions at net asset value on the dividend/distributions payment date and a redemption at the net asset value on the last day of the year. The return includes adjustments in accordance with U.S. generally accepted accounting principles and as such, the net asset values for financial reporting purposes and the returns based upon those net asset values may differ from the net asset values and returns for shareholder transactions. The return does not reflect the deduction of taxes that a shareholder would pay on Fund dividends/distributions or the redemption of Fund shares. |
| (c) | Portfolio turnover rates exclude securities received or delivered as a result of processing in-kind capital share transactions. |
| (d) | The amount shown for a share outstanding does not correspond with the aggregate net gain (loss) on investments for the year due to the timing of sales and repurchases of shares in relation to fluctuating market values of the investments of the Fund. |
| # | On April 15, 2020, the Fund effected a 1 for 20 reverse share split (See Note 11). Per share data prior to April 15, 2020 has been adjusted to reflect the reverse share split. |
| ## | On April 15, 2020, the Fund effected a 1 for 3 reverse share split (See Note 11). Per share data prior to April 15, 2020 has been adjusted to reflect the reverse share split. |
See Notes to Financial Statements
| 58 |
FINANCIAL HIGHLIGHTS
For a share outstanding throughout each year:
| (a) | Calculated based upon average shares outstanding |
| (b) | Total return is calculated assuming an initial investment made at the net asset value at the beginning of year, reinvestment of any dividends and distributions at net asset value on the dividend/distributions payment date and a redemption at the net asset value on the last day of the year. The return includes adjustments in accordance with U.S. generally accepted accounting principles and as such, the net asset values for financial reporting purposes and the returns based upon those net asset values may differ from the net asset values and returns for shareholder transactions. The return does not reflect the deduction of taxes that a shareholder would pay on Fund dividends/distributions or the redemption of Fund shares. |
| (c) | Portfolio turnover rates exclude securities received or delivered as a result of processing in-kind capital share transactions. |
| # | On April 15, 2020, The Fund effected a 1 for 10 reverse share split (See Note 11). Per share data prior to April 15, 2020 has been adjusted to reflect the reverse share split. |
See Notes to Financial Statements
| 59 |
VANECK VECTORS ETF TRUST
FINANCIAL HIGHLIGHTS
For a share outstanding throughout each year:
| (a) | Calculated based upon average shares outstanding |
| (b) | Total return is calculated assuming an initial investment made at the net asset value at the beginning of year, reinvestment of any dividends and distributions at net asset value on the dividend/distributions payment date and a redemption at the net asset value on the last day of the year. The return includes adjustments in accordance with U.S. generally accepted accounting principles and as such, the net asset values for financial reporting purposes and the returns based upon those net asset values may differ from the net asset values and returns for shareholder transactions. The return does not reflect the deduction of taxes that a shareholder would pay on Fund dividends/distributions or the redemption of Fund shares. |
| (c) | Portfolio turnover rates exclude securities received or delivered as a result of processing in-kind capital share transactions. |
See Notes to Financial Statements
| 60 |
VANECK VECTORS ETF TRUST
December 31, 2020
Note 1—Fund Organization—VanEck Vectors ETF Trust (the “Trust”) is registered under the Investment Company Act of 1940, as amended, as an open-end management investment company. The Trust was incorporated in Delaware as a statutory trust on March 15, 2001. The Trust operates as a series fund, and offers multiple investment portfolios, each of which represents a separate series of the Trust. These financial statements relate only to the investment portfolios listed in the diversification table below (each a “Fund” and, collectively, the “Funds”).
| Fund | Diversification Classification | |
| Agribusiness ETF | Non-Diversified | |
| Gold Miners ETF | Non-Diversified | |
| Junior Gold Miners ETF | Non-Diversified | |
| Low Carbon Energy ETF | Non-Diversified | |
| Natural Resources ETF | Diversified | |
| Oil Refiners ETF | Non-Diversified | |
| Oil Services ETF | Non-Diversified | |
| Rare Earth/Strategic Metals ETF | Non-Diversified | |
| Steel ETF | Non-Diversified | |
| Unconventional Oil & Gas ETF | Non-Diversified | |
| Uranium+Nuclear Energy ETF | Non-Diversified |
Each Fund was created to provide investors with the opportunity to purchase a security representing a proportionate undivided interest in a portfolio of securities consisting of substantially all of the common stocks in approximately the same weighting as their index.
Note 2—Significant Accounting Policies—The preparation of financial statements in conformity with U.S. generally accepted accounting principles (“GAAP”) requires management to make estimates and assumptions that affect the reported amounts and disclosures in the financial statements. Actual results could differ from those estimates.
The Funds are investment companies and follow accounting and reporting requirements of Accounting Standards Codification (“ASC”) 946 Financial Services—Investment Companies.
The following summarizes the Funds’ significant accounting policies.
| A. | Security Valuation—The Funds value their investments in securities and other assets and liabilities at fair value daily. Fair value is the price that would be received to sell an asset or paid to transfer a liability in an orderly transaction between market participants on the measurement date. Securities traded on national exchanges are valued at the closing price on the markets in which the securities trade. Securities traded on the NASDAQ Stock Market LLC (“NASDAQ”) are valued at the NASDAQ official closing price. Over-the-counter securities not included on NASDAQ and listed securities for which no sale was reported are valued at the mean of the bid and ask prices. To the extent these securities are actively traded they are categorized as Level 1 in the fair value hierarchy (described below). Certain foreign securities, whose values may be affected by market direction or events occurring before the Funds’ pricing time (4:00 p.m. Eastern Time) but after the last close of the securities’ primary market, are fair valued using a pricing service and are categorized as Level 2 in the fair value hierarchy. The pricing service, using methods approved by the Board of Trustees, considers the correlation of the trading patterns of the foreign security to intraday trading in the U.S. markets, based on indices of domestic securities and other appropriate indicators such as prices of relevant ADR’s and futures contracts. The Funds may also fair value securities in other situations, such as when a particular foreign market is closed but the Fund is open. Short-term obligations with sixty days or less to maturity are valued at amortized cost, which with accrued interest approximates fair value. Money market fund investments are valued at net asset value and are categorized as Level 1 in the fair value hierarchy. The Pricing Committee of Van Eck Associates Corporation (the “Adviser”) provides oversight of the Funds’ valuation policies and procedures, which are approved by the Funds’ Board of Trustees. Among other things, these procedures allow the Funds to utilize independent pricing services, quotations from securities dealers, and other market sources to determine fair value. The Pricing Committee convenes regularly to review the fair value of financial instruments or other assets. If market quotations for a security or other asset are not readily available, or if the Adviser believes they do not otherwise reflect the fair value of a security or asset, the security or asset will be fair valued by the Pricing Committee in accordance with the Funds’ valuation policies and procedures. The Pricing Committee employs various methods for calibrating the valuation approaches utilized to determine fair value, including a regular review |
| 61 |
VANECK VECTORS ETF TRUST
NOTES TO FINANCIAL STATEMENTS
(continued)
| of key inputs and assumptions, periodic comparisons to valuations provided by other independent pricing services, transactional back-testing and disposition analysis. | |
| Certain factors such as economic conditions, political events, market trends, the nature of and duration of any restrictions on disposition, trading in similar securities of the issuer or comparable issuers and other security specific information are used to determine the fair value of these securities. Depending on the relative significance of valuation inputs, these securities may be categorized either as Level 2 or Level 3 in the fair value hierarchy. The price which the Funds may realize upon sale of an investment may differ materially from the value presented in the Schedules of Investments. | |
| The Funds utilize various methods to measure the fair value of their investments on a recurring basis, which includes a hierarchy that prioritizes inputs to valuation methods used to measure fair value. The fair value hierarchy gives highest priority to unadjusted quoted prices in active markets for identical assets and liabilities (Level 1 measurements) and the lowest priority to unobservable inputs (Level 3 measurements). The inputs or methodologies used for valuing securities are not necessarily an indication of the risk associated with investing in those securities. The three levels of the fair value hierarchy are described below: | |
| Level 1 — Quoted prices in active markets for identical securities. | |
| Level 2 — Significant observable inputs (including quoted prices for similar securities, interest rates, prepayment speeds, credit risk, etc.). | |
| Level 3 — Significant unobservable inputs (including each Fund’s own assumptions in determining the fair value of investments). | |
| A summary of the inputs and the levels used to value the Funds’ investments are located in the Schedules of Investments. Additionally, tables that reconcile the valuation of the Funds’ Level 3 investments and that present additional information about valuation methodologies and unobservable inputs, if applicable, are located in the Schedules of Investments. | |
| B. | Federal Income Taxes—It is each Fund’s policy to comply with the provisions of the Internal Revenue Code applicable to regulated investment companies and to distribute all of its taxable income to its shareholders. Therefore, no federal income tax provision is required. |
| C. | Distributions to Shareholders—Dividends to shareholders from net investment income and distributions from net realized capital gains, if any, are declared and paid annually by each Fund. Income dividends and capital gain distributions are determined in accordance with U.S. income tax regulations, which may differ from such amounts determined in accordance with GAAP. |
| D. | Currency Translation—Assets and liabilities denominated in foreign currencies and commitments under foreign currency contracts are translated into U.S. dollars at the closing prices of such currencies each business day as quoted by one or more sources. Purchases and sales of investments are translated at the exchange rates prevailing when such investments are acquired or sold. Foreign denominated income and expenses are translated at the exchange rates prevailing when accrued. The portion of realized and unrealized gains and losses on investments that result from fluctuations in foreign currency exchange rates is not separately disclosed in the financial statements. Such amounts are included with the net realized and unrealized gains and losses on investment securities in the Statements of Operations. Recognized gains or losses attributable to foreign currency fluctuations on foreign currency denominated assets, other than investments, and liabilities are recorded as net realized gain (loss) and net change in unrealized appreciation (depreciation) on foreign currency transactions and foreign denominated assets and liabilities in the Statements of Operations. |
| E. | Restricted Securities—The Funds may invest in securities that are subject to legal or contractual restrictions on resale. These securities generally may be resold in transactions exempt from registration or to the public if the securities are registered. Disposal of these securities may involve time-consuming negotiations and expense, and prompt sale at an acceptable price may be difficult. Information regarding restricted securities, if any, is included at the end of each Fund’s Schedule of Investments. |
| 62 |
| F. | Offsetting Assets and Liabilities—In the ordinary course of business, the Funds enter into transactions subject to enforceable master netting or other similar agreements. Generally, the right of offset in those agreements allows the Funds to offset any exposure to a specific counterparty with any collateral received or delivered to that counterparty based on the terms of the agreements. The Funds may pledge or receive cash and or securities as collateral for securities lending. For financial reporting purposes, the Funds present securities lending assets and liabilities on a gross basis in the Statements of Assets and Liabilities. Cash collateral received for securities lending in the form of money market fund investments, if any, at December 31, 2020 is presented in the Schedules of Investments and in the Statements of Assets and Liabilities. Non-cash collateral is disclosed in Note 9 (Securities Lending). |
| G. | Other—Security transactions are accounted for on trade date. Realized gains and losses are determined based on the specific identification method. Dividend income is recorded on the ex-dividend date except that certain dividends from foreign securities are recognized upon notification of the ex-dividend date. Interest income, including amortization of premiums and discounts, is accrued as earned. |
| The Funds earn interest income on uninvested cash balances held at the custodian bank. Such amounts, if any, are presented as interest income in the Statements of Operations. | |
| In the normal course of business, the Funds enter into contracts that contain a variety of general indemnifications. The Funds’ maximum exposure under these agreements is unknown as this would involve future claims that may be made against the Funds that have not yet occurred. However, the Adviser believes the risk of loss under these arrangements to be remote. |
Note 3—Investment Management and Other Agreements—The Adviser is the investment adviser to the Funds. The Adviser receives a management fee, calculated daily and payable monthly based on an annual rate of 0.50% of each Fund’s average daily net assets (except for Oil Services ETF). The management fee rate for Oil Services ETF is 0.35%. The Adviser has agreed, until at least May 1, 2021 to waive management fees and assume expenses to prevent each Fund’s total annual operating expenses (excluding acquired fund fees and expenses, interest expense, trading expenses, taxes and extraordinary expenses) from exceeding expense limitations listed in the table below.
The current expense limitations for the year ended December 31, 2020 are as follows:
| Fund | Expense Limitations | |||
| Agribusiness ETF | 0.56 | % | ||
| Gold Miners ETF | 0.53 | |||
| Junior Gold Miners ETF | 0.56 | |||
| Low Carbon Energy ETF | 0.62 | |||
| Natural Resources ETF | 0.49 | |||
| Oil Refiners ETF | 0.59 | |||
| Oil Services ETF | 0.35 | |||
| Rare Earth/Strategic Metals ETF | 0.57 | |||
| Steel ETF | 0.55 | |||
| Unconventional Oil & Gas ETF | 0.54 | |||
| Uranium+Nuclear Energy ETF | 0.60 | |||
Refer to Statement of Operations for the amounts waived/assumed by the Adviser.
In addition, Van Eck Securities Corporation, an affiliate of the Adviser, acts as the Funds’ distributor (the “Distributor”). Certain officers and a Trustee of the Trust are officers, directors or stockholders of the Adviser and Distributor.
At December 31, 2020, the Adviser owned 2,500 shares of Gold Miners ETF.
Note 4—Capital Share Transactions—As of December 31, 2020, there were an unlimited number of capital shares of beneficial interest authorized by the Trust with no par value. Fund shares are not individually redeemable and are issued and redeemed at their net asset value per share only through certain authorized broker-dealers (“Authorized Participants”) in blocks of shares (“Creation Units”).
| 63 |
VANECK VECTORS ETF TRUST
NOTES TO FINANCIAL STATEMENTS
(continued)
The consideration for the purchase or redemption of Creation Units of the Funds generally consists of the in-kind contribution or distribution of securities constituting the Funds’ underlying index (“Deposit Securities”) plus a balancing cash component to equate the transaction to the net asset value per share of the Fund on the transaction date. Cash may also be substituted in an amount equivalent to the value of certain Deposit Securities, generally as a result of market circumstances, or when the securities are not available in sufficient quantity for delivery, or are not eligible for trading by the Authorized Participant. The Funds may issue Creation Units in advance of receipt of Deposit Securities subject to various conditions, including, for the benefit of the Funds, a requirement to maintain cash collateral on deposit at the custodian equal to at least 115% of the daily marked to market value of the missing Deposit Securities.
Authorized Participants purchasing and redeeming Creation Units may pay transaction fees directly to transfer agent. In addition, the Funds may impose variable fees on the purchase or redemption of Creation Units for cash, or on transactions effected outside the clearing process, to defray certain transaction costs. These variable fees, if any, are reflected in share transactions in the Statements of Changes in Net Assets.
Note 5—Investments—For the year ended December 31, 2020, purchases and sales of investments (excluding short-term investments and in-kind capital share transactions) and purchases and sales of investments resulting from in-kind capital share transactions (excluding short-term investments) were as follows:
| In-kind Capital Share Transactions | ||||||||||||||||
| Fund | Purchases | Sales | Purchases | Sales | ||||||||||||
| Agribusiness ETF | $ | 79,844,412 | $ | 80,180,545 | $ | 101,671,061 | $ | 96,603,670 | ||||||||
| Gold Miners ETF | 1,901,606,567 | 1,909,646,632 | 4,987,916,767 | 4,032,695,421 | ||||||||||||
| Junior Gold Miners ETF | 1,838,686,125 | 1,917,585,976 | 2,295,670,869 | 2,320,860,558 | ||||||||||||
| Low Carbon Energy ETF | 118,873,764 | 118,600,358 | 32,018,541 | — | ||||||||||||
| Natural Resources ETF | 12,872,534 | 13,441,193 | 10,829,073 | 25,062,501 | ||||||||||||
| Oil Refiners ETF | 6,802,135 | 8,938,723 | 8,599,720 | 20,805,481 | ||||||||||||
| Oil Services ETF | 168,336,306 | 168,033,988 | 1,313,023,985 | 1,126,206,001 | ||||||||||||
| Rare Earth/Strategic Metals ETF | 133,994,752 | 119,889,659 | 79,560,938 | 61,504,112 | ||||||||||||
| Steel ETF | 16,686,551 | 16,988,651 | 32,170,634 | 26,287,430 | ||||||||||||
| Unconventional Oil & Gas ETF | 2,507,011 | 2,472,434 | — | 3,221,244 | ||||||||||||
| Uranium+Nuclear Energy ETF | 4,747,154 | 4,745,942 | — | 5,005,026 | ||||||||||||
Note 6—Income Taxes—As of December 31, 2020, for Federal income tax purposes, the identified cost, gross unrealized appreciation, gross unrealized depreciation and net unrealized appreciation (depreciation) of investments owned were as follows:
| Fund | Tax Cost of Investments | Gross Unrealized Appreciation | Gross Unrealized (Depreciation) | Net Unrealized Appreciation (Depreciation) | ||||||||||||
| Agribusiness ETF | $ | 661,795,503 | $ | 200,296,842 | $ | (68,244,017 | ) | $ | 132,052,825 | |||||||
| Gold Miners ETF | 12,888,648,702 | 4,153,804,987 | (429,226,905 | ) | 3,724,578,082 | |||||||||||
| Junior Gold Miners ETF | 5,328,228,763 | 1,506,811,485 | (343,915,689 | ) | 1,162,895,796 | |||||||||||
| Low Carbon Energy ETF | 159,790,118 | 125,059,847 | (687,006 | ) | 124,372,841 | |||||||||||
| Natural Resources ETF | 49,356,990 | 10,383,508 | (7,339,173 | ) | 3,044,335 | |||||||||||
| Oil Refiners ETF | 19,706,249 | 2,573,876 | (4,757,910 | ) | (2,184,034 | ) | ||||||||||
| Oil Services ETF | 950,795,470 | 67,754,108 | (272,392,125 | ) | (204,638,017 | ) | ||||||||||
| Rare Earth/Strategic Materials ETF | 252,304,648 | 96,767,495 | (17,439,218 | ) | 79,328,277 | |||||||||||
| Steel ETF | 73,634,278 | 8,854,957 | (4,200,663 | ) | 4,654,294 | |||||||||||
| Unconventional Oil & Gas ETF | 23,043,840 | 1,036,686 | (12,744,341 | ) | (11,707,655 | ) | ||||||||||
| Uranium+Nuclear Energy ETF | 17,762,050 | 2,717,020 | (1,373,846 | ) | 1,343,174 | |||||||||||
| 64 |
At December 31, 2020, the components of total distributable earnings (losses) on a tax basis, for each Fund, were as follows:
| Fund | Undistributed Ordinary Income | Accumulated Capital Losses | Qualified Late Year Losses* | Other Temporary Differences | Unrealized Appreciation (Depreciation) | Total Distributable Earnings (Losses) | ||||||||||||||||||
| Agribusiness ETF | $ | 296,345 | $ | (717,283,926 | ) | $ | — | $ | (531,980 | ) | $ | 132,080,468 | $ | (585,439,093 | ) | |||||||||
| Gold Miners ETF | 8,113,614 | (10,546,342,164 | ) | — | (1,097,033 | ) | 3,724,580,306 | (6,814,745,277 | ) | |||||||||||||||
| Junior Gold Miners ETF | 62,653,148 | (4,397,830,326 | ) | — | (270,590 | ) | 1,162,897,794 | (3,172,549,974 | ) | |||||||||||||||
| Low Carbon Energy ETF | 89,513 | (54,410,011 | ) | — | (13,364 | ) | 124,382,670 | 70,048,808 | ||||||||||||||||
| Natural Resources ETF | 35,329 | (43,851,410 | ) | — | (13,734 | ) | 3,046,733 | (40,783,082 | ) | |||||||||||||||
| Oil Refiners ETF | — | (6,329,757 | ) | — | (639 | ) | (2,180,765 | ) | (8,511,161 | ) | ||||||||||||||
| Oil Services ETF | 93,298 | (1,586,132,380 | ) | — | (182,953 | ) | (204,638,017 | ) | (1,790,860,052 | ) | ||||||||||||||
| Rare Earth/Strategic Materials ETF | 1,882,860 | (314,911,951 | ) | — | (17,274 | ) | 79,334,543 | (233,711,822 | ) | |||||||||||||||
| Steel ETF | — | (150,591,926 | ) | — | (18,069 | ) | 4,654,294 | (145,955,701 | ) | |||||||||||||||
| Unconventional Oil & Gas ETF | 45,285 | (51,256,541 | ) | — | (4,284 | ) | (11,707,650 | ) | (62,923,190 | ) | ||||||||||||||
| Uranium+Nuclear Energy ETF | 520,596 | (84,431,140 | ) | — | (11,932 | ) | 1,343,121 | (82,579,355 | ) | |||||||||||||||
| * | Qualified late year losses incurred after October 31, 2020 are deemed to arise on the January 1, 2021. |
The tax character of dividends paid to shareholders during the years ended December 31, 2020 and December 31, 2019 was as follows:
| 2020 Dividends | 2019 Dividends | |||||||||||
| Fund | Ordinary Income * | Return of Capital | Ordinary Income * | |||||||||
| Agribusiness ETF | $ | 8,649,640 | $ | — | $ | 9,500,095 | ||||||
| Gold Miners ETF | 85,977,700 | — | 83,020,376 | |||||||||
| Junior Gold Miners ETF | 99,001,811 | — | 19,760,414 | |||||||||
| Low Carbon Energy ETF | 149,937 | — | — | |||||||||
| Natural Resources ETF | 1,274,940 | — | 1,900,000 | |||||||||
| Oil Refiners ETF | 450,520 | 11,480 | 496,080 | |||||||||
| Oil Services ETF | 8,700,087 | — | 17,651,031 | |||||||||
| Rare Earth/Strategic Materials ETF | 2,500,183 | — | 3,000,424 | |||||||||
| Steel ETF | 1,160,720 | 89,230 | 1,830,265 | |||||||||
| Unconventional Oil & Gas ETF | 175,001 | — | 350,000 | |||||||||
| Uranium+Nuclear Energy ETF | 401,975 | — | 550,019 | |||||||||
| * | Includes short-term capital gains (if any) |
At December 31, 2020, the Funds had capital loss carryforwards available to offset future capital gains, as follow:
| Fund | Short-Term Capital Losses with No Expiration | Long-Term Capital Losses with No Expiration | Total | |||||||||
| Agribusiness ETF | $ | (177,519,804 | ) | $ | (539,764,122 | ) | $ | (717,283,926 | ) | |||
| Gold Miners ETF | (1,519,879,482 | ) | (9,026,462,682 | ) | (10,546,342,164 | ) | ||||||
| Junior Gold Miners ETF | (1,507,314,030 | ) | (2,890,516,296 | ) | (4,397,830,326 | ) | ||||||
| Low Carbon Energy ETF | — | (54,410,011 | ) | (54,410,011 | ) | |||||||
| Natural Resources ETF | (3,328,176 | ) | (40,523,234 | ) | (43,851,410 | ) | ||||||
| Oil Refiners ETF | (3,155,792 | ) | (3,173,965 | ) | (6,329,757 | ) | ||||||
| Oil Services ETF | (154,740,702 | ) | (1,431,391,678 | ) | (1,586,132,380 | ) | ||||||
| Rare Earth/Strategic Materials ETF | (81,323,804 | ) | (233,588,147 | ) | (314,911,951 | ) | ||||||
| Steel ETF | (8,646,064 | ) | (141,945,862 | ) | (150,591,926 | ) | ||||||
| Unconventional Oil & Gas ETF | (7,192,997 | ) | (44,063,544 | ) | (51,256,541 | ) | ||||||
| Uranium+Nuclear Energy ETF | (13,943,688 | ) | (70,487,452 | ) | (84,431,140 | ) | ||||||
During the year ended December 31, 2020, Junior Gold Miners ETF and Low Carbon Energy ETF, utilized $128,602,802 and $41,917,163 of their capital loss carryovers available from prior years.
| 65 |
VANECK VECTORS ETF TRUST
NOTES TO FINANCIAL STATEMENTS
(continued)
During the year ended December 31, 2020, as a result of permanent book to tax differences, primarily due to the tax treatment of gains/losses from securities redeemed in-kind, the Funds incurred differences that affected distributable earnings and aggregate paid in capital by the amounts in the table below. Net assets were not affected by these reclassifications.
| Fund | Increase (Decrease) in Distributable Earnings | Increase (Decrease) in Aggregate Paid in Capital | ||||||
| Agribusiness ETF | $ | (18,335,506 | ) | $ | 18,335,506 | |||
| Gold Miners ETF | (1,226,208,198 | ) | 1,226,208,198 | |||||
| Junior Gold Miners ETF | (518,196,363 | ) | 518,196,363 | |||||
| Natural Resources ETF | (731,531 | ) | 731,531 | |||||
| Oil Refiners ETF | 443,518 | (443,518 | ) | |||||
| Oil Services ETF | (47,369,009 | ) | 47,369,009 | |||||
| Rare Earth/Strategic Materials ETF | (1,301,221 | ) | 1,301,221 | |||||
| Steel ETF | (3,504,922 | ) | 3,504,922 | |||||
| Unconventional Oil & Gas ETF | 432,883 | (432,883 | ) | |||||
| Uranium+Nuclear Energy ETF | (1,188,609 | ) | 1,188,609 | |||||
The Funds recognize the tax benefits of uncertain tax positions only where the position is “more-likely-than-not” to be sustained assuming examination by applicable tax authorities. Management has analyzed the Funds’ tax positions, and has concluded that no liability for unrecognized tax benefits should be recorded related to uncertain tax positions taken on return filings for all open tax years. The Funds do not have exposure for additional years that might still be open in certain foreign jurisdictions. Therefore, no provision for income tax is required in the Funds’ financial statements. However, the Funds are subject to foreign taxes on the appreciation in value of certain investments. The Funds provide for such taxes on both realized and unrealized appreciation.
The Funds recognize interest and penalties, if any, related to uncertain tax positions as income tax expense in the Statements of Operations. During the year ended December 31, 2020, the Funds did not incur any interest or penalties.
Note 7—Principal Risks—Non-diversified funds generally hold securities of fewer issuers than diversified funds (See Note 1) and may be more susceptible to the risks associated with these particular issuers, or to a single economic, political or regulatory occurrence affecting these issuers. The Funds may purchase securities on foreign exchanges. Securities of foreign issuers involve special risks and considerations not typically associated with investing in U.S. issuers. These risks include devaluation of currencies, currency controls, less reliable information about issuers, different securities transaction clearance and settlement practices, future adverse economic developments and political conflicts, or natural or other disasters, such as the recent coronavirus outbreak. Additionally, certain Funds may invest in securities of emerging market issuers, which are exposed to a number of risks that may make these investments volatile in price or difficult to trade. Political risks may include unstable governments, nationalization, restrictions on foreign ownership, laws that prevent investors from getting their money out of a country, sanctions and investment restrictions and legal systems that do not protect property risks as well as the laws of the United States. These and other factors can make emerging market securities more volatile and potentially less liquid than securities issued in more developed markets. Certain securities of Chinese issuers are, or may in the future become restricted, and the Funds may be forced to sell such restricted securities and incur a loss as a result.
The respiratory disease caused by a novel coronavirus, which has spread internationally and declared as a pandemic by the World Health Organization, has resulted in closing borders, quarantines, disruptions to supply chains and customer activity, loss of life, as well as general concern and uncertainty. The coronavirus has already negatively impacted the economies of many nations, individual companies, and the market. This pandemic is expected to have a continued impact in ways that cannot necessarily be foreseen presently.
A more complete description of risks is included in each Fund’s Prospectus and Statement of Additional Information.
Note 8—Trustee Deferred Compensation Plan—The Trust has a Deferred Compensation Plan (the “Plan”) for Trustees under which the Trustees can elect to defer receipt of their trustee fees until retirement, disability or termination from the Board of Trustees. The fees otherwise payable to the participating Trustees are deemed invested in shares of the Funds as directed by the Trustees.
| 66 |
The expense for the Plan is included in “Trustees’ fees and expenses” in the Statements of Operations. The liability for the Plan is shown as “Deferred Trustee fees” in the Statements of Assets and Liabilities.
Note 9—Securities Lending—To generate additional income, each of the Funds may lend its securities pursuant to a securities lending agreement with the securities lending agent. Each Fund may lend up to 33% of its investments requiring that the loan be continuously collateralized by cash, cash equivalents, U.S. government securities, or any combination of cash and such securities at all times equal to at least 102% (105% for foreign securities) of the market value of securities loaned. Daily market fluctuations could cause the value of loaned securities to be more or less than the value of the collateral received. When this occurs, the collateral is adjusted and settled on the next business day. During the term of the loan, the Funds will continue to receive any dividends, interest or amounts equivalent thereto, on the securities loaned while receiving a fee from the borrower and or earning interest on the investment of the cash collateral. Such fees and interest are shared with the securities lending agent under the terms of the securities lending agreement. Securities lending income is disclosed as such in the Statements of Operations. Cash collateral is maintained on the Funds’ behalf by the lending agent and is invested in the State Street Navigator Securities Lending Government Money Market Portfolio. Non-cash collateral consists of U.S. Treasuries and U.S. Government Agency securities, and is not disclosed in the Funds’ Schedules of Investments or Statements of Assets and Liabilities as it is held by the agent on behalf of the Funds. The Funds do not have the ability to re-hypothecate those securities. Loans are subject to termination at the option of the borrower or the Funds. Upon termination of the loan, the borrower will return to the Fund securities identical to the securities loaned. The Funds bear the risk of delay in recovery of, or even loss of rights in, the securities loaned should the borrower of the securities fail financially. The value of loaned securities and related cash collateral, if any, at December 31, 2020 is presented on a gross basis in the Schedules of Investments and Statements of Assets and Liabilities. The following is a summary of the Funds’ securities on loan and related collateral as of December 31, 2020:
| Fund | Market Value of Securities on Loan | Cash Collateral | Non-Cash Collateral | Total Collateral | ||||||||||||
| Agribusiness ETF | $ | 35,130,908 | $ | 434,046 | $ | 36,567,540 | $ | 37,001,586 | ||||||||
| Gold Miners ETF | 277,024,023 | 124,038,217 | 168,762,740 | 292,800,957 | ||||||||||||
| Junior Gold Miners ETF | 281,119,293 | 187,646,529 | 108,390,734 | 296,037,263 | ||||||||||||
| Low Carbon Energy ETF | 56,269,478 | 13,994,705 | 44,607,780 | 58,602,485 | ||||||||||||
| Natural Resources ETF | 2,644,227 | 340,095 | 2,437,865 | 2,777,960 | ||||||||||||
| Oil Refiners ETF | 634,148 | — | 666,146 | 666,146 | ||||||||||||
| Oil Services ETF | 40,399,525 | 22,425,566 | 20,392,026 | 42,817,592 | ||||||||||||
| Rare Earth/Strategic Metals ETF | 49,851,637 | 9,421,120 | 42,589,617 | 52,010,737 | ||||||||||||
| Steel ETF | 14,911,116 | 1,467,173 | 14,242,723 | 15,709,896 | ||||||||||||
| Unconventional Oil & Gas ETF | 523,899 | 253,074 | 303,286 | 556,360 | ||||||||||||
| Uranium+Nuclear Energy ETF | 975,422 | 1,037,199 | — | 1,037,199 | ||||||||||||
The following table presents money market fund investments held as collateral by type of security on loan as of December 31, 2020:
| Gross Amount of Recognized Liabilities for Securities Lending Transactions* in the Statements of Assets and Liabilities | ||||
| Fund | Equity Securities | |||
| Agribusiness ETF | $ | 434,046 | ||
| Gold Miners ETF | 124,038,217 | |||
| Junior Gold Miners ETF | 187,646,529 | |||
| Low Carbon Energy ETF | 13,994,705 | |||
| Natural Resources ETF | 340,095 | |||
| Oil Services ETF | 22,425,566 | |||
| Rare Earth/Strategic Metals ETF | 9,421,120 | |||
| Steel ETF | 1,467,173 | |||
| Unconventional Oil & Gas ETF | 253,074 | |||
| Uranium+Nuclear Energy ETF | 1,037,199 | |||
| * | Remaining contractual maturity of the agreements: overnight and continuous |
| 67 |
VANECK VECTORS ETF TRUST
NOTES TO FINANCIAL STATEMENTS
(continued)
Note 10—Bank Line of Credit—The Funds may participate in a $200 million committed credit facility (the “Facility”) to be utilized for temporary financing until the settlement of sales or purchases of portfolio securities, the repurchase or redemption of shares of the Funds at the request of the shareholders and other temporary or emergency purposes. The Funds have agreed to pay commitment fees, pro rata, based on the unused but available balance. Interest is charged to the Funds based on prevailing market rates in effect at the time of borrowings. During the year ended December 31, 2020, the following Funds borrowed under this Facility:
| Fund | Days Outstanding | Average Daily Loan Balance | Average Interest Rate | |||||||||
| Agribusiness ETF | 146 | $ | 946,165 | 1.67 | % | |||||||
| Gold Miners ETF | 149 | 5,734,792 | 1.75 | |||||||||
| Junior Gold Miners ETF | 69 | 13,078,780 | 2.66 | |||||||||
| Low Carbon Energy ETF | 94 | 311,430 | 1.43 | |||||||||
| Natural Resources ETF | 157 | 148,344 | 1.76 | |||||||||
| Oil Refiners ETF | 29 | 162,825 | 2.07 | |||||||||
| Oil Services ETF | 127 | 1,068,194 | 1.93 | |||||||||
| Rare Earth/Strategic Metals ETF | 265 | 1,177,800 | 1.83 | |||||||||
| Steel ETF | 143 | 170,802 | 2.00 | |||||||||
Outstanding loan balances as of December 31, 2020, if any, are reflected in the Statements of Assets and Liabilities.
Note 11—Share Split—The Board of Trustees approved a 1 for 20 reverse share split for Oil Services ETF, a 1 for 3 reverse share split for Rare Earth/Strategic Metals ETF, and a 1 for 10 reverse share split for Unconventional Oil & Gas ETF. On April 15, 2020, shares began trading on a split-adjusted basis. The Statements of Changes in net Assets and Financial Highlights prior to April 15, 2020 have been adjusted to reflect these reverse share splits.
Note 12—Recent Accounting Pronouncements—The Funds adopted all provisions of the Accounting Standards Update No. 2018-13, Disclosure Framework—Changes to the Disclosure Requirements for Fair Value Measurement (“ASU 2018-13”) that eliminate and modify certain disclosure requirements for fair value measurements. Based on management’s evaluation, the adoption of the ASU 2018-13 had no material impact on the financial statements and related disclosures.
Note 13—Subsequent Event Review—The Funds have evaluated subsequent events and transactions for potential recognition or disclosure through the date the financial statements were issued.
At a meeting held on February 24, 2021, the Board of Trustees of the Trust approved changing VanEck Vectors Low Carbon Energy ETF benchmark index from the Ardour Global Index (Extra Liquid) to the MVIS Global Low Carbon Energy Index effective on or after April 26, 2021. As a result of this change they also approved changing the Funds investment objective and its principal investment strategy. The Fund will seek to replicate as closely as possible, before fees and expenses, the price and yield performance of the MVIS Global Low Carbon Energy Index.
| 68 |
VANECK VECTORS ETF TRUST
REPORT OF INDEPENDENT REGISTERED PUBLIC ACCOUNTING FIRM
To the Shareholders of VanEck Vectors Agribusiness ETF, VanEck Vectors Gold Miners ETF, VanEck Vectors Junior Gold Miners ETF, VanEck Vectors Low Carbon Energy ETF, VanEck Vectors Natural Resources ETF, VanEck Vectors Oil Refiners ETF, VanEck Vectors Oil Services ETF, VanEck Vectors Rare Earth/Strategic Metals ETF, VanEck Vectors Steel ETF, VanEck Vectors Unconventional Oil & Gas ETF and VanEck Vectors Uranium+Nuclear Energy ETF and the Board of Trustees of VanEck Vectors ETF Trust
Opinion on the Financial Statements
We have audited the accompanying statements of assets and liabilities of VanEck Vectors Agribusiness ETF, VanEck Vectors Gold Miners ETF, VanEck Vectors Junior Gold Miners ETF, VanEck Vectors Low Carbon Energy ETF, VanEck Vectors Natural Resources ETF, VanEck Vectors Oil Refiners ETF, VanEck Vectors Oil Services ETF, VanEck Vectors Rare Earth/Strategic Metals ETF, VanEck Vectors Steel ETF, VanEck Vectors Unconventional Oil & Gas ETF and VanEck Vectors Uranium+Nuclear Energy ETF (collectively referred to as the “Funds”) (eleven of the series constituting VanEck Vectors ETF Trust (the “Trust”)), including the schedules of investments, as of December 31, 2020, and the related statements of operations for the year then ended, the statements of changes in net assets for each of the two years in the period then ended, the financial highlights for each of the five years in the period then ended and the related notes (collectively referred to as the “financial statements”). In our opinion, the financial statements present fairly, in all material respects, the financial position of each of the Funds (eleven of the series constituting VanEck Vectors ETF Trust) at December 31, 2020, the results of their operations for the year then ended, the changes in their net assets for each of the two years in the period then ended and their financial highlights for each of the five years in the period then ended, in conformity with U.S. generally accepted accounting principles.
Basis for Opinion
These financial statements are the responsibility of the Trust’s management. Our responsibility is to express an opinion on each of the Funds’ financial statements based on our audits. We are a public accounting firm registered with the Public Company Accounting Oversight Board (United States) (“PCAOB”) and are required to be independent with respect to the Trust in accordance with the U.S. federal securities laws and the applicable rules and regulations of the Securities and Exchange Commission and the PCAOB.
We conducted our audits in accordance with the standards of the PCAOB. Those standards require that we plan and perform the audits to obtain reasonable assurance about whether the financial statements are free of material misstatement, whether due to error or fraud. The Trust is not required to have, nor were we engaged to perform, an audit of the Trust’s internal control over financial reporting. As part of our audits, we are required to obtain an understanding of internal control over financial reporting, but not for the purpose of expressing an opinion on the effectiveness of the Trust’s internal control over financial reporting. Accordingly, we express no such opinion.
Our audits included performing procedures to assess the risks of material misstatement of the financial statements, whether due to error or fraud, and performing procedures that respond to those risks. Such procedures included examining, on a test basis, evidence regarding the amounts and disclosures in the financial statements. Our procedures included confirmation of securities owned as of December 31, 2020, by correspondence with the custodian and brokers or by other appropriate auditing procedures where replies from broker were not received. Our audits also included evaluating the accounting principles used and significant estimates made by management, as well as evaluating the overall presentation of the financial statements. We believe that our audits provide a reasonable basis for our opinion.
We have served as the auditor of one or more of the VanEck investment companies since 1999.
New York, New York
February 25, 2021
| 69 |
VANECK VECTORS ETF TRUST
(unaudited)
The following information is provided with respect to the distributions paid during the taxable year ended December 31, 2020:
| Record Date | 12/22/2020 |
| Ex Date | 12/21/2020 |
| Payable Date | 12/28/2020 |
| Agribusiness ETF | Gold Miners ETF | Junior Gold Miners ETF | Low Carbon Energy ETF | Natural Resources ETF | Oil Refiners ETF | |||||||||||||||||||||||||
| Total Distribution Paid Per Share | $ | 0.856400 | $ | 0.189900 | $ | 0.855400 | $ | 0.091800 | $ | 0.944400 | $ | 0.643600 | ||||||||||||||||||
| Ordinary Income Per Share | $ | 0.856400 | $ | 0.189900 | $ | 0.855400 | $ | 0.091800 | $ | 0.944400 | $ | 0.627200 | ||||||||||||||||||
| Return of Capital Per Share | $ | — | $ | — | $ | — | $ | — | $ | — | $ | 0.016400 | (a) | |||||||||||||||||
| Ordinary Income: | ||||||||||||||||||||||||||||||
| Qualified Dividend Income for Individuals | 100.00 | % | 100.00 | %* | 33.70 | %* | 100.00 | % | 97.50 | %* | 100.00 | %* | ||||||||||||||||||
| Dividends Qualifying for the Dividends Received Deduction for Corporations | 49.71 | % | 37.95 | %* | 0.38 | %* | 97.77 | % | 44.37 | %* | 52.71 | %* | ||||||||||||||||||
| Foreign Source Income | — | 75.08 | %* | 32.82 | %* | — | 59.17 | %* | 57.79 | %* | ||||||||||||||||||||
| Foreign Taxes Paid Per Share | — | 0.033754 | ** | $ | 0.033378 | ** | $— | $ | 0.047881 | ** | $ | 0.064871 | ** | |||||||||||||||||
| Oil Services ETF | Rare Earth / Strategic Metals ETF | Steel ETF | Unconventional Oil & Gas ETF | Uranium+ Nuclear Energy ETF | ||||||||||||||||||||||||||
| Total Distribution Paid Per Share | $ | 1.891100 | $ | 0.534800 | $ | 0.833300 | $ | 1.206900 | $ | 1.096400 | ||||||||||||||||||||
| Ordinary Income Per Share | $ | 1.891100 | $ | 0.534800 | $ | 0.773813 | $ | 1.206900 | $ | 1.096400 | ||||||||||||||||||||
| Return of Capital Per Share | $ | — | $ | — | $ | 0.059487 | (a) | $ | — | $ | — | |||||||||||||||||||
| Ordinary Income: | ||||||||||||||||||||||||||||||
| Qualified Dividend Income for Individuals | 62.61 | % | 40.93 | %* | 99.80 | %* | 100.00 | % | 100.00 | % | ||||||||||||||||||||
| Dividends Qualifying for the Dividends Received Deduction for Corporations | 55.58 | % | — | 31.24 | %* | 100.00 | % | 89.20 | % | |||||||||||||||||||||
| Foreign Source Income | — | 29.61 | %* | 62.93 | %* | — | — | |||||||||||||||||||||||
| Foreign Taxes Paid Per Share | $ | — | $ | 0.011871 | ** | $ | 0.024901 | ** | — | — | ||||||||||||||||||||
| * | Expressed as a percentage of the ordinary income distribution grossed up for foreign taxes. |
| ** | The foreign taxes paid represent taxes incurred by the Fund on income received by the Fund from foreign sources. Foreign taxes paid may be included in taxable income with an offsetting dleduction from gross income or may be taken as a credit for taxes paid to foreign governments. |
| (a) | A return of capital is not considered taxable income to shareholders. The portion of a distribution which is a dividend is includable in gross income while the portion of the distribution which is not a dividend shall be applied against and reduces the adjusted basis of the stock. Accordingly, shareholders who received these distributions should not include these amounts in taxable income, but instead should treat them as a reduction of the cost basis of the applicable shares upon which these distributions were paid. |
Please consult your tax advisor for proper treatment of this information.
| 70 |
VANECK VECTORS ETF TRUST
BOARD OF TRUSTEES AND OFFICERS
December 31, 2020 (unaudited)
| Name, Address1 and Year of Birth | Position(s) Held with the Trust | Term of Office2 and Length of Time Served | Principal Occupation(s) During Past Five Years | Number of Portfolios in Fund Complex3 Overseen | Other Directorships Held Outside the Fund Complex3 During Past Five Years | |||||
| Independent Trustees | ||||||||||
| David H. Chow, 1957*† | Chairman Trustee | Since 2008 Since 2006 | Founder and CEO, DanCourt Management LLC (financial/ strategy consulting firm and Registered Investment Adviser), March 1999 to present. | 56 | Trustee, Berea College of Kentucky, May 2009 to present and currently Chairman of the Investment Committee; Member of the Governing Council of the Independent Directors Council, October 2012 to September 2020; Trustee, MainStay Fund Complex4, January 2016 to present and currently Chairman of the Risk and Compliance Committee. | |||||
| Laurie A. Hesslein, 1959*† | Trustee | Since 2019 | Citigroup, Managing Director, and Business Head, Local Consumer Lending North America, and CEO and President, CitiFinancial Servicing LLC (2013 - 2017). | 56 | Trustee, First Eagle Senior Loan Fund. Formerly, Trustee, Eagle Growth and Income Opportunities Fund, March 2017 to December 2020. | |||||
| R. Alastair Short, 1953*† | Trustee | Since 2006 | President, Apex Capital Corporation (personal investment vehicle). | 67 | Chairman and Independent Director, EULAV Asset Management; Trustee, Kenyon Review; Trustee, Children’s Village. Formerly, Independent Director, Tremont offshore funds. | |||||
| Peter J. Sidebottom, 1962*† | Trustee | Since 2012 | Lead Partner, North America Banking and Capital Markets Strategy, Accenture, May 2017 to present; Partner, PWC/Strategy & Financial Services Advisory, February 2015 to March 2017; Founder and Board Member, AspenWoods Risk Solutions, September 2013 to February 2016; Independent consultant, June 2013 to February 2015; Partner, Bain & Company (management consulting firm), April 2012 to December 2013; Executive Vice President and Senior Operating Committee Member, TD Ameritrade (on-line brokerage firm), February 2009 to January 2012. | 56 | Board Member, Special Olympics, New Jersey, November 2011 to September 2013; Director, The Charlotte Research Institute, December 2000 to 2009; Board Member, Social Capital Institute, University of North Carolina Charlotte, November 2004 to January 2012; Board Member, NJ-CAN, July 2014 to 2016. | |||||
| Richard D. Stamberger, 1959*† | Trustee | Since 2006 | Senior Vice President, B2B, Future Plc (global media company), July 2020 to present; President, CEO and co-founder, SmartBrief, Inc., 1999 to 2019. | 67 | Director, Food and Friends, Inc. | |||||
| Interested Trustee | ||||||||||
| Jan F. van Eck, 19635 | Trustee, Chief Executive Officer and President | Trustee (Since 2006); Chief Executive Officer and President (Since 2009) | Director, President and Chief Executive Officer of Van Eck Associates Corporation (VEAC), Van Eck Absolute Return Advisers Corporation (VEARA) and Van Eck Securities Corporation (VESC); Officer and/or Director of other companies affiliated with VEAC and/or the Trust | 67 | Director, National Committee on US-China Relations. | |||||
| 1 | The address for each Trustee and officer is 666 Third Avenue, 9th Floor, New York, New York 10017. |
| 2 | Each Trustee serves until resignation, death, retirement or removal. Officers are elected yearly by the Trustees. |
| 3 | The Fund Complex consists of the VanEck Funds, VanEck VIP Trust and the Trust. |
| 4 | The MainStay Fund Complex consists of MainStay Funds, MainStay Funds Trust, MainStay VP Funds Trust and MainStay MacKay Defined Term Municipal Opportunities Fund. |
| 5 | “Interested person” of the Trust within the meaning of the 1940 Act. Mr. van Eck is an officer of VEAC, VEARA and VESC. |
| * | Member of the Audit Committee. |
| † | Member of the Nominating and Corporate Governance Committee. |
| 71 |
VANECK VECTORS ETF TRUST
BOARD OF TRUSTEES AND OFFICERS
December 31, 2020 (unaudited) (continued)
| Officer’s Name, Address1 and Year of Birth | Position(s) Held with the Trust | Term of Office2 and Length of Time Served | Principal Occupation(s) During Past Five Years | |||
| Officer Information | ||||||
| Matthew A. Babinsky, 1983 | Assistant Vice President and Assistant Secretary | Since 2016 | Assistant Vice President, Assistant General Counsel and Assistant Secretary of VEAC, VEARA and VESC; Officer of other investment companies advised by VEAC and VEARA. Formerly, Associate, Clifford Chance US LLP. | |||
| Russell G. Brennan, 1964 | Assistant Vice President and Assistant Treasurer | Since 2008 | Assistant Vice President of VEAC; Officer of other investment companies advised by VEAC and VEARA. | |||
| Charles T. Cameron, 1960 | Vice President | Since 2006 | Portfolio Manager of VEAC; Officer and/or Portfolio Manager of other investment companies advised by VEAC and VEARA. Formerly, Director of Trading of VEAC. | |||
| John J. Crimmins, 1957 | Vice President, Treasurer, Chief Financial Officer and Principal Accounting Officer | Vice President, Chief Financial Officer and Principal Accounting Officer (Since 2012); Treasurer (Since 2009) | Vice President of VEAC and VEARA; Officer of other investment companies advised by VEAC and VEARA. Formerly, Vice President of VESC. | |||
| Eduardo Escario, 1975 | Vice President | Since 2012 | Regional Director, Business Development/Sales for Southern Europe and South America of VEAC. | |||
| Henry Glynn, 1983 | Assistant Vice President | Since 2018 | Head of ETF Capital Markets Europe of Van Eck Switzerland AG. Formerly, Member of the Capital Markets team at Vanguard Group. | |||
| F. Michael Gozzillo, 1965 | Chief Compliance Officer | Since 2018 | Vice President and Chief Compliance Officer of VEAC and VEARA; Chief Compliance Officer of VESC; Officer of other investment companies advised by VEAC and VEARA. Formerly, Chief Compliance Officer of City National Rochdale, LLC and City National Rochdale Funds. | |||
| Laura Hamilton, 1977 | Vice President | Since 2019 | Assistant Vice President of VEAC and VESC; Officer of other investment companies advised by VEAC and VEARA. Formerly, Operations Manager of Royce & Associates. | |||
| Nicholas Jackson, 1974 | Assistant Vice President | Since 2018 | Director, Business Development of VanEck Australia Pty Ltd. Formerly, Vice President, Business Development of VanEck Australia Pty Ltd. | |||
| Laura I. Martínez, 1980 | Vice President and Assistant Secretary | Vice President (Since 2016); Assistant Secretary (Since 2008) | Vice President, Associate General Counsel and Assistant Secretary of VEAC, VEARA and VESC; Officer of other investment companies advised by VEAC and VEARA. Formerly, Assistant Vice President of VEAC, VEARA and VESC. | |||
| Matthew McKinnon, 1970 | Assistant Vice President | Since 2018 | Head of Business Development of Asia Pacific of VanEck Australia Pty Ltd. Formerly, Director, Intermediaries and Institutions of VanEck Australia Pty Ltd. | |||
| Arian Neiron, 1979 | Vice President | Since 2018 | Managing Director and Head of Asia Pacific of VanEck Australia Pty Ltd.; Officer and/or Director of other companies affiliated with VEAC and/or the Trust. | |||
| James Parker, 1969 | Assistant Treasurer | Since 2014 | Assistant Vice President of VEAC; Manager, Portfolio Administration of VEAC and VEARA. Officer of other investment companies advised by VEAC and VEARA. | |||
| Adam Phillips, 1970 | Vice President | Since 2018 | ETF Chief Operating Officer of VEAC; Director of other companies affiliated with VEAC. | |||
| Philipp Schlegel, 1974 | Vice President | Since 2016 | Managing Director of Van Eck Switzerland AG. | |||
| Jonathan R. Simon, 1974 | Senior Vice President, Secretary and Chief Legal Officer | Senior Vice President (Since 2016); Secretary and Chief Legal Officer (Since 2014) | Senior Vice President, General Counsel and Secretary of VEAC, VEARA and VESC; Officer and/or Director of other companies affiliated with VEAC and/or the Trust. Formerly, Vice President of VEAC, VEARA and VESC. |
| 1 | The address for each Officer is 666 Third Avenue, 9th Floor, New York, New York 10017. |
| 2 | Officers are elected yearly by the Trustees. |
| 72 |
This report is intended for the Funds’ shareholders. It may not be distributed to prospective investors unless it is preceded or accompanied by a VanEck Vectors ETF Trust (the “Trust”) prospectus and summary prospectus, which includes more complete information. Investing involves substantial risk and high volatility, including possible loss of principal. An investor should consider the investment objective, risks, charges and expenses of the Fund carefully before investing. To obtain a prospectus and summary prospectus, which contains this and other information, call 800.826.2333 or visit vaneck.com. Please read the prospectus and summary prospectus carefully before investing.
Additional information about the Trust’s Board of Trustees/Officers and a description of the policies and procedures the Trust uses to determine how to vote proxies relating to portfolio securities are provided in the Statement of Additional Information. The Statement of Additional Information and information regarding how the Trust voted proxies relating to portfolio securities during the most recent twelve month period ending June 30 is available, without charge, by calling 800.826.2333, or by visiting vaneck.com, or on the Securities and Exchange Commission’s website at http://www.sec.gov.
The Trust files its complete schedule of portfolio holdings with the Securities and Exchange Commission for the first and third quarters of each fiscal year on Form N-PORT. The Trust’s Form N-PORT Filings are available on the Commission’s website at http://www.sec.gov and may be reviewed and copied at the Commission’s Public Reference Room in Washington, D.C. Information on the operation of the Public Reference Room may be obtained by calling 202.942.8090. The Funds’ complete schedules of portfolio holdings are also available by calling 800.826.2333 or by visiting vaneck.com.
| Investment Adviser: | Van Eck Associates Corporation | |
| Distributor: | Van Eck Securities Corporation | |
| 666 Third Avenue, New York, NY 10017 | ||
| vaneck.com | ||
| Account Assistance: | 800.826.2333 | HAAR |
| Item 2. | CODE OF ETHICS. |
| (a) | The Registrant has adopted a code of ethics (the “Code of Ethics”) that applies to the principal executive officer, principal financial officer, principal accounting officer or controller, or persons performing similar functions. |
| (b) | The Registrant’s code of ethics is reasonably described in this Form N-CSR. |
| (c) | The Registrant has not amended its Code of Ethics during the period covered by the shareholder report presented in Item 1 hereto. |
| (d) | The Registrant has not granted a waiver or an implicit waiver from a provision of its Code of Ethics during the period covered by the shareholder report presented in Item 1 hereto. |
| (e) | Not applicable. |
| (f) | The Registrant’s Code of Ethics is attached as an Exhibit hereto. |
| Item 3. | AUDIT COMMITTEE FINANCIAL EXPERT. |
| The Registrant’s Board of Trustees has determined that David Chow, Laurie A. Hesslein, R. Alastair Short, Peter Sidebottom and Richard Stamberger, members of the Audit Committee, are “audit committee financial experts” and “independent” as such terms are defined in the instructions to Form N-CSR Item 3(a)(2). | |
| Item 4. | PRINCIPAL ACCOUNTANT FEES AND SERVICES. |
| The principal accountant fees disclosed in Item 4(a), 4(b), 4(c), 4(d) and 4(g) are for the Funds of the Registrant for which the fiscal year end is December 31. | |
| (a) | Audit Fees. The aggregate Audit Fees of Ernst & Young for professional services billed for the audits of the financial statements, or services that are normally provided in connection with statutory and regulatory filings or engagements for the fiscal years ended December 31, 2020 and December 31, 2019, were $644,150 and $717,650, respectively. |
| (b) | Audit-Related Fees. Not applicable. |
| (c) | Tax Fees. The aggregate Tax Fees of Ernst & Young for professional services billed for the review of Federal, state and excise tax returns and other tax compliance consultations for the fiscal years ended December 31, 2020 and December 31, 2019, were $517,814 and $604,585, respectively. |
| (d) | All Other Fees |
| None. | |
| (e) | The Audit Committee will pre-approve all audit and non-audit services, to be provided to the Funds, by the independent accountants as required by Section 10A of the Securities Exchange Act of 1934. The Audit Committee has authorized the Chairman of the Audit Committee to approve, between meeting dates, appropriate non-audit services. |
| The Audit Committee after considering all factors, including a review of independence issues, will recommend to the Board of Trustees the independent auditors to be selected to audit the financial statements of the Funds. |
| (f) | Not applicable. |
| (g) | Not applicable. |
| (h) | Not applicable. |
| Item 5. | AUDIT COMMITTEE OF LISTED REGISTRANTS. |
| The Registrant’s Board has an Audit Committee established in accordance with Section 3(a)(58)(A) of the Exchange Act (15 U.S.C. 78c(a)(58)(A)) consisting of five Independent Trustees. Messrs. Chow, Hesslein, Short, Sidebottom and Stamberger currently serve as members of the Audit Committee. Mr. Short is the Chairman of the Audit Committee. | |
| Item 6. | SCHEDULE OF INVESTMENTS. |
| Information included in Item 1. | |
| Item 7. | DISCLOSURE OF PROXY VOTING POLICIES AND PROCEDURES FOR CLOSED-END MANAGEMENT INVESTMENT COMPANIES. |
| Not applicable. | |
| Item 8. | PORTFOLIO MANAGER OF CLOSED-END MANAGEMENT INVESTMENT COMPANIES. |
| Not applicable. | |
| Item 9. | PURCHASE OF EQUITY SECURITIES BY CLOSED-END MANAGEMENT INVESTMENT COMPANY AND AFFILIATED PURCHASERS. |
| Not applicable. | |
| Item 10. | SUBMISSION OF MATTERS TO A VOTE OF SECURITY HOLDERS. |
| None. | |
| Item 11. | CONTROLS AND PROCEDURES. |
| (a) | The registrant’s principal executive and principal financial officers, or persons performing similar functions, have concluded that the registrant’s disclosure controls and procedures (as defined in Rule 30a-3(c) under the Investment Company Act of 1940, as amended (the “1940 Act”) (17 CFR 270.30a-3 (c)) are effective, as of a date within 90 days of the filing date of the report that includes the disclosure required by this paragraph, based on their evaluation of these controls and procedures required by Rule 30a-3(b) under the 1940 Act (17 CFR 270.30a-3(b)) and Rules 13a-15(b) or 15d-15(b) under the Securities Exchange Act of 1934, as amended (17 CFR 240.13a-15(b) or 240.15d-15 (b)). |
| (b) | There were no changes in the registrant’s internal control over financial reporting (as defined in Rule 30a-3(d) under the 1940 Act (17 CFR 270.30a(d)) that occurred during the period covered by this report that has materially affected, or is reasonably likely to materially affect, the registrant’s internal control over financial reporting. |
| Item 12. | DISCLOSURE OF SECURITIES LENDING ACTIVITIES FOR CLOSED-END MANAGEMENT INVESTMENT COMPANIES. |
| (a) | Not applicable. |
| (b) | Not applicable. |
| Item 13. | EXHIBITS. |
| (b) | Certification pursuant to Section 906 of the Sarbanes-Oxley Act of 2002 is furnished as Exhibit 99.906CERT. |
SIGNATURES
Pursuant to the requirements of the Securities Exchange Act of 1934 and the Investment Company Act of 1940, the registrant has duly caused this report to be signed on its behalf by the undersigned, thereunto duly authorized.
(Registrant) VANECK VECTORS ETF TRUST
| By (Signature and Title) | /s/ John J. Crimmins, Treasurer and CFO |
| Date | March 10, 2021 |
Pursuant to the requirements of the Securities Exchange Act of 1934 and the Investment Company Act of 1940, this report has been signed below by the following persons on behalf of the registrant and in the capacities and on the dates indicated.
| By (Signature and Title) | /s/ Jan F. van Eck, CEO |
| Date | March 10, 2021 |
| By (Signature and Title) | /s/ John J. Crimmins, Treasurer and CFO |
| Date | March 10, 2021 |