UNITED STATES
SECURITIES AND EXCHANGE COMMISSION
Washington, D.C. 20549
SCHEDULE 14A INFORMATION
Proxy Statement Pursuant to Section 14(a) of the
Securities Exchange Act of 1934
| | |
| Filed by the Registrant ☒ | | |
| Filed by a Party other than the Registrant ☐ |
Check the appropriate box: | | |
☐ Preliminary Proxy Statement | | ☐ Confidential, for Use of the Commission Only (as permitted by Rule 14a-6(e)(2)) |
☐ Definitive Proxy Statement |
☒ Definitive Additional Materials |
☐ Soliciting Material Pursuant to § 240.14a-12 |
BLACKROCK CALIFORNIA MUNICIPAL INCOME TRUST
(Name of Registrant as Specified In Its Charter)
(Name of Person(s) Filing Proxy Statement, if Other than the Registrant)
Payment of Filing Fee (Check the appropriate box):
| | ☐ | Fee paid previously with preliminary materials. |
| | ☐ | Fee computed on table in exhibit required by Item 25(b) per Exchange Act Rules 14a-6(i)(1) and 0-11. |
On June 15, 2023, representatives of BlackRock California Municipal Income Trust (the “Fund”) gave a presentation to representatives of Institutional Shareholder Services Inc. regarding the Fund. A copy of this presentation is filed herewith.
Presentation to Institutional Shareholder Services June 2023 June 2023 BlackRock California Municipal Income Trust (BFZ) IPO Date: July 2001
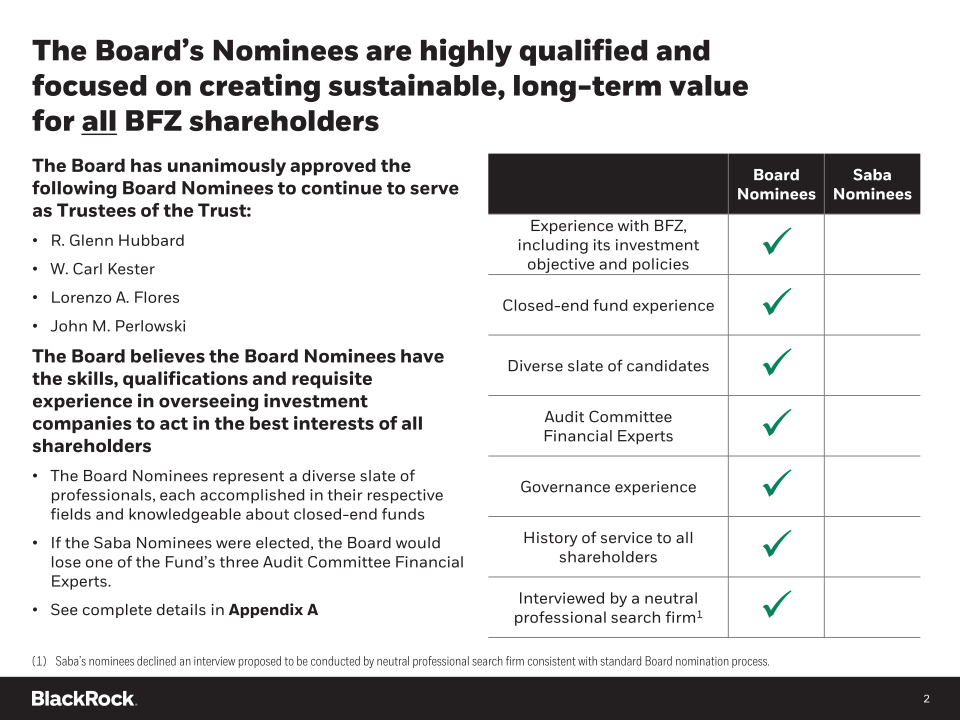
The Board's Nominees are highly qualified and focused on creating sustainable, long-term value for all BFZ shareholders The Board has unanimously approved the following Board Nominees to continue to serve as Trustees of the Trust: R. Glenn Hubbard W. Carl Kester Lorenzo A. Flores John M. Perlowski The Board believes the Board Nominees have the skills, qualifications and requisite experience in overseeing investment companies to act in the best interests of all shareholders The Board Nominees represent a diverse slate of professionals, each accomplished in their respective fields and knowledgeable about closed-end funds If the Saba Nominees were elected, the Board would lose one of the Fund's three Audit Committee Financial Experts. See complete details in Appendix A Board Nominees Saba Nominees Experience with BFZ, including its investment objective and policies Closed-end fund experience Diverse slate of candidates Audit Committee Financial Experts Governance experience History of service to all shareholders Interviewed by a neutral professional search firm1 (1) Saba's nominees declined an interview proposed to be conducted by neutral professional search firm consistent with standard Board nomination process.
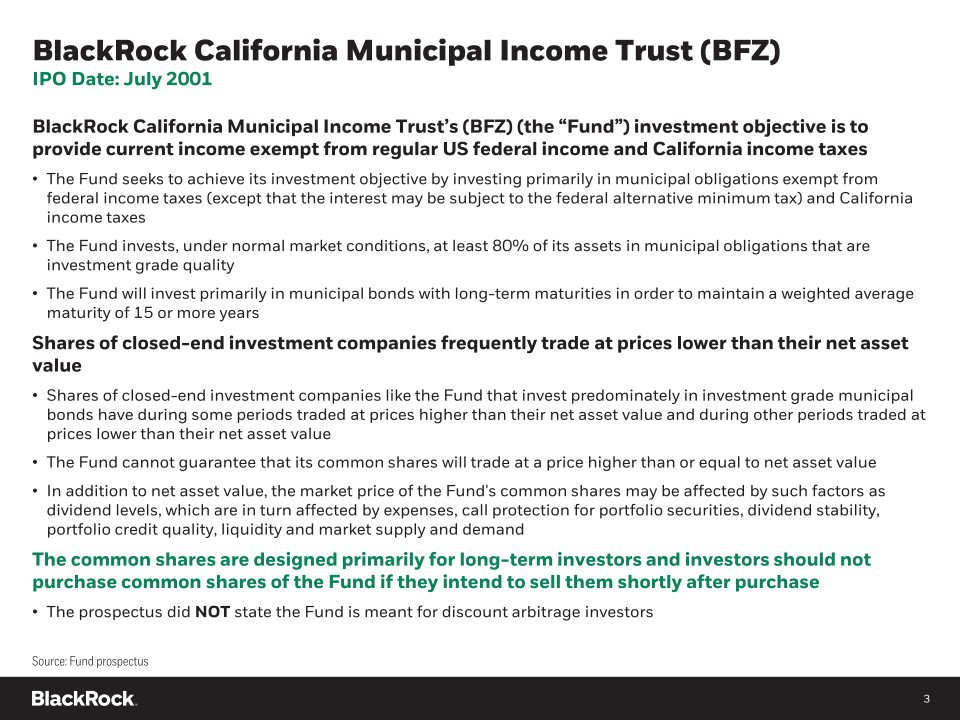
BlackRock California Municipal Income Trust (BFZ) IPO Date: July 2001 BlackRock California Municipal Income Trust's (BFZ) (the "Fund") investment objective is to provide current income exempt from regular US federal income and California income taxes The Fund seeks to achieve its investment objective by investing primarily in municipal obligations exempt from federal income taxes (except that the interest may be subject to the federal alternative minimum tax) and California income taxes The Fund invests, under normal market conditions, at least 80% of its assets in municipal obligations that are investment grade quality The Fund will invest primarily in municipal bonds with long-term maturities in order to maintain a weighted average maturity of 15 or more years Shares of closed-end investment companies frequently trade at prices lower than their net asset value Shares of closed-end investment companies like the Fund that invest predominately in investment grade municipal bonds have during some periods traded at prices higher than their net asset value and during other periods traded at prices lower than their net asset value The Fund cannot guarantee that its common shares will trade at a price higher than or equal to net asset value In addition to net asset value, the market price of the Fund's common shares may be affected by such factors as dividend levels, which are in turn affected by expenses, call protection for portfolio securities, dividend stability, portfolio credit quality, liquidity and market supply and demand The common shares are designed primarily for long-term investors and investors should not purchase common shares of the Fund if they intend to sell them shortly after purchase The prospectus did NOT state the Fund is meant for discount arbitrage investors Source: Fund prospectus
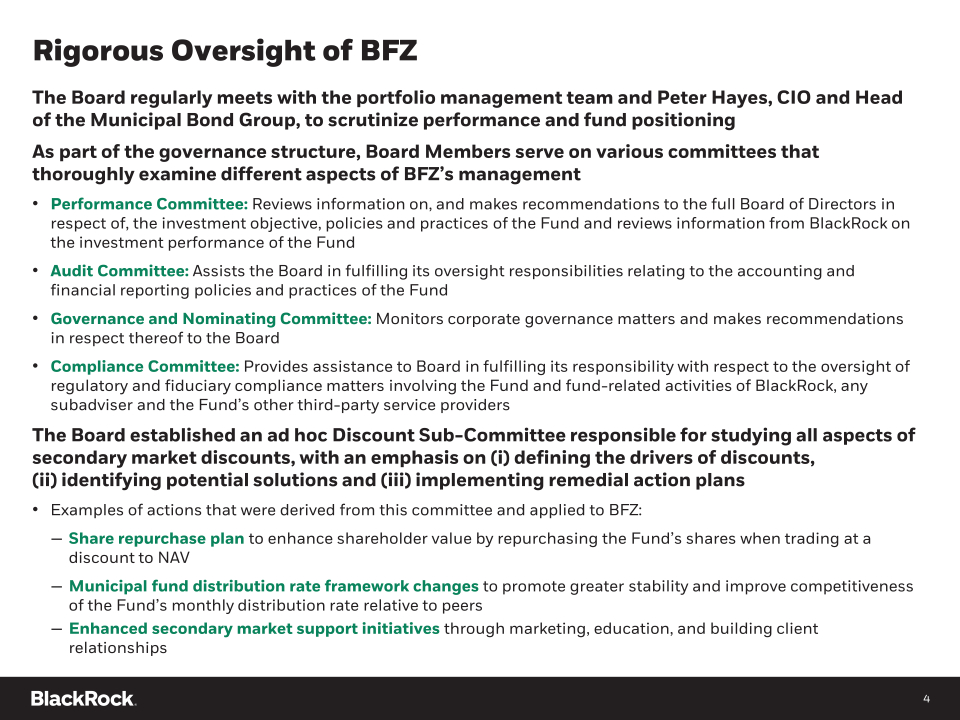
Rigorous Oversight of BFZ The Board regularly meets with the portfolio management team and Peter Hayes, CIO and Head of the Municipal Bond Group, to scrutinize performance and fund positioning As part of the governance structure, Board Members serve on various committees that thoroughly examine different aspects of BFZ's management Performance Committee:Reviews information on, and makes recommendations to the full Board of Directors in respect of, the investment objective, policies and practices of the Fund and reviews information from BlackRock on the investment performance of the Fund Audit Committee:Assists the Board in fulfilling its oversight responsibilities relating to the accounting and financial reporting policies and practices of the Fund Governance and Nominating Committee:Monitors corporate governance matters and makes recommendations in respect thereof to the Board Compliance Committee:Provides assistance to Board in fulfilling its responsibility with respect to the oversight of regulatory and fiduciary compliance matters involving the Fund and fund-related activities of BlackRock, any subadviser and the Fund's other third-party service providers The Board established an ad hoc Discount Sub-Committee responsible for studying all aspects of secondary market discounts, with an emphasis on (i) defining the drivers of discounts,(ii) identifying potential solutions and (iii) implementing remedial action plans Examples of actions that were derived from this committee and applied to BFZ: - Share repurchase plan to enhance shareholder value by repurchasing the Fund's shares when trading at a discount to NAV - Municipal fund distribution rate framework changes to promote greater stability and improve competitiveness of the Fund's monthly distribution rate relative to peers - Enhanced secondary market support initiatives through marketing, education, and building client relationships
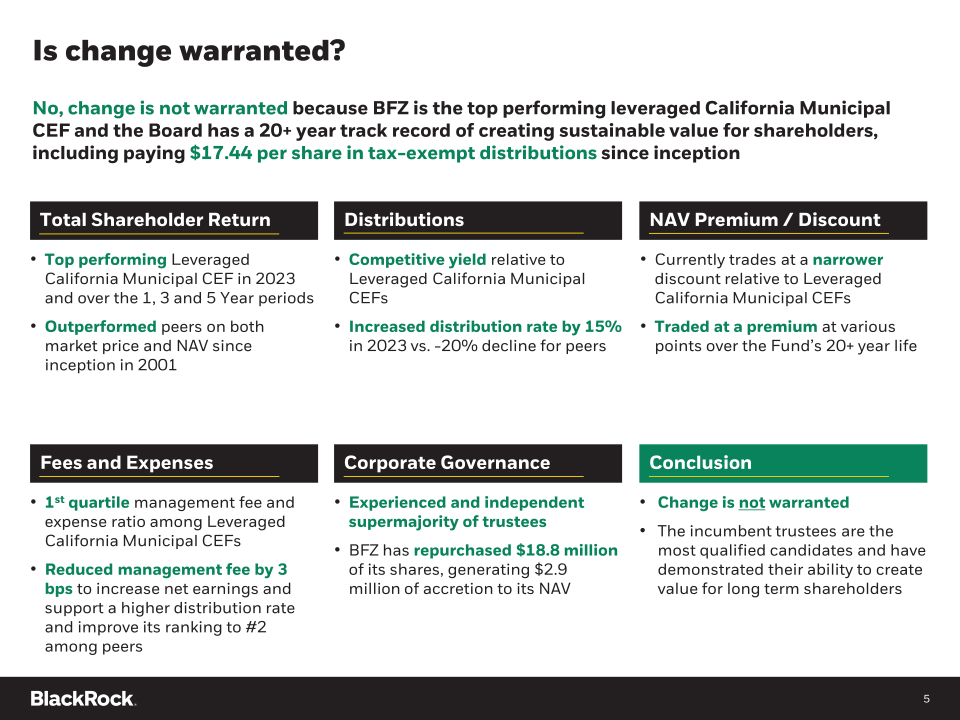
Is change warranted? No, change is not warranted because BFZ is the top performing leveraged California Municipal CEF and the Board has a 20+ year track record of creating sustainable value for shareholders, including paying $17.44 per share in tax-exempt distributions since inception Total Shareholder Return " Top performing Leveraged California Municipal CEF in 2023 and over the 1, 3 and 5 Year periods " Outperformed peers on both market price and NAV since inception in 2001 Distributions " Competitive yield relative to Leveraged California Municipal CEFs " Increased distribution rate by 15% in 2023 vs. -20% decline for peers NAV Premium / Discount " Currently trades at a narrower discount relative to Leveraged California Municipal CEFs " Traded at a premium at various points over the Fund's 20+ year life Fees and Expenses " 1st quartile management fee and expense ratio among Leveraged California Municipal CEFs " Reduced management fee by 3 bps to increase net earnings and support a higher distribution rate and improve its ranking to #2 among peers Corporate Governance " Experienced and independent supermajority of trustees " BFZ has repurchased $18.8 million of its shares, generating $2.9 million of accretion to its NAV Conclusion " Change is notwarranted " The incumbent trustees are the most qualified candidates and have demonstrated their ability to create value for long term shareholders
ISS Five Factor Framework

Total Shareholder Return Total Return on Market Price #1 BFZ is the top performing Leveraged California Municipal CEF over the Year to Date, 1-, 3- and 5- Year periods and has outperformed its peer group average by 6.36% cumulative since inception Total Return on Net Asset Value #1 BFZ is the top performing Leveraged California Municipal CEF over the 1- and 3-Year periods and has outperformed its peer group average by 16.44% cumulative since inception Source: Morningstar data as of 4/30/2023.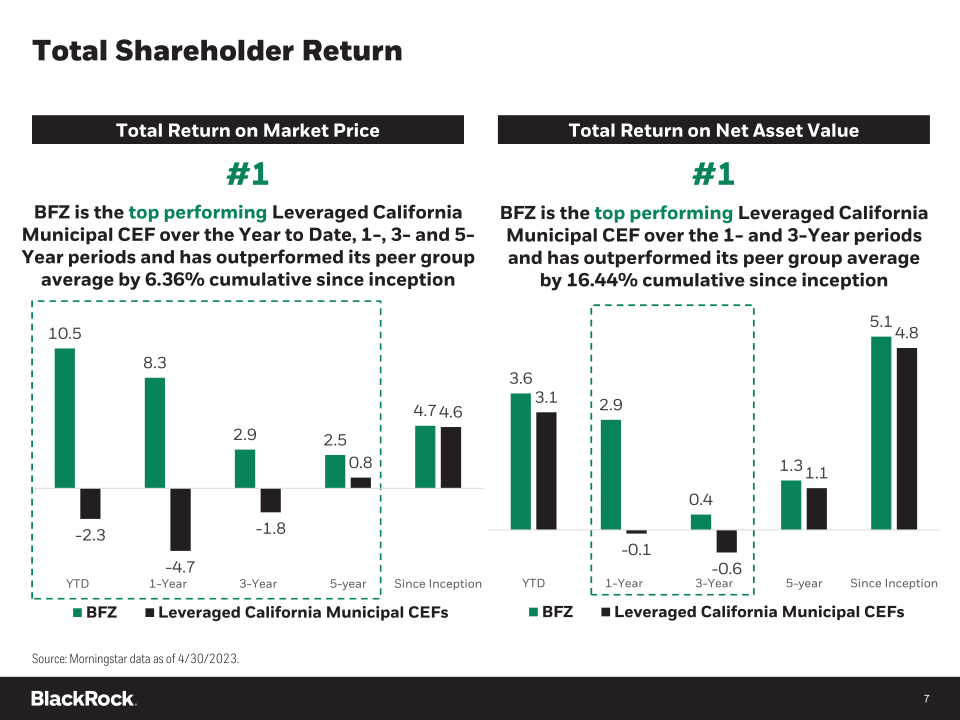
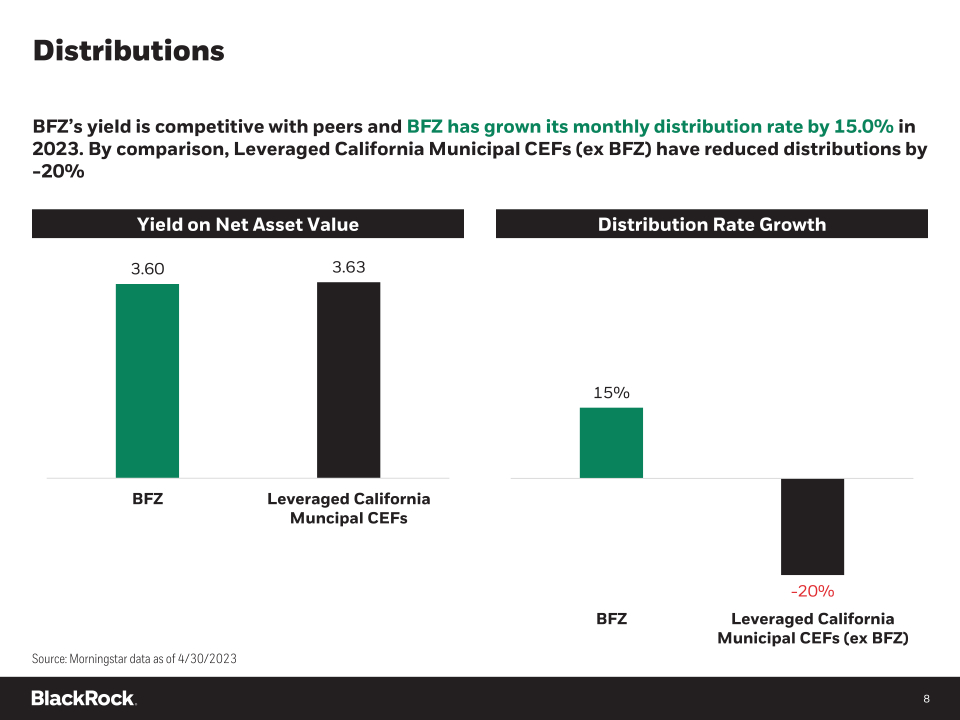
Distributions BFZ's yield is competitive with peers and BFZ has grown its monthly distribution rate by 15.0% in 2023. By comparison, Leveraged California Municipal CEFs (ex BFZ) have reduced distributions by -20% Yield on Net Asset Value Distribution Rate Growth Source: Morningstar data as of 4/30/2023
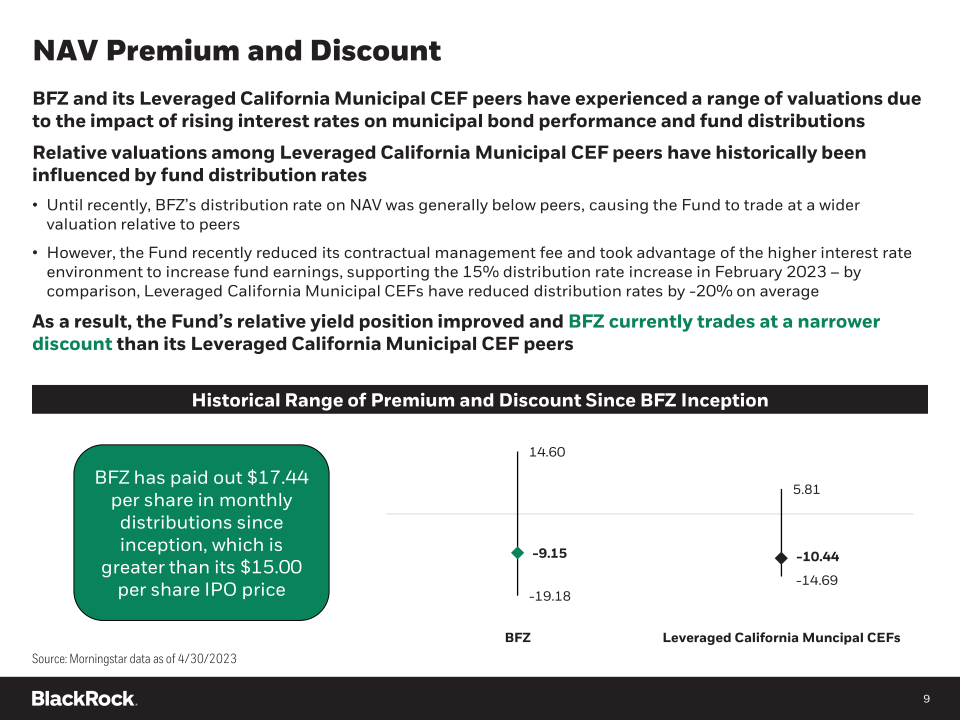
NAV Premium and Discount BFZ and its Leveraged California Municipal CEF peers have experienced a range of valuations due to the impact of rising interest rates on municipal bond performance and fund distributions Relative valuations among Leveraged California Municipal CEF peers have historically been influenced by fund distribution rates " Until recently, BFZ's distribution rate on NAV was generally below peers, causing the Fund to trade at a wider valuation relative to peers " However, the Fund recently reduced its contractual management fee and took advantage of the higher interest rate environment to increase fund earnings, supporting the 15% distribution rate increase in February 2023 -by comparison, Leveraged California Municipal CEFs have reduced distribution rates by -20% on average As a result, the Fund's relative yield position improved and BFZ currently trades at a narrower discount than its Leveraged California Municipal CEF peers Historical Range of Premium and Discount Since BFZ Inception BFZ has paid out $17.44 per share in monthly distributions since inception, which is greater than its $15.00 per share IPO price 14.60 -9.15 -19.18 5.81 -10.44 -14.69 BFZ Leveraged California Muncipal CEFs Source: Morningstar data as of 4/30/2023
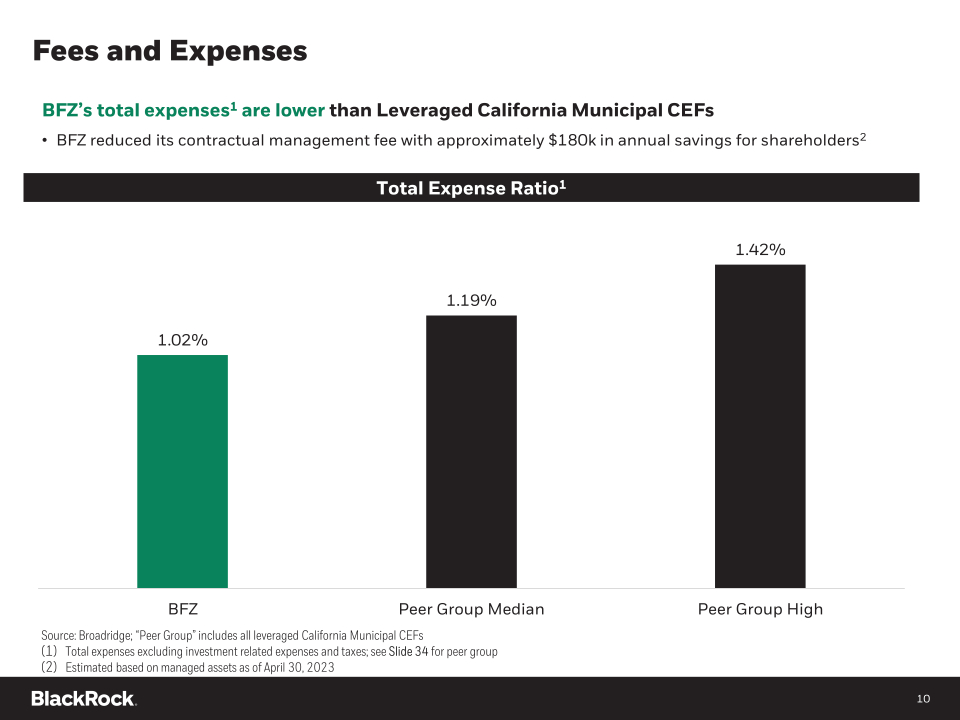
Fees and Expenses BFZ's total expenses1 are lower than Leveraged California Municipal CEFs " BFZ reduced its contractual management fee with approximately $180k in annual savings for shareholders2 Total Expense Ratio1 1.02% BFZ 1.19% Peer Group Median 1.42% Peer Group High Source: Broadridge; "Peer Group" includes all leveraged California Municipal CEFs (1) Total expenses excluding investment related expenses and taxes; see Slide 34 for peer group (2) Estimated based on managed assets as of April 30, 2023
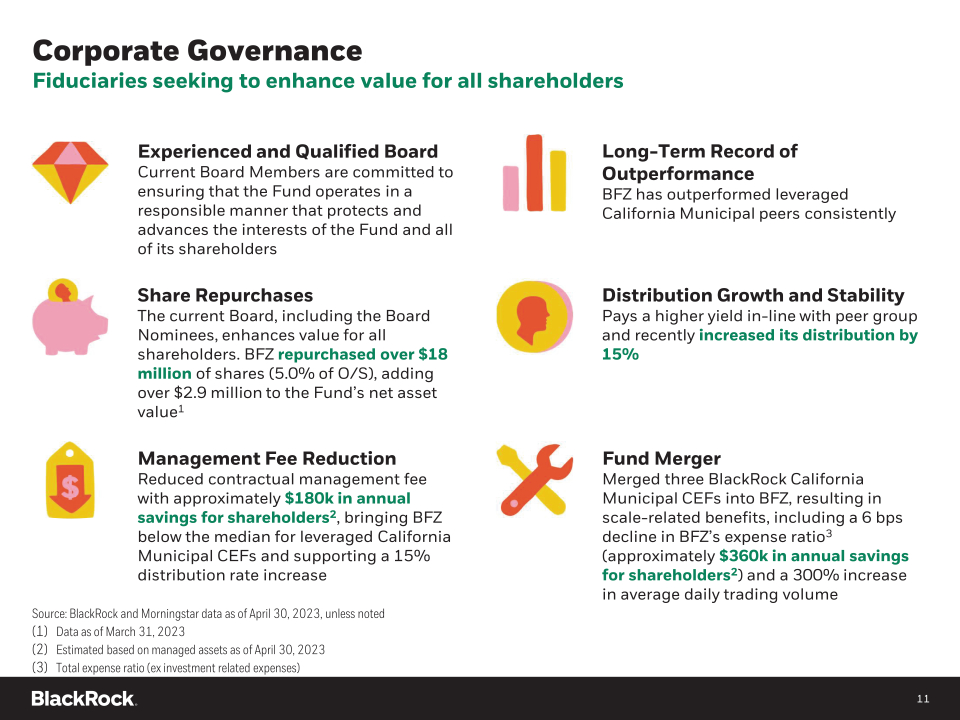
Corporate Governance Fiduciaries seeking to enhance value for all shareholders Experienced and Qualified Board Current Board Members are committed to ensuring that the Fund operates in a responsible manner that protects and advances the interests of the Fund and all of its shareholders Share Repurchases The current Board, including the Board Nominees, enhances value for all shareholders. BFZ repurchased over $18 million of shares (5.0% of O/S), adding over $2.9 million to the Fund's net asset value1 Management Fee Reduction Reduced contractual management fee with approximately $180k in annual savings for shareholders2, bringing BFZ below the median for leveraged California Municipal CEFs and supporting a 15% distribution rate increase Long-Term Record of Outperformance BFZ has outperformed leveraged California Municipal peers consistently Distribution Growth and Stability Pays a higher yield in-line with peer group and recently increased its distribution by 15% Fund Merger Merged three BlackRock California Municipal CEFs into BFZ, resulting in scale-related benefits, including a 6 bps decline in BFZ's expense ratio3 (approximately $360k in annual savings for shareholders2) and a 300% increase in average daily trading volume Source: BlackRock and Morningstar data as of April 30, 2023, unless noted (1) Data as of March 31, 2023 (2) Estimated based on managed assets as of April 30, 2023 (3) Total expense ratio (ex investment related expenses)
Trustee Nominees

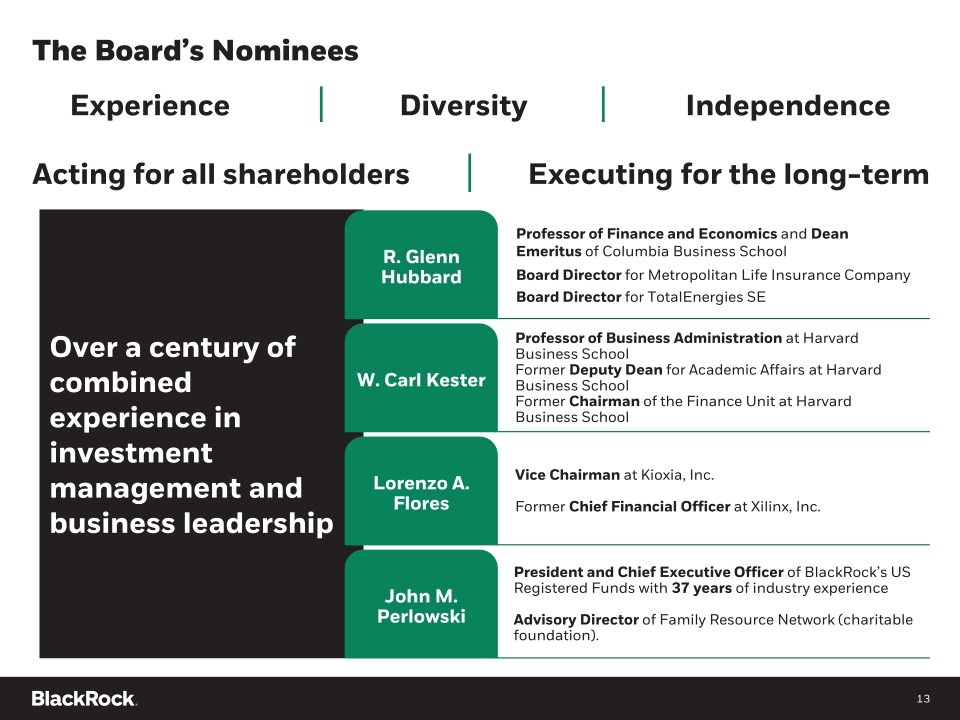
The Board's Nominees Experience Diversity Independence Acting for all shareholders Executing for the long-term Over a century of combined experience in investment management and business leadership R. Glenn Hubbard W. Carl Kester Lorenzo A. Flores John M. Perlowski Professor of Finance and Economics and Dean Emeritus of Columbia Business School Board Director for Metropolitan Life Insurance Company Board Director for Total Energies SE Professor of Business Administration at Harvard Business School Former Deputy Dean for Academic Affairs at Harvard Business School Former Chairman of the Finance Unit at Harvard Business School Vice Chairman at Kioxia, Inc. Former Chief Financial Officer at Xilinx, Inc. President and Chief Executive Officer of BlackRock's US Registered Funds with 37 years of industry experience Advisory Director of Family Resource Network (charitable foundation).
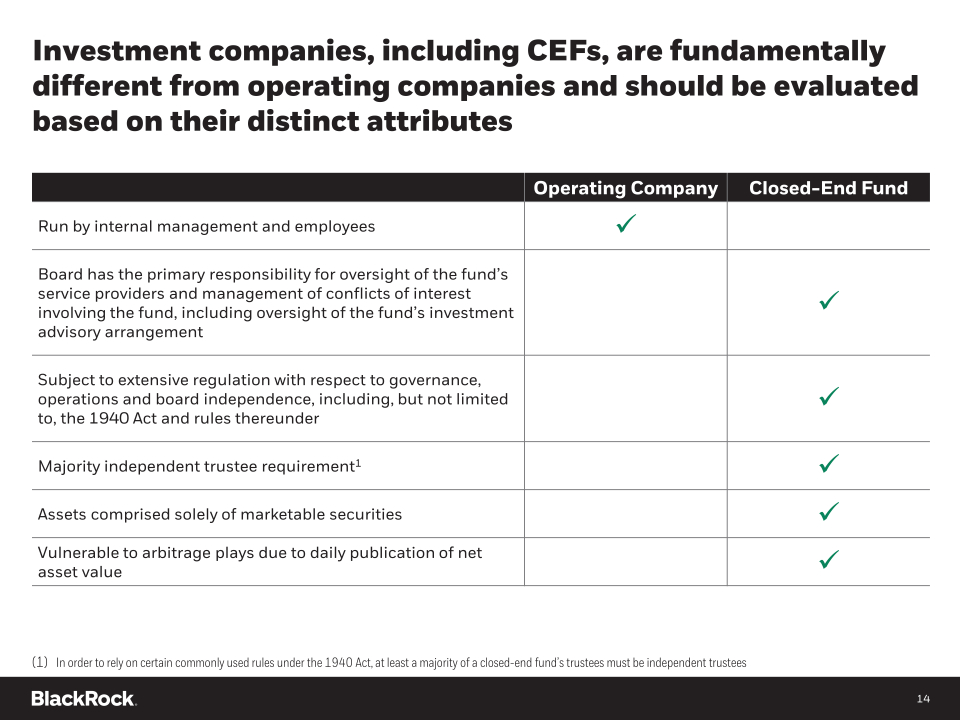
Investment companies, including CEFs, are fundamentally different from operating companies and should be evaluated based on their distinct attributes Operating Company Closed-End FundRun by internal management and employeesBoard has the primary responsibility for oversight of the fund's service providers and management of conflicts of interest involving the fund, including oversight of the fund's investment advisory arrangementSubject to extensive regulation with respect to governance, operations and board independence, including, but not limited to, the 1940 Act and rules thereunderMajority independent trustee requirement1Assets comprised solely of marketable securitiesVulnerable to arbitrage plays due to daily publication of net asset value(1) In order to rely on certain commonly used rules under the 1940 Act, at least a majority of a closed-end fund's trustees must be independent trustees
Saba's Playbook

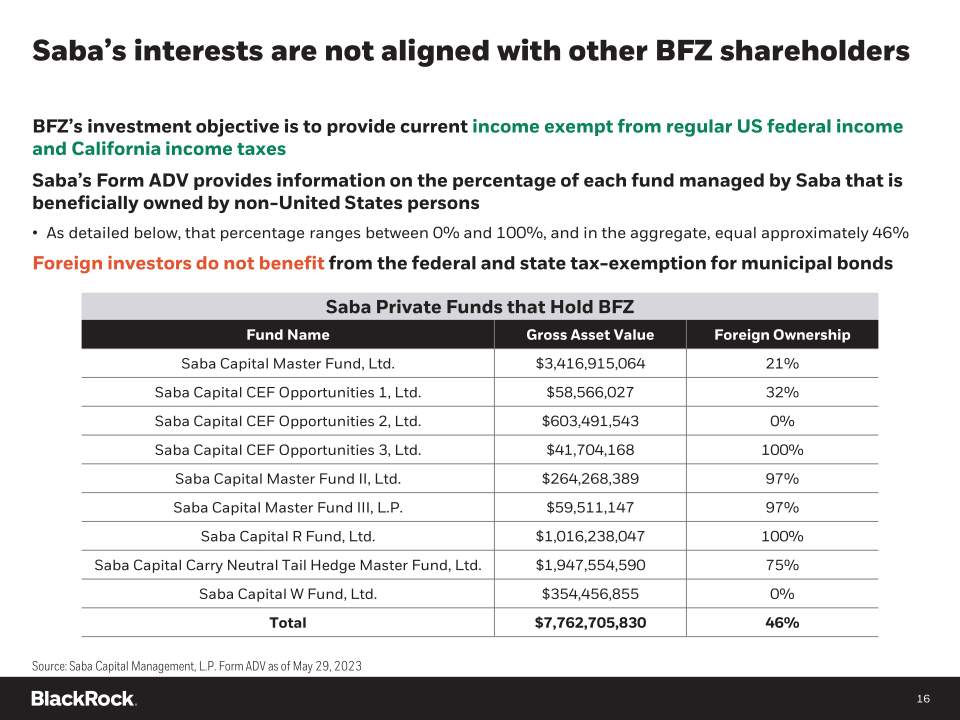
Saba's interests are not aligned with other BFZ shareholders BFZ's investment objective is to provide current income exempt from regular US federal income and California income taxes Saba's Form ADV provides information on the percentage of each fund managed by Saba that is beneficially owned by non-United States persons " As detailed below, that percentage ranges between 0% and 100%, and in the aggregate, equal approximately 46% Foreign investors do not benefit from the federal and state tax-exemption for municipal bonds Saba Private Funds that Hold BFZ Fund Name Gross Asset Value Foreign Ownership Saba Capital Master Fund, Ltd. $3,416,915,064 21% Saba Capital CEF Opportunities 1, Ltd. $58,566,027 32% Saba Capital CEF Opportunities 2, Ltd. $603,491,543 0% Saba Capital CEF Opportunities 3, Ltd. $41,704,168 100% Saba Capital Master Fund II, Ltd. $264,268,389 97% Saba Capital Master Fund III, L.P. $59,511,147 97% Saba Capital R Fund, Ltd. $1,016,238,047 100% Saba Capital Carry Neutral Tail Hedge Master Fund, Ltd. $1,947,554,590 75% Saba Capital W Fund, Ltd. $354,456,855 0% Total $7,762,705,830 46% Source: Saba Capital Management, L.P. Form ADV as of May 29, 2023
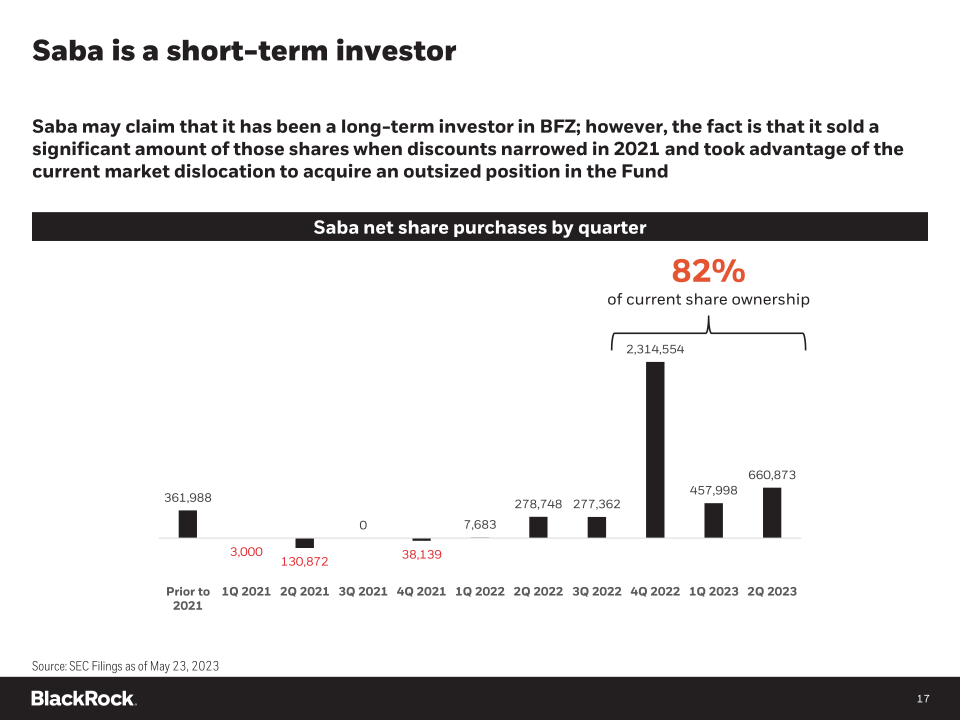
Saba is a short-term investor Saba may claim that it has been a long-term investor in BFZ; however, the fact is that it sold a significant amount of those shares when discounts narrowed in 2021 and took advantage of the current market dislocation to acquire an outsized position in the Fund Saba net share purchases by quarter 82% of current share ownership 2,314,554 361,988 3,000 130,872 0 38,139 7,683 278,748 277,362 457,998 660,873 Prior to 1Q 2021 2Q 2021 3Q 2021 4Q 2021 1Q 2022 2Q 2022 3Q 2022 4Q 2022 1Q 2023 2Q 2023 2021 Source: SEC Filings as of May 23, 2023
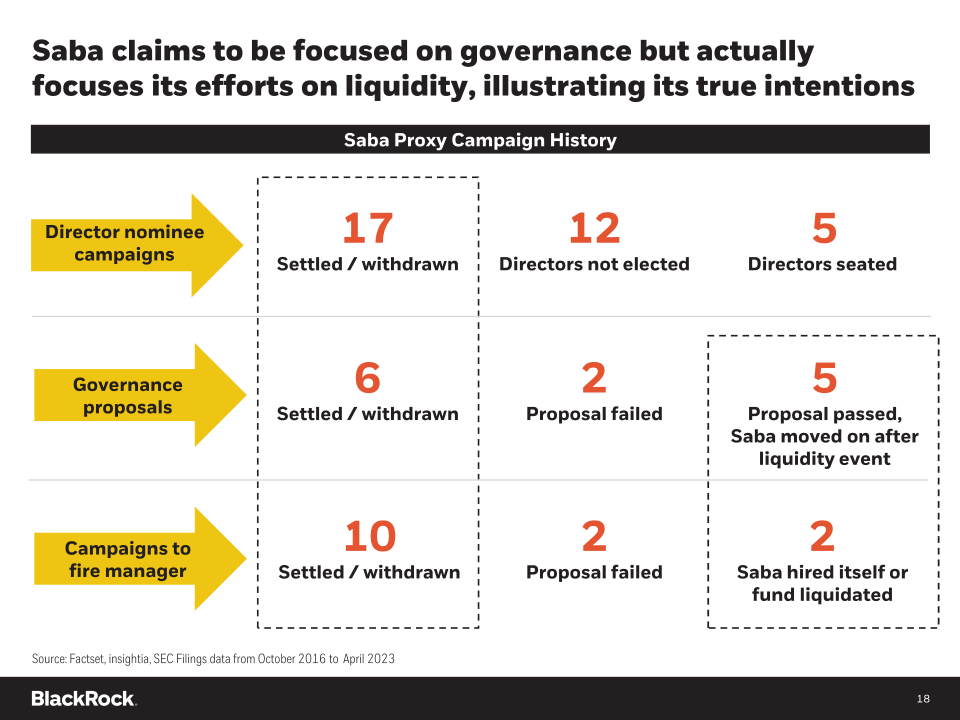
Saba claims to be focused on governance but actually focuses its efforts on liquidity, illustrating its true intentions Saba Proxy Campaign History Director nominee campaigns Governance proposals Campaigns to fire manager 17 Settled / withdrawn 6 Settled / withdrawn 10 Settled / withdrawn 12 Directors not elected 2 Proposal failed 2 Proposal failed 5 Directors seated 5 Proposal passed, Saba moved on after liquidity event 2 Saba hired itself or fund liquidated Source: Factset, insightia, SEC Filings data from October 2016 to April 2023
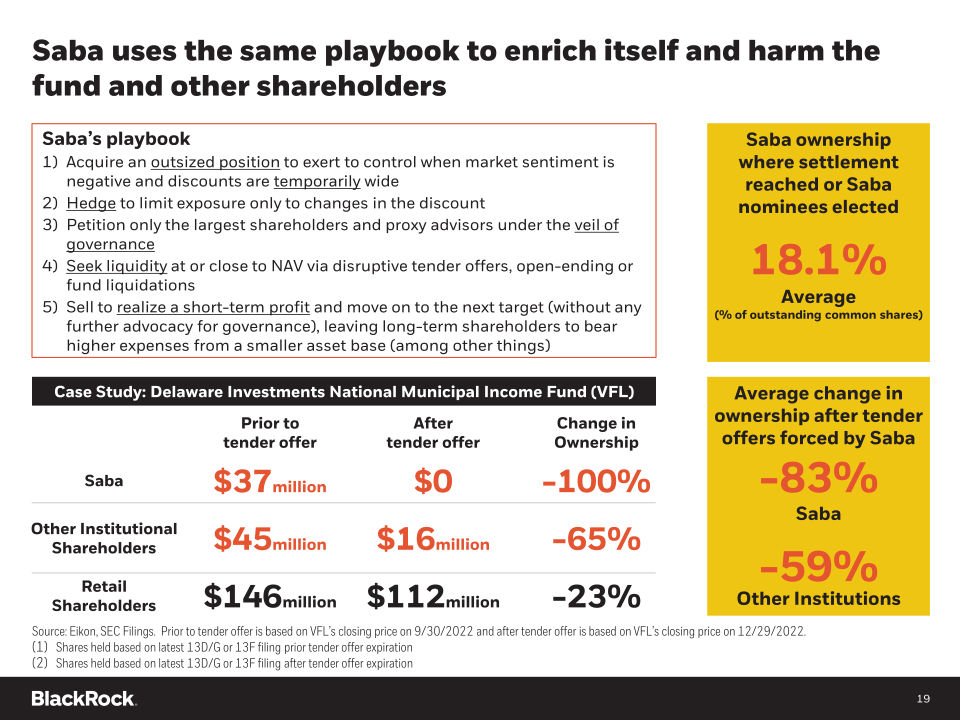
Saba uses the same playbook to enrich itself and harm the fund and other shareholders Saba's playbook1) Acquire an outsized positionto exert to control when market sentiment is negative and discounts are temporarily wide 2) Hedge to limit exposure only to changes in the discount 3) Petition only the largest shareholders and proxy advisors under the veil of governance 4) Seek liquidityat or close to NAV via disruptive tender offers, open-ending or fund liquidations 5) Sell to realize a short-term profit and move on to the next target (without any further advocacy for governance), leaving long-term shareholders to bear higher expenses from a smaller asset base (among other things) Saba ownership where settlement reached or Saba nominees elected 18.1% Average (% of outstanding common shares) Case Study: Delaware Investments National Municipal Income Fund (VFL) Prior to tender offer After tender offer Change in Ownership Saba $37million $0 -100% Other Institutional Shareholders $45million $16million -65% Retail Shareholders $146million $112million -23% Average change in ownership after tender offers forced by Saba -83% Saba -59% Other Institutions Source: Eikon, SEC Filings. Prior to tender offer is based on VFL's closing price on 9/30/2022 and after tender offer is based on VFL's closing price on 12/29/2022. (1) Shares held based on latest 13D/G or 13F filing prior tender offer expiration (2) Shares held based on latest 13D/G or 13F filing after tender offer expiration
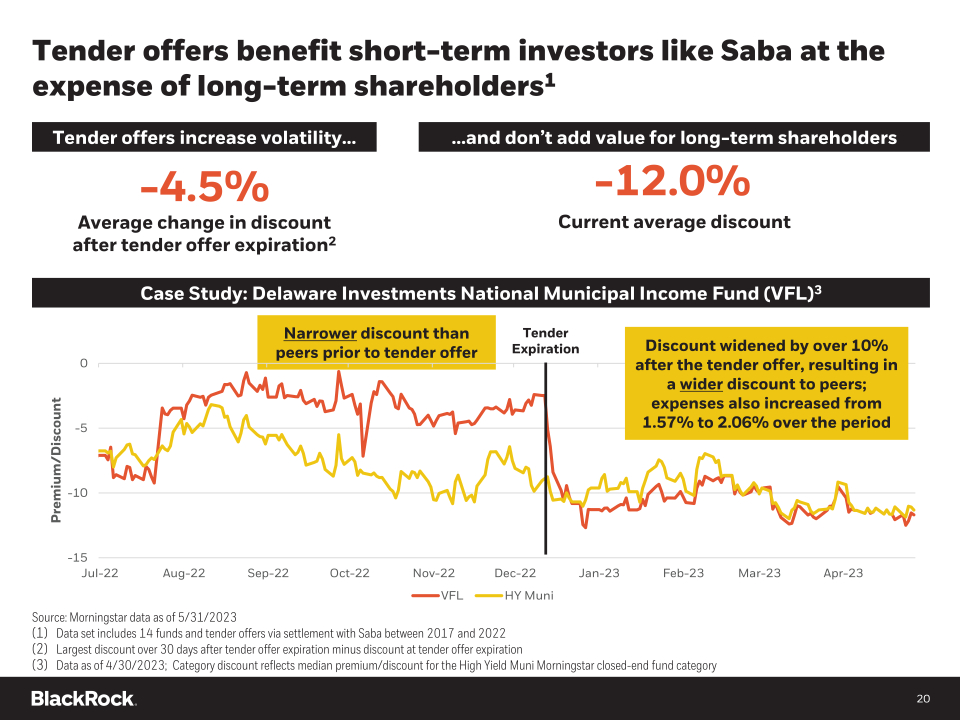
Tender offers benefit short-term investors like Saba at the expense of long-term shareholders1 Tender offers increase volatility&-4.5% Average change in discount after tender offer expiration2 &and don't add value for long-term shareholders -12.0% Current average discount Case Study: Delaware Investments National Municipal Income Fund (VFL)3 Narrower discount than peers prior to tender offer Tender Expiration Discount widened by over 10% after the tender offer, resulting in a wider discount to peers; expenses also increased from 1.57% to 2.06% over the period Premium/Discount 0 -5 -10 -15 Jul-22 Aug-22 Sep-22 Oct-22 Nov-22 Dec-22 Jan-23 Feb-23 Mar-23 Apr-23 VFL HY Muni Source: Morningstar data as of 5/31/2023 (1) Data set includes 14 funds and tender offers via settlement with Saba between 2017 and 2022 (2) Largest discount over 30 days after tender offer expiration minus discount at tender offer expiration (3) Data as of 4/30/2023; Category discount reflects median premium/discount for the High Yield Muni Morningstar closed-end fund category
Appendix A Trustee Nominee Biographies

R. Glenn Hubbard R. Glenn Hubbard has served in numerous roles in the field of economics, including as the Chairman of the U.S. Council of Economic Advisers of the President of the United States. Dr. Hubbard has served as the Dean of Columbia Business School, as a member of the Columbia Faculty and as a Visiting Professor at the John F. Kennedy School of Government at Harvard University, the Harvard Business School and the University of Chicago. Dr. Hubbard's experience as an adviser to the President of the United States adds a dimension of balance to the Fund's governance and provides perspective on economic issues. Dr. Hubbard's service on the boards of ADP and Metropolitan Life Insurance Company provides the Board with the benefit of his experience with the management practices of other financial companies. Dr. Hubbard's long-standing service on the boards of directors/trustees of theclosed-endfunds in the BlackRock Fixed-Income Complex also provides him with a specific understanding of the Fund, its operations, and the business and regulatory issues facing the Fund. Dr. Hubbard's independence from the Fund and the Advisor enhances his service as Chair of the Board, Chair of the Executive Committee and a member of the Governance Committee, the Compliance Committee and the Performance Oversight Committee.
W. Carl Kester The Board benefits from W. Carl Kester's experiences as a professor and author in finance, and his experience as the George Fisher Baker Jr. Professor of Business Administration at Harvard Business School and as Deputy Dean of Academic Affairs at Harvard Business School from 2006 through 2010 adds to the Board a wealth of expertise in corporate finance and corporate governance. Dr. Kester has authored and edited numerous books and research papers on both subject matters, including co-editing a leading volume of finance case studies used worldwide. Dr. Kester's long-standing service on the boards of directors/trustees of the closed-end funds in the BlackRock Fixed-Income Complex also provides him with a specific understanding of the Fund, its operations, and the business and regulatory issues facing the Fund. Dr. Kester's independence from the Fund and the Advisor enhances his service as a Vice Chair of the Board, Chair of the Governance Committee and a member of the Executive Committee, the Compliance Committee and the Performance Oversight Committee.
Lorenzo A. Flores The Board benefits from Lorenzo A. Flores's many years of business, leadership and financial experience in his roles at various public and private companies. In particular, Mr. Flores's service as Chief Financial Officer and Corporate Controller of Xilinx, Inc. and Vice Chairman of Kioxia, Inc. and his long experience in the technology industry allow him to provide insight to into financial, business and technology trends. Mr. Flores's knowledge of financial and accounting matters qualifies him to serve as a member of the Audit Committee. Mr. Flores's independence from the Fund and the Advisor enhances his service as a member of the Performance Oversight Committee.
John M. Perlowski John M. Perlowski's experience as Managing Director of BlackRock, Inc. since 2009, as the Head of BlackRock Global Accounting and Product Services since 2009, and as President and Chief Executive Officer of the Fund provides him with a strong understanding of the Fund, its operations, and the business and regulatory issues facing the Fund. Mr. Perlowski's prior position as Managing Director and Chief Operating Officer of the Global Product Group at Goldman Sachs Asset Management, and his former service as Treasurer and Senior Vice President of the Goldman Sachs Mutual Funds and as Director of the Goldman Sachs Offshore Funds provides the Board with the benefit of his experience with the management practices of other financial companies. Mr. Perlowski also serves as a board member for the funds in the BlackRock Multi-Asset Complex. Mr. Perlowski's experience with BlackRock enhances his service as a member of the Executive Committee.
Appendix B BFZ Overview
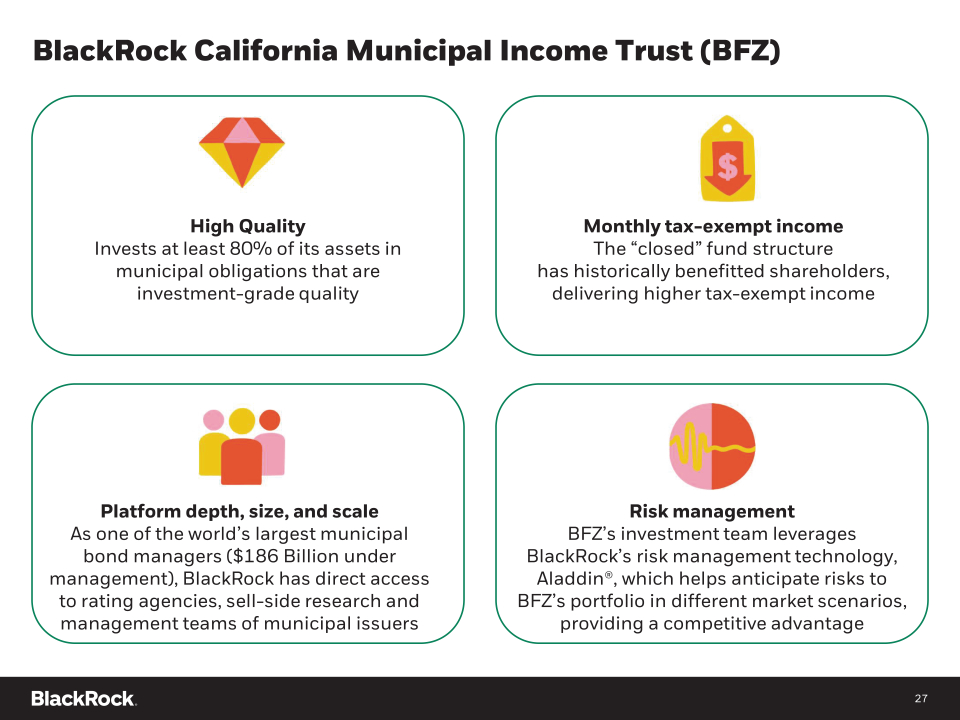
BlackRock California Municipal Income Trust (BFZ) High Quality Invests at least 80% of its assets in municipal obligations that are investment-grade quality Monthly tax-exempt income The "closed" fund structure has historically benefitted shareholders, delivering higher tax-exempt income Platform depth, size, and scale As one of the world's largest municipal bond managers ($186 Billion under management), BlackRock has direct access to rating agencies, sell-side research and management teams of municipal issuers Risk management BFZ's investment team leverages BlackRock's risk management technology, Aladdin(R), which helps anticipate risks to BFZ's portfolio in different market scenarios, providing a competitive advantage
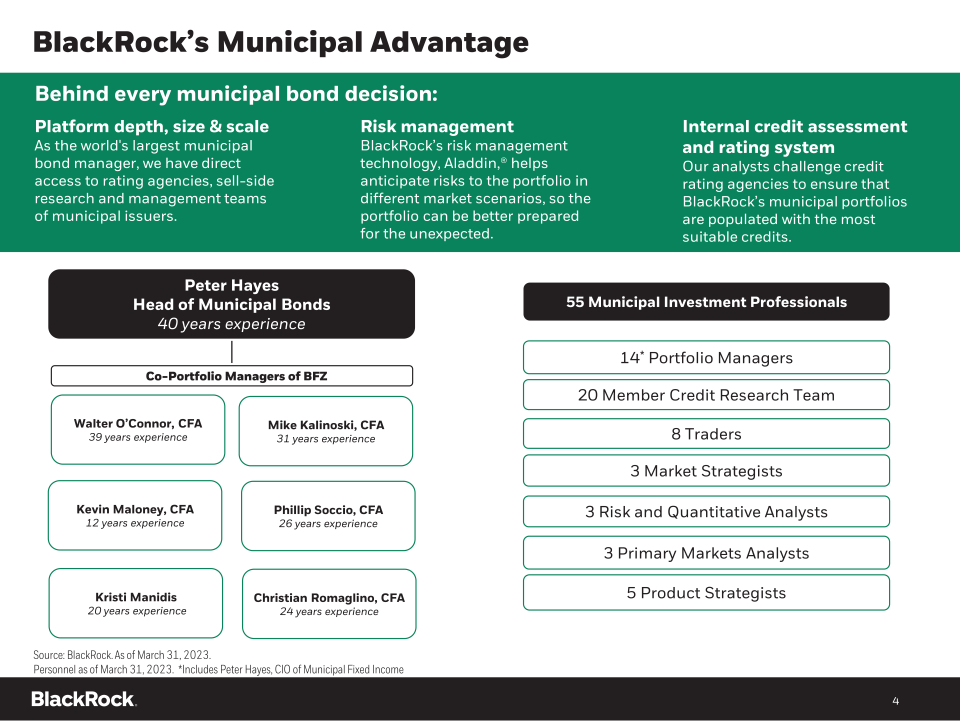
BlackRock's Municipal Advantage Behind every municipal bond decision: Platform depth, size & scale Risk management Internal credit assessment As the world's largest municipal BlackRock's risk management and rating system bond manager, we have direct technology, Aladdin,(R) helps Our analysts challenge credit access to rating agencies, sell-side anticipate risks to the portfolio in rating agencies to ensure that research and management teams different market scenarios, so the BlackRock's municipal portfolios of municipal issuers. portfolio can be better prepared are populated with the most for the unexpected. suitable credits. Peter Hayes Head of Municipal Bonds 40 years experience Co-Portfolio Managers of BFZ Walter O'Connor, CFA 39 years experience Kevin Maloney, CFA 12 years experience Kristi Manidis 20 years experience Mike Kalinoski, CFA 31 years experience Phillip Soccio, CFA 26 years experience Christian Romaglino, CFA 24 years experience 14* Portfolio Managers 20 Member Credit Research Team 8 Traders 3 Market Strategists 3 Risk and Quantitative Analysts 3 Primary Markets Analysts 5 Product Strategists Source: BlackRock. As of March 31, 2023. Personnel as of March 31, 2023. *Includes Peter Hayes, CIO of Municipal Fixed Income
Appendix C CEF Market Dynamics
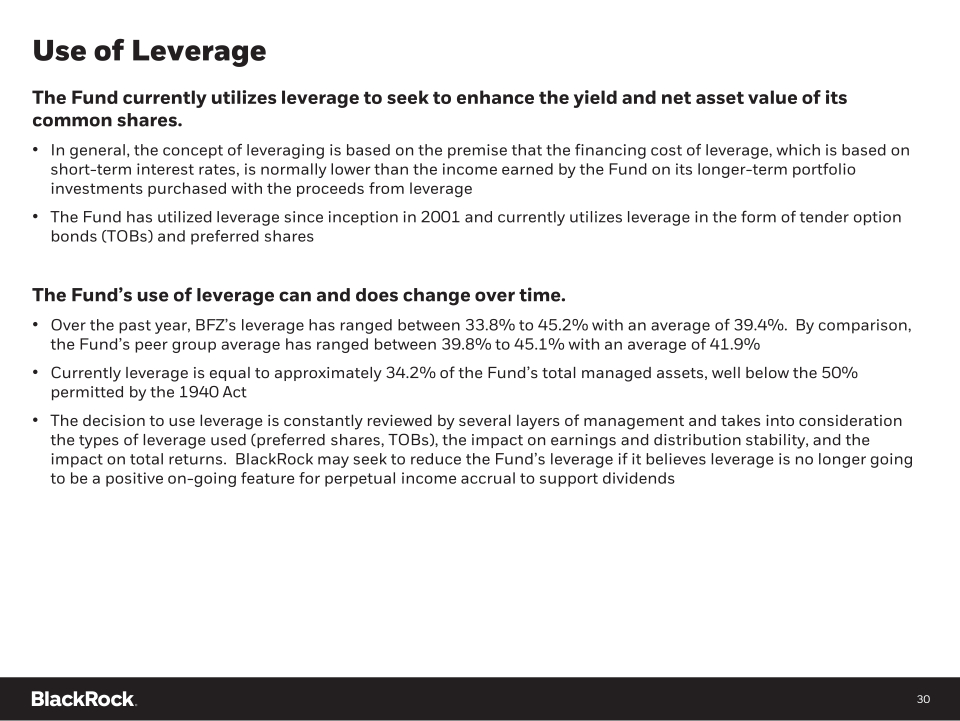
Use of Leverage The Fund currently utilizes leverage to seek to enhance the yield and net asset value of its common shares. " In general, the concept of leveraging is based on the premise that the financing cost of leverage, which is based on short-term interest rates, is normally lower than the income earned by the Fund on its longer-term portfolio investments purchased with the proceeds from leverage " The Fund has utilized leverage since inception in 2001 and currently utilizes leverage in the form of tender option bonds (TOBs) and preferred shares The Fund's use of leverage can and does change over time. " Over the past year, BFZ's leverage has ranged between 33.8% to 45.2% with an average of 39.4%. By comparison, the Fund's peer group average has ranged between 39.8% to 45.1% with an average of 41.9% " Currently leverage is equal to approximately 34.2% of the Fund's total managed assets, well below the 50% permitted by the 1940 Act " The decision to use leverage is constantly reviewed by several layers of management and takes into consideration the types of leverage used (preferred shares, TOBs), the impact on earnings and distribution stability, and the impact on total returns. BlackRock may seek to reduce the Fund's leverage if it believes leverage is no longer going to be a positive on-going feature for perpetual income accrual to support dividends
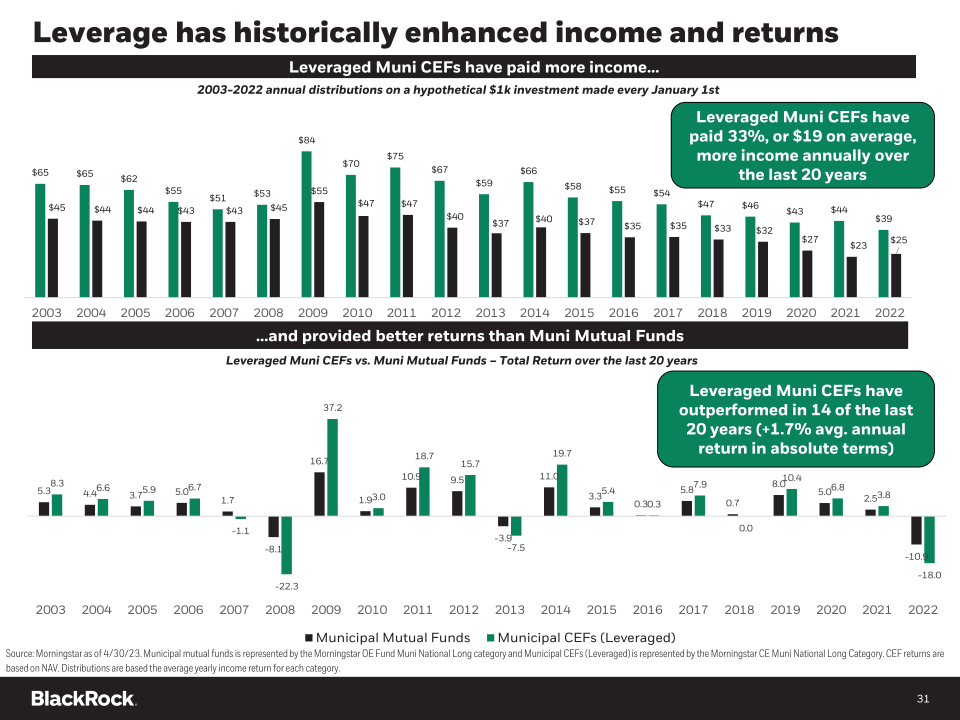
Leverage has historically enhanced income and returns Leveraged Muni CEFs have paid more income& 2003-2022 annual distributions on a hypothetical $1k investment made every January 1st Leveraged Muni CEFs have paid 33%, or $19 on average, more income annually over the last 20 years and provided better returns than Muni Mutual Funds Leveraged Muni CEFs vs. Muni Mutual Funds -Total Return over the last 20 years Leveraged Muni CEFs have outperformed in 14 of the last 20 years (+1.7% avg. annual return in absolute terms) Municipal Mutual Funds Municipal CEFs (Leveraged) Source: Morningstar as of 4/30/23. Municipal mutual funds is represented by the Morningstar OE Fund Muni National Long category and Municipal CEFs (Leveraged) is represented by the Morningstar CE Muni National Long Category. CEF returns are based on NAV. Distributions are based the average yearly income return for each category.
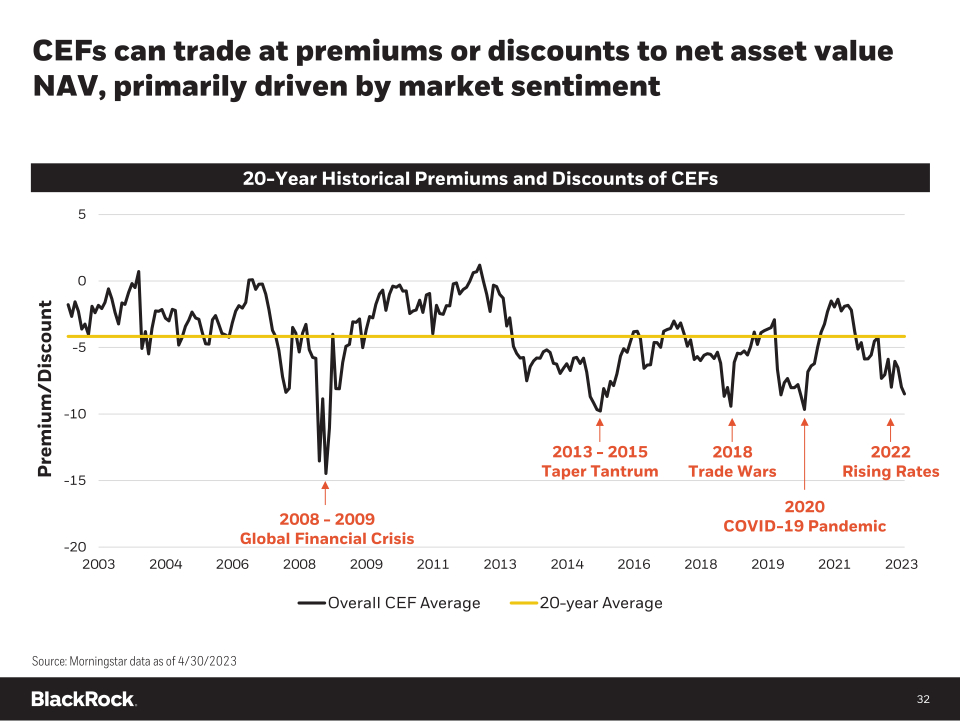
CEFs can trade at premiums or discounts to net asset value NAV, primarily driven by market sentiment 20-Year Historical Premiums and Discounts of CEFs Premium/Discount 2008-2009 Global Financial Crisis 2013-2015 Taper Tantrum 2018 Trade Wars 2022 Rising Rates 2020 COVID-19 Pandemic Overall CEF Average 20-year Average Source: Morningstar data as of 4/30/2023
Appendix D Morningstar Municipal California Leveraged category
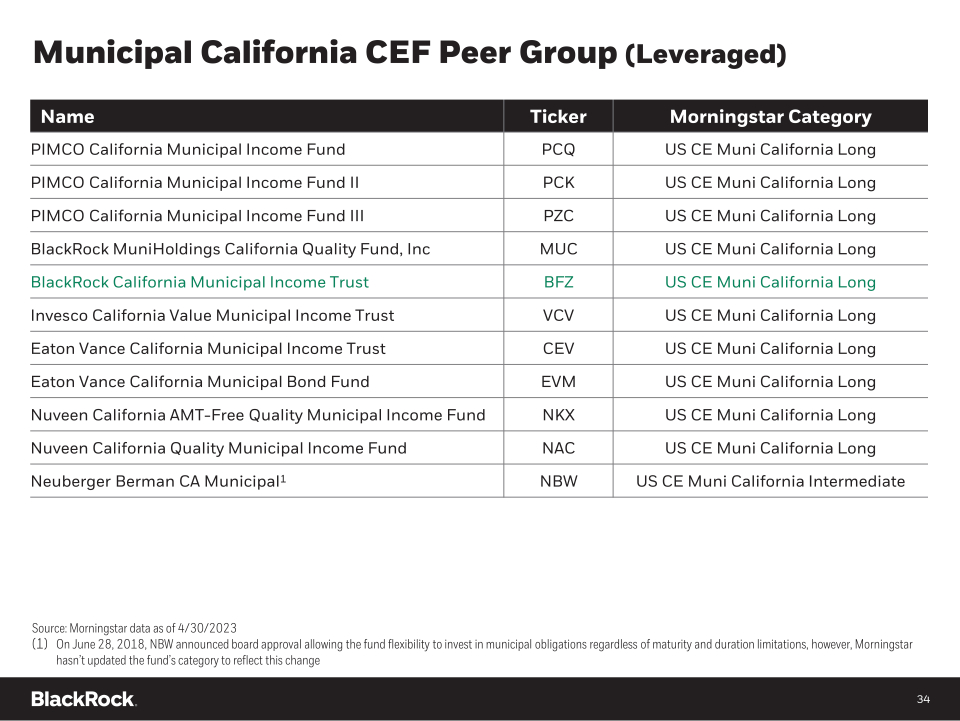
Municipal California CEF Peer Group (Leveraged) Name Ticker Morningstar Category PIMCO California Municipal Income Fund PCQ US CE Muni California Long PIMCO California Municipal Income Fund II PCK US CE Muni California Long PIMCO California Municipal Income Fund III PZC US CE Muni California Long BlackRock MuniHoldings California Quality Fund, Inc MUC US CE Muni California Long BlackRock California Municipal Income Trust BFZ US CE Muni California Long Invesco California Value Municipal Income Trust VCV US CE Muni California Long Eaton Vance California Municipal Income Trust CEV US CE Muni California Long Eaton Vance California Municipal Bond Fund EVM US CE Muni California Long Nuveen California AMT-Free Quality Municipal Income Fund NKX US CE Muni California Long Nuveen California Quality Municipal Income Fund NAC US CE Muni California Long Neuberger Berman CA Municipal1 NBW US CE Muni California Intermediate Source: Morningstar data as of 4/30/2023 (1) On June 28, 2018, NBW announced board approval allowing the fund flexibility to invest in municipal obligations regardless ofmaturity and duration limitations, however, Morningstar hasn't updated the fund's category to reflect this change