UNITED STATES
SECURITIES AND EXCHANGE COMMISSION
Washington, D.C. 20549
FORM N-CSR
CERTIFIED SHAREHOLDER REPORT OF REGISTERED MANAGEMENT INVESTMENT COMPANIES
Investment Company Act file number: 811-10333
| Name of Fund: | | BlackRock Municipal Income Investment Trust (BBF) |
| Fund Address: | | 100 Bellevue Parkway, Wilmington, DE 19809 |
Name and address of agent for service: John M. Perlowski, Chief Executive Officer, BlackRock Municipal Income Investment Trust, 55 East 52nd Street, New York, NY 10055
Registrant’s telephone number, including area code: (800) 882-0052, Option 4
Date of fiscal year end: 07/31/2021
Date of reporting period: 01/31/2021
Item 1 – Report to Stockholders
(a) The Report to Shareholders is attached herewith.
| | |

| | JANUARY 31, 2021 |
| | |
| | |
| | | 2021 Semi-Annual Report (Unaudited) |
BlackRock California Municipal Income Trust (BFZ)
BlackRock Municipal 2030 Target Term Trust (BTT)
BlackRock Municipal Income Investment Trust (BBF)
BlackRock New York Municipal Income Trust (BNY)
|
Not FDIC Insured • May Lose Value • No Bank Guarantee |
Supplemental Information (unaudited)
Section 19(a) Notices
BlackRock Municipal Income Investment Trust’s (BBF) (the “Trust”) amounts and sources of distributions reported are estimates and are being provided pursuant to regulatory requirements and are not being provided for tax reporting purposes. The actual amounts and sources for tax reporting purposes will depend upon the Trust’s investment experience during the year and may be subject to changes based on tax regulations. Shareholders will receive a Form 1099-DIV each calendar year that will inform them how to report these distributions for federal income tax purposes.
January 31, 2021
| | | | | | | | | | | | | | | | | | | | | | | | | | | | | | | | | | | | | | | | | | | | | | |
| | | | | |
| | | | | Total Cumulative Distributions for the Fiscal Period | | | | | | % Breakdown of the Total Cumulative Distributions for the Fiscal Period | | |
| | | | | | | | | | | | | |
| | Trust Name | |
| Net
Income |
| |
| Net Realized
Capital Gains Short-Term |
| |
| Net Realized
Capital Gains Long-Term |
| |
| Return of
Capital |
(a) | |
| Total Per
Common Share |
| | | | | |
| Net
Income |
| |
| Net Realized
Capital Gains Short-Term |
| |
| Net Realized
Capital Gains Long-Term |
| |
| Return of
Capital |
| | Total Per Common Share | | |
| | BBF | | $ | 0.275136 | | | $ | — | | | $ | — | | | $ | 0.027864 | | | $ | 0.303000 | | | | | | | | 91 | % | | | — | % | | | — | % | | | 9 | % | | 100% | | |
| | (a) | The Trust estimates that it has distributed more than its net income and net realized capital gains; therefore, a portion of the distribution may be a return of capital. A return of capital may occur, for example, when some or all of the shareholder’s investment in the Trust is returned to the shareholder. A return of capital does not necessarily reflect the Trust’s investment performance and should not be confused with “yield” or “income.” When distributions exceed total return performance, the difference will reduce the Trust’s net asset value per share. | |
Section 19(a) notices for the Trusts, as applicable, are available on the BlackRock website at blackrock.com.
| | |
| 2 | | 2 0 2 1 BLACK ROCK SEMI - ANNUAL REPORT TO SHAREHOLDERS |
The Markets in Review
Dear Shareholder,
The 12-month reporting period as of January 31, 2021 has been a time of sudden change, as the emergence and spread of the coronavirus (or “COVID-19”) led to a vast disruption in the global economy and financial markets. The threat from the virus became increasingly apparent throughout February and March 2020, and countries around the world took economically disruptive countermeasures. Stay-at-home orders and closures of non-essential businesses became widespread, many workers were laid off, and unemployment claims spiked, causing a global recession and a sharp fall in equity prices.
After markets hit their lowest point of the reporting period in late March 2020, a steady recovery ensued, as businesses began to re-open and governments learned to adapt to life with the virus. Equity prices continued to rise throughout the summer, fed by strong fiscal and monetary support and improving economic indicators. Many equity indices neared or surpassed all-time highs late in the reporting period following a series of successful vaccine trials and passage of additional stimuli. In the United States, both large- and small-capitalization stocks posted a significant advance. International equities from developed economies grew at a more modest pace, lagging emerging market stocks, which rebounded sharply.
During the market downturn, the performance of different types of fixed-income securities initially diverged due to a reduced investor appetite for risk. U.S. Treasuries benefited from the risk-off environment and posted positive returns, as the 10-year U.S. Treasury yield (which is inversely related to bond prices) dropped to historic lows. In the corporate bond market, support from the U.S. Federal Reserve (the “Fed”) assuaged credit concerns and both investment-grade and high-yield bonds recovered to post positive returns.
Following the coronavirus outbreak, the Fed instituted two emergency interest rate cuts, pushing short-term interest rates, already low as the year began, close to zero. To stabilize credit markets, the Fed also implemented a new bond-buying program, as did several other central banks around the world, including the European Central Bank and the Bank of Japan.
Looking ahead, while coronavirus-related disruptions have clearly hindered worldwide economic growth, we believe that the global expansion is likely to accelerate as vaccination efforts continue to ramp up. Significant additional U.S. stimulus spending in early 2021 is being negotiated in Congress, which would provide a solid tailwind for economic growth. Inflation should increase somewhat as the expansion continues, but a shift in central bank policy means that moderate inflation is less likely to be followed by interest rate hikes that could threaten the equity expansion.
Overall, we favor a positive stance toward risk, with an overweight in both equities and credit. We see U.S. and Asian equities benefiting from structural growth trends in tech, while emerging markets should be particularly helped by a vaccine-led economic expansion. In credit, rising inflation should provide tailwinds for inflation-protected bonds, and Euro area peripherals and Asian bonds also present attractive opportunities. We believe that international diversification and a focus on sustainability can help provide portfolio resilience, and the disruption created by the coronavirus appears to be accelerating the shift toward sustainable investments.
In this environment, our view is that investors need to think globally, extend their scope across a broad array of asset classes, and be nimble as market conditions change. We encourage you to talk with your financial advisor and visit blackrock.com for further insight about investing in today’s markets.
Sincerely,

Rob Kapito
President, BlackRock Advisors, LLC

Rob Kapito
President, BlackRock Advisors, LLC
| | | | |
| Total Returns as of January 31, 2021 |
| | | 6-Month | | 12-Month |
| | |
U.S. large cap equities
(S&P 500® Index) | | 14.47% | | 17.25% |
| | |
U.S. small cap equities
(Russell 2000® Index) | | 40.89 | | 30.17 |
| | |
International equities
(MSCI Europe, Australasia, Far East Index) | | 17.58 | | 8.94 |
| | |
Emerging market equities
(MSCI Emerging Markets Index) | | 24.07 | | 27.89 |
| | |
3-month Treasury bills
(ICE BofA 3-Month U.S. Treasury Bill Index) | | 0.06 | | 0.54 |
| | |
U.S. Treasury securities
(ICE BofA 10-Year U.S. Treasury Index) | | (4.56) | | 4.91 |
| | |
U.S. investment grade bonds
(Bloomberg Barclays U.S. Aggregate Bond Index) | | (0.91) | | 4.72 |
| | |
Tax-exempt municipal bonds
(S&P Municipal Bond Index) | | 2.06 | | 3.85 |
| | |
U.S. high yield bonds
(Bloomberg Barclays U.S. Corporate High Yield 2% Issuer Capped Index) | | 6.72 | | 7.38 |
|
Past performance is not an indication of future results. Index performance is shown for illustrative purposes only. You cannot invest directly in an index. |
| | |
THIS PAGE IS NOT PART OF YOUR FUND REPORT | | 3 |
Table of Contents
Municipal Market Overview For the Reporting Period Ended January 31, 2021
Municipal Market Conditions
Municipal bonds posted positive total returns during the period amid increased volatility. Initial strong performance reversed abruptly as a result of the COVID-19 pandemic induced economic shutdown. Performance plummeted -10.87% during a two-week period in March 2020, before rebounding on valuation-based buying. (For comparison, the -11.86% correction in 2008 spanned more than a month.) Fiscal stimulus, monetary policy accommodation, and the partial re-opening of the economy combined to stabilize the market and drive strong performance throughout the summer months. Performance briefly stalled on U.S. election uncertainty, but more recently benefited from a favorable technical backdrop, vaccine optimism, and expectation for additional fiscal aid from the newly unified Democratic government.
| | |
| |
Strong technical support during most of the period temporarily waned as COVID-19 fears spurred risk-off sentiment resulting in record outflows. During the 12 months ended January 31, 2021, municipal bond funds experienced net inflows totaling $40 billion, drawn down by nearly $46 billion in outflows during the months of March and April 2020 (based on data from the Investment Company Institute). For the same 12-month period, new issuance was robust at $448 billion but slowed during the height of the pandemic as market liquidity became constrained amid the flight to quality. Taxable municipal issuance was elevated as issuers increasingly advance | | S&P Municipal Bond Index Total Returns as of January 31, 2021 6 months: 2.06% 12 months: 3.85% |
refunded tax-exempt debt in the taxable municipal market for cost savings. |
A Closer Look at Yields
| | |
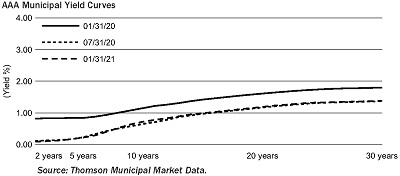
| | From January 31, 2020 to January 31, 2021, yields on AAA-rated 30-year municipal bonds decreased by 42 basis points (“bps”) from 1.80% to 1.38%, while ten-year rates decreased by 43 bps from 1.15% to 0.72% and five-year rates decreased by 62 bps from 0.84% to 0.22% (as measured by Thomson Municipal Market Data). As a result, the municipal yield curve bull steepened over the 12-month period with the spread between two- and 30-year maturities steepening by 30 bps, lagging the 106 bps of steepening experienced in the U.S. Treasury curve. After dislocating at the height of the pandemic, consistent municipal outperformance in the intermediate and long-end of the curve has resulted in extremely rich valuations with ten- and 30-year municipal-to-Treasury ratios at all-time tights. |
Financial Conditions of Municipal Issuers
The COVID-19 pandemic has been an unprecedented shock to the system impacting nearly every sector in the municipal market. Fortunately, most states and municipalities were in excellent fiscal health before the crisis, and the federal government is poised to provide another massive federal aid injection. Direct state and local government aid will provide additional support to own-source government tax receipts, which have outperformed the dire predictions made earlier in 2020. Essential public services such as power, water, and sewer remain protected segments. State housing authority bonds, flagship universities, and strong national and regional health systems have absorbed the impact of the economic shock. While some segments face daunting financial challenges, the combination of new federal stimulus and vaccine distribution should augment economic activity and, consequently, bolster revenue receipts in these sectors as well. Critical providers (safety net hospitals, mass transit systems, airports) with limited resources may still experience fiscal strain, but the additional aid and the re-opening of the economy should bring better operating results in the second half of 2021. BlackRock anticipates that a small subset of the market, mainly non-rated stand-alone projects, will remain susceptible to credit deterioration. Again, however, the effective vaccine regimen and prospects for improved distribution suggest that a rebound in economic activity could reduce the number of potential defaults in riskier non-rated credits. While credit fundamentals are expected to improve noticeably across the municipal space, BlackRock advocates careful credit selection as the market must still navigate near-term uncertainty.
The opinions expressed are those of BlackRock as of January 31, 2021 and are subject to change at any time due to changes in market or economic conditions. The comments should not be construed as a recommendation of any individual holdings or market sectors. Investing involves risk including loss of principal. Bond values fluctuate in price so the value of your investment can go down depending on market conditions. Fixed income risks include interest-rate and credit risk. Typically, when interest rates rise, there is a corresponding decline in bond values. Credit risk refers to the possibility that the bond issuer will not be able to make principal and interest payments. There may be less information on the financial condition of municipal issuers than for public corporations. The market for municipal bonds may be less liquid than for taxable bonds. Some investors may be subject to Alternative Minimum Tax (“AMT”). Capital gains distributions, if any, are taxable.
The S&P Municipal Bond Index, a broad, market value-weighted index, seeks to measure the performance of the U.S. municipal bond market. All bonds in the index are exempt from U.S. federal income taxes or subject to the AMT. Past performance is not an indication of future results. Index performance is shown for illustrative purposes only. It is not possible to invest directly in an index.
| | |
MUNICIPAL MARKET OVERVIEW | | 5 |
The Benefits and Risks of Leveraging
The Trusts may utilize leverage to seek to enhance the distribution rate on, and net asset value (“NAV”) of, their common shares (“Common Shares”). However, there is no guarantee that these objectives can be achieved in all interest rate environments.
In general, the concept of leveraging is based on the premise that the financing cost of leverage, which is based on short-term interest rates, is normally lower than the income earned by a Trust on its longer-term portfolio investments purchased with the proceeds from leverage. To the extent that the total assets of each Trust (including the assets obtained from leverage) are invested in higher-yielding portfolio investments, each Trust’s shareholders benefit from the incremental net income. The interest earned on securities purchased with the proceeds from leverage (after paying the leverage costs) is paid to shareholders in the form of dividends, and the value of these portfolio holdings (less the leverage liability) is reflected in the per share NAV.
To illustrate these concepts, assume a Trust’s Common Shares capitalization is $100 million and it utilizes leverage for an additional $30 million, creating a total value of $130 million available for investment in longer-term income securities. If prevailing short-term interest rates are 3% and longer-term interest rates are 6%, the yield curve has a strongly positive slope. In this case, a Trust’s financing costs on the $30 million of proceeds obtained from leverage are based on the lower short-term interest rates. At the same time, the securities purchased by a Trust with the proceeds from leverage earn income based on longer-term interest rates. In this case, a Trust’s financing cost of leverage is significantly lower than the income earned on a Trust’s longer-term investments acquired from such leverage proceeds, and therefore the holders of Common Shares (“Common Shareholders”) are the beneficiaries of the incremental net income.
However, in order to benefit Common Shareholders, the return on assets purchased with leverage proceeds must exceed the ongoing costs associated with the leverage. If interest and other costs of leverage exceed a Trust’s return on assets purchased with leverage proceeds, income to shareholders is lower than if a Trust had not used leverage. Furthermore, the value of the Trusts’ portfolio investments generally varies inversely with the direction of long-term interest rates, although other factors can influence the value of portfolio investments. In contrast, the value of each Trust’s obligations under its respective leverage arrangement generally does not fluctuate in relation to interest rates. As a result, changes in interest rates can influence the Trusts’ NAVs positively or negatively. Changes in the future direction of interest rates are very difficult to predict accurately, and there is no assurance that a Trust’s intended leveraging strategy will be successful.
The use of leverage also generally causes greater changes in each Trust’s NAV, market price and dividend rates than comparable portfolios without leverage. In a declining market, leverage is likely to cause a greater decline in the NAV and market price of a Trust’s Common Shares than if the Trust were not leveraged. In addition, each Trust may be required to sell portfolio securities at inopportune times or at distressed values in order to comply with regulatory requirements applicable to the use of leverage or as required by the terms of leverage instruments, which may cause the Trust to incur losses. The use of leverage may limit a Trust’s ability to invest in certain types of securities or use certain types of hedging strategies. Each Trust incurs expenses in connection with the use of leverage, all of which are borne by Common Shareholders and may reduce income to the Common Shares. Moreover, to the extent the calculation of each Trust’s investment advisory fees includes assets purchased with the proceeds of leverage, the investment advisory fees payable to the Trusts’ investment adviser will be higher than if the Trusts did not use leverage.
To obtain leverage, each Trust has issued Variable Rate Demand Preferred Shares (“VRDP Shares”), Variable Rate Muni Term Preferred Shares (“VMTP Shares”) or Remarketable Variable Rate Muni Term Preferred Shares (“RVMTP Shares”) (collectively, “Preferred Shares”) and/or leveraged its assets through the use of tender option bond trusts (“TOB Trusts”) as described in the Notes to Financial Statements.
Under the Investment Company Act of 1940, as amended (the “1940 Act”), each Trust is permitted to issue debt up to 33 1/3% of its total managed assets or equity securities (e.g., Preferred Shares) up to 50% of its total managed assets. A Trust may voluntarily elect to limit its leverage to less than the maximum amount permitted under the 1940 Act. In addition, a Trust may also be subject to certain asset coverage, leverage or portfolio composition requirements imposed by the Preferred Shares’ governing instruments or by agencies rating the Preferred Shares, which may be more stringent than those imposed by the 1940 Act.
If a Trust segregates or designates on its books and records cash or liquid assets having a value not less than the value of a Trust’s obligations under the TOB Trust (including accrued interest), then the TOB Trust is not considered a senior security and is not subject to the foregoing limitations and requirements imposed by the 1940 Act.
Derivative Financial Instruments
The Trusts may invest in various derivative financial instruments. These instruments are used to obtain exposure to a security, commodity, index, market, and/or other assets without owning or taking physical custody of securities, commodities and/or other referenced assets or to manage market, equity, credit, interest rate, foreign currency exchange rate, commodity and/or other risks. Derivative financial instruments may give rise to a form of economic leverage and involve risks, including the imperfect correlation between the value of a derivative financial instrument and the underlying asset, possible default of the counterparty to the transaction or illiquidity of the instrument. The Trusts’ successful use of a derivative financial instrument depends on the investment adviser’s ability to predict pertinent market movements accurately, which cannot be assured. The use of these instruments may result in losses greater than if they had not been used, may limit the amount of appreciation a Trust can realize on an investment and/or may result in lower distributions paid to shareholders. The Trusts’ investments in these instruments, if any, are discussed in detail in the Notes to Financial Statements.
| | |
| 6 | | 2 0 2 1 BLACK ROCK SEMI - ANNUAL REPORT TO SHAREHOLDERS |
| | |
| Trust Summary as of January 31, 2021 | | BlackRock California Municipal Income Trust (BFZ) |
Investment Objective
BlackRock California Municipal Income Trust’s (BFZ) (the “Trust”) investment objective is to provide current income exempt from regular U.S. federal income and California income taxes. The Trust seeks to achieve its investment objective by investing primarily in municipal obligations exempt from U.S. federal income taxes (except that the interest may be subject to the federal alternative minimum tax) and California income taxes. The Trust invests, under normal market conditions, at least 80% of its assets in municipal obligations that are investment grade quality, or are considered by the Trust’s investment adviser to be of comparable quality, at the time of investment. The Trust may invest directly in securities or synthetically through the use of derivatives.
No assurance can be given that the Trust’s investment objective will be achieved.
Trust Information
| | |
|
Symbol on New York Stock Exchange | | BFZ |
| |
Initial Offering Date | | July 27, 2001 |
| |
Yield on Closing Market Price as of January 31, 2021 ($14.30)(a) | | 3.19% |
| |
Tax Equivalent Yield(b) | | 6.95% |
| |
Current Monthly Distribution per Common Share(c) | | $0.0380 |
| |
Current Annualized Distribution per Common Share(c) | | $0.4560 |
| |
Leverage as of January 31, 2021(d) | | 38% |
|
| | (a) | Yield on closing market price is calculated by dividing the current annualized distribution per share by the closing market price. Past performance is not an indication of future results. | |
| | (b) | Tax equivalent yield assumes the maximum marginal U.S. federal and state tax rate of 54.1%, which includes the 3.8% Medicare tax. Actual tax rates will vary based on income, exemptions and deductions. Lower taxes will result in lower tax equivalent yields. | |
| | (c) | The monthly distribution per Common Share, declared on March 1, 2021, was increased to $0.0430 per share. The yield on closing market price, tax equivalent yield, current monthly distribution per Common Share, and current annualized distribution per Common Share do not reflect the new distribution rate. The new distribution rate is not constant and is subject to change in the future. | |
| | (d) | Represents VMTP Shares and TOB Trusts as a percentage of total managed assets, which is the total assets of the Trust, including any assets attributable to VMTP Shares and TOB Trusts, minus the sum of its accrued liabilities. Does not reflect derivatives or other instruments that may give rise to economic leverage. For a discussion of leveraging techniques utilized by the Trust, please see The Benefits and Risks of Leveraging and Derivative Financial Instruments. | |
Market Price and Net Asset Value Per Share Summary
| | | | | | | | | | | | | | | | | | | | |
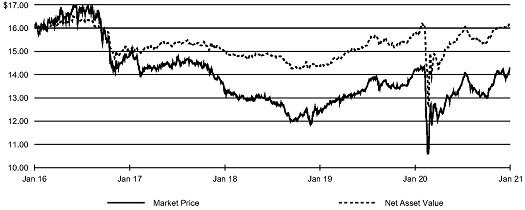
| | | 01/31/21 | | | 07/31/20 | | | Change | | | High | | | Low | |
Market Price | | $ | 14.30 | | | $ | 13.79 | | | | 3.70 | % | | $ | 14.30 | | | $ | 13.00 | |
Net Asset Value | | | 16.22 | | | | 15.86 | | | | 2.27 | | | | 16.22 | | | | 15.33 | |
Market Price and Net Asset Value History for the Past Five Years
| | |
| Trust Summary as of January 31, 2021 (continued) | | BlackRock California Municipal Income Trust (BFZ) |
Performance
Returns for the six months ended January 31, 2021 were as follows:
| | | | | | | | |
| | | Returns Based On | |
| | |
| | | Market Price | | | NAV | |
BFZ(a)(b) | | | 5.43 | % | | | 3.98 | % |
| | |
Lipper California Municipal Debt Funds(c) | | | 3.82 | | | | 3.45 | |
| | (a) | All returns reflect reinvestment of dividends and/or distributions at actual reinvestment prices. Performance results reflect the Trust’s use of leverage. | |
| | (b) | The Trust’s discount to NAV narrowed during the period, which accounts for the difference between performance based on market price and performance based on NAV. | |
| | (c) | Average return. Returns reflect reinvestment of dividends and/or distributions at NAV on the ex-dividend date as calculated by Lipper. | |
Performance results may include adjustments made for financial reporting purposes in accordance with U.S. generally accepted accounting principles. Past performance is not an indication of future results.
More information about the Trust’s historical performance can be found in the “Closed End Funds” section of blackrock.com.
The following discussion relates to the Trust’s absolute performance based on NAV:
Municipal bonds delivered positive returns in the six-month period. Although U.S. Treasury yields moved higher (as prices fell), the tax-exempt market posted a gain due to a decline in yield spreads. Investors grew increasingly optimistic about the economic outlook for 2021, particularly after the approval of a vaccine for COVID-19 in early November 2020. Inflows into the market were consistent and traditional tax-exempt supply trended lower, creating a positive supply-and-demand dynamic that aided performance.
Despite the challenges to state and local budgets from COVID-19, California’s credit quality held up well across most sectors. The potential for higher federal tax rates in the future, together with investors’ ongoing demand for income, created a favorable technical backdrop for tax-exempt municipal bonds in high-tax states such as California.
The Trust’s positions in long-duration securities provided the best returns as yields declined and the yield curve flattened. (Duration is a measure of interest rate sensitivity.) At the sector level, positions in transportation, tax-backed local, school district, utility and education issues made the largest contributions.
The use of leverage, which added to the Trust’s income and amplified the effect of rising prices, was a further positive. The Trust sought to manage interest rate risk using U.S. Treasury futures. Given that long-term U.S. Treasury yields rose, as prices fell, this strategy contributed to performance.
On the negative side, the Trust’s higher-quality bias represented an opportunity cost at a time of outperformance for lower-quality issues.
The views expressed reflect the opinions of BlackRock as of the date of this report and are subject to change based on changes in market, economic or other conditions. These views are not intended to be a forecast of future events and are no guarantee of future results.
| | |
| 8 | | 2 0 2 1 BLACK ROCK SEMI - ANNUAL REPORT TO SHAREHOLDERS |
| | |
| Trust Summary as of January 31, 2021 (continued) | | BlackRock California Municipal Income Trust (BFZ) |
Overview of the Trust’s Total Investments
SECTOR ALLOCATION
| | | | | | | | |
| | | |
| Sector(a)(b) | | 01/31/21 | | | 07/31/20 | |
| | |
County/City/Special District/School District | | | 27 | % | | | 30 | % |
| | |
Transportation | | | 20 | | | | 22 | |
| | |
Utilities | | | 15 | | | | 16 | |
| | |
Education | | | 13 | | | | 11 | |
| | |
State | | | 12 | | | | 8 | |
| | |
Health | | | 9 | | | | 9 | |
| | |
Tobacco | | | 3 | | | | 3 | |
| | |
Housing | | | 1 | | | | 1 | |
| | |
Corporate | | | — | (c) | | | — | |
CREDIT QUALITY ALLOCATION
| | | | | | | | |
| | | |
| Credit Rating(a)(e) | | 01/31/21 | | | 07/31/20 | |
| | |
AAA/Aaa | | | 7 | % | | | 9 | % |
| | |
AA/Aa | | | 68 | | | | 68 | |
| | |
A | | | 14 | | | | 14 | |
| | |
BBB/Baa | | | 1 | | | | — | (c) |
| | |
BB/Ba | | | — | (c) | | | — | (c) |
| | |
B/B | | | — | | | | 1 | |
| | |
B | | | 1 | | | | — | |
| | |
CC | | | — | | | | 1 | |
| | |
C | | | 1 | | | | — | |
| | |
N/R | | | 8 | (f) | | | 7 | |
CALL/MATURITY SCHEDULE
| | | | |
| | |
| Calendar Year Ended December 31,(a)(d) | | Percentage | |
| |
2021 | | | 3 | % |
| |
2022 | | | 3 | |
| |
2023 | | | 3 | |
| |
2024 | | | 3 | |
| |
2025 | | | 8 | |
| (a) | Excludes short-term securities. |
| (b) | For Trust compliance purposes, the Trust’s sector classifications refer to one or more of the sector sub-classifications used by one or more widely recognized market indexes or rating group indexes, and/or as defined by the investment adviser. These definitions may not apply for purposes of this report, which may combine such sector sub-classifications for reporting ease. |
| (c) | Rounds to less than 1% of total investments. |
| (d) | Scheduled maturity dates and/or bonds that are subject to potential calls by issuers over the next five years. |
| (e) | For financial reporting purposes, credit quality ratings shown above reflect the highest rating assigned by either S&P Global Ratings or Moody’s Investors Service, Inc. if ratings differ. These rating agencies are independent, nationally recognized statistical rating organizations and are widely used. Investment grade ratings are credit ratings of BBB/Baa or higher. Below investment grade ratings are credit ratings of BB/Ba or lower. Investments designated N/R are not rated by either rating agency. Unrated investments do not necessarily indicate low credit quality. Credit quality ratings are subject to change. |
| (f) | The investment adviser evaluates the credit quality of unrated investments based upon certain factors including, but not limited to, credit ratings for similar investments and financial analysis of sectors and individual investments. Using this approach, the investment adviser has deemed certain of these unrated securities as investment grade quality. As of January 31, 2021, the market value of unrated securities deemed by the investment adviser to be investment grade represents less than 1% of the Trust’s total investments. |
| | |
| Trust Summary as of January 31, 2021 | | BlackRock Municipal 2030 Target Term Trust (BTT) |
Investment Objective
BlackRock Municipal 2030 Target Term Trust’s (BTT) (the “Trust”) investment objectives are to provide current income exempt from regular U.S. federal income tax (but which may be subject to the federal alternative minimum tax in certain circumstances) and to return $25.00 per common share (the initial offering price per share) to holders of common shares on or about December 31, 2030. The Trust seeks to achieve its investment objectives by investing at least 80% of its assets in municipal bonds exempt from U.S. federal income taxes (except that the interest may be subject to the federal alternative minimum tax). The Trust invests at least 80% of its assets in municipal bonds that are investment grade quality, or are considered by the Trust’s investment adviser to be of comparable quality, at the time of investment. The Trust actively manages the maturity of its bonds to seek to have a dollar weighted average effective maturity approximately equal to the Trust’s maturity date. The Trust may invest directly in securities or synthetically through the use of derivatives.
There is no assurance that the Trust will achieve its investment objectives, including its investment objective of returning $25.00 per share.
Trust Information
| | |
|
| |
Symbol on New York Stock Exchange | | BTT |
| |
Initial Offering Date | | August 30, 2012 |
| |
Termination Date (on or about) | | December 31, 2030 |
| |
Yield on Closing Market Price as of January 31, 2021 ($25.95)(a) | | 2.89% |
| |
Tax Equivalent Yield(b) | | 4.88% |
| |
Current Monthly Distribution per Common Share(c) | | $0.0624 |
| |
Current Annualized Distribution per Common Share(c) | | $0.7488 |
| |
Leverage as of January 31, 2021(d) | | 34% |
|
| | (a) | Yield on closing market price is calculated by dividing the current annualized distribution per share by the closing market price. Past performance is not an indication of future results. | |
| | (b) | Tax equivalent yield assumes the maximum marginal U.S. federal tax rate of 40.8%, which includes the 3.8% Medicare tax. Actual tax rates will vary based on income, exemptions and deductions. Lower taxes will result in lower tax equivalent yields. | |
| | (c) | The distribution rate is not constant and is subject to change. | |
| | (d) | Represents RVMTP Shares and TOB Trusts as a percentage of total managed assets, which is the total assets of the Trust, including any assets attributable to RVMTP Shares and TOB Trusts, minus the sum of accrued liabilities. Does not reflect derivatives or other instruments that may give rise to economic leverage. For a discussion of leveraging techniques utilized by the Trust, please see The Benefits and Risks of Leveraging. | |
Market Price and Net Asset Value Per Share Summary
| | | | | | | | | | | | | | | | | | | | |
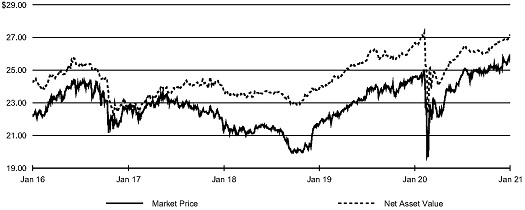
| | | 01/31/21 | | | 07/31/20 | | | Change | | | High | | | Low | |
Market Price | | $ | 25.95 | | | $ | 24.78 | | | | 4.72 | % | | | $ 25.95 | | | $ | 24.30 | |
Net Asset Value | | | 27.14 | | | | 26.31 | | | | 3.15 | | | | 27.14 | | | | 26.01 | |
Market Price and Net Asset Value History for the Past Five Years
| | |
| 10 | | 2 0 2 1 BLACK ROCK SEMI - ANNUAL REPORT TO SHAREHOLDERS |
| | |
| Trust Summary as of January 31, 2021 (continued) | | BlackRock Municipal 2030 Target Term Trust (BTT) |
Performance
Returns for the six months ended January 31, 2021 were as follows:
| | | | | | | | |
| |
| | | Returns Based On | |
| | |
| | | Market Price | | | NAV | |
BTT(a)(b) | | | 6.28 | % | | | 4.70 | % |
Lipper General & Insured Municipal Debt Funds (Leveraged)(c) | | | 6.44 | | | | 5.39 | |
| | (a) | All returns reflect reinvestment of dividends and/or distributions at actual reinvestment prices. Performance results reflect the Trust’s use of leverage. | |
| | (b) | The Trust’s discount to NAV narrowed during the period, which accounts for the difference between performance based on market price and performance based on NAV. | |
| | (c) | Average return. Returns reflect reinvestment of dividends and/or distributions at NAV on the ex-dividend date as calculated by Lipper. | |
Performance results may include adjustments made for financial reporting purposes in accordance with U.S. generally accepted accounting principles. Past performance is not an indication of future results.
More information about the Trust’s historical performance can be found in the “Closed End Funds” section of blackrock.com.
The following discussion relates to the Trust’s absolute performance based on NAV:
Municipal bonds delivered positive returns in the six-month period. Although U.S. Treasury yields moved higher (as prices fell), the tax-exempt market posted a gain due to a decline in yield spreads. Investors grew increasingly optimistic about the economic outlook for 2021, particularly after the approval of a vaccine for COVID-19 in early November 2020. Inflows into the market were consistent and traditional tax-exempt supply trended lower, creating a positive supply-and-demand dynamic that aided performance.
High yield municipal bonds outperformed the broader market, led by more liquid tobacco and Puerto Rico bonds. In this environment, the Trust’s holdings in A and BBB rated securities were sizable contributors to performance. On a sector basis, state tax-backed issues were the strongest performers, highlighted by Puerto Rico. Revenue sectors, including transportation, health care and corporate-backed debt, also performed well. Holdings in longer-maturity debt outpaced short term issues.
The use of leverage augmented returns by boosting income and amplifying the effect of rising prices. Given that the Trust limits its holding to a band around the stated termination date of 2030, its credit exposure was more of a factor in its performance than its yield curve positioning.
Reinvestment risk remained a headwind since the proceeds from bonds that matured or were called needed to be reinvested at lower yields compared with bonds that were issued when yields were higher.
The views expressed reflect the opinions of BlackRock as of the date of this report and are subject to change based on changes in market, economic or other conditions. These views are not intended to be a forecast of future events and are no guarantee of future results.
| | |
| Trust Summary as of January 31, 2021 (continued) | | BlackRock Municipal 2030 Target Term Trust (BTT) |
Overview of the Trust’s Total Investments
SECTOR ALLOCATION
| | | | | | | | | | | | |
| | | | | |
| | | |
| Sector(a)(b) | | 01/31/21 | | | 07/31/20 | | | | |
| | | | | |
| | | |
Transportation | | | 19 | % | | | 24% | | | | | |
| | | |
State | | | 18 | | | | 16 | | | | | |
| | | |
County/City/Special District/School District | | | 18 | | | | 14 | | | | | |
| | | |
Health | | | 18 | | | | 17 | | | | | |
| | | |
Corporate | | | 9 | | | | 8 | | | | | |
| | | |
Education | | | 7 | | | | 8 | | | | | |
| | | |
Utilities | | | 6 | | | | 8 | | | | | |
| | | |
Tobacco | | | 3 | | | | 3 | | | | | |
| | | |
Housing | | | 2 | | | | 2 | | | | | |
| | | | | |
CREDIT QUALITY ALLOCATION
| | | | | | | | |
| |
| | |
| Credit Rating(a)(e) | | 01/31/21 | | | 07/31/20 | |
| |
| | |
AAA/Aaa | | | 3 | % | | | 3 | % |
| | |
AA/Aa | | | 30 | | | | 30 | |
| | |
A | | | 39 | | | | 41 | |
| | |
BBB/Baa | | | 15 | | | | 14 | |
| | |
BB/Ba | | | 3 | | | | 3 | |
| | |
B | | | — | (d) | | | — | |
| | |
N/R(f) | | | 10 | | | | 9 | |
| |
CALL/MATURITY SCHEDULE
| | | | | | | | | | |
| | | | | |
| | | |
| Calendar Year Ended December 31,(a)(c) | | | | Percentage | | | | |
| | | | | |
| | | |
2021 | | | | | —% | (d) | | | | |
| | | |
2022 | | | | | 22 | | | | | |
| | | |
2023 | | | | | 10 | | | | | |
| | | |
2024 | | | | | 5 | | | | | |
| | | |
2025 | | | | | 5 | | | | | |
| | | | | |
| (a) | Excludes short-term securities. |
| (b) | For Trust compliance purposes, the Trust’s sector classifications refer to one or more of the sector sub-classifications used by one or more widely recognized market indexes or rating group indexes, and/or as defined by the investment adviser. These definitions may not apply for purposes of this report, which may combine such sector sub-classifications for reporting ease. |
| (c) | Scheduled maturity dates and/or bonds that are subject to potential calls by issuers over the next five years. |
| (d) | Rounds to less than 1% of total investments. |
| (e) | For financial reporting purposes, credit quality ratings shown above reflect the highest rating assigned by either S&P Global Ratings or Moody’s Investors Service, Inc. if ratings differ. These rating agencies are independent, nationally recognized statistical rating organizations and are widely used. Investment grade ratings are credit ratings of BBB/Baa or higher. Below investment grade ratings are credit ratings of BB/Ba or lower. Investments designated N/R are not rated by either rating agency. Unrated investments do not necessarily indicate low credit quality. Credit quality ratings are subject to change. |
| (f) | The investment adviser evaluates the credit quality of unrated investments based upon certain factors including, but not limited to, credit ratings for similar investments and financial analysis of sectors and individual investments. Using this approach, the investment adviser has deemed certain of these unrated securities as investment grade quality. As of January 31, 2021 and July 31, 2020, the market value of unrated securities deemed by the investment adviser to be investment grade each represents less than 1% of the Trust’s total investments. |
| | |
| 12 | | 2 0 2 1 BLACK ROCK SEMI - ANNUAL REPORT TO SHAREHOLDERS |
| | |
| Trust Summary as of January 31, 2021 | | BlackRock Municipal Income Investment Trust (BBF) |
Investment Objective
BlackRock Municipal Income Investment Trust’s (BBF) (the “Trust”) investment objective is to provide current income exempt from regular U.S. federal income tax. The Trust seeks to achieve its investment objective by investing at least 80% of its assets in municipal bonds, the interest of which is exempt from U.S. federal income taxes. The Trust invests at least 80% of its assets in municipal bonds that are investment grade quality, or are considered by the Trust’s investment adviser to be of comparable quality, at the time of investment. The Trust may invest directly in such securities or synthetically through the use of derivatives.
On June 16, 2020, the Board of Trustees of BBF and the Board of Trustees of BlackRock Municipal Income Trust II (BLE) each approved the reorganization of BBF into BLE. The reorganization was approved by each Trust’s shareholders and is expected to occur during the second quarter of 2021, subject to the satisfaction of customary closing conditions. Prior to the reorganization, all of BBF’s VRDP Shares will be refinanced into VMTP Shares.
No assurance can be given that the Trust’s investment objective will be achieved.
Trust Information
| | |
|
| |
Symbol on New York Stock Exchange | | BBF |
| |
Initial Offering Date | | July 27, 2001 |
| |
Yield on Closing Market Price as of January 31, 2021 ($13.89)(a) | | 4.36% |
| |
Tax Equivalent Yield(b) | | 7.36% |
| |
Current Monthly Distribution per Common Share(c) | | $0.0505 |
| |
Current Annualized Distribution per Common Share(c) | | $0.6060 |
| |
Leverage as of January 31, 2021(d) | | 37% |
|
| | (a) | Yield on closing market price is calculated by dividing the current annualized distribution per share by the closing market price. Past performance is not an indication of future results. | |
| | (b) | Tax equivalent yield assumes the maximum marginal U.S. federal tax rate of 40.8%, which includes the 3.8% Medicare tax. Actual tax rates will vary based on income, exemptions and deductions. Lower taxes will result in lower tax equivalent yields. | |
| | (c) | The distribution rate is not constant and is subject to change. A portion of the distribution may be deemed a return of capital or net realized gain. | |
| | (d) | Represents VRDP Shares and TOB Trusts as a percentage of total managed assets, which is the total assets of the Trust, including any assets attributable to VRDP Shares and TOB Trusts, minus the sum of its accrued liabilities. Does not reflect derivatives or other instruments that may give rise to economic leverage. For a discussion of leveraging techniques utilized by the Trust, please see The Benefits and Risks of Leveraging and Derivative Financial Instruments. | |
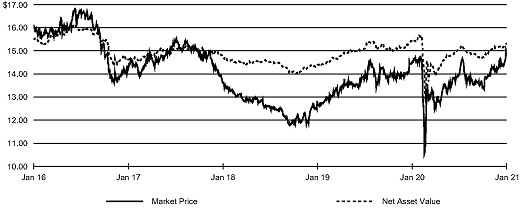
Market Price and Net Asset Value Per Share Summary
| | | | | | | | | | | | | | | | | | | | |
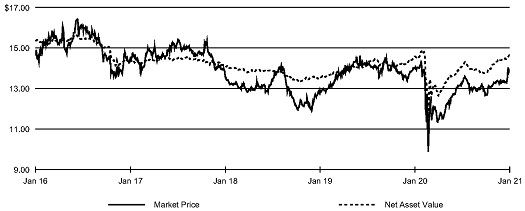
| | | 01/31/21 | | | 07/31/20 | | | Change | | | High | | | Low | |
| | | | | |
Market Price | | $ | 13.89 | | | $ | 13.32 | | | | 4.28 | % | | | $ 14.17 | | | $ | 12.64 | |
| | | | | |
Net Asset Value | | | 14.65 | | | | 14.14 | | | | 3.61 | | | | 14.65 | | | | 13.75 | |
Market Price and Net Asset Value History for the Past Five Years
| | |
| Trust Summary as of January 31, 2021 (continued) | | BlackRock Municipal Income Investment Trust (BBF) |
Performance
Returns for the six months ended January 31, 2021 were as follows:
| | | | | | | | |
| | | Returns Based On | |
| | |
| | | Market Price | | | NAV | |
| | |
BBF(a)(b) | | | 6.68 | % | | | 5.99 | % |
| | |
Lipper General & Insured Municipal Debt Funds (Leveraged)(c) | | | 6.44 | | | | 5.39 | |
| | (a) | All returns reflect reinvestment of dividends and/or distributions at actual reinvestment prices. Performance results reflect the Trust’s use of leverage. | |
| | (b) | The Trust’s discount to NAV narrowed during the period, which accounts for the difference between performance based on market price and performance based on NAV. | |
| | (c) | Average return. Returns reflect reinvestment of dividends and/or distributions at NAV on the ex-dividend date as calculated by Lipper. | |
Performance results may include adjustments made for financial reporting purposes in accordance with U.S. generally accepted accounting principles. Past performance is not an indication of future results.
More information about the Trust’s historical performance can be found in the “Closed End Funds” section of blackrock.com.
The following discussion relates to the Trust’s absolute performance based on NAV:
Municipal bonds delivered positive returns in the six-month period. Although U.S. Treasury yields moved higher (as prices fell), the tax-exempt market posted a gain due to a decline in yield spreads. Investors grew increasingly optimistic about the economic outlook for 2021, particularly after the approval of a vaccine for COVID-19 in early November 2020. Inflows into the market were consistent and traditional tax-exempt supply trended lower, creating a positive supply-and-demand dynamic that aided performance.
Given that municipal yields were little changed during the period, income was a large driver of performance. The use of leverage further augmented income as funding costs remained at depressed levels.
Yield spreads declined as the fundamental and technical backdrop for the asset class improved. As a result, some of the sectors impacted the most by COVID-19—such as health care and state tax-backed issues from lower-rated issuers (including Illinois, New Jersey and Puerto Rico)—started to recover. Holdings in the transportation sector also aided results. Additionally, longer-dated holdings with maturities of 20 years and above outperformed. The Trust actively sought to manage interest rate risk using U.S. Treasury futures. Since U.S.Treasury yields rose, as prices fell, this strategy contributed to results.
Reinvestment risk remained a headwind since the proceeds from bonds that matured or were called needed to be reinvested at lower yields compared to bonds that were issued when yields were higher.
The views expressed reflect the opinions of BlackRock as of the date of this report and are subject to change based on changes in market, economic or other conditions. These views are not intended to be a forecast of future events and are no guarantee of future results.
| | |
| 14 | | 2 0 2 1 BLACK ROCK SEMI - ANNUAL REPORT TO SHAREHOLDERS |
| | |
| Trust Summary as of January 31, 2021 (continued) | | BlackRock Municipal Income Investment Trust (BBF) |
Overview of the Trust’s Total Investments
SECTOR ALLOCATION
| | | | | | | | |
| | | |
| Sector(a)(b) | | 01/31/21 | | | 07/31/20 | |
| | |
Transportation | | | 21 | % | | | 26 | % |
| | |
Health | | | 18 | | | | 17 | |
| | |
County/City/Special District/School District | | | 15 | | | | 21 | |
| | |
State | | | 14 | | | | 8 | |
| | |
Housing | | | 12 | | | | 7 | |
| | |
Tobacco | | | 7 | | | | 7 | |
| | |
Utilities | | | 6 | | | | 9 | |
| | |
Education | | | 5 | | | | 4 | |
| | |
Corporate | | | 2 | | | | 1 | |
CREDIT QUALITY ALLOCATION
| | | | | | | | |
| | | |
| Credit Rating(a)(d) | | 01/31/21 | | | 07/31/20 | |
| | |
AAA/Aaa | | | 4 | % | | | 5 | % |
| | |
AA/Aa | | | 35 | | | | 29 | |
| | |
A | | | 26 | | | | 28 | |
| | |
BBB/Baa | | | 16 | | | | 15 | |
| | |
BB/Ba | | | 5 | | | | 5 | |
| | |
B | | | 1 | | | | 1 | |
| | |
C | | | 1 | | | | — | |
| | |
N/R(e) | | | 12 | | | | 17 | |
CALL/MATURITY SCHEDULE
| | | | |
| | |
| Calendar Year Ended December 31,(a)(c) | | Percentage | |
| |
2021 | | | 6 | % |
| |
2022 | | | 2 | |
| |
2023 | | | 16 | |
| |
2024 | | | 2 | |
| |
2025 | | | 3 | |
| (a) | Excludes short-term securities. |
| (b) | For Trust compliance purposes, the Trust’s sector classifications refer to one or more of the sector sub-classifications used by one or more widely recognized market indexes or rating group indexes, and/or as defined by the investment adviser. These definitions may not apply for purposes of this report, which may combine such sector sub-classifications for reporting ease. |
| (c) | Scheduled maturity dates and/or bonds that are subject to potential calls by issuers over the next five years. |
| (d) | For financial reporting purposes, credit quality ratings shown above reflect the highest rating assigned by either S&P Global Ratings or Moody’s Investors Service, Inc. if ratings differ. These rating agencies are independent, nationally recognized statistical rating organizations and are widely used. Investment grade ratings are credit ratings of BBB/Baa or higher. Below investment grade ratings are credit ratings of BB/Ba or lower. Investments designated N/R are not rated by either rating agency. Unrated investments do not necessarily indicate low credit quality. Credit quality ratings are subject to change. |
| (e) | The investment adviser evaluates the credit quality of unrated investments based upon certain factors including, but not limited to, credit ratings for similar investments and financial analysis of sectors and individual investments. Using this approach, the investment adviser has deemed certain of these unrated securities as investment grade quality. As of January 31, 2021 and July 31, 2020, the market value of unrated securities deemed by the investment adviser to be investment grade represents 5% and 10%, respectively, of the Trust’s total investments. |
| | |
| Trust Summary as of January 31, 2021 | | BlackRock New York Municipal Income Trust (BNY) |
Investment Objective
BlackRock New York Municipal Income Trust’s (BNY) (the “Trust”) investment objective is to provide current income exempt from regular U.S. federal income tax and New York State and New York City personal income taxes. The Trust seeks to achieve its investment objective by investing primarily in municipal bonds exempt from U.S. federal income taxes (except that the interest may be subject to the federal alternative minimum tax) and New York State and New York City personal income taxes. The Trust invests at least 80% of its assets in municipal bonds that are investment grade quality, or are considered by the Trust’s investment adviser to be of comparable quality, at the time of investment. The Trust may invest directly in securities or synthetically through the use of derivatives.
On June 16, 2020, the Board of Trustees of each of BNY, BlackRock New York Municipal Income Quality Trust (BSE) and BlackRock New York Municipal Income Trust II (BFY), as applicable, each approved the reorganizations of BSE and BFY into BNY . The reorganization was approved by each Trust’s shareholders and is expected to occur during the second quarter of 2021, subject to the satisfaction of customary closing conditions. Prior to the reorganizations, all of the VMTP Shares of BNY will be refinanced into VRDP Shares.
No assurance can be given that the Trust’s investment objective will be achieved.
Trust Information
| | |
| | |
Symbol on New York Stock Exchange | | BNY |
Initial Offering Date | | July 27, 2001 |
Yield on Closing Market Price as of January 31, 2021 ($15.04)(a) | | 4.51% |
Tax Equivalent Yield(b) | | 8.95% |
Current Monthly Distribution per Common Share(c) | | $0.0565 |
Current Annualized Distribution per Common Share(c) | | $0.6780 |
Leverage as of January 31, 2021(d) | | 41% |
| | (a) | Yield on closing market price is calculated by dividing the current annualized distribution per share by the closing market price. Past performance is not an indication of future results. | |
| | (b) | Tax equivalent yield assumes the maximum marginal U.S. federal and state tax rate of 49.62%, which includes the 3.8% Medicare tax. Actual tax rates will vary based on income, exemptions and deductions. Lower taxes will result in lower tax equivalent yields. | |
| | (c) | The distribution rate is not constant and is subject to change. | |
| | (d) | Represents VMTP Shares and TOB Trusts as a percentage of total managed assets, which is the total assets of the Trust, including any assets attributable to VMTP Shares and TOB Trusts, minus the sum of its accrued liabilities. Does not reflect derivatives or other instruments that may give rise to economic leverage. For a discussion of leveraging techniques utilized by the Trust, please see The Benefits and Risks of Leveraging and Derivative Financial Instruments. | |
Market Price and Net Asset Value Per Share Summary
| | | | | | | | | | | | | | | | | | | | |
| | | 01/31/21 | | | 07/31/20 | | | Change | | | High | | | Low | |
| | | | | |
Market Price | | $ | 15.04 | | | $ | 14.10 | | | | 6.67 | % | | $ | 15.12 | | | $ | 13.25 | |
Net Asset Value | | | 15.31 | | | | 15.09 | | | | 1.46 | | | | 15.31 | | | | 14.69 | |
Market Price and Net Asset Value History for the Past Five Years
| | |
| 16 | | 2 0 2 1 BLACK ROCK SEMI - ANNUAL REPORT TO SHAREHOLDERS |
| | |
| Trust Summary as of January 31, 2021 (continued) | | BlackRock New York Municipal Income Trust (BNY) |
Performance
Returns for the six months ended January 31, 2021 were as follows:
| | | | | | | | |
| | | Returns Based On | |
| | |
| | | Market Price | | | NAV | |
| | |
BNY(a)(b) | | | 9.13 | % | | | 3.80 | % |
Lipper New York Municipal Debt Funds(c) | | | 4.91 | | | | 3.56 | |
| | (a) | All returns reflect reinvestment of dividends and/or distributions at actual reinvestment prices. Performance results reflect the Trust’s use of leverage. | |
| | (b) | The Trust’s discount to NAV narrowed during the period, which accounts for the difference between performance based on market price and performance based on NAV. | |
| | (c) | Average return. Returns reflect reinvestment of dividends and/or distributions at NAV on the ex-dividend date as calculated by Lipper. | |
Performance results may include adjustments made for financial reporting purposes in accordance with U.S. generally accepted accounting principles. Past performance is not an indication of future results.
More information about the Trust’s historical performance can be found in the “Closed End Funds” section of blackrock.com.
The following discussion relates to the Trust’s absolute performance based on NAV:
Municipal bonds delivered positive returns in the six-month period. Although U.S. Treasury yields moved higher (as prices fell), the tax-exempt market posted a gain due to a decline in yield spreads. Investors grew increasingly optimistic about the economic outlook for 2021, particularly after the approval of a vaccine for COVID-19 in early November 2020. Inflows into the market were consistent and traditional tax-exempt supply trended lower, creating a positive supply-and-demand dynamic that aided performance.
Similar to the overall municipal market, New York has recovered from the depths of the initial pandemic sell-off due to various stimulus measures and credit facilities. In addition, New York issues generally began the period at historically inexpensive valuations. However, prices were slower to recover given that New York experienced a greater impact from COVID-19. As a result, yield spreads finished January 31, 2021 above their pre-pandemic levels.
Given that municipal yields were little changed during the period, income was a large driver of performance. The use of leverage further augmented income as funding costs remained at depressed levels.
Yield spreads declined as the fundamental and technical backdrop for the asset class improved. As a result, some of the sectors impacted the most by COVID-19—such as transportation and state tax-backed issues—started to recover. Additionally, longer-dated holdings with maturities of 20 years and above outperformed. The Trust actively sought to manage interest rate risk using U.S. Treasury futures. Since U.S. Treasury yields rose, as prices fell, this strategy contributed to results.
Reinvestment risk remained a headwind since the proceeds from bonds that matured or were called needed to be reinvested at lower yields compared to bonds that were issued when yields were higher.
The views expressed reflect the opinions of BlackRock as of the date of this report and are subject to change based on changes in market, economic or other conditions. These views are not intended to be a forecast of future events and are no guarantee of future results.
| | |
| Trust Summary as of January 31, 2021 (continued) | | BlackRock New York Municipal Income Trust (BNY) |
Overview of the Trust’s Total Investments
SECTOR ALLOCATION
| | | | | | | | |
| | | |
| Sector(a)(b) | | 01/31/21 | | | 07/31/20 | |
| | |
Transportation | | | 24 | % | | | 24 | % |
County/City/Special District/School District | | | 22 | | | | 23 | |
Utilities | | | 14 | | | | 13 | |
State | | | 13 | | | | 11 | |
Education | | | 11 | | | | 13 | |
Health | | | 6 | | | | 7 | |
Housing | | | 5 | | | | 4 | |
Corporate | | | 3 | | | | 3 | |
Tobacco | | | 2 | | | | 2 | |
CALL/MATURITY SCHEDULE
| | | | |
| | |
| Calendar Year Ended December 31,(a)(c) | | Percentage | |
2021 | | | 10 | % |
2022 | | | 10 | |
2023 | | | 10 | |
2024 | | | 8 | |
2025 | | | 3 | |
CREDIT QUALITY ALLOCATION
| | | | | | | | |
| | | |
| Credit Rating(a)(d) | | 01/31/21 | | | 07/31/20 | |
AAA/Aaa | | | 8 | % | | | 10 | % |
AA/Aa | | | 47 | | | | 48 | |
A | | | 26 | | | | 24 | |
BBB/Baa | | | 7 | | | | 8 | |
BB/Ba | | | 1 | | | | 1 | |
B/B | | | — | | | | 1 | |
B | | | 1 | | | | — | |
CC | | | — | | | | — | (e) |
C | | | 1 | | | | — | |
N/R(f) | | | 9 | | | | 8 | |
| (a) | Excludes short-term securities. |
| (b) | For Trust compliance purposes, the Trust’s sector classifications refer to one or more of the sector sub-classifications used by one or more widely recognized market indexes or rating group indexes, and/or as defined by the investment adviser. These definitions may not apply for purposes of this report, which may combine such sector sub-classifications for reporting ease. |
| (c) | Scheduled maturity dates and/or bonds that are subject to potential calls by issuers over the next five years. |
| (d) | For financial reporting purposes, credit quality ratings shown above reflect the highest rating assigned by either S&P Global Ratings or Moody’s Investors Service, Inc. if ratings differ. These rating agencies are independent, nationally recognized statistical rating organizations and are widely used. Investment grade ratings are credit ratings of BBB/Baa or higher. Below investment grade ratings are credit ratings of BB/Ba or lower. Investments designated N/R are not rated by either rating agency. Unrated investments do not necessarily indicate low credit quality. Credit quality ratings are subject to change. |
| (e) | Rounds to less than 1% of total investments. |
| (f) | The investment adviser evaluates the credit quality of unrated investments based upon certain factors including, but not limited to, credit ratings for similar investments and financial analysis of sectors and individual investments. Using this approach, the investment adviser has deemed certain of these unrated securities as investment grade quality. As of January 31, 2021 and July 31, 2020, the market value of unrated securities deemed by the investment adviser to be investment grade represents 2% and 1%, respectively, of the Trust’s total investments. |
| | |
| 18 | | 2 0 2 1 BLACK ROCK SEMI - ANNUAL REPORT TO SHAREHOLDERS |
| | |
Schedule of Investments (unaudited) January 31, 2021 | | BlackRock California Municipal Income Trust (BFZ) (Percentages shown are based on Net Assets) |
| | | | | | | | |
| Security | | Par (000) | | | Value | |
|
Municipal Bonds | |
|
| California — 88.0% | |
|
| Corporate — 0.6% | |
California Municipal Finance Authority, RB, Series A, AMT, 4.00%, 07/15/29 | | $ | 2,640 | | | $ | 2,961,420 | |
| | | | | | | | |
|
| County/City/Special District/School District — 19.3% | |
California Statewide Communities Development Authority, SAB | | | | | | | | |
Series A, 5.00%, 09/02/39 | | | 275 | | | | 317,487 | |
Series A, 5.00%, 09/02/44 | | | 160 | | | | 183,307 | |
Series A, 5.00%, 09/02/48 | | | 160 | | | | 182,456 | |
California Statewide Communities Development Authority, SAB, S/F Housing, Series C,
5.00%, 09/02/44 | | | 595 | | | | 681,674 | |
City of San Jose California Hotel Tax Revenue, RB | | | | | | | | |
6.13%, 05/01/31 | | | 500 | | | | 506,580 | |
6.50%, 05/01/36 | | | 1,210 | | | | 1,227,013 | |
6.50%, 05/01/42 | | | 2,225 | | | | 2,256,039 | |
El Dorado Irrigation District, Refunding RB,
Series A, (AGM), 5.25%, 03/01/24(a) | | | 10,000 | | | | 11,570,300 | |
Fremont Unified School District/Alameda County, GO, Series D, 2.00%, 08/01/41 | | | 5,000 | | | | 4,974,950 | |
Fremont Union High School District, GO, Series A, 4.00%, 08/01/40 | | | 3,000 | | | | 3,551,100 | |
Glendale Community College District, GO,
Series A, 5.25%, 08/01/41 | | | 5,000 | | | | 6,312,400 | |
Hayward Area Recreation & Park District, Refunding GO, Series A, 5.00%, 08/01/42 | | | 4,950 | | | | 6,226,852 | |
Hayward Unified School District, GO, (AGM), 4.00%, 08/01/45 | | | 2,500 | | | | 2,960,325 | |
Los Angeles County Metropolitan Transportation Authority, Refunding RB,
Series A, 5.00%, 07/01/42 | | | 5,030 | | | | 6,271,505 | |
Orange County Community Facilities District, ST | | | | | | | | |
4.00%, 08/15/40 | | | 260 | | | | 288,397 | |
4.00%, 08/15/50 | | | 245 | | | | 266,795 | |
Riverside County Public Financing Authority, RB, 5.25%, 11/01/45 | | | 8,990 | | | | 10,760,670 | |
Sacramento Area Flood Control Agency, Refunding SAB, 5.00%, 10/01/41 | | | 8,000 | | | | 9,775,200 | |
San Diego Unified School District, GO, CAB, Series C, 0.00%, 07/01/40(b) | | | 7,215 | | | | 4,793,574 | |
San Francisco Bay Area Rapid Transit District, GO, 3.00%, 08/01/49 | | | 9,965 | | | | 10,797,974 | |
San Jose Financing Authority, Refunding RB, Series A, 5.00%, 06/01/23(a) | | | 2,000 | | | | 2,226,200 | |
San Leandro Unified School District, GO, Series A, 5.75%, 08/01/41 | | | 3,060 | | | | 3,143,875 | |
Santa Monica Public Financing Authority, RB, 5.00%, 07/01/42 | | | 1,250 | | | | 1,538,125 | |
West Contra Costa Unified School District, GO, Series A, 5.50%, 08/01/39 | | | 2,500 | | | | 2,820,900 | |
West Valley-Mission Community College District, GO, Series A, 4.00%, 08/01/44 | | | 3,670 | | | | 4,374,787 | |
| | | | | | | | |
| | |
| | | | | | | 98,008,485 | |
|
| Education — 6.0% | |
California Enterprise Development Authority, RB(c) | |
Series A, 5.00%, 07/01/50 | | | 1,200 | | | | 1,271,052 | |
Series A, 5.00%, 07/01/55 | | | 600 | | | | 633,630 | |
California Municipal Finance Authority, RB(c) | | | | | | | | |
Series A, 5.00%, 10/01/39 | | | 220 | | | | 232,575 | |
Series A, 5.00%, 10/01/49 | | | 370 | | | | 387,168 | |
| | | | | | | | |
| Security | | Par
(000) | | | Value | |
|
| Education (continued) | |
California Municipal Finance Authority, RB(c) (continued) | |
Series A, 5.00%, 10/01/57 | | $ | 725 | | | $ | 755,160 | |
California Municipal Finance Authority, Refunding RB | | | | | | | | |
5.00%, 08/01/34 | | | 750 | | | | 857,010 | |
5.00%, 08/01/39 | | | 425 | | | | 452,039 | |
5.00%, 08/01/48 | | | 615 | | | | 638,893 | |
California Public Finance Authority, RB, Series A, 5.00%, 07/01/54(c) | | | 285 | | | | 289,862 | |
California School Finance Authority, RB(c) | | | | | | | | |
5.00%, 06/01/40 | | | 270 | | | | 289,967 | |
5.00%, 06/01/50 | | | 430 | | | | 457,873 | |
5.00%, 06/01/59 | | | 685 | | | | 725,826 | |
Series A, 5.00%, 06/01/49 | | | 1,000 | | | | 1,067,730 | |
Series A, 5.00%, 06/01/58 | | | 2,120 | | | | 2,292,292 | |
California State University, RB, Series C,
3.00%, 11/01/39 | | | 3,295 | | | | 3,725,656 | |
California Statewide Communities Development Authority, RB, 5.00%, 06/01/51(c) | | | 240 | | | | 263,537 | |
Hastings Campus Housing Finance Authority, RB | | | | | | | | |
Series A, 5.00%, 07/01/45 | | | 600 | | | | 693,810 | |
Series A, 5.00%, 07/01/61 | | | 3,600 | | | | 4,110,408 | |
University of California, Refunding RB | | | | | | | | |
Series AR, 5.00%, 05/15/38 | | | 4,250 | | | | 5,221,720 | |
Series AZ, 5.00%, 05/15/43 | | | 5,035 | | | | 6,393,292 | |
| | | | | | | | |
| | |
| | | | | | | 30,759,500 | |
|
| Health — 5.6% | |
California Health Facilities Financing Authority, RB | | | | | | | | |
Series A, 5.00%, 11/15/25(a) | | | 3,580 | | | | 4,391,550 | |
Series A, 5.25%, 11/01/41 | | | 8,500 | | | | 8,807,020 | |
California Health Facilities Financing Authority, Refunding RB | | | | | | | | |
Series A, 4.00%, 04/01/49 | | | 3,000 | | | | 3,480,510 | |
Series A, 4.00%, 08/15/50 | | | 6,350 | | | | 7,595,172 | |
Series B, 5.00%, 11/15/46 | | | 2,960 | | | | 3,600,070 | |
California Municipal Finance Authority, Refunding RB(c) | |
Series A, 5.00%, 11/01/39 | | | 195 | | | | 225,258 | |
Series A, 5.00%, 11/01/49 | | | 220 | | | | 247,584 | |
| | | | | | | | |
| | |
| | | | | | | 28,347,164 | |
|
| Housing — 1.3% | |
California Community Housing Agency, RB, Series A, 4.00%, 02/01/56(c)(d) | | | 1,260 | | | | 1,373,060 | |
California Community Housing Agency, RB, M/F Housing, Series A, 5.00%, 04/01/49(c) | | | 2,450 | | | | 2,805,985 | |
California Housing Finance, RB, M/F Housing, Series A, 4.25%, 01/15/35 | | | 1 | | | | 840 | |
CSCDA Community Improvement Authority, RB, M/F Housing(c) | | | | | | | | |
4.00%, 08/01/56(d) | | | 1,455 | | | | 1,608,022 | |
Series A, 5.00%, 07/01/51 | | | 1,015 | | | | 1,167,636 | |
| | | | | | | | |
| | |
| | | | | | | 6,955,543 | |
|
| State — 10.6% | |
California State Public Works Board, RB | |
Series F, 5.25%, 09/01/33 | | | 4,335 | | | | 4,892,047 | |
Series I, 5.50%, 11/01/33 | | | 4,940 | | | | 5,643,011 | |
California State Public Works Board, Refunding RB, Series C, 5.00%, 11/01/34 | | | 7,750 | | | | 9,552,805 | |
California Statewide Communities Development Authority, SAB, S/F Housing | | | | | | | | |
5.00%, 09/02/40 | | | 300 | | | | 349,932 | |
4.00%, 09/02/50 | | | 240 | | | | 254,722 | |
| | |
SCHEDULE OF INVESTMENTS | | 19 |
| | |
Schedule of Investments (unaudited) (continued) January 31, 2021 | | BlackRock California Municipal Income Trust (BFZ) (Percentages shown are based on Net Assets) |
| | | | | | | | |
| Security | | Par (000) | | | Value | |
|
| State (continued) | |
California Statewide Communities Development Authority, SAB, S/F Housing (continued) 5.00%, 09/02/50 | | $ | 240 | | | $ | 274,349 | |
City of Roseville California, ST, 4.00%, 09/01/45 | | | 350 | | | | 373,300 | |
State of California GO, 3.00%, 10/01/37 | | | 14,000 | | | | 15,764,560 | |
State of California, Refunding GO,
5.00%, 08/01/37 | | | 13,000 | | | | 16,751,150 | |
| | | | | | | | |
| | |
| | | | | | | 53,855,876 | |
| | |
| Tobacco — 5.4% | | | | | | |
California County Tobacco Securitization Agency, Refunding RB | | | | | | | | |
4.00%, 06/01/49 | | | 245 | | | | 286,547 | |
5.00%, 06/01/50 | | | 285 | | | | 335,382 | |
Series A, 4.00%, 06/01/49 | | | 355 | | | | 416,933 | |
California County Tobacco Securitization Agency, Refunding RB, CAB(b) | | | | | | | | |
0.00%, 06/01/55 | | | 2,425 | | | | 585,929 | |
Series B-2, Subordinate, 0.00%, 06/01/55 | | | 3,635 | | | | 701,882 | |
Golden State Tobacco Securitization Corp., Refunding RB | | | | | | | | |
Series A-1, 5.00%, 06/01/47 | | | 475 | | | | 494,076 | |
Series A-2, 5.00%, 06/01/47 | | | 18,670 | | | | 19,419,787 | |
Tobacco Securitization Authority of Northern California, Refunding RB, Series A-1,
5.38%, 06/01/38 | | | 2,000 | | | | 2,001,720 | |
Tobacco Securitization Authority of Southern California, Refunding RB, 5.00%, 06/01/48 | | | 2,695 | | | | 3,305,337 | |
| | | | | | | | |
| | |
| | | | | | | 27,547,593 | |
|
| Transportation — 22.7% | |
City of Los Angeles Department of Airports, ARB | | | | | | | | |
Series A, AMT, 5.00%, 05/15/29 | | | 2,045 | | | | 2,256,249 | |
Series A, AMT, 5.00%, 05/15/37 | | | 3,520 | | | | 4,383,597 | |
Series A, AMT, 5.00%, 05/15/44 | | | 5,885 | | | | 7,189,587 | |
Series B, AMT, 5.00%, 05/15/36 | | | 2,600 | | | | 3,122,106 | |
Sub-Series A, AMT, 5.00%, 05/15/42 | | | 26,875 | | | | 31,978,562 | |
City of Los Angeles Department of Airports, Refunding ARB, Series A, AMT, Subordinate, 5.00%, 05/15/38 | | | 5,000 | | | | 6,331,450 | |
City of Los Angeles Department of Airports, Refunding RB, Series A, 5.00%, 05/15/39 | | | 4,060 | | | | 5,292,413 | |
County of Sacramento California Airport System Revenue, Refunding RB, Series A,
5.00%, 07/01/41 | | | 13,500 | | | | 16,258,590 | |
Norman Y Mineta San Jose International Airport SJC, Refunding RB | | | | | | | | |
Series A-1, AMT, 5.75%, 03/01/34 | | | 5,875 | | | | 5,899,440 | |
Series A-1, AMT, 6.25%, 03/01/34 | | | 2,650 | | | | 2,662,084 | |
Port of Los Angeles, Refunding ARB, Series A, AMT, 5.00%, 08/01/44 | | | 4,135 | | | | 4,710,551 | |
San Francisco City & County Airport Comm-San Francisco International Airport, Refunding ARB | | | | | | | | |
Series A, AMT, 5.00%, 05/01/42 | | | 16,735 | | | | 20,065,934 | |
Series D, AMT, 5.25%, 05/01/48 | | | 2,250 | | | | 2,773,935 | |
Series E, AMT, 5.00%, 05/01/40 | | | 2,000 | | | | 2,506,520 | |
| | | | | | | | |
| | |
| | | | | | | 115,431,018 | |
| | |
| Utilities — 16.5% | | | | | | |
City of San Francisco California Public Utilities Commission Water Revenue, Refunding RB | | | | | | | | |
Series A, 5.00%, 11/01/50 | | | 10,000 | | | | 13,221,200 | |
Series D, 5.00%, 11/01/32 | | | 5,000 | | | | 6,406,200 | |
East Bay Municipal Utility District Water System Revenue, RB Series A, 5.00%, 06/01/45 | | | 3,245 | | | | 4,026,201 | |
| | | | | | | | |
| Security | | Par (000) | | | Value | |
|
| Utilities (continued) | |
East Bay Municipal Utility District Water System Revenue, RB (continued) Series C,
4.00%, 06/01/45 | | $ | 5,000 | | | $ | 5,604,800 | |
Los Angeles Department of Water & Power Power System Revenue, RB | | | | | | | | |
Series A, 5.00%, 07/01/42 | | | 10,670 | | | | 13,219,277 | |
Series B, 5.00%, 07/01/38 | | | 3,000 | | | | 3,659,430 | |
Los Angeles Department of Water, Refunding RB | | | | | | | | |
Series A, 5.00%, 07/01/41 | | | 5,000 | | | | 6,199,600 | |
Series A, 5.00%, 07/01/44 | | | 1,500 | | | | 1,847,070 | |
Series A, 5.25%, 07/01/44 | | | 3,000 | | | | 3,763,080 | |
Series B, 5.00%, 07/01/43 | | | 7,150 | | | | 9,142,062 | |
San Diego Public Facilities Financing Authority RB, Series A, 4.00%, 08/01/45 | | | 1,630 | | | | 1,998,347 | |
San Francisco City & County Public Utilities Commission Wastewater Revenue, RB, Series B, 5.00%, 10/01/43 | | | 2,485 | | | | 3,124,415 | |
South Coast Water District Financing Authority, Refunding RB, Series A, 5.00%, 02/01/44 | | | 9,130 | | | | 11,590,261 | |
| | | | | | | | |
| | |
| | | | | | | 83,801,943 | |
| | | | | | | | |
| | |
Total Municipal Bonds in California | | | | | | | 447,668,542 | |
|
| Puerto Rico — 5.7% | |
|
| State — 4.6% | |
Puerto Rico Sales Tax Financing Corp. Sales Tax Revenue, RB | | | | | | | | |
Series A-1, Restructured, 4.75%, 07/01/53 | | | 2,845 | | | | 3,184,095 | |
Series A-1, Restructured, 5.00%, 07/01/58 | | | 10,154 | | | | 11,531,492 | |
Series A-2, Restructured, 4.33%, 07/01/40 | | | 2,588 | | | | 2,860,698 | |
Series A-2, Restructured, 4.78%, 07/01/58 | | | 2,530 | | | | 2,835,270 | |
Puerto Rico Sales Tax Financing Corp. Sales Tax Revenue, RB, CAB, Series A-1, Restructured, 0.00%, 07/01/46(b) | | | 8,577 | | | | 2,712,476 | |
| | | | | | | | |
| | |
| | | | | | | 23,124,031 | |
|
| Tobacco — 0.1% | |
Children’s Trust Fund, Refunding RB,
5.50%, 05/15/39 | | | 505 | | | | 518,216 | |
| | | | | | | | |
|
| Utilities — 1.0% | |
Puerto Rico Commonwealth Aqueduct & Sewer Authority, RB | | | | | | | | |
Series A, Senior Lien, 5.00%, 07/01/33 | | | 3,865 | | | | 4,073,439 | |
Series A, Senior Lien, 5.13%, 07/01/37 | | | 1,105 | | | | 1,169,123 | |
| | | | | | | | |
| | |
| | | | | | | 5,242,562 | |
| | | | | | | | |
| | |
Total Municipal Bonds in Puerto Rico | | | | | | | 28,884,809 | |
| | | | | | | | |
| | |
Total Municipal Bonds — 93.7%
(Cost: $434,284,097) | | | | | | | 476,553,351 | |
| | | | | | | | |
|
Municipal Bonds Transferred to Tender Option Bond Trusts(e) | |
|
| California — 66.9% | |
|
| County/City/Special District/School District — 23.9% | |
Los Angeles County Metropolitan Transportation Authority, Refunding RB, Series A, 5.00%, 07/01/44 | | | 11,200 | | | | 14,249,312 | |
Palomar Community College District, GO,
Series C, 5.00%, 08/01/44(a) | | | 15,140 | | | | 18,381,020 | |
San Diego Unified School District, GO,
Series I, 5.00%, 07/01/47 | | | 10,000 | | | | 12,377,700 | |
San Francisco Bay Area Rapid Transit District, GO, Series A, 5.00%, 08/01/47 | | | 10,615 | | | | 13,187,757 | |
| | |
| 20 | | 2 0 2 1 BLACK ROCK SEMI - ANNUAL REPORT TO SHAREHOLDERS |
| | |
Schedule of Investments (unaudited) (continued) January 31, 2021 | | BlackRock California Municipal Income Trust (BFZ) (Percentages shown are based on Net Assets) |
| | | | | | | | |
| Security | | Par (000) | | | Value | |
| |
|
| County/City/Special District/School District (continued) | |
San Joaquin Delta Community College District, GO, Series C, 5.00%, 08/01/24(a) | | $ | 14,505 | | | $ | 16,924,863 | |
San Jose Unified School District, GO, Series C, 4.00%, 08/01/24(a) | | | 6,100 | | | | 6,916,302 | |
Santa Clara County Financing Authority, RB, Series A, 4.00%, 05/01/45 | | | 22,230 | | | | 26,439,028 | |
Santa Monica Community College District, GO, Series A, 5.00%, 08/01/43 | | | 10,000 | | | | 12,938,200 | |
| | | | | | | | |
| | |
| | | | | | | 121,414,182 | |
|
| Education — 15.2% | |
California State University, Refunding RB,
Series A, 5.00%, 11/01/43 | | | 11,792 | | | | 14,229,569 | |
University of California, RB | | | | | | | | |
Series AM, 5.25%, 05/15/44 | | | 5,000 | | | | 5,791,400 | |
Series M, 5.00%, 05/15/42 | | | 10,000 | | | | 12,426,400 | |
University of California, Refunding RB | | | | | | | | |
Series AI, 5.00%, 05/15/38 | | | 14,225 | | | | 15,756,317 | |
Series AR, 5.00%, 05/15/41 | | | 10,165 | | | | 12,356,165 | |
Series I, 5.00%, 05/15/40 | | | 14,065 | | | | 16,623,705 | |
| | | | | | | | |
| | |
| | | | | | | 77,183,556 | |
|
| Health — 8.9% | |
California Health Facilities Financing Authority, RB(a) | | | | | | | | |
Series A, 5.00%, 08/15/23 | | | 9,695 | | | | 10,891,267 | |
Series A, 5.00%, 11/15/41 | | | 11,620 | | | | 14,254,138 | |
California Statewide Communities Development Authority, RB, Series A, 5.00%, 04/01/42 | | | 18,960 | | | | 19,967,534 | |
| | | | | | | | |
| | |
| | | | | | | 45,112,939 | |
|
| State — 3.9% | |
State of California, Refunding GO,
4.00%, 10/01/39 | | | 16,620 | | | | 20,144,936 | |
| | | | | | | | |
|
| Transportation — 8.7% | |
City & County of San Francisco California, Refunding COP, Series A, 4.00%, 04/01/43 | | | 10,865 | | | | 12,367,623 | |
City of Los Angeles Department of Airports, ARB, AMT, Series D, 5.00%, 05/15/41 | | | 18,632 | | | | 21,852,971 | |
San Francisco City & County Airport Comm-San Francisco International Airport, Refunding ARB, AMT, Series B,
5.00%, 05/01/41 | | | 8,720 | | | | 10,346,106 | |
| | | | | | | | |
| | |
| | | | | | | 44,566,700 | |
|
| Utilities — 6.3% | |
Los Angeles Department of Water, Refunding RB, Series A, 5.00%, 07/01/46 | | | 6,412 | | | | 7,721,140 | |
Sacramento Municipal Utility District, Refunding RB, Series H, 4.00%, 08/15/45 | | | 20,000 | | | | 24,270,200 | |
| | | | | | | | |
| | |
| | | | | | | 31,991,340 | |
| | | | | | | | |
| | |
Total Municipal Bonds in California | | | | | | | 340,413,653 | |
| | | | | | | | |
| | |
Total Municipal Bonds Transferred to Tender Option Bond Trusts — 66.9%
(Cost: $311,815,723) | | | | | | | 340,413,653 | |
| | | | | | | | |
| |
Total Long-Term Investments — 160.6%
(Cost: $746,099,820) | | | | 816,967,004 | |
| | | | | | | | |
| | | | | | | | |
| Security | | Shares | | | Value | |
| |
|
Short-Term Securities | |
|
| Money Market Funds — 0.2% | |
BlackRock Liquidity Funds California Money Fund, Institutional Class, 0.01%(f)(g) | | | 928,375 | | | $ | 928,468 | |
| | | | | | | | |
| |
Total Short-Term Securities — 0.2%
(Cost: $928,375) | | | | 928,468 | |
| | | | | | | | |
| |
Total Investments — 160.8%
(Cost: $747,028,195) | | | | 817,895,472 | |
| |
Other Assets Less Liabilities — 1.1% | | | | 5,242,725 | |
| |
Liability for TOB Trust Certificates, Including Interest Expense and Fees Payable — (28.2)% | | | | (143,339,384 | ) |
| |
VMTP Shares at Liquidation Value — (33.7)% | | | | (171,300,000 | ) |
| | | | | | | | |
| |
Net Assets Applicable to Common Shares — 100.0% | | | $ | 508,498,813 | |
| | | | | | | | |
| (a) | U.S. Government securities held in escrow, are used to pay interest on this security as well as to retire the bond in full at the date indicated, typically at a premium to par. |
| (c) | Security exempt from registration pursuant to Rule 144A under the Securities Act of 1933, as amended. These securities may be resold in transactions exempt from registration to qualified institutional investors. |
| (e) | Represent bonds transferred to a TOB Trust in exchange of cash and residual certificates received by the Trust. These bonds serve as collateral in a secured borrowing. See Note 4 of the Notes to Financial Statements for details. |
| (f) | Affiliate of the Trust. |
| (g) | Annualized 7-day yield as of period end. |
| | |
SCHEDULE OF INVESTMENTS | | 21 |
| | |
Schedule of Investments (unaudited) (continued) January 31, 2021 | | BlackRock California Municipal Income Trust (BFZ) |
Affiliates
Investments in issuers considered to be affiliate(s) of the Trust during the six-months ended January 31, 2021 for purposes of Section 2(a)(3) of the Investment Company Act of 1940, as amended, were as follows:
| | | | | | | | | | | | | | | | | | | | | | | | | | | | | | | | | | | | |
| | | | | | | | | | |
| Affiliated Issuer | | Value at
07/31/20 | | | Purchases
at Cost | | | Proceeds
from Sales | | | Net
Realized
Gain (Loss) | | | Change in
Unrealized
Appreciation
(Depreciation) | | | Value at
01/31/21 | | | Shares
Held at
01/31/21 | | | Income | | | Capital Gain
Distributions
from
Underlying
Funds | |
| | | | | | | | | |
BlackRock Liquidity Funds California Money Fund, Institutional Class | | $ | 614,041 | | | $ | 314,293 | (a) | | $ | — | | | $ | 41 | | | $ | 93 | | | $ | 928,468 | | | | 928,375 | | | $ | 196 | | | $ | — | |
| | | | | | | | | | | | | | | | | | | | | | | | | | | | | | | | | | | | |
| | (a) | Represents net amount purchased (sold). | |
For Trust compliance purposes, the Trust’s sector classifications refer to one or more of the sector sub-classifications used by one or more widely recognized market indexes or rating group indexes, and/or as defined by the investment adviser. These definitions may not apply for purposes of this report, which may combine such sector sub-classifications for reporting ease.
Derivative Financial Instruments Outstanding as of Period End
Futures Contracts
| | | | | | | | | | | | | | | | |
| Description | | Number of Contracts | | | Expiration
Date | | | Notional
Amount (000) | | | Value/
Unrealized
Appreciation
(Depreciation) | |
Short Contracts | | | | | | | | | | | | | | | | |
10-Year U.S. Treasury Note | | | 193 | | | | 03/22/21 | | | $ | 26,447 | | | $ | (8,061 | ) |
Long U.S. Treasury Bond | | | 71 | | | | 03/22/21 | | | | 11,979 | | | | 52,771 | |
| | | | | | | | | | | | | | | | |
| | | | | | | | | | | | | | $ | 44,710 | |
| | | | | | | | | | | | | | | | |
Derivative Financial Instruments Categorized by Risk Exposure
As of period end, the fair values of derivative financial instruments located in the Statements of Assets and Liabilities were as follows:
| | | | | | | | | | | | | | | | | | | | | | | | | | | | |
| | | Commodity
Contracts | | | Credit
Contracts | | | Equity
Contracts | | | Foreign
Currency
Exchange
Contracts | | | Interest
Rate
Contracts | | | Other
Contracts | | | Total | |
Assets — Derivative Financial Instruments | | | | | | | | | | | | | | | | | | | | | | | | | | | | |
Futures contracts | | | | | | | | | | | | | | | | | | | | | | | | | | | | |
Unrealized appreciation on futures contracts(a) | | $ | — | | | $ | — | | | $ | — | | | $ | — | | | $ | 52,771 | | | $ | — | | | $ | 52,771 | |
| | | | | | | | | | | | | | | | | | | | | | | | | | | | |
| | | | | | | |
Liabilities — Derivative Financial Instruments | | | | | | | | | | | | | | | | | | | | | | | | | | | | |
Futures contracts | | | | | | | | | | | | | | | | | | | | | | | | | | | | |
Unrealized depreciation on futures contracts(a) | | $ | — | | | $ | — | | | $ | — | | | $ | — | | | $ | 8,061 | | | $ | — | | | $ | 8,061 | |
| | | | | | | | | | | | | | | | | | | | | | | | | | | | |
| | (a) | Net cumulative unrealized appreciation (depreciation) on futures contracts and centrally cleared swaps, if any, are reported in the Schedule of Investments. In the Statements of Assets and Liabilities, only current day’s variation margin is reported in receivables or payables and the net cumulative unrealized appreciation (depreciation) is included in accumulated earnings (loss). | |
For the six months ended January 31, 2021, the effect of derivative financial instruments in the Statements of Operations was as follows:
| | | | | | | | | | | | | | | | | | | | | | | | | | | | |
| | | | | | | | |
| | | Commodity
Contracts | | | Credit
Contracts | | | Equity
Contracts | | | Foreign
Currency
Exchange
Contracts | | | Interest
Rate
Contracts | | | Other
Contracts | | | Total | |
| | | | | | | |
Net Realized Gain (Loss) from | | | | | | | | | | | | | | | | | | | | | | | | | | | | |
Futures contracts | | $ | — | | | $ | — | | | $ | — | | | $ | — | | | $ | 884,492 | | | $ | — | | | $ | 884,492 | |
| | | | | | | | | | | | | | | | | | | | | | | | | | | | |
| | | | | | | |
Net Change in Unrealized Appreciation (Depreciation) on | | | | | | | | | | | | | | | | | | | | | | | | | | | | |
Futures contracts | | $ | — | | | $ | — | | | $ | — | | | $ | — | | | $ | 44,710 | | | $ | — | | | $ | 44,710 | |
| | | | | | | | | | | | | | | | | | | | | | | | | | | | |
| | |
| 22 | | 2 0 2 1 BLACK ROCK SEMI - ANNUAL REPORT TO SHAREHOLDERS |
| | |
Schedule of Investments (unaudited) (continued) January 31, 2021 | | BlackRock California Municipal Income Trust (BFZ) |
Average Quarterly Balances of Outstanding Derivative Financial Instruments
| | | | |
Futures contracts | | | | |
| |
Average notional value of contracts — short | | $ | 19,213,031 | |
For more information about the Trust’s investment risks regarding derivative financial instruments, refer to the Notes to Financial Statements.
Fair Value Hierarchy as of Period End
Various inputs are used in determining the fair value of financial instruments. For a description of the input levels and information about the Trust’s policy regarding valuation of financial instruments, refer to the Notes to Financial Statements.
The following table summarizes the Trust’s investments and derivative financial instruments categorized in the disclosure hierarchy. The breakdown of the Trust’s investments into major categories is disclosed in the Schedule of Investments above.
| | | | | | | | | | | | | | | | |
| | | | | |
| | | Level 1 | | | Level 2 | | | Level 3 | | | Total | |
| | | | |
Assets | | | | | | | | | | | | | | | | |
Investments | | | | | | | | | | | | | | | | |
Long-Term Investments | | | | | | | | | | | | | | | | |
Municipal Bonds | | $ | — | | | $ | 476,553,351 | | | $ | — | | | $ | 476,553,351 | |
Municipal Bonds Transferred to Tender Option Bond Trusts | | | — | | | | 340,413,653 | | | | — | | | | 340,413,653 | |
Short-Term Securities | | | | | | | | | | | | | | | | |
Money Market Funds | | | 928,468 | | | | — | | | | — | | | | 928,468 | |
| | | | | | | | | | | | | | | | |
| | | | |
| | $ | 928,468 | | | $ | 816,967,004 | | | $ | — | | | $ | 817,895,472 | |
| | | | | | | | | | | | | | | | |
Derivative Financial Instruments(a) | | | | | | | | | | | | | | | | |
Assets | | | | | | | | | | | | | | | | |
Interest Rate Contracts | | $ | 52,771 | | | $ | — | | | $ | — | | | $ | 52,771 | |
Liabilities | | | | | | | | | | | | | | | | |
Interest Rate Contracts | | | (8,061 | ) | | | — | | | | — | | | | (8,061 | ) |
| | | | | | | | | | | | | | | | |
| | | | |
| | $ | 44,710 | | | $ | — | | | $ | — | | | $ | 44,710 | |
| | | | | | | | | | | | | | | | |
| | (a) | Derivative financial instruments are futures contracts. Futures contracts are valued at the unrealized appreciation (depreciation) on the instrument. | |
The Trust may hold assets and/or liabilities in which the fair value approximates the carrying amount for financial statement purposes. As of period end, such assets and/or liabilities are categorized within the disclosure hierarchy as follows:
| | | | | | | | | | | | | | | | |
| | | | | |
| | | Level 1 | | | Level 2 | | | Level 3 | | | Total | |
| | | | |
Liabilities | | | | | | | | | | | | | | | | |
TOB Trust Certificates | | $ | — | | | $ | (143,275,836 | ) | | $ | — | | | $ | (143,275,836 | ) |
VMTP Shares at Liquidation Value | | | — | | | | (171,300,000 | ) | | | — | | | | (171,300,000 | ) |
| | | | | | | | | | | | | | | | |
| | | | |
| | $ | — | | | $ | (314,575,836 | ) | | $ | — | | | $ | (314,575,836 | ) |
| | | | | | | | | | | | | | | | |
See notes to financial statements.
| | |
SCHEDULE OF INVESTMENTS | | 23 |
| | |
Schedule of Investments (unaudited) January 31, 2021 | | BlackRock Municipal 2030 Target Term Trust (BTT) (Percentages shown are based on Net Assets) |
| | | | | | | | |
| Security | | Par (000) | | | Value | |
| | |
Municipal Bonds | | | | | | | | |
| | |
| Alabama — 3.0% | | | | | | |
Alabama Federal Aid Highway Finance Authority, RB | | | | | | | | |
Series A, 5.00%, 09/01/33 | | $ | 3,985 | | | $ | 5,048,955 | |
Series A, 5.00%, 09/01/34 | | | 3,500 | | | | 4,428,515 | |
Alabama Public School and College Authority, Refunding RB, Series A, 5.00%, 11/01/30 | | | 11,900 | | | | 16,631,797 | |
Alabama Special Care Facilities Financing Authority- Birmingham Alabama, Refunding RB, 5.00%, 06/01/30 | | | 10,000 | | | | 11,659,500 | |
Birmingham-Jefferson Civic Center Authority, ST | | | | | | | | |
Series A, 5.00%, 07/01/31 | | | 1,100 | | | | 1,265,253 | |
Series A, 5.00%, 07/01/32 | | | 1,150 | | | | 1,315,462 | |
Series A, 5.00%, 07/01/33 | | | 1,600 | | | | 1,821,200 | |
County of Jefferson Alabama Sewer Revenue, Refunding RB, CAB(a) | | | | | | | | |
Series B, Senior Lien, (AGM),
0.00%, 10/01/31 | | | 7,375 | | | | 4,577,146 | |
Series B, Senior Lien, (AGM),
0.00%, 10/01/32 | | | 6,295 | | | | 3,628,438 | |
Series B, Senior Lien, (AGM),
0.00%, 10/01/33 | | | 1,275 | | | | 683,553 | |
Homewood Educational Building Authority, Refunding RB | | | | | | | | |
Series A, 5.00%, 12/01/33 | | | 1,010 | | | | 1,243,270 | |
Series A, 5.00%, 12/01/34 | | | 1,380 | | | | 1,692,750 | |
University of South Alabama, Refunding RB | | | | | | | | |
(AGM), 5.00%, 11/01/29 | | | 1,105 | | | | 1,339,105 | |
(AGM), 5.00%, 11/01/30 | | | 2,000 | | | | 2,417,540 | |
| | | | | | | | |
| | |
| | | | | | | 57,752,484 | |
| | |
| Alaska — 0.0% | | | | | | |
Northern Tobacco Securitization Corp., Refunding RB, Series A, 4.63%, 06/01/23 | | | 735 | | | | 736,198 | |
| | | | | | | | |
| | |
| Arizona — 1.9% | | | | | | |
Arizona Health Facilities Authority, Refunding RB | | | | | | | | |
Series A, 5.00%, 02/01/34 | | | 6,340 | | | | 6,637,917 | |
Series B, 5.00%, 02/01/33 | | | 1,810 | | | | 1,978,058 | |
Arizona Industrial Development Authority, RB(b) | | | | | | | | |
4.00%, 07/01/29 | | | 760 | | | | 812,303 | |
4.50%, 07/01/29 | | | 765 | | | | 792,288 | |
4.00%, 07/01/30 | | | 700 | | | | 717,416 | |
Series A, 4.00%, 07/01/29 | | | 4,135 | | | | 4,204,261 | |
Industrial Development Authority of the City of Phoenix, RB | | | | | | | | |
6.00%, 07/01/23(c) | | | 275 | | | | 298,171 | |
Series A, 4.50%, 07/01/22 | | | 205 | | | | 209,061 | |
Series A, 5.75%, 07/01/24(b) | | | 620 | | | | 658,490 | |
Series A, 5.00%, 07/01/33 | | | 1,000 | | | | 1,026,260 | |
Industrial Development Authority of the County of Pima, Refunding RB, Series A,
4.00%, 09/01/29 | | | 6,000 | | | | 6,445,620 | |
Maricopa County Industrial Development Authority, Refunding RB | | | | | | | | |
4.00%, 07/01/29(b) | | | 855 | | | | 918,048 | |
Series A, 5.00%, 01/01/31 | | | 10,000 | | | | 12,450,200 | |
| | | | | | | | |
| | |
| | | | | | | 37,148,093 | |
| | |
| California — 7.8% | | | | | | |
Alameda Corridor Transportation Authority, Refunding RB, Series A, Sub Lien, (AMBAC),
0.00%, 10/01/30(a) | | | 10,530 | | | | 8,565,313 | |
| | | | | | | | |
| Security | | Par (000) | | | Value | |
| | |
| California (continued) | | | | | | |
California Health Facilities Financing Authority, RB | | | | | | | | |
Series A, 5.00%, 11/15/32 | | $ | 1,600 | | | $ | 2,033,408 | |
Series A, 5.00%, 11/15/33 | | | 1,855 | | | | 2,351,713 | |
California Municipal Finance Authority, ARB, AMT, Senior Lien, 5.00%, 12/31/33 | | | 4,000 | | | | 4,952,320 | |
California Municipal Finance Authority, RB,
4.00%, 10/01/33 | | | 2,500 | | | | 2,669,175 | |
California Municipal Finance Authority, RB, S/F Housing, Series A, 5.00%, 08/15/30 | | | 1,000 | | | | 1,105,410 | |
California Municipal Finance Authority, Refunding RB | | | | | | | | |
Series A, 5.00%, 07/01/30 | | | 1,200 | | | | 1,454,784 | |
Series A, 5.00%, 07/01/31 | | | 1,050 | | | | 1,269,534 | |
California School Finance Authority, RB(b) | | | | | | | | |
5.00%, 06/01/30 | | | 565 | | | | 624,596 | |
Series A, 5.00%, 06/01/29 | | | 290 | | | | 321,915 | |
Series A, 5.00%, 06/01/32 | | | 1,100 | | | | 1,233,023 | |
City of Long Beach California Harbor Revenue, ARB | | | | | | | | |
Series A, AMT, 5.00%, 05/15/31 | | | 1,200 | | | | 1,474,380 | |
Series A, AMT, 5.00%, 05/15/32 | | | 1,800 | | | | 2,204,154 | |
Series A, AMT, 5.00%, 05/15/33 | | | 675 | | | | 824,162 | |
Series A, AMT, 5.00%, 05/15/34 | | | 1,650 | | | | 2,009,799 | |
Compton Unified School District, GO(a) | | | | | | | | |
Series B, (BAM), 0.00%, 06/01/33 | | | 1,000 | | | | 765,700 | |
Series B, (BAM), 0.00%, 06/01/34 | | | 1,125 | | | | 830,250 | |
Series B, (BAM), 0.00%, 06/01/35 | | | 1,000 | | | | 711,600 | |
Series B, (BAM), 0.00%, 06/01/36 | | | 1,000 | | | | 677,850 | |
El Camino Community College District Foundation, GO, CAB(a) | | | | | | | | |
Series C, 0.00%, 08/01/30 | | | 9,090 | | | | 8,173,910 | |
Series C, 0.00%, 08/01/31 | | | 12,465 | | | | 10,946,389 | |
Series C, 0.00%, 08/01/32 | | | 17,435 | | | | 14,928,370 | |
Golden State Tobacco Securitization Corp., Refunding RB, Series A-1, 5.00%, 06/01/29 | | | 14,500 | | | | 17,865,160 | |
Los Angeles Regional Airports Improvement Corp., Refunding RB, AMT, 5.00%, 01/01/32 | | | 4,110 | | | | 4,273,290 | |
Los Angeles Unified School District, GO, Series A, 4.00%, 07/01/33 | | | 3,000 | | | | 3,421,890 | |
Monterey Peninsula Community College District, Refunding GO, CAB(a) | | | | | | | | |
0.00%, 08/01/30 | | | 3,500 | | | | 2,898,105 | |
0.00%, 08/01/31 | | | 5,940 | | | | 4,718,023 | |
M-S-R Energy Authority, RB, Series C,
6.13%, 11/01/29 | | | 2,445 | | | | 3,147,448 | |
Norman Y Mineta San Jose International Airport SJC, Refunding RB | | | | | | | | |
Series A, AMT, 5.00%, 03/01/30 | | | 500 | | | | 615,285 | |
Series A, AMT, 5.00%, 03/01/31 | | | 1,500 | | | | 1,841,025 | |
Series A, AMT, 5.00%, 03/01/32 | | | 1,000 | | | | 1,223,550 | |
Series A, AMT, 5.00%, 03/01/33 | | | 975 | | | | 1,190,222 | |
Series A, AMT, 5.00%, 03/01/34 | | | 1,250 | | | | 1,523,400 | |
Series A, AMT, 5.00%, 03/01/35 | | | 2,000 | | | | 2,433,240 | |
Poway Unified School District, GO(a) | | | | | | | | |
Series A, 0.00%, 08/01/30 | | | 10,000 | | | | 8,897,300 | |
Series A, 0.00%, 08/01/32 | | | 12,500 | | | | 10,550,000 | |
San Diego County Regional Airport Authority, ARB, Sub-Series B, AMT, 5.00%, 07/01/33 | | | 1,000 | | | | 1,229,040 | |
| | |
| 24 | | 2 0 2 1 BLACK ROCK SEMI - ANNUAL REPORT TO SHAREHOLDERS |
| | |
Schedule of Investments (unaudited) (continued) January 31, 2021 | | BlackRock Municipal 2030 Target Term Trust (BTT) (Percentages shown are based on Net Assets) |
| | | | | | | | |
| Security | | Par
(000) | | | Value | |
| | |
| California (continued) | | | | | | |
State of California, Refunding GO,
5.00%, 08/01/30 | | $ | 10,000 | | | $ | 12,729,100 | |
Washington Township Health Care District, Refunding RB, Series B, 3.00%, 07/01/28 | | | 750 | | | | 820,605 | |
| | | | | | | | |
| | |
| | | | | | | 149,504,438 | |
| | |
| Colorado — 3.4% | | | | | | |
Central Platte Valley Metropolitan District, GO | | | | | | | | |
Series A, 5.13%, 12/01/29 | | | 700 | | | | 767,172 | |
Series A, 5.50%, 12/01/29 | | | 750 | | | | 829,717 | |
City & County of Denver Colorado Airport System Revenue, Refunding ARB, Series A, AMT, 5.00%, 12/01/33 | | | 25,000 | | | | 31,345,000 | |
City & County of Denver Colorado, RB, CAB, Series A-2, 0.00%, 08/01/30(a) | | | 1,000 | | | | 821,150 | |
Colorado Educational & Cultural Facilities Authority Refunding RB, 4.00%, 12/01/30(b) | | | 1,185 | | | | 1,221,877 | |
Colorado Health Facilities Authority, Refunding RB | | | | | | | | |
4.00%, 05/15/26(d) | | | 2,860 | | | | 3,407,719 | |
Series A, 5.00%, 12/01/22(d) | | | 3,000 | | | | 3,263,970 | |
Series A, 4.00%, 08/01/37 | | | 3,000 | | | | 3,548,340 | |
Park Creek Metropolitan District, Refunding RB | | | | | | | | |
Series A, Senior Lien, 5.00%, 12/01/27 | | | 1,500 | | | | 1,784,310 | |
Series A, Senior Lien, 5.00%, 12/01/28 | | | 1,500 | | | | 1,784,340 | |
Series A, Senior Lien, 5.00%, 12/01/30 | | | 1,350 | | | | 1,604,002 | |
Series A, Senior Lien, 5.00%, 12/01/31 | | | 1,500 | | | | 1,778,865 | |
Plaza Metropolitan District No.1, Refunding TA(b) | | | | | | | | |
4.00%, 12/01/23 | | | 1,000 | | | | 1,019,310 | |
4.10%, 12/01/24 | | | 5,080 | | | | 5,179,924 | |
4.20%, 12/01/25 | | | 5,280 | | | | 5,385,970 | |
Tallyn’s Reach Metropolitan District No.3, GO, 5.00%, 12/01/23(d) | | | 502 | | | | 569,850 | |
| | | | | | | | |
| | |
| | | | | | | 64,311,516 | |
| | |
| Connecticut — 0.8% | | | | | | |
Capital Region Development Authority, Refunding RB | | | | | | | | |
(SAP), 5.00%, 06/15/30 | | | 1,095 | | | | 1,378,156 | |
(SAP), 5.00%, 06/15/31 | | | 1,125 | | | | 1,410,311 | |
Connecticut State Health & Educational Facilities Authority, RB, Series A,
5.00%, 01/01/30(b) | | | 370 | | | | 415,669 | |
Connecticut State Health & Educational Facilities Authority, Refunding RB | | | | | | | | |
Series G-1, 5.00%, 07/01/27(b) | | | 225 | | | | 263,520 | |
Series G-1, 5.00%, 07/01/28(b) | | | 300 | | | | 357,012 | |
Series G-1, 5.00%, 07/01/29(b) | | | 300 | | | | 362,181 | |
Series G-1, 5.00%, 07/01/30(b) | | | 300 | | | | 360,543 | |
Series G-1, 5.00%, 07/01/32(b) | | | 425 | | | | 506,481 | |
Series G-1, 5.00%, 07/01/34(b) | | | 355 | | | | 419,262 | |
Series I-1, 5.00%, 07/01/35 | | | 400 | | | | 482,740 | |
State of Connecticut, GO, Series A,
5.00%, 04/15/33 | | | 7,000 | | | | 8,875,860 | |
| | | | | | | | |
| | |
| | | | | | | 14,831,735 | |
| | |
| Delaware — 0.7% | | | | | | |
County of Kent Delaware, RB | | | | | | | | |
Series A, 4.00%, 07/01/22 | | | 230 | | | | 231,760 | |
Series A, 5.00%, 07/01/24 | | | 705 | | | | 736,485 | |
Series A, 5.00%, 07/01/25 | | | 805 | | | | 848,043 | |
Series A, 5.00%, 07/01/26 | | | 850 | | | | 901,332 | |
Series A, 5.00%, 07/01/27 | | | 890 | | | | 948,411 | |
Series A, 5.00%, 07/01/28 | | | 935 | | | | 996,261 | |
| | | | | | | | |
| Security | | Par
(000) | | | Value | |
| | |
| Delaware (continued) | | | | | | |
Delaware State Economic Development Authority, Refunding RB, 1.25%, 10/01/45(e) | | $ | 5,035 | | | $ | 5,101,210 | |
Delaware State Health Facilities Authority, RB, 4.00%, 06/01/35 | | | 1,250 | | | | 1,430,050 | |
Delaware Transportation Authority, Refunding RB, 5.00%, 09/01/30 | | | 2,000 | | | | 2,721,660 | |
| | | | | | | | |
| | |
| | | | | | | 13,915,212 | |
| | |
| District of Columbia — 0.1% | | | | | | |
District of Columbia, Refunding RB, Series A, 6.00%, 07/01/23(d) | | | 1,700 | | | | 1,939,751 | |
| | | | | | | | |
| | |
| Florida — 7.1% | | | | | | |
Capital Projects Finance Authority, Refunding RB, Series A-1, 5.00%, 10/01/30 | | | 1,000 | | | | 1,182,400 | |
Capital Trust Agency, Inc., RB, Series A,
4.00%, 06/15/29(b) | | | 1,790 | | | | 1,893,355 | |
Central Florida Expressway Authority, Refunding RB | | | | | | | | |
Senior Lien, 5.00%, 07/01/32 | | | 1,610 | | | | 2,063,408 | |
Senior Lien, 5.00%, 07/01/33 | | | 2,750 | | | | 3,516,287 | |
City of Lakeland Florida, Refunding RB,
5.00%, 11/15/30 | | | 3,750 | | | | 4,617,375 | |
City of Tampa Florida, Refunding RB, Series A, 4.00%, 09/01/33 | | | 10,000 | | | | 10,620,500 | |
County of Broward Florida, RB | | | | | | | | |
Series A, AMT, (AGM), 5.00%, 04/01/30 | | | 600 | | | | 654,156 | |
Series A, AMT, (AGM), 5.00%, 04/01/33 | | | 740 | | | | 806,260 | |
County of Miami-Dade Florida, Refunding RB,
Series B, 4.00%, 04/01/32 | | | 6,690 | | | | 7,715,176 | |
County of Palm Beach Florida, RB,
5.00%, 04/01/29(b) | | | 1,000 | | | | 1,082,980 | |
County of St. Johns Florida Water & Sewer Revenue, Refunding RB, CAB(a) | | | | | | | | |
Series B, 0.00%, 06/01/30 | | | 2,000 | | | | 1,779,240 | |
Series B, 0.00%, 06/01/31 | | | 1,295 | | | | 1,125,666 | |
Series B, 0.00%, 06/01/32 | | | 2,495 | | | | 2,116,758 | |
Double Branch Community Development District, Refunding SAB, Series A-1, Senior Lien,
4.13%, 05/01/31 | | | 1,200 | | | | 1,278,168 | |
Florida Development Finance Corp., RB, AMT, 5.00%, 05/01/29(b) | | | 6,930 | | | | 7,401,656 | |
Florida Development Finance Corp., Refunding RB, 4.00%, 09/15/30(b) | | | 470 | | | | 494,755 | |
Jacksonville Port Authority, Refunding ARB, AMT, 4.50%, 11/01/22(d) | | | 9,445 | | | | 10,128,818 | |
Lakewood Ranch Stewardship District, Refunding SAB, 3.20%, 05/01/30(b) | | | 540 | | | | 559,505 | |
Lakewood Ranch Stewardship District, SAB, S/F Housing, 3.40%, 05/01/30 | | | 375 | | | | 393,502 | |
LT Ranch Community Development District, SAB, 3.40%, 05/01/30 | | | 985 | | | | 1,025,877 | |
Miami Beach Health Facilities Authority, Refunding RB, 5.00%, 11/15/30 | | | 1,000 | | | | 1,142,530 | |
Orange County Convention Center/Orlando, Refunding RB, 5.00%, 10/01/30 | | | 11,470 | | | | 15,631,775 | |
Palm Beach County Health Facilities Authority, RB, Series B, 5.00%, 05/15/31 | | | 410 | | | | 476,912 | |
Palm Beach County Health Facilities Authority, Refunding RB, 5.00%, 11/15/32 | | | 16,805 | | | | 19,838,807 | |
| | |
SCHEDULE OF INVESTMENTS | | 25 |
| | |
Schedule of Investments (unaudited) (continued) January 31, 2021 | | BlackRock Municipal 2030 Target Term Trust (BTT) (Percentages shown are based on Net Assets) |
| | | | | | | | |
| Security | | Par (000) | | | Value | |
| | |
| Florida (continued) | | | | | | |
Reedy Creek Improvement District, GO,
Series A, 5.25%, 06/01/23(d) | | $ | 3,825 | | | $ | 4,281,016 | |
Sarasota National Community Development District, Refunding SAB, 3.50%, 05/01/31 | | | 1,000 | | | | 1,069,080 | |
School Board of Miami-Dade County, Refunding COP, Series A, 5.00%, 05/01/32 | | | 9,000 | | | | 10,933,110 | |
Tolomato Community Development District, Refunding SAB, Sub-Series A-2,
3.85%, 05/01/29 | | | 520 | | | | 554,518 | |
Village Community Development District No.10, SAB | | | | | | | | |
4.50%, 05/01/23 | | | 1,165 | | | | 1,203,270 | |
5.00%, 05/01/32 | | | 5,265 | | | | 5,482,655 | |
Village Community Development District No.5, Refunding SAB | | | | | | | | |
3.50%, 05/01/28 | | | 5,200 | | | | 5,471,544 | |
4.00%, 05/01/33 | | | 1,015 | | | | 1,077,057 | |
4.00%, 05/01/34 | | | 2,195 | | | | 2,321,498 | |
Village Community Development District No.6, Refunding SAB, 4.00%, 05/01/29 | | | 5,455 | | | | 5,626,178 | |
| | | | | | | | |
| | |
| | | | | | | 135,565,792 | |
| | |
| Georgia — 1.6% | | | | | | |
Main Street Natural Gas, Inc., RB | | | | | | | | |
Series A, 5.00%, 05/15/29 | | | 1,250 | | | | 1,615,013 | |
Series A, 5.00%, 05/15/30 | | | 8,000 | | | | 10,255,120 | |
Municipal Electric Authority of Georgia, RB, Series A, 5.00%, 01/01/34 | | | 8,000 | | | | 10,029,520 | |
Municipal Electric Authority of Georgia, Refunding RB | | | | | | | | |
Series A, 5.00%, 01/01/29 | | | 3,200 | | | | 4,114,400 | |
Series A, 5.00%, 01/01/30 | | | 3,155 | | | | 4,129,863 | |
| | | | | | | | |
| | |
| | | | | | | 30,143,916 | |
| | |
| Idaho — 0.0% | | | | | | |
Idaho Housing & Finance Association, RB, Series A, 4.63%, 07/01/29(b) | | | 185 | | | | 201,820 | |
| | | | | | | | |
| | |
| Illinois — 14.0% | | | | | | |
Chicago Board of Education, Refunding GO | | | | | | | | |
Series C, 5.00%, 12/01/22 | | | 14,830 | | | | 15,941,064 | |
Series C, 5.00%, 12/01/30 | | | 7,025 | | | | 8,566,425 | |
Series F, 5.00%, 12/01/22 | | | 4,760 | | | | 5,127,044 | |
Chicago Housing Authority, RB, M/F Housing | | | | | | | | |
Series A, (HUD SEC 8), 5.00%, 01/01/33 | | | 3,000 | | | | 3,679,680 | |
Series A, (HUD SEC 8), 5.00%, 01/01/35 | | | 1,500 | | | | 1,828,920 | |
Chicago Midway International Airport, Refunding ARB, Series A, 2nd Lien, AMT, 5.00%, 01/01/33 | | | 5,000 | | | | 5,530,850 | |
Chicago O’Hare International Airport, Refunding RB | | | | | | | | |
Series B, AMT, 4.00%, 01/01/27 | | | 5,000 | | | | 5,155,400 | |
Series B, Senior Lien, 5.00%, 01/01/33 | | | 6,000 | | | | 7,341,000 | |
Chicago Transit Authority, Refunding RB, 5.00%, 06/01/26 | | | 3,000 | | | | 3,686,220 | |
City of Chicago Illinois Motor Fuel Tax Revenue, Refunding RB, (AGM),
5.00%, 01/01/30 | | | 730 | | | | 806,752 | |
City of Chicago Illinois Wastewater Transmission Revenue, RB | | | | | | | | |
2nd Lien, 4.00%, 01/01/31 | | | 10,375 | | | | 10,651,909 | |
2nd Lien, 4.00%, 01/01/32 | | | 10,790 | | | | 11,077,877 | |
2nd Lien, 4.00%, 01/01/33 | | | 11,220 | | | | 11,519,237 | |
2nd Lien, 4.00%, 01/01/35 | | | 9,135 | | | | 9,378,448 | |
City of St. Charles Illinois, Refunding GO | | | | | | | | |
4.00%, 12/01/30 | | | 1,620 | | | | 1,723,518 | |
4.00%, 12/01/31 | | | 1,715 | | | | 1,824,143 | |
| | | | | | | | |
| Security | | Par (000) | | | Value | |
| | |
| Illinois (continued) | | | | | | |
County of Cook Illinois, Refunding GO, Series C, 4.00%, 11/15/29 | | $ | 19,750 | | | $ | 21,055,277 | |
Illinois Finance Authority, Refunding RB | | | | | | | | |
Series A, 4.00%, 11/01/24 | | | 425 | | | | 439,386 | |
Series A, 5.00%, 11/01/26 | | | 460 | | | | 504,611 | |
Series A, 5.00%, 11/01/28 | | | 1,745 | | | | 1,949,043 | |
Series A, 5.00%, 11/01/29 | | | 1,840 | | | | 2,051,379 | |
Series A, 5.00%, 10/01/30 | | | 1,000 | | | | 1,200,590 | |
Series A, 5.00%, 11/01/30 | | | 1,935 | | | | 2,154,352 | |
Series A, 5.00%, 11/15/31 | | | 8,415 | | | | 9,897,723 | |
Series A, 4.00%, 10/01/32 | | | 1,000 | | | | 1,130,740 | |
Series A, 5.00%, 11/15/32 | | | 2,075 | | | | 2,438,706 | |
Series A, 4.00%, 02/01/33 | | | 11,000 | | | | 11,850,080 | |
Series A, 5.00%, 11/15/33 | | | 2,125 | | | | 2,495,558 | |
Series B, 5.00%, 08/15/30 | | | 3,205 | | | | 3,912,792 | |
Series C, 5.00%, 02/15/30 | | | 12,000 | | | | 14,884,800 | |
Illinois State Toll Highway Authority, Refunding RB, Series A, 4.00%, 12/01/31 | | | 20,000 | | | | 23,110,000 | |
Kane McHenry Cook & De Kalb Counties Unit School District No.300, Refunding GO, Series A, 5.00%, 01/01/30 | | | 6,350 | | | | 7,804,594 | |
Metropolitan Pier & Exposition Authority, Refunding RB | | | | | | | | |
5.00%, 12/15/28 | | | 1,200 | | | | 1,478,052 | |
5.00%, 12/15/30 | | | 1,385 | | | | 1,682,360 | |
State of Illinois, GO | | | | | | | | |
Series A, 5.00%, 12/01/28 | | | 9,950 | | | | 12,052,733 | |
Series D, 5.00%, 11/01/28 | | | 10,805 | | | | 12,848,550 | |
State of Illinois, Refunding GO, Series B, 5.00%, 10/01/30 | | | 7,000 | | | | 8,496,530 | |
Upper Illinois River Valley Development Authority, Refunding RB, 4.00%, 01/01/31(b) | | | 370 | | | | 384,108 | |
Winnebago & Boone Counties School District No.205 Rockford, GO | | | | | | | | |
4.00%, 02/01/29 | | | 9,080 | | | | 9,734,940 | |
4.00%, 02/01/30 | | | 9,835 | | | | 10,542,923 | |
| | | | | | | | |
| | |
| | | | | | | 267,938,314 | |
| | |
| Indiana — 2.5% | | | | | | |
City of Indianapolis Department of Public Utilities Water System Revenue, Refunding RB,
Series A, 1st Lien, 5.00%, 10/01/35 | | | 10,000 | | | | 12,743,300 | |
City of Valparaiso Indiana, RB, AMT,
5.88%, 01/01/24 | | | 955 | | | | 1,007,878 | |
City of Whiting Indiana, RB, Series A, AMT, 5.00%, 03/01/46(e) | | | 5,500 | | | | 6,025,415 | |
Indiana Finance Authority, Refunding RB,
Series A, 4.00%, 05/01/23(d) | | | 22,565 | | | | 24,522,965 | |
Northern Indiana Commuter Transportation District, RB | | | | | | | | |
5.00%, 07/01/32 | | | 1,000 | | | | 1,225,170 | |
5.00%, 07/01/33 | | | 1,400 | | | | 1,709,330 | |
| | | | | | | | |
| | |
| | | | | | | 47,234,058 | |
| | |
| Iowa — 2.2% | | | | | | |
Iowa Finance Authority, Refunding RB,
5.25%, 12/01/25 | | | 13,345 | | | | 14,978,962 | |
PEFA, Inc., RB, 5.00%, 09/01/49(e) | | | 21,415 | | | | 26,256,717 | |
| | | | | | | | |
| | |
| | | | | | | 41,235,679 | |
| | |
| 26 | | 2 0 2 1 BLACK ROCK SEMI - ANNUAL REPORT TO SHAREHOLDERS |
| | |
Schedule of Investments (unaudited) (continued) January 31, 2021 | | BlackRock Municipal 2030 Target Term Trust (BTT) (Percentages shown are based on Net Assets) |
| | | | | | | | |
| Security | | Par (000) | | | Value | |
|
| Kansas — 0.1% | |
Wyandotte County-Kansas City Unified Government Utility System Revenue, RB, Series A, 5.00%, 09/01/33 | | $ | 1,370 | | | $ | 1,641,055 | |
| | | | | | | | |
| | |
| Kentucky — 0.6% | | | | | | |
Kentucky Public Transportation Infrastructure Authority, RB, CAB | | | | | | | | |
Series B, 0.00%, 07/01/30(a) | | | 1,230 | | | | 948,035 | |
Series C, Convertible, 6.40%, 07/01/33(f) | | | 1,500 | | | | 1,818,465 | |
Louisville/Jefferson County Metropolitan Government, Refunding RB, Series A,
5.00%, 10/01/32 | | | 7,300 | | | | 8,912,424 | |
| | | | | | | | |
| | |
| | | | | | | 11,678,924 | |
|
| Louisiana — 3.0% | |
City of Ruston Louisiana, RB | | | | | | | | |
(AGM), 5.00%, 06/01/29 | | | 1,060 | | | | 1,283,363 | |
(AGM), 5.00%, 06/01/30 | | | 1,000 | | | | 1,209,480 | |
(AGM), 5.00%, 06/01/31 | | | 1,020 | | | | 1,229,814 | |
(AGM), 5.00%, 06/01/32 | | | 1,225 | | | | 1,473,528 | |
Louisiana Public Facilities Authority, RB(b) | | | | | | | | |
Series A, 5.00%, 06/01/29 | | | 710 | | | | 755,880 | |
Series A, 5.00%, 04/01/30 | | | 525 | | | | 558,810 | |
Louisiana Public Facilities Authority, Refunding RB | | | | | | | | |
5.00%, 05/15/29 | | | 1,235 | | | | 1,512,529 | |
5.00%, 05/15/30 | | | 990 | | | | 1,211,760 | |
3.00%, 05/15/31 | | | 2,225 | | | | 2,422,958 | |
5.00%, 05/15/32 | | | 1,485 | | | | 1,809,294 | |
5.00%, 05/15/33 | | | 2,175 | | | | 2,640,146 | |
Series B, 3.50%, 06/01/30 | | | 5,990 | | | | 6,050,379 | |
Louisiana Stadium & Exposition District, Refunding RB, Series A, 5.00%, 07/01/30 | | | 3,000 | | | | 3,307,920 | |
Parish of St. John the Baptist Louisiana, Refunding RB | | | | | | | | |
2.00%, 06/01/37(e) | | | 2,250 | | | | 2,290,410 | |
2.10%, 06/01/37(e) | | | 1,305 | | | | 1,343,002 | |
Sub-Series B-1, 2.13%, 06/01/37(e) | | | 1,800 | | | | 1,853,928 | |
Sub-Series B-1, 2.38%, 06/01/37(e) | | | 3,260 | | | | 3,414,231 | |
Port New Orleans Board of Commissioners, Refunding RB, Series B, AMT,
5.00%, 04/01/23(d) | | | 2,875 | | | | 3,165,519 | |
State of Louisiana, GO,
Series A, 4.00%, 05/15/23(d) | | | 6,540 | | | | 7,118,855 | |
Terrebonne Levee & Conservation District, RB, 5.00%, 07/01/23(d) | | | 1,925 | | | | 2,151,111 | |
Tobacco Settlement Financing Corp., Refunding RB | | | | | | | | |
Series A, 5.25%, 05/15/32 | | | 4,375 | | | | 4,602,763 | |
Series A, 5.25%, 05/15/33 | | | 4,750 | | | | 4,997,047 | |
Series A, 5.25%, 05/15/35 | | | 1,500 | | | | 1,636,095 | |
| | | | | | | | |
| | |
| | | | | | | 58,038,822 | |
|
| Maine — 0.2% | |
City of Portland Maine General Airport Revenue, Refunding RB | | | | | | | | |
5.00%, 01/01/33 | | | 695 | | | | 852,341 | |
5.00%, 01/01/34 | | | 305 | | | | 371,484 | |
4.00%, 01/01/35 | | | 1,000 | | | | 1,121,140 | |
Maine Turnpike Authority RB | | | | | | | | |
5.00%, 07/01/29 | | | 300 | | | | 400,983 | |
5.00%, 07/01/30 | | | 275 | | | | 374,544 | |
| | | | | | | | |
| | |
| | | | | | | 3,120,492 | |
| | | | | | | | |
| Security | | Par (000) | | | Value | |
|
| Maryland — 1.8% | |
Anne Arundel County Consolidated Special Taxing District, ST | | | | | | | | |
4.20%, 07/01/24 | | $ | 540 | | | $ | 551,362 | |
4.90%, 07/01/30 | | | 1,315 | | | | 1,367,561 | |
City of Baltimore Maryland, Refunding RB,
5.00%, 09/01/31 | | | 1,250 | | | | 1,299,612 | |
County of Prince George’s Maryland, TA,
5.00%, 07/01/30(b) | | | 585 | | | | 647,618 | |
Howard County Housing Commission, RB, M/F Housing, 5.00%, 12/01/33 | | | 1,765 | | | | 2,120,895 | |
Maryland Economic Development Corp., RB,
Series D, AMT, 5.00%, 03/31/30 | | | 1,325 | | | | 1,493,831 | |
Maryland Health & Higher Educational Facilities Authority, Refunding RB | | | | | | | | |
5.00%, 07/01/29 | | | 2,200 | | | | 2,553,034 | |
5.00%, 07/01/31 | | | 2,400 | | | | 2,866,960 | |
5.00%, 07/01/32 | | | 500 | | | | 619,740 | |
5.00%, 07/01/33 | | | 2,585 | | | | 3,095,592 | |
5.00%, 07/01/34 | | | 775 | | | | 956,373 | |
Series A, 5.00%, 01/01/31 | | | 2,865 | | | | 3,325,434 | |
Series A, 5.00%, 01/01/32 | | | 3,010 | | | | 3,474,022 | |
Series A, 5.00%, 01/01/33 | | | 3,165 | | | | 3,639,117 | |
State of Maryland, GO, 1st Series, 3.00%, 03/15/34 | | | 5,000 | | | | 5,669,350 | |
| | | | | | | | |
| | |
| | | | | | | 33,680,501 | |
|
| Massachusetts — 1.5% | |
Commonwealth of Massachusetts, GO, Series I, 5.00%, 12/01/33 | | | 5,000 | | | | 6,260,550 | |
Commonwealth of Massachusetts, Refunding GO, Series A, (AMBAC), 5.50%, 08/01/30 | | | 2,500 | | | | 3,567,725 | |
Massachusetts Bay Transportation Authority, Refunding RB, CAB, Series A, 0.00%, 07/01/32(a) | | | 5,500 | | | | 4,377,285 | |
Massachusetts Development Finance Agency, RB, Series A, 5.00%, 01/01/33 | | | 1,070 | | | | 1,232,394 | |
Massachusetts Development Finance Agency, Refunding RB | | | | | | | | |
Series A, 5.00%, 01/01/32 | | | 2,020 | | | | 2,374,712 | |
Series A, 5.00%, 01/01/33 | | | 1,500 | | | | 1,753,365 | |
Series A, 5.00%, 10/01/33 | | | 1,285 | | | | 1,470,669 | |
Series A, 5.00%, 01/01/34 | | | 2,085 | | | | 2,425,105 | |
Series A, 5.00%, 01/01/35 | | | 2,000 | | | | 2,314,060 | |
Massachusetts Educational Financing Authority, Refunding RB, Series K, AMT, 5.25%, 07/01/29 | | | 3,630 | | | | 3,777,342 | |
| | | | | | | | |
| | |
| | | | | | | 29,553,207 | |
|
| Michigan — 1.6% | |
City of Detroit Michigan, GO | | | | | | | | |
5.00%, 04/01/26 | | | 735 | | | | 849,065 | |
5.00%, 04/01/27 | | | 580 | | | | 683,977 | |
5.00%, 04/01/28 | | | 665 | | | | 799,436 | |
5.00%, 04/01/29 | | | 665 | | | | 796,790 | |
5.00%, 04/01/30 | | | 510 | | | | 620,043 | |
5.00%, 04/01/31 | | | 735 | | | | 876,076 | |
5.00%, 04/01/32 | | | 625 | | | | 743,156 | |
5.00%, 04/01/33 | | | 830 | | | | 984,737 | |
Michigan Finance Authority, Refunding RB | | | | | | | | |
5.00%, 06/01/24(d) | | | 2,750 | | | | 3,189,890 | |
5.00%, 08/15/30 | | | 2,105 | | | | 2,340,128 | |
Michigan State Hospital Finance Authority, Refunding RB, Series C, 4.00%, 06/01/22(d) | | | 8,195 | | | | 8,617,616 | |
Michigan Strategic Fund, RB, AMT, 5.00%, 12/31/32 | | | 2,000 | | | | 2,528,300 | |
| | |
SCHEDULE OF INVESTMENTS | | 27 |
| | |
Schedule of Investments (unaudited) (continued) January 31, 2021 | | BlackRock Municipal 2030 Target Term Trust (BTT) (Percentages shown are based on Net Assets) |
| | | | | | | | |
| Security | | Par
(000) | | | Value | |
|
| Michigan (continued) | |
Michigan Strategic Fund, Refunding RB | | | | | | | | |
5.00%, 11/15/29 | | $ | 1,260 | | | $ | 1,491,210 | |
5.00%, 11/15/34 | | | 1,410 | | | | 1,612,800 | |
Saginaw Valley State University, Refunding RB | | | | | | | | |
Series A, 5.00%, 07/01/31 | | | 2,070 | | | | 2,485,345 | |
Series A, 5.00%, 07/01/32 | | | 1,430 | | | | 1,709,351 | |
| | | | | | | | |
| | |
| | | | | | | 30,327,920 | |
|
| Minnesota — 0.4% | |
City of Spring Lake Park Minnesota, RB,
4.00%, 06/15/29 | | | 1,185 | | | | 1,300,940 | |
Sartell-St Stephen Independent School District No.748, GO, CAB(a) | | | | | | | | |
Series B, (SD CRED PROG), 0.00%, 02/01/30 | | | 3,915 | | | | 3,277,247 | |
Series B, (SD CRED PROG), 0.00%, 02/01/31 | | | 2,190 | | | | 1,771,644 | |
Series B, (SD CRED PROG), 0.00%, 02/01/32 | | | 1,450 | | | | 1,131,392 | |
| | | | | | | | |
| | |
| | | | | | | 7,481,223 | |
| | |
| Mississippi — 1.5% | | | | | | |
Mississippi Development Bank, Refunding RB | | | | | | | | |
Series A, (AGM), 5.00%, 03/01/30 | | | 2,280 | | | | 2,677,472 | |
Series A, (AGM), 5.00%, 03/01/31 | | | 1,595 | | | | 1,869,643 | |
Series A, (AGM), 5.00%, 03/01/32 | | | 2,000 | | | | 2,333,420 | |
Series A, (AGM), 5.00%, 03/01/33 | | | 1,275 | | | | 1,482,506 | |
State of Mississippi, RB | | | | | | | | |
Series A, 5.00%, 10/15/35 | | | 5,000 | | | | 6,195,850 | |
Series E, 5.00%, 10/15/33 | | | 12,225 | | | | 14,257,040 | |
| | | | | | | | |
| | |
| | | | | | | 28,815,931 | |
|
| Missouri — 0.6% | |
Health & Educational Facilities Authority of the State of Missouri, Refunding RB | | | | | | | | |
5.00%, 05/01/30 | | | 3,000 | | | | 3,208,050 | |
5.00%, 05/15/31 | | | 1,175 | | | | 1,425,087 | |
4.00%, 05/15/32 | | | 1,680 | | | | 1,919,467 | |
4.00%, 05/15/33 | | | 2,000 | | | | 2,277,040 | |
Series A, 4.00%, 11/15/33 | | | 2,010 | | | | 2,196,267 | |
Industrial Development Authority of the City of St. Louis Missouri, Refunding RB,
Series A, 3.88%, 11/15/29 | | | 970 | | | | 943,771 | |
| | | | | | | | |
| | |
| | | | | | | 11,969,682 | |
|
| Montana — 0.6% | |
City of Forsyth Montana, Refunding RB, Series A, 3.90%, 03/01/31(e) | | | 10,050 | | | | 10,774,906 | |
| | | | | | | | |
|
| Nebraska — 0.6% | |
Central Plains Energy Project, RB | | | | | | | | |
5.00%, 09/01/27 | | | 5,000 | | | | 5,360,550 | |
5.00%, 09/01/32 | | | 4,500 | | | | 4,824,720 | |
Elkhorn School District, GO | | | | | | | | |
4.00%, 12/15/32 | | | 325 | | | | 405,044 | |
4.00%, 12/15/33 | | | 375 | | | | 464,843 | |
| | | | | | | | |
| | |
| | | | | | | 11,055,157 | |
| | | | | | | | |
| Security | | Par
(000) | | | Value | |
|
| Nevada(b) — 0.1% | |
Nevada Department of Business & Industry, RB, Series A, 5.00%, 07/15/27 | | $ | 335 | | | $ | 368,647 | |
State of Nevada Department of Business & Industry, RB, Series A, 4.50%, 12/15/29 | | | 590 | | | | 616,232 | |
| | | | | | | | |
| | |
| | | | | | | 984,879 | |
|
| New Hampshire — 0.4% | |
New Hampshire Business Finance Authority Refunding RB | | | | | | | | |
4.00%, 01/01/28 | | | 285 | | | | 326,735 | |
4.00%, 01/01/29 | | | 300 | | | | 340,392 | |
4.00%, 01/01/30 | | | 280 | | | | 315,168 | |
New Hampshire Business Finance Authority, Refunding RB, Series A, AMT, 4.00%, 11/01/27(b) | | | 2,205 | | | | 2,285,615 | |
New Hampshire State Turnpike System, RB, Series C, 4.00%, 08/01/33 | | | 4,350 | | | | 4,596,384 | |
| | | | | | | | |
| | |
| | | | | | | 7,864,294 | |
|
| New Jersey — 14.7% | |
Casino Reinvestment Development Authority, Inc., Refunding RB | | | | | | | | |
5.00%, 11/01/21 | | | 2,465 | | | | 2,522,632 | |
5.00%, 11/01/22 | | | 1,890 | | | | 1,992,003 | |
Industrial Pollution Control Financing Authority of Gloucester County, Refunding RB, Series A, AMT, 5.00%, 12/01/24 | | | 1,150 | | | | 1,203,556 | |
New Jersey Economic Development Authority RB, 5.00%, 06/15/30 | | | 600 | | | | 780,192 | |
New Jersey Economic Development Authority, RB | | | | | | | | |
Series A, 4.00%, 06/15/29(b) | | | 665 | | | | 716,252 | |
Series A, 4.00%, 07/01/29 | | | 350 | | | | 395,290 | |
Series A, 5.00%, 06/15/32 | | | 4,500 | | | | 5,471,370 | |
Series C, 5.00%, 06/15/32 | | | 3,600 | | | | 4,377,096 | |
Series DDD, 5.00%, 06/15/35 | | | 2,000 | | | | 2,395,460 | |
AMT, 5.00%, 01/01/28 | | | 4,705 | | | | 5,298,865 | |
Series A, AMT, 5.63%, 11/15/30 | | | 1,740 | | | | 1,938,273 | |
Series B, AMT, 5.63%, 11/15/30 | | | 1,315 | | | | 1,466,264 | |
New Jersey Economic Development Authority, Refunding RB | | | | | | | | |
5.00%, 06/15/26 | | | 10,610 | | | | 11,150,155 | |
4.25%, 06/15/27 | | | 16,500 | | | | 17,173,860 | |
(AGM), 5.00%, 06/01/28 | | | 1,000 | | | | 1,222,880 | |
5.00%, 01/01/29 | | | 2,280 | | | | 2,729,593 | |
(AGM), 5.00%, 06/01/30 | | | 1,500 | | | | 1,815,450 | |
(AGM), 5.00%, 06/01/31 | | | 1,750 | | | | 2,107,823 | |
(AGM), 4.00%, 06/01/32 | | | 2,125 | | | | 2,401,314 | |
Series BBB, 5.50%, 06/15/29 | | | 10,000 | | | | 12,396,400 | |
Series MMM, 4.00%, 06/15/35 | | | 5,000 | | | | 5,844,600 | |
Sub-Series A, 4.00%, 07/01/32 | | | 9,855 | | | | 10,860,111 | |
New Jersey Economic Development Authority, Refunding SAB, 5.75%, 04/01/31 | | | 5,000 | | | | 5,275,800 | |
New Jersey Educational Facilities Authority, RB, Series A, 4.00%, 09/01/30 | | | 5,860 | | | | 6,490,184 | |
New Jersey Health Care Facilities Financing Authority, Refunding RB | | | | | | | | |
5.00%, 07/01/28 | | | 1,500 | | | | 1,820,625 | |
5.00%, 07/01/29 | | | 4,150 | | | | 5,111,339 | |
5.00%, 07/01/30 | | | 3,500 | | | | 4,307,904 | |
| | |
| 28 | | 2 0 2 1 BLACK ROCK SEMI - ANNUAL REPORT TO SHAREHOLDERS |
| | |
Schedule of Investments (unaudited) (continued) January 31, 2021 | | BlackRock Municipal 2030 Target Term Trust (BTT) (Percentages shown are based on Net Assets) |
| | | | | | | | |
| Security | | Par (000) | | | Value | |
| | |
| New Jersey (continued) | | | | | | |
New Jersey Health Care Facilities Financing Authority, Refunding RB (continued) Series A, 5.00%, 07/01/30 | | $ | 11,245 | | | $ | 13,933,342 | |
New Jersey Higher Education Student Assistance Authority, RB | | | | | | | | |
Series 1A, AMT, 5.00%, 12/01/25 | | | 5,500 | | | | 6,623,760 | |
Series 1A, AMT, 5.00%, 12/01/26 | | | 2,250 | | | | 2,698,650 | |
Series A, AMT, 4.00%, 12/01/32 | | | 2,500 | | | | 2,829,850 | |
Series A, AMT, 4.00%, 12/01/33 | | | 2,000 | | | | 2,244,520 | |
Series A, AMT, 4.00%, 12/01/34 | | | 1,000 | | | | 1,120,580 | |
Series A, AMT, 4.00%, 12/01/35 | | | 1,000 | | | | 1,106,250 | |
New Jersey Housing & Mortgage Finance Agency, Refunding RB, Series A, AMT,
3.80%, 10/01/32 | | | 12,180 | | | | 13,360,364 | |
New Jersey Transportation Trust Fund Authority, RB | | | | | | | | |
Series AA, 5.25%, 06/15/27 | | | 4,225 | | | | 5,003,245 | |
Series AA, 5.25%, 06/15/28 | | | 4,500 | | | | 5,323,635 | |
Series AA, 4.00%, 06/15/30 | | | 10,815 | | | | 11,309,245 | |
Series BB, 5.00%, 06/15/30 | | | 1,500 | | | | 1,881,030 | |
Series C, 5.25%, 06/15/32 | | | 10,000 | | | | 11,556,500 | |
Series D, 5.00%, 06/15/32 | | | 5,000 | | | | 5,757,750 | |
New Jersey Transportation Trust Fund Authority, Refunding RB | | | | | | | | |
Series A, 5.00%, 06/15/30 | | | 6,600 | | | | 7,860,732 | |
Series A, 5.00%, 12/15/30 | | | 21,325 | | | | 26,682,906 | |
Newark Housing Authority Scholarship Foundation A New Jersey Non, Refunding RB, (NPFGC), 5.25%, 01/01/27 | | | 5,000 | | | | 5,791,400 | |
South Jersey Transportation Authority, Refunding RB, Series A, 5.00%, 11/01/33 | | | 500 | | | | 580,465 | |
Tobacco Settlement Financing Corp., Refunding RB | | | | | | | | |
Series A, 5.00%, 06/01/30 | | | 16,740 | | | | 21,641,472 | |
Series A, 5.00%, 06/01/32 | | | 8,270 | | | | 10,554,009 | |
Township of Irvington NJ, Refunding GO | | | | | | | | |
Series A, (AGM, SAW), 5.00%, 07/15/30 | | | 2,000 | | | | 2,283,100 | |
Series A, (AGM, SAW), 5.00%, 07/15/31 | | | 1,450 | | | | 1,654,450 | |
| | | | | | | | |
| | |
| | | | | | | 281,062,546 | |
| | |
| New Mexico — 1.3% | | | | | | |
City of Santa Fe New Mexico, RB, Series A, 5.00%, 05/15/34 | | | 480 | | | | 529,416 | |
New Mexico Educational Assistance Foundation, RB | �� | | | | | | | |
Series A-1, AMT, (GTD), 3.75%, 09/01/31 | | | 6,250 | | | | 6,483,375 | |
Series A-1, AMT, (GTD), 3.88%, 04/01/34 | | | 2,000 | | | | 2,107,600 | |
Series A-2, AMT, (GTD), 3.80%, 11/01/32 | | | 5,850 | | | | 6,174,499 | |
Series A-2, AMT, (GTD), 3.80%, 09/01/33 | | | 10,000 | | | | 10,526,300 | |
| | | | | | | | |
| | |
| | | | | | | 25,821,190 | |
| | |
| New York — 4.4% | | | | | | |
Build NYC Resource Corp., Refunding RB, AMT, 4.50%, 01/01/25(b) | | | 735 | | | | 782,136 | |
County of Nassau New York, GO | | | | | | | | |
Series A, (AGM), 5.00%, 04/01/34 | | | 4,165 | | | | 5,214,747 | |
Series A, (AGM), 5.00%, 04/01/35 | | | 4,385 | | | | 5,472,392 | |
Metropolitan Transportation Authority, Refunding RB, Sub-Series C-1, 5.00%, 11/15/34 | | | 10,000 | | | | 12,148,300 | |
Metropolitan Transportation Authority, Refunding RB, CAB(a) | | | | | | | | |
Series A, 0.00%, 11/15/30 | | | 13,000 | | | | 10,958,610 | |
Series C-2, 0.00%, 11/15/32 | | | 19,315 | | | | 15,240,308 | |
| | | | | | | | |
| Security | | Par (000) | | | Value | |
| | |
| New York (continued) | | | | | | |
New York City Transitional Finance Authority Future Tax Secured Revenue, RB, Sub-Series B-1, 5.00%, 08/01/30 | | $ | 4,980 | | | $ | 6,297,110 | |
New York Transportation Development Corp. Refunding RB | | | | | | | | |
AMT, 5.00%, 12/01/29 | | | 235 | | | | 302,624 | |
Class A, AMT, 5.00%, 12/01/28 | | | 350 | | | | 443,369 | |
Class A, AMT, 5.00%, 12/01/30 | | | 250 | | | | 327,573 | |
New York Transportation Development Corp., ARB | | | | | | | | |
Series A, AMT, 4.00%, 07/01/32 | | | 5,500 | | | | 6,095,375 | |
Series A, AMT, 4.00%, 07/01/33 | | | 6,000 | | | | 6,642,720 | |
New York Transportation Development Corp., RB, AMT, 4.00%, 10/01/30 | | | 8,140 | | | | 9,524,695 | |
Port Authority of New York & New Jersey Refunding RB, AMT, 5.00%, 07/15/30(g) | | | 3,730 | | | | 4,992,045 | |
| | | | | | | | |
| | |
| | | | | | | 84,442,004 | |
| | |
| North Carolina — 0.0% | | | | | | |
North Carolina Medical Care Commission, RB, Series A, 4.00%, 10/01/27 | | | 600 | | | | 698,586 | |
| | | | | | | | |
| | |
| Ohio — 0.9% | | | | | | |
County of Butler Ohio, Refunding RB | | | | | | | | |
5.00%, 11/15/30 | | | 1,225 | | | | 1,517,579 | |
5.00%, 11/15/31 | | | 2,500 | | | | 3,085,625 | |
5.00%, 11/15/32 | | | 2,200 | | | | 2,706,132 | |
County of Franklin Ohio, RB | | | | | | | | |
Series A, 5.25%, 07/01/28 | | | 470 | | | | 470,931 | |
Series A, 5.63%, 07/01/32 | | | 940 | | | | 942,012 | |
Ohio Air Quality Development Authority, Refunding RB, 3.25%, 09/01/29 | | | 4,450 | | | | 4,749,974 | |
State of Ohio, RB | | | | | | | | |
AMT, (AGM), 5.00%, 12/31/29 | | | 1,625 | | | | 1,896,196 | |
AMT, (AGM), 5.00%, 12/31/30 | | | 2,400 | | | | 2,798,688 | |
| | | | | | | | |
| | |
| | | | | | | 18,167,137 | |
| | |
| Oklahoma — 0.8% | | | | | | |
Norman Regional Hospital Authority, Refunding RB | | | | | | | | |
5.00%, 09/01/27 | | | 2,100 | | | | 2,467,731 | |
5.00%, 09/01/28 | | | 2,000 | | | | 2,342,360 | |
5.00%, 09/01/29 | | | 2,150 | | | | 2,511,093 | |
5.00%, 09/01/30 | | | 5,130 | | | | 5,972,089 | |
Oklahoma Capitol Improvement Authority, RB,
Series B, 5.00%, 07/01/30 | | | 2,150 | | | | 2,930,385 | |
| | | | | | | | |
| | |
| | | | | | | 16,223,658 | |
| | |
| Oregon — 0.5% | | | | | | |
Oregon Health & Science University, Refunding RB, Series B, 5.00%, 07/01/35 | | | 7,390 | | | | 8,973,012 | |
| | | | | | | | |
| | |
| Pennsylvania — 17.4% | | | | | | |
Allegheny County Hospital Development Authority, Refunding RB | | | | | | | | |
Series A, 5.00%, 04/01/31 | | | 3,075 | | | | 3,920,102 | |
Series A, 5.00%, 04/01/34 | | | 3,345 | | | | 4,226,474 | |
Series A, 5.00%, 04/01/35 | | | 1,000 | | | | 1,259,250 | |
Allentown Neighborhood Improvement Zone Development Authority, RB(b) | | | | | | | | |
5.00%, 05/01/23 | | | 490 | | | | 509,874 | |
5.00%, 05/01/28 | | | 835 | | | | 958,288 | |
Allentown Neighborhood Improvement Zone Development Authority, Refunding RB Series A, 5.00%, 05/01/27 | | | 6,750 | | | | 7,022,092 | |
| | |
SCHEDULE OF INVESTMENTS | | 29 |
| | |
Schedule of Investments (unaudited) (continued) January 31, 2021 | | BlackRock Municipal 2030 Target Term Trust (BTT) (Percentages shown are based on Net Assets) |
| | | | | | | | |
| Security | | Par (000) | | | Value | |
| | |
| Pennsylvania (continued) | | | | | | |
Allentown Neighborhood Improvement Zone Development Authority, Refunding RB (continued) | | | | | | | | |
Series A, 5.00%, 05/01/28 | | $ | 5,000 | | | $ | 5,200,950 | |
Series A, 5.00%, 05/01/29 | | | 3,745 | | | | 3,895,025 | |
Series A, 5.00%, 05/01/30 | | | 5,300 | | | | 5,511,682 | |
Chester County Health and Education Facilities Authority, Refunding RB | | | | | | | | |
Series A, 5.00%, 12/01/30 | | | 2,180 | | | | 2,287,845 | |
Series A, 5.00%, 10/01/32 | | | 1,450 | | | | 1,840,644 | |
Series A, 5.00%, 10/01/33 | | | 2,300 | | | | 2,914,284 | |
Chester County Industrial Development Authority, SAB, 4.38%, 03/01/28(b) | | | 265 | | | | 269,354 | |
City of Philadelphia Pennsylvania Airport Revenue, Refunding RB,
Series A, 5.00%, 07/01/30 | | | 5,000 | | | | 6,719,050 | |
City of Philadelphia Pennsylvania, Refunding GO | | | | | | | | |
(AGM), 5.00%, 08/01/30 | | | 9,235 | | | | 11,548,183 | |
(AGM), 4.00%, 08/01/32 | | | 6,000 | | | | 7,053,540 | |
Series A, 5.00%, 08/01/30 | | | 4,500 | | | | 5,634,990 | |
Clarion County Industrial Development Authority, Refunding RB, AMT, 2.45%, 12/01/39(e) | | | 4,200 | | | | 4,689,342 | |
Commonwealth Financing Authority, RB,
5.00%, 06/01/32 | | | 6,000 | | | | 7,574,640 | |
Commonwealth of Pennsylvania, Refunding GO, 1st Series, 4.00%, 01/01/30 | | | 7,000 | | | | 8,317,260 | |
Cumberland County Municipal Authority Refunding RB | | | | | | | | |
5.00%, 01/01/25(d) | | | 645 | | | | 766,480 | |
5.00%, 01/01/29 | | | 1,080 | | | | 1,206,338 | |
5.00%, 01/01/30 | | | 2,250 | | | | 2,510,167 | |
Cumberland County Municipal Authority, Refunding RB, 5.00%, 01/01/32 | | | 1,510 | | | | 1,686,172 | |
Dauphin County General Authority, Refunding RB, Series A, 4.00%, 06/01/31 | | | 2,275 | | | | 2,587,130 | |
Delaware County Authority, Refunding RB | | | | | | | | |
5.00%, 07/01/28 | | | 800 | | | | 912,096 | |
5.00%, 07/01/29 | | | 1,365 | | | | 1,546,095 | |
5.00%, 07/01/30 | | | 1,435 | | | | 1,611,046 | |
East Hempfield Township Industrial Development Authority, RB, 5.00%, 07/01/30 | | | 2,105 | | | | 2,167,991 | |
Geisinger Authority, Refunding RB | | | | | | | | |
Series A-2, 5.00%, 02/15/32 | | | 4,000 | | | | 4,977,600 | |
Series A-2, 5.00%, 02/15/34 | | | 1,750 | | | | 2,156,210 | |
Lancaster County Hospital Authority, Refunding RB, Series A, 3.00%, 08/15/30 | | | 2,535 | | | | 2,826,449 | |
Montgomery County Higher Education and Health | | | | | | | | |
Authority, Refunding RB | | | | | | | | |
4.00%, 09/01/34 | | | 3,000 | | | | 3,516,480 | |
4.00%, 09/01/35 | | | 1,735 | | | | 2,022,489 | |
4.00%, 09/01/36 | | | 1,500 | | | | 1,740,285 | |
Series A, 5.00%, 09/01/31 | | | 1,750 | | | | 2,191,245 | |
Series A, 5.00%, 09/01/32 | | | 1,315 | | | | 1,638,477 | |
Montgomery County Industrial Development Authority, Refunding RB | | | | | | | | |
5.00%, 05/15/22(d) | | | 2,500 | | | | 2,658,125 | |
5.00%, 01/01/30 | | | 2,000 | | | | 2,039,820 | |
Series A, 5.25%, 01/15/29 | | | 3,250 | | | | 3,698,760 | |
Northampton County General Purpose Authority, RB, Series A, 5.00%, 08/15/33 | | | 12,660 | | | | 14,001,074 | |
| | | | | | | | |
| Security | | Par (000) | | | Value | |
| | |
| Pennsylvania (continued) | | | | | | |
Northampton County General Purpose Authority, Refunding RB, 5.00%, 11/01/34 | | $ | 5,400 | | | $ | 6,696,324 | |
Pennsylvania Economic Development Financing Authority, RB | | | | | | | | |
Series A-1, 5.00%, 04/15/30 | | | 2,500 | | | | 3,363,750 | |
AMT, 5.00%, 12/31/29 | | | 5,000 | | | | 5,981,200 | |
AMT, 5.00%, 12/31/30 | | | 13,100 | | | | 15,625,942 | |
AMT, 5.00%, 12/31/34 | | | 16,500 | | | | 19,361,760 | |
Pennsylvania Economic Development Financing Authority, Refunding RB, 5.00%, 03/15/31 | | | 4,500 | | | | 5,529,915 | |
Pennsylvania Higher Educational Facilities Authority, RB, Series AT-1, 5.00%, 06/15/30 | | | 7,910 | | | | 9,679,388 | |
Pennsylvania Higher Educational Facilities Authority, Refunding RB | | | | | | | | |
5.00%, 05/01/30 | | | 425 | | | | 508,797 | |
5.00%, 05/01/31 | | | 1,275 | | | | 1,520,642 | |
4.00%, 05/01/32 | | | 3,000 | | | | 3,016,740 | |
5.00%, 05/01/32 | | | 1,750 | | | | 2,081,082 | |
5.00%, 05/01/33 | | | 3,320 | | | | 3,915,708 | |
5.00%, 05/01/35 | | | 1,000 | | | | 1,173,990 | |
Pennsylvania Housing Finance Agency, Refunding RB, Series 125A, AMT, 3.40%, 10/01/32 | | | 9,000 | | | | 9,643,320 | |
Pennsylvania Turnpike Commission, RB | | | | | | | | |
Series B, 5.00%, 12/01/29 | | | 800 | | | | 1,088,944 | |
Series B, 5.00%, 12/01/30 | | | 620 | | | | 862,860 | |
Sub-Series B-1, 5.00%, 06/01/31 | | | 3,000 | | | | 3,734,490 | |
Sub-Series B-1, 5.00%, 06/01/32 | | | 4,075 | | | | 5,067,507 | |
Sub-Series B-1, 5.00%, 06/01/33 | | | 4,000 | | | | 4,969,760 | |
Pennsylvania Turnpike Commission, Refunding RB | | | | | | | | |
2nd Series, 5.00%, 12/01/32 | | | 1,000 | | | | 1,259,360 | |
2nd Series, 5.00%, 12/01/35 | | | 2,005 | | | | 2,519,784 | |
2nd Sub Series, 5.00%, 12/01/33 | | | 1,815 | | | | 2,284,123 | |
2nd Sub Series, 5.00%, 12/01/34 | | | 1,500 | | | | 1,886,730 | |
Sub-Series B-2, (AGM), 5.00%, 06/01/34 | | | 4,000 | | | | 4,939,640 | |
Philadelphia Authority for Industrial Development, RB, 4.00%, 06/15/29 | | | 350 | | | | 365,110 | |
Philadelphia Gas Works Co, RB, Series A, (AGM), 5.00%, 08/01/30 | | | 800 | | | | 1,072,256 | |
Philadelphia Gas Works Co, Refunding RB, Series 14-T, 5.00%, 10/01/30 | | | 425 | | | | 519,558 | |
Pittsburgh Water & Sewer Authority RB, Series B, (AGM), 5.00%, 09/01/30 | | | 205 | | | | 277,855 | |
Southeastern Pennsylvania Transportation Authority, RB | | | | | | | | |
5.00%, 06/01/21 | | | 250 | | | | 253,700 | |
5.00%, 06/01/30 | | | 5,000 | | | | 6,731,050 | |
State Public School Building Authority, RB, (SAW), 5.00%, 04/01/22(d) | | | 23,630 | | | | 24,983,826 | |
Wayne County Hospital & Health Facilities Authority, RB | | | | | | | | |
Series A, (GTD), 5.00%, 07/01/31 | | | 460 | | | | 577,746 | |
Series A, (GTD), 4.00%, 07/01/33 | | | 440 | | | | 511,584 | |
Westmoreland County Municipal Authority, Refunding RB (BAM), 5.00%, 08/15/27 | | | 1,500 | | | | 1,804,500 | |
| | |
| 30 | | 2 0 2 1 BLACK ROCK SEMI - ANNUAL REPORT TO SHAREHOLDERS |
| | |
Schedule of Investments (unaudited) (continued) January 31, 2021 | | BlackRock Municipal 2030 Target Term Trust (BTT) (Percentages shown are based on Net Assets) |
| | | | | | | | |
| Security | | Par (000) | | | Value | |
| | |
| Pennsylvania (continued) | | | | | | |
Westmoreland County Municipal Authority, Refunding RB (continued) | | | | | | | | |
(BAM), 5.00%, 08/15/31 | | $ | 5,000 | | | $ | 6,300,550 | |
(BAM), 5.00%, 08/15/32 | | | 17,945 | | | | 22,571,221 | |
| | | | | | | | |
| | |
| | | | | | | 332,494,110 | |
| | |
| Puerto Rico(a) — 4.3% | | | | | | |
Puerto Rico Sales Tax Financing Corp. Sales Tax Revenue, RB, CAB | | | | | | | | |
Series A-1, Restructured, 0.00%, 07/01/29 | | | 14,055 | | | | 12,040,075 | |
Series A-1, Restructured, 0.00%, 07/01/31 | | | 38,523 | | | | 30,346,493 | |
Series A-1, Restructured, 0.00%, 07/01/33 | | | 43,149 | | | | 31,459,505 | |
Series B-1, Restructured, 0.00%, 07/01/31 | | | 5,755 | | | | 4,550,536 | |
Series B-1, Restructured, 0.00%, 07/01/33 | | | 6,477 | | | | 4,741,164 | |
| | | | | | | | |
| | |
| | | | | | | 83,137,773 | |
| | |
| Rhode Island — 1.5% | | | | | | |
Rhode Island Health and Educational Building Corp., Refunding RB, 5.00%, 05/15/30 | | | 1,500 | | | | 1,781,640 | |
Rhode Island Housing and Mortgage Finance Corp., RB, S/F Housing,
Series 68-B, 3.00%, 10/01/31 | | | 13,500 | | | | 14,258,700 | |
Tobacco Settlement Financing Corp., Refunding RB | | | | | | | | |
Series A, 5.00%, 06/01/28 | | | 2,750 | | | | 3,248,823 | |
Series A, 5.00%, 06/01/29 | | | 4,500 | | | | 5,314,095 | |
Series A, 5.00%, 06/01/30 | | | 4,215 | | | | 4,975,175 | |
| | | | | | | | |
| | |
| | | | | | | 29,578,433 | |
| | |
| South Carolina — 0.9% | | | | | | |
South Carolina Jobs-Economic Development Authority, Refunding RB,
Series A, 5.00%, 05/01/35 | | | 10,000 | | | | 12,394,800 | |
South Carolina Public Service Authority, Refunding RB, Series A, 5.00%, 12/01/31 | | | 2,800 | | | | 3,863,496 | |
| | | | | | | | |
| | |
| | | | | | | 16,258,296 | |
| | |
| Tennessee — 0.6% | | | | | | |
Chattanooga Health Educational & Housing Facility Board, Refunding RB, Series A, 4.00%, 08/01/36 | | | 2,000 | | | | 2,331,740 | |
Chattanooga-Hamilton County Hospital Authority, Refunding RB,
Series A, 5.00%, 10/01/31 | | | 6,210 | | | | 6,930,112 | |
Memphis-Shelby County Industrial Development Board, Refunding TA, Series A, 4.75%, 07/01/27 | | | 525 | | | | 510,300 | |
Metropolitan Government Nashville & Davidson County Health & Educational Facs Bd, RB, Series A, 5.00%, 07/01/31. | | | 1,300 | | | | 1,559,025 | |
| | | | | | | | |
| | |
| | | | | | | 11,331,177 | |
| | |
| Texas — 14.0% | | | | | | |
Central Texas Regional Mobility Authority, RB | | | | | | | | |
Series A, Senior Lien, 5.00%, 01/01/30 | | | 1,600 | | | | 1,894,416 | |
Series A, Senior Lien, 5.00%, 01/01/31 | | | 1,175 | | | | 1,389,954 | |
Series A, Senior Lien, 5.00%, 01/01/33 | | | 1,500 | | | | 1,771,170 | |
Central Texas Turnpike System, RB | | | | | | | | |
Series C, 5.00%, 08/15/32 | | | 12,500 | | | | 14,474,375 | |
Series C, 5.00%, 08/15/33 | | | 14,000 | | | | 16,201,360 | |
City of Austin Texas Water & Wastewater System Revenue, Refunding RB, Series C, 5.00%, 11/15/30 | | | 900 | | | | 1,257,750 | |
City of Houston Texas Airport System Revenue, Refunding RB, Sub-Series D,
5.00%, 07/01/33 | | | 7,000 | | | | 8,806,840 | |
City of Houston Texas Combined Utility System Revenue, Refunding RB Series B, 1st Lien, 5.25%, 11/15/33 | | | 4,000 | | | | 5,031,360 | |
| | | | | | | | |
| Security | | Par (000) | | | Value | |
| | |
| Texas (continued) | | | | | | |
City of Houston Texas Combined Utility System Revenue, Refunding RB (continued) Series B, 1st Lien, 5.00%, 11/15/34 | | $ | 7,315 | | | $ | 9,041,779 | |
Clifton Higher Education Finance Corp.,
RB, 6.00%, 08/15/33 | | | 1,650 | | | | 1,846,581 | |
Clifton Higher Education Finance Corp., Refunding RB | | | | | | | | |
Series A, 3.10%, 12/01/22 | | | 325 | | | | 332,995 | |
Series A, (PSF-GTD), 4.00%, 08/15/31 | | | 1,250 | | | | 1,460,050 | |
Series A, 3.95%, 12/01/32 | | | 1,800 | | | | 1,885,014 | |
Series A, (PSF-GTD), 4.00%, 08/15/33 | | | 1,200 | | | | 1,394,388 | |
County of Harris Texas, Refunding RB, Series C, Senior Lien, 4.00%, 08/15/33. | | | 12,325 | | | | 12,994,987 | |
County of Nueces Texas, Refunding GO | | | | | | | | |
4.00%, 02/15/33 | | | 1,165 | | | | 1,442,270 | |
4.00%, 02/15/35 | | | 725 | | | | 892,548 | |
Dallas Fort Worth International Airport, Refunding RB, 5.00%, 11/01/32 | | | 5,000 | | | | 6,693,450 | |
Harris County Cultural Education Facilities Finance Corp., RB | | | | | | | | |
Series B, 5.75%, 01/01/28 | | | 500 | | | | 541,650 | |
Series B, 6.38%, 01/01/33 | | | 460 | | | | 501,690 | |
Harris County Cultural Education Facilities Finance Corp., Refunding RB | | | | | | | | |
Series A, 5.00%, 06/01/28 | | | 1,150 | | | | 1,224,807 | |
Series A, 5.00%, 01/01/33 | | | 1,090 | | | | 1,163,194 | |
Series A, 5.00%, 06/01/33 | | | 3,000 | | | | 3,155,370 | |
Leander Independent School District, Refunding GO, CAB(a) | | | | | | | | |
Series D, (PSF-GTD), 0.00%, 08/15/31 | | | 1,200 | | | | 842,148 | |
Series D, (PSF-GTD), 0.00%, 08/15/32 | | | 2,000 | | | | 1,363,140 | |
Series D, (PSF-GTD), 0.00%, 08/15/33 | | | 4,485 | | | | 2,905,652 | |
Matagorda County Navigation District No.1, Refunding RB | | | | | | | | |
Series A, (AMBAC), 4.40%, 05/01/30 | | | 26,120 | | | | 32,248,274 | |
Series B-2, 4.00%, 06/01/30 | | | 12,995 | | | | 13,920,114 | |
Series B, AMT, (AMBAC), 4.55%, 05/01/30 | | | 10,000 | | | | 12,474,300 | |
Midland County Fresh Water Supply District No.1, RB, CAB(a) | | | | | | | | |
Series A, 0.00%, 09/15/31 | | | 6,235 | | | | 4,750,758 | |
Series A, 0.00%, 09/15/32 | | | 15,135 | | | | 10,949,567 | |
Mission Economic Development Corp., Refunding RB, AMT, Senior Lien, 4.63%, 10/01/31(b) | | | 3,805 | | | | 4,067,735 | |
New Hope Cultural Education Facilities Finance Corp., RB(b) | | | | | | | | |
Series A, 3.63%, 08/15/22 | | | 195 | | | | 195,932 | |
Series A, 4.25%, 08/15/27 | | | 450 | | | | 452,898 | |
Series A, 4.00%, 08/15/29 | | | 335 | | | | 363,023 | |
Red River Health Facilities Development Corp., RB | | | | | | | | |
4.70%, 01/01/22 | | | 140 | | | | 142,139 | |
5.50%, 01/01/32 | | | 1,000 | | | | 1,018,540 | |
Socorro Independent School District, Refunding GO, Series B, (PSF-GTD), 4.00%, 08/15/34 | | | 3,000 | | | | 3,606,570 | |
Tarrant County Cultural Education Facilities Finance Corp., RB | | | | | | | | |
Series A, 4.00%, 05/15/23(d) | | | 20,920 | | | | 22,751,546 | |
Series B, 5.00%, 07/01/35 | | | 6,000 | | | | 7,658,520 | |
Tarrant County Cultural Education Facilities Finance Corp., Refunding RB,
Series A-1, 5.00%, 10/01/29 | | | 1,000 | | | | 1,109,340 | |
Texas Municipal Gas Acquisition & Supply Corp. III Refunding RB, 5.00%, 12/15/30 | | | 5,435 | | | | 7,254,258 | |
| | |
SCHEDULE OF INVESTMENTS | | 31 |
| | |
Schedule of Investments (unaudited) (continued) January 31, 2021 | | BlackRock Municipal 2030 Target Term Trust (BTT) (Percentages shown are based on Net Assets) |
| | | | | | | | |
| Security | | Par (000) | | | Value | |
| | |
| Texas (continued) | | | | | | |
Texas Municipal Gas Acquisition & Supply Corp. III, RB | | | | | | | | |
5.00%, 12/15/30 | | $ | 13,000 | | | $ | 14,215,760 | |
5.00%, 12/15/31 | | | 25,000 | | | | 27,299,000 | |
Texas Public Finance Authority, Refunding RB, 4.00%, 12/01/31 | | | 1,650 | | | | 1,910,205 | |
Texas Transportation Commission State Highway Fund, Refunding RB, 5.00%, 10/01/22 | | | 1,000 | | | | 1,081,630 | |
| | | | | | | | |
| | |
| | | | | | | 267,979,047 | |
| | |
| Utah — 0.3% | | | | | | |
Utah Transit Authority, Refunding RB, Subordinate, 4.00%, 12/15/31 | | | 5,000 | | | | 5,730,150 | |
| | | | | | | | |
| | |
| Virginia — 0.6% | | | | | | |
Dulles Town Center Community Development Authority, Refunding SAB, 4.25%, 03/01/26 | | | 500 | | | | 501,115 | |
Fairfax County Economic Development Authority, RB, Series A, 5.00%, 12/01/32 | | | 2,000 | | | | 2,193,140 | |
Hanover County Economic Development Authority, Refunding RB | | | | | | | | |
Series A, 4.50%, 07/01/30 | | | 3,000 | | | | 3,046,020 | |
Series A, 4.50%, 07/01/32 | | | 1,100 | | | | 1,115,851 | |
Virginia Small Business Financing Authority, RB, AMT, Senior Lien, 5.00%, 07/01/34 | | | 3,940 | | | | 4,101,422 | |
| | | | | | | | |
| | |
| | | | | | | 10,957,548 | |
| | |
| Washington — 1.8% | | | | | | |
Greater Wenatchee Regional Events Center Public Facilities District, Refunding RB | | | | | | | | |
Series A, 5.00%, 09/01/27 | | | 1,000 | | | | 1,029,970 | |
Series A, 5.25%, 09/01/32 | | | 655 | | | | 672,619 | |
Port of Seattle Washington, ARB | | | | | | | | |
Series C, AMT, Intermediate Lien, 5.00%, 05/01/33 | | | 6,695 | | | | 8,166,695 | |
Series C, AMT, Intermediate Lien, 5.00%, 05/01/34 | | | 6,000 | | | | 7,300,200 | |
Washington Health Care Facilities Authority, Refunding RB, Series B, 5.00%, 08/15/35 | | | 9,485 | | | | 11,914,867 | |
Washington State Housing Finance Commission, Refunding RB | | | | | | | | |
5.00%, 07/01/28 | | | 1,000 | | | | 1,091,430 | |
5.00%, 07/01/33 | | | 1,100 | | | | 1,199,627 | |
WBRP 3.2, RB | | | | | | | | |
Series A, 5.00%, 01/01/31 | | | 1,000 | | | | 1,203,990 | |
Series A, 5.00%, 01/01/32 | | | 1,140 | | | | 1,371,728 | |
| | | | | | | | |
| | |
| | | | | | | 33,951,126 | |
| | |
| West Virginia — 0.2% | | | | | | |
West Virginia Hospital Finance Authority, RB | | | | | | | | |
Series A, 5.00%, 06/01/31 | | | 1,950 | | | | 2,417,786 | |
Series A, 5.00%, 06/01/33 | | | 1,100 | | | | 1,355,090 | |
| | | | | | | | |
| | |
| | | | | | | 3,772,876 | |
| | |
| Wisconsin — 2.1% | | | | | | |
Public Finance Authority, RB(b) | | | | | | | | |
5.00%, 01/01/31 | | | 650 | | | | 703,872 | |
Series A, 4.00%, 07/15/29 | | | 645 | | | | 681,526 | |
Series A, 4.00%, 03/01/30 | | | 1,305 | | | | 1,360,371 | |
Series A, 3.75%, 06/01/30 | | | 345 | | | | 338,242 | |
Public Finance Authority, Refunding RB | | | | | | | | |
4.00%, 09/01/29(b) | | | 430 | | | | 430,800 | |
AMT, 2.63%, 11/01/25 | | | 3,000 | | | | 3,287,430 | |
Series B, AMT, 5.25%, 07/01/28 | | | 2,250 | | | | 2,393,798 | |
| | | | | | | | |
| Security | | Par (000) | | | Value | |
| | |
| Wisconsin (continued) | | | | | | |
State of Wisconsin, GO, Series B,
3.00%, 05/01/21(d) | | $ | 5,000 | | | $ | 5,035,700 | |
Wisconsin Health & Educational Facilities Authority, Refunding RB | | | | | | | | |
4.00%, 10/01/32 | | | 4,520 | | | | 4,788,081 | |
5.00%, 04/01/35 | | | 2,500 | | | | 3,244,875 | |
Series C-4, 0.68%, 08/15/54 | | | 8,200 | | | | 8,254,997 | |
Wisconsin Housing & Economic Development Authority, Refunding RB, S/F Housing, Series D, (FNMA), 3.00%, 09/01/32 | | | 9,000 | | | | 9,449,460 | |
|
| | | | | | | | |
| | |
| | | | | | | 39,969,152 | |
| | | | | | | | |
| | |
Total Municipal Bonds — 124.4%
(Cost: $2,161,707,210) | | | | | | | 2,379,993,820 | |
| | | | | | | | |
|
Municipal Bonds Transferred to Tender Option Bond Trusts(h) | |
| | |
Colorado(i) — 4.4% | | | | | | | | |
City & County of Denver Colorado Airport System Revenue, Refunding ARB | | | | | | | | |
Series A, AMT, 4.25%, 11/15/22(d) | | | 69,030 | | | | 73,771,924 | |
Series A, AMT, 4.25%, 11/15/31 | | | 8,085 | | | | 8,640,388 | |
Series A, AMT, 4.25%, 11/15/32 | | | 2,230 | | | | 2,383,187 | |
| | | | | | | | |
| | |
| | | | | | | 84,795,499 | |
| | |
| Florida(i) — 5.2% | | | | | | |
County of Broward Florida Airport System Revenue, ARB | | | | | | | | |
Series Q-1, 4.00%, 10/01/29 | | | 17,200 | | | | 18,235,884 | |
Series Q-1, 4.00%, 10/01/30 | | | 18,095 | | | | 19,184,784 | |
Series Q-1, 4.00%, 10/01/31 | | | 18,820 | | | | 19,953,448 | |
Series Q-1, 4.00%, 10/01/32 | | | 19,575 | | | | 20,753,918 | |
Series Q-1, 4.00%, 10/01/33 | | | 20,355 | | | | 21,580,894 | |
| | | | | | | | |
| | |
| | | | | | | 99,708,928 | |
| | |
| Iowa — 2.3% | | | | | | |
State of Iowa Board of Regents, RB | | | | | | | | |
4.00%, 09/01/28 | | | 3,375 | | | | 3,572,250 | |
4.00%, 09/01/29 | | | 6,525 | | | | 6,906,350 | |
4.00%, 09/01/30 | | | 6,325 | | | | 6,694,661 | |
4.00%, 09/01/31 | | | 8,650 | | | | 9,155,545 | |
4.00%, 09/01/32 | | | 7,750 | | | | 8,202,945 | |
4.00%, 09/01/33 | | | 9,375 | | | | 9,922,917 | |
| | | | | | | | |
| | |
| | | | | | | 44,454,668 | |
| | |
| Nevada — 1.1% | | | | | | |
County of Clark Nevada, Refunding GO,
Series B, 4.00%, 11/01/34 | | | 17,710 | | | | 20,583,271 | |
| | | | | | | | |
| | |
| New Jersey — 2.0% | | | | | | |
State of New Jersey, GO, 4.00%, 06/01/30 | | | 30,000 | | | | 37,257,600 | |
| | | | | | | | |
| | |
| Pennsylvania — 2.6% | | | | | | |
Commonwealth of Pennsylvania, GO, 1st
Series, 5.00%, 03/01/32(i) | | | 20,000 | | | | 25,502,600 | |
County of Lehigh Pennsylvania, Refunding RB,
4.00%, 07/01/33 | | | 22,285 | | | | 23,505,994 | |
| | | | | | | | |
| | |
| | | | | | | 49,008,594 | |
| | |
| Texas(i) — 4.4% | | | | | | |
San Antonio Public Facilities Corp., Refunding RB | | | | | | | | |
4.00%, 09/15/30 | | | 15,000 | | | | 15,905,980 | |
4.00%, 09/15/31 | | | 19,475 | | | | 20,651,264 | |
4.00%, 09/15/32 | | | 18,075 | | | | 19,166,706 | |
| | |
| 32 | | 2 0 2 1 BLACK ROCK SEMI - ANNUAL REPORT TO SHAREHOLDERS |
| | |
Schedule of Investments (unaudited) (continued) January 31, 2021 | | BlackRock Municipal 2030 Target Term Trust (BTT) (Percentages shown are based on Net Assets) |
| | | | | | | | |
| Security | | Par (000) | | | Value | |
| |
| | |
| Texas (continued) | | | | | | |
San Antonio Public Facilities Corp., Refunding RB (continued) | |
4.00%, 09/15/33 | | $ | 11,000 | | | $ | 11,664,385 | |
4.00%, 09/15/34 | | | 11,885 | | | | 12,602,838 | |
4.00%, 09/15/35 | | | 4,500 | | | | 4,771,794 | |
| | | | | | | | |
| | |
| | | | | | | 84,762,967 | |
| | | | | | | | |
Total Municipal Bonds Transferred to Tender Option Bond Trusts — 22.0%
(Cost: $395,797,965) | | | | | | | 420,571,527 | |
| | | | | | | | |
Total Long-Term Investments — 146.4%
(Cost: $2,557,505,175) | | | | 2,800,565,347 | |
| | | | | | | | |
| | |
| | | Shares | | | | |
| |
| | |
Short-Term Securities | | | | | | | | |
| | |
| Money Market Funds — 4.7% | | | | | | |
BlackRock Liquidity Funds, MuniCash, Institutional Class, 0.01%(j)(k) | | | 90,628,301 | | | | 90,646,427 | |
| | | | | | | | |
| | |
Total Short-Term Securities — 4.7%
(Cost: $90,637,514) | | | | | | | 90,646,427 | |
| | | | | | | | |
| | |
Total Investments — 151.1%
(Cost: $2,648,142,689) | | | | | | | 2,891,211,774 | |
| | |
Other Assets Less Liabilities — 0.3% | | | | | | | 5,478,988 | |
| |
Liability for TOB Trust Certificates, Including Interest Expense and Fees Payable — (12.2)% | | | | (233,315,712 | ) |
| |
RVMTP Shares at Liquidation Value, Net of Deferred Offering Costs — (39.2)% | | | | (749,689,766 | ) |
| | | | | | | | |
| |
Net Assets Applicable to Common Shares — 100.0% | | | $ | 1,913,685,284 | |
| | | | | | | | |
| (b) | Security exempt from registration pursuant to Rule 144A under the Securities Act of 1933, as amended. These securities may be resold in transactions exempt from registration to qualified institutional investors. |
| (c) | Security is collateralized by municipal bonds or U.S. Treasury obligations. |
| (d) | U.S. Government securities held in escrow, are used to pay interest on this security as well as to retire the bond in full at the date indicated, typically at a premium to par. |
| (e) | Variable rate security. Interest rate resets periodically. The rate shown is the effective interest rate as of period end. Security description also includes the reference rate and spread if published and available. |
| (f) | Step-up bond that pays an initial coupon rate for the first period and then a higher coupon rate for the following periods. Rate as of period end. |
| (g) | When-issued security. |
| (h) | Represent bonds transferred to a TOB Trust in exchange of cash and residual certificates received by the Trust. These bonds serve as collateral in a secured borrowing. See Note 4 of the Notes to Financial Statements for details. |
| (i) | All or a portion of the security is subject to a recourse agreement. The aggregate maximum potential amount the Trust could ultimately be required to pay under the agreements, which expire between March 15, 2022 to March 1, 2026, is $171,383,060. See Note 4 of the Notes to Financial Statements for details. |
| (j) | Affiliate of the Trust. |
| (k) | Annualized 7-day yield as of period end. |
Affiliates
Investments in issuers considered to be affiliate(s) of the Trust during the six-months ended January 31, 2021 for purposes of Section 2(a)(3) of the Investment Company Act of 1940, as amended, were as follows:
| | | | | | | | | | | | | | | | | | | | | | | | | | | | | | | | | | | | |
| | | | | | | | | | |
| Affiliated Issuer | | Value at
07/31/20 | | | Purchases
at Cost | | | Proceeds
from Sales | | | Net
Realized
Gain (Loss) | | | Change in
Unrealized
Appreciation
(Depreciation) | | | Value at
01/31/21 | | | Shares
Held at
01/31/21 | | | Income | | | Capital Gain
Distributions
from
Underlying
Funds | |
BlackRock Liquidity Funds, MuniCash, Institutional Class | | $ | 53,785,322 | | | $ | 36,856,768 | (a) | | $ | — | | | $ | (1,211 | ) | | $ | 5,548 | | | $ | 90,646,427 | | | | 90,628,301 | | | $ | 2,940 | | | $ | — | |
| | | | | | | | | | | | | | | | | | | | | | | | | | | | | | | | | | | | |
| | (a) | Represents net amount purchased (sold). | |
| | |
SCHEDULE OF INVESTMENTS | | 33 |
| | |
Schedule of Investments (unaudited) (continued) January 31, 2021 | | BlackRock Municipal 2030 Target Term Trust (BTT) |
Fair Value Hierarchy as of Period End
Various inputs are used in determining the fair value of financial instruments. For a description of the input levels and information about the Trust’s policy regarding valuation of financial instruments, refer to the Notes to Financial Statements.
The following table summarizes the Trust’s investments categorized in the disclosure hierarchy. The breakdown of the Trust’s investments into major categories is disclosed in the Schedule of Investments above.
| | | | | | | | | | | | | | | | |
| |
| | | Level 1 | | | Level 2 | | | Level 3 | | | Total | |
| |
Assets | | | | | | | | | | | | | | | | |
Investments | | | | | | | | | | | | | | | | |
Long-Term Investments | | | | | | | | | | | | | | | | |
Municipal Bonds | | $ | — | | | $ | 2,379,993,820 | | | $ | — | | | $ | 2,379,993,820 | |
Municipal Bonds Transferred to Tender Option Bond Trusts | | | — | | | | 420,571,527 | | | | — | | | | 420,571,527 | |
Short-Term Securities | | | | | | | | | | | | | | | | |
Money Market Funds | | | 90,646,427 | | | | — | | | | — | | | | 90,646,427 | |
| | | | | | | | | | | | | | | | |
| | $ | 90,646,427 | | | $ | 2,800,565,347 | | | $ | — | | | $ | 2,891,211,774 | |
| | | | | | | | | | | | | | | | |
The Trust may hold assets and/or liabilities in which the fair value approximates the carrying amount for financial statement purposes. As of period end, such assets and/or liabilities are categorized within the disclosure hierarchy as follows:
| | | | | | | | | | | | | | | | |
| |
| | | Level 1 | | | Level 2 | | | Level 3 | | | Total | |
| |
Liabilities | | | | | | | | | | | | | | | | |
TOB Trust Certificates | | $ | — | | | | $ (233,219,952) | | | $ | — | | | $ | (233,219,952 | ) |
RVMTP Shares at Liquidation Value | | | — | | | | (750,000,000 | ) | | | — | | | | (750,000,000 | ) |
| | | | | | | | | | | | | | | | |
| | $ | — | | | | $ (983,219,952) | | | $ | — | | | $ | (983,219,952 | ) |
| | | | | | | | | | | | | | | | |
See notes to financial statements.
| | |
| 34 | | 2 0 2 1 BLACK ROCK SEMI - ANNUAL REPORT TO SHAREHOLDERS |
| | |
Schedule of Investments (unaudited) January 31, 2021 | | BlackRock Municipal Income Investment Trust (BBF) (Percentages shown are based on Net Assets) |
| | | | | | | | |
| Security | | Par
(000) | | | Value | |
| | |
Municipal Bonds | | | | | | | | |
| | |
| Alabama — 1.5% | | | | | | |
Health Care Authority of the City of Huntsville, RB | | | | | | | | |
Series B1, 4.00%, 06/01/45 | | $ | 320 | | | $ | 377,005 | |
Series B1, (AGM), 3.00%, 06/01/50 | | | 1,375 | | | | 1,452,756 | |
Selma Industrial Development Board, RB, Series A, 5.38%, 12/01/35 | | | 420 | | | | 437,564 | |
| | | | | | | | |
| | |
| | | | | | | 2,267,325 | |
| | |
| Arizona — 1.6% | | | | | | |
Arizona Industrial Development Authority, Refunding RB, Series A, 5.38%, 07/01/50(a) | | | 1,185 | | | | 1,308,832 | |
Industrial Development Authority of the City of Phoenix, Refunding RB, Series A, 5.00%, 07/01/35(a) | | | 275 | | | | 303,149 | |
Industrial Development Authority of the County of Pima, RB, 5.00%, 07/01/49(a) | | | 350 | | | | 356,542 | |
Maricopa County Industrial Development Authority, Refunding RB, Series A, 4.13%, 09/01/38 | | | 320 | | | | 371,328 | |
| | | | | | | | |
| | |
| | | | | | | 2,339,851 | |
| | |
| California — 10.7% | | | | | | |
California Health Facilities Financing Authority Refunding RB, 5.00%, 08/01/50 | | | 565 | | | | 677,904 | |
California Health Facilities Financing Authority, Refunding RB | | | | | | | | |
Series A, 4.00%, 03/01/39 | | | 890 | | | | 1,003,235 | |
Series A, 4.00%, 04/01/45 | | | 295 | | | | 343,150 | |
California School Finance Authority, Refunding RB, Series A, 5.00%, 07/01/51(a) | | | 1,200 | | | | 1,380,432 | |
California State Public Works Board, RB | | | | | | | | |
Series F, 5.25%, 09/01/33 | | | 610 | | | | 688,385 | |
Series I, 5.50%, 11/01/31 | | | 2,100 | | | | 2,400,069 | |
Series I, 5.50%, 11/01/33 | | | 1,500 | | | | 1,713,465 | |
California Statewide Communities Development Authority, Refunding RB(a) | | | | | | | | |
Series A, 5.00%, 06/01/36 | | | 990 | | | | 1,085,693 | |
Series A, 5.00%, 06/01/46 | | | 1,220 | | | | 1,306,779 | |
Golden State Tobacco Securitization Corp., Refunding RB, | | | | | | | | |
Series A-2, 5.00%, 06/01/47 | | | 475 | | | | 494,076 | |
Kern Community College District, GO, Series C, 5.50%, 11/01/23(b) | | | 1,185 | | | | 1,358,437 | |
Regents of the University of California Medical Center Pooled Revenue, Refunding RB | | | | | | | | |
Series J, 5.25%, 05/15/23(b) | | | 2,165 | | | | 2,417,677 | |
Series J, 5.25%, 05/15/38 | | | 615 | | | | 682,299 | |
Washington Township Health Care District, GO, Series B, 5.50%, 08/01/40 | | | 460 | | | | 523,291 | |
| | | | | | | | |
| | |
| | | | | | | 16,074,892 | |
| | |
| Colorado — 2.1% | | | | | | |
Centerra Metropolitan District No.1, TA, 5.00%, 12/01/47(a) | | | 250 | | | | 259,802 | |
City & County of Denver Colorado Airport System Revenue, ARB, Series B, 5.25%, 11/15/32 | | | 1,750 | | | | 1,979,810 | |
City & County of Denver Colorado, RB, CAB, Series A-2, 0.00%, 08/01/38(c) | | | 1,000 | | | | 565,300 | |
Colorado Housing and Finance Authority RB, Class I, 2.55%, 10/01/55 | | | 400 | | | | 405,836 | |
| | | | | | | | |
| | |
| | | | | | | 3,210,748 | |
| | | | | | | | |
| Security | | Par
(000) | | | Value | |
| | |
| Florida — 6.3% | | | | | | |
Celebration Pointe Community Development District, SAB(a) | | | | | | | | |
5.00%, 05/01/32 | | $ | 215 | | | $ | 238,732 | |
5.00%, 05/01/48 | | | 530 | | | | 570,073 | |
County of Miami-Dade Seaport Department, ARB, Series A, 6.00%, 10/01/38 | | | 5,675 | | | | 6,489,362 | |
County of Osceola Florida Transportation Revenue, Refunding RB, CAB(c) | | | | | | | | |
Series A-2, 0.00%, 10/01/46. | | | 635 | | | | 271,437 | |
Series A-2, 0.00%, 10/01/47 | | | 610 | | | | 251,814 | |
Series A-2, 0.00%, 10/01/48 | | | 430 | | | | 170,744 | |
Series A-2, 0.00%, 10/01/49 | | | 355 | | | | 136,146 | |
Lakewood Ranch Stewardship District, SAB | | | | | | | | |
5.25%, 05/01/37 | | | 180 | | | | 201,874 | |
5.38%, 05/01/47 | | | 185 | | | | 205,533 | |
Reedy Creek Improvement District, GO, Series A, 5.25%, 06/01/23(b) | | | 875 | | | | 979,318 | |
| | | | | | | | |
| | |
| | | | | | | 9,515,033 | |
| | |
| Georgia — 4.1% | | | | | | |
Main Street Natural Gas, Inc., RB, Series A, 5.00%, 05/15/49 | | | 2,320 | | | | 3,605,698 | |
Municipal Electric Authority of Georgia, RB | | | | | | | | |
4.00%, 01/01/49 | | | 705 | | | | 806,026 | |
4.00%, 01/01/59 | | | 1,335 | | | | 1,503,517 | |
Municipal Electric Authority of Georgia, Refunding RB, Sub-Series A, 4.00%, 01/01/49 | | | 260 | | | | 297,003 | |
| | | | | | | | |
| | |
| | | | | | | 6,212,244 | |
| | |
| Illinois — 15.4% | | | | | | |
Chicago Board of Education, GO | | | | | | | | |
Series C, 5.25%, 12/01/35 | | | 700 | | | | 782,957 | |
Series D, 5.00%, 12/01/46 | | | 880 | | | | 975,465 | |
Series H, 5.00%, 12/01/46 | | | 215 | | | | 250,628 | |
Chicago Board of Education, Refunding GO | | | | | | | | |
Series C, 5.00%, 12/01/25 | | | 295 | | | | 349,625 | |
Series D, 5.00%, 12/01/27 | | | 400 | | | | 497,912 | |
Series F, 5.00%, 12/01/23 | | | 290 | | | | 322,785 | |
Series G, 5.00%, 12/01/34 | | | 215 | | | | 256,882 | |
Chicago Transit Authority Sales Tax Receipts Fund, RB, 5.25%, 12/01/21(b) | | | 3,810 | | | | 3,972,077 | |
Cook County Community College District No.508, GO | | | | | | | | |
5.50%, 12/01/38 | | | 580 | | | | 648,701 | |
5.25%, 12/01/43 | | | 2,660 | | | | 2,919,563 | |
Illinois Finance Authority, RB, Series A, 6.00%, 08/15/41 | | | 1,750 | | | | 1,803,742 | |
Illinois Finance Authority, Refunding RB, Series A, 4.00%, 05/15/50 | | | 340 | | | | 397,130 | |
Metropolitan Pier & Exposition Authority, RB | | | | | | | | |
Series A, 5.50%, 06/15/53 | | | 280 | | | | 324,708 | |
Series A, 5.00%, 06/15/57 | | | 1,045 | | | | 1,218,878 | |
Metropolitan Pier & Exposition Authority, RB, CAB, (BAM), 0.00%, 12/15/56(c) | | | 2,165 | | | | 674,311 | |
Metropolitan Pier & Exposition Authority, Refunding RB, 4.00%, 06/15/50 | | | 470 | | | | 519,656 | |
Metropolitan Pier & Exposition Authority, Refunding RB, CAB, Series B, 0.00%, 12/15/54(c) | | | 3,020 | | | | 981,560 | |
Railsplitter Tobacco Settlement Authority, RB(b) | | | | | | | | |
5.50%, 06/01/21 | | | 1,055 | | | | 1,073,779 | |
6.00%, 06/01/21 | | | 300 | | | | 305,880 | |
State of Illinois, GO | | | | | | | | |
5.25%, 02/01/31 | | | 730 | | | | 816,228 | |
5.25%, 02/01/32 | | | 1,500 | | | | 1,675,995 | |
| | |
SCHEDULE OF INVESTMENTS | | 35 |
| | |
Schedule of Investments (unaudited) (continued) January 31, 2021 | | BlackRock Municipal Income Investment Trust (BBF) (Percentages shown are based on Net Assets) |
| | | | | | | | |
| Security | | Par (000) | | | Value | |
| | |
| Illinois (continued) | | | | | | |
State of Illinois, GO (continued) | | | | | | | | |
5.50%, 07/01/33 | | $ | 1,500 | | | $ | 1,643,205 | |
5.50%, 07/01/38 | | | 340 | | | | 371,368 | |
Series D, 5.00%, 11/01/28 | | | 165 | | | | 196,206 | |
State of Illinois, Refunding GO, Series B, 5.00%, 10/01/27 | | | 60 | | | | 72,690 | |
| | | | | | | | |
| | |
| | | | | | | 23,051,931 | |
| | |
| Indiana — 0.4% | | | | | | |
Indiana Finance Authority, Refunding RB, 4.75%, 03/01/22(b) | | | 500 | | | | 525,090 | |
| | | | | | | | |
| | |
| Iowa — 1.1% | | | | | | |
lowa Finance Authority, Refunding RB | | | | | | | | |
5.25%, 12/01/25 | | | 625 | | | | 701,525 | |
Series B, 5.25%, 12/01/50(d) | | | 905 | | | | 1,013,890 | |
| | | | | | | | |
| | |
| | | | | | | 1,715,415 | |
| | |
| Kansas — 0.3% | | | | | | |
City of Lenexa Kansas, Refunding RB,
Series A, 5.00%, 05/15/43 | | | 475 | | | | 511,295 | |
| | | | | | | | |
| | |
| Maine — 0.5% | | | | | | |
Maine Health & Higher Educational Facilities Authority, RB, 7.50%, 07/01/21(b) | | | 680 | | | | 702,311 | |
| | | | | | | | |
| | |
| Maryland — 1.2% | | | | | | |
City of Baltimore Maryland, Refunding RB, Series A, 4.50%, 09/01/33 | | | 135 | | | | 143,548 | |
Maryland Community Development Administration RB | | | | | | | | |
Series E, (FHA 542(C)), 2.35%, 07/01/45 | | | 340 | | | | 339,575 | |
Series E, (FHA 542(C)), 2.50%, 07/01/50 | | | 800 | | | | 800,328 | |
Maryland Community Development Administration, Refunding RB, S/F Housing, Series A, 4.10%, 09/01/38 | | | 520 | | | | 554,632 | |
| | | | | | | | |
| | |
| | | | | | | 1,838,083 | |
| | |
| Massachusetts — 1.2% | | | | | | |
Massachusetts Development Finance Agency, RB, Series A, 5.00%, 01/01/47 | | | 790 | | | | 880,819 | |
Massachusetts Development Finance Agency, Refunding RB, 5.00%, 01/01/45 | | | 375 | | | | 406,549 | |
Massachusetts Housing Finance Agency RB, Series D-1, 2.55%, 12/01/50 | | | 160 | | | | 162,246 | |
Metropolitan Boston Transit Parking Corp., Refunding RB, 5.25%, 07/01/36 | | | 300 | | | | 306,087 | |
| | | | | | | | |
| | |
| | | | | | | 1,755,701 | |
| | |
| Michigan — 0.9% | | | | | | |
Grand Traverse County Hospital Finance Authority, RB, Series A, 5.00%, 07/01/44 | | | 1,110 | | | | 1,359,250 | |
| | | | | | | | |
| | |
| Minnesota — 3.9% | | | | | | |
City of Minneapolis Minnesota, Refunding RB, Series A, 5.00%, 11/15/49 | | | 1,790 | | | | 2,148,054 | |
Duluth Economic Development Authority, Refunding RB | | | | | | | | |
Series A, 4.25%, 02/15/48 | | | 2,665 | | | | 2,970,462 | |
Series A, 5.25%, 02/15/58 | | | 560 | | | | 664,580 | |
| | | | | | | | |
| | |
| | | | | | | 5,783,096 | |
| | |
| Montana — 0.1% | | | | | | |
City of Kalispell Montana, Refunding RB,
Series A, 5.25%, 05/15/37 | | | 125 | | | | 129,918 | |
| | | | | | | | |
| | | | | | | | |
| Security | | Par
(000) | | | Value | |
| | |
| New Jersey — 10.3% | | | | | | |
Casino Reinvestment Development Authority, Inc., Refunding RB, 5.25%, 11/01/39 | | $ | 265 | | | $ | 284,319 | |
New Jersey Economic Development Authority, RB, Series EEE, 5.00%, 06/15/43. | | | 2,030 | | | | 2,457,823 | |
New Jersey Housing & Mortgage Finance Agency Refunding RB, Series A, (FHLMC), 2.30%, 11/01/40 | | | 650 | | | | 651,014 | |
New Jersey Transportation Trust Fund Authority, RB 5.00%, 06/15/46 | | | 1,045 | | | | 1,257,449 | |
Series AA, 5.50%, 06/15/39 | | | 2,245 | | | | 2,482,543 | |
Series AA, 4.00%, 06/15/45 | | | 485 | | | | 559,942 | |
Series S, 5.25%, 06/15/43 | | | 1,145 | | | | 1,420,338 | |
New Jersey Turnpike Authority, RB, Series A, 4.00%, 01/01/48 | | | 640 | | | | 738,163 | |
Tobacco Settlement Financing Corp., Refunding RB | | | | | | | | |
Series A, 5.00%, 06/01/35 | | | 630 | | | | 792,691 | |
Series A, 5.25%, 06/01/46 | | | 1,515 | | | | 1,854,769 | |
Sub-Series B, 5.00%, 06/01/46 | | | 2,455 | | | | 2,922,407 | |
| | | | | | | | |
| | | | | | | 15,421,458 | |
| | |
| New York — 20.0% | | | | | | |
City of New York New York, GO, Series D-1, 4.00%, 03/01/44 | | | 515 | | | | 609,374 | |
City of New York, GO, Series C, 5.00%, 08/01/42 | | | 640 | | | | 829,638 | |
Hudson Yards Infrastructure Corp., RB | | | | | | | | |
5.75%, 02/15/21(b) | | | 1,005 | | | | 1,007,030 | |
5.75%, 02/15/47 | | | 605 | | | | 607,644 | |
Metropolitan Transportation Authority, RB, Series A, 5.25%, 11/15/21(b) | | | 500 | | | | 520,295 | |
Metropolitan Transportation Authority, Refunding RB | | | | | | | | |
Series B, 5.00%, 11/15/22 | | | 400 | | | | 426,248 | |
Series C-1, 4.75%, 11/15/45 | | | 2,350 | | | | 2,842,513 | |
Monroe County Industrial Development Corp., Refunding RB, 4.00%, 12/01/46 | | | 195 | | | | 220,601 | |
New York City Housing Development Corp. RB, Series I-1, (FHA), 2.65%, 11/01/50 | | | 3,295 | | | | 3,374,343 | |
New York City Housing Development Corp., RB, M/F Housing | | | | | | | | |
Series A, 3.00%, 11/01/55 | | | 1,260 | | | | 1,305,562 | |
Series H, 2.55%, 11/01/45 | | | 925 | | | | 935,425 | |
New York City Housing Development Corp., Refunding RB, M/F Housing, Series D-1-B, (FHA 542(C)), 2.50%, 11/01/55 | | | 1,500 | | | | 1,506,000 | |
New York City Industrial Development Agency, Refunding RB | | | | | | | | |
(AGM), 3.00%, 03/01/49 | | | 740 | | | | 790,668 | |
3.00%, 03/01/49 | | | 620 | | | | 652,339 | |
New York City Transitional Finance Authority Future Tax Secured Revenue, RB, Sub-Series B-1, 4.00%, 11/01/45 | | | 5,000 | | | | 5,886,550 | |
New York Counties Tobacco Trust IV, Refunding RB, Series A, 6.25%, 06/01/41(a) | | | 900 | | | | 914,544 | |
New York Power Authority, Refunding RB, Series A, 4.00%, 11/15/60 | | | 465 | | | | 548,779 | |
New York State Housing Finance Agency, RB, M/F Housing, Series L-1, (SONYMA), 2.60%, 11/01/50 | | | 830 | | | | 852,186 | |
New York State Thruway Authority, Refunding RB, Series B, Subordinate, 4.00%, 01/01/45 | | | 1,065 | | | | 1,234,527 | |
Port Authority of New York & New Jersey, ARB 4.00%, 09/01/45 | | | 2,500 | | | | 2,924,500 | |
| | |
| 36 | | 2 0 2 1 BLACK ROCK SEMI - ANNUAL REPORT TO SHAREHOLDERS |
| | |
Schedule of Investments (unaudited) (continued) January 31, 2021 | | BlackRock Municipal Income Investment Trust (BBF) (Percentages shown are based on Net Assets) |
| | | | | | | | |
| Security | | Par (000) | | | Value | |
|
| New York (continued) | |
Port Authority of New York & New Jersey, ARB (continued) | | | | | | | | |
4.00%, 09/01/49 | | $ | 1,500 | | | $ | 1,750,260 | |
Westchester Tobacco Asset Securitization Corp., Refunding RB, Sub-Series C, 4.00%, 06/01/42 | | | 265 | | | | 289,033 | |
| | | | | | | | |
| | |
| | | | | | | 30,028,059 | |
|
| North Carolina — 0.2% | |
North Carolina Medical Care Commission, RB, Series A, 4.00%, 10/01/45 | | | 255 | | | | 282,599 | |
| | | | | | | | |
|
| Ohio — 3.0% | |
Buckeye Tobacco Settlement Financing Authority, Refunding RB, Series B-2, Class 2, 5.00%, 06/01/55 | | | 1,875 | | | | 2,185,556 | |
County of Hamilton Ohio, Refunding RB, 4.00%, 08/15/50 | | | 665 | | | | 777,152 | |
Ohio Turnpike & Infrastructure Commission, RB, Series A-1, Junior Lien, 5.25%, 02/15/31 | | | 1,385 | | | | 1,524,664 | |
| | | | | | | | |
| | |
| | | | | | | 4,487,372 | |
|
| Oklahoma — 1.0% | |
Oklahoma Development Finance Authority, RB, Series B, 5.25%, 08/15/48 | | | 560 | | | | 659,551 | |
Tulsa County Industrial Authority, Refunding RB, 5.25%, 11/15/45 | | | 850 | | | | 901,850 | |
| | | | | | | | |
| | |
| | | | | | | 1,561,401 | |
|
| Oregon — 0.2% | |
Clackamas County School District No.12 North Clackamas, GO, CAB, Series A, (GTD), 0.00%, 06/15/38(c) | | | 575 | | | | 319,959 | |
| | | | | | | | |
|
| Pennsylvania — 3.1% | |
Allentown Neighborhood Improvement Zone Development Authority, RB, 5.00%, 05/01/42(a) | | | 420 | | | | 476,284 | |
Bristol Township School District, GO, (SAW), 5.25%, 06/01/37 | | | 1,530 | | | | 1,687,712 | |
Pennsylvania Higher Educational Facilities Authority, RB, 4.00%, 08/15/44 | | | 660 | | | | 776,879 | |
Pennsylvania Turnpike Commission RB, 4.00%, 12/01/46 | | | 1,415 | | | | 1,659,654 | |
| | | | | | | | |
| | |
| | | | | | | 4,600,529 | |
| | |
| Puerto Rico — 5.9% | | | | | | |
Children’s Trust Fund, Refunding RB, 5.63%, 05/15/43 | | | 620 | | | | 627,533 | |
Puerto Rico Commonwealth Aqueduct & Sewer Authority, RB | | | | | | | | |
Series A, Senior Lien, 5.00%, 07/01/33 | | | 1,135 | | | | 1,196,211 | |
Series A, Senior Lien, 5.13%, 07/01/37 | | | 325 | | | | 343,860 | |
Puerto Rico Sales Tax Financing Corp. Sales Tax Revenue, RB | | | | | | | | |
Series A-1, Restructured, 4.75%, 07/01/53 | | | 829 | | | | 927,809 | |
Series A-1, Restructured, 5.00%, 07/01/58 | | | 3,029 | | | | 3,439,914 | |
Series A-2, Restructured, 4.33%, 07/01/40 | | | 420 | | | | 464,255 | |
Series A-2, Restructured, 4.78%, 07/01/58 | | | 770 | | | | 862,908 | |
Puerto Rico Sales Tax Financing Corp. Sales Tax Revenue, RB, CAB, Series A-1, Restructured, 0.00%, 07/01/46(c) | | | 2,949 | | | | 932,621 | |
| | | | | | | | |
| | |
| | | | | | | 8,795,111 | |
| | | | | | | | |
| Security | | Par (000) | | | Value | |
|
| Rhode Island — 2.1% | |
Tobacco Settlement Financing Corp., Refunding RB | | | | | | | | |
Series B, 4.50%, 06/01/45 | | $ | 2,870 | | | $ | 3,050,006 | |
Series B, 5.00%, 06/01/50 | | | 125 | | | | 135,153 | |
| | | | | | | | |
| | |
| | | | | | | 3,185,159 | |
|
| South Carolina — 5.3% | |
County of Charleston South Carolina, ARB, 5.25%, 12/01/38 | | | 1,825 | | | | 2,074,861 | |
South Carolina Jobs-Economic Development Authority, RB, 5.00%, 01/01/40(a) | | | 385 | | | | 386,043 | |
South Carolina Jobs-Economic Development Authority, Refunding RB | | | | | | | | |
Series A, 5.00%, 05/01/43 | | | 950 | | | | 1,142,422 | |
Series A, 5.00%, 05/01/48 | | | 565 | | | | 668,418 | |
South Carolina Public Service Authority, RB, Series E, 5.50%, 12/01/53 | | | 1,500 | | | | 1,705,260 | |
South Carolina Public Service Authority, Refunding RB | | | | | | | | |
Series A, 5.00%, 12/01/50. | | | 210 | | | | 245,110 | |
Series A, 5.00%, 12/01/55 | | | 465 | | | | 543,227 | |
Series E, 5.25%, 12/01/55 | | | 945 | | | | 1,134,747 | |
| | | | | | | | |
| | |
| | | | | | | 7,900,088 | |
|
| South Dakota — 0.6% | |
South Dakota Health & Educational Facilities Authority, Refunding RB, Series A, 4.00%, 09/01/50 | | | 720 | | | | 833,422 | |
| | | | | | | | |
|
| Tennessee — 0.8% | |
Metropolitan Government Nashville & Davidson County Health & Educational Facilities Board, RB, Series A, 5.25%, 10/01/58 | | | 855 | | | | 1,000,889 | |
Metropolitan Government Nashville & Davidson County Health & Educational Facs Bd, Refunding RB, Series A, 4.00%, 10/01/49 | | | 240 | | | | 256,845 | |
| | | | | | | | |
| | |
| | | | | | | 1,257,734 | |
| | |
| Texas — 3.3% | | | | | | |
City of Beaumont Texas, GO, 5.25%, 03/01/23(b) | | | 1,140 | | | | 1,259,791 | |
North Texas Tollway Authority, RB, Series A, 5.50%, 09/01/21(b) | | | 1,500 | | | | 1,546,590 | |
North Texas Tollway Authority, Refunding RB, 4.25%, 01/01/49 | | | 285 | | | | 331,392 | |
Red River Education Finance Corp., RB, 5.25%, 03/15/23(b) | | | 520 | | | | 576,020 | |
Texas Municipal Gas Acquisition & Supply Corp. III Refunding RB, 5.00%, 12/15/32(e) | | | 155 | | | | 212,955 | |
Texas Transportation Commission, RB, Series A, 5.00%, 08/01/57 | | | 235 | | | | 276,583 | |
Texas Transportation Commission, RB, CAB(c) | | | | | | | | |
0.00%, 08/01/41 | | | 1,000 | | | | 445,310 | |
0.00%, 08/01/42 | | | 875 | | | | 370,589 | |
| | | | | | | | |
| | |
| | | | | | | 5,019,230 | |
|
| Virginia — 2.2% | |
Ballston Quarter Community Development Authority, TA | | | | | | | | |
Series A, 5.00%, 03/01/26 | | | 240 | | | | 244,198 | |
Series A, 5.13%, 03/01/31 | | | 470 | | | | 475,687 | |
Henrico County Economic Development Authority, Refunding RB, 4.00%, 10/01/45 | | | 160 | | | | 174,506 | |
Lexington Industrial Development Authority, RB, 5.00%, 01/01/22(b) | | | 425 | | | | 444,091 | |
| | |
SCHEDULE OF INVESTMENTS | | 37 |
| | |
Schedule of Investments (unaudited) (continued) January 31, 2021 | | BlackRock Municipal Income Investment Trust (BBF) (Percentages shown are based on Net Assets) |
| | | | | | | | |
| Security | | Par (000) | | | Value | |
|
| Virginia (continued) | |
Tobacco Settlement Financing Corp., Refunding RB, Series B-1, 5.00%, 06/01/47 | | $ | 1,010 | | | $ | 1,020,958 | |
Virginia Housing Development Authority, RB, M/F Housing, Series 1, (GNMA/FNMA/FHLMC), 2.55%, 11/01/50 | | | 860 | | | | 887,133 | |
| | | | | | | | |
| | |
| | | | | | | 3,246,573 | |
| | |
| Washington — 1.1% | | | | | | |
Washington State Housing Finance Commission, Refunding RB,
5.00%, 01/01/48(a) | | | 1,405 | | | | 1,597,120 | |
| | | | | | | | |
|
| West Virginia — 0.4% | |
City of Martinsburg West Verginia, RB, M/F Housing, Series A-1, 4.63%, 12/01/43 | | | 570 | | | | 598,232 | |
| | | | | | | | |
| | |
| Wisconsin — 0.6% | | | | | | |
Public Finance Authority, RB, Series A, 5.00%, 11/15/41 | | | 75 | | | | 89,092 | |
Public Finance Authority, Refunding RB, 5.25%, 05/15/52(a) | | | 735 | | | | 780,540 | |
| | | | | | | | |
| | |
| | | | | | | 869,632 | |
| | | | | | | | |
| |
Total Municipal Bonds — 111.4%
(Cost: $149,691,422) | | | | 166,995,861 | |
| | | | | | | | |
|
Municipal Bonds Transferred to Tender Option Bond Trusts(f) | |
| | |
| California — 1.4% | | | | | | |
Fremont Union High School District, Refunding GO, Series A, 4.00%, 08/01/46 | | | 1,839 | | | | 2,119,969 | |
| | | | | | | | |
| | |
| Colorado — 1.1% | | | | | | |
Colorado Health Facilities Authority, Refunding RB, Series A, 4.00%, 08/01/49(g) | | | 1,480 | | | | 1,670,358 | |
| | | | | | | | |
|
| District of Columbia — 4.6% | |
District of Columbia Housing Finance Agency, RB, M/F Housing, Series B-2, (FHA), 4.10%, 09/01/39 | | | 1,051 | | | | 1,193,173 | |
Metropolitan Washington Airports Authority Dulles Toll Road Revenue, Refunding RB, Series B, Subordinate, (AGM), 4.00%, 10/01/53 | | | 5,008 | | | | 5,758,281 | |
| | | | | | | | |
| | |
| | | | | | | 6,951,454 | |
| | |
| Florida — 1.7% | | | | | | |
Escambia County Health Facilities Authority, Refunding RB, 4.00%, 08/15/45(g) | | | 2,151 | | | | 2,487,251 | |
| | | | | | | | |
|
| Georgia — 0.8% | |
Dalton Whitfield County Joint Development Authority, RB, 4.00%, 08/15/48 | | | 1,025 | | | | 1,174,434 | |
| | | | | | | | |
|
| Idaho — 1.4% | |
Idaho State Building Authority, RB, Series A, 4.00%, 09/01/48 | | | 1,900 | | | | 2,157,488 | |
| | | | | | | | |
|
| Illinois — 1.0% | |
Illinois State Toll Highway Authority, RB, Series C, 5.00%, 01/01/38 | | | 1,244 | | | | 1,444,198 | |
| | | | | | | | |
| | | | | | | | |
| Security | | Par (000) | | | Value | |
|
| Iowa — 1.2% | |
Iowa Finance Authority, Refunding RB, Series E, 4.00%, 08/15/46 | | $ | 1,605 | | | $ | 1,779,977 | |
| | | | | | | | |
|
| Massachusetts — 1.8% | |
Massachusetts Housing Finance Agency, RB, Series A-1, (FHA), 3.10%, 06/01/60 | | | 2,642 | | | | 2,754,268 | |
| | | | | | | | |
| | |
| Michigan — 3.4% | | | | | | |
Michigan Finance Authority, RB, 4.00%, 02/15/47 | | | 1,684 | | | | 1,938,778 | |
Michigan State Housing Development Authority, RB, M/F Housing, Series A, 4.15%, 10/01/53 | | | 2,883 | | | | 3,151,539 | |
| | | | | | | | |
| | |
| | | | | | | 5,090,317 | |
| | |
| New Jersey — 1.7% | | | | | | |
New Jersey Transportation Trust Fund Authority, RB, Series B, 5.25%, 06/15/36(g) | | | 2,481 | | | | 2,557,729 | |
| | | | | | | | |
|
| New York — 7.1% | |
New York City Housing Development Corp., Refunding RB, Series A, 4.15%, 11/01/38 | | | 2,070 | | | | 2,334,443 | |
New York City Water & Sewer System, Refunding RB, Series FF, 5.00%, 06/15/45 | | | 2,499 | | | | 2,653,609 | |
New York Liberty Development Corp., ARB, 5.25%, 12/15/43 | | | 3,375 | | | | 3,521,005 | |
New York Liberty Development Corp., Refunding RB, 5.75%, 11/15/51(g) | | | 1,980 | | | | 2,060,163 | |
| | | | | | | | |
| | |
| | | | | | | 10,569,220 | |
|
| North Carolina — 0.7% | |
North Carolina Housing Finance Agency, RB, S/F Housing, Series 39-B, (FHLMC, FNMA, GNMA), 4.00%, 01/01/48 | | | 969 | | | | 1,058,211 | |
| | | | | | | | |
|
| Pennsylvania — 6.6% | |
County of Lehigh Pennsylvania, Refunding RB, Series A, 4.00%, 07/01/49(g) | | | 4,997 | | | | 5,796,018 | |
Pennsylvania Turnpike Commission, RB, Sub-Series A, 5.50%, 12/01/42 | | | 1,514 | | | | 1,886,688 | |
Pennsylvania Turnpike Commission, Refunding RB, Sub- Series B-2, (AGM), 5.00%, 06/01/35 | | | 1,830 | | | | 2,255,402 | |
| | | | | | | | |
| | |
| | | | | | | 9,938,108 | |
|
| Rhode Island — 1.7% | |
Rhode Island Health and Educational Building Corp., RB, Series A, 4.00%, 09/15/47 | | | 2,207 | | | | 2,481,232 | |
| | | | | | | | |
|
| Texas — 1.4% | |
Texas Department of Housing & Community Affairs, RB, S/F Housing | | | | | | | | |
Series A, (GNMA), 3.63%, 09/01/44 | | | 1,140 | | | | 1,253,180 | |
Series A, (GNMA), 3.75%, 09/01/49 | | | 809 | | | | 889,236 | |
| | | | | | | | |
| | |
| | | | | | | 2,142,416 | |
|
| Virginia(g) — 2.6% | |
Hampton Roads Transportation Accountability Commission, RB | | | | | | | | |
Series A, Senior Lien, 5.50%, 07/01/57 | | | 1,473 | | | | 1,885,938 | |
Series A, Senior Lien, 4.00%, 07/01/60 | | | 1,680 | | | | 1,990,716 | |
| | | | | | | | |
| | |
| | | | | | | 3,876,654 | |
| | |
| 38 | | 2 0 2 1 BLACK ROCK SEMI - ANNUAL REPORT TO SHAREHOLDERS |
| | |
Schedule of Investments (unaudited) (continued) January 31, 2021 | | BlackRock Municipal Income Investment Trust (BBF) (Percentages shown are based on Net Assets) |
| | | | | | | | |
| Security | | Par (000) | | | Value | |
| |
|
| West Virginia — 1.3% | |
Morgantown Utility Board, Inc., RB,
Series B, 4.00%, 12/01/48(g) | | $ | 1,671 | | | $ | 1,931,044 | |
| | | | | | | | |
|
| Wisconsin — 2.4% | |
Wisconsin Housing & Economic Development Authority, RB, M/F Housing | | | | | | | | |
Series A, 4.10%, 11/01/43 | | | 1,436 | | | | 1,608,210 | |
Series A, 4.45%, 05/01/57 | | | 1,794 | | | | 2,010,298 | |
| | | | | | | | |
| | |
| | | | | | | 3,618,508 | |
| | | | | | | | |
| |
Total Municipal Bonds Transferred to Tender Option Bond Trusts — 43.9%
(Cost: $60,576,591) | | | | 65,802,836 | |
| | | | | | | | |
| | |
Total Long-Term Investments — 155.3%
(Cost: $210,268,013) | | | | | | | 232,798,697 | |
| | | | | | | | |
| | |
| | | Shares | | | | |
| |
| | |
Short-Term Securities | | | | | | | | |
|
| Money Market Funds — 2.0% | |
BlackRock Liquidity Funds, MuniCash, Institutional Class, 0.01%(h)(i) | | | 3,005,319 | | | | 3,005,920 | |
| | | | | | | | |
| |
Total Short-Term Securities — 2.0%
(Cost: $3,005,842) | | | | 3,005,920 | |
| | | | | | | | |
| |
Total Investments — 157.3%
(Cost: $213,273,855) | | | | 235,804,617 | |
| | |
Other Assets Less Liabilities — 0.9% | | | | | | | 1,263,464 | |
| | |
Liability for TOB Trust Certificates, Including Interest Expense and Fees Payable — (23.6)% | | | | | | | (35,355,697 | ) |
| |
VRDP Shares at Liquidation Value, Net of Deferred Offering Costs — (34.6)% | | | | (51,799,595 | ) |
| | | | | | | | |
| | |
Net Assets Applicable to Common Shares — 100.0% | | | | | | $ | 149,912,789 | |
| | | | | | | | |
| (a) | Security exempt from registration pursuant to Rule 144A under the Securities Act of 1933, as amended. These securities may be resold in transactions exempt from registration to qualified institutional investors. |
| (b) | U.S. Government securities held in escrow, are used to pay interest on this security as well as to retire the bond in full at the date indicated, typically at a premium to par. |
| (d) | Variable rate security. Interest rate resets periodically. The rate shown is the effective interest rate as of period end. Security description also includes the reference rate and spread if published and available. |
| (e) | When-issued security. |
| (f) | Represent bonds transferred to a TOB Trust in exchange of cash and residual certificates received by the Trust. These bonds serve as collateral in a secured borrowing. See Note 4 of the Notes to Financial Statements for details. |
| (g) | All or a portion of the security is subject to a recourse agreement. The aggregate maximum potential amount the Trust could ultimately be required to pay under the agreements, which expire between May 15, 2021 to June 15, 2036, is $11,344,266. See Note 4 of the Notes to Financial Statements for details. |
| (h) | Affiliate of the Trust. |
| (i) | Annualized 7-day yield as of period end. |
Affiliates
Investments in issuers considered to be affiliate(s) of the Trust during the six-months ended January 31, 2021 for purposes of Section 2(a)(3) of the Investment Company Act of 1940, as amended, were as follows:
| | | | | | | | | | | | | | | | | | | | | | | | | | | | | | | | | | | | |
| Affiliated Issuer | | Value at
07/31/20 | | | Purchases
at Cost | | | Proceeds
from Sales | | | Net
Realized
Gain (Loss) | | | Change in Unrealized Appreciation
(Depreciation) | | | Value at 01/31/21 | | | Shares
Held at
01/31/21 | | | Income | | | Capital Gain
Distributions
from Underlying Funds | |
BlackRock Liquidity Funds, MuniCash, Institutional Class | | $ | 2,116,934 | | | $ | 888,907 | (a) | | $ | — | | | $ | 1 | | | $ | 78 | | | $ | 3,005,920 | | | | 3,005,319 | | | $ | 197 | | | $ | — | |
| | | | | | | | | | | | | | | | | | | | | | | | | | | | | | | | | | | | |
| | (a) | Represents net amount purchased (sold). | |
For Trust compliance purposes, the Trust’s sector classifications refer to one or more of the sector sub-classifications used by one or more widely recognized market indexes or rating group indexes, and/or as defined by the investment adviser. These definitions may not apply for purposes of this report, which may combine such sector sub-classifications for reporting ease.
| | |
SCHEDULE OF INVESTMENTS | | 39 |
| | |
Schedule of Investments (unaudited) (continued) January 31, 2021 | | BlackRock Municipal Income Investment Trust (BBF) |
Derivative Financial Instruments Outstanding as of Period End
Futures Contracts
| | | | | | | | | | | | | | | | |
| Description | | Number of
Contracts | | | Expiration
Date | | | Notional
Amount (000) | | | Value/ Unrealized Appreciation (Depreciation) | |
Short Contracts | | | | | | | | | | | | | | | | |
10-Year U.S. Treasury Note | | | 44 | | | | 03/22/21 | | | $ | 6,029 | | | $ | 44,271 | |
Long U.S. Treasury Bond | | | 25 | | | | 03/22/21 | | | | 4,218 | | | | 163,680 | |
| | | | | | | | | | | | | | | | |
| | | | | | | | | | | | | | $ | 207,951 | |
| | | | | | | | | | | | | | | | |
Derivative Financial Instruments Categorized by Risk Exposure
As of period end, the fair values of derivative financial instruments located in the Statements of Assets and Liabilities were as follows:
| | | | | | | | | | | | | | | | | | | | | | | | | | | | |
| | | Commodity
Contracts | | | Credit
Contracts | | | Equity
Contracts | | | Foreign
Currency
Exchange
Contracts | | | Interest
Rate
Contracts | | | Other
Contracts | | | Total | |
Assets — Derivative Financial Instruments | | | | | | | | | | | | | | | | | | | | | | | | | | | | |
Futures contracts | | | | | | | | | | | | | | | | | | | | | | | | | | | | |
Unrealized appreciation on futures contracts(a) | | $ | — | | | $ | — | | | $ | — | | | $ | — | | | $ | 207,951 | | | $ | — | | | $ | 207,951 | |
| | | | | | | | | | | | | | | | | | | | | | | | | | | | |
| | (a) | Net cumulative unrealized appreciation (depreciation) on futures contracts and centrally cleared swaps, if any, are reported in the Schedule of Investments. In the Statements of Assets and Liabilities, only current day’s variation margin is reported in receivables or payables and the net cumulative unrealized appreciation (depreciation) is included in accumulated earnings (loss). | |
For the six months ended January 31, 2021, the effect of derivative financial instruments in the Statements of Operations was as follows:
| | | | | | | | | | | | | | | | | | | | | | | | | | | | |
| | | Commodity
Contracts | | | Credit
Contracts | | | Equity
Contracts | | | Foreign
Currency
Exchange
Contracts | | | Interest
Rate
Contracts | | | Other
Contracts | | | Total | |
Net Realized Gain (Loss) from | | | | | | | | | | | | | | | | | | | | | | | | | | | | |
Futures contracts | | $ | — | | | $ | — | | | $ | — | | | $ | — | | | $ | 43,523 | | | $ | — | | | $ | 43,523 | |
| | | | | | | | | | | | | | | | | | | | | | | | | | | | |
| | | | | | | |
Net Change in Unrealized Appreciation (Depreciation) on | | | | | | | | | | | | | | | | | | | | | | | | | | | | |
Futures contracts | | $ | — | | | $ | — | | | $ | — | | | $ | — | | | $ | 207,951 | | | $ | — | | | $ | 207,951 | |
| | | | | | | | | | | | | | | | | | | | | | | | | | | | |
Average Quarterly Balances of Outstanding Derivative Financial Instruments
| | | | | | | | |
| |
Futures contracts | | | | | | | | |
Average notional value of contracts — short | | | | | | $ | 10,544,797 | |
| |
For more information about the Trust’s investment risks regarding derivative financial instruments, refer to the Notes to Financial Statements.
Fair Value Hierarchy as of Period End
Various inputs are used in determining the fair value of financial instruments. For a description of the input levels and information about the Trust’s policy regarding valuation of financial instruments, refer to the Notes to Financial Statements.
The following table summarizes the Trust’s investments and derivative financial instruments categorized in the disclosure hierarchy. The breakdown of the Trust’s investments into major categories is disclosed in the Schedule of Investments above.
| | | | | | | | | | | | | | | | |
| | | | | |
| | | Level 1 | | | Level 2 | | | Level 3 | | | Total | |
Assets | | | | | | | | | | | | | | | | |
Investments | | | | | | | | | | | | | | | | |
Long-Term Investments | | | | | | | | | | | | | | | | |
Municipal Bonds | | $ | — | | | $ | 166,995,861 | | | $ | — | | | $ | 166,995,861 | |
Municipal Bonds Transferred to Tender Option Bond Trusts. | | | — | | | | 65,802,836 | | | | — | | | | 65,802,836 | |
Short-Term Securities | | | | | | | | | | | | | | | | |
Money Market Funds | | | 3,005,920 | | | | — | | | | — | | | | 3,005,920 | |
| | | | | | | | | | | | | | | | |
| | $ | 3,005,920 | | | $ | 232,798,697 | | | $ | — | | | $ | 235,804,617 | |
| | | | | | | | | | | | | | | | |
| | |
| 40 | | 2 0 2 1 BLACK ROCK SEMI - ANNUAL REPORT TO SHAREHOLDERS |
| | |
Schedule of Investments (unaudited) (continued) January 31, 2021 | | BlackRock Municipal Income Investment Trust (BBF) |
Fair Value Hierarchy as of Period End (continued)
| | | | | | | | | | | | | | | | |
| | | | | |
| | | Level 1 | | | Level 2 | | | Level 3 | | | Total | |
Derivative Financial Instruments(a) | | | | | | | | | | | | | | | | |
Assets | | | | | | | | | | | | | | | | |
Interest Rate Contracts | | $ | 207,951 | | | $ | — | | | $ | — | | | $ | 207,951 | |
| | | | | | | | | | | | | | | | |
| | (a) | Derivative financial instruments are futures contracts. Futures contracts are valued at the unrealized appreciation (depreciation) on the instrument. | |
The Trust may hold assets and/or liabilities in which the fair value approximates the carrying amount for financial statement purposes. As of period end, such assets and/or liabilities are categorized within the disclosure hierarchy as follows:
| | | | | | | | | | | | | | | | |
| | | | | |
| | | Level 1 | | | Level 2 | | | Level 3 | | | Total | |
Liabilities | | | | | | | | | | | | | | | | |
TOB Trust Certificates | | $ | — | | | $ | (35,342,064 | ) | | $ | — | | | $ | (35,342,064 | ) |
VRDP Shares at Liquidation Value | | | — | | | | (52,000,000 | ) | | | — | | | | (52,000,000 | ) |
| | | | | | | | | | | | | | | | |
| | $ | — | | | $ | (87,342,064 | ) | | $ | — | | | $ | (87,342,064 | ) |
| | | | | | | | | | | | | | | | |
See notes to financial statements.
| | |
SCHEDULE OF INVESTMENTS | | 41 |
| | |
Schedule of Investments (unaudited) January 31, 2021 | | BlackRock New York Municipal Income Trust (BNY) (Percentages shown are based on Net Assets) |
| | | | | | | | |
| Security | | Par (000) | | | Value | |
| | |
Municipal Bonds | | | | | | | | |
| | |
| New York — 121.0% | | | | | | |
| | |
| Corporate — 4.3% | | | | | | |
Build NYC Resource Corp., Refunding RB, AMT, 5.00%, 01/01/35(a) | | $ | 280 | | | $ | 308,635 | |
New York Liberty Development Corp., Refunding RB, 5.25%, 10/01/35 | | | 3,195 | | | | 4,669,972 | |
New York State Environmental Facilities Corp., RB, AMT, 2.75%, 09/01/50(b) | | | 415 | | | | 429,405 | |
New York Transportation Development Corp., RB | | | | | | | | |
AMT, 5.00%, 10/01/35 | | | 220 | | | | 273,383 | |
AMT, 5.00%, 10/01/40 | | | 630 | | | | 777,458 | |
Niagara Area Development Corp., Refunding RB, Series A, AMT, 4.75%, 11/01/42(a) | | | 1,970 | | | | 2,008,021 | |
| | | | | | | | |
| | |
| | | | | | | 8,466,874 | |
|
| County/City/Special District/School District — 32.4% | |
City of New York New York, GO | | | | | | | | |
Series A, 5.00%, 08/01/43. | | | 1,500 | | | | 1,895,970 | |
Series D-1, 4.00%, 03/01/44 | | | 620 | | | | 733,615 | |
City of New York, GO | | | | | | | | |
Series A-1, 5.00%, 08/01/21(c) | | | 1,000 | | | | 1,024,460 | |
Series D, 5.38%, 06/01/32 | | | 25 | | | | 25,100 | |
Sub-Series D-1, 5.00%, 08/01/31 | | | 690 | | | | 767,666 | |
Sub-Series G-1, 5.00%, 04/01/22(c) | | | 4,620 | | | | 4,883,617 | |
City of New York, Refunding GO | | | | | | | | |
Series E, 5.00%, 02/01/23(c) | | | 1,000 | | | | 1,097,230 | |
Series E, 5.50%, 08/01/25 | | | 815 | | | | 917,723 | |
County of Nassau New York, Refunding GO, Series C, 5.00%, 10/01/31 | | | 945 | | | | 1,176,355 | |
Hudson Yards Infrastructure Corp., RB, 5.75%, 02/15/47 | | | 75 | | | | 75,328 | |
Metropolitan Transportation Authority, Refunding RB, Sub-Series B-2, 4.00%, 11/15/34 | | | 750 | | | | 881,760 | |
New York City Industrial Development Agency, RB | | | | | | | | |
(AMBAC), 5.00%, 01/01/39 | | | 3,000 | | | | 3,004,800 | |
(AGC), 6.38%, 01/01/39 | | | 150 | | | | 150,696 | |
(AGC), 0.00%, 03/01/42(d) | | | 1,960 | | | | 1,060,164 | |
(AGC), 0.00%, 03/01/45(d) | | | 1,500 | | | | 720,420 | |
(AMBAC), 5.00%, 01/01/46 | | | 175 | | | | 175,254 | |
New York City Industrial Development Agency, Refunding RB | | | | | | | | |
4.00%, 03/01/45 | | | 3,165 | | | | 3,679,471 | |
(AGM), 4.00%, 03/01/45 | | | 190 | | | | 225,215 | |
New York City Transitional Finance Authority Future Tax Secured Revenue, RB | | | | | | | | |
Series A-2, 5.00%, 08/01/38. | | | 1,420 | | | | 1,757,690 | |
Series D-1, 5.00%, 02/01/32 | | | 5,000 | | | | 5,710,050 | |
Sub-Series E-1, 5.00%, 02/01/42 | | | 2,500 | | | | 2,618,450 | |
Sub-Series E-1, 5.00%, 02/01/43 | | | 1,725 | | | | 2,104,431 | |
Series C-3, Subordinate, 5.00%, 05/01/41 | | | 355 | | | | 442,972 | |
New York Convention Center Development Corp., RB, CAB, Series B, Sub Lien, (AGM-CR), 0.00%, 11/15/55(d) | | | 2,000 | | | | 635,640 | |
New York Convention Center Development Corp., Refunding RB | | | | | | | | |
5.00%, 11/15/40 | | | 2,975 | | | | 3,383,408 | |
5.00%, 11/15/45 | | | 3,700 | | | | 4,197,909 | |
New York Liberty Development Corp., Refunding RB | | | | | | | | |
5.00%, 11/15/31 | | | 860 | | | | 890,986 | |
5.00%, 11/15/44 | | | 7,655 | | | | 7,923,614 | |
5.75%, 11/15/51 | | | 1,340 | | | | 1,394,176 | |
| | | | | | | | |
| Security | | Par (000) | | | Value | |
| |
| County/City/Special District/School District (continued) | | | | |
New York Liberty Development Corp., Refunding RB (continued) | | | | | | | | |
Class 1, 4.00%, 09/15/35 | | $ | 1,935 | | | $ | 2,016,831 | |
Class 2, 5.00%, 09/15/43 | | | 1,420 | | | | 1,491,823 | |
Class 3, 5.00%, 03/15/44 | | | 2,070 | | | | 2,170,333 | |
Series 1, Class 1, 5.00%, 11/15/44(a) | | | 2,450 | | | | 2,658,740 | |
Series 2, Class 2, 5.38%, 11/15/40(a) | | | 480 | | | | 528,096 | |
New York State Dormitory Authority, RB, Series A, 5.00%, 07/01/21(c) | | | 2,000 | | | | 2,040,720 | |
| | | | | | | | |
| | |
| | | | | | | 64,460,713 | |
| | |
| Education — 15.8% | | | | | | |
Amherst Development Corp., Refunding RB | | | | | | | | |
5.00%, 10/01/43 | | | 380 | | | | 408,409 | |
5.00%, 10/01/48 | | | 290 | | | | 310,802 | |
Buffalo & Erie County Industrial Land Development Corp., Refunding RB, Series A, 5.00%, 06/01/35 | | | 245 | | | | 274,809 | |
Build NYC Resource Corp., RB(a) | | | | | | | | |
5.00%, 02/01/33 | | | 420 | | | | 446,754 | |
5.75%, 02/01/49 | | | 200 | | | | 213,056 | |
Series A, 5.13%, 05/01/38 | | | 660 | | | | 713,823 | |
Build NYC Resource Corp., Refunding RB, Series A, 5.00%, 06/01/38 | | | 250 | | | | 285,083 | |
County of Cattaraugus New York, RB, 5.00%, 05/01/34 | | | 170 | | | | 189,220 | |
Dutchess County Local Development Corp., RB | | | | | | | | |
5.00%, 07/01/43 | | | 240 | | | | 294,744 | |
5.00%, 07/01/48 | | | 360 | | | | 434,833 | |
Dutchess County Local Development Corp., Refunding RB | | | | | | | | |
5.00%, 07/01/42 | | | 395 | | | | 482,362 | |
4.00%, 07/01/46 | | | 745 | | | | 838,639 | |
Geneva Development Corp., RB,
5.25%, 09/01/23(c) | | | 500 | | | | 565,710 | |
Hempstead Town Local Development Corp., Refunding RB | | | | | | | | |
5.00%, 10/01/35 | | | 415 | | | | 469,780 | |
5.00%, 07/01/47 | | | 120 | | | | 143,809 | |
Monroe County Industrial Development Corp., RB, Series A, 5.00%, 07/01/21(c) | | | 1,350 | | | | 1,377,486 | |
Monroe County Industrial Development Corp., Refunding RB, Series A, 5.00%, 07/01/23(c) | | | 320 | | | | 357,472 | |
New York State Dormitory Authority, RB | | | | | | | | |
(AGM), 5.25%, 05/01/21(c) | | | 155 | | | | 156,981 | |
(AGM), 5.63%, 05/01/21(c) | | | 750 | | | | 760,283 | |
(AGM), 5.75%, 05/01/21(c) | | | 210 | | | | 212,944 | |
5.00%, 07/01/42 | | | 1,225 | | | | 1,297,618 | |
1st Series, (AMBAC), 5.50%, 07/01/40 | | | 1,440 | | | | 2,200,248 | |
Series A, 5.25%, 01/01/34 | | | 800 | | | | 887,888 | |
Series A, 5.50%, 01/01/39 | | | 2,000 | | | | 2,207,700 | |
Series A, 5.00%, 07/01/43 | | | 845 | | | | 1,023,946 | |
Series B, 5.00%, 07/01/22(c) | | | 1,250 | | | | 1,336,462 | |
New York State Dormitory Authority, Refunding RB | | | | | | | | |
5.00%, 07/01/42 | | | 300 | | | | 311,298 | |
5.00%, 07/01/44 | | | 850 | | | | 969,272 | |
Series A, 5.00%, 07/01/22(c) | | | 1,790 | | | | 1,913,814 | |
Series A, 5.25%, 07/01/23(c) | | | 2,800 | | | | 3,144,736 | |
Series A, 5.00%, 07/01/28 | | | 75 | | | | 76,526 | |
Series A, 5.25%, 07/01/29 | | | 85 | | | | 86,817 | |
Series A, 5.00%, 07/01/33 | | | 530 | | | | 632,847 | |
Series A, 5.00%, 07/01/34 | | | 250 | | | | 287,415 | |
Series A, 5.00%, 07/01/35 | | | 1,380 | | | | 1,611,178 | |
| | |
| 42 | | 2 0 2 1 BLACK ROCK SEMI - ANNUAL REPORT TO SHAREHOLDERS |
| | |
Schedule of Investments (unaudited) (continued) January 31, 2021 | | BlackRock New York Municipal Income Trust (BNY) (Percentages shown are based on Net Assets) |
| | | | | | | | |
| Security | | Par (000) | | | Value | |
| | |
| Education (continued) | | | | | | |
New York State Dormitory Authority, Refunding RB (continued) | | | | | | | | |
Series A, 5.00%, 07/01/37. | | $ | 835 | | | $ | 949,161 | |
Onondaga County Trust for Cultural Resources, Refunding RB, 5.00%, 05/01/40 | | | 355 | | | | 396,223 | |
Orange County Funding Corp., Refunding RB | | | | | | | | |
Series A, 5.00%, 07/01/37 | | | 360 | | | | 378,137 | |
Series A, 5.00%, 07/01/42 | | | 220 | | | | 230,881 | |
St. Lawrence County Industrial Development Agency, RB, 5.38%, 09/01/41 | | | 750 | | | | 767,250 | |
Troy Capital Resource Corp., Refunding RB | | | | | | | | |
4.00%, 08/01/35 | | | 470 | | | | 511,722 | |
4.00%, 09/01/40 | | | 680 | | | | 773,622 | |
Trust for Cultural Resources of The City of New York, Refunding RB, Series A, 5.00%, 07/01/37 | | | 225 | | | | 259,949 | |
Yonkers Economic Development Corp., RB, Series A, 5.00%, 10/15/54 | | | 200 | | | | 220,730 | |
| | | | | | | | |
| | |
| | | | | | | 31,412,439 | |
| | |
| Health — 10.5% | | | | | | |
Dutchess County Local Development Corp., RB, Series B, 4.00%, 07/01/41 | | | 1,600 | | | | 1,745,952 | |
Monroe County Industrial Development Corp., RB
4.00%, 12/01/41 | | | 200 | | | | 220,326 | |
5.00%, 12/01/46 | | | 320 | | | | 373,254 | |
Monroe County Industrial Development Corp., Refunding RB | | | | | | | | |
(FHA INS), 5.50%, 08/15/40 | | | 1,650 | | | | 1,653,185 | |
4.00%, 12/01/46 | | | 280 | | | | 316,761 | |
Series A, 5.00%, 12/01/32 | | | 240 | | | | 257,263 | |
Nassau County Local Economic Assistance Corp., Refunding RB, 5.00%, 07/01/22(c) | | | 2,800 | | | | 2,993,676 | |
New York State Dormitory Authority, RB, Series D, 4.25%, 05/01/39 | | | 500 | | | | 523,595 | |
New York State Dormitory Authority, Refunding RB | | | | | | | | |
4.00%, 07/01/38 | | | 470 | | | | 528,947 | |
4.00%, 07/01/39 | | | 615 | | | | 689,532 | |
Series A, 5.00%, 05/01/21(c) | | | 1,850 | | | | 1,872,505 | |
Series A, 5.00%, 05/01/43 | | | 1,430 | | | | 1,682,466 | |
Oneida County Local Development Corp., Refunding RB | | | | | | | | |
(AGM), 3.00%, 12/01/44 | | | 1,235 | | | | 1,313,670 | |
(AGM), 4.00%, 12/01/49 | | | 800 | | | | 906,616 | |
Suffolk County Economic Development Corp., RB,
Series C, 5.00%, 07/01/32 | | | 230 | | | | 263,228 | |
Tompkins County Development Corp., Refunding RB, 5.00%, 07/01/44 | | | 110 | | | | 117,251 | |
Westchester County Healthcare Corp., Refunding RB | | | | | | | | |
Series A, Senior Lien, 5.00%, 11/01/21(c) | | | 3,130 | | | | 3,244,934 | |
Series B, Senior Lien, 6.00%, 11/01/30 | | | 65 | | | | 65,235 | |
Westchester County Local Development Corp., Refunding RB | | | | | | | | |
5.00%, 01/01/28 | | | 675 | | | | 712,955 | |
5.00%, 01/01/34 | | | 1,250 | | | | 1,296,875 | |
| | | | | | | | |
| | |
| | | | | | | 20,778,226 | |
| | |
| Housing — 6.9% | | | | | | |
New York City Housing Development Corp., Series 2014- 8SPR, Class F, 4.50%, 02/15/48 | | | 925 | | | | 971,602 | |
New York City Housing Development Corp. RB Series D-A1, (FHA), 2.30%, 11/01/45 | | | 2,665 | | | | 2,649,943 | |
| | | | | | | | |
| Security | | Par (000) | | | Value | |
| | |
| Housing (continued) | | | | | | |
New York City Housing Development Corp. RB (continued) | | | | | | | | |
Series I-1, (FHA), 2.65%, 11/01/50 | | $ | 2,110 | | | $ | 2,160,809 | |
New York City Housing Development Corp., RB, M/F Housing | | | | | | | | |
3.15%, 11/01/44 | | | 250 | | | | 261,608 | |
Series B-1, 5.25%, 07/01/32 | | | 1,140 | | | | 1,255,106 | |
Series B-1, 5.00%, 07/01/33 | | | 500 | | | | 546,735 | |
New York City Housing Development Corp., Refunding RB, M/F Housing, Series B-1-A, 3.65%, 11/01/49 | | | 1,150 | | | | 1,233,478 | |
New York State Housing Finance Agency, RB, Series M-1, (SONYMA FHA), 2.65%, 11/01/54 | | | 845 | | | | 861,925 | |
New York State Housing Finance Agency, RB, M/F Housing | | | | | | | | |
Series E, (SONYMA FANNIE MAE), 4.15%, 11/01/47 | | | 495 | | | | 540,921 | |
Series H, 4.25%, 11/01/51 | | | 1,000 | | | | 1,118,180 | |
Series P, 3.15%, 11/01/54 | | | 750 | | | | 786,150 | |
Series A, AMT, (SONYMA), 5.00%, 02/15/39 | | | 1,335 | | | | 1,339,365 | |
State of New York Mortgage Agency, Refunding RB, S/F Housing, Series 213, 4.20%, 10/01/43 | | | 70 | | | | 70,050 | |
| | | | | | | | |
| | |
| | | | | | | 13,795,872 | |
| | |
| Other — 0.8% | | | | | | |
New York City Industrial Development Agency, Refunding RB | | | | | | | | |
Series A, AMT, 5.00%, 07/01/22 | | | 650 | | | | 687,628 | |
Series A, AMT, 5.00%, 07/01/28 | | | 795 | | | | 836,380 | |
| | | | | | | | |
| | |
| | | | | | | 1,524,008 | |
| | |
| State — 13.8% | | | | | | |
New York City Transitional Finance Authority Building Aid Revenue, RB, Sub-Series S-1B, (SAW), 4.00%, 07/15/42 | | | 1,000 | | | | 1,174,730 | |
New York City Transitional Finance Authority Building Aid Revenue, Refunding RB, Series S-3, Subordinate, (SAW), 4.00%, 07/15/38 | | | 2,360 | | | | 2,774,534 | |
New York State Dormitory Authority, RB | | | | | | | | |
Series A, 5.00%, 03/15/36 | | | 1,360 | | | | 1,664,300 | |
Series A, 5.00%, 02/15/42 | | | 1,500 | | | | 1,810,875 | |
Series B, 5.00%, 03/15/39 | | | 620 | | | | 764,144 | |
Series B, 5.00%, 03/15/42 | | | 4,380 | | | | 4,610,169 | |
Series C, 5.00%, 03/15/34 | | | 2,185 | | | | 2,197,629 | |
New York State Dormitory Authority, Refunding RB | | | | | | | | |
5.00%, 05/15/29 | | | 2,000 | | | | 2,121,760 | |
Series A, 5.25%, 03/15/39 | | | 1,030 | | | | 1,320,027 | |
Series E, 5.00%, 03/15/41 | | | 1,160 | | | | 1,453,550 | |
New York State Thruway Authority Highway & Bridge Trust Fund, Refunding RB, Series A, 5.00%, 04/01/32 | | | 2,500 | | | | 2,638,975 | |
New York State Urban Development Corp., RB | | | | | | | | |
Series A, 4.00%, 03/15/49 | | | 2,400 | | | | 2,833,344 | |
Series C, 5.00%, 03/15/30 | | | 885 | | | | 973,819 | |
Series C, 5.00%, 03/15/32 | | | 1,000 | | | | 1,100,410 | |
| | | | | | | | |
| | |
| | | | | | | 27,438,266 | |
| | |
| Tobacco — 3.3% | | | | | | |
Chautauqua Tobacco Asset Securitization Corp., Refunding RB, 4.75%, 06/01/39 | | | 150 | | | | 155,108 | |
New York Counties Tobacco Trust IV, Refunding RB, Series A, 6.25%, 06/01/41(a) | | | 1,000 | | | | 1,016,160 | |
| | |
SCHEDULE OF INVESTMENTS | | 43 |
| | |
Schedule of Investments (unaudited) (continued) January 31, 2021 | | BlackRock New York Municipal Income Trust (BNY) (Percentages shown are based on Net Assets) |
| | | | | | | | |
| Security | | Par (000) | | | Value | |
| | |
| Tobacco (continued) | | | | | | |
New York Counties Tobacco Trust VI, Refunding RB | | | | | | | | |
Series A-2-B, 5.00%, 06/01/45 | | $ | 130 | | | $ | 139,980 | |
Series A-2-B, 5.00%, 06/01/51 | | | 1,470 | | | | 1,554,084 | |
Series C, 4.00%, 06/01/51 | | | 1,500 | | | | 1,514,055 | |
Niagara Tobacco Asset Securitization Corp., Refunding RB | | | | | | | | |
5.25%, 05/15/34 | | | 250 | | | | 261,673 | |
5.25%, 05/15/40 | | | 110 | | | | 113,854 | |
Westchester Tobacco Asset Securitization Corp., Refunding RB | | | | | | | | |
Sub-Series C, 4.00%, 06/01/42 | | | 700 | | | | 763,483 | |
Sub-Series C, 5.13%, 06/01/51 | | | 870 | | | | 972,251 | |
| | | | | | | | |
| | |
| | | | | | | 6,490,648 | |
| | |
| Transportation — 23.6% | | | | | | |
Buffalo & Fort Erie Public Bridge Authority, RB, 5.00%, 01/01/47 | | | 535 | | | | 636,158 | |
Hudson Yards Infrastructure Corp., Refunding RB | | | | | | | | |
Series A, 5.00%, 02/15/39 | | | 1,370 | | | | 1,646,493 | |
Series A, 5.00%, 02/15/42 | | | 1,225 | | | | 1,464,598 | |
Metropolitan Transportation Authority, RB | | | | | | | | |
Series A-1, 5.25%, 11/15/23(c) | | | 540 | | | | 616,491 | |
Series D, 5.25%, 11/15/21(c) | | | 1,000 | | | | 1,040,590 | |
Series E, 5.00%, 11/15/38 | | | 4,000 | | | | 4,349,600 | |
Metropolitan Transportation Authority, Refunding RB | | | | | | | | |
Series A-1, 5.25%, 11/15/57 | | | 750 | | | | 885,915 | |
Series B, 5.00%, 11/15/37 | | | 500 | | | | 587,545 | |
Series D, 5.25%, 11/15/23(c) | | | 910 | | | | 1,038,901 | |
Series F, 5.00%, 11/15/30 | | | 2,000 | | | | 2,123,720 | |
MTA Hudson Rail Yards Trust Obligations, Refunding RB, Series A, 5.00%, 11/15/56 | | | 2,695 | | | | 2,974,930 | |
New York State Thruway Authority Highway & Bridge Trust Fund, Refunding RB, Series B, Subordinate, | | | | | | | | |
4.00%, 01/01/53 | | | 675 | | | | 779,665 | |
New York State Thruway Authority, RB, Series A, Junior Lien, 5.25%, 01/01/56 | | | 920 | | | | 1,093,797 | |
New York State Thruway Authority, Refunding RB | | | | | | | | |
Series I, 5.00%, 01/01/22(c) | | | 2,040 | | | | 2,131,555 | |
Series J, 5.00%, 01/01/41 | | | 2,000 | | | | 2,251,040 | |
Series K, 5.00%, 01/01/32 | | | 2,575 | | | | 3,011,746 | |
New York Transportation Development Corp., ARB | | | | | | | | |
Series A, AMT, (AGM-CR), 4.00%, 07/01/41 | | | 800 | | | | 841,968 | |
Series A, AMT, 5.00%, 07/01/41 | | | 1,040 | | | | 1,173,016 | |
Series A, AMT, 5.00%, 07/01/46 | | | 895 | | | | 1,004,288 | |
Series A, AMT, 5.25%, 01/01/50 | | | 5,625 | | | | 6,386,175 | |
Port Authority of New York & New Jersey, ARB, Consolidated, 220th Series, AMT, 4.00%, 11/01/59 | | | 1,655 | | | | 1,875,827 | |
Port Authority of New York & New Jersey, Refunding ARB Series 179, 5.00%, 12/01/38 | | | 575 | | | | 649,992 | |
178th Series, AMT, 5.00%, 12/01/43 | | | 500 | | | | 551,825 | |
195th Series, AMT, 5.00%, 04/01/36 | | | 750 | | | | 901,065 | |
Consolidated, 177th Series, AMT, 4.00%, 01/15/43 | | | 640 | | | | 673,555 | |
Series 178th, AMT, 5.00%, 12/01/33 | | | 750 | | | | 844,642 | |
Triborough Bridge & Tunnel Authority, RB | | | | | | | | |
Series A, 5.00%, 11/15/42 | | | 1,000 | | | | 1,226,110 | |
Series B, 5.00%, 11/15/40 | | | 350 | | | | 418,219 | |
Series B, 5.00%, 11/15/45 | | | 310 | | | | 367,424 | |
| | | | | | | | |
| Security | | Par (000) | | | Value | |
| | |
| Transportation (continued) | | | | | | |
Triborough Bridge & Tunnel Authority, Refunding RB | | | | | | | | |
Series A, 5.25%, 11/15/45 | | $ | 590 | | | $ | 703,133 | |
Series A, 5.00%, 11/15/50 | | | 500 | | | | 582,565 | |
Series B, 5.00%, 11/15/38 | | | 515 | | | | 636,180 | |
Triborough Bridge & Tunnel Authority, Refunding RB, CAB, Series B, 0.00%, 11/15/32(d) | | | 1,700 | | | | 1,425,977 | |
| | | | | | | | |
| | |
| | | | | | | 46,894,705 | |
| | |
| Utilities — 9.6% | | | | | | |
Long Island Power Authority, RB | | | | | | | | |
5.00%, 09/01/36 | | | 340 | | | | 426,584 | |
5.00%, 09/01/38 | | | 2,750 | | | | 3,497,065 | |
5.00%, 09/01/47 | | | 490 | | | | 597,369 | |
Series C, (AGC), 5.25%, 09/01/29 | | | 2,000 | | | | 2,722,880 | |
Long Island Power Authority, Refunding RB, Series B, 5.00%, 09/01/46 | | | 250 | | | | 301,968 | |
New York City Water & Sewer System, RB, Series DD-1, 4.00%, 06/15/50 | | | 2,565 | | | | 3,051,298 | |
New York City Water & Sewer System, Refunding RB
4.00%, 06/15/40 | | | 1,825 | | | | 2,210,987 | |
Series HH, 5.00%, 06/15/39 | | | 1,000 | | | | 1,189,990 | |
Sub-Series AA-1, 4.00%, 06/15/50 | | | 1,000 | | | | 1,197,270 | |
New York State Environmental Facilities Corp., RB, Series B, Subordinate, 5.00%, 06/15/48 | | | 930 | | | | 1,168,629 | |
New York State Environmental Facilities Corp., Refunding RB, Series B, 5.00%, 06/15/36 | | | 350 | | | | 356,213 | |
Utility Debt Securitization Authority, Refunding RB, Series TE, Restructured, 5.00%, 12/15/41 | | | 2,000 | | | | 2,264,900 | |
| | | | | | | | |
| | |
| | | | | | | 18,985,153 | |
| | | | | | | | |
| | |
Total Municipal Bonds in New York | | | | | | | 240,246,904 | |
| | |
| Puerto Rico — 6.3% | | | | | | |
| | |
| State — 4.7% | | | | | | |
Puerto Rico Sales Tax Financing Corp. Sales Tax Revenue, RB | | | | | | | | |
Series A-1, Restructured, 4.75%, 07/01/53 | | | 1,146 | | | | 1,282,592 | |
Series A-1, Restructured, 5.00%, 07/01/58 | | | 4,732 | | | | 5,373,943 | |
Series A-2, Restructured, 4.33%, 07/01/40 | | | 618 | | | | 683,119 | |
Series A-2, Restructured, 4.78%, 07/01/58 | | | 1,045 | | | | 1,171,090 | |
Puerto Rico Sales Tax Financing Corp. Sales Tax Revenue, RB, CAB, Series A-1, Restructured, 0.00%, 07/01/46(d) | | | 2,890 | | | | 913,962 | |
| | | | | | | | |
| | |
| | | | | | | 9,424,706 | |
| | |
| Tobacco — 0.5% | | | | | | |
Children’s Trust Fund, Refunding RB, 5.63%, 05/15/43 | | | 985 | | | | 996,968 | |
| | | | | | | | |
| | |
| Utilities — 1.1% | | | | | | |
Puerto Rico Commonwealth Aqueduct & Sewer Authority, RB | | | | | | | | |
Series A, Senior Lien, 5.00%, 07/01/33 | | | 1,545 | | | | 1,628,322 | |
Series A, Senior Lien, 5.13%, 07/01/37 | | | 445 | | | | 470,823 | |
| | | | | | | | |
| | |
| | | | | | | 2,099,145 | |
| | | | | | | | |
| |
Total Municipal Bonds in Puerto Rico | | | | 12,520,819 | |
| | | | | | | | |
| |
Total Municipal Bonds — 127.3%
(Cost: $231,397,450) | | | | 252,767,723 | |
| | | | | | | | |
| | |
| 44 | | 2 0 2 1 BLACK ROCK SEMI - ANNUAL REPORT TO SHAREHOLDERS |
| | |
Schedule of Investments (unaudited) (continued) January 31, 2021 | | BlackRock New York Municipal Income Trust (BNY) (Percentages shown are based on Net Assets) |
| | | | | | | | |
| Security | | Par (000) | | | Value | |
| |
|
Municipal Bonds Transferred to Tender Option Bond Trusts(e) | |
| | |
| New York — 39.4% | | | | | | |
|
| County/City/Special District/School District — 4.2% | |
City of New York, GO | | | | | | | | |
Sub-Series I-1, 5.00%, 03/01/36 | | $ | 1,500 | | | $ | 1,704,930 | |
Sub-Series-D1, Series D, 5.00%, 12/01/43(f) | | | 2,850 | | | | 3,568,628 | |
Hudson Yards Infrastructure Corp., RB(f) | | | | | | | | |
5.75%, 02/15/21(c) | | | 290 | | | | 290,483 | |
5.75%, 02/15/47 | | | 178 | | | | 178,697 | |
New York City Transitional Finance Authority Future Tax Secured Revenue, RB | | | | | | | | |
Sub-Series D-1, 5.00%, 11/01/38 | | | 825 | | | | 854,609 | |
Sub-Series F-1, 5.00%, 05/01/38 | | | 1,424 | | | | 1,753,571 | |
| | | | | | | | |
| | |
| | | | | | | 8,350,918 | |
| | |
| Education — 2.0% | | | | | | |
Trust for Cultural Resources of The City of New York, Refunding RB, Series A,
5.00%, 08/01/23(c) | | | 3,527 | | | | 3,954,172 | |
| | | | | | | | |
| | |
| Housing — 1.6% | | | | | | |
New York City Housing Development Corp., Refunding RB, Series A, 4.25%, 11/01/43 | | | 2,830 | | | | 3,174,694 | |
| | | | | | | | |
| | |
| State — 3.9% | | | | | | |
New York State Dormitory Authority, RB, Series C, 5.00%, 03/15/41 | | | 1,500 | | | | 1,508,565 | |
New York State Dormitory Authority, Refunding RB, Series C, 5.00%, 03/15/39 | | | 1,000 | | | | 1,252,890 | |
New York State Thruway Authority, Refunding RB, Series A, 5.00%, 03/15/31. | | | 1,180 | | | | 1,215,388 | |
New York State Urban Development Corp., RB, Series A, 4.00%, 03/15/47 | | | 1,497 | | | | 1,717,859 | |
Sales Tax Asset Receivable Corp., Refunding RB | | | | | | | | |
Series A, 5.00%, 10/15/31 | | | 750 | | | | 877,343 | |
Series A, 4.00%, 10/15/32 | | | 1,000 | | | | 1,130,030 | |
| | | | | | | | |
| | |
| | | | | | | 7,702,075 | |
| | |
| Transportation — 15.6% | | | | | | |
New York Liberty Development Corp., ARB, 5.25%, 12/15/43 | | | 6,495 | | | | 6,775,978 | |
New York Liberty Development Corp., Refunding RB, Class 1, 5.00%, 09/15/40 | | | 2,610 | | | | 2,749,113 | |
New York State Thruway Authority, Refunding RB, Subordinate, Series B, 4.00%, 01/01/45(f) | | | 5,998 | | | | 6,953,022 | |
Port Authority of New York & New Jersey, ARB, AMT, Series 221, 4.00%, 07/15/60 | | | 2,040 | | | | 2,326,579 | |
Port Authority of New York & New Jersey, Refunding ARB 194th Series, 5.25%, 10/15/55 | | | 1,455 | | | | 1,737,779 | |
Consolidated, 169th Series, AMT, 5.00%, 10/15/26 | | | 1,500 | | | | 1,549,545 | |
Consolidated, Series 211, 5.00%, 09/01/48 | | | 1,900 | | | | 2,335,480 | |
Triborough Bridge & Tunnel Authority, RB, Series A, 4.00%, 11/15/54(f) | | | 4,037 | | | | 4,764,652 | |
Triborough Bridge & Tunnel Authority, Refunding RB, Series A, 5.00%, 11/15/46 | | | 1,500 | | | | 1,792,410 | |
| | | | | | | | |
| | |
| | | | | | | 30,984,558 | |
| | | | | | | | |
| Security | | Par (000) | | | Value | |
| |
| | |
| Utilities — 12.1% | | | | | | |
New York City Water & Sewer System, Refunding RB | | | | | | | | |
Series BB, 5.00%, 06/15/44 | | $ | 3,511 | | | $ | 3,654,296 | |
Series HH, 5.00%, 06/15/32 | | | 5,310 | | | | 5,404,784 | |
New York Power Authority, Refunding RB, Series A, 4.00%, 11/15/60 | | | 3,751 | | | | 4,426,791 | |
Utility Debt Securitization Authority, Refunding RB | | | | | | | | |
Series A, Restructured, 5.00%, 12/15/35 | | | 2,000 | | | | 2,443,760 | |
Series B, 4.00%, 12/15/35 | | | 370 | | | | 429,829 | |
Series TE, Restructured, 5.00%, 12/15/41 | | | 6,868 | | | | 7,777,584 | |
| | | | | | | | |
| | |
| | | | | | | 24,137,044 | |
| | | | | | | | |
| |
Total Municipal Bonds in New York | | | | 78,303,461 | |
| | | | | | | | |
| |
Total Municipal Bonds Transferred to Tender Option Bond Trusts — 39.4% | | | | | |
(Cost: $72,455,266) | | | | | | | 78,303,461 | |
| | | | | | | | |
| |
Total Long-Term Investments — 166.7%
(Cost: $303,852,716) | | | | 331,071,184 | |
| | | | | | | | |
| | |
| | | Shares | | | | |
| |
|
Short-Term Securities | |
|
| Money Market Funds — 1.4% | |
BlackRock Liquidity Funds New York Money Fund Portfolio, 0.01%(g)(h) | | | 2,792,393 | | | | 2,792,393 | |
| | | | | | | | |
| |
Total Short-Term Securities — 1.4%
(Cost: $2,792,393) | | | | 2,792,393 | |
| | | | | | | | |
| |
Total Investments — 168.1%
(Cost: $306,645,109) | | | | 333,863,577 | |
| |
Other Assets Less Liabilities — 1.4% | | | | 2,755,728 | |
| |
Liability for TOB Trust Certificates, Including Interest Expense and Fees Payable — (21.9)% | | | | (43,507,762 | ) |
| |
VMTP Shares at Liquidation Value — (47.6)% | | | | (94,500,000 | ) |
| | | | | | | | |
| |
Net Assets Applicable to Common Shares — 100.0% | | | $ | 198,611,543 | |
| | | | | | | | |
| (a) | Security exempt from registration pursuant to Rule 144A under the Securities Act of 1933, as amended. These securities may be resold in transactions exempt from registration to qualified institutional investors. |
| (b) | Variable rate security. Interest rate resets periodically. The rate shown is the effective interest rate as of period end. Security description also includes the reference rate and spread if published and available. |
| (c) | U.S. Government securities held in escrow, are used to pay interest on this security as well as to retire the bond in full at the date indicated, typically at a premium to par. |
| (e) | Represent bonds transferred to a TOB Trust in exchange of cash and residual certificates received by the Trust. These bonds serve as collateral in a secured borrowing. See Note 4 of the Notes to Financial Statements for details. |
| (f) | All or a portion of the security is subject to a recourse agreement. The aggregate maximum potential amount the Trust could ultimately be required to pay under the agreements, which expire between December 1, 2026 to February 15, 2047, is $8,642,529. See Note 4 of the Notes to Financial Statements for details. |
| (g) | Affiliate of the Trust. |
| (h) | Annualized 7-day yield as of period end. |
| | |
SCHEDULE OF INVESTMENTS | | 45 |
| | |
Schedule of Investments (unaudited) (continued) January 31, 2021 | | BlackRock New York Municipal Income Trust (BNY) |
Affiliates
Investments in issuers considered to be affiliate(s) of the Trust during the six-months ended January 31, 2021 for purposes of Section 2(a)(3) of the Investment Company Act of 1940, as amended, were as follows:
| | | | | | | | | | | | | | | | | | | | | | | | | | | | | | | | | | | | |
| Affiliated Issuer | | Value at 07/31/20 | | | Purchases at Cost | | | Proceeds from Sales | | | Net Realized Gain (Loss) | | | Change in Unrealized Appreciation (Depreciation) | | | Value at 01/31/21 | | | Shares Held at 01/31/21 | | | Income | | | Capital Gain Distributions from Underlying Funds | |
BlackRock Liquidity Funds New York Money Fund Portfolio | | $ | 410,715 | | | $ | 2,382,046 | (a) | | $ | — | | | $ | (368 | ) | | $ | — | | | $ | 2,792,393 | | | | 2,792,393 | | | $ | 71 | | | $ | — | |
| | | | | | | | | | | | | | | | | | | | | | | | | | | | | | | | | | | | |
| | (a) | Represents net amount purchased (sold). | |
For Trust compliance purposes, the Trust’s sector classifications refer to one or more of the sector sub-classifications used by one or more widely recognized market indexes or rating group indexes, and/or as defined by the investment adviser. These definitions may not apply for purposes of this report, which may combine such sector sub-classifications for reporting ease.
Derivative Financial Instruments Outstanding as of Period End
Futures Contracts
| | | | | | | | | | | | | | | | |
| Description | | Number of Contracts | | | Expiration Date | | | Notional Amount (000) | | | Value/ Unrealized Appreciation (Depreciation) | |
Short Contracts | | | | | | | | | | | | | | | | |
10-Year U.S. Treasury Note | | | 60 | | | | 03/22/21 | | | $ | 8,222 | | | $ | 60,370 | |
Long U.S. Treasury Bond | | | 25 | | | | 03/22/21 | | | | 4,218 | | | | 163,680 | |
| | | | | | | | | | | | | | | | |
| | | | | | | | | | | | | | $ | 224,050 | |
| | | | | | | | | | | | | | | | |
Derivative Financial Instruments Categorized by Risk Exposure
As of period end, the fair values of derivative financial instruments located in the Statements of Assets and Liabilities were as follows:
| | | | | | | | | | | | | | | | | | | | | | | | | | | | |
| | | Commodity Contracts | | | Credit Contracts | | | Equity Contracts | | | Foreign Currency Exchange Contracts | | | Interest Rate Contracts | | | Other Contracts | | | Total | |
Assets — Derivative Financial Instruments | | | | | | | | | | | | | | | | | | | | | | | | | | | | |
Futures contracts | | | | | | | | | | | | | | | | | | | | | | | | | | | | |
Unrealized appreciation on futures contracts(a) | | $ | — | | | $ | — | | | $ | — | | | $ | — | | | $ | 224,050 | | | $ | — | | | $ | 224,050 | |
| | | | | | | | | | | | | | | | | | | | | | | | | | | | |
| | (a) | Net cumulative unrealized appreciation (depreciation) on futures contracts and centrally cleared swaps, if any, are reported in the Schedule of Investments. In the Statements of Assets and Liabilities, only current day’s variation margin is reported in receivables or payables and the net cumulative unrealized appreciation (depreciation) is included in accumulated earnings (loss). | |
For the six months ended January 31, 2021, the effect of derivative financial instruments in the Statements of Operations was as follows:
| | | | | | | | | | | | | | | | | | | | | | | | | | | | |
| | | Commodity Contracts | | | Credit Contracts | | | Equity Contracts | | | Foreign Currency Exchange Contracts | | | Interest Rate Contracts | | | Other Contracts | | | Total | |
Net Realized Gain (Loss) from | | | | | | | | | | | | | | | | | | | | | | | | | | | | |
Futures contracts | | $ | — | | | $ | — | | | $ | — | | | $ | — | | | $ | 52,474 | | | $ | — | | | $ | 52,474 | |
| | | | | | | | | | | | | | | | | | | | | | | | | | | | |
| | | | | | | |
Net Change in Unrealized Appreciation (Depreciation) on | | | | | | | | | | | | | | | | | | | | | | | | | | | | |
Futures contracts | | $ | — | | | $ | — | | | $ | — | | | $ | — | | | $ | 224,050 | | | $ | — | | | $ | 224,050 | |
| | | | | | | | | | | | | | | | | | | | | | | | | | | | |
Average Quarterly Balances of Outstanding Derivative Financial Instruments
| | | | | | | | | | | | | | | | | | | | | | | | | | | | |
Futures contracts | | | | | | | | | | | | | | | | | | | | | | | | | | | | |
Average notional value of contracts — short | | | | | | | | | | | | | | | | | | | | | | | | | | $ | 12,746,797 | |
For more information about the Trust’s investment risks regarding derivative financial instruments, refer to the Notes to Financial Statements.
| | |
| 46 | | 2 0 2 1 BLACK ROCK SEMI - ANNUAL REPORT TO SHAREHOLDERS |
| | |
Schedule of Investments (unaudited) (continued) January 31, 2021 | | BlackRock New York Municipal Income Trust (BNY) |
Fair Value Hierarchy as of Period End
Various inputs are used in determining the fair value of financial instruments. For a description of the input levels and information about the Trust’s policy regarding valuation of financial instruments, refer to the Notes to Financial Statements.
The following table summarizes the Trust’s investments and derivative financial instruments categorized in the disclosure hierarchy. The breakdown of the Trust’s investments into major categories is disclosed in the Schedule of Investments above.
| | | | | | | | | | | | | | | | |
| | | | | |
| | | Level 1 | | | Level 2 | | | Level 3 | | | Total | |
Assets | | | | | | | | | | | | | | | | |
Investments | | | | | | | | | | | | | | | | |
Long-Term Investments | | | | | | | | | | | | | | | | |
Municipal Bonds | | $ | — | | | $ | 252,767,723 | | | $ | — | | | $ | 252,767,723 | |
Municipal Bonds Transferred to Tender Option Bond Trusts | | | — | | | | 78,303,461 | | | | — | | | | 78,303,461 | |
Short-Term Securities | | | | | | | | | | | | | | | | |
Money Market Funds | | | 2,792,393 | | | | — | | | | — | | | | 2,792,393 | |
| | | | | | | | | | | | | | | | |
| | $ | 2,792,393 | | | $ | 331,071,184 | | | $ | — | | | $ | 333,863,577 | |
| | | | | | | | | | | | | | | | |
Derivative Financial Instruments(a) | | | | | | | | | | | | | | | | |
Assets | | | | | | | | | | | | | | | | |
Interest Rate Contracts | | $ | 224,050 | | | $ | — | | | $ | — | | | $ | 224,050 | |
| | | | | | | | | | | | | | | | |
| | (a) | Derivative financial instruments are futures contracts. Futures contracts are valued at the unrealized appreciation (depreciation) on the instrument. | |
The Trust may hold assets and/or liabilities in which the fair value approximates the carrying amount for financial statement purposes. As of period end, such assets and/or liabilities are categorized within the disclosure hierarchy as follows:
| | | | | | | | | | | | | | | | |
| | | | | |
| | | Level 1 | | | Level 2 | | | Level 3 | | | Total | |
Liabilities | | | | | | | | | | | | | | | | |
TOB Trust Certificates | | $ | — | | | $ | (43,492,449 | ) | | $ | — | | | $ | (43,492,449 | ) |
VMTP Shares at Liquidation Value | | | — | | | | (94,500,000 | ) | | | — | | | | (94,500,000 | ) |
| | | | | | | | | | | | | | | | |
| | $ | — | | | $ | (137,992,449 | ) | | $ | — | | | $ | (137,992,449 | ) |
| | | | | | | | | | | | | | | | |
See notes to financial statements.
| | |
SCHEDULE OF INVESTMENTS | | 47 |
Statements of Assets and Liabilities (unaudited)
January 31, 2021
| | | | | | | | | | | | | | | | |
| | | BFZ | | | BTT | | | BBF | | | BNY | |
| |
| | | | |
ASSETS | | | | | | | | | | | | | | | | |
Investments at value — unaffiliated(a) | | $ | 816,967,004 | | | $ | 2,800,565,347 | | | $ | 232,798,697 | | | $ | 331,071,184 | |
Investments at value — affiliated(b) | | | 928,468 | | | | 90,646,427 | | | | 3,005,920 | | | | 2,792,393 | |
Cash | | | 430,802 | | | | — | | | | 34,250 | | | | 38,750 | |
Cash pledged for futures contracts | | | 531,000 | | | | — | | | | 157,000 | | | | 177,000 | |
Receivables: | | | | | | | | | | | | | | | | |
Investments sold | | | — | | | | — | | | | 10,000 | | | | 426,067 | |
Dividends — affiliated | | | 34 | | | | 644 | | | | 40 | | | | 20 | |
Interest — unaffiliated | | | 8,831,992 | | | | 24,354,771 | | | | 2,120,928 | | | | 3,192,988 | |
Variation margin on futures contracts | | | 102,124 | | | | — | | | | 30,725 | | | | 34,232 | |
Prepaid expenses | | | 7,710 | | | | 18,516 | | | | — | | | | 5,353 | |
| | | | | | | | | | | | | | | | |
Total assets | | | 827,799,134 | | | | 2,915,585,705 | | | | 238,157,560 | | | | 337,737,987 | |
| | | | | | | | | | | | | | | | |
| | | | |
ACCRUED LIABILITIES | | | | | | | | | | | | | | | | |
Payables: | | | | | | | | | | | | | | | | |
Investments purchased | | | 2,862,733 | | | | 13,136,735 | | | | 210,092 | | | | — | |
Accounting services fees | | | 32,452 | | | | 173,265 | | | | 33,213 | | | | 61,085 | |
Income dividend distributions — Common Shares | | | 1,190,984 | | | | 4,399,548 | | | | 516,735 | | | | 733,148 | |
Interest expense and fees | | | 63,548 | | | | 95,760 | | | | 13,633 | | | | 15,313 | |
Investment advisory fees | | | 402,983 | | | | 974,634 | | | | 113,811 | | | | 171,027 | |
Trustees’ and Officer’s fees | | | 94,743 | | | | 14,622 | | | | 32,169 | | | | 39,293 | |
Other accrued expenses | | | 77,042 | | | | 196,139 | | | | — | | | | 33,193 | |
Reorganization costs | | | — | | | | — | | | | 183,459 | | | | 80,936 | |
| | | | | | | | | | | | | | | | |
| | | | |
Total accrued liabilities | | | 4,724,485 | | | | 18,990,703 | | | | 1,103,112 | | | | 1,133,995 | |
| | | | | | | | | | | | | | | | |
| | | | |
OTHER LIABILITIES | | | | | | | | | | | | | | | | |
TOB Trust Certificates | | | 143,275,836 | | | | 233,219,952 | | | | 35,342,064 | | | | 43,492,449 | |
RVMTP Shares, at liquidation value of $5,000,000 per share, net of deferred offering costs(c)(d)(e) | | | — | | | | 749,689,766 | | | | — | | | | — | |
VRDP Shares, at liquidation value of $100,000 per share, net of deferred offering costs(c)(d)(e) | | | — | | | | — | | | | 51,799,595 | | | | — | |
VMTP Shares, at liquidation value of $100,000 per share(c)(d)(e) | | | 171,300,000 | | | | — | | | | — | | | | 94,500,000 | |
| | | | | | | | | | | | | | | | |
| | | | |
Total other liabilities | | | 314,575,836 | | | | 982,909,718 | | | | 87,141,659 | | | | 137,992,449 | |
| | | | | | | | | | | | | | | | |
| | | | |
Total liabilities | | | 319,300,321 | | | | 1,001,900,421 | | | | 88,244,771 | | | | 139,126,444 | |
| | | | | | | | | | | | | | | | |
| | | | |
NET ASSETS APPLICABLE TO COMMON SHAREHOLDERS | | $ | 508,498,813 | | | $ | 1,913,685,284 | | | $ | 149,912,789 | | | $ | 198,611,543 | |
| | | | | | | | | | | | | | | | |
| | | | |
NET ASSETS APPLICABLE TO COMMON SHAREHOLDERS CONSIST OF | | | | | | | | | | | | | | | | |
Paid-in capital(f)(g)(h) | | $ | 439,679,321 | | | $ | 1,675,657,581 | | | $ | 134,194,799 | | | $ | 178,151,584 | |
Accumulated earnings | | | 68,819,492 | | | | 238,027,703 | | | | 15,717,990 | | | | 20,459,959 | |
| | | | | | | | | | | | | | | | |
| | | | |
NET ASSETS APPLICABLE TO COMMON SHAREHOLDERS | | $ | 508,498,813 | | | $ | 1,913,685,284 | | | $ | 149,912,789 | | | $ | 198,611,543 | |
| | | | | | | | | | | | | | | | |
| | | | |
Net asset value per Common Share | | $ | 16.22 | | | $ | 27.14 | | | $ | 14.65 | | | $ | 15.31 | |
| | | | | | | | | | | | | | | | |
| | | | |
(a) Investments at cost — unaffiliated | | $ | 746,099,820 | | | $ | 2,557,505,175 | | | $ | 210,268,013 | | | $ | 303,852,716 | |
(b) Investments at cost — affiliated | | $ | 928,375 | | | $ | 90,637,514 | | | $ | 3,005,842 | | | $ | 2,792,393 | |
(c) Preferred Shares outstanding | | | 1,713 | | | | 150 | | | | 520 | | | | 945 | |
(d) Preferred Shares authorized | | | Unlimited | | | | Unlimited | | | | Unlimited | | | | Unlimited | |
(e) Par value per Preferred Share | | $ | 0.001 | | | $ | 0.001 | | | $ | 0.001 | | | $ | 0.001 | |
(f) Common Shares outstanding | | | 31,341,683 | | | | 70,505,571 | | | | 10,232,375 | | | | 12,976,074 | |
(g) Common Shares authorized | | | Unlimited | | | | Unlimited | | | | Unlimited | | | | Unlimited | |
(h) Par value per Common Share | | $ | 0.001 | | | $ | 0.0001 | | | $ | 0.001 | | | $ | 0.001 | |
See notes to financial statements.
| | |
| 48 | | 2 0 2 1 BLACK ROCK SEMI - ANNUAL REPORT TO SHAREHOLDERS |
Statements of Operations (unaudited)
Six Months Ended January 31, 2021
| | | | | | | | | | | | | | | | |
| | | BFZ | | | BTT | | | BBF | | | BNY | |
| |
| | | | |
INVESTMENT INCOME | | | | | | | | | | | | | | | | |
Dividends — affiliated | | $ | 196 | | | $ | 2,940 | | | $ | 197 | | | $ | 71 | |
Interest — unaffiliated | | | 12,212,185 | | | | 45,760,384 | | | | 4,515,302 | | | | 6,123,816 | |
| | | | | | | | | | | | | | | | |
| | | | |
Total investment income | | | 12,212,381 | | | | 45,763,324 | | | | 4,515,499 | | | | 6,123,887 | |
| | | | | | | | | | | | | | | | |
| | | | |
EXPENSES | | | | | | | | | | | | | | | | |
Investment advisory | | | 2,366,971 | | | | 5,761,998 | | | | 665,588 | | | | 1,006,723 | |
Professional | | | 53,755 | | | | 78,835 | | | | 38,878 | | | | 38,397 | |
Rating agency | | | 25,553 | | | | 25,552 | | | | 25,553 | | | | 25,553 | |
Trustees and Officer | | | 23,735 | | | | 52,410 | | | | 7,865 | | | | 10,020 | |
Accounting services | | | 23,381 | | | | 132,979 | | | | 23,754 | | | | 29,747 | |
Transfer agent | | | 18,736 | | | | 41,396 | | | | 13,875 | | | | 14,961 | |
Registration | | | 5,323 | | | | 11,774 | | | | 4,089 | | | | 4,067 | |
Custodian | | | 3,865 | | | | 13,362 | | | | 6,234 | | | | 31,783 | |
Printing and postage | | | 1,509 | | | | 2,198 | | | | 1,262 | | | | 1,308 | |
Liquidity fees | | | — | | | | — | | | | 2,671 | | | | — | |
Remarketing fees on Preferred Shares | | | — | | | | — | | | | 2,618 | | | | — | |
Reorganization | | | — | | | | — | | | | 177,819 | | | | 119,568 | |
Miscellaneous | | | 6,216 | | | | 14,576 | | | | 4,372 | | | | 5,279 | |
| | | | | | | | | | | | | | | | |
| | | | |
Total expenses excluding interest expense, fees and amortization of offering costs | | | 2,529,044 | | | | 6,135,080 | | | | 974,578 | | | | 1,287,406 | |
Interest expense, fees and amortization of offering costs(a) | | | 1,256,355 | | | | 3,541,246 | | | | 452,434 | | | | 562,872 | |
| | | | | | | | | | | | | | | | |
| | | | |
Total expenses | | | 3,785,399 | | | | 9,676,326 | | | | 1,427,012 | | | | 1,850,278 | |
Less: | | | | | | | | | | | | | | | | |
Fees waived and/or reimbursed by the Manager | | | (380 | ) | | | (21,647 | ) | | | (1,443 | ) | | | (119 | ) |
| | | | | | | | | | | | | | | | |
| | | | |
Total expenses after fees waived and/or reimbursed | | | 3,785,019 | | | | 9,654,679 | | | | 1,425,569 | | | | 1,850,159 | |
| | | | | | | | | | | | | | | | |
| | | | |
Net investment income | | | 8,427,362 | | | | 36,108,645 | | | | 3,089,930 | | | | 4,273,728 | |
| | | | | | | | | | | | | | | | |
| | | | |
REALIZED AND UNREALIZED GAIN (LOSS) | | | | | | | | | | | | | | | | |
Net realized gain (loss) from: | | | | | | | | | | | | | | | | |
Investments — unaffiliated | | | 2,663,290 | | | | 4,802,269 | | | | 304,990 | | | | 174,277 | |
Investments — affiliated | | | 41 | | | | (1,211 | ) | | | 1 | | | | (368 | ) |
Futures contracts | | | 884,492 | | | | — | | | | 43,523 | | | | 52,474 | |
| | | | | | | | | | | | | | | | |
| | | | |
| | | 3,547,823 | | | | 4,801,058 | | | | 348,514 | | | | 226,383 | |
| | | | | | | | | | | | | | | | |
Net change in unrealized appreciation (depreciation) on: | | | | | | | | | | | | | | | | |
Investments — unaffiliated | | | 6,103,371 | | | | 44,294,719 | | | | 4,690,872 | | | | 2,273,130 | |
Investments — affiliated | | | 93 | | | | 5,548 | | | | 78 | | | | — | |
Futures contracts | | | 44,710 | | | | — | | | | 207,951 | | | | 224,050 | |
| | | | | | | | | | | | | | | | |
| | | | |
| | | 6,148,174 | | | | 44,300,267 | | | | 4,898,901 | | | | 2,497,180 | |
| | | | | | | | | | | | | | | | |
| | | | |
Net realized and unrealized gain | | | 9,695,997 | | | | 49,101,325 | | | | 5,247,415 | | | | 2,723,563 | |
| | | | | | | | | | | | | | | | |
| | | | |
NET INCREASE IN NET ASSETS APPLICABLE TO COMMON SHAREHOLDERS RESULTING FROM OPERATIONS | | $ | 18,123,359 | | | $ | 85,209,970 | | | $ | 8,337,345 | | | $ | 6,997,291 | |
| | | | | | | | | | | | | | | | |
| (a) | Related to TOB Trusts, VMTP Shares, RVMTP Shares and/or VRDP Shares. |
See notes to financial statements.
Statements of Changes in Net Assets
| | | | | | | | | | | | | | | | |
| | | BFZ | | | BTT | |
| | | | |
| | | Six Months Ended 01/31/21 (unaudited) | | | Year Ended 07/31/20 | | | Six Months Ended 01/31/21 (unaudited) | | | Year Ended 07/31/20 | |
| |
|
INCREASE (DECREASE) IN NET ASSETS APPLICABLE TO COMMON SHAREHOLDERS | |
| | | | |
OPERATIONS | | | | | | | | | | | | | | | | |
Net investment income | | $ | 8,427,362 | | | $ | 15,302,566 | | | $ | 36,108,645 | | | $ | 65,164,868 | |
Net realized gain (loss) | | | 3,547,823 | | | | (4,992,260 | ) | | | 4,801,058 | | | | 627,376 | |
Net change in unrealized appreciation | | | 6,148,174 | | | | 22,918,213 | | | | 44,300,267 | | | | 37,136,626 | |
| | | | | | | | | | | | | | | | |
| | | | |
Net increase in net assets applicable to Common Shareholders resulting from operations | | | 18,123,359 | | | | 33,228,519 | | | | 85,209,970 | | | | 102,928,870 | |
| | | | | | | | | | | | | | | | |
| | | | |
DISTRIBUTIONS TO COMMON SHAREHOLDERS(a) | | | | | | | | | | | | | | | | |
Decrease in net assets resulting from distributions to Common Shareholders | | | (7,164,889 | ) | | | (14,967,273 | ) | | | (26,397,286 | ) | | | (52,794,572 | ) |
| | | | | | | | | | | | | | | | |
| | | | |
CAPITAL SHARE TRANSACTIONS | | | | | | | | | | | | | | | | |
Redemption of shares resulting from share repurchase program (including transaction costs) | | | (2,813,059 | ) | | | (4,493,469 | ) | | | — | | | | — | |
| | | | | | | | | | | | | | | | |
| | | | |
NET ASSETS APPLICABLE TO COMMON SHAREHOLDERS | | | | | | | | | | | | | | | | |
Total increase in net assets applicable to Common Shareholders | | | 8,145,411 | | | | 13,767,777 | | | | 58,812,684 | | | | 50,134,298 | |
Beginning of period | | | 500,353,402 | | | | 486,585,625 | | | | 1,854,872,600 | | | | 1,804,738,302 | |
| | | | | | | | | | | | | | | | |
| | | | |
End of period | | $ | 508,498,813 | | | $ | 500,353,402 | | | $ | 1,913,685,284 | | | $ | 1,854,872,600 | |
| | | | | | | | | | | | | | | | |
| (a) | Distributions for annual periods determined in accordance with U.S. federal income tax regulations. |
See notes to financial statements.
| | |
| 50 | | 2 0 2 1 BLACK ROCK SEMI - ANNUAL REPORT TO SHAREHOLDERS |
Statements of Changes in Net Assets (continued)
| | | | | | | | | | | | | | | | |
| | | BBF | | | BNY | |
| | | | |
| | | Six Months Ended 01/31/21 (unaudited) | | | Year Ended 07/31/20 | | | Six Months Ended 01/31/21 (unaudited) | | | Year Ended 07/31/20 | |
| |
|
INCREASE (DECREASE) IN NET ASSETS APPLICABLE TO COMMON SHAREHOLDERS | |
| | | | |
OPERATIONS | | | | | | | | | | | | | | | | |
Net investment income | | $ | 3,089,930 | | | $ | 6,522,021 | | | $ | 4,273,728 | | | $ | 7,862,512 | |
Net realized gain (loss) | | | 348,514 | | | | (3,962,269 | ) | | | 226,383 | | | | (3,165,455 | ) |
Net change in unrealized appreciation | | | 4,898,901 | | | | 3,773,612 | | | | 2,497,180 | | | | 2,584,667 | |
| | | | | | | | | | | | | | | | |
| | | | |
Net increase in net assets applicable to Common Shareholders resulting from operations | | | 8,337,345 | | | | 6,333,364 | | | | 6,997,291 | | | | 7,281,724 | |
| | | | | | | | | | | | | | | | |
| | | | |
DISTRIBUTIONS TO COMMON SHAREHOLDERS(a) | | | | | | | | | | | | | | | | |
Decrease in net assets resulting from distributions to Common Shareholders | | | (3,100,410 | )(b) | | | (6,344,028 | ) | | | (4,230,200 | ) | | | (7,305,530 | ) |
| | | | | | | | | | | | | | | | |
| | | | |
CAPITAL SHARE TRANSACTIONS | | | | | | | | | | | | | | | | |
Reinvestment of common distributions | | | — | | | | 21,473 | | | | — | | | | — | |
| | | | | | | | | | | | | | | | |
| | | | |
NET ASSETS APPLICABLE TO COMMON SHAREHOLDERS | | | | | | | | | | | | | | | | |
Total increase (decrease) in net assets applicable to Common Shareholders | | | 5,236,935 | | | | 10,809 | | | | 2,767,091 | | | | (23,806 | ) |
Beginning of period | | | 144,675,854 | | | | 144,665,045 | | | | 195,844,452 | | | | 195,868,258 | |
| | | | | | | | | | | | | | | | |
| | | | |
End of period | | $ | 149,912,789 | | | $ | 144,675,854 | | | $ | 198,611,543 | | | $ | 195,844,452 | |
| | | | | | | | | | | | | | | | |
| (a) | Distributions for annual periods determined in accordance with U.S. federal income tax regulations. |
| (b) | A portion of the distributions from net investment income may be deemed a return of capital or net realized gain at fiscal year-end. |
See notes to financial statements.
Statements of Cash Flows (unaudited)
Six Months Ended January 31, 2021
| | | | | | | | | | | | | | | | |
| | | BFZ | | | BTT | | | BBF | | | BNY | |
| | | | |
CASH PROVIDED BY (USED FOR) OPERATING ACTIVITIES | | | | | | | | | | | | | | | | |
Net increase in net assets resulting from operations | | $ | 18,123,359 | | | $ | 85,209,970 | | | $ | 8,337,345 | | | $ | 6,997,291 | |
Adjustments to reconcile net increase in net assets resulting from operations to net cash provided by operating activities | | | | | | | | | | | | | | | | |
Proceeds from sales of long-term investments | | | 86,643,576 | | | | 178,394,626 | | | | 37,442,801 | | | | 18,836,926 | |
Purchases of long-term investments | | | (88,246,600 | ) | | | (128,426,574 | ) | | | (34,426,980 | ) | | | (18,592,056 | ) |
Net purchases of short-term securities | | | (314,293 | ) | | | (36,856,768 | ) | | | (888,907 | ) | | | (2,382,046 | ) |
Amortization of premium and accretion of discount on investments and other fees | | | 4,153,933 | | | | 5,350,706 | | | | 285,966 | | | | 982,273 | |
Net realized gain on investments | | | (2,663,331 | ) | | | (4,801,058 | ) | | | (304,991 | ) | | | (173,909 | ) |
Net unrealized appreciation on investments | | | (6,103,464 | ) | | | (44,300,267 | ) | | | (4,690,950 | ) | | | (2,273,130 | ) |
(Increase) Decrease in Assets | | | | | | | | | | | | | | | | |
Receivables | | | | | | | | | | | | | | | | |
Dividends — affiliated | | | 20 | | | | 1,479 | | | | (21 | ) | | | 1 | |
Interest — unaffiliated | | | (207,461 | ) | | | 664,052 | | | | 160,359 | | | | 9,553 | |
Variation margin on futures contracts | | | (102,124 | ) | | | — | | | | (30,725 | ) | | | (34,232 | ) |
Prepaid expenses | | | 12,048 | | | | 24,477 | | | | 69,408 | | | | 12,833 | |
Increase (Decrease) in Liabilities | | | | | | | | | | | | | | | | |
Payables | | | | | | | | | | | | | | | | |
Interest expense and fees | | | (169,948 | ) | | | (293,478 | ) | | | (45,771 | ) | | | (30,736 | ) |
Investment advisory fees | | | 6,542 | | | | 17,887 | | | | 1,801 | | | | 3,076 | |
Trustees’ and Officer’s fees | | | 9,863 | | | | 2,476 | | | | 3,299 | | | | 4,117 | |
Other accrued expenses | | | (12,945 | ) | | | (6,042 | ) | | | (62,106 | ) | | | (13,502 | ) |
Reorganization costs | | | — | | | | — | | | | 145,165 | | | | 46,263 | |
| | | | | | | | | | | | | | | | |
| | | | |
Net cash provided by operating activities | | | 11,129,175 | | | | 54,981,486 | | | | 5,995,693 | | | | 3,392,722 | |
| | | | | | | | | | | | | | | | |
| | | | |
CASH PROVIDED BY (USED FOR) FINANCING ACTIVITIES | | | | | | | | | | | | | | | | |
Cash dividends paid to Common Shareholders | | | (7,174,662 | ) | | | (26,397,286 | ) | | | (3,100,410 | ) | | | (4,145,856 | ) |
Repayments of TOB Trust Certificates | | | — | | | | (48,604,981 | ) | | | (4,403,033 | ) | | | (2,743,189 | ) |
Repayments of Loan for TOB Trust Certificates | | | — | | | | — | | | | (504,145 | ) | | | (2,352,204 | ) |
Net payments on redemption of Common Shares | | | (2,929,880 | ) | | | — | | | | — | | | | — | |
Proceeds from TOB Trust Certificates | | | — | | | | 20,005,018 | | | | 1,624,540 | | | | 3,712,205 | |
Proceeds from Loan for TOB Trust Certificates | | | — | | | | — | | | | 504,146 | | | | 2,352,203 | |
Decrease in bank overdraft | | | (62,831 | ) | | | — | | | | — | | | | (131 | ) |
Amortization of deferred offering costs | | | — | | | | 15,763 | | | | 74,459 | | | | — | |
| | | | | | | | | | | | | | | | |
| | | | |
Net cash used for financing activities | | | (10,167,373 | ) | | | (54,981,486 | ) | | | (5,804,443 | ) | | | (3,176,972 | ) |
| | | | | | | | | | | | | | | | |
| | | | |
CASH | | | | | | | | | | | | | | | | |
Net increase in restricted and unrestricted cash | | | 961,802 | | | | — | | | | 191,250 | | | | 215,750 | |
Restricted and unrestricted cash at beginning of period | | | — | | | | — | | | | — | | | | — | |
| | | | | | | | | | | | | | | | |
| | | | |
Restricted and unrestricted cash at end of period | | $ | 961,802 | | | $ | — | | | $ | 191,250 | | | $ | 215,750 | |
| | | | | | | | | | | | | | | | |
| | | | |
SUPPLEMENTAL DISCLOSURE OF CASH FLOW INFORMATION | | | | | | | | | | | | | | | | |
Cash paid during the period for interest expense | | $ | 1,426,303 | | | $ | 3,818,961 | | | $ | 423,746 | | | $ | 593,608 | |
| | | | | | | | | | | | | | | | |
| | | | |
RECONCILIATION OF RESTRICTED AND UNRESTRICTED CASH AT THE END OF PERIOD TO THE STATEMENTS OF ASSETS AND LIABILITIES | | | | | | | | | | | | | | | | |
Cash | | $ | 430,802 | | | $ | — | | | $ | 34,250 | | | $ | 38,750 | |
Cash pledged | | | | | | | | | | | | | | | | |
Futures contracts | | | 531,000 | | | | — | | | | 157,000 | | | | 177,000 | |
| | | | | | | | | | | | | | | | |
| | | | |
| | $ | 961,802 | | | $ | — | | | $ | 191,250 | | | $ | 215,750 | |
| | | | | | | | | | | | | | | | |
See notes to financial statements.
| | |
| 52 | | 2 0 2 1 BLACK ROCK SEMI - ANNUAL REPORT TO SHAREHOLDERS |
Financial Highlights
(For a share outstanding throughout each period)
| | | | | | | | | | | | | | | | | | | | | | | | | | |
| | | BFZ | |
| | |
| | | Six Months Ended 01/31/21 (unaudited) | | | Year Ended July 31, | |
| | 2020 | | | 2019 | | | 2018 | | | 2017 | | | 2016 | |
| | | | | | | |
Net asset value, beginning of period | | | | $ | 15.86 | | | $ | 15.25 | | | $ | 14.81 | | | $ | 15.34 | | | $ | 16.35 | | | $ | 15.84 | |
| | | | | | | | | | | | | | | | | | | | | | | | | | |
Net investment income(a) | | | | | 0.27 | | | | 0.48 | | | | 0.52 | | | | 0.65 | | | | 0.73 | | | | 0.83 | |
Net realized and unrealized gain (loss) | | | | | 0.32 | | | | 0.60 | | | | 0.63 | | | | (0.51 | ) | | | (0.97 | ) | | | 0.54 | |
| | | | | | | | | | | | | | | | | | | | | | | | | | |
| | | | | | | |
Net increase (decrease) from investment operations | | | | | 0.59 | | | | 1.08 | | | | 1.15 | | | | 0.14 | | | | (0.24 | ) | | | 1.37 | |
| | | | | | | | | | | | | | | | | | | | | | | | | | |
| | | | | | | |
Distributions to Common Shareholders(b) | | | | | | | | | | | | | | | | | | | | | | | | | | |
From net investment income | | | | | (0.23 | ) | | | (0.47 | ) | | | (0.55 | ) | | | (0.67 | ) | | | (0.77 | ) | | | (0.86 | ) |
From net realized gain | | | | | — | | | | — | | | | (0.16 | ) | | | — | | | | — | | | | — | |
| | | | | | | | | | | | | | | | | | | | | | | | | | |
| | | | | | | |
Total distributions to Common Shareholders | | | | | (0.23 | ) | | | (0.47 | ) | | | (0.71 | ) | | | (0.67 | ) | | | (0.77 | ) | | | (0.86 | ) |
| | | | | | | | | | | | | | | | | | | | | | | | | | |
| | | | | | | |
Net asset value, end of period | | | | $ | 16.22 | | | $ | 15.86 | | | $ | 15.25 | | | $ | 14.81 | | | $ | 15.34 | | | $ | 16.35 | |
| | | | | | | | | | | | | | | | | | | | | | | | | | |
| | | | | | | |
Market price, end of period | | | | $ | 14.30 | | | $ | 13.79 | | | $ | 13.50 | | | $ | 12.75 | | | $ | 14.71 | | | $ | 16.76 | |
| | | | | | | | | | | | | | | | | | | | | | | | | | |
| | | | | | | |
Total Return Applicable to Common Shareholders(c) | | | | | | | | | | | | | | | | | | | | | | | | | | |
Based on net asset value | | | | | 3.98 | %(d) | | | 7.69 | % | | | 8.89 | % | | | 1.41 | % | | | (1.22 | )% | | | 8.92 | % |
| | | | | | | | | | | | | | | | | | | | | | | | | | |
| | | | | | | |
Based on market price | | | | | 5.43 | %(d) | | | 5.77 | % | | | 11.96 | % | | | (8.95 | )% | | | (7.59 | )% | | | 20.72 | % |
| | | | | | | | | | | | | | | | | | | | | | | | | | |
| | | | | | | |
Ratios to Average Net Assets Applicable to Common Shareholders | | | | | | | | | | | | | | | | | | | | | | | | | | |
Total expenses | | | | | 1.52 | %(e) | | | 2.17 | % | | | 2.76 | % | | | 2.41 | % | | | 2.14 | % | | | 1.68 | % |
| | | | | | | | | | | | | | | | | | | | | | | | | | |
| | | | | | | |
Total expenses after fees waived and/or reimbursed | | | | | 1.52 | %(e) | | | 2.17 | % | | | 2.76 | % | | | 2.41 | % | | | 2.14 | % | | | 1.68 | % |
| | | | | | | | | | | | | | | | | | | | | | | | | | |
Total expenses after fees waived and/or reimbursed and excluding interest expense,fees, and amortization of offering cost(f) | | | | | 1.01 | %(e) | | | 1.02 | % | | | 1.06 | % | | | 1.05 | % | | | 1.07 | % | | | 1.04 | % |
| | | | | | | | | | | | | | | | | | | | | | | | | | |
| | | | | | | |
Net investment income to Common Shareholders | | | | | 3.38 | %(e) | | | 3.14 | % | | | 3.56 | % | | | 4.33 | % | | | 4.73 | % | | | 5.17 | % |
| | | | | | | | | | | | | | | | | | | | | | | | | | |
| | | | | | | |
Supplemental Data | | | | | | | | | | | | | | | | | | | | | | | | | | |
Net assets applicable to Common Shareholders, end of period (000) | | | | $ | 508,499 | | | $ | 500,353 | | | $ | 486,586 | | | $ | 472,407 | | | $ | 489,328 | | | $ | 521,335 | |
| | | | | | | | | | | | | | | | | | | | | | | | | | |
| | | | | | | |
VMTP Shares outstanding at $100,000 liquidation value, end of period (000) | | | | $ | 171,300 | | | $ | 171,300 | | | $ | 171,300 | | | $ | 171,300 | | | $ | 171,300 | | | $ | 171,300 | |
| | | | | | | | | | | | | | | | | | | | | | | | | | |
| | | | | | | |
Asset coverage per VMTP Shares at $100,000 liquidation value, end of period | | | | $ | 396,847 | | | $ | 392,092 | | | $ | 384,055 | | | $ | 375,778 | | | $ | 385,656 | | | $ | 404,341 | |
| | | | | | | | | | | | | | | | | | | | | | | | | | |
| | | | | | | |
Borrowings outstanding, end of period (000) | | | | $ | 143,276 | | | $ | 143,276 | | | $ | 156,312 | | | $ | 157,126 | | | $ | 169,863 | | | $ | 183,691 | |
| | | | | | | | | | | | | | | | | | | | | | | | | | |
| | | | | | | |
Portfolio turnover rate | | | | | 11 | % | | | 38 | % | | | 51 | % | | | 45 | % | | | 38 | % | | | 30 | % |
| | | | | | | | | | | | | | | | | | | | | | | | | | |
| (a) | Based on average Common Shares outstanding. |
| (b) | Distributions for annual periods determined in accordance with U.S. federal income tax regulations. |
| (c) | Total returns based on market price, which can be significantly greater or less than the net asset value, may result in substantially different returns. Where applicable, excludes the effects of any sales charges and assumes the reinvestment of distributions at actual reinvestment prices. |
| (d) | Aggregate total return. |
| (f) | Interest expense, fees and amortization of offering costs related to TOB Trusts and/or VRDP Shares. See Note 4 and Note 10 of the Notes to Financial Statements for details. |
See notes to financial statements.
Financial Highlights (continued)
(For a share outstanding throughout each period)
| | | | | | | | | | | | | | | | | | | | | | | | | | |
| | | BTT | |
| | |
| | | Six Months Ended 01/31/21 (unaudited) | | | Year Ended July 31, | |
| | 2020 | | | 2019 | | | 2018 | | | 2017 | | | 2016 | |
| | | | | | | | |
Net asset value, beginning of period | | | | $ | 26.31 | | | $ | 25.60 | | | $ | 23.62 | | | $ | 23.83 | | | $ | 25.38 | | | $ | 22.73 | |
| | | | | | | | | | | | | | | | | | | | | | | | | | |
Net investment income(a) | | | | | 0.51 | | | | 0.92 | | | | 0.80 | | | | 0.85 | | | | 0.90 | | | | 1.03 | |
Net realized and unrealized gain (loss) | | | | | 0.69 | | | | 0.54 | | | | 1.93 | | | | (0.21 | ) | | | (1.50 | ) | | | 2.58 | |
| | | | | | | | | | | | | | | | | | | | | | | | | | |
Net increase (decrease) from investment operations | | | | | 1.20 | | | | 1.46 | | | | 2.73 | | | | 0.64 | | | | (0.60 | ) | | | 3.61 | |
| | | | | | | | | | | | | | | | | | | | | | | | | | |
Distributions to Common Shareholders from net investment income(b) | | | | | (0.37 | ) | | | (0.75 | ) | | | (0.75 | ) | | | (0.85 | ) | | | (0.95 | ) | | | (0.96 | ) |
| | | | | | | | | | | | | | | | | | | | | | | | | | |
| | | | | | | |
Net asset value, end of period | | | | $ | 27.14 | | | $ | 26.31 | | | $ | 25.60 | | | $ | 23.62 | | | $ | 23.83 | | | $ | 25.38 | |
| | | | | | | | | | | | | | | | | | | | | | | | | | |
| | | | | | | |
Market price, end of period | | | | $ | 25.95 | | | $ | 24.78 | | | $ | 23.49 | | | $ | 21.43 | | | $ | 23.14 | | | $ | 24.24 | |
| | | | | | | | | | | | | | | | | | | | | | | | | | |
| | | | | | | |
Total Return Applicable to Common
Shareholders(c) | | | | | | | | | | | | | | | | | | | | | | | | | | |
Based on net asset value | | | | | 4.70 | %(d) | | | 6.04 | % | | | 12.17 | % | | | 3.04 | % | | | (2.14 | )% | | | 16.57 | % |
| | | | | | | | | | | | | | | | | | | | | | | | | | |
Based on market price | | | | | 6.28 | %(d) | | | 8.84 | % | | | 13.45 | % | | | (3.73 | )% | | | (0.51 | )% | | | 21.67 | % |
| | | | | | | | | | | | | | | | | | | | | | | | | | |
| | | | | | | |
Ratios to Average Net Assets Applicable to Common Shareholders(e) | | | | | | | | | | | | | | | | | | | | | | | | | | |
Total expenses | | | | | 1.03 | %(f) | | | 1.56 | % | | | 2.07 | % | | | 1.76 | % | | | 1.49 | % | | | 1.17 | % |
| | | | | | | | | | | | | | | | | | | | | | | | | | |
Total expenses after fees waived and/or reimbursed | | | | | 1.03 | %(f) | | | 1.56 | % | | | 2.07 | % | | | 1.76 | % | | | 1.49 | % | | | 1.09 | % |
| | | | | | | | | | | | | | | | | | | | | | | | | | |
Total expenses after fees waived and/or reimbursed and excluding interest expense, fees, and amortization of offering cost(g) | | | | | 0.65 | %(f) | | | 0.67 | % | | | 0.69 | % | | | 0.69 | % | | | 0.68 | % | | | 0.61 | % |
| | | | | | | | | | | | | | | | | | | | | | | | | | |
Net investment income to Common Shareholders | | | | | 3.85 | %(f) | | | 3.60 | % | | | 3.31 | % | | | 3.55 | % | | | 3.80 | % | | | 4.30 | % |
| | | | | | | | | | | | | | | | | | | | | | | | | | |
| | | | | | | |
Supplemental Data | | | | | | | | | | | | | | | | | | | | | | | | | | |
Net assets applicable to Common Shareholders, end of period (000) | | | | $ | 1,913,685 | | | $ | 1,854,873 | | | $ | 1,804,738 | | | $ | 1,665,198 | | | $ | 1,679,841 | | | $ | 1,789,120 | |
| | | | | | | | | | | | | | | | | | | | | | | | | | |
RVMTP Shares outstanding at $5,000,000 liquidation value, end of year (000) | | | | $ | 750,000 | | | $ | 750,000 | | | $ | 750,000 | | | $ | 750,000 | | | $ | 750,000 | | | $ | 750,000 | |
| | | | | | | | | | | | | | | | | | | | | | | | | | |
Asset coverage per RVMTP Shares at $5,000,000 liquidation value, end of period | | | | $ | 355,158 | | | $ | 347,316 | | | $ | 340,632 | | | $ | 16,101,317 | | | $ | 16,198,941 | | | $ | 16,927,465 | |
| | | | | | | | | | | | | | | | | | | | | | | | | | |
Borrowings outstanding, end of period (000) | | | | $ | 233,220 | | | $ | 261,820 | | | $ | 261,820 | | | $ | 261,820 | | | $ | 184,115 | | | $ | 184,115 | |
| | | | | | | | | | | | | | | | | | | | | | | | | | |
Portfolio turnover rate | | | | | 5 | % | | | 5 | % | | | 21 | % | | | 23 | % | | | 32 | % | | | 42 | % |
| | | | | | | | | | | | | | | | | | | | | | | | | | |
| (a) | Based on average Common Shares outstanding. |
| (b) | Distributions for annual periods determined in accordance with U.S. federal income tax regulations. |
| (c) | Total returns based on market price, which can be significantly greater or less than the net asset value, may result in substantially different returns. Where applicable, excludes the effects of any sales charges and assumes the reinvestment of distributions at actual reinvestment prices. |
| (d) | Aggregate total return. |
| (e) | Excludes expenses incurred indirectly as a result of investments in underlying funds as follows: |
| | | | | | | | | | | | | | | | | | | | | | | | | | | | | | |
| | | Six Months Ended 01/31/21 (unaudited) | | | | | Year Ended July 31, | |
| | | | | 2020 | | | 2019 | | | 2018 | | | 2017 | | | 2016 | |
Investments in underlying funds | | | | | | | 0.01 | % | | | | | — | % | | | — | % | | | — | % | | | 0.01 | % | | | — | % |
| | | | | | | | | | | | | | | | | | | | | | | | | | | | | | |
| (g) | Interest expense, fees and amortization of offering costs related to TOB Trusts and/or RVMTP Shares. See Note 4 and Note 10 of the Notes to Financial Statements for details. |
See notes to financial statements.
| | |
| 54 | | 2 0 2 1 BLACK ROCK SEMI - ANNUAL REPORT TO SHAREHOLDERS |
Financial Highlights (continued)
(For a share outstanding throughout each period)
| | | | | | | | | | | | | | | | | | | | | | | | | | |
| | | BBF | |
| | |
| | | Six Months Ended 01/31/21 (unaudited) | | | Year Ended July 31, | |
| | 2020 | | | 2019 | | | 2018 | | | 2017 | | | 2016 | |
| | | | | | | | |
Net asset value, beginning of period | | | | $ | 14.14 | | | $ | 14.14 | | | $ | 13.87 | | | $ | 14.48 | | | $ | 15.47 | | | $ | 15.14 | |
| | | | | | | | | | | | | | | | | | | | | | | | | | |
Net investment income(a) | | | | | 0.30 | | | | 0.64 | | | | 0.69 | | | | 0.80 | | | | 0.84 | | | | 0.84 | |
Net realized and unrealized gain (loss) | | | | | 0.51 | | | | (0.02 | ) | | | 0.28 | | | | (0.59 | ) | | | (0.96 | ) | | | 0.36 | |
| | | | | | | | | | | | | | | | | | | | | | | | | | |
| | | | | | | |
Net increase (decrease) from investment operations | | | | | 0.81 | | | | 0.62 | | | | 0.97 | | | | 0.21 | | | | (0.12 | ) | | | 1.20 | |
| | | | | | | | | | | | | | | | | | | | | | | | | | |
| | | | | | | |
Distributions to Common Shareholders(b) | | | | | | | | | | | | | | | | | | | | | | | | | | |
From net investment income | | | | | (0.30 | )(c) | | | (0.62 | ) | | | (0.69 | ) | | | (0.82 | ) | | | (0.87 | ) | | | (0.87 | ) |
Return of capital | | | | | — | | | | — | | | | (0.01 | ) | | | — | | | | — | | | | — | |
| | | | | | | | | | | | | | | | | | | | | | | | | | |
| | | | | | | |
Total distributions to Common Shareholders | | | | | (0.30 | ) | | | (0.62 | ) | | | (0.70 | ) | | | (0.82 | ) | | | (0.87 | ) | | | (0.87 | ) |
| | | | | | | | | | | | | | | | | | | | | | | | | | |
| | | | | | | |
Net asset value, end of period | | | | $ | 14.65 | | | $ | 14.14 | | | $ | 14.14 | | | $ | 13.87 | | | $ | 14.48 | | | $ | 15.47 | |
| | | | | | | | | | | | | | | | | | | | | | | | | | |
| | | | | | | |
Market price, end of period | | | | $ | 13.89 | | | $ | 13.32 | | | $ | 14.25 | | | $ | 13.37 | | | $ | 15.27 | | | $ | 16.00 | |
| | | | | | | | | | | | | | | | | | | | | | | | | | |
| | | | | | | |
Total Return Applicable to Common Shareholders(d) | | | | | | | | | | | | | | | | | | | | | | | | | | |
Based on net asset value | | | | | 5.99 | %(e) | | | 4.77 | % | | | 7.49 | % | | | 1.65 | % | | | (0.65 | )% | | | 8.40 | % |
| | | | | | | | | | | | | | | | | | | | | | | | | | |
| | | | | | | |
Based on market price | | | | | 6.68 | %(e) | | | (2.07 | )% | | | 12.38 | % | | | (7.08 | )% | | | 1.30 | % | | | 26.29 | % |
| | | | | | | | | | | | | | | | | | | | | | | | | | |
| | | | | | | |
Ratios to Average Net Assets Applicable to Common Shareholders | | | | | | | | | | | | | | | | | | | | | | | | | | |
Total expenses | | | | | 1.96 | %(f)(g)(h) | | | 2.19 | % | | | 2.77 | % | | | 2.53 | % | | | 2.16 | % | | | 2.01 | %(i) |
| | | | | | | | | | | | | | | | | | | | | | | | | | |
| | | | | | | |
Total expenses after fees waived and/or reimbursed | | | | | 1.96 | %(f)(g)(h) | | | 2.18 | % | | | 2.77 | % | | | 2.53 | % | | | 2.16 | % | | | 2.01 | %(i) |
| | | | | | | | | | | | | | | | | | | | | | | | | | |
Total expenses after fees waived and/or reimbursed and excluding interest expense, fees, and amortization of offering cost(j)(k) | | | | | 1.34 | %(f)(g)(h) | | | 1.12 | % | | | 1.16 | % | | | 1.15 | % | | | 1.13 | % | | | 1.45 | %(i) |
| | | | | | | | | | | | | | | | | | | | | | | | | | |
| | | | | | | |
Net investment income to Common Shareholders | | | | | 4.24 | %(f)(h) | | | 4.58 | % | | | 5.01 | % | | | 5.63 | % | | | 5.72 | % | | | 5.50 | % |
| | | | | | | | | | | | | | | | | | | | | | | | | | |
| | | | | | | |
Supplemental Data | | | | | | | | | | | | | | | | | | | | | | | | | | |
Net assets applicable to Common Shareholders, end of period (000) | | | | $ | 149,913 | | | $ | 144,676 | | | $ | 144,665 | | | $ | 141,808 | | | $ | 147,990 | | | $ | 157,965 | |
| | | | | | | | | | | | | | | | | | | | | | | | | | |
| | | | | | | |
VRDP Shares outstanding at $100,000 liquidation value, end of period (000) | | | | $ | 52,000 | | | $ | 52,000 | | | $ | 52,000 | | | $ | 52,000 | | | $ | 52,000 | | | $ | 52,000 | |
| | | | | | | | | | | | | | | | | | | | | | | | | | |
| | | | | | | |
Asset coverage per VRDP Shares at $100,000 liquidation value, end of period | | | | $ | 388,294 | | | $ | 378,223 | | | $ | 378,202 | | | $ | 372,708 | | | $ | 384,597 | | | $ | 403,780 | |
| | | | | | | | | | | | | | | | | | | | | | | | | | |
| | | | | | | |
Borrowings outstanding, end of period (000) | | | | $ | 35,342 | | | $ | 38,121 | | | $ | 39,565 | | | $ | 49,043 | | | $ | 50,028 | | | $ | 47,193 | |
| | | | | | | | | | | | | | | | | | | | | | | | | | |
| | | | | | | |
Portfolio turnover rate | | | | | 15 | % | | | 47 | % | | | 36 | % | | | 31 | % | | | 39 | % | | | 17 | % |
| | | | | | | | | | | | | | | | | | | | | | | | | | |
| (a) | Based on average Common Shares outstanding. |
| (b) | Distributions for annual periods determined in accordance with U.S. federal income tax regulations. |
| (c) | A portion of the distributions from net investment income may be deemed a return of capital or net realized gain at fiscal year-end. |
| (d) | Total returns based on market price, which can be significantly greater or less than the net asset value, may result in substantially different returns. Where applicable, excludes the effects of any sales charges and assumes the reinvestment of distributions at actual reinvestment prices. |
| (e) | Aggregate total return. |
| (g) | Includes non-recurring expenses of reorganization costs. Without these costs, total expenses, total expenses after fees waived and/or reimbursed and total expenses after fees waived and/or reimbursed and excluding interest expense, fees and amortization of offering costs would have been 1.72%, 1.72% and 1.10%, respectively. |
| (h) | Excludes 0.01% of expenses incurred indirectly as a result of investments in underlying funds. |
| (i) | Includes reorganization costs associated with the Trust’s reorganization in 2016. Without these costs, total expenses, total expenses after fees waived and/or paid indirectly and total expenses after fees waived and/or paid indirectly and excluding interest expense, fees and amortization of offering costs would have been 1.83%, 1.83% and 1.26%, respectively, for the year ended July 31, 2016. |
| (j) | Interest expense, fees and amortization of offering costs related to TOB Trusts and/or VRDP Shares. See Note 4 and Note 10 of the Notes to Financial Statements for details. |
| (k) | The total expense ratio after fees waived and/or reimbursed and excluding interest expense, fees, amortization of offering costs, liquidity and remarketing fees as follows: |
| | | | | | | | | | | | | | | | | | | | | | | | | | | | | | |
| | | Six Months Ended 01/31/21 (unaudited) | | | | | Year Ended July 31, | |
| | | | | 2020 | | | 2019 | | | 2018 | | | 2017 | | | 2016 | |
Expense ratios | | | | | | | 1.33 | % | | | | | 1.11 | % | | | 1.16 | % | | | — | % | | | — | % | | | 1.38 | % |
| | | | | | | | | | | | | | | | | | | | | | | | | | | | | | |
See notes to financial statements.
Financial Highlights (continued)
(For a share outstanding throughout each period)
| | | | | | | | | | | | | | | | | | | | | | | | | | | | |
| | | BNY | |
| | |
| | | Six Months Ended 01/31/21 (unaudited) | | | Year Ended July 31, | |
| | | 2020 | | | 2019 | | | 2018 | | | 2017 | | | 2016 | |
| | | | | | | | |
Net asset value, beginning of period | | | | | | $ | 15.09 | | | $ | 15.09 | | | $ | 14.52 | | | $ | 15.04 | | | $ | 15.94 | | | $ | 14.97 | |
| | | | | | | | | | | | | | | | | | | | | | | | | | | | |
Net investment income(a) | | | | | | | 0.33 | | | | 0.61 | | | | 0.58 | | | | 0.60 | | | | 0.67 | | | | 0.75 | |
Net realized and unrealized gain (loss) | | | | | | | 0.22 | | | | (0.05 | ) | | | 0.52 | | | | (0.48 | ) | | | (0.85 | ) | | | 1.02 | |
| | | | | | | | | | | | | | | | | | | | | | | | | | | | |
| | | | | | | |
Net increase (decrease) from investment operations | | | | | | | 0.55 | | | | 0.56 | | | | 1.10 | | | | 0.12 | | | | (0.18 | ) | | | 1.77 | |
| | | | | | | | | | | | | | | | | | | | | | | | | | | | |
| | | | | | | |
Distributions to Common Shareholders from net investment income(b) | | | | | | | (0.33 | ) | | | (0.56 | ) | | | (0.53 | ) | | | (0.64 | ) | | | (0.72 | ) | | | (0.80 | ) |
| | | | | | | | | | | | | | | | | | | | | | | | | | | | |
| | | | | | | |
Net asset value, end of period | | | | | | $ | 15.31 | | | $ | 15.09 | | | $ | 15.09 | | | $ | 14.52 | | | $ | 15.04 | | | $ | 15.94 | |
| | | | | | | | | | | | | | | | | | | | | | | | | | | | |
| | | | | | | |
Market price, end of period | | | | | | $ | 15.04 | | | $ | 14.10 | | | $ | 13.81 | | | $ | 12.53 | | | $ | 15.37 | | | $ | 16.71 | |
| | | | | | | | | | | | | | | | | | | | | | | | | | | | |
| | | | | | | |
Total Return Applicable to Common Shareholders(c) | | | | | | | | | | | | | | | | | | | | | | | | | | | | |
Based on net asset value | | | | | | | 3.80 | %(d) | | | 4.12 | % | | | 8.33 | % | | | 1.13 | % | | | (0.93 | )% | | | 12.13 | % |
| | | | | | | | | | | | | | | | | | | | | | | | | | | | |
Based on market price | | | | | | | 9.13 | %(d) | | | 6.30 | % | | | 14.88 | % | | | (14.61 | )% | | | (3.43 | )% | | | 21.02 | % |
| | | | | | | | | | | | | | | | | | | | | | | | | | | | |
| | | | | | | |
Ratios to Average Net Assets Applicable to Common Shareholders | | | | | | | | | | | | | | | | | | | | | | | | | | | | |
Total expenses | | | | | | | 1.89 | %(e)(f) | | | 2.36 | % | | | 2.73 | % | | | 2.45 | % | | | 2.15 | % | | | 1.75 | % |
| | | | | | | | | | | | | | | | | | | | | | | | | | | | |
| | | | | | | |
Total expenses after fees waived and/or reimbursed | | | | | | | 1.89 | %(e)(f) | | | 2.36 | % | | | 2.73 | % | | | 2.45 | % | | | 2.14 | % | | | 1.75 | % |
| | | | | | | | | | | | | | | | | | | | | | | | | | | | |
Total expenses after fees waived and/or reimbursed and excluding interest expense, fees, and amortization of offering cost(g) | | | | | | | 1.31 | %(e)(f) | | | 1.16 | % | | | 1.14 | % | | | 1.12 | % | | | 1.12 | % | | | 1.11 | % |
| | | | | | | | | | | | | | | | | | | | | | | | | | | | |
| | | | | | | |
Net investment income to Common Shareholders | | | | | | | 4.36 | %(e) | | | 4.06 | % | | | 3.98 | % | | | 4.06 | % | | | 4.45 | % | | | 4.89 | % |
| | | | | | | | | | | | | | | | | | | | | | | | | | | | |
| | | | | | | |
Supplemental Data | | | | | | | | | | | | | | | | | | | | | | | | | | | | |
Net assets applicable to Common Shareholders, end of
period (000) | | | | | | $ | 198,612 | | | $ | 195,844 | | | $ | 195,868 | | | $ | 188,452 | | | $ | 195,029 | | | $ | 206,414 | |
| | | | | | | | | | | | | | | | | | | | | | | | | | | | |
| | | | | | | |
VMTP Shares outstanding at $100,000 liquidation value, end of period (000) | | | | | | $ | 94,500 | | | $ | 94,500 | | | $ | 94,500 | | | $ | 94,500 | | | $ | 94,500 | | | $ | 94,500 | |
| | | | | | | | | | | | | | | | | | | | | | | | | | | | |
| | | | | | | |
Asset coverage per VMTP Shares at $100,000 liquidation value, end of period | | | | | | $ | 310,171 | | | $ | 307,243 | | | $ | 307,268 | | | $ | 299,420 | | | $ | 306,379 | | | $ | 318,428 | |
| | | | | | | | | | | | | | | | | | | | | | | | | | | | |
| | | | | | | |
Borrowings outstanding, end of period (000) | | | | | | $ | 43,492 | | | $ | 42,523 | | | $ | 35,517 | | | $ | 31,865 | | | $ | 32,047 | | | $ | 31,780 | |
| | | | | | | | | | | | | | | | | | | | | | | | | | | | |
| | | | | | | |
Portfolio turnover rate | | | | | | | 6 | % | | | 17 | % | | | 23 | % | | | 9 | % | | | 16 | % | | | 14 | % |
| | | | | | | | | | | | | | | | | | | | | | | | | | | | |
| (a) | Based on average Common Shares outstanding. |
| (b) | Distributions for annual periods determined in accordance with U.S. federal income tax regulations. |
| (c) | Total returns based on market price, which can be significantly greater or less than the net asset value, may result in substantially different returns. Where applicable, excludes the effects of any sales charges and assumes the reinvestment of distributions at actual reinvestment prices. |
| (d) | Aggregate total return. |
| (f) | Includes non-recurring expenses of reorganization costs. Without these costs, total expenses, total expenses after fees waived and/or reimbursed and total expenses after fees waived and/or reimbursed and excluding interest expense, fees and amortization of offering costs would have been 1.77%, 1.77% and 1.19%, respectively. |
| (g) | Interest expense, fees and amortization of offering costs related to TOB Trusts and/or VMTP Shares. See Note 4 and Note 10 of the Notes to Financial Statements for details. |
See notes to financial statements.
| | |
| 56 | | 2 0 2 1 BLACK ROCK SEMI - ANNUAL REPORT TO SHAREHOLDERS |
Notes to Financial Statements (unaudited)
The following are registered under the Investment Company Act of 1940, as amended (the “1940 Act”), as closed-end management investment companies and are referred to herein collectively as the “Trusts”, or individually as a “Trust”:
| | | | | | |
|
| Trust Name | | Herein Referred To As | | Organized | | Diversification Classification |
|
BlackRock California Municipal Income Trust | | BFZ | | Delaware | | Diversified |
BlackRock Municipal 2030 Target Term Trust | | BTT | | Delaware | | Diversified |
BlackRock Municipal Income Investment Trust | | BBF | | Delaware | | Diversified |
BlackRock New York Municipal Income Trust | | BNY | | Delaware | | Diversified |
|
The Boards of Trustees of the Trusts are collectively referred to throughout this report as the “Board,” and the trustees thereof are collectively referred to throughout this report as “Trustees”. The Trusts determine and make available for publication the net asset values (“NAVs”) of their Common Shares on a daily basis.
On June 16, 2020, the Board of Trustees of BBF and the Board of Trustees of BlackRock Municipal Income Trust II (BLE) each approved the reorganization of BBF into BLE. The reorganization was approved by each Trust’s shareholders and is expected to occur during the second quarter of 2021, subject to the satisfaction of customary closing conditions.
On June 16, 2020, the Board of Trustees of BlackRock New York Municipal Income Quality Trust (BSE), BlackRock New York Municipal Income Trust II (BFY) and the Board of Trustees of BNY each approved the reorganizations of BSE and BFY into BNY. The reorganizations were approved by each Trust’s shareholders and are expected to occur during the second quarter of 2021, subject to the satisfaction of customary closing conditions.
The Trusts, together with certain other registered investment companies advised by BlackRock Advisors, LLC (the “Manager”) or its affiliates, are included in a complex of non-index fixed-income mutual funds and all BlackRock-advised closed-end funds referred to as the BlackRock Fixed-Income Complex.
| 2. | SIGNIFICANT ACCOUNTING POLICIES |
The financial statements are prepared in conformity with accounting principles generally accepted in the United States of America (“U.S. GAAP”), which may require management to make estimates and assumptions that affect the reported amounts of assets and liabilities in the financial statements, disclosure of contingent assets and liabilities at the date of the financial statements and the reported amounts of increases and decreases in net assets from operations during the reporting period. Actual results could differ from those estimates. Each Trust is considered an investment company under U.S. GAAP and follows the accounting and reporting guidance applicable to investment companies. Below is a summary of significant accounting policies:
Investment Transactions and Income Recognition: For financial reporting purposes, investment transactions are recorded on the dates the transactions are executed. Realized gains and losses on investment transactions are determined using the specific identification method. Dividend income and capital gain distributions, if any, are recorded on the ex-dividend date. Non-cash dividends, if any, are recorded on the ex-dividend date at fair value. Interest income, including amortization and accretion of premiums and discounts on debt securities, is recognized daily on an accrual basis.
Segregation and Collateralization: In cases where a Trust enters into certain investments (e.g., futures contracts) or certain borrowings (e.g., TOB Trust transactions) that would be treated as “senior securities” for 1940 Act purposes, a Trust may segregate or designate on its books and records cash or liquid assets having a market value at least equal to the amount of its future obligations under such investments or borrowings. Doing so allows the investment or borrowings to be excluded from treatment as a “senior security.” Furthermore, if required by an exchange or counterparty agreement, the Trusts may be required to deliver/deposit cash and/or securities to/with an exchange, or broker-dealer or custodian as collateral for certain investments or obligations.
Distributions: Distributions from net investment income are declared monthly and paid monthly. Distributions of capital gains are recorded on the ex-dividend date and made at least annually. The portion of distributions, if any, that exceeds a fund’s current and accumulated earnings and profits, as measured on a tax basis, constitute a non-taxable return of capital. The character and timing of distributions are determined in accordance with U.S. federal income tax regulations, which may differ from U.S. GAAP.
Deferred Compensation Plan: Under the Deferred Compensation Plan (the “Plan”) approved by each Trust’s Board, the trustees who are not “interested persons” of the Trusts, as defined in the 1940 Act (“Independent Trustees”), may defer a portion of their annual complex-wide compensation. Deferred amounts earn an approximate return as though equivalent dollar amounts had been invested in common shares of certain funds in the BlackRock Fixed-Income Complex selected by the Independent Trustees. This has the same economic effect for the Independent Trustees as if the Independent Trustees had invested the deferred amounts directly in certain funds in the BlackRock Fixed-Income Complex.
The Plan is not funded and obligations thereunder represent general unsecured claims against the general assets of each Trust, as applicable. Deferred compensation liabilities, if any, are included in the Trustees’ and Officer’s fees payable in the Statements of Assets and Liabilities and will remain as a liability of the Trusts until such amounts are distributed in accordance with the Plan.
Indemnifications: In the normal course of business, a Trust enters into contracts that contain a variety of representations that provide general indemnification. A Trust’s maximum exposure under these arrangements is unknown because it involves future potential claims against a Trust, which cannot be predicted with any certainty.
Other: Expenses directly related to a Trust are charged to that Trust. Other operating expenses shared by several funds, including other funds managed by the Manager, are prorated among those funds on the basis of relative net assets or other appropriate methods.
| | |
NOTES TO FINANCIAL STATEMENTS | | 57 |
Notes to Financial Statements (unaudited) (continued)
| 3. | INVESTMENT VALUATION AND FAIR VALUE MEASUREMENTS |
Investment Valuation Policies: Each Trust’s investments are valued at fair value (also referred to as “market value” within the financial statements) each day that the Trust is open for business and, for financial reporting purposes, as of the report date. U.S. GAAP defines fair value as the price a fund would receive to sell an asset or pay to transfer a liability in an orderly transaction between market participants at the measurement date. Each Trust determines the fair values of its financial instruments using various independent dealers or pricing services under policies approved by the Board. If a security’s market price is not readily available or does not otherwise accurately represent the fair value of the security, the security will be valued in accordance with a policy approved by the Board as reflecting fair value. The BlackRock Global Valuation Methodologies Committee (the “Global Valuation Committee”) is the committee formed by management to develop global pricing policies and procedures and to oversee the pricing function for all financial instruments.
Fair Value Inputs and Methodologies: The following methods and inputs are used to establish the fair value of each Trust’s assets and liabilities:
| | • | | Fixed-income investments for which market quotations are readily available are generally valued using the last available bid price or current market quotations provided by independent dealers or third party pricing services. Pricing services generally value fixed-income securities assuming orderly transactions of an institutional round lot size, but a fund may hold or transact in such securities in smaller, odd lot sizes. Odd lots may trade at lower prices than institutional round lots. The pricing services may use matrix pricing or valuation models that utilize certain inputs and assumptions to derive values, including transaction data (e.g., recent representative bids and offers), market data, credit quality information, perceived market movements, news, and other relevant information. Certain fixed-income securities, including asset-backed and mortgage related securities may be valued based on valuation models that consider the estimated cash flows of each tranche of the entity, establish a benchmark yield and develop an estimated tranche specific spread to the benchmark yield based on the unique attributes of the tranche. The amortized cost method of valuation may be used with respect to debt obligations with sixty days or less remaining to maturity unless the Manager determines such method does not represent fair value. |
| | • | | Investments in open-end U.S. mutual funds (including money market funds) are valued at that day’s published NAV. |
| | • | | Futures contracts are valued based on that day’s last reported settlement or trade price on the exchange where the contract is traded. |
If events (e.g., a market closure, market volatility, company announcement or a natural disaster) occur that are expected to materially affect the value of such investment, or in the event that application of these methods of valuation results in a price for an investment that is deemed not to be representative of the market value of such investment, or if a price is not available, the investment will be valued by the Global Valuation Committee, or its delegate, in accordance with a policy approved by the Board as reflecting fair value (“Fair Valued Investments”). The fair valuation approaches that may be used by the Global Valuation Committee include market approach, income approach and cost approach. Valuation techniques such as discounted cash flow, use of market comparables and matrix pricing are types of valuation approaches and are typically used in determining fair value. When determining the price for Fair Valued Investments, the Global Valuation Committee, or its delegate, seeks to determine the price that each Trust might reasonably expect to receive or pay from the current sale or purchase of that asset or liability in an arm’s-length transaction. Fair value determinations shall be based upon all available factors that the Global Valuation Committee, or its delegate, deems relevant and consistent with the principles of fair value measurement. The pricing of all Fair Valued Investments is subsequently reported to the Board or a committee thereof on a quarterly basis.
Fair Value Hierarchy: Various inputs are used in determining the fair value of financial instruments. These inputs to valuation techniques are categorized into a fair value hierarchy consisting of three broad levels for financial reporting purposes as follows:
| | • | | Level 1 – Unadjusted price quotations in active markets/exchanges for identical assets or liabilities that each Trust has the ability to access; |
| | • | | Level 2 – Other observable inputs (including, but not limited to, quoted prices for similar assets or liabilities in markets that are active, quoted prices for identical or similar assets or liabilities in markets that are not active, inputs other than quoted prices that are observable for the assets or liabilities (such as interest rates, yield curves, volatilities, prepayment speeds, loss severities, credit risks and default rates) or other market–corroborated inputs); and |
| | • | | Level 3 – Unobservable inputs based on the best information available in the circumstances, to the extent observable inputs are not available (including the Global Valuation Committee’s assumptions used in determining the fair value of financial instruments). |
The hierarchy gives the highest priority to unadjusted quoted prices in active markets for identical assets or liabilities (Level 1 measurements) and the lowest priority to unobservable inputs (Level 3 measurements). Accordingly, the degree of judgment exercised in determining fair value is greatest for instruments categorized in Level 3. The inputs used to measure fair value may fall into different levels of the fair value hierarchy. In such cases, for disclosure purposes, the fair value hierarchy classification is determined based on the lowest level input that is significant to the fair value measurement in its entirety. Investments classified within Level 3 have significant unobservable inputs used by the Global Valuation Committee in determining the price for Fair Valued Investments. Level 3 investments include equity or debt issued by privately held companies or funds that may not have a secondary market and/or may have a limited number of investors. The categorization of a value determined for financial instruments is based on the pricing transparency of the financial instruments and is not necessarily an indication of the risks associated with investing in those securities.
| 4. | SECURITIES AND OTHER INVESTMENTS |
Zero-Coupon Bonds: Zero-coupon bonds are normally issued at a significant discount from face value and do not provide for periodic interest payments. These bonds may experience greater volatility in market value than other debt obligations of similar maturity which provide for regular interest payments.
Forward Commitments, When-Issued and Delayed Delivery Securities: Certain Trusts may purchase securities on a when-issued basis and may purchase or sell securities on a forward commitment basis. Settlement of such transactions normally occurs within a month or more after the purchase or sale commitment is made. A Trust may purchase securities under such conditions with the intention of actually acquiring them, but may enter into a separate agreement to sell the securities before the settlement
| | |
| 58 | | 2 0 2 1 BLACK ROCK SEMI - ANNUAL REPORT TO SHAREHOLDERS |
Notes to Financial Statements (unaudited) (continued)
date. Since the value of securities purchased may fluctuate prior to settlement, a Trust may be required to pay more at settlement than the security is worth. In addition, a Trust is not entitled to any of the interest earned prior to settlement. When purchasing a security on a delayed delivery basis, a Trust assumes the rights and risks of ownership of the security, including the risk of price and yield fluctuations. In the event of default by the counterparty, a Trust’s maximum amount of loss is the unrealized appreciation of unsettled when-issued transactions.
Municipal Bonds Transferred to TOB Trusts: Certain Trusts leverage their assets through the use of “TOB Trust” transactions. The funds transfer municipal bonds into a special purpose trust (a “TOB Trust”). A TOB Trust issues two classes of beneficial interests: short-term floating rate interests (“TOB Trust Certificates”), which are sold to third party investors, and residual inverse floating rate interests (“TOB Residuals”), which are issued to the participating funds that contributed the municipal bonds to the TOB Trust. The TOB Trust Certificates have interest rates that reset weekly and their holders have the option to tender such certificates to the TOB Trust for redemption at par and any accrued interest at each reset date. The TOB Residuals held by a fund provide the fund with the right to cause the holders of a proportional share of the TOB Trust Certificates to tender their certificates to the TOB Trust at par plus accrued interest. The funds may withdraw a corresponding share of the municipal bonds from the TOB Trust. Other funds managed by the investment adviser may also contribute municipal bonds to a TOB Trust into which a fund has contributed bonds. If multiple BlackRock-advised funds participate in the same TOB Trust, the economic rights and obligations under the TOB Residuals will be shared among the funds ratably in proportion to their participation in the TOB Trust.
TOB Trusts are supported by a liquidity facility provided by a third party bank or other financial institution (the “Liquidity Provider”) that allows the holders of the TOB Trust Certificates to tender their certificates in exchange for payment of par plus accrued interest on any business day. The tendered TOB Trust Certificates are remarketed by a Remarketing Agent. In the event of a failed remarketing, the TOB Trust may draw upon a loan from the Liquidity Provider to purchase the tendered TOB Trust Certificates. Any loans made by the Liquidity Provider will be secured by the purchased TOB Trust Certificates held by the TOB Trust and will be subject to an increased interest rate based on number of days the loan is outstanding.
The TOB Trust may be collapsed without the consent of a fund, upon the occurrence of a termination event as defined in the TOB Trust agreement. Upon the occurrence of a termination event, a TOB Trust would be liquidated with the proceeds applied first to any accrued fees owed to the trustee of the TOB Trust, the Remarketing Agent and the Liquidity Provider. Upon certain termination events, TOB Trust Certificates holders will be paid before the TOB Residuals holders (i.e., the Trusts) whereas in other termination events, TOB Trust Certificates holders and TOB Residuals holders will be paid pro rata.
While a fund’s investment policies and restrictions expressly permit investments in inverse floating rate securities, such as TOB Residuals, they restrict the ability of a fund to borrow money for purposes of making investments. Each fund’s transfer of the municipal bonds to a TOB Trust is considered a secured borrowing for financial reporting purposes. The cash received by the TOB Trust from the sale of the TOB Trust Certificates, less certain transaction expenses, is paid to a fund. A fund typically invests the cash received in additional municipal bonds.
Accounting for TOB Trusts: The municipal bonds deposited into a TOB Trust are presented in a fund’s Schedule of Investments and the TOB Trust Certificates are shown in Other Liabilities in the Statements of Assets and Liabilities. Any loans drawn by the TOB Trust pursuant to the liquidity facility to purchase tendered TOB Trust Certificates are shown as Loan for TOB Trust Certificates. The carrying amount of a fund’s payable to the holder of the TOB Trust Certificates, as reported in the Statements of Assets and Liabilities as TOB Trust Certificates, approximates its fair value.
Interest income, including amortization and accretion of premiums and discounts, from the underlying municipal bonds is recorded by a fund on an accrual basis. Interest expense incurred on the TOB Trust transaction and other expenses related to remarketing, administration, trustee, liquidity and other services to a TOB Trust are shown as interest expense, fees and amortization of offering costs in the Statements of Operations. Fees paid upon creation of the TOB Trust are recorded as debt issuance costs and are amortized to interest expense, fees and amortization of offering costs in the Statements of Operations to the expected maturity of the TOB Trust. In connection with the restructurings of the TOB Trusts to non-bank sponsored TOB Trusts, a fund incurred non-recurring, legal and restructuring fees, which are recorded as interest expense, fees and amortization of offering costs in the Statements of Operations. Amounts recorded within interest expense, fees and amortization of offering costs in the Statements of Operations are:
| | | | | | | | | | | | | | | | |
| |
| | | | |
| Trust Name | | Interest Expense | | | Liquidity Fees | | | Other Expenses | | | Total | |
| |
BFZ | | $ | 102,687 | | | $ | 325,199 | | | $ | 96,755 | | | $ | 524,641 | |
BTT | | | 204,926 | | | | 402,808 | | | | 332,443 | | | | 940,177 | |
BBF | | | 28,288 | | | | 69,103 | | | | 34,854 | | | | 132,245 | |
BNY | | | 35,274 | | | | 90,880 | | | | 33,058 | | | | 159,212 | |
| |
For the six months ended January 31, 2021, the following table is a summary of each Trust’s TOB Trusts:
| | | | | | | | | | | | | | | | | | | | |
| | | | | | |
Trust Name | |
| Underlying
Municipal Bonds Transferred to TOB Trusts |
(a) | |
| Liability for
TOB Trust Certificates |
(b) | |
| Range of
Interest Rates on TOB Trust Certificates at Period End |
| |
| Average
TOB Trust Certificates Outstanding |
| |
| Daily Weighted
Average Rate of Interest and Other Expenses on TOB Trusts |
|
BFZ | | $ | 340,413,653 | | | $ | 143,275,836 | | | | 0.05% — 0.25 | % | | $ | 143,275,836 | | | | 0.73 | % |
BTT | | | 420,571,527 | | | | 233,219,952 | | | | 0.07 — 0.34 | | | | 246,187,097 | | | | 0.76 | |
BBF | | | 65,802,836 | | | | 35,342,064 | | | | 0.06 — 0.27 | | | | 35,044,746 | | | | 0.75 | |
| | |
NOTES TO FINANCIAL STATEMENTS | | 59 |
Notes to Financial Statements (unaudited) (continued)
| | | | | | | | | | | | | | | | | | | | |
| | | | | | |
Trust Name | |
| Underlying
Municipal Bonds Transferred to TOB Trusts |
(a) | |
| Liability for
TOB Trust Certificates |
(b) | |
| Range of
Interest Rates
on TOB Trust Certificates at Period End |
| |
| Average
TOB Trust Certificates Outstanding |
| |
| Daily Weighted
Average Rate of Interest and Other Expenses on TOB Trusts |
|
| | | | | |
BNY | | $ | 78,303,461 | | | $ | 43,492,449 | | | | 0.06% — 0.20% | | | $ | 43,803,006 | | | | 0.72 | % |
| | (a) | The municipal bonds transferred to a TOB Trust are generally high grade municipal bonds. In certain cases, when municipal bonds transferred are lower grade municipal bonds, the TOB Trust transaction may include a credit enhancement feature that provides for the timely payment of principal and interest on the bonds to the TOB Trust by a credit enhancement provider in the event of default of the municipal bond. The TOB Trust would be responsible for the payment of the credit enhancement fee and the funds, as TOB Residuals holders, would be responsible for reimbursement of any payments of principal and interest made by the credit enhancement provider. The maximum potential amounts owed by the funds, for such reimbursements, as applicable, are included in the maximum potential amounts disclosed for recourse TOB Trusts in the Schedules of Investments. | |
| | (b) | TOB Trusts may be structured on a non-recourse or recourse basis. When a Trust invests in TOB Trusts on a non-recourse basis, the Liquidity Provider may be required to make a payment under the liquidity facility to allow the TOB Trust to repurchase TOB Trust Certificates. The Liquidity Provider will be reimbursed from the liquidation of bonds held in the TOB Trust. If a fund invests in a TOB Trust on a recourse basis, a fund enters into a reimbursement agreement with the Liquidity Provider where a fund is required to reimburse the Liquidity Provider for any shortfall between the amount paid by the Liquidity Provider and proceeds received from liquidation of municipal bonds held in the TOB Trust (the “Liquidation Shortfall”). As a result, if a fund invests in a recourse TOB Trust, a fund will bear the risk of loss with respect to any Liquidation Shortfall. If multiple funds participate in any such TOB Trust, these losses will be shared ratably, including the maximum potential amounts owed by a fund at January 31, 2021, in proportion to their participation in the TOB Trust. The recourse TOB Trusts are identified in the Schedules of Investments including the maximum potential amounts owed by a fund at January 31, 2021. | |
For the six months ended January 31, 2021, the following table is a summary of each Trust’s Loan for TOB Trust Certificates:
| | | | | | | | | | | | | | | | |
| Trust Name | | Loans Outstanding at Period End | | | Range of Interest Rates on Loans at Period End | | | Average Loans Outstanding | | | Daily Weighted
Average Rate of Interest and
Other Expenses
on Loans | |
BBF | | $ | — | | | | — | % | | $ | 2,740 | | | | 0.71 | % |
BNY | | | — | | | | — | | | | 38,351 | | | | 0.71 | |
| 5. | DERIVATIVE FINANCIAL INSTRUMENTS |
The Trusts engage in various portfolio investment strategies using derivative contracts both to increase the returns of the Trusts and/or to manage their exposure to certain risks such as credit risk, equity risk, interest rate risk, foreign currency exchange rate risk, commodity price risk or other risks (e.g., inflation risk). Derivative financial instruments categorized by risk exposure are included in the Schedules of Investments. These contracts may be transacted on an exchange or over-the-counter (“OTC”).
Futures Contracts: Futures contracts are purchased or sold to gain exposure to, or manage exposure to, changes in interest rates (interest rate risk) and changes in the value of equity securities (equity risk) or foreign currencies (foreign currency exchange rate risk).
Futures contracts are exchange-traded agreements between the Trusts and a counterparty to buy or sell a specific quantity of an underlying instrument at a specified price and on a specified date. Depending on the terms of a contract, it is settled either through physical delivery of the underlying instrument on the settlement date or by payment of a cash amount on the settlement date. Upon entering into a futures contract, the Trusts are required to deposit initial margin with the broker in the form of cash or securities in an amount that varies depending on a contract’s size and risk profile. The initial margin deposit must then be maintained at an established level over the life of the contract. Amounts pledged, which are considered restricted, are included in cash pledged for futures contracts in the Statements of Assets and Liabilities.
Securities deposited as initial margin are designated in the Schedules of Investments and cash deposited, if any, are shown as cash pledged for futures contracts in the Statements of Assets and Liabilities. Pursuant to the contract, the Trusts agree to receive from or pay to the broker an amount of cash equal to the daily fluctuation in market value of the contract (“variation margin”). Variation margin is recorded as unrealized appreciation (depreciation) and, if any, shown as variation margin receivable (or payable) on futures contracts in the Statements of Assets and Liabilities. When the contract is closed, a realized gain or loss is recorded in the Statements of Operations equal to the difference between the notional amount of the contract at the time it was opened and the notional amount at the time it was closed. The use of futures contracts involves the risk of an imperfect correlation in the movements in the price of futures contracts and interest rates, foreign currency exchange rates or underlying assets.
| 6. | INVESTMENT ADVISORY AGREEMENT AND OTHER TRANSACTIONS WITH AFFILIATES |
Investment Advisory: Each Trust entered into an Investment Advisory Agreement with the Manager, the Trusts’ investment adviser and an indirect, wholly-owned subsidiary of BlackRock, Inc. (“BlackRock”), to provide investment advisory and administrative services. The Manager is responsible for the management of each Trust’s portfolio and provides the personnel, facilities, equipment and certain other services necessary to the operations of each Trust.
For such services, each Trust, except BTT, pays the Manager a monthly fee at an annual rate equal to the following percentages of the average weekly value of each Trust’s managed assets:
| | | | | | | | | | | | |
| | | | |
| | | BFZ | | | BBF | | | BNY | |
| | | |
Investment advisory fees | | | 0.58 | % | | | 0.57 | % | | | 0.60 | % |
For such services, BTT pays the Manager a monthly fee at an annual rate equal to 0.40% of the average daily value of the Trust’s managed assets.
| | |
| 60 | | 2 0 2 1 BLACK ROCK SEMI - ANNUAL REPORT TO SHAREHOLDERS |
Notes to Financial Statements (unaudited) (continued)
For purposes of calculating these fees, for each Trust except for BTT, “managed assets” are determined as total assets of the Trust (including any assets attributable to money borrowed for investment purposes) less the sum of its accrued liabilities (other than money borrowed for investment purposes).
Expense Waivers: With respect to each Trust, the Manager contractually agreed to waive its investment advisory fees by the amount of investment advisory fees each Trust pays to the Manager indirectly through its investment in affiliated money market funds (the “affiliated money market fund waiver”) through June 30, 2022. The contractual agreement may be terminated upon 90 days’ notice by a majority of the Independent Trustees, or by a vote of a majority of the outstanding voting securities of a Trust. These amounts are included in fees waived and/or reimbursed by the Manager in the Statements of Operations. For the six months ended January 31, 2021, the amounts waived were as follows:
| | | | |
| |
| |
| Trust Name | | Amounts Waived | |
| |
BFZ | | $ | 380 | |
BTT | | | 21,647 | |
BBF | | | 1,443 | |
BNY | | | 119 | |
| |
The Manager contractually agreed to waive its investment advisory fee with respect to any portion of each Trust’s assets invested in affiliated equity and fixed-income mutual funds and affiliated exchange-traded funds that have a contractual management fee through June 30, 2022. The agreement can be renewed for annual periods thereafter, and may be terminated on 90 days’ notice, each subject to approval by a majority of the Trusts’ Independent Trustees. For the six months ended January 31, 2021, there were no fees waived and/or reimbursed by the Manager pursuant to this arrangement.
Trustees and Officers: Certain trustees and/or officers of the Trusts are directors and/or officers of BlackRock or its affiliates. The Trusts reimburse the Manager for a portion of the compensation paid to the Trusts’ Chief Compliance Officer, which is included in Trustees and Officer in the Statements of Operations.
For the six months ended January 31, 2021, purchases and sales of investments, excluding short-term investments, were as follows:
| | | | | | | | |
| |
| | |
| Trust Name | | Purchases | | | Sales | |
| |
BFZ | | $ | 91,109,333 | | | $ | 86,643,576 | |
BTT | | | 141,563,309 | | | | 178,309,626 | |
BBF | | | 34,637,072 | | | | 36,701,720 | |
BNY | | | 18,592,056 | | | | 19,237,993 | |
| |
It is each Trust’s policy to comply with the requirements of the Internal Revenue Code of 1986, as amended, applicable to regulated investment companies, and to distribute substantially all of its taxable income to its shareholders. Therefore, no U.S. federal income tax provision is required.
Each Trust files U.S. federal and various state and local tax returns. No income tax returns are currently under examination. The statute of limitations on each Trust’s U.S. federal tax returns generally remains open for a period of three fiscal years after they are filed. The statutes of limitations on each Trust’s state and local tax returns may remain open for an additional year depending upon the jurisdiction.
Management has analyzed tax laws and regulations and their application to the Trusts as of January 31, 2021, inclusive of the open tax return years, and does not believe that there are any uncertain tax positions that require recognition of a tax liability in the Trusts’ financial statements.
As of July 31, 2020, the Trusts had non-expiring capital loss carryforwards available to offset future realized capital gains as follows:
| | | | |
| |
| |
| Trust Name | | Non-Expiring | |
| |
BFZ | | $ | 5,543,220 | |
BTT | | | 23,773,729 | |
BBF | | | 6,960,360 | |
BNY | | | 8,204,990 | |
| |
As of January 31, 2021, gross unrealized appreciation and depreciation based on cost of investments (including short positions and derivatives, if any) for U.S. federal income tax purposes were as follows:
| | | | | | | | | | | | | | | | |
| |
| | | | |
| Trust Name | | Tax Cost | | | Gross Unrealized Appreciation | | | Gross Unrealized Depreciation | | | Net Unrealized Appreciation (Depreciation) | |
| |
BFZ | | $ | 604,694,236 | | | $ | 71,085,005 | | | $ | (1,114,896 | ) | | $ | 69,970,109 | |
BTT | | | 2,418,439,952 | | | | 243,768,986 | | | | (4,217,116 | ) | | | 239,551,870 | |
BBF | | | 177,943,959 | | | | 22,768,508 | | | | (41,963 | ) | | | 22,726,545 | |
BNY | | | 263,417,021 | | | | 27,579,119 | | | | (400,963 | ) | | | 27,178,156 | |
| |
| | |
NOTES TO FINANCIAL STATEMENTS | | 61 |
Notes to Financial Statements (unaudited) (continued)
In the normal course of business, certain Trusts invest in securities or other instruments and may enter into certain transactions, and such activities subject each Trust to various risks, including among others, fluctuations in the market (market risk) or failure of an issuer to meet all of its obligations. The value of securities or other instruments may also be affected by various factors, including, without limitation: (i) the general economy; (ii) the overall market as well as local, regional or global political and/or social instability; (iii) regulation, taxation or international tax treaties between various countries; or (iv) currency, interest rate and price fluctuations. Local, regional or global events such as war, acts of terrorism, the spread of infectious illness or other public health issues, recessions, or other events could have a significant impact on the Trusts and their investments.
The Trusts may hold a significant amount of bonds subject to calls by the issuers at defined dates and prices. When bonds are called by issuers and the Trusts reinvest the proceeds received, such investments may be in securities with lower yields than the bonds originally held, and correspondingly, could adversely impact the yield and total return performance of a Trust.
A Trust structures and “sponsors” the TOB Trusts in which it holds TOB Residuals and has certain duties and responsibilities, which may give rise to certain additional risks including, but not limited to, compliance, securities law and operational risks.
Should short-term interest rates rise, the Trusts’ investments in the TOB Trusts may adversely affect the Trusts’ net investment income and dividends to Common Shareholders. Also, fluctuations in the market value of municipal bonds deposited into the TOB Trust may adversely affect the Trusts’ NAVs per share.
The U.S. Securities and Exchange Commission (“SEC”) and various federal banking and housing agencies have adopted credit risk retention rules for securitizations (the “Risk Retention Rules”). The Risk Retention Rules would require the sponsor of a TOB Trust to retain at least 5% of the credit risk of the underlying assets supporting the TOB Trust’s municipal bonds. The Risk Retention Rules may adversely affect the Trusts’ ability to engage in TOB Trust transactions or increase the costs of such transactions in certain circumstances.
TOB Trusts constitute an important component of the municipal bond market. Any modifications or changes to rules governing TOB Trusts may adversely impact the municipal market and the Trusts, including through reduced demand for and liquidity of municipal bonds and increased financing costs for municipal issuers. The ultimate impact of any potential modifications on the TOB Trust market and the overall municipal market is not yet certain.
Each Trust may invest without limitation in illiquid or less liquid investments or investments in which no secondary market is readily available or which are otherwise illiquid, including private placement securities. A Trust may not be able to readily dispose of such investments at prices that approximate those at which a Trust could sell such investments if they were more widely traded and, as a result of such illiquidity, a Trust may have to sell other investments or engage in borrowing transactions if necessary to raise funds to meet its obligations. Limited liquidity can also affect the market price of investments, thereby adversely affecting a Trust’s net asset value and ability to make dividend distributions. Privately issued debt securities are often of below investment grade quality, frequently are unrated and present many of the same risks as investing in below investment grade public debt securities.
Market Risk: Each Trust may be exposed to prepayment risk, which is the risk that borrowers may exercise their option to prepay principal earlier than scheduled during periods of declining interest rates, which would force each Trust to reinvest in lower yielding securities. Each Trust may also be exposed to reinvestment risk, which is the risk that income from each Trust’s portfolio will decline if each Trust invests the proceeds from matured, traded or called fixed-income securities at market interest rates that are below each Trust portfolio’s current earnings rate.
Municipal securities are subject to the risk that litigation, legislation or other political events, local business or economic conditions, credit rating downgrades, or the bankruptcy of the issuer could have a significant effect on an issuer’s ability to make payments of principal and/or interest or otherwise affect the value of such securities. Municipal securities can be significantly affected by political or economic changes, including changes made in the law after issuance of the securities, as well as uncertainties in the municipal market related to, taxation, legislative changes or the rights of municipal security holders, including in connection with an issuer insolvency. Municipal securities backed by current or anticipated revenues from a specific project or specific assets can be negatively affected by the discontinuance of the tax benefits supporting the project or assets or the inability to collect revenues for the project or from the assets. Municipal securities may be less liquid than taxable bonds, and there may be less publicly available information on the financial condition of municipal security issuers than for issuers of other securities.
An outbreak of respiratory disease caused by a novel coronavirus has developed into a global pandemic and has resulted in closing borders, quarantines, disruptions to supply chains and customer activity, as well as general concern and uncertainty. The impact of this pandemic, and other global health crises that may arise in the future, could affect the economies of many nations, individual companies and the market in general in ways that cannot necessarily be foreseen at the present time. This pandemic may result in substantial market volatility and may adversely impact the prices and liquidity of a fund’s investments. The duration of this pandemic and its effects cannot be determined with certainty.
Investment Objective Risk: There is no assurance that BTT will achieve its investment objectives, including its investment objective of returning $25.00 per share. As BTT approaches its scheduled termination date, it is expected that the maturity of BTT’s portfolio securities will shorten, which is likely to reduce BTT’s income and distributions to shareholders.
Counterparty Credit Risk: The Trusts may be exposed to counterparty credit risk, or the risk that an entity may fail to or be unable to perform on its commitments related to unsettled or open transactions, including making timely interest and/or principal payments or otherwise honoring its obligations. The Trusts manage counterparty credit risk by entering into transactions only with counterparties that the Manager believes have the financial resources to honor their obligations and by monitoring the financial stability of those counterparties. Financial assets, which potentially expose the Trusts to market, issuer and counterparty credit risks, consist principally of financial instruments and receivables due from counterparties. The extent of the Trusts’ exposure to market, issuer and counterparty credit risks with respect to these financial assets is approximately their value recorded in the Statements of Assets and Liabilities, less any collateral held by the Trusts.
| | |
| 62 | | 2 0 2 1 BLACK ROCK SEMI - ANNUAL REPORT TO SHAREHOLDERS |
Notes to Financial Statements (unaudited) (continued)
A derivative contract may suffer a mark-to-market loss if the value of the contract decreases due to an unfavorable change in the market rates or values of the underlying instrument. Losses can also occur if the counterparty does not perform under the contract.
With exchange-traded futures, there is less counterparty credit risk to the Trusts since the exchange or clearinghouse, as counterparty to such instruments, guarantees against a possible default. The clearinghouse stands between the buyer and the seller of the contract; therefore, credit risk is limited to failure of the clearinghouse. While offset rights may exist under applicable law, a Trust does not have a contractual right of offset against a clearing broker or clearinghouse in the event of a default (including the bankruptcy or insolvency). Additionally, credit risk exists in exchange-traded futures with respect to initial and variation margin that is held in a clearing broker’s customer accounts. While clearing brokers are required to segregate customer margin from their own assets, in the event that a clearing broker becomes insolvent or goes into bankruptcy and at that time there is a shortfall in the aggregate amount of margin held by the clearing broker for all its clients, typically the shortfall would be allocated on a pro rata basis across all the clearing broker’s customers, potentially resulting in losses to the Trusts.
Concentration Risk: A diversified portfolio, where this is appropriate and consistent with a fund’s objectives, minimizes the risk that a price change of a particular investment will have a material impact on the NAV of a fund. The investment concentrations within certain Trust’s portfolio are disclosed in its Schedule of Investments.
Certain Trusts invest a substantial amount of their assets in issuers located in a single state or limited number of states. When a Trust concentrates its investments in this manner, it assumes the risk that economic, regulatory, political or social conditions affecting that state or group of states could have a significant impact on the fund and could affect the income from, or the value or liquidity of, the fund’s portfolio. Investment percentages in specific states or U.S. territories are presented in the Schedules of Investments.
Certain Trusts invest a significant portion of their assets in securities within a single or limited number of market sectors. When a Trust concentrates its investments in this manner, it assumes the risk that economic, regulatory, political and social conditions affecting such sectors may have a significant impact on the Trust and could affect the income from, or the value or liquidity of, the Trust’s portfolio. Investment percentages in specific sectors are presented in the Schedules of Investments.
Certain Trusts invest a significant portion of their assets in fixed-income securities and/or use derivatives tied to the fixed-income markets. Changes in market interest rates or economic conditions may affect the value and/or liquidity of such investments. Interest rate risk is the risk that prices of bonds and other fixed-income securities will increase as interest rates fall and decrease as interest rates rise. The Trusts may be subject to a greater risk of rising interest rates due to the current period of historically low rates.
LIBOR Transition Risk: The United Kingdom’s Financial Conduct Authority announced a phase out of the London Interbank Offered Rate (“LIBOR”) by the end of 2021, and it is expected that LIBOR will cease to be published after that time. The Trusts may be exposed to financial instruments tied to LIBOR to determine payment obligations, financing terms, hedging strategies or investment value. The transition process away from LIBOR might lead to increased volatility and illiquidity in markets for, and reduce the effectiveness of new hedges placed against, instruments whose terms currently include LIBOR. The ultimate effect of the LIBOR transition process on the Trusts is uncertain.
| 10. | CAPITAL SHARE TRANSACTIONS |
Each Trust is authorized to issue an unlimited number of shares, all of which were initially classified as Common Shares. The par value for each Trust’s Common Shares is $0.001. The par value for each Trust’s Preferred Shares outstanding is $0.001. Each Board is authorized, however, to reclassify any unissued Common Shares to Preferred Shares without the approval of Common Shareholders.
Common Shares
For the periods shown, shares issued and outstanding increased by the following amounts as a result of dividend reinvestment:
| | | | | | | | |
| |
| Trust Name | | Six Months Ended 01/31/21 | | | Year Ended 07/31/20 | |
|
| |
BBF | | | — | | | | 1,507 | |
| |
For the six months ended January 31, 2021 and the year ended July 31, 2020, shares issued and outstanding remained constant for BFZ, BTT and BNY.
BFZ, BBF and BNY participate in an open market share repurchase program (the “Repurchase Program”). From December 1, 2019 through November 30, 2020, each of BFZ, BBF and BNY may repurchase up to 5% of its outstanding common shares under the Repurchase Program, based on common shares outstanding as of the close of business on November 30, 2019, subject to certain conditions.
On September 28, 2020, each of BFZ, BBF and BNY announced a continuation of its open market share repurchase program. Commencing on December 1, 2020, each of BFZ, BBF and BNY may repurchase through November 30, 2021, up to 5% of its outstanding common shares under the Repurchase Program, based on common shares outstanding as of the close of business on November 30, 2020, subject to certain conditions. There is no assurance that the Trusts will purchase shares in any particular amounts. For the six months ended January 31, 2021, BBF and BNY did not repurchase any shares.
The total cost of the shares repurchased is reflected in BFZ’s Statements of Changes in Net Assets. For the periods shown, shares repurchased and cost, including transaction costs were as follows:
| | | | | | | | |
| |
| |
| | | BFZ | |
| | |
| | | Shares | | | Amounts | |
| |
Six Months Ended January 31, 2021 | | | 209,100 | | | $ | 2,813,059 | |
Year Ended July 31, 2020 | | | 352,102 | | | | 4,493,469 | |
| |
| | |
NOTES TO FINANCIAL STATEMENTS | | 63 |
Notes to Financial Statements (unaudited) (continued)
Preferred Shares
A Trust’s Preferred Shares rank prior to its Common Shares as to the payment of dividends by the Trust and distribution of assets upon dissolution or liquidation of the Trust. The 1940 Act prohibits the declaration of any dividend on Common Shares or the repurchase of Common Shares if the Trust fails to maintain asset coverage of at least 200% of the liquidation preference of the Trust’s outstanding Preferred Shares. In addition, pursuant to the Preferred Shares’ governing instruments, a Trust is restricted from declaring and paying dividends on classes of shares ranking junior to or on parity with its Preferred Shares or repurchasing such shares if the Trust fails to declare and pay dividends on the Preferred Shares, redeem any Preferred Shares required to be redeemed under the Preferred Shares’ governing instruments or comply with the basic maintenance amount requirement of the ratings agencies rating the Preferred Shares.
Holders of Preferred Shares have voting rights equal to the voting rights of holders of Common Shares (one vote per share) and vote together with holders of Common Shares (one vote per share) as a single class on certain matters. Holders of Preferred Shares, voting as a separate class, are also entitled to (i) elect two members of the Board, (ii) elect the full Board if dividends on the Preferred Shares are not paid for a period of two years and (iii) a separate class vote to amend the Preferred Share governing documents. In addition, the 1940 Act requires the approval of the holders of a majority of any outstanding Preferred Shares, voting as a separate class, to (a) adopt any plan of reorganization that would adversely affect the Preferred Shares, (b) change a Trust’s sub-classification as a closed-end investment company or change its fundamental investment restrictions or (c) change its business so as to cease to be an investment company.
VRDP Shares
BBF (for purposes of this section, a “VRDP Trust”), has issued Series W-7 VRDP Shares, $100,000 liquidation preference per share, in one or more privately negotiated offerings to qualified institutional buyers as defined pursuant to Rule 144A under the Securities Act of 1933, as amended (the “Securities Act”). The VRDP Shares include a liquidity feature and may be subject to a special rate period. As of period end, the VRDP Shares outstanding were as follows:
| | | | | | | | | | | | | | | | |
| |
| | | | |
| Trust Name | | Issue
Date | | | Shares
Issued | | | Aggregate
Principal | | | Maturity
Date | |
| |
BBF | | | 09/15/11 | | | | 342 | | | $ | 34,200,000 | | | | 10/01/41 | |
| | | 05/16/16 | | | | 178 | | | | 17,800,000 | | | | 10/01/41 | |
| |
Redemption Terms: A VRDP Trust is required to redeem its VRDP Shares on the maturity date, unless earlier redeemed or repurchased. Six months prior to the maturity date, a VRDP Trust is required to begin to segregate liquid assets with the Trust’s custodian to fund the redemption. In addition, a VRDP Trust is required to redeem certain of its outstanding VRDP Shares if it fails to comply with certain asset coverage, basic maintenance amount or leverage requirements.
Subject to certain conditions, the VRDP Shares may also be redeemed, in whole or in part, at any time at the option of a VRDP Trust. The redemption price per VRDP Share is equal to the liquidation preference per share plus any outstanding unpaid dividends.
Liquidity Feature: VRDP Shares are subject to a fee agreement between the VRDP Trust and the liquidity provider that requires a per annum liquidity fee and, in some cases, an upfront or initial commitment fee, payable to the liquidity provider. These fees, if applicable, are shown as liquidity fees in the Statements of Operations. As of period end, the fee agreement is set to expire, unless renewed or terminated in advance, as follows:
| | | | |
| |
| |
| | | BBF | |
| |
| |
Expiration date | | | 04/30/21 | |
| |
The VRDP Shares are also subject to a purchase agreement in connection with the liquidity feature. In the event a purchase agreement is not renewed or is terminated in advance, and the VRDP Shares do not become subject to a purchase agreement with an alternate liquidity provider, the VRDP Shares will be subject to mandatory purchase by the liquidity provider prior to the termination of the purchase agreement. In the event of such mandatory purchase, a VRDP Trust is required to redeem the VRDP Shares six months after the purchase date. Immediately after such mandatory purchase, the VRDP Trust is required to begin to segregate liquid assets with its custodian to fund the redemption. There is no assurance that a VRDP Trust will replace such redeemed VRDP Shares with any other preferred shares or other form of leverage.
Remarketing: A VRDP Trust may incur remarketing fees on the aggregate principal amount of all its VRDP Shares, which, if any, are included in remarketing fees on Preferred Shares in the Statements of Operations. During any special rate period (as described below), a VRDP Trust may incur nominal or no remarketing fees.
Ratings: As of period end, the VRDP Shares were assigned the following ratings:
| | | | | | |
|
| | |
| Trust Name | | Moody’s Investors Service, Inc. Long-Term Ratings | | | Fitch Ratings, Inc. Long-Term Ratings |
|
| | |
BBF | | | Aa1 | | | AAA |
|
Special Rate Period: A VRDP Trust has commenced a “special rate period” with respect to its VRDP Shares, during which the VRDP Shares will not be subject to any remarketing and the dividend rate will be based on a predetermined methodology. During a special rate period, short-term ratings on VRDP Shares are withdrawn. BBF’s special rate period has commenced on October 22, 2015 and has a current expiration date of April 15, 2021.
Prior to the expiration date, the VRDP Trust and the VRDP Shares holder may mutually agree to extend the special rate period. If a special rate period is not extended, the VRDP Shares will revert to remarketable securities upon the termination of the special rate period and will be remarketed and available for purchase by qualified institutional investors.
| | |
| 64 | | 2 0 2 1 BLACK ROCK SEMI - ANNUAL REPORT TO SHAREHOLDERS |
Notes to Financial Statements (unaudited) (continued)
During the special rate period: (i) the liquidity and fee agreements remain in effect, (ii) VRDP Shares remain subject to mandatory redemption by the VRDP Trust on the maturity date, (iii) VRDP Shares will not be remarketed or subject to optional or mandatory tender events, (iv) the VRDP Trust is required to comply with the same asset coverage, basic maintenance amount and leverage requirements for the VRDP Shares as is required when the VRDP Shares are not in a special rate period, (v) the VRDP Trust will pay dividends monthly based on the sum of an agreed upon reference rate and a percentage per annum based on the long-term ratings assigned to the VRDP Shares and (vi) the VRDP Trust will pay nominal or no fees to the liquidity provider and remarketing agent.
Dividends: Except during the Special Rate Period as described above, dividends on the VRDP Shares are payable monthly at a variable rate set weekly by the remarketing agent. Such dividend rates are generally based upon a spread over a base rate and cannot exceed a maximum rate. A change in the short-term credit rating of the liquidity provider or the VRDP Shares may adversely affect the dividend rate paid on such shares, although the dividend rate paid on the VRDP Shares is not directly based upon either short-term rating. In the event of a failed remarketing, the dividend rate of the VRDP Shares will be reset to a maximum rate. The maximum rate is determined based on, among other things, the long-term preferred share rating assigned to the VRDP Shares and the length of time that the VRDP Shares fail to be remarketed.
For the six months ended January 31, 2021, the annualized dividend rate for the VRDP Shares was 0.95%.
For the six months ended January 31, 2021, VRDP Shares issued and outstanding of the VRDP Trust remained constant.
VMTP Shares
BFZ and BNY (for purposes of this section, a “VMTP Trust”) have issued Series W-7 VMTP Shares, $100,000 liquidation preference per share, in one or more privately negotiated offerings to qualified institutional buyers as defined pursuant to Rule 144A under the Securities Act. The VMTP Shares are subject to certain restrictions on transfer, and a VMTP Trust may also be required to register its VMTP Shares for sale under the Securities Act under certain circumstances. As of period end, the VMTP Shares outstanding and assigned long-term ratings were as follows:
| | | | | | | | | | | | | | | | | | | | | | | | |
| |
| | | | | | |
| Trust Name | | Issue Date | | | Shares Issued | | | Aggregate Principal | | | Term Redemption Date | | | Moody’s Rating | | | Fitch Rating | |
| |
BFZ | | | 03/22/12 | | | | 1,713 | | | $ | 171,300,000 | | | | 03/30/22 | | | | Aa2 | | | | AAA | |
BNY | | | 03/22/12 | | | | 945 | | | | 94,500,000 | | | | 03/30/22 | | | | Aa2 | | | | AAA | |
| |
Redemption Terms: Each VMTP Trust is required to redeem its VMTP Shares on the term redemption date, unless earlier redeemed or repurchased or unless extended. There is no assurance that a term will be extended further or that any VMTP Shares will be replaced with any other preferred shares or other form of leverage upon the redemption or repurchase of the VMTP Shares. Six months prior to the term redemption date, a VMTP Trust is required to begin to segregate liquid assets with its custodian to fund the redemption. In addition, a VMTP Trust is required to redeem certain of its outstanding VMTP Shares if it fails to comply with certain asset coverage, basic maintenance amount or leverage requirements.
Subject to certain conditions, VMTP Shares may be redeemed, in whole or in part, at any time at the option of the VMTP Trust. The redemption price per VMTP Share is equal to the liquidation preference per share plus any outstanding unpaid dividends.
Dividends: Dividends on the VMTP Shares are declared daily and payable monthly at a variable rate set weekly at a fixed rate spread to the Securities Industry and Financial Markets Association (“SIFMA”) Municipal Swap Index or to a percentage of the one-month LIBOR rate, as set forth in the VMTP Shares governing instrument. The fixed spread is determined based on the long-term preferred share rating assigned to the VMTP Shares by the ratings agencies then rating the VMTP Shares.
The dividend rate on VMTP Shares is subject to a step-up spread if the VMTP Trust fails to comply with certain provisions, including, among other things, the timely payment of dividends, redemptions or gross-up payments, and complying with certain asset coverage and leverage requirements.
For the six months ended January 31, 2021, the average annualized dividend rates for the VMTP Shares were as follows:
| | | | | | | | |
| | | |
| | | BFZ | | | BNY | |
| | |
Dividend rates | | | 0.85 | % | | | 0.85 | % |
For the six months ended January 31, 2021, VMTP Shares issued and outstanding of each VMTP Trust remained constant.
RVMTP Shares
BTT has issued Series W-7 RVMTP Shares, $5,000,000 liquidation preference per share, in privately negotiated offerings to qualified institutional buyers as defined pursuant to Rule 144A under the Securities Act. The RVMTP Shares are subject to certain restrictions on transfer outside of a remarketing. As of period end, the RVMTP Shares outstanding of BTT were as follows:
| | | | | | | | | | | | | | | | | | | | |
| |
| | | | | |
| Trust Name | | Issue Date | | | Shares Issued | | | Shares Outstanding | | | Aggregate Principal | | | Term Redemption Date | |
| |
BTT | | | 01/10/13 | | | | 50 | | | | 50 | | | $ | 250,000,000 | | | | 12/31/30 | |
| | | 01/30/13 | | | | 50 | | | | 50 | | | | 250,000,000 | | | | 12/31/30 | |
| | | 02/20/13 | | | | 50 | | | | 50 | | | | 250,000,000 | | | | 12/31/30 | |
| |
| | |
NOTES TO FINANCIAL STATEMENTS | | 65 |
Notes to Financial Statements (unaudited) (continued)
Redemption Terms: BTT is required to redeem its RVMTP Shares on the term redemption date or within six months of an unsuccessful remarketing, unless earlier redeemed or repurchased. There is no assurance that RVMTP Shares will be replaced with any other preferred shares or other form of leverage upon the redemption or repurchase of the RVMTP Shares. In addition, BTT is required to redeem certain of its outstanding RVMTP Shares if it fails to comply with certain asset coverage, basic maintenance amount or leverage requirements.
Subject to certain conditions, RVMTP Shares may be redeemed, in whole or in part, at any time at the option of BTT. The redemption price per RVMTP Share is equal to the liquidation preference per share plus any outstanding unpaid dividends. The RVMTP Shares are subject to certain restrictions on transfer outside of a remarketing. The RVMTP Shares are subject to remarketing upon 90 days’ notice by holders of the RVMTP Shares and 30 days’ notice by BTT. Each remarketing must be at least six months apart from the last remarketing. A holder of RVMTP Shares may submit notice of remarketing only if such holder requests a remarketing of at least the lesser of (i) $100,000,000 of RVMTP Shares or (ii) all of the RVMTP Shares held by such holder.
Dividends: Dividends on the RVMTP Shares are declared daily and payable monthly at a variable rate set weekly at a fixed rate spread to a percentage of the one-month LIBOR rate. The fixed rate spread may be adjusted at each remarketing or upon the agreement of BTT and the then-holder(s) of the RVMTP Shares. In the event that all of the RVMTP Shares submitted for remarketing are not successfully remarketed, a failed remarketing would occur, and all holders would retain their RVMTP Shares. In the event of a failed remarketing, the fixed rate spread would be set at the fixed rate spread applicable to such failed remarketing. BTT has the right to reject any fixed spread determined at a remarketing, and such rejection would result in a failed remarketing and the fixed rate spread would be set at the fixed rate spread applicable to such failed remarketing. The fixed rate spread applicable due to a failed remarketing depends on whether the remarketing was pursuant to a mandatory or non-mandatory tender. In the case of a failed remarketing following a mandatory tender, the failed remarketing spread would be the sum of the last applicable spread in effect immediately prior to the failed remarketing date for such failed remarketing plus 0.75%. In the case of a failed remarketing not associated with a mandatory tender, the failed remarketing spread would be the sum of the last applicable spread in effect immediately prior to the failed remarketing date for such failed remarketing plus 0.25%.
For the six months ended January 31, 2021, the average annualized dividend rate for the RVMTP Shares was 0.69%.
Remarketing: In the event of a failed remarketing that is not subsequently cured, BTT will be required to redeem the RVMTP Shares subject to such failed remarketing on a date that is approximately six months from the remarketing date for such failed remarketing, provided that no redemption of any RVMTP Share may occur within one year of the date of issuance of such RVMTP Share. At the date of issuance and as of period end, the RVMTP Shares were assigned long-term ratings of Aa1 from Moody’s and AAA from Fitch. The dividend rate on the RVMTP Shares is subject to a step-up spread if BTT fails to comply with certain provisions, including, among other things, the timely payment of dividends, redemptions or gross-up payments, and complying with certain asset coverage and leverage requirements.
During the six months ended January 31, 2021, no RVMTP Shares were tendered for remarketing.
For the six months ended January 31, 2021, RVMTP Shares issued and outstanding of BTT remained constant.
Offering Costs: The Trusts incurred costs in connection with the issuance of VRDP, VMTP and RVMTP Shares, which were recorded as a direct deduction from the carrying value of the related debt liability and will be amortized over the life of the VRDP, VMTP and RVMTP Shares with the exception of any upfront fees paid by a VRDP Trust to the liquidity provider which, if any, were amortized over the life of the liquidity agreement. Amortization of these costs is included in interest expense, fees and amortization of offering costs in the Statements of Operations.
Financial Reporting: The VRDP, VMTP and RVMTP Shares are considered debt of the issuer; therefore, the liquidation preference, which approximates fair value of the VRDP, VMTP and RVMTP Shares, is recorded as a liability in the Statements of Assets and Liabilities net of deferred offering costs. Unpaid dividends are included in interest expense and fees payable in the Statements of Assets and Liabilities, and the dividends accrued and paid on the VRDP, VMTP and RVMTP Shares are included as a component of interest expense, fees and amortization of offering costs in the Statements of Operations. The VRDP, VMTP and RVMTP Shares are treated as equity for tax purposes. Dividends paid to holders of the VRDP, VMTP and RVMTP Shares are generally classified as tax-exempt income for tax-reporting purposes. Dividends and amortization of deferred offering costs on VRDP, VMTP and RVMTP Shares are included in interest expense, fees and amortization of offering costs in the Statements of Operations:
| | | | | | | | |
| |
| Trust Name | | Dividends Accrued | | | Deferred Offering
Costs Amortization | |
| |
| | |
BFZ | | $ | 731,714 | | | $ | — | |
BTT | | | 2,585,305 | | | | 15,764 | |
BBF | | | 245,730 | | | | 74,459 | |
BNY | | | 403,660 | | | | — | |
| |
Management’s evaluation of the impact of all subsequent events on the Trusts’ financial statements was completed through the date the financial statements were issued and the following items were noted:
The Trusts declared and paid or will pay distributions to Common Shareholders and Preferred Shareholders as follows:
| | | | | | | | | | | | | | | | | | | | | | | | |
| |
| Trust Name | | Dividend Per Common Share | | | Preferred Shares(a) | |
| | | Paid | (b) | | | Declared | (c) | | | Declared | (d) | | | Shares | | | | Series | | | | Declared | |
| |
BFZ | | $ | 0.038000 | | | $ | 0.043000 | | | $ | — | | | | VMTP | | | | W-7 | | | $ | 102,639 | |
BTT | | | 0.062400 | | | | 0.062400 | | | | — | | | | RVMTP | | | | W-7 | | | | 380,348 | |
| |
| | |
| 66 | | 2 0 2 1 BLACK ROCK SEMI - ANNUAL REPORT TO SHAREHOLDERS |
Notes to Financial Statements (unaudited) (continued)
| | | | | | | | | | | | | | | | | | | | | | | | |
| |
| | |
| | | Dividend Per Common Share | | | Preferred Shares(a) | |
| | | | | | |
Trust Name | | | Paid | (b) | | | Declared | (c) | | | Declared | (d) | | | Shares | | | | Series | | | | Declared | |
| |
BBF | | $ | 0.050500 | | | $ | 0.050500 | | | $ | 0.050500 | | | | VRDP | | | | W-7 | | | $ | 34,747 | |
BNY | | | 0.056500 | | | | 0.056500 | | | | 0.118166 | | | | VMTP | | | | W-7 | | | | 56,622 | |
| |
| | (a) | Dividends declared for period February 1, 2021 to February 28, 2021. | |
| | (b) | Net investment income dividend paid on March 1, 2021 to Common Shareholders of record on February 16, 2021. | |
| | (c) | Net investment income dividend declared on March 1, 2021, payable to Common Shareholders of record on March 15, 2021. | |
| | (d) | Net investment income special dividend declared on March 19, 2021, payable to Common Shareholders of record on April 8, 2021. | |
| | |
NOTES TO FINANCIAL STATEMENTS | | 67 |
Additional Information
Proxy Results
At a Joint Special Meeting of Shareholders of BlackRock Municipal Income Investment Trust held on Tuesday, December 15, 2020, Trust shareholders were asked to vote on the following proposals:
Common and Preferred Shareholders
Proposal 1(E). The common shareholders and holders of Variable Rate Demand Preferred Shares (“VRDP Shares” and the holders thereof, “VRDP Holders”) of BlackRock Municipal Income Investment Trust (“BBF”) were being asked to vote as a single class on a proposal to approve an Agreement and Plan of Reorganization between BBF and BlackRock Municipal Income Trust II (the “Acquiring Fund” and such Agreement and Plan of Reorganization, the “BBF Reorganization Agreement”) and the transactions contemplated therein, including (i) the acquisition by the Acquiring Fund of substantially all of BBF’s assets and the assumption by the Acquiring Fund of substantially all of BBF’s liabilities in exchange solely for newly issued common shares and Variable Rate Muni Term Preferred Shares (“VMTP Shares” and the holders thereof, “VMTP Holders”) of the Acquiring Fund, which will be distributed to the common shareholders (although cash may be distributed in lieu of fractional common shares) and VMTP Holders, respectively, of BBF, and which shall constitute the sole consideration to be distributed or paid to the common shareholders (although cash may be distributed in lieu of fractional common shares) and the VMTP Holders in respect of their common shares and VMTP Shares, respectively, and (ii) the termination by BBF of its registration under the Investment Company Act of 1940, as amended, and the liquidation, dissolution and termination of BBF in accordance with its Agreement and Declaration of Trust and Delaware law (the “BBF Reorganization”).
With respect to Proposal 1(E), the shares of the Trust were voted as follows:
| | | | | | | | |
| | | | |
| | | Trust Name | | For | | Against | | Abstain |
| | | | |
| | BBF | | 5,389,406 | | 280,971 | | 188,457 |
Preferred Shareholders
Proposal 1(F). The VRDP holders of BBF were being asked to vote as a separate class on a proposal to approve the BBF Reorganization Agreement and the BBF Reorganization.
With respect to Proposal 1(F), the shares of the Trust were voted as follows:
| | | | | | | | |
| | | | |
| | | Trust Name | | For | | Against | | Abstain |
| | | | |
| | BBF | | 520 | | — | | — |
At a Joint Special Meeting of Shareholders of BlackRock New York Municipal Income Trust held on Tuesday, December 15, 2020 and adjourned to Friday, January 21, 2021, Trust shareholders were asked to vote on the following proposals:
Preferred Shareholders
Proposal 1(E). The holders of Variable Rate Muni Term Preferred Shares (“VMTP Shares” and the holders thereof, “VMTP Holders”) of BlackRock New York Municipal Income Trust (the “Acquiring Fund”) were being asked to vote as a separate class on a proposal to approve an Agreement and Plan of Reorganization between BlackRock New York Municipal Income Quality Trust and the Acquiring Fund (the “BSE Reorganization Agreement”) and the transactions contemplated therein.
With respect to Proposal 1(E), the shares of the Trust were voted as follows:
| | | | | | | | |
| | | | |
| | | Trust Name | | For | | Against | | Abstain |
| | BNY | | 945 | | — | | — |
Proposal 1(F). The VMTP Holders of the Acquiring Fund are being asked to vote as a separate class on a proposal to approve an Agreement and Plan of Reorganization between BlackRock New York Municipal Income Trust II and the Acquiring Fund (the “BFY Reorganization Agreement”) and the transactions contemplated therein.
With respect to Proposal 1(F), the shares of the Trust were voted as follows:
| | | | | | | | |
| | | | |
| | | Trust Name | | For | | Against | | Abstain |
| | BNY | | 945 | | — | | — |
Common and Preferred Shareholders
Proposal 2(A). The common shareholders and holders of Variable Rate Muni Term Preferred Shares (“VMTP Shares” and the holders thereof, “VMTP Holders”) of BlackRock New York Municipal Income Trust (the “Acquiring Fund”) were being asked to vote as a single class on a proposal to approve the issuance of additional common shares of the Acquiring Fund in connection with an Agreement and Plan of Reorganization between BlackRock New York Municipal Income Quality Trust and the Acquiring Fund.
With respect to Proposal 2(A), the shares of the Trust were voted as follows:
| | | | | | | | |
| | | | |
| | | Trust Name | | For | | Against | | Abstain |
| | BNY | | 6,411,086 | | 482,385 | | 299,353 |
| | |
| 68 | | 2 0 2 1 BLACK ROCK SEMI - ANNUAL REPORT TO SHAREHOLDERS |
Additional Information (continued)
Proposal 2(B). The common shareholders and VMTP Holders of the Acquiring Fund were being asked to vote as a single class on a proposal to approve the issuance of additional common shares of the Acquiring Fund in connection with an Agreement and Plan of Reorganization between BlackRock New York Municipal Income Trust II and the Acquiring Fund.
With respect to Proposal 2(B), the shares of the Trust were voted as follows:
| | | | | | | | |
| | | | |
| | Trust Name | | For | | Against | | Abstain |
| | | | |
| | BNY | | 6,436,692 | | 456,022 | | 300,110 |
Trust Certification
The Trusts are listed for trading on the NYSE and have filed with the NYSE their annual chief executive officer certification regarding compliance with the NYSE’s listing standards. The Trusts filed with the SEC the certification of its chief executive officer and chief financial officer required by Section 302 of the Sarbanes-Oxley Act.
Regulation Regarding Derivatives
On October 28, 2020, the Securities and Exchange Commission (the “SEC”) adopted new regulations governing the use of derivatives by registered investment companies (“Rule 18f-4”). The Trusts will be required to implement and comply with Rule 18f-4 by the third quarter of 2022. Once implemented, Rule 18f-4 will impose limits on the amount of derivatives a fund can enter into, eliminate the asset segregation framework currently used by funds to comply with Section 18 of the 1940 Act, treat derivatives as senior securities so that a failure to comply with the limits would result in a statutory violation and require funds whose use of derivatives is more than a limited specified exposure amount to establish and maintain a comprehensive derivatives risk management program and appoint a derivatives risk manager.
Environmental, Social and Governance (“ESG”) Integration
Although a Trust does not seek to implement a specific ESG, impact or sustainability strategy unless otherwise disclosed, Trust management will consider ESG characteristics as part of the investment process for actively managed Trusts. These considerations will vary depending on a Trust’s particular investment strategies and may include consideration of third-party research as well as consideration of proprietary BlackRock research across the ESG risks and opportunities regarding an issuer. Trust management will consider those ESG characteristics it deems relevant or additive when making investment decisions for a Trust. The ESG characteristics utilized in a Trust’s investment process are anticipated to evolve over time and one or more characteristics may not be relevant with respect to all issuers that are eligible for investment. ESG characteristics are not the sole considerations when making investment decisions for a Trust. Further, investors can differ in their views of what constitutes positive or negative ESG characteristics. As a result, a Trust may invest in issuers that do not reflect the beliefs and values with respect to ESG of any particular investor. ESG considerations may affect a Trust’s exposure to certain companies or industries and a Trust may forego certain investment opportunities. While Trust management views ESG considerations as having the potential to contribute to a Trust’s long-term performance, there is no guarantee that such results will be achieved.
Dividend Policy
Each Trust’s dividend policy is to distribute all or a portion of its net investment income to its shareholders on a monthly basis. In order to provide shareholders with a more stable level of distributions, the Trusts may at times pay out less than the entire amount of net investment income earned in any particular month and may at times in any particular month pay out such accumulated but undistributed income in addition to net investment income earned in that month. As a result, the distributions paid by the Trusts for any particular month may be more or less than the amount of net investment income earned by the Trusts during such month. The Trusts’ current accumulated but undistributed net investment income, if any, is disclosed as accumulated earnings (loss) in the Statements of Assets and Liabilities, which comprises part of the financial information included in this report.
General Information
The Trusts do not make available copies of their Statements of Additional Information because the Trusts’ shares are not continuously offered, which means that the Statement of Additional Information of each Trust has not been updated after completion of the respective Trust’s offerings and the information contained in each Trust’s Statement of Additional Information may have become outdated.
The following information is a summary of certain changes since July 31, 2020. This information may not reflect all of the changes that have occurred since you purchased the relevant Trust.
Except if noted otherwise herein, there were no changes to the Trusts’ charters or by-laws that would delay or prevent a change of control of the Trusts that were not approved by the shareholders. Except if noted otherwise herein, there have been no changes in the persons who are primarily responsible for the day-to-day management of the Trusts’ portfolios.
In accordance with Section 23(c) of the Investment Company Act of 1940, each Trust may from time to time purchase shares of its common stock in the open market or in private transactions.
Quarterly performance, semi-annual and annual reports, current net asset value and other information regarding the Trusts may be found on BlackRock’s website, which can be accessed at blackrock.com. Any reference to BlackRock’s website in this report is intended to allow investors public access to information regarding the Trusts and does not, and is not intended to, incorporate BlackRock’s website in this report.
| | |
ADDITIONAL INFORMATION | | 69 |
Additional Information (continued)
Electronic Delivery
Shareholders can sign up for e-mail notifications of quarterly statements, annual and semi-annual shareholder reports by enrolling in the electronic delivery program. Electronic copies of shareholder reports are available on BlackRock’s website.
To enroll in electronic delivery:
Shareholders Who Hold Accounts with Investment Advisers, Banks or Brokerages:
Please contact your financial adviser. Please note that not all investment advisers, banks or brokerages may offer this service.
Householding
The Trusts will mail only one copy of shareholder documents, annual and semi-annual reports, Rule 30e-3 notices and proxy statements, to shareholders with multiple accounts at the same address. This practice is commonly called “householding” and is intended to reduce expenses and eliminate duplicate mailings of shareholder documents. Mailings of your shareholder documents may be householded indefinitely unless you instruct us otherwise. If you do not want the mailing of these documents to be combined with those for other members of your household, please call the Trusts at (800) 882-0052.
Availability of Quarterly Schedule of Investments
The Trusts file their complete schedule of portfolio holdings with the SEC for the first and third quarters of each fiscal year as an exhibit to their reports on Form N-PORT. The Trusts’ Forms N-PORT are available on the SEC’s website at sec.gov. Additionally, each Trust makes its portfolio holdings for the first and third quarters of each fiscal year available at blackrock.com/fundreports.
Availability of Proxy Voting Policies and Procedures
A description of the policies and procedures that the Trusts use to determine how to vote proxies relating to portfolio securities is available upon request and without charge (1) by calling (800) 882-0052; (2) at blackrock.com; and (3) on the SEC’s website at sec.gov.
Availability of Proxy Voting Record
Information about how the Trusts voted proxies relating to securities held in the Trusts’ portfolios during the most recent 12-month period ended June 30 is available upon request and without charge (1) at blackrock.com; or by calling (800) 882-0052 and (2) on the SEC’s website at sec.gov.
Availability of Trust Updates
BlackRock will update performance and certain other data for the Trusts on a monthly basis on its website in the “Closed-end Funds” section of blackrock.com as well as certain other material information as necessary from time to time. Investors and others are advised to check the website for updated performance information and the release of other material information about the Trusts. This reference to BlackRock’s website is intended to allow investors public access to information regarding the Trusts and does not, and is not intended to, incorporate BlackRock’s website in this report.
BlackRock Privacy Principles
BlackRock is committed to maintaining the privacy of its current and former fund investors and individual clients (collectively, “Clients”) and to safeguarding their non-public personal information. The following information is provided to help you understand what personal information BlackRock collects, how we protect that information and why in certain cases we share such information with select parties.
If you are located in a jurisdiction where specific laws, rules or regulations require BlackRock to provide you with additional or different privacy-related rights beyond what is set forth below, then BlackRock will comply with those specific laws, rules or regulations.
BlackRock obtains or verifies personal non-public information from and about you from different sources, including the following: (i) information we receive from you or, if applicable, your financial intermediary, on applications, forms or other documents; (ii) information about your transactions with us, our affiliates, or others; (iii) information we receive from a consumer reporting agency; and (iv) from visits to our websites.
BlackRock does not sell or disclose to non-affiliated third parties any non-public personal information about its Clients, except as permitted by law or as is necessary to respond to regulatory requests or to service Client accounts. These non-affiliated third parties are required to protect the confidentiality and security of this information and to use it only for its intended purpose.
We may share information with our affiliates to service your account or to provide you with information about other BlackRock products or services that may be of interest to you. In addition, BlackRock restricts access to non-public personal information about its Clients to those BlackRock employees with a legitimate business need for the information. BlackRock maintains physical, electronic and procedural safeguards that are designed to protect the non-public personal information of its Clients, including procedures relating to the proper storage and disposal of such information.
| | |
| 70 | | 2 0 2 1 BLACK ROCK SEMI - ANNUAL REPORT TO SHAREHOLDERS |
Additional Information (continued)
Trust and Service Providers
Investment Adviser
BlackRock Advisors, LLC
Wilmington, DE 19809
Accounting Agent and Custodian
State Street Bank and Trust Company
Boston, MA 02111
Transfer Agent
Computershare Trust Company, N.A.
Canton, MA 02021
VRDP Liquidity Provider
Bank of America, N.A.
New York, NY 10036
VRDP Remarketing Agent
BofA Securities, Inc.
New York, NY 10036
VRDP Tender and Paying Agent, VMTP Redemption and Paying Agent and RVMTP Tender and Paying Agent
The Bank of New York Mellon
New York, NY 10286
Independent Registered Public Accounting Firm
Deloitte & Touche LLP
Boston, MA 02116
Legal Counsel
Willkie Farr & Gallagher LLP
New York, NY 10019
Address of the Trusts
100 Bellevue Parkway
Wilmington, DE 19809
| | |
ADDITIONAL INFORMATION | | 71 |
Glossary of Terms Used in this Report
| | |
| Portfolio Abbreviation |
| |
| AGC | | Assured Guaranty Corp. |
| |
| AGM | | Assured Guaranty Municipal Corp. |
| |
| AGM-CR | | AGM Insured Custodial Receipt |
| |
| AMBAC | | AMBAC Assurance Corp. |
| |
| AMT | | Alternative Minimum Tax |
| |
| ARB | | Airport Revenue Bonds |
| |
| BAM | | Build America Mutual Assurance Co. |
| |
| CAB | | Capital Appreciation Bonds |
| |
| COP | | Certificates of Participation |
| |
| CR | | Custodian Receipt |
| |
| FHA | | Federal Housing Administration |
| |
| FHLMC | | Federal Home Loan Mortgage Corp. |
| |
| FNMA | | Federal National Mortgage Association |
| |
| GNMA | | Government National Mortgage Association |
| |
| GO | | General Obligation Bonds |
| |
| GTD | | GTD Guaranteed |
| |
| INS | | Insured |
| |
| M/F | | Multi-Family |
| |
| NPFGC | | National Public Finance Guarantee Corp. |
| |
| PSF-GTD | | Permanent School Fund Guaranteed |
| |
| RB | | Revenue Bond |
| |
| S/F | | Single-Family |
| |
| SAB | | Special Assessment Bonds |
| |
| SAP | | Subject to Appropriations |
| |
| SAW | | State Aid Withholding |
| |
| SONYMA | | State of New York Mortgage Agency |
| |
| ST | | Special Tax |
| |
| TA | | Tax Allocation |
| | |
| 72 | | 2 0 2 1 BLACK ROCK SEMI - ANNUAL REPORT TO SHAREHOLDERS |
Want to know more?
blackrock.com | 800-882-0052
This report is intended for current holders. It is not a prospectus. Past performance results shown in this report should not be considered a representation of future performance. The Trusts have leveraged their Common Shares, which creates risks for Common Shareholders, including the likelihood of greater volatility of net asset value and market price of the Common Shares, and the risk that fluctuations in short-term interest rates may reduce the Common Shares’ yield. Statements and other information herein are as dated and are subject to change.
CEF-01/21-SAR
(b) Not Applicable
| Item 2 – | Code of Ethics – Not Applicable to this semi-annual report |
| Item 3 – | Audit Committee Financial Expert – Not Applicable to this semi-annual report |
| Item 4 – | Principal Accountant Fees and Services – Not Applicable to this semi-annual report |
| Item 5 – | Audit Committee of Listed Registrant – Not Applicable to this semi-annual report |
(a) The registrant’s Schedule of Investments is included as part of the Report to Stockholders filed under Item 1 of this Form.
(b) Not Applicable due to no such divestments during the semi-annual period covered since the previous Form N-CSR filing.
| Item 7 – | Disclosure of Proxy Voting Policies and Procedures for Closed-End Management Investment Companies – Not Applicable to this semi-annual report |
| Item 8 – | Portfolio Managers of Closed-End Management Investment Companies |
(a) Not Applicable to this semi-annual report.
(b) As of the date of this filing, there have been no changes in any of the portfolio managers identified in the most recent annual report on Form N-CSR.
| Item 9 – | Purchases of Equity Securities by Closed-End Management Investment Company and Affiliated Purchasers – Not Applicable due to no such purchases during the period covered by this report. |
| Item 10 – | Submission of Matters to a Vote of Security Holders – There have been no material changes to these procedures. |
| Item 11 – | Controls and Procedures |
(a) The registrant’s principal executive and principal financial officers, or persons performing similar functions, have concluded that the registrant’s disclosure controls and procedures (as defined in Rule 30a-3(c) under the Investment Company Act of 1940, as amended (the “1940 Act”)) are effective as of a date within 90 days of the filing of this report based on the evaluation of these controls and procedures required by Rule 30a-3(b) under the 1940 Act and Rule 13a-15(b) under the Securities Exchange Act of 1934, as amended.
(b) There were no changes in the registrant’s internal control over financial reporting (as defined in Rule 30a-3(d) under the 1940 Act) that occurred during the period covered by this report that have materially affected, or are reasonably likely to materially affect, the registrant’s internal control over financial reporting.
| Item 12 – | Disclosure of Securities Lending Activities for Closed-End Management Investment Companies – Not Applicable |
| Item 13 – | Exhibits attached hereto |
2
(a)(1) Code of Ethics – Not Applicable to this semi-annual report
(a)(2) Section 302 Certifications are attached
(a)(3) Not Applicable
(a)(4) Not Applicable
(b) Section 906 Certifications are attached
3
Pursuant to the requirements of the Securities Exchange Act of 1934 and the Investment Company Act of 1940, the registrant has duly caused this report to be signed on its behalf by the undersigned, thereunto duly authorized.
BlackRock Municipal Income Investment Trust
| | | | |
| | By: | | /s/ John M. Perlowski |
| | | | John M. Perlowski |
| | | | Chief Executive Officer (principal executive officer) of |
| | | | BlackRock Municipal Income Investment Trust |
Date: April 5, 2021
Pursuant to the requirements of the Securities Exchange Act of 1934 and the Investment Company Act of 1940, this report has been signed below by the following persons on behalf of the registrant and in the capacities and on the dates indicated.
| | | | |
| | By: | | /s/ John M. Perlowski |
| | | | John M. Perlowski |
| | | | Chief Executive Officer (principal executive officer) of |
| | | | BlackRock Municipal Income Investment Trust |
Date: April 5, 2021
| | | | |
| | By: | | /s/ Trent Walker |
| | | | Trent Walker |
| | | | Chief Financial Officer (principal financial officer) of |
| | | | BlackRock Municipal Income Investment Trust |
Date: April 5, 2021
4