UNITEDSTATES
SECURITIESANDEXCHANGECOMMISSION
Washington,D.C.20549
FORM N-CSR
CERTIFIED SHAREHOLDER REPORT OF REGISTERED MANAGEMENT INVESTMENT
COMPANIES
Investment Company Act file number: 811-10333
Name of Fund: BlackRock Municipal Income Investment Trust (BBF)
Fund Address: 100 Bellevue Parkway, Wilmington, DE 19809
Name and address of agent for service: John M. Perlowski, Chief Executive Officer, BlackRock Municipal Income Investment Trust, 55 East 52nd Street, New York, NY 10055
Registrant's telephone number, including area code: (800) 882-0052, Option 4
Date of fiscal year end: 07/31/2020
Date of reporting period: 01/31/2020
Item 1 – Report to Stockholders
| | |

| | JANUARY 31, 2020 |
| | |
| |
| | 2020 Semi-Annual Report (Unaudited) |
BlackRock California Municipal Income Trust (BFZ)
BlackRock Municipal 2030 Target Term Trust (BTT)
BlackRock Municipal Income Investment Trust (BBF)
BlackRock New York Municipal Income Trust (BNY)
Beginning on January 1, 2021, as permitted by regulations adopted by the Securities and Exchange Commission, paper copies of each Trust’s shareholder reports will no longer be sent by mail, unless you specifically request paper copies of the reports from BlackRock or from your financial intermediary, such as a broker-dealer or bank. Instead, the reports will be made available on a website, and you will be notified by mail each time a report is posted and provided with a website link to access the report.
You may elect to receive all future reports in paper free of charge. If you hold accounts directly with BlackRock, you can call Computershare at (800) 699-1236 to request that you continue receiving paper copies of your shareholder reports. If you hold accounts through a financial intermediary, you can follow the instructions included with this disclosure, if applicable, or contact your financial intermediary to request that you continue to receive paper copies of your shareholder reports. Please note that not all financial intermediaries may offer this service. Your election to receive reports in paper will apply to all funds advised by BlackRock Advisors, LLC or its affiliates, or all funds held with your financial intermediary, as applicable.
If you already elected to receive shareholder reports electronically, you will not be affected by this change and you need not take any action. You may elect to receive electronic delivery of shareholder reports and other communications by contacting your financial intermediary, if you hold accounts through a financial intermediary. Please note that not all financial intermediaries may offer this service.
|
| Not FDIC Insured • May Lose Value • No Bank Guarantee |
The Markets in Review
Dear Shareholder,
U.S. equities and bonds both delivered impressive returns over the last 12 months, despite fears and doubts about the economy that were ultimately laid to rest with unprecedented monetary stimulus and a sluggish yet resolute performance from the U.S. economy. Investors were further encouraged by the apparent cessation of trade hostilities between the United States and China late in 2019, although some of these gains were reversed in January 2020, as the spread of the coronavirus injected uncertainty into markets.
Returns for most securities were particularly strong in the second half of the reporting period, as investors began to realize that the U.S. economy was maintaining the modest yet steady growth that has characterized this economic cycle. In the United States, large-cap stocks led the broader market, while small-cap equities still posted healthy returns. Emerging market stocks, however, were constrained by coronavirus fears, losing most of their gains near the end of the reporting period.
Fixed-income securities played an important role in diversified portfolios by delivering strong returns amid economic uncertainty, as interest rates declined (and bond prices rose). Long-term bonds, particularly long-term Treasuries, generally posted the strongest returns, as inflation remained low despite an uptick late in the reporting period. Investment-grade and high-yield corporate bonds also posted solid returns, as the credit fundamentals in corporate markets remained relatively solid.
Continuing the shift toward looser monetary policy that began in early 2019, the U.S. Federal Reserve (the “Fed”) increased efforts to stimulate economic activity. The Fed reduced interest rates three times during the reporting period, from July 2019 to October 2019. In December 2019, the Fed further reassured markets by indicating that it is unlikely to reverse course and tighten monetary policy in the near future. Following in the Fed’s footsteps, the European Central Bank announced aggressive economic stimulus measures, including lower interest rates and the return of its bond purchasing program. The Bank of Japan continued its accommodative monetary policy, while China committed to looser credit conditions and an increase in fiscal spending.
The outpouring of global economic stimulus led to a sharp rally in risk assets throughout the world despite the headwind of rising geopolitical and trade tensions. Hopes continued to remain high as the current economic expansion became the longest in U.S. history.
Looking ahead, we believe there are reasons to remain cautious about the U.S. economy, most notably the uncertainty around the duration of the impact of the coronavirus-driven economic contraction, the U.S. presidential election and future earnings growth. At this time we are watching the developments around the world very closely to assess the full extent of the risks of economic disruption that could result from the global pandemic. Corporate earnings underperformed in 2019, but action by the Fed led to outstanding equity returns. With the future of monetary policy and consumer behaviors uncertain, earnings deterioration could act as a drag on equities.
Overall, we favor moderately increasing investment risk to benefit from expected growth. We are neutral on U.S. equities, but we favor emerging market and Japanese equities, which could benefit from an uptick in global trade and investment. Increasing cyclical exposure through value-style investing and maintaining a meaningful emphasis on high-quality companies through quality factors also makes sense for diversified investors. In fixed income, extremely low yields and inflation risk limit the effectiveness of many bond classes as a counterweight in portfolios. We favor higher-yielding bonds from emerging markets, where central banks have more room for further accommodation, while strategically using U.S. Treasuries as stabilizers.
In this environment, investors need to think globally, extend their scope across a broad array of asset classes, and be nimble as market conditions change. We encourage you to talk with your financial advisor and visit blackrock.com for further insight about investing in today’s markets.
Sincerely,

Rob Kapito
President, BlackRock Advisors, LLC

Rob Kapito
President, BlackRock Advisors, LLC
| | | | |
| Total Returns as of January 31, 2020 |
| | | 6-month | | 12-month |
U.S. large cap equities
(S&P 500® Index) | | 9.31% | | 21.68% |
U.S. small cap equities
(Russell 2000® Index) | | 3.26 | | 9.21 |
International equities
(MSCI Europe, Australasia, Far East Index) | | 6.12 | | 12.10 |
Emerging market equities
(MSCI Emerging Markets Index) | | 3.36 | | 3.81 |
3-month Treasury bills
(ICE BofAML 3-Month U.S. Treasury Bill Index) | | 0.98 | | 2.22 |
U.S. Treasury securities
(ICE BofAML 10-Year U.S. Treasury Index) | | 5.13 | | 12.15 |
U.S. investment grade bonds
(Bloomberg Barclays U.S. Aggregate Bond Index) | | 4.20 | | 9.64 |
Tax-exempt municipal bonds
(S&P Municipal Bond Index) | | 3.08 | | 8.21 |
U.S. high yield bonds
(Bloomberg Barclays U.S. Corporate High Yield 2% Issuer Capped Index) | | 3.43 | | 9.40 |
| Past performance is no guarantee of future results. Index performance is shown for illustrative purposes only. You cannot invest directly in an index. |
| | |
| 2 | | THIS PAGE IS NOT PART OF YOUR FUND REPORT |
Table of Contents
Municipal Market Overview For the Reporting Period Ended January 31, 2020
Municipal Market Conditions
| | |
Municipal bonds posted strong total returns during the period, buoyed by a combination of rallying interest rates and a favorable technical backdrop. Interest rates moved lower in 2019 as the Fed turned more dovish on the back of slowing global growth and trade uncertainties, indicated a commitment to sustain the current economic expansion, and executed a mid-cycle adjustment consisting of three 0.25% rate cuts. This dynamic was compounded in early 2020 as elevated event risks, led by increased U.S. conflict with Iran and a coronavirus pandemic, spurred a flight to quality. At the same time, | | S&P Municipal Bond Index Total Returns as of January 31, 2020 6 months: 3.08% 12 months: 8.21% |
|
|
|
municipal bond technicals remained supportive with historically robust demand outpacing moderate supply. During the 12 months ended January 31, 2020, municipal bond funds experienced net inflows totaling $98 billion (based on data from the Investment Company Institute). Broadly, investors favored the tax-exempt income, diversification, quality, and value of municipal bonds given that tax reform ultimately lowered the top individual tax rate just 2.6% while eliminating deductions. For the same 12-month period, total new issuance was slightly above average from a historical perspective at $409 billion, but was boosted by robust taxable municipal supply. Taxable municipal bond issuance picked up late in 2019, as issuers advance refunded tax-exempt debt using taxable municipal bonds for cost savings. While increasing issuance totals, this dynamic ultimately shrank the size of the tax-exempt market and provided a positive technical tailwind for the natural buyer of the asset class.
A Closer Look at Yields
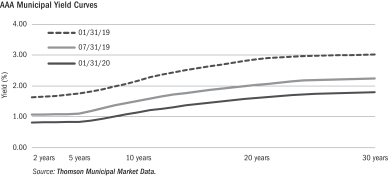
| From January 31, 2019 to January 31, 2020, yields on AAA-rated 30-year municipal bonds decreased by 122 basis points (“bps”) from 3.02% to 1.80%, while ten-year rates decreased by 102 bps from 2.17% to 1.15% and five-year rates decreased by 92 bps from 1.76% to 0.84% (as measured by Thomson Municipal Market Data). As a result, the municipal yield curve flattened over the 12-month period with the spread between two- and 30-year maturities flattening by 40 bps, compared to 14 bps of steepening in the comparable U.S. Treasury curve. |
During the same time period, tax-exempt municipal bonds outperformed duration-matched U.S. Treasuries, most notably in the long end of the yield curve. Consequently, relative valuations remained stretched versus history. Given that the corporate tax rate was lowered much more than the individual rate, institutions now have less incentive to own tax-exempt municipal bonds, while individuals are more incentivized. In a more retail-driven market, lower municipal-to-Treasury ratios are likely sustainable as individuals are focused more on generating tax-free income and less concerned with relative valuations. The asset class is known for its lower relative volatility and preservation of principal with an emphasis on income as tax rates rise.
Financial Conditions of Municipal Issuers
Most states and localities are on solid footing as tax receipts are increasing steadily and spending levels are rebounding from post-recession lows. Rising healthcare expenditures and legacy pension costs are plaguing a handful of high-profile credits. Essential service revenue bonds continue to benefit from deleveraging. Several private-public partnerships and off-balance sheet projects have made headlines for cost-overruns that are calling into question their value add. More caution is warranted in the non-profit sectors, especially less-selective private education credits that are dealing with competitive pressures and are burdened with outsized debt. Merger and acquisition activity has been elevated in the hospital sector, providing opportunities to generate performance. Additionally, high yield remains an important driver of performance. BlackRock maintains the view that municipal bond defaults will remain minimal and the overall market is fundamentally sound. However, we continue to advocate careful credit research and believe that a thoughtful approach to structure and security selection remains imperative amid uncertainty in a modestly improving economic environment.
The opinions expressed are those of BlackRock as of January 31, 2020 and are subject to change at any time due to changes in market or economic conditions. The comments should not be construed as a recommendation of any individual holdings or market sectors. Investing involves risk including loss of principal. Bond values fluctuate in price so the value of your investment can go down depending on market conditions. Fixed income risks include interest-rate and credit risk. Typically, when interest rates rise, there is a corresponding decline in bond values. Credit risk refers to the possibility that the bond issuer will not be able to make principal and interest payments. There may be less information on the financial condition of municipal issuers than for public corporations. The market for municipal bonds may be less liquid than for taxable bonds. Some investors may be subject to Alternative Minimum Tax (“AMT”). Capital gains distributions, if any, are taxable.
The S&P Municipal Bond Index, a broad, market value-weighted index, seeks to measure the performance of the U.S. municipal bond market. All bonds in the index are exempt from U.S. federal income taxes or subject to the AMT. Past performance is no guarantee of future results. Index performance is shown for illustrative purposes only. It is not possible to invest directly in an index.
| | |
| 4 | | 2020 BLACKROCK SEMI-ANNUAL REPORT TO SHAREHOLDERS |
The Benefits and Risks of Leveraging
The Trusts may utilize leverage to seek to enhance the distribution rate on, and net asset value (“NAV”) of, their common shares (“Common Shares”). However, there is no guarantee that these objectives can be achieved in all interest rate environments.
In general, the concept of leveraging is based on the premise that the financing cost of leverage, which is based on short-term interest rates, is normally lower than the income earned by a Trust on its longer-term portfolio investments purchased with the proceeds from leverage. To the extent that the total assets of the Trusts (including the assets obtained from leverage) are invested in higher-yielding portfolio investments, the Trusts’ shareholders benefit from the incremental net income. The interest earned on securities purchased with the proceeds (after paying the leverage costs) from leverage is paid to shareholders in the form of dividends, and the value of these portfolio holdings (less the leverage liability) is reflected in the per share NAV.
To illustrate these concepts, assume a Trust’s Common Shares capitalization is $100 million and it utilizes leverage for an additional $30 million, creating a total value of $130 million available for investment in longer-term income securities. If prevailing short-term interest rates are 3% and longer-term interest rates are 6%, the yield curve has a strongly positive slope. In this case, a Trust’s financing costs on the $30 million of proceeds obtained from leverage are based on the lower short-term interest rates. At the same time, the securities purchased by a Trust with the proceeds from leverage earn income based on longer-term interest rates. In this case, a Trust’s financing cost of leverage is significantly lower than the income earned on a Trust’s longer-term investments acquired from such leverage proceeds, and therefore the holders of Common Shares (“Common Shareholders”) are the beneficiaries of the incremental net income.
However, in order to benefit Common Shareholders, the return on assets purchased with leverage proceeds must exceed the ongoing costs associated with the leverage. If interest and other costs of leverage exceed the Trusts’ return on assets purchased with leverage proceeds, income to shareholders is lower than if the Trusts had not used leverage. Furthermore, the value of the Trusts’ portfolio investments generally varies inversely with the direction of long-term interest rates, although other factors can influence the value of portfolio investments. In contrast, the value of the Trusts’ obligations under their respective leverage arrangements generally does not fluctuate in relation to interest rates. As a result, changes in interest rates can influence the Trusts’ NAVs positively or negatively. Changes in the future direction of interest rates are very difficult to predict accurately, and there is no assurance that the Trusts’ intended leveraging strategy will be successful.
The use of leverage also generally causes greater changes in each Trust’s NAV, market price and dividend rates than comparable portfolios without leverage. In a declining market, leverage is likely to cause a greater decline in the NAV and market price of a Trust’s Common Shares than if the Trust were not leveraged. In addition, each Trust may be required to sell portfolio securities at inopportune times or at distressed values in order to comply with regulatory requirements applicable to the use of leverage or as required by the terms of leverage instruments, which may cause the Trusts to incur losses. The use of leverage may limit a Trust’s ability to invest in certain types of securities or use certain types of hedging strategies. Each Trust incurs expenses in connection with the use of leverage, all of which are borne by Common Shareholders and may reduce income to the Common Shares. Moreover, to the extent the calculation of the Trusts’ investment advisory fees includes assets purchased with the proceeds of leverage, the investment advisory fees payable to the Trusts’ investment adviser will be higher than if the Trusts did not use leverage.
To obtain leverage, each Trust has issued Variable Rate Demand Preferred Shares (“VRDP Shares”), Variable Rate Muni Term Preferred Shares (“VMTP Shares”) or Remarketable Variable Rate Muni Term Preferred Shares (“RVMTP Shares”) (collectively, “Preferred Shares”) and/or leveraged its assets through the use of tender option bond trusts (“TOB Trusts”) as described in the Notes to Financial Statements.
Under the Investment Company Act of 1940, as amended (the “1940 Act”), each Trust is permitted to issue debt up to 33 1/3% of its total managed assets or equity securities (e.g., Preferred Shares) up to 50% of its total managed assets. A Trust may voluntarily elect to limit its leverage to less than the maximum amount permitted under the 1940 Act. In addition, a Trust may also be subject to certain asset coverage, leverage or portfolio composition requirements imposed by the Preferred Shares’ governing instruments or by agencies rating the Preferred Shares, which may be more stringent than those imposed by the 1940 Act.
If a Trust segregates or designates on its books and records cash or liquid assets having a value not less than the value of a Trust’s obligations under the TOB Trust (including accrued interest), then the TOB Trust is not considered a senior security and is not subject to the foregoing limitations and requirements imposed by the 1940 Act.
Derivative Financial Instruments
The Trusts may invest in various derivative financial instruments. These instruments are used to obtain exposure to a security, commodity, index, market, and/or other assets without owning or taking physical custody of securities, commodities and/or other referenced assets or to manage market, equity, credit, interest rate, foreign currency exchange rate, commodity and/or other risks. Derivative financial instruments may give rise to a form of economic leverage and involve risks, including the imperfect correlation between the value of a derivative financial instrument and the underlying asset, possible default of the counterparty to the transaction or illiquidity of the instrument. The Trusts’ successful use of a derivative financial instrument depends on the investment adviser’s ability to predict pertinent market movements accurately, which cannot be assured. The use of these instruments may result in losses greater than if they had not been used, may limit the amount of appreciation a Trust can realize on an investment and/or may result in lower distributions paid to shareholders. The Trusts’ investments in these instruments, if any, are discussed in detail in the Notes to Financial Statements.
| | | | |
| THE BENEFITS AND RISKS OF LEVERAGING / DERIVATIVE FINANCIAL INSTRUMENTS | | | 5 | |
| | |
| Trust Summary as of January 31, 2020 | | BlackRock California Municipal Income Trust |
Trust Overview
BlackRock California Municipal Income Trust’s (BFZ) (the “Trust”) investment objective is to provide current income exempt from regular U.S. federal income and California income taxes. The Trust seeks to achieve its investment objective by investing primarily in municipal obligations exempt from U.S. federal income taxes (except that the interest may be subject to the federal alternative minimum tax) and California income taxes. The Trust invests, under normal market conditions, at least 80% of its assets in municipal obligations that are investment grade quality, or are considered by the Trust’s investment adviser to be of comparable quality, at the time of investment. The Trust may invest directly in securities or synthetically through the use of derivatives.
No assurance can be given that the Trust’s investment objective will be achieved.
Trust Information
| | |
Symbol on New York Stock Exchange (“NYSE”) | | BFZ |
Initial Offering Date | | July 27, 2001 |
Yield on Closing Market Price as of January 31, 2020 ($14.23)(a) | | 3.20% |
Tax Equivalent Yield(b) | | 6.97% |
Current Monthly Distribution per Common Share(c) | | $0.0380 |
Current Annualized Distribution per Common Share(c) | | $0.4560 |
Leverage as of January 31, 2020(d) | | 40% |
| | (a) | Yield on closing market price is calculated by dividing the current annualized distribution per share by the closing market price. Past performance does not guarantee future results. | |
| | (b) | Tax equivalent yield assumes the maximum marginal U.S. federal and state tax rate of 54.10%, which includes the 3.8% Medicare tax. Actual tax rates will vary based on income, exemptions and deductions. Lower taxes will result in lower tax equivalent yields. | |
| | (c) | The distribution rate is not constant and is subject to change. A portion of the distribution may be deemed a return of capital or net realized gain. | |
| | (d) | Represents VMTP Shares and TOB Trusts as a percentage of total managed assets, which is the total assets of the Trust, including any assets attributable to VMTP Shares and TOB Trusts, minus the sum of accrued liabilities. Does not reflect derivatives or other instruments that may give rise to economic leverage. For a discussion of leveraging techniques utilized by the Trust, please see The Benefits and Risks of Leveraging and Derivative Financial Instruments on page 5. | |
Performance
Returns for the six months ended January 31, 2020 were as follows:
| | | | | | | | |
| | | Returns Based On | |
| | | Market Price | | | NAV | |
BFZ(a)(b) | | | 7.27 | % | | | 5.58 | % |
Lipper California Municipal Debt Funds(c) | | | 5.74 | | | | 5.32 | |
| | (a) | All returns reflect reinvestment of dividends and/or distributions at actual reinvestment prices. | |
| | (b) | The Trust’s discount to NAV narrowed during the period, which accounts for the difference between performance based on market price and performance based on NAV. | |
| | (c) | Average return. Returns reflect reinvestment of dividends and/or distributions at NAV on the ex-dividend date as calculated by Lipper. | |
Performance results may include adjustments made for financial reporting purposes in accordance with U.S. generally accepted accounting principles.
Past performance is no guarantee of future results.
The following discussion relates to the Trust’s absolute performance based on NAV:
After moving sideways for much of the period, municipal bonds finished with positive returns thanks to their rally in January. In fact, January represented the highest one-month return for U.S. municipal issues in six years (as measured by the S&P Municipal Bond Index). The gains for the broader bond market reflected the backdrop of weaker economic data and worries about the spread of coronavirus. (Bond prices rise as yields fall.) The favorable combination of robust investor demand and relatively limited new-issue supply also provided an additional tailwind for tax-exempt securities.
California municipal debt finished slightly ahead of the national index, as the repeal of federal, state and local tax deductions fueled continued demand in high-tax states.
The Trust sought to manage interest rate risk using U.S. Treasury futures. Given that U.S. Treasury yields fell, as prices rose, this strategy detracted from Trust performance. Conversely, the Trust benefited from its position in longer-duration securities. (Duration is a measure of interest-rate sensitivity.) At the sector level, positions in transportation, tax-backed local, school district, utility and education issues provided the strongest returns.
The views expressed reflect the opinions of BlackRock as of the date of this report and are subject to change based on changes in market, economic or other conditions. These views are not intended to be a forecast of future events and are no guarantee of future results.
| | |
| 6 | | 2020 BLACKROCK SEMI-ANNUAL REPORT TO SHAREHOLDERS |
| | |
| Trust Summary as of January 31, 2020 (continued) | | BlackRock California Municipal Income Trust |
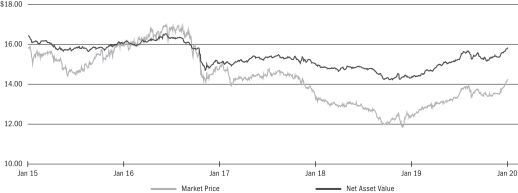
Market Price and Net Asset Value Per Share Summary
| | | | | | | | | | | | | | | | | | | | |
| | | 01/31/20 | | | 07/31/19 | | | Change | | | High | | | Low | |
Market Price | | $ | 14.23 | | | $ | 13.50 | | | | 5.41 | % | | $ | 14.24 | | | $ | 13.34 | |
Net Asset Value | | | 15.82 | | | | 15.25 | | | | 3.74 | | | | 15.82 | | | | 15.17 | |
Market Price and Net Asset Value History For the Past Five Years
Overview of the Trust’s Total Investments *
SECTOR ALLOCATION
| | | | | | | | |
| Sector | | 01/31/20 | | | 07/31/19 | |
County/City/Special District/School District | | | 35 | % | | | 36 | % |
Transportation | | | 19 | | | | 17 | |
Utilities | | | 14 | | | | 15 | |
Education | | | 12 | | | | 11 | |
Health | | | 10 | | | | 11 | |
State | | | 6 | | | | 6 | |
Tobacco | | | 3 | | | | 4 | |
Housing | | | 1 | | | | — | (b) |
| | | For Trust compliance purposes, the Trust’s sector classifications refer to one or more of the sector sub-classifications used by one or more widely recognized market indexes or rating group indexes, and/or as defined by the investment adviser. These definitions may not apply for purposes of this report, which may combine such sector sub-classifications for reporting ease. | |
CALL /MATURITY SCHEDULE (c)
| | | | |
Calendar Year Ended December 31, | | | | |
2020 | | | 4 | % |
2021 | | | 6 | |
2022 | | | 3 | |
2023 | | | 6 | |
2024 | | | 6 | |
| | (c) | Scheduled maturity dates and/or bonds that are subject to potential calls by issuers over the next five years. | |
| | * | Excludes short-term securities. | |
CREDIT QUALITY ALLOCATION (a)
| | | | | | | | |
| Credit Rating | | 01/31/20 | | | 07/31/19 | |
AAA/Aaa | | | 14 | % | | | 9 | % |
AA/Aa | | | 70 | | | | 73 | |
A | | | 6 | | | | 11 | |
BBB/Baa | | | — | (b) | | | — | (b) |
BB/Ba | | | 1 | | | | 1 | |
B | | | 1 | | | | — | |
CC | | | — | | | | 1 | |
N/R | | | 8 | | | | 5 | |
| | (a) | For financial reporting purposes, credit quality ratings shown above reflect the highest rating assigned by either S&P Global Ratings or Moody’s Investors Service (“Moody’s”) if ratings differ. These rating agencies are independent, nationally recognized statistical rating organizations and are widely used. Investment grade ratings are credit ratings of BBB/Baa or higher. Below investment grade ratings are credit ratings of BB/Ba or lower. Investments designated N/R are not rated by either rating agency. Unrated investments do not necessarily indicate low credit quality. Credit quality ratings are subject to change. | |
| | (b) | Represents less than 1% of the Trust’s total investments | |
| | |
| Trust Summary as of January 31, 2020 | | BlackRock Municipal 2030 Target Term Trust |
Trust Overview
BlackRock Municipal 2030 Target Term Trust’s (BTT) (the “Trust”) investment objectives are to provide current income exempt from regular U.S. federal income tax (but which may be subject to the federal alternative minimum tax in certain circumstances) and to return $25.00 per common share (the initial offering price per share) to holders of common shares on or about December 31, 2030. The Trust seeks to achieve its investment objectives by investing at least 80% of its assets in municipal bonds exempt from U.S. federal income taxes (except that the interest may be subject to the federal alternative minimum tax). The Trust invests at least 80% of its assets in municipal bonds that are investment grade quality, or are considered by the Trust’s investment adviser to be of comparable quality, at the time of investment. The Trust actively manages the maturity of its bonds to seek to have a dollar weighted average effective maturity approximately equal to the Trust’s maturity date. The Trust may invest directly in securities or synthetically through the use of derivatives.
There is no assurance that the Trust will achieve its investment objectives, including its investment objective of returning $25.00 per share.
Trust Information
| | |
Symbol on NYSE | | BTT |
Initial Offering Date | | August 30, 2012 |
Termination Date (on or about) | | December 31, 2030 |
Yield on Closing Market Price as of January 31, 2020 ($24.56)(a) | | 3.05% |
Tax Equivalent Yield(b) | | 5.15% |
Current Monthly Distribution per Common Share(c) | | $0.0624 |
Current Annualized Distribution per Common Share(c) | | $0.7488 |
Leverage as of January 31, 2020(d) | | 35% |
| | (a) | Current Distribution Rate on closing market price is calculated by dividing the current annualized distribution per share by the closing market price. The current distribution rate may consist of income, net realized gains and/or a return of capital. See the financial highlights for the actual sources and character of distributions. Past performance does not guarantee future results. | |
| | (b) | Tax equivalent yield assumes the maximum marginal U.S. federal tax rate of 40.80%, which includes the 3.8% Medicare tax. Actual tax rates will vary based on income, exemptions and deductions. Lower taxes will result in lower tax equivalent yields. | |
| | (c) | The distribution rate is not constant and is subject to change. | |
| | (d) | Represents RVMTP Shares and TOB Trusts as a percentage of total managed assets, which is the total assets of the Trust, including any assets attributable to RVMTP Shares and TOB Trusts, minus the sum of accrued liabilities. Does not reflect derivatives or other instruments that may give rise to economic leverage. For a discussion of leveraging techniques utilized by the Trust, please see The Benefits and Risks of Leveraging and Derivative Financial Instruments on page 5. | |
Performance
Returns for the six months ended January 31, 2020 were as follows:
| | | | | | | | |
| | | Returns Based On | |
| | | Market Price | | | NAV | |
BTT(a)(b) | | | 6.18 | % | | | 5.76 | % |
Lipper General & Insured Municipal Debt Funds (Leveraged)(c) | | | 4.81 | | | | 5.01 | |
| | (a) | All returns reflect reinvestment of dividends and/or distributions at actual reinvestment prices. | |
| | (b) | The Trust’s discount to NAV narrowed during the period, which accounts for the difference between performance based on market price and performance based on NAV. | |
| | (c) | Average return. Returns reflect reinvestment of dividends and/or distributions at NAV on the ex-dividend date as calculated by Lipper. | |
Performance results may include adjustments made for financial reporting purposes in accordance with U.S. generally accepted accounting principles.
Past performance is no guarantee of future results.
The following discussion relates to the Trust’s absolute performance based on NAV:
After moving sideways for much of the period, municipal bonds finished with positive returns thanks to a rally in January. In fact, January represented the highest one-month return for the broader U.S. municipal bond market in six years (as measured by the S&P Municipal Bond Index). The bond market’s advance reflected the backdrop of weaker economic data and worries about the spread of coronavirus. (Bond prices rise as interest rates fall.) The favorable combination of robust investor demand and relatively limited new-issue supply also provided a tailwind for the tax-exempt market.
Positions in high yield debt, which outperformed on the strength of solid credit fundamentals and investors’ appetite for yield, contributed to Trust performance. The Trust’s holdings in Puerto Rico were particularly strong performers. At the sector level, health care, transportation and tobacco issues were key contributors. In addition, the Trust’s use of leverage aided results by enhancing income and amplifying the effect of rising prices. On the negative side, reinvestment risk remained a headwind since as the proceeds from bonds that matured or were called needed to be reinvested at lower yields compared to bonds that were issued when yields were higher.
The views expressed reflect the opinions of BlackRock as of the date of this report and are subject to change based on changes in market, economic or other conditions. These views are not intended to be a forecast of future events and are no guarantee of future results.
| | |
| 8 | | 2020 BLACKROCK SEMI-ANNUAL REPORT TO SHAREHOLDERS |
| | |
| Trust Summary as of January 31, 2020 (continued) | | BlackRock Municipal 2030 Target Term Trust |
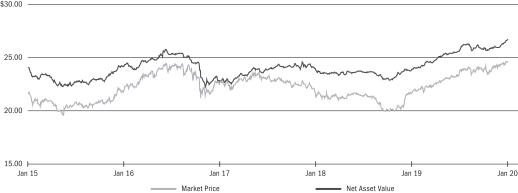
Market Price and Net Asset Value Per Share Summary
| | | | | | | | | | | | | | | | | | | | |
| | | 01/31/20 | | | 07/31/19 | | | Change | | | High | | | Low | |
Market Price | | $ | 24.56 | | | $ | 23.49 | | | | 4.56 | % | | $ | 24.65 | | | $ | 23.37 | |
Net Asset Value | | | 26.66 | | | | 25.60 | | | | 4.14 | | | | 26.66 | | | | 25.60 | |
Market Price and Net Asset Value History For the Past Five Years
Overview of the Trust’s Total Investments *
SECTOR ALLOCATION
| | | | | | | | |
| Sector | | 01/31/20 | | | 07/31/19 | |
Transportation | | | 23 | % | | | 24 | % |
Health | | | 17 | | | | 18 | |
State | | | 16 | | | | 15 | |
County/City/Special District/School District | | | 14 | | | | 14 | |
Corporate | | | 9 | | | | 9 | |
Education | | | 8 | | | | 8 | |
Utilities | | | 8 | | | | 7 | |
Tobacco | | | 3 | | | | 3 | |
Housing | | | 2 | | | | 2 | |
| | | For Trust compliance purposes, the Trust’s sector classifications refer to one or more of the sector sub-classifications used by one or more widely recognized market indexes or rating group indexes, and/or as defined by the investment adviser. These definitions may not apply for purposes of this report, which may combine such sector sub-classifications for reporting ease. | |
CALL/MATURITY SCHEDULE (c)
| | | | |
Calendar Year Ended December 31, | | | | |
2020 | | | 3 | % |
2021 | | | 1 | |
2022 | | | 26 | |
2023 | | | 9 | |
2024 | | | 5 | |
| | (c) | Scheduled maturity dates and/or bonds that are subject to potential calls by issuers over the next five years. | |
| | * | Excludes short-term securities. | |
CREDIT QUALITY ALLOCATION (a)
| | | | | | | | |
| Credit Rating | | 01/31/20 | | | 07/31/19 | |
AAA/Aaa | | | 3 | % | | | 4 | % |
AA/Aa | | | 29 | | | | 30 | |
A | | | 39 | | | | 37 | |
BBB/Baa | | | 15 | | | | 15 | |
BB/Ba | | | 4 | | | | 3 | |
B | | | 1 | | | | 2 | |
N/R(b) | | | 9 | | | | 9 | |
| | (a) | For financial reporting purposes, credit quality ratings shown above reflect the highest rating assigned by either S&P Global Ratings or Moody’s if ratings differ. These rating agencies are independent, nationally recognized statistical rating organizations and are widely used. Investment grade ratings are credit ratings of BBB/Baa or higher. Below investment grade ratings are credit ratings of BB/Ba or lower. Investments designated N/R are not rated by either rating agency. Unrated investments do not necessarily indicate low credit quality. Credit quality ratings are subject to change. | |
| | (b) | The investment adviser evaluates the credit quality of unrated investments based upon certain factors including, but not limited to, credit ratings for similar investments and financial analysis of sectors and individual investments. Using this approach, the investment adviser has deemed certain of these unrated securities as investment grade quality. As of January 31, 2020 and July 31, 2019, the market value of unrated securities deemed by the investment adviser to be investment grade represents less than 1% of the Trust’s total investments. | |
| | |
| Trust Summary as of January 31, 2020 | | BlackRock Municipal Income Investment Trust |
Trust Overview
BlackRock Municipal Income Investment Trust’s (BBF) (the “Trust”) investment objective is to provide current income exempt from regular U.S. federal income tax. The Trust seeks to achieve its investment objective by investing at least 80% of its assets in municipal bonds, the interest of which is exempt from U.S. federal income taxes. The Trust invests at least 80% of its assets in municipal bonds that are investment grade quality, or are considered by the Trust’s investment adviser to be of comparable quality, at the time of investment. The Trust may invest directly in such securities or synthetically through the use of derivatives.
No assurance can be given that the Trust’s investment objective will be achieved.
Trust Information
| | |
Symbol on NYSE | | BBF |
Initial Offering Date | | July 27, 2001 |
Yield on Closing Market Price as of January 31, 2020 ($14.03)(a) | | 4.32% |
Tax Equivalent Yield(b) | | 7.30% |
Current Monthly Distribution per Common Share(c) | | $0.0505 |
Current Annualized Distribution per Common Share(c) | | $0.6060 |
Leverage as of January 31, 2020(d) | | 39% |
| | (a) | Yield on closing market price is calculated by dividing the current annualized distribution per share by the closing market price. Past performance does not guarantee future results. | |
| | (b) | Tax equivalent yield assumes the maximum marginal U.S. federal tax rate of 40.80%, which includes the 3.8% Medicare tax. Actual tax rates will vary based on income, exemptions and deductions. Lower taxes will result in lower tax equivalent yields. | |
| | (c) | The distribution rate is not constant and is subject to change. A portion of the distribution may be deemed a return of capital or net realized gain. | |
| | (d) | Represents VRDP Shares and TOB Trusts as a percentage of total managed assets, which is the total assets of the Trust, including any assets attributable to VRDP Shares and TOB Trusts, minus the sum of accrued liabilities. Does not reflect derivatives or other instruments that may give rise to economic leverage. For a discussion of leveraging techniques utilized by the Trust, please see The Benefits and Risks of Leveraging and Derivative Financial Instruments on page 5. | |
Performance
Returns for the six months ended January 31, 2020 were as follows:
| | | | | | | | |
| | | Returns Based On | |
| | | Market Price | | | NAV | |
BBF(a)(b) | | | 0.71 | % | | | 5.40 | % |
Lipper General & Insured Municipal Debt Funds (Leveraged)(c) | | | 4.81 | | | | 5.01 | |
| | (a) | All returns reflect reinvestment of dividends and/or distributions at actual reinvestment prices. | |
| | (b) | The Trust moved from a premium to NAV to a discount during the period, which accounts for the difference between performance based on market price and performance based on NAV. | |
| | (c) | Average return. Returns reflect reinvestment of dividends and/or distributions at NAV on the ex-dividend date as calculated by Lipper. | |
Performance results may include adjustments made for financial reporting purposes in accordance with U.S. generally accepted accounting principles.
Past performance is no guarantee of future results.
The following discussion relates to the Trust’s absolute performance based on NAV:
After moving sideways for much of the period, municipal bonds finished with positive returns thanks to their rally in January. In fact, January represented the highest one-month return for U.S. municipal issues in six years (as measured by the S&P Municipal Bond Index). The gains for the broader bond market reflected the backdrop of weaker economic data and worries about the spread of coronavirus. (Bond prices rise as yields fall.) The favorable combination of robust investor demand and relatively limited new-issue supply provided an additional tailwind for tax-exempt securities.
An allocation to bonds with maturities of 20 years and above helped Trust performance, as longer-term issues outperformed. The Trust’s use of leverage aided results by enhancing income and amplifying the effect of rising prices. At the sector level, state tax-backed and health care issues were strong contributors. Performance in the tax-backed space was highlighted by strength in Puerto Rico bonds backed by sales taxes. Positions in BBB, AA and A rated debt further contributed.
The Trust sought to manage interest rate risk using U.S. Treasury futures. Since U.S. Treasury yields fell, as prices rose, this strategy detracted from Trust performance. Reinvestment risk continued to be a headwind since the proceeds from bonds that matured or were called needed to be reinvested at lower yields compared to bonds that were issued when yields were higher. In addition, positions in shorter-term bonds lagged relative to those with longer-dated maturities.
The views expressed reflect the opinions of BlackRock as of the date of this report and are subject to change based on changes in market, economic or other conditions. These views are not intended to be a forecast of future events and are no guarantee of future results.
| | |
| 10 | | 2020 BLACKROCK SEMI-ANNUAL REPORT TO SHAREHOLDERS |
| | |
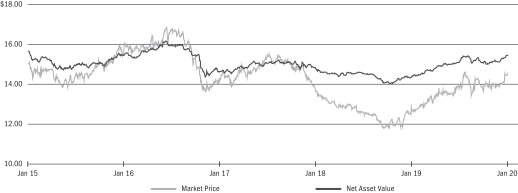
| Trust Summary as of January 31, 2020 (continued) | | BlackRock Municipal Income Investment Trust |
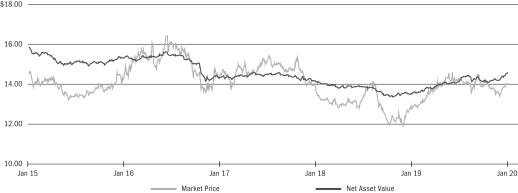
Market Price and Net Asset Value Per Share Summary
| | | | | | | | | | | | | | | | | | | | |
| | | 01/31/20 | | | 07/31/19 | | | Change | | | High | | | Low | |
Market Price | | $ | 14.03 | | | $ | 14.25 | | | | (1.54 | )% | | $ | 14.49 | | | $ | 13.34 | |
Net Asset Value | | | 14.57 | | | | 14.14 | | | | 3.04 | | | | 14.57 | | | | 14.08 | |
Market Price and Net Asset Value History For the Past Five Years
Overview of the Trust’s Total Investments *
SECTOR ALLOCATION
| | | | | | | | |
| Sector | | 01/31/20 | | | 07/31/19 | |
Transportation | | | 23 | % | | | 21 | % |
Health | | | 19 | | | | 20 | |
County/City/Special District/School District | | | 19 | | | | 21 | |
State | | | 9 | | | | 8 | |
Utilities | | | 8 | | | | 9 | |
Housing | | | 8 | | | | 8 | |
Tobacco | | | 7 | | | | 7 | |
Education | | | 6 | | | | 5 | |
Corporate | | | 1 | | | | 1 | |
| | | For Trust compliance purposes, the Trust’s sector classifications refer to one or more of the sector sub-classifications used by one or more widely recognized market indexes or rating group indexes, and/or as defined by the investment adviser. These definitions may not apply for purposes of this report, which may combine such sector sub-classifications for reporting ease. | |
CALL/MATURITY SCHEDULE (c)
| | | | |
Calendar Year Ended December 31, | | | | |
2020 | | | 10 | % |
2021 | | | 12 | |
2022 | | | 3 | |
2023 | | | 16 | |
2024 | | | 2 | |
| | (c) | Scheduled maturity dates and/or bonds that are subject to potential calls by issuers over the next five years. | |
| | * | Excludes short-term securities. | |
CREDIT QUALITY ALLOCATION (a)
| | | | | | | | |
| Credit Rating | | 01/31/20 | | | 07/31/19 | |
AAA/Aaa | | | 6 | % | | | 5 | % |
AA/Aa | | | 35 | | | | 30 | |
A | | | 22 | | | | 26 | |
BBB/Baa | | | 14 | | | | 15 | |
BB/Ba | | | 4 | | | | 2 | |
B | | | 2 | | | | 2 | |
C | | | — | | | | 1 | |
N/R(b) | | | 17 | | | | 19 | |
| | (a) | For financial reporting purposes, credit quality ratings shown above reflect the highest rating assigned by either S&P Global Ratings or Moody’s if ratings differ. These rating agencies are independent, nationally recognized statistical rating organizations and are widely used. Investment grade ratings are credit ratings of BBB/Baa or higher. Below investment grade ratings are credit ratings of BB/Ba or lower. Investments designated N/R are not rated by either rating agency. Unrated investments do not necessarily indicate low credit quality. Credit quality ratings are subject to change. | |
| | (b) | The investment adviser evaluates the credit quality of unrated investments based upon certain factors including, but not limited to, credit ratings for similar investments and financial analysis of sectors and individual investments. Using this approach, the investment adviser has deemed certain of these unrated securities as investment grade quality. As of January 31, 2020 and July 31, 2019, the market value of unrated securities deemed by the investment adviser to be investment grade represents 10% and 1%, respectively, of the Trust’s total investments. | |
| | |
| Trust Summary as of January 31, 2020 | | BlackRock New York Municipal Income Trust |
Trust Overview
BlackRock New York Municipal Income Trust’s (BNY) (the “Trust”) investment objective is to provide current income exempt from regular U.S. federal income tax and New York State and New York City personal income taxes. The Trust seeks to achieve its investment objective by investing primarily in municipal bonds exempt from U.S. federal income taxes (except that the interest may be subject to the federal alternative minimum tax) and New York State and New York City personal income taxes. The Trust invests at least 80% of its assets in municipal bonds that are investment grade quality, or are considered by the Trust’s investment adviser to be of comparable quality, at the time of investment. The Trust may invest directly in securities or synthetically through the use of derivatives.
No assurance can be given that the Trust’s investment objective will be achieved.
Trust Information
| | |
Symbol on NYSE | | BNY |
Initial Offering Date | | July 27, 2001 |
Yield on Closing Market Price as of January 31, 2020 ($14.53)(a) | | 3.80% |
Tax Equivalent Yield(b) | | 7.54% |
Current Monthly Distribution per Common Share(c) | | $0.0460 |
Current Annualized Distribution per Common Share(c) | | $0.5520 |
Leverage as of January 31, 2020(d) | | 40% |
| | (a) | Yield on closing market price is calculated by dividing the current annualized distribution per share by the closing market price. Past performance does not guarantee future results. | |
| | (b) | Tax equivalent yield assumes the maximum marginal U.S. federal and state tax rate of 49.62%, which includes the 3.8% Medicare tax. Actual tax rates will vary based on income, exemptions and deductions. Lower taxes will result in lower tax equivalent yields. | |
| | (c) | The monthly distribution per Common Share, declared on March 2, 2020, was increased to $0.0480 per share. The yield on closing market price, tax equivalent yield, current monthly distribution per Common Share, and current annualized distribution per Common Share do not reflect the new distribution rate. The distribution rate is not constant and is subject to change in the future. A portion of the distribution may be deemed a return of capital or net realized gain. | |
| | (d) | Represents VMTP Shares and TOB Trusts as a percentage of total managed assets, which is the total assets of the Trust, including any assets attributable to VMTP Shares and TOB Trusts, minus the sum of accrued liabilities. Does not reflect derivatives or other instruments that may give rise to economic leverage. For a discussion of leveraging techniques utilized by the Trust, please see The Benefits and Risks of Leveraging and Derivative Financial Instruments on page 5. | |
Performance
Returns for the six months ended January 31, 2020 were as follows:
| | | | | | | | |
| | | Returns Based On | |
| | | Market Price | | | NAV | |
BNY(a)(b) | | | 7.26 | % | | | 4.37 | % |
Lipper New York Municipal Debt Funds(c) | | | 5.82 | | | | 4.57 | |
| | (a) | All returns reflect reinvestment of dividends and/or distributions at actual reinvestment prices. | |
| | (b) | The Trust’s discount to NAV narrowed during the period, which accounts for the difference between performance based on market price and performance based on NAV. | |
| | (c) | Average return. Returns reflect reinvestment of dividends and/or distributions at NAV on the ex-dividend date as calculated by Lipper. | |
Performance results may include adjustments made for financial reporting purposes in accordance with U.S. generally accepted accounting principles.
Past performance is no guarantee of future results.
The following discussion relates to the Trust’s absolute performance based on NAV:
After moving sideways for much of the period, municipal bonds finished with positive returns thanks to their rally in January. In fact, January represented the highest one-month return for U.S. municipal issues in six years (as measured by the S&P Municipal Bond Index). The gains for the broader bond market reflected the backdrop of weaker economic data and worries about the spread of coronavirus. (Bond prices rise as yields fall.) The favorable combination of robust investor demand and relatively limited new-issue supply provided an additional tailwind for tax-exempt securities.
Trends in the New York market reflected those on the national level, with falling yields, strong inflows, and limited new-issue supply. While the state underperformed the broader U.S. market, New York still produced a solid return as investors in high-tax states continued to seek shelter in tax-exempt bonds.
The Trust sought to manage interest rate risk using U.S. Treasury futures. Since U.S. Treasury yields fell, as prices rose, this strategy detracted from Trust performance. Reinvestment risk continued to be a headwind since the proceeds from bonds that matured or were called needed to be reinvested at lower yields compared to bonds that were issued when yields were higher. In addition, positions in shorter-term bonds lagged relative to those with longer-dated maturities.
On the positive side, an allocation to bonds with maturities of 20 years and above helped performance. The Trust’s use of leverage aided results by enhancing income and amplifying the effect of rising prices. At the sector level, state tax-backed, local tax-backed and transportation issues were strong contributors. Performance in the tax-backed space was highlighted by strength in Puerto Rico bonds backed by sales taxes. Positions in AA and A rated debt further contributed to Trust performance.
The views expressed reflect the opinions of BlackRock as of the date of this report and are subject to change based on changes in market, economic or other conditions. These views are not intended to be a forecast of future events and are no guarantee of future results.
| | |
| 12 | | 2020 BLACKROCK SEMI-ANNUAL REPORT TO SHAREHOLDERS |
| | |
| Trust Summary as of January 31, 2020 (continued) | | BlackRock New York Municipal Income Trust |
Market Price and Net Asset Value Per Share Summary
| | | | | | | | | | | | | | | | | | | | |
| | | 01/31/20 | | | 07/31/19 | | | Change | | | High | | | Low | |
Market Price | | $ | 14.53 | | | $ | 13.81 | | | | 5.21 | % | | $ | 14.65 | | | $ | 13.40 | |
Net Asset Value | | | 15.45 | | | | 15.09 | | | | 2.39 | | | | 15.45 | | | | 15.00 | |
Market Price and Net Asset Value History For the Past Five Years
Overview of the Trust’s Total Investments *
SECTOR ALLOCATION
| | | | | | | | |
| Sector | | 01/31/20 | | | 07/31/19 | |
Transportation | | | 23 | % | | | 22 | % |
County/City/Special District/School District | | | 23 | | | | 25 | |
Education | | | 14 | | | | 15 | |
Utilities | | | 12 | | | | 12 | |
State | | | 10 | | | | 10 | |
Health | | | 8 | | | | 7 | |
Housing | | | 5 | | | | 4 | |
Corporate | | | 3 | | | | 3 | |
Tobacco | | | 2 | | | | 2 | |
| | | For Trust compliance purposes, the Trust’s sector classifications refer to one or more of the sector sub-classifications used by one or more widely recognized market indexes or rating group indexes, and/or as defined by the investment adviser. These definitions may not apply for purposes of this report, which may combine such sector sub-classifications for reporting ease. | |
CALL/MATURITY SCHEDULE (c)
| | | | |
Calendar Year Ended December 31, | | | | |
2020 | | | 8 | % |
2021 | | | 20 | |
2022 | | | 12 | |
2023 | | | 9 | |
2024 | | | 11 | |
| | (c) | Scheduled maturity dates and/or bonds that are subject to potential calls by issuers over the next five years. | |
| | * | Excludes short-term securities. | |
CREDIT QUALITY ALLOCATION (a)
| | | | | | | | |
| Credit Rating | | 01/31/20 | | | 07/31/19 | |
AAA/Aaa | | | 10 | % | | | 11 | % |
AA/Aa | | | 47 | | | | 46 | |
A | | | 23 | | | | 23 | |
BBB/Baa | | | 8 | | | | 9 | |
BB/Ba | | | 1 | | | | 2 | |
B | | | 1 | | | | 1 | |
N/R(b) | | | 10 | | | | 8 | |
| | (a) | For financial reporting purposes, credit quality ratings shown above reflect the highest rating assigned by either S&P Global Ratings or Moody’s if ratings differ. These rating agencies are independent, nationally recognized statistical rating organizations and are widely used. Investment grade ratings are credit ratings of BBB/Baa or higher. Below investment grade ratings are credit ratings of BB/Ba or lower. Investments designated N/R are not rated by either rating agency. Unrated investments do not necessarily indicate low credit quality. Credit quality ratings are subject to change. | |
| | (b) | The investment adviser evaluates the credit quality of unrated investments based upon certain factors including, but not limited to, credit ratings for similar investments and financial analysis of sectors and individual investments. Using this approach, the investment adviser has deemed certain of these unrated securities as investment grade quality. As of January 31, 2020 and July 31, 2019, the market value of unrated securities deemed by the investment adviser to be investment grade represents less than 1% and 4%, respectively, of the Trust’s total investments. | |
| | |
Schedule of Investments (unaudited) January 31, 2020 | | BlackRock California Municipal Income Trust (BFZ) (Percentages shown are based on Net Assets) |
| | | | | | | | |
| Security | | Par
(000) | | | Value | |
|
Municipal Bonds — 91.0% | |
|
California — 85.5% | |
|
| County/City/Special District/School District — 22.4% | |
California Municipal Finance Authority, RB, Series A: | | | | | | | | |
Orange County Civic Center Infrastructure Improvement Program Phase I, 5.00%, 06/01/42 | | $ | 5,000 | | | $ | 6,145,050 | |
Orange County Civic Center Infrastructure Improvement Program Phase II, 5.00%, 06/01/43 | | | 2,545 | | | | 3,173,946 | |
California Statewide Communities Development Authority, RB, Lancer Educational Student Housing Project, 5.00%, 06/01/51(a) | | | 240 | | | | 279,480 | |
California Statewide Communities Development Authority, Special Assessment, Statewide Community Infrastructure Program, Series A: | | | | | | | | |
5.00%, 09/02/39 | | | 290 | | | | 341,719 | |
5.00%, 09/02/44 | | | 170 | | | | 197,693 | |
5.00%, 09/02/48 | | | 170 | | | | 197,120 | |
City of San Jose California Hotel Tax, RB, Convention Center Expansion & Renovation Project: | | | | | | | | |
6.13%, 05/01/31 | | | 500 | | | | 530,975 | |
6.50%, 05/01/36 | | | 1,210 | | | | 1,289,025 | |
6.50%, 05/01/42 | | | 2,225 | | | | 2,365,954 | |
County of Los Angeles California Metropolitan Transportation Authority, Refunding RB, Series A, 5.00%, 07/01/42 | | | 6,000 | | | | 7,461,480 | |
County of Riverside California Public Financing Authority, RB, Capital Facilities Project, 5.25%, 11/01/45 | | | 8,990 | | | | 10,899,925 | |
County of San Joaquin California Transportation Authority, Refunding RB, Limited Tax, Measure K, Series A, 6.00%, 03/01/21(b) | | | 2,880 | | | | 3,038,573 | |
Fremont Union High School District, GO, Series A, 4.00%, 08/01/40 | | | 4,000 | | | | 4,650,880 | |
Glendale Community California College District, GO, Election of 2016, Series A, 5.25%, 08/01/41 | | | 5,000 | | | | 6,316,100 | |
Natomas Unified School District, GO, (AGM), 3.00%, 08/01/45 | | | 1,890 | | | | 1,947,513 | |
Sacramento Area Flood Control Agency, Refunding, Consolidated Capital Assessment District, 5.00%, 10/01/41 | | | 8,000 | | | | 9,749,200 | |
San Diego Unified School District, GO, Series C, 0.00%, 07/01/40(c) | | | 7,215 | | | | 4,435,854 | |
San Francisco Bay Area Rapid Transit District, GO, Green Bond, Series F-1: | | | | | | | | |
Election of 2004, 3.00%, 08/01/38 | | | 5,000 | | | | 5,436,800 | |
3.00%, 08/01/37 | | | 3,930 | | | | 4,217,519 | |
San Jose California Financing Authority, Refunding LRB, Civic Center Project, Series A, 5.00%, 06/01/32 | | | 3,375 | | | | 3,810,949 | |
San Leandro California Unified School District, GO, Election of 2010, Series A, 5.75%, 08/01/41 | | | 3,060 | | | | 3,265,510 | |
Santa Monica Public Financing Authority, RB, Downtown Fire Station Project, 5.00%, 07/01/42 | | | 1,250 | | | | 1,551,662 | |
State of California, GO, Refunding, Various Purposes-Bid Group, 5.00%, 08/01/37 | | | 15,000 | | | | 19,207,800 | |
Tustin California School District, GO, Election of 2008, Series B, 5.25%, 08/01/21(b) | | | 3,445 | | | | 3,669,511 | |
Washington Township Health Care District, GO, Election of 2004, Series B, 5.50%, 08/01/38 | | | 1,625 | | | | 1,918,621 | |
West Contra Costa California Unified School District, GO, Election of 2012, Series A, 5.50%, 08/01/39 | | | 2,500 | | | | 2,865,550 | |
West Valley-Mission Community College District, GO, Series A, 4.00%, 08/01/44 | | | 3,670 | | | | 4,326,122 | |
| | | | | | | | |
| | | | | | | 113,290,531 | |
| | | | | | | | |
| Security | | Par
(000) | | | Value | |
|
| Education — 6.3% | |
California Educational Facilities Authority, Refunding RB, San Francisco University, 6.13%, 10/01/21(b) | | $ | 6,280 | | | $ | 6,824,790 | |
California Enterprise Development Authority, RB, Academy for Academic Excellence Project, Series A(a)(d): | | | | | | | | |
5.00%, 07/01/50 | | | 1,200 | | | | 1,353,732 | |
5.00%, 07/01/55 | | | 600 | | | | 673,506 | |
California Municipal Finance Authority, RB: | | | | | | | | |
Emerson College, 5.75%, 01/01/22(b) | | | 2,500 | | | | 2,731,500 | |
John Adams Academy, Series A,
5.00%, 10/01/39(a) | | | 220 | | | | 238,302 | |
John Adams Academy, Series A,
5.00%, 10/01/49(a) | | | 370 | | | | 394,035 | |
John Adams Academy, Series A,
5.00%, 10/01/57(a) | | | 725 | | | | 767,362 | |
California Municipal Finance Authority, Refunding RB: | | | | | | | | |
The Master’s University, 5.00%, 08/01/48 | | | 105 | | | | 120,195 | |
The Master’s University, 5.00%, 08/01/34 | | | 750 | | | | 893,302 | |
William Jessup University, 5.00%, 08/01/39 | | | 425 | | | | 491,653 | |
William Jessup University, 5.00%, 08/01/48 | | | 510 | | | | 579,681 | |
California Public Finance Authority, RB, Trinity Classical Academy Project, Series A, 5.00%, 07/01/54(a) | | | 285 | | | | 303,200 | |
California School Finance Authority, RB(a): | | | | | | | | |
Arts in Action Charter Schools, 5.00%, 06/01/40 | | | 270 | | | | 302,160 | |
Arts in Action Charter Schools, 5.00%, 06/01/50 | | | 430 | | | | 475,129 | |
Arts in Action Charter Schools, 5.00%, 06/01/59 | | | 685 | | | | 752,240 | |
Real Journey Academies, Series A, 5.00%, 06/01/58 | | | 2,120 | | | | 2,237,384 | |
Teach Public Schools, Series A, 5.00%, 06/01/49 | | | 1,000 | | | | 1,100,240 | |
University of California, Refunding RB: | | | | | | | | |
General, Series AZ, 5.00%, 05/15/43 | | | 5,000 | | | | 6,254,100 | |
Series AR, 5.00%, 05/15/38 | | | 4,250 | | | | 5,206,462 | |
| | | | | | | | |
| | | | | | | 31,698,973 | |
|
| Health — 8.2% | |
California Health Facilities Financing Authority, RB: | | | | | | | | |
Children’s Hospital, Series A, 5.25%, 11/01/41 | | | 8,500 | | | | 9,109,450 | |
Sutter Health, Series A, 5.00%, 11/15/41 | | | 3,000 | | | | 3,526,680 | |
Sutter Health, Series B, 6.00%, 08/15/20(b) | | | 6,015 | | | | 6,179,029 | |
California Health Facilities Financing Authority, Refunding RB: | | | | | | | | |
Providence St.Joseph Health, Series A, 3.00%, 10/01/41 | | | 280 | | | | 289,316 | |
Sutter Health, Series B, 5.00%, 11/15/46 | | | 5,000 | | | | 5,963,650 | |
California Municipal Finance Authority, Refunding RB, Series A(a): | | | | | | | | |
5.00%, 11/01/39 | | | 195 | | | | 225,796 | |
5.00%, 11/01/49 | | | 220 | | | | 253,385 | |
California Statewide Communities Development Authority, RB, Loma Linda University Medical Center, 5.50%, 12/01/58(a) | | | 930 | | | | 1,112,847 | |
California Statewide Communities Development Authority, Refunding RB, Trinity Health Credit Group Composite Issue, 5.00%, 12/01/21(b) | | | 4,000 | | | | 4,300,200 | |
California Statewide Communities Development Authority, Special Assessment Bonds, S/F Housing, Statewide Community Infrastructure Program, Series C, 5.00%, 09/02/44 | | | 595 | | | | 691,937 | |
State of California Public Works Board, Refunding RB, Various Capital Projects, Series C, 5.00%, 11/01/34 | | | 7,750 | | | | 9,593,493 | |
| | | | | | | | |
| | | | | | | 41,245,783 | |
|
| Housing — 1.1% | |
California Community Housing Agency, RB, M/F Housing, Series A(a): | | | | | | | | |
Annadel Apartments, 5.00%, 04/01/49 | | | 3,470 | | | | 3,934,459 | |
Serenity at Larkspur, 5.00%, 02/01/50(d) | | | 1,300 | | | | 1,534,468 | |
California Housing Finance, RB, S/F Housing, Series A, 4.25%, 01/15/35 | | | 1 | | | | 882 | |
| | | | | | | | |
| | | | | | | 5,469,809 | |
| | |
| 14 | | 2020 BLACKROCK SEMI-ANNUAL REPORT TO SHAREHOLDERS |
| | |
Schedule of Investments (unaudited) (continued) January 31, 2020 | | BlackRock California Municipal Income Trust (BFZ) (Percentages shown are based on Net Assets) |
| | | | | | | | |
| Security | | Par
(000) | | | Value | |
|
| State — 3.4% | |
Hayward Area Recreation & Park District, GO, Series A, 5.00%, 08/01/42 | | $ | 4,950 | | | $ | 6,198,687 | |
State of California Public Works Board, LRB, Various Capital Projects, Series I, 5.50%, 11/01/33 | | | 4,940 | | | | 5,756,582 | |
State of California Public Works Board, RB, Department of Corrections & Rehabilitation, Series F, 5.25%, 09/01/33 | | | 4,335 | | | | 4,986,767 | |
| | | | | | | | |
| | | | | | | 16,942,036 | |
|
| Tobacco — 5.2% | |
County of California Tobacco Securitization Agency, Refunding RB, Asset-Backed, Merced County, Series A, 5.25%, 06/01/45 | | | 1,135 | | | | 1,146,838 | |
Golden State Tobacco Securitization Corp., Refunding RB: | | | | | | | | |
Series A-1, 5.00%, 06/01/47 | | | 18,670 | | | | 19,634,119 | |
Series A-2, 5.00%, 06/01/47 | | | 475 | | | | 499,529 | |
Tobacco Securitization Authority of Northern California, Refunding RB, Asset-Backed Bonds, Series A-1, 5.38%, 06/01/38 | | | 2,000 | | | | 2,021,580 | |
Tobacco Securitization Authority of Southern California, Refunding RB, Tobacco Asset Securitization Corporation, 5.00%, 06/01/48 | | | 2,695 | | | | 3,220,794 | |
| | | | | | | | |
| | | | | | | 26,522,860 | |
|
| Transportation — 18.0% | |
California Municipal Finance Authority, Refunding ARB, United Airlines, Inc. Project, AMT, 4.00%, 07/15/29 | | | 4,375 | | | | 5,148,850 | |
City & County of San Francisco Airports San Francisco International Airport, Refunding ARB, AMT, Series E, 5.00%, 05/01/40 | | | 1,250 | | | | 1,564,538 | |
City & County of San Francisco California Airports Commission, Refunding ARB, Series A, AMT, 5.00%, 05/01/42 | | | 16,535 | | | | 20,080,269 | |
City of Los Angeles California Department of Airports, ARB, Los Angeles International Airport, AMT: | | | | | | | | |
Series A, 5.00%, 05/15/37 | | | 3,515 | | | | 4,374,488 | |
Series A, 5.00%, 05/15/44 | | | 2,885 | | | | 3,543,992 | |
Series B, 5.00%, 05/15/36 | | | 2,600 | | | | 3,134,534 | |
Sub-Series A, 5.00%, 05/15/42 | | | 3,220 | | | | 3,806,426 | |
City of Los Angeles California Department of Airports, Refunding ARB, AMT: | | | | | | | | |
Los Angeles International Airport, 5.00%, 05/15/36 | | | 600 | | | | 762,912 | |
Subordinate, Series A, 5.00%, 05/15/38 | | | 5,000 | | | | 6,316,000 | |
City of Los Angeles Department of Airports, ARB: | | | | | | | | |
Los Angeles International Airport, AMT, 4.00%, 05/15/44 | | | 4,000 | | | | 4,584,480 | |
Los Angeles International Airport, Series A, AMT, 5.25%, 05/15/38 | | | 3,565 | | | | 4,529,725 | |
Los Angeles International Airport, Series E, 5.00%, 05/15/44 | | | 4,000 | | | | 5,059,600 | |
City of San Jose California, Refunding ARB, Norman Y Mineta San Jose International Airport SJC, Series A-1, AMT: | | | | | | | | |
5.75%, 03/01/34 | | | 3,875 | | | | 4,063,015 | |
6.25%, 03/01/34 | | | 2,650 | | | | 2,792,994 | |
County of Sacramento California Airport System Revenue, Refunding ARB, Senior Series A, 5.00%, 07/01/41 | | | 13,500 | | | | 16,442,055 | |
Port of Los Angeles California Harbor Department, Refunding RB, Series A, AMT, 5.00%, 08/01/44 | | | 4,135 | | | | 4,766,621 | |
| | | | | | | | |
| | | | | | | 90,970,499 | |
|
| Utilities — 20.9% | |
City & County of San Francisco Public Utilities Commission Wastewater Revenue, RB, Series B, 5.00%, 10/01/43 | | | 2,485 | | | | 3,125,807 | |
City of Los Angeles California Department of Water & Power, RB, Power System, Series A, 5.00%, 07/01/42 | | | 10,670 | | | | 13,088,782 | |
City of Los Angeles California Department of Water & Power, Refunding RB, Series B, 5.00%, 07/01/43 | | | 6,675 | | | | 8,449,215 | |
| | | | | | | | |
| Security | | Par
(000) | | | Value | |
|
| Utilities (continued) | |
City of Los Angeles Department of Airports, Refunding ARB, Subordinate, Los Angeles International Airports, AMT, 5.00%, 05/15/44 | | $ | 3,000 | | | $ | 3,742,350 | |
City of Petaluma California Wastewater Revenue, Refunding RB, 6.00%, 05/01/21(b) | | | 5,625 | | | | 5,982,525 | |
City of San Francisco California Public Utilities Commission Water Revenue, RB, Sub-Series A, 5.00%, 11/01/21(b) | | | 2,800 | | | | 2,999,752 | |
City of San Francisco California Public Utilities Commission Water Revenue, Refunding RB, Green Bond, Series D, 5.00%, 11/01/32 | | | 7,090 | | | | 9,136,103 | |
Dublin-San Ramon Services District Water Revenue, Refunding RB, 6.00%, 02/01/21(b) | | | 2,425 | | | | 2,548,311 | |
East Bay California Municipal Utility District Water System Revenue, RB: | | | | | | | | |
Green Bond, Series A, 5.00%, 06/01/45 | | | 3,230 | | | | 4,002,939 | |
Water System, Series C, 4.00%, 06/01/45 | | | 5,000 | | | | 5,576,850 | |
El Dorado Irrigation District, Refunding RB, Series A (AGM), 5.25%, 03/01/39 | | | 10,000 | | | | 11,656,000 | |
Los Angeles Department of Water, Refunding RB, Series A: | | | | | | | | |
5.00%, 07/01/41 | | | 5,000 | | | | 6,170,400 | |
5.25%, 07/01/44 | | | 3,000 | | | | 3,762,180 | |
Water System, 5.00%, 07/01/44 | | | 1,500 | | | | 1,842,900 | |
Los Angeles Department of Water & Power System Revenue, RB, Series B, 5.00%, 07/01/38 | | | 3,000 | | | | 3,622,500 | |
Rancho Water District Financing Authority, Refunding RB, Series A, 4.00%, 08/01/39 | | | 6,795 | | | | 8,216,106 | |
South Coast Water District Financing Authority, Refunding RB, Series A, 5.00%, 02/01/44 | | | 9,130 | | | | 11,503,618 | |
| | | | | | | | |
| | | | | | | 105,426,338 | |
| | | | | | | | |
| |
Total Municipal Bonds in California | | | | 431,566,829 | |
| | | | | | | | |
|
Puerto Rico — 5.5% | |
|
| State — 3.9% | |
Puerto Rico Sales Tax Financing Corp. Sales Tax Revenue, RB, Restructured: | | | | | | | | |
CAB, Series A-1, 0.00%, 07/01/46(c) | | | 3,157 | | | | 922,097 | |
Series A-1, 4.75%, 07/01/53 | | | 2,467 | | | | 2,729,612 | |
Series A-1, 5.00%, 07/01/58 | | | 9,125 | | | | 10,248,470 | |
Series A-2, 4.33%, 07/01/40 | | | 2,588 | | | | 2,809,792 | |
Series A-2, 4.78%, 07/01/58 | | | 2,530 | | | | 2,797,775 | |
| | | | | | | | |
| | | | | | | 19,507,746 | |
|
| Tobacco — 0.1% | |
Children’s Trust Fund, Refunding RB, Tobacco Settlement Asset-Backed Bonds, 5.50%, 05/15/39 | | | 505 | | | | 513,534 | |
| | | | | | | | |
|
| Utilities — 1.5% | |
Puerto Rico Commonwealth Aqueduct & Sewer Authority, RB, Senior Lien, Series A: | | | | | | | | |
5.00%, 07/01/33 | | | 3,865 | | | | 4,111,510 | |
5.13%, 07/01/37 | | | 1,105 | | | | 1,178,228 | |
Puerto Rico Commonwealth Aqueduct & Sewer Authority, Refunding RB, Senior Lien, Series A, 6.00%, 07/01/38 | | | 2,550 | | | | 2,602,377 | |
| | | | | | | | |
| | | | | | | 7,892,115 | |
| | | | | | | | |
| |
Total Municipal Bonds in Puerto Rico | | | | 27,913,395 | |
| | | | | | | | |
| |
Total Municipal Bonds — 91.0%
(Cost — $422,884,686) | | | | 459,480,224 | |
| | | | | |
| | | | |
| SCHEDULES OF INVESTMENTS | | | 15 | |
| | |
Schedule of Investments (unaudited) (continued) January 31, 2020 | | BlackRock California Municipal Income Trust (BFZ) (Percentages shown are based on Net Assets) |
| | | | | | | | |
| Security | | Par
(000) | | | Value | |
|
Municipal Bonds Transferred to Tender Option Bond Trusts(e) — 76.0% | |
|
California — 76.0% | |
|
| County/City/Special District/School District — 36.0% | |
County of Los Angeles California Metropolitan Transportation Authority, RB, Green Bond, Series A, 5.00%, 07/01/44 | | $ | 11,200 | | | $ | 14,198,464 | |
County of Santa Clara California Financing Authority, RB, Series A, 4.00%, 05/01/45 | | | 22,230 | | | | 25,669,648 | |
Los Angeles Community College District California, GO, Election of 2008, Series C, 5.25%, 08/01/20(b)(f) | | | 12,903 | | | | 13,181,846 | |
Palomar Community College District, GO, Election of 2006, Series C, 5.00%, 08/01/44 | | | 15,140 | | | | 18,195,252 | |
San Diego Unified School District California, GO, Election of 2012, Series I, 5.00%, 07/01/47 | | | 10,000 | | | | 12,263,400 | |
San Francisco Bay Area Rapid Transit District, GO, Green Bond, Series B-1, 3.00%, 08/01/49 | | | 9,965 | | | | 10,515,964 | |
San Francisco California Bay Area Rapid Transit District, GO, Election of 2016, Green Bond, Series A, 5.00%, 08/01/47 | | | 10,615 | | | | 13,191,362 | |
San Joaquin California Delta Community College District, GO, Election of 2004, Series C, 5.00%, 08/01/39 | | | 14,505 | | | | 16,720,199 | |
San Jose Unified School District, GO, Series C, 4.00%, 08/01/39 | | | 6,100 | | | | 6,772,586 | |
Santa Monica Community College District, GO, Election of 2016, Series A, 5.00%, 08/01/43 | | | 10,000 | | | | 12,523,700 | |
State of California, GO, Refunding: | | | | | | | | |
3.00%, 10/01/37 | | | 17,130 | | | | 18,630,074 | |
4.00%, 10/01/39 | | | 16,620 | | | | 19,923,890 | |
| | | | | | | | |
| | | | | | | 181,786,385 | |
|
| Education — 13.0% | |
University of California, RB: | | | | | | | | |
Limited Project, Series M, 5.00%, 05/15/42 | | | 10,000 | | | | 12,375,200 | |
Series AM, 5.25%, 05/15/44 | | | 5,000 | | | | 5,837,800 | |
University of California, Refunding RB: | | | | | | | | |
Series A, 5.00%, 11/01/43 | | | 11,792 | | | | 14,257,176 | |
Series AI, 5.00%, 05/15/38 | | | 14,225 | | | | 16,034,990 | |
Series I, 5.00%, 05/15/40 | | | 14,065 | | | | 16,807,248 | |
| | | | | | | | |
| | | | | | | 65,312,414 | |
|
| Health — 8.9% | |
California Health Facilities Financing Authority, RB, Sutter Health, Series A: | | | | | | | | |
5.00%, 11/15/41 | | | 11,620 | | | | 13,660,007 | |
5.00%, 08/15/52 | | | 9,695 | | | | 10,682,727 | |
California Statewide Communities Development Authority, RB, Kaiser Permanente, Series A, 5.00%, 04/01/42 | | | 18,960 | | | | 20,474,335 | |
| | | | | | | | |
| | | | | | | 44,817,069 | |
|
| State — 2.5% | |
University of California, Refunding RB, Series AR, 5.00%, 05/15/41 | | | 10,165 | | | | 12,362,977 | |
| | | | | | | | |
|
| Transportation — 14.1% | |
City & County of San Francisco California, COP, Green Bond, 49 South Van Ness Project, 4.00%, 04/01/43 | | | 10,865 | | | | 12,340,462 | |
City & County of San Francisco California Airports Commission, Refunding RB, San Francisco International Airport, Series B, AMT, 5.00%, 05/01/41 | | | 8,720 | | | | 10,433,916 | |
City of Los Angeles California Department of Airports, ARB, AMT: | | | | | | | | |
Los Angeles International Airport, Sub-Series A, 5.00%, 05/15/42 | | | 22,710 | | | | 26,845,941 | |
Series D, 5.00%, 05/15/41 | | | 18,632 | | | | 21,738,015 | |
| | | | | | | | |
| | | | | | | 71,358,334 | |
| | | | | | | | |
| Security | | Par
(000) | | | Value | |
|
| Utilities — 1.5% | |
Los Angeles Department of Water, Refunding RB, Series A, 5.00%, 07/01/46 | | $ | 6,412 | | | $ | 7,703,442 | |
| | | | | | | | |
| |
Total Municipal Bonds Transferred to Tender Option Bond Trusts — 76.0%
(Cost — $359,973,382) | | | | 383,340,621 | |
| | | | | |
| |
Total Long-Term Investments — 167.0%
(Cost — $782,858,068) | | | | 842,820,845 | |
| | | | | |
| | |
| | | Shares | | | | |
|
| Short-Term Securities — 0.2% | |
BlackRock Liquidity Funds California Money Fund, Institutional Class, 0.71%(g)(h) | | | 813,531 | | | | 813,694 | |
| | | | | | | | |
| |
Total Short-Term Securities — 0.2%
(Cost — $813,694) | | | | 813,694 | |
| | | | | |
| |
Total Investments — 167.2%
(Cost — $783,671,762) | | | | 843,634,539 | |
| |
Other Assets Less Liabilities — 0.8% | | | | 4,331,174 | |
| |
Liability for TOB Trust Certificates, Including Interest Expense and Fees Payable — (34.1)% | | | | (172,000,109 | ) |
| |
VMTP Shares, at Liquidation Value
Costs — (33.9)% | | | | (171,300,000 | ) |
| | | | | |
| |
Net Assets Applicable to Common Shares — 100.0% | | | $ | 504,665,604 | |
| | | | | |
| (a) | Security exempt from registration pursuant to Rule 144A under the Securities Act of 1933, as amended. These securities may be resold in transactions exempt from registration to qualified institutional investors. |
| (b) | U.S. Government securities held in escrow, are used to pay interest on this security as well as to retire the bond in full at the date indicated, typically at a premium to par. |
| (d) | When-issued security. |
| (e) | Represent bonds transferred to a TOB Trust in exchange of cash and residual certificates received by the Trust. These bonds serve as collateral in a secured borrowing. See Note 4 of the Notes to Financial Statements for details. |
| (f) | All or a portion of the security is subject to a recourse agreement. The aggregate maximum potential amount the Trust could ultimately be required to pay under the agreement, which expires on May 18, 2020, is $6,798,110. See Note 4 of the Notes to Financial Statements for details. |
| (g) | Annualized 7-day yield as of period end. |
| | |
| 16 | | 2020 BLACKROCK SEMI-ANNUAL REPORT TO SHAREHOLDERS |
| | |
Schedule of Investments (unaudited) (continued) January 31, 2020 | | BlackRock California Municipal Income Trust (BFZ) |
| (h) | During the six months ended January 31, 2020, investments in issuers considered to be an affiliate/affiliates of the Trust for purposes of Section 2(a)(3) of the Investment Company Act of 1940, as amended, were as follows: |
| | | | | | | | | | | | | | | | | | | | | | | | | | | | |
| Affiliate | | Shares
Held at
07/31/19 | | | Net
Activity | | | Shares
Held at
01/31/20 | | | Value at
01/31/20 | | | Income | | | Net
Realized
Gain (Loss) (a) | | | Change in
Unrealized
Appreciation
(Depreciation) | |
BlackRock Liquidity Funds California Money Fund, Institutional Class | | | — | | | | 813,531 | | | | 813,531 | | | $ | 813,694 | | | $ | 16,258 | | | $ | (4 | ) | | $ | — | |
| | | | | | | | | | | | | | | | | | | | | | | | | | | | |
| | (a) | Includes net capital gain distributions, if applicable. | |
For Trust compliance purposes, the Trust’s sector classifications refer to one or more of the sector sub-classifications used by one or more widely recognized market indexes or rating group indexes, and/or as defined by the investment adviser. These definitions may not apply for purposes of this report, which may combine such sector sub-classifications for reporting ease.
Derivative Financial Instruments Outstanding as of Period End
Futures Contracts
| | | | | | | | | | | | | | | | |
| Description | | Number of
Contracts | | | Expiration
Date | | | Notional
Amount (000) | | | Value/
Unrealized
Appreciation
(Depreciation) | |
Short Contracts | | | | | | | | | | | | | | | | |
10-Year U.S. Treasury Note | | | 121 | | | | 03/20/20 | | | $ | 15,930 | | | $ | (215,551 | ) |
U.S. Long Treasury Bond | | | 190 | | | | 03/20/20 | | | | 31,071 | | | | (746,614 | ) |
5-Year U.S. Treasury Note | | | 47 | | | | 03/31/20 | | | | 5,655 | | | | (60,242 | ) |
| | | | | | | | | | | | | | | | |
| | | | | | | | | | | | | | $ | (1,022,407 | ) |
| | | | | | | | | | | | | | | | |
Derivative Financial Instruments Categorized by Risk Exposure
As of period end, the fair values of derivative financial instruments located in the Statements of Assets and Liabilities were as follows:
| | | | | | | | | | | | | | | | | | | | | | | | | | | | |
| | | Commodity
Contracts | | | Credit
Contracts | | | Equity
Contracts | | | Foreign
Currency
Exchange
Contracts | | | Interest
Rate
Contracts | | | Other
Contracts | | | Total | |
Liabilities — Derivative Financial Instruments | | | | | | | | | | | | | | | | | | | | | | | | | | | | |
Futures contracts | | | | | | | | | | | | | | | | | | | | | | | | | | | | |
Unrealized depreciation on futures contracts(a) | | $ | — | | | $ | — | | | $ | — | | | $ | — | | | $ | 1,022,407 | | | $ | — | | | $ | 1,022,407 | |
| | | | | | | | | | | | | | | | | | | | | | | | | | | | |
| | (a) | Net cumulative unrealized appreciation (depreciation) on futures contracts and centrally cleared swaps, if any, are reported in the Schedule of Investments. In the Statements of Assets and Liabilities, only current day’s variation margin is reported in receivables or payables and the net cumulative unrealized appreciation (depreciation) is included in accumulated earnings (loss). | |
For the six months ended January 31, 2020, the effect of derivative financial instruments in the Statements of Operations were as follows:
| | | | | | | | | | | | | | | | | | | | | | | | | | | | |
| | | Commodity
Contracts | | | Credit
Contracts | | | Equity
Contracts | | | Foreign
Currency
Exchange
Contracts | | | Interest
Rate
Contracts | | | Other
Contracts | | | Total | |
Net Realized Gain (Loss) from: | | | | | | | | | | | | | | | | | | | | | | | | | | | | |
Futures contracts | | $ | — | | | $ | — | | | $ | — | | | $ | — | | | $ | (1,921,841 | ) | | $ | — | | | $ | (1,921,841 | ) |
| | | | | | | | | | | | | | | | | | | | | | | | | | | | |
| | | | | | | |
| Net Change in Unrealized Appreciation (Depreciation) on: | | | | | | | | | | | | | | | | | | | | | |
Futures contracts | | $ | — | | | $ | — | | | $ | — | | | $ | — | | | $ | (718,941 | ) | | $ | — | | | $ | (718,941 | ) |
| | | | | | | | | | | | | | | | | | | | | | | | | | | | |
Average Quarterly Balances of Outstanding Derivative Financial Instruments
| | | | |
Futures contracts: | |
Average notional value of contracts — long | | $ | — | (a) |
Average notional value of contracts — short | | | 43,352,965 | |
| | | | |
| | (a) | Derivative not held at quarter-end. The risk exposure table serves as an indicator of activity during the period. | |
For more information about the Trust’s investment risks regarding derivative financial instruments, refer to the Notes to Financial Statements
| | | | |
| SCHEDULES OF INVESTMENTS | | | 17 | |
| | |
Schedule of Investments (unaudited) (continued) January 31, 2020 | | BlackRock California Municipal Income Trust (BFZ) |
Fair Value Hierarchy as of Period End
Various inputs are used in determining the fair value of investments and derivative financial instruments. For information about the Trust’s policy regarding valuation of investments and derivative financial instruments, refer to the Notes to Financial Statements.
The following tables summarizes the Trust’s investments and derivative financial instruments categorized in the disclosure hierarchy:
| | | | | | | | | | | | | | | | |
| | | Level 1 | | | Level 2 | | | Level 3 | | | Total | |
Assets: | |
Investments: | |
Long-Term Investments(a) | | $ | — | | | $ | 842,820,845 | | | $ | — | | | $ | 842,820,845 | |
Short-Term Securities | | | 813,694 | | | | — | | | | — | | | | 813,694 | |
| | | | | | | | | | | | | | | | |
| | $ | 813,694 | | | $ | 842,820,845 | | | $ | | | | $ | 843,634,539 | |
| | | | | | | | | | | | | | | | |
Derivative Financial Instruments(b) | |
Liabilities: | |
Interest rate contracts | | $ | (1,022,407 | ) | | $ | — | | | $ | — | | | $ | (1,022,407 | ) |
| | | | | | | | | | | | | | | | |
| | (a) | See above Schedule of Investments for values in each sector. | |
| | (b) | Derivative financial instruments are futures contracts. Futures contracts are valued at the unrealized appreciation (depreciation) on the instrument. | |
The Trust may hold assets and/or liabilities in which the fair value approximates the carrying amount for financial statement purposes. As of period end, such assets and/or liabilities are categorized within the disclosure hierarchy as follows:
| | | | | | | | | | | | | | | | |
| | | Level 1 | | | Level 2 | | | Level 3 | | | Total | |
Liabilities: | |
TOB Trust Certificates | | $ | — | | | $ | (171,438,735 | ) | | $ | — | | | $ | (171,438,735 | ) |
VMTP Shares at Liquidation Value | | | — | | | | (171,300,000 | ) | | | — | | | | (171,300,000 | ) |
| | | | | | | | | | | | | | | | |
| | $ | — | | | $ | (342,738,735 | ) | | $ | — | | | $ | (342,738,735 | ) |
| | | | | | | | | | | | | | | | |
See notes to financial statements.
| | |
| 18 | | 2020 BLACKROCK SEMI-ANNUAL REPORT TO SHAREHOLDERS |
| | |
Schedule of Investments (unaudited) January 31, 2020 | | BlackRock Municipal 2030 Target Term Trust (BTT) (Percentages shown are based on Net Assets) |
| | | | | | | | |
| Security | | Par
(000) | | | Value | |
|
Municipal Bonds — 127.7% | |
|
| Alabama — 2.2% | |
Alabama Federal Aid Highway Finance Authority, RB, Series A: | | | | | | | | |
5.00%, 09/01/33 | | $ | 3,985 | | | $ | 4,968,538 | |
5.00%, 09/01/34 | | | 3,500 | | | | 4,350,955 | |
Alabama Special Care Facilities Financing Authority-Birmingham, Refunding RB, Children’s Hospital of Alabama, 5.00%, 06/01/30 | | | 10,000 | | | | 11,832,000 | |
Birmingham-Jefferson Civic Center Authority, Special Tax Bonds, Series A: | | | | | | | | |
5.00%, 07/01/31 | | | 1,100 | | | | 1,381,820 | |
5.00%, 07/01/32 | | | 1,150 | | | | 1,439,869 | |
5.00%, 07/01/33 | | | 1,600 | | | | 1,995,536 | |
County of Jefferson Alabama Sewer Revenue, Refunding RB, CAB, Senior Lien-Warrants, Series B (AGM)(a): | | | | | | | | |
0.00%, 10/01/31 | | | 7,375 | | | | 4,431,121 | |
0.00%, 10/01/32 | | | 6,295 | | | | 3,513,177 | |
0.00%, 10/01/33 | | | 1,275 | | | | 658,091 | |
Homewood Educational Building Authority, Refunding RB, Educational Facilities, Samford University, Series A: | | | | | | | | |
5.00%, 12/01/33 | | | 1,010 | | | | 1,217,484 | |
5.00%, 12/01/34 | | | 1,380 | | | | 1,658,001 | |
University of South Alabama, Refunding RB (AGM): | | | | | | | | |
5.00%, 11/01/29 | | | 1,105 | | | | 1,347,437 | |
5.00%, 11/01/30 | | | 2,000 | | | | 2,432,200 | |
| | | | | | | | |
| | | | | | | 41,226,229 | |
|
| Alaska — 0.1% | |
Northern Tobacco Securitization Corp., Refunding RB, Tobacco Settlement, Asset-Backed, Series A, 4.63%, 06/01/23 | | | 1,015 | | | | 1,016,330 | |
| | | | | | | | |
|
| Arizona — 2.0% | |
Arizona Health Facilities Authority, Refunding RB, Phoenix Children’s Hospital: | | | | | | | | |
Series A, 5.00%, 02/01/34 | | | 6,340 | | | | 6,815,944 | |
Series B, 5.00%, 02/01/33 | | | 1,810 | | | | 2,011,887 | |
Arizona IDA, RB(b): | | | | | | | | |
Leman Academy of Excellence, Series A, 4.00%, 07/01/29 | | | 4,135 | | | | 4,266,079 | |
Leman Academy of Excellence- Parker Colorado Campus Project, Series A, 4.50%, 07/01/29 | | | 765 | | | | 804,772 | |
Odyssey Preparatory Academy Project,
4.00%, 07/01/29 | | | 760 | | | | 788,356 | |
City of Phoenix Arizona IDA, RB, Facility: | | | | | | | | |
Candeo Schools, Inc. Project, 6.00%,
07/01/23(c) | | | 355 | | | | 384,270 | |
Eagle College Preparatory Project, Series A, 4.50%, 07/01/22 | | | 305 | | | | 313,857 | |
Eagle College Preparatory Project, Series A, 5.00%, 07/01/33 | | | 1,000 | | | | 1,036,050 | |
Legacy Traditional Schools Project, Series A, 5.75%, 07/01/24(b) | | | 750 | | | | 810,098 | |
City of Phoenix Arizona IDA, Refunding RB, Downtown Phoenix Student Housing, Series A, 5.00%, 07/01/29 | | | 175 | | | | 217,245 | |
County of Maricopa IDA, Refunding RB: | | | | | | | | |
Banner Health, Series A, 5.00%, 01/01/31 | | | 10,000 | | | | 12,288,400 | |
Legacy Traditional School Project, 4.00%, 07/01/29(b) | | | 855 | | | | 935,139 | |
County of Pima Arizona IDA, Refunding RB, Tucson Electric Power Co. Project, Series A, 4.00%, 09/01/29 | | | 6,000 | | | | 6,489,600 | |
| | | | | | | | |
| | | | | | | 37,161,697 | |
| | | | | | | | |
| Security | | Par
(000) | | | Value | |
|
| California — 7.8% | |
Alameda Corridor Transportation Authority, Refunding RB, CAB, Sub-Lien, Series A (AMBAC),
0.00%, 10/01/30(a) | | $ | 10,530 | | | $ | 8,223,614 | |
California Health Facilities Financing Authority, RB, Sutter Health, Series A: | | | | | | | | |
5.00%, 11/15/32 | | | 1,600 | | | | 2,021,408 | |
5.00%, 11/15/33 | | | 1,855 | | | | 2,336,873 | |
California Municipal Finance Authority, ARB, LINX APM Project, AMT, 5.00%, 12/31/33 | | | 4,000 | | | | 4,948,040 | |
California Municipal Finance Authority, RB: | | | | | | | | |
Biola University, 4.00%, 10/01/33 | | | 2,500 | | | | 2,711,025 | |
Senior, S/F Housing, Caritas Affordable Housing, Inc. Project, Series A, 5.00%, 08/15/30 | | | 1,000 | | | | 1,142,460 | |
California Municipal Finance Authority, Refunding RB, Eisenhower Medical Center, Series A: | | | | | | | | |
5.00%, 07/01/30 | | | 1,200 | | | | 1,473,156 | |
5.00%, 07/01/31 | | | 1,050 | | | | 1,284,486 | |
California School Finance Authority, RB(b): | | | | | | | | |
Arts in Action Charter Schools, 5.00%, 06/01/30 | | | 565 | | | | 645,546 | |
Real Journey Academies, Series A, 5.00%, 06/01/32 | | | 1,100 | | | | 1,213,256 | |
Teach Public Schools, Series A, 5.00%, 06/01/29 | | | 290 | | | | 331,241 | |
California Statewide Communities Development Authority, RB, Loma Linda University Medical Center(b): | | | | | | | | |
5.00%, 12/01/28 | | | 275 | | | | 340,395 | |
5.00%, 12/01/33 | | | 1,350 | | | | 1,625,711 | |
City of Long Beach California Harbor Revenue, RB, AMT, Series A: | | | | | | | | |
5.00%, 05/15/31 | | | 1,200 | | | | 1,498,296 | |
5.00%, 05/15/32 | | | 1,800 | | | | 2,244,204 | |
5.00%, 05/15/33 | | | 675 | | | | 839,680 | |
5.00%, 05/15/34 | | | 1,650 | | | | 2,046,858 | |
City of San Jose California, Refunding ARB, Norman Y Mineta San Jose International Airport SJC, Series A, AMT: | | | | | | | | |
5.00%, 03/01/30 | | | 500 | | | | 618,845 | |
5.00%, 03/01/31 | | | 1,500 | | | | 1,851,525 | |
5.00%, 03/01/32 | | | 1,000 | | | | 1,232,340 | |
5.00%, 03/01/33 | | | 975 | | | | 1,200,245 | |
5.00%, 03/01/34 | | | 1,250 | | | | 1,535,275 | |
5.00%, 03/01/35 | | | 2,000 | | | | 2,449,960 | |
Compton Unified School District, GO, Series B (BAM)(a): | | | | | | | | |
0.00%, 06/01/33 | | | 1,000 | | | | 706,340 | |
0.00%, 06/01/34 | | | 1,125 | | | | 777,330 | |
0.00%, 06/01/35 | | | 1,000 | | | | 665,850 | |
0.00%, 06/01/36 | | | 1,000 | | | | 631,140 | |
County of San Diego Regional Airport Authority, ARB, AMT, Sub-Series B, 5.00%, 07/01/33 | | | 1,000 | | | | 1,237,680 | |
El Camino Community College District Foundation, GO, CAB, Election of 2002, Series C(a): | | | | | | | | |
0.00%, 08/01/30 | | | 9,090 | | | | 7,627,328 | |
0.00%, 08/01/31 | | | 12,465 | | | | 10,216,563 | |
0.00%, 08/01/32 | | | 17,435 | | | | 13,874,773 | |
Golden State Tobacco Securitization Corp., Refunding RB, Series A-1, 5.00%, 06/01/29 | | | 14,500 | | | | 17,572,550 | |
Los Angeles California Unified School District, GO, Election of 2008, Series A, 4.00%, 07/01/33 | | | 3,000 | | | | 3,417,210 | |
Los Angeles Regional Airports Improvement Corp., Refunding RB, LAXFuel Corp., Los Angeles International, AMT, 5.00%, 01/01/32 | | | 4,110 | | | | 4,406,084 | |
M-S-R Energy Authority, RB, Series C, 6.13%, 11/01/29 | | | 2,465 | | | | 3,150,517 | |
Monterey Peninsula Community College District, GO, Refunding, CAB(a): | | | | | | | | |
0.00%, 08/01/30 | | | 3,500 | | | | 2,760,940 | |
0.00%, 08/01/31 | | | 5,940 | | | | 4,472,523 | |
| | | | |
| SCHEDULES OF INVESTMENTS | | | 19 | |
| | |
Schedule of Investments (unaudited) (continued) January 31, 2020 | | BlackRock Municipal 2030 Target Term Trust (BTT) (Percentages shown are based on Net Assets) |
| | | | | | | | |
| Security | | Par
(000) | | | Value | |
|
| California (continued) | |
Poway Unified School District, GO, Election of 2008, Series A(a): | | | | | | | | |
0.00%, 08/01/30 | | $ | 10,000 | | | $ | 8,386,800 | |
0.00%, 08/01/32 | | | 12,500 | | | | 9,884,375 | |
State of California, GO, Refunding, 5.00%, 08/01/30 | | | 10,000 | | | | 12,723,000 | |
Washington Township Health Care District, Refunding RB, Series B, 3.00%, 07/01/28 | | | 750 | | | | 801,375 | |
| | | | | | | | |
| | | | | | | 147,126,817 | |
|
| Colorado — 3.6% | |
Central Platte Valley Metropolitan District, GO, Series A: | | | | | | | | |
5.13%, 12/01/29 | | | 700 | | | | 794,997 | |
5.50%, 12/01/29 | | | 750 | | | | 861,555 | |
City & County of Denver Colorado, RB, CAB, Series A-2, 0.00%, 08/01/30(a) | | | 1,000 | | | | 778,170 | |
City & County of Denver Colorado Airport System Revenue, Refunding ARB, AMT, Series A, 5.00%, 12/01/33 | | | 25,000 | | | | 31,407,000 | |
City of Lakewood Colorado Plaza Metropolitan District No. 1, Refunding, Tax Allocation
Bonds(b): | | | | | | | | |
4.00%, 12/01/23 | | | 1,000 | | | | 1,045,280 | |
4.10%, 12/01/24 | | | 5,080 | | | | 5,313,375 | |
4.20%, 12/01/25 | | | 5,280 | | | | 5,526,734 | |
Colorado Health Facilities Authority, Refunding RB: | | | | | | | | |
Commonspirit Health, Series A, 4.00%, 08/01/37 | | | 3,000 | | | | 3,410,310 | |
Covenant Retirement Communities, Series A, 4.50%, 12/01/33 | | | 4,595 | | | | 4,605,798 | |
Covenant Retirement Communities, Series A, 5.00%, 12/01/33 | | | 3,000 | | | | 3,278,610 | |
NCMC, Inc. Project, 4.00%, 05/15/26(d) | | | 2,860 | | | | 3,388,070 | |
Copperleaf Metropolitan District No. 2, GO, Refunding, 5.25%, 12/01/30 | | | 500 | | | | 524,190 | |
Park Creek Metropolitan District, Refunding, Tax Allocation Bonds, Senior Limited Property, Series A: | | | | | | | | |
5.00%, 12/01/27 | | | 1,500 | | | | 1,785,270 | |
5.00%, 12/01/28 | | | 1,500 | | | | 1,782,870 | |
5.00%, 12/01/30 | | | 1,350 | | | | 1,599,872 | |
5.00%, 12/01/31 | | | 1,500 | | | | 1,773,585 | |
Tallyns Reach Metropolitan District No. 3, GO, Refunding, 5.00%, 12/01/33 | | | 503 | | | | 538,643 | |
| | | | | | | | |
| | | | | | | 68,414,329 | |
|
| Connecticut — 0.8% | |
Capital Region Development Authority, Refunding RB: | | | | | | | | |
5.00%, 06/15/30 | | | 1,095 | | | | 1,348,602 | |
5.00%, 06/15/31 | | | 1,125 | | | | 1,379,509 | |
State of Connecticut, GO, Series A, 5.00%, 04/15/33 | | | 7,000 | | | | 8,742,370 | |
State of Connecticut Health & Educational Facilities Authority, RB, Sacred Heart University Issue, Series I-1, 5.00%, 07/01/35 | | | 400 | | | | 487,732 | |
State of Connecticut Health & Educational Facility Authority, Refunding RB, Series G-1(b): | | | | | | | | |
5.00%, 07/01/27 | | | 225 | | | | 269,514 | |
5.00%, 07/01/28 | | | 300 | | | | 364,242 | |
5.00%, 07/01/29 | | | 300 | | | | 368,445 | |
5.00%, 07/01/30 | | | 300 | | | | 365,961 | |
5.00%, 07/01/32 | | | 425 | | | | 511,925 | |
5.00%, 07/01/34 | | | 355 | | | | 423,160 | |
| | | | | | | | |
| | | | | | | 14,261,460 | |
|
| Delaware — 0.3% | |
County of Kent Delaware, RB, CHF-Dover, LLC-Delaware State University Project, Series A: | | | | | | | | |
4.00%, 07/01/22 | | | 230 | | | | 242,556 | |
5.00%, 07/01/24 | | | 705 | | | | 799,421 | |
5.00%, 07/01/25 | | | 805 | | | | 932,608 | |
| | | | | | | | |
| Security | | Par
(000) | | | Value | |
|
| Delaware (continued) | |
5.00%, 07/01/26 | | $ | 850 | | | $ | 1,004,088 | |
5.00%, 07/01/27 | | | 890 | | | | 1,070,207 | |
5.00%, 07/01/28 | | | 935 | | | | 1,131,238 | |
State of Delaware Health Facilities Authority, RB, Beebe Medical Center Project, 4.00%, 06/01/35 | | | 1,250 | | | | 1,395,487 | |
| | | | | | | | |
| | | | | | | 6,575,605 | |
|
| District of Columbia — 0.1% | |
District of Columbia, Refunding RB, Kipp Charter School, Series A, 6.00%, 07/01/23(d) | | | 1,700 | | | | 1,987,096 | |
| | | | | | | | |
|
| Florida — 8.2% | |
Capital Trust Agency, Inc., RB, Renaissance Charter School, Inc., Series A, 4.00%, 06/15/29(b) | | | 1,790 | | | | 1,872,805 | |
Central Florida Expressway Authority, Refunding RB, Senior Lien: | | | | | | | | |
5.00%, 07/01/32 | | | 1,610 | | | | 2,052,364 | |
5.00%, 07/01/33 | | | 2,750 | | | | 3,490,053 | |
City of Lakeland Florida, Refunding RB, Lakeland Regional Health System, 5.00%, 11/15/30 | | | 3,750 | | | | 4,553,775 | |
City of Tampa Florida, Refunding RB, H. Lee Moffitt Cancer Center Project, Series A, 4.00%, 09/01/33 | | | 10,000 | | | | 10,702,700 | |
County of Alachua Florida Health Facilities Authority, RB, East Ridge Retirement Village, Inc. Project, 6.00%, 11/15/29 | | | 5,000 | | | | 4,769,500 | |
County of Broward Florida, RB, Fort Lauderdale Fuel Facilities, Series A, AMT (AGM): | | | | | | | | |
5.00%, 04/01/30 | | | 600 | | | | 664,488 | |
5.00%, 04/01/33 | | | 740 | | | | 817,463 | |
County of Martin Florida IDA, Refunding RB, Indiantown Cogeneration, L.P. Project, AMT, 4.20%, 12/15/25(b) | | | 7,250 | | | | 7,320,977 | |
County of Miami-Dade Florida, Refunding RB, Series B, 4.00%, 04/01/32 | | | 6,690 | | | | 7,643,392 | |
County of Miami-Dade Florida School Board, COP, Refunding, Series A, 5.00%, 05/01/32 | | | 9,000 | | | | 10,870,650 | |
County of Orange Convention Center, Refunding RB, 4.00%, 10/01/32 | | | 9,485 | | | | 10,927,668 | |
County of Orange Florida Tourist Development Tax Revenue, Refunding RB, 5.00%, 10/01/30 | | | 11,470 | | | | 15,520,745 | |
County of Palm Beach Florida, RB, S/F Housing, Palm Beach Atlantic University, 5.00%,
04/01/29(b) | | | 1,000 | | | | 1,154,200 | |
County of Palm Beach Florida Health Facilities Authority, Refunding RB, Acts Retirement-Life Communities, Inc. Obligated Group, 5.00%, 11/15/32 | | | 16,805 | | | | 19,926,865 | |
County of Palm Beach Health Facilities Authority, RB, Lifespace Communities, Inc., 5.00%, 05/15/31 | | | 410 | | | | 478,302 | |
County of St. Johns Florida Water & Sewer Revenue, Refunding RB, CAB, Series B(a): | | | | | | | | |
0.00%, 06/01/30 | | | 2,000 | | | | 1,648,120 | |
0.00%, 06/01/31 | | | 1,295 | | | | 1,035,262 | |
0.00%, 06/01/32 | | | 2,495 | | | | 1,933,800 | |
Double Branch Community Development District, Refunding, Special Assessment Bonds, Senior Lien, Series A-1, 4.13%, 05/01/31 | | | 1,200 | | | | 1,275,744 | |
Florida Development Finance Corp., RB, Waste Pro USA, Inc., AMT, 5.00%, 05/01/29(b) | | | 2,200 | | | | 2,405,700 | |
Greater Orlando Aviation Authority, Refunding RB, Jet Blue Airways Corp. Project, AMT, 5.00%, 11/15/26 | | | 2,000 | | | | 2,144,840 | |
Jacksonville Florida Port Authority, Refunding ARB, AMT, 4.50%, 11/01/33 | | | 630 | | | | 673,684 | |
Jacksonville Florida Port Authority, Refunding RB, AMT: | | | | | | | | |
4.50%, 11/01/30 | | | 2,895 | | | | 3,134,822 | |
4.50%, 11/01/31 | | | 3,620 | | | | 3,901,346 | |
4.50%, 11/01/32 | | | 2,300 | | | | 2,461,598 | |
| | |
| 20 | | 2020 BLACKROCK SEMI-ANNUAL REPORT TO SHAREHOLDERS |
| | |
Schedule of Investments (unaudited) (continued) January 31, 2020 | | BlackRock Municipal 2030 Target Term Trust (BTT) (Percentages shown are based on Net Assets) |
| | | | | | | | |
| Security | | Par
(000) | | | Value | |
|
| Florida (continued) | |
Lakewood Ranch Stewardship District, Special Assessment Bonds, F/F Housing, Stewardship Dist-Azario Project, 3.40%, 05/01/30 | | $ | 375 | | | $ | 384,458 | |
LT Ranch Community Development District, Special Assessment Bonds, 3.40%, 05/01/30 | | | 985 | | | | 1,009,950 | |
Miami Beach Health Facilities Authority, Refunding RB, Mont Sinai Medical Center, 5.00%, 11/15/30 | | | 1,000 | | | | 1,155,990 | |
Reedy Creek Improvement District, GO, Series A, 5.25%, 06/01/30 | | | 3,825 | | | | 4,347,954 | |
Tolomato Community Development District, Refunding, Special Assessment Bonds, Series A-2,
3.85%, 05/01/29 | | | 520 | | | | 539,510 | |
Village Community Development District No. 10, Special Assessment Bonds, Sumter County: | | | | | | | | |
4.50%, 05/01/23 | | | 1,620 | | | | 1,732,574 | |
5.00%, 05/01/32 | | | 5,405 | | | | 5,793,944 | |
Village Community Development District No. 5, Refunding, Special Assessment Bonds, Sumter County: | | | | | | | | |
Phase I, 3.50%, 05/01/28 | | | 5,420 | | | | 5,677,258 | |
Phase II, 4.00%, 05/01/33 | | | 1,075 | | | | 1,131,857 | |
Phase II, 4.00%, 05/01/34 | | | 2,275 | | | | 2,387,726 | |
Village Community Development District No. 6, Refunding, Special Assessment Bonds, Sumter County, 4.00%, 05/01/29 | | | 5,665 | | | | 5,903,100 | |
| | | | | | | | |
| | | | | | | 153,445,184 | |
|
| Georgia — 1.1% | |
Main Street Natural Gas, Inc., RB, Series A: | | | | | | | | |
5.00%, 05/15/29 | | | 1,250 | | | | 1,586,600 | |
5.00%, 05/15/30 | | | 8,000 | | | | 10,132,640 | |
Municipal Electric Authority of Georgia, RB, Plant Vogtle Units 3 & 4 Project, Series A, 5.00%, 01/01/34 | | | 8,000 | | | | 9,610,320 | |
| | | | | | | | |
| | | | | | | 21,329,560 | |
|
| Idaho — 0.0% | |
Idaho Housing & Finance Association, RB, Compass Charter School Project, Series A, 4.63%, 07/01/29(b) | | | 185 | | | | 202,458 | |
| | | | | | | | |
|
| Illinois — 14.3% | |
Chicago Board of Education, GO, Refunding: | | | | | | | | |
Dedicated Revenues, Series H, 5.00%, 12/01/30 | | | 7,025 | | | | 8,376,399 | |
Dedicated Revenues, Series F, 5.00%, 12/01/22 | | | 4,760 | | | | 5,184,211 | |
Series C, 5.00%, 12/01/22 | | | 14,830 | | | | 16,151,650 | |
Chicago Housing Authority, RB, M/F Housing, Series A: | | | | | | | | |
5.00%, 01/01/33 | | | 3,000 | | | | 3,636,570 | |
5.00%, 01/01/35 | | | 1,500 | | | | 1,815,285 | |
Chicago Midway International Airport, Refunding ARB, 2nd Lien, Series A, AMT, 5.00%, 01/01/33 | | | 5,000 | | | | 5,655,800 | |
Chicago Transit Authority, Refunding RB: | | | | | | | | |
Section 5307, Urbanized Area Formula Funds, 5.00%, 06/01/26 | | | 2,000 | | | | 2,413,020 | |
Section 5337, State of Good Repair Formula Funds, 5.00%, 06/01/26 | | | 1,000 | | | | 1,206,180 | |
City of Chicago Illinois, RB, Wastewater Transmission, 2nd Lien: | | | | | | | | |
4.00%, 01/01/31 | | | 10,375 | | | | 10,845,714 | |
4.00%, 01/01/32 | | | 10,790 | | | | 11,250,733 | |
4.00%, 01/01/33 | | | 11,220 | | | | 11,718,392 | |
4.00%, 01/01/35 | | | 9,135 | | | | 9,481,308 | |
City of Chicago Illinois, Refunding ARB, O’Hare International Airport Passenger Facility Charge, Series B, AMT, 4.00%, 01/01/27 | | | 5,000 | | | | 5,255,700 | |
City of Chicago Illinois Motor Fuel Tax Revenue, Refunding RB, (AGM), 5.00%, 01/01/30 | | | 730 | | | | 814,673 | |
| | | | | | | | |
| Security | | Par
(000) | | | Value | |
|
| Illinois (continued) | |
City of Chicago O’Hare International Airport, Refunding GARB, Senior Lien, Series B, 5.00%, 01/01/33 | | $ | 6,000 | | | $ | 7,335,060 | |
City of St. Charles Illinois, GO, Refunding, Corporate Purpose: | | | | | | | | |
4.00%, 12/01/30 | | | 1,620 | | | | 1,744,173 | |
4.00%, 12/01/31 | | | 1,715 | | | | 1,845,066 | |
Counties of Kane McHenry Cook & De Kalb Unit School District No. 300, GO, Refunding, Series A, 5.00%, 01/01/30 | | | 6,350 | | | | 7,742,174 | |
County of Cook Illinois, GO, Refunding, Series C, 4.00%, 11/15/29 | | | 19,750 | | | | 21,123,612 | |
Illinois Finance Authority, Refunding RB: | | | | | | | | |
DePaul University, Series A, 5.00%, 10/01/30 | | | 1,000 | | | | 1,208,560 | |
DePaul University, Series A, 4.00%, 10/01/32 | | | 1,000 | | | | 1,132,960 | |
Lutheran Communities, Series A, 4.00%, 11/01/24 | | | 425 | | | | 451,886 | |
Lutheran Communities, Series A, 5.00%, 11/01/26 | | | 460 | | | | 524,313 | |
Lutheran Communities, Series A, 5.00%, 11/01/28 | | | 1,745 | | | | 2,017,272 | |
Lutheran Communities, Series A, 5.00%, 11/01/29 | | | 1,840 | | | | 2,119,735 | |
Lutheran Communities, Series A, 5.00%, 11/01/30 | | | 1,935 | | | | 2,221,225 | |
Presence Health Network, Series C, 5.00%, 02/15/30 | | | 12,000 | | | | 14,779,800 | |
Rush University Medical Center, Series A, 5.00%, 11/15/31 | | | 8,415 | | | | 9,879,378 | |
Rush University Medical Center, Series A, 5.00%, 11/15/32 | | | 2,075 | | | | 2,429,327 | |
Rush University Medical Center, Series A, 5.00%, 11/15/33 | | | 2,125 | | | | 2,481,363 | |
The Peoples Gas Light & Coke Company Project, 4.00%, 02/01/33 | | | 11,000 | | | | 11,865,150 | |
The University of Chicago Medical Centre, Series B, 5.00%, 08/15/30 | | | 3,205 | | | | 3,891,190 | |
Illinois State Toll Highway Authority, Refunding RB, Senior, Series A, 4.00%, 12/01/31 | | | 20,000 | | | | 22,697,600 | |
Metropolitan Pier & Exposition Authority, Refunding RB, McCormick Place Expansion Project: | | | | | | | | |
5.00%, 12/15/28 | | | 1,200 | | | | 1,453,584 | |
5.00%, 12/15/30 | | | 1,385 | | | | 1,671,543 | |
State of Illinois, GO, Refunding, Series B,
5.00%, 10/01/30 | | | 7,000 | | | | 8,493,240 | |
State of Illinois, GO: | | | | | | | | |
Series A, 5.00%, 12/01/28 | | | 9,950 | | | | 11,999,799 | |
Series D, 5.00%, 11/01/28 | | | 10,805 | | | | 12,936,178 | |
Upper Illinois River Valley Development Authority, Refunding RB, Prairie Crossing Charter School, 4.00%, 01/01/31(b)(e) | | | 370 | | | | 388,374 | |
Winnebago & Boone Counties School District No. 205 Rockford, GO: | | | | | | | | |
4.00%, 02/01/29 | | | 9,080 | | | | 9,757,913 | |
4.00%, 02/01/30 | | | 9,835 | | | | 10,566,134 | |
| | | | | | | | |
| | | | | | | 268,562,244 | |
|
| Indiana — 2.7% | |
City of Indianapolis Department of Public Utilities Water System Revenue, Refunding RB, First Lien, Series A, 5.00%, 10/01/35 | | | 10,000 | | | | 12,720,700 | |
City of Valparaiso Indiana, RB, Exempt Facilities, Pratt Paper LLC Project, AMT, 5.88%, 01/01/24 | | | 1,250 | | | | 1,364,813 | |
City of Whiting Indiana, RB, BP Products North America, Inc. Project, AMT, 5.00%, 03/01/46(f) | | | 8,500 | | | | 9,427,265 | |
Indiana Finance Authority, Refunding RB, Community Health Network Project, Series A, 4.00%, 05/01/35 | | | 22,565 | | | | 24,041,428 | |
Northern Indiana Commuter Transportation District, RB: | | | | | | | | |
5.00%, 07/01/32 | | | 1,000 | | | | 1,222,010 | |
5.00%, 07/01/33 | | | 1,400 | | | | 1,709,148 | |
| | | | | | | | |
| | | | | | | 50,485,364 | |
| | | | |
| SCHEDULES OF INVESTMENTS | | | 21 | |
| | |
Schedule of Investments (unaudited) (continued) January 31, 2020 | | BlackRock Municipal 2030 Target Term Trust (BTT) (Percentages shown are based on Net Assets) |
| | | | | | | | |
| Security | | Par
(000) | | | Value | |
|
| Iowa — 2.2% | |
Iowa Finance Authority, Refunding RB, Midwestern Disaster Area, Iowa Fertilizer Co. Project, 5.25%, 12/01/25 | | $ | 13,345 | | | $ | 14,905,698 | |
PEFA, Inc., RB, 5.00%, 09/01/49(f) | | | 21,415 | | | | 25,812,142 | |
| | | | | | | | |
| | | | | | | 40,717,840 | |
|
| Kansas — 0.1% | |
Wyandotte County-Kansas City Unified Government Utility System Revenue, RB, Series A, 5.00%, 09/01/33 | | | 1,370 | | | | 1,633,752 | |
| | | | | | | | |
|
| Kentucky — 0.6% | |
County of Louisville/Jefferson Metropolitan Government, Refunding RB, Norton Healthcare, Inc., Series A, 5.00%, 10/01/32 | | | 7,300 | | | | 8,801,245 | |
Kentucky Public Transportation Infrastructure Authority, RB, CAB, 1st Tier-Downtown Crossing Project: | | | | | | | | |
Series B, 0.00%, 07/01/30(a) | | | 1,230 | | | | 858,306 | |
Convertible Series C, 6.40%, 07/01/33(g) | | | 1,500 | | | | 1,750,665 | |
| | | | | | | | |
| | | | | | | 11,410,216 | |
|
| Louisiana — 3.0% | |
City of Ruston Louisiana, RB (AGM): | | | | | | | | |
5.00%, 06/01/29 | | | 1,060 | | | | 1,293,698 | |
5.00%, 06/01/30 | | | 1,000 | | | | 1,217,350 | |
5.00%, 06/01/31 | | | 1,020 | | | | 1,238,096 | |
5.00%, 06/01/32 | | | 1,225 | | | | 1,484,039 | |
Louisiana Public Facilities Authority, RB, Series A(b): | | | | | | | | |
Lake Charles Collage Prep Project, 5.00%, 06/01/29 | | | 710 | | | | 769,072 | |
Young Audiences Charter School Project, 5.00%, 04/01/30 | | | 525 | | | | 576,912 | |
Louisiana Public Facilities Authority, Refunding RB: | | | | | | | | |
5.00%, 05/15/29 | | | 1,235 | | | | 1,489,077 | |
5.00%, 05/15/30 | | | 990 | | | | 1,190,109 | |
3.00%, 05/15/31 | | | 2,225 | | | | 2,353,917 | |
5.00%, 05/15/32 | | | 1,485 | | | | 1,774,337 | |
5.00%, 05/15/33 | | | 2,175 | | | | 2,593,840 | |
Entergy Louisiana, Series B, 3.50%, 06/01/30 | | | 5,990 | | | | 6,169,400 | |
Louisiana Stadium & Exposition District, Refunding RB, Senior, Series A, 5.00%, 07/01/30 | | | 3,000 | | | | 3,361,560 | |
Parish of St. John the Baptist Louisiana, Refunding RB, Marathon Oil Corporation Project(f): | | | | | | | | |
2.00%, 06/01/37 | | | 2,250 | | | | 2,287,305 | |
2.10%, 06/01/37 | | | 1,305 | | | | 1,336,633 | |
Port New Orleans Board of Commissioners, Refunding RB, Series B, AMT: | | | | | | | | |
5.00%, 04/01/31 | | | 300 | | | | 332,970 | |
5.00%, 04/01/32 | | | 1,000 | | | | 1,108,740 | |
5.00%, 04/01/33 | | | 1,575 | | | | 1,744,423 | |
State of Louisiana, GO, Series A, 4.00%, 05/15/30 | | | 6,540 | | | | 7,163,851 | |
Terrebonne Levee & Conservation District, RB, Sales Tax, 5.00%, 07/01/29 | | | 1,925 | | | | 2,166,453 | |
Tobacco Settlement Financing Corp., Refunding RB, Asset-Backed, Series A: | | | | | | | | |
5.25%, 05/15/31 | | | 3,425 | | | | 3,577,549 | |
5.25%, 05/15/32 | | | 4,375 | | | | 4,713,844 | |
5.25%, 05/15/33 | | | 4,750 | | | | 5,115,417 | |
5.25%, 05/15/35 | | | 1,500 | | | | 1,660,320 | |
| | | | | | | | |
| | | | | | | 56,718,912 | |
|
| Maine — 0.1% | |
City of Portland Maine General Airport Revenue, Refunding RB, Green Bond: | | | | | | | | |
5.00%, 01/01/33 | | | 695 | | | | 893,158 | |
5.00%, 01/01/34 | | | 305 | | | | 390,141 | |
4.00%, 01/01/35 | | | 1,000 | | | | 1,164,060 | |
| | | | | | | | |
| | | | | | | 2,447,359 | |
| | | | | | | | |
| Security | | Par
(000) | | | Value | |
|
| Maryland — 2.3% | |
City of Baltimore Maryland, Refunding RB, Convention Center Hotel, 5.00%, 09/01/31 | | $ | 1,250 | | | $ | 1,507,300 | |
County of Anne Arundel Maryland Consolidated, Special Taxing District, Special Tax Bonds, Villages at Two Rivers Project: | | | | | | | | |
4.20%, 07/01/24 | | | 630 | | | | 647,703 | |
4.90%, 07/01/30 | | | 1,315 | | | | 1,395,702 | |
County of Howard Maryland Housing Commission, RB, M/F Housing, Woodfield Oxford Square Apartments, 5.00%, 12/01/33 | | | 1,765 | | | | 2,144,616 | |
County of Prince George’s Maryland, Tax Allocation Bonds, Westphalia Town Center Project, 5.00%, 07/01/30(b) | | | 585 | | | | 679,881 | |
Maryland EDC, RB, Purple Line Light Rail Project, Series D, AMT, 5.00%, 03/31/30 | | | 1,325 | | | | 1,561,539 | |
Maryland EDC, Refunding RB, CNX Marine Terminals, Inc., 5.75%, 09/01/25 | | | 3,225 | | | | 3,292,532 | |
Maryland Health & Higher Educational Facilities Authority, Refunding RB: | | | | | | | | |
Charlestown Community, Series A,
5.00%, 01/01/31 | | | 2,865 | | | | 3,457,625 | |
Charlestown Community, Series A,
5.00%, 01/01/32 | | | 3,010 | | | | 3,622,023 | |
Charlestown Community, Series A,
5.00%, 01/01/33 | | | 3,165 | | | | 3,800,722 | |
LifeBridge Health Issue, 5.00%, 07/01/31 | | | 1,000 | | | | 1,241,590 | |
LifeBridge Health Issue, 5.00%, 07/01/32 | | | 500 | | | | 619,285 | |
LifeBridge Health Issue, 5.00%, 07/01/33 | | | 385 | | | | 466,181 | |
LifeBridge Health Issue, 5.00%, 07/01/33 | | | 1,000 | | | | 1,234,570 | |
LifeBridge Health Issue, 5.00%, 07/01/34 | | | 775 | | | | 953,669 | |
Meritus Medical Center, 5.00%, 07/01/29 | | | 2,200 | | | | 2,584,670 | |
Meritus Medical Center, 5.00%, 07/01/31 | | | 1,400 | | | | 1,634,640 | |
Meritus Medical Center, 5.00%, 07/01/33 | | | 1,200 | | | | 1,394,664 | |
State of Maryland, GO, State and Local Facilities Loan of 2019, First Series, 3.00%, 03/15/34 | | | 10,000 | | | | 11,005,300 | |
| | | | | | | | |
| | | | | | | 43,244,212 | |
|
| Massachusetts — 2.2% | |
Commonwealth of Massachusetts, Refunding, GOL, Series A (AMBAC), 5.50%, 08/01/30 | | | 2,500 | | | | 3,458,075 | |
Commonwealth of Massachusetts, GOL, Series I, 5.00%, 12/01/33 | | | 5,000 | | | | 6,207,700 | |
Massachusetts Bay Transportation Authority, Refunding RB, CAB, Series A, 0.00%, 07/01/32(a) | | | 5,500 | | | | 4,213,440 | |
Massachusetts Development Finance Agency, RB: | | | | | | | | |
Emmanuel College Issue, Series A, 5.00%, 01/01/33 | | | 1,070 | | | | 1,274,969 | |
UMass Darthmouth Student Housing Project, 5.00%, 10/01/29 | | | 2,365 | | | | 2,941,256 | |
UMass Darthmouth Student Housing Project, 5.00%, 10/01/30 | | | 2,485 | | | | 3,067,012 | |
Massachusetts Development Finance Agency, Refunding RB, Series A: | | | | | | | | |
Emmanuel College Issue, 5.00%, 10/01/31 | | | 3,635 | | | | 4,325,359 | |
Emmanuel College Issue, 5.00%, 10/01/33 | | | 1,285 | | | | 1,523,021 | |
5.00%, 01/01/32 | | | 2,020 | | | | 2,458,279 | |
5.00%, 01/01/33 | | | 1,500 | | | | 1,817,385 | |
5.00%, 01/01/34 | | | 2,085 | | | | 2,517,700 | |
5.00%, 01/01/35 | | | 2,000 | | | | 2,408,060 | |
Massachusetts Educational Financing Authority, Refunding RB, Series K, AMT, 5.25%, 07/01/29 | | | 4,495 | | | | 4,785,917 | |
| | | | | | | | |
| | | | | | | 40,998,173 | |
|
| Michigan — 1.7% | |
City of Detroit Michigan, GO: | | | | | | | | |
5.00%, 04/01/26 | | | 735 | | | | 835,386 | |
| | |
| 22 | | 2020 BLACKROCK SEMI-ANNUAL REPORT TO SHAREHOLDERS |
| | |
Schedule of Investments (unaudited) (continued) January 31, 2020 | | BlackRock Municipal 2030 Target Term Trust (BTT) (Percentages shown are based on Net Assets) |
| | | | | | | | |
| Security | | Par
(000) | | | Value | |
|
| Michigan (continued) | |
5.00%, 04/01/27 | | $ | 580 | | | $ | 668,815 | |
5.00%, 04/01/28 | | | 665 | | | | 777,285 | |
5.00%, 04/01/29 | | | 665 | | | | 774,725 | |
5.00%, 04/01/30 | | | 510 | | | | 603,978 | |
5.00%, 04/01/31 | | | 735 | | | | 851,307 | |
5.00%, 04/01/32 | | | 625 | | | | 722,231 | |
5.00%, 04/01/33 | | | 830 | | | | 957,106 | |
City of Spring Lake Park Michigan, RB, Academy for Higher Learning Project, 4.00%, 06/15/29 | | | 1,185 | | | | 1,255,128 | |
Michigan Finance Authority, Refunding RB: | | | | | | | | |
MidMichigan Health, 5.00%, 06/01/33 | | | 2,750 | | | | 3,176,278 | |
Oakwood Obligation Group, 5.00%, 08/15/30 | | | 2,105 | | | | 2,386,628 | |
Michigan Strategic Fund, RB, I-75 Improvement Projects, AMT, 5.00%, 12/31/32 | | | 2,000 | | | | 2,483,200 | |
Michigan Strategic Fund, Refunding RB, Holland Home Obligated Group: | | | | | | | | |
5.00%, 11/15/29 | | | 1,260 | | | | 1,499,425 | |
5.00%, 11/15/34 | | | 1,410 | | | | 1,647,458 | |
Saginaw Valley State University, Refunding RB, Series A: | | | | | | | | |
5.00%, 07/01/31 | | | 2,070 | | | | 2,515,092 | |
5.00%, 07/01/32 | | | 1,430 | | | | 1,732,617 | |
State of Michigan Hospital Finance Authority, Refunding RB, Trinity Health Credit Group, Series C, 4.00%, 12/01/32 | | | 8,195 | | | | 8,737,017 | |
| | | | | | | | |
| | | | | | | 31,623,676 | |
|
| Minnesota — 0.3% | |
Sartell-St Stephen Independent School District No. 748, GO, Series B(a): | | | | | | | | |
0.00%, 02/01/30 | | | 3,915 | | | | 3,120,490 | |
0.00%, 02/01/31 | | | 2,190 | | | | 1,682,161 | |
0.00%, 02/01/32 | | | 1,450 | | | | 1,067,896 | |
| | | | | | | | |
| | | | | | | 5,870,547 | |
|
| Mississippi — 1.6% | |
Mississippi Development Bank, Refunding RB, Municipal Energy Agency of Mississippi, Series A (AGM): | | | | | | | | |
5.00%, 03/01/30 | | | 2,280 | | | | 2,736,228 | |
5.00%, 03/01/31 | | | 1,595 | | | | 1,909,311 | |
5.00%, 03/01/32 | | | 2,000 | | | | 2,388,640 | |
5.00%, 03/01/33 | | | 1,275 | | | | 1,520,450 | |
State of Mississippi, RB: | | | | | | | | |
Series A, 5.00%, 10/15/35 | | | 5,000 | | | | 6,273,250 | |
Series E, 5.00%, 10/15/33 | | | 12,225 | | | | 14,416,942 | |
| | | | | | | | |
| | | | | | | 29,244,821 | |
|
| Missouri — 0.6% | |
City of St. Louis Missouri IDA, Refunding RB, Ballpark Village Development Project, Series A, 3.88%, 11/15/29 | | | 970 | | | | 1,071,064 | |
Missouri State Health & Educational Facilities Authority, Refunding RB: | | | | | | | | |
CoxHealth, Series A, 4.00%, 11/15/33 | | | 2,010 | | | | 2,184,970 | |
St. Louis College of Pharmacy, 5.00%, 05/01/30 | | | 3,000 | | | | 3,242,310 | |
The Children’s Mercy Hospital, 5.00%, 05/15/31 | | | 1,175 | | | | 1,419,236 | |
The Children’s Mercy Hospital, 4.00%, 05/15/32 | | | 1,680 | | | | 1,913,117 | |
The Children’s Mercy Hospital, 4.00%, 05/15/33 | | | 2,000 | | | | 2,266,880 | |
| | | | | | | | |
| | | | | | | 12,097,577 | |
|
| Montana — 0.6% | |
City of Forsyth Montana, Refunding RB, Puget Sound Energy Project, Series A, 3.90%, 03/01/31(f) | | | 10,050 | | | | 10,744,656 | |
| | | | | | | | |
|
| Nebraska — 0.6% | |
Central Plains Nebraska Energy Project, RB: | | | | | | | | |
Energy Project No. 3, 5.00%, 09/01/27 | | | 5,000 | | | | 5,454,050 | |
Gas Project No. 3, 5.00%, 09/01/32 | | | 4,500 | | | | 4,908,645 | |
| | | | | | | | |
| Security | | Par
(000) | | | Value | |
|
| Nebraska (continued) | |
Elkhorn School District, GO, Elkhorn Public Schools: | | | | | | | | |
4.00%, 12/15/32 | | $ | 325 | | | $ | 393,656 | |
4.00%, 12/15/33 | | | 375 | | | | 452,048 | |
| | | | | | | | |
| | | | | | | 11,208,399 | |
|
| Nevada — 0.1% | |
Nevada Department of Business & Industry, RB, Series A, 5.00%, 07/15/27(b) | | | 335 | | | | 377,582 | |
State of Nevada Department of Business & Industry, RB, Somerset Academy, Series A, 4.50%, 12/15/29(b) | | | 655 | | | | 685,359 | |
| | | | | | | | |
| | | | | | | 1,062,941 | |
|
| New Hampshire — 0.4% | |
New Hampshire Business Finance Authority, Refunding RB, Resource Recovery, Covanta Project, Series A, AMT, 4.00%, 11/01/27(b) | | | 2,205 | | | | 2,345,503 | |
New Hampshire State Turnpike System, RB, Series C, 4.00%, 08/01/33 | | | 4,350 | | | | 4,664,809 | |
| | | | | | | | |
| | | | | | | 7,010,312 | |
|
| New Jersey — 15.5% | |
Casino Reinvestment Development Authority, Inc., Refunding RB: | | | | | | | | |
5.00%, 11/01/21 | | | 2,465 | | | | 2,584,577 | |
5.00%, 11/01/22 | | | 1,890 | | | | 2,031,372 | |
County of Gloucester New Jersey Pollution Control Financing Authority, Refunding RB, Keystone Urban Renewal Project, Series A, AMT, 5.00%, 12/01/24 | | | 1,390 | | | | 1,504,453 | |
New Jersey EDA, RB: | | | | | | | | |
Beloved Community Charter School, Inc. Project, Series A, 4.00%, 06/15/29(b) | | | 665 | | | | 716,478 | |
Continental Airlines, Inc. Project, AMT,
5.25%, 09/15/29 | | | 12,230 | | | | 13,365,922 | |
Continental Airlines, Inc. Project, Series A, AMT, 5.63%, 11/15/30 | | | 1,740 | | | | 2,005,594 | |
Continental Airlines, Inc. Project, Series B, AMT, 5.63%, 11/15/30 | | | 1,315 | | | | 1,515,590 | |
Foundation Academy Charter School Project, Series A, 4.00%, 07/01/29 | | | 350 | | | | 392,924 | |
Private Activity Bond, The Goethals Bridge Replacement Project, AMT, 5.00%, 01/01/28 | | | 4,705 | | | | 5,375,886 | |
Series DDD, 5.00%, 06/15/35 | | | 2,000 | | | | 2,362,280 | |
State Government Buildings Project, Series A, 5.00%, 06/15/32 | | | 4,500 | | | | 5,390,505 | |
State Government Buildings Project, Series C, 5.00%, 06/15/32 | | | 3,600 | | | | 4,312,404 | |
New Jersey EDA, Refunding RB: | | | | | | | | |
Cigarette Tax, 5.00%, 06/15/26 | | | 10,610 | | | | 11,503,999 | |
Cigarette Tax, 4.25%, 06/15/27 | | | 16,500 | | | | 17,567,880 | |
Continental Airlines, Inc. Project, AMT,
5.75%, 09/15/27 | | | 6,200 | | | | 6,832,276 | |
Provident Group — Montclair Properties LLC (AGM), 5.00%, 06/01/30 | | | 1,500 | | | | 1,830,405 | |
Provident Group — Montclair Properties LLC (AGM), 5.00%, 06/01/31 | | | 1,750 | | | | 2,127,930 | |
Provident Group — Montclair Properties LLC (AGM), 4.00%, 06/01/32 | | | 2,125 | | | | 2,414,255 | |
Provident Group — Montclair Properties LLC (AGM), 5.00%, 06/01/28 | | | 1,000 | | | | 1,234,410 | |
Series BBB, 5.50%, 06/15/29 | | | 10,000 | | | | 12,328,600 | |
Series MMM, 4.00%, 06/15/35 | | | 5,000 | | | | 5,669,900 | |
Sub-Series A, 4.00%, 07/01/32 | | | 9,855 | | | | 10,816,651 | |
New Jersey EDA, Refunding, Special Assessment Bonds, Kapkowski Road Landfill Project, 5.75%, 04/01/31 | | | 5,000 | | | | 5,772,100 | |
| | | | |
| SCHEDULES OF INVESTMENTS | | | 23 | |
| | |
Schedule of Investments (unaudited) (continued) January 31, 2020 | | BlackRock Municipal 2030 Target Term Trust (BTT) (Percentages shown are based on Net Assets) |
| | | | | | | | |
| Security | | Par
(000) | | | Value | |
|
| New Jersey (continued) | |
New Jersey EDA, RB, Refunding Cranes Mill Project, 5.00%, 01/01/29 | | $ | 2,280 | | | $ | 2,695,690 | |
New Jersey Health Care Facilities Financing Authority, Refunding RB: | | | | | | | | |
Princeton HealthCare System, 5.00%, 07/01/29 | | | 2,900 | | | | 3,549,542 | |
Princeton HealthCare System, 5.00%, 07/01/30 | | | 2,400 | | | | 2,929,512 | |
RWJ Barnabas Health Obligated Group, Series A, 5.00%, 07/01/30 | | | 11,245 | | | | 13,743,864 | |
St. Joseph Health System, 5.00%, 07/01/28 | | | 1,500 | | | | 1,786,785 | |
St. Joseph Health System, 5.00%, 07/01/29 | | | 1,250 | | | | 1,481,462 | |
St. Joseph Health System Obligated Group Issue, 5.00%, 07/01/30 | | | 1,100 | | | | 1,299,287 | |
New Jersey Higher Education Student Assistance Authority, RB, Senior Student Loan, AMT: | | | | | | | | |
Series 1A, 5.00%, 12/01/25 | | | 5,500 | | | | 6,579,485 | |
Series 1A, 5.00%, 12/01/26 | | | 2,250 | | | | 2,684,520 | |
Series A, 4.00%, 12/01/32 | | | 2,500 | | | | 2,842,975 | |
Series A, 4.00%, 12/01/33 | | | 2,000 | | | | 2,262,920 | |
Series A, 4.00%, 12/01/34 | | | 1,000 | | | | 1,125,640 | |
Series A, 4.00%, 12/01/35 | | | 1,000 | | | | 1,121,100 | |
New Jersey Housing & Mortgage Finance Agency, Refunding RB, S/F Housing, Series BB, AMT, 3.80%, 10/01/32 | | | 12,660 | | | | 13,548,859 | |
New Jersey Transportation Trust Fund Authority, RB: | | | | | | | | |
Transportation Program, Series AA, 5.25%, 06/15/27 | | | 4,225 | | | | 4,985,965 | |
Transportation Program, Series AA, 5.25%, 06/15/28 | | | 4,500 | | | | 5,302,980 | |
Transportation System, Series AA, 4.00%, 06/15/30 | | | 10,815 | | | | 11,367,971 | |
Transportation System, Series C, 5.25%, 06/15/32 | | | 10,000 | | | | 11,550,400 | |
Transportation System, Series D, 5.00%, 06/15/32 | | | 5,000 | | | | 5,685,500 | |
New Jersey Transportation Trust Fund Authority, Refunding RB, Series A: | | | | | | | | |
Federal Highway Reimbursement Revenue Notes, 5.00%, 06/15/30 | | | 6,600 | | | | 7,684,446 | |
5.00%, 12/15/30 | | | 20,000 | | | | 24,494,800 | |
Newark Housing Authority Scholarship Foundation A New Jersey Non, Refunding RB, Newark Redevelopment Project (NPFGC), 5.25%, 01/01/27 | | | 5,000 | | | | 6,145,200 | |
South Jersey Transportation Authority, Refunding RB, Transportation System, Series A: | | | | | | | | |
5.00%, 11/01/33 | | | 500 | | | | 578,165 | |
5.00%, 11/01/34 | | | 500 | | | | 576,830 | |
Tobacco Settlement Financing Corp., Refunding RB, Series A: | | | | | | | | |
5.00%, 06/01/30 | | | 16,740 | | | | 20,945,255 | |
5.00%, 06/01/32 | | | 8,270 | | | | 10,239,831 | |
Township of Irvington New Jersey, GO, Refunding, Series A (AGM): | | | | | | | | |
5.00%, 07/15/30 | | | 2,000 | | | | 2,300,320 | |
5.00%, 07/15/31 | | | 1,450 | | | | 1,665,774 | |
| | | | | | | | |
| | | | | | | 290,831,469 | |
|
| New Mexico — 1.4% | |
City of Santa Fe New Mexico, RB, EL Castillo Retirement Residences Project, Series A, 5.00%, 05/15/34 | | | 480 | | | | 552,158 | |
New Mexico Educational Assistance Foundation, RB, AMT: | | | | | | | | |
Series A-1 (GTD), 3.88%, 04/01/34 | | | 2,000 | | | | 2,130,960 | |
Education Loan, Series A-1, 3.75%, 09/01/31 | | | 6,250 | | | | 6,686,625 | |
Education Loan, Series A-2, 3.80%, 11/01/32 | | | 5,850 | | | | 6,253,533 | |
Education Loan, Series A-2, 3.80%, 09/01/33 | | | 10,000 | | | | 10,635,100 | |
| | | | | | | | |
| | | | | | | 26,258,376 | |
|
| New York — 4.3% | |
Build NYC Resource Corp., Refunding RB, Pratt Paper, Inc. Project, AMT, 4.50%, 01/01/25(b) | | | 900 | | | | 968,472 | |
| | | | | | | | |
| Security | | Par
(000) | | | Value | |
|
| New York (continued) | |
County of Nassau New York, GOL, Series A (AGM): | | | | | | | | |
5.00%, 04/01/34 | | $ | 4,165 | | | $ | 5,197,878 | |
5.00%, 04/01/35 | | | 4,385 | | | | 5,458,141 | |
Metropolitan Transportation Authority, Refunding RB: | | | | | | | | |
Green Bond, Climate Bond Certified, Series C-1, 5.00%, 11/15/34 | | | 10,000 | | | | 12,439,400 | |
CAB, Series A, 0.00%, 11/15/30(a) | | | 23,000 | | | | 18,979,600 | |
Green Bond, CAB, Series C-2, 0.00%, 11/15/32(a) | | | 19,315 | | | | 14,471,957 | |
New York City Transitional Finance Authority Future Tax Secured Revenue, RB, Sub-Series B-1,
5.00%, 08/01/30 | | | 5,150 | | | | 6,530,560 | |
New York Transportation Development Corp., RB, LaGuardia Airport Terminal B Redevelopment Project, Series A, AMT: | | | | | | | | |
4.00%, 07/01/32 | | | 5,500 | | | | 6,052,915 | |
4.00%, 07/01/33 | | | 6,000 | | | | 6,561,480 | |
New York Transportation Development Corp., Refunding ARB, American Airlines, Inc., AMT, 5.00%, 08/01/31 | | | 3,465 | | | | 3,626,019 | |
| | | | | | | | |
| | | | | | | 80,286,422 | |
|
| Ohio — 1.3% | |
County of Butler Ohio, Refunding RB, UC Health: | | | | | | | | |
5.00%, 11/15/30 | | | 1,225 | | | | 1,536,787 | |
5.00%, 11/15/31 | | | 2,500 | | | | 3,126,650 | |
5.00%, 11/15/32 | | | 2,200 | | | | 2,742,410 | |
County of Franklin Ohio, RB, Health Care Facilities Improvement, OPRS Communities, Series A: | | | | | | | | |
5.25%, 07/01/28 | | | 500 | | | | 500,860 | |
5.63%, 07/01/32 | | | 1,000 | | | | 1,001,870 | |
County of Hamilton Ohio Sales Tax Revenue, Refunding RB, Series A, 5.00%, 12/01/30 | | | 4,500 | | | | 5,569,875 | |
Ohio Air Quality Development Authority, Refunding RB, Ohio Valley Electric Corp., 3.25%, 09/01/29 | | | 4,450 | | | | 4,674,146 | |
State of Ohio, RB, Portsmouth Bypass Project, AMT (AGM): | | | | | | | | |
5.00%, 12/31/29 | | | 1,625 | | | | 1,905,069 | |
5.00%, 12/31/30 | | | 2,400 | | | | 2,803,896 | |
| | | | | | | | |
| | | | | | | 23,861,563 | |
|
| Oklahoma — 0.7% | |
Norman Regional Hospital Authority, Refunding RB: | | | | | | | | |
5.00%, 09/01/27 | | | 2,100 | | | | 2,542,701 | |
5.00%, 09/01/28 | | | 2,000 | | | | 2,402,360 | |
5.00%, 09/01/29 | | | 2,150 | | | | 2,573,055 | |
5.00%, 09/01/30 | | | 5,130 | | | | 6,117,474 | |
| | | | | | | | |
| | | | | | | 13,635,590 | |
|
| Oregon — 0.5% | |
Oregon Health & Science University, Refunding RB, Series B, 5.00%, 07/01/35 | | | 7,390 | | | | 8,940,053 | |
| | | | | | | | |
|
| Pennsylvania — 18.0% | |
Allentown Neighborhood Improvement Zone Development Authority, RB, City Center Project(b): | | | | | | | | |
5.00%, 05/01/23 | | | 640 | | | | 677,946 | |
5.00%, 05/01/28 | | | 835 | | | | 986,870 | |
Allentown Neighborhood Improvement Zone Development Authority, Refunding RB, Series A: | | | | | | | | |
5.00%, 05/01/27 | | | 6,750 | | | | 7,280,077 | |
5.00%, 05/01/28 | | | 5,000 | | | | 5,390,000 | |
5.00%, 05/01/29 | | | 3,745 | | | | 4,035,125 | |
5.00%, 05/01/30 | | | 5,300 | | | | 5,707,305 | |
Chester County Health & Education Facilities Authority, Refunding RB, Series A: | | | | | | | | |
Main Line Health System, 5.00%, 10/01/32 | | | 1,450 | | | | 1,807,005 | |
| | |
| 24 | | 2020 BLACKROCK SEMI-ANNUAL REPORT TO SHAREHOLDERS |
| | |
Schedule of Investments (unaudited) (continued) January 31, 2020 | | BlackRock Municipal 2030 Target Term Trust (BTT) (Percentages shown are based on Net Assets) |
| | | | | | | | |
| Security | | Par
(000) | | | Value | |
|
| Pennsylvania (continued) | |
Main Line Health System, 5.00%, 10/01/33 | | $ | 2,300 | | | $ | 2,866,513 | |
Simpson Senior Services Project, 5.00%, 12/01/30 | | | 2,180 | | | | 2,375,808 | |
City of Philadelphia Pennsylvania, GO, Refunding: | | | | | | | | |
(AGM), 5.00%, 08/01/30 | | | 9,235 | | | | 11,537,008 | |
(AGM), 4.00%, 08/01/32 | | | 6,000 | | | | 6,945,960 | |
Series A, 5.00%, 08/01/30 | | | 4,500 | | | | 5,570,190 | |
Commonwealth Financing Authority, RB, Tobacco Master Settlement Payment: | | | | | | | | |
5.00%, 06/01/30 | | | 3,500 | | | | 4,411,610 | |
5.00%, 06/01/32 | | | 6,000 | | | | 7,483,740 | |
Commonwealth of Pennsylvania, GO, Refunding, 1st Series, 4.00%, 01/01/30 | | | 7,000 | | | | 8,157,100 | |
County of Allegheny Hospital Development Authority, Refunding RB, Allegheny Health Network Obligated Group Issue, Series A: | | | | | | | | |
5.00%, 04/01/31 | | | 3,075 | | | | 3,859,033 | |
5.00%, 04/01/34 | | | 3,345 | | | | 4,142,716 | |
5.00%, 04/01/35 | | | 1,000 | | | | 1,233,770 | |
County of Berks IDA, Refunding RB, Tower Health Project: | | | | | | | | |
5.00%, 11/01/29 | | | 2,000 | | | | 2,437,640 | |
5.00%, 11/01/30 | | | 2,000 | | | | 2,424,240 | |
5.00%, 11/01/34 | | | 2,500 | | | | 2,982,775 | |
5.00%, 11/01/35 | | | 3,325 | | | | 3,958,811 | |
County of Chester IDA, Woodlands at Graystone Project, 4.38%, 03/01/28(b) | | | 265 | | | | 280,044 | |
County of Cumberland Pennsylvania Municipal Authority, Refunding RB, Diakon Lutheran Social Ministries Project: | | | | | | | | |
5.00%, 01/01/29 | | | 1,300 | | | | 1,488,747 | |
5.00%, 01/01/30 | | | 2,675 | | | | 3,057,097 | |
5.00%, 01/01/32 | | | 1,510 | | | | 1,739,807 | |
County of Dauphin General Authority, Refunding RB, Pinnacle Health System Project, Series A, 4.00%, 06/01/31 | | | 2,275 | | | | 2,567,315 | |
County of Delaware Authority, Refunding RB, Cabrini University: | | | | | | | | |
5.00%, 07/01/28 | | | 800 | | | | 942,056 | |
5.00%, 07/01/29 | | | 1,365 | | | | 1,596,135 | |
5.00%, 07/01/30 | | | 1,435 | | | | 1,667,197 | |
County of Lancaster Hospital Authority, Refunding RB, University of Pennsylvania Health System Obligation, Series A, 3.00%, 08/15/30 | | | 2,535 | | | | 2,739,600 | |
County of Montgomery Higher Education & Health Authority, Refunding RB, Thomas Jefferson University: | | | | | | | | |
5.00%, 09/01/31 | | | 1,750 | | | | 2,216,532 | |
5.00%, 09/01/32 | | | 1,315 | | | | 1,659,648 | |
4.00%, 09/01/34 | | | 3,000 | | | | 3,502,680 | |
4.00%, 09/01/35 | | | 1,735 | | | | 2,018,065 | |
4.00%, 09/01/36 | | | 1,500 | | | | 1,736,565 | |
County of Montgomery Pennsylvania IDA, Refunding RB: | | | | | | | | |
Acts Retirement-Life Communities, Inc. Obligated Group, 5.00%, 11/15/26 | | | 2,500 | | | | 2,697,500 | |
Albert Einstein Healthcare Network, Series A, 5.25%, 01/15/29 | | | 3,250 | | | | 3,741,172 | |
Albert Einstein Healthcare Network, Series A, 5.25%, 01/15/30 | | | 6,185 | | | | 7,092,711 | |
Whitemarsh Continuing Care Retirement Community Project, 5.00%, 01/01/30 | | | 2,000 | | | | 2,138,520 | |
County of Northampton Pennsylvania General Purpose Authority, RB, St. Luke’s Hospital of Bethlehem, Series A, 5.00%, 08/15/33 | | | 12,660 | | | | 14,032,724 | |
County of Northampton Pennsylvania General Purpose Authority, Refunding RB, Lafayette College, 5.00%, 11/01/34 | | | 5,400 | | | | 6,703,182 | |
| | | | | | | | |
| Security | | Par
(000) | | | Value | |
|
| Pennsylvania (continued) | |
County of Westmoreland Municipal Authority, Refunding RB (BAM): | | | | | | | | |
5.00%, 08/15/27 | | $ | 1,500 | | | $ | 1,802,640 | |
5.00%, 08/15/31 | | | 5,000 | | | | 6,220,600 | |
5.00%, 08/15/32 | | | 17,945 | | | | 22,267,592 | |
Geisinger Authority, Refunding RB, Geisinger Health System, Series A-2: | | | | | | | | |
5.00%, 02/15/32 | | | 4,000 | | | | 4,867,520 | |
5.00%, 02/15/34 | | | 1,750 | | | | 2,120,580 | |
Pennsylvania Economic Development Financing Authority, RB: | | | | | | | | |
Pennsylvania Bridge Finco LP, 5.00%, 12/31/29 | | | 5,000 | | | | 5,934,000 | |
Pennsylvania Bridge Finco LP, AMT, 5.00%, 12/31/34 | | | 16,500 | | | | 19,258,635 | |
Pennsylvania Rapid Bridge Replacement Project, AMT, 5.00%, 12/31/30 | | | 13,100 | | | | 15,478,305 | |
VRDN, Waste Management, Inc. Project, AMT, 2.15%, 07/01/41(f) | | | 1,840 | | | | 1,894,501 | |
Pennsylvania Economic Development Financing Authority, Refunding RB, University of Pittsburgh Medical Center, 5.00%, 03/15/31 | | | 4,500 | | | | 5,494,590 | |
Pennsylvania Higher Educational Facilities Authority, RB, Series AT-1, 5.00%, 06/15/30 | | | 7,910 | | | | 9,582,411 | |
Pennsylvania Higher Educational Facilities Authority, Refunding RB: | | | | | | | | |
Drexel University, 5.00%, 05/01/30 | | | 425 | | | | 509,550 | |
Drexel University, 5.00%, 05/01/31 | | | 1,000 | | | | 1,194,600 | |
Drexel University, 5.00%, 05/01/32 | | | 1,750 | | | | 2,084,898 | |
Drexel University, 5.00%, 05/01/33 | | | 3,320 | | | | 3,945,986 | |
Drexel University, 5.00%, 05/01/35 | | | 1,000 | | | | 1,182,690 | |
La Salle University, 4.00%, 05/01/32 | | | 3,000 | | | | 3,129,690 | |
Pennsylvania Housing Finance Agency, Refunding RB, Series 125-A, AMT, 3.40%, 10/01/32 | | | 9,000 | | | | 9,512,190 | |
Pennsylvania Turnpike Commission, RB, Sub-Series B-1: | | | | | | | | |
5.00%, 06/01/31 | | | 3,000 | | | | 3,682,560 | |
5.00%, 06/01/32 | | | 4,075 | | | | 4,990,489 | |
5.00%, 06/01/33 | | | 4,000 | | | | 4,884,360 | |
Pennsylvania Turnpike Commission, Refunding RB: | | | | | | | | |
Motor License Fund, Enhanced Turnpike, 5.00%, 12/01/30 | | | 5,000 | | | | 6,122,400 | |
Subordinate, Series B-2 (AGM), 5.00%, 06/01/34 | | | 4,000 | | | | 4,852,560 | |
Turnpike Subordinate Revenue, Second Series, 5.00%, 12/01/32 | | | 1,000 | | | | 1,233,830 | |
Turnpike Subordinate Revenue, Second Series, 5.00%, 12/01/33 | | | 1,815 | | | | 2,231,760 | |
Turnpike Subordinate Revenue, Second Series, 5.00%, 12/01/34 | | | 1,500 | | | | 1,837,770 | |
Turnpike Subordinate Revenue, Second Series, 5.00%, 12/01/35 | | | 2,005 | | | | 2,451,072 | |
Philadelphia Authority for Industrial Development, RB, Independence Charter School West Project, 4.00%, 06/15/29 | | | 350 | | | | 364,858 | |
Philadelphia Gas Works Co., Refunding RB, General Ordinance, Series 14-T, 5.00%, 10/01/30 | | | 425 | | | | 516,035 | |
State Public School Building Authority, RB, School District of Philadelphia Project(d): | | | | | | | | |
5.00%, 04/01/22 | | | 4,130 | | | | 4,494,472 | |
5.00%, 04/01/22 | | | 8,000 | | | | 8,706,000 | |
5.00%, 04/01/22 | | | 6,000 | | | | 6,529,500 | |
5.00%, 04/01/22 | | | 5,500 | | | | 5,985,375 | |
Township of East Hempfield Pennsylvania IDA, RB, Student Services, Inc. Student Housing Project: | | | | | | | | |
5.00%, 07/01/30 | | | 1,280 | | | | 1,416,474 | |
5.00%, 07/01/30 | | | 825 | | | | 955,540 | |
| | | | |
| SCHEDULES OF INVESTMENTS | | | 25 | |
| | |
Schedule of Investments (unaudited) (continued) January 31, 2020 | | BlackRock Municipal 2030 Target Term Trust (BTT) (Percentages shown are based on Net Assets) |
| | | | | | | | |
| Security | | Par
(000) | | | Value | |
|
| Pennsylvania (continued) | |
Wayne County Hospital & Health Facilities Authority, RB, Wayne Memorial Hospital Project, Series A (GTD): | | | | | | | | |
5.00%, 07/01/31 | | $ | 460 | | | $ | 562,856 | |
4.00%, 07/01/33 | | | 440 | | | | 495,955 | |
| | | | | | | | |
| | | | | | | 338,683,383 | |
|
| Puerto Rico — 3.6% | |
Puerto Rico Sales Tax Financing Corp. Sales Tax Revenue, RB, CAB, Restructured(a): | | | | | | | | |
Series A-1, 0.00%, 07/01/29 | | | 9,330 | | | | 7,454,763 | |
Series A-1, 0.00%, 07/01/31 | | | 30,273 | | | | 22,453,787 | |
Series A-1, 0.00%, 07/01/33 | | | 43,149 | | | | 29,701,183 | |
Series B-1, 0.00%, 07/01/31 | | | 5,755 | | | | 4,236,831 | |
Series B-1, 0.00%, 07/01/33 | | | 6,477 | | | | 4,429,555 | |
| | | | | | | | |
| | | | | | | 68,276,119 | |
|
| Rhode Island — 1.5% | |
Rhode Island Health & Educational Building Corp., RB, Hospital Financing, LifeSpan Obligation, 5.00%, 05/15/30 | | | 1,500 | | | | 1,784,055 | |
Rhode Island Housing & Mortgage Finance Corp., RB, S/F Housing, Homeownership Opportunity Bonds, Series 68-B, 3.00%, 10/01/31 | | | 13,500 | | | | 14,154,345 | |
Tobacco Settlement Financing Corp., Refunding RB, Series A: | | | | | | | | |
5.00%, 06/01/28 | | | 2,750 | | | | 3,194,207 | |
5.00%, 06/01/29 | | | 4,500 | | | | 5,216,895 | |
5.00%, 06/01/30 | | | 4,215 | | | | 4,874,142 | |
| | | | | | | | |
| | | | | | | 29,223,644 | |
|
| South Carolina — 0.6% | |
South Carolina Jobs EDA, Refunding RB, Prisma Health Obligated Group, Series A, 5.00%, 05/01/35 | | | 10,000 | | | | 12,228,300 | |
| | | | | | | | |
|
| Tennessee — 0.6% | |
Chattanooga Health Educational & Housing Facility Board, Refunding RB, Commonspirit Health, Series A, 4.00%, 08/01/36 | | | 2,000 | | | | 2,278,640 | |
Chattanooga-Hamilton County Hospital Authority, Refunding RB, Erlanger Health System, Series A, 5.00%, 10/01/31 | | | 6,210 | | | | 7,074,184 | |
Counties of Nashville & Davidson Tennessee Metropolitan Government Health & Educational Facilities Board, RB, Vanderbilt University Medical Center, Series A, 5.00%, 07/01/31 | | | 1,300 | | | | 1,570,777 | |
County of Memphis-Shelby Industrial Development Board, Refunding, Tax Allocation Bonds, Graceland Project, Series A, 4.75%, 07/01/27 | | | 565 | | | | 609,957 | |
| | | | | | | | |
| | | | | | | 11,533,558 | |
|
| Texas — 14.6% | |
Central Texas Regional Mobility Authority, RB, Senior Lien, Series A: | | | | | | | | |
5.00%, 01/01/30 | | | 1,600 | | | | 1,895,728 | |
5.00%, 01/01/31 | | | 1,175 | | | | 1,389,461 | |
5.00%, 01/01/33 | | | 1,500 | | | | 1,766,580 | |
Central Texas Turnpike System, Refunding RB, Series C: | | | | | | | | |
5.00%, 08/15/32 | | | 12,500 | | | | 14,413,750 | |
5.00%, 08/15/33 | | | 14,000 | | | | 16,133,180 | |
City of Houston Texas Airport System, Refunding ARB, United Airlines, Inc. Terminal E Project, AMT, 5.00%, 07/01/29 | | | 2,665 | | | | 2,998,898 | |
City of Houston Texas Airport System Revenue, Refunding RB: | | | | | | | | |
Series B-2, AMT, 5.00%, 07/15/20 | | | 6,470 | | | | 6,571,902 | |
Series D, 5.00%, 07/01/33 | | | 7,000 | | | | 8,881,180 | |
| | | | | | | | |
| Security | | Par
(000) | | | Value | |
|
| Texas (continued) | |
City of Houston Texas Combined Utility System Revenue, Refunding RB, First Lien, Series B: | | | | | | | | |
5.25%, 11/15/33 | | $ | 4,000 | | | $ | 4,989,520 | |
5.00%, 11/15/34 | | | 7,315 | | | | 8,977,407 | |
Clifton Higher Education Finance Corp., RB, Idea Public Schools, 6.00%, 08/15/33 | | | 1,650 | | | | 1,905,733 | |
Clifton Higher Education Finance Corp., Refunding RB, Series A: | | | | | | | | |
Idea Public Schools (PSF-GTD), 4.00%, 08/15/31 | | | 1,250 | | | | 1,440,675 | |
Idea Public Schools (PSF-GTD), 4.00%, 08/15/33 | | | 1,200 | | | | 1,375,824 | |
Uplift Education, 3.10%, 12/01/22 | | | 480 | | | | 492,466 | |
Uplift Education, 3.95%, 12/01/32 | | | 1,800 | | | | 1,883,664 | |
County of Harris Texas, Refunding RB, Toll Road, Senior Lien, Series C, 4.00%, 08/15/33 | | | 12,325 | | | | 13,237,420 | |
County of Harris Texas Cultural Education Facilities Finance Corp., RB, 1st Mortgage, Brazos Presbyterian Homes, Inc. Project, Series B: | | | | | | | | |
5.75%, 01/01/28 | | | 500 | | | | 552,405 | |
6.38%, 01/01/33 | | | 460 | | | | 514,243 | |
County of Harris Texas Cultural Education Facilities Finance Corp., Refunding RB, Series A: | | | | | | | | |
Brazos Presbyterian Homes, Inc. Project, 5.00%, 01/01/33 | | | 1,090 | | | | 1,174,606 | |
YMCA of the Greater Houston Area,
5.00%, 06/01/28 | | | 1,150 | | | | 1,258,008 | |
YMCA of the Greater Houston Area,
5.00%, 06/01/33 | | | 3,000 | | | | 3,260,910 | |
County of Matagorda Texas Navigation District No. 1, Refunding RB: | | | | | | | | |
Series A (AMBAC), 4.40%, 05/01/30 | | | 26,120 | | | | 32,060,733 | |
Series B (AMBAC), AMT, 4.55%, 05/01/30(f): | | | 10,000 | | | | 12,141,200 | |
Series B-2, 4.00%, 06/01/30 | | | 12,995 | | | | 13,982,100 | |
County of Midland Texas Fresh Water Supply District No. 1, RB, CAB, City of Midland Project, Series A(a): | | | | | | | | |
0.00%, 09/15/31 | | | 6,235 | | | | 4,578,423 | |
0.00%, 09/15/32 | | | 15,135 | | | | 10,547,581 | |
County of Nueces Texas, GO, Refunding: | | | | | | | | |
4.00%, 02/15/33 | | | 1,165 | | | | 1,381,271 | |
4.00%, 02/15/35 | | | 725 | | | | 851,933 | |
County of Tarrant Texas Cultural Education Facilities Finance Corp., RB: | | | | | | | | |
Christus Health, Series B, 5.00%, 07/01/35 | | | 6,000 | | | | 7,481,100 | |
Baylor Health Care System Project, Series A, 4.00%, 11/15/31 | | | 5,500 | | | | 6,004,515 | |
Baylor Health Care System Project, Series A, 4.00%, 11/15/32 | | | 15,420 | | | | 16,818,902 | |
County of Tarrant Texas Cultural Education Facilities Finance Corp., Refunding RB, Trinity Terrace Project, Series A-1, 5.00%, 10/01/29 | | | 1,000 | | | | 1,128,920 | |
Leander ISD, GO, CAB, Refunding, Series D (PSF-GTD)(a): | | | | | | | | |
0.00%, 08/15/31 | | | 1,200 | | | | 820,164 | |
0.00%, 08/15/32 | | | 2,000 | | | | 1,310,800 | |
0.00%, 08/15/33 | | | 4,485 | | | | 2,770,250 | |
Mission EDC, Refunding RB, Senior Lien, NatGasoline Project, AMT, 4.63%, 10/01/31(b) | | | 4,125 | | | | 4,467,540 | |
New Hope Cultural Education Facilities Corp., RB, Series A: | | | | | | | | |
Station 1 LLC Texas A&M University Project, 5.00%, 04/01/29 | | | 2,290 | | | | 2,534,412 | |
Stephenville LLC Tarleton State University Project, 5.38%, 04/01/28 | | | 1,150 | | | | 1,259,722 | |
Stephenville LLC Tarleton State University Project, 5.00%, 04/01/29 | | | 725 | | | | 802,988 | |
| | |
| 26 | | 2020 BLACKROCK SEMI-ANNUAL REPORT TO SHAREHOLDERS |
| | |
Schedule of Investments (unaudited) (continued) January 31, 2020 | | BlackRock Municipal 2030 Target Term Trust (BTT) (Percentages shown are based on Net Assets) |
| | | | | | | | |
| Security | | Par
(000) | | | Value | |
|
| Texas (continued) | |
New Hope Cultural Education Facilities Corp., Refunding RB, 1st Mortgage, Morningside Ministries Project, 6.25%, 01/01/33 | | $ | 1,600 | | | $ | 1,772,928 | |
New Hope Cultural Education Facilities Finance Corp., RB, Series A(b): | | | | | | | | |
CityScape Schools, Inc., 4.00%, 08/15/29 | | | 335 | | | | 369,110 | |
Jubilee Academic Center Project, 3.63%, 08/15/22 | | | 280 | | | | 283,116 | |
Jubilee Academic Center Project, 4.25%, 08/15/27 | | | 450 | | | | 457,421 | |
North Texas Tollway Authority, Refunding RB, 1st Tier, Series A, 5.00%, 01/01/35 | | | 5,750 | | | | 7,019,715 | |
Red River Health Facilities Development Corp., RB, Wichita Falls Retirement Foundation Project: | | | | | | | | |
4.70%, 01/01/22 | | | 275 | | | | 285,511 | |
5.50%, 01/01/32 | | | 1,000 | | | | 1,053,340 | |
Socorro Independent School District, GO, Refunding, Series B (PSF-GTD), 4.00%, 08/15/34 | | | 3,000 | | | | 3,484,770 | |
Texas Municipal Gas Acquisition & Supply Corp. III, RB, Natural Gas Utility Improvements: | | | | | | | | |
5.00%, 12/15/30 | | | 13,000 | | | | 14,244,360 | |
5.00%, 12/15/31 | | | 25,000 | | | | 27,363,500 | |
Texas Public Finance Authority, Refunding RB, Midwestern State University, 4.00%, 12/01/31 | | | 1,650 | | | | 1,899,496 | |
Texas Transportation Commission State Highway Fund, Refunding RB, 1st Tier, 5.00%, 10/01/22 | | | 1,000 | | | | 1,107,840 | |
| | | | | | | | |
| | | | | | | 275,397,221 | |
|
| Virginia — 0.7% | |
County of Fairfax Virginia EDA, RB, Vinson Hall LLC, Series A, 5.00%, 12/01/32 | | | 2,000 | | | | 2,230,400 | |
County of Hanover Virginia EDA, Refunding RB, Covenant Woods, Series A: | | | | | | | | |
4.50%, 07/01/30 | | | 3,000 | | | | 3,146,190 | |
4.50%, 07/01/32 | | | 1,100 | | | | 1,150,149 | |
Dulles Town Center Community Development Authority, Refunding, Special Assessment, Dulles Town Center Project, 4.25%, 03/01/26 | | | 500 | | | | 512,765 | |
Virginia College Building Authority, RB, Green Bonds, Marymount University Project, Series B, 5.25%, 07/01/30(b) | | | 2,000 | | | | 2,247,020 | |
Virginia Small Business Financing Authority, RB, Senior Lien, Express Lanes LLC, AMT, 5.00%, 07/01/34 | | | 3,940 | | | | 4,197,834 | |
| | | | | | | | |
| | | | | | | 13,484,358 | |
|
| Washington — 2.2% | |
Grant & Douglas Counties School District No. 144-101 Quincy, GO, 4.00%, 12/01/34 | | | 7,475 | | | | 8,568,443 | |
Greater Wenatchee Regional Events Center Public Facilities District, Refunding RB, Series A: | | | | | | | | |
5.00%, 09/01/27 | | | 1,000 | | | | 1,060,890 | |
5.25%, 09/01/32 | | | 1,850 | | | | 1,956,745 | |
Port of Seattle Washington, Refunding RB, Intermediate Lien, AMT, Series C, 5.00%, 05/01/34 | | | 6,000 | | | | 7,296,240 | |
Port of Seattle Washington Industrial Development Corp., Refunding RB, Special Facilities, Delta Airline, Inc. Project, AMT, 5.00%, 04/01/30 | | | 5,000 | | | | 5,498,500 | |
Washington Biomedical Research Properties 3.2, RB, Series A: | | | | | | | | |
5.00%, 01/01/31 | | | 1,000 | | | | 1,198,180 | |
5.00%, 01/01/32 | | | 1,140 | | | | 1,363,634 | |
Washington Health Care Facilities Authority, Refunding RB, MultiCare Health System, Series B, 5.00%, 08/15/35 | | | 9,485 | | | | 11,752,199 | |
Washington State Housing Finance Commission, Refunding RB, Emerald Heights Project: | | | | | | | | |
5.00%, 07/01/28 | | | 1,000 | | | | 1,116,920 | |
| | | | | | | | |
| Security | | Par
(000) | | | Value | |
|
| Washington (continued) | |
5.00%, 07/01/33 | | $ | 1,100 | | | $ | 1,222,276 | |
| | | | | | | | |
| | | | | | | 41,034,027 | |
|
| West Virginia — 0.2% | |
West Virginia Hospital Finance Authority, RB, West Virginia University Health System, Series A: | | | | | | | | |
5.00%, 06/01/31 | | | 1,950 | | | | 2,402,127 | |
5.00%, 06/01/33 | | | 1,100 | | | | 1,348,391 | |
| | | | | | | | |
| | | | | | | 3,750,518 | |
|
| Wisconsin — 2.4% | |
Public Finance Authority, RB, American Preparatory Academy, Series A, 4.00%, 07/15/29(b) | | | 645 | | | | 689,518 | |
Public Finance Authority, Refunding RB: | | | | | | | | |
AMT, National Gypsum Co., 5.25%, 04/01/30 | | | 6,690 | | | | 7,379,672 | |
Penick Village Obligation Group, 4.00%, 09/01/29(b) | | | 445 | | | | 468,790 | |
Waste Management, Inc. Project, AMT,
2.63%, 11/01/25 | | | 3,000 | | | | 3,156,300 | |
Wisconsin Airport Facilities, Senior Obligated Group, Series B, AMT, 5.25%, 07/01/28 | | | 2,250 | | | | 2,445,435 | |
State of Wisconsin, GO, Series B, 3.00%, 05/01/33 | | | 5,000 | | | | 5,126,750 | |
Wisconsin Health & Educational Facilities Authority, Refunding RB: | | | | | | | | |
Advocate Aurora Health Credit Group, Series C-4, 1.78%, 08/15/54(f) | | | 8,200 | | | | 8,408,854 | |
Marquette University, 4.00%, 10/01/32 | | | 4,520 | | | | 4,830,840 | |
Milwaukee Regional Medical Center Thermal Service, Inc., 5.00%, 04/01/35 | | | 2,500 | | | | 3,138,825 | |
Wisconsin Housing & Economic Development Authority, Refunding RB, S/F Housing, Series D (Freddie Mac), 3.00%, 09/01/32 | | | 9,000 | | | | 9,404,190 | |
| | | | | | | | |
| | | | | | | 45,049,174 | |
| | | | | | | | |
| |
Total Municipal Bonds — 127.7%
(Cost — $2,195,472,317) | | | | 2,400,301,541 | |
| | | | | |
|
Municipal Bonds Transferred to Tender Option Bond
Trusts(h) — 24.5% | |
|
| Colorado — 4.5% | |
City & County of Denver Colorado, Refunding ARB, Department of Aviation, Series A, AMT(i): | | | | | | | | |
4.25%, 11/15/29 | | | 33,820 | | | | 36,546,188 | |
4.25%, 11/15/30 | | | 35,210 | | | | 38,048,234 | |
4.25%, 11/15/31 | | | 8,085 | | | | 8,736,722 | |
4.25%, 11/15/32 | | | 2,230 | | | | 2,409,758 | |
| | | | | | | | |
| | | | | | | 85,740,902 | |
|
| Florida — 5.4% | |
County of Broward Florida, ARB, Series Q-1(i): | | | | | | | | |
4.00%, 10/01/29 | | | 17,200 | | | | 18,523,338 | |
4.00%, 10/01/30 | | | 18,095 | | | | 19,487,198 | |
4.00%, 10/01/31 | | | 18,820 | | | | 20,267,978 | |
4.00%, 10/01/32 | | | 19,575 | | | | 21,081,066 | |
4.00%, 10/01/33 | | | 20,355 | | | | 21,921,078 | |
| | | | | | | | |
| | | | | | | 101,280,658 | |
|
| Iowa — 2.4% | |
Iowa State Board of Regents, RB, University of Iowa Hospitals & Clinics: | | | | | | | | |
4.00%, 09/01/28 | | | 3,375 | | | | 3,620,703 | |
4.00%, 09/01/29 | | | 6,524 | | | | 7,000,027 | |
4.00%, 09/01/30 | | | 6,324 | | | | 6,785,466 | |
4.00%, 09/01/31 | | | 8,649 | | | | 9,279,729 | |
4.00%, 09/01/32 | | | 7,749 | | | | 8,314,208 | |
4.00%, 09/01/33 | | | 9,374 | | | | 10,057,509 | |
| | | | | | | | |
| | | | | | | 45,057,642 | |
| | | | |
| SCHEDULES OF INVESTMENTS | | | 27 | |
| | |
Schedule of Investments (unaudited) (continued) January 31, 2020 | | BlackRock Municipal 2030 Target Term Trust (BTT) (Percentages shown are based on Net Assets) |
| | | | | | | | |
| Security | | Par
(000) | | | Value | |
|
| Nevada — 1.1% | |
Clark County Nevada, 4.00%, 11/01/34 | | $ | 17,710 | | | $ | 20,363,664 | |
| | | | | | | | |
|
| Pennsylvania — 2.6% | |
Commonwealth of Pennsylvania, GO, 1st Series, 5.00%, 03/01/32(i) | | | 20,000 | | | | 25,250,800 | |
Lehigh County Pennsylvania General Purpose Hospital, 4.00%, 07/01/33 | | | 22,285 | | | | 23,734,192 | |
| | | | | | | | |
| | | | | | | 48,984,992 | |
|
| Texas — 8.5% | |
City of San Antonio Texas Public Facilities Corp., Refunding LRB, Convention Center Refinancing & Expansion Project(i): | | | | | | | | |
4.00%, 09/15/30 | | | 15,000 | | | | 15,989,015 | |
4.00%, 09/15/31 | | | 19,475 | | | | 20,759,071 | |
4.00%, 09/15/32 | | | 18,075 | | | | 19,266,763 | |
4.00%, 09/15/33 | | | 11,000 | | | | 11,725,278 | |
4.00%, 09/15/34 | | | 11,885 | | | | 12,668,629 | |
4.00%, 09/15/35 | | | 4,500 | | | | 4,796,704 | |
Dallas Fort Worth International Airport, Refunding RB, AMT(d)(i): | | | | | | | | |
Series E, 4.00%, 11/01/20 | | | 6,915 | | | | 7,101,289 | |
Series E, 4.13%, 11/01/20 | | | 10,435 | | | | 10,716,118 | |
Series F, 5.00%, 11/01/20 | | | 55,555 | | | | 57,051,646 | |
| | | | | | | | |
| | | | | | | 160,074,513 | |
| | | | | | | | |
| |
Total Municipal Bonds Transferred to Tender Option Bond
Trusts — 24.5%
(Cost — $435,884,838) | | | | 461,502,371 | |
| | | | | |
| |
Total Long-Term Investments — 152.2%
(Cost — $2,631,357,155) | | | | 2,861,803,912 | |
| | | | | |
| | | | | | | | |
Security | | Shares | | | Value | |
|
| Short-Term Securities — 0.7% | |
BlackRock Liquidity Funds, MuniCash,
Institutional Class, 0.81%(j)(k) | | | 12,390,358 | | | $ | 12,392,836 | |
| | | | | | | | |
| |
Total Short-Term Securities — 0.7%
(Cost — $12,392,836) | | | | 12,392,836 | |
| | | | | |
| |
Total Investments — 152.9%
(Cost — $2,643,749,991) | | | | 2,874,196,748 | |
| |
Other Assets Less Liabilities — 1.0% | | | | 17,930,293 | |
| |
Liability for TOB Trust Certificates, Including Interest Expense and Fees Payable — (14.0)% | | | | (262,754,174 | ) |
| |
Preferred Shares, at Redemption Value — (39.9)% | | | | (749,658,412 | ) |
| | | | | |
| |
Net Assets Applicable to Common Shares — 100.0% | | | $ | 1,879,714,455 | |
| | | | | |
| (b) | Security exempt from registration pursuant to Rule 144A under the Securities Act of 1933, as amended. These securities may be resold in transactions exempt from registration to qualified institutional investors. |
| (c) | Security is collateralized by municipal bonds or U.S. Treasury obligations. |
| (d) | U.S. Government securities held in escrow, are used to pay interest on this security as well as to retire the bond in full at the date indicated, typically at a premium to par. |
| (e) | When-issued security. |
| (f) | Variable or floating rate security, which interest rate adjusts periodically based on changes in current interest rates and prepayments on the underlying pool of assets. Rate shown is the rate in effect as of period end. |
| (g) | Step-up bond that pays an initial coupon rate for the first period and then a higher coupon rate for the following periods. Rate as of period end. |
| (h) | Represent bonds transferred to a TOB Trust in exchange of cash and residual certificates received by the Trust. These bonds serve as collateral in a secured borrowing. See Note 4 of the Notes to Financial Statements for details. |
| (i) | All or a portion of the security is subject to a recourse agreement. The aggregate maximum potential amount the Trust could ultimately be required to pay under the agreements, which expire between May 1, 2020 to March 1, 2026, is $221,778,857. See Note 4 of the Notes to Financial Statements for details. |
| (j) | Annualized 7-day yield as of period end. |
| (k) | During the six months ended January 31, 2020, investments in issuers considered to be an affiliate/affiliates of the Trust for purposes of Section 2(a)(3) of the Investment Company Act of 1940, as amended, were as follows: |
| | | | | | | | | | | | | | | | | | | | | | | | | | | | |
| Affiliate | | Shares
Held at
07/31/19 | | | Net
Activity | | | Shares
Held at
01/31/20 | | | Value at
01/31/20 | | | Income | | | Net
Realized
Gain (Loss) (a) | | | Change in
Unrealized
Appreciation
(Depreciation) | |
BlackRock Liquidity Funds, MuniCash, Institutional Class | | | 3,725,793 | | | | 8,664,565 | | | | 12,390,358 | | | $ | 12,392,836 | | | $ | 21,272 | | | $ | (142 | ) | | $ | — | |
| | | | | | | | | | | | | | | | | | | | | | | | | | | | |
| | (a) | Includes net capital gain distributions, if applicable. | |
Fair Value Hierarchy as of Period End
Various inputs are used in determining the fair value of investments. For information about the Trust’s policy regarding valuation of investments and derivative financial instruments, refer to the Notes to Financial Statements.
The following tables summarizes the Trust’s investments categorized in the disclosure hierarchy:
| | | | | | | | | | | | | | | | |
| | | Level 1 | | | Level 2 | | | Level 3 | | | Total | |
Assets: | |
Investments: | |
Long-Term Investments(a) | | $ | — | | | $ | 2,861,803,912 | | | $ | — | | | $ | 2,861,803,912 | |
Short-Term Securities | | | 12,392,836 | | | | — | | | | — | | | | 12,392,836 | |
| | | | | | | | | | | | | | | | |
| | $ | 12,392,836 | | | $ | 2,861,803,912 | | | $ | — | | | $ | 2,874,196,748 | |
| | | | | | | | | | | | | | | | |
| | (a) | See above schedule of Investment for values in each state or political subdivision. | |
| | |
| 28 | | 2020 BLACKROCK SEMI-ANNUAL REPORT TO SHAREHOLDERS |
| | |
Schedule of Investments (unaudited) (continued) January 31, 2020 | | BlackRock Municipal 2030 Target Term Trust (BTT) |
The Trust may hold assets and/or liabilities in which the fair value approximates the carrying amount for financial statement purposes. As of period end, such assets and/or liabilities are categorized within the disclosure hierarchy as follows:
| | | | | | | | | | | | | | | | |
| | | Level 1 | | | Level 2 | | | Level 3 | | | Total | |
Liabilities: | |
TOB Trust Certificates | | $ | — | | | $ | (261,819,915 | ) | | $ | — | | | $ | (261,819,915 | ) |
RVMTP Shares at Liquidation Value | | | — | | | | (750,000,000 | ) | | | — | | | | (750,000,000 | ) |
| | | | | | | | | | | | | | | | |
| | $ | — | | | $ | (1,011,819,915 | ) | | $ | — | | | $ | (1,011,819,915 | ) |
| | | | | | | | | | | | | | | | |
See notes to financial statements.
| | | | |
| SCHEDULES OF INVESTMENTS | | | 29 | |
| | |
Schedule of Investments (unaudited) January 31, 2020 | | BlackRock Municipal Income Investment Trust (BBF) (Percentages shown are based on Net Assets) |
| | | | | | | | |
| Security | | Par
(000) | | | Value | |
|
Municipal Bonds — 112.1% | |
|
| Alabama — 0.3% | |
City of Selma Alabama IDB, RB, Gulf Opportunity Zone, International Paper Co. Project, Series A, 5.38%, 12/01/35 | | $ | 420 | | | $ | 445,830 | |
| | | | | | | | |
|
| Arizona — 1.6% | |
Arizona IDA, Refunding RB, Basis Schools, Inc. Projects, Series A, 5.38%, 07/01/50(a) | | | 1,185 | | | | 1,318,727 | |
City of Phoenix Arizona IDA, Refunding RB, Basis Schools, Inc. Projects, Series A, 5.00%, 07/01/35(a) | | | 275 | | | | 302,104 | |
County of Maricopa IDA, Refunding RB, Honorhealth, Series A, 4.13%, 09/01/38 | | | 320 | | | | 369,338 | |
Industrial Development Authority of the County of Pima, RB, Imagine East Mesa Charter Schools Project, 5.00%, 07/01/49(a) | | | 350 | | | | 372,358 | |
| | | | | | | | |
| | | | | | | 2,362,527 | |
|
| California — 11.7% | |
California Health Facilities Financing Authority, Refunding RB, Adventist Health System West, Series A, 4.00%, 03/01/39 | | | 980 | | | | 1,091,289 | |
California School Finance Authority, RB, Alliance For College-Ready Public School Projects, Series A, 5.00%, 07/01/51(a) | | | 1,200 | | | | 1,345,320 | |
California Statewide Communities Development Authority, RB, Lancer Educational student Housing Project, Series A, 5.00%, 06/01/46(a) | | | 1,220 | | | | 1,365,924 | |
California Statewide Communities Development Authority, Refunding RB, Lancer Educational student Housing Project, Series A, 5.00%, 06/01/36(a) | | | 990 | | | | 1,131,352 | |
Golden State Tobacco Securitization Corp., Refunding RB, Series A-1, 5.00%, 06/01/47 | | | 475 | | | | 499,529 | |
Kern Community College District, GO, Safety, Repair & Improvement, Series C, 5.50%, 11/01/23(b) | | | 1,185 | | | | 1,387,232 | |
Regents of the University of California Medical Center Pooled Revenue, Refunding RB, Series J: | | | | | | | | |
5.25%, 05/15/23(b) | | | 2,165 | | | | 2,472,603 | |
5.25%, 05/15/38 | | | 615 | | | | 694,999 | |
State of California, GO, Various Purposes, 6.00%, 03/01/33 | | | 1,960 | | | | 1,970,055 | |
State of California Public Works Board, LRB, Various Capital Projects, Series I: | | | | | | | | |
5.50%, 11/01/31 | | | 2,100 | | | | 2,452,086 | |
5.50%, 11/01/33 | | | 1,500 | | | | 1,747,950 | |
State of California Public Works Board, RB, Department of Corrections & Rehabilitation, Series F, 5.25%, 09/01/33 | | | 610 | | | | 701,714 | |
Township of Washington California Health Care District, GO, Election of 2004, Series B, 5.50%, 08/01/40 | | | 460 | | | | 541,719 | |
| | | | | | | | |
| | | | | | | 17,401,772 | |
|
| Colorado — 3.3% | |
Centerra Metropolitan District No. 1, Tax Allocation Bonds, 5.00%, 12/01/47(a) | | | 250 | | | | 266,250 | |
City & County of Denver Colorado, RB, Capital Appreciation Bonds Series, Series A-2, 0.00%, 08/01/38(c) | | | 1,000 | | | | 528,670 | |
City & County of Denver Colorado Airport System, ARB, Sub-System, Series B, 5.25%, 11/15/32 | | | 1,750 | | | | 2,016,490 | |
Colorado Health Facilities Authority, Refunding RB: | | | | | | | | |
Catholic Health Initiatives, Series B-1, 4.00%, 11/09/22(b) | | | 710 | | | | 770,229 | |
Frasier Meadows Retirement Community Project, Series A, 5.25%, 05/15/37 | | | 210 | | | | 243,980 | |
Colorado Housing & Finance Authority, RB, M/F Housing Project, Series B1, 3.40%, 10/01/54 | | | 1,000 | | | | 1,043,500 | |
| | | | | | | | |
| | | | | | | 4,869,119 | |
| | | | | | | | |
| Security | | Par
(000) | | | Value | |
|
| Connecticut — 0.3% | |
Connecticut Housing Finance Authority, Refunding RB, S/F Housing, Sub-Series B-1, 4.00%, 05/15/45 | | $ | 460 | | | $ | 507,274 | |
| | | | | | | | |
|
| Florida — 8.5% | |
Celebration Pointe Community Development District, Special Assessment Bonds, County of Alachua Florida(a): | | | | | | | | |
5.00%, 05/01/32 | | | 225 | | | | 247,145 | |
5.00%, 05/01/48 | | | 555 | | | | 592,873 | |
County of Escambia Health Facilities Authority, Refunding RB(d): | | | | | | | | |
Health Care Facilities (AGM), 3.00%, 08/15/50 | | | 640 | | | | 650,854 | |
Health Care Facilities Revenue Bond, 4.00%, 08/15/50 | | | 2,150 | | | | 2,388,800 | |
County of Miami-Dade Florida, RB, Seaport Department, Series A, 6.00%, 10/01/38 | | | 5,675 | | | | 6,600,933 | |
County of Osceola Florida Transportation Revenue, Refunding RB, Series A-2(c): | | | | | | | | |
0.00%, 10/01/46 | | | 635 | | | | 259,017 | |
0.00%, 10/01/47 | | | 610 | | | | 240,730 | |
0.00%, 10/01/48 | | | 430 | | | | 162,080 | |
0.00%, 10/01/49 | | | 355 | | | | 129,536 | |
Lakewood Ranch Stewardship District, Special Assessment Bonds, Lakewood National & Polo Run Projects: | | | | | | | | |
5.25%, 05/01/37 | | | 180 | | | | 200,351 | |
5.38%, 05/01/47 | | | 185 | | | | 203,319 | |
Reedy Creek Florida Improvement District, GO, Series A, 5.25%, 06/01/32 | | | 875 | | | | 993,676 | |
| | | | | | | | |
| | | | | | | 12,669,314 | |
|
| Georgia — 3.9% | |
Main Street Natural Gas, Inc., RB, Series A, 5.00%, 05/15/49 | | | 2,320 | | | | 3,342,192 | |
Municipal Electric Authority of Georgia, RB, Plant Vogtle Units 3 & 4 Project: | | | | | | | | |
4.00%, 01/01/49 | | | 705 | | | | 775,162 | |
4.00%, 01/01/59 | | | 1,335 | | | | 1,453,174 | |
Municipal Electric Authority of Georgia, Refunding RB, Series A, 4.00%, 01/01/49 | | | 260 | | | | 286,159 | |
| | | | | | | | |
| | | | | | | 5,856,687 | |
|
| Illinois — 18.6% | |
Chicago Board of Education, GO, Series C: | | | | | | | | |
Dedicated Revenues, Series H, 5.00%, 12/01/46 | | | 215 | | | | 247,102 | |
Project, 5.25%, 12/01/35 | | | 700 | | | | 785,862 | |
Chicago Board of Education, GO, Refunding: | | | | | | | | |
Dedicated Revenues, Series D, 5.00%, 12/01/27 | | | 400 | | | | 484,020 | |
Dedicated Revenues, Series F, 5.00%, 12/01/23 | | | 290 | | | | 324,321 | |
Dedicated Revenues, Series G,
5.00%, 12/01/34 | | | 215 | | | | 253,354 | |
5.00%, 12/01/25 | | | 295 | | | | 345,224 | |
Chicago Board of Education, GO: | | | | | | | | |
5.00%, 12/01/46 | | | 880 | | | | 972,049 | |
City of Chicago Illinois O’Hare International Airport, GARB, 3rd Lien, Series C, 6.50%, 01/01/21(b) | | | 4,545 | | | | 4,774,932 | |
City of Chicago Illinois Transit Authority, RB: | | | | | | | | |
5.25%, 12/01/31 | | | 560 | | | | 600,359 | |
Sales Tax Receipts, 5.25%, 12/01/36 | | | 1,500 | | | | 1,604,325 | |
Sales Tax Receipts, 5.25%, 12/01/40 | | | 1,750 | | | | 1,862,980 | |
County of Cook Illinois Community College District No. 508, GO, City College of Chicago: | | | | | | | | |
5.50%, 12/01/38 | | | 580 | | | | 648,991 | |
5.25%, 12/01/43 | | | 2,660 | | | | 2,916,823 | |
Illinois Finance Authority, RB, Carle Foundation, Series A, 6.00%, 08/15/41 | | | 1,750 | | | | 1,871,380 | |
| | |
| 30 | | 2020 BLACKROCK SEMI-ANNUAL REPORT TO SHAREHOLDERS |
| | |
Schedule of Investments (unaudited) (continued) January 31, 2020 | | BlackRock Municipal Income Investment Trust (BBF) (Percentages shown are based on Net Assets) |
| | | | | | | | |
| Security | | Par
(000) | | | Value | |
|
| Illinois (continued) | |
Metropolitan Pier & Exposition Authority, RB: | | | | | | | | |
Mccormick Place Expansion (BAM), 0.00%, 12/15/56(c) | | $ | 2,165 | | | $ | 680,178 | |
McCormick Place Expansion Project Bonds, Series A, 5.00%, 06/15/57 | | | 590 | | | | 685,132 | |
McCormick Place Expansion Project, Series A, 5.50%, 06/15/53 | | | 280 | | | | 326,256 | |
Metropolitan Pier & Exposition Authority, Refunding RB, McCormick Place Expansion Project: | | | | | | | | |
4.00%, 06/15/50(d) | | | 470 | | | | 517,423 | |
5.00%, 06/15/50(d) | | | 455 | | | | 544,985 | |
Bonds, Series B, 0.00%, 12/15/54(c) | | | 3,020 | | | | 905,426 | |
Series B-2, 5.00%, 06/15/50 | | | 150 | | | | 152,110 | |
Railsplitter Tobacco Settlement Authority, RB(b): | | | | | | | | |
5.50%, 06/01/21 | | | 1,055 | | | | 1,118,785 | |
6.00%, 06/01/21 | | | 300 | | | | 320,115 | |
State of Illinois, GO: | | | | | | | | |
5.25%, 02/01/31 | | | 730 | | | | 820,097 | |
5.25%, 02/01/32 | | | 1,500 | | | | 1,683,570 | |
5.50%, 07/01/33 | | | 1,500 | | | | 1,677,150 | |
5.50%, 07/01/38 | | | 340 | | | | 378,672 | |
State of Illinois, GO, Refunding, Series B, 5.00%, 10/01/27 | | | 225 | | | | 271,244 | |
| | | | | | | | |
| | | | | | | 27,772,865 | |
|
| Indiana — 1.2% | |
County of Allen Indiana, RB, StoryPoint Fort Wayne Project, Series A-1(a): | | | | | | | | |
6.63%, 01/15/34 | | | 125 | | | | 140,020 | |
6.75%, 01/15/43 | | | 185 | | | | 204,758 | |
6.88%, 01/15/52 | | | 375 | | | | 414,112 | |
Indiana Finance Authority, Refunding RB, Marquette Project, 4.75%, 03/01/32 | | | 500 | | | | 524,655 | |
Town of Chesterton Indiana, RB, StoryPoint Chesterton Project, Series A-1, 6.38%,
01/15/51(a) | | | 520 | | | | 565,204 | |
| | | | | | | | |
| | | | | | | 1,848,749 | |
|
| Iowa — 1.1% | |
Iowa Finance Authority, Refunding RB, Iowa Fertilizer Co. Project: | | | | | | | | |
Series B, 5.25%, 12/01/50(e) | | | 905 | | | | 1,002,432 | |
Midwestern Disaster Area, 5.25%, 12/01/25 | | | 625 | | | | 698,094 | |
| | | | | | | | |
| | | | | | | 1,700,526 | |
|
| Kansas — 0.4% | |
City of Lenexa Kansas, Refunding RB, Lakeview Village, Inc., Series A, 5.00%, 05/15/43 | | | 475 | | | | 529,791 | |
| | | | | | | | |
|
| Louisiana — 1.3% | |
Louisiana Local Government Environmental Facilities & Community Development Authority, RB, Westlake Chemical Corp. Project, Series A-1, 6.50%, 11/01/35 | | | 1,095 | | | | 1,133,008 | |
Tobacco Settlement Financing Corp., Refunding RB, Asset-Backed, Series A, 5.50%, 05/15/29 | | | 740 | | | | 741,480 | |
| | | | | | | | |
| | | | | | | 1,874,488 | |
|
| Maine — 0.5% | |
Maine Health & Higher Educational Facilities Authority, RB, Maine General Medical Center, 7.50%, 07/01/32 | | | 680 | | | | 720,079 | |
| | | | | | | | |
|
| Maryland — 0.7% | |
City of Baltimore Maryland, Refunding RB, East Baltimore Research Park, Series A, 4.50%, 09/01/33 | | | 135 | | | | 147,552 | |
Maryland Community Development Administration, Refunding RB, S/F Housing, Series A, 4.10%, 09/01/38 | | | 770 | | | | 850,673 | |
| | | | | | | | |
| | | | | | | 998,225 | |
| | | | | | | | |
| Security | | Par
(000) | | | Value | |
|
| Massachusetts — 2.4% | |
Massachusetts Development Finance Agency, RB: | | | | | | | | |
Emerson College Issue, Series A, 5.00%, 01/01/47 | | $ | 790 | | | $ | 919,007 | |
UMass Boston Student Housing Project, 5.00%, 10/01/41 | | | 500 | | | | 580,900 | |
UMass Boston Student Housing Project, 5.00%, 10/01/48 | | | 875 | | | | 1,002,837 | |
Massachusetts Development Finance Agency, Refunding RB: | | | | | | | | |
Emerson College Issue, 5.00%, 01/01/45 | | | 375 | | | | 423,405 | |
Trustees of Deerfield Academy, 5.00%, 10/01/40 | | | 375 | | | | 384,458 | |
Metropolitan Boston Transit Parking Corp., Refunding RB, 5.25%, 07/01/36 | | | 300 | | | | 317,499 | |
| | | | | | | | |
| | | | | | | 3,628,106 | |
|
| Michigan — 1.9% | |
Grand Traverse County Hospital Finance Authority, RB, Munson Health Care Obligated Group, Series A, 5.00%, 07/01/44 | | | 1,110 | | | | 1,357,552 | |
Lansing Board of Water & Light, RB, Board of Water & Light Utilities System, Series A, 5.50%, 07/01/21(b) | | | 1,400 | | | | 1,490,580 | |
| | | | | | | | |
| | | | | | | 2,848,132 | |
|
| Minnesota — 4.2% | |
City of Minneapolis Minnesota, Refunding RB, Fairview Health Services, Series A, 5.00%, 11/15/49 | | | 1,790 | | | | 2,180,256 | |
Duluth Economic Development Authority, Refunding RB, Essentia Health Obligated Group, Series A: | | | | | | | | |
4.25%, 02/15/48 | | | 2,665 | | | | 3,006,519 | |
5.25%, 02/15/58 | | | 560 | | | | 676,133 | |
Minnesota Housing Finance Agency, RB, S/F Housing, Series B (Ginnie Mae, Fannie Mae & Freddie Mac), 2.80%, 01/01/44(d) | | | 420 | | | | 423,045 | |
| | | | | | | | |
| | | | | | | 6,285,953 | |
|
| Montana — 0.1% | |
City of Kalispell Montana, Refunding RB, Immanuel Lutheran Corporation Project, Series A, 5.25%, 05/15/37 | | | 125 | | | | 140,166 | |
| | | | | | | | |
|
| New Jersey — 9.3% | |
Casino Reinvestment Development Authority, Inc., Refunding RB, 5.25%, 11/01/39 | | | 265 | | | | 288,760 | |
New Jersey Economic Development Authority, RB, School Facilities Construction, 5.00%, 06/15/44 | | | 2,030 | | | | 2,434,477 | |
New Jersey Transportation Trust Fund Authority, RB: | | | | | | | | |
Transportation Program Bonds, Series S, 5.25%, 06/15/43 | | | 1,145 | | | | 1,380,446 | |
Transportation Program Bonds, Series S, 5.00%, 06/15/46 | | | 1,045 | | | | 1,229,683 | |
Transportation System, Series AA, 5.50%, 06/15/39 | | | 2,245 | | | | 2,498,326 | |
New Jersey Turnpike Authority, RB, Series A, 4.00%, 01/01/48 | | | 640 | | | | 734,829 | |
Tobacco Settlement Financing Corp., Refunding RB: | | | | | | | | |
Series A, 5.00%, 06/01/35 | | | 630 | | | | 768,997 | |
Series A, 5.00%, 06/01/46 | | | 1,515 | | | | 1,770,278 | |
Sub-Series B, 5.00%, 06/01/46 | | | 2,455 | | | | 2,822,096 | |
| | | | | | | | |
| | | | | | | 13,927,892 | |
|
| New York — 6.8% | |
Counties of New York Tobacco Trust IV, Refunding RB, Settlement Pass-Through Turbo, Series A, 6.25%, 06/01/41(a) | | | 900 | | | | 908,820 | |
Hudson Yards Infrastructure Corp., RB, Senior, Fiscal 2012: | | | | | | | | |
5.75%, 02/15/21(b) | | | 1,005 | | | | 1,055,712 | |
5.75%, 02/15/47 | | | 615 | | | | 642,405 | |
Metropolitan Transportation Authority, RB, Series A, 5.25%, 11/15/21(b) | | | 500 | | | | 538,825 | |
| | | | |
| SCHEDULES OF INVESTMENTS | | | 31 | |
| | |
Schedule of Investments (unaudited) (continued) January 31, 2020 | | BlackRock Municipal Income Investment Trust (BBF) (Percentages shown are based on Net Assets) |
| | | | | | | | |
| Security | | Par
(000) | | | Value | |
|
| New York (continued) | |
New York State Dormitory Authority, Refunding RB, Series D, 4.00%, 02/15/47 | | $ | 700 | | | $ | 811,895 | |
Port Authority of New York & New Jersey, ARB, Consolidated Bonds, 217th Series, 4.00%, 11/01/49 | | | 4,000 | | | | 4,647,440 | |
State of New York Thruway Authority, Refunding RB, Subordinate, Series B, 4.00%, 01/01/50 | | | 1,065 | | | | 1,217,657 | |
Westchester Tobacco Asset Securitization Corp., Refunding RB, Tobacco Settlement Bonds, Sub-Series C, 4.00%, 06/01/42 | | | 275 | | | | 289,479 | |
| | | | | | | | |
| | | | | | | 10,112,233 | |
|
| North Carolina — 0.6% | |
North Carolina Turnpike Authority, RB, Senior Lien, Triangle Express Way System (AGM), 4.00%, 01/01/55 | | | 260 | | | | 293,673 | |
University of North Carolina at Chapel Hill, RB, University of North Carolina Hospital at Chapal Hills, 5.00%, 02/01/45 | | | 395 | | | | 585,208 | |
| | | | | | | | |
| | | | | | | 878,881 | |
|
| Ohio — 3.9% | |
Buckeye Tobacco Settlement Financing Authority, RB, Asset-Backed, Senior Turbo Term, Series A-2: | | | | | | | | |
5.75%, 06/01/34 | | | 245 | | | | 246,080 | |
5.88%, 06/01/47 | | | 1,600 | | | | 1,607,072 | |
County of Allen Ohio Hospital Facilities Revenue, Refunding RB, Catholic Healthcare Partners, Series A, 5.25%, 06/01/20(b) | | | 2,405 | | | | 2,438,983 | |
State of Ohio Turnpike Commission, RB, Junior Lien, Infrastructure Projects, Series A-1, 5.25%, 02/15/31 | | | 1,385 | | | | 1,557,931 | |
| | | | | | | | |
| | | | | | | 5,850,066 | |
|
| Oklahoma — 1.1% | |
Oklahoma Development Finance Authority, RB, OU Medicine Project, Series B, 5.25%, 08/15/48 | | | 560 | | | | 674,414 | |
Tulsa County Industrial Authority, Refunding RB, Montereau, Inc. Project, 5.25%, 11/15/45 | | | 850 | | | | 972,510 | |
| | | | | | | | |
| | | | | | | 1,646,924 | |
|
| Oregon — 0.2% | |
County of Clackamas Oregon School District No. 12 North Clackamas, GO, CAB, Series A, 0.00%, 06/15/38(c) | | | 575 | | | | 307,355 | |
| | | | | | | | |
|
| Pennsylvania — 3.1% | |
Allentown Neighborhood Improvement Zone Development Authority, RB, City Center Project, 5.00%, 05/01/42(a) | | | 420 | | | | 477,527 | |
Pennsylvania Higher Educational Facilities Authority, RB, University of Pennsylvania Health System Obligation, 4.00%, 08/15/49 | | | 660 | | | | 757,014 | |
Pennsylvania Turnpike Commission, RB,
Series A(b): | | | | | | | | |
5.63%, 12/01/20 | | | 1,645 | | | | 1,709,155 | |
Township of Bristol Pennsylvania School District, GO, 5.25%, 06/01/37 | | | 1,530 | | | | 1,700,029 | |
| | | | | | | | |
| | | | | | | 4,643,725 | |
|
| Puerto Rico — 5.8% | |
Children’s Trust Fund, Refunding RB, Tobacco Settlement Asset-Backed Bonds, 5.63%, 05/15/43 | | | 620 | | | | 630,472 | |
Commonwealth of Puerto Rico Aqueduct & Sewer Authority, Refunding RB, Senior Lien, Series A, 6.00%, 07/01/44 | | | 610 | | | | 622,535 | |
Puerto Rico Commonwealth Aqueduct & Sewer Authority, RB, Senior Lien, Series A: | | | | | | | | |
5.00%, 07/01/33 | | | 1,135 | | | | 1,207,390 | |
5.13%, 07/01/37 | | | 325 | | | | 346,538 | |
Puerto Rico Commonwealth Aqueduct & Sewer Authority, Refunding RB, Senior Lien, Series A, 6.00%, 07/01/38 | | | 335 | | | | 341,881 | |
Puerto Rico Sales Tax Financing Corp. Sales Tax Revenue, RB, Restructured: | | | | | | | | |
CAB, Series A-1, 0.00%, 07/01/46(c) | | | 897 | | | | 261,996 | |
| | | | | | | | |
| Security | | Par
(000) | | | Value | |
|
| Puerto Rico (continued) | |
CAB, Series A-1, 0.00%, 07/01/51(c) | | $ | 415 | | | $ | 87,694 | |
Series A-1, 4.75%, 07/01/53 | | | 720 | | | | 796,644 | |
Series A-1, 5.00%, 07/01/58 | | | 2,785 | | | | 3,127,889 | |
Series A-2, 4.33%, 07/01/40 | | | 338 | | | | 366,966 | |
Series A-2, 4.78%, 07/01/58 | | | 739 | | | | 817,216 | |
| | | | | | | | |
| | | | | | | 8,607,221 | |
|
| Rhode Island — 2.2% | |
Rhode Island Turnpike & Bridge Authority, RB, Series A, 4.00%, 10/01/44 | | | 120 | | | | 135,749 | |
Tobacco Settlement Financing Corp., Refunding RB, Series B: | | | | | | | | |
4.50%, 06/01/45 | | | 2,870 | | | | 3,015,423 | |
5.00%, 06/01/50 | | | 125 | | | | 134,775 | |
| | | | | | | | |
| | | | | | | 3,285,947 | |
|
| South Carolina — 5.3% | |
County of Charleston South Carolina, RB, Special Source, 5.25%, 12/01/38 | | | 1,825 | | | | 2,096,761 | |
South Carolina Jobs EDA, Refunding RB, Prisma Health Obligated Group, Series A, 5.00%, 05/01/48 | | | 565 | | | | 670,231 | |
South Carolina Jobs-Economic Development Authority, RB, Hilton Head Christian Academy, 5.00%, 01/01/40(a) | | | 385 | | | | 412,169 | |
State of South Carolina Jobs EDA, Refunding RB, Prisma Health Obligated Group, Series A, 5.00%, 05/01/43 | | | 950 | | | | 1,135,621 | |
State of South Carolina Public Service Authority, RB, Series E, 5.50%, 12/01/53 | | | 1,500 | | | | 1,693,155 | |
State of South Carolina Public Service Authority, Refunding RB: | | | | | | | | |
Series A, 5.00%, 12/01/50 | | | 210 | | | | 239,324 | |
Series A, 5.00%, 12/01/55 | | | 465 | | | | 526,715 | |
Series E, 5.25%, 12/01/55 | | | 945 | | | | 1,095,038 | |
| | | | | | | | |
| | | | | | | 7,869,014 | |
|
| Tennessee — 0.5% | |
County of Nashville & Davidson Metropolitan Government Health & Educational Facilities Board, Refunding RB, Lipscomb University Project, Series A: | | | | | | | | |
4.00%, 10/01/49 | | | 240 | | | | 262,512 | |
5.25%, 10/01/58 | | | 355 | | | | 430,320 | |
| | | | | | | | |
| | | | | | | 692,832 | |
|
| Texas — 6.9% | |
Central Texas Regional Mobility Authority, Refunding RB, Senior Lien, 6.00%, 01/01/21(b) | | | 2,560 | | | | 2,677,427 | |
City of Beaumont Texas, GO, Certificates of Obligation, 5.25%, 03/01/37 | | | 1,140 | | | | 1,275,580 | |
County of Tarrant Texas Cultural Education Facilities Finance Corp., RB, Scott & White Healthcare, 6.00%, 08/15/20(b) | | | 2,710 | | | | 2,782,411 | |
North Texas Tollway Authority, RB, Special Projects, Series A, 5.50%, 09/01/21(b) | | | 1,500 | | | | 1,607,520 | |
North Texas Tollway Authority, Refunding RB, 4.25%, 01/01/49 | | | 285 | | | | 323,584 | |
Red River Texas Education Financing Corp., RB, Texas Christian University Project, 5.25%, 03/15/23(b) | | | 520 | | | | 588,463 | |
Texas Transportation Commission, RB, First Tier Toll Revenue: | | | | | | | | |
CAB, 0.00%, 08/01/41(c) | | | 1,000 | | | | 417,380 | |
CAB, 0.00%, 08/01/42(c) | | | 875 | | | | 345,267 | |
5.00%, 08/01/57 | | | 235 | | | | 275,810 | |
| | | | | | | | |
| | | | | | | 10,293,442 | |
|
| Virginia — 1.5% | |
Ballston Quarter Community Development Authority, Tax Allocation Bonds, Series A: | | | | | | | | |
5.00%, 03/01/26 | | | 240 | | | | 260,580 | |
5.13%, 03/01/31 | | | 470 | | | | 527,749 | |
| | |
| 32 | | 2020 BLACKROCK SEMI-ANNUAL REPORT TO SHAREHOLDERS |
| | |
Schedule of Investments (unaudited) (continued) January 31, 2020 | | BlackRock Municipal Income Investment Trust (BBF) (Percentages shown are based on Net Assets) |
| | | | | | | | |
| Security | | Par
(000) | | | Value | |
|
| Virginia (continued) | |
City of Lexington Virginia IDA, RB, Washington & Lee University, 5.00%, 01/01/22(b) | | $ | 425 | | | $ | 458,261 | |
Tobacco Settlement Financing Corp., Refunding RB, Senior Series B-1, 5.00%, 06/01/47 | | | 1,010 | | | | 1,017,615 | |
| | | | | | | | |
| | | | | | | 2,264,205 | |
|
| Washington — 1.1% | |
Washington State Housing Finance Commission, Refunding RB, Horizon House Project, 5.00%, 01/01/48(a) | | | 1,405 | | | | 1,596,951 | |
| | | | | | | | |
|
| West Virginia — 0.4% | |
City of Martinsburg West Virginia, RB, M/F Housing, Kings Daughters Apartments, Series A-1, 4.63%, 12/01/43 | | | 570 | | | | 610,493 | |
| | | | | | | | |
|
| Wisconsin — 1.4% | |
Public Finance Authority, Refunding RB: | | | | | | | | |
Mery’s Wood at Marylhurst Projects, 5.25%, 05/15/52(a) | | | 735 | | | | 815,563 | |
Wingate University, Series A, 5.25%, 10/01/48 | | | 590 | | | | 684,377 | |
Wisconsin Housing & Economic Development Authority, RB, M/F Housing, Series A: | | | | | | | | |
3.20%, 11/01/49 | | | 310 | | | | 319,312 | |
3.38%, 05/01/57 | | | 275 | | | | 284,336 | |
| | | | | | | | |
| | | | | | | 2,103,588 | |
| | | | | | | | |
| |
Total Municipal Bonds — 112.1%
(Cost — $152,448,898) | | | | 167,150,372 | |
| | | | | |
|
Municipal Bonds Transferred to Tender Option Bond Trusts(f) | |
|
| California — 6.7% | |
Fremont Union High School District, GO, Refunding, Series A, 4.00%, 08/01/46 | | | 1,840 | | | | 2,102,881 | |
Grossmont California Union High School District, GO, Election of 2008, Series B, 5.00%, 08/01/20(b) | | | 3,700 | | | | 3,775,295 | |
Los Angeles Community College District California, GO, Election of 2008, Series C, 5.25%, 08/01/20(b)(g) | | | 4,041 | | | | 4,128,268 | |
| | | | | | | | |
| | | | | | | 10,006,444 | |
|
| Colorado — 1.1% | |
Colorado Health Facilities Authority, Refunding RB, Common spirit Health, Series A, 4.00%, 08/01/49(g) | | | 1,480 | | | | 1,642,297 | |
| | | | | | | | |
|
| District of Columbia — 4.6% | |
District of Columbia Housing Finance Agency, RB, M/F Housing, Series B-2 (FHA), 4.10%, 09/01/39 | | | 1,051 | | | | 1,160,320 | |
Metropolitan Washington Airports Authority Dulles Toll Road Revenue, 4.00%, 10/01/53 | | | 5,002 | | | | 5,659,228 | |
| | | | | | | | |
| | | | | | | 6,819,548 | |
|
| Florida — 3.1% | |
Florida Housing Finance Corp., RB, S/F Housing, Series 1, 3.30%, 07/01/49(g) | | | 4,500 | | | | 4,691,655 | |
| | | | | | | | |
|
| Georgia — 0.8% | |
County of Dalton Whitfield Joint Development Authority, RB, Hamilton Health Care System Obligation, 4.00%, 08/15/48 | | | 1,025 | | | | 1,127,295 | |
| | | | | | | | |
|
| Idaho — 1.4% | |
Idaho State Building Authority, RB, State Office Campus Project, Series A, 4.00%, 09/01/48 | | | 1,900 | | | | 2,119,811 | |
| | | | | | | | |
|
| Illinois — 1.0% | |
State of Illinois Toll Highway Authority, RB, Series C, 5.00%, 01/01/38 | | | 1,244 | | | | 1,448,713 | |
| | | | | | | | |
|
| Iowa — 1.2% | |
Iowa Finance Authority, Refunding RB, UnityPoint Health, Series E, 4.00%, 08/15/46 | | | 1,605 | | | | 1,733,127 | |
| | | | | | | | |
| | | | | | | | |
| Security | | Par
(000) | | | Value | |
|
| Michigan — 3.4% | |
Michigan Finance Authority, RB, Multi Model- McLaren Health Care, 4.00%, 02/15/47 | | $ | 1,684 | | | $ | 1,910,736 | |
Michigan State Housing Development Authority, RB, M/F Housing, Series A, 4.15%, 10/01/53 | | | 2,883 | | | | 3,130,695 | |
| | | | | | | | |
| | | | | | | 5,041,431 | |
|
| New Jersey — 1.7% | |
New Jersey Transportation Trust Fund Authority, RB, Transportation System, Series B, 5.25%, 06/15/36 | | | 2,481 | | | | 2,597,953 | |
| | | | | | | | |
|
| New York — 11.1% | |
City of New York Housing Development Corp., Refunding RB, Sustainable Neighborhood Bonds, Series A, 4.15%, 11/01/38 | | | 2,070 | | | | 2,309,996 | |
City of New York Municipal Water Finance Authority, Refunding RB, Series FF, 5.00%, 06/15/45 | | | 2,499 | | | | 2,712,573 | |
New York City Transitional Finance Authority Future Tax Secured Revenue, 4.00%, 11/01/47 | | | 5,000 | | | | 5,776,023 | |
New York Liberty Development Corp., ARB, 1 World Trade Center Port Authority Consolidated Bonds, 5.25%, 12/15/43 | | | 3,375 | | | | 3,645,843 | |
New York Liberty Development Corp., Refunding RB, 4 World Trade Center Project, 5.75%, 11/15/51(g) | | | 1,980 | | | | 2,141,269 | |
| | | | | | | | |
| | | | | | | 16,585,704 | |
|
| North Carolina — 0.8% | |
North Carolina Housing Finance Agency, RB, S/F Housing, Series 39-B (Ginnie Mae, Fannie Mae & Freddie Mac), 4.00%, 01/01/48 | | | 1,043 | | | | 1,139,478 | |
| | | | | | | | |
|
| Pennsylvania — 6.5% | |
County of Lehigh Pennsylvania, Refunding RB, Lehigh Valley Health Network, 4.00%, 07/01/49(g) | | | 4,997 | | | | 5,609,930 | |
Pennsylvania Turnpike Commission, Refunding RB, Sub Series B-2 (AGM), 5.00%, 06/01/35 | | | 1,830 | | | | 2,214,135 | |
Pennsylvania Turnpike Commission, RB, Sub-Series A, 5.50%, 12/01/42 | | | 1,514 | | | | 1,857,359 | |
| | | | | | | | |
| | | | | | | 9,681,424 | |
|
| Rhode Island — 1.6% | |
Rhode Island Health & Educational Building Corp., RB, Series A, 4.00%, 09/15/47 | | | 2,207 | | | | 2,446,557 | |
| | | | | | | | |
|
| Texas — 1.4% | |
Texas Department of Housing & Community Affairs, RB, S/F Housing, Series A (Ginnie Mae): | | | | | | | | |
3.63%, 09/01/44 | | | 1,140 | | | | 1,230,408 | |
3.75%, 09/01/49 | | | 809 | | | | 873,078 | |
| | | | | | | | |
| | | | | | | 2,103,486 | |
|
| Virginia — 1.2% | |
Hampton Roads Transportation Accountability Commission, RB, Transportation Fund, Senior Lien, Series A, 5.50%, 07/01/57(g) | | | 1,473 | | | | 1,843,170 | |
| | | | | | | | |
|
| West Virginia — 1.3% | |
Morgantown Utility Board, Inc., RB, Series B, 4.00%, 12/01/48(g) | | | 1,671 | | | | 1,881,166 | |
| | | | | | | | |
|
| Wisconsin — 2.4% | |
Wisconsin Housing & Economic Development Authority, RB, M/F Housing, Series A: | | | | | | | | |
4.10%, 11/01/43 | | | 1,436 | | | | 1,574,888 | |
4.45%, 05/01/57 | | | 1,794 | | | | 1,968,645 | |
| | | | | | | | |
| | | | | | | 3,543,533 | |
| | | | | | | | |
| |
Total Municipal Bonds Transferred to Tender Option Bond Trusts — 51.3%
(Cost — $72,137,852) | | | | 76,452,792 | |
| | | | | |
| |
Total Long-Term Investments — 163.4%
(Cost — $224,586,750) | | | | 243,603,164 | |
| | | | | |
| | | | |
| SCHEDULES OF INVESTMENTS | | | 33 | |
| | |
Schedule of Investments (unaudited) (continued) January 31, 2020 | | BlackRock Municipal Income Investment Trust (BBF) (Percentages shown are based on Net Assets) |
| | | | | | | | |
| Security | | Shares | | | Value | |
|
| Short-Term Securities — 2.0% | |
BlackRock Liquidity Funds, MuniCash, Institutional Class,
0.81%(h)(i) | | | 3,001,944 | | | $ | 3,002,545 | |
| | | | | | | | |
| |
Total Short-Term Securities — 2.0%
(Cost — $3,002,537) | | | | 3,002,545 | |
| | | | | |
| |
Total Investments — 165.4%
(Cost — $227,589,287) | | | | 246,605,709 | |
| |
Liabilities in Excess of Other Assets — (1.9)% | | | | (2,767,089 | ) |
| |
Liability for TOB Trust Certificates, Including Interest Expense and Fees Payable — (28.8)% | | | | (43,009,689 | ) |
| |
Preferred Shares, at Redemption Value — (34.7)% | | | | (51,722,087 | ) |
| | | | | |
| |
Net Assets Applicable to Common Shares — 100.0% | | | $ | 149,106,844 | |
| | | | | |
| (a) | Security exempt from registration pursuant to Rule 144A under the Securities Act of 1933, as amended. These securities may be resold in transactions exempt from registration to qualified institutional investors. |
| (b) | U.S. Government securities held in escrow, are used to pay interest on this security as well as to retire the bond in full at the date indicated, typically at a premium to par. |
| (d) | When-issued security. |
| (e) | Variable or floating rate security, which interest rate adjusts periodically based on changes in current interest rates and prepayments on the underlying pool of assets. Rate shown is the rate in effect as of period end. |
| (f) | Represent bonds transferred to a TOB Trust in exchange of cash and residual certificates received by the Trust. These bonds serve as collateral in a secured borrowing. See Note 4 of the Notes to Financial Statements for details. |
| (g) | All or a portion of the security is subject to a recourse agreement. The aggregate maximum potential amount the Trust could ultimately be required to pay under the agreements, which expire between May 18, 2020 to August 1, 2027, is $12,353,862. See Note 4 of the Notes to Financial Statements for details. |
| (h) | Annualized 7-day yield as of period end. |
| (i) | During the six months ended January 31, 2020, investments in issuers considered to be an affiliate/affiliates of the Trust for purposes of Section 2(a)(3) of the Investment Company Act of 1940, as amended, were as follows: |
| | | | | | | | | | | | | | | | | | | | | | | | | | | | |
| Affiliate | | Shares
Held at
07/31/19 | | | Net
Activity | | | Shares
Held at
01/31/20 | | | Value at
01/31/20 | | | Income | | | Net
Realized
Gain (Loss) (a) | | | Change in
Unrealized
Appreciation
(Depreciation) | |
BlackRock Liquidity Funds, MuniCash, Institutional Class | | | 3,202,995 | | | | (201,051 | ) | | | 3,001,944 | | | $ | 3,002,545 | | | $ | 15,024 | | | $ | (827 | ) | | $ | 8 | |
| | | | | | | | | | | | | | | | | | | | | | | | | | | | |
| | (a) | Includes net capital gain distributions, if applicable. | |
Derivative Financial Instruments Outstanding as of Period End
Futures Contracts
| | | | | | | | | | | | | | | | |
| Description | | Number of
Contracts | | | Expiration
Date | | | Notional
Amount (000) | | | Value /
Unrealized
Appreciation
(Depreciation) | |
Short Contracts | | | | | | | | | | | | | | | | |
10-Year U.S. Treasury Note | | | 7 | | | | 03/20/20 | | | $ | 922 | | | $ | (18,276 | ) |
U.S. Long Treasury Bond | | | 87 | | | | 03/20/20 | | | | 14,227 | | | | (389,447 | ) |
5-Year U.S. Treasury Note | | | 11 | | | | 03/31/20 | | | | 1,324 | | | | (13,998 | ) |
| | | | | | | | | | | | | | | | |
| | | | | | | | | | | | | | $ | (421,721 | ) |
| | | | | | | | | | | | | | | | |
Derivative Financial Instruments Categorized by Risk Exposure
As of period end, the fair values of derivative financial instruments located in the Statements of Assets and Liabilities were as follows:
| | | | | | | | | | | | | | | | | | | | | | | | | | | | |
| | | Commodity
Contracts | | | Credit
Contracts | | | Equity
Contracts | | | Foreign
Currency
Exchange
Contracts | | | Interest
Rate
Contracts | | | Other
Contracts | | | Total | |
Liabilities — Derivative Financial Instruments | | | | | | | | | | | | | | | | | | | | | | | | | | | | |
Futures contracts | | | | | | | | | | | | | | | | | | | | | | | | | | | | |
Unrealized depreciation on futures contracts(a) | | $ | — | | | $ | — | | | $ | — | | | $ | — | | | $ | 421,721 | | | $ | — | | | $ | 421,721 | |
| | | | | | | | | | | | | | | | | | | | | | | | | | | | |
| | (a) | Net cumulative unrealized appreciation (depreciation) on futures contracts and centrally cleared swaps, if any, are reported in the Schedule of Investments. In the Statements of Assets and Liabilities, only current day’s variation margin is reported in receivables or payables and the net cumulative unrealized appreciation (depreciation) is included in accumulated earnings (loss). | |
| | |
| 34 | | 2020 BLACKROCK SEMI-ANNUAL REPORT TO SHAREHOLDERS |
| | |
Schedule of Investments (unaudited) (continued) January 31, 2020 | | BlackRock Municipal Income Investment Trust (BBF) |
For the six months period ended January 31, 2020, the effect of derivative financial instruments in the Statements of Operations was as follows:
| | | | | | | | | | | | | | | | | | | | | | | | | | | | |
| | | Commodity
Contracts | | | Credit
Contracts | | | Equity
Contracts | | | Foreign
Currency
Exchange
Contracts | | | Interest
Rate
Contracts | | | Other
Contracts | | | Total | |
Net Realized Gain (Loss) from: | | | | | | | | | | | | | | | | | | | | | | | | | | | | |
Futures contracts | | $ | — | | | $ | — | | | $ | — | | | $ | — | | | $ | (504,229 | ) | | $ | — | | | $ | (504,229 | ) |
| | | | | | | | | | | | | | | | | | | | | | | | | | | | |
| | | | | | | |
| Net Change in Unrealized Appreciation (Depreciation) on: | | | | | | | | | | | | | | | | | | | | | |
Futures contracts | | $ | — | | | $ | — | | | $ | — | | | $ | — | | | $ | (294,518 | ) | | $ | — | | | $ | (294,518 | ) |
| | | | | | | | | | | | | | | | | | | | | | | | | | | | |
Average Quarterly Balances of Outstanding Derivative Financial Instruments
| | | | |
Futures contracts: | |
Average notional value of contracts — long | | $ | — | (a) |
Average notional value of contracts — short | | | 12,181,090 | |
| | (a) | Derivative not held at quarter-end. The risk exposure table serves as an indicator of activity during the period. | |
For more information about the Trust’s investment risks regarding derivative financial instruments, refer to the Notes to Financial Statements.
Fair Value Hierarchy as of Period End
Various inputs are used in determining the fair value of investments and derivative financial instruments. For information about the Trust’s policy regarding valuation of investments and derivative financial instruments, refer to the Notes to Financial Statements.
The following tables summarize the Trust’s investments and derivative financial instruments categorized in the disclosure hierarchy:
| | | | | | | | | | | | | | | | |
| | | Level 1 | | | Level 2 | | | Level 3 | | | Total | |
Assets: | | | | | | | | | | | | | | | | |
Investments: | | | | | | | | | | | | | | | | |
Long-Term Investments(a) | | $ | — | | | $ | 243,603,164 | | | $ | — | | | $ | 243,603,164 | |
Short-Term Securities | | | 3,002,545 | | | | — | | | | — | | | | 3,002,545 | |
| | | | | | | | | | | | | | | | |
| | $ | 3,002,545 | | | $ | 243,603,164 | | | $ | — | | | $ | 246,605,709 | |
| | | | | | | | | | | | | | | | |
Derivative Financial Instruments(b) | | | | | | | | | | | | | | | | |
Liabilities: | | | | | | | | | | | | | | | | |
Interest Rate Contracts | | $ | (421,721 | ) | | $ | — | | | $ | — | | | $ | (421,721 | ) |
| | | | | | | | | | | | | | | | |
| | (a) | See above Schedule of Investments for values in each state or political subdivision. | |
| | (b) | Derivative financial instruments are futures contracts. Futures contracts are valued at the unrealized appreciation (depreciation) on the instrument. | |
The Trust may hold assets and/or liabilities in which the fair value approximates the carrying amount for financial statement purposes. As of period end, such assets and/or liabilities are categorized within the disclosure hierarchy as follows:
| | | | | | | | | | | | | | | | |
| | | Level 1 | | | Level 2 | | | Level 3 | | | Total | |
Liabilities: | |
TOB Trust Certificates | | $ | — | | | $ | (42,889,056 | ) | | $ | — | | | $ | (42,889,056 | ) |
VRDP Shares at Liquidation Value | | | — | | | | (52,000,000 | ) | | | — | | | | (52,000,000 | ) |
| | | | | | | | | | | | | | | | |
| | $ | — | | | $ | (94,889,056 | ) | | $ | — | | | $ | (94,889,056 | ) |
| | | | | | | | | | | | | | | | |
See notes to financial statements.
| | | | |
| SCHEDULES OF INVESTMENTS | | | 35 | |
| | |
Schedule of Investments (unaudited) January 31, 2020 | | BlackRock New York Municipal Income Trust (BNY) (Percentages shown are based on Net Assets) |
| | | | | | | | |
| Security | | Par
(000) | | | Value | |
|
Municipal Bonds — 129.6% | |
|
New York — 123.6% | |
|
| Corporate — 5.6% | |
Build NYC Resource Corp., Refunding RB, Pratt Paper, Inc. Project, AMT, 5.00%, 01/01/35(a) | | $ | 280 | | | $ | 306,544 | |
City of New York Industrial Development Agency, Refunding RB, Transportation Infrastructure Properties LLC, Series A, AMT: | | | | | | | | |
5.00%, 07/01/22 | | | 650 | | | | 704,574 | |
5.00%, 07/01/28 | | | 795 | | | | 857,391 | |
New York Liberty Development Corp., Refunding RB, Goldman Sachs Headquarters, 5.25%, 10/01/35 | | | 3,195 | | | | 4,498,049 | |
New York Transportation Development Corp., Refunding ARB, American Airlines, Inc., AMT, 5.00%, 08/01/31 | | | 2,305 | | | | 2,412,113 | |
Niagara Area Development Corp., Refunding RB, Covanta Project, Series A, AMT, 4.75%, 11/01/42(a) | | | 2,370 | | | | 2,488,761 | |
| | | | | | | | |
| | | | | | | 11,267,432 | |
|
| County/City/Special District/School District — 28.7% | |
City of New York, GO, Refunding, Series E: | | | | | | | | |
5.50%, 08/01/25 | | | 815 | | | | 943,053 | |
5.00%, 08/01/30 | | | 1,000 | | | | 1,119,100 | |
City of New York, GO: | | | | | | | | |
Series A-1, 5.00%, 08/01/35 | | | 1,000 | | | | 1,058,870 | |
Series D, 5.38%, 06/01/32 | | | 25 | | | | 25,086 | |
Sub-Series D-1, Fiscal 2014, 5.00%, 08/01/31 | | | 690 | | | | 784,516 | |
Sub-Series G-1, 5.00%, 04/01/29 | | | 750 | | | | 815,167 | |
SubSeries A-1, Series A, 5.00%, 08/01/43 | | | 1,500 | | | | 1,900,845 | |
City of New York Convention Center Development Corp., RB, CAB, Sub Lien, Hotel Unit Fee, Series B (AGM), 0.00%, 11/15/55(b) | | | 2,000 | | | | 733,360 | |
City of New York Convention Center Development Corp., Refunding RB, Hotel Unit Fee Secured: | | | | | | | | |
5.00%, 11/15/40 | | | 2,975 | | | | 3,571,606 | |
5.00%, 11/15/45 | | | 3,700 | | | | 4,434,376 | |
City of New York Industrial Development Agency, RB, PILOT: | | | | | | | | |
CAB, Yankee Stadium Project, Series A (AGC), 0.00%, 03/01/42(b) | | | 1,960 | | | | 1,042,936 | |
CAB, Yankee Stadium Project, Series A (AGC), 0.00%, 03/01/45(b) | | | 1,500 | | | | 732,165 | |
(AMBAC), 5.00%, 01/01/39 | | | 3,000 | | | | 3,007,560 | |
Queens Baseball Stadium (AGC), 6.38%, 01/01/39 | | | 150 | | | | 150,573 | |
Queens Baseball Stadium (AMBAC), 5.00%, 01/01/46 | | | 175 | | | | 175,406 | |
Yankee Stadium Project (NPFGC), 4.75%, 03/01/46 | | | 350 | | | | 350,875 | |
Yankee Stadium Project (NPFGC), 5.00%, 03/01/46 | | | 500 | | | | 509,125 | |
City of New York Transitional Finance Authority Future Tax Secured, RB: | | | | | | | | |
Fiscal 2012, Sub-Series E-1, 5.00%, 02/01/42 | | | 2,500 | | | | 2,688,100 | |
Future Tax Secured, 5.00%, 02/01/32 | | | 5,000 | | | | 5,785,550 | |
Future Tax Secured Subordinate Bond, Series C-3, 5.00%, 05/01/41 | | | 355 | | | | 442,010 | |
Future Tax Secured, Sub-Series E-1, 5.00%, 02/01/43 | | | 1,725 | | | | 2,091,976 | |
Series A-2, 5.00%, 08/01/38 | | | 1,420 | | | | 1,758,372 | |
County of Nassau New York, GO, Refunding, Series C, 5.00%, 10/01/31 | | | 945 | | | | 1,177,479 | |
Hudson Yards Infrastructure Corp., RB, Senior, Fiscal 2012: | | | | | | | | |
5.75%, 02/15/21(c) | | | 125 | | | | 131,308 | |
5.75%, 02/15/47 | | | 75 | | | | 78,342 | |
Hudson Yards Infrastructure Corp., Refunding RB, Series A: | | | | | | | | |
5.00%, 02/15/39 | | | 1,370 | | | | 1,678,729 | |
5.00%, 02/15/42 | | | 1,225 | | | | 1,499,657 | |
New York Liberty Development Corp., Refunding RB, World Trade Center Project: | | | | | | | | |
3 Class 1, 5.00%, 11/15/44(a) | | | 1,835 | | | | 2,015,546 | |
3 Class 2, 5.38%, 11/15/40(a) | | | 480 | | | | 539,486 | |
| | | | | | | | |
| Security | | Par
(000) | | | Value | |
|
| County/City/Special District/School District (continued) | |
4, 5.00%, 11/15/31 | | $ | 860 | | | $ | 917,027 | |
4, 5.00%, 11/15/44 | | | 7,655 | | | | 8,134,433 | |
7 Class 1, 4.00%, 09/15/35 | | | 1,935 | | | | 2,041,657 | |
7 Class 2, 5.00%, 09/15/43 | | | 1,420 | | | | 1,523,277 | |
7 Class 3, 5.00%, 03/15/44 | | | 2,070 | | | | 2,227,962 | |
5.75%, 11/15/51 | | | 1,340 | | | | 1,449,063 | |
| | | | | | | | |
| | | | | | | 57,534,593 | |
|
| Education — 21.5% | |
Amherst Development Corp., Refunding RB: | | | | | | | | |
Daemen College Project, 5.00%, 10/01/43 | | | 380 | | | | 447,674 | |
Daemen College Project, 5.00%, 10/01/48 | | | 290 | | | | 338,897 | |
University at Buffalo Foundation Faculty-Student Housing Corp., Series A (AGM), 4.63%, 10/01/20(c) | | | 1,100 | | | | 1,127,137 | |
Build NYC Resource Corp., RB(a): | | | | | | | | |
Inwood Academy for Leadership Charter School Project, Series A, 5.13%, 05/01/38 | | | 660 | | | | 727,571 | |
New Dawn Charter School Project, 5.75%, 02/01/49 | | | 200 | | | | 212,922 | |
New Dawn Charter Schools Project, 5.00%, 02/01/33 | | | 435 | | | | 456,567 | |
Build NYC Resource Corp., Refunding RB, City University New York-Queens College Student Residences, LLC Project, Series A, 5.00%, 06/01/38 | | | 250 | | | | 288,355 | |
City of New York Trust for Cultural Resources, Refunding RB, American Museum of Natural History, Series A, 5.00%, 07/01/37 | | | 225 | | | | 260,901 | |
City of Troy New York Capital Resource Corp., Refunding RB, Rensselaer Polytechnic Institute Project: | | | | | | | | |
Series A, 5.13%, 09/01/40 | | | 3,135 | | | | 3,208,516 | |
Series B, 4.00%, 08/01/35 | | | 470 | | | | 524,308 | |
Counties of Buffalo & Erie New York Industrial Land Development Corp., Refunding RB, The Charter School for Applied Technologies Project, Series A, 5.00%, 06/01/35 | | | 245 | | | | 274,998 | |
County of Cattaraugus New York, RB, St. Bonaventure University Project, 5.00%, 05/01/34 | | | 170 | | | | 191,966 | |
County of Dutchess New York Local Development Corp., RB, Marist College Project: | | | | | | | | |
5.00%, 07/01/43 | | | 240 | | | | 298,169 | |
5.00%, 07/01/48 | | | 360 | | | | 443,369 | |
County of Dutchess New York Local Development Corp., Refunding RB, Vassar College Project: | | | | | | | | |
5.00%, 07/01/42 | | | 395 | | | | 489,650 | |
4.00%, 07/01/46 | | | 745 | | | | 844,614 | |
County of Monroe New York Industrial Development Corp., RB, University of Rochester Project, Series A, 5.00%, 07/01/21(c) | | | 1,900 | | | | 2,010,105 | |
County of Monroe New York Industrial Development Corp., Refunding RB, University of Rochester Project, Series A, 5.00%, 07/01/23(c) | | | 320 | | | | 364,835 | |
County of Nassau New York Industrial Development Agency, Refunding RB, New York Institute of Technology Project, Series A, 4.75%, 03/01/20(c) | | | 500 | | | | 501,455 | |
County of Orange New York Funding Corp., Refunding RB, Mount St. Mary College Project, Series A: | | | | | | | | |
5.00%, 07/01/37 | | | 360 | | | | 389,099 | |
5.00%, 07/01/42 | | | 220 | | | | 236,694 | |
County of St. Lawrence New York Industrial Development Agency, RB, Clarkson University Project, 5.38%, 09/01/41 | | | 750 | | | | 793,020 | |
County of Tompkins New York Development Corp., RB, Ithaca College Project (AGM), 5.50%, 01/01/21(c) | | | 700 | | | | 729,337 | |
Geneva Development Corp., Refunding RB, Hobart & William Smith Colleges, 5.25%, 09/01/44 | | | 500 | | | | 566,805 | |
| | |
| 36 | | 2020 BLACKROCK SEMI-ANNUAL REPORT TO SHAREHOLDERS |
| | |
Schedule of Investments (unaudited) (continued) January 31, 2020 | | BlackRock New York Municipal Income Trust (BNY) (Percentages shown are based on Net Assets) |
| | | | | | | | |
| Security | | Par
(000) | | | Value | |
|
| Education (continued) | |
State of New York Dormitory Authority, RB: | | | | | | | | |
Convent of the Sacred Heart (AGM), 5.25%, 05/01/21(c) | | $ | 155 | | | $ | 163,396 | |
Convent of the Sacred Heart (AGM), 5.63%, 05/01/21(c) | | | 750 | | | | 794,092 | |
Convent of the Sacred Heart (AGM), 5.75%, 05/01/21(c) | | | 210 | | | | 222,669 | |
New York University, Series 1 (AMBAC), 5.50%, 07/01/40 | | | 1,440 | | | | 2,150,482 | |
New York University, Series B, 5.00%, 07/01/37 | | | 1,250 | | | | 1,369,600 | |
State University Dormitory Facilities, Series A, 5.00%, 07/01/21(c) | | | 2,000 | | | | 2,115,900 | |
State University Of New York Dormitory Facilities, Series A, 5.00%, 07/01/43 | | | 845 | | | | 1,058,692 | |
Teachers College, Series B, 5.00%, 07/01/42 | | | 1,225 | | | | 1,333,547 | |
Touro College & University System, Series A, 5.25%, 01/01/34 | | | 800 | | | | 906,032 | |
Touro College & University System, Series A, 5.50%, 01/01/39 | | | 2,000 | | | | 2,257,100 | |
University of Rochester, Series A, 5.13%, 07/01/39 | | | 110 | | | | 110,359 | |
University of Rochester, Series A, 5.75%, 07/01/39 | | | 85 | | | | 85,320 | |
State of New York Dormitory Authority, Refunding RB: | | | | | | | | |
3rd General Resolution, State University Educational Facilities Issue, Series A, 5.00%, 05/15/29 | | | 2,000 | | | | 2,187,820 | |
Barnard College, Series A, 5.00%, 07/01/33 | | | 530 | | | | 632,380 | |
Cornell University, Series A, 5.00%, 07/01/40 | | | 800 | | | | 812,744 | |
Culinary Institute of America, 5.00%, 07/01/42 | | | 300 | | | | 321,015 | |
Fordham University, 5.00%, 07/01/44 | | | 850 | | | | 980,976 | |
Icahn School of Medicine at Mount Sinai, Series A, 5.00%, 07/01/35 | | | 1,380 | | | | 1,618,809 | |
New York University, Series A, 5.00%, 07/01/37 | | | 1,790 | | | | 1,960,712 | |
Skidmore College, Series A, 5.00%, 07/01/28 | | | 75 | | | | 79,364 | |
Skidmore College, Series A, 5.25%, 07/01/29 | | | 85 | | | | 90,229 | |
St. John’s University, Series A, 5.00%, 07/01/37 | | | 835 | | | | 979,138 | |
State University Dormitory Facilities, Series A, 5.25%, 07/01/23(c) | | | 2,355 | | | | 2,704,717 | |
State University Dormitory Facilities, Series A, 5.25%, 07/01/23(c) | | | 445 | | | | 511,083 | |
St. John’s Univerisity, Series A, 5.00%, 07/01/34 | | | 250 | | | | 294,595 | |
Town of Hempstead New York Local Development Corp., Refunding RB: | | | | | | | | |
Adelphi University Project, 5.00%, 10/01/35 | | | 415 | | | | 479,072 | |
Hofstra University Project, 5.00%, 07/01/47 | | | 120 | | | | 145,702 | |
Troy Capital Resource Corp., Refunding RB, Rensselaer Polytechnic Institute Project, 4.00%, 09/01/40(d) | | | 680 | | | | 772,575 | |
Yonkers Economic Development Corp., RB, Charter School of Educational Excellance Project, Series A, 5.00%, 10/15/54 | | | 200 | | | | 223,530 | |
| | | | | | | | |
| | | | | | | 43,088,614 | |
|
| Health — 13.5% | |
County of Dutchess New York Local Development Corp., RB, Health Quest Systems, Inc., Series B, 4.00%, 07/01/41 | | | 1,600 | | | | 1,763,344 | |
County of Dutchess New York Local Development Corp., Refunding RB, Health Quest System, Inc., Series A, 5.75%, 07/01/20(c) | | | 300 | | | | 305,970 | |
County of Genesee New York Industrial Development Agency, Refunding RB, United Memorial Medical Center Project, 5.00%, 12/01/27 | | | 360 | | | | 361,181 | |
County of Monroe New York Industrial Development Corp., RB, Rochester General Hospital Project: | | | | | | | | |
4.00%, 12/01/41 | | | 200 | | | | 224,228 | |
5.00%, 12/01/46 | | | 320 | | | | 383,994 | |
Series A, 5.00%, 12/01/32 | | | 240 | | | | 265,080 | |
County of Monroe New York Industrial Development Corp., Refunding RB, Unity Hospital of Rochester Project (FHA), 5.50%, 08/15/40 | | | 1,650 | | | | 1,718,805 | |
| | | | | | | | |
| Security | | Par
(000) | | | Value | |
|
| Health (continued) | |
County of Nassau New York Local Economic Assistance Corp., Refunding RB, Winthrop University Hospital Association Project, 5.00%, 07/01/42 | | $ | 2,800 | | | $ | 3,032,092 | |
County of Oneida New York Local Development Corp., Refunding RB, Mohawk Valley Health System Project (AGM): | | | | | | | | |
4.00%, 12/01/38 | | | 1,790 | | | | 2,055,153 | |
3.00%, 12/01/44 | | | 1,410 | | | | 1,432,095 | |
4.00%, 12/01/49 | | | 800 | | | | 906,520 | |
County of Suffolk New York EDC, RB, Catholic Health Services, Series C, 5.00%, 07/01/32 | | | 230 | | | | 264,341 | |
County of Tompkins New York Development Corp., Refunding RB, Kendal at Ithaca, Inc. Project, Series A, 5.00%, 07/01/44 | | | 110 | | | | 121,647 | |
County of Westchester New York Healthcare Corp., Refunding RB, Senior Lien: | | | | | | | | |
Remarketing, Series A, 5.00%, 11/01/30 | | | 3,130 | | | | 3,321,086 | |
Series B, 6.00%, 11/01/20(c) | | | 435 | | | | 451,574 | |
Series B, 6.00%, 11/01/30 | | | 65 | | | | 67,205 | |
County of Westchester New York Local Development Corp., Refunding RB, Kendal On Hudson Project: | | | | | | | | |
5.00%, 01/01/28 | | | 675 | | | | 731,558 | |
5.00%, 01/01/34 | | | 1,250 | | | | 1,348,638 | |
State of New York Dormitory Authority, RB: | | | | | | | | |
New York University Hospitals Center, Series A, 6.00%, 07/01/20(c) | | | 500 | | | | 510,460 | |
North Shore-Long Island Jewish Obligated Group, Series D, 4.25%, 05/01/39 | | | 500 | | | | 529,090 | |
State of New York Dormitory Authority, Refunding RB: | | | | | | | | |
Catholic Health Syatem Obligation, 4.00%, 07/01/38 | | | 470 | | | | 535,551 | |
Catholic Health Syatem Obligation, 4.00%, 07/01/39 | | | 615 | | | | 699,249 | |
Mount Sinai Hospital, Series A, 5.00%, 07/01/20(c) | | | 1,385 | | | | 1,408,226 | |
North Shore-Long Island Jewish Obligated Group, Series A, 5.00%, 05/01/21(c) | | | 1,750 | | | | 1,839,407 | |
North Shore-Long Island Jewish Obligated Group, Series A, 5.00%, 05/01/21(c) | | | 1,000 | | | | 1,051,000 | |
North Shore-Long Island Jewish Obligated Group, Series A, 5.00%, 05/01/43 | | | 1,430 | | | | 1,655,168 | |
| | | | | | | | |
| | | | | | | 26,982,662 | |
|
| Housing — 5.3% | |
City of New York Housing Development Corp., RB, M/F Housing: | | | | | | | | |
Fund Grant Program, New York City Housing Authority Program, Series B1, 5.25%, 07/01/32 | | | 1,140 | | | | 1,283,549 | |
Fund Grant Program, New York City Housing Authority Program, Series B1, 5.00%, 07/01/33 | | | 500 | | | | 563,970 | |
Sustainable Neighborhood Bonds, 3.15%, 11/01/44 | | | 250 | | | | 262,013 | |
City of New York Housing Development Corp., Refunding RB, M/F Housing: | | | | | | | | |
8 Spruce Street, Class F, 4.50%, 02/15/48 | | | 925 | | | | 987,419 | |
Sustainable Neighborhood, Series B-1-A, 3.65%, 11/01/49 | | | 1,150 | | | | 1,218,448 | |
County of Onondaga New York Trust for Cultural Resources, Refunding RB, Abby Lane Housing Corporation Project, 5.00%, 05/01/40 | | | 355 | | | | 431,968 | |
State of New York HFA, RB: | | | | | | | | |
M/F housing Housing, Green Bond, 3.15%, 11/01/54 | | | 750 | | | | 770,332 | |
M/F Housing, Highland Avenue Senior Apartments, Series A, AMT (SONYMA), 5.00%, 02/15/39 | | | 1,380 | | | | 1,382,939 | |
M/F, Affordable Housing, Series E (SONYMA) ( Fannie Mae), 4.15%, 11/01/47 | | | 495 | | | | 538,382 | |
Series H, 4.25%, 11/01/51 | | | 1,000 | | | | 1,099,660 | |
State of New York Mortgage Agency, Refunding RB, S/F Housing, Series 213, 4.20%, 10/01/43 | | | 1,785 | | | | 2,002,359 | |
| | | | | | | | |
| | | | | | | 10,541,039 | |
| | | | |
| SCHEDULES OF INVESTMENTS | | | 37 | |
| | |
Schedule of Investments (unaudited) (continued) January 31, 2020 | | BlackRock New York Municipal Income Trust (BNY) (Percentages shown are based on Net Assets) |
| | | | | | | | |
| Security | | Par
(000) | | | Value | |
|
| State — 10.3% | |
City of New York Transitional Finance Authority Building Aid Revenue, RB, Subordinated, Series S1-B, 4.00%, 07/15/42 | | $ | 1,000 | | | $ | 1,162,470 | |
City of New York Transitional Finance Authority Building Aid Revenue, Refunding RB, Series S-3, 4.00%, 07/15/38 | | | 2,360 | | | | 2,737,742 | |
New York State Dormitory Authority, Refunding RB, Series D, 4.00%, 02/15/47 | | | 515 | | | | 597,323 | |
State of New York Dormitory Authority, RB: | | | | | | | | |
General Purpose, Series C, 5.00%, 03/15/34 | | | 2,185 | | | | 2,283,019 | |
Group B, State Sales Tax, Series A, 5.00%, 03/15/39 | | | 620 | | | | 763,648 | |
Series A, 5.00%, 03/15/36 | | | 1,360 | | | | 1,668,666 | |
Series A, 5.00%, 02/15/42 | | | 1,500 | | | | 1,818,270 | |
Unrefunded, Series B, 5.00%, 03/15/42 | | | 4,380 | | | | 4,725,144 | |
State of New York Dormitory Authority, Refunding RB: | | | | | | | | |
Group 3, Series E, 5.00%, 03/15/41 | | | 1,160 | | | | 1,456,032 | |
Series A, 5.25%, 03/15/39 | | | 1,030 | | | | 1,316,999 | |
State of New York Urban Development Corp., RB, State Personal Income Tax, Series C: | | | | | | | | |
5.00%, 03/15/30 | | | 885 | | | | 995,474 | |
5.00%, 03/15/32 | | | 1,000 | | | | 1,123,260 | |
| | | | | | | | |
| | | | | | | 20,648,047 | |
|
| Tobacco — 3.2% | |
Chautauqua Tobacco Asset Securitization Corp., Refunding RB, Asset-Backed, 4.75%, 06/01/39 | | | 150 | | | | 156,136 | |
Counties of New York Tobacco Trust IV, Refunding RB, Settlement Pass-Through Turbo, Series A, 6.25%, 06/01/41(a) | | | 1,000 | | | | 1,009,800 | |
Counties of New York Tobacco Trust VI, Refunding RB: | | | | | | | | |
Settlement Pass-Through Turbo, Series C, 4.00%, 06/01/51 | | | 1,500 | | | | 1,485,105 | |
Tobacco Settlement Pass-Through, Series A-2B, 5.00%, 06/01/45 | | | 130 | | | | 139,476 | |
Tobacco Settlement Pass-Through, Series A-2B, 5.00%, 06/01/51 | | | 1,470 | | | | 1,561,669 | |
County of Niagara New York Tobacco Asset Securitization Corp., Refunding RB, Asset-Backed: | | | | | | | | |
5.25%, 05/15/34 | | | 250 | | | | 273,735 | |
5.25%, 05/15/40 | | | 110 | | | | 119,065 | |
Westchester Tobacco Asset Securitization Corp., Refunding RB, Tobacco Settlement Bonds, Sub-Series C: | | | | | | | | |
4.00%, 06/01/42 | | | 720 | | | | 757,908 | |
5.13%, 06/01/51 | | | 870 | | | | 945,316 | |
| | | | | | | | |
| | | | | | | 6,448,210 | |
|
| Transportation — 27.5% | |
Buffalo & Fort Erie Public Bridge Authority, RB, 5.00%, 01/01/47 | | | 535 | | | | 635,724 | |
Metropolitan Transportation Authority, RB: | | | | | | | | |
Series A-1, 5.25%, 11/15/23(c) | | | 540 | | | | 628,846 | |
Series D, 5.25%, 11/15/21(c) | | | 220 | | | | 237,083 | |
Series E, 5.00%, 11/15/38 | | | 4,000 | | | | 4,522,080 | |
Metropolitan Transportation Authority, Refunding RB: | | | | | | | | |
Green Bond, Group 2, Series C (AGM), 4.00%, 11/15/46 | | | 1,000 | | | | 1,148,320 | |
Green Bond, Series A-1 (AGM), 4.00%, 11/15/44 | | | 1,000 | | | | 1,156,260 | |
Green Bonds, Climate Bond Certified, Sub-Series B-2, 4.00%, 11/15/34 | | | 750 | | | | 879,165 | |
Green Bonds, Series A-1, 5.25%, 11/15/56 | | | 750 | | | | 890,205 | |
Series D, 5.25%, 11/15/21(c) | | | 780 | | | | 840,567 | |
Series D, 5.25%, 11/15/23(c) | | | 910 | | | | 1,059,722 | |
Series F, 5.00%, 11/15/30 | | | 2,000 | | | | 2,210,880 | |
Series F, 5.00%, 11/15/35 | | | 500 | | | | 593,515 | |
Transportation, Series D, 5.00%, 11/15/20(c) | | | 800 | | | | 825,712 | |
| | | | | | | | |
| Security | | Par
(000) | | | Value | |
|
| Transportation (continued) | |
Metropolitan Transportation Authority Hudson Rail Yards Trust Obligations, Refunding RB, Series A, 5.00%, 11/15/56 | | $ | 2,695 | | | $ | 3,023,278 | |
New York Transportation Development Corp., ARB, LaGuardia Airport Terminal B Redevelopment Project, Series A, AMT: | | | | | | | | |
5.00%, 07/01/41 | | | 1,040 | | | | 1,173,245 | |
5.00%, 07/01/46 | | | 5,960 | | | | 6,732,416 | |
5.25%, 01/01/50 | | | 560 | | | | 639,005 | |
(AGM), 4.00%, 07/01/41 | | | 800 | | | | 867,552 | |
Port Authority of New York & New Jersey, ARB, AMT: | | | | | | | | |
Consolidated Bonds, 220th Series, 4.00%, 11/01/59 | | | 1,655 | | | | 1,882,033 | |
JFK International Air Terminal LLC, Special Project, Series 6 (NPFGC), 5.75%, 12/01/22 | | | 3,800 | | | | 3,936,496 | |
Special Project, JFK International Air Terminal LLC, Series 8, 6.00%, 12/01/42 | | | 1,000 | | | | 1,034,420 | |
Port Authority of New York & New Jersey, Refunding ARB: | | | | | | | | |
178th Series, AMT, 5.00%, 12/01/33 | | | 750 | | | | 853,658 | |
179th Series, 5.00%, 12/01/38 | | | 575 | | | | 656,725 | |
195th Series, AMT, 5.00%, 04/01/36 | | | 750 | | | | 907,485 | |
Consolidated, 177th Series, AMT, 4.00%, 01/15/43 | | | 640 | | | | 680,723 | |
Consolidated, 178th Series, AMT, 5.00%, 12/01/43 | | | 500 | | | | 563,680 | |
State of New York Thruway Authority, RB, Junior Lien, Series A, 5.25%, 01/01/56 | | | 920 | | | | 1,095,628 | |
State of New York Thruway Authority, Refunding RB, General: | | | | | | | | |
2nd Highway & Bridge Trust, Series A, 5.00%, 04/01/32 | | | 2,500 | | | | 2,714,700 | |
Series I, 5.00%, 01/01/22(c) | | | 1,760 | | | | 1,895,978 | |
Series I, 5.00%, 01/01/22(c) | | | 280 | | | | 301,675 | |
Series J, 5.00%, 01/01/41 | | | 2,000 | | | | 2,267,040 | |
Series K, 5.00%, 01/01/32 | | | 2,575 | | | | 3,034,843 | |
Triborough Bridge & Tunnel Authority, RB: | | | | | | | | |
Series A, 5.00%, 11/15/42 | | | 1,000 | | | | 1,234,760 | |
Series B, 5.00%, 11/15/40 | | | 350 | | | | 422,741 | |
Series B, 5.00%, 11/15/45 | | | 310 | | | | 372,124 | |
Triborough Bridge & Tunnel Authority, Refunding RB: | | | | | | | | |
General, CAB, Series B, 0.00%, 11/15/32(b) | | | 1,700 | | | | 1,333,888 | |
General, Series A, 5.25%, 11/15/45 | | | 590 | | | | 709,392 | |
General, Series A, 5.00%, 11/15/50 | | | 500 | | | | 591,195 | |
Series B, 5.00%, 11/15/38 | | | 515 | | | | 641,484 | |
| | | | | | | | |
| | | | | | | 55,194,243 | |
|
| Utilities — 8.0% | |
City of New York Municipal Water & Sewer System, Refunding RB: | | | | | | | | |
Series AA, 4.00%, 06/15/40 | | | 1,825 | | | | 2,160,161 | |
Water & Sewer System, 2nd General Resolution, Fiscal 2011, Series BB, 5.00%, 06/15/31 | | | 1,000 | | | | 1,015,050 | |
Water & Sewer System, 2nd General Resolution, Fiscal 2015, Series HH, 5.00%, 06/15/39 | | | 1,000 | | | | 1,188,860 | |
Long Island Power Authority, RB: | | | | | | | | |
5.00%, 09/01/38 | | | 2,750 | | | | 3,439,507 | |
General, 5.00%, 09/01/47 | | | 490 | | | | 592,562 | |
General, 5.00%, 09/01/36 | | | 340 | | | | 420,410 | |
General, Electric Systems, Series A (AGM), 5.00%, 05/01/21(c) | | | 500 | | | | 525,655 | |
General, Electric Systems, Series C (AGC), 5.25%, 09/01/29 | | | 2,000 | | | | 2,653,480 | |
Long Island Power Authority, Refunding RB, Electric System, Series B, 5.00%, 09/01/46 | | | 250 | | | | 296,375 | |
State of New York Environmental Facilities Corp., RB, Subordinated SRF Bonds, Series B, 5.00%, 06/15/48 | | | 930 | | | | 1,158,957 | |
State of New York Environmental Facilities Corp., Refunding RB, Revolving Funds, New York City Municipal Water, Series B, 5.00%, 06/15/36 | | | 350 | | | | 369,184 | |
| | |
| 38 | | 2020 BLACKROCK SEMI-ANNUAL REPORT TO SHAREHOLDERS |
| | |
Schedule of Investments (unaudited) (continued) January 31, 2020 | | BlackRock New York Municipal Income Trust (BNY) (Percentages shown are based on Net Assets) |
| | | | | | | | |
| Security | | Par
(000) | | | Value | |
|
| Utilities (continued) | |
Utility Debt Securitization Authority, Refunding RB, Restructuring, Series E, 5.00%, 12/15/41 | | $ | 2,000 | | | $ | 2,280,900 | |
| | | | | | | | |
| | | | | | | 16,101,101 | |
| | | | | | | | |
| |
Total Municipal Bonds in New York | | | | 247,805,941 | |
| | | | | |
|
Puerto Rico — 6.0% | |
|
| State — 3.9% | |
Puerto Rico Sales Tax Financing Corp. Sales Tax Revenue, RB, Restructured: | | | | | | | | |
Series A-1, 4.75%, 07/01/53 | | | 1,475 | | | | 1,632,014 | |
Series A-1, 5.00%, 07/01/58 | | | 3,881 | | | | 4,358,828 | |
Series A-2, 4.33%, 07/01/40 | | | 523 | | | | 567,821 | |
Series A-2, 4.78%, 07/01/58 | | | 1,082 | | | | 1,196,519 | |
| | | | | | | | |
| | | | | | | 7,755,182 | |
|
| Tobacco — 0.5% | |
Children’s Trust Fund, Refunding RB, Tobacco Settlement Asset-Backed Bonds, 5.63%, 05/15/43 | | | 985 | | | | 1,001,637 | |
| | | | | | | | |
|
| Utilities — 1.6% | |
Puerto Rico Commonwealth Aqueduct & Sewer Authority, RB, Senior Lien, Series A: | | | | | | | | |
5.00%, 07/01/33 | | | 1,545 | | | | 1,643,540 | |
5.13%, 07/01/37 | | | 445 | | | | 474,490 | |
Puerto Rico Commonwealth Aqueduct & Sewer Authority, Refunding RB, Senior Lien, Series A, 6.00%, 07/01/38 | | | 1,020 | | | | 1,040,951 | |
| | | | | | | | |
| | | | | | | 3,158,981 | |
| | | | | | | | |
| |
Total Municipal Bonds in Puerto Rico | | | | 11,915,800 | |
| | | | | |
| |
Total Municipal Bonds — 129.6%
(Cost — $237,462,252) | | | | 259,721,741 | |
| | | | | |
|
Municipal Bonds Transferred to Tender Option Bond Trusts(e) | |
|
New York — 35.9% | |
|
| County/City/Special District/School District — 8.4% | |
City of New York, GO: | | | | | | | | |
Sub-Series G-1, 5.00%, 04/01/29 | | | 4,370 | | | | 4,749,709 | |
Sub-Series I-1, 5.00%, 03/01/36 | | | 1,500 | | | | 1,729,275 | |
Sub-Series-D1, Series D, 5.00%, 12/01/43(f) | | | 2,850 | | | | 3,568,998 | |
City of New York Transitional Finance Authority, RB, Future Tax Secured: | | | | | | | | |
Sub-Series D-1, 5.00%, 11/01/38 | | | 825 | | | | 880,176 | |
Sub-Series F-1, 5.00%, 05/01/38 | | | 1,424 | | | | 1,758,384 | |
Hudson Yards Infrastructure Corp., RB, Senior-Fiscal 2012: | | | | | | | | |
5.75%, 02/15/21(f) | | | 774 | | | | 811,154 | |
5.75%, 02/15/47 | | | 476 | | | | 498,997 | |
New York Liberty Development Corp., Refunding RB, 7 World Trade Center Project, Class 1, 5.00%, 09/15/40 | | | 2,610 | | | | 2,819,244 | |
| | | | | | | | |
| | | | | | | 16,815,937 | |
|
| Education — 2.0% | |
City of New York Trust for Cultural Resources, Refunding RB, Wildlife Conservation Society, Series A, 5.00%, 08/01/33 | | | 3,527 | | | | 3,963,132 | |
| | | | | | | | |
|
| Housing — 1.6% | |
City of New York Housing Development Corp., Refunding RB, Sustainable Neighborhood Bonds, Series A, 4.25%, 11/01/43 | | | 2,830 | | | | 3,141,894 | |
| | | | | | | | |
|
| State — 3.2% | |
Sales Tax Asset Receivable Corp., Refunding RB, Fiscal 2015, Series A: | | | | | | | | |
5.00%, 10/15/31 | | | 750 | | | | 888,825 | |
4.00%, 10/15/32 | | | 1,000 | | | | 1,128,340 | |
| | | | | | | | |
| Security | | Par
(000) | | | Value | |
|
| State (continued) | |
State of New York Dormitory Authority, RB, General Purpose, Series C, 5.00%, 03/15/41 | | $ | 1,500 | | | $ | 1,563,945 | |
State of New York Dormitory Authority, Refunding RB, Bid Group 4, Series C, 5.00%, 03/15/39 | | | 1,000 | | | | 1,248,820 | |
State of New York Urban Development Corp., RB, State Personal Income Tax, General Purpose, Series A, 4.00%, 03/15/47 | | | 1,497 | | | | 1,716,706 | |
| | | | | | | | |
| | | | | | | 6,546,636 | |
|
| Transportation — 10.7% | |
New York Liberty Development Corp., ARB, 1 World Trade Center Port Authority Consolidated Bonds, 5.25%, 12/15/43 | | | 6,495 | | | | 7,016,222 | |
Port Authority of New York & New Jersey, Refunding ARB: | | | | | | | | |
Consolidated, Series 169th, 5.00%, 10/15/26 | | | 1,500 | | | | 1,599,405 | |
Consolidated, Series 210th, 5.00%, 09/01/48 | | | 1,900 | | | | 2,366,051 | |
Series 194th, 5.25%, 10/15/55 | | | 1,455 | | | | 1,755,792 | |
State of New York Thruway Authority, Refunding RB: | | | | | | | | |
Series B, 4.00%, 01/01/53(f) | | | 5,024 | | | | 5,742,161 | |
Transportation, Personal Income Tax, Series A, 5.00%, 03/15/31 | | | 1,180 | | | | 1,257,266 | |
Triborough Bridge & Tunnel Authority, Refunding RB, General, Series A, 5.00%, 11/15/46 | | | 1,500 | | | | 1,813,185 | |
| | | | | | | | |
| | | | | | | 21,550,082 | |
|
| Utilities — 10.0% | |
City of New York Municipal Water & Sewer System, Refunding RB, Water & Sewer System, 2nd General Resolution: | | | | | | | | |
Fiscal 2011, Series HH, 5.00%, 06/15/32 | | | 5,310 | | | | 5,604,227 | |
Fiscal 2012, Series BB, 5.00%, 06/15/44 | | | 3,511 | | | | 3,751,062 | |
Utility Debt Securitization Authority, Refunding RB: | | | | | | | | |
5.00%, 12/15/41 | | | 6,868 | | | | 7,832,528 | |
Restructuring, Series A, 5.00%, 12/15/35 | | | 2,000 | | | | 2,443,260 | |
Restructuring, Series B, 4.00%, 12/15/35 | | | 370 | | | | 425,689 | |
| | | | | | | | |
| | | | | | | 20,056,766 | |
| | | | | | | | |
| |
Total Municipal Bonds Transferred to Tender Option Bond
Trusts — 35.9%
(Cost — $67,042,204) | | | | 72,074,447 | |
| | | | | |
| |
Total Long-Term Investments — 165.5%
(Cost — $304,504,456) | | | | 331,796,188 | |
| | | | | |
| | |
| | | Shares | | | | |
|
| Short-Term Securities — 0.1% | |
BlackRock Liquidity Funds New York Money Fund Portfolio, 0.77%(g)(h) | | | 193,680 | | | | 193,680 | |
| | | | | | | | |
| |
Total Short-Term Securities — 0.1%
(Cost — $193,680) | | | | 193,680 | |
| | | | | |
| |
Total Investments — 165.6%
(Cost — $304,698,136) | | | | 331,989,868 | |
| |
Other Assets Less Liabilities — 1.0% | | | | 1,910,152 | |
| |
Liability for TOB Trust Certificates, Including Interest Expense and Fees Payable — (19.4)% | | | | (38,975,459 | ) |
| |
VMTP Shares, at Liquidation Value
Costs — (47.2)% | | | | (94,500,000 | ) |
| | | | | |
| |
Net Assets Applicable to Common Shares — 100.0% | | | $ | 200,424,561 | |
| | | | | |
| (a) | Security exempt from registration pursuant to Rule 144A under the Securities Act of 1933, as amended. These securities may be resold in transactions exempt from registration to qualified institutional investors. |
| | | | |
| SCHEDULES OF INVESTMENTS | | | 39 | |
| | |
Schedule of Investments (unaudited) (continued) January 31, 2020 | | BlackRock New York Municipal Income Trust (BNY) |
| (c) | U.S. Government securities held in escrow, are used to pay interest on this security as well as to retire the bond in full at the date indicated, typically at a premium to par. |
| (d) | When-issued security. |
| (e) | Represent bonds transferred to a TOB Trust in exchange of cash and residual certificates received by the Trust. These bonds serve as collateral in a secured borrowing. See Note 4 of the Notes to Financial Statements for details. |
| (f) | All or a portion of the security is subject to a recourse agreement. The aggregate maximum potential amount the Trust could ultimately be required to pay under the agreements, which expire between August 15, 2020 to July 01, 2027, is $5,613,425. See Note 4 of the Notes to Financial Statements for details. |
| (g) | Annualized 7-day yield as of period end. |
| (h) | During the six months ended January 31, 2020, investments in issuers considered to be an affiliate/affiliates of the Trust for purposes of Section 2(a)(3) of the Investment Company Act of 1940, as amended, were as follows: |
| | | | | | | | | | | | | | | | | | | | | | | | | | | | |
| Affiliate | | Shares
Held at
07/31/19 | | | Net
Activity | | | Shares
Held at
01/31/20 | | | Value at
01/31/20 | | | Income | | | Net Realized
Gain (Loss) (a) | | | Change in
Unrealized
Appreciation
(Depreciation) | |
BlackRock Liquidity Funds New York Money Fund Portfolio | | | 4,949,042 | | | | (4,755,362 | ) | | | 193,680 | | | $ | 193,680 | | | $ | 3,990 | | | $ | — | | | $ | — | |
| | | | | | | | | | | | | | | | | | | | | | | | | | | | |
| | (a) | Includes net capital gain distributions, if applicable. | |
For Trust compliance purposes, the Trust’s sector classifications refer to one or more of the sector sub-classifications used by one or more widely recognized market indexes or rating group indexes, and/or as defined by the investment adviser. These definitions may not apply for purposes of this report, which may combine such sector sub-classifications for reporting ease.
Futures Contracts
| | | | | | | | | | | | | | | | |
| Description | | Number of
Contracts | | | Expiration
Date | | | Notional
Amount (000) | | | Value /
Unrealized
Appreciation
(Depreciation) | |
Short Contracts | | | | | | | | | | | | | | | | |
10-Year U.S. Treasury Note | | | 20 | | | | 03/20/20 | | | $ | 2,633 | | | $ | (45,904 | ) |
U.S. Long Treasury Bond | | | 71 | | | | 03/20/20 | | | | 11,611 | | | | (355,478 | ) |
5-Year U.S. Treasury Note | | | 32 | | | | 03/31/20 | | | | 3,850 | | | | (40,166 | ) |
| | | | | | | | | | | | | | | | |
| | | | | | | | | | | | | | $ | (441,548 | ) |
| | | | | | | | | | | | | | | | |
Derivative Financial Instruments Categorized by Risk Exposure
As of period end, the fair values of derivative financial instruments located in the Statements of Assets and Liabilities were as follows:
| | | | | | | | | | | | | | | | | | | | | | | | | | | | |
| | | Commodity
Contracts | | | Credit
Contracts | | | Equity
Contracts | | | Foreign
Currency
Exchange
Contracts | | | Interest
Rate
Contracts | | | Other
Contracts | | | Total | |
Liabilities — Derivative Financial Instruments | | | | | | | | | | | | | | | | | | | | | | | | | | | | |
Futures contracts | | | | | | | | | | | | | | | | | | | | | | | | | | | | |
unrealized depreciation on future contracts(a) | | $ | — | | | $ | — | | | $ | — | | | $ | — | | | $ | 441,548 | | | $ | — | | | $ | 441,548 | |
| | | | | | | | | | | | | | | | | | | | | | | | | | | | |
| | (a) | Net cumulative unrealized appreciation (depreciation) on futures contracts and centrally cleared swaps, if any, are reported in the Schedule of Investments. In the Statements of Assets and Liabilities, only current day’s variation margin is reported in receivables or payables and the net cumulative unrealized appreciation (depreciation) is included in accumulated earnings (loss). | |
For the six months period ended January 31, 2020, the effect of derivative financial instruments in the Statements of Operations was as follows:
| | | | | | | | | | | | | | | | | | | | | | | | | | | | |
| | | Commodity
Contracts | | | Credit
Contracts | | | Equity
Contracts | | | Foreign
Currency
Exchange
Contracts | | | Interest
Rate
Contracts | | | Other
Contracts | | | Total | |
Net Realized Gain (Loss) from: | | | | | | | | | | | | | | | | | | | | | | | | | | | | |
Futures contracts | | $ | — | | | $ | — | | | $ | — | | | $ | — | | | $ | (573,806 | ) | | $ | — | | | $ | (573,806 | ) |
| | | | | | | | | | | | | | | | | | | | | | | | | | | | |
| | | | | | | |
| Net Change in Unrealized Appreciation (Depreciation) on: | | | | | | | | | | | | | | | | | | | | | |
Futures contracts | | $ | — | | | $ | — | | | $ | — | | | $ | — | | | $ | (283,193 | ) | | $ | — | | | $ | (283,193 | ) |
| | | | | | | | | | | | | | | | | | | | | | | | | | | | |
| | |
| 40 | | 2020 BLACKROCK SEMI-ANNUAL REPORT TO SHAREHOLDERS |
| | |
Schedule of Investments (unaudited) (continued) January 31, 2020 | | BlackRock New York Municipal Income Trust (BNY) |
Average Quarterly Balances of Outstanding Derivative Financial Instruments
| | | | |
Futures contracts: | |
Average notional value of contracts — long | | $ | — | (a) |
Average notional value of contracts — short | | | 13,765,336 | |
| | (a) | Derivative not held at quarter-end. The risk exposure table serves as an indicator of activity during the period. | |
For more information about the Trust’s investment risks regarding derivative financial instruments, refer to the Notes to Financial Statements.
Fair Value Hierarchy as of Period End
Various inputs are used in determining the fair value of investments and derivative financial instruments. For information about the Trust’s policy regarding valuation of investments and derivative financial instruments, refer to the Notes to Financial Statements.
The following tables summarize the Trust’s investments and derivative financial instruments categorized in the disclosure hierarchy:
| | | | | | | | | | | | | | | | |
| | | Level 1 | | | Level 2 | | | Level 3 | | | Total | |
Assets: | |
Investments: | |
Long-Term Investments(a) | | $ | — | | | $ | 331,796,188 | | | $ | — | | | $ | 331,796,188 | |
Short-Term Securities | | | 193,680 | | | | — | | | | — | | | | 193,680 | |
| | | | | | | | | | | | | | | | |
| | $ | 193,680 | | | $ | 331,796,188 | | | $ | | | | $ | 331,989,868 | |
| | | | | | | | | | | | | | | | |
Derivative Financial Instruments(b) | |
Liabilities: | |
Interest rate contracts | | $ | (441,548 | ) | | $ | — | | | $ | — | | | $ | (441,548 | ) |
| | | | | | | | | | | | | | | | |
| | (a) | See above Schedule of Investments for values in each sector. | |
| | (b) | Derivative financial instruments are futures contracts. Futures contracts are valued at the unrealized appreciation (depreciation) on the instrument. | |
The Trust may hold assets and/or liabilities in which the fair value approximates the carrying amount for financial statement purposes. As of period end, such assets and/or liabilities are categorized within the disclosure hierarchy as follows:
| | | | | | | | | | | | | | | | |
| | | Level 1 | | | Level 2 | | | Level 3 | | | Total | |
Liabilities: | |
TOB Trust Certificates | | $ | — | | | $ | (38,865,798 | ) | | $ | — | | | $ | (38,865,798 | ) |
VMTP Shares at Liquidation Value | | | — | | | | (94,500,000 | ) | | | — | | | | (94,500,000 | ) |
| | | | | | | | | | | | | | | | |
| | $ | — | | | $ | (133,365,798 | ) | | $ | — | | | $ | (133,365,798 | ) |
| | | | | | | | | | | | | | | | |
See notes to financial statements.
| | | | |
| SCHEDULES OF INVESTMENTS | | | 41 | |
Statements of Assets and Liabilities (unaudited)
January 31, 2020
| | | | | | | | | | | | | | | | |
| | | BFZ | | | BTT | | | BBF | | | BNY | |
|
ASSETS | |
Investments at value — unaffiliated(a) | | $ | 842,820,845 | | | $ | 2,861,803,912 | | | $ | 243,603,164 | | | $ | 331,796,188 | |
Investments at value — affiliated(b) | | | 813,694 | | | | 12,392,836 | | | | 3,002,545 | | | | 193,680 | |
Cash | | | — | | | | — | | | | 5,527 | | | | — | |
Cash pledged for futures contracts | | | 707,000 | | | | — | | | | 262,850 | | | | 247,250 | |
Receivables: | |
Interest — unaffiliated | | | 9,555,528 | | | | 25,825,587 | | | | 2,321,576 | | | | 3,280,766 | |
Investments sold | | | — | | | | — | | | | — | | | | 264,420 | |
Dividends — affiliated | | | 1,356 | | | | 4,130 | | | | 676 | | | | 181 | |
Prepaid expenses | | | 7,412 | | | | 15,651 | | | | 33,778 | | | | 5,872 | |
| | | | | | | | | | | | | | | | |
Total assets | | | 853,905,835 | | | | 2,900,042,116 | | | | 249,230,116 | | | | 335,788,357 | |
| | | | | | | | | | | | | | | | |
|
ACCRUED LIABILITIES | |
Payables: | |
Investments purchased | | | 3,524,173 | | | | 1,078,525 | | | | 4,442,630 | | | | 745,858 | |
Income dividend distributions — Common Shares | | | 1,212,310 | | | | 4,399,548 | | | | 516,735 | | | | 596,899 | |
Interest expense and fees | | | 561,374 | | | | 934,259 | | | | 120,633 | | | | 109,661 | |
Investment advisory fees | | | 806,118 | | | | 1,932,670 | | | | 228,877 | | | | 336,038 | |
Variation margin on futures contracts | | | 172,374 | | | | — | | | | 59,612 | | | | 59,488 | |
Trustees’ and Officer’s fees | | | 90,464 | | | | 13,319 | | | | 30,694 | | | | 37,539 | |
Other accrued expenses | | | 134,683 | | | | 491,013 | | | | 112,948 | | | | 112,515 | |
| | | | | | | | | | | | | | | | |
Total accrued liabilities | | | 6,501,496 | | | | 8,849,334 | | | | 5,512,129 | | | | 1,997,998 | |
| | | | | | | | | | | | | | | | |
|
OTHER LIABILITIES | |
TOB Trust Certificates | | | 171,438,735 | | | | 261,819,915 | | | | 42,889,056 | | | | 38,865,798 | |
RVMTP Shares, at liquidation value of $5,000,000 per share, net of deferred offering costs(c) | | | — | | | | 749,658,412 | | | | — | | | | — | |
VRDP Shares, at liquidation value of $100,000 per share, net of deferred offering costs(c) | | | — | | | | — | | | | 51,722,087 | | | | — | |
VMTP Shares, at liquidation value of $100,000 per share(c) | | | 171,300,000 | | | | — | | | | — | | | | 94,500,000 | |
| | | | | | | | | | | | | | | | |
Total other liabilities | | | 342,738,735 | | | | 1,011,478,327 | | | | 94,611,143 | | | | 133,365,798 | |
| | | | | | | | | | | | | | | | |
Total liabilities | | | 349,240,231 | | | | 1,020,327,661 | | | | 100,123,272 | | | | 135,363,796 | |
| | | | | | | | | | | | | | | | |
| | | | |
NET ASSETS APPLICABLE TO COMMON SHAREHOLDERS | | $ | 504,665,604 | | | $ | 1,879,714,455 | | | $ | 149,106,844 | | | $ | 200,424,561 | |
| | | | | | | | | | | | | | | | |
|
NET ASSETS APPLICABLE TO COMMON SHAREHOLDERS CONSIST OF | |
Paid-in capital(d) | | $ | 446,985,849 | | | $ | 1,671,126,936 | | | $ | 134,239,222 | | | $ | 178,186,257 | |
Accumulated earnings | | | 57,679,755 | | | | 208,587,519 | | | | 14,867,622 | | | | 22,238,304 | |
| | | | | | | | | | | | | | | | |
NET ASSETS APPLICABLE TO COMMON SHAREHOLDERS | | $ | 504,665,604 | | | $ | 1,879,714,455 | | | $ | 149,106,844 | | | $ | 200,424,561 | |
| | | | | | | | | | | | | | | | |
| | | | |
Net asset value per Common share | | $ | 15.82 | | | $ | 26.66 | | | $ | 14.57 | | | $ | 15.45 | |
| | | | | | | | | | | | | | | | |
| | | | |
(a) Investments at cost — unaffiliated | | $ | 782,858,068 | | | $ | 2,631,357,155 | | | $ | 224,586,750 | | | $ | 304,504,456 | |
(b) Investments at cost — affiliated | | $ | 813,694 | | | $ | 12,392,836 | | | $ | 3,002,537 | | | $ | 193,680 | |
(c) Preferred Shares outstanding, unlimited number of shares authorized, par value $0.001 per share | | | 1,713 | | | | 150 | | | | 520 | | | | 945 | |
(d) Common Shares outstanding, unlimited number of shares authorized, par value $0.001 per share. | | | 31,902,885 | | | | 70,505,571 | | | | 10,232,375 | | | | 12,976,074 | |
See notes to financial statements.
| | |
| 42 | | 2020 BLACKROCK SEMI-ANNUAL REPORT TO SHAREHOLDERS |
Statements of Operations (unaudited)
Six Months Ended January 31, 2020
| | | | | | | | | | | | | | | | |
| | | BFZ | | | BTT | | | BBF | | | BNY | |
|
INVESTMENT INCOME | |
Dividends — affiliated | | $ | 16,258 | | | $ | 21,272 | | | $ | 15,024 | | | $ | 3,990 | |
Interest — unaffiliated | | | 13,004,406 | | | | 46,815,924 | | | | 4,849,376 | | | | 6,254,701 | |
| | | | | | | | | | | | | | | | |
Total investment income | | | 13,020,664 | | | | 46,837,196 | | | | 4,864,400 | | | | 6,258,691 | |
| | | | | | | | | | | | | | | | |
|
EXPENSES | |
Investment advisory | | | 2,368,701 | | | | 5,719,476 | | | | 668,987 | | | | 991,981 | |
Professional | | | 51,753 | | | | 100,504 | | | | 37,570 | | | | 35,511 | |
Accounting services | | | 23,570 | | | | 138,252 | | | | 24,673 | | | | 30,717 | |
Trustees and Officer | | | 23,178 | | | | 63,834 | | | | 7,599 | | | | 9,779 | |
Rating agency | | | 22,492 | | | | 22,494 | | | | 22,492 | | | | 22,492 | |
Transfer agent | | | 17,177 | | | | 37,907 | | | | 11,935 | | | | 10,734 | |
Registration | | | 5,959 | | | | 13,170 | | | | 4,552 | | | | 4,547 | |
Custodian | | | 4,471 | | | | 16,391 | | | | 2,951 | | | | 2,382 | |
Printing | | | 4,236 | | | | 8,286 | | | | 3,462 | | | | 3,728 | |
Liquidity fees | | | — | | | | — | | | | 2,670 | | | | — | |
Remarketing fees on Preferred Shares | | | — | | | | — | | | | 2,621 | | | | — | |
Miscellaneous | | | 11,219 | | | | 54,128 | | | | 8,621 | | | | 9,278 | |
| | | | | | | | | | | | | | | | |
Total expenses excluding interest expense, fees and amortization of offering costs | | | 2,532,756 | | | | 6,174,442 | | | | 798,133 | | | | 1,121,149 | |
Interest expense, fees and amortization of offering costs(a) | | | 3,084,557 | | | | 10,054,320 | | | | 885,403 | | | | 1,288,839 | |
| | | | | | | | | | | | | | | | |
Total expenses | | | 5,617,313 | | | | 16,228,762 | | | | 1,683,536 | | | | 2,409,988 | |
Less fees waived and/or reimbursed by the Manager | | | (843 | ) | | | (1,771 | ) | | | (1,199 | ) | | | (113 | ) |
| | | | | | | | | | | | | | | | |
Total expenses after fees waived and/or reimbursed | | | 5,616,470 | | | | 16,226,991 | | | | 1,682,337 | | | | 2,409,875 | |
| | | | | | | | | | | | | | | | |
Net investment income | | | 7,404,194 | | | | 30,610,205 | | | | 3,182,063 | | | | 3,848,816 | |
| | | | | | | | | | | | | | | | |
|
REALIZED AND UNREALIZED GAIN (LOSS) | |
Net realized gain (loss) from: | |
Futures contracts | | | (1,921,841 | ) | | | — | | | | (504,229 | ) | | | (573,806 | ) |
Investments — affiliated | | | (4 | ) | | | (142 | ) | | | (827 | ) | | | — | |
Investments — unaffiliated | | | 3,223,441 | | | | 1,949,911 | | | | 458,437 | | | | 334,300 | |
| | | | | | | | | | | | | | | | |
| | | 1,301,596 | | | | 1,949,769 | | | | (46,619 | ) | | | (239,506 | ) |
| | | | | | | | | | | | | | | | |
Net change in unrealized appreciation (depreciation) on: | | | | | | | | | | | | | | | | |
Futures contracts | | | (718,941 | ) | | | — | | | | (294,518 | ) | | | (283,193 | ) |
Investments — affiliated | | | — | | | | — | | | | 8 | | | | — | |
Investments — unaffiliated | | | 17,813,628 | | | | 68,813,465 | | | | 4,823,011 | | | | 4,772,654 | |
| | | | | | | | | | | | | | | | |
| | | 17,094,687 | | | | 68,813,465 | | | | 4,528,501 | | | | 4,489,461 | |
| | | | | | | | | | | | | | | | |
Net realized and unrealized gain | | | 18,396,283 | | | | 70,763,234 | | | | 4,481,882 | | | | 4,249,955 | |
| | | | | | | | | | | | | | | | |
NET INCREASE IN NET ASSETS APPLICABLE TO COMMON SHAREHOLDERS RESULTING FROM OPERATIONS | | $ | 25,800,477 | | | $ | 101,373,439 | | | $ | 7,663,945 | | | $ | 8,098,771 | |
| | | | | | | | | | | | | | | | |
| (a) | Related to TOB Trusts, VMTP Shares, RVMTP Shares and/or VRDP Shares. |
See notes to financial statements.
Statements of Changes in Net Assets
| | | | | | | | | | | | | | | | | | | | |
| | | BFZ | | | | | | BTT | |
| | | Six Months Ended
01/31/20 (unaudited) | | | Year Ended
07/31/19 | | | | | | Six Months Ended
01/31/20 (unaudited) | | | Year Ended 07/31/19 | |
|
INCREASE (DECREASE) IN NET ASSETS APPLICABLE TO COMMON SHAREHOLDERS | |
|
OPERATIONS | |
Net investment income | | $ | 7,404,194 | | | $ | 16,645,348 | | | | | | | $ | 30,610,205 | | | $ | 56,228,804 | |
Net realized gain (loss) | | | 1,301,596 | | | | (1,200,360 | ) | | | | | | | 1,949,769 | | | | (455,434 | ) |
Net change in unrealized appreciation (depreciation) | | | 17,094,687 | | | | 21,337,820 | | | | | | | | 68,813,465 | | | | 136,561,904 | |
| | | | | | | | | | | | | | | | | | | | |
Net increase in net assets applicable to Common Shareholders resulting from operations | | | 25,800,477 | | | | 36,782,808 | | | | | | | | 101,373,439 | | | | 192,335,274 | |
| | | | | | | | | | | | | | | | | | | | |
| |
DISTRIBUTIONS TO COMMON SHAREHOLDERS(a) | | | | | |
Decrease in net assets resulting from distributions to Common Shareholders | | | (7,720,498 | )(b) | | | (22,604,406 | ) | | | | | | | (26,397,286 | ) | | | (52,794,572 | ) |
| | | | | | | | | | | | | | | | | | | | |
| |
NET ASSETS APPLICABLE TO COMMON SHAREHOLDERS | | | | | |
Total increase in net assets applicable to Common Shareholders | | | 18,079,979 | | | | 14,178,402 | | | | | | | | 74,976,153 | | | | 139,540,702 | |
Beginning of period | | | 486,585,625 | | | | 472,407,223 | | | | | | | | 1,804,738,302 | | | | 1,665,197,600 | |
| | | | | | | | | | | | | | | | | | | | |
End of period | | $ | 504,665,604 | | | $ | 486,585,625 | | | | | | | $ | 1,879,714,455 | | | $ | 1,804,738,302 | |
| | | | | | | | | | | | | | | | | | | | |
| (a) | Distributions for annual periods determined in accordance with U.S. federal income tax regulations. |
| (b) | A portion of the distributions from net investment income may be deemed a return of capital or net realized gain at fiscal year end. |
See notes to financial statements.
| | |
| 44 | | 2020 BLACKROCK SEMI-ANNUAL REPORT TO SHAREHOLDERS |
Statements of Changes in Net Assets (continued)
| | | | | | | | | | | | | | | | | | | | |
| | | BBF | | | | | | BNY | |
| | | Six Months Ended
01/31/20 (unaudited) | | | Year Ended 07/31/19 | | | | | | Six Months Ended
01/31/20 (unaudited) | | | Year Ended 07/31/19 | |
| | | | | |
INCREASE (DECREASE) IN NET ASSETS APPLICABLE TO COMMON SHAREHOLDERS | | | | | | | | | | | | | | | | | | | | |
| | | |
OPERATIONS | | | | | | | | | | | | | |
Net investment income | | $ | 3,182,063 | | | $ | 7,037,901 | | | | | | | $ | 3,848,816 | | | $ | 7,498,728 | |
Net realized loss | | | (46,619 | ) | | | (265,894 | ) | | | | | | | (239,506 | ) | | | (1,777,884 | ) |
Net change in unrealized appreciation (depreciation) | | | 4,528,501 | | | | 3,200,388 | | | | | | | | 4,489,461 | | | | 8,635,270 | |
| | | | | | | | | | | | | | | | | | | | |
Net increase in net assets applicable to Common Shareholders resulting from operations | | | 7,663,945 | | | | 9,972,395 | | | | | | | | 8,098,771 | | | | 14,356,114 | |
| | | | | | | | | | | | | | | | | | | | |
| | | |
DISTRIBUTIONS TO COMMON SHAREHOLDERS(a) | | | | | | | | | | | | | |
From net investment income | | | (3,243,619 | )(b) | | | (7,106,298 | ) | | | | | | | (3,542,468 | ) | | | (6,939,968 | ) |
From return of capital | | | — | | | | (73,775 | ) | | | | | | | — | | | | — | |
| | | | | | | | | | | | | | | | | | | | |
Decrease in net assets resulting from distributions to Common Shareholders | | | (3,243,619 | ) | | | (7,180,073 | ) | | | | | | | (3,542,468 | ) | | | (6,939,968 | ) |
| | | | | | | | | | | | | | | | | | | | |
| | | |
CAPITAL SHARE TRANSACTIONS | | | | | | | | | | | | | |
Reinvestment of common distributions | | | 21,473 | | | | 64,363 | | | | | | | | — | | | | — | |
| | | | | | | | | | | | | | | | | | | | |
| | | |
NET ASSETS APPLICABLE TO COMMON SHAREHOLDERS | | | | | | | | | | | | | |
Total increase in net assets applicable to Common Shareholders | | | 4,441,799 | | | | 2,856,685 | | | | | | | | 4,556,303 | | | | 7,416,146 | |
Beginning of period | | | 144,665,045 | | | | 141,808,360 | | | | | | | | 195,868,258 | | | | 188,452,112 | |
| | | | | | | | | | | | | | | | | | | | |
End of period | | $ | 149,106,844 | | | $ | 144,665,045 | | | | | | | $ | 200,424,561 | | | $ | 195,868,258 | |
| | | | | | | | | | | | | | | | | | | | |
| (a) | Distributions for annual periods determined in accordance with U.S. federal income tax regulations. |
| (b) | A portion of the distributions from net investment income may be deemed a return of capital or net realized gain at fiscal year end. |
See notes to financial statements.
Statements of Cash Flows (unaudited)
Six Months Ended January 31, 2020
| | | | | | | | | | | | | | | | |
| | | BFZ | | | BTT | | | BBF | | | BNY | |
| | | | |
CASH PROVIDED BY (USED FOR) OPERATING ACTIVITIES | | | | | | | | | | | | | | | | |
Net increase in net assets resulting from operations | | $ | 25,800,477 | | | $ | 101,373,439 | | | $ | 7,663,945 | | | $ | 8,098,771 | |
Adjustments to reconcile net increase in net assets resulting from operations to net cash provided by (used for) operating activities: | | | | | | | | | | | | | | | | |
Proceeds from sales of long-term investments | | | 191,851,590 | | | | 76,407,827 | | | | 68,536,615 | | | | 20,984,682 | |
Purchases of long-term investments | | | (207,489,531 | ) | | | (91,253,477 | ) | | | (73,080,734 | ) | | | (29,483,524 | ) |
Net proceeds from sales (purchases) of short-term securities | | | (813,698 | ) | | | 3,833,560 | | | | 200,272 | | | | 4,755,362 | |
Amortization of premium and accretion of discount on investments and other fees | | | 4,179,111 | | | | 6,454,003 | | | | 342,658 | | | | 925,221 | |
Net realized gain (loss) on investments | | | (3,223,437 | ) | | | (1,949,769 | ) | | | (457,610 | ) | | | (334,300 | ) |
Net unrealized (appreciation) depreciation on investments | | | (17,813,628 | ) | | | (68,813,465 | ) | | | (4,823,019 | ) | | | (4,772,654 | ) |
| | | | |
(Increase) Decrease in Assets: | | | | | | | | | | | | | | | | |
Receivables: | | | | | | | | | | | | | | | | |
Interest — unaffiliated | | | 403,795 | | | | (357,377 | ) | | | 344,908 | | | | (66,471 | ) |
Dividends — affiliated | | | 287 | | | | 2,054 | | | | 2,569 | | | | 5,354 | |
Variation margin on futures contracts | | | 3,982 | | | | — | | | | 983 | | | | 2,512 | |
Prepaid expenses | | | 11,059 | | | | 29,411 | | | | (1,687 | ) | | | 10,402 | |
| | | | |
Increase (Decrease) in Liabilities: | | | | | | | | | | | | | | | | |
Payables: | | | | | | | | | | | | | | | | |
Investment advisory fees | | | 406,205 | | | | 979,328 | | | | 115,517 | | | | 170,422 | |
Interest expense and fees | | | (227,976 | ) | | | (320,527 | ) | | | (74,519 | ) | | | (32,835 | ) |
Trustees’ and Officer’s fees | | | 5,953 | | | | 1,846 | | | | 1,969 | | | | 2,436 | |
Variation margin on futures contracts | | | (41,248 | ) | | | — | | | | 10,662 | | | | 5,934 | |
Other accrued expenses | | | (35,079 | ) | | | (5,331 | ) | | | (20,189 | ) | | | (26,721 | ) |
| | | | | | | | | | | | | | | | |
Net cash provided by (used for) operating activities | | | (6,982,138 | ) | | | 26,381,522 | | | | (1,237,660 | ) | | | 244,591 | |
| | | | | | | | | | | | | | | | |
| | | | |
CASH PROVIDED BY (USED FOR) FINANCING ACTIVITIES | | | | | | | | | | | | | | | | |
Proceeds from TOB Trust Certificates | | | 37,410,879 | | | | — | | | | 15,459,496 | | | | 3,348,632 | |
Repayments of TOB Trust Certificates | | | (22,284,321 | ) | | | — | | | | (10,835,167 | ) | | | — | |
Cash dividends paid to Common Shareholders | | | (7,832,158 | ) | | | (26,397,286 | ) | | | (3,257,878 | ) | | | (3,523,004 | ) |
Increase (decrease) in bank overdraft | | | (253,262 | ) | | | — | | | | — | | | | — | |
Amortization of deferred offering costs | | | — | | | | 15,764 | | | | 3,080 | | | | — | |
| | | | | | | | | | | | | | | | |
Net cash (provided by) used for financing activities | | | 7,041,138 | | | | (26,381,522 | ) | | | 1,369,531 | | | | (174,372 | ) |
| | | | | | | | | | | | | | | | |
| | | | |
CASH | | | | | | | | | | | | | | | | |
Net increase in restricted and unrestricted cash and foreign currency | | | 59,000 | | | | — | | | | 131,871 | | | | 70,219 | |
Restricted and unrestricted cash and foreign currency at beginning of period | | | 648,000 | | | | — | | | | 136,506 | | | | 177,031 | |
| | | | | | | | | | | | | | | | |
Restricted and unrestricted cash and foreign currency at end of period | | $ | 707,000 | | | $ | — | | | $ | 268,377 | | | $ | 247,250 | |
| | | | | | | | | | | | | | | | |
| | | | |
SUPPLEMENTAL DISCLOSURE OF CASH FLOW INFORMATION | | | | | | | | | | | | | | | | |
Cash paid during the period for interest expense | | $ | 3,312,533 | | | $ | 10,359,083 | | | $ | 956,842 | | | $ | 1,321,674 | |
| | | | | | | | | | | | | | | | |
| | | | |
NON-CASH FINANCING ACTIVITIES | | | | | | | | | | | | | | | | |
Capital shares issued in reinvestment of distributions paid to Common Shareholders | | | — | | | | — | | | | 21,473 | | | | — | |
| | | | | | | | | | | | | | | | |
| | | | |
RECONCILIATION OF RESTRICTED AND UNRESTRICTED CASH AT THE END OF PERIOD TO THE STATEMENTS OF ASSETS AND LIABILITIES | | | | | | | | | | | | | | | | |
Cash | | $ | — | | | $ | — | | | $ | 5,527 | | | $ | — | |
Cash pledged: | | | | | | | | | | | | | | | | |
Futures contracts | | | 707,000 | | | | — | | | | 262,850 | | | | 247,250 | |
| | | | | | | | | | | | | | | | |
| | $ | 707,000 | | | $ | — | | | $ | 268,377 | | | $ | 247,250 | |
| | | | | | | | | | | | | | | | |
| | | | |
RECONCILIATION OF RESTRICTED AND UNRESTRICTED CASH AT THE BEGINNING OF PERIOD TO THE STATEMENTS OF ASSETS AND LIABILITIES | | | | | | | | | | | | | | | | |
Cash | | $ | — | | | $ | — | | | $ | 8,656 | | | $ | 11,781 | |
Cash pledged: | | | | | | | | | | | | | | | | |
Futures contracts | | | 648,000 | | | | — | | | | 127,850 | | | | 165,250 | |
| | | | | | | | | | | | | | | | |
| | $ | 648,000 | | | $ | — | | | $ | 136,506 | | | $ | 177,031 | |
| | | | | | | | | | | | | | | | |
| | |
| 46 | | 2020 BLACKROCK SEMI-ANNUAL REPORT TO SHAREHOLDERS |
Financial Highlights
(For a share outstanding throughout each period)
| | | | | | | | | | | | | | | | | | | | | | | | | | | | |
| | | BFZ | |
| | | Six Months Ended
01/31/20
(unaudited) | | | | | | Year Ended July 31, | |
| | | 2019 | | | 2018 | | | 2017 | | | 2016 | | | 2015 | |
| | | | | | | | |
Net asset value, beginning of period | | $ | 15.25 | | | | | | | $ | 14.81 | | | $ | 15.34 | | | $ | 16.35 | | | $ | 15.84 | | | $ | 15.83 | |
| | | | | | | | | | | | | | | | | | | | | | | | | | | | |
Net investment income(a) | | | 0.23 | | | | | | | | 0.52 | | | | 0.65 | | | | 0.73 | | | | 0.83 | | | | 0.83 | |
Net realized and unrealized gain (loss) | | | 0.58 | | | | | | | | 0.63 | | | | (0.51 | ) | | | (0.97 | ) | | | 0.54 | | | | 0.05 | |
| | | | | | | | | | | | | | | | | | | | | | | | | | | | |
Net increase (decrease) from investment operations | | | 0.81 | | | | | | | | 1.15 | | | | 0.14 | | | | (0.24 | ) | | | 1.37 | | | | 0.88 | |
| | | | | | | | | | | | | | | | | | | | | | | | | | | | |
|
Distributions to Common Shareholders(b) | |
From net investment income | | | (0.24 | )(c) | | | | | | | (0.55 | ) | | | (0.67 | ) | | | (0.77 | ) | | | (0.86 | ) | | | (0.87 | ) |
From net realized gain | | | — | | | | | | | | (0.16 | ) | | | — | | | | — | | | | — | | | | — | |
| | | | | | | | | | | | | | | | | | | | | | | | | | | | |
Total distributions | | | (0.24 | ) | | | | | | | (0.71 | ) | | | (0.67 | ) | | | (0.77 | ) | | | (0.86 | ) | | | (0.87 | ) |
| | | | | | | | | | | | | | | | | | | | | | | | | | | | |
Net asset value, end of period | | $ | 15.82 | | | | | | | $ | 15.25 | | | $ | 14.81 | | | $ | 15.34 | | | $ | 16.35 | | | $ | 15.84 | |
| | | | | | | | | | | | | | | | | | | | | | | | | | | | |
Market price, end of period | | $ | 14.23 | | | | | | | $ | 13.50 | | | $ | 12.75 | | | $ | 14.71 | | | $ | 16.76 | | | $ | 14.65 | |
| | | | | | | | | | | | | | | | | | | | | | | | | | | | |
|
Total Return Applicable to Common Shareholders(d) | |
Based on net asset value | | | 5.58 | %(e) | | | | | | | 8.89 | % | | | 1.41 | % | | | (1.22 | )% | | | 8.92 | % | | | 5.96 | % |
| | | | | | | | | | | | | | | | | | | | | | | | | | | | |
Based on market price | | | 7.27 | %(e) | | | | | | | 11.96 | % | | | (8.95 | )% | | | (7.59 | )% | | | 20.72 | % | | | 7.66 | % |
| | | | | | | | | | | | | | | | | | | | | | | | | | | | |
|
Ratios to Average Net Assets Applicable to Common Shareholders | |
Total expenses | | | 2.27 | %(f) | | | | | | | 2.76 | % | | | 2.41 | % | | | 2.14 | % | | | 1.68 | % | | | 1.53 | % |
| | | | | | | | | | | | | | | | | | | | | | | | | | | | |
Total expenses after fees waived and/or reimbursed and paid indirectly | | | 2.27 | %(f) | | | | | | | 2.76 | % | | | 2.41 | % | | | 2.14 | % | | | 1.68 | % | | | 1.53 | % |
| | | | | | | | | | | | | | | | | | | | | | | | | | | | |
Total expenses after fees waived and/or reimbursed and paid indirectly and excluding interest expense, fees, and amortization of offering costs(g) | | | 1.02 | %(f) | | | | | | | 1.06 | % | | | 1.05 | % | | | 1.07 | % | | | 1.04 | % | | | 1.00 | % |
| | | | | | | | | | | | | | | | | | | | | | | | | | | | |
Net investment income to Common Shareholders | | | 2.99 | %(f) | | | | | | | 3.56 | % | | | 4.33 | % | | | 4.73 | % | | | 5.17 | % | | | 5.20 | % |
| | | | | | | | | | | | | | | | | | | | | | | | | | | | |
|
Supplemental Data | |
Net assets applicable to Common Shareholders, end of period (000) | | $ | 504,666 | | | | | | | $ | 486,586 | | | $ | 472,407 | | | $ | 489,328 | | | $ | 521,335 | | | $ | 504,967 | |
| | | | | | | | | | | | | | | | | | | | | | | | | | | | |
VMTP Shares outstanding at $100,000 liquidation value, end of period (000) | | $ | 171,300 | | | | | | | $ | 171,300 | | | $ | 171,300 | | | $ | 171,300 | | | $ | 171,300 | | | $ | 171,300 | |
| | | | | | | | | | | | | | | | | | | | | | | | | | | | |
Asset coverage per VMTP Shares at $100,000 liquidation value, end of period | | $ | 394,609 | | | | | | | $ | 384,055 | | | $ | 375,778 | | | $ | 385,656 | | | $ | 404,341 | | | $ | 394,785 | |
| | | | | | | | | | | | | | | | | | | | | | | | | | | | |
Borrowings outstanding, end of period (000) | | $ | 171,439 | | | | | | | $ | 156,312 | | | $ | 157,126 | | | $ | 169,863 | | | $ | 183,691 | | | $ | 155,533 | |
| | | | | | | | | | | | | | | | | | | | | | | | | | | | |
Portfolio turnover rate | | | 22 | % | | | | | | | 51 | % | | | 45 | % | | | 38 | % | | | 30 | % | | | 37 | % |
| | | | | | | | | | | | | | | | | | | | | | | | | | | | |
| (a) | Based on average Common Shares outstanding. |
| (b) | Distributions for annual periods determined in accordance with U.S. federal income tax regulations. |
| (c) | A portion of the distributions from net investment income may be deemed a return of capital or net realized gain at fiscal year end. |
| (d) | Total returns based on market price, which can be significantly greater or less than the net asset value, may result in substantially different returns. Where applicable, excludes the effects of any sales charges and assumes the reinvestment of distributions at actual reinvestment prices. |
| (e) | Aggregate total return. |
| (g) | Interest expense, fees and amortization of offering costs related to TOBs and/or VMTP Shares. See Note 4 and Note 10 of the Notes to Financial Statements for details. |
See notes to financial statements.
Financial Highlights (continued)
(For a share outstanding throughout each period)
| | | | | | | | | | | | | | | | | | | | | | | | | | | | |
| | | BTT | |
| | | Six Months Ended
01/31/20
(unaudited) | | | | | | Year Ended July 31, | |
| | | 2019 | | | 2018 | | | 2017 | | | 2016 | | | 2015 | |
| | | | | | | | |
Net asset value, beginning of period | | $ | 25.60 | | | | | | | $ | 23.62 | | | $ | 23.83 | | | $ | 25.38 | | | $ | 22.73 | | | $ | 21.99 | |
| | | | | | | | | | | | | | | | | | | | | | | | | | | | |
Net investment income(a) | | | 0.43 | | | | | | | | 0.80 | | | | 0.85 | | | | 0.90 | | | | 1.03 | | | | 1.09 | |
Net realized and unrealized gain (loss) | | | 1.00 | | | | | | | | 1.93 | | | | (0.21 | ) | | | (1.50 | ) | | | 2.58 | | | | 0.61 | |
| | | | | | | | | | | | | | | | | | | | | | | | | | | | |
Net increase (decrease) from investment operations | | | 1.43 | | | | | | | | 2.73 | | | | 0.64 | | | | (0.60 | ) | | | 3.61 | | | | 1.70 | |
| | | | | | | | | | | | | | | | | | | | | | | | | | | | |
Distributions to Common Shareholders from net investment income(b) | | | (0.37 | ) | | | | | | | (0.75 | ) | | | (0.85 | ) | | | (0.95 | ) | | | (0.96 | ) | | | (0.96 | ) |
| | | | | | | | | | | | | | | | | | | | | | | | | | | | |
| | | | | | | |
Net asset value, end of period | | $ | 26.66 | | | | | | | $ | 25.60 | | | $ | 23.62 | | | $ | 23.83 | | | $ | 25.38 | | | $ | 22.73 | |
| | | | | | | | | | | | | | | | | | | | | | | | | | | | |
| | | | | | | |
Market price, end of period | | $ | 24.56 | | | | | | | $ | 23.49 | | | $ | 21.43 | | | $ | 23.14 | | | $ | 24.24 | | | $ | 20.80 | |
| | | | | | | | | | | | | | | | | | | | | | | | | | | | |
|
Total Return Applicable to Common Shareholders(c) | |
Based on net asset value | | | 5.76 | %(d) | | | | | | | 12.17 | % | | | 3.04 | % | | | (2.14 | )% | | | 16.57 | % | | | 8.32 | % |
| | | | | | | | | | | | | | | | | | | | | | | | | | | | |
Based on market price | | | 6.18 | %(d) | | | | | | | 13.45 | % | | | (3.73 | )% | | | (0.51 | )% | | | 21.67 | % | | | 11.37 | % |
| | | | | | | | | | | | | | | | | | | | | | | | | | | | |
|
Ratios to Average Net Assets Applicable to Common Shareholders | |
Total expenses | | | 1.76 | %(e) | | | | | | | 2.07 | % | | | 1.76 | % | | | 1.49 | %(f) | | | 1.17 | % | | | 1.14 | % |
| | | | | | | | | | | | | | | | | | | | | | | | | | | | |
Total expenses after fees waived and/or reimbursed and paid indirectly | | | 1.76 | %(e) | | | | | | | 2.07 | % | | | 1.76 | % | | | 1.49 | %(f) | | | 1.09 | % | | | 1.06 | % |
| | | | | | | | | | | | | | | | | | | | | | | | | | | | |
Total expenses after fees waived and/or reimbursed and paid indirectly and excluding interest expense, fees, and amortization of offering costs(g) | | | 0.67 | %(e) | | | | | | | 0.69 | % | | | 0.69 | % | | | 0.68 | %(f) | | | 0.61 | % | | | 0.62 | % |
| | | | | | | | | | | | | | | | | | | | | | | | | | | | |
Net investment income to Common Shareholders | | | 3.32 | %(e) | | | | | | | 3.31 | % | | | 3.55 | % | | | 3.80 | %(f) | | | 4.30 | % | | | 4.77 | % |
| | | | | | | | | | | | | | | | | | | | | | | | | | | | |
|
Supplemental Data | |
Net assets applicable to Common Shareholders, end of period (000) | | $ | 1,879,714 | | | | | | | $ | 1,804,738 | | | $ | 1,665,198 | | | $ | 1,679,841 | | | $ | 1,789,120 | | | $ | 1,602,414 | |
| | | | | | | | | | | | | | | | | | | | | | | | | | | | |
RVMTP Shares outstanding at $5,000,000 liquidation value, end of period (000) | | $ | 750,000 | | | | | | | $ | 750,000 | | | $ | 750,000 | | | $ | 750,000 | | | $ | 750,000 | | | $ | 750,000 | |
| | | | | | | | | | | | | | | | | | | | | | | | | | | | |
Asset coverage per RVMTP Shares at $5,000,000 liquidation value, end of period | | $ | 350,629 | | | | | | | $ | 340,632 | | | $ | 16,101,317 | | | $ | 16,198,941 | | | $ | 16,927,465 | | | $ | 15,682,760 | |
| | | | | | | | | | | | | | | | | | | | | | | | | | | | |
Borrowings outstanding, end of period (000) | | $ | 261,820 | | | | | | | $ | 261,820 | | | $ | 261,820 | | | $ | 184,115 | | | $ | 184,115 | | | $ | 184,120 | |
| | | | | | | | | | | | | | | | | | | | | | | | | | | | |
Portfolio turnover rate | | | 3 | % | | | | | | | 21 | % | | | 23 | % | | | 32 | % | | | 42 | % | | | 12 | % |
| | | | | | | | | | | | | | | | | | | | | | | | | | | | |
| (a) | Based on average Common Shares outstanding. |
| (b) | Distributions for annual periods determined in accordance with U.S. federal income tax regulations. |
| (c) | Total returns based on market price, which can be significantly greater or less than the net asset value, may result in substantially different returns. Where applicable, excludes the effects of any sales charges and assumes the reinvestment of distributions at actual reinvestment prices. |
| (d) | Aggregate total return. |
| (f) | Excludes 0.01% of expenses incurred indirectly as a result of investments in underlying funds. |
| (g) | Interest expense, fees and amortization of offering costs related to TOB Trusts and/or RVMTP Shares. See Note 4 and Note 10 of the Notes to Financial Statements for details. |
See notes to financial statements.
| | |
| 48 | | 2020 BLACKROCK SEMI-ANNUAL REPORT TO SHAREHOLDERS |
Financial Highlights (continued)
(For a share outstanding throughout each period)
| | | | | | | | | | | | | | | | | | | | | | | | | | | | |
| | | BBF | |
| | | Six Months Ended 01/31/20
(unaudited) | | | | | | Year Ended July 31, | |
| | | | | | 2019 | | | 2018 | | | 2017 | | | 2016 | | | 2015 | |
| | | | | | | | |
Net asset value, beginning of period | | $ | 14.14 | | | | | | | $ | 13.87 | | | $ | 14.48 | | | $ | 15.47 | | | $ | 15.14 | | | $ | 15.09 | |
| | | | | | | | | | | | | | | | | | | | | | | | | | | | |
Net investment income(a) | | | 0.31 | | | | | | | | 0.69 | | | | 0.80 | | | | 0.84 | | | | 0.84 | | | | 0.87 | |
Net realized and unrealized gain (loss) | | | 0.44 | | | | | | | | 0.28 | | | | (0.59 | ) | | | (0.96 | ) | | | 0.36 | | | | 0.05 | |
| | | | | | | | | | | | | | | | | | | | | | | | | | | | |
Net increase (decrease) from investment operations | | | 0.75 | | | | | | | | 0.97 | | | | 0.21 | | | | (0.12 | ) | | | 1.20 | | | | 0.92 | |
| | | | | | | | | | | | | | | | | | | | | | | | | | | | |
| | | | | | | |
Distributions to Common Shareholders(b) | | | | | | | | | | | | | | | | | | | | | | | | | | | | |
From net investment income | | | (0.32 | )(c) | | | | | | | (0.69 | ) | | | (0.82 | ) | | | (0.87 | ) | | | (0.87 | ) | | | (0.87 | ) |
From return of capital | | | — | | | | | | | | (0.01 | ) | | | — | | | | — | | | | — | | | | — | |
| | | | | | | | | | | | | | | | | | | | | | | | | | | | |
Total distributions | | | (0.32 | ) | | | | | | | (0.70 | ) | | | (0.82 | ) | | | (0.87 | ) | | | (0.87 | ) | | | (0.87 | ) |
| | | | | | | | | | | | | | | | | | | | | | | | | | | | |
| | | | | | | |
Net asset value, end of period | | $ | 14.57 | | | | | | | $ | 14.14 | | | $ | 13.87 | | | $ | 14.48 | | | $ | 15.47 | | | $ | 15.14 | |
| | | | | | | | | | | | | | | | | | | | | | | | | | | | |
| | | | | | | |
Market price, end of period | | $ | 14.03 | | | | | | | $ | 14.25 | | | $ | 13.37 | | | $ | 15.27 | | | $ | 16.00 | | | $ | 13.44 | |
| | | | | | | | | | | | | | | | | | | | | | | | | | | | |
| | | | | | | |
Total Return Applicable to Common Shareholders(d) | | | | | | | | | | | | | | | | | | | | | | | | | | | | |
Based on net asset value | | | 5.40 | %(e) | | | | | | | 7.49 | % | | | 1.65 | % | | | (0.65 | )% | | | 8.40 | % | | | 6.76 | % |
| | | | | | | | | | | | | | | | | | | | | | | | | | | | |
Based on market price | | | 0.71 | %(e) | | | | | | | 12.38 | % | | | (7.08 | )% | | | 1.30 | % | | | 26.29 | % | | | 6.09 | % |
| | | | | | | | | | | | | | | | | | | | | | | | | | | | |
| | | | | | | |
Ratios to Average Net Assets Applicable to Common Shareholders | | | | | | | | | | | | | | | | | | | | | | | | | | | | |
Total expenses | | | 2.29 | %(f) | | | | | | | 2.77 | % | | | 2.53 | % | | | 2.16 | % | | | 2.01 | %(g) | | | 1.76 | % |
| | | | | | | | | | | | | | | | | | | | | | | | | | | | |
Total expenses after fees waived and/or reimbursed and paid indirectly | | | 2.29 | %(f) | | | | | | | 2.77 | % | | | 2.53 | % | | | 2.16 | % | | | 2.01 | %(g) | | | 1.76 | % |
| | | | | | | | | | | | | | | | | | | | | | | | | | | | |
Total expenses after fees waived and/or reimbursed and paid indirectly and excluding interest expense, fees, and amortization of offering costs(h)(i) | | | 1.09 | %(f) | | | | | | | 1.16 | % | | | 1.15 | % | | | 1.13 | % | | | 1.45 | %(g) | | | 1.50 | % |
| | | | | | | | | | | | | | | | | | | | | | | | | | | | |
Net investment income to Common Shareholders | | | 4.34 | %(f) | | | | | | | 5.01 | % | | | 5.63 | % | | | 5.72 | % | | | 5.50 | % | | | 5.65 | % |
| | | | | | | | | | | | | | | | | | | | | | | | | | | | |
| | | | | | | |
Supplemental Data | | | | | | | | | | | | | | | | | | | | | | | | | | | | |
Net assets applicable to Common Shareholders, end of period (000) | | $ | 149,107 | | | | | | | $ | 144,665 | | | $ | 141,808 | | | $ | 147,990 | | | $ | 157,965 | | | $ | 101,509 | |
| | | | | | | | | | | | | | | | | | | | | | | | | | | | |
VRDP Shares outstanding at $100,000 liquidation value, end of period (000) | | $ | 52,000 | | | | | | | $ | 52,000 | | | $ | 52,000 | | | $ | 52,000 | | | $ | 52,000 | | | $ | 34,200 | |
| | | | | | | | | | | | | | | | | | | | | | | | | | | | |
Asset coverage per VRDP Shares at $100,000 liquidation value, end of period | | $ | 386,744 | | | | | | | $ | 378,202 | | | $ | 372,708 | | | $ | 384,597 | | | $ | 403,780 | | | $ | 396,809 | |
| | | | | | | | | | | | | | | | | | | | | | | | | | | | |
Borrowings outstanding, end of period (000) | | $ | 42,889 | | | | | | | $ | 39,565 | | | $ | 49,043 | | | $ | 50,028 | | | $ | 47,193 | | | $ | 29,682 | |
| | | | | | | | | | | | | | | | | | | | | | | | | | | | |
Portfolio turnover rate | | | 19 | % | | | | | | | 36 | % | | | 31 | % | | | 39 | % | | | 17 | % | | | 11 | % |
| | | | | | | | | | | | | | | | | | | | | | | | | | | | |
| (a) | Based on average Common Shares outstanding. |
| (b) | Distributions for annual periods determined in accordance with U.S. federal income tax regulations. |
| (c) | A portion of the distributions from net investment income may be deemed a return of capital or net realized gain at fiscal year end. |
| (d) | Total returns based on market price, which can be significantly greater or less than the net asset value, may result in substantially different returns. Where applicable, excludes the effects of any sales charges and assumes the reinvestment of distributions at actual reinvestment prices. |
| (e) | Aggregate total return. |
| (g) | Includes reorganization costs associated with the Trust’s reorganization in 2016. Without these costs, total expenses, total expenses after fees waived and/or paid indirectly and total expenses after fees waived and/or paid indirectly and excluding interest expense, fees and amortization of offering costs would have been 1.83%, 1.83% and 1.26%, respectively, for the year ended July 31, 2016. |
| (h) | Interest expense, fees and amortization of offering costs related to TOBs and/or VRDP Shares. See Note 4 and Note 10 of the Notes to Financial Statements for details. |
| (i) | The total expense ratio after fees waived and paid indirectly and excluding interest expense, fees, amortization of offering costs, liquidity and remarketing fees as follows: |
| | | | | | | | | | | | | | | | | | | | | | | | | | | | |
| | | | | | | | | Year Ended July 31, | |
| | | Six Months Ended
01/31/20 (unaudited) | | | | | | 2019 | | | 2018 | | | 2017 | | | 2016 | | | 2015 | |
Expense ratios . . . . . . . . . . . . . . . . . . . . . . . . . . . . | | | 1.08 | % | | | | | | | 1.16 | % | | | 1.15 | % | | | 1.13 | % | | | 1.38 | % | | | 1.17 | % |
| | | | | | | | | | | | | | | | | | | | | | | | | | | | |
See notes to financial statements.
Financial Highlights (continued)
(For a share outstanding throughout each period)
| | | | | | | | | | | | | | | | | | | | | | | | | | | | |
| | | BNY | |
| | | Six Months Ended
01/31/20
(unaudited) | | | | | | Year Ended July 31, | |
| | | 2019 | | | 2018 | | | 2017 | | | 2016 | | | 2015 | |
| | | | | | | | |
Net asset value, beginning of period | | $ | 15.09 | | | | | | | $ | 14.52 | | | $ | 15.04 | | | $ | 15.94 | | | $ | 14.97 | | | $ | 14.68 | |
| | | | | | | | | | | | | | | | | | | | | | | | | | | | |
Net investment income(a) | | | 0.30 | | | | | | | | 0.58 | | | | 0.60 | | | | 0.67 | | | | 0.75 | | | | 0.79 | |
Net realized and unrealized gain (loss) | | | 0.33 | | | | | | | | 0.52 | | | | (0.48 | ) | | | (0.85 | ) | | | 1.02 | | | | 0.33 | |
| | | | | | | | | | | | | | | | | | | | | | | | | | | | |
Net increase (decrease) from investment operations | | | 0.63 | | | | | | | | 1.10 | | | | 0.12 | | | | (0.18 | ) | | | 1.77 | | | | 1.12 | |
| | | | | | | | | | | | | | | | | | | | | | | | | | | | |
Distributions to Common Shareholders from net investment income(b) | | | (0.27 | ) | | | | | | | (0.53 | ) | | | (0.64 | ) | | | (0.72 | ) | | | (0.80 | ) | | | (0.83 | ) |
| | | | | | | | | | | | | | | | | | | | | | | | | | | | |
| | | | | | | |
Net asset value, end of period | | $ | 15.45 | | | | | | | $ | 15.09 | | | $ | 14.52 | | | $ | 15.04 | | | $ | 15.94 | | | $ | 14.97 | |
| | | | | | | | | | | | | | | | | | | | | | | | | | | | |
| | | | | | | |
Market price, end of period | | $ | 14.53 | | | | | | | $ | 13.81 | | | $ | 12.53 | | | $ | 15.37 | | | $ | 16.71 | | | $ | 14.54 | |
| | | | | | | | | | | | | | | | | | | | | | | | | | | | |
| | | | | | | |
Total Return Applicable to Common Shareholders(c) | | | | | | | | | | | | | | | | | | | | | | | | | | | | |
Based on net asset value | | | 4.37 | %(d) | | | | | | | 8.33 | % | | | 1.13 | % | | | (0.93 | )% | | | 12.13 | % | | | 8.00 | % |
| | | | | | | | | | | | | | | | | | | | | | | | | | | | |
Based on market price | | | 7.26 | %(d) | | | | | | | 14.88 | % | | | (14.61 | )% | | | (3.43 | )% | | | 21.02 | % | | | 11.67 | % |
| | | | | | | | | | | | | | | | | | | | | | | | | | | | |
| | | | | | | |
Ratios to Average Net Assets Applicable to Common Shareholders | | | | | | | | | | | | | | | | | | | | | | | | | | | | |
Total expenses | | | 2.43 | %(e) | | | | | | | 2.73 | % | | | 2.45 | % | | | 2.15 | % | | | 1.75 | % | | | 1.73 | % |
| | | | | | | | | | | | | | | | | | | | | | | | | | | | |
Total expenses after fees waived and/or reimbursed and paid indirectly | | | 2.43 | %(e) | | | | | | | 2.73 | % | | | 2.45 | % | | | 2.14 | % | | | 1.75 | % | | | 1.73 | % |
| | | | | | | | | | | | | | | | | | | | | | | | | | | | |
Total expenses after fees waived and/or reimbursed and paid indirectly and excluding interest expense, fees, and amortization of offering costs(f) | | | 1.13 | %(e) | | | | | | | 1.14 | % | | | 1.12 | % | | | 1.12 | % | | | 1.11 | % | | | 1.12 | % |
| | | | | | | | | | | | | | | | | | | | | | | | | | | | |
Net investment income to Common Shareholders | | | 3.88 | %(e) | | | | | | | 3.98 | % | | | 4.06 | % | | | 4.45 | % | | | 4.89 | % | | | 5.24 | % |
| | | | | | | | | | | | | | | | | | | | | | | | | | | | |
| | | | | | | |
Supplemental Data | | | | | | | | | | | | | | | | | | | | | | | | | | | | |
Net assets applicable to Common Shareholders, end of period (000) | | $ | 200,425 | | | | | | | $ | 195,868 | | | $ | 188,452 | | | $ | 195,029 | | | $ | 206,414 | | | $ | 193,299 | |
| | | | | | | | | | | | | | | | | | | | | | | | | | | | |
VMTP Shares outstanding at $100,000 liquidation value, end of period (000) | | $ | 94,500 | | | | | | | $ | 94,500 | | | $ | 94,500 | | | $ | 94,500 | | | $ | 94,500 | | | $ | 94,500 | |
| | | | | | | | | | | | | | | | | | | | | | | | | | | | |
Asset coverage per VMTP Shares at $100,000 liquidation value, end of period | | $ | 312,089 | | | | | | | $ | 307,268 | | | $ | 299,420 | | | $ | 306,379 | | | $ | 318,428 | | | $ | 304,549 | |
| | | | | | | | | | | | | | | | | | | | | | | | | | | | |
Borrowings outstanding, end of period (000) | | $ | 38,866 | | | | | | | $ | 35,517 | | | $ | 31,865 | | | $ | 32,047 | | | $ | 31,780 | | | $ | 28,961 | |
| | | | | | | | | | | | | | | | | | | | | | | | | | | | |
Portfolio turnover rate | | | 6 | % | | | | | | | 23 | % | | | 9 | % | | | 16 | % | | | 14 | % | | | 11 | % |
| | | | | | | | | | | | | | | | | | | | | | | | | | | | |
| (a) | Based on average Common Shares outstanding. |
| (b) | Distributions for annual periods determined in accordance with U.S. federal income tax regulations. |
| (c) | Total returns based on market price, which can be significantly greater or less than the net asset value, may result in substantially different returns. Where applicable, excludes the effects of any sales charges and assumes the reinvestment of distributions at actual reinvestment prices. |
| (d) | Aggregate total return. |
| (f) | Interest expense, fees and amortization of offering costs related to TOBs and/or VMTP Shares. See Note 4 and Note 10 of the Notes to Financial Statements for details. |
See notes to financial statements.
| | |
| 50 | | 2020 BLACKROCK SEMI-ANNUAL REPORT TO SHAREHOLDERS |
Notes to Financial Statements (unaudited)
The following are registered under the Investment Company Act of 1940, as amended (the “1940 Act”), as closed-end management investment companies and are referred to herein collectively as the “Trusts”, or individually as a “Trust”:
| | | | | | |
| Trust Name | | Herein Referred To As | | Organized | | Diversification
Classification |
BlackRock California Municipal Income Trust | | BFZ | | Delaware | | Diversified |
BlackRock Municipal 2030 Target Term Trust | | BTT | | Delaware | | Diversified |
BlackRock Municipal Income Investment Trust | | BBF | | Delaware | | Diversified |
BlackRock New York Municipal Income Trust | | BNY | | Delaware | | Diversified |
The Board of Trustees of the Trusts are collectively referred to throughout this report as the “Board of Trustees” or the “Board,” and the trustees thereof are collectively referred to throughout this report as “Trustees”. The Trusts determine and make available for publication the net asset values (“NAVs”) of their Common Shares on a daily basis.
The Trusts, together with certain other registered investment companies advised by BlackRock Advisors, LLC (the “Manager”) or its affiliates, are included in a complex of non-index fixed-income mutual funds and all BlackRock-advised closed-end funds referred to as the BlackRock Fixed-Income Complex.
| 2. | SIGNIFICANT ACCOUNTING POLICIES |
The financial statements are prepared in conformity with accounting principles generally accepted in the United States of America (“U.S. GAAP”), which may require management to make estimates and assumptions that affect the reported amounts of assets and liabilities in the financial statements, disclosure of contingent assets and liabilities at the date of the financial statements and the reported amounts of increases and decreases in net assets from operations during the reporting period. Actual results could differ from those estimates. Each Trust is considered an investment company under U.S. GAAP and follows the accounting and reporting guidance applicable to investment companies. Below is a summary of significant accounting policies:
Investment Transactions and Income Recognition: For financial reporting purposes, investment transactions are recorded on the dates the transactions are executed. Realized gains and losses on investment transactions are determined on the identified cost basis. Dividend income is recorded on the ex-dividend date. Interest income, including amortization and accretion of premiums and discounts on debt securities, are recognized on an accrual basis.
Segregation and Collateralization: In cases where a Trust enters into certain investments (e.g. futures contracts) or certain borrowings (e.g. TOB Trust transactions) that would be treated as “senior securities” for 1940 Act purposes, a Trust may segregate or designate on its books and records cash or liquid assets having a market value at least equal to the amount of its future obligations under such investments or borrowings. Doing so allows the investment or borrowings to be excluded from treatment as a “senior security.” Furthermore, if required by an exchange or counterparty agreement, the Trusts may be required to deliver/deposit cash and/or securities to/with an exchange, or broker-dealer or custodian as collateral for certain investments or obligations.
Distributions: Distributions from net investment income are declared monthly and paid monthly. Distributions of capital gains are recorded on the ex-dividend date and made at least annually. The portion of distributions, if any, that exceeds a fund’s current and accumulated earnings and profits, as measured on a tax basis, constitute a non-taxable return of capital. The character and timing of distributions are determined in accordance with U.S. federal income tax regulations, which may differ from U.S. GAAP.
Deferred Compensation Plan: Under the Deferred Compensation Plan (the “Plan”) approved by each Board of Trustees of the Trusts (the “Board”), the trustees who are not “interested persons” of the Trusts, as defined in the 1940 Act, (“Independent Trustees”), may defer a portion of their annual complex-wide compensation. Deferred amounts earn an approximate return as though equivalent dollar amounts had been invested in common shares of certain funds in the BlackRock Fixed-Income Complex selected by the Independent Trustees. This has the same economic effect for the Independent Trustees as if the Independent Trustees had invested the deferred amounts directly in certain funds in the BlackRock Fixed-Income Complex.
The Plan is not funded and obligations thereunder represent general unsecured claims against the general assets of each Trust, if applicable. Deferred compensation liabilities are included in the Trustees’ and Officer’s fees payable in the Statements of Assets and Liabilities and will remain as a liability of the Trusts until such amounts are distributed in accordance with the Plan.
Recent Accounting Standards: The Trusts have adopted Financial Accounting Standards Board Accounting Standards Update 2017-08 to amend the amortization period for certain purchased callable debt securities held at a premium. Under the new standard, the trusts have changed the amortization period for the premium on certain purchased callable debt securities with non-contingent call features to the earliest call date. In accordance with the transition provisions of the standard, the Trusts applied the amendments on a modified retrospective basis beginning with the fiscal period ended January 31, 2020. The adjusted cost basis of securities at July 31, 2019 are as follows:
| | | | |
BFZ | | $ | 788,792,864 | |
BTT | | | 2,636,048,610 | |
BBF | | | 234,804,000 | |
BNY | | | 307,160,539 | |
This change in accounting policy has been made to comply with the newly issued accounting standard and had no impact on accumulated earnings (loss) or the net asset value of the Trusts.
| | | | |
| NOTES TO FINANCIAL STATEMENTS | | | 51 | |
Notes to Financial Statements (unaudited) (continued)
Indemnifications: In the normal course of business, a Trust enters into contracts that contain a variety of representations that provide general indemnification. A Trust’s maximum exposure under these arrangements is unknown because it involves future potential claims against a Trust, which cannot be predicted with any certainty.
Other: Expenses directly related to a Trust are charged to that Trust. Other operating expenses shared by several funds, including other funds managed by the Manager, are prorated among those funds on the basis of relative net assets or other appropriate methods.
| 3. | INVESTMENT VALUATION AND FAIR VALUE MEASUREMENTS |
Investment Valuation Policies: The Trusts’ investments are valued at fair value (also referred to as “market value” within the financial statements) as of the close of trading on the New York Stock Exchange (“NYSE”) (generally 4:00 p.m., Eastern time). U.S. GAAP defines fair value as the price the Trusts would receive to sell an asset or pay to transfer a liability in an orderly transaction between market participants at the measurement date. The Trusts determine the fair values of their financial instruments using various independent dealers or pricing services under policies approved by the Board of Trustees of each Trust (the “Board”). The BlackRock Global Valuation Methodologies Committee (the “Global Valuation Committee”) is the committee formed by management to develop global pricing policies and procedures and to oversee the pricing function for all financial instruments.
Fair Value Inputs and Methodologies: The following methods and inputs are used to establish the fair value of each Trust’s assets and liabilities:
| | • | | Municipal investments (including commitments to purchase such investments on a “when-issued” basis) are valued on the basis of prices provided by dealers or pricing services. In determining the value of a particular investment, pricing services may use certain information with respect to transactions in such investments, quotations from dealers, pricing matrixes, market transactions in comparable investments and information with respect to various relationships between investments. |
| | • | | Investments in open-end U.S. mutual funds are valued at NAV each business day. |
| | • | | Futures contracts traded on exchanges are valued at their last sale price. |
If events (e.g., a company announcement, market volatility or a natural disaster) occur that are expected to materially affect the value of such investments, or in the event that the application of these methods of valuation results in a price for an investment that is deemed not to be representative of the market value of such investment, or if a price is not available, the investment will be valued by the Global Valuation Committee, or its delegate, in accordance with a policy approved by the Board as reflecting fair value (“Fair Valued Investments”). The fair valuation approaches that may be used by the Global Valuation Committee will include market approach, income approach and cost approach. Valuation techniques such as discounted cash flow, use of market comparables and matrix pricing are types of valuation approaches and are typically used in determining fair value. When determining the price for Fair Valued Investments, the Global Valuation Committee, or its delegate, seeks to determine the price that each Trust might reasonably expect to receive or pay from the current sale or purchase of that asset or liability in an arm’s-length transaction. Fair value determinations shall be based upon all available factors that the Global Valuation Committee, or its delegate, deems relevant and consistent with the principles of fair value measurement. The pricing of all Fair Valued Investments is subsequently reported to the Board or a committee thereof on a quarterly basis.
Fair Value Hierarchy: Various inputs are used in determining the fair value of investments and derivative financial instruments. These inputs to valuation techniques are categorized into a fair value hierarchy consisting of three broad levels for financial statement purposes as follows:
| | • | | Level 1 — Unadjusted price quotations in active markets/exchanges for identical assets or liabilities that each Trust has the ability to access |
| | • | | Level 2 — Other observable inputs (including, but not limited to, quoted prices for similar assets or liabilities in markets that are active, quoted prices for identical or similar assets or liabilities in markets that are not active, inputs other than quoted prices that are observable for the assets or liabilities (such as interest rates, yield curves, volatilities, prepayment speeds, loss severities, credit risks and default rates) or other market–corroborated inputs) |
| | • | | Level 3 — Unobservable inputs based on the best information available in the circumstances, to the extent observable inputs are not available (including the Global Valuation Committee’s assumptions used in determining the fair value of investments and derivative financial instruments) |
The hierarchy gives the highest priority to unadjusted quoted prices in active markets for identical assets or liabilities (Level 1 measurements) and the lowest priority to unobservable inputs (Level 3 measurements). Accordingly, the degree of judgment exercised in determining fair value is greatest for instruments categorized in Level 3. The inputs used to measure fair value may fall into different levels of the fair value hierarchy. In such cases, for disclosure purposes, the fair value hierarchy classification is determined based on the lowest level input that is significant to the fair value measurement in its entirety. Investments classified within Level 3 have significant unobservable inputs used by the Global Valuation Committee in determining the price for Fair Valued Investments. Level 3 investments include equity or debt issued by privately held companies or funds. There may not be a secondary market, and/or there are a limited number of investors. The categorization of a value determined for investments and derivative financial instruments is based on the pricing transparency of the investments and derivative financial instruments and is not necessarily an indication of the risks associated with investing in those securities.
| 4. | SECURITIES AND OTHER INVESTMENTS |
Zero-Coupon Bonds: Zero-coupon bonds are normally issued at a significant discount from face value and do not provide for periodic interest payments. These bonds may experience greater volatility in market value than other debt obligations of similar maturity which provide for regular interest payments.
Forward Commitments, When-Issued and Delayed Delivery Securities: Certain trusts may purchase securities on a when-issued basis and may purchase or sell securities on a forward commitment basis. Settlement of such transactions normally occurs within a month or more after the purchase or sale commitment is made. A trust may purchase securities under such conditions with the intention of actually acquiring them, but may enter into a separate agreement to sell the securities before the settlement date. Since the value of securities purchased may fluctuate prior to settlement, a trust may be required to pay more at settlement than the security is worth. In
| | |
| 52 | | 2020 BLACKROCK SEMI-ANNUAL REPORT TO SHAREHOLDERS |
Notes to Financial Statements (unaudited) (continued)
addition, a trust is not entitled to any of the interest earned prior to settlement. When purchasing a security on a delayed delivery basis, a trust assumes the rights and risks of ownership of the security, including the risk of price and yield fluctuations. In the event of default by the counterparty, a trust’s maximum amount of loss is the unrealized appreciation of unsettled when-issued transactions.
Municipal Bonds Transferred to TOB Trusts: Certain trusts leverage their assets through the use of “TOB Trust” transactions. The trusts transfer municipal bonds into a special purpose trust (a “TOB Trust”). A TOB Trust issues two classes of beneficial interests: short-term floating rate interests (“TOB Trust Certificates”), which are sold to third party investors, and residual inverse floating rate interests (“TOB Residuals”), which are issued to the participating trusts that contributed the municipal bonds to the TOB Trust. The TOB Trust Certificates have interest rates that reset weekly and their holders have the option to tender such certificates to the TOB Trust for redemption at par and any accrued interest at each reset date. The TOB Residuals held by a trust provides the trust with the right to cause the holders of a proportional share of the TOB Trust Certificates to tender their certificates to the TOB Trust at par plus accrued interest. The trust may withdraw a corresponding share of the municipal bonds from the TOB Trust. Other trusts managed by the investment adviser may also contribute municipal bonds to a TOB Trust into which a trust has contributed bonds. If multiple BlackRock-advised funds participate in the same TOB Trust, the economic rights and obligations under the TOB Residuals will be shared among the trusts ratably in proportion to their participation in the TOB Trust.
TOB Trusts are supported by a liquidity facility provided by a third party bank or other financial institution (the “Liquidity Provider”) that allows the holders of the TOB Trust Certificates to tender their certificates in exchange for payment of par plus accrued interest on any business day. The tendered TOB Trust Certificates are remarketed by a Remarketing Agent. In the event of a failed remarketing, the TOB Trust may draw upon a loan from the Liquidity Provider to purchase the tendered TOB Trust Certificates. Any loans made by the Liquidity Provider will be secured by the purchased TOB Trust Certificates held by the TOB Trust and will be subject to an increased interest rate based on number of days the loan is outstanding.
The TOB Trust may be collapsed without the consent of a trust, upon the occurrence of a termination event, as defined in the TOB Trust agreement. Upon the occurrence of a termination event, a TOB Trust would be liquidated with the proceeds applied first to any accrued fees owed to the trustee of the TOB Trust, the Remarketing Agent and the Liquidity Provider. Upon certain termination events, TOB Trust Certificates holders will be paid before the TOB Residuals holders (i.e., the Trusts) whereas in other termination events, TOB Trust Certificates holders and TOB Residuals holders will be paid pro rata.
While a trust’s investment policies and restrictions expressly permit investments in inverse floating rate securities, such as TOB Residuals, they restrict the ability of a trust to borrow money for purposes of making investments. Each trust’s transfer of the municipal bonds to a TOB Trust is considered a secured borrowing for financial reporting purposes. The cash received by the TOB Trust from the sale of the TOB Trust Certificates, less certain transaction expenses, is paid to a trust. A trust typically invests the cash received in additional municipal bonds.
Accounting for TOB Trusts: The municipal bonds deposited into a TOB Trust are presented in a trust’s Schedule of Investments and the TOB Trust Certificates are shown in Other Liabilities in the Statements of Assets and Liabilities. Any loans drawn by the TOB Trust pursuant to the liquidity facility to purchase tendered TOB Trust Certificates are shown as Loan for TOB Trust Certificates. The carrying amount of a trust’s payable to the holder of the TOB Trust Certificates, as reported in the Statements of Assets and Liabilities as TOB Trust Certificates, approximates its fair value.
Interest income, including amortization and accretion of premiums and discounts, from the underlying municipal bonds is recorded by a Trust on an accrual basis. Interest expense incurred on the TOB Trust transaction and other expenses related to remarketing, administration, trustee, liquidity and other services to a TOB Trust are shown as interest expense, fees and amortization of offering costs in the Statements of Operations. Fees paid upon creation of the TOB Trust are recorded as debt issuance costs and are amortized to interest expense, fees and amortization of offering costs in the Statements of Operations to the expected maturity of the TOB Trust. In connection with the restructurings of the TOB Trusts to non-bank sponsored TOB Trusts, a Trust incurred non-recurring, legal and restructuring fees, which are recorded as interest expense, fees and amortization of deferred offering costs in the Statements of Operations.
Amounts recorded within interest expense, fees and amortization of offering costs in the Statements of Operations are:
| | | | | | | | | | | | | | | | |
| | | Interest
Expense | | | Liquidity
Fees | | | Other
Expense | | | Total | |
BFZ | | $ | 925,241 | | | $ | 341,910 | | | $ | 103,126 | | | $ | 1,370,277 | |
BTT | | | 1,705,590 | | | | 429,051 | | | | 360,575 | | | | 2,495,216 | |
BBF | | | 224,389 | | | | 71,393 | | | | 32,026 | | | | 327,808 | |
BNY | | | 237,214 | | | | 82,658 | | | | 23,261 | | | | 343,133 | |
For the six months ended January 31, 2020, the following table is a summary of each Trust’s TOB Trusts:
| | | | | | | | | | | | | | | | | | | | |
| | | Underlying
Municipal Bonds
Transferred to
TOB Trusts (a) | | | Liability for
TOB Trust
Certificates (b) | | | Range of
Interest Rates
on TOB Trust
Certificates at
Period End | | | Average
TOB Trust
Certificates
Outstanding | | | Daily Weighted
Average Rate
of Interest and
Other Expenses
on TOB Trusts | |
BFZ . . . | | $ | 383,340,621 | | | $ | 171,438,735 | | | | 0.90% — 1.19% | | | $ | 148,620,870 | | | | 1.83 | % |
BTT . . . | | | 461,502,371 | | | | 261,819,915 | | | | 0.97% — 1.09% | | | | 261,819,915 | | | | 1.90 | |
BBF . . . | | | 76,452,792 | | | | 42,889,056 | | | | 0.94% — 1.12% | | | | 35,645,161 | | | | 1.83 | |
BNY . . . | | | 72,074,447 | | | | 38,865,798 | | | | 0.95% — 1.09% | | | | 37,264,278 | | | | 1.83 | |
| | (a) | The municipal bonds transferred to a TOB Trust are generally high grade municipal bonds. In certain cases, when municipal bonds transferred are lower grade municipal bonds, the TOB Trust transaction may include a credit enhancement feature that provides for the timely payment of principal and interest on the bonds to the TOB Trust by a credit | |
| | | | |
| NOTES TO FINANCIAL STATEMENTS | | | 53 | |
Notes to Financial Statements (unaudited) (continued)
| | enhancement provider in the event of default of the municipal bond. The TOB Trust would be responsible for the payment of the credit enhancement fee and the trusts, as TOB Residuals holders, would be responsible for reimbursement of any payments of principal and interest made by the credit enhancement provider. The maximum potential amounts owed by the trusts, for such reimbursements, as applicable, are included in the maximum potential amounts disclosed for recourse TOB Trusts. | |
| | (b) | TOB Trusts may be structured on a non-recourse or recourse basis. When a Trust invests in TOB Trusts on a non-recourse basis, the Liquidity Provider may be required to make a payment under the liquidity facility to allow the TOB Trust to repurchase TOB Trust Certificates. The Liquidity Provider will be reimbursed from the liquidation of bonds held in the TOB Trust. If the trust invests in a TOB Trust on a recourse basis, the trust enters into a reimbursement agreement with the Liquidity Provider where the trust is required to reimburse the Liquidity Provider for any shortfall between the amount paid by the Liquidity Provider and proceeds received from liquidation of municipal bonds held in the TOB Trust (the “Liquidation Shortfall”). As a result, if the trust invests in a recourse TOB Trust, the trust will bear the risk of loss with respect to any Liquidation Shortfall. If multiple funds participate in any such TOB Trust, these losses will be shared ratably, including the maximum potential amounts owed by the trust at January 31, 2020, in proportion to their participation in the TOB Trust. The recourse TOB Trusts are identified in the Schedule of Investments including the maximum potential amounts owed by the trust at January 31, 2020. | |
| 5. | DERIVATIVE FINANCIAL INSTRUMENTS |
The Trusts engage in various portfolio investment strategies using derivative contracts both to increase the returns of the Trusts and/or to manage their exposure to certain risks such as credit risk, equity risk, interest rate risk, foreign currency exchange rate risk, commodity price risk or other risks (e.g., inflation risk). Derivative financial instruments categorized by risk exposure are included in the Schedules of Investments. These contracts may be transacted on an exchange or over-the-counter.
Futures Contracts: Futures contracts are purchased or sold to gain exposure to, or manage exposure to, changes in interest rates (interest rate risk) and changes in the value of equity securities (equity risk) or foreign currencies (foreign currency exchange rate risk).
Futures contracts are agreements between the Trusts and a counterparty to buy or sell a specific quantity of an underlying instrument at a specified price and on a specified date. Depending on the terms of a contract, it is settled either through physical delivery of the underlying instrument on the settlement date or by payment of a cash amount on the settlement date. Upon entering into a futures contract, the Trusts are required to deposit initial margin with the broker in the form of cash or securities in an amount that varies depending on a contract’s size and risk profile. The initial margin deposit must then be maintained at an established level over the life of the contract. Amounts pledged, which are considered restricted, are included in cash pledged for futures contracts in the Statements of Assets and Liabilities.
Securities deposited as initial margin are designated in the Schedules of Investments and cash deposited, if any, is shown as cash pledged for futures contracts in the Statements of Assets and Liabilities. Pursuant to the contract, the Trusts agree to receive from or pay to the broker an amount of cash equal to the daily fluctuation in market value of the contract (“variation margin”). Variation margin is recorded as unrealized appreciation (depreciation) and, if any, shown as variation margin receivable (or payable) on futures contracts in the Statements of Assets and Liabilities. When the contract is closed, a realized gain or loss is recorded in the Statements of Operations equal to the difference between the notional amount of the contract at the time it was opened and the notional amount at the time it was closed. The use of futures contracts involves the risk of an imperfect correlation in the movements in the price of futures contracts and interest, foreign currency exchange rates or underlying assets.
| 6. | INVESTMENT ADVISORY AGREEMENT AND OTHER TRANSACTIONS WITH AFFILIATES |
Investment Advisory: Each Trust entered into an Investment Advisory Agreement with the Manager, the Trusts’ investment adviser and an indirect, wholly-owned subsidiary of BlackRock, Inc. (“BlackRock”), to provide investment advisory and administrative services. The Manager is responsible for the management of each Trust’s portfolio and provides the personnel, facilities, equipment and certain other services necessary to the operations of each Trust.
For such services, each Trust, except BTT, pays the Manager a monthly fee at an annual rate equal to the following percentages of the average weekly value of each Trust’s managed assets.
| | | | | | | | | | | | |
| | | BFZ | | | BBF | | | BNY | |
Investment advisory fees | | | 0.58 | % | | | 0.57 | % | | | 0.60 | % |
For such services, BTT pays the Manager a monthly fee at an annual rate equal to 0.40% of the average daily value of the Trust’s managed assets.
For purposes of calculating these fees, “managed assets” are determined as total assets of the Trust (including any assets attributable to money borrowed for investment purposes) less the sum of its accrued liabilities (other than money borrowed for investment purposes).
Expense Waivers: With respect to each Trust, the Manager contractually agreed to waive its investment advisory fees by the amount of investment advisory fees each Trust pays to the Manager indirectly through its investment in affiliated money market funds (the “affiliated money market fund waiver”) through June 30, 2021. The contractual agreement may be terminated upon 90 days’ notice by a majority of the Independent Trustees, or by a vote of a majority of the outstanding voting securities of a Trust. Prior to December 1, 2019, this waiver was voluntary. For the six months ended January 31, 2020, the amounts waived were as follows:
| | | | | | | | | | | | | | | | |
| | | BFZ | | | BTT | | | BBF | | | BNY | |
Amounts waived | | $ | 843 | | | $ | 1,771 | | | $ | 1,199 | | | $ | 113 | |
The Manager contractually agreed to waive its investment advisory fee with respect to any portion of each Trust’s assets invested in affiliated equity and fixed-income mutual funds and affiliated exchange-traded funds that have a contractual management fee through June 30, 2021. The agreement can be renewed for annual periods thereafter, and may be terminated on 90 days’ notice, each subject to approval by a majority of the Trust’s Independent Trustees. For the six months ended January 31, 2020, there were no fees waived by the Manager pursuant to these arrangements.
| | |
| 54 | | 2020 BLACKROCK SEMI-ANNUAL REPORT TO SHAREHOLDERS |
Notes to Financial Statements (unaudited) (continued)
Trustees and Officers: Certain trustees and/or officers of the Trusts are directors and/or officers of BlackRock or its affiliates. The Trusts reimburse the Manager for a portion of the compensation paid to the Trusts’ Chief Compliance Officer, which is included in Trustees and Officer in the Statements of Operations.
Other Transactions: The Trusts may purchase securities from, or sell securities to, an affiliated fund provided the affiliation is due solely to having a common investment adviser, common officers, or common trustees. For the six months ended January 31, 2020, the purchase and sale transactions and any net realized gains (losses) with an affiliated fund in compliance with Rule 17a-7 under the 1940 Act were as follows:
| | | | | | | | | | | | |
| | | Purchases | | | Sales | | | Net Realized Gain (Loss) | |
BTT | | $ | — | | | $ | 1,700,840 | | | $ | — | |
For the six months ended January 31, 2020, purchases and sales of investments, excluding short-term securities, were as follows:
| | | | | | | | | | | | | | | | |
| | | BFZ | | | BTT | | | BBF | | | BNY | |
Purchases | | $ | 179,932,939 | | | $ | 92,332,002 | | | $ | 59,207,080 | | | $ | 24,112,982 | |
Sales | | | 184,912,065 | | | | 76,292,827 | | | | 66,336,473 | | | | 21,229,102 | |
It is each Trust’s policy to comply with the requirements of the Internal Revenue Code of 1986, as amended, applicable to regulated investment companies, and to distribute substantially all of its taxable income to its shareholders. Therefore, no U.S. federal income tax provision is required.
Each Trust files U.S. federal and various state and local tax returns. No income tax returns are currently under examination. The statute of limitations on each Trust’s U.S. federal tax returns generally remains open for each of the four years ended July 31, 2019. The statutes of limitations on each Trust’s state and local tax returns may remain open for an additional year depending upon the jurisdiction.
Management has analyzed tax laws and regulations and their application to the Trusts as of January 31, 2020, inclusive of the open tax return years, and does not believe that there are any uncertain tax positions that require recognition of a tax liability in the Trusts’ financial statements.
As of July 31, 2019, the Trusts had non-expiring capital loss carryforwards available to offset future realized capital gains as follows:
| | | | | | | | | | | | | | | | | | | | |
| BFZ | | | | | BTT | | | | | BBF | | | | | BNY | |
| $ | 1,242,628 | | | | | $ | 24,405,259 | | | | | $ | 3,116,059 | | | | | $ | 5,375,343 | |
As of January 31, 2020, gross unrealized appreciation and depreciation for investments and derivatives based on cost for U.S. federal income tax purposes were as follows:
| | | | | | | | | | | | | | | | |
| | | BFZ | | | BTT | | | BBF | | | BNY | |
Tax cost | | $ | 612,866,865 | | | $ | 2,386,695,407 | | | $ | 184,754,391 | | | $ | 266,015,253 | |
| | | | | | | | | | | | | | | | |
Gross unrealized appreciation | | $ | 59,961,616 | | | $ | 231,007,371 | | | $ | 19,016,929 | | | $ | 27,502,051 | |
Gross unrealized depreciation | | | (1,655,084 | ) | | | (5,325,945 | ) | | | (476,388 | ) | | | (834,782 | ) |
| | | | | | | | | | | | | | | | |
Net unrealized appreciation | | $ | 58,306,532 | | | $ | 225,681,426 | | | $ | 18,540,541 | | | $ | 26,667,269 | |
| | | | | | | | | | | | | | | | |
Many municipalities insure repayment of their bonds, which may reduce the potential for loss due to credit risk. The market value of these bonds may fluctuate for other reasons, including market perception of the value of such insurance, and there is no guarantee that the insurer will meet its obligation.
Inventories of municipal bonds held by brokers and dealers may decrease, which would lessen their ability to make a market in these securities. Such a reduction in market making capacity could potentially decrease a Trust’s ability to buy or sell bonds. As a result, a Trust may sell a security at a lower price, sell other securities to raise cash, or give up an investment opportunity, any of which could have a negative impact on performance. If a Trust needed to sell large blocks of bonds, those sales could further reduce the bonds’ prices and impact performance.
In the normal course of business, certain Trusts invest in securities or other instruments and may enter into certain transactions, and such activities subject each Trust to various risks, including among others, fluctuations in the market (market risk) or failure of an issuer to meet all of its obligations. The value of securities or other instruments may also be affected by various factors, including, without limitation: (i) the general economy; (ii) the overall market as well as local, regional or global political and/or social instability; (iii) regulation, taxation or international tax treaties between various countries; or (iv) currency, interest rate and price fluctuations. Local, regional or global events such as war, acts of terrorism, the spread of infectious illness or other public health issues, recessions, or other events could have a significant impact on each Trust and its investments.
Each Trust may be exposed to prepayment risk, which is the risk that borrowers may exercise their option to prepay principal earlier than scheduled during periods of declining interest rates, which would force each Trust to reinvest in lower yielding securities. Each Trust may also be exposed to reinvestment risk, which is the risk that
| | | | |
| NOTES TO FINANCIAL STATEMENTS | | | 55 | |
Notes to Financial Statements (unaudited) (continued)
income from each Trust’s portfolio will decline if each Trust invests the proceeds from matured, traded or called fixed-income securities at market interest rates that are below each Trust portfolio’s current earnings rate.
The Trusts may hold a significant amount of bonds subject to calls by the issuers at defined dates and prices. When bonds are called by issuers and the Trusts reinvest the proceeds received, such investments may be in securities with lower yields than the bonds originally held, and correspondingly, could adversely impact the yield and total return performance of a Trust.
There is no assurance that BTT will achieve its investment objectives, including its investment objective of returning $25.00 per share. As BTT approaches its scheduled termination date, it is expected that the maturity of BTT’s portfolio securities will shorten, which is likely to reduce BTT’s income and distributions to shareholders.
A Trust structures and “sponsors” the TOB Trusts in which it holds TOB Residuals and has certain duties and responsibilities, which may give rise to certain additional risks including, but not limited to, compliance, securities law and operational risks.
Should short-term interest rates rise, the Trusts’ investments in the TOB Trusts may adversely affect the Trusts’ net investment income and dividends to Common Shareholders. Also, fluctuations in the market value of municipal bonds deposited into the TOB Trust may adversely affect the Trusts’ NAVs per share.
The SEC and various federal banking and housing agencies have adopted credit risk retention rules for securitizations (the “Risk Retention Rules”). The Risk Retention Rules would require the sponsor of a TOB Trust to retain at least 5% of the credit risk of the underlying assets supporting the TOB Trust’s municipal bonds. The Risk Retention Rules may adversely affect the Trusts’ ability to engage in TOB Trust transactions or increase the costs of such transactions in certain circumstances.
TOB Trusts constitute an important component of the municipal bond market. Any modifications or changes to rules governing TOB Trusts may adversely impact the municipal market and the Trusts, including through reduced demand for and liquidity of municipal bonds and increased financing costs for municipal issuers. The ultimate impact of any potential modifications on the TOB Trust market and the overall municipal market is not yet certain.
Each Trust may invest without limitation in illiquid or less liquid investments or investments in which no secondary market is readily available or which are otherwise illiquid, including private placement securities. A Trust may not be able to readily dispose of such investments at prices that approximate those at which the Trust could sell such investments if they were more widely traded and, as a result of such illiquidity, the Trust may have to sell other investments or engage in borrowing transactions if necessary to raise funds to meet its obligations. Limited liquidity can also affect the market price of investments, thereby adversely affecting a Trust’s net asset value and ability to make dividend distributions. Privately issued debt securities are often of below investment grade quality, frequently are unrated and present many of the same risks as investing in below investment grade public debt securities.
A recent outbreak of respiratory disease caused by a novel coronavirus was first detected in China in December 2019 and has now been detected internationally. This coronavirus has resulted in closing borders, quarantines, disruptions to supply chains and customer activity, as well as general concern and uncertainty. The impact of epidemics and pandemics such as the coronavirus, could affect the economies of many nations, individual companies and the market in general in ways that cannot necessarily be foreseen at the present time. The impact of the outbreak may be short term or may last for an extended period of time.
Counterparty Credit Risk: The Trusts may be exposed to counterparty credit risk, or the risk that an entity may fail to or be unable to perform on its commitments related to unsettled or open transactions. The Trusts manage counterparty credit risk by entering into transactions only with counterparties that the Manager believes have the financial resources to honor their obligations and by monitoring the financial stability of those counterparties. Financial assets, which potentially expose the Trusts to market, issuer and counterparty credit risks, consist principally of financial instruments and receivables due from counterparties. The extent of the Trusts’ exposure to market, issuer and counterparty credit risks with respect to these financial assets is approximately their value recorded in the Statements of Assets and Liabilities, less any collateral held by the Trusts.
A derivative contract may suffer a mark-to-market loss if the value of the contract decreases due to an unfavorable change in the market rates or values of the underlying instrument. Losses can also occur if the counterparty does not perform under the contract.
With exchange-traded futures, there is less counterparty credit risk to the Trusts since the exchange or clearinghouse, as counterparty to such instruments, guarantees against a possible default. The clearinghouse stands between the buyer and the seller of the contract; therefore, credit risk is limited to failure of the clearinghouse. While offset rights may exist under applicable law, a Trust does not have a contractual right of offset against a clearing broker or clearinghouse in the event of a default (including the bankruptcy or insolvency). Additionally, credit risk exists in exchange-traded futures and centrally cleared swaps with respect to initial and variation margin that is held in a clearing broker’s customer accounts. While clearing brokers are required to segregate customer margin from their own assets, in the event that a clearing broker becomes insolvent or goes into bankruptcy and at that time there is a shortfall in the aggregate amount of margin held by the clearing broker for all its clients, typically the shortfall would be allocated on a pro rata basis across all the clearing broker’s customers, potentially resulting in losses to the Trusts.
Concentration Risk: BFZ and BNY invests a substantial amount of their assets in issuers located in a single state or limited number of states. This may subject each Trust to the risk that economic, political or social issues impacting a particular state or group of states could have an adverse and disproportionate impact on the income from, or the value or liquidity of, the Trusts’ respective portfolios. Investment percentages in specific states or U.S. territories are presented in the Schedules of Investments.
As of period end, BFZ invested a significant portion of its assets in securities in the county, city, special district and school district sector. Changes in economic conditions affecting such sector would have a greater impact on the Trusts and could affect the value, income and/or liquidity of positions in such securities.
The Trusts invest a significant portion of their assets in fixed-income securities and/or use derivatives tied to the fixed-income markets. Changes in market interest rates or economic conditions may affect the value and/or liquidity of such investments. Interest rate risk is the risk that prices of bonds and other fixed-income securities will increase as interest rates fall and decrease as interest rates rise. The Trusts may be subject to a greater risk of rising interest rates due to the current period of historically low rates.
| | |
| 56 | | 2020 BLACKROCK SEMI-ANNUAL REPORT TO SHAREHOLDERS |
Notes to Financial Statements (unaudited) (continued)
| 10. | CAPITAL SHARE TRANSACTIONS |
Each Trust is authorized to issue an unlimited number of shares, all of which were initially classified as Common Shares. The par value for each Trust’s Common Shares is $0.10. The par value for each Trust’s Preferred Shares outstanding is $0.10. The Board is authorized, however, to reclassify any unissued Common Shares to Preferred Shares without the approval of Common Shareholders.
Common Shares
For the periods shown, shares issued and outstanding increased by the following amounts as a result of dividend reinvestment:
| | | | |
| | | BBF | |
Six Months Ended January 31, 2020 | | | 1,507 | |
Year Ended July 31, 2019 | | | 4,609 | |
For the six months ended January 31, 2020 and year ended July 31, 2019, shares issued and outstanding remained constant for BFZ, BTT and BNY.
BFZ, BBF and BNY participate in an open market share repurchase program (the “Repurchase Program”). From December 1, 2018 through November 30, 2019, each of BFZ, BBF and BNY may repurchase up to 5% of its outstanding common shares under the Repurchase Program, based on common shares outstanding as of the close of business on November 30, 2018, subject to certain conditions. From December 1, 2019 through November 30, 2020, each of BFZ, BBF and BNY may repurchase up to 5% of its outstanding common shares under the Repurchase Program, based on common shares outstanding as of the close of business on November 30, 2019, subject to certain conditions. There is no assurance that each Trust will purchase shares in any particular amounts. For the six months ended January 31, 2020, BFZ, BBF and BNY did not repurchase any shares.
Preferred Shares
A Trust’s Preferred Shares rank prior to its Common Shares as to the payment of dividends by the Trust and distribution of assets upon dissolution or liquidation of the Trust. The 1940 Act prohibits the declaration of any dividend on Common Shares or the repurchase of Common Shares if the Trust fails to maintain asset coverage of at least 200% of the liquidation preference of the its outstanding Preferred Shares. In addition, pursuant to the Preferred Shares’ governing instruments, a Trust is restricted from declaring and paying dividends on classes of shares ranking junior to or on parity with its Preferred Shares or repurchasing such shares if the Trust fails to declare and pay dividends on the Preferred Shares, redeem any Preferred Shares required to be redeemed under the Preferred Shares’ governing instruments or comply with the basic maintenance amount requirement of the ratings agencies rating the Preferred Shares.
Holders of Preferred Shares have voting rights equal to the voting rights of holders of Common Shares (one vote per share) and vote together with holders of Common Shares (one vote per share) as a single class on certain matters. Holders of Preferred Shares, voting as a separate class, are also entitled to (i) elect two members of the Board, (ii) elect the full Board if dividends on the Preferred Shares are not paid for a period of two years and (iii) a separate class vote to amend the Preferred Share governing documents. In addition, the 1940 Act requires the approval of the holders of a majority of any outstanding Preferred Shares, voting as a separate class, to (a) adopt any plan of reorganization that would adversely affect the Preferred Shares, (b) change a Trust’s sub-classification as a closed-end investment company or change its fundamental investment restrictions or (c) change its business so as to cease to be an investment company.
VRDP Shares
BBF has issued Series W-7 VRDP Shares, $100,000 liquidation preference per share, in one or more privately negotiated offerings to qualified institutional buyers as defined pursuant to Rule 144A under the Securities Act of 1933, as amended (the “Securities Act”). The VRDP Shares include a liquidity feature and may be subject to a special rate period. As of period end, the VRDP Shares outstanding were as follows:
| | | | | | | | | | | | | | | | |
| | | Issue
Date | | | Shares
Issued | | | Aggregate
Principal | | | Maturity
Date | |
BBF | | | 09/15/11 | | | | 342 | | | $ | 34,200,000 | | | | 10/01/41 | |
BBF | | | 05/16/16 | | | | 178 | | | | 17,800,000 | | | | 10/01/41 | |
Redemption Terms: BBF is required to redeem its VRDP Shares on the maturity date, unless earlier redeemed or repurchased. Six months prior to the maturity date, BBF is required to begin to segregate liquid assets with the Trust’s custodian to fund the redemption. In addition, BBF is required to redeem certain of its outstanding VRDP Shares if it fails to comply with certain asset coverage, basic maintenance amount or leverage requirements.
Subject to certain conditions, the VRDP Shares may also be redeemed, in whole or in part, at any time at the option of BBF. The redemption price per VRDP Share is equal to the liquidation preference per share plus any outstanding unpaid dividends.
Liquidity Feature: VRDP Shares are subject to a fee agreement between the VRDP Trust and the liquidity provider that requires a per annum liquidity fee and, in some cases, an upfront or initial commitment fee, payable to the liquidity provider. These fees, if applicable, are shown as liquidity fees in the Statements of Operations. As of period end, the fee agreement is set to expire, unless renewed or terminated in advance, as follows:
| | | | |
| | | BBF | |
Expiration Date | | | 04/15/20 | |
| | | | |
| NOTES TO FINANCIAL STATEMENTS | | | 57 | |
Notes to Financial Statements (unaudited) (continued)
The VRDP Shares are also subject to a purchase agreement in connection with the liquidity feature. In the event a purchase agreement is not renewed or is terminated in advance, and VRDP Shares do not become subject to a purchase agreement with an alternate liquidity provider, the VRDP Shares will be subject to mandatory purchase by the liquidity provider prior to the termination of the purchase agreement. In the event of such mandatory purchase, BBF is required to redeem the VRDP Shares six months after the purchase date. Immediately after such mandatory purchase, the VRDP Trust is required to begin to segregate liquid assets with its custodian to fund the redemption. There is no assurance BBF will replace such redeemed VRDP Shares with any other preferred shares or other form of leverage.
Remarketing: BBF may incur remarketing fees on the aggregate principal amount of all its VRDP Shares, which, if any, are included in remarketing fees on Preferred Shares in the Statements of Operations. During any special rate period (as described below), BBF may incur nominal or no remarketing fees.
Ratings: As of period end, the VRDP Shares were assigned the following long-term ratings:
| | | | | | | | |
| | | Moody’s | | | Fitch | |
BBF . . . . . . . . . . . . . . . . . . . . . . . . . . . . . . . . . .. . . . . . . . . . . . . . . . . . . . . . . . . . . . . . . . . . . . . . | | | Aa1 | | | | AAA | |
Special Rate Period: BBF may commence a “special rate period” with respect to its VRDP Shares, during which the VRDP Shares will not be subject to any remarketing and the dividend rate will be based on a predetermined methodology. During a special rate period, short-term ratings on VRDP Shares are withdrawn. BBF’s special rate period has commenced on October 22, 2015 and has a current expiration date of April 15, 2020.
Prior to the expiration date, the VRDP Trust and the VRDP Shares holder may mutually agree to extend the special rate period. If a special rate period is not extended, the VRDP Shares will revert to remarketable securities upon the termination of the special rate period and will be remarketed and available for purchase by qualified institutional investors.
During the special rate period: (i) the liquidity and fee agreements remain in effect, (ii) VRDP Shares remain subject to mandatory redemption by the VRDP Trust on the maturity date, (iii) VRDP Shares will not be remarketed or subject to optional or mandatory tender events, (iv) the VRDP Trust is required to comply with the same asset coverage, basic maintenance amount and leverage requirements for the VRDP Shares as is required when the VRDP Shares are not in a special rate period, (v) the VRDP Trust will pay dividends monthly based on the sum of an agreed upon reference rate and a percentage per annum based on the long-term ratings assigned to the VRDP Shares and (vi) the VRDP Trust will pay nominal or no fees to the liquidity provider and remarketing agent.
If a VRDP Trust redeems its VRDP Shares prior to end of the special rate period and the VRDP Shares have long-term ratings above A1/A+ and its equivalent by all ratings agencies then rating the VRDP Shares, then such redemption may be subject to a redemption premium payable to the holder of the VRDP Shares based on the time remaining in the special rate period, subject to certain exceptions for redemptions that are required to comply with minimum asset coverage requirements.
Dividends: Except during the Special Rate Period as described above, dividends on the VRDP Shares are payable monthly at a variable rate set weekly by the remarketing agent. Such dividend rates are generally based upon a spread over a base rate and cannot exceed a maximum rate. A change in the short-term credit rating of the liquidity provider or the VRDP Shares may adversely affect the dividend rate paid on such shares, although the dividend rate paid on the VRDP Shares is not directly based upon either short-term rating. In the event of a failed remarketing, the dividend rate of the VRDP Shares will be reset to a maximum rate. The maximum rate is determined based on, among other things, the long-term preferred share rating assigned to the VRDP Shares and the length of time that the VRDP Shares fail to be remarketed.
For the six months ended January 31, 2020, the annualized dividend rate for the VRDP Shares was 2.13%.
VMTP Shares
BFZ and BNY (for purposes of this section, the “VMTP Trusts”) have issued Series W-7 VMTP Shares, $100,000 liquidation preference per share, in one or more privately negotiated offerings to qualified institutional buyers as defined pursuant to Rule 144A under the Securities Act The VMTP Shares are subject to certain restrictions on transfer, and VMTP Trusts may also be required to register the VMTP Shares for sale under the Securities Act under certain circumstances. As of period end, the VMTP Shares outstanding and assigned long-term ratings were as follows:
| | | | | | | | | | | | | | | | | | | | | | | | |
| | | Issue
Date | | | Shares
Issued | | | Aggregate
Principal | | | Term Redemption Date | | | Moody’s
Rating | | | Fitch Rating | |
BFZ | | | 03/22/12 | | | | 1,713 | | | $ | 171,300,000 | | | | 03/30/21 | | | | Aa2 | | | | AAA | |
BNY | | | 03/22/12 | | | | 945 | | | | 94,500,000 | | | | 03/30/21 | | | | Aa2 | | | | AAA | |
Redemption Terms: Each VMTP Trust is required to redeem its VMTP Shares on the term redemption date, unless earlier redeemed or repurchased or unless extended. There is no assurance that a term will be extended further or that any VMTP Shares will be replaced with any other preferred shares or other form of leverage upon the redemption or repurchase of the VMTP Shares. Six months prior to the term redemption date, a VMTP Trust is required to begin to segregate liquid assets with its custodian to fund the redemption. In addition, a VMTP Trust is required to redeem certain of its outstanding VMTP Shares if it fails to comply with certain asset coverage, basic maintenance amount or leverage requirements.
Subject to certain conditions, VMTP Shares may be redeemed, in whole or in part, at any time at the option of the VMTP Trust. The redemption price per VMTP Share is equal to the liquidation preference per share plus any outstanding unpaid dividends.
| | |
| 58 | | 2020 BLACKROCK SEMI-ANNUAL REPORT TO SHAREHOLDERS |
Notes to Financial Statements (unaudited) (continued)
Dividends: Dividends on the VMTP Shares are declared daily and payable monthly at a variable rate set weekly at a fixed rate spread to the Securities Industry and Financial Markets Association Municipal Swap Index or to a percentage of the one-month LIBOR rate, as set forth in the VMTP Shares governing instrument. The fixed spread is determined based on the long-term preferred share rating assigned to the VMTP Shares by the ratings agencies then rating the VMTP Shares.
The dividend rate on VMTP Shares is subject to a step-up spread if the VMTP Trust fails to comply with certain provisions, including, among other things, the timely payment of dividends, redemptions or gross-up payments, and complying with certain asset coverage and leverage requirements.
For the six months ended January 31, 2020, the average annualized dividend rates for the VMTP Shares were as follows.
RVMTP Shares
BTT has issued Series W-7 RVMTP Shares, $5,000,000 liquidation preference per share, in privately negotiated offerings to qualified institutional buyers as defined pursuant to Rule 144A under the Securities Act. The RVMTP Shares are subject to certain restrictions on transfer outside of a remarketing. As of period end, the RVMTP Shares outstanding of BTT were as follows:
| | | | | | | | | | | | | | | | | | | | |
| | | Issue
Date | | | Shares
Issued | | | Shares Outstanding | | | Aggregate Principal | | | Term
Redemption
Date | |
BTT | | | 01/10/2013 | | | | 50 | | | | 50 | | | $ | 250,000,000 | | | | 12/31/2030 | |
| | | 01/30/2013 | | | | 50 | | | | 50 | | | | 250,000,000 | | | | 12/31/2030 | |
| | | | 02/20/2013 | | | | 50 | | | | 50 | | | | 250,000,000 | | | | 12/31/2030 | |
Redemption Terms: BTT is required to redeem its RVMTP Shares on the term redemption date or within six months of an unsuccessful remarketing, unless earlier redeemed or repurchased. There is no assurance that RVMTP Shares will be replaced with any other preferred shares or other form of leverage upon the redemption or repurchase of the RVMTP Shares. In addition, BTT is required to redeem certain of its outstanding RVMTP Shares if it fails to comply with certain asset coverage, basic maintenance amount or leverage requirements.
Subject to certain conditions, RVMTP Shares may be redeemed, in whole or in part, at any time at the option of BTT. The redemption price per RVMTP Share is equal to the liquidation preference per share plus any outstanding unpaid dividends. The RVMTP Shares are subject to certain restrictions on transfer outside of a remarketing. The RVMTP Shares are subject to remarketing upon 90 days’ notice by holders of the RVMTP Shares and 30 days’ notice by BTT. Each remarketing must be at least six months apart from the last remarketing. A holder of RVMTP Shares may submit notice of remarketing only if such holder requests a remarketing of at least the lesser of (i) $100,000,000 of RVMTP Shares or (ii) all of the RVMTP Shares held by such holder.
Dividends: Dividends on the RVMTP Shares are declared daily and payable monthly at a variable rate set weekly at a fixed rate spread to a percentage of the one-month LIBOR rate. The fixed rate spread may be adjusted at each remarketing or upon the agreement of BTT and the then-holder(s) of the RVMTP Shares. In the event that all of the RVMTP Shares submitted for remarketing are not successfully remarketed, a failed remarketing would occur, and all holders would retain their RVMTP Shares. In the event of a failed remarketing, the fixed rate spread would be set at the fixed rate spread applicable to such failed remarketing. BTT has the right to reject any fixed spread determined at a remarketing, and such rejection would result in a failed remarketing and the fixed rate spread would be set at the fixed rate spread applicable to such failed remarketing. The fixed rate spread applicable due to a failed remarketing depends on whether the remarketing was pursuant to a mandatory or non-mandatory tender. In the case of a failed remarketing following a mandatory tender, the failed remarketing spread would be the sum of the last applicable spread in effect immediately prior to the failed remarketing date for such failed remarketing plus 0.75%. In the case of a failed remarketing not associated with a mandatory tender, the failed remarketing spread would be the sum of the last applicable spread in effect immediately prior to the failed remarketing date for such failed remarketing plus 0.25%.
For the six months ended January 31, 2019, the average annualized dividend rate for the RVMTP Shares was 2.01%.
Remarketing: In the event of a failed remarketing that is not subsequently cured, BTT will be required to redeem the RVMTP Shares subject to such failed remarketing on a date that is approximately six months from the remarketing date for such failed remarketing, provided that no redemption of any RVMTP Share may occur within one year of the date of issuance of such RVMTP Share. At the date of issuance and as of period end, the RVMTP Shares were assigned long-term ratings of Aa1 from Moody’s and AAA from Fitch. The dividend rate on the RVMTP Shares is subject to a step-up spread if BTT fails to comply with certain provisions, including, among other things, the timely payment of dividends, redemptions or gross-up payments, and complying with certain asset coverage and leverage requirements.
During the six months ended January 31, 2020, no RVMTP Shares were tendered for remarketing.
For the six months ended January 31, 2020, RVMTP Shares issued and outstanding of BTT remained constant.
Offering Costs: The Trusts incurred costs in connection with the issuance of VRDP, VMTP and RVMTP Shares, which were recorded as a direct deduction from the carrying value of the related debt liability and will be amortized over the life of the VRDP, VMTP and RVMTP Shares with the exception of upfront fees paid by BBF to the liquidity provider which, if any, were amortized over the life of the liquidity agreement. Amortization of these costs is included in interest expense, fees and amortization of offering costs in the Statements of Operations.
Financial Reporting: The VRDP, VMTP and RVMTP Shares are considered debt of the issuer; therefore, the liquidation preference, which approximates fair value of the VRDP, VMTP and RVMTP Shares, is recorded as a liability in the Statements of Assets and Liabilities net of deferred offering costs. Unpaid dividends are included in
| | | | |
| NOTES TO FINANCIAL STATEMENTS | | | 59 | |
Notes to Financial Statements (unaudited) (continued)
interest expense and fees payable in the Statements of Assets and Liabilities, and the dividends accrued and paid on the VRDP, VMTP and RVMTP Shares are included as a component of interest expense, fees and amortization of offering costs in the Statements of Operations. The VRDP, VMTP and RVMTP Shares are treated as equity for tax purposes. Dividends paid to holders of the VRDP, VMTP and RVMTP Shares are generally classified as tax-exempt income for tax-reporting purposes. Dividends and amortization of deferred offering costs on VRDP, VMTP and RVMTP Shares are included in interest expense, fees and amortization of offering costs in the Statements of Operations.
| | | | | | | | |
| | | Dividends Accrued | | | Deferred Offering Costs Amortization | |
BFZ | | $ | 1,714,280 | | | $ | — | |
BTT | | | 7,543,340 | | | | 15,764 | |
BBF | | | 554,515 | | | | 3,080 | |
BNY | | | 945,706 | | | | — | |
Management’s evaluation of the impact of all subsequent events on the Trusts’ financial statements was completed through the date the financial statements were issued and the following items were noted.
The Trusts declared and paid distributions to Common Shareholders and Preferred Shareholders as follows:
| | | | | | | | | | | | | | | | | | | | | | | | |
| | | Common Dividend
Per Share | | | | | | Preferred Shares (c) | |
| | | Paid (a) | | | Declared (b) | | | | | | Shares | | | Series | | | Declared | |
BFZ | | $ | 0.038000 | | | $ | 0.038000 | | | | | | | | VMTP | | | | W-7 | | | $ | 248,713 | |
BTT | | | 0.062400 | | | | 0.062400 | | | | | | | | RVMTP | | | | W-7 | | | | 1,077,099 | |
BBF | | | 0.050500 | | | | 0.050500 | | | | | | | | VRDP | | | | W-7 | | | | 77,338 | |
BNY | | | 0.046000 | | | | 0.048000 | | | | | | | | VMTP | | | | W-7 | | | | 137,206 | |
| | (a) | Net investment income dividend paid on March 2, 2020 to Common Shareholders of record on February 14, 2020. | |
| | (b) | Net investment income dividend declared on March 2, 2020, payable to Common Shareholders of record on March 16, 2020. | |
| | (c) | Dividends declared for period February 1, 2020 to February 29, 2020. | |
| | |
| 60 | | 2020 BLACKROCK SEMI-ANNUAL REPORT TO SHAREHOLDERS |
Trustee and Officer Information
Richard E. Cavanagh, Co-Chair of the Board and Trustee
Karen P. Robards, Co-Chair of the Board and Trustee
Michael J. Castellano, Trustee
Cynthia L. Egan, Trustee
Frank J. Fabozzi, Trustee
Henry Gabbay, Trustee
R. Glenn Hubbard, Trustee
W. Carl Kester, Trustee
Catherine A. Lynch, Trustee
Robert Fairbairn, Trustee
John M. Perlowski, Trustee, President and Chief Executive Officer
Jonathan Diorio, Vice President
Neal J. Andrews, Chief Financial Officer
Jay M. Fife, Treasurer
Charles Park, Chief Compliance Officer
Janey Ahn, Secretary
Effective February 19, 2020, Henry Gabbay resigned as a Trustee of the Trusts.
Investment Adviser
BlackRock Advisors, LLC
Wilmington, DE 19809
Accounting Agent and Custodian
State Street Bank and Trust Company
Boston, MA 02111
Transfer Agent
Computershare Trust Company, N.A.
Canton, MA 02021
VRDP Tender and Paying Agent, VMTP Tender and Paying Agent and RVMTP Redemption and Paying Agent
The Bank of New York Mellon
New York, NY 10286
VRDP Liquidity Provider
Bank of America, N.A.
New York, NY 10036
VRDP Remarketing Agent
BofA Securities, Inc.
New York, NY 10036
Independent Registered Public Accounting Firm
Deloitte & Touche LLP
Boston, MA 02116
Legal Counsel
Willkie Farr & Gallagher LLP
New York, NY 10019
Address of the Trusts
100 Bellevue Parkway
Wilmington, DE 19809
| | | | |
| TRUSTEE AND OFFICER INFORMATION | | | 61 | |
Additional Information
Section 19(a) Notices
The amounts and sources of distributions reported are estimates and are being provided pursuant to regulatory requirements and are not being provided for tax reporting purposes. The actual amounts and sources for tax reporting purposes will depend upon each Trust’s investment experience during the year and may be subject to changes based on tax regulations. Shareholders will receive a Form 1099-DIV each calendar year that will inform them how to report these distributions for federal income tax purposes.
January 31, 2020
| | | | | | | | | | | | | | | | | | | | | | | | | | | | | | | | | | | | | | | | |
| | | Total Fiscal Year to Date Cummulative
Distributions by Character | | | Percentage of Fiscal Year to Date
Cumulative Distributions by Character | |
| | | Net
Investment
Income | | | Net Realized
Capital Gains
Short Term | | | Net Realized
Capital Gains
Long Term | | | Return of
Capital (a) | | | Total Per
Common
Share | | | Net
Investment
Income | | | Net Realized
Capital Gains
Short Term | | | Net Realized
Capital Gains
Long Term | | | Return of
Capital | | | Total Per
Common
Share | |
| BFZ | | $ | 0.208776 | | | $ | — | | | $ | — | | | $ | 0.033224 | | | $ | 0.242000 | | | | 86 | % | | | 0 | % | | | 0 | % | | | 14 | % | | | 100 | % |
| BBF | | | 0.282117 | | | | — | | | | — | | | | 0.034883 | | | | 0.317000 | | | | 89 | | | | 0 | | | | 0 | | | | 11 | | | | 100 | |
| | (a) | The Trust estimates that it has distributed more than its net investment income and net realized capital gains; therefore, a portion of the distribution may be a return of capital. A return of capital may occur, for example, when some or all of the shareholder’s investment in the Trust is returned to the shareholder. A return of capital does not necessarily reflect the Trust’s investment performance and should not be confused with “yield” or “income.” When distributions exceed total return performance, the difference will reduce the Trust’s net asset value per share. | |
Section 19(a) notices for the Trusts, as applicable, are available on the BlackRock website at blackrock.com.
Trust Certification
The Trusts are listed for trading on the NYSE and have filed with the NYSE their annual chief executive officer certification regarding compliance with the NYSE’s listing standards. The Trusts filed with the SEC the certification of its chief executive officer and chief financial officer required by section 302 of the Sarbanes-Oxley Act.
Dividend Policy
Each Trust’s dividend policy is to distribute all or a portion of its net investment income to its shareholders on a monthly basis. In order to provide shareholders with a more stable level of distributions, the Trusts may at times pay out less than the entire amount of net investment income earned in any particular month and may at times in any particular month pay out such accumulated but undistributed income in addition to net investment income earned in that month. As a result, the distributions paid by the Trusts for any particular month may be more or less than the amount of net investment income earned by the Trusts during such month. The Trusts’ current accumulated but undistributed net investment income, if any, is disclosed as accumulated earnings (loss) in the Statements of Assets and Liabilities, which comprises part of the financial information included in this report.
General Information
The Trusts do not make available copies of their Statements of Additional Information because the Trusts’ shares are not continuously offered, which means that the Statement of Additional Information of each Trust has not been updated after completion of the respective Trust’s offerings and the information contained in each Trust’s Statement of Additional Information may have become outdated.
During the period, there were no material changes in the Trusts’ investment objectives or policies or to the Trusts’ charters or by-laws that would delay or prevent a change of control of the Trusts that were not approved by the shareholders or in the principal risk factors associated with investment in the Trusts. There have been no changes in the persons who are primarily responsible for the day-to-day management of the Trusts’ portfolios.
In accordance with Section 23(c) of the Investment Company Act of 1940, each Trust may from time to time purchase shares of its common stock in the open market or in private transactions.
Quarterly performance, semi-annual and annual reports, current net asset value and other information regarding the Trusts may be found on BlackRock’s website, which can be accessed at blackrock.com. Any reference to BlackRock’s website in this report is intended to allow investors public access to information regarding the Trusts and does not, and is not intended to, incorporate BlackRock’s website in this report.
Electronic Delivery
Shareholders can sign up for e-mail notifications of quarterly statements, annual and semi-annual shareholder reports by enrolling in the electronic delivery program. Electronic copies of shareholder reports are available on BlackRock’s website.
To enroll in electronic delivery:
Shareholders Who Hold Accounts with Investment Advisers, Banks or Brokerages:
Please contact your financial advisor. Please note that not all investment advisers, banks or brokerages may offer this service.
| | |
| 62 | | 2020 BLACKROCK SEMI-ANNUAL REPORT TO SHAREHOLDERS |
Additional Information (continued)
Householding
The Trusts will mail only one copy of shareholder documents, annual and semi-annual reports and proxy statements, to shareholders with multiple accounts at the same address. This practice is commonly called “householding” and is intended to reduce expenses and eliminate duplicate mailings of shareholder documents. Mailings of your shareholder documents may be householded indefinitely unless you instruct us otherwise. If you do not want the mailing of these documents to be combined with those for other members of your household, please call the Trusts at (800) 882-0052.
Availability of Quarterly Schedule of Investments
The Trusts file their complete schedule of portfolio holdings with the SEC for the first and third quarters of each fiscal year as an exhibit to its reports on Form N-PORT, and for reporting periods ended prior to March 31, 2019, filed such information on Form N-Q. The Trusts’ Forms N-PORT and N-Q are available on the SEC’s website at sec.gov. The Trusts’ Forms N-PORT may also be obtained upon request and without charge by calling (800) 882-0052.
Availability of Proxy Voting Policies and Procedures
A description of the policies and procedures that the Trusts use to determine how to vote proxies relating to portfolio securities is available upon request and without charge (1) by calling (800) 882-0052; (2) at blackrock.com; and (3) on the SEC’s website at sec.gov.
Availability of Proxy Voting Record
Information about how the Trusts voted proxies relating to securities held in the Trusts’ portfolios during the most recent 12-month period ended June 30 is available upon request and without charge (1) at blackrock.com; or by calling (800) 882-0052; and (2) on the SEC’s website at sec.gov.
Availability of Trust Updates
BlackRock will update performance and certain other data for the Trusts on a monthly basis on its website in the “Closed-end Funds” section of blackrock.com as well as certain other material information as necessary from time to time. Investors and others are advised to check the website for updated performance information and the release of other material information about the Trusts. This reference to BlackRock’s website is intended to allow investors public access to information regarding the Trusts and does not, and is not intended to, incorporate BlackRock’s website in this report.
BlackRock Privacy Principles
BlackRock is committed to maintaining the privacy of its current and former fund investors and individual clients (collectively, “Clients”) and to safeguarding their non-public personal information. The following information is provided to help you understand what personal information BlackRock collects, how we protect that information and why in certain cases we share such information with select parties.
If you are located in a jurisdiction where specific laws, rules or regulations require BlackRock to provide you with additional or different privacy-related rights beyond what is set forth below, then BlackRock will comply with those specific laws, rules or regulations.
BlackRock obtains or verifies personal non-public information from and about you from different sources, including the following: (i) information we receive from you or, if applicable, your financial intermediary, on applications, forms or other documents; (ii) information about your transactions with us, our affiliates, or others; (iii) information we receive from a consumer reporting agency; and (iv) from visits to our websites.
BlackRock does not sell or disclose to non-affiliated third parties any non-public personal information about its Clients, except as permitted by law or as is necessary to respond to regulatory requests or to service Client accounts. These non-affiliated third parties are required to protect the confidentiality and security of this information and to use it only for its intended purpose.
We may share information with our affiliates to service your account or to provide you with information about other BlackRock products or services that may be of interest to you. In addition, BlackRock restricts access to non-public personal information about its Clients to those BlackRock employees with a legitimate business need for the information. BlackRock maintains physical, electronic and procedural safeguards that are designed to protect the non-public personal information of its Clients, including procedures relating to the proper storage and disposal of such information.
| | | | |
| ADDITIONAL INFORMATION | | | 63 | |
Glossary of Terms Used in this Report
| | |
| Portfolio Abbreviations |
| |
| AGC | | Assured Guarantee Corp. |
| |
| AGM | | Assured Guaranty Municipal Corp. |
| |
| AMBAC | | American Municipal Bond Assurance Corp. |
| |
| AMT | | Alternative Minimum Tax (subject to) |
| |
| ARB | | Airport Revenue Bonds |
| |
| BAM | | Build America Mutual Assurance Co. |
| |
| CAB | | Capital Appreciation Bonds |
| |
| COP | | Certificates of Participation |
| |
| EDA | | Economic Development Authority |
| |
| EDC | | Economic Development Corp. |
| |
| FHA | | Federal Housing Administration |
| |
| GARB | | General Airport Revenue Bonds |
| |
| GO | | General Obligation Bonds |
| |
| GTD | | Guaranteed |
| |
| HFA | | Housing Finance Agency |
| |
| IDA | | Industrial Development Authority |
| |
| IDB | | Industrial Development Board |
| |
| ISD | | Independent School District |
| |
| LRB | | Lease Revenue Bonds |
| |
| M/F | | Multi-Family |
| |
| NPFGC | | National Public Finance Guarantee Corp. |
| |
| PILOT | | Payment in Lieu of Taxes |
| |
| PSF-GTD | | Permanent School Fund Guaranteed |
| |
| RB | | Revenue Bonds |
| |
| S/F | | Single-Family |
| |
| SRF | | State Revolving Fund |
| |
| SONYMA | | State of New York Mortgage Agency |
| | |
| 64 | | 2020 BLACKROCK SEMI-ANNUAL REPORT TO SHAREHOLDERS |
Want to know more?
blackrock.com | 877-275-1255 (1-877-ASK-1BLK)
This report is intended for current holders. It is not a prospectus. Past performance results shown in this report should not be considered a representation of future performance. The Trusts have leveraged their Common Shares, which creates risks for Common Shareholders, including the likelihood of greater volatility of net asset value and market price of the Common Shares, and the risk that fluctuations in short-term interest rates may reduce the Common Shares’ yield. Statements and other information herein are as dated and are subject to change.
CEF-BK6-1/20-SAR
| | |
| |  |
Item 2 – Code of Ethics – Not Applicable to this semi-annual report
Item 3 – Audit Committee Financial Expert – Not Applicable to this semi-annual report
Item 4 – Principal Accountant Fees and Services – Not Applicable to this semi-annual report
Item 5 – Audit Committee of Listed Registrants – Not Applicable to this semi-annual report
Item 6 – Investments
(a)The registrant's Schedule of Investments is included as part of the Report to Stockholders filed under Item 1 of this Form.
(b)Not Applicable due to no such divestments during the semi-annual period covered since the previous Form N-CSR filing.
Item 7 – Disclosure of Proxy Voting Policies and Procedures for Closed-End Management Investment Companies – Not Applicable to this semi-annual report
Item 8 – Portfolio Managers of Closed-End Management Investment Companies
(a)Not Applicable to this semi-annual report.
(b)As of the date of this filing, there have been no changes in any of the portfolio managers identified in the most recent annual report on Form N-CSR.
Item 9 – Purchases of Equity Securities by Closed-End Management Investment Company and Affiliated Purchasers – Not Applicable due to no such purchases during the period covered by this report.
Item 10 – Submission of Matters to a Vote of Security Holders – There have been no material changes to these procedures.
Item 11 – Controls and Procedures
(a)The registrant's principal executive and principal financial officers, or persons performing similar functions, have concluded that the registrant's disclosure controls and procedures (as defined in Rule 30a- 3(c) under the Investment Company Act of 1940, as amended (the "1940 Act")) are effective as of a date within 90 days of the filing of this report based on the evaluation of these controls and procedures required by Rule 30a-3(b) under the 1940 Act and Rule 13a-15(b) under the Securities Exchange Act of 1934, as amended.
(b)There were no changes in the registrant's internal control over financial reporting (as defined in Rule
30a-3(d) under the 1940 Act) that occurred during the period covered by this report that have materially affected, or are reasonably likely to materially affect, the registrant's internal control over financial reporting.
Item 12 – Disclosure of Securities Lending Activities for Closed-End Management Investment Companies – Not Applicable
Item 13 – Exhibits attached hereto
2
Pursuant to the requirements of the Securities Exchange Act of 1934 and the Investment Company Act of 1940, the registrant has duly caused this report to be signed on its behalf by the undersigned, thereunto duly authorized.
BlackRock Municipal Income Investment Trust
By: /s/ John M. Perlowski
John M. Perlowski
Chief Executive Officer (principal executive officer) of
BlackRock Municipal Income Investment Trust
Date: April 3, 2020
Pursuant to the requirements of the Securities Exchange Act of 1934 and the Investment Company Act of 1940, this report has been signed below by the following persons on behalf of the registrant and in the capacities and on the dates indicated.
By: /s/ John M. Perlowski
John M. Perlowski
Chief Executive Officer (principal executive officer) of
BlackRock Municipal Income Investment Trust
Date: April 3, 2020
By: /s/ Neal J. Andrews
Neal J. Andrews
Chief Financial Officer (principal financial officer) of
BlackRock Municipal Income Investment Trust
Date: April 3, 2020
4
