Table of Contents
UNITED STATES
SECURITIES AND EXCHANGE COMMISSION
Washington, D.C. 20549
FORM N-CSR
CERTIFIED SHAREHOLDER REPORT OF REGISTERED
MANAGEMENT INVESTMENT COMPANIES
Investment Company Act file number 811-10385
Pacific Life Funds
(Exact name of registrant as specified in charter)
700 Newport Center Drive, P.O. Box 7500
Newport Beach, CA 92660
(Address of principal executive offices) (Zip code)
Robin S. Yonis
Vice President and General Counsel of Pacific Life Funds
700 Newport Center Drive, P.O. Box 9000
Newport Beach, CA 92660
(Name and address of agent for service)
Copies to:
Anthony H. Zacharski, Esq.
Dechert LLP
90 State House Square
Hartford, CT 06103
Registrant’s telephone number, including area code: 949-219-6767
Date of fiscal year end: March 31
Date of reporting period: April 1, 2011 - March 31, 2012
Form N-CSR is to be used by management investment companies to file reports with the Commission not later than 10 days after the transmission to stockholders of any report that is required to be transmitted to stockholders under Rule 30e-1 under the Investment Company Act of 1940 (17 CFR 270.30e-1). The Commission may use the information provided on Form N-CSR in its regulatory, disclosure review, inspection, and policymaking roles.
A registrant is required to disclose the information specified by Form N-CSR, and the Commission will make this information public. A registrant is not required to respond to the collection of information contained in Form N-CSR unless the Form displays a currently valid Office of Management and Budget (“OMB”) control number. Please direct comments concerning the accuracy of the information collection burden estimate and any suggestions for reducing the burden to Secretary, Securities and Exchange Commission, 100 F Street, NE, Washington, DC 20549. The OMB has reviewed this collection of information under the clearance requirements of 44 U.S.C. § 3507.
Table of Contents
Item 1. Reports to Stockholders.
The following is a copy of the reports transmitted to stockholders pursuant to Rule 30e-1 under the Act (17 CFR 270.30e-1).
Table of Contents
PACIFIC LIFE FUNDS | ||||
| A-1 | ||||
| A-2 | ||||
| B-1 | ||||
Financial Statements: | ||||
| C-1 | ||||
| C-3 | ||||
| C-5 | ||||
| C-8 | ||||
| D-1 | ||||
| E-1 | ||||
| F-1 | ||||
| F-3 | ||||
Approval of Investment Advisory Agreement and Fund Management Agreements | F-7 | |||
| F-11 | ||||
Table of Contents
Dear Shareholders:
We are pleased to share with you the Pacific Life Funds Annual Report dated March 31, 2012. Pacific Life Funds is comprised of twenty-eight funds, eight of which are included in this report, (each individually, a “fund” and collectively, the “funds”) and are available for direct investment. Pacific Life Fund Advisors LLC (PLFA), as adviser to the funds, manages the PL Portfolio Optimization Conservative, PL Portfolio Optimization Moderate-Conservative, PL Portfolio Optimization Moderate, PL Portfolio Optimization Moderate-Aggressive, and PL Portfolio Optimization Aggressive Funds (PL Portfolio Optimization Funds), each of which is an asset allocation “fund of funds” and which invests in certain other funds (PL Underlying Funds) of Pacific Life Funds. PLFA supervises the management of the PL Underlying Funds which are only available for investment by the PL Portfolio Optimization Funds and are included in a separate Annual Report. Please see “Where to Go for More Information” for instructions on how to obtain the PL Underlying Funds’ Annual Report. PLFA also does business under the name “Pacific Asset Management” and manages the PL Floating Rate Income, PL Income and PL Money Market Funds under that name. The funds and the fund managers as of March 31, 2012 are listed below:
Fund | Fund Manager | |
PL Portfolio Optimization Conservative | ||
PL Portfolio Optimization Moderate-Conservative | ||
PL Portfolio Optimization Moderate | Pacific Life Fund Advisors LLC (PLFA) | |
PL Portfolio Optimization Moderate-Aggressive | ||
PL Portfolio Optimization Aggressive | ||
PL Floating Rate Income | ||
PL Income | Pacific Asset Management | |
PL Money Market | ||
We appreciate your confidence in the Pacific Life Funds and look forward to serving your financial needs in the years to come.
Sincerely,
 |  | |
James T. Morris Chairman of the Board Pacific Life Funds | Mary Ann Brown Chief Executive Officer Pacific Life Funds |
A-1
Table of Contents
PACIFIC LIFE FUNDS PERFORMANCE DISCUSSION
This Annual Report is provided for the general information of investors with beneficial interests in Pacific Life Funds. This report is not authorized for distribution to prospective investors unless preceded or accompanied by a current Pacific Life Funds’ Prospectus, as supplemented, which contains information about Pacific Life Funds and each of its funds, including their investment objectives, risks, charges and expenses. You should read the Prospectus carefully before investing. There is no assurance that a fund will achieve its investment objective. Each fund is subject to market risk. The net asset value of a fund changes as its asset values go up or down. The value of a fund’s shares will fluctuate, and when redeemed, may be worth more or less than their original cost. The total return for each fund (including the 7-day yield for the PL Money Market Fund) includes reinvestment of all dividends and capital gain distributions, if any, and does not include deductions of any applicable sales charges. Past performance is not predictive of future performance. Performance figures for each class reflect the deduction of any applicable maximum front-end sales charge at the time of investment and reflect any applicable contingent deferred sales charge that would be deducted upon redemption at the end of the period presented.
This report shows you the performance of the funds compared to benchmark indices. Index performance is provided for illustrative and comparative purposes only and does not predict or depict the performance of the funds. Indices are unmanaged, do not incur transaction costs and cannot be purchased directly by investors. Index returns on equity securities include reinvested dividends.
The composite benchmarks are composed using the four broad-based indices for the PL Portfolio Optimization Funds. The percentage amounts of each broad-based index within each composite benchmark are based on each fund’s target asset class allocations in effect during the applicable period. The percentages attributed to a broad-based index within a composite benchmark will change if a fund’s target asset class allocations change.
PLFA has written the general market conditions commentary which expresses PLFA’s opinions and view on how the market generally performed for the twelve-month period ended March 31, 2012. All views are subject to change at any time based upon market or other conditions, and Pacific Life Funds, its adviser and the fund managers disclaim any responsibility to update such views. Any references to “we”, “I”, or “ours” are references to the adviser or fund manager. The adviser and fund managers may include statements that constitute “forward-looking statements” under the United States (U.S.) securities laws. Forward-looking statements include information concerning possible or assumed future results of the Pacific Life Funds’ investment operations, asset levels, earnings, expenses, industry or market conditions, regulatory developments and other aspects of the Pacific Life Funds’ operations or general economic conditions. In addition, when used in this report, predictive verbs such as “believes”, “expects”, “anticipates”, “intends”, “plans”, “estimates”, “projects” and future or conditional verbs such as “will”, “may”, “could”, “should”, and “would”, or any other statement that necessarily depends on future events, are intended to identify forward-looking statements. Forward-looking statements are not guarantees of performance or economic results. They involve risks, uncertainties and assumptions. Although such statements are based on expectations that the adviser or fund manager believes to be reasonable, actual results may differ materially from expectations. Investors must not rely on any forward-looking statements.
In connection with any forward-looking statements and any investment in the Pacific Life Funds, investors should carefully consider the investment objectives, policies and risks described in the Pacific Life Funds’ current Prospectus, as supplemented and Statement of Additional Information, as supplemented as filed with the Securities and Exchange Commission (SEC), which may be obtained from the SEC’s website at www.sec.gov.
Market Conditions (for the twelve-month period ended March 31, 2012)
Executive Summary
Markets faced turbulent conditions over the trailing twelve-month period ended March 31, 2012. Obstacles came from multiple areas of the world, and dealing with crises became a common event. Macroeconomic factors became the primary driver to performance over the reporting period, as markets moved on a “risk-on” and “risk-off” basis—riskier securities generally outperformed when macro headlines were positive, and conservative securities tended to outperform when news was negative. Despite the large market swings, the U.S. equity market finished the period with gains.
In the earlier months of the reporting period, markets endured a wave of geopolitical tension in the Middle East and Northern Africa (MENA) region, which ultimately led to regime changes in many of these nations. The uncertainty in the region caused commodity prices to move erratically. Both oil and gold prices fluctuated wildly throughout the reporting period.
The spotlight on the debt crisis in Europe also resurfaced during the reporting period. Global equity markets plummeted, as uncertainty was amplified in the eurozone countries in the third quarter of 2011. Further contributing to the volatility, news of a potential resolution caused equity markets to rally, whereas opposition to such propositions pushed markets back down. The lack of progress and uniformity in resolving the situation fueled the volatility in the global marketplace. U.S. politicians also contributed a fair share of disruption during the reporting period. Political debate became rampant as the parties prepared for the upcoming 2012 presidential election. The gridlock in Washington D.C. was clearly evident in the manner Congress handled fiscal planning. Instead of productively negotiating terms, political members fought over the fiscal budget plan without finding a clear resolution. Such a display triggered Standard & Poor’s to downgrade the U.S. credit rating from the highest rating of AAA down to AA+.
| A-2 | See benchmark definitions on page A-14 |
Table of Contents
PACIFIC LIFE FUNDS PERFORMANCE DISCUSSION (Continued)
While fundamental factors seemed to have been largely neglected when geopolitical concerns overwhelmed investors, the attractive valuations helped fuel a rally in the U.S. equity market during the latter half of the reporting period. The improved sentiments over the last two quarters helped offset the effects from the “flight-to-safety” (e.g. shift into U.S. Treasuries) that dominated the earlier part of the reporting period.
The following sections highlight how specific market segments responded to the events that unfolded over the reporting period.
Fixed Income
After outpacing equities throughout much of 2011, the fixed income markets finished the reporting period slightly behind U.S. equities, particularly due to the late rally in the equity market. For the trailing twelve-month period ended March 31, 2012, the overall fixed income market, as measured by the Barclays U.S. Aggregate Bond Index gained 7.71%. During the challenging economic environment, long-term U.S. Treasuries led the bond market. The Barclays Long Term U.S. Treasury Index increased by 23.65% for the reporting period. Despite Standard & Poor’s downgrade of the U.S. credit rating, investors continued to shift assets into U.S. Treasuries during the volatile market environment. U.S. Treasury yields (which have an inverse relationship to prices) reached historic lows during the period, as the ten-year U.S. Treasury yield dipped below 2.00%. This phenomenon was partially supported by the Federal Reserve’s (Fed) stimulus plan called “Operation Twist.” This policy, which began in October 2011, is expected to run until June 2012 and entails selling approximately $400 billion in short-term U.S. Treasuries and using the funds to purchase long-term bonds. This effort seeks to keep long-term interest rates low and encourage borrowing.
While U.S. regulators continued to intervene, investors showed concerns abroad. European bonds (both sovereign and non-sovereign) were among the worst performing categories of the fixed income market. The jittery sentiment spilled into other sectors, which was reflected in widening credit spreads in the first half of the reporting period. During these months, riskier credits experienced a sharper increase in spreads, resulting in high yield bonds generally lagging behind investment grade credits. Spreads have narrowed in the latter half of the reporting period, which helped bridge some of the gap in performance between investment grade and high yield credits for the full reporting period. The securitized credit group (i.e. commercial mortgage-backed securities (CMBS), mortgage-backed securities (MBS), and asset-backed securities (ABS)) generally trailed the broad, fixed income market. Short-term credit returns barely budged in the reporting period, as the Fed continued to hold the Federal Funds (Fed Funds) rate near zero percent. Low cash yields and the Fed’s ongoing message of maintaining “exceptionally low levels for the Fed Funds rate for an extended period” have kept the short end of the yield curve relatively flat for approximately three years.
Domestic Equity
The domestic equity market plummeted in the first half of the reporting period but experienced a solid recovery in the latter half. Despite the sharp fall in the third quarter of 2011, the S&P 500 Index managed to finish the reporting period with an 8.54% gain. Risk adversity prevailed over this reporting period, as higher quality and conservative stocks generally performed better than their counterparts. In terms of market capitalization tiers, large-capitalization stocks outperformed small-capitalization stocks. Large-capitalization stocks (as measured by the Russell 1000 Index) returned 7.86%, whereas small-capitalization stocks (as measured by the Russell 2000 Index) fell 0.18% for the reporting period. Investors may have preferred more established companies that could better withstand the difficult economic conditions. Additionally, higher quality companies (as determined by those with lower debt-to-capital, higher return-on-equity, and higher profit margins) generally fared well during this reporting period. With respect to style, domestic growth stocks outpaced their value counterparts. Defensive sectors (which tend to have less sensitivity to economic cycles) generally performed better during the reporting period than cyclical sectors such as energy, materials and financials which returned -6.86%, -4.01% and -1.76%1, respectively. Higher yielding securities also performed well as investors searched for yield and income amid the low interest rate environment and the turbulent market conditions. In particular, the real estate investment trust (REIT) market delivered solid returns. The Financial Times Stock Exchange National Association of Real Estate Investment Trust (FTSE NAREIT) Equity REITs Index returned 12.83% over the reporting period. Self storage and apartment REITs performed well, which may have been a result of a receding trend in homeownership rates. On the other hand, the riskier hotel segment continued to struggle.
International Equity
With much of the global concerns centering on Europe, the developed international equity market trailed the U.S. stock market, as the Morgan Stanley Capital International Europe, Australasia, and Far East (MSCI EAFE) Index dropped 5.77% for the reporting period. Similar to the U.S. equity market, foreign growth stocks fared better than their value counterparts. However, performance was relatively even among the market capitalization tiers for the reporting period. Although the sovereign debt problems have been concentrated in several, peripheral European countries (i.e. Portugal, Ireland, Italy, Greece and Spain), the lack of progress in finding a definitive solution has fed concerns to other regions around the world. Even China has expressed concerns over its exports to Europe as the export-led country has begun to refocus on growth over inflation. Many emerging market countries had been addressing inflationary pressures by raising interest rates in 2011. However, such measures may have had additional downward pressure on their respective stock markets as the MSCI Emerging Markets Index fell 8.80% for the period.
| 1 | Source: Standard & Poor’s. |
| A-3 | See benchmark definitions on page A-14 |
Table of Contents
PACIFIC LIFE FUNDS PERFORMANCE DISCUSSION (Continued)
Concluding Remarks
The trailing twelve-month period repeated another period of volatility. In such environments, many investors seek shelter in U.S. Treasuries. Despite the harsh conditions, the S&P 500 Index managed to climb out of negative territory toward the end of 2011 and maintained its upward momentum throughout the first quarter of 2012. Foreign equity markets experienced some recovery in early 2012, but the continuing difficulties in Europe may cause some drag on market performance in the near future. Conditions in the U.S. have shown slight signs of stabilization—albeit still a distance from normalization. Housing starts have slowly trended in a positive direction, but levels remain well below the historical average. Similarly, the unemployment rate continues to fall but lingers at an elevated level. On a brighter side, corporate profits continue to rise to all-time highs.
The debt crisis in Europe, which began in late 2009, became the primary focus throughout the reporting period. The lack of collaboration in resolving the problem reverberated throughout the global marketplace. Wild swings in the global market had become a frequent occurrence in recent quarters. Although economic reports indicate that the U.S. economy is healing modestly, it continues to deal with its fair share of uncertainty. As noted earlier in this discussion, political disorder had contributed to the fluctuation in the U.S. marketplace, and heading into 2012 with the next U.S. presidential election on the horizon, political debate has become extensive. Congress continues to quarrel over issues instead of collaborating to fix the economy. While this may create additional noise in the marketplace, fundamental factors provide some support as valuation levels continue to look fairly attractive compared to long-term historical levels, and corporate balance sheets appear healthy with relatively low debt levels and high cash positions. Markets will likely remain sensitive to various factors as developed economies go through this prolonged de-leveraging cycle. As investors continue to deal with a balance between negative headline events and hints of positive statistics, markets could continue to display erratic trends.
PL Portfolio Optimization Funds
The Portfolio Optimization Funds are five, risk-based funds that commenced operations on December 31, 2003. Each of the PL Portfolio Optimization Funds invests a specified target amount in the PL Underlying Funds of the Pacific Life Funds to accomplish the risk/return profile that corresponds to the respective PL Portfolio Optimization Fund. Each PL Portfolio Optimization Fund seeks to optimize returns for a given level of risk (or minimize risk for a given level of return).
Performance
Since the performance of each PL Portfolio Optimization Fund is a composite of the performance of each of the PL Underlying Funds in which each invests (which may include bonds, domestic and/or international equities), there is no one, broad-based industry index to use as a comparison to a PL Portfolio Optimization Fund’s performance. Therefore, we at PLFA have provided information regarding four broad-based indices to use as a comparison to each fund’s performance.
In addition, to assist in performance comparisons, composite benchmarks were constructed for each PL Portfolio Optimization Fund; each is comprised of the four broad-based indices shown below. The composite benchmarks were constructed with allocations to each asset class that correspond to the target allocations for the PL Portfolio Optimization Funds. However, the actual allocation of any PL Portfolio Optimization Fund will naturally vary from these targets as a result of market performance over time. The one-year performance for these broad-based indices is shown in the following table. The PL Underlying Funds’ performance listed is net of fund expenses.
Broad-Based Indices | One-Year Performance (as of 3-31-12) | |||
S&P 500 Index (U.S. Stocks) | 8.54 | % | ||
Morgan Stanley Capital International (MSCI) EAFE Index (International Stocks) | -5.77 | % | ||
Barclays U.S. Aggregate Bond Index (Fixed Income) | 7.71 | % | ||
BofA Merrill Lynch U.S. 3-Month T-Bill (Cash) | 0.06 | % | ||
It should be noted that the benchmark indices for the PL Underlying Funds may differ from the PL Portfolio Optimization Funds’ broad-based indices.
| A-4 | See benchmark definitions on page A-14 |
Table of Contents
PACIFIC LIFE FUNDS PERFORMANCE DISCUSSION (Continued)
The PL Portfolio Optimization Funds had investments in the following PL Underlying Funds, which were some of the primary contributors to performance relative to the indices. Not all of the PL Underlying Funds were represented in each of the models, and the allocation of each of the funds within the models did vary:
PL Underlying Funds | One-Year Performance (as of 3-31-12) | |||
PL Large-Cap Growth ‘P’ | 13.65 | % | ||
PL Main Street Core ‘P’ | 12.12 | % | ||
PL Inflation Managed ‘P’ | 11.11 | % | ||
PL Real Estate ‘P’ | 10.62 | % | ||
PL Large Cap Value ‘P’ | 8.21 | % | ||
The PL Portfolio Optimization Funds had investments in the following PL Underlying Funds, which were some of the primary detractors to performance relative to the indices. Not all of the PL Underlying Funds were represented in each of the models, and the allocation of each of the funds within the models did vary:
PL Underlying Funds | One-Year Performance (as of 3-31-12) | |||
PL Mid-Cap Equity ‘P’ | -1.17 | % | ||
PL Mid-Cap Growth ‘P’ | -1.08 | % | ||
PL Small-Cap Growth ‘P’ | -0.34 | % | ||
PL Small-Cap Value ‘P’ | 1.19 | % | ||
PL Short Duration Bond ‘P’ | 1.62 | % | ||
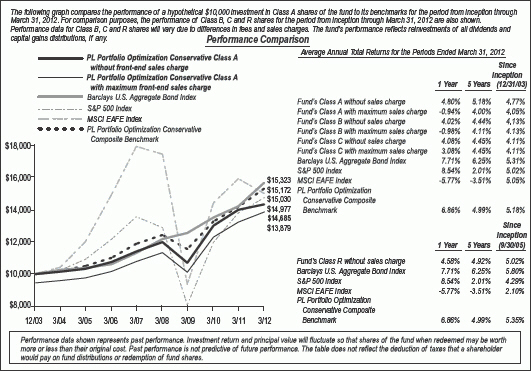
PL Portfolio Optimization Conservative Fund (managed by Pacific Life Fund Advisors LLC)
Q. How did the fund perform over the year ended March 31, 2012?
A. For the year ended March 31, 2012, the fund’s Class A returned 4.80%, compared to a 7.71% return for the Barclays U.S. Aggregate Bond Index, a 8.54% return for the S&P 500 Index, a -5.77% return for the MSCI EAFE Index, and a 6.86% return for the PL Portfolio Optimization Conservative Composite Benchmark.
| A-5 | See benchmark definitions on page A-14 |
Table of Contents
PACIFIC LIFE FUNDS PERFORMANCE DISCUSSION (Continued)
Q. Discuss both positive and negative factors that materially affected the fund’s performance during the year, including relevant market conditions, investment strategies and techniques, and particular sectors or securities.
A. The PL Portfolio Optimization Conservative Fund is primarily comprised of various fixed income funds with a small allocation to domestic and international equity funds. The allocation to fixed income funds includes exposure to intermediate-term bonds, short duration securities, inflation-protected bonds, and floating rate loans. The fund’s allocation to equity mainly encompasses domestic and foreign large-capitalization funds.
At the broad asset class level, the fund’s fixed income allocation collectively underperformed the Barclays U.S. Aggregate Bond Index. Additionally, the fund’s domestic equity allocation modestly lagged behind the S&P 500 Index. However, the international equity group slightly outpaced the MSCI EAFE Index.
Within the fund’s fixed income allocation, long-term U.S. Treasuries led the pace while credit sectors dealt with headwinds over this volatile reporting period. Allocation to riskier, fixed income categories such as the PL Floating Rate Loan Fund detracted from fund performance. The PL Managed Bond Fund, with its underexposure to long-term U.S. Treasuries, also dragged fund performance. The PL Short Duration Bond Fund’s subdued returns also hampered the fund’s relative performance. This was primarily a result of the Fed’s policy on maintaining the short-term rates near zero percent. On the other hand, the fund’s allocation to the PL Inflation Managed Fund helped its performance as concerns over inflation led investors to seek protection in inflation-linked securities.
Although the fund’s equity allocation consists of primarily large-capitalization strategies, exposure to the PL Mid-Cap Equity Fund hurt its performance. However, the allocation to the PL Large-Cap Growth and PL Main Street Core Funds helped offset some of the fund’s detractors. The PL International Large-Cap Fund was a solid contributor to relative fund performance within the international equity segment.
| A-6 | See benchmark definitions on page A-14 |
Table of Contents
PACIFIC LIFE FUNDS PERFORMANCE DISCUSSION (Continued)
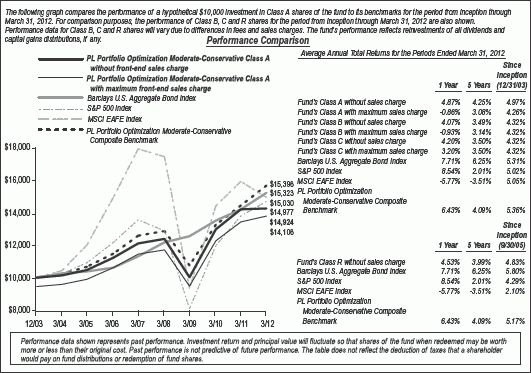
PL Portfolio Optimization Moderate-Conservative Fund (managed by Pacific Life Fund Advisors LLC)
Q. How did the fund perform over the year ended March 31, 2012?
A. For the year ended March 31, 2012, the fund’s Class A returned 4.87%, compared to a 7.71% return for the Barclays U.S. Aggregate Bond Index, a 8.54% return for the S&P 500 Index, a -5.77% return for the MSCI EAFE Index, and an 6.43% return for the PL Portfolio Optimization Moderate-Conservative Composite Benchmark.
Q. Discuss both positive and negative factors that materially affected the fund’s performance during the year, including relevant market conditions, investment strategies and techniques, and particular sectors or securities.
A. The PL Portfolio Optimization Moderate-Conservative Fund has a diversified allocation mix that is modestly overweight in fixed income funds with the remainder in several domestic and international equity funds. The allocation to fixed income funds includes exposure to intermediate-term bonds as well as short duration securities, inflation-protected bonds, and floating rate loans. The exposure to equity funds is diversified across style (growth/value), market capitalization and region (including an allocation to emerging market funds).
At the broad asset class level, the fund’s fixed income allocation collectively underperformed the Barclays U.S. Aggregate Bond Index. Additionally, while the fund’s allocation to domestic equity modestly lagged behind the S&P 500 Index, its exposure to international equity slightly outpaced the MSCI EAFE Index.
Within the fund’s fixed income allocation, long-term U.S. Treasuries led the pace while credit sectors dealt with headwinds over this volatile reporting period. Allocation to riskier, fixed income categories such as the PL Floating Rate Loan Fund detracted from fund performance. The PL Managed Bond Fund, with its underexposure to long-term U.S. Treasuries, also dragged fund performance. The PL Short Duration Bond Fund’s subdued returns also hampered the fund’s relative performance. This was primarily a result of the Fed’s policy on maintaining the short-term rates near zero percent. On the other hand, the fund’s allocation to the PL Inflation Managed Fund helped its performance as concerns over inflation led investors to seek protection in inflation-linked securities.
| A-7 | See benchmark definitions on page A-14 |
Table of Contents
PACIFIC LIFE FUNDS PERFORMANCE DISCUSSION (Continued)
Although the fund’s equity allocation consists of primarily large-capitalization strategies, exposure to smaller-capitalization holdings (e.g. PL Mid-Cap Equity, PL Mid-Cap Growth and PL Small-Cap Value Funds) hurt its performance. However, the allocation to the PL Large-Cap Growth and PL Main Street Core Funds helped offset some of the fund’s detractors. The PL International Large-Cap Fund was a solid contributor to the fund’s relative performance within the international equity allocation.
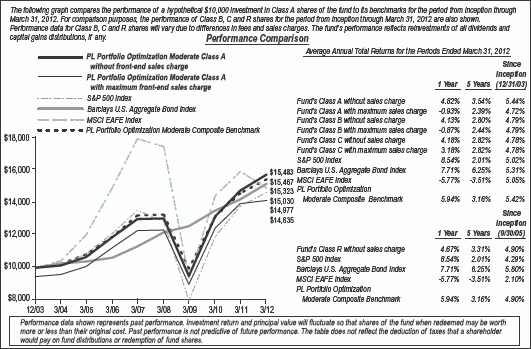
PL Portfolio Optimization Moderate Fund (managed by Pacific Life Fund Advisors LLC)
Q. How did the fund perform over the year ended March 31, 2012?
A. For the year ended March 31, 2012, the fund’s Class A returned 4.82%, compared to a 8.54% return for the S&P 500 Index, a 7.71% return for the Barclays U.S. Aggregate Bond Index, a -5.77% return for the MSCI EAFE Index, and a 5.94% return for the PL Portfolio Optimization Moderate Composite Benchmark.
Q. Discuss both positive and negative factors that materially affected the fund’s performance during the year, including relevant market conditions, investment strategies and techniques, and particular sectors or securities.
A. The PL Portfolio Optimization Moderate Fund has an allocation mix that is moderately overweight in domestic and international equity funds with the remainder in fixed income funds. The exposure to equity funds is diversified across style (growth/value), market capitalization and region (including allocations to emerging markets stocks). The allocation to fixed income funds includes exposure to intermediate-term bonds, short duration securities, inflation-protected bonds, and floating rate loans.
At the broad asset class level, the fund’s fixed income allocation collectively underperformed the Barclays U.S. Aggregate Bond Index. Additionally, while the fund’s allocation to domestic equity moderately lagged behind the S&P 500 Index, it’s exposure to international equities outpaced the MSCI EAFE Index.
Within the fund’s fixed income allocation, long-term U.S. Treasuries led the pace while credit sectors dealt with headwinds over this volatile reporting period. Allocation to riskier, fixed income categories such as the PL Floating Rate Loan Fund detracted from fund performance. The PL Managed Bond Fund, with its underexposure to long-term U.S. Treasuries, also hurt fund performance. The PL Short Duration Bond Fund’s subdued returns also hampered the fund’s relative performance. This was primarily a result of the Fed’s
| A-8 | See benchmark definitions on page A-14 |
Table of Contents
PACIFIC LIFE FUNDS PERFORMANCE DISCUSSION (Continued)
policy on maintaining the short-term rates near zero percent. On the other hand, the fund’s allocation to the PL Inflation Managed Fund helped its performance as concerns over inflation led investors to seek protection in inflation-linked securities.
Although the fund’s equity allocation consists of primarily large-capitalization strategies, the group’s exposure to smaller-capitalization holdings (e.g. PL Mid-Cap Equity, PL Mid-Cap Growth and PL Small-Cap Value Funds) hurt its performance. However, the allocation to the PL Large-Cap Growth and PL Main Street Core Funds helped offset some of the fund’s detractors. The PL International Large-Cap Fund was a solid contributor to the fund’s relative performance within the international equity allocation.
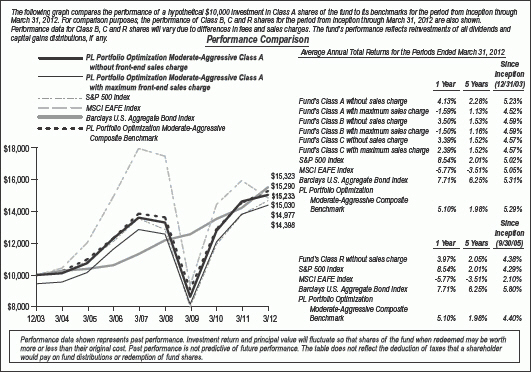
PL Portfolio Optimization Moderate-Aggressive Fund (managed by Pacific Life Fund Advisors LLC)
Q. How did the fund perform over the year ended March 31, 2012?
A. For the year ended March 31, 2012, the fund’s Class A returned 4.13%, compared to a 8.54% return for the S&P 500 Index, a -5.77% return for the MSCI EAFE Index, a 7.71% return for the Barclays U.S. Aggregate Bond Index, and a 5.10% return for the PL Portfolio Optimization Moderate-Aggressive Composite Benchmark.
Q. Discuss both positive and negative factors that materially affected the fund’s performance during the year, including relevant market conditions, investment strategies and techniques, and particular sectors or securities.
A. The PL Portfolio Optimization Moderate-Aggressive Fund has a diversified allocation mix that is overweight in domestic and international equity funds and has a moderate allocation to fixed income and sector funds. The exposure to equity funds is diversified across style (growth/value), market capitalization and region (which include allocations to emerging markets stocks).
At the broad asset class level, the fund’s domestic equity allocation lagged behind the S&P 500 Index. However, the international equity segment outpaced the MSCI EAFE Index. Additionally, the fund’s fixed income allocation modestly underperformed the Barclays U.S. Aggregate Bond Index.
| A-9 | See benchmark definitions on page A-14 |
Table of Contents
PACIFIC LIFE FUNDS PERFORMANCE DISCUSSION (Continued)
Although the fund’s allocation to equity consists of primarily large-capitalization strategies, exposure to smaller-capitalization holdings (e.g. PL Mid-Cap Equity, PL Mid-Cap Growth, PL Small-Cap Value and PL Small-Cap Growth Funds) hurt its performance. However, the allocation to the PL Large-Cap Growth and PL Main Street Core Funds helped offset some of the fund’s detractors. The PL International Large-Cap Fund was a solid contributor to the fund’s relative performance within the international equity allocation.
Within the fund’s fixed income allocation, long-term U.S. Treasuries led the pace while credit sectors dealt with headwinds over this volatile reporting period. The PL Managed Bond Fund, with its underexposure to long-term U.S. Treasuries, also hurt fund performance. The PL Short Duration Bond Fund’s subdued returns also hampered the fund’s relative performance. This was primarily a result of the Fed’s policy on maintaining the short-term rates near zero percent. On the other hand, the fund’s allocation to the PL Inflation Managed Fund helped its performance as concerns over inflation led investors to seek protection in inflation-linked securities.
PL Portfolio Optimization Aggressive Fund (managed by Pacific Life Fund Advisors LLC)
Q. How did the fund perform over the year ended March 31, 2012?
A. For the year ended March 31, 2012, the fund’s Class A returned 2.73%, compared to a 8.54% return for the S&P 500 Index, a -5.77% return for the MSCI EAFE Index, a 7.71% return for the Barclays U.S. Aggregate Bond Index, and a 4.30% return for the PL Portfolio Optimization Aggressive Composite Benchmark.
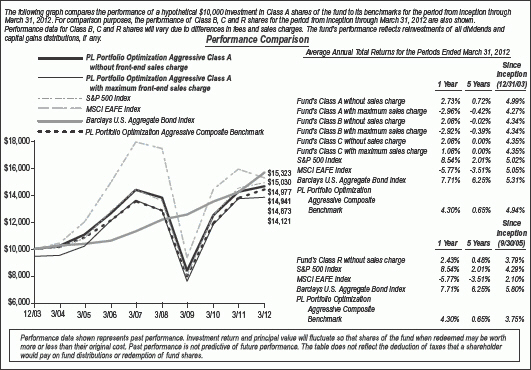
Q. Discuss both positive and negative factors that materially affected the fund’s performance during the year, including relevant market conditions, investment strategies and techniques, and particular sectors or securities.
A. The PL Portfolio Optimization Aggressive Fund allocates primarily to domestic and international equity funds that are diversified across style (growth/value), market capitalization and region (which include allocations to emerging markets stocks). The fund also has a small allocation to fixed income and sector funds.
| A-10 | See benchmark definitions on page A-14 |
Table of Contents
PACIFIC LIFE FUNDS PERFORMANCE DISCUSSION (Continued)
At the broad asset class level, the fund’s domestic equity allocation lagged behind the S&P 500 Index. However, the international equity allocation outpaced the MSCI EAFE Index. The fund’s fixed income allocation also modestly underperformed the Barclays U.S. Aggregate Bond Index.
Although the fund’s allocation to equity consists of primarily large-capitalization strategies, exposure to smaller-capitalization holdings (e.g. PL Mid-Cap Equity, PL Mid-Cap Growth, PL Small-Cap Value and PL Small-Cap Growth Funds) hurt its performance. However, the allocation to the PL Large-Cap Growth and PL Main Street Core Funds helped offset some of the fund’s detractors. The PL International Large-Cap Fund was a solid contributor to the fund’s relative performance within the international equity allocation.
Within the fund’s fixed income allocation, long-term U.S. Treasuries led the pace while credit sectors dealt with headwinds over this volatile reporting period. The PL Managed Bond Fund, with its underexposure to long-term U.S. Treasuries, detracted from fund performance.
PL Floating Rate Income Fund (managed by Pacific Asset Management)
Q. How did the fund perform over the period ended March 31, 2012?
A. This fund commenced operations on June 30, 2011. For the period from inception through March 31, 2012, the fund’s Class I returned 4.11%, compared to a 2.29% return for its benchmark, the Credit Suisse Leveraged Loan Index.
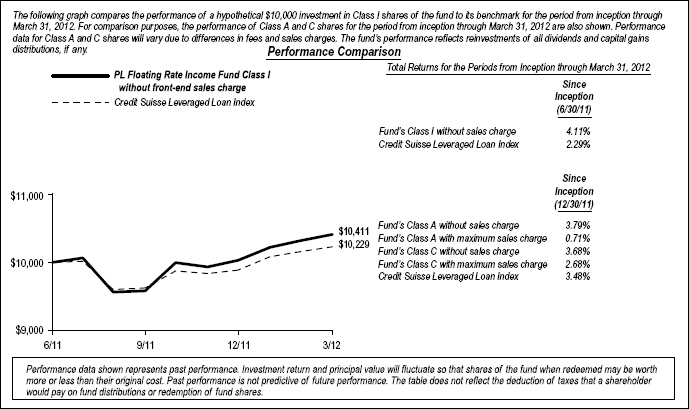
Q. Discuss both positive and negative factors that materially affected the fund’s performance during the period, including relevant market conditions, investment strategies and techniques, and particular sectors or securities.
A. The fund principally invests in income producing floating rate loans and floating rate debt securities. The fund seeks to outperform the benchmark through security selection and active management with an investment process focused on the larger-rated issuers within the loan universe.
For the reporting period, the fund outperformed the benchmark primarily through security selection and asset allocation. The fund’s overweight to higher quality loans versus the benchmark was a benefit to performance. The third and fourth fiscal quarters of 2011 saw high volatility, leading to underperformance of lower quality (rated CCC and below) securities, which detracted from fund performance. The causes for this high volatility were European sovereign risk, U.S. fiscal gridlock, and policy language by the Fed to keep interest rates low for many years. The fund’s tactical allocation to high yield bonds was a benefit to fund performance as the sector saw significant total returns in the last six months of the reporting period.
| A-11 | See benchmark definitions on page A-14 |
Table of Contents
PACIFIC LIFE FUNDS PERFORMANCE DISCUSSION (Continued)
PL Income Fund (managed by Pacific Asset Management)
Q. How did the fund perform over the year ended March 31, 2012?
A. For the year ended March 31, 2012, the fund’s Class A returned 7.79%, compared to a 7.71% return for its benchmark, the Barclays U.S. Aggregate Bond Index.
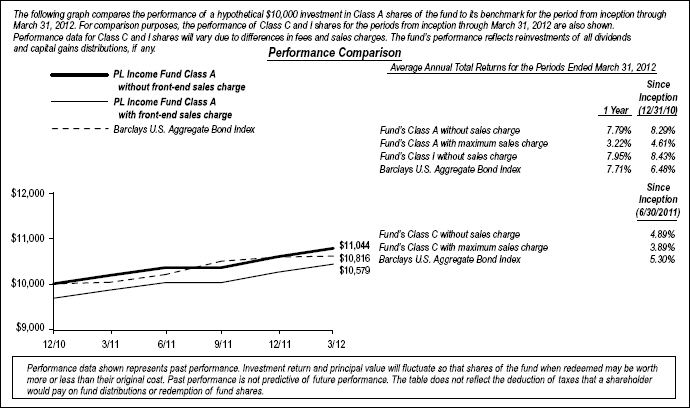
Q. Discuss both positive and negative factors that materially affected the fund’s performance during the year, including relevant market conditions, investment strategies and techniques, and particular sectors or securities.
A. The fund invests principally in income producing investment grade corporate debt instruments with the ability to invest up to 40% in non-investment grade debt instruments, including high yield bonds and floating rate senior loans. As a result, we at Pacific Asset Management expect the fund to be structurally overweight corporate securities and generally underweight government securities such as U.S. Treasuries, agencies, and MBS relative to the benchmark. The fund’s permitted duration range is plus/minus two years to that of the benchmark.
For the reporting period, the fund outperformed the benchmark. The fund’s sector allocation was the most significant contributor to the fund’s relative return. Investment grade corporate bonds returned solid results, benefiting the fund’s performance as a combination of improving corporate fundamentals, high income levels, and investor demand supported valuations. While volatile on a quarter-by-quarter basis, the fund’s structural overweight to corporate debt securities was a benefit to shareholders with, on average, two-thirds of the fund positioned in corporate bonds. Within the non-investment grade sectors, the fund’s allocation to high yield and floating rate loans was mixed regarding relative performance. The fund held, on average, a 30% weighting to non-investment grade securities, high yield bonds, and floating rate loans. The allocation to high yield bonds (rated BB and B) was neutral to performance while the overweight to floating rate loans was negative. The Fed’s announcement to keep interest rates low for many years, coupled with higher volatility, negatively impacted relative returns of floating rate loans.
The fund’s underweight to euro-area financials and banks was a benefit to its performance while the underweight to supranational(s)2 was a negative. Duration was slightly below benchmark, primarily through an underweight to longer maturity government securities—this was neutral on fund performance.
| 2 | Supranational(s) is a term used to describe an international organization, or union, whereby member states transcend national boundaries or interests to share in the decision-making and vote on issues pertaining to the wider grouping. (Source: Investopedia.com.) |
| A-12 | See benchmark definitions on page A-14 |
Table of Contents
PACIFIC LIFE FUNDS PERFORMANCE DISCUSSION (Continued)
PL Money Market Fund (managed by Pacific Asset Management)
Q. How did the fund perform over the year ended March 31, 2012?
A. For the year ended March 31, 2012, the fund’s Class A returned 0.00%, compared to a 0.06% return for the BofA Merrill Lynch U.S. 3-Month T-bill Index. The current yield measured during the seven-day period ended March 31, 2012 was 0.00%.
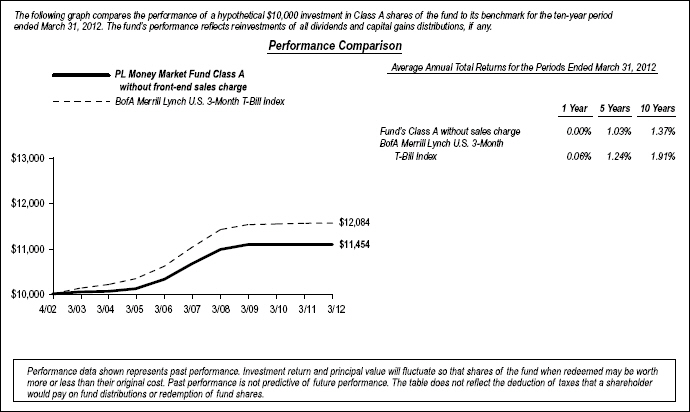
Q. Discuss both positive and negative factors that materially affected the fund’s performance during the year, including relevant market conditions, investment strategies and techniques, and particular sectors or securities.
A. Global macro uncertainty diminished in the first quarter of 2012 through a reduction in European sovereign risk and an improvement in the U.S. economy. However, liquidity and solvency concerns in European government bonds (sovereign debt) remain, leading central banks around the world to remain highly accommodative. The Federal Open Market Committee (FOMC) took an additional accommodative step to extend its policy language, indicating its expectation for “exceptionally low levels for the Fed Funds rate at least through late-2014”.
The low Fed Funds rate and newly established timeline provided by the FOMC has suppressed U.S. Treasury rates across the entire front end of the yield curve. These factors limited the absolute return performance profile for the fund during the reporting period. Based on our expectation for rates to remain low for the foreseeable future, we at Pacific Asset Management expect to look for opportunities to extend the fund’s average maturity if the yield curve creates sufficient yield pick-up opportunities. Pacific Asset Management manages the fund with a focus on stability, liquidity and current income through a consistent, disciplined investment approach.
| A-13 | See benchmark definitions on page A-14 |
Table of Contents
PACIFIC LIFE FUNDS PERFORMANCE DISCUSSION (Continued)
Benchmark Definitions
Barclays U.S. Aggregate Bond Index covers the U.S. dollar-denominated, investment-grade, fixed-rate, taxable bond market of SEC-registered securities. The index includes bonds from the Treasury, government-related, corporate, mortgage-backed securities, asset-backed securities, and corporate mortgage-backed securities sectors. The total return is equal to the change in price plus the coupon return.
BofA Merrill Lynch U.S. 3-Month Treasury Bill (T-Bill) Index is an index comprised of a single Treasury bill issue purchased at the beginning of the month and held for a full month, then sold and rolled into a newly selected Treasury bill issue. Results include the reinvestment of all distributions.
Credit Suisse Leveraged Loan Index is an index of U.S. dollar-denominated leveraged loan market securities. The total return is equal to the change in price plus the coupon return.
Morgan Stanley Capital International (MSCI) Europe, Australasia and Far East (EAFE) Index is an index of stocks from 21 countries/regions in Europe, Australia, New Zealand and Asia. Results include reinvested dividends after deducting withholding taxes.
PL Portfolio Optimization Conservative Composite Benchmark is 15% S&P 500; 73% Barclays U.S. Aggregate Bond; 5% MSCI EAFE (Net), and 7% BofA Merrill Lynch U.S. 3-Month Treasury Bill Indices as of March 31, 2012.
PL Portfolio Optimization Moderate-Conservative Composite Benchmark is 29% S&P 500; 55% Barclays U.S. Aggregate Bond; 11% MSCI EAFE (Net), and 5% BofA Merrill Lynch U.S. 3-Month Treasury Bill Indices as of March 31, 2012.
PL Portfolio Optimization Moderate Composite Benchmark is 43% S&P 500; 38% Barclays U.S. Aggregate Bond; 17% MSCI EAFE (Net), and 2% BofA Merrill Lynch U.S. 3-Month Treasury Bill Indices as of March 31, 2012.
PL Portfolio Optimization Moderate-Aggressive Composite Benchmark is 56% S&P 500; 20% Barclays U.S. Aggregate Bond; and 24% MSCI EAFE (Net) Indices as of March 31, 2012.
PL Portfolio Optimization Aggressive Composite Benchmark is 66% S&P 500; 5% Barclays U.S. Aggregate Bond; and 29% MSCI EAFE (Net) Indices as of March 31, 2012.
S&P 500 Index is an index of the stocks of approximately 500 large-capitalization companies traded in U.S. stock markets. Results include reinvested dividends.
| A-14 |
Table of Contents
PL PORTFOLIO OPTIMIZATION CONSERVATIVE FUND Schedule of Investments March 31, 2012 | PACIFIC LIFE FUNDS PL PORTFOLIO OPTIMIZATION MODERATE-CONSERVATIVE FUND Schedule of Investments March 31, 2012 |
| Shares | Value | |||||||
AFFILIATED MUTUAL FUNDS - 99.8% |
| |||||||
PL Floating Rate Loan | 3,475,442 | $ | 35,101,966 | |||||
PL Inflation Managed | 6,320,595 | 68,199,217 | ||||||
PL Managed Bond | 13,360,936 | 145,233,374 | ||||||
PL Short Duration Bond | 5,289,153 | 53,261,770 | ||||||
PL Comstock Fund ‘P’ | 1,267,828 | 15,809,818 | ||||||
PL Large-Cap Growth | 807,350 | 8,315,703 | ||||||
PL Large-Cap Value Fund ‘P’ | 1,594,683 | 19,630,552 | ||||||
PL Main Street Core Fund ‘P’ | 691,523 | 7,786,550 | ||||||
PL Mid-Cap Equity Fund ‘P’ | 1,136,941 | 11,699,118 | ||||||
PL International Large- | 776,407 | 11,739,271 | ||||||
PL International Value | 884,082 | 7,620,789 | ||||||
|
| |||||||
Total Affiliated Mutual Funds | ||||||||
(Cost $357,576,937) | 384,398,128 | |||||||
|
| |||||||
TOTAL INVESTMENTS - 99.8% |
| |||||||
(Cost $357,576,937) |
| 384,398,128 | ||||||
OTHER ASSETS & LIABILITIES, |
| 906,261 | ||||||
|
| |||||||
NET ASSETS - 100.0% |
| $ | 385,304,389 | |||||
|
| |||||||
Notes to Schedule of Investments |
| |||||||
(a) As of March 31, 2012, the fund was diversified as a percentage of net assets as follows:
|
| |||||||
Affiliated Fixed Income Funds | 78.3 | % | ||||||
Affiliated Equity Funds | 21.5 | % | ||||||
|
| |||||||
| 99.8 | % | |||||||
Other Assets & Liabilities, Net | 0.2 | % | ||||||
|
| |||||||
| 100.0 | % | |||||||
|
| |||||||
| Shares | Value | |||||||
AFFILIATED MUTUAL FUNDS - 99.8% |
| |||||||
PL Floating Rate Loan | 2,586,417 | $ | 26,122,815 | |||||
PL Inflation Managed | 4,762,625 | 51,388,726 | ||||||
PL Managed Bond | 9,561,150 | 103,929,699 | ||||||
PL Short Duration Bond | 3,682,961 | 37,087,423 | ||||||
PL Comstock Fund ‘P’ | 1,839,410 | 22,937,445 | ||||||
PL Growth LT Fund ‘P’ | 622,123 | 8,162,251 | ||||||
PL Large-Cap Growth | 1,621,742 | 16,703,941 | ||||||
PL Large-Cap Value Fund ‘P’ | 2,509,087 | 30,886,858 | ||||||
PL Main Street Core Fund ‘P’ | 1,719,790 | 19,364,841 | ||||||
PL Mid-Cap Equity | 1,489,447 | 15,326,405 | ||||||
PL Mid-Cap Growth Fund ‘P’ | 955,550 | 8,475,728 | ||||||
PL Small-Cap Value Fund ‘P’ | 352,564 | 3,730,125 | ||||||
PL Emerging Markets Fund ‘P’ | 301,701 | 4,088,047 | ||||||
PL International Large-Cap Fund ‘P’ | 1,330,728 | 20,120,603 | ||||||
PL International Value Fund ‘P’ | 1,362,288 | 11,742,921 | ||||||
|
| |||||||
Total Affiliated Mutual Funds | ||||||||
(Cost $344,258,461) |
| 380,067,828 | ||||||
|
| |||||||
TOTAL INVESTMENTS - 99.8% |
| |||||||
(Cost $344,258,461) |
| 380,067,828 | ||||||
OTHER ASSETS & LIABILITIES, |
| 604,897 | ||||||
|
| |||||||
NET ASSETS - 100.0% |
| $ | 380,672,725 | |||||
|
| |||||||
Notes to Schedule of Investments |
| |||||||
(a) As of March 31, 2012, the fund was diversified as a percentage of net assets as follows: |
| |||||||
Affiliated Fixed Income Funds | 57.4 | % | ||||||
Affiliated Equity Funds | 42.4 | % | ||||||
|
| |||||||
| 99.8 | % | |||||||
Other Assets & Liabilities, Net | 0.2 | % | ||||||
|
| |||||||
| 100.0 | % | |||||||
|
| |||||||
| (b) | Fair Value Measurements |
The following is a summary of the funds’ investments as categorized under the three-tier hierarchy of inputs used in valuing the funds’ assets and liabilities (See Note 3C in Notes to Financial Statements) as of March 31, 2012:
| Total Value at March 31, 2012 | Level 1 Quoted Price | Level 2 Significant Observable Inputs | Level 3 Significant Unobservable Inputs | |||||||||||||||
PL Portfolio Optimization Conservative Fund |
| |||||||||||||||||
Assets | Affiliated Mutual Funds | $ | 384,398,128 | $ | 384,398,128 | $ | — | $ | — | |||||||||
|
|
|
|
|
|
|
| |||||||||||
PL Portfolio Optimization Moderate-Conservative Fund |
| |||||||||||||||||
Assets | Affiliated Mutual Funds | $ | 380,067,828 | $ | 380,067,828 | $ | — | $ | — | |||||||||
|
|
|
|
|
|
|
| |||||||||||
| See Notes to Financial Statements | B-1 | See explanation of symbols and terms, if any, on page B-12 |
Table of Contents
PACIFIC LIFE FUNDS PL PORTFOLIO OPTIMIZATION MODERATE FUND Schedule of Investments March 31, 2012 | PACIFIC LIFE FUNDS PL PORTFOLIO OPTIMIZATION MODERATE-AGGRESSIVE FUND Schedule of Investments March 31, 2012 |
| Shares | Value | |||||||
AFFILIATED MUTUAL FUNDS - 99.9% |
| |||||||
PL Floating Rate Loan | 5,037,837 | $ | 50,882,158 | |||||
PL Inflation Managed | 10,289,313 | 111,021,687 | ||||||
PL Managed Bond | 15,886,061 | 172,681,481 | ||||||
PL Short Duration Bond Fund ‘P’ | 5,018,504 | 50,536,332 | ||||||
PL Comstock Fund ‘P’ | 6,489,719 | 80,926,793 | ||||||
PL Growth LT Fund ‘P’ | 3,110,046 | 40,803,800 | ||||||
PL Large-Cap Growth Fund ‘P’ | 5,213,196 | 53,695,918 | ||||||
PL Large-Cap Value Fund ‘P’ | 8,318,102 | 102,395,841 | ||||||
PL Main Street Core Fund ‘P’ | 6,435,707 | 72,466,065 | ||||||
PL Mid-Cap Equity Fund ‘P’ | 5,941,294 | 61,135,915 | ||||||
PL Mid-Cap Growth Fund ‘P’ | 2,393,288 | 21,228,466 | ||||||
PL Small-Cap Growth Fund ‘P’ * | 858,471 | 10,181,466 | ||||||
PL Small-Cap Value Fund ‘P’ | 2,858,038 | 30,238,045 | ||||||
PL Real Estate Fund ‘P’ | 1,604,724 | 20,203,471 | ||||||
PL Emerging Markets Fund ‘P’ | 2,300,606 | 31,173,205 | ||||||
PL International Large- | 5,454,144 | 82,466,664 | ||||||
PL International Value Fund ‘P’ | 3,497,038 | 30,144,471 | ||||||
|
| |||||||
Total Affiliated Mutual Funds |
| |||||||
(Cost $909,777,480) |
| 1,022,181,778 | ||||||
|
| |||||||
TOTAL INVESTMENTS - 99.9% |
| |||||||
(Cost $909,777,480) |
| 1,022,181,778 | ||||||
OTHER ASSETS & LIABILITIES, NET - 0.1% |
| 1,350,623 | ||||||
|
| |||||||
NET ASSETS - 100.0% |
| $ | 1,023,532,401 | |||||
|
| |||||||
| Notes to Schedule of Investments | ||||||||
(a) As of March 31, 2012, the fund was diversified as a percentage of net assets as follows: |
| |||||||
Affiliated Equity Funds | 62.3 | % | ||||||
Affiliated Fixed Income Funds | 37.6 | % | ||||||
|
| |||||||
| 99.9 | % | |||||||
Other Assets & Liabilities, Net | 0.1 | % | ||||||
|
| |||||||
| 100.0 | % | |||||||
|
| |||||||
| Shares | Value | |||||||
AFFILIATED MUTUAL FUNDS - 100.0% |
| |||||||
PL Inflation Managed | 5,309,772 | $ | 57,292,440 | |||||
PL Managed Bond | 5,305,501 | 57,670,797 | ||||||
PL Short Duration Bond | 1,439,323 | 14,493,982 | ||||||
PL Comstock Fund ‘P’ | 5,297,478 | 66,059,556 | ||||||
PL Growth LT Fund ‘P’ | 3,423,460 | 44,915,791 | ||||||
PL Large-Cap Growth | 3,722,511 | 38,341,867 | ||||||
PL Large-Cap Value | 6,612,673 | 81,402,000 | ||||||
PL Main Street Core | 5,965,476 | 67,171,262 | ||||||
PL Mid-Cap Equity | 5,627,241 | 57,904,304 | ||||||
PL Mid-Cap Growth | 3,328,754 | 29,526,051 | ||||||
PL Small-Cap Growth | 1,217,764 | 14,442,682 | ||||||
PL Small-Cap Value | 3,382,690 | 35,788,864 | ||||||
PL Real Estate Fund ‘P’ | 1,802,603 | 22,694,774 | ||||||
PL Emerging Markets | 2,690,289 | 36,453,408 | ||||||
PL International Large-Cap | 4,369,466 | 66,066,327 | ||||||
PL International Value Fund ‘P’ | 4,974,411 | 42,879,424 | ||||||
|
| |||||||
Total Affiliated Mutual Funds | ||||||||
(Cost $639,858,783) | 733,103,529 | |||||||
|
| |||||||
TOTAL INVESTMENTS - 100.0% |
| |||||||
(Cost $639,858,783) |
| 733,103,529 | ||||||
OTHER ASSETS & LIABILITIES, |
| 82,997 | ||||||
|
| |||||||
NET ASSETS - 100.0% |
| $ | 733,186,526 | |||||
|
| |||||||
| Notes to Schedule of Investments | ||||||||
(a) As of March 31, 2012, the fund was diversified as a percentage of net assets as follows: |
| |||||||
Affiliated Equity Funds | 82.3 | % | ||||||
Affiliated Fixed Income Funds | 17.7 | % | ||||||
|
| |||||||
| 100.0 | % | |||||||
Other Assets & Liabilities, Net | 0.0 | % | ||||||
|
| |||||||
| 100.0 | % | |||||||
|
| |||||||
| (b) | Fair Value Measurements |
The following is a summary of the funds’ investments as categorized under the three-tier hierarchy of inputs used in valuing the funds’ assets and liabilities (See Note 3C in Notes to Financial Statements) as of March 31, 2012:
| Total Value at March 31, 2012 | Level 1 Quoted Price | Level 2 Significant Observable Inputs | Level 3 Significant Unobservable Inputs | |||||||||||||||
PL Portfolio Optimization Moderate Fund |
| |||||||||||||||||
Assets | Affiliated Mutual Funds | $ | 1,022,181,778 | $ | 1,022,181,778 | $ | — | $ | — | |||||||||
|
|
|
|
|
|
|
| |||||||||||
PL Portfolio Optimization Moderate-Aggressive Fund |
| |||||||||||||||||
Assets | Affiliated Mutual Funds | $ | 733,103,529 | $ | 733,103,529 | $ | — | $ | — | |||||||||
|
|
|
|
|
|
|
| |||||||||||
| See Notes to Financial Statements | B-2 | See explanation of symbols and terms, if any, on page B-12 |
Table of Contents
PACIFIC LIFE FUNDS
PL PORTFOLIO OPTIMIZATION AGGRESSIVE FUND
Schedule of Investments
March 31, 2012
| Shares | Value | |||||||
AFFILIATED MUTUAL FUNDS - 100.1% |
| |||||||
PL Managed Bond Fund ‘P’ | 645,201 | $ | 7,013,338 | |||||
PL Comstock Fund ‘P’ | 1,731,129 | 21,587,180 | ||||||
PL Growth LT Fund ‘P’ | 1,102,592 | 14,466,008 | ||||||
PL Large-Cap Growth Fund ‘P’ | 1,181,931 | 12,173,884 | ||||||
PL Large-Cap Value Fund ‘P’ | 2,329,930 | 28,681,436 | ||||||
PL Main Street Core Fund ‘P’ | 2,369,634 | 26,682,081 | ||||||
PL Mid-Cap Equity Fund ‘P’ | 1,849,882 | 19,035,285 | ||||||
PL Mid-Cap Growth Fund ‘P’ | 1,616,523 | 14,338,560 | ||||||
PL Small-Cap Growth Fund ‘P’ * | 989,527 | 11,735,785 | ||||||
PL Small-Cap Value Fund ‘P’ | 1,550,145 | 16,400,533 | ||||||
PL Real Estate Fund ‘P’ | 776,215 | 9,772,549 | ||||||
PL Emerging Markets Fund ‘P’ | 1,015,476 | 13,759,699 | ||||||
PL International Large-Cap | 1,555,373 | 23,517,244 | ||||||
PL International Value Fund ‘P’ | 2,174,223 | 18,741,800 | ||||||
|
| |||||||
Total Affiliated Mutual Funds |
| |||||||
(Cost $194,404,815) | 237,905,382 | |||||||
|
| |||||||
TOTAL INVESTMENTS - 100.1% |
| |||||||
(Cost $194,404,815) |
| 237,905,382 | ||||||
OTHER ASSETS & LIABILITIES, |
| (264,257 | ) | |||||
|
| |||||||
NET ASSETS - 100.0% |
| $ | 237,641,125 | |||||
|
| |||||||
Notes to Schedule of Investments |
| |||||||
(a) As of March 31, 2012, the fund was diversified as a percentage of net assets as follows: |
| |||||||
Affiliated Equity Funds | 97.1 | % | ||||||
Affiliated Fixed Income Funds | 3.0 | % | ||||||
|
| |||||||
| 100.1 | % | |||||||
Other Assets & Liabilities, Net | (0.1 | %) | ||||||
|
| |||||||
| 100.0 | % | |||||||
|
| |||||||
| (b) | Fair Value Measurements |
The following is a summary of the fund’s investments as categorized under the three-tier hierarchy of inputs used in valuing the fund’s assets and liabilities (See Note 3C in Notes to Financial Statements) as of March 31, 2012:
| Total Value at March 31, 2012 | Level 1 Quoted Price | Level 2 Significant Observable Inputs | Level 3 Significant Unobservable Inputs | |||||||||||||||
Assets | Affiliated Mutual Funds | $ | 237,905,382 | $ | 237,905,382 | $ | — | $ | — | |||||||||
| See Notes to Financial Statements | B-3 | See explanation of symbols and terms, if any, on page B-12 |
Table of Contents
PACIFIC LIFE FUNDS
PL FLOATING RATE INCOME FUND
Schedule of Investments
March 31, 2012
| Principal Amount | Value | |||||||
CORPORATE BONDS & NOTES - 7.6% |
| |||||||
Consumer Discretionary - 2.4% | ||||||||
CityCenter Holdings LLC | ||||||||
7.625% due 01/15/16 ~ | $ | 250,000 | $ | 264,375 | ||||
CKE Restaurants Inc | ||||||||
11.375% due 07/15/18 | 500,000 | 573,750 | ||||||
Dana Holding Corp | ||||||||
6.750% due 02/15/21 | 250,000 | 267,500 | ||||||
NPC International Inc | ||||||||
10.500% due 01/15/20 ~ | 150,000 | 164,250 | ||||||
ServiceMaster Co | ||||||||
8.000% due 02/15/20 ~ | 100,000 | 107,000 | ||||||
|
| |||||||
| 1,376,875 | ||||||||
|
| |||||||
Consumer Staples - 0.9% | ||||||||
Reynolds Group Issuer Inc | ||||||||
9.875% due 08/15/19 ~ | 500,000 | 511,875 | ||||||
|
| |||||||
Energy - 0.6% | ||||||||
Arch Coal Inc | ||||||||
7.000% due 06/15/19 ~ | 250,000 | 231,875 | ||||||
Holly Energy Partners LP | ||||||||
6.500% due 03/01/20 ~ | 100,000 | 101,750 | ||||||
|
| |||||||
| 333,625 | ||||||||
|
| |||||||
Financials - 0.2% | ||||||||
Neuberger Berman Group LLC | ||||||||
5.875% due 03/15/22 ~ | 100,000 | 101,500 | ||||||
|
| |||||||
Industrials - 1.3% | ||||||||
Monitronics International Inc | ||||||||
9.125% due 04/01/20 ~ | 250,000 | 254,374 | ||||||
U.S. Airways 2011-1 Pass-Through Trust ‘A’ | ||||||||
7.125% due 04/22/25 | 250,000 | 262,500 | ||||||
UR Financing Escrow Corp | ||||||||
7.375% due 05/15/20 ~ | 150,000 | 153,750 | ||||||
7.625% due 04/15/22 ~ | 100,000 | 103,000 | ||||||
|
| |||||||
| 773,624 | ||||||||
|
| |||||||
Materials - 0.3% | ||||||||
Hexion U.S. Finance Corp | ||||||||
6.625% due 04/15/20 ~ | 150,000 | 154,125 | ||||||
|
| |||||||
Telecommunication Services - 1.9% |
| |||||||
Hughes Satellite Systems Corp | ||||||||
7.625% due 06/15/21 | 250,000 | 269,375 | ||||||
Intelsat Luxembourg SA (Luxembourg) | ||||||||
11.500% due 02/04/17 | 500,000 | 521,250 | ||||||
UPCB Finance VI Ltd (Cayman) | ||||||||
6.875% due 01/15/22 ~ | 300,000 | 311,250 | ||||||
|
| |||||||
| 1,101,875 | ||||||||
|
| |||||||
Total Corporate Bonds & Notes | ||||||||
(Cost $4,271,753) | 4,353,499 | |||||||
|
| |||||||
| Principal Amount | Value | |||||||
SENIOR LOAN NOTES - 92.1% |
| |||||||
Consumer Discretionary - 22.1% |
| |||||||
99 Cents Only Stores | ||||||||
7.750% due 01/11/19 § | $ | 498,750 | $ | 508,881 | ||||
Bresnan Broadband Holdings LLC Term B | ||||||||
4.500% due 12/14/17 § | 496,231 | 496,334 | ||||||
Burger King Corp Tranche B | ||||||||
4.500% due 10/19/16 § | 469,755 | 469,731 | ||||||
Caesars Entertainment Operating Co Inc Term B-6 | ||||||||
5.492% due 01/28/18 § | 446,625 | 404,056 | ||||||
Capital Automotive LP Tranche B | ||||||||
5.250% due 03/11/17 § | 493,242 | 489,132 | ||||||
Cequel Communications LLC | ||||||||
4.000% due 02/14/19 § | 1,000,000 | 992,188 | ||||||
Chrysler Group LLC Term B | ||||||||
6.000% due 05/25/17 § | 495,006 | 503,707 | ||||||
Clear Channel Communications Inc Tranche B | ||||||||
3.891% due 01/29/16 § | 984,266 | 800,577 | ||||||
ClubCorp Club Operations Inc Term B | ||||||||
6.000% due 11/30/16 § | 746,222 | 750,885 | ||||||
Focus Brands Inc | ||||||||
(1st Lien) | ||||||||
6.263% due 02/21/18 § | 493,033 | 495,498 | ||||||
(2nd Lien) | ||||||||
10.250% due 08/21/18 § | 500,000 | 497,500 | ||||||
Interactive Data Corp Term B | ||||||||
4.500% due 02/11/18 § | 495,000 | 496,340 | ||||||
Jo-Ann Stores Inc | ||||||||
4.750% due 03/16/18 § | 485,951 | 483,764 | ||||||
Lonestar Intermediate Super Holdings LLC | ||||||||
11.000% due 09/02/19 § | 250,000 | 254,063 | ||||||
Lord & Taylor Holdings LLC | ||||||||
5.750% due 01/11/19 § | 500,000 | 503,542 | ||||||
MCC Iowa LLC Tranche F | ||||||||
4.500% due 10/23/17 § | 494,962 | 494,653 | ||||||
MGM Resorts International Term C (Extended) | ||||||||
6.000% due 02/23/15 § | 1,000,000 | 1,003,329 | ||||||
NPC International Inc | ||||||||
5.250% due 12/28/18 § | 500,000 | 501,875 | ||||||
Petco Animal Supplies Inc Term B (1st Lien) | ||||||||
4.500% due 11/30/17 § | 494,950 | 494,896 | ||||||
The Neiman Marcus Group Inc | ||||||||
4.750% due 05/16/18 § | 500,000 | 499,688 | ||||||
The Yankee Candle Company Inc (Initial Term Loan) due 03/02/19 ¥ | 500,000 | 502,604 | ||||||
TI Group Automotive Systems LLC | ||||||||
6.750% due 03/14/18 § | 500,000 | 503,437 | ||||||
Wendy’s/Arby’s Restaurants LLC | ||||||||
5.000% due 05/24/17 § | 496,212 | 498,693 | ||||||
|
| |||||||
| 12,645,373 | ||||||||
|
| |||||||
Consumer Staples - 13.5% | ||||||||
B&G Foods Inc Tranche B | ||||||||
4.500% due 11/30/18 § | 498,750 | 501,867 | ||||||
BJ’s Wholesale Club LLC (Replacement 1st Lien) | ||||||||
5.250% due 09/28/18 § | 498,750 | 501,867 | ||||||
Del Monte Foods Co (Initial Term Loan) | ||||||||
4.500% due 03/08/18 § | 744,375 | 743,445 | ||||||
Pinnacle Foods Finance LLC Term E due 09/16/18 ¥ | 500,000 | 502,188 | ||||||
Prestige Brands International Inc Term B | ||||||||
5.297% due 01/31/19 § | 481,061 | 484,819 | ||||||
Revlon Consumer Products Corp Term B | ||||||||
4.750% due 11/19/17 § | 997,487 | 998,592 | ||||||
| See Notes to Financial Statements | B-4 | See explanation of symbols and terms, if any, on page B-12 |
Table of Contents
PACIFIC LIFE FUNDS
PL FLOATING RATE INCOME FUND
Schedule of Investments (Continued)
March 31, 2012
| Principal Amount | Value | |||||||
Reynolds Group Holdings Inc |
| |||||||
6.486% due 08/09/18 § | $ | 984,295 | $ | 998,008 | ||||
Rite Aid Corp Tranche 5 | ||||||||
4.500% due 03/03/18 § | 500,000 | 495,156 | ||||||
Roundy’s Supermarket Inc |
| |||||||
5.750% due 02/13/19 § | 1,000,000 | 1,007,500 | ||||||
Sprouts Farmers Markets Holdings LLC (Initial Term) | ||||||||
6.000% due 04/18/18 § | 497,487 | 491,580 | ||||||
U.S. Foodservice Inc | ||||||||
5.750% due 03/31/17 § | 990,000 | 987,772 | ||||||
|
| |||||||
| 7,712,794 | ||||||||
|
| |||||||
Energy - 0.9% |
| |||||||
CCS Inc Term A | ||||||||
6.500% due 11/14/14 § | 498,750 | 501,244 | ||||||
|
| |||||||
Financials - 5.6% |
| |||||||
First Data Corp | ||||||||
4.242% due 03/23/18 § | 1,000,000 | 913,750 | ||||||
Nuveen Investments Inc | ||||||||
(Extended 1st Lien) | ||||||||
5.754% due 05/13/17 § | 500,000 | 500,156 | ||||||
(2nd Lien) | ||||||||
8.250% due 02/28/19 § | 1,000,000 | 1,020,000 | ||||||
Realogy Corp (Extended) | 695,319 | 648,095 | ||||||
(Synthetic Commitment) due 10/10/16 ¥ | 54,681 | 50,968 | ||||||
3.242% due 10/10/13 § | 70,178 | 66,787 | ||||||
|
| |||||||
| 3,199,756 | ||||||||
|
| |||||||
Health Care - 10.5% |
| |||||||
Alere Inc Term B-2 due 06/30/17 ¥ | 500,000 | 498,750 | ||||||
Capsugel (Initial Term Loan) | ||||||||
5.250% due 07/30/18 § | 989,565 | 999,152 | ||||||
Catalent Pharma Solutions Inc Term-2 |
| |||||||
5.250% due 09/15/17 § | 498,750 | 498,750 | ||||||
DJO Finance LLC Tranche B-3 | ||||||||
6.250% due 09/15/17 § | 500,000 | 499,271 | ||||||
Emdeon Business Services LLC Term B | ||||||||
6.750% due 11/02/18 § | 498,750 | 506,668 | ||||||
Emergency Medical Services Corp (Initial Term Loan) | ||||||||
5.250% due 05/25/18 § | 495,000 | 496,114 | ||||||
Grifols Inc Tranche B | ||||||||
4.500% due 11/02/16 § | 498,382 | 498,538 | ||||||
Health Management Associates Inc Term B | ||||||||
4.500% due 11/16/18 § | 498,750 | 495,583 | ||||||
IASIS Healthcare LLC Term B | ||||||||
5.000% due 05/03/18 § | 496,241 | 497,326 | ||||||
Pharmaceutical Product Development Inc | ||||||||
6.250% due 12/05/18 § | 498,750 | 505,348 | ||||||
Quinteles Transnational Holdings Inc | ||||||||
7.500% due 02/24/17 § | 500,000 | 502,500 | ||||||
|
| |||||||
| 5,998,000 | ||||||||
|
| |||||||
Industrials - 12.9% |
| |||||||
AWAS Finance Luxembourg SARL Term B | ||||||||
5.250% due 06/10/16 § | 936,170 | 942,021 | ||||||
Ceridian Corp | ||||||||
3.241% due 11/09/14 § | 493,590 | 463,460 | ||||||
Colfax Corp Term B Facility | ||||||||
4.500% due 01/11/19 § | 498,750 | 499,999 | ||||||
| Principal Amount | Value | |||||||
Delta Air Lines Inc | ||||||||
5.500% due 04/20/17 § | $ | 496,250 | $ | 495,630 | ||||
Flying Fortress Inc Term B | ||||||||
5.000% due 02/10/17 § | 1,000,000 | 1,008,750 | ||||||
Hupah Finance Inc (Initial |
| |||||||
6.250% due 01/19/19 § | 500,000 | 504,063 | ||||||
John Maneely Co | ||||||||
4.750% due 04/01/17 § | 498,742 | 499,989 | ||||||
Monitronics International Inc | ||||||||
5.500% due 03/23/18 § | 500,000 | 501,042 | ||||||
Protection One Alarm Monitoring Inc (Initial Term Loan) | ||||||||
5.750% due 03/21/19 § | 500,000 | 497,813 | ||||||
Rexnord LLC Term B | ||||||||
5.000% due 04/01/18 § | 500,000 | 500,734 | ||||||
Ship Luxco 3 SARL (Facility B2A) | ||||||||
5.250% due 11/30/17 § | 500,000 | 499,140 | ||||||
Terex Corp | ||||||||
5.500% due 04/28/17 § | 497,500 | 502,631 | ||||||
WCA Waste Corp | ||||||||
5.500% due 03/23/18 § | 500,000 | 503,125 | ||||||
|
| |||||||
| 7,418,397 | ||||||||
|
| |||||||
Information Technology - 11.2% |
| |||||||
CDW LLC (Extended) | ||||||||
4.000% due 07/15/17 § | 434,761 | 421,610 | ||||||
Commscope Inc Tranche 1 | ||||||||
4.250% due 01/14/18 § | 498,742 | 499,745 | ||||||
Freescale Semiconductor Inc | ||||||||
6.000% due 02/28/19 § | 1,000,000 | 998,018 | ||||||
Lawson Software Term B | ||||||||
due 03/30/18 ¥ | 1,000,000 | 990,000 | ||||||
Neustar Inc (Advanced) | ||||||||
5.000% due 11/08/18 § | 497,500 | 499,988 | ||||||
NXP BV Term B (Incremental) | ||||||||
5.250% due 02/24/19 § | 1,000,000 | 992,500 | ||||||
Rovi Solutions Corp Term B | ||||||||
due 03/30/19 ¥ | 1,000,000 | 1,001,045 | ||||||
Sophia LP (Initial Term Loan) | ||||||||
6.250% due 07/19/18 § | 500,000 | 508,500 | ||||||
SSI Investments II Ltd Tranche C |
| |||||||
6.500% due 05/26/17 § | 497,500 | 499,987 | ||||||
|
| |||||||
| 6,411,393 | ||||||||
|
| |||||||
Materials - 7.8% |
| |||||||
Exopack LLC Term B | ||||||||
6.500% due 05/31/17 § | 496,250 | 496,870 | ||||||
Momentive Performance Term B-3 | ||||||||
due 05/05/15 ¥ | 500,000 | 478,750 | ||||||
Noranda Aluminum Term B | ||||||||
5.750% due 02/28/19 § | 500,000 | 504,375 | ||||||
Polyone Corp | ||||||||
5.000% due 12/20/17 § | 498,750 | 501,400 | ||||||
Sealed Air Corp Term B (Advance) | ||||||||
4.750% due 10/03/18 § | 985,000 | 997,441 | ||||||
Taminco Global Chemical Co | ||||||||
6.250% due 02/15/19 § | 500,000 | 504,219 | ||||||
Tube City IMS Corp | ||||||||
5.750% due 03/20/19 § | 500,000 | 498,750 | ||||||
Univar Inc Term B | ||||||||
5.000% due 06/30/17 § | 494,987 | 496,689 | ||||||
|
| |||||||
| 4,478,494 | ||||||||
|
| |||||||
| See Notes to Financial Statements | B-5 | See explanation of symbols and terms, if any, on page B-12 |
Table of Contents
PACIFIC LIFE FUNDS
PL FLOATING RATE INCOME FUND
Schedule of Investments (Continued)
March 31, 2012
| Principal Amount | Value | |||||||
Telecommunication Services - 5.7% |
| |||||||
Greeneden U.S. Holdings II LLC | ||||||||
6.750% due 01/31/19 § | $ | 500,000 | $ | 504,813 | ||||
Intelsat Jackson Holdings Ltd | ||||||||
3.242% due 02/01/14 § | 750,000 | 738,750 | ||||||
Level 3 Financing Inc | ||||||||
Tranche B-2 | ||||||||
5.750% due 09/01/18 § | 500,000 | 505,750 | ||||||
Tranche B-3 | ||||||||
5.750% due 09/01/18 § | 500,000 | 505,750 | ||||||
Telesat Canada Term B | 1,000,000 | 1,000,875 | ||||||
|
| |||||||
| 3,255,938 | ||||||||
|
| |||||||
Utilities - 1.9% |
| |||||||
Calpine Corp | ||||||||
4.500% due 04/01/18 § | 496,241 | 494,829 | ||||||
Texas Competitive Electric |
| |||||||
3.743% due 10/10/14 § | 1,000,000 | 614,583 | ||||||
|
| |||||||
| 1,109,412 | ||||||||
|
| |||||||
Total Senior Loan Notes | ||||||||
(Cost $52,368,101) | 52,730,801 | |||||||
|
| |||||||
| Shares | ||||||||
SHORT-TERM INVESTMENT - 6.0% |
| |||||||
Money Market Fund - 6.0% |
| |||||||
BlackRock Liquidity Funds | 3,444,558 | 3,444,558 | ||||||
|
| |||||||
Total Short-Term Investment | ||||||||
(Cost $3,444,558) | 3,444,558 | |||||||
|
| |||||||
TOTAL INVESTMENTS - 105.7% |
| |||||||
(Cost $60,084,412) | 60,528,858 | |||||||
OTHER ASSETS & LIABILITIES, |
| (3,251,650 | ) | |||||
|
| |||||||
NET ASSETS - 100.0% | $ | 57,277,208 | ||||||
|
| |||||||
| Notes to Schedule of Investments | ||||
(a) As of March 31, 2012, the fund was diversified as a percentage of netassets as follows: |
| |||
Consumer Discretionary | 24.5 | % | ||
Consumer Staples | 14.4 | % | ||
Industrials | 14.2 | % | ||
Information Technology | 11.2 | % | ||
Health Care | 10.5 | % | ||
Materials | 8.1 | % | ||
Telecommunication Services | 7.6 | % | ||
Short-Term Investment | 6.0 | % | ||
Financials | 5.8 | % | ||
Utilities | 1.9 | % | ||
Energy | 1.5 | % | ||
|
| |||
| 105.7 | % | |||
Other Assets & Liabilities, Net | (5.7 | %) | ||
|
| |||
| 100.0 | % | |||
|
| |||
(b) As of March 31, 2012, the fund’s Standard & Poor’s quality ratings as a percentage of total fixed income investments were as follows (Unaudited): |
| |||
BBB | 3.9 | % | ||
BB | 40.6 | % | ||
B | 43.0 | % | ||
CCC | 4.4 | % | ||
Not Rated | 8.1 | % | ||
|
| |||
| 100.0 | % | |||
|
| |||
| (c) | Fair Value Measurements |
The following is a summary of the fund’s investments as categorized under the three-tier hierarchy of inputs used in valuing the fund’s assets and liabilities (See Note 3C in Notes to Financial Statements) as of March 31, 2012:
| Total Value at March 31, 2012 | Level 1 Quoted Price | Level 2 Significant Observable Inputs | Level 3 Significant Unobservable Inputs | |||||||||||||||
Assets | Corporate Bonds & Notes | $ | 4,353,499 | $ | — | $ | 4,353,499 | $ | — | |||||||||
| Senior Loan Notes | 52,730,801 | — | 52,730,801 | — | ||||||||||||||
| Short-Term Investment | 3,444,558 | 3,444,558 | — | — | ||||||||||||||
Total | $ | 60,528,858 | $ | 3,444,558 | $ | 57,084,300 | $ | — | ||||||||||
| See Notes to Financial Statements | B-6 | See explanation of symbols and terms, if any, on page B-12 |
Table of Contents
PACIFIC LIFE FUNDS
PL INCOME FUND
Schedule of Investments
March 31, 2012
| Principal Amount | Value | |||||||
CORPORATE BONDS & NOTES - 71.8% |
| |||||||
Consumer Discretionary - 11.5% |
| |||||||
CBS Corp | ||||||||
3.375% due 03/01/22 | $ | 2,500,000 | $ | 2,417,315 | ||||
Dana Holding Corp | ||||||||
6.750% due 02/15/21 | 1,250,000 | 1,337,500 | ||||||
DIRECTV Holdings LLC | ||||||||
2.400% due 03/15/17 ~ | 6,000,000 | 5,952,270 | ||||||
Echostar DBS Corp | ||||||||
7.125% due 02/01/16 | 2,000,000 | 2,222,500 | ||||||
Hyatt Hotels Corp | ||||||||
3.875% due 08/15/16 | 1,000,000 | 1,042,990 | ||||||
6.875% due 08/15/19 ~ | 1,750,000 | 2,020,037 | ||||||
Kia Motors Corp (South Korea) | ||||||||
3.625% due 06/14/16 ~ | 1,500,000 | 1,530,584 | ||||||
Limited Brands Inc | ||||||||
5.625% due 02/15/22 | 2,000,000 | 2,027,500 | ||||||
Marriott International Inc | ||||||||
3.000% due 03/01/19 | 2,000,000 | 1,969,482 | ||||||
NBCUniversal Media LLC | ||||||||
2.875% due 04/01/16 | 4,250,000 | 4,419,873 | ||||||
5.950% due 04/01/41 | 750,000 | 863,653 | ||||||
The Interpublic Group of Cos Inc | ||||||||
6.250% due 11/15/14 | 1,500,000 | 1,642,500 | ||||||
Time Warner Cable Inc | ||||||||
4.000% due 09/01/21 | 3,000,000 | 3,078,564 | ||||||
Viacom Inc | ||||||||
3.500% due 04/01/17 | 2,000,000 | 2,146,568 | ||||||
Virgin Media Secured Finance PLC (United Kingdom) | ||||||||
6.500% due 01/15/18 | 2,500,000 | 2,728,125 | ||||||
Wyndham Worldwide Corp | ||||||||
2.950% due 03/01/17 | 2,000,000 | 1,984,436 | ||||||
|
| |||||||
| 37,383,897 | ||||||||
|
| |||||||
Consumer Staples - 4.3% |
| |||||||
Coca-Cola Enterprises Inc | ||||||||
2.000% due 08/19/16 | 1,250,000 | 1,254,061 | ||||||
Lorillard Tobacco Co | ||||||||
3.500% due 08/04/16 | 2,500,000 | 2,604,935 | ||||||
Pernod-Ricard SA (France) | ||||||||
4.250% due 07/15/22 ~ | 3,500,000 | 3,514,865 | ||||||
SABMiller Holdings Inc | ||||||||
2.450% due 01/15/17 ~ | 5,000,000 | 5,067,270 | ||||||
The Procter & Gamble Co | ||||||||
1.450% due 08/15/16 | 1,500,000 | 1,515,762 | ||||||
|
| |||||||
| 13,956,893 | ||||||||
|
| |||||||
Energy - 11.8% | ||||||||
Arch Coal Inc | ||||||||
7.000% due 06/15/19 ~ | 1,250,000 | 1,159,375 | ||||||
Cimarex Energy Co | ||||||||
5.875% due 05/01/22 | 850,000 | 869,125 | ||||||
Ensco PLC (United Kingdom) | ||||||||
4.700% due 03/15/21 | 2,500,000 | 2,701,168 | ||||||
Holly Energy Partners LP | ||||||||
6.500% due 03/01/20 ~ | 450,000 | 457,875 | ||||||
Key Energy Services Inc | ||||||||
6.750% due 03/01/21 | 1,500,000 | 1,548,750 | ||||||
6.750% due 03/01/21 ~ | 300,000 | 308,250 | ||||||
Kinder Morgan Energy Partners LP | ||||||||
3.950% due 09/01/22 | 1,000,000 | 991,737 | ||||||
Kinder Morgan Kansas Inc | ||||||||
5.150% due 03/01/15 | 2,250,000 | 2,373,750 | ||||||
Korea National Oil Corp (South Korea) | ||||||||
3.125% due 04/03/17 ~ | 3,000,000 | 3,000,342 | ||||||
| Principal Amount | Value | |||||||
Newfield Exploration Co | ||||||||
5.750% due 01/30/22 | $ | 1,000,000 | $ | 1,052,500 | ||||
Noble Energy Inc | ||||||||
4.150% due 12/15/21 | 2,000,000 | 2,047,424 | ||||||
Noble Holding International Ltd (Cayman) | ||||||||
3.950% due 03/15/22 | 2,000,000 | 2,001,790 | ||||||
OGX Austria GmbH (Austria) | ||||||||
8.375% due 04/01/22 ~ | 1,000,000 | 1,012,500 | ||||||
Peabody Energy Corp | ||||||||
6.000% due 11/15/18 ~ | 1,750,000 | 1,723,750 | ||||||
Petrobras International Finance Co (Cayman) | ||||||||
5.375% due 01/27/21 | 3,000,000 | 3,244,077 | ||||||
Phillips 66 | ||||||||
2.950% due 05/01/17 ~ | 2,500,000 | 2,543,393 | ||||||
Plains Exploration & Production Co | ||||||||
6.750% due 02/01/22 | 1,500,000 | 1,575,000 | ||||||
Samson Investment Co | ||||||||
9.750% due 02/15/20 ~ | 1,000,000 | 1,013,750 | ||||||
Transocean Inc (Cayman) | ||||||||
5.050% due 12/15/16 | 4,000,000 | 4,287,296 | ||||||
Weatherford International Ltd (Bermuda) | ||||||||
4.500% due 04/15/22 | 2,000,000 | 1,997,100 | ||||||
Williams Partners LP | ||||||||
4.000% due 11/15/21 | 1,500,000 | 1,518,129 | ||||||
WPX Energy Inc | ||||||||
5.250% due 01/15/17 ~ | 1,000,000 | 1,000,000 | ||||||
|
| |||||||
| 38,427,081 | ||||||||
|
| |||||||
Financials - 17.0% | ||||||||
American Express Credit Corp | ||||||||
2.375% due 03/24/17 | 2,000,000 | 2,004,946 | ||||||
American Honda Finance Corp | ||||||||
2.125% due 02/28/17 ~ | 2,500,000 | 2,511,935 | ||||||
American International Group Inc | ||||||||
5.850% due 01/16/18 | 1,500,000 | 1,634,882 | ||||||
Aon Corp | ||||||||
3.125% due 05/27/16 | 3,000,000 | 3,115,170 | ||||||
Bank of America Corp | ||||||||
1.973% due 01/30/14 § | 1,000,000 | 982,332 | ||||||
5.000% due 05/13/21 | 500,000 | 501,498 | ||||||
Bank of America NA | ||||||||
5.300% due 03/15/17 | 2,500,000 | 2,611,190 | ||||||
Berkshire Hathaway Inc | ||||||||
1.900% due 01/31/17 | 2,000,000 | 2,024,742 | ||||||
3.400% due 01/31/22 | 3,500,000 | 3,538,441 | ||||||
BRE Properties Inc REIT | ||||||||
5.500% due 03/15/17 | 2,500,000 | 2,762,080 | ||||||
Capital One Financial Corp | ||||||||
2.150% due 03/23/15 | 3,000,000 | 3,006,783 | ||||||
Citigroup Inc | ||||||||
4.750% due 05/19/15 | 750,000 | 790,202 | ||||||
5.875% due 01/30/42 | 1,000,000 | 1,036,728 | ||||||
Commonwealth Bank of Australia (Australia) | ||||||||
1.950% due 03/16/15 | 2,000,000 | 2,014,838 | ||||||
Dexus Diversified Trust (Australia) | ||||||||
5.600% due 03/15/21 ~ | 500,000 | 498,765 | ||||||
ERP Operating LP REIT | ||||||||
5.200% due 04/01/13 | 1,750,000 | 1,808,973 | ||||||
Ford Motor Credit Co LLC | ||||||||
3.875% due 01/15/15 | 2,500,000 | 2,526,058 | ||||||
FUEL Trust | ||||||||
3.984% due 06/15/16 ~ | 1,500,000 | 1,522,997 | ||||||
Health Care REIT Inc | ||||||||
4.125% due 04/01/19 | 1,500,000 | 1,489,838 | ||||||
Host Hotels & Resorts LP REIT | ||||||||
5.875% due 06/15/19 | 2,000,000 | 2,117,500 | ||||||
Hyundai Capital America | ||||||||
4.000% due 06/08/17 ~ | 1,500,000 | 1,542,615 | ||||||
JPMorgan Chase & Co | ||||||||
3.150% due 07/05/16 | 1,000,000 | 1,031,683 | ||||||
| See Notes to Financial Statements | B-7 | See explanation of symbols and terms, if any, on page B-12 |
Table of Contents
PACIFIC LIFE FUNDS
PL INCOME FUND
Schedule of Investments (Continued)
March 31, 2012
| Principal Amount | Value | |||||||
Morgan Stanley | ||||||||
4.750% due 03/22/17 | $ | 1,500,000 | $ | 1,501,815 | ||||
5.500% due 07/28/21 | 1,250,000 | 1,223,361 | ||||||
Neuberger Berman Group LLC | ||||||||
5.625% due 03/15/20 ~ | 1,500,000 | 1,518,750 | ||||||
Raymond James Financial Inc | ||||||||
5.625% due 04/01/24 | 1,000,000 | 1,021,773 | ||||||
The Goldman Sachs Group Inc | ||||||||
3.625% due 02/07/16 | 500,000 | 500,214 | ||||||
5.750% due 01/24/22 | 1,250,000 | 1,287,848 | ||||||
UDR Inc REIT | ||||||||
4.625% due 01/10/22 | 2,000,000 | 2,050,602 | ||||||
Ventas Realty LP REIT | ||||||||
4.250% due 03/01/22 | 2,000,000 | 1,946,504 | ||||||
Vornado Realty LP REIT | ||||||||
5.000% due 01/15/22 | 2,500,000 | 2,558,313 | ||||||
Wells Operating Partnership II LP REIT | ||||||||
5.875% due 04/01/18 | 750,000 | 760,295 | ||||||
|
| |||||||
| 55,443,671 | ||||||||
|
| |||||||
Health Care - 3.5% | ||||||||
Aristotle Holding Inc | ||||||||
2.650% due 02/15/17 ~ | 3,000,000 | 3,036,663 | ||||||
Baxter International Inc | ||||||||
1.850% due 01/15/17 | 2,000,000 | 2,027,330 | ||||||
LVB Acquisition Inc | ||||||||
10.375% due 10/15/17 | 2,000,000 | 2,165,000 | ||||||
Fresenius Medical Care U.S. Finance II Inc | ||||||||
5.625% due 07/31/19 ~ | 2,000,000 | 2,065,000 | ||||||
HCA Inc | ||||||||
5.875% due 03/15/22 | 2,000,000 | 2,007,500 | ||||||
|
| |||||||
| 11,301,493 | ||||||||
|
| |||||||
Industrials - 6.2% | ||||||||
Air Lease Corp | ||||||||
5.625% due 04/01/17 ~ | 2,000,000 | 2,002,500 | ||||||
Avis Budget Car Rental LLC | ||||||||
3.003% due 05/15/14 § | 1,260,000 | 1,241,100 | ||||||
Hutchison Whampoa International 11 Ltd (Cayman) | ||||||||
3.500% due 01/13/17 ~ | 2,000,000 | 2,033,914 | ||||||
International Lease Finance Corp | ||||||||
5.650% due 06/01/14 | 2,500,000 | 2,556,250 | ||||||
7.125% due 09/01/18 ~ | 1,000,000 | 1,095,000 | ||||||
Lockheed Martin Corp | ||||||||
2.125% due 09/15/16 | 2,750,000 | 2,799,607 | ||||||
Owens Corning | ||||||||
6.500% due 12/01/16 | 1,500,000 | 1,667,807 | ||||||
U.S. Airways 2011-1 Pass-Through Trust ‘A’ | ||||||||
7.125% due 10/22/23 | 500,000 | 525,000 | ||||||
Union Pacific Corp | ||||||||
4.750% due 09/15/41 | 500,000 | 510,387 | ||||||
UR Financing Escrow Corp | ||||||||
5.750% due 07/15/18 ~ | 2,250,000 | 2,309,063 | ||||||
URS Corp | ||||||||
5.000% due 04/01/22 ~ | 1,000,000 | 990,030 | ||||||
Waste Management Inc | ||||||||
2.600% due 09/01/16 | 2,500,000 | 2,563,820 | ||||||
|
| |||||||
| 20,294,478 | ||||||||
|
| |||||||
Information Technology - 0.8% | ||||||||
FLIR Systems Inc | ||||||||
3.750% due 09/01/16 | 500,000 | 510,139 | ||||||
Hewlett-Packard Co | ||||||||
2.600% due 09/15/17 | 2,000,000 | 2,000,788 | ||||||
|
| |||||||
| 2,510,927 | ||||||||
|
| |||||||
| Principal Amount | Value | |||||||
Materials - 9.0% | ||||||||
ArcelorMittal (Luxembourg) | ||||||||
6.250% due 02/25/22 | $ | 3,000,000 | $ | 3,037,740 | ||||
Ball Corp | ||||||||
7.125% due 09/01/16 | 1,750,000 | 1,916,250 | ||||||
Barrick Gold Corp (Canada) | ||||||||
3.850% due 04/01/22 ~ | 1,500,000 | 1,502,863 | ||||||
Celulosa Arauco y Constitucion SA (Chile) | ||||||||
4.750% due 01/11/22 ~ | 1,000,000 | 1,028,256 | ||||||
FMG Resources August 2006 Property Ltd (Australia) | ||||||||
7.000% due 11/01/15 ~ | 2,500,000 | 2,562,500 | ||||||
Freeport-McMoran Copper & Gold Inc | ||||||||
2.150% due 03/01/17 | 2,500,000 | 2,478,965 | ||||||
International Paper Co | ||||||||
4.750% due 02/15/22 | 2,500,000 | 2,638,608 | ||||||
LyondellBasell Industries NV (Netherlands) | ||||||||
5.000% due 04/15/19 ~ | 1,500,000 | 1,503,750 | ||||||
Rock-Tenn Co | ||||||||
4.450% due 03/01/19 ~ | 3,750,000 | 3,771,075 | ||||||
Sealed Air Corp | ||||||||
8.375% due 09/15/21 ~ | 1,000,000 | 1,128,750 | ||||||
Teck Resources Ltd (Canada) | ||||||||
3.000% due 03/01/19 | 1,500,000 | 1,482,056 | ||||||
Vale Overseas Ltd (Cayman) | ||||||||
4.375% due 01/11/22 | 2,750,000 | 2,774,888 | ||||||
Valspar Corp | ||||||||
4.200% due 01/15/22 | 2,000,000 | 2,050,870 | ||||||
Xstrata Finance Canada Ltd (Canada) | ||||||||
4.950% due 11/15/21 ~ | 1,500,000 | 1,573,874 | ||||||
|
| |||||||
| 29,450,445 | ||||||||
|
| |||||||
Telecommunication Services - 3.9% |
| |||||||
America Movil SAB de CV (Mexico) | ||||||||
2.375% due 09/08/16 | 2,000,000 | 2,034,226 | ||||||
AT&T Inc | ||||||||
1.600% due 02/15/17 | 3,000,000 | 2,985,753 | ||||||
2.400% due 08/15/16 | 2,250,000 | 2,327,292 | ||||||
Qwest Corp | ||||||||
7.500% due 06/15/23 | 750,000 | 761,250 | ||||||
UPCB Finance VI Ltd (Cayman) | ||||||||
6.875% due 01/15/22 ~ | 2,000,000 | 2,075,000 | ||||||
Verizon Communications Inc | ||||||||
2.000% due 11/01/16 | 2,500,000 | 2,541,495 | ||||||
|
| |||||||
| 12,725,016 | ||||||||
|
| |||||||
Utilities - 3.8% | ||||||||
Calpine Corp | ||||||||
7.250% due 10/15/17 ~ | 1,499,000 | 1,596,435 | ||||||
CMS Energy Corp | ||||||||
5.050% due 03/15/22 | 2,000,000 | 2,021,754 | ||||||
Commonwealth Edison Co | ||||||||
1.950% due 09/01/16 | 1,000,000 | 1,016,890 | ||||||
Duke Energy Corp | ||||||||
2.150% due 11/15/16 | 1,500,000 | 1,530,357 | ||||||
Pacific Gas & Electric Co | ||||||||
4.500% due 12/15/41 | 750,000 | 751,290 | ||||||
Sempra Energy | ||||||||
2.300% due 04/01/17 | 2,750,000 | 2,786,110 | ||||||
Southern Co | ||||||||
1.950% due 09/01/16 | 1,000,000 | 1,016,890 | ||||||
The AES Corp | ||||||||
7.750% due 03/01/14 | 1,500,000 | 1,627,500 | ||||||
|
| |||||||
| 12,347,226 | ||||||||
|
| |||||||
Total Corporate Bonds & Notes | ||||||||
(Cost $230,532,782) | 233,841,127 | |||||||
|
| |||||||
| See Notes to Financial Statements | B-8 | See explanation of symbols and terms, if any, on page B-12 |
Table of Contents
PACIFIC LIFE FUNDS
PL INCOME FUND
Schedule of Investments (Continued)
March 31, 2012
| Principal Amount | Value | |||||||
SENIOR LOAN NOTES - 18.8% |
| |||||||
Consumer Discretionary - 6.4% |
| |||||||
Burger King Corp Term B | ||||||||
4.500% due 10/19/16 § | $ | 1,897,436 | $ | 1,897,340 | ||||
Capital Automotive LP Tranche B | ||||||||
5.250% due 03/11/17 § | 1,930,607 | 1,914,518 | ||||||
Cequel Communications LLC | ||||||||
4.000% due 02/14/19 § | 2,000,000 | 1,984,376 | ||||||
ClubCorp Club Operations Inc Term B | ||||||||
6.000% due 11/30/16 § | 1,494,328 | 1,503,667 | ||||||
Interactive Data Corp Term B | ||||||||
4.500% due 02/11/18 § | 1,491,215 | 1,495,253 | ||||||
Jo-Ann Stores Inc | ||||||||
4.750% due 03/16/18 § | 974,344 | 969,959 | ||||||
Lamar Media Corp Term B | ||||||||
4.000% due 12/30/16 § | 657,019 | 659,482 | ||||||
Lord & Taylor Holdings LLC | ||||||||
5.750% due 01/11/19 § | 1,500,000 | 1,510,624 | ||||||
MGM Resorts International Class C (Extended) | ||||||||
6.000% due 02/23/15 § | 2,000,000 | 2,006,658 | ||||||
NPC International Inc | ||||||||
5.250% due 12/28/18 § | 1,500,000 | 1,515,000 | ||||||
Petco Animal Supplies Inc Term B (1st Lien) | ||||||||
4.500% due 11/30/17 § | 1,479,899 | 1,479,741 | ||||||
Protection One Alarm Monitoring Inc | ||||||||
5.750% due 03/21/19 § | 1,000,000 | 995,625 | ||||||
Six Flags Theme Parks Inc Tranche B | ||||||||
4.250% due 12/20/18 § | 1,250,000 | 1,250,430 | ||||||
The Neiman Marcus Group Inc | ||||||||
4.750% due 05/16/18 § | 1,500,000 | 1,499,062 | ||||||
|
| |||||||
| 20,681,735 | ||||||||
|
| |||||||
Consumer Staples - 3.6% | ||||||||
BJ’s Wholesale Club Inc | ||||||||
(Initial 1st Lien) | ||||||||
due 09/28/18 ¥ | 1,000,000 | 1,006,250 | ||||||
(Replacement 1st Lien) | ||||||||
5.250% due 09/28/18 § | 1,000,000 | 1,006,250 | ||||||
Del Monte Foods Co (Initial Term Loan) | ||||||||
4.500% due 03/08/18 § | 2,241,222 | 2,238,420 | ||||||
NBTY Inc Term B-1 | ||||||||
4.250% due 10/01/17 § | 1,583,832 | 1,587,791 | ||||||
Pinnacle Foods Finance LLC Term E |
| |||||||
due 09/16/18 ¥ | 500,000 | 502,188 | ||||||
Revlon Consumer Products Corp | ||||||||
due 11/19/17 ¥ | 2,000,000 | 2,002,214 | ||||||
Reynolds Group Holdings Inc Tranche C | ||||||||
6.500% due 08/09/18 § | 1,476,442 | 1,497,012 | ||||||
Sprouts Farmers Markets Holdings LLC | ||||||||
(Initial Term Loan) | ||||||||
6.000% due 04/18/18 § | 1,989,969 | 1,966,337 | ||||||
|
| |||||||
| 11,806,462 | ||||||||
|
| |||||||
Financials - 1.5% | ||||||||
First Data Corp (Non Extended B-1) |
| |||||||
due 09/24/14 ¥ | 1,500,000 | 1,447,821 | ||||||
Nuveen Investments Inc | ||||||||
(Extended 1st Lien) | ||||||||
5.754% due 05/13/17 § | 1,500,000 | 1,500,469 | ||||||
(Incremental 1st Lien) | ||||||||
7.250% due 05/13/17 § | 500,000 | 506,250 | ||||||
Realogy Corp | ||||||||
(Extended Synthetic Commitment) | ||||||||
due 10/10/16 ¥ | 109,363 | 101,935 | ||||||
(Extended Term Loan) due 10/10/16 ¥ | 1,390,637 | 1,296,189 | ||||||
|
| |||||||
| 4,852,664 | ||||||||
|
| |||||||
| Principal Amount | Value | |||||||
Health Care - 1.5% | ||||||||
Alere Inc Term B-2 | ||||||||
due 06/30/17 ¥ | $ | 1,000,000 | $ | 997,500 | ||||
Capsugel Holdings US Inc (Initial Term Loan) | ||||||||
5.250% due 08/01/18 § | 1,484,348 | 1,498,728 | ||||||
DJO Finance LLC Tranche Term B-3 |
| |||||||
6.250% due 09/15/17 § | 1,000,000 | 998,542 | ||||||
Pharmaceutical Product Development Inc Term B | ||||||||
6.250% due 11/23/18 § | 1,496,250 | 1,516,043 | ||||||
|
| |||||||
| 5,010,813 | ||||||||
|
| |||||||
Industrials - 2.4% | ||||||||
AWAS Finance Luxembourg SARL Term B | ||||||||
5.250% due 06/10/16 § | 1,435,234 | 1,444,205 | ||||||
CSC Holdings LLC | ||||||||
(Incremental B-2) | ||||||||
2.021% due 03/29/16 § | 497,194 | 494,915 | ||||||
(Incremental B-3) | ||||||||
1.991% due 03/29/16 § | 744,224 | 740,813 | ||||||
Flying Fortress Inc Term B | ||||||||
5.000% due 02/10/17 § | 2,000,000 | 2,017,500 | ||||||
Rexnord LLC Term B | 500,000 | 500,734 | ||||||
due 04/01/18 ¥ | ||||||||
5.000% due 04/01/18 § | 1,500,000 | 1,502,200 | ||||||
Terex Corp | ||||||||
5.500% due 04/28/17 § | 995,000 | 1,005,261 | ||||||
|
| |||||||
| 7,705,628 | ||||||||
|
| |||||||
Information Technology - 0.9% |
| |||||||
NXP BV Term B (Incremental) | ||||||||
5.250% due 02/24/19 § | 2,000,000 | 1,985,000 | ||||||
Rovi Corp Term B | ||||||||
due 03/30/19 ¥ | 1,000,000 | 1,001,045 | ||||||
|
| |||||||
| 2,986,045 | ||||||||
|
| |||||||
Materials - 0.3% | ||||||||
Exopack LLC Term B | ||||||||
6.500% due 05/31/17 § | 993,744 | 994,985 | ||||||
|
| |||||||
Telecommunication Services - 2.2% |
| |||||||
Crown Castle Operating Co Tranche B | ||||||||
4.000% due 01/31/19 § | 1,995,000 | 1,987,241 | ||||||
Intelstat Jackson Holdings SA | ||||||||
5.250% due 04/02/18 § | 1,494,981 | 1,504,592 | ||||||
Level 3 Financing Inc Tranche B-3 | ||||||||
5.750% due 09/01/18 § | 1,500,000 | 1,517,250 | ||||||
Telesat Canada Term B | ||||||||
due 03/13/19 ¥ | 2,000,000 | 2,001,750 | ||||||
|
| |||||||
| 7,010,833 | ||||||||
|
| |||||||
Total Senior Loan Notes | ||||||||
(Cost $60,416,617) | 61,049,165 | |||||||
|
| |||||||
U.S. TREASURY OBLIGATIONS - 5.0% |
| |||||||
U.S. Treasury Bonds - 1.7% |
| |||||||
3.750% due 08/15/41 | 5,000,000 | 5,386,720 | ||||||
|
| |||||||
U.S. Treasury Notes - 3.3% |
| |||||||
0.125% due 08/31/13 | 1,000,000 | 997,852 | ||||||
0.250% due 12/15/14 | 1,750,000 | 1,739,747 | ||||||
1.000% due 09/30/16 | 1,000,000 | 1,003,360 | ||||||
1.500% due 07/31/16 | 1,000,000 | 1,026,016 | ||||||
| See Notes to Financial Statements | B-9 | See explanation of symbols and terms, if any, on page B-12 |
Table of Contents
PACIFIC LIFE FUNDS
PL INCOME FUND
Schedule of Investments (Continued)
March 31, 2012
| Principal Amount | Value | |||||||
1.500% due 08/31/18 | $ | 1,500,000 | $ | 1,503,516 | ||||
1.750% due 05/31/16 | 2,250,000 | 2,334,200 | ||||||
2.000% due 02/15/22 | 1,500,000 | 1,470,704 | ||||||
3.125% due 05/15/21 | 750,000 | 816,094 | ||||||
|
| |||||||
| 10,891,489 | ||||||||
|
| |||||||
Total U.S. Treasury Obligations | ||||||||
(Cost $16,431,314) | 16,278,209 | |||||||
|
| |||||||
FOREIGN GOVERNMENT BONDS & NOTES - 0.3% |
| |||||||
The Korea Development Bank (South Korea) |
| |||||||
3.875% due 05/04/17 | 1,000,000 | 1,037,383 | ||||||
|
| |||||||
Total Foreign Government Bonds & Notes |
| |||||||
(Cost $995,794) | 1,037,383 | |||||||
|
| |||||||
| Shares | ||||||||
SHORT-TERM INVESTMENT - 9.9% |
| |||||||
Money Market Fund - 9.9% | ||||||||
BlackRock Liquidity Funds Treasury |
| |||||||
Trust Fund Portfolio | 32,311,819 | 32,311,819 | ||||||
|
| |||||||
Total Short-Term Investment | ||||||||
(Cost $32,311,819) | 32,311,819 | |||||||
|
| |||||||
TOTAL INVESTMENTS - 105.8% |
| |||||||
(Cost $340,688,326) | 344,517,703 | |||||||
OTHER ASSETS & LIABILITIES, |
| (18,977,333 | ) | |||||
|
| |||||||
NET ASSETS - 100.0% | $ | 325,540,370 | ||||||
|
| |||||||
Notes to Schedule of Investments
| (a) | As of March 31, 2012, the fund was diversified as a percentage of net assets as follows: |
Corporate Bonds & Notes | 71.8 | % | ||
Senior Loan Notes | 18.8 | % | ||
Short-Term Investment | 9.9 | % | ||
U.S. Treasury Obligations | 5.0 | % | ||
Foreign Government Bonds & Notes | 0.3 | % | ||
|
| |||
| 105.8 | % | |||
Other Assets & Liabilities, Net | (5.8 | %) | ||
|
| |||
| 100.0 | % | |||
|
|
| (b) | As of March 31, 2012, the fund’s Standard & Poor’s quality ratings as a percentage of total fixed income investments were as follows (Unaudited): |
AA / U.S. Government & Agency Issues | 8.1 | % | ||
A | 13.0 | % | ||
BBB | 43.0 | % | ||
BB | 22.1 | % | ||
B | 11.9 | % | ||
Not Rated | 1.9 | % | ||
|
| |||
| 100.0 | % | |||
|
|
| (c) | Fair Value Measurements |
The following is a summary of the fund’s investments as categorized under the three-tier hierarchy of inputs used in valuing the fund’s assets and liabilities (See Note 3C in Notes to Financial Statements) as of March 31, 2012:
| Total Value at March 31, 2012 | Level 1 Quoted Price | Level 2 Significant Observable Inputs | Level 3 Significant Unobservable Inputs | |||||||||||||||
Assets | Corporate Bonds & Notes | $ | 233,841,127 | $ | — | $ | 233,316,127 | $ | 525,000 | |||||||||
| Senior Loan Notes | 61,049,165 | — | 61,049,165 | — | ||||||||||||||
| U.S. Treasury Obligations | 16,278,209 | — | 16,278,209 | — | ||||||||||||||
| Foreign Government Bonds & Notes | 1,037,383 | — | 1,037,383 | — | ||||||||||||||
| Short-Term Investment | 32,311,819 | 32,311,819 | — | — | ||||||||||||||
|
|
|
|
|
|
|
| |||||||||||
Total | $ | 344,517,703 | $ | 32,311,819 | $ | 311,680,884 | $ | 525,000 | ||||||||||
|
|
|
|
|
|
|
| |||||||||||
The following is a reconciliation of investments for significant unobservable inputs (Level 3) used in valuing the fund’s assets and liabilities (See Note 3C in Notes to Financial Statements) for the year ended March 31, 2012:
| Corporate Bonds & Notes | ||||
Value, Beginning of Year | $ | 1,504,015 | ||
Purchases | 1,733,128 | |||
Sales | (2,733,072 | ) | ||
Accrued Discounts (Premiums) | (2,444 | ) | ||
Net Realized Losses | (49,393 | ) | ||
Change in Net Unrealized Appreciation | 72,766 | |||
Transfers In | — | |||
Transfers Out | — | |||
|
| |||
Value, End of Year | $ | 525,000 | ||
|
| |||
Change in Net Unrealized Appreciation on Level 3 Investments Held at the End of Year, if Applicable | $ | 25,000 | ||
|
| |||
| See Notes to Financial Statements | B-10 | See explanation of symbols and terms, if any, on page B-12 |
Table of Contents
PACIFIC LIFE FUNDS
PL MONEY MARKET FUND
Schedule of Investments
March 31, 2012
| Principal Amount | Value | |||||||
SHORT-TERM INVESTMENTS - 100.3% |
| |||||||
Certificates of Deposit - 3.9% | ||||||||
Bank of Montreal NY | ||||||||
0.100% due 04/09/12 | $ | 1,250,000 | $ | 1,250,000 | ||||
|
| |||||||
Commercial Paper - 77.5% | ||||||||
Bank of Nova Scotia NY | ||||||||
0.100% due 04/10/12 | 1,400,000 | 1,399,965 | ||||||
Commonwealth Bank of Australia (Australia) | ||||||||
0.150% due 05/07/12 | 1,250,000 | 1,249,813 | ||||||
Dell Inc | ||||||||
0.130% due 05/07/12 | 500,000 | 499,935 | ||||||
Emerson Electric Co | ||||||||
0.100% due 04/23/12 | 500,000 | 499,969 | ||||||
Harvard University | ||||||||
0.090% due 04/13/12 | 1,000,000 | 999,970 | ||||||
Illinois Tool Works Inc | ||||||||
0.120% due 04/02/12 | 800,000 | 799,997 | ||||||
John Deere Bank SA (Luxembourg) | ||||||||
0.100% due 04/18/12 | 1,300,000 | 1,299,939 | ||||||
Johnson & Johnson | ||||||||
0.040% due 04/03/12 | 500,000 | 499,999 | ||||||
0.070% due 05/02/12 | 800,000 | 799,952 | ||||||
Kreditanstalt fuer Wiederaufbau (Germany) | ||||||||
0.143% due 05/15/12 | 400,000 | 399,927 | ||||||
Nestle Capital Corp | ||||||||
0.030% due 04/03/12 | 750,000 | 749,999 | ||||||
0.100% due 05/18/12 | 500,000 | 499,935 | ||||||
NetJets Inc | ||||||||
0.110% due 04/04/12 | 900,000 | 899,991 | ||||||
Northwestern University | ||||||||
0.110% due 05/02/12 | 750,000 | 749,929 | ||||||
0.140% due 05/21/12 | 550,000 | 549,893 | ||||||
Novartis Securities Investment Ltd (Bermuda) | ||||||||
0.110% due 04/12/12 | 800,000 | 799,973 | ||||||
Parker Hannifin Corp | ||||||||
0.100% due 04/02/12 | 1,250,000 | 1,249,997 | ||||||
PepsiCo Inc | ||||||||
0.070% due 04/18/12 | 700,000 | 699,977 | ||||||
Pfizer Inc | ||||||||
0.100% due 04/19/12 | 1,400,000 | 1,399,930 | ||||||
Philip Morris International Inc | ||||||||
0.150% due 04/05/12 | 600,000 | 599,990 | ||||||
0.170% due 05/21/12 | 750,000 | 749,823 | ||||||
Province of Quebec (Canada) | ||||||||
0.090% due 04/30/12 | 1,300,000 | 1,299,906 | ||||||
Sysco Corp | ||||||||
0.130% due 04/09/12 | 1,000,000 | 999,971 | ||||||
The Coca-Cola Co | ||||||||
0.100% due 04/16/12 | 1,000,000 | 999,958 | ||||||
The Walt Disney Co | ||||||||
0.080% due 04/23/12 | 850,000 | 849,958 | ||||||
Toronto-Dominion Holdings USA Inc | ||||||||
0.130% due 04/20/12 | 900,000 | 899,938 | ||||||
Total Capital Canada Ltd (Canada) | ||||||||
0.110% due 04/13/12 | 1,200,000 | 1,199,956 | ||||||
Unilever Capital Corp | ||||||||
0.150% due 06/20/12 | 1,200,000 | 1,199,600 | ||||||
|
| |||||||
| 24,848,190 | ||||||||
|
| |||||||
| Principal Amount | Value | |||||||
U.S. Treasury Bills - 17.2% | ||||||||
0.020% due 04/12/12 | $ | 1,000,000 | $ | 999,994 | ||||
0.040% due 06/28/12 | 1,250,000 | 1,249,863 | ||||||
0.050% due 05/31/12 | 1,000,000 | 999,923 | ||||||
0.074% due 06/07/12 | 1,000,000 | 999,860 | ||||||
0.104% due 05/17/12 | 1,250,000 | 1,249,832 | ||||||
|
| |||||||
| 5,499,472 | ||||||||
|
| |||||||
| Shares | ||||||||
Money Market Fund - 1.7% | ||||||||
BlackRock Liquidity Funds Treasury | ||||||||
Trust Fund Portfolio | 552,221 | 552,221 | ||||||
|
| |||||||
Total Short-Term Investments | ||||||||
(Amortized Cost $32,149,883) |
| 32,149,883 | ||||||
|
| |||||||
TOTAL INVESTMENTS - 100.3% |
| |||||||
(Amortized Cost $32,149,883) |
| 32,149,883 | ||||||
OTHER ASSETS & LIABILITIES, |
| (82,272 | ) | |||||
|
| |||||||
NET ASSETS - 100.0% | $ | 32,067,611 | ||||||
|
| |||||||
Notes to Schedule of Investments
| (a) | As of March 31, 2012, the fund was diversified as a percentage of net assets as follows: |
Commercial Paper | 77.5 | % | ||
U.S. Treasury Bills | 17.2 | % | ||
Certificates of Deposit | 3.9 | % | ||
Money Market Fund | 1.7 | % | ||
|
| |||
| 100.3 | % | |||
Other Assets & Liabilities, Net | (0.3 | %) | ||
|
| |||
| 100.0 | % | |||
|
|
| (b) | As of March 31, 2012, the fund’s Standard & Poor’s quality ratings as a percentage of total fixed income investments were as follows (Unaudited): |
A-1 (Short -Term Debt Only) | 96.0 | % | ||
Not Rated | 4.0 | % | ||
|
| |||
| 100.0 | % | |||
|
|
| (c) | Short-term investments reflect either the stated coupon rate or the annualized effective yield on the date of purchase for discounted investments. |
| (d) | Fair Value Measurements |
The following is a summary of the fund’s investments as categorized under the three-tier hierarchy of inputs used in valuing the fund’s assets and liabilities (See Note 3C in Notes to Financial Statements) as of March 31, 2012:
| Total Value at March 31, 2012 | Level 1 Quoted Price | Level 2 Significant Observable Inputs | Level 3 Significant Unobservable Inputs | |||||||||||||||
Assets | Short-Term Investments | $ | 32,149,883 | $ | 552,221 | $ | 31,597,662 | $ | — | |||||||||
|
|
|
|
|
|
|
| |||||||||||
| See Notes to Financial Statements | B-11 | See explanation of symbols and terms, if any, on page B-12 |
Table of Contents
PACIFIC LIFE FUNDS
Schedule of Investments (Continued)
Explanation of Symbols and Terms
March 31, 2012
Explanation of Symbols:
| * | Non-income producing investments. |
| ~ | Securities are not registered under the Securities Act of 1933 (1933 Act). These securities are either (1) exempt from registration pursuant to Rule 144A under the 1933 Act and may only be sold to “qualified institutional buyers”, or (2) the securities comply with Regulation S rules governing offers and sales made outside the United States without registration under the 1933 Act and contain certain restrictions as to public resale. |
| § | Variable rate investments. The rate shown is based on the latest available information as of March 31, 2012. For Senior Loan Notes, the rate shown may represent a weighted average interest rate. |
| ¥ | Unsettled position. Contract rates do not take effect until settlement date. |
Abbreviation:
| REIT | Real Estate Investment Trust |
Notes:
The countries listed in the Schedules of Investments are based on country of incorporation.
The descriptions and Standard and Poor’s quality ratings of the companies, if any, shown in the Schedules of Investments were obtained from published reports or other sources believed to be reliable, and are not audited by the Independent Registered Public Accounting Firm.
| See Notes to Financial Statements | B-12 |
Table of Contents
STATEMENTS OF ASSETS AND LIABILITIES
MARCH 31, 2012
| PL Portfolio Optimization Funds | ||||||||||||||||||||
| Conservative Fund | Moderate- Conservative Fund | Moderate Fund | Moderate- Aggressive Fund | Aggressive Fund | ||||||||||||||||
ASSETS | ||||||||||||||||||||
Investments in affiliated mutual funds, at cost | $ | 357,576,937 | $ | 344,258,461 | $ | 909,777,480 | $ | 639,858,783 | $ | 194,404,815 | ||||||||||
|
|
|
|
|
|
|
|
|
| |||||||||||
Investments in affiliated mutual funds, at value | $ | 384,398,128 | $ | 380,067,828 | $ | 1,022,181,778 | $ | 733,103,529 | $ | 237,905,382 | ||||||||||
Receivables: | ||||||||||||||||||||
Fund shares sold | 2,735,618 | 4,739,776 | 7,420,495 | 4,312,196 | 930,034 | |||||||||||||||
Due from adviser | 36,130 | 40,088 | 92,119 | 67,182 | 25,048 | |||||||||||||||
Prepaid expenses and other assets | 30,761 | 21,692 | 41,591 | 29,378 | 18,047 | |||||||||||||||
|
|
|
|
|
|
|
|
|
| |||||||||||
Total Assets | 387,200,637 | 384,869,384 | 1,029,735,983 | 737,512,285 | 238,878,511 | |||||||||||||||
|
|
|
|
|
|
|
|
|
| |||||||||||
LIABILITIES | ||||||||||||||||||||
Payables: | ||||||||||||||||||||
Fund shares redeemed | 494,785 | 754,232 | 1,849,993 | 1,356,594 | 459,015 | |||||||||||||||
Securities purchased | 1,142,674 | 3,186,347 | 3,678,846 | 2,475,346 | 615,358 | |||||||||||||||
Accrued advisory fees | 63,996 | 62,673 | 169,402 | 121,600 | 39,761 | |||||||||||||||
Accrued administration fees | 47,997 | 47,004 | 127,051 | 91,200 | 29,821 | |||||||||||||||
Accrued support service expenses | 11,250 | 11,250 | 29,489 | 21,648 | 6,989 | |||||||||||||||
Accrued custodian fees and expenses | 5,058 | 5,058 | 5,058 | 5,058 | 5,058 | |||||||||||||||
Accrued transfer agency out-of-pocket expenses | 22,965 | 23,682 | 63,203 | 49,374 | 16,023 | |||||||||||||||
Accrued legal, audit and tax service fees | 45,230 | 45,230 | 118,557 | 87,033 | 28,097 | |||||||||||||||
Accrued trustees’ fees and expenses and deferred compensation | 698 | 612 | 1,326 | 770 | 144 | |||||||||||||||
Accrued distribution and/or service fees | 33,019 | 31,986 | 84,889 | 61,514 | 19,470 | |||||||||||||||
Accrued other | 28,576 | 28,585 | 75,768 | 55,622 | 17,650 | |||||||||||||||
|
|
|
|
|
|
|
|
|
| |||||||||||
Total Liabilities | 1,896,248 | 4,196,659 | 6,203,582 | 4,325,759 | 1,237,386 | |||||||||||||||
|
|
|
|
|
|
|
|
|
| |||||||||||
NET ASSETS | $ | 385,304,389 | $ | 380,672,725 | $ | 1,023,532,401 | $ | 733,186,526 | $ | 237,641,125 | ||||||||||
|
|
|
|
|
|
|
|
|
| |||||||||||
NET ASSETS CONSIST OF: | ||||||||||||||||||||
Paid-in capital | $ | 361,960,316 | $ | 353,896,526 | $ | 941,699,578 | $ | 685,854,997 | $ | 233,033,429 | ||||||||||
Undistributed/accumulated net investment income (loss) | (502,655 | ) | 262,665 | 1,676,553 | 1,546,068 | 410,096 | ||||||||||||||
Accumulated net realized loss | (2,974,463 | ) | (9,295,833 | ) | (32,248,028 | ) | (47,459,285 | ) | (39,302,967 | ) | ||||||||||
Net unrealized appreciation on investments | 26,821,191 | 35,809,367 | 112,404,298 | 93,244,746 | 43,500,567 | |||||||||||||||
|
|
|
|
|
|
|
|
|
| |||||||||||
NET ASSETS | $ | 385,304,389 | $ | 380,672,725 | $ | 1,023,532,401 | $ | 733,186,526 | $ | 237,641,125 | ||||||||||
|
|
|
|
|
|
|
|
|
| |||||||||||
Class A Shares: | ||||||||||||||||||||
Net Assets | $ | 182,912,408 | $ | 188,660,087 | $ | 517,945,446 | $ | 365,425,761 | $ | 122,397,280 | ||||||||||
Shares of beneficial interest outstanding | 16,529,635 | 16,318,684 | 42,230,380 | 29,438,756 | 9,745,244 | |||||||||||||||
Net Asset Value per share* | $ | 11.07 | $ | 11.56 | $ | 12.26 | $ | 12.41 | $ | 12.56 | ||||||||||
Sales Charge (1) | 0.64 | 0.67 | 0.71 | 0.72 | 0.73 | |||||||||||||||
|
|
|
|
|
|
|
|
|
| |||||||||||
Maximum offering price per share | $ | 11.71 | $ | 12.23 | $ | 12.97 | $ | 13.13 | $ | 13.29 | ||||||||||
|
|
|
|
|
|
|
|
|
| |||||||||||
Class B Shares: | ||||||||||||||||||||
Net Assets | $ | 33,122,182 | $ | 40,811,680 | $ | 115,512,761 | $ | 95,936,958 | $ | 31,969,033 | ||||||||||
Shares of beneficial interest outstanding | 3,022,111 | 3,560,056 | 9,485,382 | 7,802,346 | 2,603,681 | |||||||||||||||
Net Asset Value and offering price per share* | $ | 10.96 | $ | 11.46 | $ | 12.18 | $ | 12.30 | $ | 12.28 | ||||||||||
|
|
|
|
|
|
|
|
|
| |||||||||||
Class C Shares: | ||||||||||||||||||||
Net Assets | $ | 158,747,692 | $ | 144,899,870 | $ | 366,753,059 | $ | 257,114,030 | $ | 76,612,853 | ||||||||||
Shares of beneficial interest outstanding | 14,487,979 | 12,635,509 | 30,143,771 | 20,950,979 | 6,240,042 | |||||||||||||||
Net Asset Value and offering price per share* | $ | 10.96 | $ | 11.47 | $ | 12.17 | $ | 12.27 | $ | 12.28 | ||||||||||
|
|
|
|
|
|
|
|
|
| |||||||||||
Class R Shares: | ||||||||||||||||||||
Net Assets | $ | 10,522,107 | $ | 6,301,088 | $ | 23,321,135 | $ | 14,709,777 | $ | 6,661,959 | ||||||||||
Shares of beneficial interest outstanding | 953,982 | 546,947 | 1,905,643 | 1,186,539 | 533,714 | |||||||||||||||
Net Asset Value per share | $ | 11.03 | $ | 11.52 | $ | 12.24 | $ | 12.40 | $ | 12.48 | ||||||||||
|
|
|
|
|
|
|
|
|
| |||||||||||
| * | Redemption price per share is equal to the Net Asset Value per share less any applicable contingent deferred sales charge. |
| (1) | The PL Portfolio Optimization Funds are subject to a maximum 5.50% front-end sales charge. |
| See Notes to Financial Statements | ||||
| C-1 | ||||
Table of Contents
PACIFIC LIFE FUNDS
STATEMENTS OF ASSETS AND LIABILITIES (Continued)
MARCH 31, 2012
| PL Floating Rate Income Fund | PL Income Fund | PL Money Market Fund | ||||||||||
ASSETS | ||||||||||||
Investments, at cost | $ | 60,084,412 | $ | 340,688,326 | $ | 32,149,883 | ||||||
|
|
|
|
|
| |||||||
Investments, at value | $ | 60,528,858 | $ | 344,517,703 | $ | 32,149,883 | ||||||
Receivables: | ||||||||||||
Dividends and interest | 204,512 | 2,051,217 | — | |||||||||
Fund shares sold | 346,002 | 5,573,436 | 19,274 | |||||||||
Securities sold | 4,842,633 | 9,460,637 | — | |||||||||
Due from adviser | 3,331 | 68,066 | 6,426 | |||||||||
Prepaid expenses and other assets | 40,712 | 21,833 | 5,603 | |||||||||
|
|
|
|
|
| |||||||
Total Assets | 65,966,048 | 361,692,892 | 32,181,186 | |||||||||
|
|
|
|
|
| |||||||
LIABILITIES | ||||||||||||
Payables: | ||||||||||||
Fund shares redeemed | 5,803 | 1,479,991 | 88,030 | |||||||||
Securities purchased | 8,600,005 | 34,216,350 | — | |||||||||
Income distributions | 27,436 | 198,174 | — | |||||||||
Accrued advisory fees | 29,056 | 127,880 | — | |||||||||
Accrued administration fees | 6,705 | 38,364 | — | |||||||||
Accrued support service expenses | 1,193 | 6,137 | 1,193 | |||||||||
Accrued custodian fees and expenses | 7,797 | 10,518 | 10,176 | |||||||||
Accrued transfer agency out-of-pocket expenses | 1,796 | 12,468 | 1,937 | |||||||||
Accrued legal, audit and tax service fees | 4,797 | 24,671 | 4,797 | |||||||||
Accrued trustees’ fees and expenses and deferred compensation | 36 | 200 | 3,264 | |||||||||
Accrued distribution and/or service fees | 845 | 18,667 | 420 | |||||||||
Accrued other | 3,371 | 19,102 | 3,758 | |||||||||
|
|
|
|
|
| |||||||
Total Liabilities | 8,688,840 | 36,152,522 | 113,575 | |||||||||
|
|
|
|
|
| |||||||
NET ASSETS | $ | 57,277,208 | $ | 325,540,370 | $ | 32,067,611 | ||||||
|
|
|
|
|
| |||||||
NET ASSETS CONSIST OF: | ||||||||||||
Paid-in capital | $ | 56,868,781 | $ | 318,576,730 | $ | 32,071,417 | ||||||
Undistributed/accumulated net investment income (loss) | 22,716 | 49,246 | (3,657 | ) | ||||||||
Undistributed/accumulated net realized gain (loss) | (58,735 | ) | 3,085,017 | (149 | ) | |||||||
Net unrealized appreciation (depreciation) on investments | 444,446 | 3,829,377 | — | |||||||||
|
|
|
|
|
| |||||||
NET ASSETS | $ | 57,277,208 | $ | 325,540,370 | $ | 32,067,611 | ||||||
|
|
|
|
|
| |||||||
Class A Shares: | ||||||||||||
Net Assets | $ | 12,071,576 | $ | 247,522,594 | $ | 32,067,611 | ||||||
Shares of beneficial interest outstanding | 1,199,066 | 23,336,646 | 32,078,570 | |||||||||
Net Asset Value per share* | $ | 10.07 | $ | 10.61 | $ | 1.00 | ||||||
Sales Charge (1) | 0.31 | 0.47 | — | |||||||||
|
|
|
|
|
| |||||||
Maximum offering price per share | $ | 10.38 | $ | 11.08 | $ | 1.00 | ||||||
|
|
|
|
|
| |||||||
Class C Shares: | ||||||||||||
Net Assets | $ | 3,371,665 | $ | 76,725,624 | ||||||||
Shares of beneficial interest outstanding | 334,906 | 7,227,383 | ||||||||||
Net Asset Value and offering price per share* | $ | 10.07 | $ | 10.62 | ||||||||
|
|
|
| |||||||||
Class I Shares: | ||||||||||||
Net Assets | $ | 41,833,967 | $ | 1,292,152 | ||||||||
Shares of beneficial interest outstanding | 4,151,825 | 121,696 | ||||||||||
Net Asset Value per share | $ | 10.08 | $ | 10.62 | ||||||||
|
|
|
| |||||||||
| * | Redemption price per share is equal to the Net Asset Value per share less any applicable contingent deferred sales charge. |
| (1) | The PL Floating Rate Income Fund is subject to a maximum 3.00% front-end sales charge, the PL Income Fund is subject to a maximum 4.25% front-end sales charge, and the PL Money Market is not subject to a front-end sales charge. |
| See Notes to Financial Statements | ||||
| C-2 | ||||
Table of Contents
STATEMENTS OF OPERATIONS
FOR THE YEAR ENDED MARCH 31, 2012
| PL Portfolio Optimization Funds | ||||||||||||||||||||
| Conservative Fund | Moderate- Conservative Fund | Moderate Fund | Moderate- Aggressive Fund | Aggressive Fund | ||||||||||||||||
INVESTMENT INCOME | ||||||||||||||||||||
Dividends from affiliated mutual fund investments | $ | 8,377,573 | $ | 7,167,011 | $ | 15,726,930 | $ | 9,268,309 | $ | 2,457,852 | ||||||||||
Dividends from mutual fund investments | — | — | 5,727 | 160 | 601 | |||||||||||||||
|
|
|
|
|
|
|
|
|
| |||||||||||
Total Investment Income | 8,377,573 | 7,167,011 | 15,732,657 | 9,268,469 | 2,458,453 | |||||||||||||||
|
|
|
|
|
|
|
|
|
| |||||||||||
EXPENSES | ||||||||||||||||||||
Advisory fees | 646,259 | 645,660 | 1,763,978 | 1,307,384 | 438,794 | |||||||||||||||
Administration fees | 484,694 | 484,245 | 1,322,984 | 980,538 | 329,095 | |||||||||||||||
Support services expenses | 53,508 | 54,498 | 150,024 | 113,823 | 38,846 | |||||||||||||||
Custodian fees and expenses | 8,676 | 8,676 | 8,676 | 8,676 | 8,676 | |||||||||||||||
Shareholder report expenses | 54,840 | 55,089 | 153,627 | 117,769 | 40,662 | |||||||||||||||
Distribution and/or service fees (1) | ||||||||||||||||||||
Class A | 374,911 | 385,722 | 1,084,366 | 795,904 | 282,435 | |||||||||||||||
Class B | 268,305 | 335,873 | 1,000,487 | 863,448 | 297,117 | |||||||||||||||
Class C | 1,365,406 | 1,206,911 | 3,244,895 | 2,313,111 | 710,452 | |||||||||||||||
Class R | 48,970 | 71,314 | 118,522 | 88,372 | 28,330 | |||||||||||||||
Transfer agency out-of-pocket expenses | 95,554 | 100,817 | 286,730 | 234,801 | 78,007 | |||||||||||||||
Registration fees | 89,213 | 93,127 | 149,129 | 120,977 | 78,030 | |||||||||||||||
Legal, audit and tax service fees | 65,686 | 66,116 | 176,813 | 131,581 | 43,448 | |||||||||||||||
Trustees’ fees and expenses | 12,847 | 12,977 | 35,670 | 27,129 | 9,273 | |||||||||||||||
Other | 25,876 | 25,392 | 67,033 | 52,257 | 19,148 | |||||||||||||||
|
|
|
|
|
|
|
|
|
| |||||||||||
Total Expenses | 3,594,745 | 3,546,417 | 9,562,934 | 7,155,770 | 2,402,313 | |||||||||||||||
Adviser Reimbursement (2) | (406,199 | ) | (416,693 | ) | (1,027,703 | ) | (807,014 | ) | (316,090 | ) | ||||||||||
|
|
|
|
|
|
|
|
|
| |||||||||||
Net Expenses | 3,188,546 | 3,129,724 | 8,535,231 | 6,348,756 | 2,086,223 | |||||||||||||||
|
|
|
|
|
|
|
|
|
| |||||||||||
NET INVESTMENT INCOME | 5,189,027 | 4,037,287 | 7,197,426 | 2,919,713 | 372,230 | |||||||||||||||
|
|
|
|
|
|
|
|
|
| |||||||||||
NET REALIZED AND UNREALIZED GAIN (LOSS) | ||||||||||||||||||||
Net Realized Gain (Loss) On: | ||||||||||||||||||||
Investment security transactions in affiliated mutual funds | 490,376 | (973,427 | ) | (1,689,309 | ) | (2,647,164 | ) | (1,802,515 | ) | |||||||||||
Investment security transactions | 32 | 32 | 89 | 68 | 23 | |||||||||||||||
Capital gain distributions from affiliated mutual fund investments | 2,787,255 | 3,140,894 | 7,524,832 | 6,396,260 | 1,932,847 | |||||||||||||||
|
|
|
|
|
|
|
|
|
| |||||||||||
Net Realized Gain | 3,277,663 | 2,167,499 | 5,835,612 | 3,749,164 | 130,355 | |||||||||||||||
|
|
|
|
|
|
|
|
|
| |||||||||||
Change In Net Unrealized Appreciation (Depreciation) On: | ||||||||||||||||||||
Investment securities in affiliated mutual funds | 6,885,771 | 9,994,683 | 31,124,333 | 20,625,477 | 4,646,591 | |||||||||||||||
|
|
|
|
|
|
|
|
|
| |||||||||||
Change in Net Unrealized Appreciation | 6,885,771 | 9,994,683 | 31,124,333 | 20,625,477 | 4,646,591 | |||||||||||||||
|
|
|
|
|
|
|
|
|
| |||||||||||
NET GAIN | 10,163,434 | 12,162,182 | 36,959,945 | 24,374,641 | 4,776,946 | |||||||||||||||
|
|
|
|
|
|
|
|
|
| |||||||||||
NET INCREASE IN NET ASSETS RESULTING FROM OPERATIONS | $ | 15,352,461 | $ | 16,199,469 | $ | 44,157,371 | $ | 27,294,354 | $ | 5,149,176 | ||||||||||
|
|
|
|
|
|
|
|
|
| |||||||||||
| (1) | See Notes 1 and 6 in Notes to Financial Statements. |
| (2) | See Note 7B in Notes to Financial Statements. |
See Notes to Financial Statements
C-3
Table of Contents
PACIFIC LIFE FUNDS
STATEMENTS OF OPERATIONS (Continued)
FOR THE YEAR OR PERIOD ENDED MARCH 31, 2012
| PL Floating Rate Income Fund (1) | PL Income Fund | PL Money Market Fund | ||||||||||
INVESTMENT INCOME | ||||||||||||
Dividends from mutual fund investments | $ | 129 | $ | 15,129 | $ | 8 | ||||||
Interest | 1,523,277 | 5,993,051 | 38,429 | |||||||||
Other | 13,727 | 33,273 | — | |||||||||
|
|
|
|
|
| |||||||
Total Investment Income | 1,537,133 | 6,041,453 | 38,437 | |||||||||
|
|
|
|
|
| |||||||
EXPENSES | ||||||||||||
Advisory fees | 183,208 | 777,930 | 71,653 | |||||||||
Administration fees | 44,434 | 419,160 | 107,479 | |||||||||
Support services expenses | 8,010 | 26,453 | 10,606 | |||||||||
Custodian fees and expenses | 9,886 | 17,775 | 17,628 | |||||||||
Shareholder report expenses | 2,147 | 19,610 | 7,007 | |||||||||
Distribution and/or service fees (2) | ||||||||||||
Class A | 2,758 | 251,127 | 89,566 | |||||||||
Class C | 3,335 | 234,037 | — | |||||||||
Transfer agency out-of-pocket expenses | 1,810 | 36,429 | 6,119 | |||||||||
Registration fees | 2,717 | 154,262 | 34,496 | |||||||||
Legal, audit and tax service fees | 6,013 | 32,641 | 7,486 | |||||||||
Trustees’ fees and expenses | 877 | 4,715 | 1,636 | |||||||||
Offering expenses | 86,169 | 143,656 | — | |||||||||
Other | 4,172 | 30,091 | 8,537 | |||||||||
|
|
|
|
|
| |||||||
Total Expenses | 355,536 | 2,147,886 | 362,213 | |||||||||
Advisory Fee Waiver (3) | — | — | (71,653 | ) | ||||||||
Adviser Reimbursement (3) | (123,956 | ) | (651,413 | ) | (93,514 | ) | ||||||
Administration Fee Waiver (3) | — | — | (107,479 | ) | ||||||||
Service Fee Waiver (3) | — | — | (51,125 | ) | ||||||||
|
|
|
|
|
| |||||||
Net Expenses | 231,580 | 1,496,473 | 38,442 | |||||||||
|
|
|
|
|
| |||||||
NET INVESTMENT INCOME (LOSS) | 1,305,553 | 4,544,980 | (5 | ) | ||||||||
|
|
| �� |
|
| |||||||
NET REALIZED AND UNREALIZED GAIN (LOSS) | ||||||||||||
Net Realized Gain (Loss) On: | ||||||||||||
Investment security transactions | (11,235 | ) | 3,201,825 | (149 | ) | |||||||
Swap transactions | (43,819 | ) | — | — | ||||||||
|
|
|
|
|
| |||||||
Net Realized Gain (Loss) | (55,054 | ) | 3,201,825 | (149 | ) | |||||||
|
|
|
|
|
| |||||||
Change In Net Unrealized Appreciation (Depreciation) On: | ||||||||||||
Investment securities | 444,446 | 3,709,953 | — | |||||||||
|
|
|
|
|
| |||||||
Change in Net Unrealized Appreciation (Depreciation) | 444,446 | 3,709,953 | — | |||||||||
|
|
|
|
|
| |||||||
NET GAIN (LOSS) | 389,392 | 6,911,778 | (149 | ) | ||||||||
|
|
|
|
|
| |||||||
NET INCREASE (DECREASE) IN NET ASSETS RESULTING FROM OPERATIONS | $ | 1,694,945 | $ | 11,456,758 | ($ | 154 | ) | |||||
|
|
|
|
|
| |||||||
| (1) | Operations commenced on June 30, 2011. |
| (2) | See Notes 1 and 6 in Notes to Financial Statements. |
| (3) | See Note 7B in Notes to Financial Statements. |
See Notes to Financial Statements
C-4
Table of Contents
STATEMENTS OF CHANGES IN NET ASSETS
| PL Portfolio Optimization Conservative Fund | PL Portfolio Optimization Moderate-Conservative Fund | PL Portfolio Optimization Moderate Fund | ||||||||||||||||||||||
| Year Ended March 31, 2012 | Year Ended March 31, 2011 | Year Ended March 31, 2012 | Year Ended March 31, 2011 | Year Ended March 31, 2012 | Year Ended March 31, 2011 | |||||||||||||||||||
OPERATIONS | ||||||||||||||||||||||||
Net investment income | $ | 5,189,027 | $ | 2,426,963 | $ | 4,037,287 | $ | 1,742,933 | $ | 7,197,426 | $ | 3,443,119 | ||||||||||||
Net realized gain (loss) | 3,277,663 | 5,614,508 | 2,167,499 | 1,177,208 | 5,835,612 | (4,722,550 | ) | |||||||||||||||||
Change in net unrealized appreciation | 6,885,771 | 9,101,884 | 9,994,683 | 18,241,955 | 31,124,333 | 77,730,242 | ||||||||||||||||||
|
|
|
|
|
|
|
|
|
|
|
| |||||||||||||
Net Increase in Net Assets Resulting from Operations | 15,352,461 | 17,143,355 | 16,199,469 | 21,162,096 | 44,157,371 | 76,450,811 | ||||||||||||||||||
|
|
|
|
|
|
|
|
|
|
|
| |||||||||||||
DISTRIBUTIONS TO SHAREHOLDERS | ||||||||||||||||||||||||
Net investment income | ||||||||||||||||||||||||
Class A | (3,963,242 | ) | (3,593,206 | ) | (3,227,833 | ) | (2,708,809 | ) | (6,896,937 | ) | (5,861,904 | ) | ||||||||||||
Class B | (582,094 | ) | (479,073 | ) | (513,693 | ) | (453,971 | ) | (890,273 | ) | (947,544 | ) | ||||||||||||
Class C | (2,791,770 | ) | (2,524,717 | ) | (1,709,111 | ) | (1,680,826 | ) | (2,663,615 | ) | (3,190,968 | ) | ||||||||||||
Class R | (238,985 | ) | (227,648 | ) | (297,928 | ) | (297,015 | ) | (267,714 | ) | (392,225 | ) | ||||||||||||
Net realized gains | ||||||||||||||||||||||||
Class A | (463,189 | ) | — | — | — | — | — | |||||||||||||||||
Class B | (88,712 | ) | — | — | — | — | — | |||||||||||||||||
Class C | (435,773 | ) | — | — | — | — | — | |||||||||||||||||
Class R | (30,666 | ) | — | — | — | — | — | |||||||||||||||||
|
|
|
|
|
|
|
|
|
|
|
| |||||||||||||
Net Decrease from Dividends and Distributions to Shareholders | (8,594,431 | ) | (6,824,644 | ) | (5,748,565 | ) | (5,140,621 | ) | (10,718,539 | ) | (10,392,641 | ) | ||||||||||||
|
|
|
|
|
|
|
|
|
|
|
| |||||||||||||
CAPITAL SHARE TRANSACTIONS | ||||||||||||||||||||||||
Proceeds from sale of shares | ||||||||||||||||||||||||
Class A | 102,650,253 | 104,781,421 | 87,677,363 | 80,784,715 | 216,395,619 | 185,986,071 | ||||||||||||||||||
Class B | 13,149,877 | 12,759,957 | 15,240,310 | 12,279,576 | 32,094,003 | 33,183,939 | ||||||||||||||||||
Class C | 86,058,302 | 88,154,402 | 56,767,607 | 55,590,836 | 114,353,551 | 123,838,803 | ||||||||||||||||||
Class R | 5,023,414 | 4,081,989 | 7,592,421 | 7,703,990 | 11,467,594 | 11,894,550 | ||||||||||||||||||
Dividends and distribution reinvestments | ||||||||||||||||||||||||
Class A | 3,886,280 | 2,892,117 | 2,943,320 | 2,437,411 | 6,444,881 | 5,379,578 | ||||||||||||||||||
Class B | 588,109 | 427,599 | 474,922 | 424,066 | 849,836 | 899,819 | ||||||||||||||||||
Class C | 2,793,302 | 2,127,507 | 1,540,112 | 1,479,706 | 2,433,641 | 2,904,360 | ||||||||||||||||||
Class R | 269,651 | 227,284 | 297,928 | 297,015 | 267,001 | 391,387 | ||||||||||||||||||
Cost of shares repurchased | ||||||||||||||||||||||||
Class A | (56,980,878 | ) | (51,195,607 | ) | (40,032,576 | ) | (36,084,313 | ) | (107,176,991 | ) | (84,457,616 | ) | ||||||||||||
Class B | (3,481,193 | ) | (5,031,808 | ) | (4,517,933 | ) | (5,109,134 | ) | (13,415,950 | ) | (14,909,440 | ) | ||||||||||||
Class C | (50,444,496 | ) | (44,764,772 | ) | (24,889,408 | ) | (20,738,361 | ) | (70,089,870 | ) | (54,487,355 | ) | ||||||||||||
Class R | (3,836,556 | ) | (3,774,101 | ) | (16,849,072 | ) | (4,035,851 | ) | (12,699,459 | ) | (15,183,105 | ) | ||||||||||||
|
|
|
|
|
|
|
|
|
|
|
| |||||||||||||
Net Increase in Net Assets from Capital Share Transactions | 99,676,065 | 110,685,988 | 86,244,994 | 95,029,656 | 180,923,856 | 195,440,991 | ||||||||||||||||||
|
|
|
|
|
|
|
|
|
|
|
| |||||||||||||
NET INCREASE IN NET ASSETS | 106,434,095 | 121,004,699 | 96,695,898 | 111,051,131 | 214,362,688 | 261,499,161 | ||||||||||||||||||
|
|
|
|
|
|
|
|
|
|
|
| |||||||||||||
NET ASSETS | ||||||||||||||||||||||||
Beginning of Year | 278,870,294 | 157,865,595 | 283,976,827 | 172,925,696 | 809,169,713 | 547,670,552 | ||||||||||||||||||
|
|
|
|
|
|
|
|
|
|
|
| |||||||||||||
End of Year | $ | 385,304,389 | $ | 278,870,294 | $ | 380,672,725 | $ | 283,976,827 | $ | 1,023,532,401 | $ | 809,169,713 | ||||||||||||
|
|
|
|
|
|
|
|
|
|
|
| |||||||||||||
Undistributed/Accumulated Net Investment Income (Loss) | ($ | 502,655 | ) | ($ | 1,541 | ) | $ | 262,665 | $ | 481,698 | $ | 1,676,553 | $ | 2,129,617 | ||||||||||
|
|
|
|
|
|
|
|
|
|
|
| |||||||||||||
See Notes to Financial Statements
C-5
Table of Contents
PACIFIC LIFE FUNDS
STATEMENTS OF CHANGES IN NET ASSETS (Continued)
| PL Portfolio Optimization Moderate-Aggressive Fund | PL Portfolio Optimization Aggressive Fund | PL Floating Rate Income Fund (1) | ||||||||||||||||||
| Year Ended March 31, 2012 | Year Ended March 31, 2011 | Year Ended March 31, 2012 | Year Ended March 31, 2011 | Period Ended March 31, 2012 | ||||||||||||||||
OPERATIONS | ||||||||||||||||||||
Net investment income | $ | 2,919,713 | $ | 1,257,765 | $ | 372,230 | $ | 161,068 | $ | 1,305,553 | ||||||||||
Net realized gain (loss) | 3,749,164 | (7,062,030 | ) | 130,355 | (5,865,275 | ) | (55,054 | ) | ||||||||||||
Change in net unrealized appreciation | 20,625,477 | 79,657,093 | 4,646,591 | 36,869,932 | 444,446 | |||||||||||||||
|
|
|
|
|
|
|
|
|
| |||||||||||
Net Increase in Net Assets Resulting from Operations | 27,294,354 | 73,852,828 | 5,149,176 | 31,165,725 | 1,694,945 | |||||||||||||||
|
|
|
|
|
|
|
|
|
| |||||||||||
DISTRIBUTIONS TO SHAREHOLDERS | ||||||||||||||||||||
Net investment income | ||||||||||||||||||||
Class A | (3,489,595 | ) | (3,198,720 | ) | (561,009 | ) | (653,565 | ) | (76,686 | ) | ||||||||||
Class B | (329,689 | ) | (413,315 | ) | — | (139,088 | ) | — | ||||||||||||
Class C | (803,908 | ) | (1,199,785 | ) | — | (314,226 | ) | (19,277 | ) | |||||||||||
Class R | (158,188 | ) | (140,419 | ) | (14,803 | ) | (27,172 | ) | — | |||||||||||
Class I | — | — | — | — | (1,190,555 | ) | ||||||||||||||
|
|
|
|
|
|
|
|
|
| |||||||||||
Net Decrease from Dividends and Distributions to Shareholders | (4,781,380 | ) | (4,952,239 | ) | (575,812 | ) | (1,134,051 | ) | (1,286,518 | ) | ||||||||||
|
|
|
|
|
|
|
|
|
| |||||||||||
CAPITAL SHARE TRANSACTIONS | ||||||||||||||||||||
Proceeds from sale of shares | ||||||||||||||||||||
Class A | 117,617,903 | 121,425,845 | 31,784,559 | 38,968,570 | 11,991,538 | |||||||||||||||
Class B | 21,114,174 | 22,860,115 | 5,002,321 | 6,508,358 | — | |||||||||||||||
Class C | 59,635,150 | 65,553,149 | 24,218,955 | 30,970,677 | 3,395,490 | |||||||||||||||
Class R | 9,034,035 | 7,156,992 | 4,243,854 | 2,314,952 | — | |||||||||||||||
Class I | — | — | — | — | 40,343,574 | |||||||||||||||
Dividends and distribution reinvestments | ||||||||||||||||||||
Class A | 3,328,483 | 2,983,736 | 536,454 | 628,094 | 49,677 | |||||||||||||||
Class B | 317,388 | 398,886 | — | 133,256 | — | |||||||||||||||
Class C | 751,703 | 1,118,086 | — | 294,024 | 7,229 | |||||||||||||||
Class R | 158,188 | 140,419 | 14,803 | 27,172 | — | |||||||||||||||
Class I | — | — | — | — | 1,173,730 | |||||||||||||||
Cost of shares repurchased | ||||||||||||||||||||
Class A | (68,423,799 | ) | (80,660,446 | ) | (26,695,077 | ) | (39,713,135 | ) | (26,109 | ) | ||||||||||
Class B | (12,303,686 | ) | (17,358,312 | ) | (4,355,282 | ) | (8,809,245 | ) | — | |||||||||||
Class C | (41,950,485 | ) | (51,398,155 | ) | (24,561,074 | ) | (33,444,485 | ) | (46,348 | ) | ||||||||||
Class R | (11,879,593 | ) | (3,961,554 | ) | (3,221,587 | ) | (1,932,830 | ) | — | |||||||||||
Class I | — | — | — | — | (20,000 | ) | ||||||||||||||
|
|
|
|
|
|
|
|
|
| |||||||||||
Net Increase (Decrease) in Net Assets from Capital Share Transactions | 77,399,461 | 68,258,761 | 6,967,926 | (4,054,592 | ) | 56,868,781 | ||||||||||||||
|
|
|
|
|
|
|
|
|
| |||||||||||
NET INCREASE IN NET ASSETS | 99,912,435 | 137,159,350 | 11,541,290 | 25,977,082 | 57,277,208 | |||||||||||||||
|
|
|
|
|
|
|
|
|
| |||||||||||
NET ASSETS | ||||||||||||||||||||
Beginning of Year or Period | 633,274,091 | 496,114,741 | 226,099,835 | 200,122,753 | — | |||||||||||||||
|
|
|
|
|
|
|
|
|
| |||||||||||
End of Year or Period | $ | 733,186,526 | $ | 633,274,091 | $ | 237,641,125 | $ | 226,099,835 | $ | 57,277,208 | ||||||||||
|
|
|
|
|
|
|
|
|
| |||||||||||
Undistributed Net Investment Income | $ | 1,546,068 | $ | 1,749,205 | $ | 410,096 | $ | 573,483 | $ | 22,716 | ||||||||||
|
|
|
|
|
|
|
|
|
| |||||||||||
| (1) | Operations commenced on June 30, 2011. |
See Notes to Financial Statements
C-6
Table of Contents
PACIFIC LIFE FUNDS
STATEMENTS OF CHANGES IN NET ASSETS (Continued)
| PL Income Fund (1) | PL Money Market Fund | |||||||||||||||
| Year Ended March 31, 2012 | Period Ended March 31, 2011 | Year Ended March 31, 2012 | Year Ended March 31, 2011 | |||||||||||||
OPERATIONS | ||||||||||||||||
Net investment income (loss) | $ | 4,544,980 | $ | 459,207 | ($ | 5 | ) | ($ | 34 | ) | ||||||
Net realized gain (loss) | 3,201,825 | 501,867 | (149 | ) | 34 | |||||||||||
Change in net unrealized appreciation (depreciation) | 3,709,953 | 119,424 | — | — | ||||||||||||
|
|
|
|
|
|
|
| |||||||||
Net Increase (Decrease) in Net Assets Resulting from Operations | 11,456,758 | 1,080,498 | (154 | ) | — | |||||||||||
|
|
|
|
|
|
|
| |||||||||
DISTRIBUTIONS TO SHAREHOLDERS | ||||||||||||||||
Net investment income | ||||||||||||||||
Class A | (3,012,121 | ) | (23,783 | ) | — | — | ||||||||||
Class C | (549,513 | ) | — | — | — | |||||||||||
Class I | (940,375 | ) | (437,607 | ) | — | — | ||||||||||
Net realized gains | ||||||||||||||||
Class A | (486,579 | ) | — | — | — | |||||||||||
Class C | (122,517 | ) | — | — | — | |||||||||||
Class I | (2,113 | ) | — | — | — | |||||||||||
|
|
|
|
|
|
|
| |||||||||
Net Decrease from Dividends and Distributions to Shareholders . | (5,113,218 | ) | (461,390 | ) | — | — | ||||||||||
|
|
|
|
|
|
|
| |||||||||
CAPITAL SHARE TRANSACTIONS | ||||||||||||||||
Proceeds from sale of shares | ||||||||||||||||
Class A | 270,672,136 | 5,581,764 | 45,578,881 | 88,260,849 | ||||||||||||
Class C | 78,065,409 | — | — | — | ||||||||||||
Class I | 1,088,751 | 50,161,102 | — | — | ||||||||||||
Dividends and distribution reinvestments | ||||||||||||||||
Class A | 2,349,682 | 16,590 | — | — | ||||||||||||
Class C | 545,408 | — | — | — | ||||||||||||
Class I | 942,488 | 437,607 | — | — | ||||||||||||
Cost of shares repurchased | ||||||||||||||||
Class A | (35,115,509 | ) | (285,716 | ) | (51,953,637 | ) | (84,487,252 | ) | ||||||||
Class C | (2,932,504 | ) | — | — | — | |||||||||||
Class I | (52,949,486 | ) | — | — | — | |||||||||||
|
|
|
|
|
|
|
| |||||||||
Net Increase (Decrease) in Net Assets from Capital Share Transactions | 262,666,375 | 55,911,347 | (6,374,756 | ) | 3,773,597 | |||||||||||
|
|
|
|
|
|
|
| |||||||||
NET INCREASE (DECREASE) IN NET ASSETS | 269,009,915 | 56,530,455 | (6,374,910 | ) | 3,773,597 | |||||||||||
|
|
|
|
|
|
|
| |||||||||
NET ASSETS | ||||||||||||||||
Beginning of Year or Period | 56,530,455 | — | 38,442,521 | 34,668,924 | ||||||||||||
|
|
|
|
|
|
|
| |||||||||
End of Year or Period | $ | 325,540,370 | $ | 56,530,455 | $ | 32,067,611 | $ | 38,442,521 | ||||||||
|
|
|
|
|
|
|
| |||||||||
Undistributed/Accumulated Net Investment Income (Loss) | $ | 49,246 | $ | 6,275 | ($ | 3,657 | ) | ($ | 3,699 | ) | ||||||
|
|
|
|
|
|
|
| |||||||||
| (1) | Operations commenced on December 31, 2010. |
See Notes to Financial Statements
C-7
Table of Contents
FINANCIAL HIGHLIGHTS
Selected per share, ratios and supplemental data for each year ended March 31 were as follows:
For the Year Ended | Net Asset Value, Beginning of Year | Net Investment Income (1) | Net Realized and Unrealized Gain (Loss) | Total from Investment Operations | Distributions from Net Investment Income | Distributions from Capital Gains | Total Distributions | Net Asset Value, End of Year | Total Returns (2) | Net Assets, End of Year (in thousands) | Ratios of Expenses Before Expense Reductions to Average Net Assets (3) | Ratios of Expenses After Expense Reductions to Average Net Assets (3), (4) | Ratios of Net Investment Income to Average Net Assets (3) | Portfolio Turnover Rates | ||||||||||||||||||||||||||||||||||||||||||
PL Portfolio Optimization Conservative Fund |
| |||||||||||||||||||||||||||||||||||||||||||||||||||||||
Class A: |
| |||||||||||||||||||||||||||||||||||||||||||||||||||||||
4/1/2011 - 3/31/2012 | $ | 10.87 | $ | 0.22 | $ | 0.29 | $ | 0.51 | ($ | 0.28 | ) | ($ | 0.03 | ) | ($ | 0.31 | ) | $ | 11.07 | 4.80 | % | $ | 182,912 | 0.73 | % | 0.60 | % | 1.99 | % | 10.20 | % | |||||||||||||||||||||||||
4/1/2010 - 3/31/2011 | 10.41 | 0.15 | 0.63 | 0.78 | (0.32 | ) | — | (0.32 | ) | 10.87 | 7.60 | % | 130,249 | 0.78 | % | 0.53 | % | 1.43 | % | 18.42 | % | |||||||||||||||||||||||||||||||||||
4/1/2009 - 3/31/2010 | 8.84 | 0.32 | 1.59 | 1.91 | (0.31 | ) | (0.03 | ) | (0.34 | ) | 10.41 | 21.67 | % | 68,938 | 0.95 | % | 0.20 | % | 3.20 | % | 20.50 | % | ||||||||||||||||||||||||||||||||||
4/1/2008 - 3/31/2009 | 10.55 | 0.37 | (1.50 | ) | (1.13 | ) | (0.55 | ) | (0.03 | ) | (0.58 | ) | 8.84 | (10.78 | %) | 32,817 | 0.95 | % | 0.16 | % | 3.91 | % | 26.41 | % | ||||||||||||||||||||||||||||||||
4/1/2007 - 3/31/2008 | 10.51 | 0.34 | 0.19 | 0.53 | (0.35 | ) | (0.14 | ) | (0.49 | ) | 10.55 | 5.15 | % | 24,003 | 0.94 | % | 0.00 | % | 3.20 | % | 43.30 | % | ||||||||||||||||||||||||||||||||||
Class B: | ||||||||||||||||||||||||||||||||||||||||||||||||||||||||
4/1/2011 - 3/31/2012 | $ | 10.78 | $ | 0.13 | $ | 0.29 | $ | 0.42 | ($ | 0.21 | ) | ($ | 0.03 | ) | ($ | 0.24 | ) | $ | 10.96 | 4.02 | % | $ | 33,122 | 1.48 | % | 1.35 | % | 1.24 | % | 10.20 | % | |||||||||||||||||||||||||
4/1/2010 - 3/31/2011 | 10.34 | 0.07 | 0.63 | 0.70 | (0.26 | ) | — | (0.26 | ) | 10.78 | 6.80 | % | 22,282 | 1.53 | % | 1.27 | % | 0.68 | % | 18.42 | % | |||||||||||||||||||||||||||||||||||
4/1/2009 - 3/31/2010 | 8.77 | 0.24 | 1.60 | 1.84 | (0.24 | ) | (0.03 | ) | (0.27 | ) | 10.34 | 21.07 | % | 13,336 | 1.70 | % | 0.95 | % | 2.45 | % | 20.50 | % | ||||||||||||||||||||||||||||||||||
4/1/2008 - 3/31/2009 | 10.49 | 0.30 | (1.50 | ) | (1.20 | ) | (0.49 | ) | (0.03 | ) | (0.52 | ) | 8.77 | (11.51 | %) | 8,306 | 1.70 | % | 0.91 | % | 3.16 | % | 26.41 | % | ||||||||||||||||||||||||||||||||
4/1/2007 - 3/31/2008 | 10.46 | 0.26 | 0.19 | 0.45 | (0.28 | ) | (0.14 | ) | (0.42 | ) | 10.49 | 4.42 | % | 4,895 | 1.69 | % | 0.75 | % | 2.45 | % | 43.30 | % | ||||||||||||||||||||||||||||||||||
Class C: | ||||||||||||||||||||||||||||||||||||||||||||||||||||||||
4/1/2011 - 3/31/2012 | $ | 10.77 | $ | 0.13 | $ | 0.30 | $ | 0.43 | ($ | 0.21 | ) | ($ | 0.03 | ) | ($ | 0.24 | ) | $ | 10.96 | 4.08 | % | $ | 158,748 | 1.48 | % | 1.35 | % | 1.24 | % | 10.20 | % | |||||||||||||||||||||||||
4/1/2010 - 3/31/2011 | 10.33 | 0.07 | 0.63 | 0.70 | (0.26 | ) | — | (0.26 | ) | 10.77 | 6.81 | % | 117,458 | 1.53 | % | 1.27 | % | 0.68 | % | 18.42 | % | |||||||||||||||||||||||||||||||||||
4/1/2009 - 3/31/2010 | 8.76 | 0.24 | 1.61 | 1.85 | (0.25 | ) | (0.03 | ) | (0.28 | ) | 10.33 | 21.14 | % | 67,620 | 1.70 | % | 0.95 | % | 2.45 | % | 20.50 | % | ||||||||||||||||||||||||||||||||||
4/1/2008 - 3/31/2009 | 10.49 | 0.30 | (1.51 | ) | (1.21 | ) | (0.49 | ) | (0.03 | ) | (0.52 | ) | 8.76 | (11.63 | %) | 37,659 | 1.70 | % | 0.91 | % | 3.16 | % | 26.41 | % | ||||||||||||||||||||||||||||||||
4/1/2007 - 3/31/2008 | 10.45 | 0.26 | 0.20 | 0.46 | (0.28 | ) | (0.14 | ) | (0.42 | ) | 10.49 | 4.48 | % | 25,841 | 1.69 | % | 0.75 | % | 2.45 | % | 43.30 | % | ||||||||||||||||||||||||||||||||||
Class R: | ||||||||||||||||||||||||||||||||||||||||||||||||||||||||
4/1/2011 - 3/31/2012 | $ | 10.83 | $ | 0.19 | $ | 0.29 | $ | 0.48 | ($ | 0.25 | ) | ($ | 0.03 | ) | ($ | 0.28 | ) | $ | 11.03 | 4.58 | % | $ | 10,522 | 0.98 | % | 0.85 | % | 1.74 | % | 10.20 | % | |||||||||||||||||||||||||
4/1/2010 - 3/31/2011 | 10.38 | 0.13 | 0.61 | 0.74 | (0.29 | ) | — | (0.29 | ) | 10.83 | 7.25 | % | 8,881 | 1.03 | % | 0.75 | % | 1.20 | % | 18.42 | % | |||||||||||||||||||||||||||||||||||
4/1/2009 - 3/31/2010 | 8.81 | 0.29 | 1.60 | 1.89 | (0.29 | ) | (0.03 | ) | (0.32 | ) | 10.38 | 21.53 | % | 7,972 | 1.20 | % | 0.45 | % | 2.95 | % | 20.50 | % | ||||||||||||||||||||||||||||||||||
4/1/2008 - 3/31/2009 | 10.53 | 0.34 | (1.50 | ) | (1.16 | ) | (0.53 | ) | (0.03 | ) | (0.56 | ) | 8.81 | (11.07 | %) | 3,197 | 1.20 | % | 0.41 | % | 3.66 | % | 26.41 | % | ||||||||||||||||||||||||||||||||
4/1/2007 - 3/31/2008 | 10.50 | 0.31 | 0.19 | 0.50 | (0.33 | ) | (0.14 | ) | (0.47 | ) | 10.53 | 4.90 | % | 1,629 | 1.19 | % | 0.25 | % | 2.95 | % | 43.30 | % | ||||||||||||||||||||||||||||||||||
PL Portfolio Optimization Moderate-Conservative Fund |
| |||||||||||||||||||||||||||||||||||||||||||||||||||||||
Class A: | ||||||||||||||||||||||||||||||||||||||||||||||||||||||||
4/1/2011 - 3/31/2012 | $ | 11.25 | $ | 0.18 | $ | 0.35 | $ | 0.53 | ($ | 0.22 | ) | $ | — | ($ | 0.22 | ) | $ | 11.56 | 4.87 | % | $ | 188,660 | 0.73 | % | 0.60 | % | 1.62 | % | 9.52 | % | ||||||||||||||||||||||||||
4/1/2010 - 3/31/2011 | 10.54 | 0.12 | 0.87 | 0.99 | (0.28 | ) | — | (0.28 | ) | 11.25 | 9.53 | % | 132,919 | 0.78 | % | 0.52 | % | 1.16 | % | 9.61 | % | |||||||||||||||||||||||||||||||||||
4/1/2009 - 3/31/2010 | 8.36 | 0.26 | 2.19 | 2.45 | (0.27 | ) | — | (0.27 | ) | 10.54 | 29.60 | % | 78,160 | 0.95 | % | 0.20 | % | 2.58 | % | 10.42 | % | |||||||||||||||||||||||||||||||||||
4/1/2008 - 3/31/2009 | 10.96 | 0.30 | (2.36 | ) | (2.06 | ) | (0.44 | ) | (0.10 | ) | (0.54 | ) | 8.36 | (19.15 | %) | 39,518 | 0.92 | % | 0.14 | % | 3.10 | % | 31.68 | % | ||||||||||||||||||||||||||||||||
4/1/2007 - 3/31/2008 | 11.21 | 0.28 | (0.01 | ) | 0.27 | (0.34 | ) | (0.18 | ) | (0.52 | ) | 10.96 | 2.31 | % | 50,389 | 0.82 | % | 0.00 | % | 2.50 | % | 10.38 | % | |||||||||||||||||||||||||||||||||
Class B: | ||||||||||||||||||||||||||||||||||||||||||||||||||||||||
4/1/2011 - 3/31/2012 | $ | 11.17 | $ | 0.10 | $ | 0.35 | $ | 0.45 | ($ | 0.16 | ) | $ | — | ($ | 0.16 | ) | $ | 11.46 | 4.07 | % | $ | 40,812 | 1.48 | % | 1.35 | % | 0.87 | % | 9.52 | % | ||||||||||||||||||||||||||
4/1/2010 - 3/31/2011 | 10.47 | 0.04 | 0.87 | 0.91 | (0.21 | ) | — | (0.21 | ) | 11.17 | 8.78 | % | 28,411 | 1.53 | % | 1.27 | % | 0.41 | % | 9.61 | % | |||||||||||||||||||||||||||||||||||
4/1/2009 - 3/31/2010 | 8.30 | 0.18 | 2.20 | 2.38 | (0.21 | ) | — | (0.21 | ) | 10.47 | 28.87 | % | 19,202 | 1.70 | % | 0.95 | % | 1.83 | % | 10.42 | % | |||||||||||||||||||||||||||||||||||
4/1/2008 - 3/31/2009 | 10.89 | 0.23 | (2.36 | ) | (2.13 | ) | (0.36 | ) | (0.10 | ) | (0.46 | ) | 8.30 | (19.85 | %) | 11,943 | 1.67 | % | 0.89 | % | 2.35 | % | 31.68 | % | ||||||||||||||||||||||||||||||||
4/1/2007 - 3/31/2008 | 11.15 | 0.20 | (0.02 | ) | 0.18 | (0.26 | ) | (0.18 | ) | (0.44 | ) | 10.89 | 1.53 | % | 15,092 | 1.57 | % | 0.75 | % | 1.75 | % | 10.38 | % | |||||||||||||||||||||||||||||||||
Class C: | ||||||||||||||||||||||||||||||||||||||||||||||||||||||||
4/1/2011 - 3/31/2012 | $ | 11.16 | $ | 0.10 | $ | 0.36 | $ | 0.46 | ($ | 0.15 | ) | $ | — | ($ | 0.15 | ) | $ | 11.47 | 4.20 | % | $ | 144,900 | 1.48 | % | 1.35 | % | 0.87 | % | 9.52 | % | ||||||||||||||||||||||||||
4/1/2010 - 3/31/2011 | 10.47 | 0.04 | 0.86 | 0.90 | (0.21 | ) | — | (0.21 | ) | 11.16 | 8.71 | % | 107,411 | 1.53 | % | 1.27 | % | 0.41 | % | 9.61 | % | |||||||||||||||||||||||||||||||||||
4/1/2009 - 3/31/2010 | 8.30 | 0.18 | 2.20 | 2.38 | (0.21 | ) | — | (0.21 | ) | 10.47 | 28.87 | % | 65,086 | 1.70 | % | 0.95 | % | 1.83 | % | 10.42 | % | |||||||||||||||||||||||||||||||||||
4/1/2008 - 3/31/2009 | 10.89 | 0.22 | (2.35 | ) | (2.13 | ) | (0.36 | ) | (0.10 | ) | (0.46 | ) | 8.30 | (19.84 | %) | 40,640 | 1.67 | % | 0.89 | % | 2.35 | % | 31.68 | % | ||||||||||||||||||||||||||||||||
4/1/2007 - 3/31/2008 | 11.16 | 0.20 | (0.02 | ) | 0.18 | (0.27 | ) | (0.18 | ) | (0.45 | ) | 10.89 | 1.51 | % | 48,205 | 1.57 | % | 0.75 | % | 1.75 | % | 10.38 | % | |||||||||||||||||||||||||||||||||
Class R: | ||||||||||||||||||||||||||||||||||||||||||||||||||||||||
4/1/2011 - 3/31/2012 | $ | 11.22 | $ | 0.15 | $ | 0.35 | $ | 0.50 | ($ | 0.20 | ) | $ | — | ($ | 0.20 | ) | $ | 11.52 | 4.53 | % | $ | 6,301 | 0.98 | % | 0.85 | % | 1.37 | % | 9.52 | % | ||||||||||||||||||||||||||
4/1/2010 - 3/31/2011 | 10.51 | 0.10 | 0.86 | 0.96 | (0.25 | ) | — | (0.25 | ) | 11.22 | 9.32 | % | 15,236 | 1.03 | % | 0.76 | % | 0.91 | % | 9.61 | % | |||||||||||||||||||||||||||||||||||
4/1/2009 - 3/31/2010 | 8.34 | 0.23 | 2.20 | 2.43 | (0.26 | ) | — | (0.26 | ) | 10.51 | 29.32 | % | 10,478 | 1.20 | % | 0.45 | % | 2.33 | % | 10.42 | % | |||||||||||||||||||||||||||||||||||
4/1/2008 - 3/31/2009 | 10.94 | 0.27 | (2.36 | ) | (2.09 | ) | (0.41 | ) | (0.10 | ) | (0.51 | ) | 8.34 | (19.36 | %) | 4,957 | 1.17 | % | 0.39 | % | 2.85 | % | 31.68 | % | ||||||||||||||||||||||||||||||||
4/1/2007 - 3/31/2008 | 11.20 | 0.25 | (0.01 | ) | 0.24 | (0.32 | ) | (0.18 | ) | (0.50 | ) | 10.94 | 2.03 | % | 3,031 | 1.07 | % | 0.25 | % | 2.25 | % | 10.38 | % | |||||||||||||||||||||||||||||||||
| See Notes to Financial Statements | See explanation of references on C-10 |
C-8
Table of Contents
PACIFIC LIFE FUNDS
FINANCIAL HIGHLIGHTS (Continued)
Selected per share, ratios and supplemental data for each year ended March 31 were as follows:
For the Year Ended | Net Asset Value, Beginning of Year | Net Investment Income (Loss) (1) | Net Realized and Unrealized Gain (Loss) | Total from Investment Operations | Distributions from Net Investment Income | Distributions from Capital Gains | Total Distributions | Net Asset Value, End of Year | Total Returns (2) | Net Assets, End of Year (in thousands) | Ratios of Expenses Before Expense Reductions to Average Net Assets (3) | Ratios of Expenses After Expense Reductions to Average Net Assets (3), (4) | Ratios of Net Investment Income (Loss) to Average Net Assets (3) | Portfolio Turnover Rates | ||||||||||||||||||||||||||||||||||||||||||
PL Portfolio Optimization Moderate Fund |
| |||||||||||||||||||||||||||||||||||||||||||||||||||||||
Class A: | ||||||||||||||||||||||||||||||||||||||||||||||||||||||||
4/1/2011 - 3/31/2012 | $ | 11.88 | $ | 0.14 | $ | 0.42 | $ | 0.56 | ($ | 0.18 | ) | $ | — | ($ | 0.18 | ) | $ | 12.26 | 4.82 | % | $ | 517,945 | 0.72 | % | 0.60 | % | 1.18 | % | 6.77 | % | ||||||||||||||||||||||||||
4/1/2010 - 3/31/2011 | 10.81 | 0.10 | 1.19 | 1.29 | (0.22 | ) | — | (0.22 | ) | 11.88 | 12.10 | % | 384,999 | 0.77 | % | 0.52 | % | 0.91 | % | 9.36 | % | |||||||||||||||||||||||||||||||||||
4/1/2009 - 3/31/2010 | 7.96 | 0.20 | 2.87 | 3.07 | (0.22 | ) | — | (0.22 | ) | 10.81 | 38.85 | % | 247,213 | 0.92 | % | 0.20 | % | 1.99 | % | 9.43 | % | |||||||||||||||||||||||||||||||||||
4/1/2008 - 3/31/2009 | 11.51 | 0.23 | (3.30 | ) | (3.07 | ) | (0.31 | ) | (0.17 | ) | (0.48 | ) | 7.96 | (27.25 | %) | 137,205 | 0.89 | % | 0.14 | % | 2.35 | % | 25.95 | % | ||||||||||||||||||||||||||||||||
4/1/2007 - 3/31/2008 | 12.08 | 0.23 | (0.17 | ) | 0.06 | (0.35 | ) | (0.28 | ) | (0.63 | ) | 11.51 | 0.28 | % | 192,707 | 0.78 | % | 0.00 | % | 1.90 | % | 5.01 | % | |||||||||||||||||||||||||||||||||
Class B: | ||||||||||||||||||||||||||||||||||||||||||||||||||||||||
4/1/2011 - 3/31/2012 | $ | 11.80 | $ | 0.05 | $ | 0.43 | $ | 0.48 | ($ | 0.10 | ) | $ | — | ($ | 0.10 | ) | $ | 12.18 | 4.13 | % | $ | 115,513 | 1.47 | % | 1.35 | % | 0.43 | % | 6.77 | % | ||||||||||||||||||||||||||
4/1/2010 - 3/31/2011 | 10.74 | 0.02 | 1.18 | 1.20 | (0.14 | ) | — | (0.14 | ) | 11.80 | 11.33 | % | 92,064 | 1.52 | % | 1.26 | % | 0.17 | % | 9.36 | % | |||||||||||||||||||||||||||||||||||
4/1/2009 - 3/31/2010 | 7.90 | 0.12 | 2.87 | 2.99 | (0.15 | ) | — | (0.15 | ) | 10.74 | 38.14 | % | 65,336 | 1.67 | % | 0.95 | % | 1.24 | % | 9.43 | % | |||||||||||||||||||||||||||||||||||
4/1/2008 - 3/31/2009 | 11.44 | 0.16 | (3.30 | ) | (3.14 | ) | (0.23 | ) | (0.17 | ) | (0.40 | ) | 7.90 | (27.95 | %) | 40,658 | 1.64 | % | 0.89 | % | 1.60 | % | 25.95 | % | ||||||||||||||||||||||||||||||||
4/1/2007 - 3/31/2008 | 12.02 | 0.14 | (0.17 | ) | (0.03 | ) | (0.27 | ) | (0.28 | ) | (0.55 | ) | 11.44 | (0.48 | %) | 56,387 | 1.53 | % | 0.75 | % | 1.15 | % | 5.01 | % | ||||||||||||||||||||||||||||||||
Class C: | ||||||||||||||||||||||||||||||||||||||||||||||||||||||||
4/1/2011 - 3/31/2012 | $ | 11.78 | $ | 0.05 | $ | 0.43 | $ | 0.48 | ($ | 0.09 | ) | $ | — | ($ | 0.09 | ) | $ | 12.17 | 4.18 | % | $ | 366,753 | 1.47 | % | 1.35 | % | 0.43 | % | 6.77 | % | ||||||||||||||||||||||||||
4/1/2010 - 3/31/2011 | 10.73 | 0.02 | 1.17 | 1.19 | (0.14 | ) | — | (0.14 | ) | 11.78 | 11.26 | % | 308,449 | 1.52 | % | 1.26 | % | 0.17 | % | 9.36 | % | |||||||||||||||||||||||||||||||||||
4/1/2009 - 3/31/2010 | 7.88 | 0.12 | 2.88 | 3.00 | (0.15 | ) | — | (0.15 | ) | 10.73 | 38.36 | % | 210,889 | 1.67 | % | 0.95 | % | 1.24 | % | 9.43 | % | |||||||||||||||||||||||||||||||||||
4/1/2008 - 3/31/2009 | 11.42 | 0.16 | (3.30 | ) | (3.14 | ) | (0.23 | ) | (0.17 | ) | (0.40 | ) | 7.88 | (28.02 | %) | 123,122 | 1.64 | % | 0.89 | % | 1.60 | % | 25.95 | % | ||||||||||||||||||||||||||||||||
4/1/2007 - 3/31/2008 | 12.00 | 0.14 | (0.17 | ) | (0.03 | ) | (0.27 | ) | (0.28 | ) | (0.55 | ) | 11.42 | (0.46 | %) | 180,421 | 1.53 | % | 0.75 | % | 1.15 | % | 5.01 | % | ||||||||||||||||||||||||||||||||
Class R: | ||||||||||||||||||||||||||||||||||||||||||||||||||||||||
4/1/2011 - 3/31/2012 | $ | 11.84 | $ | 0.11 | $ | 0.43 | $ | 0.54 | ($ | 0.14 | ) | $ | — | ($ | 0.14 | ) | $ | 12.24 | 4.67 | % | $ | 23,321 | 0.97 | % | 0.85 | % | 0.93 | % | 6.77 | % | ||||||||||||||||||||||||||
4/1/2010 - 3/31/2011 | 10.77 | 0.07 | 1.18 | 1.25 | (0.18 | ) | — | (0.18 | ) | 11.84 | 11.82 | % | 23,658 | 1.02 | % | 0.75 | % | 0.68 | % | 9.36 | % | |||||||||||||||||||||||||||||||||||
4/1/2009 - 3/31/2010 | 7.93 | 0.17 | 2.87 | 3.04 | (0.20 | ) | — | (0.20 | ) | 10.77 | 38.61 | % | 24,232 | 1.17 | % | 0.45 | % | 1.74 | % | 9.43 | % | |||||||||||||||||||||||||||||||||||
4/1/2008 - 3/31/2009 | 11.48 | 0.20 | (3.29 | ) | (3.09 | ) | (0.29 | ) | (0.17 | ) | (0.46 | ) | 7.93 | (27.48 | %) | 12,323 | 1.14 | % | 0.39 | % | 2.10 | % | 25.95 | % | ||||||||||||||||||||||||||||||||
4/1/2007 - 3/31/2008 | 12.06 | 0.20 | (0.17 | ) | 0.03 | (0.33 | ) | (0.28 | ) | (0.61 | ) | 11.48 | 0.05 | % | 7,754 | 1.03 | % | 0.25 | % | 1.65 | % | 5.01 | % | |||||||||||||||||||||||||||||||||
PL Portfolio Optimization Moderate-Aggressive Fund |
| |||||||||||||||||||||||||||||||||||||||||||||||||||||||
Class A: | ||||||||||||||||||||||||||||||||||||||||||||||||||||||||
4/1/2011 - 3/31/2012 | $ | 12.05 | $ | 0.10 | $ | 0.38 | $ | 0.48 | ($ | 0.12 | ) | $ | — | ($ | 0.12 | ) | $ | 12.41 | 4.13 | % | $ | 365,426 | 0.72 | % | 0.60 | % | 0.82 | % | 7.52 | % | ||||||||||||||||||||||||||
4/1/2010 - 3/31/2011 | 10.68 | 0.07 | 1.44 | 1.51 | (0.14 | ) | — | (0.14 | ) | 12.05 | 14.36 | % | 301,232 | 0.77 | % | 0.51 | % | 0.62 | % | 13.33 | % | |||||||||||||||||||||||||||||||||||
4/1/2009 - 3/31/2010 | 7.31 | 0.13 | 3.38 | 3.51 | (0.14 | ) | — | (0.14 | ) | 10.68 | 48.26 | % | 225,236 | 0.92 | % | 0.20 | % | 1.33 | % | 13.96 | % | |||||||||||||||||||||||||||||||||||
4/1/2008 - 3/31/2009 | 11.79 | 0.16 | (4.21 | ) | (4.05 | ) | (0.19 | ) | (0.24 | ) | (0.43 | ) | 7.31 | (35.15 | %) | 128,976 | 0.89 | % | 0.14 | % | 1.63 | % | 22.98 | % | ||||||||||||||||||||||||||||||||
4/1/2007 - 3/31/2008 | 12.74 | 0.17 | (0.41 | ) | (0.24 | ) | (0.33 | ) | (0.38 | ) | (0.71 | ) | 11.79 | (2.25 | %) | 203,091 | 0.78 | % | 0.00 | % | 1.30 | % | 5.05 | % | ||||||||||||||||||||||||||||||||
Class B: | ||||||||||||||||||||||||||||||||||||||||||||||||||||||||
4/1/2011 - 3/31/2012 | $ | 11.93 | $ | 0.01 | $ | 0.40 | $ | 0.41 | ($ | 0.04 | ) | $ | — | ($ | 0.04 | ) | $ | 12.30 | 3.50 | % | $ | 95,937 | 1.47 | % | 1.35 | % | 0.07 | % | 7.52 | % | ||||||||||||||||||||||||||
4/1/2010 - 3/31/2011 | 10.57 | (0.01 | ) | 1.43 | 1.42 | (0.06 | ) | — | (0.06 | ) | 11.93 | 13.59 | % | 83,812 | 1.52 | % | 1.26 | % | (0.13 | %) | 13.33 | % | ||||||||||||||||||||||||||||||||||
4/1/2009 - 3/31/2010 | 7.21 | 0.05 | 3.38 | 3.43 | (0.07 | ) | — | (0.07 | ) | 10.57 | 47.84 | % | 68,751 | 1.67 | % | 0.95 | % | 0.58 | % | 13.96 | % | |||||||||||||||||||||||||||||||||||
4/1/2008 - 3/31/2009 | 11.69 | 0.08 | (4.19 | ) | (4.11 | ) | (0.13 | ) | (0.24 | ) | (0.37 | ) | 7.21 | (35.97 | %) | 43,587 | 1.64 | % | 0.89 | % | 0.88 | % | 22.98 | % | ||||||||||||||||||||||||||||||||
4/1/2007 - 3/31/2008 | 12.67 | 0.07 | (0.41 | ) | (0.34 | ) | (0.26 | ) | (0.38 | ) | (0.64 | ) | 11.69 | (3.04 | %) | 68,162 | 1.53 | % | 0.75 | % | 0.55 | % | 5.05 | % | ||||||||||||||||||||||||||||||||
Class C: | ||||||||||||||||||||||||||||||||||||||||||||||||||||||||
4/1/2011 - 3/31/2012 | $ | 11.91 | $ | 0.01 | $ | 0.39 | $ | 0.40 | ($ | 0.04 | ) | $ | — | ($ | 0.04 | ) | $ | 12.27 | 3.39 | % | $ | 257,114 | 1.47 | % | 1.35 | % | 0.07 | % | 7.52 | % | ||||||||||||||||||||||||||
4/1/2010 - 3/31/2011 | 10.55 | (0.01 | ) | 1.43 | 1.42 | (0.06 | ) | — | (0.06 | ) | 11.91 | 13.64 | % | 230,964 | 1.52 | % | 1.26 | % | (0.13 | %) | 13.33 | % | ||||||||||||||||||||||||||||||||||
4/1/2009 - 3/31/2010 | 7.18 | 0.05 | 3.39 | 3.44 | (0.07 | ) | — | (0.07 | ) | 10.55 | 48.18 | % | 189,917 | 1.67 | % | 0.95 | % | 0.58 | % | 13.96 | % | |||||||||||||||||||||||||||||||||||
4/1/2008 - 3/31/2009 | 11.67 | 0.08 | (4.20 | ) | (4.12 | ) | (0.13 | ) | (0.24 | ) | (0.37 | ) | 7.18 | (36.12 | %) | 117,549 | 1.64 | % | 0.89 | % | 0.88 | % | 22.98 | % | ||||||||||||||||||||||||||||||||
4/1/2007 - 3/31/2008 | 12.65 | 0.07 | (0.41 | ) | (0.34 | ) | (0.26 | ) | (0.38 | ) | (0.64 | ) | 11.67 | (3.03 | %) | 184,634 | 1.53 | % | 0.75 | % | 0.55 | % | 5.05 | % | ||||||||||||||||||||||||||||||||
Class R: | ||||||||||||||||||||||||||||||||||||||||||||||||||||||||
4/1/2011 - 3/31/2012 | $ | 12.03 | $ | 0.07 | $ | 0.40 | $ | 0.47 | ($ | 0.10 | ) | $ | — | ($ | 0.10 | ) | $ | 12.40 | 3.97 | % | $ | 14,710 | 0.97 | % | 0.85 | % | 0.57 | % | 7.52 | % | ||||||||||||||||||||||||||
4/1/2010 - 3/31/2011 | 10.67 | 0.04 | 1.44 | 1.48 | (0.12 | ) | — | (0.12 | ) | 12.03 | 14.00 | % | 17,265 | 1.02 | % | 0.76 | % | 0.37 | % | 13.33 | % | |||||||||||||||||||||||||||||||||||
4/1/2009 - 3/31/2010 | 7.30 | 0.10 | 3.39 | 3.49 | (0.12 | ) | — | (0.12 | ) | 10.67 | 48.07 | % | 12,211 | 1.17 | % | 0.45 | % | 1.08 | % | 13.96 | % | |||||||||||||||||||||||||||||||||||
4/1/2008 - 3/31/2009 | 11.79 | 0.13 | (4.21 | ) | (4.08 | ) | (0.17 | ) | (0.24 | ) | (0.41 | ) | 7.30 | (35.38 | %) | 5,307 | 1.14 | % | 0.39 | % | 1.38 | % | 22.98 | % | ||||||||||||||||||||||||||||||||
4/1/2007 - 3/31/2008 | 12.74 | 0.13 | (0.39 | ) | (0.26 | ) | (0.31 | ) | (0.38 | ) | (0.69 | ) | 11.79 | (2.39 | %) | 3,147 | 1.03 | % | 0.25 | % | 1.05 | % | 5.05 | % | ||||||||||||||||||||||||||||||||
| See Notes to Financial Statements | See explanation of references on C-10 |
C-9
Table of Contents
PACIFIC LIFE FUNDS
FINANCIAL HIGHLIGHTS (Continued)
Selected per share, ratios and supplemental data for each year or period ended March 31 were as follows:
For the Year or | Net Asset Value, Beginning of Year or Period | Net Investment Income (Loss) (1) | Net Realized and Unrealized Gain (Loss) | Total from Investment Operations | Distributions from Net Investment Income | Distributions from Capital Gains | Total Distributions | Net Asset Value, End of Year or Period | Total Returns (2) | Net Assets, End of Year or Period (in thousands) | Ratios of Before Assets (3) | Ratios of After to Average Assets (3), (4) | Ratios of Net Investment Income (Loss) to Average Net Assets (3) | Portfolio | ||||||||||||||||||||||||||||||||||||
PL Portfolio Optimization Aggressive Fund | ||||||||||||||||||||||||||||||||||||||||||||||||||
Class A: | ||||||||||||||||||||||||||||||||||||||||||||||||||
| 4/1/2011 - 3/31/2012 | $ | 12.29 | $ | 0.06 | $ | 0.27 | $ | 0.33 | ($ | 0.06 | ) | $ | — | ($ | 0.06 | ) | $ | 12.56 | 2.73 | % | $ | 122,397 | 0.74% | 0.60% | 0.52 | % | 12.51% | |||||||||||||||||||||||
| 4/1/2010 - 3/31/2011 | 10.66 | 0.05 | 1.65 | 1.70 | (0.07 | ) | — | (0.07 | ) | 12.29 | 16.11 | % | 114,246 | 0.80% | 0.51% | 0.44 | % | 26.22% | ||||||||||||||||||||||||||||||||
| 4/1/2009 - 3/31/2010 | 6.92 | 0.09 | 3.75 | 3.84 | (0.10 | ) | — | (0.10 | ) | 10.66 | 55.84 | % | 98,669 | 0.94% | 0.20% | 0.94 | % | 25.89% | ||||||||||||||||||||||||||||||||
| 4/1/2008 - 3/31/2009 | 12.04 | 0.09 | (4.88 | ) | (4.79 | ) | — | (0.33 | ) | (0.33 | ) | 6.92 | (40.88 | %) | 59,937 | 0.92% | 0.14% | 0.97 | % | 18.16% | ||||||||||||||||||||||||||||||
| 4/1/2007 - 3/31/2008 | 13.49 | 0.08 | (0.77 | ) | (0.69 | ) | (0.33 | ) | (0.43 | ) | (0.76 | ) | 12.04 | (5.70 | %) | 96,230 | 0.80% | 0.00% | 0.62 | % | 9.66% | |||||||||||||||||||||||||||||
| Class B: | ||||||||||||||||||||||||||||||||||||||||||||||||||
| 4/1/2011 - 3/31/2012 | $ | 12.03 | ($ | 0.03 | ) | $ | 0.28 | $ | 0.25 | $ | — | $ | — | �� | $ | — | $ | 12.28 | 2.08 | % | $ | 31,969 | 1.49% | 1.35% | (0.23 | %) | 12.51% | |||||||||||||||||||||||
| 4/1/2010 - 3/31/2011 | 10.46 | (0.03 | ) | 1.65 | 1.62 | (0.05 | ) | — | (0.05 | ) | 12.03 | 15.62 | % | 30,693 | 1.55% | 1.25% | (0.31 | %) | 26.22% | |||||||||||||||||||||||||||||||
| 4/1/2009 - 3/31/2010 | 6.72 | 0.02 | 3.75 | 3.77 | (0.03 | ) | — | (0.03 | ) | 10.46 | 56.15 | % | 28,776 | 1.69% | 0.95% | 0.19 | % | 25.89% | ||||||||||||||||||||||||||||||||
| 4/1/2008 - 3/31/2009 | 11.93 | 0.02 | (4.90 | ) | (4.88 | ) | — | (0.33 | ) | (0.33 | ) | 6.72 | (42.04 | %) | 18,042 | 1.67% | 0.89% | 0.22 | % | 18.16% | ||||||||||||||||||||||||||||||
| 4/1/2007 - 3/31/2008 | 13.41 | (0.02 | ) | (0.78 | ) | (0.80 | ) | (0.25 | ) | (0.43 | ) | (0.68 | ) | 11.93 | (6.46 | %) | 30,059 | 1.55% | 0.75% | (0.13 | %) | 9.66% | ||||||||||||||||||||||||||||
| Class C: | ||||||||||||||||||||||||||||||||||||||||||||||||||
| 4/1/2011 - 3/31/2012 | $ | 12.03 | ($ | 0.03 | ) | $ | 0.28 | $ | 0.25 | $ | — | $ | — | $ | — | $ | 12.28 | 2.08 | % | $ | 76,613 | 1.49% | 1.35% | (0.23 | %) | 12.51% | ||||||||||||||||||||||||
| 4/1/2010 - 3/31/2011 | 10.46 | (0.03 | ) | 1.65 | 1.62 | (0.05 | ) | — | (0.05 | ) | 12.03 | 15.61 | % | 75,607 | 1.55% | 1.25% | (0.31 | %) | 26.22% | |||||||||||||||||||||||||||||||
| 4/1/2009 - 3/31/2010 | 6.71 | 0.02 | 3.75 | 3.77 | (0.02 | ) | — | (0.02 | ) | 10.46 | 56.11 | % | 68,230 | 1.69% | 0.95% | 0.19 | % | 25.89% | ||||||||||||||||||||||||||||||||
| 4/1/2008 - 3/31/2009 | 11.92 | 0.02 | (4.90 | ) | (4.88 | ) | — | (0.33 | ) | (0.33 | ) | 6.71 | (41.99 | %) | 43,588 | 1.67% | 0.89% | 0.22 | % | 18.16% | ||||||||||||||||||||||||||||||
| 4/1/2007 - 3/31/2008 | 13.40 | (0.02 | ) | (0.77 | ) | (0.79 | ) | (0.26 | ) | (0.43 | ) | (0.69 | ) | 11.92 | (6.44 | %) | 75,389 | 1.55% | 0.75% | (0.13 | %) | 9.66% | ||||||||||||||||||||||||||||
| Class R: | ||||||||||||||||||||||||||||||||||||||||||||||||||
| 4/1/2011 - 3/31/2012 | $ | 12.22 | $ | 0.03 | $ | 0.26 | $ | 0.29 | ($ | 0.03 | ) | $ | — | ($ | 0.03 | ) | $ | 12.48 | 2.43 | % | $ | 6,662 | 0.99% | 0.85% | 0.27 | % | 12.51% | |||||||||||||||||||||||
| 4/1/2010 - 3/31/2011 | 10.61 | 0.02 | 1.65 | 1.67 | (0.06 | ) | — | (0.06 | ) | 12.22 | 16.02 | % | 5,553 | 1.05% | 0.76% | 0.19 | % | 26.22% | ||||||||||||||||||||||||||||||||
| 4/1/2009 - 3/31/2010 | 6.88 | 0.06 | 3.76 | 3.82 | (0.09 | ) | — | (0.09 | ) | 10.61 | 55.70 | % | 4,448 | 1.19% | 0.45% | 0.69 | % | 25.89% | ||||||||||||||||||||||||||||||||
| 4/1/2008 - 3/31/2009 | 12.03 | 0.06 | (4.88 | ) | (4.82 | ) | — | (0.33 | ) | (0.33 | ) | 6.88 | (41.17 | %) | 2,106 | 1.17% | 0.39% | 0.72 | % | 18.16% | ||||||||||||||||||||||||||||||
| 4/1/2007 - 3/31/2008 | 13.49 | 0.05 | (0.77 | ) | (0.72 | ) | (0.31 | ) | (0.43 | ) | (0.74 | ) | 12.03 | (5.88 | %) | 1,236 | 1.05% | 0.25% | 0.37 | % | 9.66% | |||||||||||||||||||||||||||||
| PL Floating Rate Income Fund (5) | ||||||||||||||||||||||||||||||||||||||||||||||||||
| Class A: | ||||||||||||||||||||||||||||||||||||||||||||||||||
| 12/30/2011 - 3/31/2012 | $ | 9.81 | $ | 0.13 | $ | 0.24 | $ | 0.37 | ($ | 0.11 | ) | $ | — | ($ | 0.11 | ) | $ | 10.07 | 3.79 | % | $ | 12,071 | 1.55% | 1.05% | 5.33 | % | 139.00% | |||||||||||||||||||||||
| Class C: | ||||||||||||||||||||||||||||||||||||||||||||||||||
| 12/30/2011 - 3/31/2012 | $ | 9.81 | $ | 0.11 | $ | 0.25 | $ | 0.36 | ($ | 0.10 | ) | $ | — | ($ | 0.10 | ) | $ | 10.07 | 3.68 | % | $ | 3,372 | 2.30% | 1.80% | 4.61 | % | 139.00% | |||||||||||||||||||||||
| Class I: | ||||||||||||||||||||||||||||||||||||||||||||||||||
| 6/30/2011 - 3/31/2012 | $ | 10.00 | $ | 0.34 | $ | 0.06 | $ | 0.40 | ($ | 0.32 | ) | $ | — | ($ | 0.32 | ) | $ | 10.08 | 4.11 | % | $ | 41,834 | 1.24% | 0.80% | 4.60 | % | 139.00% | |||||||||||||||||||||||
| PL Income Fund | ||||||||||||||||||||||||||||||||||||||||||||||||||
| Class A: | ||||||||||||||||||||||||||||||||||||||||||||||||||
| 4/1/2011 - 3/31/2012 | $ | 10.16 | $ | 0.30 | $ | 0.48 | $ | 0.78 | ($ | 0.30 | ) | ($ | 0.03 | ) | ($ | 0.33 | ) | $ | 10.61 | 7.79 | % | $ | 247,522 | 1.35% | 0.90% | 2.94 | % | 199.30% | ||||||||||||||||||||||
| 12/31/2010 - 3/31/2011 | 10.00 | 0.09 | 0.16 | 0.25 | (0.09 | ) | — | (0.09 | ) | 10.16 | 2.46 | % | 5,300 | 1.77% | 0.90% | 3.62 | % | 142.25% | ||||||||||||||||||||||||||||||||
| Class C: | ||||||||||||||||||||||||||||||||||||||||||||||||||
| 6/30/2011 - 3/31/2012 (6) | $ | 10.32 | $ | 0.17 | $ | 0.33 | $ | 0.50 | ($ | 0.17 | ) | ($ | 0.03 | ) | ($ | 0.20 | ) | $ | 10.62 | 4.89 | % | $ | 76,726 | 2.07% | 1.65% | 2.17 | % | 199.30% | ||||||||||||||||||||||
| Class I: | ||||||||||||||||||||||||||||||||||||||||||||||||||
| 4/1/2011 - 3/31/2012 | $ | 10.16 | $ | 0.36 | $ | 0.44 | $ | 0.80 | ($ | 0.31 | ) | ($ | 0.03 | ) | ($ | 0.34 | ) | $ | 10.62 | 7.95 | % | $ | 1,292 | 0.95% | 0.65% | 3.42 | % | 199.30% | ||||||||||||||||||||||
| 12/31/2010 - 3/31/2011 | 10.00 | 0.10 | 0.15 | 0.25 | (0.09 | ) | — | (0.09 | ) | 10.16 | 2.48 | % | 51,231 | 1.37% | 0.65% | 3.87 | % | 142.25% | ||||||||||||||||||||||||||||||||
| PL Money Market Fund | ||||||||||||||||||||||||||||||||||||||||||||||||||
| Class A: | ||||||||||||||||||||||||||||||||||||||||||||||||||
| 4/1/2011 - 3/31/2012 | $ | 1.00 | ($ | 0.00 | )(7) | $ | 0.00 | (7) | $ | 0.00 | $ | — | $ | — | $ | — | $ | 1.00 | 0.00 | % | $ | 32,068 | 1.01% | 0.11% | (0.00 | %)(7) | N/A | |||||||||||||||||||||||
| 4/1/2010 - 3/31/2011 | 1.00 | (0.00 | )(7) | 0.00 | (7) | 0.00 | — | — | — | 1.00 | 0.00 | % | 38,443 | 1.00% | 0.24% | (0.00 | %)(7) | N/A | ||||||||||||||||||||||||||||||||
| 4/1/2009 - 3/31/2010 | 1.00 | (0.00 | )(7) | 0.00 | (7) | 0.00 | (0.00 | )(7) | — | (0.00 | )(7) | 1.00 | 0.03 | % | 34,669 | 1.09% | 0.36% | (0.00 | %)(7) | N/A | ||||||||||||||||||||||||||||||
| 4/1/2008 - 3/31/2009 | 1.00 | 0.01 | — | 0.01 | (0.01 | ) | — | (0.01 | ) | 1.00 | 1.27 | % | 55,424 | 1.18% | 0.78% | 1.22 | % | N/A | ||||||||||||||||||||||||||||||||
| 4/1/2007 - 3/31/2008 | 1.00 | 0.04 | — | 0.04 | (0.04 | ) | — | (0.04 | ) | 1.00 | 3.90 | % | 42,636 | 1.28% | 0.95% | 3.68 | % | N/A | ||||||||||||||||||||||||||||||||
| (1) | Net investment income (loss) per share has been calculated using the average shares method except for the PL Money Market Fund. |
| (2) | The total returns include reinvestment of all dividends and capital gain distributions, if any, and do not include deductions of any applicable sales charges. Total returns are not annualized for periods less than one full year. |
| (3) | The ratios are annualized for periods of less than one full year. |
| (4) | The ratios of expenses after expense reductions to average net assets are after any advisory fee waivers, adviser expense reimbursements, administration fee waivers, and service fee waivers, as discussed in Note 7B in Notes to Financial Statements. The expense ratios for all the PL Portfolio Optimization Funds do not include expenses of the underlying funds (see Note 1 in Notes to Financial Statements) in which the PL Portfolio Optimization Funds invest. |
| (5) | Class I shares of the PL Floating Rate Income Fund commenced operations on June 30, 2011 and Class A and Class C shares commenced operations on December 30, 2011. |
| (6) | Class C shares of the PL Income Fund commenced operations on June 30, 2011. |
| (7) | Amount represents less than $0.005 per share or less than 0.005%. |
See Notes to Financial Statements
C-10
Table of Contents
NOTES TO FINANCIAL STATEMENTS
1. ORGANIZATION
Pacific Life Funds (the “Trust”) is a Delaware statutory trust, which was formed on May 21, 2001, and is registered under the Investment Company Act of 1940 (“1940 Act”), as amended, as an open-end management investment company. Pacific Life Fund Advisors LLC (“PLFA” or “Adviser”) serves as investment adviser to the Trust. As of March 31, 2012, the Trust was comprised of twenty-eight separate funds, eight of which are presented in this report (each individually, a “Fund”, and collectively the “Funds”): PL Portfolio Optimization Conservative Fund, PL Portfolio Optimization Moderate-Conservative Fund, PL Portfolio Optimization Moderate Fund, PL Portfolio Optimization Moderate-Aggressive Fund, PL Portfolio Optimization Aggressive Fund (collectively, the “Portfolio Optimization Funds”); and the PL Floating Rate Income Fund, PL Income Fund and PL Money Market Fund.
The Portfolio Optimization Funds offer Class A, Class B, Class C and Class R shares. Each class is distinguished by its applicable sales charges and distribution and/or service fees and in general: (i) Class A shares are subject to a maximum 5.50% front-end sales charge; (ii) Class B shares are subject to a maximum 5.00% contingent deferred sales charge (“CDSC”); (iii) Class C shares are subject to a maximum 1.00% CDSC; and (iv) Class R shares are sold at net asset value (“NAV”) without an initial sales charge. The sales charge for Class A shares is reduced for purchases of $50,000 or more and may be waived in certain circumstances. There is no sales charge for Class A shares for purchases of $1 million or more, although there is a CDSC of 1.00% on redemptions of such Class A shares within one year of purchase.
The PL Floating Rate Income Fund and PL Income Fund offer Class A, Class C and Class I shares. Each class is distinguished by its level of distribution and/or service fees and in general: (i) Class A shares are subject to a maximum 3.00% front-end sales charge and 4.25% front-end sales charge, respectively; (ii) Class C shares are subject to a maximum 1.00% CDSC; and (iii) Class I shares are sold at NAV without an initial sales charge. The sales charge for Class A shares is reduced for purchases of $100,000 or more and may be waived in certain circumstances. There is no sales charge for Class A shares for purchases of $500,000 or more, although there is a CDSC of 1.00% of such Class A shares within one year of purchase.
The PL Money Market Fund offers Class A shares only, which are sold at NAV without an initial sales charge.
The Portfolio Optimization Funds invest their assets in Class P shares of other funds of the Trust (collectively, the “PL Underlying Funds”).
The annual report for the PL Underlying Funds is not included in this report; there is a separate annual report for the PL Underlying Funds, which is available without charge. For information on how to obtain the annual report for the PL Underlying Funds, see the Where to Go for More Information section of this report on page F-11.
2. SIGNIFICANT ACCOUNTING POLICIES
The financial statements have been prepared in conformity with accounting principles generally accepted in the United States of America (“U.S. GAAP”) for investment companies. In preparing the financial statements, management is required to make estimates and assumptions that affect the reported amounts of assets and liabilities and disclosure of contingent assets and liabilities at the date of the financial statements and the reported increases and decreases in net assets from operations during the reporting period. Actual results could differ from those estimates. The following is a summary of the significant accounting policies followed by the Trust in the preparation of the financial statements.
A. INVESTMENT TRANSACTIONS AND INCOME
Investment transactions are recorded on a trade date basis. Dividend income is recorded on the ex-dividend date. Interest income, adjusted for amortization of premium and accretion of discount, is recorded daily on an accrual basis. Facility fees and other fees (such as origination fees) received from senior loans purchased (see Note 4) by a Fund are amortized over the expected term of each applicable senior loan. Commitment fees received by a Fund relating to unfunded senior loan commitments are amortized to income over the period of the commitment. Consent fees, which are compensation for agreeing to changes in the terms of debt instruments, are included in interest income in the Statements of Operations when received. Realized gains and losses from investment transactions are recorded on the basis of identified cost, which is also used for Federal income tax purposes.
B. DISTRIBUTIONS TO SHAREHOLDERS
The Funds declare and pay dividends on net investment income at least annually, except for the PL Floating Rate Income Fund, PL Income Fund and PL Money Market Fund. Dividends, if any, are generally declared and paid monthly for the PL Floating Rate Income Fund and PL Income Fund and declared daily and paid monthly for the PL Money Market Fund. Dividends may be declared more or less frequently if advantageous to the specific Fund and its shareholders. All realized capital gains are distributed at least annually for each Fund. Dividends and distributions paid to shareholders are recorded on the ex-dividend date.
C. ALLOCATION OF INCOME, EXPENSES, GAINS AND LOSSES
Income, non-class specific expenses, and realized and unrealized gains and losses are allocated on a daily basis to each class of shares based upon the relative portion of net assets of each class. Certain Trust expenses directly attributable to a particular Fund are charged to that Fund (such as Fund-specific transactional fees, proxies, liquidations, litigation, and organizational/start-up costs) and class-specific fees and expenses are charged directly to the respective share class within each Fund. Generally other Fund expenses are allocated proportionately among all the Funds in relation to the net assets of each Fund.
D-1
Table of Contents
PACIFIC LIFE FUNDS
NOTES TO FINANCIAL STATEMENTS (Continued)
D. OFFERING COSTS
A new Fund bears all costs (or the applicable pro-rata share if there is more than one new Fund) associated with the offering expenses of the Fund including legal, printing and support services (see Notes 6 and 7A). All such costs are amortized as an expense of the new Fund on a straight-line basis over twelve months from commencement of operations.
E. RECENT ACCOUNTING PRONOUNCEMENTS
In April 2011, the Financial Accounting Standards Board (“FASB”) issued an Accounting Standards Update (“ASU”) related to accounting for repurchase agreements and similar agreements that both entitle and obligate a transferor to repurchase or redeem financial assets before their maturity. The ASU modifies the criteria for determining effective control of transferred assets and as a result certain agreements may now be accounted for as secured borrowings. The ASU is effective for interim and annual reporting periods beginning on or after December 15, 2011.
In May 2011, FASB issued an ASU to establish common requirements for measurement of and disclosure about fair value between U.S. GAAP and International Financial Reporting Standards (“IFRS”) to improve the comparability of fair value measurements presented and disclosed in financial statements prepared in accordance with both accounting standards. This update will require additional qualitative disclosures for fair value measurements categorized within Level 3 of the three-tier hierarchy (see Note 3C), as well as additional disclosures for all transfers in and out of Level 1 and Level 2. The ASU is effective for interim and annual reporting periods beginning after December 15, 2011.
In December 2011, FASB issued an ASU that requires disclosures to make financial statements that are prepared under U.S. GAAP more comparable to those prepared under IFRS. The new disclosure requirements mandate that entities disclose both gross and net information about instruments and transactions eligible for offset in the statement of assets and liabilities such as instruments and transactions subject to an agreement similar to a master netting arrangement. In addition, the ASU requires disclosure of collateral received and posted in connection with master netting agreements or similar arrangements. The ASU is effective for interim and annual reporting periods beginning on or after January 1, 2013.
Management is currently evaluating the impact, if any, that the implementation of these ASUs will have on the Trust’s financial statement disclosures.
3. INVESTMENT VALUATION AND FAIR VALUE MEASUREMENTS
A. NET ASSET VALUE
Each Fund is divided into shares. The price per share of each class of a Fund’s shares is called NAV. The NAV forms the basis for all transactions involving buying, selling, exchanging or reinvesting shares. Each Fund’s NAV is calculated by taking the total value of a Fund’s assets (the value of the securities and other investments a Fund holds), subtracting a Fund’s liabilities, and dividing by the total number of shares outstanding. The value of each security or other investment is the amount which a Fund might reasonably expect to receive for the investment upon its current sale in the ordinary course of business. The valuation of investments held by the Funds is discussed in further detail below.
Each Fund’s NAV is calculated once a day, every day the New York Stock Exchange (“NYSE”) is open, including days when foreign markets are closed. For purposes of calculating the NAV, the value of investments held by each Fund is generally determined as of the time of the close of the NYSE, which is usually 4:00 p.m. Eastern Time. Information that becomes known to the Trust or its agents after the NAV has been calculated on a particular day will not normally be used to retroactively adjust the price of an investment or the NAV determined earlier that day.
Each Fund’s NAV will not be calculated on days when the NYSE is closed. There may be a delay in calculating the NAV if: (i) the NYSE is closed on a day other than a regular holiday or weekend, (ii) trading on the NYSE is restricted, (iii) an emergency exists (as determined by the Securities and Exchange Commission (“SEC”)), making the sale of securities or other instruments or determinations of NAV not practicable, or (iv) the SEC permits a delay for the protection of shareholders.
B. INVESTMENT VALUATION
For purposes of calculating the NAV, the value of investments held by each Fund is based primarily on pricing data obtained from various sources approved by the Trust’s Board of Trustees (the “Board”).
Portfolio Optimization Funds
The investments of each Portfolio Optimization Fund consist of Class P shares of the PL Underlying Funds, which are valued at their respective NAV’s at the time of computation.
Money Market Instruments and Short-Term Investments
The investments of the PL Money Market Fund and money market and short-term investments in other Funds maturing within 60 days are valued at amortized cost in accordance with the 1940 Act. Amortized cost involves valuing an investment at cost on the date of acquisition and thereafter assuming a constant accretion of a discount or amortization of a premium to maturity, regardless of the impact of fluctuating interest rates on the market value of the instrument. While this method provides consistency in valuation (and may only be used if it approximates market value), it may result in periods during which value, as determined by amortized cost, is higher or lower than the price that would be received if the Fund sold the investment. Fund investments of other mutual funds for temporary cash purposes are valued at their respective NAVs.
| D-2 |
Table of Contents
PACIFIC LIFE FUNDS
NOTES TO FINANCIAL STATEMENTS (Continued)
Domestic and Foreign Fixed Income Investments
Fixed income investments of the PL Floating Rate Income Fund and PL Income Fund are generally valued by approved pricing and quotation services using the mean between the bid and ask prices which are based upon evaluated prices determined from various observable market and other factors. Certain bonds are valued by benchmark, matrix, or other pricing processes approved by the Board.
Investment Values Determined by a Trustee Valuation Committee or a Valuation Committee Approved by the Board
The Board has adopted procedures (“Trust Procedures”) that include methodologies approved for valuing investments in circumstances where market quotations are not readily available. In such circumstances, a Trustee Valuation Committee or other valuation committee will determine the value of such investments in accordance with alternative valuation methodologies under the Trust Procedures which may include, among others, the use of broker quotes, the use of a purchase price for initial public offerings, proration rates, and benchmark and matrix pricing. In the event market quotations or Board approved alternate valuation methodologies are not readily available or reliable, the value of the investments will be determined in good faith by a Trustee Valuation Committee or determined by a Board approved valuation committee and then subsequently approved by the Board. Valuations determined by a Trustee Valuation Committee or other valuation committee may require subjective inputs about the value of such investments. While these valuations are intended to estimate the value a Fund might reasonably expect to receive upon the current sale of the investments in the ordinary course of business, such values may differ from the value that a Fund would actually realize if the investments were sold.
Market quotes are considered not readily available if: (1) the market quotations received are deemed unreliable or inaccurate, (2) approved pricing services do not provide a valuation for a particular investment, or (3) material events occur after the close of the principal market for a particular investment but prior to the close of the NYSE.
C. FAIR VALUE MEASUREMENTS AND DISCLOSURES
The Trust characterizes its investments as Level 1, Level 2 or Level 3 based upon the various inputs or methodologies used to value the investments. The three-tier hierarchy of inputs is summarized in the three broad levels listed below:
| • | Level 1 - Quoted prices (unadjusted) in active markets for identical investments |
| • | Level 2 - Significant observable market-based inputs, other than Level 1 quoted prices, or unobservable inputs that are corroborated by market data |
| • | Level 3 - Significant unobservable inputs that are not corroborated by observable market data |
The inputs or methodologies used for valuing each Fund’s investments are not necessarily an indication of the risks associated with investing in those investments. For example, money market instruments are valued using amortized cost in accordance with the rules under the 1940 Act. Generally, amortized cost approximates the current fair value of an investment, but since the value is not obtained from a quoted price in an active market, such investments are reflected as Level 2. For fair valuations using significant unobservable inputs, the Trust presents a reconciliation of the beginning to ending balances for reported market values that presents changes attributable to total realized and unrealized gains or losses, purchase and sales, and transfers in and out of Level 3 during the period. Transfers in and out between levels are based on values at the end of the period. For the year or period ended March 31, 2012, there were no significant transfers between Level 1, Level 2, and Level 3 for any of the Funds covered in this report. A summary of each Fund’s investments as of March 31, 2012 as categorized under the three-tier hierarchy of inputs can be found in the Notes to Schedule of Investments section of each Fund’s Schedule of Investments.
The following is a description of valuation inputs and techniques that the Trust currently utilizes to fair value each major category of assets and liabilities:
Mutual Funds
Investments in mutual funds, including affiliated mutual funds, are valued at their respective NAV and are categorized as Level 1.
U.S. Treasury Obligations
U.S. Treasuries are fair valued based on pricing models that evaluate the mean between the most recently published bid and ask price. The models also take into consideration data received from active market makers and inter-dealer brokers, yield curves, and the spread over comparable U.S. Treasury issues. The spreads change daily in response to market conditions and are generally obtained from the new issue market and broker-dealer sources. To the extent that these inputs are observable and timely, the fair values of U.S. Treasury obligations would be categorized as Level 2; otherwise the fair values would be categorized as Level 3.
Corporate Bonds and Notes and U.S. Government & Agency Issues
Corporate bonds held by a Fund are generally comprised of two main categories: investment grade bonds and high yield bonds. Investment grade bonds are reported at fair value using various inputs and techniques, which include broker-dealer quotations, live trading levels, recently executed transactions in securities of the issuer or comparable issuers, issuer credit information and options adjusted spread models where applicable. Fair values for high yield bonds are based primarily on broker-dealer quotations from relevant market makers and recently executed transactions in securities of the issuer or comparable issuers. The broker-dealer quotations received are supported by credit analysis of the issuer that takes into consideration credit quality assessments, daily trading activity, and the activity of the underlying equities, listed bonds and sector-specific trends. To the extent that these inputs are observable and timely, the fair values of corporate bonds would be categorized as Level 2; otherwise the fair values would be categorized as Level 3.
| D-3 |
Table of Contents
PACIFIC LIFE FUNDS
NOTES TO FINANCIAL STATEMENTS (Continued)
U.S. Government & Agency Issues are reported at fair value using various inputs and techniques, which include broker-dealer quotations, live trading levels, recently executed transactions in securities of the issuer, issuer credit information, and options adjusted spread models where applicable. To the extent that these inputs are observable and timely, the fair values of U.S. Government & Agency Issues would be categorized as Level 2; otherwise the fair values would be categorized as Level 3.
Credit Default Swaps
Credit default swaps that are actively traded and cleared on a securities exchange are fair valued based on quoted prices from the applicable exchange, and to the extent valuation adjustments are not applied to these securities, they are categorized as Level 1. Credit default swaps traded over-the-counter are fair valued using pricing models that take into account, among other factors, information received from market makers and broker-dealers, default probabilities from index specific credit spread curves, recovery rates, and cash flows. To the extent that these inputs are observable and timely, the fair values of credit default swaps would be categorized as Level 2; otherwise the fair values would be categorized as Level 3.
Senior Loan Notes
Floating rate senior loans (“Senior Loans”) are fair valued based on a quoted price received from a single broker-dealer or an average of quoted prices received from multiple broker-dealers or valued relative to other benchmark securities when broker-dealer quotes are unavailable. To the extent that these inputs are observable, the fair values of Senior Loans would be categorized as Level 2; otherwise the fair values would be categorized as Level 3.
Short-Term Investments
Short-term investments maturing within 60 days are valued using amortized cost, which is used if it approximates market value, and are reflected as Level 2. Repurchase agreements are fully collateralized. The collateral is evaluated daily to ensure its market value equals or exceeds the current market value of the repurchase agreements including accrued interest.
4. INVESTMENTS AND RISKS
General Investment Risks
An investment in each Fund represents an indirect investment in the assets owned by that Fund. As with any mutual fund, the value of these investments may move up or down and as a result, an investment in a Fund at any point in time may be worth more or less than the original investment. Events in the financial markets have the potential to cause increased volatility and uncertainty, which may impact the value of each Fund’s investments. Due to interdependencies between markets, events in one market may adversely impact other markets or issuers in unforeseen ways. As a result, the value of a Fund’s investments may be adversely affected by events in the markets, either directly or indirectly, and each Fund is exposed to potential decreases in the value of those investments. In addition, traditionally liquid investments may experience periods of diminished liquidity. Governmental and regulatory responses to market events may impair the Adviser’s ability to pursue certain investment techniques or strategies and may have unexpected consequences on particular markets, strategies, or investments. Future events may impact a Fund in unforeseen ways, leading a Fund to alter its existing strategies or, potentially, to liquidate and close.
Fund of Funds Investments
The Portfolio Optimization Funds are exposed to the same risks as the PL Underlying Funds in direct proportion to the allocation of assets among those funds. The annual report for the PL Underlying Funds contains information about the risks associated with investing in the PL Underlying Funds. Allocations among the PL Underlying Funds are determined using an asset allocation process, which seeks to optimize returns by allocating among different asset classes given various levels of risk tolerance. The allocations of the Portfolio Optimization Funds may not effectively decrease risk or increase returns for investors, and the selection and weighting of allocations to asset classes and/or PL Underlying Funds may cause them to underperform other mutual funds with a similar investment objective. Although the Portfolio Optimization Funds seek to provide diversification across major asset classes, they may invest a significant portion of their assets in any one or several PL Underlying Funds (See Note 7C).
Equity Investments
The price of equity investments changes in response to many factors, including a company’s historical and prospective earnings, cash flows, the value of its assets, investor perceptions and many of the General Investment Risk factors noted above.
Fixed Income Investments
Fixed income (debt) investments are affected primarily by the financial condition of the companies or other entities that have issued them and by changes in interest rates, although the factors noted above may also have a significant impact on fixed income (debt) investments. There is a risk that an issuer of a Fund’s fixed income (debt) investments may not be able to meet its financial obligations (e.g., may not be able to make principal and/or interest payments when they are due or otherwise default on other financial terms) and/or go bankrupt. Securities such as high-yield/high-risk bonds, e.g. bonds with low credit ratings by Moody’s (Ba or lower) or Standard & Poor’s (BB and lower) or no rating, are especially subject to credit risk during periods of economic uncertainty or during economic downturns and are more likely to default on their interest and/or principal payments than higher rated securities. Certain asset-backed instruments, such as collateralized debt obligations, collateralized mortgage obligations and other mortgage related securities, structured investment vehicles and other debt investments may have exposure to subprime loans or subprime mortgages, which are loans to persons with lower credit ratings. These
| D-4 |
Table of Contents
PACIFIC LIFE FUNDS
NOTES TO FINANCIAL STATEMENTS (Continued)
instruments may present credit risk that is not transparent and that is greater than indicated by their ratings. The value of these instruments may be more acutely affected by downturns in the credit markets or the real estate market than certain other investments, and it may be difficult to value these instruments because of a thin secondary market.
Foreign Investments
There are certain additional risks involved in investing in foreign securities that are generally not inherent in investments in domestic securities. These risks may involve foreign currency fluctuations, adverse political, social and economic developments and the possible imposition of currency exchange blockages or other foreign governmental laws or restrictions. In addition, the securities of some foreign companies and securities markets are less liquid and at times more volatile than securities of comparable U.S. companies and U.S. securities markets. The markets in emerging markets countries can be extremely volatile. The foreign investments of the PL Money Market Fund must be denominated in U.S. dollars.
Illiquid Investments
Each Fund may not invest in illiquid securities and illiquid bank loans (collectively, “Illiquid Investments”) if as a result of such investment, more than 15% of its net assets (5% of total assets for the PL Money Market Fund), taken at market value at the time of such investment, would be invested in Illiquid Investments. The term “Illiquid Investments” for this purpose means investments that cannot be disposed of within seven days in the ordinary course of business at approximately the amount at which a Fund has valued the investments. Illiquid Investments may be difficult to value and difficult to sell, which means a Fund may not be able to sell such investments quickly for their full value. The value of Illiquid Investments held by each Fund as of March 31, 2012 was less than 15% of its net assets (5% of total assets for the PL Money Market Fund).
Senior Loan Participations and Assignments
Certain Funds may invest in Senior Loans, the interest rates of which float or adjust periodically based upon a specified adjustment schedule, benchmark indicator, or prevailing interest rates of domestic or foreign corporations, partnerships and other entities (“Borrowers”). Senior Loans generally pay interest at rates which are periodically redetermined by reference to a base lending rate plus a premium. These base lending rates generally include prime rates of one or more major U.S. banks, LIBOR rates or certificates of deposit rates. Senior Loans often require prepayments from excess cash flow or permit the borrower to repay at its election. The degree to which borrowers repay cannot be predicted with accuracy. As a result, the actual maturity may be substantially less than the stated maturities. Senior Loans are exempt from registration under the Securities Act of 1933, may contain certain restrictions on resale, and cannot be sold publicly. A Fund’s investments in Senior Loans may be in the form of participations in loans or assignments of all or a portion of loans from third parties.
When a Fund purchases assignments, it acquires all the rights and obligations under the loan agreement of the assigning lender. Assignments may, however, be arranged through private negotiations between potential assignees and potential assignors, and the rights and obligations acquired by the purchaser of an assignment may differ from, and be more limited than those held by the assigning lender.
When a Fund purchases a participation of a Senior Loan interest, the Fund typically enters into a contractual agreement with the lender or other third party selling the participation. A participation interest in Senior Loans includes the right to receive payments of principal, interest and any fees to which it is entitled from the lender and only upon receipt by the lender of payments from the Borrower, but not from the Borrower directly. When investing in a participation interest, if a Borrower is unable to meet its obligations under a loan agreement, a Fund generally has no right to enforce compliance with the terms of the loan agreement. As a result, the Fund assumes the credit risk of the Borrower, the selling participant, and any other persons that are interpositioned between the Fund and the Borrower. If the lead lender in a typical lending syndicate becomes insolvent, enters FDIC receivership or, if not FDIC insured, enters into bankruptcy, the Fund may incur certain costs and delays in receiving payment or may suffer a loss of principal and/or interest. As of March 31, 2012, no participation interest in Senior Loans was held by any of the Funds covered in this report.
U.S. Government Agencies or Government-Sponsored Enterprises
Certain Funds may invest in U.S. Government agencies or government-sponsored enterprises. U.S. Government securities are obligations of and, in certain cases, guaranteed by, the U.S. Government, its agencies or instrumentalities. The U.S. Government does not guarantee the NAV of the Funds’ shares. Some U.S. Government securities, such as Treasury bills, notes and bonds, and securities guaranteed by the Government National Mortgage Association (“GNMA” or “Ginnie Mae”), are supported by the full faith and credit of the United States Government; others, such as those of the Federal Home Loan Bank, are supported by the right of the issuer to borrow from the U.S. Department of the Treasury (the “U.S. Treasury”); others, such as those of the Federal National Mortgage Association (“FNMA” or “Fannie Mae”), are supported by the discretionary authority of the U.S. Government to purchase the agency’s obligations. Securities not backed by the full faith and credit of the United States Government may be subject to a greater risk of default. U.S. Government securities may include zero coupon securities, which do not distribute interest on a current basis and tend to be subject to greater risk than interest-paying securities of similar maturities.
Government-related guarantors (i.e., not backed by the full faith and credit of the United States Government) include FNMA and the Federal Home Loan Mortgage Corporation (“FHLMC” or “Freddie Mac”). FNMA is a government-sponsored corporation, the common stock of which is owned entirely by private stockholders. FNMA purchases conventional (i.e., not insured or guaranteed by any government agency) residential mortgages from a list of approved seller/servicers which include state and federally chartered savings and loan associations, mutual savings banks, commercial banks and credit unions and mortgage bankers. Pass-through securities issued by FNMA are guaranteed
| D-5 |
Table of Contents
PACIFIC LIFE FUNDS
NOTES TO FINANCIAL STATEMENTS (Continued)
as to timely payment of principal and interest by FNMA, but are not backed by the full faith and credit of the United States Government. FHLMC issues Participation Certificates (“PCs”), which are pass-through securities, each representing an undivided interest in a pool of residential mortgages. FHLMC guarantees the timely payment of interest and ultimate collection of principal, but PCs are not backed by the full faith and credit of the United States Government.
Segregation and Collateral
If a Fund engages in certain transactions such as derivative investments or repurchase agreements, it may require collateral in the form of cash or investments to be held in segregated accounts at the Trust’s custodian, with an exchange or clearing member firm, or segregated on the Trust’s books and records maintained by the custodian and/or the portfolio manager. In each instance that segregation of collateral is required, it is done so in accordance with the 1940 Act and/or any interpretive guidance issued by the SEC. There is a possibility that a Fund could experience a delay in selling investments that are segregated as collateral.
5. DERIVATIVE INVESTMENTS AND RISKS
A. PRINCIPAL MARKET RISKS MANAGED BY INVESTING IN DERIVATIVES
Derivative instruments are investments whose values are tied to the value of an underlying security or asset, a group of assets, interest rates, exchange rates, currency or an index. Certain Funds are permitted to invest in derivative instruments, including, but not limited to, futures contracts, options contracts, forward foreign currency contracts, interest rate swaps, and credit default swaps. Derivatives may have little or no initial cash investment value relative to their market value exposure and therefore can produce significant gains or losses in excess of their cost. This is sometimes referred to as leverage. Leverage can magnify a Fund’s gains and losses and therefore increase its volatility. A Fund’s investments in derivatives may increase, decrease or change the level or types of exposure to certain risk factors. The primary risks a Fund may attempt to manage through investing in derivative instruments include, but are not limited to, interest rate, foreign investments and currency, price volatility, and credit (including counterparty) risks.
Interest rate risk - A Fund may be exposed to interest rate risk through investments in fixed income securities. Interest rate risk is the risk that fixed income securities will decline in value as a result of changes in interest rates. For example, the value of bonds, fixed rate loans and short-term money market instruments may decline in value when interest rates rise. Fixed income securities with longer durations tend to be more sensitive to changes in interest rates, making them more volatile than fixed income securities with shorter durations or money market instruments. Therefore, duration is a potentially useful tool to measure the sensitivity of a fixed income security’s yield (market price to interest rate movement). To manage these risks, certain Funds may invest in derivative instruments tied to interest rates.
Foreign investments and currency risk - A Fund may be exposed to foreign investments and/or currency risk through direct investment in securities or through options, futures or currency transactions. The prices of foreign securities that are denominated in foreign currencies are affected by the value of the U.S. dollar. With respect to securities denominated in foreign currencies, in general, as the value of the U.S. dollar rises, the U.S. dollar price of a foreign security will fall. As the value of the U.S. dollar falls, the U.S. dollar value of the foreign security will rise. Currency rates in foreign countries may fluctuate significantly over short periods of time for a number of reasons. Foreign investments may be riskier than U.S. investments for many reasons, including changes in currency exchange rates, unstable political and economic conditions, a lack of adequate and timely company information, differences in the way securities markets operate, relatively lower market liquidity, less stringent financial reporting and accounting guidance and controls, less secure foreign banks or securities depositories than those in the U.S., foreign taxation issues and foreign controls on investments. As a result, a Fund’s investments in foreign currency denominated securities and other foreign investments may reduce the returns of the Fund. To manage these risks, certain Funds may invest in derivative instruments tied to foreign investments and currencies.
Price volatility risk - Derivatives tied to equity and fixed income securities are exposed to potential price volatility. Fixed income securities are affected by many factors, including prevailing interest rates, market conditions and market liquidity. Volatility of below investment grade fixed income securities (including loans) may be relatively greater than for investment grade fixed income securities. Equity securities tend to go up or down in value, sometimes rapidly and unpredictably. The prices of equity securities change in response to many factors, including a company’s historical and prospective earnings, the value of its assets, general economic conditions, interest rates, investor perceptions and market liquidity. Due to the complexities of markets, events in one market or sector may adversely impact other markets or sectors.
To manage these risks, certain Funds may invest in various derivative instruments. Derivative instruments may be used to manage a Fund’s exposure to price volatility risk but may also be subject to greater price volatility than investments in traditional securities. The value of commodity-linked derivative instruments may be affected by changes in overall market movements, commodity index volatility, changes in interest rates, or factors affecting a particular industry or commodity, such as drought, floods, weather, livestock disease, embargoes, tariffs and international economic, political and regulatory developments.
Credit and Counterparty risk - Credit risk is the risk that a fixed income security’s issuer (or borrower or counterparty) will be unable or unwilling to meet its financial obligations (e.g. may not be able to make principal and/or interest payments when they are due or otherwise default on other financial terms) and/or may go bankrupt. This is also sometimes described as counterparty risk. A Fund may lose money if the issuer or guarantor of fixed income security, or counterparty of a derivative contract, repurchase or reverse repurchase agreement, or a loan of Fund securities, is unable or unwilling to make timely principal and/or interest payments, or to otherwise honor its obligations. A Fund may attempt to minimize concentrations of credit risk by undertaking transactions with a large number of borrowers or counterparties on recognized and reputable exchanges. A Fund’s investments in fixed income (debt) investments may range in quality from those rated in the
| D-6 |
Table of Contents
PACIFIC LIFE FUNDS
NOTES TO FINANCIAL STATEMENTS (Continued)
lowest category in which it is permitted to invest to those rated in the highest category by a rating agency, or if unrated, determined by the manager to be of comparable quality.
Similar to credit risk, a Fund may be exposed to counterparty risk, or the risk that an institution or other entity with which a Fund has unsettled or open transactions will default. Financial assets of counterparties, which potentially expose a Fund to counterparty risk, consist mainly of cash due from counterparties and investments. Certain managers may attempt to minimize credit risks to a Fund by performing extensive reviews of each counterparty, entering into transactions with counterparties that the manager believes to be creditworthy at the time of the transaction and requiring the posting of collateral in applicable transactions. To manage these risks, certain Funds may invest in derivative instruments tied to a security issuers’ financial strength.
A Fund’s transactions in listed securities are settled/paid for upon delivery with their counterparties. Therefore, the risk of counterparty default for listed securities is considered minimal, as delivery of securities sold is only made once a Fund has received payment. Payment is made on a purchase once the securities have been delivered by the counterparty. The trade will fail if either party fails to meet its obligations.
Credit Related Contingent Features
Certain Funds are parties to various agreements, including but not limited to International Swaps and Derivatives Agreements, Master Repurchase Agreements, and Master Securities Forward Transactions Agreements (collectively “Master Agreements”), which govern the terms of certain transactions with select counterparties. These Master Agreements generally include provisions for general obligations, representations, agreements, collateral and certain events of default or termination, such as credit related contingent features. These provisions reduce the counterparty risk associated with relevant transactions by allowing a Fund or its counterparties to elect to terminate early and cause settlement of all outstanding transactions if a triggering event occurs under the applicable Master Agreement. These triggering events include, but are not limited to, bankruptcy, failure to make timely payments, restructuring, obligation acceleration, obligation default, a material decline in net assets, decline in credit rating or repudiation/moratorium. Thus, if a credit related contingent feature is triggered, it would allow a Fund or its counterparty to close out all transactions under the agreement and demand payment or additional collateral to cover their exposure to the other counterparty. Any election made by a counterparty to early terminate a transaction could have a material adverse impact on a Fund’s financial statements. To reduce credit and counterparty risk associated with transactions, a Fund may enter into master netting arrangements to the extent that if an event of default occurs, all amounts with the counterparty are terminated and settled on a net basis. A Fund’s overall exposure to credit risk, subject to master netting arrangements, can change substantially within a short period, as it is affected by each transaction subject to the arrangement.
B. DERIVATIVE INVESTMENTS
In addition to managing the market risks described above, certain Funds, if permitted by their investment objectives, may also invest in derivatives for purposes of hedging, duration management, as a substitute for securities, to increase returns, or to otherwise help achieve a Fund’s investment goal. Each derivative instrument and the reasons the Funds invested in derivatives during the reporting period are discussed in further detail below.
Swaps Agreements - Swaps are privately negotiated agreements between the Funds and their counterparties to exchange cash flows, assets, foreign currencies or market-linked returns at specified intervals and may be executed in the over-the-counter market or in a multilateral or other trade facility platform, such as a registered commodities exchange (“centrally cleared swaps”). In connection with these agreements, securities may be identified as collateral in accordance with the terms of the respective swap agreements to provide assets of value and recourse in the event of default or bankruptcy/insolvency. Swaps are marked-to-market daily based upon values received from third party vendors or quotations from market makers. Market values greater than zero are recorded as an asset and market values less than zero are recorded as a liability on the Statements of Assets and Liabilities. The change in value of swaps, including accruals of periodic amounts of interest to be paid or received on swaps, is recorded as unrealized appreciation or depreciation in the Statements of Operations. Daily changes in valuation of centrally cleared swaps, if any, are recorded as variation margin receivable or payable on the Statements of Assets and Liabilities. Payments received or made at the beginning of the measurement period are reflected as such in the Statements of Assets and Liabilities and represent payments made or received upon entering into the swap agreement to compensate for differences between the stated terms of the swap agreement and prevailing market conditions (credit spreads, currency exchange rates, interest rates, and other relevant factors). These upfront payments are included in the calculation of realized gain or loss in the Statements of Operations, when the swap is closed. A liquidation payment received or made at the termination of the swap is recorded as realized gain or loss in the Statements of Operations. Net periodic payments received by a Fund are included as part of realized gain or loss in the Statements of Operations.
Credit Default Swaps - Credit default swap agreements involve one party making a stream of payments (referred to as the buyer of protection) to another party (the seller of protection) in exchange for the right to receive a specified return in the event of a default or other credit event for the referenced entity, obligation or index. As a seller of protection, a Fund generally receives an upfront payment or a fixed rate of income throughout the term of the swap provided there is no credit event. As the seller, a Fund would effectively add leverage to its Fund because, in addition to its total net assets, a Fund would be subject to investment exposure on the notional amount of the swap.
A Fund investing in credit default swaps is subject to the risk that there is no liquid market for these agreements, that the counterparties may default on their obligations to perform or disagree as to the meaning of the contractual terms in the agreements, or that there may be unfavorable changes in interest rates.
| D-7 |
Table of Contents
PACIFIC LIFE FUNDS
NOTES TO FINANCIAL STATEMENTS (Continued)
If a Fund is a seller of protection and a credit event occurs, as defined under the terms of that particular swap agreement, a Fund will either (i) pay to the buyer of protection an amount equal to the notional amount of the swap and take delivery of the referenced obligation, other deliverable obligations or underlying securities comprising the referenced index or (ii) pay a net settlement amount in the form of cash or securities equal to the notional amount of the swap less the recovery value of the referenced obligation or underlying securities comprising the referenced index. If a Fund is a buyer of protection and a credit event occurs, as defined under the terms of that particular swap agreement, a Fund will either (i) receive from the seller of protection an amount equal to the notional amount of the swap and deliver the referenced obligation, other deliverable obligations or underlying securities comprising the referenced index or (ii) receive a net settlement amount in the form of cash or securities equal to the notional amount of the swap less the recovery value of the referenced obligation or underlying securities comprising the referenced index. Recovery values are assumed by market makers considering either industry standard recovery rates or entity specific factors and considerations until a credit event occurs. If a credit event has occurred, the recovery value is determined by a facilitated auction whereby a minimum number of allowable broker bids, together with a specified valuation method, are used to calculate the settlement value.
Credit default swap agreements on credit indices involve one party making a stream of payments to another party in exchange for the right to receive a specified return in the event of a write-down, principal shortfall, interest shortfall or default of all or part of the referenced entities comprising the credit index. Credit default swap on indices are benchmarks for protecting investors owning bonds against default. A credit index is a list of a basket of credit instruments or exposures designed to be representative of some part of the credit market as a whole. These indices are made up of reference credits that are judged by a poll of dealers to be the most liquid entities in the credit default swap market based on the sector of the index. Components of the indices may include, but are not limited to, investment grade securities, high yield securities, asset-backed securities, emerging markets, and/or various credit ratings within each sector. Credit indices are traded using credit default swaps with standardized terms including a fixed spread and standard maturity dates. An index credit default swap references all the names in the index, and if there is a default, the credit event is settled based on that name’s weight in the index. The composition of the indices changes periodically, usually every six months, and for most indices, each name has an equal weight in the index. A Fund may use credit default swaps on credit indices to hedge a Fund of credit default swaps or bonds with a credit default swap on indices which is less expensive than it would be to buy many credit default swaps to achieve a similar effect.
An implied credit spread is the spread in yield between a U.S. Treasury security and the referenced obligation or underlying investment that are identical in all respects except for the quality rating. Wider credit spreads, in absolute terms when compared to the notional amount of the swap, represent a deterioration of the referenced entity’s credit soundness and a greater likelihood or risk of default or other credit event occurring as defined under the terms of the agreement. Implied credit spreads, represented in absolute terms, utilized in determining the market value of credit default swap agreements on corporate issues or sovereign issues of an emerging country as of period end, are disclosed in the Notes to Schedules of Investments and serve as an indicator of the current status of the payment/performance risk and represent the likelihood or risk of default for the credit derivative. The implied credit spread of a particular referenced entity reflects the cost of buying/selling protection and may include upfront payments required to be made to enter into the agreement. For credit default swap agreements on asset-backed securities and credit indices, the quoted market prices and resulting values serve as the indicator of the current status of the payment/performance risk.
A Fund may use pair trades of credit default swaps. Pair trades attempt to match a long position with a short position of two securities in the same market sector for hedging purposes. Pair trades of credit default swaps attempt to gain exposure to credit risk while hedging or offsetting the effects of overall market movements. For example, a Fund may purchase protection through a credit default swap referenced to the debt of an issuer, and simultaneously selling protection through a credit default swap referenced to the debt of a different issuer with the intent to realize gains from the pricing differences of the two issuers who are expected to have similar market risks.
A Fund may use spread curve trades by simultaneously purchasing and selling protection through credit default swaps referenced to the same issuer but with different maturities. Spread curves attempt to gain exposure to credit risk on a forward basis by realizing gains on the expected differences in spreads.
A Fund’s maximum risk of loss from counterparty credit risk related to credit default swaps, either as the buyer or seller of protection, is the fair value of the contract. The risk may be mitigated to some extent if a master netting arrangement between a Fund and the counterparty is in place and to the extent a Fund obtains collateral to cover the Fund’s exposure to the counterparty.
During the reporting period, PL Floating Rate Income Fund entered into index based credit default swaps as a substitute for securities in order to gain broad exposure to the bank loan markets and all swap agreements were terminated prior to March 31, 2012. The amount of net realized loss of $43,819 on swap transactions during the period ended March 31, 2012 disclosed as net realized loss on swap transactions in the Statement of Operations serves as an indicator of the volume of derivative activity for the PL Floating Rate Income Fund. None of the other Funds covered in this report invested in derivative instruments during the year ended March 31, 2012.
The Trust records its derivative investments, if any, at fair value, which are not accounted for as hedging investments under U.S. GAAP.
6. INVESTMENT ADVISORY, ADMINISTRATION AND SHAREHOLDER SERVICES, SUPPORT SERVICES AND DISTRIBUTION AGREEMENTS
Pursuant to an Investment Advisory Agreement, PLFA, a wholly-owned subsidiary of Pacific Life Insurance Company (“Pacific Life”), serves as investment adviser to the Trust. PLFA manages the Portfolio Optimization Funds. PLFA manages the PL Floating Rate Income
| D-8 |
Table of Contents
PACIFIC LIFE FUNDS
NOTES TO FINANCIAL STATEMENTS (Continued)
Fund, PL Income Fund and PL Money Market Fund under the name Pacific Asset Management. PLFA receives advisory fees from each Fund based on the following advisory fee rates, which are based on an annual percentage of average daily net assets of each Fund:
PL Portfolio Optimization Conservative | 0.20 | % | PL Portfolio Optimization Aggressive | 0.20 | % | |||||
PL Portfolio Optimization Moderate-Conservative | 0.20 | % | PL Floating Rate Income Fund | 0.65 | % | |||||
PL Portfolio Optimization Moderate | 0.20 | % | PL Income Fund | 0.50 | % | |||||
PL Portfolio Optimization Moderate-Aggressive | 0.20 | % | PL Money Market | See | (1) |
| (1) | An annual rate of 0.20% of the first $250 million of the average daily net assets, 0.15% of the next $250 million, and 0.10% in excess of $500 million. |
Pursuant to an Administration and Shareholder Services Agreement (the “Administration Agreement”), Pacific Life serves as administrator (the “Administrator”) to the Trust. During the reporting period, the Trust paid the Administrator an administration fee at an annual rate of 0.15% for each of the Portfolio Optimization Funds (which invest in the PL Underlying Funds that also have an administration fee at an annual rate of 0.15%) and 0.30% for the PL Money Market Fund. The Trust also compensated the Administrator at an annual rate of 0.30% for Class A and Class C shares and 0.15% for Class I shares of the PL Floating Rate Income Fund and PL Income Fund. The administration fee is for procuring or providing administrative, transfer agency, and shareholder services. In addition, Pacific Life and PLFA provide support services to the Trust that are outside the scope of the Administrator’s and Adviser’s responsibilities under the Administration Agreement and Investment Advisory Agreement. Under the Support Services Agreement, the Trust compensated Pacific Life and PLFA for their expenses in providing support services to the Trust in connection with various matters, some of which include the time spent by legal, accounting, and compliance personnel of PLFA (including individuals who may be officers or Trustees of the Trust), to attend meetings of the Board and to provide assistance with the coordination and supervision in connection with the services procured for the Trust under the Administration Agreement. The Trust reimbursed Pacific Life and PLFA for these support services on an approximate cost basis.
Pursuant to a Distribution Agreement, Pacific Select Distributors, Inc. (the “Distributor”), a wholly owned subsidiary of Pacific Life, serves as distributor of the Trust’s shares. The Distributor bears all expenses of providing services, including costs of sales presentations, mailings, advertisements, and other marketing efforts by the Distributor in connection with the distribution or sale of the Trust’s shares and makes distribution and/or service payments to selling groups in connection with the sale of certain of the Trust’s shares and subsequent servicing needs of shareholders provided by selling groups. The Distributor received distribution and service fees pursuant to class-specific distribution and service plans, each adopted in accordance with Rule 12b-1 under the 1940 Act (together the “12b-1 Plans”) for Class B, C and R shares. The Distributor also received service fees pursuant to a Class A Service Plan (“Class A Plan”), which is not a plan adopted in accordance with Rule 12b-1 under the 1940 Act. Under the 12b-1 Plans, each Fund paid to the Distributor both distribution and service fees at an annual rate expressed as a percentage of average daily net assets. The distribution fee was 0.75% for Class B and C shares and 0.25% for R shares. The service fee was 0.25% for Class B, C, and R shares. Under the Class A Plan, each Fund paid the Distributor service fees at an annual rate of 0.25% of the average daily net assets attributable to Class A shares. There are no distribution and service fees for Class I shares. The distribution and service fees were accrued daily. For the year ended March 31, 2012, the Distributor, acting as underwriter, received net commissions (upfront sales charges) of $20,829,227 from the sale of Class A shares and received $907,653 in CDSC from redemptions of Class A, B and C shares.
7. TRANSACTIONS WITH AFFILIATES
A. ADVISORY FEES, ADMINISTRATION FEES, DISTRIBUTION AND SERVICE FEES AND EXPENSES FOR SUPPORT SERVICES
The Adviser, the Distributor and Pacific Life are related parties. The advisory fees payable to the Adviser, the administration fees payable to Pacific Life, the distribution and service fees payable to the Distributor, including any fee waivers, and expenses for support services payable to PLFA and Pacific Life (see Note 6) by each Fund covered in this report for the year or period ended March 31, 2012 are presented in the Statements of Operations. The amounts of each of these fees that remained payable as of March 31, 2012 are presented in the Statements of Assets and Liabilities.
B. EXPENSE LIMITATION AGREEMENTS
To help limit the Trust’s expenses, PLFA has entered into expense limitation agreements with the Trust and has contractually agreed to reduce its fees or otherwise reimburse each Fund for certain operating expenses that exceed an annual rate based on a percentage of a Fund’s average daily net assets. These operating expenses include, but are not limited to, administration fees, organizational expenses, custody expenses, expenses for audit, tax and certain legal services, preparation, printing, filing and distribution to existing shareholders of proxies, prospectuses and shareholder reports and other regulatory documents as applicable, independent trustees’ fees and establishing, overseeing and administering the Trust’s compliance program. These operating expenses do not include investment advisory fees; distribution and/or service fees; interest; taxes (including foreign taxes on dividends, interest or gains); brokerage commissions and other transactional expenses; dividends on securities sold short; acquired fund fees and expenses; and extraordinary expenses such as litigation expenses and
| D-9 |
Table of Contents
PACIFIC LIFE FUNDS
NOTES TO FINANCIAL STATEMENTS (Continued)
other expenses not incurred in the ordinary course of each Fund’s business. The current expense cap for each Portfolio Optimization Fund is 0.15% through June 30, 2014 and 0.30% from July 1, 2014 through June 30, 2021. The current expense cap for the PL Floating Rate Income Fund and the PL Income Fund is 0.15% through June 30, 2014. The current expense cap for the PL Money Market Fund is 0.30% through June 30, 2012. There is no guarantee that PLFA will continue to reimburse expenses upon the expiration of the applicable expense caps.
Any expense reimbursements are subject to repayment to PLFA for a period of time as permitted under regulatory and/or accounting guidance (currently 3 years from the end of the fiscal year in which the reimbursement or reduction took place) to the extent such expenses fall below the current expense cap in future years. Any amounts repaid to PLFA will have the effect of increasing such expenses of the Fund, but not above the expense cap. There was no recoupment of expense reimbursement by PLFA from any Funds covered in this report during the year or period ended March 31, 2012.
For the PL Money Market Fund, in addition to the above expense cap, PLFA, the Administrator and/or the Distributor have agreed, temporarily, to waive a portion of their fees, to the extent necessary to prevent the Fund’s expenses from exceeding earnings (i.e., to prevent the Fund from having a negative yield). However, there can be no assurance that a negative yield will not occur. Any fee waivers for the PL Money Market Fund are not subject to repayment to PLFA, the Administrator and/or the Distributor. There is no guarantee that PLFA, the Administrator, and/or the Distributor will continue to waive a portion of their fees in the future.
The investment adviser expense reimbursement, the advisory fee waiver, the administration fee waiver, and the service fee waiver, if any, of each of the applicable Funds covered in this report for the year or period ended March 31, 2012 are presented in the Statements of Operations. Any amounts that remained due from the Adviser as of March 31, 2012 are presented in the Statements of Assets and Liabilities.
The cumulative reimbursement and fee reduction amounts, if any, as of March 31, 2012 that are subject to repayment for each Fund covered in this report are as follows:
| Expiration Date | ||||||||||||
Fund | 3/31/2013 | 3/31/2014 | 3/31/2015 | |||||||||
PL Portfolio Optimization Conservative | $ | 592,826 | $ | 486,514 | $ | 406,199 | ||||||
PL Portfolio Optimization Moderate-Conservative | 678,602 | 467,467 | 416,693 | |||||||||
PL Portfolio Optimization Moderate | 2,044,114 | 1,294,312 | 1,027,703 | |||||||||
PL Portfolio Optimization Moderate-Aggressive | 1,951,672 | 1,124,694 | 807,014 | |||||||||
PL Portfolio Optimization Aggressive | 851,173 | 477,661 | 316,090 | |||||||||
PL Floating Rate Income | 123,956 | |||||||||||
PL Income | 85,763 | 651,413 | ||||||||||
PL Money Market | 147,762 | 112,758 | 93,514 | |||||||||
|
|
|
|
|
| |||||||
Total | $ | 6,266,149 | $ | 4,049,169 | $ | 3,842,582 | ||||||
|
|
|
|
|
| |||||||
Due to the current regulatory and/or accounting guidance, all expense reimbursements made by the investment adviser for the period September 28, 2001 (the Pacific Life Funds’ commencement date of operations) to March 31, 2009 expired for future recoupment as of March 31, 2012. Based on the Trust’s experience, the likelihood of repayment by a Fund for the amounts presented in the table above prior to the expiration is considered remote and no liabilities for such repayments were recorded by any Fund as of March 31, 2012.
C. INVESTMENTS IN AFFILIATED FUNDS
As of March 31, 2012, each of the Portfolio Optimization Funds (aggregate of Classes A, B, C and R) owned Class P shares in each of the affiliated applicable PL Underlying Funds. A summary of transactions for the year ended March 31, 2012 and total investments by each of the Portfolio Optimization Funds in each PL Underlying Fund as of March 31, 2012 is as follows:
| As of March 31, 2012 | ||||||||||||||||||||||||||||||||||||
Fund/PL Underlying Fund | Value as of April 1, 2011 | Purchase Cost (1) | Distributions Received and Reinvested (2) | Sales Proceeds | Net Realized Gain (Loss) (3) | Change in Unrealized Appreciation (Depreciation) | Value | Shares Balance | Ownership Percentage | |||||||||||||||||||||||||||
PL Portfolio Optimization Conservative Fund |
| |||||||||||||||||||||||||||||||||||
PL Floating Rate Loan | $ | 24,260,513 | $ | 10,731,378 | $ | 1,221,928 | $ | 1,130,320 | ($ | 28,340 | ) | $ | 46,807 | $ | 35,101,966 | 3,475,442 | 31.31 | % | ||||||||||||||||||
PL Inflation Managed | 48,760,953 | 16,415,383 | 2,110,275 | 2,936,695 | 2,732,685 | 1,116,616 | 68,199,217 | 6,320,595 | 23.69 | % | ||||||||||||||||||||||||||
PL Managed Bond | 102,504,610 | 38,998,955 | 3,547,503 | 1,210,026 | (36,706 | ) | 1,429,038 | 145,233,374 | 13,360,936 | 29.86 | % | |||||||||||||||||||||||||
PL Short Duration Bond | 38,742,817 | 13,885,496 | 544,351 | 109,730 | 66,360 | 132,476 | 53,261,770 | 5,289,153 | 34.28 | % | ||||||||||||||||||||||||||
PL Comstock | 9,983,099 | 9,881,411 | 171,530 | 5,331,136 | 27,881 | 1,077,033 | 15,809,818 | 1,267,828 | 7.64 | % | ||||||||||||||||||||||||||
PL Growth LT | 5,337,813 | 1,461,838 | — | 6,098,215 | 580,747 | (1,282,183 | ) | — | — | 0.00 | % | |||||||||||||||||||||||||
PL Large-Cap Growth | 4,928,497 | 3,463,048 | — | 1,157,134 | 98,107 | 983,185 | 8,315,703 | 807,350 | 6.43 | % | ||||||||||||||||||||||||||
PL Large-Cap Value | 15,817,051 | 7,323,752 | 302,150 | 5,460,984 | 42,525 | 1,606,058 | 19,630,552 | 1,594,683 | 7.47 | % | ||||||||||||||||||||||||||
PL Main Street Core | 6,069,708 | 1,328,986 | 58,013 | 592,182 | (10,357 | ) | 932,382 | 7,786,550 | 691,523 | 4.02 | % | |||||||||||||||||||||||||
PL Mid-Cap Equity | 9,585,544 | 5,196,414 | 43,573 | 3,440,960 | (65,068 | ) | 379,615 | 11,699,118 | 1,136,941 | 7.09 | % | |||||||||||||||||||||||||
PL International Large-Cap | 6,166,303 | 7,951,421 | 135,507 | 3,002,784 | (90,351 | ) | 579,175 | 11,739,271 | 776,407 | 5.76 | % | |||||||||||||||||||||||||
PL International Value | 6,163,334 | 4,020,756 | 243,164 | 2,652,182 | (39,852 | ) | (114,431 | ) | 7,620,789 | 884,082 | 6.86 | % | ||||||||||||||||||||||||
|
|
|
|
|
|
|
|
|
|
|
|
|
| |||||||||||||||||||||||
| $ | 278,320,242 | $ | 120,658,838 | $ | 8,377,994 | $ | 33,122,348 | $ | 3,277,631 | $ | 6,885,771 | $ | 384,398,128 | |||||||||||||||||||||||
|
|
|
|
|
|
|
|
|
|
|
|
|
| |||||||||||||||||||||||
| D-10 |
Table of Contents
PACIFIC LIFE FUNDS
NOTES TO FINANCIAL STATEMENTS (Continued)
| As of March 31, 2012 | ||||||||||||||||||||||||||||||||||||
Fund/PL Underlying Fund | Value as of April 1, 2011 | Purchase Cost (1) | Distributions Received and Reinvested (2) | Sales Proceeds | Net Realized Gain (Loss) (3) | Change in Unrealized Appreciation (Depreciation) | Value | Shares Balance | Ownership Percentage | |||||||||||||||||||||||||||
PL Portfolio Optimization Moderate-Conservative Fund |
| |||||||||||||||||||||||||||||||||||
PL Floating Rate Loan | $ | 21,066,994 | $ | 5,650,081 | $ | 909,228 | $ | 1,500,271 | ($ | 21,264 | ) | $ | 18,047 | $ | 26,122,815 | 2,586,417 | 23.30 | % | ||||||||||||||||||
PL Inflation Managed | 39,824,008 | 10,263,821 | 1,647,040 | 3,399,147 | 2,292,584 | 760,420 | 51,388,726 | 4,762,625 | 17.85 | % | ||||||||||||||||||||||||||
PL Managed Bond | 80,434,335 | 27,078,433 | 2,561,246 | 7,170,028 | (226,302 | ) | 1,252,015 | 103,929,699 | 9,561,150 | 21.36 | % | |||||||||||||||||||||||||
PL Short Duration Bond | 28,978,853 | 9,421,377 | 389,135 | 1,839,152 | 36,097 | 101,113 | 37,087,423 | 3,682,961 | 23.87 | % | ||||||||||||||||||||||||||
PL Comstock | 16,277,697 | 5,782,616 | 274,863 | 562,867 | (67,037 | ) | 1,232,173 | 22,937,445 | 1,839,410 | 11.06 | % | |||||||||||||||||||||||||
PL Growth LT | 8,297,223 | 1,711,519 | 37,610 | 2,167,376 | (176,097 | ) | 459,372 | 8,162,251 | 622,123 | 7.53 | % | |||||||||||||||||||||||||
PL Large-Cap Growth | 10,977,797 | 4,314,777 | — | 714,927 | 205,713 | 1,920,581 | 16,703,941 | 1,621,742 | 12.93 | % | ||||||||||||||||||||||||||
PL Large-Cap Value | 22,157,836 | 11,705,456 | 505,167 | 5,664,180 | (123,506 | ) | 2,306,085 | 30,886,858 | 2,509,087 | 11.74 | % | |||||||||||||||||||||||||
PL Main Street Core | 13,557,385 | 5,352,892 | 146,953 | 1,779,474 | (19,683 | ) | 2,106,768 | 19,364,841 | 1,719,790 | 10.01 | % | |||||||||||||||||||||||||
PL Mid-Cap Equity | 10,930,378 | 4,623,316 | 62,087 | 577,484 | (74,967 | ) | 363,075 | 15,326,405 | 1,489,447 | 9.28 | % | |||||||||||||||||||||||||
PL Mid-Cap Growth | 6,447,601 | 2,464,060 | 33,000 | 656,216 | 762,629 | (575,346 | ) | 8,475,728 | 955,550 | 11.52 | % | |||||||||||||||||||||||||
PL Small-Cap Value | 2,816,817 | 1,964,838 | 46,618 | 1,111,812 | 38,168 | (24,504 | ) | 3,730,125 | 352,564 | 4.32 | % | |||||||||||||||||||||||||
PL Emerging Markets | — | 5,494,173 | 19,401 | 1,183,687 | (95,648 | ) | (146,192 | ) | 4,088,047 | 301,701 | 4.78 | % | ||||||||||||||||||||||||
PL International Large-Cap | 13,666,052 | 7,274,571 | 210,861 | 1,456,173 | (186,491 | ) | 611,783 | 20,120,603 | 1,330,728 | 9.87 | % | |||||||||||||||||||||||||
PL International Value | 7,837,656 | 5,312,782 | 324,219 | 1,164,300 | (176,729 | ) | (390,707 | ) | 11,742,921 | 1,362,288 | 10.57 | % | ||||||||||||||||||||||||
|
|
|
|
|
|
|
|
|
|
|
|
|
| |||||||||||||||||||||||
| $ | 283,270,632 | $ | 108,414,712 | $ | 7,167,428 | $ | 30,947,094 | $ | 2,167,467 | $ | 9,994,683 | $ | 380,067,828 | |||||||||||||||||||||||
|
|
|
|
|
|
|
|
|
|
|
|
|
| |||||||||||||||||||||||
PL Portfolio Optimization Moderate Fund |
| |||||||||||||||||||||||||||||||||||
PL Floating Rate Loan | $ | 40,695,802 | $ | 11,598,963 | $ | 1,691,463 | $ | 3,037,373 | ($ | 84,696 | ) | $ | 17,999 | $ | 50,882,158 | 5,037,837 | 45.39 | % | ||||||||||||||||||
PL Inflation Managed | 89,349,110 | 26,132,028 | 3,373,071 | 14,702,417 | 5,503,608 | 1,366,287 | 111,021,687 | 10,289,313 | 38.56 | % | ||||||||||||||||||||||||||
PL Managed Bond | 137,704,785 | 42,731,905 | 4,042,343 | 13,635,475 | (458,606 | ) | 2,296,529 | 172,681,481 | 15,886,061 | 35.49 | % | |||||||||||||||||||||||||
PL Short Duration Bond | 40,548,010 | 13,979,721 | 505,087 | 4,698,311 | 36,831 | 164,994 | 50,536,332 | 5,018,504 | 32.52 | % | ||||||||||||||||||||||||||
PL Comstock | 62,942,312 | 14,765,519 | 969,396 | 1,137,183 | (174,081 | ) | 3,560,830 | 80,926,793 | 6,489,719 | 39.03 | % | |||||||||||||||||||||||||
PL Growth LT | 40,726,523 | 6,842,812 | 203,727 | 8,614,541 | (588,547 | ) | 2,233,826 | 40,803,800 | 3,110,046 | 37.66 | % | |||||||||||||||||||||||||
PL Large-Cap Growth | 40,192,558 | 7,642,275 | — | 704,634 | 739,184 | 5,826,535 | 53,695,918 | 5,213,196 | 41.55 | % | ||||||||||||||||||||||||||
PL Large-Cap Value | 88,175,057 | 12,335,198 | 1,673,446 | 5,824,340 | (685,502 | ) | 6,721,982 | 102,395,841 | 8,318,102 | 38.93 | % | |||||||||||||||||||||||||
PL Main Street Core | 56,402,491 | 8,989,582 | 542,599 | 873,048 | (78,471 | ) | 7,482,912 | 72,466,065 | 6,435,707 | 37.46 | % | |||||||||||||||||||||||||
PL Mid-Cap Equity | 47,206,923 | 14,248,722 | 246,931 | 1,095,613 | (175,502 | ) | 704,454 | 61,135,915 | 5,941,294 | 37.03 | % | |||||||||||||||||||||||||
PL Mid-Cap Growth | 17,403,026 | 3,826,314 | 87,097 | 289,103 | 1,991,706 | (1,790,574 | ) | 21,228,466 | 2,393,288 | 28.86 | % | |||||||||||||||||||||||||
PL Small-Cap Growth | 8,060,122 | 2,200,531 | — | 261,850 | (33,426 | ) | 216,089 | 10,181,466 | 858,471 | 28.00 | % | |||||||||||||||||||||||||
PL Small-Cap Value | 24,752,795 | 5,839,604 | 364,581 | 877,743 | (30,058 | ) | 188,866 | 30,238,045 | 2,858,038 | 35.10 | % | |||||||||||||||||||||||||
PL Real Estate | 15,330,373 | 3,791,087 | 125,914 | 980,131 | (20,510 | ) | 1,956,738 | 20,203,471 | 1,604,724 | 38.36 | % | |||||||||||||||||||||||||
PL Emerging Markets | 25,015,984 | 7,220,775 | 153,689 | 159,829 | 491,574 | (1,548,988 | ) | 31,173,205 | 2,300,606 | 36.47 | % | |||||||||||||||||||||||||
PL International Large-Cap | 47,581,150 | 33,757,184 | 892,407 | 2,486,976 | (405,949 | ) | 3,128,848 | 82,466,664 | 5,454,144 | 40.44 | % | |||||||||||||||||||||||||
PL International Value | 23,738,005 | 7,938,970 | 855,179 | 792,657 | (192,032 | ) | (1,402,994 | ) | 30,144,471 | 3,497,038 | 27.12 | % | ||||||||||||||||||||||||
|
|
|
|
|
|
|
|
|
|
|
|
|
| |||||||||||||||||||||||
| $ | 805,825,026 | $ | 223,841,190 | $ | 15,726,930 | $ | 60,171,224 | $ | 5,835,523 | $ | 31,124,333 | $ | 1,022,181,778 | |||||||||||||||||||||||
|
|
|
|
|
|
|
|
|
|
|
|
|
| |||||||||||||||||||||||
PL Portfolio Optimization Moderate-Aggressive Fund |
| |||||||||||||||||||||||||||||||||||
PL Inflation Managed | $ | 51,395,357 | $ | 11,063,514 | $ | 1,765,798 | $ | 10,825,280 | $ | 3,376,668 | $ | 516,383 | $ | 57,292,440 | 5,309,772 | 19.90 | % | |||||||||||||||||||
PL Managed Bond | 51,491,942 | 11,905,960 | 1,363,199 | 7,765,815 | (118,561 | ) | 794,072 | 57,670,797 | 5,305,501 | 11.85 | % | |||||||||||||||||||||||||
PL Short Duration Bond | 12,923,837 | 3,509,329 | 144,766 | 2,141,699 | 10,447 | 47,302 | 14,493,982 | 1,439,323 | 9.33 | % | ||||||||||||||||||||||||||
PL Comstock | 56,878,863 | 8,087,359 | 799,436 | 1,980,683 | (411,636 | ) | 2,686,217 | 66,059,556 | 5,297,478 | 31.86 | % | |||||||||||||||||||||||||
PL Growth LT | 43,513,697 | 5,436,270 | 221,766 | 6,037,258 | (727,161 | ) | 2,508,477 | 44,915,791 | 3,423,460 | 41.46 | % | |||||||||||||||||||||||||
PL Large-Cap Growth | 31,845,940 | 3,082,726 | — | 1,102,556 | 440,537 | 4,075,220 | 38,341,867 | 3,722,511 | 29.67 | % | ||||||||||||||||||||||||||
PL Large-Cap Value | 75,517,862 | 7,869,328 | 1,343,410 | 7,520,826 | (1,019,180 | ) | 5,211,406 | 81,402,000 | 6,612,673 | 30.95 | % | |||||||||||||||||||||||||
PL Main Street Core | 56,725,420 | 5,686,619 | 509,710 | 2,430,735 | (257,520 | ) | 6,937,768 | 67,171,262 | 5,965,476 | 34.72 | % | |||||||||||||||||||||||||
PL Mid-Cap Equity | 49,918,924 | 9,597,149 | 240,079 | 1,873,938 | (217,433 | ) | 239,523 | 57,904,304 | 5,627,241 | 35.07 | % | |||||||||||||||||||||||||
PL Mid-Cap Growth | 26,130,860 | 3,290,638 | 130,884 | — | 2,987,028 | (3,013,359 | ) | 29,526,051 | 3,328,754 | 40.13 | % | |||||||||||||||||||||||||
PL Small-Cap Growth | 13,364,373 | 1,646,031 | — | 880,279 | (39,576 | ) | 352,133 | 14,442,682 | 1,217,764 | 39.72 | % | |||||||||||||||||||||||||
PL Small-Cap Value | 32,494,550 | 3,578,287 | 440,400 | 825,332 | (52,758 | ) | 153,717 | 35,788,864 | 3,382,690 | 41.54 | % | |||||||||||||||||||||||||
PL Real Estate | 18,257,445 | 5,202,155 | 138,011 | 3,018,689 | 24,269 | 2,091,583 | 22,694,774 | 1,802,603 | 43.09 | % | ||||||||||||||||||||||||||
PL Emerging Markets | 27,095,906 | 9,845,927 | 188,830 | 165,673 | 610,141 | (1,121,723 | ) | 36,453,408 | 2,690,289 | 42.65 | % | |||||||||||||||||||||||||
PL International Large-Cap | 49,935,619 | 16,068,505 | 735,419 | 1,803,878 | (242,615 | ) | 1,373,277 | 66,066,327 | 4,369,466 | 32.40 | % | |||||||||||||||||||||||||
PL International Value | 35,559,482 | 10,272,069 | 1,246,601 | 1,358,655 | (613,554 | ) | (2,226,519 | ) | 42,879,424 | 4,974,411 | 38.59 | % | ||||||||||||||||||||||||
|
|
|
|
|
|
|
|
|
|
|
|
|
| |||||||||||||||||||||||
| $ | 633,050,077 | $ | 116,141,866 | $ | 9,268,309 | $ | 49,731,296 | $ | 3,749,096 | $ | 20,625,477 | $ | 733,103,529 | |||||||||||||||||||||||
|
|
|
|
|
|
|
|
|
|
|
|
|
| |||||||||||||||||||||||
| D-11 |
Table of Contents
PACIFIC LIFE FUNDS
NOTES TO FINANCIAL STATEMENTS (Continued)
| As of March 31, 2012 | ||||||||||||||||||||||||||||||||||||
Fund/PL Underlying Fund | Value as of April 1, 2011 | Purchase Cost (1) | Distributions Received and Reinvested (2) | Sales Proceeds | Net Realized Gain (Loss) (3) | Change in Unrealized Appreciation (Depreciation) | Value | Shares Balance | Ownership Percentage | |||||||||||||||||||||||||||
PL Portfolio Optimization Aggressive Fund |
| |||||||||||||||||||||||||||||||||||
PL Managed Bond | $ | 6,580,263 | $ | 2,236,520 | $ | 173,529 | $ | 2,068,764 | ($ | 466 | ) | $ | 92,256 | $ | 7,013,338 | 645,201 | 1.44 | % | ||||||||||||||||||
PL Comstock | 20,432,657 | 1,438,301 | 254,184 | 1,047,565 | (149,466 | ) | 659,069 | 21,587,180 | 1,731,129 | 10.41 | % | |||||||||||||||||||||||||
PL Growth LT | 17,657,777 | 1,844,691 | 73,063 | 5,695,230 | (28,528 | ) | 614,235 | 14,466,008 | 1,102,592 | 13.35 | % | |||||||||||||||||||||||||
PL Large-Cap Growth | 11,145,737 | 1,009,320 | — | 1,386,013 | 176,000 | 1,228,840 | 12,173,884 | 1,181,931 | 9.42 | % | ||||||||||||||||||||||||||
PL Large-Cap Value | 26,795,440 | 2,296,704 | 466,032 | 2,409,687 | (357,849 | ) | 1,890,796 | 28,681,436 | 2,329,930 | 10.91 | % | |||||||||||||||||||||||||
PL Main Street Core | 25,131,584 | 2,201,799 | 202,670 | 3,333,018 | (400,153 | ) | 2,879,199 | 26,682,081 | 2,369,634 | 13.79 | % | |||||||||||||||||||||||||
PL Mid-Cap Equity | 18,176,927 | 1,778,868 | 76,787 | 689,379 | (113,964 | ) | (193,954 | ) | 19,035,285 | 1,849,882 | 11.53 | % | ||||||||||||||||||||||||
PL Mid-Cap Growth | 14,475,253 | 1,461,269 | 65,410 | 1,559,969 | 1,466,511 | (1,569,914 | ) | 14,338,560 | 1,616,523 | 19.49 | % | |||||||||||||||||||||||||
PL Small-Cap Growth | 10,935,764 | 2,406,176 | — | 1,549,841 | (130,008 | ) | 73,694 | 11,735,785 | 989,527 | 32.28 | % | |||||||||||||||||||||||||
PL Small-Cap Value | 16,150,663 | 2,016,351 | 194,854 | 1,798,427 | (91,448 | ) | (71,460 | ) | 16,400,533 | 1,550,145 | 19.04 | % | ||||||||||||||||||||||||
PL Real Estate | 8,271,792 | 2,629,826 | 60,194 | 1,939,333 | (38,183 | ) | 788,253 | 9,772,549 | 776,215 | 18.55 | % | |||||||||||||||||||||||||
PL Emerging Markets | 12,166,048 | 3,935,999 | 74,971 | 1,957,673 | 191,371 | (651,017 | ) | 13,759,699 | 1,015,476 | 16.10 | % | |||||||||||||||||||||||||
PL International Large-Cap | 20,655,991 | 4,337,555 | 267,587 | 1,801,122 | (150,539 | ) | 207,772 | 23,517,244 | 1,555,373 | 11.53 | % | |||||||||||||||||||||||||
PL International Value | 16,966,308 | 3,332,087 | 548,571 | 561,042 | (242,946 | ) | (1,301,178 | ) | 18,741,800 | 2,174,223 | 16.86 | % | ||||||||||||||||||||||||
|
|
|
|
|
|
|
|
|
|
|
|
|
| |||||||||||||||||||||||
| $ | 225,542,204 | $ | 32,925,466 | $ | 2,457,852 | $ | 27,797,063 | $ | 130,332 | $ | 4,646,591 | $ | 237,905,382 | |||||||||||||||||||||||
|
|
|
|
|
|
|
|
|
|
|
|
|
| |||||||||||||||||||||||
| (1) | Purchased cost excludes distributions received and reinvested, if any. |
| (2) | Distributions received include distributions from net investment income from the PL Underlying Funds, if any. |
| (3) | Net realized gain (loss) includes distributions from capital gains from the PL Underlying Funds, if any. |
As of March 31, 2012, Pacific Life owned 63.49% of the total (aggregate of Class A, C and I) shares outstanding of the PL Floating Rate Income Fund.
D. INDEPENDENT TRUSTEES
The Trust pays each independent trustee of the Board retainer fees and specified amounts for various Board and committee services and for chairing the committees. The fees and expenses of the independent trustees of the Board are presented in the Statements of Operations.
Each independent trustee of the Board is eligible to participate in the Trust’s Deferred Compensation Plan (the “Plan”). The Plan allows each independent trustee to voluntarily defer receipt of all or a percentage of fees, which otherwise would be payable for services performed. Amounts in the deferral account are obligations of each Fund at the time of such deferral and are payable in accordance with the Plan. Deferral amounts are treated as though equivalent dollar amounts had been invested in shares of certain Funds. An independent trustee who defers compensation has the option to select credit rate options that track the performance, at NAV of Class A shares of the corresponding Portfolio Optimization Funds, PL Floating Rate Income Fund, PL Income Fund and/or PL Money Market Fund, and/or Class P shares of the corresponding PL Underlying Funds without a sales load. The obligation of each Fund under the Plan (the “DCP Liability”) is included in “Accrued trustees’ fees and expenses and deferred compensation” in the Statements of Assets and Liabilities. Accordingly, the market value appreciation or depreciation on a Fund’s DCP Liability account will cause the expenses of that Fund to increase or decrease due to market fluctuation. The change in net unrealized appreciation or deprecation on a Fund’s DCP Liability account is included in “Trustees’ fees and expenses” in the Statements of Operations. For the year or period ended March 31, 2012, such expenses decreased by $377 for all applicable Funds covered in this report as a result of the market value depreciation on such accounts. During the year or period ended March 31, 2012, the Funds covered in this report paid $14,661 of deferred compensation to current independent trustees. As of March 31, 2012, the total amount in the DCP Liability accounts was $7,342 for all applicable Funds covered in this report.
E. OFFICERS OF THE TRUST
None of the officers of the Trust received compensation from the Trust.
F. INDEMNIFICATIONS
Under the Trust’s organizational documents, its officers and trustees are indemnified against certain liabilities arising out of performance of their duties to the Trust. In addition, the Trust entered into an agreement with each of the trustees which provides that the Trust will indemnify and hold harmless each trustee against any expenses actually and reasonably incurred by any trustee in any proceeding arising out of or in connection with the trustee’s services to the Trust, to the fullest extent permitted by the Trust’s Declaration of Trust and By-Laws, the general trust law of the State of Delaware, the Securities Act of 1933, and the 1940 Act, each as now or hereinafter in force. In the normal course of business, the Trust enters into contracts with service providers and others that contain general indemnification clauses. The Trust’s maximum exposure under these arrangements and agreements is dependent on future claims that may be made against the Trust and/or the trustees and, therefore, cannot be estimated; however, based on experience, the risk of loss from such claims is considered remote.
8. UNFUNDED SENIOR LOAN COMMITMENTS
Unfunded loan commitments on senior loan participations and assignments (Note 4), if any, are marked to market daily and valued according to the Trust’s valuation policies and procedures. Any outstanding unfunded loan commitments are presented in the Notes to Schedules of Investments section of each applicable Fund’s Schedule of Investments. Any applicable net unrealized appreciation or depreciation at the end of the reporting period and change in net unrealized appreciation or depreciation on unfunded loan commitments for
| D-12 |
Table of Contents
PACIFIC LIFE FUNDS
NOTES TO FINANCIAL STATEMENTS (Continued)
the reporting period is reflected on the Statements of Assets and Liabilities and the Statements of Operations, respectively. As of March 31, 2012, no unfunded loan commitments were held by any Fund covered in this report.
9. PURCHASES AND SALES OF SECURITIES
The cost of purchases and proceeds from sales of investments (excluding short-term investments and the PL Money Market Fund since it trades exclusively in short-term debt investments) for the year or period ended March 31, 2012, is as follows:
| U.S. Government Securities | Other Securities | |||||||||||||||
Fund | Purchases | Sales | Purchases | Sales | ||||||||||||
PL Portfolio Optimization Conservative | $ | — | $ | — | $ | 131,824,087 | $ | 33,122,348 | ||||||||
PL Portfolio Optimization Moderate-Conservative | — | — | 118,723,034 | 30,947,094 | ||||||||||||
PL Portfolio Optimization Moderate | — | — | 247,092,952 | 60,171,224 | ||||||||||||
PL Portfolio Optimization Moderate-Aggressive | — | — | 131,806,435 | 49,731,296 | ||||||||||||
PL Portfolio Optimization Aggressive | — | — | 37,316,165 | 27,797,063 | ||||||||||||
PL Floating Rate Income | — | — | 107,490,747 | 50,984,019 | ||||||||||||
PL Income | 43,254,708 | 31,659,952 | 504,769,860 | 265,100,105 | ||||||||||||
10. FEDERAL INCOME TAX INFORMATION
Each Fund intends to qualify each year as a regulated investment company (“RIC”) under Subchapter M of the Internal Revenue Code (the “Code”). A Fund that qualifies as a RIC does not have to pay income tax as long as it distributes sufficient taxable income and net capital gains. Each Fund declared and paid sufficient dividends on net investment income and capital gains distributions during the year or period ended March 31, 2012, to qualify as a RIC and is not required to pay Federal income tax under the Code. Accordingly, no provision for Federal income taxes is required in the financial statements. Required distributions are based on net investment income and net realized gains determined in accordance with income tax regulations, which may differ from U.S. GAAP for financial reporting purposes. These differences are primarily due to differing treatments for short-term capital gain distributions received, late year ordinary and post-October capital losses, capital loss carryforwards, and losses deferred due to wash sales. Permanent book and tax differences relating to shareholder distributions will result in reclassifications of capital accounts (see Note 12). In addition, the year in which amounts are distributed may differ from the year in which the net investment income is earned and the net gains are realized by each Fund.
The following table shows the accumulated capital losses and components of distributable earnings on a tax basis, and late year ordinary losses and post-October capital losses deferred, if any, for tax purposes as of March 31, 2012:
| Distributable Earnings | Late Year Ordinary and Post-October Capital Loss Deferrals | |||||||||||||||||||||||
Fund | Accumulated Capital Losses | Undistributed Ordinary Income | Undistributed Long-Term Capital Gains | Late Year Ordinary Losses | Short-Term Capital Losses | Total | ||||||||||||||||||
PL Portfolio Optimization Conservative | $ | — | $ | — | $ | 867,444 | ($ | 501,898 | ) | ($ | 146,895 | ) | ($ | 648,793 | ) | |||||||||
PL Portfolio Optimization Moderate-Conservative | (4,252,819 | ) | 263,341 | — | — | (125,683 | ) | (125,683 | ) | |||||||||||||||
PL Portfolio Optimization Moderate | (20,077,747 | ) | 1,678,069 | — | — | (452,803 | ) | (452,803 | ) | |||||||||||||||
PL Portfolio Optimization Moderate-Aggressive | (34,120,255 | ) | 1,546,988 | — | — | (197,311 | ) | (197,311 | ) | |||||||||||||||
PL Portfolio Optimization Aggressive | (26,793,781 | ) | 410,296 | — | — | (203,208 | ) | (203,208 | ) | |||||||||||||||
PL Floating Rate Income | (58,735 | ) | 50,152 | — | — | — | — | |||||||||||||||||
PL Income | — | 3,329,767 | 126,335 | — | — | — | ||||||||||||||||||
PL Money Market | (149 | ) | — | — | (383 | ) | — | (383 | ) | |||||||||||||||
Accumulated capital losses represent net capital loss carryovers as of March 31, 2012 that may be available to offset future realized capital gains and thereby reduce future capital gains distributions. Under the Regulated Investment Company Modernization Act of 2010 (the “Modernization Act”), each Fund is permitted to carry forward capital losses incurred in taxable years beginning after December 22, 2010 for an unlimited period. Any losses incurred during those future taxable years will be required to be utilized prior to any losses incurred in pre-enactment taxable years. Additionally, post-enactment capital losses that are carried forward will retain their character as either short-term or long-term capital losses rather than being considered all short-term as under the previous law. Each Fund’s first fiscal year end subject to the Modernization Act is March 31, 2012. The following table shows the expiration dates for capital loss carryover from pre-enactment taxable years and the amounts of capital loss carryover, if any, by each of the applicable Funds as of March 31, 2012:
| Post-Enactment | Accumulated Capital Loss Carryover | |||||||||||||||||||||||
| Pre-Enactment | Unlimited Period of Net Capital Loss Carryover | |||||||||||||||||||||||
| Net Capital Loss Carryover Expiring in | ||||||||||||||||||||||||
Fund | 2017 | 2018 | 2019 | Short Term | Long-Term | |||||||||||||||||||
PL Portfolio Optimization Moderate-Conservative | $ | — | ($ | 4,252,819 | ) | $ | — | $ | — | $ | — | ($ | 4,252,819 | ) | ||||||||||
PL Portfolio Optimization Moderate | — | (16,205,051 | ) | (3,872,696 | ) | — | — | (20,077,747 | ) | |||||||||||||||
PL Portfolio Optimization Moderate-Aggressive | — | (30,011,150 | ) | (4,109,105 | ) | — | — | (34,120,255 | ) | |||||||||||||||
PL Portfolio Optimization Aggressive | (951,758 | ) | (22,811,627 | ) | (3,030,396 | ) | — | — | (26,793,781 | ) | ||||||||||||||
PL Floating Rate Income | — | — | — | (58,735 | ) | — | (58,735 | ) | ||||||||||||||||
PL Money Market | — | — | — | (149 | ) | — | (149 | ) | ||||||||||||||||
| D-13 |
Table of Contents
PACIFIC LIFE FUNDS
NOTES TO FINANCIAL STATEMENTS (Continued)
The aggregate Federal tax cost of investments and the composition of unrealized appreciation and depreciation on investments as of March 31, 2012, were as follows:
Fund | Total Cost of Investments on Tax Basis | Gross Unrealized Appreciation on Investments | Gross Unrealized Depreciation on Investments | Net Unrealized Appreciation (Depreciation) on Investments | ||||||||||||
PL Portfolio Optimization Conservative | $ | 361,271,949 | $ | 26,821,191 | ($ | 3,695,012 | ) | $ | 23,126,179 | |||||||
PL Portfolio Optimization Moderate-Conservative | 349,175,792 | 35,955,559 | (5,063,523 | ) | 30,892,036 | |||||||||||
PL Portfolio Optimization Moderate | 921,494,958 | 112,404,298 | (11,717,478 | ) | 100,686,820 | |||||||||||
PL Portfolio Optimization Moderate-Aggressive | 653,000,502 | 96,357,625 | (16,254,598 | ) | 80,103,027 | |||||||||||
PL Portfolio Optimization Aggressive | 206,710,793 | 44,088,493 | (12,893,904 | ) | 31,194,589 | |||||||||||
PL Floating Rate Income | 60,084,412 | 794,561 | (350,115 | ) | 444,446 | |||||||||||
PL Income | 340,811,991 | 4,503,529 | (797,817 | ) | 3,705,712 | |||||||||||
PL Money Market | 32,149,883 | — | — | — | ||||||||||||
Each Fund recognizes the financial statement effects of a tax position taken or expected to be taken in a tax return when it is more likely than not, based on the technical merits, that the position will be sustained upon examination by the applicable tax authority. Tax positions not deemed to meet the more-likely-than-not threshold would be recorded as a tax liability for unrecognized tax benefits in the Statement of Assets and Liabilities with a corresponding expense in the Statement of Operations. Each Fund is required to analyze all open tax years, as defined by the statute of limitations, for all major jurisdictions. As a result of each Fund’s evaluation, as of and during the year or period ended March 31, 2012, each Fund did not record a liability for any unrecognized tax benefits. Each Fund’s policy is to recognize interest and penalties on unrecognized tax benefits in income tax expense in the Statements of Operations. During the year or period ended March 31, 2012, none of the Funds covered in this report incurred any interest or penalties. Each Fund is also not aware of any tax positions for which it is reasonably possible that the total amounts of unrecognized tax benefits will change materially in the next twelve months.
Each Fund remains subject to examination by Federal and State tax authorities (principal state jurisdictions include California and Delaware) for the tax years ended March 31, 2009 through March 31, 2012 for Federal purposes and March 31, 2008 through March 31, 2012 for State purposes.
11. TAX CHARACTER OF DISTRIBUTIONS
The tax character of income and capital gain distributions to shareholders during the years or periods ended March 31, 2012 and 2011, were as follows:
| For the Year or Period Ended March 31, 2012 | For the Year or Period Ended March 31, 2011 | |||||||||||||||||||||||
Fund | Ordinary Income | Long-Term Capital Gains | Total Distributions | Ordinary Income | Long-Term Capital Gains | Total Distributions | ||||||||||||||||||
PL Portfolio Optimization Conservative | $ | 7,728,384 | $ | 866,047 | $ | 8,594,431 | $ | 6,824,644 | $ | — | $ | 6,824,644 | ||||||||||||
PL Portfolio Optimization Moderate-Conservative | 5,748,565 | — | 5,748,565 | 5,140,621 | — | 5,140,621 | ||||||||||||||||||
PL Portfolio Optimization Moderate | 10,718,539 | — | 10,718,539 | 10,392,641 | — | 10,392,641 | ||||||||||||||||||
PL Portfolio Optimization Moderate-Aggressive | 4,781,380 | — | 4,781,380 | 4,952,239 | — | 4,952,239 | ||||||||||||||||||
PL Portfolio Optimization Aggressive | 575,812 | — | 575,812 | 1,134,051 | — | 1,134,051 | ||||||||||||||||||
PL Floating Rate Income | 1,286,518 | — | 1,286,518 | — | — | — | ||||||||||||||||||
PL Income | 5,113,218 | — | 5,113,218 | 461,390 | — | 461,390 | ||||||||||||||||||
12. RECLASSIFICATION OF ACCOUNTS
During the year or period ended March 31, 2012, reclassifications as shown in the following table have been made in each Fund’s capital accounts to report these balances on a tax basis, excluding certain temporary differences, as of March 31, 2012. Additional adjustments may be required in subsequent reporting periods. These reclassifications, which have no impact on the NAV of the Funds, are primarily attributable to reclassifications of swap income, treatment of net operating losses and capital gains under Federal tax rules versus U.S. GAAP. The calculation of net investment income per share in the financial highlights excludes these adjustments.
Fund | Paid-In Capital | Undistributed Net Investment Income | Accumulated Net Realized Loss | |||||||||
PL Portfolio Optimization Conservative | $ | — | $ | 1,885,950 | ($ | 1,855,950 | ) | |||||
PL Portfolio Optimization Moderate-Conservative | — | 1,492,245 | (1,492,245 | ) | ||||||||
PL Portfolio Optimization Moderate | — | 3,068,049 | (3,068,049 | ) | ||||||||
PL Portfolio Optimization Moderate-Aggressive | — | 1,658,530 | (1,658,530 | ) | ||||||||
PL Portfolio Optimization Aggressive | — | 40,195 | (40,195 | ) | ||||||||
PL Floating Rate Income Fund | — | 3,681 | (3,681 | ) | ||||||||
PL Money Market | (13 | ) | 47 | (34 | ) | |||||||
| D-14 |
Table of Contents
PACIFIC LIFE FUNDS
NOTES TO FINANCIAL STATEMENTS (Continued)
13. SHARES OF BENEFICIAL INTEREST
Each Fund is authorized to issue an unlimited number of shares of beneficial interest with no par value. Changes in shares of beneficial interest of each Fund for the years or periods ended March 31, 2012 and 2011 were as follows:
| PL Portfolio Optimization | PL Portfolio Optimization | PL Portfolio Optimization | PL Portfolio Optimization | |||||||||||||||||||||||||||||
| Conservative Fund | Moderate-Conservative Fund | Moderate Fund | Moderate-Aggressive Fund | |||||||||||||||||||||||||||||
| Year ended 3/31/2012 | Year ended 3/31/2011 | Year ended 3/31/2012 | Year ended 3/31/2011 | Year ended 3/31/2012 | Year ended 3/31/2011 | Year ended 3/31/2012 | Year ended 3/31/2011 | |||||||||||||||||||||||||
Class A | ||||||||||||||||||||||||||||||||
Shares sold | 9,414,786 | 9,883,219 | 7,831,859 | 7,499,767 | 18,477,094 | 16,639,175 | 10,012,961 | 10,900,181 | ||||||||||||||||||||||||
Dividends and distribution reinvested | 365,940 | 273,222 | 271,273 | 228,388 | 571,355 | 494,777 | 296,921 | 282,851 | ||||||||||||||||||||||||
Shares repurchased | (5,234,709 | ) | (4,793,123 | ) | (3,599,667 | ) | (3,327,441 | ) | (9,238,552 | ) | (7,572,182 | ) | (5,875,333 | ) | (7,258,951 | ) | ||||||||||||||||
|
|
|
|
|
|
|
|
|
|
|
|
|
|
|
| |||||||||||||||||
Net increase | 4,546,017 | 5,363,318 | 4,503,465 | 4,400,714 | 9,809,897 | 9,561,770 | 4,434,549 | 3,924,081 | ||||||||||||||||||||||||
Beginning shares outstanding | 11,983,618 | 6,620,300 | 11,815,219 | 7,414,505 | 32,420,483 | 22,858,713 | 25,004,207 | 21,080,126 | ||||||||||||||||||||||||
|
|
|
|
|
|
|
|
|
|
|
|
|
|
|
| |||||||||||||||||
Ending shares outstanding | 16,529,635 | 11,983,618 | 16,318,684 | 11,815,219 | 42,230,380 | 32,420,483 | 29,438,756 | 25,004,207 | ||||||||||||||||||||||||
|
|
|
|
|
|
|
|
|
|
|
|
|
|
|
| |||||||||||||||||
Class B | ||||||||||||||||||||||||||||||||
Shares sold | 1,221,610 | 1,209,958 | 1,382,047 | 1,147,366 | 2,768,421 | 2,989,542 | 1,820,845 | 2,076,087 | ||||||||||||||||||||||||
Dividends and distribution reinvested | 55,798 | 40,641 | 44,056 | 40,051 | 75,743 | 84,489 | 28,570 | 40,570 | ||||||||||||||||||||||||
Shares repurchased | (322,557 | ) | (473,616 | ) | (409,613 | ) | (477,945 | ) | (1,163,612 | ) | (1,351,393 | ) | (1,069,955 | ) | (1,595,557 | ) | ||||||||||||||||
|
|
|
|
|
|
|
|
|
|
|
|
|
|
|
| |||||||||||||||||
Net increase | 954,851 | 776,983 | 1,016,490 | 709,472 | 1,680,552 | 1,722,638 | 779,460 | 521,100 | ||||||||||||||||||||||||
Beginning shares outstanding | 2,067,260 | 1,290,277 | 2,543,566 | 1,834,094 | 7,804,830 | 6,082,192 | 7,022,886 | 6,501,786 | ||||||||||||||||||||||||
|
|
|
|
|
|
|
|
|
|
|
|
|
|
|
| |||||||||||||||||
Ending shares outstanding | 3,022,111 | 2,067,260 | 3,560,056 | 2,543,566 | 9,485,382 | 7,804,830 | 7,802,346 | 7,022,886 | ||||||||||||||||||||||||
|
|
|
|
|
|
|
|
|
|
|
|
|
|
|
| |||||||||||||||||
Class C | ||||||||||||||||||||||||||||||||
Shares sold | 7,994,971 | 8,387,689 | 5,134,378 | 5,199,896 | 9,843,078 | 11,224,010 | 5,151,759 | 5,999,834 | ||||||||||||||||||||||||
Dividends and distribution reinvested | 265,270 | 202,508 | 142,867 | 139,873 | 217,096 | 272,946 | 67,782 | 113,765 | ||||||||||||||||||||||||
Shares repurchased | (4,677,810 | ) | (4,231,977 | ) | (2,262,176 | ) | (1,937,194 | ) | (6,101,604 | ) | (4,970,189 | ) | (3,665,505 | ) | (4,720,942 | ) | ||||||||||||||||
|
|
|
|
|
|
|
|
|
|
|
|
|
|
|
| |||||||||||||||||
Net increase | 3,582,431 | 4,358,220 | 3,015,069 | 3,402,575 | 3,958,570 | 6,526,767 | 1,554,036 | 1,392,657 | ||||||||||||||||||||||||
Beginning shares outstanding | 10,905,548 | 6,547,328 | 9,620,440 | 6,217,865 | 26,185,201 | 19,658,434 | 19,396,943 | 18,004,286 | ||||||||||||||||||||||||
|
|
|
|
|
|
|
|
|
|
|
|
|
|
|
| |||||||||||||||||
Ending shares outstanding | 14,487,979 | 10,905,548 | 12,635,509 | 9,620,440 | 30,143,771 | 26,185,201 | 20,950,979 | 19,396,943 | ||||||||||||||||||||||||
|
|
|
|
|
|
|
|
|
|
|
|
|
|
|
| |||||||||||||||||
Class R | ||||||||||||||||||||||||||||||||
Shares sold | 463,890 | 383,168 | 689,513 | 711,711 | 990,223 | 1,078,079 | 777,958 | 640,197 | ||||||||||||||||||||||||
Dividends and distribution reinvested | 25,463 | 21,554 | 27,509 | 27,930 | 23,691 | 36,679 | 14,124 | 13,461 | ||||||||||||||||||||||||
Shares repurchased | (355,060 | ) | (353,249 | ) | (1,528,021 | ) | (378,253 | ) | (1,106,493 | ) | (1,365,474 | ) | (1,040,572 | ) | (362,686 | ) | ||||||||||||||||
|
|
|
|
|
|
|
|
|
|
|
|
|
|
|
| |||||||||||||||||
Net increase (decrease) | 134,293 | 51,473 | (810,999 | ) | 361,388 | (92,579 | ) | (250,716 | ) | (248,490 | ) | 290,972 | ||||||||||||||||||||
Beginning shares outstanding | 819,689 | 768,216 | 1,357,946 | 996,558 | 1,998,222 | 2,248,938 | 1,435,029 | 1,144,057 | ||||||||||||||||||||||||
|
|
|
|
|
|
|
|
|
|
|
|
|
|
|
| |||||||||||||||||
Ending shares outstanding | 953,982 | 819,689 | 546,947 | 1,357,946 | 1,905,643 | 1,998,222 | 1,186,539 | 1,435,029 | ||||||||||||||||||||||||
|
|
|
|
|
|
|
|
|
|
|
|
|
|
|
| |||||||||||||||||
| D-15 |
Table of Contents
PACIFIC LIFE FUNDS
NOTES TO FINANCIAL STATEMENTS (Continued)
| PL Portfolio Optimization | PL Floating Rate | PL Income Fund (2) | ||||||||||||||||||||||||||
| Aggressive Fund | Income Fund (1) | Year or | PL Money Market Fund | |||||||||||||||||||||||||
| Year ended 3/31/2012 | Year ended 3/31/2011 | Period ended 3/31/2012 | Period ended 3/31/2012 | Period ended 3/31/2011 | Year ended 3/31/2012 | Year ended 3/31/2011 | ||||||||||||||||||||||
Class A | ||||||||||||||||||||||||||||
Shares sold | 2,681,939 | 3,514,980 | 1,196,731 | 25,930,108 | 548,189 | 45,578,881 | 88,260,849 | |||||||||||||||||||||
Dividends and distribution reinvested | 47,941 | 66,115 | 4,943 | 224,292 | 1,632 | — | — | |||||||||||||||||||||
Shares repurchased | (2,280,849 | ) | (3,543,645 | ) | (2,608 | ) | (3,339,586 | ) | (27,989 | ) | (51,953,637 | ) | (84,487,252 | ) | ||||||||||||||
|
|
|
|
|
|
|
|
|
|
|
|
|
| |||||||||||||||
Net increase (decrease) | 449,031 | 37,450 | 1,199,066 | 22,814,814 | 521,832 | (6,374,756 | ) | 3,773,597 | ||||||||||||||||||||
Beginning shares outstanding | 9,296,213 | 9,258,763 | — | 521,832 | — | 38,453,326 | 34,679,729 | |||||||||||||||||||||
|
|
|
|
|
|
|
|
|
|
|
|
|
| |||||||||||||||
Ending shares outstanding | 9,745,244 | 9,296,213 | 1,199,066 | 23,336,646 | 521,832 | 32,078,570 | 38,453,326 | |||||||||||||||||||||
|
|
|
|
|
|
|
|
|
|
|
|
|
| |||||||||||||||
Class B | ||||||||||||||||||||||||||||
Shares sold | 435,514 | 594,910 | ||||||||||||||||||||||||||
Dividends and distribution reinvested | — | 14,313 | ||||||||||||||||||||||||||
Shares repurchased | (382,304 | ) | (808,725 | ) | ||||||||||||||||||||||||
|
|
|
| |||||||||||||||||||||||||
Net increase (decrease) | 53,210 | (199,502 | ) | |||||||||||||||||||||||||
Beginning shares outstanding | 2,550,471 | 2,749,973 | ||||||||||||||||||||||||||
|
|
|
| |||||||||||||||||||||||||
Ending shares outstanding | 2,603,681 | 2,550,471 | ||||||||||||||||||||||||||
|
|
|
| |||||||||||||||||||||||||
Class C | ||||||||||||||||||||||||||||
Shares sold | 2,135,369 | 2,856,844 | 338,818 | 7,455,154 | ||||||||||||||||||||||||
Dividends and distribution reinvested | — | 31,582 | 719 | 51,918 | ||||||||||||||||||||||||
Shares repurchased | (2,178,209 | ) | (3,126,313 | ) | (4,631 | ) | (279,689 | ) | ||||||||||||||||||||
|
|
|
|
|
|
|
| |||||||||||||||||||||
Net increase (decrease) | (42,840 | ) | (237,887 | ) | 334,906 | 7,227,383 | ||||||||||||||||||||||
Beginning shares outstanding | 6,282,882 | 6,520,769 | — | — | ||||||||||||||||||||||||
|
|
|
|
|
|
|
| |||||||||||||||||||||
Ending shares outstanding | 6,240,042 | 6,282,882 | 334,906 | 7,227,383 | ||||||||||||||||||||||||
|
|
|
|
|
|
|
| |||||||||||||||||||||
Class R | ||||||||||||||||||||||||||||
Shares sold | 360,732 | 210,892 | ||||||||||||||||||||||||||
Dividends and distribution reinvested | 1,331 | 2,875 | ||||||||||||||||||||||||||
Shares repurchased | (282,883 | ) | (178,354 | ) | ||||||||||||||||||||||||
|
|
|
| |||||||||||||||||||||||||
Net increase | 79,180 | 35,413 | ||||||||||||||||||||||||||
Beginning shares outstanding | 454,534 | 419,121 | ||||||||||||||||||||||||||
|
|
|
| |||||||||||||||||||||||||
Ending shares outstanding | 533,714 | 454,534 | ||||||||||||||||||||||||||
|
|
|
| |||||||||||||||||||||||||
Class I | ||||||||||||||||||||||||||||
Shares sold | 4,034,813 | 103,371 | 5,000,965 | |||||||||||||||||||||||||
Dividends and distribution reinvested | 119,051 | 91,641 | 43,044 | |||||||||||||||||||||||||
Shares repurchased | (2,039 | ) | (5,117,325 | ) | — | |||||||||||||||||||||||
|
|
|
|
|
| |||||||||||||||||||||||
Net increase (decrease) | 4,151,825 | (4,922,313 | ) | 5,044,009 | ||||||||||||||||||||||||
Beginning shares outstanding | — | 5,044,009 | — | |||||||||||||||||||||||||
|
|
|
|
|
| |||||||||||||||||||||||
Ending shares outstanding | 4,151,825 | 121,696 | 5,044,009 | |||||||||||||||||||||||||
|
|
|
|
|
| |||||||||||||||||||||||
| (1) | Class I shares of the PL Floating Rate Income Fund commenced operations on June 30, 2011 and Class A and Class C shares commenced operations on December 30, 2011. |
| (2) | Class A and Class I shares of the PL Income Fund commenced operations on December 31, 2010 and Class C shares commenced operations on June 30, 2011. |
14. OTHER TAX INFORMATION (Unaudited)
For corporate shareholders, the percentage of investment income (dividend income and short-term gains, if any) for each of the Funds that qualify for the dividends-received deductions for the year ended March 31, 2012 is as follows:
Fund | Percentage | |||
PL Portfolio Optimization Conservative | 8.24 | % | ||
PL Portfolio Optimization Moderate-Conservative | 20.10 | % | ||
PL Portfolio Optimization Moderate | 38.48 | % | ||
PL Portfolio Optimization Moderate-Aggressive | 75.50 | % | ||
PL Portfolio Optimization Aggressive | 100.00 | % | ||
For the year ended March 31, 2012, certain dividends paid by the Funds may be subject to a maximum tax rate of 15%, as provided by the Jobs and Growth Tax Relief Reconciliation Act of 2003. Of the distributions made by the following Funds, the corresponding percentages represent the amount of each distribution which may qualify for the 15% dividend income tax rate.
| D-16 |
Table of Contents
PACIFIC LIFE FUNDS
NOTES TO FINANCIAL STATEMENTS (Continued)
Fund | Percentage | |||
PL Portfolio Optimization Conservative | 13.10 | % | ||
PL Portfolio Optimization Moderate-Conservative | 29.84 | % | ||
PL Portfolio Optimization Moderate | 56.50 | % | ||
PL Portfolio Optimization Moderate-Aggressive | 100.00 | % | ||
PL Portfolio Optimization Aggressive | 100.00 | % | ||
Shareholders should not use the above tax information to prepare their tax returns. The information will be included with your Form 1099 DIV which will be sent to you separately in January 2013.
The following Funds designated the listed amounts as long-term capital gain dividends during the year ended March 31, 2012. Distributable long-term gains are based on net realized long-term gains determined on a tax basis and may differ from such amounts for financial reporting purposes.
Fund | Amount | |||
PL Portfolio Optimization Conservative | $ | 1,533,719 | ||
PL Income | 126,335 | |||
| D-17 |
Table of Contents
REPORT OF INDEPENDENT REGISTERED PUBLIC ACCOUNTING FIRM
To The Board of Trustees and Shareholders of
Pacific Life Funds
We have audited the accompanying statements of assets and liabilities, including the schedules of investments, of PL Portfolio Optimization Conservative Fund, PL Portfolio Optimization Moderate-Conservative Fund, PL Portfolio Optimization Moderate Fund, PL Portfolio Optimization Moderate-Aggressive Fund, PL Portfolio Optimization Aggressive Fund, PL Floating Rate Income Fund, PL Income Fund, and PL Money Market Fund (collectively the “Funds”) (eight of twenty-eight funds comprising the Pacific Life Funds) as of March 31, 2012, and the related statements of operations for the year then ended (as to the PL Floating Rate Income Fund, for the period from commencement of operations through March 31, 2012), the statements of changes in net assets for each of the two years in the period then ended (as to the PL Floating Rate Income Fund, for the period from commencement of operations through March 31, 2012 and as to the PL Income Fund, for the year then ended and for the period from commencement of operations through March 31, 2011), and the financial highlights for each of the periods presented. These financial statements and financial highlights are the responsibility of the Funds’ management. Our responsibility is to express an opinion on these financial statements and financial highlights based on our audits.
We conducted our audits in accordance with the standards of the Public Company Accounting Oversight Board (United States). Those standards require that we plan and perform the audit to obtain reasonable assurance about whether the financial statements and financial highlights are free of material misstatement. The Funds are not required to have, nor were we engaged to perform, an audit of their internal control over financial reporting. Our audits included consideration of internal control over financial reporting as a basis for designing audit procedures that are appropriate in the circumstances, but not for the purpose of expressing an opinion on the effectiveness of the Funds’ internal control over financial reporting. Accordingly, we express no such opinion. An audit also includes examining, on a test basis, evidence supporting the amounts and disclosures in the financial statements, assessing the accounting principles used and significant estimates made by management, as well as evaluating the overall financial statement presentation. Our procedures included confirmation of investments owned as of March 31, 2012, by correspondence with the custodian, agent banks, transfer agent, and brokers; where replies were not received from brokers, we performed other auditing procedures. We believe that our audits provide a reasonable basis for our opinion.
In our opinion, such financial statements and financial highlights referred to above present fairly, in all material respects, the financial position of each of the respective Funds as of March 31, 2012, and the results of their operations, the changes in their net assets, and the financial highlights for each of the periods presented, in conformity with accounting principles generally accepted in the United States of America.

Costa Mesa, California
May 25, 2012
E-1
Table of Contents
DISCLOSURE OF FUND EXPENSES
(Unaudited)
We believe it is important for you to understand the impact of fees and expenses regarding your investment. All mutual funds have operating expenses. As a shareholder of a mutual fund, you incur two types of costs: (1) transactions costs such as initial sales charges (loads) on purchase payments and/or contingent deferred sales charges on redemptions; and (2) ongoing costs, which include advisory fees, administration fees, distribution and/or service fees, and other fund expenses. The following example is intended to help you understand your ongoing costs (in dollars) of investing in each fund and to compare these costs with those of other mutual funds. The example is based on an investment of $1,000.00 made at the beginning of the period and held for the entire six-month period from October 1, 2011 to March 31, 2012.
ACTUAL EXPENSES
The first section of the table for each fund entitled “Actual Fund Return”, provides information about actual account values and actual expenses based on each fund’s actual performance and each fund’s actual expenses, after any applicable fee waivers and expense reimbursements (See Note 7B in Notes to Financial Statements). The “Ending Account Value at 03/31/12” column shown is derived from the fund’s actual performance; the “Annualized Expense Ratio” column shows the fund’s actual annualized expense ratio; and the “Expenses Paid During the Period 10/01/11-03/31/12” column shows the dollar amount that would have been paid by you. All the information illustrated in the following table is based on the past six-month period from October 1, 2011 to March 31, 2012.
You may use the information in this section, together with the amount you invested, to estimate the expenses that you paid over the period. To do so, for each fund in your account, simply divide that fund’s value by $1,000.00 (for example, an $8,600.00 fund value divided by $1,000.00 = 8.6), then multiply the result by the number given for your fund(s) in the “Expenses Paid During the Period 10/01/11-03/31/12.”
HYPOTHETICAL EXAMPLE FOR COMPARISON PURPOSES
The second section of the table for each fund, entitled “Hypothetical”, provides information about hypothetical account values and hypothetical expenses based on a 5% per year hypothetical rate of return and actual fund’s expenses, after any applicable fee waivers and expense reimbursements (See Note 7B in Notes to Financial Statements). It assumes that the fund had an annual 5% rate of return before expenses, but that the expense ratio is unchanged. The hypothetical account values and expenses may not be used to estimate the actual ending account values or expenses you paid for the period.
You may use the hypothetical example information to compare the ongoing costs of investing in the fund compared to other mutual funds. To do so, compare this 5% hypothetical example with the 5% hypothetical examples that appear in the shareholder reports of other mutual funds.
Please note that the expenses shown in the table are meant to highlight your ongoing costs only and do not reflect any transactional costs, such as initial sales charges (loads) or contingent deferred sales charges. Therefore, the second section of the table is useful in comparing ongoing costs only, and will not help you determine the relative total costs of owning different mutual funds. In addition, if these other costs were included, your costs would have been higher.
| Beginning Account Value at 10/01/11 | Ending Account Value at 03/31/12 | Annualized Expense Ratio | Expenses Paid During the Period (1) 10/01/11 - 03/31/12 | |||||||||||||
PL Portfolio Optimization Conservative Fund (2) | ||||||||||||||||
Actual Fund Return | ||||||||||||||||
Class A | $ | 1,000.00 | $ | 1,078.70 | 0.60 | % | $ | 3.12 | ||||||||
Class B | 1,000.00 | 1,075.10 | 1.35 | % | 7.00 | |||||||||||
Class C | 1,000.00 | 1,075.70 | 1.35 | % | 7.01 | |||||||||||
Class R | 1,000.00 | 1,076.60 | 0.85 | % | 4.41 | |||||||||||
Hypothetical | ||||||||||||||||
Class A | $ | 1,000.00 | $ | 1,022.00 | 0.60 | % | $ | 3.03 | ||||||||
Class B | 1,000.00 | 1,018.25 | 1.35 | % | 6.81 | |||||||||||
Class C | 1,000.00 | 1,018.25 | 1.35 | % | 6.81 | |||||||||||
Class R | 1,000.00 | 1,020.75 | 0.85 | % | 4.29 | |||||||||||
PL Portfolio Optimization Moderate-Conservative Fund (2) | ||||||||||||||||
Actual Fund Return | ||||||||||||||||
Class A | $ | 1,000.00 | $ | 1,118.30 | 0.60 | % | $ | 3.18 | ||||||||
Class B | 1,000.00 | 1,115.60 | 1.35 | % | 7.14 | |||||||||||
Class C | 1,000.00 | 1,116.00 | 1.35 | % | 7.14 | |||||||||||
Class R | 1,000.00 | 1,117.00 | 0.85 | % | 4.50 | |||||||||||
Hypothetical | ||||||||||||||||
Class A | $ | 1,000.00 | $ | 1,022.00 | 0.60 | % | $ | 3.03 | ||||||||
Class B | 1,000.00 | 1,018.25 | 1.35 | % | 6.81 | |||||||||||
Class C | 1,000.00 | 1,018.25 | 1.35 | % | 6.81 | |||||||||||
Class R | 1,000.00 | 1,020.75 | 0.85 | % | 4.29 | |||||||||||
PL Portfolio Optimization Moderate Fund (2) | ||||||||||||||||
Actual Fund Return | ||||||||||||||||
Class A | $ | 1,000.00 | $ | 1,161.70 | 0.60 | % | $ | 3.24 | ||||||||
Class B | 1,000.00 | 1,159.20 | 1.35 | % | 7.29 | |||||||||||
Class C | 1,000.00 | 1,160.00 | 1.35 | % | 7.29 | |||||||||||
Class R | 1,000.00 | 1,161.50 | 0.85 | % | 4.59 | |||||||||||
Hypothetical | ||||||||||||||||
Class A | $ | 1,000.00 | $ | 1,022.00 | 0.60 | % | $ | 3.03 | ||||||||
Class B | 1,000.00 | 1,018.25 | 1.35 | % | 6.81 | |||||||||||
Class C | 1,000.00 | 1,018.25 | 1.35 | % | 6.81 | |||||||||||
Class R | 1,000.00 | 1,020.75 | 0.85 | % | 4.29 | |||||||||||
PL Portfolio Optimization Moderate-Aggressive Fund (2) | ||||||||||||||||
Actual Fund Return | ||||||||||||||||
Class A | $ | 1,000.00 | $ | 1,199.60 | 0.60 | % | $ | 3.30 | ||||||||
Class B | 1,000.00 | 1,198.80 | 1.35 | % | 7.42 | |||||||||||
Class C | 1,000.00 | 1,197.90 | 1.35 | % | 7.42 | |||||||||||
Class R | 1,000.00 | 1,199.20 | 0.85 | % | 4.67 | |||||||||||
Hypothetical | ||||||||||||||||
Class A | $ | 1,000.00 | $ | 1,022.00 | 0.60 | % | $ | 3.03 | ||||||||
Class B | 1,000.00 | 1,018.25 | 1.35 | % | 6.81 | |||||||||||
Class C | 1,000.00 | 1,018.25 | 1.35 | % | 6.81 | |||||||||||
Class R | 1,000.00 | 1,020.75 | 0.85 | % | 4.29 | |||||||||||
| F-1 | See explanation of references on page F-2 |
Table of Contents
PACIFIC LIFE FUNDS
DISCLOSURE OF FUND EXPENSES (Continued)
(Unaudited)
| Beginning Account Value at 10/01/11 | Ending Account Value at 03/31/12 | Annualized Expense Ratio | Expenses Paid During the Period (1) 10/01/11 - 03/31/12 | |||||||||||||
| PL Portfolio Optimization Aggressive Fund (2) | ||||||||||||||||
Actual Fund Return | ||||||||||||||||
Class A | $ | 1,000.00 | $ | 1,228.20 | 0.60 | % | $ | 3.34 | ||||||||
Class B | 1,000.00 | 1,230.50 | 1.35 | % | 7.53 | |||||||||||
Class C | 1,000.00 | 1,230.50 | 1.35 | % | 7.53 | |||||||||||
Class R | 1,000.00 | 1,228.30 | 0.85 | % | 4.74 | |||||||||||
Hypothetical | ||||||||||||||||
Class A | $ | 1,000.00 | $ | 1,022.00 | 0.60 | % | $ | 3.03 | ||||||||
Class B | 1,000.00 | 1,018.25 | 1.35 | % | 6.81 | |||||||||||
Class C | 1,000.00 | 1,018.25 | 1.35 | % | 6.81 | |||||||||||
Class R | 1,000.00 | 1,020.75 | 0.85 | % | 4.29 | |||||||||||
| PL Floating Rate Income Fund (3) | ||||||||||||||||
Actual Fund Return | ||||||||||||||||
Class A (3) | $ | 1,000.00 | $ | 1,037.90 | 1.05 | % | $ | 2.72 | ||||||||
Class C (3) | 1,000.00 | 1,036.80 | 1.80 | % | 4.66 | |||||||||||
Class I | 1,000.00 | 1,086.60 | 0.80 | % | 4.17 | |||||||||||
Hypothetical | ||||||||||||||||
Class A (3) | $ | 1,000.00 | $ | 1,019.75 | 1.05 | % | $ | 5.30 | ||||||||
Class C (3) | 1,000.00 | 1,016.00 | 1.80 | % | 9.07 | |||||||||||
Class I | 1,000.00 | 1,021.00 | 0.80 | % | 4.04 | |||||||||||
| PL Income Fund | ||||||||||||||||
Actual Fund Return | ||||||||||||||||
Class A | $ | 1,000.00 | $ | 1,054.20 | 0.90 | % | $ | 4.62 | ||||||||
Class C | 1,000.00 | 1,049.70 | 1.65 | % | 8.46 | |||||||||||
Class I | 1,000.00 | 1,053.90 | 0.65 | % | 3.34 | |||||||||||
Hypothetical | ||||||||||||||||
Class A | $ | 1,000.00 | $ | 1,020.50 | 0.90 | % | $ | 4.55 | ||||||||
Class C | 1,000.00 | 1,016.75 | 1.65 | % | 8.32 | |||||||||||
Class I | 1,000.00 | 1,021.75 | 0.65 | % | 3.29 | |||||||||||
| PL Money Market Fund | ||||||||||||||||
Actual Fund Return | ||||||||||||||||
Class A | $ | 1,000.00 | $ | 1,000.00 | 0.08 | % | $ | 0.40 | ||||||||
Hypothetical | ||||||||||||||||
Class A | $ | 1,000.00 | $ | 1,024.60 | 0.08 | % | $ | 0.40 | ||||||||
| (1) | Expenses paid during the six-month period are equal to the fund’s annualized expense ratio (shown in table above), multiplied by the average account value over the period, multiplied by the number of days in the most recent fiscal half-year or applicable period, then divided by 366 days. |
| (2) | The annualized expense ratios for the Portfolio Optimization Funds do not include expenses of the PL Underlying Funds (See Note 1 in Notes to Financial Statements) in which the Portfolio Optimization Funds invest. |
| (3) | PL Floating Rate Income Fund Class A and Class C commenced operations on December 30, 2011. The actual fund return and expenses paid during the period by this fund was for the period from December 30, 2011 to March 31, 2012, instead of the entire six-month period. The hypothetical return and expenses paid during the period are based on the entire six-month period for comparison purposes. |
| F-2 |
Table of Contents
TRUSTEES AND OFFICERS INFORMATION
(Unaudited)
The business and affairs of the Pacific Life Funds (the “Trust”) are managed under the direction of the Board of Trustees under the Pacific Life Funds’ Declaration of Trust. Information pertaining to the trustees and officers of the Trust is set forth below, effective April 1, 2012. Trustees who are not deemed to be “interested persons” of the Trust, as defined in the 1940 Act, are referred to as “Independent Trustees.” Certain trustees and officers are deemed to be “interested persons” of the Trust and thus are referred to as “Interested Persons”, because of their positions with Pacific Life Insurance Company (“Pacific Life”) and Pacific Life Fund Advisors LLC, a wholly-owned subsidiary of Pacific Life. The Trust’s Statement of Additional Information includes additional information about the trustees. For information on availability of the Trust’s Statement of Additional Information, refer to the WHERE TO GO FOR MORE INFORMATION section of this report.
The address of each trustee and officer is c/o Pacific Life Funds, 700 Newport Center Drive, Newport Beach, CA 92660.
Name and Age | Position(s) with the Fund and Length of Time Served* | Current Directorship(s) Held and Principal Occupation(s) (and certain additional occupation information) During Past 5 Years | Number of Portfolios in Fund Complex Overseen** | |||
INDEPENDENT TRUSTEES | ||||||
Frederick L. Blackmon Year of birth 1952 | Trustee since 9/13/05 | Trustee (1/05 to present) of Pacific Select Fund; Director (2005 to present) of Trustmark Mutual Holding Company; Former Executive Vice President and Chief Financial Officer (1995 to 2003) of Zurich Life and has been retired since that time; Executive Vice President and Chief Financial Officer (1989 to 1995) of Alexander Hamilton Life Insurance Company (subsidiary of Household International); Member of Board of Trustees (2010 to present) of Cranbrook Educational Community; Former Member of Board of Governors (1994 to 1999) of Cranbrook Schools; and Former Member, Board of Regents (1993 to 1996), Eastern Michigan University. | 78 | |||
Gale K. Caruso Year of birth 1957 | Trustee since 1/01/06 | Trustee (1/06 to present) of Pacific Select Fund; Former Member of the Board of Directors (2005 to 2009) of LandAmerica Financial Group, Inc.; Former President and Chief Executive Officer (1999 to 2003) of Zurich Life; Former Chairman, President and Chief Executive Officer of Scudder Canada Investor Services, Ltd. and Managing Director of Scudder Kemper Investments; Former Member of the Advisory Council of the Trust for Public Land in Maine; Member of the Board of Directors of Make-A-Wish of Maine; and Former Member, Board of Directors of the Illinois Life Insurance Council. | 78 | |||
Lucie H. Moore Year of birth 1956 | Trustee since 6/13/01 | Trustee (10/98 to present) of Pacific Select Fund; Former Partner (1984 to 1994) with Gibson, Dunn & Crutcher (Law); Member of the Board of Trustees (2007 to 2011) of Sage Hill School; Former Member (2000 to 2009) and Former Vice Chairman (2001 to 2007) of the Board of Trustees of The Pegasus School; Former Member of the Board of Directors (2005 to 2010) of HomeWord; and Former Member of the Advisory Board (1993 to 2004) of Court Appointed Special Advocates (CASA) of Orange County. | 78 | |||
Nooruddin (Rudy) S. Veerjee Year of birth 1958 | Trustee since 9/13/05 | Trustee (1/05 to present) of Pacific Select Fund; Former President (1997 to 2000) of Transamerica Insurance and Investment Group and has been retired since that time; Former President (1994 to 1997) of Transamerica Asset Management; Former Chairman and Chief Executive Officer (1995 to 2000) of Transamerica Premier Funds (Mutual Fund); and Former Director (1994 to 2000) of various Transamerica Life Companies. | 78 | |||
G. Thomas Willis Year of birth 1942 | Trustee since 2/24/04 | Trustee (11/03 to present) of Pacific Select Fund; Certified Public Accountant in California (1967 to present); Former Audit Partner (1976 to 2002) of PricewaterhouseCoopers LLP, (Accounting and Auditing) and has been retired since that time. | 78 | |||
| F-3 | See explanation of symbols on page F-6 |
Table of Contents
PACIFIC LIFE FUNDS
TRUSTEES AND OFFICERS INFORMATION (Continued)
(Unaudited)
Name and Age | Position(s) with the Fund and Length of Time Served* | Current Directorship(s) Held and Principal Occupation(s) (and certain additional occupation information) During Past 5 Years | Number of Portfolios in Fund Complex Overseen** | |||
INTERESTED PERSONS | ||||||
James T. Morris Year of birth 1960 | Chairman of the Board and Trustee since 1/11/07, (Chief Executive Officer 1/11/07 to 12/31/09, President 11/14/05 to 1/10/07 and Executive Vice President 6/05 to 11/05) | Director (4/07 to present), Chairman (5/08 to present), Chief Executive Officer (4/07 to present), President (4/07 to 3/12), Chief Operating Officer (1/06 to 4/07), Executive Vice President and Chief Insurance Officer (7/05 to 1/06) of Pacific Mutual Holding Company and Pacific LifeCorp; Director (4/07 to present), Chairman (5/08 to present), Chief Executive Officer (4/07 to present), President (4/07 to 3/12), Chief Operating Officer (1/06 to 4/07), Chief Insurance Officer (4/05 to 1/06), Executive Vice President (1/02 to 1/06), Senior Vice President (4/96 to 1/02), and Vice President (4/90 to 4/96) of Pacific Life; President and Chief Executive Officer (5/07 to present) of Pacific Life Fund Advisors LLC; Director (4/06 to present), Chairman (5/08 to present), President and Chief Executive Officer (4/07 to present), Chief Operating Officer (1/06 to 4/07), Chief Insurance Officer (4/05 to 1/06), Executive Vice President (1/02 to 1/06), and Senior Vice President (8/99 to 1/02) of Pacific Life & Annuity Company; and similar positions with other subsidiaries and affiliates of Pacific Life; and Chairman of the Board and Trustee (1/07 to present), Chief Executive Officer (1/07 to 12/09), President (11/05 to 1/07) and Executive Vice President (6/05 to 11/05) of Pacific Select Fund. | 78 | |||
Mary Ann Brown Year of birth 1951 | Chief Executive Officer since 1/01/10, (President 1/11/07 to 12/31/09, Executive Vice President 6/20/06 to 1/10/07) | Executive Vice President (4/10 to present) and Senior Vice President (5/06 to 4/10) of Pacific LifeCorp; Executive Vice President (4/10 to present) and Senior Vice President (3/05 to 4/10) of Pacific Life; Trustee (9/05 to 12/10), Pacific Life Employees Retirement Plan; Executive Vice President (4/10 to present) and Senior Vice President (5/07 to 4/10) of Pacific Life Fund Advisors LLC; Executive Vice President (4/10 to present) and Senior Vice President (6/08 to 4/10) of Pacific Life Re Holdings LLC; Director (6/08 to present) Executive Vice President (4/10 to present) and Senior Vice President (6/08 to 4/10) of Pacific Life Re Holdings Limited; Director (9/11 to present) of Pacific Life Reinsurance (Barbados) Ltd; Board Member (1/12 to present) and Director (9/11 to 12/11) of Pacific Services Canada Ltd; Board Member and Vice Chairman (8/01 to present) and Chairman (7/04 to 10/05) of National Association of Variable Annuities; Senior Vice President of Finance, (7/03 to 11/03), New York Life Insurance Company; MetLife, Inc. (12/98 to 6/03), Senior Vice President and Head of Individual Business Product Management (12/98 to 7/02) responsibilities included: President of New England Products and Services; Chairman, Security First Group (later MetLife Investors); Chairman, Chief Executive Officer and President, New England Pension and Annuity Company; Board Member, New England Zenith Funds; Board Member, Reinsurance Group of America, Chairman and Chief Executive Officer of Exeter Reinsurance Company, Ltd.; Chairman and Chief Executive Officer of Missouri Reinsurance Company, Ltd; Chairman of Underwriting Policy and Rate Setting Committees; Senior Vice President and Chief Actuary (7/02 to 6/03), of MetLife, Inc.; Director (12/05 to present), Executive Vice President (4/10 to present) and Senior Vice President (12/05 to 4/10) of Pacific Alliance Reinsurance Ltd; Director (10/07 to present), Executive Vice President (6/10 to present) and Senior Vice President (10/07 to 6/10) of Pacific Alliance Reinsurance Company of Vermont; and Chief Executive Officer (1/10 to present), President (1/07 to 12/09) and Executive Vice President (6/06 to 1/07) of Pacific Select Fund. | 78 | |||
| F-4 | See explanation of symbols on page F-6 |
Table of Contents
PACIFIC LIFE FUNDS
TRUSTEES AND OFFICERS INFORMATION (Continued)
(Unaudited)
Name and Age | Position(s) with the Fund and Length of Time Served* | Current Directorship(s) Held and Principal Occupation(s) (and certain additional occupation information) During Past 5 Years | Number of Portfolios in Fund Complex Overseen** | |||
| INTERESTED PERSONS (Continued) | ||||||
Robin S. Yonis Year of birth 1954 | Vice President and General Counsel since 6/13/01 | Vice President, Fund Advisor General Counsel, and Assistant Secretary (5/07 to present) of Pacific Life Fund Advisors LLC; Vice President and Counsel (4/04 to present), Assistant Vice President and Investment Counsel (11/93 to 4/04) of Pacific Life; Vice President and Investment Counsel (4/04 to 9/09), Assistant Vice President and Investment Counsel (8/99 to 4/04) of Pacific Life & Annuity Company; and Vice President and General Counsel (4/05 to present) of Pacific Select Fund. | 78 | |||
Brian D. Klemens Year of birth 1956 | Vice President and Treasurer since 6/13/01 | Vice President and Controller (10/07 to present) and Vice President and Treasurer (6/99 to 10/07) of Pacific Mutual Holding Company and Pacific LifeCorp; Vice President and Controller (10/07 to present) and Vice President and Treasurer (12/98 to 10/07) of Pacific Life; Vice President and Controller (10/07 to present) and Vice President and Treasurer (5/07 to 10/07) of Pacific Life Fund Advisors LLC; and similar positions with other subsidiaries and affiliates of Pacific Life; and Vice President and Treasurer (4/96 to present) of Pacific Select Fund. | 78 | |||
Sharon E. Pacheco Year of birth 1957 | Vice President and Chief Compliance Officer since 6/04/04 | Vice President and Chief Compliance Officer (11/03 to present) of Pacific Mutual Holding Company and Pacific LifeCorp; Vice President (2/00 to present) and Chief Compliance Officer (1/03 to present) and Assistant Vice President (11/97 to 2/00) of Pacific Life; Vice President (4/00 to present), Chief Compliance Officer (1/03 to present), and Assistant Vice President (8/99 to 4/00) of Pacific Life & Annuity Company; Vice President and Chief Compliance Officer (5/07 to present) of Pacific Life Fund Advisors LLC; and Vice President and Chief Compliance Officer (6/04 to present) of Pacific Select Fund | 78 | |||
Eddie Tung Year of birth 1957 | Vice President and Assistant Treasurer since 11/14/05 | Assistant Vice President (4/03 to present) and Director (Variable Products Accounting) (4/00 to 4/03) of Pacific Life; Assistant Vice President (4/10 to present) of Pacific Life & Annuity Company; Assistant Vice President (5/07 to present) of Pacific Life Fund Advisors LLC; and Assistant Vice President and Assistant Treasurer (11/05 to present) of Pacific Select Fund. | 78 | |||
Howard T. Hirakawa Year of birth 1962 | Vice President since 6/20/06 | Vice President (5/07 to present) of Pacific Life Fund Advisors LLC; Vice President (4/05 to present), Assistant Vice President (4/00 to 4/05) and Director (Annuities & Mutual Funds) (5/98 to 4/00) of Pacific Life; Vice President (4/05 to 9/09) of Pacific Life & Annuity Company; and Vice President (6/06 to present) of Pacific Select Fund. | 78 | |||
Jane M. Guon Year of birth 1964 | Vice President since 1/01/11 and Secretary since 1/01/11 | Vice President and Secretary (1/11 to present) and Assistant Vice President (4/06 to 12/10) and Assistant Secretary (6/98 to 12/10) of Pacific Mutual Holding Company and Pacific LifeCorp; Director, Vice President, and Secretary (1/11 to present) and Assistant Vice President (4/06 to 12/10) and Assistant Secretary (2/95 to 12/10) of Pacific Life; Vice President and Secretary (1/11 to present) and Assistant Vice President and Assistant Secretary (05/07 to 12/10) of Pacific Life Fund Advisors LLC and similar positions with other subsidiaries of Pacific Life; and Vice President (1/11 to present) and Secretary (1/11 to present) of Pacific Select Fund. | 78 | |||
| F-5 | See explanation of symbols on page F-6 |
Table of Contents
PACIFIC LIFE FUNDS
TRUSTEES AND OFFICERS INFORMATION (Continued)
(Unaudited)
Name and Age | Position(s) with the Fund and Length of Time Served* | Current Directorship(s) Held and Principal Occupation(s) (and certain additional occupation information) During Past 5 Years | Number of Portfolios in Fund Complex Overseen** | |||
INTERESTED PERSONS (Continued) | ||||||
Laurene E. MacElwee Year of birth 1966 | Vice President since 4/04/05 and Assistant Secretary since 6/13/01 | Vice President (4/11 to present), Assistant Secretary (5/07 to present), and Assistant Vice President (5/07 to 3/11) of Pacific Life Fund Advisors LLC; Vice President (4/11 to present); Assistant Vice President (4/02 to 3/11) and Director (Variable Products & Fund Compliance) (4/00 to 4/02) of Pacific Life; and Vice President (12/11 to present), Assistant Secretary (4/05 to present), and Assistant Vice President (4/05 to 12/11) of Pacific Select Fund. | 78 | |||
Carleton J. Muench Year of birth 1973 | Vice President since 11/30/06 | Assistant Vice President (5/07 to present) of Pacific Life Fund Advisors LLC; Assistant Vice President (10/06 to present) of Pacific Life; Director of Research (5/05 to 9/06) and Senior Investment Analyst (10/03 to 4/05) of Mason Investment Advisory Services, Inc.; Investment Analyst (2/01 to 9/02), Due Diligence Analyst (1/00 to 1/01) and Performance Analyst (10/98 to 12/99) of Manulife Financial; and Assistant Vice President (11/06 to present) of Pacific Select Fund. | 78 | |||
| * | A trustee serves until he or she resigns, retires, or his or her successor is elected and qualified. |
| ** | As of March 31, 2012, the “Fund Complex” consisted of Pacific Life Funds (28 funds) and Pacific Select Fund (50 portfolios). |
| F-6 |
Table of Contents
APPROVAL OF INVESTMENT ADVISORY AGREEMENT
AND FUND MANAGEMENT AGREEMENTS
(Unaudited)
The Board of Trustees (the “Trustees” or “Board”) of Pacific Life Funds (the “Trust”) oversees the management of each of the separate funds of the Trust (each a “Fund” and collectively, the “Funds”) and, as required by Section 15(c) of the Investment Company Act of 1940, as amended (the “1940 Act”), initially approves, and determines annually whether to renew the investment advisory agreement (the “Advisory Agreement”) with Pacific Life Fund Advisors LLC (“PLFA”) and each Fund management agreement (the “Fund Management Agreements,” together with the Advisory Agreement, the “Agreements”) with the various sub-advisers (“Fund Managers”). PLFA serves as the investment adviser for all of the Funds and directly manages the PL Money Market, PL Income and PL Floating Rate Income Funds (the “PAM Managed Funds”) under the name Pacific Asset Management (“PAM”) and the PL Portfolio Optimization Conservative, PL Portfolio Optimization Moderate-Conservative, PL Portfolio Optimization Moderate, PL Portfolio Optimization Moderate-Aggressive, and PL Portfolio Optimization Aggressive Funds (the “Asset Allocation Funds,” and together with the PAM Managed Funds, the “Directly Managed Funds”). For all other Funds (other than the PL High Income, PL Short Duration Income and PL Strategic Income Funds, which are new funds and are discussed in a separate Annual Report dated March 31, 2012), PLFA has retained other firms to serve as Fund Managers under PLFA’s supervision. The Board, including all of the Trustees who are not “interested persons,” as that term is defined in the 1940 Act (“Independent Trustees”), last renewed the Agreements at an in-person meeting of the Trustees held on December 12-13, 2011.
At this meeting and other meetings, the Board considered information (both written and oral) provided to assist it in its review of the Agreements and made assessments with respect to each Agreement. The Board requested, received and reviewed written materials from PLFA and each Fund Manager that were submitted in response to requests from the Independent Trustees and supporting materials relating to those questions and responses. In addition, the Board received in-person presentations about the Funds throughout the year, and the Independent Trustees were advised by independent legal counsel with respect to these and other relevant matters. The Board reviewed a variety of factors and considered a significant amount of information, including information received on an ongoing basis at Board and committee meetings, including reports on Fund performance, expenses, fee comparisons, investment advisory, compliance, and other services provided to the Funds by PLFA and the Fund Managers. The Board also reviewed financial and profitability information regarding PLFA and the Fund Managers and information regarding the organization and operations of each entity, such as their compliance monitoring, portfolio trading and brokerage practices and the personnel providing investment management and administrative services to each Fund. The Board reviewed data provided by PLFA that was gathered from various independent providers of investment company data to provide the Board with information concerning the Funds’ investment performance, management fees and expense information. Additionally, the Independent Trustees retained an independent consultant (“Independent Consultant”) to assist the Trustees with certain of their analyses and to provide other relevant information. The Independent Consultant utilized and provided the Independent Trustees with data obtained from independent service providers as well as from other sources.
The Trustees’ determinations were made on the basis of each Trustee’s business judgment after consideration of all the information presented. In reviewing the materials presented and in considering the information in the management presentations, the Trustees did not identify any single issue or particular information that, in isolation, would be a controlling factor in making a final decision regarding the proposed renewals. Individual Trustees may have given different weights to certain factors and assigned various degrees of materiality to information received in connection with the approval process. The following summary describes the most important, but not all, of the factors considered by the Trustees in approving the renewals, and in the case of the Independent Trustees, certain factors were considered in light of the legal advice furnished to them by independent legal counsel and information from the Independent Consultant that they had retained. This discussion is not intended to be all-inclusive.
Annual Consideration and Approval of Investment Advisory and Fund Management Agreements
In evaluating the Advisory Agreement and each Fund Management Agreement, the Board, including all the Independent Trustees, considered the following factors, among others:
1. Nature, Extent and Quality of Services
Fund Oversight and Supervision - PLFA, its personnel and its resources. The Trustees considered the depth and quality of PLFA’s investment management process, including its monitoring and oversight of the Fund Managers and PAM; the experience, capability and integrity of its senior management and other personnel; the low turnover rates of its key personnel; and the overall financial strength and stability of its organization. The Trustees considered the high quality of the products and services provided by PLFA and its affiliates, such as the many educational services and tools offered to assist intermediaries in effectively understanding and meeting shareholder needs. The Trustees also noted that PLFA regularly informs the Trustees about matters relevant to the Trust, its shareholders and investing.
The Trustees also considered that the investment, legal, compliance and accounting professionals of PLFA and its affiliates have access to and utilize a variety of resources and systems relating to investment management, compliance, trading, performance analysis, security valuation and fund accounting. The Trustees further considered PLFA’s continuing need to attract and retain qualified personnel and to maintain and enhance its resources and systems to provide appropriate investment management, compliance and monitoring services for the Funds. The Board noted that PLFA monitors numerous investment, performance and compliance metrics for the Funds.
The Trustees considered PLFA’s continued development and use of analytical tools for assessing Fund performance and the performance of the Fund Managers, conducting an attribution analysis on performance and reporting on performance to the Trustees. The Trustees noted
F-7
Table of Contents
PACIFIC LIFE FUNDS
APPROVAL OF INVESTMENT ADVISORY AGREEMENT
AND FUND MANAGEMENT AGREEMENTS (Continued)
(Unaudited)
that PLFA uses these tools to identify Funds that are underperforming applicable benchmarks or peer groups, and then conducts various analyses to try to assess the sources of and reasons for underperformance. The Trustees noted that PLFA has developed processes to oversee and monitor the performance of Fund Managers, including the use of analytical methods to review Fund performance and execution of investment strategies. The Trustees noted that PLFA provides the Trustees with analysis of this data over rolling periods to assist the Trustees in identifying trends in Fund performance and other areas, and periodically provides the Trustees with information on economic and market trends to provide a context for assessing recent performance. The Trustees also noted that PLFA conducts periodic due diligence on Fund Managers involving onsite visits, in-person meetings and telephonic meetings to gather information that PLFA uses to gain an in-depth understanding of a Fund Manager’s investment process and to seek to identify issues that may be relevant to a Fund Manager’s services to a Fund or a Fund’s performance, including, but not limited to, the financial strength of a Fund Manager, significant staffing changes that could affect a Fund, material changes in a Fund Manager’s assets under management, compliance and regulatory concerns, best execution review and portfolio security valuation support. The Trustees also noted that PLFA appeared to have implemented effective methods for monitoring investment style consistency by Fund Managers and for analyzing the use of derivatives by Fund Managers. With respect to the PAM Managed Funds, the Trustees considered that PLFA provided oversight, diligence and reporting with regard to its PAM unit that is similar to the process it employs with regard to the Fund Managers. The Trustees also considered that PLFA directly manages the Asset Allocation Funds.
The Trustees considered the time and attention paid by PLFA to matters involving the valuation of Trust securities, including researching and evaluating information concerning securities that are not actively or publicly traded, valuing securities subject to a trading halt, the value of equity securities traded on foreign exchanges, oversight of and due diligence on pricing vendors and the development of alternate valuation methodologies. The Trustees also considered PLFA’s oversight of transition management when overseeing significant changes in the Funds, such as cash movements between the Funds arising from reallocations by the Asset Allocation Funds and the transition from one Fund Manager to another, including steps taken by PLFA to reduce transaction costs associated with a Fund Manager transition.
The Trustees considered PLFA’s policies, procedures and systems to ensure compliance with applicable laws and regulations with respect to the Directly Managed Funds, its compliance monitoring of the Fund Managers and its commitment to those programs; PLFA’s efforts to keep the Trustees informed about the Fund Managers; and its attention to matters that may involve conflicts of interest with each Fund. In this regard, the Trustees reviewed, throughout the year, information on PLFA’s compliance policies and procedures, its compliance history, and reports from the Trust’s Chief Compliance Officer (“CCO”) on compliance by PLFA, the Fund Managers, and the Funds with applicable laws and regulations. The Trustees also reviewed information on any responses by PLFA to regulatory and compliance developments throughout the year. The Trustees further considered the monitoring and additional services provided by PLFA to the Funds, including risk management analysis, preparation of periodic performance and financial reports, review of trade execution and coordination of other service providers to the Trust.
Fund Management – PLFA and the Fund Managers. The Trustees considered various materials relating to PLFA, including PAM, and the Fund Managers, including copies of each existing Advisory Agreement and Fund Management Agreement; copies of the Form ADV for PLFA and each Fund Manager; financial information relating to PLFA and each Fund Manager; and other information deemed relevant to the Trustees’ evaluation of PLFA and each Fund Manager, including qualitative assessments from senior management of PLFA.
The Trustees considered the benefits to shareholders of retaining PLFA, including its PAM unit, and each Fund Manager and continuing the Advisory Agreement and Fund Management Agreements particularly in light of the nature, extent, and quality of the services that have been provided by PLFA, including its PAM unit, and the Fund Managers. The Trustees noted the fund management services that have been provided by PLFA or PAM to the Directly Managed Funds and the fund management services that have been provided by the Fund Managers to the other Funds. The Trustees considered the quality of the fund management services which have benefited and should continue to benefit the Funds and their shareholders, the organizational depth and resources of PLFA and the Fund Managers, including the background and experience of PLFA, including its PAM unit, and each of the Fund Managers’, and the expertise of PLFA, its PAM unit, and each Fund Manager’s fund management team, as well as the investment methodology used by PLFA, its PAM unit, and the Fund Manager.
The Trustees further noted the compliance monitoring conducted on an ongoing basis by PLFA, including PAM, and also noted the development of procedures and systems necessary to maintain compliance with applicable laws and regulations as well as the resources that PLFA dedicates to these programs. The Trustees considered that the CCO had in place a systematic process for periodically reviewing PLFA and each Fund Manager’s written compliance policies and procedures, including the assessment of PLFA and each Fund Manager’s compliance program as required under Rule 38a-1 of the 1940 Act and PLFA and each Fund Manager’s code of ethics. The Trustees also considered that PLFA and each Fund Manager continue to cooperate with the CCO in reviewing its compliance operations.
In making their assessments, the Trustees considered that PLFA has historically exercised diligence in monitoring the performance of the Fund Managers and PAM, and has recommended and taken measures to attempt to remedy relative underperformance by a Fund when PLFA and the Trustees believed it to be appropriate.
| F-8 |
Table of Contents
PACIFIC LIFE FUNDS
APPROVAL OF INVESTMENT ADVISORY AGREEMENT
AND FUND MANAGEMENT AGREEMENTS (Continued)
(Unaudited)
The Board concluded that it was satisfied with the nature, extent and quality of the investment management services provided by PLFA and the Fund Managers.
2. Investment Results
The Trustees considered the investment results of each Fund in light of its objective and market conditions over the past year. The Trustees compared each Fund’s total returns with both the total returns of appropriate groups of peer funds, based on information provided by PLFA using data from independent sources, and with one or more relevant benchmark indices. The Independent Trustees also considered information provided by an Independent Consultant who provided a presentation and analysis to the Trustees regarding peer group performance utilizing data from independent sources. The information provided to the Trustees included each Fund’s performance record for up to the last ten calendar years, and three-month, year-to-date, one-, three-, five- and ten-year or since inception periods, as applicable. In reviewing the performance data drawn from independent sources, as well as the performance of the respective benchmark indices, the Trustees noted that some Funds outperformed their peer groups over certain periods and/or exceeded their respective benchmark indices while others underperformed their peer groups over certain periods and/or trailed their respective benchmark indices. The Trustees discussed with PLFA the fact that certain periods of underperformance may be transitory while other periods of underperformance may be reflective of broader issues that may warrant consideration of corrective action. The Trustees discussed these Funds with representatives of PLFA, including an assessment of the approaches used by the Fund Managers as well as oversight and monitoring by PLFA as the investment adviser, to gain an understanding of underperformance and to assess whether any actions would be appropriate.
The Trustees also reviewed the monitoring of the Fund Managers’ investment results by PLFA, including PLFA’s historical practice of recommending to the Trustees the use of a new manager if performance lagged and could not be improved within a reasonable timeframe and reviewed the monitoring of the PAM unit’s investment results by PLFA. The Trustees noted that many of the best investment advisory firms consistently compete to be considered to provide fund management services for the Funds. Generally, the Trustees noted that there continues to be a strong record of well-managed Funds that work well in the Asset Allocation Funds and that the Asset Allocation Funds provide a range of professionally managed asset allocation investment options. The Trustees also noted that the Funds continue to deliver the investment style as disclosed to shareholders. The Trustees also noted only the Directly Managed Funds are open to new investors.
The Board concluded that PLFA continues to have a strong record of effectively managing a multi-manager fund group and asset allocation and income funds designed to give shareholders a reasonable array of choices through which to implement their investment programs. The Board further concluded that PLFA was implementing each Fund’s investment objective either directly or through the selection of Fund Managers and that PLFA’s record in managing each Fund indicates that its continued management as well as the continuation of the applicable Fund Management Agreements will benefit each Fund and its shareholders.
3. Advisory Fees and Total Expense Ratios
The Trustees requested, received and reviewed information from PLFA relating to the advisory fees and the sub-advisory fees, including the portion of the advisory fees paid to each Fund Manager and the portion retained by PLFA, and operating expense ratios for each of the Funds. The Independent Trustees also requested and reviewed information from the Independent Consultant along with their analysis of advisory fees, sub-advisory fees and certain other expenses. The Trustees reviewed the advisory fees, sub-advisory fees and operating expense ratios of each Fund and compared such amounts with the average fee and expense levels of other funds in applicable peer fund groups. During their review, the Trustees noted that all of the Funds were subject to contractual expense limitations agreed to by PLFA. The Trustees also reviewed written materials prepared by PLFA based on peer fund group information retrieved from the independent sources. The Independent Trustees requested and reviewed an analysis provided by the Independent Consultant of the asset-based breakpoint schedule for the Funds. The Independent Trustees noted that the breakpoints offer meaningful potential savings to shareholders of many of the Funds.
The Trustees also considered information from the Fund Managers regarding the comparative sub-advisory fees charged under other investment advisory contracts, such as contracts of each Fund Manager with other registered investment companies or other types of clients. The Trustees noted that in many cases there were differences in the level of services provided to the Funds by the Fund Managers and that the level of services provided by these Fund Managers on these other accounts were due to the different nature of the accounts or because there were other reasons to support the difference in fees, such as an affiliation between the Fund Manager and the account. These differences often explained variations in fee schedules. The Trustees were mindful that, with regard to the sub-advised Funds, the fee rates were the result of arms’-length negotiations between PLFA and the Fund Managers, and that any sub-advisory fees are paid by PLFA and are not paid directly by a Fund. The Trustees observed that certain of the Funds’ contractual advisory fees were higher than the average of their respective Morningstar category while others were either lower or approximately equal to these averages.
The Board concluded that the advisory fees, sub-advisory fees and total expenses of each Fund were fair and reasonable.
4. Costs, Level of Profits and Economies of Scale
The Trustees reviewed information provided by PLFA and the Fund Managers regarding PLFA’s costs of sponsoring the Funds and the profitability of PLFA and the Fund Managers.
| F-9 |
Table of Contents
PACIFIC LIFE FUNDS
APPROVAL OF INVESTMENT ADVISORY AGREEMENT
AND FUND MANAGEMENT AGREEMENTS (Continued)
(Unaudited)
PLFA and the Fund Managers’ Costs and Profitability. The Trustees noted that, based on the information available, PLFA appears to be providing products that are competitively priced with other funds, especially multi-manager and asset allocation funds. The Board considered the costs of the services to be provided and the overall financial results for PLFA and its affiliates from the management of the Funds, both including and excluding distribution costs. The Board noted that the Funds are not projected to produce profits for PLFA for the year ended December 31, 2011 and considered that the Funds have not been profitable to PLFA and its affiliates in the past, due in part, to the relatively low level of assets. The Board also noted the projected profitability of the Funds to PLFA in the near-term and noted that PLFA and its affiliates continue to subsidize and reimburse expenses for many of the Funds.
The Trustees also reviewed information regarding the structure and manner in which PLFA and the Fund Managers’ investment professionals were compensated and their respective views of the relationship of such compensation to the attraction and retention of quality personnel. The Trustees considered PLFA’s willingness to invest in technology, infrastructure and staff to reinforce and offer new services and to accommodate changing regulatory requirements.
With respect to the Fund Managers, the Trustees noted that it was difficult in many cases to accurately determine or evaluate the profitability of the Fund Management Agreements to the Fund Managers because of, among other things, the differences in the types of information provided by the Fund Managers, the fact that many Fund Managers manage substantial assets other than the Funds and, further, that any such assessment would involve assumptions regarding the Fund Managers’ expense allocation policies, capital structure, cost of capital, business mix and other factors.
Accordingly, in the case of the Fund Managers, the Trustees gave less weight to profitability considerations and did not view that this data was as important as other data given the arms’-length nature of the relationship (for the Funds that are sub-advised) between PLFA and such Fund Managers with respect to the negotiation of fund management fees.
Economies of Scale. The Trustees noted and considered the extent to which economies of scale are realized as each Fund grows and whether advisory fee levels reflect economies of scale if the Funds grow in size. The Trustees noted the Funds have relatively small asset levels that do not currently produce significant economies of scale. The Trustee noted, however, PLFA’s commitment to competitive total expenses of the Funds through expense limitation agreements, and its and its affiliates’ consistent reinvestment in the business in the form of improvements in technology, product innovations and customer service. The Board concluded that the Funds’ cost structures were reasonable in light of the Trust’s size.
5. Ancillary Benefits
The Trustees requested and received from PLFA and the Fund Managers information concerning other benefits received by PLFA, the Fund Managers, and their affiliates as a result of their respective relationships with the Funds, including information about various service arrangements with PLFA affiliates and reimbursement at an approximate cost basis for support services in the case of PLFA and its affiliates, as well as commissions paid to broker-dealers affiliated with certain Fund Managers and the use of soft dollars by certain Fund Managers. The Trustees also considered information concerning other significant economic relationships between the Fund Managers and their affiliates, PLFA and its affiliates, and noted PLFA’s processes and procedures to identify and disclose such relationships to the Board. The Trustees also considered information provided to them as to how conflicts of interest that may arise from these relationships are managed.
The Board concluded that such benefits were consistent with those generally derived by investment advisers to mutual funds or were otherwise not unusual.
6. Conclusion
Based on their review, including their consideration of each of the factors referred to above, and assisted by the advice of the Independent Consultant and independent counsel to the Independent Trustees, the Board, including the Independent Trustees, found that (i) the compensation payable under the Advisory Agreement and each applicable Fund Management Agreement is fair and reasonable; and (ii) the renewal of the Advisory Agreement and each applicable Fund Management Agreement is in the best interests of each Fund and its shareholders. The Board did not indicate that any single factor was determinative of its decision to approve the Advisory Agreement and each applicable Fund Management Agreement but indicated that the Board based its determination on the total mix of information available to it.
| F-10 |
Table of Contents
WHERE TO GO FOR MORE INFORMATION
(Unaudited)
Availability of Quarterly Holdings
The Trust files Form N-Q (complete schedules of fund holdings) with the Securities and Exchange Commission (the “SEC”) for the first and third quarters of each fiscal year not later than 60 days after the close of the applicable quarter end. The Trust’s Form N-Q, (when required) is filed pursuant to applicable regulation and is available after filing (i) on the SEC’s Website at www.sec.gov; (ii) for review and copying at the SEC’s Public Reference Room in Washington, D.C. (Information on the operation of the Public Reference Room may be obtained by calling the SEC at 1-800-SEC-0330); and (iii) on the Trust’s Webpage at www.pacificlife.com/pacificlifefunds.htm. The SEC may charge you a fee for this information.
Availability of Proxy Voting Record
By August 31 of each year, the Trust files information regarding how portfolio managers voted proxies relating to fund securities during the most recent twelve-month period ended June 30. Such information is available after filing on the Trust’s’ Website and on the SEC’s Website noted below.
Information Relating to Investments Held by the Pacific Life Funds
For complete descriptions of the various securities and other instruments held by the Trust and their risks, please see the Trust’s Prospectus and Statement of Additional Information (“SAI”). For a description of bond ratings, please see the Trust’s SAI. The Prospectus and SAI are available as noted below.
Availability of Proxy Voting Policies
A description of the Proxy Voting Policies and Procedures that the Trust uses to determine how to vote proxies relating to fund securities is described in the Trust’s SAI.
How to obtain Information
The Trust’s Prospectus, SAI (including Proxy Voting Policies) and the PL Underlying Funds’ annual and semi-annual reports are available:
| • | On the Trust’s Website at www.pacificlife.com/pacificlifefunds.htm |
| • | On the SEC’s Website at www.sec.gov |
| • | Upon request by calling, without charge, 1-800-722-2333, 7 a.m. through 5 p.m. Pacific Time |
F-11
Table of Contents
PACIFIC LIFE FUNDS | ||||
| A-1 | ||||
| B-1 | ||||
| C-1 | ||||
| C-5 | ||||
| C-9 | ||||
| C-16 | ||||
| D-1 | ||||
| E-1 | ||||
| F-1 | ||||
| F-3 | ||||
Approval of Investment Advisory Agreement and Fund Management Agreements | F-7 | |||
| F-13 | ||||
Table of Contents
PACIFIC LIFE FUNDS PERFORMANCE DISCUSSION
PL Fund | Fund Manager | |
PL High Income Fund PL Short Duration Income Fund PL Strategic Income Fund | Pacific Asset Management |
The PL High Income Fund, PL Short Duration Income Fund and PL Strategic Income Fund commenced operations on December 19, 2011. Although the funds are effective, they are currently not offering shares to investors and are not available for sale at this time. Presently, the only shareholders of the PL High Income Fund, PL Short Duration Income Fund and PL Strategic Income Fund are Pacific Life Fund Advisors LLC (PLFA), the adviser to Pacific Life Funds, and certain of its affiliates.
PL Underlying Fund | Fund Manager | |
| PL Floating Rate Loan | Eaton Vance Management (Eaton Vance) | |
| PL Inflation Managed | Pacific Investment Management Company LLC (PIMCO) | |
| PL Managed Bond | ||
| PL Short Duration Bond | T. Rowe Price Associates, Inc. (T. Rowe Price) | |
| PL Comstock | Invesco Advisers, Inc. (Invesco) | |
| PL Growth LT | Janus Capital Management LLC (Janus) | |
| PL Large-Cap Growth | UBS Global Asset Management (Americas) Inc. (UBS) | |
| PL Large-Cap Value | ClearBridge Advisors, LLC (ClearBridge) | |
| PL Main Street® Core | OppenheimerFunds, Inc. (Oppenheimer) | |
| PL Mid-Cap Equity | Lazard Asset Management LLC (Lazard) | |
| PL Mid-Cap Growth | Morgan Stanley Investment Management Inc. (Morgan Stanley) | |
| PL Small-Cap Growth | Fred Alger Management, Inc. (Alger) | |
| PL Small-Cap Value | NFJ Investment Group LLC (NFJ) | |
| PL Real Estate | Morgan Stanley Investment Management Inc. (Morgan Stanley) | |
| PL Emerging Markets | OppenheimerFunds, Inc. (Oppenheimer) | |
| PL International Large-Cap | MFS Investment Management (MFS) | |
| PL International Value | J.P. Morgan Investment Management Inc. (JPMorgan) |
This Annual Report is provided for the general information of investors with beneficial interests in Pacific Life Funds. This report is not authorized for distribution to prospective investors unless preceded or accompanied by a current Pacific Life Funds’ Prospectus, as supplemented, which contains information about Pacific Life Funds and each of its funds, including their investment objectives, risks, charges and expenses. You should read the Prospectus carefully before investing. There is no assurance that a fund will achieve its investment objective. Each fund is subject to market risk. The net asset value of a fund changes as its asset values go up or down. The value of a fund’s shares will fluctuate, and when redeemed, may be worth more or less than their original cost. The total return for each fund includes reinvestment of all dividends and capital gain distributions, if any, and does not include deductions of any applicable sales charges. Past performance is not predictive of future performance. Performance figures for each class reflect the deduction of any applicable maximum front-end sales charge at the time of investment and reflect any applicable contingent deferred sales charge that would be deducted upon redemption at the end of the period presented.
This report shows you the performance of the funds compared to benchmark indices. Index performance is provided for illustrative and comparative purposes only and does not predict or depict the performance of the funds. Indices are unmanaged, do not incur transaction costs and cannot be purchased directly by investors. Index returns on equity securities include reinvested dividends.
PLFA supervises the management of all of the funds above, subject to the review of the Pacific Life Funds’ Board, and also does business under the name Pacific Asset Management. PLFA has written the general market conditions commentary which expresses PLFA’s opinions and view on how the market generally performed for the twelve-month period ended March 31, 2012. All views are subject to change at any time based upon market or other conditions, and Pacific Life Funds, its adviser and the fund managers disclaim any responsibility to update such views. Any references to “we”, “I”, or “ours” are references to the adviser or fund manager. The adviser and fund managers may include statements that constitute “forward-looking statements” under the United States (U.S.) securities laws. Forward-looking statements include information concerning possible or assumed future results of the Pacific Life Funds’ investment operations, asset levels, earnings, expenses, industry or market conditions, regulatory developments and other aspects of the Pacific Life Funds’ operations or general economic conditions. In addition, when used in this report, predictive verbs such as “believes”, “expects”, “anticipates”, “intends”, “plans”, “estimates”, “projects” and future or conditional verbs such as “will”, “may”, “could”, “should” and “would” or any other statement that necessarily depends on future events, are intended to identify forward-looking statements. Forward-looking statements are not guarantees of performance or economic results. They involve risks, uncertainties and assumptions. Although such statements are based on expectations that the adviser or fund manager believes to be reasonable, actual results may differ materially from expectations. Investors must not rely on any forward-looking statements.
A-1
Table of Contents
PACIFIC LIFE FUNDS PERFORMANCE DISCUSSION (Continued)
In connection with any forward-looking statements and any investment in the Pacific Life Funds, investors should carefully consider the investment objectives, policies and risks described in the Pacific Life Funds’ current Prospectus, as supplemented and Statement of Additional Information, as supplemented as filed with the Securities and Exchange Commission (SEC), which may be obtained from the SEC’s website at www.sec.gov.
Market Conditions (for the twelve-month period ended March 31, 2012)
Executive Summary
Markets faced turbulent conditions over the trailing twelve-month period ended March 31, 2012. Obstacles came from multiple areas of the world, and dealing with crises became a common event. Macroeconomic factors became the primary driver to performance over the reporting period, as markets moved on a “risk-on” and “risk-off” basis—riskier securities generally outperformed when macro headlines were positive, and conservative securities tended to outperform when news was negative. Despite the large market swings, the U.S. equity market finished the period with gains.
In the earlier months of the reporting period, markets endured a wave of geopolitical tension in the Middle East and Northern Africa (MENA) region, which ultimately led to regime changes in many of these nations. The uncertainty in the region caused commodity prices to move erratically. Both oil and gold prices fluctuated wildly throughout the reporting period.
The spotlight on the debt crisis in Europe also resurfaced during the reporting period. Global equity markets plummeted, as uncertainty was amplified in the eurozone countries in the third quarter of 2011. Further contributing to the volatility, news of a potential resolution caused equity markets to rally, whereas opposition to such propositions pushed markets back down. The lack of progress and uniformity in resolving the situation fueled the volatility in the global marketplace. U.S. politicians also contributed a fair share of disruption during the reporting period. Political debate became rampant as the parties prepared for the upcoming 2012 presidential election. The gridlock in Washington D.C. was clearly evident in the manner Congress handled fiscal planning. Instead of productively negotiating terms, political members fought over the fiscal budget plan without finding a clear resolution. Such a display triggered Standard & Poor’s to downgrade the U.S. credit rating from the highest rating of AAA down to AA+.
While fundamental factors seemed to have been largely neglected when geopolitical concerns overwhelmed investors, the attractive valuations helped fuel a rally in the U.S. equity market during the latter half of the reporting period. The improved sentiments over the last two quarters helped offset the effects from the “flight-to-safety” (e.g. shift into U.S. Treasuries) that dominated the earlier part of the reporting period.
The following sections highlight how specific market segments responded to the events that unfolded over the reporting period.
Fixed Income
After outpacing equities throughout much of 2011, the fixed income markets finished the reporting period slightly behind U.S. equities, particularly due to the late rally in the equity market. For the trailing twelve-month period ended March 31, 2012, the overall fixed income market, as measured by the Barclays U.S. Aggregate Bond Index gained 7.71%. During the challenging economic environment, long-term U.S. Treasuries led the bond market. The Barclays Long Term U.S. Treasury Index increased by 23.65% for the reporting period. Despite Standard & Poor’s downgrade of the U.S. credit rating, investors continued to shift assets into U.S. Treasuries during the volatile market environment. U.S. Treasury yields (which have an inverse relationship to prices) reached historic lows during the period, as the ten-year U.S. Treasury yield dipped below 2.00%. This phenomenon was partially supported by the Federal Reserve’s (Fed) stimulus plan called “Operation Twist”. This policy, which began in October 2011, is expected to run until June 2012 and entails selling approximately $400 billion in short-term U.S. Treasuries and using the funds to purchase long-term bonds. This effort seeks to keep long-term interest rates low and encourage borrowing.
While U.S. regulators continued to intervene, investors showed concerns abroad. European bonds (both sovereign and non-sovereign) were among the worst performing categories of the fixed income market. The jittery sentiment spilled into other sectors, which was reflected in widening credit spreads in the first half of the reporting period. During these months, riskier credits experienced a sharper increase in spreads, resulting in high yield bonds generally lagging behind investment grade credits. Spreads have narrowed in the latter half of the reporting period, which helped bridge some of the gap in performance between investment grade and high yield credits for the full reporting period. The securitized credit group (i.e. commercial mortgage-backed securities (CMBS), mortgage-backed securities (MBS), and asset-backed securities (ABS)) generally trailed the broad, fixed income market. Short-term credit returns barely budged in the reporting period, as the Fed continued to hold the Federal Funds (Fed Funds) rate near zero percent. Low cash yields and the Fed’s ongoing message of maintaining “exceptionally low levels for the Fed Funds rate for an extended period” have kept the short end of the yield curve relatively flat for approximately three years.
| A-2 | See benchmark definitions on page A-27 and A-28 |
Table of Contents
PACIFIC LIFE FUNDS PERFORMANCE DISCUSSION (Continued)
Domestic Equity
The domestic equity market plummeted in the first half of the reporting period but experienced a solid recovery in the latter half. Despite the sharp fall in the third quarter of 2011, the S&P 500 Index managed to finish the reporting period with an 8.54% gain. Risk adversity prevailed over this reporting period, as higher quality and conservative stocks generally performed better than their counterparts. In terms of market capitalization tiers, large-capitalization stocks outperformed small-capitalization stocks. Large-capitalization stocks (as measured by the Russell 1000 Index) returned 7.86%, whereas small-capitalization stocks (as measured by the Russell 2000 Index) fell 0.18% for the reporting period. Investors may have preferred more established companies that could better withstand the difficult economic conditions. Additionally, higher quality companies (as determined by those with lower debt-to-capital, higher return-on-equity, and higher profit margins) generally fared well during this reporting period. With respect to style, domestic growth stocks outpaced their value counterparts. Defensive sectors (which tend to have less sensitivity to economic cycles) generally performed better during the reporting period than cyclical sectors such as energy, materials and financials which returned -6.86%, -4.01% and -1.76%1, respectively. Higher yielding securities also performed well as investors searched for yield and income amid the low interest rate environment and the turbulent market conditions. In particular, the real estate investment trust (REIT) market delivered solid returns. The Financial Times Stock Exchange National Association of Real Estate Investment Trust (FTSE NAREIT) Equity REITs Index returned 12.83% over the reporting period. Self storage and apartment REITs performed well, which may have been a result of a receding trend in homeownership rates. On the other hand, the riskier hotel segment continued to struggle.
International Equity
With much of the global concerns centering on Europe, the developed international equity market trailed the U.S. stock market, as the Morgan Stanley Capital International Europe, Australasia, and Far East (MSCI EAFE) Index dropped 5.77% for the reporting period. Similar to the U.S. equity market, foreign growth stocks fared better than their value counterparts. However, performance was relatively even among the market capitalization tiers for the reporting period. Although the sovereign debt problems have been concentrated in several, peripheral European countries (i.e. Portugal, Ireland, Italy, Greece and Spain), the lack of progress in finding a definitive solution has fed concerns to other regions around the world. Even China has expressed concerns over its exports to Europe as the export-led country has begun to refocus on growth over inflation. Many emerging market countries had been addressing inflationary pressures by raising interest rates in 2011. However, such measures may have had additional downward pressure on their respective stock markets. The MSCI Emerging Markets Index fell 8.80% for the period.
Concluding Remarks
The trailing twelve-month period repeated another period of volatility. In such environments, many investors seek shelter in U.S. Treasuries. Despite the harsh conditions, the S&P 500 Index managed to climb out of negative territory toward the end of 2011 and maintained its upward momentum throughout the first quarter of 2012. Foreign equity markets experienced some recovery in early 2012, but the continuing difficulties in Europe may cause some drag on market performance in the near future. Conditions in the U.S. have shown slight signs of stabilization—albeit still a distance from normalization. Housing starts have slowly trended in a positive direction, but levels remain well below the historical average. Similarly, the unemployment rate continues to fall but lingers at an elevated level. On a brighter side, corporate profits continue to rise to all-time highs.
The debt crisis in Europe, which began in late 2009, became the primary focus throughout the reporting period. The lack of collaboration in resolving the problem reverberated throughout the global marketplace. Wild swings in the global market had become a frequent occurrence in recent quarters. Although economic reports indicate that the U.S. economy is healing modestly, it continues to deal with its fair share of uncertainty. As noted earlier in this discussion, political disorder had contributed to the fluctuation in the U.S. marketplace, and heading into 2012 with the next U.S. presidential election on the horizon, political debate has become extensive. Congress continues to quarrel over issues instead of collaborating to fix the economy. While this may create additional noise in the marketplace, fundamental factors provide some support as valuation levels continue to look fairly attractive compared to long-term historical levels, and corporate balance sheets appear healthy with relatively low debt levels and high cash positions. Markets will likely remain sensitive to various factors as developed economies go through this prolonged de-leveraging cycle. As investors continue to deal with a balance between negative headline events and hints of positive statistics, markets could continue to display erratic trends.
| 1 | Source: Standard & Poor’s |
| A-3 | See benchmark definitions on page A-27 and A-28 |
Table of Contents
PACIFIC LIFE FUNDS PERFORMANCE DISCUSSION (Continued)
PL Floating Rate Loan Fund (managed by Eaton Vance Management)
Q. How did the fund perform over the year ended March 31, 2012?
A. For the year ended March 31, 2012, the fund’s Class P returned 3.80%, compared to a 2.85% return for its benchmark, S&P/LSTA Leveraged Loan Index.
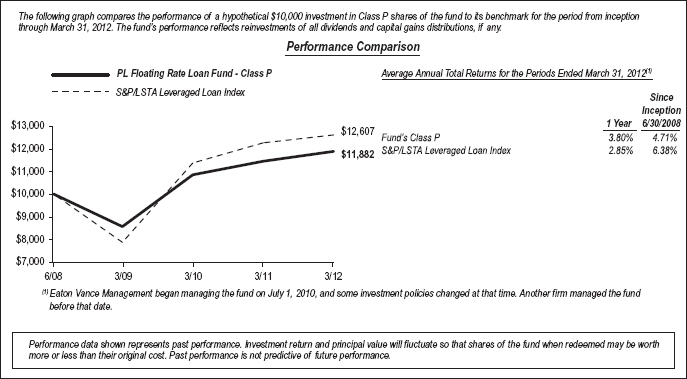
Q. Discuss both positive and negative factors that materially affected the fund’s performance during the year, including relevant market conditions, investment strategies and techniques, and particular sectors or securities.
A. Relative to the benchmark, the fund maintains a greater focus on higher-quality loans. Over the reporting period ended March 31, 2012, the higher quality segments of the loan market generally outpaced their lower quality counterparts. The BB rated loan group had the strongest performance results over the reporting period, followed by B and BBB loans. On the lower quality end of the loan spectrum, both the CCC loan group and loans in the defaulted loan category registered negative returns during the reporting period, underperforming the broader loan market by a wide margin. The fund’s meaningful overweight to the BB and B loan groups and sizeable underweight to CCC loans aided relative performance.
We at Eaton Vance employ a rigorous, bottom-up credit research process where loan selection tends to drive fund performance. That said, analyzing results through the lens of industry exposures relative to the fund’s benchmark can be instructive. The two worst-performing industries over the period, publishing and utilities, were also the two largest underweighted industry exposures for the fund, which contributed to the fund’s outperformance over the reporting period. Underweight exposures to the building & development and lodging & casinos industries detracted from the fund’s relative performance as both industry groups outpaced the benchmark.
As of March 31, 2012, the fund continues to be well diversified with 166 loan issuer positions across 32 industries. The fund’s greater focus on higher-quality loans relative to the benchmark is also expressed in the average loan price of $98.96 versus a $95.12 average loan price for the benchmark as of March 31, 2012. Additionally, given the floating-rate nature of the asset class, the fund’s loans reset their coupons every 47 days on average as of March 31, 2012, resulting in limited interest rate risk exposure for the fund as compared to longer duration fixed income funds.
PL High Income Fund (managed by Pacific Asset Management)
Q. How did the fund perform over the period ended March 31, 2012?
A. This fund commenced operations on December 19, 2011. For the period from inception through March 31, 2012, the fund’s Class I returned 7.50%, compared to a 5.35% return for its benchmark, the Barclays U.S. High-Yield 2% Issuer Capped Bond Index.
| A-4 | See benchmark definitions on page A-27 and A-28 |
Table of Contents
PACIFIC LIFE FUNDS PERFORMANCE DISCUSSION (Continued)
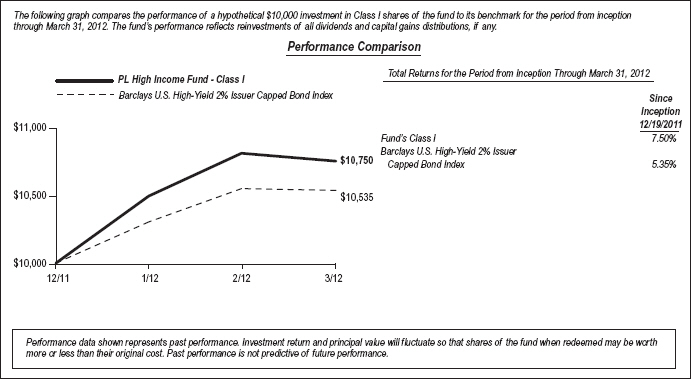
Q. Discuss both positive and negative factors that materially affected the fund’s performance during the period, including relevant market conditions, investment strategies and techniques, and particular sectors or securities.
A. The fund principally invests in non-investment grade corporate debt instruments. The fund seeks to outperform the benchmark through an investment process focused on fundamental credit research and sector allocations determined by Pacific Asset Management’s assessment of risk/reward opportunities.
During the reporting period, the fund outperformed the benchmark due primarily to asset allocation and security selection. The fund’s overweight to CCC rated securities was a benefit to fund performance as the 1st quarter of 2012 experienced a reduction in European policy risk which led to a “risk-on” environment that was supportive of lower rated securities. The fund’s overweight to the communications sector was a benefit to fund performance as an improving economic backdrop provided a tailwind to cyclical industries. An underweight to banking was negative to fund performance as the sector saw significant total return with the reduction in systemic risk in the financial system. Duration was neutral in terms of performance attribution relative to the benchmark.
PL Inflation Managed Fund (managed by Pacific Investment Management Company LLC)
Q. How did the fund perform over the year ended March 31, 2012?
A. For the year ended March 31, 2012, the fund’s Class P returned 11.11%, compared to a 12.20% return for its benchmark, the Barclays U.S. TIPS Index.
| A-5 | See benchmark definitions on page A-27 and A-28 |
Table of Contents
PACIFIC LIFE FUNDS PERFORMANCE DISCUSSION (Continued)
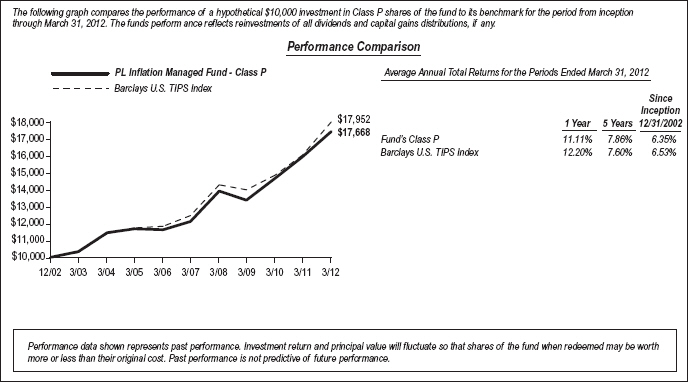
Q. Discuss both positive and negative factors that materially affected the fund’s performance during the year, including relevant market conditions, investment strategies and techniques, and particular sectors or securities.
A. The fund underperformed its benchmark during the reporting period. Investment strategies were implemented by investing in bonds and derivative instruments. Exposure to non-U.S. developed interest rates, particularly core Europe and the United Kingdom (U.K.), through inflation-linked bonds and interest rate swaps was positive for the fund as rates fell. Additionally, holdings of Australian inflation-linked bonds (ILBs), which rallied over the year on strong investor demand for high-quality yield, also added to fund returns. However, an underweight to U.S. Treasury Inflation Protected Securities (TIPS) that favored U.S. nominal duration through investments in cash bonds and interest rate swaps was negative for performance as TIPS outperformed nominal U.S. Treasuries during the year. Holdings of Agency and non-Agency MBS added to performance as these sectors outpaced TIPS. Exposure to the investment grade corporate sector, with an emphasis on financials, was negative for returns as this sector underperformed the broader corporate market. Finally, exposure to a variety of emerging market currencies detracted from the fund’s returns as these depreciated relative to the U.S. dollar.
PIMCO expects the global economy to grow at a real rate of 1.00% to 2.00% over the year ahead. The Long-Term Repo Operations (LTROs) carried out by the European Central Bank (ECB) have temporarily stabilized financial markets. While the LTROs improve liquidity and capital market access, they do not address the more fundamental problems of credit quality of sovereign borrowers, uneven competitiveness, currency rigidity, and a lack of coordinated vision between monetary and fiscal authorities. PIMCO expects the deleveraging process in Europe to continue to play a dominant role in the global economy over the cyclical horizon. Eurozone solvency will only be improved with higher nominal growth and a reduction in sovereign borrowing costs. The flood of liquidity from central bank actions has driven most financial asset prices higher so that they are fair to richly priced relative to outstanding risks. In light of these valuations, PIMCO portfolios have reduced risk exposures and will remain somewhat defensively positioned with a preference for yield over price appreciation.
With regard to fund’s strategy, PIMCO anticipates positioning the fund defensively with a preference for income over price appreciation, as risk premiums are fairly or richly priced relative to our outlook. We will look to maintain a neutral duration position, focus on countries with healthier balance sheets and independent monetary policy—primarily the U.S., but also Canada, Australia, and Brazil. We also plan to focus on ILBs in Canada and Australia given relatively higher real yields and more persistent inflation than in the U.S. Additionally, we plan to concentrate on the ten-year portion of the TIPS curve which offers the best potential for price appreciation as this maturity “rolls” down the real yield curve. We will avoid shorter maturity TIPS given the significant negative real yields on these maturities.
On the spread sector (non-Government debt) front, we seek to hold non-Agency mortgages and CMBS that have senior positions in the capital structure as another source of yield. Within the corporate sector, we will aim to avoid default risk, reduce exposure to corporate credit generally and move up in the capital structure, and favor U.S. over European corporates. Finally, we plan to maintain U.S. dollar currency exposure relative to the euro and Australian dollar. The euro could be further negatively impacted by the region’s ongoing sovereign debt crisis, and the Australian dollar tends to exhibit weakness during market turbulence.
| A-6 | See benchmark definitions on page A-27 and A-28 |
Table of Contents
PACIFIC LIFE FUNDS PERFORMANCE DISCUSSION (Continued)
PL Managed Bond Fund (managed by Pacific Investment Management Company LLC)
Q. How did the fund perform over the year ended March 31, 2012?
A. For the year ended March 31, 2012, the fund’s Class P returned 4.02%, compared to a 7.71% return for its benchmark, the Barclays U.S. Aggregate Bond Index.
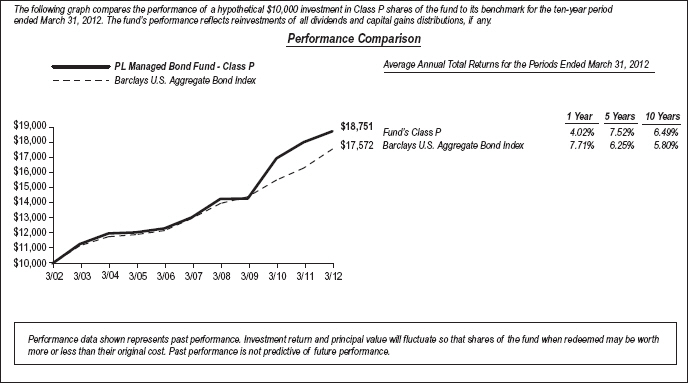
Q. Discuss both positive and negative factors that materially affected the fund’s performance during the year, including relevant market conditions, investment strategies and techniques, and particular sectors or securities.
A. The fund underperformed the benchmark during the reporting period. Investment strategies were implemented by investing in bonds and derivative instruments including futures, options, credit default swaps and interest rate swaps. Tactical duration and curve positioning in the U.S., through the use of cash bonds and interest rate swaps, was negative for fund performance as rates fell after a volatile year in yields with the ten-year rate falling 126 basis points to end the period at 2.21%. However, tactical duration positioning in core Europe added to fund performance as rates fell.
On the spread sector (non-Government debt) front, positioning in investment grade corporates with an emphasis on financials was negative for fund returns as this sector underperformed the broader investment grade corporate market. Beyond core sectors, modest exposure to emerging local rates in Brazil, implemented via Brazilian zero coupon swaps, slightly detracted from fund returns as rates rose in this country; however, an overweight to emerging markets external debt implemented via cash bonds and credit default swaps, offset these losses. Exposure to a variety of emerging market currencies detracted from fund returns as these depreciated relative to the U.S. dollar. Finally, modest exposure to Build America Bonds added to fund returns for the period as the asset class continued to benefit from strong technical factors.
PIMCO expects the global economy to grow at a real rate of 1.00% to 2.00% over the year ahead. The LTROs carried out by the ECB have temporarily stabilized financial markets. While the LTROs improve liquidity and capital market access, they do not address the more fundamental problems of credit quality of sovereign borrowers, uneven competitiveness, currency rigidity, and a lack of coordinated vision between monetary and fiscal authorities. PIMCO expects the deleveraging process in Europe to continue to play a dominant role in the global economy over the cyclical horizon. Eurozone solvency will only be improved with higher nominal growth and a reduction in sovereign borrowing costs. The flood of liquidity from central bank actions has driven most financial asset prices higher so that they are fair to richly-priced relative to outstanding risks. In light of these valuations, PIMCO portfolios have reduced risk exposures and will remain somewhat defensively positioned with a preference for yield over price appreciation.
| A-7 | See benchmark definitions on page A-27 and A-28 |
Table of Contents
PACIFIC LIFE FUNDS PERFORMANCE DISCUSSION (Continued)
With regard to portfolio strategy, PIMCO anticipates positioning portfolios defensively with a preference for income over price appreciation, as risk premiums are fairly or richly-priced relative to our outlook. We plan to continue to maintain a neutral duration position, focused on countries with healthier balance sheets and independent monetary policy—primarily the U.S., but also Canada, Australia, and Brazil. Additionally, we plan to concentrate on the five-to-ten year portion of yield curves which offer the best potential for price appreciation given the suppression of yields on shorter maturities.
On the spread sector front, we plan to maintain holdings in Agency mortgages as a source of high quality yield; while mortgages appear to be fairly valued, we believe they offer favorable risk-adjusted returns relative to other sectors. Furthermore, we seek to hold non-Agency mortgages and CMBS that have senior positions in the capital structure as another source of yield. We also plan to retain exposure to select corporate and quasi-sovereign bonds in countries with strong, initial conditions and high quality balance sheets such as Brazil, Mexico and Russia. Within this sector, we aim to avoid default risk, reduce exposure to corporate credit generally and move up in the capital structure, and favor the U.S. over European corporates. PIMCO plans to continue to hold high quality municipal bonds with a focus on essential service revenue bonds such as water and sewer, power, and airports. Finally, we plan to reduce exposure to emerging market and commodity-intensive currencies and instead focus on the U.S. dollar as the domestic economy improves relative to slowing emerging economies.
PL Short Duration Bond Fund (managed by T. Rowe Price Associates, Inc.)
Q. How did the fund perform over the year ended March 31, 2012?
A. For the year ended March 31, 2012, the fund’s Class P returned 1.62%, compared to a 1.78% return for its benchmark, the Barclays 1-3 Year U.S. Government/Credit Bond Index and a 1.43% return for the BofA Merrill Lynch 1-3 Year U.S. Treasury Index. The fund’s performance is being compared to its current and former benchmark index. The former benchmark index, BofA Merrill Lynch 1-3 Year U.S. Treasury Index, is being provided to compare performance of the fund prior to July 1, 2011 when the fund had a different investment focus.
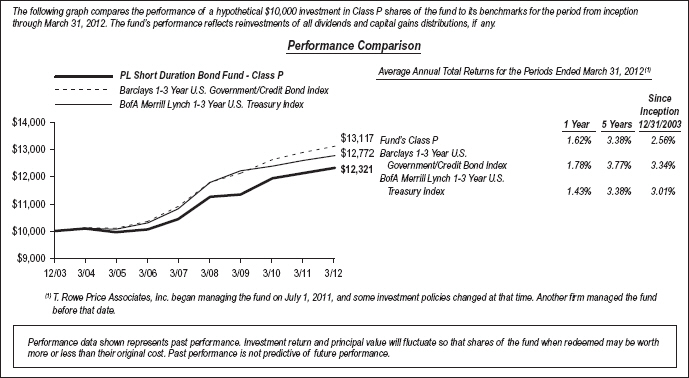
Q. Discuss both positive and negative factors that materially affected the fund’s performance during the year, including relevant market conditions, investment strategies and techniques, and particular sectors or securities.
A. The fund underperformed its benchmark. Yield curve positioning and sector allocations were generally favorable. After T. Rowe Price assumed management of the fund on July 1, 2011, the investment team made sector adjustments to keep consistent with T. Rowe Price’s short-term strategy. We maintain a meaningful overweight to investment grade corporate bonds, an out-of-benchmark allocation to securitized sectors, and a significant underweight to U.S. Treasuries and government-related securities.
| A-8 | See benchmark definitions on page A-27 and A-28 |
Table of Contents
PACIFIC LIFE FUNDS PERFORMANCE DISCUSSION (Continued)
Positioning on the yield curve aided the fund’s relative performance. Concerns over global economic growth, as well as the U.S. debt ceiling debate, drove rates lower. The fund’s modest exposure to intermediate maturities, mostly through MBS and investment grade corporate bonds, thereby, benefited the fund.
Sector allocations were also key contributors relative to the benchmark as short-dated corporate bonds outperformed U.S. Treasuries. Specifically, our overweight allocation to investment grade corporate debt, and the fund’s underweight allocation to U.S. Treasury securities, added to its value. The largest allocation and overweight within corporate bonds was to industrials, which typically hold up well during market volatility.
Although our overweight allocation benefited the fund, security selection within investment grade corporate issues detracted from its relative performance, particularly within several money-center banking firms such as Morgan Stanley and The Goldman Sachs Group, Inc. Banks faced substantial pressure stemming from the escalating eurozone debt crisis, concerns over regulation of the industry, ongoing exposure to the weakened mortgage market, and long-term concerns for profitability.
We participated in the corporate new issue market and made adjustments within our existing holdings by swapping out of issues approaching maturity, particularly over the recent quarter. We also rotated into more stable industrial names. Finally, we continue to see value in crossover names, credits rated investment grade by one rating agency and below investment grade by another, specifically those in the front end of the curve.
The investment team purchased TIPS in August, as more inflation risk premium was being priced in, consistent with a deteriorating U.S. fiscal profile. We maintained a modest allocation to this sector throughout the period.
The recent increase in U.S. Treasury yields suggests that the market has begun to price in expectations of stronger growth and eventual policy renormalization. Credit spreads have tightened significantly over the past six months, limiting some upside potential, but spreads could narrow further if investor sentiment remains positive. That said, we are monitoring risks that could spark a renewed flight-to-quality. Credit fundamentals remain strong, and our analysts are finding compelling values in the markets. As always, we remain committed to a disciplined, risk-conscious investment process. Our goal is to maintain a diversified portfolio that generates a distinct yield advantage while providing downside protection.
PL Short Duration Income Fund (managed by Pacific Asset Management)
Q. How did the fund perform over the period ended March 31, 2012?
A. This fund commenced operations on December 19, 2011. For the period from inception through March 31, 2012, the fund’s Class I returned 2.10%, compared to a 0.36% return for its benchmark, the Barclays 1-3 Year U.S. Government/Credit Bond Index.
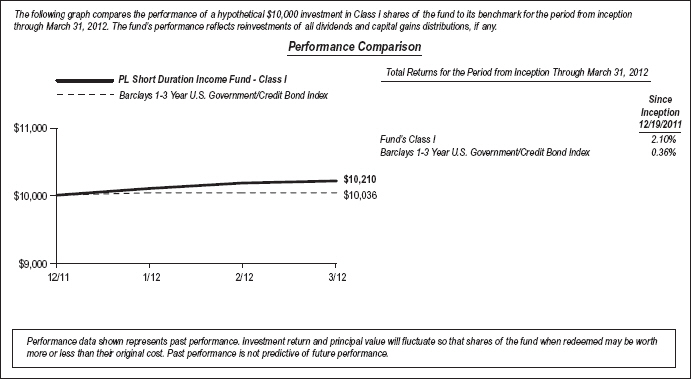
| A-9 | See benchmark definitions on page A-27 and A-28 |
Table of Contents
PACIFIC LIFE FUNDS PERFORMANCE DISCUSSION (Continued)
Q. Discuss both positive and negative factors that materially affected the fund’s performance during the period, including relevant market conditions, investment strategies and techniques, and particular sectors or securities.
A. The fund is a fixed income portfolio that invests primarily in short-term investment grade corporate debt instruments with the ability to invest up to 30% of its assets in non-investment grade debt instruments, including high yield bonds and floating rate senior loans. Pacific Asset Management expects the fund to be structurally overweight corporate securities and generally underweight government securities such as U.S. Treasuries and agencies relative to the benchmark. The fund has a permitted duration range of plus/minus one year of the fund’s benchmark.
For the reporting period, the fund outperformed the benchmark primarily due to asset allocation. The fund’s structure of being overweight corporate bonds versus government securities was a benefit to fund performance. Non-investment grade securities saw significant price appreciation in the first quarter of 2012, as strong corporate fundamentals and a reduction in European policy risk led to strong total returns. The fund’s allocation to high yield and floating rate securities was also a benefit to its performance. An overweight to REITs was a benefit to fund performance while the underweight to euro-area financials detracted from its performance. Duration was neutral to performance as the fund, on average, maintained benchmark duration.
PL Strategic Income Fund (managed by Pacific Asset Management)
Q. How did the fund perform over the period ended March 31, 2012?
A. This fund commenced operations on December 19, 2011. For the period from inception through March 31, 2012, the fund’s Class I returned 5.22%, compared to a 0.30% return for its benchmark, the Barclays U.S. Aggregate Bond Index.
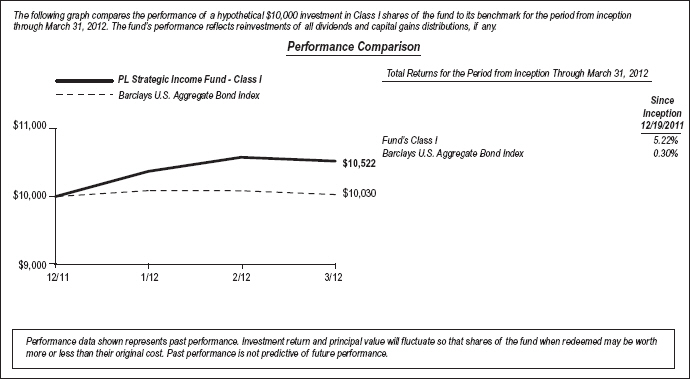
Q. Discuss both positive and negative factors that materially affected the fund’s performance during the period, including relevant market conditions, investment strategies and techniques, and particular sectors or securities.
A. The fund is a multi-sector, intermediate maturity bond fund investing principally in income producing debt instruments. Pacific Asset Management expects the fund to be structurally overweight corporate securities and generally underweight government securities such as U.S. Treasuries, agencies, and MBS relative to the benchmark. The fund will normally invest up to 70% of its assets in non-investment grade debt instruments with the ability to invest up to 65% of its assets in investment grade corporate debt instruments. The fund’s average portfolio duration is expected to be one-to-six years.
For the reporting period, the fund outperformed the benchmark primarily due to asset allocation. The fund’s overweight to high yield bonds was the primary driver of the fund’s relative performance. High yield bonds saw significant price appreciation in the first quarter of 2012, as improving corporate fundamentals and a reduction in European policy risk led to strong total returns. The fund’s sector selection
| A-10 | See benchmark definitions on page A-27 and A-28 |
Table of Contents
PACIFIC LIFE FUNDS PERFORMANCE DISCUSSION (Continued)
was also a positive contributor to fund performance. The fund’s overweight to the consumer cyclical sector was a benefit to its performance due to an improving economic backdrop in the U.S. An underweight to the banking sector was a detractor to performance due to less systemic risk perceived in the financial system.
PL Comstock Fund (managed by Invesco Advisers, Inc.)
Q. How did the fund perform over the year ended March 31, 2012?
A. For the year ended March 31, 2012, the fund’s Class P returned 4.22%, compared to a 4.79% return for its benchmark, the Russell 1000 Value Index.
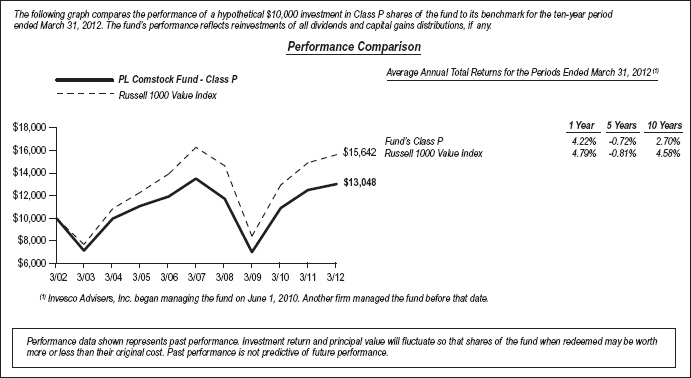
Q. Discuss both positive and negative factors that materially affected the fund’s performance during the year, including relevant market conditions, investment strategies and techniques, and particular sectors or securities.
A. The fund underperformed the benchmark for the reporting period. The fund’s investable universe includes all large-capitalization U.S. denominated equities. We at Invesco filter for companies with sufficient liquidity and then on valuation metrics depending upon the growth or cyclical nature of their business. The result of this filtering process is a pool of highly liquid securities that we believe are statistically inexpensive relative to the broader market. Companies identified in the filtering process are thoroughly analyzed to assess intrinsic value and their ability to achieve fair value. We will initiate a purchase of a security only if we believe the potential for stock price appreciation outweighs potential downside risk. To be eligible for inclusion in the portfolio, the stock must be statistically undervalued on the basis of its primary valuation criteria and determined, through rigorous fundamental and financial statement analysis, that the company is undervalued and possesses potential financial strength and improved quality of management for future growth. The investment team employs truly active management, by staying benchmark agnostic; portfolio construction and risk mitigation is based solely on bottom-up stock selection, as opposed to utilizing macro or top-down factors.
Our investment philosophy appreciates that, as financial markets tend to focus on short-term factors, stock prices often fail to reflect the intrinsic value of companies. We believe that longer-term investors can take advantage of pricing anomalies in financial markets by purchasing stocks of companies that are currently under-priced. The fund aims to exploit these market inefficiencies by investing in companies that appear undervalued relative to the market in general. Ultimately, we believe that the market will recognize the value in these companies and will sell them as their stock price begins to reflect their intrinsic value.
Unfavorable stock selection in the energy sector was the largest detractor from fund performance. Specifically, the fund had exposure to oil equipment and services companies Halliburton Co. and Weatherford International Ltd. which were two of the main detractors in this sector. Both holdings were affected by decreasing profit margins from international drilling efforts that fell through during the economic slow-down in Europe and overseas, causing earnings expectations to be lowered, thereby, negatively affecting the stock price.
| A-11 | See benchmark definitions on page A-27 and A-28 |
Table of Contents
PACIFIC LIFE FUNDS PERFORMANCE DISCUSSION (Continued)
Unfavorable stock selection in information technology companies also hurt fund performance relative to the benchmark. Hardware and internet-related stocks, including Cisco Systems, Inc. and Hewlett-Packard Co., performed poorly over the reporting period, dragging down fund performance. Cisco Systems’ stock declined on cautious guidance regarding company revenue forecasts and worries of information technology spending cuts from both the U.S. Government and corporations. Hewlett-Packard’s stock declined on concerns of overpaying for the acquisition of an enterprise software company. However, the company’s CEO was replaced in September 2011 by Meg Whitman which we believe to be a positive for the company long-term.
A material underweight exposure to the utilities sector also dampened fund performance. Utilities was a top performing sector for the reporting period, as investors sought defensive-oriented, dividend-yielding stocks during the market turmoil.
Finally, stock selection in the financials sector acted as a detractor from relative fund performance for the third quarter of 2011. Notably, exposure to diversified financials like Citigroup, Inc., The Bank of New York Mellon Corp. and Morgan Stanley detracted from both absolute and relative fund performance as investors fled bank stocks beginning in the summer of 2011 on concerns of European debt crisis contagion.
On the positive side, strong stock selection and a significant overweight position in the consumer discretionary sector was one the largest contributors to fund performance. The fund’s main consumer discretionary exposure was in the media companies industry. Time Warner Cable, Inc. and Comcast Corp. were top fund performers within this sector, as the media stocks performed well during the reporting period.
Stock selection in the health care sector also contributed to the fund’s relative performance. Health care provider UnitedHealth Group, Inc., and pharmaceuticals companies, Bristol-Myers Squibb Co. and GlaxoSmithKline P.L.C., were top fund performers in this sector on a relative and absolute basis.
Favorable stock selection in the telecommunication services sector also contributed to fund performance. In this sector, not owning certain stocks helped the most as the fund had no exposure to companies such as Sprint Nextel Corp. and Frontier Communications Corp. which boosted relative fund performance versus the benchmark.
PL Growth LT Fund (managed by Janus Capital Management LLC)
Q. How did the fund perform over the year ended March 31, 2012?
A. For the year ended March 31, 2012, the fund’s Class P returned 6.26% compared to an 11.02% return for its benchmark, the Russell 1000 Growth Index.
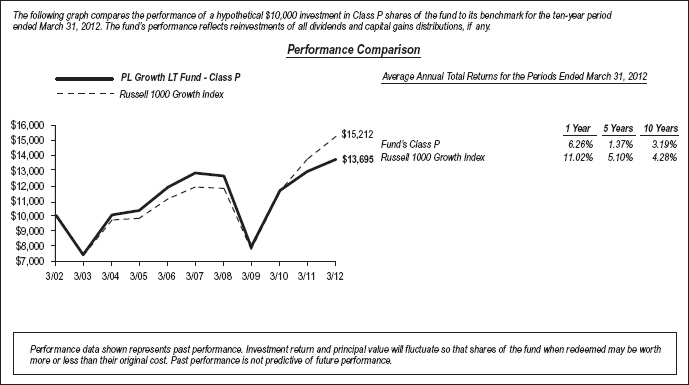
| A-12 | See benchmark definitions on page A-27 and A-28 |
Table of Contents
PACIFIC LIFE FUNDS PERFORMANCE DISCUSSION (Continued)
Q. Discuss both positive and negative factors that materially affected the fund’s performance during the year, including relevant market conditions, investment strategies and techniques, and particular sectors or securities.
A. We at Janus seek to deliver strong risk-adjusted returns over an entire market cycle by managing a diversified, moderately positioned, classic large-cap growth portfolio. We look for durable franchises with consistent, above average revenue, earnings and free cash flow growth, high and improving returns on capital, and a market leadership position driven by a clearly articulated strategy.
Fundamentally, well-positioned companies that weren’t appreciated by the market in 2011 started to be rewarded in the first quarter of 2012 as macro fears eased. We have built the fund with a core group of companies that are market share gainers in attractive industries, with strong business models and long-duration growth profiles, in our view. Many of these stocks outperformed in the first quarter, and we are encouraged that the market now seems to be rewarding these types of businesses. Despite these recent gains, the fund underperformed the benchmark for the reporting period.
Stock selection drove much of the fund’s underperformance during the reporting period, particularly within the energy, financials and information technology sectors. On a positive note, the fund’s holdings in the industrials sector aided relative fund performance.
Hess Corp. was the largest individual detractor from fund performance during the reporting period. The integrated energy company had an attractive valuation, in our view. However, we prefer companies with exposure to domestic oil shale and that have proven to be better capital allocators; therefore, the fund’s position was sold.
The fund also sold its position in Morgan Stanley, a diversified financial services firm as it detracted from fund performance. Its investment banking business remained susceptible to regulatory and capital market headwinds. Required higher liquidity and capital levels will reduce returns as will less opportunity for proprietary and complex trading, a meaningful profit driver previously, in our view. The low interest rate environment is also not conducive to trading by major market participants.
In addition, the fund’s position in Baker Hughes, Inc., an oilfield service company, detracted from fund performance and was sold due to concerns about rising competitive intensity in the North American market. The region suffers from weaker pricing and higher input costs than other areas.
Apple, Inc. was the top individual contributor to fund performance. The company has created a strong ecosystem around its products, bringing more customers in the Apple family. Customers then spend more on Apple products and are more profitable to the company. Apple has been gaining massive amounts of market share in the consumer space and will potentially gain share in the enterprise market. We like the company’s durable franchise and long-term growth prospects.
Celgene Corp. was a top performer, benefiting fund performance. We believe the biotech company continues to gain product momentum for its multiple myeloma drug, Revlimid. The addressable market is growing and physicians are increasingly recognizing the value of multi-year treatment with Revlimid. We consider the drug to be early in its product cycle, making Celgene an attractive multi-year growth opportunity.
Limited Brands, Inc. also contributed to the fund’s relative performance results. We like the specialty retailer for its dominant and growing market share in intimate apparel and personal care categories in the U.S. We also appreciate the company’s international expansion opportunities and that management is returning capital to shareholders.
Rather than try to tilt the portfolio toward pro-cyclical or defensive stocks, depending on the economic environment, we continue to focus on identifying a core group of market share gainers that operate in attractive industries and have long-duration growth potential. Stated simply, these are “steady eddy” businesses that looked very similar five years ago and that we believe will look similar in another five years—except that they should be bigger and stronger, with moderately higher margins and returns on invested capital. These companies have strong management teams with good track records and the ability to execute. They have high or increasing returns on capital, and attractive business models with low capital intensity, high margins and strong recurring revenues. These stocks may not always be rewarded during periods of extreme volatility and high correlations. But creating a portfolio focused around these businesses, at reasonable prices, is likely to result in outperformance over multi-year periods, in our view.
We are also supplementing the fund’s holdings with a moderate number of exceptional companies benefiting from significant positive change, in our view. Elements that we look for include a significant change in the company’s strategy; new management driving better execution; and a reduction in the industry’s competitive intensity, resulting in improving returns on capital. We added a department store retailer, J.C. Penney Co., Inc., that fits many of these criteria, and we are excited about its potential as management executes on a number of growth and profitability initiatives. Overall, our focus remains on identifying long-duration growth stocks that we think can perform well in a variety of economic climates. We think these stocks, bought at reasonable prices, offer the greatest potential for long-term capital appreciation in the marketplace today.
The last twelve months have been tumultuous, and we expect volatility to remain elevated throughout 2012. Markets may continue to trade on headlines related to Europe’s debt crisis, the U.S. fiscal situation or other macro issues, and we are likely to see some periods of
| A-13 | See benchmark definitions on page A-27 and A-28 |
Table of Contents
PACIFIC LIFE FUNDS PERFORMANCE DISCUSSION (Continued)
extreme risk aversion, as we did in 2011. While macro issues may pressure the markets, they do not heavily influence our outlook or security selection. Much more important to us is identifying companies with long-duration growth drivers, quality management teams and competitive advantages that can help them grow margins and gain market share. While the markets may be volatile, we continue to identify companies with strong businesses and valuations that are likely to provide attractive total returns on a multi-year basis.
We also think this is an opportune time for the fund to hold large-capitalization equities. The spread between the earnings yields of stocks and the yields of U.S. Treasuries is historically wide, offering greater potential for total returns in equities on a multi-year basis. With the risk of inflation eroding one’s principal in bonds, we think the odds are stacked in favor of equities, especially if they have growing free cash flows.
PL Large-Cap Growth Fund (managed by UBS Global Asset Management (Americas) Inc.)
Q. How did the fund perform over the year ended March 31, 2012?
A. For the year ended March 31, 2012, the fund’s Class P returned 13.65%, compared to an 11.02% return for its benchmark, the Russell 1000 Growth Index.
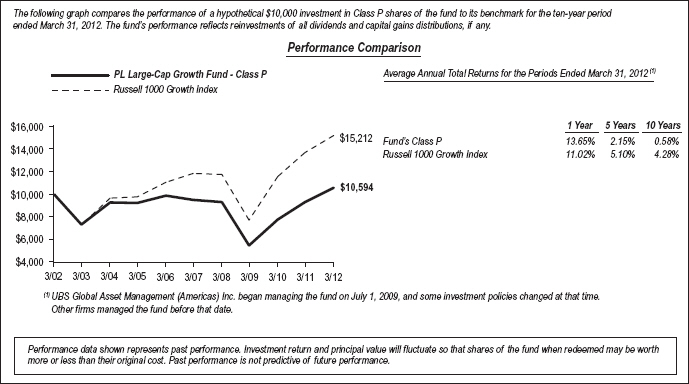
Q. Discuss both positive and negative factors that materially affected the fund’s performance during the year, including relevant market conditions, investment strategies and techniques, and particular sectors or securities.
A. During the reporting period, the fund outperformed the benchmark. Both stock selection and sector allocations contributed positively to fund performance during the period. During the period, the UBS Large Cap Growth team focused on adhering to its investment discipline, seeking to identify and invest in three, diverse sources of growth and emphasizing the management of our risk budget. What is unique about the strategy is that the team seeks to identify and invest in three diverse sources of alpha. The funds’ holdings are diversified into classic growth, elite growth, and cyclical growth companies.
The largest contributor to fund performance was stock selection within the consumer discretionary sector. The fund’s positions in Las Vegas Sands Corp., priceline.com, Inc., Ralph Lauren Corp., McDonald’s Corp. and Nike, Inc. outperformed the benchmark. Stock selection within the consumer staples sector also contributed to its performance as holdings in CVS Caremark Corp. and The Estee Lauder Cos., Inc. outperformed. Stock selection within the industrials sector was also positive as the fund’s position in Precision Castparts Corp. outperformed. In addition, the fund was underweight the industrials and materials sectors which benefited its relative performance during the market volatility of the second half of 2011. Stock selection within the information technology sector was also positive to the fund’s performance, specifically its holdings in Visa, Inc., Teradata Corp., Apple, Inc., and QUALCOMM, Inc.
Detractors from fund performance included stock selection within the financials sector where the fund’s holdings in CME Group, Inc.,
| A-14 | See benchmark definitions on page A-27 and A-28 |
Table of Contents
PACIFIC LIFE FUNDS PERFORMANCE DISCUSSION (Continued)
and The Goldman Sachs Group, Inc. underperformed. Both of the holdings were sold during the reporting period. Stock selection within the energy sector detracted from the fund’s performance during the period due to its holdings in CONSOL Energy, Inc., Cimarex Energy Co., Cabot Oil & Gas Corp., and Whiting Petroleum Corp. The fund was also negatively impacted due to its underweight to consumer staples, a sector which performed well during a flight-to-safety in the second half of 2011.
From a sector standpoint, the strategy’s overweight to consumer discretionary and information technology and underweight to energy, materials and industrials contributed to fund performance. However, the fund’s underweight to consumer staples detracted from its performance, as did its overweight to the health care sector.
PL Large-Cap Value Fund (managed by ClearBridge Advisors, LLC)
Q. How did the fund perform over the year ended March 31, 2012?
A. For the year ended March 31, 2012, the fund’s Class P returned 8.21%, compared to a 4.79% return for its benchmark, the Russell 1000 Value Index.
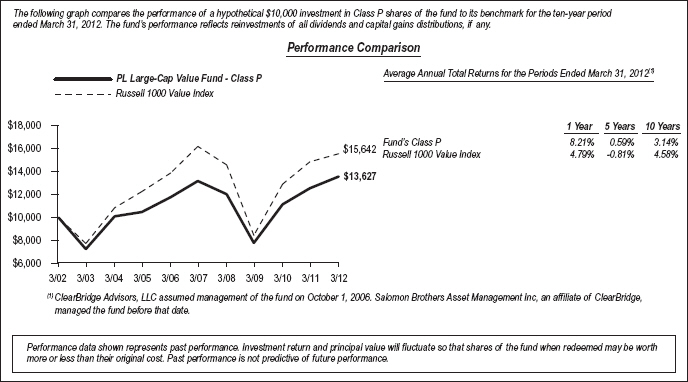
Q. Discuss both positive and negative factors that materially affected the fund’s performance during the year, including relevant market conditions, investment strategies and techniques, and particular sectors or securities.
A. The fund outperformed its benchmark during the reporting period. On an absolute basis, the fund had positive returns in 9 of the 10 economic sectors in which it was invested during the reporting period. The greatest contributions to the fund’s absolute return during the reporting period came from the consumer staples, consumer discretionary and health care sectors. Relative to the benchmark, the fund’s overall security selection contributed to its performance for the reporting period. In addition, the fund’s overweight to the consumer discretionary and staples sectors and underweight to the financials sector added to its relative performance. In terms of individual fund holdings, the leading contributors to fund performance included positions in El Paso Corp., Philip Morris International, Inc., DISH Network Corp., U.S. Bancorp. and International Business Machines Corp.
We at ClearBridge utilize an interactive, research-driven approach to identify companies with strong business franchises and attractive valuations. We look for companies with proven business models that we can understand such as companies with a sustainable competitive advantage and stocks capable of generating superior returns across a range of potential scenarios. We place a heavy emphasis on higher certainty of near-and medium-term cash flows, while heavily discounting earnings from emerging business models or products. We consider valuations relative to normalized earnings power.
| A-15 | See benchmark definitions on page A-27 and A-28 |
Table of Contents
PACIFIC LIFE FUNDS PERFORMANCE DISCUSSION (Continued)
On an absolute basis, the energy sector modestly detracted from fund performance for the reporting period. Relative to the benchmark, overall sector allocation was flat and did not have much of an impact to the fund’s performance. The fund’s underweight position relative to the benchmark’s weightings in the health care and utilities sectors detracted from relative fund performance for the reporting period. Furthermore, security selection within the information technology and health care sectors subtracted from the fund’s performance relative to the benchmark. On an individual holding basis, the leading detractors from fund performance for the reporting period included positions in Hewlett-Packard Co., Halliburton Co., Xerox Corp., Suncor Energy, Inc. and Bank of America Corp.
During the reporting period, we identified multiple opportunities to establish the fund’s positions in what we considered to be strong franchises trading at very attractive valuations. New fund positions were established in Anheuser-Busch InBev N.V., Chevron Corp., Capital One Financial Corp. and TE Connectivity Ltd. At the same time, the fund’s positions in: Unilever N.V., Wal-Mart Stores, Inc, The Chubb Corp., Total S.A., The Charles Schwab Corp. and Bank of America Corp., were sold, and the proceeds were reinvested in areas where we believed there to be better risk-adjusted return opportunities.
In our view, a portfolio of large-capitalization companies with growing profits, undemanding valuations, strong balance sheets and competitive dividend yields should generate attractive returns for investors over time. We remain optimistic about the return potential for equities over the next several years and believe our sound investment philosophy and consistent approach properly positions us to generate competitive, risk-adjusted returns over the long-term. We remain selective in our approach, focusing on high quality companies that we think have competitively advantaged business models, trade at attractive valuations and will be able to navigate the challenging economic environment.
PL Main Street Core Fund (managed by OppenheimerFunds, Inc.)
Q. How did the fund perform over the year ended March 31, 2012?
A. For the year ended March 31, 2012, the fund’s Class P returned 12.12%, compared to an 8.54% return for its benchmark, the S&P 500 Index.
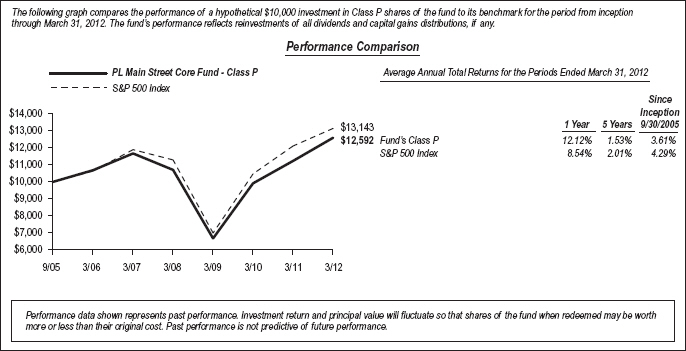
Q. Discuss both positive and negative factors that materially affected the fund’s performance during the year, including relevant market conditions, investment strategies and techniques, and particular sectors or securities.
A. During the reporting period, the fund outperformed the benchmark primarily within the information technology, energy, consumer staples and industrials sectors due to stronger, relative stock selection. The fund also outperformed the benchmark in the materials sector. The most significant underperforming sector for the fund was financials, as a result of weaker relative stock selection. The fund underperformed to a lesser degree in the health care, utilities and telecommunication services sectors.
During the reporting period, the top individual contributor to fund performance by far was Apple, Inc. (information technology), which continued to out-execute its peers. The company’s continued success at innovation and its highly recognizable brand led to global growth
| A-16 | See benchmark definitions on page A-27 and A-28 |
Table of Contents
PACIFIC LIFE FUNDS PERFORMANCE DISCUSSION (Continued)
and share gains across its top revenue producing products—iPhones, iPads and Mac PCs. Phillip Morris International, Inc. (consumer staples) was the second best performing stock during the reporting period, positively impacting fund performance. The company continued to generate substantial free cash flow stemming from ongoing market share gains, and its considerable ability to raise prices.
Also contributing positively to performance this period were The TJX Cos., Inc. (consumer discretionary), Tyco International Ltd. (industrials) and Abbott Laboratories (health care). TJX manages stores such as Marshalls, T.J. Maxx and Homegoods which benefited from a strong holiday season and increased sales during the period. Tyco’s stock has been a strong performer since management announced plans to split the company into three publicly traded segments. Tyco’s favorable contribution to the fund’s returns during the reporting period was largely due to investors’ anticipation that each new business, with its renewed focus on execution, would unlock value that previously had been masked by a conglomerate business structure. Abbott Laboratories performed well over the reporting period in which it announced that the Food and Drug Administration (FDA) approved its Absolute Pro® Vascular Self-Expanding Stent System for treatment of Iliac Artery Disease.
Three of the top detractors from fund performance were in the financials sector: Citigroup, Inc, Wells Fargo & Co. and State Street Corp. Wells Fargo was sold by period end. Investors became increasingly bearish towards financials over the third quarter of 2011 as fears heightened due to a weakening global economy and an uncertain regulatory environment. A lack of transparency regarding the extent of exposure to both European bank and sovereign debt weighed heavily on financial stocks such as Citigroup, Inc. Numerous financial stocks were also negatively impacted by the ongoing high degree of home foreclosures and the razor thin net interest margins that have resulted from the persistence of historically low interest rates. The financials sector did rally over the first quarter of 2012, however, and was the strongest performing sector of the benchmark during that time.
Also detracting from fund performance during the reporting period were Ford Motor Co. (consumer discretionary) and Hospira, Inc. (health care). In the case of Ford, the auto industry suffered several set-backs over 2011. Production costs were negatively impacted from soaring commodity prices and delivery disruptions from Japanese auto parts suppliers. Uncertainty about the health of the economy also tempered expectations for strong auto sales. Despite these hurdles, Ford successfully negotiated a new long-term union contract, which locks-in favorable labor costs, and re-initiated its dividend.
Hospira develops and manufactures specialty pharmaceutical and medication delivery products, which include acute-care and oncology injectables, as well as integrated infusion therapy and medication management. Rising concerns about manufacturing quality, identified by the FDA, caused this stock to sell-off early in the fourth quarter of 2011. Hospira’s production has been curtailed as it works through these issues to the satisfaction of the FDA, and this process may extend beyond 2012. The reduced earnings outlook, in combination with the potential for fines imposed, precipitated our decision to sell the stock.
We believe the U.S. economy will continue to improve at a gradual and perhaps uneven rate. The slow-growth environment could create a bifurcated stock market in which well-run companies with solid business models outperform. While cyclical stocks and companies with cyclical earnings generally performed well during the reporting period, we believe this trend is shifting to the benefit of consistent, longer-term performers.
If our expectations are correct, the current market environment could potentially favor our investment style and process, which focuses on companies with sustainable competitive advantages. We at Oppenheimer view such firms as well-positioned to generate stronger profit margins and take market share from weaker players. We will continue to seek to buy such companies when their valuations are attractive and believe that this disciplined investment process is the key to generating solid long-term performance.
PL Mid-Cap Equity Fund (managed by Lazard Asset Management LLC)
Q. How did the fund perform over the year ended March 31, 2012?
A. For the year ended March 31, 2012, the fund’s Class P returned -1.17%, compared to a 3.31% return for its benchmark, the Russell Midcap Index.
| A-17 | See benchmark definitions on page A-27 and A-28 |
Table of Contents
PACIFIC LIFE FUNDS PERFORMANCE DISCUSSION (Continued)
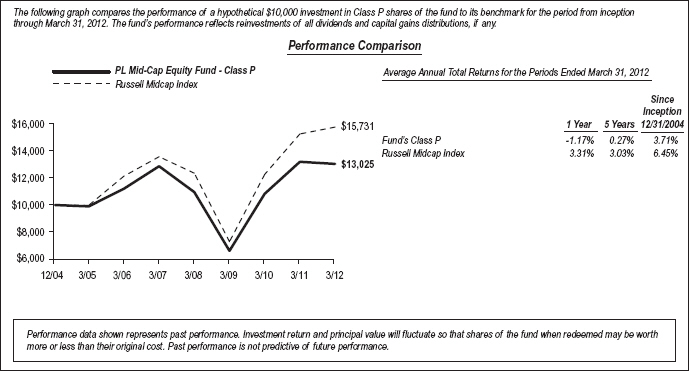
Q. Discuss both positive and negative factors that materially affected the fund’s performance during the year, including relevant market conditions, investment strategies and techniques, and particular sectors or securities.
A. A lack of exposure to the telecommunication services sector contributed to fund performance, as the sector was one of the worst performers in the benchmark during the reporting period. Stock selection in the information technology sector also helped fund returns. Shares of Motorola Mobility Holdings, Inc., the spin-off of Motorola’s wireless and cable business, climbed after Google, Inc. announced a deal to purchase it. The fund’s position was subsequently sold.
In contrast, stock selection in the health care sector detracted from fund performance. Shares of pharmaceutical company Warner Chilcott P.L.C. declined on investor concerns over the firm’s levered balance sheet, an FDA review of its osteoporosis drugs, and the risk of generic competition for an oral acne drug. The fund’s position was sold. Stock selection in the consumer discretionary sector also hurt returns. Shares of for-profit higher education organization, DeVry, Inc., declined as enrollment rates were lower than expected. Stock selection in the materials sector also detracted from returns. Shares of salt maker Compass Minerals International, Inc. declined on weather-related concerns. A warmer than usual winter reduced demand for de-icing salt, and a tornado impacted one of the company’s mines. However, we at Lazard believe the company has a strong balance sheet and good growth potential.
As we look at the rest of 2012, we believe the economic outlook has improved. The improvement, however, largely reflects a lower probability of an extremely negative scenario, such as the dissolution of the eurozone, or a Chinese hard landing. We do still face risks. In fact, the key bright spot is that the eurozone has been given a reprieve to begin the long task of structural reform. China has more work ahead to resolve housing and local government financing vehicles (LGFV) challenges but has many tools at its disposal. The U.S. has effectively delayed its day of reckoning until after elections in November. We believe, however, there is no way for the U.S. to avoid dealing with fiscal imbalances and long-term entitlement reform. The good news is that, for now, there appears to be a window of opportunity to address these global challenges calmly and thoughtfully, rather than in the heat of a crisis.
In conclusion, this period of calm could also lead to a market environment in which security selection is the primary driver of investment performance, rather than a more highly correlated market, driven by macro news flow. We continue to find excellent investment opportunities. These companies not only have excellent organic cash flow, strong balance sheets and operational flexibility but also have attractive valuations. We believe these characteristics should enable the companies to persevere through different market environments and be rewarded appropriately when the major macro, political and regulatory concerns have become less prominent in investors’ minds. We will continue to diligently assess the potential for volatility that might derail or enhance prospects for the companies we analyze. The good news is that while we are not yet out of the woods entirely, we do appear to see the clearing ahead.
| A-18 | See benchmark definitions on page A-27 and A-28 |
Table of Contents
PACIFIC LIFE FUNDS PERFORMANCE DISCUSSION (Continued)
PL Mid-Cap Growth Fund (managed by Morgan Stanley Investment Management Inc.)
Q. How did the fund perform over the year ended March 31, 2012?
A. For the year ended March 31, 2012, the fund’s Class P returned -1.08%, compared to a 4.43% return for its benchmark, the Russell Midcap Growth Index.
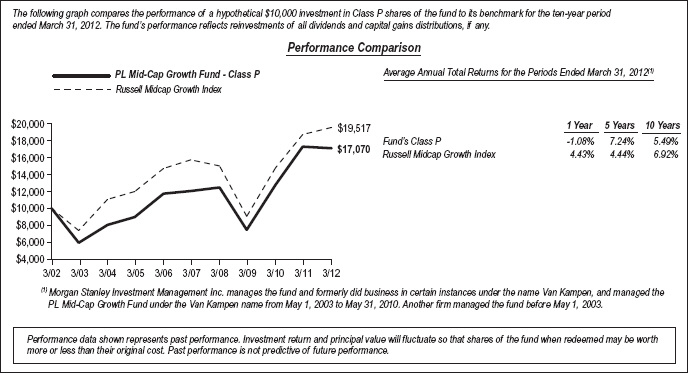
Q. Discuss both positive and negative factors that materially affected the fund’s performance during the year, including relevant market conditions, investment strategies and techniques, and particular sectors or securities.
A. The fund underperformed the benchmark during the reporting period. Stock selection in the technology sector was the largest detractor from relative performance. Russian search engine Yandex N.V., online daily deals service Groupon, Inc., and Chinese social networking provider Renren, Inc. were among the fund’s weakest performers in the sector. The consumer discretionary sector also contributed to underperformance, with both stock selection and an underweight to the sector diminishing returns. The fund’s performance was dampened by exposure to video streaming service Netflix, Inc., Chinese online travel service Ctrip.com International Ltd., and South African media company Naspers Ltd. Stock selection in the energy sector hampered performance as well. Holdings in solar power equipment maker First Solar, Inc. and crude oil producer Ultra Petroleum Corp. were disadvantageous to fund performance during the period.
The fund achieved relative gains in the utilities sector, where its only two holdings, Brookfield Infrastructure Partners L.P. and Millicom International Cellular S.A., performed well. Stock selection in the producer durables sector contributed positively to fund performance, led by risk data and analysis provider Verisk Analytics, Inc., product testing provider Intertek Group P.L.C., and water treatment services provider Nalco Holding Co. The consumer staples sector was also additive to fund performance due to good performance from the fund’s only holding in the sector, Mead Johnson Nutrition Co.
We, the Morgan Stanley portfolio management team, look for high-quality growth companies that we believe have sustainable competitive advantages, business visibility, rising return on invested capital, free cash flow and a favorable risk/reward profile. We find these companies through intense fundamental research. Our emphasis is on secular growth, and as a result, short-term market events are not as meaningful in the stock selection process. We continue to focus on assessing company prospects over a three-to-five-year time horizon and on owning a portfolio of high quality companies with diverse business drivers not tied to a particular market environment.
| A-19 | See benchmark definitions on page A-27 and A-28 |
Table of Contents
PACIFIC LIFE FUNDS PERFORMANCE DISCUSSION (Continued)
PL Small-Cap Growth Fund (managed by Fred Alger Management, Inc.)
Q. How did the fund perform over the year ended March 31, 2012?
A. For the year ended March 31, 2012, the fund’s Class P returned -0.34%, compared to a 0.68% return for its benchmark, the Russell 2000 Growth Index.
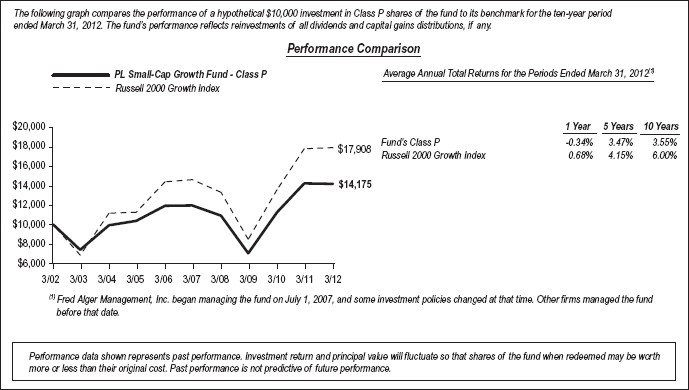
Q. Discuss both positive and negative factors that materially affected the fund’s performance during the year, including relevant market conditions, investment strategies and techniques, and particular sectors or securities.
A. For the year ended March 31, 2012, the fund underperformed the benchmark. During the reporting period, the largest sector weightings in the fund were in the information technology and consumer discretionary sectors. The largest sector overweight for the period was in consumer discretionary, where our analysts identified many small-capitalization companies generating strong earnings and cash flow growth while the largest underweight sector for the reporting period was in health care. It’s important to note, however, that this strategy usually maintains sector weights that are reasonably close to the weightings within the benchmark without major dispersion. Favorable stock selection in the health care and industrials sectors was the most important absolute contributor to fund performance. Conversely, sub-par selection in the energy and materials sectors detracted from the fund’s performance. Among the most important absolute contributors were United Rentals, Inc., an industrial and construction equipment rental company, HealthSpring, Inc., a manager of coordinated health care plans with a primary focus on Medicare Advantage plans and Novellus Systems, Inc., a manufacturer of equipment used in the fabrication of integrated circuits.
Conversely, detracting from overall results were Patriot Coal Corp., where lower coal production due to flooding problems at one of its mines resulted in lower than anticipated earnings; Shutterfly, Inc., where severe competitive pressures and the departure of the CFO early in the year caused the shares to decline; and OpenTable, Inc., where the shares detracted from fund performance after the company noted that domestic restaurant additions added to their network had softened. However, we at Alger continue to believe in the company due to their robust international expansion and their recent implementation of a share repurchase program.
As of March 31, 2012, the fund remained well diversified. During the reporting period, Alger’s investment philosophy and process remained unchanged: a research intensive, bottom-up, fundamental approach focused on discovering the fastest growing companies undergoing “Positive Dynamic Change”. Our experienced research team continues to identify many small-capitalization companies undergoing “Positive Dynamic Change” where our forward-looking assessment of their fundamentals exceeded Wall Street’s consensus. We believe that market resilience in the first quarter of 2012 signaled investors’ understanding of a vital fact: the U.S. economic recovery is strengthening. This has and will continue to support, we believe, a continuing rally in U.S. equity markets. We believe that Alger’s philosophy of “Investing in Positive Dynamic Change” has never been more appropriate than today. Change, whether from political events
| A-20 | See benchmark definitions on page A-27 and A-28 |
Table of Contents
PACIFIC LIFE FUNDS PERFORMANCE DISCUSSION (Continued)
such as the uprisings in the Middle East or from the continuing impact of growing emerging markets across Asia and South America, has never been more evident. While change is almost always unsettling for some investors, we believe that it generates opportunities to buy strong companies with superior potential for growth that are trading at attractive valuations. We continue to believe that research is the cornerstone of superior portfolio management, regardless of economic conditions, and that our proven and disciplined process for identifying companies experiencing “Positive Dynamic Change” will continue to produce superior long-term results for our clients.
PL Small-Cap Value Fund (managed by NFJ Investment Group LLC)
Q. How did the fund perform over the year ended March 31, 2012?
A. For the year ended March 31, 2012, the fund’s Class P returned 1.19%, compared to a -1.07% return for its benchmark, the Russell 2000 Value Index.
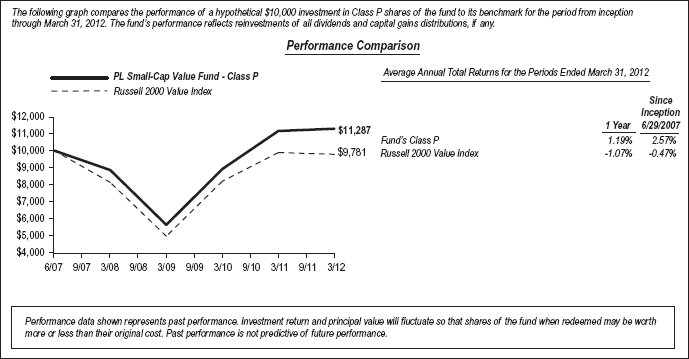
Q. Discuss both positive and negative factors that materially affected the fund’s performance during the year, including relevant market conditions, investment strategies and techniques, and particular sectors or securities.
A. The fund outperformed the benchmark for the reporting period. We at NFJ focus on investing in undervalued companies relative to the market across a broad range of industry groups. We normally invest significantly in securities of companies that the portfolio managers expect will generate income (for example, by paying dividends).
Stock selection in the energy sector was beneficial to the fund’s performance, in part due to the successful completion of a merger between portfolio holdings, Southern Union Co. and Energy Transfer Equity subsidiary, Sigma Acquisition Corp. Though energy was the weakest-performing sector in the benchmark, pipeline companies Magellan Midstream Partners L.P. and Sunoco Logistics Partners L.P. saw gains during the reporting period, benefiting the fund’s performance results. Not only do these firms generate revenue based on the amount of oil transferred, making them less susceptible to price fluctuations, but establishing pipelines can be expensive and resource-intensive, so barriers to entry are high.
Stock selection in the materials sector contributed to the fund’s performance. Royal Gold, Inc. benefited from higher gold prices over the period, as well as record revenue in the second quarter and strong earnings growth, adding to the fund’s performance.
In contrast, selection in the utilities sector detracted from the fund’s performance during the reporting period, in part due to Energen Corp., a diversified energy company that has a natural gas utility division as well as oil and gas exploration operations. The company suffered from falling natural gas prices, as well as an unusually warm winter in the U.S., which created supply/demand imbalances.
An overweight in the energy sector detracted from the fund’s returns, because, as previously mentioned, energy was the weakest sector within the benchmark. During the calendar year of 2011, many investors seeking energy sector exposure piled into larger-capitalization
| A-21 | See benchmark definitions on page A-27 and A-28 |
Table of Contents
PACIFIC LIFE FUNDS PERFORMANCE DISCUSSION (Continued)
corporations, such as Exxon Mobil Corp. and Chevron Corp. More recently, tensions in the Middle East coupled with an oversupply of and decreased demand for, natural gas have put further strain on the sector.
Being underweight financials also detracted from fund performance. The sector experienced a sharp ascend during the first quarter of 2012. This underweight bias remains the fund’s greatest deviation from the benchmark, as the portfolio management team seeks to maintain a well-diversified portfolio.
On the other hand, being underweight in the information technology sector contributed to the fund’s absolute returns. After financials, information technology was the weakest performing sector in the benchmark for the trailing twelve-month period.
PL Real Estate Fund (managed by Morgan Stanley Investment Management Inc.)
Q. How did the fund perform over the year ended March 31, 2012?
A. For the year ended March 31, 2012, the fund’s Class P returned 10.62%, compared to a 12.83% return for its benchmark, the FTSE NAREIT Equity REITs Index.
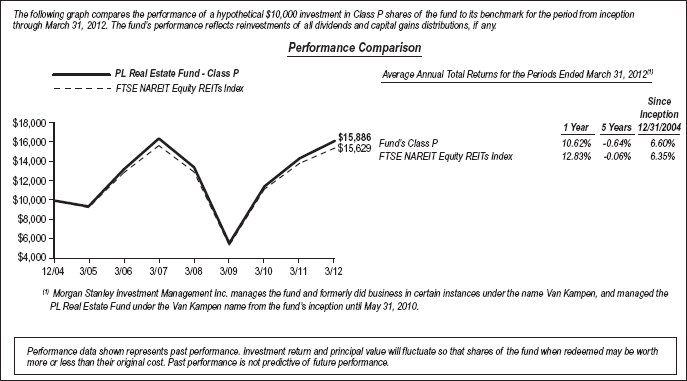
Q. Discuss both positive and negative factors that materially affected the fund’s performance during the year, including relevant market conditions, investment strategies and techniques, and particular sectors or securities.
A. For the reporting period, the fund underperformed the benchmark. Bottom-up stock selection detracted from, while top-down sector allocation contributed to, the fund’s performance relative to the benchmark. Stock selection was especially strong in the office sector; this benefited the fund’s performance but was offset by stock selection in the diversified and health care sectors, which detracted from its performance. From a top-down perspective, the fund benefited from the underweight position to the industrial sector and the overweight to the mall sector; this benefit to the fund’s performance was partially offset by the negative impact of the overweight position to the hotel sector and underweight to the storage sector. Additionally, cash held in the fund detracted from its relative performance.
We, the Morgan Stanley portfolio management team, has maintained our core investment philosophy as a real estate value investor, resulting in the ownership of stocks whose share prices provide real estate exposure at what we believed, during the reporting period, were the best valuation relative to their underlying asset values. We continue to focus on relative, implied valuations as a key metric. During the reporting period, our company-specific research leads us to an overweighting in the fund to a group of companies that are focused in the ownership of upscale urban hotels, regional malls, and central business district office assets, and underweight to companies concentrated in the ownership of health care, suburban office, and industrial assets.
| A-22 | See benchmark definitions on page A-27 and A-28 |
Table of Contents
PACIFIC LIFE FUNDS PERFORMANCE DISCUSSION (Continued)
PL Emerging Markets Fund (managed by OppenheimerFunds, Inc.)
Q. How did the fund perform over the year ended March 31, 2012?
A. For the year ended March 31, 2012, the fund’s Class P returned -5.15%, compared to a -8.80% return for its benchmark, the MSCI Emerging Markets Index.
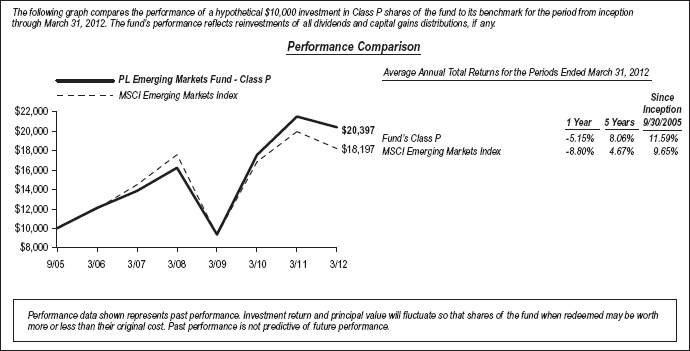
Q. Discuss both positive and negative factors that materially affected the fund’s performance during the year, including relevant market conditions, investment strategies and techniques, and particular sectors or securities.
A. For the twelve-month period ended March 31, 2012, the fund outperformed the benchmark primarily in the consumer staples sector, due to an overweight position to what was, by far, the strongest performing sector of the benchmark. Stronger relative stock selection in the financials sector also contributed positively to the fund’s relative performance. The fund underperformed in the consumer discretionary and information technology sectors during the reporting period. On a country basis, relative to the benchmark, the fund’s strongest performers were Mexico, the Philippines, India and Russia. The weakest performing countries relative to the benchmark were South Africa and Taiwan.
During the reporting period, the top individual contributors to performance were Fomento Economico Mexicano SAB de C.V. (consumer staples) (Mexico), NHN Corp. (information technology) (Korea), SM Prime Holdings, Inc. (financials) (Philippines), Cia de Bebidas das Americas (consumer staples) (Brazil) and Prada S.P.A. (consumer discretionary) (Italy). Mexican beverage company Fomento Economico Mexicano (FEMSA) owns and operates OXXO, the largest convenience store chain in Latin America. It controls Coca-Cola FEMSA S.A.B. de C.V., one of the largest independent Coca-Cola bottlers in the world. At period end, the company also held a stake in Heineken N.V., with whom it cooperates closely in Latin America beer distribution. The stock continued to perform well as demand grew for FEMSA’s line of soft drink products throughout Latin America, the U.S. and Mexico. NHN runs a successful internet portal and search engine in Korea, known as “naver.com”. The company reported solid results for its fourth quarter ended December 31, 2011. SM Prime is the largest shopping mall and retail operator in the Philippines. The company performed well during a period in which it opened its fourth shopping mall in China and its forty-second shopping mall in the Philippines. Cia de Bebidas, also known as Ambev, is majority owned by Anheuser-Busch Inbev N.V. The company is the largest brewer in Latin America and the largest PepsiCo, Inc. bottler outside of the U.S. Continued demand for the company’s products caused its stock to perform well. Fashion and luxury goods company, Prada, reported strong sales for 2011.
The most significant detractors from performance this period were HTC Corp. (information technology) (Taiwan), Infosys Ltd. (information technology) (India), Petroleo Brasileiro S.A. (Petrobras) (energy) (Brazil), Impala Platinum Holdings Ltd. (materials) (South Africa) and Ctrip.com International Ltd. (consumer discretionary) (China). HTC, the Taiwanese manufacturer of the Android phone, sharply reduced guidance as the Apple iPhone 4S and new offerings from Samsung cut into sales. In our view, HTC remains one of the leaders in smartphones and continues to grow its market share in China, among other markets. Infosys is an India-based, international information
| A-23 | See benchmark definitions on page A-27 and A-28 |
Table of Contents
PACIFIC LIFE FUNDS PERFORMANCE DISCUSSION (Continued)
technology consulting and software service company that declined in 2011 due to weaker than expected results. Sales were slower than anticipated and the appreciating Rupee dampened foreign currency earnings. Petrobras, the Brazilian oil and gas exploration and production company, is the largest component of the Brazilian stock index. As a result, it suffered early in the reporting period as investors continued to take profits in Brazil in the face of central bank tightening. The decline in oil prices over the third quarter of 2011 also negatively impacted Petrobras. Impala Platinum (South Africa) is a producer of platinum that experienced a degree of volatility during the quarter. Ctrip is the dominant travel aggregator in China, participating in a highly fragmented travel and hotel property market. The company has been investing aggressively in sales, marketing and research and development (R&D), and this has taken its toll on margins. We at Oppenheimer consider the price-fall in reaction to this to be excessive.
At the end of the reporting period, the fund had a significant overweight position in the consumer staples sector and was overweight to a lesser degree within the information technology and consumer discretionary sectors. We find that these sectors tend to house companies whose characteristics are generally ones that we seek when identifying companies in which to invest. The fund had significant underweight positions within the materials, financials, energy, industrials and telecommunication services sectors and did not hold any positions within the utilities sector. On a country basis, the fund had large, relatively overweight positions in India, Mexico, the U.K and the Philippines, along with relative underweight positions primarily in Korea, Taiwan, South Africa, Brazil, China and Malaysia.
We believe that developing economies are the most significant engine of global growth in a scarce-growth world. Although the external climate will contribute less to aggregate demand in the broader emerging world, the theme of convergence may likely drive relatively high structural expansion in the larger emerging economies, most notably China and India. We anticipate economic reform will continue, characterized by high levels of total-factor productivity growth and capital deepening. We believe that the developing economies, while vastly diverse, still have, in aggregate, enormous endogenous growth potential given structural convergence and should account for the majority of worldwide output expansion in this decade. It is also worth noting that relatively uninspiring growth in the developed world frames low global inflation and interest rates, which will be powerful stimuli for growth economies that are capital-constrained, such as Turkey.
Despite the potential for near-term market volatility, our strategy remains the same by focusing on our long-term approach of committing capital to high quality businesses with durable, above-average growth and sustainable competitive advantage, with minimal benchmark orientation. We are long-term shareholders seeking to invest in extraordinary businesses, which we believe are rare in dynamic, often high growth, developing economies, poised to take advantage of global structural changes to grow sales and earning sustainably. These factors have historically been key drivers of long-term stock price appreciation. Focusing on individual companies instead of specific countries or sectors, we search for those that may benefit from our thematic approach to investing.
PL International Large-Cap Fund (managed by MFS Investment Management)
Q. How did the fund perform over the year ended March 31, 2012?
A. For the year ended March 31, 2012, the fund’s Class P returned -0.32%, compared to a -5.77% return for its benchmark, the MSCI EAFE Index.
| A-24 | See benchmark definitions on page A-27 and A-28 |
Table of Contents
PACIFIC LIFE FUNDS PERFORMANCE DISCUSSION (Continued)
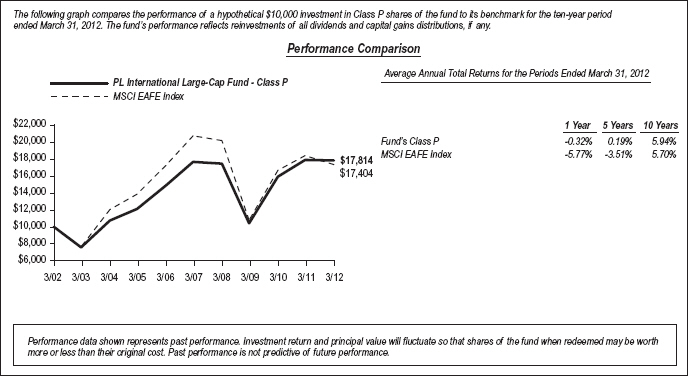
Q. Discuss both positive and negative factors that materially affected the fund’s performance during the year, including relevant market conditions, investment strategies and techniques, and particular sectors or securities.
A. For the twelve-month period ended March 31, 2012, the fund outperformed the benchmark. We at MFS use a bottom up investment style, involving the research of the fundamentals of each individual opportunity and analyzing certain aspects of a company such as earnings, cash flows, growth potential and management capabilities.
During the reporting period, stock selection in the materials and technology sectors led the fund’s relative outperformance. Within the basic materials sector, overweight positions in industrial gas supplier Linde A.G. (Germany) and specialty chemicals manufacturer Shin-Etsu Chemical Co. Ltd. (Japan) boosted the fund’s relative performance as both stocks outperformed the broad market as defined by the fund’s benchmark. The fund’s avoidance of shares in poor-performing mining giant BHP Billiton Ltd. (Australia), which was not held at period end, also supported its relative results. In the technology sector, the fund’s holdings of South Korean microchip and electronics manufacturer Samsung Electronics Co. Ltd. and Taiwan Semiconductor Manufacturing Co. Ltd., the largest contract semiconductor manufacturer in the world, benefited the fund’s returns. Both holdings were not benchmark constituents.
Stock selection, and to a lesser extent, an underweight position in the utilities and communications sectors were additional contributing factors to fund relative performance as the sectors lagged the benchmark during the period. There were no individual securities within these sectors that were among the fund’s top relative contributors.
Overweight positions in the consumer staples also contributed positively to the fund’s relative results as both sectors outperformed the benchmark during the reporting period. The fund’s overweight positions in alcoholic beverage producer Diageo P.L.C. and U.K.-based household products manufacturer Reckitt Benckiser Group P.L.C. were among the main drivers of the fund’s relative performance within the consumer staples sector. In the retailing sector, an overweight position in convenience store chain Lawson, Inc. (Japan), which also outperformed the broad market, aided relative returns.
Elsewhere, overweight positions in medical device manufacturer Synthes, Inc. (Switzerland) and advertising and marketing firm WPP P.L.C. (U.K.) bolstered relative fund performance as both stocks outperformed the benchmark.
Stock selection in the special products & services industry was a primary detractor from the fund’s relative performance. This was mainly due to the fund’s overweight position in human resources and employment services provider Randstad Holding N.V. (Netherlands) which underperformed during the reporting period.
Stock selection in the financials sector also negatively affected the fund’s relative results. Holdings of financial services firms ICICI Bank Ltd. (India) which was not a benchmark constituent, ING Groep N.V. (Netherlands), Erste Group Bank A.G. (Austria), Nomura
| A-25 | See benchmark definitions on page A-27 and A-28 |
Table of Contents
PACIFIC LIFE FUNDS PERFORMANCE DISCUSSION (Continued)
Holdings, Inc. (Japan), and UBS A.G. (Switzerland) held back the fund’s relative returns as all five stocks underperformed the broad market.
Elsewhere, overweight positions in shares of Hong Kong-headquartered retailer Esprit Holdings Ltd. and French electrical distribution equipment manufacturer Schneider Electric S.A. hampered fund relative performance as both stocks performed poorly during the period. Not holding shares of strong-performing tobacco distributor British American Tobacco P.L.C. (U.K.) and U.K.-based pharmaceutical firm GlaxoSmithKline P.L.C. also hurt the fund’s relative returns.
During the reporting period, the fund’s currency exposure was another detractor from the fund’s relative performance, resulting primarily from differences between the fund and the benchmark’s exposure to holdings of securities denominated in foreign currencies. All of the investment decisions are driven by the fundamentals of each individual opportunity and as such, it is common for our portfolios to have different currency exposure than the benchmark.
PL International Value Fund (managed by J.P. Morgan Investment Management Inc.)
Q. How did the fund perform over the year ended March 31, 2012?
A. For the year ended March 31, 2012, the fund’s Class P returned -6.20%, compared to a -5.77% return for its benchmark, the MSCI EAFE Index.
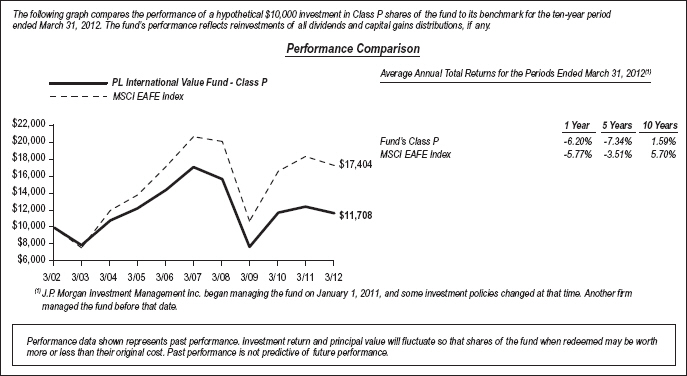
Q. Discuss both positive and negative factors that materially affected the fund’s performance during the year, including relevant market conditions, investment strategies and techniques, and particular sectors or securities.
A. JPMorgan’s transparent and uniform investment philosophy drives all in-house research efforts and all investment decisions. The fund underperformed its benchmark during the twelve-month period ended March 31, 2012. The fund’s strategy adheres to a bottom-up approach. Asset allocation is a by-product of stock selection opportunities. We at JPMorgan maintain a transparent and uniform investment philosophy which drives all in-house research efforts and investment decisions.
We seek to add value to the fund by capitalizing on mis-valuations that arise within and across the world’s equity markets. We do this by investing in undervalued securities, as identified by in-house valuation tools and research analysts.
From a sector perspective, stock selection in banks & finance was the largest detractor along with stock selection in insurance and capital market banks. An underweight in consumer nondurables also negatively impacted performance. Stock selection in telecommunications, transportation services & consumer cyclicals, and technology-semiconductors contributed to fund performance.
| A-26 | See benchmark definitions on page A-27 and A-28 |
Table of Contents
PACIFIC LIFE FUNDS PERFORMANCE DISCUSSION (Continued)
Regionally, stock selection in Continental Europe was the major detractor with an overweight allocation to Canada also hurting performance. Stock selection in the U.K. and Japan aided relative returns.
At the stock level, BNP Paribas, the French banking group, struggled as European bank stocks generally have risen and fallen in line with European sovereign debt concerns. The stock collapsed in the second half of 2011 as sovereign debt concerns re-surfaced. French banks were particularly hit hard due to the perception that they were heavily exposed to Greek sovereign debt and in anticipation that France would lose its AAA credit rating. To help mitigate risk, BNP Paribas aggressively scaled back its exposure to peripheral European sovereigns. It wrote off the majority of its Greek bond holdings and reduced its exposure to Italian debt. The write-downs and losses from disposing of European government bonds were the primary causes of BNP’s fourth quarter drop in net income of 51% year-over-year and its net profit falling 23% for 2011. BNP’s management believes the bank can still achieve (by Jan. 1, 2013) the capital ratio targets set under the rules of the Basel Committee on Banking Supervision (Basel III) without having to go to the market to raise additional capital. The Basel Committee formulates broad supervisory standards and guidelines and recommends statements of best practice in banking supervision in the expectation that member authorities and other nations’ authorities will take steps to implement them through their own national systems, whether in statutory form or otherwise.
Alternatively, Japan Tobacco, Inc., the Japanese tobacco company, aided returns. Tobacco stocks, in general, performed well during the reporting period as investors continued to be attracted by their ability to raise prices and generate cash. Despite the disruptions caused by Japan’s massive earthquake in March 2011, the company’s earnings held up better than expected as aggressive cost cuts combined with continued growth overseas helped compensate for production losses. Operations have since come back on line. The share price was further boosted by speculation that a debt-ridden Japanese government might sell at least part of its stake in the company. With its huge cash position, Japan Tobacco would be in a position to buy back a good chunk of those shares—a move that would be highly accretive for earnings per share. The company is raising prices and gaining share in a number of overseas markets, including Russia. As part of its ongoing bid to reduce dependence on the Japanese market, Japan Tobacco recently agreed to purchase Haggar Cigarette (in the Sudan) as part of a push to increase its presence in emerging markets.
Benchmark Definitions
Barclays U.S. Aggregate Bond Index covers the U.S. dollar-denominated, investment grade, fixed-rate, taxable bond market of SEC-registered securities. The index includes bonds from the U.S. Treasury, government-related, corporate, mortgage-backed securities, asset-backed securities, and corporate mortgage-backed securities sectors. The total return is equal to the change in price plus the coupon return.
Barclays U.S. High-Yield 2% Issuer Capped Bond Index is an index that is an issuer-constrained version for the U.S. Corporate High-Yield Index that coves the U.S. dollar-denominated, non-investment grade fixed-rate taxable corporate bond market and limits issuer exposures to a maximum of 2% and redistributes eth excess market value index-wide on a pro-rata basis. The total return is equal to the change in price plus the coupon return.
Barclays 1-3 Year U.S. Government/Credit Bond Index is the 1-3 year component for the U.S. Government/Credit Index. The U.S. Government/Credit Bond Index is the non-securitized component of the U.S. Aggregate Bond Index. The U.S. Government/Credit Bond Index includes U.S. Treasuries, Government-related issues and corporates. The total return is equal to the change in price plus the coupon return.
Barclays U.S. Treasury Inflation Protected Securities (TIPS) Index is an index of all outstanding treasury inflation protected securities issued by the U.S. government. The total return is equal to the change in price plus the coupon return.
BofA Merrill Lynch 1-3 Year U.S. Treasury Index is an index of U.S. Treasury issues that has maturities from one-to-three years. The total return is equal to the change in price plus the coupon return.
FTSE National Association of Real Estate Investment Trusts (NAREIT) Equity Real Estate Investment Trusts (REITs) Index is one index of a series of indexes represented in the FTSE NAREIT U.S. Real Estate Index Series and represents tax-qualified REITs listed on the New York Stock Exchange (NYSE), American Stock Exchange and National Association of Securities Dealers Automated Quotations (NASDAQ). Results include reinvested dividends. Effective December 20, 2010, the FTSE NAREIT Equity REITs Index no longer includes Timber REITs.
Morgan Stanley Capital International (MSCI) Europe, Australasia and Far East (EAFE) Index is an index of stocks from 21 countries/regions in Europe, Australia, New Zealand and Asia. Results include reinvested dividends after deducting withholding taxes.
MSCI Emerging Markets Index is an index typically made up of stocks from approximately 26 emerging market countries. Results include reinvested dividends.
Russell 1000 Growth Index is an index of large companies that have higher price-to-book ratios and forecasted growth values than the Russell 1000 Value Index. Results include reinvested dividends.
| A-27 |
Table of Contents
PACIFIC LIFE FUNDS PERFORMANCE DISCUSSION (Continued)
Russell 1000 Value Index measures the performance of the large-capitalization value segment of the U.S. equity universe. It is an index of companies with a less-than average growth orientation. Companies in this index have lower price-to book and price-earnings ratios, higher dividend yields and lower forecasted growth rates than companies in the Russell 1000 Growth Index. Results include reinvested dividends.
Russell 2000 Growth Index measures the performance of the small-capitalization growth segment of the U.S. equity universe. It is an index of approximately 1,200 small companies with higher price-to-book ratios and forecasted growth values than companies in the Russell 2000 Value Index. Results include reinvested dividends.
Russell 2000 Value Index measures the performance of the small-capitalization value segment of the U.S. equity universe. It is an index of companies that have lower price-to-book ratios and lower forecasted growth values than companies in the Russell 2000 Growth Index. Results include reinvested dividends.
Russell Midcap Growth Index is an index that measures the performance of the mid-capitalization growth segment of the U.S. equity universe. It includes those companies within the Russell Midcap Index with higher price-to-book ratios and higher forecasted growth values. Results include reinvested dividends.
Russell Midcap Index is an index of approximately 800 of the smallest companies in the Russell 1000 Index. Results include reinvested dividends.
S&P 500 Index is an index of the stocks of approximately 500 large-capitalization companies traded in U.S. stock markets. Results include reinvested dividends.
S&P/LSTA Leveraged Loan Index is a daily total return index that uses Loan Syndications & Trading Association/Loan Pricing Corp. (LSTA/LPC) mark-to-market pricing to calculate market value change. On a real-time basis, the leveraged loan index (LLI) tracks the current outstanding balance and spread over London Interbank Offered Rate (LIBOR) for fully funded term loans. The facilities included in the LLI represent a broad cross section of leveraged loans syndicated in the U.S., including dollar-denominated loans to overseas issuers.
| A-28 |
Table of Contents
PACIFIC LIFE FUNDS
PL FLOATING RATE LOAN FUND
March 31, 2012
| Shares | Value | |||||||
COMMON STOCKS - 0.6% |
| |||||||
Consumer Discretionary - 0.6% |
| |||||||
Metro-Goldwyn-Mayer Studios Inc ‘A’ * ¯ | 27,061 | $ | 705,954 | |||||
|
| |||||||
Total Common Stocks |
| |||||||
(Cost $671,651) |
| 705,954 | ||||||
|
| |||||||
| Principal Amount | ||||||||
SENIOR LOAN NOTES - 96.4% |
| |||||||
Consumer Discretionary - 34.2% |
| |||||||
99 Cents Only Stores | ||||||||
7.750% due 01/11/19 § | $ | 498,750 | 508,881 | |||||
Advantage Sales & Marketing Inc (1st Lien) | ||||||||
5.250% due 12/18/17 § | 669,044 | 669,211 | ||||||
Affinion Group Inc | ||||||||
5.000% due 10/09/16 § | 1,081,220 | 1,027,497 | ||||||
Allison Transmission Inc Term B-1 | ||||||||
2.750% due 08/07/14 § | 959,121 | 953,878 | ||||||
AMC Entertainment Inc Term B-3 | ||||||||
4.250% due 02/07/18 § | 997,500 | 990,019 | ||||||
AMC Networks Inc Term B | ||||||||
4.000% due 12/31/18 § | 497,494 | 496,250 | ||||||
ARAMARK Corp | ||||||||
2.020% due 01/26/14 § | 838,203 | 836,858 | ||||||
(Letter of Credit Facility Deposit Non-Extended) | ||||||||
2.020% due 01/26/14 § | 67,524 | 67,416 | ||||||
Asurion LLC (1st Lien) | ||||||||
5.500% due 05/24/18 § | 1,067,738 | 1,058,929 | ||||||
Burger King Corp Tranche B | ||||||||
4.500% due 10/19/16 § | 467,406 | 467,383 | ||||||
Caesars Entertainment Operating Co Inc | ||||||||
5.492% due 01/28/18 § | 600,000 | 542,813 | ||||||
Catalina Marketing Corp (Non-Extended) | ||||||||
2.991% due 10/01/14 § | 934,052 | 901,360 | ||||||
Cequel Communications LLC | ||||||||
4.000% due 02/14/19 § | 550,000 | 545,703 | ||||||
Charter Communications Operating LLC Term C | ||||||||
3.720% due 09/06/16 § | 493,687 | 493,070 | ||||||
Chrysler Group LLC Term B | ||||||||
6.000% due 05/25/17 § | 1,042,125 | 1,060,443 | ||||||
Clear Channel Communication Inc Tranche B | ||||||||
3.894% due 01/29/16 § | 492,133 | 400,289 | ||||||
Cumulus Media Holdings Inc Term B (1st Lien) | ||||||||
5.750% due 09/16/18 § | 498,491 | 500,858 | ||||||
DineEquity Inc Term B-1 | ||||||||
4.250% due 10/19/17 § | 817,010 | 818,198 | ||||||
Dollar General Corp | ||||||||
2.991% due 07/07/14 § | 500,000 | 501,232 | ||||||
Dunkin Brands Inc Term B-2 | ||||||||
4.000% due 11/23/17 § | 977,586 | 978,501 | ||||||
Education Management LLC Tranche C-3 | ||||||||
due 12/30/18 ¥ | 300,000 | 298,500 | ||||||
Federal-Mogul Corp | ||||||||
Tranche B | ||||||||
2.178% due 12/27/14 § | 645,313 | 621,741 | ||||||
Tranche C | ||||||||
2.178% due 12/28/15 § | 329,241 | 317,215 | ||||||
General Nutrition Centers Inc Tranche B | ||||||||
4.250% due 03/02/18 § | 975,000 | 974,591 | ||||||
| Principal Amount | Value | |||||||
Getty Images Inc | ||||||||
5.250% due 11/09/16 § | $ | 490,344 | $ | 493,409 | ||||
Incremental Term B-1 | ||||||||
4.221% due 11/05/15 § | 50,000 | 50,240 | ||||||
Go Daddy Operating Co LLC | ||||||||
due 12/17/18 ¥ | 300,000 | 301,125 | ||||||
Tranche B-1 | ||||||||
5.500% due 12/17/18 § | 174,125 | 174,778 | ||||||
HHI Holdings LLC Term B | ||||||||
due 03/21/17 ¥ | 1,000,000 | 1,005,000 | ||||||
Interactive Data Corp Term B | ||||||||
4.500% due 02/11/18 § | 479,027 | 480,324 | ||||||
J. Crew Group Inc | ||||||||
due 03/07/18 ¥ | 500,000 | 492,277 | ||||||
Jo-Ann Stores Inc | ||||||||
4.750% due 03/16/18 § | 735,951 | 732,639 | ||||||
Language Line LLC Tranche B | ||||||||
6.250% due 06/20/16 § | 622,697 | 626,589 | ||||||
Las Vegas Sands LLC (Extended) | ||||||||
(Delayed Draw I) | ||||||||
2.750% due 11/23/16 § | 107,252 | 103,632 | ||||||
Tranche B | ||||||||
2.750% due 11/23/16 § | 530,786 | 513,038 | ||||||
Laureate Education Inc (Extended) | ||||||||
5.250% due 06/15/18 § | 991,241 | 972,655 | ||||||
Live Nation Entertainment Inc Term B | ||||||||
4.500% due 11/07/16 § | 997,455 | 998,910 | ||||||
MCC Iowa LLC Tranche E | ||||||||
4.500% due 10/23/17 § | 982,500 | 982,090 | ||||||
Michaels Stores Inc | ||||||||
Term B-2 | ||||||||
5.073% due 07/31/16 § | 688,114 | 690,964 | ||||||
Term B-3 | ||||||||
5.073% due 07/31/16 § | 463,828 | 465,749 | ||||||
Mission Broadcasting Inc | ||||||||
5.000% due 09/30/16 § | 989,959 | 993,671 | ||||||
National Bedding Co LLC (Extended) | ||||||||
3.756% due 11/28/13 § | 491,526 | 491,833 | ||||||
Orbitz Worldwide Inc | ||||||||
3.316% due 07/25/14 § | 447,166 | 425,646 | ||||||
OSI Restaurant Partners LLC | ||||||||
2.572% due 06/14/14 § | 870,921 | 856,774 | ||||||
(Pre-Funded Revolving Credit Loan) | ||||||||
1.089% due 06/14/13 § | 85,856 | 84,461 | ||||||
Petco Animal Supplies Inc Term B | ||||||||
4.500% due 11/24/17 § | 490,000 | 489,948 | ||||||
Pilot Travel Centers LLC Tranche B (Initial Term Loan) | ||||||||
4.250% due 03/30/18 § | 412,832 | 414,483 | ||||||
Pinnacle Entertainment Inc (Incremental) Term A | ||||||||
4.000% due 03/19/19 § | 75,000 | 75,297 | ||||||
Regal Cinemas Corp | ||||||||
3.368% due 08/23/17 § | 839,375 | 837,627 | ||||||
Sabre Inc (Non-Extended Initial Term Loan) | ||||||||
2.328% due 09/30/14 § | 968,575 | 910,865 | ||||||
SeaWorld Parks & Entertainment Inc Term A | ||||||||
2.991% due 02/17/16 § | 242,701 | 241,488 | ||||||
Term B | ||||||||
due 08/17/17 ¥ | 75,000 | 75,023 | ||||||
4.000% due 08/17/17 § | 227,453 | 227,523 | ||||||
Six Flags Theme Parks Inc Tranche B | ||||||||
4.250% due 12/20/18 § | 750,000 | 750,258 | ||||||
SymphonyIRI Group Inc | ||||||||
5.000% due 12/01/17 § | 496,250 | 496,353 | ||||||
The Goodyear Tire & Rubber Co (2nd Lien) | ||||||||
1.750% due 04/30/14 § | 1,000,000 | 998,542 | ||||||
The Neiman Marcus Group Inc | ||||||||
4.750% due 05/16/18 § | 825,000 | 824,484 | ||||||
| See Notes to Financial Statements | B-1 | See explanation of symbols and terms, if any, on page B-71 |
Table of Contents
PACIFIC LIFE FUNDS
PL FLOATING RATE LOAN FUND
Schedule of Investments (Continued)
March 31, 2012
| Principal Amount | Value | |||||||
Travelport LLC | ||||||||
(Extended Delayed Draw Term Loan) | ||||||||
5.081% due 08/21/15 § | $ | 697,634 | $ | 637,463 | ||||
TWCC Holding Corp | ||||||||
4.250% due 02/11/17 § | 734,303 | 736,028 | ||||||
Univision Communications Inc | ||||||||
(Extended 1st Lien Term Loan) | ||||||||
4.491% due 03/31/17 § | 766,960 | 712,739 | ||||||
(Initial Term Loan) | ||||||||
2.241% due 09/29/14 § | 333,040 | 329,016 | ||||||
Visant Corp Tranche B | ||||||||
5.250% due 12/22/16 § | 511,391 | 498,073 | ||||||
Weight Watchers International Inc Term F | ||||||||
4.000% due 03/15/19 § | 175,000 | 174,537 | ||||||
Zuffa LLC (Initial Term Loan) | ||||||||
2.250% due 06/19/15 § | 984,496 | 959,064 | ||||||
|
| |||||||
| 38,355,451 | ||||||||
|
| |||||||
Consumer Staples - 9.6% |
| |||||||
Dean Foods Co Tranche B (Non-Extended) | ||||||||
1.750% due 04/02/14 § | 492,228 | 487,921 | ||||||
Del Monte Foods Co | ||||||||
(Initial Term Loan) | ||||||||
4.500% due 03/08/18 § | 992,500 | 991,259 | ||||||
Dole Food Co Inc | ||||||||
Tranche B-2 | ||||||||
5.040% due 07/08/18 § | 356,669 | 359,121 | ||||||
Tranche C-2 | ||||||||
5.026% due 07/08/18 § | 638,250 | 642,638 | ||||||
JBS USA LLC (Initial Term Loan) | ||||||||
4.250% due 05/25/18 § | 992,500 | 995,130 | ||||||
KIK Custom Products Inc (2nd Lien) | ||||||||
5.243% due 12/01/14 § | 500,000 | 335,000 | ||||||
Michael Foods Group Inc Term B (Facility) | ||||||||
4.253% due 02/25/18 § | 960,476 | 962,277 | ||||||
NBTY Inc Term B-1 | ||||||||
4.250% due 10/01/17 § | 861,429 | 863,582 | ||||||
Pierre Foods Inc (1st Lien) | ||||||||
7.001% due 09/30/16 § | 494,987 | 495,606 | ||||||
Pinnacle Foods Finance LLC | ||||||||
2.829% due 04/02/14 § | 496,333 | 497,573 | ||||||
Reynolds Group Holdings Inc Tranche B | ||||||||
6.500% due 02/09/18 § | 979,322 | 992,966 | ||||||
Rite Aid Corp | ||||||||
Tranche 2 | ||||||||
2.003% due 06/04/14 § | 1,446,717 | 1,423,931 | ||||||
Tranche 5 | ||||||||
4.500% due 03/03/18 § | 194,383 | 192,500 | ||||||
Supervalu Inc Term B-3 (Advance) | ||||||||
4.500% due 04/30/18 § | 1,014,750 | 1,016,227 | ||||||
U.S. Foodservice Inc | ||||||||
2.740% due 07/03/14 § | 493,523 | 477,219 | ||||||
|
| |||||||
| 10,732,950 | ||||||||
|
| |||||||
Energy - 3.6% | ||||||||
CCS Corp Term A | ||||||||
6.500% due 11/14/14 § | 498,750 | 501,244 | ||||||
Citgo Petroleum Corp Term B | ||||||||
8.000% due 06/24/15 § | 170,536 | 171,388 | ||||||
Crestwood Holdings | ||||||||
1.500% due 03/30/18 § | 150,000 | 152,937 | ||||||
Energy Transfer Equity LP Term B | ||||||||
5.250% due 03/21/17 § | 325,000 | 319,245 | ||||||
Frac Tech Services Term B | ||||||||
6.250% due 04/29/16 § | 912,919 | 911,208 | ||||||
Gibson Energy ULC | ||||||||
5.750% due 06/15/18 § | 248,125 | 249,924 | ||||||
| Principal Amount | Value | |||||||
MEG Energy Corp (Initial Term Loan) | ||||||||
4.000% due 03/18/18 § | $ | 995,000 | $ | 994,901 | ||||
Obsidian Natural Gas Trust | ||||||||
7.000% due 11/02/15 § | 740,494 | 746,048 | ||||||
|
| |||||||
| 4,046,895 | ||||||||
|
| |||||||
Financials - 3.4% | ||||||||
Citco III Ltd | ||||||||
5.500% due 06/29/18 § | 496,250 | 492,528 | ||||||
First Data Corp | ||||||||
Term B-1 (Non-Extended) | ||||||||
2.992% due 09/24/14 § | 271,216 | 261,782 | ||||||
(Dollar Term Loan) | ||||||||
4.242% due 03/23/18 § | 223,620 | 204,333 | ||||||
HUB International Ltd | ||||||||
(Delayed Draw Term Loan) | ||||||||
2.970% due 06/13/14 § | 175,915 | 173,891 | ||||||
(Initial Term Loan) | ||||||||
2.970% due 06/13/14 § | 782,560 | 777,180 | ||||||
LPL Holdings Inc. | ||||||||
Term A | ||||||||
due 03/22/17 ¥ | 125,000 | 122,500 | ||||||
Tranche B (Initial Term Loan) | ||||||||
4.000% due 03/29/19 § | 300,000 | 300,188 | ||||||
Nuveen Investments Inc (1st Lien) | ||||||||
(Extended) | ||||||||
5.754% due 05/13/17 § | 808,260 | 808,513 | ||||||
(Additional Extended) | ||||||||
5.755% due 05/13/17 § | 691,740 | 693,037 | ||||||
|
| |||||||
| 3,833,952 | ||||||||
|
| |||||||
Health Care - 14.0% | ||||||||
Alere Inc Term B | ||||||||
4.500% due 07/08/18 § | 796,000 | 792,767 | ||||||
Alliance Imaging Inc (Initial Term Loan) | ||||||||
7.250% due 06/01/16 § | 463,346 | 428,595 | ||||||
Aptalis Pharma Inc | ||||||||
5.500% due 02/10/17 § | 493,750 | 494,161 | ||||||
Aveta Inc | ||||||||
(MMM Facility) | ||||||||
due 03/31/17 ¥ | 100,000 | 97,000 | ||||||
(MMM Term Loan) | ||||||||
8.500% due 04/14/15 § | 148,003 | 148,250 | ||||||
(NAMM Facility) | ||||||||
due 03/31/17 ¥ | 100,000 | 97,000 | ||||||
(NAMM Term Loan) | ||||||||
8.500% due 04/14/15 § | 148,003 | 148,250 | ||||||
Bausch & Lomb Inc | ||||||||
(Delayed Draw Term Loan) | ||||||||
3.491% due 04/24/15 § | 96,585 | 96,561 | ||||||
(Parent Term Loan) | ||||||||
3.670% due 04/24/15 § | 395,287 | 395,188 | ||||||
Biomet Inc (Dollar Term Loan) | ||||||||
3.376% due 03/25/15 § | 982,005 | 972,634 | ||||||
Capsugel (Intial Term Loan) | ||||||||
5.250% due 07/30/18 § | 123,696 | 124,894 | ||||||
CHS/Community Health Systems Inc | ||||||||
(Extended Term Loan) | ||||||||
3.956% due 01/25/17 § | 310,085 | 306,137 | ||||||
(Non-Extended Funded Term Loan) | ||||||||
2.751% due 07/25/14 § | 514,658 | 508,769 | ||||||
DJO Finance LLC | ||||||||
Tranche B-2 | ||||||||
5.241% due 11/01/16 § | 272,244 | 270,542 | ||||||
Tranche B-3 | ||||||||
6.250% due 09/15/17 § | 175,000 | 174,745 | ||||||
Emergency Medical Services Corp (Initial Term Loan) | ||||||||
5.250% due 05/25/18 § | 992,481 | 994,714 | ||||||
| See Notes to Financial Statements | B-2 | See explanation of symbols and terms, if any, on page B-71 |
Table of Contents
PACIFIC LIFE FUNDS
PL FLOATING RATE LOAN FUND
Schedule of Investments (Continued)
March 31, 2012
| Principal Amount | Value | |||||||
Grifols Inc Tranche B | ||||||||
4.500% due 06/01/17 § | $ | 769,129 | $ | 769,369 | ||||
HCA Inc Tranche B-3 | ||||||||
3.491% due 05/01/18 § | 1,581,925 | 1,553,010 | ||||||
Health Management Associates Inc Term B | ||||||||
4.500% due 11/16/18 § | 1,172,063 | 1,164,620 | ||||||
IMS Health Inc Tranche B | ||||||||
4.500% due 08/26/17 § | 490,008 | 492,151 | ||||||
InVentiv Health Inc (Consolidated) | ||||||||
6.500% due 08/04/16 § | 491,294 | 466,729 | ||||||
Kindred Healthcare Inc | ||||||||
5.250% due 06/01/18 § | 173,688 | 167,174 | ||||||
Kinetic Concepts Inc | ||||||||
7.000% due 05/04/18 § | 523,688 | 534,857 | ||||||
MultiPlan Inc Term B | ||||||||
4.750% due 08/26/17 § | 638,492 | 633,304 | ||||||
Pharmaceutical Product Development Inc Term B | ||||||||
6.250% due 11/23/18 § | 997,500 | 1,010,696 | ||||||
Quintiles Transnational Corp Term B | ||||||||
5.000% due 06/08/18 § | 421,813 | 423,394 | ||||||
RPI Finance Trust | ||||||||
4.000% due 05/09/18 § | 421,813 | 422,867 | ||||||
Select Medical Corp | ||||||||
5.500% due 06/01/18 § | 522,060 | 510,314 | ||||||
The TriZetto Group Inc | ||||||||
due 05/02/18 ¥ | 500,000 | 500,000 | ||||||
Warner Chilcott Co LLC | ||||||||
Term B-1 | ||||||||
4.250% due 03/15/18 § | 452,571 | 452,770 | ||||||
Term B-2 | ||||||||
4.250% due 03/15/18 § | 226,286 | 226,385 | ||||||
WC Luxco SARL | ||||||||
Term B-3 | ||||||||
4.250% due 03/15/18 § | 311,143 | 311,279 | ||||||
|
| |||||||
| 15,689,126 | ||||||||
|
| |||||||
Industrials - 8.7% |
| |||||||
Acco Brands Corp Term B | ||||||||
due 02/18/19 ¥ | 50,000 | 50,094 | ||||||
Bombardier Recreational Products Inc. Term B-2 | ||||||||
4.500% due 06/28/16 § | 497,803 | 497,648 | ||||||
Colfax Corp Term B (Facility) | ||||||||
4.500% due 01/11/19 § | 648,375 | 649,999 | ||||||
Delos Aircraft Inc Term 2 | ||||||||
7.000% due 03/17/16 § | 1,000,000 | 1,006,185 | ||||||
Flying Fortress Inc. Term B | ||||||||
5.000% due 06/30/17 § | 425,000 | 428,719 | ||||||
Goodman Global Inc (1st Lien Initial Term Loan) | ||||||||
5.750% due 10/28/16 § | 139,625 | 140,647 | ||||||
Husky Injection Molding Systems Ltd (Initial Term Loan) | ||||||||
6.500% due 06/29/18 § | 497,494 | 501,745 | ||||||
John Maneely Co | ||||||||
4.750% due 04/01/17 § | 997,485 | 999,979 | ||||||
KAR Auction Services Inc | ||||||||
5.000% due 05/19/17 § | 322,562 | 323,671 | ||||||
Metaldyne LLC Term B | ||||||||
5.250% due 05/18/17 § | 471,742 | 473,119 | ||||||
Monitronics International Inc | ||||||||
5.500% due 03/23/18 § | 125,000 | 125,260 | ||||||
Rexnord LLC | ||||||||
(Initial Term Loan) | ||||||||
due 04/01/18 ¥ | 600,000 | 600,880 | ||||||
Term B | ||||||||
5.000% due 04/01/18 § | 425,000 | 425,623 | ||||||
Schaeffler AG Term C2 (Facility) | ||||||||
6.000% due 01/27/17 § | 150,000 | 150,881 | ||||||
| Principal Amount | Value | |||||||
Sensata Technologies Finance Co LLC | ||||||||
4.000% due 05/12/18 § | $ | 347,375 | $ | 347,556 | ||||
Swift Transportation Co LLC | ||||||||
Tranche B-1 | ||||||||
3.993% due 12/21/16 § | 500,000 | 501,557 | ||||||
Tranche B-2 | ||||||||
5.000% due 12/15/17 § | 275,000 | 277,149 | ||||||
TASC Inc | ||||||||
4.500% due 12/18/15 § | 148,611 | 146,939 | ||||||
Tomkins LLC Term B-1 | ||||||||
4.250% due 09/29/16 § | 515,621 | 516,373 | ||||||
Transdigm Inc | ||||||||
Term B | ||||||||
4.000% due 02/15/17 § | 246,875 | 247,369 | ||||||
Tranche B-2 | ||||||||
4.000% due 02/14/17 § | 99,750 | 99,958 | ||||||
U.S. Security Associates Holdings Inc | ||||||||
Term B | ||||||||
6.000% due 07/28/17 § | 498,747 | 500,826 | ||||||
VWR Funding Inc (Dollar Term Loan) | ||||||||
2.741% due 06/30/14 § | 720,207 | 716,306 | ||||||
|
| |||||||
| 9,728,483 | ||||||||
|
| |||||||
Information Technology - 8.7% |
| |||||||
Aeroflex Inc. Term B | ||||||||
due 05/09/18 ¥ | 500,000 | 490,084 | ||||||
Dealer Computer Services Inc Tranche B | ||||||||
3.750% due 04/21/18 § | 205,893 | 205,507 | ||||||
DG Fastchannel Inc (Initial Term Loan) | ||||||||
5.750% due 07/26/18 § | 473,105 | 473,697 | ||||||
Eagle Parent Inc | ||||||||
(Initial Term Loan) | ||||||||
due 05/16/18 ¥ | 200,000 | 198,719 | ||||||
Term B | ||||||||
5.000% due 05/16/18 § | 272,938 | 271,189 | ||||||
Freescale Semiconductor Inc Tranche B-1 | ||||||||
4.494% due 12/01/16 § | 983,911 | 959,928 | ||||||
Infor Enterprise Solutions Holdings Ltd (First Lien) | ||||||||
(Extended Initial Term Loan) | ||||||||
5.970% due 07/28/15 § | 642,924 | 639,977 | ||||||
(Extended Delayed) | ||||||||
5.970% due 07/28/15 § | 341,451 | 339,744 | ||||||
Kronos Inc Tranche B-1 (Second Lien) | ||||||||
10.470% due 04/12/12 § | 500,000 | 512,500 | ||||||
Lawson Software Tranche B | ||||||||
due 03/30/18 ¥ | 700,000 | 693,000 | ||||||
Microsemi Corp Term B | ||||||||
4.000% due 02/02/18 § | 972,156 | 973,979 | ||||||
Novell Inc (1st Lien) | ||||||||
6.500% due 04/27/17 § | 493,671 | 492,591 | ||||||
NXP B.V. | ||||||||
Term B (Incremental) | ||||||||
5.250% due 03/19/19 § | 175,000 | 173,688 | ||||||
Tranche A-2 | ||||||||
5.500% due 03/03/17 § | 74,625 | 74,501 | ||||||
Rocket Software Inc Term B | ||||||||
7.000% due 02/19/18 § | 498,750 | 500,309 | ||||||
Rovi Solutions Corporation Tranche B-2 | ||||||||
due 03/29/19 ¥ | 100,000 | 100,000 | ||||||
Sophia LP (Initial Term Loan) | ||||||||
6.250% due 07/19/18 § | 150,000 | 152,550 | ||||||
Spansion LLC | ||||||||
4.750% due 02/09/15 § | 734,392 | 734,545 | ||||||
SSI Investments II Ltd | ||||||||
6.500% due 05/26/17 § | 489,194 | 491,640 | ||||||
| See Notes to Financial Statements | B-3 | See explanation of symbols and terms, if any, on page B-71 |
Table of Contents
PACIFIC LIFE FUNDS
PL FLOATING RATE LOAN FUND
Schedule of Investments (Continued)
March 31, 2012
| Principal Amount | Value | |||||||
SunGard Data Systems Inc | ||||||||
Tranche B | ||||||||
3.975% due 02/28/16 § | $ | 512,043 | $ | 513,498 | ||||
Tranche C | ||||||||
3.994% due 02/28/17 § | 174,571 | 175,313 | ||||||
Vantiv Inc Tranche B | ||||||||
2.750% due 02/24/19 § | 50,000 | 50,109 | ||||||
Web.com Group Inc (1st Lien) | ||||||||
7.000% due 10/27/17 § | 490,417 | 487,147 | ||||||
|
| |||||||
| 9,704,215 | ||||||||
|
| |||||||
Materials - 6.4% | ||||||||
Arizona Chemicals | ||||||||
7.250% due 12/22/17 § | 137,727 | 139,564 | ||||||
BWAY Holding Co (Replacement) | ||||||||
Term B | ||||||||
4.500% due 02/23/18 § | 457,799 | 459,043 | ||||||
Term C | ||||||||
4.500% due 02/23/18 § | 42,201 | 42,316 | ||||||
Fairmount Minerals Ltd Tranche B | ||||||||
5.250% due 03/15/17 § | 979,000 | 982,059 | ||||||
Hexion Specialty Chemicals Inc | ||||||||
Tranche C-1B | ||||||||
4.000% due 05/05/15 § | 685,986 | 682,556 | ||||||
Tranche C-2B | ||||||||
4.250% due 05/05/15 § | 291,500 | 290,042 | ||||||
Huntsman International LLC (Extended Term B) | ||||||||
Series 2 | ||||||||
3.359% due 04/19/17 § | 268,345 | 265,494 | ||||||
Term B | ||||||||
2.850% due 04/19/17 § | 731,655 | 722,509 | ||||||
Ineos US Finance LLC | ||||||||
8.000% due 12/16/14 § | 65,437 | 67,993 | ||||||
Momentive Performance Materials Term B-3 | ||||||||
due 05/05/15 ¥ | 50,000 | 48,063 | ||||||
Noranda Aluminum Term B | ||||||||
5.750% due 02/28/19 § | 125,000 | 126,094 | ||||||
Novelis Inc (Canada) | ||||||||
4.000% due 03/10/17 § | 987,500 | 986,579 | ||||||
Trinseo Materials Operating S.C.A. Term B | ||||||||
6.000% due 08/02/17 § | 493,750 | 452,398 | ||||||
Tronox Pigments BV (Netherlands) (Delayed Draw Term Loan) | ||||||||
due 02/08/18 ¥ | 21,429 | 21,442 | ||||||
Term B | ||||||||
4.250% due 01/27/19 § | 78,571 | 78,719 | ||||||
Univar Inc Term B | ||||||||
5.000% due 06/30/17 § | 839,375 | 842,261 | ||||||
Walter Energy Inc Term B | ||||||||
4.000% due 04/02/18 § | 964,258 | 961,506 | ||||||
|
| |||||||
| 7,168,638 | ||||||||
|
| |||||||
Telecommunication Services - 5.4% |
| |||||||
Crown Castle Operating Co | ||||||||
Term B | ||||||||
due 01/31/19 ¥ | 500,000 | 498,056 | ||||||
Tranche B | ||||||||
4.000% due 01/31/19 § | 224,438 | 223,565 | ||||||
Digicel International Finance Ltd Tranche A - T&T | ||||||||
3.125% due 09/30/12 § | 100,048 | 99,798 | ||||||
Greeneden U.S. Holdings II LLC | ||||||||
6.750% due 01/31/19 § | 50,000 | 50,481 | ||||||
Intelsat Jackson Holdings SA Tranche B | ||||||||
5.250% due 04/02/18 § | 1,935,375 | 1,947,818 | ||||||
MetroPCS Wireless Inc Tranche B-3 | ||||||||
4.043% due 03/17/18 § | 619,874 | 616,465 | ||||||
| Principal Amount | Value | |||||||
SBA Communications Corp | ||||||||
3.750% due 06/30/18 § | $ | 74,438 | $ | 74,438 | ||||
Syniverse Holdings Inc Term B | ||||||||
5.250% due 12/22/17 § | 988,737 | 994,101 | ||||||
Telesat Canada Term B | ||||||||
due 03/23/19 ¥ | 525,000 | 525,459 | ||||||
UPC Financing Partnership (Facility X) | ||||||||
3.744% due 12/31/17 § | 1,000,000 | 995,625 | ||||||
|
| |||||||
| 6,025,806 | ||||||||
|
| |||||||
Utilities - 2.4% |
| |||||||
Calpine Corp | ||||||||
4.500% due 04/01/18 § | 1,138,750 | 1,135,558 | ||||||
Dynergy Power LLC (CoalCo Term Loan) | ||||||||
due 08/04/16 ¥ | 500,000 | 513,125 | ||||||
NRG Energy Inc Term B | ||||||||
4.000% due 07/01/18 § | 521,063 | 520,918 | ||||||
Texas Competitive Electric Holding Co LLC (Extended) | ||||||||
4.743% due 10/10/17 § | 500,000 | 279,219 | ||||||
The AES Corp (Initial Term Loan) | ||||||||
4.250% due 06/01/18 § | 297,000 | 297,707 | ||||||
|
| |||||||
| 2,746,527 | ||||||||
|
| |||||||
Total Senior Loan Notes | ||||||||
(Cost $107,191,961) | 108,032,043 | |||||||
|
| |||||||
| Shares | ||||||||
SHORT-TERM INVESTMENT - 7.9% |
| |||||||
Money Market Fund - 7.9% |
| |||||||
BlackRock Liquidity Funds Treasury Trust Fund Portfolio | 8,882,936 | 8,882,936 | ||||||
|
| |||||||
Total Short-Term Investment |
| |||||||
(Cost $8,882,936) |
| 8,882,936 | ||||||
|
| |||||||
TOTAL INVESTMENTS - 104.9% |
| |||||||
(Cost $116,746,548) |
| 117,620,933 | ||||||
OTHER ASSETS & LIABILITIES, NET - (4.9%) |
| (5,532,897 | ) | |||||
|
| |||||||
NET ASSETS - 100.0% |
| $ | 112,088,036 | |||||
|
| |||||||
| See Notes to Financial Statements | B-4 | See explanation of symbols and terms, if any, on page B-71 |
Table of Contents
PACIFIC LIFE FUNDS
PL FLOATING RATE LOAN FUND
Schedule of Investments (Continued)
March 31, 2012
Notes to Schedule of Investments
| (a) | As of March 31, 2012, the fund was diversified as a percentage of net assets as follows: |
Consumer Discretionary | 34.8 | % | ||
Health Care | 14.0 | % | ||
Consumer Staples | 9.6 | % | ||
Industrials | 8.7 | % | ||
Information Technology | 8.7 | % | ||
Short-Term Investment | 7.9 | % | ||
Materials | 6.4 | % | ||
Telecommunication Services | 5.4 | % | ||
Energy | 3.6 | % | ||
Financials | 3.4 | % | ||
Utilities | 2.4 | % | ||
|
| |||
| 104.9 | % | |||
Other Assets & Liabilities, Net | (4.9 | %) | ||
|
| |||
| 100.0 | % | |||
|
| |||
| (b) | As of March 31, 2012, the fund’s Standard & Poor’s quality ratings as a percentage of total fixed income investments were as follows (Unaudited): |
BBB | 5.0 | % | ||
BB | 52.5 | % | ||
B | 39.8 | % | ||
CCC | 1.5 | % | ||
Not Rated | 1.2 | % | ||
|
| |||
| 100.0 | % | |||
|
| |||
| (c) | Restricted securities as of March 31, 2012 were as follows: |
Issuer and Acquisition Date | Cost | Value | Value as a % of Net Assets | |||||||||
Metro-Goldwyn-Mayer | ||||||||||||
Studios Inc ‘A’ Acq. 12/30/10 | $ | 671,651 | $ | 705,954 | 0.6 | % | ||||||
|
|
|
|
|
| |||||||
| (d) | Fair Value Measurements |
The following is a summary of the fund’s investments as categorized under the three-tier hierarchy of inputs used in valuing the fund’s assets and liabilities (See Note 3C in Notes to Financial Statements) as of March 31, 2012:
| Total Value at March 31, 2012 | Level 1 Quoted Price | Level 2 Significant Observable Inputs | Level 3 Significant Unobservable Inputs | |||||||||||||||
Assets | Common Stocks (1) | $ | 705,954 | $ | — | $ | 705,954 | $ | — | |||||||||
| Senior Loan Notes | 108,032,043 | — | 108,032,043 | — | ||||||||||||||
| Short-Term Investment | 8,882,936 | 8,882,936 | — | — | ||||||||||||||
|
|
|
|
|
|
|
| |||||||||||
| Total | $ | 117,620,933 | $ | 8,882,936 | $ | 108,737,997 | $ | — | ||||||||||
|
|
|
|
|
|
|
| |||||||||||
| (1) | For equity investments categorized in a single level, refer to the schedule of investments for further industry breakout. |
| See Notes to Financial Statements | B-5 | See explanation of symbols and terms, if any, on page B-71 |
Table of Contents
PACIFIC LIFE FUNDS
PL HIGH INCOME FUND
Schedule of Investments
March 31, 2012
| Principal Amount | Value | |||||||
CORPORATE BONDS & NOTES - 96.2% |
| |||||||
Consumer Discretionary - 19.1% |
| |||||||
ARAMARK Holdings Corp | ||||||||
8.625% due 05/01/16 ~ | $ | 100,000 | $ | 102,750 | ||||
Cablevision Systems Corp | ||||||||
8.625% due 09/15/17 | 100,000 | 109,375 | ||||||
Caesars Operating Escrow LLC | ||||||||
8.500% due 02/15/20 ~ | 50,000 | 51,000 | ||||||
CCO Holdings LLC | ||||||||
6.625% due 01/31/22 | 50,000 | 52,125 | ||||||
7.250% due 10/30/17 | 100,000 | 107,750 | ||||||
Chrysler Group LLC | ||||||||
8.000% due 06/15/19 | 100,000 | 101,000 | ||||||
CityCenter Holdings LLC | ||||||||
7.625% due 01/15/16 | 100,000 | 106,000 | ||||||
Clear Channel Communications Inc | ||||||||
5.500% due 12/15/16 | 100,000 | 58,750 | ||||||
DISH DBS Corp | ||||||||
6.750% due 06/01/21 | 100,000 | 108,250 | ||||||
Harrahs’s Operating Co | ||||||||
11.250% due 06/01/17 | 50,000 | 54,750 | ||||||
Jo-Ann Stores Inc | ||||||||
8.125% due 03/15/19 ~ | 108,000 | 109,080 | ||||||
Limited Brands Inc | ||||||||
5.625% due 02/15/22 | 50,000 | 50,688 | ||||||
MGM Resorts International | ||||||||
7.625% due 01/15/17 | 100,000 | 103,750 | ||||||
NPC International Inc | ||||||||
10.500% due 01/15/20 ~ | 50,000 | 54,750 | ||||||
Standard Pacific Corp | ||||||||
8.375% due 05/15/18 | 100,000 | 106,875 | ||||||
The Goodyear Tire & Rubber Co | ||||||||
8.250% due 08/15/20 | 100,000 | 106,750 | ||||||
The ServiceMaster Co | ||||||||
8.000% due 02/15/20 ~ | 50,000 | 53,500 | ||||||
|
| |||||||
| 1,437,143 | ||||||||
|
| |||||||
Consumer Staples - 5.4% | ||||||||
Del Monte Corp | ||||||||
7.625% due 02/15/19 | 100,000 | 100,000 | ||||||
JBS USA LLC | ||||||||
8.250% due 02/01/20 ~ | 100,000 | 103,000 | ||||||
Reynolds Group Issuer Inc | ||||||||
9.000% due 04/15/19 ~ | 100,000 | 99,000 | ||||||
9.875% due 08/15/19 ~ | 50,000 | 51,187 | ||||||
Spectrum Brands Inc | ||||||||
6.750% due 03/15/20 ~ | 50,000 | 50,688 | ||||||
|
| |||||||
| 403,875 | ||||||||
|
| |||||||
Energy - 16.6% | ||||||||
Arch Coal Inc | ||||||||
7.250% due 06/15/21 ~ | 100,000 | 92,750 | ||||||
Basic Energy Services Inc | ||||||||
7.750% due 02/15/19 | 100,000 | 103,000 | ||||||
Chaparral Energy Inc | ||||||||
8.250% due 09/01/21 | 100,000 | 107,000 | ||||||
Chesapeake Energy Corp | ||||||||
9.500% due 02/15/15 | 100,000 | 115,000 | ||||||
Chesapeake Midstream Partners LP | ||||||||
6.125% due 07/15/22 ~ | 50,000 | 50,625 | ||||||
Cimarex Energy Co | ||||||||
5.875% due 05/01/22 | 50,000 | 51,125 | ||||||
Crosstex Energy LP | ||||||||
8.875% due 02/15/18 | 100,000 | 106,750 | ||||||
EV Energy Partners LP | ||||||||
8.000% due 04/15/19 | 50,000 | 51,500 | ||||||
| Principal Amount | Value | |||||||
Holly Energy Partners LP | ||||||||
6.500% due 03/01/20 ~ | $ | 50,000 | $ | 50,875 | ||||
Key Energy Services Inc | ||||||||
6.750% due 03/01/21 ~ | 50,000 | 51,375 | ||||||
Linn Energy LLC | ||||||||
7.750% due 02/01/21 | 100,000 | 104,250 | ||||||
Sabine Pass LNG LP | ||||||||
7.500% due 11/30/16 | 100,000 | 107,750 | ||||||
Samson Investment Co | ||||||||
9.750% due 02/15/20 ~ | 50,000 | 50,687 | ||||||
SandRidge Energy Inc | ||||||||
8.000% due 06/01/18 ~ | 100,000 | 102,500 | ||||||
SESI LLC | ||||||||
6.375% due 05/01/19 | 100,000 | 106,500 | ||||||
|
| |||||||
| 1,251,687 | ||||||||
|
| |||||||
Financials - 9.0% | ||||||||
Ally Financial Inc | ||||||||
5.500% due 02/15/17 | 100,000 | 100,203 | ||||||
American International Group Inc | ||||||||
8.175% due 05/15/68 § | 100,000 | 106,350 | ||||||
CIT Group Inc | ||||||||
5.250% due 03/15/18 | 50,000 | 51,062 | ||||||
First Data Corp | ||||||||
12.625% due 01/15/21 | 100,000 | 100,750 | ||||||
Ford Motor Credit Co LLC | ||||||||
5.875% due 08/02/21 | 100,000 | 108,015 | ||||||
Neuberger Berman Group LLC | ||||||||
5.875% due 03/15/22 ~ | 50,000 | 50,750 | ||||||
Nuveen Investments Inc | ||||||||
10.500% due 11/15/15 | 100,000 | 104,125 | ||||||
Realogy Corp | ||||||||
7.625% due 01/15/20 ~ | 50,000 | 52,500 | ||||||
|
| |||||||
| 673,755 | ||||||||
|
| |||||||
Health Care - 8.2% | ||||||||
Apria Healthcare Group Inc | ||||||||
11.250% due 11/01/14 | 100,000 | 105,125 | ||||||
CHS/Community Health Systems Inc | ||||||||
8.000% due 11/15/19 ~ | 100,000 | 103,500 | ||||||
DJO Finance LLC | ||||||||
7.750% due 04/15/18 | 50,000 | 41,250 | ||||||
Fresenius Medical Care US Finance II Inc | ||||||||
5.875% due 01/31/22 ~ | 50,000 | 51,500 | ||||||
HCA Inc | ||||||||
5.875% due 03/15/22 | 100,000 | 100,375 | ||||||
LVB Acquisition Inc | ||||||||
10.375% due 10/15/17 | 100,000 | 108,250 | ||||||
Tenet Healthcare Corp | ||||||||
8.000% due 08/01/20 | 100,000 | 103,500 | ||||||
|
| |||||||
| 613,500 | ||||||||
|
| |||||||
Industrials - 8.8% | ||||||||
Air Lease Corp | ||||||||
5.625% due 04/01/17 ~ | 50,000 | 50,062 | ||||||
Aircastle Ltd (Bermuda) | ||||||||
7.625% due 04/15/20 ~ | 50,000 | 50,000 | ||||||
Bombardier Inc (Canada) | ||||||||
5.750% due 03/15/22 ~ | 100,000 | 97,750 | ||||||
International Lease Finance Corp | ||||||||
6.250% due 05/15/19 | 100,000 | 98,705 | ||||||
JMC Steel Group | ||||||||
8.250% due 03/15/18 ~ | 50,000 | 52,250 | ||||||
Monitronics International Inc | ||||||||
9.125% due 04/01/20 ~ | 50,000 | 50,875 | ||||||
U.S. Airways 2011-1 Pass-Through Trust ‘A’ | ||||||||
7.125% due 04/22/25 | 100,000 | 105,000 | ||||||
| See Notes to Financial Statements | B-6 | See explanation of symbols and terms, if any, on page B-71 |
Table of Contents
PACIFIC LIFE FUNDS
PL HIGH INCOME FUND
Schedule of Investments (Continued)
March 31, 2012
| Principal Amount | Value | |||||||
United Rentals North America Inc | ||||||||
8.375% due 09/15/20 | $ | 100,000 | $ | 104,000 | ||||
UR Financing Escrow Corp | ||||||||
7.375% due 05/15/20 ~ | 50,000 | 51,250 | ||||||
|
| |||||||
| 659,892 | ||||||||
|
| |||||||
Information Technology - 2.0% | ||||||||
CDW LLC | ||||||||
8.500% due 04/01/19 | 50,000 | 53,375 | ||||||
Freescale Semiconductor Inc | ||||||||
8.050% due 02/01/20 | 100,000 | 101,000 | ||||||
|
| |||||||
| 154,375 | ||||||||
|
| |||||||
Materials - 11.1% | ||||||||
AK Steel Corp | ||||||||
8.375% due 04/01/22 | 50,000 | 48,750 | ||||||
ArcelorMittal (Luxembourg) | ||||||||
6.250% due 02/25/22 | 50,000 | 50,629 | ||||||
Ardagh Packaging Finance PLC (Ireland) | ||||||||
9.125% due 10/15/20 ~ | 100,000 | 105,250 | ||||||
Berry Plastics Corp | ||||||||
9.500% due 05/15/18 | 100,000 | 106,500 | ||||||
Boise Paper Holdings LLC | ||||||||
9.000% due 11/01/17 | 100,000 | 110,750 | ||||||
FMG Resources August 2006 Property Ltd (Australia) | ||||||||
6.875% due 02/01/18 ~ | 100,000 | 100,500 | ||||||
Hexion U.S. Finance Corp | ||||||||
9.000% due 11/15/20 | 100,000 | 93,500 | ||||||
Novelis Inc (Canada) | ||||||||
8.375% due 12/15/17 | 100,000 | 109,000 | ||||||
Sealed Air Corp | ||||||||
8.375% due 09/15/21 ~ | 100,000 | 112,875 | ||||||
|
| |||||||
| 837,754 | ||||||||
|
| |||||||
Telecommunication Services - 11.8% |
| |||||||
Avaya Inc | ||||||||
7.000% due 04/01/19 ~ | 50,000 | 50,375 | ||||||
Clearwire Communications LLC | ||||||||
12.000% due 12/01/15 ~ | 50,000 | 49,500 | ||||||
Cricket Communications Inc | ||||||||
7.750% due 10/15/20 | 50,000 | 49,313 | ||||||
Digicel Ltd (Bermuda) | ||||||||
8.250% due 09/01/17 ~ | 75,000 | 80,063 | ||||||
Frontier Communications Corp | ||||||||
8.250% due 04/15/17 | 50,000 | 54,000 | ||||||
Hughes Satellite Systems Corp | ||||||||
7.625% due 06/15/21 | 100,000 | 107,750 | ||||||
Intelsat Luxembourg SA (Luxembourg) | ||||||||
11.500% due 02/04/17 | 175,000 | 182,438 | ||||||
Level 3 Financing Inc | ||||||||
8.625% due 07/15/20 ~ | 100,000 | 105,250 | ||||||
Sprint Nextel Corp | ||||||||
9.000% due 11/15/18 ~ | 100,000 | 110,000 | ||||||
9.125% due 03/01/17 ~ | 50,000 | 49,875 | ||||||
UPCB Finance VI Ltd (Cayman) | ||||||||
6.875% due 01/15/22 ~ | 50,000 | 51,875 | ||||||
|
| |||||||
| 890,439 | ||||||||
|
| |||||||
Utilities - 4.2% | ||||||||
AmeriGas Finance LLC | ||||||||
7.000% due 05/20/22 | 50,000 | 51,125 | ||||||
Calpine Corp | ||||||||
7.250% due 10/15/17 ~ | 100,000 | 106,500 | ||||||
| Principal Amount | Value | |||||||
GenOn Energy Inc | ||||||||
9.875% due 10/15/20 | $ | 50,000 | $ | 45,750 | ||||
The AES Corp | ||||||||
7.375% due 07/01/21 ~ | 100,000 | 111,000 | ||||||
|
| |||||||
| 314,375 | ||||||||
|
| |||||||
Total Corporate Bonds & Notes | ||||||||
(Cost $6,965,613) | 7,236,795 | |||||||
|
| |||||||
| Shares | ||||||||
SHORT-TERM INVESTMENT - 2.3% |
| |||||||
Money Market Fund - 2.3% | ||||||||
BlackRock Liquidity Funds Treasury Trust Fund Portfolio | 172,857 | 172,857 | ||||||
|
| |||||||
Total Short-Term Investment | ||||||||
(Cost $172,857) | 172,857 | |||||||
|
| |||||||
TOTAL INVESTMENTS - 98.5% | ||||||||
(Cost $7,138,470) | 7,409,652 | |||||||
OTHER ASSETS & LIABILITIES, NET - 1.5% | 113,731 | |||||||
|
| |||||||
NET ASSETS - 100.0% | $ | 7,523,383 | ||||||
|
| |||||||
Notes to Schedule of Investments
| (a) | As of March 31, 2012, the fund was diversified as a percentage of net assets as follows: |
Consumer Discretionary | 19.1 | % | ||
Energy | 16.6 | % | ||
Telecommunications Services | 11.8 | % | ||
Materials | 11.1 | % | ||
Financials | 9.0 | % | ||
Industrials | 8.8 | % | ||
Health Care | 8.2 | % | ||
Consumer Staples | 5.4 | % | ||
Utilities | 4.2 | % | ||
Short-Term Investment | 2.3 | % | ||
Information Technology | 2.0 | % | ||
|
| |||
| 98.5 | % | |||
Other Assets & Liabilities, Net | 1.5 | % | ||
|
| |||
| 100.0 | % | |||
|
|
| (b) | As of March 31, 2012, the fund’s Standard & Poor’s quality ratings as a percentage of total fixed income investments were as follows (Unaudited): |
BBB | 5.0 | % | ||
BB | 32.1 | % | ||
B | 40.7 | % | ||
CCC | 19.0 | % | ||
Not Rated | 3.2 | % | ||
|
| |||
| 100.0 | % | |||
|
|
| See Notes to Financial Statements | B-7 | See explanation of symbols and terms, if any, on page B-71 |
Table of Contents
PACIFIC LIFE FUNDS
PL HIGH INCOME FUND
Schedule of Investments (Continued)
March 31, 2012
| (c) | Fair Value Measurements |
The following is a summary of the fund’s investments as categorized under the three-tier hierarchy of inputs used in valuing the fund’s assets and liabilities (See Note 3C in Notes to Financial Statements) as of March 31, 2012:
| Total Value at March 31, 2012 | Level 1 Quoted Price | Level 2 Significant Observable Inputs | Level 3 Significant Unobservable Inputs | |||||||||||||||
Assets | Corporate Bonds & Notes | $ | 7,236,795 | $ | — | $ | 7,236,795 | $ | — | |||||||||
| Short-Term Investment | 172,857 | 172,857 | — | — | ||||||||||||||
|
|
|
|
|
|
|
| |||||||||||
Total | $ | 7,409,652 | $ | 172,857 | $ | 7,236,795 | $ | — | ||||||||||
|
|
|
|
|
|
|
| |||||||||||
| See Notes to Financial Statements | B-8 | See explanation of symbols and terms, if any, on page B-71 |
Table of Contents
PACIFIC LIFE FUNDS
PL INFLATION MANAGED FUND
Schedule of Investments
March 31, 2012
| Shares | Value | |||||||
CONVERTIBLE PREFERRED STOCKS - 0.0% |
| |||||||
Financials - 0.0% | ||||||||
Wells Fargo & Co 7.500% | 100 | $ | 111,670 | |||||
|
| |||||||
Total Convertible Preferred Stocks |
| |||||||
(Cost $100,00) |
| 111,670 | ||||||
|
| |||||||
| Principal Amount | ||||||||
CORPORATE BONDS & NOTES - 12.2% |
| |||||||
Consumer Discretionary - 0.1% |
| |||||||
Starwood Hotels & Resorts Worldwide Inc | ||||||||
6.250% due 02/15/13 | $ | 300,000 | 313,500 | |||||
|
| |||||||
Energy - 0.8% | ||||||||
EOG Resources Inc | ||||||||
1.287% due 02/03/14 § | 1,000,000 | 1,008,099 | ||||||
Petrobras International Finance Co (Cayman) | ||||||||
3.875% due 01/27/16 | 1,000,000 | 1,057,416 | ||||||
Petroleos Mexicanos (Mexico) | ||||||||
5.500% due 01/21/21 | 100,000 | 110,750 | ||||||
|
| |||||||
| 2,176,265 | ||||||||
|
| |||||||
Financials - 10.4% | ||||||||
Ally Financial Inc | ||||||||
3.710% due 02/11/14 § | 700,000 | 693,028 | ||||||
American International Group Inc | ||||||||
8.175% due 05/15/68 § | 200,000 | 212,700 | ||||||
Banco Santander (Chile) | ||||||||
1.811% due 04/20/12 § ~ | 300,000 | 300,015 | ||||||
Banco Santander Brazil SA (Brazil) | ||||||||
2.574% due 03/18/14 § ~ | 1,600,000 | 1,573,376 | ||||||
4.250% due 01/14/16 ~ | 400,000 | 401,840 | ||||||
Countrywide Financial Corp | ||||||||
5.800% due 06/07/12 | 400,000 | 403,174 | ||||||
Credit Agricole Home Loan SFH (France) | ||||||||
1.311% due 07/21/14 § ~ | 400,000 | 392,266 | ||||||
Dexia Credit Local SA NY (France) | ||||||||
0.880% due 03/05/13 § ~ | 4,400,000 | 4,217,453 | ||||||
Ford Motor Credit Co LLC | ||||||||
7.500% due 08/01/12 | 900,000 | 913,725 | ||||||
FUEL Trust | ||||||||
3.984% due 12/15/22 ~ | 1,000,000 | 1,015,331 | ||||||
HSBC Finance Corp | ||||||||
0.817% due 01/15/14 § | 4,600,000 | 4,472,295 | ||||||
ICICI Bank Ltd (India) | ||||||||
2.242% due 02/24/14 § ~ | 300,000 | 294,190 | ||||||
ING Bank NV (Netherlands) | ||||||||
1.875% due 06/09/14 § ~ | 3,000,000 | 2,970,192 | ||||||
Merrill Lynch & Co Inc | ||||||||
1.558% due 09/27/12 § | EUR | 1,000,000 | 1,324,551 | |||||
1.645% due 07/22/14 § | 300,000 | 380,158 | ||||||
Morgan Stanley | ||||||||
3.006% due 05/14/13 § | $ | 1,000,000 | 1,007,882 | |||||
Nordea Eiendomskreditt AS (Norway) | ||||||||
1.003% due 04/07/15 § ~ | 2,200,000 | 2,138,935 | ||||||
SLM Corp | ||||||||
3.125% due 09/17/12 | EUR | 300,000 | 400,569 | |||||
The Goldman Sachs Group Inc | ||||||||
1.408% due 02/04/13 § | 1,500,000 | 1,989,919 | ||||||
5.375% due 02/15/13 | 500,000 | 686,694 | ||||||
| Principal Amount | Value | |||||||
The Royal Bank of Scotland Group PLC (United Kingdom) | ||||||||
2.913% due 08/23/13 § | $ | 700,000 | $ | 700,155 | ||||
Volkswagen International Finance NV (Netherlands) | ||||||||
1.031% due 10/01/12 § ~ | 1,900,000 | 1,902,081 | ||||||
Wachovia Corp | ||||||||
4.660% due 05/25/12 § | AUD | 1,400,000 | 1,448,920 | |||||
|
| |||||||
| 29,839,449 | ||||||||
|
| |||||||
Health Care - 0.2% | ||||||||
HCA Inc | ||||||||
7.250% due 09/15/20 | $ | 600,000 | 656,250 | |||||
|
| |||||||
Industrials - 0.1% | ||||||||
International Lease Finance Corp | ||||||||
6.500% due 09/01/14 ~ | 100,000 | 106,125 | ||||||
6.750% due 09/01/16 ~ | 100,000 | 107,625 | ||||||
7.125% due 09/01/18 ~ | 200,000 | 219,000 | ||||||
|
| |||||||
| 432,750 | ||||||||
|
| |||||||
Telecommunication Services - 0.6% |
| |||||||
TDC A/S (Denmark) | ||||||||
3.500% due 02/23/15 ~ | EUR | 1,200,000 | 1,679,193 | |||||
|
| |||||||
Total Corporate Bonds & Notes |
| |||||||
(Cost $35,395,075) |
| 35,097,407 | ||||||
|
| |||||||
MORTGAGE-BACKED SECURITIES - 6.9% |
| |||||||
Collateralized Mortgage Obligations - |
| |||||||
Banc of America Large Loan Inc | ||||||||
1.992% due 11/15/15 “ § ~ | $ | 945,509 | 884,752 | |||||
DBUBS Mortgage Trust | ||||||||
3.386% due 07/10/44 “ ~ | 1,900,000 | 2,012,454 | ||||||
European Loan Conduit (Ireland) | ||||||||
1.207% due 05/15/19 “ § ~ | EUR | 422,045 | 492,524 | |||||
JPMorgan Chase Commercial Mortgage Securities Corp | ||||||||
5.336% due 05/15/47 “ | $ | 110,000 | 120,923 | |||||
Morgan Stanley Capital I | ||||||||
5.882% due 06/11/49 “ § | 100,000 | 113,225 | ||||||
UBS Commercial Mortgage Trust | ||||||||
1.142% due 07/15/24 “ § ~ | 285,566 | 274,339 | ||||||
Wachovia Bank Commercial Mortgage Trust | ||||||||
5.418% due 01/15/45 “ § | 210,000 | 234,263 | ||||||
|
| |||||||
| 4,132,480 | ||||||||
|
| |||||||
Collateralized Mortgage Obligations - Residential - 5.5% |
| |||||||
Arran Residential Mortgages Funding PLC (United Kingdom) |
| |||||||
2.241% due 11/19/47 “ § ~ | EUR | 871,803 | 1,163,841 | |||||
2.491% due 11/19/47 “ § ~ | 500,000 | 668,865 | ||||||
Bear Stearns Adjustable Rate Mortgage Trust | ||||||||
2.220% due 08/25/35 “ § | $ | 26,595 | 25,806 | |||||
2.250% due 08/25/35 “ § | 46,836 | 43,302 | ||||||
2.570% due 03/25/35 “ § | 91,728 | 89,246 | ||||||
2.917% due 01/25/35 “ § | 2,889,061 | 2,740,519 | ||||||
3.078% due 03/25/35 “ § | 27,343 | 27,063 | ||||||
Citigroup Mortgage Loan Trust Inc | ||||||||
2.230% due 09/25/35 “ § | 43,516 | 41,113 | ||||||
2.450% due 09/25/35 “ § | 36,554 | 32,200 | ||||||
| See Notes to Financial Statements | B-9 | See explanation of symbols and terms, if any, on page B-71 |
Table of Contents
PACIFIC LIFE FUNDS
PL INFLATION MANAGED FUND
Schedule of Investments (Continued)
March 31, 2012
| Principal Amount | Value | |||||||
Countrywide Home Loan Mortgage Pass-Through Trust | ||||||||
0.582% due | $ | 29,832 | $ | 25,520 | ||||
4.326% due 01/19/34 “ § | 118,000 | 114,162 | ||||||
Fannie Mae | ||||||||
0.592% due 07/25/37 “ § | 637,460 | 636,737 | ||||||
0.622% due 07/25/37 “ § | 537,272 | 537,216 | ||||||
0.682% due 05/25/36 “ § | 455,398 | 455,979 | ||||||
0.687% due 02/25/37 “ § | 134,410 | 134,466 | ||||||
0.922% due 02/25/41 “ § | 731,196 | 731,853 | ||||||
Freddie Mac | ||||||||
0.842% due 12/15/37 “ § | 2,162,401 | 2,171,689 | ||||||
GSR Mortgage Loan Trust | ||||||||
2.659% due 09/25/35 “ § | 72,120 | 70,318 | ||||||
Holmes Master Issuer (United Kingdom) | ||||||||
2.581% due | EUR | 1,200,000 | 1,606,212 | |||||
JP Morgan Mortgage Trust | ||||||||
5.136% due 06/25/35 “ § | $ | 301,703 | 304,155 | |||||
MLCC Mortgage Investors Inc | ||||||||
2.235% due 12/25/34 “ § | 204,391 | 205,238 | ||||||
New York Mortgage Trust Inc | ||||||||
2.906% due 05/25/36 “ § | 667,121 | 543,815 | ||||||
Permanent Master Issuer PLC (United Kingdom) | ||||||||
2.531% due 07/15/42 “ § ~ | EUR | 500,000 | 668,204 | |||||
RBSSP Resecuritization Trust | ||||||||
2.566% due | $ | 961,176 | 943,599 | |||||
Residential Accredit Loans Inc | ||||||||
0.422% due 06/25/46 “ § | 152,160 | 61,205 | ||||||
Structured Asset Mortgage Investments Inc | ||||||||
0.452% due 05/25/46 “ § | 141,293 | 69,445 | ||||||
Wells Fargo Mortgage Backed Securities Trust | ||||||||
2.717% due 10/25/35 “ § | 488,086 | 463,102 | ||||||
2.720% due 10/25/35 “ § | 1,400,000 | 1,260,656 | ||||||
|
| |||||||
| 15,835,526 | ||||||||
|
| |||||||
Total Mortgage-Backed Securities | ||||||||
(Cost $19,662,623) | 19,968,006 | |||||||
|
| |||||||
ASSET-BACKED SECURITIES - 3.0% |
| |||||||
Aames Mortgage Investment Trust | ||||||||
0.822% due 10/25/35 “ § | 17,894 | 17,859 | ||||||
AMMC CLO (Cayman) | ||||||||
0.709% due | 193,592 | 187,766 | ||||||
ARES Ltd CLO (Cayman) | ||||||||
0.701% due | 409,590 | 398,391 | ||||||
Asset Backed Funding Certificates | ||||||||
0.722% due 06/25/35 “ § | 532,945 | 526,241 | ||||||
Freddie Mac Structured Pass-Through Securities | ||||||||
0.522% due 09/25/31 “ § | 2,431 | 2,240 | ||||||
Harvest SA CLO (Luxembourg) | ||||||||
1.587% due | EUR | 147,439 | 189,066 | |||||
Hillmark Funding CDO (Cayman) | ||||||||
0.743% due | $ | 1,100,000 | 1,039,637 | |||||
Katonah Ltd CLO (Cayman) | ||||||||
0.794% due | 430,239 | 425,644 | ||||||
MAGI Funding I PLC CLO | ||||||||
2.015% due | EUR | 464,742 | 584,815 | |||||
Pacifica Ltd CLO (Cayman) | ||||||||
0.853% due | $ | 381,820 | 378,049 | |||||
Park Place Securities Inc | ||||||||
0.922% due | 280,059 | 272,611 | ||||||
Plymouth Rock Ltd Inc CLO | ||||||||
1.998% due | 624,688 | 623,239 | ||||||
Race Point CLO (Cayman) | ||||||||
1.053% due | 123,662 | 123,562 | ||||||
SLM Student Loan Trust | ||||||||
1.136% due 12/15/23 “ § | EUR | 1,927,656 | 2,407,494 | |||||
1.146% due | 908,933 | 1,184,785 | ||||||
| Principal Amount | Value | |||||||
Structured Asset Securities Corp | ||||||||
0.332% due | $ | 27,042 | $ | 26,937 | ||||
Wood Street BV CLO (Netherlands) | ||||||||
1.347% due | EUR | 188,869 | 238,850 | |||||
|
| |||||||
Total Asset-Backed Securities | ||||||||
(Cost $8,856,329) | 8,627,186 | |||||||
|
| |||||||
U.S. TREASURY OBLIGATIONS - 87.4% |
| |||||||
U.S. Treasury Inflation Protected Securities - 87.4% |
| |||||||
0.125% due 04/15/16 ^ | $ | 4,004,286 | 4,232,967 | |||||
0.125% due 01/15/22 ^ | 15,958,194 | 16,304,584 | ||||||
0.500% due 04/15/15 ^ | 4,078,542 | 4,327,716 | ||||||
0.625% due 04/15/13 ^ | 2,037,237 | 2,091,511 | ||||||
0.625% due | 19,112,920 | 20,672,991 | ||||||
0.750% due 02/15/42 ^ | 601,788 | 573,156 | ||||||
1.125% due 01/15/21 ^ | 9,427,782 | 10,613,618 | ||||||
1.250% due 04/15/14 ^ | 2,034,672 | 2,159,296 | ||||||
1.250% due 07/15/20 ^ | 12,158,523 | 13,887,319 | ||||||
1.375% due 01/15/20 ^ | 7,860,225 | 9,028,820 | ||||||
1.625% due 01/15/15 ^ | 6,765,330 | 7,375,265 | ||||||
1.625% due 01/15/18 ^ | 1,622,700 | 1,866,358 | ||||||
1.750% due 01/15/28 ^ | 6,382,620 | 7,621,250 | ||||||
1.875% due 07/15/19 ^ | 5,943,952 | 7,065,409 | ||||||
2.000% due | 16,499,519 | 17,639,118 | ||||||
2.000% due 01/15/26 ^ | 5,366,742 | 6,580,130 | ||||||
2.125% due 01/15/19 ^ | 4,222,320 | 5,054,248 | ||||||
2.125% due 02/15/40 ^ | 3,565,070 | 4,684,727 | ||||||
2.125% due 02/15/41 ^ | 4,553,560 | 6,002,516 | ||||||
2.375% due 01/15/25 ^ | 8,271,962 | 10,525,426 | ||||||
2.375% due | 17,538,166 | 22,408,258 | ||||||
2.500% due 01/15/29 ^ | 7,072,386 | 9,339,970 | ||||||
2.625% due 07/15/17 ^ | 8,310,524 | 9,996,006 | ||||||
3.000% due 07/15/12 ^ | 23,395,162 | 23,868,887 | ||||||
3.375% due 04/15/32 ^ | 191,522 | 291,636 | ||||||
3.625% due 04/15/28 ^ | 4,021,501 | 5,936,428 | ||||||
3.875% due 04/15/29 ^ | 13,992,790 | 21,568,570 | ||||||
|
| |||||||
| 251,716,180 | ||||||||
|
| |||||||
Total U.S. Treasury Obligations | ||||||||
(Cost $243,354,347) | 251,716,180 | |||||||
|
| |||||||
FOREIGN GOVERNMENT BONDS & NOTES - 4.7% |
| |||||||
Australian Government Index-Linked Bond (Australia) | ||||||||
2.500% due 09/20/30 ^ | AUD | 200,000 | 251,524 | |||||
3.000% due 09/20/25 ^ | 900,000 | 1,204,488 | ||||||
4.000% due 08/20/20 ^ | 1,600,000 | 3,072,256 | ||||||
Canada Housing Trust No. 1 (Canada) | ||||||||
2.450% due 12/15/15 ~ | CAD | 1,200,000 | 1,235,948 | |||||
Canadian Government Bond (Canada) | ||||||||
2.750% due 09/01/16 | 700,000 | 737,981 | ||||||
Canadian Government Index-Linked Bond (Canada) | ||||||||
3.000% due 12/01/36 ^ | 351,534 | 565,602 | ||||||
4.250% due 12/01/21 ^ | 1,307,403 | 1,853,538 | ||||||
Instituto de Credito Oficial (Spain) | ||||||||
2.567% due | EUR | 1,600,000 | 2,095,934 | |||||
| See Notes to Financial Statements | B-10 | See explanation of symbols and terms, if any, on page B-71 |
Table of Contents
PACIFIC LIFE FUNDS
PL INFLATION MANAGED FUND
Schedule of Investments (Continued)
March 31, 2012
| Principal Amount | Value | |||||||
New South Wales Treasury Index-Linked Corp (Australia) | ||||||||
2.750% due 11/20/25 ^ | AUD | 1,000,000 | $ | 1,245,181 | ||||
United Kingdom Treasury Gilt Inflation-Linked (United Kingdom) | ||||||||
1.875% due 11/22/22 ^ | GBP | 578,740 | 1,179,604 | |||||
|
| |||||||
Total Foreign Government Bonds & Notes | ||||||||
(Cost $12,837,113) | 13,442,056 | |||||||
|
| |||||||
MUNICIPAL BONDS - 0.0% |
| |||||||
Tobacco Settlement Finance Authority of WV ‘A’ | ||||||||
7.467% due 06/01/47 | $ | 95,000 | 70,023 | |||||
Tobacco Settlement Financing Corp of RI ‘A’ | ||||||||
6.000% due 06/01/23 | 55,000 | 55,156 | ||||||
|
| |||||||
Total Municipal Bonds | ||||||||
(Cost $139,749) | 125,179 | |||||||
|
| |||||||
SHORT-TERM INVESTMENTS - 1.8% |
| |||||||
Repurchase Agreement - 1.3% |
| |||||||
Citigroup Inc | ||||||||
0.150% due 04/02/12 (Dated 03/30/12,repurchase price of $3,700,046,collateralized by Federal Home Loan Bank: 0.200% due 04/30/13 and value $3,777,728) | 3,700,000 | 3,700,000 | ||||||
|
| |||||||
| Shares | ||||||||
Money Market Fund - 0.5% |
| |||||||
BlackRock Liquidity Funds Treasury | ||||||||
Trust Fund Portfolio | 1,375,565 | 1,375,565 | ||||||
|
| |||||||
Total Short-Term Investments | ||||||||
(Cost $5,075,565) | 5,075,565 | |||||||
|
| |||||||
TOTAL INVESTMENTS - 116.0% |
| |||||||
(Cost $325,420,801) | 334,163,249 | |||||||
OTHER ASSETS & LIABILITIES, |
| (46,207,121 | ) | |||||
|
| |||||||
NET ASSETS - 100.0% | $ | 287,956,128 | ||||||
|
| |||||||
Notes to Schedule of Investments
| (a) | As of March 31, 2012, the fund was diversified as a percentage of net assets as follows: |
U.S. Treasury Obligations | 87.4 | % | ||||
Corporate Bonds & Notes | 12.2 | % | ||||
Mortgage-Backed Securities | 6.9 | % | ||||
Foreign Government Bonds & Notes | 4.7 | % | ||||
Asset-Backed Securities | 3.0 | % | ||||
Short-Term Investments | 1.8 | % | ||||
|
| |||||
| 116.0 | % | |||||
Other Assets & Liabilities, Net | (16.0 | %) | ||||
|
| |||||
| 100.0 | % | |||||
|
|
|
| (b) | As of March 31, 2012, the fund’s Standard & Poor’s quality ratings as a percentage of total fixed income investments were as follows (Unaudited): |
AAA | 3.5 | % | ||||
A-1 (Short-term debt only) | 1.1 | % | ||||
AA / U.S. Government & Agency Issues | 79.7 | % | ||||
A | 5.8 | % | ||||
BBB | 2.4 | % | ||||
BB | 0.6 | % | ||||
B | 0.4 | % | ||||
CC | 0.4 | % | ||||
Not Rated | 6.1 | % | ||||
|
| |||||
| 100.0 | % | |||||
|
|
|
(c) Short-term investments reflect either the stated coupon rate or the annualized effective yield on the date of purchase for discounted investments.
(d) As of March 31, 2012, less than 0.1% of the fund’s net assets were reported illiquid by the portfolio manager under the Trust’s policy.
(e) Open futures contracts outstanding as of March 31, 2012 were as follows:
|
Long Futures Outstanding | Number of Contracts | Notional Amount | Unrealized Appreciation (Depreciation) | |||||||
Eurodollar (12/13) | 94 | $ | 94,000,000 | $ | 128,898 | |||||
Eurodollar (03/15) | 52 | 52,000,000 | 16,820 | |||||||
Eurodollar (03/15) | 6 | 6,000,000 | (308 | ) | ||||||
Eurodollar (06/15) | 21 | 21,000,000 | 3,385 | |||||||
|
| |||||||||
Total Futures Contracts | $ | 148,795 | ||||||||
|
| |||||||||
| (f) | Forward foreign currency contracts outstanding as of March 31, 2012 were as follows: |
Contracts to Buy or to Sell | Currency | Principal Amount | Expiration | Counterparty | Unrealized Appreciation | |||||
Buy | AUD | 591,000 | 04/12 | DUB | $1,182 | |||||
Buy | AUD | 149,000 | 04/12 | DUB | (4,285) | |||||
Sell | AUD | 9,866,000 | 04/12 | BRC | 332,187 | |||||
Buy | BRL | 263,566 | 04/12 | MSC | (8,540) | |||||
Sell | BRL | 263,566 | 04/12 | JPM | 7,327 | |||||
Sell | BRL | 263,566 | 06/12 | MSC | 8,472 | |||||
Buy | CAD | 456,000 | 06/12 | JPM | 656 | |||||
Sell | CAD | 4,939,000 | 06/12 | BRC | 43,343 | |||||
Buy | CNY | 3,199,500 | 06/12 | BRC | 7,479 | |||||
Buy | CNY | 2,548,929 | 06/12 | CIT | 3,893 |
| See Notes to Financial Statements | B-11 | See explanation of symbols and terms, if any, on page B-71 |
Table of Contents
PACIFIC LIFE FUNDS
PL INFLATION MANAGED FUND
Schedule of Investments (Continued)
March 31, 2012
Contracts | Currency | Principal Amount Covered by Contracts | Expiration | Counterparty | Unrealized Appreciation (Depreciation) | |||||||||
| Sell | CNY | 379,140 | 06/12 | BRC | ($ | 136 | ) | |||||||
| Sell | CNY | 2,584,435 | 06/12 | BRC | 78 | |||||||||
| Sell | CNY | 1,761,964 | 06/12 | DUB | (1,468 | ) | ||||||||
| Sell | CNY | 3,283,800 | 06/12 | HSB | (850 | ) | ||||||||
| Buy | CNY | 2,318,616 | 02/13 | BRC | (196 | ) | ||||||||
| Buy | EUR | 940,000 | 04/12 | BRC | 18,639 | |||||||||
| Buy | EUR | 2,558,000 | 04/12 | CIT | 138,496 | |||||||||
| Buy | EUR | 196,000 | 04/12 | DUB | 13,327 | |||||||||
| Buy | EUR | 501,000 | 04/12 | JPM | 3,883 | |||||||||
| Buy | EUR | 236,000 | 04/12 | MSC | 9,425 | |||||||||
| Buy | EUR | 1,884,000 | 04/12 | RBC | 77,096 | |||||||||
| Buy | EUR | 248,000 | 04/12 | UBS | 2,941 | |||||||||
| Sell | EUR | 23,951,000 | 04/12 | UBS | (492,152 | ) | ||||||||
| Sell | GBP | 784,000 | 06/12 | UBS | (17,766 | ) | ||||||||
| Sell | IDR | 8,540 | 07/12 | UBS | — | |||||||||
| Buy | INR | 110,944,900 | 07/12 | JPM | (255,241 | ) | ||||||||
| Sell | INR | 35,376,000 | 07/12 | BRC | 20,285 | |||||||||
| Sell | INR | 23,140,400 | 07/12 | BRC | (11,619 | ) | ||||||||
| Sell | INR | 7,687,298 | 07/12 | DUB | (8,894 | ) | ||||||||
| Sell | INR | 4,740,450 | 07/12 | GSC | (6,083 | ) | ||||||||
| Sell | INR | 8,390,660 | 07/12 | HSB | (9,218 | ) | ||||||||
| Sell | INR | 22,722,000 | 07/12 | JPM | 8,133 | |||||||||
| Sell | INR | 8,888,000 | 07/12 | JPM | (10,774 | ) | ||||||||
| Sell | JPY | 56,435,000 | 06/12 | BRC | 4,542 | |||||||||
| Buy | KRW | 189,000 | 07/12 | UBS | (2 | ) | ||||||||
| Buy | MXN | 149,407 | 06/12 | HSB | (38 | ) | ||||||||
| Buy | MYR | 283,084 | 04/12 | CIT | 780 | |||||||||
| Buy | MYR | 2,057,395 | 04/12 | JPM | (7,918 | ) | ||||||||
| Sell | MYR | 755,606 | 04/12 | BRC | (10,041 | ) | ||||||||
| Sell | MYR | 838,128 | 04/12 | DUB | (11,111 | ) | ||||||||
| Sell | MYR | 265,683 | 04/12 | HSB | (3,575 | ) | ||||||||
| Sell | MYR | 481,050 | 04/12 | JPM | (6,754 | ) | ||||||||
| Buy | PHP | 35,610 | 06/12 | CIT | (1 | ) | ||||||||
| Buy | SGD | 209 | 05/12 | UBS | 1 | |||||||||
|
| |||||||||||||
Total Forward Foreign Currency Contracts | ($ | 164,497 | ) | |||||||||||
|
| |||||||||||||
| (g) | Transactions in written options for the year ended March 31, 2012 were as follows: |
| Number of Contracts | Notional Amount in $ | Premium | ||||||||||
Outstanding, March 31, 2011 | 87 | 34,800,000 | $ | 351,070 | ||||||||
Call Options Written | 27 | 32,100,000 | 217,553 | |||||||||
Put Options Written | 48 | 86,000,000 | 581,550 | |||||||||
Call Options Closed | (60 | ) | (2,800,000 | ) | (33,561 | ) | ||||||
Put Options Closed | — | (74,900,000 | ) | (419,696 | ) | |||||||
Call Options Expired | (30 | ) | (16,500,000 | ) | (141,684 | ) | ||||||
Put Options Expired | (72 | ) | (13,300,000 | ) | (135,404 | ) | ||||||
|
|
|
|
|
| |||||||
Outstanding, March 31, 2012 | — | 45,400,000 | $ | 419,828 | ||||||||
|
|
|
|
|
| |||||||
| (h) | Premiums received and value of written options outstanding as of March 31, 2012 were as follows: |
Inflation Floor/Cap Options |
Description | Strike Index | Exercise Index | Expiration Date | Counter- party | Notional Amount | Premium | Value | |||||||||||||
Floor - OTC U.S. CPI Urban Consumers NSA | 215.95 | Maximum of [(1+0.00%)10 - Inflation Adjustment] or $0 | 03/12/20 | CIT | $ | 1,200,000 | $ | 10,320 | ($ | 1,884 | ) | |||||||||
Floor - OTC U.S. CPI Urban Consumers NSA | 216.69 | Maximum of [(1+0.00%)10 - Inflation Adjustment] or $0 | 04/07/20 | CIT | 2,000,000 | 17,720 | (3,311 | ) | ||||||||||||
Floor - OTC U.S. CPI Urban Consumers NSA | 217.97 | Maximum of [(1+0.00%)10 - Inflation Adjustment] or $0 | 09/29/20 | CIT | 300,000 | 3,870 | (536 | ) | ||||||||||||
Floor - OTC U.S. CPI Urban Consumers NSA | 218.01 | Maximum of [(1+0.00%)10 - Inflation Adjustment] or $0 | 10/13/20 | DUB | 700,000 | 6,860 | (1,989 | ) | ||||||||||||
|
|
|
| |||||||||||||||||
| $ | 38,770 | ($ | 7,720 | ) | ||||||||||||||||
|
|
|
| |||||||||||||||||
| See Notes to Financial Statements | B-12 | See explanation of symbols and terms, if any, on page B-71 |
Table of Contents
PACIFIC LIFE FUNDS
PL INFLATION MANAGED FUND
Schedule of Investments (Continued)
March 31, 2012
Interest Rate Swaptions
Description | Pay/Receive Floating Rate Based on 3-Month USD-LIBOR | Exercise Rate | Expiration Date | Counter- party | Notional Amount | Premium | Value | |||||||||||||||||
Call - OTC 5-Year Interest Rate Swap | Receive | 1.500 | % | 09/24/12 | DUB | $ | 4,400,000 | $ | 37,795 | ($ | 43,263 | ) | ||||||||||||
Call - OTC 1-Year Interest Rate Swap | Receive | 0.795 | % | 10/11/12 | JPM | 1,200,000 | — | (3,405 | ) | |||||||||||||||
Call - OTC 2-Year Interest Rate Swap | Receive | 1.056 | % | 10/11/12 | MSC | 2,600,000 | — | (19,925 | ) | |||||||||||||||
Call - OTC 2-Year Interest Rate Swap | Receive | 0.915 | % | 11/14/12 | MSC | 2,900,000 | — | (14,655 | ) | |||||||||||||||
Call - OTC 5-Year Interest Rate Swap | Receive | 1.700 | % | 03/18/13 | CIT | 2,200,000 | 25,960 | (29,837 | ) | |||||||||||||||
Call - OTC 5-Year Interest Rate Swap | Receive | 1.700 | % | 03/18/13 | DUB | 6,500,000 | 76,925 | (88,156 | ) | |||||||||||||||
|
|
|
| |||||||||||||||||||||
| 140,680 | (199,241 | ) | ||||||||||||||||||||||
|
|
|
| |||||||||||||||||||||
Put - OTC 10-Year Interest Rate Swap | Pay | 10.000 | % | 07/10/12 | MSC | 200,000 | 1,320 | — | ||||||||||||||||
Put - OTC 10-Year Interest Rate Swap | Pay | 10.000 | % | 07/10/12 | RBS | 500,000 | 3,400 | — | ||||||||||||||||
Put - OTC 5-Year Interest Rate Swap | Pay | 1.500 | % | 09/24/12 | DUB | 4,400,000 | 59,400 | (43,549 | ) | |||||||||||||||
Put - OTC 1-Year Interest Rate Swap | Pay | 0.795 | % | 10/11/12 | JPM | 1,200,000 | — | (631 | ) | |||||||||||||||
Put - OTC 2-Year Interest Rate Swap | Pay | 1.056 | % | 10/11/12 | MSC | 2,600,000 | — | (2,630 | ) | |||||||||||||||
Put - OTC 2-Year Interest Rate Swap | Pay | 0.915 | % | 11/14/12 | MSC | 2,900,000 | — | (5,153 | ) | |||||||||||||||
Put - OTC 5-Year Interest Rate Swap | Pay | 1.700 | % | 03/18/13 | CIT | 2,200,000 | 41,360 | (34,300 | ) | |||||||||||||||
Put - OTC 5-Year Interest Rate Swap | Pay | 1.700 | % | 03/18/13 | DUB | 6,500,000 | 126,500 | (101,342 | ) | |||||||||||||||
Put - OTC 5-Year Interest Rate Swap | Pay | 2.000 | % | 03/18/13 | DUB | 900,000 | 8,398 | (9,461 | ) | |||||||||||||||
|
|
|
| |||||||||||||||||||||
| 240,378 | (197,066 | ) | ||||||||||||||||||||||
|
|
|
| |||||||||||||||||||||
| $ | 381,058 | ($ | 396,307 | ) | ||||||||||||||||||||
|
|
|
| |||||||||||||||||||||
Total Written Options | $ | 419,828 | ($ | 404,027 | ) | |||||||||||||||||||
|
|
|
| |||||||||||||||||||||
| (i) | Swap agreements outstanding as of March 31, 2012 were as follows: |
Credit Default Swaps on Corporate and Sovereign Issues - Buy Protection (1)
Referenced Obligation | Fixed Deal Pay Rate | Expiration Date | Counter- party | Implied Credit Spread at 03/31/12 (3) | Notional Amount (4) | Value | Upfront Premiums Paid (Received) | Unrealized Depreciation | ||||||||||||||||||||||
Starwood Hotels & Resorts Worldwide Inc | ||||||||||||||||||||||||||||||
6.750% due 05/15/18 | 1.000 | % | 03/20/13 | DUB | 0.363 | % | $ | 300,000 | ($ | 1,971 | ) | $ | 5,065 | ($ | 7,036 | ) | ||||||||||||||
Societe Generale SA | ||||||||||||||||||||||||||||||
5.250% due 03/28/13 D | 1.000 | % | 06/20/14 | BRC | 2.214 | % | 1,200,000 | 30,949 | 46,690 | (15,741 | ) | |||||||||||||||||||
|
|
|
|
|
| |||||||||||||||||||||||||
| $ | 28,978 | $ | 51,755 | ($ | 22,777 | ) | ||||||||||||||||||||||||
|
|
|
|
|
| |||||||||||||||||||||||||
Credit Default Swaps on Corporate and Sovereign Issues - Sell Protection (2)
Referenced Obligation | Fixed Deal Receive Rate | Expiration Date | Counter- party | Implied Credit Spread at 03/31/12 (3) | Notional Amount (4) | Value | Upfront Premiums Paid (Received) | Unrealized Appreciation (Depreciation) | ||||||||||||||||||||||
Petrobras International Finance Co | ||||||||||||||||||||||||||||||
8.375% due 12/10/18 | 1.000 | % | 09/20/12 | DUB | 0.549 | % | $ | 100,000 | $ | 250 | ($ | 1,241 | ) | $ | 1,491 | |||||||||||||||
Brazil Government Bond | ||||||||||||||||||||||||||||||
12.250% due 03/06/30 | 1.000 | % | 06/20/15 | BRC | 0.876 | % | 800,000 | 3,408 | (6,842 | ) | 10,250 | |||||||||||||||||||
United Kingdom Index-Linked Treasury Gilt | ||||||||||||||||||||||||||||||
4.250% due 06/07/32 D | 1.000 | % | 06/20/15 | GSC | 0.288 | % | 1,600,000 | 37,085 | 17,606 | 19,479 | ||||||||||||||||||||
Brazil Government Bond | ||||||||||||||||||||||||||||||
12.250% due 03/06/30 | 1.000 | % | 06/20/15 | HSB | 0.876 | % | 700,000 | 2,981 | (7,024 | ) | 10,005 | |||||||||||||||||||
Japanese Government Bond | ||||||||||||||||||||||||||||||
2.000% due 03/21/22 D | 1.000 | % | 12/20/15 | GSC | 0.737 | % | 1,000,000 | 9,963 | 22,098 | (12,135 | ) | |||||||||||||||||||
Japanese Government Bond | ||||||||||||||||||||||||||||||
2.000% due 03/21/22 D | 1.000 | % | 06/20/16 | HSB | 0.819 | % | 1,300,000 | 10,131 | (635 | ) | 10,766 | |||||||||||||||||||
|
|
|
|
|
| |||||||||||||||||||||||||
| $ | 63,818 | $ | 23,962 | $ | 39,856 | |||||||||||||||||||||||||
|
|
|
|
|
| |||||||||||||||||||||||||
| See Notes to Financial Statements | B-13 | See explanation of symbols and terms, if any, on page B-71 |
Table of Contents
PACIFIC LIFE FUNDS
PL INFLATION MANAGED FUND
Schedule of Investments (Continued)
March 31, 2012
Credit Default Swaps on Credit Indices - Sell Protection (2)
Referenced Obligation | Fixed Deal Receive Rate | Expiration Date | Counter- party | Notional Amount (4) | Value (5) | Upfront Premiums Paid (Received) | Unrealized Depreciation | |||||||||||||||||||
Dow Jones CDX NA EM14 5Y | 5.000 | % | 12/20/15 | CIT | $ | 1,400,000 | $ | 142,807 | $ | 178,585 | ($ | 35,778 | ) | |||||||||||||
Dow Jones CDX NA EM14 5Y | 5.000 | % | 12/20/15 | DUB | 200,000 | 20,401 | 30,200 | (9,799 | ) | |||||||||||||||||
Dow Jones CDX NA EM14 5Y | 5.000 | % | 12/20/15 | MSC | 500,000 | 51,003 | 70,500 | (19,497 | ) | |||||||||||||||||
Dow Jones CDX NA EM14 5Y | 5.000 | % | 12/20/15 | UBS | 300,000 | 30,601 | 42,300 | (11,699 | ) | |||||||||||||||||
Dow Jones CDX NA EM15 5Y | 5.000 | % | 06/20/16 | BRC | 100,000 | 11,052 | 13,500 | (2,448 | ) | |||||||||||||||||
|
|
|
|
|
| |||||||||||||||||||||
| $ | 255,864 | $ | 335,085 | ($ | 79,221 | ) | ||||||||||||||||||||
|
|
|
|
|
| |||||||||||||||||||||
Total Credit Default Swaps | $ | 348,660 | $ | 410,802 | ($ | 62,142 | ) | |||||||||||||||||||
|
|
|
|
|
| |||||||||||||||||||||
| (1) | If the fund is a buyer of protection and a credit event occurs, as defined under the terms of that particular swap agreement, the fund will either (i) receive from the seller of protection an amount equal to the notional amount of the swap and deliver the referenced obligation or underlying investments comprising the referenced index or (ii) receive a net settlement amount in the form of cash or investments equal to the notional amount of the swap less the recovery value of the referenced obligation or underlying investments comprising the referenced index. |
| (2) | If the fund is a seller of protection and a credit event occurs, as defined under the terms of that particular swap agreement, the fund will either (i) pay to the buyer of protection an amount equal to the notional amount of the swap and take delivery of the referenced obligation or underlying investments comprising the referenced index or (ii) pay net settlement amount in the form of cash or investments equal to the notional amount of the swap less the recovery value of the referenced obligation or underlying investments comprising the referenced index. |
| (3) | An implied credit spread is the spread in yield between a U.S. Treasury security and the referenced obligation or underlying investment that are identical in all respects except for the quality rating. Implied credit spreads, represented in absolute terms, utilized in determining the value of credit default swap agreements on corporate issues or sovereign issues of an emerging country as of year end serve as an indicator of the current status of the payment/performance risk and represent the likelihood of risk of default for the credit derivative. The implied credit spread of a particular referenced entity reflects the cost of buying/selling protection and may include upfront payments required to be made to enter into the agreement. Wider credit spreads, in comparison to narrower credit spreads, represent a deterioration of the referenced entity’s credit soundness and a greater likelihood of risk of default or other credit event occurring as defined under the terms of the agreement. A credit spread identified as “Defaulted” indicates a credit event has occurred for the referenced entity or obligation. |
| (4) | The maximum potential amount the fund could be required to pay as a seller of credit protection or receive as a buyer of credit protection if a credit event occurs as defined under the terms of that particular swap agreement. |
| (5) | The quoted market prices and resulting values for credit default swap agreements on credit indices serve as an indicator of the current status of the payment/performance risk and is a representation of the likelihood of an expected liability (or profit) for the credit derivative should the notional amount of the swap agreement had been closed/sold as of the year end. Increasing values, in absolute terms when compared to the notional amount of the swap, represent a deterioration of the referenced entity’s credit soundness and a greater likelihood of risk of default or other credit event occurring as defined under the terms of the agreement. |
Interest Rate Swaps
Floating Rate Index | Counter- party | Pay/Receive Floating Rate | Fixed Rate | Expiration Date | Notional Amount | Value | Upfront Premiums Paid (Received) | Unrealized Appreciation (Depreciation) | ||||||||||||||||||||
OTC BRL - CDI Compounded D | GSC | Pay | 9.980 | % | 01/02/14 | BRL | 4,300,000 | $ | 14,978 | $ | 6,469 | $ | 8,509 | |||||||||||||||
OTC BRL - CDI Compounded D | HSB | Pay | 10.180 | % | 01/02/14 | 6,500,000 | 34,847 | (3,121 | ) | 37,968 | ||||||||||||||||||
OTC BRL - CDI Compounded D | MSC | Pay | 10.220 | % | 01/02/14 | 1,900,000 | 11,301 | 9,458 | 1,843 | |||||||||||||||||||
OTC BRL - CDI Compounded D | UBS | Pay | 10.380 | % | 01/02/14 | 5,900,000 | 39,302 | 22,510 | 16,792 | |||||||||||||||||||
OTC BRL - CDI Compounded | MSC | Pay | 10.580 | % | 01/02/14 | 7,500,000 | 57,780 | 30,958 | 26,822 | |||||||||||||||||||
OTC France CPI Excluding Tobacco | BRC | Pay | 1.850 | % | 10/15/16 | EUR | 500,000 | (10,259 | ) | (5,316 | ) | (4,943 | ) | |||||||||||||||
OTC France CPI Excluding Tobacco | UBS | Pay | 1.850 | % | 10/15/16 | 1,000,000 | (20,517 | ) | (665 | ) | (19,852 | ) | ||||||||||||||||
CME 3-Month USD -LIBOR | CME | Receive | 2.250 | % | 06/20/22 | $ | 2,600,000 | 27,999 | 4,966 | 23,033 | ||||||||||||||||||
|
|
|
|
|
| |||||||||||||||||||||||
Total Interest Rate Swaps | $ | 155,431 | $ | 65,259 | $ | 90,172 | ||||||||||||||||||||||
|
|
|
|
|
| |||||||||||||||||||||||
Total Swap Agreements | $ | 504,091 | $ | 476,061 | $ | 28,030 | ||||||||||||||||||||||
|
|
|
|
|
| |||||||||||||||||||||||
| (j) | As of March 31, 2012, investments with total aggregate values of $243,808, and $456,213 were fully or partially segregated with the broker(s)/custodian as collateral for open futures contracts and swaps, respectively. Additionally, $4,000 in cash was segregated as collateral for open swap contracts. |
| See Notes to Financial Statements | B-14 | See explanation of symbols and terms, if any, on page B-71 |
Table of Contents
PACIFIC LIFE FUNDS
PL INFLATION MANAGED FUND
Schedule of Investments (Continued)
March 31, 2012
| (k) | Fair Value Measurements |
The following is a summary of the fund’s investments as categorized under the three-tier hierarchy of inputs used in valuing the fund’s assets and liabilities (See Note 3C in Notes to Financial Statements) as of March 31, 2012:
| Total Value at March 30, 2012 | Level 1 Quoted Price | Level 2 Significant Observable Inputs | Level 3 Significant Unobservable Inputs | |||||||||||||||
Assets | Convertible Preferred Stocks (1) | $ | 111,670 | $ | 111,670 | $ | — | $ | — | |||||||||
Corporate Bonds & Notes | 35,097,407 | — | 35,097,407 | — | ||||||||||||||
Mortgage-Backed Securities | 19,968,006 | — | 19,968,006 | — | ||||||||||||||
Asset-Backed Securities | 8,627,186 | — | 8,627,186 | — | ||||||||||||||
U.S. Treasury Obligations | 251,716,180 | — | 251,716,180 | — | ||||||||||||||
Foreign Government Bonds & Notes | 13,442,056 | — | 13,442,056 | — | ||||||||||||||
Municipal Bonds | 125,179 | — | 125,179 | — | ||||||||||||||
Short-Term Investments | 5,075,565 | 1,375,565 | 3,700,000 | — | ||||||||||||||
Derivatives: | ||||||||||||||||||
Credit Contracts | ||||||||||||||||||
Swaps | 350,631 | — | 350,631 | — | ||||||||||||||
Foreign Currency Contracts | ||||||||||||||||||
Forward Foreign Currency Contracts | 702,165 | — | 702,165 | — | ||||||||||||||
Interest Rate Contracts | ||||||||||||||||||
Futures | 149,103 | 149,103 | — | — | ||||||||||||||
Swaps | 186,207 | — | 186,207 | — | ||||||||||||||
|
|
|
|
|
|
|
| |||||||||||
Total Interest Rate Contracts | 335,310 | 149,103 | 186,207 | — | ||||||||||||||
|
|
|
|
|
|
|
| |||||||||||
Total Assets - Derivatives | 1,388,106 | 149,103 | 1,239,003 | — | ||||||||||||||
|
|
|
|
|
|
|
| |||||||||||
Total Assets | 335,551,355 | 1,636,338 | 333,915,017 | — | ||||||||||||||
|
|
|
|
|
|
|
| |||||||||||
Liabilities | Derivatives: | |||||||||||||||||
Credit Contracts | ||||||||||||||||||
Swaps | (1,971 | ) | — | (1,971 | ) | — | ||||||||||||
Foreign Currency Contracts | ||||||||||||||||||
Forward Foreign Currency Contracts | (866,662 | ) | — | (866,662 | ) | — | ||||||||||||
Interest Rate Contracts | ||||||||||||||||||
Futures | (308 | ) | (308 | ) | — | — | ||||||||||||
Written Options | (404,027 | ) | — | (396,307 | ) | (7,720 | ) | |||||||||||
Swaps | (30,776 | ) | — | (30,776 | ) | — | ||||||||||||
|
|
|
|
|
|
|
| |||||||||||
Total Interest Rate Contracts | (435,111 | ) | (308 | ) | (427,083 | ) | (7,720 | ) | ||||||||||
|
|
|
|
|
|
|
| |||||||||||
Total Liabilities - Derivatives | (1,303,744 | ) | (308 | ) | (1,295,716 | ) | (7,720 | ) | ||||||||||
|
|
|
|
|
|
|
| |||||||||||
Total Liabilities | (1,303,744 | ) | (308 | ) | (1,295,716 | ) | (7,720 | ) | ||||||||||
|
|
|
|
|
|
|
| |||||||||||
Total | $ | 334,247,611 | $ | 1,636,030 | $ | 332,619,301 | ($ | 7,720 | ) | |||||||||
|
|
|
|
|
|
|
| |||||||||||
The following is a reconciliation of investments for significant unobservable inputs (Level 3) used in valuing the fund’s assets and liabilities (See Note 3C in Notes to Financial Statements) for the year ended March 31, 2012:
| Liabilities Derivatives | ||||||||||||||||||||
| Interest Rate Contracts | ||||||||||||||||||||
| Corporate Bonds & Notes | Asset-Backed Securities | Foreign Government Bonds & Notes | Written Options | Total | ||||||||||||||||
Value, Beginning of Year | $ | 4,597,626 | $ | 4,420,360 | $ | 2,261,770 | ($ | 132,634 | ) | $ | 11,147,122 | |||||||||
Purchases | — | — | — | — | — | |||||||||||||||
Sales (includes paydowns) | (2,084,838 | ) | (1,035,350 | ) | — | — | (3,120,188 | ) | ||||||||||||
Accrued Discounts (Premiums) | — | — | — | — | — | |||||||||||||||
Net Realized Gains (Losses) | (15,162 | ) | 34,589 | — | 66,479 | 85,906 | ||||||||||||||
Change in Net Unrealized Appreciation (Depreciation) | (64,501 | ) | (430,104 | ) | (165,836 | ) | 58,435 | (602,006 | ) | |||||||||||
Transfer In | — | — | — | — | — | |||||||||||||||
Transfer Out | (2,433,125 | ) | (2,989,495 | ) | (2,095,934 | ) | — | (7,518,554 | ) | |||||||||||
|
|
|
|
|
|
|
|
|
| |||||||||||
Value, End of Year | $ | — | $ | — | $ | — | ($ | 7,720 | ) | ($ | 7,720 | ) | ||||||||
|
|
|
|
|
|
|
|
|
| |||||||||||
Change in Net Unrealized Appreciation (Depreciation) on Level 3 Investments Held at the End of Year, if Applicable | $ | — | $ | — | $ | — | $ | 17,742 | $ | 17,742 | ||||||||||
|
|
|
|
|
|
|
|
|
| |||||||||||
| (1) | For equity investments categorized in a single level, refer to the schedule of investments for further industry breakout. |
| See Notes to Financial Statements | B-15 | See explanation of symbols and terms, if any, on page B-71 |
Table of Contents
PACIFIC LIFE FUNDS
PL MANAGED BOND FUND
Schedule of Investments
March 31, 2012
| Shares | Value | |||||||
CONVERTIBLE PREFERRED STOCKS - 0.7% |
| |||||||
Financials - 0.7% |
| |||||||
Lehman Brothers Holdings Inc. 8.75% W | 1,500 | $ | — | |||||
Wells Fargo & Co 7.500% | 3,000 | 3,350,100 | ||||||
|
| |||||||
| 3,350,100 | ||||||||
|
| |||||||
Total Convertible Preferred Stocks | ||||||||
(Cost $2,112,213) | 3,350,100 | |||||||
|
| |||||||
PREFERRED STOCKS - 0.0% |
| |||||||
Financials - 0.0% | ||||||||
Fannie Mae | 8,000 | 10,560 | ||||||
|
| |||||||
Total Preferred Stocks | ||||||||
(Cost $200,000) | 10,560 | |||||||
|
| |||||||
| Principal Amount | ||||||||
CORPORATE BONDS & NOTES - 25.7% |
| |||||||
Consumer Staples - 0.6% |
| |||||||
Anheuser-Busch InBev Worldwide Inc | ||||||||
1.107% due 01/27/14 § | $ | 1,300,000 | 1,307,331 | |||||
Kraft Foods Inc | ||||||||
6.125% due 02/01/18 | 700,000 | 840,848 | ||||||
6.875% due 02/01/38 | 100,000 | 125,669 | ||||||
Reynolds American Inc | ||||||||
7.625% due 06/01/16 | 100,000 | 120,108 | ||||||
Wal-Mart Stores Inc | ||||||||
5.800% due 02/15/18 | 200,000 | 243,555 | ||||||
|
| |||||||
| 2,637,511 | ||||||||
|
| |||||||
Energy - 0.9% | ||||||||
Colorado Interstate Gas Co LLC | ||||||||
6.800% due 11/15/15 | 200,000 | 230,862 | ||||||
Gaz Capital SA (Luxembourg) | ||||||||
8.146% due 04/11/18 ~ | 300,000 | 353,199 | ||||||
NGPL PipeCo LLC | ||||||||
7.119% due 12/15/17 ~ | 500,000 | 456,023 | ||||||
Novatek Finance Ltd (Ireland) | ||||||||
5.326% due 02/03/16 ~ | 200,000 | 211,290 | ||||||
Odebrecht Drilling Norbe VIII/IX Ltd (Cayman) | ||||||||
6.350% due 06/30/21 ~ | 98,000 | 104,860 | ||||||
Petrobras International Finance Co (Cayman) | ||||||||
5.375% due 01/27/21 | 900,000 | 973,223 | ||||||
5.875% due 03/01/18 | 400,000 | 450,550 | ||||||
Petroleos Mexicanos (Mexico) | ||||||||
5.500% due 01/21/21 | 600,000 | 664,500 | ||||||
Ras Laffan Liquefied Natural Gas Co Ltd III (Qatar) | ||||||||
4.500% due 09/30/12 ~ D | 400,000 | 405,800 | ||||||
TNK-BP Finance SA (Luxembourg) | ||||||||
7.250% due 02/02/20 ~ | 200,000 | 232,500 | ||||||
Transneft (Ireland) | ||||||||
8.700% due 08/07/18 ~ | 100,000 | 123,375 | ||||||
|
| |||||||
| 4,206,182 | ||||||||
|
| |||||||
Financials - 19.5% | ||||||||
Ally Financial Inc | ||||||||
3.874% due 06/20/14 § | 4,600,000 | 4,508,736 | ||||||
4.500% due 02/11/14 | 500,000 | 501,875 | ||||||
7.500% due 09/15/20 | 200,000 | 216,750 | ||||||
8.300% due 02/12/15 | 600,000 | 654,750 | ||||||
| Principal Amount | Value | |||||||
American Express Bank FSB | ||||||||
5.500% due 04/16/13 | $ | 600,000 | $ | 628,258 | ||||
American Express Centurion Bank | ||||||||
6.000% due 09/13/17 | 1,200,000 | 1,405,630 | ||||||
American Express Co | ||||||||
4.875% due 07/15/13 | 200,000 | 209,474 | ||||||
American International Group Inc | ||||||||
5.450% due 05/18/17 | 100,000 | 107,721 | ||||||
5.850% due 01/16/18 | 800,000 | 871,937 | ||||||
6.250% due 03/15/87 | 200,000 | 181,000 | ||||||
ANZ National International Ltd (New Zealand) | ||||||||
6.200% due 07/19/13 ~ | 300,000 | 315,308 | ||||||
Banco Santander Brasil SA (Brazil) | ||||||||
2.574% due 03/18/14 § ~ | 600,000 | 590,016 | ||||||
4.250% due 01/14/16 ~ | 300,000 | 301,380 | ||||||
Banco Santander Chile (Chile) | ||||||||
1.811% due 04/20/12 § ~ | 400,000 | 400,020 | ||||||
2.162% due 01/19/16 § ~ | 1,000,000 | 955,000 | ||||||
Bank of America Corp | ||||||||
1.973% due 01/30/14 § | 1,200,000 | 1,178,798 | ||||||
4.500% due 04/01/15 | 1,900,000 | 1,969,325 | ||||||
4.875% due 01/15/13 | 100,000 | 102,249 | ||||||
5.650% due 05/01/18 | 700,000 | 748,021 | ||||||
Bank of China Ltd (Hong Kong) | ||||||||
5.550% due 02/11/20 ~ | 100,000 | 105,155 | ||||||
Bank of Montreal (Canada) | ||||||||
1.300% due 10/31/14 ~ D | 300,000 | 302,815 | ||||||
2.850% due 06/09/15 ~ | 100,000 | 105,472 | ||||||
Bank of Nova Scotia (Canada) | ||||||||
1.650% due 10/29/15 ~ | 200,000 | 203,373 | ||||||
Banque PSA Finance SA (France) | ||||||||
2.481% due 04/04/14 § ~ | 600,000 | 579,491 | ||||||
Barclays Bank PLC (United Kingdom) | ||||||||
5.450% due 09/12/12 | 800,000 | 815,083 | ||||||
6.050% due 12/04/17 ~ | 2,700,000 | 2,788,846 | ||||||
10.179% due 06/12/21 ~ | 720,000 | 853,963 | ||||||
BBVA Bancomer SA (Mexico) | ||||||||
6.500% due 03/10/21 ~ | 3,800,000 | 3,980,500 | ||||||
BM&FBOVESPA SA (Brazil) | ||||||||
5.500% due 07/16/20 ~ | 100,000 | 107,250 | ||||||
BNP Paribas SA (France) | ||||||||
1.482% due 01/10/14 § | 1,000,000 | 979,820 | ||||||
BPCE SA (France) | ||||||||
2.375% due 10/04/13 ~ | 100,000 | 98,378 | ||||||
9.000% § ± | EUR | 300,000 | 370,104 | |||||
CIT Group Inc | ||||||||
5.250% due 04/01/14 ~ | $ | 100,000 | 102,625 | |||||
Citigroup Capital XXI | ||||||||
8.300% due 12/21/77 | 2,000,000 | 2,024,000 | ||||||
Citigroup Inc | ||||||||
2.510% due 08/13/13 § | 200,000 | 200,675 | ||||||
3.625% due 11/30/17 § | EUR | 500,000 | 584,597 | |||||
5.500% due 04/11/13 | $ | 700,000 | 726,577 | |||||
5.500% due 10/15/14 | 1,000,000 | 1,073,445 | ||||||
5.625% due 08/27/12 | 50,000 | 50,847 | ||||||
8.500% due 05/22/19 | 200,000 | 246,850 | ||||||
Commonwealth Bank of Australia (Australia) | ||||||||
1.000% due 07/12/13 § ~ | 1,600,000 | 1,608,126 | ||||||
Credit Agricole Home Loan SFH (France) | ||||||||
1.311% due 07/21/14 § ~ | 1,400,000 | 1,372,931 | ||||||
Credit Agricole SA (France) | ||||||||
5.136% § ± | GBP | 300,000 | 328,695 | |||||
Credit Suisse NY (Switzerland) | ||||||||
2.200% due 01/14/14 | $ | 300,000 | 303,071 | |||||
Daimler Finance North America LLC | ||||||||
1.674% due 09/13/13 § ~ | 400,000 | 401,782 | ||||||
Danske Bank AS (Denmark) | ||||||||
2.500% due 05/10/12 ~ | 200,000 | 200,349 | ||||||
Dexia Credit Local SA (France) | ||||||||
1.033% due 04/29/14 § ~ | 800,000 | 746,186 | ||||||
| See Notes to Financial Statements | B-16 | See explanation of symbols and terms, if any, on page B-71 |
Table of Contents
PACIFIC LIFE FUNDS
PL MANAGED BOND FUND
Schedule of Investments (Continued)
March 31, 2012
| Principal Amount | Value | |||||||
European Investment Bank (Multi-National) | ||||||||
4.625% due 04/15/20 | EUR | 100,000 | $ | 153,410 | ||||
Export-Import Bank of Korea (South Korea) | ||||||||
4.000% due 01/29/21 | $ | 100,000 | 98,867 | |||||
5.125% due 06/29/20 | 100,000 | 107,648 | ||||||
Ford Motor Credit Co LLC | ||||||||
7.000% due 04/15/15 | 500,000 | 547,430 | ||||||
8.700% due 10/01/14 | 200,000 | 226,684 | ||||||
General Electric Capital Corp | ||||||||
5.875% due 01/14/38 | 900,000 | 989,857 | ||||||
6.875% due 01/10/39 | 200,000 | 247,122 | ||||||
General Motors Acceptance Corp | ||||||||
8.375% due 07/05/33 W | EUR | 200,000 | 3,001 | |||||
HBOS PLC (United Kingdom) | ||||||||
0.676% due 09/06/17 § | $ | 8,100,000 | 6,006,150 | |||||
HSBC Bank PLC (United Kingdom) | ||||||||
2.000% due 01/19/14 ~ | 200,000 | 200,830 | ||||||
ICICI Bank Ltd (India) | ||||||||
4.750% due 11/25/16 ~ | 1,700,000 | 1,699,529 | ||||||
5.500% due 03/25/15 ~ | 600,000 | 623,787 | ||||||
ING Bank NV (Netherlands) | ||||||||
2.500% due 01/14/16 ~ | 100,000 | 101,643 | ||||||
Intesa Sanpaolo SPA (Italy) | ||||||||
2.375% due 12/21/12 | 1,400,000 | 1,377,678 | ||||||
2.892% due 02/24/14 § ~ | 500,000 | 487,963 | ||||||
JPMorgan Chase & Co | ||||||||
7.900% § ± | 300,000 | 329,797 | ||||||
LBG Capital No. 2 PLC (United Kingdom) | ||||||||
9.125% due 07/15/20 | GBP | 800,000 | 1,142,034 | |||||
Lehman Brothers Holdings Inc | ||||||||
5.625% due 01/24/13 W | $ | 800,000 | 240,000 | |||||
6.750% due 12/28/17 W | 500,000 | — | ||||||
Lloyds TSB Bank PLC (United Kingdom) | ||||||||
4.875% due 01/21/16 | 200,000 | 207,511 | ||||||
12.000% § ~ ± | 1,100,000 | 1,151,978 | ||||||
Macquarie Bank Ltd (Australia) | ||||||||
3.300% due 07/17/14 ~ | 5,300,000 | 5,593,482 | ||||||
Merrill Lynch & Co Inc | ||||||||
6.875% due 04/25/18 | 900,000 | 1,001,531 | ||||||
MetLife Institutional Funding II | ||||||||
1.481% due 04/04/14 § ~ | 1,700,000 | 1,707,050 | ||||||
Metropolitan Life Global Funding I | ||||||||
5.125% due 04/10/13 ~ | 300,000 | 313,665 | ||||||
Morgan Stanley | ||||||||
5.950% due 12/28/17 | 1,900,000 | 1,958,113 | ||||||
National Australia Bank Ltd (Australia) | ||||||||
1.301% due 04/11/14 § ~ | 2,000,000 | 1,993,962 | ||||||
Nationwide Building Society (United Kingdom) | ||||||||
6.250% due 02/25/20 ~ | 300,000 | 311,351 | ||||||
Nordea Bank AB (Sweden) | ||||||||
2.125% due 01/14/14 ~ | 100,000 | 100,378 | ||||||
Nordea Eiendomskreditt AS (Norway) | ||||||||
1.003% due 04/07/14 § ~ | 900,000 | 875,019 | ||||||
Nykredit Realkredit AS (Denmark) | ||||||||
2.092% due 04/01/38 § | DKK | 715,015 | 126,677 | |||||
2.092% due 10/01/38 § | 894,472 | 158,150 | ||||||
Principal Life Income Funding Trusts | ||||||||
5.300% due 04/24/13 | $ | 100,000 | 104,492 | |||||
Qatari Diar Finance QSC (Qatar) | ||||||||
5.000% due 07/21/20 ~ | 200,000 | 215,250 | ||||||
RCI Banque SA (France) | ||||||||
2.451% due 04/11/14 § ~ | 1,300,000 | 1,257,295 | ||||||
Realkredit Danmark AS (Denmark) | ||||||||
2.440% due 01/01/38 § | DKK | 3,156,164 | 555,986 | |||||
Regions Bank | ||||||||
7.500% due 05/15/18 | $ | 300,000 | 342,750 | |||||
Regions Financial Corp | ||||||||
0.644% due 06/26/12 § | 900,000 | 897,679 | ||||||
RZD Capital Ltd (Ireland) | ||||||||
5.739% due 04/03/17 | 500,000 | 531,875 | ||||||
| Principal Amount | Value | |||||||
Santander Issuances SAU (Spain) | ||||||||
7.300% due 07/27/19 § | GBP | 3,000,000 | $ | 4,397,792 | ||||
Sberbank of Russia Via Sb Capital SA (Luxembourg) | ||||||||
6.125% due 02/07/22 ~ D | $ | 500,000 | 515,625 | |||||
SLM Corp | ||||||||
4.444% due 10/01/14 § | 100,000 | 95,939 | ||||||
5.000% due 10/01/13 | 2,600,000 | 2,665,000 | ||||||
6.250% due 01/25/16 | 100,000 | 104,070 | ||||||
8.000% due 03/25/20 | 400,000 | 433,000 | ||||||
8.450% due 06/15/18 | 600,000 | 672,000 | ||||||
Springleaf Finance Corp | ||||||||
4.125% due 11/29/13 | EUR | 1,000,000 | 1,147,995 | |||||
SSIF Nevada LP | ||||||||
1.267% due 04/14/14 § ~ | $ | 3,300,000 | 3,276,798 | |||||
State Bank of India (India) | ||||||||
4.500% due 07/27/15 ~ | 1,000,000 | 1,035,008 | ||||||
Stone Street Trust | ||||||||
5.902% due 12/15/15 ~ | 700,000 | 703,777 | ||||||
Temasek Financial I Ltd (Singapore) | ||||||||
4.300% due 10/25/19 ~ | 300,000 | 327,209 | ||||||
The Bear Stearns Cos LLC | ||||||||
6.400% due 10/02/17 | 400,000 | 466,172 | ||||||
The Dai-ichi Life Insurance Co Ltd (Japan) | ||||||||
7.250% § ~ ± | 300,000 | 310,919 | ||||||
The Goldman Sachs Group Inc | ||||||||
1.553% due 07/29/13 § | 200,000 | 199,699 | ||||||
6.250% due 09/01/17 | 1,100,000 | 1,206,811 | ||||||
6.750% due 10/01/37 | 1,200,000 | 1,173,047 | ||||||
The Royal Bank of Scotland Group PLC (United Kingdom) | ||||||||
2.625% due 05/11/12 ~ | 100,000 | 100,181 | ||||||
3.950% due 09/21/15 | 400,000 | 404,764 | ||||||
7.640% § ± | 500,000 | 345,000 | ||||||
UBS AG (Switzerland) | ||||||||
5.875% due 12/20/17 | 700,000 | 776,853 | ||||||
Wachovia Corp | ||||||||
0.737% due 08/01/13 § | 300,000 | 300,339 | ||||||
Wells Fargo & Co | ||||||||
7.980% § ± | 1,700,000 | 1,859,375 | ||||||
Westpac Banking Corp (Australia) | ||||||||
1.200% due 03/31/14 § ~ | 1,000,000 | 999,607 | ||||||
|
| |||||||
| 94,611,858 | ||||||||
|
| |||||||
Health Care - 0.0% | ||||||||
UnitedHealth Group Inc | ||||||||
6.875% due 02/15/38 | 100,000 | 131,282 | ||||||
|
| |||||||
Industrials - 1.0% | ||||||||
Caterpillar Inc | ||||||||
0.663% due 05/21/13 § | 1,400,000 | 1,404,511 | ||||||
International Lease Finance Corp | ||||||||
0.927% due 07/13/12 § | 2,682,000 | 2,668,507 | ||||||
5.300% due 05/01/12 | 300,000 | 301,764 | ||||||
5.625% due 09/20/13 | 255,000 | 259,144 | ||||||
5.750% due 05/15/16 | 100,000 | 99,960 | ||||||
Noble Group Ltd (Bermuda) | ||||||||
6.750% due 01/29/20 ~ | 200,000 | 199,000 | ||||||
|
| |||||||
| 4,932,886 | ||||||||
|
| |||||||
Information Technology - 0.3% |
| |||||||
Hewlett-Packard Co | ||||||||
0.772% due 05/24/13 § | 1,600,000 | 1,596,923 | ||||||
|
| |||||||
| See Notes to Financial Statements | B-17 | See explanation of symbols and terms, if any, on page B-71 |
Table of Contents
PACIFIC LIFE FUNDS
PL MANAGED BOND FUND
Schedule of Investments (Continued)
March 31, 2012
| Principal Amount | Value | |||||||
Materials - 1.4% | ||||||||
Braskem Finance Ltd (Cayman) | ||||||||
5.750% due 04/15/21 ~ | $ | 3,600,000 | $ | 3,786,480 | ||||
Codelco Inc (Chile) | ||||||||
6.150% due 10/24/36 ~ | 200,000 | 242,683 | ||||||
CSN Islands XI Corp (Cayman) | ||||||||
6.875% due 09/21/19 ~ | 700,000 | 799,260 | ||||||
CSN Resources SA (Luxembourg) | ||||||||
6.500% due 07/21/20 ~ | 600,000 | 675,000 | ||||||
Gerdau Holdings Inc | ||||||||
7.000% due 01/20/20 ~ | 400,000 | 462,880 | ||||||
GTL Trade Finance Inc (United Kingdom) | ||||||||
7.250% due 10/20/17 ~ | 600,000 | 694,200 | ||||||
Vale Overseas Ltd (Cayman) | ||||||||
6.250% due 01/23/17 | 200,000 | 231,437 | ||||||
6.875% due 11/10/39 | 100,000 | 116,985 | ||||||
|
| |||||||
| 7,008,925 | ||||||||
|
| |||||||
Telecommunication Services - 1.6% |
| |||||||
AT&T Inc | ||||||||
6.300% due 01/15/38 | 200,000 | 235,188 | ||||||
BellSouth Corp | ||||||||
4.463% due 04/26/12 ~ | 4,800,000 | 4,810,944 | ||||||
Deutsche Telekom International Finance BV (Netherlands) | ||||||||
6.500% due 04/08/22 | GBP | 900,000 | 1,718,975 | |||||
Verizon Communications Inc | ||||||||
1.083% due 03/28/14 § | $ | 900,000 | 907,999 | |||||
|
| |||||||
| 7,673,106 | ||||||||
|
| |||||||
Utilities - 0.4% | ||||||||
CMS Energy Corp | ||||||||
5.050% due 02/15/18 | 1,000,000 | 1,055,245 | ||||||
Electricite de France (France) | ||||||||
5.500% due 01/26/14 ~ | 200,000 | 214,583 | ||||||
6.500% due 01/26/19 ~ | 200,000 | 234,113 | ||||||
6.950% due 01/26/39 ~ | 100,000 | 118,785 | ||||||
Entergy Corp | ||||||||
3.625% due 09/15/15 | 500,000 | 508,825 | ||||||
|
| |||||||
| 2,131,551 | ||||||||
|
| |||||||
Total Corporate Bonds & Notes | ||||||||
(Cost $122,303,922) | 124,930,224 | |||||||
|
| |||||||
SENIOR LOAN NOTES - 0.4% |
| |||||||
Financials - 0.4% |
| |||||||
Springleaf Finance Corp (Initial Term Loan) | ||||||||
5.500% due 05/10/17 § | 2,000,000 | 1,846,250 | ||||||
|
| |||||||
Total Senior Loan Notes | ||||||||
(Cost $1,991,386) | 1,846,250 | |||||||
|
| |||||||
MORTGAGE-BACKED SECURITIES - 49.2% |
| |||||||
Collateralized Mortgage Obligations - Commercial - 1.5% |
| |||||||
Bear Stearns Commercial Mortgage Securities | ||||||||
5.471% due | 100,000 | 113,781 | ||||||
5.700% due 06/11/50 “ | 200,000 | 229,499 | ||||||
Commercial Mortgage Pass-Through Certificates | ||||||||
5.306% due 12/10/46 “ | 200,000 | 224,855 | ||||||
Credit Suisse Mortgage Capital Certificates | ||||||||
5.467% due 09/15/39 “ | 900,000 | 996,359 | ||||||
5.663% due | 100,000 | 110,092 | ||||||
| Principal Amount | Value | |||||||
European Loan Conduit (Ireland) | ||||||||
1.207% due | EUR | 52,756 | $ | 61,566 | ||||
Greenwich Capital Commercial Funding Corp | ||||||||
5.444% due 03/10/39 “ | $ | 400,000 | 441,772 | |||||
JPMorgan Chase Commercial Mortgage Securities Corp | ||||||||
4.070% due 11/15/43 “ ~ | 500,000 | 533,741 | ||||||
LB-UBS Commercial Mortgage Trust | ||||||||
5.866% due 09/15/45 “ § | 600,000 | 682,787 | ||||||
Merrill Lynch Floating Trust | ||||||||
0.780% due | 499,897 | 480,557 | ||||||
Merrill Lynch/Countrywide Commercial Mortgage Trust | ||||||||
5.700% due 09/12/49 “ | 500,000 | 548,798 | ||||||
Morgan Stanley Capital I | ||||||||
5.731% due 07/12/44 “ § | 1,700,000 | 1,936,088 | ||||||
Wachovia Bank Commercial Mortgage Trust | ||||||||
0.332% due | 226,480 | 217,949 | ||||||
5.342% due 12/15/43 “ | 600,000 | 650,091 | ||||||
|
| |||||||
| 7,227,935 | ||||||||
|
| |||||||
Collateralized Mortgage Obligations - Residential - 4.1% |
| |||||||
Adjustable Rate Mortgage Trust | ||||||||
2.872% due 05/25/35 “ § | 9,885 | 9,769 | ||||||
Arran Residential Mortgages Funding PLC (United Kingdom) | ||||||||
2.241% due | EUR | 2,615,410 | 3,491,522 | |||||
2.451% due | 1,000,000 | 1,332,173 | ||||||
Banc of America Funding Corp | ||||||||
2.653% due 05/25/35 “ § | $ | 137,623 | 138,094 | |||||
Banc of America Mortgage Securities Inc | ||||||||
2.873% due 07/25/33 “ § | 63,084 | 60,419 | ||||||
5.000% due 05/25/34 “ | 223 | 222 | ||||||
BCAP LLC Trust | ||||||||
5.579% due | 100,000 | 75,300 | ||||||
Bear Stearns Adjustable Rate Mortgage Trust | ||||||||
2.250% due 08/25/35 “ § | 60,047 | 55,516 | ||||||
2.400% due 10/25/35 “ § | 389,085 | 337,437 | ||||||
2.614% due 08/25/33 “ § | 153,755 | 154,012 | ||||||
2.913% due 01/25/35 “ § | 1,502,668 | 1,367,509 | ||||||
3.078% due 03/25/35 “ § | 120,630 | 119,395 | ||||||
Bear Stearns Alt-A Trust | ||||||||
2.809% due 05/25/35 “ § | 60,739 | 48,253 | ||||||
2.826% due 09/25/35 “ § | 72,085 | 48,030 | ||||||
2.863% due 11/25/36 “ § | 95,569 | 52,373 | ||||||
Chase Mortgage Finance Corp | ||||||||
5.891% due 09/25/36 “ § | 315,131 | 277,890 | ||||||
Chevy Chase Mortgage Funding Corp | ||||||||
0.492% due | 74,444 | 53,029 | ||||||
Citigroup Mortgage Loan Trust Inc | ||||||||
2.450% due 09/25/35 “ § | 73,107 | 64,401 | ||||||
2.580% due 10/25/35 “ § | 125,264 | 112,359 | ||||||
Countrywide Alternative Loan Trust | ||||||||
2.948% due 06/25/37 “ § | 386,808 | 253,674 | ||||||
Countrywide Home Loan Mortgage Pass-Through Trust | ||||||||
0.562% due 03/25/35 “ § | 34,384 | 21,480 | ||||||
0.582% due | 149,161 | 127,600 | ||||||
Credit Suisse First Boston Mortgage Securities Corp | ||||||||
0.929% due | 5,910 | 4,523 | ||||||
6.000% due 11/25/35 “ | 116,774 | 92,391 | ||||||
Downey Saving and Loan Association Mortgage Loan Trust | ||||||||
0.422% due 04/19/47 “ § | 518,686 | 127,560 | ||||||
Fannie Mae | ||||||||
0.442% due 10/27/37 “ § | 3,400,000 | 3,380,955 | ||||||
0.552% due 04/25/37 “ § | 165,484 | 165,089 | ||||||
0.692% due 09/25/35 “ § | 314,506 | 314,596 | ||||||
| See Notes to Financial Statements | B-18 | See explanation of symbols and terms, if any, on page B-71 |
Table of Contents
PACIFIC LIFE FUNDS
PL MANAGED BOND FUND
Schedule of Investments (Continued)
March 31, 2012
| Principal Amount | Value | |||||||
1.625% due | $ | 253,925 | $ | 260,772 | ||||
4.250% due | 45,349 | 45,952 | ||||||
4.500% due | 52,682 | 53,721 | ||||||
Freddie Mac | ||||||||
1.340% due | 49,961 | 49,978 | ||||||
1.549% due | 264,110 | 268,756 | ||||||
5.000% due | 41,731 | 41,871 | ||||||
8.000% due | 271,274 | 324,370 | ||||||
Granite Master Issuer PLC | ||||||||
0.502% due | 531,912 | 510,529 | ||||||
0.678% due | EUR | 665,474 | 853,110 | |||||
0.738% due | 1,070,473 | 1,372,302 | ||||||
Granite Mortgages PLC (United Kingdom) | ||||||||
1.416% due | GBP | 199,711 | 308,431 | |||||
1.470% due | 36,795 | 56,967 | ||||||
1.584% due | EUR | 36,360 | 47,255 | |||||
Harborview Mortgage Loan Trust | ||||||||
0.412% due | $ | 670,379 | 363,478 | |||||
0.432% due | 216,188 | 140,557 | ||||||
0.462% due | 38,319 | 24,440 | ||||||
JPMorgan Mortgage Trust | ||||||||
5.015% due | 35,454 | 35,748 | ||||||
5.315% due | 390,745 | 396,853 | ||||||
5.750% due | 70,266 | 66,000 | ||||||
Mellon Residential Funding Corp | ||||||||
0.722% due | 10,690 | 10,252 | ||||||
Merrill Lynch Mortgage Investors Inc | ||||||||
0.452% due | 51,078 | 37,170 | ||||||
Morgan Stanley Mortgage Loan Trust | ||||||||
5.500% due | 350,190 | 351,594 | ||||||
Residential Accredit Loans Inc | ||||||||
0.422% due | 101,440 | 40,803 | ||||||
6.000% due | 287,299 | 190,509 | ||||||
Residential Asset Securitization Trust | ||||||||
0.642% due | 12,644 | 12,032 | ||||||
Structured Asset Mortgage Investments Inc | ||||||||
0.462% due | 226,931 | 115,341 | ||||||
Structured Asset Securities Corp | ||||||||
2.718% due | 28,484 | 28,268 | ||||||
2.795% due | 72,322 | 57,232 | ||||||
Washington Mutual Mortgage Pass-Through Certificates | ||||||||
0.552% due | 28,394 | 23,679 | ||||||
0.562% due | 29,673 | 24,987 | ||||||
1.559% due | 4,956 | 4,044 | ||||||
2.474% due | 9,097 | 8,999 | ||||||
2.724% due | 103,196 | 79,745 | ||||||
5.442% due | 600,000 | 503,392 | ||||||
Wells Fargo Mortgage-Backed Securities Trust | ||||||||
2.628% due | 736,859 | 608,831 | ||||||
2.686% due | 88,480 | 72,171 | ||||||
2.724% due | 121,869 | 121,930 | ||||||
4.500% due | 30,183 | 30,416 | ||||||
|
| |||||||
| 19,828,056 | ||||||||
|
| |||||||
Fannie Mae - 42.0% |
| |||||||
1.382% due | 47,643 | 47,964 | ||||||
2.167% due | 173,533 | 182,670 | ||||||
2.497% due | 166,166 | 176,958 | ||||||
2.612% due | 49,012 | 52,327 | ||||||
2.660% due | 190,409 | 203,383 | ||||||
3.000% due 04/17/27-05/17/27 “ | 56,400,000 | 58,354,094 | ||||||
3.500% due 08/01/26-05/14/42 “ | 47,075,593 | 48,996,243 | ||||||
4.000% due 04/01/24-04/12/42 “ | 10,954,339 | 11,508,669 | ||||||
4.500% due 01/01/23-08/01/41 “ | 36,414,070 | 38,832,970 | ||||||
4.517% due | 19,845 | 20,904 | ||||||
5.000% due 03/01/34-05/15/38 “ | 30,124,135 | 32,504,030 | ||||||
5.500% due 12/01/20-07/01/41 “ | 7,548,344 | 8,244,090 | ||||||
6.000% due 09/01/22-01/01/39 “ | 4,668,108 | 5,156,668 | ||||||
6.500% due | 34,862 | 38,556 | ||||||
|
| |||||||
| 204,319,526 | ||||||||
|
| |||||||
| Principal Amount | Value | |||||||
Freddie Mac - 1.6% | ||||||||
2.095% due | $ | 24,253 | $ | 25,636 | ||||
2.375% due | 7,495 | 7,916 | ||||||
2.468% due | 283,589 | 300,416 | ||||||
2.490% due | 24,040 | 25,182 | ||||||
2.620% due | 186,042 | 199,306 | ||||||
4.500% due | 871,829 | 925,246 | ||||||
5.500% due | 5,684,706 | 6,187,793 | ||||||
6.000% due | 115,124 | 127,001 | ||||||
|
| |||||||
| 7,798,496 | ||||||||
|
| |||||||
Total Mortgage-Backed Securities | ||||||||
(Cost $237,885,925) | 239,174,013 | |||||||
|
| |||||||
ASSET-BACKED SECURITIES - 4.5% |
| |||||||
Asset Backed Funding Certificates | ||||||||
0.592% due | 125,090 | 89,311 | ||||||
Auto ABS SARL (Italy) | ||||||||
1.308% due | EUR | 466,693 | 617,147 | |||||
Bear Stearns Asset Backed Securities Trust | ||||||||
0.442% due | $ | 500,000 | 333,824 | |||||
3.025% due | 170,585 | 117,517 | ||||||
Citibank Omni Master Trust | ||||||||
2.342% due | 8,200,000 | 8,220,612 | ||||||
2.992% due | 3,200,000 | 3,372,425 | ||||||
Duane Street CLO (Cayman) | ||||||||
0.773% due | 3,784,464 | 3,697,449 | ||||||
Galaxy CLO Ltd (Cayman) | ||||||||
0.847% due | 707,193 | 693,437 | ||||||
Halcyon Structured Asset Management Long Short CLO Ltd (Cayman) | ||||||||
0.752% due | 2,500,000 | 2,435,030 | ||||||
Hillmark Funding CDO (Cayman) | ||||||||
0.743% due | 1,100,000 | 1,039,638 | ||||||
HSBC Home Equity Loan Trust | ||||||||
0.392% due | 511,157 | 472,756 | ||||||
Long Beach Mortgage Loan Trust | ||||||||
0.802% due | 18,554 | 14,961 | ||||||
Park Place Securities Inc | ||||||||
0.502% due | 138,718 | 123,287 | ||||||
Securitized Asset-Backed Receivables LLC Trust | ||||||||
0.372% due | 157,908 | 81,472 | ||||||
United States Small Business Administration | ||||||||
4.754% due | 34,867 | 36,868 | ||||||
Wind River Ltd CLO (Cayman) | ||||||||
0.804% due | 856,893 | 827,036 | ||||||
|
| |||||||
Total Asset-Backed Securities | ||||||||
(Cost $22,283,319) | 22,172,770 | |||||||
|
| |||||||
U.S. GOVERNMENT AGENCY ISSUES - 11.8% |
| |||||||
Fannie Mae | ||||||||
0.375% due | 24,800,000 | 24,632,352 | ||||||
1.125% due | 2,200,000 | 2,187,929 | ||||||
1.250% due | 16,700,000 | 16,752,221 | ||||||
5.000% due 02/13/17-05/11/17 | 1,800,000 | 2,125,042 | ||||||
5.250% due | 100,000 | 118,497 | ||||||
5.375% due | 3,400,000 | 4,096,803 | ||||||
Freddie Mac | ||||||||
1.000% due | 3,300,000 | 3,256,562 | ||||||
1.250% due | 900,000 | 899,450 | ||||||
2.000% due | 100,000 | 104,025 | ||||||
2.375% due | 400,000 | 393,353 | ||||||
| See Notes to Financial Statements | B-19 | See explanation of symbols and terms, if any, on page B-71 |
Table of Contents
PACIFIC LIFE FUNDS
PL MANAGED BOND FUND
Schedule of Investments (Continued)
March 31, 2012
| Principal Amount | Value | |||||||
4.875% due 06/13/18 | $ | 1,400,000 | $ | 1,671,456 | ||||
5.500% due 08/23/17 | 900,000 | 1,096,057 | ||||||
|
| |||||||
Total U.S. Government Agency Issues |
| |||||||
(Cost $57,468,330) | 57,333,747 | |||||||
|
| |||||||
U.S. TREASURY OBLIGATIONS - 28.4% |
| |||||||
U.S. Treasury Inflation Protected Securities - 5.8% |
| |||||||
0.625% due | 4,625,484 | 5,004,917 | ||||||
1.125% due | 3,108,060 | 3,498,995 | ||||||
1.250% due | 207,838 | 237,390 | ||||||
2.000% due | 2,169,534 | 2,660,053 | ||||||
2.125% due | 6,186,445 | 8,129,378 | ||||||
2.375% due | 1,202,320 | 1,529,858 | ||||||
2.375% due | 3,933,335 | 5,048,805 | ||||||
3.625% due | 1,261,098 | 1,861,598 | ||||||
|
| |||||||
| 27,970,994 | ||||||||
|
| |||||||
U.S. Treasury Notes - 22.6% |
| |||||||
0.250% due 02/28/14 | 16,200,000 | 16,177,223 | ||||||
0.250% due 03/31/14 | 1,900,000 | 1,896,884 | ||||||
0.250% due 02/15/15 | 13,900,000 | 13,802,269 | ||||||
0.875% due | 62,300,000 | 61,973,922 | ||||||
1.250% due 03/15/14 | 1,300,000 | 1,322,851 | ||||||
1.375% due 12/31/18 | 1,300,000 | 1,285,985 | ||||||
1.500% due | 11,400,000 | 11,426,722 | ||||||
2.625% due 08/15/20 | 1,100,000 | 1,159,384 | ||||||
3.375% due 11/15/19 | 800,000 | 892,875 | ||||||
|
| |||||||
| 109,938,115 | ||||||||
|
| |||||||
Total U.S. Treasury Obligations |
| 137,909,109 | ||||||
|
| |||||||
FOREIGN GOVERNMENT BONDS & NOTES - 3.0% |
| |||||||
Banco Nacional Desenvolvimento Economico e Social (Brazil) | ||||||||
4.125% due | EUR | 100,000 | 139,759 | |||||
Canada Housing Trust No 1 (Canada) | ||||||||
3.350% due | CAD | 800,000 | 855,413 | |||||
3.750% due | 400,000 | 440,174 | ||||||
3.800% due | 300,000 | 331,547 | ||||||
Province of British Columbia (Canada) | ||||||||
3.250% due 12/18/21 | 100,000 | 102,483 | ||||||
4.300% due 06/18/42 | 100,000 | 114,417 | ||||||
Province of Ontario (Canada) | ||||||||
3.000% due 07/16/18 | $ | 100,000 | 105,972 | |||||
3.150% due 06/02/22 | CAD | 2,700,000 | 2,712,804 | |||||
4.000% due 06/02/21 | 800,000 | 865,375 | ||||||
4.200% due 06/02/20 | 200,000 | 219,909 | ||||||
4.300% due 03/08/17 | 400,000 | 441,514 | ||||||
4.400% due 06/02/19 | 300,000 | 334,715 | ||||||
4.600% due 06/02/39 | 100,000 | 116,971 | ||||||
4.700% due 06/02/37 | 400,000 | 471,013 | ||||||
5.500% due 06/02/18 | 100,000 | 117,760 | ||||||
Province of Quebec (Canada) | ||||||||
3.500% due 07/29/20 | $ | 400,000 | 430,550 | |||||
3.500% due 12/01/22 | CAD | 2,100,000 | 2,158,740 | |||||
4.250% due 12/01/21 | 700,000 | 768,221 | ||||||
4.500% due 12/01/17 | 200,000 | 223,654 | ||||||
4.500% due 12/01/18 | 200,000 | 224,057 | ||||||
4.500% due 12/01/20 | 200,000 | 223,957 | ||||||
Republic of Panama (Panama) | ||||||||
9.375% due 04/01/29 | $ | 40,000 | 64,260 | |||||
| Principal Amount | Value | |||||||
Russia Foreign Bond (Russia) | ||||||||
3.625% due | $ | 100,000 | $ | 104,250 | ||||
7.500% due | 1,336,000 | 1,604,870 | ||||||
Societe Financement de l’Economie Francaise (France) | ||||||||
2.125% due 05/20/12 | EUR | 300,000 | 400,911 | |||||
3.375% due | $ | 200,000 | 209,379 | |||||
Turkey Government International Bond (Turkey) | ||||||||
7.000% due 09/26/16 | 500,000 | 565,000 | ||||||
United Mexican States (Mexico) | ||||||||
6.050% due 01/11/40 | 100,000 | 121,000 | ||||||
Vnesheconombank PLC (Ireland) | ||||||||
5.375% due | 200,000 | 207,000 | ||||||
5.450% due | 100,000 | 103,767 | ||||||
|
| |||||||
Total Foreign Government Bonds & Notes | ||||||||
(Cost $14,357,298) |
| 14,779,442 | ||||||
|
| |||||||
MUNICIPAL BONDS - 4.3% |
| |||||||
American Municipal Power | ||||||||
8.084% due 02/15/50 | 1,000,000 | 1,381,800 | ||||||
Buckeye Tobacco Settlement Financing Authority | ||||||||
5.875% due 06/01/47 | 1,100,000 | 825,198 | ||||||
City of North Las Vegas NV | ||||||||
6.572% due 06/01/40 | 900,000 | 1,012,599 | ||||||
Clark County NV | ||||||||
6.820% due 07/01/45 | 200,000 | 264,068 | ||||||
County of Fresno CA | ||||||||
0.000% due 08/15/22 | 1,400,000 | 812,462 | ||||||
Los Angeles Unified School District | ||||||||
4.500% due 01/01/28 | 400,000 | 419,964 | ||||||
New Jersey Economic Development Authority ‘B’ | ||||||||
0.000% due 02/15/19 | 4,100,000 | 3,111,490 | ||||||
New York Liberty Development Corp | ||||||||
5.750% due 11/15/51 | 3,700,000 | 4,146,516 | ||||||
North Carolina Turnpike | ||||||||
6.700% due 01/01/39 | 100,000 | 113,221 | ||||||
Southern California Public Power Authority | ||||||||
5.943% due 07/01/40 | 1,600,000 | 1,826,816 | ||||||
State of California | ||||||||
5.650% due | 100,000 | 104,986 | ||||||
7.500% due 04/01/34 | 100,000 | 127,144 | ||||||
7.550% due 04/01/39 | 100,000 | 129,848 | ||||||
7.600% due 11/01/40 | 1,400,000 | 1,835,876 | ||||||
Tobacco Securitization Authority of Southern California ‘A1’ | ||||||||
5.000% due 06/01/37 | 800,000 | 604,960 | ||||||
Tobacco Settlement Finance Authority of WV ‘A’ | ||||||||
7.467% due 06/01/47 | 845,000 | 622,833 | ||||||
University of Arizona | ||||||||
6.423% due 08/01/35 | 2,700,000 | 2,989,791 | ||||||
University of California | ||||||||
6.270% due 05/15/31 | 500,000 | 563,050 | ||||||
|
| |||||||
Total Municipal Bonds |
| |||||||
(Cost $19,312,741) | 20,892,622 | |||||||
|
| |||||||
| See Notes to Financial Statements | B-20 | See explanation of symbols and terms, if any, on page B-71 |
Table of Contents
PACIFIC LIFE FUNDS
PL MANAGED BOND FUND
Schedule of Investments (Continued)
March 31, 2012
| Principal Amount | Value | |||||||
SHORT-TERM INVESTMENTS - 2.0% |
| |||||||
Repurchase Agreements - 1.6% |
| |||||||
Morgan Stanley | ||||||||
0.170% due 04/03/12 (Dated 03/30/12, repurchase price of $2,600,012; collateralized by a Federal National Mortgage Association Note: 0.750% due 02/26/13 and value $2,653,572) | $ | 2,600,000 | $ | 2,600,000 | ||||
Morgan Stanley | ||||||||
0.150% due 04/02/12 (Dated 03/29/12, repurchase price of $4,900,061; collateralized by a Federal Home Loan Mortgage Corporation Note: 1.080% due 06/15/12 and value $5,000,522) | 4,900,000 | 4,900,000 | ||||||
|
| |||||||
| 7,500,000 | ||||||||
|
| |||||||
| Shares | ||||||||
Money Market Fund - 0.4% |
| |||||||
BlackRock Liquidity Funds Treasury Trust Fund Portfolio | 2,073,833 | 2,073,833 | ||||||
|
| |||||||
Total Short-Term Investments | ||||||||
(Cost $9,573,833) | 9,573,833 | |||||||
|
| |||||||
TOTAL INVESTMENTS - 130.0% |
| |||||||
(Cost $625,069,273) |
| 631,972,670 | ||||||
TOTAL SECURITIES SOLD SHORT – (0.5%) |
| |||||||
(See Note (f) to Schedule of Investments) |
| |||||||
(Proceeds $2,127,813) |
| (2,127,813 | ) | |||||
OTHER ASSETS & LIABILITIES, |
| (143,630,084 | ) | |||||
|
| |||||||
NET ASSETS - 100.0% | $ | 486,214,773 | ||||||
|
| |||||||
Notes to Schedule of Investments
| (a) | As of March��31, 2012, the fund was diversified as a percentage of net assets as follows: |
Mortgage-Backed Securities | 49.2 | % | ||||
U.S. Treasury Obligations | 28.4 | % | ||||
Corporate Bonds & Notes | 25.7 | % | ||||
U.S. Government Agency Issues | 11.8 | % | ||||
Asset-Backed Securities | 4.5 | % | ||||
Municipal Bonds | 4.3 | % | ||||
Foreign Government Bonds & Notes | 3.0 | % | ||||
Short-Term Investments | 2.0 | % | ||||
Convertible Preferred Stocks | 0.7 | % | ||||
Senior Loan Notes | 0.4 | % | ||||
|
|
| ||||
| 130.0 | % | |||||
Securities Sold Short | (0.5 | %) | ||||
Other Assets & Liabilities, Net | (29.5 | %) | ||||
|
|
| ||||
| 100.0 | % | |||||
|
|
|
| (b) | As of March 31, 2012, the fund’s Standard & Poor’s quality ratings as a percentage of total fixed income investments were as follows (Unaudited): |
AAA | 4.6 | % | ||
A-1 (Short-Term Debt Only) | 1.2 | % | ||
AA / U.S. Government & Agency Issues | 71.5 | % | ||
A | 8.3 | % | ||
BBB | 7.4 | % | ||
BB | 2.3 | % | ||
B | 1.5 | % | ||
CCC | 0.5 | % | ||
CC | 0.2 | % | ||
C | 0.1 | % | ||
Not Rated | 2.4 | % | ||
|
| |||
| 100.0 | % | |||
|
|
| (c) | Short-term investments reflect either the stated coupon rate or the annualized effective yield on the date of purchase for discounted investments. |
| (d) | Investments with a total aggregate value of $240,000 or less than 0.1% of the net assets were in default as of March 31, 2012. |
| (e) | As of March 31, 2012, 0.4% of the fund’s net assets were reported illiquid by the portfolio manager under the Trust’s policy. |
| (f) | Securities sold short outstanding as of March 31, 2012 were as follows: |
| Principal Amount | Value | |||||||
Mortgage-Backed Securities | ||||||||
Fannie Mae | ||||||||
4.500% due 04/12/42 | $ | 2,000,000 | ($ | 2,127,813 | ) | |||
|
| |||||||
Total Securities Sold Short | ||||||||
(Proceeds $2,127,813) | ($ | 2,127,813 | ) | |||||
|
| |||||||
| (g) | Open futures contracts outstanding as of March 31, 2012 were as follows: |
Long Futures Outstanding | Number of Contracts | Notional Amount | Unrealized Appreciation (Depreciation) | |||||||||
Eurodollar (03/14) | 20 | $ | 20,000,000 | $ | 65,304 | |||||||
U.S. Treasury 5-Year Notes (06/12) | 281 | 28,100,000 | (231,791 | ) | ||||||||
|
| |||||||||||
Total Futures Contracts | ($ | 166,487 | ) | |||||||||
|
| |||||||||||
| See Notes to Financial Statements | B-21 | See explanation of symbols and terms, if any, on page B-71 |
Table of Contents
PACIFIC LIFE FUNDS
PL MANAGED BOND FUND
Schedule of Investments (Continued)
March 31, 2012
| (h) | Forward foreign currency contracts outstanding as of March 31, 2012 were as follows: |
Contracts | Currency | Principal Amount Covered by Contracts | Expiration | Counterparty | Unrealized Appreciation (Depreciation) | |||||||||
| Sell | AUD | 839,000 | 04/12 | CIT | $ | 26,911 | ||||||||
| Buy | BRL | 863,356 | 04/12 | MSC | (27,974 | ) | ||||||||
| Sell | BRL | 863,356 | 04/12 | JPM | 24,002 | |||||||||
| Sell | BRL | 863,356 | 06/12 | MSC | 27,750 | |||||||||
| Sell | CAD | 11,044,000 | 06/12 | BRC | 96,918 | |||||||||
| Buy | CNY | 1,917,000 | 06/12 | BRC | 4,059 | |||||||||
| Buy | CNY | 2,992,575 | 06/12 | CIT | 5,331 | |||||||||
| Buy | CNY | 7,026,950 | 06/12 | HSB | 14,559 | |||||||||
| Buy | CNY | 11,507,850 | 06/12 | JPM | 25,280 | |||||||||
| Buy | CNY | 1,912,650 | 06/12 | MSC | 3,369 | |||||||||
| Sell | CNY | 1,409,174 | 06/12 | BRC | (1,865 | ) | ||||||||
| Sell | CNY | 6,289,000 | 06/12 | CIT | 2,490 | |||||||||
| Sell | CNY | 638,700 | 06/12 | CSF | (1,305 | ) | ||||||||
| Sell | CNY | 629,550 | 06/12 | DUB | 146 | |||||||||
| Sell | CNY | 1,258,950 | 06/12 | HSB | 316 | |||||||||
| Sell | CNY | 2,537,100 | 06/12 | JPM | (2,413 | ) | ||||||||
| Sell | CNY | 12,594,550 | 06/12 | UBS | 2,354 | |||||||||
| Buy | CNY | 10,222,705 | 02/13 | DUB | 7,326 | |||||||||
| Sell | CNY | 2,012,955 | 02/13 | BRC | (134 | ) | ||||||||
| Sell | CNY | 8,209,750 | 02/13 | UBS | (1,409 | ) | ||||||||
| Sell | DKK | 4,384,000 | 05/12 | DUB | (5,276 | ) | ||||||||
| Buy | EUR | 704,000 | 04/12 | BRC | 7,077 | |||||||||
| Buy | EUR | 1,052,000 | 04/12 | DUB | 61,236 | |||||||||
| Buy | EUR | 638,000 | 04/12 | HSB | 4,536 | |||||||||
| Buy | EUR | 883,000 | 04/12 | JPM | 6,941 | |||||||||
| Buy | EUR | 173,000 | 04/12 | MSC | 6,909 | |||||||||
| Buy | EUR | 205,000 | 04/12 | UBS | 3,007 | |||||||||
| Sell | EUR | 4,122,000 | 04/12 | BRC | (214,148 | ) | ||||||||
| Sell | EUR | 3,483,000 | 04/12 | CIT | (169,343 | ) | ||||||||
| Sell | EUR | 10,024,000 | 04/12 | DUB | (501,639 | ) | ||||||||
| Sell | EUR | 487,000 | 04/12 | RBC | (29,928 | ) | ||||||||
| Sell | EUR | 7,450,000 | 04/12 | UBS | (449,615 | ) | ||||||||
| Buy | EUR | 438,000 | 05/12 | CIT | 4,461 | |||||||||
| Buy | EUR | 1,027,000 | 06/12 | BNS | 24,515 | |||||||||
| Buy | EUR | 200,000 | 06/12 | CIT | (72 | ) | ||||||||
| Buy | EUR | 1,210,000 | 06/12 | DUB | 13,187 | |||||||||
| Buy | EUR | 603,000 | 06/12 | JPM | 8,077 | |||||||||
| Buy | EUR | 800,000 | 06/12 | MSC | 8,099 | |||||||||
| Buy | EUR | 1,012,000 | 06/12 | UBS | 14,845 | |||||||||
| Buy | EUR | 202,000 | 06/12 | UBS | 3,089 | |||||||||
| Sell | EUR | 4,000 | 06/12 | BRC | (39 | ) | ||||||||
| Sell | EUR | 2,000 | 06/12 | MSC | (37 | ) | ||||||||
| Buy | GBP | 100,000 | 04/12 | JPM | 930 | |||||||||
| Buy | GBP | 200,000 | 06/12 | CIT | (113 | ) | ||||||||
| Buy | GBP | 300,000 | 06/12 | DUB | 2,328 | |||||||||
| Buy | GBP | 215,000 | 06/12 | JPM | 2,418 | |||||||||
| Sell | GBP | 6,499,000 | 06/12 | UBS | (147,273 | ) | ||||||||
| Buy | IDR | 10,089,755,000 | 07/12 | HSB | (24,257 | ) | ||||||||
| Sell | IDR | 651,000,000 | 07/12 | BRC | (676 | ) | ||||||||
| Sell | IDR | 60,375,000 | 07/12 | GSC | (49 | ) | ||||||||
| Sell | IDR | 4,160,000,000 | 07/12 | HSB | (3,614 | ) | ||||||||
| Sell | IDR | 5,218,380,000 | 07/12 | UBS | (11,060 | ) | ||||||||
| Buy | INR | 73,367,500 | 07/12 | JPM | (168,790 | ) | ||||||||
| Sell | INR | 43,931,000 | 07/12 | BRC | 7,450 | |||||||||
| Sell | INR | 10,184,000 | 07/12 | DUB | 4,324 | |||||||||
| Sell | INR | 19,252,500 | 07/12 | JPM | 8,471 | |||||||||
| Buy | MXN | 3,007,771 | 06/12 | HSB | (700 | ) | ||||||||
| Buy | MYR | 1,660,405 | 04/12 | JPM | (6,390 | ) | ||||||||
| Sell | MYR | 1,660,405 | 04/12 | CIT | (4,577 | ) | ||||||||
| Sell | SGD | 500 | 05/12 | DUB | 3 | |||||||||
|
| |||||||||||||
Total Forward Foreign Currency Contracts |
| ($ | 1,339,982 | ) | ||||||||||
|
| |||||||||||||
| See Notes to Financial Statements | B-22 | See explanation of symbols and terms, if any, on page B-71 |
Table of Contents
PACIFIC LIFE FUNDS
PL MANAGED BOND FUND
Schedule of Investments (Continued)
March 31, 2012
| (i) | Transactions in written options for the year ended March 31, 2012 were as follows: |
| Number of Contracts | Notional Amount in $ | Premium | ||||||||||
Outstanding, March 31, 2011 | 67 | 87,300,000 | $ | 810,099 | ||||||||
Call Options Written | 77 | 57,300,000 | 270,438 | |||||||||
Put Options Written | 77 | 165,900,000 | 1,178,034 | |||||||||
Call Options Closed | (94 | ) | (43,100,000 | ) | (196,038 | ) | ||||||
Put Options Closed | (33 | ) | (49,400,000 | ) | (170,852 | ) | ||||||
Call Options Expired | (19 | ) | (29,200,000 | ) | (202,027 | ) | ||||||
Put Options Expired | (75 | ) | (48,900,000 | ) | (305,903 | ) | ||||||
|
|
|
|
|
| |||||||
Outstanding, March 31, 2012 | — | 139,900,000 | $ | 1,383,751 | ||||||||
|
|
|
|
|
| |||||||
| (j) | Premiums received and value of written options outstanding as of March 31, 2012 were as follows: |
Inflation Floor/Cap Options
Description | Strike Index | Exercise Index | Expiration Date | Counter- party | Notional Amount | Premium | Value | |||||||||||||||
Floor - OTC U.S. CPI Urban Consumers NSA | 215.95 | Maximum of ((1+0.00%)10- Inflation Adjustment)) or $0 | 03/12/20 | CIT | $ | 1,200,000 | $ | 10,320 | ($ | 1,884 | ) | |||||||||||
Floor - OTC U.S. CPI Urban Consumers NSA | 217.97 | Maximum of ((1+0.00%)10- Inflation Adjustment)) or $0 | 09/29/20 | CIT | 600,000 | 7,740 | (1,072 | ) | ||||||||||||||
|
|
|
| |||||||||||||||||||
| $ | 18,060 | ($ | 2,956 | ) | ||||||||||||||||||
|
|
|
| |||||||||||||||||||
Interest Rate Swaptions
Description | Pay/Receive Floating Rate Based on 3-Month USD-LIBOR | Exercise Rate | Expiration Date | Counter- party | Notional Amount | Premium | Value | |||||||||||||||
Call - OTC 5-Year Interest Rate Swap | Receive | 1.400 | % | 03/18/13 | MSC | $ | 2,400,000 | $ | 22,440 | ($ | 15,712 | ) | ||||||||||
|
|
|
| |||||||||||||||||||
Put - OTC 3-Year Interest Rate Swap | Pay | 2.750 | % | 06/18/12 | DUB | 6,200,000 | 64,360 | (6 | ) | |||||||||||||
Put - OTC 3-Year Interest Rate Swap | Pay | 2.750 | % | 06/18/12 | RBS | 4,400,000 | 43,120 | (4 | ) | |||||||||||||
Put - OTC 3-Year Interest Rate Swap | Pay | 3.000 | % | 06/18/12 | BRC | 4,300,000 | 38,951 | (1 | ) | |||||||||||||
Put - OTC 3-Year Interest Rate Swap | Pay | 3.000 | % | 06/18/12 | CIT | 3,100,000 | 34,590 | (1 | ) | |||||||||||||
Put - OTC 3-Year Interest Rate Swap | Pay | 3.000 | % | 06/18/12 | DUB | 1,900,000 | 21,236 | – | ||||||||||||||
Put - OTC 3-Year Interest Rate Swap | Pay | 3.000 | % | 06/18/12 | RBS | 6,600,000 | 55,422 | (1 | ) | |||||||||||||
Put - OTC 10-Year Interest Rate Swap | Pay | 10.000 | % | 07/10/12 | MSC | 1,200,000 | 7,230 | – | ||||||||||||||
Put - OTC 5-Year Interest Rate Swap | Pay | 3.250 | % | 07/16/12 | CIT | 3,800,000 | 93,949 | (166 | ) | |||||||||||||
Put - OTC 5-Year Interest Rate Swap | Pay | 3.250 | % | 07/16/12 | RBS | 1,200,000 | 30,132 | (52 | ) | |||||||||||||
Put - OTC 3-Year Interest Rate Swap | Pay | 1.000 | % | 08/13/12 | DUB | 1,600,000 | 16,440 | (4,155 | ) | |||||||||||||
Put - OTC 5-Year Interest Rate Swap | Pay | 1.550 | % | 08/13/12 | CIT | 4,000,000 | 27,600 | (26,686 | ) | |||||||||||||
Put - OTC 5-Year Interest Rate Swap | Pay | 1.550 | % | 08/13/12 | DUB | 15,600,000 | 171,798 | (104,075 | ) | |||||||||||||
Put - OTC 5-Year Interest Rate Swap | Pay | 1.550 | % | 08/13/12 | MSC | 2,500,000 | 11,188 | (16,679 | ) | |||||||||||||
Put - OTC 5-Year Interest Rate Swap | Pay | 1.700 | % | 08/13/12 | CIT | 19,900,000 | 210,315 | (92,975 | ) | |||||||||||||
Put - OTC 5-Year Interest Rate Swap | Pay | 1.700 | % | 08/13/12 | DUB | 9,500,000 | 119,884 | (44,385 | ) | |||||||||||||
Put - OTC 5-Year Interest Rate Swap | Pay | 1.700 | % | 08/13/12 | RBS | 7,400,000 | 102,626 | (34,574 | ) | |||||||||||||
Put - OTC 2-Year Interest Rate Swap | Pay | 2.250 | % | 09/24/12 | CIT | 700,000 | 4,769 | (70 | ) | |||||||||||||
Put - OTC 2-Year Interest Rate Swap | Pay | 2.250 | % | 09/24/12 | MSC | 4,800,000 | 29,501 | (480 | ) | |||||||||||||
Put - OTC 2-Year Interest Rate Swap | Pay | 2.250 | % | 09/24/12 | RBS | 15,000,000 | 117,839 | (1,499 | ) | |||||||||||||
Put - OTC 2-Year Interest Rate Swap | Pay | 0.915 | % | 11/14/12 | CIT | 900,000 | 4,050 | (1,599 | ) | |||||||||||||
Put - OTC 2-Year Interest Rate Swap | Pay | 0.915 | % | 11/14/12 | MSC | 6,500,000 | 17,961 | (11,551 | ) | |||||||||||||
Put - OTC 1-Year Interest Rate Swap | Pay | 1.750 | % | 11/19/12 | RBS | 5,400,000 | 20,385 | (983 | ) | |||||||||||||
Put - OTC 5-Year Interest Rate Swap | Pay | 1.400 | % | 03/18/13 | MSC | 2,400,000 | 46,560 | (55,142 | ) | |||||||||||||
Put - OTC 5-Year Interest Rate Swap | Pay | 2.000 | % | 03/18/13 | DUB | 2,300,000 | 21,585 | (24,179 | ) | |||||||||||||
Put - OTC 2-Year Interest Rate Swap | Pay | 1.200 | % | 07/11/13 | DUB | 4,500,000 | 31,760 | (18,515 | ) | |||||||||||||
|
|
|
| |||||||||||||||||||
| 1,343,251 | (437,778 | ) | ||||||||||||||||||||
|
|
|
| |||||||||||||||||||
| $ | 1,365,691 | ($ | 453,490 | ) | ||||||||||||||||||
|
|
|
| |||||||||||||||||||
Total Written Options | $ | 1,383,751 | ($ | 456,446 | ) | |||||||||||||||||
|
|
|
| |||||||||||||||||||
| See Notes to Financial Statements | B-23 | See explanation of symbols and terms, if any, on page B-71 |
Table of Contents
PACIFIC LIFE FUNDS
PL MANAGED BOND FUND
Schedule of Investments (Continued)
March 31, 2012
| (k) | Swap agreements outstanding as of March 31, 2012 were as follows: |
Credit Default Swaps on Corporate and Sovereign Issues - Sell Protection (1)
Referenced Obligation | Fixed Deal Receive Rate | Expiration Date | Counter- party | Implied Credit Spread at 03/31/12 (3) | Notional Amount (4) | Value | Upfront Premiums Paid (Received) | Unrealized Appreciation (Depreciation) | ||||||||||||||||||
Morgan Stanley | ||||||||||||||||||||||||||
6.600% due 04/01/12 | 1.000% | 09/20/12 | BRC | 2.172 | % | $ | 100,000 | ($ | 527 | ) | ($ | 1,967 | ) | $ | 1,440 | |||||||||||
Brazil Government Bond | ||||||||||||||||||||||||||
12.250% due 03/06/30 D | 1.000% | 12/20/12 | BRC | 0.427 | % | 1,700,000 | 7,700 | 2,600 | 5,100 | |||||||||||||||||
General Electric Capital Corp | ||||||||||||||||||||||||||
5.625% due 09/15/17 | 4.000% | 12/20/13 | CIT | 0.779 | % | 200,000 | 11,361 | — | 11,361 | |||||||||||||||||
General Electric Capital Corp | ||||||||||||||||||||||||||
5.625% due 09/15/17 | 4.230% | 12/20/13 | DUB | 0.779 | % | 200,000 | 12,169 | — | 12,169 | |||||||||||||||||
General Electric Capital Corp | ||||||||||||||||||||||||||
5.625% due 09/15/17 | 4.325% | 12/20/13 | CIT | 0.779 | % | 200,000 | 12,502 | — | 12,502 | |||||||||||||||||
General Electric Capital Corp | ||||||||||||||||||||||||||
6.000% due 06/15/12 | 4.400% | 12/20/13 | BRC | 0.779 | % | 200,000 | 12,785 | — | 12,785 | |||||||||||||||||
General Electric Capital Corp | ||||||||||||||||||||||||||
6.000% due 06/15/12 | 4.500% | 12/20/13 | BRC | 0.779 | % | 300,000 | 19,675 | — | 19,675 | |||||||||||||||||
General Electric Capital Corp | ||||||||||||||||||||||||||
6.000% due 06/15/12 | 4.700% | 12/20/13 | BRC | 0.779 | % | 400,000 | 27,638 | — | 27,638 | |||||||||||||||||
General Electric Capital Corp | ||||||||||||||||||||||||||
5.625% due 09/15/17 | 4.750% | 12/20/13 | DUB | 0.779 | % | 400,000 | 27,988 | — | 27,988 | |||||||||||||||||
MetLife Inc | ||||||||||||||||||||||||||
5.000% due 06/15/15 | 1.000% | 12/20/14 | CIT | 1.565 | % | 100,000 | (1,462 | ) | (1,584 | ) | 122 | |||||||||||||||
United Mexican States | ||||||||||||||||||||||||||
7.500% due 04/08/33 | 1.000% | 03/20/15 | BRC | 0.782 | % | 400,000 | 2,706 | (8,999 | ) | 11,705 | ||||||||||||||||
United Mexican States | ||||||||||||||||||||||||||
7.500% due 04/08/33 | 1.000% | 03/20/15 | CIT | 0.782 | % | 400,000 | 2,706 | (9,184 | ) | 11,890 | ||||||||||||||||
Japanese Government Bond | ||||||||||||||||||||||||||
2.000% due 03/21/22 D | 1.000% | 03/20/15 | DUB | 0.593 | % | 1,000,000 | 12,354 | 11,616 | 738 | |||||||||||||||||
United Mexican States | ||||||||||||||||||||||||||
7.500% due 04/08/33 | 1.000% | 03/20/15 | DUB | 0.782 | % | 200,000 | 1,354 | (4,592 | ) | 5,946 | ||||||||||||||||
Brazil Government Bond | ||||||||||||||||||||||||||
12.250% due 03/06/30 | 1.000% | 06/20/15 | DUB | 0.876 | % | 1,000,000 | 4,259 | (10,975 | ) | 15,234 | ||||||||||||||||
United Kingdom | ||||||||||||||||||||||||||
4.250% due 06/07/32 D | 1.000% | 06/20/15 | GSC | 0.288 | % | 1,100,000 | 25,496 | 10,164 | 15,332 | |||||||||||||||||
Brazil Government Bond | ||||||||||||||||||||||||||
12.250% due 03/06/30 | 1.000% | 06/20/15 | HSB | 0.876 | % | 1,000,000 | 4,259 | (10,975 | ) | 15,234 | ||||||||||||||||
Brazil Government Bond | ||||||||||||||||||||||||||
12.250% due 03/06/30 | 1.000% | 09/20/15 | BRC | 0.924 | % | 1,000,000 | 2,927 | (7,735 | ) | 10,662 | ||||||||||||||||
United Mexican States | ||||||||||||||||||||||||||
7.500% due 04/08/33 | 1.000% | 09/20/15 | BRC | 0.872 | % | 1,000,000 | 4,728 | (7,735 | ) | 12,463 | ||||||||||||||||
Brazil Government Bond | ||||||||||||||||||||||||||
12.250% due 03/06/30 | 1.000% | 09/20/15 | HSB | 0.924 | % | 600,000 | 1,756 | (5,961 | ) | 7,717 | ||||||||||||||||
Brazil Government Bond | ||||||||||||||||||||||||||
12.250% due 03/06/30 | 1.000% | 09/20/15 | UBS | 0.924 | % | 500,000 | 1,464 | (4,731 | ) | 6,195 | ||||||||||||||||
France Government Bond OAT | ||||||||||||||||||||||||||
4.250% due 04/25/19 | 0.250% | 12/20/15 | RBS | 1.378 | % | 700,000 | (28,321 | ) | (13,898 | ) | (14,423 | ) | ||||||||||||||
MetLife Inc | ||||||||||||||||||||||||||
5.000% due 06/15/15 | 1.000% | 12/20/15 | CIT | 1.861 | % | 800,000 | (24,231 | ) | (29,083 | ) | 4,852 | |||||||||||||||
United Kingdom | ||||||||||||||||||||||||||
4.250% due 06/07/32 D | 1.000% | 12/20/15 | GSC | 0.389 | % | 1,200,000 | 27,460 | 27,797 | (337 | ) | ||||||||||||||||
General Electric Capital Corp | ||||||||||||||||||||||||||
5.625% due 09/15/17 | 1.000% | 12/20/15 | MSC | 1.176 | % | 500,000 | (3,020 | ) | (9,796 | ) | 6,776 | |||||||||||||||
France Government Bond OAT | ||||||||||||||||||||||||||
4.250% due 04/25/19 | 0.250% | 03/20/16 | RBS | 1.423 | % | 2,900,000 | (129,593 | ) | (89,270 | ) | (40,323 | ) | ||||||||||||||
China Government Bond | ||||||||||||||||||||||||||
4.750% due 10/29/13 | 1.000% | 03/20/16 | BRC | 0.868 | % | 1,000,000 | 5,469 | 11,950 | (6,481 | ) | ||||||||||||||||
United Mexican States | ||||||||||||||||||||||||||
7.500% due 04/08/33 | 1.000% | 03/20/16 | BRC | 0.954 | % | 100,000 | 214 | (768 | ) | 982 | ||||||||||||||||
Brazil Government Bond | ||||||||||||||||||||||||||
12.250% due 03/06/30 | 1.000% | 03/20/16 | CIT | 1.000 | % | 2,300,000 | 759 | (16,240 | ) | 16,999 | ||||||||||||||||
Republic of Kazakhstan Debt | 1.000% | 03/20/16 | CIT | 1.797 | % | 300,000 | (9,039 | ) | (8,658 | ) | (381 | ) | ||||||||||||||
United Mexican States | ||||||||||||||||||||||||||
5.950% due 03/19/19 | 1.000% | 03/20/16 | CIT | 0.954 | % | 1,100,000 | 2,354 | (8,978 | ) | 11,332 | ||||||||||||||||
United Mexican States | ||||||||||||||||||||||||||
7.500% due 04/08/33 | 1.000% | 03/20/16 | DUB | 0.954 | % | 700,000 | 1,497 | (5,135 | ) | 6,632 | ||||||||||||||||
| See Notes to Financial Statements | B-24 | See explanation of symbols and terms, if any, on page B-71 |
Table of Contents
PACIFIC LIFE FUNDS
PL MANAGED BOND FUND
Schedule of Investments (Continued)
March 31, 2012
Referenced Obligation | Fixed Deal Receive Rate | Expiration Date | Counter- party | Implied Credit Spread at 03/31/12 (3) | Notional Amount (4) | Value | Upfront Premiums Paid (Received) | Unrealized Appreciation (Depreciation) | ||||||||||||||||||||||||
Italy Government Global Debt Bond | ||||||||||||||||||||||||||||||||
6.875% due 09/27/23 | 1.000 | % | 03/20/16 | GSC | 3.726 | % | $ | 700,000 | ($ | 67,645 | ) | ($ | 23,247 | ) | ($ | 44,398 | ) | |||||||||||||||
Berkshire Hathaway Finance Corp | ||||||||||||||||||||||||||||||||
2.450% due 12/15/15 | 1.000 | % | 06/20/16 | CIT | 1.259 | % | 900,000 | (9,156 | ) | (2,156 | ) | (7,000 | ) | |||||||||||||||||||
Brazil Government Bond | ||||||||||||||||||||||||||||||||
12.250% due 03/06/30 | 1.000 | % | 06/20/16 | CIT | 1.032 | % | 700,000 | (676 | ) | (2,363 | ) | 1,687 | ||||||||||||||||||||
France Government Bond OAT | ||||||||||||||||||||||||||||||||
4.250% due 04/25/19 | 0.250 | % | 09/20/16 | HSB | 1.526 | % | 400,000 | (21,683 | ) | (17,549 | ) | (4,134 | ) | |||||||||||||||||||
China Government Bond | ||||||||||||||||||||||||||||||||
4.750% due 10/29/13 | 1.000 | % | 09/20/16 | DUB | 0.977 | % | 400,000 | 528 | 2,210 | (1,682 | ) | |||||||||||||||||||||
Brazil Government Bond | ||||||||||||||||||||||||||||||||
12.250% due 03/06/30 | 1.000 | % | 09/20/16 | GSC | 1.085 | % | 200,000 | (670 | ) | (1,217 | ) | 547 | ||||||||||||||||||||
South Korea Government Bond | ||||||||||||||||||||||||||||||||
4.875% due 09/22/14 | 1.000 | % | 09/20/16 | HSB | 1.069 | % | 100,000 | (267 | ) | (218 | ) | (49 | ) | |||||||||||||||||||
China Government Bond | ||||||||||||||||||||||||||||||||
4.750% due 10/29/13 | 1.000 | % | 09/20/16 | MSC | 0.977 | % | 400,000 | 528 | 2,019 | (1,491 | ) | |||||||||||||||||||||
China Government Bond | ||||||||||||||||||||||||||||||||
4.750% due 10/29/13 | 1.000 | % | 09/20/16 | UBS | 0.977 | % | 300,000 | 396 | 1,557 | (1,161 | ) | |||||||||||||||||||||
Indonesia Government Bond | ||||||||||||||||||||||||||||||||
7.250% due 04/20/15 | 1.000 | % | 09/20/16 | UBS | 1.441 | % | 100,000 | (1,858 | ) | (1,578 | ) | (280 | ) | |||||||||||||||||||
United Kingdom | ||||||||||||||||||||||||||||||||
4.250% due 06/07/32 D | 1.000 | % | 12/20/16 | CIT | 0.556 | % | 2,000,000 | 41,794 | 7,916 | 33,878 | ||||||||||||||||||||||
United Kingdom | ||||||||||||||||||||||||||||||||
4.250% due 06/07/32 D | 1.000 | % | 12/20/16 | GSC | 0.556 | % | 1,400,000 | 29,256 | 4,152 | 25,104 | ||||||||||||||||||||||
Ally Financial Inc | ||||||||||||||||||||||||||||||||
8.300% due 02/12/15 | 5.000 | % | 12/20/16 | DUB | 4.319 | % | 300,000 | 8,543 | (3,675 | ) | 12,218 | |||||||||||||||||||||
South Korea Government Bond | ||||||||||||||||||||||||||||||||
4.875% due 09/22/14 | 1.000 | % | 06/20/17 | CIT | 1.235 | % | 400,000 | (4,582 | ) | (3,926 | ) | (656 | ) | |||||||||||||||||||
Brazil Government Bond | ||||||||||||||||||||||||||||||||
12.250% due 03/06/30 | 1.000 | % | 06/20/17 | DUB | 1.212 | % | 1,300,000 | (13,456 | ) | (14,173 | ) | 717 | ||||||||||||||||||||
Indonesia Government Bond | ||||||||||||||||||||||||||||||||
7.250% due 04/20/15 | 1.000 | % | 06/20/17 | DUB | 1.665 | % | 200,000 | (6,490 | ) | (5,884 | ) | (606 | ) | |||||||||||||||||||
South Korea Government Bond | ||||||||||||||||||||||||||||||||
4.875% due 09/22/14 | 1.000 | % | 06/20/17 | HSB | 1.235 | % | 300,000 | (3,437 | ) | (2,872 | ) | (565 | ) | |||||||||||||||||||
Japanese Government Bond | ||||||||||||||||||||||||||||||||
2.000% due 03/21/22 D | 1.000 | % | 06/20/17 | MSC | 1.000 | % | 2,000,000 | 435 | 2,504 | (2,069 | ) | |||||||||||||||||||||
United Mexican States | ||||||||||||||||||||||||||||||||
5.950% due 03/19/19 | 1.000 | % | 06/20/17 | MSC | 1.172 | % | 1,000,000 | (8,372 | ) | (7,846 | ) | (526 | ) | |||||||||||||||||||
Indonesia Government Bond | ||||||||||||||||||||||||||||||||
7.250% due 04/20/15 | 1.000 | % | 06/20/17 | UBS | 1.665 | % | 800,000 | (25,960 | ) | (24,192 | ) | (1,768 | ) | |||||||||||||||||||
South Korea Government Bond | ||||||||||||||||||||||||||||||||
4.875% due 09/22/14 | 1.000 | % | 06/20/17 | UBS | 1.235 | % | 900,000 | (10,309 | ) | (9,272 | ) | (1,037 | ) | |||||||||||||||||||
Reynolds American Inc | ||||||||||||||||||||||||||||||||
7.625% due 06/01/16 | 1.280 | % | 06/20/17 | DUB | 1.442 | % | 200,000 | (1,520 | ) | — | (1,520 | ) | ||||||||||||||||||||
MetLife Inc | ||||||||||||||||||||||||||||||||
5.000% due 06/15/15 | 1.000 | % | 03/20/18 | DUB | 2.169 | % | 1,200,000 | (74,769 | ) | (68,165 | ) | (6,604 | ) | |||||||||||||||||||
United Mexican States | ||||||||||||||||||||||||||||||||
7.500% due 04/08/33 | 1.000 | % | 03/20/21 | CIT | 1.476 | % | 100,000 | (3,738 | ) | (4,247 | ) | 509 | ||||||||||||||||||||
Indonesia Government Bond | ||||||||||||||||||||||||||||||||
7.250% due 04/20/15 | 1.000 | % | 06/20/21 | BRC | 2.138 | % | 1,500,000 | (130,591 | ) | (95,221 | ) | (35,370 | ) | |||||||||||||||||||
United Mexican States | ||||||||||||||||||||||||||||||||
7.500% due 04/08/33 | 1.000 | % | 06/20/21 | BRC | 1.490 | % | 1,200,000 | (47,197 | ) | (34,805 | ) | (12,392 | ) | |||||||||||||||||||
|
|
|
|
|
| |||||||||||||||||||||||||||
| ($ | 313,509 | ) | ($ | 494,385 | ) | $ | 180,876 | |||||||||||||||||||||||||
|
|
|
|
|
| |||||||||||||||||||||||||||
Credit Default Swaps on Credit Indices - Buy Protection (2)
Referenced Obligation | Fixed Deal Pay Rate | Expiration Date | Counterparty | Notional Amount (4) | Value (5) | Upfront Premiums Paid (Received) | Unrealized Appreciation | |||||||||||||||
OTC - Dow Jones iTraxx 17SEN2 BP D | 1.000% | 06/20/17 | BRC | EUR | 1,400,000 | $ | 103,580 |
| $ | 91,912 | $ | 11,668 | ||||||||||
OTC - Dow Jones iTraxx 17SEN2 BP D | 1.000% | 06/20/17 | CIT | 200,000 | 14,797 | 13,130 | 1,667 | |||||||||||||||
|
|
|
|
|
| |||||||||||||||||
| $ | 118,377 | $ | 105,042 | $ | 13,335 | |||||||||||||||||
|
|
|
|
|
| |||||||||||||||||
| See Notes to Financial Statements | B-25 | See explanation of symbols and terms, if any, on page B-71 |
Table of Contents
PACIFIC LIFE FUNDS
PL MANAGED BOND FUND
Schedule of Investments (Continued)
March 31, 2012
Credit Default Swaps on Credit Indices - Sell Protection (1)
Referenced Obligation | Fixed Deal Receive Rate | Expiration Date | Counterparty | Notional Amount (4) | Value (5) | Upfront Premiums Paid (Received) | Unrealized Appreciation (Depreciation) | |||||||||||||||||||||
OTC - Dow Jones CDX NA HY-8 5Y D | 0.483 | % | 06/20/12 | BRC | $ | 755,752 | $ | 224 | $ | — | $ | 224 | ||||||||||||||||
OTC - Dow Jones CDX NA HY-9 5Y D | 2.080 | % | 12/20/12 | BOA | 1,416,690 | 17,604 | — | 17,604 | ||||||||||||||||||||
OTC - Dow Jones CDX NA EM13 5Y | 5.000 | % | 06/20/15 | BRC | 2,600,000 | 243,829 | 174,200 | 69,629 | ||||||||||||||||||||
OTC - Dow Jones CDX NA EM13 5Y | 5.000 | % | 06/20/15 | DUB | 900,000 | 84,402 | 117,500 | (33,098 | ) | |||||||||||||||||||
OTC - Dow Jones CDX NA EM13 5Y | 5.000 | % | 06/20/15 | HSB | 1,200,000 | 112,536 | 135,550 | (23,014 | ) | |||||||||||||||||||
OTC - Dow Jones CDX NA EM13 5Y | 5.000 | % | 06/20/15 | MSC | 900,000 | 84,402 | 101,250 | (16,848 | ) | |||||||||||||||||||
OTC - Dow Jones CDX NA EM14 5Y | 5.000 | % | 12/20/15 | CIT | 200,000 | 20,401 | 27,650 | (7,249 | ) | |||||||||||||||||||
OTC - Dow Jones CDX NA EM14 5Y | 5.000 | % | 12/20/15 | DUB | 600,000 | 61,203 | 74,750 | (13,547 | ) | |||||||||||||||||||
OTC - Dow Jones CDX NA EM14 5Y | 5.000 | % | 12/20/15 | MSC | 400,000 | 40,802 | 52,000 | (11,198 | ) | |||||||||||||||||||
CME - Dow Jones CDX NA IG-17 5Y | 1.000 | % | 12/20/16 | CME | 40,700,000 | (273,067 | ) | 694,915 | (967,982 | ) | ||||||||||||||||||
OTC - Dow Jones CDX NA IG-9 10Y | 0.548 | % | 12/20/17 | GSC | 96,450 | 2,038 | — | 2,038 | ||||||||||||||||||||
|
|
|
|
|
| |||||||||||||||||||||||
| $ | 394,374 | $ | 1,377,815 | ($ | 983,441 | ) | ||||||||||||||||||||||
|
|
|
|
|
| |||||||||||||||||||||||
Total Credit Default Swaps | $ | 199,242 | $ | 988,472 | ($ | 789,230 | ) | |||||||||||||||||||||
|
|
|
|
|
| |||||||||||||||||||||||
| (1) | If the fund is a seller of protection and a credit event occurs, as defined under the terms of that particular swap agreement, the fund will either (i) pay to the buyer of protection an amount equal to the notional amount of the swap and take delivery of the referenced obligation or underlying investments comprising the referenced index or (ii) pay a net settlement amount in the form of cash or investments equal to the notional amount of the swap less the recovery value of the referenced obligation or underlying investments comprising the referenced index. |
| (2) | If the fund is a buyer of protection and a credit event occurs, as defined under the terms of that particular swap agreement, the fund will either (i) receive from the seller of protection an amount equal to the notional amount of the swap and deliver the referenced obligation or underlying investments comprising the referenced index or (ii) receive a settlement amount in the form of cash or investments equal to the notional amount of the swap less the recovery value of the referenced obligation or underlying investments comprising the referenced index. |
| (3) | An implied credit spread is the spread in yield between a U.S. Treasury security and the referenced obligation or underlying investment that are identical in all respects except for the quality rating. Implied credit spreads, represented in absolute terms, utilized in determining the value of credit default swap agreements on corporate issues or sovereign issues of an emerging country as of year end serve as an indicator of the current status of the payment/performance risk and represent the likelihood of risk of default for the credit derivative. The implied credit spread of a particular referenced entity reflects the cost of buying/selling protection and may include upfront payments required to be made to enter into the agreement. Wider credit spreads, in comparison to narrower credit spreads, represent a deterioration of the referenced entity’s credit soundness and a greater likelihood of risk of default or other credit event occurring as defined under the terms of the agreement. A credit spread identified as “Defaulted” indicates a credit event has occurred for the referenced entity or obligation. |
| (4) | The maximum potential amount the fund could be required to pay as a seller of credit protection or receive as a buyer of credit protection if a credit event occurs as defined under the terms of that particular swap agreement. |
| (5) | The quoted market prices and resulting values for credit default swap agreements on credit indices serve as an indicator of the current status of the payment/performance risk and is a representation of the likelihood of an expected liability (or profit) for the credit derivative should the notional amount of the swap agreement had been closed/sold as of the year end. Increasing values, in absolute terms when compared to the notional amount of the swap, represent a deterioration of the referenced entity’s credit soundness and a greater likelihood of risk of default or other credit event occurring as defined under the terms of the agreement. |
Interest Rate Swaps
Floating Rate Index | Counter- party | Pay/Receive Floating Rate | Fixed Rate | Expiration Date | Notional Amount | Value | Upfront Premiums Paid (Received) | Unrealized Appreciation (Depreciation) | ||||||||||||||||||||||||
OTC - BRL - CDI Compounded | HSB | Pay | 10.450 | % | 01/02/13 | BRL | 400,000 | $ | 1,688 | ($ | 300 | ) | $ | 1,988 | ||||||||||||||||||
OTC - BRL - CDI Compounded | MSC | Pay | 10.455 | % | 01/02/13 | 600,000 | 2,597 | (239 | ) | 2,836 | ||||||||||||||||||||||
OTC - BRL - CDI Compounded | UBS | Pay | 10.605 | % | 01/02/13 | 1,200,000 | 6,421 | — | 6,421 | |||||||||||||||||||||||
OTC - BRL - CDI Compounded | HSB | Pay | 11.880 | % | 01/02/13 | 1,300,000 | 25,479 | (989 | ) | 26,468 | ||||||||||||||||||||||
OTC - BRL - CDI Compounded | GSC | Pay | 11.890 | % | 01/02/13 | 200,000 | 4,235 | �� | 314 | 3,921 | ||||||||||||||||||||||
OTC - BRL - CDI Compounded | HSB | Pay | 11.890 | % | 01/02/13 | 2,000,000 | 42,347 | 4,283 | 38,064 | |||||||||||||||||||||||
OTC - BRL - CDI Compounded | BRC | Pay | 11.910 | % | 01/02/13 | 1,000,000 | 20,494 | 2,348 | 18,146 | |||||||||||||||||||||||
OTC - BRL - CDI Compounded | GSC | Pay | 11.930 | % | 01/02/13 | 900,000 | 19,249 | (1,293 | ) | 20,542 | ||||||||||||||||||||||
OTC - BRL - CDI Compounded | MSC | Pay | 11.980 | % | 01/02/13 | 600,000 | 13,282 | 935 | 12,347 | |||||||||||||||||||||||
OTC - BRL - CDI Compounded | HSB | Pay | 12.300 | % | 01/02/13 | 1,300,000 | 35,086 | 3,928 | 31,158 | |||||||||||||||||||||||
OTC - BRL - CDI Compounded | BRC | Pay | 12.455 | % | 01/02/13 | 800,000 | 13,315 | 391 | 12,924 | |||||||||||||||||||||||
OTC - BRL - CDI Compounded | MSC | Pay | 12.500 | % | 01/02/13 | 1,800,000 | 30,586 | 1,366 | 29,220 | |||||||||||||||||||||||
OTC - BRL - CDI Compounded | MSC | Pay | 12.590 | % | 01/02/13 | 2,400,000 | 62,025 | 9,023 | 53,002 | |||||||||||||||||||||||
OTC - BRL - CDI Compounded | HSB | Pay | 10.530 | % | 01/02/14 | 900,000 | 6,460 | (2,621 | ) | 9,081 | ||||||||||||||||||||||
OTC - BRL - CDI Compounded | MSC | Pay | 10.580 | % | 01/02/14 | 3,600,000 | 27,735 | (7,265 | ) | 35,000 | ||||||||||||||||||||||
OTC - BRL - CDI Compounded | UBS | Pay | 10.770 | % | 01/02/14 | 3,800,000 | 36,491 | (4,453 | ) | 40,944 | ||||||||||||||||||||||
OTC - BRL - CDI Compounded | HSB | Pay | 10.990 | % | 01/02/14 | 300,000 | 3,470 | 411 | 3,059 | |||||||||||||||||||||||
OTC - BRL - CDI Compounded | HSB | Pay | 11.530 | % | 01/02/14 | 600,000 | 10,331 | (171 | ) | 10,502 | ||||||||||||||||||||||
OTC - BRL - CDI Compounded | MSC | Pay | 11.670 | % | 01/02/14 | 1,500,000 | 26,770 | 1,275 | 25,495 | |||||||||||||||||||||||
OTC - BRL - CDI Compounded | MSC | Pay | 11.890 | % | 01/02/14 | 3,500,000 | 82,916 | (21 | ) | 82,937 | ||||||||||||||||||||||
OTC - BRL - CDI Compounded | UBS | Pay | 12.250 | % | 01/02/14 | 600,000 | 19,871 | 1,667 | 18,204 | |||||||||||||||||||||||
OTC - BRL - CDI Compounded | MSC | Pay | 12.510 | % | 01/02/14 | 200,000 | 7,476 | 919 | 6,557 | |||||||||||||||||||||||
OTC - BRL - CDI Compounded | HSB | Pay | 12.540 | % | 01/02/14 | 100,000 | 3,783 | 648 | 3,135 | |||||||||||||||||||||||
OTC - BRL - CDI Compounded | GSC | Pay | 12.650 | % | 01/02/14 | 1,200,000 | 47,447 | 9,627 | 37,820 | |||||||||||||||||||||||
| See Notes to Financial Statements | B-26 | See explanation of symbols and terms, if any, on page B-71 |
Table of Contents
PACIFIC LIFE FUNDS
PL MANAGED BOND FUND
Schedule of Investments (Continued)
March 31, 2012
Floating Rate Index | Counter- party | Pay/Receive Floating Rate | Fixed Rate | Expiration Date | Notional Amount | Value | Upfront Premiums Paid (Received) | Unrealized Appreciation (Depreciation) | ||||||||||||||||||||
OTC - 28-Day Mexico Interbank TIIE Banxico | BRC | Pay | 5.600 | % | 09/06/16 | MXN | 1,100,000 | $ | 232 | $ | 552 | ($ | 320 | ) | ||||||||||||||
OTC - 28-Day Mexico Interbank TIIE Banxico | HSB | Pay | 5.600 | % | 09/06/16 | 2,100,000 | 446 | 820 | (374 | ) | ||||||||||||||||||
OTC - 28-Day Mexico Interbank TIIE Banxico | MSC | Pay | 5.600 | % | 09/06/16 | 1,400,000 | 325 | 280 | 45 | |||||||||||||||||||
OTC - 28-Day Mexico Interbank TIIE Banxico | GSC | Pay | 8.170 | % | 11/04/16 | 1,200,000 | 10,016 | 1,757 | 8,259 | |||||||||||||||||||
OTC - 6-Month Australian Bank Bill | BRC | Pay | 4.250 | % | 06/15/17 | AUD | 100,000 | (831 | ) | (98 | ) | (733 | ) | |||||||||||||||
OTC - 6-Month Australian Bank Bill | CIT | Pay | 4.250 | % | 06/15/17 | 200,000 | (1,663 | ) | (962 | ) | (701 | ) | ||||||||||||||||
OTC - 6-Month Australian Bank Bill | DUB | Pay | 4.250 | % | 06/15/17 | 300,000 | (2,494 | ) | (584 | ) | (1,910 | ) | ||||||||||||||||
OTC - 6-Month Australian Bank Bill | CIT | Pay | 5.000 | % | 06/15/17 | 200,000 | 5,398 | 1,509 | 3,889 | |||||||||||||||||||
OTC - 6-Month Australian Bank Bill | DUB | Pay | 5.000 | % | 06/15/17 | 100,000 | 2,699 | 789 | 1,910 | |||||||||||||||||||
OTC - 6-Month Australian Bank Bill | RBS | Pay | 5.000 | % | 06/15/17 | 300,000 | 8,097 | 2,410 | 5,687 | |||||||||||||||||||
OTC - 3-Month Canadian Bank Bill | RBS | Pay | 5.700 | % | 12/18/24 | CAD | 2,100,000 | 148,022 | (1,439 | ) | 149,461 | |||||||||||||||||
OTC - 3-Month USD-LIBOR | BRC | Receive | 2.750 | % | 06/20/42 | $ | 1,400,000 | 83,853 | 12,600 | 71,253 | ||||||||||||||||||
OTC - 3-Month USD-LIBOR | MSC | Receive | 2.750 | % | 06/20/42 | 2,200,000 | 131,769 | 21,230 | 110,539 | |||||||||||||||||||
|
|
|
|
|
| |||||||||||||||||||||||
Total Interest Rate Swaps | $ | 935,423 | $ | 58,647 | $ | 876,776 | ||||||||||||||||||||||
|
|
|
|
|
| |||||||||||||||||||||||
Total Swap Agreements | $ | 1,134,665 | $ | 1,047,119 | $ | 87,546 | ||||||||||||||||||||||
|
|
|
|
|
| |||||||||||||||||||||||
| (l) | As of March 31, 2012, securities with total aggregate values of $239,006 and $953,903 were fully or partially segregated with the broker(s)/custodian as collateral for open futures and swap contracts, respectively. Additionally, $3,000 in cash was segregated as collateral for open swap contracts. |
| (m) | Fair Value Measurements |
The following is a summary of the fund’s investments as categorized under the three-tier hierarchy of inputs used in valuing the fund’s assets and liabilities (See Note 3C in Notes to Financial Statements) as of March 31, 2012:
| Total Value at March 30, 2012 | Level 1 Quoted Price | Level 2 Significant Observable Inputs | Level 3 Significant Unobservable Inputs | |||||||||||||||
| Assets | Convertible Preferred Stocks (1) | $ | 3,350,100 | $ | 3,350,100 | $ | — | $ | — | |||||||||
| Preferred Stocks (1) | 10,560 | 10,560 | — | — | ||||||||||||||
| Corporate Bonds & Notes | 124,930,224 | — | 124,927,223 | 3,001 | ||||||||||||||
| Senior Loan Notes | 1,846,250 | — | 1,846,250 | — | ||||||||||||||
| Mortgage-Backed Securities | 239,174,013 | — | 239,098,713 | 75,300 | ||||||||||||||
| Asset-Backed Securities | 22,172,770 | — | 22,172,770 | — | ||||||||||||||
| U.S. Government Agency Issues | 57,333,747 | — | 57,333,747 | — | ||||||||||||||
| U.S. Treasury Obligations | 137,909,109 | — | 137,909,109 | — | ||||||||||||||
| Foreign Government Bonds & Notes | 14,779,442 | — | 14,779,442 | — | ||||||||||||||
| Municipal Bonds | 20,892,622 | — | 20,892,622 | — | ||||||||||||||
| Short-Term Investments | 9,573,833 | 2,073,833 | 7,500,000 | — | ||||||||||||||
| Derivatives: | ||||||||||||||||||
Credit Contracts | ||||||||||||||||||
Swaps | 1,100,878 | — | 1,100,878 | — | ||||||||||||||
Foreign Currency Contracts | ||||||||||||||||||
Forward Foreign Currency Contracts | 432,714 | — | 432,714 | — | ||||||||||||||
Interest Rate Contracts | ||||||||||||||||||
Futures | 65,304 | 65,304 | — | — | ||||||||||||||
Swaps | 940,411 | — | 940,411 | — | ||||||||||||||
|
|
|
|
|
|
|
| |||||||||||
Total Interest Rate Contracts | 1,005,715 | 65,304 | 940,411 | — | ||||||||||||||
|
|
|
|
|
|
|
| |||||||||||
Total Assets - Derivatives | 2,539,307 | 65,304 | 2,474,003 | — | ||||||||||||||
|
|
|
|
|
|
|
| |||||||||||
Total Assets | 634,511,977 | 5,499,797 | 628,933,879 | 78,301 | ||||||||||||||
|
|
|
|
|
|
|
| |||||||||||
| Liabilities | Securities Sold Short | |||||||||||||||||
Mortgage-Backed Securities | (2,127,813 | ) | — | (2,127,813 | ) | — | ||||||||||||
| Derivatives: | ||||||||||||||||||
Credit Contracts | ||||||||||||||||||
Swaps | (901,636 | ) | — | (901,636 | ) | — | ||||||||||||
Foreign Currency Contracts | ||||||||||||||||||
Forward Foreign Currency Contracts | (1,772,696 | ) | — | (1,772,696 | ) | — | ||||||||||||
Interest Rate Contracts | ||||||||||||||||||
Futures | (231,791 | ) | (231,791 | ) | — | — | ||||||||||||
Written Options | (456,446 | ) | — | (453,490 | ) | (2,956 | ) | |||||||||||
Swaps | (4,988 | ) | — | (4,988 | ) | — | ||||||||||||
|
|
|
|
|
|
|
| |||||||||||
Total Interest Rate Contracts | (693,225 | ) | (231,791 | ) | (458,478 | ) | (2,956 | ) | ||||||||||
|
|
|
|
|
|
|
| |||||||||||
Total Liabilities - Derivatives | (3,367,557 | ) | (231,791 | ) | (3,132,810 | ) | (2,956 | ) | ||||||||||
|
|
|
|
|
|
|
| |||||||||||
Total Liabilities | (5,495,370 | ) | (231,791 | ) | (5,260,623 | ) | (2,956 | ) | ||||||||||
|
|
|
|
|
|
|
| |||||||||||
Total | $ | 629,016,607 | $ | 5,268,006 | $ | 623,673,256 | $ | 75,345 | ||||||||||
|
|
|
|
|
|
|
| |||||||||||
| See Notes to Financial Statements | B-27 | See explanation of symbols and terms, if any, on page B-71 |
Table of Contents
PACIFIC LIFE FUNDS
PL MANAGED BOND FUND
Schedule of Investments (Continued)
March 31, 2012
The following is a reconciliation of investments for significant unobservable inputs (Level 3) used in valuing the fund’s assets and liabilities (See Note 3C in Notes to Financial Statements) for the year ended March 31, 2012:
| Convertible Preferred Stocks | Corporate Bonds & Notes | Mortgage- Backed Securities | Asset-Backed Securities | Foreign Government Bonds & Notes | Liabilities Derivatives Interest Rate Contracts Written Options | Total | ||||||||||||||||||||||
Value, Beginning of Year | $ | — | $ | — | $ | — | $ | 6,819,355 | $ | 848,164 | ($ | 182,584 | ) | $ | 7,484,935 | |||||||||||||
Purchases | 385 | 7,432 | 77,837 | — | — | — | 85,654 | |||||||||||||||||||||
Sales (includes paydowns) | — | — | — | (608,343 | ) | (591,300 | ) | — | (1,199,643 | ) | ||||||||||||||||||
Accrued Discounts (Premiums) | — | — | — | — | — | — | — | |||||||||||||||||||||
Net Realized Gains (Losses) | — | — | — | 18,368 | (71,505 | ) | 107,618 | 54,481 | ||||||||||||||||||||
Change in Net Unrealized Appreciation (Depreciation) | (385 | ) | (4,431 | ) | (2,537 | ) | 28,178 | (185,359 | ) | 72,010 | (92,524 | ) | ||||||||||||||||
Transfers In | — | — | — | — | — | — | — | |||||||||||||||||||||
Transfers Out | — | — | — | (6,257,558 | ) | — | — | (6,257,558 | ) | |||||||||||||||||||
|
|
|
|
|
|
|
|
|
|
|
|
|
| |||||||||||||||
Value, End of Year | $ | — | $ | 3,001 | $ | 75,300 | $ | — | $ | — | ($ | 2,956 | ) | $ | 75,345 | |||||||||||||
|
|
|
|
|
|
|
|
|
|
|
|
|
| |||||||||||||||
Change in Net Unrealized Appreciation (Depreciation) on Level 3 Investments Held at the End of Year, if Applicable | ($ | 385 | ) | ($ | 4,431 | ) | ($ | 2,537 | ) | $ | — | $ | — | $ | 7,399 | $ | 46 | |||||||||||
|
|
|
|
|
|
|
|
|
|
|
|
|
| |||||||||||||||
| (1) | For equity investments categorized in a single level, refer to the schedule of investments for further industry breakout. |
| See Notes to Financial Statements | B-28 | See explanation of symbols and terms, if any, on page B-71 |
Table of Contents
PACIFIC LIFE FUNDS
PL SHORT DURATION BOND FUND
Schedule of Investments
March 31, 2012
| Principal Amount | Value | |||||||
CORPORATE BONDS & NOTES - 49.4% |
| |||||||
Consumer Discretionary - 3.1% |
| |||||||
ACE Hardware Corp | ||||||||
9.125% due 06/01/16 ~ | $ | 135,000 | $ | 142,425 | ||||
Cox Communications Inc | ||||||||
7.125% due 10/01/12 | 325,000 | 335,545 | ||||||
DIRECTV Holdings LLC | ||||||||
4.750% due 10/01/14 | 650,000 | 706,862 | ||||||
Easton-Bell Sports Inc | ||||||||
9.750% due 12/01/16 | 130,000 | 144,463 | ||||||
NBCUniversal Media LLC | ||||||||
2.100% due 04/01/14 | 420,000 | 429,084 | ||||||
Sirius XM Radio Inc | ||||||||
9.750% due 09/01/15 ~ | 130,000 | 141,050 | ||||||
Speedway Motorsports Inc | ||||||||
8.750% due 06/01/16 | 140,000 | 154,000 | ||||||
Staples Inc | ||||||||
9.750% due 01/15/14 | 425,000 | 483,058 | ||||||
Starwood Hotels & Resorts Worldwide Inc | ||||||||
6.250% due 02/15/13 | 290,000 | 303,050 | ||||||
TCM Sub LLC | ||||||||
3.550% due 01/15/15 ~ | 405,000 | 428,306 | ||||||
The Interpublic Group of Cos Inc | ||||||||
6.250% due 11/15/14 | 398,000 | 435,810 | ||||||
Thomson Reuters Corp (Canada) | ||||||||
5.700% due 10/01/14 | 250,000 | 275,890 | ||||||
Ticketmaster Entertainment LLC | ||||||||
10.750% due 08/01/16 | 135,000 | 145,969 | ||||||
Time Warner Cable Inc | ||||||||
5.400% due 07/02/12 | 381,000 | 385,371 | ||||||
8.250% due 02/14/14 | 175,000 | 198,204 | ||||||
Wendy’s/Arby’s Restaurant | ||||||||
10.000% due 07/15/16 | 50,000 | 54,750 | ||||||
|
| |||||||
| 4,763,837 | ||||||||
|
| |||||||
Consumer Staples - 2.4% | ||||||||
Altria Group Inc | ||||||||
8.500% due 11/10/13 | 418,000 | 467,224 | ||||||
Anheuser-Busch InBev Worldwide Inc | ||||||||
1.500% due 07/14/14 | 210,000 | 213,182 | ||||||
3.000% due 10/15/12 | 375,000 | 379,907 | ||||||
5.375% due 11/15/14 | 75,000 | 83,327 | ||||||
BAT International Finance PLC (United Kingdom) | ||||||||
8.125% due 11/15/13 ~ | 150,000 | 165,911 | ||||||
Coca-Cola Amatil Ltd (Australia) | ||||||||
3.250% due 11/02/14 ~ | 400,000 | 417,260 | ||||||
H.J. Heinz Co | ||||||||
1.500% due 03/01/17 | 255,000 | 253,417 | ||||||
Kraft Foods Inc | ||||||||
2.625% due 05/08/13 | 275,000 | 280,345 | ||||||
PepsiCo Inc | ||||||||
0.750% due 03/05/15 | 250,000 | 249,202 | ||||||
Pernod-Ricard SA (France) | ||||||||
2.950% due 01/15/17 ~ | 360,000 | 363,969 | ||||||
Philip Morris International Inc | ||||||||
1.625% due 03/20/17 | 385,000 | 383,594 | ||||||
SABMiller Holdings Inc | ||||||||
1.850% due 01/15/15 ~ | 330,000 | 334,658 | ||||||
The Kroger Co | ||||||||
6.750% due 04/15/12 | 100,000 | 100,184 | ||||||
|
| |||||||
| 3,692,180 | ||||||||
|
| |||||||
Energy - 6.1% | ||||||||
Apache Corp | ||||||||
6.000% due 09/15/13 | 400,000 | 431,095 | ||||||
BG Energy Capital PLC (United Kingdom) | ||||||||
2.875% due 10/15/16 ~ | 450,000 | 465,943 | ||||||
| Principal Amount | Value | |||||||
Bill Barrett Corp | ||||||||
9.875% due 07/15/16 | $ | 75,000 | $ | 82,875 | ||||
Canadian Natural Resources Ltd (Canada) | ||||||||
5.150% due 02/01/13 | 300,000 | 311,062 | ||||||
5.450% due 10/01/12 | 315,000 | 322,386 | ||||||
DCP Midstream LLC | ||||||||
9.700% due 12/01/13 ~ | 230,000 | 257,295 | ||||||
Devon Energy Corp | ||||||||
2.400% due 07/15/16 | 425,000 | 436,965 | ||||||
Diamond Offshore Drilling Inc | ||||||||
5.150% due 09/01/14 | 284,000 | 309,081 | ||||||
Ensco PLC (United Kingdom) | ||||||||
3.250% due 03/15/16 | 500,000 | 522,016 | ||||||
Enterprise Products Operating LLC | ||||||||
4.600% due 08/01/12 | 150,000 | 152,000 | ||||||
6.375% due 02/01/13 | 100,000 | 104,318 | ||||||
Florida Gas Transmission Co LLC | ||||||||
4.000% due 07/15/15 ~ | 165,000 | 171,559 | ||||||
Gazprom OAO Via Gaz Capital SA (Luxembourg) | ||||||||
4.950% due 05/23/16 ~ | 360,000 | 374,857 | ||||||
Kinder Morgan Energy Partners LP | ||||||||
3.500% due 03/01/16 | 85,000 | 89,599 | ||||||
5.125% due 11/15/14 | 140,000 | 153,046 | ||||||
Kinder Morgan Kansas Inc | ||||||||
6.500% due 09/01/12 | 470,000 | 480,575 | ||||||
Magellan Midstream Partners LP | ||||||||
6.450% due 06/01/14 | 225,000 | 248,069 | ||||||
Noble Corp (Cayman) | ||||||||
5.875% due 06/01/13 | 365,000 | 384,576 | ||||||
Noble Holding International Ltd (Cayman) | ||||||||
2.500% due 03/15/17 | 65,000 | 65,597 | ||||||
3.450% due 08/01/15 | 110,000 | 115,900 | ||||||
7.375% due 03/15/14 | 55,000 | 61,035 | ||||||
Occidental Petroleum Corp | ||||||||
1.450% due 12/13/13 | 500,000 | 507,506 | ||||||
1.750% due 02/15/17 | 305,000 | 308,677 | ||||||
Petrohawk Energy Corp | ||||||||
10.500% due 08/01/14 | 125,000 | 139,844 | ||||||
Phillips 66 | ||||||||
1.950% due 03/05/15 ~ | 290,000 | 292,213 | ||||||
Plains All American Pipeline LP | ||||||||
4.250% due 09/01/12 | 590,000 | 597,215 | ||||||
Regency Energy Partners LP | ||||||||
9.375% due 06/01/16 | 50,000 | 55,188 | ||||||
SeaRiver Maritime Inc | ||||||||
0.00% due 09/01/12 | 315,000 | 312,615 | ||||||
TransCanada Pipelines Ltd (Canada) | ||||||||
0.875% due 03/02/15 | 120,000 | 119,842 | ||||||
Transocean Inc (Cayman) | ||||||||
5.050% due 12/15/16 | 130,000 | 139,337 | ||||||
5.250% due 03/15/13 | 508,000 | 525,801 | ||||||
Williams Partners LP | ||||||||
3.800% due 02/15/15 | 325,000 | 345,581 | ||||||
Woodside Finance Ltd (Australia) | ||||||||
4.500% due 11/10/14 ~ | 275,000 | 292,063 | ||||||
XTO Energy Inc | ||||||||
7.500% due 04/15/12 | 300,000 | 300,557 | ||||||
|
| |||||||
| 9,476,288 | ||||||||
|
| |||||||
Financials - 20.6% | ||||||||
ACE INA Holdings Inc | ||||||||
5.875% due 06/15/14 | 370,000 | 407,757 | ||||||
Aflac Inc | ||||||||
2.650% due 02/15/17 | 75,000 | 75,917 | ||||||
American Express Centurion Bank | ||||||||
5.550% due 10/17/12 | 250,000 | 256,457 | ||||||
American Express Credit Corp | ||||||||
5.125% due 08/25/14 | 460,000 | 500,533 | ||||||
American Honda Finance Corp | ||||||||
1.450% due 02/27/15 ~ | 650,000 | 653,482 | ||||||
| See Notes to Financial Statements | B-29 | See explanation of symbols and terms, if any, on page B-71 |
Table of Contents
PACIFIC LIFE FUNDS
PL SHORT DURATION BOND FUND
Schedule of Investments (Continued)
March 31, 2012
| Principal Amount | Value | |||||||
American International Group Inc | ||||||||
3.000% due 03/20/15 | $ | 175,000 | $ | 176,329 | ||||
4.250% due 09/15/14 | 410,000 | 423,450 | ||||||
Banco Bilbao Vizcaya Argentaria SA | ||||||||
2.450% due 06/22/12 | 2,400,000 | 2,412,046 | ||||||
Bank of America Corp | ||||||||
1.973% due 01/30/14 § | 475,000 | 466,608 | ||||||
Bank of Scotland PLC (United Kingdom) | ||||||||
5.250% due 02/21/17 ~ | 100,000 | 109,649 | ||||||
Barclays Bank PLC (United Kingdom) | ||||||||
5.200% due 07/10/14 | 700,000 | 742,214 | ||||||
BB&T Corp | ||||||||
3.850% due 07/27/12 | 250,000 | 252,670 | ||||||
5.700% due 04/30/14 | 350,000 | 383,522 | ||||||
Berkshire Hathaway Inc | ||||||||
2.200% due 08/15/16 | 630,000 | 653,104 | ||||||
Capital One Financial Corp | ||||||||
2.125% due 07/15/14 | 135,000 | 135,833 | ||||||
2.150% due 03/23/15 | 245,000 | 245,554 | ||||||
7.375% due 05/23/14 | 275,000 | 304,545 | ||||||
Caterpillar Financial Services Corp | ||||||||
0.871% due 04/01/14 § | 600,000 | 603,090 | ||||||
Citigroup Inc | ||||||||
1.511% due 04/01/14 § | 800,000 | 786,483 | ||||||
Commonwealth Bank of Australia (Australia) | ||||||||
1.950% due 03/16/15 | 425,000 | 428,153 | ||||||
Daimler Finance North America LLC | ||||||||
1.083% due 03/28/14 § ~ | 500,000 | 497,275 | ||||||
1.875% due 09/15/14 ~ | 190,000 | 192,821 | ||||||
DNB Bank ASA (Norway) | ||||||||
3.200% due 04/03/17 ~ | 585,000 | 587,845 | ||||||
Fifth Third Bancorp | ||||||||
3.625% due 01/25/16 | 85,000 | 89,585 | ||||||
6.250% due 05/01/13 | 175,000 | 184,105 | ||||||
Fifth Third Bank | ||||||||
0.605% due 05/17/13 § | 250,000 | 247,899 | ||||||
General Electric Capital Corp | ||||||||
1.213% due 04/07/14 § | 1,175,000 | 1,177,316 | ||||||
2.375% due 06/30/15 | 85,000 | 86,420 | ||||||
General Motors Acceptance Corp | ||||||||
6.625% due 05/15/12 | 140,000 | 141,103 | ||||||
HSBC Finance Corp | ||||||||
0.817% due 01/15/14 § | 100,000 | 97,224 | ||||||
0.831% due 04/24/12 § | 250,000 | 250,034 | ||||||
HSBC USA Inc | ||||||||
2.375% due 02/13/15 | 585,000 | 589,417 | ||||||
Hyundai Capital Services Inc (South Korea) | ||||||||
3.500% due 09/13/17 ~ | 200,000 | 200,667 | ||||||
4.375% due 07/27/16 ~ | 325,000 | 340,234 | ||||||
Intesa Sanpaolo SPA (Italy) | ||||||||
2.375% due 12/21/12 | 275,000 | 270,615 | ||||||
JPMorgan Chase & Co | ||||||||
1.224% due 05/02/14 § | 750,000 | 751,737 | ||||||
1.361% due 01/24/14 § | 400,000 | 401,990 | ||||||
KeyCorp | ||||||||
3.750% due 08/13/15 | 325,000 | 343,802 | ||||||
Kilroy Realty LP | ||||||||
5.000% due 11/03/15 | 405,000 | 432,921 | ||||||
MassMutual Global Funding II | ||||||||
0.973% due 09/27/13 § ~ | 450,000 | 449,896 | ||||||
MetLife Inc | ||||||||
2.375% due 02/06/14 | 125,000 | 128,153 | ||||||
Metropolitan Life Global Funding I |
| |||||||
2.500% due 01/11/13 ~ | 525,000 | 530,568 | ||||||
5.125% due 06/10/14 ~ | 250,000 | 271,606 | ||||||
Morgan Stanley | ||||||||
2.161% due 01/24/14 § | 1,000,000 | 973,419 | ||||||
National Australia Bank Ltd (Australia) | ||||||||
2.350% due 11/16/12 ~ | 325,000 | 328,577 | ||||||
| Principal Amount | Value | |||||||
National Rural Utilities Cooperative Finance Corp | ||||||||
1.000% due 02/02/15 | $ | 80,000 | $ | 80,154 | ||||
New York Life Global Funding | ||||||||
2.450% due 07/14/16 ~ | 580,000 | 597,819 | ||||||
Nordea Bank AB (Sweden) | ||||||||
2.125% due 01/14/14 ~ | 760,000 | 762,873 | ||||||
PACCAR Financial Corp | ||||||||
1.600% due 03/15/17 | 485,000 | 481,518 | ||||||
PNC Funding Corp | ||||||||
3.625% due 02/08/15 | 350,000 | 372,334 | ||||||
Principal Financial Group Inc | ||||||||
7.875% due 05/15/14 | 360,000 | 397,567 | ||||||
Prudential Financial Inc | ||||||||
2.750% due 01/14/13 | 325,000 | 329,706 | ||||||
5.100% due 09/20/14 | 100,000 | 108,269 | ||||||
RCI Banque SA (France) | ||||||||
2.451% due 04/11/14 § ~ | 200,000 | 193,430 | ||||||
Regions Financial Corp | ||||||||
5.750% due 06/15/15 | 200,000 | 211,500 | ||||||
Royal Bank of Canada (Canada) | ||||||||
0.867% due 04/17/14 § | 700,000 | 702,195 | ||||||
Simon Property Group LP | ||||||||
4.200% due 02/01/15 | 275,000 | 294,580 | ||||||
SLM Corp | ||||||||
5.125% due 08/27/12 | 710,000 | 715,380 | ||||||
Societe Generale SA (France) | ||||||||
2.500% due 01/15/14 ~ | 225,000 | 222,440 | ||||||
Standard Chartered PLC (United Kingdom) | ||||||||
3.850% due 04/27/15 ~ | 175,000 | 181,865 | ||||||
Sumitomo Mitsui Banking Corp (Japan) | ||||||||
1.900% due 01/12/15 ~ | 705,000 | 711,262 | ||||||
Sun Life Financial Global Funding III LP | ||||||||
0.853% due 10/06/13 § ~ | 375,000 | 371,180 | ||||||
The Bank of New York Mellon Corp | ||||||||
4.950% due 11/01/12 | 1,199,000 | 1,229,977 | ||||||
The Goldman Sachs Group Inc | ||||||||
1.527% due 02/07/14 § | 805,000 | 790,877 | ||||||
The Toronto-Dominion Bank (Canada) | ||||||||
0.739% due 07/26/13 § | 230,000 | 230,750 | ||||||
0.867% due 07/14/14 § | 235,000 | 236,049 | ||||||
Toyota Motor Credit Corp | ||||||||
2.000% due 09/15/16 | 585,000 | 597,486 | ||||||
U.S. Bancorp | ||||||||
2.200% due 11/15/16 | 645,000 | 658,089 | ||||||
UBS AG (Switzerland) | ||||||||
1.553% due 01/28/14 § | 400,000 | 398,662 | ||||||
Volkswagen International Finance NV (Netherlands) | ||||||||
1.625% due 03/22/15 ~ | 595,000 | 595,411 | ||||||
WEA Finance LLC | ||||||||
5.400% due 10/01/12 ~ | 375,000 | 382,874 | ||||||
Wells Fargo & Co | ||||||||
1.250% due 02/13/15 | 500,000 | 498,308 | ||||||
|
| |||||||
| 31,935,180 | ||||||||
|
| |||||||
Health Care - 3.0% | ||||||||
Aristotle Holding Inc | ||||||||
2.750% due 11/21/14 ~ | 275,000 | 282,703 | ||||||
Baxter International Inc | ||||||||
1.850% due 01/15/17 | 145,000 | 146,981 | ||||||
Boston Scientific Corp | ||||||||
4.500% due 01/15/15 | 600,000 | 644,051 | ||||||
Cardinal Health Inc | ||||||||
5.500% due 06/15/13 | 505,000 | 531,988 | ||||||
Express Scripts Inc | ||||||||
3.125% due 05/15/16 | 250,000 | 260,527 | ||||||
5.250% due 06/15/12 | 545,000 | 549,655 | ||||||
6.250% due 06/15/14 | 100,000 | 109,981 | ||||||
Gilead Sciences Inc | ||||||||
2.400% due 12/01/14 | 245,000 | 253,601 | ||||||
| See Notes to Financial Statements | B-30 | See explanation of symbols and terms, if any, on page B-71 |
Table of Contents
PACIFIC LIFE FUNDS
PL SHORT DURATION BOND FUND
Schedule of Investments (Continued)
March 31, 2012
| Principal Amount | Value | |||||||
Life Technologies Corp | ||||||||
3.375% due 03/01/13 | $ | 500,000 | $ | 508,846 | ||||
4.400% due 03/01/15 | 225,000 | 240,634 | ||||||
Teva Pharmaceutical Finance III BV (Netherlands) | ||||||||
0.974% due 03/21/14 § | 50,000 | 50,158 | ||||||
UnitedHealth Group Inc | ||||||||
1.875% due 11/15/16 | 155,000 | 156,597 | ||||||
Watson Pharmaceuticals Inc | ||||||||
5.000% due 08/15/14 | 365,000 | 390,965 | ||||||
WellPoint Inc | ||||||||
6.000% due 02/15/14 | 300,000 | 326,709 | ||||||
6.800% due 08/01/12 | 250,000 | 255,047 | ||||||
|
| |||||||
| 4,708,443 | ||||||||
|
| |||||||
Industrials - 2.3% | ||||||||
ACCO Brands Corp | ||||||||
10.625% due 03/15/15 | 125,000 | 136,720 | ||||||
Casella Waste Systems Inc | ||||||||
11.000% due 07/15/14 | 125,000 | 134,375 | ||||||
CSX Corp | ||||||||
5.750% due 03/15/13 | 225,000 | 235,248 | ||||||
Delta Air Lines Inc | ||||||||
12.250% due 03/15/15 ~ | 125,000 | 135,313 | ||||||
ERAC USA Finance LLC | ||||||||
2.750% due 07/01/13 ~ | 915,000 | 926,323 | ||||||
2.750% due 03/15/17 ~ | 175,000 | 174,982 | ||||||
GATX Corp | ||||||||
3.500% due 07/15/16 | 360,000 | 366,414 | ||||||
John Deere Capital Corp | ||||||||
4.950% due 12/17/12 | 450,000 | 464,302 | ||||||
Roper Industries Inc | ||||||||
6.625% due 08/15/13 | 150,000 | 159,689 | ||||||
Southwest Airlines Co | ||||||||
5.250% due 10/01/14 | 315,000 | 338,909 | ||||||
United Air Lines Inc | ||||||||
9.875% due 08/01/13 ~ | 135,000 | 142,425 | ||||||
Waste Management Inc | ||||||||
5.000% due 03/15/14 | 150,000 | 161,217 | ||||||
6.375% due 11/15/12 | 250,000 | 258,444 | ||||||
|
| |||||||
| 3,634,361 | ||||||||
|
| |||||||
Information Technology - 1.9% |
| |||||||
Broadcom Corp | ||||||||
1.500% due 11/01/13 | 150,000 | 151,741 | ||||||
2.375% due 11/01/15 | 200,000 | 208,369 | ||||||
Fiserv Inc | ||||||||
3.125% due 06/15/16 | 425,000 | 434,625 | ||||||
Hewlett-Packard Co | ||||||||
2.350% due 03/15/15 | 340,000 | 346,709 | ||||||
2.600% due 09/15/17 | 300,000 | 300,118 | ||||||
HP Enterprise Services LLC | ||||||||
6.000% due 08/01/13 | 375,000 | 398,651 | ||||||
International Business Machines Corp | ||||||||
0.550% due 02/06/15 | 400,000 | 398,193 | ||||||
Xerox Corp | ||||||||
1.318% due 05/16/14 § | 400,000 | 397,157 | ||||||
2.950% due 03/15/17 | 70,000 | 70,798 | ||||||
5.650% due 05/15/13 | 275,000 | 287,846 | ||||||
|
| |||||||
| 2,994,207 | ||||||||
|
| |||||||
Materials - 2.2% | ||||||||
ArcelorMittal (Luxembourg) | ||||||||
3.750% due 02/25/15 | 60,000 | 61,018 | ||||||
5.375% due 06/01/13 | 275,000 | 285,480 | ||||||
Barrick Gold Financeco LLC | ||||||||
6.125% due 09/15/13 | 400,000 | 429,156 | ||||||
BHP Billiton Finance USA Ltd (Australia) | ||||||||
1.000% due 02/24/15 | 715,000 | 714,775 | ||||||
1.125% due 11/21/14 | 500,000 | 503,738 | ||||||
| Principal Amount | Value | |||||||
CRH America Inc | ||||||||
5.300% due 10/15/13 | $ | 150,000 | $ | 157,524 | ||||
Ecolab Inc | ||||||||
2.375% due 12/08/14 | 280,000 | 290,168 | ||||||
Rio Tinto Finance USA Ltd (Australia) | ||||||||
8.950% due 05/01/14 | 390,000 | 452,306 | ||||||
The Dow Chemical Co | ||||||||
2.500% due 02/15/16 | 475,000 | 487,944 | ||||||
|
| |||||||
| 3,382,109 | ||||||||
|
| |||||||
Telecommunication Services - 3.2% |
| |||||||
America Movil SAB de CV (Mexico) | ||||||||
2.375% due 09/08/16 | 275,000 | 279,706 | ||||||
3.625% due 03/30/15 | 200,000 | 212,437 | ||||||
American Tower Corp REIT | ||||||||
4.625% due 04/01/15 | 525,000 | 559,607 | ||||||
AT&T Inc | ||||||||
0.875% due 02/13/15 | 310,000 | 308,380 | ||||||
British Telecommunications PLC (United Kingdom) | ||||||||
5.150% due 01/15/13 | 350,000 | 361,689 | ||||||
CenturyLink Inc | ||||||||
7.875% due 08/15/12 | 175,000 | 179,041 | ||||||
Crown Castle Towers LLC | ||||||||
4.523% due 01/15/15 ~ | 550,000 | 575,607 | ||||||
Digicel Ltd (Bermuda) | ||||||||
12.000% due 04/01/14 ~ | 125,000 | 140,313 | ||||||
GTP Acquisition Partners I LLC | ||||||||
4.347% due 06/15/16 ~ | 190,000 | 195,810 | ||||||
Rogers Communications Inc (Canada) | ||||||||
6.250% due 06/15/13 | 300,000 | 319,113 | ||||||
Telecom Italia Capital SA (Luxembourg) | ||||||||
5.250% due 11/15/13 | 565,000 | 581,950 | ||||||
Telefonica Emisiones SAU (Spain) | ||||||||
5.855% due 02/04/13 | 450,000 | 465,356 | ||||||
Verizon Virginia Inc | ||||||||
4.625% due 03/15/13 | 790,000 | 819,909 | ||||||
|
| |||||||
| 4,998,918 | ||||||||
|
| |||||||
Utilities - 4.6% | ||||||||
Abu Dhabi National Energy Co (United Arab Emirates) | ||||||||
5.620% due 10/25/12 ~ | 450,000 | 461,250 | ||||||
CenterPoint Energy Resources Corp | ||||||||
7.875% due 04/01/13 | 75,000 | 80,029 | ||||||
CMS Energy Corp | ||||||||
2.750% due 05/15/14 | 375,000 | 377,007 | ||||||
Commonwealth Edison Co | ||||||||
1.625% due 01/15/14 | 450,000 | 457,295 | ||||||
1.950% due 09/01/16 | 120,000 | 122,027 | ||||||
Dominion Resources Inc | ||||||||
1.800% due 03/15/14 | 325,000 | 332,175 | ||||||
1.950% due 08/15/16 | 165,000 | 167,410 | ||||||
Duke Energy Corp | ||||||||
2.150% due 11/15/16 | 460,000 | 469,309 | ||||||
Enel Finance International NV (Netherlands) | ||||||||
5.700% due 01/15/13 ~ | 250,000 | 255,036 | ||||||
Georgia Power Co | ||||||||
1.300% due 09/15/13 | 325,000 | 328,476 | ||||||
Great Plains Energy Inc | ||||||||
2.750% due 08/15/13 | 225,000 | 228,912 | ||||||
Iberdrola Finance Ireland Ltd (Ireland) | ||||||||
3.800% due 09/11/14 ~ | 275,000 | 282,364 | ||||||
Korea Hydro & Nuclear Power Co Ltd (South Korea) | ||||||||
3.125% due 09/16/15 ~ | 275,000 | 280,584 | ||||||
MidAmerican Energy Holdings Co | ||||||||
3.150% due 07/15/12 | 525,000 | 528,700 | ||||||
5.000% due 02/15/14 | 250,000 | 268,867 | ||||||
Mississippi Power Co | ||||||||
2.350% due 10/15/16 | 120,000 | 123,907 | ||||||
| See Notes to Financial Statements | B-31 | See explanation of symbols and terms, if any, on page B-71 |
Table of Contents
PACIFIC LIFE FUNDS
PL SHORT DURATION BOND FUND
Schedule of Investments (Continued)
March 31, 2012
| Principal Amount | Value | |||||||
Nisource Finance Corp | ||||||||
5.400% due 07/15/14 | $ | 260,000 | $ | 282,846 | ||||
6.150% due 03/01/13 | 334,000 | 348,988 | ||||||
PacifiCorp | ||||||||
5.450% due 09/15/13 | 200,000 | 213,183 | ||||||
Progress Energy Inc | ||||||||
6.050% due 03/15/14 | 150,000 | 164,549 | ||||||
PSEG Power LLC | ||||||||
2.750% due 09/15/16 | 130,000 | 131,348 | ||||||
Sempra Energy | ||||||||
1.234% due 03/15/14 § | 450,000 | 450,364 | ||||||
Southern Co | ||||||||
1.950% due 09/01/16 | 145,000 | 147,449 | ||||||
Veolia Environnement SA (France) | ||||||||
5.250% due 06/03/13 | 250,000 | 260,602 | ||||||
Wisconsin Electric Power Co | ||||||||
6.000% due 04/01/14 | 375,000 | 414,186 | ||||||
|
| |||||||
| 7,176,863 | ||||||||
|
| |||||||
Total Corporate Bonds & Notes | ||||||||
(Cost $76,220,152) | 76,762,386 | |||||||
|
| |||||||
MORTGAGE-BACKED SECURITIES - 25.1% |
| |||||||
Collateralized Mortgage Obligations - |
| |||||||
Bear Stearns Commercial Mortgage Securities | ||||||||
4.674% due 06/11/41 “ | 150,000 | 163,534 | ||||||
4.715% due 02/11/41 “ | 635,000 | 667,664 | ||||||
4.978% due 07/11/42 “ § | 625,000 | 673,664 | ||||||
5.116% due 02/11/41 “ § | 260,000 | 284,422 | ||||||
5.200% due 01/12/41 “ § | 625,000 | 664,870 | ||||||
Citigroup Commercial Mortgage Trust | ||||||||
5.361% due 04/15/40 “ § | 305,000 | 327,724 | ||||||
Commercial Mortgage Pass-Through Certificates | ||||||||
1.156% due 07/10/16 “ | 90,000 | 90,281 | ||||||
5.357% due 07/10/37 “ § | 100,000 | 108,116 | ||||||
Credit Suisse First Boston Mortgage Securities Corp | ||||||||
4.940% due 12/15/35 “ | 595,414 | 603,712 | ||||||
DBUBS Mortgage Trust | ||||||||
2.238% due 08/10/44 “ | 190,974 | 195,859 | ||||||
GS Mortgage Securities Corp II | ||||||||
5.553% due 04/10/38 “ § | 320,000 | 355,891 | ||||||
JP Morgan Chase Commercial Mortgage Securities Corp | ||||||||
4.719% due 01/15/38 “ | 330,000 | 346,551 | ||||||
5.355% due 06/12/41 “ § | 620,000 | 668,977 | ||||||
LB-UBS Commercial Mortgage Trust | ||||||||
4.954% due 09/15/30 “ | 75,000 | 82,639 | ||||||
Morgan Stanley Capital I | ||||||||
5.270% due 06/13/41 “ § | 620,000 | 668,941 | ||||||
WF-RBS Commercial Mortgage Trust |
| |||||||
1.607% due 06/15/44 “ ~ | 298,550 | 300,750 | ||||||
|
| |||||||
| 6,203,595 | ||||||||
|
| |||||||
Collateralized Mortgage Obligations - Residential - 2.8% |
| |||||||
Fannie Mae | ||||||||
5.000% due 08/25/19 “ | 550,243 | 593,101 | ||||||
Fosse Master Issuer PLC (United Kingdom) | ||||||||
1.965% due 10/18/54 “ § ~ | 200,000 | 200,857 | ||||||
Freddie Mac | ||||||||
0.692% due 05/15/36 “ § | 73,090 | 73,202 | ||||||
0.742% due 08/15/41 “ § | 516,255 | 517,179 | ||||||
Holmes Master Issuer PLC | ||||||||
2.165% due 10/15/54 “ ~ | 275,000 | 276,204 | ||||||
NCUA Guaranteed Notes | ||||||||
0.623% due 03/06/20 “ § | 377,251 | 377,017 | ||||||
0.623% due 04/06/20 “ § | 367,867 | 368,096 | ||||||
0.642% due 03/11/20 “ § | 418,339 | 418,601 | ||||||
0.643% due 05/07/20 “ § | 367,112 | 367,584 | ||||||
| Principal Amount | Value | |||||||
Silverstone Master Issuer PLC (United Kingdom) | ||||||||
1.792% due 01/21/55 “ § ~ | $ | 525,000 | $ | 528,780 | ||||
2.111% due 01/21/55 “ § ~ | 315,000 | 313,633 | ||||||
Structured Adjustable Rate Mortgage Loan Trust | ||||||||
2.616% due 11/25/34 “ § | 284,163 | 257,190 | ||||||
|
| |||||||
| 4,291,444 | ||||||||
|
| |||||||
Fannie Mae - 17.2% | ||||||||
2.105% due 01/01/35 “ § | 1,215,536 | 1,293,380 | ||||||
2.381% due 09/01/34 “ § | 903,520 | 953,611 | ||||||
2.497% due 11/01/34 “ § | 685,435 | 729,952 | ||||||
2.626% due 09/01/35 “ § | 1,063,390 | 1,135,043 | ||||||
3.000% due 02/01/27 “ | 482,467 | 500,841 | ||||||
3.500% due 03/01/26-01/01/27 “ | 4,008,381 | 4,209,956 | ||||||
4.000% due 04/01/26-09/01/26 “ | 3,756,575 | 3,991,877 | ||||||
4.500% due 04/01/24-09/01/25 “ | 4,962,798 | 5,316,302 | ||||||
5.000% due 07/01/19-07/01/41 “ | 1,724,429 | 1,868,551 | ||||||
5.500% due 10/01/35-10/01/38 “ | 5,665,303 | 6,187,862 | ||||||
6.000% due 11/01/35 “ | 536,616 | 594,205 | ||||||
|
| |||||||
| 26,781,580 | ||||||||
|
| |||||||
Freddie Mac - 1.1% | ||||||||
5.000% due 11/01/16-04/01/18 “ | 157,003 | 168,986 | ||||||
5.500% due 01/01/20-12/01/39 “ | 1,434,498 | 1,561,917 | ||||||
|
| |||||||
| 1,730,903 | ||||||||
|
| |||||||
Total Mortgage-Backed Securities | ||||||||
(Cost $38,793,198) | 39,007,522 | |||||||
|
| |||||||
ASSET-BACKED SECURITIES - 11.1% |
| |||||||
Ally Auto Receivables Trust | ||||||||
0.930% due 02/15/16 “ | 155,000 | 155,308 | ||||||
Ally Master Owner Trust | ||||||||
2.150% due 01/15/16 “ | 385,000 | 393,378 | ||||||
American Express Credit Account Master Trust | ||||||||
0.412% due 04/17/17 “ § | 315,000 | 315,831 | ||||||
AmeriCredit Automobile Receivables Trust | ||||||||
1.170% due 05/09/16 “ | 345,000 | 345,735 | ||||||
1.730% due 02/08/17 “ | 200,000 | 200,307 | ||||||
Bank of America Auto Trust | ||||||||
1.670% due 12/15/13 “ ~ | 82,613 | 82,763 | ||||||
BMW Vehicle Owner Trust | ||||||||
0.760% due 08/25/15 “ | 255,000 | 255,498 | ||||||
Capital Auto Receivables Asset Trust | ||||||||
8.250% due 01/15/15 “ ~ | 365,000 | 394,691 | ||||||
CarMax Auto Owner Trust | ||||||||
0.890% due 09/15/16 “ | 380,000 | 379,585 | ||||||
0.910% due 12/15/15 “ | 330,000 | 331,087 | ||||||
CNH Equipment Trust | ||||||||
0.910% due 08/15/16 “ | 300,000 | 300,922 | ||||||
0.940% due 05/15/17 “ | 150,000 | 150,306 | ||||||
1.030% due 11/17/14 “ | 46,749 | 46,853 | ||||||
5.170% due 10/15/14 “ | 80,854 | 82,204 | ||||||
College Loan Corp Trust | ||||||||
0.660% due 07/25/24 “ § | 1,000,000 | 949,965 | ||||||
0.720% due 04/25/21 “ § | 817,249 | 815,859 | ||||||
Collegiate Funding Services Education Loan Trust | ||||||||
0.563% due 12/28/21 “ § | 293,372 | 289,319 | ||||||
Ford Credit Auto Owner Trust | ||||||||
0.850% due 01/15/15 “ | 210,000 | 210,064 | ||||||
1.350% due 12/15/16 “ | 435,000 | 439,665 | ||||||
1.510% due 01/15/14 “ | 205,660 | 206,285 | ||||||
4.050% due 10/15/16 “ | 100,000 | 105,616 | ||||||
6.070% due 05/15/14 “ | 185,274 | 190,023 | ||||||
Ford Credit Floorplan Master Owner Trust | ||||||||
4.200% due 02/15/17 “ ~ | 365,000 | 395,290 | ||||||
4.990% due 02/15/17 “ ~ | 260,000 | 279,436 | ||||||
| See Notes to Financial Statements | B-32 | See explanation of symbols and terms, if any, on page B-71 |
Table of Contents
PACIFIC LIFE FUNDS
PL SHORT DURATION BOND FUND
Schedule of Investments (Continued)
March 31, 2012
| Principal Amount | Value | |||||||
GE Capital Credit Card Master Note Trust | ||||||||
1.030% due 01/15/18 “ | $ | 535,000 | $ | 537,666 | ||||
GE Dealer Floorplan Master Note Trust | ||||||||
0.842% due 07/20/16 “ § | 270,000 | 270,000 | ||||||
Honda Auto Receivables Owner Trust | ||||||||
0.770% due 01/15/16 “ | 725,000 | 725,233 | ||||||
Huntington Auto Trust | ||||||||
0.810% due 09/15/16 “ ~ | 470,000 | 470,597 | ||||||
1.010% due 01/15/16 “ ~ | 240,000 | 241,167 | ||||||
Hyundai Auto Receivables Trust | ||||||||
0.720% due 03/15/16 “ | 205,000 | 205,061 | ||||||
John Deere Owner Trust | ||||||||
1.320% due 05/15/14 “ | 53,605 | 53,768 | ||||||
Mercedes-Benz Auto Lease Trust | ||||||||
0.880% due 11/17/14 “ | 220,000 | 221,158 | ||||||
1.070% due 11/15/17 “ | 180,000 | 180,258 | ||||||
Mercedes-Benz Auto Receivables Trust | ||||||||
1.220% due 12/15/17 “ | 680,000 | 686,055 | ||||||
Nissan Auto Lease Trust | ||||||||
0.920% due 02/16/15 “ | 375,000 | 374,948 | ||||||
1.040% due 08/15/14 “ | 680,000 | 682,564 | ||||||
Nissan Auto Receivables Owner Trust | ||||||||
0.730% due 05/16/16 “ | 505,000 | 504,835 | ||||||
Northstar Education Finance Inc | ||||||||
0.673% due 04/28/16 “ § | 496,898 | 484,660 | ||||||
SLM Student Loan Trust | ||||||||
0.560% due 07/25/17 “ § | 312,789 | 310,562 | ||||||
0.590% due 07/25/18 “ § | 1,044,947 | 1,040,521 | ||||||
SMART Trust (Australia) | ||||||||
1.040% due 09/14/14 “ ~ | 275,000 | 274,918 | ||||||
1.540% due 03/14/15 “ ~ | 100,000 | 100,665 | ||||||
Student Loan Consolidation Center | ||||||||
1.462% due 10/25/27 “ § ~ | 271,894 | 267,498 | ||||||
SunTrust Student Loan Trust | ||||||||
0.653% due 07/28/20 “ § ~ | 319,221 | 318,145 | ||||||
Volkswagen Auto Loan Enhanced Trust | ||||||||
0.850% due 08/22/16 “ | 245,000 | 245,563 | ||||||
World Financial Network Credit Card Master Trust |
| |||||||
0.372% due 02/15/17 “ § ~ | 1,100,000 | 1,095,999 | ||||||
3.790% due 05/15/16 “ | 400,000 | 403,651 | ||||||
World Omni Auto Receivables Trust | ||||||||
5.120% due 05/15/14 “ | 265,776 | 271,235 | ||||||
|
| |||||||
Total Asset-Backed Securities | ||||||||
(Cost $17,306,780) | 17,282,717 | |||||||
|
| |||||||
U.S. GOVERNMENT AGENCY ISSUES - 4.5% |
| |||||||
Fannie Mae | ||||||||
0.750% due 12/19/14 | 1,055,000 | 1,060,285 | ||||||
0.875% due 08/28/14 | 990,000 | 999,011 | ||||||
1.000% due 09/23/13 | 525,000 | 530,158 | ||||||
Freddie Mac | ||||||||
0.500% due 04/17/15 | 730,000 | 727,519 | ||||||
0.750% due 11/25/14 | 700,000 | 704,056 | ||||||
0.875% due 10/28/13 | 1,325,000 | 1,336,394 | ||||||
1.625% due 11/21/12 | 1,275,000 | 1,286,768 | ||||||
4.500% due 01/15/13 | 300,000 | 310,150 | ||||||
|
| |||||||
Total U.S. Government Agency Issues | ||||||||
(Cost $6,940,840) | 6,954,341 | |||||||
|
| |||||||
| Principal Amount | Value | |||||||
U.S. TREASURY OBLIGATIONS - 3.7% |
| |||||||
U.S. Treasury Inflation Protected Securities - 2.3% |
| |||||||
0.500% due 04/15/15 ^ | $ | 763,419 | $ | 810,060 | ||||
3.000% due 07/15/12 ^ | 2,627,198 | 2,687,952 | ||||||
|
| |||||||
| 3,498,012 | ||||||||
|
| |||||||
U.S. Treasury Notes - 1.4% | ||||||||
1.000% due 10/31/16 | 1,910,000 | 1,914,477 | ||||||
1.500% due 07/31/16 | 275,000 | 282,154 | ||||||
|
| |||||||
| 2,196,631 | ||||||||
|
| |||||||
Total U.S. Treasury Obligations |
| |||||||
(Cost $5,651,867) | 5,694,643 | |||||||
|
| |||||||
MUNICIPAL BONDS - 0.5% |
| |||||||
Florida Hurricane Catastrophe Fund Finance Corp ‘A’ | ||||||||
1.022% due 10/15/12 § | 690,000 | 690,055 | ||||||
|
| |||||||
Total Municipal Bonds | ||||||||
(Cost $690,000) | 690,055 | |||||||
|
| |||||||
| Shares | ||||||||
SHORT-TERM INVESTMENT - 4.9% |
| |||||||
Money Market Fund - 4.9% | ||||||||
BlackRock Liquidity Funds Treasury |
| |||||||
Trust Fund Portfolio | 7,657,496 | 7,657,496 | ||||||
|
| |||||||
Total Short-Term Investment | ||||||||
(Cost $7,657,496) | 7,657,496 | |||||||
|
| |||||||
TOTAL INVESTMENTS - 99.2% |
| |||||||
(Cost $153,260,333) | 154,049,160 | |||||||
OTHER ASSETS & LIABILITIES, |
| 1,318,688 | ||||||
|
| |||||||
NET ASSETS - 100.0% | $ | 155,367,848 | ||||||
|
| |||||||
Notes to Schedule of Investments
| (a) | As of March 31, 2012, the fund was diversified as a percentage of net assets as follows: |
Corporate Bonds & Notes | 49.4 | % | ||
Mortgage-Backed Securities | 25.1 | % | ||
Asset-Backed Securities | 11.1 | % | ||
Short-Term Investment | 4.9 | % | ||
U.S. Government Agency Issues | 4.5 | % | ||
U.S. Treasury Obligations | 3.7 | % | ||
Municipal Bonds | 0.5 | % | ||
|
| |||
| 99.2 | % | |||
Other Assets & Liabilities, Net | 0.8 | % | ||
|
| |||
| 100.0 | % | |||
|
|
| See Notes to Financial Statements | B-33 | See explanation of symbols and terms, if any, on page B-71 |
Table of Contents
PACIFIC LIFE FUNDS
PL SHORT DURATION BOND FUND
Schedule of Investments (Continued)
March 31, 2012
| (b) | As of March 31, 2012, the fund’s Standard & Poor’s quality ratings as a percentage of total fixed income investments were as follows (Unaudited): |
AAA | 9.0 | % | ||
AA / U.S. Government & Agency Issues | 40.0 | % | ||
A | 22.0 | % | ||
BBB | 21.0 | % | ||
BB | 2.0 | % | ||
Not Rated | 6.0 | % | ||
|
| |||
| 100.0 | % | |||
|
|
| (c) | Forward foreign currency contracts outstanding as of March 31, 2012 were as follows: |
Contracts to Buy or to Sell | Currency | Principal Amount Covered by Contracts | Expiration | Counterparty | Unrealized Appreciation (Depreciation) | |||||||
Buy | CNY | 6,495,000 | 06/12 | GSC | $ | 13,067 | ||||||
Sell | CNY | 485,000 | 06/12 | DUB | (1,118 | ) | ||||||
Sell | CNY | 6,010,000 | 06/12 | CSF | (14,780 | ) | ||||||
|
| |||||||||||
| ($ | 2,831 | ) | ||||||||||
|
| |||||||||||
Total Forward Foreign Currency Contracts
| (d) | Fair Value Measurements |
The following is a summary of the fund’s investments as categorized under the three-tier hierarchy of inputs used in valuing the fund’s assets and liabilities (See Note 3C in Notes to Financial Statements) as of March 31, 2012:
| Total Value at March 31, 2012 | Level 1 Quoted Price | Level 2 Significant Observable Inputs | Level 3 Significant Unobservable Inputs | |||||||||||||||
Assets | Corporate Bonds & Notes | $ | 76,762,386 | $ | — | $ | 76,762,386 | $ | — | |||||||||
Mortgage-Backed Securities | 39,007,522 | — | 38,630,505 | 377,017 | ||||||||||||||
Asset-Backed Securities | 17,282,717 | — | 17,282,717 | — | ||||||||||||||
U.S. Government Agency Issues | 6,954,341 | — | 6,954,341 | — | ||||||||||||||
U.S. Treasury Obligations | 5,694,643 | — | 5,694,643 | — | ||||||||||||||
Municipal Bonds | 690,055 | — | 690,055 | — | ||||||||||||||
Short-Term Investment | 7,657,496 | 7,657,496 | — | |||||||||||||||
Derivatives: | ||||||||||||||||||
Foreign Currency Contracts | ||||||||||||||||||
Forward Foreign Currency Contracts | 13,067 | — | 13,067 | — | ||||||||||||||
|
|
|
|
|
|
|
| |||||||||||
Total Assets | 154,062,227 | 7,657,496 | 146,027,714 | 377,017 | ||||||||||||||
|
|
|
|
|
|
|
| |||||||||||
Liabilities | Derivatives: | |||||||||||||||||
Foreign Currency Contracts | ||||||||||||||||||
Forward Foreign Currency Contracts | (15,898 | ) | — | (15,898 | ) | — | ||||||||||||
|
|
|
|
|
|
|
| |||||||||||
Total Liabilities | (15,898 | ) | — | (15,898 | ) | — | ||||||||||||
|
|
|
|
|
|
|
| |||||||||||
Total | $ | 154,046,329 | $ | 7,657,496 | $ | 146,011,816 | $ | 377,017 | ||||||||||
|
|
|
|
|
|
|
| |||||||||||
The following is a reconciliation of investments for significant unobservable inputs (Level 3) used in valuing the fund’s assets and liabilities (See Note 3C in Notes to Financial Statements) for the year ended March 31, 2012:
| Mortgage- Backed Securities | Asset- Backed Securities | Total | ||||||||||
Value, Beginning of Year | $ | 1,000,000 | $ | 299,330 | $ | 1,299,330 | ||||||
Purchases | — | — | — | |||||||||
Sales (includes paydowns) | (186,425 | ) | (20,851 | ) | (207,276 | ) | ||||||
Accrued Discount (Premiums) | — | — | — | |||||||||
Net Realized Gains (Losses) | — | — | — | |||||||||
Change in Net Unrealized Depreciation | (17,957 | ) | (10,980 | ) | (28,937 | ) | ||||||
Transfers In | — | — | — | |||||||||
Transfers Out | (418,601 | ) | (267,499 | ) | (686,100 | ) | ||||||
|
|
|
|
|
| |||||||
Value, End of Year | $ | 377,017 | $ | — | $ | 377,017 | ||||||
|
|
|
|
|
| |||||||
Change in Net Unrealized Appreciation (Depreciation) on Level 3 Investments Held at the End of Year, If Applicable | $ | 77 | $ | — | $ | 77 | ||||||
|
|
|
|
|
| |||||||
| See Notes to Financial Statements | B-34 | See explanation of symbols and terms, if any, on page B-71 |
Table of Contents
PACIFIC LIFE FUNDS
PL SHORT DURATION INCOME FUND
Schedule of Investments
March 31, 2012
| Principal Amount | Value | |||||||
CORPORATE BONDS & NOTES - 75.0% |
| |||||||
Consumer Discretionary - 12.9% | ||||||||
DIRECTV Holdings LLC | ||||||||
3.125% due 02/15/16 | $ | 250,000 | $ | 259,534 | ||||
NBCUniversal Media LLC | ||||||||
2.875% due 04/01/16 | 250,000 | 259,992 | ||||||
The Interpublic Group of Cos Inc | ||||||||
6.250% due 11/15/14 | 250,000 | 273,750 | ||||||
Time Warner Cable Inc | ||||||||
3.500% due 02/01/15 | 250,000 | 264,982 | ||||||
Viacom Inc | ||||||||
1.250% due 02/27/15 | 250,000 | 249,921 | ||||||
Virgin Media Secured Finance PLC (United Kingdom) | ||||||||
6.500% due 01/15/18 | 250,000 | 272,813 | ||||||
|
| |||||||
| 1,580,992 | ||||||||
|
| |||||||
Consumer Staples - 7.1% | ||||||||
Kraft Foods Inc | ||||||||
1.457% due 07/10/13 § | 250,000 | 251,688 | ||||||
Pernod-Ricard SA (France) | ||||||||
2.950% due 01/15/17 ~ | 250,000 | 252,757 | ||||||
Reynolds Group Issuer Inc | ||||||||
8.750% due 10/15/16 ~ | 100,000 | 106,250 | ||||||
SABMiller Holdings Inc | ||||||||
1.850% due 01/15/15 ~ | 250,000 | 253,528 | ||||||
|
| |||||||
| 864,223 | ||||||||
|
| |||||||
Energy - 14.8% | ||||||||
Enterprise Products Operating LLC | ||||||||
3.700% due 06/01/15 | 250,000 | 267,452 | ||||||
Kinder Morgan Kansas Inc | ||||||||
5.150% due 03/01/15 | 250,000 | 263,750 | ||||||
Korea National Oil Corp (South Korea) | ||||||||
3.125% due 04/03/17 ~ | 250,000 | 250,029 | ||||||
Petrobras International Finance Co (Cayman) | ||||||||
2.875% due 02/06/15 | 500,000 | 514,291 | ||||||
Phillips 66 | ||||||||
1.950% due 03/05/15 ~ | 250,000 | 251,908 | ||||||
Williams Partners LP | ||||||||
3.800% due 02/15/15 | 250,000 | 265,831 | ||||||
|
| |||||||
| 1,813,261 | ||||||||
|
| |||||||
Financials - 18.8% | ||||||||
Bank of America Corp | ||||||||
1.973% due 01/30/14 § | 250,000 | 245,583 | ||||||
BRE Properties Inc REIT | ||||||||
5.500% due 03/15/17 | 250,000 | 276,208 | ||||||
Capital One Financial Corp | ||||||||
2.150% due 03/23/15 | 250,000 | 250,565 | ||||||
Citigroup Inc | ||||||||
2.650% due 03/02/15 | 250,000 | 250,128 | ||||||
Commonwealth Bank of Australia (Australia) | ||||||||
1.950% due 03/16/15 | 250,000 | 251,855 | ||||||
ERP Operating LP REIT | ||||||||
5.200% due 04/01/13 | 250,000 | 258,425 | ||||||
Ford Motor Credit Co LLC | ||||||||
3.875% due 01/15/15 | 250,000 | 252,606 | ||||||
Metropolitan Life Global Funding I | ||||||||
2.000% due 01/09/15 ~ | 250,000 | 252,819 | ||||||
Westfield Capital Corp (Multi-National) | ||||||||
5.125% due 11/15/14 ~ | 250,000 | 266,453 | ||||||
|
| |||||||
| 2,304,642 | ||||||||
|
| |||||||
| Principal Amount | Value | |||||||
Health Care - 3.1% | ||||||||
Aristotle Holding Inc | ||||||||
2.100% due 02/12/15 ~ | $ | 250,000 | $ | 253,256 | ||||
HCA Inc | ||||||||
6.300% due 10/01/12 | 125,000 | 127,500 | ||||||
|
| |||||||
| 380,756 | ||||||||
|
| |||||||
Industrials - 5.0% | ||||||||
Avis Budget Car Rental LLC | ||||||||
3.003% due 05/15/14 § | 100,000 | 98,500 | ||||||
Hutchison Whampoa International 11 Ltd (Cayman) | ||||||||
3.500% due 01/13/17 ~ | 250,000 | 254,239 | ||||||
International Lease Finance Corp | ||||||||
5.650% due 06/01/14 | 250,000 | 255,625 | ||||||
|
| |||||||
| 608,364 | ||||||||
|
| |||||||
Information Technology - 6.1% | ||||||||
Hewlett-Packard Co | ||||||||
0.891% due 05/30/14 § | 250,000 | 247,265 | ||||||
Tyco Electronics Group SA (Luxembourg) | ||||||||
1.600% due 02/03/15 | 250,000 | 250,613 | ||||||
Xerox Corp | ||||||||
1.874% due 09/13/13 § | 250,000 | 252,321 | ||||||
|
| |||||||
| 750,199 | ||||||||
|
| |||||||
Materials - 5.0% | ||||||||
ArcelorMittal (Luxembourg) | ||||||||
3.750% due 02/25/15 | 250,000 | 254,241 | ||||||
Ball Corp | ||||||||
7.125% due 09/01/16 | 100,000 | 109,500 | ||||||
Xstrata Canada Financial Corp (Canada) | ||||||||
2.850% due 11/10/14 ~ | 250,000 | 254,673 | ||||||
|
| |||||||
| 618,414 | ||||||||
|
| |||||||
Utilities - 2.2% | ||||||||
The AES Corp | ||||||||
7.750% due 03/01/14 | 250,000 | 271,250 | ||||||
|
| |||||||
Total Corporate Bonds & Notes | ||||||||
(Cost $9,067,767) | 9,192,101 | |||||||
|
| |||||||
SENIOR LOAN NOTES - 18.7% | ||||||||
Consumer Discretionary - 4.1% | ||||||||
Capital Automotive LP Tranche B | ||||||||
5.250% due 03/11/17 § | 246,621 | 244,566 | ||||||
Lord & Taylor Holdings LLC | ||||||||
5.750% due 01/11/19 § | 250,000 | 251,771 | ||||||
|
| |||||||
| 496,337 | ||||||||
|
| |||||||
Financials - 0.3% | ||||||||
Fidelity National Information Services Inc Term B | ||||||||
4.250% due 07/18/16 § | 40,000 | 40,275 | ||||||
|
| |||||||
Health Care - 2.1% | ||||||||
Warner Chilcott Co LLC | ||||||||
Term B-1 | ||||||||
4.250% due 03/15/18 § | 113,998 | 114,048 | ||||||
Term B-2 | ||||||||
4.250% due 03/15/18 § | 56,999 | 57,024 | ||||||
WC Luxco SARL Term B-3 | ||||||||
4.250% due 03/15/18 § | 78,374 | 78,408 | ||||||
|
| |||||||
| 249,480 | ||||||||
|
| |||||||
| See Notes to Financial Statements | B-35 | See explanation of symbols and terms, if any, on page B-71 |
Table of Contents
PACIFIC LIFE FUNDS
PL SHORT DURATION INCOME FUND
Schedule of Investments (Continued)
March 31, 2012
| Principal Amount | Value | |||||||
Industrials - 4.1% |
| |||||||
AWAS Finance Luxembourg SARL Term B | ||||||||
5.250% due 06/10/16 § | $ | 244,444 | $ | 245,972 | ||||
Flying Fortress Inc Term B | ||||||||
5.000% due 06/30/17 § | 250,000 | 252,188 | ||||||
|
| |||||||
| 498,160 | ||||||||
|
| |||||||
Information Technology - 6.1% |
| |||||||
Semtech Corp Term B | ||||||||
4.250% due 03/20/17 § | 250,000 | 250,000 | ||||||
VanTiv LLC Tranche B | ||||||||
due 02/24/19 ¥ | 250,000 | 250,547 | ||||||
Verifone Inc Term B | ||||||||
4.250% due 12/28/18 § | 249,375 | 250,341 | ||||||
|
| |||||||
| 750,888 | ||||||||
|
| |||||||
Telecommunication Services - 2.0% |
| |||||||
Crown Castle Operating Co Tranche B | ||||||||
4.000% due 01/31/19 § | 249,375 | 248,405 | ||||||
|
| |||||||
Total Senior Loan Notes | ||||||||
(Cost $2,270,544) | 2,283,545 | |||||||
|
| |||||||
U.S. TREASURY OBLIGATIONS - 3.9% |
| |||||||
U.S. Treasury Notes - 3.9% |
| |||||||
0.250% due 11/30/13 | 50,000 | 49,953 | ||||||
0.875% due 11/30/16 | 175,000 | 174,262 | ||||||
1.375% due 12/31/18 | 250,000 | 247,305 | ||||||
|
| |||||||
Total U.S. Treasury Obligations | ||||||||
(Cost $475,101) | 471,520 | |||||||
|
| |||||||
FOREIGN GOVERNMENT BONDS & NOTES - 1.6% |
| |||||||
Russian Foreign Bond (Russia) | ||||||||
3.250% due 04/04/17 ~ | 200,000 | 200,100 | ||||||
|
| |||||||
Total Foreign Government Bonds & Notes | ||||||||
(Cost $199,314) | 200,100 | |||||||
|
| |||||||
| Shares | Value | |||||||
SHORT-TERM INVESTMENT - 5.8% |
| |||||||
Money Market Fund - 5.8% | ||||||||
BlackRock Liquidity Funds Treasury Trust Fund Portfolio | 711,109 | $ | 711,109 | |||||
|
| |||||||
Total Short-Term Investment | ||||||||
(Cost $711,109) | 711,109 | |||||||
|
| |||||||
TOTAL INVESTMENTS - 105.0% |
| |||||||
(Cost $12,723,835) |
| 12,858,375 | ||||||
OTHER ASSETS & LIABILITIES, NET - (5.0%) |
| (607,151 | ) | |||||
|
| |||||||
NET ASSETS - 100.0% |
| $ | 12,251,224 | |||||
|
| |||||||
Notes to Schedule of Investments
| (a) | As of March 31, 2012, the fund was diversified as a percentage of net assets as follows: |
Corporate Bonds & Notes | 75.0 | % | ||
Senior Loan Notes | 18.7 | % | ||
Short-Term Investment | 5.8 | % | ||
U.S. Treasury Obligations | 3.9 | % | ||
Foreign Government Bonds & Notes | 1.6 | % | ||
|
| |||
| 105.0 | % | |||
Other Assets & Liabilities, Net | (5.0 | %) | ||
|
| |||
| 100.0 | % | |||
|
|
| (b) | As of March 31, 2012, the fund’s Standard & Poor’s quality ratings as a percentage of total fixed income investments were as follows (Unaudited): |
AA / U.S. Government & Agency Issues | 8.0 | % | ||
A | 8.3 | % | ||
BBB | 57.3 | % | ||
BB | 14.7 | % | ||
B | 5.9 | % | ||
Not Rated | 5.8 | % | ||
|
| |||
| 100.0 | % | |||
|
|
| (c) | Fair Value Measurements |
The following is a summary of the fund’s investments as categorized under the three-tier hierarchy of inputs used in valuing the fund’s assets and liabilities (See Note 3C in Notes to Financial Statements) as of March 31, 2012:
| Total Value at March 31, 2012 | Level 1 Quoted Price | Level 2 Significant Observable Inputs | Level 3 Significant Unobservable Inputs | |||||||||||||||
| Assets | Corporate Bonds & Notes | $ | 9,192,101 | $ | — | $ | 9,192,101 | $ | — | |||||||||
| Senior Loan Notes | 2,283,545 | — | 2,283,545 | — | ||||||||||||||
| U.S. Treasury Obligations | 471,520 | — | 471,520 | — | ||||||||||||||
| Foreign Government Bonds & Notes | 200,100 | — | 200,100 | — | ||||||||||||||
| Short-Term Investment | 711,109 | 711,109 | — | — | ||||||||||||||
|
|
|
|
|
|
|
| |||||||||||
| Total | $ | 12,858,375 | $ | 711,109 | $ | 12,147,266 | $ | — | ||||||||||
|
|
|
|
|
|
|
| |||||||||||
| See Notes to Financial Statements | B-36 | See explanation of symbols and terms, if any, on page B-71 |
Table of Contents
PACIFIC LIFE FUNDS
PL STRATEGIC INCOME FUND
Schedule of Investments
March 31, 2012
| Shares | Value | |||||||
COMMON STOCKS - 0.4% | ||||||||
Consumer Discretionary - 0.1% | ||||||||
MGM Resorts International * | 1,900 | $ | 25,878 | |||||
|
| |||||||
Industrials - 0.2% | ||||||||
Kansas City Southern * | 400 | 28,676 | ||||||
|
| |||||||
Materials - 0.1% | ||||||||
Barrick Gold Corp (Canada) | 500 | 21,740 | ||||||
|
| |||||||
Total Common Stocks | ||||||||
(Cost $76,813) | 76,294 | |||||||
|
| |||||||
EXCHANGE-TRADED FUNDS - 7.6% |
| |||||||
PowerShares Senior Loan Portfolio | 31,341 | 770,362 | ||||||
SPDR Barclays Capital High Yield Bond | 15,000 | 590,550 | ||||||
|
| |||||||
Total Exchange-Traded Funds | ||||||||
(Cost $1,329,235) | 1,360,912 | |||||||
|
| |||||||
| Principal Amount | ||||||||
CORPORATE BONDS & NOTES - 87.2% |
| |||||||
Consumer Discretionary - 15.4% |
| |||||||
99 Cents Only Stores | ||||||||
11.000% due 12/15/19 ~ | $ | 100,000 | 107,500 | |||||
Ameristar Casinos Inc | ||||||||
7.500% due 04/15/21 | 100,000 | 105,375 | ||||||
ARAMARK Holdings Corp | ||||||||
8.625% due 05/01/16 ~ | 100,000 | 102,750 | ||||||
Caesars Operating Escrow LLC | ||||||||
8.500% due 02/15/20 ~ | 100,000 | 102,000 | ||||||
Chrysler Group LLC | ||||||||
8.250% due 06/15/21 | 100,000 | 101,500 | ||||||
CityCenter Holdings LLC | ||||||||
7.625% due 01/15/16 | 100,000 | 106,000 | ||||||
Dana Holding Corp | ||||||||
6.750% due 02/15/21 | 100,000 | 107,000 | ||||||
DISH DBS Corp | ||||||||
6.750% due 06/01/21 | 100,000 | 108,250 | ||||||
Harrah’s Operating Co | ||||||||
11.250% due 06/01/17 | 100,000 | 109,500 | ||||||
Hyatt Hotels Corp | ||||||||
6.875% due 08/15/19 ~ | 100,000 | 115,431 | ||||||
Jarden Corp | ||||||||
7.500% due 01/15/20 | 100,000 | 109,000 | ||||||
Jo-Ann Stores Inc | ||||||||
8.125% due 03/15/19 ~ | 150,000 | 151,500 | ||||||
Kia Motors Corp (South Korea) | ||||||||
3.625% due 06/14/16 ~ | 250,000 | 255,097 | ||||||
Limited Brands Inc | ||||||||
5.625% due 02/15/22 | 100,000 | 101,375 | ||||||
Marriott International Inc | ||||||||
3.000% due 03/01/19 | 250,000 | 246,185 | ||||||
MGM Resorts International | ||||||||
7.625% due 01/15/17 | 100,000 | 103,750 | ||||||
NCL Corp Ltd (Bermuda) | ||||||||
11.750% due 11/15/16 | 100,000 | 116,250 | ||||||
NPC International Inc | ||||||||
10.500% due 01/15/20 ~ | 150,000 | 164,250 | ||||||
| Principal Amount | Value | |||||||
The ServiceMaster Co | ||||||||
8.000% due 02/15/20 ~ | $ | 100,000 | $ | 107,000 | ||||
Toll Brothers Finance Corp | ||||||||
5.875% due 02/15/22 | 50,000 | 51,466 | ||||||
Virgin Media Secured Finance PLC |
| |||||||
6.500% due 01/15/18 | 145,000 | 158,231 | ||||||
Wyndham Worldwide Corp | ||||||||
5.750% due 02/01/18 | 100,000 | 111,468 | ||||||
|
| |||||||
| 2,740,878 | ||||||||
|
| |||||||
Consumer Staples - 7.2% | ||||||||
Constellation Brands Inc | ||||||||
7.250% due 05/15/17 | 100,000 | 113,750 | ||||||
Del Monte Corp | ||||||||
7.625% due 02/15/19 | 200,000 | 200,000 | ||||||
JBS USA LLC | ||||||||
8.250% due 02/01/20 ~ | 100,000 | 103,000 | ||||||
Pernod-Ricard SA (France) | ||||||||
4.250% due 07/15/22 ~ | 250,000 | 251,062 | ||||||
Pinnacle Foods Finance LLC | ||||||||
8.250% due 09/01/17 | 100,000 | 109,000 | ||||||
Revlon Consumer Products Corp | ||||||||
9.750% due 11/15/15 | 100,000 | 108,000 | ||||||
Reynolds Group Issuer Inc | ||||||||
9.250% due 05/15/18 ~ | 250,000 | 250,625 | ||||||
9.875% due 08/15/19 ~ | 50,000 | 51,188 | ||||||
Spectrum Brands Inc | ||||||||
6.750% due 03/15/20 ~ | 100,000 | 101,375 | ||||||
|
| |||||||
| 1,288,000 | ||||||||
|
| |||||||
Energy - 15.7% | ||||||||
Arch Coal Inc | ||||||||
7.250% due 06/15/21 ~ | 100,000 | 92,750 | ||||||
Basic Energy Services Inc | ||||||||
7.750% due 02/15/19 | 100,000 | 103,000 | ||||||
Chesapeake Midstream Partners LP | ||||||||
6.125% due 07/15/22 ~ | 100,000 | 101,250 | ||||||
Cimarex Energy Co | ||||||||
5.875% due 05/01/22 | 100,000 | 102,250 | ||||||
Crosstex Energy LP | ||||||||
8.875% due 02/15/18 | 100,000 | 106,750 | ||||||
Ensco PLC (United Kingdom) | ||||||||
4.700% due 03/15/21 | 100,000 | 108,047 | ||||||
EV Energy Partners LP | ||||||||
8.000% due 04/15/19 | 150,000 | 154,500 | ||||||
Hilcorp Energy I LP | ||||||||
7.625% due 04/15/21 ~ | 100,000 | 108,500 | ||||||
Holly Energy Partners LP | ||||||||
6.500% due 03/01/20 ~ | 100,000 | 101,750 | ||||||
Inergy LP | ||||||||
6.875% due 08/01/21 | 100,000 | 96,750 | ||||||
Key Energy Services Inc | ||||||||
6.750% due 03/01/21 | 100,000 | 103,250 | ||||||
Kinder Morgan Energy Partners LP | ||||||||
5.800% due 03/15/35 | 100,000 | 103,363 | ||||||
Korea National Oil Corp | ||||||||
3.125% due 04/03/17 ~ | 100,000 | 100,011 | ||||||
Linn Energy LLC | ||||||||
6.250% due 11/01/19 ~ | 100,000 | 97,125 | ||||||
Lukoil International Finance BV | ||||||||
6.356% due 06/07/17 ~ | 100,000 | 109,528 | ||||||
OGX Austria GmbH (Austria) | ||||||||
8.375% due 04/01/22 ~ | 200,000 | 202,500 | ||||||
Petrobras International Finance Co (Cayman) | ||||||||
5.375% due 01/27/21 | 200,000 | 216,272 | ||||||
Plains Exploration & Production Co | ||||||||
6.750% due 02/01/22 | 250,000 | 262,500 | ||||||
| See Notes to Financial Statements | B-37 | See explanation of symbols and terms, if any, on page B-71 |
Table of Contents
PACIFIC LIFE FUNDS
PL STRATEGIC INCOME FUND
Schedule of Investments (Continued)
March 31, 2012
| Principal Amount | Value | |||||||
Regency Energy Partners LP | ||||||||
6.875% due 12/01/18 | $ | 100,000 | $ | 106,250 | ||||
Sabine Pass LNG LP | ||||||||
7.500% due 11/30/16 | 100,000 | 107,750 | ||||||
Samson Investment Co | ||||||||
9.750% due 02/15/20 ~ | 100,000 | 101,375 | ||||||
SESI LLC | ||||||||
6.375% due 05/01/19 | 100,000 | 106,500 | ||||||
Weatherford International Ltd (Bermuda) | ||||||||
4.500% due 04/15/22 | 100,000 | 99,855 | ||||||
|
| |||||||
| 2,791,826 | ||||||||
|
| |||||||
Financials - 11.4% | ||||||||
BRE Properties Inc REIT | ||||||||
5.500% due 03/15/17 | 250,000 | 276,208 | ||||||
First Data Corp | ||||||||
7.375% due 06/15/19 ~ | 100,000 | 102,375 | ||||||
Ford Motor Credit Co LLC | ||||||||
5.875% due 08/02/21 | 100,000 | 108,015 | ||||||
Host Hotels & Resorts LP REIT | ||||||||
6.000% due 11/01/20 | 250,000 | 266,250 | ||||||
Hyundai Capital America | ||||||||
4.000% due 06/08/17 ~ | 250,000 | 257,103 | ||||||
Neuberger Berman Group LLC | ||||||||
5.875% due 03/15/22 ~ | 100,000 | 101,500 | ||||||
Nuveen Investments Inc | ||||||||
10.500% due 11/15/15 | 150,000 | 156,187 | ||||||
Raymond James Financial Inc | ||||||||
5.625% due 04/01/24 | 100,000 | 102,177 | ||||||
Realogy Corp | ||||||||
7.625% due 01/15/20 ~ | 100,000 | 105,000 | ||||||
7.875% due 02/15/19 ~ | 100,000 | 100,500 | ||||||
UDR Inc REIT | ||||||||
4.625% due 01/10/22 | 250,000 | 256,325 | ||||||
Ventas Realty LP REIT | ||||||||
4.250% due 03/01/22 | 100,000 | 97,325 | ||||||
Vornado Realty LP REIT | ||||||||
5.000% due 01/15/22 | 100,000 | 102,333 | ||||||
|
| |||||||
| 2,031,298 | ||||||||
|
| |||||||
Health Care - 3.9% | ||||||||
CHS/Community Health Systems Inc | ||||||||
8.000% due 11/15/19 ~ | 100,000 | 103,500 | ||||||
DJO Finance LLC | ||||||||
7.750% due 04/15/18 | 100,000 | 82,500 | ||||||
HCA Inc | ||||||||
5.875% due 03/15/22 | 200,000 | 200,750 | ||||||
Mylan Inc | ||||||||
7.625% due 07/15/17 ~ | 100,000 | 110,500 | ||||||
Tenet Healthcare Corp | ||||||||
8.000% due 08/01/20 | 100,000 | 103,500 | ||||||
Valeant Pharmaceuticals International | ||||||||
6.750% due 10/01/17 ~ | 100,000 | 101,749 | ||||||
|
| |||||||
| 702,499 | ||||||||
|
| |||||||
Industrials - 11.2% | ||||||||
Air Lease Corp | ||||||||
5.625% due 04/01/17 ~ | 200,000 | 200,250 | ||||||
Aircastle Ltd (Bermuda) | ||||||||
7.625% due 04/15/20 ~ | 100,000 | 100,000 | ||||||
Avis Budget Car Rental LLC | ||||||||
8.250% due 01/15/19 | 100,000 | 104,750 | ||||||
BE Aerospace Inc | ||||||||
6.875% due 10/01/20 | 100,000 | 110,000 | ||||||
Bombardier Inc (Canada) | ||||||||
5.750% due 03/15/22 ~ | 100,000 | 97,750 | ||||||
| Principal Amount | Value | |||||||
International Lease Finance Corp | ||||||||
5.875% due 04/01/19 | $ | 100,000 | $ | 96,754 | ||||
6.750% due 09/01/16 ~ | 200,000 | 215,250 | ||||||
Monitronics International Inc | ||||||||
9.125% due 04/01/20 ~ | 100,000 | 101,750 | ||||||
Owens Corning | ||||||||
6.500% due 12/01/16 | 150,000 | 166,781 | ||||||
RBS Global Inc | ||||||||
11.750% due 08/01/16 | 250,000 | 265,313 | ||||||
The Manitowoc Co Inc | ||||||||
9.500% due 02/15/18 | 100,000 | 111,000 | ||||||
Tomkins LLC | ||||||||
9.000% due 10/01/18 | 100,000 | 111,250 | ||||||
U.S. Airways 2011-1 Pass-Through Trust ‘A’ | ||||||||
7.125% due 10/22/23 | 100,000 | 105,000 | ||||||
UR Financing Escrow Corp | ||||||||
7.375% due 05/15/20 ~ | 100,000 | 102,500 | ||||||
7.625% due 04/15/22 ~ | 100,000 | 103,000 | ||||||
|
| |||||||
| 1,991,348 | ||||||||
|
| |||||||
Materials - 14.2% | ||||||||
AK Steel Corp | ||||||||
8.375% due 04/01/22 | 150,000 | 146,250 | ||||||
ArcelorMittal (Luxembourg) | ||||||||
6.250% due 02/25/22 | 250,000 | 253,145 | ||||||
Ardagh Packaging Finance PLC (Ireland) | ||||||||
9.125% due 10/15/20 ~ | 100,000 | 105,250 | ||||||
Berry Plastics Corp | ||||||||
9.500% due 05/15/18 | 250,000 | 266,250 | ||||||
Building Materials Corp of America | ||||||||
6.875% due 08/15/18 ~ | 100,000 | 105,625 | ||||||
Celulosa Arauco y Constitucion SA (Chile) | ||||||||
4.750% due 01/11/22 ~ | 250,000 | 257,064 | ||||||
Domtar Corp | ||||||||
4.400% due 04/01/22 | 100,000 | 98,976 | ||||||
FMG Resources August 2006 Property Ltd (Australia) | ||||||||
6.875% due 02/01/18 ~ | 250,000 | 251,250 | ||||||
Graphic Packaging International Inc | ||||||||
7.875% due 10/01/18 | 100,000 | 111,250 | ||||||
Hexion U.S. Finance Corp | ||||||||
6.625% due 04/15/20 ~ | 150,000 | 154,125 | ||||||
Huntsman International LLC | ||||||||
5.500% due 06/30/16 | 100,000 | 100,375 | ||||||
Longview Fibre Paper & Packaging Inc | ||||||||
8.000% due 06/01/16 ~ | 100,000 | 102,375 | ||||||
Rock-Tenn Co | ||||||||
4.900% due 03/01/22 ~ | 100,000 | 100,009 | ||||||
Sealed Air Corp | ||||||||
8.375% due 09/15/21 ~ | 100,000 | 112,875 | ||||||
Vale Overseas Ltd (Cayman) | ||||||||
4.375% due 01/11/22 | 250,000 | 252,263 | ||||||
Xstrata Finance Canada Ltd (Canada) | ||||||||
4.950% due 11/15/21 ~ | 100,000 | 104,925 | ||||||
|
| |||||||
| 2,522,007 | ||||||||
|
| |||||||
Telecommunication Services - 5.5% |
| |||||||
CenturyLink Inc | ||||||||
6.000% due 04/01/17 | 200,000 | 212,801 | ||||||
Cricket Communications Inc | ||||||||
7.750% due 10/15/20 | 100,000 | 98,625 | ||||||
Intelsat Luxembourg SA (Luxembourg) | ||||||||
11.250% due 02/04/17 | 250,000 | 260,625 | ||||||
MetroPCS Wireless Inc | ||||||||
7.875% due 09/01/18 | 100,000 | 105,750 | ||||||
| See Notes to Financial Statements | B-38 | See explanation of symbols and terms, if any, on page B-71 |
Table of Contents
PACIFIC LIFE FUNDS
PL STRATEGIC INCOME FUND
Schedule of Investments (Continued)
March 31, 2012
| Principal Amount | Value | |||||||
Sprint Nextel Corp | ||||||||
6.000% due 12/01/16 | $ | 100,000 | $ | 89,750 | ||||
7.000% due 03/01/20 ~ | 100,000 | 101,750 | ||||||
UPCB Finance VI Ltd (Cayman) | ||||||||
6.875% due 01/15/22 ~ | 100,000 | 103,750 | ||||||
|
| |||||||
| 973,051 | ||||||||
|
| |||||||
Utilities - 2.7% | ||||||||
Calpine Corp | ||||||||
7.500% due 02/15/21 ~ | 250,000 | 268,125 | ||||||
CMS Energy Corp | ||||||||
5.050% due 03/15/22 | 100,000 | 101,088 | ||||||
Dominion Resources Inc | ||||||||
4.900% due 08/01/41 | 100,000 | 104,979 | ||||||
|
| |||||||
| 474,192 | ||||||||
|
| |||||||
Total Corporate Bonds & Notes | ||||||||
(Cost $15,176,055) | 15,515,099 | |||||||
|
| |||||||
U.S. TREASURY OBLIGATIONS - 2.2% |
| |||||||
U.S. Treasury Notes - 2.2% | ||||||||
3.125% due 11/15/41 | 400,000 | 382,250 | ||||||
|
| |||||||
Total U.S. Treasury Obligations | ||||||||
(Cost $406,443) | 382,250 | |||||||
|
| |||||||
| Shares | ||||||||
SHORT-TERM INVESTMENT - 1.6% |
| |||||||
Money Market Fund - 1.6% |
| |||||||
BlackRock Liquidity Funds Treasury Trust Fund Portfolio | 279,450 | 279,450 | ||||||
|
| |||||||
Total Short-Term Investment | ||||||||
(Cost $279,450) | 279,450 | |||||||
|
| |||||||
TOTAL INVESTMENTS - 99.0% |
| |||||||
(Cost $17,267,996) | 17,614,005 | |||||||
OTHER ASSETS & LIABILITIES, |
| 181,857 | ||||||
|
| |||||||
NET ASSETS - 100.0% | $ | 17,795,862 | ||||||
|
| |||||||
Notes to Schedule of Investments
| (a) | As of March 31, 2012, the fund was diversified as a percentage of net assets as follows: |
Energy | 15.7 | % | ||
Consumer Discretionary | 15.5 | % | ||
Materials | 14.3 | % | ||
Financials | 11.4 | % | ||
Industrials | 11.4 | % | ||
Exchange-Traded Funds | 7.6 | % | ||
Consumer Staples | 7.2 | % | ||
Telecommunications Services | 5.5 | % | ||
Health Care | 3.9 | % | ||
Utilities | 2.7 | % | ||
U.S. Treasury Obligations | 2.2 | % | ||
Short-Term Investment | 1.6 | % | ||
|
| |||
| 99.0 | % | |||
Other Assets & Liabilities, Net | 1.0 | % | ||
|
| |||
| 100.0 | % | |||
|
|
| (b) | As of March 31, 2012, the fund’s Standard & Poor’s quality ratings as a percentage of total fixed income investments were as follows (Unaudited): |
AA / U.S. Government & Agency Issues | 2.4 | % | ||
A | 2.9 | % | ||
BBB | 26.2 | % | ||
BB | 27.7 | % | ||
B | 27.5 | % | ||
CCC | 10.1 | % | ||
Not Rated | 3.2 | % | ||
|
| |||
| 100.0 | % | |||
|
|
| (c) | Fair Value Measurements |
The following is a summary of the fund’s investments as categorized under the three-tier hierarchy of inputs used in valuing the fund’s assets and liabilities (See Note 3C in Notes to Financial Statements) as of March 31, 2012:
| Total Value at March 31, 2012 | Level 1 Quoted Price | Level 2 Significant Observable Inputs | Level 3 Significant Unobservable Inputs | |||||||||||||||
Assets | Common Stocks (1) | $ | 76,294 | $ | 76,294 | $ | — | $ | — | |||||||||
Exchange-Traded Funds | 1,360,912 | 1,360,912 | — | — | ||||||||||||||
Corporate Bonds & Notes | 15,515,099 | — | 15,515,099 | — | ||||||||||||||
U.S. Treasury Obligations | 382,250 | — | 382,250 | — | ||||||||||||||
Short-Term Investment | 279,450 | 279,450 | — | — | ||||||||||||||
|
|
|
|
|
|
|
| |||||||||||
Total | $ | 17,614,005 | $ | 1,716,656 | $ | 15,897,349 | $ | — | ||||||||||
|
|
|
|
|
|
|
| |||||||||||
| (1) | For equity investments categorized in a single level, refer to the schedule of investments for further industry breakout. |
| See Notes to Financial Statements | B-39 | See explanation of symbols and terms, if any, on page B-71 |
Table of Contents
PACIFIC LIFE FUNDS
PL COMSTOCK FUND
Schedule of Investments
March 31, 2012
| Shares | Value | |||||||
COMMON STOCKS - 94.7% | ||||||||
Consumer Discretionary - 14.4% | ||||||||
Carnival Corp (Panama) | 35,383 | $ | 1,135,087 | |||||
Comcast Corp ‘A’ | 243,399 | 7,304,404 | ||||||
General Motors Co * | 113,943 | 2,922,638 | ||||||
Lowe’s Cos Inc | 73,072 | 2,292,999 | ||||||
News Corp ‘B’ | 157,289 | 3,142,634 | ||||||
Staples Inc | 103,448 | 1,673,789 | ||||||
Target Corp | 25,062 | 1,460,363 | ||||||
Time Warner Cable Inc | 50,863 | 4,145,335 | ||||||
Time Warner Inc | 49,959 | 1,885,952 | ||||||
Viacom Inc ‘B’ | 81,224 | 3,854,891 | ||||||
|
| |||||||
| 29,818,092 | ||||||||
|
| |||||||
Consumer Staples - 7.0% | ||||||||
Avon Products Inc | 33,936 | 657,001 | ||||||
CVS Caremark Corp | 81,841 | 3,666,477 | ||||||
Kraft Foods Inc ‘A’ | 86,862 | 3,301,625 | ||||||
PepsiCo Inc | 13,597 | 902,161 | ||||||
The Procter & Gamble Co | 10,941 | 735,345 | ||||||
Unilever NV ‘NY’ (Netherlands) | 96,081 | 3,269,636 | ||||||
Wal-Mart Stores Inc | 31,912 | 1,953,014 | ||||||
|
| |||||||
| 14,485,259 | ||||||||
|
| |||||||
Energy - 11.9% | ||||||||
BP PLC ADR (United Kingdom) | 93,005 | 4,185,225 | ||||||
Chesapeake Energy Corp | 58,966 | 1,366,242 | ||||||
Chevron Corp | 37,372 | 4,007,773 | ||||||
Halliburton Co | 111,909 | 3,714,260 | ||||||
Murphy Oil Corp | 39,176 | 2,204,434 | ||||||
Noble Corp (Switzerland) * | 26,792 | 1,003,896 | ||||||
QEP Resources Inc | 37,666 | 1,148,813 | ||||||
Royal Dutch Shell PLC ‘A’ ADR (United Kingdom) | 51,979 | 3,645,287 | ||||||
Weatherford International Ltd (Switzerland) * | 221,269 | 3,338,949 | ||||||
|
| |||||||
| 24,614,879 | ||||||||
|
| |||||||
Financials - 22.2% | ||||||||
Aflac Inc | 14,795 | 680,422 | ||||||
Bank of America Corp | 292,934 | 2,803,378 | ||||||
Citigroup Inc | 167,512 | 6,122,564 | ||||||
Fifth Third Bancorp | 123,721 | 1,738,280 | ||||||
JPMorgan Chase & Co | 144,154 | 6,628,201 | ||||||
MetLife Inc | 63,759 | 2,381,399 | ||||||
Morgan Stanley | 99,401 | 1,952,236 | ||||||
State Street Corp | 21,051 | 957,820 | ||||||
The Allstate Corp | 156,657 | 5,157,148 | ||||||
The Bank of New York Mellon Corp | 171,242 | 4,132,069 | ||||||
The Goldman Sachs Group Inc | 15,780 | 1,962,559 | ||||||
The PNC Financial Services Group Inc | 49,400 | 3,185,806 | ||||||
The Travelers Cos Inc | 41,035 | 2,429,272 | ||||||
U.S. Bancorp | 50,236 | 1,591,476 | ||||||
Wells Fargo & Co | 125,472 | 4,283,614 | ||||||
|
| |||||||
| 46,006,244 | ||||||||
|
| |||||||
Health Care - 13.3% | ||||||||
Bristol-Myers Squibb Co | 114,594 | 3,867,547 | ||||||
Cardinal Health Inc | 42,865 | 1,847,910 | ||||||
GlaxoSmithKline PLC ADR (United Kingdom) | 46,771 | 2,100,486 | ||||||
Merck & Co Inc | 96,383 | 3,701,107 | ||||||
Novartis AG (Switzerland) | 13,048 | 722,143 | ||||||
Pfizer Inc | 232,322 | 5,264,417 | ||||||
Roche Holding AG ADR (Switzerland) | 39,152 | 1,708,593 | ||||||
Sanofi ADR (France) | 55,202 | 2,139,078 | ||||||
UnitedHealth Group Inc | 69,514 | 4,097,155 | ||||||
WellPoint Inc | 28,027 | 2,068,393 | ||||||
|
| |||||||
| 27,516,829 | ||||||||
|
| |||||||
| Shares | Value | |||||||
Industrials - 6.0% | ||||||||
Emerson Electric Co | 23,641 | $ | 1,233,587 | |||||
General Electric Co | 159,159 | 3,194,321 | ||||||
Honeywell International Inc | 33,862 | 2,067,275 | ||||||
Ingersoll-Rand PLC (Ireland) | 103,480 | 4,278,898 | ||||||
Textron Inc | 56,519 | 1,572,924 | ||||||
|
| |||||||
| 12,347,005 | ||||||||
|
| |||||||
Information Technology - 11.1% |
| |||||||
Cisco Systems Inc | 83,659 | 1,769,388 | ||||||
Corning Inc | 115,405 | 1,624,902 | ||||||
Dell Inc * | 83,395 | 1,384,357 | ||||||
eBay Inc * | 115,593 | 4,264,226 | ||||||
Hewlett-Packard Co | 142,414 | 3,393,726 | ||||||
Intel Corp | 53,872 | 1,514,342 | ||||||
KLA-Tencor Corp | 13,749 | 748,221 | ||||||
Microsoft Corp | 167,401 | 5,398,682 | ||||||
Yahoo! Inc * | 197,988 | 3,013,377 | ||||||
|
| |||||||
| 23,111,221 | ||||||||
|
| |||||||
Materials - 3.4% | ||||||||
Alcoa Inc | 219,997 | 2,204,370 | ||||||
International Paper Co | 137,945 | 4,841,869 | ||||||
|
| |||||||
| 7,046,239 | ||||||||
|
| |||||||
Telecommunication Services - 2.8% |
| |||||||
AT&T Inc | 58,512 | 1,827,330 | ||||||
Verizon Communications Inc | 57,078 | 2,182,092 | ||||||
Vodafone Group PLC ADR (United Kingdom) | 68,426 | 1,893,347 | ||||||
|
| |||||||
| 5,902,769 | ||||||||
|
| |||||||
Utilities - 2.6% | ||||||||
FirstEnergy Corp | 50,952 | 2,322,902 | ||||||
PPL Corp | 111,451 | 3,149,605 | ||||||
|
| |||||||
| 5,472,507 | ||||||||
|
| |||||||
Total Common Stocks | ||||||||
(Cost $162,665,844) | 196,321,044 | |||||||
|
| |||||||
SHORT-TERM INVESTMENT - 5.2% |
| |||||||
Money Market Fund - 5.2% | ||||||||
BlackRock Liquidity Funds Treasury Trust Fund Portfolio | 10,774,139 | 10,774,139 | ||||||
|
| |||||||
Total Short-Term Investment | ||||||||
(Cost $10,774,139) | 10,774,139 | |||||||
|
| |||||||
TOTAL INVESTMENTS - 99.9% |
| |||||||
(Cost $173,439,983) | 207,095,183 | |||||||
OTHER ASSETS & LIABILITIES, |
| 234,451 | ||||||
|
| |||||||
NET ASSETS - 100.0% | $ | 207,329,634 | ||||||
|
| |||||||
| See Notes to Financial Statements | B-40 | See explanation of symbols and terms, if any, on page B-71 |
Table of Contents
PACIFIC LIFE FUNDS
PL COMSTOCK FUND
Schedule of Investments (Continued)
March 31, 2012
Notes to Schedule of Investments
| (a) | As of March 31, 2012, the fund was diversified as a percentage of net assets as follows: |
Financials | 22.2 | % | ||
Consumer Discretionary | 14.4 | % | ||
Health Care | 13.3 | % | ||
Energy | 11.9 | % | ||
Information Technology | 11.1 | % | ||
Consumer Staples | 7.0 | % | ||
Industrials | 6.0 | % | ||
Short-Term Investment | 5.2 | % | ||
Materials | 3.4 | % | ||
Telecommunication Services | 2.8 | % | ||
Utilities | 2.6 | % | ||
|
| |||
| 99.9 | % | |||
Other Assets & Liabilities, Net | 0.1 | % | ||
|
| |||
| 100.0 | % | |||
|
|
| (b) | Fair Value Measurements |
The following is a summary of the fund’s investments as categorized under the three-tier hierarchy of inputs used in valuing the fund’s assets and liabilities (See Note 3C in Notes to Financial Statements) as of March 31, 2012:
| Total Value at March 31, 2012 | Level 1 Quoted Price | Level 2 Significant Observable Inputs | Level 3 Significant Unobservable Inputs | |||||||||||||||
Assets | Common Stocks (1) | $ | 196,321,044 | $ | 196,321,044 | $ | — | $ | — | |||||||||
Short-Term Investment | $ | 10,774,139 | 10,774,139 | — | — | |||||||||||||
|
|
|
|
|
|
|
| |||||||||||
Total | $ | 207,095,183 | $ | 207,095,183 | $ | — | $ | — | ||||||||||
|
|
|
|
|
|
|
| |||||||||||
| (1) | For equity investments categorized in a single level, refer to the schedule of investments for further industry breakout. |
| See Notes to Financial Statements | B-41 | See explanation of symbols and terms, if any, on page B-71 |
Table of Contents
PACIFIC LIFE FUNDS
PL GROWTH LT FUND
Schedule of Investments
March 31, 2012
| Shares | Value | |||||||
COMMON STOCKS - 93.3% | ||||||||
Consumer Discretionary - 17.0% |
| |||||||
Amazon.com Inc * | 6,455 | $ | 1,307,202 | |||||
AutoZone Inc * | 1,445 | 537,251 | ||||||
CBS Corp ‘B’ | 56,845 | 1,927,614 | ||||||
Cie Financiere Richemont SA ‘A’ (Switzerland) | 15,156 | 951,618 | ||||||
J.C. Penney Co Inc | 41,655 | 1,475,837 | ||||||
Limited Brands Inc | 57,020 | 2,736,960 | ||||||
Mattel Inc | 33,559 | 1,129,596 | ||||||
McDonald’s Corp | 5,290 | 518,949 | ||||||
Nike Inc ‘B’ | 13,837 | 1,500,484 | ||||||
Nordstrom Inc | 38,175 | 2,127,111 | ||||||
Prada SPA (Italy) * | 153,600 | 998,354 | ||||||
Starbucks Corp | 10,475 | 585,448 | ||||||
The Walt Disney Co | 27,720 | 1,213,582 | ||||||
Time Warner Cable Inc | 17,455 | 1,422,583 | ||||||
|
| |||||||
| 18,432,589 | ||||||||
|
| |||||||
Consumer Staples - 8.6% | ||||||||
Anheuser-Busch InBev NV (Belgium) | 20,571 | 1,498,971 | ||||||
Colgate-Palmolive Co | 10,410 | 1,017,890 | ||||||
Costco Wholesale Corp | 25,620 | 2,326,296 | ||||||
Pernod-Ricard SA (France) | 14,095 | 1,473,570 | ||||||
Philip Morris International Inc | 11,525 | 1,021,230 | ||||||
Reckitt Benckiser Group PLC (United Kingdom) | 13,534 | 764,291 | ||||||
SABMiller PLC (United Kingdom) | 31,268 | 1,257,865 | ||||||
|
| |||||||
| 9,360,113 | ||||||||
|
| |||||||
Energy - 9.0% | ||||||||
Apache Corp | 10,090 | 1,013,440 | ||||||
Canadian Natural Resources Ltd (Canada) | 14,215 | 471,654 | ||||||
Dresser-Rand Group Inc * | 25,129 | 1,165,734 | ||||||
EOG Resources Inc | 12,360 | 1,373,196 | ||||||
Helmerich & Payne Inc | 18,810 | 1,014,799 | ||||||
Kinder Morgan Inc | 16,800 | 649,320 | ||||||
National Oilwell Varco Inc | 8,515 | 676,687 | ||||||
Noble Energy Inc | 5,090 | 497,700 | ||||||
Occidental Petroleum Corp | 10,430 | 993,249 | ||||||
OGX Petroleo e Gas Participacoes SA (Brazil) * | 11,000 | 91,112 | ||||||
OGX Petroleo e Gas Participacoes SA ADR (Brazil) * | 59,406 | 500,793 | ||||||
Petroleo Brasileiro SA ADR (Brazil) | 20,270 | 538,371 | ||||||
Schlumberger Ltd (Netherlands) | 10,915 | 763,286 | ||||||
|
| |||||||
| 9,749,341 | ||||||||
|
| |||||||
Financials - 3.5% | ||||||||
Banco do Brasil SA (Brazil) | 33,300 | 473,017 | ||||||
Prudential PLC (United Kingdom) | 86,180 | 1,034,955 | ||||||
Standard Chartered PLC (United Kingdom) | 33,354 | 831,718 | ||||||
T. Rowe Price Group Inc | 18,445 | 1,204,458 | ||||||
Ventas Inc REIT | 3,780 | 215,838 | ||||||
|
| |||||||
| 3,759,986 | ||||||||
|
| |||||||
Health Care - 11.2% | ||||||||
AmerisourceBergen Corp | 19,405 | 769,990 | ||||||
Celgene Corp * | 44,100 | 3,418,632 | ||||||
Covidien PLC (Ireland) | 34,270 | 1,873,884 | ||||||
DaVita Inc * | 2,960 | 266,903 | ||||||
Express Scripts Inc * | 31,075 | 1,683,643 | ||||||
Perrigo Co | 11,675 | 1,206,144 | ||||||
Regeneron Pharmaceuticals Inc * | 1,980 | 230,908 | ||||||
Valeant Pharmaceuticals International Inc (Canada) * | 19,886 | 1,067,679 | ||||||
Varian Medical Systems Inc * | 9,045 | 623,743 | ||||||
Vertex Pharmaceuticals Inc * | 23,391 | 959,265 | ||||||
|
| |||||||
| 12,100,791 | ||||||||
|
| |||||||
| Shares | Value | |||||||
Industrials - 10.8% | ||||||||
C.H. Robinson Worldwide Inc | 21,205 | $ | 1,388,715 | |||||
Canadian Pacific Railway Ltd (Canada) | 2,760 | 209,622 | ||||||
Danaher Corp | 27,245 | 1,525,720 | ||||||
Expeditors International of Washington Inc | 19,200 | 892,992 | ||||||
FANUC Corp (Japan) | 7,700 | 1,383,908 | ||||||
Fastenal Co | 8,683 | 469,750 | ||||||
Precision Castparts Corp | 12,545 | 2,169,030 | ||||||
Sensata Technologies Holding NV (Netherlands) * | 56,826 | 1,902,534 | ||||||
Tyco International Ltd (Switzerland) | 13,645 | 766,576 | ||||||
Union Pacific Corp | 3,170 | 340,712 | ||||||
Verisk Analytics Inc ‘A’ * | 13,625 | 639,966 | ||||||
|
| |||||||
| 11,689,525 | ||||||||
|
| |||||||
Information Technology - 29.4% |
| |||||||
Amdocs Ltd (United Kingdom) * | 36,890 | 1,164,986 | ||||||
Amphenol Corp ‘A’ | 26,463 | 1,581,693 | ||||||
ANSYS Inc * | 4,270 | 277,635 | ||||||
Apple Inc * | 15,640 | 9,375,711 | ||||||
Atmel Corp * | 90,887 | 896,146 | ||||||
Autodesk Inc * | 30,675 | 1,298,166 | ||||||
eBay Inc * | 99,240 | 3,660,964 | ||||||
EMC Corp * | 96,885 | 2,894,924 | ||||||
MasterCard Inc ‘A’ | 1,520 | 639,221 | ||||||
Microsoft Corp | 33,575 | 1,082,794 | ||||||
ON Semiconductor Corp * | 150,577 | 1,356,699 | ||||||
Oracle Corp | 92,498 | 2,697,242 | ||||||
Taiwan Semiconductor Manufacturing Co Ltd (Taiwan) | 360,455 | 1,036,962 | ||||||
TE Connectivity Ltd (Switzerland) | 63,748 | 2,342,739 | ||||||
Teradata Corp * | 14,685 | 1,000,783 | ||||||
Zynga Inc ‘A’ * | 39,527 | 519,780 | ||||||
|
| |||||||
| 31,826,445 | ||||||||
|
| |||||||
Materials - 3.1% | ||||||||
Ball Corp | 40,460 | 1,734,925 | ||||||
Praxair Inc | 14,380 | 1,648,523 | ||||||
|
| |||||||
| 3,383,448 | ||||||||
|
| |||||||
Telecommunication Services - 0.7% |
| |||||||
Crown Castle International Corp * | 13,855 | 739,026 | ||||||
|
| |||||||
Total Common Stocks | ||||||||
(Cost $75,951,315) | 101,041,264 | |||||||
|
| |||||||
PURCHASED OPTIONS - 0.3% |
| |||||||
(See Note (d) in Notes to Schedule of Investments) | ||||||||
(Cost $261,869) | 362,760 | |||||||
|
| |||||||
| Principal Amount | ||||||||
SHORT-TERM INVESTMENTS - 6.7% |
| |||||||
Commercial Paper - 4.9% | ||||||||
Nieuw Amsterdam Receivables Corp |
| |||||||
0.100% due 04/02/12 | $ | 5,300,000 | 5,299,985 | |||||
|
| |||||||
| See Notes to Financial Statements | B-42 | See explanation of symbols and terms, if any, on page B-71 |
Table of Contents
PACIFIC LIFE FUNDS
PL GROWTH LT FUND
Schedule of Investments (Continued)
March 31, 2012
| Shares | Value | |||||||
Money Market Fund - 1.8% | ||||||||
BlackRock Liquidity Funds Treasury Trust Fund Portfolio | 1,914,339 | $ | 1,914,339 | |||||
|
| |||||||
Total Short-Term Investments | ||||||||
(Cost $7,214,324) | 7,214,324 | |||||||
|
| |||||||
TOTAL INVESTMENTS - 100.3% |
| |||||||
(Cost $83,427,508) | 108,618,348 | |||||||
OTHER ASSETS & LIABILITIES, | (278,690 | ) | ||||||
|
| |||||||
NET ASSETS - 100.0% | $ | 108,339,658 | ||||||
|
| |||||||
Notes to Schedule of Investments
| (a) | As of March 31, 2012, the fund was diversified as a percentage of net assets as follows: |
Information Technology | 29.4 | % | ||
Consumer Discretionary | 17.0 | % | ||
Health Care | 11.2 | % | ||
Industrials | 10.8 | % | ||
Energy | 9.0 | % | ||
Consumer Staples | 8.6 | % | ||
Short-Term Investments | 6.7 | % | ||
Financials | 3.5 | % | ||
Materials | 3.1 | % | ||
Telecommunication Services | 0.7 | % | ||
Purchased Options | 0.3 | % | ||
|
| |||
| 100.3 | % | |||
Other Assets & Liabilities, Net | (0.3 | %) | ||
|
| |||
| 100.0 | % | |||
|
|
| (b) | Short-term investments reflect either the stated coupon rate or the annualized effective yield on the date of purchase for discounted investments. |
| (c) | Forward foreign currency contracts outstanding as of March 31, 2012 were as follows: |
Contracts to Buy or to Sell | Currency | Principal Amount Covered by Contracts | Expiration | Counterparty | Unrealized Appreciation (Depreciation) | |||||||
Buy | EUR | 85,000 | 04/12 | CSF | $ | 547 | ||||||
Sell | EUR | 85,000 | 04/12 | CSF | (2,712 | ) | ||||||
Sell | EUR | 260,000 | 04/12 | HSB | (2,943 | ) | ||||||
Sell | EUR | 85,000 | 05/12 | CSF | (594 | ) | ||||||
Sell | EUR | 915,000 | 05/12 | JPM | (16,211 | ) | ||||||
Sell | EUR | 445,000 | 05/12 | RBC | (5,990 | ) | ||||||
Buy | GBP | 490,000 | 04/12 | CSF | 6,686 | |||||||
Sell | GBP | 490,000 | 04/12 | CSF | (15,284 | ) | ||||||
Sell | GBP | 525,000 | 04/12 | HSB | (11,693 | ) | ||||||
Sell | GBP | 410,000 | 05/12 | CSF | (4,809 | ) | ||||||
Sell | GBP | 415,000 | 05/12 | JPM | (8,506 | ) | ||||||
Sell | GBP | 465,000 | 05/12 | RBC | (5,069 | ) | ||||||
Buy | JPY | 35,000,000 | 04/12 | CSF | (2,679 | ) | ||||||
Sell | JPY | 35,000,000 | 04/12 | CSF | 10,033 | |||||||
Sell | JPY | 37,000,000 | 04/12 | HSB | 5,871 | |||||||
Sell | JPY | 33,300,000 | 05/12 | CSF | 2,078 | |||||||
Sell | JPY | 7,000,000 | 05/12 | JPM | 27 | |||||||
Sell | JPY | 35,000,000 | 05/12 | RBC | (2,975 | ) | ||||||
|
| |||||||||||
Total Forward Foreign Currency Contracts | ($ | 54,223 | ) | |||||||||
|
| |||||||||||
| (d) | Purchased options outstanding as of March 31, 2012 were as follows: |
Options on Securities
Description | Strike Price | Expiration Date | Counter- party | Number of Contracts | Cost | Value | ||||||||||||||||||
Call CME - Canadian Pacific Railway Ltd | $ | 75.00 | 06/16/12 | GSC | 144 | $ | 62,980 | $ | 65,520 | |||||||||||||||
Call CME - Microsoft Corp | 30.00 | 01/19/13 | GSC | 496 | 105,823 | 181,040 | ||||||||||||||||||
Call CME - Valeant Pharmaceuticals International Inc | 52.50 | 01/19/13 | GSC | 140 | 93,066 | 116,200 | ||||||||||||||||||
|
|
|
| |||||||||||||||||||||
| $ | 261,869 | $ | 362,760 | |||||||||||||||||||||
|
|
|
| |||||||||||||||||||||
Total Purchased Options | $ | 261,869 | $ | 362,760 | ||||||||||||||||||||
|
|
|
| |||||||||||||||||||||
| See Notes to Financial Statements | B-43 | See explanation of symbols and terms, if any, on page B-71 |
Table of Contents
PACIFIC LIFE FUNDS
PL GROWTH LT FUND
Schedule of Investments (Continued)
March 31, 2012
| (e) | Fair Value Measurements |
The following is a summary of the fund’s investments as categorized under the three-tier hierarchy of inputs used in valuing the fund’s assets and liabilities (See Note 3C in Notes to Financial Statements) as of March 31, 2012:
| Total Value at March 31, 2012 | Level 1 Quoted Price | Level 2 Significant Observable Inputs | Level 3 Significant Unobservable Inputs | |||||||||||||||
Assets | Common Stocks | |||||||||||||||||
Consumer Discretionary | $ | 18,432,589 | $ | 16,482,617 | $ | 1,949,972 | $ | — | ||||||||||
Consumer Staples | 9,360,113 | 4,365,416 | 4,994,697 | — | ||||||||||||||
Energy | 9,749,341 | 9,749,341 | — | — | ||||||||||||||
Financials | 3,759,986 | 1,893,313 | 1,866,673 | — | ||||||||||||||
Health Care | 12,100,791 | 12,100,791 | — | — | ||||||||||||||
Industrials | 11,689,525 | 10,305,617 | 1,383,908 | — | ||||||||||||||
Information Technology | 31,826,445 | 29,624,497 | 2,201,948 | — | ||||||||||||||
Materials | 3,383,448 | 3,383,448 | — | — | ||||||||||||||
Telecommunication Services | 739,026 | 739,026 | — | — | ||||||||||||||
|
|
|
|
|
|
|
| |||||||||||
| 101,041,264 | 88,644,066 | 12,397,198 | — | |||||||||||||||
Short-Term Investments | 7,214,324 | 1,914,339 | 5,299,985 | — | ||||||||||||||
Derivatives: | ||||||||||||||||||
Equity Contracts | ||||||||||||||||||
Purchased Options | 362,760 | 362,760 | — | — | ||||||||||||||
Foreign Currency Contracts | ||||||||||||||||||
Forward Foreign Currency Contracts | 25,242 | — | 25,242 | — | ||||||||||||||
|
|
|
|
|
|
|
| |||||||||||
Total Assets Derivatives | 388,002 | 362,760 | 25,242 | — | ||||||||||||||
|
|
|
|
|
|
|
| |||||||||||
Total Assets | 108,643,590 | 90,921,165 | 17,722,425 | — | ||||||||||||||
|
|
|
|
|
|
|
| |||||||||||
Liabilities | Derivatives: | |||||||||||||||||
Foreign Currency Contracts | ||||||||||||||||||
Forward Foreign Currency Contracts | (79,465 | ) | — | (79,465 | ) | — | ||||||||||||
|
|
|
|
|
|
|
| |||||||||||
Total Liabilities | (79,465 | ) | — | (79,465 | ) | — | ||||||||||||
|
|
|
|
|
|
|
| |||||||||||
Total | $ | 108,564,125 | $ | 90,921,165 | $ | 17,642,960 | $ | — | ||||||||||
|
|
|
|
|
|
|
| |||||||||||
| See Notes to Financial Statements | B-44 | See explanation of symbols and terms, if any, on page B-71 |
Table of Contents
PACIFIC LIFE FUNDS
PL LARGE-CAP GROWTH FUND
Schedule of Investments
March 31, 2012
| Shares | Value | |||||||
COMMON STOCKS - 98.5% | ||||||||
Consumer Discretionary - 23.8% | ||||||||
Amazon.com Inc * | 23,200 | $ | 4,698,232 | |||||
Chipotle Mexican Grill Inc * | 4,200 | 1,755,600 | ||||||
Comcast Corp ‘A’ | 43,200 | 1,296,432 | ||||||
Discovery Communications | 37,400 | 1,892,440 | ||||||
Dollar General Corp * | 70,300 | 3,247,860 | ||||||
Las Vegas Sands Corp | 72,600 | 4,179,582 | ||||||
McDonald’s Corp | 29,200 | 2,864,520 | ||||||
Nike Inc ‘B’ | 33,400 | 3,621,896 | ||||||
priceline.com Inc * | 6,000 | 4,305,000 | ||||||
Ralph Lauren Corp | 16,900 | 2,946,177 | ||||||
|
| |||||||
| 30,807,739 | ||||||||
|
| |||||||
Consumer Staples - 5.9% | ||||||||
CVS Caremark Corp | 85,000 | 3,808,000 | ||||||
The Estee Lauder Cos Inc ‘A’ | 62,200 | 3,852,668 | ||||||
|
| |||||||
| 7,660,668 | ||||||||
|
| |||||||
Energy - 7.3% | ||||||||
Cabot Oil & Gas Corp | 39,500 | 1,231,215 | ||||||
Concho Resources Inc * | 19,300 | 1,970,144 | ||||||
EOG Resources Inc | 13,600 | 1,510,960 | ||||||
FMC Technologies Inc * | 50,300 | 2,536,126 | ||||||
Schlumberger Ltd (Netherlands) | 31,600 | 2,209,788 | ||||||
|
| |||||||
| 9,458,233 | ||||||||
|
| |||||||
Health Care - 12.1% | ||||||||
Agilent Technologies Inc | 71,900 | 3,200,269 | ||||||
Allergan Inc | 40,400 | 3,855,372 | ||||||
Biogen Idec Inc * | 16,200 | 2,040,714 | ||||||
Express Scripts Inc * | 46,300 | 2,508,534 | ||||||
Gilead Sciences Inc * | 38,700 | 1,890,495 | ||||||
Watson Pharmaceuticals Inc * | 31,300 | 2,098,978 | ||||||
|
| |||||||
| 15,594,362 | ||||||||
|
| |||||||
Industrials - 8.0% | ||||||||
Cummins Inc | 10,500 | 1,260,420 | ||||||
Danaher Corp | 58,500 | 3,276,000 | ||||||
Roper Industries Inc | 17,400 | 1,725,384 | ||||||
Union Pacific Corp | 12,500 | 1,343,500 | ||||||
United Technologies Corp | 33,100 | 2,745,314 | ||||||
|
| |||||||
| 10,350,618 | ||||||||
|
| |||||||
Information Technology - 36.7% | ||||||||
Apple Inc * | 17,900 | 10,730,513 | ||||||
Baidu Inc ADR (Cayman) * | 22,700 | 3,308,979 | ||||||
Broadcom Corp ‘A’ * | 34,400 | 1,351,920 | ||||||
EMC Corp * | 111,200 | 3,322,656 | ||||||
Google Inc ‘A’ * | 6,400 | 4,103,936 | ||||||
MasterCard Inc ‘A’ | 4,400 | 1,850,376 | ||||||
MercadoLibre Inc | 13,900 | 1,359,281 | ||||||
NetApp Inc * | 69,500 | 3,111,515 | ||||||
QUALCOMM Inc | 68,300 | 4,645,766 | ||||||
Riverbed Technology Inc * | 80,800 | 2,268,864 | ||||||
salesforce.com inc * | 23,500 | 3,630,985 | ||||||
SINA Corp (Cayman) * | 18,600 | 1,209,000 | ||||||
Teradata Corp * | 20,000 | 1,363,000 | ||||||
Visa Inc ‘A’ | 43,300 | 5,109,400 | ||||||
|
| |||||||
| 47,366,191 | ||||||||
|
| |||||||
Materials - 3.2% | ||||||||
FMC Corp | 14,300 | 1,513,798 | ||||||
The Sherwin-Williams Co | 24,600 | 2,673,282 | ||||||
|
| |||||||
| 4,187,080 | ||||||||
|
| |||||||
| Shares | Value | |||||||
Telecommunication Services - 1.5% |
| |||||||
Crown Castle International Corp * | 35,900 | $ | 1,914,906 | |||||
|
| |||||||
Total Common Stocks | ||||||||
(Cost $90,973,248) | 127,339,797 | |||||||
|
| |||||||
EXCHANGE-TRADED FUND - 0.9% |
| |||||||
iShares Russell 1000 Growth Index Fund | 18,000 | 1,189,440 | ||||||
|
| |||||||
Total Exchange-Traded Fund | ||||||||
(Cost $1,180,460) | 1,189,440 | |||||||
|
| |||||||
SHORT-TERM INVESTMENT - 0.2% |
| |||||||
Money Market Fund - 0.2% | ||||||||
BlackRock Liquidity Funds | 219,069 | 219,069 | ||||||
|
| |||||||
Total Short-Term Investment | ||||||||
(Cost $219,069) | 219,069 | |||||||
|
| |||||||
TOTAL INVESTMENTS - 99.6% |
| |||||||
(Cost $92,372,777) |
| 128,748,306 | ||||||
OTHER ASSETS & LIABILITIES, |
| 473,901 | ||||||
|
| |||||||
NET ASSETS - 100.0% | $ | 129,222,207 | ||||||
|
| |||||||
Note to Schedule of Investments
| (a) | As of March 31, 2012, the fund was diversified as a percentage of net assets as follows: |
Information Technology | 36.7 | % | ||
Consumer Discretionary | 23.8 | % | ||
Health Care | 12.1 | % | ||
Industrials | 8.0 | % | ||
Energy | 7.3 | % | ||
Consumer Staples | 5.9 | % | ||
Materials | 3.2 | % | ||
Telecommunication Services | 1.5 | % | ||
Exchange-Traded Fund | 0.9 | % | ||
Short-Term Investment | 0.2 | % | ||
|
| |||
| 99.6 | % | |||
Other Assets & Liabilities, Net | 0.4 | % | ||
|
| |||
| 100.0 | % | |||
|
| |||
| See Notes to Financial Statements | B-45 | See explanation of symbols and terms, if any, on page B-71 |
Table of Contents
PACIFIC LIFE FUNDS
PL LARGE-CAP GROWTH FUND
Schedule of Investments (Continued)
March 31, 2012
| (b) | Fair Value Measurements |
The following is a summary of the fund’s investments as categorized under the three-tier hierarchy of inputs used in valuing the fund’s assets and liabilities (See Note 3C in Notes to Financial Statements) as of March 31, 2012:
| Total Value at March 31, 2012 | Level 1 Quoted Price | Level 2 Significant Observable Inputs | Level 3 Significant Unobservable Inputs | |||||||||||||||
Assets | Common Stocks (1) | $ | 127,339,797 | $ | 127,339,797 | $ | — | $ | — | |||||||||
Exchange-Traded Fund | 1,189,440 | 1,189,440 | — | — | ||||||||||||||
Short-Term Investment | 219,069 | 219,069 | — | — | ||||||||||||||
|
|
|
|
|
|
|
| |||||||||||
Total | $ | 128,748,306 | $ | 128,748,306 | $ | — | $ | — | ||||||||||
|
|
|
|
|
|
|
| |||||||||||
| (1) | For equity investments categorized in a single level, refer to the schedule of investments for further industry breakout. |
| See Notes to Financial Statements | B-46 | See explanation of symbols and terms, if any, on page B-71 |
Table of Contents
PACIFIC LIFE FUNDS
PL LARGE-CAP VALUE FUND
Schedule of Investments
March 31, 2012
| Shares | Value | |||||||
COMMON STOCKS - 97.7% | ||||||||
Consumer Discretionary - 16.5% | ||||||||
DISH Network Corp ‘A’ | 165,566 | $ | 5,452,088 | |||||
Johnson Controls Inc | 94,875 | 3,081,540 | ||||||
McDonald’s Corp | 24,806 | 2,433,469 | ||||||
News Corp ‘A’ | 416,143 | 8,193,856 | ||||||
SES SA FDR (Luxembourg) | 132,695 | 3,291,908 | ||||||
Target Corp | 50,850 | 2,963,030 | ||||||
The Home Depot Inc | 89,470 | 4,501,236 | ||||||
Time Warner Cable Inc | 88,373 | 7,202,400 | ||||||
Time Warner Inc | 169,229 | 6,388,395 | ||||||
|
| |||||||
| 43,507,922 | ||||||||
|
| |||||||
Consumer Staples - 11.8% |
| |||||||
Altria Group Inc | 90,189 | 2,784,134 | ||||||
Anheuser-Busch InBev NV ADR (Belgium) | 67,160 | 4,883,875 | ||||||
CVS Caremark Corp | 123,327 | 5,525,049 | ||||||
Kimberly-Clark Corp | 59,859 | 4,422,982 | ||||||
Lorillard Inc | 27,982 | 3,623,109 | ||||||
Philip Morris International Inc | 110,278 | 9,771,734 | ||||||
|
| |||||||
| 31,010,883 | ||||||||
|
| |||||||
Energy - 12.3% | ||||||||
Apache Corp | 21,853 | 2,194,915 | ||||||
Chevron Corp | 49,322 | 5,289,291 | ||||||
El Paso Corp | 235,964 | 6,972,736 | ||||||
Exxon Mobil Corp | 75,278 | 6,528,861 | ||||||
Halliburton Co | 101,517 | 3,369,349 | ||||||
Royal Dutch Shell PLC ‘A’ ADR (United Kingdom) | 47,298 | 3,317,009 | ||||||
Suncor Energy Inc (Canada) | 78,410 | 2,564,007 | ||||||
Transocean Ltd (Switzerland) | 36,889 | 2,017,828 | ||||||
|
| |||||||
| 32,253,996 | ||||||||
|
| |||||||
Financials - 22.9% | ||||||||
American Express Co | 75,139 | 4,347,542 | ||||||
Capital One Financial Corp | 49,705 | 2,770,557 | ||||||
JPMorgan Chase & Co | 226,415 | 10,410,562 | ||||||
Loews Corp | 85,711 | 3,417,298 | ||||||
Marsh & McLennan Cos Inc | 132,553 | 4,346,413 | ||||||
MetLife Inc | 86,587 | 3,234,024 | ||||||
State Street Corp | 121,661 | 5,535,576 | ||||||
The Bank of New York Mellon Corp | 76,171 | 1,838,006 | ||||||
The Progressive Corp | 116,582 | 2,702,371 | ||||||
The Travelers Cos Inc | 60,377 | 3,574,318 | ||||||
U.S. Bancorp | 262,972 | 8,330,953 | ||||||
Wells Fargo & Co | 280,896 | 9,589,789 | ||||||
|
| |||||||
| 60,097,409 | ||||||||
|
| |||||||
Health Care - 6.9% | ||||||||
Johnson & Johnson | 66,293 | 4,372,686 | ||||||
Merck & Co Inc | 139,263 | 5,347,699 | ||||||
Novartis AG ADR (Switzerland) | 47,133 | 2,611,640 | ||||||
Pfizer Inc | 130,445 | 2,955,884 | ||||||
| 40,026 | 2,953,919 | |||||||
|
| |||||||
| 18,241,828 | ||||||||
|
| |||||||
Industrials - 9.3% | ||||||||
General Electric Co | 285,674 | 5,733,477 | ||||||
Honeywell International Inc | 99,911 | 6,099,567 | ||||||
Illinois Tool Works Inc | 84,045 | 4,800,650 | ||||||
Raytheon Co | 49,512 | 2,613,243 | ||||||
United Technologies Corp | 63,857 | 5,296,300 | ||||||
|
| |||||||
| 24,543,237 | ||||||||
|
| |||||||
| Shares | Value | |||||||
Information Technology - 9.4% |
| |||||||
Hewlett-Packard Co | 83,992 | $ | 2,001,529 | |||||
International Business Machines Corp | 32,661 | 6,814,718 | ||||||
Microsoft Corp | 139,346 | 4,493,909 | ||||||
Motorola Solutions Inc | 79,557 | 4,043,882 | ||||||
TE Connectivity Ltd (Switzerland) | 108,985 | 4,005,199 | ||||||
Xerox Corp | 409,952 | 3,312,412 | ||||||
|
| |||||||
| 24,671,649 | ||||||||
|
| |||||||
Materials - 3.1% | ||||||||
Air Products & Chemicals Inc | 47,569 | 4,366,834 | ||||||
Crown Holdings Inc * | 102,149 | 3,762,147 | ||||||
|
| |||||||
| 8,128,981 | ||||||||
|
| |||||||
Telecommunication Services - 3.6% |
| |||||||
AT&T Inc | 112,588 | 3,516,123 | ||||||
CenturyLink Inc | 82,315 | 3,181,475 | ||||||
Verizon Communications Inc | 69,883 | 2,671,627 | ||||||
|
| |||||||
| 9,369,225 | ||||||||
|
| |||||||
Utilities - 1.9% | ||||||||
Sempra Energy | 83,562 | 5,010,378 | ||||||
|
| |||||||
Total Common Stocks | ||||||||
(Cost $197,507,584) | 256,835,508 | |||||||
|
| |||||||
SHORT-TERM INVESTMENT - 2.0% |
| |||||||
Money Market Fund - 2.0% | ||||||||
BlackRock Liquidity Funds | 5,380,660 | 5,380,660 | ||||||
|
| |||||||
Total Short-Term Investment | ||||||||
(Cost $5,380,660) | 5,380,660 | |||||||
|
| |||||||
TOTAL INVESTMENTS - 99.7% |
| |||||||
(Cost $202,888,244) | 262,216,168 | |||||||
OTHER ASSETS & LIABILITIES, |
| 700,897 | ||||||
|
| |||||||
NET ASSETS - 100.0% | $ | 262,917,065 | ||||||
|
| |||||||
Notes to Schedule of Investments
| (a) | As of March 31, 2012, the fund was diversified as a percentage of net assets as follows: |
Financials | 22.9 | % | ||
Consumer Discretionary | 16.5 | % | ||
Energy | 12.3 | % | ||
Consumer Staples | 11.8 | % | ||
Information Technology | 9.4 | % | ||
Industrials | 9.3 | % | ||
Health Care | 6.9 | % | ||
Telecommunication Services | 3.6 | % | ||
Materials | 3.1 | % | ||
Short-Term Investment | 2.0 | % | ||
Utilities | 1.9 | % | ||
|
| |||
| 99.7 | % | |||
Other Assets & Liabilities, Net | 0.3 | % | ||
|
| |||
| 100.0 | % | |||
|
|
| See Notes to Financial Statements | B-47 | See explanation of symbols and terms, if any, on page B-71 |
Table of Contents
PACIFIC LIFE FUNDS
PL LARGE-CAP VALUE FUND
Schedule of Investments (Continued)
March 31, 2012
| (b) | Fair Value Measurements |
The following is a summary of the fund’s investments as categorized under the three-tier hierarchy of inputs used in valuing the fund’s assets and liabilities (See Note 3C in Notes to Financial Statements) as of March 31, 2012:
| Total Value at March 31, 2012 | Level 1 Quoted Price | Level 2 Significant Observable Inputs | Level 3 Significant Unobservable Inputs | |||||||||||||||
Assets | Common Stocks | |||||||||||||||||
Consumer Discretionary | $ | 43,507,922 | $ | 40,216,014 | $ | 3,291,908 | $ | — | ||||||||||
Consumer Staples | 31,010,883 | 31,010,883 | — | — | ||||||||||||||
Energy | 32,253,996 | 32,253,996 | — | — | ||||||||||||||
Financials | 60,097,409 | 60,097,409 | — | — | ||||||||||||||
Health Care | 18,241,828 | 18,241,828 | — | — | ||||||||||||||
Industrials | 24,543,237 | 24,543,237 | — | — | ||||||||||||||
Information Technology | 24,671,649 | 24,671,649 | — | — | ||||||||||||||
Materials | 8,128,981 | 8,128,981 | — | — | ||||||||||||||
Telecommunication Services | 9,369,225 | 9,369,225 | — | — | ||||||||||||||
Utilities | 5,010,378 | 5,010,378 | — | — | ||||||||||||||
|
|
|
|
|
|
|
| |||||||||||
| 256,835,508 | 253,543,600 | 3,291,908 | — | |||||||||||||||
Short-Term Investment | 5,380,660 | 5,380,660 | — | — | ||||||||||||||
|
|
|
|
|
|
|
| |||||||||||
Total | $ | 262,216,168 | $ | 258,924,260 | $ | 3,291,908 | $ | — | ||||||||||
|
|
|
|
|
|
|
| |||||||||||
| See Notes to Financial Statements | B-48 | See explanation of symbols and terms, if any, on page B-71 |
Table of Contents
PACIFIC LIFE FUNDS
PL MAIN STREET® CORE FUND
Schedule of Investments
March 31, 2012
| Shares | Value | |||||||
COMMON STOCKS - 97.3% |
| |||||||
Consumer Discretionary - 11.4% |
| |||||||
AutoZone Inc * | 4,660 | $ | 1,732,588 | |||||
CarMax Inc * | 42,370 | 1,468,120 | ||||||
Ford Motor Co | 476,492 | 5,951,385 | ||||||
Hyatt Hotels Corp ‘A’ * | 61,838 | 2,641,719 | ||||||
McDonald’s Corp | 11,452 | 1,123,441 | ||||||
The McGraw-Hill Cos Inc | 125,418 | 6,079,010 | ||||||
The TJX Cos Inc | 78,140 | 3,102,939 | ||||||
|
| |||||||
| 22,099,202 | ||||||||
|
| |||||||
Consumer Staples - 10.6% |
| |||||||
Dr Pepper Snapple Group Inc | 112,180 | 4,510,758 | ||||||
General Mills Inc | 47,430 | 1,871,113 | ||||||
Mead Johnson Nutrition Co | 27,570 | 2,273,974 | ||||||
Philip Morris International Inc | 90,600 | 8,028,066 | ||||||
The J.M. Smucker Co | 46,880 | 3,814,157 | ||||||
|
| |||||||
| 20,498,068 | ||||||||
|
| |||||||
Energy - 11.0% |
| |||||||
Chevron Corp | 79,974 | 8,576,412 | ||||||
Kinder Morgan Inc | 53,500 | 2,067,775 | ||||||
National Oilwell Varco Inc | 34,280 | 2,724,232 | ||||||
Noble Energy Inc | 39,218 | 3,834,736 | ||||||
Occidental Petroleum Corp | 42,778 | 4,073,749 | ||||||
|
| |||||||
| 21,276,904 | ||||||||
|
| |||||||
Financials - 16.9% |
| |||||||
Berkshire Hathaway Inc ‘B’ * | 11,740 | 952,701 | ||||||
CIT Group Inc * | 160,530 | 6,620,257 | ||||||
Citigroup Inc | 133,737 | 4,888,087 | ||||||
CME Group Inc ‘A’ | 10,490 | 3,035,072 | ||||||
Discover Financial Services | 97,270 | 3,242,982 | ||||||
JPMorgan Chase & Co | 136,520 | 6,277,190 | ||||||
M&T Bank Corp | 10,780 | 936,566 | ||||||
Marsh & McLennan Cos Inc | 93,260 | 3,057,995 | ||||||
MSCI Inc ‘A’ * | 41,510 | 1,527,983 | ||||||
The Blackstone Group LP | 137,300 | 2,188,562 | ||||||
|
| |||||||
| 32,727,395 | ||||||||
|
| |||||||
Health Care - 11.7% |
| |||||||
Abbott Laboratories | 81,320 | 4,984,103 | ||||||
Bristol-Myers Squibb Co | 116,660 | 3,937,275 | ||||||
Celgene Corp * | 31,212 | 2,419,554 | ||||||
Covidien PLC (Ireland) | 36,020 | 1,969,574 | ||||||
DaVita Inc * | 17,440 | 1,572,565 | ||||||
Edwards Lifesciences Corp * | 10,340 | 752,028 | ||||||
Medco Health Solutions Inc * | 21,530 | 1,513,559 | ||||||
Watson Pharmaceuticals Inc * | 16,120 | 1,081,007 | ||||||
WellPoint Inc | 60,120 | 4,436,856 | ||||||
|
| |||||||
| 22,666,521 | ||||||||
|
| |||||||
Industrials - 9.7% | ||||||||
CSX Corp | 183,450 | 3,947,844 | ||||||
QR National Ltd (Australia) | 54,100 | 209,092 | ||||||
The Boeing Co | 49,678 | 3,694,553 | ||||||
Tyco International Ltd (Switzerland) | 98,745 | 5,547,494 | ||||||
United Parcel Service Inc ‘B’ | 54,366 | 4,388,424 | ||||||
Xylem Inc | 35,190 | 976,523 | ||||||
|
| |||||||
| 18,763,930 | ||||||||
|
| |||||||
Information Technology - 21.0% |
| |||||||
Apple Inc * | 25,152 | 15,077,869 | ||||||
Corning Inc | 107,260 | 1,510,221 | ||||||
eBay Inc * | 181,830 | 6,707,709 | ||||||
| Shares | Value | |||||||
Google Inc ‘A’ * | 7,686 | $ | 4,928,571 | |||||
International Business Machines Corp | 18,060 | 3,768,219 | ||||||
Microsoft Corp | 60,772 | 1,959,897 | ||||||
Oracle Corp | 59,020 | 1,721,023 | ||||||
QUALCOMM Inc | 73,632 | 5,008,449 | ||||||
|
| |||||||
| 40,681,958 | ||||||||
|
| |||||||
Materials - 1.5% | ||||||||
Praxair Inc | 16,682 | 1,912,424 | ||||||
Vulcan Materials Co | 22,050 | 942,197 | ||||||
|
| |||||||
| 2,854,621 | ||||||||
|
| |||||||
Telecommunication Services - 2.0% |
| |||||||
America Movil SAB de CV ‘L’ ADR (Mexico) | 157,910 | 3,920,905 | ||||||
|
| |||||||
Utilities - 1.5% | ||||||||
The AES Corp * | 218,308 | 2,853,285 | ||||||
|
| |||||||
Total Common Stocks | ||||||||
(Cost $141,716,447) | 188,342,789 | |||||||
|
| |||||||
SHORT-TERM INVESTMENT - 1.0% |
| |||||||
Money Market Fund - 1.0% | ||||||||
BlackRock Liquidity Funds | 1,885,152 | 1,885,152 | ||||||
|
| |||||||
Total Short-Term Investment | ||||||||
(Cost $1,885,152) | 1,885,152 | |||||||
|
| |||||||
TOTAL INVESTMENTS - 98.3% |
| |||||||
(Cost $143,601,599) | 190,227,941 | |||||||
OTHER ASSETS & LIABILITIES, |
| 3,309,793 | ||||||
|
| |||||||
NET ASSETS - 100.0% | $ | 193,537,734 | ||||||
|
| |||||||
Notes to Schedule of Investments
| (a) | As of March 31, 2012, the fund was diversified as a percentage of net assets as follows: |
Information Technology | 21.0 | % | ||
Financials | 16.9 | % | ||
Health Care | 11.7 | % | ||
Consumer Discretionary | 11.4 | % | ||
Energy | 11.0 | % | ||
Consumer Staples | 10.6 | % | ||
Industrials | 9.7 | % | ||
Telecommunication Services | 2.0 | % | ||
Materials | 1.5 | % | ||
Utilities | 1.5 | % | ||
Short-Term Investment | 1.0 | % | ||
|
| |||
| 98.3 | % | |||
Other Assets & Liabilities, Net | 1.7 | % | ||
|
| |||
| 100.0 | % | |||
|
|
| See Notes to Financial Statements | B-49 | See explanation of symbols and terms, if any, on page B-71 |
Table of Contents
PACIFIC LIFE FUNDS
PL MAIN STREET CORE FUND
Schedule of Investments (Continued)
March 31, 2012
| (b) | Fair Value Measurements |
The following is a summary of the fund’s investments as categorized under the three-tier hierarchy of inputs used in valuing the fund’s assets and liabilities (See Note 3C in Notes to Financial Statements) as of March 31, 2012:
| Total Value at March 31, 2012 | Level 1 Quoted Price | Level 2 Significant Observable Inputs | Level 3 Significant Unobservable Inputs | |||||||||||||||
Assets | Common Stocks | |||||||||||||||||
Consumer Discretionary | $ | 22,099,202 | $ | 22,099,202 | $ | — | $ | — | ||||||||||
Consumer Staples | 20,498,068 | 20,498,068 | — | — | ||||||||||||||
Energy | 21,276,904 | 21,276,904 | — | — | ||||||||||||||
Financials | 32,727,395 | 32,727,395 | — | — | ||||||||||||||
Health Care | 22,666,521 | 22,666,521 | — | — | ||||||||||||||
Industrials | 18,763,930 | 18,554,838 | 209,092 | — | ||||||||||||||
Information Technology | 40,681,958 | 40,681,958 | — | — | ||||||||||||||
Materials | 2,854,621 | 2,854,621 | — | — | ||||||||||||||
Telecommunication Services | 3,920,905 | 3,920,905 | — | |||||||||||||||
Utilities | 2,853,285 | 2,853,285 | — | — | ||||||||||||||
|
|
|
|
|
|
|
| |||||||||||
| 188,342,789 | 188,133,697 | 209,092 | — | |||||||||||||||
Short-Term Investment | 1,885,152 | 1,885,152 | — | — | ||||||||||||||
|
|
|
|
|
|
|
| |||||||||||
Total | $ | 190,227,941 | $ | 190,018,849 | $ | 209,092 | $ | — | ||||||||||
|
|
|
|
|
|
|
| |||||||||||
| See Notes to Financial Statements | B-50 | See explanation of symbols and terms, if any, on page B-71 |
Table of Contents
PACIFIC LIFE FUNDS
PL MID-CAP EQUITY FUND
Schedule of Investments
March 31, 2012
| Shares | Value | |||||||
CONVERTIBLE PREFERRED STOCKS - 0.6% |
| |||||||
Industrials - 0.6% | ||||||||
Better Place LLC ‘B’ 8.000% * à D + | 229,480 | $ | 1,041,839 | |||||
|
| |||||||
Total Convertible Preferred Stocks | ||||||||
(Cost $573,700) | 1,041,839 | |||||||
|
| |||||||
COMMON STOCKS - 94.8% |
| |||||||
Consumer Discretionary - 18.7% |
| |||||||
ANN Inc * | 41,400 | 1,185,696 | ||||||
AutoZone Inc * | 13,335 | 4,957,953 | ||||||
Big Lots Inc * | 69,300 | 2,981,286 | ||||||
Darden Restaurants Inc | 47,090 | 2,409,124 | ||||||
DeVry Inc | 31,300 | 1,060,131 | ||||||
Lear Corp | 51,700 | 2,403,533 | ||||||
Macy’s Inc | 126,800 | 5,037,764 | ||||||
Marriott International Inc ‘A’ | 30,100 | 1,139,285 | ||||||
Newell Rubbermaid Inc | 135,230 | 2,408,446 | ||||||
Ross Stores Inc | 95,600 | 5,554,360 | ||||||
The Interpublic Group of Cos Inc | 158,500 | 1,808,485 | ||||||
|
| |||||||
| 30,946,063 | ||||||||
|
| |||||||
Consumer Staples - 5.6% |
| |||||||
Energizer Holdings Inc * | 32,000 | 2,373,760 | ||||||
Molson Coors Brewing Co ‘B’ | 94,740 | 4,286,985 | ||||||
Ralcorp Holdings Inc * | 34,650 | 2,567,219 | ||||||
|
| |||||||
| 9,227,964 | ||||||||
|
| |||||||
Energy - 6.7% |
| |||||||
Cameron International Corp * | 62,200 | 3,286,026 | ||||||
Energen Corp | 3,650 | 179,398 | ||||||
Marathon Petroleum Corp | 29,400 | 1,274,784 | ||||||
Noble Energy Inc | 20,510 | 2,005,468 | ||||||
Rosetta Resources Inc * | 26,100 | 1,272,636 | ||||||
Rowan Cos Inc * | 94,540 | 3,113,202 | ||||||
|
| |||||||
| 11,131,514 | ||||||||
|
| |||||||
Financials - 15.4% |
| |||||||
Ameriprise Financial Inc | 57,800 | 3,302,114 | ||||||
CBRE Group Inc ‘A’ * | 68,700 | 1,371,252 | ||||||
Duke Realty Corp REIT | 147,300 | 2,112,282 | ||||||
Fifth Third Bancorp | 217,800 | 3,060,090 | ||||||
Invesco Ltd (Bermuda) | 136,800 | 3,648,456 | ||||||
Janus Capital Group Inc | 98,800 | 880,308 | ||||||
Kilroy Realty Corp REIT | 53,600 | 2,498,296 | ||||||
LaSalle Hotel Properties REIT | 46,600 | 1,311,324 | ||||||
PartnerRe Ltd (Bermuda) | 25,090 | 1,703,360 | ||||||
Signature Bank * | 34,100 | 2,149,664 | ||||||
The Macerich Co REIT | 29,800 | 1,720,950 | ||||||
Willis Group Holdings PLC (Ireland) | 47,100 | 1,647,558 | ||||||
|
| |||||||
| 25,405,654 | ||||||||
|
| |||||||
Health Care - 10.4% |
| |||||||
Aetna Inc | 65,500 | 3,285,480 | ||||||
Agilent Technologies Inc | 74,200 | 3,302,642 | ||||||
AMERIGROUP Corp * | 17,800 | 1,197,584 | ||||||
CareFusion Corp * | 82,600 | 2,141,818 | ||||||
Henry Schein Inc * | 22,400 | 1,695,232 | ||||||
Medicis Pharmaceutical Corp ‘A’ | 46,000 | 1,729,140 | ||||||
Vertex Pharmaceuticals Inc * | 22,900 | 939,129 | ||||||
Zimmer Holdings Inc | 43,780 | 2,814,178 | ||||||
|
| |||||||
| 17,105,203 | ||||||||
|
| |||||||
| Shares | Value | |||||||
Industrials - 11.0% |
| |||||||
BE Aerospace Inc * | 37,400 | $ | 1,737,978 | |||||
Corrections Corp of America * | 107,190 | 2,927,359 | ||||||
Dover Corp | 51,440 | 3,237,634 | ||||||
Equifax Inc | 33,100 | 1,465,006 | ||||||
Parker-Hannifin Corp | 37,000 | 3,128,350 | ||||||
Rockwell Collins Inc | 55,790 | 3,211,272 | ||||||
SPX Corp | 32,500 | 2,519,725 | ||||||
|
| |||||||
| 18,227,324 | ||||||||
|
| |||||||
Information Technology - 20.4% |
| |||||||
Amdocs Ltd (United Kingdom) * | 78,800 | 2,488,504 | ||||||
Analog Devices Inc | 40,900 | 1,652,360 | ||||||
Autodesk Inc * | 84,900 | 3,592,968 | ||||||
BMC Software Inc * | 66,540 | 2,672,246 | ||||||
Fidelity National Information Services Inc | 64,700 | 2,142,864 | ||||||
Intuit Inc | 46,050 | 2,768,987 | ||||||
Lexmark International Inc ‘A’ | 73,000 | 2,426,520 | ||||||
Marvell Technology Group Ltd (Bermuda) * | 162,900 | 2,562,417 | ||||||
NetApp Inc * | 75,000 | 3,357,750 | ||||||
Polycom Inc * | 75,700 | 1,443,599 | ||||||
Quest Software Inc * | 71,200 | 1,656,824 | ||||||
Symantec Corp * | 121,190 | 2,266,253 | ||||||
Vantiv Inc ‘A’ | 61,700 | 1,211,171 | ||||||
Xilinx Inc | 92,900 | 3,384,347 | ||||||
|
| |||||||
| 33,626,810 | ||||||||
|
| |||||||
Materials - 6.6% |
| |||||||
Ball Corp | 81,420 | 3,491,290 | ||||||
Cliffs Natural Resources Inc | 19,950 | 1,381,737 | ||||||
Compass Minerals International Inc | 16,040 | 1,150,710 | ||||||
Eastman Chemical Co | 81,020 | 4,187,924 | ||||||
Walter Energy Inc | 10,600 | 627,626 | ||||||
|
| |||||||
| 10,839,287 | ||||||||
|
| |||||||
Total Common Stocks |
| |||||||
(Cost $135,633,858) |
| 156,509,819 | ||||||
|
| |||||||
SHORT-TERM INVESTMENT - 3.6% |
| |||||||
Money Market Fund - 3.6% |
| |||||||
BlackRock Liquidity Funds Treasury Trust Fund Portfolio | 6,015,306 | 6,015,306 | ||||||
|
| |||||||
Total Short-Term Investment |
| |||||||
(Cost $6,015,306) |
| 6,015,306 | ||||||
|
| |||||||
TOTAL INVESTMENTS - 99.0% |
| |||||||
(Cost $142,222,864) |
| 163,566,964 | ||||||
OTHER ASSETS & LIABILITIES, NET - 1.0% |
| 1,601,365 | ||||||
|
| |||||||
NET ASSETS - 100.0% |
| $ | 165,168,329 | |||||
|
| |||||||
| See Notes to Financial Statements | B-51 | See explanation of symbols and terms, if any, on page B-71 |
Table of Contents
PACIFIC LIFE FUNDS
PL MID-CAP EQUITY FUND
Schedule of Investments (Continued)
March 31, 2012
Notes to Schedule of Investments
| (a) | As of March 31, 2012, the fund was diversified as a percentage of net assets as follows: |
Information Technology | 20.4 | % | ||
Consumer Discretionary | 18.7 | % | ||
Financials | 15.4 | % | ||
Industrials | 11.6 | % | ||
Health Care | 10.4 | % | ||
Energy | 6.7 | % | ||
Materials | 6.6 | % | ||
Consumer Staples | 5.6 | % | ||
Short-Term Investment | 3.6 | % | ||
|
| |||
| 99.0 | % | |||
Other Assets & Liabilities, Net | 1.0 | % | ||
|
| |||
| 100.0 | % | |||
|
|
| (b) | An investment with a total aggregate value of $1,041,839 or 0.6% of the net assets was valued by a Trustee Valuation Committee or determined by a Board approved valuation committee and then subsequently approved by the Board. |
| (c) | As of March 31, 2012, 0.6% of the fund’s net assets were reported illiquid by the portfolio manager under the Trust’s policy. |
| (d) | Restricted securities as of March 31, 2012 were as follows: |
Issuer and Acquisition Date | Cost | Value | Value as a % of Net Assets | |||||||||
Better Place LLC ‘B’ 8.000% Acq. 01/25/10 | $ | 573,700 | $ | 1,041,839 | 0.6 | % | ||||||
|
|
|
|
|
| |||||||
| (e) | Fair Value Measurements |
The following is a summary of the fund’s investments as categorized under the three-tier hierarchy of inputs used in valuing the fund’s assets and liabilities (See Note 3C in Notes to Financial Statements) as of March 31, 2012:
| Total Value at March 31, 2012 | Level 1 Quoted Price | Level 2 Significant Observable Inputs | Level 3 Significant Unobservable Inputs | |||||||||||||||
Assets | Convertible Preferred Stocks (1) | $ | 1,041,839 | $ | — | $ | — | $ | 1,041,839 | |||||||||
| Common Stocks (1) | 156,509,819 | 156,509,819 | — | — | ||||||||||||||
| Short-Term Investment | 6,015,306 | 6,015,306 | — | — | ||||||||||||||
|
|
|
|
|
|
|
| |||||||||||
Total | $ | 163,566,964 | $ | 162,525,125 | $ | — | $ | 1,041,839 | ||||||||||
|
|
|
|
|
|
|
| |||||||||||
The following is a reconciliation of investments for significant unobservable inputs (Level 3) used in valuing the fund’s assets and liabilities (See Note 3C in Notes to Financial Statements) for the year ended March 31, 2012:
| Convertible Preferred Stocks (1) | ||||
Value, Beginning of Year | $ | 573,700 | ||
Purchases | — | |||
Sales | — | |||
Net Realized Gains (Losses) | — | |||
Change in Net Unrealized Appreciation | 468,139 | |||
Transfers In | — | |||
Transfers Out | — | |||
|
| |||
Value, End of Year | $ | 1,041,839 | ||
|
| |||
Change in Net Unrealized Appreciation on Level 3 Investments Held at the End of Year, if Applicable | $ | 468,139 | ||
|
| |||
| (1) | For equity investments categorized in a single level, refer to the schedule of investments for further industry breakout. |
| See Notes to Financial Statements | B-52 | See explanation of symbols and terms, if any, on page B-71 |
Table of Contents
PACIFIC LIFE FUNDS
PL MID-CAP GROWTH FUND
Schedule of Investments
March 31, 2012
| Shares | Value | |||||||
CONVERTIBLE PREFERRED STOCKS - 0.7% |
| |||||||
Industrials - 0.7% |
| |||||||
Better Place LLC ‘B’ 8.000% * à D + | 118,395 | $ | 537,513 | |||||
|
| |||||||
Total Convertible Preferred Stocks |
| |||||||
(Cost $295,986) |
| 537,513 | ||||||
|
| |||||||
COMMON STOCKS - 95.9% |
| |||||||
Consumer Discretionary - 13.3% |
| |||||||
Ctrip.com International Ltd ADR (Cayman) * | 23,629 | 511,332 | ||||||
Dollar Tree Inc * | 11,792 | 1,114,226 | ||||||
Dunkin’ Brands Group Inc | 28,588 | 860,785 | ||||||
Groupon Inc * | 71,938 | 1,322,220 | ||||||
Morningstar Inc | 15,987 | 1,007,980 | ||||||
Netflix Inc * | 8,894 | 1,023,166 | ||||||
New Oriental Education & Technology Group ADR (Cayman) * | 25,414 | 697,868 | ||||||
The McGraw-Hill Cos Inc | 23,967 | 1,161,681 | ||||||
Weight Watchers International Inc | 27,338 | 2,110,220 | ||||||
|
| |||||||
| 9,809,478 | ||||||||
|
| |||||||
Consumer Staples - 4.4% |
| |||||||
Mead Johnson Nutrition Co | 23,668 | 1,952,137 | ||||||
Natura Cosmeticos SA (Brazil) | 30,256 | 653,866 | ||||||
Sun Art Retail Group Ltd (Hong Kong) * | 470,000 | 638,406 | ||||||
|
| |||||||
| 3,244,409 | ||||||||
|
| |||||||
Energy - 2.6% |
| |||||||
Range Resources Corp | 21,228 | 1,234,196 | ||||||
Ultra Petroleum Corp (Canada) * | 30,880 | 698,814 | ||||||
|
| |||||||
| 1,933,010 | ||||||||
|
| |||||||
Financials - 6.0% | ||||||||
Greenhill & Co Inc | 11,127 | 485,582 | ||||||
IntercontinentalExchange Inc * | 8,054 | 1,106,781 | ||||||
Leucadia National Corp | 35,053 | 914,883 | ||||||
MSCI Inc ‘A’ * | 52,547 | 1,934,255 | ||||||
|
| |||||||
| 4,441,501 | ||||||||
|
| |||||||
Health Care - 12.5% | ||||||||
athenahealth Inc * | 12,034 | 891,960 | ||||||
IDEXX Laboratories Inc * | 13,280 | 1,161,336 | ||||||
Illumina Inc * | 30,474 | 1,603,237 | ||||||
Intuitive Surgical Inc * | 5,251 | 2,844,729 | ||||||
Ironwood Pharmaceuticals Inc ‘A’ * | 35,487 | 472,332 | ||||||
Techne Corp | 12,731 | 892,443 | ||||||
Valeant Pharmaceuticals International Inc (Canada) * | 24,599 | 1,320,720 | ||||||
|
| |||||||
| 9,186,757 | ||||||||
|
| |||||||
Industrials - 20.4% |
| |||||||
Covanta Holding Corp | 41,516 | 673,805 | ||||||
Edenred (France) | 87,727 | 2,639,063 | ||||||
Expeditors International of Washington Inc | 31,157 | 1,449,112 | ||||||
Fastenal Co | 51,526 | 2,787,557 | ||||||
IHS Inc ‘A’ * | 12,079 | 1,131,198 | ||||||
Intertek Group PLC (United Kingdom) | 32,732 | 1,312,054 | ||||||
Qualicorp SA (Brazil) * | 112,082 | 962,747 | ||||||
Schindler Holding AG Participation Certificates (Switzerland) | 8,694 | 1,045,511 | ||||||
Stericycle Inc * | 11,943 | 998,913 | ||||||
Verisk Analytics Inc ‘A’ * | 42,398 | 1,991,434 | ||||||
|
| |||||||
| 14,991,394 | ||||||||
|
| |||||||
| Shares | Value | |||||||
Information Technology - 28.8% |
| |||||||
Akamai Technologies Inc * | 34,479 | $ | 1,265,379 | |||||
Alibaba.com Ltd (Cayman) * | 326,600 | 554,914 | ||||||
ARM Holdings PLC ADR (United Kingdom) | 40,258 | 1,138,899 | ||||||
Citrix Systems Inc * | 8,122 | 640,907 | ||||||
FactSet Research Systems Inc | 10,659 | 1,055,667 | ||||||
First Solar Inc * | 11,813 | 295,916 | ||||||
Gartner Inc * | 26,666 | 1,137,038 | ||||||
LinkedIn Corp ‘A’ * | 21,206 | 2,162,800 | ||||||
MercadoLibre Inc | 7,209 | 704,968 | ||||||
Motorola Solutions Inc | 58,868 | 2,992,260 | ||||||
Nexon Co Ltd (Japan) * | 32,092 | 559,439 | ||||||
NVIDIA Corp * | 14,310 | 220,231 | ||||||
Red Hat Inc * | 19,004 | 1,138,150 | ||||||
salesforce.com inc * | 10,839 | 1,674,734 | ||||||
Solera Holdings Inc | 28,074 | 1,288,316 | ||||||
Yandex NV ‘A’ (Netherlands) * | 62,808 | 1,687,651 | ||||||
Youku Inc ADR (Cayman) * | 32,210 | 708,298 | ||||||
Zynga Inc ‘A’ * | 146,105 | 1,921,281 | ||||||
|
| |||||||
| 21,146,848 | ||||||||
|
| |||||||
Materials - 5.3% |
| |||||||
Intrepid Potash Inc * | 32,319 | 786,321 | ||||||
Lynas Corp Ltd (Australia) * | 241,014 | 273,625 | ||||||
Martin Marietta Materials Inc | 9,210 | 788,652 | ||||||
Molycorp Inc * | 26,990 | 913,072 | ||||||
Rockwood Holdings Inc * | 21,323 | 1,111,994 | ||||||
|
| |||||||
| 3,873,664 | ||||||||
|
| |||||||
Telecommunication Services - 0.9% |
| |||||||
Millicom International Cellular SA SDR (Luxemburg) | 5,923 | 671,813 | ||||||
|
| |||||||
Utilities - 1.7% |
| |||||||
Brookfield Infrastructure Partners LP (Bermuda) | 39,138 | 1,236,761 | ||||||
|
| |||||||
Total Common Stocks | ||||||||
(Cost $55,891,878) | 70,535,635 | |||||||
|
| |||||||
SHORT-TERM INVESTMENT - 3.8% |
| |||||||
Money Market Fund - 3.8% |
| |||||||
BlackRock Liquidity Funds Treasury Trust Fund Portfolio | 2,788,697 | 2,788,697 | ||||||
|
| |||||||
Total Short-Term Investment |
| |||||||
(Cost $2,788,697) |
| 2,788,697 | ||||||
|
| |||||||
TOTAL INVESTMENTS - 100.4% |
| |||||||
(Cost $58,976,561) |
| 73,861,845 | ||||||
OTHER ASSETS & LIABILITIES, NET - (0.4%) |
| (275,420 | ) | |||||
|
| |||||||
NET ASSETS - 100.0% | $ | 73,586,425 | ||||||
|
| |||||||
| See Notes to Financial Statements | B-53 | See explanation of symbols and terms, if any, on page B-71 |
Table of Contents
PACIFIC LIFE FUNDS
PL MID-CAP GROWTH FUND
Schedule of Investments (Continued)
March 31, 2012
Notes to Schedule of Investments
| (a) | As of March 31, 2012, the fund was diversified as a percentage of net assets as follows: |
Information Technology | 28.8 | % | ||
Industrials | 21.1 | % | ||
Consumer Discretionary | 13.3 | % | ||
Health Care | 12.5 | % | ||
Financials | 6.0 | % | ||
Materials | 5.3 | % | ||
Consumer Staples | 4.4 | % | ||
Short-Term Investment | 3.8 | % | ||
Energy | 2.6 | % | ||
Utilities | 1.7 | % | ||
Telecommunication Services | 0.9 | % | ||
|
| |||
| 100.4 | % | |||
Other Assets & Liabilities, Net | (0.4 | %) | ||
|
| |||
| 100.0 | % | |||
|
|
| (b) | An investment with a total aggregate value of $537,513 or 0.7% of the net assets was valued by a Trustee Valuation Committee or determined by a Board approved valuation committee and then subsequently approved by the Board. |
| (c) | As of March 31, 2012, 0.7% of the fund’s net assets were reported illiquid by the portfolio manager under the Trust’s policy. |
| (d) | Restricted securities as of March 31, 2012 were as follows: |
Issuer and Acquisition Date | Cost | Value | Value as a% of Net Assets | |||||||||
Better Place LLC ‘B’ 8.000% Acq. 01/25/10 | $ | 295,986 | $ | 537,513 | 0.7 | % | ||||||
|
|
|
|
|
| |||||||
| (e) | Fair Value Measurements |
The following is a summary of the fund’s investments as categorized under the three-tier hierarchy of inputs used in valuing the fund’s assets and liabilities (See Note 3C in Notes to Financial Statements) as of March 31, 2012:
| Total Value at March 31, 2012 | Level 1 Quoted Price | Level 2 Significant Observable Inputs | Level 3 Significant Unobservable Inputs | |||||||||||||||
Assets | Convertible Preferred Stocks (1) | $ | 537,513 | $ | — | $ | — | $ | 537,513 | |||||||||
| Common Stocks | ||||||||||||||||||
Consumer Discretionary | 9,809,478 | 9,809,478 | — | — | ||||||||||||||
Consumer Staples | 3,244,409 | 1,952,137 | 1,292,272 | — | ||||||||||||||
Energy | 1,933,010 | 1,933,010 | — | — | ||||||||||||||
Financials | 4,441,501 | 4,441,501 | — | — | ||||||||||||||
Health Care | 9,186,757 | 9,186,757 | — | — | ||||||||||||||
Industrials | 14,991,394 | 9,032,019 | 5,959,375 | — | ||||||||||||||
Information Technology | 21,146,848 | 20,032,495 | 1,114,353 | — | ||||||||||||||
Materials | 3,873,664 | 3,600,039 | 273,625 | — | ||||||||||||||
Telecommunication Services | 671,813 | — | 671,813 | |||||||||||||||
Utilities | 1,236,761 | 1,236,761 | — | — | ||||||||||||||
|
|
|
|
|
|
|
| |||||||||||
| 70,535,635 | 61,224,197 | 9,311,438 | — | |||||||||||||||
Short-Term Investment | 2,788,697 | 2,788,697 | — | — | ||||||||||||||
|
|
|
|
|
|
|
| |||||||||||
Total | $ | 73,861,845 | $ | 64,012,894 | $ | 9,311,438 | $ | 537,513 | ||||||||||
|
|
|
|
|
|
|
| |||||||||||
The following is a reconciliation of investments for significant unobservable inputs (Level 3) used in valuing the fund’s assets and liabilities (See Note 3C in Notes to Financial Statements) for the year ended March 31, 2012:
| Convertible Preferred Stocks (1) | ||||
Value, Beginning of Year | $ | 295,986 | ||
Purchases | — | |||
Sales | — | |||
Net Realized Gains (Losses) | — | |||
Change in Net Unrealized Appreciation | 241,527 | |||
Transfers In | — | |||
Transfers Out | — | |||
|
| |||
Value, End of Year | $ | 537,513 | ||
|
| |||
Change in Net Unrealized Appreciation on Level 3 Investments Held at the End of Year, if Applicable | $ | 241,527 | ||
|
| |||
| (1) | For equity investments categorized in a single level, refer to the schedule of investments for further industry breakout. |
| See Notes to Financial Statements | B-54 | See explanation of symbols and terms, if any, on page B-71 |
Table of Contents
PACIFIC LIFE FUNDS
PL SMALL-CAP GROWTH FUND
Schedule of Investments
March 31, 2012
| Shares | Value | |||||||
COMMON STOCKS - 95.0% |
| |||||||
Consumer Discretionary - 16.1% |
| |||||||
AMC Networks Inc ‘A’ * | 7,150 | $ | 319,104 | |||||
American Public Education Inc * | 5,900 | 224,200 | ||||||
ANN Inc * | 12,950 | 370,888 | ||||||
Brunswick Corp | 11,550 | 297,412 | ||||||
Dana Holding Corp | 16,500 | 255,750 | ||||||
Domino’s Pizza Inc | 7,650 | 277,695 | ||||||
DSW Inc ‘A’ | 6,500 | 356,005 | ||||||
Express Inc * | 12,450 | 311,001 | ||||||
Interval Leisure Group Inc | 10,665 | 185,571 | ||||||
Life Time Fitness Inc * | 5,520 | 279,146 | ||||||
LKQ Corp * | 11,550 | 360,014 | ||||||
Pier 1 Imports Inc * | 14,050 | 255,429 | ||||||
Six Flags Entertainment Corp | 9,600 | 448,992 | ||||||
Sotheby’s | 4,150 | 163,261 | ||||||
Tenneco Inc * | 4,800 | 178,320 | ||||||
The Cheesecake Factory Inc * | 8,750 | 257,162 | ||||||
The Children’s Place * | 6,330 | 327,071 | ||||||
The Warnaco Group Inc * | 5,250 | 306,600 | ||||||
Tupperware Brands Corp | 4,925 | 312,738 | ||||||
Vitamin Shoppe Inc * | 8,550 | 377,996 | ||||||
|
| |||||||
| 5,864,355 | ||||||||
|
| |||||||
Consumer Staples - 2.9% | ||||||||
The Fresh Market Inc * | 3,750 | 179,813 | ||||||
The Hain Celestial Group Inc * | 9,985 | 437,443 | ||||||
United Natural Foods Inc * | 9,050 | 422,273 | ||||||
|
| |||||||
| 1,039,529 | ||||||||
|
| |||||||
Energy - 7.2% |
| |||||||
Berry Petroleum Co ‘A’ | 5,850 | 275,711 | ||||||
Dril-Quip Inc * | 3,865 | 251,302 | ||||||
Energy XXI Ltd (Bermuda) * | 8,850 | 319,574 | ||||||
Gulfport Energy Corp * | 3,300 | 96,096 | ||||||
Key Energy Services Inc * | 13,850 | 213,983 | ||||||
Kodiak Oil & Gas Corp (Canada) * | 31,000 | 308,760 | ||||||
Lufkin Industries Inc | 1,600 | 129,040 | ||||||
Northern Oil & Gas Inc * | 10,750 | 222,955 | ||||||
Rosetta Resources Inc * | 6,150 | 299,874 | ||||||
Stone Energy Corp * | 9,550 | 273,035 | ||||||
Swift Energy Co * | 8,250 | 239,498 | ||||||
|
| |||||||
| 2,629,828 | ||||||||
|
| |||||||
Financials - 7.3% |
| |||||||
American Campus Communities Inc REIT | 5,200 | 232,544 | ||||||
Cohen & Steers Inc | 7,250 | 231,275 | ||||||
Endurance Specialty Holdings Ltd (Bermuda) | 6,050 | 245,993 | ||||||
Extra Space Storage Inc REIT | 7,250 | 208,727 | ||||||
Fortress Investment Group LLC ‘A’ | 48,750 | 173,550 | ||||||
Home Properties Inc REIT | 3,700 | 225,737 | ||||||
Jones Lang LaSalle Inc | 3,750 | 312,413 | ||||||
Northwest Bancshares Inc | 27,550 | 349,885 | ||||||
Signature Bank * | 4,650 | 293,136 | ||||||
SVB Financial Group * | 2,200 | 141,548 | ||||||
Two Harbors Investment Corp REIT | 22,550 | 228,657 | ||||||
|
| |||||||
| 2,643,465 | ||||||||
|
| |||||||
Health Care - 16.2% | ||||||||
Align Technology Inc * | 10,350 | 285,142 | ||||||
Alkermes PLC (Ireland) * | 8,200 | 152,110 | ||||||
Catalyst Health Solutions Inc * | 6,350 | 404,685 | ||||||
Centene Corp * | 3,050 | 149,358 | ||||||
Cepheid Inc * | 2,950 | 123,398 | ||||||
Cubist Pharmaceuticals Inc * | 5,400 | 233,550 | ||||||
HealthSouth Corp * | 12,500 | 256,000 | ||||||
HMS Holdings Corp * | 9,500 | 296,495 | ||||||
| Shares | Value | |||||||
Incyte Corp Ltd * | 11,150 | $ | 215,195 | |||||
Insulet Corp * | 17,070 | 326,720 | ||||||
Ironwood Pharmaceuticals Inc ‘A’ * | 10,400 | 138,424 | ||||||
LifePoint Hospitals Inc * | 5,000 | 197,200 | ||||||
Medicis Pharmaceutical Corp ‘A’ | 9,880 | 371,389 | ||||||
Medivation Inc * | 2,200 | 164,384 | ||||||
NxStage Medical Inc * | 10,450 | 201,372 | ||||||
Onyx Pharmaceuticals Inc * | 3,500 | 131,880 | ||||||
Optimer Pharmaceuticals Inc * | 14,710 | 204,469 | ||||||
PAREXEL International Corp * | 9,475 | 255,541 | ||||||
Salix Pharmaceuticals Ltd * | 3,400 | 178,500 | ||||||
Seattle Genetics Inc * | 7,850 | 159,983 | ||||||
Sirona Dental Systems Inc * | 4,650 | 239,661 | ||||||
Theravance Inc * | 7,750 | 151,125 | ||||||
Thoratec Corp * | 5,070 | 170,910 | ||||||
ViroPharma Inc * | 7,500 | 225,525 | ||||||
Volcano Corp * | 8,900 | 252,315 | ||||||
WellCare Health Plans Inc | *2,400 | 172,512 | ||||||
Wright Medical Group Inc * | 12,550 | 242,466 | ||||||
|
| |||||||
| 5,900,309 | ||||||||
|
| |||||||
Industrials - 16.0% |
| |||||||
A.O. Smith Corp | 3,150 | 141,593 | ||||||
AAR Corp | 16,721 | 305,158 | ||||||
Actuant Corp ‘A’ | 15,545 | 450,650 | ||||||
Avis Budget Group Inc * | 25,500 | 360,825 | ||||||
Barnes Group Inc | 15,850 | 417,013 | ||||||
Clean Harbors Inc * | 6,450 | 434,278 | ||||||
CoStar Group Inc * | 4,500 | 310,725 | ||||||
Esterline Technologies Corp * | 5,830 | 416,612 | ||||||
Genesee & Wyoming Inc ‘A’ * | 6,320 | 344,946 | ||||||
Hub Group Inc ‘A’ * | 10,550 | 380,117 | ||||||
RBC Bearings Inc * | 9,265 | 427,394 | ||||||
Tetra Tech Inc * | 15,050 | 396,718 | ||||||
Towers Watson & Co ‘A’ | 3,800 | 251,066 | ||||||
United Rentals Inc * | 10,200 | 437,478 | ||||||
Waste Connections Inc | 10,060 | 327,252 | ||||||
Woodward Inc | 9,380 | 401,745 | ||||||
|
| |||||||
| 5,803,570 | ||||||||
|
| |||||||
Information Technology - 24.0% |
| |||||||
Acme Packet Inc * | 6,350 | 174,752 | ||||||
Ancestry.com Inc * | 9,960 | 226,490 | ||||||
AVG Technologies NV (Netherlands) * | 11,800 | 176,410 | ||||||
BroadSoft Inc * | 7,300 | 279,225 | ||||||
Cadence Design Systems Inc * | 35,700 | 422,688 | ||||||
Cavium Inc * | 5,400 | 167,076 | ||||||
Ciena Corp * | 14,950 | 242,040 | ||||||
Cognex Corp | 7,350 | 311,346 | ||||||
CommVault Systems Inc * | 3,950 | 196,078 | ||||||
comScore Inc * | 16,500 | 352,935 | ||||||
Concur Technologies Inc * | 5,350 | 306,983 | ||||||
DealerTrack Holdings Inc * | 11,900 | 360,094 | ||||||
Finisar Corp * | 9,650 | 194,447 | ||||||
Fortinet Inc * | 8,900 | 246,085 | ||||||
InterXion Holding NV | 8,300 | 148,985 | ||||||
Jack Henry & Associates Inc | 8,650 | 295,138 | ||||||
LogMeIn Inc * | 9,815 | 345,782 | ||||||
Mellanox Technologies Ltd (Israel) * | 8,890 | 371,869 | ||||||
NICE Systems Ltd ADR (Israel) * | 8,495 | 333,854 | ||||||
Novellus Systems Inc * | 8,800 | 439,208 | ||||||
OpenTable Inc * | 6,290 | 254,556 | ||||||
QLIK Technologies Inc * | 11,500 | 368,000 | ||||||
RealPage Inc * | 10,650 | 204,161 | ||||||
RF Micro Devices Inc * | 45,600 | 227,088 | ||||||
Silicon Graphics International Corp * | 14,400 | 139,392 | ||||||
SolarWinds Inc * | 7,150 | 276,348 | ||||||
Solera Holdings Inc | 6,815 | 312,740 | ||||||
Tangoe Inc * | 3,200 | 60,192 | ||||||
The Ultimate Software Group Inc * | 5,700 | 417,696 | ||||||
| See Notes to Financial Statements | B-55 | See explanation of symbols and terms, if any, on page B-71 |
Table of Contents
PACIFIC LIFE FUNDS
PL SMALL-CAP GROWTH FUND
Schedule of Investments (Continued)
March 31, 2012
| Shares | Value | |||||||
TTM Technologies Inc * | 15,350 | $ | 176,372 | |||||
VistaPrint NV (Netherlands) * | 7,075 | 273,449 | ||||||
Wright Express Corp * | 6,765 | 437,898 | ||||||
|
| |||||||
| 8,739,377 | ||||||||
|
| |||||||
Materials - 4.2% | ||||||||
AuRico Gold Inc (Canada) * | 19,067 | 169,124 | ||||||
Cytec Industries Inc | 4,150 | 252,278 | ||||||
Globe Specialty Metals Inc | 6,150 | 91,450 | ||||||
PolyOne Corp | 17,400 | 250,560 | ||||||
Rockwood Holdings Inc * | 6,700 | 349,405 | ||||||
Silgan Holdings Inc | 9,640 | 426,088 | ||||||
|
| |||||||
| 1,538,905 | ||||||||
|
| |||||||
Utilities - 1.1% | ||||||||
ITC Holdings Corp | 4,980 | 383,161 | ||||||
|
| |||||||
Total Common Stocks | 34,542,499 | |||||||
|
| |||||||
SHORT-TERM INVESTMENT - 4.2% |
| |||||||
Money Market Fund - 4.2% |
| |||||||
BlackRock Liquidity Funds Treasury Trust Fund Portfolio | 1,541,556 | 1,541,556 | ||||||
|
| |||||||
Total Short-Term Investment | ||||||||
(Cost $1,541,556) | 1,541,556 | |||||||
|
| |||||||
TOTAL INVESTMENTS - 99.2% |
| 36,084,055 | ||||||
OTHER ASSETS & LIABILITIES, |
| 285,796 | ||||||
|
| |||||||
NET ASSETS - 100.0% |
| $ | 36,369,851 | |||||
|
| |||||||
Notes to Schedule of Investments
| (a) | As of March 31, 2012, the fund was diversified as a percentage of net assets as follows: |
Information Technology | 24.0 | % | ||
Health Care | 16.2 | % | ||
Consumer Discretionary | 16.1 | % | ||
Industrials | 16.0 | % | ||
Financials | 7.3 | % | ||
Energy | 7.2 | % | ||
Short-Term Investment | 4.2 | % | ||
Materials | 4.2 | % | ||
Consumer Staples | 2.9 | % | ||
Utilities | 1.1 | % | ||
|
| |||
| 99.2 | % | |||
Other Assets & Liabilities, Net | 0.8 | % | ||
|
| |||
| 100.0 | % | |||
|
|
| (b) | Fair Value Measurements |
The following is a summary of the fund’s investments as categorized under the three-tier hierarchy of inputs used in valuing the fund’s assets and liabilities (See Note 3C in Notes to Financial Statements) as of March 31, 2012:
| Total Value at March 31, 2012 | Level 1 Quoted Price | Level 2 Significant Observable Inputs | Level 3 Significant Unobservable Inputs | |||||||||||||||
Assets | Common Stocks (1) | $ | 34,542,499 | $ | 34,542,499 | $ | — | $ | — | |||||||||
Short-Term Investment | 1,541,556 | 1,541,556 | — | — | ||||||||||||||
|
|
|
|
|
|
|
| |||||||||||
Total | $ | 36,084,055 | $ | 36,084,055 | $ | — | $ | — | ||||||||||
|
|
|
|
|
|
|
| |||||||||||
| (1) | For equity investments categorized in a single level, refer to the schedule of investments for further industry breakout. |
| See Notes to Financial Statements | B-56 | See explanation of symbols and terms, if any, on page B-71 |
Table of Contents
PACIFIC LIFE FUNDS
PL SMALL-CAP VALUE FUND
Schedule of Investments
March 31, 2012
| Shares | Value | |||||||
COMMON STOCKS - 92.7% | ||||||||
Consumer Discretionary - 8.4% | ||||||||
Aaron’s Inc | 29,500 | $ | 764,050 | |||||
Bob Evans Farms Inc | 10,100 | 380,972 | ||||||
Cinemark Holdings Inc | 42,500 | 932,875 | ||||||
Group 1 Automotive Inc | 15,300 | 859,401 | ||||||
Hillenbrand Inc | 17,700 | 406,215 | ||||||
International Speedway Corp ‘A’ | 16,800 | 466,200 | ||||||
Meredith Corp | 30,200 | 980,292 | ||||||
Sturm Ruger & Co Inc | 10,900 | 535,190 | ||||||
The Buckle Inc | 21,600 | 1,034,640 | ||||||
Wolverine World Wide Inc | 23,100 | 858,858 | ||||||
|
| |||||||
| 7,218,693 | ||||||||
|
| |||||||
Consumer Staples - 7.3% | ||||||||
Cal-Maine Foods Inc | 15,200 | 581,552 | ||||||
Casey’s General Stores Inc | 20,000 | 1,109,200 | ||||||
Cia Cervecerias Unidas SA ADR (Chile) | 5,600 | 440,664 | ||||||
Corn Products International Inc | 19,100 | 1,101,115 | ||||||
Embotelladora Andina SA ‘B’ ADR (Chile) | 10,500 | 353,115 | ||||||
Fresh Del Monte Produce Inc (Cayman) | 10,100 | 230,684 | ||||||
Ruddick Corp | 18,100 | 725,810 | ||||||
The Andersons Inc | 13,409 | 652,884 | ||||||
Universal Corp | 19,100 | 890,060 | ||||||
Weis Markets Inc | 4,300 | 187,480 | ||||||
|
| |||||||
| 6,272,564 | ||||||||
|
| |||||||
Energy - 15.2% | ||||||||
Alliance Resource Partners LP | 6,700 | 402,670 | ||||||
Berry Petroleum Co ‘A’ | 23,900 | 1,126,407 | ||||||
Bristow Group Inc | 17,300 | 825,729 | ||||||
Buckeye Partners LP | 9,100 | 556,738 | ||||||
Cimarex Energy Co | 9,600 | 724,512 | ||||||
CVR Energy Inc * | 28,200 | 754,350 | ||||||
Energen Corp | 17,000 | 835,550 | ||||||
EXCO Resources Inc | 6,700 | 44,421 | ||||||
HollyFrontier Corp | 30,200 | 970,930 | ||||||
Knightsbridge Tankers Ltd (Bermuda) | 3,900 | 56,082 | ||||||
Linn Energy LLC | 17,200 | 656,180 | ||||||
Magellan Midstream Partners LP | 12,800 | 925,952 | ||||||
Patterson-UTI Energy Inc | 41,000 | 708,890 | ||||||
Pioneer Southwest Energy Partners LP | 8,300 | 221,776 | ||||||
Ship Finance International Ltd (Bermuda) | 17,800 | 272,340 | ||||||
Sunoco Logistics Partners LP | 18,000 | 680,580 | ||||||
TC Pipelines LP | 6,900 | 310,224 | ||||||
Tidewater Inc | 17,200 | 929,144 | ||||||
TransMontaigne Partners LP | 6,100 | 212,036 | ||||||
W&T Offshore Inc | 37,300 | 786,284 | ||||||
World Fuel Services Corp | 26,300 | 1,078,300 | ||||||
|
| |||||||
| 13,079,095 | ||||||||
|
| |||||||
Financials - 13.9% | ||||||||
Advance America Cash Advance Centers Inc | 36,000 | 377,640 | ||||||
American Equity Investment Life Holding Co | 21,100 | 269,447 | ||||||
American Financial Group Inc | 25,000 | 964,500 | ||||||
AmTrust Financial Services Inc | 1,800 | 48,384 | ||||||
Bank of Hawaii Corp | 18,600 | 899,310 | ||||||
Cash America International Inc | 18,300 | 877,119 | ||||||
CreXus Investment Corp REIT | 12,100 | 125,114 | ||||||
Cullen/Frost Bankers Inc | 14,600 | 849,574 | ||||||
Delphi Financial Group Inc ‘A’ | 16,600 | 743,182 | ||||||
Franklin Street Properties Corp REIT | 33,100 | 350,860 | ||||||
Healthcare Realty Trust Inc REIT | 28,000 | 616,000 | ||||||
Infinity Property & Casualty Corp | 1,500 | 78,495 | ||||||
Montpelier Re Holdings Ltd (Bermuda) | 9,109 | 175,986 | ||||||
Old National Bancorp | 18,400 | 241,776 | ||||||
Omega Healthcare Investors Inc REIT | 41,000 | 871,660 | ||||||
| Shares | Value | |||||||
Prosperity Bancshares Inc | 17,500 | $ | 801,500 | |||||
PS Business Parks Inc REIT | 8,400 | 550,536 | ||||||
Raymond James Financial Inc | 23,800 | 869,414 | ||||||
RLI Corp | 8,200 | 587,448 | ||||||
Sovran Self Storage Inc REIT | 10,100 | 503,283 | ||||||
Susquehanna Bancshares Inc | 37,000 | 365,560 | ||||||
Trustmark Corp | 33,800 | 844,324 | ||||||
|
| |||||||
| 12,011,112 | ||||||||
|
| |||||||
Health Care - 6.7% | ||||||||
Invacare Corp | 18,700 | 309,859 | ||||||
Owens & Minor Inc | 26,100 | 793,701 | ||||||
PerkinElmer Inc | 35,550 | 983,313 | ||||||
STERIS Corp | 25,500 | 806,310 | ||||||
Teleflex Inc | 14,400 | 880,560 | ||||||
The Cooper Cos Inc | 12,300 | 1,005,033 | ||||||
The Ensign Group Inc | 9,600 | 260,736 | ||||||
West Pharmaceutical Services Inc | 16,700 | 710,251 | ||||||
|
| |||||||
| 5,749,763 | ||||||||
|
| |||||||
Industrials - 14.0% | ||||||||
Alliant Techsystems Inc | 14,000 | 701,680 | ||||||
Applied Industrial Technologies Inc | 6,700 | 275,571 | ||||||
Barnes Group Inc | 25,000 | 657,750 | ||||||
Belden Inc | 21,800 | 826,438 | ||||||
Cascade Corp | 4,547 | 227,896 | ||||||
Crane Co | 18,700 | 906,950 | ||||||
Cubic Corp | 7,100 | 335,688 | ||||||
Curtiss-Wright Corp | 22,600 | 836,426 | ||||||
Elbit Systems Ltd (Israel) | 3,900 | 150,150 | ||||||
Ennis Inc | 14,300 | 226,226 | ||||||
Great Lakes Dredge & Dock Co | 22,800 | 164,616 | ||||||
ITT Corp | 35,223 | 808,016 | ||||||
KBR Inc | 26,300 | 934,965 | ||||||
Kennametal Inc | 21,500 | 957,395 | ||||||
Standex International Corp | 3,567 | 146,925 | ||||||
The Brink’s Co | 26,100 | 623,007 | ||||||
Titan International Inc | 23,600 | 558,140 | ||||||
Triumph Group Inc | 18,600 | 1,165,476 | ||||||
Twin Disc Inc | 5,100 | 133,059 | ||||||
UniFirst Corp | 5,800 | 356,990 | ||||||
Valmont Industries Inc | 9,300 | 1,091,913 | ||||||
|
| |||||||
| 12,085,277 | ||||||||
|
| |||||||
Information Technology - 3.3% | ||||||||
AVX Corp | 18,200 | 241,332 | ||||||
Brooks Automation Inc | 19,400 | 239,202 | ||||||
Diebold Inc | 24,200 | 932,184 | ||||||
j2 Global Inc | 12,212 | 350,240 | ||||||
Jabil Circuit Inc | 38,500 | 967,120 | ||||||
Micrel Inc | 14,299 | 146,708 | ||||||
|
| |||||||
| 2,876,786 | ||||||||
|
| |||||||
Materials - 16.5% | ||||||||
A. Schulman Inc | 14,800 | 399,896 | ||||||
AMCOL International Corp | 7,782 | 229,491 | ||||||
Bemis Co Inc | 28,900 | 933,181 | ||||||
Buckeye Technologies Inc | 3,600 | 122,292 | ||||||
Cabot Corp | 23,700 | 1,011,516 | ||||||
Compass Minerals International Inc | 11,700 | 839,358 | ||||||
Gold Resource Corp | 32,720 | 795,423 | ||||||
HudBay Minerals Inc (Canada) | 73,099 | 801,747 | ||||||
IAMGOLD Corp (Canada) | 42,800 | 568,812 | ||||||
Innophos Holdings Inc | 12,600 | 631,512 | ||||||
International Flavors & Fragrances Inc | 12,200 | 714,920 | ||||||
Methanex Corp (Canada) | 24,500 | 794,535 | ||||||
Neenah Paper Inc | 9,300 | 276,582 | ||||||
NewMarket Corp | 3,600 | 674,640 | ||||||
Quaker Chemical Corp | 7,094 | 279,858 | ||||||
| See Notes to Financial Statements | B-57 | See explanation of symbols and terms, if any, on page B-71 |
Table of Contents
PACIFIC LIFE FUNDS
PL SMALL-CAP VALUE FUND
Schedule of Investments (Continued)
March 31, 2012
| Shares | Value | |||||||
Rock-Tenn Co ‘A’ | 12,900 | $ | 871,524 | |||||
Royal Gold Inc | 14,600 | 952,212 | ||||||
Sensient Technologies Corp | 21,200 | 805,600 | ||||||
Sonoco Products Co | 27,270 | 905,364 | ||||||
Steel Dynamics Inc | 24,400 | 354,776 | ||||||
Stepan Co | 2,958 | 259,712 | ||||||
The Scotts Miracle-Gro Co ‘A’ | 17,800 | 964,048 | ||||||
|
| |||||||
| 14,186,999 | ||||||||
|
| |||||||
Telecommunication Services - 0.2% |
| |||||||
Cellcom Israel Ltd (Israel) | 13,700 | 169,743 | ||||||
|
| |||||||
Utilities - 7.2% | ||||||||
AGL Resources Inc | 18,500 | 725,570 | ||||||
Atmos Energy Corp | 22,900 | 720,434 | ||||||
Avista Corp | 19,900 | 509,042 | ||||||
Great Plains Energy Inc | 21,500 | 435,805 | ||||||
OGE Energy Corp | 15,800 | 845,300 | ||||||
Portland General Electric Co | 21,500 | 537,070 | ||||||
Southwest Gas Corp | 10,000 | 427,400 | ||||||
Suburban Propane Partners LP | 9,800 | 421,400 | ||||||
UGI Corp | 29,200 | 795,700 | ||||||
Westar Energy Inc | 28,400 | 793,212 | ||||||
|
| |||||||
| 6,210,933 | ||||||||
|
| |||||||
Total Common Stocks | ||||||||
(Cost $62,982,704) | 79,860,965 | |||||||
|
| |||||||
SHORT-TERM INVESTMENT - 6.9% |
| |||||||
Money Market Fund - 6.9% | ||||||||
BlackRock Liquidity Funds Treasury Trust Fund Portfolio | 5,932,236 | 5,932,236 | ||||||
|
| |||||||
Total Short-Term Investment | ||||||||
(Cost $5,932,236) | 5,932,236 | |||||||
|
| |||||||
TOTAL INVESTMENTS - 99.6% |
| |||||||
(Cost $68,914,940) | 85,793,201 | |||||||
OTHER ASSETS & LIABILITIES, |
| 358,624 | ||||||
|
| |||||||
NET ASSETS - 100.0% | $ | 86,151,825 | ||||||
|
| |||||||
Notes to Schedule of Investments
| (a) | As of March 31, 2012, the fund was diversified as a percentage of net assets as follows: |
Materials | 16.5 | % | ||
Energy | 15.2 | % | ||
Industrials | 14.0 | % | ||
Financials | 13.9 | % | ||
Consumer Discretionary | 8.4 | % | ||
Consumer Staples | 7.3 | % | ||
Utilities | 7.2 | % | ||
Short-Term Investment | 6.9 | % | ||
Health Care | 6.7 | % | ||
Information Technology | 3.3 | % | ||
Telecommunication Services | 0.2 | % | ||
|
| |||
| 99.6 | % | |||
Other Assets & Liabilities, Net | 0.4 | % | ||
|
| |||
| 100.0 | % | |||
|
|
| (b) | Fair Value Measurements |
The following is a summary of the fund’s investments as categorized under the three-tier hierarchy of inputs used in valuing the fund’s assets and liabilities (See Note 3C in Notes to Financial Statements) as of March 31, 2012:
| Total Value at March 31, 2012 | Level 1 Quoted Price | Level 2 Significant Observable Inputs | Level 3 Significant Unobservable Inputs | |||||||||||||||
Assets | Common Stocks (1) | $ | 79,860,965 | $ | 79,860,965 | $ | — | $ | — | |||||||||
Short-Term Investment | 5,932,236 | 5,932,236 | — | — | ||||||||||||||
|
|
|
|
|
|
|
| |||||||||||
Total | $ | 85,793,201 | $ | 85,793,201 | $ | — | $ | — | ||||||||||
|
|
|
|
|
|
|
| |||||||||||
| (1) | For equity investments categorized in a single level, refer to the schedule of investments for further industry breakout. |
See Notes to Financial Statements | B-58 | See explanation of symbols and terms, if any, on page B-71 |
Table of Contents
PACIFIC LIFE FUNDS
PL REAL ESTATE FUND
Schedule of Investments
March 31, 2012
| Shares | Value | |||||||
COMMON STOCKS - 94.0% | ||||||||
Consumer Discretionary - 3.1% | ||||||||
Starwood Hotels & Resorts Worldwide Inc | 29,364 | $ | 1,656,423 | |||||
|
| |||||||
Financials - 89.9% | ||||||||
Acadia Realty Trust REIT | 21,193 | 477,690 | ||||||
Apartment Investment & Management Co ‘A’ REIT | 60,846 | 1,606,943 | ||||||
Ashford Hospitality Trust Inc REIT | 24,660 | 222,187 | ||||||
AvalonBay Communities Inc REIT | 11,619 | 1,642,346 | ||||||
BioMed Realty Trust Inc REIT | 4,515 | 85,695 | ||||||
Boston Properties Inc REIT | 21,409 | 2,247,731 | ||||||
BRE Properties Inc REIT | 10,840 | 547,962 | ||||||
Brookfield Office Properties Inc (Canada) | 74,374 | 1,297,826 | ||||||
Camden Property Trust REIT | 10,334 | 679,460 | ||||||
CommonWealth REIT | 7,467 | 139,036 | ||||||
Coresite Realty Corp REIT | 6,590 | 155,458 | ||||||
Cousins Properties Inc REIT | 74,931 | 567,977 | ||||||
DCT Industrial Trust Inc REIT | 131,770 | 777,443 | ||||||
Digital Realty Trust Inc REIT | 2,690 | 198,979 | ||||||
Douglas Emmett Inc REIT | 5,790 | 132,070 | ||||||
Equity Lifestyle Properties Inc REIT | 13,824 | 964,086 | ||||||
Equity One Inc REIT | 281 | 5,682 | ||||||
Equity Residential REIT | 70,915 | 4,440,697 | ||||||
Federal Realty Investment Trust REIT | 6,678 | 646,364 | ||||||
Forest City Enterprises Inc ‘A’ * | 94,293 | 1,476,628 | ||||||
General Growth Properties Inc REIT | 132,803 | 2,256,323 | ||||||
HCP Inc REIT | 61,360 | 2,421,266 | ||||||
Health Care REIT Inc | 9,110 | 500,686 | ||||||
Healthcare Realty Trust Inc REIT | 58,119 | 1,278,618 | ||||||
Host Hotels & Resorts Inc REIT | 172,642 | 2,834,782 | ||||||
Hudson Pacific Properties Inc REIT | 17,860 | 270,222 | ||||||
Lexington Realty Trust REIT | 2,730 | 24,543 | ||||||
Liberty Property Trust REIT | 3,254 | 116,233 | ||||||
Mack-Cali Realty Corp REIT | 33,318 | 960,225 | ||||||
Omega Healthcare Investors Inc REIT | 9,740 | 207,072 | ||||||
Parkway Properties Inc REIT | 1,310 | 13,729 | ||||||
Plum Creek Timber Co Inc REIT | 2,389 | 99,287 | ||||||
ProLogis Inc REIT | 27,272 | 982,337 | ||||||
PS Business Parks Inc REIT | 3,741 | 245,185 | ||||||
Public Storage REIT | 13,437 | 1,856,590 | ||||||
Regency Centers Corp REIT | 57,911 | 2,575,881 | ||||||
Retail Opportunity Investments Corp REIT | 27,053 | 325,718 | ||||||
Senior Housing Properties Trust REIT | 44,743 | 986,583 | ||||||
Simon Property Group Inc REIT | 47,527 | 6,923,733 | ||||||
Sovran Self Storage Inc REIT | 2,982 | 148,593 | ||||||
STAG Industrial Inc REIT | 6,810 | 95,068 | ||||||
Starwood Property Trust Inc REIT | 15,820 | 332,536 | ||||||
The Macerich Co REIT | 2,730 | 157,657 | ||||||
Vornado Realty Trust REIT | 38,681 | 3,256,940 | ||||||
Winthrop Realty Trust REIT | 15,101 | 175,021 | ||||||
|
| |||||||
| 47,357,088 | ||||||||
|
| |||||||
| Shares | Value | |||||||
Health Care - 1.0% | ||||||||
Assisted Living Concepts Inc ‘A’ | 25,820 | $ | 428,870 | |||||
Capital Senior Living Corp * | 8,950 | 82,698 | ||||||
|
| |||||||
| 511,568 | ||||||||
|
| |||||||
Total Common Stocks | ||||||||
(Cost $30,537,366) | 49,525,079 | |||||||
|
| |||||||
SHORT-TERM INVESTMENT - 5.3% |
| |||||||
Money Market Fund - 5.3% | ||||||||
BlackRock Liquidity Funds Treasury Trust Fund Portfolio | 2,776,253 | 2,776,253 | ||||||
|
| |||||||
Total Short-Term Investment | ||||||||
(Cost $2,776,253) | 2,776,253 | |||||||
|
| |||||||
TOTAL INVESTMENTS - 99.3% |
| |||||||
(Cost $33,313,619) | 52,301,332 | |||||||
OTHER ASSETS & LIABILITIES, |
| 377,633 | ||||||
|
| |||||||
NET ASSETS - 100.0% | $ | 52,678,965 | ||||||
|
| |||||||
Notes to Schedule of Investments
| (a) | As of March 31, 2012, the fund was diversified by property sector as a percentage of net assets as follows: |
Retail | 25.4 | % | ||
Specialized | 20.0 | % | ||
Residential | 18.8 | % | ||
Diversified | 8.3 | % | ||
Office | 8.0 | % | ||
Real Estate Operating Companies | 5.3 | % | ||
Industrial | 3.5 | % | ||
Hotels, Resorts & Cruise Lines | 3.1 | % | ||
Health Care Facilities | 1.0 | % | ||
Mortgage | 0.6 | % | ||
|
| |||
| 94.0 | % | |||
Short-Term Investment | 5.3 | % | ||
Other Assets & Liabilities, Net | 0.7 | % | ||
|
| |||
| 100.0 | % | |||
|
|
| (b) | Fair Value Measurements |
The following is a summary of the fund’s investments as categorized under the three-tier hierarchy of inputs used in valuing the fund’s assets and liabilities (See Note 3C in Notes to Financial Statements) as of March 31, 2012:
| Total Value at March 31, 2012 | Level 1 Quoted Price | Level 2 Significant Observable Inputs | Level 3 Significant Unobservable Inputs | |||||||||||||||
Assets | Common Stocks (1) | $ | 49,525,079 | $ | 49,525,079 | $ | — | $ | — | |||||||||
| Short-Term Investment | 2,776,253 | 2,776,253 | — | — | ||||||||||||||
|
|
|
|
|
|
|
| |||||||||||
Total | $ | 52,301,332 | $ | 52,301,332 | $ | — | $ | — | ||||||||||
|
|
|
|
|
|
|
| |||||||||||
| (1) | For equity investments categorized in a single level, refer to the schedule of investments for further industry breakout. |
| See Notes to Financial Statements | B-59 | See explanation of symbols and terms, if any, on page B-71 |
Table of Contents
PACIFIC LIFE FUNDS
PL EMERGING MARKETS FUND
Schedule of Investments
March 31, 2012
| Shares | Value | |||||||
PREFERRED STOCKS - 7.0% |
| |||||||
Brazil - 6.1% | ||||||||
Cia Brasileira de Distribuicao Grupo Pao de Acucar ADR | 26,660 | $ | 1,269,549 | |||||
Cia de Bebidas das Americas ADR | 25,400 | 1,049,528 | ||||||
Kroton Educacional SA * | 429 | 764 | ||||||
Lojas Americanas SA | 118,310 | 1,113,460 | ||||||
Petroleo Brasileiro SA ADR | 37,200 | 950,832 | ||||||
Vale SA ADR | 38,330 | 869,708 | ||||||
|
| |||||||
| 5,253,841 | ||||||||
|
| |||||||
Colombia - 0.9% | ||||||||
Banco Davivienda SA | 29,292 | 317,034 | ||||||
BanColombia SA ADR | 6,540 | 422,876 | ||||||
|
| |||||||
| 739,910 | ||||||||
|
| |||||||
Total Preferred Stocks | ||||||||
(Cost $4,201,463) | 5,993,751 | |||||||
|
| |||||||
COMMON STOCKS - 89.6% |
| |||||||
Belgium - 0.1% | ||||||||
Anheuser-Busch InBev NV | 1,189 | 86,640 | ||||||
|
| |||||||
Bermuda - 0.9% | ||||||||
Credicorp Ltd | 3,720 | 490,370 | ||||||
Dairy Farm International Holdings Ltd | 28,000 | 292,190 | ||||||
|
| |||||||
| 782,560 | ||||||||
|
| |||||||
Brazil - 5.5% | ||||||||
B2W Cia Global do Varejo * | 39,981 | 180,472 | ||||||
BM&FBOVESPA SA | 263,816 | 1,617,191 | ||||||
Embraer SA ADR | 30,250 | 967,395 | ||||||
Estacio Participacoes SA | 38,900 | 421,934 | ||||||
Kroton Educacional SA * | 2,444 | 4,351 | ||||||
Kroton Educacional SA - Share Deposit Certificates * | 33,841 | 489,600 | ||||||
Multiplan Empreendimentos Imobiliarios SA | 5,000 | 114,794 | ||||||
Natura Cosmeticos SA | 41,300 | 892,539 | ||||||
|
| |||||||
| 4,688,276 | ||||||||
|
| |||||||
Cayman - 9.1% | ||||||||
Ambow Education Holding Ltd ADR * | 7,280 | 53,581 | ||||||
Baidu Inc ADR * | 12,510 | 1,823,583 | ||||||
Ctrip.com International Ltd ADR * | 46,720 | 1,011,021 | ||||||
Eurasia Drilling Co Ltd GDR (LI) ~ | 15,210 | 419,340 | ||||||
Home Inns & Hotels Management Inc ADR * | 13,340 | 340,303 | ||||||
New Oriental Education & Technology Group ADR * | 16,510 | 453,365 | ||||||
Tencent Holdings Ltd | 59,000 | 1,644,565 | ||||||
Tingyi Holding Corp | 366,000 | 1,057,607 | ||||||
Want Want China Holdings Ltd | 782,000 | 872,322 | ||||||
Youku Inc ADR * | 3,760 | 82,682 | ||||||
|
| |||||||
| 7,758,369 | ||||||||
|
| |||||||
Chile - 0.4% | ||||||||
Banco Santander Chile SA | 3,127,255 | 259,730 | ||||||
Cencosud SA | 10,349 | 68,414 | ||||||
|
| |||||||
| 328,144 | ||||||||
|
| |||||||
China - 1.3% | ||||||||
China Shenhua Energy Co Ltd ‘H’ | 201,000 | 847,191 | ||||||
Shanghai Zhenhua Heavy Industries Co Ltd ‘B’ * | 166,590 | 73,080 | ||||||
Wumart Stores Inc ‘H’ | 70,000 | 153,555 | ||||||
|
| |||||||
| 1,073,826 | ||||||||
|
| |||||||
| Shares | Value | |||||||
Colombia - 1.4% | ||||||||
Almacenes Exito SA | 42,137 | $ | 612,164 | |||||
Almacenes Exito SA GDR ~ | 39,100 | 553,781 | ||||||
|
| |||||||
| 1,165,945 | ||||||||
|
| |||||||
Denmark - 2.1% | ||||||||
Carlsberg AS ‘B’ | 21,578 | 1,786,212 | ||||||
|
| |||||||
Egypt - 0.6% | ||||||||
Commercial International Bank SAE | 75,537 | 313,404 | ||||||
Eastern Co SAE | 2,562 | 44,118 | ||||||
Egyptian Financial Group-Hermes Holding * | 80,133 | 177,381 | ||||||
Medinet Nasr Housing * | 2,986 | 7,919 | ||||||
|
| |||||||
| 542,822 | ||||||||
|
| |||||||
France - 1.2% | ||||||||
Casino Guichard-Perrachon SA | 60 | 5,911 | ||||||
CFAO SA | 13,370 | 574,415 | ||||||
Technip SA | 390 | 46,022 | ||||||
Vallourec SA | 7,060 | 446,895 | ||||||
|
| |||||||
| 1,073,243 | ||||||||
|
| |||||||
Hong Kong - 4.1% | ||||||||
AIA Group Ltd | 254,200 | 930,870 | ||||||
CNOOC Ltd | 374,000 | 764,556 | ||||||
Hang Lung Group Ltd | 68,000 | 438,132 | ||||||
Hang Lung Properties Ltd | 173,000 | 634,807 | ||||||
Hong Kong Exchanges & Clearing Ltd | 41,700 | 700,280 | ||||||
Sun Art Retail Group Ltd * | 5,000 | 6,792 | ||||||
|
| |||||||
| 3,475,437 | ||||||||
|
| |||||||
India - 13.3% | ||||||||
Asian Paints Ltd | 6,824 | 434,179 | ||||||
Cipla Ltd | 45,956 | 275,624 | ||||||
Colgate-Palmolive India Ltd | 25,236 | 553,864 | ||||||
Dabur India Ltd | 110,533 | 231,235 | ||||||
HDFC Bank Ltd ADR | 36,730 | 1,252,493 | ||||||
Hindustan Unilever Ltd | 86,109 | 692,616 | ||||||
Housing Development Finance Corp Ltd | 111,034 | 1,465,254 | ||||||
ICICI Bank Ltd ADR | 24,810 | 865,125 | ||||||
Infosys Ltd | 56,286 | 3,165,475 | ||||||
Marico Ltd | 110,739 | 381,754 | ||||||
Sun Pharmaceutical Industries Ltd | 42,227 | 473,150 | ||||||
Tata Consultancy Services Ltd | 38,202 | 875,832 | ||||||
TV18 Broadcast Ltd * | 42,024 | 22,676 | ||||||
Zee Entertainment Enterprises Ltd | 262,053 | 651,464 | ||||||
Zee Learn Ltd * | 15,223 | 4,403 | ||||||
|
| |||||||
| 11,345,144 | ||||||||
|
| |||||||
Indonesia - 1.6% | ||||||||
P.T. Astra International Tbk | 90,900 | 734,838 | ||||||
P.T. Bank Central Asia Tbk | 79,500 | 69,528 | ||||||
P.T. Kalbe Farma Tbk | 318,500 | 123,623 | ||||||
P.T. Unilever Indonesia Tbk | 211,000 | 461,329 | ||||||
|
| |||||||
| 1,389,318 | ||||||||
|
| |||||||
Italy - 0.9% | ||||||||
Prada SPA * | 125,300 | 814,412 | ||||||
|
| |||||||
Kenya - 0.1% | ||||||||
East African Breweries Ltd | 23,224 | 56,471 | ||||||
|
| |||||||
| See Notes to Financial Statements | B-60 | See explanation of symbols and terms, if any, on page B-71 |
Table of Contents
PACIFIC LIFE FUNDS
PL EMERGING MARKETS FUND
Schedule of Investments (Continued)
March 31, 2012
| Shares | Value | |||||||
Luxembourg - 1.1% | ||||||||
Tenaris SA ADR | 24,940 | $ | 953,456 | |||||
|
| |||||||
Malaysia - 0.4% | ||||||||
Genting Bhd | 93,900 | 332,171 | ||||||
|
| |||||||
Mexico - 10.1% | ||||||||
America Movil SAB de CV ‘L’ ADR | 122,680 | 3,046,144 | ||||||
Fomento Economico Mexicano SAB de CV | 189,819 | 1,560,831 | ||||||
Fomento Economico Mexicano SAB de CV ADR | 25,370 | 2,087,190 | ||||||
Grupo Financiero Inbursa SAB de CV ‘O’ | 189,036 | 392,292 | ||||||
Grupo Televisa SAB ADR | 34,620 | 729,790 | ||||||
Wal-Mart de Mexico SAB de CV ‘V’ | 253,932 | 852,077 | ||||||
|
| |||||||
| 8,668,324 | ||||||||
|
| |||||||
Netherlands - 1.0% | ||||||||
Yandex NV ‘A’ * | 30,540 | 820,610 | ||||||
|
| |||||||
Nigeria - 0.5% | ||||||||
Guaranty Trust Bank PLC | 131,938 | 11,286 | ||||||
Nigerian Breweries PLC | 616,451 | 381,129 | ||||||
Zenith Bank PLC | 94,091 | 7,398 | ||||||
|
| |||||||
| 399,813 | ||||||||
|
| |||||||
Philippines - 3.5% | ||||||||
Jollibee Foods Corp | 196,360 | 535,675 | ||||||
Philippine Long Distance Telephone Co | 5,620 | 353,148 | ||||||
SM Investments Corp | 37,830 | 581,904 | ||||||
SM Prime Holdings Inc | 3,923,056 | 1,545,548 | ||||||
|
| |||||||
| 3,016,275 | ||||||||
|
| |||||||
Portugal - 0.4% | ||||||||
Galp Energia SGPS SA ‘B’ | 19,265 | 317,408 | ||||||
|
| |||||||
Russia - 5.0% | ||||||||
Magnit OJSC (MICEX) * | 11,888 | 1,478,387 | ||||||
Magnit OJSC (RTS) | 4,168 | 517,336 | ||||||
Magnit OJSC GDR | 14,780 | 430,883 | ||||||
NovaTek OAO GDR | 10,700 | 1,453,047 | ||||||
NovaTek OAO GDR (OTC) ~D | 3,200 | 434,556 | ||||||
|
| |||||||
| 4,314,209 | ||||||||
|
| |||||||
South Africa - 3.9% | ||||||||
Anglo American Platinum Ltd | 10,279 | 719,539 | ||||||
Impala Platinum Holdings Ltd | 49,009 | 974,135 | ||||||
MTN Group Ltd | 67,597 | 1,186,731 | ||||||
Standard Bank Group Ltd | 31,957 | 463,477 | ||||||
|
| |||||||
| 3,343,882 | ||||||||
|
| |||||||
South Korea - 5.4% | ||||||||
E-Mart Co Ltd | 4,994 | 1,098,744 | ||||||
MegaStudy Co Ltd | 1,770 | 182,077 | ||||||
NHN Corp | 12,789 | 2,936,054 | ||||||
Shinsegae Co Ltd | 1,876 | 395,848 | ||||||
|
| |||||||
| 4,612,723 | ||||||||
|
| |||||||
Taiwan - 4.0% | ||||||||
Epistar Corp | 219,000 | 557,653 | ||||||
HTC Corp | 61,210 | 1,238,620 | ||||||
Synnex Technology International Corp | 247,118 | 616,795 | ||||||
Taiwan Semiconductor Manufacturing Co Ltd | 349,995 | 1,006,871 | ||||||
|
| |||||||
| 3,419,939 | ||||||||
|
| |||||||
| Shares | Value | |||||||
Thailand - 0.7% | ||||||||
Siam Commercial Bank PCL | 131,200 | $ | 610,282 | |||||
|
| |||||||
Turkey - 4.5% | ||||||||
Akbank TAS * | 86,679 | 340,984 | ||||||
Anadolu Efes Biracilik Ve Malt Sanayii AS | 38,832 | 543,222 | ||||||
BIM Birlesik Magazalar AS | 15,514 | 587,956 | ||||||
Enka Insaat ve Sanayi AS | 241,915 | 772,093 | ||||||
Haci Omer Sabanci Holding AS | 265,658 | 1,143,386 | ||||||
Turkiye Garanti Bankasi AS | 123,967 | 491,766 | ||||||
|
| |||||||
| 3,879,407 | ||||||||
|
| |||||||
United Arab Emirates - 0.7% |
| |||||||
DP World Ltd * | 54,944 | 640,266 | ||||||
|
| |||||||
United Kingdom - 5.8% | ||||||||
Anglo American PLC | 30,027 | 1,125,167 | ||||||
BG Group PLC | 14,280 | 331,247 | ||||||
Cairn Energy PLC * | 6,226 | 32,616 | ||||||
Genting Singapore PLC * | 333,000 | 451,437 | ||||||
Mail.ru Group Ltd GDR * ~ | 2,200 | 85,852 | ||||||
SABMiller PLC | 26,510 | 1,066,458 | ||||||
Tullow Oil PLC | 63,130 | 1,548,202 | ||||||
Unilever PLC | 9,400 | 309,984 | ||||||
|
| |||||||
| 4,950,963 | ||||||||
|
| |||||||
Total Common Stocks | ||||||||
(Cost $60,206,153) | 76,646,547 | |||||||
|
| |||||||
EQUITY-LINKED STRUCTURED |
| |||||||
Vietnam - 0.1% | ||||||||
UBS AG (for Vietnam Dairy Products) | ||||||||
Exp. 01/31/13 *D | 18,000 | 79,424 | ||||||
|
| |||||||
Total Equity-Linked Structured Securities |
| |||||||
(Cost $74,067) | 79,424 | |||||||
|
| |||||||
SHORT-TERM INVESTMENT - 2.9% |
| |||||||
Money Market Fund - 2.9% | ||||||||
BlackRock Liquidity Funds Treasury |
| |||||||
Trust Fund Portfolio | 2,454,586 | 2,454,586 | ||||||
|
| |||||||
Total Short-Term Investment | ||||||||
(Cost $2,454,586) | 2,454,586 | |||||||
|
| |||||||
TOTAL INVESTMENTS - 99.6% |
| |||||||
(Cost $66,936,269) | 85,174,308 | |||||||
OTHER ASSETS & LIABILITIES, |
| 308,926 | ||||||
|
| |||||||
NET ASSETS - 100.0% | $ | 85,483,234 | ||||||
|
| |||||||
| See Notes to Financial Statements | B-61 | See explanation of symbols and terms, if any, on page B-71 |
Table of Contents
PACIFIC LIFE FUNDS
PL EMERGING MARKETS FUND
Schedule of Investments (Continued)
March 31, 2012
Notes to Schedule of Investments
| (a) | As of March 31, 2012, the fund was diversified as a percentage of net assets as follows: |
Consumer Staples | 25.8 | % | ||
Financials | 17.6 | % | ||
Information Technology | 17.4 | % | ||
Consumer Discretionary | 11.1 | % | ||
Energy | 9.4 | % | ||
Telecommunication Services | 5.4 | % | ||
Materials | 4.8 | % | ||
Industrials | 4.1 | % | ||
Short-Term Investment | 2.9 | % | ||
Health Care | 1.0 | % | ||
Equity-Linked Structured Securities | 0.1 | % | ||
|
| |||
| 99.6 | % | |||
Other Assets & Liabilities, Net | 0.4 | % | ||
|
| |||
| 100.0 | % | |||
|
|
| (b) | As of March 31, 2012, the fund was diversified by country of incorporation as a percentage of net assets as follows: |
India | 13.3 | % | ||
Brazil | 11.6 | % | ||
Mexico | 10.1 | % | ||
Cayman | 9.1 | % | ||
United Kingdom | 5.8 | % | ||
South Korea | 5.4 | % | ||
Russia | 5.0 | % | ||
Turkey | 4.5 | % | ||
Hong Kong | 4.1 | % | ||
Taiwan | 4.0 | % | ||
South Africa | 3.9 | % | ||
Philippines | 3.5 | % | ||
United States | 2.9 | % | ||
Colombia | 2.3 | % | ||
Denmark | 2.1 | % | ||
Indonesia | 1.6 | % | ||
China | 1.3 | % | ||
France | 1.2 | % | ||
Luxembourg | 1.1 | % | ||
Netherlands | 1.0 | % | ||
Others (each less than 1.0%) | 5.8 | % | ||
|
| |||
| 99.6 | % | |||
Other Assets & Liabilities, Net | 0.4 | % | ||
|
| |||
| 100.0 | % | |||
|
|
| (c) | As of March 31, 2012, 0.6% of the fund’s net assets were reported illiquid by the portfolio manager under the Trust’s policy. |
| See Notes to Financial Statements | B-62 | See explanation of symbols and terms, if any, on page B-71 |
Table of Contents
PACIFIC LIFE FUNDS
PL EMERGING MARKETS FUND
Schedule of Investments (Continued)
March 31, 2012
| (d) | Fair Value Measurements |
The following is a summary of the fund’s investments as categorized under the three-tier hierarchy of inputs used in valuing the fund’s assets and liabilities (See Note 3C in Notes to Financial Statements) as of March 31, 2012:
| Total Value at March 31, 2012 | Level 1 Quoted Price | Level 2 Significant Observable Inputs | Level 3 Significant Unobservable Inputs | |||||||||||||||
Assets | Preferred Stocks | |||||||||||||||||
Brazil | $ | 5,253,841 | $ | 5,253,077 | $ | 764 | $ | — | ||||||||||
Colombia | 739,910 | 739,910 | — | — | ||||||||||||||
|
|
|
|
|
|
|
| |||||||||||
| 5,993,751 | 5,992,987 | 764 | — | |||||||||||||||
Common Stocks | ||||||||||||||||||
Belgium | 86,640 | — | 86,640 | — | ||||||||||||||
Bermuda | 782,560 | 490,370 | 292,190 | — | ||||||||||||||
Brazil | 4,688,276 | 4,198,676 | 489,600 | — | ||||||||||||||
Cayman | 7,758,369 | 3,764,535 | 3,993,834 | — | ||||||||||||||
Chile | 328,144 | 328,144 | — | — | ||||||||||||||
China | 1,073,826 | — | 1,073,826 | — | ||||||||||||||
Colombia | 1,165,945 | 612,164 | 553,781 | — | ||||||||||||||
Denmark | 1,786,212 | — | 1,786,212 | — | ||||||||||||||
Egypt | 542,822 | — | 542,822 | — | ||||||||||||||
France | 1,073,243 | — | 1,073,243 | — | ||||||||||||||
Hong Kong | 3,475,437 | — | 3,475,437 | — | ||||||||||||||
India | 11,345,144 | 2,117,618 | 9,227,526 | — | ||||||||||||||
Indonesia | 1,389,318 | — | 1,389,318 | — | ||||||||||||||
Italy | 814,412 | — | 814,412 | — | ||||||||||||||
Kenya | 56,471 | — | 56,471 | — | ||||||||||||||
Luxembourg | 953,456 | 953,456 | — | — | ||||||||||||||
Malaysia | 332,171 | — | 332,171 | — | ||||||||||||||
Mexico | 8,668,324 | 8,668,324 | — | — | ||||||||||||||
Netherlands | 820,610 | 820,610 | — | — | ||||||||||||||
Nigeria | 399,813 | 399,813 | — | — | ||||||||||||||
Philippines | 3,016,275 | — | 3,016,275 | — | ||||||||||||||
Portugal | 317,408 | — | 317,408 | — | ||||||||||||||
Russia | 4,314,209 | 517,336 | 3,796,873 | — | ||||||||||||||
South Africa | 3,343,882 | — | 3,343,882 | — | ||||||||||||||
South Korea | 4,612,723 | — | 4,612,723 | — | ||||||||||||||
Taiwan | 3,419,939 | — | 3,419,939 | — | ||||||||||||||
Thailand | 610,282 | — | 610,282 | — | ||||||||||||||
Turkey | 3,879,407 | — | 3,879,407 | — | ||||||||||||||
United Arab Emirates | 640,266 | 640,266 | — | — | ||||||||||||||
United Kingdom | 4,950,963 | 85,852 | 4,865,111 | — | ||||||||||||||
|
|
|
|
|
|
|
| |||||||||||
| 76,646,547 | 23,597,164 | 53,049,383 | — | |||||||||||||||
Equity-Linked Structured Securities | 79,424 | — | 79,424 | — | ||||||||||||||
Short-Term Investment | 2,454,586 | 2,454,586 | — | — | ||||||||||||||
|
|
|
|
|
|
|
| |||||||||||
Total | $ | 85,174,308 | $ | 32,044,737 | $ | 53,129,571 | $ | — | ||||||||||
|
|
|
|
|
|
|
| |||||||||||
| See Notes to Financial Statements | B-63 | See explanation of symbols and terms, if any, on page B-71 |
Table of Contents
PACIFIC LIFE FUNDS
PL INTERNATIONAL LARGE-CAP FUND
Schedule of Investments
March 31, 2012
| Shares | Value | |||||||
COMMON STOCKS - 98.8% |
| |||||||
Australia - 2.6% | ||||||||
QBE Insurance Group Ltd | 205,824 | $ | 3,027,962 | |||||
Westpac Banking Corp | 102,800 | 2,332,030 | ||||||
|
| |||||||
| 5,359,992 | ||||||||
|
| |||||||
Bermuda - 1.1% | ||||||||
Li & Fung Ltd | 996,400 | 2,276,145 | ||||||
|
| |||||||
Brazil - 2.0% | ||||||||
BM&FBOVESPA SA | 284,537 | 1,744,210 | ||||||
Tim Participacoes SA ADR | 74,430 | 2,401,112 | ||||||
|
| |||||||
| 4,145,322 | ||||||||
|
| |||||||
Canada - 2.2% | ||||||||
Canadian National Railway Co | 55,709 | 4,424,966 | ||||||
|
| |||||||
Czech Republic - 0.8% | ||||||||
Komercni Banka AS | 8,550 | 1,718,586 | ||||||
|
| |||||||
France - 12.7% | ||||||||
Air Liquide SA | 33,069 | 4,409,848 | ||||||
Danone SA | 63,164 | 4,404,676 | ||||||
Dassault Systemes SA | 13,370 | 1,229,471 | ||||||
Legrand SA | 64,037 | 2,355,571 | ||||||
LVMH Moet Hennessy Louis Vuitton SA | 30,703 | 5,274,765 | ||||||
Pernod-Ricard SA | 38,166 | 3,990,086 | ||||||
Schneider Electric SA | 64,169 | 4,189,817 | ||||||
|
| |||||||
| 25,854,234 | ||||||||
|
| |||||||
Germany - 11.5% | ||||||||
Bayer AG | 50,246 | 3,537,218 | ||||||
Beiersdorf AG | 64,262 | 4,196,796 | ||||||
Deutsche Boerse AG | 27,010 | 1,818,630 | ||||||
Linde AG | 42,524 | 7,630,683 | ||||||
Merck KGaA | 17,282 | 1,912,585 | ||||||
SAP AG | 61,211 | 4,274,498 | ||||||
|
| |||||||
| 23,370,410 | ||||||||
|
| |||||||
Hong Kong - 2.3% | ||||||||
AIA Group Ltd | 518,800 | 1,899,823 | ||||||
China Unicom Ltd | 1,032,000 | 1,735,322 | ||||||
CNOOC Ltd | 537,000 | 1,097,772 | ||||||
|
| |||||||
| 4,732,917 | ||||||||
|
| |||||||
India - 2.0% | ||||||||
ICICI Bank Ltd ADR | 79,126 | 2,759,124 | ||||||
Infosys Ltd ADR | 23,622 | 1,347,163 | ||||||
|
| |||||||
| 4,106,287 | ||||||||
|
| |||||||
Japan - 13.3% | ||||||||
Canon Inc | 73,150 | 3,488,150 | ||||||
Denso Corp | 91,900 | 3,106,399 | ||||||
FANUC Corp | 15,900 | 2,857,680 | ||||||
Honda Motor Co Ltd | 69,200 | 2,660,007 | ||||||
HOYA Corp | 91,000 | 2,046,898 | ||||||
INPEX Corp | 514 | 3,490,603 | ||||||
Lawson Inc | 59,100 | 3,726,560 | ||||||
NTT DoCoMo Inc | 542 | 903,361 | ||||||
Shin-Etsu Chemical Co Ltd | 81,600 | 4,752,073 | ||||||
|
| |||||||
| 27,031,731 | ||||||||
|
| |||||||
| Shares | Value | |||||||
Netherlands - 8.8% | ||||||||
Akzo Nobel NV | 64,773 | $ | 3,821,231 | |||||
Heineken NV | 119,799 | 6,656,818 | ||||||
ING Groep NV CVA * | 430,365 | 3,588,931 | ||||||
Randstad Holding NV | 76,736 | 2,892,956 | ||||||
Wolters Kluwer NV | 54,272 | 1,027,290 | ||||||
|
| |||||||
| 17,987,226 | ||||||||
|
| |||||||
Singapore - 0.4% | ||||||||
Singapore Telecommunications Ltd | 313,380 | 785,121 | ||||||
|
| |||||||
South Africa - 0.3% | ||||||||
MTN Group Ltd | 33,019 | 579,681 | ||||||
|
| |||||||
South Korea - 1.7% | ||||||||
Samsung Electronics Co Ltd | 3,112 | 3,504,610 | ||||||
|
| |||||||
Spain - 2.8% | ||||||||
Amadeus IT Holding SA ‘A’ | 139,680 | 2,634,571 | ||||||
Banco Santander SA | 275,990 | 2,121,741 | ||||||
Red Electrica Corp SA | 20,408 | 998,192 | ||||||
|
| |||||||
| 5,754,504 | ||||||||
|
| |||||||
Sweden - 0.8% | ||||||||
Hennes & Mauritz AB ‘B’ | 44,171 | 1,597,833 | ||||||
|
| |||||||
Switzerland - 10.5% | ||||||||
Cie Financiere Richemont | 11,096 | 696,698 | ||||||
Givaudan SA | 328 | 316,475 | ||||||
Julius Baer Group Ltd | 98,205 | 3,966,463 | ||||||
Nestle SA | 105,385 | 6,632,378 | ||||||
Roche Holding AG | 22,130 | 3,852,982 | ||||||
Sonova Holding AG | 12,151 | 1,350,978 | ||||||
Swiss Re AG | 24,720 | 1,581,169 | ||||||
UBS AG (XVTX) | 215,613 | 3,023,641 | ||||||
|
| |||||||
| 21,420,784 | ||||||||
|
| |||||||
Taiwan - 3.0% | ||||||||
Hon Hai Precision Industry Co Ltd | 523,800 | 2,032,452 | ||||||
HTC Corp | 55,100 | 1,114,980 | ||||||
Taiwan Semiconductor Manufacturing Co Ltd ADR | 199,546 | 3,049,063 | ||||||
|
| |||||||
| 6,196,495 | ||||||||
|
| |||||||
United Kingdom - 19.7% | ||||||||
Barclays PLC | 372,531 | 1,413,421 | ||||||
BG Group PLC | 77,100 | 1,788,456 | ||||||
Burberry Group PLC | 24,044 | 572,347 | ||||||
Compass Group PLC | 376,552 | 3,936,854 | ||||||
Delphi Automotive PLC * | 13,460 | 425,336 | ||||||
Diageo PLC | 179,098 | 4,321,996 | ||||||
Hays PLC | 659,166 | 895,591 | ||||||
HSBC Holdings PLC (LI) | 684,040 | 6,046,811 | ||||||
Reckitt Benckiser Group PLC | 57,667 | 3,256,565 | ||||||
Rio Tinto PLC | 49,522 | 2,745,059 | ||||||
Royal Dutch Shell PLC ‘A’ (LI) | 109,721 | 3,849,669 | ||||||
Smiths Group PLC | 122,419 | 2,059,302 | ||||||
Standard Chartered PLC | 156,166 | 3,894,170 | ||||||
Tesco PLC | 128,642 | 674,548 | ||||||
WPP PLC | 309,698 | 4,218,546 | ||||||
|
| |||||||
| 40,098,671 | ||||||||
|
| |||||||
| See Notes to Financial Statements | B-64 | See explanation of symbols and terms, if any, on page B-71 |
Table of Contents
PACIFIC LIFE FUNDS
PL INTERNATIONAL LARGE-CAP FUND
Schedule of Investments (Continued)
March 31, 2012
| Shares | Value | |||||||
United States - 0.3% | ||||||||
Synthes Inc ~ | 3,465 | $ | 601,334 | |||||
|
| |||||||
Total Common Stocks | ||||||||
(Cost $164,763,243) | 201,546,849 | |||||||
|
| |||||||
| Principal Amount | ||||||||
SHORT-TERM INVESTMENTS - 0.9% |
| |||||||
Commercial Paper - 0.9% | ||||||||
HSBC USA Inc | ||||||||
0.070% due 04/02/12 | $ | 1,865,000 | 1,864,996 | |||||
|
| |||||||
| Shares | ||||||||
Money Market Fund - 0.0% |
| |||||||
BlackRock Liquidity Funds Treasury Trust Fund Portfolio | 18,144 | 18,144 | ||||||
|
| |||||||
Total Short-Term Investments | ||||||||
(Cost $1,883,140) | 1,883,140 | |||||||
|
| |||||||
TOTAL INVESTMENTS - 99.7% |
| |||||||
(Cost $166,646,383) |
| 203,429,989 | ||||||
OTHER ASSETS & LIABILITIES, |
| 513,769 | ||||||
|
| |||||||
NET ASSETS - 100.0% | $ | 203,943,758 | ||||||
|
| |||||||
Notes to Schedule of Investments
| (a) | As of March 31, 2012, the fund was diversified as a percentage of net assets as follows: |
Financials | 20.1 | % | ||
Consumer Staples | 18.6 | % | ||
Consumer Discretionary | 12.7 | % | ||
Information Technology | 12.1 | % | ||
Materials | 11.6 | % | ||
Industrial | 9.6 | % | ||
Health Care | 5.5 | % | ||
Energy | 5.0 | % | ||
Telecommunication Services | 3.1 | % | ||
Short-Term Investments | 0.9 | % | ||
Utilities | 0.5 | % | ||
|
| |||
| 99.7 | % | |||
Other Assets & Liabilities, Net | 0.3 | % | ||
|
| |||
| 100.0 | % | |||
|
|
| (b) | As of March 31, 2012, the fund was diversified by country of incorporation as a percentage of net assets as follows: |
United Kingdom | 19.7 | % | ||
Japan | 13.3 | % | ||
France | 12.7 | % | ||
Germany | 11.5 | % | ||
Switzerland | 10.5 | % | ||
Netherlands | 8.8 | % | ||
Taiwan | 3.0 | % | ||
Spain | 2.8 | % | ||
Australia | 2.6 | % | ||
Hong Kong | 2.3 | % | ||
Canada | 2.2 | % | ||
Brazil | 2.0 | % | ||
India | 2.0 | % | ||
South Korea | 1.7 | % | ||
United States (Includes Short-Term Investments) | 1.2 | % | ||
Bermuda | 1.1 | % | ||
Others (each less than 1.0%) | 2.3 | % | ||
|
| |||
| 99.7 | % | |||
Other Assets & Liabilities, Net | 0.3 | % | ||
|
| |||
| 100.0 | % | |||
|
|
| (c) | Short-term investments reflect either the stated coupon rate or the annualized effective yield on the date of purchase for discounted investments. |
| See Notes to Financial Statements | B-65 | See explanation of symbols and terms, if any, on page B-71 |
Table of Contents
PACIFIC LIFE FUNDS
PL INTERNATIONAL LARGE-CAP FUND
Schedule of Investments (Continued)
March 31, 2012
| (d) | Fair Value Measurements |
The following is a summary of the fund’s investments as categorized under the three-tier hierarchy of inputs used in valuing the fund’s assets and liabilities (See Note 3C in Notes to Financial Statements) as of March 31, 2012:
| Total Value at March 31, 2012 | Level 1 Quoted Price | Level 2 Significant Observable Inputs | Level 3 Significant Unobservable Inputs | |||||||||||||||
Assets | Common Stocks | |||||||||||||||||
Australia | $ | 5,359,992 | $ | — | $ | 5,359,992 | $ | — | ||||||||||
Bermuda | 2,276,145 | — | 2,276,145 | — | ||||||||||||||
Brazil | 4,145,322 | 4,145,322 | — | — | ||||||||||||||
Canada | 4,424,966 | 4,424,966 | — | — | ||||||||||||||
Czech Republic | 1,718,586 | — | 1,718,586 | — | ||||||||||||||
France | 25,854,234 | — | 25,854,234 | — | ||||||||||||||
Germany | 23,370,410 | — | 23,370,410 | — | ||||||||||||||
Hong Kong | 4,732,917 | — | 4,732,917 | — | ||||||||||||||
India | 4,106,287 | 4,106,287 | — | — | ||||||||||||||
Japan | 27,031,731 | — | 27,031,731 | — | ||||||||||||||
Netherlands | 17,987,226 | — | 17,987,226 | — | ||||||||||||||
Singapore | 785,121 | — | 785,121 | — | ||||||||||||||
South Africa | 579,681 | — | 579,681 | — | ||||||||||||||
South Korea | 3,504,610 | — | 3,504,610 | — | ||||||||||||||
Spain | 5,754,504 | — | 5,754,504 | — | ||||||||||||||
Sweden | 1,597,833 | — | 1,597,833 | — | ||||||||||||||
Switzerland | 21,420,784 | — | 21,420,784 | — | ||||||||||||||
Taiwan | 6,196,495 | 3,049,063 | 3,147,432 | — | ||||||||||||||
United Kingdom | 40,098,671 | 425,336 | 39,673,335 | — | ||||||||||||||
United States | 601,334 | — | 601,334 | — | ||||||||||||||
|
|
|
|
|
|
|
| |||||||||||
| 201,546,849 | 16,150,974 | 185,395,875 | — | |||||||||||||||
Short-Term Investments | 1,883,140 | 18,144 | 1,864,996 | — | ||||||||||||||
|
|
|
|
|
|
|
| |||||||||||
Total | $ | 203,429,989 | $ | 16,169,118 | $ | 187,260,871 | $ | — | ||||||||||
|
|
|
|
|
|
|
| |||||||||||
| See Notes to Financial Statements | B-66 | See explanation of symbols and terms, if any, on page B- 71 |
Table of Contents
PACIFIC LIFE FUNDS
PL INTERNATIONAL VALUE FUND
Schedule of Investments
March 31, 2012
| Shares | Value | |||||||
PREFERRED STOCKS - 1.0% |
| |||||||
Germany - 1.0% | ||||||||
Volkswagen AG | 6,409 | $ | 1,128,115 | |||||
|
| |||||||
Total Preferred Stocks | ||||||||
(Cost $1,028,320) |
| 1,128,115 | ||||||
|
| |||||||
COMMON STOCKS - 96.6% |
| |||||||
Australia - 2.2% | ||||||||
Australia & New Zealand Banking Group Ltd | 100,280 | 2,417,097 | ||||||
|
| |||||||
Belgium - 1.1% | ||||||||
Solvay SA | 10,635 | 1,258,155 | ||||||
|
| |||||||
Canada - 0.7% | ||||||||
First Quantum Minerals Ltd | 38,895 | 741,674 | ||||||
|
| |||||||
China - 1.1% | ||||||||
China Construction Bank | 1,538,000 | 1,187,600 | ||||||
|
| |||||||
Finland - 1.4% | ||||||||
UPM-Kymmene OYJ | 111,303 | 1,514,729 | ||||||
|
| |||||||
France - 9.3% | ||||||||
BNP Paribas | 32,094 | 1,524,491 | ||||||
Cie de Saint-Gobain | 25,124 | 1,122,779 | ||||||
GDF Suez | 59,841 | 1,544,880 | ||||||
Sanofi | 25,217 | 1,955,028 | ||||||
Schneider Electric SA | 29,568 | 1,930,597 | ||||||
Sodexo | 18,709 | 1,535,779 | ||||||
Suez Environnement Co | 48,478 | 743,807 | ||||||
|
| |||||||
| 10,357,361 | ||||||||
|
| |||||||
Germany - 9.4% | ||||||||
Allianz SE | 19,675 | 2,351,339 | ||||||
BASF SE | 14,111 | 1,235,639 | ||||||
Bayer AG | 31,895 | 2,245,344 | ||||||
Bayerische Motoren Werke AG | 10,857 | 976,273 | ||||||
Deutsche Bank AG | 26,959 | 1,341,157 | ||||||
Deutsche Boerse AG | 8,104 | 545,656 | ||||||
E.ON AG | 74,795 | 1,791,490 | ||||||
|
| |||||||
| 10,486,898 | ||||||||
|
| |||||||
Hong Kong - 2.4% | ||||||||
CNOOC Ltd | 496,000 | 1,013,957 | ||||||
Hutchison Whampoa Ltd | 171,000 | 1,707,250 | ||||||
|
| |||||||
| 2,721,207 | ||||||||
|
| |||||||
Israel - 0.9% | ||||||||
Teva Pharmaceutical Industries Ltd ADR | 21,344 | 961,761 | ||||||
|
| |||||||
Italy - 4.6% | ||||||||
ENI SPA | 113,143 | 2,651,051 | ||||||
Snam Rete Gas SPA | 321,353 | 1,544,932 | ||||||
UniCredit SPA | 178,962 | 897,100 | ||||||
|
| |||||||
| 5,093,083 | ||||||||
|
| |||||||
| Shares | Value | |||||||
Japan - 21.2% | ||||||||
Asahi Group Holdings Ltd | 32,000 | $ | 711,875 | |||||
Bridgestone Corp | 40,300 | 985,852 | ||||||
Canon Inc | 31,000 | 1,478,232 | ||||||
East Japan Railway Co | 12,700 | 802,844 | ||||||
Fujitsu Ltd | 281,000 | 1,484,282 | ||||||
Hitachi Ltd | 221,000 | 1,428,667 | ||||||
Honda Motor Co Ltd | 53,800 | 2,068,040 | ||||||
Japan Tobacco Inc | 335 | 1,898,893 | ||||||
JX Holdings Inc | 163,260 | 1,021,308 | ||||||
KDDI Corp | 177 | 1,151,712 | ||||||
Marubeni Corp | 141,000 | 1,021,984 | ||||||
Mitsubishi Electric Corp | 92,000 | 818,174 | ||||||
Mitsui & Co Ltd | 39,100 | 643,538 | ||||||
Nippon Telegraph & Telephone Corp | 26,400 | 1,201,297 | ||||||
Nissan Motor Co Ltd | 179,700 | 1,926,027 | ||||||
Sumitomo Corp | 140,600 | 2,052,463 | ||||||
Sumitomo Mitsui Financial Group Inc | 85,100 | 2,825,614 | ||||||
|
| |||||||
| 23,520,802 | ||||||||
|
| |||||||
Luxembourg - 0.8% | ||||||||
ArcelorMittal | 50,101 | 958,511 | ||||||
|
| |||||||
Netherlands - 3.3% | ||||||||
European Aeronautic Defence & Space Co NV | 39,694 | 1,624,749 | ||||||
ING Groep NV CVA * | 105,238 | 877,608 | ||||||
Koninklijke KPN NV | 23,821 | 261,905 | ||||||
Unilever NV CVA | 26,045 | 886,254 | ||||||
|
| |||||||
| 3,650,516 | ||||||||
|
| |||||||
New Zealand - 0.8% | ||||||||
Telecom Corp of New Zealand Ltd | 468,937 | 931,195 | ||||||
|
| |||||||
South Africa - 0.5% | ||||||||
African Bank Investments Ltd | 114,100 | 591,564 | ||||||
|
| |||||||
South Korea - 2.1% | ||||||||
KT Corp ADR * | 46,360 | 634,668 | ||||||
Samsung Electronics Co Ltd | 1,509 | 1,699,376 | ||||||
|
| |||||||
| 2,334,044 | ||||||||
|
| |||||||
Spain - 1.8% | ||||||||
Banco Bilbao Vizcaya Argentaria SA | 119,794 | 952,366 | ||||||
Repsol YPF SA | 40,625 | 1,020,608 | ||||||
|
| |||||||
| 1,972,974 | ||||||||
|
| |||||||
Sweden - 3.4% | ||||||||
Nordea Bank AB | 181,776 | 1,653,504 | ||||||
Swedbank AB ‘A’ | 37,050 | 576,794 | ||||||
Telefonaktiebolaget LM Ericsson ‘B’ | 147,380 | 1,524,377 | ||||||
|
| |||||||
| 3,754,675 | ||||||||
|
| |||||||
Switzerland - 4.3% | ||||||||
Credit Suisse Group AG * | 38,749 | 1,103,958 | ||||||
Holcim Ltd * | 6,003 | 391,907 | ||||||
Roche Holding AG | 9,741 | 1,695,974 | ||||||
Swiss Re AG * | 24,855 | 1,589,804 | ||||||
|
| |||||||
| 4,781,643 | ||||||||
|
| |||||||
Taiwan - 0.7% | ||||||||
Hon Hai Precision Industry Co Ltd GDR ~ | 116,898 | 771,527 | ||||||
|
| |||||||
| See Notes to Financial Statements | B-67 | See explanation of symbols and terms, if any, on page B-71 |
Table of Contents
PACIFIC LIFE FUNDS
PL INTERNATIONAL VALUE FUND
Schedule of Investments (Continued)
March 31, 2012
| Shares | Value | |||||||
United Kingdom - 24.6% | ||||||||
Barclays PLC | 530,771 | $ | 2,013,800 | |||||
BP PLC | 304,530 | 2,262,962 | ||||||
British American Tobacco PLC | 38,807 | 1,968,126 | ||||||
Centrica PLC | 319,983 | 1,627,006 | ||||||
Experian PLC | 49,832 | 777,832 | ||||||
GlaxoSmithKline PLC | 85,031 | 1,904,046 | ||||||
HSBC Holdings PLC | 329,291 | 2,910,883 | ||||||
InterContinental Hotels Group PLC | 55,573 | 1,284,044 | ||||||
Kingfisher PLC | 273,696 | 1,342,018 | ||||||
Petropavlovsk PLC | 27,571 | 248,959 | ||||||
Prudential PLC | 201,725 | 2,422,561 | ||||||
Royal Dutch Shell PLC ‘A’ | 102,821 | 3,607,576 | ||||||
SABMiller PLC | 22,149 | 891,021 | ||||||
Vodafone Group PLC | 1,464,058 | 4,048,760 | ||||||
|
| |||||||
| 27,309,594 | ||||||||
|
| |||||||
Total Common Stocks | ||||||||
(Cost $100,181,837) | 107,316,610 | |||||||
|
| |||||||
SHORT-TERM INVESTMENT - 1.3% |
| |||||||
Money Market Fund - 1.3% |
| |||||||
BlackRock Liquidity Funds Treasury | ||||||||
Trust Fund Portfolio | 1,492,045 | 1,492,045 | ||||||
|
| |||||||
Total Short-Term Investment | ||||||||
(Cost $1,492,045) | 1,492,045 | |||||||
|
| |||||||
TOTAL INVESTMENTS - 98.9% |
| |||||||
(Cost $102,702,202) |
| 109,936,770 | ||||||
OTHER ASSETS & LIABILITIES, |
| 1,181,734 | ||||||
|
| |||||||
NET ASSETS - 100.0% | $ | 111,118,504 | ||||||
|
| |||||||
Notes to Schedule of Investments
| (a) | As of March 31, 2012, the fund was diversified as a percentage of net assets as follows: |
Financials | 25.1 | % | ||
Industrials | 11.2 | % | ||
Energy | 10.4 | % | ||
Consumer Discretionary | 10.2 | % | ||
Health Care | 7.8 | % | ||
Information Technology | 7.5 | % | ||
Telecommunication Services | 7.3 | % | ||
Utilities | 6.6 | % | ||
Consumer Staples | 5.8 | % | ||
Materials | 5.7 | % | ||
Short-Term Investment | 1.3 | % | ||
|
| |||
| 98.9 | % | |||
Other Assets & Liabilities, Net | 1.1 | % | ||
|
| |||
| 100.0 | % | |||
|
|
| (b) | As of March 31, 2012, the fund was diversified by country of incorporation as a percentage of net assets as follows: |
United Kingdom | 24.6 | % | ||
Japan | 21.2 | % | ||
Germany | 10.4 | % | ||
France | 9.3 | % | ||
Italy | 4.6 | % | ||
Switzerland | 4.3 | % | ||
Sweden | 3.4 | % | ||
Netherlands | 3.3 | % | ||
Hong Kong | 2.4 | % | ||
Australia | 2.2 | % | ||
South Korea | 2.1 | % | ||
Spain | 1.8 | % | ||
Finland | 1.4 | % | ||
United States (Includes Short-Term Investment) | 1.3 | % | ||
Belgium | 1.1 | % | ||
China | 1.1 | % | ||
Others (each less than 1.0%) | 4.4 | % | ||
|
| |||
| 98.9 | % | |||
Other Assets & Liabilities, Net | 1.1 | % | ||
|
| |||
| 100.0 | % | |||
|
|
| (c) | Open futures contracts outstanding as of March 31, 2012 were as follows: |
Long Futures Outstanding | Number of Contracts | Notional Amount | Unrealized Appreciation | |||||||
EURO STOXX 50 (06/12) | 17 | EUR | 406,730 | $ | 3,705 | |||||
FTSE 100 Index (06/12) | 5 | GBP | 285,885 | 934 | ||||||
|
| |||||||||
Total Future Contracts | $ | 4,639 | ||||||||
|
| |||||||||
| See Notes to Financial Statements | B-68 | See explanation of symbols and terms, if any, on page B- 71 |
Table of Contents
PACIFIC LIFE FUNDS
PL INTERNATIONAL VALUE FUND
Schedule of Investments (Continued)
March 31, 2012
| (d) | Forward foreign currency contracts as of March 31, 2012 were as follows: |
Contracts to Buy or to Sell | Currency | Principal Amount Covered by Contracts | Expiration | Counterparty | Unrealized Appreciation (Depreciation) | |||||||||
Buy | AUD | 6,785,073 | 05/12 | WPC | ($ | 165,549 | ) | |||||||
Buy | CAD | 200,721 | 05/12 | BRC | (1,323 | ) | ||||||||
Sell | CAD | 782,224 | 05/12 | WPC | (2,110 | ) | ||||||||
Buy | CHF | 352,956 | 05/12 | RBC | 5,297 | |||||||||
Buy | CHF | 4,040,240 | 05/12 | WPC | 50,637 | |||||||||
Buy | EUR | 315,782 | 05/12 | BRC | 4,308 | |||||||||
Buy | EUR | 166,327 | 05/12 | BRC | (923 | ) | ||||||||
Buy | EUR | 252,074 | 05/12 | CIT | 2,176 | |||||||||
Buy | EUR | 649,956 | 05/12 | CSF | 8,418 | |||||||||
Buy | EUR | 324,663 | 05/12 | HSB | 1,912 | |||||||||
Buy | EUR | 241,277 | 05/12 | MSC | 3,413 | |||||||||
Buy | EUR | 540,496 | 05/12 | RBS | 12,604 | |||||||||
Buy | EUR | 253,158 | 05/12 | UBS | 443 | |||||||||
Sell | EUR | 2,445,440 | 05/12 | BRC | (59,940 | ) | ||||||||
Sell | EUR | 171,642 | 05/12 | CIT | (2,081 | ) | ||||||||
Sell | EUR | 216,987 | 05/12 | CSF | (6,564 | ) | ||||||||
Sell | EUR | 76,709 | 05/12 | HSB | 955 | |||||||||
Sell | EUR | 567,518 | 05/12 | MSC | (23,599 | ) | ||||||||
Sell | EUR | 554,232 | 05/12 | RBC | (8,742 | ) | ||||||||
Sell | EUR | 2,347,205 | 05/12 | SSB | (31,863 | ) | ||||||||
Sell | EUR | 285,418 | 05/12 | WPC | 2,746 | |||||||||
Sell | EUR | 333,242 | 05/12 | WPC | (7,412 | ) | ||||||||
Buy | GBP | 713,652 | 05/12 | BRC | 30,628 | |||||||||
Buy | GBP | 143,098 | 05/12 | CIT | 1,946 | |||||||||
Buy | GBP | 189,907 | 05/12 | CSF | 5,405 | |||||||||
Buy | GBP | 107,012 | 05/12 | RBC | 2,434 | |||||||||
Buy | GBP | 148,206 | 05/12 | RBS | 4,080 | |||||||||
Buy | GBP | 277,638 | 05/12 | WPC | 6,854 | |||||||||
Sell | GBP | 579,821 | 05/12 | BRC | (13,273 | ) | ||||||||
Sell | GBP | 281,889 | 05/12 | CSF | (3,420 | ) | ||||||||
Sell | GBP | 148,201 | 05/12 | HSB | (4,029 | ) | ||||||||
Sell | GBP | 543,516 | 05/12 | RBC | (7,562 | ) | ||||||||
Sell | GBP | 3,263,157 | 05/12 | SSB | (78,340 | ) | ||||||||
Sell | GBP | 457,632 | 05/12 | WPC | (8,918 | ) | ||||||||
Buy | HKD | 10,241,005 | 05/12 | MSC | (1,856 | ) | ||||||||
Buy | HKD | 2,428,325 | 05/12 | RBC | (36 | ) | ||||||||
Buy | JPY | 27,713,665 | 05/12 | RBC | 363 | |||||||||
Buy | JPY | 16,310,615 | 05/12 | RBC | (17,061 | ) | ||||||||
Buy | JPY | 25,858,925 | 05/12 | SSB | (15,461 | ) | ||||||||
Buy | JPY | 28,745,763 | 05/12 | WPC | (27,572 | ) | ||||||||
Sell | JPY | 38,402,912 | 05/12 | CIT | 41,501 | |||||||||
Sell | JPY | 50,027,662 | 05/12 | CIT | (646 | ) | ||||||||
Sell | JPY | 18,111,596 | 05/12 | CSF | 4,066 | |||||||||
Sell | JPY | 39,956,386 | 05/12 | HSB | 13,440 | |||||||||
Sell | JPY | 18,906,329 | 05/12 | RBS | (4,070 | ) | ||||||||
Sell | JPY | 73,366,318 | 05/12 | SSB | 76,499 | |||||||||
Sell | JPY | 28,078,080 | 05/12 | UBS | (2,096 | ) | ||||||||
Buy | NOK | 1,674,043 | 05/12 | CSF | 10,632 | |||||||||
Buy | NOK | 2,098,749 | 05/12 | MSC | 7,879 | |||||||||
Buy | NOK | 2,006,944 | 05/12 | RBC | 7,204 | |||||||||
Sell | NZD | 635,276 | 05/12 | CIT | 3,818 | |||||||||
Sell | NZD | 195,560 | 05/12 | WPC | 2,202 | |||||||||
Buy | SEK | 2,680,848 | 05/12 | MSC | 8,625 | |||||||||
Sell | SEK | 717,001 | �� | 05/12 | BRC | (2,324 | ) | |||||||
Sell | SEK | 2,151,392 | 05/12 | MSC | (6,234 | ) | ||||||||
Sell | SEK | 1,475,000 | 05/12 | WPC | 1,180 | |||||||||
Buy | SGD | 2,174,389 | 05/12 | HSB | (8,170 | ) | ||||||||
|
| |||||||||||||
| Total Forward Foreign Currency Contracts | ($ | 189,509 | ) | |||||||||||
|
| |||||||||||||
| See Notes to Financial Statements | B-69 | See explanation of symbols and terms, if any, on page B-71 |
Table of Contents
PACIFIC LIFE FUNDS
PL INTERNATIONAL VALUE FUND
Schedule of Investments (Continued)
March 31, 2012
| (e) | Fair Value Measurements |
The following is a summary of the fund’s investments as categorized under the three-tier hierarchy of inputs used in valuing the fund’s assets and liabilities (See Note 3C in Notes to Financial Statements) as of March 31, 2012:
| Total Value at March 31, 2012 | Level 1 Quoted Price | Level 2 Significant Observable Inputs | Level 3 Significant Unobservable Inputs | |||||||||||||||
Assets | Preferred Stocks (1) | $ | 1,128,115 | $ | — | $ | 1,128,115 | $ | — | |||||||||
Common Stocks | ||||||||||||||||||
Australia | 2,417,097 | — | 2,417,097 | — | ||||||||||||||
Belgium | 1,258,155 | — | 1,258,155 | — | ||||||||||||||
Canada | 741,674 | 741,674 | — | — | ||||||||||||||
China | 1,187,600 | — | 1,187,600 | — | ||||||||||||||
Finland | 1,514,729 | — | 1,514,729 | — | ||||||||||||||
France | 10,357,361 | — | 10,357,361 | — | ||||||||||||||
Germany | 10,486,898 | — | 10,486,898 | — | ||||||||||||||
Hong Kong | 2,721,207 | — | 2,721,207 | — | ||||||||||||||
Israel | 961,761 | 961,761 | — | — | ||||||||||||||
Italy | 5,093,083 | — | 5,093,083 | — | ||||||||||||||
Japan | 23,520,802 | — | 23,520,802 | — | ||||||||||||||
Luxembourg | 958,511 | — | 958,511 | — | ||||||||||||||
Netherlands | 3,650,516 | — | 3,650,516 | — | ||||||||||||||
New Zealand | 931,195 | — | 931,195 | |||||||||||||||
South Africa | 591,564 | — | 591,564 | — | ||||||||||||||
South Korea | 2,334,044 | 634,668 | 1,699,376 | — | ||||||||||||||
Spain | 1,972,974 | — | 1,972,974 | — | ||||||||||||||
Sweden | 3,754,675 | — | 3,754,675 | — | ||||||||||||||
Switzerland | 4,781,643 | — | 4,781,643 | — | ||||||||||||||
Taiwan | 771,527 | — | 771,527 | — | ||||||||||||||
United Kingdom | 27,309,594 | — | 27,309,594 | — | ||||||||||||||
|
|
|
|
|
|
|
| |||||||||||
| 107,316,610 | 2,338,103 | 104,978,507 | — | |||||||||||||||
Short-Term Investment | 1,492,045 | 1,492,045 | — | — | ||||||||||||||
Derivatives: | ||||||||||||||||||
Equity Contracts | ||||||||||||||||||
Futures | 4,639 | 4,639 | — | — | ||||||||||||||
Foreign Currency Contracts | ||||||||||||||||||
Forward Foreign Currency Contracts | 321,665 | — | 321,665 | — | ||||||||||||||
|
|
|
|
|
|
|
| |||||||||||
Total Assets-Derivatives | 326,304 | 4,639 | 321,665 | — | ||||||||||||||
|
|
|
|
|
|
|
| |||||||||||
Total Assets | 110,263,074 | 3,834,787 | 106,428,287 | — | ||||||||||||||
|
|
|
|
|
|
|
| |||||||||||
Liabilities | Derivatives: | |||||||||||||||||
Foreign Currency Contracts | ||||||||||||||||||
Forward Foreign Currency Contracts | (511,174 | ) | — | (511,174 | ) | — | ||||||||||||
|
|
|
|
|
|
|
| |||||||||||
Total Liabilities | (511,174 | ) | — | (511,174 | ) | — | ||||||||||||
|
|
|
|
|
|
|
| |||||||||||
Total | $ | 109,751,900 | $ | 3,834,787 | $ | 105,917,113 | $ | — | ||||||||||
|
|
|
|
|
|
|
| |||||||||||
| (1) | For equity investments categorized in a single level, refer to the schedule of investments for further geographical region breakout. |
| See Notes to Financial Statements | B-70 | See explanation of symbols and terms, if any, on page B-71 |
Table of Contents
PACIFIC LIFE FUNDS
Schedule of Investments (Continued)
Explanation of Symbols and Terms
March 31, 2012
| Explanation of Symbols: |
* Non-income producing investments. |
“ Pass-through securities backed by a pool of mortgages or other loans on which principal payments are periodically made. Therefore, the effective maturity is shorter than the stated maturity. |
^ Investments with their principal amount adjusted for inflation. |
§ Variable rate investments. The rate shown is based on the latest available information as of March 31, 2012. For Senior Loan Notes, the rate shown may represent a weighted average interest rate. |
W Investments were in default as of March 31, 2012. |
± The security is a perpetual bond and has no definite maturity date. |
¥ Unsettled position. Contract rates do not take effect until settlement date. |
~ Securities are not registered under the Securities Act of 1933 (1933 Act). These securities are either (1) exempt from registration pursuant to Rule 144A under the 1933 Act and may only be sold to “qualified institutional buyers”, or (2) the securities comply with Regulation S rules governing offers and sales made outside the United States without registration under the 1933 Act and contain certain restrictions as to public resale. |
¯ Restricted Securities. These securities are not registered and may not be sold to the public. There are legal and/or contractual restrictions on resale. The Trust does not have the right to demand that such securities be registered. The values of these securities are determined by valuations provided by pricing services, brokers, dealers, market makers, or in good faith under the procedures established by the Trust’s Board of Trustees (the “Board”). |
‡ Investments were fully or partially segregated with the broker(s)/custodian as collateral for securities sold short, futures contracts, written option contracts, swap contracts and/or reverse repurchase agreements, if any, as of March 31, 2012. |
+ The values of these investments were determined by a Trustee Valuation Committee or determined by a Board approved valuation committee, and then subsequently approved by the Board. Each determination was made in good faith in accordance with the procedures established by the Board and the provisions of the Investment Company Act of 1940 (See Note 3B in Notes to Financial Statements). |
D Illiquid Investments. Investments were reported as illiquid by the portfolio manager pursuant to the Trust’s policy and procedures (See Note 4 in Notes to Financial Statements). |
Counterparty Abbreviations:
| BOA | Bank of America | |
| BNS | Bank of Nova Scotia | |
| BRC | Barclays | |
| CIT | Citigroup | |
| CME | Chicago Mercantile Exchange | |
| CSF | Credit Suisse | |
| DUB | Deutsche Bank | |
| GSC | Goldman Sachs | |
| HSB | HSBC | |
| JPM | JPMorgan Chase | |
| MSC | Morgan Stanley | |
| RBC | Royal Bank of Canada | |
| RBS | Royal Bank of Scotland | |
SSB | State Street Bank | |
UBS | UBS | |
WPC | Westpac Banking Group | |
| Currency Abbreviations: | ||
| AUD | Australian Dollar | |
| BRL | Brazilian Real | |
| CAD | Canadian Dollar | |
| CHF | Swiss Franc | |
| CNY | Chinese Renminbi | |
| DKK | Danish Krone | |
| EUR | Euro | |
| GBP | British Pound | |
| HKD | Hong Kong Dollar | |
| IDR | Indonesian Rupiah | |
| INR | Indian Rupee | |
| JPY | Japanese Yen | |
| KRW | Korean Won | |
| MXN | Mexican Peso | |
| MYR | Malaysian Ringgit | |
| NOK | Norwegian Krone | |
| NZD | New Zealand Dollar | |
| PHP | Philippine Peso | |
| SEK | Swedish Krona | |
| SGD | Singapore Dollar | |
| USD | United States Dollar | |
| Other Abbreviations: | ||
| ADR | American Depositary Receipt | |
| CDO | Collateralized Debt Obligation | |
| CLO | Collateralized Loan Obligation | |
| CPI | Consumer Price Index | |
| CVA | Certificaten Van Aandelen (Dutch Certificate) | |
| FDR | Fiduciary Depositary Receipt | |
| GDR | Global Depositary Receipt | |
| LIBOR | London Interbank Offered Rate | |
| ‘NY’ | New York Shares | |
| OTC | Over the Counter | |
| REIT | Real Estate Investment Trust | |
| SDR | Swedish Depository Receipt | |
Notes:
The countries listed in the Schedules of Investments are based on country of incorporation.
The descriptions and Standard & Poor’s quality ratings of the companies, if any, and credit spreads, if any, shown in the Schedules of Investments were obtained from published reports or other sources believed to be reliable, and are not audited by the Independent Registered Public Accounting Firm.
| See Notes to Financial Statements | B-71 |
Table of Contents
PACIFIC LIFE FUNDS
STATEMENTS OF ASSETS AND LIABILITIES
MARCH 31, 2012
| PL Floating Rate Loan Fund | PL High Income Fund | PL Inflation Managed Fund | PL Managed Bond Fund | PL Short Duration Bond Fund | PL Short Duration Income Fund | |||||||||||||||||||
ASSETS | ||||||||||||||||||||||||
Investments and repurchase agreements, at cost | $ | 116,746,548 | $ | 7,138,470 | $ | 325,420,801 | $ | 625,069,273 | $ | 153,260,333 | $ | 12,723,835 | ||||||||||||
|
|
|
|
|
|
|
|
|
|
|
| |||||||||||||
Investments, at value | $ | 117,620,933 | $ | 7,409,652 | $ | 330,463,249 | $ | 624,472,670 | $ | 154,049,160 | $ | 12,858,375 | ||||||||||||
Repurchase agreements, at value | — | — | 3,700,000 | 7,500,000 | — | — | ||||||||||||||||||
Cash (1) | — | — | 4,000 | 3,000 | — | — | ||||||||||||||||||
Foreign currency held, at value (2) | — | — | 164,380 | 635,914 | — | — | ||||||||||||||||||
Receivables: | ||||||||||||||||||||||||
Dividends and interest | 294,847 | 135,300 | 1,304,908 | 2,928,082 | 843,491 | 78,611 | ||||||||||||||||||
Fund shares sold | 944,612 | — | 2,680,639 | 4,406,036 | 1,188,073 | — | ||||||||||||||||||
Securities sold | 34,364 | 306,671 | 1,854,972 | 107,486,329 | 55,707 | 42,535 | ||||||||||||||||||
Swap agreements | — | — | — | 1,556 | — | — | ||||||||||||||||||
Variation margin | — | — | — | 211,551 | — | — | ||||||||||||||||||
Securities sold short | — | — | — | 2,127,813 | — | — | ||||||||||||||||||
Due from adviser | 16,299 | 14,069 | 22,207 | 27,571 | 21,426 | 13,172 | ||||||||||||||||||
Forward foreign currency contracts appreciation | — | — | 702,165 | 432,714 | 13,067 | — | ||||||||||||||||||
Prepaid expenses and other assets | 2,128 | 110 | 5,494 | 9,081 | 2,913 | 220 | ||||||||||||||||||
Swap contracts, at value | — | — | 536,838 | 2,041,289 | — | — | ||||||||||||||||||
|
|
|
|
|
|
|
|
|
|
|
| |||||||||||||
Total Assets | 118,913,183 | 7,865,802 | 341,438,852 | 752,283,606 | 156,173,837 | 12,992,913 | ||||||||||||||||||
|
|
|
|
|
|
|
|
|
|
|
| |||||||||||||
LIABILITIES | ||||||||||||||||||||||||
Payables: | ||||||||||||||||||||||||
Securities purchased | 6,706,777 | 299,500 | 51,297,545 | 258,837,622 | 667,192 | 697,329 | ||||||||||||||||||
Swap agreements | — | — | — | 4,469 | — | — | ||||||||||||||||||
Securities sold short, at value (proceeds $2,127,813) | — | — | — | 2,127,813 | — | — | ||||||||||||||||||
Variation margin | — | — | 28,035 | — | — | — | ||||||||||||||||||
Due to brokers (3) | — | — | 620,000 | 1,560,000 | — | — | ||||||||||||||||||
Accrued advisory fees | 59,438 | 3,824 | 94,317 | 159,181 | 51,174 | 4,140 | ||||||||||||||||||
Accrued administration fees | 13,716 | 956 | 35,369 | 59,693 | 19,190 | 1,553 | ||||||||||||||||||
Accrued support service expenses | 3,239 | 170 | 8,352 | 13,807 | 4,432 | 341 | ||||||||||||||||||
Accrued custodian fees and expenses | 13,902 | 4,598 | 28,617 | 52,068 | 9,355 | 4,704 | ||||||||||||||||||
Accrued transfer agency out-of-pocket expenses | 4,859 | — | 12,532 | 20,716 | 6,649 | — | ||||||||||||||||||
Accrued legal, audit and tax service fees | 13,021 | 685 | 33,580 | 55,510 | 17,818 | 1,371 | ||||||||||||||||||
Accrued trustees’ fees and expenses and deferred compensation | 98 | 7 | 1,350 | 6,936 | 403 | 15 | ||||||||||||||||||
Accrued offering expenses | — | 30,972 | — | — | — | 30,972 | ||||||||||||||||||
Accrued other | 10,097 | 1,707 | 19,591 | 35,252 | 13,878 | 1,264 | ||||||||||||||||||
Forward foreign currency contracts depreciation | — | — | 866,662 | 1,772,696 | 15,898 | — | ||||||||||||||||||
Outstanding options written, at value (premiums received $419,828 and $1,383,751) | — | — | 404,027 | 456,446 | — | — | ||||||||||||||||||
Swap contracts, at value | — | — | 32,747 | 906,624 | — | — | ||||||||||||||||||
|
|
|
|
|
|
|
|
|
|
|
| |||||||||||||
Total Liabilities | 6,825,147 | 342,419 | 53,482,724 | 266,068,833 | 805,989 | 741,689 | ||||||||||||||||||
|
|
|
|
|
|
|
|
|
|
|
| |||||||||||||
NET ASSETS | $ | 112,088,036 | $ | 7,523,383 | $ | 287,956,128 | $ | 486,214,773 | $ | 155,367,848 | $ | 12,251,224 | ||||||||||||
|
|
|
|
|
|
|
|
|
|
|
| |||||||||||||
NET ASSETS CONSIST OF: | ||||||||||||||||||||||||
Paid-in capital | $ | 110,034,989 | $ | 7,111,399 | $ | 276,812,839 | $ | 477,416,926 | $ | 154,259,352 | $ | 12,052,636 | ||||||||||||
Undistributed net investment income | 1,198,339 | 29,213 | 849,845 | 6,200,177 | 483,512 | 7,918 | ||||||||||||||||||
Undistributed/accumulated net realized gain (loss) | (19,677 | ) | 111,589 | 1,519,240 | (3,840,256 | ) | (161,012 | ) | 56,130 | |||||||||||||||
Net unrealized appreciation on investments and assets and liabilities in foreign currencies | 874,385 | 271,182 | 8,774,204 | 6,437,926 | 785,996 | 134,540 | ||||||||||||||||||
|
|
|
|
|
|
|
|
|
|
|
| |||||||||||||
NET ASSETS | $ | 112,088,036 | $ | 7,523,383 | $ | 287,956,128 | $ | 486,214,773 | $ | 155,367,848 | $ | 12,251,224 | ||||||||||||
|
|
|
|
|
|
|
|
|
|
|
| |||||||||||||
Class I Shares: | ||||||||||||||||||||||||
Shares of beneficial interest outstanding | 711,256 | 1,208,179 | ||||||||||||||||||||||
|
|
|
| |||||||||||||||||||||
Net Asset Value per share | $ | 10.58 | $ | 10.14 | ||||||||||||||||||||
|
|
|
| |||||||||||||||||||||
Class P Shares: | ||||||||||||||||||||||||
Shares of beneficial interest outstanding | 11,099,697 | 26,682,305 | 44,758,849 | 15,429,941 | ||||||||||||||||||||
|
|
|
|
|
|
|
| |||||||||||||||||
Net Asset Value per share | $ | 10.10 | $ | 10.79 | $ | 10.86 | $ | 10.07 | ||||||||||||||||
|
|
|
|
|
|
|
| |||||||||||||||||
| (1) | Includes cash collateral segregated for open swap contracts in the PL Inflation Managed and PL Managed Bond Funds of $4,000 and $3,000, respectively. |
| (2) | The cost of foreign currency for the PL Inflation Managed and PL Managed Bond Funds were $162,642 and $632,329, respectively. |
| (3) | The PL Inflation Managed and PL Managed Bond Funds received cash collateral to mitigate risk of loss to certain counterparties, which will be repaid based on master netting arrangements between the Funds and the counterparty. The Funds invest such cash collateral in investment securities. (See Note 5 in Notes to Financial Statements). |
See Notes to Financial Statements
| C-1 |
Table of Contents
PACIFIC LIFE FUNDS
STATEMENTS OF ASSETS AND LIABILITIES (Continued)
MARCH 31, 2012
| PL Strategic Income Fund | PL Comstock Fund | PL Growth LT Fund | PL Large-Cap Growth Fund | PL Large-Cap Value Fund | PL Main Street Core Fund | |||||||||||||||||||
ASSETS | ||||||||||||||||||||||||
Investments, at cost | $ | 17,267,996 | $ | 173,439,983 | $ | 83,427,508 | $ | 92,372,777 | $ | 202,888,244 | $ | 143,601,599 | ||||||||||||
|
|
|
|
|
|
|
|
|
|
|
| |||||||||||||
Investments, at value | $ | 17,614,005 | $ | 207,095,183 | $ | 108,618,348 | $ | 128,748,306 | $ | 262,216,168 | $ | 190,227,941 | ||||||||||||
Receivables: | ||||||||||||||||||||||||
Dividends and interest | 220,985 | 379,192 | 107,336 | 50,590 | 697,174 | 138,604 | ||||||||||||||||||
Fund shares sold | — | 152,219 | — | — | 237,373 | — | ||||||||||||||||||
Securities sold | 2,134,951 | �� | 713,768 | 26,503 | 548,254 | — | 4,576,661 | |||||||||||||||||
Due from adviser | 14,939 | 9,371 | 31,279 | 11,064 | 12,387 | 16,146 | ||||||||||||||||||
Forward foreign currency contracts appreciation | — | — | 25,242 | — | — | — | ||||||||||||||||||
Prepaid expenses and other assets | 330 | 4,034 | 2,029 | 2,354 | 5,160 | 3,698 | ||||||||||||||||||
|
|
|
|
|
|
|
|
|
|
|
| |||||||||||||
Total Assets | 19,985,210 | 208,353,767 | 108,810,737 | 129,360,568 | 263,168,262 | 194,963,050 | ||||||||||||||||||
|
|
|
|
|
|
|
|
|
|
|
| |||||||||||||
LIABILITIES | ||||||||||||||||||||||||
Payables: | ||||||||||||||||||||||||
Securities purchased | 2,136,151 | 807,358 | 257,004 | — | — | 1,272,308 | ||||||||||||||||||
Due to custodian in foreign currency (1) | — | — | 66 | — | — | — | ||||||||||||||||||
Accrued advisory fees | 9,043 | 127,257 | 49,907 | 77,890 | 142,048 | 72,061 | ||||||||||||||||||
Accrued administration fees | 2,261 | 25,971 | 13,611 | 16,115 | 32,780 | 24,020 | ||||||||||||||||||
Accrued support service expenses | 511 | 6,137 | 3,068 | 3,580 | 7,841 | 5,625 | ||||||||||||||||||
Accrued custodian fees and expenses | 5,544 | 11,254 | 39,490 | 9,169 | 8,943 | 10,814 | ||||||||||||||||||
Accrued transfer agency out-of-pocket expenses | — | 9,207 | 4,603 | 5,371 | 11,764 | 8,440 | ||||||||||||||||||
Accrued legal, audit and tax service fees | 2,056 | 24,671 | 12,335 | 14,391 | 31,525 | 22,615 | ||||||||||||||||||
Accrued trustees’ fees and expenses and deferred compensation | 22 | 2,163 | 2,338 | 5,881 | 3,824 | 292 | ||||||||||||||||||
Accrued offering expenses | 30,972 | — | — | — | — | — | ||||||||||||||||||
Accrued other | 2,788 | 10,115 | 9,192 | 5,964 | 12,472 | 9,141 | ||||||||||||||||||
Forward foreign currency contracts depreciation | — | — | 79,465 | — | — | — | ||||||||||||||||||
|
|
|
|
|
|
|
|
|
|
|
| |||||||||||||
Total Liabilities | 2,189,348 | 1,024,133 | 471,079 | 138,361 | 251,197 | 1,425,316 | ||||||||||||||||||
|
|
|
|
|
|
|
|
|
|
|
| |||||||||||||
NET ASSETS | $ | 17,795,862 | $ | 207,329,634 | $ | 108,339,658 | $ | 129,222,207 | $ | 262,917,065 | $ | 193,537,734 | ||||||||||||
|
|
|
|
|
|
|
|
|
|
|
| |||||||||||||
NET ASSETS CONSIST OF: | ||||||||||||||||||||||||
Paid-in capital | $ | 17,181,742 | $ | 200,134,881 | $ | 103,482,679 | $ | 92,353,052 | $ | 220,129,368 | $ | 174,120,403 | ||||||||||||
Undistributed/accumulated net investment income (loss) | 39,748 | 674,594 | 601,465 | (106,408 | ) | 1,179,441 | 739,211 | |||||||||||||||||
Undistributed/accumulated net realized gain (loss) | 228,363 | (27,134,273 | ) | (20,881,930 | ) | 600,034 | (17,719,668 | ) | (27,948,164 | ) | ||||||||||||||
Net unrealized appreciation on investments and assets and liabilities in foreign currencies | 346,009 | 33,654,432 | 25,137,444 | 36,375,529 | 59,327,924 | 46,626,284 | ||||||||||||||||||
|
|
|
|
|
|
|
|
|
|
|
| |||||||||||||
NET ASSETS | $ | 17,795,862 | $ | 207,329,634 | $ | 108,339,658 | $ | 129,222,207 | $ | 262,917,065 | $ | 193,537,734 | ||||||||||||
|
|
|
|
|
|
|
|
|
|
|
| |||||||||||||
Class I Shares: | ||||||||||||||||||||||||
Shares of beneficial interest outstanding | 1,711,221 | |||||||||||||||||||||||
|
| |||||||||||||||||||||||
Net Asset Value per share | $ | 10.40 | ||||||||||||||||||||||
|
| |||||||||||||||||||||||
Class P Shares: | ||||||||||||||||||||||||
Shares of beneficial interest outstanding | 16,625,565 | 8,258,220 | 12,546,730 | 21,364,475 | 17,182,131 | |||||||||||||||||||
|
|
|
|
|
|
|
|
|
| |||||||||||||||
Net Asset Value per share | $ | 12.47 | $ | 13.12 | $ | 10.30 | $ | 12.31 | $ | 11.26 | ||||||||||||||
|
|
|
|
|
|
|
|
|
| |||||||||||||||
| (1) | The cost of foreign currency for the PL Growth LT Fund was ($66). |
| See Notes to Financial Statements | C-2 |
Table of Contents
PACIFIC LIFE FUNDS
STATEMENTS OF ASSETS AND LIABILITIES (Continued)
MARCH 31, 2012
| PL Mid-Cap Equity Fund | PL Mid-Cap Growth Fund | PL Small-Cap Growth Fund | PL Small-Cap Value Fund | PL Real Estate Fund | PL Emerging Markets Fund | |||||||||||||||||||
ASSETS | ||||||||||||||||||||||||
Investments, at cost | $ | 142,222,864 | $ | 58,976,561 | $ | 27,692,990 | $ | 68,914,940 | $ | 33,313,619 | $ | 66,936,269 | ||||||||||||
|
|
|
|
|
|
|
|
|
|
|
| |||||||||||||
Investments, at value | $ | 163,566,964 | $ | 73,861,845 | $ | 36,084,055 | $ | 85,793,201 | $ | 52,301,332 | $ | 85,174,308 | ||||||||||||
Foreign currency held, at value (1) | — | 882 | — | — | — | 222,300 | ||||||||||||||||||
Receivables: | ||||||||||||||||||||||||
Dividends and interest | 119,237 | 45,927 | 37,997 | 79,804 | 98,352 | 198,996 | ||||||||||||||||||
Fund shares sold | 351,884 | — | 104,432 | 434,584 | 449,199 | 149,519 | ||||||||||||||||||
Securities sold | 2,577,273 | — | 294,437 | 65,866 | 43,139 | 667,370 | ||||||||||||||||||
Foreign tax reclaim | — | 9,983 | — | — | — | 3,050 | ||||||||||||||||||
Due from adviser | 10,414 | 11,531 | 2,381 | — | 5,805 | 62,990 | ||||||||||||||||||
Prepaid expenses and other assets | 3,248 | 1,346 | 784 | 1,792 | 1,010 | 1,679 | ||||||||||||||||||
|
|
|
|
|
|
|
|
|
|
|
| |||||||||||||
Total Assets | 166,629,020 | 73,931,514 | 36,524,086 | 86,375,247 | 52,898,837 | 86,480,212 | ||||||||||||||||||
|
|
|
|
|
|
|
|
|
|
|
| |||||||||||||
LIABILITIES | ||||||||||||||||||||||||
Payables: | ||||||||||||||||||||||||
Securities purchased | 1,300,132 | 254,378 | 106,510 | 124,798 | 153,128 | 705,999 | ||||||||||||||||||
Accrued advisory fees | 89,437 | 43,038 | 18,264 | 53,778 | 38,042 | 57,505 | ||||||||||||||||||
Accrued administration fees | 20,639 | 9,222 | 4,566 | 10,756 | 6,340 | 10,782 | ||||||||||||||||||
Accrued support service expenses | 4,943 | 2,046 | 1,193 | 2,727 | 1,534 | 2,557 | ||||||||||||||||||
Accrued custodian fees and expenses | 9,802 | 18,564 | 12,084 | 10,351 | 9,392 | 135,230 | ||||||||||||||||||
Accrued transfer agency out-of-pocket expenses | 7,417 | 3,069 | 1,790 | 4,092 | 2,302 | 3,836 | ||||||||||||||||||
Accrued legal, audit and tax service fees | 19,874 | 8,224 | 4,797 | 10,965 | 6,168 | 10,279 | ||||||||||||||||||
Accrued trustees’ fees and expenses and deferred compensation | 170 | 2,461 | 1,519 | — | 44 | 145 | ||||||||||||||||||
Accrued foreign capital gains tax | — | — | — | — | — | 59,489 | ||||||||||||||||||
Accrued other | 8,277 | 4,087 | 3,512 | 5,955 | 2,922 | 11,156 | ||||||||||||||||||
|
|
|
|
|
|
|
|
|
|
|
| |||||||||||||
Total Liabilities | 1,460,691 | 345,089 | 154,235 | 223,422 | 219,872 | 996,978 | ||||||||||||||||||
|
|
|
|
|
|
|
|
|
|
|
| |||||||||||||
NET ASSETS | $ | 165,168,329 | $ | 73,586,425 | $ | 36,369,851 | $ | 86,151,825 | $ | 52,678,965 | $ | 85,483,234 | ||||||||||||
|
|
|
|
|
|
|
|
|
|
|
| |||||||||||||
NET ASSETS CONSIST OF: | ||||||||||||||||||||||||
Paid-in capital | $ | 152,059,978 | $ | 58,006,558 | $ | 34,190,332 | $ | 74,947,573 | $ | 44,210,856 | $ | 70,225,733 | ||||||||||||
Undistributed/accumulated net investment income (loss) | 187,653 | (94,893 | ) | (8,199 | ) | 325,094 | 195,232 | (165,916 | ) | |||||||||||||||
Undistributed/accumulated net realized gain (loss) | (8,423,402 | ) | 790,815 | (6,203,347 | ) | (5,999,065 | ) | (10,714,836 | ) | (2,751,630 | ) | |||||||||||||
Net unrealized appreciation on investments and assets and liabilities in foreign currencies | 21,344,100 | 14,883,945 | 8,391,065 | 16,878,223 | 18,987,713 | 18,175,047 | ||||||||||||||||||
|
|
|
|
|
|
|
|
|
|
|
| |||||||||||||
NET ASSETS | $ | 165,168,329 | $ | 73,586,425 | $ | 36,369,851 | $ | 86,151,825 | $ | 52,678,965 | $ | 85,483,234 | ||||||||||||
|
|
|
|
|
|
|
|
|
|
|
| |||||||||||||
Class P Shares: | ||||||||||||||||||||||||
Shares of beneficial interest outstanding | 16,044,803 | 8,294,116 | 3,065,762 | 8,143,437 | 4,183,542 | 6,308,071 | ||||||||||||||||||
|
|
|
|
|
|
|
|
|
|
|
| |||||||||||||
Net Asset Value per share | $ | 10.29 | $ | 8.87 | $ | 11.86 | $ | 10.58 | $ | 12.59 | $ | 13.55 | ||||||||||||
|
|
|
|
|
|
|
|
|
|
|
| |||||||||||||
| (1) | The cost of foreign currency for the PL Mid-Cap Growth and PL Emerging Markets Funds was $934 and $222,735, respectively. |
| See Notes to Financial Statements | C-3 |
Table of Contents
PACIFIC LIFE FUNDS
STATEMENTS OF ASSETS AND LIABILITIES (Continued)
MARCH 31, 2012
| PL International Large-Cap Fund | PL International Value Fund | |||||||
ASSETS | ||||||||
Investments, at cost | $ | 166,646,383 | $ | 102,702,202 | ||||
|
|
|
| |||||
Investments, at value | $ | 203,429,989 | $ | 109,936,770 | ||||
Foreign currency held, at value (1) | 58,277 | 64,017 | ||||||
Receivables: | ||||||||
Dividends and interest | 638,891 | 591,926 | ||||||
Securities sold | 406,391 | 1,699,803 | ||||||
Variation margin | — | 4,639 | ||||||
Foreign tax reclaim | 141,803 | 41,845 | ||||||
Due from adviser | 34,100 | 4,964 | ||||||
Forward foreign currency contracts appreciation | — | 321,665 | ||||||
Prepaid expenses and other assets | 3,913 | 2,131 | ||||||
|
|
|
| |||||
Total Assets | 204,713,364 | 112,667,760 | ||||||
|
|
|
| |||||
LIABILITIES | ||||||||
Payables: | ||||||||
Securities purchased | 469,879 | 869,316 | ||||||
Accrued advisory fees | 145,965 | 61,337 | ||||||
Accrued administration fees | 25,758 | 14,155 | ||||||
Accrued support service expenses | 5,966 | 3,239 | ||||||
Accrued custodian fees and expenses | 76,226 | 58,694 | ||||||
Accrued transfer agency out-of-pocket expenses | 8,951 | 4,859 | ||||||
Accrued legal, audit and tax service fees | 23,985 | 13,021 | ||||||
Accrued trustees’ fees and expenses and deferred compensation | 1,647 | 2,709 | ||||||
Accrued other | 11,229 | 10,752 | ||||||
Forward foreign currency contracts depreciation | — | 511,174 | ||||||
|
|
|
| |||||
Total Liabilities | 769,606 | 1,549,256 | ||||||
|
|
|
| |||||
NET ASSETS | $ | 203,943,758 | $ | 111,118,504 | ||||
|
|
|
| |||||
NET ASSETS CONSIST OF: | ||||||||
Paid-in capital | $ | 184,504,428 | $ | 158,838,168 | ||||
Undistributed net investment income | 1,305,157 | 1,083,553 | ||||||
Accumulated net realized loss | (18,651,667 | ) | (55,863,317 | ) | ||||
Net unrealized appreciation on investments and assets and liabilities in foreign currencies | 36,785,840 | 7,060,100 | ||||||
|
|
|
| |||||
NET ASSETS | $ | 203,943,758 | $ | 111,118,504 | ||||
|
|
|
| |||||
Class P Shares: | ||||||||
Shares of beneficial interest outstanding | 13,486,118 | 12,892,042 | ||||||
|
|
|
| |||||
Net Asset Value per share | $ | 15.12 | $ | 8.62 | ||||
|
|
|
| |||||
| (1) | The cost of foreign currency for the PL International Large-Cap and PL International Value Funds was $58,270 and $62,766, respectively. |
| See Notes to Financial Statements | C-4 |
Table of Contents
STATEMENTS OF OPERATIONS
FOR THE YEAR ENDED MARCH 31, 2012
| PL Floating Rate Loan Fund | PL High Income Fund (1) | PL Inflation Managed Fund | PL Managed Bond Fund | PL Short Duration Bond Fund | PL Short Duration Income Fund (1) | |||||||||||||||||||
INVESTMENT INCOME | ||||||||||||||||||||||||
Dividends, net of foreign taxes withheld | $ | — | $ | — | $ | 7,500 | $ | 245,435 | $ | — | $ | — | ||||||||||||
Dividends from mutual fund investments | 207 | 13 | 44 | 1 | 319 | 40 | ||||||||||||||||||
Interest, net of foreign taxes withheld | 4,712,153 | 157,302 | 8,580,641 | 11,850,852 | 2,263,464 | 77,542 | ||||||||||||||||||
Other | 180,114 | — | — | — | — | 620 | ||||||||||||||||||
|
|
|
|
|
|
|
|
|
|
|
| |||||||||||||
Total Investment Income | 4,892,474 | 157,315 | 8,588,185 | 12,096,288 | 2,263,783 | 78,202 | ||||||||||||||||||
|
|
|
|
|
|
|
|
|
|
|
| |||||||||||||
EXPENSES | ||||||||||||||||||||||||
Advisory fees | 714,757 | 12,528 | 1,014,169 | 1,678,429 | 535,596 | 11,765 | ||||||||||||||||||
Administration fees | 142,951 | 3,132 | 380,313 | 629,411 | 200,849 | 4,412 | ||||||||||||||||||
Support services expenses | 18,715 | 170 | 43,946 | 71,896 | 33,750 | 341 | ||||||||||||||||||
Custodian fees and expenses | 22,730 | 4,598 | 53,595 | 92,002 | 19,321 | 4,704 | ||||||||||||||||||
Shareholder report expenses | 4,395 | 66 | 11,596 | 19,164 | 6,078 | 132 | ||||||||||||||||||
Transfer agency out-of-pocket expenses | 19,591 | — | 53,092 | 87,605 | 27,727 | — | ||||||||||||||||||
Registration fees | 2,665 | 136 | 6,874 | 11,367 | 3,652 | 271 | ||||||||||||||||||
Legal, audit and tax service fees | 23,567 | 697 | 50,535 | 83,324 | 26,854 | 1,394 | ||||||||||||||||||
Trustees’ fees and expenses | 3,806 | 54 | 10,330 | 16,982 | 5,400 | 108 | ||||||||||||||||||
Offering expenses | — | 35,519 | — | — | — | 35,519 | ||||||||||||||||||
Interest expense | — | — | 20,524 | 4,237 | — | — | ||||||||||||||||||
Other | 36,194 | 2,057 | 65,975 | 123,734 | 45,734 | 1,487 | ||||||||||||||||||
|
|
|
|
|
|
|
|
|
|
|
| |||||||||||||
Total Expenses | 989,371 | 58,957 | 1,710,949 | 2,818,151 | 904,961 | 60,133 | ||||||||||||||||||
Advisory Fee Waiver (2) | (95,301 | ) | — | — | — | — | — | |||||||||||||||||
Adviser Reimbursement (3) | (131,663 | ) | (42,254 | ) | (295,942 | ) | (506,074 | ) | (168,516 | ) | (42,485 | ) | ||||||||||||
|
|
|
|
|
|
|
|
|
|
|
| |||||||||||||
Net Expenses | 762,407 | 16,703 | 1,415,007 | 2,312,077 | 736,445 | 17,648 | ||||||||||||||||||
|
|
|
|
|
|
|
|
|
|
|
| |||||||||||||
NET INVESTMENT INCOME | 4,130,067 | 140,612 | 7,173,178 | 9,784,211 | 1,527,338 | 60,554 | ||||||||||||||||||
|
|
|
|
|
|
|
|
|
|
|
| |||||||||||||
NET REALIZED AND UNREALIZED GAIN (LOSS) |
| |||||||||||||||||||||||
Net Realized Gain (Loss) On: | ||||||||||||||||||||||||
Investment security transactions | 502,188 | 111,589 | 14,013,559 | 976,090 | 457,959 | 56,130 | ||||||||||||||||||
Closed short positions | — | — | 57,358 | (5,628 | ) | (2,812 | ) | — | ||||||||||||||||
Futures contracts and swap transactions | — | — | 639,792 | 3,804,900 | (4,515 | ) | — | |||||||||||||||||
Written option transactions | — | — | 621,249 | (1,437,370 | ) | — | — | |||||||||||||||||
Foreign currency transactions | — | — | 565,110 | 1,042,105 | (85,603 | ) | — | |||||||||||||||||
|
|
|
|
|
|
|
|
|
|
|
| |||||||||||||
Net Realized Gain | 502,188 | 111,589 | 15,897,068 | 4,380,097 | 365,029 | 56,130 | ||||||||||||||||||
|
|
|
|
|
|
|
|
|
|
|
| |||||||||||||
Change In Net Unrealized Appreciation (Depreciation) On: | ||||||||||||||||||||||||
Investment securities | (922,280 | ) | 271,182 | 3,140,158 | 3,726,814 | 311,292 | 134,540 | |||||||||||||||||
Short positions | — | — | — | (12,474 | ) | — | — | |||||||||||||||||
Futures contracts and swaps | — | — | (94,416 | ) | (1,258,668 | ) | 26,766 | — | ||||||||||||||||
Written options | — | — | 118,727 | 1,207,567 | — | — | ||||||||||||||||||
Foreign currencies | — | — | 353,806 | (1,696,908 | ) | (2,831 | ) | — | ||||||||||||||||
|
|
|
|
|
|
|
|
|
|
|
| |||||||||||||
Change in Net Unrealized Appreciation (Depreciation) | (922,280 | ) | 271,182 | 3,518,275 | 1,966,331 | 335,227 | 134,540 | |||||||||||||||||
|
|
|
|
|
|
|
|
|
|
|
| |||||||||||||
NET GAIN (LOSS) | (420,092 | ) | 382,771 | 19,415,343 | 6,346,428 | 700,256 | 190,670 | |||||||||||||||||
|
|
|
|
|
|
|
|
|
|
|
| |||||||||||||
NET INCREASE IN NET ASSETS RESULTING FROM OPERATIONS | $ | 3,709,975 | $ | 523,383 | $ | 26,588,521 | $ | 16,130,639 | $ | 2,227,594 | $ | 251,224 | ||||||||||||
|
|
|
|
|
|
|
|
|
|
|
| |||||||||||||
Foreign taxes withheld on dividends and interest | $ | — | $ | — | $ | 2,774 | $ | 37,050 | $ | — | $ | — | ||||||||||||
|
|
|
|
|
|
|
|
|
|
|
| |||||||||||||
| (1) | Operations commenced on December 19, 2011. |
| (2) | See Note 6 in Notes to Financial Statements. |
| (3) | See Note 7B in Notes to Financial Statements. |
| See Notes to Financial Statements | C-5 |
Table of Contents
PACIFIC LIFE FUNDS
STATEMENTS OF OPERATIONS (Continued)
FOR THE YEAR ENDED MARCH 31, 2012
| PL Strategic Income Fund (1) | PL Comstock Fund | PL Growth LT Fund | PL Large-Cap Growth Fund | PL Large-Cap Value Fund | PL Main Street Core Fund | |||||||||||||||||||
INVESTMENT INCOME | ||||||||||||||||||||||||
Dividends, net of foreign taxes withheld | $ | 64 | $ | 4,250,017 | $ | 1,307,285 | $ | 647,126 | $ | 6,458,743 | $ | 2,688,523 | ||||||||||||
Dividends from mutual fund investments | 17,351 | 201 | 120 | 10,200 | 183 | 98 | ||||||||||||||||||
Interest, net of foreign taxes withheld | 240,704 | — | 1,480 | — | — | — | ||||||||||||||||||
|
|
|
|
|
|
|
|
|
|
|
| |||||||||||||
Total Investment Income | 258,119 | 4,250,218 | 1,308,885 | 657,326 | 6,458,926 | 2,688,621 | ||||||||||||||||||
|
|
|
|
|
|
|
|
|
|
|
| |||||||||||||
EXPENSES | ||||||||||||||||||||||||
Advisory fees | 27,471 | 1,353,582 | 581,617 | 807,892 | 1,522,090 | 755,374 | ||||||||||||||||||
Administration fees | 6,868 | 270,716 | 158,623 | 161,578 | 351,252 | 251,791 | ||||||||||||||||||
Support services expenses | 511 | 30,855 | 22,459 | 22,381 | 40,772 | 32,189 | ||||||||||||||||||
Custodian fees and expenses | 5,544 | 21,726 | 63,335 | 15,999 | 18,217 | 23,412 | ||||||||||||||||||
Shareholder report expenses | 198 | 8,435 | 5,275 | 5,019 | 11,239 | 7,794 | ||||||||||||||||||
Transfer agency out-of-pocket expenses | — | 37,880 | 23,538 | 22,474 | 50,169 | 35,292 | ||||||||||||||||||
Registration fees | 407 | 5,050 | 2,558 | 2,950 | 6,471 | 4,634 | ||||||||||||||||||
Legal, audit and tax service fees | 2,091 | 36,610 | 20,109 | 21,504 | 47,447 | 33,791 | ||||||||||||||||||
Trustees’ fees and expenses | 161 | 7,347 | 4,531 | 4,360 | 9,717 | 6,853 | ||||||||||||||||||
Offering expenses | 35,519 | — | — | — | — | — | ||||||||||||||||||
Other | 2,884 | 19,302 | 21,963 | 11,705 | 22,498 | 16,901 | ||||||||||||||||||
|
|
|
|
|
|
|
|
|
|
|
| |||||||||||||
Total Expenses | 81,654 | 1,791,503 | 904,008 | 1,075,862 | 2,079,872 | 1,168,031 | ||||||||||||||||||
Advisory Fee Waiver (2) | — | (27,072 | ) | — | (26,930 | ) | — | — | ||||||||||||||||
Adviser Reimbursement (3) | (45,025 | ) | (167,205 | ) | (163,768 | ) | (106,391 | ) | (206,530 | ) | (160,866 | ) | ||||||||||||
|
|
|
|
|
|
|
|
|
|
|
| |||||||||||||
Net Expenses | 36,629 | 1,597,226 | 740,240 | 942,541 | 1,873,342 | 1,007,165 | ||||||||||||||||||
|
|
|
|
|
|
|
|
|
|
|
| |||||||||||||
NET INVESTMENT INCOME (LOSS) | 221,490 | 2,652,992 | 568,645 | (285,215 | ) | 4,585,584 | 1,681,456 | |||||||||||||||||
|
|
|
|
|
|
|
|
|
|
|
| |||||||||||||
NET REALIZED AND UNREALIZED GAIN (LOSS) |
| |||||||||||||||||||||||
Net Realized Gain (Loss) On: | ||||||||||||||||||||||||
Investment security transactions | 228,363 | 8,095,226 | (880,933 | ) | 2,701,430 | 947,160 | 2,718,723 | |||||||||||||||||
Foreign currency transactions | — | (181 | ) | 101,920 | — | 6,313 | (1,415 | ) | ||||||||||||||||
|
|
|
|
|
|
|
|
|
|
|
| |||||||||||||
Net Realized Gain (Loss) | 228,363 | 8,095,045 | (779,013 | ) | 2,701,430 | 953,473 | 2,717,308 | |||||||||||||||||
|
|
|
|
|
|
|
|
|
|
|
| |||||||||||||
Change In Net Unrealized Appreciation (Depreciation) On: | ||||||||||||||||||||||||
Investment securities | 346,009 | 221,329 | 4,304,555 | 13,258,222 | 14,293,809 | 16,698,003 | ||||||||||||||||||
Foreign currencies | — | (768 | ) | (14,865 | ) | — | (1,814 | ) | (58 | ) | ||||||||||||||
|
|
|
|
|
|
|
|
|
|
|
| |||||||||||||
Change in Net Unrealized Appreciation | 346,009 | 220,561 | 4,289,690 | 13,258,222 | 14,291,995 | 16,697,945 | ||||||||||||||||||
|
|
|
|
|
|
|
|
|
|
|
| |||||||||||||
NET GAIN | 574,372 | 8,315,606 | 3,510,677 | 15,959,652 | 15,245,468 | 19,415,253 | ||||||||||||||||||
|
|
|
|
|
|
|
|
|
|
|
| |||||||||||||
NET INCREASE IN NET ASSETS RESULTING FROM OPERATIONS | $ | 795,862 | $ | 10,968,598 | $ | 4,079,322 | $ | 15,674,437 | $ | 19,831,052 | $ | 21,096,709 | ||||||||||||
|
|
|
|
|
|
|
|
|
|
|
| |||||||||||||
Foreign taxes withheld on dividends and interest | $ | 11 | $ | 67,354 | $ | 34,668 | $ | 502 | $ | 112,682 | $ | 1,788 | ||||||||||||
|
|
|
|
|
|
|
|
|
|
|
| |||||||||||||
| (1) | Operations commenced on December 19, 2011. |
| (2) | See Note 6 in Notes to Financial Statements. |
| (3) | See Note 7B in Notes to Financial Statements. |
| See Notes to Financial Statements | C-6 |
Table of Contents
PACIFIC LIFE FUNDS
STATEMENTS OF OPERATIONS (Continued)
FOR THE YEAR ENDED MARCH 31, 2012
| PL Mid-Cap Equity Fund | PL Mid-Cap Growth Fund | PL Small-Cap Growth Fund | PL Small-Cap Value Fund | PL Real Estate Fund | PL Emerging Markets Fund | |||||||||||||||||||
INVESTMENT INCOME | ||||||||||||||||||||||||
Dividends, net of foreign taxes withheld | $ | 1,885,587 | $ | 407,187 | $ | 143,129 | $ | 1,937,282 | $ | 1,002,374 | $ | 1,458,631 | ||||||||||||
Dividends from mutual fund investments | 222 | 133 | 29 | 140 | 42 | 80 | ||||||||||||||||||
Interest, net of foreign taxes withheld | — | 58 | — | — | 83 | — | ||||||||||||||||||
|
|
|
|
|
|
|
|
|
|
|
| |||||||||||||
Total Investment Income | 1,885,809 | 407,378 | 143,158 | 1,937,422 | 1,002,499 | 1,458,711 | ||||||||||||||||||
|
|
|
|
|
|
|
|
|
|
|
| |||||||||||||
EXPENSES | ||||||||||||||||||||||||
Advisory fees | 937,297 | 443,391 | 196,368 | 584,343 | 413,666 | 573,058 | ||||||||||||||||||
Administration fees | 216,299 | 95,012 | 49,092 | 116,869 | 68,944 | 107,448 | ||||||||||||||||||
Support services expenses | 24,678 | 13,565 | 6,047 | 13,928 | 10,513 | 23,728 | ||||||||||||||||||
Custodian fees and expenses | 18,620 | 25,718 | 23,154 | 20,313 | 16,841 | 279,338 | ||||||||||||||||||
Shareholder report expenses | 6,831 | 2,924 | 1,600 | 3,766 | 2,219 | 3,296 | ||||||||||||||||||
Transfer agency out-of-pocket expenses | 30,297 | 13,340 | 7,048 | 17,005 | 9,929 | 14,614 | ||||||||||||||||||
Registration fees | 4,073 | 1,693 | 982 | 2,249 | 1,267 | 2,095 | ||||||||||||||||||
Legal, audit and tax service fees | 29,519 | 12,629 | 6,981 | 16,338 | 9,328 | 14,788 | ||||||||||||||||||
Trustees’ fees and expenses | 5,872 | 2,591 | 1,365 | 3,309 | 1,921 | 2,841 | ||||||||||||||||||
Other | 16,490 | 10,995 | 12,531 | 16,604 | 7,555 | 48,007 | ||||||||||||||||||
|
|
|
|
|
|
|
|
|
|
|
| |||||||||||||
Total Expenses | 1,289,976 | 621,858 | 305,168 | 794,724 | 542,183 | 1,069,213 | ||||||||||||||||||
Adviser Reimbursement (1) | (136,380 | ) | (83,455 | ) | (59,708 | ) | (93,513 | ) | (59,572 | ) | (388,707 | ) | ||||||||||||
|
|
|
|
|
|
|
|
|
|
|
| |||||||||||||
Net Expenses | 1,153,596 | 538,403 | 245,460 | 701,211 | 482,611 | 680,506 | ||||||||||||||||||
|
|
|
|
|
|
|
|
|
|
|
| |||||||||||||
NET INVESTMENT INCOME (LOSS) | 732,213 | (131,025 | ) | (102,302 | ) | 1,236,211 | 519,888 | 778,205 | ||||||||||||||||
|
|
|
|
|
|
|
|
|
|
|
| |||||||||||||
NET REALIZED AND UNREALIZED GAIN (LOSS) |
| |||||||||||||||||||||||
Net Realized Gain (Loss) On: | ||||||||||||||||||||||||
Investment security transactions | 6,873,001 | 5,890,106 | 1,939,806 | 610,689 | 1,062,070 | 438,196 | ||||||||||||||||||
Foreign currency transactions | — | (18,586 | ) | 679 | (926 | ) | (3 | ) | (97,596 | ) | ||||||||||||||
|
|
|
|
|
|
|
|
|
|
|
| |||||||||||||
Net Realized Gain | 6,873,001 | 5,871,520 | 1,940,485 | 609,763 | 1,062,067 | 340,600 | ||||||||||||||||||
|
|
|
|
|
|
|
|
|
|
|
| |||||||||||||
Change In Net Unrealized Appreciation (Depreciation) On: | ||||||||||||||||||||||||
Investment securities (2) | (5,959,364 | ) | (5,165,102 | ) | (1,384,256 | ) | (726,970 | ) | 3,552,200 | (2,932,782 | ) | |||||||||||||
Foreign currencies | — | (1,537 | ) | — | (38 | ) | — | (3,067 | ) | |||||||||||||||
|
|
|
|
|
|
|
|
|
|
|
| |||||||||||||
Change in Net Unrealized Appreciation (Depreciation) | (5,959,364 | ) | (5,166,639 | ) | (1,384,256 | ) | (727,008 | ) | 3,552,200 | (2,935,849 | ) | |||||||||||||
|
|
|
|
|
|
|
|
|
|
|
| |||||||||||||
NET GAIN (LOSS) | 913,637 | 704,881 | 556,229 | (117,245 | ) | 4,614,267 | (2,595,249 | ) | ||||||||||||||||
|
|
|
|
|
|
|
|
|
|
|
| |||||||||||||
NET INCREASE (DECREASE) IN NET ASSETS RESULTING FROM OPERATIONS | $ | 1,645,850 | $ | 573,856 | $ | 453,927 | $ | 1,118,966 | $ | 5,134,155 | ($ | 1,817,044 | ) | |||||||||||
|
|
|
|
|
|
|
|
|
|
|
| |||||||||||||
Foreign taxes withheld on dividends and interest | $ | — | $ | 19,486 | $ | — | $ | 16,439 | $ | 5,247 | $ | 107,540 | ||||||||||||
|
|
|
|
|
|
|
|
|
|
|
| |||||||||||||
| (1) | See Note 7B in Notes to Financial Statements. |
| (2) | Change in net unrealized appreciation (depreciation) on investment securities for the PL Emerging Markets Fund was net of increase in deferred foreign capital gains tax of $44,697. |
| See Notes to Financial Statements | C-7 |
Table of Contents
PACIFIC LIFE FUNDS
STATEMENTS OF OPERATIONS (Continued)
FOR THE YEAR ENDED MARCH 31, 2012
| PL International Large-Cap Fund | PL International Value Fund | |||||||
INVESTMENT INCOME | ||||||||
Dividends, net of foreign taxes withheld | $ | 4,176,165 | $ | 3,794,895 | ||||
Dividends from mutual fund investments | 5 | 82 | ||||||
Interest, net of foreign taxes withheld | 907 | — | ||||||
|
|
|
| |||||
Total Investment Income | 4,177,077 | 3,794,977 | ||||||
|
|
|
| |||||
EXPENSES | ||||||||
Advisory fees | 1,408,791 | 639,310 | ||||||
Administration fees | 248,610 | 147,533 | ||||||
Support services expenses | 27,692 | 17,405 | ||||||
Custodian fees and expenses | 145,480 | 117,081 | ||||||
Shareholder report expenses | 7,433 | 4,684 | ||||||
Transfer agency out-of-pocket expenses | 33,421 | 20,627 | ||||||
Registration fees | 4,882 | 2,670 | ||||||
Legal, audit and tax service fees | 34,259 | 19,544 | ||||||
Trustees’ fees and expenses | 6,508 | 3,986 | ||||||
Other | 29,916 | 27,246 | ||||||
|
|
|
| |||||
Total Expenses | 1,946,992 | 1,000,086 | ||||||
Adviser Reimbursement (1) | (289,591 | ) | (213,243 | ) | ||||
|
|
|
| |||||
Net Expenses | 1,657,401 | 786,843 | ||||||
|
|
|
| |||||
NET INVESTMENT INCOME | 2,519,676 | 3,008,134 | ||||||
|
|
|
| |||||
NET REALIZED AND UNREALIZED GAIN (LOSS) | ||||||||
Net Realized Gain (Loss) On: | ||||||||
Investment security transactions | (2,560,823 | ) | (9,388,943 | ) | ||||
Futures contracts | — | (181,955 | ) | |||||
Foreign currency transactions | (63,338 | ) | 1,188,282 | |||||
|
|
|
| |||||
Net Realized Loss | (2,624,161 | ) | (8,382,616 | ) | ||||
|
|
|
| |||||
Change In Net Unrealized Appreciation (Depreciation) On: | ||||||||
Investment securities | 7,189,354 | 2,169,450 | ||||||
Futures contracts | — | 5,611 | ||||||
Foreign currencies | (12,422 | ) | (272,185 | ) | ||||
|
|
|
| |||||
Change in Net Unrealized Appreciation | 7,176,932 | 1,902,876 | ||||||
|
|
|
| |||||
NET GAIN (LOSS) | 4,552,771 | (6,479,740 | ) | |||||
|
|
|
| |||||
NET INCREASE (DECREASE) IN NET ASSETS RESULTING FROM OPERATIONS | $ | 7,072,447 | ($ | 3,471,606 | ) | |||
|
|
|
| |||||
Foreign taxes withheld on dividends and interest | $ | 505,525 | $ | 430,206 | ||||
|
|
|
| |||||
| (1) | See Note 7B in Notes to Financial Statements. |
| C-8 |
Table of Contents
STATEMENTS OF CHANGES IN NET ASSETS
| PL Floating Rate Loan Fund | PL High Income Fund (1) | PL Inflation Managed Fund | ||||||||||||||||||
| Year Ended March 31, 2012 | Year Ended March 31, 2011 | Period Ended March 31, 2012 | Year Ended March 31, 2012 | Year Ended March 31, 2011 | ||||||||||||||||
OPERATIONS | ||||||||||||||||||||
Net investment income | $ | 4,130,067 | $ | 2,925,912 | $ | 140,612 | $ | 7,173,178 | $ | 4,287,172 | ||||||||||
Net realized gain | 502,188 | 625,495 | 111,589 | 15,897,068 | 9,060,553 | |||||||||||||||
Change in net unrealized appreciation (depreciation) | (922,280 | ) | 516,066 | 271,182 | 3,518,275 | 834,235 | ||||||||||||||
|
|
|
|
|
|
|
|
|
| |||||||||||
Net Increase in Net Assets Resulting from Operations | 3,709,975 | 4,067,473 | 523,383 | 26,588,521 | 14,181,960 | |||||||||||||||
|
|
|
|
|
|
|
|
|
| |||||||||||
DISTRIBUTIONS TO SHAREHOLDERS | ||||||||||||||||||||
Net investment income | ||||||||||||||||||||
Class A | — | (576,673 | ) | — | — | (1,981,141 | ) | |||||||||||||
Class P | (3,822,618 | ) | (1,463,098 | ) | — | (8,896,184 | ) | (1,520,135 | ) | |||||||||||
Class I | — | — | (117,780 | ) | — | — | ||||||||||||||
Net realized gains | ||||||||||||||||||||
Class A | — | — | — | — | — | |||||||||||||||
Class P | — | — | — | (11,006,526 | ) | (3,913,597 | ) | |||||||||||||
|
|
|
|
|
|
|
|
|
| |||||||||||
Net Decrease from Dividends and Distributions to Shareholders | (3,822,618 | ) | (2,039,771 | ) | (117,780 | ) | (19,902,710 | ) | (7,414,873 | ) | ||||||||||
|
|
|
|
|
|
|
|
|
| |||||||||||
CAPITAL SHARE TRANSACTIONS | ||||||||||||||||||||
Proceeds from sale of shares | ||||||||||||||||||||
Class A | — | 7,659,141 | — | — | 20,082,422 | |||||||||||||||
Class P | 27,980,424 | 24,589,520 | — | 63,874,744 | 69,727,535 | |||||||||||||||
Class I | — | — | 7,000,000 | — | — | |||||||||||||||
Dividends and distribution reinvestments | ||||||||||||||||||||
Class A | — | 576,673 | — | — | 1,978,436 | |||||||||||||||
Class P | 3,822,618 | 1,463,098 | — | 19,902,710 | 5,433,732 | |||||||||||||||
Class I | — | — | 117,780 | — | — | |||||||||||||||
Cost of shares repurchased | ||||||||||||||||||||
Class A | — | (232,057 | ) | — | — | (4,960,351 | ) | |||||||||||||
Class P | (5,667,963 | ) | (3,140,337 | ) | — | (31,863,538 | ) | (19,125,619 | ) | |||||||||||
Share class conversions | ||||||||||||||||||||
Class A (2) | — | (59,055,247 | ) | — | — | 169,787,788 | ||||||||||||||
Class P (2) | — | 59,055,247 | — | — | (169,787,788 | ) | ||||||||||||||
|
|
|
|
|
|
|
|
|
| |||||||||||
Net Increase in Net Assets from Capital Share Transactions | 26,135,079 | 30,916,038 | 7,117,780 | 51,913,916 | 73,136,155 | |||||||||||||||
|
|
|
|
|
|
|
|
|
| |||||||||||
NET INCREASE IN NET ASSETS | 26,022,436 | 32,943,740 | 7,523,383 | 58,599,727 | 79,903,242 | |||||||||||||||
|
|
|
|
|
|
|
|
|
| |||||||||||
NET ASSETS | ||||||||||||||||||||
Beginning of Year or Period | 86,065,600 | 53,121,860 | — | 229,356,401 | 149,453,159 | |||||||||||||||
|
|
|
|
|
|
|
|
|
| |||||||||||
End of Year or Period | $ | 112,088,036 | $ | 86,065,600 | $ | 7,523,383 | $ | 287,956,128 | $ | 229,356,401 | ||||||||||
|
|
|
|
|
|
|
|
|
| |||||||||||
Undistributed Net Investment Income | $ | 1,198,339 | $ | 890,890 | $ | 29,213 | $ | 849,845 | $ | 1,571,041 | ||||||||||
|
|
|
|
|
|
|
|
|
| |||||||||||
| (1) | Operations commenced on December 19, 2011 (see Note 1 in Notes to Financial Statements). |
| (2) | Class A shares were converted to Class P shares on July 2, 2010 (see Note 1 in Notes to Financial Statements). |
| See Notes to Financial Statements |
C-9 |
Table of Contents
PACIFIC LIFE FUNDS
STATEMENTS OF CHANGES IN NET ASSETS (Continued)
| PL Managed Bond Fund | PL Short Duration Bond Fund | PL Short Duration Income Fund (1) | ||||||||||||||||||
| Year Ended March 31, 2012 | Year Ended March 31, 2011 | Year Ended March 31, 2012 | Year Ended March 31, 2011 | Period Ended March 31, 2012 | ||||||||||||||||
OPERATIONS | ||||||||||||||||||||
Net investment income | $ | 9,784,211 | $ | 6,582,841 | $ | 1,527,338 | $ | 969,429 | $ | 60,554 | ||||||||||
Net realized gain | 4,380,097 | 9,493,481 | 365,029 | 539,458 | 56,130 | |||||||||||||||
Change in net unrealized appreciation (depreciation) | 1,966,331 | 1,054,913 | 335,227 | (174,321 | ) | 134,540 | ||||||||||||||
|
|
|
|
|
|
|
|
|
| |||||||||||
Net Increase in Net Assets Resulting from Operations | 16,130,639 | 17,131,235 | 2,227,594 | 1,334,566 | 251,224 | |||||||||||||||
|
|
|
|
|
|
|
|
|
| |||||||||||
DISTRIBUTIONS TO SHAREHOLDERS | ||||||||||||||||||||
Net investment income | ||||||||||||||||||||
Class A | — | (2,619,779 | ) | — | (226,394 | ) | — | |||||||||||||
Class P | (11,687,819 | ) | (5,686,622 | ) | (1,583,339 | ) | (548,974 | ) | — | |||||||||||
Class I | — | — | — | — | (59,453 | ) | ||||||||||||||
Net realized gains | ||||||||||||||||||||
Class A | — | (2,540,364 | ) | — | — | — | ||||||||||||||
Class P | — | (8,056,500 | ) | (194,538 | ) | (403,149 | ) | — | ||||||||||||
|
|
|
|
|
|
|
|
|
| |||||||||||
Net Decrease from Dividends and Distributions to Shareholders | (11,687,819 | ) | (18,903,265 | ) | (1,777,877 | ) | (1,178,517 | ) | (59,453 | ) | ||||||||||
|
|
|
|
|
|
|
|
|
| |||||||||||
CAPITAL SHARE TRANSACTIONS | ||||||||||||||||||||
Proceeds from sale of shares | ||||||||||||||||||||
Class A | — | 33,695,419 | — | 14,306,748 | — | |||||||||||||||
Class P | 122,951,772 | 122,376,254 | 40,795,923 | 43,262,438 | — | |||||||||||||||
Class I | — | — | — | — | 12,000,000 | |||||||||||||||
Dividends and distribution reinvestments | ||||||||||||||||||||
Class A | — | 5,154,057 | — | 226,240 | — | |||||||||||||||
Class P | 11,687,819 | 13,743,122 | 1,777,877 | 952,123 | — | |||||||||||||||
Class I | — | — | — | — | 59,453 | |||||||||||||||
Cost of shares repurchased | ||||||||||||||||||||
Class A | — | (7,768,096 | ) | — | (952,151 | ) | — | |||||||||||||
Class P | (31,850,108 | ) | (22,403,735 | ) | (8,788,892 | ) | (12,491,880 | ) | — | |||||||||||
Share class conversions | ||||||||||||||||||||
Class A (2) | — | (268,664,284 | ) | — | (89,594,322 | ) | — | |||||||||||||
Class P (2) | — | 268,664,284 | — | 89,594,322 | — | |||||||||||||||
|
|
|
|
|
|
|
|
|
| |||||||||||
Net Increase in Net Assets from Capital Share Transactions | 102,789,483 | 144,797,021 | 33,784,908 | 45,303,518 | 12,059,453 | |||||||||||||||
|
|
|
|
|
|
|
|
|
| |||||||||||
NET INCREASE IN NET ASSETS | 107,232,303 | 143,024,991 | 34,234,625 | 45,459,567 | 12,251,224 | |||||||||||||||
|
|
|
|
|
|
|
|
|
| |||||||||||
NET ASSETS | ||||||||||||||||||||
Beginning of Year or Period | 378,982,470 | 235,957,479 | 121,133,223 | 75,673,656 | — | |||||||||||||||
|
|
|
|
|
|
|
|
|
| |||||||||||
End of Year or Period | $ | 486,214,773 | $ | 378,982,470 | $ | 155,367,848 | $ | 121,133,223 | $ | 12,251,224 | ||||||||||
|
|
|
|
|
|
|
|
|
| |||||||||||
Undistributed Net Investment Income | $ | 6,200,177 | $ | 2,525,457 | $ | 483,512 | $ | 267,511 | $ | 7,918 | ||||||||||
|
|
|
|
|
|
|
|
|
| |||||||||||
| (1) | Operations commenced on December 19, 2011 (see Note 1 in Notes to Financial Statements). |
| (2) | Class A shares were converted to Class P shares on July 2, 2010 (see Note 1 in Notes to Financial Statements). |
| See Notes to Financial Statements |
C-10 |
Table of Contents
PACIFIC LIFE FUNDS
STATEMENTS OF CHANGES IN NET ASSETS (Continued)
| PL Strategic Income Fund (1) | PL Comstock Fund | PL Growth LT Fund | ||||||||||||||||||
| Period Ended March 31, 2012 | Year Ended March 31, 2012 | Year Ended March 31, 2011 | Year Ended March 31, 2012 | Year Ended March 31, 2011 | ||||||||||||||||
OPERATIONS | ||||||||||||||||||||
Net investment income | $ | 221,490 | $ | 2,652,992 | $ | 1,635,028 | $ | 568,645 | $ | 570,028 | ||||||||||
Net realized gain (loss) | 228,363 | 8,095,045 | 3,283,482 | (779,013 | ) | 8,265,977 | ||||||||||||||
Change in net unrealized appreciation | 346,009 | 220,561 | 16,761,825 | 4,289,690 | 2,461,139 | |||||||||||||||
|
|
|
|
|
|
|
|
|
| |||||||||||
Net Increase in Net Assets Resulting from Operations | 795,862 | 10,968,598 | 21,680,335 | 4,079,322 | 11,297,144 | |||||||||||||||
|
|
|
|
|
|
|
|
|
| |||||||||||
DISTRIBUTIONS TO SHAREHOLDERS | ||||||||||||||||||||
Net investment income | ||||||||||||||||||||
Class A | — | — | (236,849 | ) | — | — | ||||||||||||||
Class P | — | (2,469,410 | ) | (1,140,637 | ) | (536,165 | ) | — | ||||||||||||
Class I | (190,597 | ) | — | — | — | — | ||||||||||||||
Net realized gains | ||||||||||||||||||||
Class A | — | — | — | — | — | |||||||||||||||
Class P | — | — | — | — | — | |||||||||||||||
|
|
|
|
|
|
|
|
|
| |||||||||||
Net Decrease from Dividends and Distributions to Shareholders | (190,597 | ) | (2,469,410 | ) | (1,377,486 | ) | (536,165 | ) | — | |||||||||||
|
|
|
|
|
|
|
|
|
| |||||||||||
CAPITAL SHARE TRANSACTIONS | ||||||||||||||||||||
Proceeds from sale of shares | ||||||||||||||||||||
Class A | — | — | 8,415,520 | — | 5,457,542 | |||||||||||||||
Class P | — | 39,955,205 | 23,950,764 | 17,297,129 | 20,262,936 | |||||||||||||||
Class I | 17,000,000 | — | — | — | — | |||||||||||||||
Dividends and distribution reinvestments | ||||||||||||||||||||
Class A | — | — | 236,711 | — | — | |||||||||||||||
Class P | — | 2,469,410 | 1,140,637 | 536,165 | — | |||||||||||||||
Class I | 190,597 | — | — | — | — | |||||||||||||||
Cost of shares repurchased | ||||||||||||||||||||
Class A | — | — | (1,921,221 | ) | — | (1,796,334 | ) | |||||||||||||
Class P | — | (10,059,434 | ) | (13,829,114 | ) | (28,612,620 | ) | (8,864,918 | ) | |||||||||||
Share class conversions | ||||||||||||||||||||
Class A (2) | — | — | (119,192,019 | ) | — | (82,580,720 | ) | |||||||||||||
Class P (2) | — | — | 119,192,019 | — | 82,580,720 | |||||||||||||||
|
|
|
|
|
|
|
|
|
| |||||||||||
Net Increase (Decrease) in Net Assets from Capital Share Transactions | 17,190,597 | 32,365,181 | 17,993,297 | (10,779,326 | ) | 15,059,226 | ||||||||||||||
|
|
|
|
|
|
|
|
|
| |||||||||||
NET INCREASE (DECREASE) IN NET ASSETS | 17,795,862 | 40,864,369 | 38,296,146 | (7,236,169 | ) | 26,356,370 | ||||||||||||||
|
|
|
|
|
|
|
|
|
| |||||||||||
NET ASSETS | ||||||||||||||||||||
Beginning of Year or Period | — | 166,465,265 | 128,169,119 | 115,575,827 | 89,219,457 | |||||||||||||||
|
|
|
|
|
|
|
|
|
| |||||||||||
End of Year or Period | $ | 17,795,862 | $ | 207,329,634 | $ | 166,465,265 | $ | 108,339,658 | $ | 115,575,827 | ||||||||||
|
|
|
|
|
|
|
|
|
| |||||||||||
Undistributed Net Investment Income | $ | 39,748 | $ | 674,594 | $ | 491,193 | $ | 601,465 | $ | 399,303 | ||||||||||
|
|
|
|
|
|
|
|
|
| |||||||||||
| (1) | Operations commenced on December 19, 2011 (see Note 1 in Notes to Financial Statements). |
| (2) | Class A shares were converted to Class P shares on July 2, 2010 (see Note 1 in Notes to Financial Statements). |
See Notes to Financial Statements
C-11
Table of Contents
PACIFIC LIFE FUNDS
STATEMENTS OF CHANGES IN NET ASSETS (Continued)
| PL Large Cap Growth Fund | PL Large-Cap Value Fund | PL Main Street Core Fund | ||||||||||||||||||||||
| Year Ended March 31, 2012 | Year Ended March 31, 2011 | Year Ended March 31, 2012 | Year Ended March 31, 2011 | Year Ended March 31, 2012 | Year Ended March 31, 2011 | |||||||||||||||||||
OPERATIONS | ||||||||||||||||||||||||
Net investment income (loss) | ($ | 285,215 | ) | ($ | 84,438 | ) | $ | 4,585,584 | $ | 2,942,019 | $ | 1,681,456 | $ | 1,305,535 | ||||||||||
Net realized gain (loss) | 2,701,430 | 6,298,659 | 953,473 | (1,819,227 | ) | 2,717,308 | 7,391,931 | |||||||||||||||||
Change in net unrealized appreciation | 13,258,222 | 11,649,279 | 14,291,995 | 26,049,979 | 16,697,945 | 8,326,713 | ||||||||||||||||||
|
|
|
|
|
|
|
|
|
|
|
| |||||||||||||
Net Increase in Net Assets Resulting from Operations | 15,674,437 | 17,863,500 | 19,831,052 | 27,172,771 | 21,096,709 | 17,024,179 | ||||||||||||||||||
|
|
|
|
|
|
|
|
|
|
|
| |||||||||||||
DISTRIBUTIONS TO SHAREHOLDERS | ||||||||||||||||||||||||
Net investment income | ||||||||||||||||||||||||
Class A | — | — | — | (467,480 | ) | — | (95,654 | ) | ||||||||||||||||
Class P | — | — | (4,290,204 | ) | (2,058,011 | ) | (1,459,944 | ) | (819,251 | ) | ||||||||||||||
Net realized gains | ||||||||||||||||||||||||
Class A | — | — | — | — | — | — | ||||||||||||||||||
Class P | (1,890,797 | ) | — | — | — | — | — | |||||||||||||||||
|
|
|
|
|
|
|
|
|
|
|
| |||||||||||||
Net Decrease from Dividends and Distributions to Shareholders | (1,890,797 | ) | — | (4,290,204 | ) | (2,525,491 | ) | (1,459,944 | ) | (914,905 | ) | |||||||||||||
|
|
|
|
|
|
|
|
|
|
|
| |||||||||||||
CAPITAL SHARE TRANSACTIONS | ||||||||||||||||||||||||
Proceeds from sale of shares | ||||||||||||||||||||||||
Class A | — | 4,037,967 | — | 14,633,209 | — | 8,538,755 | ||||||||||||||||||
Class P | 19,512,148 | 26,906,134 | 41,530,441 | 44,341,564 | 23,559,879 | 24,547,598 | ||||||||||||||||||
Dividends and distribution reinvestments | ||||||||||||||||||||||||
Class A | — | — | — | 467,255 | — | 95,654 | ||||||||||||||||||
Class P | 1,890,797 | — | 4,290,204 | 2,058,011 | 1,459,944 | 819,251 | ||||||||||||||||||
Cost of shares repurchased | ||||||||||||||||||||||||
Class A | — | (1,396,630 | ) | — | (3,090,654 | ) | — | (125,274 | ) | |||||||||||||||
Class P | (5,065,264 | ) | (9,416,192 | ) | (26,880,017 | ) | (16,932,785 | ) | (9,008,456 | ) | (38,124,068 | ) | ||||||||||||
Share class conversions | ||||||||||||||||||||||||
Class A (1) | — | (56,182,987 | ) | — | (153,219,431 | ) | — | (136,507,682 | ) | |||||||||||||||
Class P (1) | — | 56,182,987 | — | 153,219,431 | — | 136,507,682 | ||||||||||||||||||
|
|
|
|
|
|
|
|
|
|
|
| |||||||||||||
Net Increase (Decrease) in Net Assets from Capital Share Transactions | 16,337,681 | 20,131,279 | 18,940,628 | 41,476,600 | 16,011,367 | (4,248,084 | ) | |||||||||||||||||
|
|
|
|
|
|
|
|
|
|
|
| |||||||||||||
NET INCREASE IN NET ASSETS | 30,121,321 | 37,994,779 | 34,481,476 | 66,123,880 | 35,648,132 | 11,861,190 | ||||||||||||||||||
|
|
|
|
|
|
|
|
|
|
|
| |||||||||||||
NET ASSETS | ||||||||||||||||||||||||
Beginning of Year | 99,100,886 | 61,106,107 | 228,435,589 | 162,311,709 | 157,889,602 | 146,028,412 | ||||||||||||||||||
|
|
|
|
|
|
|
|
|
|
|
| |||||||||||||
End of Year | $ | 129,222,207 | $ | 99,100,886 | $ | 262,917,065 | $ | 228,435,589 | $ | 193,537,734 | $ | 157,889,602 | ||||||||||||
|
|
|
|
|
|
|
|
|
|
|
| |||||||||||||
Undistributed/Accumulated Net Investment Income (Loss) | ($ | 106,408 | ) | ($ | 6,382 | ) | $ | 1,179,441 | $ | 877,748 | $ | 739,211 | $ | 398,039 | ||||||||||
|
|
|
|
|
|
|
|
|
|
|
| |||||||||||||
| (1) | Class A shares were converted to Class P shares on July 2, 2010 (see Note 1 in Notes to Financial Statements). |
See Notes to Financial Statements
C-12
Table of Contents
PACIFIC LIFE FUNDS
STATEMENTS OF CHANGES IN NET ASSETS (Continued)
| PL Mid-Cap Equity Fund | PL Mid-Cap Growth Fund | PL Small-Cap Growth Fund | ||||||||||||||||||||||
| Year Ended March 31, 2012 | Year Ended March 31, 2011 | Year Ended March 31, 2012 | Year Ended March 31, 2011 | Year Ended March 31, 2012 | Year Ended March 31, 2011 | |||||||||||||||||||
OPERATIONS | ||||||||||||||||||||||||
Net investment income (loss) | $ | 732,213 | $ | 1,003,153 | ($ | 131,025 | ) | $ | 131,973 | ($ | 102,302 | ) | ($ | 171,915 | ) | |||||||||
Net realized gain | 6,873,001 | 13,268,146 | 5,871,520 | 7,350,264 | 1,940,485 | 3,696,262 | ||||||||||||||||||
Change in net unrealized appreciation (depreciation) | (5,959,364 | ) | 10,335,351 | (5,166,639 | ) | 8,770,729 | (1,384,256 | ) | 3,595,499 | |||||||||||||||
|
|
|
|
|
|
|
|
|
|
|
| |||||||||||||
Net Increase in Net Assets Resulting from Operations | 1,645,850 | 24,606,650 | 573,856 | 16,252,966 | 453,927 | 7,119,846 | ||||||||||||||||||
|
|
|
|
|
|
|
|
|
|
|
| |||||||||||||
DISTRIBUTIONS TO SHAREHOLDERS | ||||||||||||||||||||||||
Net investment income | ||||||||||||||||||||||||
Class A | — | (47,048 | ) | — | — | — | — | |||||||||||||||||
Class P | (669,458 | ) | (877,377 | ) | (316,392 | ) | (105,080 | ) | — | — | ||||||||||||||
Net realized gains | ||||||||||||||||||||||||
Class A | — | — | — | (524,490 | ) | — | — | |||||||||||||||||
Class P | — | — | (7,220,657 | ) | (4,624,405 | ) | — | — | ||||||||||||||||
|
|
|
|
|
|
|
|
|
|
|
| |||||||||||||
Net Decrease from Dividends and Distributions to Shareholders | (669,458 | ) | (924,425 | ) | (7,537,049 | ) | (5,253,975 | ) | — | — | ||||||||||||||
|
|
|
|
|
|
|
|
|
|
|
| |||||||||||||
CAPITAL SHARE TRANSACTIONS | ||||||||||||||||||||||||
Proceeds from sale of shares | ||||||||||||||||||||||||
Class A | — | 7,987,693 | — | 997,962 | — | 241,073 | ||||||||||||||||||
Class P | 35,444,468 | 16,991,531 | 11,042,280 | 8,108,597 | 6,252,737 | 6,958,753 | ||||||||||||||||||
Dividends and distribution reinvestments | ||||||||||||||||||||||||
Class A | — | 47,047 | — | 523,636 | — | — | ||||||||||||||||||
Class P | 669,458 | 877,377 | 7,537,049 | 4,729,485 | — | — | ||||||||||||||||||
Cost of shares repurchased | ||||||||||||||||||||||||
Class A | — | (3,190,726 | ) | — | (5,043,424 | ) | — | (2,114,592 | ) | |||||||||||||||
Class P | (7,677,376 | ) | (12,289,913 | ) | (2,505,288 | ) | (10,833,939 | ) | (2,691,970 | ) | (5,541,320 | ) | ||||||||||||
Share class conversions | ||||||||||||||||||||||||
Class A (1) | — | (96,440,538 | ) | — | (48,202,865 | ) | — | (21,274,966 | ) | |||||||||||||||
Class P (1) | — | 96,440,538 | — | 48,202,865 | — | 21,274,966 | ||||||||||||||||||
|
|
|
|
|
|
|
|
|
|
|
| |||||||||||||
Net Increase (Decrease) in Net Assets from Capital Share Transactions | 28,436,550 | 10,423,009 | 16,074,041 | (1,517,683 | ) | 3,560,767 | (456,086 | ) | ||||||||||||||||
|
|
|
|
|
|
|
|
|
|
|
| |||||||||||||
NET INCREASE IN NET ASSETS | 29,412,942 | 34,105,234 | 9,110,848 | 9,481,308 | 4,014,694 | 6,663,760 | ||||||||||||||||||
|
|
|
|
|
|
|
|
|
|
|
| |||||||||||||
NET ASSETS | ||||||||||||||||||||||||
Beginning of Year | 135,755,387 | 101,650,153 | 64,475,577 | 54,994,269 | 32,355,157 | 25,691,397 | ||||||||||||||||||
|
|
|
|
|
|
|
|
|
|
|
| |||||||||||||
End of Year | $ | 165,168,329 | $ | 135,755,387 | $ | 73,586,425 | $ | 64,475,577 | $ | 36,369,851 | $ | 32,355,157 | ||||||||||||
|
|
|
|
|
|
|
|
|
|
|
| |||||||||||||
Undistributed/Accumulated Net Investment Income (Loss) | $ | 187,653 | $ | 124,898 | ($ | 94,893 | ) | $ | 9,435 | ($ | 8,199 | ) | ($ | 2,021 | ) | |||||||||
|
|
|
|
|
|
|
|
|
|
|
| |||||||||||||
| (1) | Class A shares were converted to Class P shares on July 2, 2010 (see Note 1 in Notes to Financial Statements). |
See Notes to Financial Statements
C-13
Table of Contents
PACIFIC LIFE FUNDS
STATEMENTS OF CHANGES IN NET ASSETS (Continued)
| PL Small-Cap Value Fund | PL Real Estate Fund | PL Emerging Markets Fund | ||||||||||||||||||||||
| Year Ended March 31, 2012 | Year Ended March 31, 2011 | Year Ended March 31, 2012 | Year Ended March 31, 2011 | Year Ended March 31, 2012 | Year Ended March 31, 2011 | |||||||||||||||||||
OPERATIONS | ||||||||||||||||||||||||
Net investment income | $ | 1,236,211 | $ | 985,586 | $ | 519,888 | $ | 286,040 | $ | 778,205 | $ | 410,281 | ||||||||||||
Net realized gain | 609,763 | 3,286,911 | 1,062,067 | 3,406,977 | 340,600 | 5,064,457 | ||||||||||||||||||
Change in net unrealized appreciation (depreciation) | (727,008 | ) | 11,588,543 | 3,552,200 | 4,637,930 | (2,935,849 | ) | 5,215,893 | ||||||||||||||||
|
|
|
|
|
|
|
|
|
|
|
| |||||||||||||
Net Increase (Decrease) in Net Assets Resulting from Operations | 1,118,966 | 15,861,040 | 5,134,155 | 8,330,947 | (1,817,044 | ) | 10,690,631 | |||||||||||||||||
|
|
|
|
|
|
|
|
|
|
|
| |||||||||||||
DISTRIBUTIONS TO SHAREHOLDERS | ||||||||||||||||||||||||
Net investment income | ||||||||||||||||||||||||
Class A | — | (68,741 | ) | — | (68,821 | ) | — | — | ||||||||||||||||
|
|
|
|
|
|
|
|
|
|
|
| |||||||||||||
Class P | (1,046,454 | ) | (638,985 | ) | (324,119 | ) | (270,054 | ) | (436,891 | ) | (940,708 | ) | ||||||||||||
|
|
|
|
|
|
|
|
|
|
|
| |||||||||||||
Net realized gains | ||||||||||||||||||||||||
Class A | — | — | — | — | — | — | ||||||||||||||||||
Class P | — | — | — | — | (1,469,568 | ) | — | |||||||||||||||||
Net Decrease from Dividends and Distributions to Shareholders | (1,046,454 | ) | (707,726 | ) | (324,119 | ) | (338,875 | ) | (1,906,459 | ) | (940,708 | ) | ||||||||||||
CAPITAL SHARE TRANSACTIONS | ||||||||||||||||||||||||
Proceeds from sale of shares | ||||||||||||||||||||||||
Class A | — | 1,360,677 | — | 179,622 | — | 763,496 | ||||||||||||||||||
Class P | 13,399,076 | 27,468,646 | 11,623,068 | 7,071,793 | 26,496,874 | 14,652,817 | ||||||||||||||||||
Dividends and distribution reinvestments | ||||||||||||||||||||||||
Class A | — | 68,740 | — | 68,818 | — | — | ||||||||||||||||||
Class P | 1,046,454 | 638,985 | 324,119 | 270,054 | 1,906,459 | 940,708 | ||||||||||||||||||
Cost of shares repurchased | ||||||||||||||||||||||||
Class A | — | (1,398,444 | ) | — | (3,964,447 | ) | — | (95,644 | ) | |||||||||||||||
Class P | (4,613,313 | ) | (5,217,990 | ) | (5,938,153 | ) | (6,110,043 | ) | (3,466,862 | ) | (9,454,654 | ) | ||||||||||||
Share class conversions | ||||||||||||||||||||||||
Class A (1) | — | (35,260,361 | ) | — | (31,360,853 | ) | — | (45,487,862 | ) | |||||||||||||||
Class P (1) | — | 35,260,361 | — | 31,360,853 | — | 45,487,862 | ||||||||||||||||||
|
|
|
|
|
|
|
|
|
|
|
| |||||||||||||
Net Increase (Decrease) in Net Assets from Capital Share Transactions | 9,832,217 | 22,920,614 | 6,009,034 | (2,484,203 | ) | 24,936,471 | 6,806,723 | |||||||||||||||||
|
|
|
|
|
|
|
|
|
|
|
| |||||||||||||
NET INCREASE IN NET ASSETS | 9,904,729 | 38,073,928 | 10,819,070 | 5,507,869 | 21,212,968 | 16,556,646 | ||||||||||||||||||
|
|
|
|
|
|
|
|
|
|
|
| |||||||||||||
NET ASSETS | ||||||||||||||||||||||||
Beginning of Year | 76,247,096 | 38,173,168 | 41,859,895 | 36,352,026 | 64,270,266 | 47,713,620 | ||||||||||||||||||
|
|
|
|
|
|
|
|
|
|
|
| |||||||||||||
End of Year | $ | 86,151,825 | $ | 76,247,096 | $ | 52,678,965 | $ | 41,859,895 | $ | 85,483,234 | $ | 64,270,266 | ||||||||||||
|
|
|
|
|
|
|
|
|
|
|
| |||||||||||||
Undistributed/Accumulated Net Investment Income (Loss) | $ | 325,094 | $ | 253,449 | $ | 195,232 | ($ | 534 | ) | ($ | 165,916 | ) | ($ | 409,632 | ) | |||||||||
|
|
|
|
|
|
|
|
|
|
|
| |||||||||||||
| (1) | Class A shares were converted to Class P shares on July 2, 2010 (see Note 1 in Notes to Financial Statements). |
See Notes to Financial Statements
C-14
Table of Contents
PACIFIC LIFE FUNDS
STATEMENTS OF CHANGES IN NET ASSETS (Continued)
| PL International Large-Cap Fund | PL International Value Fund | |||||||||||||||
| Year Ended March 31, 2012 | Year Ended March 31, 2011 | Year Ended March 31, 2012 | Year Ended March 31, 2011 | |||||||||||||
OPERATIONS | ||||||||||||||||
Net investment income | $ | 2,519,676 | $ | 1,365,148 | $ | 3,008,134 | $ | 1,682,757 | ||||||||
Net realized gain (loss) | (2,624,161 | ) | (2,124,405 | ) | (8,382,616 | ) | 2,245,933 | |||||||||
Change in net unrealized appreciation | 7,176,932 | 16,242,751 | 1,902,876 | 1,157,427 | ||||||||||||
|
|
|
|
|
|
|
| |||||||||
Net Increase (Decrease) in Net Assets Resulting from Operations | 7,072,447 | 15,483,494 | (3,471,606 | ) | 5,086,117 | |||||||||||
|
|
|
|
|
|
|
| |||||||||
DISTRIBUTIONS TO SHAREHOLDERS | ||||||||||||||||
Net investment income | ||||||||||||||||
Class A | — | (926,192 | ) | — | (468,259 | ) | ||||||||||
Class P | (2,241,781 | ) | (261,079 | ) | (3,217,735 | ) | (1,543,617 | ) | ||||||||
Net realized gains | ||||||||||||||||
Class A | — | — | — | — | ||||||||||||
Class P | — | — | — | — | ||||||||||||
|
|
|
|
|
|
|
| |||||||||
Net Decrease from Dividends and Distributions to Shareholders | (2,241,781 | ) | (1,187,271 | ) | (3,217,735 | ) | (2,011,876 | ) | ||||||||
|
|
|
|
|
|
|
| |||||||||
CAPITAL SHARE TRANSACTIONS | ||||||||||||||||
Proceeds from sale of shares | ||||||||||||||||
Class A | — | 11,388,585 | — | 10,276,598 | ||||||||||||
Class P | 69,389,238 | 23,576,016 | 30,876,665 | 14,606,762 | ||||||||||||
Dividends and distribution reinvestments | ||||||||||||||||
Class A | — | 925,856 | — | 468,104 | ||||||||||||
Class P | 2,241,781 | 261,079 | 3,217,735 | 1,543,617 | ||||||||||||
Cost of shares repurchased | ||||||||||||||||
Class A | — | (1,280,976 | ) | — | (1,331,608 | ) | ||||||||||
Class P | (10,550,933 | ) | (19,135,979 | ) | (6,528,836 | ) | (24,679,366 | ) | ||||||||
Share class conversions | ||||||||||||||||
Class A (1) | — | (105,495,716 | ) | — | (80,620,211 | ) | ||||||||||
Class P (1) | — | 105,495,716 | — | 80,620,211 | ||||||||||||
|
|
|
|
|
|
|
| |||||||||
Net Increase in Net Assets from Capital Share Transactions | 61,080,086 | 15,734,581 | 27,565,564 | 884,107 | ||||||||||||
|
|
|
|
|
|
|
| |||||||||
NET INCREASE IN NET ASSETS | 65,910,752 | 30,030,804 | 20,876,223 | 3,958,348 | ||||||||||||
|
|
|
|
|
|
|
| |||||||||
NET ASSETS | ||||||||||||||||
Beginning of Year | 138,033,006 | 108,002,202 | 90,242,281 | 86,283,933 | ||||||||||||
|
|
|
|
|
|
|
| |||||||||
End of Year | $ | 203,943,758 | $ | 138,033,006 | $ | 111,118,504 | $ | 90,242,281 | ||||||||
|
|
|
|
|
|
|
| |||||||||
Undistributed Net Investment Income | $ | 1,305,157 | $ | 1,065,721 | $ | 1,083,553 | $ | 378,185 | ||||||||
|
|
|
|
|
|
|
| |||||||||
| (1) | Class A shares were converted to Class P shares on July 2, 2010 (see Note 1 in Notes to Financial Statements). |
See Notes to Financial Statements
C-15
Table of Contents
FINANCIAL HIGHLIGHTS (1)
Selected per share, ratios and supplemental data for each year or period ended March 31, were as follows:
For the Year or Period Ended | Net Asset Value, Beginning of Year or Period | Net Investment Income (Loss) (2) | Net Realized and Unrealized Gain (Loss) | Total from Investment Operations | Distributions from Net Investment Income | Distributions from Capital Gains | Total Distributions | Net Asset Value, End of Year or Period | Total Returns (3) | Net Assets, End of Year or Period (in thousands) | Ratios of Expenses Before Expense Reductions to Average Net Assets (4) | Ratios of Expenses After Expense Reductions to Average Net Assets (4), (5) | Ratios of Net Investment Income (Loss) to Average Net Assets (4) | Portfolio Turnover Rates | ||||||||||||||||||||||||||||||||||||||||||
PL Floating Rate Loan Fund |
| |||||||||||||||||||||||||||||||||||||||||||||||||||||||
4/1/2011 - 3/31/2012 | $ | 10.12 | $ | 0.43 | ($ | 0.06 | ) | $ | 0.37 | ($ | 0.39 | ) | $ | — | ($ | 0.39 | ) | $ | 10.10 | 3.80 | % | $ | 112,088 | 1.04 | % | 0.80 | % | 4.33 | % | 44.93 | % | |||||||||||||||||||||||||
4/1/2010 - 3/31/2011 | 9.88 | 0.34 | 0.19 | 0.53 | (0.29 | ) | — | (0.29 | ) | 10.12 | 5.51 | % | 86,066 | 1.22 | % | 0.90 | % | 4.29 | % | 92.44 | % | |||||||||||||||||||||||||||||||||||
4/1/2009 - 3/31/2010 | 8.18 | 0.45 | 1.70 | 2.15 | (0.45 | ) | — | (0.45 | ) | 9.88 | 26.70 | % | 53,122 | 1.54 | % | 1.30 | % | 4.78 | % | 118.03 | % | |||||||||||||||||||||||||||||||||||
6/30/2008 - 3/31/2009 | 10.00 | 0.39 | (1.82 | ) | (1.43 | ) | (0.39 | ) | — | (0.39 | ) | 8.18 | (14.37 | %) | 27,811 | 1.53 | % | 1.30 | % | 5.90 | % | 56.30 | % | |||||||||||||||||||||||||||||||||
PL High Income Fund (1) |
| |||||||||||||||||||||||||||||||||||||||||||||||||||||||
12/19/2011 - 3/31/2012 | $ | 10.00 | $ | 0.20 | $ | 0.55 | $ | 0.75 | ($ | 0.17 | ) | $ | — | ($ | 0.17 | ) | $ | 10.58 | 7.50 | % | $ | 7,523 | 2.82 | % | 0.80 | % | 6.73 | % | 92.87 | % | ||||||||||||||||||||||||||
PL Inflation Managed Fund |
| |||||||||||||||||||||||||||||||||||||||||||||||||||||||
4/1/2011 - 3/31/2012 | $ | 10.53 | $ | 0.31 | $ | 0.85 | $ | 1.16 | ($ | 0.40 | ) | ($ | 0.50 | ) | ($ | 0.90 | ) | $ | 10.79 | 11.11 | % | $ | 287,956 | 0.67 | % | 0.56 | % | 2.83 | % | 372.47 | % | |||||||||||||||||||||||||
4/1/2010 - 3/31/2011 | 10.10 | 0.24 | 0.61 | 0.85 | (0.21 | ) | (0.21 | ) | (0.42 | ) | 10.53 | 8.56 | % | 229,356 | 0.82 | % | 0.64 | % | 2.31 | % | 322.90 | % | ||||||||||||||||||||||||||||||||||
4/1/2009 - 3/31/2010 | 9.59 | 0.29 | 0.62 | 0.91 | (0.40 | ) | — | (0.40 | ) | 10.10 | 9.68 | % | 149,453 | 1.21 | % | 0.95 | % | 2.90 | % | 299.61 | % | |||||||||||||||||||||||||||||||||||
4/1/2008 - 3/31/2009 | 11.08 | 0.39 | (0.80 | ) | (0.41 | ) | (0.41 | ) | (0.67 | ) | (1.08 | ) | 9.59 | (3.85 | %) | 81,266 | 1.35 | % | 1.01 | % | 3.94 | % | 745.76 | % | ||||||||||||||||||||||||||||||||
4/1/2007 - 3/31/2008 | 10.13 | 0.49 | 0.95 | 1.44 | (0.49 | ) | — | (0.49 | ) | 11.08 | 14.80 | % | 122,386 | 1.49 | % | 1.15 | % | 4.77 | % | 474.46 | % | |||||||||||||||||||||||||||||||||||
PL Managed Bond Fund |
| |||||||||||||||||||||||||||||||||||||||||||||||||||||||
4/1/2011 - 3/31/2012 | $ | 10.75 | $ | 0.25 | $ | 0.15 | $ | 0.40 | ($ | 0.29 | ) | $ | — | ($ | 0.29 | ) | $ | 10.86 | 4.02 | % | $ | 486,215 | 0.67 | % | 0.55 | % | 2.33 | % | 519.00 | % | ||||||||||||||||||||||||||
4/1/2010 - 3/31/2011 | 10.75 | 0.24 | 0.43 | 0.67 | (0.30 | ) | (0.37 | ) | (0.67 | ) | 10.75 | 6.31 | % | 378,982 | 0.82 | % | 0.63 | % | 2.16 | % | 501.72 | % | ||||||||||||||||||||||||||||||||||
4/1/2009 - 3/31/2010 | 9.70 | 0.30 | 1.48 | 1.78 | (0.50 | ) | (0.23 | ) | (0.73 | ) | 10.75 | 18.68 | % | 235,957 | 1.22 | % | 0.95 | % | 2.86 | % | 351.53 | % | ||||||||||||||||||||||||||||||||||
4/1/2008 - 3/31/2009 | 10.73 | 0.43 | (0.45 | ) | (0.02 | ) | (0.55 | ) | (0.46 | ) | (1.01 | ) | 9.70 | 0.07 | % | 137,724 | 1.30 | % | 1.01 | % | 4.36 | % | 441.01 | % | ||||||||||||||||||||||||||||||||
4/1/2007 - 3/31/2008 | 10.16 | 0.42 | 0.53 | 0.95 | (0.37 | ) | (0.01 | ) | (0.38 | ) | 10.73 | 9.44 | % | 175,800 | 1.50 | % | 1.15 | % | 4.05 | % | 424.71 | % | ||||||||||||||||||||||||||||||||||
PL Short Duration Bond Fund |
| |||||||||||||||||||||||||||||||||||||||||||||||||||||||
4/1/2011 - 3/31/2012 | $ | 10.04 | $ | 0.11 | $ | 0.05 | $ | 0.16 | ($ | 0.12 | ) | ($ | 0.01 | ) | ($ | 0.13 | ) | $ | 10.07 | 1.62 | % | $ | 155,368 | 0.68 | % | 0.55 | % | 1.14 | % | 150.23 | % | |||||||||||||||||||||||||
4/1/2010 - 3/31/2011 | 10.00 | 0.10 | 0.06 | 0.16 | (0.08 | ) | (0.04 | ) | (0.12 | ) | 10.04 | 1.57 | % | 121,133 | 0.81 | % | 0.64 | % | 1.00 | % | 195.72 | % | ||||||||||||||||||||||||||||||||||
4/1/2009 - 3/31/2010 | 9.69 | 0.18 | 0.33 | 0.51 | (0.20 | ) | — | (0.20 | ) | 10.00 | 5.27 | % | 75,674 | 1.22 | % | 0.95 | % | 1.84 | % | 167.12 | % | |||||||||||||||||||||||||||||||||||
4/1/2008 - 3/31/2009 | 10.22 | 0.32 | (0.25 | ) | 0.07 | (0.31 | ) | (0.29 | ) | (0.60 | ) | 9.69 | 0.75 | % | 47,355 | 1.26 | % | 1.02 | % | 3.20 | % | 146.36 | % | |||||||||||||||||||||||||||||||||
4/1/2007 - 3/31/2008 | 9.81 | 0.35 | 0.41 | 0.76 | (0.35 | ) | — | (0.35 | ) | 10.22 | 7.86 | % | 83,683 | 1.42 | % | 1.15 | % | 3.48 | % | 41.74 | % | |||||||||||||||||||||||||||||||||||
PL Short Duration Income Fund (1) |
| |||||||||||||||||||||||||||||||||||||||||||||||||||||||
12/19/2011 - 3/31/2012 | $ | 10.00 | $ | 0.06 | $ | 0.15 | $ | 0.21 | ($ | 0.07 | ) | $ | — | ($ | 0.07 | ) | $ | 10.14 | 2.10 | % | $ | 12,251 | 2.04 | % | 0.60 | % | 2.06 | % | 73.40 | % | ||||||||||||||||||||||||||
PL Strategic Income Fund (1) |
| |||||||||||||||||||||||||||||||||||||||||||||||||||||||
12/19/2011 - 3/31/2012 | $ | 10.00 | $ | 0.14 | $ | 0.38 | $ | 0.52 | ($ | 0.12 | ) | $ | — | ($ | 0.12 | ) | $ | 10.40 | 5.22 | % | $ | 17,796 | 1.78 | % | 0.80 | % | 4.84 | % | 155.66 | % | ||||||||||||||||||||||||||
PL Comstock Fund |
| |||||||||||||||||||||||||||||||||||||||||||||||||||||||
4/1/2011 - 3/31/2012 | $ | 12.13 | $ | 0.17 | $ | 0.32 | $ | 0.49 | ($ | 0.15 | ) | $ | — | ($ | 0.15 | ) | $ | 12.47 | 4.22 | % | $ | 207,330 | 0.99 | % | 0.89 | % | 1.47 | % | 23.54 | % | ||||||||||||||||||||||||||
4/1/2010 - 3/31/2011 | 10.69 | 0.13 | 1.41 | 1.54 | (0.10 | ) | — | (0.10 | ) | 12.13 | 14.55 | % | 166,465 | 1.13 | % | 0.99 | % | 1.16 | % | 30.58 | % | |||||||||||||||||||||||||||||||||||
4/1/2009 - 3/31/2010 | 6.95 | 0.09 | 3.74 | 3.83 | (0.09 | ) | — | (0.09 | ) | 10.69 | 55.34 | % | 128,169 | 1.51 | % | 1.30 | % | 0.93 | % | 27.65 | % | |||||||||||||||||||||||||||||||||||
4/1/2008 - 3/31/2009 | 11.84 | 0.16 | (4.89 | ) | (4.73 | ) | (0.16 | ) | — | (0.16 | ) | 6.95 | (40.11 | %) | 74,862 | 1.58 | % | 1.37 | % | 1.68 | % | 59.96 | % | |||||||||||||||||||||||||||||||||
4/1/2007 - 3/31/2008 | 14.11 | 0.15 | (1.95 | ) | (1.80 | ) | (0.12 | ) | (0.35 | ) | (0.47 | ) | 11.84 | (13.16 | %) | 124,271 | 1.77 | % | 1.50 | % | 1.09 | % | 23.28 | % | ||||||||||||||||||||||||||||||||
PL Growth LT Fund |
| |||||||||||||||||||||||||||||||||||||||||||||||||||||||
4/1/2011 - 3/31/2012 | $ | 12.42 | $ | 0.06 | $ | 0.71 | $ | 0.77 | ($ | 0.07 | ) | $ | — | ($ | 0.07 | ) | $ | 13.12 | 6.26 | % | $ | 108,340 | 0.85 | % | 0.70 | % | 0.54 | % | 83.66 | % | ||||||||||||||||||||||||||
4/1/2010 - 3/31/2011 | 11.21 | 0.07 | 1.14 | 1.21 | — | — | — | 12.42 | 10.79 | % | 115,576 | 0.95 | % | 0.79 | % | 0.58 | % | 82.71 | % | |||||||||||||||||||||||||||||||||||||
4/1/2009 - 3/31/2010 | 7.74 | 0.02 | 3.60 | 3.62 | (0.15 | ) | — | (0.15 | ) | 11.21 | 47.26 | % | 89,219 | 1.37 | % | 1.10 | % | 0.19 | % | 60.31 | % | |||||||||||||||||||||||||||||||||||
4/1/2008 - 3/31/2009 | 12.63 | 0.03 | (4.63 | ) | (4.60 | ) | — | (0.29 | ) | (0.29 | ) | 7.74 | (37.27 | %) | 74,158 | 1.42 | % | 1.15 | % | 0.32 | % | 80.89 | % | |||||||||||||||||||||||||||||||||
4/1/2007 - 3/31/2008 | 13.10 | 0.05 | (0.22 | ) | (0.17 | ) | (0.05 | ) | (0.25 | ) | (0.30 | ) | 12.63 | (1.55 | %) | 77,196 | 1.66 | % | 1.30 | % | 0.36 | % | 81.50 | % | ||||||||||||||||||||||||||||||||
PL Large-Cap Growth Fund |
| |||||||||||||||||||||||||||||||||||||||||||||||||||||||
4/1/2011 - 3/31/2012 | $ | 9.23 | ($ | 0.02 | ) | $ | 1.25 | $ | 1.23 | $ | — | ($ | 0.16 | ) | ($ | 0.16 | ) | $ | 10.30 | 13.65 | % | $ | 129,222 | 1.00 | % | 0.88 | % | (0.26 | %) | 76.21 | % | |||||||||||||||||||||||||
4/1/2010 - 3/31/2011 | 7.71 | (0.01 | ) | 1.53 | 1.52 | — | — | — | 9.23 | 19.72 | % | 99,101 | 1.12 | % | 0.95 | % | (0.11 | %) | 101.69 | % | ||||||||||||||||||||||||||||||||||||
4/1/2009 - 3/31/2010 | 5.44 | (0.03 | ) | 2.30 | 2.27 | — | — | — | 7.71 | 41.73 | % | 61,106 | 1.59 | % | 1.28 | % | (0.38 | %) | 115.83 | % | ||||||||||||||||||||||||||||||||||||
4/1/2008 - 3/31/2009 | 9.24 | (0.05 | ) | (3.75 | ) | (3.80 | ) | — | — | — | 5.44 | (41.13 | %) | 16,515 | 1.81 | % | 1.37 | % | (0.61 | %) | 179.61 | % | ||||||||||||||||||||||||||||||||||
4/1/2007 - 3/31/2008 | 9.43 | (0.08 | ) | (0.11 | ) | (0.19 | ) | — | — | — | 9.24 | (2.01 | %) | 26,235 | 1.92 | % | 1.50 | % | (0.79 | %) | 178.83 | % | ||||||||||||||||||||||||||||||||||
PL Large-Cap Value Fund |
| |||||||||||||||||||||||||||||||||||||||||||||||||||||||
4/1/2011 - 3/31/2012 | $ | 11.59 | $ | 0.22 | $ | 0.71 | $ | 0.93 | ($ | 0.21 | ) | $ | — | ($ | 0.21 | ) | $ | 12.31 | 8.21 | % | $ | 262,917 | 0.89 | % | 0.80 | % | 1.96 | % | 20.28 | % | ||||||||||||||||||||||||||
4/1/2010 - 3/31/2011 | 10.42 | 0.16 | 1.15 | 1.31 | (0.14 | ) | — | (0.14 | ) | 11.59 | 12.69 | % | 228,436 | 1.01 | % | 0.89 | % | 1.56 | % | 18.76 | % | |||||||||||||||||||||||||||||||||||
4/1/2009 - 3/31/2010 | 7.35 | 0.14 | 3.07 | 3.21 | (0.14 | ) | — | (0.14 | ) | 10.42 | 43.79 | % | 162,312 | 1.38 | % | 1.20 | % | 1.52 | % | 16.28 | % | |||||||||||||||||||||||||||||||||||
4/1/2008 - 3/31/2009 | 11.59 | 0.16 | (4.27 | ) | (4.11 | ) | (0.12 | ) | (0.01 | ) | (0.13 | ) | 7.35 | (35.61 | %) | 62,931 | 1.48 | % | 1.25 | % | 1.63 | % | 38.49 | % | ||||||||||||||||||||||||||||||||
4/1/2007 - 3/31/2008 | 13.03 | 0.10 | (1.21 | ) | (1.11 | ) | (0.08 | ) | (0.25 | ) | (0.33 | ) | 11.59 | (8.80 | %) | 68,901 | 1.69 | % | 1.40 | % | 0.79 | % | 24.35 | % | ||||||||||||||||||||||||||||||||
| See Notes to Financial Statements | See explanation of references on C-18 |
C-16
Table of Contents
PACIFIC LIFE FUNDS
FINANCIAL HIGHLIGHTS (Continued) (1)
Selected per share, ratios and supplemental data for each year or period ended March 31, were as follows:
For the Year or | Net Asset Value, Beginning of Year or Period | Net Investment Income (Loss) (2) | Net Realized and Unrealized Gain (Loss) | Total from Investment Operations | Distributions from Net Investment Income | Distributions from Capital Gains | Total Distributions | Net Asset Value, End of Year or Period | Total Returns (3) | Net Assets, End of Year or Period (in thousands) | Ratios of | Ratios of | Ratios of | Portfolio | ||||||||||||||||||||||||||||||||||
PL Main Street Core Fund | ||||||||||||||||||||||||||||||||||||||||||||||||
4/1/2011 - 3/31/2012 | $ | 10.13 | $ | 0.10 | $ | 1.11 | $ | 1.21 | ($ | 0.08 | ) | $ | — | ($ | 0.08 | ) | $ | 11.26 | 12.12 | % | $ | 193,538 | 0.70% | 0.60% | 1.00% | 47.65% | ||||||||||||||||||||||
4/1/2010 - 3/31/2011 | 9.00 | 0.09 | 1.10 | 1.19 | (0.06 | ) | — | (0.06 | ) | 10.13 | 13.28 | % | 157,890 | 0.83% | 0.70% | 0.93% | 58.13% | |||||||||||||||||||||||||||||||
4/1/2009 - 3/31/2010 | 6.11 | 0.07 | 2.89 | 2.96 | (0.07 | ) | — | (0.07 | ) | 9.00 | 48.57 | % | 146,028 | 1.23% | 1.00% | 0.89% | 130.37% | |||||||||||||||||||||||||||||||
4/1/2008 - 3/31/2009 | 9.91 | 0.09 | (3.81 | ) | (3.72 | ) | (0.08 | ) | — | (0.08 | ) | 6.11 | (37.66 | %) | 85,261 | 1.41% | 1.06% | 1.07% | 101.22% | |||||||||||||||||||||||||||||
4/1/2007 - 3/31/2008 | 11.46 | 0.08 | (0.94 | ) | (0.86 | ) | (0.08 | ) | (0.61 | ) | (0.69 | ) | 9.91 | (8.29 | %) | 111,936 | 1.50% | 1.20% | 0.69% | 126.84% | ||||||||||||||||||||||||||||
PL Mid-Cap Equity Fund (6) | ||||||||||||||||||||||||||||||||||||||||||||||||
4/1/2011 - 3/31/2012 | $ | 10.46 | $ | 0.05 | ($ | 0.18 | ) | ($ | 0.13 | ) | ($ | 0.04 | ) | $ | — | ($ | 0.04 | ) | $ | 10.29 | (1.17 | %) | $ | 165,168 | 0.89% | 0.80% | 0.51% | 102.11% | ||||||||||||||||||||
4/1/2010 - 3/31/2011 | 8.66 | 0.08 | 1.79 | 1.87 | (0.07 | ) | — | (0.07 | ) | 10.46 | 21.70 | % | 135,755 | 1.02% | 0.89% | 0.87% | 87.04% | |||||||||||||||||||||||||||||||
4/1/2009 - 3/31/2010 | 5.33 | 0.03 | 3.34 | 3.37 | (0.04 | ) | — | (0.04 | ) | 8.66 | 63.29 | % | 101,650 | 1.41% | 1.20% | 0.44% | 74.00% | |||||||||||||||||||||||||||||||
4/1/2008 - 3/31/2009 | 8.92 | 0.07 | (3.58 | ) | (3.51 | ) | (0.08 | ) | (0.00 | )(7) | (0.08 | ) | 5.33 | (39.44 | %) | 59,135 | 1.52% | 1.26% | 1.01% | 82.26% | ||||||||||||||||||||||||||||
4/1/2007 - 3/31/2008 | 11.62 | 0.06 | (1.61 | ) | (1.55 | ) | (0.03 | ) | (1.12 | ) | (1.15 | ) | 8.92 | (14.81 | %) | 85,208 | 1.69% | 1.40% | 0.55% | 70.09% | ||||||||||||||||||||||||||||
PL Mid-Cap Growth Fund | ||||||||||||||||||||||||||||||||||||||||||||||||
4/1/2011 - 3/31/2012 | $ | 10.28 | ($ | 0.02 | ) | ($ | 0.28 | ) | ($ | 0.30 | ) | ($ | 0.05 | ) | ($ | 1.06 | ) | ($ | 1.11 | ) | $ | 8.87 | (1.08 | %) | $ | 73,586 | 0.98% | 0.85% | (0.21%) | 26.59% | ||||||||||||||||||
4/1/2010 - 3/31/2011 | 8.41 | 0.02 | 2.83 | 2.85 | (0.02 | ) | (0.96 | ) | (0.98 | ) | 10.28 | 35.16 | % | 64,476 | 1.17% | 0.95% | 0.24% | 44.37% | ||||||||||||||||||||||||||||||
4/1/2009 - 3/31/2010 | 4.98 | (0.03 | ) | 3.56 | 3.53 | — | (0.10 | ) | (0.10 | ) | 8.41 | 70.89 | % | 54,994 | 1.53% | 1.25% | (0.42%) | 31.79% | ||||||||||||||||||||||||||||||
4/1/2008 - 3/31/2009 | 9.31 | (0.05 | ) | (3.57 | ) | (3.62 | ) | — | (0.71 | ) | (0.71 | ) | 4.98 | (40.02 | %) | 18,873 | 1.80% | 1.34% | (0.60%) | 47.92% | ||||||||||||||||||||||||||||
4/1/2007 - 3/31/2008 | 10.93 | (0.02 | ) | 0.66 | 0.64 | — | (2.26 | ) | (2.26 | ) | 9.31 | 3.48 | % | 50,189 | 1.80% | 1.45% | (0.19%) | 77.63% | ||||||||||||||||||||||||||||||
PL Small-Cap Growth Fund | ||||||||||||||||||||||||||||||||||||||||||||||||
4/1/2011 - 3/31/2012 | $ | 11.90 | ($ | 0.03 | ) | ($ | 0.01 | ) | ($ | 0.04 | ) | $ | — | $ | — | $ | — | $ | 11.86 | (0.34 | %) | $ | 36,370 | 0.93% | 0.75% | (0.31%) | 66.60% | |||||||||||||||||||||
4/1/2010 - 3/31/2011 | 9.41 | (0.06 | ) | 2.55 | 2.49 | — | — | — | 11.90 | 26.46 | % | 32,355 | 1.11% | 0.84% | (0.63%) | 85.58% | ||||||||||||||||||||||||||||||||
4/1/2009 - 3/31/2010 | 5.88 | (0.06 | ) | 3.59 | 3.53 | — | — | — | 9.41 | 60.03 | % | 25,691 | 1.56% | 1.15% | (0.81%) | 87.50% | ||||||||||||||||||||||||||||||||
4/1/2008 - 3/31/2009 | 9.12 | (0.07 | ) | (3.17 | ) | (3.24 | ) | — | — | — | 5.88 | (35.53 | %) | 24,046 | 1.71% | 1.28% | (0.96%) | 72.93% | ||||||||||||||||||||||||||||||
4/1/2007 - 3/31/2008 | 11.24 | (0.12 | ) | (0.62 | ) | (0.74 | ) | — | (1.38 | ) | (1.38 | ) | 9.12 | (8.81 | %) | 37,258 | 1.90% | 1.55% | (1.07%) | 163.56% | ||||||||||||||||||||||||||||
PL Small-Cap Value Fund | ||||||||||||||||||||||||||||||||||||||||||||||||
4/1/2011 - 3/31/2012 | $ | 10.60 | $ | 0.16 | ($ | 0.05 | ) | $ | 0.11 | ($ | 0.13 | ) | $ | — | ($ | 0.13 | ) | $ | 10.58 | 1.19 | % | $ | 86,152 | 1.02% | 0.90% | 1.59% | 20.85% | |||||||||||||||||||||
4/1/2010 - 3/31/2011 | 8.57 | 0.16 | 1.98 | 2.14 | (0.11 | ) | — | (0.11 | ) | 10.60 | 25.11 | % | 76,247 | 1.13% | 0.97% | 1.71% | 31.06% | |||||||||||||||||||||||||||||||
4/1/2009 - 3/31/2010 | 5.49 | 0.13 | 3.06 | 3.19 | (0.11 | ) | — | (0.11 | ) | 8.57 | 58.28 | % | 38,173 | 1.58% | 1.30% | 1.82% | 31.57% | |||||||||||||||||||||||||||||||
4/1/2008 - 3/31/2009 | 8.80 | 0.16 | (3.34 | ) | (3.18 | ) | (0.13 | ) | — | (0.13 | ) | 5.49 | (36.39 | %) | 27,018 | 1.73% | 1.34% | 2.21% | 47.41% | |||||||||||||||||||||||||||||
6/29/2007 - 3/31/2008 | 10.00 | 0.10 | (1.24 | ) | (1.14 | ) | (0.06 | ) | — | (0.06 | ) | 8.80 | (11.47 | %) | 19,112 | 2.07% | 1.50% | 1.46% | 17.98% | |||||||||||||||||||||||||||||
PL Real Estate Fund | ||||||||||||||||||||||||||||||||||||||||||||||||
4/1/2011 - 3/31/2012 | $ | 11.46 | $ | 0.13 | $ | 1.08 | $ | 1.21 | ($ | 0.08 | ) | $ | — | ($ | 0.08 | ) | $ | 12.59 | 10.62 | % | $ | 52,679 | 1.18% | 1.05% | 1.13% | 23.69% | ||||||||||||||||||||||
4/1/2010 - 3/31/2011 | 9.24 | 0.08 | 2.23 | 2.31 | (0.09 | ) | — | (0.09 | ) | 11.46 | 25.16 | % | 41,860 | 1.34% | 1.14% | 0.77% | 32.30% | |||||||||||||||||||||||||||||||
4/1/2009 - 3/31/2010 | 4.60 | 0.12 | 4.64 | 4.76 | (0.12 | ) | — | (0.12 | ) | 9.24 | 104.32 | % | 36,352 | 1.76% | 1.45% | 1.68% | 26.55% | |||||||||||||||||||||||||||||||
4/1/2008 - 3/31/2009 | 11.25 | 0.15 | (6.65 | ) | (6.50 | ) | (0.15 | )(8) | — | (0.15 | ) | 4.60 | (58.24 | %) | 20,775 | 1.89% | 1.51% | 1.79% | 42.37% | |||||||||||||||||||||||||||||
4/1/2007 - 3/31/2008 | 14.94 | 0.13 | (2.77 | ) | (2.64 | ) | (0.18 | ) | (0.87 | ) | (1.05 | ) | 11.25 | (18.03 | %) | 37,872 | 2.03% | 1.65% | 1.02% | 34.98% | ||||||||||||||||||||||||||||
PL Emerging Markets Fund | ||||||||||||||||||||||||||||||||||||||||||||||||
4/1/2011 - 3/31/2012 | $ | 14.68 | $ | 0.14 | ($ | 0.95 | ) | ($ | 0.81 | ) | ($ | 0.07 | ) | ($ | 0.25 | ) | ($ | 0.32 | ) | $ | 13.55 | (5.15 | %) | $ | 85,483 | 1.49% | 0.95% | 1.09% | 29.84% | |||||||||||||||||||
4/1/2010 - 3/31/2011 | 12.19 | 0.11 | 2.64 | 2.75 | (0.26 | ) | — | (0.26 | ) | 14.68 | 22.53 | % | 64,270 | 1.56% | 1.04% | 0.80% | 45.98% | |||||||||||||||||||||||||||||||
4/1/2009 - 3/31/2010 | 6.54 | 0.06 | 5.66 | 5.72 | (0.07 | ) | — | (0.07 | ) | 12.19 | 87.45 | % | 47,714 | 2.15% | 1.35% | 0.57% | 55.24% | |||||||||||||||||||||||||||||||
4/1/2008 - 3/31/2009 | 13.58 | 0.11 | (5.39 | ) | (5.28 | ) | (0.07 | ) | (1.69 | ) | (1.76 | ) | 6.54 | (42.31 | %) | 30,820 | 2.34% | 1.42% | 1.18% | 61.50% | ||||||||||||||||||||||||||||
4/1/2007 - 3/31/2008 | 13.01 | 0.07 | 2.32 | 2.39 | (0.05 | ) | (1.77 | ) | (1.82 | ) | 13.58 | 17.21 | % | 47,633 | 2.38% | 1.55% | 0.46% | 60.20% | ||||||||||||||||||||||||||||||
PL International Large-Cap Fund | ||||||||||||||||||||||||||||||||||||||||||||||||
4/1/2011 - 3/31/2012 | $ | 15.37 | $ | 0.22 | ($ | 0.30 | ) | ($ | 0.08 | ) | ($ | 0.17 | ) | $ | — | ($ | 0.17 | ) | $ | 15.12 | (0.32 | %) | $ | 203,944 | 1.17% | 1.00% | 1.52% | 23.96% | ||||||||||||||||||||
4/1/2010 - 3/31/2011 | 13.83 | 0.16 | 1.52 | 1.68 | (0.14 | ) | — | (0.14 | ) | 15.37 | 12.36 | % | 138,033 | 1.30% | 1.09% | 1.16% | 33.73% | |||||||||||||||||||||||||||||||
4/1/2009 - 3/31/2010 | 9.17 | 0.16 | 4.64 | 4.80 | (0.14 | ) | — | (0.14 | ) | 13.83 | 52.64 | % | 108,002 | 1.72% | 1.40% | 1.26% | 24.61% | |||||||||||||||||||||||||||||||
4/1/2008 - 3/31/2009 | 15.55 | 0.17 | (6.37 | ) | (6.20 | ) | (0.06 | ) | (0.12 | ) | (0.18 | ) | 9.17 | (40.24 | %) | 65,124 | 1.82% | 1.46% | 1.39% | 25.95% | ||||||||||||||||||||||||||||
4/1/2007 - 3/31/2008 | 16.64 | 0.19 | (0.34 | ) | (0.15 | ) | (0.15 | ) | (0.79 | ) | (0.94 | ) | 15.55 | (1.17 | %) | 96,049 | 1.99% | 1.60% | 1.18% | 28.23% | ||||||||||||||||||||||||||||
| See Notes to Financial Statements | See explanation of references on C-18 |
C-17
Table of Contents
PACIFIC LIFE FUNDS
FINANCIAL HIGHLIGHTS (Continued) (1)
Selected per share, ratios and supplemental data for each year or period ended March 31, were as follows:
For the Year or | Net Asset Value, Beginning of Year or Period | Net Investment Income (Loss) (2) | Net Realized and Unrealized Gain (Loss) | Total from Investment Operations | Distributions from Net Investment Income | Distributions from Capital Gains | Total Distributions | Net Asset Value, End of Year of Period | Total Returns (3) | Net Assets, End of Year or Period (in thousands) | Ratios of Expenses Before Expense Reductions to Average Net Assets (4) | Ratios of Expenses After Expense Reductions to Average Net Assets(4), (5) | Ratios of Net Investment Income (Loss) to Average Net Assets (4) | Portfolio Turnover Rates | ||||||||||||||||||||||||||||||||||||||||||
PL International Value Fund |
| |||||||||||||||||||||||||||||||||||||||||||||||||||||||
4/1/2011 - 3/31/2012 | $ | 9.51 | $ | 0.26 | ($ | 0.89 | ) | ($ | 0.63 | ) | ($ | 0.26 | ) | $ | — | ($ | 0.26 | ) | $ | 8.62 | (6.20 | %) | $ | 111,119 | 1.02 | % | 0.80 | % | 3.06 | % | 63.04 | % | ||||||||||||||||||||||||
4/1/2010 - 3/31/2011 | 9.19 | 0.18 | 0.35 | 0.53 | (0.21 | ) | — | (0.21 | ) | 9.51 | 5.99 | % | 90,242 | 1.14 | % | 0.90 | % | 2.01 | % | 149.95 | % | |||||||||||||||||||||||||||||||||||
4/1/2009 - 3/31/2010 | 6.14 | 0.19 | 3.00 | 3.19 | (0.14 | ) | — | (0.14 | ) | 9.19 | 52.10 | % | 86,284 | 1.56 | % | 1.20 | % | 2.28 | % | 59.92 | % | |||||||||||||||||||||||||||||||||||
4/1/2008 - 3/31/2009 | 12.82 | 0.26 | (6.72 | ) | (6.46 | ) | (0.22 | ) | (0.00 | )(7) | (0.22 | ) | 6.14 | (50.74 | %) | 78,604 | 1.58 | % | 1.27 | % | 2.82 | % | 31.43 | % | ||||||||||||||||||||||||||||||||
4/1/2007 - 3/31/2008 | 14.39 | 0.22 | (1.38 | ) | (1.16 | ) | (0.13 | ) | (0.28 | ) | (0.41 | ) | 12.82 | (8.27 | %) | 124,055 | 1.72 | % | 1.40 | % | 1.50 | % | 17.40 | % | ||||||||||||||||||||||||||||||||
| (1) | All the funds, except for the PL High Income, PL Short Duration Income, and PL Strategic Income Funds, covered in this report currently offer Class P shares only. Effective July 2, 2010, all Class A shares of these funds were converted to Class P shares (See Note 1 in Notes to Financial Statements). Performance information prior to the conversion for these funds pertains to Class A shares and reflects the fees and expenses associated with that share class. The PL High Income, PL Short Duration Income, and PL Strategic Income Funds, commenced operations on December 19, 2011, and currently offers Class I shares only. |
| (2) | Net investment income (loss) per share has been calculated using the average shares method. |
| (3) | The total returns include reinvestment of all dividends and capital gain distributions, if any, and do not include deductions of any applicable sales charges. Total returns are not annualized for periods less than one full year. |
| (4) | The ratios are annualized for periods of less than one full year. |
| (5) | The ratios of expenses after expense reductions to average net assets are after any advisory fee waivers and adviser expense reimbursements as discussed in Note 6 and Note 7B, respectively, in Notes to the Financial Statements. |
| (6) | Prior to July 1, 2008, the PL Mid-Cap Equity Fund was named PL Mid-Cap Value Fund. |
| (7) | Amount represents less than $0.005 per share or less than 0.005%. |
| (8) | Includes return of capital distribution of $0.01 per share. |
See Notes to Financial Statements
C-18
Table of Contents
NOTES TO FINANCIAL STATEMENTS
1. ORGANIZATION
Pacific Life Funds (the “Trust”) is a Delaware statutory trust, which was formed on May 21, 2001, and is registered under the Investment Company Act of 1940 (“1940 Act”), as amended, as an open-end management investment company. Pacific Life Fund Advisors LLC (“PLFA” or “Adviser”) serves as investment advisor to the Trust. As of March 31, 2012, the Trust was comprised of twenty-eight separate funds, twenty of which are covered by this report (each individually, a “Fund”, and collectively the “Funds”): PL Floating Rate Loan Fund, PL Inflation Managed Fund, PL Managed Bond Fund, PL Short Duration Bond Fund, PL Comstock Fund, PL Growth LT Fund, PL Large-Cap Growth Fund, PL Large-Cap Value Fund, PL Main Street® Core Fund (Main Street is a registered trademark of OppenheimerFunds, Inc.), PL Mid-Cap Equity Fund, PL Mid-Cap Growth Fund, PL Small-Cap Growth Fund, PL Small-Cap Value Fund, PL Real Estate Fund, PL Emerging Markets Fund, PL International Large-Cap Fund, and PL International Value Fund (collectively the “PL Underlying Funds”); and PL High Income Fund, PL Short Duration Income Fund and PL Strategic Income Fund.
Effective July 2, 2010, all Class A Shares of PL Underlying Funds were converted to Class P Shares. The PL Underlying Funds offer Class P shares only, which are sold at Net Asset Value (“NAV”). Presently, only the PL Portfolio Optimization Conservative Fund, PL Portfolio Optimization Moderate-Conservative Fund, PL Portfolio Optimization Moderate Fund, PL Portfolio Optimization Moderate-Aggressive Fund, and PL Portfolio Optimization Aggressive Fund (collectively, the “Portfolio Optimization Funds”), and the Adviser and certain of its affiliates can invest in the PL Underlying Funds.
The PL High Income Fund, PL Short Duration Income Fund and PL Strategic Income Fund commenced operations on December 19, 2011. Although the Funds are effective, they are not currently offering shares to investors and are not available for sale at this time. Presently, the only shareholders of the PL High Income Fund, PL Short Duration Income Fund and PL Strategic Income Fund are the Adviser and certain of its affiliates.
The annual report for the Portfolio Optimization Funds is not included in this report; there is a separate annual report for the Portfolio Optimization Funds, which is available without charge. For information on how to obtain the annual report for the Portfolio Optimization Funds, see the Where to Go for More Information section of this report on page F-13.
2. SIGNIFICANT ACCOUNTING POLICIES
The financial statements have been prepared in conformity with accounting principles generally accepted in the United States of America (“U.S. GAAP”) for investment companies. In preparing the financial statements, management is required to make estimates and assumptions that affect the reported amounts of assets and liabilities and disclosures of contingent assets and liabilities at the date of the financial statements and the reported amounts of increases and decreases in net assets from operations during the reporting period. Actual results could differ from those estimates. The following is a summary of the significant accounting policies followed by the Trust in the preparation of the financial statements.
A. INVESTMENT TRANSACTIONS AND INCOME
Investment transactions are recorded on a trade date basis. Securities purchased or sold on a when-issued or delayed-delivery basis as well as certain loan transactions and mortgage securities (such as Government National Mortgage Association (“GNMA”) securities) may be settled a month or more after the trade date. Dividend income is recorded on the ex-dividend date, except certain dividends from foreign securities, which are recorded as soon as a Fund is informed of the ex-dividend date or upon receipt of the dividend. A Fund’s estimated components of distributions received from real estate investment trusts may be considered income, return of capital distributions or capital gain distributions. Return of capital distributions are recorded as a reduction of cost of the related investments. Interest income, adjusted for amortization of premium and accretion of discount, is recorded daily on an accrual basis. Investment income is recorded net of foreign taxes withheld, if any. A Fund may be subject to foreign taxes on income, gains on investments or currency repatriation, a portion of which may be recoverable. A Fund will accrue such taxes and reclaims as applicable, based upon the current interpretation of tax rules and regulations that exist in the markets in which a Fund invests. Facility fees and other fees (such as origination fees) received from senior loans purchased (see Note 4) by a Fund are amortized over the expected term of each applicable senior loan. Commitment fees received by a Fund relating to unfunded senior loan commitments are deferred and amortized to income over the period of the commitment. Consent fees, which are compensation for agreeing to changes in the terms of debt instruments, are included in interest income in the Statements of Operations when received. Realized gains and losses from investment transactions are recorded on the basis of identified cost, which is also used for Federal income tax purposes. Gains and losses realized on principal paydowns from mortgage- and asset-backed securities are recorded as interest income in the Statements of Operations.
B. DISTRIBUTIONS TO SHAREHOLDERS
The Funds declare and pay dividends on net investment income at least annually, except for the PL High Income Fund, PL Short Duration Income Fund and PL Strategic Income Fund, for which dividends are generally declared and paid monthly. Dividends may be declared more or less frequently if advantageous to the specific Fund and its shareholders. All realized capital gains are distributed at least annually for each Fund. Dividends and distributions paid to shareholders are recorded on the ex-dividend date.
C. FOREIGN CURRENCY TRANSLATION
The Trust’s accounting records are maintained in U.S. dollars. The market value of investments and other assets and liabilities, initially expressed in non-U.S. currencies, are translated into U.S. dollars based on the applicable exchange rates at the end of each business day.
D-1
Table of Contents
PACIFIC LIFE FUNDS
NOTES TO FINANCIAL STATEMENTS (Continued)
Purchases and sales of investments and income and expenses, denominated in foreign currencies, are translated into U.S. dollars at the exchange rates in effect on the transaction date.
None of the Funds separately report the effect of changes in foreign exchange rates from changes in market prices of investments held. Such changes are included with the net realized gain or loss and change in net unrealized appreciation or depreciation on investments in the Statements of Operations. Other foreign currency transactions resulting in realized and unrealized gain or loss, if any, are reported separately as net realized gain or loss on foreign currency transactions and change in net unrealized appreciation or depreciation on foreign currencies in the Statements of Operations.
D. ALLOCATION OF INCOME, EXPENSES, GAINS AND LOSSES
Income, non-class specific expenses, realized and unrealized gains and losses are allocated on a daily basis to each class of shares based upon the relative proportion of net assets of each class. Certain Trust expenses directly attributable to a particular Fund are charged to that Fund (such as Fund-specific transactional fees, proxies, liquidations, litigation, and organizational/start-up costs) and class-specific fees and expenses are charged directly to the respective share class within each Fund. Generally other Fund expenses are allocated proportionately among all the Funds in relation to the net assets of each Fund.
E. OFFERING COSTS
A new Fund bears all costs (or the applicable pro-rata share if there is more than one new Fund) associated with the offering expenses of the Fund including legal, printing and support services (see Notes 6 and 7A). All such costs are amortized as an expense of the new Fund on a straight-line basis over twelve months from commencement of operations.
F. RECENT ACCOUNTING PRONOUNCEMENTS
In April 2011, Financial Accounting Standards Board (“FASB”) issued an Accounting Standards Update (“ASU”) related to accounting for repurchase agreements and similar agreements that both entitle and obligate a transferor to repurchase or redeem financial assets before their maturity. The ASU modifies the criteria for determining effective control of transferred assets and as a result certain agreements may now be accounted for as secured borrowings. This ASU is effective for the first interim or annual periods beginning on or after December 15, 2011.
In May 2011, FASB issued an ASU to establish common requirements for measurement of and disclosure about fair value between U.S. GAAP and International Financial Reporting Standards (“IFRS”) to improve the comparability of fair value measurements presented and disclosed in financial statements prepared in accordance with both accounting standards. This ASU will require additional qualitative disclosures for fair value measurements categorized within Level 3 of the three-tier hierarchy (see Note 3C), as well as additional disclosures for all transfers in and out of Level 1 and Level 2. This ASU is effective for interim and annual reporting periods beginning after December 15, 2011.
In December 2011, FASB issued an ASU that requires disclosures to make financial statements that are prepared under U.S. GAAP more comparable to those prepared under IFRS. The new disclosure requirements mandate that entities disclose both gross and net information about instruments and transactions eligible for offset in the statement of assets and liabilities such as instruments and transactions subject to an agreement similar to a master netting arrangement. In addition, this ASU requires disclosure of collateral received and posted in connection with master netting agreements or similar arrangements. This ASU is effective for interim and annual reporting periods beginning on or after January 1, 2013.
Management is currently evaluating the impact, if any, that the implementation of these ASUs will have on the Trust’s financial statement disclosures.
3. INVESTMENT VALUATION AND FAIR VALUE MEASUREMENTS
A. NET ASSET VALUE
Each Fund is divided into shares. The price per share of each class of a Fund’s shares is called NAV. The NAV forms the basis for all transactions involving buying, selling, exchanging or reinvesting shares. Each Fund’s NAV is calculated by taking the total value of a Fund’s assets (the value of the securities and other investments a Fund holds), subtracting a Fund’s liabilities, and dividing by the total number of shares outstanding. The value of each security or other investment is the amount which a Fund might reasonably expect to receive for the investment upon its current sale in the ordinary course of business. The valuation of investments held by the Funds is discussed in further detail below.
Each Fund’s NAV is calculated once a day, every day the New York Stock Exchange (“NYSE”) is open, including days when foreign markets are closed. For purposes of calculating the NAV, the value of investments held by each Fund is generally determined as of the time of the close of the NYSE, which is usually 4:00 p.m. Eastern Time. Information that becomes known to the Trust or its agents after the NAV has been calculated on a particular day will not normally be used to retroactively adjust the price of an investment or the NAV determined earlier that day.
Each Fund’s NAV will not be calculated on days when the NYSE is closed. There may be a delay in calculating the NAV if: (i) the NYSE is closed on a day other than a regular holiday or weekend, (ii) trading on the NYSE is restricted, (iii) an emergency exists (as determined by the Securities and Exchange Commission (“SEC”)), making the sale of securities or other instruments or determinations of NAV not practicable, or (iv) the SEC permits a delay for the protection of shareholders.
| D-2 |
Table of Contents
PACIFIC LIFE FUNDS
NOTES TO FINANCIAL STATEMENTS (Continued)
B. INVESTMENT VALUATION
For purposes of calculating the NAV, the value of investments held by each Fund is based primarily on pricing data obtained from various sources approved by the Trust’s Board of Trustees (the “Board”):
Money Market Instruments and Short-Term Investments
Money market instruments and short-term investments maturing within 60 days are valued at amortized cost in accordance with the 1940 Act. Amortized cost involves valuing an investment at cost on the date of acquisition and thereafter assuming a constant accretion of a discount or amortization of a premium to maturity, regardless of the impact of fluctuating interest rates on the market value of the instrument. While this method provides consistency in valuation (and may only be used if it approximates market value), it may result in periods during which value, as determined by amortized cost, is higher or lower than the price that would be received if the Fund sold the investment. Fund investments in other mutual funds for temporary cash purposes are valued at their respective NAVs.
Domestic Equity Investments
For domestic equity investments, the Trust uses the last reported sale price or official closing price as of the time of the NYSE close and do not normally take into account trading, clearances or settlements that take place after the NYSE close.
Foreign Equity Investments
Foreign equity investments are normally priced based on data reflecting the closing of the principal markets or market participants for those investments, which may be earlier than the NYSE close. The Trust then may adjust for market events that occur between the close of certain foreign exchanges and the NYSE. The Trust has retained an independent statistical service approved by the Board to assist in determining the value of certain foreign equity securities. This service utilizes proprietary computer models based on historical performance of markets and other considerations to determine the appropriate adjustments for market events. Quotations of foreign investments in foreign currencies are converted into U.S. dollar equivalents using a foreign exchange quotation from an approved source.
Over the Counter (“OTC”) Investments and Certain Equity Investments
OTC investments, including options contracts and listed investments for which no sales are reported, are generally valued at the mean between the most recent bid and ask prices obtained from a quotation and valuation reporting system, from established market makers, or from broker-dealers. OTC swap contracts are generally valued by approved pricing and quotation services that use evaluated prices determined from various observable market and other factors. Certain OTC swap contracts are valued by other pricing processes approved by the Board.
Domestic and Foreign Fixed Income Investments
Fixed income investments are generally valued by approved pricing and quotation services using the mean between the most recent bid and ask prices which are based upon evaluated prices determined from various observable market and other factors. Certain bonds are valued by a benchmark, matrix, or other pricing processes approved by the Board.
Investment Values Determined by a Trustee Valuation Committee or a Valuation Committee Approved by the Board
The Board has adopted procedures (“Trust Procedures”) that include methodologies approved for valuing investments in circumstances where market quotations are not readily available. In such circumstances, a Trustee Valuation Committee or other valuation committee will determine the value of such investments in accordance with alternative valuation methodologies under the Trust Procedures which may include, among others, the use of broker quotes, the use of a purchase price for initial public offerings, proration rates, and benchmark and matrix pricing. In the event market quotations or Board approved alternate valuation methodologies are not readily available or reliable, the value of the investments will be determined in good faith by a Trustee Valuation Committee or determined by a Board approved valuation committee and then subsequently approved by the Board. Valuations determined by a Trustee Valuation Committee or other valuation committee may require subjective inputs about the value of such investments. While these valuations are intended to estimate the value a Fund might reasonably expect to receive upon the current sale of the investments in the ordinary course of business, such values may differ from the value that a Fund would actually realize if the investments were sold.
Market quotes are considered not readily available if: (1) the market quotations received are deemed unreliable or inaccurate, (2) approved pricing services do not provide a valuation for a particular investment, or (3) material events occur after the close of the principal market for a particular investment but prior to the close of the NYSE.
C. FAIR VALUE MEASUREMENTS AND DISCLOSURES
The Trust characterizes its investments as Level 1, Level 2 or Level 3 based upon the various inputs or methodologies used to value the investments. The three-tier hierarchy of inputs is summarized in the three broad levels listed below:
• Level 1 - | Quoted prices (unadjusted) in active markets for identical investments | |
• Level 2 - | Significant observable market-based inputs, other than Level 1 quoted prices, or unobservable inputs that are corroborated by market data | |
• Level 3 - | Significant unobservable inputs that are not corroborated by observable market data | |
| D-3 |
Table of Contents
PACIFIC LIFE FUNDS
NOTES TO FINANCIAL STATEMENTS (Continued)
The inputs or methodologies used for valuing each Fund’s investments are not necessarily an indication of the relative risks associated with investing in those investments. For example, money market instruments are valued using amortized cost in accordance with the rules under the 1940 Act. Generally, amortized cost approximates the current fair value of an investment, but since the value is not obtained from a quoted price in an active market, such investments are reflected as Level 2. Foreign investments that are valued with the assistance of a statistical research service approved by the Board, and based on significant observable inputs (as described in Note 3B) are reflected as Level 2. For fair valuations using significant unobservable inputs, the Trust presents a reconciliation of the beginning to ending balances for reported market values that presents changes attributable to total realized and unrealized gains or losses, purchase and sales, and transfers in and out of Level 3 during the period. Transfers in and out between levels are based on values at the end of the period. For the year or period ended March 31, 2012, there were no significant transfers between Level 1, Level 2, and Level 3 for any of the Funds covered in this report. A summary of each Fund’s investments as of March 31, 2012 as categorized under the three-tier hierarchy of inputs can be found in the Notes to Schedule of Investments section of each Fund’s Schedule of Investments.
The following is a description of valuation inputs and techniques that the Trust currently utilizes to fair value each major category of assets and liabilities.
Equity Securities (Common and Preferred Stock) and Mutual Funds
Equity securities (foreign or domestic) that are actively traded on a securities exchange are fair valued based on quoted prices from the applicable exchange, and to the extent valuation adjustments are not applied to these securities, they are categorized as Level 1. Equity securities traded on inactive markets and certain foreign equity securities are fair valued using significant other observable inputs which include broker-dealer quotes, recently executed transactions adjusted for changes in the benchmark index, or evaluated price quotes received from pricing vendors that take into account the integrity of the market sector and issuer, the individual characteristics of the security, and information received from broker-dealers and other market sources pertaining to the issuer or security. To the extent that these inputs are observable and timely, the fair values of these securities would be categorized as Level 2; otherwise the fair values would be categorized as Level 3.
Investments in mutual funds are valued at their respective NAV per share and are categorized as Level 1.
U.S. Treasury Obligations
U.S. Treasuries are fair valued based on pricing models that evaluate the mean between the most recently published bid and ask price. The models also take into consideration data received from active market makers and inter-dealer brokers, yield curves, and the spread over comparable U.S. Treasury issues. The spreads change daily in response to market conditions and are generally obtained from the new issue market and broker-dealer sources. To the extent that these inputs are observable and timely, the fair values of U.S. Treasury obligations would be categorized as Level 2; otherwise the fair values would be categorized as Level 3.
Mortgage-Backed Securities and Asset-Backed Securities
Mortgage-backed securities, including government sponsored enterprises, are fair valued using pricing models based on inputs that include issuer type, coupon, and cash flows, mortgage prepayment projection tables and adjustable rate mortgage evaluations that incorporate index data, periodic and life caps, and the next coupon reset date, and the convertibility of the bond. To the extent that these inputs are observable and timely, the fair values of mortgage-backed securities would be categorized as Level 2; otherwise the fair value would be categorized as Level 3.
Asset-backed securities and collateralized mortgage obligations are fair valued using pricing models based on a security’s average life volatility. The models also take into account tranche characteristics such as coupon average life, collateral types, ratings, the issuer and tranche type, underlying collateral and performance of the collateral, and discount margin for certain floating rate issues. To the extent that these inputs are observable and timely, the fair values of asset-backed securities and collateralized mortgage obligations would be categorized as Level 2; otherwise the fair values would be categorized as Level 3.
Municipal Bonds
Municipal bonds are fair valued based on pricing models that take into account, among other factors, information received from market makers and broker-dealers, current trades, bid lists, offerings, market movements, the callability of the bond, state of issuance, benchmark yield curves, and bond insurance. To the extent that these inputs are observable and timely, the fair values of municipal bonds would be categorized as Level 2; otherwise the fair values would be categorized as Level 3.
Foreign Government Bonds and Notes
Foreign government bonds and notes are fair valued based on discounted cash flow models that incorporate option adjusted spreads along with benchmark curves and credit spreads. In addition, international bond markets are monitored daily for information pertaining to the issuer and/or the specific issue. To the extent that these inputs are observable and timely, the fair values of foreign government bonds and notes would be categorized as Level 2; otherwise the fair values would be categorized as Level 3.
Corporate Bonds and Notes and U.S. Government & Agency Issues
Corporate bonds held by a Fund generally comprise two main categories: investment grade bonds and high yield bonds. Investment grade bonds are reported at fair value using various inputs and techniques, which include broker-dealer quotations, live trading levels, recently executed transactions in securities of the issuer or comparable issuers, issuer credit information, and option adjusted spread models where
| D-4 |
Table of Contents
PACIFIC LIFE FUNDS
NOTES TO FINANCIAL STATEMENTS (Continued)
applicable. Fair values for high yield bonds are based primarily on broker-dealer quotations from relevant market makers and recently executed transactions in securities of the issuer or comparable issuers. The broker-dealer quotations received are supported by credit analysis of the issuer that takes into consideration credit quality assessments, daily trading activity, and the activity of the underlying equities, listed bonds and sector-specific trends. To the extent that these inputs are observable and timely, the fair values of corporate bonds would be categorized as Level 2; otherwise the fair values would be categorized as Level 3.
U.S. Government & Agency Issues are reported at fair value using various inputs and techniques, which include broker-dealer quotations, live trading levels, recently executed transactions in securities of the issuer, issuer credit information, and option adjusted spread models where applicable. To the extent that these inputs are observable and timely, the fair values of U.S. Government & Agency Issues would be categorized as Level 2; otherwise the fair values would be categorized as Level 3.
Futures Contracts
Futures contracts and options on futures contracts are traded on commodity exchanges and are fair valued based on quoted prices from the applicable exchange, and to the extent valuation adjustments are not applied to futures contracts, they are categorized as Level 1. To the extent that valuation adjustments are observable and timely, the fair values of futures contracts would be categorized as Level 2; otherwise the fair values would be categorized as Level 3.
Options Contracts
Exchange listed options contracts are traded on securities exchanges and are fair valued based on quoted prices from the applicable exchange, and to the extent valuation adjustments are not applied or mean variation to exchange listed options contracts, they are categorized as Level 1. If valuation adjustments are applied and such adjustments are observable and timely, the fair values of exchange listed options contracts would be categorized as Level 2; otherwise the fair values would be categorized as Level 3. OTC options contracts are fair valued based on either broker-dealer quotations or pricing models that incorporate various inputs such as interest rates, credit spreads, currency exchange rates and volatility measurements for in-the-money, at-the-money, and out-of-the-money contracts based on a given strike price. To the extent that these inputs are observable and timely, the fair values of OTC options contracts would be categorized as Level 2; otherwise the fair values would be categorized as Level 3.
Forward Foreign Currency Contracts
Forward foreign currency contracts are fair valued using various inputs and techniques, which include broker-dealer quotations, actual trading information, and foreign currency exchange rates gathered from leading market makers. To the extent that these inputs are observable and timely, the fair values of forward foreign currency contracts would be categorized as Level 2; otherwise the fair values would be categorized as Level 3.
Swaps
Interest Rate Swaps – Interest rate swaps that are actively traded and cleared on a securities exchange are fair valued based on quoted prices from the applicable exchange, and to the extent valuation adjustments are not applied to these securities, they are categorized as Level 1. Interest rate swaps traded over-the-counter are fair valued using pricing models that are based on real-time snap shots of relevant interest rate curves that are built using the most actively traded securities for a given maturity. The pricing models also incorporate cash and money market rates. In addition, market data pertaining to interest rate swaps are monitored regularly to ensure that interest rates are properly depicting the current market rate. To the extent that these inputs are observable and timely, the fair values of interest rate swaps would be categorized as Level 2; otherwise the fair values would be categorized as Level 3.
Credit Default Swaps – Credit default swaps that are actively traded and cleared on a securities exchange are fair valued based on quoted prices from the applicable exchange, and to the extent valuation adjustments are not applied to these securities, they are categorized as Level 1. Credit default swaps traded over-the-counter are fair valued using pricing models that take into account, among other factors, information received from market makers and broker-dealers, default probabilities from index specific credit spread curves, recovery rates, and cash flows. To the extent that these inputs are observable and timely, the fair values of credit default swaps would be categorized as Level 2; otherwise the fair values would be categorized as Level 3.
Senior Loan Notes
Floating rate senior loans (“Senior Loans”) are fair valued based on a quoted price received from a single broker-dealer or an average of quoted prices received from multiple broker-dealers or valued relative to other benchmark securities when broker-dealer quotes are unavailable. To the extent that these inputs are observable, the fair values of Senior Loans would be categorized as Level 2; otherwise the fair values would be categorized as Level 3.
Short-Term Investments
Short-term investments maturing within 60 days are valued using amortized cost, which is used if it approximates market value, and are reflected as Level 2. Repurchase agreements are fully collateralized. The collateral is evaluated daily to ensure its market value equals or exceeds the current market value of the repurchase agreements including accrued interest.
| D-5 |
Table of Contents
PACIFIC LIFE FUNDS
NOTES TO FINANCIAL STATEMENTS (Continued)
4. INVESTMENTS AND RISKS
General Investment Risks
An investment in each Fund represents an indirect investment in the assets owned by that Fund. As with any mutual fund, the value of these investments may move up or down, and as a result, an investment in a Fund at any point in time may be worth more or less than the original investment. Events in the financial markets have the potential to cause increased volatility and uncertainty, which may impact the value of each Fund’s investments. Due to interdependencies between markets, events in one market may adversely impact other markets or issuers in unforeseen ways. As a result, the value of a Fund’s investments may be adversely affected by events in the markets, either directly or indirectly, and each Fund is exposed to potential decreases in the value of those investments. In addition, traditionally liquid investments may experience periods of diminished liquidity. Governmental and regulatory responses to market events may impair either the Adviser’s or a sub-adviser’s ability to pursue certain investment techniques or strategies and may have unexpected consequences on particular markets, strategies, or investments. Future events may impact a Fund in unforeseen ways, leading a Fund to alter its existing strategies or, potentially, to liquidate and close.
Equity Investments
The price of equity investments change in response to many factors, including a company’s historical and prospective earnings, cash flows, the value of its assets, investor perceptions and many of the General Investment Risk factors noted above.
Fixed Income Investments
Fixed income (debt) investments are affected primarily by the financial condition of the companies or other entities that have issued them and by changes in interest rates, although the factors noted above may also have a significant impact on fixed income (debt) investments. There is a risk that an issuer of a Fund’s fixed income (debt) investments may not be able to meet its financial obligations (e.g., may not be able to make principal and/or interest payments when they are due or otherwise default on other financial terms) and/or go bankrupt. Securities such as high-yield/high-risk bonds, e.g. bonds with low credit ratings by Moody’s (Ba or lower) or Standard & Poor’s (BB and lower) or no rating, are especially subject to credit risk during periods of economic uncertainty or during economic downturns and are more likely to default on their interest and/or principal payments than higher rated securities. Certain asset-backed instruments, such as collateralized debt obligations, collateralized mortgage obligations and other mortgage related securities, structured investment vehicles and other debt investments may have exposure to subprime loans or subprime mortgages, which are loans to persons with lower credit ratings. These instruments may present credit risk that is not transparent and that is greater than indicated by their ratings. The value of these instruments may be more acutely affected by downturns in the credit markets or the real estate market than certain other investments, and it may be difficult to value these instruments because of a thin secondary market.
Foreign Investments
There are certain additional risks involved in investing in foreign securities that are generally not inherent in investments in domestic securities. These risks may involve foreign currency fluctuations, adverse political, social and economic developments and the possible imposition of currency exchange blockages or other foreign governmental laws or restrictions. In addition, the securities of some foreign companies and securities markets are less liquid and at times more volatile than securities of comparable U.S. companies and U.S. securities markets. The markets in emerging markets countries can be extremely volatile.
Illiquid Investments
Each Fund may not invest in illiquid securities and illiquid bank loans (collectively, “Illiquid Investments”) if as a result of such investment, more than 15% of its net assets, taken at market value at the time of such investment, would be invested in Illiquid Investments. The term “Illiquid Investments” for this purpose means investments that cannot be disposed of within seven days in the ordinary course of business at approximately the amount at which a Fund has valued the investments. Illiquid Investments may be difficult to value and difficult to sell, which means a Fund may not be able to sell such investments quickly for their full value. The value of Illiquid Investments held by each Fund as of March 31, 2012 was less than 15% of its net assets.
Senior Loan Participations and Assignments
Certain Funds may invest in Senior Loans, the interest rates of which float or adjust periodically based upon a specified adjustment schedule, benchmark indicator, or prevailing interest rates of domestic or foreign corporations, partnerships and other entities (“Borrowers”). Senior Loans generally pay interest at rates which are periodically redetermined by reference to a base lending rate plus a premium. These base lending rates generally include prime rates of one or more major U.S. banks, LIBOR rates or certificates of deposit rates. Senior Loans often require prepayments from excess cash flow or permit the borrower to repay at its election. The degree to which borrowers repay cannot be predicted with accuracy. As a result, the actual maturity may be substantially less than the stated maturities. Senior Loans are exempt from registration under the Securities Act of 1933, may contain certain restrictions on resale, and cannot be sold publicly. A Fund’s investments in Senior Loans may be in the form of participations in loans or assignments of all or a portion of loans from third parties.
When a Fund purchases assignments, it acquires all the rights and obligations under the loan agreement of the assigning lender. Assignments may, however, be arranged through private negotiations between potential assignees and potential assignors, and the rights and obligations acquired by the purchaser of an assignment may differ from, and be more limited than those held by the assigning lender.
| D-6 |
Table of Contents
PACIFIC LIFE FUNDS
NOTES TO FINANCIAL STATEMENTS (Continued)
When a Fund purchases a participation of a Senior Loan interest, the Fund typically enters into a contractual agreement with the lender or other third party selling the participation. A participation interest in Senior Loans includes the right to receive payments of principal, interest and any fees to which it is entitled from the lender and only upon receipt by the lender of payments from the Borrower, but not from the Borrower directly. When investing in a participation interest, if a Borrower is unable to meet its obligations under a loan agreement, a Fund generally has no right to enforce compliance with the terms of the loan agreement. As a result, the Fund assumes the credit risk of the Borrower, the selling participant, and any other persons that are interpositioned between the Fund and the Borrower. If the lead lender in a typical lending syndicate becomes insolvent, enters FDIC receivership or, if not FDIC insured, enters into bankruptcy, the Fund may incur certain costs and delays in receiving payment or may suffer a loss of principal and/or interest. As of March 31, 2012, no participation interest in Senior Loans was held by any of the Funds covered in this report.
Inflation-Indexed Bonds
Certain Funds may invest in inflation-indexed bonds. Inflation-indexed bonds are fixed income (debt) securities whose principal value is periodically adjusted to the rate of inflation. The interest rate on these bonds is generally fixed at issuance at a rate lower than typical bonds. Over the life of an inflation indexed bond, however, interest will be paid based on a principal value, which is adjusted for inflation. Any increase or decrease in the principal amount of an inflation-indexed bond will result in an adjustment of interest income in the Statements of Operations.
Mortgage-Related and Other Asset-Backed Securities
Certain Funds may invest in mortgage-related and other asset-backed securities. These securities include mortgage pass-through securities, collateralized mortgage obligations (“CMOs”), collateralized loan obligations (“CLOs”), mortgage dollar rolls, CMO residuals, stripped mortgage-backed securities (“SMBS”), and other securities that directly or indirectly represent a participation in, or are secured by and payable from, mortgage loans secured by real property. Mortgage-related and other asset-backed securities are debt securities issued by a corporation, trust or custodian, or by a U.S. Government agency or instrumentality, that are collateralized by a pool of mortgages, mortgage pass-through securities, U.S. Government securities or other assets. The value of some mortgage-related and asset-backed securities may be particularly sensitive to changes in prevailing interest rates. Early repayment of principal on some mortgage-related securities may expose a Fund to a lower rate of return upon reinvestment of principal. The value of these securities may fluctuate in response to the market’s perception of the creditworthiness of the issuers. Additionally, although mortgage and mortgage-related securities are generally supported by some form of government or private guarantee and/or insurance, there is no assurance that private guarantors or issuers will meet their obligations.
Mortgage dollar rolls, principally on a forward commitment basis, involve a Fund selling mortgage-backed securities for delivery in the current month and simultaneously contracting to repurchase similar, but not substantially the same securities at an agreed-upon price on a fixed date in the future. A Fund accounts for such dollar rolls as purchases and sales and receives compensation as consideration for entering into the commitment to repurchase. A Fund must maintain liquid securities having a value not less than the repurchase price (including accrued interest) for such dollar rolls. The market value of the securities that a Fund is required to purchase may decline below the agreed upon repurchase price of those securities.
SMBS represent a participation in, or are secured by and payable from, mortgage loans on real property, and may be structured in classes with rights to receive varying proportions of principal and interest. SMBS include interest-only securities (“IOs”), which receive all of the interest, and principal-only securities (“POs”), which receive the entire principal. The cash flows and yields on IOs are extremely sensitive to the rate of principal payments (including prepayments) on the underlying mortgage loans. If the underlying mortgages experience higher than anticipated prepayments, an investor in IOs of SMBS may fail to recoup fully its initial investment, even if the IOs are highly rated or are derived from securities guaranteed by the U.S. Government. Unlike other fixed-income and other mortgage-backed securities, the market value of IOs tends to move in the same direction as interest rates. As prepayments on the underlying mortgages of POs increase, the yields on POs increase. Payments received from IOs are included in interest income in the Statements of Operations. Because principal will not be received at the maturity of an IO, adjustments are made to the book value of the security on the coupon date until maturity. These adjustments are included in interest income in the Statements of Operations. Payments received from POs are treated as reductions to the cost and par value of the securities. Any excess principal paydown gains or losses associated with the payments received are reported as interest income in the Statements of Operations.
U.S. Government Agencies or Government-Sponsored Enterprises
Certain Funds may invest in U.S. Government agencies or government-sponsored enterprises. U.S. Government securities are obligations of and, in certain cases, guaranteed by, the U.S. Government, its agencies or instrumentalities. The U.S. Government does not guarantee the NAV of the Funds’ shares. Some U.S. Government securities, such as Treasury bills, notes and bonds, and securities guaranteed by GNMA (or “Ginnie Mae”), are supported by the full faith and credit of the United States Government; others, such as those of the Federal Home Loan Bank, are supported by the right of the issuer to borrow from the U.S. Department of the Treasury (the “U.S. Treasury”); others, such as those of the Federal National Mortgage Association (“FNMA” or “Fannie Mae”), are supported by the discretionary authority of the U.S. Government to purchase the agency’s obligations. Securities not backed by the full faith and credit of the United States Government may be subject to a greater risk of default. U.S. Government securities may include zero coupon securities, which do not distribute interest on a current basis and tend to be subject to greater risk than interest-paying securities of similar maturities.
| D-7 |
Table of Contents
PACIFIC LIFE FUNDS
NOTES TO FINANCIAL STATEMENTS (Continued)
Government-related guarantors (i.e., not backed by the full faith and credit of the United States Government) include FNMA and the Federal Home Loan Mortgage Corporation (“FHLMC” or “Freddie Mac”). FNMA is a government-sponsored corporation, the common stock of which is owned entirely by private stockholders. FNMA purchases conventional (i.e., not insured or guaranteed by any government agency) residential mortgages from a list of approved seller/servicers which include state and federally chartered savings and loan associations, mutual savings banks, commercial banks and credit unions and mortgage bankers. Pass-through securities issued by FNMA are guaranteed as to timely payment of principal and interest by FNMA, but are not backed by the full faith and credit of the United States Government. FHLMC issues Participation Certificates (“PCs”), which are pass-through securities, each representing an undivided interest in a pool of residential mortgages. FHLMC guarantees the timely payment of interest and ultimate collection of principal, but PCs are not backed by the full faith and credit of the United States Government.
When-Issued Securities
Certain Funds may purchase and sell securities on a when-issued basis. These transactions are made conditionally because a security, although authorized, has not yet been issued in the market. A commitment by a Fund is made regarding these transactions to purchase or sell securities for a predetermined price or yield, with payment and delivery taking place beyond the customary settlement period. A Fund may sell when-issued securities before they are delivered, which may result in a capital gain or loss. Risk may arise upon entering these contracts from the potential inability of a counterparty to meet the terms of their contracts, or if the issuer does not issue the securities due to political, economic, or other factors.
Delayed-Delivery Transactions
Certain Funds may purchase or sell securities on a delayed-delivery basis. Payment and delivery may take place after the customary settlement period for that security. The price or yield of the underlying securities is fixed at the time the transaction is negotiated. When delayed-delivery purchases are outstanding, a Fund will set aside, and maintain until the settlement date in a segregated account, liquid assets in an amount sufficient to meet the purchase price. When purchasing a security on a delayed-delivery basis, a Fund assumes the rights and risks of ownership of the security, including the risk of price and yield fluctuations, and takes such fluctuations into account when determining its NAV. A Fund may dispose of or renegotiate a delayed-delivery transaction after it is entered into, and may sell delayed-delivery securities before they are delivered, which may result in a capital gain or loss. When a Fund has sold a security on a delayed-delivery basis, the Fund does not participate in future gains and losses with respect to the security.
Short Sales
Certain Funds may enter into short sales. A short sale is a transaction in which a Fund sells securities it does not own. A Fund’s use of short sales involves the risk that the price of the security in the open market may be higher when purchased to close out the Fund’s short position, resulting in a loss to the Fund. Such a loss is theoretically unlimited because there is no limit on the potential increase in the price of a security or guarantee as to the price at which the manager would be able to purchase the security in the open market.
When a Fund sells securities short, it must borrow those securities to make delivery to the buyer. The Fund incurs an expense for such borrowing. The Fund may not be able to purchase a security that it needs to deliver to close out a short position at an acceptable price. This may result in losses and/or require the Fund to sell long positions before the manager had intended. A Fund may not be able to successfully implement its short sale strategy, which may limit its ability to achieve its investment goal, due to limited availability of desired or eligible securities, the cost of borrowing securities, regulatory changes limiting or barring short sales, or for other reasons. Securities sold in short sale transactions and the interest and dividends payable on such securities, if any, are reflected as a liability in the Statements of Assets and Liabilities.
The use of proceeds received from selling short to purchase additional securities (long positions), results in leverage which may increase a Fund’s exposure to long positions. Leverage could magnify gains and losses and, therefore, increases a Fund’s volatility.
Repurchase Agreements
Certain Funds may invest in repurchase agreements. Repurchase agreements permit the investor to maintain liquidity and earn income over periods of time as short as overnight. Repurchase agreements held by a Fund are fully collateralized by U.S. Government securities, or securities issued by U.S. Government agencies, or securities that are within the three highest credit categories assigned by established rating agencies (Aaa, Aa, or A by Moody’s or AAA, AA or A by Standard & Poor’s) or, if not rated by Moody’s or Standard & Poor’s, are of equivalent investment quality as determined by the investment adviser or the applicable portfolio manager. Such collateral is in the possession of the Trust’s custodian or a designated broker-dealer. The collateral is evaluated daily to ensure its market value equals or exceeds the current market value of the repurchase agreements including accrued interest. In the event of default on the obligation to repurchase, a Fund has the right to liquidate the collateral and apply the proceeds in satisfaction of the obligation.
Reverse Repurchase Agreements
Certain Funds may enter into reverse repurchase agreements. In a reverse repurchase agreement, a Fund sells to a financial institution a security that it holds with an agreement to repurchase the same security at the agreed-upon price and date. Securities sold under reverse repurchase agreements are reflected as a liability on the Statements of Assets and Liabilities. Interest payments made are recorded as a component of interest expense on the Statements of Operations. In periods of increased demand for the security, a Fund may receive a fee for use of the security by the counterparty, which may result in interest income to the Fund. A reverse repurchase agreement involves the
| D-8 |
Table of Contents
PACIFIC LIFE FUNDS
NOTES TO FINANCIAL STATEMENTS (Continued)
risk that the market value of the security sold by a Fund may decline below the repurchase price of the security. A Fund will segregate assets determined to be liquid by the investment adviser or otherwise cover its obligations under reverse repurchase agreements.
Segregation and Collateral
If a Fund engages in certain transactions such as derivative investments or repurchase agreements, it may require collateral in the form of cash or investments to be held in segregated accounts at the Trust’s custodian, with an exchange or clearing member firm, or segregated on the Trust’s books and records maintained by the custodian and/or the portfolio manager. In each instance that segregation of collateral is required, it is done so in accordance with the 1940 Act and/or any interpretive guidance issued by the SEC. There is a possibility that a Fund could experience a delay in selling investments that are segregated as collateral.
5. DERIVATIVE INVESTMENTS AND RISKS
A. PRINCIPAL MARKET RISKS MANAGED BY INVESTING IN DERIVATIVES
Derivative instruments are investments whose values are tied to the value of an underlying security or asset, a group of assets, interest rates, exchange rates, currency or an index. Certain Funds are permitted to invest in derivative instruments, including, but not limited to, futures contracts, options contracts, forward foreign currency contracts, interest rate swaps, and credit default swaps. Derivatives may have little or no initial cash investment value relative to their market value exposure and therefore can produce significant gains or losses in excess of their cost. This is sometimes referred to as leverage. Leverage can magnify a Fund’s gains and losses and therefore increase its volatility. A Fund’s investments in derivatives may increase, decrease or change the level or types of exposure to certain risk factors. The primary risks a Fund may attempt to manage through investing in derivative instruments include, but are not limited to, interest rate, foreign investments and currency, price volatility, and credit (including counterparty) risks.
Interest rate risk - A Fund may be exposed to interest rate risk through investments in fixed income securities. Interest rate risk is the risk that fixed income securities will decline in value as a result of changes in interest rates. For example, the value of bonds, fixed rate loans and short-term money market instruments may decline in value when interest rates rise. Fixed income securities with longer durations tend to be more sensitive to changes in interest rates, making them more volatile than fixed income securities with shorter durations or money market instruments. Therefore, duration is a potentially useful tool to measure the sensitivity of a fixed income security’s yield (market price to interest rate movement). To manage these risks, certain Funds may invest in derivative instruments tied to interest rates.
Foreign investments and currency risk - A Fund may be exposed to foreign investments and/or currency risk through direct investment in securities or through options, futures or currency transactions. The prices of foreign securities that are denominated in foreign currencies are affected by the value of the U.S. dollar. With respect to securities denominated in foreign currencies, in general, as the value of the U.S. dollar rises, the U.S. dollar price of a foreign security will fall. As the value of the U.S. dollar falls, the U.S. dollar value of the foreign security will rise. Currency rates in foreign countries may fluctuate significantly over short periods of time for a number of reasons. Foreign investments may be riskier than U.S. investments for many reasons, including changes in currency exchange rates, unstable political and economic conditions, a lack of adequate and timely company information, differences in the way securities markets operate, relatively lower market liquidity, less stringent financial reporting and accounting guidance and controls, less secure foreign banks or securities depositories than those in the U.S., foreign taxation issues and foreign controls on investments. As a result, a Fund’s investments in foreign currency denominated securities and other foreign investments may reduce the returns of the Fund. To manage these risks, certain Funds may invest in derivative instruments tied to foreign investments and currencies.
Price volatility risk - Derivatives tied to equity and fixed income securities are exposed to potential price volatility. Fixed income securities are affected by many factors, including prevailing interest rates, market conditions and market liquidity. Volatility of below investment grade fixed income securities (including loans) may be relatively greater than for investment grade fixed income securities. Equity securities tend to go up or down in value, sometimes rapidly and unpredictably. The prices of equity securities change in response to many factors, including a company’s historical and prospective earnings, the value of its assets, general economic conditions, interest rates, investor perceptions and market liquidity. Due to the complexities of markets, events in one market or sector may adversely impact other markets or sectors.
To manage these risks, certain Funds may invest in various derivative instruments. Derivative instruments may be used to manage a Fund’s exposure to price volatility risk but may also be subject to greater price volatility than investments in traditional securities. The value of commodity-linked derivative instruments may be affected by changes in overall market movements, commodity index volatility, changes in interest rates, or factors affecting a particular industry or commodity, such as drought, floods, weather, livestock disease, embargoes, tariffs and international economic, political and regulatory developments.
Credit and Counterparty risk - Credit risk is the risk that a fixed income security’s issuer (or borrower or counterparty) will be unable or unwilling to meet its financial obligations (e.g. may not be able to make principal and/or interest payments when they are due or otherwise default on other financial terms) and/or may go bankrupt. This is also sometimes described as counterparty risk. A Fund may lose money if the issuer or guarantor of fixed income security, or counterparty of a derivative contract, repurchase or reverse repurchase agreement, or a loan of Fund securities, is unable or unwilling to make timely principal and/or interest payments, or to otherwise honor its obligations. A Fund may attempt to minimize concentrations of credit risk by undertaking transactions with a large number of borrowers or counterparties on recognized and reputable exchanges. A Fund’s investments in fixed income (debt) investments may range in quality from those rated in the lowest category in which it is permitted to invest to those rated in the highest category by a rating agency, or if unrated, determined by the manager to be of comparable quality.
| D-9 |
Table of Contents
PACIFIC LIFE FUNDS
NOTES TO FINANCIAL STATEMENTS (Continued)
Similar to credit risk, a Fund may be exposed to counterparty risk, or the risk that an institution or other entity with which a Fund has unsettled or open transactions will default. Financial assets of counterparties, which potentially expose a Fund to counterparty risk, consist mainly of cash due from counterparties and investments. Certain managers may attempt to minimize credit risks to a Fund by performing extensive reviews of each counterparty, entering into transactions with counterparties that the manager believes to be creditworthy at the time of the transaction and requiring the posting of collateral in applicable transactions. To manage these risks, certain Funds may invest in derivative instruments tied to a security issuers’ financial strength.
A Fund’s transactions in listed securities are settled/paid for upon delivery with their counterparties. Therefore, the risk of counterparty default for listed securities is considered minimal, as delivery of securities sold is only made once a Fund has received payment. Payment is made on a purchase once the securities have been delivered by the counterparty. The trade will fail if either party fails to meet its obligations.
Credit Related Contingent Features
Certain Funds are parties to various agreements, including but not limited to International Swaps and Derivatives Agreements, Master Repurchase Agreements, and Master Securities Forward Transactions Agreements (collectively “Master Agreements”), which govern the terms of certain transactions with select counterparties. These Master Agreements generally include provisions for general obligations, representations, agreements, collateral and certain events of default or termination, such as credit related contingent features. These provisions reduce the counterparty risk associated with relevant transactions by allowing a Fund or its counterparties to elect to terminate early and cause settlement of all outstanding transactions if a triggering event occurs under the applicable Master Agreement. These triggering events include, but are not limited to, bankruptcy, failure to make timely payments, restructuring, obligation acceleration, obligation default, a material decline in net assets, decline in credit rating or repudiation/moratorium. Thus, if a credit related contingent feature is triggered, it would allow a Fund or its counterparty to close out all transactions under the agreement and demand payment or additional collateral to cover their exposure to the other counterparty. Any election made by a counterparty to early terminate a transaction could have a material adverse impact on a Fund’s financial statements. To reduce credit and counterparty risk associated with transactions, a Fund may enter into master netting arrangements to the extent that if an event of default occurs, all amounts with the counterparty are terminated and settled on a net basis. A Fund’s overall exposure to credit risk, subject to master netting arrangements, can change substantially within a short period, as it is affected by each transaction subject to the arrangement.
B. DERIVATIVE INVESTMENTS
In addition to managing the market risks described above, certain Funds, if permitted by their investment objectives, may also invest in derivatives for purposes of hedging, duration management, as a substitute for securities, to increase returns, or to otherwise help achieve a Fund’s investment goal. Each derivative instrument and the reasons a Fund invested in derivatives during the reporting period are discussed in further detail below.
Futures Contracts - A futures contract is a commitment to buy or sell a specific amount of a financial instrument or commodity at a negotiated price on a specified future date. Futures contracts are subject to the possibility of illiquid markets, and the possibility of an imperfect correlation between the value of the instruments and the underlying securities. Initial margin deposits are made upon entering into futures contracts and can be funded with either cash or securities. During the period a futures contract is open, changes in the value of the contract are recognized as unrealized appreciation or depreciation by marking-to-market on a daily basis to reflect the market value of the contract at the end of each day’s trading. Variation margin receivables or payables represent the difference between the change in unrealized appreciation and depreciation on the open contracts and the cash deposits made on the margin accounts. When the contract is closed, a Fund records a realized gain or loss equal to the difference between the proceeds from (or cost of) the closing transaction and the Fund’s cost of the contract. Futures contracts are valued at the settlement price established each day by the board of trade or exchange on which they are traded.
During the reporting period, the Funds entered into futures contracts for the following reasons: The PL Inflation Managed and PL Managed Bond Funds used financial and money market futures as a means of managing exposure to the securities markets or to movements in interest rates. The PL Short Duration Bond Fund entered into treasury futures to manage exposure to changes in the securities markets, and to manage duration. The PL International Value Fund entered into futures contracts to maintain full exposure to the equity markets.
Options Contracts - An options contract is a commitment that gives the purchaser of the contract the right, but not the obligation, to buy or sell an underlying asset at a specific price on or before a specified future date. On the other hand, the writer of an options contract is obligated, upon the exercise of the option, to buy or sell an underlying asset at a specific price on or before a specified future date. A swaption is an option contract granting the owner the right to enter into an underlying swap. Inflation-capped options are options on U.S. inflation rates at a stated strike price. The seller of an inflation capped option receives an upfront premium and in return the buyer receives the right to receive a payment at the expiration of the option if the cumulative annualized inflation rate over the life of the option is above (for caps) or below (for floors) the stated strike price. The purpose of inflation-capped options is to protect the buyer from inflation erosion above a certain rate on a given notional exposure. A floor can be used to give downside protection to investments in inflation-linked products below a certain rate on a given notional exposure. Writing put options or purchasing call options tends to increase a Fund’s exposure to the underlying instrument. Writing call options or purchasing put options tends to decrease a Fund’s exposure to the underlying instrument. When a Fund writes or purchases a call, put, or inflation-capped option, an amount equal to the premium received or paid by the Fund is
| D-10 |
Table of Contents
PACIFIC LIFE FUNDS
NOTES TO FINANCIAL STATEMENTS (Continued)
included in a Fund’s Statement of Assets and Liabilities as a liability or an investment, respectively, and subsequently adjusted to the current market value, based on the quoted daily settlement price of the option written or purchased. Certain options may be written or purchased with premiums to be determined on a future date. The premiums for these options are based upon implied volatility parameters at specified terms. Premiums received or paid from writing or purchasing options, which expire unexercised, are treated by a Fund on the expiration date as realized gains or losses. The difference between the premium and the amount paid or received on a closing purchase or sale transaction, including brokerage commissions, is also treated as a realized gain or loss. If an option is exercised, the premium paid or realized is added to the cost of the purchase or proceeds from the sale in determining whether the Fund has realized a gain or loss on investment transactions. A Fund, as a writer of an option, may have no control over whether the underlying instrument may be sold (call) or purchased (put) and as a result bears the market risk of an unfavorable change in the price of the underlying written option. In addition, an illiquid market may make it difficult for a Fund to close out an option contract.
The maximum risk of loss associated with writing put options is limited to the exercised fair value of the option contract. The maximum risk of loss associated with writing call options is potentially unlimited. Listed options contracts present minimal counterparty credit risk since they are exchange traded and the exchange’s clearinghouse, as counterparty to all exchange traded options, guarantees the options against default. A Fund’s maximum risk of loss from counterparty credit risk related to OTC options contracts is limited to the premium paid.
During the reporting period, the Funds entered into option contracts for the following reasons: The PL Inflation Managed and PL Managed Bond Funds purchased or wrote options and swaptions on futures, currencies, volatility and swaps, as a means of capitalizing on anticipated changes in market volatility and to generate income. Both Funds also purchased or wrote inflation floors as a means of hedging duration. The PL Growth LT Fund invested in option contracts for purposes of risk management and to increase returns.
Forward Foreign Currency Contracts - A forward foreign currency contract (“Forward Contract”) is a commitment to buy or sell a specific amount of a foreign currency at a negotiated price on a specified future date. Forward Contracts can help a Fund manage the risk of changes in currency exchange rates. These contracts are marked-to-market daily at the applicable forward currency translation rates. A Fund records realized gains or losses at the time the Forward Contract is closed. A Forward Contract is extinguished through a closing transaction or upon delivery of the currency or entering an offsetting contract. A Fund’s maximum risk of loss from counterparty credit risk related to Forward Contracts is the fair value of the contract. The risk may be mitigated to some extent if a master netting arrangement between a Fund and the counterparty is in place and to the extent a Fund obtains collateral to cover the Fund’s exposure to the counterparty.
During the reporting period, the Funds entered into Forward Contracts for the following reasons: The PL Inflation Managed and PL Managed Bond Funds entered into Forward Contracts in connection with settling planned purchases or sales of securities, to hedge the currency exposure associated with some or all of a Fund’s securities or as part of each Funds’ investment strategy. The PL Short Duration Bond Fund entered into Forward Contracts for hedging purposes to insulate the Fund’s returns against adverse currency movements, and to increase exposure to a foreign currency the manager believed to be appreciating in value versus other currencies. The PL Growth LT Fund entered into Forward Contracts for hedging purposes to protect the Fund’s returns against adverse currency movements. The PL International Value Fund entered into Forward Contracts to manage currency risk and for hedging purposes to insulate the Fund’s returns against adverse currency movements.
Swaps Agreements - Swaps are privately negotiated agreements between the Funds and their counterparties to exchange cash flows, assets, foreign currencies or market-linked returns at specified intervals and may be executed in the over-the-counter market or in a multilateral or other trade facility platform, such as a registered commodities exchange (“centrally cleared swaps”). In connection with these agreements, securities may be identified as collateral in accordance with the terms of the respective swap agreements to provide assets of value and recourse in the event of default or bankruptcy/insolvency. Swaps are marked-to-market daily based upon values received from third party vendors or quotations from market makers. Market values greater than zero are recorded as an asset and market values less than zero are recorded as a liability on the Statements of Assets and Liabilities. The change in value of swaps, including accruals of periodic amounts of interest to be paid or received on swaps, is recorded as unrealized appreciation or depreciation in the Statements of Operations. Daily changes in valuation of centrally cleared swaps, if any, are recorded as variation margin receivable or payable on the Statements of Assets and Liabilities. Payments received or made at the beginning of the measurement period are reflected as such in the Statements of Assets and Liabilities and represent payments made or received upon entering into the swap agreement to compensate for differences between the stated terms of the swap agreement and prevailing market conditions (credit spreads, currency exchange rates, interest rates, and other relevant factors). These upfront payments are included in the calculation of realized gain or loss in the Statements of Operations, when the swap is closed. A liquidation payment received or made at the termination of the swap is recorded as realized gain or loss in the Statements of Operations. Net periodic payments received by a Fund are included as part of realized gain or loss in the Statements of Operations.
Interest Rate Swaps - Interest rate swap agreements involve the exchange by a Fund with another party of their respective commitments to pay or receive interest with respect to the notional amount of principal. Certain forms of interest rate swap agreements may include: (i) interest rate caps, under which, in return for a premium, one party agrees to make payments to the other to the extent that interest rates exceed a specified rate, or “cap”, (ii) interest rate floors, under which, in return for a premium, one party agrees to make payments to the other to the extent that interest rates fall below a specified rate, or “floor”, (iii) interest rate collars, under which a party sells a cap and purchases a floor or vice versa in an attempt to protect itself against interest rate movements exceeding given minimum or maximum levels, (iv) callable interest rate swaps, under which the counterparty may terminate the swap transaction in whole at zero cost by a predetermined
| D-11 |
Table of Contents
PACIFIC LIFE FUNDS
NOTES TO FINANCIAL STATEMENTS (Continued)
date and time prior to the maturity date, (v) spreadlocks, which allow the interest rate swap users to lock in the forward differential (or spread) between the interest rate swap rate and a specified benchmark, or (vi) basis swaps, under which two parties can exchange variable interest rates based on different money markets.
Certain Funds hold fixed rate bonds whose value may decrease if interest rates rise. To help hedge against this risk and to maintain the ability to generate income at prevailing market rates, certain Funds enter into interest rate swap agreements.
A Fund investing in interest rate swaps is subject to the risk that there is no liquid market for these agreements, that the counterparties may default on their obligations to perform or disagree as to the meaning of the contractual terms in the agreements, or that there may be unfavorable changes in interest rates. A Fund’s maximum risk of loss from counterparty credit risk related to interest rate swaps is the discounted net value of the cash flows to be received from/paid to the counterparty over the contract’s remaining life, to the extent that the amount is positive. The risk may be mitigated to some extent if a master netting arrangement between a Fund and the counterparty is in place and to the extent a Fund obtains collateral to cover the Fund’s exposure to the counterparty.
During the reporting period, the Funds entered into interest rate swaps for the following reasons: The PL Inflation Managed and PL Managed Bond Funds entered into interest rate swaps to manage nominal or real interest rate risk, as well as other risk exposures in various global markets, or as a substitute for cash bond exposure.
Credit Default Swaps - Credit default swap agreements involve one party making a stream of payments (referred to as the buyer of protection) to another party (the seller of protection) in exchange for the right to receive a specified return in the event of a default or other credit event for the referenced entity, obligation or index. As a seller of protection, a Fund generally receives an upfront payment or a fixed rate of income throughout the term of the swap provided there is no credit event. As the seller, a Fund would effectively add leverage to its Fund because, in addition to its total net assets, a Fund would be subject to investment exposure on the notional amount of the swap.
A Fund investing in credit default swaps is subject to the risk that there is no liquid market for these agreements, that the counterparties may default on their obligations to perform or disagree as to the meaning of the contractual terms in the agreements, or that there may be unfavorable changes in interest rates.
If a Fund is a seller of protection and a credit event occurs, as defined under the terms of that particular swap agreement, a Fund will either (i) pay to the buyer of protection an amount equal to the notional amount of the swap and take delivery of the referenced obligation, other deliverable obligations or underlying securities comprising the referenced index or (ii) pay a net settlement amount in the form of cash or securities equal to the notional amount of the swap less the recovery value of the referenced obligation or underlying securities comprising the referenced index. If a Fund is a buyer of protection and a credit event occurs, as defined under the terms of that particular swap agreement, a Fund will either (i) receive from the seller of protection an amount equal to the notional amount of the swap and deliver the referenced obligation, other deliverable obligations or underlying securities comprising the referenced index or (ii) receive a net settlement amount in the form of cash or securities equal to the notional amount of the swap less the recovery value of the referenced obligation or underlying securities comprising the referenced index. Recovery values are assumed by market makers considering either industry standard recovery rates or entity specific factors and considerations until a credit event occurs. If a credit event has occurred, the recovery value is determined by a facilitated auction whereby a minimum number of allowable broker bids, together with a specified valuation method, are used to calculate the settlement value.
Credit default swap agreements on corporate or sovereign issues of an emerging country involve one party making a stream of payments to another party in exchange for the right to receive a specified return in the event of a default or other credit event. If a credit event occurs and cash settlement is not elected, a variety of other deliverable obligations may be delivered in lieu of the specific referenced obligation. The ability to deliver other obligations may result in a cheapest-to-deliver option (the buyer of protection’s right to choose the deliverable obligation with the lowest value following a credit event). A Fund may use credit default swaps on corporate issues or sovereign issues of an emerging country to provide a measure of protection against defaults of the issuers (i.e., to reduce risk where a Fund owns or has exposure to the referenced obligation) or to take an active long or short position with respect to the likelihood of a particular issuer’s default.
Credit default swap agreements on asset-backed securities involve one party making a stream of payments to another party in exchange for the right to receive a specified return in the event of a default or other credit event. Unlike credit default swaps on corporate and sovereign issues of an emerging country, deliverable obligations in most instances would be limited to the specific referenced obligation as performance for asset-backed securities can vary across deals. Prepayments, principal paydowns, and other writedowns or loss events on the underlying mortgage loans will reduce the outstanding principal balance of the referenced obligation. These reductions may be temporary or permanent as defined under the terms of the swap agreement and the notional amount for the swap agreement will be adjusted by corresponding amounts. A Fund may use credit default swaps on asset-backed securities to provide a measure of protection against defaults of the referenced obligation or to take an active long or short position with respect to the likelihood of a particular referenced obligation’s default.
Credit default swap agreements on credit indices involve one party making a stream of payments to another party in exchange for the right to receive a specified return in the event of a write-down, principal shortfall, interest shortfall or default of all or part of the referenced entities comprising the credit index. Credit default swap agreements on indices are benchmarks for protecting investors owning bonds against default. A credit index is a list of a basket of credit instruments or exposures designed to be representative of some part of the credit market as a whole. These indices are made up of reference credits that are judged by a poll of dealers to be the most liquid entities in the credit default swap market based on the sector of the index. Components of the indices may include, but are not limited to, investment grade securities,
| D-12 |
Table of Contents
PACIFIC LIFE FUNDS
NOTES TO FINANCIAL STATEMENTS (Continued)
high yield securities, asset-backed securities, emerging markets, and/or various credit ratings within each sector. Credit indices are traded using credit default swaps with standardized terms including a fixed spread and standard maturity dates. An index credit default swap references all the names in the index, and if there is a default, the credit event is settled based on that name’s weight in the index. The composition of the indices changes periodically, usually every six months, and for most indices, each name has an equal weight in the index. A Fund may use credit default swaps on credit indices to hedge a Fund of credit default swaps or bonds with a credit default swap on indices which is less expensive than it would be to buy many credit default swaps to achieve a similar effect.
An implied credit spread is the spread in yield between a U.S. Treasury security and the referenced obligation or underlying investment that are identical in all respects except for the quality rating. Wider credit spreads, in absolute terms when compared to the notional amount of the swap, represent a deterioration of the referenced entity’s credit soundness and a greater likelihood or risk of default or other credit event occurring as defined under the terms of the agreement. Implied credit spreads, represented in absolute terms, utilized in determining the market value of credit default swap agreements on corporate or sovereign issues of an emerging country as of period end, are disclosed in the Notes to Schedules of Investments and serve as an indicator of the current status of the payment/performance risk and represent the likelihood or risk of default for the credit derivative. The implied credit spread of a particular referenced entity reflects the cost of buying/selling protection and may include upfront payments required to be made to enter into the agreement. For credit default swap agreements on asset-backed securities and credit indices, the quoted market prices and resulting values serve as the indicator of the current status of the payment/performance risk.
A Fund may use pair trades of credit default swaps. Pair trades attempt to match a long position with a short position of two securities in the same market sector for hedging purposes. Pair trades of credit default swaps attempt to gain exposure to credit risk while hedging or offsetting the effects of overall market movements. For example, a Fund may purchase protection through a credit default swap referenced to the debt of an issuer, and simultaneously selling protection through a credit default swap referenced to the debt of a different issuer with the intent to realize gains from the pricing differences of the two issuers who are expected to have similar market risks.
A Fund may use spread curve trades by simultaneously purchasing and selling protection through credit default swaps referenced to the same issuer but with different maturities. Spread curves attempt to gain exposure to credit risk on a forward basis by realizing gains on the expected differences in spreads.
A Fund’s maximum risk of loss from counterparty credit risk related to credit default swaps, either as the buyer or seller of protection, is the fair value of the contract. The risk may be mitigated to some extent if a master netting arrangement between a Fund and the counterparty is in place and to the extent a Fund obtains collateral to cover the Fund’s exposure to the counterparty.
The aggregate fair value of credit default swaps in a net liability position is reflected as unrealized depreciation and is disclosed in the Notes to Schedules of Investments. The collateral posted, net of assets received as collateral, for swap contracts is also disclosed in the Notes to Schedules of Investments. The maximum potential amount of future payments (undiscounted) that a Fund as a seller of protection could be required to make under a credit default swap agreement is an amount equal to the notional amount of the agreement. Notional amounts of all credit default swap agreements outstanding as of March 31, 2012 for which a Fund is the seller of protection are disclosed in the Notes to Schedules of Investments. These potential amounts are partially offset by any recovery values of the respective referenced obligations, upfront payments received upon entering into the agreement, or net amounts received from the settlement of buy protection credit default swap agreements entered into by a Fund for the same referenced entity or entities.
During the reporting period, the Funds entered into credit default swaps for the following reasons: The PL Inflation Managed and PL Managed Bond Funds sold credit protection through credit default swaps to increase exposure to the credit risk of individual securities or to the broader investment grade, high yield, or emerging markets through the use of credit default swaps on credit indices. Both Funds also purchased credit protection to reduce credit exposure to individual issuers, reduce broader credit risk, or to take advantage of the basis between the credit default swap and the cash bond market.
For financial reporting purposes, the Trust does not offset fair value amounts recognized for derivative instruments and fair value amounts recognized for the right to reclaim cash collateral (receivables) or the obligation to return cash collateral (payables) arising from derivative instruments recognized at fair value executed with the same counterparty under a master netting arrangement. The derivative investments held as of March 31, 2012 as disclosed in the Notes to Schedules of Investments and the amounts of realized gains and losses and changes in net unrealized appreciation and depreciation on derivative investments as disclosed in the Statements of Operations serve as indicators of the volume of derivative activity for each applicable Fund during the year or period ended March 31, 2012.
The following is a summary of the location of fair value amounts of derivative investments, if any, on the Trust’s Statements of Assets and Liabilities:
Location on the Statements of Assets and Liabilities | ||||
Derivative Investments Risk Type | Asset Derivative Investments | Liability Derivative Investments | ||
Interest rate contracts | Investments, at value Receivable: Variation margin Swap contracts, at value | Outstanding options written, at value Payable: Variation margin Swap contracts, at value | ||
Foreign exchange contracts | Investments, at value Receivable: Variation margin Forward foreign currency contracts appreciation | Outstanding options written, at value Payable: Variation margin Forward foreign currency contracts depreciation | ||
| D-13 |
Table of Contents
PACIFIC LIFE FUNDS
NOTES TO FINANCIAL STATEMENTS (Continued)
Location on the Statements of Assets and Liabilities | ||||
Derivative Investments Risk Type | Asset Derivative Investments | Liability Derivative Investments | ||
Credit contracts | Swap contracts, at value | Swap contracts, at value | ||
Equity contracts | Investments, at value Receivable: Variation margin | Outstanding options written, at value Payable: Variation margin | ||
The following is a summary of fair values of derivative investments on the Statements of Assets and Liabilities, which are not accounted for as hedging investments under U.S. GAAP, categorized by primary risk exposure as of March 31, 2012:
| Asset Derivative Investments Value | ||||||||||||||||||||
Fund | Total Value at March 31, 2012 | Credit Contracts | Equity Contracts | Foreign Exchange Contracts | Interest Rate Contracts | |||||||||||||||
PL Inflation Managed | $ | 1,388,106 | $ | 350,631 | $ | — | $ | 702,165 | $ | 335,310 | * | |||||||||
PL Managed Bond | 2,539,307 | 1,100,878 | — | 432,714 | 1,005,715 | * | ||||||||||||||
PL Short Duration Bond | 13,067 | — | — | 13,067 | — | |||||||||||||||
PL Growth LT | 388,002 | — | 362,760 | 25,242 | — | |||||||||||||||
PL International Value | 326,304 | — | 4,639 | * | 321,665 | — | ||||||||||||||
| Liability Derivative Investments Value | ||||||||||||||||||||
Fund | Total Value at March 31, 2012 | Credit Contracts | Equity Contracts | Foreign Exchange Contracts | Interest Rate Contracts | |||||||||||||||
PL Inflation Managed | ($ | 1,303,744 | ) | ($ | 1,971 | ) | $ | — | ($ | 866,662 | ) | ($ | 435,111 | )* | ||||||
PL Managed Bond | (3,367,557 | ) | (901,636 | ) | — | (1,772,696 | ) | (693,225 | )* | |||||||||||
PL Short Duration Bond | (15,898 | ) | — | — | (15,898 | ) | — | |||||||||||||
PL Growth LT | (79,465 | ) | — | — | (79,465 | ) | — | |||||||||||||
PL International Value | (511,174 | ) | — | — | (511,174 | ) | — | |||||||||||||
| * | Includes cumulative appreciation (depreciation) of futures contracts and centrally cleared swaps as reported in the Schedules of Investments and its notes. Only current day’s variation margin is reported within the Statements of Assets and Liabilities. |
The following is a summary of the location of realized gains and losses and changes in net unrealized appreciation and depreciation of derivative investments, if any, on the Trust’s Statements of Operations:
Derivative Investments Risk Type | Location of Gain (Loss) on Derivative Investments Recognized in the Statements of Operations | |
Interest rate contracts | Net realized gain (loss) on investment security transactions | |
Equity contracts | Net realized gain (loss) on futures contracts and swap transactions | |
| Net realized gain (loss) on written option transactions | ||
| Change in net unrealized appreciation (depreciation) on investment securities | ||
| Change in net unrealized appreciation (depreciation) on futures contracts and swaps | ||
| Change in net unrealized appreciation (depreciation) on written options | ||
|
| |
Foreign exchange contracts | Net realized gain (loss) on investment security transactions | |
| Net realized gain (loss) on futures contracts and swap transactions | ||
| Net realized gain (loss) on written option transactions | ||
| Net realized gain (loss) on foreign currency transactions | ||
| Change in net unrealized appreciation (depreciation) on investment securities | ||
| Change in net unrealized appreciation (depreciation) on futures contracts and swaps | ||
| Change in net unrealized appreciation (depreciation) on written options | ||
| Change in net unrealized appreciation (depreciation) on foreign currencies | ||
|
| |
Credit contracts | Net realized gain (loss) on futures contracts and swap transactions | |
| Change in net unrealized appreciation (depreciation) on futures contracts and swaps | ||
|
| |
The following is a summary of each Fund’s realized gain and/or loss and change in net unrealized appreciation and/or depreciation on derivative investments recognized in the Statements of Operations categorized by primary risk exposure for the year ended March 31, 2012:
| Realized Gain (Loss) on Derivative Investments Recognized in the Statement of Operations | ||||||||||||||||||||
Fund | Total | Credit Contracts | Equity Contracts | Foreign Exchange Contracts | Interest Rate Contracts | |||||||||||||||
PL Inflation Managed | $ | 2,119,421 | $ | 106,385 | $ | — | $ | 794,162 | $ | 1,218,874 | ||||||||||
PL Managed Bond | 4,488,715 | 381,412 | — | 2,111,425 | 1,995,878 | |||||||||||||||
PL Short Duration Bond | 36 | — | — | 4,551 | (4,515 | ) | ||||||||||||||
PL Growth LT | 113,410 | — | — | 113,410 | — | |||||||||||||||
PL International Value | 1,044,785 | — | (181,955 | ) | 1,226,740 | — | ||||||||||||||
D-14
Table of Contents
PACIFIC LIFE FUNDS
NOTES TO FINANCIAL STATEMENTS (Continued)
| Change in Net Unrealized Appreciation (Depreciation) on Derivative Investments Recognized in the Statement of Operations | ||||||||||||||||||||
Fund | Total | Credit Contracts | Equity Contracts | Foreign Exchange Contracts | Interest Rate Contracts | |||||||||||||||
PL Inflation Managed | $ | 377,561 | ($ | 90,920 | ) | $ | — | $ | 353,250 | $ | 115,231 | |||||||||
PL Managed Bond | (1,769,908 | ) | (1,356,113 | ) | — | (1,718,807 | ) | 1,305,012 | ||||||||||||
PL Short Duration Bond | 23,935 | — | — | (2,831 | ) | 26,766 | ||||||||||||||
PL Growth LT | 86,257 | — | 100,891 | (14,634 | ) | — | ||||||||||||||
PL International Value | (271,847 | ) | — | 5,611 | (277,458 | ) | — | |||||||||||||
6. INVESTMENT ADVISORY, ADMINISTRATION AND SHAREHOLDER SERVICES, SUPPORT SERVICES AND DISTRIBUTION AGREEMENTS
Pursuant to an Investment Advisory Agreement, PLFA, a wholly-owned subsidiary of Pacific Life Insurance Company (“Pacific Life”), serves as investment adviser to the Trust. PLFA manages the PL High Income Fund, PL Short Duration Income Fund and PL Strategic Income Fund under the name Pacific Asset Management. For the PL Underlying Funds, PLFA has retained other management firms to sub-advise each Fund, as discussed later in this section. PLFA receives advisory fees from each Fund based on the following advisory fee rates, which are based on an annual percentage of average daily net assets of each Fund:
PL Floating Rate Loan (1) | 0.75 | % | PL Comstock (2) | 0.75 | % | PL Small-Cap Growth | 0.60 | % | ||||||||
PL High Income | 0.60 | % | PL Growth LT | 0.55 | % | PL Small-Cap Value | 0.75 | % | ||||||||
PL Inflation Managed | 0.40 | % | PL Large-Cap Growth (3) | 0.75 | % | PL Real Estate | 0.90 | % | ||||||||
PL Managed Bond | 0.40 | % | PL Large-Cap Value | 0.65 | % | PL Emerging Markets | 0.80 | % | ||||||||
PL Short Duration Bond | 0.40 | % | PL Main Street Core | 0.45 | % | PL International Large-Cap | 0.85 | % | ||||||||
PL Short Duration Income | 0.40 | % | PL Mid-Cap Equity | 0.65 | % | PL International Value | 0.65 | % | ||||||||
PL Strategic Income | 0.60 | % | PL Mid-Cap Growth | 0.70 | % |
| (1) | PLFA has contractually agreed to waive 0.10% of its advisory fees through June 30, 2012 as long as Eaton Vance Management remains manager of the Fund. There is no guarantee that PLFA will continue such waiver after that date. |
| (2) | PLFA has contractually agreed to waive 0.015% of its advisory fees through June 30, 2012 as long as Invesco Advisers, Inc. remains manager of the Fund. There is no guarantee that PLFA will continue such waiver after that date. |
| (3) | PLFA has contractually agreed to waive 0.025% of its advisory fees through June 30, 2012 as long as UBS Global Asset Management (Americas) Inc. remains manager of the Fund. There is no guarantee that PLFA will continue such waiver after that date. |
Pursuant to Fund Management Agreements, the Trust and PLFA engage various management firms under PLFA’s supervision for the PL Underlying Funds. As of March 31, 2012, the following firms serve as sub-advisers for their respective Fund: Eaton Vance Management for the PL Floating Rate Loan Fund; Pacific Investment Management Company LLC for the PL Inflation Managed and PL Managed Bond Funds; T. Rowe Price Associates, Inc. for the PL Short Duration Bond Fund; Invesco Advisers, Inc. for the PL Comstock Fund; Janus Capital Management LLC for the PL Growth LT Fund; UBS Global Asset Management (Americas) Inc. for the PL Large-Cap Growth Fund; ClearBridge Advisors, LLC for the PL Large-Cap Value Fund; OppenheimerFunds, Inc. for the PL Main Street Core and PL Emerging Markets Funds; Lazard Asset Management LLC for the PL Mid-Cap Equity Fund; Morgan Stanley Investment Management Inc. for the PL Mid-Cap Growth and PL Real Estate Funds; Fred Alger Management, Inc. for the PL Small-Cap Growth Fund; NFJ Investment Group LLC for the PL Small-Cap Value Fund; MFS Investment Management for the PL International Large-Cap Fund; and J.P. Morgan Investment Management Inc. for the PL International Value Fund; PLFA, as investment adviser to the Trust, pays the related management fees to these sub-advisers as compensation for their sub-advisory services provided to their respective Fund.
Pursuant to an Administration and Shareholder Services Agreement (the “Administration Agreement”), Pacific Life serves as administrator (the “Administrator”) to the Trust. The Trust paid the Administrator an administration fee at an annual rate of 0.15% for each of the PL Underlying Funds and Class I shares of the PL High Income Fund, PL Short Duration Income Fund, and PL Strategic Income Fund. The administration fee is for procuring or providing administrative, transfer agency, and shareholder services. In addition, Pacific Life and PLFA provide support services to the Trust that are outside the scope of the Administrator’s and investment adviser’s responsibilities under the Administration Agreement and Investment Advisory Agreement. Under the Support Services Agreement, the Trust compensated Pacific Life and PLFA for their expenses in providing support services to the Trust in connection with various matters, some of which include the time spent by legal, accounting, and compliance personnel of PLFA (including individuals who may be officers or Trustees of the Trust), to attend meetings of the Board and to provide assistance with the coordination and supervision in connection with the services procured for the Trust
D-15
Table of Contents
PACIFIC LIFE FUNDS
NOTES TO FINANCIAL STATEMENTS (Continued)
under the Administration Agreement. Support services do not include any services for which PLFA is responsible pursuant to the Investment Advisory Agreement. The Trust reimbursed Pacific Life and PLFA for these support services on an approximate cost basis.
Pursuant to a Distribution Agreement, Pacific Select Distributors, Inc. (the “Distributor”), a wholly owned subsidiary of Pacific Life, serves as distributor of the Trust’s shares. The Distributor bears all expenses of providing services, including costs of sales presentations, mailings, advertisements, and other marketing efforts by the Distributor in connection with the distribution or sale of the Trust’s shares and makes distribution and/or service payments to selling groups in connection with the sale of certain of the Trust’s shares and subsequent servicing needs of shareholders provided by selling groups. None of the share classes of the Funds covered in this report incurred a distribution and/or service fee during the year or period ended March 31, 2012.
7. TRANSACTIONS WITH AFFILIATES
| A. | ADVISORY FEES, ADMINISTRATION FEES, DISTRIBUTION AND SERVICE FEES AND EXPENSES FOR SUPPORT SERVICES |
The Adviser, the Distributor and Pacific Life are related parties. The advisory fees payable to the Adviser, including any advisory fee waiver, the administration fees payable to Pacific Life, including any fee waivers, and expenses for support services payable to PLFA and Pacific Life (see Note 6) by each Fund covered in this report for the year or period ended March 31, 2012 are presented in the Statements of Operations. The amounts of each of these fees that remained payable as of March 31, 2012 are presented in the Statements of Assets and Liabilities.
B. EXPENSE LIMITATION AGREEMENTS
To help limit the Trust’s expenses, PLFA has entered into expense limitation agreements with the Trust and has contractually agreed to reduce its fees or otherwise reimburse each Fund for certain operating expenses that exceed an annual rate based on a percentage of a Fund’s average daily net assets. These operating expenses include, but are not limited to, administration fees, organizational expenses, custody expenses, expenses for audit, tax and certain legal services, preparation, printing, filing and distribution to existing shareholders of proxies, prospectuses and shareholder reports and other regulatory documents as applicable, independent trustees’ fees and establishing, overseeing and administering the Trust’s compliance program. These operating expenses do not include investment advisory fees; distribution and/or service fees, if any; interest; taxes (including foreign taxes on dividends, interest or gains); brokerage commissions and other transactional expenses; dividends on securities sold short; acquired fund fees and expenses; and extraordinary expenses such as litigation expenses and other expenses not incurred in the ordinary course of each Fund’s business. The current expense cap for the PL Underlying Funds is 0.15% through June 30, 2014, and 0.30% from July 1, 2014 through June 30, 2021. The current expense cap for the PL High Income Fund, PL Short Duration Income Fund and PL Strategic Income Fund is 0.20% through June 30, 2015.
There is no guarantee that PLFA will continue to cap expenses upon the expiration of the applicable expense caps. Any expense reimbursements are subject to repayment to PLFA for a period of time as permitted under regulatory and/or accounting guidance (currently 3 years from the end of the fiscal year in which the reimbursement or reduction took place), to the extent such expenses fall below the expense cap in future years. Any amounts repaid to PLFA will have the effect of increasing such expenses of the Fund, but not above the expense cap. There was no recoupment of expense reimbursement by PLFA from any Funds covered in this report during the year or period ended March 31, 2012.
The cumulative reimbursement and fee reduction amounts, if any, as of March 31, 2012 that are subject to repayment for each Fund covered in this report are as follows:
| Expiration Date | ||||||||||||
Fund | 3/31/2013 | 3/31/2014 | 3/31/2015 | |||||||||
PL Floating Rate Loan | $ | 98,235 | $ | 161,181 | $ | 131,663 | ||||||
PL High Income | 42,254 | |||||||||||
PL Inflation Managed | 308,763 | 329,563 | 295,942 | |||||||||
PL Managed Bond | 502,729 | 558,213 | 506,074 | |||||||||
PL Short Duration Bond | 164,724 | 164,455 | 168,516 | |||||||||
PL Short Duration Income | 42,485 | |||||||||||
PL Strategic Income | 45,025 | |||||||||||
PL Comstock | 214,415 | 194,706 | 167,205 | |||||||||
PL Growth LT | 216,805 | 154,975 | 163,768 | |||||||||
PL Large-Cap Growth | 120,503 | 112,128 | 106,391 | |||||||||
PL Large-Cap Value | 216,004 | 228,247 | 206,530 | |||||||||
PL Main Street Core | 266,417 | 176,595 | 160,866 | |||||||||
PL Mid-Cap Equity | 177,580 | 153,964 | 136,380 | |||||||||
PL Mid-Cap Growth | 115,208 | 116,589 | 83,455 | |||||||||
PL Small-Cap Growth | 96,729 | 73,729 | 59,708 | |||||||||
PL Small-Cap Value | 92,384 | 92,291 | 93,513 | |||||||||
PL Real Estate | 94,439 | 72,505 | 59,572 | |||||||||
PL Emerging Markets | 319,937 | 270,343 | 388,707 | |||||||||
PL International Large-Cap | 286,639 | 255,021 | 289,591 | |||||||||
PL International Value | 289,342 | 200,306 | 213,243 | |||||||||
|
|
|
|
|
| |||||||
Total | $ | 3,580,853 | $ | 3,314,811 | $ | 3,360,888 | ||||||
|
|
|
|
|
| |||||||
D-16
Table of Contents
PACIFIC LIFE FUNDS
NOTES TO FINANCIAL STATEMENTS (Continued)
Due to the current regulatory and/or accounting guidance, all expense reimbursements made by the Adviser for the period September 28, 2001 (the Pacific Life Funds’ commencement date of operations) to March 31, 2009 expired for future recoupment as of March 31, 2012. Based on the Trust’s experience, the likelihood of repayment by a Fund for the amounts presented in the table above prior to the expiration is considered remote and no liabilities for such repayments were recorded by any Fund as of March 31, 2012. The Adviser expense reimbursement is presented in the Statements of Operations.
C. INVESTMENTS IN AFFILIATED FUNDS
As of March 31, 2012, Pacific Life owned 100% of the Class I shares outstanding of the PL High Income Fund, PL Short Duration Income Fund and PL Strategic Income Fund.
D. INDEPENDENT TRUSTEES
The Trust pays each independent trustee of the Board retainer fees and specified amounts for various Board and committee services and for chairing the committees. The fees and expenses of the independent trustees of the Board are presented in the Statements of Operations.
Each independent trustee of the Board is eligible to participate in the Trust’s Deferred Compensation Plan (the “Plan”). The Plan allows each independent trustee to voluntarily defer receipt of all or a percentage of fees which otherwise would be payable for services performed. Amounts in the deferral account are obligations of each Fund at the time of such deferral and are payable in accordance with the Plan. Deferral amounts are treated as though equivalent dollar amounts had been invested in shares of certain Funds. An independent trustee who defers compensation has the option to select credit rate options that track the performance, at NAV of Class A shares of the corresponding Portfolio Optimization Funds, PL Floating Rate Income Fund, PL Income Fund and/or PL Money Market Fund, and/or Class P shares of the corresponding PL Underlying Funds without a sale load. The obligation of each Fund under the Plan (the “DCP Liability”) is included in “Accrued trustees’ fees and expenses and deferred compensation” in the Statements of Assets and Liabilities. Accordingly, the market value appreciation or depreciation on a Fund’s DCP Liability account will cause the expenses of that Fund to increase or decrease due to market fluctuation. The change in net unrealized appreciation or depreciation on a Fund’s DCP Liability account is included in “Trustees’ fees and expenses” in the Statements of Operations. For the year or period ended March 31, 2012, such expenses decreased by $428 for all applicable Funds covered in this report as a result of the market value depreciation on such accounts. During the year or period ended March 31, 2012, the Funds covered in this report paid $15,499 of deferred compensation to current independent trustees. As of March 31, 2012, the total amount in the DCP Liability accounts was $32,384 for all applicable Funds covered in this report.
E. OFFICERS OF THE TRUST
None of the officers of the Trust received compensation from the Trust.
F. INDEMNIFICATIONS
Under the Trust’s organizational documents, its officers and trustees are indemnified against certain liabilities arising out of performance of their duties to the Trust. In addition, the Trust entered into an agreement with each of the trustees which provides that the Trust will indemnify and hold harmless each trustee against any expenses actually and reasonably incurred by any trustee in any proceeding arising out of or in connection with the trustee’s services to the Trust, to the fullest extent permitted by the Trust’s Declaration of Trust and By-Laws, the general trust law of the State of Delaware, the Securities Act of 1933, and the 1940 Act, each as now or hereinafter in force. In the normal course of business, the Trust enters into contracts with service providers and others that contain general indemnification clauses. The Trust’s maximum exposure under these arrangements and agreements is dependent on future claims that may be made against the Trust and/or the trustees and, therefore, cannot be estimated; however, based on experience, the risk of loss from such claims is considered remote.
8. UNFUNDED SENIOR LOAN COMMITMENTS
Unfunded loan commitments on senior loan participations and assignments (Note 4), if any, are marked to market daily and valued according to the Trust’s valuation policies and procedures. Any outstanding unfunded loan commitments are presented in the Notes to Schedules of Investments section of each applicable Fund’s Schedule of Investments. Any applicable net unrealized appreciation or depreciation at the end of the reporting period and change in net unrealized appreciation or depreciation on unfunded loan commitments for the reporting period is reflected on the Statements of Assets and Liabilities and the Statements of Operations, respectively. As of March 31, 2012, no unfunded loan commitments were held by any Funds covered in this report.
9. PURCHASES AND SALES OF SECURITIES
The cost of purchases and proceeds from sales of investments (excluding short-term investments) for the year or period ended March 31, 2012, were as follows:
| U.S. Government Securities | Other Securities | |||||||||||||||
Fund | Purchases | Sales | Purchases | Sales | ||||||||||||
PL Floating Rate Loan | $ | — | $ | — | $ | 67,316,639 | $ | 41,627,655 | ||||||||
PL High Income | — | — | 13,429,377 | 6,573,068 | ||||||||||||
PL Inflation Managed | 1,185,921,338 | 1,148,129,016 | 38,345,339 | 51,503,741 | ||||||||||||
PL Managed Bond | 2,560,495,180 | 2,238,893,502 | 100,821,572 | 71,052,895 | ||||||||||||
PL Short Duration Bond | 140,273,989 | 149,686,653 | 89,085,832 | 34,846,563 | ||||||||||||
PL Short Duration Income | 1,477,404 | 1,000,713 | 17,043,953 | 5,548,346 | ||||||||||||
D-17
Table of Contents
PACIFIC LIFE FUNDS
NOTES TO FINANCIAL STATEMENTS (Continued)
| U.S. Government Securities | Other Securities | |||||||||||||||
Fund | Purchases | Sales | Purchases | Sales | ||||||||||||
PL Strategic Income | $ | 1,008,262 | $ | 598,852 | $ | 38,902,436 | $ | 22,538,648 | ||||||||
PL Comstock | — | — | 71,620,630 | 41,132,386 | ||||||||||||
PL Growth LT | — | — | 83,639,515 | 95,819,718 | ||||||||||||
PL Large-Cap Growth | — | — | 96,697,704 | 81,997,563 | ||||||||||||
PL Large-Cap Value | — | — | 65,186,391 | 46,874,409 | ||||||||||||
PL Main Street Core | — | — | 96,314,307 | 78,817,093 | ||||||||||||
PL Mid-Cap Equity | — | — | 168,065,767 | 143,268,461 | ||||||||||||
PL Mid-Cap Growth | — | — | 27,723,961 | 16,190,291 | ||||||||||||
PL Small-Cap Growth | — | — | 23,658,374 | 21,449,535 | ||||||||||||
PL Small-Cap Value | — | — | 23,776,335 | 15,506,916 | ||||||||||||
PL Real Estate | — | — | 15,421,521 | 10,703,627 | ||||||||||||
PL Emerging Markets | — | — | 44,618,991 | 21,057,472 | ||||||||||||
PL International Large-Cap | — | — | 101,717,809 | 39,962,941 | ||||||||||||
PL International Value | — | — | 88,972,900 | 61,529,143 | ||||||||||||
10. FEDERAL INCOME TAX INFORMATION
Each Fund intends to qualify each year as a regulated investment company (“RIC”) under Subchapter M of the Internal Revenue Code (the “Code”). A Fund that qualifies as a RIC does not have to pay income tax as long as it distributes sufficient taxable income and net capital gains. Each Fund declared and paid sufficient dividends on net investment income and capital gains distributions during the year or period ended March 31, 2012, to qualify as a RIC and is not required to pay Federal income tax under the Code. Accordingly, no provision for Federal income taxes is required in the financial statements. Required distributions are based on net investment income and net realized gains determined in accordance with income tax regulations, which may differ from such amounts for financial reporting purposes. These differences are primarily due to differing treatments for futures and options, swap income, paydown gain/loss, partnership income, foreign currency transactions, passive foreign investment companies, late year ordinary and post-October capital losses, capital loss carryforwards, and losses deferred due to wash sales. Permanent book and tax differences relating to shareholder distributions will result in reclassifications of capital accounts (see Note 12). In addition, the year in which amounts are distributed may differ from the year in which the net investment income is earned and the net gains are realized by each Fund.
The following table shows the accumulated capital losses and components of distributable earnings on a tax basis, and late year ordinary losses and post-October capital losses deferred, if any, as of March 31, 2012:
| Distributable Earnings | Late Year Ordinary and Post-October Capital Loss Deferrals | |||||||||||||||||||||||||||
Fund | Accumulated Capital Losses | Undistributed Ordinary Income | Undistributed Long-Term Capital Gains | Late Year Ordinary Losses | Short-Term Capital Losses | Long-Term Capital Losses | Total | |||||||||||||||||||||
PL Floating Rate Loan | ($ | 16,487 | ) | $ | 1,198,457 | $ | — | $ | — | $ | — | $ | — | $ | — | |||||||||||||
PL High Income | — | 140,802 | — | — | — | — | — | |||||||||||||||||||||
PL Inflation Managed | — | 2,841,061 | 733,035 | — | — | — | — | |||||||||||||||||||||
PL Managed Bond | (216,538 | ) | 5,074,047 | — | — | — | (3,280,889 | ) | (3,280,889 | ) | ||||||||||||||||||
PL Short Duration Bond | — | 481,115 | 46,127 | — | (207,126 | ) | — | (207,126 | ) | |||||||||||||||||||
PL Short Duration Income | — | 64,048 | — | — | — | — | — | |||||||||||||||||||||
PL Strategic Income | — | 268,111 | — | — | — | — | — | |||||||||||||||||||||
PL Comstock | (22,005,888 | ) | 676,793 | — | — | — | — | — | ||||||||||||||||||||
PL Growth LT | (18,416,497 | ) | 549,611 | — | — | (1,698,768 | ) | — | (1,698,768 | ) | ||||||||||||||||||
PL Large-Cap Growth | — | — | 1,019,041 | (100,504 | ) | — | — | (100,504 | ) | |||||||||||||||||||
PL Large-Cap Value | (15,679,047 | ) | 1,183,317 | — | — | (602,951 | ) | — | (602,951 | ) | ||||||||||||||||||
PL Main Street Core | (26,543,145 | ) | 739,538 | — | — | (362,630 | ) | — | (362,630 | ) | ||||||||||||||||||
PL Mid-Cap Equity | (7,425,609 | ) | 187,850 | — | — | — | — | — | ||||||||||||||||||||
PL Mid-Cap Growth | — | — | 1,054,638 | (17,119 | ) | (100,750 | ) | — | (117,869 | ) | ||||||||||||||||||
PL Small-Cap Growth | (5,887,020 | ) | — | — | — | — | — | — | ||||||||||||||||||||
PL Small-Cap Value | (5,895,087 | ) | 324,995 | — | — | (95,549 | ) | — | (95,549 | ) | ||||||||||||||||||
PL Real Estate | (8,860,152 | ) | 195,287 | — | — | (47,531 | ) | — | (47,531 | ) | ||||||||||||||||||
PL Emerging Markets | — | 168,621 | — | — | (1,022,619 | ) | (266,107 | ) | (1,288,726 | ) | ||||||||||||||||||
PL International Large-Cap | (12,478,029 | ) | 1,308,918 | — | — | (691,996 | ) | (775,436 | ) | (1,467,432 | ) | |||||||||||||||||
PL International Value | (49,011,024 | ) | 906,833 | — | — | (3,629,237 | ) | (1,471,976 | ) | (5,101,213 | ) | |||||||||||||||||
Accumulated capital losses represent net capital loss carryovers as of March 31, 2012 that may be available to offset future realized capital gains and thereby reduce future capital gains distributions. Under the Regulated Investment Company Modernization Act of 2010 (the “Modernization Act”), each Fund is permitted to carry forward capital losses incurred in taxable years beginning after December 22, 2010 for an unlimited period. Any losses incurred during those future taxable years will be required to be utilized prior to any losses incurred in pre-enactment taxable years. Additionally, post-enactment capital losses that are carried forward will retain their character as either short-term or long-term capital losses rather than being considered all short-term as under the previous law. Each Fund’s first fiscal year end subject to the
D-18
Table of Contents
PACIFIC LIFE FUNDS
NOTES TO FINANCIAL STATEMENTS (Continued)
Modernization Act is March 31, 2012. The following table shows the expiration dates for capital loss carryover from pre-enactment taxable years and the amounts of capital loss carryover, if any, by each of the applicable Funds as of March 31, 2012:
| Post-Enactment | ||||||||||||||||||||||||
| Pre-Enactment | Unlimited Period of Net | Accumulated | ||||||||||||||||||||||
| Net Capital Loss Capital Loss Carryover Expiring in | Capital Loss Carry Over | Capital Loss | ||||||||||||||||||||||
Fund | 2017 | 2018 | 2019 | Short Term | Long-Term | Carryover | ||||||||||||||||||
PL Floating Rate Loan | $ | — | ($ | 16,487 | ) | $ | — | $ | — | $ | — | ($ | 16,487 | ) | ||||||||||
PL Managed Bond | — | — | — | (216,538 | ) | — | (216,538 | ) | ||||||||||||||||
PL Comstock | (1,791,441 | ) | (20,214,447 | ) | — | — | — | (22,005,888 | ) | |||||||||||||||
PL Growth LT | — | (18,416,497 | ) | — | — | — | (18,416,497 | ) | ||||||||||||||||
PL Large-Cap Value | (4,851,176 | ) | (10,501,973 | ) | (325,898 | ) | — | — | (15,679,047 | ) | ||||||||||||||
PL Main Street Core | (2,767,952 | ) | (23,775,193 | ) | — | — | — | (26,543,145 | ) | |||||||||||||||
PL Mid-Cap Equity | — | (7,425,609 | ) | — | — | — | (7,425,609 | ) | ||||||||||||||||
PL Small-Cap Growth | (3,377 | ) | (5,883,643 | ) | — | — | — | (5,887,020 | ) | |||||||||||||||
PL Small-Cap Value | — | (5,895,087 | ) | — | — | — | (5,895,087 | ) | ||||||||||||||||
PL Real Estate | — | (8,860,152 | ) | — | — | — | (8,860,152 | ) | ||||||||||||||||
PL International Large-Cap | (1,530,732 | ) | (8,295,134 | ) | (2,652,163 | ) | — | — | (12,478,029 | ) | ||||||||||||||
PL International Value | (6,971,246 | ) | (38,541,418 | ) | — | (3,027,169 | ) | (471,191 | ) | (49,011,024 | ) | |||||||||||||
The aggregate Federal tax cost of investments and the composition of unrealized appreciation and depreciation on investments as of March 31, 2012, were as follows:
Fund | Total Cost of Investments on Tax Basis | Gross Unrealized Appreciation on Investments | Gross Unrealized Depreciation on Investments | Net Unrealized Appreciation on Investments | Net Unrealized Appreciation (Depreciation) on Other (1) | Net Unrealized Appreciation | ||||||||||||||||||
PL Floating Rate Loan | $ | 116,749,738 | $ | 1,447,112 | ($ | 575,917 | ) | $ | 871,195 | $ | — | $ | 871,195 | |||||||||||
PL High Income | 7,138,470 | 292,602 | (21,420 | ) | 271,182 | — | 271,182 | |||||||||||||||||
PL Inflation Managed | 326,321,801 | 10,992,283 | (3,150,835 | ) | 7,841,448 | 31,756 | 7,873,204 | |||||||||||||||||
PL Managed Bond | 625,580,965 | 13,010,617 | (6,618,912 | ) | 6,391,705 | (465,471 | ) | 5,926,234 | ||||||||||||||||
PL Short Duration Bond | 153,260,346 | 1,070,008 | (281,194 | ) | 788,814 | (2,831 | ) | 785,983 | ||||||||||||||||
PL Short Duration Income | 12,723,835 | 139,914 | (5,374 | ) | 134,540 | — | 134,540 | |||||||||||||||||
PL Strategic Income | 17,267,996 | 409,897 | (63,888 | ) | 346,009 | — | 346,009 | |||||||||||||||||
PL Comstock | 178,568,368 | 40,277,310 | (11,750,495 | ) | 28,526,815 | (768 | ) | 28,526,047 | ||||||||||||||||
PL Growth LT | 84,194,173 | 26,317,460 | (1,893,285 | ) | 24,424,175 | (53,396 | ) | 24,370,779 | ||||||||||||||||
PL Large-Cap Growth | 92,791,784 | 36,904,560 | (948,038 | ) | 35,956,522 | — | 35,956,522 | |||||||||||||||||
PL Large-Cap Value | 204,325,914 | 63,187,334 | (5,297,080 | ) | 57,890,254 | — | 57,890,254 | |||||||||||||||||
PL Main Street Core | 144,643,988 | 47,100,989 | (1,517,036 | ) | 45,583,953 | (58 | ) | 45,583,895 | ||||||||||||||||
PL Mid-Cap Equity | 143,220,657 | 22,435,011 | (2,088,704 | ) | 20,346,307 | — | 20,346,307 | |||||||||||||||||
PL Mid-Cap Growth | 59,214,932 | 17,652,351 | (3,005,438 | ) | 14,646,913 | (1,339 | ) | 14,645,574 | ||||||||||||||||
PL Small-Cap Growth | 28,015,992 | 9,042,595 | (974,532 | ) | 8,068,063 | — | 8,068,063 | |||||||||||||||||
PL Small-Cap Value | 68,923,369 | 18,614,626 | (1,744,794 | ) | 16,869,832 | (38 | ) | 16,869,794 | ||||||||||||||||
PL Real Estate | 35,120,772 | 19,191,808 | (2,011,248 | ) | 17,180,560 | — | 17,180,560 | |||||||||||||||||
PL Emerging Markets | 68,732,531 | 20,092,284 | (3,650,507 | ) | 16,441,777 | (62,992 | ) | 16,378,785 | ||||||||||||||||
PL International Large-Cap | 171,352,590 | 40,064,844 | (7,987,445 | ) | 32,077,399 | 2,234 | 32,079,633 | |||||||||||||||||
PL International Value | 104,452,338 | 10,391,724 | (4,907,292 | ) | 5,484,432 | (174,468 | ) | 5,309,964 | ||||||||||||||||
| (1) | Other includes net appreciation or deprecation on derivatives, securities sold short, unfunded loan commitments, and assets and liabilities in foreign currencies, if any. |
Each Fund recognizes the financial statement effects of a tax position taken or expected to be taken in a tax return when it is more likely than not, based on the technical merits, that the position will be sustained upon examination by the applicable tax authority. Tax positions not deemed to meet the more-likely-than-not threshold would be recorded as a tax liability for unrecognized tax benefits in the Statement of Assets and Liabilities with a corresponding expense in the Statement of Operations. Each Fund is required to analyze all open tax years, as defined by the statute of limitations, for all major jurisdictions. As a result of each Fund’s evaluation, as of and during the year or period ended March 31, 2012, each Fund did not record a liability for any unrecognized tax benefits. Each Fund’s policy is to recognize interest and penalties on unrecognized tax benefits in income tax expense in the Statements of Operations. During the year or period ended March 31, 2012, none of the Funds covered in this report incurred any interest or penalties. Each Fund is also not aware of any tax positions for which it is reasonably possible that the total amounts of unrecognized tax benefits will change materially in the next twelve months.
Each Fund remains subject to examination by Federal and State tax authorities (principal state jurisdictions include California and Delaware) for the tax years ended March 31, 2009 through March 31, 2012 for Federal purposes and March 31, 2008 through March 31, 2012 for State purposes.
D-19
Table of Contents
PACIFIC LIFE FUNDS
NOTES TO FINANCIAL STATEMENTS (Continued)
11. TAX CHARACTER OF DISTRIBUTIONS
The tax character of income and capital gain distributions to shareholders during the years or periods ended March 31, 2012 and 2011, were as follows:
| For the Year or Period Ended March 31, 2012 | For the Year or Period Ended March 31, 2011 | |||||||||||||||||||||||
Fund | Ordinary Income | Long-Term Capital Gains | Total Distributions | Ordinary Income | Long-Term Capital Gains | Total Distributions | ||||||||||||||||||
PL Floating Rate Loan | $ | 3,822,618 | $ | — | $ | 3,822,618 | $ | 2,039,771 | $ | — | $ | 2,039,771 | ||||||||||||
PL High Income | 117,780 | 117,780 | ||||||||||||||||||||||
PL Inflation Managed | 16,846,737 | 3,055,973 | 19,902,710 | 7,414,873 | — | 7,414,873 | ||||||||||||||||||
PL Managed Bond | 11,687,819 | — | 11,687,819 | 16,002,758 | 2,900,507 | 18,903,265 | ||||||||||||||||||
PL Short Duration Bond | 1,583,339 | 194,538 | 1,777,877 | 939,371 | 239,146 | 1,178,517 | ||||||||||||||||||
PL Short Duration Income | 59,453 | — | 59,453 | |||||||||||||||||||||
PL Strategic Income | 190,597 | — | 190,597 | |||||||||||||||||||||
PL Comstock | 2,469,410 | — | 2,469,410 | 1,377,486 | — | 1,377,486 | ||||||||||||||||||
PL Growth LT | 536,165 | — | 536,165 | — | — | — | ||||||||||||||||||
PL Large-Cap Growth | — | 1,890,797 | 1,890,797 | — | — | — | ||||||||||||||||||
PL Large-Cap Value | 4,290,204 | — | 4,290,204 | 2,525,491 | — | 2,525,491 | ||||||||||||||||||
PL Main Street Core | 1,459,944 | — | 1,459,944 | 914,905 | — | 914,905 | ||||||||||||||||||
PL Mid-Cap Equity | 669,458 | — | 669,458 | 924,425 | — | 924,425 | ||||||||||||||||||
PL Mid-Cap Growth | 510,818 | 7,026,231 | 7,537,049 | 1,329,323 | 3,924,652 | 5,253,975 | ||||||||||||||||||
PL Small Cap Value | 1,046,454 | — | 1,046,454 | 707,726 | — | 707,726 | ||||||||||||||||||
PL Real Estate | 324,119 | — | 324,119 | 338,875 | — | 338,875 | ||||||||||||||||||
PL Emerging Markets | 436,893 | 1,469,566 | 1,906,459 | 940,708 | — | 940,708 | ||||||||||||||||||
PL International Large-Cap | 2,241,781 | — | 2,241,781 | 1,187,271 | — | 1,187,271 | ||||||||||||||||||
PL International Value | 3,217,735 | — | 3,217,735 | 2,011,876 | — | 2,011,876 | ||||||||||||||||||
12. RECLASSIFICATION OF ACCOUNTS
During the year or period ended March 31, 2012, reclassifications as shown in the following table have been made in each Fund’s capital accounts to report these balances on a tax basis, excluding certain temporary differences, as of March 31, 2012. Additional adjustments may be required in subsequent reporting periods. These reclassifications, which have no impact on the NAV of the Funds, are primarily attributable to reclassifications of swap income, paydown gain/loss, partnership income, foreign currency transactions, non-deductible expenses, treatment of net operating losses and capital gains under Federal tax rules versus U.S. GAAP. The calculation of net investment income per share in the financial highlights excludes these adjustments.
Fund | Paid-In Capital | Undistributed/ Accumulated Net Investment Income (Loss) | Undistributed/ Accumulated Net Realized Gain (Loss) | |||||||||
PL High Income | ($ | 6,381 | ) | $ | 6,381 | $ | — | |||||
PL Inflation Managed | — | 1,001,810 | (1,001,810 | ) | ||||||||
PL Managed Bond | — | 5,578,328 | (5,578,328 | ) | ||||||||
PL Short Duration Bond | — | 272,002 | (272,002 | ) | ||||||||
PL Short Duration Income | (6,817 | ) | 6,817 | — | ||||||||
PL Strategic Income | (8,855 | ) | 8,855 | — | ||||||||
PL Comstock | — | (181 | ) | 181 | ||||||||
PL Growth LT | — | 169,682 | (169,682 | ) | ||||||||
PL Large-Cap Growth | (185,189 | ) | 185,189 | — | ||||||||
PL Large-Cap Value | — | 6,313 | (6,313 | ) | ||||||||
PL Main Street Core | (897 | ) | 119,660 | (118,763 | ) | |||||||
PL Mid-Cap Growth | — | 343,089 | (343,089 | ) | ||||||||
PL Small-Cap Growth | (92,412 | ) | 96,124 | (3,712 | ) | |||||||
PL Small-Cap Value | — | (118,112 | ) | 118,112 | ||||||||
PL Real Estate | — | (3 | ) | 3 | ||||||||
PL Emerging Markets | — | (97,598 | ) | 97,598 | ||||||||
PL International Large-Cap | — | (38,459 | ) | 38,459 | ||||||||
PL International Value | — | 914,969 | (914,969 | ) | ||||||||
D-20
Table of Contents
PACIFIC LIFE FUNDS
NOTES TO FINANCIAL STATEMENTS (Continued)
13. SHARES OF BENEFICIAL INTEREST
Each Fund is authorized to issue an unlimited number of shares of beneficial interest with no par value. Changes in shares of beneficial interest of each Fund for the years or periods ended March 31, 2012 and 2011 were as follows:
PL Floating Rate Loan Fund (1) | PL High Income Fund (2) | PL Inflation Managed Fund (1) | PL Managed Bond Fund (1) | |||||||||||||||||||||||||||
| Year ended | Year ended | Period ended | Year ended | Year ended | Year ended | Year ended | Year ended | |||||||||||||||||||||||
| 3/31/2012 | 3/31/2011 | 3/31/2012 | 3/31/2011 | 3/31/2012 | 3/31/2011 | 3/31/2012 | 3/31/2011 | |||||||||||||||||||||||
Class A | ||||||||||||||||||||||||||||||
Shares sold | 783,698 | 1,956,632 | 3,125,323 | |||||||||||||||||||||||||||
Dividends and distribution reinvested | 59,430 | 192,834 | 476,813 | |||||||||||||||||||||||||||
Shares repurchased | (26,716 | ) | (481,900 | ) | (717,827 | ) | ||||||||||||||||||||||||
Converted to Class P shares | (6,194,222 | ) | (16,468,262 | ) | (24,830,341 | ) | ||||||||||||||||||||||||
|
|
|
|
|
| |||||||||||||||||||||||||
Net decrease | (5,377,810 | ) | (14,800,696 | ) | (21,946,032 | ) | ||||||||||||||||||||||||
Beginning shares outstanding | 5,377,810 | 14,800,696 | 21,946,032 | |||||||||||||||||||||||||||
|
|
|
|
|
| |||||||||||||||||||||||||
Ending shares outstanding | — | — | — | |||||||||||||||||||||||||||
|
|
|
|
|
| |||||||||||||||||||||||||
Class P | ||||||||||||||||||||||||||||||
Shares sold | 2,778,851 | 2,473,194 | 5,832,301 | 6,605,011 | 11,330,537 | 11,171,594 | ||||||||||||||||||||||||
Dividends and distributions reinvested | 391,261 | 147,193 | 1,868,799 | 529,088 | 1,103,666 | 1,296,521 | ||||||||||||||||||||||||
Shares repurchased | (570,742 | ) | (314,282 | ) | (2,797,468 | ) | (1,823,688 | ) | (2,937,545 | ) | (2,036,265 | ) | ||||||||||||||||||
Converted from Class A Shares | — | 6,194,222 | — | 16,468,262 | — | 24,830,341 | ||||||||||||||||||||||||
|
|
|
|
|
|
|
|
|
|
|
| |||||||||||||||||||
Net increase | 2,599,370 | 8,500,327 | 4,903,632 | 21,778,673 | 9,496,658 | 35,262,191 | ||||||||||||||||||||||||
Beginning shares outstanding | 8,500,327 | — | 21,778,673 | — | 35,262,191 | — | ||||||||||||||||||||||||
|
|
|
|
|
|
|
|
|
|
|
| |||||||||||||||||||
Ending shares outstanding | 11,099,697 | 8,500,327 | 26,682,305 | 21,778,673 | 44,758,849 | 35,262,191 | ||||||||||||||||||||||||
|
|
|
|
|
|
|
|
|
|
|
| |||||||||||||||||||
Class I | ||||||||||||||||||||||||||||||
Shares sold | 700,000 | |||||||||||||||||||||||||||||
Dividends and distribution reinvested | 11,256 | |||||||||||||||||||||||||||||
Shares repurchased | — | |||||||||||||||||||||||||||||
|
| |||||||||||||||||||||||||||||
Net increase | 711,256 | |||||||||||||||||||||||||||||
Beginning shares outstanding | — | |||||||||||||||||||||||||||||
|
| |||||||||||||||||||||||||||||
Ending shares outstanding | 711,256 | |||||||||||||||||||||||||||||
|
| |||||||||||||||||||||||||||||
PL Short Duration Bond Fund (1) | PL Short Duration Income Fund (2) | PL Strategic Income Fund (2) | PL Comstock Fund (1) | |||||||||||||||||||||||||||
| Year ended | Year ended | Period ended | Year ended | Period ended | Year ended | Year ended | Year ended | |||||||||||||||||||||||
| 3/31/2012 | 3/31/2011 | 3/31/2012 | 3/31/2011 | 3/31/2012 | 3/31/2011 | 3/31/2012 | 3/31/2011 | |||||||||||||||||||||||
Class A | ||||||||||||||||||||||||||||||
Shares sold | 1,426,601 | 840,641 | ||||||||||||||||||||||||||||
Dividends and distribution reinvested | 22,578 | 25,075 | ||||||||||||||||||||||||||||
Shares repurchased | (94,972 | ) | (199,075 | ) | ||||||||||||||||||||||||||
Converted to Class P shares | (8,923,737 | ) | (12,653,081 | ) | ||||||||||||||||||||||||||
|
|
|
| |||||||||||||||||||||||||||
Net decrease | (7,569,530 | ) | (11,986,440 | ) | ||||||||||||||||||||||||||
Beginning shares outstanding | 7,569,530 | 11,986,440 | ||||||||||||||||||||||||||||
|
|
|
| |||||||||||||||||||||||||||
Ending shares outstanding | — | — | ||||||||||||||||||||||||||||
|
|
|
| |||||||||||||||||||||||||||
Class P | ||||||||||||||||||||||||||||||
Shares sold | 4,052,837 | 4,291,769 | 3,553,403 | 2,223,407 | ||||||||||||||||||||||||||
Dividends and distributions reinvested | 178,681 | 95,117 | 225,311 | 99,619 | ||||||||||||||||||||||||||
Shares repurchased | (872,644 | ) | (1,239,556 | ) | (880,653 | ) | (1,248,603 | ) | ||||||||||||||||||||||
Converted from Class A Shares | — | 8,923,737 | — | 12,653,081 | ||||||||||||||||||||||||||
|
|
|
|
|
|
|
| |||||||||||||||||||||||
Net increase | 3,358,874 | 12,071,067 | 2,898,061 | 13,727,504 | ||||||||||||||||||||||||||
Beginning shares outstanding | 12,071,067 | — | 13,727,504 | — | ||||||||||||||||||||||||||
|
|
|
|
|
|
|
| |||||||||||||||||||||||
Ending shares outstanding | 15,429,941 | 12,071,067 | 16,625,565 | 13,727,504 | ||||||||||||||||||||||||||
|
|
|
|
|
|
|
| |||||||||||||||||||||||
D-21
Table of Contents
PACIFIC LIFE FUNDS
NOTES TO FINANCIAL STATEMENTS (Continued)
PL Short Duration Bond Fund (1) | PL Short Duration Income Fund (2) | PL Strategic Income Fund (2) | PL Comstock Fund (1) | |||||||||||||||||||||||||||||
| Year ended | Year ended | Period ended | Year ended | Period ended | Year ended | Year ended | Year ended | |||||||||||||||||||||||||
| 3/31/2012 | 3/31/2011 | 3/31/2012 | 3/31/2011 | 3/31/2012 | 3/31/2011 | 3/31/2012 | 3/31/2011 | |||||||||||||||||||||||||
Class I | ||||||||||||||||||||||||||||||||
Shares sold | 1,202,305 | 1,692,857 | ||||||||||||||||||||||||||||||
Dividends and distribution reinvested | 5,874 | 18,364 | ||||||||||||||||||||||||||||||
Shares repurchased | — | — | ||||||||||||||||||||||||||||||
|
|
|
| |||||||||||||||||||||||||||||
Net increase | 1,208,179 | 1,711,221 | ||||||||||||||||||||||||||||||
Beginning shares outstanding | — | — | ||||||||||||||||||||||||||||||
|
|
|
| |||||||||||||||||||||||||||||
Ending shares outstanding | 1,208,179 | 1,711,221 | ||||||||||||||||||||||||||||||
|
|
|
| |||||||||||||||||||||||||||||
PL Growth LT Fund (1) | PL Large Cap Growth Fund (1) | PL Large Cap Value Fund (1) | PL Main Street Core Fund (1) | |||||||||||||||||||||||||||||
| Year ended | Year ended | Year ended | Year ended | Year ended | Year ended | Year ended | Year ended | |||||||||||||||||||||||||
| 3/31/2012 | 3/31/2011 | 3/31/2012 | 3/31/2011 | 3/31/2012 | 3/31/2011 | 3/31/2012 | 3/31/2011 | |||||||||||||||||||||||||
Class A | ||||||||||||||||||||||||||||||||
Shares sold | 515,246 | 565,551 | 1,490,054 | 1,015,605 | ||||||||||||||||||||||||||||
Dividends and distribution reinvested | — | — | 51,066 | 12,032 | ||||||||||||||||||||||||||||
Shares repurchased | (175,781 | ) | (200,745 | ) | (329,474 | ) | (18,854 | ) | ||||||||||||||||||||||||
Converted to | (8,299,570 | ) | (8,286,576 | ) | (16,781,975 | ) | (17,231,149 | ) | ||||||||||||||||||||||||
|
|
|
|
|
|
|
| |||||||||||||||||||||||||
Net decrease | (7,960,105 | ) | (7,921,770 | ) | (15,570,329 | ) | (16,222,366 | ) | ||||||||||||||||||||||||
Beginning shares outstanding | 7,960,105 | 7,921,770 | 15,570,329 | 16,222,366 | ||||||||||||||||||||||||||||
|
|
|
|
|
|
|
| |||||||||||||||||||||||||
Ending shares outstanding | — | — | — | — | ||||||||||||||||||||||||||||
|
|
|
|
|
|
|
| |||||||||||||||||||||||||
Class P | ||||||||||||||||||||||||||||||||
Shares sold | 1,423,438 | 1,755,602 | 2,164,349 | 3,571,915 | 3,684,819 | 4,330,848 | 2,375,126 | 2,582,319 | ||||||||||||||||||||||||
Dividends and distributions reinvested | 47,701 | — | 220,116 | — | 390,728 | 190,557 | 150,046 | 82,836 | ||||||||||||||||||||||||
Shares repurchased | (2,515,096 | ) | (752,995 | ) | (573,437 | ) | (1,122,789 | ) | (2,423,173 | ) | (1,591,279 | ) | (929,081 | ) | (4,310,264 | ) | ||||||||||||||||
Converted from Class A Shares | — | 8,299,570 | — | 8,286,576 | — | 16,781,975 | — | 17,231,149 | ||||||||||||||||||||||||
|
|
|
|
|
|
|
|
|
|
|
|
|
|
|
| |||||||||||||||||
Net increase (decrease) | (1,043,957 | ) | 9,302,177 | 1,811,028 | 10,735,702 | 1,652,374 | 19,712,101 | 1,596,091 | 15,586,040 | |||||||||||||||||||||||
Beginning shares outstanding | 9,302,177 | — | 10,735,702 | — | 19,712,101 | — | 15,586,040 | — | ||||||||||||||||||||||||
|
|
|
|
|
|
|
|
|
|
|
|
|
|
|
| |||||||||||||||||
Ending shares outstanding | 8,258,220 | 9,302,177 | 12,546,730 | 10,735,702 | 21,364,475 | 19,712,101 | 17,182,131 | 15,586,040 | ||||||||||||||||||||||||
|
|
|
|
|
|
|
|
|
|
|
|
|
|
|
| |||||||||||||||||
PL Mid-Cap Equity Fund (1) | PL Mid-Cap Growth Fund (1) | PL Small-Cap Growth Fund (1) | PL Small-Cap Value Fund (1) | |||||||||||||||||||||||||||||
| Year ended | Year ended | Year ended | Year ended | Year ended | Year ended | Year ended | Year ended | |||||||||||||||||||||||||
| 3/31/2012 | 3/31/2011 | 3/31/2012 | 3/31/2011 | 3/31/2012 | 3/31/2011 | 3/31/2012 | 3/31/2011 | |||||||||||||||||||||||||
Class A | ||||||||||||||||||||||||||||||||
Shares sold | 949,982 | 117,550 | 27,664 | 157,009 | ||||||||||||||||||||||||||||
Dividends and distribution reinvested | 5,986 | 66,283 | — | 8,614 | ||||||||||||||||||||||||||||
Shares repurchased | (377,103 | ) | (620,970 | ) | (234,932 | ) | (160,735 | ) | ||||||||||||||||||||||||
Converted to Class P shares | (12,316,799 | ) | (6,101,628 | ) | (2,523,721 | ) | (4,458,487 | ) | ||||||||||||||||||||||||
|
|
|
|
|
|
|
| |||||||||||||||||||||||||
Net decrease | (11,737,934 | ) | (6,538,765 | ) | (2,730,989 | ) | (4,453,599 | ) | ||||||||||||||||||||||||
Beginning shares outstanding | 11,737,934 | 6,538,765 | 2,730,989 | 4,453,599 | ||||||||||||||||||||||||||||
|
|
|
|
|
|
|
| |||||||||||||||||||||||||
Ending shares outstanding | — | — | — | — | ||||||||||||||||||||||||||||
|
|
|
|
|
|
|
| |||||||||||||||||||||||||
Class P | ||||||||||||||||||||||||||||||||
Shares sold | 3,794,349 | 1,862,192 | 1,280,313 | 860,631 | 603,780 | 717,380 | 1,315,442 | 3,207,574 | ||||||||||||||||||||||||
Dividends and distributions reinvested | 72,609 | 89,164 | 994,334 | 495,234 | — | — | 106,890 | 65,004 | ||||||||||||||||||||||||
Shares repurchased | (806,734 | ) | (1,283,576 | ) | (250,642 | ) | (1,187,382 | ) | (257,367 | ) | (521,752 | ) | (468,973 | ) | (540,987 | ) | ||||||||||||||||
Converted from Class A Shares | — | 12,316,799 | — | 6,101,628 | — | 2,523,721 | — | 4,458,487 | ||||||||||||||||||||||||
|
|
|
|
|
|
|
|
|
|
|
|
|
|
|
| |||||||||||||||||
Net increase | 3,060,224 | 12,984,579 | 2,024,005 | 6,270,111 | 346,413 | 2,719,349 | 953,359 | 7,190,078 | ||||||||||||||||||||||||
Beginning shares outstanding | 12,984,579 | — | 6,270,111 | — | 2,719,349 | — | 7,190,078 | — | ||||||||||||||||||||||||
|
|
|
|
|
|
|
|
|
|
|
|
|
|
|
| |||||||||||||||||
Ending shares outstanding | 16,044,803 | 12,984,579 | 8,294,116 | 6,270,111 | 3,065,762 | 2,719,349 | 8,143,437 | 7,190,078 | ||||||||||||||||||||||||
|
|
|
|
|
|
|
|
|
|
|
|
|
|
|
| |||||||||||||||||
D-22
Table of Contents
PACIFIC LIFE FUNDS
NOTES TO FINANCIAL STATEMENTS (Continued)
| PL Real Estate | PL Emerging | PL International | PL International | |||||||||||||||||||||||||||||
| Fund (1) | Markets Fund (1) | Large-Cap Fund (1) | Value Fund (1) | |||||||||||||||||||||||||||||
| Year ended | Year ended | Year ended | Year ended | Year ended | Year ended | Year ended | Year ended | |||||||||||||||||||||||||
| 3/31/2012 | 3/31/2011 | 3/31/2012 | 3/31/2011 | 3/31/2012 | 3/31/2011 | 3/31/2012 | 3/31/2011 | |||||||||||||||||||||||||
Class A | ||||||||||||||||||||||||||||||||
Shares sold | 18,349 | 64,136 | 899,940 | 1,269,450 | ||||||||||||||||||||||||||||
Dividends and distribution reinvested | 7,759 | — | 76,898 | 61,755 | ||||||||||||||||||||||||||||
Shares repurchased | (423,437 | ) | (7,619 | ) | (104,013 | ) | (170,122 | ) | ||||||||||||||||||||||||
Converted to Class P shares | (3,535,609 | ) | (3,969,965 | ) | (8,682,775 | ) | (10,552,384 | ) | ||||||||||||||||||||||||
|
|
|
|
|
|
|
| |||||||||||||||||||||||||
Net decrease | (3,932,938 | ) | (3,913,448 | ) | (7,809,950 | ) | (9,391,301 | ) | ||||||||||||||||||||||||
Beginning shares outstanding | 3,932,938 | 3,913,448 | 7,809,950 | 9,391,301 | ||||||||||||||||||||||||||||
|
|
|
|
|
|
|
| |||||||||||||||||||||||||
Ending shares outstanding | — | — | — | — | ||||||||||||||||||||||||||||
|
|
|
|
|
|
|
| |||||||||||||||||||||||||
Class P | ||||||||||||||||||||||||||||||||
Shares sold | 1,025,141 | 688,375 | 2,024,174 | 1,054,854 | 5,074,872 | 1,645,551 | 3,744,103 | 1,627,362 | ||||||||||||||||||||||||
Dividends and distributions reinvested | 28,862 | 24,982 | 162,945 | 64,256 | 172,048 | 17,428 | 424,503 | 167,784 | ||||||||||||||||||||||||
Shares repurchased | (523,132 | ) | (596,295 | ) | (257,654 | ) | (710,469 | ) | (739,664 | ) | (1,366,892 | ) | (768,129 | ) | (2,855,965 | ) | ||||||||||||||||
Converted from Class A Shares | — | 3,535,609 | — | 3,969,965 | — | 8,682,775 | — | 10,552,384 | ||||||||||||||||||||||||
|
|
|
|
|
|
|
|
|
|
|
|
|
|
|
| |||||||||||||||||
Net increase | 530,871 | 3,652,671 | 1,929,465 | 4,378,606 | 4,507,256 | 8,978,862 | 3,400,477 | 9,491,565 | ||||||||||||||||||||||||
Beginning shares outstanding | 3,652,671 | — | 4,378,606 | — | 8,978,862 | — | 9,491,565 | — | ||||||||||||||||||||||||
|
|
|
|
|
|
|
|
|
|
|
|
|
|
|
| |||||||||||||||||
Ending shares outstanding | 4,183,542 | 3,652,671 | 6,308,071 | 4,378,606 | 13,486,118 | 8,978,862 | 12,892,042 | 9,491,565 | ||||||||||||||||||||||||
|
|
|
|
|
|
|
|
|
|
|
|
|
|
|
| |||||||||||||||||
| (1) | Class A shares were converted to Class P shares on July 2, 2010 (see Note 1 to Financial Statements). |
| (2) | The PL High Income Fund, PL Short Duration Income Fund and PL Strategic Income Funds commenced operations on December 19, 2011. |
14. OTHER TAX INFORMATION (Unaudited)
For corporate shareholders, the percentage of investment income (dividend income and short-term gains, if any) for each of the Funds that qualify for the dividends-received deductions for the year or period ended March 31, 2012 is as follows:
Fund | Percentage | |||
PL Inflation Managed | 0.05 | % | ||
PL Managed Bond | 1.63 | % | ||
PL Comstock | 100.00 | % | ||
PL Growth LT | 100.00 | % | ||
PL Large-Cap Value | 100.00 | % | ||
PL Main Street Core | 100.00 | % | ||
PL Mid-Cap Equity | 100.00 | % | ||
PL Mid-Cap Growth | 25.96 | % | ||
PL Small-Cap Value | 100.00 | % | ||
PL Real Estate | 5.86 | % | ||
PL International Large-Cap | 1.46 | % | ||
For the year or period ended March 31, 2012 certain dividends paid by the Funds may be subject to a maximum tax rate of 15% as provided by the Jobs and Growth Relief Reconciliation Act of 2003. Of the distributions made by the following Funds, the corresponding percentages represent the amount of each distribution which may qualify for the 15% dividend income tax rate.
Fund | Percentage | |||
PL Inflation Managed | 0.05 | % | ||
PL Managed Bond | 1.63 | % | ||
PL Strategic Income | 0.02 | % | ||
PL Comstock | 100.00 | % | ||
PL Growth LT | 100.00 | % | ||
PL Large-Cap Value | 100.00 | % | ||
PL Main Street Core | 100.00 | % | ||
PL Mid-Cap Equity | 100.00 | % | ||
PL Mid-Cap Growth | 34.07 | % | ||
PL Small-Cap Value | 100.00 | % | ||
PL Real Estate | 13.01 | % | ||
PL Emerging Markets | 93.24 | % | ||
PL International Large-Cap | 100.00 | % | ||
PL International Value | 96.17 | % | ||
D-23
Table of Contents
PACIFIC LIFE FUNDS
NOTES TO FINANCIAL STATEMENTS (Continued)
Shareholders should not use the above tax information to prepare their tax returns. The information will be included with your Form 1099 DIV which will be sent to you separately in January 2013.
The following Funds designated the listed amounts as long-term capital gain dividends during the year or period ended March 31, 2012. Distributable long-term gains are based on net realized long-term gains determined on a tax basis and may differ from such amounts for financial reporting purposes.
Fund | Amount | |||
PL Inflation Managed | $ | 3,789,008 | ||
PL Short Duration Bond | 240,665 | |||
PL Large-Cap Growth | 2,866,749 | |||
PL Mid-Cap Growth | 7,026,231 | |||
PL Emerging Markets | 1,469,566 | |||
D-24
Table of Contents
REPORT OF INDEPENDENT REGISTERED PUBLIC ACCOUNTING FIRM
To The Board of Trustees and Shareholders of
Pacific Life Funds
We have audited the accompanying statements of assets and liabilities, including the schedules of investments, of PL Floating Rate Loan Fund, PL High Income Fund, PL Inflation Managed Fund, PL Managed Bond Fund, PL Short Duration Bond Fund, PL Short Duration Income Fund, PL Strategic Income Fund, PL Comstock Fund, PL Growth LT Fund, PL Large-Cap Growth Fund, PL Large-Cap Value Fund, PL Main Street Core Fund, PL Mid-Cap Equity Fund, PL Mid-Cap Growth Fund, PL Small-Cap Growth Fund, PL Small-Cap Value Fund, PL Real Estate Fund, PL Emerging Markets Fund, PL International Large-Cap Fund, and PL International Value Fund (collectively the “Funds”) (twenty of twenty-eight funds comprising the Pacific Life Funds) as of March 31, 2012, and the related statements of operations for the year then ended (as to the PL High Income Fund, PL Short Duration Income Fund, and PL Strategic Income Fund, for the period from commencement of operations through March 31, 2012), the statements of changes in net assets for each of the two years in the period then ended (as to the PL High Income Fund, PL Short Duration Income Fund, and PL Strategic Income Fund, for the period from commencement of operations through March 31, 2012), and the financial highlights for each of the periods presented. These financial statements and financial highlights are the responsibility of the Funds’ management. Our responsibility is to express an opinion on these financial statements and financial highlights based on our audits.
We conducted our audits in accordance with the standards of the Public Company Accounting Oversight Board (United States). Those standards require that we plan and perform the audit to obtain reasonable assurance about whether the financial statements and financial highlights are free of material misstatement. The Funds are not required to have, nor were we engaged to perform, an audit of their internal control over financial reporting. Our audits included consideration of internal control over financial reporting as a basis for designing audit procedures that are appropriate in the circumstances, but not for the purpose of expressing an opinion on the effectiveness of the Funds’ internal control over financial reporting. Accordingly, we express no such opinion. An audit also includes examining, on a test basis, evidence supporting the amounts and disclosures in the financial statements, assessing the accounting principles used and significant estimates made by management, as well as evaluating the overall financial statement presentation. Our procedures included confirmation of investments owned as of March 31, 2012, by correspondence with the custodian, agent banks, and brokers; where replies were not received from brokers, we performed other auditing procedures. We believe that our audits provide a reasonable basis for our opinion.
In our opinion, such financial statements and financial highlights referred to above present fairly, in all material respects, the financial position of each of the respective Funds as of March 31, 2012, and the results of their operations, the changes in their net assets, and the financial highlights for each of the periods presented, in conformity with accounting principles generally accepted in the United States of America.
Costa Mesa, California
May 25, 2012
E-1
Table of Contents
DISCLOSURE OF FUND EXPENSES
(Unaudited)
We believe it is important for you to understand the impact of fees and expenses regarding your investment. All mutual funds have operating expenses. As a shareholder of a mutual fund, you incur ongoing costs, which include advisory fees, administration fees and other fund expenses. The following example is intended to help you understand your ongoing costs (in dollars) of investing in each fund and to compare these costs with those of other mutual funds. The example is based on an investment of $1,000.00 made at the beginning of the period and held for the entire six-month period from October 1, 2011 to March 31, 2012.
ACTUAL EXPENSES
The first section of the table for each fund entitled “Actual Fund Return”, provides information about actual account values and actual expenses based on each fund’s actual performance and each fund’s actual expenses, after any applicable advisory fee waivers and adviser expense reimbursements (See Notes 6 and 7B in Notes to Financial Statements). The “Ending Account Value at 03/31/12” column shown is derived from the fund’s actual performance; the “Annualized Expense Ratio” column shows the fund’s actual annualized expense ratio; and the “Expenses Paid During the Period 10/01/11-03/31/12” column shows the dollar amount that would have been paid by you. All the information illustrated in the following table is based on the past six-month period from October 1, 2011 to March 31, 2012.
You may use the information in this section, together with the amount you invested, to estimate the expenses that you paid over the period. To do so, for each fund in your account, simply divide that fund’s value by $1,000.00 (for example, an $8,600.00 fund value divided by $1,000.00 = 8.6), then multiply the result by the number given for your fund(s) in the “Expenses Paid During the Period 10/01/11-03/31/12.”
HYPOTHETICAL EXAMPLE FOR COMPARISON PURPOSES
The second section of the table for each fund, entitled “Hypothetical”, provides information about hypothetical account values and hypothetical expenses based on a 5% per year hypothetical rate of return and actual fund’s expenses, after any applicable advisory fee waivers and adviser expense reimbursements (See Note 6 and 7B in Notes to Financial Statements). It assumes that the fund had an annual 5% rate of return before expenses, but that the expense ratio is unchanged. The hypothetical account values and expenses may not be used to estimate the actual ending account values or expenses you paid for the period.
You may use the hypothetical example information to compare the ongoing costs of investing in the fund compared to other mutual funds. To do so, compare this 5% hypothetical example with the 5% hypothetical examples that appear in the shareholder reports of other mutual funds.
Please note that the expenses shown in the table are meant to highlight your ongoing costs only and do not reflect any transactional costs, such as initial sales charges (loads) or contingent deferred sales charges. Therefore, the second section of the table is useful in comparing ongoing costs only, and will not help you determine the relative total costs of owning different mutual funds. In addition, if these other costs were included, your costs would have been higher.
| Beginning Account Value at 10/01/11 | Ending Account Value at 03/31/12 | Annualized Expense Ratio | Expenses Paid During the Period (1) 10/01/11 - 03/31/12 | |||||||||||||
PL Floating Rate Loan Fund | ||||||||||||||||
Actual Fund Return | ||||||||||||||||
Class P | $ | 1,000.00 | $ | 1,063.20 | 0.80 | % | $ | 4.13 | ||||||||
Hypothetical | ||||||||||||||||
Class P | $ | 1,000.00 | $ | 1,021.00 | 0.80 | % | $ | 4.04 | ||||||||
PL High Income Fund (2) | ||||||||||||||||
Actual Fund Return | ||||||||||||||||
Class I (2) | $ | 1,000.00 | $ | 1,075.00 | 0.80 | % | $ | 2.36 | ||||||||
Hypothetical | ||||||||||||||||
Class I (2) | $ | 1,000.00 | $ | 1,021.00 | 0.80 | % | $ | 4.04 | ||||||||
PL Inflation Managed Fund | ||||||||||||||||
Actual Fund Return | ||||||||||||||||
Class P | $ | 1,000.00 | $ | 1,042.80 | 0.56 | % | $ | 2.86 | ||||||||
Hypothetical | ||||||||||||||||
Class P | $ | 1,000.00 | $ | 1,022.20 | 0.56 | % | $ | 2.83 | ||||||||
PL Managed Bond Fund | ||||||||||||||||
Actual Fund Return | ||||||||||||||||
Class P | $ | 1,000.00 | $ | 1,042.10 | 0.55 | % | $ | 2.81 | ||||||||
Hypothetical | ||||||||||||||||
Class P | $ | 1,000.00 | $ | 1,022.25 | 0.55 | % | $ | 2.78 | ||||||||
PL Short Duration Bond Fund | ||||||||||||||||
Actual Fund Return | ||||||||||||||||
Class P | $ | 1,000.00 | $ | 1,014.20 | 0.55 | % | $ | 2.77 | ||||||||
Hypothetical | ||||||||||||||||
Class P | $ | 1,000.00 | $ | 1,022.25 | 0.55 | % | $ | 2.78 | ||||||||
PL Short Duration Income Fund (2) | ||||||||||||||||
Actual Fund Return | ||||||||||||||||
Class I (2) | $ | 1,000.00 | $ | 1,021.00 | 0.60 | % | $ | 1.72 | ||||||||
Hypothetical | ||||||||||||||||
Class I (2) | $ | 1,000.00 | $ | 1,022.00 | 0.60 | % | $ | 3.03 | ||||||||
PL Strategic Income Fund (2) | ||||||||||||||||
Actual Fund Return | ||||||||||||||||
Class I (2) | $ | 1,000.00 | $ | 1,052.20 | 0.80 | % | $ | 2.33 | ||||||||
Hypothetical | ||||||||||||||||
Class I (2) | $ | 1,000.00 | $ | 1,021.00 | 0.80 | % | $ | 4.04 | ||||||||
PL Comstock Fund | ||||||||||||||||
Actual Fund Return | ||||||||||||||||
Class P | $ | 1,000.00 | $ | 1,262.90 | 0.89 | % | $ | 5.03 | ||||||||
Hypothetical | ||||||||||||||||
Class P | $ | 1,000.00 | $ | 1,020.55 | 0.89 | % | $ | 4.50 | ||||||||
| F-1 | See explanation of references on page F-2 |
Table of Contents
PACIFIC LIFE FUNDS
DISCLOSURE OF FUND EXPENSES (Continued)
(Unaudited)
| Beginning Account Value at 10/01/11 | Ending Account Value at 03/31/12 | Annualized Expense Ratio | Expenses Paid During the Period (1) 10/01/11 - 03/31/12 | |||||||||||||
PL Growth LT Fund | ||||||||||||||||
Actual Fund Return | ||||||||||||||||
Class P | $ | 1,000.00 | $ | 1,254.50 | 0.70 | % | $ | 3.95 | ||||||||
Hypothetical | ||||||||||||||||
Class P | $ | 1,000.00 | $ | 1,021.50 | 0.70 | % | $ | 3.54 | ||||||||
PL Large-Cap Growth Fund | ||||||||||||||||
Actual Fund Return | ||||||||||||||||
Class P | $ | 1,000.00 | $ | 1,296.70 | 0.88 | % | $ | 5.05 | ||||||||
Hypothetical | ||||||||||||||||
Class P | $ | 1,000.00 | $ | 1,020.60 | 0.88 | % | $ | 4.45 | ||||||||
PL Large-Cap Value Fund | ||||||||||||||||
Actual Fund Return | ||||||||||||||||
Class P | $ | 1,000.00 | $ | 1,259.20 | 0.80 | % | $ | 4.52 | ||||||||
Hypothetical | ||||||||||||||||
Class P | $ | 1,000.00 | $ | 1,021.00 | 0.80 | % | $ | 4.04 | ||||||||
PL Main Street Core Fund | ||||||||||||||||
Actual Fund Return | ||||||||||||||||
Class P | $ | 1,000.00 | $ | 1,281.90 | 0.60 | % | $ | 3.42 | ||||||||
Hypothetical | ||||||||||||||||
Class P | $ | 1,000.00 | $ | 1,022.00 | 0.60 | % | $ | 3.03 | ||||||||
PL Mid-Cap Equity Fund | ||||||||||||||||
Actual Fund Return | ||||||||||||||||
Class P | $ | 1,000.00 | $ | 1,239.50 | 0.80 | % | $ | 4.48 | ||||||||
Hypothetical | ||||||||||||||||
Class P | $ | 1,000.00 | $ | 1,021.00 | 0.80 | % | $ | 4.04 | ||||||||
PL Mid-Cap Growth Fund | ||||||||||||||||
Actual Fund Return | ||||||||||||||||
Class P | $ | 1,000.00 | $ | 1,202.00 | 0.85 | % | $ | 4.68 | ||||||||
Hypothetical | ||||||||||||||||
Class P | $ | 1,000.00 | $ | 1,020.75 | 0.85 | % | $ | 4.29 | ||||||||
PL Small-Cap Growth Fund | ||||||||||||||||
Actual Fund Return | ||||||||||||||||
Class P | $ | 1,000.00 | $ | 1,291.90 | 0.75 | % | $ | 4.30 | ||||||||
Hypothetical | ||||||||||||||||
Class P | $ | 1,000.00 | $ | 1,021.25 | 0.75 | % | $ | 3.79 | ||||||||
PL Small-Cap Value Fund | ||||||||||||||||
Actual Fund Return | ||||||||||||||||
Class P | $ | 1,000.00 | $ | 1,213.30 | 0.90 | % | $ | 4.98 | ||||||||
Hypothetical | ||||||||||||||||
Class P | $ | 1,000.00 | $ | 1,020.50 | 0.90 | % | $ | 4.55 | ||||||||
PL Real Estate Fund | ||||||||||||||||
Actual Fund Return | ||||||||||||||||
Class P | $ | 1,000.00 | $ | 1,283.20 | 1.05 | % | $ | 5.99 | ||||||||
Hypothetical | ||||||||||||||||
Class P | $ | 1,000.00 | $ | 1,019.75 | 1.05 | % | $ | 5.30 | ||||||||
| Beginning Account Value at 10/01/11 | Ending Account Value at 03/31/12 | Annualized Expense Ratio | Expenses Paid During the Period (1) 10/01/11 - 03/31/12 | |||||||||||||
PL Emerging Markets Fund | ||||||||||||||||
Actual Fund Return | ||||||||||||||||
Class P | $ | 1,000.00 | $ | 1,193.20 | 0.95 | % | $ | 5.21 | ||||||||
Hypothetical | ||||||||||||||||
Class P | $ | 1,000.00 | $ | 1,020.25 | 0.95 | % | $ | 4.80 | ||||||||
PL International Large-Cap Fund | ||||||||||||||||
Actual Fund Return | ||||||||||||||||
Class P | $ | 1,000.00 | $ | 1,210.20 | 1.00 | % | $ | 5.53 | ||||||||
Hypothetical | ||||||||||||||||
Class P | $ | 1,000.00 | $ | 1,020.00 | 1.00 | % | $ | 5.05 | ||||||||
PL International Value Fund | ||||||||||||||||
Actual Fund Return | ||||||||||||||||
Class P | $ | 1,000.00 | $ | 1,173.70 | 0.80 | % | $ | 4.35 | ||||||||
Hypothetical | ||||||||||||||||
Class P | $ | 1,000.00 | $ | 1,021.00 | 0.80 | % | $ | 4.04 | ||||||||
| (1) | Expenses paid during the six-month period are equal to the fund’s annualized expense ratio (shown in table above), multiplied by the average account value over the period, multiplied by the number of days in the most recent fiscal half-year or applicable period, then divided by 366 days. |
| (2) | This Fund commenced operations on December 19, 2011. The actual fund return and expenses paid during the period by this fund were for the period from December 19, 2011 to March 31, 2012, instead of the entire six-month period. The hypothetical return and expenses paid during the period are based on the entire six-month period for comparison purposes. |
| F-2 |
Table of Contents
TRUSTEES AND OFFICERS INFORMATION
(Unaudited)
The business and affairs of the Pacific Life Funds (the “Trust”) are managed under the direction of the Board of Trustees under the Pacific Life Funds’ Declaration of Trust. Information pertaining to the trustees and officers of the Trust is set forth below, effective April 1, 2012. Trustees who are not deemed to be “interested persons” of the Trust, as defined in the 1940 Act, are referred to as “Independent Trustees.” Certain trustees and officers are deemed to be “interested persons” of the Trust and thus are referred to as “Interested Persons”, because of their positions with Pacific Life Insurance Company (“Pacific Life”) and Pacific Life Fund Advisors LLC, a wholly-owned subsidiary of Pacific Life. The Trust’s Statement of Additional Information includes additional information about the trustees. For information on availability of the Trust’s Statement of Additional Information, refer to the WHERE TO GO FOR MORE INFORMATION section of this report.
The address of each trustee and officer is c/o Pacific Life Funds, 700 Newport Center Drive, Newport Beach, CA 92660.
Name and Age | Position(s) with the Fund and Length of Time Served* | Current Directorship(s) Held and Principal Occupation(s) (and certain additional occupation information) | Number of Portfolios in Fund Complex Overseen** | |||
INDEPENDENT TRUSTEES | ||||||
Frederick L. Blackmon Year of birth 1952 | Trustee since 9/13/05 | Trustee (1/05 to present) of Pacific Select Fund; Director (2005 to present) of Trustmark Mutual Holding Company; Former Executive Vice President and Chief Financial Officer (1995 to 2003) of Zurich Life and has been retired since that time; Executive Vice President and Chief Financial Officer (1989 to 1995) of Alexander Hamilton Life Insurance Company (subsidiary of Household International); Member of Board of Trustees (2010 to present) of Cranbrook Educational Community; Former Member of Board of Governors (1994 to 1999) of Cranbrook Schools; and Former Member, Board of Regents (1993 to 1996), Eastern Michigan University. | 78 | |||
Gale K. Caruso Year of birth 1957 | Trustee since 1/01/06 | Trustee (1/06 to present) of Pacific Select Fund; Former Member of the Board of Directors (2005 to 2009) of LandAmerica Financial Group, Inc.; Former President and Chief Executive Officer (1999 to 2003) of Zurich Life; Former Chairman, President and Chief Executive Officer of Scudder Canada Investor Services, Ltd. and Managing Director of Scudder Kemper Investments; Former Member of the Advisory Council of the Trust for Public Land in Maine; Member of the Board of Directors of Make-A-Wish of Maine; and Former Member, Board of Directors of the Illinois Life Insurance Council. | 78 | |||
Lucie H. Moore Year of birth 1956 | Trustee since 6/13/01 | Trustee (10/98 to present) of Pacific Select Fund; Former Partner (1984 to 1994) with Gibson, Dunn & Crutcher (Law); Member of the Board of Trustees (2007 to 2011) of Sage Hill School; Former Member (2000 to 2009) and Former Vice Chairman (2001 to 2007) of the Board of Trustees of The Pegasus School; Former Member of the Board of Directors (2005 to 2010) of HomeWord; and Former Member of the Advisory Board (1993 to 2004) of Court Appointed Special Advocates (CASA) of Orange County. | 78 | |||
Nooruddin (Rudy) S. Veerjee Year of birth 1958 | Trustee since 9/13/05 | Trustee (1/05 to present) of Pacific Select Fund; Former President (1997 to 2000) of Transamerica Insurance and Investment Group and has been retired since that time; Former President (1994 to 1997) of Transamerica Asset Management; Former Chairman and Chief Executive Officer (1995 to 2000) of Transamerica Premier Funds (Mutual Fund); and Former Director (1994 to 2000) of various Transamerica Life Companies. | 78 | |||
| G. Thomas Willis Year of birth 1942 | Trustee since 2/24/04 | Trustee (11/03 to present) of Pacific Select Fund; Certified Public Accountant in California (1967 to present); Former Audit Partner (1976 to 2002) of PricewaterhouseCoopers LLP, (Accounting and Auditing) and has been retired since that time. | 78 | |||
| F-3 | See explanation of symbols on page F-6 |
Table of Contents
PACIFIC LIFE FUNDS
TRUSTEES AND OFFICERS INFORMATION (Continued)
(Unaudited)
Name and Age | Position(s) with the Fund and Length of Time Served* | Current Directorship(s) Held and Principal Occupation(s) (and certain additional occupation information) During Past 5 Years | Number of Portfolios in Fund Complex Overseen** | |||
INTERESTED PERSONS | ||||||
James T. Morris Year of birth 1960 | Chairman of the Board and Trustee since 1/11/07, (Chief Executive Officer 1/11/07 to 12/31/09, President 11/14/05 to 1/10/07 and Executive Vice President 6/05 to 11/05) | Director (4/07 to present), Chairman (5/08 to present), Chief Executive Officer (4/07 to present), President (4/07 to 3/12), Chief Operating Officer (1/06 to 4/07), Executive Vice President and Chief Insurance Officer (7/05 to 1/06) of Pacific Mutual Holding Company and Pacific LifeCorp; Director (4/07 to present), Chairman (5/08 to present), Chief Executive Officer (4/07 to present), President (4/07 to 3/12), Chief Operating Officer (1/06 to 4/07), Chief Insurance Officer (4/05 to 1/06), Executive Vice President (1/02 to 1/06), Senior Vice President (4/96 to 1/02), and Vice President (4/90 to 4/96) of Pacific Life; President and Chief Executive Officer (5/07 to present) of Pacific Life Fund Advisors LLC; Director (4/06 to present), Chairman (5/08 to present), President and Chief Executive Officer (4/07 to present), Chief Operating Officer (1/06 to 4/07), Chief Insurance Officer (4/05 to 1/06), Executive Vice President (1/02 to 1/06), and Senior Vice President (8/99 to 1/02) of Pacific Life & Annuity Company; and similar positions with other subsidiaries and affiliates of Pacific Life; and Chairman of the Board and Trustee (1/07 to present), Chief Executive Officer (1/07 to 12/09), President (11/05 to 1/07) and Executive Vice President (6/05 to 11/05) of Pacific Select Fund. | 78 | |||
Mary Ann Brown Year of birth 1951 | Chief Executive Officer since 1/01/10, (President 1/11/07 to 12/31/09, Executive Vice President 6/20/06 to 1/10/07) | Executive Vice President (4/10 to present) and Senior Vice President (5/06 to 4/10) of Pacific LifeCorp; Executive Vice President (4/10 to present) and Senior Vice President (3/05 to 4/10) of Pacific Life; Trustee (9/05 to 12/10), Pacific Life Employees Retirement Plan; Executive Vice President (4/10 to present) and Senior Vice President (5/07 to 4/10) of Pacific Life Fund Advisors LLC; Executive Vice President (4/10 to present) and Senior Vice President (6/08 to 4/10) of Pacific Life Re Holdings LLC; Director (6/08 to present) Executive Vice President (4/10 to present) and Senior Vice President (6/08 to 4/10) of Pacific Life Re Holdings Limited; Director (9/11 to present) of Pacific Life Reinsurance (Barbados) Ltd; Board Member (1/12 to present) and Director (9/11 to 12/11) of Pacific Services Canada Ltd; Board Member and Vice Chairman (8/01 to present) and Chairman (7/04 to 10/05) of National Association of Variable Annuities; Senior Vice President of Finance (7/03 to 11/03), New York Life Insurance Company; MetLife, Inc. (12/98 to 6/03), Senior Vice President and Head of Individual Business Product Management (12/98 to 7/02) responsibilities included: President of New England Products and Services; Chairman, Security First Group (later MetLife Investors); Chairman, Chief Executive Officer and President, New England Pension and Annuity Company; Board Member, New England Zenith Funds; Board Member, Reinsurance Group of America, Chairman and Chief Executive Officer of Exeter Reinsurance Company, Ltd.; Chairman and Chief Executive Officer of Missouri Reinsurance Company, Ltd; Chairman of Underwriting Policy and Rate Setting Committees; Senior Vice President and Chief Actuary (7/02 to 6/03), of MetLife, Inc.; Director (12/05 to present), Executive Vice President (4/10 to present) and Senior Vice President (12/05 to 4/10) of Pacific Alliance Reinsurance Ltd; Director (10/07 to present), Executive Vice President (6/10 to present) and Senior Vice President (10/07 to 6/10) of Pacific Alliance Reinsurance Company of Vermont; and Chief Executive Officer (1/10 to present), President (1/07 to 12/09) and Executive Vice President (6/06 to 1/07) of Pacific Select Fund. | 78 | |||
| F-4 | See explanation of symbols on page F-6 |
Table of Contents
PACIFIC LIFE FUNDS
TRUSTEES AND OFFICERS INFORMATION (Continued)
(Unaudited)
Name and Age | Position(s) with the Fund and Length of Time Served* | Current Directorship(s) Held and Principal Occupation(s) (and certain additional occupation information) During Past 5 Years | Number of Portfolios in Fund Complex Overseen** | |||
INTERESTED PERSONS (Continued) | ||||||
Robin S. Yonis Year of birth 1954 | Vice President and General Counsel since 6/13/01 | Vice President, Fund Advisor General Counsel, and Assistant Secretary (5/07 to present) of Pacific Life Fund Advisors LLC; Vice President and Counsel (4/04 to present), Assistant Vice President and Investment Counsel (11/93 to 4/04) of Pacific Life; Vice President and Investment Counsel (4/04 to 9/09), Assistant Vice President and Investment Counsel (8/99 to 4/04) of Pacific Life & Annuity Company; and Vice President and General Counsel (4/05 to present) of Pacific Select Fund. | 78 | |||
Brian D. Klemens Year of birth 1956 | Vice President and Treasurer since 6/13/01 | Vice President and Controller (10/07 to present) and Vice President and Treasurer (6/99 to 10/07) of Pacific Mutual Holding Company and Pacific LifeCorp; Vice President and Controller (10/07 to present) and Vice President and Treasurer (12/98 to 10/07) of Pacific Life; Vice President and Controller (10/07 to present) and Vice President and Treasurer (5/07 to 10/07) of Pacific Life Fund Advisors LLC; and similar positions with other subsidiaries and affiliates of Pacific Life; and Vice President and Treasurer (4/96 to present) of Pacific Select Fund. | 78 | |||
Sharon E. Pacheco Year of birth 1957 | Vice President and Chief Compliance Officer since 6/04/04 | Vice President and Chief Compliance Officer (11/03 to present) of Pacific Mutual Holding Company and Pacific LifeCorp; Vice President (2/00 to present) and Chief Compliance Officer (1/03 to present) and Assistant Vice President (11/97 to 2/00) of Pacific Life; Vice President (4/00 to present), Chief Compliance Officer (1/03 to present), and Assistant Vice President (8/99 to 4/00) of Pacific Life & Annuity Company; Vice President and Chief Compliance Officer (5/07 to present) of Pacific Life Fund Advisors LLC; and Vice President and Chief Compliance Officer (6/04 to present) of Pacific Select Fund | 78 | |||
Eddie Tung Year of birth 1957 | Vice President and Assistant Treasurer since 11/14/05 | Assistant Vice President (4/03 to present) and Director (Variable Products Accounting) (4/00 to 4/03) of Pacific Life; Assistant Vice President (4/10 to present) of Pacific Life & Annuity Company; Assistant Vice President (5/07 to present) of Pacific Life Fund Advisors LLC; and Assistant Vice President and Assistant Treasurer (11/05 to present) of Pacific Select Fund. | 78 | |||
Howard T. Hirakawa Year of birth 1962 | Vice President since 6/20/06 | Vice President (5/07 to present) of Pacific Life Fund Advisors LLC; Vice President (4/05 to present), Assistant Vice President (4/00 to 4/05) and Director (Annuities & Mutual Funds) (5/98 to 4/00) of Pacific Life; Vice President (4/05 to 9/09) of Pacific Life & Annuity Company; and Vice President (6/06 to present) of Pacific Select Fund. | 78 | |||
Jane M. Guon Year of birth 1964 | Vice President since 1/01/11 and Secretary since 1/01/11 | Vice President and Secretary (1/11 to present) and Assistant Vice President (4/06 to 12/10) and Assistant Secretary (6/98 to 12/10) of Pacific Mutual Holding Company and Pacific LifeCorp; Director, Vice President, and Secretary (1/11 to present) and Assistant Vice President (4/06 to 12/10) and Assistant Secretary (2/95 to 12/10) of Pacific Life; Vice President and Secretary (1/11 to present) and Assistant Vice President and Assistant Secretary (05/07 to 12/10) of Pacific Life Fund Advisors LLC and similar positions with other subsidiaries of Pacific Life; and Vice President (1/11 to present) and Secretary (1/11 to present) of Pacific Select Fund. | 78 | |||
| F-5 | See explanation of symbols on page F-6 |
Table of Contents
PACIFIC LIFE FUNDS
TRUSTEES AND OFFICERS INFORMATION (Continued)
(Unaudited)
Name and Age | Position(s) with the Fund and Length of Time Served* | Current Directorship(s) Held and Principal Occupation(s) (and certain additional occupation information) During Past 5 Years | Number of Portfolios in Fund Complex Overseen** | |||
INTERESTED PERSONS (Continued) | ||||||
Laurene E. MacElwee Year of birth 1966 | Vice President since 4/04/05 and Assistant Secretary since 6/13/01 | Vice President (4/11 to present), Assistant Secretary (5/07 to present), and Assistant Vice President (5/07 to 3/11) of Pacific Life Fund Advisors LLC; Vice President (4/11 to present); Assistant Vice President (4/02 to 3/11) and Director (Variable Products & Fund Compliance) (4/00 to 4/02) of Pacific Life; and Vice President (12/11 to present), Assistant Secretary (4/05 to present), and Assistant Vice President (4/05 to 12/11) of Pacific Select Fund. | 78 | |||
Carleton J. Muench Year of birth 1973 | Vice President since 11/30/06 | Assistant Vice President (5/07 to present) of Pacific Life Fund Advisors LLC; Assistant Vice President (10/06 to present) of Pacific Life; Director of Research (5/05 to 9/06) and Senior Investment Analyst (10/03 to 4/05) of Mason Investment Advisory Services, Inc.; Investment Analyst (2/01 to 9/02), Due Diligence Analyst (1/00 to 1/01) and Performance Analyst (10/98 to 12/99) of Manulife Financial; and Assistant Vice President (11/06 to present) of Pacific Select Fund. | 78 | |||
| * | A trustee serves until he or she resigns, retires, or his or her successor is elected and qualified. |
| ** | As of March 31, 2012, the “Fund Complex” consisted of Pacific Life Funds (28 funds) and Pacific Select Fund (50 portfolios). |
| F-6 |
Table of Contents
PACIFIC LIFE FUNDS
APPROVAL OF INVESTMENT ADVISORY AGREEMENT
AND FUND MANAGEMENT AGREEMENTS
(Unaudited)
The Board of Trustees (the “Trustees” or “Board”) of Pacific Life Funds (the “Trust”) oversees the management of each of the separate funds of the Trust (each a “Fund” and collectively, the “Funds”) and, as required by Section 15(c) of the Investment Company Act of 1940, as amended (the “1940 Act”), initially approves, and determines annually whether to renew the investment advisory agreement (the “Advisory Agreement”) with Pacific Life Fund Advisors LLC (“PLFA”) and each Fund management agreement (the “Fund Management Agreements,” together with the Advisory Agreement, the “Agreements”) with the various sub-advisers (“Fund Managers”). PLFA serves as the investment adviser for all of the Funds and directly manages the PL Money Market, PL Income and PL Floating Rate Income Funds (the “PAM Managed Funds”) under the name Pacific Asset Management (“PAM”) and the PL Portfolio Optimization Conservative, PL Portfolio Optimization Moderate-Conservative, PL Portfolio Optimization Moderate, PL Portfolio Optimization Moderate-Aggressive, and PL Portfolio Optimization Aggressive Funds (the “Asset Allocation Funds,” and together with the PAM Managed Funds, the “Directly Managed Funds”). For all other Funds (other than the PL High Income, PL Short Duration Income and PL Strategic Income Funds, which are new funds and are discussed below), PLFA has retained other firms to serve as Fund Managers under PLFA’s supervision. The Board, including all of the Trustees who are not “interested persons,” as that term is defined in the 1940 Act (“Independent Trustees”), last renewed the Agreements at an in-person meeting of the Trustees held on December 12-13, 2011.
At this meeting and other meetings, the Board considered information (both written and oral) provided to assist it in its review of the Agreements and made assessments with respect to each Agreement. The Board requested, received and reviewed written materials from PLFA and each Fund Manager that were submitted in response to requests from the Independent Trustees and supporting materials relating to those questions and responses. In addition, the Board received in-person presentations about the Funds throughout the year, and the Independent Trustees were advised by independent legal counsel with respect to these and other relevant matters. The Board reviewed a variety of factors and considered a significant amount of information, including information received on an ongoing basis at Board and committee meetings, including reports on Fund performance, expenses, fee comparisons, investment advisory, compliance, and other services provided to the Funds by PLFA and the Fund Managers. The Board also reviewed financial and profitability information regarding PLFA and the Fund Managers and information regarding the organization and operations of each entity, such as their compliance monitoring, portfolio trading and brokerage practices and the personnel providing investment management and administrative services to each Fund. The Board reviewed data provided by PLFA that was gathered from various independent providers of investment company data to provide the Board with information concerning the Funds’ investment performance, management fees and expense information. Additionally, the Independent Trustees retained an independent consultant (“Independent Consultant”) to assist the Trustees with certain of their analyses and to provide other relevant information. The Independent Consultant utilized and provided the Independent Trustees with data obtained from independent service providers as well as from other sources.
The Trustees’ determinations were made on the basis of each Trustee’s business judgment after consideration of all the information presented. In reviewing the materials presented and in considering the information in the management presentations, the Trustees did not identify any single issue or particular information that, in isolation, would be a controlling factor in making a final decision regarding the proposed renewals. Individual Trustees may have given different weights to certain factors and assigned various degrees of materiality to information received in connection with the approval process. The following summary describes the most important, but not all, of the factors considered by the Trustees in approving the renewals, and in the case of the Independent Trustees, certain factors were considered in light of the legal advice furnished to them by independent legal counsel and information from the Independent Consultant that they had retained. This discussion is not intended to be all-inclusive.
Annual Consideration and Approval of Investment Advisory and Fund Management Agreements
In evaluating the Advisory Agreement and each Fund Management Agreement, the Board, including all the Independent Trustees, considered the following factors, among others:
1. Nature, Extent and Quality of Services
Fund Oversight and Supervision - PLFA, its personnel and its resources. The Trustees considered the depth and quality of PLFA’s investment management process, including its monitoring and oversight of the Fund Managers and PAM; the experience, capability and integrity of its senior management and other personnel; the low turnover rates of its key personnel; and the overall financial strength and stability of its organization. The Trustees considered the high quality of the products and services provided by PLFA and its affiliates, such as the many educational services and tools offered to assist intermediaries in effectively understanding and meeting shareholder needs. The Trustees also noted that PLFA regularly informs the Trustees about matters relevant to the Trust, its shareholders and investing.
The Trustees also considered that the investment, legal, compliance and accounting professionals of PLFA and its affiliates have access to and utilize a variety of resources and systems relating to investment management, compliance, trading, performance analysis, security valuation and fund accounting. The Trustees further considered PLFA’s continuing need to attract and retain qualified personnel and to maintain and enhance its resources and systems to provide appropriate investment management, compliance and monitoring services for the Funds. The Board noted that PLFA monitors numerous investment, performance and compliance metrics for the Funds.
The Trustees considered PLFA’s continued development and use of analytical tools for assessing Fund performance and the performance of the Fund Managers, conducting an attribution analysis on performance and reporting on performance to the Trustees. The Trustees noted
F-7
Table of Contents
PACIFIC LIFE FUNDS
APPROVAL OF INVESTMENT ADVISORY AGREEMENT
AND FUND MANAGEMENT AGREEMENTS (Continued)
(Unaudited)
that PLFA uses these tools to identify Funds that are underperforming applicable benchmarks or peer groups, and then conducts various analyses to try to assess the sources of and reasons for underperformance. The Trustees noted that PLFA has developed processes to oversee and monitor the performance of Fund Managers, including the use of analytical methods to review Fund performance and execution of investment strategies. The Trustees noted that PLFA provides the Trustees with analysis of this data over rolling periods to assist the Trustees in identifying trends in Fund performance and other areas, and periodically provides the Trustees with information on economic and market trends to provide a context for assessing recent performance. The Trustees also noted that PLFA conducts periodic due diligence on Fund Managers involving onsite visits, in-person meetings and telephonic meetings to gather information that PLFA uses to gain an in-depth understanding of a Fund Manager’s investment process and to seek to identify issues that may be relevant to a Fund Manager’s services to a Fund or a Fund’s performance, including, but not limited to, the financial strength of a Fund Manager, significant staffing changes that could affect a Fund, material changes in a Fund Manager’s assets under management, compliance and regulatory concerns, best execution review and portfolio security valuation support. The Trustees also noted that PLFA appeared to have implemented effective methods for monitoring investment style consistency by Fund Managers and for analyzing the use of derivatives by Fund Managers. With respect to the PAM Managed Funds, the Trustees considered that PLFA provided oversight, diligence and reporting with regard to its PAM unit that is similar to the process it employs with regard to the Fund Managers. The Trustees also considered that PLFA directly manages the Asset Allocation Funds.
The Trustees considered the time and attention paid by PLFA to matters involving the valuation of Trust securities, including researching and evaluating information concerning securities that are not actively or publicly traded, valuing securities subject to a trading halt, the value of equity securities traded on foreign exchanges, oversight of and due diligence on pricing vendors and the development of alternate valuation methodologies. The Trustees also considered PLFA’s oversight of transition management when overseeing significant changes in the Funds, such as cash movements between the Funds arising from reallocations by the Asset Allocation Funds and the transition from one Fund Manager to another, including steps taken by PLFA to reduce transaction costs associated with a Fund Manager transition.
The Trustees considered PLFA’s policies, procedures and systems to ensure compliance with applicable laws and regulations with respect to the Directly Managed Funds, its compliance monitoring of the Fund Managers and its commitment to those programs; PLFA’s efforts to keep the Trustees informed about the Fund Managers; and its attention to matters that may involve conflicts of interest with each Fund. In this regard, the Trustees reviewed, throughout the year, information on PLFA’s compliance policies and procedures, its compliance history, and reports from the Trust’s Chief Compliance Officer (“CCO”) on compliance by PLFA, the Fund Managers, and the Funds with applicable laws and regulations. The Trustees also reviewed information on any responses by PLFA to regulatory and compliance developments throughout the year. The Trustees further considered the monitoring and additional services provided by PLFA to the Funds, including risk management analysis, preparation of periodic performance and financial reports, review of trade execution and coordination of other service providers to the Trust.
Fund Management – PLFA and the Fund Managers. The Trustees considered various materials relating to PLFA, including PAM, and the Fund Managers, including copies of each existing Advisory Agreement and Fund Management Agreement; copies of the Form ADV for PLFA and each Fund Manager; financial information relating to PLFA and each Fund Manager; and other information deemed relevant to the Trustees’ evaluation of PLFA and each Fund Manager, including qualitative assessments from senior management of PLFA.
The Trustees considered the benefits to shareholders of retaining PLFA, including its PAM unit, and each Fund Manager and continuing the Advisory Agreement and Fund Management Agreements particularly in light of the nature, extent, and quality of the services that have been provided by PLFA, including its PAM unit, and the Fund Managers. The Trustees noted the fund management services that have been provided by PLFA or PAM to the Directly Managed Funds and the fund management services that have been provided by the Fund Managers to the other Funds. The Trustees considered the quality of the fund management services which have benefited and should continue to benefit the Funds and their shareholders, the organizational depth and resources of PLFA and the Fund Managers, including the background and experience of PLFA, including its PAM unit, and each of the Fund Managers’, and the expertise of PLFA, its PAM unit, and each Fund Manager’s fund management team, as well as the investment methodology used by PLFA, its PAM unit, and the Fund Manager.
The Trustees further noted the compliance monitoring conducted on an ongoing basis by PLFA, including PAM, and also noted the development of procedures and systems necessary to maintain compliance with applicable laws and regulations as well as the resources that PLFA dedicates to these programs. The Trustees considered that the CCO had in place a systematic process for periodically reviewing PLFA and each Fund Manager’s written compliance policies and procedures, including the assessment of PLFA and each Fund Manager’s compliance program as required under Rule 38a-1 of the 1940 Act and PLFA’s and each Fund Manager’s code of ethics. The Trustees also considered that PLFA and each Fund Manager continue to cooperate with the CCO in reviewing its compliance operations.
In making their assessments, the Trustees considered that PLFA has historically exercised diligence in monitoring the performance of the Fund Managers and PAM, and has recommended and taken measures to attempt to remedy relative underperformance by a Fund when PLFA and the Trustees believed it to be appropriate.
The Board concluded that it was satisfied with the nature, extent and quality of the investment management services provided by PLFA and the Fund Managers.
F-8
Table of Contents
PACIFIC LIFE FUNDS
APPROVAL OF INVESTMENT ADVISORY AGREEMENT
AND FUND MANAGEMENT AGREEMENTS (Continued)
(Unaudited)
2. Investment Results
The Trustees considered the investment results of each Fund in light of its objective and market conditions over the past year. The Trustees compared each Fund’s total returns with both the total returns of appropriate groups of peer funds, based on information provided by PLFA using data from independent sources, and with one or more relevant benchmark indices. The Independent Trustees also considered information provided by an Independent Consultant who provided a presentation and analysis to the Trustees regarding peer group performance utilizing data from independent sources. The information provided to the Trustees included each Fund’s performance record for up to the last ten calendar years, and three-month, year-to-date, one-, three-, five- and ten-year or since inception periods, as applicable. In reviewing the performance data drawn from independent sources, as well as the performance of the respective benchmark indices, the Trustees noted that some Funds outperformed their peer groups over certain periods and/or exceeded their respective benchmark indices while others underperformed their peer groups over certain periods and/or trailed their respective benchmark indices. The Trustees discussed with PLFA the fact that certain periods of underperformance may be transitory while other periods of underperformance may be reflective of broader issues that may warrant consideration of corrective action. The Trustees discussed these Funds with representatives of PLFA, including an assessment of the approaches used by the Fund Managers as well as oversight and monitoring by PLFA as the investment adviser, to gain an understanding of underperformance and to assess whether any actions would be appropriate.
The Trustees also reviewed the monitoring of the Fund Managers’ investment results by PLFA, including PLFA’s historical practice of recommending to the Trustees the use of a new manager if performance lagged and could not be improved within a reasonable timeframe, and reviewed the monitoring of the PAM unit’s investment results by PLFA. The Trustees noted that many of the best investment advisory firms consistently compete to be considered to provide fund management services for the Funds. Generally, the Trustees noted that there continues to be a strong record of well-managed Funds that work well in the Asset Allocation Funds and that the Asset Allocation Funds provide a range of professionally managed asset allocation investment options. The Trustees also noted that the Funds continue to deliver the investment style as disclosed to shareholders. The Trustees also noted only the Directly Managed Funds are open to new investors.
The Board concluded that PLFA continues to have a strong record of effectively managing a multi-manager fund group and asset allocation and income funds designed to give shareholders a reasonable array of choices through which to implement their investment programs. The Board further concluded that PLFA was implementing each Fund’s investment objective either directly or through the selection of Fund Managers and that PLFA’s record in managing each Fund indicates that its continued management as well as the continuation of the applicable Fund Management Agreements will benefit each Fund and its shareholders.
3. Advisory Fees and Total Expense Ratios
The Trustees requested, received and reviewed information from PLFA relating to the advisory fees and the sub-advisory fees, including the portion of the advisory fees paid to each Fund Manager and the portion retained by PLFA, and operating expense ratios for each of the Funds. The Independent Trustees also requested and reviewed information from the Independent Consultant along with their analysis of advisory fees, sub-advisory fees and certain other expenses. The Trustees reviewed the advisory fees, sub-advisory fees and operating expense ratios of each Fund and compared such amounts with the average fee and expense levels of other funds in applicable peer fund groups. During their review, the Trustees noted that all of the Funds were subject to contractual expense limitations agreed to by PLFA. The Trustees also reviewed written materials prepared by PLFA based on peer fund group information retrieved from the independent sources. The Independent Trustees requested and reviewed an analysis provided by the Independent Consultant of the asset-based breakpoint schedule for the Funds. The Independent Trustees noted that the breakpoints offer meaningful potential savings to shareholders of many of the Funds.
The Trustees also considered information from the Fund Managers regarding the comparative sub-advisory fees charged under other investment advisory contracts, such as contracts of each Fund Manager with other registered investment companies or other types of clients. The Trustees noted that in many cases there were differences in the level of services provided to the Funds by the Fund Managers and that the level of services provided by these Fund Managers on these other accounts were due to the different nature of the accounts or because there were other reasons to support the difference in fees, such as an affiliation between the Fund Manager and the account. These differences often explained variations in fee schedules. The Trustees were mindful that, with regard to the sub-advised Funds, the fee rates were the result of arms’-length negotiations between PLFA and the Fund Managers, and that any sub-advisory fees are paid by PLFA and are not paid directly by a Fund. The Trustees observed that certain of the Funds’ contractual advisory fees were higher than the average of their respective Morningstar category while others were either lower or approximately equal to these averages.
The Board concluded that the advisory fees, sub-advisory fees and total expenses of each Fund were fair and reasonable.
4. Costs, Level of Profits and Economies of Scale
The Trustees reviewed information provided by PLFA and the Fund Managers regarding PLFA’s costs of sponsoring the Funds and the profitability of PLFA and the Fund Managers.
PLFA and the Fund Managers’ Costs and Profitability. The Trustees noted that, based on the information available, PLFA appears to be providing products that are competitively priced with other funds, especially multi-manager and asset allocation funds. The Board considered
F-9
Table of Contents
PACIFIC LIFE FUNDS
APPROVAL OF INVESTMENT ADVISORY AGREEMENT
AND FUND MANAGEMENT AGREEMENTS (Continued)
(Unaudited)
the costs of the services to be provided and the overall financial results for PLFA and its affiliates from the management of the Funds, both including and excluding distribution costs. The Board noted that the Funds are not projected to produce profits for PLFA for the year ended December 31, 2011, and considered that the Funds have not been profitable to PLFA and its affiliates in the past, due in part to the relatively low level of assets. The Board also noted the projected profitability of the Funds to PLFA in the near-term and noted that PLFA and its affiliates continue to subsidize and reimburse expenses for many of the Funds.
The Trustees also reviewed information regarding the structure and manner in which PLFA and the Fund Managers’ investment professionals were compensated and their respective views of the relationship of such compensation to the attraction and retention of quality personnel. The Trustees considered PLFA’s willingness to invest in technology, infrastructure and staff to reinforce and offer new services and to accommodate changing regulatory requirements.
With respect to the Fund Managers, the Trustees noted that it was difficult in many cases to accurately determine or evaluate the profitability of the Fund Management Agreements to the Fund Managers because of, among other things, the differences in the types of information provided by the Fund Managers, the fact that many Fund Managers manage substantial assets other than the Funds and, further, that any such assessment would involve assumptions regarding the Fund Managers’ expense allocation policies, capital structure, cost of capital, business mix and other factors.
Accordingly, in the case of the Fund Managers, the Trustees gave less weight to profitability considerations and did not view that this data was as important as other data given the arms’-length nature of the relationship (for the Funds that are sub-advised) between PLFA and such Fund Managers with respect to the negotiation of fund management fees.
Economies of Scale. The Trustees noted and considered the extent to which economies of scale are realized as each Fund grows and whether advisory fee levels reflect economies of scale if the Funds grow in size. The Trustees noted the Funds have relatively small asset levels that do not currently produce significant economies of scale. The Trustee noted, however, PLFA’s commitment to competitive total expenses of the Funds through expense limitation agreements, and its and its affiliates’ consistent reinvestment in the business in the form of improvements in technology, product innovations and customer service. The Board concluded that the Funds’ cost structures were reasonable in light of the Trust’s size.
5. Ancillary Benefits
The Trustees requested and received from PLFA and the Fund Managers information concerning other benefits received by PLFA, the Fund Managers, and their affiliates as a result of their respective relationships with the Funds, including information about various service arrangements with PLFA affiliates and reimbursement at an approximate cost basis for support services in the case of PLFA and its affiliates, as well as commissions paid to broker-dealers affiliated with certain Fund Managers and the use of soft dollars by certain Fund Managers. The Trustees also considered information concerning other significant economic relationships between the Fund Managers and their affiliates, and PLFA and its affiliates, and noted PLFA’s processes and procedures to identify and disclose such relationships to the Board. The Trustees also considered information provided to them as to how conflicts of interest that may arise from these relationships are managed.
The Board concluded that such benefits were consistent with those generally derived by investment advisers to mutual funds or were otherwise not unusual.
6. Conclusion
Based on their review, including their consideration of each of the factors referred to above, and assisted by the advice of the Independent Consultant and independent counsel to the Independent Trustees, the Board, including the Independent Trustees, found that (i) the compensation payable under the Advisory Agreement and each applicable Fund Management Agreement is fair and reasonable; and (ii) the renewal of the Advisory Agreement and each applicable Fund Management Agreement is in the best interests of each Fund and its shareholders. The Board did not indicate that any single factor was determinative of its decision to approve the Advisory Agreement and each applicable Fund Management Agreement but indicated that the Board based its determination on the total mix of information available to it.
Approval of Advisory Agreement with PLFA with Respect to the PL High Income, PL Short Duration Income and PL Strategic Income Funds
At an in-person meeting on September 15, 2011, the Board, including all of the Independent Trustees, approved the establishment and designation of the PL High Income, PL Short Duration Income and PL Strategic Income Funds (the “New Funds”). PLFA will directly manage the New Funds under the name, Pacific Asset Management. In connection with the approval of the New Funds, the Board also approved the Advisory Agreement with PLFA with respect to the New Funds.
In evaluating the Advisory Agreement with respect to the New Funds, the Board, including all the Independent Trustees, considered the following factors, among others:
1. Nature, Extent and Quality of Services to be Provided
The Trustees considered the depth and quality of PLFA’s investment management process, including its monitoring and oversight of the other Funds; its direct management of certain of those Funds; the experience, capability and integrity of its senior management and other
F-10
Table of Contents
PACIFIC LIFE FUNDS
APPROVAL OF INVESTMENT ADVISORY AGREEMENT
AND FUND MANAGEMENT AGREEMENTS (Continued)
(Unaudited)
personnel; the low turnover rates of its key personnel; and the overall financial strength and stability of its organization. The Trustees considered the high quality of the products and services provided by PLFA and its affiliates, such as the many educational services and tools to assist intermediaries in effectively understanding and meeting shareholder needs. The Trustees also noted that PLFA regularly informs the Trustees about matters relevant to the Trust, its shareholders and investing.
The Trustees also considered that PLFA’s investment, legal and compliance professionals have access to and utilize a variety of resources and systems relating to investment management, compliance, trading, performance, security valuation and fund accounting. The Trustees further considered PLFA’s continuing need to attract and retain qualified personnel and to maintain and enhance its resources and systems.
The Trustees considered the benefits to shareholders of retaining PLFA to serve as the adviser to each of the New Funds and to directly manage the New Funds within its PAM unit in light of the nature, extent, and quality of services expected to be provided. The Trustees considered the ability of PLFA and PAM to provide an appropriate level of support and resources to each New Fund and whether PLFA and PAM have sufficiently qualified personnel to provide the investment management, compliance and monitoring services required for the new Funds. The Trustees based this review on information and materials provided to them by PLFA and PAM. The Trustees also considered the background and experience of PLFA and PAM’s senior management and the significant amount of attention expected to be given to each New Fund by PLFA and PAM’s management and staff. The Trustees also considered various materials relating to PLFA and PAM, including copies of PLFA’s Form ADV; financial information; and other information deemed relevant to the Trustees’ evaluation.
The Trustees considered that under the Advisory Agreement, PLFA would be responsible for providing the investment management services for each New Fund, including investment research, advice and supervision, and determining which securities and other investments would be purchased or sold by each New Fund. The Trustees considered that the investment management services would be provided by the PAM unit, and that other units of PLFA would provide monitoring, compliance and other services, including reporting to the Board. The Trustees considered the quality of the management services expected to be provided to each New Fund over both the short- and long-term, the organizational depth and resources of PLFA (including PAM), including the background and experience of PAM’s management and the expertise of the fund management team, as well as the investment strategies, processes and philosophy to be used with respect to the investment strategy. In making these assessments, the Trustees were aided by the in-person presentation and materials provided by PLFA and PAM. The Trustees noted that PLFA serves as adviser to each Fund of the Trust and directly manages, within its PAM business unit, the PL Income, PL Floating Rate Income and PL Money Market Funds, each a series of the Trust, and the Cash Management and High Yield Bond Portfolios, each a series of Pacific Select Fund. The Board noted that PLFA would monitor numerous investment, performance and compliance metrics for the New Funds over daily, weekly, monthly, quarterly and annual periods.
The Trustees further considered the monitoring and additional services that would be provided by PLFA to the Fund, including assistance with security valuation, risk management oversight, preparation of periodic performance and financial reports, review of trade execution and coordinating the services of other service providers to the Trust. In addition, the Trustees considered that they had previously reviewed and approved PLFA’s written compliance policies and procedures and that the Trust’s CCO had previously provided an assessment of PLFA’s compliance program as required under Rule 38a-1 of the 1940 Act and its code of ethics. The Trustees further noted the compliance monitoring to be conducted on an ongoing basis by PLFA, including PAM, and also noted the development of procedures and systems necessary to maintain compliance with applicable laws and regulations and the resources that PLFA, including PAM, dedicates to its compliance program.
The Board concluded that it was satisfied with the nature, extent and quality of the investment management, compliance and monitoring services anticipated to be provided by PLFA to each New Fund under the PLFA Advisory Agreement.
2. Performance
The Trustees considered PLFA’s experience managing funds directly by PAM and its qualifications to manage each New Fund. Because this consideration related to newly organized funds, no actual performance records were available. However, the Trustees considered the investment process and techniques to be used by PAM for each New Fund and PAM’s experience directly managing other Funds, two portfolios of Pacific Select Fund, and Pacific Life Insurance Company’s general account, as well as the factors concerning performance in connection with its consideration of this matter, as described below.
The Trustees considered information about the historical performance of accounts managed by the same fund management team that would manage each New Fund according to the strategies proposed to be used by each New Fund (the “Comparable Performance”). The Trustees considered the Comparable Performance against pertinent benchmark indices and peer groups for the year-to-date and most recent one- and three-year periods as of June 30, 2011. The Trustees also considered the Comparable Performance against pertinent benchmark indexes and Morningstar peer groups, as available, for the 2008, 2009 and 2010 calendar year periods.
The Board determined that the performance record of PAM’s investment team was acceptable.
3. Advisory Fees
The Trustees requested, received and reviewed information from PLFA relating to the proposed advisory fees and total operating expenses for each New Fund. The Trustees reviewed the advisory fees and estimated total operating expense ratios for each New Fund and compared
F-11
Table of Contents
PACIFIC LIFE FUNDS
APPROVAL OF INVESTMENT ADVISORY AGREEMENT
AND FUND MANAGEMENT AGREEMENTS (Continued)
(Unaudited)
such amounts with the average fee and expense levels of other funds in applicable peer fund groups. The Trustees also noted that each New Fund was subject to expense limits agreed to by PLFA. The Trustees considered that the proposed advisory fee rates would be in line with industry averages for similar funds based on the data presented to the Board.
The Board concluded that the compensation payable under the PLFA Advisory Agreement is fair and reasonable.
4. Costs, Level of Profits and Economies of Scale
The Trustees reviewed information regarding PLFA’s projected costs of sponsoring each New Fund and information regarding the anticipated potential profitability of each New Fund to PLFA.
Costs and Profitability. The Trustees considered the cost of services to be provided and projected profits to be realized by PLFA from the relationship with each New Fund based on the projected assets, and income and expenses of PLFA in its relationship with each New Fund. The Trustees noted that this information contains estimates because there is no actual operating history for any of the New Funds. The Trustees considered the overall financial soundness of PLFA. The Trustees reviewed projected profitability information with respect to the profit or loss to PLFA from the PLFA Advisory Agreement. The Trustees reviewed the revenues and other benefits that are expected to be derived by PLFA from each New Fund.
Economies of Scale. The Trustees considered the extent to which economies of scale may be realized by each New Fund and the Trust as assets grow. Because the New Funds do not have any operating history and no assets, no economies of scale exist at this time with respect to any of the New Funds. The Trustees also noted that the advisory fee schedule for each of the New Funds does not contain breakpoints, but there is an expense limitation agreement in place for each New Fund and that PLFA had stated it would consider the implementation of breakpoints in the future, as warranted.
The Board concluded that the fee structure of each New Fund reflected in the PLFA Advisory Agreement was fair and reasonable.
5. Ancillary Benefits
The Trustees received from PLFA information concerning other benefits that may be received by PLFA and its affiliates as a result of its relationship with each New Fund, including fees for administrative services and reimbursement at an approximate cost basis for certain support services. The Trustees considered that PAM represented that it does not anticipate utilizing soft dollars or an affiliated broker dealer for trades. The Trustees considered that the potential benefits that could be derived by PLFA and PAM from their relationships with each New Fund may include larger assets under management and reputational benefits, which are consistent with those generally derived by investment advisers to mutual funds.
6. Conclusion
Based on its review, including the consideration of each of the factors referred to above, and assisted by the advice of independent counsel to the Independent Trustees, the Board, including the Independent Trustees, found that: (i) the compensation payable under the PLFA Advisory Agreement is fair and reasonable; and (ii) the PLFA Advisory Agreement is in the best interests of each New Fund and its shareholders. The Board did not indicate that any single factor was determinative of its decision to approve the Advisory Agreement, but indicated that the Board based its determination on the total mix of information available to it.
F-12
Table of Contents
WHERE TO GO FOR MORE INFORMATION
(Unaudited)
Availability of Quarterly Holdings
The Trust files Form N-Q (complete schedules of fund holdings) with the Securities and Exchange Commission (the “SEC”) for the first and third quarters of each fiscal year not later than 60 days after the close of the applicable quarter end. The Trust’s Form N-Q, (when required) is filed pursuant to applicable regulation and is available after filing (i) on the SEC’s Website at www.sec.gov; (ii) for review and copying at the SEC’s Public Reference Room in Washington, D.C. (Information on the operation of the Public Reference Room may be obtained by calling the SEC at 1-800-SEC-0330); and (iii) on the Trust’s Webpage at www.pacificlife.com/pacificlifefunds.htm. The SEC may charge you a fee for this information.
Availability of Proxy Voting Record
By August 31 of each year, the Trust files information regarding how portfolio managers voted proxies relating to fund securities during the most recent twelve-month period ended June 30. Such information is available after filing on the Trust’s’ Website and on the SEC’s Website noted below.
Information Relating to Investments Held by the Pacific Life Funds
For complete descriptions of the various securities and other instruments held by the Trust and their risks, please see the Trust’s Prospectus and Statement of Additional Information (“SAI”). For a description of bond ratings, please see the Trust’s SAI. The Prospectus and SAI are available as noted below.
Availability of Proxy Voting Policies
A description of the Proxy Voting Policies and Procedures that the Trust uses to determine how to vote proxies relating to fund securities is described in the Trust’s SAI.
How to obtain Information
The Trust’s Prospectus, SAI (including Proxy Voting Policies) and the Portfolio Optimization Funds’ annual and semi-annual reports are available:
| • | On the Trust’s Website at www.pacificlife.com/pacificlifefunds.htm |
| • | On the SEC’s Website at www.sec.gov |
| • | Upon request by calling, without charge, 1-800-722-2333, 7 a.m. through 5 p.m. Pacific Time |
F-13
Table of Contents
Item 2. Code of Ethics.
As of the end of the period covered by this report, the Registrant has adopted a code of ethics that applies to the Registrant’s principal executive officer, principal financial officer, principal accounting officer or controller, or persons performing similar functions. There were no substantive amendments or waivers to the Code of Ethics during the period covered by this report.
A copy of this Code of Ethics is filed as Exhibit 99 to this Form N-CSR.
Item 3. Audit Committee Financial Expert.
The Registrant’s Board has determined that G. Thomas Willis, a member of the Registrant’s Audit Committee, is an “audit committee financial expert” and “independent,” as such terms are defined in this Item. This designation does not increase the designee’s duties, obligations or liability as compared to his duties, obligations and liability as a member of the Audit Committee and of the Board; nor does it reduce the responsibility of the other Audit Committee members. There may be other individuals who, through education or experience, would qualify as “audit committee financial experts” if the Board had designated them as such. Most importantly, the Board believes each member of the Audit Committee contributes significantly to the effective oversight of the Registrant’s financial statements and condition. Mr. Willis is a retired partner of PricewaterhouseCoopers LLP.
Item 4. Principal Accountant Fees and Services.
Audit Fees
| (a) | The aggregate fees billed for the fiscal years ended March 31, 2012 and 2011 for professional services rendered by the principal accountant for the audit of the registrant’s annual financial statements or services that are normally provided by the accountant in connection with statutory and regulatory filings or engagements for those fiscal years are $422,786 and $378,437, respectively. |
Audit-Related Fees
| (b) | There were no aggregate fees billed for the fiscal years ended March 31, 2012 and 2011 for assurance and related services by the principal accountant that are reasonably related to the performance of the audit of the registrant’s financial statements and are not reported under paragraph (a) of this Item. |
Table of Contents
Tax Fees
| (c) | The aggregate fees billed for the fiscal years ended March 31, 2012 and 2011 for professional services rendered by the principal accountant for tax compliance, tax advice, and tax planning are $82,800 and $79,350, respectively. The nature of the services comprising the fees was the review of income tax returns and excise tax. |
All Other Fees
| (d) | There were no aggregate fees billed for the fiscal years ended March 31, 2012 and 2011 for products and services provided by the principal accountant, other than the services reported in paragraphs (a) through (c) of this Item. |
| (e)(1) | The Audit Committee is required to pre-approve audit and non-audit services performed for the Registrant by the independent auditor as outlined below in order to assure that the provision of such services does not impair the auditor’s independence: |
Pre-Approval Requirements for Services to Registrant. Before the Auditor is engaged by the Registrant to render audit related or permissible non-audit services, either:
(i) The Audit Committee shall pre-approve such engagement; or
(ii) Such engagement shall be entered into pursuant to pre-approval policies and procedures established by the Audit committee. Any such policies and procedures must (1) be detailed as to the particular service and (2) not involve any delegation of the Audit Committee’s responsibilities to the Adviser. The Audit Committee may delegate to one or more of its members the authority to grant pre-approvals. The pre-approval policies and procedures shall include the requirement that the decisions of any member to whom authority is delegated under this Section shall be presented to the full Audit Committee at its next scheduled meeting.
(iii) De Minimis Exceptions to Pre-Approval Requirements. Pre-approval for a service provided to the Registrant other than audit, review or attest services is not required if: (1) the aggregate amount of all such non-audit services provided to the Registrant constitutes not more than 5 percent of the total amount of revenues paid by the Registrant to the Auditor during the fiscal year in which the non-audit services are provided; (2) such services were not recognized by the Registrant at the time of the engagement to be non-audit services; and (3) such services are promptly brought to the attention of the Audit Committee and are approved by the Audit Committee or by one or more members of the Audit Committee to whom authority to grant such approvals has been delegated by the Audit Committee.
Pre-Approval of Non-Audit Services Provided to the Adviser and Others. The Audit Committee shall pre-approve any non-audit services proposed to be provided by the Auditor to (i) the Adviser and (ii) any entity in the investment company complex (see note 4), if the nature of the services provided relate directly to the operations or financial reporting of the Registrant.
Application of De Minimis Exception: The De Minimis exceptions set forth above apply to pre-approvals under this Section as well, except that the “total amount of revenues” calculation for this Section’s services is based on the total amount of revenues paid to the Auditor by the Registrant and any other entity that has its services approved under this Section (i.e., the Adviser or any control person).
Table of Contents
| (e)(2) | No services included in (b)-(d) above were approved pursuant to paragraph (c)(7)(i)(C) of Rule 2-01 of Regulation S-X. |
| (f) | Not applicable. |
| (g) | The aggregate fees billed for the years ended March 31, 2012 and 2011 by the Registrant’s principal accountant for non-audit services rendered to the Registrant, its investment adviser, and any entity controlling, controlled by, or under common control with the investment adviser that provides ongoing services to the Registrant were $120,300 and $84,350, respectively. |
| (h) | The Registrant’s Audit Committee has considered whether the provision of non-audit services that were rendered to the Registrant’s investment adviser, and any entity controlling, controlled by, or under common control with the investment adviser that provides ongoing services to the Registrant which were not pre-approved (not requiring pre-approval) is compatible with maintaining the principal accountant’s independence. |
Item 5. Audit Committee of Listed registrants.
Not applicable.
Item 6. Investments.
| (a) | Schedule I. |
| (b) | Not applicable. |
Item 7. Disclosure of Proxy Voting Policies and Procedures for Closed-End Management Investment Companies.
Not applicable.
Item 8. Portfolio Managers of Closed-End Management Investment Companies.
Not applicable.
Item 9. Purchases of Equity Securities by Closed-End Management Investment Company and Affiliated Purchasers.
Not applicable.
Table of Contents
Item 10. Submission of Matters to a Vote of Security Holders.
There have been no material changes to the procedures by which shareholders may recommend nominees to the Registrant’s Board of Directors.
Item 11. Controls and Procedures.
| (a) | The Chief Executive Officer and Treasurer have concluded that Registrant’s disclosure controls and procedures (as defined in Rule 30a-3(c) under the Investment Company Act) and internal controls over financial reporting (as defined in Rule 30a-3(d) under the Investment Company Act) provide reasonable assurances that material information relating to Registrant is made known to them by the appropriate persons, based on their evaluation of these controls and procedures as of a date within 90 days of the filing of this report. |
| (b) | There were no changes in Registrant’s internal control over financial reporting that occurred during the second fiscal quarter of the period covered by this report that have materially affected, or are reasonably likely to materially affect, the Registrant’s internal control over financial reporting. |
Item 12. Exhibits.
| (a)(1) | Code of Ethics, subject to the disclosure of Item 2 hereof- attached hereto as Exhibit 99. | |
| (a)(2) | Separate certifications pursuant to Rule 30a-2(a) under the Investment Company Act of 1940 (17 CFR 270.30a-2(a)) is attached hereto as Exhibit 99 CERT. | |
| (a)(3) | Not applicable. | |
| (b) | Certification pursuant to Rule 30a-2(b) under the Investment Company Act of 1940 (17 CFR 270.30a-2(b)) is attached hereto as Exhibit 99.906 CERT pursuant to Section 906 of the Sarbanes Oxley Act of 2002. | |
Table of Contents
Signatures
Pursuant to the requirements of the Securities Exchange Act of 1934 and the Investment Company Act of 1940, the registrant has duly caused this report to be signed on its behalf by the undersigned, thereunto duly authorized.
| Pacific Life Funds | ||
| By: | /s/ Mary Ann Brown | |
| Mary Ann Brown | ||
| Chief Executive Officer | ||
| Date: | June 8, 2012 | |
Pursuant to the requirements of the Securities Exchange Act of 1934 and the Investment Company Act of 1940, this report has been signed below by the following persons on behalf of the registrant and in the capacities and on the dates indicated.
| By: | /s/ Mary Ann Brown | |
| Mary Ann Brown | ||
| Chief Executive Officer | ||
| Date: | June 8, 2012 | |
| By: | /s/ Brian D. Klemens | |
| Brian D. Klemens | ||
| Treasurer (Principal Financial and Accounting Officer) | ||
| Date: | June 8, 2012 | |