Table of Contents
UNITED STATES
SECURITIES AND EXCHANGE COMMISSION
Washington, D.C. 20549
FORM 10-Q
| x | QUARTERLY REPORT PURSUANT TO SECTION 13 OR 15(d) OF THE SECURITIES EXCHANGE ACT OF 1934 |
For the quarterly period ended June 30, 2009
OR
| ¨ | TRANSITION REPORT PURSUANT TO SECTION 13 OR 15(d) OF THE SECURITIES EXCHANGE ACT OF 1934 |
For the transition period from to
Mirant Americas Generation, LLC
(Exact Name of Registrant as Specified in Its Charter)
Commission File Number: 333-63240
51-0390520 (I.R.S. Employer Identification No.)
Mirant North America, LLC
(Exact Name of Registrant as Specified in Its Charter)
Commission File Number: 333-134722
20-4514609 (I.R.S. Employer Identification No.)
Mirant Mid-Atlantic, LLC
(Exact Name of Registrant as Specified in Its Charter)
Commission File Number: 333-61668
58-2574140 (I.R.S. Employer Identification No.)
Delaware
(State or Other Jurisdiction of Incorporation or Organization of All Registrants)
1155 Perimeter Center West, Suite 100, Atlanta, Georgia 30338
(Address of Principal Executive Offices, Including Zip Code, of All Registrants)
(678) 579-5000
(Registrant’s Telephone Number, Including Area Code)
Indicate by check mark whether the registrant (1) has filed all reports required to be filed by Section 13 or 15(d) of the Securities Exchange Act of 1934 during the preceding 12 months (or for such shorter period that the registrant was required to file such reports), and (2) has been subject to such filing requirements for the past 90 days.
Mirant Americas Generation, LLC | x Yes ¨ No | |||
Mirant North America, LLC | x Yes ¨ No | |||
Mirant Mid-Atlantic, LLC | x Yes ¨ No | |||
Indicate by check mark whether the registrant has submitted electronically and posted on its corporate Web site, if any, every Interactive Data File required to be submitted and posted pursuant to Rule 405 of Regulation S-T (§ 232.405 of this chapter) during the preceding 12 months (or for such shorter period that the registrant was required to submit and post such files).
Mirant Americas Generation, LLC | ¨ Yes ¨ No | |||
Mirant North America, LLC | ¨ Yes ¨ No | |||
Mirant Mid-Atlantic, LLC | ¨ Yes ¨ No | |||
Table of Contents
Indicate by check mark whether the registrant is a large accelerated filer, an accelerated filer, a non-accelerated filer or a smaller reporting company. See the definitions of “large accelerated filer,” “accelerated filer” and “smaller reporting company” in Rule 12b-2 of the Exchange Act.
| Large Accelerated Filer | Accelerated Filer | Non-accelerated Filer | Smaller Reporting Company | |||||
Mirant Americas Generation, LLC | ¨ | ¨ | x | ¨ | ||||
Mirant North America, LLC | ¨ | ¨ | x | ¨ | ||||
Mirant Mid-Atlantic, LLC | ¨ | ¨ | x | ¨ | ||||
Indicate by check mark whether the registrant is a shell company (as defined in Rule 12b-2 of the Exchange Act).
Mirant Americas Generation, LLC | ¨ Yes x No | |||
Mirant North America, LLC | ¨ Yes x No | |||
Mirant Mid-Atlantic, LLC | ¨ Yes x No | |||
Indicate by check mark whether the registrant has filed all documents and reports required to be filed by Section 12, 13 or 15(d) of the Securities Exchange Act of 1934 subsequent to the distribution of securities under a plan confirmed by a court.
Mirant Americas Generation, LLC | x Yes ¨ No | |||
Mirant North America, LLC | x Yes ¨ No | |||
Mirant Mid-Atlantic, LLC | x Yes ¨ No | |||
All of the registrant’s outstanding membership interests are held by its parent and there are no membership interest held by nonaffiliates.
Registrant | Parent | |||||
Mirant Americas Generation, LLC | Mirant Americas, Inc. | |||||
Mirant North America, LLC | Mirant Americas Generation, LLC | |||||
Mirant Mid-Atlantic, LLC | Mirant North America, LLC | |||||
This combined Form 10-Q is separately filed by Mirant Americas Generation, LLC, Mirant North America, LLC and Mirant Mid-Atlantic, LLC. Information contained in this combined Form 10-Q relating to Mirant Americas Generation, LLC, Mirant North America, LLC and Mirant Mid-Atlantic, LLC is filed by such registrant on its own behalf and each registrant makes no representation as to information relating to registrants other than itself.
NOTE: WHEREAS MIRANT AMERICAS GENERATION, LLC, MIRANT NORTH AMERICA, LLC AND MIRANT MID-ATLANTIC, LLC MEET THE CONDITIONS SET FORTH IN GENERAL INSTRUCTION H(1)(a) AND (b) OF FORM 10-Q, THIS COMBINED FORM 10-Q IS BEING FILED WITH THE REDUCED DISCLOSURE FORMAT PURSUANT TO GENERAL INSTRUCTION H(2).
2
Table of Contents
| Page | ||||
| i-iii | ||||
| 4 | ||||
| PART I—FINANCIAL INFORMATION | ||||
Item 1. | Interim Financial Statements (Unaudited): | |||
Mirant Americas Generation, LLC | ||||
| 7 | ||||
| 8 | ||||
| 9 | ||||
| 10 | ||||
Mirant North America, LLC | ||||
| 11 | ||||
| 12 | ||||
| 13 | ||||
| 14 | ||||
Mirant Mid-Atlantic, LLC | ||||
| 15 | ||||
| 16 | ||||
| 17 | ||||
| 18 | ||||
Combined Notes to Condensed Consolidated Financial Statements | 19 | |||
Item 2. | Management’s Discussion and Analysis of Results of Operations and Financial Condition | |||
| 64 | ||||
| 87 | ||||
| 97 | ||||
Item 3. | 111 | |||
Item 4. | 116 | |||
| PART II—OTHER INFORMATION | ||||
Item 1. | 117 | |||
Item 1A. | 117 | |||
Item 6. | 117 | |||
| 117 | ||||
| 118 | ||||
| 118 | ||||
3
Table of Contents
Glossary of Certain Defined Terms
Administrative Services Agreement—Management, personnel and services agreement with Mirant Services, effective January 3, 2006.
APB—Accounting Principles Board.
APB 28—APB Opinion No. 28,Interim Financial Reporting.
APSA—Asset Purchase and Sale Agreement dated June 7, 2000, between Mirant and Pepco.
Bankruptcy Code—United States Bankruptcy Code.
Bankruptcy Court—United States Bankruptcy Court for the Northern District of Texas, Fort Worth Division.
Baseload Generating Units—Units that satisfy minimum baseload requirements of the system and produce electricity at an essentially constant rate and run continuously.
CAIR—Clean Air Interstate Rule.
CAISO—California Independent System Operator.
Cal PX—California Power Exchange.
Clean Air Act—Federal Clean Air Act.
Clean Water Act—Federal Water Pollution Control Act.
CO2—Carbon dioxide.
Companies—Mirant Americas Generation, LLC, Mirant North America, LLC, Mirant Mid-Atlantic, LLC and their subsidiaries.
CPUC—California Public Utilities Commission.
DWR—California Department of Water Resources.
EBITDA—Earnings before interest, taxes, depreciation and amortization.
EOB—California Electricity Oversight Board.
EPA—United States Environmental Protection Agency.
Exchange Act—Securities Exchange Act of 1934.
FASB—Financial Accounting Standards Board.
FERC—Federal Energy Regulatory Commission.
FIN—FASB Interpretation.
FIN 45—FIN No. 45,Guarantor’s Accounting and Disclosure Requirements for Guarantees, Including Indirect Guarantees of Indebtedness of Others—An Interpretation of FASB Statements Nos. 5, 57, and 107 and Rescission of FASB Interpretation No. 34.
FSP—FASB Staff Position.
FSP FAS 107-1 and APB 28-1—FSP FAS No. 107-1 and APB Opinion No. 28-1,Interim Disclosures about Fair Value of Financial Instruments.
FSP FAS 157-2—FSP FAS No. 157-2,Effective Date of FASB Statement No.157.
FSP FAS 157-4—FSP FAS No. 157-4,Determining Fair Value When the Volume and Level of Activity for the Asset or Liability Have Significantly Decreased and Identifying Transactions That Are Not Orderly.
GAAP—United States generally accepted accounting principles.
Gross Margin—Operating revenue less cost of fuel, electricity and other products, excluding depreciation and amortization.
i
Table of Contents
Hudson Valley Gas—Hudson Valley Gas Corporation.
Intermediate Generating Units—Units that meet system requirements that are greater than baseload and less than peaking.
ISO—Independent System Operator.
ISO-NE—Independent System Operator-New England.
LIBOR—London InterBank Offered Rate.
MDE—Maryland Department of the Environment.
Mirant—Old Mirant prior to January 3, 2006, and New Mirant on or after January 3, 2006.
Mirant Americas—Mirant Americas, Inc.
Mirant Americas Energy Marketing—Mirant Americas Energy Marketing, LP.
Mirant Bowline—Mirant Bowline, LLC.
Mirant Chalk Point—Mirant Chalk Point, LLC.
Mirant Delta—Mirant Delta, LLC.
Mirant Energy Trading—Mirant Energy Trading, LLC.
Mirant Lovett—Mirant Lovett, LLC, owner of the Lovett generating facility, which was shut down on April 19, 2008.
Mirant MD Ash Management—Mirant MD Ash Management, LLC.
Mirant New York—Mirant New York, LLC.
Mirant NY-Gen—Mirant NY-Gen, LLC sold by Mirant North America in the second quarter of 2007.
Mirant Potomac River—Mirant Potomac River, LLC.
Mirant Services—Mirant Services, LLC.
MW—Megawatt.
MWh—Megawatt hour.
Net Capacity Factor—The average production as a percentage of the potential net dependable capacity used over a year.
New Mirant—Mirant Corporation on or after January 3, 2006.
NOL—Net operating loss.
NOx—Nitrogen oxides.
NSR—New source review.
NYISO—New York Independent System Operator.
NYMEX—New York Mercantile Exchange.
NYSDEC—New York State Department of Environmental Conservation.
Old Mirant—MC 2005, LLC, known as Mirant Corporation prior to January 3, 2006.
OTC—Over-the-Counter.
Peaking Generating Units—Units used to meet demand requirements during the periods of greatest or peak load on the system.
Pepco—Potomac Electric Power Company.
ii
Table of Contents
PG&E—Pacific Gas & Electric Company.
PJM—PJM Interconnection, LLC.
Plan—The plan of reorganization that was approved in conjunction with Mirant’s and the Companies’ emergence from bankruptcy protection on January 3, 2006.
Power Sale, Fuel Supply and Services Agreement—Power sale, fuel supply and services agreement with Mirant Americas Energy Marketing, effective January 3, 2006.
Reserve Margin—Excess capacity over peak demand.
RGGI—Regional Greenhouse Gas Initiative.
RMR—Reliability-must-run.
RTO—Regional Transmission Organization.
SFAS—Statement of Financial Accounting Standards.
SFAS 5—SFAS No. 5,Accounting for Contingencies.
SFAS 107—SFAS No. 107,Disclosure about Fair Value of Financial Instruments.
SFAS 133—SFAS No. 133,Accounting for Derivative Instruments and Hedging Activities (As Amended).
SFAS 141R—SFAS No. 141R,Business Combinations (Revised 2007).
SFAS 144—SFAS No. 144,Accounting for the Impairment or Disposal of Long-Lived Assets.
SFAS 157—SFAS No. 157,Fair Value Measurements.
SFAS 159—SFAS No. 159,The Fair Value Option for Financial Assets and Financial Liabilities—Including an Amendment of FASB Statement No.115.
SFAS 161—SFAS No. 161,Disclosures about Derivative Instruments and Hedging Activities—An Amendment of FASB Statement No.133.
SFAS 165—SFAS No. 165,Subsequent Events.
SFAS 168—SFAS No. 168,The FASB Accounting Standards Codification and the Hierarchy of Generally Accepted Accounting Principles—a replacement of FASB Statement No. 162.
SO2—Sulfur dioxide.
VaR—Value at risk.
Virginia DEQ—Virginia Department of Environmental Quality.
iii
Table of Contents
CAUTIONARY STATEMENT REGARDING FORWARD-LOOKING INFORMATION
In addition to historical information, the information presented in this combined Form 10-Q includes forward-looking statements within the meaning of Section 27A of the Securities Act of 1933 and Section 21E of the Securities Exchange Act of 1934. These statements involve known and unknown risks and uncertainties and relate to future events, our future financial performance or our projected business results. In some cases, one can identify forward-looking statements by terminology such as “may,” “will,” “should,” “expect,” “intend,” “seek,” “plan,” “think,” “anticipate,” “estimate,” “predict,” “target,” “potential” or “continue” or the negative of these terms or other comparable terminology.
Forward-looking statements are only predictions. Actual events or results may differ materially from any forward-looking statement as a result of various factors, which include:
| • | legislative and regulatory initiatives regarding deregulation, regulation or restructuring of the industry of generating, transmitting and distributing electricity (the “electricity industry”); changes in state, federal and other regulations affecting the electricity industry (including rate and other regulations); changes in, or changes in the application of, environmental and other laws and regulations to which we and our subsidiaries and affiliates are or could become subject; |
| • | failure of our plants to perform as expected, including outages for unscheduled maintenance or repair; |
| • | environmental regulations that restrict our ability or render it uneconomic to operate our business, including regulations related to the emission of CO2 and other greenhouse gases; |
| • | increased regulation that limits our access to adequate water supplies and landfill options needed to support power generation or that increases the costs of cooling water and handling, transporting and disposing off-site of ash and other byproducts; |
| • | changes in market conditions, including developments in the supply, demand, volume and pricing of electricity and other commodities in the energy markets, including efforts to reduce demand for electricity, and the extent and timing of the entry of additional competition in our markets; |
| • | continued poor economic and financial market conditions, including impacts on financial institutions and other current and potential counterparties, and negative impacts on liquidity in the power and fuel markets in which we hedge and transact; |
| • | increased credit standards, margin requirements, market volatility or other market conditions that could increase the obligations of Mirant Americas Generation, Mirant North America and affiliates of Mirant Mid-Atlantic to post collateral beyond amounts that are expected; |
| • | our inability to access effectively the OTC and exchange-based commodity markets or changes in commodity market conditions and liquidity, which may affect our ability to engage in asset management and, for Mirant Americas Generation and Mirant North America, proprietary trading and fuel oil management activities as expected, or result in material gains or losses from open positions; |
| • | deterioration in the financial condition of Mirant Americas Generation, Mirant North America and Mirant Mid-Atlantic counterparties or Mirant Mid-Atlantic affiliates and the failure of counterparties or Mirant Mid-Atlantic affiliates to pay amounts owed to Mirant Americas Generation, Mirant North America and Mirant Mid-Atlantic or to perform obligations or services due to Mirant Americas Generation, Mirant North America and Mirant Mid-Atlantic beyond collateral posted; |
| • | hazards customary to the power generation industry and the possibility that we may not have adequate insurance to cover losses resulting from such hazards or the inability of our insurers to provide agreed upon coverage; |
| • | price mitigation strategies employed by ISOs or RTOs that reduce our revenue and may result in a failure to compensate our generating units adequately for all of their costs; |
4
Table of Contents
| • | changes in the rules used to calculate capacity, energy and ancillary services payments; |
| • | legal and political challenges to the rules used to calculate capacity, energy and ancillary services payments; |
| • | volatility in our gross margin as a result of our accounting for derivative financial instruments used in our asset management and Mirant Americas Generation’s and Mirant North America’s proprietary trading and fuel oil management activities and volatility in our cash flow from operations resulting from working capital requirements, including collateral, to support our asset management and Mirant Americas Generation’s and Mirant North America’s proprietary trading and fuel oil management activities; |
| • | our ability to enter into intermediate and long-term contracts to sell power and to obtain adequate supply and delivery of fuel for our facilities, at our required specifications and on terms and prices acceptable to us; |
| • | the failure to utilize new or advancements in power generation technologies; |
| • | the inability of Mirant Americas Generation’s and Mirant North America’s operating subsidiaries to generate sufficient cash flow to support their operations; |
| • | our and our affiliates’ ability to borrow additional funds and access capital markets; |
| • | strikes, union activity or labor unrest; |
| • | our ability to obtain or develop capable leaders and our ability to retain or replace the services of key employees; |
| • | weather and other natural phenomena, including hurricanes and earthquakes; |
| • | the cost and availability of emissions allowances; |
| • | curtailment of operations because of transmission constraints; |
| • | our inability to complete construction and obtain permits necessary to operate emissions reduction equipment by January 2010 to meet the requirements of the Maryland Healthy Air Act, which may result in reduced unit operations and reduced cash flows and revenues from operations; |
| • | the ability of Mirant Americas Generation and Mirant North America to execute the business plan in California, including entering into new tolling arrangements for their existing generating facilities; |
| • | our relative lack of geographic diversification in revenue sources resulting in concentrated exposure to the Mid-Atlantic market; |
| • | the ability of lenders under Mirant North America’s revolving credit facility to perform their obligations; |
| • | war, terrorist activities, cyberterrorism and inadequate cybersecurity, or the occurrence of a catastrophic loss; |
| • | the failure to provide a safe working environment for our employees and visitors thereby increasing our exposure to additional liability, loss of productive time, other costs and a damaged reputation; |
| • | Mirant Americas Generation’s and Mirant North America’s consolidated indebtedness and the possibility that Mirant Americas Generation, Mirant North America or their subsidiaries may incur additional indebtedness in the future; |
| • | restrictions on the ability of Mirant Americas Generation’s subsidiaries to pay dividends, make distributions or otherwise transfer funds to Mirant Americas Generation, including restrictions on Mirant North America contained in its financing agreements and restrictions on Mirant Mid-Atlantic contained in its leveraged lease documents, which may affect Mirant Americas Generation’s ability to access the cash flows of those subsidiaries to make debt service and other payments; |
5
Table of Contents
| • | restrictions on the ability of Mirant North America’s subsidiaries to pay dividends, make distributions or otherwise transfer funds to Mirant North America, including restrictions on Mirant Mid-Atlantic contained in its leveraged lease documents, which may affect Mirant North America’s ability to access the cash flows of those subsidiaries to make debt service and other payments; |
| • | the failure to comply with or monitor provisions of our loan agreements and debt may lead to a breach and, if not remedied, result in an event of default thereunder, which would limit access to needed capital and damage our reputation and relationships with financial institutions; and |
| • | the disposition of the pending litigation described in this combined Form 10-Q. |
Many of these risks, uncertainties and assumptions are beyond our ability to control or predict. All forward-looking statements attributable to us or persons acting on our behalf are expressly qualified in their entirety by cautionary statements contained throughout this report. Because of these risks, uncertainties and assumptions, you should not place undue reliance on these forward-looking statements. Furthermore, forward-looking statements speak only as of the date they are made.
Factors that Could Affect Future Performance
We undertake no obligation to update publicly or revise any forward-looking statements to reflect events or circumstances that may arise after the date of this report.
In addition to the discussion of certain risks in Management’s Discussion and Analysis of Results of Operations and Financial Condition and the accompanying combined Notes to Mirant Americas Generation, LLC’s, Mirant North America, LLC’s and Mirant Mid-Atlantic, LLC’s unaudited condensed consolidated financial statements, other factors that could affect the Companies’ future performance (business, results of operations or financial condition and cash flows) are set forth in the Companies’ 2008 Annual Report on Form 10-K and in Part II. Item 1A. Risk Factors in this Form 10-Q.
Certain Terms
As used in this report, “we,” “us,” “our,” and the “Companies” refer to Mirant Americas Generation, LLC, Mirant North America, LLC, Mirant Mid-Atlantic, LLC and their subsidiaries, unless the context requires otherwise. In addition, as used in this report, “Mirant Americas Generation” refers to Mirant Americas Generation, LLC and its subsidiaries, “Mirant North America” refers to Mirant North America, LLC and its subsidiaries and “Mirant Mid-Atlantic” refers to Mirant Mid-Atlantic, LLC and its subsidiaries, unless the context requires otherwise.
6
Table of Contents
MIRANT AMERICAS GENERATION, LLC AND SUBSIDIARIES
(Wholly-Owned Indirect Subsidiary of Mirant Corporation)
CONDENSED CONSOLIDATED STATEMENTS OF OPERATIONS (UNAUDITED)
| Three Months Ended June 30, | Six Months Ended June 30, | |||||||||||||||
| 2009 | 2008 | 2009 | 2008 | |||||||||||||
| (in millions) | ||||||||||||||||
Operating revenues (including unrealized gains (losses) of $(44) million, $(911) million, $211 million and $(1.213) billion, respectively) | $ | 496 | $ | (393 | ) | $ | 1,374 | $ | (91 | ) | ||||||
Cost of fuel, electricity and other products—nonaffiliate (including unrealized gains of $30 million, $37 million, $29 million and $36 million, respectively) | 148 | 164 | 417 | 402 | ||||||||||||
Cost of fuel, electricity and other products—affiliate (including unrealized (gains) losses of $0, $0, $0 and $0, respectively) | 2 | 2 | 4 | 4 | ||||||||||||
Total cost of fuel, electricity and other products | 150 | 166 | 421 | 406 | ||||||||||||
Gross Margin (excluding depreciation and amortization) | 346 | (559 | ) | 953 | (497 | ) | ||||||||||
Operating Expenses: | ||||||||||||||||
Operations and maintenance—nonaffiliate | 93 | 120 | 181 | 206 | ||||||||||||
Operations and maintenance—affiliate | 69 | 74 | 137 | 146 | ||||||||||||
Depreciation and amortization | 34 | 38 | 68 | 69 | ||||||||||||
Gain on sales of assets, net | (2 | ) | (12 | ) | (17 | ) | (16 | ) | ||||||||
Total operating expenses, net | 194 | 220 | 369 | 405 | ||||||||||||
Operating Income (Loss) | 152 | (779 | ) | 584 | (902 | ) | ||||||||||
Other Expense (Income), net: | ||||||||||||||||
Interest expense | 34 | 48 | 72 | 100 | ||||||||||||
Interest income | — | (4 | ) | (1 | ) | (11 | ) | |||||||||
Other, net | — | 4 | 1 | 6 | ||||||||||||
Total other expense, net | 34 | 48 | 72 | 95 | ||||||||||||
Net Income (Loss) | $ | 118 | $ | (827 | ) | $ | 512 | $ | (997 | ) | ||||||
The accompanying combined notes are an integral part of these unaudited condensed consolidated financial statements.
7
Table of Contents
MIRANT AMERICAS GENERATION, LLC AND SUBSIDIARIES
(Wholly-Owned Indirect Subsidiary of Mirant Corporation)
CONDENSED CONSOLIDATED BALANCE SHEETS (UNAUDITED)
| At June 30, 2009 | At December 31, 2008 | |||||||
| (in millions) | ||||||||
ASSETS | ||||||||
Current Assets: | ||||||||
Cash and cash equivalents | $ | 423 | $ | 354 | ||||
Funds on deposit | 174 | 196 | ||||||
Receivables—nonaffiliate | 488 | 742 | ||||||
Receivables—affiliate | 1 | 1 | ||||||
Derivative contract assets | 3,110 | 2,582 | ||||||
Inventories | 259 | 238 | ||||||
Prepaid rent and other payments | 112 | 120 | ||||||
Total current assets | 4,567 | 4,233 | ||||||
Property, Plant and Equipment, net | 3,495 | 3,192 | ||||||
Noncurrent Assets: | ||||||||
Intangible assets, net | 191 | 195 | ||||||
Derivative contract assets | 669 | 585 | ||||||
Prepaid rent | 311 | 258 | ||||||
Debt issuance costs, net | 34 | 38 | ||||||
Other | 42 | 51 | ||||||
Total noncurrent assets | 1,247 | 1,127 | ||||||
Total Assets | $ | 9,309 | $ | 8,552 | ||||
LIABILITIES AND MEMBER’S EQUITY | ||||||||
Current Liabilities: | ||||||||
Current portion of long-term debt | $ | 40 | $ | 45 | ||||
Accounts payable and accrued liabilities | 674 | 813 | ||||||
Payable to affiliate | 28 | 34 | ||||||
Derivative contract liabilities | 2,596 | 2,268 | ||||||
Other | 21 | 22 | ||||||
Total current liabilities | 3,359 | 3,182 | ||||||
Noncurrent Liabilities: | ||||||||
Long-term debt, net of current portion | 2,594 | 2,630 | ||||||
Derivative contract liabilities | 285 | 244 | ||||||
Other | 91 | 112 | ||||||
Total noncurrent liabilities | 2,970 | 2,986 | ||||||
Commitments and Contingencies | ||||||||
Member’s Equity: | ||||||||
Member’s interest | 3,252 | 2,729 | ||||||
Preferred stock in affiliate | (272 | ) | (345 | ) | ||||
Total member’s equity | 2,980 | 2,384 | ||||||
Total Liabilities and Member’s Equity | $ | 9,309 | $ | 8,552 | ||||
The accompanying combined notes are an integral part of these unaudited condensed consolidated financial statements.
8
Table of Contents
MIRANT AMERICAS GENERATION, LLC AND SUBSIDIARIES
(Wholly-Owned Indirect Subsidiary of Mirant Corporation)
CONDENSED CONSOLIDATED STATEMENTS OF MEMBER’S EQUITY (UNAUDITED)
| Member’s Interest | Preferred Stock in Affiliate | Total Member’s Equity | ||||||||
| (in millions) | ||||||||||
Balance, December 31, 2008 | $ | 2,729 | $ | (345 | ) | $ | 2,384 | |||
Net income | 512 | — | 512 | |||||||
Amortization of discount on preferred stock in affiliate | 11 | (11 | ) | — | ||||||
Redemption of preferred stock | — | 84 | 84 | |||||||
Balance, June 30, 2009 | $ | 3,252 | $ | (272 | ) | $ | 2,980 | |||
The accompanying combined notes are an integral part of these unaudited condensed consolidated financial statements.
9
Table of Contents
MIRANT AMERICAS GENERATION, LLC AND SUBSIDIARIES
(Wholly-Owned Indirect Subsidiary of Mirant Corporation)
CONDENSED CONSOLIDATED STATEMENTS OF CASH FLOWS (UNAUDITED)
| Six Months Ended June 30, | ||||||||
| 2009 | 2008 | |||||||
| (in millions) | ||||||||
Cash Flows from Operating Activities: | ||||||||
Net income (loss) | $ | 512 | $ | (997 | ) | |||
Adjustments to reconcile net income (loss) and changes in other operating assets and liabilities to net cash provided by (used in) operating activities: | ||||||||
Depreciation and amortization | 73 | 74 | ||||||
Gain on sales of assets, net | (17 | ) | (16 | ) | ||||
Unrealized losses (gains) on derivative contracts, net | (240 | ) | 1,177 | |||||
Lower of cost or market inventory adjustments | 22 | 1 | ||||||
Other, net | — | 8 | ||||||
Funds on deposit | 30 | (269 | ) | |||||
Changes in other operating assets and liabilities | 4 | (39 | ) | |||||
Total adjustments | (128 | ) | 936 | |||||
Net cash provided by (used in) operating activities of continuing operations | 384 | (61 | ) | |||||
Net cash provided by operating activities of discontinued operations | — | 1 | ||||||
Net cash provided by (used in) operating activities | 384 | (60 | ) | |||||
Cash Flows from Investing Activities: | ||||||||
Capital expenditures | (376 | ) | (308 | ) | ||||
Proceeds from the sales of assets | 17 | 15 | ||||||
Other | 1 | — | ||||||
Net cash used in investing activities of continuing operations | (358 | ) | (293 | ) | ||||
Net cash provided by investing activities of discontinued operations | — | 18 | ||||||
Net cash used in investing activities | (358 | ) | (275 | ) | ||||
Cash Flows from Financing Activities: | ||||||||
Redemption of preferred stock | 84 | 31 | ||||||
Repayment of long-term debt—nonaffiliate | (41 | ) | (270 | ) | ||||
Repayment of debt—affiliate | — | (6 | ) | |||||
Capital contributions | — | 139 | ||||||
Distribution to member | — | (137 | ) | |||||
Other | — | (1 | ) | |||||
Net cash provided by (used in) financing activities | 43 | (244 | ) | |||||
Net Increase (Decrease) in Cash and Cash Equivalents | 69 | (579 | ) | |||||
Cash and Cash Equivalents, beginning of period | 354 | 698 | ||||||
Cash and Cash Equivalents, end of period | $ | 423 | $ | 119 | ||||
Supplemental Cash Flow Disclosures: | ||||||||
Cash paid for interest, net of amounts capitalized | $ | 63 | $ | 94 | ||||
Financing Activity: | ||||||||
Capital contributions—non-cash | $ | — | $ | 1 | ||||
The accompanying combined notes are an integral part of these unaudited condensed consolidated financial statements.
10
Table of Contents
MIRANT NORTH AMERICA, LLC AND SUBSIDIARIES
(Wholly-Owned Indirect Subsidiary of Mirant Corporation)
CONDENSED CONSOLIDATED STATEMENTS OF OPERATIONS (UNAUDITED)
| Three Months Ended June 30, | Six Months Ended June 30, | |||||||||||||||
| 2009 | 2008 | 2009 | 2008 | |||||||||||||
| (in millions) | ||||||||||||||||
Operating revenues (including unrealized gains (losses) of $(44) million, $(911) million, $211 million and $(1.213) billion, respectively) | $ | 496 | $ | (393 | ) | $ | 1,374 | $ | (91 | ) | ||||||
Cost of fuel, electricity and other products—nonaffiliate (including unrealized gains of $30 million, $37 million, $29 million and $36 million, respectively) | 148 | 164 | 417 | 402 | ||||||||||||
Cost of fuel, electricity and other products—affiliate (including unrealized (gains) losses of $0, $0, $0 and $0, respectively) | 2 | 2 | 4 | 4 | ||||||||||||
Total cost of fuel, electricity and other products | 150 | 166 | 421 | 406 | ||||||||||||
Gross Margin (excluding depreciation and amortization) | 346 | (559 | ) | 953 | (497 | ) | ||||||||||
Operating Expenses: | ||||||||||||||||
Operations and maintenance—nonaffiliate | 93 | 120 | 181 | 206 | ||||||||||||
Operations and maintenance—affiliate | 69 | 74 | 137 | 146 | ||||||||||||
Depreciation and amortization | 34 | 38 | 68 | 69 | ||||||||||||
Gain on sales of assets, net | (2 | ) | (12 | ) | (17 | ) | (16 | ) | ||||||||
Total operating expenses, net | 194 | 220 | 369 | 405 | ||||||||||||
Operating Income (Loss) | 152 | (779 | ) | 584 | (902 | ) | ||||||||||
Other Expense (Income), net: | ||||||||||||||||
Interest expense | 5 | 12 | 12 | 29 | ||||||||||||
Interest income—nonaffiliate | — | (4 | ) | (1 | ) | (11 | ) | |||||||||
Interest income—affiliate | — | — | — | (1 | ) | |||||||||||
Other, net | — | (1 | ) | 1 | — | |||||||||||
Total other expense, net | 5 | 7 | 12 | 17 | ||||||||||||
Net Income (Loss) | $ | 147 | $ | (786 | ) | $ | 572 | $ | (919 | ) | ||||||
The accompanying combined notes are an integral part of these unaudited condensed consolidated financial statements.
11
Table of Contents
MIRANT NORTH AMERICA, LLC AND SUBSIDIARIES
(Wholly-Owned Indirect Subsidiary of Mirant Corporation)
CONDENSED CONSOLIDATED BALANCE SHEETS (UNAUDITED)
| At June 30, 2009 | At December 31, 2008 | |||||||
| (in millions) | ||||||||
ASSETS | ||||||||
Current Assets: | ||||||||
Cash and cash equivalents | $ | 423 | $ | 354 | ||||
Funds on deposit | 174 | 196 | ||||||
Receivables—nonaffiliate | 488 | 742 | ||||||
Receivables—affiliate | 11 | 10 | ||||||
Notes receivables—affiliate | 93 | 93 | ||||||
Derivative contract assets | 3,110 | 2,582 | ||||||
Inventories | 259 | 238 | ||||||
Prepaid rent and other payments | 112 | 120 | ||||||
Total current assets | 4,670 | 4,335 | ||||||
Property, Plant and Equipment, net | 3,492 | 3,189 | ||||||
Noncurrent Assets: | ||||||||
Intangible assets, net | 191 | 195 | ||||||
Derivative contract assets | 669 | 585 | ||||||
Prepaid rent | 311 | 258 | ||||||
Debt issuance costs, net | 27 | 32 | ||||||
Other | 42 | 51 | ||||||
Total noncurrent assets | 1,240 | 1,121 | ||||||
Total Assets | $ | 9,402 | $ | 8,645 | ||||
LIABILITIES AND MEMBER’S EQUITY | ||||||||
Current Liabilities: | ||||||||
Current portion of long-term debt | $ | 40 | $ | 45 | ||||
Accounts payable and accrued liabilities | 650 | 789 | ||||||
Payable to affiliate | 28 | 34 | ||||||
Derivative contract liabilities | 2,596 | 2,268 | ||||||
Other | 21 | 22 | ||||||
Total current liabilities | 3,335 | 3,158 | ||||||
Noncurrent Liabilities: | ||||||||
Long-term debt, net of current portion | 1,212 | 1,248 | ||||||
Derivative contract liabilities | 285 | 244 | ||||||
Other | 91 | 112 | ||||||
Total noncurrent liabilities | 1,588 | 1,604 | ||||||
Commitments and Contingencies | ||||||||
Member’s Equity: | ||||||||
Member’s interest | 4,613 | 4,094 | ||||||
Preferred stock in affiliate | (134 | ) | (211 | ) | ||||
Total member’s equity | 4,479 | 3,883 | ||||||
Total Liabilities and Member’s Equity | $ | 9,402 | $ | 8,645 | ||||
The accompanying combined notes are an integral part of these unaudited condensed consolidated financial statements.
12
Table of Contents
MIRANT NORTH AMERICA, LLC AND SUBSIDIARIES
(Wholly-Owned Indirect Subsidiary of Mirant Corporation)
CONDENSED CONSOLIDATED STATEMENTS OF MEMBER’S EQUITY (UNAUDITED)
| Member’s Interest | Preferred Stock in Affiliate | Total Member’s Equity | ||||||||||
| (in millions) | ||||||||||||
Balance, December 31, 2008 | $ | 4,094 | $ | (211 | ) | $ | 3,883 | |||||
Net income | 572 | — | 572 | |||||||||
Amortization of discount on preferred stock in affiliate | 7 | (7 | ) | — | ||||||||
Redemption of preferred stock | — | 84 | 84 | |||||||||
Distribution to member | (60 | ) | — | (60 | ) | |||||||
Balance, June 30, 2009 | $ | 4,613 | $ | (134 | ) | $ | 4,479 | |||||
The accompanying combined notes are an integral part of these unaudited condensed consolidated financial statements.
13
Table of Contents
MIRANT NORTH AMERICA, LLC AND SUBSIDIARIES
(Wholly-Owned Indirect Subsidiary of Mirant Corporation)
CONDENSED CONSOLIDATED STATEMENTS OF CASH FLOWS (UNAUDITED)
| Six Months Ended June 30, | ||||||||
| 2009 | 2008 | |||||||
| (in millions) | ||||||||
Cash Flows from Operating Activities: | ||||||||
Net income (loss) | $ | 572 | $ | (919 | ) | |||
Adjustments to reconcile net income (loss) and changes in other operating assets and liabilities to net cash provided by operating activities: | ||||||||
Depreciation and amortization | 73 | 73 | ||||||
Gain on sales of assets, net | (17 | ) | (16 | ) | ||||
Unrealized losses (gains) on derivative contracts, net | (240 | ) | 1,177 | |||||
Lower of cost or market inventory adjustments | 22 | 1 | ||||||
Other, net | — | 8 | ||||||
Funds on deposit | 30 | (269 | ) | |||||
Changes in other operating assets and liabilities | 4 | (39 | ) | |||||
Total adjustments | (128 | ) | 935 | |||||
Net cash provided by operating activities of continuing operations | 444 | 16 | ||||||
Net cash provided by operating activities of discontinued operations | — | 1 | ||||||
Net cash provided by operating activities | 444 | 17 | ||||||
Cash Flows from Investing Activities: | ||||||||
Capital expenditures | (376 | ) | (308 | ) | ||||
Proceeds from the sales of assets | 17 | 15 | ||||||
Other | 1 | — | ||||||
Net cash used in investing activities of continuing operations | (358 | ) | (293 | ) | ||||
Net cash provided by investing activities of discontinued operations | — | 18 | ||||||
Net cash used in investing activities | (358 | ) | (275 | ) | ||||
Cash Flows from Financing Activities: | ||||||||
Redemption of preferred stock | 84 | 31 | ||||||
Repayment of long-term debt—nonaffiliate | (41 | ) | (138 | ) | ||||
Repayment of debt—affiliate | — | (20 | ) | |||||
Distribution to member | (60 | ) | (192 | ) | ||||
Settlement of member’s obligations pursuant to the Plan | — | (1 | ) | |||||
Net cash used in financing activities | (17 | ) | (320 | ) | ||||
Net Increase (Decrease) in Cash and Cash Equivalents | 69 | (578 | ) | |||||
Cash and Cash Equivalents, beginning of period | 354 | 697 | ||||||
Cash and Cash Equivalents, end of period | $ | 423 | $ | 119 | ||||
Supplemental Cash Flow Disclosures: | ||||||||
Cash paid for interest, net of amounts capitalized | $ | 4 | $ | 22 | ||||
The accompanying combined notes are an integral part of these unaudited condensed consolidated financial statements.
14
Table of Contents
MIRANT MID-ATLANTIC, LLC AND SUBSIDIARIES
(Wholly-Owned Indirect Subsidiary of Mirant Corporation)
CONDENSED CONSOLIDATED STATEMENTS OF OPERATIONS (UNAUDITED)
| Three Months Ended June 30, | Six Months Ended June 30, | |||||||||||||||
| 2009 | 2008 | 2009 | 2008 | |||||||||||||
| (in millions) | ||||||||||||||||
Operating revenues—nonaffiliate (including unrealized gains (losses) of $(30) million, $(564) million, $145 million and $(804) million, respectively) | $ | 44 | $ | (600 | ) | $ | 266 | $ | (838 | ) | ||||||
Operating revenues—affiliate (including unrealized gains (losses) of $26 million, $(265) million, $93 million and $(320) million, respectively) | 347 | 101 | 797 | 449 | ||||||||||||
Total operating revenues | 391 | (499 | ) | 1,063 | (389 | ) | ||||||||||
Cost of fuel, electricity and other products—nonaffiliate (including unrealized gains of $0, $1 million, $0 and $0, respectively) | 3 | 3 | 10 | 10 | ||||||||||||
Cost of fuel, electricity and other products—affiliate (including unrealized gains of $4 million, $10 million, $5 million and $6 million, respectively) | 131 | 103 | 289 | 242 | ||||||||||||
Total cost of fuel, electricity and other products | 134 | 106 | 299 | 252 | ||||||||||||
Gross Margin (excluding depreciation and amortization) | 257 | (605 | ) | 764 | (641 | ) | ||||||||||
Operating Expenses: | ||||||||||||||||
Operations and maintenance—nonaffiliate | 57 | 68 | 117 | 123 | ||||||||||||
Operations and maintenance—affiliate | 44 | 45 | 89 | 87 | ||||||||||||
Depreciation and amortization | 24 | 23 | 48 | 44 | ||||||||||||
Gain on sales of assets, net | (2 | ) | (2 | ) | (10 | ) | (2 | ) | ||||||||
Total operating expenses, net | 123 | 134 | 244 | 252 | ||||||||||||
Operating Income (Loss) | 134 | (739 | ) | 520 | (893 | ) | ||||||||||
Other Expense (Income), net: | ||||||||||||||||
Interest expense | 1 | 1 | 2 | 2 | ||||||||||||
Interest income | — | (2 | ) | — | (3 | ) | ||||||||||
Other, net | — | 1 | — | 1 | ||||||||||||
Total other expense, net | 1 | — | 2 | — | ||||||||||||
Net Income (Loss) | $ | 133 | $ | (739 | ) | $ | 518 | $ | (893 | ) | ||||||
The accompanying combined notes are an integral part of these unaudited condensed consolidated financial statements.
15
Table of Contents
MIRANT MID-ATLANTIC, LLC AND SUBSIDIARIES
(Wholly-Owned Indirect Subsidiary of Mirant Corporation)
CONDENSED CONSOLIDATED BALANCE SHEETS (UNAUDITED)
| At June 30, 2009 | At December 31, 2008 | |||||||
| (in millions) | ||||||||
ASSETS | ||||||||
Current Assets: | ||||||||
Cash and cash equivalents | $ | 164 | $ | 125 | ||||
Funds on deposit | 12 | 3 | ||||||
Receivables—nonaffiliate | 25 | 16 | ||||||
Receivables—affiliate | 231 | 211 | ||||||
Derivative contract assets—nonaffiliate | 198 | 87 | ||||||
Derivative contract assets—affiliate | 969 | 603 | ||||||
Inventories | 118 | 129 | ||||||
Prepaid rent | 96 | 96 | ||||||
Other | 1 | 9 | ||||||
Total current assets | 1,814 | 1,279 | ||||||
Property, Plant and Equipment, net | 2,904 | 2,622 | ||||||
Noncurrent Assets: | ||||||||
Goodwill, net | 799 | 799 | ||||||
Other intangible assets, net | 142 | 144 | ||||||
Derivative contract assets—nonaffiliate | 361 | 314 | ||||||
Derivative contract assets—affiliate | 196 | 172 | ||||||
Prepaid rent | 311 | 258 | ||||||
Other | 21 | 32 | ||||||
Total noncurrent assets | 1,830 | 1,719 | ||||||
Total Assets | $ | 6,548 | $ | 5,620 | ||||
LIABILITIES AND MEMBER’S EQUITY | ||||||||
Current Liabilities: | ||||||||
Current portion of long-term debt | $ | 4 | $ | 3 | ||||
Accounts payable and accrued liabilities | 135 | 119 | ||||||
Payable to affiliate | 179 | 143 | ||||||
Derivative contract liabilities—nonaffiliate | 2 | — | ||||||
Derivative contract liabilities—affiliate | 772 | 485 | ||||||
Other | 14 | 20 | ||||||
Total current liabilities | 1,106 | 770 | ||||||
Noncurrent Liabilities: | ||||||||
Long-term debt, net of current portion | 22 | 25 | ||||||
Derivative contract liabilities—nonaffiliate | 11 | 1 | ||||||
Derivative contract liabilities—affiliate | 167 | 164 | ||||||
Contract retention liability | 43 | 64 | ||||||
Other | 14 | 13 | ||||||
Total noncurrent liabilities | 257 | 267 | ||||||
Commitments and Contingencies | ||||||||
Member’s Equity: | ||||||||
Member’s interest | 5,319 | 4,794 | ||||||
Preferred stock in affiliate | (134 | ) | (211 | ) | ||||
Total member’s equity | 5,185 | 4,583 | ||||||
Total Liabilities and Member’s Equity | $ | 6,548 | $ | 5,620 | ||||
The accompanying combined notes are an integral part of these unaudited condensed consolidated financial statements.
16
Table of Contents
MIRANT MID-ATLANTIC, LLC AND SUBSIDIARIES
(Wholly-Owned Indirect Subsidiary of Mirant Corporation)
CONDENSED CONSOLIDATED STATEMENTS OF MEMBER’S EQUITY (UNAUDITED)
| Member’s Interest | Preferred Stock in Affiliate | Total Member’s Equity | ||||||||
| (in millions) | ||||||||||
Balance, December 31, 2008 | $ | 4,794 | $ | (211 | ) | $ | 4,583 | |||
Net income | 518 | — | 518 | |||||||
Amortization of discount on preferred stock in affiliate | 7 | (7 | ) | — | ||||||
Redemption of preferred stock | — | 84 | 84 | |||||||
Balance, June 30, 2009 | $ | 5,319 | $ | (134 | ) | $ | 5,185 | |||
The accompanying combined notes are an integral part of these unaudited condensed consolidated financial statements.
17
Table of Contents
MIRANT MID-ATLANTIC, LLC AND SUBSIDIARIES
(Wholly-Owned Indirect Subsidiary of Mirant Corporation)
CONDENSED CONSOLIDATED STATEMENTS OF CASH FLOWS (UNAUDITED)
| Six Months Ended June 30, | ||||||||
| 2009 | 2008 | |||||||
| (in millions) | ||||||||
Cash Flows from Operating Activities: | ||||||||
Net income (loss) | $ | 518 | $ | (893 | ) | |||
Adjustments to reconcile net income (loss) and changes in other operating assets and liabilities to net cash provided by operating activities: | ||||||||
Depreciation and amortization | 48 | 44 | ||||||
Gain on sales of assets, net | (10 | ) | (2 | ) | ||||
Unrealized losses (gains) on derivative contracts, net | (243 | ) | 1,118 | |||||
Lower of cost or market inventory adjustments | 21 | — | ||||||
Funds on deposit | — | 2 | ||||||
Changes in other operating assets and liabilities | (56 | ) | (50 | ) | ||||
Total adjustments | (240 | ) | 1,112 | |||||
Net cash provided by operating activities | 278 | 219 | ||||||
Cash Flows from Investing Activities: | ||||||||
Capital expenditures | (331 | ) | (265 | ) | ||||
Proceeds from the sales of assets | 9 | 1 | ||||||
Other | 1 | — | ||||||
Net cash used in investing activities | (321 | ) | (264 | ) | ||||
Cash Flows from Financing Activities: | ||||||||
Redemption of preferred stock | 84 | 31 | ||||||
Repayment of long-term debt—nonaffiliate | (2 | ) | — | |||||
Capital contributions | — | 155 | ||||||
Distribution to member | — | (325 | ) | |||||
Other | — | (1 | ) | |||||
Net cash provided by (used in) financing activities | 82 | (140 | ) | |||||
Net Increase (Decrease) in Cash and Cash Equivalents | 39 | (185 | ) | |||||
Cash and Cash Equivalents, beginning of period | 125 | 242 | ||||||
Cash and Cash Equivalents, end of period | $ | 164 | $ | 57 | ||||
Supplemental Cash Flow Disclosures: | ||||||||
Cash paid for interest | $ | 1 | $ | 1 | ||||
The accompanying combined notes are an integral part of these unaudited condensed consolidated financial statements.
18
Table of Contents
MIRANT AMERICAS GENERATION, LLC AND SUBSIDIARIES
MIRANT NORTH AMERICA, LLC AND SUBSIDIARIES
MIRANT MID-ATLANTIC, LLC AND SUBSIDIARIES
COMBINED NOTES TO CONDENSED CONSOLIDATED FINANCIAL STATEMENTS (UNAUDITED)
| A. | Description of Business (Mirant Americas Generation, Mirant North America and Mirant Mid-Atlantic) |
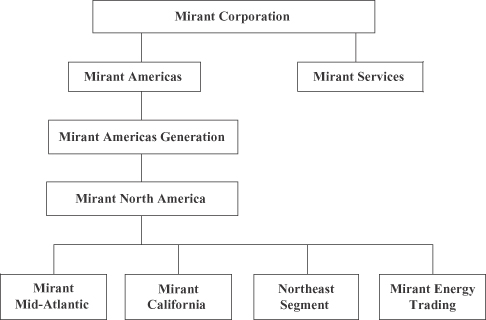
Mirant Americas Generation and Mirant North America are competitive energy companies that produce and sell electricity in the United States. Mirant Americas Generation and Mirant North America own or lease 10,112 MW of net electric generating capacity in the Mid-Atlantic and Northeast regions and in California. Mirant Americas Generation and Mirant North America also operate an integrated asset management and energy marketing organization based in Atlanta, Georgia.
Mirant Mid-Atlantic operates and owns or leases 5,230 MW of net electric generating capacity in the Washington, D.C. area. Mirant Mid-Atlantic’s electric generating capacity is part of the 10,112 MW of net electric generating capacity of Mirant Americas Generation and Mirant North America. Mirant Mid-Atlantic’s generating facilities serve the PJM markets. The PJM ISO operates the largest centrally dispatched control area in the United States.
Mirant Americas Generation, Mirant North America and Mirant Mid-Atlantic are Delaware limited liability companies and indirect wholly-owned subsidiaries of Mirant Corporation. Mirant North America is a wholly-owned subsidiary of Mirant Americas Generation. Mirant Mid-Atlantic is a wholly-owned subsidiary of Mirant North America and an indirect wholly-owned subsidiary of Mirant Americas Generation. The chart below is a summary representation of the Companies’ organizational structure and is not a complete organizational chart of Mirant Corporation.
Mirant Americas Generation, Mirant North America and Mirant Mid-Atlantic have a number of service agreements for labor and administrative services with Mirant Services. See Note G for further discussion of arrangements with these related parties.
19
Table of Contents
| B. | Accounting and Reporting Policies (Mirant Americas Generation, Mirant North America and Mirant Mid-Atlantic) |
Basis of Presentation
The accompanying unaudited condensed consolidated financial statements of the Companies and their wholly-owned subsidiaries have been prepared in accordance with GAAP for interim financial information and with the instructions for Form 10-Q and Article 10 of Regulation S-X. Accordingly, they do not include all of the information and footnotes required by GAAP for complete financial statements. In the opinion of management, all adjustments (consisting of normal recurring accruals) considered necessary for a fair presentation have been included. For further information, refer to the consolidated financial statements and notes thereto included in the Companies’ 2008 Annual Report on Form 10-K.
The accompanying unaudited condensed consolidated financial statements include the accounts of the Companies and their wholly-owned subsidiaries and have been prepared from records maintained by the Companies and their subsidiaries. All significant intercompany accounts and transactions within consolidated entities have been eliminated in consolidation.
The preparation of the unaudited condensed consolidated financial statements in conformity with GAAP requires management to make various estimates and assumptions that affect the reported amounts of assets and liabilities, disclosures of contingent assets and liabilities at the date of the unaudited condensed consolidated financial statements and the reported amounts of revenues and expenses during the period. Actual results could differ from those estimates. Certain prior period amounts have been reclassified to conform to the current period financial statement presentation.
The Companies evaluate events that occur after their balance sheet date but before their financial statements are issued for potential recognition or disclosure. Based on their evaluations, as of August 6, 2009, the Companies determined that there were no material subsequent events for recognition or disclosure other than those disclosed herein.
In preparing Mirant Americas Generation’s and Mirant North America’s unaudited condensed consolidated financial statements for the three months ended March 31, 2009, management discovered that the amounts previously disclosed for cash paid for interest and cash paid for interest, net of amount capitalized were overstated for each interim period in 2008. For the three and six months ended June 30, 2008, Mirant Americas Generation’s and Mirant North America’s cash paid for interest was overstated by approximately $20 million and $23 million, respectively. TheCapitalization of Interest Cost discussed later in Note B has been adjusted to reflect the immaterial correction of these misstatements. For the six months ended June 30, 2008, cash paid for interest, net of amounts capitalized was overstated by approximately $23 million. The supplemental cash flow disclosure for the unaudited condensed consolidated statements of cash flows for the six months ended June 30, 2008, has been adjusted to reflect the immaterial correction of this misstatement. The misstatement of cash paid for interest and cash paid for interest, net of amount capitalized had no effect on Mirant Americas Generation’s and Mirant North America’s cash and cash equivalents, net loss or member’s equity.
Inventories
Inventories consist primarily of fuel oil, coal, materials and supplies, and purchased emissions allowances. Inventory is generally stated at the lower of cost or market value. Fuel stock is removed from the inventory account as it is used in the production of electricity. Materials and supplies are removed from the inventory account on a weighted average cost basis when they are used for repairs, maintenance or capital projects. The cost of purchased emissions allowances is also computed on a weighted average cost basis. Purchased emissions allowances are removed from inventory and charged to cost of fuel, electricity and other products in the Companies’ accompanying unaudited condensed consolidated statements of operations as they are utilized for emissions volumes.
20
Table of Contents
Inventories were comprised of the following (in millions):
Mirant Americas Generation and Mirant North America
| At June 30, 2009 | At December 31, 2008 | |||||
Fuel stock: | ||||||
Fuel oil | $ | 126 | $ | 113 | ||
Coal | 53 | 43 | ||||
Other | 1 | 1 | ||||
Materials and supplies | 65 | 63 | ||||
Purchased emissions allowances | 14 | 18 | ||||
Total inventories | $ | 259 | $ | 238 | ||
For the six months ended June 30, 2009, Mirant Americas Generation and Mirant North America recognized lower of cost or market inventory adjustments of $22 million, primarily related to coal inventory. For the year ended December 31, 2008, Mirant Americas Generation and Mirant North America recognized lower of cost or market inventory adjustments of $65 million, primarily related to fuel oil inventory.
Mirant Mid-Atlantic
| At June 30, 2009 | At December 31, 2008 | |||||
Fuel stock: | ||||||
Fuel oil | $ | 21 | $ | 25 | ||
Coal | 53 | 43 | ||||
Other | 1 | 1 | ||||
Materials and supplies | 43 | 41 | ||||
Purchased emissions allowances | — | 19 | ||||
Total inventories | $ | 118 | $ | 129 | ||
For the six months ended June 30, 2009, Mirant Mid-Atlantic recognized lower of cost or market inventory adjustments of $21 million, primarily related to coal inventory. For the year ended December 31, 2008, Mirant Mid-Atlantic recognized lower of cost or market inventory adjustments of $14 million, primarily related to fuel oil inventory.
Impairment of Long-Lived Assets
The Companies evaluate long-lived assets, such as property, plant and equipment and purchased intangible assets subject to amortization, for impairment whenever events or changes in circumstances indicate that the carrying amount of the asset may not be recoverable. Such evaluations are performed in accordance with SFAS 144. Recoverability of assets to be held and used is measured by a comparison of the carrying amount of an asset to the estimated undiscounted future cash flows expected to be generated by the asset. If the carrying amount of an asset exceeds its estimated undiscounted future cash flows, an impairment charge is recognized as the amount by which the carrying amount of the asset exceeds its fair value. In the second quarter of 2009, Mirant Americas Generation and Mirant North America evaluated the Bowline generating facility for impairment. The sum of the probability weighted undiscounted cash flows for the Bowline generating facility exceeded the carrying value as of June 30, 2009. As a result, Mirant Americas Generation and Mirant North America did not record an impairment charge for the three and six months ended June 30, 2009. See Note D for further discussion.
21
Table of Contents
Capitalization of Interest Cost (Mirant Americas Generation and Mirant North America)
Mirant Americas Generation and Mirant North America capitalize interest on projects during their construction period. Mirant Americas Generation and Mirant North America determine which debt instruments represent a reasonable measure of the cost of financing construction in terms of interest costs incurred that otherwise could have been avoided. These debt instruments and associated interest costs are included in the calculation of the weighted average interest rate used for determining the capitalization rate. Once a project is placed in service, capitalized interest, as a component of the total cost of the construction, is amortized over the estimated useful life of the asset constructed.
For the three and six months ended June 30, 2009 and 2008, Mirant Americas Generation and Mirant North America incurred the following interest costs on debt to nonaffiliates (in millions):
Mirant Americas Generation
| Three Months Ended June 30, | Six Months Ended June 30, | |||||||||||||||
| 2009 | 2008 | 2009 | 2008 | |||||||||||||
Total interest costs | $ | 52 | $ | 60 | $ | 105 | $ | 123 | ||||||||
Capitalized and included in property, plant and equipment, net | (18 | ) | (12 | ) | (33 | ) | (23 | ) | ||||||||
Interest expense | $ | 34 | $ | 48 | $ | 72 | $ | 100 | ||||||||
The amounts of capitalized interest above include interest accrued. For the three and six months ended June 30, 2009, cash paid for interest was $93 million and $96 million, respectively, of which $31 million and $33 million, respectively, was capitalized. For the three and six months ended June 30, 2008, cash paid for interest was $108 million and $117 million, respectively, of which $20 million and $23 million, respectively, was capitalized.
Mirant North America
| Three Months Ended June 30, | Six Months Ended June 30, | |||||||||||||||
| 2009 | 2008 | 2009 | 2008 | |||||||||||||
Total interest costs | $ | 23 | $ | 24 | $ | 45 | $ | 52 | ||||||||
Capitalized and included in property, plant and equipment, net | (18 | ) | (12 | ) | (33 | ) | (23 | ) | ||||||||
Interest expense | $ | 5 | $ | 12 | $ | 12 | $ | 29 | ||||||||
The amounts of capitalized interest above include interest accrued. For the three and six months ended June 30, 2009, cash paid for interest was $34 million and $37 million, respectively, of which $31 million and $33 million, respectively, was capitalized. For the three and six months ended June 30, 2008, cash paid for interest was $37 million and $45 million, respectively, of which $20 million and $23 million, respectively, was capitalized.
Recently Adopted Accounting Standards
In December 2007, the FASB issued SFAS 141R, which requires an acquirer of a business to recognize the assets acquired, the liabilities assumed and any noncontrolling interest in the acquiree at their acquisition-date fair values. SFAS 141R also requires disclosure of information necessary for investors and other users to evaluate and understand the nature and financial effect of the business combination. Additionally, SFAS 141R requires that acquisition-related costs be expensed as incurred. The provisions of SFAS 141R became effective for acquisitions completed on or after January 1, 2009; however, the income tax considerations included in SFAS
22
Table of Contents
141R were effective as of that date for all acquisitions, regardless of the acquisition date. The Companies adopted SFAS 141R on January 1, 2009, and the adoption had no effect on the Companies’ consolidated statements of operations, financial position or cash flows.
On February 12, 2008, the FASB issued FSP FAS 157-2, which deferred the effective date of SFAS 157 for one year for certain nonfinancial assets and liabilities, with the exception of those nonfinancial assets and liabilities that are recognized or disclosed on a recurring basis (at least annually). The Companies’ non-recurring nonfinancial assets and liabilities that could be measured at fair value in the Companies’ unaudited condensed consolidated financial statements include long-lived asset impairments and the initial recognition of asset retirement obligations. The Companies adopted FSP FAS 157-2 on January 1, 2009, and the adoption had no effect on the Companies’ consolidated statements of operations, financial position or cash flows. The Companies will incorporate the recognition and disclosure provisions of SFAS 157 when required for fair value measurements for non-recurring nonfinancial assets and liabilities. As of June 30, 2009, the Companies did not have any events that required a fair value measurement for non-recurring nonfinancial assets or liabilities.
On March 19, 2008, the FASB issued SFAS 161, which amends SFAS 133 to enhance the required disclosures for derivative instruments and hedging activities. The Companies utilize derivative financial instruments to manage their exposure to commodity price risks and for Mirant Americas Generation’s and Mirant North America’s proprietary trading and fuel oil management activities. The Companies adopted SFAS 161 on January 1, 2009. See Note C for these disclosures.
On April 9, 2009, the FASB issued FSP FAS 107-1 and APB 28-1, which amended SFAS 107 and APB 28 to require disclosures about the fair value of financial instruments in interim financial statements. This FSP is effective for interim periods ending after June 15, 2009. The Companies adopted FSP FAS 107-1 and APB 28-1 for their disclosures of the fair value of financial instruments for the quarter ended June 30, 2009, and the adoption had no effect on the Companies’ consolidated statements of operations, financial position or cash flows. See “Fair Value of Other Financial Instruments” in Note C for these disclosures.
On April 9, 2009, the FASB issued FSP FAS 157-4, which amended SFAS 157 to provide additional guidance on determining whether a market for a financial asset is not active and a transaction is not distressed for fair value measurements. Under distressed market conditions, the Companies need to weigh all available evidence in determining whether a transaction occurred in an orderly market. FSP FAS 157-4 requires additional judgment by the Companies when determining the fair value of derivative contracts in the current economic environment. The Companies adopted FSP FAS 157-4 for their fair value measurements for the quarter ended June 30, 2009, and the adoption did not have a material effect on the Companies’ consolidated statements of operations, financial position or cash flows.
On May 28, 2009, the FASB issued SFAS 165, which requires the Companies to disclose the date through which they have evaluated subsequent events and the basis for that date, that is, whether that date represents the date the financial statements were issued or were available to be issued. SFAS 165 defines two types of subsequent events; recognized and non-recognized events, with recognized events giving rise to conditions that existed as of the balance sheet date. SFAS 165 is effective for interim periods ending after June 15, 2009. The Companies adopted the disclosure requirements of SFAS 165 for the quarter ended June 30, 2009, and the adoption had no effect on the Companies’ consolidated statements of operations, financial position or cash flows.
New Accounting Standards Not Yet Adopted at June 30, 2009
On July 1, 2009, the FASB issued SFAS 168, which codified all authoritative nongovernmental GAAP into a single source. SFAS 168 will be effective for interim and annual periods ending after September 15, 2009. SFAS 168 will supersede all existing accounting standards, but does not change the contents of those standards. The Companies will adopt SFAS 168 beginning with their Form 10-Q for the quarter ending September 30, 2009, and the adoption will require the Companies to change their references to accounting literature to conform to the codified source of authoritative nongovernmental GAAP.
23
Table of Contents
| C. | Financial Instruments (Mirant Americas Generation, Mirant North America and Mirant Mid-Atlantic) |
Derivative Financial Instruments
In connection with generating electricity, the Companies are exposed to energy commodity price risk associated with the acquisition of fuel needed to generate electricity, the price of electricity produced and sold, and the fair value of fuel inventories. In addition, the open positions in Mirant Americas Generation’s and Mirant North America’s trading activities, comprised of proprietary trading and fuel oil management activities, expose them to risks associated with changes in energy commodity prices. The Companies, through their asset management activities, enter into a variety of exchange-traded and OTC energy and energy-related derivative financial instruments, such as forward contracts, futures contracts, option contracts and financial swap agreements to manage exposure to commodity price risks. These contracts have varying terms and durations, which range from a few days to years, depending on the instrument. Mirant Americas Generation’s and Mirant North America’s proprietary trading activities also utilize similar derivative contracts in markets where they have a physical presence to attempt to generate incremental gross margin. Mirant Americas Generation’s and Mirant North America’s fuel oil management activities use derivative financial instruments to hedge economically the fair value of their physical fuel oil inventories and to optimize the approximately three million barrels of storage capacity that they own or lease.
Changes in the fair value and settlements of derivative financial instruments used to hedge electricity economically are reflected in operating revenue, and changes in the fair value and settlements of derivative financial instruments used to hedge fuel economically are reflected in cost of fuel, electricity and other products in the accompanying unaudited condensed consolidated statements of operations. Most of Mirant Americas Generation’s and Mirant North America’s long-term coal agreements are not required to be recorded at fair value under SFAS 133. As such, these contracts are not included in derivative contract assets and liabilities in the accompanying condensed consolidated balance sheets. Changes in the fair value and settlements of derivative contracts for trading activities, comprised of proprietary trading and fuel oil management, are recorded on a net basis as operating revenue in the accompanying unaudited condensed consolidated statements of operations. As of June 30, 2009, the Companies do not have any derivative financial instruments for which hedge accounting, as defined by SFAS 133, has been elected.
The Companies also consider risks associated with interest rates, counterparty credit and Mirant Americas Generation’s, Mirant North America’s and Mirant Mid-Atlantic’s own non-performance risk when valuing their derivative financial instruments. The nominal value of the derivative contract assets and liabilities is discounted to account for time value using a LIBOR forward interest rate curve based on the tenor of the Companies’ transactions being valued.
24
Table of Contents
Mirant Americas Generation and Mirant North America
The following table presents the fair value of derivative financial instruments related to commodity price risk (in millions):
| Fair Value at | ||||||||||
Commodity Derivative Contracts | Balance Sheet Location | June 30, 2009 | December 31, 2008 | |||||||
Asset management | Derivative contract assets | $ | 1,903 | $ | 1,285 | |||||
Trading activities | Derivative contract assets | 1,876 | 1,882 | |||||||
Total derivative contract assets | 3,779 | 3,167 | ||||||||
Asset management | Derivative contract liabilities | (1,051 | ) | (736 | ) | |||||
Trading activities | Derivative contract liabilities | (1,830 | ) | (1,776 | ) | |||||
Total derivative contract liabilities | (2,881 | ) | (2,512 | ) | ||||||
Asset management, net | 852 | 549 | ||||||||
Trading activities, net | 46 | 106 | ||||||||
Total derivative contracts, net | $ | 898 | $ | 655 | ||||||
The following tables present the net gains (losses) for derivative financial instruments recognized in income in the unaudited condensed consolidated statements of operations (in millions):
Commodity Derivative Contracts | Location of Net Gains (Losses) Recognized in Income | Amount of Net Gains (Losses) Recognized in Income for the Three Months Ended | |||||||||||||||||||||||
| June 30, 2009 | June 30, 2008 | ||||||||||||||||||||||||
| Realized | Unrealized | Total | Realized | Unrealized | Total | ||||||||||||||||||||
Asset management | Operating revenues | $ | 191 | $ | (10 | ) | $ | 181 | $ | (94 | ) | $ | (856 | ) | $ | (950 | ) | ||||||||
Trading activities | Operating revenues | 46 | (34 | ) | 12 | (15 | ) | (55 | ) | (70 | ) | ||||||||||||||
Asset management | Cost of fuel, electricity and other products | (28 | ) | 30 | 2 | 8 | 37 | 45 | |||||||||||||||||
Total | $ | 209 | $ | (14 | ) | $ | 195 | $ | (101 | ) | $ | (874 | ) | $ | (975 | ) | |||||||||
Commodity Derivative Contracts | Location of Net Gains (Losses) | Amount of Net Gains (Losses) Recognized in Income for the Six Months Ended | ||||||||||||||||||||||||
| June 30, 2009 | June 30, 2008 | |||||||||||||||||||||||||
| Realized | Unrealized | Total | Realized | Unrealized | Total | |||||||||||||||||||||
Asset management | Operating revenues | $ | 327 | $ | 260 | $ | 587 | $ | (110 | ) | $ | (1,164 | ) | $ | (1,274 | ) | ||||||||||
Trading activities | Operating revenues | 74 | (49 | ) | 25 | (19 | ) | (49 | ) | (68 | ) | |||||||||||||||
Asset management | Cost of fuel, electricity and other products | (44 | ) | 29 | (15 | ) | 17 | 36 | 53 | |||||||||||||||||
Total | $ | 357 | $ | 240 | $ | 597 | $ | (112 | ) | $ | (1,177 | ) | $ | (1,289 | ) | |||||||||||
25
Table of Contents
The following table presents the notional quantity on long (short) positions for derivative financial instruments on a gross and net basis at June 30, 2009 (in equivalent MWh):
| Notional Quantity | |||||||||
| Derivative Contract Assets | Derivative Contract Liabilities | Net Derivative Contracts | |||||||
| (in millions) | |||||||||
Commodity Type: | |||||||||
Power1 | (169 | ) | 126 | (43 | ) | ||||
Natural gas | (45 | ) | 46 | 1 | |||||
Fuel oil | 2 | (3 | ) | (1 | ) | ||||
Total | (212 | ) | 169 | (43 | ) | ||||
| 1 | Includes MWh equivalent of natural gas transactions used to hedge power. |
Mirant Mid-Atlantic
The following table presents the fair value of derivative financial instruments related to commodity price risk (in millions):
Commodity Derivative Contracts | Balance Sheet Location | Fair Value at | ||||||||
| June 30, 2009 | December 31, 2008 | |||||||||
Asset management—nonaffiliate | Derivative contract assets—nonaffiliate | $ | 559 | $ | 401 | |||||
Asset management—affiliate | Derivative contract assets—affiliate | 1,165 | 775 | |||||||
Total derivative contract assets | 1,724 | 1,176 | ||||||||
Asset management—nonaffiliate | Derivative contract liabilities—nonaffiliate | (13 | ) | (1 | ) | |||||
Asset management—affiliate | Derivative contract liabilities—affiliate | (939 | ) | (649 | ) | |||||
Total derivative contract liabilities | (952 | ) | (650 | ) | ||||||
Asset management—nonaffiliate, net | 546 | 400 | ||||||||
Asset management—affiliate, net | 226 | 126 | ||||||||
Total derivative contracts, net | $ | 772 | $ | 526 | ||||||
The following tables present the net gains (losses) for derivative financial instruments recognized in income in the unaudited condensed consolidated statements of operations (in millions):
Commodity Derivative Contracts | Location of Net Gains (Losses) | Amount of Net Gains (Losses) Recognized in Income for the Three Months Ended | |||||||||||||||||||||||
| June 30, 2009 | June 30, 2008 | ||||||||||||||||||||||||
| Realized | Unrealized | Total | Realized | Unrealized | Total | ||||||||||||||||||||
Asset management | Operating revenues | $ | 174 | $ | (4 | ) | $ | 170 | $ | (91 | ) | $ | (829 | ) | $ | (920 | ) | ||||||||
Asset management | Cost of fuel, electricity and other products | (2 | ) | 4 | 2 | 1 | 11 | 12 | |||||||||||||||||
Total | $ | 172 | $ | — | $ | 172 | $ | (90 | ) | $ | (818 | ) | $ | (908 | ) | ||||||||||
26
Table of Contents
Commodity Derivative Contracts | Location of Net Gains (Losses) Recognized in Income | Amount of Net Gains (Losses) Recognized in Income for the Six Months Ended | |||||||||||||||||||||
| June 30, 2009 | June 30, 2008 | ||||||||||||||||||||||
| Realized | Unrealized | Total | Realized | Unrealized | Total | ||||||||||||||||||
Asset management | Operating revenues | $ | 283 | $ | 238 | $ | 521 | $ | (112 | ) | $ | (1,124 | ) | $ | (1,236 | ) | |||||||
Asset management | Cost of fuel, electricity and other products | 4 | 5 | 9 | 1 | 6 | 7 | ||||||||||||||||
Total | $ | 287 | $ | 243 | $ | 530 | $ | (111 | ) | $ | (1,118 | ) | $ | (1,229 | ) | ||||||||
The following table presents the notional quantity on long (short) positions for derivative financial instruments on a gross and net basis at June 30, 2009 (in equivalent MWh):
| Notional Quantity | ||||||||
| Derivative Contract Assets | Derivative Contract Liabilities | Net Derivative Contracts | ||||||
Commodity Type: | ||||||||
Power1 | (99 | ) | 57 | (42 | ) | |||
Total | (99 | ) | 57 | (42 | ) | |||
| 1 | Includes MWh equivalent of natural gas transactions used to hedge power. |
Fair Value Hierarchy
Based on the observability of the inputs used in the valuation techniques for fair value measurement, the Companies are required to classify recorded fair value measurements according to the fair value hierarchy. The fair value hierarchy ranks the quality and reliability of the information used to determine fair values. The hierarchy gives the highest priority to unadjusted quoted prices in active markets for identical assets or liabilities (Level 1 measurement) and the lowest priority to unobservable inputs (Level 3 measurement). The fair value measurement inputs the Companies use vary from readily observable prices for exchange-traded instruments to price curves that cannot be validated through external pricing sources. The Companies’ financial assets and liabilities carried at fair value in the consolidated financial statements are classified in three categories based on the inputs used.
In certain cases, the inputs used to measure fair value may fall into different levels of the fair value hierarchy. In such cases, the level in the fair value hierarchy within which the fair value measurement in its entirety falls must be determined based on the lowest level input that is significant to the fair value measurement. The Companies’ assessment of the significance of a particular input to the fair value measurement in its entirety requires judgment and consideration of factors specific to the asset or liability.
The following tables set forth by level within the fair value hierarchy the Companies’ financial assets and liabilities that were accounted for at fair value on a recurring basis as of June 30, 2009, by category and tenor, respectively. At June 30, 2009, the Companies’ only financial assets and liabilities measured at fair value on a recurring basis are derivative financial instruments.
27
Table of Contents
Mirant Americas Generation and Mirant North America
The following table presents financial assets and liabilities, net accounted for at fair value on a recurring basis as of June 30, 2009, by category (in millions):
| Quoted Prices in Active Markets for Identical Assets (Level 1) | Significant Other Observable Inputs (Level 2) | Significant Other Unobservable Inputs (Level 3) | Total | |||||||||||||
Assets: | ||||||||||||||||
Commodity contracts—asset management | $ | 13 | $ | 1,852 | $ | 38 | $ | 1,903 | ||||||||
Commodity contracts—trading activities | 634 | 1,203 | 39 | 1,876 | ||||||||||||
Total derivative contract assets | 647 | 3,055 | 77 | 3,779 | ||||||||||||
Liabilities: | ||||||||||||||||
Commodity contracts—asset management | (41 | ) | (1,007 | ) | (3 | ) | (1,051 | ) | ||||||||
Commodity contracts—trading activities | (612 | ) | (1,209 | ) | (9 | ) | (1,830 | ) | ||||||||
Total derivative contract liabilities | (653 | ) | (2,216 | ) | (12 | ) | (2,881 | ) | ||||||||
Net: | ||||||||||||||||
Commodity contracts—asset management, net | (28 | ) | 845 | 35 | 852 | |||||||||||
Commodity contracts—trading activities, net | 22 | (6 | ) | 30 | 46 | |||||||||||
Total derivative contract assets and liabilities, net | $ | (6 | ) | $ | 839 | $ | 65 | $ | 898 | |||||||
The following table presents financial assets and liabilities, net accounted for at fair value on a recurring basis as of December 31, 2008, by category (in millions):
| Quoted Prices in Active Markets for Identical Assets (Level 1) | Significant Other Observable Inputs (Level 2) | Significant Other Unobservable Inputs (Level 3) | Total | |||||||||||||
Assets: | ||||||||||||||||
Commodity contracts—asset management | $ | 5 | $ | 1,256 | $ | 24 | $ | 1,285 | ||||||||
Commodity contracts—trading activities | 540 | 1,319 | 23 | 1,882 | ||||||||||||
Total derivative contract assets | 545 | 2,575 | 47 | 3,167 | ||||||||||||
Liabilities: | ||||||||||||||||
Commodity contracts—asset management | (22 | ) | (714 | ) | — | (736 | ) | |||||||||
Commodity contracts—trading activities | (539 | ) | (1,236 | ) | (1 | ) | (1,776 | ) | ||||||||
Total derivative contract liabilities | (561 | ) | (1,950 | ) | (1 | ) | (2,512 | ) | ||||||||
Net: | ||||||||||||||||
Commodity contracts—asset management, net | (17 | ) | 542 | 24 | 549 | |||||||||||
Commodity contracts—trading activities, net | 1 | 83 | 22 | 106 | ||||||||||||
Total derivative contract assets and liabilities, net | $ | (16 | ) | $ | 625 | $ | 46 | $ | 655 | |||||||
28
Table of Contents
The following table presents financial assets and liabilities, net accounted for at fair value on a recurring basis as of June 30, 2009, by tenor (in millions):
| Commodity Contracts | |||||||||
| Asset Management | Trading Activities | Total | |||||||
Remainder of 2009 | $ | 325 | $ | 45 | $ | 370 | |||
2010 | 239 | 1 | 240 | ||||||
2011 | 57 | — | 57 | ||||||
2012 | 44 | — | 44 | ||||||
2013 | 90 | — | 90 | ||||||
Thereafter | 97 | — | 97 | ||||||
Total | $ | 852 | $ | 46 | $ | 898 | |||
The volumetric weighted average maturity, or weighted average tenor, of the asset management derivative contract portfolio at both June 30, 2009 and December 31, 2008, was approximately 23 months. The volumetric weighted average maturity, or weighted average tenor, of the trading derivative contract portfolio at June 30, 2009 and December 31, 2008, was approximately 10 months and 8 months, respectively.
Mirant Mid-Atlantic
The following table presents financial assets and liabilities, net accounted for at fair value on a recurring basis as of June 30, 2009, by category (in millions):
| Quoted Prices in Active Markets for Identical Assets (Level 1) | Significant Other Observable Inputs (Level 2) | Significant Other Unobservable Inputs (Level 3) | Total | ||||||||||||
Total assets | $ | 4 | $ | 1,715 | $ | 5 | $ | 1,724 | |||||||
Total liabilities | (5 | ) | (947 | ) | — | (952 | ) | ||||||||
Total | $ | (1 | ) | $ | 768 | $ | 5 | $ | 772 | ||||||
The following table presents financial assets and liabilities, net accounted for at fair value on a recurring basis as of December 31, 2008, by category (in millions):
| Quoted Prices in Active Markets for Identical Assets (Level 1) | Significant Other Observable Inputs (Level 2) | Significant Other Unobservable Inputs (Level 3) | Total | |||||||||||
Total assets | $ | 3 | $ | 1,173 | $ | — | $ | 1,176 | ||||||
Total liabilities | — | (650 | ) | — | (650 | ) | ||||||||
Total | $ | 3 | $ | 523 | $ | — | $ | 526 | ||||||
29
Table of Contents
The following table presents financial assets and liabilities, net accounted for at fair value on a recurring basis as of June 30, 2009, by tenor (in millions):
| Asset Management | |||
Remainder of 2009 | $ | 272 | |
2010 | 214 | ||
2011 | 55 | ||
2012 | 44 | ||
2013 | 90 | ||
Thereafter | 97 | ||
Total | $ | 772 | |
The volumetric weighted average maturity, or weighted average tenor, of the derivative contract portfolio at June 30, 2009 and December 31, 2008, was approximately 23 months and 26 months, respectively.
Level 3 Disclosures
Mirant Americas Generation and Mirant North America
The following tables present a roll forward of fair values of assets and liabilities, net categorized in Level 3 and the amount included in income for the six months ended June 30, 2009 and 2008 (in millions):
| Commodity Contracts | ||||||||||||
| Asset Management | Trading Activities | Total | ||||||||||
Fair value of assets and liabilities categorized in Level 3 at January 1, 2009 | $ | 24 | $ | 22 | $ | 46 | ||||||
Total gains or losses (realized/unrealized): | ||||||||||||
Included in income of existing contracts (or changes in net assets or liabilities)1 | (11 | ) | (11 | ) | (22 | ) | ||||||
Purchases, issuances and settlements2 | 22 | 19 | 41 | |||||||||
Transfers in and/or out of Level 33 | — | — | — | |||||||||
Fair value of assets and liabilities categorized in Level 3 at June 30, 2009 | $ | 35 | $ | 30 | $ | 65 | ||||||
| Commodity Contracts | ||||||||||||
| Asset Management | Trading Activities | Total | ||||||||||
Fair value of assets and liabilities categorized in Level 3 at January 1, 2008 | $ | 12 | $ | — | $ | 12 | ||||||
Total gains or losses (realized/unrealized): | ||||||||||||
Included in income of existing contracts (or changes in net assets or liabilities)1 | (11 | ) | (1 | ) | (12 | ) | ||||||
Purchases, issuances and settlements2 | 4 | 3 | 7 | |||||||||
Transfers in and/or out of Level 33 | (1 | ) | 20 | 19 | ||||||||
Fair value of assets and liabilities categorized in Level 3 at June 30, 2008 | $ | 4 | $ | 22 | $ | 26 | ||||||
| 1 | Reflects the total gains or losses on contracts included in Level 3 at the beginning of each quarterly reporting period and at the end of each quarterly reporting period, and contracts entered into during each quarterly reporting period that remain at the end of each quarterly reporting period. |
| 2 | Represents the total cash settlements of contracts during each quarterly reporting period that existed at the beginning of each quarterly reporting period. |
| 3 | Denotes the total contracts that existed at the beginning of each quarterly reporting period and were still held at the end of each quarterly reporting period that were either previously categorized as a higher level for which the inputs to the model became unobservable or assets and liabilities that were previously classified as Level 3 for which the lowest significant input became observable during each quarterly reporting period. Amounts reflect fair value as of the end of each quarterly reporting period. |
30
Table of Contents
| Three Months Ended June 30, 2009 | Six Months Ended June 30, 2009 | |||||||||||||||||||
| Operating Revenues | Cost of Fuel | Total | Operating Revenues | Cost of Fuel | Total | |||||||||||||||
Gains (losses) included in income | $ | (10 | ) | $ | 3 | $ | (7 | ) | $ | 16 | $ | 3 | $ | 19 | ||||||
Gains (losses) included in income (or changes in net assets) attributable to the change in unrealized gains or losses relating to assets still held at June 30, 2009 | $ | (10 | ) | $ | 3 | $ | (7 | ) | $ | 18 | $ | 3 | $ | 21 | ||||||
| Three Months Ended June 30, 2008 | Six Months Ended June 30, 2008 | ||||||||||||||||||
| Operating Revenues | Cost of Fuel | Total | Operating Revenues | Cost of Fuel | Total | ||||||||||||||
Gains (losses) included in income | $ | 19 | $ | — | $ | 19 | $ | 18 | $ | (3 | ) | $ | 15 | ||||||
Gains included in income (or changes in net assets) attributable to the change in unrealized gains or losses relating to assets still held at June 30, 2008 | $ | 19 | $ | — | $ | 19 | $ | 19 | $ | 2 | $ | 21 | |||||||
Mirant Mid-Atlantic
The following tables present a roll forward of fair values of assets and liabilities, net categorized in Level 3 and the amount included in income for the six months ended June 30, 2009 and 2008 (in millions):
| Asset Management | |||
Fair value of assets and liabilities categorized in Level 3 at January 1, 2009 | $ | — | |
Total gains or losses (realized/unrealized): | |||
Included in income of existing contracts (or changes in net assets or liabilities)1 | 1 | ||
Purchases, issuances and settlements2 | 4 | ||
Transfers in and/or out of Level 33 | — | ||
Fair value of assets and liabilities categorized in Level 3 at June 30, 2009, net | $ | 5 | |
| Asset Management | ||||
Fair value of assets and liabilities categorized in Level 3 at January 1, 2008, net | $ | 2 | ||
Total gains or losses (realized/unrealized): | ||||
Included in income of existing contracts (or changes in net assets or liabilities) 1 | (8 | ) | ||
Purchases, issuances and settlements2 | — | |||
Transfers in and/or out of Level 33 | — | |||
Fair value of assets and liabilities categorized in Level 3 at June 30, 2008 | $ | (6 | ) | |
| 1 | Reflects the total gains or losses on contracts included in Level 3 at the beginning of each quarterly reporting period and at the end of each quarterly reporting period, and contracts entered into during each quarterly reporting period that remain at the end of each quarterly reporting period. |
| 2 | Represents the total cash settlements of contracts during each quarterly reporting period that existed at the beginning of each quarterly reporting period. |
| 3 | Denotes the total contracts that existed at the beginning of each quarterly reporting period and were still held at the end of each quarterly reporting period that were either previously categorized as a higher level for which the inputs to the model became unobservable or assets and liabilities that were previously classified as Level 3 for which the lowest significant input became observable during each quarterly reporting period. Amounts reflect fair value as of the end of each quarterly reporting period. |
31
Table of Contents
| Three Months Ended June 30, 2009 | Six Months Ended June 30, 2009 | |||||||||||||||||
| Operating Revenues | Cost of Fuel | Total | Operating Revenues | Cost of Fuel | Total | |||||||||||||
Gains included in income | $ | 2 | $ | 3 | $ | 5 | $ | 2 | $ | 3 | $ | 5 | ||||||
Gains included in income (or changes in net assets) attributable to the change in unrealized gains or losses relating to assets still held at June 30, 2009 | $ | 2 | $ | 3 | $ | 5 | $ | 2 | $ | 3 | $ | 5 | ||||||
| Three Months Ended June 30, 2008 | Six Months Ended June 30, 2008 | |||||||||||||||||||||
| Operating Revenues | Cost of Fuel | Total | Operating Revenues | Cost of Fuel | Total | |||||||||||||||||
Gains (losses) included in income | $ | (8 | ) | $ | — | $ | (8 | ) | $ | (10 | ) | $ | 2 | $ | (8 | ) | ||||||
Gains (losses) included in income (or changes in net assets) attributable to the change in unrealized gains or losses relating to assets still held at June 30, 2008 | $ | (8 | ) | $ | — | $ | (8 | ) | $ | (10 | ) | $ | 2 | $ | (8 | ) | ||||||
Counterparty Credit Concentration Risk
The Companies are exposed to the default risk of the counterparties with which they transact. The Companies manage their credit risk by entering into master netting agreements and requiring counterparties to post cash collateral or other credit enhancements based on the net exposure and the credit standing of the counterparty. The Companies also have non-collateralized power hedges entered into by Mirant Mid-Atlantic. These transactions are senior unsecured obligations of Mirant Mid-Atlantic and the counterparties and do not require either party to post cash collateral for initial margin or for securing exposure as a result of changes in power or natural gas prices. The Companies’ credit reserve on their derivative contract assets was $25 million and $52 million for Mirant Americas Generation and Mirant North America at June 30, 2009 and December 31, 2008, respectively, and $24 million and $51 million for Mirant Mid-Atlantic at June 30, 2009 and December 31, 2008, respectively.
At June 30, 2009 and December 31, 2008, approximately $45 million and $20 million, respectively, of cash collateral posted to Mirant Americas Generation and Mirant North America by counterparties under master netting agreements were included in accounts payable and accrued liabilities on Mirant Americas Generation’s and Mirant North America’s condensed consolidated balance sheets.
32
Table of Contents
The Companies also monitor counterparty credit concentration risk on both an individual basis and a group counterparty basis. The following tables highlight the credit quality and the balance sheet settlement exposures related to these activities as of June 30, 2009 and December 31, 2008 (dollars in millions):
Mirant Americas Generation and Mirant North America
| At June 30, 2009 | |||||||||||||||
Credit Rating Equivalent | Gross Exposure Before Collateral1 | Net Exposure Before Collateral2 | Collateral3 | Exposure Net of Collateral | % of Net Exposure | ||||||||||
Clearing and Exchange | $ | 1,718 | $ | 177 | $ | 177 | $ | — | — | ||||||
Investment Grade: | |||||||||||||||
Financial institutions | 1,466 | 718 | 39 | 679 | 81 | % | |||||||||
Energy companies | 935 | 186 | 50 | 136 | 16 | % | |||||||||
Other | — | — | — | — | — | ||||||||||
Non-investment Grade: | |||||||||||||||
Financial institutions | — | — | — | — | — | ||||||||||
Energy companies | — | — | — | — | — | ||||||||||
Other | — | — | — | — | — | ||||||||||
No External Ratings: | |||||||||||||||
Internally-rated investment grade | 25 | 20 | — | 20 | 3 | % | |||||||||
Internally-rated non-investment grade | 4 | 4 | — | 4 | — | ||||||||||
Not internally rated | — | — | — | — | — | ||||||||||
Total | $ | 4,148 | $ | 1,105 | $ | 266 | $ | 839 | 100 | % | |||||
| At December 31, 2008 | |||||||||||||||
Credit Rating Equivalent | Gross Exposure Before Collateral1 | Net Exposure Before Collateral2 | Collateral3 | Exposure Net of Collateral | % of Net Exposure | ||||||||||
Clearing and Exchange | $ | 1,428 | $ | 107 | $ | 107 | $ | — | — | ||||||
Investment Grade: | |||||||||||||||
Financial institutions | 1,219 | 553 | 20 | 533 | 72 | % | |||||||||
Energy companies | 1,060 | 232 | 73 | 159 | 22 | % | |||||||||
Other | — | — | — | — | — | ||||||||||
Non-investment Grade: | |||||||||||||||
Financial institutions | — | — | — | — | — | ||||||||||
Energy companies | — | — | — | — | — | ||||||||||
Other | — | — | — | — | — | ||||||||||
No External Ratings: | |||||||||||||||
Internally-rated investment grade | 41 | 41 | — | 41 | 6 | % | |||||||||
Internally-rated non-investment grade | 4 | 4 | — | 4 | — | ||||||||||
Not internally rated | — | — | — | — | — | ||||||||||
Total | $ | 3,752 | $ | 937 | $ | 200 | $ | 737 | 100 | % | |||||
| 1 | Gross exposure before collateral represents credit exposure, including realized and unrealized transactions, before applying the terms of master netting agreements with counterparties and netting of transactions with clearing brokers and exchanges. The table excludes amounts related to contracts classified as normal purchases/normal sales and non-derivative contractual commitments that are not recorded at fair value in the condensed consolidated balance sheets, except for any related accounts receivable. Such contractual commitments contain credit and economic risk if a counterparty does not perform. Non-performance could have a material adverse effect on the future results of operations, financial condition and cash flows. |
| 2 | Net exposure before collateral represents the credit exposure, including both realized and unrealized transactions, after applying the terms of master netting agreements. |
| 3 | Collateral includes cash and letters of credit received from counterparties. |
33
Table of Contents
Mirant Mid-Atlantic
| At June 30, 2009 | |||||||||||||||
Credit Rating Equivalent | Gross Exposure Before Collateral1,4 | Net Exposure Before Collateral2 | Collateral3 | Exposure Net of Collateral | % of Net Exposure | ||||||||||
Clearing and Exchange | $ | — | $ | — | $ | — | $ | — | — | ||||||
Investment Grade: | |||||||||||||||
Financial institutions | 613 | 600 | — | 600 | 99 | % | |||||||||
Energy companies | — | — | — | — | — | ||||||||||
Other | — | — | — | — | — | ||||||||||
Non-investment Grade: | |||||||||||||||
Financial institutions | — | — | — | — | — | ||||||||||
Energy companies | — | — | — | — | — | ||||||||||
Other | — | — | — | — | — | ||||||||||
No External Ratings: | |||||||||||||||
Internally-rated investment grade | — | — | — | — | — | ||||||||||
Internally-rated non-investment grade | 4 | 4 | — | 4 | 1 | % | |||||||||
Not internally rated | — | — | — | — | — | ||||||||||
Total | $ | 617 | $ | 604 | $ | — | $ | 604 | 100 | % | |||||
| At December 31, 2008 | |||||||||||||||
Credit Rating Equivalent | Gross Exposure Before Collateral1,4 | Net Exposure Before Collateral2 | Collateral3 | Exposure Net of Collateral | % of Net Exposure | ||||||||||
Clearing and Exchange | $ | — | $ | — | $ | — | $ | — | — | ||||||
Investment Grade: | |||||||||||||||
Financial institutions | 477 | 477 | — | 477 | 100 | % | |||||||||
Energy companies | — | — | — | — | — | ||||||||||
Other | — | — | — | — | — | ||||||||||
Non-investment Grade: | |||||||||||||||
Financial institutions | — | — | — | — | — | ||||||||||
Energy companies | — | — | — | — | — | ||||||||||
Other | — | — | — | — | — | ||||||||||
No External Ratings: | |||||||||||||||
Internally-rated investment grade | — | — | — | — | — | ||||||||||
Internally-rated non-investment grade | 2 | 2 | — | 2 | — | ||||||||||
Not internally rated | — | — | — | — | — | ||||||||||
Total | $ | 479 | $ | 479 | $ | — | $ | 479 | 100 | % | |||||
| 1 | Gross exposure before collateral represents credit exposure, including realized and unrealized transactions, before applying the terms of master netting agreements with counterparties and netting of transactions with clearing brokers and exchanges. The table excludes amounts related to contracts classified as normal purchases/normal sales and non-derivative contractual commitments that are not recorded at fair value in the condensed consolidated balance sheets, except for any related accounts receivable. Such contractual commitments contain credit and economic risk if a counterparty does not perform. Non-performance could have a material adverse effect on the future results of operations, financial condition and cash flows. |
| 2 | Net exposure before collateral represents the credit exposure, including both realized and unrealized transactions, after applying the terms of master netting agreements. |
| 3 | Collateral includes cash and letters of credit received from counterparties. |
| 4 | Amounts do not include exposures with affiliates or exposures incurred by Mirant Mid-Atlantic in connection with transactions entered into with external counterparties by affiliates on its behalf. |
34
Table of Contents
Mirant Americas Generation and Mirant North America had credit exposure to three investment grade counterparties that each represented an exposure of more than 10% of total credit exposure, net of collateral. The aggregate credit exposure, net of collateral, to such counterparties was $528 million and $491 million at June 30, 2009 and December 31, 2008, respectively.
Mirant Mid-Atlantic had credit exposure to three investment grade counterparties at June 30, 2009, and credit exposure to two investment grade counterparties at December 31, 2008, that each represented an exposure of more than 10% of total credit exposure, net of collateral. The aggregate credit exposure, net of collateral, to such counterparties was $493 million and $378 million at June 30, 2009 and December 31, 2008, respectively.
Mirant Americas Generation, Mirant North America and Mirant Mid-Atlantic Credit Risk
The Companies’ standard industry contracts contain credit-risk-related contingent features such as ratings-related thresholds and adequate assurance language whereby the Companies would be required to post additional cash collateral as a result of a credit event, including a downgrade. However, as a result of the Companies’ current credit ratings, the Companies are typically required to post collateral in the normal course of business to offset completely their net liability positions. At June 30, 2009, the fair value of Mirant Americas Generation’s and Mirant North America’s financial instruments with credit-risk-related contingent features in a net liability position were approximately $8 million for which Mirant Americas Generation and Mirant North America posted collateral, including cash and letters of credit, of $8 million to offset the position. At June 30, 2009, Mirant Mid-Atlantic did not have any financial instruments with credit-risk-related contingent features in a net liability position.
In addition, at both June 30, 2009 and December 31, 2008, Mirant Americas Generation and Mirant North America had approximately $1 million of cash collateral posted with counterparties under master netting agreements that was included in funds on deposit on the condensed consolidated balance sheets.
Fair Values of Other Financial Instruments (Mirant Americas Generation and Mirant North America)
Other financial instruments recorded at fair value include cash and interest-bearing cash equivalents. The following methods are used by Mirant Americas Generation and Mirant North America to estimate the fair value of financial instruments that are not otherwise carried at fair value on the accompanying condensed consolidated balance sheets:
Notes and Other Receivables. The fair value of Mirant Americas Generation’s and Mirant North America’s notes receivable are estimated using interest rates it would receive currently for similar types of arrangements.
Long- and Short-Term Debt. The fair value of Mirant Americas Generation’s and Mirant North America’s long- and short-term debt is estimated using quoted market prices, when available.
The carrying amounts and fair values of Mirant Americas Generation’s and Mirant North America’s financial instruments are as follows (in millions):
Mirant Americas Generation
| At June 30, 2009 | At December 31, 2008 | |||||||||||
| Carrying Amount | Fair Value | Carrying Amount | Fair Value | |||||||||
Liabilities: | ||||||||||||
Long- and short-term debt | $ | 2,634 | $ | 2,385 | $ | 2,675 | $ | 2,344 | ||||
35
Table of Contents
Mirant North America
| At June 30, 2009 | At December 31, 2008 | |||||||||||
| Carrying Amount | Fair Value | Carrying Amount | Fair Value | |||||||||
Assets: | ||||||||||||
Notes and other receivables | $ | 93 | $ | 93 | $ | 93 | $ | 93 | ||||
Liabilities: | ||||||||||||
Long- and short-term debt | $ | 1,252 | $ | 1,195 | $ | 1,293 | $ | 1,203 | ||||
| D. | Impairments on Assets Held and Used (Mirant Americas Generation and Mirant North America) |
Bowline Generating Facility
Background
During the second quarter of 2009, the NYISO issued its annual peak load and energy forecast in itsLoad and Capacity Data report (the “Gold Book”). The Gold Book reports projected supply and demand for the New York control area for the next ten years. The Gold Book reflected a significant decrease in future demand as a result of current economic conditions and the expected future effects of demand-side management programs in New York. The reduction in future demand as a result of demand-side management programs is being driven primarily by an energy efficiency program being instituted within the State of New York that will seek to achieve a 15% reduction from 2007 energy volumes by 2015. The decrease in the projected future demand resulted in a decrease in Mirant Americas Generation’s and Mirant North America’s forecast of the capacity revenue that their 1,139 MW Bowline generating facility will earn in future periods.
In addition to the change in the forecasted capacity revenue, Mirant Bowline also received its property tax assessment during the second quarter of 2009. The assessment significantly exceeds the estimated fair value of the generating facility.
Based on Mirant Americas Generation’s and Mirant North America’s current five-year forecast incorporating these developments, Mirant Bowline is projected to operate at a net loss for the current year and to continue to have operating losses for the next several years because of the excessive level of taxation imposed on the Bowline generating facility combined with the forecasted decrease in capacity revenues. Therefore, Mirant Americas Generation and Mirant North America determined that the Bowline generating facility should be evaluated for impairment in the second quarter of 2009.
Asset Grouping
For purposes of impairment testing, a long-lived asset or assets must be grouped at the lowest level of identifiable cash flows. Mirant Americas Generation and Mirant North America included their Hudson Valley Gas subsidiary in the impairment analysis as the pipeline operated by Hudson Valley Gas relates solely to the supply of gas for the Bowline generating facility.
Assumptions and Results
Mirant Americas Generation and Mirant North America developed estimates related to the future costs of the facility, including future property tax payments. Additionally, Mirant Americas Generation and Mirant North America developed capacity and energy revenue forecasts based on supply and demand assumptions from the NYISO’s Gold Book and proprietary fundamental modeling. Mirant Americas Generation and Mirant North America also assumed they would monetize excess emissions allowances by selling them. The cash flows for the Bowline generating facility were projected through its estimated remaining useful life of 2027. The sum of the probability weighted undiscounted cash flows for the Bowline generating facility exceeded the carrying value as of June 30, 2009. As a result, Mirant Americas Generation and Mirant North America did not record an impairment charge for the three and six months ended June 30, 2009.
36
Table of Contents
| E. | Long-Term Debt (Mirant Americas Generation, Mirant North America and Mirant Mid-Atlantic) |
Long-term debt was as follows (dollars in millions):
| At June 30, 2009 | At December 31, 2008 | Interest Rate | Secured/ Unsecured | ||||||||||
Long-term debt: | |||||||||||||
Mirant Mid-Atlantic: | |||||||||||||
Mirant Chalk Point capital lease, through 2009 to 2015 | $ | 26 | $ | 28 | 8.19 | % | — | ||||||
Less: current portion of long-term debt | (4 | ) | (3 | ) | |||||||||
Total Mirant Mid-Atlantic long-term debt, net of current portion | 22 | 25 | |||||||||||
Mirant North America: | |||||||||||||
Senior secured term loan, due 2009 to 2013 | 376 | 415 | LIBOR + 1.75 | % | Secured | ||||||||
Senior notes, due 2013. | 850 | 850 | 7.375 | % | Unsecured | ||||||||
Less: current portion of senior secured term loan | (36 | ) | (42 | ) | |||||||||
Total Mirant North America long-term debt, net of current portion | 1,212 | 1,248 | |||||||||||
Mirant Americas Generation: | |||||||||||||
Senior notes: | |||||||||||||
Due 2011 | 535 | 535 | 8.30 | % | Unsecured | ||||||||
Due 2021 | 450 | 450 | 8.50 | % | Unsecured | ||||||||
Due 2031 | 400 | 400 | 9.125 | % | Unsecured | ||||||||
Unamortized debt premiums (discounts), net | (3 | ) | (3 | ) | |||||||||
Total Mirant Americas Generation long-term debt, net of current portion | $ | 2,594 | $ | 2,630 | |||||||||
Mirant Americas Generation Senior Notes
The senior notes are senior unsecured obligations of Mirant Americas Generation having no recourse to any subsidiary or affiliate of Mirant Americas Generation.
Mirant North America Senior Secured Credit Facilities
Mirant North America, a wholly-owned subsidiary of Mirant Americas Generation, entered into senior secured credit facilities in January 2006, which are comprised of a senior secured term loan, due January 2013, and a senior secured revolving credit facility, due January 2012. The senior secured term loan had an initial principal balance of $700 million, which has amortized to $376 million as of June 30, 2009. At the closing, $200 million drawn under the senior secured term loan was deposited into a cash collateral account to support the issuance of up to $200 million of letters of credit. Although the senior secured revolving credit facility has lender commitments of $800 million, availability thereunder reflects a $45 million reduction as a result of the expectation that Lehman Commercial Paper, Inc., which filed for bankruptcy in October 2008, will not honor its $45 million commitment under the facility. During 2008, Mirant North America transferred to the senior secured revolving credit facility approximately $78 million of letters of credit previously supported by the cash collateral account and withdrew approximately $78 million from the cash collateral account, thereby reducing the cash collateral account to approximately $122 million. At June 30, 2009, the cash collateral balance was approximately $123 million as a result of interest earned on the invested cash balances. At June 30, 2009, there were approximately $139 million of letters of credit outstanding under the senior secured revolving credit facility and $123 million of letters of credit outstanding under the senior secured term loan cash collateral account. At June 30, 2009, $615.8 million was available under the senior secured revolving credit facility and $0.2 million was available under the senior secured term loan for cash draws or for the issuance of letters of credit.
37
Table of Contents
In addition to quarterly principal installments, which are currently $1.2 million, Mirant North America is required to make annual principal prepayments under the senior secured term loan equal to a specified percentage of its excess free cash flow, which is based on adjusted EBITDA less capital expenditures and as further defined in the loan agreement. On March 19, 2009, Mirant North America made a mandatory principal prepayment of approximately $37 million on the term loan. At June 30, 2009, the current estimate of the mandatory principal prepayment of the term loan in March 2010 is approximately $32 million. This amount has been reclassified from long-term debt to current portion of long-term debt at June 30, 2009.
The senior secured credit facilities are senior secured obligations of Mirant North America. In addition, certain subsidiaries of Mirant North America (not including Mirant Mid-Atlantic or Mirant Energy Trading) have jointly and severally guaranteed, as senior secured obligations, the senior secured credit facilities. The senior secured credit facilities have no recourse to any other Mirant entities.
Mirant North America Senior Notes
The senior notes due in 2013 are senior unsecured obligations of Mirant North America. In addition, certain subsidiaries of Mirant North America (not including Mirant Mid-Atlantic or Mirant Energy Trading) have jointly and severally guaranteed, as senior unsecured obligations, the senior notes. The Mirant North America senior notes have no recourse to any other Mirant entities, including Mirant Americas Generation.
| F. | Guarantees and Letters of Credit (Mirant Americas Generation and Mirant North America) |
Mirant generally conducts its business through various intermediate holding companies, including Mirant Americas Generation and Mirant North America, and various operating subsidiaries, which enter into contracts as a routine part of their business activities. In certain instances, the contractual obligations of such subsidiaries are guaranteed by, or otherwise supported by, Mirant or another of its subsidiaries, including guarantees of Mirant North America or letters of credit issued under the credit facilities of Mirant North America.
In addition, Mirant Americas Generation and its subsidiaries and Mirant North America and its subsidiaries enter into various contracts that include indemnification and guarantee provisions. Examples of these contracts include financing and lease arrangements, purchase and sale agreements, commodity purchase and sale agreements, construction agreements and agreements with vendors. Although the primary obligation of Mirant Americas Generation, Mirant North America or a subsidiary under such contracts is to pay money or render performance, such contracts may include obligations to indemnify the counterparty for damages arising from the breach thereof and, in certain instances, other existing or potential liabilities. In many cases Mirant Americas Generation’s and Mirant North America’s maximum potential liability cannot be estimated, because some of the underlying agreements contain no limits on potential liability.
Upon issuance or modification of a guarantee, Mirant Americas Generation and Mirant North America determine if the obligation is subject to initial recognition and measurement of a liability and/or disclosure of the nature and terms of the guarantee under FIN 45. Generally, guarantees of the performance of a third party are subject to the recognition and measurement, as well as the disclosure provisions, of FIN 45. Such guarantees must initially be recorded at fair value, as determined in accordance with the interpretation. Mirant Americas Generation and Mirant North America did not have any guarantees at June 30, 2009, that met the recognition requirements under FIN 45.
For the six months ended June 30, 2009, Mirant Americas Generation and Mirant North America had net decreases to their guarantees of approximately $41 million, which included a decrease of approximately $32 million to their letters of credit and a decrease of $9 million to their surety bonds.
This Note should be read in conjunction with the complete description under Note 9,Commitments and Contingencies—Guarantees, to the Companies’ financial statements in their 2008 Annual Report on Form 10-K.
38
Table of Contents
| G. | Related Party Arrangements and Transactions (Mirant Americas Generation, Mirant North America and Mirant Mid-Atlantic) |
Administrative Services Agreement with Mirant Services
Mirant Services provides the Companies with various management, personnel and other services as set forth in the Administrative Services Agreement. The Companies reimburse Mirant Services for amounts equal to Mirant Services’ direct costs of providing such services.
The total costs incurred by the Companies under the Administrative Services Agreement with Mirant Services have been included in the Companies’ accompanying unaudited condensed consolidated statements of operations as follows (in millions):
Mirant Americas Generation and Mirant North America
| Three Months Ended June 30, | Six Months Ended June 30, | |||||||||||
| 2009 | 2008 | 2009 | 2008 | |||||||||
Cost of fuel, electricity and other products—affiliate | $ | 2 | $ | 2 | $ | 4 | $ | 4 | ||||
Operations and maintenance expense—affiliate | 38 | 38 | 74 | 74 | ||||||||
Total | $ | 40 | $ | 40 | $ | 78 | $ | 78 | ||||
Mirant Mid-Atlantic
| Three Months Ended June 30, | Six Months Ended June 30, | |||||||||||
| 2009 | 2008 | 2009 | 2008 | |||||||||
Cost of fuel, electricity and other products—affiliate | $ | 2 | $ | 1 | $ | 4 | $ | 3 | ||||
Operations and maintenance expense—affiliate | 20 | 20 | 40 | 39 | ||||||||
Total | $ | 22 | $ | 21 | $ | 44 | $ | 42 | ||||
Power Sales and Fuel Supply Arrangement with Mirant Energy Trading (Mirant Mid-Atlantic)
Mirant Mid-Atlantic operates under a Power Sale, Fuel Supply and Services Agreement with Mirant Energy Trading. Amounts due to Mirant Energy Trading for fuel purchases and due from Mirant Energy Trading for power and capacity sales are recorded as a payable to affiliate or accounts receivable—affiliate in Mirant Mid-Atlantic’s accompanying condensed consolidated balance sheets.
Under the Power Sale, Fuel Supply and Services Agreement, Mirant Energy Trading resells Mirant Mid-Atlantic’s energy products in the PJM spot and forward markets and to other third parties. Mirant Mid-Atlantic is paid the amount received by Mirant Energy Trading for such capacity and energy. Mirant Mid-Atlantic has counterparty credit risk in the event that Mirant Energy Trading is unable to collect amounts owed from third parties for the resale of Mirant Mid-Atlantic’s energy products.
Services Provided by Mirant Energy Trading (Mirant Mid-Atlantic)
Mirant Mid-Atlantic receives services from Mirant Energy Trading which include the bidding and dispatch of the generating units, fuel procurement and the execution of contracts, including economic hedges, to reduce price risk. Amounts due to and from Mirant Energy Trading under the Power Sale, Fuel Supply and Services Agreement are recorded as a net payable to affiliate or accounts receivable—affiliate, as appropriate. Substantially all energy marketing overhead expenses are allocated to Mirant’s operating subsidiaries. During the
39
Table of Contents
three and six months ended June 30, 2009 and 2008, Mirant Mid-Atlantic incurred approximately $4 million and $7 million of energy marketing overhead expense, respectively. These costs are included in operations and maintenance expense—affiliate in Mirant Mid-Atlantic’s accompanying unaudited condensed consolidated statements of operations.
Administration Arrangements with Mirant Services
Substantially all of Mirant’s corporate overhead costs are allocated to Mirant’s operating subsidiaries. For the three and six months ended June 30, 2009 and 2008, the Companies incurred the following in costs under these arrangements, which are included in operations and maintenance expense—affiliate in the Companies’ accompanying unaudited condensed consolidated statements of operations (in millions):
| Three Months Ended June 30, | Six Months Ended June 30, | |||||||||||
| 2009 | 2008 | 2009 | 2008 | |||||||||
Mirant Americas Generation | $ | 31 | $ | 36 | $ | 63 | $ | 72 | ||||
Mirant North America | $ | 31 | $ | 36 | $ | 63 | $ | 72 | ||||
Mirant Mid-Atlantic | $ | 20 | $ | 21 | $ | 42 | $ | 41 | ||||
Notes Receivable from Affiliate (Mirant North America)
During the pendency of the Chapter 11 proceedings, Mirant Americas Generation and certain of its subsidiaries and Mirant and certain of its subsidiaries (excluding Mirant Americas Generation and its subsidiaries) participated in separate intercompany cash management programs whereby cash balances at Mirant and the respective participating subsidiaries were transferred to central concentration accounts to fund working capital and other needs of the respective participants. At June 30, 2009 and December 31, 2008, Mirant North America had current notes receivable from Mirant Americas Generation of $93 million related to its pre-emergence intercompany cash management program. For the three and six months ended June 30, 2009, Mirant North America earned interest income of less than $1 million, compared to $0 and $1 million, respectively, for the same periods in 2008, which is recorded in interest income—affiliate in Mirant North America’s accompanying unaudited condensed consolidated statements of operations.
Purchased Emissions Allowances (Mirant Mid-Atlantic)
In the first quarter of 2009, Mirant Energy Trading began maintaining the inventory of certain purchased emissions allowances on behalf of Mirant Mid-Atlantic. The emissions allowances are sold by Mirant Energy Trading to Mirant Mid-Atlantic as they are needed for operations. Mirant Mid-Atlantic purchases emissions allowances from Mirant Energy Trading at Mirant Energy Trading’s original cost to purchase the allowances. Where allowances have been purchased by Mirant Energy Trading from a Mirant affiliate, the price paid by Mirant Energy Trading is determined by market indices. As of June 30, 2009 and December 31, 2008, Mirant Mid-Atlantic had $0 and $19 million, respectively, of emissions allowances recorded in inventories in Mirant Mid-Atlantic’s accompanying condensed consolidated balance sheets.
Emissions allowances purchased from Mirant Energy Trading that were utilized in the three and six months ended June 30, 2009, were $12 million and $25 million, respectively, compared to $2 million and $9 million, respectively, for the same periods in 2008 and are recorded in cost of fuel, electricity and other products—affiliate in Mirant Mid-Atlantic’s accompanying unaudited condensed consolidated statements of operations. Amounts expensed as a result of writing down emissions allowances to the lower of cost or market were $0 and $1 million, respectively, for the three and six months ended June 30, 2008, and are recorded in cost of fuel, electricity and other products—affiliate in Mirant Mid-Atlantic’s accompanying unaudited condensed consolidated statements of operations.
40
Table of Contents
Preferred Shares in Mirant Americas
Series A
Mirant Americas issued mandatorily redeemable Series A preferred shares to Mirant Mid-Atlantic for the purpose of funding future environmental capital expenditures. For the six months ended June 30, 2009, the Companies recorded $7 million in preferred stock in affiliate and member’s interest in the accompanying unaudited condensed consolidated balance sheets of each entity related to the amortization of the discount on the preferred stock in Mirant Americas.
The Series A preferred shares issued by Mirant Americas are mandatorily redeemable by Mirant Americas at various dates. In June 2009, Mirant Americas was required to and did redeem $84 million in the Series A preferred stock held by Mirant Mid-Atlantic.
Series B (Mirant Americas Generation)
Mirant Americas issued mandatorily redeemable Series B preferred shares to Mirant Americas Generation for the purpose of supporting the refinancing of Mirant Americas Generation senior notes due in 2011. For the six months ended June 30, 2009, Mirant Americas Generation recorded $4 million in preferred stock in affiliate and member’s interest in Mirant Americas Generation’s unaudited condensed consolidated balance sheets related to the amortization of the discount on the preferred stock in Mirant Americas.
| H. | Income Taxes (Mirant Americas Generation, Mirant North America and Mirant Mid-Atlantic) |
Mirant Americas Generation and Mirant North America
Mirant Americas Generation and Mirant North America are limited liability companies treated as branches of Mirant Americas for income tax purposes. As a result, Mirant Americas and Mirant have direct liability for the majority of the United States federal and state income taxes relating to Mirant Americas Generation’s and Mirant North America’s operations. Certain of Mirant Americas Generation’s and Mirant North America’s subsidiaries continue to exist as regarded corporate entities for income tax purposes. For those regarded corporate entities, Mirant Americas Generation and Mirant North America allocate current and deferred income taxes to each regarded corporate entity as if such entity were a single taxpayer utilizing the asset and liability method to account for income taxes. To the extent Mirant Americas Generation and Mirant North America provide tax provision or benefit, any related tax payable or receivable to Mirant is reclassified to equity in the same period.
If Mirant Americas Generation were to be allocated income taxes attributable to its operations, the pro forma income tax provision (benefit) attributable to income before tax would be $(24) million and $8 million, respectively, for the three and six months ended June 30, 2009, compared to $11 million for both the three and six months ended June 30, 2008. The pro forma income tax benefit for the three months ended June 30, 2009, reflects a change in Mirant Americas Generation’s estimated effective tax rate to eliminate the effect of volatility in the fair value of derivative contracts. The pro forma balance of Mirant Americas Generation’s net deferred income taxes would be $0 as of June 30, 2009. If Mirant North America were to be allocated income taxes attributable to its operations, the pro forma income tax provision attributable to income before tax would be $49 million and $215 million, respectively, for the three and six months ended June 30, 2009, compared to $264 million for both the three and six months ended June 30, 2008. The pro forma balance of Mirant North America’s deferred income taxes would be a net deferred tax liability of $321 million as of June 30, 2009.
If Mirant experiences another “ownership change” within the meaning of Section (“§”) 382 of the Internal Revenue Code of 1986, Mirant Americas Generation’s and Mirant North America’s annual limitation on their NOLs as regarded corporate entities and the pro forma annual limitation on Mirant Americas Generation’s pro forma NOLs could be lower and could result in the recognition of additional current tax expense for the regarded corporate entities and additional pro forma current tax expense in future periods. Given §382’s broad definition,
41
Table of Contents
an ownership change could be the unintended consequence of otherwise normal market trading in Mirant’s stock that is outside Mirant’s control. On March 26, 2009, Mirant announced the adoption of a stockholder rights plan (the “Stockholder Rights Plan”) to reduce the likelihood of an unintended ownership change. However, there can be no assurance that the Stockholder Rights Plan will prevent such an ownership change.
Mirant Mid-Atlantic
Mirant Mid-Atlantic is a single member limited liability corporation for income tax purposes. Mirant Mid-Atlantic is treated as though it were a branch or division of Mirant Americas Generation’s parent, Mirant Americas for income tax purposes. As a result Mirant Mid-Atlantic is not subject to United States federal and state income taxes. If Mirant Mid-Atlantic were to be allocated income taxes attributable to its operations, the pro forma income tax provision (benefit) attributable to income before tax would be $53 million and $207 million for the three and six months ended June 30, 2009, respectively, compared to $(296) million and $(357) million, respectively, for the same periods in 2008. The balance of Mirant Mid-Atlantic’s pro forma deferred income taxes would be a net deferred tax liability of $528 million as of June 30, 2009.
| I. | Segment Reporting (Mirant Americas Generation and Mirant North America) |
Mirant Americas Generation and Mirant North America have four operating segments: Mid-Atlantic, Northeast, California and Other Operations. The Mid-Atlantic segment consists of four generating facilities located in Maryland and Virginia with total net generating capacity of 5,230 MW. The Northeast segment consists of three generating facilities located in Massachusetts and one generating facility located in New York with total net generating capacity of 2,535 MW. For the three and six months ended June 30, 2008, the Northeast region also included the Lovett generating facility, which was shut down on April 19, 2008. The California segment consists of three generating facilities located in or near the City of San Francisco, with total net generating capacity of 2,347 MW. Other Operations includes proprietary trading and fuel oil management activities, parent company adjustments for affiliate transactions, interest expense on debt at Mirant Americas Generation and Mirant North America and interest income on the invested cash balances of Mirant Americas Generation and Mirant North America. In the following tables, eliminations are primarily related to intercompany sales of emissions allowances, intercompany revenues, cost of fuel and interest on intercompany notes receivable and notes payable.
In preparing the Mirant Americas Generation and Mirant North America segment reporting note for the three and nine months ended September 30, 2008, management identified a classification error between cost of fuel, electricity and other products—nonaffiliate and cost of fuel, electricity and other products—affiliate for its Northeast, California and Other Operations segments. For the three and six months ended June 30, 2008, for the Northeast and California segments, the misstatement resulted in an overstatement of cost of fuel, electricity and other products—nonaffiliate and an understatement of cost of fuel, electricity and other products—affiliate. For the Other Operations segment, the result of the misstatement was an overstatement of cost of fuel, electricity and other products—affiliate and an understatement of cost of fuel, electricity and other products—nonaffiliate for the three and six months ended June 30, 2008. For the Northeast segment, the amount of the reclassification was $75 million and $146 million for the three and six months ended June 30, 2008, respectively. For the California segment, the amount of the reclassification was $3 million and $5 million for the three and six months ended June 30, 2008, respectively. For the Other Operations segment, the amount of the reclassification was $78 million and $151 million for the three and six months ended June 30, 2008, respectively. The misstatement had no effect on total cost of fuel, electricity and other products for any of the segments. Further, the misstatement had no effect on the consolidated financial statements of Mirant Americas Generation or Mirant North America. The following tables for the three and six months ended June 30, 2008, have been adjusted to reflect the immaterial correction of these misstatements.
42
Table of Contents
Mirant Americas Generation Operating Segments
| Mid-Atlantic | Northeast | California | Other Operations | Eliminations | Total | |||||||||||||||||
| (in millions) | ||||||||||||||||||||||
Three Months Ended June 30, 2009: | ||||||||||||||||||||||
Operating revenues—nonaffiliate1 | $ | 44 | $ | 3 | $ | 25 | $ | 424 | $ | — | $ | 496 | ||||||||||
Operating revenues—affiliate2 | 347 | 55 | 8 | 23 | (433 | ) | — | |||||||||||||||
Total operating revenues | 391 | 58 | 33 | 447 | (433 | ) | 496 | |||||||||||||||
Cost of fuel, electricity and other products—nonaffiliate3 | 3 | 1 | — | 144 | — | 148 | ||||||||||||||||
Cost of fuel, electricity and other products—affiliate4 | 131 | 12 | 4 | 288 | (433 | ) | 2 | |||||||||||||||
Total cost of fuel, electricity and other products | 134 | 13 | 4 | 432 | (433 | ) | 150 | |||||||||||||||
Gross margin | 257 | 45 | 29 | 15 | — | 346 | ||||||||||||||||
Operating Expenses: | ||||||||||||||||||||||
Operations and maintenance—nonaffiliate | 57 | 22 | 13 | 1 | — | 93 | ||||||||||||||||
Operations and maintenance—affiliate | 44 | 13 | 10 | 2 | — | 69 | ||||||||||||||||
Depreciation and amortization | 24 | 5 | 5 | — | — | 34 | ||||||||||||||||
Gain on sales of assets, net | (2 | ) | — | — | — | — | (2 | ) | ||||||||||||||
Total operating expenses, net | 123 | 40 | 28 | 3 | — | 194 | ||||||||||||||||
Operating income | 134 | 5 | 1 | 12 | — | 152 | ||||||||||||||||
Total other expense, net | 1 | — | — | 33 | — | 34 | ||||||||||||||||
Net income (loss) | $ | 133 | $ | 5 | $ | 1 | $ | (21 | ) | $ | — | $ | 118 | |||||||||
Total assets at June 30, 2009 | $ | 6,548 | $ | 715 | $ | 160 | $ | 5,648 | $ | (3,762 | ) | $ | 9,309 | |||||||||
| 1 | Includes unrealized losses of $30 million and $14 million for Mid-Atlantic and Other Operations, respectively. |
| 2 | Includes unrealized gains of $26 million for Mid-Atlantic and unrealized losses of $6 million and $20 million for Northeast and Other Operations, respectively. |
| 3 | Includes unrealized gains of $30 million for Other Operations. |
| 4 | Includes unrealized losses of $30 million for Other Operations and unrealized gains of $4 million and $26 million for Mid-Atlantic and Northeast, respectively. |
43
Table of Contents
Mirant Americas Generation Operating Segments
| Mid-Atlantic | Northeast | California | Other Operations | Eliminations | Total | |||||||||||||||||||
| (in millions) | ||||||||||||||||||||||||
Six Months Ended June 30, 2009: | ||||||||||||||||||||||||
Operating revenues—nonaffiliate1 | $ | 266 | $ | 8 | $ | 57 | $ | 1,046 | $ | (3 | ) | $ | 1,374 | |||||||||||
Operating revenues—affiliate2 | 797 | 202 | 11 | (16 | ) | (994 | ) | — | ||||||||||||||||
Total operating revenues | 1,063 | 210 | 68 | 1,030 | (997 | ) | 1,374 | |||||||||||||||||
Cost of fuel, electricity and other products—nonaffiliate3 | 10 | 1 | — | 406 | — | 417 | ||||||||||||||||||
Cost of fuel, electricity and other products—affiliate4 | 289 | 100 | 12 | 597 | (994 | ) | 4 | |||||||||||||||||
Total cost of fuel, electricity and other products | 299 | 101 | 12 | 1,003 | (994 | ) | 421 | |||||||||||||||||
Gross margin | 764 | 109 | 56 | 27 | (3 | ) | 953 | |||||||||||||||||
Operating Expenses: | ||||||||||||||||||||||||
Operations and maintenance—nonaffiliate | 117 | 41 | 21 | 2 | — | 181 | ||||||||||||||||||
Operations and maintenance—affiliate | 89 | 26 | 19 | 3 | — | 137 | ||||||||||||||||||
Depreciation and amortization | 48 | 9 | 10 | 1 | — | 68 | ||||||||||||||||||
Gain on sales of assets, net | (10 | ) | (2 | ) | (1 | ) | — | (4 | ) | (17 | ) | |||||||||||||
Total operating expenses (income), net | 244 | 74 | 49 | 6 | (4 | ) | 369 | |||||||||||||||||
Operating income | 520 | 35 | 7 | 21 | 1 | 584 | ||||||||||||||||||
Total other expense, net | 2 | — | 1 | 69 | — | 72 | ||||||||||||||||||
Net income (loss) | $ | 518 | $ | 35 | $ | 6 | $ | (48 | ) | $ | 1 | $ | 512 | |||||||||||
Total assets at June 30, 2009 | $ | 6,548 | $ | 715 | $ | 160 | $ | 5,648 | $ | (3,762 | ) | $ | 9,309 | |||||||||||
| 1 | Includes unrealized gains of $145 million and $66 million for Mid-Atlantic and Other Operations, respectively. |
| 2 | Includes unrealized gains of $93 million and $22 million for Mid-Atlantic and Northeast, respectively, and unrealized losses of $115 million for Other Operations. |
| 3 | Includes unrealized gains of $29 million for Other Operations. |
| 4 | Includes unrealized losses of $29 million for Other Operations and unrealized gains of $5 million and $24 million for Mid-Atlantic and Northeast, respectively. |
44
Table of Contents
Mirant Americas Generation Operating Segments
| Mid-Atlantic | Northeast | California | Other Operations | Eliminations | Total | |||||||||||||||||||
| (in millions) | ||||||||||||||||||||||||
Three Months Ended June 30, 2008: | ||||||||||||||||||||||||
Operating revenues—nonaffiliate1 | $ | (600 | ) | $ | 4 | $ | 32 | $ | 171 | $ | — | $ | (393 | ) | ||||||||||
Operating revenues—affiliate2 | 101 | 109 | 12 | 331 | (553 | ) | — | |||||||||||||||||
Total operating revenues | (499 | ) | 113 | 44 | 502 | (553 | ) | (393 | ) | |||||||||||||||
Cost of fuel, electricity and other products—nonaffiliate3 | 3 | 3 | — | 158 | — | 164 | ||||||||||||||||||
Cost of fuel, electricity and other products—affiliate4 | 103 | 60 | 13 | 379 | (553 | ) | 2 | |||||||||||||||||
Total cost of fuel, electricity and other products | 106 | 63 | 13 | 537 | (553 | ) | 166 | |||||||||||||||||
Gross margin | (605 | ) | 50 | 31 | (35 | ) | — | (559 | ) | |||||||||||||||
Operating Expenses: | ||||||||||||||||||||||||
Operations and maintenance—nonaffiliate | 68 | 40 | 12 | — | — | 120 | ||||||||||||||||||
Operations and maintenance—affiliate | 45 | 16 | 10 | 3 | — | 74 | ||||||||||||||||||
Depreciation and amortization | 23 | 4 | 10 | 1 | — | 38 | ||||||||||||||||||
Loss (gain) on sales of assets, net | (2 | ) | (12 | ) | (1 | ) | — | 3 | (12 | ) | ||||||||||||||
Total operating expenses, net | 134 | 48 | 31 | 4 | 3 | 220 | ||||||||||||||||||
Operating income (loss) | (739 | ) | 2 | — | (39 | ) | (3 | ) | (779 | ) | ||||||||||||||
Total other expense, net | — | 1 | — | 47 | — | 48 | ||||||||||||||||||
Net income (loss) | $ | (739 | ) | $ | 1 | $ | — | $ | (86 | ) | $ | (3 | ) | $ | (827 | ) | ||||||||
Total assets at December 31, 2008 | $ | 5,620 | $ | 722 | $ | 181 | $ | 5,083 | $ | (3,054 | ) | $ | 8,552 | |||||||||||
| 1 | Includes unrealized losses of $564 million and $347 million for Mid-Atlantic and Other Operations, respectively. |
| 2 | Includes unrealized losses of $265 million and $27 million for Mid-Atlantic and Northeast, respectively, and unrealized gains of $292 million for Other Operations. |
| 3 | Includes unrealized gains of $1 million and $36 million for Mid-Atlantic and Other Operations, respectively. |
| 4 | Includes unrealized gains of $10 million and $26 million for Mid-Atlantic and Northeast, respectively, and unrealized losses of $36 million for Other Operations. |
45
Table of Contents
Mirant Americas Generation Operating Segments
| Mid-Atlantic | Northeast | California | Other Operations | Eliminations | Total | |||||||||||||||||||
| (in millions) | ||||||||||||||||||||||||
Six Months Ended June 30, 2008: | ||||||||||||||||||||||||
Operating revenues—nonaffiliate1 | $ | (838 | ) | $ | 11 | $ | 63 | $ | 673 | $ | — | $ | (91 | ) | ||||||||||
Operating revenues—affiliate2 | 449 | 243 | 23 | 437 | (1,152 | ) | — | |||||||||||||||||
Total operating revenues | (389 | ) | 254 | 86 | 1,110 | (1,152 | ) | (91 | ) | |||||||||||||||
Cost of fuel, electricity and other products—nonaffiliate3 | 10 | 12 | — | 380 | — | 402 | ||||||||||||||||||
Cost of fuel, electricity and other products—affiliate4 | 242 | 140 | 26 | 748 | (1,152 | ) | 4 | |||||||||||||||||
Total cost of fuel, electricity and other products | 252 | 152 | 26 | 1,128 | (1,152 | ) | 406 | |||||||||||||||||
Gross margin | (641 | ) | 102 | 60 | (18 | ) | — | (497 | ) | |||||||||||||||
Operating Expenses: | ||||||||||||||||||||||||
Operations and maintenance—nonaffiliate | 123 | 62 | 21 | — | — | 206 | ||||||||||||||||||
Operations and maintenance—affiliate | 87 | 35 | 19 | 5 | — | 146 | ||||||||||||||||||
Depreciation and amortization | 44 | 10 | 14 | 1 | — | 69 | ||||||||||||||||||
Loss (gain) on sales of assets, net | (2 | ) | (16 | ) | (1 | ) | — | 3 | (16 | ) | ||||||||||||||
Total operating expenses, net | 252 | 91 | 53 | 6 | 3 | 405 | ||||||||||||||||||
Operating income (loss) | (893 | ) | 11 | 7 | (24 | ) | (3 | ) | (902 | ) | ||||||||||||||
Total other expense, net | — | — | — | 95 | — | 95 | ||||||||||||||||||
Net income (loss) | $ | (893 | ) | $ | 11 | $ | 7 | $ | (119 | ) | $ | (3 | ) | $ | (997 | ) | ||||||||
Total assets at December 31, 2008 | $ | 5,620 | $ | 722 | $ | 181 | $ | 5,083 | $ | (3,054 | ) | $ | 8,552 | |||||||||||
| 1 | Includes unrealized losses of $804 million and $409 million for Mid-Atlantic and Other Operations, respectively. |
| 2 | Includes unrealized losses of $320 million and $40 million for Mid-Atlantic and Northeast, respectively, and unrealized gains of $360 million for Other Operation. |
| 3 | Includes unrealized gains of $36 million for Other Operations. |
| 4 | Includes unrealized gains of $6 million and $30 million for Mid-Atlantic and Northeast, respectively, and unrealized losses of $36 million for Other Operations. |
46
Table of Contents
Mirant North America Operating Segments
| Mid-Atlantic | Northeast | California | Other Operations | Eliminations | Total | ||||||||||||||||
| (in millions) | |||||||||||||||||||||
Three Months Ended June 30, 2009: | |||||||||||||||||||||
Operating revenues—nonaffiliate1 | $ | 44 | $ | 3 | $ | 25 | $ | 424 | $ | — | $ | 496 | |||||||||
Operating revenues—affiliate2 | 347 | 55 | 8 | 23 | (433 | ) | — | ||||||||||||||
Total operating revenues | 391 | 58 | 33 | 447 | (433 | ) | 496 | ||||||||||||||
Cost of fuel, electricity and other products—nonaffiliate3 | 3 | 1 | — | 144 | — | 148 | |||||||||||||||
Cost of fuel, electricity and other products—affiliate4 | 131 | 12 | 4 | 288 | (433 | ) | 2 | ||||||||||||||
Total cost of fuel, electricity and other products | 134 | 13 | 4 | 432 | (433 | ) | 150 | ||||||||||||||
Gross margin | 257 | 45 | 29 | 15 | — | 346 | |||||||||||||||
Operating Expenses: | |||||||||||||||||||||
Operations and maintenance—nonaffiliate | 57 | 22 | 13 | 1 | — | 93 | |||||||||||||||
Operations and maintenance—affiliate | 44 | 13 | 10 | 2 | — | 69 | |||||||||||||||
Depreciation and amortization | 24 | 5 | 5 | — | — | 34 | |||||||||||||||
Gain on sales of assets, net | (2 | ) | — | — | — | — | (2 | ) | |||||||||||||
Total operating expenses, net | 123 | 40 | 28 | 3 | — | 194 | |||||||||||||||
Operating income | 134 | 5 | 1 | 12 | — | 152 | |||||||||||||||
Total other expense, net | 1 | — | — | 4 | — | 5 | |||||||||||||||
Net income | $ | 133 | $ | 5 | $ | 1 | $ | 8 | $ | — | $ | 147 | |||||||||
Total assets at June 30, 2009 | $ | 6,548 | $ | 715 | $ | 160 | $ | 5,639 | $ | (3,660 | ) | $ | 9,402 | ||||||||
| 1 | Includes unrealized losses of $30 million and $14 million for Mid-Atlantic and Other Operations, respectively. |
| 2 | Includes unrealized gains of $26 million for Mid-Atlantic and unrealized losses of $6 million and $20 million for Northeast and Other Operations, respectively. |
| 3 | Includes unrealized gains of $30 million for Other Operations. |
| 4 | Includes unrealized losses of $30 million for Other Operations and unrealized gains of $4 million and $26 million for Mid-Atlantic and Northeast, respectively. |
47
Table of Contents
Mirant North America Operating Segments
| Mid-Atlantic | Northeast | California | Other Operations | Eliminations | Total | |||||||||||||||||||
| (in millions) | ||||||||||||||||||||||||
Six Months Ended June 30, 2009: | ||||||||||||||||||||||||
Operating revenues—nonaffiliate1 | $ | 266 | $ | 8 | $ | 57 | $ | 1,046 | $ | (3 | ) | $ | 1,374 | |||||||||||
Operating revenues—affiliate2 | 797 | 202 | 11 | (16 | ) | (994 | ) | — | ||||||||||||||||
Total operating revenues | 1,063 | 210 | 68 | 1,030 | (997 | ) | 1,374 | |||||||||||||||||
Cost of fuel, electricity and other products—nonaffiliate3 | 10 | 1 | — | 406 | — | 417 | ||||||||||||||||||
Cost of fuel, electricity and other products—affiliate4 | 289 | 100 | 12 | 597 | (994 | ) | 4 | |||||||||||||||||
Total cost of fuel, electricity and other products | 299 | 101 | 12 | 1,003 | (994 | ) | 421 | |||||||||||||||||
Gross margin | 764 | 109 | 56 | 27 | (3 | ) | 953 | |||||||||||||||||
Operating Expenses: | ||||||||||||||||||||||||
Operations and maintenance—nonaffiliate | 117 | 41 | 21 | 2 | — | 181 | ||||||||||||||||||
Operations and maintenance—affiliate | 89 | 26 | 19 | 3 | — | 137 | ||||||||||||||||||
Depreciation and amortization | 48 | 9 | 10 | 1 | — | 68 | ||||||||||||||||||
Gain on sales of assets, net | (10 | ) | (2 | ) | (1 | ) | — | (4 | ) | (17 | ) | |||||||||||||
Total operating expenses (income), net | 244 | 74 | 49 | 6 | (4 | ) | 369 | |||||||||||||||||
Operating income | 520 | 35 | 7 | 21 | 1 | 584 | ||||||||||||||||||
Total other expense, net | 2 | — | 1 | 9 | — | 12 | ||||||||||||||||||
Net income (loss) | $ | 518 | $ | 35 | $ | 6 | $ | 12 | $ | 1 | $ | 572 | ||||||||||||
Total assets at June 30, 2009 | $ | 6,548 | $ | 715 | $ | 160 | $ | 5,639 | $ | (3,660 | ) | $ | 9,402 | |||||||||||
| 1 | Includes unrealized gains of $145 million and $66 million for Mid-Atlantic and Other Operations, respectively. |
| 2 | Includes unrealized gains of $93 million and $22 million for Mid-Atlantic and Northeast, respectively, and unrealized losses of $115 million for Other Operations. |
| 3 | Includes unrealized gains of $29 million for Other Operations. |
| 4 | Includes unrealized losses of $29 million for Other Operations and unrealized gains of $5 million and $24 million for Mid-Atlantic and Northeast, respectively. |
48
Table of Contents
Mirant North America Operating Segments
| Mid-Atlantic | Northeast | California | Other Operations | Eliminations | Total | |||||||||||||||||||
| (in millions) | ||||||||||||||||||||||||
Three Months Ended June 30, 2008: | ||||||||||||||||||||||||
Operating revenues—nonaffiliate1 | $ | (600 | ) | $ | 4 | $ | 32 | $ | 171 | $ | — | $ | (393 | ) | ||||||||||
Operating revenues—affiliate2 | 101 | 109 | 12 | 331 | (553 | ) | — | |||||||||||||||||
Total operating revenues | (499 | ) | 113 | 44 | 502 | (553 | ) | (393 | ) | |||||||||||||||
Cost of fuel, electricity and other products—nonaffiliate3 | 3 | 3 | — | 158 | — | 164 | ||||||||||||||||||
Cost of fuel, electricity and other products—affiliate4 | 103 | 60 | 13 | 379 | (553 | ) | 2 | |||||||||||||||||
Total cost of fuel, electricity and other products | 106 | 63 | 13 | 537 | (553 | ) | 166 | |||||||||||||||||
Gross margin | (605 | ) | 50 | 31 | (35 | ) | — | (559 | ) | |||||||||||||||
Operating Expenses: | ||||||||||||||||||||||||
Operations and maintenance—nonaffiliate | 68 | 40 | 12 | — | — | 120 | ||||||||||||||||||
Operations and maintenance—affiliate | 45 | 16 | 10 | 3 | — | 74 | ||||||||||||||||||
Depreciation and amortization | 23 | 4 | 10 | 1 | — | 38 | ||||||||||||||||||
Loss (gain) on sales of assets, net | (2 | ) | (12 | ) | (1 | ) | — | 3 | (12 | ) | ||||||||||||||
Total operating expenses, net | 134 | 48 | 31 | 4 | 3 | 220 | ||||||||||||||||||
Operating income (loss) | (739 | ) | 2 | — | (39 | ) | (3 | ) | (779 | ) | ||||||||||||||
Total other expense, net | — | 1 | — | 6 | — | 7 | ||||||||||||||||||
Net income (loss) | $ | (739 | ) | $ | 1 | $ | — | $ | (45 | ) | $ | (3 | ) | $ | (786 | ) | ||||||||
Total assets at December 31, 2008 | $ | 5,620 | $ | 722 | $ | 181 | $ | 5,074 | $ | (2,952 | ) | $ | 8,645 | |||||||||||
| 1 | Includes unrealized losses of $564 million and $347 million for Mid-Atlantic and Other Operations, respectively. |
| 2 | Includes unrealized losses of $265 million and $27 million for Mid-Atlantic and Northeast, respectively, and unrealized gains of $292 million for Other Operations. |
| 3 | Includes unrealized gains of $1 million and $36 million for Mid-Atlantic and Other Operations, respectively. |
| 4 | Includes unrealized gains of $10 million and $26 million for Mid-Atlantic and Northeast, respectively, and unrealized losses of $36 million for Other Operations. |
49
Table of Contents
Mirant North America Operating Segments
| Mid-Atlantic | Northeast | California | Other Operations | Eliminations | Total | |||||||||||||||||||
| (in millions) | ||||||||||||||||||||||||
Six Months Ended June 30, 2008: | ||||||||||||||||||||||||
Operating revenues—nonaffiliate1 | $ | (838 | ) | $ | 11 | $ | 63 | $ | 673 | $ | — | $ | (91 | ) | ||||||||||
Operating revenues—affiliate2 | 449 | 243 | 23 | 437 | (1,152 | ) | — | |||||||||||||||||
Total operating revenues | (389 | ) | 254 | 86 | 1,110 | (1,152 | ) | (91 | ) | |||||||||||||||
Cost of fuel, electricity and other products—nonaffiliate3 | 10 | 12 | — | 380 | — | 402 | ||||||||||||||||||
Cost of fuel, electricity and other products—affiliate4 | 242 | 140 | 26 | 748 | (1,152 | ) | 4 | |||||||||||||||||
Total cost of fuel, electricity and other products | 252 | 152 | 26 | 1,128 | (1,152 | ) | 406 | |||||||||||||||||
Gross margin | (641 | ) | 102 | 60 | (18 | ) | — | (497 | ) | |||||||||||||||
Operating Expenses: | ||||||||||||||||||||||||
Operations and maintenance—nonaffiliate | 123 | 62 | 21 | — | — | 206 | ||||||||||||||||||
Operations and maintenance—affiliate | 87 | 35 | 19 | 5 | — | 146 | ||||||||||||||||||
Depreciation and amortization | 44 | 10 | 14 | 1 | — | 69 | ||||||||||||||||||
Loss (gain) on sales of assets, net | (2 | ) | (16 | ) | (1 | ) | — | 3 | (16 | ) | ||||||||||||||
Total operating expenses, net | 252 | 91 | 53 | 6 | 3 | 405 | ||||||||||||||||||
Operating income (loss) | (893 | ) | 11 | 7 | (24 | ) | (3 | ) | (902 | ) | ||||||||||||||
Total other expense, net | — | — | — | 17 | — | 17 | ||||||||||||||||||
Net income (loss) | $ | (893 | ) | $ | 11 | $ | 7 | $ | (41 | ) | $ | (3 | ) | $ | (919 | ) | ||||||||
Total assets at December 31, 2008 | $ | 5,620 | $ | 722 | $ | 181 | $ | 5,074 | $ | (2,952 | ) | $ | 8,645 | |||||||||||
| 1 | Includes unrealized losses of $804 million and $409 million for Mid-Atlantic and Other Operations, respectively. |
| 2 | Includes unrealized losses of $320 million and $40 million for Mid-Atlantic and Northeast, respectively, and unrealized gains of $360 million for Other Operation. |
| 3 | Includes unrealized gains of $36 million for Other Operations. |
| 4 | Includes unrealized gains of $6 million and $30 million for Mid-Atlantic and Northeast, respectively, and unrealized losses of $36 million for Other Operations. |
50
Table of Contents
| J. | Litigation and Other Contingencies (Mirant Americas Generation, Mirant North America and Mirant Mid-Atlantic) |
The Companies are involved in a number of significant legal proceedings. In certain cases, plaintiffs seek to recover large and sometimes unspecified damages, and some matters may be unresolved for several years. The Companies cannot currently determine the outcome of the proceedings described below or the ultimate amount of potential losses and therefore have not made any provision for such matters unless specifically noted below. Pursuant to SFAS 5, management provides for estimated losses to the extent information becomes available indicating that losses are probable and that the amounts are reasonably estimable. Additional losses could have a material adverse effect on the Companies’ results of operations, financial position or cash flows.
Environmental Matters
EPA Information Request. In January 2001, the EPA issued a request for information to Mirant concerning the implications under the EPA’s NSR regulations promulgated under the Clean Air Act of past repair and maintenance activities at the Potomac River facility in Virginia and the Chalk Point, Dickerson and Morgantown facilities in Maryland. The requested information concerned the period of operations that predates the ownership and lease of those facilities by Mirant Potomac River, Mirant Chalk Point and Mirant Mid-Atlantic. Mirant responded fully to this request. Under the APSA, Pepco is responsible for fines and penalties arising from any violation of the NSR regulations associated with operations prior to the acquisition or lease of the facilities by Mirant Potomac River, Mirant Chalk Point and Mirant Mid-Atlantic. If a violation is determined to have occurred at any of the facilities, Mirant Potomac River, Mirant Chalk Point and Mirant Mid-Atlantic, as the owner or lessee of the facility, may be responsible for the cost of purchasing and installing emissions control equipment, the cost of which may be material. Mirant Chalk Point and Mirant Mid-Atlantic have installed and are installing a variety of emissions control equipment on the Chalk Point, Dickerson and Morgantown facilities in Maryland to comply with the Maryland Healthy Air Act, but that equipment may not include all of the emissions control equipment that could be required if a violation of the EPA’s NSR regulations is determined to have occurred at one or more of those facilities. If such a violation is determined to have occurred after the acquisition or lease of the facilities by Mirant Potomac River, Mirant Chalk Point and Mirant Mid-Atlantic or, if occurring prior to the acquisition or lease, is determined to constitute a continuing violation, Mirant Potomac River, Mirant Chalk Point or Mirant Mid-Atlantic could also be subject to fines and penalties by the state or federal government for the period after its acquisition or lease of the facility at issue, the cost of which may be material, although applicable bankruptcy law may bar such liability for periods prior to January 3, 2006, when the Plan became effective for Mirant Potomac River, Mirant Chalk Point and Mirant Mid-Atlantic.
Faulkner Fly Ash Facility. By letter dated April 2, 2008, the Environmental Integrity Project and the Potomac Riverkeeper notified Mirant, the Companies and various of the Companies’ subsidiaries that they and certain individuals intend to file suit alleging that violations of the Clean Water Act are occurring at the Faulkner Fly Ash Facility owned by Mirant MD Ash Management. The April 2, 2008, letter alleges that the Faulkner facility discharges certain pollutants at levels that exceed Maryland’s water quality criteria, that it discharged certain pollutants without obtaining an appropriate National Pollutant Discharge Elimination System (“NPDES”) permit, and that Mirant MD Ash Management failed to perform monthly monitoring required under an applicable NPDES permit. The letter indicated that the organizations intend to file suit to enjoin the violations alleged, to obtain civil penalties for past violations occurring after January 3, 2006, and to recover attorneys’ fees. Mirant disputes the allegations of violations of the Clean Water Act made by the two organizations in the April 2, 2008, letter.
In May 2008, the MDE filed a complaint in the Circuit Court for Charles County, Maryland, against Mirant MD Ash Management and Mirant Mid-Atlantic. The complaint alleges violations of Maryland’s water pollution laws similar to those asserted in the April 2, 2008, letter from the Environmental Integrity Project and the Potomac Riverkeeper. The MDE complaint requests that the court (1) prohibit continuation of the alleged unpermitted discharges, (2) require Mirant MD Ash Management and Mirant Mid-Atlantic to cease from
51
Table of Contents
disposing of any further coal combustion byproducts at the Faulkner Fly Ash Facility and close and cap the existing disposal cells within one year and (3) assess civil penalties of up to $10,000 per day for each violation. The discharges that are the subject of the MDE’s complaint result from a leachate treatment system installed by Mirant MD Ash Management in accordance with a December 18, 2000, Complaint and Consent Order (the “December 2000 Consent Order”) entered by the Maryland Secretary of the Environment, Water Management Administration pursuant to an agreement between the MDE and Pepco, the previous owner of the Faulkner Fly Ash Facility. Mirant MD Ash Management and Mirant Mid-Atlantic on July 23, 2008, filed a motion seeking dismissal of the MDE complaint, arguing that the discharges are permitted by the December 2000 Consent Order.
Suit Regarding Chalk Point Emissions. On June 25, 2009, the Chesapeake Climate Action Network and four individuals filed a complaint against Mirant Mid-Atlantic and Mirant Chalk Point in the United States District Court for the District of Maryland. The plaintiffs allege that Mirant Chalk Point has violated the Clean Air Act and Maryland environmental regulations by failing to install controls to limit emissions of particulate matter on Unit 3 and Unit 4 of the Chalk Point generating facility, which at times burn residual fuel oil. The plaintiffs seek to enjoin the alleged violations, to obtain civil penalties of up to $32,500 per day for past noncompliance and to recover attorney’s fees. Mirant Mid-Atlantic and Mirant Chalk Point dispute the plaintiffs’ allegations of violations of the Clean Air Act and Maryland environmental regulations.
New York State Administrative Claims (Mirant Americas Generation and Mirant North America). On January 24, 2006, the State of New York and the NYSDEC filed a notice of administrative claims in the Chapter 11 proceedings of Mirant Corporation and certain of its subsidiaries (collectively, the “Mirant Debtors”) asserting a claim seeking to require the Mirant Debtors to provide funding to Mirant Americas Generation’s and Mirant North America’s subsidiaries owning generating facilities in New York to satisfy certain specified environmental compliance obligations, citing various then outstanding matters between the State and Mirant Americas Generation’s and Mirant North America’s subsidiaries owning generating facilities in New York related to compliance with environmental laws and regulations. On April 12, 2008, the State of New York and the NYSDEC filed a separate notice of administrative claims in the bankruptcy proceedings of Mirant New York, Mirant Bowline and Mirant Lovett (all of which emerged from bankruptcy in 2007) alleging various potential violations of New York environmental laws and regulations related to the operation of the Bowline and Lovett generating facilities during the period those entities were in bankruptcy. Except for the alleged violations described below in Lovett Coal Ash Management Facility Notice of Hearing and Complaint, all of the matters or alleged violations set out in the January 24, 2006, and April 12, 2008, administrative claims have now been resolved.
Riverkeeper Suit Against Mirant Lovett (Mirant Americas Generation and Mirant North America). On March 11, 2005, Riverkeeper, Inc. filed suit against Mirant Lovett in the United States District Court for the Southern District of New York under the Clean Water Act. The suit alleges that Mirant Lovett failed to implement a marine life exclusion system at its Lovett generating facility and to perform monitoring for the exclusion of certain aquatic organisms from the facility’s cooling water intake structures in violation of Mirant Lovett’s water discharge permit issued by the State of New York. The plaintiff requested the court to impose civil penalties of $32,500 per day of violation and to award the plaintiff attorneys’ fees. Mirant Lovett’s view is that it complied with the terms of its water discharge permit, as amended by a Consent Order entered June 29, 2004. Mirant Lovett has filed a motion seeking dismissal of the suit on the grounds that it complied with the terms of its water discharge permit, the closure of the Lovett generating facility in April 2008 moots the plaintiff’s request for injunctive relief, and the discharge in bankruptcy received by Mirant Lovett in 2007 bars any claim for penalties.
Lovett Coal Ash Management Facility Notice of Hearing and Complaint (Mirant Americas Generation and Mirant North America). On April 16, 2008, the staff of the NYSDEC filed a complaint with the NYSDEC against Mirant Lovett alleging various violations of New York’s Environmental Conservation Law arising from the coal ash management facility (“CAMF”) located near the former Lovett generating facility, including the alleged discharge of pollutants into the groundwater in excess of allowed levels. The complaint also contends
52
Table of Contents
that Mirant Lovett failed to provide an adequate Leachate Assessment Report related to the CAMF that the NYSDEC staff asserts was required under the terms of a Consent Order dated June 2, 2006. The complaint requests that Mirant Lovett be required to perform various assessments related to groundwater quality and causes of leachate from the CAMF and seeks assessment of a civil penalty of $200,000 and the recovery of $15,000 for the portion of a penalty imposed under the June 2, 2006, Consent Order that had been suspended. On July 17, 2009, Mirant Lovett and the NYSDEC entered into a consent order that resolved the proceeding initiated by the NYSDEC staff’s April 16, 2008, complaint. Under the consent order, Mirant Lovett is to investigate the nature, extent and source of sulfate contamination, and any other contamination, that may be on or emanating from the CAMF or the property on which the former Lovett generating facility was located, and provide a report of its investigation to the NYSDEC. If Mirant Lovett fails to comply with the consent order, it is to pay a civil penalty of $30,000.
Notices of Intent to Sue for Alleged Violations of the Endangered Species Act (Mirant Americas Generation and Mirant North America). By letter dated September 27, 2007, the Coalition for a Sustainable Delta, four water districts, and an individual (the “Noticing Parties”) provided notice to Mirant and Mirant Delta of their intent to file suit alleging that Mirant Delta has violated, and continues to violate, the Federal Endangered Species Act through the operation of its Contra Costa and Pittsburg generating facilities. The Noticing Parties contend that the facilities use of water drawn from the Sacramento-San Joaquin Delta for cooling purposes results in harm to four species of fish listed as endangered species. The Noticing Parties assert that Mirant Delta’s authorizations to take (i.e., cause harm to) those species, a biological opinion and incidental take statement issued by the National Marine Fisheries Service on October 17, 2002, for three of the fish species and a biological opinion and incidental take statement issued by the United States Fish and Wildlife Service on November 4, 2002, for the fourth fish species, have been violated by Mirant Delta and no longer apply to permit the effects on the four fish species caused by the operation of the Contra Costa and Pittsburg generating facilities. Following receipt of these letters, in late October 2007, Mirant Delta received correspondence from the United States Fish and Wildlife Service, the National Marine Fisheries Service and the United States Army Corps of Engineers (the “Corps”) clarifying that Mirant Delta continued to be authorized to take the four species of fish protected under the Federal Endangered Species Act. The agencies have initiated a process that will review the environmental effects of Mirant Delta’s water usage, including effects on the protected species of fish. That process could lead to changes in the manner in which Mirant Delta can use river water for the operation of the Contra Costa and Pittsburg generating facilities. In a subsequent letter, the Coalition for a Sustainable Delta also alleged violations of the National Environmental Policy Act and the California Endangered Species Act associated with the operation of Mirant Delta’s facilities. On May 14, 2009, the Coalition for a Sustainable Delta, Kern County Water Agency and an individual sent a new notice of intent to sue to the Corps alleging that the Corps had violated the Federal Endangered Species Act by issuing permits related to the operation of Mirant Delta’s Contra Costa and Pittsburg generating facilities without ensuring that conservation measures would be implemented to minimize and mitigate the harm to the four endangered fish species and their habitat allegedly resulting from such operation. Mirant Delta disputes the allegations made by the Noticing Parties and those made in the May 14, 2009, notice.
Notice of Violations Relating to State Line Generating Station (Mirant Americas Generation). On April 16, 2009, the EPA issued a Notice and Finding of Violations to Mirant Americas, Dominion Resources Services, Inc., Dominion Resources, Inc. and Commonwealth Edison Company. The notice alleges that various activities occurring from 1994 through 2008 at the Kincaid generating facility in Illinois and the State Line generating facility in Indiana violated the EPA’s NSR regulations and other provisions of the Clean Air Act. Mirant Americas Generation and its subsidiaries have had no ownership interest in or other involvement with the Kincaid facility. Through subsidiaries, Mirant Americas Generation acquired the State Line facility from a subsidiary of Commonwealth Edison Company in December 1997. Mirant Americas Generation sold its subsidiaries owning the State Line facility to subsidiaries of Dominion Resources in June 2002. The contracts under which Mirant Americas Generation acquired and sold its ownership interests in the State Line facility were rejected in Mirant’s bankruptcy proceedings, and, as a result, Mirant Americas Generation and its subsidiaries have no contractual obligations to either Commonwealth Edison Company and its subsidiaries or Dominion resources and its subsidiaries related to the State Line facility. Furthermore, applicable bankruptcy law may bar
53
Table of Contents
any liability of Mirant Americas Generation and its subsidiaries for fines based on events occurring in periods prior to January 3, 2006, when the Plan became effective. The EPA advised Mirant in May 2009 that it did not intend to take further action against Mirant Americas with respect to the activities addressed by the April 16, 2009, notice.
Chapter 11 Proceedings
On July 14, 2003, and various dates thereafter, the Mirant Debtors, including the Companies and their subsidiaries, filed voluntary petitions for relief under Chapter 11 of the Bankruptcy Code in the Bankruptcy Court. Mirant, the Companies and most of the Mirant Debtors emerged from bankruptcy on January 3, 2006, when the Plan became effective. The remaining Mirant Debtors (Mirant New York, Mirant Bowline, Mirant Lovett, Mirant NY-Gen and Hudson Valley Gas) emerged from bankruptcy on various dates in 2007. As of June 30, 2009, approximately 850,000 of the shares of Mirant common stock to be distributed under the Plan had not yet been distributed and have been reserved for distribution with respect to claims disputed by the Mirant Debtors that have not been resolved. Under the terms of the Plan, upon the resolution of such a disputed claim, the claimant will receive the same pro rata distributions of Mirant common stock, cash, or both common stock and cash as previously allowed claims, regardless of the price at which Mirant common stock is trading at the time the claim is resolved.
To the extent the aggregate amount of the payouts determined to be due with respect to disputed claims ultimately exceeds the amount of the funded claim reserve, Mirant would have to issue additional shares of common stock to address the shortfall, which would dilute existing Mirant stockholders, and Mirant and Mirant Americas Generation would have to pay additional cash amounts as necessary under the terms of the Plan to satisfy such pre-petition claims.
California and Western Power Markets (Mirant Americas Generation and Mirant North America)
FERC Refund Proceedings Arising Out of California Energy Crisis.High prices experienced in California and western wholesale electricity markets in 2000 and 2001 caused various purchasers of electricity in those markets to initiate proceedings seeking refunds. Several of those proceedings remain pending either before the FERC or on appeal to the United States Court of Appeals for the Ninth Circuit (the “Ninth Circuit”). The proceedings that remain pending include proceedings (1) ordered by the FERC on July 25, 2001, (the “FERC Refund Proceedings”) to determine the amount of any refunds and amounts owed for sales made by market participants, including Mirant Americas Energy Marketing, in the CAISO or the Cal PX markets from October 2, 2000, through June 20, 2001 (the “Refund Period”), (2) ordered by the FERC to determine whether there had been unjust and unreasonable charges for spot market bilateral sales in the Pacific Northwest from December 25, 2000, through June 20, 2001 (the “Pacific Northwest Proceeding”), and (3) arising from a complaint filed in 2002 by the California Attorney General that sought refunds for transactions conducted in markets administered by the CAISO and the Cal PX outside the Refund Period set by the FERC and for transactions between the DWR and various owners of generation and power marketers, including Mirant Americas Energy Marketing and subsidiaries of Mirant Americas Generation and Mirant North America. Various parties appealed the FERC orders related to these proceedings to the Ninth Circuit seeking review of a number of issues, including changing the Refund Period to include periods prior to October 2, 2000, and expanding the sales of electricity subject to potential refund to include bilateral sales made to the DWR and other parties. While various of these appeals remain pending, the Ninth Circuit ruled in orders issued on August 2, 2006, and September 9, 2004, that the FERC should consider further whether to grant relief for sales of electricity made in the CAISO and Cal PX markets prior to October 2, 2000, at rates found to be unjust, and, in the proceeding initiated by the California Attorney General, what remedies, including potential refunds, are appropriate where entities, including Mirant Americas Energy Marketing, purportedly did not comply with certain filing requirements for transactions conducted under market-based rate tariffs.
On January 14, 2005, Mirant and certain of its subsidiaries, including Mirant Americas Generation and Mirant North America (the “Mirant Settling Parties”) entered into a Settlement and Release of Claims Agreement
54
Table of Contents
(the “California Settlement”) with PG&E, Southern California Edison Company, San Diego Gas and Electric Company, the CPUC, the DWR, the EOB and the Attorney General of the State of California (collectively, the “California Parties”). The California Settlement was approved by the FERC on April 13, 2005, and became effective on April 15, 2005, upon its approval by the Bankruptcy Court. The California Settlement resulted in the release of most of Mirant Americas Energy Marketing’s potential liability (1) in the FERC Refund Proceedings for sales made in the CAISO or the Cal PX markets, (2) in the Pacific Northwest Proceeding, and (3) in any proceedings at the FERC resulting from the complaint filed in 2002 by the California Attorney General. Based on the California Settlement, on April 15, 2008, the FERC dismissed Mirant Americas Energy Marketing and the other subsidiaries of Mirant Americas Generation and Mirant North America from the proceeding initiated by the complaint filed in 2002 by the California Attorney General.
Under the California Settlement, the California Parties and those other market participants who have opted into the settlement have released the Mirant Settling Parties, including Mirant Americas Energy Marketing, from any liability for refunds related to sales of electricity and natural gas in the western markets from January 1, 1998, through July 14, 2003. Also, the California Parties have assumed the obligation of Mirant Americas Energy Marketing to pay any refunds determined by the FERC to be owed by Mirant Americas Energy Marketing to other parties that do not opt into the settlement for transactions in the CAISO and Cal PX markets during the Refund Period, with the liability of the California Parties for such refund obligation limited to the amount of certain receivables assigned by Mirant Americas Energy Marketing to the California Parties under the California Settlement. The settlement did not relieve Mirant Americas Energy Marketing of liability for any refunds that the FERC determines it to owe (1) to participants in the Cal PX and CAISO markets that are not California Parties (or that did not elect to opt into the settlement) for periods outside the Refund Period and (2) to participants in bilateral transactions with Mirant Americas Energy Marketing that are not California Parties (or that did not elect to opt into the settlement).
Resolution of the refund proceedings that remain pending before the FERC or that currently are on appeal to the Ninth Circuit could ultimately result in the FERC concluding that the prices received by Mirant Americas Energy Marketing in some transactions occurring in 2000 and 2001 should be reduced. Mirant Americas Generation’s and Mirant North America’s view is that the bulk of any obligations of Mirant Americas Energy Marketing to make refunds as a result of sales completed prior to July 14, 2003, in the CAISO or Cal PX markets or in bilateral transactions either have been addressed by the California Settlement or have been resolved as part of Mirant Americas Energy Marketing’s bankruptcy proceedings. To the extent that Mirant Americas Energy Marketing’s potential refund liability arises from contracts that were transferred to Mirant Energy Trading as part of the transfer of the trading and marketing business under the Plan, Mirant Energy Trading may have exposure to any refund liability related to transactions under those contracts.
Mirant Americas Energy Marketing Contract Dispute with Nevada Power.On December 5, 2001, Nevada Power Company filed a complaint at the FERC seeking reformation of the purchase price of energy under a contract it had entered with Mirant Americas Energy Marketing, claiming that the prices under that contract were unjust and unreasonable because, when it entered into the contract, western power markets were dysfunctional and non-competitive. On June 25, 2003, the FERC dismissed the complaint. Nevada Power appealed that dismissal to the United States Court of Appeals for the Ninth Circuit, which on December 19, 2006, reversed the dismissal of the Nevada Power complaint and a number of other similar complaints and remanded the proceedings to the FERC. On June 26, 2008, the United States Supreme Court affirmed the remand of the Nevada Power proceeding and the other similar proceedings to the FERC, concluding that the FERC should analyze further (1) whether the contracts at issue imposed an excessive burden on consumers in the later periods covered by the contracts, not just at their outset, and (2) whether any of the sellers engaged in unlawful market manipulation, which the Court concluded would remove the premise underlying the FERC’s dismissal of the complaints that the rates agreed to in the contracts were based on fair, arm’s length negotiations. On December 18, 2008, the FERC issued an order on remand providing for the record to be supplemented through further written filings by the parties regarding the specific issues raised by the ruling entered by the United States Supreme Court. The sales made by Mirant Americas Energy Marketing under the contract with Nevada Power
55
Table of Contents
have been completed, and Mirant Americas Generation and Mirant North America expect that any refund claim related to that contract, if not now barred by the discharge in bankruptcy received by Mirant Energy Trading when the Plan became effective on January 3, 2006, will be addressed in the Chapter 11 proceedings.
Mirant Americas Energy Marketing Contract Dispute with Southern California Water. On December 21, 2001, Southern California Water Company filed a complaint at the FERC seeking reformation of the purchase price of energy under a long-term contract it had entered with Mirant Americas Energy Marketing, claiming that the prices under that contract were unjust and unreasonable because, when it entered the contract, western power markets were dysfunctional and non-competitive. The contract was for the purchase of 15 MWs during the period April 1, 2001, through December 31, 2006. Upon the transfer of the assets of the trading and marketing business to Mirant Energy Trading under the Plan, Mirant Energy Trading assumed Mirant Americas Energy Marketing’s contract obligations to Southern California Water Company, including any potential refund obligations. On May 1, 2009, Mirant Energy Trading and Southern California Water Company entered into a settlement agreement under which Southern California Water Company agreed to release its claims in return for a payment from Mirant Energy Trading of $1 million. The settlement agreement became effective on May 21, 2009, upon Southern California Water Company’s withdrawal of its complaint at the FERC becoming effective.
Complaint Challenging Capacity Rates Under the RPM Provisions of PJM’s Tariff
On May 30, 2008, a variety of parties, including the state public utility commissions of Maryland, Pennsylvania, New Jersey, and Delaware, ratepayer advocates, certain electric cooperatives, various groups representing industrial electricity users, and federal agencies (the “RPM Buyers”), filed a complaint with the FERC asserting that capacity auctions held to determine capacity payments under PJM’s reliability pricing model (the “RPM”) tariff had produced rates that were unjust and unreasonable. PJM conducted the capacity auctions that are the subject of the complaint to set the capacity payments in effect under the RPM provisions of PJM’s tariff for twelve month periods beginning June 1, 2008, June 1, 2009, and June 1, 2010. The RPM Buyers allege that (i) the time between when the auctions were held and the periods that the resulting capacity rates would be in effect were too short to allow competition from new resources in the auctions, (ii) the administrative process established under the RPM provisions of PJM’s tariff was inadequate to restrain the exercise of market power through the withholding of capacity to increase prices, and (iii) the locational pricing established under the RPM provisions of PJM’s tariff created opportunities for sellers to raise prices while serving no legitimate function. The RPM Buyers asked the FERC to reduce significantly the capacity rates established by the capacity auctions and to set June 1, 2008, as the date beginning on which any rates found by the FERC to be excessive would be subject to refund. If the FERC were to reduce the capacity payments set through the capacity auctions to the rates proposed by the RPM Buyers, the capacity revenue the Companies have received or expect to receive for the period June 1, 2008 through May 31, 2011, would be reduced by approximately $600 million. On September 19, 2008, the FERC issued an order dismissing the complaint. The FERC found that no party had violated the RPM provisions of PJM’s tariff and that the prices determined during the auctions were in accordance with the tariff’s provisions. The RPM Buyers filed a request for rehearing, which the FERC denied on June 18, 2009.
Other Legal Matters
The Companies are involved in various other claims and legal actions arising in the ordinary course of business. In the opinion of management, the ultimate disposition of these matters will not have a material adverse effect on the Companies’ results of operations, financial position or cash flows.
| K. | Settlements and Other Charges (Mirant Americas Generation, Mirant North America and Mirant Mid-Atlantic) |
Potomac River Settlement
In July 2008, the City of Alexandria, Virginia (in which the Potomac River generating facility is located) and Mirant Potomac River entered into an agreement containing certain terms that were included in a proposed
56
Table of Contents
comprehensive state operating permit for the Potomac River generating facility issued by the Virginia DEQ that month. Under that agreement, Mirant Potomac River committed to spend $34 million over several years to reduce particulate emissions. The $34 million was placed in escrow and is included in funds on deposit and other noncurrent assets in the accompanying condensed consolidated balance sheets and in the Companies’ estimated capital expenditures. On July 30, 2008, the Virginia State Air Pollution Control Board approved the comprehensive permit with terms consistent with the agreement between Mirant Potomac and the City of Alexandria, and the Virginia DEQ issued the permit on July 31, 2008.
Prior to the issuance of the comprehensive state operating permit in July 2008, the Potomac River generating facility operated under a state operating permit issued June 1, 2007, that significantly restricted the facility’s operations by imposing stringent limits on its SO2 emissions and constraining unit operations so that no more than three of the facility’s five units could operate at one time. In compliance with the comprehensive permit, in 2008 Mirant Potomac River merged the stacks for units 3, 4 and 5 into one stack at the Potomac River generating facility and, in January 2009, merged the stacks for units 1 and 2 into one stack. With the completion of the stack mergers, the permit issued in July 2008 will not constrain operations of the Potomac River generating facility below historical operations and will allow operation of all five units at one time. Certain provisions of Virginia’s air emissions regulations adopted to implement the CAIR, however, could constrain the facility’s operations. Mirant Potomac River has challenged those regulations in court.
57
Table of Contents
| L. | Guarantor/Non-Guarantor Condensed Consolidating Financial Information (Mirant North America) |
Mirant North America’s revolving and term loan credit facilities and 7.375% senior notes are jointly and severally and fully and unconditionally guaranteed on a senior secured basis and senior unsecured basis, respectively, by certain subsidiaries of Mirant North America (all of which are wholly-owned). The accompanying condensed consolidating financial information has been prepared and presented pursuant to SEC Regulation S-X Rule 3-10, “Financial Statements of Guarantors and Issuers of Guaranteed Securities Registered or being Registered.” This information is not intended to present the financial position, results of operations and cash flows of the individual companies or groups of companies in accordance with GAAP.
The following sets forth unaudited condensed consolidating financial statements of the guarantor and non-guarantor subsidiaries:
MIRANT NORTH AMERICA
GUARANTOR/NON-GUARANTOR
CONDENSED CONSOLIDATING STATEMENTS OF OPERATIONS (UNAUDITED)
Three Months Ended June 30, 2009
(in millions)
| Parent | Guarantor | Non- Guarantor | Eliminations | Consolidated | |||||||||||||||
Operating revenues | $ | — | $ | 91 | $ | 513 | $ | (108 | ) | $ | 496 | ||||||||
Cost of fuel, electricity and other products | — | 17 | 241 | (108 | ) | 150 | |||||||||||||
Gross margin | — | 74 | 272 | — | 346 | ||||||||||||||
Operating Expenses: | |||||||||||||||||||
Operations and maintenance | — | 59 | 103 | — | 162 | ||||||||||||||
Depreciation and amortization | — | 9 | 25 | — | 34 | ||||||||||||||
Gain on sales of assets, net | — | — | (2 | ) | — | (2 | ) | ||||||||||||
Total operating expenses, net | — | 68 | 126 | — | 194 | ||||||||||||||
Operating income | — | 6 | 146 | — | 152 | ||||||||||||||
Equity earnings of subsidiaries | (168 | ) | — | — | 168 | — | |||||||||||||
Other expense (income), net | 21 | — | 1 | (17 | ) | 5 | |||||||||||||
Net income (loss) | $ | 147 | $ | 6 | $ | 145 | $ | (151 | ) | $ | 147 | ||||||||
58
Table of Contents
MIRANT NORTH AMERICA
GUARANTOR/NON-GUARANTOR
CONDENSED CONSOLIDATING STATEMENTS OF OPERATIONS (UNAUDITED)
Three Months Ended June 30, 2008
(in millions)
| Parent | Guarantor | Non- Guarantor | Eliminations | Consolidated | ||||||||||||||||
Operating revenues | $ | — | $ | 157 | $ | (382 | ) | $ | (168 | ) | $ | (393 | ) | |||||||
Cost of fuel, electricity and other products | — | 77 | 257 | (168 | ) | 166 | ||||||||||||||
Gross margin | — | 80 | (639 | ) | — | (559 | ) | |||||||||||||
Operating Expenses: | ||||||||||||||||||||
Operations and maintenance | — | 79 | 115 | — | 194 | |||||||||||||||
Depreciation and amortization | — | 15 | 23 | — | 38 | |||||||||||||||
Loss (gain) on sales of assets, net | 4 | (14 | ) | (2 | ) | — | (12 | ) | ||||||||||||
Total operating expenses, net | 4 | 80 | 136 | — | 220 | |||||||||||||||
Operating loss | (4 | ) | — | (775 | ) | — | (779 | ) | ||||||||||||
Equity earnings of subsidiaries | 761 | — | — | (761 | ) | — | ||||||||||||||
Other expense (income), net | 21 | (1 | ) | — | (13 | ) | 7 | |||||||||||||
Net income (loss) | $ | (786 | ) | $ | 1 | $ | (775 | ) | $ | 774 | $ | (786 | ) | |||||||
MIRANT NORTH AMERICA
GUARANTOR/NON-GUARANTOR
CONDENSED CONSOLIDATING STATEMENTS OF OPERATIONS (UNAUDITED)
Six Months Ended June 30, 2009
(in millions)
| Parent | Guarantor | Non- Guarantor | Eliminations | Consolidated | ||||||||||||||||
Operating revenues | $ | (3 | ) | $ | 278 | $ | 1,381 | $ | (282 | ) | $ | 1,374 | ||||||||
Cost of fuel, electricity and other products | — | 113 | 590 | (282 | ) | 421 | ||||||||||||||
Gross margin | (3 | ) | 165 | 791 | — | 953 | ||||||||||||||
Operating Expenses: | ||||||||||||||||||||
Operations and maintenance | — | 108 | 210 | — | 318 | |||||||||||||||
Depreciation and amortization | — | 18 | 49 | 1 | 68 | |||||||||||||||
Gain on sales of assets, net | (4 | ) | (3 | ) | (10 | ) | — | (17 | ) | |||||||||||
Total operating expenses, net | (4 | ) | 123 | 249 | 1 | 369 | ||||||||||||||
Operating income (loss) | 1 | 42 | 542 | (1 | ) | 584 | ||||||||||||||
Equity earnings of subsidiaries | (613 | ) | — | — | 613 | — | ||||||||||||||
Other expense (income), net | 42 | 1 | 2 | (33 | ) | 12 | ||||||||||||||
Net income (loss) | $ | 572 | $ | 41 | $ | 540 | $ | (581 | ) | $ | 572 | |||||||||
59
Table of Contents
MIRANT NORTH AMERICA
GUARANTOR/NON-GUARANTOR
CONDENSED CONSOLIDATING STATEMENTS OF OPERATIONS (UNAUDITED)
Six Months Ended June 30, 2008
(in millions)
| Parent | Guarantor | Non- Guarantor | Eliminations | Consolidated | ||||||||||||||||
Operating revenues | $ | — | $ | 340 | $ | (82 | ) | $ | (349 | ) | $ | (91 | ) | |||||||
Cost of fuel, electricity and other products | — | 179 | 576 | (349 | ) | 406 | ||||||||||||||
Gross margin | — | 161 | (658 | ) | — | (497 | ) | |||||||||||||
Operating Expenses: | ||||||||||||||||||||
Operations and maintenance | — | 137 | 215 | — | 352 | |||||||||||||||
Depreciation and amortization | — | 25 | 44 | — | 69 | |||||||||||||||
Loss (gain) on sales of assets, net | 4 | (18 | ) | (2 | ) | — | (16 | ) | ||||||||||||
Total operating expenses, net | 4 | 144 | 257 | — | 405 | |||||||||||||||
Operating income (loss) | (4 | ) | 17 | (915 | ) | — | (902 | ) | ||||||||||||
Equity earnings of subsidiaries | 871 | — | — | (871 | ) | — | ||||||||||||||
Other expense (income), net | 44 | (1 | ) | (2 | ) | (24 | ) | 17 | ||||||||||||
Net income (loss) | $ | (919 | ) | $ | 18 | $ | (913 | ) | $ | 895 | $ | (919 | ) | |||||||
60
Table of Contents
MIRANT NORTH AMERICA
GUARANTOR/NON-GUARANTOR
CONDENSED CONSOLIDATING BALANCE SHEETS (UNAUDITED)
At June 30, 2009
(in millions)
| Parent | Guarantor | Non- Guarantor | Eliminations | Consolidated | |||||||||||||
ASSETS | |||||||||||||||||
Current Assets: | |||||||||||||||||
Cash and cash equivalents | $ | 43 | $ | — | $ | 380 | $ | — | $ | 423 | |||||||
Funds on deposit | 123 | — | 51 | — | 174 | ||||||||||||
Receivables—nonaffiliate | — | 2 | 486 | — | 488 | ||||||||||||
Receivables—affiliate | — | 55 | 36 | (80 | ) | 11 | |||||||||||
Notes receivable—affiliate | 21 | 100 | — | (28 | ) | 93 | |||||||||||
Derivative contract assets—nonaffiliate | — | — | 3,110 | — | 3,110 | ||||||||||||
Derivative contract assets—affiliate | — | 141 | 94 | (235 | ) | — | |||||||||||
Inventories | — | 29 | 230 | — | 259 | ||||||||||||
Prepaid rent and other payments | — | 8 | 104 | — | 112 | ||||||||||||
Total current assets | 187 | 335 | 4,491 | (343 | ) | 4,670 | |||||||||||
Property, Plant and Equipment, net | — | 472 | 2,908 | 112 | 3,492 | ||||||||||||
Noncurrent Assets: | |||||||||||||||||
Goodwill, net | (799 | ) | — | 799 | — | — | |||||||||||
Intangible assets, net | — | 49 | 142 | — | 191 | ||||||||||||
Derivative contract assets—nonaffiliate | — | — | 669 | — | 669 | ||||||||||||
Derivative contract assets—affiliate | — | 11 | 4 | (15 | ) | — | |||||||||||
Prepaid rent | — | — | 311 | — | 311 | ||||||||||||
Debt issuance costs, net | 27 | — | — | — | 27 | ||||||||||||
Investments in subsidiaries | 6,300 | — | — | (6,300 | ) | — | |||||||||||
Other | — | 20 | 22 | — | 42 | ||||||||||||
Total noncurrent assets | 5,528 | 80 | 1,947 | (6,315 | ) | 1,240 | |||||||||||
Total Assets | $ | 5,715 | $ | 887 | $ | 9,346 | $ | (6,546 | ) | $ | 9,402 | ||||||
LIABILITIES AND MEMBER’S EQUITY | |||||||||||||||||
Current Liabilities: | |||||||||||||||||
Current portion of long-term debt | $ | 36 | $ | — | $ | 4 | $ | — | $ | 40 | |||||||
Notes payable—affiliate | 8 | 20 | — | (28 | ) | — | |||||||||||
Accounts payable and accrued liabilities | 2 | 21 | 627 | — | 650 | ||||||||||||
Payable to affiliate | — | 42 | 66 | (80 | ) | 28 | |||||||||||
Derivative contract liabilities—nonaffiliate | — | — | 2,596 | — | 2,596 | ||||||||||||
Derivative contract liabilities—affiliate | — | 94 | 141 | (235 | ) | — | |||||||||||
Other | — | 13 | 8 | — | 21 | ||||||||||||
Total current liabilities | 46 | 190 | 3,442 | (343 | ) | 3,335 | |||||||||||
Noncurrent Liabilities: | |||||||||||||||||
Long-term debt | 1,190 | — | 22 | — | 1,212 | ||||||||||||
Derivative contract liabilities—nonaffiliate | — | — | 285 | — | 285 | ||||||||||||
Derivative contract liabilities—affiliate | — | 4 | 11 | (15 | ) | — | |||||||||||
Other | — | 32 | �� | 59 | — | 91 | |||||||||||
Total noncurrent liabilities | 1,190 | 36 | 377 | (15 | ) | 1,588 | |||||||||||
Commitments and Contingencies | |||||||||||||||||
Member’s Equity | 4,479 | 661 | 5,527 | (6,188 | ) | 4,479 | |||||||||||
Total Liabilities and Member’s Equity | $ | 5,715 | $ | 887 | $ | 9,346 | $ | (6,546 | ) | $ | 9,402 | ||||||
61
Table of Contents
MIRANT NORTH AMERICA
GUARANTOR/NON-GUARANTOR
CONDENSED CONSOLIDATING BALANCE SHEETS
At December 31, 2008
(in millions)
| Parent | Guarantor | Non- Guarantor | Eliminations | Consolidated | |||||||||||||
ASSETS | |||||||||||||||||
Current Assets: | |||||||||||||||||
Cash and cash equivalents | $ | 101 | $ | — | $ | 253 | $ | — | $ | 354 | |||||||
Funds on deposit | 123 | — | 73 | — | 196 | ||||||||||||
Receivables—nonaffiliate | — | 4 | 738 | — | 742 | ||||||||||||
Receivables—affiliate | — | 111 | 76 | (177 | ) | 10 | |||||||||||
Notes receivable—affiliate | 10 | 109 | — | (26 | ) | 93 | |||||||||||
Derivative contract assets—nonaffiliate | — | — | 2,582 | — | 2,582 | ||||||||||||
Derivative contract assets—affiliate | — | 92 | 86 | (178 | ) | — | |||||||||||
Inventories | (2 | ) | 30 | 210 | — | 238 | |||||||||||
Prepaid rent and other payments | — | 13 | 107 | — | 120 | ||||||||||||
Total current assets | 232 | 359 | 4,125 | (381 | ) | 4,335 | |||||||||||
Property, Plant and Equipment, net | — | 483 | 2,626 | 80 | 3,189 | ||||||||||||
Noncurrent Assets: | |||||||||||||||||
Goodwill, net | (799 | ) | — | 799 | — | — | |||||||||||
Intangible assets, net | — | 51 | 144 | — | 195 | ||||||||||||
Derivative contract assets—nonaffiliate | — | — | 585 | — | 585 | ||||||||||||
Derivative contract assets—affiliate | — | 2 | — | (2 | ) | — | |||||||||||
Prepaid rent | — | — | 258 | — | 258 | ||||||||||||
Debt issuance costs, net | 32 | — | — | — | 32 | ||||||||||||
Investments in subsidiaries | 5,700 | — | — | (5,700 | ) | — | |||||||||||
Other | — | 19 | 32 | — | 51 | ||||||||||||
Total noncurrent assets | 4,933 | 72 | 1,818 | (5,702 | ) | 1,121 | |||||||||||
Total Assets | $ | 5,165 | $ | 914 | $ | 8,569 | $ | (6,003 | ) | $ | 8,645 | ||||||
LIABILITIES AND MEMBER’S EQUITY | |||||||||||||||||
Current Liabilities: | |||||||||||||||||
Current portion of long-term debt | $ | 42 | $ | — | $ | 3 | $ | — | $ | 45 | |||||||
Notes payable—affiliate | 17 | 9 | — | (26 | ) | — | |||||||||||
Accounts payable and accrued liabilities | — | 24 | 765 | — | 789 | ||||||||||||
Payable to affiliate | — | 85 | 126 | (177 | ) | 34 | |||||||||||
Derivative contract liabilities—nonaffiliate | — | — | 2,268 | — | 2,268 | ||||||||||||
Derivative contract liabilities—affiliate | — | 86 | 92 | (178 | ) | — | |||||||||||
Other | — | 13 | 9 | — | 22 | ||||||||||||
Total current liabilities | 59 | 217 | 3,263 | (381 | ) | 3,158 | |||||||||||
Noncurrent Liabilities: | |||||||||||||||||
Long-term debt | 1,223 | — | 25 | — | 1,248 | ||||||||||||
Derivative contract liabilities—nonaffiliate | — | — | 244 | — | 244 | ||||||||||||
Derivative contract liabilities—affiliate | — | — | 2 | (2 | ) | — | |||||||||||
Other | — | 30 | 82 | — | 112 | ||||||||||||
Total noncurrent liabilities | 1,223 | 30 | 353 | (2 | ) | 1,604 | |||||||||||
Commitments and Contingencies | |||||||||||||||||
Member’s Equity | 3,883 | 667 | 4,953 | (5,620 | ) | 3,883 | |||||||||||
Total Liabilities and Member’s Equity | $ | 5,165 | $ | 914 | $ | 8,569 | $ | (6,003 | ) | $ | 8,645 | ||||||
62
Table of Contents
MIRANT NORTH AMERICA
GUARANTOR/NON-GUARANTOR
CONDENSED CONSOLIDATING STATEMENT OF CASH FLOWS (UNAUDITED)
Six Months Ended June 30, 2009
(in millions)
| Parent | Guarantor | Non- Guarantor | Eliminations | Consolidated | ||||||||||||||||
Cash Flows provided by (used in): | ||||||||||||||||||||
Operating activities | $ | 44 | $ | 27 | $ | 417 | $ | (44 | ) | $ | 444 | |||||||||
Investing activities | (55 | ) | (51 | ) | (322 | ) | 70 | (358 | ) | |||||||||||
Financing activities | (47 | ) | 24 | 32 | (26 | ) | (17 | ) | ||||||||||||
Net increase (decrease) in cash and cash equivalents | (58 | ) | — | 127 | — | 69 | ||||||||||||||
Cash and cash equivalents, beginning of period | 101 | — | 253 | — | 354 | |||||||||||||||
Cash and cash equivalents, end of period | $ | 43 | $ | — | $ | 380 | $ | — | $ | 423 | ||||||||||
MIRANT NORTH AMERICA
GUARANTOR/NON-GUARANTOR
CONDENSED CONSOLIDATING STATEMENT OF CASH FLOWS (UNAUDITED)
Six Months Ended June 30, 2008
(in millions)
| Parent | Guarantor | Non- Guarantor | Eliminations | Consolidated | ||||||||||||||||
Cash Flows provided by (used in): | ||||||||||||||||||||
Operating activities | $ | 485 | $ | 85 | $ | (128 | ) | $ | (425 | ) | $ | 17 | ||||||||
Investing activities | (255 | ) | (77 | ) | (246 | ) | 303 | (275 | ) | |||||||||||
Financing activities | (393 | ) | (8 | ) | (41 | ) | 122 | (320 | ) | |||||||||||
Net decrease in cash and cash equivalents | (163 | ) | — | (415 | ) | — | (578 | ) | ||||||||||||
Cash and cash equivalents, beginning of period | 224 | — | 473 | — | 697 | |||||||||||||||
Cash and cash equivalents, end of period | $ | 61 | $ | — | $ | 58 | $ | — | $ | 119 | ||||||||||
63
Table of Contents
| Item 2. | Management’s Discussion and Analysis of Results of Operations and Financial Condition |
| A. | Mirant Americas Generation |
The following discussion should be read in conjunction with the unaudited condensed consolidated financial statements of Mirant Americas Generation and the notes thereto, which are included elsewhere in this report.
Overview
Mirant Americas Generation, an indirect wholly-owned subsidiary of Mirant, is a competitive energy company that produces and sells electricity in the United States. Mirant Americas Generation owns or leases 10,112 MW of net electric generating capacity in the Mid-Atlantic and Northeast regions and in California. Mirant Americas Generation also operates an integrated asset management and energy marketing organization based in Atlanta, Georgia.
Hedging Activities
We hedge economically a substantial portion of our Mid-Atlantic coal-fired baseload generation and certain of our Mid-Atlantic and Northeast gas and oil-fired generation through OTC transactions. However, we generally do not hedge our intermediate and peaking units for tenors greater than 12 months. A significant portion of our hedges are financial swap transactions between Mirant Mid-Atlantic and financial counterparties that are senior unsecured obligations of such parties and do not require either party to post cash collateral either for initial margin or for securing exposure as a result of changes in power or natural gas prices. At July 14, 2009, our aggregate hedge levels based on expected generation for each period were as follows:
| Aggregate Hedge Levels Based on Expected Generation | |||||||||||||||
| 2009 | 2010 | 2011 | 2012 | 2013 | |||||||||||
Power | 100 | % | 84 | % | 44 | % | 41 | % | 24 | % | |||||
Fuel | 92 | % | 83 | % | 62 | % | 32 | % | 6 | % | |||||
Capital Expenditures and Capital Resources
For the six months ended June 30, 2009, we paid $343 million for capital expenditures, excluding capitalized interest, of which $248 million related to compliance with the Maryland Healthy Air Act. As of June 30, 2009, we have paid approximately $1.245 billion for capital expenditures related to compliance with the Maryland Healthy Air Act. Including amounts already spent to date, we expect to incur total capital expenditures of $1.674 billion to comply with the limitations on SO2, NOx and mercury emissions imposed by the Maryland Healthy Air Act.
The following table details the expected timing of payments for our estimated capital expenditures, excluding capitalized interest, for the remaining six months of 2009 and for 2010 (in millions):
| 2009 | 2010 | |||||
Maryland Healthy Air Act | $ | 242 | $ | 187 | ||
Other environmental | 11 | 28 | ||||
Maintenance | 87 | 137 | ||||
Construction | 28 | 69 | ||||
Other | 6 | 6 | ||||
Total | $ | 374 | $ | 427 | ||
The 2010 estimated capital expenditures for compliance with the Maryland Healthy Air Act include amounts that are withheld from progress payments under construction contracts and that will be paid after final
64
Table of Contents
completion of the project. As of June 30, 2009, we have a total contract retention liability of $94 million, of which $51 million is included in current accounts payable and accrued liabilities in our unaudited condensed consolidated balance sheet. The remainder of the contract retention liability is included in other noncurrent liabilities in our unaudited condensed consolidated balance sheet.
We expect that available cash, proceeds from redemption of preferred shares in Mirant Americas and future cash flows from operations will be sufficient to fund these capital expenditures.
Scrubber Operating Expenses
Our capital expenditures related to compliance with the Maryland Healthy Air act include the installation of flue gas desulfurization emissions controls (“scrubbers”) at our Chalk Point, Dickerson and Morgantown coal-fired units. Beginning in the first quarter of 2010, we expect to recognize additional costs associated with operating the scrubbers. Examples of these costs include limestone, water, and chemicals used during the removal of SO2 emissions and also include handling and marketing related to the recyclable gypsum byproduct created during the scrubbing process. In addition, we expect to recognize higher depreciation expense because the scrubbers will be placed in service and we will begin depreciating the capitalized costs associated with them over the shorter of their expected life or the remaining lease term for the leased Dickerson and Morgantown generating units.
Commodity Prices
The forward prices for power, natural gas, fuel oil and coal decreased during the three and six months ended June 30, 2009, and we recognized unrealized losses of $14 million and unrealized gains of $240 million, respectively. In addition, during the three and six months ended June 30, 2009, the average spot market price for power decreased at a faster pace than the decline in the average market price of coal. As a result, the energy gross margin from our baseload coal units was negatively affected by contracting “dark spreads,” the difference between the price received for electricity generated compared to the market price of the coal required to produce the electricity. However, we are generally economically neutral for that portion of the portfolio that we have hedged because our realized gross margin will reflect the contractual prices of our power and fuel contracts.
Our coal supply comes primarily from the Central Appalachian and Northern Appalachian coal regions. We enter into contracts of varying tenors to secure appropriate quantities of fuel that meet the varying specifications of our generating facilities. For our coal-fired generating facilities, we purchase coal from a variety of suppliers under contracts with varying lengths, some of which extend to 2013. Most of our coal contracts are not required to be recorded at fair value under SFAS 133. As such, these contracts are not included in derivative contract assets and liabilities in the accompanying condensed consolidated balance sheets. As of June 30, 2009, the estimated net fair value of these long-term coal agreements was approximately $(186) million.
Granted Emissions Allowances
As a result of the capital expenditures we are incurring to comply with the requirements of the Maryland Healthy Air Act, we anticipate that we will have excess SO2 and NOx emissions allowances in future periods. We plan to continue to maintain some SO2 and NOx emissions allowances above those needed for our current expected generation in case our actual generation exceeds our current forecasts for future periods and for possible future additions of generating capacity. At June 30, 2009, the estimated fair value of our anticipated excess SO2 and NOx emissions allowances was approximately $48 million.
Results of Operations
The following discussion of our performance is organized by reportable segment, which is consistent with the way we manage our business.
65
Table of Contents
In the tables below, the Mid-Atlantic region includes our Chalk Point, Dickerson, Morgantown and Potomac River facilities. The Northeast region includes our Bowline, Canal, Kendall and Martha’s Vineyard facilities. For the three and six months ended June 30, 2008, the Northeast region also included the Lovett generating facility, which was shut down on April 19, 2008. The California region includes our Contra Costa, Pittsburg and Potrero facilities. Other Operations includes proprietary trading and fuel oil management activities. Other Operations also includes interest expense on debt at Mirant Americas Generation and Mirant North America and interest income on our invested cash balances.
66
Table of Contents
Three Months Ended June 30, 2009 versus Three Months Ended June 30, 2008
Consolidated Financial Performance
We reported net income of $118 million for the three months ended June 30, 2009, compared to a net loss of $827 million for the same period in 2008. The change in net income (loss) is detailed as follows (in millions):
| Three Months Ended June 30, | Increase/ (Decrease) | |||||||||||
| 2009 | 2008 | |||||||||||
Realized gross margin | $ | 360 | $ | 315 | $ | 45 | ||||||
Unrealized gross margin | (14 | ) | (874 | ) | 860 | |||||||
Total gross margin | 346 | (559 | ) | 905 | ||||||||
Operating Expenses: | ||||||||||||
Operations and maintenance—nonaffiliate | �� | 93 | 120 | (27 | ) | |||||||
Operations and maintenance—affiliate | 69 | 74 | (5 | ) | ||||||||
Depreciation and amortization | 34 | 38 | (4 | ) | ||||||||
Gain on sales of assets, net | (2 | ) | (12 | ) | 10 | |||||||
Total operating expenses, net | 194 | 220 | (26 | ) | ||||||||
Operating income (loss) | 152 | (779 | ) | 931 | ||||||||
Total other expense, net | 34 | 48 | (14 | ) | ||||||||
Net income (loss) | $ | 118 | $ | (827 | ) | $ | 945 | |||||
The following discussion includes non-GAAP financial measures because we present our consolidated financial performance in terms of gross margin. Gross margin is our operating revenue less cost of fuel, electricity and other products, and excludes depreciation and amortization. We present gross margin, excluding depreciation and amortization, and realized gross margin separately from unrealized gross margin in order to be consistent with how we manage our business. Realized gross margin and unrealized gross margin are both non-GAAP financial measures. Realized gross margin represents our gross margin less unrealized gains and losses on derivative financial instruments for the periods presented. Conversely, unrealized gross margin is equivalent to our unrealized gains and losses on derivative financial instruments for the periods presented. Management evaluates our operating results excluding the impact of unrealized gains and losses. None of our derivative financial instruments recorded at fair value are designated as hedges under SFAS 133 and changes in their fair values are therefore recognized currently in income as unrealized gains or losses. As a result, our financial results are, at times, volatile and subject to fluctuations in value primarily because of changes in forward electricity and fuel prices. Adjusting our gross margin to exclude unrealized gains and losses provides a measure of performance that eliminates the volatility created by significant shifts in market values between periods. However, our realized and unrealized gross margin may not be comparable to similarly titled non-GAAP financial measures used by other companies. We encourage our investors to review our unaudited condensed consolidated financial statements and other publicly filed reports in their entirety and not to rely on a single financial measure.
For the three months ended June 30, 2009, our realized gross margin increase of $45 million was principally a result of the following:
| • | an increase of $171 million in realized value of hedges. In 2009, realized value of hedges was $152 million, which reflects the amount by which the settlement value of power contracts exceeded market prices, partially offset by the amount by which contract prices for fuel exceeded market prices for fuel. In 2008, realized value of hedges was $(19) million, which reflects the amount by which market prices exceeded the settlement value of power contracts, partially offset by the amount by which market prices for fuel exceeded the contract prices for fuel; and |
67
Table of Contents
| • | an increase of $5 million in contracted and capacity primarily related to higher capacity prices in 2009; partially offset by |
| • | a decrease of $131 million in energy, primarily as a result of a decrease in power prices, an increase in the cost of emissions allowances, including $12 million to comply with the RGGI during the three months ended June 30, 2009, and decreases in natural gas prices which at times made it uneconomic for certain of our coal-fired units to generate. These decreases were partially offset by an 18% increase in generation volumes at our Mid-Atlantic baseload units primarily because of a decrease in planned outages in 2009 compared to 2008. |
For the three months ended June 30, 2009, our unrealized gross margin increase of $860 million was principally a result of the following:
| • | unrealized losses of $14 million in 2009, which included unrealized losses of $167 million from power and fuel contracts that settled during the period for which net unrealized gains had been recorded in prior periods, partially offset by a $153 million net increase in the value of hedge and trading contracts for future periods primarily related to decreases in forward power and natural gas prices; and |
| • | unrealized losses of $874 million in 2008, which included a $932 million net decrease in the value of hedge contracts for future periods primarily related to increases in forward power and natural gas prices, partially offset by unrealized gains of $58 million from power and fuel contracts that settled during the period for which net unrealized losses had been recorded in prior periods. |
Our operating expense decrease of $26 million was primarily a result of a decrease of $32 million in operations and maintenance expense, partially offset by a decrease of $10 million in gain on sales of emissions allowances sold to third parties. The decrease in operations and maintenance expense was primarily a result of the shutdown of the Lovett generating facility in April 2008 and a decrease in maintenance costs associated with planned outages at our Mid-Atlantic generating facilities during 2009 compared to 2008.
Other expense, net decreased $14 million for the three months ended June 30, 2009, and reflects lower interest expense as a result of lower outstanding debt and higher interest capitalized on projects under construction, partially offset by lower interest income primarily as a result of lower interest rates on invested cash in 2009 compared to the same period in 2008.
Gross Margin Overview
The following tables detail realized and unrealized gross margin for the three months ended June 30, 2009 and 2008, by operating segments (in millions):
| Three Months Ended June 30, 2009 | ||||||||||||||||||||
| Mid- Atlantic | Northeast | California | Other Operations | Eliminations | Total | |||||||||||||||
Energy | $ | 19 | $ | 3 | $ | — | $ | 49 | $ | — | $ | 71 | ||||||||
Contracted and capacity | 86 | 22 | 29 | — | — | 137 | ||||||||||||||
Realized value of hedges | 152 | — | — | — | — | 152 | ||||||||||||||
Total realized gross margin | 257 | 25 | 29 | 49 | — | 360 | ||||||||||||||
Unrealized gross margin | — | 20 | — | (34 | ) | — | (14 | ) | ||||||||||||
Total gross margin | $ | 257 | $ | 45 | $ | 29 | $ | 15 | $ | — | $ | 346 | ||||||||
68
Table of Contents
| Three Months Ended June 30, 2008 | ||||||||||||||||||||||
| Mid- Atlantic | Northeast | California | Other Operations | Eliminations | Total | |||||||||||||||||
Energy | $ | 161 | $ | 20 | $ | 1 | $ | 20 | $ | — | $ | 202 | ||||||||||
Contracted and capacity | 81 | 21 | 30 | — | — | 132 | ||||||||||||||||
Realized value of hedges | (29 | ) | 10 | — | — | — | (19 | ) | ||||||||||||||
Total realized gross margin | 213 | 51 | 31 | 20 | — | 315 | ||||||||||||||||
Unrealized gross margin | (818 | ) | (1 | ) | — | (55 | ) | — | (874 | ) | ||||||||||||
Total gross margin | $ | (605 | ) | $ | 50 | $ | 31 | $ | (35 | ) | $ | — | $ | (559 | ) | |||||||
Energy represents gross margin from the generation of electricity, fuel sales and purchases at market prices, fuel handling, steam sales and our proprietary trading and fuel oil management activities.
Contracted and capacity represents gross margin received from capacity sold in ISO and RTO administered capacity markets, through RMR contracts, through tolling agreements and from ancillary services.
Realized value of hedges represents the actual margin upon the settlement of our power and fuel hedging contracts and the difference between market prices and contract costs for coal that we purchased under long-term agreements. Power hedging contracts include sales of both power and natural gas used to hedge power prices as well as hedges to capture the incremental value related to the geographic location of our physical assets.
Unrealized gross margin represents the net unrealized gain or loss on our derivative contracts, including the reversal of unrealized gains and losses recognized in prior periods and changes in value for future periods.
Operating Statistics
The following table summarizes Net Capacity Factor by region for the three months ended June 30, 2009 and 2008:
| Three Months Ended June 30, | Increase/ (Decrease) | ||||||||
| 2009 | 2008 | ||||||||
Mid-Atlantic | 30 | % | 27 | % | 3 | % | |||
Northeast | 7 | % | 11 | % | (4 | )% | |||
California | 4 | % | 3 | % | 1 | % | |||
Total | 18 | % | 17 | % | 1 | % | |||
69
Table of Contents
The following table summarizes power generation volumes by region for the three months ended June 30, 2009 and 2008 (in gigawatt hours):
| Three Months Ended June 30, | Increase/ (Decrease) | Increase/ (Decrease) | ||||||||
| 2009 | 2008 | |||||||||
Mid-Atlantic: | ||||||||||
Baseload | 3,441 | 2,904 | 537 | 18 | % | |||||
Intermediate | 34 | 111 | (77 | ) | (69 | )% | ||||
Peaking | 5 | 42 | (37 | ) | (88 | )% | ||||
Total Mid-Atlantic | 3,480 | 3,057 | 423 | 14 | % | |||||
Northeast: | ||||||||||
Baseload | 333 | 207 | 126 | 61 | % | |||||
Intermediate | 38 | 402 | (364 | ) | (91 | )% | ||||
Peaking | — | 1 | (1 | ) | (100 | )% | ||||
Total Northeast | 371 | 610 | (239 | ) | (39 | )% | ||||
California: | ||||||||||
Intermediate | 213 | 158 | 55 | 35 | % | |||||
Peaking | 1 | 10 | (9 | ) | (90 | )% | ||||
Total California | 214 | 168 | 46 | 27 | % | |||||
Total | 4,065 | 3,835 | 230 | 6 | % | |||||
The total increase in power generation volumes for the three months ended June 30, 2009, as compared to the three months ended June 30, 2008, is primarily the result of the following:
Mid-Atlantic. An increase in our Mid-Atlantic baseload generation as a result of a decrease in planned outages in 2009 compared to 2008, partially offset by a decrease in our Mid-Atlantic intermediate and peaking generation.
Northeast. A decrease in our Northeast intermediate generation as a result of transmission upgrades in 2009, which reduced the demand for certain of our intermediate units, partially offset by an increase in our Northeast baseload generation as a result of an increase in market spark spreads.
California. All of our California facilities operate under tolling agreements or are subject to RMR arrangements. Our natural gas-fired units in service at Contra Costa and Pittsburg operate under tolling agreements with PG&E for 100% of the capacity from these units and our Potrero units are subject to RMR arrangements. Therefore, changes in power generation volumes from those facilities, which can be caused by weather, planned outages or other factors, generally do not affect our gross margin.
70
Table of Contents
Mid-Atlantic
Our Mid-Atlantic segment, which accounts for approximately 50% of our net generating capacity, includes four generating facilities with total net generating capacity of 5,230 MW.
The following table summarizes the results of operations of our Mid-Atlantic segment (in millions):
| Three Months Ended June 30, | Increase/ (Decrease) | |||||||||||
| 2009 | 2008 | |||||||||||
Gross Margin: | ||||||||||||
Energy | $ | 19 | $ | 161 | $ | (142 | ) | |||||
Contracted and capacity | 86 | 81 | 5 | |||||||||
Realized value of hedges | 152 | (29 | ) | 181 | ||||||||
Total realized gross margin | 257 | 213 | 44 | |||||||||
Unrealized gross margin | — | (818 | ) | 818 | ||||||||
Total gross margin | 257 | (605 | ) | 862 | ||||||||
Operating Expenses: | ||||||||||||
Operations and maintenance | 101 | 113 | (12 | ) | ||||||||
Depreciation and amortization | 24 | 23 | 1 | |||||||||
Gain on sales of assets, net | (2 | ) | (2 | ) | — | |||||||
Total operating expenses, net | 123 | 134 | (11 | ) | ||||||||
Operating income (loss) | 134 | (739 | ) | 873 | ||||||||
Total other expense, net | 1 | — | 1 | |||||||||
Net income (loss) | $ | 133 | $ | (739 | ) | $ | 872 | |||||
Gross Margin
The increase of $44 million in realized gross margin was principally a result of the following:
| • | an increase of $181 million in realized value of hedges. In 2009, realized value of hedges was $152 million, which reflects the amount by which the settlement value of power contracts exceeded market prices, partially offset by the amount by which contract prices for coal that we purchased under long-term agreements exceeded market prices for coal. In 2008, realized value of hedges was $(29) million, which was the result of market prices exceeding the settlement value of power contracts, partially offset by the amount by which market prices for coal exceeded the contract prices for coal that we purchased under long-term agreements; and |
| • | an increase of $5 million in contracted and capacity primarily related to higher capacity prices in 2009; partially offset by |
| • | a decrease of $142 million in energy, primarily as a result of a decrease in power prices and an increase in the cost of emissions allowances, including $11 million to comply with the RGGI during the three months ended June 30, 2009. These decreases were partially offset by an 18% increase in generation volumes at our Mid-Atlantic baseload units primarily because of a decrease in planned outages in 2009 compared to 2008 and a decrease in the price of coal. |
The increase of $818 million in unrealized gross margin was comprised of the following:
| • | unrealized gross margin in 2009 included a $123 million net increase in the value of hedge contracts for future periods primarily related to decreases in forward power and natural gas prices, offset by unrealized losses of $123 million from power and fuel contracts that settled during the period for which net unrealized gains had been recorded in prior periods; and |
71
Table of Contents
| • | unrealized losses of $818 million in 2008, which included an $868 million net decrease in the value of hedge contracts for future periods primarily related to increases in forward power and natural gas prices, partially offset by unrealized gains of $50 million from power and fuel contracts that settled during the period for which net unrealized losses had been recorded in prior periods. |
Operating Expenses
The decrease of $11 million in operating expenses was primarily a result of a decrease in planned outages during 2009 compared to 2008.
Northeast
Our Northeast segment is comprised of our three generating facilities located in Massachusetts and one generating facility located in New York with total net generating capacity of 2,535 MW.
The following table summarizes the results of operations of our Northeast segment (in millions):
| Three Months Ended June 30, | Increase/ (Decrease) | ||||||||||
| 2009 | 2008 | ||||||||||
Gross Margin: | |||||||||||
Energy | $ | 3 | $ | 20 | $ | (17 | ) | ||||
Contracted and capacity | 22 | 21 | 1 | ||||||||
Realized value of hedges | — | 10 | (10 | ) | |||||||
Total realized gross margin | 25 | 51 | (26 | ) | |||||||
Unrealized gross margin | 20 | (1 | ) | 21 | |||||||
Total gross margin | 45 | 50 | (5 | ) | |||||||
Operating Expenses: | |||||||||||
Operations and maintenance | 35 | 56 | (21 | ) | |||||||
Depreciation and amortization | 5 | 4 | 1 | ||||||||
Gain on sales of assets, net | — | (12 | ) | 12 | |||||||
Total operating expenses, net | 40 | 48 | (8 | ) | |||||||
Operating income | 5 | 2 | 3 | ||||||||
Total other expense, net | — | 1 | (1 | ) | |||||||
Net income | $ | 5 | $ | 1 | $ | 4 | |||||
Gross Margin
The decrease of $26 million in realized gross margin was principally a result of the following:
| • | a decrease of $17 million in energy, primarily as a result of a decrease in power prices and a 39% decrease in generation volumes because of transmission upgrades in 2009 and the shutdown of unit 5 of the Lovett generating facility in 2008, partially offset by lower fuel costs; and |
| • | a decrease of $10 million in realized value of hedges. In 2008, realized value of hedges was $10 million, which reflects the amount by which market prices for fuel exceeded the contract prices for fuel, offset by the amount by which market prices exceeded the settlement value of power contracts; partially offset by |
| • | an increase of $1 million in contracted and capacity primarily related to higher capacity prices in 2009. |
72
Table of Contents
The increase of $21 million in unrealized gross margin was comprised of the following:
| • | unrealized gains of $20 million in 2009, which included a $29 million net increase in the value of hedge contracts for future periods primarily related to decreases in forward power and fuel prices; partially offset by unrealized losses of $9 million from power and fuel contracts that settled during the period for which net unrealized gains had been recorded in prior periods; and |
| • | unrealized losses of $1 million in 2008, which included a $2 million net decrease in the value of hedge contracts for future periods, partially offset by unrealized gains of $1 million from power and fuel contracts that settled during the period for which net unrealized losses had been recorded in prior periods. |
Operating Expenses
The decrease of $8 million in operating expenses included a decrease of $21 million in operations and maintenance expense primarily related to the shutdown of the Lovett generating facility in April 2008, partially offset by a decrease of $12 million in gain on sale of assets related to emissions allowances sold to third parties in 2008.
California
Our California segment consists of the Contra Costa, Pittsburg and Potrero facilities with total net generating capacity of 2,347 MW.
The following table summarizes the results of operations of our California segment (in millions):
| Three Months Ended June 30, | Increase/ (Decrease) | ||||||||||
| 2009 | 2008 | ||||||||||
Gross Margin: | |||||||||||
Energy | $ | — | $ | 1 | $ | (1 | ) | ||||
Contracted and capacity | 29 | 30 | (1 | ) | |||||||
Total realized gross margin | 29 | 31 | (2 | ) | |||||||
Unrealized gross margin | — | — | — | ||||||||
Total gross margin | 29 | 31 | (2 | ) | |||||||
Operating Expenses: | |||||||||||
Operations and maintenance | 23 | 22 | 1 | ||||||||
Depreciation and amortization | 5 | 10 | (5 | ) | |||||||
Gain on sales of assets, net | — | (1 | ) | 1 | |||||||
Total operating expenses, net | 28 | 31 | (3 | ) | |||||||
Net income | $ | 1 | $ | — | $ | 1 | |||||
73
Table of Contents
Other Operations
Other Operations includes proprietary trading and fuel oil management activities, interest expense on debt at Mirant Americas Generation and Mirant North America and interest income on our invested cash balances.
The following table summarizes the results of operations of our Other Operations segment (in millions):
| Three Months Ended June 30, | Increase/ (Decrease) | |||||||||||
| 2009 | 2008 | |||||||||||
Gross Margin: | ||||||||||||
Energy | $ | 49 | $ | 20 | $ | 29 | ||||||
Total realized gross margin | 49 | 20 | 29 | |||||||||
Unrealized gross margin | (34 | ) | (55 | ) | 21 | |||||||
Total gross margin | 15 | (35 | ) | 50 | ||||||||
Operating Expenses: | ||||||||||||
Operations and maintenance | 3 | 3 | — | |||||||||
Depreciation and amortization | — | 1 | (1 | ) | ||||||||
Total operating expenses, net | 3 | 4 | (1 | ) | ||||||||
Operating income (loss) | 12 | (39 | ) | 51 | ||||||||
Total other expense, net | 33 | 47 | (14 | ) | ||||||||
Net loss | $ | (21 | ) | $ | (86 | ) | $ | 65 | ||||
Gross Margin
The increase of $29 million in realized gross margin was a result of an $11 million increase in gross margin from proprietary trading activities and an $18 million increase in gross margin from our fuel oil management activities. The increase in gross margin from proprietary trading activities was a result of higher realized value associated with power positions in 2009 as compared to 2008. The increase in gross margin from fuel oil management activities was a result of an increase in the realized value associated with positions related to our fuel oil inventory.
The increase of $21 million in unrealized gross margin was comprised of the following:
| • | unrealized losses of $34 million in 2009, which included unrealized losses of $35 million from power and fuel contracts that settled during the period for which net unrealized gains had been recorded in prior periods, partially offset by a $1 million net increase in the value of contracts for future periods; and |
| • | unrealized losses of $55 million in 2008, which included a $62 million net decrease in the value of contracts for future periods, partially offset by unrealized gains of $7 million from power and fuel contracts that settled during the period for which net unrealized losses had been recorded in prior periods. |
Other Expense, Net
The decrease of $14 million in other expense, net was principally the result of the following:
| • | a decrease of $14 million in interest expense primarily as a result of lower outstanding debt and higher interest capitalized on projects under construction; and |
| • | a decrease of $3 million in other expenses, net, primarily related to the loss on the 2008 purchase of Mirant Americas Generation senior notes due in 2011; partially offset by |
| • | a decrease of $3 million in interest income primarily related to lower interest rates on invested cash. |
74
Table of Contents
Six Months Ended June 30, 2009 versus Six Months Ended June 30, 2008
Consolidated Financial Performance
We reported net income of $512 million for the six months ended June 30, 2009, compared to a net loss of $997 million for the same period in 2008. The change in net income (loss) is detailed as follows (in millions):
| Six Months Ended June 30, | Increase/ (Decrease) | |||||||||||
| 2009 | 2008 | |||||||||||
Realized gross margin | $ | 713 | $ | 680 | $ | 33 | ||||||
Unrealized gross margin | 240 | (1,177 | ) | 1,417 | ||||||||
Total gross margin | 953 | (497 | ) | 1,450 | ||||||||
Operating Expenses: | ||||||||||||
Operations and maintenance—nonaffiliate | 181 | 206 | (25 | ) | ||||||||
Operations and maintenance—affiliate | 137 | 146 | (9 | ) | ||||||||
Depreciation and amortization | 68 | 69 | (1 | ) | ||||||||
Gain on sales of assets, net | (17 | ) | (16 | ) | (1 | ) | ||||||
Total operating expenses, net | 369 | 405 | (36 | ) | ||||||||
Operating income (loss) | 584 | (902 | ) | 1,486 | ||||||||
Total other expense, net | 72 | �� | 95 | (23 | ) | |||||||
Net income (loss) | $ | 512 | $ | (997 | ) | $ | 1,509 | |||||
For the six months ended June 30, 2009, our realized gross margin increase of $33 million was principally a result of the following:
| • | an increase of $243 million in realized value of hedges. In 2009, realized value of hedges was $260 million, which reflects the amount by which the settlement value of power contracts exceeded market prices, partially offset by the amount by which contract prices for fuel exceeded market prices for fuel. In 2008, realized value of hedges was $17 million, which reflects the amount by which market prices for fuel exceeded the contract prices for fuel, partially offset by the amount by which market prices exceeded the settlement value of power contracts; and |
| • | an increase of $9 million in contracted and capacity primarily related to higher capacity prices in 2009; partially offset by |
| • | a decrease of $219 million in energy, primarily as a result of a decrease in power prices and an increase in the cost of emissions allowances, including $27 million to comply with the RGGI in 2009. The decreases in energy gross margin were partially offset by a decrease in the price of fuel. |
For the six months ended June 30, 2009, our unrealized gross margin increase of $1.417 billion was principally a result of the following:
| • | unrealized gains of $240 million in 2009, which included a $494 million net increase in the value of hedge and trading contracts for future periods primarily related to decreases in forward power and natural gas prices, partially offset by unrealized losses of $254 million from power and fuel contracts that settled during the period for which net unrealized gains had been recorded in prior periods; and |
| • | unrealized losses of $1.177 billion in 2008, which included a $1.241 billion net decrease in the value of hedge contracts for future periods primarily related to increases in forward power and natural gas prices, partially offset by unrealized gains of $64 million from power and fuel contracts that settled during the period for which net unrealized losses had been recorded in prior periods. |
75
Table of Contents
Our operating expense decrease of $36 million was primarily a result of a decrease of $34 million in operations and maintenance expense. The decrease in operations and maintenance expense was primarily a result of the shutdown of the Lovett generating facility in April 2008 and a decrease in maintenance costs associated with planned outages at our Mid-Atlantic generating facilities during 2009 compared to 2008.
Other expense, net decreased $23 million for the six months ended June 30, 2009, and reflects lower interest expense as a result of lower outstanding debt and higher interest capitalized on projects under construction, partially offset by lower interest income primarily as a result of lower interest rates on invested cash in 2009 compared to the same period in 2008.
Gross Margin Overview
The following tables detail realized and unrealized gross margin for the six months ended June 30, 2009 and 2008, by operating segments (in millions):
| Six Months Ended June 30, 2009 | |||||||||||||||||||||||
| Mid- Atlantic | Northeast | California | Other Operations | Eliminations | Total | ||||||||||||||||||
Energy | $ | 91 | $ | 18 | $ | — | $ | 76 | $ | (3 | ) | $ | 182 | ||||||||||
Contracted and capacity | 171 | 44 | 56 | — | — | 271 | |||||||||||||||||
Realized value of hedges | 259 | 1 | — | — | — | 260 | |||||||||||||||||
Total realized gross margin | 521 | 63 | 56 | 76 | (3 | ) | 713 | ||||||||||||||||
Unrealized gross margin | 243 | 46 | — | (49 | ) | — | 240 | ||||||||||||||||
Total gross margin | $ | 764 | $ | 109 | $ | 56 | $ | 27 | $ | (3 | ) | $ | 953 | ||||||||||
Six Months Ended June 30, 2008 | |||||||||||||||||||||||
| Mid- Atlantic | Northeast | California | Other Operations | Eliminations | Total | ||||||||||||||||||
Energy | $ | 326 | $ | 42 | $ | 2 | $ | 31 | $ | — | $ | 401 | |||||||||||
Contracted and capacity | 159 | 45 | 58 | — | — | 262 | |||||||||||||||||
Realized value of hedges | (8 | ) | 25 | — | — | — | 17 | ||||||||||||||||
Total realized gross margin | 477 | 112 | 60 | 31 | — | 680 | |||||||||||||||||
Unrealized gross margin | (1,118 | ) | (10 | ) | — | (49 | ) | — | (1,177 | ) | |||||||||||||
Total gross margin | $ | (641 | ) | $ | 102 | $ | 60 | $ | (18 | ) | $ | — | $ | (497 | ) | ||||||||
Energy represents gross margin from the generation of electricity, fuel sales and purchases at market prices, fuel handling, steam sales and our proprietary trading and fuel oil management activities.
Contracted and capacity represents gross margin received from capacity sold in ISO and RTO administered capacity markets, through RMR contracts, through tolling agreements and from ancillary services.
Realized value of hedges represents the actual margin upon the settlement of our power and fuel hedging contracts and the difference between market prices and contract costs for coal that we purchased under long-term agreements. Power hedging contracts include sales of both power and natural gas used to hedge power prices as well as hedges to capture the incremental value related to the geographic location of our physical assets.
Unrealized gross margin represents the net unrealized gain or loss on our derivative contracts, including the reversal of unrealized gains and losses recognized in prior periods and changes in value for future periods.
76
Table of Contents
Operating Statistics
The following table summarizes Net Capacity Factor by region for the six months ended June 30, 2009 and 2008:
| Six Months Ended June 30, | Increase/ (Decrease) | ||||||||
| 2009 | 2008 | ||||||||
Mid-Atlantic | 32 | % | 32 | % | — | % | |||
Northeast | 12 | % | 13 | % | (1 | )% | |||
California | 4 | % | 3 | % | 1 | % | |||
Total | 20 | % | 20 | % | — | % | |||
The following table summarizes power generation volumes by region for the six months ended June 30, 2009 and 2008 (in gigawatt hours):
| Six Months Ended June 30, | Increase/ (Decrease) | Increase/ (Decrease) | ||||||||
| 2009 | 2008 | |||||||||
Mid-Atlantic: | ||||||||||
Baseload | 7,167 | 6,974 | 193 | 3 | % | |||||
Intermediate | 139 | 184 | (45 | ) | (24 | )% | ||||
Peaking | 36 | 88 | (52 | ) | (59 | )% | ||||
Total Mid-Atlantic | 7,342 | 7,246 | 96 | 1 | % | |||||
Northeast: | ||||||||||
Baseload | 698 | 575 | 123 | 21 | % | |||||
Intermediate | 572 | 915 | (343 | ) | (37 | )% | ||||
Peaking | — | 1 | (1 | ) | (100 | )% | ||||
Total Northeast | 1,270 | 1,491 | (221 | ) | (15 | )% | ||||
California: | ||||||||||
Intermediate | 389 | 289 | 100 | 35 | % | |||||
Peaking | 1 | 20 | (19 | ) | (95 | )% | ||||
Total California | 390 | 309 | 81 | 26 | % | |||||
Total | 9,002 | 9,046 | (44 | ) | — | % | ||||
The total decrease in power generation volumes for the six months ended June 30, 2009, as compared to the six months ended June 30, 2008, is primarily the result of the following:
Mid-Atlantic. An increase in our Mid-Atlantic baseload generation as a result of a decrease in planned outages in 2009 compared to 2008, partially offset by a decrease in our Mid-Atlantic intermediate and peaking generation.
Northeast. A decrease in our Northeast intermediate generation as a result of transmission upgrades in 2009, which reduced the demand for certain of our intermediate units, partially offset by an increase in our Northeast baseload generation as a result of an increase in market spark spreads.
California. All of our California facilities operate under tolling agreements or are subject to RMR arrangements. Our natural gas-fired units in service at Contra Costa and Pittsburg operate under tolling agreements with PG&E for 100% of the capacity from these units and our Potrero units are subject to RMR arrangements. Therefore, changes in power generation volumes from those facilities, which can be caused by weather, planned outages or other factors, generally do not affect our gross margin.
77
Table of Contents
Mid-Atlantic
Our Mid-Atlantic segment, which accounts for approximately 50% of our net generating capacity, includes four generating facilities with total net generating capacity of 5,230 MW.
The following table summarizes the results of operations of our Mid-Atlantic segment (in millions):
| Six Months Ended June 30, | Increase/ (Decrease) | |||||||||||
| 2009 | 2008 | |||||||||||
Gross Margin: | ||||||||||||
Energy | $ | 91 | $ | 326 | $ | (235 | ) | |||||
Contracted and capacity | 171 | 159 | 12 | |||||||||
Realized value of hedges | 259 | (8 | ) | 267 | ||||||||
Total realized gross margin | 521 | 477 | 44 | |||||||||
Unrealized gross margin | 243 | (1,118 | ) | 1,361 | ||||||||
Total gross margin | 764 | (641 | ) | 1,405 | ||||||||
Operating Expenses: | ||||||||||||
Operations and maintenance | 206 | 210 | (4 | ) | ||||||||
Depreciation and amortization | 48 | 44 | 4 | |||||||||
Gain on sales of assets, net | (10 | ) | (2 | ) | (8 | ) | ||||||
Total operating expenses, net | 244 | 252 | (8 | ) | ||||||||
Operating income (loss) | 520 | (893 | ) | 1,413 | ||||||||
Total other expense, net | 2 | — | 2 | |||||||||
Net income (loss) | $ | 518 | $ | (893 | ) | $ | 1,411 | |||||
Gross Margin
The increase of $44 million in realized gross margin was principally a result of the following:
| • | an increase of $267 million in realized value of hedges. In 2009, realized value of hedges was $259 million, which reflects the amount by which the settlement value of power contracts exceeded market prices, partially offset by the amount by which contract prices for coal that we purchased under long-term agreements exceeded market prices for coal. In 2008, realized value of hedges was $(8) million, which was the result of market prices exceeding the settlement value of power contracts, partially offset by the amount by which market prices for coal exceeded the contract prices for coal that we purchased under long-term agreements; and |
| • | an increase of $12 million in contracted and capacity primarily related to higher capacity prices in 2009; partially offset by |
| • | a decrease of $235 million in energy, primarily as a result of a decrease in power prices and an increase in the cost of emissions allowances, including $24 million to comply with the RGGI in 2009. These decreases were partially offset by a decrease in the price of coal. |
The increase of $1.361 billion in unrealized gross margin was comprised of the following:
| • | unrealized gains of $243 million in 2009, which included a $434 million net increase in the value of hedge contracts for future periods primarily related to decreases in forward power and natural gas prices, partially offset by unrealized losses of $191 million from power and fuel contracts that settled during the period for which net unrealized gains had been recorded in prior periods; and |
| • | unrealized losses of $1.118 billion in 2008, which included a $1.184 billion net decrease in the value of hedge contracts for future periods primarily related to increases in forward power and natural gas prices, partially offset by unrealized gains of $66 million from power and fuel contracts that settled during the period for which net unrealized losses had been recorded in prior periods. |
78
Table of Contents
Operating Expenses
The decrease of $8 million in operating expenses was primarily a result of the following:
| • | an increase of $8 million in gain on sale of assets related to emissions allowances sold to third parties in 2009; and |
| • | a decrease of $4 million in operations and maintenance expense primarily as a result of a decrease in planned outages during 2009 compared to 2008; partially offset by |
| • | an increase of $4 million in depreciation and amortization expense related to pollution control equipment to reduce emissions of NOx placed in service as part of our compliance with the Maryland Healthy Air Act. |
Northeast
Our Northeast segment is comprised of our three generating facilities located in Massachusetts and one generating facility located in New York with total net generating capacity of 2,535 MW.
The following table summarizes the results of operations of our Northeast segment (in millions):
| Six Months Ended June 30, | Increase/ (Decrease) | |||||||||||
| 2009 | 2008 | |||||||||||
Gross Margin: | ||||||||||||
Energy | $ | 18 | $ | 42 | $ | (24 | ) | |||||
Contracted and capacity | 44 | 45 | (1 | ) | ||||||||
Realized value of hedges | 1 | 25 | (24 | ) | ||||||||
Total realized gross margin | 63 | 112 | (49 | ) | ||||||||
Unrealized gross margin | 46 | (10 | ) | 56 | ||||||||
Total gross margin | 109 | 102 | 7 | |||||||||
Operating Expenses: | ||||||||||||
Operations and maintenance | 67 | 97 | (30 | ) | ||||||||
Depreciation and amortization | 9 | 10 | (1 | ) | ||||||||
Gain on sales of assets, net | (2 | ) | (16 | ) | 14 | |||||||
Total operating expenses, net | 74 | 91 | (17 | ) | ||||||||
Net income | $ | 35 | $ | 11 | $ | 24 | ||||||
Gross Margin
The decrease of $49 million in realized gross margin was principally a result of the following:
| • | a decrease of $24 million in realized value of hedges. In 2009, realized value of hedges was $1 million, which reflects the amount by which the settlement value of power contracts exceeded market prices, offset by the amount by which contract prices for fuel exceeded market prices for fuel. In 2008, realized value of hedges was $25 million, which reflects the amount by which market prices for fuel exceeded the contract prices for fuel and the amount by which the settlement value of power contracts exceeded market prices; and |
| • | a decrease of $24 million in energy, primarily as a result of a decrease in power prices, an increase in the cost of emissions allowances, including $3 million to comply with the RGGI in 2009, the shutdown of the Lovett generating facility in 2008 and a 15% decrease in generation volumes because of transmission upgrades, partially offset by lower fuel costs; and |
| • | a decrease of $1 million in contracted and capacity primarily related to the shutdown of the Lovett generating facility. |
79
Table of Contents
The increase of $56 million in unrealized gross margin was comprised of the following:
| • | unrealized gains of $46 million in 2009, which included a $54 million net increase in the value of hedge contracts for future periods primarily related to decreases in forward power and fuel prices; partially offset by unrealized losses of $8 million from power and fuel contracts that settled during the period for which net unrealized gains had been recorded in prior periods; and |
| • | unrealized losses of $10 million in 2008, which included a $9 million net decrease from power and fuel contracts that settled during the period for which net unrealized gains had been recorded in prior periods and a $1 million net decrease in the value of hedge contracts for future periods. |
Operating Expenses
The decrease of $17 million in operating expenses included a decrease of $30 million in operations and maintenance expense primarily related to the shutdown of the Lovett generating facility in April 2008, partially offset by a decrease of $14 million in gain on sale of assets related to emissions allowances sold to third parties in 2008.
California
Our California segment consists of the Contra Costa, Pittsburg and Potrero facilities with total net generating capacity of 2,347 MW.
The following table summarizes the results of operations of our California segment (in millions):
| Six Months Ended June 30, | Increase/ (Decrease) | |||||||||||
| 2009 | 2008 | |||||||||||
Gross Margin: | ||||||||||||
Energy | $ | — | $ | 2 | $ | (2 | ) | |||||
Contracted and capacity | 56 | 58 | (2 | ) | ||||||||
Total realized gross margin | 56 | 60 | (4 | ) | ||||||||
Unrealized gross margin | — | — | — | |||||||||
Total gross margin | 56 | 60 | (4 | ) | ||||||||
Operating Expenses: | ||||||||||||
Operations and maintenance | 40 | 40 | — | |||||||||
Depreciation and amortization | 10 | 14 | (4 | ) | ||||||||
Gain on sales of assets, net | (1 | ) | (1 | ) | — | |||||||
Total operating expenses, net | 49 | 53 | (4 | ) | ||||||||
Operating income | 7 | 7 | — | |||||||||
Total other expense, net | 1 | — | 1 | |||||||||
Net income | $ | 6 | $ | 7 | $ | (1 | ) | |||||
80
Table of Contents
Other Operations
Other Operations includes proprietary trading and fuel oil management activities, interest expense on debt at Mirant Americas Generation and Mirant North America and interest income on our invested cash balances.
The following table summarizes the results of operations of our Other Operations segment (in millions):
| Six Months Ended June 30, | Increase/ (Decrease) | |||||||||||
| 2009 | 2008 | |||||||||||
Gross Margin: | ||||||||||||
Energy | $ | 76 | $ | 31 | $ | 45 | ||||||
Total realized gross margin | 76 | 31 | 45 | |||||||||
Unrealized gross margin | (49 | ) | (49 | ) | — | |||||||
Total gross margin | 27 | (18 | ) | 45 | ||||||||
Operating Expenses: | ||||||||||||
Operations and maintenance | 5 | 5 | — | |||||||||
Depreciation and amortization | 1 | 1 | — | |||||||||
Total operating expenses, net | 6 | 6 | — | |||||||||
Operating income (loss) | 21 | (24 | ) | 45 | ||||||||
Total other expense, net | 69 | 95 | (26 | ) | ||||||||
Net loss | $ | (48 | ) | $ | (119 | ) | $ | 71 | ||||
Gross Margin
The increase of $45 million in realized gross margin was a result of a $34 million increase in gross margin from proprietary trading activities and an $11 million increase in gross margin from our fuel oil management activities. The increase in gross margin from proprietary trading activities was a result of higher realized value associated with power positions in 2009 as compared to 2008. The increase in gross margin from fuel oil management activities was a result of an increase in the realized value associated with positions related to our fuel oil inventory.
Unrealized gross margin was the same for each period and was comprised of the following:
| • | unrealized losses of $49 million in 2009, which included unrealized losses of $54 million from power and fuel contracts that settled during the period for which net unrealized gains had been recorded in prior periods, partially offset by a $5 million net increase in the value of contracts for future periods; and |
| • | unrealized losses of $49 million in 2008, which included a $57 million net decrease in the value of contracts for future periods, partially offset by unrealized gains of $8 million from power and fuel contracts that settled during the period for which net unrealized losses had been recorded in prior periods. |
Other Expense, Net
The decrease of $26 million in other expense, net was principally the result of the following:
| • | a decrease of $30 million in interest expense primarily as a result of lower outstanding debt and higher interest capitalized on projects under construction; partially offset by |
| • | a decrease of $9 million in interest income primarily related to lower interest rates on invested cash; and |
| • | a loss of $6 million in 2008 related to the purchase in 2008 of $134 million of Mirant Americas Generation senior notes due in 2011. |
81
Table of Contents
Financial Condition
Liquidity and Capital Resources
We expect that we have sufficient liquidity for our future operations, capital expenditures and debt obligations. The principal sources of our liquidity are expected to be: (1) existing cash on hand and cash flows from the operations of our subsidiaries; (2) letters of credit issued or borrowings made under Mirant North America’s senior secured revolving credit facility; (3) letters of credit issued under Mirant North America’s senior secured term loan; (4) capital contributions received upon redemptions of preferred shares in Mirant Americas; and (5) at their discretion, additional capital contributions from Mirant Corporation and Mirant Americas.
Sources of Funds
The table below sets forth total cash, cash equivalents and availability under credit facilities of Mirant Americas Generation and its subsidiaries at June 30, 2009 and December 31, 2008 (in millions):
| At June 30, 2009 | At December 31, 2008 | |||||
Cash and Cash Equivalents: | ||||||
Mirant Americas Generation | $ | — | $ | — | ||
Mirant North America | 259 | 229 | ||||
Mirant Mid-Atlantic | 164 | 125 | ||||
Total cash and cash equivalents | 423 | 354 | ||||
Available under credit facilities | 616 | 583 | ||||
Total cash, cash equivalents and credit facilities availability | $ | 1,039 | $ | 937 | ||
We consider all short-term investments with an original maturity of three months or less to be cash equivalents. At June 30, 2009 and December 31, 2008, except for amounts held in bank accounts to cover upcoming payables, all of our cash and cash equivalents were invested in AAA-rated United States Treasury money market funds.
Available under credit facilities at June 30, 2009 and December 31, 2008, reflects a $45 million reduction as a result of the expectation that Lehman Commercial Paper, Inc., which filed for bankruptcy protection in October 2008, will not honor its $45 million commitment under the Mirant North America senior secured revolving credit facility.
82
Table of Contents
Mirant Americas Generation is a holding company. The chart below is a summary representation of our capital structure and is not a complete organizational chart.
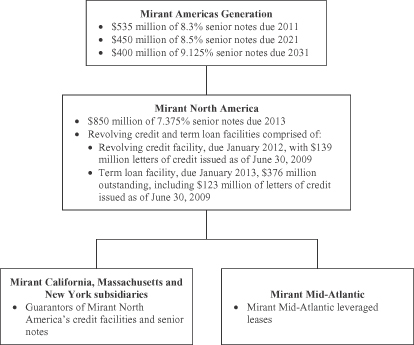
Except for existing cash on hand and, in the case of Mirant North America, borrowings and letters of credit under its credit facilities, the Mirant Americas Generation and Mirant North America holding companies are dependent for liquidity on the distributions and dividends of their subsidiaries, capital contributions received upon redemptions of preferred shares in Mirant Americas and, at their discretion, additional capital contributions from Mirant Corporation and Mirant Americas. The ability of Mirant North America and its subsidiary Mirant Mid-Atlantic to make distributions and pay dividends is restricted under the terms of Mirant North America’s debt agreements and Mirant Mid-Atlantic’s leveraged lease documentation, respectively. At June 30, 2009, Mirant North America had distributed to us all available cash that was permitted to be distributed under the terms of its debt agreements, leaving $423 million at Mirant North America and its subsidiaries. Of this amount, $164 million was held by Mirant Mid-Atlantic, which, as of June 30, 2009, met the tests under the leveraged lease documentation permitting it to make distributions to Mirant North America. Although Mirant North America is in compliance with its financial covenants, as of June 30, 2009, it is restricted from making distributions by the free cash flow requirements under the restricted payment test of its senior credit facility. The primary factor lowering the free cash flow calculation for Mirant North America is the significant capital expenditure program of Mirant Mid-Atlantic to install emissions controls at its Chalk Point, Dickerson and Morgantown coal-fired units to comply with the Maryland Healthy Air Act. We do not expect the liquidity effect of the restriction on distributions under the Mirant North America senior credit facility to be material given that the majority of our liquidity needs arise from the activities of Mirant North America and its subsidiaries, the restriction does not limit Mirant North America from making distributions to us to fund interest payments on our senior notes and Mirant Corporation has significant unrestricted cash and cash equivalents available, at its discretion, to make capital contributions to us and our subsidiaries.
83
Table of Contents
Uses of Funds
Our requirements for liquidity and capital resources, other than for the day-to-day operation of our generating facilities, are significantly influenced by the following activities: (1) capital expenditures; (2) debt service and payments under the Mirant Mid-Atlantic leveraged leases; and (3) collateral required for our asset management and proprietary trading and fuel oil management activities.
Capital Expenditures. Our capital expenditures, excluding capitalized interest, for the six months ended June 30, 2009, were $343 million. Our estimated capital expenditures, excluding capitalized interest, for the period July 1, 2009, through December 31, 2010, are $801 million. See “Capital Expenditures and Capital Resources” in this Item 2 for further discussion of our capital expenditures.
Cash Collateral and Letters of Credit. In order to sell power and purchase fuel in the forward markets and perform other energy trading and marketing activities, we often are required to provide credit support to our counterparties or make deposits with brokers. In addition, we often are required to provide cash collateral or letters of credit to access the transmission grid, to participate in power pools, to fund debt service and rent reserves and for other operating activities. Credit support includes cash collateral, letters of credit and financial guarantees. In the event that we default, the counterparty can draw on a letter of credit or apply cash collateral held to satisfy the existing amounts outstanding under an open contract. As of June 30, 2009, we had approximately $76 million of posted cash collateral and $262 million of letters of credit outstanding primarily to support our asset management activities, trading activities, debt service and rent reserve requirements and other commercial arrangements. Our liquidity requirements are highly dependent on the level of our hedging activities, forward prices for energy, emissions allowances and fuel, commodity market volatility and credit terms with third parties.
The following table summarizes cash collateral posted with counterparties and brokers, letters of credit issued and surety bonds as of June 30, 2009 and December 31, 2008 (in millions):
| At June 30, 2009 | At December 31, 2008 | |||||
Cash collateral posted—energy trading and marketing | $ | 35 | $ | 67 | ||
Cash collateral posted—other operating activities | 41 | 43 | ||||
Letters of credit—energy trading and marketing | 55 | 76 | ||||
Letters of credit—debt service and rent reserves | 101 | 101 | ||||
Letters of credit—other operating activities | 106 | 117 | ||||
Surety bonds—energy trading and marketing | 16 | 25 | ||||
Total | $ | 354 | $ | 429 | ||
Debt Obligations, Off-Balance Sheet Arrangements and Contractual Obligations
There were no significant changes to our debt obligations, off-balance sheet arrangements and contractual obligations as of June 30, 2009, from those presented in our 2008 Annual Report on Form 10-K.
Cash Flows
Continuing Operations
Operating Activities. Our cash provided by operating activities is affected by seasonality, changes in energy prices and fluctuations in our working capital requirements. Net cash provided by operating activities from continuing operations increased $445 million for the six months ended June 30, 2009, compared to the same period in 2008, primarily as a result of the following:
| • | Funds on deposit.An increase in cash provided of $299 million primarily related to a decrease in collateral posted with our counterparties primarily as a result of decreases in forward energy prices; |
84
Table of Contents
| • | Net accounts receivable and payable.An increase in cash provided of $77 million primarily related to a decrease in power prices in 2009 compared to the same period in 2008. In addition, the implementation in June 2009 of weekly settlements with PJM (in lieu of monthly settlements) has reduced the amount of outstanding receivables for the PJM market; |
| • | Realized gross margin. An increase in cash provided of $54 million in 2009, compared to the same period in 2008, excluding the non-cash charge for lower of cost or market fuel inventory adjustments of $21 million. See “Results of Operations” for additional discussion of our performance in 2009 compared to the same period in 2008; |
| • | Collateral posted by counterparties.An increase in cash provided of $28 million primarily as a result of decreases in forward energy prices; |
| • | Operating expense.A decrease in cash used related to lower operations and maintenance expense of $26 million. See “Results of Operations” for additional discussion of our performance in 2009 compared to the same period in 2008; |
| • | Interest expense, net.A decrease in cash used of $18 million for interest expense, net reflecting lower interest expense from lower outstanding debt partially offset by lower interest income primarily as a result of lower interest rates on invested cash; and |
| • | Other operating assets and liabilities.An increase in cash provided of $13 million related to changes in other operating assets and liabilities. |
The decreases in cash used in and increases in cash provided by operating activities were partially offset by the following:
| • | Inventories. An increase in cash used of $47 million as a result of higher inventory levels of coal and fuel oil, partially offset by lower market prices in 2009 as compared to 2008; and |
| • | Prepaid rent. An increase in cash used of $23 million because the scheduled rent payments for our Mirant Mid-Atlantic leveraged leases were higher for 2009 than 2008. |
Investing Activities. Net cash used in investing activities from continuing operations increased by $65 million for the six months ended June 30, 2009, compared to the same period in 2008. This difference was primarily related to an increase in cash used for capital expenditures of $68 million primarily related to our environmental capital expenditures for our Maryland generating facilities.
Financing Activities. Net cash provided by financing activities increased by $287 million for the six months ended June 30, 2009, compared to the same period in 2008. This difference was primarily a result of the following:
| • | Repayment of long-term debt-nonaffiliate. A decrease in cash used of $229 million for repayments and repurchases of debt, including $132 million for the 2008 purchase and retirement of Mirant Americas Generation senior notes due in 2011; |
| • | Distribution to member.A decrease in cash used of $137 million as a result of distributions in 2008. We made no distribution in 2009; |
| • | Redemption of preferred stock.An increase in cash provided of $53 million as result of the redemption of Series A preferred stock held by Mirant Mid-Atlantic. See Note G to our unaudited condensed consolidated financial statements contained elsewhere in this report for additional information; |
| • | Repayment of debt-affiliate.A decrease in cash used of $6 million as a result of the repayment in 2008; partially offset by |
| • | Capital contributions.A decrease in cash provided of $139 million as a result of contributions from Mirant Americas primarily for the purchase of our bonds in 2008. We received no contributions in 2009. |
85
Table of Contents
Discontinued Operations
Operating Activities.In 2008, net cash provided by operating activities from discontinued operations was a result of final working capital adjustments related to the 2007 dispositions.
Investing Activities.In 2008, net cash provided by investing activities from discontinued operations was $18 million, of which $16 million related to insurance recoveries for repairs of the Swinging Bridge facility of Mirant NY-Gen.
86
Table of Contents
| B. | Mirant North America |
The following discussion should be read in conjunction with the unaudited condensed consolidated financial statements of Mirant North America and the notes thereto, which are included elsewhere in this report.
Overview
Mirant North America, an indirect wholly-owned subsidiary of Mirant and a direct subsidiary of Mirant Americas Generation, is a competitive energy company that produces and sells electricity in the United States. Mirant North America owns or leases 10,112 MW of net electric generating capacity in the Mid-Atlantic and Northeast regions and in California. Mirant North America also operates an integrated asset management and energy marketing organization based in Atlanta, Georgia.
Hedging Activities
Refer to “Hedging Activities” above for Mirant Americas Generation.
Capital Expenditures and Capital Resources
Refer to “Capital Expenditures and Capital Resources” above for Mirant Americas Generation.
Scrubber Operating Expenses
Refer to “Scrubber Operating Expenses” above for Mirant Americas Generation.
Commodity Prices
Refer to “Commodity Prices” above for Mirant Americas Generation.
Granted Emissions Allowances
Refer to “Granted Emissions Allowances” above for Mirant Americas Generation.
Results of Operations
The following discussion of our performance is organized by reportable segment, which is consistent with the way we manage our business.
The Mid-Atlantic region includes our Chalk Point, Dickerson, Morgantown and Potomac River facilities. The Northeast region includes our Bowline, Canal, Kendall and Martha’s Vineyard facilities. For the three and six months ended June 30, 2008, the Northeast region also included the Lovett generating facility, which was shut down on April 19, 2008. The California region includes our Contra Costa, Pittsburg and Potrero facilities. Other Operations includes proprietary trading and fuel oil management activities, interest expense on our debt and interest income on our invested cash balances.
87
Table of Contents
Three Months Ended June 30, 2009 versus Three Months Ended June 30, 2008
Consolidated Financial Performance
We reported net income of $147 million for the three months ended June 30, 2009, compared to a net loss of $786 million for the same period in 2008. The change in net income (loss) is detailed as follows (in millions):
| Three Months Ended June 30, | Increase/ (Decrease) | |||||||||||
| 2009 | 2008 | |||||||||||
Realized gross margin | $ | 360 | $ | 315 | $ | 45 | ||||||
Unrealized gross margin | (14 | ) | (874 | ) | 860 | |||||||
Total gross margin | 346 | (559 | ) | 905 | ||||||||
Operating Expenses: | ||||||||||||
Operations and maintenance—nonaffiliate | 93 | 120 | (27 | ) | ||||||||
Operations and maintenance—affiliate | 69 | 74 | (5 | ) | ||||||||
Depreciation and amortization | 34 | 38 | (4 | ) | ||||||||
Gain on sales of assets, net | (2 | ) | (12 | ) | 10 | |||||||
Total operating expenses, net | 194 | 220 | (26 | ) | ||||||||
Operating income (loss) | 152 | (779 | ) | 931 | ||||||||
Total other expense, net | 5 | 7 | (2 | ) | ||||||||
Net income (loss) | $ | 147 | $ | (786 | ) | $ | 933 | |||||
The following discussion includes non-GAAP financial measures because we present our consolidated financial performance in terms of gross margin. Gross margin is our operating revenue less cost of fuel, electricity and other products, and excludes depreciation and amortization. We present gross margin, excluding depreciation and amortization, and realized gross margin separately from unrealized gross margin in order to be consistent with how we manage our business. Realized gross margin and unrealized gross margin are both non-GAAP financial measures. Realized gross margin represents our gross margin less unrealized gains and losses on derivative financial instruments for the periods presented. Conversely, unrealized gross margin is equivalent to our unrealized gains and losses on derivative financial instruments for the periods presented. Management evaluates our operating results excluding the impact of unrealized gains and losses. None of our derivative financial instruments recorded at fair value are designated as hedges under SFAS 133 and changes in their fair values are therefore recognized currently in income as unrealized gains or losses. As a result, our financial results are, at times, volatile and subject to fluctuations in value primarily because of changes in forward electricity and fuel prices. Adjusting our gross margin to exclude unrealized gains and losses provides a measure of performance that eliminates the volatility created by significant shifts in market values between periods. However, our realized and unrealized gross margin may not be comparable to similarly titled non-GAAP financial measures used by other companies. We encourage our investors to review our unaudited condensed consolidated financial statements and other publicly filed reports in their entirety and not to rely on a single financial measure.
Refer to “Consolidated Financial Performance—Mirant Americas Generation” above for realized and unrealized gross margin and operating expenses, additional related details and variance explanations.
Other expense, net decreased $2 million for the three months ended June 30, 2009, and reflects lower interest expense as a result of lower outstanding debt and higher interest capitalized on projects under construction, partially offset by lower interest income primarily as a result of lower interest rates on invested cash in 2009 compared to the same period in 2008.
88
Table of Contents
Gross Margin Overview
Refer to “Gross Margin Overview” in “Results of Operations—Mirant Americas Generation” above for realized and unrealized gross margin by operating segments, additional related details and variance explanations.
Operating Statistics
Refer to “Operating Statistics” in “Results of Operations—Mirant Americas Generation” above for Net Capacity Factor and power generation volumes by region.
Mid-Atlantic
Refer to “Mid-Atlantic” in “Results of Operations—Mirant Americas Generation” above for our Mid-Atlantic segment summary.
Northeast
Refer to “Northeast” in “Results of Operations—Mirant Americas Generation” above for our Northeast segment summary.
California
Refer to “California” in “Results of Operations—Mirant Americas Generation” above for our California segment summary.
Other Operations
Other Operations includes proprietary trading and fuel oil management activities, interest expense on our debt and interest income on our invested cash balances.
The following table summarizes the results of operations of our Other Operations segment (in millions):
| Three Months Ended June 30, | Increase/ (Decrease) | |||||||||||
| 2009 | 2008 | |||||||||||
Gross Margin: | ||||||||||||
Energy | $ | 49 | $ | 20 | $ | 29 | ||||||
Total realized gross margin | 49 | 20 | 29 | |||||||||
Unrealized gross margin | (34 | ) | (55 | ) | 21 | |||||||
Total gross margin | 15 | (35 | ) | 50 | ||||||||
Operating Expenses: | ||||||||||||
Operations and maintenance | 3 | 3 | — | |||||||||
Depreciation and amortization | — | 1 | (1 | ) | ||||||||
Total operating expenses, net | 3 | 4 | (1 | ) | ||||||||
Operating income (loss) | 12 | (39 | ) | 51 | ||||||||
Total other expense, net | 4 | 6 | (2 | ) | ||||||||
Net income (loss) | $ | 8 | $ | (45 | ) | $ | 53 | |||||
Gross Margin
Refer to “Other Operations” in “Results of Operations—Mirant Americas Generation” above for our gross margin variance explanations.
89
Table of Contents
Other Expense, Net
The decrease of $2 million in other expense, net was principally the result of the following:
| • | a decrease of $7 million in interest expense related to lower debt outstanding and higher interest capitalized on construction projects in 2008; partially offset by |
| • | a decrease of $4 million in interest income primarily related to lower interest rates on invested cash. |
90
Table of Contents
Six Months Ended June 30, 2009 versus Six Months Ended June 30, 2008
Consolidated Financial Performance
We reported net income of $572 million for the six months ended June 30, 2009, compared to a net loss of $919 million for the same period in 2008. The change in net income (loss) is detailed as follows (in millions):
| Six Months Ended June 30, | Increase/ (Decrease) | |||||||||||
| 2009 | 2008 | |||||||||||
Realized gross margin | $ | 713 | $ | 680 | $ | 33 | ||||||
Unrealized gross margin | 240 | (1,177 | ) | 1,417 | ||||||||
Total gross margin | 953 | (497 | ) | 1,450 | ||||||||
Operating Expenses: | ||||||||||||
Operations and maintenance—nonaffiliate | 181 | 206 | (25 | ) | ||||||||
Operations and maintenance—affiliate | 137 | 146 | (9 | ) | ||||||||
Depreciation and amortization | 68 | 69 | (1 | ) | ||||||||
Gain on sales of assets, net | (17 | ) | (16 | ) | (1 | ) | ||||||
Total operating expenses, net | 369 | 405 | (36 | ) | ||||||||
Operating income (loss) | 584 | (902 | ) | 1,486 | ||||||||
Total other expense (income), net | ||||||||||||
Nonaffiliate | 12 | 18 | (6 | ) | ||||||||
Affiliate | — | (1 | ) | 1 | ||||||||
Net income (loss) | $ | 572 | $ | (919 | ) | $ | 1,491 | |||||
Refer to “Consolidated Financial Performance—Mirant Americas Generation” above for realized and unrealized gross margin and operating expenses, additional related details and variance explanations.
Other expense (income), net decreased $5 million for the six months ended June 30, 2009, and reflects lower interest expense as a result of lower outstanding debt and higher interest capitalized on projects under construction, partially offset by lower interest income primarily as a result of lower interest rates on invested cash in 2009 compared to the same period in 2008.
Gross Margin Overview
Refer to “Gross Margin Overview” in “Results of Operations—Mirant Americas Generation” above for realized and unrealized gross margin by operating region, additional related details and variance explanations.
Operating Statistics
Refer to “Operating Statistics” in “Results of Operations—Mirant Americas Generation” above for Net Capacity Factor and power generation volumes by region.
Mid-Atlantic
Refer to “Mid-Atlantic” in “Results of Operations—Mirant Americas Generation” above for our Mid-Atlantic segment summary.
Northeast
Refer to “Northeast” in “Results of Operations—Mirant Americas Generation” above for our Northeast segment summary.
91
Table of Contents
California
Refer to “California” in “Results of Operations—Mirant Americas Generation” above for our California segment summary.
Other Operations
Other Operations includes proprietary trading and fuel oil management activities, interest expense on our debt and interest income on our invested cash balances.
The following table summarizes the results of operations of our Other Operations segment (in millions):
| Six Months Ended June 30, | Increase/ (Decrease) | |||||||||||
| 2009 | 2008 | |||||||||||
Gross Margin: | ||||||||||||
Energy | $ | 76 | $ | 31 | $ | 45 | ||||||
Total realized gross margin | 76 | 31 | 45 | |||||||||
Unrealized gross margin | (49 | ) | (49 | ) | — | |||||||
Total gross margin | 27 | (18 | ) | 45 | ||||||||
Operating Expenses: | ||||||||||||
Operations and maintenance | 5 | 5 | — | |||||||||
Depreciation and amortization | 1 | 1 | — | |||||||||
Total operating expenses, net | 6 | 6 | — | |||||||||
Operating income (loss) | 21 | (24 | ) | 45 | ||||||||
Total other expense, net | 9 | 17 | (8 | ) | ||||||||
Net income (loss) | $ | 12 | $ | (41 | ) | $ | 53 | |||||
Gross Margin
Refer to “Other Operations” in “Results of Operations—Mirant Americas Generation” above for our gross margin variance explanations.
Other Expense, Net
Other expense, net decreased $8 million, primarily as a result of the following:
| • | a decrease of $17 million in interest expense related to lower debt outstanding and higher interest capitalized on construction projects in 2008; partially offset by |
| • | a decrease of $9 million in interest income primarily related to lower interest rates on invested cash. |
92
Table of Contents
Financial Condition
Liquidity and Capital Resources
We expect that we have sufficient liquidity for our future operations, capital expenditures and debt obligations. The principal sources of our liquidity are expected to be: (1) existing cash on hand and cash flows from the operations of our subsidiaries; (2) letters of credit issued or borrowings made under our senior secured revolving credit facility; (3) letters of credit issued under our senior secured term loan; (4) capital contributions received upon redemptions of preferred shares in Mirant Americas; and (5) at their discretion, additional capital contributions from Mirant Corporation and Mirant Americas.
Sources of Funds
The table below sets forth total cash, cash equivalents and availability under credit facilities of Mirant North America and its subsidiaries at June 30, 2009 and December 31, 2008 (in millions):
| At June 30, 2009 | At December 31, 2008 | |||||
Cash and Cash Equivalents: | ||||||
Mirant North America | $ | 259 | $ | 229 | ||
Mirant Mid-Atlantic | 164 | 125 | ||||
Total cash and cash equivalents | 423 | 354 | ||||
Available under credit facilities | 616 | 583 | ||||
Total cash, cash equivalents and credit facilities availability | $ | 1,039 | $ | 937 | ||
We consider all short-term investments with an original maturity of three months or less to be cash equivalents. At June 30, 2009 and December 31, 2008, except for amounts held in bank accounts to cover upcoming payables, all of our cash and cash equivalents were invested in AAA-rated United States Treasury money market funds.
Available under credit facilities at June 30, 2009 and December 31, 2008, reflects a $45 million reduction as a result of the expectation that Lehman Commercial Paper, Inc., which filed for bankruptcy protection in October 2008, will not honor its $45 million commitment under the Mirant North America senior secured revolving credit facility.
Mirant North America is a holding company. The chart below is a summary representation of our capital structure and is not a complete organizational chart.
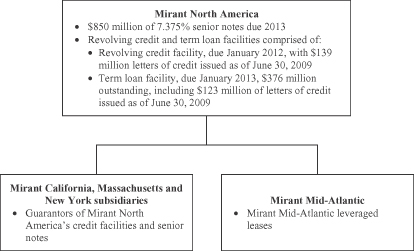
93
Table of Contents
Except for existing cash on hand and borrowings and letters of credit under our credit facilities, as a holding company we are dependent for liquidity on the distributions and dividends of our subsidiaries, capital contributions received upon redemptions of preferred shares in Mirant Americas and, at their discretion, additional capital contributions from Mirant Corporation and Mirant Americas. Our ability and the ability of our subsidiary, Mirant Mid-Atlantic, to make distributions and pay dividends is restricted under the terms of our debt agreements and Mirant Mid-Atlantic’s leveraged lease documentation, respectively. At June 30, 2009, we had distributed to our parent, Mirant Americas Generation, all available cash that was permitted to be distributed under the terms of our debt agreements, leaving $423 million with us and our subsidiaries. Of this amount, $164 million was held by Mirant Mid-Atlantic, which, as of June 30, 2009, met the tests under the leveraged lease documentation permitting it to make distributions to us. Although we are in compliance with our financial covenants, as of June 30, 2009, we are restricted from making distributions (other than amounts to fund interest payments on the Mirant Americas Generation senior notes) by the free cash flow requirements under the restricted payment test of our senior credit facility. The primary factor lowering our free cash flow calculation is the significant capital expenditure program of Mirant Mid-Atlantic to install emissions controls at its Chalk Point, Dickerson and Morgantown coal-fired units to comply with the Maryland Healthy Air Act.
Uses of Funds
Our requirements for liquidity and capital resources, other than for the day-to-day operation of our generating facilities, are significantly influenced by the following activities: (1) capital expenditures; (2) debt service and payments under the Mirant Mid-Atlantic leveraged leases; and (3) collateral required for our asset management and proprietary trading and fuel oil management activities.
Capital Expenditures. Our capital expenditures, excluding capitalized interest for the six months ended June 30, 2009, were $343 million. Our estimated capital expenditures, excluding capitalized interest, for the period July 1, 2009, through December 31, 2010, are $801 million. See “Capital Expenditures and Capital Resources” above under Mirant Americas Generation for further discussion of our capital expenditures.
Cash Collateral and Letters of Credit. In order to sell power and purchase fuel in the forward markets and perform other energy trading and marketing activities, we often are required to provide credit support to our counterparties or make deposits with brokers. In addition, we often are required to provide cash collateral or letters of credit to access the transmission grid, to participate in power pools, to fund debt service and rent reserves and for other operating activities. Credit support includes cash collateral, letters of credit and financial guarantees. In the event that we default, the counterparty can draw on a letter of credit or apply cash collateral held to satisfy the existing amounts outstanding under an open contract. As of June 30, 2009, we had approximately $76 million of posted cash collateral and $262 million of letters of credit outstanding primarily to support our asset management activities, trading activities, debt service and rent reserve requirements and other commercial arrangements. Our liquidity requirements are highly dependent on the level of our hedging activities, forward prices for energy, emissions allowances and fuel, commodity market volatility and credit terms with third parties.
94
Table of Contents
The following table summarizes cash collateral posted with counterparties and brokers, letters of credit issued and surety bonds as of June 30, 2009 and December 31, 2008 (in millions):
| At June 30, 2009 | At December 31, 2008 | |||||
Cash collateral posted—energy trading and marketing | $ | 35 | $ | 67 | ||
Cash collateral posted—other operating activities | 41 | 43 | ||||
Letters of credit—energy trading and marketing | 55 | 76 | ||||
Letters of credit—debt service and rent reserves | 101 | 101 | ||||
Letters of credit—other operating activities | 106 | 117 | ||||
Surety bonds—energy trading and marketing | 16 | 25 | ||||
Total | $ | 354 | $ | 429 | ||
Debt Obligations, Off-Balance Sheet Arrangements and Contractual Obligations
There were no significant changes to our debt obligations, off-balance sheet arrangements and contractual obligations as of June 30, 2009, from those presented in our 2008 Annual Report on Form 10-K.
Cash Flows
Continuing Operations
Operating Activities. Our cash provided by operating activities is affected by seasonality, changes in energy prices and fluctuations in our working capital requirements. Net cash provided by operating activities from continuing operations increased $428 million for the six months ended June 30, 2009, compared to the same period in 2008, primarily as a result of the following:
| • | Funds on deposit. An increase in cash provided of $299 million primarily related to a decrease in collateral posted with our counterparties primarily as a result of decreases in forward energy prices; |
| • | Net accounts receivable and payable. An increase in cash provided of $77 million primarily related to a decrease in power prices in 2009 compared to the same period in 2008. In addition, the implementation in June 2009 of weekly settlements with PJM (in lieu of monthly settlements) has reduced the amount of outstanding receivables for the PJM market; |
| • | Realized gross margin. An increase in cash provided of $54 million in 2009, compared to the same period in 2008, excluding the non-cash charge for lower of cost or market fuel inventory adjustments of $21 million. See “Results of Operations” for additional discussion of our performance in 2009 compared to the same period in 2008; |
| • | Collateral posted by counterparties. An increase in cash provided of $28 million primarily as a result of decreases in forward energy prices; |
| • | Operating expense.A decrease in cash used related to lower operations and maintenance expense of $26 million. See “Results of Operations” for additional discussion of our performance in 2009 compared to the same period in 2008; and |
| • | Other operating assets and liabilities. An increase in cash provided of $14 million related to changes in other operating assets and liabilities. |
The decreases in cash used in and increases in cash provided by operating activities were partially offset by the following:
| • | Inventories. An increase in cash used of $47 million as a result of higher inventory levels of coal and fuel oil, partially offset by lower market prices in 2009 as compared to 2008; and |
| • | Prepaid rent. An increase in cash used of $23 million because the scheduled rent payments for our Mirant Mid-Atlantic leveraged leases were higher for 2009 than 2008. |
95
Table of Contents
Investing Activities.Net cash used in investing activities from continuing operations increased by $65 million for the six months ended June 30, 2009, compared to the same period in 2008. This difference was primarily related to an increase in cash used for capital expenditures of $68 million primarily related to our environmental capital expenditures for our Maryland generating facilities.
Financing Activities. Net cash used in financing activities decreased by $303 million for the six months ended June 30, 2009, compared to the same period in 2008. This difference was primarily a result of the following:
| • | Distribution to member. A decrease in cash used of $132 million as a result of a $60 million distribution in 2009, as compared to a $192 million distribution for the same period in 2008; |
| • | Repayment of long-term debt-nonaffiliate. A decrease in cash used of $97 million for repayments; |
| • | Redemption of preferred stock.An increase in cash provided of $53 million as result of the redemption of Series A preferred stock held by Mirant Mid-Atlantic. See Note G to our unaudited condensed consolidated financial statements contained elsewhere in this report for additional information; and |
| • | Repayment of debt-affiliate. A decrease in cash used of $20 million as a result of the repayment in 2008. |
Discontinued Operations
Operating Activities.In 2008, net cash provided by operating activities from discontinued operations was a result of final working capital adjustments related to the 2007 dispositions.
Investing Activities.In 2008, net cash provided by investing activities from discontinued operations was $18 million, of which $16 million related to insurance recoveries for repairs of the Swinging Bridge facility of Mirant NY-Gen.
96
Table of Contents
| C. | Mirant Mid-Atlantic |
The following discussion should be read in conjunction with the unaudited condensed consolidated financial statements of Mirant Mid-Atlantic and the notes thereto, which are included elsewhere in this report.
Overview
Mirant Mid-Atlantic, an indirect wholly-owned subsidiary of Mirant and Mirant Americas Generation and a direct subsidiary of Mirant North America, is a competitive energy company that produces and sells electricity in the United States. Mirant Mid-Atlantic owns or leases 5,230 MW of net electric generating capacity in the Mid-Atlantic region.
Hedging Activities
We use derivative financial instruments, such as commodity forwards, futures, options and swaps, to manage our exposure to fluctuations in electric energy and fuel commodity prices. In addition, we hedge economically a substantial portion of our coal-fired baseload generation through OTC transactions. However, we generally do not hedge our intermediate and peaking units for tenors greater than 12 months. While some of our hedges are executed through our affiliate, Mirant Energy Trading, a significant portion of our hedges are financial swap transactions with counterparties that are senior unsecured obligations of such parties and do not require either party to post cash collateral either for initial margin or for securing exposure as a result of changes in power or natural gas prices. At July 14, 2009, our aggregate hedge levels based on expected generation for each period were as follows:
| Aggregate Hedge Levels Based on Expected Generation | |||||||||||||||
| 2009 | 2010 | 2011 | 2012 | 2013 | |||||||||||
Power | 100 | % | 85 | % | 46 | % | 46 | % | 27 | % | |||||
Fuel | 93 | % | 86 | % | 66 | % | 35 | % | 7 | % | |||||
Capital Expenditures and Capital Resources
For the six months ended June 30, 2009, we paid $331 million for capital expenditures, of which $248 million related to compliance with the Maryland Healthy Air Act. As of June 30, 2009, we have paid approximately $1.245 billion for capital expenditures related to compliance with the Maryland Healthy Air Act. Including amounts already spent to date, we expect to incur total capital expenditures of $1.674 billion to comply with the limitations on SO2, NOx and mercury emissions imposed by the Maryland Healthy Air Act.
The following table details the expected timing of payments for our estimated capital expenditures, excluding capitalized interest, for the remaining six months of 2009 and for 2010 (in millions):
| 2009 | 2010 | |||||
Maryland Healthy Air Act | $ | 242 | $ | 187 | ||
Other environmental | 10 | 28 | ||||
Maintenance | 80 | 112 | ||||
Construction | 28 | 69 | ||||
Other | 6 | 5 | ||||
Total | $ | 366 | $ | 401 | ||
The 2010 estimated capital expenditures for compliance with the Maryland Healthy Air Act include amounts that are withheld from progress payments under construction contracts and that will be paid after final completion of the project. As of June 30, 2009, we have a total contract retention liability of $94 million, of which $51 million is included in current accounts payable and accrued liabilities in our unaudited condensed consolidated balance sheet. The remainder of the contract retention liability is included in other noncurrent liabilities in our unaudited condensed consolidated balance sheet.
97
Table of Contents
We expect that available cash, proceeds from redemption of preferred shares in Mirant Americas and future cash flows from operations will be sufficient to fund these capital expenditures.
Scrubber Operating Expenses
Refer to “Scrubber Operating Expenses” above for Mirant Americas Generation.
Commodity Prices
The forward prices for power, natural gas, fuel oil and coal decreased during the three and six months ended June 30, 2009, and we recognized unrealized gains of $0 and $243 million, respectively. In addition, during the three and six months ended June 30, 2009, the average spot market price for power decreased at a faster pace than the decline in the average market price of coal. As a result, the energy gross margin from our baseload coal units was negatively affected by contracting dark spreads. However, we are generally economically neutral for that portion of the portfolio that we have hedged because our realized gross margin will reflect the contractual prices of our power and fuel contracts.
Our coal supply comes primarily from the Central Appalachian and Northern Appalachian coal regions. Our coal supply is procured through long-term coal agreements entered into on our behalf by our affiliate, Mirant Energy Trading. As of June 30, 2009, the estimated net fair value of these long-term coal agreements entered into by Mirant Energy Trading was approximately $(186) million. See Note G to our unaudited condensed consolidated financial statements contained elsewhere in this report for further information.
Granted Emissions Allowances
As a result of the capital expenditures we are incurring to comply with the requirements of the Maryland Healthy Air Act, we anticipate that we will have excess SO2 and NOx emissions allowances in future periods. We plan to continue to maintain some SO2 and NOx emissions allowances above those needed for our current expected generation in case our actual generation exceeds our current forecasts for future periods and for possible future additions of generating capacity. At June 30, 2009, the estimated fair value of our anticipated excess SO2 and NOx emissions allowances was approximately $25 million.
98
Table of Contents
Results of Operations
Three Months Ended June 30, 2009 versus Three Months Ended June 30, 2008
Consolidated Financial Performance
We reported net income of $133 million for the three months ended June 30, 2009, compared to a net loss of $739 million for the same period in 2008. The change in net income (loss) is detailed as follows (in millions):
| Three Months Ended June 30, | Increase/ (Decrease) | |||||||||||
| 2009 | 2008 | |||||||||||
Realized gross margin | $ | 257 | $ | 213 | $ | 44 | ||||||
Unrealized gross margin | — | (818 | ) | 818 | ||||||||
Total gross margin | 257 | (605 | ) | 862 | ||||||||
Operating Expenses: | ||||||||||||
Operations and maintenance—nonaffiliate | 57 | 68 | (11 | ) | ||||||||
Operations and maintenance—affiliate | 44 | 45 | (1 | ) | ||||||||
Depreciation and amortization | 24 | 23 | 1 | |||||||||
Gain on sales of assets, net | (2 | ) | (2 | ) | — | |||||||
Total operating expenses, net | 123 | 134 | (11 | ) | ||||||||
Operating income (loss) | 134 | (739 | ) | 873 | ||||||||
Total other expense, net | 1 | — | 1 | |||||||||
Net income (loss) | $ | 133 | $ | (739 | ) | $ | 872 | |||||
The following discussion includes non-GAAP financial measures because we present our consolidated financial performance in terms of gross margin. Gross margin is our operating revenue less cost of fuel, electricity and other products, and excludes depreciation and amortization. We present gross margin, excluding depreciation and amortization, and realized gross margin separately from unrealized gross margin in order to be consistent with how we manage our business. Realized gross margin and unrealized gross margin are both non-GAAP financial measures. Realized gross margin represents our gross margin less unrealized gains and losses on derivative financial instruments for the periods presented. Conversely, unrealized gross margin is equivalent to our unrealized gains and losses on derivative financial instruments for the periods presented. Management evaluates our operating results excluding the impact of unrealized gains and losses. None of our derivative financial instruments recorded at fair value are designated as hedges under SFAS 133 and changes in their fair values are therefore recognized currently in income as unrealized gains or losses. As a result, our financial results are, at times, volatile and subject to fluctuations in value primarily because of changes in forward electricity and fuel prices. Adjusting our gross margin to exclude unrealized gains and losses provides a measure of performance that eliminates the volatility created by significant shifts in market values between periods. However, our realized and unrealized gross margin may not be comparable to similarly titled non-GAAP financial measures used by other companies. We encourage our investors to review our unaudited condensed consolidated financial statements and other publicly filed reports in their entirety and not to rely on a single financial measure.
Refer to “Mid-Atlantic” in “Results of Operations—Mirant Americas Generation” above for realized and unrealized gross margin and operating expenses, additional related details and variance explanations.
Operating Statistics
Our Net Capacity Factor for the three months ended June 30, 2009, was 30% compared to 27% for the same period in 2008. Our power generation volume for the three months ended June 30, 2009 (in gigawatt hours) was
99
Table of Contents
3,480 compared to 3,057 for the same period in 2008. See “Operating Statistics” in “Results of Operations—Mirant Americas Generation” above for additional details on Net Capacity Factor and power generation volumes.
Gross Margin
Refer to “Mid-Atlantic” in “Results of Operations—Mirant Americas Generation” above for our realized and unrealized gross margin, additional related details and variance explanations.
Operating Expenses
Refer to “Mid-Atlantic” in “Results of Operations—Mirant Americas Generation” above for our operating expenses variance explanations.
100
Table of Contents
Six Months Ended June 30, 2009 versus Six Months Ended June 30, 2008
Consolidated Financial Performance
We reported net income of $518 million for the six months ended June 30, 2009, compared to a net loss of $893 million for the same period in 2008. The change in net income (loss) is detailed as follows (in millions):
| Six Months Ended June 30, | Increase/ (Decrease) | |||||||||||
| 2009 | 2008 | |||||||||||
Realized gross margin | $ | 521 | $ | 477 | $ | 44 | ||||||
Unrealized gross margin | 243 | (1,118 | ) | 1,361 | ||||||||
Total gross margin | 764 | (641 | ) | 1,405 | ||||||||
Operating Expenses: | ||||||||||||
Operations and maintenance—nonaffiliate | 117 | 123 | (6 | ) | ||||||||
Operations and maintenance—affiliate | 89 | 87 | 2 | |||||||||
Depreciation and amortization | 48 | 44 | 4 | |||||||||
Gain on sales of assets, net | (10 | ) | (2 | ) | (8 | ) | ||||||
Total operating expenses, net | 244 | 252 | (8 | ) | ||||||||
Operating income (loss) | 520 | (893 | ) | 1,413 | ||||||||
Total other expense, net | 2 | — | 2 | |||||||||
Net income (loss) | $ | 518 | $ | (893 | ) | $ | 1,411 | |||||
Refer to “Mid-Atlantic” in “Results of Operations—Mirant Americas Generation” above for realized and unrealized gross margin and operating expenses, additional related details and variance explanations.
Operating Statistics
Our Net Capacity Factor for the six months ended June 30, 2009 and June 30, 2008, was 32%. Our power generation volume for the six months ended June 30, 2009 (in gigawatt hours) was 7,342 compared to 7,246 for the same period in 2008. See “Operating Statistics” in “Results of Operations—Mirant Americas Generation” above for additional details on Net Capacity Factor and power generation volumes.
Gross Margin
Refer to “Mid-Atlantic” in “Results of Operations—Mirant Americas Generation” above for our realized and unrealized gross margin, additional related details and variance explanations.
Operating Expenses
Refer to “Mid-Atlantic” in “Results of Operations—Mirant Americas Generation” above for our operating expenses variance explanations.
101
Table of Contents
Financial Condition
Liquidity and Capital Resources
We expect that we have sufficient liquidity for our future operations and capital expenditures The principal sources of our liquidity are expected to be: (1) existing cash on hand and cash flows from the operations of the Company and its subsidiaries; (2) redemptions of the preferred shares in Mirant Americas; (3) at its discretion, capital contributions or advances from Mirant North America or letters of credit under its senior credit facilities; and (4) at their discretion, capital contributions from Mirant Corporation and Mirant Americas.
Sources of Funds
At June 30, 2009, we had $164 million of cash, which amount was available under the leveraged leases for distribution to Mirant North America.
The availability of capital contributions from Mirant Corporation and Mirant Americas and capital contributions, advances or letters of credit under Mirant North America’s senior credit facilities are subject to their discretion and such accommodations may not be available as a source of liquidity to Mirant Mid-Atlantic.
We consider all short-term investments with an original maturity of three months or less to be cash equivalents. At June 30, 2009 and December 31, 2008, except for amounts held in bank accounts to cover upcoming payables, all of our cash and cash equivalents were invested in AAA-rated United States Treasury money market funds.
Uses of Funds
Our requirements for liquidity and capital resources, other than for the day-to-day operation of our generating facilities, are significantly influenced by capital expenditures and payments under our leveraged leases.
Capital Expenditures. Our capital expenditures for the six months ended June 30, 2009, were $331 million. Our estimated capital expenditures, excluding capitalized interest, for the period July 1, 2009, through December 31, 2010, are $767 million. See “Capital Expenditures and Capital Resources” above under Mirant Mid-Atlantic for further discussion of our capital expenditures.
Operating Leases. We lease the Dickerson and Morgantown baseload units and associated property through 2029 and 2034, respectively, and have an option to extend the leases. We are accounting for these leases as operating leases. While there is variability in the scheduled payment amounts over the lease term, we recognize rent expense for these leases on a straight-line basis in accordance with the applicable accounting literature. Rent expense under our leases was $24 million and $48 million for the three and six months ended June 30, 2009 and 2008, respectively.
Debt Obligations, Off-Balance Sheet Arrangements and Contractual Obligations
There were no significant changes to our debt obligations, off-balance sheet arrangements and contractual obligations as of June 30, 2009, from those presented in our 2008 Annual Report on Form 10-K.
102
Table of Contents
Cash Flows
Operating Activities. Our cash provided by operating activities is affected by seasonality, changes in energy prices and fluctuations in our working capital requirements. Net cash provided by operating activities increased $59 million for the six months ended June 30, 2009, compared to the same period in 2008, primarily as a result of the following:
| • | Realized gross margin. An increase in cash provided of $65 million in 2009, compared to the same period in 2008, excluding the non-cash charge for lower of cost or market fuel inventory adjustments of $21 million. See “Results of Operations” for additional discussion of our performance in 2009 compared to the same period in 2008; |
| • | Net accounts receivable and payable. An increase in cash provided of $27 million primarily related to a decrease in power prices in 2009 compared to the same period in 2008; partially offset by |
| • | Prepaid rent. An increase in cash used of $23 million because the scheduled rent payments for our leveraged leases were higher for 2009 than 2008; and |
| • | Other operating assets and liabilities. An increase in cash used of $10 million related to changes in other operating assets and liabilities. |
Investing Activities.Net cash used in investing activities increased by $57 million for the six months ended June 30, 2009, compared to the same period in 2008. This difference was primarily a result of the following:
| • | Capital expenditures. An increase in cash used of $66 million primarily related to our environmental capital expenditures for our Maryland generating facilities; partially offset by |
| • | Proceeds from the sales of assets. An increase in cash provided of $8 million related to sales of emissions allowances to third parties. |
Financing Activities. Net cash provided by financing activities increased by $222 million for the six months ended June 30, 2009, compared to the same period in 2008. This difference was primarily a result of the following:
| • | Distribution to member. A decrease in cash used of $325 million as a result of a distribution in 2008. We made no distribution in 2009; |
| • | Redemption of preferred stock.An increase in cash provided of $53 million as result of the redemption of Series A preferred stock of Mirant Americas. See Note G to our unaudited condensed consolidated financial statements contained elsewhere in this report for additional information; partially offset by |
| • | Capital contributions. A decrease in cash provided of $155 million as a result of contributions received from Mirant North America in 2008. We received no contributions in 2009. |
Environmental and Regulatory Matters (Mirant Americas Generation, Mirant North America and Mirant Mid-Atlantic)
PJM Reliability Pricing Model Forward Capacity Market. Our Mid-Atlantic facilities sell electricity into the markets operated by PJM. Load-serving entities within PJM are required to have adequate sources of generating capacity. Our facilities located in the Mid-Atlantic region that sell electricity into the PJM market participate in the reliability pricing model (the “RPM”) forward capacity market. On December 12, 2008, PJM filed with the FERC to revise elements of the RPM forward capacity market. PJM sought to implement these changes in time for the May 2009 annual auction for the provision of capacity from June 1, 2012, to May 31, 2013. We and others filed oppositions to the proposed changes with the FERC. On February 9, 2009, PJM, a coalition of PJM customers, and several state public service commissions filed a settlement agreement with the FERC that, if approved, would materially modify several provisions of the December 2008 filing to the detriment of suppliers in the RPM capacity auction. Under the FERC’s rules and regulations, any party to a contested
103
Table of Contents
proceeding may unilaterally file a settlement in that proceeding with the FERC. We and others filed comments opposing the settlement. On March 26, 2009, the FERC issued an order that accepted the majority of changes to elements of the RPM forward capacity market proposed in the December 2008 filing and rejected the majority of changes to elements of the RPM forward capacity market proposed in the February 2009 settlement filing. Other parties have sought rehearing of the FERC’s March 26, 2009, order.
Virginia CAIR Implementation.In April 2006, Virginia enacted legislation that, among other things, granted the Virginia State Air Pollution Control Board the discretion to prohibit electric generating facilities located in a non-attainment area from purchasing SO2 and NOx allowances to achieve compliance under the EPA’s CAIR. In the fourth quarter of 2007, the Virginia State Air Pollution Control Board approved regulations that it interprets as prohibiting the acquisition in any manner of SO2 and NOx allowances by facilities in non-attainment areas to satisfy the requirements of the CAIR as implemented by Virginia. Mirant Potomac River’s Potomac River facility is located in a non-attainment area for ozone. Thus, this Virginia regulation effectively caps the Potomac River facility’s SO2 and NOx emissions at amounts equal to the allowances allocated to the facility. Mirant Potomac River challenged the legality of the regulations regarding the trading of NOx allowances in Virginia state court. In July 2008, the Circuit Court for the City of Richmond, Virginia issued a ruling dismissing that challenge, which ruling Mirant Potomac River appealed. On June 23, 2009, the Court of Appeals of Virginia issued an opinion reversing the circuit court, concluding that the Virginia State Air Pollution Control Board exceeded its statutory authority in the Virginia regulation by prohibiting facilities in non-attainment areas from using allowances acquired by any form of transfer to satisfy the requirements of the CAIR, rather than limiting the prohibition to purchased allowances. On August 4, 2009, the Virginia Court of Appeals denied a request for rehearing filed by the Virginia State Air Pollution Control Board. The Virginia State Air Pollution Control Board may petition the Virginia Supreme Court to review the decision by the Virginia Court of Appeals, and the ruling by the Virginia Court of Appeals has not yet become effective.
Regulation of Greenhouse Gases, including the RGGI. Concern over climate change has led to significant legislative and regulatory efforts at the state and federal level to limit greenhouse gas emissions. One such effort is the RGGI, a multi-state initiative in the Northeast outlining a cap-and-trade program to reduce CO2 emissions from electric generating units with capacity of 25 MW or greater. The RGGI program calls for signatory states, which include Maryland, Massachusetts and New York, to stabilize CO2 emissions to an established baseline from 2009 through 2014, followed by a 2.5% reduction each year from 2015 to 2018.
In 2009, Mirant Americas Generation and Mirant North America expect to produce approximately 14.6 million tons of CO2 at their Maryland, Massachusetts and New York generating facilities. In 2009, Mirant Mid-Atlantic expects to produce approximately 13.3 million tons of CO2 at its Maryland generating facilities. The RGGI regulations require those facilities to obtain allowances to emit CO2 beginning in 2009. No allowances were granted to existing sources of such emissions. Instead, allowances have been made available for such facilities only by purchase through periodic auctions conducted quarterly or through subsequent purchase from a party that holds allowances sold through a quarterly auction process. The Maryland regulations implementing the RGGI, which were amended on May 8, 2009, also provide that if the allowance clearing price reaches or exceeds $7 per ton of CO2 in the auctions of allowances that occur during the first three years, Maryland will withhold the remainder of that year’s allowances from sale in any future auction during that calendar year and make those allowances available by direct sale to generators in Maryland. In this scenario, between 0 and 50% of Maryland’s allowances allocated for sale in that year may be made available for purchase by such generators. Any such allowances made available for each generator to purchase at $7 per ton will be in proportion to each generator’s annual average heat input during specified historical periods as compared to the total average input for all affected Maryland generators in existence at that time. In none of the auctions held to date has the price reached $7 per ton.
The fourth auction of allowances by the RGGI states was held on June 17, 2009. The clearing price for the approximately 30.9 million allowances sold in the auction allocated for use beginning in 2009 was $3.23 per ton. Allowances allocated for use beginning in 2012 were also made available, and the clearing price for the
104
Table of Contents
approximately 2.2 million of such allowances sold in the auction was $2.06 per ton. The allowances sold in this auction can be used for compliance in any of the RGGI states. Further auctions will occur quarterly through the end of the first compliance period in 2011, with the next auction scheduled for September 9, 2009.
Complying with the RGGI could have a material adverse effect upon Mirant Americas Generation’s, Mirant North America’s and Mirant Mid-Atlantic’s operations and their operating costs, depending upon the availability and cost of emissions allowances and the extent to which such costs may be offset by higher market prices to recover increases in operating costs caused by the RGGI.
In California, emissions of greenhouse gases are governed by California’s Global Warming Solutions Act (“AB 32”), which requires that greenhouse gas emissions be reduced to 1990 levels by 2020. In December 2008, the California Air Resource Board (“CARB”) approved a Scoping Plan for implementing AB 32. The Scoping Plan requires that CARB adopt a cap-and-trade regulation by January 2011 and that the cap and trade program begin in 2012. The CARB’s schedule for developing regulations to implement AB 32 is being coordinated with the schedule of the Western Climate Initiative (“WCI”) for development of a regional cap-and-trade program for greenhouse gas emissions. Through the WCI, California is working with six other western states and four Canadian provinces to coordinate and implement a regional cap-and-trade program. AB 32, and any plans, rules and programs approved to implement AB 32, could have a material adverse effect on how Mirant Americas Generation and Mirant North America operate their California facilities and the costs of operating the facilities.
In August 2008, Massachusetts adopted its Global Warming Solutions Act (the “Climate Protection Act”), which establishes a program to reduce greenhouse gas emissions significantly over the next 40 years. Under the Climate Protection Act, the Commonwealth of Massachusetts Department of Environmental Protection has established a reporting and verification system for statewide greenhouse gas emissions, including emissions from generating facilities producing all electricity consumed in Massachusetts, and determined the state’s greenhouse gas emissions level from 1990. The Massachusetts Executive Office of Energy and Environmental Affairs (“MAEEA”) is to establish statewide greenhouse gas emissions limits effective beginning in 2020 that will reduce such emissions from the 1990 levels by a range of 10% to 25% beginning in 2020, with the reduction increasing to 80% below 1990 levels by 2050. In setting these limits, the MAEEA is to consider the potential costs and benefits of various reduction measures, including emissions limits for electric generating facilities, and may consider the use of market-based compliance mechanisms. A violation of the emissions limits established under the Climate Protection Act may result in a civil penalty of up to $25,000 per day. Implementation of the Climate Protection Act could have a material adverse effect on how Mirant Americas Generation and Mirant North America operate their Massachusetts facilities and the costs of operating those facilities.
In April 2009, the Maryland General Assembly passed the Greenhouse Gas Emissions Reduction Act of 2009 (the “Maryland Act”), which will become effective in October 2009. The Maryland Act requires a reduction in greenhouse gas emissions in Maryland by 25% from 2006 levels by 2020. However, this provision of the Maryland Act is only in effect through 2016 unless a subsequent statutory enactment extends its effective period. The Maryland Act requires the MDE to develop a proposed implementation plan to achieve these reductions by the end of 2011 and to adopt a final plan by the end of 2012.
Various bills have been proposed in Congress to govern CO2 emissions from generating facilities. Also, in light of the United States Supreme Court ruling inMassachusetts v. EPA that greenhouse gases fit within the Clean Air Act’s definition of “air pollutant,” the EPA may also promulgate regulations regarding the emission of greenhouse gases. On April 17, 2009, the EPA issued a proposed determination under a portion of the Clean Air Act that regulates vehicles that greenhouse gases in the atmosphere endanger the public’s health and welfare through their contribution to climate change. The EPA has also proposed a rule that would require owners of facilities in many sectors of the economy, including power generation, to report annually to the EPA the quantity and source of greenhouse gas emissions released from those facilities in the preceding year. Neither of these proposals seek to restrict the emission of CO2, but Congress or the EPA will likely take action to regulate CO2 emissions within the next several years. The final form of such regulation will be influenced by political and
105
Table of Contents
economic factors and is uncertain at this time. Current proposals include a cap-and-trade system that would require us to purchase allowances for some or all of the CO2 emitted by our generating facilities. Although we expect that market prices for electricity would increase following such regulation and would allow us to recover most of the cost of these allowances, we cannot predict with any certainty the actual increases in costs such regulation could impose upon us or our ability to recover such cost increases through higher market rates for electricity, and such regulation could have a material adverse effect on our consolidated statements of operations, financial position or cash flows. Mirant Americas Generation and Mirant North America expect to produce approximately 16.3 million total tons of CO2 at their generating facilities in 2009. Mirant Mid-Atlantic expects to produce approximately 14.4 million total tons of CO2 at its generating facilities in 2009.
106
Table of Contents
Critical Accounting Estimates (Mirant Americas Generation, Mirant North America and Mirant Mid-Atlantic)
The sections below contain updates to our summary of critical accounting estimates included under Item 7, Management’s Discussion and Analysis of Results of Operations and Financial Condition, in our 2008 Annual Report on Form 10-K.
Revenue Recognition and Accounting for Energy Trading and Marketing Activities
Nature of Estimates Required. We utilize two comprehensive accounting models, an accrual model and a fair value model, in reporting our results of operations and financial position. We determine the appropriate model for our operations based on applicable accounting standards.
The accrual model is used to account for our revenues from the sale of energy, capacity and ancillary services. We recognize revenue when it has been earned and collection is probable as a result of electricity delivered to customers pursuant to contractual commitments that specify volume, price and delivery requirements. Sales of energy are based on economic dispatch, or they may be ‘as-ordered’ by an ISO or RTO, based on member participation agreements, but without an underlying contractual commitment. ISO and RTO revenues and revenues for sales of energy based on economic dispatch are recorded on the basis of MWh delivered, at the relevant day-ahead or real-time prices.
The fair value model is used to measure fair value on a recurring basis for derivative energy contracts that hedge economically our electricity generating facilities or that are used in Mirant Americas Generation’s and Mirant North America’s proprietary trading and fuel oil management activities. We use a variety of derivative financial instruments, such as futures, forwards, swaps and option contracts, in the management of our business. Such derivative financial instruments have varying terms and durations, or tenors, which range from a few days to a number of years, depending on the instrument.
Pursuant to SFAS 133, derivative financial instruments are reflected in our consolidated financial statements at fair value, with changes in fair value recognized currently in income unless they qualify for a scope exception. Management considers fair value techniques and valuation adjustments related to credit and liquidity to be critical accounting estimates. These estimates are considered significant because they are highly susceptible to change from period to period and are dependent on many subjective factors. The fair value of derivative financial instruments is included in derivative contract assets and liabilities in our condensed consolidated balance sheets. Transactions that are not accounted for using the fair value model under SFAS 133 are either not derivatives or qualify for a scope exception and are accounted for under accrual accounting. We recognize inception gains and losses, which are transacted at different prices between the bid price and the ask price, immediately in income.
Key Assumptions and Approach Used.Determining the fair value of our derivatives is based largely on observable quoted prices from exchanges and independent brokers in active markets. We think that these prices represent the best available information for valuation purposes. For most delivery locations and tenors where we have positions, we receive multiple independent broker price quotes. If no active market exists, we estimate the fair value of certain derivative financial instruments using price extrapolation, interpolation and other quantitative methods. We have not identified any distressed market conditions that would alter our valuation techniques at June 30, 2009. Fair value estimates involve uncertainties and matters of significant judgment. Our techniques for fair value estimation include assumptions for market prices, correlation and volatility. The degree of estimation increases for longer duration contracts, contracts with multiple pricing features, option contracts and off-hub delivery points. Note C to our unaudited condensed consolidated financial statements contained elsewhere in this report explains the fair value hierarchy. Mirant Americas Generation’s and Mirant North America’s assets and liabilities classified as Level 3 in the fair value hierarchy represent approximately 2% of their total assets and less than 1% of their total liabilities measured at fair value at June 30, 2009. Mirant Mid-Atlantic’s assets classified as Level 3 in the fair value hierarchy represented less than 1% of its total assets and its liabilities measured at fair value classified as Level 3 were inconsequential.
107
Table of Contents
The fair value of derivative contract assets and liabilities in our condensed consolidated balance sheets is also affected by our assumptions as to time value, credit risk and non-performance risk. The nominal value of the contracts is discounted using a forward interest rate curve based on LIBOR. In addition, the fair value of our derivative contract assets is reduced to reflect the estimated default risk of counterparties on their contractual obligations to us. The default risk of our counterparties for a significant portion of our overall net position is measured based on published spreads on credit default swaps. The fair value of our derivative contract liabilities is reduced to reflect our estimated risk of default on our contractual obligations to counterparties and is measured based on published default rates of our debt. The credit risk reflected in the fair value of our derivative contract assets and the non-performance risk reflected in the fair value of our derivative contract liabilities are calculated with consideration of our master netting agreements with counterparties and our exposure is reduced by cash collateral posted to us against these obligations.
Effect if Different Assumptions Used. The amounts recorded as revenue or cost of fuel, electricity and other products change as estimates are revised to reflect actual results and changes in market conditions or other factors, many of which are beyond our control. Because we use derivative financial instruments and have not elected cash flow or fair value hedge accounting under SFAS 133, certain components of our financial statements, including gross margin, operating income and balance sheet ratios, are at times volatile and subject to fluctuations in value primarily as a result of changes in energy and fuel prices. Significant negative changes in fair value could require us to post additional collateral either in the form of cash or letters of credit. Because the fair value measurements of our material assets and liabilities are based on observable market information, there is not a significant range of values around the fair value estimate. For our derivative financial instruments that are measured at fair value using quantitative pricing models, a significant change in estimate could affect our results of operations and cash flows at the time contracts are ultimately settled. See Item 3. “Quantitative and Qualitative Disclosures about Market Risk” for further sensitivities in our assumptions used to calculate fair value. See Note C to our unaudited condensed consolidated financial statements contained elsewhere in this report for further information on derivative financial instruments related to energy trading and marketing activities.
Asset Impairments
Nature of Estimates Required. We evaluate our long-lived assets, including intangible assets, for impairment in accordance with applicable accounting guidance. The amount of an impairment charge is calculated as the excess of the asset’s carrying value over its fair value, which generally represents the discounted expected future cash flows attributable to the asset, or, in the case of an asset we expect to sell, as its fair value less costs to sell.
SFAS 144 requires management to recognize an impairment charge if the sum of the undiscounted expected future cash flows from a long-lived asset or definite-lived intangible asset is less than the carrying value of that asset. We evaluate our long-lived assets (property, plant and equipment) and definite-lived intangible assets for impairment whenever indicators of impairment exist or when we commit to sell the asset. These evaluations of long-lived assets and definite-lived intangible assets may result from significant decreases in the market price of an asset, a significant adverse change in the extent or manner in which an asset is being used or in its physical condition, a significant adverse change in legal factors or in the business climate that could affect the value of an asset, as well as other economic or operational analyses. If the carrying amount is not recoverable, an impairment charge is recorded.
The continued decline in natural gas prices has caused power prices to continue to decline over the past year, thereby affecting the energy gross margin earned by our generating facilities. Additionally, the current economic recession and various demand-response programs have resulted in a decrease in the forecasted generation volumes of our generating facilities. On an ongoing basis, we evaluate our long-lived assets for indications of impairment; however, given the remaining useful lives for many of our generating facilities, the total undiscounted cash flows for these generating facilities are more significantly affected by the long-term view of supply and demand than by the short term fluctuations in energy prices and demand. As such, we typically do not consider short term decreases in either energy prices or demand to cause an impairment evaluation.
108
Table of Contents
Key Assumptions and Approach Used. The impairment evaluation is a two-step process, the first of which involves comparing the undiscounted cash flows to the carrying value of the asset. If the carrying value exceeds the undiscounted cash flows, the fair value of the asset must be calculated on a discounted basis. The fair value of an asset is the price that would be received from a sale of the asset in an orderly transaction between market participants at the measurement date. Quoted market prices in active markets are the best evidence of fair value and are used as the basis for the measurement, when available. In the absence of quoted prices for identical or similar assets, fair value is estimated using various internal and external valuation methods. These methods include discounted cash flow analyses and reviewing available information on comparable transactions. The determination of fair value requires management to apply judgment in estimating future capacity and energy prices, environmental and maintenance expenditures and other cash flows. Our estimates of the fair value of the assets include significant assumptions about the timing of future cash flows, remaining useful lives and the selection of a discount rate that reflects the risk inherent in future cash flows.
Mirant Bowline—Based on Mirant Americas Generation’s and Mirant North America’s current five-year forecast, Mirant Bowline is projected to operate at a net loss for the current year and to continue to have operating losses for the next several years. Therefore, Mirant Americas Generation and Mirant North America determined that their 1,139 MW Bowline generating facility should be evaluated for impairment in the second quarter. Mirant Americas Generation’s and Mirant North America’s estimates of the asset’s undiscounted future cash flows for purposes of their impairment analysis required significant judgments related to future property tax assessments of the asset. Mirant Americas Generation’s and Mirant North America’s estimates also included assumptions related to the future capacity and energy revenues their Bowline generating facility is projected to earn. Additionally, Mirant Americas Generation and Mirant North America assumed they would monetize excess emissions allowances by selling them. The sum of the probability weighted undiscounted cash flows through the facility’s estimated remaining useful life of 2027 exceeded the carrying value as of June 30, 2009. As a result, Mirant Americas Generation and Mirant North America did not record an impairment charge for the three and six months ended June 30, 2009. See Note D to our unaudited condensed consolidated financial statements contained elsewhere in this report for further information related to Mirant Americas Generation’s and Mirant North America’s impairment analysis of the Bowline generating facility.
Mirant Canal—Mirant Americas Generation’s and Mirant North America’s 1,126 MW Canal generating facility is located in the lower Southeastern Massachusetts (“SEMA”) load zone in the ISO-NE control area. ISO-NE previously has determined that, at times, it is necessary for the Canal generating facility to operate to meet local reliability criteria for SEMA when it is not economic for the Canal generating facility to operate based upon prevailing market prices. When the Canal facility operates to meet local reliability criteria, Mirant Americas Generation and Mirant North America are compensated at the price they bid into the ISO-NE, pursuant to ISO-NE market rules, rather than at the lower market price.
During the first half of 2009, NSTAR Electric completed two of three planned phases to upgrade the SEMA transmission system. These upgrades are expected to reduce the need for the Canal generating facility to operate to maintain local reliability. The final phase of these transmission upgrades is scheduled to be completed in September 2009. Mirant Americas Generation and Mirant North America are currently evaluating whether an impairment review of Canal is required in light of the effect of the transmission upgrades.
Mirant Potrero—Mirant Americas Generation’s and Mirant North America’s 362 MW Potrero generating facility continues to be subject to an RMR arrangement through 2009, which is renewable annually, based on the CAISO’s local reliability requirements. There are several projects underway in the San Francisco area to increase reliability for the region that once completed are expected to reduce and possibly eliminate the need for the Potrero generating facility to operate for reliability reasons. Among these projects is the TransBay Cable, which is an underwater cable in San Francisco Bay that is expected to decrease the need for generating resources in the City of San Francisco. While the TransBay Cable project has been long planned, it currently is expected to become operational by mid-2010. However, there is still uncertainty as to the timing of the completion of the TransBay cable, and until such time that the cable is operational, Potrero unit 3 will continue to be needed for
109
Table of Contents
reliability as determined by the CAISO. Mirant Americas Generation and Mirant North America will continue to monitor developments to assess whether an impairment review is required.
Effect if Different Assumptions Used. The estimates and assumptions used to determine whether an impairment exists are subject to a high degree of uncertainty. The estimated fair value of an asset would change if different estimates and assumptions were used in our applied valuation techniques, including estimated undiscounted cash flows, discount rates and remaining useful lives for assets held and used. If actual results are not consistent with the assumptions used in estimating future cash flows and asset fair values, we may be exposed to additional losses that could be material to our results of operations.
Litigation
See Note J to our unaudited condensed consolidated financial statements contained elsewhere in this report for further information related to our legal proceedings.
We are currently involved in certain legal proceedings. We estimate the range of liability through discussions with applicable legal counsel and analysis of case law and legal precedents. We record our best estimate of a loss, or the low end of our range if no estimate is better than another estimate within a range of estimates, when the loss is considered probable. As additional information becomes available, we reassess the potential liability related to our pending litigation and revise our estimates. Revisions in our estimates of the potential liability could materially affect our results of operations and the ultimate resolution may be materially different from the estimates that we make.
Recently Adopted Accounting Standards
See Note B to our unaudited condensed consolidated financial statements contained elsewhere in this report for further information related to our recently adopted accounting standards.
110
Table of Contents
| Item 3. | Quantitative and Qualitative Disclosures about Market Risk (Mirant Americas Generation, Mirant North America and Mirant Mid-Atlantic) |
We are exposed to market risk, primarily associated with commodity prices. We also consider risks associated with interest rates and credit when valuing our derivative financial instruments.
Mirant Americas Generation and Mirant North America
The estimated net fair value of our derivative contract assets and liabilities was a net asset of $898 million at June 30, 2009. The estimated net fair value of our derivative contract assets and liabilities was a net liability of $1.307 billion at June 30, 2008. The following tables provide a summary of the factors affecting the change in fair value of the derivative contract asset and liability accounts for the six months ended June 30, 2009 and 2008, respectively (in millions):
| Commodity Contracts | ||||||||||||
| Asset Management | Trading Activities | Total | ||||||||||
Fair value of portfolio of assets and liabilities at January 1, 2009 | $ | 549 | $ | 106 | $ | 655 | ||||||
Gains (losses) recognized in the period, net: | ||||||||||||
New contracts and other changes in fair value1 | 217 | (80 | ) | 137 | ||||||||
Roll off of previous values2 | (197 | ) | (54 | ) | (251 | ) | ||||||
Purchases, issuances and settlements3 | 283 | 74 | 357 | |||||||||
Fair value of portfolio of assets and liabilities at June 30, 2009 | $ | 852 | $ | 46 | $ | 898 | ||||||
| Commodity Contracts | ||||||||||||
| Asset Management | Trading Activities | Total | ||||||||||
Fair value of portfolio of assets and liabilities at January 1, 20084 | $ | (133 | ) | $ | 4 | $ | (129 | ) | ||||
Gains (losses) recognized in the period, net: | ||||||||||||
New contracts and other changes in fair value1 | (1,095 | ) | (39 | ) | (1,134 | ) | ||||||
Roll off of previous values2 | 57 | 10 | 67 | |||||||||
Purchases, issuances and settlements3 | (92 | ) | (19 | ) | (111 | ) | ||||||
Fair value of portfolio of assets and liabilities at June 30, 2008 | $ | (1,263 | ) | $ | (44 | ) | $ | (1,307 | ) | |||
| 1 | The fair value, as of the end of each quarterly reporting period, of contracts entered into during each quarterly reporting period and the gains or losses attributable to contracts that existed as of the beginning of each quarterly reporting period and were still held at the end of each quarterly reporting period. |
| 2 | The fair value, as of the beginning of each quarterly reporting period, of contracts that settled during each quarterly reporting period. |
| 3 | Denotes cash settlements during each quarterly reporting period of contracts that existed at the beginning of each quarterly reporting period. |
| 4 | Reflects our portfolio of derivative contract assets and liabilities at December 31, 2007, adjusted for a day one net gain of $1 million recognized upon adoption of SFAS 157 on January 1, 2008. |
111
Table of Contents
Mirant Mid-Atlantic
The estimated net fair value of our derivative contract assets and liabilities was a net asset of $772 million at June 30, 2009. The estimated net fair value of our derivative contract assets and liabilities was a net liability of $1.268 billion at June 30, 2008. The following tables provide a summary of the factors affecting the change in fair value of the derivative contract asset and liability accounts for the six months ended June 30, 2009 and 2008, respectively (in millions):
| Asset Management | ||||
Fair value of portfolio of assets and liabilities at January 1, 2009 | $ | 526 | ||
Gains (losses) recognized in the period, net: | ||||
New contracts and other changes in fair value1 | 147 | |||
Roll off of previous values2 | (188 | ) | ||
Purchases, issuances and settlements3 | 287 | |||
Fair value of portfolio of assets and liabilities at June 30, 2009 | $ | 772 | ||
| Asset Management | ||||
Fair value of portfolio of assets and liabilities at January 1, 20084 | $ | (150 | ) | |
Gains (losses) recognized in the period, net: | ||||
New contracts and other changes in fair value1 | (1,073 | ) | ||
Roll off of previous values2 | 66 | |||
Purchases, issuances and settlements3 | (111 | ) | ||
Fair value of portfolio of assets and liabilities at June 30, 2008 | $ | (1,268 | ) | |
| 1 | The fair value, as of the end of each quarterly reporting period, of contracts entered into during each quarterly reporting period and the gains or losses attributable to contracts that existed as of the beginning of each quarterly reporting period and were still held at the end of each quarterly reporting period. |
| 2 | The fair value, as of the beginning of each quarterly reporting period, of contracts that settled during each quarterly reporting period. |
| 3 | Denotes cash settlements during each quarterly reporting period of contracts that existed at the beginning of each quarterly reporting period. |
| 4 | Reflects our portfolio of derivative contract assets and liabilities at December 31, 2007, adjusted for a day one net gain of $3 million recognized upon adoption of SFAS 157 on January 1, 2008. |
The tables above do not include long-term coal agreements that are not required to be recorded at fair value under SFAS 133. As such, these contracts are not included in derivative contract assets and liabilities in the accompanying condensed consolidated balance sheets. As of June 30, 2009, these coal agreements had an estimated net fair value of approximately $(186) million. See “Long-Term Coal Agreement Risk” for further discussion later in this section.
We did not elect the fair value option for any financial instruments under SFAS 159. However, we do transact using derivative financial instruments, which are required to be recorded at fair value under SFAS 133 in our unaudited condensed consolidated balance sheets.
Counterparty Credit Risk
The valuation of our derivative contract assets is affected by the default risk of the counterparties with which we transact. Mirant Americas Generation and Mirant North America recognized a reserve, which is reflected as a reduction of their derivative contract assets, related to counterparty credit risk of $25 million and $52 million at June 30, 2009 and December 31, 2008, respectively. Mirant Mid-Atlantic recognized a reserve, which is reflected as a reduction of its derivative contract assets, related to counterparty credit risk of $24 million and $51 million at June 30, 2009 and December 31, 2008, respectively.
112
Table of Contents
We have historically calculated the credit reserve for all of our derivative contract assets considering our current exposure, net of the effect of credit enhancements, and potential loss exposure from the financial commitments in our risk management portfolio, and applied historical default probabilities using current credit ratings of our counterparties. In accordance with SFAS 157, we calculate the credit reserve through consideration of observable market inputs, when available. Our non-collateralized power hedges entered into by Mirant Mid-Atlantic with our major trading partners, which represent 65% of the net notional position for Mirant Americas Generation and Mirant North America and 68% of the net notional position for Mirant Mid-Atlantic at June 30, 2009, are senior unsecured obligations of Mirant Mid-Atlantic and the counterparties, and do not require either party to post cash collateral for initial margin or for securing exposure as a result of changes in power or natural gas prices. We calculate a credit reserve using published spreads on credit default swaps for our counterparties applied to our current exposure and potential loss exposure from the financial commitments in our risk management portfolio. Potential loss exposure is calculated as our current exposure plus a calculated VaR over the remaining life of the contracts. We apply a similar approach to calculate the fair value of our coal contracts that are not included in derivative contract assets and liabilities in the condensed consolidated balance sheets and which also do not require either party to post cash collateral for initial margin or for securing exposure as a result of changes in coal prices. We do not, however, transact in credit default swaps or any other credit derivative. An increase of 10% in the spread of credit default swaps of our major trading partners for our non-collateralized power hedges entered into by Mirant Mid-Atlantic would result in an increase of $2 million in the credit reserve of Mirant Americas Generation, Mirant North America and Mirant Mid-Atlantic as of June 30, 2009. An increase of 10% in the spread of credit default swaps of our coal suppliers would result in an increase of less than $1 million in the credit reserve of Mirant Americas Generation, Mirant North America and Mirant Mid-Atlantic related to long-term coal agreements that are not included in derivative contract assets and liabilities in the accompanying unaudited condensed consolidated balance sheets as of June 30, 2009.
The default risk for the remainder of the portfolio is generally offset by cash collateral or other credit enhancements. For the remainder of our risk management portfolio, we use published historical default probabilities to calculate a credit reserve applied to our current exposure, net of the effect of credit enhancements, and potential loss exposure from the financial commitments. Potential loss exposure is calculated as our current exposure plus a calculated five-day VaR. An increase in counterparty credit risk could affect the ability of our counterparties to deliver on their obligations to us. As a result, we may require our counterparties to post additional collateral or provide other credit enhancements. A downgrade of one notch in the average credit rating of our counterparties in this portion of the portfolio would result in an increase of $1 million in the credit reserve of Mirant Americas Generation and Mirant North America and no change in the credit reserve of Mirant Mid-Atlantic as of June 30, 2009. For Mirant Mid-Atlantic, the potential loss exposure does not include the effect of a credit downgrade on exposure with affiliates.
Once Mirant Americas Generation and Mirant North America have delivered a physical commodity or have financially settled the credit risk, they are subject to collection risk. Collection risk is similar to credit risk and collection risk is accounted for when we establish our provision for uncollectible accounts. We manage this risk using the same techniques and processes used in credit risk discussed above.
We also monitor counterparty credit concentration risk on both an individual basis and a group counterparty basis. See Note C to our unaudited condensed consolidated financial statements contained elsewhere in this report for further discussion of our counterparty credit concentration risk.
Mirant Americas Generation, Mirant North America and Mirant Mid-Atlantic Credit Risk
In valuing our derivative contract liabilities, we apply a valuation adjustment for non-performance, which is based on the probability of our default. We determine this non-performance adjustment value by multiplying our liability exposure, including outstanding balances for realized transactions, unrealized transactions and the effect of credit enhancements, by the one-year probability of our default based on the current credit ratings of the Companies. The one-year probability of default rate considers the tenor of our portfolio and the correlation of
113
Table of Contents
default between counterparties within our industry. The Companies non-performance adjustments related to their credit risk at June 30, 2009, were immaterial. A downgrade of one notch in the credit ratings of the Companies would have an immaterial effect on Mirant Americas Generation’s, Mirant North America’s or Mirant Mid-Atlantic’s unaudited condensed consolidated statement of operations as of June 30, 2009.
Broker Quotes
In determining the fair value of our derivative contract assets and liabilities, we use third-party market pricing where available. We consider active markets to be those in which transactions for the asset or liability occur in sufficient frequency and volume to provide pricing information on an ongoing basis. Our transactions in Level 1 of the fair value hierarchy primarily consist of natural gas and crude oil futures traded on the NYMEX and swaps cleared against NYMEX prices. For these transactions, we use the unadjusted published settled prices on the valuation date. Our transactions in Level 2 of the fair value hierarchy typically include non-exchange-traded derivatives such as OTC forwards, swaps and options. We value these transactions using quotes from independent brokers or other widely accepted valuation methodologies. Transactions are classified in Level 2 if substantially all (greater than 90%) of the fair value can be corroborated using observable market inputs such as transactable broker quotes. In accordance with the exit price objective under SFAS 157, the fair value of our derivative contract assets and liabilities is determined using bid prices for our assets and ask prices for liabilities. The quotes that we obtain from brokers are non-binding in nature, but are from brokers that typically transact in the market being quoted and are based on their knowledge of market transactions on the valuation date. We typically obtain multiple broker quotes on the valuation date for each delivery location that extend for the tenor of our underlying contracts. The number of quotes that we can obtain depends on the relative liquidity of the delivery location on the valuation date. If multiple broker quotes are received for a contract, we use an average of the quoted bid or ask prices. If only one broker quote is received for a delivery location and it cannot be validated through other external sources, we will assign the quote to a lower level within the fair value hierarchy. In some instances, we may combine broker quotes for a liquid delivery hub with broker quotes for the price spread between the liquid delivery hub and the delivery location under the contract. We also may apply interpolation techniques to value monthly strips if broker quotes are only available on a seasonal or annual basis. We perform validation procedures on the broker quotes at least on a monthly basis. The validation procedures include reviewing the quotes for accuracy and comparing them to our internal price curves. In certain instances, we may discard a broker quote if it is a clear outlier and multiple other quotes are obtained. At June 30, 2009, the Companies obtained broker quotes for 100% of their delivery locations classified in Level 2 of the fair value hierarchy.
Inactive markets are considered those markets with few transactions, non-current pricing or prices that vary over time or among market makers. Our transactions in Level 3 of the fair value hierarchy may involve transactions whereby observable market data, such as broker quotes, are not available for substantially all of the tenor of the contract or we are only able to obtain indicative broker quotes that cannot be corroborated by observable market data. In such cases, we may apply valuation techniques such as extrapolation to determine fair value. Proprietary models may also be used to determine the fair value of certain of our derivative contract assets and liabilities that may be structured or otherwise tailored. The degree of estimation increases for longer duration contracts, contracts with multiple pricing features, option contracts and off-hub delivery points. Our techniques for fair value estimation include assumptions for market prices, correlation and volatility. At June 30, 2009, Mirant Americas Generation’s and Mirant North America’s assets and liabilities classified as Level 3 in the fair value hierarchy represented approximately 2% of their total assets and less than 1% of their total liabilities measured at fair value. At June 30, 2009, Mirant Mid-Atlantic’s assets classified as Level 3 in the fair value hierarchy represented less than 1% of its total assets. At June 30, 2009, Mirant Mid-Atlantic’s liabilities measured at fair value classified as Level 3 were inconsequential. See Note C to our unaudited condensed consolidated financial statements contained elsewhere in this report for further explanation of the fair value hierarchy.
114
Table of Contents
Interest Rate Risk
Fair Value Measurement
We are also subject to interest rate risk when determining the fair value of our derivative contract assets and liabilities. The nominal value of our derivative contract assets and liabilities is also discounted to account for time value using a LIBOR forward interest rate curve based on the tenor of our transactions. An increase of 100 basis points in the average LIBOR rate would result in a decrease of $3 million to Mirant Americas Generation’s and Mirant North America’s derivative contract assets and a decrease of $2 million to Mirant Americas Generation’s and Mirant North America’s derivative contract liabilities at June 30, 2009. An increase of 100 basis points in the average LIBOR rate would result in a decrease of $2 million to Mirant Mid-Atlantic’s derivative contract assets and a decrease of $1 million to Mirant Mid-Atlantic’s derivative contract liabilities at June 30, 2009.
Debt (Mirant Americas Generation and Mirant North America)
Our debt that is subject to variable interest rates consists of the Mirant North America senior secured term loan and senior secured revolving credit facility. If both were fully drawn, the amount subject to variable interest rates would be approximately $1.1 billion and a 1% per annum increase in the average market rate would result in an increase in our annual interest expense of approximately $11 million.
Long-Term Coal Agreement Risk
As noted above, the credit concentration table excludes amounts related to contracts classified as normal purchases/normal sales, including our long-term coal agreements. We have non-performance risk associated with these agreements. There is risk that our coal suppliers may not provide the contractual quantities on the dates specified within the agreements or the deliveries may be carried over to future periods. If our coal suppliers do not perform in accordance with the agreements, we may have to procure coal in the market to meet our needs, or power in the market to meet our obligations. In addition, a number of the coal suppliers do not currently have an investment grade credit rating and, accordingly, we may have limited recourse to collect damages in the event of default by a supplier. We seek to mitigate this risk through diversification of coal suppliers and through guarantees. Despite this, there can be no assurance that these efforts will be successful in mitigating credit risk from coal suppliers. Non-performance or default risk by our coal suppliers could have a material adverse effect on our future results of operations, financial condition and cash flows.
For a further discussion of market risks, our risk management policy and our use of VaR to measure some of these risks, see Item 7A. “Quantitative and Qualitative Disclosures about Market Risk” in our 2008 Annual Report on Form 10-K.
115
Table of Contents
| Item 4. | Controls and Procedures (Mirant Americas Generation, Mirant North America and Mirant Mid-Atlantic) |
Effectiveness of Disclosure Controls and Procedures
As required by Exchange Act Rule 13a-15(b), our management, including our Chief Executive Officer and our Chief Financial Officer, conducted an assessment of the effectiveness of the design and operation of our disclosure controls and procedures (as defined by Rules 13a-15(e) and 15d-15(e) under the Exchange Act), as of June 30, 2009. Based upon this assessment, our management concluded that, as of June 30, 2009, the design and operation of these disclosure controls and procedures were effective.
Appearing as exhibits to this report are the certifications of the Chief Executive Officer and the Chief Financial Officer required in accordance with Section 302 of the Sarbanes-Oxley Act of 2002.
Changes in Internal Control over Financial Reporting
There have been no changes in the Companies’ internal control over financial reporting that have occurred during the six month period ended June 30, 2009, that have materially affected, or are reasonably likely to materially affect, the Companies’ internal control over financial reporting.
116
Table of Contents
PART II
| Item 1. | Legal Proceedings (Mirant Americas Generation, Mirant North America and Mirant Mid-Atlantic) |
See Note J to our unaudited condensed consolidated financial statements contained elsewhere in this report for discussion of the material legal proceedings to which we are a party.
| Item 1A. | Risk Factors (Mirant Americas Generation, Mirant North America and Mirant Mid-Atlantic) |
Part I, Item 1A. Risk Factors of our 2008 Annual Report on Form 10-K includes a discussion of our risk factors. There have been no material changes in our risk factors since those reported in our 2008 Annual Report on Form 10-K.
| Item 6. | Exhibits (Mirant Americas Generation, Mirant North America and Mirant Mid-Atlantic) |
| (a) | Exhibits. |
Exhibit No. | Exhibit Name | |
| 3.1 | Certificate of Formation for Mirant Americas Generation, LLC, filed with the Delaware Secretary of State on November 1, 2001 (Incorporated herein by reference to Exhibit 3.1 to Registrant’s Form 10-Q filed November 9, 2001) | |
| 3.2 | Amended and Restated Limited Liability Company Agreement for Mirant Americas Generation, LLC dated January 3, 2006 (Incorporated herein by reference to Exhibit 3.2 Registrant’s Form 10-Q filed November 13, 2006) | |
| 4.1 | Mirant Americas Generation agrees to furnish to the Securities and Exchange Commission, upon request, a copy of any instrument defining the rights of holders of long-term debt of Mirant Americas Generation and all of its consolidated subsidiaries for which financial statements are required to be filed with the Securities and Exchange Commission. | |
| 31.1A1* | Certification of the Chief Executive Officer Pursuant to 15 U.S.C. Section 7241, as adopted pursuant to Section 302 of the Sarbanes-Oxley Act of 2002 (Rule 13a-14(a)) | |
| 31.2A4* | Certification of the Chief Financial Officer Pursuant to 15 U.S.C. Section 7241, as adopted pursuant to Section 302 of the Sarbanes-Oxley Act of 2002 (Rule 13a-14(a)) | |
| 32.1A1* | Certification of the Chief Executive Officer Pursuant to 18 U.S.C. Section 1350, as adopted pursuant to Section 906 of the Sarbanes-Oxley Act of 2002 (Rule 13a-14(b)) | |
| 32.2A4* | Certification of the Chief Financial Officer Pursuant to 18 U.S.C. Section 1350, as adopted pursuant to Section 906 of the Sarbanes-Oxley Act of 2002 (Rule 13a-14(b)) | |
| * | Asterisk indicates exhibits filed herewith. |
117
Table of Contents
Exhibit No. | Exhibit Name | |
| 3.1 | Certificate of Formation of Mirant North America, LLC (Incorporated herein by reference to Exhibit 3.1 to Registrant’s Form S-4 filed June 5, 2006) | |
| 3.2 | Limited Liability Company Agreement of Mirant North America, LLC (Incorporated herein by reference to Exhibit 3.2 to Registrant’s Form S-4 filed June 5, 2006) | |
| 3.3 | Certificate of Incorporation of MNA Finance Corp. (Incorporated herein by reference to Exhibit 3.3 to Registrant’s Form S-4 filed June 5, 2006) | |
| 3.4 | Bylaws of MNA Finance Corp. (Incorporated herein by reference to Exhibit 3.4 to Registrant’s Form S-4 filed June 5, 2006) | |
| 4.1 | Mirant North America agrees to furnish to the Securities and Exchange Commission, upon request, a copy of any instrument defining the rights of holders of long-term debt of Mirant North America and all of its consolidated subsidiaries for which financial statements are required to be filed with the Securities and Exchange Commission. | |
| 31.1A2* | Certification of the Chief Executive Officer Pursuant to 15 U.S.C. Section 7241, as adopted pursuant to Section 302 of the Sarbanes-Oxley Act of 2002 (Rule 13a-14(a)) | |
| 31.2A5* | Certification of the Chief Financial Officer Pursuant to 15 U.S.C. Section 7241, as adopted pursuant to Section 302 of the Sarbanes-Oxley Act of 2002 (Rule 13a-14(a)) | |
| 32.1A2* | Certification of the Chief Executive Officer Pursuant to 18 U.S.C. Section 1350, as adopted pursuant to Section 906 of the Sarbanes-Oxley Act of 2002 (Rule 13a-14(b)) | |
| 32.2A5* | Certification of the Chief Financial Officer Pursuant to 18 U.S.C. Section 1350, as adopted pursuant to Section 906 of the Sarbanes-Oxley Act of 2002 (Rule 13a-14(b)) | |
| * | Asterisk indicates exhibits filed herewith. |
Exhibit No. | Exhibit Name | |
| 3.1 | Certificate of Formation of Southern Energy Mid-Atlantic, LLC (Incorporated herein by reference to Exhibit 3.1 to Registrant’s Form S-4 in Registration No. 333-61668) | |
| 3.2 | Amended and Restated Limited Liability Company Agreement of Mirant Mid-Atlantic, LLC, dated as of January 3, 2006 (Incorporated herein by reference to Exhibit 3.2 to Registrant’s Form 10-Q filed November 13, 2006) | |
| 4.1 | Mirant Mid-Atlantic agrees to furnish to the Securities and Exchange Commission, upon request, a copy of any instrument defining the rights of holders of long-term debt of Mirant Mid-Atlantic. | |
| 31.1A3* | Certification of the Chief Executive Officer Pursuant to 15 U.S.C. Section 7241, as adopted pursuant to Section 302 of the Sarbanes-Oxley Act of 2002 (Rule 13a-14(a)) | |
| 31.2A6* | Certification of the Chief Financial Officer Pursuant to 15 U.S.C. Section 7241, as adopted pursuant to Section 302 of the Sarbanes-Oxley Act of 2002 (Rule 13a-14(a)) | |
| 32.1A3* | Certification of the Chief Executive Officer Pursuant to 18 U.S.C. Section 1350, as adopted pursuant to Section 906 of the Sarbanes-Oxley Act of 2002 (Rule 13a-14(b)) | |
| 32.2A6* | Certification of the Chief Financial Officer Pursuant to 18 U.S.C. Section 1350, as adopted pursuant to Section 906 of the Sarbanes-Oxley Act of 2002 (Rule 13a-14(b)) | |
| * | Asterisk indicates exhibits filed herewith. |
118
Table of Contents
SIGNATURES
Pursuant to the requirements of the Securities Exchange Act of 1934, the registrant has duly caused this report to be signed on its behalf by the undersigned thereunto duly authorized.
| Mirant Americas Generation, LLC | ||||||
| Date: August 10, 2009 | By: | /s/ THOMAS E. LEGRO | ||||
| Thomas E. Legro | ||||||
| Senior Vice President and Controller | ||||||
| (Duly Authorized Officer and Principal Accounting Officer) | ||||||
Table of Contents
SIGNATURES
Pursuant to the requirements of the Securities Exchange Act of 1934, the registrant has duly caused this report to be signed on its behalf by the undersigned thereunto duly authorized.
| Mirant North America, LLC | ||||||
| Date: August 10, 2009 | By: | /s/ THOMAS E. LEGRO | ||||
| Thomas E. Legro | ||||||
| Senior Vice President and Controller | ||||||
| (Duly Authorized Officer and Principal Accounting Officer) | ||||||
Table of Contents
SIGNATURES
Pursuant to the requirements of the Securities Exchange Act of 1934, the registrant has duly caused this report to be signed on its behalf by the undersigned thereunto duly authorized.
| Mirant Mid-Atlantic, LLC | ||||||
| Date: August 10, 2009 | By: | /s/ THOMAS E. LEGRO | ||||
| Thomas E. Legro | ||||||
| Senior Vice President and Controller | ||||||
| (Duly Authorized Officer and Principal Accounting Officer) | ||||||