As filed with the Securities and Exchange Commission on March 25, 2013
| | UNITED STATES
SECURITIES AND EXCHANGE COMMISSION
Washington, DC 20549 |
| | FORM 20-F |
| (Mark one) |
| o | REGISTRATION STATEMENT PURSUANT TO SECTION 12(B) OR (G) |
| | OF THE SECURITIES EXCHANGE ACT OF 1934 |
| | OR |
| x | ANNUAL REPORT PURSUANT TO SECTION 13 OR 15(D) |
| | OF THE SECURITIES EXCHANGE ACT OF 1934 |
| | For the fiscal year ended December 31, 2012 |
| | OR |
| o | TRANSITION REPORT PURSUANT TO SECTION 13 OR 15(d) |
| | OF THE SECURITIES EXCHANGE ACT OF 1934 |
| | OR |
| o | SHELL COMPANY REPORT PURSUANT TO SECTION 13 OR 15(d) |
| | OF THE SECURITIES EXCHANGE ACT OF 1934 |
| | |
| | Commission file number: 001-34486 |
| | AVIVA PLC
(Exact Name of Registrant as Specified in its Charter) |
| | |
| | ENGLAND AND WALES
(Jurisdiction of Incorporation) |
| | |
| | St. Helen’s, 1 Undershaft
London EC3P 3DQ, England
(Address of Principal Executive Offices) |
| | |
| | David Rogers
Chief Accounting Officer
Aviva plc
St. Helen’s, 1 Undershaft
London EC3P 3DQ, England
+44 20 7662 8934 david.f.rogers@aviva.com
(Name, telephone, e-mail and/or facsimile number and address of company contact person)
Securities registered or to be registered pursuant to Section 12(b) of the Act: |
| Title of Each Class | Name of Each Exchange on Which Registered |
American Depositary Shares, each representing 2 Ordinary Shares,
25 pence par value each
Ordinary Shares 8.25% Capital Securities | New York Stock Exchange
New York Stock Exchange (for listing purposes only) New York Stock Exchange |
Securities registered or to be registered pursuant to Section 12(g) of the Act:
None
Securities for which there is a reporting obligation pursuant to Section 15(d) of the Act:
None
The number of outstanding shares of each of the issuer’s classes of capital or common stock as of December 31, 2012 was:
Ordinary Shares, 25 pence par value each 2,945,972,261
Indicate by check mark if the registrant is a well-known seasoned issuer, as defined in Rule 405 of the Securities Act.
If this report is an annual or transition report, indicate by check mark if the registrant is not required to file reports pursuant to Section 13 or 15(d) of the Securities Exchange Act of 1934.
Indicate by check mark whether the registrant: (1) has filed all reports required to be filed by Section 13 or 15(d) of the Securities Exchange Act of 1934 during the preceding 12 months (or for such shorter period that the registrant was required to file such reports) and (2) has been subject to such filing requirements for the past 90 days.
Indicate by check mark whether the registrant has submitted electronically and posted on its corporate website, if any, every Interactive Data file required to be submitted and posted pursuant to of this chapter) during the preceding 12 months (or for such shorter period that the registrant was required to submit and post such files).**
**This requirement does not apply to the registrant.
Indicate by check mark whether the registrant is a large accelerated filer, an accelerated filer, or a non-accelerated filer. See definition of "accelerated filer and large accelerated filer" in Rule 12b-2 of the Exchange Act. (Check one):
| Large accelerated filerx | Accelerated filero | Non-accelerated filero |
Indicate by check mark which basis of accounting the registrant has used to prepare the financial statements included in this filing:
| U.S. GAAPo | International Financial Reporting Standards as issued by the International Accounting Standards Boardx | Othero |
If ‘‘Other’’ has been checked in response to the previous question, indicate by check mark which financial statement item the registrant has elected to follow:
If this is an annual report, indicate by check mark whether the registrant is a shell company (as defined in Rule 12b-2 of the Exchange Act).
* Not for trading, but only in connection with the registration of American Depositary Shares.
Cross reference to Form 20-F
| | | | Page |
| Item 1. | Identity of Directors, Senior Management and Advisors | n/a |
| Item 2. | Offer Statistics and Expected Timetable | n/a |
| Item 3. | Key Information | |
| | A. | Selected financial data | 17,84-85,239 |
| | B. | Capitalisation and indebtedness | n/a |
| | C. | Reason for the offer and use of proceeds | n/a |
| | D. | Risk factors | 95-104 |
| Item 4. | Information on the Company | |
| | A. | History and development of the company | 3,5,18, 82 |
| | B. | Business overview | 2-16, 18-24, 25, 27-31, 89-94 |
| | C. | Organisational structure | 25-26 |
| | D. | Property, plants and equipment | 31 |
| Item 4A. | Unresolved Staff Comments | n/a |
| Item 5. | Operating and Financial Review and Prospects | |
| | A. | Operating results | 2-16 |
| | B. | Liquidity and capital resources | 33-35,85-88, 219-220 |
| | C. | Research and development, patents and licences, etc. | n/a |
| | D. | Trend information | 2-17,85, 239 |
| | E. | Off-balance sheet arrangements | 85 |
| | F. | Tabular disclosure of contractual arrangements | 32 |
| | G. | Safe harbour | ii |
| Item 6. | Directors, Senior Management and Employees | |
| | A. | Directors and senior management | 40-44 |
| | B. | Compensation | 64-80, 84, 197-202 |
| | C. | Board practices | 45-54, 57-59, 64-80 |
| | D. | Employees | 145, 256 |
| | E. | Share ownership | 72, 77-80,171-174 |
| Item 7. | Major Shareholders and Related Party Transactions | |
| | A. | Major Shareholders | 239 |
| | B. | Related Party Transactions | 84, 229, 237 |
| | C. | Interests of Experts and Counsel | n/a |
| Item 8. | A. | Financial information | 2-17, 84-85, 105--237 |
| | B. | Significant changes | 239 |
| Item 9. | The Offer and Listing | 239 |
| Item 10. | Additional Information | |
| | A. | Share capital | 82-83, 171, 175 |
| | B. | Articles of association | 248-252 |
| | C. | Material contracts | 5 |
| | D. | Exchange controls | 252 |
| | E. | Taxation | 253-254 |
| | F. | Dividends and paying agents | 255 |
| | G. | Statements by experts | n/a |
| | H. | Documents on display | 255 |
| | I. | Subsidiary information | n/a |
| Item 11. | Quantitative and Qualitative Disclosures about Market Risk | 33,95-98, 217-219 |
| Item 12. | Description of Securities Other Than Equity Securities | 255 |
| Item 13. | Defaults, Dividend Arrearages and Delinquencies | n/a |
| Item 14. | Material Modifications to the Rights of Security Holders and Use of Proceeds | n/a |
| Item 15. | Controls and Procedures | 256 |
| Item 16A. | Audit Committee Financial Expert | 57 |
| Item 16B. | Code of Ethics | 94 |
| Item 16C. | Principal Accountant Fees and Services | 59, 146-147 |
| Item 16D. | Exemptions from the Listing Standards for Audit Committees | n/a |
| Item 16E. | Purchases of Equity Securities by the Issuer and Affiliated Purchaser | 256 |
| Item 16F. | Change in Registrant’s Certifying Accountant | n/a |
| Item 16G. | Corporate Governance | 54 |
| Item 16H. | Mine Safety Disclosure | n/a |
| Item 17. | Financial Statements | n/a |
| Item 18. | Financial Statements | 105 – 237 |
| Item 19. | Exhibits | 262 |
| | | | |
| Glossary | | 259-260 |
| Signatures | | 261 |
Main contents
| In this Form 20-F | |
| Performance review | 1 |
| Governance | 37 |
| Shareholder information | 81 |
| Financial statements IFRS | 105 |
| Additional disclosures for SEC | 238 |
| Other information | 258 |
Forward looking statements
This Annual Report on Form 20-F may contain certain “forward-looking statements” with respect to certain of our plans, current goals and expectations relating to our future financial condition, performance, results, strategic initiatives and objectives. Statements containing the words “believes”, “intends”, “expects”, “plans”, “will”, “seeks”, “aims”, “may”, “could”, “outlook”, “target”, “goal”, “projects”, “estimates” and “anticipates”, and words of similar meaning, are forward-looking. By their nature, all forward-looking statements involve risk and uncertainty because they relate to future events and circumstances which are beyond our control. These forward-looking statements reflect our current views with respect to future events and because our business is subject to numerous risks, uncertainties and other factors, our actual future financial condition, performance and results may differ materially from those anticipated in our forward-looking statements and the differences could be significant.
All forward-looking statements address matters that involve risks and uncertainties. We believe that these factors include, but are not limited to, those set forth under “Financial and operating performance” and “Risks relating to our business” included in our most recent Annual Report on Form 20-F as filed with the SEC, with regard to trends, risk management, and exchange rates and with regard to the effects of changes or prospective changes in regulation, and the following:
| n | the impact of ongoing difficult conditions in the global financial markets and the economy generally; |
| n | the impact of simplifying our operating structure and activities; |
| n | the impact of various local political, regulatory and economic conditions; |
| n | market developments and government actions regarding the sovereign debt crisis in Europe; |
| n | the effect of credit spread volatility on the net unrealised value of the investment portfolio; |
| n | the effect of losses due to defaults by counterparties, including potential sovereign debt defaults or restructurings, on the value of our investments; |
| n | changes in interest rates that may cause policyholders to surrender their contracts, reduce the value of our portfolio and impact our asset and liability matching; |
| n | the impact of changes in equity or property prices on our investment portfolio; |
| n | fluctuations in currency exchange rates; |
| n | the effect of market fluctuations on the value of options and guarantees embedded in some of our life insurance products and the value of the assets backing their reserves; |
| n | the amount of allowances and impairments taken on our investments; |
| n | the effect of adverse capital and credit market conditions on our ability to meet liquidity needs and our access to capital; |
| n | a cyclical downturn of the insurance industry; |
| n | changes in or inaccuracy of assumptions in pricing and reserving for insurance business (particularly with regard to mortality and morbidity trends, lapse rates and policy renewal rates), longevity and endowments; |
| n | the impact of catastrophic events on our business activities and results of operations; |
| n | the inability of reinsurers to meet obligations or unavailability of reinsurance coverage; |
| n | increased competition in the UK and in other countries where we have significant operations; |
| n | the effect of the European Union’s “Solvency II” rules on our regulatory capital requirements; |
| n | the impact of actual experience differing from estimates used in valuing and amortising deferred acquisition costs (“DAC”) and acquired value of in-force business (“AVIF”); |
| n | the impact of recognising an impairment of our goodwill or intangibles with indefinite lives; |
| n | changes in valuation methodologies, estimates and assumptions used in the valuation of investment securities; |
| n | the effect of legal proceedings and regulatory investigations; |
| n | the impact of operational risks, including inadequate or failed internal and external processes, systems and human error or from external events; |
| n | risks associated with arrangements with third parties, including joint ventures; |
| n | funding risks associated with our participation in defined benefit staff pension schemes; |
| n | the failure to attract or retain the necessary key personnel; |
| n | the effect of systems errors or regulatory changes on the calculation of unit prices or deduction of charges for our unit-linked products that may require retrospective compensation to our customers; |
| n | the effect of a decline in any of our ratings by rating agencies on our standing among customers, broker-dealers, agents, wholesalers and other distributors of our products and services; |
| n | changes to our brand and reputation; |
| n | changes in government regulations or tax laws in jurisdictions where we conduct business; |
| n | the inability to protect our intellectual property; |
| n | the effect of undisclosed liabilities, integration issues and other risks associated with our acquisitions; and |
| n | the timing, regulatory approval and impact and other uncertainties relating to announced acquisitions and pending disposals and relating to future acquisitions, combinations or disposals within relevant industries. |
The foregoing review of important factors should not be construed as exhaustive and should be read in conjunction with the other cautionary statements that are included in this Annual Report.
You should not place undue reliance on forward-looking statements. Each forward-looking statement speaks only as of the date hereof. Except as required by the Financial Services Authority, the London Stock Exchange plc or applicable law, we do not intend to, and undertake no obligation to (and expressly disclaim any such obligations to), update publicly or revise any forward-looking statement as a result of new information, future events or otherwise. In light of these risks, our results could differ materially from the forward-looking statements contained in this Annual Report. We may also make or disclose written and/or oral forward-looking statements in reports filed or furnished to the US Securities and Exchange Commission (“SEC”), our annual report and accounts to shareholders, proxy statements, offering circulars, registration statements and prospectuses, press releases and other written materials and in oral statements made by our directors, officers or employees to third parties, including financial analysts.
Performance review
| In this section | |
| Financial and operating performance | 2 |
| Selected consolidated financial data | 17 |
| Information on the company | 18 |
| Organisational structure | 25 |
| Analysis of investments | 27 |
| Contractual obligations | 32 |
| Risk and capital management | 33 |
| Basis of preparation | 36 |
Financial and operating performance
Financial performance overview
Overview
We have made good progress improving our capital strength and narrowing the Group’s focus so that we now operate in materially fewer countries.
The agreed sale of the US business has been a main contributor to a loss before tax of £2.7 billion. Operating performance is broadly in line with the previous year, but with higher restructuring costs as we transform the company.
We have seen improvements in profitability of new business, cash flows to Group and good levels of operating capital generation. The economic capital position has significantly improved but, as a result of the disposals we have made, leverage has increased. We have also taken action to simplify the group’s corporate structure, formalising the inter-divisional balance into a loan of which we will pay down £600 million over the next three years.
Financial strength
The number one priority in 2012 was to improve Aviva’s IGD and economic capital solvency surplus position. During the year we have taken a number of management actions and this, combined with market movements, means that our IGD and economic capital solvency surpluses1, 2, have improved significantly.
We have simplified our portfolio of businesses and as a result Aviva will operate in 18 countries, from 30 three years ago. These changes, including the announced sales of Aviva USA and Delta Lloyd and the settlement of our agreement to transfer Aseval to Bankia in Spain, will result in a positive movement in our economic capital. Including the effect of these transactions, the estimated economic capital surplus would improve to £7.1 billion with a coverage ratio of 172% as at 31 December 2012(2011: £3.6 billion; 130% coverage). In addition, we have now made the calculation more prudent to now include the pension deficit funding on a 10 year basis (previously five year basis). The IGD solvency surplus has improved to £3.8 billion as at 31 December 2012(2011: £2.2 billion).
At the end of February 2013, including the effect of the transactions noted above, our estimated economic capital coverage ratio was 175%.
We also took a number of steps to reduce the volatility of our capital position. In July we reduced our holding in Delta Lloyd from 41% to just under 20% and in January 2013 we sold our remaining stake.
Over the course of the year we also reduced our exposure to Italian sovereign debt with a gross sell down of €6.5 billion3this year from our shareholder and participating funds. After taking into account market movements and new business, the value of our net direct shareholder and participating fund holdings (net of NCI) in Italian sovereign debt is now £4.9 billion(2011: £6.4 billion) of which net direct shareholder exposure is £0.4 billion. Of the £4.9 billion Italian sovereign debt 74% is held in Italy.
Loss before tax
The overall result for the year was a loss before tax of £2.7 billion(2011: profit before tax £87 million).
The largest driver of the overall loss is the agreed sale of our US business. At HY12 we recognised an impairment of goodwill and intangibles of £0.9 billion related to that business, and at the full year we recognised a further impairment of £2.4 billion.This was partially offset by positive investment variances of £0.3 billion.
For continuing operations, the profit before tax was £25 million. Drivers of this profit before tax are adjusted operating profits offset by integration and restructuring costs of £461 million, primarily reflecting the execution of the transformation plan; adverse investment variances of £634 million; net adverse pre-tax non-operating items in Delta Lloyd of £411 million (principally relating to movements in the Delta Lloyd Group curve), and loss on disposals of £164 million and other goodwill and intangible impairments of £188 million.
Total earnings per share was negative 113.1p(2011: 5.8p) reflecting the loss on the sale of the US business.
Cash flows
Aviva increased the amount of cash remittances from the businesses to Group to £0.9 billion in 2012(2011: £0.8 billion).France resumed dividend payments to Group and management actions in UK Life led to a significant increase in cash remitted to Group.
The following table shows dividends paid to Group by business units.
| | Received in
2012
(£m) | |
| Total by country | | Dividend | |
| UK Life | | | 150 | |
| UK GI | | | 150 | |
| France | | | 202 | |
| Canada | | | 136 | |
| Poland | | | 70 | |
| Spain | | | 68 | |
| Singapore | | | 17 | |
| Italy | | | 0 | |
| Ireland | | | 0 | |
| Other* | | | 151 | |
| Total | | | 944 | |
*includes Aviva Re, US and Delta Lloyd
We continue to take a number of actions on capital efficiency and our corporate structures to increase cash remittances going forward.
Changes to Aviva’s capital structure
We are taking action to reduce the complexity of the balance sheet and reduce internal leverage. Prior to 2013 in the Group’s corporate structure, AIL (Aviva Insurance Limited) was both the underwriting company for the UK General Insurance business and the holding company for the majority of the Group’s overseas subsidiaries. Prior to 2013 an inter-divisional loan balance of around £5 billion was in place between the UK General Insurance business and the Group and this was used over a number of years to purchase overseas subsidiaries and for other general corporate purposes.
This structure was complex from a corporate governance point of view; created the potential for dividend traps and made demonstrating that Aviva has appropriate resolution arrangements in place (a key requirement of the PRA/FSA) more difficult. A more straightforward structure has now been put in place with two separate legal entities — Aviva Group Holdings Ltd (as holding company) and Aviva Insurance Limited (as the general insurance underwriting company). As a result of this change the inter-divisional balance between the Group and UK General Insurance will be formalised into an interest bearing loan of around £5.8 billion between AGH and AIL. We have decided to reduce the size of this loan balance and will pay down £600 million in total over the next three years.
As a result of this change, which the FSA are supportive of, our corporate structure will be more transparent, the Group will have direct ownership of overseas subsidiaries and the exposure of our UK general insurance business to these will be reduced over time.
| 1 | The economic capital surplus represents an estimated unaudited position. The capital requirement is based on Aviva’s own internal assessment and capital management policies. The term ‘economic capital’ does not imply capital as required by regulators or other third parties. Pension scheme risk is allowed for through ten years of stressed contributions. |
| 2 | Economic capital surplus shows the estimated risk adjusted capital position of the Group. This metric does not relate and cannot be reconciled to IFRS GAAP |
| 3 | Gross of non-controlling interests (NCI), purchases and redemptions. |
Financial and operating performance
Our main activities are the provision of products and services in relation to long-term insurance and savings, fund management and general insurance.
Factors affecting results of operations
Our financial results are affected, to some degree, by a number of external factors, including demographic trends, general economic and market conditions, government policy and legislation and exchange rate fluctuations. See ‘Performance review – Risk and capital management’ and ‘Shareholder Information – Risks relating to our business’ for more information on these and other risk factors. In addition, our financial results are affected by corporate actions taken by the Group, including acquisitions, disposals and other actions aimed at achieving our stated strategy. We believe that all of these factors will continue to affect our results in the future.
Group restructuring
During the year, the Group undertook the following actions which impacted the overall results and performance:
| n | The Group changed its organisational reporting structure, and the Group’s operating segments were changed to align them with this revised structure. Further details of the reportable segments are given in ‘Financial statements – note 4 – Segmental information’. |
| n | The Group undertook restructuring and transformation activity to align our business operations with our strategy, including the Group’s Simplify programme. Integration and restructuring costs of £468 million (2011: £268 million) include Simplify costs of £165 million, Ireland transformation costs (including the merger of the UK and Ireland businesses) of £130 million, £24 million in relation to the transformation of Aviva Investors, £30 million in respect of other restructuring activities and £119 million relating to the cost of preparing the businesses for the implementation of Solvency II. |
| n | The Group also announced a number of disposals during the year, including the Group’s US life and related internal asset management businesses (‘US Life’) which have been classified as discontinued operations for reporting of financial performance, and held for sale in the statement of financial position. |
As a result of the held for sale classification, US Life has been written down to fair value less costs to sell which is the main driver for the loss from discontinued operations of £2,848 million and the Group’s loss for the year of £3,050 million. Further details are given in ‘Financial statements – note 3 – Subsidiaries’.
Demographic trends
Our results are affected by the demographic make-up of the countries in which we operate. The types of products that we sell reflect the needs of our customers. For example, in countries with a high proportion of older people, a larger proportion of our sales will reflect their needs for pre- and post-retirement planning. Our sales levels will also be impacted by our ability to help provide useful information to such policyholders on retirement planning and to offer products that are competitive and respond to such policyholders’ needs.
In our long-term insurance and savings business we make assumptions about key non-economic factors, such as the mortality rate that we expect to be experienced by our policyholders. In countries where the life expectancy is growing, this will need to be reflected in our pricing models as lower mortality rates will increase profitability of life insurance products but will reduce the returns on annuity products. We review our assumptions against our own experience and industry expectations.
Economic conditions
Our results are affected by the economic conditions in our geographic markets and, consequently, by economic cycles in those markets. High levels of general economic activity typically result in high levels of demand for, and sales of, our products and services. Economic activity in turn is affected by government monetary and fiscal policy as well as by global trading conditions and external shocks such as terrorist activity, war and oil price movements.
During 2012, conditions remained challenging with continued concerns over levels of sovereign debt within the eurozone. Towards the year end, market sentiment started to improve which saw improvements in credit spreads. However, the challenging conditions in the economies of major European markets (including the UK) has led to lower demand for savings products. During 2011, concerns over slowing economic growth, higher levels of sovereign debt within, and to a lesser degree outside the eurozone, the stability and solvency of financial institutions, longer-term low interest rates in developed markets, inflationary threats as well as geopolitical issues contributed to increased volatility in the financial markets. The continued market volatility across global financial markets saw customers reassert their preference for less complex products and reduce their exposure to investment markets.
The European economies where the Group has operations were impacted in 2012 by forecast low or negative growth including: UK (-0.1%)4; France (0.2%)1; Spain (-1.3%)1; and Italy (-2.2%)1.
Capital and credit market conditions
An important part of our business involves investing client, policyholder and shareholder funds across a wide range of financial investments, including equities, fixed income securities and properties. Our results are sensitive to volatility in the market value of these investments, either directly because we bear some or all of the investment risk, or indirectly because we earn management fees for investments managed on behalf of policyholders. Investment market conditions also affect the demand for a substantial portion of our life insurance products. In general, rising equity price levels have a positive effect on the demand for equity-linked products, such as unit trusts and unit-linked life insurance products, and conversely have a negative effect on the demand for products offering fixed or guaranteed minimum rates of return. Declining equity price levels tend to have the opposite effects.
During 2012, the challenging conditions continued to impact the Group’s performance. The total long-term business investment return variance was negative £278 million(2011: £1,616million negative).
For continuing operations, negative long-term business investment variances of £620 million (2011: £897 million negative) mainly relates to the UK. This is mainly due to increasing the allowance for credit defaults on UK commercial mortgages to reflect uncertainty in the macro-economic environment, and the cost of de-risking activity. Elsewhere, positive variances in Spain and France were offset by a negative variance in Italy.
For 2011, the adverse life investment variances of £897 million related largely to the impact of lower risk-free interest rates, wider credit spreads and increased market volatility in the UK and Europe.
4 http://www.oecd-ilibrary.org/economics/real-gross-domestic-product-forecasts_gdp-kusd-gr-table-en
The positive variance of £342 million for discontinued operations relates to the US, driven by reductions in interest rates and credit spreads and the impact of favourable equity market performance on embedded derivatives. The prior period negative variance(2011: £719 million negative) includes the result for Delta Lloyd up to the partial disposal on 6 May 2011 of £820 million negative.
With-profits business
We write products through our with-profits funds mainly in our UK & Ireland operating segment, with a small fund in Singapore. These funds enable policyholders to participate in a large pool of diverse investments, therefore reducing their exposure to individual securities or asset classes. The investment pool is managed by us with returns to with-profits policyholders paid through bonuses which are added to the value of their policy. In order to provide an element of stability in the returns to policyholders, bonuses are designed to reduce policyholders’ exposure to the volatility of investment returns over time and to provide an equitable share of surplus earned, depending on the investment and operating performance of the fund. Shareholders also have a participating interest in the with-profits funds and any declared bonuses. Generally, policyholder and shareholder participation in with-profits funds in the UK is split 90:10.
Shareholders’ profits arising on with-profits business under IFRS depend on the total bonuses declared to policyholders on an annual basis.
The level of bonuses declared to policyholders is influenced by the actual returns on investments and our expectation of future rates of return. Whilst bonuses can never be negative, a predicted sustained fall in equity markets could lead to a reduction in regular and final bonus rates, thereby reducing both policyholder returns and shareholders’ profit under IFRS. In 2011, low investment returns and the difficult economic outlook led to reductions in regular and final bonus rates. Better investment performance in 2012 meant that we have been able to increase the majority of final bonus rates.
General insurance and health underwriting cycle
Our general insurance and health business is comprised of our property and casualty insurance and health insurance operations. In 2012, general insurance and health sales accounted for 42% of Group net written premiums (“NWP”) from continuing operations. Demand for general insurance is usually price-sensitive because of the limited degree of product differentiation inherent in the industry. As a result, the price of insuring property and casualty risks is subject to a cycle (called an underwriting cycle). In periods when the price of risk is high, the high profitability of selling insurance attracts new entrants and hence new capital into the market. Increased competition, however, drives prices down. Eventually the business becomes uneconomic and some industry players, suffering from losses, exit the market whilst others fail, resulting in lower capital invested within the market. Decreased competition leads to increasing prices, thereby repeating the cycle. Our various general insurance markets are not always at the same stage of the underwriting cycle.
In the UK, the personal motor market has seen rate reductions in 2012 reflecting intense competition and regulatory change. This follows a period of rate increases in previous periods in response to rising claims costs and frequencies. Challenging rating conditions also apply to other UK classes of business.
We expect the underwriting cycle to continue in the future but to be less pronounced than in the past because of structural changes to the industry over the past decade. Capital markets are imposing financial discipline by being increasingly more demanding about performance from insurance companies before extending new capital. Such discipline, together with the increased concentration of competitors within the market, recent natural disasters and the adoption of more advanced pricing methods, is expected to make the underwriting cycle less pronounced in the future.
Natural and man-made disasters
Our general insurance and health business results are affected by the amount of claims we need to pay out which, in turn, can be subject to significant volatility depending on many factors, including natural and man-made disasters. Natural disasters arise from adverse weather, earthquakes and other such natural phenomena. Man-made disasters include accidents and intentional events, such as acts of terrorism. These events are difficult to predict with a high degree of accuracy, although they generally occur infrequently at a material level. Our exposure to large disasters is somewhat reduced through our focus on personal lines business and small to medium sized commercial risks in the general insurance business. The Group cedes much of its worldwide catastrophe risk to third-party reinsurers but retains a pooled element for its own account gaining diversification benefit. See ‘Financial statements IFRS – Note 53 – Risk management’.
In 2012, the UK and Ireland were impacted by flood losses and France by a severe freeze. In 2011, France and Ireland were impacted by storm and flood losses and Canada incurred losses from a wildfire in Slave Lake.
Government policy and legislation
Changes in government policy and legislation applicable to our business in many of the markets in which we operate, particularly in the UK, may affect the results of our operations. These include changes to the tax treatment of financial products and services, government pension arrangements and policies, the regulation of selling practices and the regulation of solvency standards. Such changes may affect our existing and future business by, for example, causing customers to cancel existing policies, requiring us to change our range of products and services, forcing us to redesign our technology, requiring us to retrain our staff or increase our tax liability. As a global business, we are exposed to various local political, regulatory and economic conditions, and business risks and challenges which may affect the demand for our products and services, the value of our investments portfolio and the credit quality of local counterparties. Our regulated business is subject to extensive regulatory supervision both in the UK and internationally. For details please refer to the section ‘Shareholder information – Regulation’.
Exchange rate fluctuations
We publish our consolidated financial statements in pounds sterling. Due to our substantial non-UK operations, a significantportion of our operating earnings and net assets are denominated in currencies other than sterling, most notably the euro and the US dollar. As a consequence, our results are exposed to translation risk arising from fluctuations in the values of these currencies against sterling. Total foreign currency translation recognised in the income statement was a gain of £128 million (2011: £35 million loss).
We generally do not hedge foreign currency revenues, as we prefer to retain revenue locally in each business to support business growth, to meet local and regulatory market requirements and to maintain sufficient assets in local currency to match local currency liabilities.
Movements in exchange rates may affect the value of consolidated shareholders’ equity, which is expressed in sterling. Exchange differences taken to other comprehensive income arise on the translation of the net investment in foreign subsidiaries, associates and joint ventures. This aspect of foreign exchange risk is monitored centrally against limits that we have set to control the extent to which capital deployment and capital requirements are not aligned. We use currency borrowings and derivatives when necessary to keep currency exposures within these predetermined limits, and to hedge specific foreign exchange risks when appropriate; for example, in any acquisition or disposal activity.
During 2012, sterling strengthened in value against the euro and marginally strengthened against the dollar, resulting in a foreign currency loss in other comprehensive income from continuing operations of £200 million(2011:£284 million loss).
The impact of these fluctuations is limited to a significant degree, however, by the fact that revenues, expenses, assets and liabilities within our non-UK operations are generally denominated in local currencies.
Acquisitions and disposals
Over the last two years we have completed and announced a number of transactions, some of which have had a material impact on our results. These transactions reflect our strategic objectives of narrowing our focus to businesses where we can produce attractive returns and exit businesses which we do not consider central to our future growth.
Activity in 2012
In March Aviva’s distribution arrangement with Allied Irish Bank (“AIB”) for long term business ceased and the bancassurance partnership with AIB is being unwound. A strategic review is underway to determine the most effective distribution channels going forward.
In July the Group sold 37.2 million shares in Delta Lloyd for £313 million (net of transaction costs), reducing our holding to 19.8% of Delta Lloyd’s ordinary share capital, representing 18.6% of shareholder voting rights. As the Group no longer had significant influence over Delta Lloyd, we ceased to account for that company as an associate from 5 July 2012. Subsequent to the 2012 year end we disposed of our entire remaining holding.
In July, the Group sold its life businesses in the Czech Republic, Hungary and Romania to MetLife Inc., for £37 million. The sale of our Romania pensions business is still subject to regulatory approval and is expected to complete later in 2013.
In December we sold our controlling 58.4% interest in AVIVA NDB Holdings Lanka to a subsidiary of AIA group for a consideration of £31 million.
On 18 December we reached an agreement with Bankia S.A. to transfer our holding in our Spanish joint venture Aseval to Bankia for £494 million. The transfer is subject to regulatory approval and is expected to be completed no later than 30 April 2013. Due to the announced sale, Aseval has been treated as held for sale at the balance sheet date.
During the year the Group entered into negotiations to dispose of Aviva ZAo, its Russian long-term business subsidiary, and the requirements for that business to be classified as held for sale were met. The disposal of the business was announced in February 2013 for consideration of €35 million and is expected to complete in the first half of 2013.
In December 2012 the Group announced the disposal of its US life and related internal fund management business to Athene Holding Ltd for £1.0 billion, including the shareholder loan.
There is uncertainty in the ultimate consideration received, which depends on changes in statutory surplus which would be taken into account in a purchase price adjustment mechanism. The transaction agreement includes customary representations, warranties and indemnities from Aviva plc as the seller. The transaction is currently anticipated to complete in 2013, subject to closing conditions including approvals by insurance regulators in Iowa and New York and by other insurance and non-insurance regulatory authorities. As a result of this announcement the results of the business for 2012 and comparative periods have been classified as a discontinued operation and it is held for sale at the balance sheet date.
Further details can be found in the section ‘Financial statements IFRS – Note 3 –Subsidiaries’.
Subsequent events
In January 2013, we announced the sale of our 49% stake in CIMB Aviva Assurance Berhad and CIMB Aviva Takaful Berhad (together “CIMB-Aviva”) to Sun Life Assurance Company of Canada for a consideration of £152 million. Further details can be found in ‘Financial statements IFRS – Note 3c –Subsidiaries’ and ‘Financial statements – Note 15 – Interests in, and loans to, joint ventures’.
On 8 January 2013, we sold the remainder of our stake in Delta Lloyd at €12.65 per share resulting in total cash proceeds for Aviva of £353 million.
As noted above, on 27 February we announced the sale of our Russian Life business.
On 8 March 2013 we completed the transaction with AIB. Further details can be found in, ‘Financial statements IFRS – note 3 – Subsidiaries’.
Activity in 2011
On 6 May 2011, the Group sold 25 million shares in Delta Lloyd reducing our holding to 42.7% (41.9% as at 31 December 2011) of Delta Lloyd's ordinary share capital, representing 40% (39.3% as at 31 December 2011) of shareholder voting rights. Accordingly, the Group ceased to consolidate the results of Delta Lloyd in its financial statements. Cash consideration of £380 million was received for the sale of shares, and £8 million of costs were attributable to the disposal transaction. The transaction resulted in the loss of control of a major geographical area of operations, previously presented as 'Delta Lloyd' in the segmental reporting note. The results of Delta Lloyd as a subsidiary for 2011 as well as those for the comparative periods were therefore classified as discontinued operations. The Group’s share of the profits of its retained interest in Delta Lloyd as an associate are shown separately within continuing operations.
On 30 September 2011, the Group sold RAC Limited (“RAC”) to The Carlyle Group for £977 million, realising a profit of £532 million. Aviva is continuing its commercial relationship with RAC, both as a key underwriter of motor insurance on RAC’s panel and as a partner selling RAC breakdown cover to our customers. The Group has retained the RAC (2003) Pension Scheme which, at 31 December 2011, had an IAS 19 deficit of £51 million.
On 1 October 2011, the Group sold its Australian fund management business, Aviva Investors Australia Ltd, to nabInvest, National Australia Bank’s direct asset management business, for £35 million, which included contingent consideration with a fair value of £3 million. This resulted in a profit on disposal of £20 million, increased to £23 million after recycling £3 million from currency translation reserve to the income statement.
Activity in 2010
On 17 February 2010, we sold our 35% holding in Sogessur SA to that company’s main shareholder for a consideration of £35 million, realising a profit on disposal of £24 million. On 24 February 2010, we acquired 100% of River Road Asset Management, a US equity manager, to support the expansion of Aviva Investors’ third-party institutional asset management business. The total consideration was estimated as £83 million (US$128 million).
On 31 December 2010, the Group entered into transactions with RBS Group plc (RBSG) and agreed that, with effect from 31 December 2010, the Group would take ownership of the back book of RBS Life in exchange for RBSG taking 100% ownership of RBS Collective. Separately, a new distribution agreement was signed between our UK Life business and RBSG, with the new structure providing more flexibility in our long-term business operations.
Basis of earnings by line of business
Our earnings originate from three main lines of business: our long-term insurance and savings business, which includes a range of life insurance and savings products; general insurance and health, which focuses on personal and commercial lines; and fund management, which manages funds on behalf of our long-term insurance and general insurance businesses, external institutions, pension funds and retail clients. These lines of business are present in our various operating segments to a greater or lesser extent.
In the UK, we have major long-term insurance and savings businesses and general insurance businesses; in Europe we have long-term insurance and savings businesses in all countries in which we operate, large general insurance businesses in France, Ireland and Italy, and smaller general insurance operations in several other countries; in Canada we have a leading general insurance operation; in Asia we predominantly have long-term insurance and savings businesses. Our fund management businesses operate across Europe, Asia, North America and the UK.
Long-term insurance and savings business
For most of our life insurance businesses, such as those in the UK and France, operating earnings are generated principally from our in-force books of business. Our in-force books consist of business written in prior years and on which we continue to generate profits for shareholders. Nevertheless new business written in these markets, with the exception of our UK with-profits business which is discussed below, has a significant direct effect on our operating earnings. Under IFRS, certain costs incurred in acquiring new business must be expensed thereby typically giving rise to a loss in the period of acquisition, though the degree of this effect will depend on the pricing structure of product offerings. In certain higher growth markets, current year sales have a more significant effect on current year operating earnings.
UK with-profits business
With-profits products are designed to pay policyholders smoother investment returns through a combination of regular bonuses and final bonuses. Shareholders’ profit emerges from this business in direct proportion to policyholder bonuses, as shareholders receive up to one-ninth of the value of each year’s bonus declaration to policyholders. Accordingly, the smoothing inherent in the bonus declarations provides for relatively stable annual shareholders’ profit from this business. The most significant factors that influence the determination of bonus rates are the return on the investments of the with-profits funds and expectations about future investment returns. Actual and expected investment returns are affected by, among other factors, the mix of investments supporting the with-profits fund, which in turn is influenced by the extent of the inherited estate within the with-profits fund.
The annual excess of premiums and investment return over operating expenses, benefit provisions and claims payments within our with-profits funds that are not distributed as bonuses and related shareholders’ profit is transferred from the income statement to the unallocated divisible surplus. Conversely, if a shortfall arises one year, for example because of insufficient investment return, a transfer out of the unallocated divisible surplus finances bonus declarations and related shareholders’ profit.
The unallocated divisible surplus consists of future (as yet undetermined) policyholder benefits, associated shareholders’ profit and the orphan estate. The orphan estate serves as working capital for our with-profits funds. It affords the with-profits fund a degree of freedom to invest a substantial portion of the funds’ assets in investments yielding higher returns than might otherwise be obtainable without being constrained by the need to absorb the cash-flow strain of writing large volumes of new business and the need to demonstrate solvency.
Other participating business
Outside of the UK, most of our long-term operations write participating business. This is predominantly savings or pensions business, where the policyholders receive guaranteed minimum investment returns, and additional earnings are shared between policyholders and shareholders in accordance with local regulatory and policy conditions. This may also be referred to as ‘with-profits’ business.
Other long-term insurance and savings business
Non-profit business falls into two categories: investment type business and risk cover and annuity business. Investment type business, which accounts for most of our non-profit business, includes predominantly unit-linked life and pensions business where the risk of investing policy assets is borne entirely by the policyholder. In addition, investment type business includes life and pensions business where the risk of investing policy assets is typically shared between policyholders and shareholders, subject to a minimum rate of investment return guaranteed to policyholders. Operating earnings arise from unit-linked business when fees charged to policyholders based on the value of the policy assets exceed costs of acquiring new business and administration costs. In respect of remaining investment type business, investment return generated from policy assets has an effect on operating earnings though this is often non-proportional. Finally, in respect of all investment type business, shareholders bear the risk of investing shareholder capital in support of these operations.
Risk cover business includes term assurance, or term life insurance business. Annuity business includes immediate annuities purchased for individuals or on a bulk purchase basis for groups of people. The risk of investing policy assets in this business is borne entirely by the shareholders. Operating earnings arise when premiums, and investment return earned on assets supporting insurance liabilities and shareholder capital, exceed claims and benefit costs, costs of acquiring new business and administration costs.
General insurance and health business
Operating earnings within our general insurance and health business arise when premiums and investment return earned on assets supporting insurance liabilities and shareholder capital exceed claims costs, costs of acquiring new business and administration costs.
Fund management
Fund management operating earnings consist of fees earned for managing policyholder funds and external retail and institutional funds on behalf of clients, net of operating expenses.
Arrangements for the management of proprietary funds are conducted on an arm’s length basis between our fund management and insurance businesses. Such arrangements exist mainly in the UK, France, Ireland, and Canada. Proprietary insurance funds in other countries are externally managed.
Other business
Other business includes our operations other than insurance and fund management, including Group Centre expenses. In 2011 this also included the RAC roadside recovery operation in the UK up to its sale on 30 September 2011.
Financial highlights
The following analysis is based on our consolidated financial statements and should be read in conjunction with those statements. In order to fully explain the performance of our business, we discuss and analyse the results of our business in terms of certain financial measures which are based on ‘non-GAAP measures’ and which we use for internal monitoring and for executive remuneration purposes. We review these in addition to GAAP measures, such as profit before and after tax.
The remainder of the financial performance section focuses on the activity of the Group’s continuing operations. Details of the performance of the United States which has been classified as discontinued can be found in the market performance section.
Non-GAAP measures
Sales
The total sales of the Group consist of long-term insurance and savings new business sales and general insurance and health net written premiums.
Long-term insurance and savings new business sales
Sales of the long-term insurance and savings business consist of:
| n | Insurance and participating investment business |
| – | This includes traditional life insurance, annuity business and with-profits business. |
| – | There is an element of insurance risk borne by the Group therefore, under IFRS, these are reported within net written premiums. |
| n | Non-participating investment business |
| – | This includes unit-linked business and pensions business. |
| – | The amounts received for this business are treated as deposits under IFRS and an investment management fee is earned on the funds deposited. |
| – | For new business reporting in the UK, companies continue to report non-participating investment business within their ‘covered business’ sales, in line with the historic treatment under UK GAAP. |
| n | Non-covered business or investment sales: |
| – | These include retail sales of mutual fund type products. |
| – | There is no insurance risk borne by the Group therefore, under IFRS, these are treated as deposits and investment management fee income is earned on the funds deposited. These have never been treated as ‘covered business’ for long-term insurance and savings reporting so we show these separately as investment sales. |
Sales is a non-GAAP financial measure and key performance indicator that we report to our key decision makers in the businesses in order to assess the value of new business from our customers and compare performance across the markets in which we operate. We consider sales to be a critical indicator of new business, and is the basis on which we provide analysis of our results to our shareholders and analysts. The non-GAAP measure of sales is also currently used internally in the determination of bonus awards as an executive performance measure.
For long-term insurance and savings new business, we define sales as the sum of the present value of new business premiums (PVNBP) of life, pension and savings products and investment sales.
PVNBP is equal to total single premium sales received in the year plus the discounted value of annual premiums expected to be received over the terms of newly incepted contracts and is calculated as at the date of sale. We adjust annual premiums to reflect the expected stream of business coming from this new business over future years. In the view of management, this performance measure better recognises the relative economic value of regular premium contracts compared with single premium contracts. PVNBP is a European insurance industry standard measure of new business.
For our long-term insurance and savings business, we believe that sales is an important measure of underlying performance and a better measure for new business than IFRS net written premiums. We consider that the use of sales over IFRS net written premiums provides a:
| n | Consistent treatment of long-term insurance and investment contracts: IFRS net written premiums do not include deposits received on non-participating investment contracts. Long-term insurance contracts and participating investment contracts both contain a deposit component, which are included in IFRS net written premiums, in addition to an insurance risk component. Therefore, to assess the revenue generated on a consistent basis between types of contracts, we evaluate the present value of new business sales of long-term insurance and investment products on the basis of total premiums and deposits collected, including sales of mutual fund type products such as unit trusts and Open ended investment companies (OEICs). |
| n | Better reflection of the relative economic value of regular premium contracts compared to single premium contracts: Sales recognise the economic value of all expected contractual cash flows for regular premium contracts in the year of inception, whereas IFRS net written premiums only recognise premiums received in the year. |
| n | Better reflection of current management actions in the year: IFRS net written premiums include premiums on regular premium contracts which incepted in prior years, and therefore reflect the actions of management in prior years. |
In comparison with IFRS net written premiums, sales do not include premiums received from contracts in-force at the beginning of the year, even though these are a source of IFRS revenue, as these have already been recognised as sales in the year of inception of the contract. In addition, unlike IFRS net written premiums, sales do not reflect the effect on premiums of any increase or decrease in persistency of regular premium contracts compared with what was assumed at the inception of the contract.
PVNBP is not a substitute for net written premiums as determined in accordance with IFRS. Our definition of sales may differ from similar measures used by other companies, and may change over time.
General insurance and health sales
General insurance and health sales are defined as IFRS net written premiums, which are premiums written during the year net of amounts reinsured with third parties. For sales reporting, we use the GAAP measure for general insurance and health business.
The table below presents our consolidated sales for the three years ended 31 December 2012, 2011 and 2010 for our continuing operations, as well as the reconciliation of sales to net written premiums in IFRS.
| Continuing operations | | 2012
£m | | | 2011
£m | | | 2010
£m | |
| Long-term insurance and savings new business sales | | | 25,232 | | | | 27,461 | | | | 28,839 | |
| General insurance and health sales | | | 8,894 | | | | 9,162 | | | | 8,522 | |
| Total sales | | | 34,126 | | | | 36,623 | | | | 37,361 | |
| Less: Effect of capitalisation factor on regular premium long-term business | | | (5,935 | ) | | | (6,079 | ) | | | (5,482 | ) |
| Share of long-term new business sales from JVs and associates | | | (592 | ) | | | (604 | ) | | | (1,446 | ) |
| Annualisation impact of regular premium long-term business | | | (239 | ) | | | (533 | ) | | | (357 | ) |
| Deposits taken on non-participating investment contracts and equity release contracts | | | (4,607 | ) | | | (4,573 | ) | | | (3,795 | ) |
| Retail sales of mutual fund type products (investment sales) | | | (4,586 | ) | | | (3,473 | ) | | | (3,387 | ) |
| Add: IFRS gross written premiums from existing long-term business | | | 3,936 | | | | 4,305 | | | | 3,547 | |
| Less: long-term insurance and savings business premiums ceded to reinsurers | | | (930 | ) | | | (959 | ) | | | (855 | ) |
| Total IFRS net written premiums | | | 21,173 | | | | 24,707 | | | | 25,586 | |
| Analysed as: | | | | | | | | | | | | |
| Long-term insurance and savings net written premiums | | | 12,279 | | | | 15,545 | | | | 17,064 | |
| General insurance and health net written premiums | | | 8,894 | | | | 9,162 | | | | 8,522 | |
| | | | 21,173 | | | | 24,707 | | | | 25,586 | |
| n | Effect of capitalisation factor on regular premium long-term business |
PVNBP is derived from the single and regular premiums of the products sold during the financial period and is expressed at the point of sale. The PVNBP calculation is equal to total single premium sales received in the year plus the discounted value of regular premiums expected to be received over the term of the new contracts. The discounted value of regular premiums is calculated using the market consistent embedded value methodology proposed by the CFO Forum Principles.
The discounted value reflects the expected income streams over the life of the contract, adjusted for expected levels of persistency, discounted back to present value. The discounted value can also be expressed as annualised regular premiums multiplied by a weighted average capitalisation factor (WACF). The WACF varies over time depending on the mix of new products sold, the average outstanding term of the new contracts and the projection assumptions.
| n | Share of long-term new business sales from joint ventures and associates |
Total long-term new business sales include our share of sales from joint ventures and associates. Under IFRS reporting, premiums from these sales are excluded from our consolidated accounts, with only our share of profits or losses from such businesses being brought into the income statement separately.
| n | Annualisation impact of regular premium long-term business |
As noted above, the calculation of PVNBP includes annualised regular premiums. The impact of this annualisation is removed in order to reconcile the non-GAAP new business sales to IFRS premiums and will vary depending on the volume of regular premium sales during the year.
| n | Deposits taken on non-participating investment contracts and equity release contracts |
Under IFRS, non-participating investment contracts are recognised in the Statement of Financial position by recording the cash received as a deposit and an associated liability and are not recorded as premiums received in the Income Statement. Only the margin earned is recognised in the Income Statement.
| n | Retail sales of mutual fund type products (investment sales) |
Investment sales included in the total sales number represent the cash inflows received from customers to invest in mutual fund type products such as unit trusts and OEICs. We earn fees on the investment and management of these funds which are recorded separately in the IFRS income statement as ’fees and commissions received’ and are not included in statutory premiums.
| n | IFRS gross written premiums from existing long-term business |
The non-GAAP measure of long-term and savings sales focuses on new business written in the year under review whilst the IFRS income statement includes premiums received from all business, both new and existing.
Adjusted operating profit
We report to our chief operating decision makers in the businesses the results of our operating segments using a financial performance measure we refer to as ‘adjusted operating profit’. We define our segment adjusted operating profit as profit before income taxes and non-controlling interests in earnings, excluding the following items: investment return variances and economic assumption changes on long-term and non-long-term business, impairment of goodwill, joint ventures and associates, amortisation and impairment ofother intangibles (excluding the acquired value of in-force business), profit or loss on the disposal and remeasurement of subsidiaries and associates, integration and restructuring costs and exceptional items.
Whilst these excluded items are significant components in understanding and assessing our consolidated financial performance, we believe that the presentation of adjusted operating profit enhances the understanding and comparability of the underlying performance of our segments by highlighting net income attributable to on-going segment operations.
Adjusted operating profit for long-term insurance and savings business is based on expected investment returns on financial investments backing shareholder and policyholder funds over the period, with consistent allowance for the corresponding expected movements in liabilities. The expected rate of return is determined using consistent assumptions between operations, having regard to local economic and market forecasts of investment return and asset classification. Where assets are classified as fair value through profit and loss, expected return is based on the same assumptions used under embedded value principles for fixed income securities, equities and properties. Where fixed interest securities are classified as available for sale, such as in the US, the expected return comprises interest or dividend payments and amortisation of the premium or discount at purchase. Adjusted operating profit includes the effect of variances in experience for non-economic items, such as mortality, persistency and expenses, and the effect of changes in non-economic assumptions. Changes due to economic items, such as market value movement and interest rate changes, which give rise to variances between actual and expected investment returns, and the impact of changes in economic assumptions on liabilities, are disclosed as non-operating items.
Adjusted operating profit for non-long-term insurance business is based on expected investment returns on financial investments backing shareholder funds over the period. Expected investment returns are calculated for equities and properties by multiplying the opening market value of the investments, adjusted for sales and purchases during the year, by the longer-term rate of return. This rate of return is the same as that applied for the long-term business expected returns. The longer-term return for other investments is the actual income receivable for the period. Changes due to market value movement and interest rate changes, which give rise to variances between actual and expected investment returns, are disclosed as non-operating items. The impact of changes in the discount rate applied to claims provisions is also treated outside adjusted operating profit.
Adjusted operating profit is not a substitute for profit before income taxes and non-controlling interests in earnings or net income as determined in accordance with IFRS. Our definition of adjusted operating profit may differ from similar measures used by other companies, and may change over time.
The table below presents our consolidated adjusted operating profit for the three years ended 31 December 2012, 2011 and 2010, as well as the reconciliation of adjusted operating profit to loss/profit before tax attributable to shareholders’ profits under IFRS.
| Continuing operations | | 2012
£m | | | 2011
£m | | | 2010
£m | |
| United Kingdom & Ireland | | | 1,340 | | | | 1,509 | | | | 1,478 | |
| France | | | 422 | | | | 471 | | | | 362 | |
| Canada | | | 276 | | | | 254 | | | | 229 | |
| Italy, Spain and Other | | | 414 | | | | 334 | | | | 400 | |
| Higher growth markets | | | 202 | | | | 229 | | | | 170 | |
| Aviva Investors | | | 42 | | | | 53 | | | | 63 | |
| Other Group Activities | | | (920 | ) | | | (918 | ) | | | (878 | ) |
| Adjusted operating profit before tax (excl Delta Lloyd as an associate) | | | 1,776 | | | | 1,932 | | | | 1,824 | |
| Share of Delta Lloyd’s adjusted operating profit (before tax) as an associate | | | 112 | | | | 157 | | | | – | |
| Adjusted operating profit before tax | | | 1,888 | | | | 2,089 | | | | 1,824 | |
| Integration and restructuring costs | | | (461 | ) | | | (261 | ) | | | (216 | ) |
| Adjusted operating profit before tax after integration and restructuring costs | | | 1,427 | | | | 1,828 | | | | 1,608 | |
| Adjusting items: | | | | | | | | | | | | |
| Investment return variances and economic assumption changes on long-term business | | | (620 | ) | | | (897 | ) | | | (229 | ) |
| Short-term fluctuation in return on investments on non-long-term business | | | 7 | | | | (266 | ) | | | (199 | ) |
| Economic assumption changes on general insurance and health business | | | (21 | ) | | | (90 | ) | | | (61 | ) |
| Impairment of goodwill, associates and joint ventures and other amounts expensed | | | (60 | ) | | | (392 | ) | | | (23 | ) |
| Amortisation and impairment of intangibles | | | (128 | ) | | | (116 | ) | | | (139 | ) |
| (Loss)/profit on the disposal and remeasurement of subsidiaries and associates | | | (164 | ) | | | 565 | | | | 163 | |
| Exceptional items | | | – | | | | (57 | ) | | | 276 | |
| Share of Delta Lloyd’s non-operating items (before tax) as an associate | | | (523 | ) | | | 10 | | | | – | |
| Share of Delta Lloyd’s tax expense, as an associate | | | 107 | | | | (34 | ) | | | – | |
| Profit before tax attributable to shareholders’ profits – continuing operations | | | 25 | | | | 551 | | | | 1,396 | |
| (Loss)/profit before tax attributable to shareholders’ profits – discontinued operations | | | (2,696 | ) | | | (464 | ) | | | 1,044 | |
| (Loss)/Profit before tax attributable to shareholders’ profits | | | (2,671 | ) | | | 87 | | | | 2,440 | |
Adjusting items (from continuing operations)
Year ended 31 December 2012
The negative investment return variances and economic assumption changes of £620 million (2011: £897 million negative) mainly relates to the UK, where the allowance for credit defaults on UK commercial mortgages has increased to reflect uncertainty in the macroeconomic environment and the cost of de-risking activity. Elsewhere, positive variances in Spain and France were offset by a negative variance in Italy.
Short term fluctuations and economic assumption changes on non-long term business of £7 million positive (2011: £266 million negative) reflected favourable market movements.
The impairment of goodwill, associates and joint ventures was £60 million in 2012(2011: £392 million). This includes an impairment of £147 million in respect of the Group’s Indian associate, an impairment of £76 million in relation to goodwill on the Spanish business, an impairment of £33 million in relation to the Italian business and a small write down of £9 million in respect of the Group’s Korean joint venture. These impairments were partly offset by a reversal of the impairment recognised in 2011 in respect of our associate investment in Delta Lloyd of £205 million.
Loss on disposal of subsidiaries and associates was £164 million (2011: £565 million profit). This includes a loss of £129 million relating to the disposal of our associate stake in Delta Lloyd.
Integration and restructuring costs are £461 million(2011: £261 million). This includes costs relating to restructuring and transformation activity that has been taken to align our business operations with our strategy, including the Group’s Simplify programme (£165 million), £130 million in Ireland which includes expenses associated with the merging of the UK and Irish business, £24 million for restructuring in Aviva Investors, £25 million in respect of restructuring activities and £117 million relating to preparing the businesses for the implementation of Solvency II.
Exceptional items in 2012 were £nil (2011: £57 million unfavourable).
Year ended 31 December 2011
The investment return variances and economic assumption changes on long-term insurance business in 2011 produced a £897 million charge (2010: £229 million charge). The short-term fluctuations and economic assumption changes on the non-life business produced a £266 million charge (2010: £199 million charge). This was due to unfavourable market movements in a number of our markets.
The impairment of goodwill, associates and joint ventures was £392 million in 2011(2010: £23 million). An impairment of £217 million was recognised in respect of the associate, Delta Lloyd. The fair value was calculated based on the market price of the ordinary shares of Delta Lloyd NV quoted on the NYSE Euronext Amsterdam as at 31 December 2011. Following the announcement of the termination of Aviva Ireland’s bancassurance distribution contract, management reviewed the recoverability of the goodwill associated with this business and an impairment loss of £120 million was recognised, reducing the carrying value of goodwill relating to this business to nil. The UK long-term business had an impairment of £29 million. In Italy, an impairment of £11 million was recognised in respect of Aviva Assicurazioni Vita Spa, as a result of a reduction in management’s estimates for the future profitability of the business due to current economic circumstances. There was an impairment charge of £15 million recognised in respect of goodwill within interests in joint ventures relating to South Korea.
Amortisation of intangibles decreased by £23 million, or 17%, to £116 million (2010: £139 million).
Profit on disposal of subsidiaries and associates was £565 million (2010: £163 million). The profit comprised principally of a £532 million profit in relation to the sale of RAC, as described in note 3 to the IFRS financial statements.
Integration and restructuring costs for 2011 were £261 million (2010: £216 million). This includes costs associated with preparing the businesses for Solvency II implementation of £96 million, a £30 million charge in the UK relating to the reattribution of the inherited estate and expenditure relating to the Quantum Leap project (the Group’s previous European restructuring program) in Europe of £51 million. Expenditure relating to other restructuring exercises across the Group amounted to £84 million.
Exceptional items in 2011 were £57 million unfavourable (2010: £276 million favourable) relating to a £22 million provision for compensation scheme costs for the leveraged property fund in Ireland, and a £35 million expense for the discounted cost of strengthening latent claims provisions in the UK written a significant number of years ago. In 2010, exceptional items mainly related to a £286 million benefit from the closure of the final salary section of the UK staff pension scheme.
Consolidated results of operations
The table below presents our consolidated sales from continuing operations for the three years ended 31 December 2012, 2011 and 2010.
| Continuing operations | | 2012
£m | | | 2011
£m | | | 2010
£m | |
| United Kingdom & Ireland | | | 17,790 | | | | 19,175 | | | | 17,458 | |
| France | | | 4,640 | | | | 5,063 | | | | 5,886 | |
| Canada | | | 2,176 | | | | 2,083 | | | | 1,958 | |
| Italy, Spain and Other | | | 3,849 | | | | 5,665 | | | | 7,484 | |
| Higher growth markets | | | 2,944 | | | | 3,039 | | | | 2,959 | |
| Aviva Investors | | | 2,727 | | | | 1,598 | | | | 1,616 | |
| Total sales | | | 34,126 | | | | 36,623 | | | | 37,361 | |
Sales (from continuing operations)
Year ended 31 December 2012
Total sales from continuing operations decreased £2,497 million or 7% to £34,126 million(2011: £36,623 million). This decrease was mainly driven by lower life and pension sales in the UK, Italy, and Spain, partly offset by higher investment sales.
Sales in the UK and Ireland decreased for long-term insurance and savings, by £1,088 million, or 8%, to £12,772 million(2011:£13,860 million).The decline in UK sales reflects lower sales of bulk purchase annuities following our decision to withdraw from this market, as well as falls in bonds and savings products. These were partly offset by increased sales of individual annuities and protection products. In Ireland, life sales are down due to the closure to new business of our joint venture with AIB from April 2012. General insurance and health sales decreased by £297 million, or 6%, to £5,018 million(2011: £5,315million)mainly as a result of the disposal of RAC in 2011.Results across Europe have also been adversely impacted by the weakness of the euro and zloty. In our European operations, long term sales in France decreased £409 million, or 10% (4% decrease on a local currency basis), to £3,638 million(2011: £4,047 million) due to lower sales in the AFER (Association Francaise d’Epargne et de Retraite) product. Sales in Italy, Spain and Other decreased by £1,756 million, or 34% (29% decrease on a local currency basis) to £3,425 million(2011: £5,181 million) reflecting lower sales of protection and savings products due to the challenging economic environment. General insurance and health sales in France decreased by £14 million, or 1%, to £1,002 million(2011: £1,016 million) whilst sales in Italy and Other were down £60 million, or 12%, to £424 million(2011: £484 million) primarily due to declining credit protection and motor sales. Sales in Canada increased by £93 million, or 4%, to £2,176 million(2011:£2,083 million)due to a combination of improved retention levels and rate increases across both personal and commercial lines. Total sales in Higher growth markets decreased by £95 million, or 3%, to £2,944 million(2011: £3,039million) with higher long-term sales in Singapore more than offset by lower sales in other markets. Aviva Investors sales increased by £1,129 million or 71%. The opening of distribution offices in Europe contributed to most of this growth.
Year ended 31 December 2011
Sales in 2011 were £36,623 million, a decrease of £738 million, or 2%, from £37,361 million in 2010. Sales in the UK and Ireland for long-term insurance and savings were £13,860 million, an increase of £1,337 million, or 11%, from £12,523 million in 2010 and general insurance and health was £5,315 million, an increase of £380 million, or 8%, from £4,935 million in 2010. Long term sales in France decreased by £871 million, or 18% to £4,047 million(2010: £4,918 million) and Italy, Spain and other decreased by £1,865 million, or 26%, to £5,181 million(2010: £7,046 million).The decrease in sales in France and Italy was primarily driven by management actions to reduce sales of participating business. Sales in France for general insurance and health increased by £48 million, or 5%, to £1,016 million(2010: £968 million) while sales in Italy and other increased £46 million or 11% to £484 million(2011: £438 million). General insurance sales in Canada increased by £125 million, or 6%, to £2,083 million(2010: £1,958 million). Total sales in Higher Growth markets increased £80 million, or 3%, to £3,039 million(2010: £2,961 million) due to higher life and pension sales from bancassurance channels in Asia.
The table below presents our consolidated income statement from continuing operations under IFRS for the three years ended 31 December 2012, 2011 and 2010, before the effects of taxation to shareholder profit.
| Continuing operations | | 2012
£m | | | Restated1 2011
£m | | | Restated1 2010
£m | |
| Income | | | | | | | | | | | | |
| Gross written premiums | | | 22,744 | | | | 26,255 | | | | 27,192 | |
| Premiums ceded to reinsurers | | | (1,571 | ) | | | (1,548 | ) | | | (1,606 | ) |
| Premiums written net of reinsurance | | | 21,173 | | | | 24,707 | | | | 25,586 | |
| Net change in provision for unearned premiums | | | (16 | ) | | | (236 | ) | | | (72 | ) |
| Net earned premiums | | | 21,157 | | | | 24,471 | | | | 25,514 | |
| Fee and commission income | | | 1,273 | | | | 1,465 | | | | 1,451 | |
| Net investment income | | | 21,106 | | | | 4,341 | | | | 16,746 | |
| Share of (loss)/profit of joint ventures and associates | | | (277 | ) | | | (123 | ) | | | 141 | |
| (Loss)/profit on the disposal and re-measurement of subsidiaries and associates | | | (164 | ) | | | 565 | | | | 163 | |
| | | | 43,095 | | | | 30,719 | | | | 44,015 | |
| Expenses | | | | | | | | | | | | |
| Claims and benefits paid, net of recoveries from reinsurers | | | (23,601 | ) | | | (24,380 | ) | | | (22,240 | ) |
| Change in insurance liabilities, net of reinsurance | | | (430 | ) | | | (2,284 | ) | | | (2,837 | ) |
| Change in investment contract provisions | | | (4,450 | ) | | | 1,478 | | | | (9,212 | ) |
| Change in unallocated divisible surplus | | | (6,316 | ) | | | 2,721 | | | | 362 | |
| Fee and commission expense | | | (4,472 | ) | | | (4,326 | ) | | | (5,500 | ) |
| Other expenses | | | (2,845 | ) | | | (2,779 | ) | | | (2,116 | ) |
| Finance costs | | | (735 | ) | | | (776 | ) | | | (682 | ) |
| | | | (42,849 | ) | | | (30,346 | ) | | | (42,225 | ) |
| Profit before tax | | | 246 | | | | 373 | | | | 1,790 | |
| Tax attributable to policyholders’ returns | | | (221 | ) | | | 178 | | | | (394 | ) |
| Profit before tax attributable to shareholders’ profits | | | 25 | | | | 551 | | | | 1,396 | |
| 1 | Following a review of the classification of contracts issued by the Group’s Italian long-term business, certain portfolios have been reclassified from participating insurance to participating investment contracts for all years presented. There is no impact on the result for any year presented as a result of this reclassification. |
Income (from continuing operations)
Year ended 31 December 2012
Net written premiums for continuing operations decreased by £3,534 million, or 14%, to £21,173 million(2011:£24,707million). Long-term insurance and savings decreased by £3,266 million, or 21%, to £12,279 million(2011: £15,545 million) mainly reflecting lower sales in the UK and continental Europe. General and health insurance decreased by £268 million, or 3%, to £8,894 million(2011: £9,162million). Excluding RAC in 2011, sales were broadly in line.
Year ended 31 December 2011
Net written premiums in 2011 were £24,707 million, a decrease of £879 million, or 3%(2010: £25,586 million). Long-term insurance and savings were £15,545 million, a decrease of £1,519 million, or 9%(2010: £17,064 million), driven by lower sales in Ireland, France and Italy. General and health insurance was £9,162 million, an increase of £640 million, or 8%(2010: £8,522 million), with growth primarily in the UK, France and Canada.
Net investment income (from continuing operations)
Year ended 31 December 2012
Net investment income for the year increased by £16,765 million, or 386%, to £21,106 million (2011:£4,341million) reflecting positive market performance and narrowing credit spreads on assets as market sentiment improved in the Eurozone. This led to significant increases in net unrealised gains on investments.
Year ended 31 December 2011
Net investment income was £4,341 million, a decrease of £12,405 million, or 74% (2010: £16,746million). Investment returns were impacted by market volatility in 2011 resulting in higher unrealised losses on investments.
Other income (from continuing operations)
Year ended 31 December 2012
Other income, which consists of fee and commission income, share of loss after tax of joint ventures and associates, and (loss)/profit on disposal of subsidiaries and associates, decreased by £1,075 million, or 56%, to £832 million in 2012 (2011:£1,907million). 2011 benefited from the profit on disposal of RAC (£532 million), whilst 2012 has seen a loss on disposal of our associate stake in Delta Lloyd, lower fee and commission income and higher losses from our share of JV’s and associates.
Year ended 31 December 2011
Other income increased by £152 million, or 9%, to £1,907 million in 2011 (2010:£1,755million). The increase was primarily due to the profit on disposal of RAC of £532 million, which was partly offset by a loss from Aviva’s share of joint ventures and associates of £123 million(2010: £141 million profit).
Expenses (from continuing operations)
Year ended 31 December 2012
Claims and benefits paid net of reinsurance in 2012 decreased by £779 million, or 3%, to £23,601 million (2011:£24,380million) mainly reflecting lower claims payments in our life businesses.
Changes in insurance liabilities in 2012 was a charge of £430 million(2011: £2,284 million charge). This was primarily due to changes in economic and non-economic assumptions.
The change in investment contract provisions was a charge of £4,450 million (2011:£1,478million credit) as a result of improved investment market conditions causing an increase in contract liabilities.
The change in unallocated divisible surplus (“UDS”) was a charge of £6,316 million (2011: £2,721million credit). UDS in certain funds in Italy and Spain were negative as at 31 December 2012. The main driver of the movement is a charge in France due to an increase in fixed interest asset values from lower risk-free rates and credit spreads.
Fee and commission expense, other expenses and finance costs increased by £171 million to £8,052 million(2011:£7,881million). See ‘Financial Statements IFRS – Note 6 – Details of expenses’.
Year ended 31 December 2011
Claims and benefits paid net of reinsurance in 2011 increased by £2,140 million, or 10%, to £24,380 million (2010: £22,240million) reflecting increased claims payments in our life businesses.
Changes in insurance liabilities in 2011 was a charge of £2,284 million (2010: £2,837 million). This was primarily due to changes in economic and non-economic assumptions.
The change in investment contract provisions was a £1,478 million credit (2010: £9,212million charge) as a result of deteriorating investment market conditions across our regions causing a decrease in contract liabilities.
The change in UDS was a £2,721 million credit (2010: £362million). UDS in Italy and certain funds in Spain and France were negative as at 31 December 2011, impacted by increased government bond yields. The change in UDS included losses of £17 million in Italy and £49 million in Spain relating to negative UDS considered unrecoverable.
Fee and commission expense, other expenses and finance costs decreased by £417 million to £7,881 million(2010: £8,298 million). See ‘Financial Statements IFRS – Note 6 – Details of expenses’.
Profit/(loss) before tax attributable to shareholders’ profits (from continuing operations)
Year ended 31 December 2012
Profit before tax attributable to shareholders was £25 million (2011:£551million profit). The decrease was primarily due to the increased tax charge attributable to policyholders’ returns.
Year ended 31 December 2011
Profit before tax attributable to shareholders in 2011 was £551 million (2010: £1,396 million profit). The decrease was primarily due to the drop in net investment income.
Market performance
UK & Ireland life
The table below presents sales, net written premiums, adjusted operating profit and profit before tax attributable to shareholders’ profits under IFRS from our UK and Ireland long-term businesses for the three years ended 31 December 2012, 2011 and 2010.
| | | 2012
£m | | | 2011
£m | | | 2010
£m | |
| Pensions | | | 5,158 | | | | 5,279 | | | | 3,801 | |
| Annuities | | | 3,211 | | | | 3,832 | | | | 3,170 | |
| Bonds | | | 379 | | | | 801 | | | | 1,686 | |
| Protection | | | 1,228 | | | | 1,025 | | | | 944 | |
| Equity release | | | 434 | | | | 317 | | | | 436 | |
| UK | | | 10,410 | | | | 11,254 | | | | 10,037 | |
| Ireland | | | 632 | | | | 917 | | | | 938 | |
| Life and pension sales | | | 11,042 | | | | 12,171 | | | | 10,975 | |
| Investment sales | | | 1,730 | | | | 1,689 | | | | 1,548 | |
| Long term saving sales | | | 12,772 | | | | 13,860 | | | | 12,523 | |
| UK Health net written premiums | | | 528 | | | | 473 | | | | 428 | |
| Net written premiums | | | 5,623 | | | | 6,823 | | | | 6,287 | |
| | | | | | | | | | | | | |
| Adjusted operating profit before tax | | | | | | | | | | | | |
| United Kingdom | | | 887 | | | | 917 | | | | 848 | |
| Ireland | | | 5 | | | | 47 | | | | 126 | |
| Life business | | | 892 | | | | 964 | | | | 974 | |
| General insurance and health – UK health | | | 14 | | | | 12 | | | | 12 | |
| Fund management | | | 11 | | | | 11 | | | | 3 | |
| Non-Insurance | | | (7 | ) | | | (10 | ) | | | (8 | ) |
| Total adjusted operating profit before tax | | | 910 | | | | 977 | | | | 981 | |
| Integration and restructuring costs | | | (87 | ) | | | (46 | ) | | | (51 | ) |
| Adjusted operating profit before tax after integration and restructuring costs | | | 823 | | | | 931 | | | | 930 | |
| Profit before tax attributable to shareholders’ profits | | | 98 | | | | 151 | | | | 835 | |
Year ended 31 December 2012
On a PVNBP basis, sales in the UK long-term insurance and savings business decreased by £844 million, or 7%, to £10,410 million(2011: £11,254million). Protection sales were up 20% to £1,228 million(2011: £1,025 million), benefiting from a full year’s sales from the distribution deal with Santander. Sales of annuities were down 16% to £3,211 million(2011: £3,832 million) following the decision to withdraw from the large scale bulk purchase annuity market. However, sales of individual annuities were up 10% to £3,024 million despite price increases to manage capital usage. Sales of Equity Release were up 37% to £434 million(2011: £317 million) as Aviva deployed risk based pricing expertise, developed in the annuities market, to this product. Pensions sales were down 2% to £5,158 million(2011: £5,279 million). Within this, Group Personal Pensions sales were up 9% to £3,231 million(2011: £2,961 million) as benefits were seen from increased levels of activity in the run up to Retail Distribution Review (“RDR”) and Auto-Enrolment. Individual Pensions (including SIPP (self invested pension plan) were down 4% to £1,803 million(2011: £1,876 million) as a disciplined approach to pricing was maintained. Sales of Bonds were down 53% to £379 million(2011: £801 million), impacted by changes in distribution channels in advance of RDR.
Ireland sales were down 31% to £632 million(2011: £917 million) due to the closure to new business of the joint venture with Allied Irish Bank (“AIB”) from April 2012. Non AIB business sales were £530 million(2011: £485 million), with the increase driven by sales of fixed rate deposit funds and the re-launch of protection business in the second half of 2012.
Net written premiums in our UK & Ireland long-term insurance and savings businesses decreased by £1,200 million, or 18%, to £5,623 million (2011: £6,823 million). The decrease is primarily due the reduction in BPA (bulk purchase annuities) premiums.
Adjusted operating profit before tax decreased by £67 million, or 7%, to £910 million(2011: £977 million). This mainly reflects lower profits in Ireland where the Life operations result fell to £5 million from £47 million in 2011, as the closure to new business of our joint venture with AIB became effective. The UK Life business saw profits fall by £30 million or 3% to £887 million, mainly due to a lower level of one-off items in 2012 (2011 included one-off benefits of £93 million relating to the Part VII transfers of the former RBS JV entities and £30 million relating to the release of tax provisions associated with the reattribution of the inherited estate). Profit before tax decreased by £53 million, or 35%, to £98 million for 2012(2011: £151 million).
Year ended 31 December 2011
On a PVNBP basis, sales in our UK and Ireland long-term insurance and savings business were £11,254 million, an increase of £1,217 million, or 12%(2010: £10,037 million). In the UK, protection sales grew by 9%, including a 7% increase in core protection products. Pension sales increased by 39% and annuities increased by 21% supported by a 23% growth in bulk purchase annuities and a 20% increase in the sale of individual annuities. Bonds decreased 52% reflecting our continued stance on writing profitable business, the changing distributor landscape pre RDR, and relative attractiveness of bonds following tax treatment changes. Equity release sales decreased 27% following an exceptional performance in 2010 when the market was less competitive. Investment sales increased by 9%, reflecting growth in managed funds and good performance from global property. In Ireland, sales fell 2% to £917 million(2010: £938 million).
Net written premiums in our UK and Ireland long-term insurance and savings business were £6,823 million, an increase of £536 million, or 9%(2010: £6,287 million). The increase was primarily due to higher sales in the UK of group personal pensions and individual annuities, offset by lower sales of single premium bonds.
Adjusted operating profit was £977 million, a decrease of £4 million(2010: £981 million). An increase in the UK was offset by a decrease in Ireland. In the UK, the non-profit result was driven by strong performance in annuities, increased annual management charges and inclusion of the full results of RBS Life, following its purchase by Aviva at the end of 2010. Included in the result are one-off benefits of £93 million relating to the Part VII transfers of the former RBS JV entities, and £30 million relating to the release of tax provisions associated with the reattribution of the inherited estate. The with-profit result, which includes the shareholders’ share of regular and terminal bonus payments, decreased from 2010 mainly driven by the absence of the final special distribution(2010: £84 million). In Ireland, the 2010 result included a release of reserves following a review of assumptions of £75 million.
Profit before tax was £151 million, a decrease of £684 million, or 82%(2010: £835 million) reflecting an adverse impact from market movements in 2011 and impairment of goodwill in Ireland.
UK & Ireland general insurance and health
The table below presents sales, net written premiums, adjusted operating profit and profit before tax attributable to shareholders’ profits under IFRS from our UK and Ireland general insurance and health businesses for the three years ended 31 December 2012, 2011 and 2010.
| | | 2012
£m | | | 2011
£m | | | 2010
£m | |
| Sales/net written premiums | | | | | | | | | | | | |
| United Kingdom | | | 4,062 | | | | 4,371 | | | | 4,048 | |
| Ireland GI | | | 326 | | | | 367 | | | | 397 | |
| Ireland Health | | | 102 | | | | 104 | | | | 62 | |
| | | | 4,490 | | | | 4,842 | | | | 4,507 | |
| | | | | | | | | | | | | |
| Adjusted operating profit before tax | | | | | | | | | | | | |
| United Kingdom | | | 448 | | | | 508 | | | | 457 | |
| Ireland GI | | | 21 | | | | 32 | | | | 32 | |
| Ireland health | | | 8 | | | | 12 | | | | 19 | |
| General insurance and health | | | 477 | | | | 552 | | | | 508 | |
| | | | | | | | | | | | | |
| Integration and restructuring costs | | | (154 | ) | | | (37 | ) | | | (48 | ) |
| Profit before tax attributable to shareholders’ profits | | | 206 | | | | 806 | | | | 348 | |
Year end 31 December 2012
UK and Ireland general insurance and health NWP decreased by £352 million, or 7%, to £4,490 million(2011: £4,842million), mainly as a result of the disposal of RAC. Excluding RAC, NWP decreased by £48 million, or 1%, to £4,062 million(2011: £4,110 million). The UK has seen growth in personal motor, corporate and speciality risks and personal speciality lines. This has been offset by management actions to reduce exposure in unprofitable business segments.
Adjusted general insurance and health operating profit in 2012 decreased by £75 million, or 14%, to £477 million(2011: £552million). Our UK general insurance operation has seen a decrease of £60 million, or 12%, to £448 million(2011:£508 million) reflecting the RAC which was sold in 2011. Excluding the RAC contribution of £75 million in 2011, this represented a like for like increase of 3% with the 2012 result benefiting from a favourable movement on prior year claims and an increase in long term investment return. 2012 was the second wettest year on record and whilst UKGI had more flood claims, weather-related claims were broadly in line with long-term average compared to the favourable experience in 2011. In Ireland, general insurance adjusted operating profit has decreased by £11 million, or 34%, to £21 million (2011: £32 million) reflecting the difficult environment with intense competition and the adverse effect of the economy on premium volumes.
Restructuring costs have increased £117 million to £154 million (2011: £37 million), mainly due to the transformation of the Irish business and the program to simplify the organisational structure within the UK.
Profit before tax decreased by £600 million, or 74%, to £206 million(2011: £806 million). 2011 benefited from the profit on disposal of RAC of £532 million. This combined with the increase in restructuring costs described above accounts for the majority of the year on year decrease.
Year end 31 December 2011
UK and Ireland general insurance and health NWP was £4,842 million, an increase of £335 million, or 7%(2010:£4,507 million). Performance was driven by the UK general insurance operation where NWP increased by £323 million, or 8%, to £4,371 million(2010: £4,048 million). In personal motor, NWP (excluding RAC) was £1,126 million, an increase of £272 million, or 32%(2010: £854 million)reflecting rating action, strong growth in direct sales and the roll out of direct pricing to brokers.
Adjusted general insurance and health operating profit in 2011 was £552 million, an increase of £44 million, or 9%(2010: £508 million). Our UK general insurance operation increased £51 million, or 11%, to £508 million(2010: £457 million). Excluding RAC, adjusted operating profit grew by £61 million, or 16%, to £433 million(2010: £372 million), with the 2011 result benefiting from favourable weather and a further improvement in underlying profitability. These factors were offset in part by small strengthening in prior year claims reserves (excluding adverse 2010 freeze development) of £37 million(2010: £87 million release). This primarily reflected adverse experience on 2010 commercial motor business (for some vans, taxis and scheme accounts) and on one historic professional indemnity account. We took rating action and selective exits with respect to these poor performing business lines.
Profit before tax was £806 million, an increase of £458 million, or 132%(2010: £348 million). The increase was driven by the profit on disposal of RAC in the UK of £532 million.
France
The table below presents sales, net written premiums, adjusted operating profit and profit before tax attributable to shareholders’ profits under IFRS from our operations in France for the three years ended 31 December 2012, 2011 and 2010.
| | | 2012
£m | | | 2011
£m | | | 2010
£m | |
| Sales | | | | | | | | | | | | |
| Long-term insurance and savings business | | | 3,638 | | | | 4,047 | | | | 4,918 | |
| General insurance and health | | | 1,002 | | | | 1,016 | | | | 968 | |
| Total sales | | | 4,640 | | | | 5,063 | | | | 5,886 | |
| Net written premiums | | | 4,702 | | | | 5,233 | | | | 5,979 | |
| | | | | | | | | | | | | |
| Adjusted operating profit before tax | | | | | | | | | | | | |
| Long-term insurance and savings business | | | 335 | | | | 323 | | | | 319 | |
| General insurance and health | | | 95 | | | | 144 | | | | 76 | |
| Non-insurance | | | (8 | ) | | | 4 | | | | (34 | ) |
| Total adjusted operating profit before tax | | | 422 | | | | 471 | | | | 361 | |
| Integration and restructuring costs | | | (11 | ) | | | (30 | ) | | | (8 | ) |
| Adjusted operating profit before tax after integration and restructuring costs | | | 411 | | | | 441 | | | | 353 | |
| Profit before tax attributable to shareholders’ profits | | | 482 | | | | 267 | | | | 387 | |
Year ended 31 December 2012
Total sales in France were down £423 million, or 8%, to £4,640 million(2011: £5,063 million) mainly due to a reduction in long-term insurance and savingssales. Total life and pensions sales decreased 10% to £3,638 million(2011: £4,047 million), a reduction of 4% on a local currency basis, with sales in the AFER product declining and sales through the Bancassurance channel remaining broadly flat.
France’s net written premium was £4,702 million, down £531 million, or 10%(2011: £5,233 million) driven by the decrease in AFER sales and relatively flat sales in general insurance.
Adjusted operating profit for long-term insurance and savings business in 2012 was £335 million (2011: £323 million), an increase of £12 million or 4%.
General insurance and health adjusted operating profit decreased by £49 million, or 34%, to £95 million(2011: £144 million) due in part to the one-off release in 2011 of surplus reserve margins of £45 million. There was also adverse claims experience from the February 2012 freeze, partly offset by a decrease in personal motor bodily injury claims.
Restructuring costs in France were down £19 million, or 63%, to £11 million(2011: £30 million). 2011 included higher costs from the previous European restructuring programme.
Profit before tax attributable to shareholders’ profits was £482 million, an increase of £215 million, or 81%(2011: £267 million).
Year ended 31 December 2011
In France, our focus on value over volume resulted in a decrease of £871 million, or 18%, in life and pension sales to £4,047 million(2010: £4,918 million). Sales in AFER decreased by £1,007 million, or 38%, to £1,639 million(2010: £2,646 million) offset by strong sales through Credit du Nord which increased by 13% to £1,407 million.
Our general insurance and health sales increased £48 million, or 5%, to £1,016 million(2010: £968 million) driven by pricing actions as we focused on value generation. Health net written premiums decreased £7 million, or 3%, to £227 million(2010: £234 million) reflecting customers reducing protection cover in a difficult economic environment.
France’s net written premiums decreased £746 million, or 12%, to £5,233 million(2010: £5,979 million) primarily driven by lower sales.
Total adjusted operating profit increased £110 million, or 30%, to £471 million (2010: £361 million).
Our adjusted operating profit for long-term insurance and savings business in 2011 was £323 million (2010: £319 million).
General insurance and health adjusted operating profit increased by £68 million, or 89%, to £144 million(2010: £76 million) driven mainly by reserve margin releases.
France’s profit before tax attributable to shareholders’ profits was £267 million, down £120 million(2011: £387 million).
Canada
The table below presents sales, adjusted operating profit and IFRS profit before tax attributable to shareholders for the three years ended 31 December 2012, 2011 and 2010.
| | | 2012
£m | | | 2011
£m | | | 2010
£m | |
| Sales/net written premiums | | | 2,176 | | | | 2,083 | | | | 1,958 | |
| | | | | | | | | | | | | |
| Adjusted operating profit before tax | | | | | | | | | | | | |
| General insurance | | | 276 | | | | 254 | | | | 222 | |
| Non-insurance | | | – | | | | – | | | | 7 | |
| Total adjusted operating profit before tax | | | 276 | | | | 254 | | | | 229 | |
| Integration and restructuring costs | | | (11 | ) | | | (6 | ) | | | (20 | ) |
| Adjusted operating profit before tax after integration and restructuring costs | | | 265 | | | | 248 | | | | 209 | |
| Profit before tax attributable to shareholders’ profits | | | 244 | | | | 297 | | | | 223 | |
Year ended 31 December 2012
General insurance sales in Canada increased by £93 million, or 4%, to £2,176 million(2011: £2,083 million), due to a combination of improved retention levels and rate increases across both personal and commercial lines.
Adjusted operating profit improved by £22 million, or 9%, to £276 million(2011: £254 million) mainly due to favourable underwriting results partially offset by lower long-term investment return.
Restructuring costs have increased £5 million, or 83%, to £11 million(2011: £6 million) due to an increase in Solvency II costs and some Simplify transformation program costs.
Profit before tax attributable to shareholders’ profits decreased by £53 million, or 18%, to £244 million(2011:£297 million).
Year ended 31 December 2011
General insurance sales in Canada increased by £125 million, or 6%, to £2,083 million(2010: £1,958 million), reflecting growth in both Personal and Commercial Lines.
Adjusted operating profit from general insurance improved by £32 million, or 14%, to £254 million(2010: £222 million) driven by growth in underwriting profit.
Profit before tax attributable to shareholders’ profits increased by £74 million, or 33%, to £297 million(2010: £223 million).
Italy, Spain and Other
The table below presents sales and net written premiums, adjusted operating profit and profit before tax attributable to shareholders’ profits under IFRS from our operations in Italy, Spain and Other for the three years ended 31 December 2012, 2011 and 2010.
| | | 2012
£m | | | 2011
£m | | | 2010
£m | |
| Sales | | | | | | | | | | | | |
| Long-term insurance and savings business | | | | | | | | | | | | |
| Spain | | | 1,295 | | | | 1,926 | | | | 2,084 | |
| Italy | | | 1,971 | | | | 2,993 | | | | 4,456 | |
| Other | | | 159 | | | | 262 | | | | 506 | |
| Total long term insurance and savings business | | | 3,425 | | | | 5,181 | | | | 7,046 | |
| General insurance and health | | | | | | | | | | | | |
| Italy & other | | | 424 | | | | 484 | | | | 438 | |
| Total sales | | | 3,849 | | | | 5,665 | | | | 7,484 | |
| Net written premiums | | | 2,942 | | | | 4,512 | | | | 5,665 | |
| | | | | | | | | | | | | |
| Adjusted operating profit before tax | | | | | | | | | | | | |
| Long-term insurance and savings business | | | | | | | | | | | | |
| Spain | | | 215 | | | | 216 | | | | 179 | |
| Italy | | | 159 | | | | 140 | | | | 119 | |
| Other | | | – | | | | 4 | | | | (6 | ) |
| | | | 374 | | | | 360 | | | | 292 | |
| General insurance and health | | | | | | | | | | | | |
| Italy & other | | | 53 | | | | (2 | ) | | | 96 | |
| Non-insurance | | | (13 | ) | | | (24 | ) | | | (7 | ) |
| Total adjusted operating profit before tax | | | 414 | | | | 334 | | | | 381 | |
| Integration and restructuring costs | | | (12 | ) | | | (10 | ) | | | (6 | ) |
| Adjusted operating profit before tax after integration and restructuring costs | | | 402 | | | | 324 | | | | 375 | |
| Profit/(loss) before tax attributable to shareholders’ profits | | | 340 | | | | (48 | ) | | | 224 | |
Year ended 31 December 2012
Total long-term savings sales fell by £1,756 million, 34% to £3,425 million(2011: £5,181 million).
In Italy, lower savings and protection sales reflected the challenging conditions and decreased by £1,022 million, or 34%, to £1,971 million(2011: £2,993 million).
In Spain, life sales decreased by £631 million, or 33%, to £1,295 million(2011: £1,926 million) reflecting the continued tough economic conditions.
Our general insurance and health sales decreased by £60 million, or 12%, to £424 million(2011: £484 million). The decrease was driven by Italy where credit protection sales fell reflecting low levels of loan activity by partner banks and motor sales were also lower.
Net written premiums for the segment decreased £1,570 million, or 35%, to £2,942 million(2011: £4,512 million) due to lower sales as described above.
Total adjusted operating profit increased £80 million, or 24%, to £414 million (2011: £334 million).
General insurance and health adjusted operating profit increased by £55 million to £53 million profits(2011: £2 million loss) driven mainly by the Italian business which saw its combined operating ratio fall below 100%.
The profit before tax attributable to shareholders’ profits was £340 million(2011: £48 million loss).
Year ended 31 December 2011
Long-term insurance and savingssales decreased £1,865 million, or 26%, to £5,181 million(2010: £7,046 million) and was primarily driven by management actions to reduce sales of capital intensive participating business.
In Italy, challenging conditions and management actions to focus on capital efficient products and move the product mix led to a fall in participating business sales, with life sales down £1,463 million, or 33%, to £2,993 million(2010: £4,456 million).
In Spain, sales decreased by £158 million, or 8%, to £1,926 million(2010: £2,084 million).
Our general insurance sales increased by £46 million, or 11%, to £484 million(2010: £438 million).
Net written premiums decreased by £1,153 million, or 20%, to £4,512 million(2010: £5,665 million) primarily driven by lower sales as described above.
Total adjusted operating profit decreased £47 million, or 12% to £334 million (2010: £381 million).
Loss before tax attributable to shareholders’ profits was
£48 million in 2011(2010: £224 million profit). The loss primarily reflected negative investment variances.
In Italy, the UDS balance was £1,449 million negative as at 31 December 2011(2010: £420 million negative). The method for estimation of the recoverable negative UDS balance was changed in 2011 to a real-world embedded value method. Further details on this including the impact of this change are set out in section ‘Financial statements IFRS – Note 41 – Unallocated divisible surplus’.
Higher growth markets
The table below presents the sales, net written premiums, adjusted operating profit and profit before tax attributable to shareholders’ profits under IFRS of Higher growth markets for the three years ended 31 December 2012, 2011 and 2010.
| | | 2012
£m | | | 2011
£m | | | 2010
£m | |
| Sales | | | | | | | | | | | | |
| Long-term insurance and savings business | | | | | | | | | | | | |
| Asia | | | 1,765 | | | | 1,782 | | | | 1,617 | |
| Poland (including Lithuania) | | | 373 | | | | 487 | | | | 603 | |
| Other | | | 403 | | | | 320 | | | | 295 | |
| Total long-term insurance and savings business | | | 2,541 | | | | 2,589 | | | | 2,515 | |
| General insurance and health | | | | | | | | | | | | |
| Asia | | | 120 | | | | 108 | | | | 72 | |
| Poland (including Lithuania) | | | 65 | | | | 65 | | | | 51 | |
| Other | | | 89 | | | | 91 | | | | 100 | |
| Total general insurance and health | | | 274 | | | | 264 | | | | 223 | |
| Investment sales | | | 129 | | | | 186 | | | | 223 | |
| Total sales | | | 2,944 | | | | 3,039 | | | | 2,961 | |
| Net written premiums | | | 1,240 | | | | 1,215 | | | | 1,190 | |
| | | | | | | | | | | | | |
| Adjusted operating profit before tax | | | | | | | | | | | | |
| Long-term insurance and savings business | | | | | | | | | | | | |
| Poland (including Lithuania) | | | 153 | | | | 167 | | | | 157 | |
| Asia | | | 69 | | | | 108 | | | | 70 | |
| Other | | | 8 | | | | 4 | | | | 2 | |
| | | | 230 | | | | 279 | | | | 229 | |
| General insurance and health | | | | | | | | | | | | |
| Asia | | | (5 | ) | | | (8 | ) | | | (6 | ) |
| Poland (including Lithuania) | | | 9 | | | | (5 | ) | | | (10 | ) |
| Other | | | (26 | ) | | | (12 | ) | | | (12 | ) |
| | | | (22 | ) | | | (25 | ) | | | (28 | ) |
| Non-insurance and fund management | | | (6 | ) | | | (25 | ) | | | (29 | ) |
| Total adjusted operating profit before tax | | | 202 | | | | 229 | | | | 172 | |
| Integration and restructuring costs | | | (9 | ) | | | (9 | ) | | | (15 | ) |
| Adjusted operating profit before tax after integration and restructuring costs | | | 193 | | | | 220 | | | | 157 | |
| Profit before tax attributable to shareholders’ profits | | | 217 | | | | 178 | | | | 161 | |
Year ended 31 December 2012
Total sales for the segment were £2,944 million, a decrease of £95 million or 3% (2011: £3,039 million). Long-term insurance and savings sales in Asia decreased by £17 million, or 1%, to £1,765 million(2011: £1,782 million)with higher sales in Singapore more than offset by lower sales in other markets. Long term sales in Poland decreased by £114 million, or 23%, to £373 million(2011: £487 million) as a result of lower appetite for unit-linked products and regulatory changes relating to pensions. Sales in other markets increased by £83 million or, 26%, to £403 million (2011: £320 million)driven by Turkey which saw a 35% sales increase as a result of expansion of the bancassurance and direct sales channels.
Overallnet written premiums in the general insurance and health business increased to £274 million(2011: £264 million).
InAsia, net written premiums in the general insurance and health business rose to £120 million(2011: £108 million) due to growth inSingapore.
Adjusted operating profit decreased by £27 million, or 12%, to £202 million(2011: £229 million). The change mainly reflects the non recurrence of a Hong Kong reserving change which benefited the results by £25 million in 2011.
Profit before tax attributable to shareholders increased by £39 million, or 22%, to £217 million(2011: £178 million).
Year ended 31 December 2011
Total sales increased by £78 million, or 3%, to £3,039 million(2010: £2,961 million) despite uncertain economic conditions and regulatory climates in China and India. The strong performance in Asia, up 10%, reflects the success of our existing bancassurance partnerships. Life and pension sales in Poland decreased 19% to £467 million as a result of legislation changes.
Net written premiums increased by £25 million, or 2%, to £1,215 million(2010: £1,190 million).
Adjusted operating profit increased by £57 million, or 33%, to £229 million(2010: £172 million). This includes a reserving change benefit in Hong Kong of £25 million in 2011.
Profit before tax increased by £17 million, or 11%, to £178 million(2010: £161 million).
Aviva Investors
The table below presents the investment sales, adjusted operating profit, profit before tax attributable to shareholders’ profits under IFRS and funds under management of Aviva Investors for the three years ended 31 December 2012, 2011 and 2010. As set out in ‘Financial Statements IFRS – note 3 – Subsidiaries’, the internal asset management operations of Aviva Investors North America are being sold with the US life business and have been classified within discontinued operations.
| Continuing operations | | 2012
£m | | | 2011
£m | | | 2010
£m | |
| Investment sales | | | 2,727 | | | | 1,598 | | | | 1,616 | |
| Fund management | | | 39 | | | | 50 | | | | 60 | |
| Long-term insurance and savings business – Pooled Pensions1 | | | 3 | | | | 3 | | | | 3 | |
| Total adjusted operating profit before tax | | | 42 | | | | 53 | | | | 63 | |
| Integration and restructuring costs | | | (33 | ) | | | (30 | ) | | | (28 | ) |
| Adjusted operating profit before tax after integration and restructuring costs | | | 9 | | | | 23 | | | | 35 | |
| Profit before tax attributable to shareholders’ profits | | | 2 | | | | 36 | | | | 29 | |
| Assets under management (including discontinued operations) | | | 274,484 | | | | 262,506 | | | | 259,787 | |
| 1 | Aviva Investors adjusted operating profit includes profit relating to the Aviva Investors Pooled Pension business. |
Year ended 31 December 2012
Aviva Investors’ adjusted operating profit for fund management from continuing operations decreased by £11 million, or 22%, to £39 million(2011:£50 million). The reduction in profits was as a result of lower performance fees, partially offset by lower operating expenditure driven by cost savings.
Profit before tax attributable to shareholders from continuing operations decreased by £34 million, or 94%, to £2 million(2011: £36 million), mainly due to the reduction in adjusted operating profit and a one-off profit in 2011 arising on the disposal of Aviva Investors Australia.
Aviva Investors’ funds under management (including discontinued operations), increased by £11 billion, or 4%, to £274 billion(2011: £263 billion). This is due to capital appreciation more than offsetting negative net flows. Further details are given in ‘Financial Statements IFRS – note 55 – Assets under management’.
Year ended 31 December 2011
Aviva Investors’ adjusted operating profit for fund management was £50 million, a decrease of £10 million, or 17%(2010: £60 million). The fall in adjusted operating profit reflected the impact of ongoing investment in our global infrastructure and clients re-evaluating their risk appetite in the face of the continuing economic downturn which, in some instances, lead them to re-allocate towards lower fee-bearing asset classes, with a consequential impact on revenue.
Profit before tax attributable to shareholders from continuing operations was £36 million, an increase of £7 million, or 24%(2010: £29 million), which benefited from the £23 million profit recognised on the sale of our Australian asset management subsidiary, offset by an impairment charge made against the value of an intangible asset.
Aviva Investors’ funds under management (including discontinued operations) were £263 billion, an increase of £3 billion, or 1%(2010: £260 billion). The increase was a result of positive net funded sales, and capital appreciation, partially offset by the impact of the sale of our business in Australia.
Corporate centre and Group debt costs and other interest (from continuing operations)
The table below presents corporate centre and Group debt costs and other interest from continuing operations for the three years ended 31 December 2012, 2011 and 2010.
| | | 2012
£m | | | 2011
£m | | | 2010
£m | |
| Corporate centre | | | (136 | ) | | | (138 | ) | | | (143 | ) |
| Group debt costs and other interest | | | (659 | ) | | | (648 | ) | | | (644 | ) |
| Other Group operations | | | (204 | ) | | | (204 | ) | | | (176 | ) |
Year ended 31 December 2012
Corporate centre costs decreased by £2 million, to £136 million(2011: £138 million). This was driven by a reduction in central spend and share award costs, partly offset by higher project costs, including the impact of meeting greater financial and regulatory requirements.
Group debt and other interest costs increased by £11 million, or 2% to £659 million(2011: £648 million). This increase principally relates to higher interest costs on internal lending arrangements driven by changes in internal loan balances throughout the year. Group debt costs and other interest includes a net pension charge of £35 million (2011: £46 million). This represents the difference between the expected return on pension scheme assets and the interest charge on pension scheme liabilities.
Other Group operations costs have remained flat at £204 million(2011: £204 million). This includes balances described as non-insurance in the market sections above, and £48 million relating to the running costs of the Aviva Europe and North America regional offices, which have subsequently both closed. It also includes Group banking and finance charges of £26 million and marketing spend of £22 million.
Year ended 31 December 2011
Corporate centre costs were £138 million, a decrease of £5 million, or 3% (2010: £143 million). The decrease principally reflected a reduction in project spend of £18 million in the year, and was offset by central spend which increased by £11 million arising from continued commitment to meeting increased regulatory and reporting requirements.
Group debt and other interest costs were £648 million, an increase of £4 million, or 1%(2010: £644 million). This increase principally related to higher interest costs on internal lending arrangements driven by changes in internal loan balances throughout the year.
Group debt costs and other interest included net pension charge of £46 million (2010: £87 million). This represented the difference between the expected return on pension scheme assets and the interest charge on pension scheme liabilities.
Other Group operations incurred costs of £204 million(2010: £176 million).
Adjusted operating profit before tax (from continuing operations)
Year ended 31 December 2012
Adjusted operating profit before tax decreased by £201 million, or 10%, to £1,888 million (2011: £2,089million) for the reasons set out above.
Year ended 31 December 2011
Adjusted operating profitincreased by £265 million, or 15%, to £2,089 million (2010: £1,824 million) for the reasons set out above.
Discontinued operations
United States
In December 2012 the Group announced the sale of its United States life and related internal asset management businesses (US Life) to Athene Holding Ltd for £1.0 billion after the repayment of an external loan. The transaction is expected to be completed in 2013. See ‘Financial statements IFRS – Note 3 – Subsidiaries’ for further details. As a result of this announcement the results of US Life for 2012 and comparative periods have been classified as discontinued operations. The table below presents sales, net written premiums, adjusted operating profit and IFRS profit/(loss) before tax attributable to shareholders for the three years ended 31 December 2012, 2011 and 2010.
| | | 2012
£m | | | 2011
£m | | | 2010
£m | |
| Sales | | | | | | | | | | | | |
| Life | | | 1,441 | | | | 1,093 | | | | 999 | |
| Annuities | | | 2,598 | | | | 2,839 | | | | 3,729 | |
| Total sales | | | 4,039 | | | | 3,932 | | | | 4,728 | |
| Net written premiums | | | 3,589 | | | | 3,620 | | | | 4,485 | |
| | | | | | | | | | | | | |
| Adjusted operating profit before tax | | | | | | | | | | | | |
| Long-term insurance and savings business | | | 200 | | | | 197 | | | | 174 | |
| Non-insurance | | | (16 | ) | | | (11 | ) | | | (6 | ) |
| Fund management | | | 55 | | | | 37 | | | | 34 | |
| Total adjusted operating profit before tax | | | 239 | | | | 223 | | | | 202 | |
| Integration and restructuring costs | | | (7 | ) | | | (7 | ) | | | (9 | ) |
| Adjusted operating profit before tax after integration and restructuring costs | | | 232 | | | | 216 | | | | 193 | |
| (Loss)/profit before tax attributable to shareholders’ profits | | | (2,696 | ) | | | 262 | | | | 149 | |
Year ended 31 December 2012
Sales increased by 3% to £4,039 million(2011: £3,932 million). Life sales were up 32% to £1,441 million (2011: £1,093 million) as the business focussed on accelerating the growth of the life insurance business. Sales of our annuity products declined by 8% to £2,598 million (2011: £2,839 million) as a result of pricing actions taken throughout the year. Net written premiums decreased by 1% to £3,589 million (2011: £3,620 million) as higher sales were offset by increased outward reinsurance premiums.
Adjusted operating profit increased by £16 million, or 7%, to £239 million(2011: £223 million). Long-term insurance and savings adjusted operating profit remained broadly flat at £200 million(2011: £197 million). Fund management operations generated profits of £55 million(2011: £37 million).
Loss before tax attributable to shareholders was £2,696 million (2011: £262 million profit) which mainly relates to the impairment to write the value of the business down to fair value less costs to sell.
Year ended 31 December 2011
Sales decreased by £796 million, or 17%, to £3,932 million(2010: £4,728 million).
Annuity sales in 2011 declined by £890 million, or 24%, to £2,839 million(2010: £3,729 million), primarily driven by a focus on value over volume, with strong annuity price competition and increased consumer demand for variable annuity products in the first half of 2011.
Life sales increased by £94 million, or 9%, to £1,093 million(2010: £999 million) reflecting a focus on growth in life business.
Net written premiums decreased by £865 million, or 19%, to £3,620 million(2010: £4,485 million) due to lower annuity sales.
Adjusted operating profit increased by £21 million, or 10%, to £223 million(2010: £202 million) as our in-force book grew and we maintained strong spread management and disciplined pricing in a competitive environment.
Profit before tax attributable to shareholders’ profits increased by £113 million, or 76%, to £262 million(2010: £149 million). The increase was mainly as a result of improved operating results and favourable short term investment variances.
Delta Lloyd
On 6 May 2011, the Group sold 25 million shares in Delta Lloyd, reducing our holding at that date to 42.7% of Delta Lloyd’s ordinary share capital, representing 40% of shareholder voting rights. As the Group no longer commanded a majority of shareholder voting rights, it no longer controlled Delta Lloyd. Accordingly, from 6 May 2011, the Group ceased to consolidate the results and net assets of Delta Lloyd and its results up to that date were shown as discontinued operations. For the period from 6 May 2011 to 5 July 2012, the Group had an associate interest in Delta Lloyd. In July 2012, following a further sell-down, the Group’s holding fell to 19.8% of Delta Lloyd’s ordinary share capital representing 18.6% of shareholder voting rights and for the remainder of 2012 it was treated as a financial investment. In January 2013, the Group sold the remainder of its holding in Delta Lloyd. The table below presents sales, net written premiums, adjusted operating profit and IFRS (loss)/profit before tax for Delta Lloyd as a subsidiary for the three years ended 31 December 2012, 2011 and 2010.
| Discontinued operations | | 2012
£m | | | 2011
£m | | | 2010
£m | |
| Sales | | | | | | | | | | | | |
| Long-term insurance and savings business | | | – | | | | 1,255 | | | | 3,793 | |
| General insurance and health | | | – | | | | 557 | | | | 1,177 | |
| Total sales | | | – | | | | 1,812 | | | | 4,970 | |
| Net written premiums | | | | | | | 2,043 | | | | 4,340 | |
| | | | | | | | | | | | | |
| Total adjusted operating profit – discontinued operations | | | – | | | | 191 | | | | 524 | |
| (Loss)/profit before tax attributable to shareholders’ profits | | | – | | | | (726 | ) | | | 895 | |
Year ended 31 December 2012
The Group’s share of the loss of its associate interest in Delta Lloyd to 5 July 2012 was £304 million.
Year ended 31 December 2011
Delta Lloyd’s adjusted operating profit for the period to 6 May 2011, when it was deconsolidated, was £191 million.
The Group’s share of the profits of its retained interest in Delta Lloyd as an associate for the remainder of 2011 was £133 million.
From the start of 2011 to the partial disposal on 6 May 2011, the AAA collateralised bond spread narrowed by about 80 basis points (“bps”) as a result of changes in the underlying bond index. This movement was the main driver of the adverse life investment variance of £820 million and the loss before tax of £726 million seen in the first four months of 2011.
Selected consolidated financial data
This data is derived from our consolidated financial statements which have been prepared and approved by the directors in accordance with International Financial Reporting Standards (IFRS) as issued by the International Accounting Standards Board (IASB) and as endorsed by the European Union (EU).
In December 2012 the Group announced the sale of its US Life and related internal asset management operations, which have been classified as held for sale in the statement of financial position and their results shown as discontinued operations.
The results presented as discontinued operations for 2011 and preceding years also include the results of Delta Lloyd N.V. which was deconsolidated during 2011. Between May 2011 and July 2012 Delta Lloyd was accounted for as an associate within continuing operations. In July 2012, following a further sell-down, the Group’s shareholding fell below 20% and from July 2012 Delta Lloyd was treated as a financial investment within continuing operations at fair value through profit and loss.
Following a review of the classification of contracts issued by the Italian Life business, certain portfolios have been reclassified from participating insurance to participating investment contracts. This change has been reflected for all years in the table below. There is no impact on the result for any period as the result of this reclassification.
Income statement data
Amounts in accordance with IFRS Continuing operations | | 2012
£m | | | Restated
2011
£m | | | Restated
2010
£m | | | Restated
2009
£m | | | Restated
2008
£m | |
| Income | | | | | | | | | | | | | | | |
| Gross written premiums | | | 22,744 | | | | 26,255 | | | | 27,192 | | | | 25,690 | | | | 25,428 | |
| Premiums ceded to reinsurers | | | (1,571 | ) | | | (1,548 | ) | | | (1,606 | ) | | | (2,294 | ) | | | (1,613 | ) |
| Premiums written net of reinsurance | | | 21,173 | | | | 24,707 | | | | 25,586 | | | | 23,396 | | | | 23,815 | |
| Net change in provision for unearned premiums | | | (16 | ) | | | (236 | ) | | | (72 | ) | | | 552 | | | | 296 | |
| Net earned premiums | | | 21,157 | | | | 24,471 | | | | 25,514 | | | | 23,948 | | | | 24,111 | |
| Fee and commission income | | | 1,273 | | | | 1,465 | | | | 1,451 | | | | 1,552 | | | | 1,672 | |
| Net investment income/(expense) | | | 21,106 | | | | 4,341 | | | | 16,746 | | | | 19,902 | | | | (17,946 | ) |
| Share of (loss)/profit after tax of joint ventures and associates | | | (277 | ) | | | (123 | ) | | | 141 | | | | (463 | ) | | | (1,101 | ) |
| (Loss)/profit on the disposal and remeasurement of subsidiaries and associates | | | (164 | ) | | | 565 | | | | 163 | | | | 122 | | | | (8 | ) |
| | | | 43,095 | | | | 30,719 | | | | 44,015 | | | | 45,061 | | | | 6,728 | |
| Expenses | | | | | | | | | | | | | | | | | | | | |
| Claims and benefits paid, net of recoveries from reinsurers | | | (23,601 | ) | | | (24,380 | ) | | | (22,240 | ) | | | (21,080 | ) | | | (23,425 | ) |
| Change in insurance liabilities, net of reinsurance | | | (430 | ) | | | (2,284 | ) | | | (2,837 | ) | | | (1,119 | ) | | | 7,219 | |
| Change in investment contract provisions | | | (4,450 | ) | | | 1,478 | | | | (9,212 | ) | | | (11,096 | ) | | | 10,880 | |
| Change in unallocated divisible surplus | | | (6,316 | ) | | | 2,721 | | | | 362 | | | | (1,479 | ) | | | 4,452 | |
| Fee and commission expense | | | (4,472 | ) | | | (4,326 | ) | | | (5,500 | ) | | | (4,081 | ) | | | (4,038 | ) |
| Other expenses | | | (2,845 | ) | | | (2,779 | ) | | | (2,116 | ) | | | (3,583 | ) | | | (2,668 | ) |
| Finance costs | | | (735 | ) | | | (776 | ) | | | (682 | ) | | | (755 | ) | | | (847 | ) |
| | | | (42,849 | ) | | | (30,346 | ) | | | (42,225 | ) | | | (43,193 | ) | | | (8,427 | ) |
| Profit/(loss) before tax | | | 246 | | | | 373 | | | | 1,790 | | | | 1,869 | | | | (1,699 | ) |
| Tax attributable to policyholders’ returns | | | (221 | ) | | | 178 | | | | (394 | ) | | | (217 | ) | | | 1,068 | |
| Profit/(loss) before tax attributable to shareholders’ profits | | | 25 | | | | 551 | | | | 1,396 | | | | 1,652 | | | | (631 | ) |
| Tax attributable to shareholders’ profits | | | (227 | ) | | | (134 | ) | | | (345 | ) | | | (440 | ) | | | 294 | |
| (Loss)/profit after tax from continuing operations | | | (202 | ) | | | 417 | | | | 1,051 | | | | 1,212 | | | | (337 | ) |
| (Loss)/profit after tax from discontinued operations | | | (2,848 | ) | | | (357 | ) | | | 841 | | | | 103 | | | | (548 | ) |
| Total (loss)/profit for the year | | | (3,050 | ) | | | 60 | | | | 1,892 | | | | 1,315 | | | | (885 | ) |
| Amounts in accordance with IFRS | | Per share | | | Per share | | | Per share | | | Per share | | | Per share | |
| (Loss)/profit per share attributable to equity shareholders: | | | | | | | | | | | | | | | | | | | | |
| Basic (pence per share) | | | (113.1 | )p | | | 5.8 | p | | | 50.4 | p | | | 37.8 | p | | | (36.8 | )p |
| Diluted (pence per share) | | | (113.1 | )p | | | 5.7 | p | | | 49.6 | p | | | 37.5 | p | | | (36.8 | )p |
| Continuing operations – Basic (pence per share) | | | (15.2 | )p | | | 11.1 | p | | | 37.6 | p | | | 35.3 | p | | | (15.7 | )p |
| Continuing operations – Diluted (pence per share) | | | (15.2 | )p | | | 10.9 | p | | | 37.0 | p | | | 35.0 | p | | | (15.8 | )p |
| | | Per share | | | Per share | | | Per share | | | Per share | | | Per share | |
| Dividends paid per share | | | 19.0 | p | | | 26.0 | p | | | 25.5 | p | | | 24.0 | p | | | 33.0 | p |
| | | Millions | | | Millions | | | Millions | | | Millions | | | Millions | |
| Number of shares in issue at 31 December | | | 2,946 | | | | 2,906 | | | | 2,820 | | | | 2,767 | | | | 2,658 | |
| Weighted average number of shares in issue for the year | | | 2,910 | | | | 2,845 | | | | 2,784 | | | | 2,705 | | | | 2,643 | |
Statement of financial position data
| Amounts in accordance with IFRS | | 2012
£m | | | Restated
2011
£m | | | Restated
2010
£m | | | Restated
2009
£m | | | Restated
2008
£m | |
| Total assets | | | 315,689 | | | | 312,376 | | | | 370,107 | | | | 354,391 | | | | 354,562 | |
| Gross insurance liabilities | | | 113,091 | | | | 147,379 | | | | 174,742 | | | | 168,699 | | | | 172,550 | |
| Gross liabilities for investment contracts | | | 110,494 | | | | 113,366 | | | | 120,745 | | | | 112,408 | | | | 109,859 | |
| Unallocated divisible surplus | | | 6,931 | | | | 650 | | | | 3,428 | | | | 3,866 | | | | 2,325 | |
| Core structural borrowings | | | 5,139 | | | | 5,255 | | | | 6,066 | | | | 5,489 | | | | 5,525 | |
| Other liabilities | | | 68,674 | | | | 30,363 | | | | 47,401 | | | | 48,843 | | | | 49,730 | |
| Total liabilities | | | 304,329 | | | | 297,013 | | | | 352,382 | | | | 339,305 | | | | 339,989 | |
| Total equity | | | 11,360 | | | | 15,363 | | | | 17,725 | | | | 15,086 | | | | 14,573 | |
Information on the company
History and development of Aviva
General
Aviva, a public limited company incorporated under the laws of England and Wales, provides customers with long-term insurance and savings, general and health insurance, and fund management products and services. Over the last few years we have simplified and streamlined Aviva, focusing on markets where we can produce attractive returns.
We are committed to serving our customers well in order to build a strong, sustainable business which makes a positive contribution to society and which our people are proud to work for.
Our history
The Group was formed by the merger of CGU plc and Norwich Union plc on 30 May 2000. CGU plc was renamed CGNU plc on completion of the merger, and subsequently renamed Aviva plc on 1 July 2002.
CGU plc and Norwich Union plc were both major UK-based insurers operating in the long-term insurance business and general insurance markets. Both companies had long corporate histories. Hand in Hand, which was incorporated in 1696, was acquired by Commercial Union in 1905, which itself was incorporated in 1861. General Accident plc was incorporated in 1865. Norwich Union plc was founded as a mutual society in 1797 and operated as such until 1997 when it demutualised and became an English public limited company. CGU plc was formed in 1998 from the merger of Commercial Union plc and General Accident plc.
In 2011 and 2012 the Group has undertaken and announced a number of disposals as we have continued the process of streamlining our business. Further details of these can be found in the sections ‘Financial statements IFRS – note 3 – Subsidiaries’ , ‘note 15 – Interests in, and loans to, joint ventures’ and ‘note 16 – Interests in, and loans to, associates’.
Business overview
Our aims and strategy
In July 2012, we announced our new strategic plan which has three main objectives:
We aim to focus on fewer business segments where we believe we can produce attractive returns with a high probability of success.
| n | Build financial strength |
We will achieve target economic capital levels in line with our industry peers, reduce capital volatility and bring leverage down to a conservative level. We announced new target economic capital levels of 160-175%.
| n | Improve financial performance |
We aim to deliver a higher level of revenue growth, lower losses and claims and higher return on capital, notwithstanding the subdued economic environment in developed markets. During 2012 we announced a new expense reduction target of £400 million.
Our business
Overview
Following the announcement in the second quarter of 2012 relating to the restructuring of the Group, the Group’s operatingsegments were changed to align them with the new management reporting structure. The new operating segments are: UK & Ireland; France; Canada; Italy, Spain and Other; Higher growth markets and Aviva Investors. In December we announced the sale of our United States life, savings and related internal fund management business and this has been classified as a discontinued operation for the purposes of reporting financial performance.
Due to the size of the UK & Ireland segment, it has been split into separate Life and General Insurance segments, which undertake long-term insurance and savings business and general insurance, respectively. Aviva Investors, our fund management business, operates across most markets providing fund management services to third-party investors and to our long-term insurance businesses and general insurance operations.
Our business operates across three main market sectors – life insurance and savings; general and health insurance; and fund management.
Life insurance and savings business
Long-term insurance and savings business from continuing operations accounted for approximately 74% of our total business based on worldwide total sales from continuing operations for the year ended 31 December 2012. We reported total long-term insurance and savings new business sales from continuing operations of £20.6 billion and investment sales of £4.6 billion for the year ended 31 December 2012. Our focus remains on growing our business profitably and improving our operational efficiency so that we can fully benefit as our major markets return to economic growth.
Market position
In the UK we are a market leader and have a market share of 12% based on annual premium equivalent (APE)1according to the Association of British Insurers (ABI) data as at 30 September 2012. Sales of life, investment and general insurance products in the UK represented 49% of our worldwide sales for the year ended 31 December 2012. Further details of our position in each market are set out in the market sections below.
Brands and products
We have operated under the Aviva brand globally since 2010.
Our long-term insurance and savings businesses offer a broad range of life insurance and savings products. Our products are split into the following categories:
| n | Pensions – is a means of providing income in retirement for an individual and possibly his or her dependants. Our pension products include personal and group pensions, stakeholder pensions and income drawdown. |
| n | Annuities – is a type of policy that pays out regular amounts of benefit, either immediately and for the remainder of a person’s lifetime, or deferred to commence from a future date. Immediate annuities may be purchased for an individual and his or her dependants or on a bulk purchase basis for groups of people. Deferred annuities are asset accumulation contracts, which may be used to provide benefits in retirement, and may be guaranteed, unit-linked or index-linked. |
| n | Protection – is an insurance contract that protects the policyholder or his or her dependants against financial loss on death or ill-health. Our product ranges include term assurance, mortgage life insurance, flexible whole life and critical illness cover. |
| n | Bonds and savings – are accumulation products with single or regular premiums and unit-linked or guaranteed investment returns. Our product ranges include single premium investment bonds, regular premium savings plans, mortgage endowment products and funding agreements. |
| n | Investment sales - comprise retail sales of mutual fund type products such as unit trusts, individual savings accounts (“ISAs”) and open ended investment companies (“OEICs”). |
| n | Other - includes equity release and structured settlements. |
Some of our insurance and investment contracts contain a discretionary participation feature, which is a contractual right to receive additional benefits as a supplement to guaranteed benefits. These are referred to as participating contracts.
| 1 | APE is a recognised sales measure in the UK and is the total of new annual premiums plus 10% of single premiums. |
General insurance and health insurance
General insurance and health insurance accounted for26% of our total worldwide sales for the year ended 31 December 2012. In the year ended 31 December 2012, we reported general and health insurance net written premiums of £8.9 billion.
Market position
We are a leading general insurer in the United Kingdom and Canada and also have general insurance operations in France, Italy, Ireland, Poland and Turkey. We sell health products in the UK, Ireland, Singapore and Indonesia. In the year ended 31 December 2012, 52% of our total general insurance and health new business from continuing operations was written in the UK.
Brands and products
Our general insurance business operates under the Aviva brand globally and concentrates on the following products:
| n | Personal lines – motor, household, travel and creditor; |
| n | Commercial lines – fleet, liability and commercial property insurance; |
| n | Health insurance – private health insurance, income protection and personal accident insurance, as well as a range of corporate healthcare products; and |
| n | Corporate and specialty risks – products for large clients or where the risk is specialised. |
Distribution
Customers can buy our products through a range of distribution channels, including:
| n | Direct – In many of our markets, customers can buy our products over the telephone or via the internet. This method of distribution is most commonly available for simple, low cost products which do not require advice. |
| n | Direct sales force – In some of our European and Asian markets we operate direct sales forces that only sell Aviva’s products and the sales forces receive commission on the products they sell. |
| n | Intermediaries – We offer a range of long-term insurance, savings, retirement, general insurance and health insurance products which can be bought through an intermediary, such as an independent financial adviser or an insurance broker. Intermediaries receive a commission on sales of Aviva’s products. |
| n | Corporate partnerships, bancassurance and joint ventures – Aviva is a corporate partner for many organisations, including banks and other financial institutions, who wish to offer their customers insurance products. We have various distribution agreements with bancassurance partners and joint ventures across the markets in which we operate. In return for offering our products to their customers, the bank or joint venture partners receive a commission as a percentage of sales and in some cases achieve extra commission if agreed target levels of sales are met. Certain agreements have a profit sharing element based on a predetermined percentage. In some cases, if the agreed targets are not met, certain terms of the contract can be renegotiated. Under the joint venture agreements, the cost of running the venture are often split between the partners. |
Further details of the distribution channels specific to each market are included in the following market analysis.
Fund management
Aviva Investors, our fund management business, provides fund management services to Aviva’s long-term insurance and savings, and general insurance operations as well as to third-party investors. The main fund management operations are in the UK, North America, Europe, Asia Pacific and the Middle East. All sales of retail fund management products are included in our long-term insurance and savings business sales.
In December 2012 it was announced that the internal asset management operations of Aviva Investors North America would be sold alongside the United States life business.
Market position
Aviva Investors was ranked 43rd globally by assets under management, according to the Towers Watson World 500 largest asset managers study 2011 ranking of asset managers by assets under management. Total worldwide funds managed by Aviva Investors at 31 December 2012 was £274 billion, including £38 billion relating to the United States Life and related internal asset management operations which are classified as discontinued operations in the financial statements. The substantial majority of this relates to Aviva’s insurance and savings operations.
Brands and products
Aviva Investors operates under a single brand across our markets.
Our business invests in most significant asset classes on behalf of institutional, pension fund and retail clients. In the US, Aviva Investors also own an asset management company called River Road Asset Management LLC.
Developed markets
UK & Ireland life
Business overview and strategy
In 2012, Aviva began combining its UK and Irish life insurance businesses under a single management structure, with the aim of allowing Ireland to leverage the scale and expertise that exists in the UK.
The UK business is a leading long-term insurance and savings provider with an overall market share of 12%, based on third quarter 2012 ABI returns. The Irish business is a large life and pension provider in Ireland.
Our strategy is to hold leading positions in workplace savings, individual annuities and protection whilst delivering strong margins and an Internal Rate of Return (IRR) in excess of the Group’s target, overall and at a product level.
Our Irish long-term business is carried out through a subsidiary, Aviva Life Holdings Ireland Limited (“ALHI”), which is 75% owned by Aviva and 25% owned by Allied Irish Bank (“AIB”). ALHI holds four subsidiaries, one of which is Ark Life Assurance Company Limited (“Ark Life”) which carries out bancassurance business via a distribution agreement with AIB. The original distribution agreement was renewable in 2011 but, on 15 December 2011, AIB notified the Group that they did not wish to renew it and the existing shareholders’ agreement governing ALHI was terminated. The termination of this agreement triggered the ability for both parties to exercise put and call options that will result in the unwind of the original structure such that the Ark Life business returns 100% to AIB and the Group will purchase the 25% minority stake in ALHI. The formal exercise of these options was approved on 17 January 2012 and, as a result, the Ark Life business became held for sale on that date. Completion of the transaction is subject to agreement of terms with AIB and regulatory approval. Completion is expected in the next 12 months.
Market and competition
The UK industry has entered a period of significant regulatory change, with the Retail Distribution Review (RDR) and Auto-Enrolment, transforming the way that long-term savings products are bought and sold. We have been selling a full suite of RDR compliant products since September 2012 and during 2012 processed our first schemes under Auto-Enrolment. We also hold leading positions in the protection and annuities marketplaces which are largely unaffected by the RDR.
The UK long-term savings market is highly competitive and we consider our main competitors to be Standard Life, Prudential, Legal & General, and Lloyds Banking Group.
In Ireland, the economic environment remains challenging. The life insurance market in Ireland is largely consolidated. We consider our main competitors to be Bank of Ireland Life, Irish Life, Canada Life and Friends First.
Products
In the UK, we provide a comprehensive product range focused on both the consumer and corporate market with an approximate 70:30 split. The pensions and `at retirement’ products we offer include stakeholder and personal pensions, equity release, annuities, income drawdown and with-profits products. Our annuity offerings include immediate life, enhanced, fixed-term annuities and with-profits pension annuities. We provide a number of traditional life insurance products, including level-term, decreasing-term (with or without critical illness), guaranteed whole life insurance, and guaranteed lifelong protection plans. Our savings and investment products include ISAs, investment bonds, funds, base rate trackers, investments with guarantees and with-profits products.
In Ireland, our long-term insurance and savings business offers a wide range of protection, bonds, savings and pension products. Our protection products include life insurance, mortgage protection, specified illness and guaranteed and whole life cover products. The pension range covers retirement and investment products including government personal retirement savings accounts (PRSA) schemes.
Distribution
We have a multi-distribution strategy, which means we sell our products through intermediaries, corporate partners, in the workplace, and directly to customers. We are a leading provider in the UK intermediary market with a 12.5% share.2
In 2012, in the UK, we agreed an exclusive distribution deal with Tesco for the sale of protection products, following the extension of our distribution agreements with Santander and Barclays in 2011. We are also the provider of choice to the Royal Bank of Scotland and other leading organisations including the Post Office. We remain committed to building on our existing relationships and distribution partnerships as well as to growing our workplace and direct channels.
UK & Ireland general insurance
Business overview and strategy
In 2012, Aviva continued to combine its UK and Irish general insurance businesses, allowing Ireland to leverage the scale and expertise that exists in the UK. We are a leading general insurer in both the UK and Ireland with market shares of 10.5%3 and 15.1%4respectively, and have approximately 9 million customers. We employ around 11,000 people and operate from a number of locations throughout the UK and Ireland, including Norwich, Perth, Glasgow, London, Dublin and Galway.
We focus on personal and commercial insurance. In the UK we hold top three positions in all our major classes of business3. In Ireland we are a leader in general insurance4 and health insurance. We believe our key strengths include underwriting excellence, claims and cost management and excellent customer service. We focus on the fundamentals of the insurance business to maximise returns through the insurance cycle and provide stability of earnings.
Market
The UK is the third largest insurance market in the world.5 In 2011, the top four companies had a 32%3share of the general insurance market.
The UK and Ireland general insurance markets are cyclical in nature and remain very competitive, particularly in personal lines, where the market is highly commoditised.
Following significant premium rate increases in recent years in response to rising claims costs and frequencies, the UK personal motor market has seen rate reductions in 2012 reflecting intense competition and regulatory change. Challenging conditions also apply to other UK classes of business, with rating increases typically limited to low single digits. In Ireland, the market remains challenging reflecting the economic downturn, increased competition and market contraction of 3% in 2010 and a further 5% in 2011.
In the UK our main competitors are Direct Line Group, RSA, The Admiral Group, AXA, Zurich, Lloyds Banking Group, Allianz and Ageas. In Ireland, our competitors include RSA, AXA, Zurich and Liberty.
Products
We provide a wide range of general insurance products both in the UK and Ireland. In the UK we have a business mix of approximately 60% personal lines and 40% commercial lines. Our UK personal products include motor, home and travel insurance. Our UK commercial products include motor, property and liability insurance for small and medium size enterprises (“SMEs”) and the larger UK Corporate and Speciality Risks market.
In Ireland our products include property, motor, travel, farm and business insurance and our health insurance business provides products for both the personal and company sector.
Distribution
We have a multi-distribution strategy. Our personal products are sold directly to customers over the phone and through our websites www.aviva.co.uk, www.aviva.ie and www.quotemehappy.com, via brokers and through corporate partnerships. Our Quotemehappy insurance products are also available through price comparison websites. For commercial insurance, we focus on broker distribution and believe that independent brokers remain the best source of advice for business customers.
In Ireland, to deliver further efficiency benefits, we closed our network of high street branches and transferred customers to both One Direct and strategic broker partners, which ensured they retained access to local face-to-face solutions for their insurance needs.
France
Business overview and strategy
France is the fourth largest insurance market in the world5. Aviva France operates through two main companies: Aviva Vie and Antarius (JV structure with Crédit Du Nord). Aviva France, one of the top ten insurance businesses in France, is ranked seventh in life insurance (excluding bancassurance) and tenth in general insurance as measured by gross written premiums, according to L’Argus de l’Assurance, as at 31 December 2011. Our health business has a 1.8% share of the market based on 2011 premium income6. Aviva France’s strategy is to continue to diversify and grow our business profitability.
Market
The life insurance market is driven by individual savings and dominated by bancassurance, which has accounted for around 60% of the life insurance market over the past decade according to the FFSA. We believe that the current volatility in the financial markets has affected customer confidence but that over a longer period, multi-funds policies and unit-linked funds are the best insurance vehicles for performance. We believe the long-term insurance and savings market in France has longer-term growth potential due to the ageing population and the growing need for private pensions.
| 2 | ABI Stats Q3 2012 |
| 3 | Source: Datamonitor analysis of market share based on 2011 GWP |
| 4 | Source: Irish Insurance Federation, 2011 |
| 5 | New Swiss Re Sigma Study (World insurance 2011) |
| 6 | Source: Fédération française des sociétés d'assurance (FFSA) |
The general insurance market in France is mature and highly competitive. For several years, price competition was high as insurers sought market share, particularly in the personal lines market. In our opinion, the market has now entered a phase of price increases that currently makes up the majority of its marginal growth.
Products
Aviva France provides a wide range of insurance solutions: life and long-term savings, general insurance and asset management through Aviva Investors France. The products sold through our life channel are long-term savings, pensions and regular premium products and a broad range of protection products, primarily for individuals, and with a focus on the unit-linked market.
We have a longstanding relationship with the Association Française d’Epargne et de Retraite (AFER) which is the largest retirement savings association in France with 735,000 members as at 31 December 2011, to manufacture and distribute the AFER savings product. In the general insurance market our product range includes household, motor, health and legal protection products and also a range of insurance products for farms, craftsmen, tradesmen and small to medium sized entities and specific products for building firms and motor fleets.
Distribution
Aviva France has developed a multi-distribution model combining retail, direct and bancassurance networks through owned distribution channels, independent networks and partnerships. Our retail networks sell through 896 tied agents, a direct sales force made up of more than 280 advisors and 700 Union Financiere de France (UFF) consultants (Aviva France also holds a majority stake in UFF) and more than 1,000 active brokers in the life, health and construction markets. Direct distribution is sold through Eurofil for personal general insurance, Aviva Direct for health and protection and Epargne Actuelle for the AFER product.Eurofil is the second largest direct general insurer and Aviva Direct is the leading provider of direct protection in France according to the FFSA as at December 2011. We operate in the bancassurance market through our partnership with Crédit du Nord, a subsidiary of Société Générale, selling life, savings, protection and general insurance products. This partnership gives Aviva access to over 1.9 million customers, as at December 2011.
Canada
Business overview and strategy
Aviva Canada is the country’s second largest general insurer7 Through its distribution partners it provides a range of personal and commercial lines insurance products to nearly three million policyholders. It has an 8.4% market share and a top five position in all major provinces.7 Aviva Canada employs approximately 3,800 people and operates from a head office in Toronto, with other offices located throughout Canada.
We believe that we are well placed for continued growth and that our success is underpinned by our two strategic priorities of building strong broker relationships and maintaining sophisticated pricing and underwriting. We believe the transformation of our personal lines business over the last few years has ensured the business is highly competitive. We expect that continued refinement to our models will allow us to leverage this position to positively react to market opportunities. We will continue to address increasing customer demand for choice, simplicity and self-service by working with our broker partners on processes and technology solutions in order to help them compete with other channels.
Market
As the eighth largest8in the world, Canada’s general insurance market is established and stable.The four largest provinces generate around 89% of total premiums with Ontario, the largest, representing 48% of total Canadian premiums.9
The Canadian general insurance industry is highly fragmented with many small players and no dominant consumer brand. Steady consolidation has resulted in the top five companies representing 40% of the market and the top two companies, Intact Financial and Aviva, controlling 24% of the market.9 The rest of the industry includes several national carriers as well as smaller, provincially based or niche companies.
Whilst direct and affinity channels are gradually increasing in market share, the traditional broker channel accounts for over 65% of distribution.10In addition to the growth of direct and affinity channels, insurance carriers are increasingly supporting and controlling distribution through investment in brokers.
Products
The general insurance products that we provide through our Canadian companies are:
| n | Personal, home and motor insurance; |
| n | Small and medium-size enterprise commercial insurance, including motor, property, liability, boiler and machinery, and surety; and |
| n | Niche personal insurance products including holiday and park model trailers, hobby farms, boats as well as antique, classic and custom cars. |
Distribution
We operate in Canada through a distribution network focused on approximately 1,700 independent group and retail brokers who distribute our core personal and commercial line products. In addition, we work closely with both independent and wholly owned specialty brokers to distribute specialty personal line products.
Italy, Spain and Other
Italy
Business overview and strategy
Aviva Italy is the country’s sixth largest life insurer, with a market share of 4.44% based on 2011 premiums (excluding Eurovita)11and is the 12th largest general insurance company with a market share of 1.54%12. We have approximately 2.5 million customers across both the Life and General Insurance businesses.
Aviva Italy has set up a transformation plan to navigate through the current challenging economic environment and consolidate its business structure. Aviva Italy aims to reinforce its business partnerships with three of the five largest Italian banks and with 500 agents.
Market
The Italian life market is dominated by the top 10 providers which represent around 79% of the total market share13. The life insurance industry in Italy reported a decline in volumes as of 30 September 2012 with gross written premiums down by 10.2% compared to the same period in 2011, whilst the the general insurance segment decreased by 2.1% in the same period14.
In 2012 the Italian insurance industry went through three major changes:
| n | The Italian government introduced new legislation (Decreto Monti) which has led insurance companies to transform both their product ranges and their customer relationships (eg. separate private area for customers on the company website; black box service for motor insurance; new quotation tools); |
| 7 | MSA Research Inc., 2011 online database. |
| 8 | New Swiss Re Sigma Study (World insurance 2011) |
| 9 | MSA Research Inc., 2011 online database |
| 10 | Axco Insurance Report for Canada |
| 11 | Associazione Nazionale fra le Imprese Assicuratrici (ANIA) |
| 12 | ANIA as at 31 December 2011 |
| 13 | ANIA: www.ania.it/PUBBLICAZIONI/Premi_del_Lavoro_diretto_Italiano_.html |
| 14 | IVASS (Istituto per la Vigilanza sulle Assicurazioni) |
| n | Two of the leading general insurance companies announced their merger: Unipol and Fondiaria Sai; |
| n | The insurance regulator went through a restructure and as of 1 January 2013 is reporting to the Bank of Italy. It is now called IVASS (Istituto per la Vigilanza sulle Assicurazioni). |
Products
Our long-term insurance and savings business offers a wide range of products covering protection, bonds and savings and pensions.
We are focussed on less capital intensive products. We have reduced product guarantees and launched three new life products all with improved economic returns and reduced capital consumption.
We have increased our share of unit-linked business and reduced our with-profit sales, to manage down our exposure to this sector. We have been focusing to further develop our offering in protection where we are one of the market leaders.
Our general insurance business in Italy mainly provides motor and home insurance products to individuals, as well as small commercial risk insurance, including marine insurance, to businesses. In 2013 we will further develop our partnership with Banco Popolare distributing motor insurance through their branches.
Distribution
Our products are distributed through bancassurance partnerships with UniCredit Group, Banco Popolare Group and Unione di Banche Italiane (UBI). These partnerships give us access to more than 5,900 branches. In addition, we also have approximately 5,500 sales advisers, and 600 insurance (multi-mandate) agents and brokers as at the end of 2012.
Spain
Business overview and strategy
Aviva Spain is the country’s fifth largest long-term insurer by gross written premiums with a market share of 5% in the third quarter of 2012.15Aviva Spain sells protection, long-term savings and pensions, health and accident insurance through a bancassurance network based on joint ventures with six banks. We also sell through Aviva Vida y Pensiones, the wholly-owned Aviva branded long-term insurance company and through our exclusive distribution agreement with Spanish mutual insurance company Pelayo.
Our strategy in Spain is to maintain our bancassurance footprint and further develop our retail operations and attract new partners when the opportunities arise. In December 2012, we announced our intention to sell our share of our joint venture with Aseval to Bankia S.A for £494 million. We expect this transaction to be completed during the second quarter of 2013.
Market
The Spanish market is significantly affected by the current economic climate and the financial sector continues to be under pressure as a result of the ongoing restructuring process and mergers taking place. Any opportunities arising from these will be considered by Aviva on their merits. In relation to distribution agreements with bancassurance partners, Aviva is protected financially within our contracts with Spain’s savings banks (“the cajas”) from any detrimental affect arising from these mergers.
The top positions in the long-term life insurance market are dominated by bank-owned or bank-insurer joint ventures, with the overall bancassurance channel accounting for more than 74% of gross written premiums at the end of 201116 in the Spanish life insurance market.
Customers in Spain are accustomed to receiving advice through banking channels, and we continue to use our relationship with our partners to capitalise on this whilst developing our retail agents and broker distribution network.
Products
We offer a wide range of bonds, savings, and protection products. Investment products include both unit linked and traditional plans, where profit sharing is regularly used to increase the policy return. Our traditional plans include savings schemes and income products. Pension savings products have valuable tax advantages. We offer a flexible range of individual and group pension plans with alternative investment choices. We also offer protection products, covering both mortgages and credit loans typically providing cover for the family in the event of death or disability. The ongoing focus is on less capital intensive products.
Distribution
Through bancassurance partnerships we have established subsidiaries to distribute our products with each of the banks as set out below:
| n | Unicorp Vida – in conjunction with Unicaja since 2001; |
| n | CxG – in conjunction with Caixa Galicia since 2001; |
| n | Caja España Vida – in conjunction with Caja España since 2001; |
| n | Caja Granada Vida – in conjunction with Caja Granada since 2002; |
| n | Cajamurcia Vida – in conjunction with Cajamurcia since 2007; and |
| n | Aseval – in conjunction with Bancaja (now Bankia) since 2000 (sale announced December 2012 as set out in ‘Financial statements IFRS – note 3 – Subsidiaries’). |
Aviva Vida y Pensiones distributes our products through professional intermediaries (financial advisers, agents and brokers), supported by a branch office network and call centres. In 2012 we saw the start of distribution through Pelayo´s network of 200 branches and approximately 1,000 exclusive agents.
Our distribution relationships have enabled us to maintain our position as the largest provider of individual protection products in the market17.
Other
The Italy, Spain and Other segment also includes our Romanian pensions business, which is held for sale as at 31 December 2012, our reinsurance and run-off businesses and the results of our life businesses in Hungary, the Czech Republic and Romania up until the date of sale in July 2012.
Higher growth markets
Business overview and strategy
The higher growth markets segment covers our operations in nine markets in Asia as well as Poland, Lithuania, Turkey and Russia.
As at 30 June 2012, our Singapore subsidiary ranks fifth by APE according to the Life Insurance Association,18 providing employee benefits and healthcare insurance. In Singapore, we have a strong relationship with the Development Bank of Singapore (DBS).
In China, through our 50% joint venture with COFCO Ltd, we are ranked in the top five among the foreign life insurers in terms of APE.19We have a presence in 12 provinces and over 50 branches. Due to regulatory changes in bancassurance, we are developing alternative distribution channels to reach high net worth customers.
| 15 | Investigación Cooperativa entre Entidades Aseguradoras y Fondos de Pensiones (ICEA). |
| 16 | ICEA in the publication ‘Canales de Distribución - Estadística 2011’. |
| 17 | ICEA at 30 September 2012 |
| 18 | Life Insurance Association |
| 19 | APE data released by National Insurance Industry Communication Club |
In India, with a distribution network of 140 branches, we operate in partnership with the Dabur Group through a 26% interest in Aviva Life Insurance Company India Ltd. Tighter regulations on unit-linked products are driving an industry shift towards traditional products such as endowment and health policies. As at 31 August 2012, we ranked ninth among the private life insurance companies in India based on APE according to the Insurance Regulatory and Development Authority (IRDA).20
In Asia we are focused on creating franchise value through organic growth. Increasing the value of our new business remains our first priority. We are achieving this through scale benefits and by focusing our product mix on higher margin products.
As of 30 June 2012, our Polish life operation is the fourth largest overall life insurer in Poland (including JV Life), with a market share of 7% based on total premium income according to the Polish Financial Supervision Authority (KNF).21Our product strategy for pensions in Poland is to retain our status as one of the market leaders in terms of assets and customers. We have updated our pay and bonus structure for our sales force to link compensation directly with the value generated by the sale.
We also operate in Turkey (offering both general insurance and life products) and Russia (life operations).
Russia is held for sale at 31 December 2012 and we announced the disposal in February 2013.
Market
We believe the fundamentals of the Asian markets are strong. The Asian Development Bank predicts GDP growth for emerging markets in Asia of 7.2% in 2012.22Despite inflationary pressures, we believe Asia’s strong domestic demand and intra-regional trade is likely to sustain this growth momentum, with China and India driving the overall trend. We expect Asia to be the fastest growing region for life insurance globally, with the potential for 15-20% average market growth per annum over the next decade. We believe that South East Asia in particular offers one of the highest insurance margins in the world. By strengthening our multi-channel distribution capability as well as managing our product portfolio for margin and profit, we believe we are well-positioned to continue delivering strong growth in franchise value.
Outside of Asia, the Polish market for protection products has seen significant growth since 1999, although penetration rates remain relatively low according to KNF statistics. We expect the insurance market in Turkey to continue to grow as its economy matures.
Products
Our Asian businesses offer a range of protection, bonds and savings and pension products, including universal life, participating and non-participating endowments, unit-linked single and regular premium life insurance, other savings and pensions products and a range of accident and health insurance products.
Outside of Asia, our life business in Poland provides a broad range of unit-linked, annuities and bonds and savings products and health insurance. For institutions we offer group life insurance and employee pension programmes, which are both unit-linked products.Our pension business offers a standard product for all customers as part of the privately managed second pillar pensions market.We offer general insurance products to both commercial entities and individuals in Poland. For institutions we offer selected commercial lines risks. For individuals we offer home, accident and travel insurance, which are primarily sold by tied agents, as well as motor insurance, which is sold primarily through our direct operation. In Russia, we sell a wide range of products including personal and group life as well as personal accident policies. In Turkey, we sell life and savings products including unit-linked pensions, supplemented by protection insurance and other savings products. Our Turkish general insurance operations sell personal motor, household, commercial property, small and medium size enterprises, personal accident, marine and travel insurance.
Distribution
Across Higher growth markets we operate a multi-distribution strategy. In Singapore, we have a core bancassurance relationship with DBS Bank. In China and South Korea, we distribute the majority of our products through bancassurance and IFAs. In Hong Kong, India and Malaysia, bancassurance is the main distribution channel. We are investing in other channels, such as direct marketing, to diversify our sources of revenue.
Outside of Asia, the direct sales force and bancassurance is the main distribution channel for most of the Polish group and is made up of 2,200 tied insurance agents. Our biggest relationship is a joint venture with Bank Zachodni WBK (a subsidiary of Banco Santander) that sells both life and general insurance products through the bank’s network of over 620 branches.23We also co-operate with independent insurance agencies and brokers. Our mutual funds are also sold in brokerage houses and our individual products are supported by call centre and website sales. We also have a direct platform (internet and call centre) for distribution of motor insurance. In Turkey, we operate through a multi-channel distribution framework consisting of bancassurance, direct sales force, corporate sales, agencies, telemarketing and brokers. In Russia we focus on bancassurance, where we sell through 21 banks and through brokers.
Aviva Investors
Business overview and strategy
Aviva Investors was established in 2008 when the Aviva Group combined all of its major fund management components into a single global fund management business. As at 31 December 2012, we had £274 billion in assets under management including £38 billion relating to the United States Life and related internal asset management operations which are classified as discontinued operations in the financial statements. Aviva Investors offers a range of investment management services, most notably in the UK, Europe, the US and Asia Pacific.
Our largest clients are the long-term insurance, savings, and general insurance businesses of Aviva, to whom we provide bespoke asset management services across a broad spectrum of asset classes.
We provide external clients with bespoke segregated solutions or offer access to a variety of fund ranges. Our principal target clients for the larger segregated solutions tend to be large pension funds and financial institutions such as insurance companies and banks.
Our strategy is to grow our share of higher-margin, external business, offering client-focused solutions and products to our customers across our international network.
Products and distribution
Our products cover a broad range of asset classes. In Europe, we have a range of SICAVs (open-ended collective investment schemes), which are domiciled in France, Luxembourg and Poland. These funds have different share classes depending on the size and type of investor. Our traditional distribution model for these funds focuses on wholesale distributors, asset allocators and small to mid-size institutional investors.
In the UK, we largely sell segregated mandates and specialist funds to pension schemes, local authorities and insurance companies. We also supply products to the retail and wholesale markets, principally through UK domiciled equity, bond and real estate funds. These are promoted to investors via IFAs, fund platforms, fund supermarkets and discretionary asset managers. In addition, we have a range of pooled pension funds which are aimed at the smaller pension fund market. These funds are normally defined benefit schemes and tend to be advised by investment consultants.
| 20 | http://www.irda.gov.in/ADMINCMS/cms/frmGeneral_List.aspx?DF=MBFL&mid=3.1.8 |
| 21 | KNF: www.knf.gov.pl/Images/A_Informacje_IIkw_2011k_tcm75-27692.xls |
| 22 | Asian Development outlook 2011 update, December 2011. |
| 23 | Bank Zachodni WBK: http://indywidualni.bzwbk.pl/kontakt/wyszukiwarka-placowek-i bankomatow/wyszukiwarka placowek-i-bankomatow.html |
We manage hedge funds in the UK and the US. These funds are generally registered offshore and are promoted to institutional clients, family offices and wealth managers. They include both fund of fund and single strategy funds across fixed interest and convertibles markets. In the US we also have an asset management company called River Road Asset Management LLC.
We also have a range of specialist property funds. These funds are targeted at specialist real estate buyers and large institutions (mostly pension funds and local authorities), and provide real estate solutions to a wide range of risk appetites, ranging from secure income generating funds to leveraged growth funds.
We have six money market funds, domiciled in Dublin and Paris, addressing the sterling and euro money market segments. These funds are sold by a specialist sales team and target corporate treasury functions.
Discontinued operations
United States
Business overview and strategy
On 21 December 2012, the Group announced that it had agreed to sell its United States life operations, consisting of our United States life and annuities business (Aviva USA) and the related asset management operations of Aviva Investors North America, to Athene Holding Ltd. Completion of the sale is expected in 2013. As the disposal will result in the loss of a major geographical area of operations, previously presented as “United States” in the segmental reporting note, the results of Aviva USA for all periods presented in the income statement have been classified as a discontinued operation. Aviva USA has been classified as held for sale in the statement of financial position as at 31 December 2012.
Market
Aviva USA is a leading provider of fixed indexed life insurance and fixed indexed annuities in the USA. According to AnnuitySpecs.com, as of 30 September 2012, Aviva USA is ranked first in the market for the sale of fixed indexed life products with a 14% market share, and second for the sale of fixed indexed annuities with a 13% market share.24
Products
Aviva USA offers both protection and savings products, with traditional fixed as well as indexed accumulation options that pay interest based on the movement of a market index. Depending on such movement, indexed policies can deliver higher returns than traditional fixed products, especially when interest rates are low. Indexed products also serve to protect the customer’s investment and provide a guaranteed income even when the market is down.
Aviva USA also offers a range of optional extras or `riders’ that can be added to policies to meet customised individual needs.
In the savings market, Aviva USA’s fixed annuity portfolio offers tax-advantaged savings opportunities and protection against the risk of outliving one’s assets. Some of these products include a guaranteed lifetime withdrawal benefit that allows customers to make guaranteed minimum withdrawals from their annuity for the entirety of their lives.
Distribution
Aviva USA uses a multi-channel distribution strategy by focusing on more than 50 key distribution partners. Its distribution channels include career marketing organisations, independent marketing organisations, brokerage general agents and personal producing agents. Its network covers all 50 states with agents largely contracted through key distribution partners.
Delta Lloyd
Delta Lloyd is a financial services provider in the Netherlands and Belgium, operating in the life insurance and pensions, general insurance, fund management and selected banking markets.
The Group ceased to control Delta Lloyd on 6 May 2011 and its results for 2011 up to that date and prior years are presented as discontinued operations.
As explained in ‘Financial Statements IFRS – note 3 – Subsidiaries’, and ‘Financial Statements IFRS – note 16 – Interests in, and loans to, Associates’, for the period from 7 May 2011 to 5 July 2012, the Group had an associate interest in Delta Lloyd. From 6 July 2012, following a further selldown, the Group’s stake was treated as a financial investment. The Group’s share of Delta Lloyd’s results as an associate and its interest in Delta Lloyd as a financial investment are both included in ‘other Group activities’ within continuing operations.
In January 2013, the Group sold its remaining stake in Delta Lloyd.
Organisational structure
Organisational structure
The following chart shows, in simplified form, the organisational structure of the Group as at 31 December 2012. Aviva plc is the holding company of the Group.
Parent company
Aviva plc
Subsidiaries
The principal subsidiaries of the Company are listed below by country of incorporation. All are wholly-owned, directly or indirectly, and transact insurance or reinsurance business, fund management activities or services in connection therewith, unless otherwise stated.
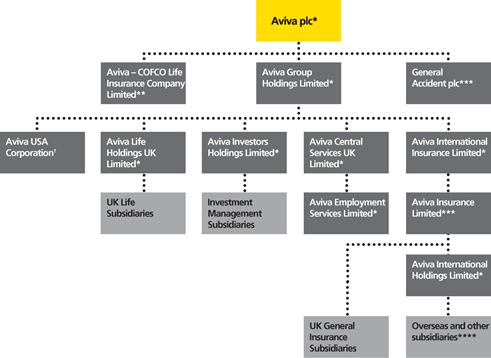
A complete list of the Group’s subsidiaries is contained in the Group’s annual return to Companies House.
| * | Incorporated in England and Wales |
| ** | Incorporated in People’s Republic of China. Aviva plc has a 50% interest in the joint venture |
| *** | Incorporated in Scotland |
| **** | Includes certain investment management businesses |
| † | Incorporated in the United States |
United Kingdom Aviva Annuity UK Limited Aviva Central Services UK Limited Aviva Consumer Products UK Limited Aviva Employment Services Limited Aviva Equity Release UK Limited Aviva Health UK Limited Aviva Insurance Limited Aviva Insurance Services UK Limited Aviva International Insurance Limited Aviva Investors Global Services Limited Aviva Investors Pensions Limited Aviva Investors UK Fund Services Limited Aviva Investors UK Funds Limited Aviva Life & Pensions UK Limited Aviva Life Services UK Limited Aviva Risk Management Solutions UK Limited Aviva UKGI Investments Limited Gresham Insurance Company Limited
The Ocean Marine Insurance Company Limited Barbados Victoria Reinsurance Company Ltd Bermuda Aviva Re Limited Canada Aviva Canada Inc. and its principal subsidiaries: Aviva Insurance Company of Canada Elite Insurance Company Pilot Insurance Company Scottish & York Insurance Co. Limited S&Y Insurance Company Traders General Insurance Company | France Aviva France SA and its principal subsidiaries: Antarius S.A. (50.0%) Aviva Assurances S.A. (99.9%) Aviva Investors France S.A. (99.9%) Aviva Vie SA (99.9%) Aviva Epargne Retraite (99.9%) Eurofil S.A. (99.9%) Union Financière de France Banque (Banking) (74.3%) Hong Kong Aviva Life Insurance Company Limited Indonesia PT Asuransi Aviva Indonesia (60.0%) Ireland Aviva Insurance Europe SE Aviva Health Group Ireland Limited (70.0%) Aviva Life & Pensions Ireland Limited (75.0%) Italy Aviva Italia Holding S.p.A and its principal subsidiaries: Avipop Assicurazioni S.p.A (50.0%) Avipop Vita S.p.A (50.0%) Aviva S.p.A (51.0%) Aviva Assicurazioni Vita S.p.A (50.0%) Aviva Italia S.p.A Aviva Previdenza S.p.A (55.0%) Aviva Vita S.p.A (25.5%) Eurovita Assicurazioni S.p.A (41.0%) |
Lithuania Uždaroji akcinė gyvybės draudimo ir pensijų bendrovė”Aviva Lietuva” Poland Aviva Powszechne Towarzystwo Emerytalne Aviva BZ WBK S.A. (90.0%) Aviva Towarzystwo Ubezpieczen na Zycie SA (90.0%) Aviva Towarzystwo Ubezpieczen Ogolnych SA (90.0%) Russia Closed Joint Stock Insurance Company Aviva (Zao) Singapore Aviva Ltd Navigator Investment Services Limited Spain Aseguradora Valenciana S.A., de Seguros y Reaseguros (Aseval) (50.0%) Aviva Vida y Pensiones, SA de seguros y reaseguros Caja Espana Vida, Compania de Seguros y Reaseguros (50.0%) Caja Murcia Vida y Pensiones, de Seguros y Reaseguros S.A. (50.0%) Caja Granada Vida, de Seguros y Reaseguros, S.A. (25.0%) CxG Aviva Corporación CaixaGalicia de Seguros y Reaseguros, S.A. (50.0%) Unicorp Vida, Compania de Seguros y Reaseguros (50.0%) Turkey Aviva Sigorta A.S. (98.6%) United States Aviva USA Corporation and its principal subsidiaries: Aviva Life and Annuity Company Aviva Investors North America, Inc. River Road Asset Management, LLC Associates and joint ventures The Group has ongoing interests in the following operations that are classified as associates or joint ventures. Further details of those operations that were most significant in 2012 are set out in notes 15 and 16 to the financial statements. United Kingdom The Group has interests in several property limited partnerships. Further details are provided in note 15 to the financial statements. | China Aviva-COFCO Life Insurance Co. Limited (50.0%) India Aviva Life Insurance Company India Limited (26.0%) Italy Banca Network Investimenti SpA (50.0%) Malaysia CIMB Aviva Assurance Berhad (49.0%) CIMB Aviva Takaful Berhad (49.0%) South Korea Woori Aviva Life Insurance Co, Ltd (47.3%) Turkey AvivaSA Emeklilik ve Hayat A.S (49.8%) Vietnam Vietinbank Aviva Life Insurance Company Limited (50.0%) Group Restructuring On 28 February 2013, a major restructuring of the Group was completed, which will have economic effect from 1 January 2013. Prior to the restructure, Aviva Insurance Limited (“AIL”) acted both as the main UK general insurance underwriter as well as a holding company for the Group’s non-UK operations. In order to enhance the governance relating to AIL and reduce the UK general insurance policyholders exposure to the non-UK operations, Aviva International Holdings Limited (“AIH”), the owner of the majority of the non-UK operations has been transferred to Aviva Group Holdings Limited (“AGH”) in consideration for a loan from AIL, secured on the non-UK operations by way of the shareholding in the UK holding companies including AIH. At the same time, the shares in AIL, held by Aviva International Insurance Limited (“AII”) were transferred to AGH in consideration for a loan secured on the shares of AIL. The impact of the above restructuring is to reduce the complexity of the current Group corporate structure resulting in a greater degree of direct control of subsidiaries creating a flatter, more transparent corporate structure. The following chart shows, in simplified form, the organisational structure of the Group after the completion of the restructure: |

Analysis of investments
Analysis of investments
We invest our policyholders’ funds and our own funds in order to generate a return for both policyholders and shareholders. The financial strength of the Group and both our current and future operating results and financial performance are, therefore, in part dependent on the quality and performance of our investment portfolios in the UK, Europe, North America and Asia.
For additional information on our financial investments, see ‘Financial statements IFRS – Note 22 – Financial investments’. For a quantitative analysis of funds under management by Aviva and third-party fund managers, see ‘Financial statements IFRS – Note 55 – Assets under management’.
Investment strategy
Our investment portfolio supports a range of businesses operating in a number of geographical locations. Our aim is to match the investments held to support a line of business to the nature of the underlying liabilities, whilst at the same time considering local regulatory requirements, the level of risk inherent within different investments, and the desire to generate superior investment returns, where compatible with this stated strategy and risk appetite.
Long-term insurance and savings business
As stated above, we aim to optimise investment returns whilst ensuring that sufficient assets are held to meet future liabilities and regulatory requirements. As different types of life insurance business vary in their cash flows and in the expectations placed upon them by policyholders, we need to hold different types of investments to meet these different cash flows and expectations.
The UK with-profits business is comprised largely of long-term contracts with some guaranteed payments. We are therefore able to invest a significant proportion of the funds supporting this business in equities and real estate. This is because the long-term nature of these contracts allows us to take advantage of the long-term growth potential within these classes of assets, whilst the level of guaranteed payments is managed to mitigate the level of risk that we bear in relation to the volatility of these classes of assets.
Non-UK participating business, annuities and non-participating contracts in all countries, have a high level of guaranteed future payments. We endeavour to match the investments held against these types of business to future cash flows. We therefore have a policy of generally holding fixed income securities and mortgage loans with appropriate maturity dates.
With unit-linked business, the primary objective is to maximise investment returns, subject to following an investment policy consistent with the representations that we have made to our unit-linked product policyholders.
General insurance and health business
The general insurance and health business is comprised of shorter-term liabilities than the long-term insurance business. Furthermore, all the risk attaching to the investments is borne by our shareholders. As a result, the investment portfolio held to cover general insurance liabilities contains a higher proportion of fixed income securities than the portfolio held to cover life insurance liabilities.
Property partnerships
As part of their investment strategy, the UK and certain European policyholder funds have invested in a number of property limited partnerships (“PLPs”), either directly or via property unit trusts (“PUTs”), through a mix of capital and loans. The nature of our involvement in property partnerships is set out in the second and third paragraphs of the Investment vehicles section of ‘Financial Statements IFRS – Accounting policies – (D) Consolidation principles’. Property partnerships are accounted for as subsidiaries, joint ventures or financial investments depending on our participation and the terms of each partnership agreement. For each property partnership accounted for as a subsidiary, joint venture or financial investment, we are exposed to falls in the value of the underlying properties which are reflected as unrealised gains/losses on investment properties, our share of joint venture results and unrealised gains/losses on financial investments, respectively. However, the majority of these are in policyholder funds (rather than shareholder funds) so such losses are offset by changes in the amounts due to policyholders or unitholders, or UDS.
Analysis of investments
We distinguish between policyholder, participating fund and shareholder investments, which are terms used to reflect the differing exposure to investment gains and losses. Policyholder assets are connected to our unit-linked business, where the policyholder bears the investment risk on the assets in the unit-linked funds. Our exposure to loss on policyholder assets is limited to the extent that income arising from asset management charges is based on the value of assets in the funds. Participating fund assets relate to some of our insurance and investment contracts which contain a discretionary participation feature, which is a contractual right to receive additional benefits as a supplement to guaranteed benefits. Our exposure to investment losses on participating funds is generally limited to our participation in the fund. Shareholder assets are other assets held within our businesses that are not backing unit-linked liabilities or participating funds.
Investments held at 31 December 2012 and 31 December 2011 are listed below:
| 2012 | | Policyholder
assets
£m | | | Participating
fund assets
£m | | | Shareholder
assets
£m | | | Total
assets
analysed
£m | | | Less
assets of
operations
classified
as held
for sale
£m | | | Carrying value in the statement of financial position
£m | |
| Investment property | | | 4,172 | | | | 6,079 | | | | 582 | | | | 10,833 | | | | (18 | ) | | | 10,815 | |
| Loans | | | 605 | | | | 5,562 | | | | 21,767 | | | | 27,934 | | | | (3,397 | ) | | | 24,537 | |
| Financial investments | | | | | | | | | | | | | | | | | | | | | | | | |
| Debt securities | | | 16,472 | | | | 83,497 | | | | 61,654 | | | | 161,623 | | | | (33,617 | ) | | | 128,006 | |
| Equity securities | | | 22,500 | | | | 9,854 | | | | 1,423 | | | | 33,777 | | | | (1,248 | ) | | | 32,529 | |
| Other investments | | | 23,704 | | | | 4,258 | | | | 2,131 | | | | 30,093 | | | | (1,550 | ) | | | 28,543 | |
| Total | | | 67,453 | | | | 109,250 | | | | 87,557 | | | | 264,260 | | | | (39,830 | ) | | | 224,430 | |
| Total % | | | 25.5% | | | | 41.3% | | | | 33.2% | | | | 100.0% | | | | | | | | 100.0% | |
| 2011 | | | 64,215 | | | | 108,171 | | | | 83,773 | | | | 256,159 | | | | (347 | ) | | | 255,812 | |
| 2011% | | | 25.1% | | | | 42.2% | | | | 32.7% | | | | 100.0% | | | | | | | | 100.0% | |
As the table indicates, approximately 33.2% of total investments can be directly attributed to shareholders. The apportionment of our shareholder assets is predominantly weighted towards debt securities and loans. In comparison, policyholder and participating funds contain a greater proportion of equities and other investments (e.g. unit trusts), reflecting the underlying investment mandates.
We carry investments on our statement of financial position at either fair value or amortised cost. At 31 December 2012, approximately 97% of the Group’s total investments were carried at fair value on the statement of financial position.
Financial investment balances included in the remainder of these disclosures include financial investments of operations classified as held for sale. For more information about financial investments analysed according to their accounting classification and valuation approach, as well as the cost, unrealised gains and losses, impairments, fair value and other information concerning financial investments, see ‘Financial statements IFRS – Note 22 – Financial investments’.
Debt securities
Participating fund asset and shareholder debt securities analysed by credit rating and sector
Participating fund asset and shareholder debt securities analysed by credit rating and product type as at 31 December 2012 are set out in the table below. Government and corporate debt securities are further analysed by type of issuer.
| | Ratings | | | | | | | | | |
| 2012 – Participating fund assets | | | AAA £m | | | | AA £m | | | | A £m | | | | BBB £m | | | | Less than BBB £m | | | | Non-rated £m | | | | Total £m | |
| Government | | | | | | | | | | | | | | | | | | | | | | | | | | | | |
| UK government | | | 10,610 | | | | 4 | | | | 28 | | | | – | | | | – | | | | 11 | | | | 10,653 | |
| Non-UK government | | | 6,779 | | | | 11,830 | | | | 1,677 | | | | 10,471 | | | | 833 | | | | 10 | | | | 31,600 | |
| Corporate | | | | | | | | | | | | | | | | | | | | | | | | | | | | |
| Public utilities | | | 18 | | | | 93 | | | | 1,712 | | | | 1,012 | | | | 20 | | | | 17 | | | | 2,872 | |
| Convertibles and bonds with warrants | | | �� | | | | – | | | | 21 | | | | 284 | | | | 4 | | | | 19 | | | | 328 | |
| Other corporate bonds | | | 3,881 | | | | 4,955 | | | | 11,902 | | | | 9,731 | | | | 1,739 | | | | 2,369 | | | | 34,577 | |
| Certificate of deposits | | | – | | | | 6 | | | | 42 | | | | 12 | | | | 614 | | | | – | | | | 674 | |
| Structured | | | 307 | | | | 58 | | | | 132 | | | | 47 | | | | 39 | | | | 1 | | | | 584 | |
| Wrapped credit | | | – | | | | 57 | | | | 12 | | | | 22 | | | | 2 | | | | – | | | | 93 | |
| Other | | | 402 | | | | 120 | | | | 534 | | | | 397 | | | | 570 | | | | 93 | | | | 2,116 | |
| Total | | | 21,997 | | | | 17,123 | | | | 16,060 | | | | 21,976 | | | | 3,821 | | | | 2,520 | | | | 83,497 | |
| Total % | | | 26.3% | | | | 20.5% | | | | 19.2% | | | | 26.3% | | | | 4.6% | | | | 3.1% | | | | 100.0% | |
| 2011 | | | 30,540 | | | | 11,204 | | | | 24,004 | | | | 9,786 | | | | 1,465 | | | | 2,451 | | | | 79,450 | |
| 2011 % | | | 38.4% | | | | 14.1% | | | | 30.2% | | | | 12.3% | | | | 1.8% | | | | 3.2% | | | | 100.0% | |
| | Ratings | | | | | | | | | |
| 2012 – Shareholder assets | | | AAA £m | | | | AA £m | | | | A £m | | | | BBB £m | | | | Less than BBB £m | | | | Non-rated £m | | | | Total £m | |
| Government | | | | | | | | | | | | | | | | | | | | | | | | | | | | |
| UK government | | | 3,251 | | | | 81 | | | | 4 | | | | – | | | | – | | | | 197 | | | | 3,533 | |
| Non-UK government | | | 4,582 | | | | 4,557 | | | | 1,208 | | | | 1,671 | | | | 40 | | | | 50 | | | | 12,108 | |
| Corporate | | | | | | | | | | | | | | | | | | | | | | | | | | | | |
| Public utilities | | | 27 | | | | 185 | | | | 3,797 | | | | 1,776 | | | | 45 | | | | 153 | | | | 5,983 | |
| Convertibles and bonds with warrants | | | 6 | | | | – | | | | 19 | | | | 112 | | | | 2 | | | | – | | | | 139 | |
| Other corporate bonds | | | 1,349 | | | | 3,143 | | | | 12,250 | | | | 11,577 | | | | 1,394 | | | | 4,885 | | | | 34,598 | |
| Certificate of deposits | | | – | | | | 143 | | | | 58 | | | | 21 | | | | 165 | | | | 3 | | | | 390 | |
| Structured | | | 3,027 | | | | 554 | | | | 304 | | | | 143 | | | | 177 | | | | 15 | | | | 4,220 | |
| Wrapped credit | | | 1 | | | | 201 | | | | 81 | | | | 80 | | | | 38 | | | | 46 | | | | 447 | |
| Other | | | 45 | | | | 13 | | | | 59 | | | | 44 | | | | 63 | | | | 12 | | | | 236 | |
| Total | | | 12,288 | | | | 8,877 | | | | 17,780 | | | | 15,424 | | | | 1,924 | | | | 5,361 | | | | 61,654 | |
| Total % | | | 19.9% | | | | 14.4% | | | | 28.8% | | | | 25.0% | | | | 3.1% | | | | 8.8% | | | | 100.0% | |
| 2011 | | | 13,011 | | | | 7,831 | | | | 17,903 | | | | 12,101 | | | | 2,416 | | | | 5,338 | | | | 58,600 | |
| 2011 % | | | 22.2% | | | | 13.4% | | | | 30.6% | | | | 20.7% | | | | 4.1% | | | | 9.0% | | | | 100.0% | |
We grade debt securities according to external credit ratings issued at the balance sheet date. The credit rating used for each individual security is the median rating of the available ratings from the major credit rating agencies. If a credit rating is available from only one of these rating agencies then this rating is used. If an individual security has not been given a credit rating by any of the major rating agencies, the security is classified as ‘non-rated’.
For the table above we have expressed our rating using a rating scale whereby investment grade debt securities are classified within the range of AAA (extremely strong) to BBB (good) ratings, with AAA being the highest possible rating. Debt securities which fall outside this range are classified as less than BBB. This rating scale is analogous with that used by major rating agencies.
At 31 December 2012, the proportion of our shareholder debt securities that are investment grade increased to 88.1%(2011: 86.9%). The remaining 11.9% of shareholder debt securities that do not have an external rating of BBB or higher can be split as follows:
| n | 3.1% are debt securities that are rated as below investment grade; |
| n | 3.7% are US private placements which are not rated by the major rating agencies, but are rated as investment grade by
the Securities Valuation Office of the National Association of Insurance Commissioners (“NAIC”), a US national regulatory agency; and, |
| n | 5.1% are not rated by the major rating agencies or the NAIC. |
Of the securities not rated by an external agency or NAIC most are allocated an internal rating using a methodology largely consistent with that adopted by an external rating agency, and are considered to be of investment grade credit quality; these include £2.4 billion of debt securities held in our UK Life business, predominantly made up of private placements and other corporate bonds, which have been internally rated as investment grade.
Total wrapped credit
In respect of the wrapped credit investments, the table below shows the credit rating of the securities as they are officially rated, and an estimate of their rating without the guarantee. As rating agencies do not provide credit ratings for individual wrapped credit securities without consideration of the insurance guarantee, the credit ratings disclosed in the table below are based on internal best estimates.
| | | | | | | | | | | | 2012 | | | | | | | | | | | | 2011 | |
| | Rating with
insurance guarantee | | | | | | Rating without
insurance guarantee | | | Rating with
insurance guarantee | | | Rating without
insurance guarantee | |
| 2012 | | Fair value
£m | | | % of total | | | Fair value
£m | | | % of total | | | Fair value
£m | | | % of total | | | Fair value
£m | | | % of total | |
| Wrapped credit | | | | | | | | | | | | | | | | | | | | | | | | | | | | | | | | |
| AAA | | | 1 | | | | 0.2% | | | | – | | | | 0.0% | | | | – | | | | 0.0% | | | | – | | | | 0.0% | |
| AA | | | 269 | | | | 48.3% | | | | 29 | | | | 5.2% | | | | 292 | | | | 43.8% | | | | 32 | | | | 4.8% | |
| A | | | 94 | | | | 16.8% | | | | 124 | | | | 22.3% | | | | 127 | | | | 19.0% | | | | 150 | | | | 22.5% | |
| BBB | | | 104 | | | | 18.7% | | | | 160 | | | | 28.7% | | | | 131 | | | | 19.6% | | | | 207 | | | | 31.0% | |
| Less than BBB | | | 42 | | | | 7.6% | | | | 43 | | | | 7.7% | | | | 51 | | | | 7.7% | | | | 51 | | | | 7.7% | |
| Non-rated | | | 47 | | | | 8.4% | | | | 186 | | | | 33.4% | | | | 66 | | | | 9.9% | | | | 214 | | | | 32.1% | |
| Not available without insurance guarantee | | | – | | | | 0.0% | | | | 15 | | | | 2.7% | | | | – | | | | 0.0% | | | | 13 | | | | 1.9% | |
| | | | 557 | | | | 100.0% | | | | 557 | | | | 100.0% | | | | 667 | | | | 100.0% | | | | 667 | | | | 100.0% | |
| RMBS agency | | | | | | | | | | | | | | | | | | | | | | | | | | | | | | | | |
| AAA | | | 907 | | | | 100.0% | | | | 907 | | | | 100.0% | | | | 1,378 | | | | 100.0% | | | | 1,378 | | | | 100.0% | |
Exposures to peripheral European countries
Included in our debt securities and other financial assets are exposures to peripheral European countries. All of these assets are valued on a mark to market basis under IAS 39, and therefore our statement of financial position and income statement already reflect any reduction in value between the date of purchase and the balance sheet date. The significant majority of these holdings are within our participating funds where the risk to our shareholders is governed by the nature and extent of our participation within those funds.
Net of non-controlling interests, our direct shareholder and participating fund asset exposure to the government (and local authorities and agencies) of Italy is £4.9 billion(2011: £6.4 billion), a decrease of £1.5 billion. Gross of non-controlling interests, 82% of our shareholder asset exposure to Italy arises from investment exposure of our Italian business.
Direct sovereign exposures to Greece, Ireland, Portugal, Italy and Spain (net of non-controlling interests, excluding policyholder assets)
| | | | | | | | Participating | | | | | | | | Shareholder | | | | | | | | Total | |
| | | 31 December 2012 £bn | | | | 31 December 2011 £bn | | | | 31 December 2012 £bn | | | | 31 December 2011 £bn | | | | 31 December 2012 £bn | | | | 31 December
2011
£bn | |
| Greece | | | – | | | | – | | | | – | | | | – | | | | – | | | | – | |
| Ireland | | | 0.4 | | | | 0.3 | | | | – | | | | 0.2 | | | | 0.4 | | | | 0.5 | |
| Portugal | | | 0.3 | | | | 0.2 | | | | – | | | | – | | | | 0.3 | | | | 0.2 | |
| Italy | | | 4.5 | | | | 5.6 | | | | 0.4 | | | | 0.8 | | | | 4.9 | | | | 6.4 | |
| Spain | | | 0.9 | | | | 0.8 | | | | 0.5 | | | | 0.3 | | | | 1.4 | | | | 1.1 | |
| Total Greece, Ireland, Portugal, Italy and Spain | | | 6.1 | | | | 6.9 | | | | 0.9 | | | | 1.3 | | | | 7.0 | | | | 8.2 | |
Direct sovereign exposures to Greece, Ireland, Portugal, Italy and Spain (gross of non-controlling interests, excluding policyholder assets)
| | | | | | | Participating | | | | | | | | Shareholder | | | | | | | | Total | |
| | | 31 December 2012 £bn | | | | 31 December 2011 £bn | | | | 31 December 2012 £bn | | | | 31 December 2011 £bn | | | | 31 December 2012 £bn | | | | 31 December
2011
£bn | |
| Greece | | | – | | | | – | | | | – | | | | – | | | | – | | | | – | |
| Ireland | | | 0.4 | | | | 0.4 | | | | – | | | | 0.2 | | | | 0.4 | | | | 0.6 | |
| Portugal | | | 0.3 | | | | 0.2 | | | | – | | | | – | | | | 0.3 | | | | 0.2 | |
| Italy | | | 8.5 | | | | 9.7 | | | | 0.6 | | | | 1.1 | | | | 9.1 | | | | 10.8 | |
| Spain | | | 1.3 | | | | 1.0 | | | | 0.9 | | | | 0.6 | | | | 2.2 | | | | 1.6 | |
| Total Greece, Ireland, Portugal, Italy and Spain | | | 10.5 | | | | 11.3 | | | | 1.5 | | | | 1.9 | | | | 12.0 | | | | 13.2 | |
Equity securities
The table below analyses our investments in equity securities by sector.
| 2012 | | Policyholder
£m | | | Participating
£m | | | Shareholder
£m | | | Total
£m | |
| Public utilities | | | 2,571 | | | | 1,095 | | | | 18 | | | | 3,684 | |
| Banks, trusts and insurance companies | | | 3,904 | | | | 2,395 | | | | 959 | | | | 7,258 | |
| Industrial, miscellaneous and all other | | | 15,935 | | | | 6,340 | | | | 123 | | | | 22,398 | |
| Non-redeemable preference shares | | | 90 | | | | 24 | | | | 323 | | | | 437 | |
| Total | | | 22,500 | | | | 9,854 | | | | 1,423 | | | | 33,777 | |
| Total % | | | 66.6% | | | | 29.2% | | | | 4.2% | | | | 100.0% | |
| 2011 | | | 20,602 | | | | 10,788 | | | | 1,293 | | | | 32,683 | |
| 2011 % | | | 63.0% | | | | 33.0% | | | | 4.0% | | | | 100.0% | |
At 31 December 2012, shareholder investment in equity securities amounted to £1,423 million. The investments include a strategic holding in Italian banks of £289 million (£148 million net of non-controlling interests).
Of our £7,258 million exposure to equity investments in banks, trusts and insurance companies, £959 million relates to shareholder investments, which includes our strategic holding as mentioned above.
Other investments
The table below analyses other investments by type.
| 2012 | | Policyholder
£m | | | Participating
£m | | | Shareholder
£m | | | Total
£m | |
| Unit trusts and other investment vehicles | | | 22,823 | | | | 3,171 | | | | 762 | | | | 26,756 | |
| Derivative financial instruments | | | 41 | | | | 432 | | | | 1,117 | | | | 1,590 | |
| Deposits and credit institutions | | | 515 | | | | 44 | | | | 180 | | | | 739 | |
| Minority holdings in property management undertakings | | | 14 | | | | 555 | | | | 15 | | | | 584 | |
| Other | | | 311 | | | | 56 | | | | 57 | | | | 424 | |
| Total | | | 23,704 | | | | 4,258 | | | | 2,131 | | | | 30,093 | |
| Total % | | | 78.8% | | | | 14.1% | | | | 7.1% | | | | 100.0% | |
| 2011 | | | 23,233 | | | | 5,078 | | | | 2,066 | | | | 30,377 | |
| 2011% | | | 76.5% | | | | 16.7% | | | | 6.8% | | | | 100.0% | |
Property
Our global headquarters are located in St. Helen’s, 1 Undershaft, London, England, EC3P 3DQ. In addition, we have major offices in the following locations:
| n | UK: UK Life, York; UK General Insurance, Norwich; Aviva Investors, London; |
| n | North America: Scarborough, Ontario, Canada and West Des Moines, Iowa, USA; and |
| n | Europe: Paris, France; Dublin, Ireland; Madrid, Spain; Warsaw, Poland; and Milan, Italy. |
As of 31 December 2012, we owned and occupied land and buildings for our own use with a total book value of £245 million(2011: £215 million). We believe that these facilities are adequate for our present needs in all material respects. We also hold other properties, both directly and indirectly, for investment purposes, valued at £9,075 million at 31 December 2012 (2011: £9,848 million).
Contractual obligations
Contractual obligations
Contractual obligations with specified payment dates at 31 December 2012 included the following:
| | | Less
than one
year
£m | | | Between
one and
three
years
£m | | | Between
three
and five
years
£m | | | After
five
years
£m | | | Total
£m | |
| Insurance and investment contracts | | | | | | | | | | | | | | | | | | | | |
| Long-term business | | | | | | | | | | | | | | | | | | | | |
| —Insurance contracts – non-linked1 | | | 7,044 | | | | 15,195 | | | | 11,633 | | | | 75,415 | | | | 109,287 | |
| —Investment contracts – non-linked2 | | | 57,547 | | | | – | | | | – | | | | – | | | | 57,547 | |
| —Linked business2 | | | 66,099 | | | | – | | | | – | | | | – | | | | 66,099 | |
| General insurance3 | | | 6,176 | | | | 3,848 | | | | 1,957 | | | | 3,475 | | | | 15,456 | |
| | | | 136,866 | | | | 19,043 | | | | 13,590 | | | | 78,890 | | | | 248,389 | |
| Other contractual obligations4 | | | | | | | | | | | | | | | | | | | | |
| Borrowings | | | 1,699 | | | | 921 | | | | 1,686 | | | | 12,409 | | | | 16,715 | |
| Operating lease obligations | | | 136 | | | | 238 | | | | 183 | | | | 587 | | | | 1,144 | |
| Capital commitments | | | 21 | | | | 18 | | | | 3 | | | | – | | | | 42 | |
| Payables and other financial liabilities5 | | | 8,567 | | | | 289 | | | | 345 | | | | 1,606 | | | | 10,807 | |
| Net asset value attributable to unitholders | | | 11,146 | | | | – | | | | – | | | | – | | | | 11,146 | |
| Total | | | 158,435 | | | | 20,509 | | | | 15,807 | | | | 93,492 | | | | 288,243 | |
| Reconciliation to the statement of financial position | | £m | |
| Total contractual obligations above | | | 288,243 | |
| Effect of discounting contractual cash flows for insurance contracts | | | (24,804 | ) |
| Contractual undiscounted interest payments6 | | | (7,910 | ) |
| Difference between carrying value of borrowings and undiscounted cash flows of principal | | | (611 | ) |
| Contractual cash flows under operating leases and capital commitments | | | (1,186 | ) |
| Difference between derivative liabilities contractual cash flows and carrying value | | | (1,366 | ) |
| Liabilities of operations classified as held for sale | | | 41,411 | |
| Non-contractual/short-term obligations | | | | |
| —Unallocated divisible surplus7 | | | 6,931 | |
| —Provisions8 | | | 1,119 | |
| — Current and deferred tax liabilities | | | 659 | |
| — Other liabilities | | | 1,843 | |
| Total liabilities per statement of financial position | | | 304,329 | |
| 1. | Amounts shown in respect of long-term insurance contracts represent estimated undiscounted cash flows for the Group’s life assurance contracts. In determining the projected payments, account has been taken of the contract features, in particular that the amount and timing of the contractual payments reflect either surrender, death or contract maturity. In addition, the undiscounted amounts shown include the expected payments based on assumed future investment returns on assets backing insurance and investment contract liabilities. The projected cash flows exclude the unallocated divisible surplus of with-profits funds (see below). |
| 2. | All linked contracts and almost all non-linked investment contracts may be surrendered or transferred on demand. For such contracts the earliest contractual maturity is therefore at the current statement of financial position date, for a surrender amount approximately equal to the current statement of financial position liability. Although we expect surrenders, transfers and maturities to occur over many years, the total liability for linked non-linked investment contracts is shown in the less than one year column above. |
| 3. | Amounts shown in respect of general insurance contracts are based on undiscounted estimates of future claim payments, including for those classes of business for which discounted provisions are held, see ‘Financial statements IFRS – Note 36– Insurance liabilities’. The timing of cash flows reflects a best estimate of when claims will be settled. |
| 4. | The Group has no material finance leases for property and equipment. |
| 5. | Includes obligations for repayment of collateral received under stock lending arrangements and derivative transactions amounting to £4,460 million. |
| 6. | When subordinated debt is undated or loan notes perpetual, the interest payments have not been included beyond 15 years. Annual interest payments for these borrowings are £72 million. Contractual undiscounted interest payments are calculated using fixed interest rates or prevailing market floating rates as applicable. |
| 7. | The unallocated divisible surplus represents the excess of assets over liabilities, including policyholder ‘asset share’ liabilities in the UK, which reflect the amount payable under the realistic Peak 2 reporting regime of the FSA. Although accounted for as a liability, as permitted by IFRS 4, there is currently no expected payment date for the unallocated divisible surplus. |
| 8. | Provisions include pension obligations, which have been excluded from the contractual obligations table above, due to the uncertainty of the amount and timing of future cash flows. The Group operates both funded defined benefit and funded defined contribution pension schemes, full details of which are provided in ‘Financial Statements IFRS – Note 44 – Pension obligations’. We have a contractual obligation to fund these schemes. However, the amount and timing of the Group’s cash contributions to these schemes is uncertain and will be affected by factors such as future investment returns and demographic changes. Our cash funding of defined contribution schemes is based on percentages of salary. Our cash contribution to defined benefit schemes is agreed in advance with scheme trustees. The Company and trustees have agreed to a long-term funding plan where contributions, together with anticipated growth on scheme investments are expected to eliminate the funding deficits over time. Contributions to these and the other schemes are regularlyreviewed in light of changes in expectations of investment returns and other assumptions. The discounted scheme liabilities have an average duration of 20 years in the main UK scheme, 21 years in the RAC scheme, 22 years in the Irish scheme and 13 years in the Canadian scheme. |
Risk and capital management
Risk management objectives
As a global insurance group, risk management is at the heart of what we do and is the source of value creation as well as a vital form of control. It is an integral part of maintaining financial stability for our customers, shareholders and other stakeholders.
Our sustainability and financial strength are underpinned by an effective risk management process which helps us identify major risks to which we may be exposed, establish appropriate controls and take mitigating actions for the benefit of our customers and investors. The Group’s risk strategy is to invest its available capital to optimise the balance between return and risk whilst maintaining an appropriate level of economic (i.e. risk-based) capital and regulatory capital in accordance with our risk appetite. Consequently, our risk management objectives are to:
| n | Embed rigorous risk management throughout the business, based on setting clear risk appetites and staying within these; |
| n | Allocate capital where it will make the highest returns on a risk-adjusted basis; and |
| n | Meet the expectations of our customers, investors and regulators that we will maintain sufficient capital surpluses to meet our liabilities even if a number of extreme risks materialise. |
Aviva’s risk management framework has been designed and implemented to support these objectives. The key elements of our risk management framework comprise our risk appetite; risk governance, including risk policies and business standards, risk oversight committees and roles & responsibilities; and the processes we use to identify, measure, manage, monitor and report (IMMMR) risks, including the use of our risk models and stress and scenario testing. These elements are expanded in the Financial statements IFRS – Note 53.
Principal risks and uncertainties
In accordance with the requirements of the FSA Handbook (DTR 4.1.8) we provide a description of the principal risks and uncertainties facing the Group here and in note 53. Our disclosures covering ‘risks relating to our business’ in line with reporting requirements of the Securities Exchange Commission (SEC) provide more detail and can be found in the shareholder information section ‘Risks relating to our business’.
Risk environment
Financial market conditions during 2012 were volatile although positive overall, benefiting from the expansionary monetary policies followed by central banks across a number of economies in the second half of the year. However, the continued political and economic uncertainty relating to the Eurozone combined with the high levels of debt in many western economies continues to act as a brake on economic growth and raises the likelihood of a low growth, low interest rate environment persisting for some time.
Reflecting the wider financial and economic conditions, both UK and international regulatory authorities have implemented, or are in the process of considering, enhanced regulatory requirements intended to prevent future crises arising or assure the stability of institutions under their supervision. A good example of this in the UK is the Prudential Regulatory Authority’s (PRA) proposed focus on ensuring that firms have adequate resolution arrangements in place.
Further regulatory uncertainty arose from the ongoing discussions regarding the technical standards for, and the implementation date of, Solvency II. Aviva continues to actively participate in the development of Solvency II through key European industry working groups.
Risk profile
The types of risk to which the Group is exposed have not changed significantly over the year and remain credit, market, insurance, asset management, liquidity, operational and reputational risks as described in note 53 of the IFRS financial statements.
Reflecting Aviva’s objective of building financial strength and reducing capital volatility, the Group has taken steps to amend its risk profile. These include a net sell down of approximately €3.6 billion (gross of minority interests) Italian government bonds, a reduction in credit exposure to European financial institutions and a move towards a more general reduction in credit risk predominantly achieved through the sale of the Group’s US subsidiary (which remains subject to regulatory approval). Restrictions on non-domestic investment in sovereign and corporate debt from Greece, Ireland, Italy, Portugal and Spain remain in place and balance sheet volatility was further reduced through the sell down of Delta Lloyd in July 2012. As described in note 53, a number of foreign exchange rate, credit and equity hedges are also in place. The reduction in credit and equity exposure noted above also reflects a broader move towards a more balanced risk profile.
Subsequent to the year end, the Group has also taken action to improve its access to dividends from the Group’s insurance and asset management businesses by undertaking a corporate restructuring whereby Aviva Group Holdings (AGH) has purchased from Aviva Insurance Limited (AIL) its interest in the majority of its overseas businesses. This purchase has been funded by intercompany loans. It is planned to pay down the intercompany loan balances over time, in addition to meeting the Groups normal operating expenses, taxes, interest on our external debt, dividends and repayment of maturing debt.
Going forward, the Groups focus is on fewer businesses as is reflected in the sale of Aviva’s Czech Republic, Hungarian and Romanian life businesses, the sale of Aviva’s interest in our Sri Lankan joint venture, our remaining stake in Delta Lloyd and the agreed sale of the US business, the Romanian pensions business, Aviva Russia, and our stake in the Malaysian joint venture CIMB. The process of exiting these non-core businesses will reduce the amount of the Group’s capital employed in less economically profitable areas, decrease balance sheet volatility and required capital, and will allow capital to be re-employed in businesses that enhance the Group’s return on risk based capital. Execution risk is inherent in the completion of all strategic transactions, with a corresponding potential impact on capital requirements and liquidity.
As a result of the sale of businesses (in particular the US), the Group’s future earnings have been reduced and the tangible net asset value of the Group has fallen (leading to an increase in the leverage ratio to close to 50%). We have plans in place to improve earnings through managing the deployment of capital to maximise return and expense reduction (though clearly execution risk remains). These additional earnings, combined with higher retained profits, should enable us to reduce our external leverage ratio to 40% in the medium term and reduce internal leverage.
Capital management
Capital management objectives
The primary objective of capital management is to optimise the balance between return and risk, whilst maintaining economic and regulatory capital in accordance with risk appetite. Aviva’s capital and risk management objectives are closely interlinked, and support the dividend policy and earnings per share growth, whilst also recognising the critical importance of protecting policyholder and other stakeholder interests.
Overall capital risk appetite, which is reviewed and approved by the Aviva Board, is set and managed with reference to the requirements of a range of different stakeholders including shareholders, policyholders, regulators and rating agencies. Risk appetite is expressed in relation to a number of key capital and risk measures, and includes an economic capital risk appetite of holding sufficient capital resources to enable the Group to meet its liabilities in extreme adverse scenarios, on an ongoing basis, calibrated at a level consistent with a AA range credit rating.
In managing capital we seek to:
| n | maintain sufficient, but not excessive, financial strength in accordance with risk appetite, to support new business growth and satisfy the requirements of our regulators and other stakeholders giving both our customers and shareholders assurance of our financial strength; |
| n | optimise our overall debt to equity structure to enhance our returns to shareholders, subject to our capital risk appetite and balancing the requirements of the range of stakeholders; |
| n | retain financial flexibility by maintaining strong liquidity, including significant unutilised committed credit facilities and access to a range of capital markets; |
| n | allocate capital rigorously across the Group, to drive value adding growth through optimising risk and return; and |
| n | declare dividends with reference to factors including growth in cash flows and earnings. |
Capital is measured and managed on a number of different bases. These are discussed further in the following sections.
Accounting basis:
Capital employed by segment and financing of capital
The table below shows how our capital, on an IFRS basis is deployed by segment and how that capital is funded.
| | | 2012
£m | | | 2011
£m | |
| Long-term savings | | | 11,467 | | | | 11,237 | |
| General insurance and health | | | 6,089 | | | | 5,875 | |
| Fund management | | | 225 | | | | 184 | |
| Other business | | | (1,059 | ) | | | (1,102 | ) |
| Corporate1 | | | (588 | ) | | | 508 | |
| Delta Lloyd | | | – | | | | 776 | |
| United States | | | 365 | | | | 361 | |
| Total capital employed | | | 16,499 | | | | 20,618 | |
| Financed by: | | | | | | | | |
| Equity shareholders’ funds | | | 8,204 | | | | 12,643 | |
| Non-controlling interests | | | 1,574 | | | | 1,530 | |
| Direct capital instruments and fixed rate tier 1 notes | | | 1,382 | | | | 990 | |
| Preference shares | | | 200 | | | | 200 | |
| Subordinated debt | | | 4,337 | | | | 4,550 | |
| External debt | | | 802 | | | | 705 | |
| Total capital employed | | | 16,499 | | | | 20,618 | |
| 1 | ‘Corporate’ includes centrally held tangible net assets, the staff pension scheme surplus and also reflects internal lending arrangements. These internal lending arrangements, which net out on consolidation, arise in relation to the following: |
| | – Aviva Insurance Limited (AI) acts as both a UK general insurer and as the primary holding company for our foreign subsidiaries. Internal capital management mechanisms in place allocate a portion of the total capital of the company to the UK general insurance operations, giving rise to notional lending between the general insurance and holding company activities. These mechanisms also allow for some of the assets of the general insurance business to be made available for use across the Group. |
| 2 | – Subsequent to the year end, the Group has taken action to improve its access to dividends from the Group’s insurance and asset management business by undertaking a corporate restructure. This will see the Group’s interest in the majority of its overseas businesses move to Aviva Group Holdings Limited from Aviva Insurance Limited. |
| | – Certain subsidiaries, subject to continuing to satisfy stand-alone capital and liquidity requirements, loan funds to corporate and holding entities. These loans satisfy arm’s length criteria and all interest payments are made when due. |
Total capital employed is financed by a combination of equity shareholders’ funds, preference capital, subordinated debt and borrowings.
At the end of 2012 we had £16.5 billion (2011: £20.6 billion) of total capital employed in our trading operations measured on an IFRS basis. The reduction is primarily driven by the Group’s loss after tax, actuarial losses on staff pension schemes and the payment of the dividend.
In May 2012 we issued US$650 million of hybrid Tier 1 Notes. The Notes are perpetual and may be called from November 2017. The Notes qualify as Innovative Tier 1 capital under current regulatory rules and are expected to be treated as Fixed Rate Tier 1 capital under Solvency II transitional rules. The transaction had a positive impact on Group IGD solvency and Economic Capital measures.
In June 2012 US$300 million of Lower Tier 2 floating rate notes were redeemed at first call.
Regulatory capital – overview
Individual regulated subsidiaries measure and report solvency based on applicable local regulations, including in the UK the regulations established by the Financial Services Authority (FSA). These measures are also consolidated under the European Insurance Groups Directive (IGD) to calculate regulatory capital adequacy at an aggregate Group level, where we have a regulatory obligation to have a positive position at all times. This measure represents the excess of the aggregate value of regulatory capital employed in our business over the aggregate minimum solvency requirements imposed by local regulators, excluding the surplus held in the UK and Ireland with-profit life funds. The minimum solvency requirement for our European businesses is based on the Solvency 1 Directive. In broad terms, for EU operations, this is set at 4% and 1% of non-linked and unit-linked life reserves respectively and for our general insurance portfolio of business is the higher of 18% of gross premiums or 26% of gross claims, in both cases adjusted to reflect the level of reinsurance recoveries. For our major non-European businesses (the US and Canada) a risk charge on assets and liabilities approach is used.
Regulatory capital – Group
European Insurance Groups Directive
| | | UK Life
funds
£bn | | | Other
business
£bn | | | 2012
£bn | | | 2011
£bn | |
| Insurance Groups Directive (IGD) capital resources | | | 5.2 | | | | 9.2 | | | | 14.4 | | | | 14.1 | |
| Less: capital resource requirement (CRR) | | | (5.2 | ) | | | (5.4 | ) | | | (10.6 | ) | | | (11.9 | ) |
| Insurance Groups Directive (IGD) excess solvency | | | – | | | | 3.8 | | | | 3.8 | | | | 2.2 | |
| Cover of EU minimum (calculated excluding UK Life funds) | | | | | | | | | | | 1.7 times | | | | 1.3 times | |
The EU Insurance Groups Directive (IGD) regulatory capital solvency surplus has increased by £1.6 billion since 31 December 2011 to £3.8 billion. The key movements over the period are set out in the following table:
| | | £bn | |
| IGD solvency surplus at 31 December 2011 | | | 2.2 | |
| Adjusted operating profits net of other income and expenses | | | 0.9 | |
| Dividend and appropriations, net of shares issued in lieu of dividends | | | (0.7 | ) |
| Market movements including foreign exchange1 | | | 1.3 | |
| Pension scheme funding | | | (0.2 | ) |
| Movement in hybrid debt | | | 0.2 | |
| UK reinsurance transactions | | | 0.1 | |
| Increase in Capital Resources Requirement | | | (0.1 | ) |
| Other regulatory adjustments | | | 0.1 | |
| Estimated IGD solvency surplus at 31 December 2012 | | | 3.8 | |
| 1. | Market movements include the impact of equity, credit spread, interest rate and foreign exchange movements net of the effect of hedging instruments. |
Regulatory capital – UK Life with-profits fund
The available capital of the with-profits funds is represented by the realistic inherited estate. The estate represents the assets of the long-term with-profits funds less the realistic liabilities for non-profit policies within the funds, less asset shares aggregated across the with-profits policies and any additional amounts expected at the valuation date to be paid to in-force policyholders in the future in respect of smoothing costs, guarantees and promises. Realistic balance sheet information is shown below for the three main UK with-profit funds: Old With-Profit Sub-Fund (OWPSF), New With-Profit Sub-Fund (NWPSF) and With-Profit Sub-Fund (WPSF). These realistic liabilities have been included within the long-term business provision and the liability for insurance and investment contracts on the consolidated IFRS statement of financial position at 31 December 2012 and 31 December 2011.
| | | Estimated
realistic
assets
£bn | | | Estimate
realistic liabilities1 £bn | | | Estimated
realistic
inherited estate2 £bn | | | Capital support arrange- ment3 £bn | | | Estimated
risk capital
margin
£bn | | | 2012 Estimated
excess available capital
£bn | | | 2011
Estimated
excess available capital
£bn | |
| NWPSF | | | 17.3 | | | | (17.3 | ) | | | – | | | | 0.7 | | | | (0.4 | ) | | | 0.3 | | | | 0.7 | |
| OWPSF | | | 2.9 | | | | (2.6 | ) | | | 0.3 | | | | – | | | | (0.1 | ) | | | 0.2 | | | | 0.2 | |
| WPSF4 | | | 18.3 | | | | (16.5 | ) | | | 1.8 | | | | – | | | | (0.5 | ) | | | 1.3 | | | | 1.0 | |
| Aggregate | | | 38.5 | | | | (36.4 | ) | | | 2.1 | | | | 0.7 | | | | (1.0 | ) | | | 1.8 | | | | 1.9 | |
| 1 | These realistic liabilities include the shareholders’ share of future bonuses of £0.3 billion (31 December 2011: £0.3 billion).Realistic liabilities adjusted to eliminate the shareholders’ share of future bonuses are £36.0 billion (31 December 2011: £38.8 billion).These realistic liabilities make provision for guarantees, options and promises on a market consistent stochastic basis. The value of the provision included within realistic liabilities is £1.8 billion, £0.3 billion and £3.5 billion for NWPSF, OWPSF and WPSF respectively(31 December 2011: £1.9 billion, £0.3 billion and £3.1 billion for NWPSF, OWPSF and WPSF respectively). |
| 2 | Estimated realistic inherited estate at 31 December 2011 was £nil, £0.3 billion and £1.6 billion for NWPSF, OWPSF and WPSF respectively. |
| 3 | This represents the reattributed estate of £0.7 billion at 31 December 2012(31 December 2011: £1.1 billion) held within NPSF1 (a non-profit fund within UKLAP included within other UK life operations). |
| 4 | The WPSF fund includes the Provident Mutual (PM) fund, which has realistic assets and liabilities of £1.7 billion and therefore does not impact the realistic inherited estate. |
Investment mix
The aggregate investment mix of the assets in the three main with-profits funds at 31 December 2012 was:
| | | 2012
% | | | 2011
% | |
| Equity | | | 23% | | | | 22% | |
| Property | | | 16% | | | | 17% | |
| Fixed interest | | | 51% | | | | 54% | |
| Other | | | 10% | | | | 7% | |
The equity backing ratios, including property, supporting with-profit asset shares are 71% in NWPSF and OWPSF, and 64% in WPSF.
Economic capital
We use a risk-based capital model to assess economic capital requirements and to aid in risk and capital management across the Group. The model is based on a framework for identifying the risks to which business units, and the Group as a whole, are exposed. Where appropriate, businesses also supplement these with additional risk models and stressed scenarios specific to their own risk profile. When aggregating capital requirements at business unit and Group level, we allow for diversification benefits between risks and between businesses, with restrictions to allow for non-fungibility of capital where appropriate. This means that the aggregate capital requirement is less than the sum of capital required to cover all of the individual risks. The capital requirement reflects the cost of mitigating the risk of insolvency to a 99.5% confidence level over a one year time horizon (equivalent to events occurring in 1 out of 200 years) against financial and non-financial tests.
The financial modelling techniques employed in economic capital enhance our practice of risk and capital management. They enable understanding of the impact of the interaction of different risks allowing us to direct risk management activities appropriately. These same techniques are employed to enhance product pricing and capital allocation processes. Unlike more traditional regulatory capital measures, economic capital also recognises the value of longer-term profits emerging from in-force and new business, allowing for consideration of longer-term value emergence as well as shorter-term net worth volatility in our risk and capital management processes. We continue to develop our economic capital modelling capability for all our businesses as part of our development programme to increase the focus on economic capital management and meeting the emerging requirements of the Solvency II framework and external agencies.
Solvency II
The development of Solvency II continues in 2012 with a view to complete discussions about legislation. The key priority is concluding the discussions on the Omnibus II directive to provide clarity about the implementation date as well as the role of transitionals in the Level 2. Once this is concluded we expect the European Commission to complete the development of the Level 2 implementing measures that will establish the technical requirements governing the practical application of Solvency II. Aviva continues to actively participate in these developments through the key European industry working groups and by engaging with the FSA and HM Treasury to inform the ongoing negotiations in Brussels.
Rating agency
Credit ratings are an important indicator of financial strength and support access to debt markets as well as providing assurance to business partners and policyholders over our ability to service contractual obligations. In recognition of this we have solicited relationships with a number of rating agencies. The agencies generally assign ratings based on an assessment of a range of financial factors (e.g. capital strength, gearing, liquidity and fixed charge cover ratios) and non-financial factors (e.g. strategy, competitive position, and quality of management).
Certain rating agencies have proprietary capital models which they use to assess available capital resources against capital requirements as a component in their overall criteria for assigning ratings. Managing our capital and liquidity position in accordance with our target rating levels is a core consideration in all material capital management and capital allocation decisions.
The Group’s overall financial strength is reflected in our credit ratings. The Group’s rating from Standard and Poor’s is A+ (“strong”) with a Stable outlook; Aa3 (“excellent”) on review for downgrade from Moody’s; and A (”excellent”) with a Stable outlook from A.M. Best.
Financial flexibility
The Group’s borrowings are comprised primarily of long dated hybrid instruments with maturities spread over many years, minimising refinancing risk. In addition to central liquid asset holdings of £1.4 billion, the majority of which was held within Aviva Insurance Limited at the 2012 year end, the Group also has access to unutilised committed credit facilities of £2.1 billion provided by a range of leading international banks.
Basis of preparation
Accounting basis of preparation
International Financial Reporting Standards (IFRS)
Our consolidated financial statements are prepared under IFRS, using standards issued by the International Accounting Standards Board (IASB) and endorsed by the EU and those parts of the Companies Act 2006 applicable to those reporting under IFRS. In addition to fulfilling this legal obligation, the Group has also complied with IFRS as issued by the IASB and applicable at 31 December 2012.
The financial data contained in the report has been prepared using the Group’s accounting policies set out on pages 108 to 119.
Governance
| In this section | |
| Chairman’s governance letter | 38 |
| Board of directors | 40 |
| Group Executive | 43 |
| Directors’ report | 45 |
| Corporate governance report | 49 |
| Nomination Committee report | 55 |
| Audit Committee report | 57 |
| Risk Committee report | 60 |
| Corporate Responsibility Committee report | 63 |
| Directors’ remuneration report | 64 |
Chairman’s governance letter

John McFarlane
Chairman
“Strong corporate governance is the cornerstone of a successful organisation.
I have taken corporate governance incredibly seriously throughout my career as a leader of major financial services organisations around the world, and will continue to do so at Aviva. This is also firmly the position of our Board. A system of good governance keeps shareholder interests front of mind, and ensures a balanced outcome for stakeholders in general. Tone is always set from the top, and we have therefore made a number of changes in 2012 to enhance but also simplify the Group’s governance arrangements. As a cornerstone of this, the way authority is delegated throughout the Group was revised to give greater empowerment to businesses whilst strengthening central controls over the major risks in the Company, and these are subject to regular scrutiny by the Board Committees.
UK Corporate Governance Code
The UK Corporate Governance Code (Code) sets out the standards of corporate governance that UK premium listed companies must meet. The Company aims to meet all the Code requirements and I am pleased to confirm that the Company has complied with most of the principles and provisions of the Code throughout the year. However, there is one area of non-compliance to which I should draw your attention and which relates to my role as executive chairman for part of the year.
I joined the Board as chairman designate in September 2011 with the intention of learning about the Group and the business in order to succeed Lord Sharman as chairman on 1 July 2012. However, as we approached the 2012 annual general meeting, the Company came under strong shareholder pressure to accelerate change, and the Board asked me, as a former seasoned CEO, to take executive responsibility for the Group, and to seek and appoint a new Group Chief Executive Officer (Group CEO). Consequently, in the period from 1 July to 31 December 2012 whilst we did not comply with the Code requirement for the separation of the roles of chief executive and chairman, this was clearly in the interest of shareholders, and firm action was taken during this period to put the Group on to a firmer footing, that may not otherwise have taken place in such a short timeframe. This included major changes to the composition of the Board. We appointed Mark Wilson as Group CEO from 1 January 2013 and this regularised the position, such that we are now compliant with the Code.
Further details of how the Company has applied the Code principles and complied with its provisions are set out in the Corporate Governance Report on pages 49 to 54.
Role of the Board
The Board is responsible to shareholders for promoting the long term success of the Company, and in particular, for setting the Group’s strategic aims, monitoring management’s performance against these strategic aims, setting the Group’s risk appetite and ensuring the Group is adequately resourced and that effective controls are in place in the business. The Board sets the values, tone and culture of the Group. As a regulated Group, the Board also has a duty to protect the interests of policyholders.
Effectiveness of the Board
The effectiveness of the Board is vital to the success of the Group and we undertake a rigorous evaluation each year in order to assess how well the Board, its Committees, the directors and myself are performing and how our effectiveness could be improved. Given the significant changes to the Board during the year I felt that an internal effectiveness review led by myself would be appropriate for 2012. The review was carried out using questionnaires followed by discussion at Board and Committee meetings and through meetings between myself and each director individually. The review focused on the effectiveness of the Board and each Committee, how efficiently time at meetings was used, and the appropriateness of the balance of skills, knowledge and experience represented by Board and Committee members. Overall, the directors concluded that the Board and its Committees operated effectively and agreed that the actions identified for focus and improvement in previous reviews had been addressed and implemented during the year. Areas identified for greater Board focus in 2013 included allocating a greater proportion of time to in-depth discussion of the markets in which the Group operates and their competitive position and re-focusing strategy discussions on long-term strategy, as well as continuing to monitor the Group’s capital and liquidity position. I also concluded that each director contributes effectively and demonstrates full commitment to his/her duties.
Board changes
There have been a number of changes to the Board during the year and in early 2013:
| n | Lord Sharman retired from the Board and as chairman on 30 June 2012. He chaired the Board during a period of significant economic uncertainty, bringing extensive experience in the international financial services industry to bear during his tenure. |
| n | Andrew Moss, group chief executive, left the Group in May 2012 having led the consolidation of our international presence and the integration of 40 brands into the very powerful single Aviva brand. |
| n | Mark Wilson replaced Andrew Moss as Group CEO with effect from 1 January 2013. |
| n | Igal Mayer, chief executive of Aviva Europe, resigned in April 2012 when the Group was restructured into Developed Markets and Higher Growth Markets. |
| n | Leslie Van de Walle resigned as a non-executive director in May 2012 to pursue other activities. |
| n | Mary Francis stepped down from the Board in October 2012 to pursue other interests. Mary had previously been chairman of the Risk Committee. |
| n | Euleen Goh resigned from the Board at the end of the year to concentrate on her commitments in Asia. |
| n | Trevor Matthews, executive director and chairman, Developed Markets, will step down from the Board prior to the 2013 AGM. |
| n | Richard Goeltz, senior independent director, andRussell Walls, chairman of the Audit Committee, will both have completed nine years service in May 2013 and will retire from the Board on 8 May 2013. Both have been senior and valuable members of the Board. |
| n | Glyn Barker joined the Board as a non-executive director in February 2012 and will become chairman of the Audit Committee on 8 May 2013. |
| n | At the same time, we are actively refreshing the Board with new non-executive appointments: |
| n | Sir Adrian Montague joined the Board in January 2013 bringing strong insurance and plc credentials, and will become senior independent director on 8 May 2013. |
| n | Bob Stein joined the Board in January 2013 bringing strong insurance and actuarial skills. |
| n | We are actively searching for two additional female non-executive directors. |
On behalf of the Board I would like to thank all the directors for their contribution to the Company during the year, and particularly those who have retired, or will retire, in 2013 for their dedicated service.
John McFarlane
Chairman
6 March 2013
Board of directors

John McFarlane
Chairman
(Born June 1947)
Appointed to the Board in September 2011 and became executive chairman in July 2012 and non-executive chairman following the appointment of Mark Wilson as Group CEO on 1 January 2013. Currently a non-executive director of Westfield Holdings Ltd (retail mall developer and operator) and Old Oak Holdings Ltd (financial holding company). Former chief executive officer of Australia and New Zealand Banking Group Ltd (banking), executive director of Standard Chartered plc (banking), head of Citicorp and Citibank UK and Ireland, and managing director of Citicorp Investment Bank Ltd (banking). Former director and council member of the London Stock Exchange (financial services) and former non-executive director of the Royal Bank of Scotland Group plc (banking), National Westminster Bank plc (banking), Capital Radio plc (media), The Securities Association (UK securities regulator), the Auditing Practices Board (auditing regulator) and the Business Council of Australia. Former chairman of the Australian Bankers Association and president of the International Monetary Conference. He is chairman of the Board and the Nomination Committee. He has substantial global listed company experience and an excellent track record spanning over 30 years in the UK and international financial services industry.
As executive chairman, he was instrumental in driving forward the Company’s strategic plan to narrow the focus of the Group’s business portfolio, build financial strength and improve financial performance. He successfully managed the implementation of a culture and values change programme, cutting bureaucracy and delayering the organisation. He has extensive experience in banking, including investment, corporate and retail banking, and in general management, insurance, strategy, risk and cultural change. His wide-ranging board and executive experience provides him with the requisite skills for his chairmanship of the Company and the Board.

Mark Wilson
Group chief executive officer
(Born August 1966)
Appointed to the Board as Group CEO designate in December 2012 and became Group CEO on 1 January 2013. Formerly chief executive officer and president of AIA Group (insurance), and former chief executive of AXA China and AXA South East Asia (insurance). He also previously held a number of senior management positions at National Mutual in New Zealand (insurance).
He has over 25 years of operational and executive experience in the insurance industry across life assurance, general insurance and asset management, in both mature and growth markets. He has extensive experience of leading major international insurance companies and has an excellent track record as a focused and inspirational business leader. At AIA Group and AXA, he successfully developed and implemented short, medium and long-term strategies, delivered robust change programmes and developed and transformed business performance and cultures in challenging market conditions.

Patrick Regan
Chief financial officer
(Born March 1966)
Appointed to the Board in February 2010 as chief financial officer and, since April 2012, has assumed responsibility for Aviva USA. He is chairman of Aviva Investors and is currently a member of the supervisory board of Delta Lloyd N.V.
Formerly group chief financial officer and chief operating officer of Willis Group Holdings Ltd (insurance broking), group financial controller for RSA Insurance Group plc (insurance) and finance and claims director, UK general insurance for AXA Insurance (insurance). He also held a number of senior management positions at GE Capital (financial services) and specialised in corporate finance and investigations at Grant Thornton (professional services).
He has extensive global experience in various executive functions within the insurance industry. He also has an excellent track record of driving change programmes and corporate actions to deliver improved profitability.He has been instrumental in improving the Group’s financial strength, resilience and performance against the backdrop of a challenging macro-economic and regulatory environment. He has brought his significant financial acumen and analytical skills to bear in driving forward the change agenda and in successfully delivering the Group’s strategic priorities.

Trevor Matthews
Executive director and chairman, Developed Markets
(Born March 1952)
Appointed to the Board in December 2011 as chief executive, Aviva UK. In April 2012, he became chairman of the UK & Ireland board and was appointed executive director and chairman, Developed Markets. Currently chairman of the Financial Skills Partnership and a commissioner for the UK Commission for Employment and Skills. Previously chief executive officer and vice chairman of Friends Life (life assurance) and chief executive officer of Friends Provident plc (life assurance). Former chief executive of Standard Life Assurance Company Ltd (life assurance), president and chief executive officer of Manulife Japan (life assurance) and executive vice president, Canadian operations and chairman, Manulife Bank, Toronto (financial services). He has also held senior management positions at National Australia Bank (banking) and Legal & General Assurance Holdings Australia Ltd (insurance).
He has over 40 years of experience in the financial services industry with a track record of achievement in the insurance sector globally. He has brought to the Board an in-depth operational and functional knowledge of insurance, both in the UK and overseas. He will be stepping down from the Board prior to the 2013 AGM.

Glyn Barker
Independent non-executive director
(Born September 1953)
Appointed to the Board in February 2012. Currently chairman of Irwin Mitchell (law firm), a non-executive director of Transocean Ltd (offshore drilling) and The Berkeley Group Holdings plc (construction) and a trustee of the English National Opera. Formerly vice-chairman UK of PricewaterhouseCoopers LLP with responsibility for leading the executive team for the Europe, Middle East, Africa and India region and was previously UK managing partner, UK head of assurance and a member of the UK management board of PricewaterhouseCoopers LLP. He is a member of the Audit, Nomination and Risk Committees.
He has extensive experience as a business leader and a trusted adviser to FTSE 100 companies and their boards on a wide variety of corporate and finance issues. He brings to the Board a deep understanding of accounting and regulatory issues together with in-depth transactional and financial services experience. He will become chairman of the Audit Committee on 8 May 2013.

Richard Karl Goeltz
Senior independent non-executive director
(Born September 1942)
Appointed to the Board in May 2004 and became senior independent non-executive director in January 2009. Currently a non-executive director of the New Germany Fund (investment trust), the Central Europe and Russia Fund (investment trust) and the European Equity Fund (investment trust), and is also a member of the Council and Court of Governors of the London School of Economics and Political Science. Former non-executive director of the Warnaco Group Inc. (clothing), vice-chairman and chief financial officer of American Express Company (financial services) and director and chief financial officer of NatWest Group plc (banking). Former non-executive director of Delta Air Lines, Inc. (transport) and Federal Home Loan Mortgage Corporation (Freddie Mac) (financial services) and a former member of the Accounting Standards Board (UK).
He has a strong financial background and has over 20 years’ experience in the financial services industry. He has held a broad range of executive and non-executive positions in major global corporations. His experience of audit and governance committees has been invaluable in providing effective oversight as a member of the Company’s Audit Committee.
He is currently a member of the Audit and Nomination Committees and will retire from the Board, as senior independent non-executive director, and from the Audit and Nomination Committees after nine years of service to the Board on 8 May 2013.

Michael HawkerAM
Independent non-executive director
(Born October 1959)
Appointed to the Board in January 2010. Currently a non-executive director of Macquarie Group Ltd (banking) and Macquarie Bank Ltd (banking), Washington H Soul Pattinson Pty Ltd (investment), International Rugby Development Ltd (rugby), and IRFB Services (Ireland) Ltd (rugby). He is chairman and non-executive director of the Australian Rugby Union and SANZAR Pty Limited (rugby union) and is a non-executive director/trustee of the George Institute for Global Health (UK). He is a member of the advisory council at General Enterprise Management Services International Ltd (private equity), and council member of the International Rugby Board. Formerly chief executive and managing director of Insurance Australia Group (insurance), group chief executive of business and consumer banking at Westpac Banking Corporation (banking) and chairman of the Insurance Council of Australia. Senior fellow of the Financial Services Institute of Australasia and a fellow of the Australian Institute of Company Directors. He is chairman of the Risk Committee and a member of the Audit, Nomination and Remuneration Committees. He will step down as a member of the Remuneration Committee on 8 May 2013.
He has a wealth of knowledge and experience gained over a long career in the banking and insurance industries, in both executive and non-executive roles in Europe, Asia and Australia. He has been a highly effective chairman of the Risk Committee during a period of significant volatility in the external economic environment.

Gay Huey Evans
Independent non-executive director
(Born July 1954)
Appointed to the Board in October 2011. Currently a non-executive director of the London Stock Exchange Group plc (financial services), Clariden Leu (Europe) Ltd (financial services), Bank Itau BBA International Limited (banking) and the Financial Reporting Council. Member of the management board and of the panel of finance experts of the Panel of Recognised International Market Experts in Finance (PRIME Finance), and a trustee of Wellbeing of Women (UK) (charity) and The Wigmore Hall Trust (charity). Formerly chairman of the International Swaps and Derivatives Association, Inc. (ISDA) (financial trade association), vice-chairman, investment banking & investment management at Barclays Capital (banking) and she held senior management positions at Citi Alternative Investments (EMEA) (banking), the Financial Services Authority (UK regulator) and Bankers Trust Company (banking). She is chairman of the Corporate Responsibility Committee and a member of the Nomination and Remuneration Committees.
She has over 30 years of experience within the financial services industry, having held key positions in government and in a number of global financial and banking institutions. In addition to the financial expertise she brings to the Board, her experience at the Financial Services Authority continues to provide an insight into the priorities and focus of the Group’s lead regulator.

Sir Adrian Montague CBE
Independent non-executive director
(Born February 1948)
Appointed to the Board in January 2013. Currently chairman of 3i Group plc (private equity) and Anglian Water Group Ltd (utilities), deputy-chairman and senior independent director of UK Green Investment Bank plc (investment bank) and a non-executive director of Skanska AB (construction). Formerly chairman of Friends Provident plc (life insurance), British Energy Group plc (utilities), Michael Page International plc (recruitment), and Cross London Rail Links Ltd (Crossrail), and was formerly deputy-chairman of Network Rail Ltd (railway network authority) and Partnerships UK plc (public private partnership). He was also previously chief executive of the Treasury Taskforce. He is a member of the Audit, Corporate Responsibility and Nomination Committees. He will become senior independent non-executive director on 8 May 2013.
Sir Adrian brings his significant experience of the financial services industry and in government and regulatory circles to the Board.

Bob Stein
Independent non-executive director
(Born February 1949)
Appointed to the Board in January 2013. Currently a non-executive director and vice-chair of the audit committee of Assurant, Inc (US specialty insurance) and is a trustee emeritus of the board of trustees of the Actuarial Foundation. He spent most of his working life at Ernst & Young in the US, where he held a number of managing partner roles in the actuarial, insurance and financial services practices in the US and globally, culminating in being managing partner, global actuarial practice. He is a member of the Nomination, Risk and Remuneration Committees.
He brings significant accounting and financial services experience to the Board.

Russell Walls
Independent non-executive director
(Born February 1944)
Appointed to the Board in May 2004. Currently non-executive director of Biocon Ltd (biopharmaceuticals), Signet Jewelers Ltd (retail), Syngene Ltd (contract research pharmaceuticals), and Mytrah Energy Ltd (wind power producer). Former group finance director of BAA plc (transport), Wellcome plc (pharmaceuticals) and Coats Viyella plc (textiles), treasurer and trustee of the British Red Cross (charity) and a member of the Finance Commission of the International Federation of the Red Cross (charity). Formerly senior independent director and chairman of the audit committee of Stagecoach Group plc (transport) and Hilton Group plc (leisure) and a non-executive director of Delphic Diagnostics Ltd (medical), and Mersey Docks and Harbour Company (transport).
He has a strong financial background and a wealth of international experience across a range of sectors. With his deep financial acumen, analytical approach and extensive audit experience over a long financial career, he has been a robust Audit Committee chairman against a backdrop of macro-economic instability and changes to the audit environment.
He is currently chairman of the Audit Committee and a member of the Nomination and Risk Committees and will retire from the Board, as Audit Committee chairman and from the Nomination and Risk Committees after nine years of service to the Board on 8 May 2013.

Scott Wheway
Independent non-executive director
(Born August 1966)
Appointed to the Board in December 2007. Former chief executive officer of Best Buy Europe (retail services), director of The Boots Company plc (now known as The Boots Company Ltd) (pharmacy) and managing director and retail director of Boots the Chemist at Alliance Boots plc, and director of the British Retail Consortium. He formerly held a number of senior executive positions at Tesco plc (retail services), including chief executive of Tesco in Japan. He is chairman of the Remuneration Committee and a member of the Corporate Responsibility and Nomination Committees.
He has a wealth of business experience in the retail sector and his understanding of customer priorities has been greatly beneficial in driving the customer agenda and excellence in customer service within the business. He has chaired the Remuneration Committee with vigour and has rebuilt the Group’s standing with its significant investors in relation to the Group’s remuneration policy. Following the issues raised at the 2012 annual general meeting, he led an extensive consultation exercise with the Company’s major shareholders and a significant review of the Group’s remuneration policies and practices.
Group Executive
The Group Executive is made up of the executive directors and the senior executives whose biographies appear below. The Group Executive meets weekly as a forum for the Group CEO to discuss the strategic, financial, reputational and commercial aspects of the Group. The forum does not have decision-making authority in its own right and authority rests with each of the members (within their respective remits).
David Barral
Chief executive officer, Aviva UK & Ireland Life
(Born March 1962)
Appointed chief executive officer, Aviva UK Life in June 2011. In March 2012 he took on additional responsibility for Aviva's Life business in Ireland, becoming chief executive officer, Aviva UK & Ireland Life. He became a member of the Group Executive in April 2012.
He was formerly chief operating officer for Aviva UK Life responsible for customer propositions, pricing and customer operations.
He joined Aviva in 1999 as director of independent financial advisor business and was appointed distribution director in 2005 covering independent financial advisor (IFA), retail, partnership and employee benefit channels. In 2008 he was appointed marketing director and led the Aviva rebrand for the UK Life business.
During his time at Aviva, he has spearheaded much of the UK Life and pensions business’ activities to champion the customer, including supporting a move to the open market option for UK annuity customers.
Prior to joining Aviva, he spent 20 years in financial services including roles in sales, marketing, operations and business transformation at organisations including Eagle Star, Prudential and Morgan Grenfell.
Paul Boyle
Chief audit officer
(Born July 1959)
Joined Aviva in November 2010 as chief audit officer and became a member of the Group Executive in August 2012.
He was formerly the first chief executive of the Financial Reporting Council (FRC), the UK’s independent regulator responsible for promoting confidence in corporate reporting and governance, from 2004 until 2009. Whilst in this role, he led the establishment of the International Forum of Independent Audit Regulators serving as its chairman or vice-chairman from 2006 until 2009. Before joining the FRC, he was a member of the leadership team at the Financial Services Authority, serving as chief operating officer from 2000 until 2004. He has also held senior management roles in WH Smith Group plc and Cadbury Schweppes plc.
Kirstine Cooper
Group general counsel and company secretary
(Born August 1964)
Joined Aviva in 1991 and is the group general counsel and company secretary for Aviva plc and heads the Office of the Chairman. She was appointed to the Group Executive in May 2012 and leads the legal and company secretarial function for Aviva globally.
She is a lawyer and worked in the legal function at Aviva’s legacy companies before leading the property division of General Accident and the group legal function of CGU for eight years. She was formerly deputy group company secretary and legal counsel of Aviva plc. Since her appointment as group general counsel and company secretary she has created Aviva's first global legal leadership team.
Carole Jones
Acting group HR director
(Born June 1960)
Joined Aviva in 1990 and is acting group HR director with responsibility for managing human resources across the Group. She joined the Group Executive in July 2012.
She has been with the Group for more than 20 years, initially as HR manager in the UK Life and General Insurance businesses. In 2006 she was appointed acting human resources director for the Group's Norwich Union Life business in the UK, and in 2008 she relocated to the US where she led the HR function for Aviva's North American region until she returned to the UK as director of HR strategy & organisational development in 2011. She was appointed acting group HR director in July 2012.
John Lister
Group chief risk and capital officer
(Born April 1958)
Joined Aviva in 1986 and is the group chief risk and capital officer. He has overall responsibility for managing capital across Aviva, preparing the business for Solvency II and ensuring that an appropriate risk management framework is in place.
He has more than 25 years’ experience working in the UK Life business. He is an actuary and spent the first nine years of his career in a variety of senior actuarial roles across the UK Life business before becoming its chief actuary in 2005. In 2009 he became finance director of Aviva UK Life, and in April 2012 he was appointed group chief capital officer.
His role was expanded in July 2012 and he became group chief capital and risk officer, with responsibility for the Group’s risk and capital functions, and a member of the Group Executive reporting to Mark Wilson for risk matters and Patrick Regan for capital matters.
Amanda Mackenzie
Chief marketing and communications officer
(Born December 1963)
Joined Aviva in March 2008 and is chief marketing and communications officer with responsibility for all Group marketing, communications and public affairs. She is also the executive sponsor for diversity and inclusion. She joined the Group Executive in 2008.
She oversaw the rebrand of the Group and set up the global marketing and communications function.
She has 25 years of marketing and advertising experience, including director roles at British Airways Airmiles, BT and British Gas. She is a non-executive director at Mothercare plc.
David McMillan
Chief executive officer, Aviva Europe (Born February 1966)
Joined Aviva in November 2002 and is chief executive officer Aviva Europe with accountability for the Group’s businesses in Italy, Lithuania, Poland, Russia, Spain and Turkey. He is also chairman of Aviva France SA. He joined the Group Executive in April 2012.
He was previously group transformation director with responsibility for managing the implementation of Aviva’s strategic plan across the Group, refocusing and optimising the Group’s business portfolio, achieving financial strength, improving performance, and building a high-performance ethic across Aviva.
He was previously chief executive officer, Aviva UK & Ireland General Insurance, chief operating officer for Aviva UK General Insurance, chairman of Aviva Global Services and non-executive director of Aviva Health and began his career with Aviva as director of partnerships (bancassurance).
Prior to joining Aviva, he spent 12 years as director of management consultancy with PricewaterhouseCoopers LLP. His role involved leading projects spanning mergers and acquisitions, retail banking, organisational strategy and change.
Cathryn Riley
Chief operations officer
(Born April 1962)
Joined Aviva in 1996 and is chief operations officer with responsibility for IT, business change and shared services across the Group. She joined the Group Executive in May 2011.
She joined Commercial Union in 1996 and subsequently held a number of senior roles in its successor companies, CGU and Norwich Union. She served as operations director and retail director at Norwich Union and spent seven years in various executive roles within Aviva's UK General Insurance business. She has also previously served as managing director Norwich Union Healthcare, business services director of Norwich Union Life, chief operating officer Aviva UK Life, chief operating officer and chief information officer of Aviva Europe and UK commercial director. She is currently a non-executive director of Equitable Life.
Robin Spencer
Chief executive officer, Aviva UK & Ireland General Insurance
(Born January 1970)
Joined Aviva in 1995 and is chief executive officer, UK & Ireland General Insurance with responsibility for leading Aviva’s largest general insurance business. He joined the Group Executive in January 2010.
He was previously group chief risk officer, chief financial officer and subsequently president and chief executive officer of Aviva Canada. Prior to that, he was global finance transformation director.
He previously worked in Group Finance in London and held a number of senior finance roles with Norwich Union Insurance, including finance director for London & Edinburgh, a subsidiary of Aviva. Prior to joining Aviva, he spent five years with Procter & Gamble in the UK.
Maurice Tulloch
President and chief executive officer, Aviva Canada
(Born March 1969)
Joined Aviva in 1992 and is president and chief executive officer of Aviva Canada with responsibility for the strategic direction and operation of Canada’s second largest property and casualty insurer, and the second largest general insurance operation in the Group. He joined the Group Executive in July 2012.
He was previously executive vice-president and chief operating officer, Aviva Ontario and specialty distribution and previously held several senior management positions in the Group.
He is chair of the Insurance Bureau of Canada (IBC), chair of the Property & Casualty Insurance Compensation Corporation (PACICC) Board, chair of the Insurance Institute of Canada (IIC) Board and a member of the General Insurance Statistical Agency (GISA) Board.
He is a member of IBC’s National Auto Insurance Committee, GISA’s Executive Committee and Statistical Plan Committee, Toronto Financial Services Alliance (TFSA) Leadership Council Committee, and the Financial Services Commission of Ontario (FSCO) CEO Advisory Committee.
Jason Windsor
Chief strategy and development officer (Born August 1972)
Joined Aviva in May 2010 and is the chief strategy and development officer, with additional executive responsibility for overseeing Aviva Investors. He joined the Group Executive in February 2013.
He was formerly chief strategy & planning officer with responsibility for mergers, acquisitions and disposals, the Group’s strategic financial plan and oversight of Aviva’s Investor Relations function.
Prior to joining Aviva, he was managing director in the Financial Institutions Group at Morgan Stanley, with management responsibility for the European asset management sector.
Directors’ report
The directors submit their Annual Report and Accounts for Aviva plc, together with the consolidated financial statements of the Aviva group of companies, for the year ended 31 December 2012.
The Performance Review on pages 1 to 36, the Corporate Responsibility Report on page 63, Shareholder Information on pages 81 to 104 (which includes the risks relating to our business), the Corporate Governance Report on pages 49 to 54, and the Directors’ Remuneration Report on pages 64 to 80 are incorporated into this Directors’ Report by reference and, together with this Directors’ Report constitute the Business Review required under the Companies Act 2006 and the Management Report required under Disclosure and Transparency Rule 4.1.5R. Details of material acquisitions and disposals made by the Group during the year are contained in note 3.
Results
The Group’s results for the year are shown in the consolidated income statement on page 120.
Principal activity
The Company is the holding company of the Aviva plc group of companies (Group) whose principal activities are the provision of general insurance, life assurance, long term savings and fund management services.
Dividends
The directors are recommending a final dividend of 9.00 pence per ordinary share(2011: 16.00 pence), which, together with the interim dividend of 10.00 pence per ordinary share paid on 16 November 2012(2011:10.00 pence), produces a total dividend for the year of 19.00 pence per ordinary share(2011: 26.00 pence). The total cost of ordinary dividends paid in 2012 was £757 million(2011: £738 million). Subject to shareholder approval at the 2013 Annual General Meeting, the final dividend for 2012 will be paid on 17 May 2013 to all holders of ordinary shares on the Register of Members at the close of business on 22 March 2013 (and approximately five business days later for holders of the Company’s American Depositary Receipts).
Share capital and control
The issued ordinary share capital of the Company was increased by 40,259,323 ordinary shares during the year. 3,335,566 shares were allotted under the Group’s employee share and incentive plans and 36,923,757 shares were allotted under the Aviva Scrip Dividend Scheme for the May 2012 and November 2012 dividends. At 31 December 2012 the issued ordinary share capital totalled 2,945,972,261 shares of 25 pence each and the issued preference share capital totalled 200 million shares of £1 each. Accordingly, the issued and paid-up ordinary share capital constituted 79% of the Company’s total issued share capital and the issued preference share capital constituted 21% of the Company’s total issued share capital at 31 December 2012. All the Company’s shares in issue are fully paid up and the ordinary and preference shares have a Premium and Standard listing respectively on the London Stock Exchange. The Company is listed on the New York Stock Exchange (NYSE) in the form of American Depositary Shares, referenced to ordinary shares, under a depositary agreement with Citibank. Details of the Company’s share capital and shares under option at 31 December 2012 and shares issued during the year are given in notes 26 to 29.
The rights and obligations attaching to the Company’s ordinary shares and preference shares, together with the powers of the Company’s directors, are set out in the Company’s articles of association, copies of which can be obtained from Companies House and the Company’s website at www.aviva.com/investor-relations/corporate-governance/articles-of-association, or by writing to the group company secretary.
With the exception of restrictions on transfer of the ordinary shares under the Company’s employee share incentive plans whilst the shares are subject to the rules of the plans, there are no restrictions on the voting rights attaching to the Company’s ordinary shares or the transfer of securities in the Company.
Where, under an employee share incentive plan operated by the Company, participants are the beneficial owners of shares but not the registered owners, the voting rights are normally exercised at the discretion of the participants. No person holds securities in the Company carrying special rights with regard to control of the Company. The Company is not aware of any agreements between holders of securities that may result in restrictions in the transfer of securities or voting rights. Unless expressly specified to the contrary in the articles of association, the articles of association may only be amended by special resolution of the Company’s shareholders in general meeting. There are a number of agreements that take effect, alter or terminate upon a change of control of the Company, such as commercial contracts and joint venture agreements. None are considered to be significant in terms of their potential impact on the business of the Group as a whole. All of the Company’s employee share incentive plans contain provisions relating to a change of control. Outstanding awards and options would normally vest and become exercisable on a change of control, subject to the satisfaction of any performance conditions and pro rata reduction as may be applicable under the rules of the employee share incentive plans.
At the Annual General Meeting (AGM) in 2013, shareholders will be asked to renew the directors’ authority to allot new securities. Details are contained in the 2013 Notice of Annual General Meeting (Notice of AGM).
Authority to purchase own shares
At the Company’s 2012 AGM, shareholders renewed the Company’s authorities to make market purchases of up to 290 million ordinary shares, up to 100 million 8¾% preference shares and up to 100 million 83/8% preference shares. These authorities were not used during the year or up to the date of this Report. At the 2013 AGM, shareholders will be asked to renew these authorities for another year and the resolution will once again propose a maximum aggregate number of ordinary shares which the Company can purchase of less than 10% of the issued ordinary share capital. Details are contained in the Notice of AGM. The Company held no treasury shares during the year or up to the date of this Report.
Major shareholdings
The table below shows the holdings of major shareholders in the Company’s issued ordinary share capital in accordance with the Disclosure and Transparency Rules as at 31 December 2012 and 5 March 2013.
Shareholding interest
| | At 31 December 2012 | At 5 March 2013 |
| Shareholder | Notified
holdings | Nature of
holding | Notified
holdings | Nature of
holding |
| BlackRock, Inc1 | 5.15% | Indirect | 5.15% | Indirect |
| Legal & General Group plc2 | 3.98% | Direct | 3.98% | Direct |
| AXA S.A.1 | 3.86% | Direct & indirect | 3.86% | Direct & indirect |
| 1. | Holding includes holdings of subsidiaries. |
| 2. | Interest held by Legal & General Assurance (Pensions Management) Ltd. |
Directors
The directors as at the date of this Report are shown together with their biographical details on pages 40 to 42. During the year and up to the date of this Report, the following Board appointments, resignations and retirements occurred:
Glyn Barker – appointed 27 February 2012
Igal Mayer – resigned 19 April 2012
Leslie Van de Walle – resigned 2 May 2012
Andrew Moss – resigned 8 May 2012
Lord Sharman of Redlynch – retired 30 June 2012
Mary Francis – resigned 3 October 2012
Mark Wilson – appointed 1 December 2012 and became
Group CEO on 1 January 2013
Euleen Goh – resigned 31 December 2012
Sir Adrian Montague – appointed 14 January 2013
Bob Stein – appointed 28 January 2013
Directors’ interests and indemnity arrangements
At no time during the year did any director hold a material interest in any contract of significance with the Company or any of its subsidiary undertakings other than an indemnity provision between each director and the Company and employment contracts between each executive director and a Group company. There is no arrangement or understanding with any shareholder, customer, supplier, or any other external party, to appoint a director or a member of the Group Executive. The Company has purchased and maintained throughout the year, directors’ and officers’ liability insurance in respect of itself and its directors. The directors also have the benefit of the indemnity provision contained in the Company’s articles of association. The Company has executed deeds of indemnity for the benefit of each director of the Company, and each person who was a director of the Company during the year, in respect of liabilities that may attach to them in their capacity as directors of the Company or of associated companies. These indemnities were granted at different times according to the law in place at the time and where relevant are qualifying third-party indemnity provisions as defined by section 234 of the Companies Act 2006. These indemnities were in force throughout the year and are currently in force. Details of directors’ remuneration, service contracts, employment contracts and interests in the shares of the Company are set out in the Directors’ Remuneration Report.
Financial instruments
Group companies use financial instruments to manage certain types of risks, including those relating to credit, foreign currency exchange, cash flow, liquidity, interest rates, and equity and property prices. Details of the objectives and management of these instruments are contained in the Risk and Capital Management section on pages 33 to 35, the Shareholder Information section on pages 81 to 104 and an indication of the exposure of the Group companies to such risks is contained in note 53 to the consolidated financial statements.
Health and safety
Aviva is committed to providing a safe and healthy working environment for all staff, contractors and anyone who is or may be affected by the business’ undertakings. The Group’s health and safety standard sets out the range of policies, procedures and systems required to manage risks and promote wellbeing. This includes appropriate staff consultation through nominated health and safety representatives. The Group CEO has overall accountability for health and safety across the organisation. Health and safety performance is regularly reviewed through the Corporate Responsibility Committee.
Charitable donations
Aviva takes its corporate citizenship seriously and recognises the role it plays in the communities in which it operates and the role they play in its business. The Group’s flagship community development programme is ‘Street to School’. Further details of this and the Group’s other charitable, community and corporate responsibility initiatives are disclosed in the Corporate Responsibility Report on page 63.
During 2012, £5.7 million was donated to UK-based charities by the Company and its subsidiaries. A total of £8.9 million was donated by the Group world-wide.
Political donations
At the 2012 AGM, shareholders passed a resolution, on a precautionary basis, to authorise the Company to make political donations and/or incur political expenditure (as such terms are defined in sections 362 to 379 of the Companies Act 2006), in each case in amounts not exceeding £100,000 in aggregate. As the authority granted will expire on 9 May 2013, renewal of this authority will be sought at this year’s AGM. Further details are available in the Notice of AGM. The definitions of political donations and political expenditure used in the Companies Act 2006 are broad in nature and this authority is sought to ensure that any activities undertaken throughout the Group, which could otherwise be construed to fall within these provisions, can be undertaken without inadvertently infringing them. It is not the policy of the Company to make donations to EU political organisations or to incur other political expenditure.
During the year, the Aviva USA Political Action Committee, which is funded solely by voluntary contributions from employees of Aviva USA Corporation (a subsidiary of the Company), made contributions to six candidate campaigns and industry political action committees. The total sum of the donations made was $32,500 and the donations were used to support candidates for nomination and/or election to public office.
Group employees
The Group’s statement on its employees is set out in the Corporate Responsibility Report. In summary, the Group’s commitment to communication and dialogue with employees continues. The existence of a Group-wide intranet enables engagement and communication with employees throughout the Group. It also helps management to share information, ideas and opportunities quickly and to achieve a common awareness on the part of all employees of the financial and economic factors affecting the performance of the Company. A strong emphasis is placed on the provision of news and information through a range of media. Employees have opportunities to voice their opinions and ask questions through intranet sites, question and answer sessions with the Group CEO, via telephone conferencing, opinion surveys and the Group’s Employee Promise Survey which is open to all employees. Face-to-face briefings and team meetings are actively encouraged and are held in business units across the Group. The Group’s businesses in the UK have established employee consultative forums and a European Consultative Forum convenes annually to discuss matters impacting the business across Europe. The Group ensures that involvement of employees in its performance is encouraged by allowing eligible employees in the UK to participate in the Group’s employee share ownership plans.
Employee practice
The Group respects all fundamental human rights and is guided in the conduct of its business by the provisions of the United Nations Universal Declaration of Human Rights and the International Labour Organization core labour standards. The Group also supports the United Nations Global Compact Principles. The Group is committed to providing equal opportunities to all employees, irrespective of their gender, sexual orientation, marital status, race, nationality, ethnic origin, disability, age, religion or union membership status. Aviva is an inclusive employer and values diversity among its employees. These commitments extend to recruitment and selection, training, career development, flexible working arrangements, promotion and performance appraisal.
Creditor payment policy and practice
It is the Group’s policy to pay creditors when they fall due for payment and the Company follows the government endorsed Prompt Payment Code which can be found at www.promptpaymentcode.org.uk. Terms of payment are agreed with suppliers when negotiating each transaction and the policy is to abide by those terms, provided that the suppliers also comply with all relevant terms and conditions. In respect of Group activities in the UK, the amounts due to trade creditors at 31 December 2012 represented 17.9 days of average daily purchases through the year(2011: 22.2 days).
Disclosure of information to the auditor
In accordance with section 418 of the Companies Act 2006, the directors in office at the date of approval of this Report confirm that, so far as they are each aware, there is no relevant audit information of which the Company’s auditor, PricewaterhouseCoopers LLP (PwC), is unaware and each director has taken all steps that ought to have been taken as a director to be aware of any relevant audit information and to establish that PwC is aware of that information.
Change of auditor
Following a tender process in 2011, PwC was appointed as the Company’s external auditor commencing with the 2012 financial year and its appointment was approved by shareholders at the 2012 AGM. PwC is subject to annual re-election and resolutions on its appointment and seeking authorisation for the directors to set the auditor’s remuneration are included in the Notice of AGM.
Annual General Meeting
The 2013 AGM of the Company will be held on Thursday, 9 May 2013 at the Barbican Centre, Silk Street, London EC2Y 8DS at 11am. The Notice of AGM convening the meeting describes the business to be conducted thereat.
Related party transactions
Details of related party transactions are disclosed in note 56 which is incorporated into this Report by reference.
Value of interests in land
Any difference between market value and the value included in the balance sheet regarding the Group’s interests in land are disclosed in notes 17 and 18 and are incorporated into this Report by reference.
Events after the reporting period
On 8 January 2013 the Company announced its intention to sell the Group’s remaining stake in Delta Lloyd N.V., a Dutch listed insurance company. The sale took place by way of an accelerated book build offering and the Group’s entire remaining holding of 34,288,795 ordinary shares in Delta Lloyd N.V. was sold at a price of €12.65 per share. The sale completed on 14 January 2013.
On 17 January 2013 the Company announced it had agreed to sell the Group’s stake in its Malaysian joint ventures, CIMB Aviva Assurance Berhad and CIMB Aviva Takaful Berhad, to Sun Life Assurance Company of Canada for £152 million payable in cash. The deal is subject to regulatory approval and is expected to complete during the first half of 2013.
On 27 February 2013 the Company announced it had agreed to sell Aviva Russia to Blagosostoyanie, a non-state pension fund in Russia, for a consideration of €35 million payable in cash. The sale is subject to approval by the Federal Antimonopoly Service of the Russian Federation and it is expected that the sale will complete during the first half of 2013.
On 8 March 2013 the Company completed the transaction with AIB. Further details can be found in ‘Financial Statements – IFRS – note 3 – Subsidiaries’.
Going concern
The Group’s business activities, together with the factors likely to affect its future development, performance and position are set out in the Performance Review. The Performance Review is set out on pages 1 to 36 and includes the Risk and Capital Management section on pages 33 to 35. In addition, the financial statements sections include notes on the Group’s borrowings (note 45); its contingent liabilities and other risk factors (note 48); its capital structure and position (note 50); management of its risks including market, credit and liquidity risk (note 53); and derivative financial instruments (note 54).
The Group has considerable financial resources together with a diversified business model, with a spread of businesses and geographical reach. As a consequence, the directors believe that the Group is well placed to manage its business risks successfully.
After making enquiries, the directors have a reasonable expectation that the Company and the Group as a whole have adequate resources to continue in operational existence for the foreseeable future. For this reason, they continue to adopt the going concern basis in preparing the financial statements.
Directors’ responsibilities
The directors are responsible for preparing the Annual Report, the Directors’ Remuneration Report and the financial statements in accordance with applicable law and regulations.
Company law requires the directors to prepare financial statements for each financial year. Under that law the directors have prepared the Group and parent company financial statements in accordance with International Financial Reporting Standards (IFRS) as adopted by the EU. Under company law the directors must not approve the financial statements unless they are satisfied that they give a true and fair view of the state of affairs of the Group and the Company and of the profit or loss of the Group for that period. In preparing these financial statements, the directors are required to:
| n | Select suitable accounting policies and then apply them consistently; |
| n | Make judgements and accounting estimates that are reasonable and prudent; |
| n | State whether applicable IFRS as adopted by the European Union have been followed, subject to any material departures disclosed and explained in the financial statements; and |
| n | Prepare the financial statements on the going concern basis unless it is inappropriate to presume that the Company will continue in business. |
The directors are responsible for keeping adequate accounting records that are sufficient to show and explain the Company’s transactions and disclose with reasonable accuracy at any time the financial position of the Company and the Group and enable them to ensure that the financial statements and the Directors’ Remuneration Report comply with the Companies Act 2006 and, as regards the Group financial statements, Article 4 of the IAS Regulation. They are also responsible for safeguarding the assets of the Company and the Group and hence for taking reasonable steps for the prevention and detection of fraud and other irregularities.
The directors are responsible for the maintenance and integrity of the Company’s website. Legislation in the UK governing the preparation and dissemination of financial statements may differ from legislation in other jurisdictions.
Directors’ responsibility statement
Each of the directors listed on pages 40 to 42 confirm that, to the best of their knowledge:
| n | The Group financial statements, which have been prepared in accordance with IFRS as adopted by the EU, give a true and fair view of the assets, liabilities, financial position and profit/(loss) of the Group; and |
| n | The Directors’ Report and the Management Report include a fair review of the development and performance of the business and the position of the Group, together with a description of the principal risks and uncertainties that it faces. |
By order of the Board on 6 March 2013.
| Mark Wilson | Patrick Regan |
| Group chief executive officer | Chief financial officer |
Corporate governance report
This Report sets out the role and activities of the Board, its effectiveness, and how the Group is governed. The Board’s role is to provide entrepreneurial leadership of the Company within a framework of prudent and effective controls which enables risk to be assessed and managed. The Board believes that a strong system of governance is essential to help the business run smoothly and aid effective decision making in order to support the achievement of the Group’s objectives.
The UK Corporate Governance Code
As a UK listed company, Aviva seeks to comply with the UK Corporate Governance Code 2010 (the Code). An amended version of the Code was issued in September 2012 which is applicable to companies with a UK premium listing with financial years beginning on or after 1 October 2012; the Company will report on its compliance with the 2012 version of the Code in its 2013 Annual Report and Accounts.
It is the Board’s view that the Company has been fully compliant throughout the accounting period with the relevant provisions of the Code with the exception of the following:
| n | Provision A.2.1 states that the roles of chairman and chief executive should not be exercised by the same individual and provision A.3.1 states that the chairman should be independent on appointment to the Board. John McFarlane joined the Board as chairman designate in 2011 with the intention that he would take over the chairmanship of the Company on the retirement of Lord Sharman in June 2012. However, due to the unforeseen departure of Andrew Moss in May 2012, the Board asked John McFarlane to take on executive responsibility for running the Company in the interim period until a new Group CEO was appointed. As a result from 1 July 2012 until 1 January 2013 John McFarlane acted as executive chairman. He became non-executive chairman on 1 January 2013 on the appointment of Mark Wilson as Group CEO. The Board believes that this non-compliance with the Code was justified in the circumstances given the timing of Andrew Moss’ departure and the need to ensure the continued effective operation of the Company until a new Group CEO could be identified and appointed. The Board was satisfied that there was a sufficient balance between executive and non-executive directors on the Board during this period to ensure that no one individual had unfettered decision-making powers. |
| n | Provision E.1.1 states that the senior independent director should attend sufficient meetings with a range of major shareholders to listen to their views in order to help develop a balanced understanding of the issues and concerns of major shareholders. Whilst Richard Goeltz did not meet with major shareholders during 2012, throughout the year John McFarlane and, separately, the chairman of the Remuneration Committee, undertook a programme of meetings with major shareholders to take soundings regarding the Company and to understand their concerns. |
Further details of how the Company has applied the Code principles and complied with its provisions are set out in this Report, the Reports of each Board Committee and the Directors’ Remuneration Report.
Further information on the Code can be found on the Financial Reporting Council’s website at www.frc.org.uk.
The Board
The Board is responsible to shareholders for promoting the long term success of the Company and, in particular, for setting the Group’s strategic aims, monitoring management’s performance against the strategic aims, setting the Group’s risk appetite, ensuring the Group is adequately resourced and ensuring that effective controls are in place in the business. The Board also sets the values and the culture of the Group and has a duty to protect the interests of policyholders.
The specific duties of the Board are clearly set out in its terms of reference which address a wide range of corporate governance issues and lists those items that are specifically reserved for decision by the Board. Matters requiring Board approval include:
| n | Group strategy and business plans; |
| n | Financial reporting and controls, capital structure and dividend policy; |
| n | Group risk appetite and framework; |
| n | Significant transactions and expenditure; and |
| n | Other matters (e.g. appointment and removal of the group company secretary and chief risk and capital officer, Board and Committee succession planning and the constitution of Board Committees). |
The Board’s terms of reference also set out those matters that must be reported to the Board, such as senior leadership changes, significant litigation or material regulatory breaches, and cover how matters requiring consideration by the Board that arise between scheduled meetings should be dealt with.
The directors
As at the date of this Report the Board comprises the chairman, Group CEO, two further executive directors and eight independent non-executive directors. The following charts show the balance of the Board between executive and non-executive representation, length of tenure and the diversity of the Board in terms of gender and nationality.
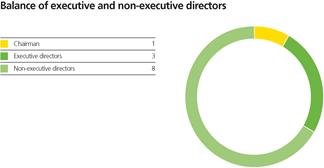

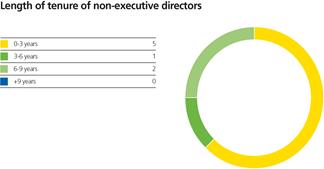
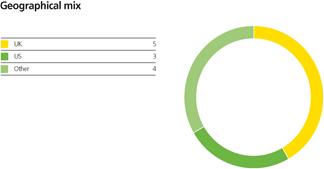
The Board’s policy is to appoint and retain non-executive directors who can apply their wider business knowledge and experiences to their understanding of the Aviva Group, and to review and refresh regularly the skills of the Board. In line with Code requirements regarding the independence of non-executive directors, several non-executive directors, including the chairman, retired in 2012 or are due to retire in 2013. The Report of the Nomination Committee sets out the work carried out during the year on succession planning which culminated in the appointment of Sir Adrian Montague and Bob Stein as non-executive directors in January 2013 and Mark Wilson joining the Board in December 2012 and becoming Group CEO on 1 January 2013.
It is the Board’s view that independent non-executive directors need to be able to present objective, rigorous and constructive challenge to management, drawing on their wider experiences to question assumptions and viewpoints and where necessary defend a given position. The independent non-executive directors should also assist management in the development of the Company’s strategy. To be effective, an independent director needs to acquire a sound understanding of the industry and the Company so as to be able to evaluate properly the information provided. Having considered the matter carefully, the Board is of the opinion that all of the current non-executive directors are independent and free from any relationship or circumstances that could affect, or appear to affect, their independent judgement. Accordingly, over half of the Board members, excluding the chairman, are independent non-executive directors. All of the current directors that served during 2012 were subject to a formal performance evaluation during 2012 except Mark Wilson as he only joined the Board in December 2012. Non-executive directors who had served on the Board for more than six years were subject to a particularly rigorous review of their independence. As at the date of this Report, Richard Goeltz and Russell Walls have served on the Board for more than six years and they will both be retiring from the Board on 8May 2013 having completed nine years of service. Biographical details including a summary of the skills and experience the directors bring to the Board are set out on pages 40 to 42.
Each director must be able to devote sufficient time to the role in order to discharge his or her responsibilities effectively. On average, directors spend at least 41 days a year on Company business, with the chairmen of the Audit, Risk and Remuneration Committees spending substantially more.
The chairman and Group CEO
Role profiles are in place for the chairman and Group CEO which clearly set out the duties of each role. The chairman’s priority is leadership of the Board and ensuring its effectiveness; the Group CEO’s priority is the management of the Group. The Board has delegated the day-to-day running of the Group to the Group CEO within certain limits, above which matters must be escalated to the Board for consideration and approval. As noted above, the roles of chairman and Group CEO were combined and undertaken by John McFarlane prior to the 2013 AGM until the end of the year. The Board agrees with the principle in the Code requiring these roles to be carried out by separate individuals. However, due to unforeseen circumstances during the year the Board unanimously agreed that it was in the best interests of the Company for the benefit of its shareholders to combine the roles for a short period until a new Group CEO could be recruited. From 1 January 2013 the roles are no longer combined.
Senior independent director
Richard Goeltz has served as the senior independent director since January 2009 and as an independent non-executive director for nearly nine years. Sir Adrian Montague will take over this role on 8 May 2013 when Richard Goeltz retires from the Board. The role of the senior independent director is to provide a sounding board for the chairman, to serve as an intermediary for the other directors where necessary and to be available to shareholders should they have concerns that they have been unable to resolve through normal channels, or when such channels would be inappropriate. During the year, the non-executive directors, led by Richard Goeltz, have met twice without the chairman present and he led the review of the chairman’s performance during the year.
Board activities during 2012
The work of the Board follows an agreed annual work plan and principally falls under six main areas. The following chart shows how the Board allocated its time during 2012.
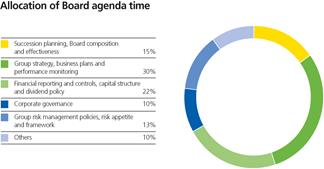
The Board monitored the performance of the Group and its compliance with the governance framework described below through regular:
| n | Group CEO reports highlighting issues such as strategic planning and execution; updates on ongoing corporate transactions; financial forecasts and results; the Group’s vision and values; the external environment; personnel changes and market and competitor developments; |
| n | Chief financial officer reports on a range of issues including financial results and forecasts; capital; operational performance; strategic initiatives; pensions funding deficit; investor relations and rating agency updates; risk appetite; corporate transactions and progress against Solvency II; |
| n | Reports and recommendations from each Board Committee; and |
| n | Reports from business units and functions. |
As part of its annual work plan, the Board reviewed and approved all financial results announcements, the Annual Report and Accounts, the operational plan and dividend payments; considered succession plans for the Board and Group Executive; approved all changes to the composition of the Board and its Committees; reviewed the performance of the group chief executive; received regular updates on progress against strategy; considered personnel issues including the results of the annual employee promise survey; and reviewed public policy trends.
In addition, the Board undertook the following specific activities during the year:
| n | Agreed a revised strategic plan to narrow the focus of the Group, build financial strength and improve financial performance; |
| n | Approved the Group transformation project to implement the revised strategic plan; |
| n | Appointed PwC as the Company’s auditor following a tender process; |
| n | Approved the sale of Aviva USA Corporation; |
| n | Approved a further sale of Aviva’s stake in Delta Lloyd N.V.; |
| n | Approved the issue of Tier 1 hybrid debt; |
| n | Approved the project to merge the Group’s Irish General Insurance business into the UK General Insurance business; |
| n | Reviewed the progress of the project to reorganise and flatten the Group’s legal entity structure; and |
| n | Considered and approved a new IT strategy. |
The Board held one meeting in France during the year to gain a deeper understanding of the operations of the French business.
Board effectiveness
The effectiveness of the Board is vital to the success of the Group and the Company undertakes a rigorous evaluation each year in order to assess how well the Board, its Committees, the directors and the chairman are performing. The aim is to improve the effectiveness of the Board and its Committees and the Group’s overall performance. The evaluation process for 2012 was led by the chairman and supported by the group company secretary. For a number of years the Board effectiveness review had been facilitated by external consultants. However, given the number of changes to the composition of the Board during the year the chairman considered that it would be more appropriate to carry out the 2012 effectiveness review internally using questionnaires tailored to the Board and each Committee. The results were discussed by the Board and each of the Committees and actions agreed. The review focused on the effective operation of the Board and each Committee, the effective use of meeting time, the appropriateness of the balance of skills, knowledge and experience of the Committee members, and identified key areas of focus for the Board and each Committee for 2013. Overall, the directors concluded that the Board and its Committees operated effectively and agreed that the issues identified for action or improvement in previous reviews had been implemented or addressed during the year. Areas identified for greater Board focus in 2013 included allocating a greater proportion of time to in-depth discussions of the markets in which the Group operates and their competitive positions and re-focusing strategy discussions towards the Group’s long-term strategy, as well as continuing to monitor the Group’s capital and liquidity position. The focus of the Board Committees in 2013 are detailed in each Committee’s Report.
The review of the performance of the chairman, led by the senior independent director, concluded that the chairman continued to lead the Board effectively and had been instrumental in the progress which the Company and the Group had made during the year to deliver the Group’s strategy.
The chairman assessed the performance of the executive directors in their capacity as directors of the Company and also assessed the performance of the non-executive directors. To assess the executive directors in respect of their executive duties a separate process was carried out by the chairman measuring performance against each executive director’s role objectives.
The chairman concluded that each director contributes effectively and demonstrates full commitment to his/her duties.
Induction, training and development
The Board believes strongly in the development of all of its employees and directors and it is a requirement of each director’s appointment that they commit to continuing their development.
During the year, directors attended a number of internal courses, including on Solvency II, the Internal Model approval process and how rating agencies rate insurance companies. Training sessions have also been built into the Board’s and Committees’ work plans for 2013.
The Board has a comprehensive induction programme for new executive and non-executive directors which is tailored to their particular needs and which consists of several separate training sessions over a number of months. These include presentations from key members of senior management, visits to the Group’s main operating businesses and functions, and meetings with the external auditor and one of the Company’s corporate brokers. Further or follow-up meetings are arranged where a director requires a deeper understanding on a particular issue. All new directors also receive induction materials which includes the current strategic and operational plan, recent Board and Committee minutes and meeting packs, organisational structure charts, role profiles, a history of the Group, and relevant policies, procedures and governance material.
Directors’ attendance
The Company requires directors to attend all meetings of the Board and the Committees on which they serve and to devote sufficient time to the Company in order to perform their duties. The attendance of the directors at the Board meetings held in 2012 is shown in the table below and the attendance at Committee meetings is shown in the Committee reports.
Board attendance 2012
| Director | Number of meetings attended | Percentage attendance1 |
| Glyn Barker (appointed 27 February 2012) | 11 | 79%2 |
| Mary Francis (retired 3 October 2012) | 9 | 90%2 |
| Richard Karl Goeltz | 15 | 100% |
| Euleen Goh (retired 31 December 2012) | 15 | 100% |
| Michael Hawker | 14 | 93%2 |
| Gay Huey Evans | 15 | 100% |
| John McFarlane | 14 | 93%2 |
| Trevor Matthews | 14 | 93%2 |
| Igal Mayer (resigned 19 April 2012) | 2 | 50%2 |
| Andrew Moss (resigned 8 May 2012) | 5 | 71%2 |
| Patrick Regan | 14 | 93%2 |
| Lord Sharman (retired 30 June 2012) | 8 | 100% |
| Leslie Van de Walle (retired 2 May 2012) | 3 | 60%2 |
| Russell Walls | 15 | 100% |
| Scott Wheway | 14 | 93%2 |
| Mark Wilson (appointed 1 December 2012) | 2 | 100% |
| 1 | This shows the percentage of meetings which the director attended during the year whilst a member of the Board. |
| 2 | The director was unable to attend Board meeting(s) due to prior commitments and the meetings being called at short notice or where a conflict of interest prevented the director from taking part in the meeting. |
During 2012, there were fifteen Board meetings held, of which, eight were scheduled Board meetings and seven were additional Board meetings called at short notice. In addition the Board delegated responsibility for certain items, such as giving final approval to proposals broadly agreed by the full Board, to specially created sub-Committees of the Board which met seven times during 2012.
The chairman and the non-executive directors met several times in the absence of the executive directors and the non-executive directors met in the absence of the chairman, including one meeting chaired by the senior independent director to appraise the chairman’s performance.
Conflicts of interest
In line with the Companies Act 2006, the Company’s articles of association allow the Board to authorise potential conflicts of interest that may arise and to impose such limits or conditions as it thinks fit. The decision to authorise a conflict of interest can only be made by non-conflicted directors (those who have no interest in the matter being considered) and in making such a decision the directors must act in a way they consider in good faith will be most likely to promote the Company’s success. The Board’s procedure to regularly review and approve actual and potential conflicts of interest as they arise and prior to the appointment of new directors operated effectively during the year.
Governance structure
The Board is responsible for promoting the long term success of the Company for the benefit of shareholders. This includes ensuring that an appropriate system of governance is in place throughout the Group. To discharge this responsibility, the Board has established frameworks for risk management and internal control using a ‘three lines of defence’ model and reserves to itself the setting of the Group’s risk appetite. In-depth monitoring of the establishment and operation of prudent and effective controls in order to assess and manage risks associated with the Group’s operations is delegated to the Audit Committee and the Risk Committee which report regularly to the Board. However, the Board retains ultimate responsibility for the Company’s systems of internal control and risk management and their effectiveness. These frameworks play a key role in the management of risks that may impact the fulfilment of the Board’s objectives. They are designed to identify and manage, rather than eliminate, the risk of failure to achieve business objectives and can only provide reasonable and not absolute assurance against material misstatement or losses. These frameworks are regularly reviewed and comply with the Turnbull Guidance (Internal Control: Revised Guidance for Directors).
Risk Management Framework
The Risk Management Framework (RMF) is designed to identify, measure, manage, monitor and report significant risks to the achievement of business objectives and is embedded throughout the Group. It is codified through risk policies and business standards which set out the risk strategy, appetite, framework and minimum requirements for the Group’s world-wide operations. Further details on procedures for the management of risks are given in note 53.
Internal controls
Internal controls facilitate effective and efficient business operations, the development of robust and reliable internal reporting and compliance with laws and regulations.
A Group Reporting Manual including International Financial Reporting Standards (IFRS) requirements and a Financial Reporting Control Framework (FRCF) are in place across the Group. FRCF relates to the preparation of reliable financial reporting and preparation of local and consolidated financial statements in accordance with IFRS and with the requirements of the Sarbanes-Oxley Act of 2002. The FRCF process follows a risk-based approach, with management identification, assessment (documentation and testing), remediation (as required), reporting and certification over key financial reporting-related controls.
The Board has delegated to the Group CEO the day-to-day management of the Company and approval of specific issues up to set financial limits including limits on revenue and capital expenditure, reinsurance spend and the settlement of claims. In turn the Group CEO has delegated some of his authority to his direct reports. There is a similar delegated authority framework in place throughout the Group.
First line
Management are responsible for the application of the RMF, for implementing and monitoring the operation of the system of internal control and for providing assurance to the Audit Committee, the Risk Committee and the Board.
The Group Executive members and each business unit chief executive officer are responsible for the implementation of group strategies, plans and policies, the monitoring of operational and financial performance, the assessment and control of financial, business and operational risks and the maintenance and ongoing development of a robust control framework and environment in their areas of responsibility.
The chief financial officer has established the Asset Liability Committee (ALCO) which assists him in discharging his responsibilities in relation to management of the Group’s balance sheet within risk appetite and to provide financial risk management oversight. This includes recommending financial and insurance risk appetites and limit frameworks, evaluating the asset and liability impact of strategies and business plans, financial risk oversight, monitoring and management of the Group’s capital and liquidity position, transaction risk oversight, stress and scenario testing, and identification of emerging financial risks.
Management regularly undertakes quality assurance procedures over the application of the FRCF process and FRCF controls. The results of the FRCF process are signed off by business unit chief executives and chief financial officers and FRCF compliance is reported up to the Disclosure Committee and the Audit Committee.
The Disclosure Committee is chaired by the chief financial officer and reports to the Audit Committee. It oversees the design and effectiveness of the Group’s disclosure controls, for both financial and non-financial information, evaluates the Group’s disclosure controls and reviews and endorses the Group’s key periodic external reports, including the consolidated financial statements.
Second line
The Risk function is accountable for the quantitative and qualitative oversight and challenge of the identification, measurement, monitoring and reporting of significant risks and for developing the RMF.
As the business responds to changing market conditions and customer needs, the Risk function regularly monitors the appropriateness of the Company’s risk policies and the RMF to ensure they remain up to date. This helps to provide assurance to the various risk oversight committees that there are appropriate controls in place for all core businessactivities, and that the processes for managing risk are understood and followed consistently across the Group.
To assist with the execution of his duties the chief risk and capital officer has established the Operational Risk and Reputation Committee (ORRC) which oversees operational risks and reputation impacts arising from activities across the Group. It oversees the operational risk elements of the implementation and maintenance of the risk policies and business standards, the Group’s adherence to the Operational Risk Policy, and the adequacy and implementation of the RMF throughout the Group.
Third line
The Internal Audit function provides independent and objectiveassessment on the robustness of the RMF and the appropriatenessand effectiveness of internal control to the Audit and Risk Committees, business unit audit committees and the Board. Further information on the activities of the Internal Audit function is contained within the Audit Committee Report.
Board oversight
The Risk Committee assists the Board in its oversight of risk and risk management across the Group and makes recommendations on risk appetite to the Board. The responsibilities and activities of the Risk Committee are set out in the Risk Committee Report on pages 60 to 62.
The Audit Committee, working closely with the Risk Committee, is responsible for assisting the Board in discharging its responsibilities for the integrity of the Company’s financial statements, the effectiveness of the system of internal financial controls and for monitoring the effectiveness, performance and objectivity of the internal and external auditors. The responsibilities and activities of the Audit Committee are set out in the Audit Committee Report on pages 57 to 59.
Both the Audit and Risk Committees report regularly to the Board on their activities and make recommendations and escalate significant risk exposures to the Board as appropriate. They ensure that mitigating actions are taken when risks are, or are expected to move, out of appetite.
The chart below shows the Board and Committee structure that oversees the Company’s frameworks for risk management and internal control.
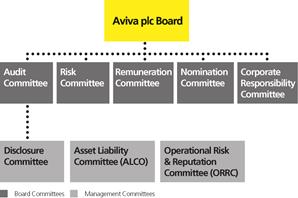
Further details on procedures for the management of risk operated by the Group are given in note 53.
Effectiveness of controls
To support an assessment of the effectiveness of the Group’s governance, internal control and risk management systems, the chief executive officer of each business unit is required to certify that:
| n | There are sound risk management and internal control systems that are effective and fit for purpose in place across the business; and |
| n | Material existing or emerging risks within the business have been identified and assessed and the business operates in a manner which conforms to the minimum requirements outlined in Group risk policies and business standards. |
The chief risk officer of each business unit must certify that:
| n | The Risk function has reviewed and challenged the process supporting the business unit chief executive officer’s certification, and is satisfied that it can provide reasonable assurance of the material accuracy and completeness of the business unit chief executive officer’s assessment; and |
| n | No material gaps exist in the RMF, as it applies to the business unit. |
Any material risks not previously identified, control weaknesses or non-compliance with the Group’s risk policies and business standards or local delegations of authority, must be highlighted as part of this process. This is then supplemented by investigations carried out at Group level and ultimately a Group CEO and group chief risk and capital officer certification for Aviva plc. In respect of 2012 and in view of the recent start of the Group CEO, the certification was made by the chief financial officer instead of the Group CEO. The effectiveness assessment also draws on the regular cycle of assurance activity carried out during the year.
The Audit Committee, working closely with the Risk Committee, on behalf of the Board, last reviewed the effectiveness of the systems of internal control and risk management in March 2013, covering all material controls, including financial, operational and compliance controls and the risk management framework and processes.
The necessary actions have been or are being taken to remedy any significant failings and weaknesses identified from these reviews. The Board confirms that there is an ongoing process for identifying, measuring, managing, monitoring and reporting the significant risks faced by the Group, which has been in place for the year under review and up to the date of approval of the Annual Report and Accounts.
Communication with shareholders
The Company places considerable importance on communication with shareholders and engages with them on a wide range of issues.
The Group has an ongoing programme of dialogue and meetings between the executive directors and institutional investors, fund managers and analysts managed by the Company’s Investor Relations function. At these meetings a wide range of relevant issues including strategy, performance, management, remuneration and governance are discussed within the constraints of information already made public, to understand any issues of concern to investors.
During the year, the chairman and the chairman of the Remuneration Committee met with the Company’s major institutional investors. In addition, the senior independent director was available to meet with major investors to discuss any areas of concern that could not be resolved through normal channels of investor communication. In 2012 the Board, through the Remuneration Committee chairman, consulted with institutional investors on executive remuneration.
The Company’s AGM provides a valuable opportunity for the Board to communicate with private shareholders. There is a dedicated email address and a query facility on the Company’s website which shareholders can use to ask questions on the business of the AGM. The details of these are highlighted in the shareholder information section of the Notice of AGM. A presentation on the Group’s performance is given at the AGM and made available on the website after the meeting at www.aviva.com/agm. Whenever possible, all directors attend the AGM and shareholders are invited to ask questions related to the business of the meeting during the meeting and have an opportunity to meet with the directors following the conclusion of the meeting. All the directors on the Board at the time of the 2012 AGM attended the meeting.
New York Stock Exchange listing requirements
The Company’s ordinary shares are admitted to the New York Stock Exchange (NYSE) and are traded as American Depositary Shares. As a foreign company listed on the NYSE, the Company is required to comply with the NYSE corporate governance rules to the extent that these rules apply to foreign private issuers. As a foreign private issuer, the Company is therefore required to comply with NYSE Rule 303A.11 by making a disclosure of the differences between the Company’s corporate governance practices and NYSE corporate governance rules applicable to US companies listed on NYSE. These differences are summarised below together with Aviva’s approach to compliance:
| NYSE Listing Rules | UK Corporate Governance Code | Aviva approach |
| Independence criteria for directors |
| Independent directors must form the majority of the board of directors. A director cannot qualify as independent unless the Board affirmatively determines that the director has no material relationship with the company. NYSE rules prescribe a list of specific factors and tests that US companies must use for determining independence. | At least half the Board, excluding the chairman, should comprise independent non-executive directors, as determined by the Board. The Code sets out its own criteria that may be relevant to the independence determination, but the Board is permitted to conclude affirmative independence notwithstanding the existence of relationships or circumstances which may appear relevant to its determination, so long as it states its reasons. | The majority of the Board comprises independent non-executive directors who are deemed independent under the Code. |
| Non-executive director meetings |
| Non-management directors of each listed company must meet at regularly scheduled executive sessions without management and, if that group includes directors who are not independent, listed companies should at least once a year schedule an executive session including only independent directors. | The chairman should hold meetings with the non-executive directors without the executive directors present. | The independent non-executive directors meet without executive directors present at least once annually. |
| Committees |
| US companies are required to have a nominating/corporate governance committee. In addition to identifying individuals qualified to become Board members, this committee must develop and recommend to the Board a set of corporate governance principles. | The Company is required to have a nomination committee but not a corporate governance committee. | The Company has a Nomination Committee. The Board as a whole is responsible for the corporate governance of the Group and oversees this through reports to the Board and its Committees. |
| Code of business conduct and ethics |
| Companies are required to adopt and disclose a code of business conduct and ethics for directors, officers and employees, and promptly disclose any waivers of the code for directors or executive officers. | Not required under the Code. | The Company has adopted a Business Ethics Code to which all employees are bound and a Code of Ethics for senior management, to comply with the Sarbanes-Oxley Act of 2002. |
Shareholder approval of equity-compensation plans |
| Shareholders must be given the opportunity to vote on all equity-compensation plans and ‘material revisions’ to those plans, with limited exceptions. Detailed definitions of ‘material revisions’ are provided by NYSE. | Shareholder approval is necessary for certain equity-compensation plans and ‘significant changes’ thereto, subject to certain exceptions. The Code does not provide a detailed definition or explanation of what are considered to be ‘significant changes’. | All new equity-compensation plans or amendments to existing plans that are required to be approved by shareholders under the Code are put to shareholders for approval. |
By order of the Board
John McFarlane
Chairman
6 March 2013
Nomination Committee report
This Report provides details of the role of the Nomination Committee and the work it has undertaken during the year.
Committee role and responsibilities
The Board strongly believes that good governance and strong, responsible, balanced leadership by the Board are critical to creating long-term shareholder value and business success. The Committee assists the Board by regularly reviewing the composition of the Board and conducting a rigorous and transparent process when recommending or renewing the appointment of directors to the Board. The key responsibilities of the Committee are to:
| n | Evaluate and review the balance of skills, knowledge, and experience of the Board, taking into account the Company’s risk appetite and strategy; |
| n | Monitor succession plans for the appointment of non-executive directors, the group chief executive and other executive directors to the Board; |
| n | Identify and nominate suitable candidates for appointment to the Board, including chairmanship of the Board and its Committees, against a specification of the role and capabilities required for the appointment; |
| n | Assess the independence of each of the non-executive directors; |
| n | Assess directors’ conflicts of interest as they arise; |
| n | Review the external interests and time commitments of the directors to ensure that each has sufficient time to undertake his/her duties to the Company; and |
| n | Approve a report on the Committee’s activities for inclusion in the Company’s Annual Report and Accounts. |
The full terms of reference for the Committee can be found on the Company’s website at www.aviva.com/terms-of-reference and are also available from the group company secretary.
Committee membership and attendance
As at the date of this Report, the Committee comprises the chairman and all the Company’s independent non-executive directors. Prior to leaving the Group, Andrew Moss was also a member of the Committee. The table below shows the Committee members during the year and their attendance
at Committee meetings:
Membership and attendance
| Committee member | Number of meetings
attended | Percentage attendance1 |
| John McFarlane (Chairman)2 | 6 | 100% |
| Lord Sharman3 | 1 | 50% |
| Glyn Barker4 | 4 | 100% |
| Mary Francis5 | 3 | 75% |
| Richard Karl Goeltz | 6 | 100% |
| Euleen Goh4 | 4 | 100% |
| Michael Hawker4 | 4 | 100% |
| Gay Huey Evans4 | 4 | 100% |
| Andrew Moss6 | 1 | 50% |
| Russell Walls | 6 | 100% |
| Scott Wheway4 | 4 | 100% |
| 1. | This shows the percentage of meetings which the Committee member attended during the year whilst a member of the Committee. A number of Committee members could not attend meetings called at short notice or where they had a conflict of interest. |
| 2. | Attended all meetings, became chairman of the Committee on 1 July 2012. |
| 3. | Lord Sharman retired from the Board and as chairman of the Committee on 30 June 2012. |
| 4. | Appointed to the Committee on 1 July 2012. |
| 5. | Resigned on 3 October 2012. |
| 6. | Resigned on 8 May 2012. The Committee notes that the UK Corporate Governance Code does not preclude the group chief executive from membership of the Committee. |
The Committee met on six occasions in 2012, of which three were scheduled meetings and three were additional meetings called at short notice. The group company secretary acts as the secretary to the Committee. Members of the Committee took no part in any discussions concerning their own circumstances. The chairman of the Committee reported to meetings of the Board on the Committee’s work and the Board receives a copy of the agenda and the minutes of each meeting of the Committee.
Committee activities during 2012
During 2012 the Committee was principally focused on two particular issues: identifying the successor for the group chief executive and the recruitment of new non-executive directors as part of the continual cycle to refresh the Board and maintain an appropriate balance of skills, knowledge and experience. These issues are discussed in detail below. The chart below shows how the Committee allocated its time during 2012.
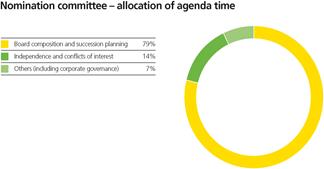
Group chief executive officer search
The Committee led the process for the recruitment of a new group chief executive following the departure of Andrew Moss in May 2012. The Committee approved the search brief and engaged Spencer Stuart to identify suitable candidates. The brief included finding candidates with strong insurance experience, a track record of running large global organisations, and the skills and leadership qualities to unite and motivate the Group’s employees and to embed a high-performance culture.
A shortlist of candidates were interviewed by the chairman, the senior independent director and two non-executive directors. The preferred candidates met with all non-executive directors and the successful candidate met with the Financial Services Authority (FSA). The Remuneration Committee led on the development of an appropriate remuneration package for the role and approved the final package to be offered to the successful candidate. Both the Remuneration and Nomination Committees were mindful of shareholder views when considering the remuneration package for the role. Having considered all the skills, experience and personal attributes of the preferred candidates, the Committee recommended Mark Wilson be appointed to the role and to the Board. The Board appointed Mark Wilson as a director with effect from 1 December 2012 and as Group CEO from 1 January 2013. He has extensive experience in leading major international insurance companies across life insurance, general insurance and asset management. Spencer Stuart does not have any other connection with the Company.
Non-executive director search
As part of the continual cycle to refresh the Board, the Committee led the process to recruit two new non-executive directors to succeed Richard Goeltz and Russell Walls who will both retire from the Board, having completed nine years of service, on 8 May 2013. The Committee engaged The Zygos Partnership to identify suitable candidates. The Committee prepared comprehensive candidate search briefs with an emphasis on finding a candidate who could become the next senior independent director and a candidate with strong life assurance experience. Shortlisted candidates were interviewed by the chairman, the senior independent director and two non-executive directors and, additionally, executive and non-executive directors met with the preferred candidates. Following FSA approval, the Board accepted the Committee’s recommendations and appointed Sir Adrian Montague and Bob Stein as non-executive directors on 14 and 28 January 2013 respectively.
The Committee further recommended to the Board that Sir Adrian Montague be appointed as senior independent director prior to the 2013 AGM to succeed Richard Goeltz. The Committee believes that Sir Adrian has the requisite skills and experience to be an effective senior independent director. The Committee has also recommended that Glyn Barker be appointed as chairman of the Audit Committee to succeed Russell Walls prior to the 2013 AGM. Glyn Barker was formerly vice-president, UK of PwC and has a deep understanding of accounting and regulatory issues together with in-depth transactional and assurance experience. In his role at PwC he did not carry out external audit work for the Company and the Committee is satisfied that his former connection to PwC does not compromise the external auditor’s independence.
The Zygos Partnership has no other connection with the Company.
Diversity
The Committee strongly believes that diversity throughout the Group and at Board and senior management level is a driver of business success. Diversity brings a broader, more rounded perspective to decision making and risk management, making the Board and senior management more effective. During the year, candidate searches were conducted and Board appointments were made, on merit, against the criteria identified by the Committee having regard to the benefits of diversity on the Board, including gender.
However, with the retirement of Euleen Goh and Mary Francis during the year to concentrate on other commitments the Board currently only has one female non-executive director, representing 10% of the Board. In its last report the Committee stated that it intends to maintain a minimum of 25% female representation on the Board by the end of 2013. The Company remains committed to having a diverse Board in terms of gender as well as diversity of experience, skills and knowledge, background and nationality. Recruitment of additional non-executive directors is ongoing and the Committee is taking diversity into account in the selection process. At the date of this Report, 29%(2011: 18%) of Group Executive members and 21%(2011: 20%) of senior executives in the Company were female. It is the Company’s intention to increase this number as it is recognised that a higher number of women in senior management will create a stronger talent pipeline and is better for business.
Other activities
During the year the Committee recommended Committee composition changes to the Board and has been involved in the ongoing process to recruit a new chief executive officer for Aviva Investors and a new group HR director. The Committee also reviewed the independence of each non-executive director, all directors’ conflicts of interest and the balance of skills, knowledge, experience and diversity on the Board prior to recommending directors’ re-election at the AGM. Following consideration of these issues the Committee recommended the election or re-election of each director standing for election or re-election at the 2013 AGM.
Committee performance and effectiveness
The Board undertook an annual review of the Committee’s performance and effectiveness and the results of the review will be incorporated into the Committee’s processes and activities for 2013.
Nomination Committee Report
This Nomination Committee Report was reviewed and approved by the Board on 6 March 2013.
John McFarlane
Chairman, Nomination Committee
Audit Committee report
This Report provides details of the role of the Audit Committee and the work it has undertaken during the year.
Committee role and responsibilities
The purpose of the Committee is to assist the Board in discharging its responsibilities for monitoring the integrity of the Group’s financial statements, assessing the effectiveness of the Group’s system of internal controls and monitoring the effectiveness, independence and objectivity of the internal and external auditors. Whilst the Board as a whole has a duty to act in the best interests of the Company, the Committee has a particular role, acting independently of management, to ensure that the interests of shareholders are properly protected in relation to financial reporting and the effectiveness of the Group’s systems of financial internal controls. The key responsibilities of the Committee are to:
| n | Review the significant issues and judgements of management, and the methodology and assumptions used in relation to the Group’s financial statements and formal announcements on the Group’s financial performance including the reserving position relating to the Group’s life assurance and general insurance operations; |
| n | Review the Group’s going concern assumptions; |
| n | Assess the effectiveness of the Group’s system of internal controls, including financial reporting, financial controls and the Internal Audit function; |
| n | Consider and review the performance of the chief audit officer, and agree with management his effectiveness and his remuneration; |
| n | Consider and make recommendations to the Board on the appointment, reappointment, dismissal or resignation and remuneration of the external auditor; and |
| n | Assess the independence and objectivity of the external auditor and approve and monitor the application of the external auditor business standard. |
In preparation for the new Code requirement that will apply to Aviva during the 2013 reporting period, revised terms of reference for the Committee were adopted in January 2013.
The full terms of reference for the Committee can be found on the Company’s website at www.aviva.com/terms-of-reference and are also available from the group company secretary.
Committee membership and attendance
The Committee comprises independent non-executive directors only. The table below shows the Committee members during the year and their attendance at Committee meetings:
Membership and attendance
| Committee member | Number of meetings attended | Percentage attendance1 |
| Russell Walls (Chairman) | 13 | 100% |
| Glyn Barker2 | 3 | 75% |
| Mary Francis3 | 9 | 90% |
| Richard Karl Goeltz | 12 | 92% |
| Euleen Goh4 | 12 | 92% |
| Michael Hawker | 12 | 92% |
| 1. | This shows the percentage of meetings which the Committee member attended during the year whilst a member .of the Committee. A number of the Committee members were unable to attend meetings called at short notice. |
| 2. | Appointed to the Committee on 8 August 2012. |
| 3. | Resigned from the Board and the Committee on 3 October 2012. |
| 4. | Resigned from the Board and the Committee on 31 December 2012. |
The Committee met on thirteen occasions in 2012, of which two meetings were called at short notice. Two of the meetings were held jointly with the Risk Committee to focus on the business of Aviva France and the Group’s capital and liquidity position, and five of the meetings were held in relation to the Group’s financial results only. Training and information sessions were held during the year on the Group tax and treasury functions and the integrated assurance framework. The group company secretary acts as the secretary to the Committee.
The chairman, Group CEO, chief financial officer, chief audit officer and the external auditor normally attended Committee meetings. Other members of senior management were also invited to attend as appropriate to present reports. The Committee regularly held private sessions to discuss issues to be raised with management in the main meeting, and met separately with senior management, with the chief audit officer without management present and with the external auditor without management present during the year. The Committee chairman held regular meetings with management and the chief audit officer, and with the external audit partner to ensure he was aware of issues that needed to be raised at the Committee. The Committee chairman reported to subsequent Board meetings on the Committee’s work and the Board received copies of the agenda and minutes of each Committee meeting.
In performing its duties, the Committee had access to the services of the chief audit officer, the group company secretary, senior financial management and external professional advisers.
Committee expertise
The Committee members have significant financial experience and expertise.
Russell Walls, a Fellow Chartered Certified Accountant, is former group finance director of BAA plc, Wellcome plc and Coats Viyella plc. Richard Goeltz is a former chief financial officer of American Express Company and NatWest Group plc and a former member of the Accounting Standards Board.
Glyn Barker is a chartered accountant and has held a number of senior positions at PwC where, most recently, he was UK vice chairman. Michael Hawker, a Senior Fellow of the Financial Services Institute of Australasia, is a former chief executive officer and managing director of Insurance Australia Group.
The Board is satisfied that each of the current Committee members has recent and relevant financial experience and also meets US requirements to be an audit committee financial expert.
Glyn Barker will succeed Russell Walls as Committee chairman on 8 May 2013. As former vice-chairman of PwC, Glyn Barker has a recent connection with the Group’s current auditor. However, he did not perform any audit work and had no responsibility for the audit business of PwC. PwC has concluded that Glyn Barker was not in the chain of command for the audit engagement team in the two years prior to his retirement, and has confirmed that he does not have any significant ongoing financial connection with the firm with respect to his pension arrangements. As he retired from PwC before PwC was appointed as the Company’s auditor and as he complies with the rules of the US Securities and Exchange Commission and the Auditing Practices Board’s Ethical Standards on auditor independence the Committee is satisfied that PwC is independent of the Company.
Committee activities during 2012
The work of the Committee followed an agreed annual work plan and principally fell under four main areas: financial statements and accounting policies, internal controls, the oversight of the internal audit function and the oversight of external audit. The Committee’s work in each of these areas is described below. The group company secretary assisted the Committee chairman in planning the Committee’s work, and ensured that the Committee received information and papers in a timely manner. The chart on the next page shows how the Committee allocated its time during 2012.
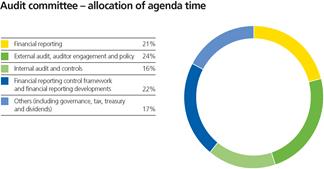
Financial statements and accounting policies
In conjunction with members of management and the internal and external auditors, the Committee reviewed the Group’s financial announcements, including the Annual Report and Accounts and associated documentation, the half year results and the interim management statements, and the going concern statement in relation to the Annual Report and Accounts. The Committee placed particular emphasis on their fair presentation and the reasonableness of the judgement factors and appropriateness of significant accounting policies used in their preparation.
During the year, the Committee considered the treatment of various assets in the Group’s accounts and the accounting assumptions applied to the results, including the reclassification of Delta Lloyd from an associate to an investment following a further disposal of the Group’s holding in Delta Lloyd; the ‘held for sale’ classification of Aviva’s US business; the impairment assumptions for the US business and the Group’s Spanish bancassurance joint ventures; and the impact of unwinding the Irish joint venture arrangements with Allied Irish Bank. A number of new accounting standards were issued by the International Accounting Standards Board at the end of 2011 which become effective in 2013 and the Committee monitored the action taken by management to ensure compliance with the new standards. The Committee also considered the changes to the Code and associated guidance relating to audit committees and the Committee’s Report in the 2013 Annual Report and Accounts will include disclosure of the significant issues it has considered in relation to the Group’s financial statements. During the year the Committee also received reports on the adequacy of the Group’s life assurance and general insurance reserves, reviewed the audit representation letters prior to signature on behalf of the Board to ensure that the information provided to the external auditor was complete and appropriate and monitored management’s responsiveness to the external auditor’s findings and recommendations.
Internal control
During the year the Committee received quarterly updates on the effectiveness of the Group’s financial reporting control framework and discussed rectification of any deficiencies in controls. In that respect, the Committee focused on the work by management to improve the internal control framework in Aviva Investors, where a new controls assurance team had been established, and enhancing controls around end-user computing policies and practices and monitoring US IT change management.
The Committee reported to the Board regarding the effectiveness of the Group’s overall risk management and internal control systems including the risk management system in relation to the financial reporting process. The Committee worked closely with the Risk Committee in its overall review of the Company’s systems of risk management and internal controls. The Committee encouraged continuous improvements in the effectiveness of internal controls where appropriate.
The system of internal controls extends to the Group’s business units, each of which has an audit committee that provides an oversight role for its business. Membership of these business unit audit committees is very largely comprised of non-executive directors. The chief audit officer attended business unit audit committee meetings throughout the year and reported back on their effectiveness to the Committee. During 2012 the members of the Committee attended several business unit audit committee meetings, including those in the US, Italy, Canada and Aviva Investors. Revised terms of reference for business unit audit committees were discussed and implemented within the business units together with a new induction pack for business unit audit and risk committee members.
The Committee’s terms of reference require it to establish and monitor procedures for dealing with complaints from employees in relation to accounting issues. The Committee reviews the procedures annually and received regular updates from the chief audit officer on any significant complaints received. A description of the Company’s systems of internal control is included in the Corporate Governance Report on pages 49 to 54.
Internal audit
Internal Audit reports to the Board (primarily via the Audit and Risk Committees) and to management on the effectiveness of the Company’s system of internal controls and the adequacy of this system to manage business risk and to safeguard the Group’s assets and resources.
Internal audit charter and business standard
The Committee approved a new Internal Audit charter and an Internal Audit business standard in early 2012. The charter sets out the purpose, functions, scope and responsibilities of the Internal Audit function and how it maintains independence from the first and second line management of the Group. The three main functions of Internal Audit are to:
| n | Assess and report on the effectiveness of the design and operation of the framework of controls which enable risk to be assessed and managed; |
| n | Investigate and report on cases of suspected financial crime and employee fraud; and |
| n | Undertake advisory projects for management provided that they do not threaten the function’s actual or perceived independence from management. |
The Internal Audit business standard sets out the business requirements of senior management across the Group in order to support Internal Audit in achieving its objectives and requires businesses to design and operate processes and controls to satisfy the mandatory requirements in the standard based on the size and complexity of the business and the nature of the risks and challenges it faces. The standard also includes controls around local legal and regulatory risks. Any breaches of the standard must be reported to the chief audit officer and others as appropriate.
Annual plan and focus of reviews in 2012
Internal Audit’s 2012 annual plan was reviewed and approved by the Committee. Planned reviews were prioritised following a risk-based assessment of the business and a review against the Group’s risk policies. The reviews carried out covered an extensive sample of controls over all risk types, business units and regulated entities and covered ‘business as usual’ activities and an assessment of change programmes. The Committee received quarterly reports from the chief audit officer on audit reviews carried out, management’s response to the findings and progress in addressing identified issues. During 2012, Internal Audit carried out assurance reviews over inherent risks throughout the Group. Reviews were focused on, but not limited to, areas such as major projects including Solvency II and the Aviva Ireland Transformation Programme; maintenance of controls during the management restructuring programme; IT availability, security and recoverability; financial reporting and disclosure; financial risk, central liquidity and capital management; and the internal control environment at Aviva Investors. The chief audit officer increased management’s focus throughout the year on management’s progress on closing overdue audit issues where further improvement is still required.
The Committee assessed the effectiveness of the Internal Audit function against criteria provided by the Institute of Chartered Accountants in England and Wales and by the Institute of Internal Auditors and concluded that the function was effective. An independent review is carried out every five years and the next independent review is due to be carried out in 2013.
Chief audit officer
The chief audit officer had direct access to the Board chairman, the Committee chairman and the Committee members. The Committee worked with the chief financial officer to determine the chief audit officer’s objectives and evaluate his levels of achievement, and to approve the chief audit officer’s remuneration. His annual performance related bonus was unconnected to the Group’s financial performance. During the year the chief audit officer became a member of the Group Executive and his reporting line changed from the Group CEO to the chief financial officer. The chief audit officer’s membership of the Group Executive assisted the relationship between Internal Audit and management. Notwithstanding his appointment to the Group Executive, his independence was maintained as the Group Executive, acting as a committee, has no decision making authority and assurances were received from management that adequate safeguards had been put in place to maintain the independence, authority and standing of the chief audit officer and the Internal Audit function. Following the senior management restructuring which took place during the year the Internal Audit function aligned itself to the new structure and the Committee remained satisfied that the Internal Audit function had sufficient resources to undertake its duties.
External auditor
PwC was appointed by the Board as the Company’s external auditor on 22 March 2012 for the 2012 reporting period and was re-appointed by shareholders at the 2012 AGM. The Committee led the tender and selection process through which PwC was appointed and has recommended to the Board that PwC be re-appointed by shareholders at the 2013 AGM. There are no contractual obligations that restrict the Committee’s choice of external auditor.
Given the resignation of Ernst & Young LLP as external auditor in early 2012 and that PwC has only just completed its first full year audit, no external auditor effectiveness review was carried out in 2012. A review will be conducted in 2013.
The Company has an external auditor business standard in place which is aimed at safeguarding and supporting the independence and objectivity of the external auditor. The standard is in full compliance with all UK, US and International Federation of Accountants (IFAC) rules and takes into account the Auditing Practices Board Ethical Standards for Auditors.
As discussed above, the Committee believes that Glyn Barker’s connection with PwC does not compromise PwC’s independence.
The standard regulates the appointment of former audit employees to senior finance positions in the Group and sets out the approach to be taken by the Group when using the non-audit services of the principal external auditor. It distinguishes between (i) those services where an independent view is required and those that should be performed by the external auditor (such as statutory and non-statutory audit and assurance work); (ii) prohibited services where the independence of the external auditor could be threatened and must not be used; and (iii) other non-audit services where the external auditor may be used. Non-audit services where the external auditor may be used include: non-recurring internal controls and risk management reviews (excluding outsourcing of internal audit work), advice on financial reporting and regulatory matters, due diligence on acquisitions and disposals, project assurance and advice, tax compliance services, and employee tax services. During the year the Committee received quarterly reports of compliance against the standard.
The Group paid £13.5 million to PwC for audit services in 2012, relating to the statutory audit of the Group and Company financial statements, the audit of Group subsidiaries, and audit-related assurance services(2011: £17.3 million to Ernst & Young LLP).
Prior to 2012, PwC was a significant provider of consulting services to the Group. The level of fees for non-audit services in 2012 below includes fees billed in the year relating to projects that commenced prior to PwC’s appointment as external auditor. All of these services are in compliance with applicable UK, US and International Federation of Accountants independence rules. We do not expect PwC’s non-audit fees to continue at this level in the future.
The fees for other services, which included MCEV supplementary reporting, assurance on the Group’s 2012 Corporate Responsibility Report, advice on accounting, risk and regulatory matters, reporting on internal controls, reporting on the Group’s Individual Capital Assessment and Economic Capital, work in relation to preparing the business for Solvency II implementation, and work on capital transactions, were £18.3 million to PwC(2011: £11.2 million to Ernst & Young LLP), giving a total fee to PwC of £31.8 million(2011: £28.5 million to Ernst & Young LLP). In addition the Group paid £1 million to Ernst & Young LLP in 2012 in relation to the 2011 audit.
The 2012 fees for other non-audit services for continuing operations of £7.7 million includes advice to our European businesses in relation to the risk management aspects of Solvency II (£1.9 million), £1.9 million relating to four regulatory advice engagements, £0.7 million relating to restructuring at Aviva Investors, £0.3 million for risk training, £0.3 million supporting an industry-wide competition review, £0.3 million for an additional claims reserves review and £2.3 million for other services. The 2012 fees for tax compliance services of £0.4 million includes fees for one engagement in Higher Growth markets of £0.3 million, and fees for corporate finance transactions of £0.3 million relates to an engagement for an Aviva Investors property fund. In line with the external auditor business standard, the Committee satisfied itself that for these engagements, robust controls (including appropriate levels of review) were in place to ensure that PwC’s objectivity and independence was safeguarded, and concluded that it was in the interests of the Company to purchase these services from PwC due to their specific expertise. Further details are provided in note 9.
Committee performance and effectiveness
The Committee undertook an annual review of its performance and effectiveness which concluded that overall the Committee was effective in carrying out its duties. The Committee agreed that its priorities for 2013 should include continuing to monitor Group liquidity jointly with the Risk Committee, ensuring that appropriate controls remain in place during the continued restructuring of the Group, closely monitoring reserving and actuarial assumptions changes, and considering compliance with the relevant new requirements of the UK Corporate Governance Code.
Audit Committee Report
This Audit Committee Report was reviewed and approved by the Board on 6 March 2013.
Russell Walls
Chairman, Audit Committee
Risk Committee report
This Report provides details of the role of the Risk Committee and the work it has undertaken during the year.
Committee role and responsibilities
The purpose of the Committee is to assist the Board in its oversight of risk within the Group through reviewing the Group’s risk appetite and risk profile, the effectiveness of the Group’s risk management framework and the methodology and assumptions used in determining the Group’s capital requirements. The Committee also works with the Remuneration Committee to ensure that risk is properly considered in setting the Group’s remuneration policy.The Committee oversees all aspects of risk management in the Group, including market, credit, liquidity, insurance and operational risk (including franchise risk), and their impact on both financial and non-financial goals.
The key responsibilities of the Committee are to:
| n | Review the Group’s risk appetite and future risk strategy, particularly in relation to economic (i.e. risk-based) capital, liquidity, reputation and operational risk, and make recommendations on risk appetite to the Board; |
| n | Review the Group’s risk profile against its risk appetite and strategy and review the drivers of changes, if any, in the Group’s risk profile; |
| n | Review the design, completeness and effectiveness of the risk management framework relative to the Group’s activities; |
| n | Assess the adequacy and quality of the risk management function and the effectiveness of risk reporting within the Group; |
| n | Review the methodology and assumptions used in the Group’s models for determining its economic and regulatory capital requirements; and |
| n | Work with the Remuneration Committee, to ensure that risk is considered in setting the overall remuneration policy for the Group. |
Revised Committee terms of reference were adopted in January 2013 following an annual refresh. The full terms of reference for the Committee can be found on the Company’s website at www.aviva.com/terms-of-reference, and are also available from the group company secretary.
Committee membership and attendance
The Committee comprises independent non-executive directors only. The table below shows the Committee members during the year and their attendance at Committee meetings.
Membership and attendance
| Committee member | Number of meetings attended | Percentage attendance1 |
| Michael Hawker (Chairman) | 11 | 100% |
| Glyn Barker2 | 7 | 88% |
| Mary Francis3 | 8 | 100% |
| Leslie Van de Walle4 | 3 | 100% |
| Russell Walls | 11 | 100% |
| 1. | This shows the percentage of meetings which the Committee member attended during the year whilst a member of the Committee. |
| 2. | Glyn Barker joined the Committee on 2 May 2012. He was unable to attend the Committee meeting held on 4 December 2012 due to prior commitments and this meeting being called at short notice. |
| 3. | Mary Francis resigned from the Committee on 3 October 2012. |
| 4. | Leslie Van de Walle resigned from the Committee on 2 May 2012. |
The Committee met on eleven occasions in 2012, of which nine were scheduled Committee meetings and two were additional Committee meetings called at short notice. Two of the meetings were held jointly with the Audit Committee to consider the business of Aviva France and the Group’s capital and liquidity position.The Committee followed a programme of attending meetings of business unit risk committees and, during the year, members of the Committee attended meetings in the US and Canada. The group company secretary acted as the secretary to the Committee.
In November, the Committee chairman hosted a two-day conference for the chairmen of the boards and risk committees of the Group’s principal subsidiaries. The agenda included discussions on Solvency II; revisions to the timing of implementation of Solvency II and the impact on the Group’s capital regime; the FSA’s perspective of the roles and responsibilities of the Board, the Committee and the business unit boards and risk committees under Solvency II; calculation of economic capital and the internal model; and an in-depth analysis of the Group’s key risk types.
The chairman of the Company, Group CEO, chief risk and capital officer, chief financial officer and the chief audit officer normally attended all Committee meetings. Other members of senior management were also invited to attend as appropriate to present reports. It was the Committee’s practice to hold private sessions at the beginning of each meeting to discuss issues to be raised with management in the main meeting, and to meet with the Group CEO, chief finance officer and chief risk and capital officer without any other members of management being present.
The Committee chairman reported to the subsequent meeting of the Board on the Committee’s work and the Board received a copy of the agenda and the minutes of each Committee meeting. Throughout the year, the Committee chairman sat on the Audit and Remuneration Committees to ensure that risk considerations were fully reflected in the decisions of those Committees.
In performing its duties, the Committee had access to the services of the chief risk and capital officer, chief audit officer, the group company secretary and external professional advisers.
External environment
The external environment was once again one of much international economic uncertainty. Doubts about the strength and economic recovery rates in the OECD, political uncertainty in the world’s two largest economies with leadership changes in China and presidential elections in the United States, and the increased regulatory and capital burden on the financial services industry, dampened the risk appetite of investors.
This resulted in the continued reduction in OECD interest rates, further quantitative easing from the US, Japanese, UK and European Governments, high levels of OECD unemployment, and times of excessive volatility in credit spreads.
Towards the end of the year, the emergence of early growth in the US, greater clarity surrounding the political changes in the US and China, and a continuation of low interest rates saw a rally in the equity markets and a tightening of credit spreads and lower volatility.
The question one asks, is whether these perceived improvements in the world’s economic environment are sustainable or short lived?
Committee activities during 2012
The work of the Committee followed an agreed annual work plan, which evolved throughout the year in response to the changing macro-economic and regulatory environment and changes in the Company’s strategy. The group company secretary and the group chief capital and risk officer assisted the Committee chairman in planning the Committee’s work, and ensured that the Committee received information and papers in a timely manner.
The chart below shows how the Committee allocated its time during 2012.
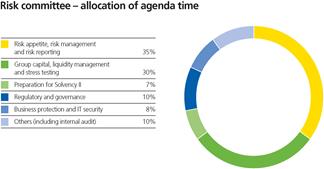
During the year the Committee focused on the following areas:
Risk appetite monitoring
Against a backdrop of significant market volatility during the year, the Committee received regular detailed reports on key risk exposures, emerging and potential risks, and the drivers of risk throughout the Group. It assessed and challenged the appropriateness of the Group’s overall risk appetite and approved revised economic capital risk appetites by risk type. The Committee monitored the Group’s exposure against these appetites, particularly in relation to European sovereign debt holdings and counterparty and credit exposure and, throughout the year, discussed and agreed the actions to be taken to reduce exposure and to address or mitigate risks that had become out of appetite. It also agreed a comprehensive, revised capital management framework by which capital issues would be escalated to the Committee and the Board. Mindful of the potential economic, social and regulatory impact of a Eurozone default, the Committee monitored significant market and Group level contingency planning to produce tailored ‘financial event response plans’.
Capital and liquidity management
Throughout the year, the Committee closely monitored the Group’s economic capital and liquidity positions against risk appetite and targets, and considered in detail the results of stress and scenario testing at Group and local market level. Given the volatility in market conditions during the year, the Committee challenged the appropriateness of the Group’s regulatory and economic capital surplus and liquidity targets and, after detailed consideration, recommended to the Board revised, strengthened targets. The Committee gave particular focus to considering and approving a programme of strategic, economic and operational actions to be undertaken to strengthen and provide greater resilience to the Group’s capital and liquidity positions, and monitored the results and effectiveness of the programme.
Methodology and assumptions
In early 2012, the Committee considered and approved the methodology and assumptions used to calculate the economic capital for the 2012 Individual Capital Adequacy (ICA) submission.
Preparing for Solvency II
The Committee closely monitored the evolving position in relation to the implementation of the Solvency II Directive. Notwithstanding the eventual agreement in October 2012 to delay implementation until 2014, the Committee continued to have oversight of all aspects of the Group’s programme to implement the Solvency II Directive. Throughout the year, the Committee received detailed progress reports on the development of the models used to calculate economic capital requirements and the techniques used to validate the results. The Committee also reviewed the detailed contingency plans in relation to the Group’s internal model and had oversight of the programme of board training and preparations for legal entity sign-off to the Group’s Internal Model Approval Process (IMAP) submission. Following confirmation of the delay to implementation of the Solvency II Directive, the Committee reviewed the revised management programme to deliver enhancements to the economic capital model in the interim period.
Risk management and governance
The Committee had an ongoing programme of receiving reports from local risk committee chairmen or chief executive officers on the risk environment and issues arising in the Group’s businesses and in respect of particular product lines. During the year, the Committee received reports on the businesses in Italy, Spain, France, the UK and the European region as a whole, and in respect of the Corporate and Speciality Risks business in the UK and business lines in France. The Committee also received updates on issues concerning IT and data security and on the Group’s reinsurance programme. The Committee received regular reports from the chief risk and capital officer and monitored the effectiveness of the Company’s Risk Management Framework which is described in more detail in the Corporate Governance Report on pages 49 to 54 and in note 53.
Throughout the year, the Committee had significant oversight of the development of a comprehensive Group-wide restructuring programme, designed to better align legal and management structures throughout the organisation and to optimise governance practices at Group and subsidiary level. In addition, as part of the annual refresh of the suite of risk policies and business standards which underpin the RMF, the Committee reviewed and approved the updated policies and approved a sign-off process in respect of the business standards.
At the end of the year, the Committee commenced an analysis of the Group’s asset and investment portfolio and the framework by which business units set their investment strategies. Further analysis will continue in 2013.
Regulatory oversight
The Committee maintained oversight of the regulatory risks throughout the organisation and discussed the specific management actions identified to address or mitigate issues which arose during the year. The Committee also considered the impact of the changes in the UK and European regulatory landscape, particularly in light of the shift in UK regulatory focus ahead of the split of the FSA into the Prudential Regulation Authority and the Financial Conduct Authority in 2013, and of increasing policyholder protectionism by European regulators.
Fraud and financial crime
The Committee reviewed compliance with controls against financial malpractice including fraud, and of the arrangements for employees to report in confidence any concerns about lack of probity (whistleblowing). It received updates on, and approved enhancements to, the financial crime prevention programme, which was designed to further embed and ensure enforcement of the Group’s anti-bribery and corruption policies and to provide on-going training for the Group’s businesses and employees.
Personnel and remuneration policy
During the year, the Committee approved the appointment of the group chief risk and capital officer. In early 2013 it approved his objectives for the coming year and reviewed his performance against 2012 objectives. The Committee also assessed senior management’s performance against the agreed common risk objective and considered the appropriateness of the risk metrics when setting senior management remuneration policy.
Internal controls
Working with the Audit Committee, the Committee monitored the adequacy of the RMF. Throughout the year, the Group’s Internal Audit function continued to provide the Committee with independent and objective reports on the appropriateness, effectiveness and sustainability of the Company’s system of internal controls. Key control issues reported by Internal Audit to management and to the Committee members were monitored on a quarterly basis until the related risk exposures had been properly mitigated.
More detail on the management of risk is contained in note 53.
Committee performance and effectiveness
The Committee undertook an annual review of its performance and effectiveness which concluded that overall the Committee was effective in carrying out its duties. In addition to undertaking its agreed annual programme of activities, the Committee agreed that its priorities for 2013 should be to continue to focus on capital and liquidity issues; to monitor the Group’s preparedness for Solvency II; to review the quality and mix of the Group’s asset portfolio; to monitor the Group’s customer agenda and to oversee management actions to improve IT resilience.
Risk Committee Report
This Risk Committee Report was reviewed and approved by the Board on 6 March 2013.
Michael Hawker
Chairman, Risk Committee
Corporate Responsibility Committee report
This Report provides details of the role of the Corporate Responsibility Committee and the work it has undertaken during the year.
Committee role and responsibilities
The purpose of the Committee is to set guidance and direction and to oversee the policies and progress of the Group’s corporate responsibility (CR) activities. The key responsibilities of the Committee are to:
| n | Assist the Board in the development of the Group’s strategy on CR related issues and monitor external developments. |
| n | Review the Group’s CR, environment and climate change business standard to ensure it continues to meet the Group’s CR strategy and objectives; |
| n | Review and monitor the Group’s CR risks and, working with the Risk Committee, ensure that the Group’s CR risks are properly considered; |
| n | Review and approve the CR Report in the Company’s Annual Report and Accounts and provide for an appropriate form of assurance; and |
| n | Review the overall CR content contained within the Group’s financial reports. |
Revised terms of reference were adopted in January 2013. The responsibility of the Committee was expanded to include providing oversight for the Board in respect of the Group’s conduct with customers and reviewing the overall corporate governance of the Group and business standards as they relate to the culture, values and reputational risks of the Group. The full terms of reference for the Committee can be found on the Company’s website atwww.aviva.com/terms-of-reference and are also available from the group company secretary.
Committee membership and attendance
The Committee comprises independent non-executive directors only. The table below shows the Committee members during the year and their attendance at Committee meetings.
Membership and attendance
| Committee member | Number of meetings attended | Percentage attendance1 |
| Gay Huey Evans (Chairman) | 4 | 100% |
| Euleen Goh2 | 4 | 100% |
| Andrew Moss3 | 2 | 100% |
| Lord Sharman4 | 2 | 100% |
| Scott Wheway | 4 | 100% |
| 1. | This shows the percentage of meetings which the Committee member attended during the year whilst a member of the Committee. |
| 2. | Euleen Goh resigned from the Committee in December 2012. |
| 3. | Andrew Moss resigned from the Committee in May 2012. |
| 4. | Lord Sharman retired from the Committee in June 2012. |
The Committee met on four occasions in 2012. The group company secretary or her nominee acts as the secretary to the Committee. The executive chairman attended all meetings of the Committee and the group CR director, the group HR director, the chief marketing and communications officer and other members of senior management also attended meetings by invitation. The chairman of the Committee reported to the subsequent meeting of the Board on the Committee’s work and the Board received a copy of the agenda and the minutes of each meeting of the Committee.
Committee activities during 2012
The following chart shows how the Committee allocated its time during 2012, with key activities set out in more detail below:
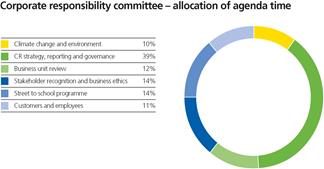
CR Strategy Performance and Risk Management
During the year the Committee reviewed and approved the Group CR strategy and functional plan for 2012-2014 and monitored progress made by the Group’s businesses against each of the CR key performance indicators. Updates were given on CR programme activities such as the Street to School programme; business ethics; health, safety and wellbeing; and stakeholder recognition. The Committee also focused on ensuring a strengthening of CR performance across the Group through enhanced employee engagement, influencing key stakeholders and by further encouraging diversity and inclusion throughout the Group. The Committee continued to monitor risks relating to the Group’s CR activities together with associated risk mitigation initiatives.
Assurance
In respect of the 2011 reporting year, independent assurance on the Group’s CR and related activities and reporting was provided to the Committee by Ernst & Young LLP. For the 2012 reporting year, PwC was appointed to provide independent assurance. Members of the Committee were interviewed as part of the external assurance process and the subsequent report; and management’s action plan; were reviewed by the Committee to assist in strengthening and setting the future direction of the CR programme. Internal Audit reported to the Committee on any relevant matters from its reviews and will provide support for the Committee going forward.
Corporate Responsibility Report
During the year, the Committee approved the scope and content of the Company’s 2012 CR Report, which provides a summary of the Group’s CR performance in 2012. The Report can be found at www.aviva.com/reports. The Report will be put to an advisory vote of shareholders at the 2013 AGM and further details of the relevant resolution are set out in the Notice of AGM.
Committee performance and effectiveness
The Committee undertook an annual review of its performance and effectiveness which concluded that overall the Committee was effective in carrying out its duties. Committee members identified areas for greater focus in 2013 and the Committee’s remit will be extended to provide an increased focus on corporate governance, oversight of the brand, values and reputation of the Group and the Group’s conduct with customers.
Corporate Responsibility Committee Report
This Corporate Responsibility Committee Report was reviewed and approved by the Board on 6 March 2013.
Gay Huey Evans
Chairman, Corporate Responsibility Committee
Directors’ remuneration report

Scott Wheway
Chairman, Remuneration Committee
Dear shareholder
On behalf of the Board, I am pleased to present the Directors’ Remuneration Report for the year ended 31 December 2012.
Our on-going commitment to shareholders
Whilst we have traditionally had good shareholder support for our remuneration policies over many years, we believe in 2011 we clearly got it wrong. As a result, the Committee has worked over the last year to make changes that will give us a better framework for the decisions we take. Specifically, we agreed the following:
| n | We introduced ‘underpin’ metrics to 2012 bonuses to ensure that bonus payouts were more closely aligned to shareholder experience. We will consider these metrics annually until alternative arrangements are agreed; |
| n | We will make any future buyouts on the hire of senior executives on a strict ‘like for like’ basis; and |
| n | We will continue a regular dialogue with shareholders and take account of their feedback. |
We have met our major institutional shareholders and the main proxy agencies on many occasions over the last year. We have consulted them on these changes and will continue the open and honest discussions we have established.
Putting the changes into practice
These changes have impacted our operational practices and our decisions in the 2013 reward round. Key agreed outcomes have been:
| n | Base pay – the Committee has frozen executive directors’ base pay for 2013; |
| n | Annual bonus – the Committee has not awarded bonuses to executive directors for 2012. Our annual bonus plan is based on key financial, employee and customer performance indicators. Solely taking into account performance against these measures at Group level (assuming ‘on-plan’ personal performance), the bonus outcome for 2012 would have been 52% of maximum. However, we have taken account of the underpin metrics to ensure bonus outcomes that are better aligned with the creation of shareholder value. Following careful consideration of those metrics the Committee decided that executive directors would not receive a bonus for 2012; |
| n | Chairman fees – John McFarlane indicated he did not wish any increase in the fees paid to him when he undertook his executive role in the period from May 2012 to 31 December 2012; and |
| n | ACAP/ACDT – the Aviva Capital Accumulation Plan (ACAP) and the Aviva Cash Deferral Trust (ACDT) will close from 31 March 2014. Payments in lieu of pension have been standardised at senior management levels and a small number of individual arrangements above the standard level have been closed from 31 March 2013. |
Linking pay to the Group’s strategic plan
We believe our remuneration policy and practice is now more closely linked to the main strategic priorities of the Group:
| n | Improve financial performance – remuneration is heavily weighted towards pay that is dependent on the outcomes against the key performance indicators of our business, notably profit and Return on Equity (ROE); |
| n | Build capital and financial strength – variable pay is strongly aligned to the measurement of the financial strength of our business. Furthermore, economic capital performance is carefully considered before bonus payments are made to ensure that the Group’s financial strength continues to improve; and |
| n | Focus on core businesses – through the measurement of a number of key financial, operational and longer term return measures, overall remuneration is closely aligned to the achievement of the Group’s strategic objectives. |
Appointment of Group chief executive officer
The Board was delighted to announce, on 20 November 2012, the appointment of Mark Wilson as Group CEO. He joined the Board on 1 December 2012 and took up the role of Group CEO from 1 January 2013. Details of his remuneration arrangements were announced at the time of his appointment.
We are committed to maintaining an open, transparent dialogue with shareholders. I hope you will find this Report clear and informative.
Scott Wheway
Chairman, Remuneration Committee
This Report sets out the details of the remuneration policy and practices for the Company’s directors, describes its implementation and discloses the amounts paid in respect of 2012. It also provides details of the role of the Remuneration Committee and the work it has undertaken during the year. In addition to meeting statutory requirements, particularly the regulations on directors’ remuneration reports pursuant to the Companies Act 2006 and Schedule 8 of the Large and Medium-sized Companies and Group (Accounts and Reports) Regulations 2008, the Committee has complied with best practice guidelines in producing this Report, including guidance issued by the Association of British Insurers and the National Association of Pension Funds.
In this Report, the sections headed ‘Share awards’, ‘Share options’, ‘Directors’ remuneration in 2012’ and ‘EDs’ pension arrangements’ along with their associated footnotes have been audited in accordance with the Companies Act 2006.
Committee role and responsibilities
The Remuneration Committee is responsible for reviewing and making recommendations to the Board regarding the remuneration policy of the Group and for reviewing compliance with the policy. The Committee is further responsible for monitoring the level and structure of remuneration for the senior management of the Group.
The key responsibilities of the Committee are to:
| n | Make recommendations to the Board regarding the Group’s remuneration policy in respect of the Board chairman, executive directors (EDs), members of the Group Executive and members of senior management; |
| n | Work with the Risk Committee to ensure that risk and risk appetite are properly considered in setting the remuneration policy for the Group; |
| n | Review and determine the remuneration of the chairman of the Board and the terms of employment and remuneration of individual EDs and Group Executive members, including any specific recruitment or severance terms; |
| n | Review and recommend to management the level and structure of senior management remuneration; |
| n | Approve the Aviva Investors' reward strategy, including any changes to the strategy and agree the total bonus pool, receive remuneration details of Aviva Investors' ’material’ employees, and approve any new share and incentive plans or any changes to existing share and incentive plans; |
| n | Recommend to the Board the establishment of any employee share plans, exercise all the Board’s powers in relation to the operation of all share and incentive plans and the Group’s all employee share ownership plan; and |
| n | Select, appoint and determine terms of reference for independent remuneration consultants to advise the Committee on remuneration policy and levels of remuneration. |
Revised Committee terms of reference were adopted in January 2013 following an annual refresh. The responsibilities of the Committee were clarified to include:
| n | Having regard to remuneration trends across the Group when setting remuneration policy for directors; |
| n | Ensuring that remuneration arrangements for all employees are commensurate with promoting ethical behaviour; |
| n | Ensuring the effectiveness of the process for assessing the senior management group for talent and succession planning purposes, ensuring appropriate reward for performance and a consistent approach to the development of talent throughout the Group; |
| n | Extending the list of employees whose remuneration is reviewed by the Committee to include a wider senior management group, those in controlled functions and identified staff; |
| n | Approving any exceptional remuneration activity that is outside the agreed reward policy; |
| n | Annually approving the list of FSA Code Staff and any severance packages for Code Staff; and |
| n | Approving the Group remuneration business standard. |
The full terms of reference for the Committee can be found on the Company’s website at www.aviva.com/terms-of-reference and are also available from the group company secretary.
Committee membership and attendance
The Committee comprises independent non-executive directors only. Table 1 below shows the Committee members during the year and their attendance at Committee meetings.
Table 1: Committee membership and attendance
| Committee member | | Number of
meetings attended | | | Percentage attendance1 | |
| Scott Wheway (Chairman) | | | 12 | | | | 100% | |
| Michael Hawker2 | | | 10 | | | | 83% | |
| Gay Huey Evans3 | | | 8 | | | | 100% | |
| Leslie Van de Walle4 | | | 4 | | | | 100% | |
Notes
| 1. | This shows the percentage of meetings which the Committee member attended during the year whilst a member of the Committee. |
| 2. | Michael Hawker was unable to attend two meetings held in April 2012 due to prior commitments and the meetings being called at short notice. |
| 3. | Gay Huey Evans attended all of the meetings held following her appointment to the Committee on 2 May 2012. |
| 4. | Leslie Van de Walle resigned from the Committee on 2 May 2012. |
The Committee met twelve times during 2012 of which eight were scheduled Committee meetings and four were additional Committee meetings called at short notice to deal with specific issues as they arose during 2012.
Lord Sharman and subsequently John McFarlane normally attended all meetings of the Committee. Gay Huey Evans attended two meetings by invitation prior to being appointed to the Committee. The group company secretary acted as secretary to the Committee.
The chairman of the Committee reported to meetings of the Board on the Committee’s work and the Board received a copy of the agenda and the minutes of each meeting of the Committee.
The persons listed in table 2 materially assisted the Committee in considering executive remuneration and attended meetings by invitation during the year.
Table 2: Attendees of the Committee during 2012
| Attendee | Position | Comments |
| Lord Sharman | Chairman of the Company | Attended by invitation |
| John McFarlane | Chairman designate and then executive chairman | Attended by invitation |
| Andrew Moss | Group chief executive | Attended by invitation |
| Kirstine Cooper | Group general counsel and company secretary | Attended as secretary to the Committee |
| John Ainley | Group HR director | Attended as an executive responsible for advising on remuneration |
| Carole Jones | Acting group HR director | Attended as an executive responsible for advising on remuneration policy |
| David Hope | HR director, centres of expertise | Attended as an executive responsible for advising on remuneration policy |
| Tracey O’Rourke | Group reward and HR policy director | Attended as an executive responsible for advising on remuneration policy |
| Andrew Pooley | Executive reward director | Attended as an executive responsible for advising on remuneration policy |
| David Rogers | Chief accounting officer | Attended to advise on matters relating to the performance measures and targets for the Group’s share incentive plans |
| Jason Windsor | Chief strategy and planning officer | Attended to advise on matters relating to the performance measures and targets for the Group’s share incentive plans |
| Amanda Mackenzie | Chief marketing and communications officer | Attended to advise on matters relating to customer target setting |
No person was present during any discussion relating to their own remuneration.
In addition to the attendees listed in the table above, Mark Wilson (Group CEO), Russell Walls (non-executive director), Glyn Barker (non-executive director), Patrick Regan (chief financial officer), Paul Boyle (chief audit officer), Rupert McNeill (HR director, centres of expertise) and Bob Orme (director of reward and performance) attended Committee meetings during the year, none of whom were present at meetings when their own remuneration was being discussed.
FIT Remuneration Consultants (FIT) acted as independent advisors to the Committee until May 2012 (having been appointed as advisor to the Committee in August 2011). FIT is a member of the Remuneration Consultants Group and adheres to its Code of Conduct. It provided no other services to the Company during the year.
During the year, the Committee received advice on executive remuneration matters from Deloitte LLP which is a member of the Remuneration Consultants Group and adheres to its Code of Conduct. Deloitte LLP was appointed as advisor to the Committee on 4 December 2012. In addition during the year, management received advice on remuneration matters and taxation from Deloitte LLP and on remuneration matters from Linklaters LLP.
Committee activities during 2012
The Committee takes its responsibility to shareholders very seriously and following the 2012 annual general meeting (AGM) undertook an enhanced engagement programme with major institutional shareholders. The Committee considered the following matters during the year:
Routine remuneration matters:
Consideration of remuneration matters within the Committee’s terms of reference, specifically including:
| n | Consideration and recommendation to the Board of the Group’s policy and practices concerning base salaries and benefits-in-kind for EDs and senior management; |
| n | Consideration and approval of the level of bonus awards in respect of the 2011 financial year and approval of the associated grant of share awards under the Annual Bonus Plan (ABP) for EDs and senior management; |
| n | Performance testing of subsisting Long Term Incentive Plan (LTIP) grants which vested in the 2012 financial year; and subsisting One Aviva Twice the Value (OATTV) Plan grants which did not vest and which expired; |
| n | Setting targets for the bonus awards for the 2012 financial year and approving the associated grant of awards under the ABP; |
| n | Approval of 2012 LTIP grants to the EDs and senior management and the associated performance conditions for these grants; |
| n | Reviewing the likely outcomes against the ABP 2012 targets and agreeing underpin measures; |
| n | Approval of the grant of share awards under the Aviva Investors LTIP for the 2012 financial year; |
| n | Approval of the award of Free Shares to UK employees in respect of 2011 under the Aviva All Employee Share Ownership Plan (AESOP); awards to Irish employees under the Aviva Group Employee Share Ownership Scheme; and the invitation to UK employees to participate in the Aviva Savings Related Share Option Scheme and to Irish employees to participate in the Aviva Ireland Save As You Earn Scheme; |
| n | Initial consideration of targets for bonus awards for the 2013 financial year and of 2013 LTIP targets; |
| n | Review of the shareholding requirements of EDs and Group Executive members; |
| n | Review of share plan dilution limits; |
| n | Review of the standard employment terms within employment contracts of EDs and senior management; and |
| n | Review of senior management remuneration at Aviva Investors and of FSA Code Staff. |
Non-routine remuneration matters:
| n | Approval of the departure terms of EDs and members of the Group Executive who left the Group during 2012; |
| n | Consideration and approval of the remuneration arrangements for new members of the Group Executive following the restructuring of the Group and for other senior managers; and |
| n | Review and, as appropriate, approval of any exceptional remuneration proposals for senior managers outside the agreed Group remuneration policy. |
Remuneration policy:
| n | Approval of amendments to the rules of discretionary share plans regarding the reduction in categories of automatic ’good leavers’ and the early vesting of awards; |
| n | Review of the policy for buying out unvested awards when recruiting EDs and senior managers; |
| n | Review of pension arrangements for senior management, including the approval of recommendations in relation to contributions into the ACAP; and |
| n | Approval of the cessation of the free share element of the AESOP and the introduction of a matching shares element in 2013. |
Governance:
| n | Approval of the 2011 Directors’ Remuneration Report; |
| n | Consideration of the structure of the 2012 Directors’ Remuneration Report; |
| n | Review of the Committee’s 2012 and 2013 work plan; |
| n | Annual approval of the Remuneration business standard; |
| n | Review and consideration of regulatory developments, including the consultation by the Department for Business, Innovation and Skills on revised remuneration reporting regulations; and |
| n | Consideration of, and agreement on, the appropriate overview of Aviva Investors’ remuneration matters. |
Shareholder feedback:
| n | Consultation with major institutional shareholders in respect of their concerns regarding elements of the 2011 Directors’ Remuneration Report. |
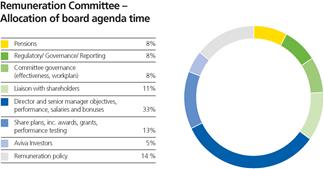
Governance
FSA’s Remuneration Code: Aviva Investors
The FSA’s Remuneration Code applies to Aviva Investors and two small ‘firms’ (as defined by the FSA) within the UK & Ireland Life business. These businesses are subject to the requirement of the FSA’s Remuneration Code. Remuneration disclosures for Aviva Investors can be found at www.avivainvestors.com/about_us/our_approach_to_remuneration/index.htm and for the UK & Ireland Life firms at www.aviva.com/media/news/item/fsa-remuneration-code-disclosure-15575/.
Aviva’s reward principles and arrangements are designed accurately and appropriately to incentivise and reward employees for achieving stated business goals in a manner that is consistent with the Company’s approach to sound and effective risk management.
Committee performance and effectiveness
The Committee undertook an annual review of its performance and effectiveness which concluded that overall the Committee was effective in carrying out its duties. In addition to undertaking an annual programme of activities in 2013, the Committee identified a number of areas for increased focus in 2013.
Remuneration policy in practice
Table 3 below sets out the purpose of key elements of our remuneration structure, how they relate to the Company’s strategy and how they will operate, highlighting any changes from 2012.
Table 3: Remuneration policy for EDs
| Element | Purpose and link to strategy | Operation for 2013 | Changes and associated rationale |
| Base salary | To provide a core reward for undertaking the role, at a level needed to recruit and retain individuals. | Annual review, with changes taking effect from 1 April each year. This review is informed by: nRelevant pay data including market practice among the 25 FTSE listed companies either side of Aviva in terms of market capitalisation. nLevels of increase for the broader UK employee population. nIndividual and business performance. | Taking into account both the Company’s performance and the prevailing economic climate, no increases are being made to EDs’ base salaries for 2013. |
| Benefits | To provide employees with market competitive benefits at a level needed to recruit and retain individuals. | Benefits are provided on a market competitive basis and include a cash car allowance, Private Medical Insurance (PMI) and life insurance. | No changes proposed. |
| Pension | To provide a market competitive level of provision for post-retirement income. | All EDs are eligible to participate in a defined contribution plan up to the annual limit. Any amounts above the annual or lifetime limits are paid in cash. | Payments will no longer be made into the ACAP or the ACDT after 31 March 2014. These were discretionary savings vehicles into which payments in lieu of pension were made and held for at least five years. |
| ABP | To incentivise executives to achieve the annual business plan. Deferral provides alignment with shareholders and aids retention of key personnel. | Maximum opportunity of 150% of base salary with 75% of base salary payable for plan performance. Performance is assessed against a range of key financial, employee and customer performance indicators and personal objectives. Two-thirds of any bonus awarded is deferred into shares which vest after three years. Additional shares are awarded at vesting in lieu of dividends paid on the deferred shares. Unvested awards are subject to clawback in the event of misconduct or materially adverse misstatement of accounts. | Bonus payments will take account of achievements in relation to Economic Value Added, Economic Capital, and absolute and relative Total Shareholder Return (TSR) to ensure payouts are closely aligned with the shareholder experience. |
| LTIP | To motivate executives to achieve the Company’s longer-term objectives, to align executive interests with those of shareholders and to aid the retention of key personnel. | The plan rules allow for awards to be made up to a maximum of 350% of base salary (and up to 450% of base salary for US employees in exceptional circumstances). In 2013, an award of 300% of base salary will be made to the Group CEO and 225% of base salary to Patrick Regan. No grant will be made to Trevor Matthews who will cease to be an ED prior to the 2013 AGM. Awards will vest subject to the achievement of the following performance targets over a three year performance period: n50% of awards vest based on absolute ROE1,3 performance; and n50% based on relative TSR2 against a comparator group. nAdditional shares are awarded at vesting in lieu of dividends on any shares which vest. Unvested awards are subject to clawback in the event of misconduct or materially adverse misstatement of accounts. | The definition of ROE has been refined. The TSR comparator group was reviewed and refocused on the insurance sector. Further details on both of these changes are set out on pages 71 and 72. |
| Shareholding requirements | To strengthen alignment between executives and shareholders. | Shareholding of 150% of base salary for EDs, and 200% for the Group CEO. EDs are required to retain 50% of the net shares released from executive share plans until the requirements are met. | No change. |
| Recruitment awards | To secure the required talent in order for Aviva to deliver its strategic plans whilst ensuring any recruitment award represents good value for shareholders. | Any buyout awards will not be more generous than the awards being forfeited and will be made on an equivalent basis, including phased delivery and the application of performance conditions where appropriate. | A revised buyout policy was approved by the Remuneration Committee in 2012. |
Notes:
| 1. | ROE is used as an absolute measure of performance, and is commonly used amongst our peers. Targets are set annually within the context of the Company’s three-year business plan. Vesting depends upon performance over the three-year period against a target return. |
| 2. | Relative TSR is a commonly used method of determining performance against a set of suitable peers, providing a view of relative performance against those peers. TSR is calculated by measuring total capital gains (or losses) accruing in the period if shares are held continuously and dividends paid are immediately reinvested in new shares. The impact of short-term increases (or decreases) in share price on TSRs is reduced by averaging share price across the three months prior to the start and end of the performance period. |
| 3. | ROE performance is the same metric described as ROCE performance in the 2011 Directors’ Remuneration Report. This is a change in nomenclature only; the definition of the metric has not changed from 2011 to 2012. The definition of ROE in respect of the 2013 has been refined and is described on page 72. |
Consideration of wider employee pay
When setting the policy for EDs’ remuneration, the Committee has regard to the pay and employment conditions elsewhere within the Group. In particular, the Committee has sight of:
| n | Salary increases for the general employee population; |
| n | Group-wide benefit offerings (including pensions); |
| n | Overall spend on annual bonus; and |
| n | Participation levels in the annual bonus and LTIP. |
The Company does not directly consult with employees when formulating ED pay policy. However it does take into account information provided by the HR function and feedback from employee opinion surveys.
Remuneration scenarios
The charts below illustrate how much the current EDs could earn under different performance scenarios (assuming a constant share price):
| n | Threshold – Threshold bonus of 25% of base salary and 20% vesting under the LTIP. |
| n | Plan – Plan bonus of 75% of base salary and 50% vesting under the LTIP. |
| n | Stretch – Stretch bonus of 150% of base salary and maximum vesting under the LTIP. |
| Mark Wilson | Patrick Regan and Trevor Matthews1 |
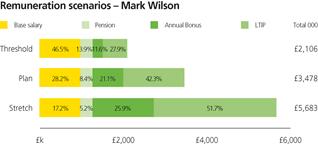 | 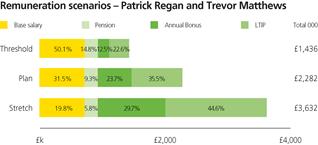 |
| 1. | Scenarios for Patrick Regan and Trevor Matthews are the same as their base salaries are identical. Trevor Matthews will step down from the Board prior to the 2013 AGM. The above scenarios therefore applied to him for 2012, but will not apply for 2013. |
Total remuneration earned in respect of 2012
The Committee recognises the need for transparency on the link between remuneration decisions and performance. We have therefore set out below detail of pay earned by the current EDs in respect of performance to December 2012 and how payments under both the ABP and LTIP have been determined.
Table 4 below sets out the total remuneration earned by each current ED who served during 2012.
Table 4: Total ED remuneration in respect of 2012
| | Patrick Regan | | Trevor Matthews |
| Base salary | | £698,750 | | £720,000 |
| Annual bonus (cash and deferred elements) | | – | | – |
| LTIP vesting (2010 award)1 | | £607,302 | | – |
| Pension contributions2 | | £193,103 | | £212,304 |
| Benefits | | £34,114 | | £85,370 |
| Total remuneration earned in respect to 2012 | | £1,533,269 | | £1,017,674 |
Notes
| 1. | Patrick Regan’s 2010 LTIP award relates to the three-year performance period ending on 31 December 2012. 69.83% of the award is due to vest in March 2013. An assumed Aviva ordinary share price of 373.00 pence has been used to determine the value of the award. |
| 2. | Pension contributions consist of employer contributions into the defined contribution section of the Aviva Staff Pension Scheme, excluding salary exchange contributions made by the employees, plus payments in lieu of pension above the lifetime or annual allowance caps. |
| 3. | Mark Wilson joined the board as an ED on 1 December 2012, and became Group CEO on 1 January 2013. He received no emoluments in respect of 2012. |
Further explanatory notes, and information on former EDs who served during 2012, are set out on page 70.
Annual bonus
Table 5 below sets out the Group’s performance against its financial, employee and customer KPIs in 2012 and how these would have translated into bonus payments.
Table 5: Group performance in 2012 against its KPIs
| | | | | Weighting (% of total bonus opportunity)* | |
| | | KPIs | | Plan
(%) | | | Stretch
(%) | | | Actual outcome (%) | |
| Business measures (70%) | | Total Capital Generation | | | 10 | | | | 18.75 | | | | 18.75 | |
| | | Adjusted Operating Profit | | | 5 | | | | 18.75 | | | | 4.48 | |
| | | Economic Gain | | | 5 | | | | 5 | | | | 0 | |
| | | Internal Rate of Return (IRR) | | | 2.5 | | | | 5 | | | | 5 | |
| | | Volume – Total long-term savings | | | 1.25 | | | | 1.25 | | | | 1.25 | |
| | | Volume – Net written premium | | | 1.25 | | | | 1.25 | | | | 0.92 | |
| | | Customer | | | 5 | | | | 10 | | | | 6.43 | |
| | | Employee | | | 5 | | | | 10 | | | | 0 | |
| Personal measures (30%) | | Personal – individual strategic | | | 12.5 | | | | 25 | | | | 12.5 | |
| (shown at ‘on – plan’) | | Personal – Common Risk Objective | | | 2.5 | | | | 5 | | | | 2.5 | |
| | | Total | | | 50 | | | | 100 | | | | 51.83 | |
| * | Percentages do not necessarily add up due to rounding. |
Solely taking into account Group businessand ‘on-plan’ personal measures would have resulted in a bonus of 78% of salary for EDs in respect of 2012 performance, although business unit performance would also be taken into account reflecting the remit of each ED.
The Committee has taken into account the ‘underpin’ measures, namely Economic Value Added, Economic Capital, absolute and relative TSR, as described below, to ensure that any bonus payments are more closely aligned to shareholders’ experience. Following careful consideration of these metrics by the Committee, it agreed that no ED would receive a bonus in respect of 2012.
LTIP
The award made to Patrick Regan in 2010 was subject to performance conditions set out in table 6 below.
Table 6: LTIP performance conditions
| | | Threshold
(30% vests) | | | Maximum
(100% vests) |
| ROE performance over three years | | | 31.5% | | | 37.5% |
| Relative TSR performance | | | Median | | | Upper quintile
and above |
ROE over the three year performance period was 36.9% leading to 46.5% of the maximum 50% vesting. Relative TSR performance resulted in a ranking of 7 out of 15, leading to 23.33% of the maximum 50% vesting. Correspondingly 69.83%of the award is due to vest in March 2013.
Former directors
Igal Mayer
Igal Mayer resigned from the Board on 19 April 2012 and left the Company on 31 May 2012. He is receiving base salary for 12 months in lieu of notice (less gross base salary paid between 19 April 2012 and 31 May 2012), amounting to CAD $899,732.20. This is being paid in instalments and is subject to mitigation. He also received payment for ten days’ accrued but untaken holiday entitlement.
The deferred elements of Mr Mayer’s bonuses earned for 2009, 2010 and 2011 were released to him on the first dealing day following his departure date. Mr Mayer received no bonus in respect of the financial year 2012. All unvested LTIP and OATTV plan awards lapsed, with no shares being released from these awards.
Legal fees of £25,000 were paid to Mr Mayer’s solicitor in respect of advising on his departure. He will also be eligible to claim for tax compliance services fees until April 2013, up to a maximum of £65,000.
Andrew Moss
Andrew Moss resigned from the Board on 8 May 2012 and left the Company on 31 May 2012. He is receiving base salary in lieu of 12 months’ notice (less gross base salary paid between 8 May 2012 and 31 May 2012), amounting to £898,462 in accordance with his contractual entitlements. This is being paid in instalments and is subject to mitigation. In addition, he received £300,000 in full and final settlement of all claims that he might have to a bonus under his contract. Mr Moss will retain the benefit of £209,000 (being 5/12ths of the annual payment made in April 2012) under the ACAP (i.e. the equivalent of a money purchase pension plan). He also received payment for half a day accrued but untaken holiday entitlement.
The 2010 and 2011 bonuses that were deferred into shares lapsed in accordance with the rules of the ABP, as did outstanding awards under the LTIP and the OATTV plans. 75% of the element of the 2009 bonus that was deferred into shares will vest in accordance with the rules of the relevant plan and 25% lapsed upon Mr Moss leaving the Group.
Legal fees of £25,000 were paid to Mr Moss’s solicitor in respect of advising on his departure. He also claimed for outplacement services of £20,000.
Remuneration for 2013
Shareholder context
The result of the shareholder vote at the Company’s 2012 AGM in respect of the 2011 Directors’ Remuneration Report is set out in table 7 below.
Table 7: Result of the vote on Directors’ Remuneration Report at 2012 AGM
| | | For | | | Against | |
| 2012 vote | | | 45.59% | | | | 54.41% | |
Aviva recognises that pay was not sufficiently linked to performance in 2011. As set out in the Remuneration Committee chairman’s letter, following consultation with our major institutional shareholders, a number of changes have been made:
| n | We introduced ‘underpin’ metrics in respect of bonuses for 2012 and have committed to consider these ‘underpin’ metrics for future years (until any alternative arrangements are agreed following consultation) to ensure annual bonus pay-outs are more closely aligned to the shareholder experience. Taking into account performance against these measures, the Remuneration Committee will use its discretion to revise bonus outcomes where appropriate. Such discretion, if applied, would only be used to reduce the outcome; |
| n | Future buyouts will be made on a ‘like-for-like’ basis in line with best market practice; and |
| n | We have also reviewed and changed senior management contracts and the ‘good leaver’ definition in our share plan rules. |
Appointment of Group CEO
Mark Wilson joined the Board on 1 December 2012 and took up the role of Group CEO on 1 January 2013. As announced at the time of his appointment, his remuneration details are as follows:
| n | Base salary – £980,000 per annum, subject to review in 2014; |
| n | Annual bonus – 75% of base salary for plan performance and 150% of base salary for stretch performance; |
| n | LTIP – he is eligible for an LTIP grant of up to 350% of base salary subject to meeting specific performance conditions over a three year performance period. His 2013 grant will be at 300% of base salary; |
| n | Relocation expenses – he is eligible to claim reasonable and appropriate relocation expenses of up to £200,000 (inclusive of any benefit-in-kind liability which may arise) in respect of relocation from Hong Kong to the UK. If any additional reasonable expenses above this limit are incurred in the course of Mr Wilson’s relocation the Remuneration Committee has agreed to consider reimbursement of such additional expenses up to a further limit to be agreed; and |
| n | Benefits – a cash car allowance and PMI. |
Base salaries
As highlighted in the Remuneration Committee chairman’s letter, EDs’ base salaries will not be increased in 2013.
Table 8: EDs’ base salaries
| | 1 April 2012 salary | | 1 April 2013 salary | | Change from 2012 |
| Patrick Regan | | £720,000 | | £720,000 | | 0% |
| Trevor Matthews | | £720,000 | | £720,000 | | 0% |
Annual bonus
As summarised in table 3, the maximum bonus opportunity for all EDs will remain unchanged for the 2013 financial year at 150% of base salary, with two-thirds of any bonus earned subject to compulsory deferral for three years. Unvested awards are subject to clawback and risk of forfeiture during this period.
Annual performance is measured against a range of key financial, employee and customer performance indicators, which account for 70% of the maximum, and against personal objectives, which account for 30% of the maximum.
To align with the business priorities for 2013, the financial measures at Group level will be: net capital returns’ profit before tax; MCEV value of new business (for the Life business); combined operating ratio (for the General Insurance business); and total expenses. Personal objectives will include common objectives for effective leadership and risk management.
As highlighted previously, bonus outcomes will also be subject to consideration of our performance against our underpin metrics (Economic Value Added, Economic Capital and TSR).
LTIP
As summarised in table 6, the LTIP vests subject to the degree of achievement of two equally weighted performance measures, absolute ROE and relative TSR performance, which have been chosen to reflect shareholders’ long-term interests.For 2013, a grant of 225% of base salary will be made to Patrick Regan and 300% of base salary to Mark Wilson. No grant will be made to Trevor Matthews who will cease to be a director prior to the 2013 AGM.
ROE targets
ROE targets determine the vesting of 50% of any LTIP award and are set annually within the context of the Company’s three-year business plan. Vesting depends upon performance over the three-year period against a target return. The 2012 LTIP award ROE targets are set out in table 9.
Table 9: 2012 LTIP ROE Targets
| Achievement of ROE targets over the three-year performance period | | Percentage of shares in award that vest based on achievement of ROE targets1 |
| Less than 30%(2011: less than 33%) | | 0% |
| 30%(2011: 33%) | | 10% |
| Between 30% and 37.5% (2011: Between 33% and 40.5%) | | Pro rata between 10% and 50% on a straight line basis |
| 37.5% and above (2011: 40.5% and above) | | 50% |
Notes
| 1. | The percentage of shares in award that vest based on achievement of ROE targets is the same in 2011 and 2012. |
The definition of ROE was refined inearly 2013. ROE will now be calculated as IFRS profit after tax and non-controlling interest, excluding the impact of investment variances and economic assumption changes, over average IFRS equity (excluding pension scheme net surplus/deficit) attributable to ordinary shareholders of the Company.
TSR targets
Relative TSR determines the vesting of the other 50% of any LTIP award. To ensure that Aviva’s performance is measured against appropriate comparators with similar business operations and geographic footprints, some minor changes were made to the TSR comparator group for 2013. Companies focused on banking were excluded and some more relevant comparators within the insurance sector were added to ensure a robust group.
For the 2013 LTIP grant, performance will therefore be assessed against the following companies: Aegon, Allianz, AXA, CNP Assurances, Direct Line Group, Generali, Legal & General, MetLife, Old Mutual, Prudential, Resolution Limited, Royal & Sun Alliance, Standard Life and Zurich.
TSR vesting operates as set out in table 10 below.
Table 10: TSR vesting schedule for the 2012 LTIP award
| TSR position over the three-year performance period | | Percentage of shares in award that vests based on achievement of TSR targets |
| Below median | | 0% |
| Median | | 10% |
| Between median and upper quintile | | Pro rata between 10% and 50% on a straight line basis |
| Upper quintile and above | | 50% |
For the 2010, 2011 and 2012 LTIP grants, relative TSR is assessed against the following companies: Aegon, Ageas (formerly known as Fortis until January 2011), Allianz, AXA, Generali, ING, Legal & General, Lloyds Banking Group, Prudential, Resolution Limited, Royal Bank of Scotland, Royal & Sun Alliance, Standard Life and Zurich.
All employee share plans
EDs are eligible to participate in a number of HMRC-approved all employee share plans on the same basis as other eligible employees.
These plans included a free share element under the AESOP. Under this element of the AESOP, eligible employees can receive up to a maximum of £3,000 per annum in shares based upon the profits of the Company’s UK businesses. The shares are free of tax subject to a retention period. Free shares were awarded in 2012. However, this element of the AESOP has since been discontinued and no awards will be made in 2013. The partnership share element of the AESOP, which the Company also operates, allows participants to invest up to £125 per month out of their gross salary in the Company’s shares. There is currently no matching element to this investment by the Company. However a matching element is due to be introduced in April 2013 through which the Company will match every purchased share with two matching shares for the first £40 of a participant’s monthly contribution. For as long as the employee remains employed by the Company, matching shares will be subject to forfeiture if purchased shares are withdrawn from the AESOP within three years of purchase. From May 2013 participants will also be eligible to receive Dividend Shares through the AESOP. Shares awarded to, or investments made by, EDs through the AESOP are included in table 20 of this Report.
The Aviva Savings Related Share Option Scheme and Aviva Savings Related Share Option Scheme 2007 allow eligible employees to acquire options over the Company’s shares at a discount of up to 20% of their market value at the date of grant. In order to exercise these options, participants must have saved through a three, five, or seven year HMRC-approved savings contract, subject to a maximum savings limit of £250 per month. In 2012, only three and five year contracts were offered. Details of options granted to EDs under these schemes are included in table 19.
Share ownership requirements
The Company has an internal shareholding requirement such that the Group CEO is required to build a shareholding in the Company equivalent to 200% of base salary and each ED is required to build a shareholding in the Company equivalent to 150% of base salary.
The EDs, including the Group CEO, are required to retain 50% of the net shares released from deferred annual bonuses and LTIPs until the shareholding requirement is met. There is no target date for meeting the share ownership requirement.
Unvested share awards including shares held in connection with compulsory bonus deferrals are not taken into account in applying this test. Table 11 below shows the position at 31 December 2012, based on that day’s closing middle market price of an ordinary share of the Company of 373.00 pence.
Table 11: EDs’ share ownership requirements as at 31 December 20121
| | Basic salary | Shareholding excluding restricted shares | Value of shareholding based on a share price of 373.00 pence2 | Percentage of basic salary | Shareholding requirement |
| Patrick Regan | £720,000 | 191,279 | £713,470.67 | 99% (2011: 47%) | 150% |
| Trevor Matthews | £720,000 | 104,595 | £390,139.35 | 54% (2011: 0%) | 150% |
Notes
| 1. | Mark Wilson joined the Board as an ED on 1 December 2012 and became Group CEO on 1 January 2013. He is entitled to receive a base salary of £980,000 per annum with effect from 1 January 2013 and did not receive a salary in 2012. As Group CEO, he will be required to build a shareholding in the Company equivalent to 200% of his base salary. He did not hold any Aviva shares as at 31 December 2012. |
| 2. | Based on the closing middle market price of an ordinary share of the Company on 31 December 2012. |
Pension
EDs participate in a defined contribution plan under which they can elect to receive 31% of base salary from the Company minus a contribution of 8% of base salary up to the Scheme Specific Earnings cap (£138,000 in 2012/2013). Above the annual or life-time allowance, a cash alternative in lieu of pension is offered subject to a limit of 31% of base salary minus the 8% contribution.
Performance graph
Table 12 below compares the TSR performance of the Company over the past five years with the TSR of the FTSE 100 Return Index. This index has been chosen because it is a recognised equity market index of which Aviva is a member. The companies which comprise the current LTIP comparator group for TSR purposes are listed in the ‘TSR targets’ section above. The TSR graph for the comparator group has been plotted using the 15 companies (including Aviva) in the comparator group for the 2007 grant, the 16 companies (including Aviva) in the comparator group for the 2008 grant, the 15 companies (including Aviva) in the comparator group for the 2009 and 2010 grants, and the 14 companies (excluding Aviva) in the comparator group for the 2011 and 2012 grants.
Table 12: Aviva plc five-year TSR performance against the FTSE 100 Return Index and the median of the comparator group
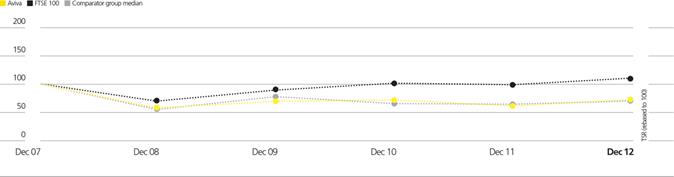
EDs’ employment contracts
The key employment terms and conditions of each of the current EDs, as stipulated in their employment contracts, are set out in table 13 below.
Table 13:EDs’ key terms and conditions of employment
| Provision | | Policy |
Notice period By the director By the Company | | 6 months. 12 months, rolling. No notice or payment in lieu to be paid where the Company terminates for cause. |
| Termination payment | | Pay in lieu of notice up to a maximum of 12 months’ base salary. This may be increased by a discretionary redundancy payment (where appropriate) but any such further termination payment is capped at 12 months’ base salary. Any amount is subject to phased payment and mitigation requirements. |
| Remuneration and benefits | | As described in this Report the operation of the ABP and LTIP is at the Company’s discretion and, in the case of the ACAP and ACDT, at the trustees’ discretion. |
| Expenses | | Reimbursement of expenses reasonably incurred in accordance with their duties. |
| Car allowance | | Car allowance is received in accordance with the terms of the relevant scheme in operation for the Company as varied from time to time. |
| Holiday entitlement | | 30 working days plus public holidays. |
| Other benefits | | Other benefits include PMI and participation in the Company’s staff pension scheme. |
| Private medical insurance | | Private medical insurance is provided for the ED and the ED’s family or the ED can choose to opt out of this benefit or take a lower level of cover and receive 75% of the difference in the cash value of this benefit which will be paid through salary on a monthly basis. |
| Sickness | | In line with senior management terms, i.e. 100% of base salary for 52 weeks, and 75% thereafter. |
| Non-compete | | During employment and for six months after leaving. |
| Contract dates | | Director: Mark Wilson Patrick Regan Trevor Matthews Igal Mayer Andrew Moss | Date current contract commenced: 1 January 2013 22 February 2010 2 December 20113 19 January 20111 1 January 20072 |
Notes
| 1. | Igal Mayer resigned from the Board on 19 April 2012 and left the Company on 31 May 2012. |
| 2. | Andrew Moss resigned from the Board on 8 May 2012 and left the Company on 31 May 2012. |
| 3. | Trevor Matthews will resign from the Board prior to the 2013 AGM. |
External board appointments
The Company recognises that its EDs can benefit from serving in a personal capacity as a non-executive director of non-Aviva Group companies. At the same time, it is conscious of the corporate governance recommendations that EDs should take account of the time commitment required by a non-executive director (NED) position and ensure that any such role does not impact their ability to carry out fully their executive duties. The Company therefore has a policy of normally allowing senior executives to serve as a NED of one external company, subject to approval by the Board, and for the individual to retain any board fees. None of the EDs held external NED appointments during 2012. Following the disposal of the Group’s interests in Delta Lloyd N.V. in January 2013, Patrick Regan, who was until that time a Company-nominated member on the supervisory board of Delta Lloyd N.V., continued to be a member of the supervisory board in a personal capacity. From that point he has therefore held an external NED appointment. During the time he was a Company-nominated member on the supervisory board of Delta Lloyd N.V. he did not receive a board fee.
Non-executive directors
The NEDs, including the chairman of the Company, have letters of appointment which set out their duties and responsibilities. The key terms of the appointments are set out in table 14 below.
Table 14: NED key terms of appointment
| Provision | | Policy |
| Period | | In line with the requirement of the UK Corporate Governance Code, all NEDs are subject to annual re-election by shareholders at each AGM. |
| Termination | | By the director or the Company at their discretion without compensation upon giving one month’s written notice for NEDs and three months’ written notice for the chairman of the Company. |
| Fees | | As set out in table 15. |
| Expenses | | Reimbursement of travel and other expenses reasonably incurred in the performance of their duties. |
| Time commitment | | Each director must be able to devote sufficient time to the role in order to discharge his or her responsibilities effectively and spend a minimum of 25 days a year on Company business. NEDs spend an average of 41 days a year on Company business, with the chairmen of the Audit, Remuneration and Risk Committees spending substantially more. |
| Appointment dates | | Director | Date of last appointment on letter
of appointment | Appointment end date on letter
of appointment |
| | | Glyn Barker | 3 May 2012 | AGM 2013 |
| | | Mary Francis1 | 3 May 2012 | AGM 2013 |
| | | Richard Karl Goeltz2 | 3 May 2012 | AGM 2013 |
| | | Euleen Goh3 | 3 May 2012 | AGM 2013 |
| | | Michael Hawker | 3 May 2012 | AGM 2013 |
| | | Gay Huey Evans | 3 May 2012 | AGM 2013 |
| | | John McFarlane | 3 May 2012 | AGM 2013 |
| | | Lord Sharman4 | 3 May 2012 | AGM 2013 |
| | | Leslie Van de Walle5 | 4 May 2011 | AGM 2012 |
| | | Russell Walls6 | 3 May 2012 | AGM 2013 |
| | | Scott Wheway | 3 May 2012 | AGM 2013 |
Notes
| 1. Mary Francis resigned from the Board on 3 October 2012. | 4. Lord Sharman retired from the Board on 30 June 2012. |
| 2. Richard Karl Goeltz will retire from the Board prior to the 2013 AGM. | 5. Leslie Van de Walle resigned from the Board on 2 May 2012. |
| 3. Euleen Goh resigned from the Board on 31 December 2012. | 6. Russell Walls will retire from the Board prior to the 2013 AGM. |
It is the Company’s policy to set the fees paid to the chairman of the Company and NEDs taking account of the median market payments in international companies of similar size and complexity. NEDs receive a basic annual fee in respect of their Board duties. A further fee is paid to NEDs in respect of membership and, where appropriate, chairmanship of Board committees.
Fees are reviewed annually and are set by the Board to attract individuals with the required range of skills and experience. In determining the level of fees paid to the NEDs, the Board receives recommendations from the EDs, who consider the NEDs’ duties and responsibilities, together with the time commitment required in preparing for and attending meetings, and the amounts paid by competitors and similar-sized companies.
The Chairman of the Company and NEDs do not participate in any incentive or performance plans or pension arrangements and they also do not receive an expense allowance.
The Company’s articles of association provide that the total aggregate remuneration paid to the Chairman of the Company and NEDs will be determined by the Board within the limits set by shareholders. The current aggregate limit of £2 million was approved by shareholders at the Company’s 2012 AGM. EDs are remunerated under their employment contracts and receive no additional fee for serving as Board directors.
Following a review of the fees for holding the position of the senior independent director or a committee chairman or in respect of committee membership, the Board agreed to the fee changes shown in table 15 below. These increases were effective from 1 April 2012. The Board does not intend to increase the fees in 2013. The total amount paid to NEDs in 2012 was £1.5 million.
Table 15: NEDs’ fees from 1 April 2012
| Role | | Fee from 1 April 2011 | | Fee from 1 April 2012 |
| Chairman of the Company1 | | £550,000 | | £550,000 |
| Chairman designate1,2 | | N/A | | £275,000 |
| Board membership fee | | £65,000 | | £65,000 |
| Additional fees are paid as follows: | | | | |
| Senior independent director | | £25,000 | | £35,000 |
| Committee chairman (inclusive of committee membership fee) | | | | |
| – Audit | | £35,000 | | £45,000 |
| – Corporate Responsibility | | £10,000 | | £20,000 |
| – Remuneration | | £30,000 | | £35,000 |
| – Risk | | £35,000 | | £45,000 |
| Committee membership | | | | |
| – Audit | | £10,000 | | £15,000 |
| – Corporate Responsibility | | £7,500 | | £10,000 |
| – Nomination | | £7,500 | | £7,500 |
| – Remuneration | | £10,000 | | £12,500 |
| – Risk | | £10,000 | | £15,000 |
Notes
| 1. | Inclusive of Board membership fee and any committee membership fees. |
| 2. | The fee for the chairman designate was effective from the commencement of the role on 1 January 2012 until 30 June 2012. |
Chairman
John McFarlane became chairman designate on 1 January 2012. The fees for his role as chairman of the Company had been set at £550,000 per annum. He became interim executive deputy chairman in May 2012 following Andrew Moss’ departure and executive chairman of the Company on 1 July 2012 until 31 December 2012. Despite the increased responsibilities and time commitment required, John McFarlane indicated that he did not wish to be considered for any additional fee in respect of his role and his fees remained at £550,000 per annum.
Employment contracts and letters of appointment
EDs’ employment contracts and NEDs’ letters of appointment are available for inspection at the Company’s registered office during normal hours of business, and at the place of the Company’s 2013 AGM from 10.45am on 9 May 2013 until the close of the meeting.
Directors’ remuneration in 2012 (audited information)
Table 16 below sets out the remuneration paid or payable to the directors in respect of the year to 31 December 2012.
Table 16: Directors’ remuneration in 20129, 10
| | Base salary/fees | | | | Bonus1 | | In-Lieu Pension | | | | Bonus2 | | | | Total |
| | | 2012
£000 | | 2011
£000 | | 2012
£000 | | 2011
£000 | | 2012
£000 | | 2011
£000 | | 2012
£000 | | 2011
£000 | | 2012
£000 | | 2011
£000 |
| Chairman/executive chairman | | | | | | | | | | | | |
| John McFarlane3 | | 413 | | 24 | | — | | — | | — | | — | | 145 | | 11 | | 558 | | 35 |
| Executive directors | | | | | | | | | | | | | | | | | | | | |
| Trevor Matthews4 | | 720 | | 58 | | — | | 45 | | 188 | | — | | 85 | | 51 | | 993 | | 154 |
| Patrick Regan5 | | 699 | | 626 | | — | | 765 | | 153 | | — | | 34 | | 32 | | 886 | | 1,423 |
| Non-executive directors6 |
| Glyn Barker | | 76 | | — | | — | | — | | — | | — | | 1 | | — | | 77 | | — |
| Richard Karl Goeltz | | 119 | | 107 | | — | | — | | — | | — | | 1 | | — | | 120 | | 107 |
| Michael Hawker | | 137 | | 93 | | — | | — | | — | | — | | — | | — | | 137 | | 93 |
| Gay Huey Evans | | 96 | | 15 | | — | | — | | — | | — | | — | | — | | 96 | | 15 |
| Russell Walls | | 129 | | 118 | | — | | — | | — | | — | | 2 | | — | | 131 | | 118 |
| Scott Wheway | | 112 | | 103 | | — | | — | | — | | — | | — | | — | | 112 | | 103 |
| Former executive directors11 | | | | | | | | |
| Igal Mayer7 | | 193 | | 606 | | — | | 632 | | — | | — | | 408 | | 455 | | 601 | | 1,693 |
| Andrew Moss8 | | 338 | | 951 | | — | | 1,156 | | 216 | | 480 | | 16 | | 98 | | 570 | | 2,685 |
| Former non-executive directors11 | | | | | | | | | |
| Mary Francis | | 76 | | 113 | | — | | — | | — | | — | | 1 | | — | | 77 | | 113 |
| Euleen Goh | | 92 | | 83 | | — | | — | | — | | — | | — | | — | | 92 | | 83 |
| Lord Sharman | | 275 | | 536 | | — | | — | | — | | — | | 20 | | 33 | | 295 | | 569 |
| Leslie Van de Walle | | 30 | | 85 | | — | | — | | — | | — | | — | | — | | 30 | | 85 |
| Total emoluments of directors9 | | 3,505 | | 3,518 | | — | | 2,598 | | 557 | | 480 | | 713 | | 680 | | 4,775 | | 7,276 |
Notes
| 1. | As disclosed elsewhere in this Report, following careful consideration the Committee decided that EDs would not receive a bonus for 2012. |
| 2. | The benefits disclosure includes the cost, where appropriate, of PMI, life assurance, accommodation, travel and car benefits. All the numbers disclosed include the tax charged on the benefits, where applicable. No directors received an expense allowance during the year. |
| 3. | The chairman received travel related benefits, and medical insurance during his period as executive chairman. In accordance with the terms of his appointment, as disclosed in the 2011 Directors’ Remuneration Report, he received reimbursement for such costs reasonably incurred in connection with his relocation to the UK during the 12 month period from the date of his appointment up to a maximum of £125,000, plus reimbursement of the costs incurred in respect of advice sought on the legal and tax implications of his appointment, together with any VAT or equivalent tax payable thereon. |
| 4. | Trevor Matthews received contributions in lieu of pension above the pension annual allowance limit. The figure shown represents contributions paid or payable for 2012. Cash payments were made for the period January to March 2012. A payment into the ACDT was made in April 2012, covering the period April 2012 to March 2013. The portion of the payment relating to 2012 is shown here. |
| 5. | Patrick Regan received contributions in lieu of pension above the pension annual allowance limit, paid as cash. The figure shown represents contributions paid or payable for 2012. |
| 6. | NEDs are reimbursed for expenses, and any tax arising on those expenses is settled directly by Aviva. |
| 7. | Figures shown for Igal Mayer have been converted from Canadian dollars to pounds sterling at the average exchange rate for 2012 of CAD $1.58: £1.00. As disclosed in the 2011 Directors’ Remuneration Report, Mr Mayer was entitled to first class return flights between Toronto and London, and a travel allowance of up to £40,000 per annum for his spouse and dependent children for travel to and from Toronto and London. Aviva also met the cost of rental accommodation in London and utility costs, as well as assistance in preparing his tax returns in line with standard policy. Aviva met the cost of any taxes due on these benefits. Mr Mayer is entitled to receive a further £594,451 in termination payments. This is made up of a payment in lieu of notice (paid in instalments) and legal fees as set out on page 70. |
| 8. | Andrew Moss received no bonus for 2012, although details of a £300,000 payment in full and final settlement of all claims that he might have a bonus are set out elsewhere in this Report. Mr Moss received a contribution in lieu of pension of £503,000 into the ACAP in April 2012, although only £209,000 of this payment was allowed to vest as part of his departure terms. The remaining £294,000 lapsed. He also received a cash supplement in lieu of pension of £6,769. Mr Moss is entitled to receive a further £923,462 in termination payments. This is made up of a payment in lieu of notice (paid in instalments) and legal fees as set out on page 70. |
| 9. | For the purposes of the disclosure required by Schedule 5 to the Large & Medium-sized Companies and Groups (Accounts & Reports) Regulation 2008, the total aggregate emoluments of the directors in respect of 2012 was £6.3 million (2011: £7.7 million). The 2012 figure includes the emoluments for all the directors set out in table 16 and the termination benefits payable to Mr Moss and Mr Mayer as set out in Notes 7 and 8 above. The total aggregate emoluments for 2011 included in table 16 excludes those directors that resigned from office prior to 1 January 2012. Those directors are Mark Hodges (2011 emoluments: £278,722), Andrea Moneta (2011 emoluments: £76,116) and Carole Piwnica (2011 emoluments: £85,000). The total aggregate emoluments for 2011 including those directors was £7.7 million. |
| 10. | Mark Wilson joined the Board as an ED on 1 December 2012, and became Group CEO on 1 January 2013. He received no emoluments in respect of 2012 and so is not included in this table. |
| 11. | The remuneration figures shown in the table are for or relate to the period during which the director was a director of the Company. |
EDs’ pension arrangements (audited information)
The position of the EDs with respect to accumulated pension benefits under the defined benefits section of the Aviva Staff Pension Scheme (ASPS) is set out in table 17 below.
Table 17: EDs’ pension benefits5, 8
| | Igal Mayer7 £000 | | Andrew Moss
£000 | | Trevor Matthews
£000 | | Patrick Regan
£000 |
| Benefit type | | Defined benefit/defined contribution | | Defined
benefit | | Defined
contribution | | Defined
contribution |
| Accrued annual pension at 31 December 20111 | | 431.9 | | 22.5 | | — | | — |
| Accrued annual pension at 31 December 20127 | | 447.3 | | 23.6 | | — | | — |
| Gross increase in accrued pension over the year | | 15.4 | | 1.1 | | — | | — |
| Increase (decrease) in accrued pension net of inflation over the year | | 8.5 | | — | | — | | — |
| Employee contribution during the year | | — | | — | | — | | — |
| Defined contribution/defined benefit employer contributions during the year2 | | 96.3 | | — | | 32.9 | | 50.0 |
| Transfer value of accrued pension at 31 December 20114 | | 7,677.5 | | 529.5 | | | | |
| Transfer value of accrued pension at 31 December 20124 | | 8,730.9 | | 545.3 | | — | | — |
| Change in transfer value during the period less employee contributions3 | | 1,053.4 | | 15.8 | | — | | — |
| Transfer value of net increase (decrease) in accrued pension less employee contributions6 | | 166.8 | | — | | — | | — |
| Age at 31 December 2012 (years) | | 51 | | 54 | | 60 | | 46 |
Notes
| 1. | Accrued pensions shown are the amounts that would be paid annually on retirement based on service to the end of the year (or date of leaving if earlier). |
| 2. | The defined contribution employer contributions during the year for Patrick Regan and Trevor Matthews include salary exchange contributions of £9,534 and £8,280 respectively. |
| 3. | The change in transfer value allows for fluctuations in the transfer value due to factors beyond the control of the Company and directors, such as changes in market conditions. |
| 4. | The transfer values have been calculated in line with the relevant legislation and using actuarial assumptions agreed by the trustee. The transfer value at 31 December 2011 previously provided for Igal Mayer included the value of the early retirement subsidies for which Mr Mayer did not qualify following his resignation during 2012. |
| 5. | No former directors received any increase in retirement benefits in excess of the amount to which they were entitled, on the later of the date when the benefits first became payable, or 31 March 1997. |
| 6. | The transfer value of net increase (decrease) in accrued pension shows the value of the increase (decrease) in accrued pension net of the inflation, over the year, net of contributions. This is zero for UK based employees as there is no further accrual of benefits and accrued benefits are increased up to retirement in line with inflation. |
| 7. | Igal Mayer is a member of the Aviva Canada Pension Plan, and the figures shown for him have been converted from Canadian dollars to pounds sterling at the average exchange rate for 2012 of CAD $1.58 : £1.00. Igal Mayer received contributions into the defined contribution section of the Aviva Canada pension plan. The value of his defined benefit pension plan, whilst no longer subject to future service accrual, remained subject to revaluation by reference to salary during 2012. |
| 8. | Benefits deriving from additional voluntary contributions (AVCs) paid by directors are excluded from the amounts below. |
Developments in 2013
On 7 February 2013, Aviva announced that Trevor Matthews, executive director and chairman, Developed Markets, will step down from the Board prior to the 2013 AGM. Mr Matthews’ departure terms are not yet agreed, and will be reported in the 2013 Directors’ Remuneration Report.
On 14 January 2013, Aviva announced that Sir Adrian Montague had joined the Board as a non-executive director with effect from the same date.
On 28 January 2013, Aviva announced that Bob Stein had joined the Board as a non-executive director with effect from the same date.
On 6 March 2013, Aviva announced that Richard Karl Goeltz, senior independent director, and Russell Walls, non-executive director, will step down from the Board prior to the 2013 AGM.
Share awards (audited information)
Table 18 below sets out the current position (or the position as at the date of resignation of the director from the Board) of those share-based awards made to the EDs who served during 2012 under current remuneration arrangements.
Table 18: LTIP, ABP, OATTV Plan, CFO Recruitment Share Awards Plan and Conditional Share Award
| | | At 1 January
2012
Number | | Awards granted during year14 Number | | Awards vesting during year4 Number | | Awards lapsing during year
Number | | At 31
December 201211 Number | | Market price at
date awards granted1 Pence | | Market price at date awards vested
Pence | | Normal
Vesting
Date |
| Patrick Regan | | | | | | | | | | | | | | | | |
| Aviva Long Term Incentive Plan | | | | | | | | | | | | | | | | |
| 20102 | | 233,160 | | — | | — | | — | | 233,160 | | 387.70 | | | | Mar-13 |
| 20112 | | 311,059 | | — | | — | | — | | 311,059 | | 435.60 | | | | Mar-14 |
| 20123 | | — | | 425,223 | | — | | — | | 425,223 | | 331.50 | | | | Mar-15 |
| Aviva Annual Bonus Plan | | | | | | | | | | | | | | | | |
| 2011 | | 102,741 | | — | | — | | — | | 102,741 | | 435.60 | | | | Mar-14 |
| 2012 | | — | | 151,700 | | — | | — | | 151,700 | | 331.50 | | | | Mar-15 |
| CFO Recruitment Share Awards Plan7 | | | | | | | | | | | | | | | | |
| 2010 (RRSA)5 | | 170,393 | | 13,4146 | | 98,610 | | — | | 85,197 | | 394.20 | | 356.80 | | Feb-12,138 |
| 2010 (BRDSA)5 | | 43,231 | | — | | — | | — | | 43,231 | | 387.70 | | | | Mar-13 |
| 2010 (OATTV)2 | | 55,051 | | — | | — | | — | | 55,051 | | 387.70 | | | | Mar-13 |
| Trevor Matthews | | | | | | | | | | | | | | | | |
| Aviva Long Term Incentive Plan | | | | | | | | | | | | | | | | |
| 20112 | | 373,27110 | | — | | — | | — | | 373,27110 | | 300.80 | | | | Mar-14 |
| 20123 | | — | | 482,142 | | — | | — | | 482,142 | | 331.50 | | | | Mar-15 |
| Aviva Annual Bonus Plan | | | | | | | | | | | | | | | | |
| 2012 | | — | | 8,928 | | — | | — | | 8,928 | | 331.50 | | | | Mar-15 |
| Conditional Share Award9 | | | | | | | | | | | | | | | | |
| 2011 | | 653,721 | | — | | 217,907 | | — | | 435,814 | | 320.80 | | 356.80 | | Mar-12, 13,14 |
Table 18: LTIP, ABP, OATTV Plan, CFO Recruitment Share Awards Plan and Conditional Share Award (continued)
| | | At 1 January
2012
Number | | Awards granted during year14 Number | | Awards vesting during year4 Number | | Awards lapsing during year
Number | | At 31
December 201211 Number | | Market price at
date awards granted1 Pence | | Market price at
date awards vested
Pence | | Normal
Vesting
Date |
| Andrew Moss12 | | | | | | | | | | | | | | | | |
| Aviva Long Term Incentive Plan | | | | | | | | | | | | | | | | |
| 20093 | | 632,324 | | — | | 516,419 | | 115,905 | | — | | 245.00 | | 344.80 | | Mar-12 |
| 20102 | | 419,365 | | — | | — | | — | | 419,365 | | 387.70 | | | | Mar-13 |
| 20112 | | 586,117 | | — | | — | | — | | 586,117 | | 435.60 | | | | Mar-14 |
| 20123 | | — | | 785,714 | | — | | — | | 785,714 | | 331.50 | | | | Mar-15 |
| Aviva Annual Bonus Plan | | | | | | | | | | | | | | | | |
| 2009 | | 115,365 | | 58,4466 | | 173,811 | | — | | — | | 245.00 | | 344.80 | | Mar-12 |
| 2010 | | 104,702 | | — | | — | | — | | 104,702 | | 387.70 | | | | Mar-13 |
| 2011 | | 158,393 | | — | | — | | — | | 158,393 | | 435.60 | | | | Mar-14 |
| 2012 | | — | | 229,342 | | — | | — | | 229,342 | | 331.50 | | | | Mar-15 |
| One Aviva, Twice The Value bonus plan | | | | | | | | | | | | | | | | |
| 20093 | | 195,876 | | — | | — | | 195,876 | | — | | 245.00 | | | | Mar-12 |
| 20102 | | 177,770 | | — | | — | | — | | 177,770 | | 387.70 | | | | Mar-13 |
| Igal Mayer13 | | | | | | | | | | | | | | | | |
| Aviva Long Term Incentive Plan | | | | | | | | | | | | | | | | |
| 20093 | | 192,871 | | — | | 157,517 | | 35,354 | | — | | 245.00 | | 344.80 | | Mar-12 |
| 20102 | | 433,29610 | | — | | — | | — | | 433,29610 | | 387.70 | | | | Mar-13 |
| 20112 | | 362,056 | | — | | — | | — | | 362,056 | | 435.60 | | | | Mar-14 |
| 20123 | | — | | 472,873 | | — | | — | | 472,873 | | 331.50 | | | | Mar-15 |
| Aviva Annual Bonus Plan | | | | | | | | | | | | | | | | |
| 2010 | | 51,155 | | — | | — | | — | | 51,155 | | 387.70 | | | | Dec-12 |
| 2011 | | 96,722 | | — | | — | | — | | 96,722 | | 435.60 | | | | Mar-14 |
| 2012 | | — | | 125,989 | | — | | — | | 125,989 | | 331.50 | | | | Mar-15 |
| One Aviva, Twice The Value bonus plan | | | | | | | | | | | | | | | | |
| 20093 | | 64,486 | | — | | — | | 64,486 | | — | | 245.00 | | | | Mar-12 |
| 20102 | | 38,366 | | — | | — | | — | | 38,366 | | 387.70 | | | | Mar-13 |
Notes
| 1. | The actual price used to calculate the ABP and LTIP awards is based on a three day average closing middle market price of an ordinary share of the Company. These were in 2009: 256 pence, 2010: 386 pence, 2011: 434 pence and 2012: 336 pence. The three day average closing middle market price of an ordinary share of the Company used to grant the 2009 OATTV Plan awards were in 2009: 256 pence and 2010: 386 pence. The five day average closing middle market price of an ordinary share of the Company used to grant the Replacement Restricted Share Award (RRSA) in 2010 was 380.22 pence. The three day average closing middle market price of an ordinary share of the Company used to grant the Bonus Replacement Deferred Share Award (BRDSA) in 2010 was 386 pence. The three day average closing middle market price of an ordinary share of the Company used to grant the Conditional Share Award in 2011 was 309 pence. |
| 2. | The performance periods for these awards begin at the commencement of the financial year in which the award is granted. |
| 3. | The performance conditions for awards which were granted or which vested during 2012 are explained elsewhere in this Report. The performance periods for these awards begin at the commencement of the financial year in which the award is granted. |
| 4. | The award date for the awards granted in 2009 which vested in 2012 was 26 March 2009, the award date for the award granted in 2010 which vested in 2012 was 11 March 2010 and the award date for the award granted in 2011 which vested in 2012 was 2 December 2011. The awards which vested in 2012 were released with the net amount being settled in shares and the balance settled in cash and used to pay the resulting tax liability. The monetary value of awards will be calculated by multiplying the relevant number of shares by the closing middle market price of an ordinary share of the Company at the date of vesting. |
| 5. | The shares comprising these awards are restricted shares which are beneficially owned by Patrick Regan and held in trust on his behalf under the terms of a restricted share award agreement. As outlined in the 2010 Directors’ Remuneration Report, income tax and National Insurance Contributions liabilities were paid on the RRSA on 11 March 2010 and on the BRDSA on 30 March 2010. |
| 6. | These figures relate to shares issued in lieu of dividends accrued during the deferral period. |
| 7. | The awards under the CFO Recruitment Share Awards Plan were granted to Patrick Regan following his recruitment in 2010. As disclosed in the 2010 Directors’ Remuneration Report, the RRSA will vest in tranches subject to Mr Regan meeting his personal performance targets, the OATTV is subject to the same performance conditions as the OATTV Plan awards granted to other EDs in 2010 and the BRDSA is not subject to performance conditions and will vest on the third anniversary of the date of grant subject to Mr Regan remaining in employment with the Company. |
| 8. | The performance target attached to the second tranche of the RRSA was met and this tranche vested on 8 March 2012 being the first dealing day following the normal vesting date where no dealing restrictions were in place. |
| 9. | The Conditional Share Award was granted to Trevor Matthews following his recruitment in 2011. As disclosed in the 2011 Directors’ Remuneration Report, this award is not subject to performance conditions and will vest in tranches subject to Trevor Matthews remaining in employment with the Company. Trevor Matthews will cease to be a director of the Company prior to the 2013 AGM. The treatment of his awards will be determined on his ceasing to be an employee of the Company. |
| 10. | These shares were awarded as Phantom Units which will be cash settled on vesting and no shares will be transferred or allotted. |
| 11. | The information shown in this column for Andrew Moss is as at his resignation from the Board on 8 May 2012 and for Igal Mayer is as at his resignation from the Board on 19 April 2012. |
| 12. | 25% of Andrew Moss’ 2010 ABP award and 100% of his 2011 and 2012 ABP awards, 2010, 2011 and 2012 LTIP awards and 2010 OATTV award lapsed on his leaving the Company on 31 May 2012. The remaining 75% of his 2010 ABP award will vest on the normal vesting date. |
| 13. | Igal Mayer’s ABP awards vested on 1 June 2012, the first business day after leaving the Company on 31 May 2012. Mr Mayer’s 2010, 2011 and 2012 LTIP awards and 2010 OATTV award lapsed on his leaving the Company on 31 May 2012. |
| 14. | The aggregate net value of share awards granted to the directors in the period was £8.9 million (2011: £12.1 million). The net value has been calculated by reference to the closing middle market price of an ordinary share of the Company at the date of grant. This excludes shares issued in lieu of dividends. |
Share options (audited information)
Details of the EDs who were in office for any part of the 2012 financial year and hold or held options over ordinary shares of the Company pursuant to the Company’s share based incentive plans are set out in table 19 below.
Savings-related share options refer to options granted under the HMRC-approved Aviva Savings Related Share Option Scheme 2007. Options are normally exercisable during the six-month period following the end of the relevant (three, five and seven year) savings contract.
Executive share options (approved) refer to options granted under the HMRC-approved schedule to the Aviva Executive Share Option Plan 2005. Options will be exercisable on 30 March 2013 to the extent that the LTIP awards granted in 2010 have vested. Any gain made on exercise of these options will be used to reduce the number of shares vesting under the LTIP. Therefore, the vesting of the options will not increase the overall number of shares received by the EDs from their LTIP awards.
Table 19: EDs’ options over Aviva plc shares
| | At 1 January 2012
Number | | Options granted during year Number | | Options exercised during year Number | | Options lapsing during year
Number | | At 31
December
2012
Number | | Exercise Price
Pence | | Exercise
Period3 | |
| Patrick Regan | | | | | | | | | | | | | | | | | | | | | |
| Savings-related options 2010 | | 2,903 | | | – | | | – | | | – | | | 2,903 | | | 310.0 | | | Dec 13 –
May 14 | |
| Executive share options (approved) 2010 | | 7,772 | | | – | | | – | | | – | | | 7,772 | | | 386.0 | | | Mar 13 | |
| Andrew Moss1 | | | | | | | | | | | | | | | | | | | | | |
| Executive share options (approved) 2010 | | 7,772 | | | – | | | – | | | – | | | 7,772 | | | 386.0 | | | Mar 13 | |
| Igal Mayer2 | | | | | | | | | | | | | | | | | | | | | |
| Savings-related options 2011 | | 5,923 | | | – | | | – | | | – | | | 5,923 | | | 268.0 | | | Dec 18 –
May 19 | |
Notes
| 1. | The information shown for Andrew Moss is as at the date of his resignation from the Board on 8 May 2012. Mr Moss’ executive share options lapsed on leaving the Company on 31 May 2012. |
| 2. | The information shown for Igal Mayer is as at his resignation from the Board on 19 April 2012. Mr Mayer’s savings-related options lapsed on leaving the Company on 31 May 2012. |
| 3. | Any unexercised options will lapse at the end of the exercise period. |
The closing middle market price of an ordinary share of the Company on 31 December 2012 was 373.00 pence, and the closing middle market price of an ordinary share of the Company during the year ranged from 255.30 pence to 384.00 pence. During the year, no share options were exercised by directors(2011: nil).
EDs did not pay for the award of any share options. The savings related options are granted under an all-employee share scheme and are not subject to performance conditions. The executive share options are linked to awards under the LTIP which are subject to performance conditions (ROE and relative TSR). Additional information can be found in the sections titled ‘LTIP’, ‘ROE targets’ and ‘TSR targets’ on pages 71 and 72.
Dilution
Awards granted under the Aviva employee share plans are met by the funding of two employee trusts administered by external trustees that acquire shares in the market. The current practice is that new issue shares will generally only be issued where it is not practicable or permissable to use the trust. However, the funding policy is kept under review by the Committee and the Board. Details of the shares currently held in the employee trusts are set out in note 28.
During 2012, loans totalling £21.3 million were made to RBC Trustees (CI) Ltd and loans totalling £11.6 million were made to EES Trustees International Ltd to ensure sufficient shares were available to meet the Company’s on-going liabilities.
The Company monitors the number of shares issued under the Aviva employee share plans and their impact on dilution limits. The Company’s usage of shares compared to the relevant dilution limits set by the Association of British Insurers (ABI) in respect of all share plans (10% in any rolling ten-year period) and executive share plans (5% in any rolling ten-year period) was 3.53% and 2.06% respectively on 31 December 2012.
Directors’ interests in Aviva shares
The interests held by eachperson who was a director during the 2012 financial year and their connected persons in the ordinary shares of the Company are shown in table 20 below. All the disclosed interests are beneficial. The table also summarises the interests in shares held through the Company’s various share incentive plans.
Table 20: Directors’ interests in Aviva shares9
| | | Shares1 | | ABP2 | | LTIP3 | OATTV Plan4 | Options5 |
| | 1 January
20127 | | 31 December
20128 | | 1 January
2012 | | 31 December
2012 | | 1 January
2012 | | 31 December
2012 | | 1 January
2012 | | 31 December
2012 | | 1 January
2012 | | 31 December
2012 |
| Glyn Barker7 | | — | | — | | — | | — | | — | | — | | — | | — | | — | | — |
| Mary Francis | | 4,700 | | 4,700 | | | | | | | | | | | | | | | | |
| Richard Karl Goeltz6 | | 17,500 | | 17,500 | | — | | — | | — | | — | | — | | — | | — | | — |
| Euleen Goh | | — | | — | | — | | — | | — | | — | | — | | — | | — | | — |
| Michael Hawker | | 5,000 | | 5,000 | | — | | — | | — | | — | | — | | — | | — | | — |
| Gay Huey Evans | | — | | — | | — | | — | | — | | — | | — | | — | | — | | — |
| Trevor Matthews | | — | | 104,595 | | 653,72110 | | 444,74210 | | 373,27111 | | 855,41312 | | — | | — | | — | | — |
| Igal Mayer17 | | 226,150 | | 312,575 | | 147,877 | | 273,866 | | 988,22315 | | 1,268,22515 | | 102,852 | | 38,366 | | 5,923 | | 5,923 |
| John McFarlane | | 10,000 | | 10,000 | | — | | — | | — | | — | | — | | — | | — | | — |
| Andrew Moss18 | | 572,216 | | 603,815 | | 378,460 | | 492,437 | | 1,637,806 | | 1,791,196 | | 373,646 | | 177,770 | | 7,772 | | 7,772 |
| Patrick Regan | | 312,335 | | 319,707 | | 316,365 | | 382,869 | | 544,219 | | 969,442 | | 55,05113 | | 55,05113 | | 10,675 | | 10,675 |
| Lord Sharman | | 38,42614 | | 40,17614 | | | | | | | | | | | | | | | | |
| Leslie Van de Walle | | 17,48516 | | 17,48516 | | | | | | | | | | | | | | | | |
| Russell Walls | | 8,000 | | 8,000 | | — | | — | | — | | — | | — | | — | | — | | — |
| Scott Wheway | | 13,579 | | 13,579 | | — | | — | | — | | — | | — | | — | | — | | — |
| Mark Wilson | | — | | — | | — | | — | | — | | — | | — | | — | | — | | — |
| Other PDMRs (not included above)19 | | 435,741 | | 799,268 | | 642,969 | | 676,970 | | 1,277,848 | | 1,197,144 | | 199,493 | | 118,512 | | 42,790 | | 42,790 |
Notes
| 1. | ‘Shares’ are the directors’ beneficial holdings in the ordinary shares of the Company and in respect of the EDs include any shares held in trust under the AESOP, being shares purchased by them under the partnership element of the AESOP and any shares granted under the free share element of the AESOP. In respect of Patrick Regan, it also includes the remaining restricted shares held in trust from his RRSA and BRDSA awarded under the rules of the CFO Recruitment Share Awards Plan. In respect of Andrew Moss, it also includes the remaining restricted shares held in trust from his 2009 and 2010 ABP awards (220,067 shares held at 1 January 2012 and 104,702 shares held at 8 May 2012 the date he ceased to be a director). |
| 2. | ABP relates to entitlements to shares arising through the Aviva Annual Bonus Plan 2005 and the Aviva Annual Bonus Plan 2011. Under these plans, some of the earned bonuses are paid in the form of conditional shares and deferred for three years. For Andrew Moss, this includes the restricted shares referred to in note 1 above. The transfer of the shares to the director at the end of the period is not subject to the attainment of performance conditions but the shares can be forfeited if the ED leaves service before the end of the period. In respect of Patrick Regan, 213,624 shares held at 1 January 2012 and 128,428 shares held at 31 December 2012 represent the outstanding shares from the RRSA and BRDSA awarded under the rules of the CFO Recruitment Share Awards Plan and are restricted shares. In respect of Trevor Matthews, 653,721 shares held as at 1 January 2012 and 435,814 shares held as at 31 December 2012 represent the unvested shares awarded under the terms of the Conditional Share Award. |
| 3. | Awards granted under the LTIP which vest only if the performance conditions are achieved. |
| 4. | OATTV Plan awards were granted as a match to the bonus plan awards under the ABP and vest only if the performance conditions are achieved. |
| 5. | ‘Options’ are options over shares granted under the SAYE and the Aviva Executive Share Option Plan 2005. |
| 6. | In addition to his ordinary shareholding Richard Karl Goeltz held 14,000 8.25% Capital Securities on 1 January 2012 and 31 December 2012. |
| 7. | The information given in this column is as at 1 January 2012 or the date of appointment of the director (Glyn Barker: 27 February 2012; Mark Wilson: 1 December 2012). On appointment neither of the directors held any shares, awards or options. |
| 8. | The information given in this column is as at 31 December 2012 or the date on which a director ceased to be a director of the Company (Mary Francis: 3 October 2012; Igal Mayer: 19 April 2012; Andrew Moss: 8 May 2012: Lord Sharman: 30 June 2012 and Leslie Van de Walle: 2 May 2012). |
| 9. | The interests of connected persons to the directors are included in the directors’ interests given in the table. |
| 10. | These shares include the balance of the Conditional Share Award. |
| 11. | These shares were awarded as phantom units in 2011 which will be cash settled on vesting and no shares will be transferred or allotted. |
| 12. | These shares represent the phantom units awarded as per note 11 and the LTIP award granted in 2012. |
| 13. | These shares represent the OATTV awarded under the rules of the CFO Recruitment Share Awards Plan. |
| 14. | These shares include 100 American Depository Shares (the equivalent of 200 Aviva ordinary shares). The opening balance figure for Lord Sharman differs from the closing balance figure at 31 December 2011 due to scrip dividend shares issued in November 2011 not being included in the closing balance figure at 31 December 2011. |
| 15 | These LTIP awards include 433,296 phantom units which will be cash settled on vesting and for which no shares will be transferred or allotted. |
| 16. | The opening balance figure for Leslie Van de Walle differs from the closing balance figure at 31 December 2011 due to scrip dividend shares issued in November 2011, to his spouse through a nominee account, not being included in the closing balance figure at 31 December 2011. In addition to his ordinary shareholding, Leslie Van de Walle held 897,000 5.9021% £500m Direct Capital Instrument (DCI) on 1 January 2012 and 2 May 2012. The DCIs were held by his spouse through a nominee account. |
| 17. | Igal Mayer’s ABP awards vested on 1 June 2012, the first business day after his leaving the Company on 31 May 2012. Mr Mayer’s 2010, 2011 and 2012 LTIP awards and 2010 OATTV award lapsed on his leaving the Company on 31 May 2012. |
| 18. | 25% of Andrew Moss’ 2010 ABP award, and 100% of his 2011 and 2012 ABP awards and 2010 OATTV award lapsed on his leaving the Company on 31 May 2012. The remaining 75% of his 2010 ABP award will vest on the normal vesting date. |
| 19 | In prior years, all members of the Group Executive were Persons Discharging Managerial Responsibility (PDMRs). However, during 2012, the PDMRs changed and were no longer reflective of the whole Group Executive. The table shows the aggregate holding of Aviva shares, options and awards for those who were regarded as PDMRs at 31 December 2012, and from the date they became PDMRs during 2012 if they were not a PDMR on 1 January 2012. |
In the period from 1 January 2013 to 20 March 2013, the interests of the current directors in Aviva shares increased as follows: Gay Huey Evans acquired 5,000 ordinary shares, Sir Adrian Montague acquired 15,500 ordinary shares, Mark Wilson acquired 150,000 ordinary shares, Bob Stein acquired 7,000 ordinary shares and Michael Hawker’s shareholding increased by 15,500 ordinary shares, all through market purchases. The share interests of Patrick Regan and Trevor Matthews increased by 95,732 and 113,646 ordinary shares respectively following releases of awards under the CFO Recruitment Share Plan and the Conditional Share Plan respectively. The holdings of ordinary shares by “Other PDMRs” increased by an aggregate of 138 ordinary shares as a result of monthly purchases under the AESOP.
Approval by the Board
This Directors’ Remuneration Report was reviewed and approved by the Board on 6 March 2013.
Scott Wheway
Chairman, Remuneration Committee
Shareholder information
| In this section | |
| Company address | 82 |
| Share capital | 82 |
| Related party disclosures | 84 |
| Dividend data | 84 |
| Guarantees, securitised assets and off-balance sheet arrangements | 85 |
| Liquidity and capital resources | 85 |
| Regulation | 89 |
| Risks relating to our business | 95 |
Company address
The Company’s registered office is St Helens, 1 Undershaft, London, EC3P 3DQ.
The Company’s telephone number is +44 (0)20 7283 2000.
Share capital
The Company has four classes of shares:
| n | Ordinary Shares of £0.25 each which constitute equity security and hold voting rights; |
| n | Cumulative Irredeemable Preference Shares of £1 each, which entitle holders to attend and vote at general meetings only when dividends on such shares are in arrears. Cumulative irredeemable preference shareholders may also attend general meetings and vote on particular proposals when such proposals relate to an alteration of the rights attaching to such shares, a reduction of capital (other than through a redemption or repurchase of shares) or a winding up of business. On a winding up, they carry a preferential right of return of capital ahead of the ordinary shares; |
| n | Sterling New Preference Shares of £1 each, which have such rights and terms (including terms related to the redemption of shares, ranking and entitlement to dividend and capital) as the Board determines; and |
| n | Euro New Preference Shares of €1 each, which have such rights and terms (including, terms related to the redemption of such shares, ranking and entitlement to dividend and capital) as the Board determines. |
Issued share capital
The Company had an aggregate issued and outstanding ordinary share capital of £736 million as of 31 December 2012. The following table sets out information about the issued and outstanding classes of equity as of 31 December 2012.
| | Shares issued and outstanding | | Shares covered by outstanding option |
| Share class | | 2012
Million | | 2011
Million | | 2010
Million | | 2012
Million | | 2011
Million | | 2010
Million |
| Ordinary Shares, nominal value 25p | | 2,946 | | 2,905 | | 2,820 | | 25 | | 30 | | 27 |
8.375% Cumulative Irredeemable
Preference Shares, nominal value £1 | | 100 | | 100 | | 100 | | — | | — | | — |
8.75% Cumulative Irredeemable
Preference Shares, nominal value £1 | | 100 | | 100 | | 100 | | — | | — | | — |
The Companies Act 2006 abolished the requirement for a company to have an authorised share capital and the articles of association adopted by the Company on 28 April 2010 reflect this. Directors are still limited as to the number of shares they can allot, as the allotment authority continues to be required under the Act, save in respect of employee share schemes. Ordinary shares in issue in the Company rank pari passu. All the ordinary shares in issue carry the same right to receive all dividends and other distributions declared, made or paid by the Company.
The Company is not permitted under English law to hold its own ordinary shares. Whilst the Company is presently authorised to repurchase up to 290 million ordinary shares, any shares that are repurchased must be cancelled. Details of the Company’s dividends are set out below under ‘Dividend data’. The Company’s preference shares rank, as to the payment of dividends and capital, as set out in note 29.
Share options and awards
The Company maintains a number of active stock option and share award schemes. Details of these schemes are set out in ‘Financial statements IFRS – Note 27 – Group’s share plans’.
Share Investment Plan
The Company’s UK resident employees of participating companies can buy ordinary shares in the Company by making monthly contributions from their gross salary. Contributions can be a minimum of £5 and a maximum of £125 per month (or, if less, 10% of gross salary). Contributions are held in a trust by an independent trustee and shares are allocated within 30 days of the employee’s monthly contribution date. Employees can withdraw their shares from the trust at any time on payment of income tax and National Insurance Contributions (NIC). However, after five years shares can be withdrawn from the trust free of income tax and NIC.
There is currently no matching element to this investment by the Company. However a matching element is due to be introduced in April 2013 through which the Company will match every purchased share with two matching shares for the first £40 of a participant’s monthly contribution. Matching shares will be subject to forfeiture if purchasedshares are withdrawn from the Aviva All Employee Share Ownership Plan (AESOP) within three years of purchase, as long as the employee remains employed by the Company. From May 2013 participants will also be eligible to receive Dividend Shares through the AESOP.
Shares to satisfy options and awards
Since July 2008, it has been the Company’s practice to satisfy all awards and options using shares purchased in the market and held by employee trusts except where local regulations make it necessary to issue new shares.
At 31 December 2012, 10,053,515 shares were held by the employee share trusts as compared to 13,284,476 at 31 December 2011, in both instances following the share purchases and distributions to individual employees throughout the year. These shares have an aggregate nominal value of £2,513,379 and market value £37,499,611 as of 31 December 2012, compared to £3,321,119 and £39,959,704 at 31 December 2011, respectively. Shares held by separate employee share trusts on behalf of specific individuals have not been included in these amounts. Further details are given in ‘Financial statements IFRS – Note 28 – Shares held by employee trusts.’
History of share capital
The following table sets out information about the history of the Company’s ordinary shares over the last three full calendar years.
| | Number of
shares outstanding |
| At 1 January 2010 | 2,766,611,374 |
| Shares issued under the Group’s Employee and Executive Share Option Schemes1 | 722,968 |
| Shares issued in lieu of dividends2 | 52,814,300 |
| At 31 December 2010 | 2,820,148,642 |
| Shares issued under the Group’s Employee and Executive Share Option Schemes1 | 1,574,706 |
| Shares issued in lieu of dividends2 | 83,989,590 |
| At 31 December 2011 | 2,905,712,938 |
| Shares issued under the Group’s Employee and Executive Share Option Schemes1 | 3,335,566 |
| Shares issued in lieu of dividends2 | 36,923,757 |
| At 31 December 2012 | 2,945,972,261 |
1. For more information on our various option schemes, see note 27 in thefinancial statements.
2. The issue of shares in lieu of cash dividends is considered a bonus issue under the terms of the Companies Act 2006 and the nominal value of the shares is charged to the share premium account.
The Companies Act 2006 abolished the requirement for a company to have an authorised share capital and the articles of association adopted by the Company on 28 April 2010 reflect this. Directors are still limited as to the number of shares they can at any time, allot as the allotment authority continues to be required in the Act save in respect of employee share schemes.
There were no changes to the voting rights of any class of shares during 2010, 2011 or 2012, other than issuances in connection with our various employee option schemes and under the Company’s scrip dividend scheme. The Company did not issue shares for consideration other than cash during 2010, 2011 or 2012. In addition, at the Company’s general meetings in 2010, 2011 and 2012, shareholders authorised the limited dis-application of Section 561 of the Companies Act 2006 to permit the Company to issue new equity securities for cash without applying shareholders’ statutory pre-emptive rights.
Related party disclosures
Related party transactions
For more information relating to related party transactions, including more information about the transactions described below, please see ‘Financial Statements IFRS – Note 56 – Related party transactions’.
Subsidiaries
Transactions between the Company and its subsidiaries are eliminated on consolidation.
Key management compensation
The total compensation to those employees classified as key management, being those having authority and responsibility for planning, directing and controlling the activities of the Group, including the executive and non-executive directors is as follows:
| | 2012
£m | | 2011
£m | | 2010
£m |
| Salary and other short-term benefits | | 4.7 | | 6.7 | | 8.1 |
| Post-employment benefits | | 1.9 | | 1.7 | | 1.6 |
| Equity compensation plans | | 4.8 | | 5.9 | | 6.4 |
| Termination benefits | | 1.5 | | 0.7 | | — |
| Other long term benefits | | 0.4 | | 2.8 | | 2.5 |
| Total | | 13.3 | | 17.8 | | 18.6 |
Various directors and key management of Aviva may from time to time purchase insurance, asset management or annuity products, from Aviva Group companies in the ordinary course of business on substantially the same terms, including interest rates and security requirements, as those prevailing at the time for comparable transactions with other persons.
Apart from the disclosed transactions discussed above and in the ‘Governance’ section of this report, no director had an interest in shares, transactions or arrangements that requires disclosure under applicable rules and regulations.
Other related parties
The Group received income from and paid expenses to other related parties from transactions made in the normal course of business. Loans to other related parties are made on normal arm’s length commercial terms.
Services provided to other related parties
| | | | 2012 | | | | 2011 | | | | 2010 |
| | Income
earned
in year
£m | | Receivable
at year
end
£m | | Income
earned
in year
£m | | Receivable
at year
end
£m | | Income
earned
in year
£m | | Receivable
at year
end
£m |
| Associates | | — | | — | | — | | — | | 47 | | — |
| Joint ventures | | 23 | | 103 | | 23 | | 125 | | 18 | | 375 |
| Employee pension schemes | | 12 | | 6 | | 13 | | 9 | | 10 | | 2 |
| | | 35 | | 109 | | 36 | | 134 | | 75 | | 377 |
In addition to the amounts disclosed for associates and joint ventures above, at 31 December 2012 amounts payable at year-end were £nil, and expenses incurred during the period were
£5 million.
Transactions with joint ventures in the UK relate to the property management undertakings, the most material of which are listed in note 15(b). Our interest in these joint ventures comprises a mix of equity and loans, together with the provision of administration services and financial management to many of them. Our UK life insurance companies earn interest on loans advanced to these entities, movements in which may be found in note 15(a).
Our fund management companies also charge fees to these joint ventures for administration services and for arranging
external finance.
Our UK fund management companies manage most of the assets held by the Group’s main UK staff pension scheme, for which they charge fees based on the level of funds under management. The main UK scheme holds investments in Group-managed funds and insurance policies with other Group companies, as explained in note 44(e)(iii).
The related parties’ receivables are not secured and no guarantees were received in respect thereof. The receivables will be settled in accordance with normal credit terms. Details of guarantees, indemnities and warranties provided on behalf of related parties are given in note 48(g).
Loans to joint ventures
We make loans to our property management joint ventures to fund property developments which we undertake with our joint venture partners. Movements in these loans may be found in ‘Financial Statements IFRS – Note 15 – Interests in, and loans to, joint ventures’. Total loans at 31 December 2012 and at the end of each of the last three financial years are shown in the table below:
| | 2012
£m | | 2011
£m | | 2010
£m |
| Loans to joint ventures | | 92 | | 100 | | 375 |
Dividend data
The Company has a policy to pay a progressive dividend with reference to growth in cash flows and earnings. Under UK company law, we may only pay dividends if the company has ‘distributable profits’ available. ‘Distributable profits’ are accumulated, realised profits not previously distributed or capitalised, less accumulated, unrealised losses not previously written off based on IFRS. Even if distributable profits are available, we pay dividends only if the amount of our net assets is not less than the aggregate of our called-up share capital and undistributable reserves and the payment of the dividend does not reduce the amount of our net assets to less than that aggregate.
As a holding company, the Company is dependent upon dividends and interest from our subsidiaries to pay cash dividends. Many of the Company’s subsidiaries are subject to insurance regulations that restrict the amount of dividends that they can pay to us.
Historically, the Company has declared an interim and a final dividend for each year (with the final dividend being paid in the year following the year to which it relates). Subject to the restrictions set out above, the payment of interim dividends on ordinary shares is made at the discretion of our Board, whilst payment of any final dividend requires the approval of the Company’s shareholders at a general meeting. Preference shares are irredeemable and dividends on preference shares are made at the discretion of our Board.
The Company pays cash dividends in pounds sterling, although the articles of association permit payment of dividends on ordinary shares in other currencies and in forms other than cash, such as ordinary shares. If dividends on ordinary shares held by the American Depositary Shares (ADS) depositary are paid in pounds sterling, the ADS depositary will convert the pounds sterling that it receives on behalf of the ADS holders into US dollars according to the prevailing market rate on the date that the ADS depositary actually receives the dividends.
For the 2007 final dividend and previous final and interim dividends, shareholders on record were provided with the opportunity to elect to receive dividends in the form of newly issued ordinary shares through the Aviva Scrip Dividend Scheme. For the 2008 interim dividend, the Aviva Scrip Dividend Scheme was replaced by a dividend reinvestment plan (DRIP). For those shareholders participating in the DRIP, the Company paid a cash dividend, which was then used to buy existing shares on the open market. For the 2008 final dividend, Aviva withdrew the DRIP and reintroduced the Aviva Scrip Dividend Scheme. For the 2012 final dividend, the Aviva Scrip Dividend Scheme has been withdrawn.For the 2012 final dividend, the Aviva Scrip Dividend Scheme has been withdrawn.
An interim dividend is generally paid in November of each year. A final dividend is proposed by the Company’s Board after the end of the relevant year and generally paid in May. The following table shows certain information regarding the dividends that we paid on ordinary shares for the periods indicated in pounds sterling and converted into US dollars at the noon buying rate in effect on each payment date.
| Year | | Interim dividend
per share
(pence) | | Interim dividend
per share
(cents) | | Final dividend
per share
(pence) | | Final dividend
per share
(cents) |
| 2007 | | 11.90 | | 24.37 | | 21.10 | | 41.31 |
| 2008 | | 13.09 | | 19.69 | | 19.91 | | 30.31 |
| 2009 | | 9.00 | | 14.75 | | 15.00 | | 23.55 |
| 2010 | | 9.50 | | 15.20 | | 16.00 | | 25.80 |
| 2011 | | 10.00 | | 15.70 | | 16.00 | | 25.27 |
| 2012 | | 10.00 | | 15.85 | | 9.00 | | na |
Guarantees, securitised assets and off-balance sheet arrangements
As a normal part of our operating activities, various Group companies have given financial guarantees and options, including interest rate guarantees, in respect of certain long-term assurance and fund management products, as set out in Note 38. These are accounted for on-balance sheet as either part of the host insurance contract or as financial instruments under IFRS.
Information on operating lease commitments can be found in Note 49(b).
It is standard business practice for our Group companies to give guarantees, indemnities and warranties in connection with disposals of subsidiaries and associates to third parties. As of 31 December 2012, we believe no material loss will arise in respect of these guarantees, indemnities and warranties. Principal warranties include the accuracy and completeness of the statement of financial position at an agreed specified date, details of outstanding litigation, regulatory matters, material contractual commitments, the position on tax filings and other customary matters together with any specific items identified during due diligence. In addition, specific clauses cover such items as regulatory approvals and licences, the basis of calculation regarding actuarial insurance liabilities, reinsurance contracts and the status of employee pension plans. Their exact terms are tailored to each disposal and are set out in the respective sale and purchase agreement. Similarly, the open warranty periods, within which the purchaser could claim, and limits on the maximum amount potentially recoverable will vary for each item covered in each disposal.
There are a number of outstanding claims on recent disposals, none of which are material. There are also open claim periods on other recent disposals on which we have neither received, nor expect to receive, any such claims. We believe that there is no material exposure in this respect.
We have loans receivable, secured by mortgages, which have then been securitised through non-recourse borrowings by special purpose entities in our UK Life business, as set out in Note 21. These special purpose entities have been consolidated and included in the statement of financial position, as we retain the residual interest in them.
Limited liability partnerships classified as joint ventures
As part of their investment strategy, the UK and certain European long-term business policyholder funds have invested in a number of property limited partnerships (PLP), either directly or via property unit trusts (PUT), through a mix of capital and loans. The PLPs are managed by general partners (GP), in which the long-term business shareholder companies hold equity stakes and which themselves hold nominal stakes in the PLPs. The PUTs are managed by a Group subsidiary.
Accounting for the PUTs and PLPs as subsidiaries, joint ventures or other financial investments depends on the shareholdings in the GPs and the terms of each partnership agreement. If a partnership is managed by a contractual agreement where the parties have joint control but no individual party exerts overall control, notwithstanding that the Group’s partnership share or economic interest in the PLP (including its indirect stake via the relevant PUT and GP) may be greater than 50%, such PUTs and PLPs have been classified as joint ventures. Of the PLPs accounted for as joint ventures at 31 December 2012, the Group’s economic interest exceeded 50% in respect of one partnership, The Mall Limited Partnership, in which the Group had a 50.52% economic interest.
Note 15 provides a list of the principal PLPs accounted for as joint ventures, as well as summarised information on the income, expenses, assets and liabilities of the Group’s interests in its joint ventures in aggregate. In respect of these PLPs, there are no significant contingent liabilities to which we are exposed, nor do we have any significant contingent liabilities in relation to our interests in them. External debt raised by the PLPs is secured on their respective property portfolios, and the lenders are only entitled to obtain payment of both interest and principal to the extent there are sufficient resources in the respective PLPs. The lenders have no recourse whatsoever to the policyholder and shareholders’ funds of any companies in the Aviva Group. At 31 December 2012, we had £157 million capital commitments to these PLP joint ventures.
Liquidity and capital resources
Treasury function
The treasury function of our business is managed by our centralised treasury team, headed by the Group treasurer. The Group treasurer acts as owner of Group business standards for liquidity and foreign exchange risk management within the Group risk governance and oversight framework. Changes in policy require the agreement of the chief risk and capital officer. These policies are independently implemented and monitored by each of our businesses. Our central treasury team is split into distinct functions: a Group team, which develops our overall treasury strategy and our treasury team at Aviva Investors, which manages and monitors our treasury and cash flow positions for our holding
companies. Each business unit is responsible for monitoring its own cash and liquidity positions, as well as its ongoing funding requirements. It is our policy to make the majority of our financing arrangements at the parent company level for our business units, primarily through external borrowings and equity offerings. This enables us to achieve the efficiencies afforded by our collective size. A number of our business units also raise debt on their own behalf.
Our principal objective in managing our liquidity and capital resources is to maximise the return on capital to shareholders, while enabling us to pay dividends, service our debt and our holding companies’ cash flows. In the context of a financial services company where our working capital is largely representative of our liquidity, we believe that our working capital is sufficient for our present operational requirements. For additional information, see ‘Note 53 – Risk management – liquidity risk’.
Extraordinarymarket conditions
Starting in mid-September 2008, the global financial markets experienced unprecedented disruption, adversely affecting the business environment in general, as well as financial services companies in particular. Markets have improved but continue to be fragile, particularly given the Eurozone sovereign debt crisis. A return to adverse financial market conditions could significantly affect our ability to meet liquidity needs and obtain capital, although management believes that we have liquidity and capital resources to meet business requirements under current market conditions.
At 31 December 2012, total consolidated cash and cash equivalents net of bank overdrafts amounted to £23,248 million, an increase of £847 million over £22,401 million in 2011.
Processes for monitoring and managing liquidity risk, including liquidity stress models, have been enhanced to take into account the extraordinary market conditions, including the impact on policyholder and counterparty behaviour, the ability to sell various investment assets and the ability to raise incremental funding from various sources. Management has taken steps to strengthen liquidity in light of its assessment of the impact of market conditions, such as issuing $650 million Fixed Rate Tier 1 notes in May 2012, and intends to continue to monitor liquidity closely.
Management of capital resources
We seek to maintain an efficient capital structure using a combination of equity shareholders’ funds, preference capital, subordinated debt and borrowings. This structure is consistent with our risk profile and the regulatory and market requirements of our business.
In managing our capital, we seek to:
| n | Match the profile of our assets and liabilities, taking into account the risks inherent in each business; |
| n | maintain financial strength to support new business growth whilst still satisfying the requirements of policyholders, regulators and rating agencies; |
| n | retain financial flexibility by maintaining strong liquidity, access to a range of capital markets and significant unutilised committed credit lines; |
| n | allocate capital efficiently to support growth and repatriate excess capital where appropriate; and |
| n | manage exposures to movements in exchange rates by aligning the deployment of capital by currency with our capital requirements by currency. |
We are subject to a number of regulatory capital tests and employ realistic scenario tests to allocate capital and manage risk. The impact of these regulatory capital tests on our ability to transfer capital around the Group through dividends and capital injections is discussed later in this section under the headings ‘Sources of liquidity’ and ‘Capital injections’.
At 31 December 2012, the Group had £16.5 billion(31 December 2011: £20.6 billion) of total capital employed on an IFRS basis in our trading operations which is financed by a combination of equity shareholders’ funds, preference capital, direct capital instruments, subordinated debt and internal and external borrowings.
In 2012, the total capital employed decreased by £4.1 billion. The decrease is primarily driven by the Group’s loss after tax, actuarial losses on staff pension schemes and the payment of the dividend.
In addition to external funding sources, we have a number of internal debt arrangements in place. These have allowed the assets supporting technical liabilities to be invested into the pool of central assets for use across the Group. They have also enabled us to deploy cash from some parts of the business to others in order to fund growth. Although intra-Group loans in nature, they are counted as part of the capital base for the purpose of capital management. All internal loans satisfy arm’s length criteria and all interest payments have been made when due.
Management of debt
Aviva plc is the principal financing vehicle in our centralised funding strategy. Our senior debt obligations are supported by guarantees from our principal UK non-life trading subsidiaries. We also manage our external debt in line with rating agency limits applicable for entities with a rating in the AA range. We aim to maintain a balance of fixed and floating rate debt, and manage the maturity of our borrowings and our undrawn committed facilities to avoid bunching of maturities. We aim to maintain access to a range of funding sources, including the banking market, the commercial paper market and the long-term debt capital markets. We issue debt in a variety of currencies, predominantly sterling, euros and US dollars, based on investor demand at the time of issuance and management of the Group’s foreign exchange translation exposures in the statement of financial position.
In May 2012, we issued $650 million of Fixed Rate Tier 1 notes callable in 2017. In June 2012, we repaid a $300 million subordinated debt instrument at its first call date.
At 31 December 2012, our total external borrowings, including subordinated debt and securitised mortgage loans, amounted to £8.3 billion(2011: £8.5 billion). Of the total borrowings, £5.1 billion (2011: £5.3 billion)are considered to be core borrowings and are included within the Group’s capital employed. The balance of £3.2 billion(2011: £3.2 billion) represents operational debt issued by operating subsidiaries. We also have substantial committed credit facilities available for our use. At 31 December 2012, we had undrawn committed credit facilities expiring within one year of £0.4 billion (2011: £1.0 billion) and £1.7 billion in credit facilities expiring after more than one year(2011: £1.1 billion). Of these facilities, £750 million was allocated in 2012(2011: £750 million) to support our commercial paper programme.
Further information on the maturity profile, currency and interest rate structure of our borrowings is presented in ‘Financial statements IFRS – Note 45 – Borrowings’. Commercial paper is issued for terms up to 12 months and is generally reissued at maturity. The earliest repayment date for other debt instruments is a €650 million subordinated debt instrument with a first call date of 2 October 2013 at the option of the company. At this time Aviva will have the option of repaying the debt or accepting a step-up in the coupon and deferring repayment until future coupon dates or 2023 at the latest.
The table below presents our debt position for the periods indicated:
| | | 2012
£m | | | 2011
£m | |
| Core structural borrowings | | | | | | | | |
| Subordinated debt | | | 4,337 | | | | 4,550 | |
| Debenture loans | | | 199 | | | | 199 | |
| Commercial paper | | | 603 | | | | 506 | |
| | | | 5,139 | | | | 5,255 | |
| Operating borrowings | | | | | | | | |
| Operational borrowings at amortised cost | | | 1,868 | | | | 1,889 | |
| Operational borrowings at fair value | | | 1,332 | | | | 1,306 | |
| | | | 3,200 | | | | 3,195 | |
| | | | 8,339 | | | | 8,450 | |
| Less: Amounts classified as held for sale | | | (145 | ) | | | – | |
| Total | | | 8,194 | | | | 8,450 | |
Inthe UK, we have raised non-recourse funding secured against books of mortgages. This funding has been raised through the use of special-purpose entities. The beneficial interest in the books of mortgages has been passed to these special-purpose entities. These entities, which are owned by independent trustees, have funded this transfer through the issue of loan notes.
The value of the secured assets and the corresponding non-recourse funding was £1,332 million(2011: £1,306million). We continue to receive fees from these special purpose entities in respect of loan administration services.
These special purpose entities have been consolidated as we retain the residual interest in them. The transactions and reasons for consolidation are discussed further within ‘Financial statements IFRS – Note 21 – Securitised mortgages and related assets’.
Undrawn borrowings
At 31 December 2012, we had £2.1 billion(2011: £2.1 billion) undrawn committed central borrowing facilities available to us, provided by a range of leading international banks, all of which have investment grade credit ratings. We have allocated £750 million to support the credit rating of Aviva’s commercial paper programme. Undrawn borrowings are analysed below:
| | | 2012
£m | | 2011
£m |
| Expiring within one year | | 420 | | 955 |
| Expiring beyond one year | | 1,725 | | 1,160 |
| Total | | 2,145 | | 2,115 |
Our committed central borrowing facilities have two financial covenants:
| n | Borrowings (excluding non-recourse indebtedness) may not exceed total shareholders’ funds. At 31 December 2012, borrowings were 62% of total shareholders funds. |
| n | Total shareholders’ funds to exceed 32% of non-life net written premiums for the previous 12 months. At 31 December 2012, total shareholders funds were 140% of non-life net written premiums. |
Total shareholders’ funds are defined as the aggregate of nominal share capital of Aviva and the IFRS retained profits and reserves, plus the value of in-force long-term business, on a consolidated basis.
Sources of liquidity
In managing our cash flow position, we have a number of sources of liquidity, including:
| n | dividends from operating subsidiaries; |
| n | external debt issuance; |
| n | internal debt and central assets; and |
| n | funds generated by the sale of businesses. |
One of our principal sources of liquidity is dividends from our subsidiaries. The level of dividends is based on two primary factors: the financial performance and the local solvency and capital requirements of our individual business units.
The table below shows liquid resources provided to Group Centre from operating companies, subsidiaries, associates and joint ventures in 2012:
| | 2012
Amounts
received
£m |
| UK life insurance | | 150 |
| UK general insurance | | 150 |
| Canada | | 136 |
| France | | 217 |
| Spain | | 68 |
| Poland | | 70 |
| Other operations | | 153 |
| Total | | 944 |
Subsequent to the year end, the Group has taken action to improve its access to dividends from the Group’s insurance and asset management businesses by undertaking a corporate restructuring whereby Aviva Group Holdings (“AGH”) has purchased from Aviva Insurance Limited (“AIL”) its interest in the majority of its overseas businesses.
Under UK company law, dividends can only be paid if a company has distributable reserves sufficient to cover the dividend. At 31 December 2012, Aviva plc itself had distributable reserves of £3,037 million, which would have covered three years of historic dividend payments to our shareholders. In UK Life, our largest operating subsidiary, distributable reserves, which could be paid to Aviva plc via its intermediate holding company, are created mainly by the statutory long-term business profit transfer to shareholders. While the UK insurance regulatory laws applicable to UK Life and our other UK subsidiaries impose no statutory restrictions on an insurer’s ability to declare a dividend, the rules require maintenance of each insurance company’s solvency margin, which might impact their ability to pay dividends to the parent company. Our other life and general insurance, and fund management subsidiaries’ ability to pay dividends and make loans to the parent company is similarly restricted by local corporate or insurance laws and regulations. In all jurisdictions, when paying dividends, the relevant subsidiary must take into account its capital position and must set the level of dividend to maintain sufficient capital to meet minimum solvency requirements and any additional target capital expected by local regulators. These minimum solvency requirements, which are consolidated under the European Insurance Group Directive, are discussed later in this section under the heading ‘Regulatory capital position’. We do not believe that the legal and regulatory restrictions constitute a material limitation on the ability of our businesses to meet their obligations or to pay dividends to the parent company, Aviva plc.
The Group has received and expects to receive proceeds on completion of the disposals as disclosed in ‘Financial statements IFRS – Note 3 – Subsidiaries’.
Aviva plc has established two main programmes for the issuance of external debt by Aviva plc. For short-term senior debt issuance we have a £2 billion commercial paper programme which allows debt to be issued in a range of currencies. At 31 December 2012, the outstanding debt issued under this programme was £603 million (2011: £506 million excludes commercial paper issued by Delta Lloyd).More details of movements in debt can be found on page 86 in the ‘Management of debt section’.
For longer term debt we have established a Euro Medium Term Note (EMTN) programme. This programme has documentation readily available to allow quick issuance of long-term debt with a variety of terms and conditions. Debt issued under this programme may be senior debt or regulatory qualifying debt and may have a fixed or floating interest rate. At 31 December 2012, the outstanding debt issued under this programme was £2,076 million(2011: £1,894 million).
Application of funds
We use funds to pay dividends to our shareholders, to service our debt and to pay our central Group cash flows.
In 2012, total cash paid by the Company as ordinary and preference dividends and coupon payments on direct capital instruments and Fixed Rate Tier 1 notes amounted to £720 million, compared with £506 million in 2011.
In 2012, our total interest costs on central borrowings were £317 million. This compared with £324 million of interest paid on central borrowings in 2011. Total corporate centre expenses in 2012 were £136 million compared with £138 million in 2011.
An additional application of our funds is the acquisition of businesses. In 2012, cash paid for the acquisition of subsidiaries, joint ventures and associates from continuing operations net of cash acquired amounted to £129 million, compared with cash paid of £114 million in 2011.
Capital injections
We make capital injections into our businesses where necessary to ensure that they meet their local solvency requirements and also to support development of their operations. Capital is provided either by equity or, where a local holding company is in place, may be via loans with the holding company subsequently injecting equity capital in the regulated operating company. Each capital injection is subject to central review and approval by the Board of the relevant holding company and needs to meet our required internal rates of return. To the extent that capital injections are provided or funded by regulated entities, then we have to consider the impact on regulatory capital of the capital injection.
Otherwise our ability to make capital injections into our businesses is not materially limited by applicable legal and regulatory restrictions. Total capital injections into the business units were £169 million and £296 million in 2012 and 2011 respectively.
Consolidated cash flows
The cash and cash equivalents consist of cash at banks and in hand, deposits held at call with banks, treasury bills and other short-term highly liquid investments that are readily convertible to known amounts of cash and which are subject to an insignificant risk of change in value.
For the purposes of the cash flow statement, cash and cash equivalents also include bank overdrafts, which are included in payables and other financial liabilities on the balance sheet.
Year ended 31 December 2012
Net cash from operating activities
Total net cash from operating activities increased by £2,636 million to a £2,294 million inflow in 2012 (2011: £342 million outflow). The increase is primarily due to an increase in flows from the net purchase/sale of operating assets.
Net cash from investing activities
Net cash from investing activities decreased by £93 million to £15 million outflow (2011: £78 million inflow). The decrease is mainly a result of a decrease in cash inflows from disposal of subsidiaries, joint ventures and associates, partly offset by lower cash used in discontinued operations.
Net cash out flow on financing activities
Net cash used in financing activities decreased by £654 million to an outflow of £1,119 million (2011: £1,773 million outflow). The decrease is due to proceeds from the issuance of a Fixed Rate Tier 1 notes, and lower cash used in discontinued operations partly offset by higher dividend payments.
Net cash and cash equivalents
At 31 December 2012, total consolidated net cash and cash equivalents, net of bank overdrafts, amounted to £23,248 million, a increase of £847 million over £22,401 million in 2011.
Currency
Our exposures to movements in exchange rates and the management of these exposures is detailed in ‘Performance review – Financial and operating performance – Exchange rate fluctuations’.
Year ended 31 December 2011
Net cash from operating activities
Total net cash from operating activities decreased by £2,149 million to £342 million outflow in 2011(2010: £1,807 millioninflow). The decrease is primarily due to higher claims in the long-term business.
Net cash used in investing activities
Net cash from investing activities decreased by £271 million to £78 million utilised(2010: £349 million utilised). The decrease is a result of cash used in discontinued operations.
Net cash out flow on financing activities
Net cash used in financing activities was £420 million higher at £1,773 million(2010: £1,353 million). The increase is due to a higher repayment of borrowings during the year.
Net cash and cash equivalents
At 31 December 2011, total consolidated net cash and cash equivalents amounted to £22,401 million, an decrease of £2,294 million over £24,695 million in 2010.
Currency
Our exposures to movements in exchange rates and the management of these exposures is detailed in ‘Performance review – Financial and operating performance – Exchange rate fluctuations’.
Regulatory capital position
Individual regulated subsidiaries measure and report solvency based on applicable local regulations, including in the UK the regulations established by the FSA. These measures are also consolidated under the European Insurance Groups Directive (IGD) to calculate regulatory capital adequacy at an aggregate group level, where we have a regulatory obligation to have a positive position at all times.
This measure represents the excess of the aggregate value of regulatory capital employed in our business over the aggregate minimum solvency requirements imposed by local regulators, excluding the surplus held in the UK and Ireland with-profit life funds. The minimum solvency requirement for our European businesses is based on the Solvency 1 Directive. In broad terms, for EU operations, this is set at 4% and 1% of non-linked and unit-linked life reserves respectively and for our general insurance portfolio of business is the higher of 18% of gross premiums or 26% of gross claims, in both cases adjusted to reflect the level of reinsurance recoveries. For our major non-European businesses (the US and Canada) a risk charge on assets and liabilities approach is used.
European Insurance Groups Directive
| | | UK Life
funds
£bn | | | Other
business
£bn | | | 2012
£bn | | | 2011
£bn | |
| Insurance Groups Directive (IGD) capital resource | | | 5.2 | | | | 9.2 | | | | 14.4 | | | | 14.1 | |
| Less: capital resources requirement (CRR) | | | (5.2 | ) | | | (5.4 | ) | | | (10.6 | ) | | | (11.9 | ) |
| Insurance Groups Directive (IGD) excess solvency | | | – | | | | 3.8 | | | | 3.8 | | | | 2.2 | |
| Cover of EU minimum (calculated excluding UK Life funds) | | | | | | | | | | | 1.7 times | | | | 1.3 times | |
The EU IGD regulatory capital solvency surplus has increased by £1.6 billion since 31 December 2011 to £3.8 billion. The key movements over the period are set out in the following table:
| | | £bn | |
| IGD solvency surplus at 31 December 2011 | | | 2.2 | |
| Adjusted operating profits net of other income and expenses | | | 0.9 | |
| Dividend and appropriations, net of shares issued in lieu of dividends | | | (0.7 | ) |
| Market movements including foreign exchange1 | | | 1.3 | |
| Pension scheme funding | | | (0.2 | ) |
| Movement in hybrid debt | | | 0.2 | |
| UK reinsurance transactions | | | 0.1 | |
| Increase in Capital Resources Requirement | | | (0.1 | ) |
| Other regulatory adjustments | | | 0.1 | |
| Estimated IGD solvency surplus at 31 December 2012 | | | 3.8 | |
1. Market movements include the impact of equity, credit spread, interest rate and foreign exchange movements net of the effect of hedging instruments.
Capital commitments
Contractual commitments for acquisitions or capital expenditures of investment property, property and equipment and intangible assets, which have not been recognised in our consolidated financial statements, are as follows:
| | | 2012
£m | | | 2011
£m | | | 2010
£m | |
| Investment property | | | 6 | | | | 23 | | | | 63 | |
| Property and equipment | | | 36 | | | | 36 | | | | 160 | |
| Total | | | 42 | | | | 59 | | | | 223 | |
Contractual obligations for future repairs and maintenance on investment properties are £nil(2011: £nil, 2010: £1 million). We have capital commitments to our joint ventures of £157 million(2011: £258 million, 2010: £45 million) and to other investment vehicles of £nil(2011: £nil, 2010: £nil). These commitments are expected to be funded through operational cash flow without recourse to core structural borrowings.
Regulation
Compliance
In both our insurance and fund management businesses, matters may arise as a result of industry-wide issues, inspection visits or other regulatory activity, requiring discussion and resolution with industry regulators. The Group needs to ensure that procedures are in place to address any regulatory concerns, and that such procedures are properly planned, managed and resourced. Corrective action is undertaken, when necessary, with progress reported to relevant regulatory bodies in a timely manner.
Overview of regulation as it affects our business
Our principal insurance and fund management operations are in the UK, Europe, North America and the Asia Pacific region. We are therefore subject to financial services regulation and local regulatory supervision in all these areas, as individually covered below.
As the Group’s parent company is based in the UK, both EU legislation and the rules of the FSA can impact Aviva’s business practices worldwide. Regulators supervising the Group co-ordinate on a cross-border basis through a ‘college’.
The European Union
In addition to its UK businesses, Aviva is active in other EU member states through wholly owned subsidiary and joint venture companies. These companies are subject to the laws and regulations of the EU member state in which they are based, but are also affected by higher level EU legislation, which will continue to have a significant influence on the legislative environment in the UK and other EU markets.
The EU operates by promulgating directives that must be implemented into local national legislation within each EU member country. These directives set minimum standards for national legislatures to meet, with each legislature able to decide how they should be implemented. National governments may not pass laws which fail to meet the minimum standards set out in a directive, but are generally free to impose legal requirements which go beyond those required. Directives are written at a fairly high level, with more detail being provided at national level through legislation developed in accordance with the local legal system. Even greater detail may be imposed through the rules and regulations of national regulators and, for financial services businesses these rules can be extensive.
The EU may also impose requirements directly on countries through regulation. EU financial services regulation is based on the principle of ‘home country control’, which makes the home country regulator responsible for monitoring compliance with all applicable regulation.
Key directives of particular relevance to the financial services industry, and so to Aviva’s businesses in the EU include:
Third Life and Non-Life Directives
These directives implemented the home country control principle for life and non-life insurance business in the mid-1990s and placed the responsibility for such issues as solvency, actuarial reserves, investment of assets, and certain governance issues on the home country regulator. Most companies licensed to conduct insurance business in one member state may rely on their home country regulation to ‘passport’ into all other member states to conduct business without having to be separately licensed in each. The generalexception is selling activity which continues to be regulated by the state in which the sale takes place.
Insurance Groups Directive (IGD)
The IGD requires member states to introduce the following measures to strengthen supervision of insurance companies which are part of a group:
| n | An adjustment margin to the solvency calculation in relation to participating interests in other insurance undertakings in order to eliminate ‘double-gearing’ (the use of the same regulatory capital in more than one entity of a group). |
| n | An additional parent undertaking solvency margin calculation analogous to the adjusted margin test referred to above, to be applied at the level of the parent undertaking. |
| n | The introduction of new solo supervision requirements, including rules as to internal control within the insurance undertaking regarding the production of information relevant to supplementary supervision, the exchange of information within the group and the supervision of intra-group transactions. |
| n | Further provisions aimed at ensuring co-operation between competent regulatory authorities of member states. |
Since 31 December 2006, the group capital resources requirement (the parent undertaking solvency calculation mentioned above) has been a ‘hard’ test (i.e. it constitutes a requirement to maintain the group capital resources, rather than simply to make the calculation) for UK-based companies operating under FSA rules.
Reinsurance Directive
Adopted on 16 November 2005, this directive requires that all reinsurance undertakings be authorised in their home member state. To obtain that authorisation, they need to meet strict requirements, but are then free to operate anywhere in the EU through the single market passport process.
Distance Marketing Directive
Under the Distance Marketing Directive, EU member states are required to implement a framework of rules and guidance in order to protect consumers by:
| n | setting minimum standards for information that must be provided to consumers before entering into a financial services contract by ‘distance means’; and |
| n | for certain products and services, giving a cooling-off period in which a consumer may cancel a contract without penalty. |
Insurance Mediation Directive
This requires EU member states to establish a framework to:
| n | ensure that insurance and reinsurance intermediaries have been registered on the basis of a minimum set of professional and financial requirements; |
| n | ensure that registered intermediaries will be able to operate in other member states by availing themselves of the freedom to provide services or by establishing a branch; and |
| n | impose requirements on insurance intermediaries to provide specified minimum information to potential customers. |
Markets in FinancialInstruments Directive (MiFID)
MiFID, which superseded the earlier Investment Services Directive, builds on the home country control principle, extending the range of ‘core’ investment services and activities that may be passported from one member state to another, clarifying the allocation of responsibilities between home and host country jurisdictions, and introducing greater harmonisation governing the organisation and conduct of business of investment firms.
Solvency II
The agreed Solvency II Level 1 Directive was published in November 2009. Solvency II represents a fundamental change in European regulation and will result in a more sophisticated economic risk-based capital approach. Its objectives are to establish a solvency system that is better aligned to the true risks of insurers, and aims to enable supervisors to protect policyholder interests as effectively as possible in accordance with common principles across the EU.
Since approval, the focus has been on developing the technical standards and requirements necessary to determine how the directive will be applied in practice, and expected amendments to the Solvency II Directive (Omnibus II Directive) following the creation of the new European Supervisory Authorities (ESAs) in September 2010. It is still not clear when these developments, including the implementation requirements will become legislation.
The European Insurance and Occupational Pensions Authority (EIOPA), replaced CEIOPS on 1 January 2011. A proposed amending directive was published in January 2011 (‘Omnibus II Directive’) to update Solvency II. Omnibus II set out powers for EIOPA to issue binding guidance/standards, changes to specific aspects of Solvency II and delays to the implementation of Solvency II. The details of Omnibus II are still being negotiated and it is not clear when Omnibus II will become legislation. Solvency II is currently set to apply to insurers from 1 January 2014. This date is expected to be changed in 2013.
EIOPA proposes to issue guidelines for supervisors in 2013 as interim measures to address the uncertainty caused by the ongoing delays to Solvency II and encourage harmonisation of supervisory approach across jurisdictions while Solvency I remains in force. These guidelines are expected to cover systems of governance, ORSA, internal model application procedures and reporting to supervisors. The FSA has proposed changes to its ICAS regime following the continuing delay. These changes will allow companies to use the work done in preparation for Solvency II for ICA.
This highlights the need for continued and engaged industry participation. Aviva continues to actively participate, through the key European industry working groups, who provide the voice of the industry, in ongoing discussions in Brussels.
Future EU developments
During 2013 the European Commission will be undertaking a review of the European System of Financial Supervision (ESFS). The ESFS includes the three sector specific European Supervisory Authorities (ESAs) that have powers to make binding rules and drive supervisory consistency and convergence through a single rule book.
There are a number of European dossiers that are expected to progress during 2013, including Packaged Retail Investment Products (PRIPs) that will introduce common product disclosure standards and sales conduct rules, the review of the Insurance Mediation Directive (IMD) and the MiFID, the European Market Infrastructure Regulation (EMIR) that will introduce central clearing for standard Over the Counter (OTC) derivatives, the Directive for Institutions of Occupational Retirement Provisions (IORP) that sets rules for occupational pension schemes, and the Alternative Investment Fund Managers Directive (AIFMD) that will introduce a regime governing the marketing of alternative investments to EU investors.
United Kingdom
The Financial Services Authority
In the UK, the FSA is currently the single regulator for those individuals and firms conducting defined regulated activities in the financial services sector. The FSA has the authority to make rules and issue guidance, taking into account relevant EU directives, in relation to a wide sphere of activity encompassing the governance of the conduct of business by, and the prudential supervision of, individuals and firms authorised by the FSA to conduct such business (‘Authorised Persons’ or ‘Authorised Firms’).
Under the Financial Services and Markets Act 2000 (FSMA) no person may carry on, or purport to carry on, a regulated activity by way of business in the UK unless he is an Authorised Person or an exempt person. A firm granted permission by the FSA to carry on regulated activities becomes an Authorised Person for the purposes of FSMA. ‘Regulated activities’ are prescribed in the FSMA (Regulated Activities) Order 2001 and include banking, insurance and investment business, stakeholder pension schemes, insurance mediation and certain mortgage mediation and lending activities.
Authorised Firms must at all times meet specified threshold conditions, including possession of adequate resources for the carrying on of their business, and being fit and proper to conduct that business, having regard to all the circumstances. Authorised Firms must also operate in accordance with the FSA’s Principles for Business. These are 11 high level principles for conducting financial services business in the UK, including maintenance of adequate systems and controls, treating customers fairly, and communicating with customers in a manner that is clear, fair and not misleading.
The FSA regime is based on the principle that firms should have effective systems and controls, including robust risk management, which are appropriate to the size, complexity and diversity of their business.
It should be noted that during 2013 the FSA will be replaced by two separate regulatory bodies, the Prudential Regulation Authority (PRA) and the Financial Conduct Authority (FCA).
The FSA’s regulation of the Group
A number of the Group’s UK subsidiaries are directly authorised and regulated by the FSA, including our insurance companies (e.g. the UK Life and UK General Insurance companies), asset managers (Aviva Investors) and intermediaries (UK Healthcare). Aviva plc, although not directly authorised by the FSA, does itself come within the scope of some regulation as the ultimate insurance holding company in the Group.
As Aviva is a UK-based group, the FSA has the responsibility of acting as lead regulator (i.e. the cross-sector supervisory co-ordinator) for the Group within the EU.
Approved persons and controllers
The FSA places great emphasis on the principle of senior management responsibility. The directors of, and senior managers carrying out FSA defined controlled function roles in, any of the Group’s regulated entities are individually registered with the FSA under the ‘Approved Person’ regime, and can be held directly accountable to the FSA for control failings in those entities. A number of senior managers at Group level have also been registered as Approved Persons for the regulated subsidiaries, even though they are neither directors nor senior managers of these firms. This recognises that these managers exert significant influence over the regulated subsidiaries, because they are responsible for key parts of the Group’s control framework on which the regulated subsidiaries place reliance.
The FSA regulates from a legal entity perspective, even though Aviva tends to operate by business unit. However, the FSA also expects that Aviva’s regulated subsidiaries operate within an overall framework of Group governance and controls. Its rules expressly provide that any systems and controls which operate on a Group basis will be taken into account in determining the adequacy of a regulated subsidiary’s systems and controls. The robustness of these Group controls is therefore subject to scrutiny and challenge by the FSA.
The FSA regulates the acquisition and increase of control over Authorised Firms. Under FSMA, any person proposing to acquire control of, or increase control over certain thresholds of, an Authorised Firm must first obtain the consent of the FSA. The Authorised Firm must also inform the FSA of any such proposed acquisition or increase. In considering whether to grant or withhold its approval of the acquisition or increase of control, the FSA must be satisfied both that the acquirer is a fit and proper person and that the interests of consumers would not be threatened by this acquisition or increase of control.
Control over a UK Authorised Firm is acquired if the acquirer:
| n | holds 10% (or 20% if the Authorised Firm is an insurance intermediary) or more of the shares, or voting power, in that firm, or a parent undertaking of the firm; or |
| n | is able to exercise significant influence over the management of the firm by virtue of the acquirer’s shares or voting power in that company or a parent undertaking of the firm. |
Increases in control require the consent of the FSA when they reach thresholds of 20%, 30% and 50% of the shares or voting power of the firm (or its parent).
In order to determine whether a person or a group of persons is a ‘controller’ for the purposes of FSMA, the holdings (shares or voting rights) of the person and any other person ‘acting in concert’, if any, are aggregated.
FSA conduct of business rules
The FSA’s Conduct of Business (COB) and Insurance: Conduct of Business (ICOB) Rules apply to every Authorised Firm carrying on relevant regulated activities, and regulate the day-to-day conduct of business standards to be observed by all Authorised Persons in carrying out regulated activities.
The COB and ICOB Rules are principle based, and the scope and range of obligations imposed on an Authorised Firm will vary according to the scope of its business and range of the Authorised Firm’s clients. Generally speaking, however, the obligations imposed on an Authorised Firm by the COB and ICOB Rules will include the need to classify its clients according to their level of sophistication, provide them with information about the Authorised Firm, meet certain standards of product disclosures (including fee and remuneration arrangements), ensure that promotional material which it produces is clear, fair and not misleading, assess suitability when advising on certain products, control the range and scope of advice given, manage conflicts of interest, report appropriately to its clients and provide certain protections in relation to client assets.
Capital and solvency rules for insurers
The FSA rules require that a UK insurer (including those within the Group) must hold capital resources equal to at least the MinimumCapital Requirement (MCR). Insurers with with-profits liabilities of more than £500 million (which is the case with Aviva’s with-profits fund) must hold capital equal to the higher of MCR and the Enhanced Capital Requirement (ECR). The ECR is intended to provide a more risk responsive and ‘realistic’ measure of a with-profits insurer’s capital requirements, whereas the MCR is broadly equivalent to the previous required minimum margin, and satisfies the minimum EU standards.
Determination of the ECR involves the comparison of two separate measurements of the Authorised Firm’s financial resources requirements, which the FSA refers to as the ‘twin peaks’ approach. The two separate peaks are:
| n | the requirement comprised by the mathematical reserves plus the ‘long term insurance capital requirement’ (the LTICR), together known as the ‘regulatory peak’; and |
| n | a calculation of the ‘realistic’ present value of the insurer’s expected future contractual liabilities together with projected ‘fair’ discretionary bonuses to policyholders, plus a risk capital margin, together known as the ‘realistic peak’. |
All insurers must also carry out an Individual Capital Assessment (ICA) to calculate the amount of capital needed to back their business. If the FSA decides that the final ICA amount is insufficient, it may draw up its own Individual Capital Guidance (ICG) for the firm, which can be imposed as a requirement on the scope of the Authorised Firm’s permission.
Day-to-day supervision
The FSA takes a risk-based approach to its regulatory activity, concentrating its resources on those firms and activities which it assesses pose the greatest potential threats to its four statutory objectives of:
| n | maintaining confidence in the UK financial system; |
| n | contributing to the protection and enhancement of stability of the UK financial system; |
| n | securing the appropriate degree of protection for consumers; and |
| n | reducing the extent to which it is possible for a regulated business to be used for a purpose connected with financial crime. |
Given our size and our share of the UK retail market, a major issue within our business which causes concern for the FSA may have a significant impact on these objectives.
The FSA therefore maintains a ‘close and continuous’ relationship with us, with day-to-day supervision of Aviva conducted by a dedicated team within its Prudential and Conduct Business Units. In practice, this means that a wide range of Group, regional and UK business unit senior managers have regular scheduled meetings with the FSA, and other meetings and discussions on specific issues take place as the need occurs. This adds up to weekly or even daily FSA interaction at UK region, business unit and Group level, and the sharing of detailed information about the Group.
The FSA has also, periodically, conducted formal Advanced Risk-Responsive Operating framework (ARROW) reviews of Aviva to assess the level of risk posed by the Group to each of the FSA’s objectives. The last full risk assessment was conducted in 2011/2012.
Areas of potential risk or weakness where the FSA particularly requires Aviva to focus attention are formally set out in a Risk Mitigation Plan (RMP), with both risk assessment and RMP issues up-dated on an ongoing basis between each ARROW review.
The majority of RMP actions set by the FSA after the 2011/2012 ARROW review have been actioned by Aviva, and the remainder are being progressed in accordance with timescales agreed with the FSA.
The FSA has highlighted in its Business Plan 2012/2013 that its key focus areas for 2012/2013 would be:
| n | delivering the regulatory reform programme; |
| n | continuing to influence the international and European policy agenda; |
| n | delivering financial stability by maintaining ongoing supervision of firms in a period of continued fragility in markets including business model analysis, capital/liquidity assessments, recovery and resolution planning and the Significant Influence Function regime; |
| n | delivering market confidence and credible deterrence; and |
| n | delivering on the principal FSA initiatives to improve consumer protection – early product intervention, the Retail Distribution Review (RDR) and Mortgage Market Review (MMR). |
Outside of the UK, each Aviva business is regulated by its own national regulator(s). However, overseas operations are also within the remit of the FSA to the extent that they have an interest in the systems and controls by which the Group manages its overseas businesses to mitigate the risk of financial shocks arising overseas flowing through to the UK.
The FSA monitors the strategy and performance of the Group’s international businesses through its programme of regular meetings and thematic reviews.
The FSA aims to play a leading role in the development of both EU and international regulation. It is, in particular, in the vanguard of the movement towards risk-based insurance regulation.
The FSA continues to place weight on the ‘Treating Customers Fairly’ principle.
Intervention and enforcement
The FSA has extensive powers to investigate and intervene in the affairs of Authorised Firms and is obliged to monitor compliance with the requirements imposed by, and to enforce the provisions of, FSMA related to secondary legislation and the rules made thereunder.
The FSA’s enforcement powers, which may be exercised against both Authorised Firms and Approved Persons, include public censure, imposition of unlimited fines and, in serious cases, the variation or revocation of permission to carry on regulated activities or of an Approved Person’s status. The FSA may also vary or revoke an Authorised Firm’s permissions to protect the interests of consumers or potential consumers if the Authorised Firm has not engaged in regulated activity for 12 months, or if it is failing to meet the threshold conditions for authorisation. The FSA has further powers to obtain injunctions against Authorised Persons and to impose or seek restitution orders where consumers have suffered loss.
In addition to applying sanctions for market abuse, the FSA has the power to prosecute criminal offences arising under FSMA and insider dealing under Part V of the Criminal Justice Act 1993, and breaches of money laundering regulations. The FSA’s stated policy is to pursue criminal prosecution in all appropriate cases.
The Financial Services Compensation Scheme (FSCS)
The FSCS is intended to compensate individuals and small businesses for claims against an Authorised Firm where the Authorised Firm is unable or unlikely to be able to meet those claims (generally, when it is insolvent or has gone out of business).
The FSCS funding system, for the purposes of meeting FSCS compensation costs, has been reviewed to take into account the replacement of the FSA by the PRA and the FCA in 2013. Following this review the FSCS levy is to split into eight broad classes:
| n | the life and pensions provision class; |
| n | the general insurance provision class; |
| n | the investment provision class; |
| n | the life and pensions intermediation class; |
| n | the home finance intermediation class; |
| n | the investment intermediation class; and |
| n | the general insurance intermediation class. |
The permissions held by each firm determine into which class, or classes, it falls.
Restrictions on business
FSA rules restrict an insurance company from carrying on any commercial business other than insurance business and activities directly arising from that business. Therefore, the FSA authorised insurance companies in the Group are bound by this restriction.
Long-term assets and liabilities
Where a UK insurer carries on life insurance business, its long-term business assets and liabilities – i.e. those assets and liabilities relating to life and health insurance policies – must be segregated from the assets and liabilities attributable to non-life insurance business or to shareholders. Separate accounting and other records must be maintained and a separate fund established to hold all receipts of long-term business.
The extent to which long-term fund assets may be used for purposes other than long-term business is restricted by the FSA rules. Only the ‘established surplus’, which is the excess of assets over liabilities in the long-term fund as determined by actuarial investigation, may be transferred so as to be available for other purposes. Restrictions also apply to the payment of dividends by the insurance company, as described below. FSA rules also require insurers to maintain sufficient assets in the separate long-term insurance fund to cover the actuarially determined value of the insurance liabilities.
Distribution of profits and with-profits business
For UK authorised life insurers carrying on with-profits business, such as Aviva Life and Pensions UK Ltd (‘AVLAP’), the FSA’s rules require that where a firm decides to make a distribution of surplus from the with-profits fund it must distribute at least the required percentage (as defined in the FSA Handbook) of the total amount distributed to policyholders, with the balance of the total amount to be distributed being payable to the shareholders.
In addition, at least once a year the AVLAP Board must consider whether a distribution is required to be made from the Old WPSF inherited estate. Such a distribution will ordinarily be required if the level of the inherited estate of the OWPSF exceeds the Required Distribution Threshold as described in the Reattribution Scheme of Transfer effective from 1 October 2009 (‘The Scheme’) on any such annual investigation from the third such investigation after 1 October 2009. Annual investigation may also be carried out to determine if a Release to shareholders can be made from the RIEESA. Releases can only be made:
| n | if the Reattributed Inherited Estate exceeds the Permitted Release Threshold as defined in the Scheme; |
| n | the AVLAP Board (based on appropriate actuarial advice including that of the With-Profits Actuary) are of the opinion that the Release will not give rise to a significant risk that the New WPSF (including the RIEESA) would be unable to meet its obligations to policyholders and its capital requirements or the Old WPSF would be unable to meet its obligations to policyholders; and |
| n | following the sixth annual investigation after 1 October 2009 or later investigation and provided that investigation and investigations made in the previous 2 years determined that the Reattributed Inherited Estate exceeded the Permitted Release Threshold. |
Reporting requirements
FSA rules require insurance companies to file their audited annual accounts, statements of financial position and life insurers’ annual reports from the actuary performing the actuarial function with the regulator. There is also a requirement to report the annual solvency position of the insurance company’s ultimate parent.
The FSA uses the annual return to monitor the solvency (i.e. the ability to meet current and future obligations such as claims payments to policyholders) of the insurance company. For general insurance business, the return is also used to assess retrospectively the adequacy of the company’s claims provisions. The directors of an insurance company are required to sign a certificate, which includes a statement as to whether the company has maintained the required minimum margin of solvency throughout the year. The directors must also certify that the company has completed its return to the FSA properly in accordance with the FSA’s instructions, and that the directors are satisfied that the company has complied in all material respects with the requirements set out in the FSA rules.
UK winding up rules
The general insolvency laws and regulations applicable to UK companies are modified in certain respects in relation to UK insurance companies where direct insurance claims will have priority over the claims of other unsecured creditors (with the exception of preferred creditors), including reinsurance creditors, on a winding up by the court or a creditors’ voluntary winding up of the insurance company. Furthermore, instead of making a winding-up order when an insurance company has been proved unable to pay its debts, a UK court may reduce the amount of one or more of the insurance company’s contracts on terms and subject to conditions (if any) which the court considers fit. Where an insurance company is in financial difficulties but not in liquidation, the FSCS may take measures to secure the transfer of all or part of the business to another insurance company.
FSMA provides further protection to policyholders of insurance companies effecting or carrying out contracts of long-term insurance. Unless the court orders otherwise, a liquidator and/or administrator must carry on the insurer’s business so far as it consists of carrying out the insurer’s contracts of long-term insurance with a view to it being transferred as a going concern to a person who may lawfully carry out those contracts. In carrying on the business, the liquidator/administrator may agree to the variation of any contracts of insurance in existence when the winding-up order is made, but must not effect any new contracts of insurance.
United States
During 2012 we wrote life and annuity business in the United States through Aviva USA Corporation (Aviva USA), a wholly owned subsidiary formed by the merger of Aviva Life Insurance Company of America with AmerUS which it acquired in July 2006. Aviva USA is domiciled in Iowa and is the holding company for Aviva Life and Annuity Company which is licensed to conduct business in all states except New York and Washington D.C. In New York it operates a wholly owned subsidiary, Aviva Life Insurance Company of New York. Aviva plc reached agreement, in December 2012, to sell Aviva USA and, subject to regulatory approval, the sale is expected to close during 2013.
The US insurance industry is regulated primarily on a state-by-state basis. Individual states have authority to pass statutes, adopt regulation or issue directives to regulate insurance activities within their jurisdiction.
Consequently, life insurance companies are subject to regulation both in their domicile state as well as in each state in which they operate. State regulation can vary from state to state. All have laws and regulations covering the financial aspects of the insurance business, including standards of solvency, reserves, reinsurance and capital adequacy. In addition, most states have specific regulation governing licensing and the conduct of selling agents as well as the approval of products and associated product forms and literature.
Federal initiatives
While the National Association of Insurance Commissioners (‘NAIC’) has no statutory powers, its members are the insurance commissioners in each state and it acts as a forum to develop and propose model laws and regulations. Each state then decides whether to adopt the NAIC model laws or regulations and each state may make changes to the model laws during the adoption process. However, the models are generally widely adopted; an example being the ‘Suitability in Annuity Transactions Model Regulation’.
NAIC has a commitment to modernising the state-based system of insurance regulation and is pushing forward an action plan aimed at achieving consistency of approach between states on a number of issues including risk management and the solvency regulatory framework . The American Council of Life Insurers (‘ACLI’) has, in the past, proposed an optional federal charter (‘OFC’) under which life insurers could choose to be federally regulated instead of state regulated. However, the OFC has not been adopted.
In 2010, Congress passed a law adopting significant federal regulatory reforms for the financial services industry in the US. The new law will impose stricter prudential standards on systemically significant financial companies, higher risk financial activities and introduce new mechanisms for resolving failures of significant financial companies. The law requires additional stress testing and reporting on a regular basis. In addition, a Federal Insurance Office (‘FIO’) has been established within the Treasury Department to monitor the insurance industry, co-ordinate federal policy and, along with the US Trade Representative, enter into international agreements on prudential insurance matters.
While the FIO will have no direct regulatory authority over the business of insurance, such international agreements could pre-empt inconsistent state insurance laws. The FIO is also required, among other things, to conduct a study of how to improve and modernise insurance regulation and to report to Congress. The new law does not currently have any immediate and significant impact on the Company and the FIO is still in the process of drafting its required report. We will continue to monitor the FIO and its activities.
Additionally, there is active discussion within the NAIC of moving to a principles-based valuation system for the setting of reserves and capital for life insurance companies. This could change our statutory reserve and capital requirements significantly and it is not possible to estimate the impact on our financial condition and results of operation at this time.
Risk-based capital
The NAIC has developed risk-based capital standards for life insurance companies as well as a model act for state legislatures to enact. The model act requires that life insurance companies report on a formula-based, risk-based capital standard that they calculate by applying factors to various asset, premium and reserve items. The formula takes into account the risk characteristics of a company, including asset risk, insurance risk, interest rate risk and business risk. The NAIC designed the formula as an early-warning tool to identify potentially inadequately capitalised companies for the purposes of initiating regulatory action. The model act imposes broad confidentiality requirements on those engaged in the insurance business (including insurers, agents, brokers and others) and on state insurance departments as to the use and publication of risk-based capital data.
Any state adopting the model act gives the state insurance commissioner explicit regulatory authority to require various actions by, or take various actions against, insurance companies whose adjusted capital does not meet minimum risk-based capital standards. The Iowa Insurance Commissioner takes into account the NAIC’s risk-based capital standards to determine adequate compliance with Iowa insurance law.
Effective 31 December 2005, the NAIC implemented new requirements, referred to as C-3 Phase II, for calculating risk-based capital in connection with variable annuity products with death and living benefit guarantees. These changes did not have a material effect on our US operations, and at 31 December 2012, the Company’s total adjusted capital under the NAIC’s definition substantially exceeded Iowa standards.
Canada
We write property and casualty business in Canada via a number of wholly owned companies.
Insurance business in Canada is regulated federally by the Office of the Superintendent of Financial Institutions (OSFI) for prudential supervision (i.e. capital adequacy, solvency, etc). OSFI derives its powers from the federal Insurance Companies Act (Canada) which governs the structure and operation of federally incorporated insurance companies.
The capital adequacy of insurance companies is monitored under the Minimum Capital Test (‘MCT’), a risk-based framework allowing for capital to be assessed on the basis of an individual company’s risk profile taking account of the investments held and insurance business being written. Companies have their own internal MCT target that is communicated to OSFI, which is set to ensure that they maintain capital in excess of 150% of the OSFI minimum requirement.
There are also ten individual provincial regulators each regulating predominantly conduct of business issues such as policy terms and conditions, and rates and underwriting of companies they have licensed to write business in the province.
Asia
We operate in Asia through a network of subsidiary companies either wholly owned or established as a joint venture with a local partner. Our business is predominantly long-term and savings business, with small general insurance and health operations.
There are wholly owned businesses in Singapore and Hong Kong. During 2012 Aviva also operated businesses in China, India, Malaysia, Sri Lanka, Taiwan, Korea, Indonesia and Vietnam which, depending on the nature and extent of the control exerted by Aviva, were accounted for as subsidiaries, joint ventures or associates. Aviva plc reached agreement in 2012 to sell its business in Sri Lanka, and in January 2013 also reached agreement to sell its business in Malaysia, subject to regulatory approval.
The Asia area is made up of a number of widely differing and independent markets. The markets tend to be at different stages in their development but each has its own regulatory structures and Aviva complies with the local regulation in each of the countries in which it operates.
Industry regulation typically focuses on financial stability, i.e. minimum capital and the basis for calculating solvency, reserves and policyholder liability. In many of the markets regulators have the power to revoke operating licences, regulate shareholder structures and the participation in and the payment of dividends. Asia markets are moving quickly to modernise insurance regulation with an increasing focus on governance and conduct of business.
Intellectual property
Our primary brands (the Aviva name and Logo) are registered trademarks in the UK and are registered or pending in all other countries where Aviva has operations.
Aviva has an active programme of review of marks and watching for infringements. There are no material infringements in the UK known to us as at the date of this report, either by the Group or third parties.
Code of ethics
The Company has adopted a code of ethics for its senior management, including the Board, the Group Executive Committee and the group chief accounting officer as required by the provisions of Section 406 of the Sarbanes-Oxley Act of 2002 and the rules issued by the SEC. There have been no amendments to, or waivers from, the code of ethics relating to any of those officers. The code of ethics was filed on 7 October 2009 as an exhibit to our Form 20-F registration document.
Risks relating to our business
You should carefully review the following risk factors together with other information contained in this Annual Report before making an investment decision relating to our ordinary shares or ADSs. Our business, financial position, results of our operations and cash flow could be materially affected by any of these risks, the trading price of our ordinary shares or ADSs could decline due to any of these risks and investors may lose part or all of their investment.
Ongoing difficult conditions in the global financial markets and the economy generally may adversely affect our business and results of operations, and these conditions may continue.
Our results of operations are materially affected by uncertainty in the worldwide financial markets and macro-economic conditions generally. A wide variety of factors, including concerns over slowing growth, high sovereign debt within, and to a lesser degree outside, the Eurozone, the stability and solvency of financial institutions, longer-term low interest rates in developed markets, inflationary threats as well as geopolitical issues in the Middle East and North Africa, have contributed to increased volatility in the financial markets and diminished expectations for the global economy going forward. Global fixed income markets continue to experience periods of both volatility and limited market liquidity, which have affected a broad range of asset classes and sectors.
Factors relating to general economic conditions, such as consumer spending, business investment, government spending, the volatility and strength of both debt and equity markets, and inflation, all affect the profitability of our business. In a sustained economic phase of low growth and high public debt, characterised by higher unemployment, lower household income, lower corporate earnings, lower business investment and lower consumer spending, the demand for our financial and insurance products could be adversely affected. In addition, we may experience an elevated incidence of claims or surrenders of policies. Any potential material adverse affect will also be dependent upon customer behaviour and confidence.
As a global business, we are exposed to various local political, regulatory and economic conditions, business risks and challenges which may affect the demand for our products and services, the value of our investment portfolios and the credit quality of local counterparties.
We offer our products and services in Europe (including the UK), North America and the Asia Pacific region through wholly owned and majority-owned subsidiaries, joint ventures, companies in which we hold non-controlling equity stakes, agents and independent contractors. Our international operations expose us to different local political, regulatory, business and financial risks and challenges which may affect the demand for our products and services, the value of our investment portfolio, the required levels of capital and surplus, and the credit quality of local counterparties. These risks include, for example, political, social or economic instability in countries in which we operate, discriminatory regulation, credit risks of our counterparties, lack of local business experience in certain markets, risks associated with exposure to insurance industry insolvencies through policyholder guarantee funds or similar mechanisms set up in markets in which we are present and, in certain cases, risks associated with the potential incompatibility with foreign partners, especially in countries in which we are conducting business through entities we do not control. Some of our international insurance operations are, and are likely to continue to be, in emerging markets where these risks are heightened. Our overall success as a global business depends, in part, upon our ability to succeed in different economic, social, regulatory and political conditions.
Credit risks relating to Aviva’s business
Market developments and government actions regarding the sovereign debt crisis in Europe, particularly in Greece, Ireland, Italy, Portugal and Spain, could have a material adverse effect on our results of operations, financial condition and liquidity.
The continued uncertainty over the outcome of various EU and international financial support programs and the possibility that other EU member states may experience similar financial pressures could further disrupt global markets. In particular, this crisis has disrupted and could further disrupt equity and fixed income markets and result in volatile bond yields on the sovereign debt of EU members.
The issues arising out of the current sovereign debt crisis may transcend Europe, cause investors to lose confidence in the safety and soundness of European financial institutions and the stability of European member economies, and likewise affect UK and US-based financial institutions, the stability of the global financial markets and any economic recovery. The Group holds investments in UK and non-UK securities. See ‘Performance Review – Analysis of Investments’ for more information.
If an EU member state were to default on its obligations or seek to leave the Eurozone, or if the Eurozone were broken up entirely, the impact on the financial and currency markets would be significant and could impact materially all financial institutions, including the Group. Such events could adversely affect our business and results of operations, financial condition and liquidity.
Credit spread volatility may adversely affect the net unrealised value of the investment portfolio and our results of operations.
Our exposure to credit spreads primarily relates to market price variability associated with changes in credit spreads in our investment portfolio, which is largely held to maturity. Credit spread moves may be caused by changes in the perception of the credit worthiness of the issuer, or from market factors such as the markets risk appetite and liquidity. A widening of credit spreads will generally reduce the value of fixed income securities we hold. Conversely, credit spread tightening will generally increase the value of fixed income securities we hold. It can be difficult to value certain of our securities if trading becomes less liquid. Accordingly, valuations of investments may include assumptions or estimates that may have significant period to period changes that could have a material adverse effect on our consolidated results of operations or financial condition. Downturns in the net unrealised value of our investment portfolio may also have a material adverse effect on our regulatory capital surplus based on the EU Insurance Groups Directive. Although our financial statements reflect the market value of assets, our priority remains the management of assets and liabilities over the longer term.
Losses due to defaults by counterparties, including potential sovereign debt defaults or restructurings, could adversely affect the value of our investments and reduce our profitability and shareholders’ equity.
We choose to take and manage credit risk through our investment assets partly to increase returns to policy holders whose policies the assets back, and partly to optimise the return for shareholders.
We have a significant exposure to third parties that owe us money, securities or other assets who may not perform under their payment obligations. These parties include private sector and government (or government-backed) issuers whose debt securities we hold in our investment portfolios (including mortgage-backed, asset-backed, government bonds and other types of securities), borrowers under residential and commercial mortgages and other loans, re-insurers to which we have ceded insurance risks, customers, trading counterparties, and counterparties under swap and other derivative contracts. We also execute transactions with other counterparties in the financial services industry, including brokers and dealers, commercial and investment banks, hedge funds and other investment funds, insurance groups and institutions. Many of these transactions expose us to credit risk in the event of default of our counterparty.
In addition, with respect to secured transactions, our credit risk may be increased when the collateral held by us cannot be realised or is liquidated at prices insufficient to recover the full amount of the loan or other value due. Losses or impairments to the carrying value of these assets could materially and adversely affect our financial condition and results of operations.
We use reinsurance and hedging programs to hedge various risks, including certain guaranteed minimum benefits contained in many of our long-term insurance and fund management products. These programs cannot eliminate all of the risks and no assurance can be given as to the extent to which such programs will be effective in reducing such risks. Our obligations under our fund management and insurance products are not changed by our hedging activities and we are liable for our obligations even if our derivative counterparties do not pay us. Defaults by such counterparties could have a material adverse effect on our financial condition and results of operations.
We are also susceptible to an adverse financial outcome from a change in third-party credit standing. As well as having a potential impact on spreads, rating movements can trigger solvency and accounting impacts.
For additional information about our investments, see ‘Performance review – Analysis of investments’.
Market risks relating to Aviva’s business
Changes in interest rates may cause policyholders to surrender their contracts, reduce the value of our investment portfolio and impact our asset and liability matching, which could adversely affect our results of operation and financial condition.
Our exposure to interest rate risk relates primarily to the market price and cash flow variability of assets and liabilities associated with changes in interest rates.
Some of our products, principally traditional participating products, universal life insurance and annuities, including fixed and equity indexed annuities, expose us to the risk that changes in interest rates will reduce our ‘spread’, or the difference between the amounts that we are required to pay under the contracts and the rate of return we are able to earn on investments intended to support obligations under the contracts. Our spread is a key component of our net income.
As interest rates decrease or remain at low levels, we may be forced to reinvest proceeds from investments that have matured or have been prepaid or sold at lower yields, reducing our investment return. Moreover, borrowers may prepay or redeem the fixed-income securities, commercial mortgages and mortgage-backed securities in our investment portfolio with greater frequency in order to borrow at lower market rates, which increases this risk. Lowering interest crediting or policyholder bonus rates can help offset decreases in investment margins on some products. However, our ability to lower these rates could be limited by competition or contractually guaranteed minimum rates and may not match the timing or magnitude of changes in asset yields. As a result, our spread could decrease or potentially become negative. Our expectation for future spreads is an important component in the amortisation of policy acquisition costs and significantly lower spreads may cause us to accelerate amortisation, thereby reducing net income in the affected reporting period. In addition, during periods of declining interest rates, the guarantees within existing life insurance and annuity products may be more attractive to consumers, resulting in increased premium payments on products with flexible premium features, and a higher percentage of insurance policies remaining in force from year to year, during a period when our new investments carry lower returns. Accordingly, during periods of declining interest rates, our profitability may suffer as the result of a decrease in the spread between interest rates credited to policyholders and returns on our investment portfolio.
Increases in market interest rates could also negatively affect our profitability. Surrenders of life insurance policies and fixed annuity contracts may increase as policyholders seek higher returns and higher guaranteed minimum returns. Obtaining cash to satisfy these surrenders may require us to liquidate fixed maturity investments at a time when market prices for those assets are depressed which may result in realised investment losses. Regardless of whether we realise an investment loss, these cash payments would result in a decrease in total invested assets, and may decrease our net income. Premature withdrawals may also cause us to accelerate amortisation of policy acquisition costs, which would also reduce our net income.
Our mitigation efforts with respect to interest rate risk are primarily focused on maintaining an investment portfolio with diversified maturities that has a weighted average duration approximately equal to the duration of our estimated liability cash flow profile. However, it may not be possible to hold assets that will provide cash flows to exactly match those relating to policyholder liabilities, in particular in jurisdictions with less developed bond markets and in certain markets where regulated surrender value or maturity values are set with reference to the interest rate environment prevailing at the time of policy issue. This is due to the duration and uncertainty of the liability cash flows and the lack of sufficient assets of suitable duration. This results in a residual asset/liability mismatch risk that can be managed but not eliminated. In addition, our estimate of the liability cash flow profile may be inaccurate for other reasons, such as varying mortality or general insurance claims, and we may be forced to liquidate investments prior to maturity at a loss in order to cover the liability. Such a loss could have a material adverse affect on our results of operations and financial condition.
See ‘Financial statements IFRS – Note 53 – Risk management’.
Changes in short or long term inflation may cause policyholders to surrender their contracts, increase the size of our claims payments and expenses and reduce the value of our investments, which could adversely affect our results of operations and financial condition.
We are subject to inflation risk through our holdings of fixed interest and other investments and as a result of the potential for the cost of claims and expenses to rise faster than anticipated in our pricing or reserving. Changes in inflation could also affect the value perceived to be offered by our policies and so adversely affect persistency levels.
Falls in equity or property prices could have an adverse impact on our investment portfolio and impact our results of operations and shareholders’ equity.
We are subject to equity and property price risk due to holdings of equities and investment properties in a variety of locations worldwide. Downturns in equity markets will depress equity prices and have a negative impact on our capital position in that unrealised losses in our net investment portfolio will increase, and our defined benefit pension scheme surplus/deficit will reduce/increase as the market value of scheme assets invested in equities decreases.
Downturns and volatility in equity markets can have a material adverse effect on the revenues and returns from our unit-linked, participating and fund management business. The unit-linked and fund management business depends on fees related primarily to the value of assets under management and would therefore be
reduced by declines in equity and property markets. Profits could also be reduced as a result of current investors withdrawing funds or reducing their rates of ongoing investment with our fund management companies, or switching to lower risk funds generating lower income, or as a result of our fund management companies failing to attract funds from new investors. Similarly, bonuses credited to participating policyholders will reduce, following declines in equity and property markets and this will generally also lead to reductions in transfers to shareholders.
Downturns in equity markets may also have a material adverse effect on our regulatory capital surplus as measured under the EU Insurance Groups Directive. We provide certain guarantees within some of our products that protect policyholders against significant downturns in the equity markets. In volatile or declining equity market conditions, we may need to increase liabilities for future policy benefits and policyholder account balances, negatively affecting net income. For a discussion of guarantees we have given for our insurance and investment products, see ‘Financial statements IFRS – Note 38 – Financial guarantees and options’.
In our US business in particular, market downturns and volatility may discourage purchases of accumulation products, such as equity-indexed annuities and equity-indexed life insurance, that have returns linked to the performance of the equity markets and may cause some of our existing customers to withdraw cash values or reduce investments in those products. A sustained weakness in the markets will decrease revenues and earnings in these types of products.
For property investment, we are subject to counterparty, valuation and liquidity risks. These investments may be adversely affected by weakness in property markets and increased mortgage delinquencies. We are also subject to property risk indirectly in our investments in residential mortgage-backed securities (RMBS) and commercial mortgage-backed securities (CMBS). There is the risk that the underlying collateral may fall in value causing the investment in securities to fall in value. The markets for these property investments and instruments can become illiquid, and issues relating to counterparty credit ratings and other factors may increase pricing and valuation uncertainties.
Fluctuations in currency exchange rates may adversely affect our results of operations and financial condition.
We operate internationally and are exposed to foreign currency exchange risk arising from fluctuations in exchange rates of various currencies. For the year ended 31 December 2012, over half of our premium income arises in currencies other than sterling, and our net assets are denominated in a variety of currencies, of which the largest are the euro, sterling and US dollar. In managing our foreign currency exposures, we do not hedge revenues as these are substantially retained locally to support the growth of the business and meet local regulatory and market requirements. Nevertheless, the effect of exchange rate fluctuations on local operating results could lead to significant fluctuations in our consolidated financial statements upon translation of the results into sterling. Although we take certain actions to address this risk, foreign currency exchange rate fluctuation could materially adversely affect our reported results due to unhedged positions or the failure of hedges to effectively offset the impact of the foreign currency exchange rate fluctuation. Any adverse foreign currency exchange fluctuation may also have a material adverse effect on our regulatory capital surplus based on the EU Insurance Groups Directive.
For a discussion of the impact of changes in foreign exchange rates on our results of operations, see ‘Financial statements IFRS – Note 53 – Risk management’.
Market fluctuations may cause the value of options and guarantees embedded in some of our life insurance products to exceed the value of the assets backing their reserves, which could adversely affect our results of operations or financial condition.
As a normal part of their operating activities, various Group companies have given guarantees and options, including interest rate and investment return guarantees, in respect of certain long-term insurance and fund management products. In providing these guarantees and options, our capital position is sensitive to fluctuations in financial variables, including foreign currency exchange rates, interest rates, property values and equity prices.
Interest rate guaranteed returns, such as those available on guaranteed annuity options (GAOs), are sensitive to interest rates falling below the guaranteed level. Other guarantees, such as maturity value guarantees and guarantees in relation to minimum rates of return, are sensitive to fluctuations in the investment return below the level assumed when the guarantee was made.
Periods of significant and sustained downturns in equity markets, increased equity or interest rate volatility or reduced interest rates could result in an increase in the valuation of the future policy benefit or policyholder account balance liabilities associated with such products, resulting in a reduction to net income. We use reinsurance in combination with derivative instruments to mitigate some of the liability exposure and the volatility of net income associated with these liabilities, and while we believe that these and other actions mitigate the risks related to these benefits, we remain liable for the guaranteed benefits in the event that reinsurers or derivative counterparties are unable or unwilling to pay, although this may be partially mitigated by the posting of collateral by our counterparties.
We are also subject to the risk that the cost of hedging these guaranteed minimum benefits increases, resulting in a reduction to net income. In addition, we are subject to the risk that unanticipated policyholder behaviour or mortality, combined with adverse market events, produces economic losses beyond the scope of the risk management techniques employed. These, individually or collectively, may have a material adverse effect on our results of operations, financial condition or liquidity.
The determination of the amount of allowances and impairments taken on our investments is highly subjective. If our business does not perform well, we may be required to recognise an impairment of our goodwill or intangibles with indefinite and finite useful lives, which could adversely affect our results of operations or financial condition.
The determination of the amount of allowances and impairments vary by investment type and is based upon our periodic evaluation and assessment of known risks associated with the respective asset class. Such evaluations and assessments are revised as conditions change and new information becomes available and additional impairments may need to be taken or allowances provided for in the future. If the carrying value of an investment is greater than the recoverable amount, the carrying value is reduced through a charge to the income statement in the period of impairment. There can be no assurance that management has accurately assessed the level of impairments taken and allowances reflected in our financial statements.
Goodwill represents the excess of the amounts we paid to acquire subsidiaries and other businesses over the fair value of their net assets at the date of acquisition. We test goodwill and intangible assets with indefinite useful lives at least annually for impairment or when circumstances or events indicate there may be uncertainty over this value. We test intangibles with finite lives when circumstances or events indicate there may be uncertainty over this value. For impairment testing, goodwill and intangibles have been allocated to cash-generating units by geographical reporting unit and business segment.
The fair value of the reporting unit is impacted by the performance of the business. Goodwill, negative unallocated divisible surplus and indefinite life intangibles are written down for impairment where the recoverable amount is insufficient to support its carrying value. Such write downs could have a material adverse effect on our results of operations or financial condition.
Liquidity risks relating to Aviva’s business
Adverse capital and credit market conditions may affect our ability to meet liquidity needs and to access capital which could adversely affect our results of operations or financial condition.
At a Group level, we need our subsidiaries to remit dividends to the Group to meet operating expenses, taxes, interest on our debt, dividends on our capital stock and repay maturing debt. Dividends from subsidiaries can become constrained by adverse business experience, regulatory actions etc which could have a material adverse effect on our business. At an operational level we also need liquidity to meet our liabilities. Without sufficient liquidity, we could be forced to curtail our operations and our business would suffer. The principal sources of our liquidity are insurance premiums, annuity considerations, deposit fundsand cash flow from our investment portfolio and assets, consisting mainly of cash or assets that are readily convertible into cash. Sources of liquidity in normal markets also include a variety of short and long-term instruments, including repurchase agreements, commercial paper, medium and long-term debt, junior subordinated debt, securities, capital securities and stockholders’ equity.
We hold certain investments that may lack liquidity such as privately placed fixed-maturity securities, and unlisted equities, and other investments where the inputs used for their valuation are not directly observable in the market. These asset classes represented approximately 5.3% of the total assets held at fair value as of 31 December 2012 (6.3% excluding assets held for sale). As has been the case across the industry, even some of our higher-quality assets have been more illiquid as a result of the recent challenging market conditions.
The reported value of our relatively illiquid types of investments, our investments in the asset classes described in the paragraph above and, at times, our higher-quality, generally liquid asset classes, do not necessarily reflect the lowest current market price for each asset. If we were forced to sell certain of our assets in the current market, there can be no certainty that we would be able to sell them for the prices at which we have recorded them and we may be forced to sell them at significantly lower prices.
We may need to seek additional financing in the event internal resources are not sufficient to meet our needs. The availability of additional financing would depend on a variety of factors such as market conditions, the general availability of credit, the overall availability of credit to the financial services industry and the market’s perception of our financial condition. Disruptions and uncertainty or volatility in the capital and credit markets may exert downward pressure on availability of liquidity and credit capacity for certain issuers and may limit our access to capital required to operate and grow our business. Such market conditions may limit our ability to replace, in a timely manner, maturing debt, satisfy statutory capital requirements and generate fee income and market-related revenue to meet liquidity needs.
As such, we may be forced to delay raising capital, issue shorter-term securities than we prefer, or bear an unattractive cost of capital which could decrease our profitability and reduce our financial flexibility. Our results of operations, financial condition and cash flows could be materially adversely affected.
As a holding company, we are dependent on our operating subsidiaries to cover operating expenses and dividend payments.
As a holding company, Aviva plc has no substantial operations of its own. Its principal sources of funding are dividends from subsidiaries, shareholder-backed funds and any amounts that may be raised through the issuance of debt and commercial paper. Our insurance and fund management operations are generally conducted through direct and indirect subsidiaries. Certain subsidiaries have regulatory restrictions that may limit the payment of dividends, which in some circumstances could limit our ability to pay dividends to shareholders. The inability of our subsidiaries to pay dividends in an amount sufficient to enable us to meet our cash requirements at the holding company level could have a material adverse effect on our business.
Insurance risks relating to Aviva’s business
The cyclical nature of the insurance industry may cause fluctuations in our results.
Historically, the insurance industry has been cyclical and operating results of insurers have fluctuated because of volatile and sometimes unpredictable developments, many of which are beyond the direct control of any insurer. Although we have a geographically diverse group of businesses providing a wide range of products, we expect to experience the effects of this cyclical nature, including changes in sales and premium levels. The unpredictability and competitive nature of the general insurance business has contributed historically to significant quarter-to-quarter and year-to-year fluctuations in underwriting results and net earnings.
The use of inaccurate assumptions in pricing and reserving for insurance business may have an adverse effect on our business profitability.
The Group’s life insurance companies are required to make a number of assumptions in relation to the business written, including the mortality and morbidity rates of our customers, the development of interest rates, lapse rates (the rates at which customers terminate existing policies prior to their maturity dates) and future levels of expenses. These assumptions may turn out to be incorrect.
When establishing their liabilities, our life insurance companies allow for changes in the assumptions made, monitor their experience against the actuarial assumptions used and assess the information gathered to refine their long-term assumptions, together with taking actual claims experience into account. However, it is not possible to determine precisely the total amounts that will ultimately be paid under the policies written by the business as amounts may vary from estimates. Changes in assumptions may also lead to changes in the level of capital required to be maintained, meaning that we may need to increase the amount of our reserves. This could have a material adverse impact on the Group’s value, the results of our operations and financial condition.
Additionally, our management of the general insurance business requires the general insurance companies to make a number of assumptions in relation to the business written. These assumptions include the costs of writing the business and settling claims, and the frequency and severity of claims. The assumptions may turn out to be incorrect, thereby adversely impacting our profit. Additionally, man-made disasters, including accidents and intentional events, are particularly difficult to predict with a high degree of accuracy. These would also have an adverse impact on our profit due to higher than expected claims.
Furthermore, outstanding claims provisions for the general insurance business are based on the best-estimateof the cost of future claim payments, plus an explicit allowance for risk and uncertainty. together with related claims handling costs.
Any provisions for re-opened claims are also included. A range of methods, including stochastic projections, may be used to determine these provisions. Underlying these methods are a number of explicit or implicit assumptions relating to the
expected settlement amount and settlement pattern of claims.
If the assumptions underlying the reserving basis were to prove incorrect, we might have to increase the amount of the general insurance provisions, which would adversely impact our financial condition or results of operations.
We have a significant exposure to annuity business and a significant life insurance risk is associated with longevity.
Longevity statistics are monitored in detail and compared with emerging industry trends. The results are used to inform both the reserving and pricing of annuities within the Group. It is likely that uncertainty will remain in the development of future longevity that cannot be mitigated.
A strengthening in the longevity assumption, either to reflect changes in the underlying life expectancy of the population or of our particular portfolio used to calculate our long-term business liabilities, would result in an increase in these reserves and reduce our shareholders’ equity.
See ‘Financial statements IFRS – Note 53 – Risk management’.
If our business does not perform well or if actual experience versus estimates used in valuing and amortising Deferred Acquisition Costs (DAC) and Acquired value of in-force business (AVIF) vary significantly, we may be required to accelerate the amortisation and/or impair the DAC and AVIF which could adversely affect our results of operations or financial condition.
We incur significant costs in connection with acquiring new and renewal business. Those costs that vary with and are driven by the production of new and renewal business are deferred and referred to as DAC. The recovery of DAC is dependent upon the future profitability of the related business. The amount of future profit or margin is dependent principally on investment returns in excess of the amounts credited to policyholders, mortality, morbidity, persistency and expenses to administer the business. Of these factors, investment margins and general insurance underwriting profit are most likely to impact the rate of amortisation of such costs. The aforementioned factors enter into management’s estimates of gross profits or margins, which generally are used to amortise such costs. If the estimates of gross profits or margins were overstated, then the amortisation of such costs would be accelerated in the period the actual amount is known and would result in a charge to income. Significant or sustained equity market declines could result in an acceleration of amortisation of the DAC related to unit-linked business, resulting in a charge to income. Such adjustments could have a material adverse effect on our results of operations or financial condition.
AVIF reflects the estimated present value of future profits that will emerge over the remaining life of certain in-force contracts in a life insurance company, acquired either directly or through the purchase of a subsidiary, and represents the portion of the purchase price that is allocated to the value of the right to receive future cash flows from the insurance and investment contracts in-force at the acquisition date. AVIF is based on actuarially determined projections. Actual experience may vary from the projections. Revisions to estimates result in changes to the amounts expensed in the reporting period in which the revisions are made and could result in impairment and a charge to income. Where AVIF is amortised, an acceleration of the amortisation of AVIF would occur if the estimates of gross profits or margins were overstated in the period in which the actual experience is known and would result in a charge to net income. Such adjustments could have an adverse effect on our results of operations or financial condition.
Catastrophic events, which are often unpredictable by nature, could result in material losses and abruptly and significantly interrupt our business activities.
Our business is exposed to volatile natural and man-made disasters such as pandemics, hurricanes, windstorms, earthquakes, terrorism, riots, fires and explosions. Over the past several years, changing weather patterns and climatic conditions have added to the unpredictability and frequency of natural disasters in certain parts of the world and created additional uncertainty as to future trends and exposure.
Our life insurance operations are exposed to the risk of catastrophic mortality, such as a pandemic or other event that causes a large number of deaths. The effectiveness of external parties, including governmental and non-governmental organisations, in combating the spread and severity of such a pandemic could have a material impact on the losses experienced by us.
The extent of losses from a catastrophe is a function of both the total amount of insured exposure in the area affected by the event and the severity of the event. Most catastrophes are restricted to small geographic areas; however, pandemics, hurricanes, earthquakes and man-made catastrophes may produce significant damage in larger areas, especially those that are heavily populated. Catastrophic events could also harm the financial condition of our reinsurers and thereby increase the probability of default on reinsurance recoveries and could also reduce our ability to write new business. Furthermore, pandemics, natural disasters, terrorism and fires could disrupt our operations and result in significant loss of property, key personnel and information about our clients and our business if our business continuity plans fail to cope with the scale or nature of the catastrophe. Such events could adversely affect our business, results or operations, corporate reputation and financial condition for a substantial period of time.
Furthermore, market conditions beyond our control determine the availability and cost of the reinsurance protection we purchase. Accordingly, we may be forced to incur additional expenses for reinsurance or may not be able to obtain sufficient reinsurance on acceptable terms, which could adversely affect our ability to write future business.
Operational risks relating to Aviva’s business
All of our businesses are subject to operational risks, including the risk of direct or indirect loss resulting from inadequate or failed internal and external processes, systems and human error or from external events.
Our business is dependent on processing a large number of complex transactions across numerous and diverse products. Furthermore, the long-term nature of the majority of our business means that accurate records have to be maintained for significant periods.
We also outsource several operations, including certain servicing and IT functions and are therefore partially reliant upon the operational processing performance of our outsourcing partners.
Our systems and processes on which we are dependent to serve our customers are designed to appropriately identify and address the operational risks associated with our activities. However, they may nonetheless fail due to IT malfunctions, human error, intentional disruption or hacking of IT systems by third parties, business interruptions, non-performance by third parties or other external events. This could disrupt business operations resulting in material reputational damage and the loss of customers, and have a consequent material adverse effect on our results of operations and financial condition. Although we have taken steps to upgrade systems and processes to reduce these operational risks, we cannot anticipate the details or timing of all possible operational and systems failures which may adversely impact our business.
We operate in several markets through arrangements with third parties. These arrangements involve certain risks that we do not face with our subsidiaries.
Our ability to exercise management control over our partnership operations, our joint ventures and our investment in them depends on the terms of the legal agreements. In particular, the relationships depend on the allocation of control among, and continued co-operation between, the participants.
We may also face financial or other exposure in the event that any of our partners fail to meet their obligations under the agreement or encounter financial difficulty. For example, a significant proportion of our product distribution, such as bancassurance, is carried out through arrangements with third parties not controlled by us and is dependent upon the continuation of these relationships. A temporary or permanent disruption to these distribution arrangements could affect our financial condition. Some of these arrangements require our third-party partners to participate in and provide capital to our joint venture, associate and subsidiary undertakings. Our partners may change their strategic priorities or encounter financial difficulties preventing them from providing the necessary capital to promote future growth.
In addition, we outsource certain customer service, technology and legacy policy administration functions to third parties and may do so increasingly in the future. If we do not effectively develop and implement our outsourcing strategy, third-party providers do not perform as anticipated or we experience technological or other problems with a transition to or between such providers, we may not realise the full extent of productivity improvements or cost efficiencies and may experience operational difficulties, increased costs and a loss of business.
The failure to attract or retain the necessary personnel could have a material adverse effect on our results and/or financial condition.
As a global financial services organisation, we rely to an extent on the quality of local management in the countries in which we operate. The success of our operations is dependent, among other things, on our ability to attract and retain highly qualified professional employees. Competition for such key employees is intense. Our ability to attract and retain key employees is dependent on a number of factors, including prevailing market conditions and compensation packages offered by companies competing for the same talent.
There are inherent funding risks associated with our participation in defined benefit staff pension schemes.
We operate both defined benefit and defined contribution staff pension schemes. The defined benefit section of the UK staff pension scheme was closed to new members from 1 April 2011, with entry into the defined contribution sections being offered to the staff members affected. Closure of the defined benefit scheme has removed the volatility associated with adding future accrual for active members.
There are inherent funding risks associated with the defined benefit schemes. Events could result in a material reduction in the funding position of such schemes and, in some cases, may result in a deficit between the pension scheme’s assets and liabilities. The factors that affect the scheme’s position include: poor investment performance of pension fund investments; greater life expectancy than assumed; adverse changes in interest rates or inflation; and other events occurring that increase the costs of past service benefits over the amounts predicted in the actuarial assumptions. In the short term, the funding position is inherently volatile due to movements in the market value of assets. Where a funding deficit or surplus arises, the position will be discussed with the scheme trustees to agree appropriate actions. This may include a plan to fund the deficit over a period of years. Any surplus or deficit in the defined benefit pension scheme will affect our shareholders’ equity, although the IFRS position may diverge from the scheme funding position.
The UK pension schemes are subject to statutory requirements with regards to funding and other matters relating to the administration of the schemes. Compliance with these requirements is subject to regular review. A determination that we have failed to comply with applicable regulations could have a negative impact on our results of operations or our relationship with current and potential contributors and employees and adverse publicity.
Our process for valuing investments may include methodologies, estimations and assumptions which require judgement and could result in changes to investment valuations.
We value our available for sale (AFS) and fair value ( FV) securities using designated methodologies, estimation and assumptions. These securities, which are reported at fair value on the consolidated statement of financial position, represent the majority of invested assets. We have categorised the measurement basis for assets carried at fair value into a ‘fair value hierarchy’ in accordance with the valuation inputs and consistent with IFRS 7 Financial Instruments: Disclosures. The fair value hierarchy gives the highest priority to quoted prices in active markets for identical assets or liabilities (Level 1); the middle priority to fair values other than quoted prices basedon observable market information (Level 2); and the lowest priority to unobservable inputs that reflect the assumptions that we consider market participants would normally use (Level 3). The majority of our financial assets are valued based on quoted market information (Level 1) or observable market data (Level 2). The majority of investment property and commercial mortgages are classified as Level 2. At 31 December 2012, 5.1% of total financial investments, loans and investment properties at fair value were classified as Level 3, amounting to £13,434 million (5.8% and £12,918 million excluding assets held for sale). Where estimates were used for inputs to Level 3 fair values, these were based on a combination of independent third-party evidence and internally developed models, intended to be calibrated to market observable data where possible.
An asset or liability’s classification within the fair value hierarchy is based on the lowest level of significant input to its valuation.
See ‘IFRS critical accounting policies – Investments’. Any change to investment valuations may affect our results of operations and reported financial condition.
Systems errors or regulatory changes may affect the calculation of unit prices or deduction of charges for our unit-linked products which may require us to compensate customers retrospectively.
A significant proportion of our product sales are unit-linked contracts, where product benefits are linked to the prices of underlying unit funds. While comprehensive controls are in place, there is a risk of error in the calculation of the prices of these funds due to human error in data entry, IT-related issues or other causes. Additionally, it is possible that policy charges which are deducted from these contracts are taken incorrectly, or the methodology is subsequently challenged by policyholders or regulators and changed retrospectively. Any of these can give rise to compensation payments to customers. Controls are in place to mitigate these risks, but errors could give rise to future liabilities. Payments due to errors or compensation may negatively impact our profits.
Moves to simplify the operating structure and activities of the Group increases the reliance placed on core businesses and is subject to execution risk.
As part of the Group’s move to a more simplified structure, a number of business disposals and operational restructures have taken place and may continue to occur in the future. This includes the removal of the regional organisational structure and the potential sale of a number of non-core businesses. These changes are expected to reduce the operational costs of the Group and allow resources to be re-deployed in more capital efficient businesses. There is no assurance that these expected benefits will be realised. These changes may reduce adjusted operating profits in the short-term and will lead to changes in the geographical and product risk profile of the Group. The execution risk including the risks relating to securing the regulatory approvals necessary to complete our planned business disposals, could result in the failure to achieve cost savings, the loss of key staff, and disruption to core business activities and governance structures which could have a material adverse effect on our business, results of operations and financial condition.
Brand and reputation risks relating to Aviva’s business
We are rated by several rating agencies, and a decline in any of these ratings could affect our standing among customers, broker-dealers, agents, wholesalers and other distributors of our products and services and cause our sales and earnings to decrease.
A rating downgrade, or the perceived potential for such a downgrade, of Aviva plc or any of our rated insurance subsidiaries may, among other things, materially increase the number of policy surrenders and withdrawals by policyholders of cash values from their policies. The outcome of such activities may be cash payments requiring the sale of invested assets, including illiquid assets, at a price that may result in realised investment losses. These cash payments to policyholders would result in a decrease in total invested assets and a decrease in net income. Among other things, early withdrawals may also cause us to accelerate amortisation of policy acquisition costs, which would reduce net income. A rating downgrade may also impact sales volumes, particularly in the US where there is more focus on ratings when evaluating similar products. The ratings provided by A.M. Best are widely considered to be the most important for distribution in the US, and although we have agreed to sell such operations, a downgrade could lead to a significant loss of sales.
Similarly, a rating downgrade may increase our cost of borrowing or limit our access to some forms of financing.
We are dependent on the strength of our brand, the brands of our partners and our reputation with customers and agents in the sale of our products and services.
Our results are, to a certain extent, dependent on the strength of our brand and reputation. While we as a Group are well recognised, we are vulnerable to adverse market and customer perception. We operate in an industry where integrity, customer trust and confidence are paramount. We are exposed to the risk that litigation, employee misconduct, operational failures, the outcome of regulatory investigations, press speculation and negative publicity, disclosure of confidential client information, inadequate services, amongst others, whether true or not, could impact our brand or reputation. Our brand and reputation could also be affected if products or services recommended by us (or any of our intermediaries) do not perform as expected (whether or not the expectations are founded) or in line with the customers’ expectations for the product range. Such a change to our brand strength could adversely affect our results of operations and financial condition.
We may not be able to protect our intellectual property and may be subject to infringement claims by a third party.
Our primary brand (Aviva) is a registered trade mark in the UK and elsewhere. We own other registered or pending trade marks in the UK, including Community trade marks having effect in the entire EU. We rely on a combination of contractual rights, copyright and trademark laws to establish and protect our intellectual property. Although we use a broad range of measures to protect our intellectual property rights, third parties may infringe or misappropriate our intellectual property. The loss of intellectual property protection or the inability to secure or enforce the protection of our intellectual property assets could have a material adverse effect on our business and our ability to compete.
Third parties may have, or may eventually be issued, patents or other protections that could be infringed by our products, methods, processes or services or could limit our ability to offer certain product features. In recent years, there has been increasing intellectual property litigation in the financial services industry challenging, among other things, product designs and business processes. If a third party were to successfully assert an intellectual property infringement claim against us, or if we were
otherwise precluded from offering certain features or designs, or utilising certain processes, it could have a material effect on our business, results of operation and financial condition.
Our businesses are conducted in highly competitive environments.
There are many factors which affect our ability to sell our products, including fiscal incentives, price and yields offered, financial strength and ratings, range of product lines and product quality, brand strength and name recognition, investment management performance and historical bonus levels. In some of our markets, the Group faces competitors that are larger, have greater financial resources or greater market share, offer a broader range of products, benefit from more advantageous tax treatments, or have higher bonus rates or claims-paying ratios. Further, heightened competition for talented and skilled employees with local experience, particularly in the emerging, high-growth markets, may limit our potential to grow our business as quickly as planned.
Our principal competitors in the life market include many of the major financial services businesses including, in particular, Axa, Allianz, Generali, Prudential and Standard Life. Our principal competitors in the general insurance market include Royal Bank of Scotland Insurance, RSA, Zurich, Axa and Allianz.
We also face competitors who specialise in many of the niche markets in which we operate. We believe that competition will intensify across all businesses in response to consumer demand, technological advances, the impact of consolidation, regulatory actions and other factors.
Our ability to generate an appropriate return depends significantly upon our capacity to anticipate and respond appropriately to these competitive pressures.
Our regulated business is subject to extensive regulatory supervision both in the UK and internationally.
We are subject to extensive laws and regulations that are administered and enforced by a number of different governmental authorities and non-governmental self-regulatory agencies, including the FSA and other regulators. In light of wider financial and economic conditions, some of these authorities are considering, or may in the future consider, enhanced or new regulatory requirements intended to prevent future crises or otherwise assure the stability of institutions under their supervision. These authorities may also seek to exercise their supervisory or enforcement authority in new or more robust ways. All of these possibilities, if they occurred, could affect the way we conduct our business and manage our capital, and may require us to satisfy increased capital requirements.
Insurance regulation in the UK is largely based on the requirements of EU directives. Inconsistent application of directives by regulators in different EU member states may place our business at a competitive disadvantage to other European financial services groups. In addition, changes in the local regulatory regimes of designated territories could affect the calculation of our solvency position.
Our insurance subsidiaries worldwide are subject to detailed and comprehensive government regulation in each of the jurisdictions in which they conduct business. Regulatory agencies have broad administrative power over many aspects of the insurance business, which may include premium rates, marketing and selling practices, advertising, licensing agents, policy forms, capital adequacy and permitted investments. Government regulators are concerned primarily with the protection of policyholders rather than our shareholders or creditors. In the UK, our business is subject to regulation by the FSA, which has broad powers under the FSMA, including the authority to grant, vary the terms of, or cancel a regulated firm’s authorisation, to investigate
marketing and sales practices and to require the maintenance of adequate financial resources. The FSA has the power to take a range of investigative, disciplinary or enforcement actions, including public censure, restitution, fines or sanctions and to award compensation. The FSA is being replaced by twin regulators, the Prudential Regulation Authority and the Financial Conduct Authority. This change will take effect on 1 April 2013.
The FSA may make enquiries of the companies which it regulates regarding compliance with regulations governing the operation of business and, similar to the other UK regulated financial services companies, we face the risk that the FSA could find that we have failed to comply with applicable regulations or have not undertaken corrective action as required.
Issues and disputes may arise from time to time from the way in which the insurance industry or fund management industry has sold or administered an insurance policy or other product or in the way in which they have treated policyholders or customers, either individually or collectively.
Where larger groups or matters of public policy are concerned, the FSA may intervene directly. There have been several industry-wide issues in recent years in which the FSA has intervened directly, including the sale of personal pensions, the sale of mortgage-related endowments and investments in split capital investment trusts and payment protection insurance.
Outside of the UK, our business is regulated by local regulators that often have similar powers to the FSA and could therefore have a similar negativeimpact on perceptions of our business or have a material adverse effect on our business.
Furthermore, various jurisdictions in which we operate, including the UK, have created investor compensation schemes that require mandatory contributions from market participants in some instances in the event of a failure of another market participant. As a major participant in the majority of our chosen markets, circumstances could arise where we, along with other companies, may be required to make such contributions.
A determination that we have failed to comply with applicable regulation could have a negative impact on our results of operations or on our relations with current and potential customers. Regulatory action against a member of the Group could result in adverse publicity for, or negative perceptions regarding, the Group, or could have a material adverse effect on our business, our results of operations and financial condition and divert management’s attention from the day-to-day management of the business.
We will not always be able to predict the impact of future legislation or regulation or changes in the interpretation or operation of existing legislation or regulation on our business, results of operations and financial condition. Changes in government policy, legislation or regulatory interpretation applying to companies in the financial services and insurance industries in any of the markets in which we operate, which may be applied retrospectively, may adversely affect our product range, distribution channels, capital requirements, dividends payable by subsidiaries and, consequently, results and financing requirements.
We may face increased compliance costs due to the need to set up additional compliance controls or the direct cost of such compliance because of changes to financial services legislation or regulation.
The Solvency II Directive (‘Solvency II’), an insurance industry regulation agreed by the European Parliament in 2009, will require European domiciled insurers to move to more risk-based capital requirements. The implementation date for Solvency II has been extended to January 2014 and may be extended further. There continue to be material uncertainties around the impact of the more detailed technical requirements of Solvency II and there is a risk that this could lead to a significant increase in the capital required to support our business.
We are involved in various legal proceedings, regulatory investigations and examinations and may be involved in more in the future.
We have been named as defendants in lawsuits, including class actions and individual lawsuits. We have been subject to regulatory investigations or examinations in the various jurisdictions where we operate. These actions arise in various contexts, including in connection with our activities as an insurer, securities issuer, employer, investment adviser, investor and taxpayer. Certain of these lawsuits and investigations seek significant or unspecified amounts of damages, including punitive damages, and certain of the regulatory authorities involved in these proceedings have substantial powers over the conduct and operations of our business.
Due to the nature of certain of these lawsuits and investigations, we cannot make an estimate of loss or predict with any certainty the potential impact of these lawsuits or investigations.
In the course of conducting insurance business, we receive general insurance liability claims, and become involved in actual or threatened related litigation arising there from, including claims in respect of pollution and other environmental hazards. Given the significant delays that are experienced in the notification of these claims, the potential number of incidents that they cover and the uncertainties associated with establishing liability and the availability of reinsurance, the ultimate cost cannot be determined with certainty.
Additionally, it is possible that a regulator in one of our major markets may conduct a review of products previously sold, either as part of an industry-wide review or specific to us. The result of this review may be to compensate customers for losses they have incurred as a result of the products they were sold.
All of the above could adversely impact our results of operations or financial condition.
From time to time, changes in the interpretation of existing tax laws, amendments to existing tax rates or the introduction of new tax legislation may adversely impact our business.
We operate in numerous tax jurisdictions around the world and face risks associated with changes in tax law, interpretation of tax law, changes in tax rates and the risk of failure to comply with procedures required by tax authorities. Failure to manage tax risks could lead to an additional tax charge or a financial penalty.
If, as a result of a particular tax risk materialising, the tax costs associated with certain transactions are greater than anticipated, it could affect the profitability of those transactions.
There are also specific rules governing the taxation of policyholders. We are unable to predict accurately the impact of future changes in tax law on the taxation of life insurance and pension policies in the hands of policyholders. Amendments to existing legislation, particularly if there is the withdrawal of any tax relief, or an increase in tax rates, or the introduction of new rules, may affect the future long-term business and the decisions of policyholders. The impact of such changes upon us might depend on the mix of business in-force at the time of such change.
The design of life insurance products by our life insurance companies takes into account a number of factors, including risks and taxation. The design of long-term insurance products is based on the tax legislation in force at that time. Changes in tax legislation or in the interpretation of tax legislation may therefore, when applied to such products, have a material adverse effect on the financial condition of the relevant long-term business fund of the company in which the business was written.
Risks related to ownership of the ADSs and ordinary shares
The trading price of our ADRs and dividends paid on our ADSs may be materially adversely affected by fluctuations in the exchange rate for converting sterling into US dollars.
An ADS is a negotiable US security representing ownership in one share. An ADR is denominated in US dollars and represents ownership of any number of ADSs. ADRs are publicly traded shares in a non-US corporation, quoted and traded in US dollars in the US securities market. Any dividends are paid to investors in US dollars. ADRs are specifically designed to facilitate the purchase, holding and sale of non-US securities by US investors. The term ADR is often used to mean both the certificates and
the securities themselves.
Fluctuations in the exchange rate for converting pound sterling into US dollars may affect the value of our ADRs. Specifically, as the relative value of the pound sterling against the US dollar declines, each of the following values will also decline:
| n | the US dollar equivalent of the pound sterling trading price of our ordinary shares on the London Stock Exchange which may consequently cause the trading price of our ADRs in the US to also decline; |
| n | the US dollar equivalent of the proceeds that a holder of our ADSs would receive upon the sale in the UK of any our ordinary shares withdrawn from the depositary; and |
| n | the US dollar equivalent of cash dividends paid in pound sterling on our ordinary shares represented by our ADSs. |
The holders of our ADSs may not be able to exercise their voting rights due to delays in notification to, and by, the depositary.
The depositary for our ADSs may not receive voting materials for our ordinary shares represented by our ADSs in time to ensure that holders of our ADSs can instruct the depositary to vote their shares. In addition, the depositary’s liability to holders of our ADSs for failing to carry out voting instructions or for the manner of carrying out voting instructions is limited by the Deposit Agreement governing our ADR facility. As a result, holders of our ADSs may not be able to exercise their right to vote and may have limited or no recourse against the depositary or us, if their shares are not voted according to their request.
Holders of our ADSs will have limited recourse if we or the depositary fail to meet our respective obligations under the Deposit Agreement.
The Deposit Agreement expressly limits our obligations and liability and those of the depositary. Neither we nor the depositary will be liable if either of us:
| n | are prevented from or delayed in performing any obligation by circumstances beyond our/their control; |
| n | exercise or fail to exercise discretion under the Deposit Agreement; or |
| n | take any action based upon the advice of, or information from, legal counsel, accountants, any person presenting ordinary shares for deposit, any person in whose name the ADSs are registered on the books of the depository, any person or entity having a beneficial interest deriving from the ownership of ADRs, or any other person believed by us or the depositary in good faith to be competent to give such advice or information. |
In addition, the depositary has the obligation to participate in any action, suit or other proceeding with respect to our ADSs which may involve it in expense or liability only if it is indemnified. These provisions of the Deposit Agreement will limit the ability of holders of our ADSs to obtain recourse if we or the depositary fail to meet our obligations under the Deposit Agreement or if they wish to involve us or the depositary in a legal proceeding.
The holders of our ADRs in the US may not be able to participate in offerings of rights, warrants or similar securities to holders of our ordinary shares on the same terms and conditions as holders of our ordinary shares.
In the event that we offer rights, warrants or similar securities to the holders of our ordinary shares or distribute dividends payable, in whole or in part, in securities, the Deposit Agreement provides that the depositary (after consultation with us) shall have discretion as to the procedure to be followed in making such rights or other securities available to ADR holders, including disposing of such rights or other securities and distributing the net proceeds in US dollars to ADR holders. Given the significant number of our ADR holders in the US, we generally would be required to register with the SEC any public offering of rights, warrants or other securities made to our ADR holders unless an exemption from the registration requirements of the US securities laws is available. Registering such an offering with the SEC can be a lengthy process which may be inconsistent with the timetable for a global capital raising operation. Consequently, we have in the past elected and may in the future elect not to make such an offer in the US, including to our ADR holders in the US, and rather only conduct such an offering in an ‘offshore’ transaction in accordance with ‘Regulation S’ under the US Securities Act of 1933, as amended (the ‘Securities Act’). Therefore, there can be no assurance that our ADR holders will be able to participate in such an offering in the same manner as our ordinary shareholders.
The ADR and ordinary share price of Aviva has been, and may continue to be volatile.
The share price of our ADRs and ordinary shares has been volatile in the past and the share price and trading volume of our ADRs may continue to be subject to significant fluctuations due, in part, to changes in our actual or forecast operating results and the inability to fulfil the profit expectations of securities analysts, as well as to the high volatility in the securities markets generally and more particularly in shares of financial institutions. Other factors, besides our financial results, that may impact our share price include, but are not limited to:
| n | market expectations of the performance and capital adequacy of financial institutions in general; |
| n | investor perceptions of the success and impact of our strategies; |
| n | a downgrade or review of our credit ratings; |
| n | potential litigation or regulatory action involving Aviva or sectors we have exposure to through our insurance and fund management activities; |
| n | the operations, accounting practices or regulatory investigations, and share price performance of other companies in the insurance and fund management markets in which the Group operates; and |
| n | conjecture about the Group’s business in the press, media or investment communities. |
As a ‘foreign private issuer’ in the US we are exempt from certain rules under the US securities laws and are permitted to file less information with the SEC than US companies.
As a ‘foreign private issuer’ we are exempt from certain rules under the US Securities Exchange Act of 1934, as amended (the ‘Exchange Act’), that impose certain disclosure obligations and procedural requirements for proxy solicitations under Section 14 of the Exchange Act. In addition, our officers, directors and principal shareholders are exempt from the reporting and ‘short-swing’ profit recovery provisions of Section 16 of the Exchange Act and the rules under the Exchange Act with respect to their purchases and sales of our ordinary shares and ADRs. Moreover, we are not required to file periodic reports and financial statements with the SEC as frequently or as promptly as US companies whose securities are registered under the Exchange Act. In addition, we are not required to comply with Regulation FD, which restricts the selective disclosure of material information. Although we must comply with UK Listing Rules on insider reporting of share ownership and on protection of inside information, there may be less publicly available information concerning us than there is for US public companies.
Aviva plc is an English company and it may be difficult to enforce judgments against us or our directors and executive officers.
Aviva plc is incorporated under the laws of England and Wales and our business is based in the UK. In addition, certain of our directors and officers reside outside the US, and a substantial portion of our assets and the assets of such persons are located in jurisdictions outside the US. As such, it may be difficult or impossible to effect service of process within the US upon us or those persons or to recover against us or them on judgments of US courts, including judgments predicated upon civil liability provisions of the US federal securities laws.
Shareholder rights under English law differ from the US.
Individual shareholders of an English company (including US persons) have the right under English law to bring lawsuits on behalf of the company in which they are a shareholder, and on their own behalf against the company, in certain limited circumstances. English law does not permit class action lawsuits by shareholders, except in limited circumstances.
Financial statements IFRS
| In this section | | | 26 | Ordinary share capital | 171 |
| Report of Independent Registered Public Accounting Firm | 106 | | 27 | Group’s share plans | 171 |
Report of Independent Registered Public Accounting Firm | 107 | | 28 | Shares held by employee trusts | 174 |
| Accounting policies | 108 | | 29 | Preference share capital | 175 |
| Consolidated financial statements | 120 | | 30 | Direct capital instruments and fixed rate tier 1 notes | 175 |
| Consolidated income statement | 120 | | 31 | Merger reserve | 176 |
| Consolidated statement of comprehensive income | 121 | | 32 | Other reserves | 176 |
| Consolidated statement of changes in equity | 122 | | 33 | Retained earnings | 177 |
| Consolidated statement of financial position | 125 | | 34 | Non-controlling interests | 177 |
| Consolidated statement of cash flows | 126 | | 35 | Contract liabilities and associated reinsurance | 178 |
| | | | | | | |
| Notes to the consolidated financial statements | | | 36 | Insurance liabilities | 178 |
| | | | | | 37 | Liability for investment contracts | 188 |
| | 1 | Exchange rates | 127 | | 38 | Financial guarantees and options | 189 |
| | 2 | Presentation changes | 128 | | 39 | Reinsurance assets | 192 |
| | 3 | Subsidiaries | 129 | | 40 | Effect of changes in assumptions and estimates during the year | 193 |
| | 4 | Segmental information | 132 | | 41 | Unallocated divisible surplus | 194 |
| | 5 | Details of income | 142 | | 42 | Tax assets and liabilities | 195 |
| | 6 | Details of expenses | 143 | | 43 | Provisions | 196 |
| | 7 | Finance costs | 144 | | 44 | Pension obligations | 197 |
| | 8 | Employee information | 145 | | 45 | Borrowings | 203 |
| | 9 | Auditors’ remuneration | 146 | | 46 | Payables and other financial liabilities | 206 |
| | 10 | Tax | 148 | | 47 | Other liabilities | 206 |
| | 11 | (Loss)/earnings per share | 150 | | 48 | Contingent liabilities and other risk factors | 206 |
| | 12 | Dividends and appropriations | 151 | | 49 | Commitments | 208 |
| | 13 | Goodwill | 152 | | 50 | Group capital structure | 209 |
| | 14 | Acquired value of in-force business (AVIF) and intangible assets | 154 | | 51 | Statement of cash flows | 210 |
| | 15 | Interests in, and loans to, joint ventures | 155 | | 52 | Capital statement | 212 |
| | 16 | Interests in, and loans to, associates | 157 | | 53 | Risk management | 214 |
| | 17 | Property and equipment | 158 | | 54 | Derivative financial instruments and hedging | 226 |
| | 18 | Investment property | 159 | | 55 | Assets under management | 228 |
| | 19 | Fair value methodology | 159 | | 56 | Related party transactions | 229 |
| | 20 | Loans | 162 | | | Financial Statement Schedule – Financial Statements of the Company | 230 |
| | 21 | Securitised mortgages and related assets | 164 | | | | |
| | 22 | Financial investments | 165 | | | | |
| | 23 | Receivables | 169 | | | | |
| | 24 | Deferred acquisition costs, other assets, prepayments and accrued income | 169 | | | | |
| | 25 | Assets held to cover linked liabilities | 170 | | | | |
Report of Independent Registered Public Accounting Firm
To the Board of Directors and the Shareholders
In our opinion, the accompanying consolidated statement of financial position and the related consolidated statements of income and comprehensive income, changes in equity and cash flows present fairly, in all material respects, the financial position of Aviva plc and its subsidiaries at December 31, 2012, and the results of their operations and their cash flows for the year ended December 31, 2012in conformity with International Financial Reporting Standards as issued by the International Accounting Standards Board. In addition, in our opinion, the Financial Statement Schedule – Financial Statements of the Company presents fairly, in all material respects, the information set forth therein when read in conjunction with the related consolidated financial statements. Also in our opinion, the Company maintained, in all material respects, effective internal control over financial reporting as of December 31, 2012 based on criteria established inInternal Control - Integrated Framework issued by the Committee of Sponsoring Organizations of the Treadway Commission (COSO). The Company's management is responsible for these financial statements, for maintaining effective internal control over financial reporting and for its assessment of the effectiveness of internal control over financial reporting, included in ‘Management’s annual report on internal control over financial reporting’, appearing on page 257 of the Annual report on Form 20-F 2012. Our responsibility is to express opinions on these financial statements and on the Company's internal control over financial reporting based on our integrated audits. We conducted our audits in accordance with the standards of the Public Company Accounting Oversight Board (United States). Those standards require that we plan and perform the audits to obtain reasonable assurance about whether the financial statements are free of material misstatement and whether effective internal control over financial reporting was maintained in all material respects. Our audits of the financial statements included examining, on a test basis, evidence supporting the amounts and disclosures in the financial statements, assessing the accounting principles used and significant estimates made by management, and evaluating the overall financial statement presentation. Our audit of internal control over financial reporting included obtaining an understanding of internal control over financial reporting, assessing the risk that a material weakness exists, and testing and evaluating the design and operating effectiveness of internal control based on the assessed risk. Our audits also included performing such other procedures as we considered necessary in the circumstances. We believe that our audits provide a reasonable basis for our opinions.
We also have audited the adjustments to the 2011 and 2010 financial statements to retrospectively apply the changes in presentation with regard to the 2012 discontinued operations, changes to operating segments, the restatement of prior period figures and the additional information as described in Note 2- Presentation changes to the consolidated financial statements. In addition, we also have audited the adjustments to the 2011 and 2010 financial information described in Note A – Presentation changes included within the Financial Statement Schedule – Financial Statements of the Company. In our opinion, such adjustments are appropriate and have been properly applied. We were not engaged to audit, review, or apply any procedures to the 2011 and 2010 consolidated financial statements and the 2011 and 2010 Financial Statement Schedule – Financial Statements of the Company other than with respect to how the adjustments have been applied and, accordingly, we do not express an opinion or any other form of assurance on the 2011 and 2010 consolidated financial statements or the 2011 and 2010 Financial Statement Schedule – Financial Statements of the Company taken as a whole.
A company’s internal control over financial reporting is a process designed to provide reasonable assurance regarding the reliability of financial reporting and the preparation of financial statements for external purposes in accordance with generally accepted accounting principles. A company’s internal control over financial reporting includes those policies and procedures that (i) pertain to the maintenance of records that, in reasonable detail, accurately and fairly reflect the transactions and dispositions of the assets of the company; (ii) provide reasonable assurance that transactions are recorded as necessary to permit preparation of financial statements in accordance with generally accepted accounting principles, and that receipts and expenditures of the company are being made only in accordance with authorizations of management and directors of the company; and (iii) provide reasonable assurance regarding prevention or timely detection of unauthorized acquisition, use, or disposition of the company’s assets that could have a material effect on the financial statements.
Because of its inherent limitations, internal control over financial reporting may not prevent or detect misstatements. Also, projections of any evaluation of effectiveness to future periods are subject to the risk that controls may become inadequate because of changes in conditions, or that the degree of compliance with the policies or procedures may deteriorate.
PricewaterhouseCoopers LLP
London, United Kingdom
22 March 2013
Report of Independent Registered Public Accounting Firm
The Board of Directors and Shareholders of Aviva plc
We have audited, before the effects of adjustments to retrospectively reflect the discontinued operations, the change in the composition of reportable segments, the restatement of prior period figures and the additional information, discussed in Note 2 of the consolidated financial statements, the accompanying consolidated statement of financial position of Aviva plc and subsidiaries as of December 31, 2011, and the related consolidated income statements, statements of comprehensive income, changes in equity, and cash flows for each of the two years in the period ended December 31, 2011 (the 2011 and 2010 consolidated financial statements before the effects of the retrospective adjustments described above are not presented herein). Our audits also included the financial statement schedule listed in the Index at Item 18, before the effects of adjustments to retrospectively reflect the presentation changes discussed in Note A to the Financial Statement Schedule – Financial Statements of the Company, for the same period as noted above (not presented separately herein). These financial statements and schedule are the responsibility of Aviva plc’s management. Our responsibility is to express an opinion on these financial statements and the schedule based on our audits.
We conducted our audits, before the effects of the adjustments described above, in accordance with the standards of the Public Company Accounting Oversight Board (United States of America). Those standards require that we plan and perform the audit to obtain reasonable assurance about whether the financial statements are free of material misstatement. An audit includes examining, on a test basis, evidence supporting the amounts and disclosures in the financial statements. An audit also includes assessing the accounting principles used and significant estimates made by management, as well as evaluating the overall financial statement presentation. We believe that our audits provide a reasonable basis for our opinion.
In our opinion, the financial statements referred to above, before the effects of the adjustments described above, present fairly, in all material respects, the consolidated financial position of Aviva plc and subsidiaries at December 31, 2011, and the consolidated results of their operations and their cash flows for each of the two years in the period ended December 31, 2011, in conformity with International Financial Reporting Standards as issued by the International Accounting Standards Board. Also in our opinion, the related financial statement schedule, before the effects of the adjustments described above, when considered in relation to the basic consolidated financial statements taken as a whole, presents fairly in all material respects the information set forth therein.
We were not engaged to audit, review, or apply any procedures to the adjustments to retrospectively reflect the discontinued operations, the change in the composition of reportable segments, the restatement of prior period figures and the additional information, described in Note 2 to the consolidated financial statements or the adjustments to retrospectively reflect the presentation changes discussed in Note A to the financial statement schedule. Accordingly, we do not express an opinion nor any other form of assurance about whether such adjustments are appropriate and have been properly applied. Those retrospective adjustments were audited by PricewaterhouseCoopers LLP.
Ernst & Young LLP
London, United Kingdom
20 March 2012
Accounting policies
Aviva plc (the ‘Company’), a public limited company incorporated and domiciled in the United Kingdom (UK), together with its subsidiaries (collectively, the ‘Group’ or ‘Aviva’) transacts life assurance and long-term savings business, fund management and most classes of general insurance and health business through its subsidiaries, associates and branches in the UK, Ireland, continental Europe, United States (US), Canada, Asia and other countries throughout the world.
Following the announcement in April 2012 relating to the restructuring of the Group, the Group’s operating segments were changed to align them with the new organisational reporting structure. The Group has determined its operating segments along market reporting lines, reflecting the management structure whereby a member of the Executive Management team is accountable to the group chief executive for the operating segment for which he is responsible. Further details of the reportable segments are given in note 4.
The principal accounting policies adopted in the preparation of these financial statements are set out below. These policies have been consistently applied to all years presented, unless otherwise stated.
(A) Basis of presentation
The consolidated financial statements and those of the Company have been prepared and approved by the directors in accordance with International Financial Reporting Standards (IFRS) as issued by the International Accounting Standards Board (IASB) and as endorsed by the European Union (EU), and those parts of the Companies Act 2006 applicable to those reporting under IFRS. In addition to fulfilling their legal obligation to comply with IFRS as adopted by the EU, the Group and Company have also complied with IFRS as issued by the IASB and applicable at 31 December 2012. The consolidated financial statements have been prepared under the historical cost convention, as modified by the revaluation of land and buildings, available-for-sale financial assets, and financial assets and financial liabilities (including derivative instruments) at fair value through profit and loss.
In accordance with IFRS 4, Insurance Contracts, the Group has applied existing accounting practices for insurance and participating investment contracts, modified as appropriate to comply with the IFRS framework and applicable standards. Further details are given in accounting policy F .
Items included in the financial statements of each of the Group’s entities are measured in the currency of the primary economic environment in which that entity operates (the functional currency). The consolidated financial statements are stated in sterling, which is the Company’s functional and presentation currency. Unless otherwise noted, the amounts shown in these financial statements are in millions of pounds sterling (£m). The separate financial statements of the Company are on pages 230 to 237.
See note 2 for presentation changes to the consolidated financial statements.
New standards, interpretations and amendments to published standards that have been adopted by the Group
The Group has adopted the following new amendments to standards which became effective for financial years beginning on or after 1 January 2012. Neither of these amendments has a material impact on these financial statements.
| (i) | Amendment to IFRS 7, Financial Instruments – Disclosures, relating to the transfer of financial assets. |
| (ii) | Amendment to IAS 12, Income Taxes, relating to deferred tax. |
Standards, interpretations and amendments to published standards that are not yet effective and have not been adopted early by the Group
The following new standards, amendments to existing standards and interpretations have been issued, are effective for accounting periods beginning on or after the following dates and have not been adopted by the Group:
Effective for annual periods beginning on or after 1 July 2012
| | Amendment to IAS 1, Financial Statement Presentation |
| | The amendment requires entities to group items presented in other comprehensive income according to whether they will subsequently be reclassified to profit and loss. The adoption of the amendment will change the presentation of the consolidated statement of comprehensive income in the financial statements. The amendment has been endorsed by the EU. |
Effective for annual periods beginning on or after 1 January 2013
| (i) | Amendment to IAS 19, Employee Benefits |
| | The amendment revises requirements for pensions and other post-retirement benefits, termination benefits and other employee benefits. The key changes include the revision of the calculation of the finance cost, enhanced disclosures surrounding the characteristics and risk profile of defined benefit plans, and a requirement to include all actuarial gains and losses immediately in other comprehensive income which is already in line with the Group’s current policy. The amended standard will impact finance costs as the concept of expected return is removed and replaced with interest on scheme assets, which is calculated using the same interest rate that is applied for the purposes of discounting the defined benefit obligation. The difference between interest income on scheme assets and the actual return is included in other comprehensive income. If this amendment had been adopted for the year ended 31 December 2012, the net impact would have been an increase in profit before tax and a corresponding decrease in other comprehensive income of £145 million. This is the difference between the current expected return on scheme assets and the interest income on scheme assets calculated using the discount rate. The amendment has been endorsed by the EU. |
| (ii) | Amendment to IFRS 7, Financial Instruments – Disclosures |
| | The amendment includes enhanced disclosures to enable users of the financial statements to evaluate the effect or potential effect of netting arrangements in the statement of financial position. The amendments will not have a significant impact for the Group. The amendment has been endorsed by the EU. |
| (iii) | IFRS 10, Consolidated Financial Statements |
| | IFRS 10 replaces the portion of IAS 27 Consolidated and Separate Financial Statements that addresses the accounting for consolidated financial statements. IFRS 10 establishes a single control model that applies to all entities including special purpose entities, based on the concept of power, exposure or rights to variable returns and their linkage. This will replace the current approach which emphasises the power to govern the financial and operating policies, and exposure to risks and rewards, depending on the nature of the entity. IFRS 10 defines and prescribes how to apply the principle of control in determining which entities are required to be consolidated in the consolidated financial statements. The standard has been endorsed by the EU. |
| | Based on our assessment to date, the Group does not expect the overall impact of the adoption of IFRS 10 on the Group’s equity and profit before tax for the year to be material. The implementation of IFRS 10 is expected to mainly result in the Group consolidating some investment vehicles that were previously not consolidated. |
| (iv) | IFRS 11, Joint Arrangements |
| | IFRS 11 defines and establishes accounting principles for joint arrangements. It distinguishes between two types of joint arrangements – joint ventures and joint operations – based on how rights and obligations are shared by parties to the arrangements. The full impact of the changes has yet to be fully assessed but is not expected to have a significant impact on the Group’s equity and profit before tax for the year. The standard has been endorsed by the EU. |
| (v) | IFRS 12, Disclosure of Interests in Other Entities |
| | IFRS 12 includes the disclosure requirements for all forms of interests in other entities, including joint arrangements, associates, special purpose vehicles and other off balance sheet vehicles. The standard is expected to have a significant impact on the level of disclosure in respect of these interests. The standard has been endorsed by the EU. |
| (vi) | IAS 27, Separate Financial Statements (2011) |
| | IAS 27 has been revised to remove the requirements for consolidated financial statements which are superseded by the issue of IFRS 10. The standard has been endorsed by the EU. |
| (vii) | IAS 28, Investment in Associates and Joint Ventures (2011) |
| | IAS 28 has been revised to include joint ventures as well as associates. Joint ventures are required to be equity accounted following the issue of IFRS 11. There are no implications for the Group financial statements. The standard has been endorsed by the EU. |
| (viii) | IFRS 13, Fair Value Measurement |
| | IFRS 13 replaces the guidance on fair value measurement in existing IFRSs with a single standard. The standard does not include requirements regarding which items should be measured at fair value but provides guidance on how to determine fair value. The standard also includes enhanced disclosures about fair value measurement. The adoption of IFRS 13 is not expected to have a significant impact on the financial statements. The standard has been endorsed by the EU |
.
| (ix) | Improvements to IFRSs 2009-2011 |
| | Improvements to IFRSs 2009-2011 details amendments to five IFRSs, including IAS 1, Presentation of Financial Statements, IAS 32, Financial Instruments – Presentation, and IAS 34, Interim Financial Reporting. The amendments clarify existing guidance and do not give rise to a change in existing accounting practice. There are no implications for the Group’s consolidated financial statements. The amendments have yet to be endorsed by the EU. |
Effective for annual periods beginning on or after 1 January 2014
| (i) | Amendment to IAS 32, Financial Instruments – Presentation |
| | The amendment to IAS 32 clarifies the requirements for offsetting financial assets and financial liabilities on the statement of financial position. The impact of the adoption of the amendment has yet to be fully assessed but is not expected to have significant implications for the Group financial statements. The amendment has been endorsed by the EU. |
| (ii) | Amendments to IFRS 10, IFRS 12 and IAS 27 (2011) |
| | The amendments provide an exemption from consolidation of subsidiaries under IFRS 10 'Consolidated Financial Statements' for entities which meet the definition of an 'investment entity', such as certain investment funds. Instead, such entities would measure their investment in particular subsidiaries at fair value through profit or loss in accordance with IFRS 9 'Financial Instruments' or IAS 39 'Financial Instruments: Recognition and Measurement'. There are no implications for the Group’s consolidated financial statements. The amendments have yet to be endorsed by the EU. |
Effective for annual periods beginning on or after 1 January 2015
| | IFRS 9, Financial Instruments |
IFRS 9 will replace IAS 39, Financial Instruments – Recognition and Measurement. Under IFRS 9, all recognised financial assets that are currently within the scope of IAS 39 will be measured at either amortised cost or fair value. The basis of classification will depend on the business model and the contractual cash flow characteristics of the financial asset. All equity instruments will be measured at fair value.
A debt instrument is measured at amortised cost only if it is held to collect the contractual cash flows and the cash flows represent principal and interest, otherwise it is measured at fair value through profit and loss (FVTPL). For financial liabilities designated as at FVTPL, the change in the fair value attributable to changes in the liability’s credit risk is recognised in other comprehensive income unless it gives rise to an accounting mismatch in profit or loss.
We have not yet completed our assessment of the impact of the adoption of IFRS 9 on the Group which, to a large extent, will need to take into account the finalisation of the standard and the interaction of the requirements of IFRS 9 with the IASB’s ongoing insurance contracts accounting project. The standard has not yet been endorsed by the EU.
(B) Operations held for sale
Assets and liabilities held for disposal as part of operations which are held for sale are shown separately in the consolidated statement of financial position. Operations held for sale are recorded at the lower of their carrying amount and their fair value less the estimated selling costs
(C) Critical accounting policies and the use of estimates
The preparation of financial statements requires the Group to select accounting policies and make estimates and assumptions that affect items reported in the consolidated income statement, consolidated statement of financial position, other primary statements and notes to the consolidated financial statements.
Critical accounting policies and the use of estimates
These major areas of judgement on policy application are summarised below:
| Item | Critical accounting judgement estimate or assumption | Accounting policy |
| Consolidation | Assessment of whether the Group controls the underlying entities | D |
| Insurance and participating investment contract liabilities | Assessment of the significance of insurance risk passed | F |
| Financial investments | Classification of investments | S |
All estimates are based on management’s knowledge of current facts and circumstances, assumptions based on that knowledge and their predictions of future events and actions. Actual results may differ from those estimates, possibly significantly.
The table below sets out those items we consider particularly susceptible to changes in estimates and assumptions, and the relevant accounting policy.
| Item | Accounting policy |
| Insurance and participating investment contract liabilities | F&K |
| Goodwill, AVIF and intangible assets | N |
| Fair values of financial investments | S |
| Impairment of financial investments | S |
| Fair value of derivative financial instruments | T |
| Deferred acquisition costs and other assets | W |
| Provisions and contingent liabilities | Z |
| Pension obligations | AA |
| Deferred income taxes | AB |
| Operations held for sale | B |
(D) Consolidation principles
Subsidiaries
Subsidiaries are those entities (including special purpose entities) in which the Group, directly or indirectly, has power to exercise control over financial and operating policies in order to gain economic benefits. Subsidiaries are consolidated from the date on which effective control is transferred to the Group and are excluded from consolidation from the date the Group no longer has effective control. All inter-company transactions, balances and unrealised surpluses and deficits on transactions between Group companies have been eliminated. Accounting policies of subsidiaries are aligned on acquisition to ensure consistency with the Group policies.
The Group is required to use the acquisition method of accounting for business combinations. Under this method, the cost of an acquisition is measured as the aggregate of the consideration transferred, measured at acquisition date fair value, and the amount of any non-controlling interest in the acquiree. For each business combination, the Group has the option to measure the non-controlling interest in the acquiree either at fair value or at the proportionate share of the acquiree’s identifiable net assets. The excess of the consideration transferred over the fair value of the net assets of the subsidiary acquired is recorded as goodwill (see accounting policy N below). Acquisition-related costs are expensed as incurred. Transactions that do not result in a loss of control are treated as equity transactions with non-controlling interests.
Merger accounting and the merger reserve
Prior to 1 January 2004, the date of first time adoption of IFRS, certain significant business combinations were accounted for using the ‘pooling of interests method’ (or merger accounting), which treats the merged groups as if they had been combined throughout the current and comparative accounting periods. Merger accounting principles for these combinations gave rise to a merger reserve in the consolidated statement of financial position, being the difference between the nominal value of new shares issued by the Parent Company for the acquisition of the shares of the subsidiary and the subsidiary’s own share capital and share premium account. These transactions have not been restated, as permitted by the IFRS 1 transitional arrangements.
The merger reserve is also used where more than 90% of the shares in a subsidiary are acquired and the consideration includes the issue of new shares by the Company, thereby attracting merger relief under the Companies Act 1985 and, from 1 October 2009, the Companies Act 2006.
Investment vehicles
In several countries, the Group has invested in a number of specialised investment vehicles such as Open-ended Investment Companies (OEICs) and unit trusts. These invest mainly in equities, bonds, cash and cash equivalents, and properties, and distribute most of their income. The Group’s percentage ownership in these vehicles can fluctuate from day to day according to the Group’s and third-party participation in them. Where Group companies are deemed to control such vehicles, with control determined based on an analysis of the guidance in IAS 27 and SIC 12, they are consolidated, with the interests of parties other than Aviva being classified as liabilities. These appear as ‘Net asset value attributable to unitholders’ in the consolidated statement of financial position. Where the Group does not control such vehicles, and these investments are held by its insurance or investment funds, they do not meet the definition of associates (see below) and are, instead, carried at fair value through profit and loss within financial investments in the consolidated statement of financial position, in accordance with IAS 39, Financial Instruments: Recognition and Measurement.
As part of their investment strategy, the UK and certain European long-term business policyholder funds have invested in a number of property limited partnerships (PLPs), either directly or via property unit trusts (PUTs), through a mix of capital and loans. The PLPs are managed by general partners (GPs), in which the long-term business shareholder companies hold equity stakes and which themselves hold nominal stakes in the PLPs. The PUTs are managed by a Group subsidiary.
Accounting for the PUTs and PLPs as subsidiaries, joint ventures or other financial investments depends on the shareholdings in the GPs and the terms of each partnership agreement. Where the Group exerts control over a PLP, it has been treated as a subsidiary and its results, assets and liabilities have been consolidated. Where the partnership is managed by a contractual agreement such that there is joint control between the parties, notwithstanding that the Group’s partnership share in the PLP (including its indirect stake via the relevant PUT and GP) may be greater than 50%, such PUTs and PLPs have been classified as joint ventures. Where the Group holds minority stakes in PLPs, with no significant influence or control over their associated GPs, the relevant investments are carried at fair value through profit and loss within financial investments.
Associates and joint ventures
Associates are entities over which the Group has significant influence, but which it does not control. Generally, it is presumed that the Group has significant influence if it has between 20% and 50% of voting rights. Joint ventures are entities whereby the Group and other parties undertake an economic activity which is subject to joint control arising from a contractual agreement. In a number of these, the Group’s share of the underlying assets and liabilities may be greater than 50% but the terms of the relevant agreements make it clear that control is not exercised. Such jointly controlled entities are referred to as joint ventures in these financial statements.
Gains on transactions between the Group and its associates and joint ventures are eliminated to the extent of the Group’s interest in the associates and joint ventures. Losses are also eliminated, unless the transaction provides evidence of an impairment of the asset transferred between entities.
Investments in associates and joint ventures are accounted for using the equity method of accounting. Under this method, the cost of the investment in a given associate or joint venture, together with the Group’s share of that entity’s post-acquisition changes to shareholders’ funds, is included as an asset in the consolidated statement of financial position. As explained in accounting policy N, the cost includes goodwill identified on acquisition. The Group’s share of their post-acquisition profits or losses is recognised in the income statement and its share of post-acquisition movements in reserves is recognised in reserves. Equity accounting is discontinued when the Group no longer has significant influence or joint control over the investment.
If the Group’s share of losses in an associate or joint venture equals or exceeds its interest in the undertaking, the Group does not recognise further losses unless it has incurred obligations or made payments on behalf of the entity.
The Company’s investments
In the Company statement of financial position, subsidiaries, associates and joint ventures are stated at their fair values, estimated using applicable valuation models underpinned by the Company’s market capitalisation. These investments are classified as available for sale (AFS) financial assets, with changes in their fair value being recognised in other comprehensive income and recorded in a separate investment valuation reserve within equity.
(E) Foreign currency translation
Income statements and cash flows of foreign entities are translated into the Group’s presentation currency at average exchange rates for the year while their statements of financial position are translated at the year-end exchange rates. Exchange differences arising from the translation of the net investment in foreign subsidiaries, associates and joint ventures, and of borrowings and other currency instruments designated as hedges of such investments, are recognised in other comprehensive income and taken to the currency translation reserve within equity. On disposal of a foreign entity, such exchange differences are transferred out of this reserve and are recognised in the income statement as part of the gain or loss on sale. The cumulative translation differences were deemed to be zero at the transition date to IFRS.
Foreign currency transactions are accounted for at the exchange rates prevailing at the date of the transactions. Gains and losses resulting from the settlement of such transactions, and from the translation of monetary assets and liabilities denominated in foreign currencies, are recognised in the income statement.
Translation differences on debt securities and other monetary financial assets measured at fair value and designated as held at fair value through profit or loss (FV) (see accounting policy S) are included in foreign exchange gains and losses in the income statement. For monetary financial assets designated as AFS, translation differences are calculated as if they were carried at amortised cost and so are recognised in the income statement, whilst foreign exchange differences arising from fair value gains and losses are recognised in other comprehensive income and included in the investment valuation reserve within equity. Translation differences on non-monetary items, such as equities which are designated as FV, are reported as part of the fair value gain or loss, whereas such differences on AFS equities are included in the investment valuation reserve.
(F) Product classification
Insurance contracts are defined as those containing significant insurance risk if, and only if, an insured event could cause an insurer to make significant additional payments in any scenario, excluding scenarios that lack commercial substance, at the inception of the contract. Such contracts remain insurance contracts until all rights and obligations are extinguished or expire. Contracts can be reclassified as insurance contracts after inception if insurance risk becomes significant. Any contracts not considered to be insurance contracts under IFRS are classified as investment contracts. Some insurance and investment contracts contain a discretionary participating feature, which is a contractual right to receive additional benefits as a supplement to guaranteed benefits. These are referred to as participating contracts.
As noted in accounting policy A above, insurance contracts and participating investment contracts in general continue to be measured and accounted for under existing accounting practices at the later of the date of transition to IFRS or the date of the acquisition of the entity, in accordance with IFRS 4. Accounting for insurance contracts in UK companies is determined in accordance with the Statement of Recommended Practice issued by the Association of British Insurers, the most recent version of which was issued in December 2005 and amended in December 2006. In certain businesses, the accounting policies or accounting estimates have been changed, as permitted by IFRS 4 and IAS 8 respectively, to remeasure designated insurance liabilities to reflect current market interest rates and changes to regulatory capital requirements. When accounting policies or accounting estimates have been changed, and adjustments to the measurement basis have occurred, the financial statements of that year will have disclosed the impacts accordingly. One such example is our adoption of Financial Reporting Standard 27, Life Assurance, (FRS 27) which was issued by the UK’s Accounting Standards Board (ASB) in December 2004. Aviva, along with other major insurance companies and the ABI, signed a Memorandum of Understanding with the ASB, under which we voluntarily agreed to adopt in full the standard from 2005 in the Group’s IFRS financial statements. FRS 27 adds to the requirements of IFRS but does not vary them in any way. The additional requirements of FRS 27 are detailed in accounting policy K below and in note 52.
(G) Premiums earned
Premiums on long-term insurance contracts and participating investment contracts are recognised as income when receivable, except for investment-linked premiums which are accounted for when the corresponding liabilities are recognised. For single premium business, this is the date from which the policy is effective. For regular premium contracts, receivables are recognised at the date when payments are due. Premiums are shown before deduction of commission and before any sales-based taxes or duties. Where policies lapse due to non-receipt of premiums, then all the related premium income accrued but not received from the date they are deemed to have lapsed is offset against premiums.
General insurance and health premiums written reflect business incepted during the year, and exclude any sales-based taxes or duties. Unearned premiums are those proportions of the premiums written in a year that relate to periods of risk after the statement of financial position date. Unearned premiums are calculated on either a daily or monthly pro rata basis. Premiums collected by intermediaries, but not yet received, are assessed based on estimates from underwriting or past experience, and are included in premiums written.
Deposits collected under investment contracts without a discretionary participating feature (non-participating contracts) are not accounted for through the income statement, except for the fee income (covered in accounting policy H) and the investment income attributable to those contracts, but are accounted for directly through the statement of financial position as an adjustment to the investment contract liability.
(H) Other investment contract fee revenue
Investment contract policyholders are charged fees for policy administration, investment management, surrenders or other contract services. The fees may be for fixed amounts or vary with the amounts being managed, and will generally be charged as an adjustment to the policyholder’s balance. The fees are recognised as revenue in the period in which they are collected unless they relate to services to be provided in future periods, in which case they are deferred and recognised as the service is provided.
Initiation and other ‘front-end’ fees (fees that are assessed against the policyholder balance as consideration for origination of the contract) are charged on some non-participating investment and investment fund management contracts. Where the investment contract is recorded at amortised cost, these fees are deferred and recognised over the expected term of the policy by an adjustment to the effective yield. Where the investment contract is measured at fair value, the front-end fees that relate to the provision of investment management services are deferred and recognised as the services are provided.
(I) Other fee and commission income
Other fee and commission income consists primarily of fund management fees, distribution fees from mutual funds, commissions on reinsurance ceded, commission revenue from the sale of mutual fund shares and transfer agent fees for shareholder record keeping. Reinsurance commissions receivable are deferred in the same way as acquisition costs, as described in accounting policy W. All other fee and commission income is recognised as the services are provided.
(J) Net investment income
Investment income consists of dividends, interest and rents receivable for the year, movements in amortised cost on debt securities, realised gains and losses, and unrealised gains and losses on FV investments (as defined in accounting policy S). Dividends on equity securities are recorded as revenue on the ex-dividend date. Interest income is recognised as it accrues, taking into account the effective yield on the investment. It includes the interest rate differential on forward foreign exchange contracts. Rental income is recognised on an accruals basis.
A gain or loss on a financial investment is only realised on disposal or transfer, and is the difference between the proceeds received, net of transaction costs, and its original cost or amortised cost, as appropriate.
Unrealised gains and losses, arising on investments which have not been derecognised as a result of disposal or transfer, represent the difference between the carrying value at the year end and the carrying value at the previous year end or purchase value during the year, less the reversal of previously recognised unrealised gains and losses in respect of disposals made during the year. Realised gains or losses on investment property represent the difference between the net disposal proceeds and the carrying amount of the property.
(K) Insurance and participating investment contract liabilities
Claims
Long-term business claims reflect the cost of all claims arising during the year, including claims handling costs, as well as policyholder bonuses accrued in anticipation of bonus declarations.
General insurance and health claims incurred include all losses occurring during the year, whether reported or not, related handling costs, a reduction for the value of salvage and other recoveries, and any adjustments to claims outstanding from previous years.
Claims handling costs include internal and external costs incurred in connection with the negotiation and settlement of claims. Internal costs include all direct expenses of the claims department and any part of the general administrative costs directly attributable to the claims function.
Long-term business provisions
Under current IFRS requirements, insurance and participating investment contract liabilities are measured using accounting policies consistent with those adopted previously under existing accounting practices, with the exception of liabilities remeasured to reflect current market interest rates to be consistent with the value of the backing assets, and those relating to UK with-profit and non-profit contracts. For liabilities relating to UK with-profit contracts, the Group has adopted FRS 27, Life Assurance, as described in policy F above, in addition to the requirements of IFRS.
In the United States, shadow adjustments are made to the liabilities or related deferred acquisition costs and are recognised directly in other comprehensive income. This means that the measurement of these items is adjusted for unrealised gains or losses on the backing assets such as AFS financial investments (see accounting policy S), that are recognised directly in other comprehensive income, in the same way as if those gains or losses had been realised.
The long-term business provisions are calculated separately for each life operation, based either on local regulatory requirements or existing local GAAP at the later of the date of transition to IFRS or the date of the acquisition of the entity, and actuarial principles consistent with those applied in the UK. Each calculation represents a determination within a range of possible outcomes, where the assumptions used in the calculations depend on the circumstances prevailing in each life operation. The principal assumptions are disclosed in note 36(a). For liabilities of the UK with-profit funds, FRS 27 requires liabilities to be calculated as the realistic basis liabilities as set out by the UK’s Financial Services Authority (FSA), adjusted to remove the shareholders’ share of future bonuses. For UK non-profit insurance contracts, the Group applies the realistic regulatory basis as set out in the FSA Policy Statement 06/14, Prudential Changes for Insurers, where applicable.
Unallocated divisible surplus
In certain participating long-term insurance and investment business, the nature of the policy benefits is such that the division between shareholder reserves and policyholder liabilities is uncertain. Amounts whose allocation to either policyholders or shareholders has not been determined by the end of the financial year are held within liabilities as an unallocated divisible surplus.
If the aggregate carrying value of liabilities for a particular participating business fund is in excess of the aggregate carrying value of its assets, then the difference is held as a negative unallocated divisible surplus balance, subject to recoverability from margins in that fund’s participating business. Any excess of this difference over the recoverable amount is charged to net income in the reporting period.
Embedded derivatives
Embedded derivatives that meet the definition of an insurance contract or correspond to options to surrender insurance contracts for a set amount (or based on a fixed amount and an interest rate) are not separately measured. All other embedded derivatives are separated and measured at fair value if they are not considered as closely related to the host insurance contract or do not meet the definition of an insurance contract. Fair value reflects own credit risk to the extent the embedded derivative is not fully collateralised.
Liability adequacy
At each reporting date, an assessment is made of whether the recognised long-term business provisions are adequate, using current estimates of future cash flows. If that assessment shows that the carrying amount of the liabilities (less related assets) is insufficient in light of the estimated future cash flows, the deficiency is recognised in the income statement by setting up an additional provision in the statement of financial position.
General insurance and health provisions
Outstanding claims provisions
General insurance and health outstanding claims provisions are based on the estimated ultimate cost of all claims incurred but not settled at the statement of financial position date, whether reported or not, together with related claims handling costs. Significant delays are experienced in the notification and settlement of certain types of general insurance claims, particularly in respect of liability business, including environmental and pollution exposures, the ultimate cost of which cannot be known with certainty at the statement of financial position date. Any estimate represents a determination within a range of possible outcomes. Further details of estimation techniques are given in note 36(c).
Provisions for latent claims are discounted, using rates based on the relevant swap curve, in the relevant currency at the reporting date, having regard to the expected settlement dates of the claims. The discount rate is set at the start of the accounting period with any change in rates between the start and end of the accounting period being reflected below adjusted operating profit as an economic assumption change. The range of discount rates used is described in note 36(c). Outstanding claims provisions are valued net of an allowance for expected future recoveries. Recoveries include non-insurance assets that have been acquired by exercising rights to salvage and subrogation under the terms of insurance contracts.
Provision for unearned premiums
The proportion of written premiums, gross of commission payable to intermediaries, attributable to subsequent periods is deferred as a provision for unearned premiums. The change in this provision is taken to the income statement as recognition of revenue over the period of risk.
Liability adequacy
At each reporting date, the Group reviews its unexpired risks and carries out a liability adequacy test for any overall excess of expected claims and deferred acquisition costs over unearned premiums, using the current estimates of future cash flows under its contracts after taking account of the investment return expected to arise on assets relating to the relevant general business provisions. If these estimates show that the carrying amount of its insurance liabilities (less related deferred acquisition costs) is insufficient in light of the estimated future cash flows, the deficiency is recognised in the income statement by setting up a provision in the statement of financial position.
Other assessments and levies
The Group is subject to various periodic insurance-related assessments or guarantee fund levies. Related provisions are established where there is a present obligation (legal or constructive) as a result of a past event. Such amounts are not included in insurance liabilities but are included under ‘Provisions’ in the statement of financial position.
(L) Non-participating investment contract liabilities
Claims
For non-participating investment contracts with an account balance, claims reflect the excess of amounts paid over the account balance released.
Contract liabilities
Deposits collected under non-participating investment contracts are not accounted for through the income statement, except for the investment income attributable to those contracts, but are accounted for directly through the statement of financial position as an adjustment to the investment contract liability.
The majority of the Group’s contracts classified as non-participating investment contracts are unit-linked contracts and are measured at fair value. Certain liabilities for non-linked non-participating contracts are measured at amortised cost.
The fair value liability is determined in accordance with IAS 39, using a valuation technique to provide a reliable estimate of the amount for which the liability could be settled between knowledgeable willing parties in an arm’s length transaction, subject to a minimum equal to the surrender value. For unit-linked contracts, the fair value liability is equal to the current unit fund value, plus additional non-unit reserves if required based on a discounted cash flow analysis. For non-linked contracts, the fair value liability is based on a discounted cash flow analysis, with allowance for risk calibrated to match the market price for risk.
Amortised cost is calculated as the fair value of consideration received at the date of initial recognition, less the net effect of payments such as transaction costs and front-end fees, plus or minus the cumulative amortisation (using the effective interest rate method) of any difference between that initial amount and the maturity value, and less any write-down for surrender payments. The effective interest rate is the one that equates the discounted cash payments to the initial amount. At each reporting date, the amortised cost liability is determined as the value of future best estimate cash flows discounted at the effective interest rate.
(M) Reinsurance
The Group assumes and cedes reinsurance in the normal course of business, with retention limits varying by line of business. Premiums on reinsurance assumed are recognised as revenue in the same manner as they would be if the reinsurance were considered direct business, taking into account the product classification of the reinsured business. The cost of reinsurance related to long-duration contracts is accounted for over the life of the underlying reinsured policies, using assumptions consistent with those used to account for these policies.
Where general insurance liabilities are discounted, any corresponding reinsurance assets are also discounted using consistent assumptions.
Gains or losses on buying retroactive reinsurance are recognised in the income statement immediately at the date of purchase and are not amortised. Premiums ceded and claims reimbursed are presented on a gross basis in the consolidated income statement and statement of financial position as appropriate.
Reinsurance assets primarily include balances due from both insurance and reinsurance companies for ceded insurance and investment contract liabilities. This includes balances in respect of investment contracts which are legally reinsurance contracts but do not meet the definition of a reinsurance contract under IFRS. Amounts recoverable from reinsurers are estimated in a manner consistent with the underlying contract liabilities, outstanding claims provisions or settled claims associated with the reinsured policies and in accordance with the relevant reinsurance contract.
Reinsurance of non-participating investment contracts and reinsurance contracts that principally transfer financial risk are accounted for directly through the statement of financial position. A deposit asset or liability is recognised, based on the consideration paid or received less any explicitly identified premiums or fees to be retained by the reinsured. These deposit assets or liabilities are shown within reinsurance assets in the consolidated statement of financial position.
If a reinsurance asset is impaired, the Group reduces the carrying amount accordingly and recognises that impairment loss in the income statement. A reinsurance asset is impaired if there is objective evidence, as a result of an event that occurred after initial recognition of the reinsurance asset, that the Group may not receive all amounts due to it under the terms of the contract, and the event has a reliably measurable impact on the amounts that the Group will receive from the reinsurer.
(N) Goodwill, AVIF and intangible assets
Goodwill
Goodwill represents the excess of the cost of an acquisition over the fair value of the Group’s share of the net assets of the acquired subsidiary, associate or joint venture at the date of acquisition. Goodwill on acquisitions prior to 1 January 2004 (the date of transition to IFRS) is carried at its book value (original cost less cumulative amortisation) on that date, less any impairment subsequently incurred. Goodwill arising before 1 January 1998 was eliminated against reserves and has not been reinstated. Goodwill arising on the Group’s investments in subsidiaries since that date is shown as a separate asset, whilst that on associates and joint ventures is included within the carrying value of those investments.
Acquired value of in-force business (AVIF)
The present value of future profits on a portfolio of long-term insurance and investment contracts, acquired either directly or through the purchase of a subsidiary, is recognised as an asset. If the AVIF results from the acquisition of an investment in a joint venture or an associate, it is held within the carrying amount of that investment. In all cases, the AVIF is amortised over the useful lifetime of the related contracts in the portfolio on a systematic basis. The rate of amortisation is chosen by considering the profile of the additional value of in-force business acquired and the expected depletion in its value. The value of the acquired in-force long-term business is reviewed annually for any impairment in value and any reductions are charged as expenses in the income statement.
Intangible assets
Intangibles consist primarily of contractual relationships such as access to distribution networks and customer lists. The economic lives of these are determined by considering relevant factors such as usage of the asset, typical product life cycles, potential obsolescence, maintenance costs, the stability of the industry, competitive position and the period of control over the assets. These intangibles are amortised over their useful lives, which range from five to 30 years, using the straight-line method.
The amortisation charge for the year is included in the income statement under ‘Other operating expenses’. For intangibles with finite lives, impairment charges will be recognised in the income statement where evidence of such impairment is observed. Intangibles with indefinite lives are subject to regular impairment testing, as described below.
Impairment testing
For impairment testing, goodwill and intangibles with indefinite useful lives have been allocated to cash-generating units. The carrying amount of goodwill and intangible assets with indefinite useful lives is reviewed at least annually or when circumstances or events indicate there may be uncertainty over this value. Goodwill and indefinite life intangibles are written down for impairment where the recoverable amount is insufficient to support its carrying value. Further details on goodwill allocation and impairment testing are given in note 13.
(O) Property and equipment
Owner-occupied properties are carried at their revalued amounts, which are supported by market evidence, and movements are recognised in other comprehensive income and taken to a separate reserve within equity. When such properties are sold, the accumulated revaluation surpluses are transferred from this reserve to retained earnings. These properties are depreciated down to their estimated residual values over their useful lives. All other items classed as property and equipment within the statement of financial position are carried at historical cost less accumulated depreciation.
Investment properties under construction are included within property and equipment until completion, and are stated at cost less any provision for impairment in their values until construction is completed or fair value becomes reliably measurable.
Depreciation is calculated on the straight-line method to write-down the cost of other assets to their residual values over their estimated useful lives as follows:
| n Properties under construction | No depreciation |
| n Owner-occupied properties, and related mechanical and electrical equipment | 25 years |
| n Motor vehicles | Three years, or lease term if longer |
| n Computer equipment | Three to five years |
| n Other assets | Three to five years |
The assets’ residual values, useful lives and method of depreciation are reviewed regularly, and at least at each financial year end, and adjusted if appropriate. Where the carrying amount of an asset is greater than its estimated recoverable amount, it is written down immediately to its recoverable amount. Gains and losses on disposal of property and equipment are determined by reference to their carrying amount.
Borrowing costs directly attributable to the acquisition and construction of property and equipment are capitalised. All repairs and maintenance costs are charged to the income statement during the financial period in which they are incurred. The cost of major renovations is included in the carrying amount of the asset when it is probable that future economic benefits in excess of the most recently assessed standard of performance of the existing asset will flow to the Group and the renovation replaces an identifiable part of the asset. Major renovations are depreciated over the remaining useful life of the related asset.
(P) Investment property
Investment property is held for long-term rental yields and is not occupied by the Group. Completed investment property is stated at its fair value, which is supported by market evidence, as assessed by qualified external valuers or by local qualified staff of the Group in overseas operations. Changes in fair values are recorded in the income statement in net investment income.
As described in accounting policy O above, investment properties under construction are included within property and equipment, and are stated at cost less any impairment in their values until construction is completed or fair value becomes reliably measurable.
(Q) Impairment of non-financial assets
Property and equipment and other non-financial assets are reviewed for impairment losses whenever events or changes in circumstances indicate that the carrying amount may not be recoverable. An impairment loss is recognised for the amount by which the carrying amount of the asset exceeds its recoverable amount, which is the higher of an asset’s net selling price and value in use. For the purposes of assessing impairment, assets are grouped at the lowest level for which there are separately identifiable cash flows. Non-financial assets except goodwill which have suffered an impairment are reviewed for possible reversal of the impairment at each reporting date.
(R) Derecognition and offset of financial assets and financial liabilities
A financial asset (or, where applicable, a part of a financial asset or part of a group of similar financial assets) is derecognised where:
n The rights to receive cash flows from the asset have expired.
n The Group retains the right to receive cash flows from the asset, but has assumed an obligation to pay them in full without material delay to a third party under a ‘pass-through’ arrangement.
n The Group has transferred its rights to receive cash flows from the asset and has either transferred substantially all the risks and rewards of the asset, or has neither transferred nor retained substantially all the risks and rewards of the asset, but has transferred control of the asset.
A financial liability is derecognised when the obligation under the liability is discharged or cancelled or expires.
Financial assets and liabilities are offset and the net amount reported in the statement of financial position when there is a legally enforceable right to set off the recognised amounts and there is an intention to settle on a net basis, or realise the asset and settle the liability simultaneously.
(S) Financial investments
The Group classifies its investments as either financial assets at fair value through profit or loss (FV) or financial assets available for sale (AFS). The classification depends on the purpose for which the investments were acquired, and is determined by local management at initial recognition. The FV category has two subcategories – those that meet the definition as being held for trading and those the Group chooses to designate as FV (referred to in this accounting policy as ‘other than trading’).
In general, the other than trading category is used as, in most cases, the Group’s investment or risk management strategy is to manage its financial investments on a fair value basis. Debt securities and equity securities, which the Group buys with the intention to resell in the short term, are classified as trading, as are non-hedge derivatives (see accounting policy T below). The AFS category is used where the relevant long-term business liability (including shareholders’ funds) is passively managed, as well as in certain fund management and non-insurance operations.
Purchases and sales of investments are recognised on the trade date, which is the date that the Group commits to purchase or sell the assets, at their fair values. Debt securities are initially recorded at their fair value, which is taken to be amortised cost, with amortisation credited or charged to the income statement. Investments classified as trading, other than trading and AFS, are subsequently carried at fair value. Changes in the fair value of trading and other than trading investments are included in the income statement in the period in which they arise. Changes in the fair value of securities classified as AFS are recognised in other comprehensive income and recorded in a separate investment valuation reserve within equity.
Investments carried at fair value are measured using a fair value hierarchy, described in note 19, with values based on quoted bid prices or amounts derived from cash flow models. Fair values for unlisted equity securities are estimated using applicable price/earnings or price/cash flow ratios refined to reflect the specific circumstances of the issuer.
When securities classified as AFS are sold or impaired, the accumulated fair value adjustments are transferred out of the investment valuation reserve to the income statement with a corresponding movement through other comprehensive income.
Impairment
The Group reviews the carrying value of its AFS investments on a regular basis. If the carrying value of an AFS investment is greater than the recoverable amount, the carrying value is reduced through a charge to the income statement in the period of impairment. The following policies are used to determine the level of any impairment, some of which involve considerable judgement:
AFS debt securities: An AFS debt security is impaired if there is objective evidence that a loss event has occurred which has impaired the expected cash flows, i.e. where all amounts due according to the contractual terms of the security are not considered collectible. An impairment charge, measured as the difference between the security’s fair value and amortised cost, is recognised when the issuer is known to be either in default or in financial difficulty. Determining when an issuer is in financial difficulty requires the use of judgement, and we consider a number of factors including industry risk factors, financial condition, liquidity position and near-term prospects of the issuer, credit rating declines and a breach of contract. A decline in fair value below amortised cost due to changes in risk-free interest rates does not necessarily represent objective evidence of a loss event.
For securities identified as being impaired, the cumulative unrealised net loss previously recognised within the investment valuation reserve is transferred to realised losses for the year, with a corresponding movement through other comprehensive income. Any subsequent increase in fair value of these impaired securities is recognised in other comprehensive income and recorded in the investment valuation reserve unless this increase can be objectively related to an event occurring after the impairment loss was recognised in the income statement. In such an event, the reversal of the impairment loss is recognised as a gain in the income statement.
AFS equity securities: An AFS equity security is considered impaired if there is objective evidence that the cost may not be recovered. In addition to qualitative impairment criteria, such evidence includes a significant or prolonged decline in fair value below cost. Unless there is evidence to the contrary, an equity security is considered impaired if the decline in fair value relative to cost has been either at least 20% for a continuous six-month period or more than 40% at the end of the reporting period, or been in an unrealised loss position for a continuous period of more than 12 months at the end of the reporting period. We also review our largest equity holdings for evidence of impairment, as well as individual equity holdings in industry sectors known to be in difficulty. Where there is objective evidence that impairment exists, the security is written down regardless of the size of the unrealised loss.
For securities identified as being impaired, the cumulative unrealised net loss previously recognised within the investment valuation reserve is transferred to realised losses for the year with a corresponding movement through other comprehensive income. Any subsequent increase in fair value of these impaired securities is recognised in other comprehensive income and recorded in the investment valuation reserve.
Reversals of impairments on any of these assets are only recognised where the decrease in the impairment can be objectively related to an event occurring after the write-down (such as an improvement in the debtor’s credit rating), and are not recognised in respect of equity instruments.
(T) Derivative financial instruments and hedging
Derivative financial instruments include foreign exchange contracts, interest rate futures, currency and interest rate swaps, currency and interest rate options (both written and purchased) and other financial instruments that derive their value mainly from underlying interest rates, foreign exchange rates, credit indices, commodity values or equity instruments.
All derivatives are initially recognised in the statement of financial position at their fair value, which usually represents their cost. They are subsequently remeasured at their fair value, with the method of recognising movements in this value depending on whether they are designated as hedging instruments and, if so, the nature of the item being hedged. Fair values are obtained from quoted market prices or, if these are not available, by using valuation techniques such as discounted cash flow models or option pricing models. All derivatives are carried as assets when the fair values are positive and as liabilities when the fair values are negative. Premiums paid for derivatives are recorded as an asset on the statement of financial position at the date of purchase, representing their fair value at that date.
Derivative contracts may be traded on an exchange or over-the-counter (OTC). Exchange-traded derivatives are standardised and include certain futures and option contracts. OTC derivative contracts are individually negotiated between contracting parties and include forwards, swaps, caps and floors. Derivatives are subject to various risks including market, liquidity and credit risk, similar to those related to the underlying financial instruments. Many OTC transactions are contracted and documented under International Swaps and Derivatives Association (ISDA) master agreements or their equivalent, which are designed to provide legally enforceable set-off in the event of default, reducing the Group’s exposure to credit risk.
The notional or contractual amounts associated with derivative financial instruments are not recorded as assets or liabilities on the statement of financial position as they do not represent the fair value of these transactions. These amounts are disclosed in note 54.
The Group has collateral agreements in place between the individual Group entities and relevant counterparties. Accounting policy V below covers collateral, both received and pledged, in respect of these derivatives.
Interest rate and currency swaps
Interest rate swaps are contractual agreements between two parties to exchange periodic payments in the same currency, each of which is computed on a different interest rate basis, on a specified notional amount. Most interest rate swaps involve the net exchange of payments calculated as the difference between the fixed and floating rate interest payments. Currency swaps, in their simplest form, are contractual agreements that involve the exchange of both periodic and final amounts in two different currencies. Both types of swap contracts may include the net exchange of principal. Exposure to gain or loss on these contracts will increase or decrease over their respective lives as a function of maturity dates, interest and foreign exchange rates, and the timing of payments.
Interest rate futures, forwards and options contracts
Interest rate futures are exchange-traded instruments and represent commitments to purchase or sell a designated security or money market instrument at a specified future date and price. Interest rate forward agreements are OTC contracts in which two parties agree on an interest rate and other terms that will become a reference point in determining, in concert with an agreed notional principal amount, a net payment to be made by one party to the other, depending what rate in fact prevails at a future point in time. Interest rate options, which consist primarily of caps and floors, are interest rate protection instruments that involve the potential obligation of the seller to pay the buyer an interest rate differential in exchange for a premium paid by the buyer. This differential represents the difference between current rate and an agreed rate applied to a notional amount. Exposure to gain or loss on all interest rate contracts will increase or decrease over their respective lives as interest rates fluctuate.
Foreign exchange contracts
Foreign exchange contracts, which include spot, forward and futures contracts, represent agreements to exchange the currency of one country for the currency of another country at an agreed price and settlement date. Foreign exchange option contracts are similar to interest rate option contracts, except that they are based on currencies, rather than interest rates.
Exposure to gain or loss on these contracts will increase or decrease over their respective lives as currency exchange and interest rates fluctuate.
Derivative instruments for hedging
On the date a derivative contract is entered into, the Group designates certain derivatives as either:
| (i) | a hedge of the fair value of a recognised asset or liability (fair value hedge); |
| (ii) | a hedge of a future cash flow attributable to a recognised asset or liability, a highly probable forecast transaction or a firm commitment (cash flow hedge); or |
| (iii) | a hedge of a net investment in a foreign operation (net investment hedge). |
Hedge accounting is used for derivatives designated in this way, provided certain criteria are met. At the inception of the transaction, the Group documents the relationship between the hedging instrument and the hedged item, as well as the risk management objective and the strategy for undertaking the hedge transaction. The Group also documents its assessment of whether the hedge is expected to be, and has been, highly effective in offsetting the risk in the hedged item, both at inception and on an ongoing basis.
Changes in the fair value of derivatives that are designated and qualify as net investment or cash flow hedges, and that prove to be highly effective in relation to the hedged risk, are recognised in other comprehensive income and a separate reserve within equity. Gains and losses accumulated in this reserve are included in the income statement on disposal of the relevant investment or occurrence of the cash flow as appropriate. Changes in the fair value of derivatives that are designated and qualify as fair value hedges against assets carried at amortised cost are adjusted against the carrying value of the hedged asset to the extent those changes relate to the hedged risk. This adjustment is then amortised to the income statement over the anticipated remaining life of the hedged instrument. Where the hedge is against the value of AFS securities, changes in its value are recognised in the income statement, partially or wholly offset by a transfer from the investment valuation reserve for the change in value of the hedged item.
The Group discontinues hedge accounting if the hedging instrument expires, is sold, terminated or exercised, the hedge no longer meets the criteria for hedge accounting or the Group revokes the designation.
For a variety of reasons, certain derivative transactions, while providing effective economic hedges under the Group’s risk management positions, do not qualify for hedge accounting under the specific IFRS rules and are therefore treated as derivatives held for trading. Their fair value gains and losses are recognised immediately in other trading income.
(U) Loans
Loans with fixed maturities, including policyholder loans, mortgage loans on investment property, securitised mortgages and collateral loans, are recognised when cash is advanced to borrowers. The majority of these loans are carried at their unpaid principal balances and adjusted for amortisation of premium or discount, non-refundable loan fees and related direct costs. These amounts are deferred and amortised over the life of the loan as an adjustment to loan yield using the effective interest rate method. Loans with indefinite future lives are carried at unpaid principal balances or cost.
For certain mortgage loans, the Group has taken advantage of the fair value option under IAS 39 to present the mortgages, associated borrowings and derivative financial instruments at fair value, since they are managed as a portfolio on a fair value basis. This presentation provides more relevant information and eliminates any accounting mismatch that would otherwise arise from using different measurement bases for these three items. The fair values of mortgages classified as FV are estimated using discounted cash flow forecasts, based on a risk-adjusted discount rate which reflects the risks associated with these products, calibrated using the margins available on new lending or with reference to the rates offered by competitors. They are revalued at each period end, with movements in their fair values being taken to the income statement.
At each reporting date, we review loans carried at amortised cost for objective evidence that they are impaired and uncollectable, either at the level of an individual security or collectively within a group of loans with similar credit risk characteristics. To the extent that a loan is uncollectable, it is written down as impaired to its recoverable amount, measured as the present value of expected future cash flows discounted at the original effective interest rate of the loan, taking into account the fair value of the underlying collateral. Subsequent recoveries in excess of the loan’s written-down carrying value are credited to the income statement.
(V) Collateral
The Group receives and pledges collateral in the form of cash or non-cash assets in respect of stock lending transactions, certain derivative contracts and loans, in order to reduce the credit risk of these transactions. Collateral is also pledged as security for bank letters of credit. The amount and type of collateral required depends on an assessment of the credit risk of the counterparty.
Collateral received in the form of cash, which is not legally segregated from the Group, is recognised as an asset in the statement of financial position with a corresponding liability for the repayment in financial liabilities (note 46). However, where the Group has a currently enforceable legal right of set-off, the collateral liability and associated derivative balances are shown net, in line with market practice. Non-cash collateral received is not recognised in the statement of financial position unless the Group either (a) sells or repledges these assets in the absence of default, at which point the obligation to return this collateral is recognised as a liability; or (b) the counterparty to the arrangement defaults, at which point the collateral is seized and recognised as an asset.
Collateral pledged in the form of cash, which is legally segregated from the Group, is derecognised from the statement of financial position with a corresponding receivable recognised for its return. Non-cash collateral pledged is not derecognised from the statement of financial position unless the Group defaults on its obligations under the relevant agreement, and therefore continues to be recognised in the statement of financial position within the appropriate asset classification.
(W) Deferred acquisition costs and other assets
Costs relating to the acquisition of new business for insurance and participating investment contracts are deferred in line with existing local accounting practices, to the extent that they are expected to be recovered out of future margins in revenues on these contracts. For participating contracts written in the UK, acquisition costs are generally not deferred as the liability for these contracts is calculated in accordance with the FSA’s realistic capital regime and FRS 27. For non-participating investment and investment fund management contracts, incremental acquisition costs and sales enhancements that are directly attributable to securing an investment management service are also deferred.
Where such business is reinsured, an appropriate proportion of the deferred acquisition costs is attributed to the reinsurer, and is treated as a separate liability.
Long-term business deferred acquisition costs are amortised systematically over a period no longer than that in which they are expected to be recoverable out of these future margins. Deferrable acquisition costs for non-participating investment and investment fund management contracts are amortised over the period in which the service is provided. General insurance and health deferred acquisition costs are amortised over the period in which the related revenues are earned. The reinsurers’ share of deferred acquisition costs is amortised in the same manner as the underlying asset.
Deferred acquisition costs are reviewed by category of business at the end of each reporting period and are written-off where they are no longer considered to be recoverable.
Other assets include vehicles which are subject to repurchase agreements and inventories of vehicle parts. The former are carried at the lower of their agreed repurchase price or net realisable value, whilst the latter are carried at the lower of cost and net realisable value, where cost is arrived at on the weighted average cost formula or ‘first in first out’ (FIFO) basis. Provision is made against inventories which are obsolete or surplus to requirements.
(X) Statement of cash flows
Cash and cash equivalents
Cash and cash equivalents consist of cash at banks and in hand, deposits held at call with banks, treasury bills and other short-term highly liquid investments that are readily convertible to known amounts of cash and which are subject to an insignificant risk of change in value. Such investments are those with less than three months’ maturity from the date of acquisition, or which are redeemable on demand with only an insignificant change in their fair values.
For the purposes of the statement of cash flows, cash and cash equivalents also include bank overdrafts, which are included in payables and other financial liabilities on the statement of financial position.
Operating cash flows
Purchases and sales of investment property, loans and financial investments are included within operating cash flows as the purchases are funded from cash flows associated with the origination of insurance and investment contracts, net of payments of related benefits and claims.
(Y) Leases
Leases, where a significant portion of the risks and rewards of ownership is retained by the lessor, are classified as operating leases. Where the Group is the lessee, payments made under operating leases (net of any incentives received from the lessor) are charged to the income statement on a straight-line basis over the term of the relevant leases.
Where the Group is the lessor, lease income from operating leases is recognised in the income statement on a straight-line basis over the lease term.
When assets are subject to finance leases, the present value of the lease payments, together with any unguaranteed residual value, is recognised as a receivable. The Group has not entered into any material finance lease arrangements either as lessor or lessee.
(Z) Provisions and contingent liabilities
Provisions are recognised when the Group has a present legal or constructive obligation as a result of past events, it is more probable than not that an outflow of resources embodying economic benefits will be required to settle the obligation, and a reliable estimate of the amount of the obligation can be made. Restructuring provisions comprise lease termination penalties and employee termination payments. Provisions are not recognised for future operating losses.
Where the Group expects a provision to be reimbursed, for example under an insurance contract, the reimbursement is recognised as a separate asset but only when the reimbursement is virtually certain.
The Group recognises a provision for onerous contracts when the expected benefits to be derived from a contract are less than the unavoidable costs of meeting the obligations under the contract. Contingent liabilities are disclosed if there is a possible future obligation as a result of a past event, or if there is a present obligation as a result of a past event but either a payment is not probable or the amount cannot be reasonably estimated.
(AA) Employee benefits
Annual leave and long service leave
Employee entitlements to annual leave and long service leave are recognised when they accrue to employees. A provision is made for the estimated liability for annual leave and long service leave as a result of services rendered by employees up to the statement of financial position date.
Pension obligations
The Group operates a large number of pension schemes, whose members receive benefits on either a defined benefit basis (generally related to a member’s final salary and length of service) or a defined contribution basis (generally related to the amount invested, investment return and annuity rates), the assets of which are generally held in separate trustee-administered funds. The pension plans are generally funded by payments from employees and the relevant Group companies.
For defined benefit plans, the pension costs are assessed using the projected unit credit method. Under this method, the cost of providing pensions is charged to the income statement so as to spread the regular cost over the service lives of employees. The pension obligation is measured as the present value of the estimated future cash outflows, using a discount rate based on market yields for high-quality corporate bonds that are denominated in the currency in which the benefits will be paid and that have terms to maturity approximating to the terms of the related pension liability. The resulting pension scheme surplus or deficit appears as an asset or liability in the consolidated statement of financial position.
Costs charged to the income statement comprise the current service cost (the increase in pension obligation resulting from employees’ service in the current period, together with the schemes’ administration expenses), past service cost (resulting from changes to benefits with respect to previous years’ service), and gains or losses on curtailment (when the employer materially reduces the number of employees covered by the scheme) or on settlements (when a scheme’s obligations are transferred outside the Group). In addition, the difference between the expected return on scheme assets, less investment expenses, and the interest cost of unwinding the discount on the scheme liabilities (to reflect the benefits being one period closer to being paid out) is credited to investment income. All actuarial gains and losses, being the difference between the actual and expected returns on scheme assets, changes in assumptions underlying the liability calculations and experience gains or losses on the assumptions made at the beginning of the period, are recognised immediately in other comprehensive income.
For defined contribution plans, the Group pays contributions to publicly or privately administered pension plans. Once the contributions have been paid, the Group, as employer, has no further payment obligations. The Group’s contributions are charged to the income statement in the year to which they relate and are included in staff costs.
Other post-employment obligations
Some Group companies provide post-employment healthcare or other benefits to their retirees. The entitlement to these benefits is usually based on the employee remaining in service up to retirement age and the completion of a minimum service period. Unlike the pension schemes, no assets are set aside in separate funds to provide for the future liability but none of these schemes is material to the Group. The costs of the Canadian scheme are included within those for the defined benefit pension schemes in that country. For such schemes in other countries, provisions are calculated in line with local regulations, with movements being charged to the income statement within staff costs.
Equity compensation plans
The Group offers share award and option plans over the Company’s ordinary shares for certain employees, including a Save As You Earn plan (SAYE plan), details of which are given in the Directors’ Remuneration Report.
The Group accounts for options and awards under equity compensation plans, which were granted after 7 November 2002, until such time as they are fully vested, using the fair value based method of accounting (the ‘fair value method’). Under this method, the cost of providing equity compensation plans is based on the fair value of the share awards or option plans at date of grant, which is recognised in the income statement over the expected vesting period of the related employees and credited to the equity compensation reserve, part of shareholders’ funds. In certain jurisdictions, awards must be settled in cash instead of shares, and the credit is taken to liabilities rather than reserves. The fair value of these cash-settled awards is recalculated each year, with the income statement charge and liability being adjusted accordingly.
As described in accounting policy AD below, shares purchased by employee share trusts to fund these awards are shown as a deduction from shareholders’ funds at their original cost.
When the options are exercised and new shares are issued, the proceeds received, net of any transaction costs, are credited to share capital (par value) and the balance to share premium. Where the shares are already held by employee trusts, the net proceeds are credited against the cost of these shares, with the difference between cost and proceeds being taken to retained earnings. In both cases, the relevant amount in the equity compensation reserve is then credited to retained earnings.
(AB) Income taxes
The current tax expense is based on the taxable profits for the year, after any adjustments in respect of prior years. Tax, including tax relief for losses if applicable, is allocated over profits before taxation and amounts charged or credited to components of other comprehensive income and equity, as appropriate.
Provision is made for deferred tax liabilities, or credit taken for deferred tax assets, using the liability method, on all material temporary differences between the tax bases of assets and liabilities and their carrying amounts in the consolidated financial statements.
The principal temporary differences arise from depreciation of property and equipment, revaluation of certain financial assets and liabilities including derivative contracts, provisions for pensions and other post-retirement benefits and tax losses carried forward; and, in relation to acquisitions, on the difference between the fair values of the net assets acquired and their tax base. The rates enacted or substantively enacted at the statement of financial position date are used to determine the deferred tax.
Deferred tax assets are recognised to the extent that it is probable that future taxable profit will be available against which the temporary differences can be utilised. In countries where there is a history of tax losses, deferred tax assets are only recognised in excess of deferred tax liabilities if there is convincing evidence that future profits will be available.
Deferred tax is provided on temporary differences arising from investments in subsidiaries, associates and joint ventures, except where the timing of the reversal of the temporary difference can be controlled and it is probable that the difference will not reverse in the foreseeable future.
Deferred taxes are not provided in respect of temporary differences arising from the initial recognition of goodwill, or from goodwill for which amortisation is not deductible for tax purposes, or from the initial recognition of an asset or liability in a transaction which is not a business combination and affects neither accounting profit nor taxable profit or loss at the time of the transaction.
Current and deferred tax relating to items recognised in other comprehensive income and directly in equity are similarly recognised in other comprehensive income and directly in equity respectively. Deferred tax related to fair value re-measurement of available for sale investments, owner-occupied properties and other amounts charged or credited directly to other comprehensive income is recognised in the statement of financial position as a deferred tax asset or liability. Current tax on interest paid on direct capital instruments and fixed rate tier 1 notes is credited directly in equity.
In addition to paying tax on shareholders’ profits, the Group’s life businesses in the UK, Ireland and Singapore pay tax on policyholders’ investment returns (‘policyholder tax’) on certain products at policyholder tax rates. Policyholder tax is accounted for as an income tax and is included in the total tax expense. The Group has decided to show separately the amounts of policyholder tax to provide a more meaningful measure of the tax the Group pays on its profits. In the pro forma reconciliations, adjusted operating profit has been calculated after charging policyholder tax.
(AC) Borrowings
Borrowings are classified as being for either core structural or operational purposes. They are recognised initially at their issue proceeds less transaction costs incurred. Subsequently, most borrowings are stated at amortised cost, and any difference between net proceeds and the redemption value is recognised in the income statement over the period of the borrowings using the effective interest rate method. All borrowing costs are expensed as they are incurred except where they are directly attributable to the acquisition or construction of property and equipment as described in accounting policy O above.
Where loan notes have been issued in connection with certain securitised mortgage loans, the Group has taken advantage of the revised fair value option under IAS 39 to present the mortgages, associated liabilities and derivative financial instruments at fair value, since they are managed as a portfolio on a fair value basis. This presentation provides more relevant information and eliminates any accounting mismatch which would otherwise arise from using different measurement bases for these three items.
(AD) Share capital and treasury shares
Equity instruments
An equity instrument is a contract that evidences a residual interest in the assets of an entity after deducting all its liabilities. Accordingly, a financial instrument is treated as equity if:
| (i) | there is no contractual obligation to deliver cash or other financial assets or to exchange financial assets or liabilities on terms that may be unfavourable; and |
| (ii) | the instrument is a non-derivative that contains no contractual obligation to deliver a variable number of shares or is a derivative that will be settled only by the Group exchanging a fixed amount of cash or other assets for a fixed number of the Group’s own equity instruments. |
Share issue costs
Incremental external costs directly attributable to the issue of new shares are shown in equity as a deduction, net of tax, from the proceeds of the issue and disclosed where material.
Dividends
Interim dividends on ordinary shares are recognised in equity in the period in which they are paid. Final dividends on these shares are recognised when they have been approved by shareholders. Dividends on preference shares are recognised in the period in which they are declared and appropriately approved.
Treasury shares
Where the Company or its subsidiaries purchase the Company’s share capital or obtain rights to purchase its share capital, the consideration paid (including any attributable transaction costs net of income taxes) is shown as a deduction from total shareholders’ equity. The Group’s only such holding comprises shares purchased by employee trusts to fund certain awards under the equity compensation plans described in accounting policy AA above. Gains and losses on sales of own shares are charged or credited to the treasury share account in equity.
(AE) Fiduciary activities
Assets and income arising from fiduciary activities, together with related undertakings to return such assets to customers, are excluded from these financial statements where the Group has no contractual rights in the assets and acts in a fiduciary capacity such as nominee, trustee or agent.
(AF) (Loss)/earnings per share
Basic losses/earnings per share is calculated by dividing net income available to ordinary shareholders by the weighted average number of ordinary shares in issue during the year, excluding the weighted average number of ordinary shares purchased by the Group and held as Treasury shares.
For the diluted earnings per share, the weighted average number of ordinary shares in issue is adjusted to assume conversion of all dilutive potential ordinary shares, such as convertible debt and share options granted to employees.
Potential or contingent share issuances are treated as dilutive when their conversion to shares would decrease net (losses) earnings per share.
Consolidated financial statements
Consolidated income statement
For the year ended 31 December 2012
| | | | | | 2012
£m | | | 2011
£m | | | | | | 2010
£m | |
| | | | | | | | | | | | | | | | Restated2 | | | | | | | | Restated2 | | | | | |
| | | | Note | | | | Continuing
operations | | | | Discontinued operations1 | | | | Continuing operations | | | | Discontinued Operations1 | | | | Continuing operations | | | | Discontinued Operations1 | |
| Income | | | 5 | | | | | | | | | | | | | | | | | | | | | | | | | |
| Gross written premiums | | | | | | | 22,744 | | | | 3,796 | | | | 26,255 | | | | 5,863 | | | | 27,192 | | | | 9,082 | |
| Premiums ceded to reinsurers | | | | | | | (1,571 | ) | | | (207 | ) | | | (1,548 | ) | | | (200 | ) | | | (1,606 | ) | | | (257 | ) |
| Premiums written net of reinsurance | | | | | | | 21,173 | | | | 3,589 | | | | 24,707 | | | | 5,663 | | | | 25,586 | | | | 8,825 | |
| Net change in provision for unearned premiums | | | | | | | (16 | ) | | | – | | | | (236 | ) | | | (56 | ) | | | (72 | ) | | | (3 | ) |
| Net earned premiums | | | G | | | | 21,157 | | | | 3,589 | | | | 24,471 | | | | 5,607 | | | | 25,514 | | | | 8,822 | |
| Fee and commission income | | | H & I | | | | 1,273 | | | | 23 | | | | 1,465 | | | | 111 | | | | 1,451 | | | | 331 | |
| Net investment income | | | J | | | | 21,106 | | | | 2,241 | | | | 4,341 | | | | 2,086 | | | | 16,746 | | | | 5,247 | |
| Share of (loss)/profit after tax of joint ventures and associates | | | | | | | (277 | ) | | | – | | | | (123 | ) | | | 28 | | | | 141 | | | | (10 | ) |
| (Loss)/profit on the disposal and remeasurement of subsidiaries and associates | | | 3b | | | | (164 | ) | | | (2,359 | ) | | | 565 | | | | (32 | ) | | | 163 | | | | (4 | ) |
| | | | | | | | 43,095 | | | | 3,494 | | | | 30,719 | | | | 7,800 | | | | 44,015 | | | | 14,386 | |
| Expenses | | | 6 | | | | | | | | | | | | | | | | | | | | | | | | | |
| Claims and benefits paid, net of recoveries from reinsurers | | | | | | | (23,601 | ) | | | (2,721 | ) | | | (24,380 | ) | | | (4,029 | ) | | | (22,240 | ) | | | (6,912 | ) |
| Change in insurance liabilities, net of reinsurance | | | | | | | (430 | ) | | | (1,566 | ) | | | (2,284 | ) | | | (2,523 | ) | | | (2,837 | ) | | | (3,692 | ) |
| Change in investment contract provisions | | | | | | | (4,450 | ) | | | (77 | ) | | | 1,478 | | | | (180 | ) | | | (9,212 | ) | | | (177 | ) |
| Change in unallocated divisible surplus | | | | | | | (6,316 | ) | | | – | | | | 2,721 | | | | (19) | | | | 362 | | | | (33 | ) |
| Fee and commission expense | | | | | | | (4,472 | ) | | | (498 | ) | | | (4,326 | ) | | | (420 | ) | | | (5,500 | ) | | | (367 | ) |
| Other expenses | | | | | | | (2,845 | ) | | | (1,307 | ) | | | (2,779 | ) | | | (809 | ) | | | (2,116 | ) | | | (1,421 | ) |
| Finance costs | | | 7 | | | | (735 | ) | | | (21 | ) | | | (776 | ) | | | (284 | ) | | | (682 | ) | | | (740 | ) |
| | | | | | | | (42,849 | ) | | | (6,190 | ) | | | (30,346 | ) | | | (8,264 | ) | | | (42,225 | ) | | | (13,342 | ) |
| Profit/(loss) before tax | | | | | | | 246 | | | | (2,696 | ) | | | 373 | | | | (464 | ) | | | 1,790 | | | | 1,044 | |
| Tax attributable to policyholders’ returns | | | 10d | | | | (221 | ) | | | – | | | | 178 | | | | – | | | | (394 | ) | | | – | |
| Profit/(loss) before tax attributable to shareholders’ profits | | | | | | | 25 | | | | (2,696 | ) | | | 551 | | | | (464 | ) | | | 1,396 | | | | 1,044 | |
| Tax (expense)/credit | | | AB & 10 | | | | (448 | ) | | | (152 | ) | | | 44 | | | | 107 | | | | (739 | ) | | | (203 | ) |
| Less: tax attributable to policyholders’ returns | | | 10d | | | | 221 | | | | – | | | | (178 | ) | | | – | | | | 394 | | | | – | |
| Tax attributable to shareholders’ profits | | | | | | | (227 | ) | | | (152 | ) | | | (134 | ) | | | 107 | | | | (345 | ) | | | (203 | ) |
| (Loss)/profit after tax | | | | | | | (202 | ) | | | (2,848 | ) | | | 417 | | | | (357 | ) | | | 1,051 | | | | 841 | |
| (Loss) from discontinued operations | | | | | | | (2,848 | ) | | | | | | | (357 | ) | | | | | | | 841 | | | | | |
| (Loss)/profit for the year | | | | | | | (3,050 | ) | | | | | | | 60 | | | | | | | | 1,892 | | | | | |
| | | | | | | | | | | | | | | | | | | | | | | | | | | | | |
| Attributable to: | | | | | | | | | | | | | | | | | | | | | | | | | | | | |
| Equity shareholders of Aviva plc | | | | | | | (3,218 | ) | | | | | | | 225 | | | | | | | | 1,463 | | | | | |
| Non-controlling interests | | | 34 | | | | 168 | | | | | | | | (165 | ) | | | | | | | 429 | | | | | |
| (Loss)/profit for the year | | | | | | | (3,050 | ) | | | | | | | 60 | | | | | | | | 1,892 | | | | | |
| (Loss)/earnings per share | | | AF & 11 | | | | | | | | | | | | | | | | | | | | | | | | | |
| Basic (pence per share) | | | | | | | (113.1 | )p | | | | | | | 5.8 | p | | | | | | | 50.4 | p | | | | |
| Diluted (pence per share) | | | | | | | (113.1 | )p | | | | | | | 5.7 | p | | | | | | | 49.6 | p | | | | |
| | | | | | | | | | | | | | | | | | | | | | | | | | | | | |
| Continuing operations – Basic (pence per share) | | | | | | | (15.2 | )p | | | | | | | 11.1 | p | | | | | | | 37.6 | p | | | | |
| Continuing operations – Diluted (pence per share) | | | | | | | (15.2 | )p | | | | | | | 10.9 | p | | | | | | | 37.0 | p | | | | |
| 1 | Discontinued operations in the current period represents the results of the US life and related internal asset management businesses (US Life), and in the prior periods represents the results of US Life and Delta Lloyd to 6 May 2011. |
| 2. | Following a review of the classification of contracts issued by the Group’s Italian long-term business, certain portfolios have been reclassified from participating insurance to participating investment contracts for all years presented. There
is no impact on the result for any year presented as a result of this reclassification. |
The accounting policies (identified alphabetically) on pages 108 to 119 and notes (identified numerically) on pages 127 to 229 are an integral part of these financial statements.
Consolidated statement of comprehensive income
For the year ended 31 December 2012
| | | Note | | | 2012
£m | | | 2011
£m | | | 2010
£m | |
| (Loss)/profit for the year from continuing operations | | | | | | | (202 | ) | | | 417 | | | | 1,051 | |
| (Loss) for the year from discontinued operations1 | | | | | | | (2,848 | ) | | | (357 | ) | | | 841 | |
| Total (loss)/profit for the year | | | | | | | (3,050 | ) | | | 60 | | | | 1,892 | |
| | | | | | | | | | | | | | | | | |
| Other comprehensive income/(expense) from continuing operations: | | | | | | | | | | | | | | | | |
| Investments classified as available for sale | | | | | | | | | | | | | | | | |
| Fair value gains/(losses) | | | | | | | 27 | | | | (5 | ) | | | – | |
| Fair value gains transferred to profit on disposals | | | | | | | 1 | | | | 1 | | | | (2 | ) |
Impairment losses on assets previously revalued through other comprehensive income
now taken to the income statement | | | | | | | – | | | | 2 | | | | – | |
| Owner-occupied properties – fair value (losses)/gains | | | | | | | (3 | ) | | | 2 | | | | (14 | ) |
| Share of other comprehensive income of joint ventures and associates | | | | | | | 14 | | | | (134 | ) | | | – | |
| Actuarial (losses)/gains on pension schemes | | | 44e(iv) | | | | (830 | ) | | | 996 | | | | 1,078 | |
| Other pension scheme movements | | | | | | | – | | | | (22 | ) | | | (18 | ) |
| Foreign exchange rate movements | | | | | | | (200 | ) | | | (284 | ) | | | (12 | ) |
| Aggregate tax effect – shareholder tax | | | 10b | | | | 163 | | | | (160 | ) | | | 35 | |
| Other comprehensive (expense)/income, net of tax from continuing operations | | | | | | | (828 | ) | | | 396 | | | | 1,067 | |
| Other comprehensive income, net of tax from discontinued operations1 | | | 3c(i) | | | | 68 | | | | 300 | | | | 364 | |
| Total other comprehensive (expense)/income, net of tax | | | | | | | (760 | ) | | | 696 | | | | 1,431 | |
| | | | | | | | | | | | | | | | | |
| Total comprehensive (expense)/income for the year from continuing operations | | | | | | | (1,030 | ) | | | 813 | | | | 2,118 | |
| Total comprehensive (expense)/income for the year from discontinued operations1 | | | | | | | (2,780 | ) | | | (57 | ) | | | 1,205 | |
| Total comprehensive (expense)/income for the year | | | | | | | (3,810 | ) | | | 756 | | | | 3,323 | |
| | | | | | | | | | | | | | | | | |
| Attributable to: | | | | | | | | | | | | | | | | |
| Equity shareholders of Aviva plc | | | | | | | (3,942 | ) | | | 923 | | | | 2,950 | |
| Non-controlling interests | | | | | | | 132 | | | | (167 | ) | | | 373 | |
| | | | | | | | (3,810 | ) | | | 756 | | | | 3,323 | |
| 1 | Discontinued operations in the current period represents the results of the US life and related internal asset management businesses (US Life), and in the prior periods represents the results of US Life and Delta Lloyd to 6 May 2011. |
The accounting policies (identified alphabetically) on pages 108 to 119 and notes (identified numerically) on pages 127 to 229 are an integral part of these financial statements.
Consolidated statement of changes in equity
For the year ended 31 December 2012
| | Ordinary share capital
£m | | Preference share capital
£m | | Share premium
£m | | Merger reserve
£m | | Shares
held by employee trusts
£m | | Currency translation reserve
£m | | Owner-occupied properties reserve
£m | | Investment valuation reserve
£m | | Hedging instru-ments reserve
£m | | Equity compensation reserve
£m | | Retained earnings
£m | | Equity attributable to shareholders of Aviva plc
£m | | DCI and Fixed rate tier1 notes
£m | | Non controlling interests
£m | | Total
equity
£m | |
| Balance at 1 January | | 726 | | | 200 | | | 1,173 | | | 3,271 | | | (43 | ) | | 1,530 | | | 79 | | | 530 | | | (663 | ) | | 86 | | | 5,954 | | | 12,843 | | | 990 | | | 1,530 | | | 15,363 | |
| (Loss)/profit for the year | | – | | | – | | | – | | | – | | | – | | | – | | | – | | | – | | | – | | | – | | | (3,218 | ) | | (3,218 | ) | | – | | | 168 | | | (3,050 | ) |
| Other comprehensive (expense)/income | | – | | | – | | | – | | | – | | | – | | | (349 | ) | | (2 | ) | | 229 | | | 74 | | | – | | | (676 | ) | | (724 | ) | | – | | | (36 | ) | | (760 | ) |
| Total comprehensive (expense)/income for the year | | – | | | – | | | – | | | – | | | – | | | (349 | ) | | (2 | ) | | 229 | | | 74 | | | – | | | (3,894 | ) | | (3,942 | ) | | – | | | 132 | | | (3,810 | ) |
| Dividends and appropriations | | – | | | – | | | – | | | – | | | – | | | – | | | – | | | – | | | – | | | – | | | (847 | ) | | (847 | ) | | – | | | – | | | (847 | ) |
| Shares issued in lieu of dividends | | 9 | | | – | | | (9 | ) | | – | | | – | | | – | | | – | | | – | | | – | | | – | | | 127 | | | 127 | | | – | | | – | | | 127 | |
| Capital contributions from non-controlling interests | | – | | | – | | | – | | | – | | | – | | | – | | | – | | | – | | | – | | | – | | | – | | | – | | | – | | | 20 | | | 20 | |
| Non-controlling interests share of dividends declared in the year | | – | | | – | | | – | | | – | | | – | | | – | | | – | | | – | | | – | | | – | | | – | | | – | | | – | | | (102 | ) | | (102 | ) |
| Transfer to profit on disposal of subsidiaries, joint ventures and associates | | – | | | – | | | – | | | – | | | – | | | 91 | | | – | | | 96 | | | – | | | – | | | – | | | 187 | | | – | | | – | | | 187 | |
| Changes in non- controlling interests in existing subsidiaries | | – | | | – | | | – | | | – | | | – | | | – | | | – | | | – | | | – | | | – | | | – | | | – | | | – | | | (6 | ) | | (6 | ) |
| Shares acquired by employee trusts | | – | | | – | | | – | | | – | | | (33 | ) | | – | | | – | | | – | | | – | | | – | | | – | | | (33 | ) | | – | | | – | | | (33 | ) |
| Shares distributed by employee trusts | | – | | | – | | | – | | | – | | | 44 | | | – | | | – | | | – | | | – | | | – | | | (36 | ) | | 8 | | | – | | | – | | | 8 | |
| Reserves credit for equity compensation plans | | – | | | – | | | – | | | – | | | – | | | – | | | – | | | – | | | – | | | 42 | | | – | | | 42 | | | – | | | – | | | 42 | |
| Shares issued under equity compensation plans | | 1 | | | – | | | 1 | | | – | | | – | | | – | | | – | | | – | | | – | | | (68 | ) | | 67 | | | 1 | | | – | | | – | | | 1 | |
| Aggregate tax effect – shareholder tax | | – | | | – | | | – | | | – | | | – | | | – | | | – | | | – | | | – | | | – | | | 18 | | | 18 | | | – | | | – | | | 18 | |
| Issue of fixed rate tier 1 notes | | – | | | – | | | – | | | – | | | – | | | – | | | – | | | – | | | – | | | – | | | – | | | – | | | 392 | | | – | | | 392 | |
Balance at
31 December | | 736 | | | 200 | | | 1,165 | | | 3,271 | | | (32 | ) | | 1,272 | | | 77 | | | 855 | | | (589 | ) | | 60 | | | 1,389 | | | 8,404 | | | 1,382 | | | 1,574 | | | 11,360 | |
The accounting policies (identified alphabetically) on pages 108 to 119 and notes (identified numerically) on pages 127 to 229 are an integral part of these financial statements.
Consolidated statement of changes in equity continued
For the year ended 31 December 2011
| | Ordinary share capital
£m | | Preference share capital
£m | | Share premium
£m | | Merger reserve
£m | | Shares held by employee trusts
£m | | Currency translation reserve
£m | | Owner-occupied properties reserve
£m | | Investment valuation reserve
£m | | Hedging instru-ments reserve
£m | | Equity compensation reserve
£m | | Retained earnings
£m | | Equity attributable to shareholders of Aviva plc
£m | | DCI and Fixed rate tier 1 notes
£m | | Non controlling interests
£m | | Total equity
£m | |
| Balance at 1 January | | 705 | | | 200 | | | 1,194 | | | 3,271 | | | (32 | ) | | 2,183 | | | 83 | | | 573 | | | (693 | ) | | 99 | | | 5,411 | | | 12,994 | | | 990 | | | 3,741 | | | 17,725 | |
| Profit/(loss) for the year | | – | | | – | | | – | | | – | | | – | | | – | | | – | | | – | | | – | | | – | | | 225 | | | 225 | | | – | | | (165 | ) | | 60 | |
| Other comprehensive (expense)/income | | – | | | – | | | – | | | – | | | – | | | (165 | ) | | 4 | | | 72 | | | 30 | | | – | | | 757 | | | 698 | | | – | | | (2 | ) | | 696 | |
| Total comprehensive (expense)/income for the year | | – | | | – | | | – | | | – | | | – | | | (165 | ) | | 4 | | | 72 | | | 30 | | | – | | | 982 | | | 923 | | | – | | | (167 | ) | | 756 | |
| Owner-occupied properties fair value gains transferred to retained earnings on disposals | | – | | | – | | | – | | | – | | | – | | | – | | | (6 | ) | | – | | | – | | | – | | | 6 | | | – | | | – | | | – | | | – | |
| Dividends and appropriations | | – | | | – | | | – | | | – | | | – | | | – | | | – | | | – | | | – | | | – | | | (813 | ) | | (813 | ) | | – | | | – | | | (813 | ) |
| Shares issued in lieu of dividends | | 21 | | | – | | | (21 | ) | | – | | | – | | | – | | | – | | | – | | | – | | | – | | | 307 | | | 307 | | | – | | | – | | | 307 | |
Capital contributions from non-controlling interests | | – | | | – | | | – | | | – | | | – | | | – | | | – | | | – | | | – | | | – | | | – | | | – | | | – | | | 68 | | | 68 | |
| Effect of deconsolidation of Delta Lloyd | | – | | | – | | | – | | | – | | | – | | | (485 | ) | | (2 | ) | | (115 | ) | | – | | | – | | | 2 | | | (600 | ) | | – | | | (1,770 | ) | | (2,370 | ) |
| Non-controlling interests share of dividends declared in the year | | – | | | – | | | – | | | – | | | – | | | – | | | – | | | – | | | – | | | – | | | – | | | – | | | – | | | (126 | ) | | (126 | ) |
| Transfer to profit on disposal of subsidiaries, joint ventures and associates | | – | | | – | | | – | | | – | | | – | | | (3 | ) | | – | | | – | | | – | | | – | | | – | | | (3 | ) | | – | | | – | | | (3 | ) |
| Changes in non-controlling interests in existing subsidiaries | | – | | | – | | | – | | | – | | | – | | | – | | | – | | | – | | | – | | | – | | | – | | | – | | | – | | | (11 | ) | | (11 | ) |
| Shares acquired by employee trusts | | – | | | – | | | – | | | – | | | (29 | ) | | – | | | – | | | – | | | – | | | – | | | – | | | (29 | ) | | – | | | – | | | (29 | ) |
| Shares distributed by employee trusts | | – | | | – | | | – | | | – | | | 18 | | | – | | | – | | | – | | | – | | | – | | | (18 | ) | | – | | | – | | | – | | | – | |
| Reserves credit for equity compensation plans | | – | | | – | | | – | | | – | | | – | | | – | | | – | | | – | | | – | | | 48 | | | – | | | 48 | | | – | | | – | | | 48 | |
| Shares issued under equity compensation plans | | – | | | �� | | | – | | | – | | | – | | | – | | | – | | | – | | | – | | | (61 | ) | | 61 | | | – | | | – | | | – | | | – | |
| Reclassification to financial liabilities | | – | | | – | | | – | | | – | | | – | | | – | | | – | | | – | | | – | | | – | | | – | | | – | | | – | | | (205 | ) | | (205 | ) |
| Aggregate tax effect – shareholder tax | | – | | | – | | | – | | | – | | | – | | | – | | | – | | | – | | | – | | | – | | | 16 | | | 16 | | | – | | | – | | | 16 | |
| Balance at 31 December | | 726 | | | 200 | | | 1,173 | | | 3,271 | | | (43 | ) | | 1,530 | | | 79 | | | 530 | | | (663 | ) | | 86 | | | 5,954 | | | 12,843 | | | 990 | | | 1,530 | | | 15,363 | |
The accounting policies (identified alphabetically) on pages 108 to 119 and notes (identified numerically) on pages 127 to 229 are an integral part of these financial statements.
Consolidated statement of changes in equity continued
For the year ended 31 December 2010
| | Ordinary share capital
£m | | Preference share capital
£m | | Share premium
£m | | Merger reserve
£m | | Shares held by employee trusts
£m | | Currency translation reserve
£m | | Owner-occupied properties reserve
£m | | Investment valuation reserve
£m | | Hedging instru-
ments reserve
£m | | Equity compensation reserve
£m | | Retained earnings
£m | | Equity attributable to shareholders of Aviva plc
£m | | DCI and Fixed rate tier 1 notes
£m | | Non controlling interests
£m | | Total equity
£m | |
| Balance at 1 January | | 692 | | | 200 | | | 1,207 | | | 3,271 | | | (68 | ) | | 2,224 | | | 104 | | | 163 | | | (771 | ) | | 109 | | | 3,425 | | | 10,556 | | | 990 | | | 3,540 | | | 15,086 | |
| Profit/(loss) for the year | | – | | | – | | | – | | | – | | | – | | | – | | | – | | | – | | | – | | | – | | | 1,463 | | | 1,463 | | | – | | | 429 | | | 1,892 | |
| Other comprehensive (expense)/income | | – | | | – | | | – | | | – | | | – | | | (38 | ) | | (21 | ) | | 411 | | | 78 | | | – | | | 1,057 | | | 1,487 | | | – | | | (56 | ) | | 1,431 | |
| Total comprehensive (expense)/income for the year | | – | | | – | | | – | | | – | | | – | | | (38 | ) | | (21 | ) | | 411 | | | 78 | | | – | | | 2,520 | | | 2,950 | | | – | | | 373 | | | 3,323 | |
| Owner-occupied properties fair value gains transferred to retained earnings on disposals | | – | | | – | | | – | | | – | | | – | | | – | | | – | | | – | | | – | | | – | | | – | | | – | | | – | | | – | | | – | |
| Dividends and appropriations | | – | | | – | | | – | | | – | | | – | | | – | | | – | | | – | | | – | | | – | | | (757 | ) | | (757 | ) | | – | | | – | | | (757 | ) |
| Shares issued in lieu of dividends | | 13 | | | – | | | (13 | ) | | – | | | – | | | – | | | – | | | – | | | – | | | – | | | 209 | | | 209 | | | – | | | – | | | 209 | |
| Capital contributions from non-controlling interests | | – | | | – | | | – | | | – | | | – | | | – | | | – | | | – | | | – | | | – | | | – | | | – | | | – | | | 42 | | | 42 | |
| Dilution of shareholding in Delta Lloyd | | – | | | – | | | – | | | – | | | – | | | (3 | ) | | – | | | (1 | ) | | – | | | – | | | (4 | ) | | (8 | ) | | – | | | 8 | | | – | |
| Non-controlling interests share of dividends declared in the year | | – | | | – | | | – | | | – | | | – | | | – | | | – | | | – | | | – | | | – | | | – | | | – | | | – | | | (187 | ) | | (187 | ) |
Transfer to profit
on disposal of subsidiaries, joint ventures and associates | | – | | | – | | | – | | | – | | | – | | | – | | | – | | | – | | | – | | | – | | | – | | | – | | | – | | | – | | | – | |
| Non-controlling interests in acquired/(disposed) subsidiaries | | – | | | – | | | – | | | – | | | – | | | – | | | – | | | – | | | – | | | – | | | – | | | – | | | – | | | 3 | | | 3 | |
| Changes in non-controlling interests in existing subsidiaries | | – | | | – | | | – | | | – | | | – | | | – | | | – | | | – | | | – | | | – | | | – | | | – | | | – | | | (38 | ) | | (38 | ) |
| Shares acquired by employee trusts | | – | | | – | | | – | | | – | | | (14 | ) | | – | | | – | | | – | | | – | | | – | | | – | | | (14 | ) | | – | | | – | | | (14 | ) |
| Shares distributed by employee trusts | | – | | | – | | | – | | | – | | | 50 | | | – | | | – | | | – | | | – | | | – | | | (50 | ) | | – | | | – | | | – | | | – | |
| Reserves credit for equity compensation plans | | – | | | – | | | – | | | – | | | – | | | – | | | – | | | – | | | – | | | 41 | | | – | | | 41 | | | – | | | – | | | 41 | |
| Shares issued under equity compensation plans | | – | | | – | | | – | | | – | | | – | | | – | | | – | | | – | | | – | | | (51 | ) | | 51 | | | – | | | – | | | – | | | – | |
| Reclassification to financial liabilities | | – | | | – | | | – | | | – | | | – | | | – | | | – | | | – | | | – | | | – | | | – | | | – | | | – | | | – | | | – | |
| Aggregate tax effect – shareholder tax | | – | | | – | | | – | | | – | | | – | | | – | | | – | | | – | | | – | | | – | | | 17 | | | 17 | | | – | | | – | | | 17 | |
Balance at
31 December | | 705 | | | 200 | | | 1,194 | | | 3,271 | | | (32 | ) | | 2,183 | | | 83 | | | 573 | | | (693 | ) | | 99 | | | 5,411 | | | 12,994 | | | 990 | | | 3,741 | | | 17,725 | |
The accounting policies (identified alphabetically) on pages 108 to 119 and notes (identified numerically) on pages 127 to 229 are an integral part of these financial statements.
Consolidated statement of financial position
As at 31 December 2012
| | | | | Restated1 | |
| | Note | 2012
£m | | 2011
£m | |
| Assets | | | | | | | |
| Goodwill | N & 13 | | 1,520 | | | 2,640 | |
| Acquired value of in-force business and intangible assets | N & 14 | | 1,084 | | | 2,021 | |
| Interests in, and loans to, joint ventures | D & 15 | | 1,493 | | | 1,700 | |
| Interests in, and loans to, associates | D & 16 | | 215 | | | 1,118 | |
| Property and equipment | O & 17 | | 391 | | | 510 | |
| Investment property | P & 18 | | 10,815 | | | 11,638 | |
| Loans | U & 20 | | 24,537 | | | 28,116 | |
| Financial investments | R, S & 22 | | 189,078 | | | 216,058 | |
| Reinsurance assets | M & 39 | | 6,684 | | | 7,112 | |
| Deferred tax assets | AB | | 188 | | | 238 | |
| Current tax assets | | | 67 | | | 140 | |
| Receivables | 23 | | 7,617 | | | 7,937 | |
| Deferred acquisition costs and other assets | W & 24 | | 3,799 | | | 6,444 | |
| Prepayments and accrued income | | | 2,701 | | | 3,235 | |
| Cash and cash equivalents | X & 51d | | 22,897 | | | 23,043 | |
| Assets of operations classified as held for sale | B & 3c | | 42,603 | | | 426 | |
| Total assets | | | 315,689 | | | 312,376 | |
| Equity | | | | | | | |
| Capital | AD | | | | | | |
| Ordinary share capital | 26 | | 736 | | | 726 | |
| Preference Share Capital | 29 | | 200 | | | 200 | |
| | | | 936 | | | 926 | |
| Capital reserves | | | | | | | |
| Share premium | 26b | | 1,165 | | | 1,173 | |
| Merger reserve | D & 31 | | 3,271 | | | 3,271 | |
| | | | 4,436 | | | 4,444 | |
| Shares held by employee trusts | 28 | | (32 | ) | | (43 | ) |
| Other reserves | 32 | | 1,675 | | | 1,562 | |
| Retained earnings | 33 | | 1,389 | | | 5,954 | |
| Equity attributable to shareholders of Aviva plc | | | 8,404 | | | 12,843 | |
| Direct capital instruments and fixed rate tier 1 notes | 30 | | 1,382 | | | 990 | |
| Non-controlling interests | 34 | | 1,574 | | | 1,530 | |
| Total equity | | | 11,360 | | | 15,363 | |
| Liabilities | | | | | | | |
| Gross insurance liabilities | K & 36 | | 113,091 | | | 147,379 | |
| Gross liabilities for investment contracts | L & 37 | | 110,494 | | | 113,366 | |
| Unallocated divisible surplus | K & 41 | | 6,931 | | | 650 | |
| Net asset value attributable to unitholders | D | | 11,146 | | | 10,352 | |
| Provisions | Z, AA & 43 | | 1,119 | | | 992 | |
| Deferred tax liabilities | AB | | 547 | | | 1,171 | |
| Current tax liabilities | | | 112 | | | 232 | |
| Borrowings | AC & 45 | | 8,194 | | | 8,450 | |
| Payables and other financial liabilities | R & 46 | | 9,441 | | | 11,230 | |
| Other liabilities | 47 | | 1,843 | | | 2,828 | |
| Liabilities of operations classified as held for sale | B & 3c | | 41,411 | | | 363 | |
| Total liabilities | | | 304,329 | | | 297,013 | |
| Total equity and liabilities | | | 315,689 | | | 312,376 | |
| 1. | Following a review of the classification of contracts issued by the Group’s Italian long-term business, certain portfolios have been reclassified from participating insurance to participating investment contracts for all years presented. There is no impact on the result for any year presented as a result of this reclassification. |
Approved by the Board on 22 March 2013.
Patrick Regan
Chief financial officer
Company number: 2468686
The accounting policies (identified alphabetically) on pages 108 to 119 and notes (identified numerically) on pages 127 to 229 are an integral part of these financial statements.
Consolidated statement of cash flows
For the year ended 31 December 2012
The cash flows presented in this statement cover all the Group’s activities and include flows from both policyholder and shareholder activities. All cash and cash equivalents are available for use by the Group.
| | Notes | 2012
£m | | 2011
£m | | 2010
£m | |
| Cash flows from operating activities | | | | | | | | | | |
| Cash generated from continuing operations | 51a | | 2,676 | | | 111 | | | 1,419 | |
| Tax paid | | | (428 | ) | | (425 | ) | | (443 | ) |
| Net cash from/(used in) operating activities – continuing operations | | | 2,248 | | | (314 | ) | | 976 | |
| Net cash from/(used in) operating activities – discontinued operations | | | 46 | | | (28 | ) | | 831 | |
| Total net cash from/(used in) operating activities | | | 2,294 | | | (342 | ) | | 1,807 | |
| Cash flows from investing activities | | | | | | | | | | |
| Acquisition of, and additions to subsidiaries, joint ventures and associates, net of cash acquired | 51b | | (129 | ) | | (114 | ) | | 542 | |
| Disposals of subsidiaries, joint ventures and associates, net of cash transferred | 51c | | 421 | | | 877 | | | 222 | |
| New loans to joint ventures | 15a | | (4) | | | (18 | ) | | (64 | ) |
| Repayment of loans to joint ventures | | | 12 | | | 17 | | | 5 | |
| Net new loans to joint ventures | | | 8 | | | (1 | ) | | (59 | ) |
| Purchases of property and equipment | 17 | | (220 | ) | | (86 | ) | | (109 | ) |
| Proceeds on sale of property and equipment | | | 43 | | | 40 | | | 14 | |
| Purchases of intangible assets | 14 | | (128 | ) | | (109 | ) | | (128 | ) |
| Net cash (used in)/from investing activities – continuing operations | | | (5 | ) | | 607 | | | 482 | |
| Net cash (used in) investing activities – discontinued operations | | | (10 | ) | | (529 | ) | | (133 | ) |
| Total net cash (used in)/from investing activities | | | (15 | ) | | 78 | | | 349 | |
| Cash flows from financing activities | | | | | | | | | | |
| Proceeds from issue of ordinary shares and fixed rate tier 1 notes, net of transaction costs | | | 392 | | | – | | | – | |
| Treasury shares purchased for employee trusts | | | (33 | ) | | (29 | ) | | (14 | ) |
| New borrowings drawn down, net of expenses | | | 2,529 | | | 3,423 | | | 2,825 | |
| Repayment of borrowings | | | (2,513 | ) | | (3,359 | ) | | (1,988 | ) |
| Net drawdown of borrowings | | | 16 | | | 64 | | | 837 | |
| Interest paid on borrowings | | | (665 | ) | | (686 | ) | | (679 | ) |
| Preference dividends paid | 12 | | (17 | ) | | (17 | ) | | (17 | ) |
| Ordinary dividends paid | | | (630 | ) | | (431 | ) | | (472 | ) |
| Coupon payments on direct capital instruments and fixed rate tier 1 notes | 12 | | (73 | ) | | (58 | ) | | (59 | ) |
| Capital contributions from non-controlling interests | 34 | | 20 | | | 68 | | | 42 | |
| Dividends paid to non-controlling interests of subsidiaries | | | (102 | ) | | (126 | ) | | (157 | ) |
| Changes in non controlling interests | | | – | | | – | | | 15 | |
| Net cash (used in) financing activities – continuing operations | | | (1,092 | ) | | (1,215 | ) | | (504 | ) |
| Net cash (used in) financing activities – discontinued operations | | | (27 | ) | | (558 | ) | | (849 | ) |
| Total net cash (used in) financing activities | | | (1,119 | ) | | (1,773 | ) | | (1,353 | ) |
| Total net increase/(decrease) in cash and cash equivalents | | | 1,160 | | | (2,037 | ) | | 803 | |
| Cash and cash equivalents at 1 January | | | 22,401 | | | 24,695 | | | 24,251 | |
| Effect of exchange rate changes on cash and cash equivalents | | | (313 | ) | | (257 | ) | | (359 | ) |
| Cash and cash equivalents at 31 December | 51d | | 23,248 | | | 22,401 | | | 24,695 | |
The accounting policies (identified alphabetically) on pages 108 to 119 and notes (identified numerically) on pages 127 to 229 are an integral part of these financial statements.
Notes to the consolidated financial statements
1 – Exchange rates
The Group’s principal overseas operations during the year were located within the Eurozone and the United States. The results and cash flows of these operations have been translated into sterling at the average rates for the year and the assets and liabilities have been translated at the year end rates as follows:
| | 2012 | 2011 | 2010 |
| Eurozone | | | |
| – Average rate (€1 equals) | £0.81 | £0.87 | £0.85 |
| – Period end rate (€1 equals) | £0.81 | £0.84 | £0.86 |
United States | | | |
| – Average rate ($US1 equals) | £0.63 | £0.63 | £0.65 |
| – Period end rate ($US1 equals) | £0.62 | £0.65 | £0.64 |
Total foreign currency translations from continuing operations amounted to a gain of £128 million(2011: £35 million loss; 2010: £36 million gain) in the income statement. These result from the settlement of transactions and translations of assets and liabilities denominated in foreign currencies.
2 – Presentation changes
(a) Discontinued operations
As described in note 3c, the Group’s US life and annuity business and associated investment management operations (together ‘US Life’), have been classified as held for sale. As the Group will exit from a major geographical area of operations, previously presented as ‘United States’ in the segmental reporting note, the results of US Life for the year, as well as those for preceding years, have been classified as discontinued operations.
The results presented as discontinued operations for 2011 and preceding years also include the results of Delta Lloyd N.V. as a subsidiary, which was deconsolidated during 2011.
(b) Change to operating segments
Following the announcement in April 2012 relating to the restructuring of the Group, the Group’s operating segments were changed to align them with the revised organisational reporting structure. The Group has determined its operating segments along market reporting lines, reflecting the management structure whereby a member of the Executive Management team is accountable to the group chief executive for the operating segment for which he is responsible. Further details of the reportable segments are given
in note 4.
(c) Restatement of prior period figures
Following a review of the classification of contracts issued by the Group’s Italian long-term business certain portfolios have been reclassified from participating insurance contracts to participating investment contracts. As a result there has been a reallocation from gross insurance liabilities at 31 December 2011 to gross liabilities for investment contracts of £2,722 million. The change in insurance liabilities net of reinsurance recognised in the income statement for the year to 31 December 2011 has decreased by £168 million, and the change in investment contract provisions has increased by an equal amount. There is no impact on profit for the year or equity reported for the year ended 31 December 2011. The change in insurance liabilities net of reinsurance recognised in the income statement for the year to 31 December 2010 has increased by £648 million, and the change in investment contract provisions has decreased by an equal amount. There is no impact on profit for the year or equity reported for the year ended 31 December 2010.
(i) Following a review of the classification of contracts issued by the Group’s Italian long-term business certain portfolios have been reclassified from participating insurance contracts to participating investment contracts. As a result there has been a reallocation from gross insurance liabilities at 31 December 2011 to gross liabilities for investment contracts of £2,722 million. The change in insurance liabilities net of reinsurance recognised in the income statement for the year to 31 December 2011 has decreased by £168 million, and the change in investment contract provisions has increased by an equal amount. There is no impact on profit for the year or equity reported for the year ended 31 December 2011. The change in insurance liabilities net of reinsurance recognised in the income statement for the year to 31 December 2010 has increased by £648 million, and the change in investment contract provisions has decreased by an equal amount. There is no impact on profit for the year or equity reported for the year ended 31 December 2010.
(ii) Certain other comparative information in the notes to the financial statements has been restated as follows:
| n | In note 20, information relating to loans carried at fair value has been restated to include certain mortgage portfolios; |
| n | In note 22(d)(i), information relating to non-cash collateral received has been restated to include collateral relating to certain additional financial investments used in stock-lending arrangements. |
| n | In note 53(b)(i), following a review of the collateral reported, the total net credit exposure has been restated. |
| n | In note 53(d)(i), the linked business maturity profile has been restated to reflect an expected rather than contractual basis. |
| n | In note 56, following a review of the composition of key management in the current year comparative amounts have been restated. |
These changes to comparative information relate solely to disclosures and do not impact the line items reported in the primary financial statements.There is no impact on the profit or equity reported for any period presented as a result of these restatements.
(d) Additional information
Additional disclosure has been included in the current year and accordingly comparative information has been provided as follows:
| n | As set out in notes 14 and 24, the amount of AVIF and DAC expected to be recovered or settled after more than 12 months; |
| n | As set out in note 53(c)(v) and note 53(j)(iv), additional disclosure relating to the sensitivity to a 10% change to foreign exchange rates and a 0.5% increase in credit spreads. |
These changes to comparative information relate solely to disclosures and do not impact the line items reported in the primary financial statements. There is no impact on the profit or equity reported for any period presented as a result of these additional disclosures.
3 – Subsidiaries
This note provides details of the acquisitions and disposals of subsidiaries that the Group has made during the year, together with details of businesses held for sale at the year end. The principal Group subsidiaries are listed in the performance review section.
(a) Acquisitions
There have been no material acquisitions during 2012.
(b) Disposal and remeasurement of subsidiaries, joint ventures and associates
The (loss)/profit on the disposal and remeasurement of subsidiaries, joint ventures and associates comprises:
| | | 2012
£m | | | 2011
£m | | | 2010
£m | |
| Continuing operations | | | | | | | | | | | | |
| United Kingdom – RAC Limited (see (i) below) | | | (21 | ) | | | 532 | | | | – | |
United Kingdom –RBS Life and RBS Collective | | | – | | | | – | | | | 128 | |
| Delta Lloyd associate (see (iii) below) | | | (129 | ) | | | – | | | | – | |
| Australia | | | – | | | | 23 | | | | – | |
| Sri Lanka (see (iv) below) | | | 12 | | | | – | | | | – | |
| Czech Republic, Hungary and Romania (see (ii) below) | | | 7 | | | | – | | | | – | |
| Other small operations | | | (33 | ) | | | 10 | | | | 35 | |
| (Loss)/profit on disposal and remeasurement from continuing operations | | | (164 | ) | | | 565 | | | | 163 | |
| Loss on disposal and remeasurement from discontinued operations (see note 3c(i) below) | | | (2,359 | ) | | | (32 | ) | | | (4 | ) |
| Total (loss)/profit on disposal and remeasurement | | | (2,523 | ) | | | 533 | | | | 159 | |
No tax arises on the profits and losses on these disposals.
3 – Subsidiaries continued
(i) RAC Limited
The loss in respect of RAC Limited in 2012 arises from residual costs related to the sale of that company in September 2011.
(ii) Czech Republic, Hungary and Romania life business
On 31 July 2012, the Group sold its operations in the Czech Republic and Hungary and its Romania life assurance business to MetLife, Inc, for £37 million. Net assets disposed of were £32 million, comprising gross assets of £379 million and liabilities of £347 million, giving a profit on disposal of £3 million after transaction costs. Recycling currency translation reserves of £4 million to the income statement resulted in an overall profit on disposal of £7 million. The sale of our Romania pensions business is still subject to regulatory approval and is expected to complete in the next 12 months, so it has been classified as held for sale (see note 3c(v)).
(iii) Delta Lloyd associate
On 5 July 2012, the Group sold 37.2 million shares in Delta Lloyd for £313 million (net of transaction costs), reducing our holding at that date to 19.8% of Delta Lloyd’s ordinary share capital, representing 18.6% of shareholder voting rights. As the Group no longer had significant influence over Delta Lloyd, the Group ceased to account for that company as an associate from 5 July 2012. From that date, our holding was classified as a financial investment, held at fair value through profit and loss.
The loss on disposal is calculated as follows:
| | | 2012
£m | |
| Cash consideration, net of transaction costs | | | 313 | |
| Fair value of financial investment holding at 5 July 2012 | | | 315 | |
| Net Consideration | | | 628 | |
| Interest in associate | | | (595 | ) |
| Currency translation and investment valuation reserves recycled to income statement | | | (162 | ) |
| Loss on disposal | | | (129 | ) |
On 8 January 2013 the Group announced the sale of its remaining shareholding in Delta Lloyd, resulting in gross cash proceeds of £353 million.
(iv) Sri Lanka
On 4 December 2012, the Group sold its controlling 58.4% interest in Aviva NDB Holdings Lanka (Private) Limited (“Aviva NDB”),
to AIA Group Limited for consideration of £31 million. Net assets of the business were £16 million (comprising gross assets of £205 million and liabilities of £189 million). After recycling of currency translation reserves of £3 million the profit on disposal amounted
to £12 million.
(c) Assets and liabilities of operations classified as held for sale
The assets and liabilities of operations classified as held for sale as at 31 December 2012 are as follows:
| | | | | | | | | 2012 | | | 2011 | |
| | | US Life1 £m | | | Other
£m | | | Total
£m | | | Total
£m | |
| Assets | | | | | | | | | | | | | | | | |
| Goodwill | | | – | | | | 183 | | | | 183 | | | | – | |
| Acquired value of in-force and intangible assets | | | 408 | | | | 83 | | | | 491 | | | | 1 | |
| Interests in, and loans to, joint ventures and associates | | | – | | | | 126 | | | | 126 | | | | 12 | |
| Property and equipment | | | – | | | | 2 | | | | 2 | | | | 1 | |
| Investment Property | | | 6 | | | | 12 | | | | 18 | | | | – | |
| Loans | | | 3,397 | | | | – | | | | 3,397 | | | | – | |
| Financial investments | | | 31,212 | | | | 5,203 | | | | 36,415 | | | | 347 | |
| Reinsurance assets | | | 644 | | | | 239 | | | | 883 | | | | 1 | |
| Deferred acquisition costs | | | 1,468 | | | | 70 | | | | 1,538 | | | | 23 | |
| Other assets | | | 769 | | | | 97 | | | | 866 | | | | 15 | |
| Cash and cash equivalents | | | 544 | | | | 373 | | | | 917 | | | | 26 | |
| | | | 38,448 | | | | 6,388 | | | | 44,836 | | | | 426 | |
| Additional impairment to write down the disposal group to fair value less costs to sell | | | (2,233 | ) | | | – | | | | (2,233 | ) | | | – | |
| Total assets | | | 36,215 | | | | 6,388 | | | | 42,603 | | | | 426 | |
| Liabilities | | | | | | | | | | | | | | | | |
| Gross insurance liabilities | | | (31,153 | ) | | | (3,294 | ) | | | (34,447 | ) | | | (344 | ) |
| Gross liabilities for investment contracts | | | (2,197 | ) | | | (1,857 | ) | | | (4,054 | ) | | | – | |
| Unallocated divisible surplus | | | – | | | | (55 | ) | | | (55 | ) | | | – | |
| Provisions | | | (184 | ) | | | (3 | ) | | | (187 | ) | | | (4 | ) |
| Deferred tax liabilities | | | (672 | ) | | | (8 | ) | | | (680 | ) | | | – | |
| Borrowings | | | (145 | ) | | | – | | | | (145 | ) | | | – | |
| Other liabilities | | | (1,497 | ) | | | (346 | ) | | | (1,843 | ) | | | (15 | ) |
| Total liabilities | | | (35,848 | ) | | | (5,563 | ) | | | (41,411 | ) | | | (363 | ) |
| Net assets | | | 367 | | | | 825 | | | | 1,192 | | | | 63 | |
| 1 | US Life comprises US long term business previously reported under the heading “United States” and associated internal asset management operations previously reported under “Aviva Investors” in note 4 – segmental information. |
3 – Subsidiaries continued
The businesses classified as held for sale comprise:
(i) US long term business
On 8 November 2012 the Group confirmed it was in discussions with external parties with respect to its US life operations, consisting of Aviva Life and Annuity Company and the associated internal asset management operations of Aviva Investors North America, Inc (“US Life”) and these have been classified as held for sale. On 21 December 2012 the Group announced that it had agreed to sell US Life to Athene Holding Ltd for consideration of £1.0 billion including the shareholder loan (£1.1 billion including repayment of an external loan). There is uncertainty in the ultimate consideration, which depends on the development of statutory surplus between the announcement of sale and ultimate completion date. The transaction is expected to complete in 2013.
Following classification as held for sale, US Life has been re-measured to fair value less costs to sell resulting in an impairment loss of £2,359 million, recognised within “Loss on the disposal and re-measurement of subsidiaries and associates” in the income statement, as a component of the result of discontinued operations.
An impairment of £126 million has reduced the carrying value of property and equipment, investments in associates and prepayments within US Life to nil. The remaining impairment of £2,233 million reduces the value of the US Life disposal group so that the carrying value of this business is equal to its fair value less costs to sell of £367 million.
As described in Note 2a, the results of US Life for the year, as well as those for preceding years, have been classified as discontinued operations in the income statement.
Other comprehensive income, net of tax from discontinued operations of £68 million includes £528 million fair value gains on available for sale financial investments, £(235) million fair value gains on available for sale financial investments transferred to the income statement on disposal, £(130) million foreign exchange losses, £12 million of impairment losses transferred to the income statement, and £(107) million aggregate shareholder tax effect.
On completion of the disposal the currency translation reserves and investment valuation reserves relating to the US Life operations, currently recognised within equity, will be recycled to the income statement.
(ii) Irish long-term business – Ark Life
Irish long-term business is carried out through a subsidiary, Aviva Life Holdings Ireland Limited (“ALHI”), which is 75% owned by Aviva and 25% owned by Allied Irish Bank (“AIB”). ALHI holds four subsidiaries, one of which is Ark Life Assurance Company Limited (“Ark Life”) which carries out bancassurance business via a distribution agreement with AIB. The original distribution agreement was renewable in 2011 but, on 15 December 2011, AIB notified the Group that they did not wish to renew it and the existing shareholders’ agreement governing ALHI was terminated. The termination of this agreement triggered the ability for both parties to exercise put and call options that will result in the unwind of the original structure such that the Ark Life business returns 100% to AIB and the Group will purchase the 25% minority stake in ALHI. The formal exercise of these options was approved on 17 January 2012 and, as a result, the Ark Life business became held for sale on that date. The exercise of the put options in January 2012 over AIB’s non-controlling interest in ALHI led to our reclassifying this non-controlling interest from equity to financial liabilities as at 31 December 2011.
The net impact of movements in expected disposal proceeds and financial liability was a charge to profit of £35 million, before exchange movements, recognised within net investment income. On 8 March 2013, Aviva completed the transaction with AIB having agreed net proceeds of €135 million.
(iii) Spanish long-term business – Aseval
On 18 December 2012 Aviva reached a settlement with Bankia S.A. (“Bankia”) to transfer the Group’s entire holding in Aseval Aseguradora Valenciana, Sociedad Anónima de Seguros y Reaseguros (“Aseval”), a Spanish life assurance company, to Bankia. Aseval was classified as held for sale at this date. The transfer is expected to complete on or before 30 April 2013 with proceeds of £494 million. Aseval is included within the ‘Italy, Spain and Other’ operating segment at its carrying value.
(iv) Russian long-term business
During the year the Group entered into negotiations to dispose of Aviva Russia. On 27 February 2013 the Group announced the sale of the business to Blagosostoyanie for consideration of €35 million. The transaction is expected to complete in the first half of 2013. The business is included in the statement of financial position at its carrying value.
(v) Other
Other businesses classified as held for sale comprise joint ventures in Taiwan and Malaysia, details of which are given in note 15(a), and the Group’s pensions business subsidiary in Romania.
4 – Segmental information
The Group’s results can be segmented, either by activity or by geography. Our primary reporting format is on market reporting lines, with supplementary information being given by business activity. This note provides segmental information on the consolidated income statement and consolidated statement of financial position.
(a) Operating segments
Following the announcement in April 2012 relating to the restructuring of the Group, the Group’s operating segments were changed to align them with the new management structure. The revised segments are set out below. Results for prior years have been restated to facilitate comparison with this new structure.
United Kingdom & Ireland
The United Kingdom and Ireland comprises two operating segments – Life and General Insurance. The principal activities of our UK and Ireland Life operations are life insurance, long-term health and accident insurance, savings, pensions and annuity business and Health in the UK, whilst UK and Ireland General Insurance provides insurance cover to individuals and businesses, for risks associated mainly with motor vehicles, property and liability (such as employers’ liability and professional indemnity liability) and medical expenses. UK & Ireland General Insurance business also includes the results of Ireland Health. For the period to its disposal on 30 September 2011, UK and Ireland General Insurance also included the RAC motor recovery business.
France
The principal activities of our French operations are long-term business and general insurance. The long-term business offers a range of long-term insurance and savings products, primarily for individuals, with a focus on the unit-linked market. The general insurance business predominantly sells personal and small commercial lines insurance products through agents and a direct insurer.
Canada
The principal activity of the Canadian operation is general insurance. In particular it provides personal and commercial lines insurance products through a range of distribution partners.
Italy, Spain and Other
These countries are not individually significant at a Group level, so have been aggregated into a single reporting segment in line with IFRS8. This segment includes our operations in Italy and Spain (including Aseval which is held for sale as at 31 December 2012). The principal activities of our Italian operations are long-term business and general insurance. The life business offers a range of long-term insurance and savings products, and the general insurance business provides motor and home insurance products to individuals, as well as small commercial risk insurance to businesses. The principal activity of the Spanish operation is the sale of long-term business, accident and health insurance and a selection of savings products. This segment also includes the results of our Czech, Hungarian and Romanian life businesses up until the date of their sale in July 2012 as well as our Reinsurance and Run Off businesses.
Higher growth markets
Activities reported in the higher growth markets operating segment include our businesses in Asia, Poland, Turkey and Russia. Our activities in Asia principally comprise our long-term business operations in China, India, Singapore, Hong Kong, South Korea, Vietnam and Indonesia as well as our life operations in Taiwan and Malaysia which are held for sale as at the balance sheet date and the results of Sri Lanka up until the date of disposal in December 2012. Higher growth also includes general insurance operations in Singapore, Indonesia, Poland and Turkey and long-term business in Poland, Turkey and Russia (which is held for sale at the year-end).
Aviva Investors
Aviva Investors operates in most of the markets in which the Group operates, in particular the UK, France and Canada and other international businesses, managing policyholders’ and shareholders’ invested funds, providing investment management services for institutional pension fund mandates and managing a range of retail investment products, including investment funds, unit trusts, OEICs and ISAs. The internal asset management operations of Aviva Investors North America are being sold with the Group’s US life operations and are classified as held for sale and as a discontinued operation in these financial statements.
Other Group activities
Investment return on centrally held assets and head office expenses, such as Group treasury and finance functions, together with certain taxes and financing costs arising on central borrowings are included in ‘Other Group activities’, along with central core structural borrowings and certain tax balances in the segmental statement of financial position. Also included here are consolidation and elimination adjustments and the Group’s interest in Delta Lloyd, as an associate to 5 July 2012, and as a financial investment after that date.
Discontinued operations
In December 2012 the Group announced it had agreed to sell its US life operations (including the related internal asset management operations of Aviva Investors) and therefore it has been classified as a discontinued operation for presentation in the income statement and held for sale in the statement of financial position.
On 6 May 2011 the Group ceased to hold a majority of the shareholder voting rights in Delta Lloyd and therefore the results of Delta Lloyd up to 6 May 2011 are presented as discontinued operations for 2011 and prior years. After this date, the Group ceased to consolidate Delta Lloyd.
Measurement basis
The accounting policies of the segments are the same as those for the Group as a whole. Any transactions between the business segments are on normal commercial terms and market conditions. The Group evaluates performance of operating segments on the basis of:
| (i) | profit or loss from operations before tax attributable to shareholders |
| (ii) | profit or loss from operations before tax attributable to shareholders, adjusted for non-operating items outside the segment management’s control, including investment market performance and fiscal policy changes |
4 – Segmental information continued
a (i) Segmental income statement for the year ended 31 December 2012
| | Developed Markets | | | | | | | | | | | | | |
| | United Kingdom & Ireland | | | | | | | | | | | | | | | | | | | |
| | | Life £m | | | GI £m | | | France £m | | | Canada £m | | | Italy, Spain and Other £m | | | Higher growth markets £m | | | Aviva Investors3 £m | | | Other Group activities4 £m | | | Continuing operations £m | | | Discontinued
Operations2 £m | | | Total £m | |
| Gross written premiums | | 6,363 | | | 4,951 | | | 4,763 | | | 2,248 | | | 3,033 | | | 1,386 | | | – | | | – | | | 22,744 | | | 3,796 | | | 26,540 | |
| Premiums ceded to reinsurers | | (740 | ) | | (450 | ) | | (55 | ) | | (63 | ) | | (127 | ) | | (136 | ) | | – | | | – | | | (1,571 | ) | | (207 | ) | | (1,778 | ) |
| Internal reinsurance revenue | | – | | | (11 | ) | | (6 | ) | | (9 | ) | | 36 | | | (10 | ) | | – | | | – | | | – | | | – | | | – | |
| Net written premiums | | 5,623 | | | 4,490 | | | 4,702 | | | 2,176 | | | 2,942 | | | 1,240 | | | – | | | – | | | 21,173 | | | 3,589 | | | 24,762 | |
Net change in provision for
unearned premiums | | (15 | ) | | 63 | | | (28 | ) | | (31 | ) | | 3 | | | (8 | ) | | – | | | – | | | (16 | ) | | – | | | (16 | ) |
| Net earned premiums | | 5,608 | | | 4,553 | | | 4,674 | | | 2,145 | | | 2,945 | | | 1,232 | | | – | | | – | | | 21,157 | | | 3,589 | | | 24,746 | |
| Fee and commission income | | 448 | | | 188 | | | 121 | | | 42 | | | 125 | | | 70 | | | 279 | | | – | | | 1,273 | | | 23 | | | 1,296 | |
| | | 6,056 | | | 4,741 | | | 4,795 | | | 2,187 | | | 3,070 | | | 1,302 | | | 279 | | | – | | | 22,430 | | | 3,612 | | | 26,042 | |
| Net investment income/(expense) | | 8,639 | | | 523 | | | 8,042 | | | 140 | | | 3,140 | | | 697 | | | (8 | ) | | (67 | ) | | 21,106 | | | 2,241 | | | 23,347 | |
| Inter-segment revenue | | – | | | – | | | – | | | – | | | – | | | – | | | 134 | | | – | | | 134 | | | 75 | | | 209 | |
| Share of (loss)/profit of joint ventures and associates | | (37 | ) | | – | | | 8 | | | – | | | – | | | 1 | | | 7 | | | (256 | ) | | (277 | ) | | – | | | (277 | ) |
(Loss)/profit on the disposal and remeasurement of subsidiaries
and associates | | (2 | ) | | (21 | ) | | – | | | – | | | 7 | | | 12 | | | – | | | (160 | ) | | (164 | ) | | (2,359 | ) | | (2,523 | ) |
| Segmental income | | 14,656 | | | 5,243 | | | 12,845 | | | 2,327 | | | 6,217 | | | 2,012 | | | 412 | | | (483 | ) | | 43,229 | | | 3,569 | | | 46,798 | |
| Claims and benefits paid, net of recoveries from reinsurers | | (9,224 | ) | | (2,908 | ) | | (5,272 | ) | | (1,268 | ) | | (3,916 | ) | | (1,013 | ) | | – | | | – | | | (23,601 | ) | | (2,721 | ) | | (26,322 | ) |
Change in insurance liabilities,
net of reinsurance | | 404 | | | (22 | ) | | (880 | ) | | (40 | ) | | 400 | | | (292 | ) | | – | | | – | | | (430 | ) | | (1,566 | ) | | (1,996 | ) |
| Change in investment contract provisions | | (3,151 | ) | | – | | | (983 | ) | | – | | | (295 | ) | | 18 | | | (39 | ) | | – | | | (4,450 | ) | | (77 | ) | | (4,527 | ) |
| Change in UDS | | (347 | ) | | – | | | (4,359 | ) | | – | | | (1,491 | ) | | (119 | ) | | – | | | – | | | (6,316 | ) | | – | | | (6,316 | ) |
Amortisation of acquired value of
in-force business | | (13 | ) | | – | | | (18 | ) | | – | | | (9 | ) | | (3 | ) | | – | | | – | | | (43 | ) | | (183 | ) | | (226 | ) |
Impairment of goodwill and other intangibles, depreciation and
other amortisation expense | | (107 | ) | | (59 | ) | | (3 | ) | | (17 | ) | | (129 | ) | | (7 | ) | | (9 | ) | | (5 | ) | | (336 | ) | | (916 | ) | | (1,252 | ) |
| Other operating expenses | | (1,505 | ) | | (1,944 | ) | | (845 | ) | | (745 | ) | | (432 | ) | | (352 | ) | | (357 | ) | | (678 | ) | | (6,858 | ) | | (691 | ) | | (7,549 | ) |
| Impairment losses on AVIF and tangible assets1 | | (34 | ) | | (43 | ) | | (1 | ) | | – | | | (3 | ) | | 1 | | | – | | | – | | | (80 | ) | | (15 | ) | | (95 | ) |
| Inter-segment expenses | | (122 | ) | | (3 | ) | | – | | | (4 | ) | | – | | | (5 | ) | | – | | | – | | | (134 | ) | | (75 | ) | | (209 | ) |
| Finance costs | | (261 | ) | | (58 | ) | | (2 | ) | | (9 | ) | | (2 | ) | | – | | | (5 | ) | | (398 | ) | | (735 | ) | | (21 | ) | | (756 | ) |
| Segmental expenses | | (14,360 | ) | | (5,037 | ) | | (12,363 | ) | | (2,083 | ) | | (5,877 | ) | | (1,772 | ) | | (410 | ) | | (1,081 | ) | | (42,983 | ) | | (6,265 | ) | | (49,248 | ) |
| Profit/(loss) before tax | | 296 | | | 206 | | | 482 | | | 244 | | | 340 | | | 240 | | | 2 | | | (1,564 | ) | | 246 | | | (2,696 | ) | | (2,450 | ) |
| Tax attributable to policyholders' returns | | (198 | ) | | – | | | – | | | – | | | – | | | (23 | ) | | – | | | – | | | (221 | ) | | – | | | (221 | ) |
| Profit/(loss) before tax attributable to shareholders | | 98 | | | 206 | | | 482 | | | 244 | | | 340 | | | 217 | | | 2 | | | (1,564 | ) | | 25 | | | (2,696 | ) | | (2,671 | ) |
| Reclassification of corporate costs and unallocated interest | | 7 | | | (1 | ) | | 25 | | | – | | | 3 | | | – | | | 1 | | | (35 | ) | | – | | | – | | | – | |
Investment return variances and economic assumption changes
on long-term business | | 663 | | | – | | | (28 | ) | | – | | | – | | | (15 | ) | | – | | | – | | | 620 | | | (342 | ) | | 278 | |
Short-term fluctuation in return on investments backing non-long-
term business | | – | | | (36 | ) | | (68 | ) | | 10 | | | (56 | ) | | (1 | ) | | – | | | 144 | | | (7 | ) | | – | | | (7 | ) |
Economic assumption changes
on general insurance and
health business | | – | | | 20 | | | – | | | – | | | 1 | | | – | | | – | | | – | | | 21 | | | – | | | 21 | |
| Impairment of goodwill, associates and joint ventures | | (1 | ) | | – | | | – | | | – | | | 108 | | | – | | | – | | | (47 | ) | | 60 | | | 782 | | | 842 | |
| Amortisation and impairment of intangibles | | 54 | | | 40 | | | – | | | 11 | | | 13 | | | 4 | | | 6 | | | – | | | 128 | | | 129 | | | 257 | |
| (Profit)/loss on the disposal of subsidiaries and associates | | 2 | | | 21 | | | – | | | – | | | (7 | ) | | (12 | ) | | – | | | 160 | | | 164 | | | 2,359 | | | 2,523 | |
| Integration and restructuring costs | | 87 | | | 154 | | | 11 | | | 11 | | | 12 | | | 9 | | | 33 | | | 144 | | | 461 | | | 7 | | | 468 | |
| Share of Delta Lloyd's non-operating items (before tax), as an associate | | – | | | – | | | – | | | – | | | – | | | – | | | – | | | 523 | | | 523 | | | – | | | 523 | |
Share of Delta Lloyd's tax expense,
as an associate | | – | | | – | | | – | | | – | | | – | | | – | | | – | | | (107 | ) | | (107 | ) | | – | | | (107 | ) |
| Adjusted operating profit/(loss) before tax attributable to shareholders5 | | 910 | | | 404 | | | 422 | | | 276 | | | 414 | | | 202 | | | 42 | | | (782 | ) | | 1,888 | | | 239 | | | 2,127 | |
| 1 | Impairment losses, and reversal of such losses, recognised directly in other comprehensive income were £nil million and £nil million respectively. |
| 2 | Discontinued operations represent the operations of the United States Life business and related internal asset management activities. |
| 3 | Aviva Investors adjusted operating profit includes £3 million profit relating to the Aviva Investors Pooled Pension business. |
| 4 | Other group activities include Delta Lloyd as an associate up until 5 July 2012 and as a financial investment thereafter. |
| 5 | Adjusted operating profit is a non-GAAP measure as defined in the glossary. |
4 – Segmental information continued
a (ii) Segmental income statement for the year ended 31 December 2011
| | Developed Markets | | | | | | | | | | | | | | | | | | | |
| | | United Kingdom & Ireland | | | | | | | | | | | | | | | | | | | | | | | | | | | | |
| | | Life £m | | | GI £m | | | France £m | | | Canada £m | | | Restated4 Italy, Spain and Other £m | | | Higher growth markets £m | | | Aviva Investors3 £m | | | Other Group activities5 £m | | | Restated4 Continuing operations £m | | | Discontinued Operations2 £m | | | Total £m | |
| Gross written premiums | | 7,639 | | | 5,227 | | | 5,305 | | | 2,164 | | | 4,586 | | | 1,334 | | | – | | | – | | | 26,255 | | | 5,863 | | | 32,118 | |
| Premiums ceded to reinsurers | | (816 | ) | | (375 | ) | | (66 | ) | | (70 | ) | | (108 | ) | | (115 | ) | | – | | | – | | | (1,550 | ) | | (198 | ) | | (1,748 | ) |
| Internal reinsurance revenue | | – | | | (11 | ) | | (6 | ) | | (11 | ) | | 34 | | | (4 | ) | | – | | | – | | | 2 | | | (2 | ) | | – | |
| Net written premiums | | 6,823 | | | 4,841 | | | 5,233 | | | 2,083 | | | 4,512 | | | 1,215 | | | – | | | – | | | 24,707 | | | 5,663 | | | 30,370 | |
| Net change in provision for unearned premiums | | (39 | ) | | (78 | ) | | (22 | ) | | (46 | ) | | (25 | ) | | (26 | ) | | – | | | – | | | (236 | ) | | (56 | ) | | (292 | ) |
| Net earned premiums | | 6,784 | | | 4,763 | | | 5,211 | | | 2,037 | | | 4,487 | | | 1,189 | | | – | | | – | | | 24,471 | | | 5,607 | | | 30,078 | |
| Fee and commission income | | 462 | | | 240 | | | 147 | | | 38 | | | 174 | | | 80 | | | 324 | | | – | | | 1,465 | | | 111 | | | 1,576 | |
| | | 7,246 | | | 5,003 | | | 5,358 | | | 2,075 | | | 4,661 | | | 1,269 | | | 324 | | | – | | | 25,936 | | | 5,718 | | | 31,654 | |
| Net investment income/(expense) | | 5,495 | | | 451 | | | (896 | ) | | 236 | | | (747 | ) | | (158 | ) | | 79 | | | (119 | ) | | 4,341 | | | 2,086 | | | 6,427 | |
| Inter-segment revenue | | – | | | – | | | – | | | – | | | – | | | – | | | 148 | | | – | | | 148 | | | 71 | | | 219 | |
| Share of (loss)/profit of joint ventures and associates | | (41 | ) | | – | | | 9 | | | – | | | (12 | ) | | 1 | | | 4 | | | (84 | ) | | (123 | ) | | 28 | | | (95 | ) |
| Profit/(loss) on the disposal and remeasurement of subsidiaries and associates | | – | | | 528 | | | 37 | | | – | | | – | | | – | | | 23 | | | (23 | ) | | 565 | | | (32 | ) | | 533 | |
| Segmental income | | 12,700 | | | 5,982 | | | 4,508 | | | 2,311 | | | 3,902 | | | 1,112 | | | 578 | | | (226 | ) | | 30,867 | | | 7,871 | | | 38,738 | |
| Claims and benefits paid, net of recoveries from reinsurers | | (9,589 | ) | | (3,217 | ) | | (5,366 | ) | | (1,308 | ) | | (4,118 | ) | | (782 | ) | | – | | | – | | | (24,380 | ) | | (4,029 | ) | | (28,409 | ) |
| Change in insurance liabilities, net of reinsurance | | (2,373 | ) | | 89 | | | 62 | | | (1 | ) | | (283 | ) | | 222 | | | – | | | – | | | (2,284 | ) | | (2,523 | ) | | (4,807 | ) |
| Change in investment contract provisions | | 949 | | | – | | | 583 | | | – | | | 37 | | | 46 | | | (137 | ) | | – | | | 1,478 | | | (180 | ) | | 1,298 | |
| Change in UDS | | 358 | | | – | | | 1,334 | | | – | | | 1,053 | | | (24 | ) | | – | | | – | | | 2,721 | | | (19 | ) | | 2,702 | |
| Amortisation of acquired value of in-force business | | (35 | ) | | – | | | (19 | ) | | – | | | (11 | ) | | (5 | ) | | – | | | – | | | (70 | ) | | (200 | ) | | (270 | ) |
| Impairment of goodwill and other intangibles, depreciation and other amortisation expense | | (260 | ) | | (36 | ) | | (7 | ) | | (18 | ) | | (28 | ) | | (8) | | | (17 | ) | | (2 | ) | | (376 | ) | | (64 | ) | | (440 | ) |
| Other operating expenses | | (1,375 | ) | | (1,894 | ) | | (806 | ) | | (673 | ) | | (567 | ) | | (369 | ) | | (384 | ) | | (495 | ) | | (6,563 | ) | | (932 | ) | | (7,495 | ) |
| Impairment losses on AVIF and tangible assets1 | | – | | | (60 | ) | | (4 | ) | | – | | | (31 | ) | | – | | | (1 | ) | | – | | | (96 | ) | | (33 | ) | | (129 | ) |
| Inter-segment expenses | | (133 | ) | | (6 | ) | | – | | | (3 | ) | | – | | | (6 | ) | | – | | | – | | | (148 | ) | | (71 | ) | | (219 | ) |
| Finance costs | | (277 | ) | | (52 | ) | | (18 | ) | | (11 | ) | | (2 | ) | | – | | | (3 | ) | | (413 | ) | | (776 | ) | | (284 | ) | | (1,060 | ) |
| Segmental expenses | | (12,735 | ) | | (5,176 | ) | | (4,241 | ) | | (2,014 | ) | | (3,950 | ) | | (926 | ) | | (542 | ) | | (910 | ) | | (30,494 | ) | | (8,335 | ) | | (38,829 | ) |
| (Loss)/profit before tax | | (35 | ) | | 806 | | | 267 | | | 297 | | | (48 | ) | | 186 | | | 36 | | | (1,136 | ) | | 373 | | | (464 | ) | | (91 | ) |
| Tax attributable to policyholders' returns | | 186 | | | – | | | – | | | – | | | – | | | (8 | ) | | – | | | – | | | 178 | | | – | | | 178 | |
| Profit/(loss) before tax attributable to shareholders | | 151 | | | 806 | | | 267 | | | 297 | | | (48 | ) | | 178 | | | 36 | | | (1,136 | ) | | 551 | | | (464 | ) | | 87 | |
| Reclassification of corporate costs and unallocated interest | | – | | | 2 | | | 20 | | | – | | | 2 | | | – | | | 1 | | | (25 | ) | | – | | | – | | | – | |
| Investment return variances and economic assumption changes | | 543 | | | – | | | 47 | | | – | | | 285 | | | 22 | | | – | | | – | | | 897 | | | 719 | | | 1,616 | |
| Short term fluctuation in return on investments backing non-long-term business | | – | | | 54 | | | 140 | | | (64 | ) | | 62 | | | – | | | – | | | 74 | | | 266 | | | 60 | | | 326 | |
| Economic assumption changes on general insurance and health business | | – | | | 86 | | | – | | | 4 | | | – | | | – | | | – | | | – | | | 90 | | | – | | | 90 | |
| Impairment of goodwill, associates and joint ventures | | 149 | | | – | | | – | | | – | | | 11 | | | 15 | | | – | | | 217 | | | 392 | | | – | | | 392 | |
| Amortisation and impairment of intangibles | | 66 | | | 9 | | | 4 | | | 11 | | | 12 | | | 5 | | | 9 | | | – | | | 116 | | | 60 | | | 176 | |
| (Profit)/loss on the disposal of subsidiaries and associates | | – | | | (528 | ) | | (37 | ) | | – | | | – | | | – | | | (23 | ) | | 23 | | | (565 | ) | | 32 | | | (533 | ) |
| Integration and restructuring costs | | 46 | | | 37 | | | 30 | | | 6 | | | 10 | | | 9 | | | 30 | | | 93 | | | 261 | | | 7 | | | 268 | |
| Exceptional items | | 22 | | | 35 | | | – | | | – | | | – | | | – | | | – | | | – | | | 57 | | | – | | | 57 | |
| Share of Delta Lloyd's non-operating items (before tax), as an associate | | – | | | – | | | – | | | – | | | – | | | – | | | – | | | (10 | ) | | (10 | ) | | – | | | (10 | ) |
| Share of Delta Lloyd's tax expense, as an associate | | – | | | – | | | – | | | – | | | – | | | – | | | – | | | 34 | | | 34 | | | – | | | 34 | |
| Adjusted operating profit/(loss) before tax attributable to shareholders6 | | 977 | | | 501 | | | 471 | | | 254 | | | 334 | | | 229 | | | 53 | | | (730 | ) | | 2,089 | | | 414 | | | 2,503 | |
| 1 | Impairment losses, and reversal of such losses, recognised directly in other comprehensive income were £2 million and £nil respectively. |
| 2 | Discontinued operations represent the operations of the United States Life assurance and related asset management activities, and the results of Delta Lloyd up until its deconsolidation in May 2011. |
| 3 | Aviva Investors adjusted operating profit includes £3 million profit relating to the Aviva Investors Pooled Pension business. |
| 4 | Following a review of the classification of contracts issued by the Group’s Italian long-term business, certain portfolios have been reclassified from participating insurance to participating investment contracts for all years presented. There is no impact on the result for any year presented as a result of this reclassification. |
| 5 | Other group activities include Delta Lloyd as an associate. |
| 6 | Adjusted operating profit is a non-GAAP measure as defined in the glossary. |
4 – Segmental information continued
a (iii) Segmental income statement for the year ended 31 December 2010
| | Developed Markets | | | | | | | | | | | | | | | | | | | |
| | | United Kingdom & Ireland | | | | | | | | | | | | | | | | | | | | | | | | | | | | |
| | | Life £m | | | GI £m | | | France £m | | | Canada £m | | | Restated4 Italy, Spain and Other £m | | | Higher growth markets £m | | | Aviva Investors3 £m | | | Other Group activities5 £m | | | Restated4 Continuing operations £m | | | Discontinued Operations2 £m | | | Total £m | |
| Gross written premiums | | 7,068 | | | 5,002 | | | 6,040 | | | 2,067 | | | 5,732 | | | 1,283 | | | – | | | – | | | 27,192 | | | 9,082 | | | 36,274 | |
| Premiums ceded to reinsurers | | (777 | ) | | (532 | ) | | (53 | ) | | (93 | ) | | (66 | ) | | (90 | ) | | – | | | – | | | (1,611 | ) | | (252 | ) | | (1,863 | ) |
| Internal reinsurance revenue | | (4 | ) | | 37 | | | (8 | ) | | (16 | ) | | (1 | ) | | (3 | ) | | – | | | – | | | 5 | | | (5 | ) | | – | |
| Net written premiums | | 6,287 | | | 4,507 | | | 5,979 | | | 1,958 | | | 5,665 | | | 1,190 | | | – | | | – | | | 25,586 | | | 8,825 | | | 34,411 | |
| Net change in provision for unearned premiums | | (12 | ) | | (19 | ) | | (24 | ) | | 29 | | | (34 | ) | | (12 | ) | | – | | | – | | | (72 | ) | | (3 | ) | | (75 | ) |
| Net earned premiums | | 6,275 | | | 4,488 | | | 5,955 | | | 1,987 | | | 5,631 | | | 1,178 | | | – | | | – | | | 25,514 | | | 8,822 | | | 34,336 | |
| Fee and commission income | | 374 | | | 288 | | | 148 | | | 44 | | | 167 | | | 91 | | | 339 | | | – | | | 1,451 | | | 331 | | | 1,782 | |
| | | 6,649 | | | 4,776 | | | 6,103 | | | 2,031 | | | 5,798 | | | 1,269 | | | 339 | | | – | | | 26,965 | | | 9,153 | | | 36,118 | |
| Net investment income/(expense) | | 11,387 | | | 403 | | | 2,610 | | | 220 | | | 587 | | | 555 | | | 171 | | | 813 | | | 16,746 | | | 5,247 | | | 21,993 | |
| Inter-segment revenue | | – | | | – | | | – | | | – | | | – | | | – | | | 147 | | | – | | | 147 | | | 67 | | | 214 | |
| Share of (loss)/profit of joint ventures and associates | | 127 | | | – | | | 8 | | | – | | | (24 | ) | | 36 | | | 3 | | | (9 | ) | | 141 | | | (10 | ) | | 131 | |
| Profit/(loss) on the disposal and remeasurement of subsidiaries and associates | | 128 | | | 5 | | | 25 | | | 1 | | | 1 | | | – | | | – | | | 3 | | | 163 | | | (4 | ) | | 159 | |
| Segmental income | | 18,291 | | | 5,184 | | | 8,746 | | | 2,252 | | | 6,362 | | | 1,860 | | | 660 | | | 807 | | | 44,162 | | | 14,453 | | | 58,615 | |
| Claims and benefits paid, net of recoveries from reinsurers | | (8,704 | ) | | (3,230 | ) | | (4,175 | ) | | (1,391 | ) | | (3,879 | ) | | (861 | ) | | – | | | – | | | (22,240 | ) | | (6,912 | ) | | (29,152 | ) |
| Change in insurance liabilities, net of reinsurance | | (2,699 | ) | | 273 | | | (414 | ) | | 103 | | | 402 | | | (502 | ) | | – | | | – | | | (2,837 | ) | | (3,692 | ) | | (6,529 | ) |
| Change in investment contract provisions | | (3,695 | ) | | – | | | (2,930 | ) | | – | | | (2,394 | ) | | 37 | | | (230 | ) | | – | | | (9,212 | ) | | (177 | ) | | (9,389 | ) |
| Change in UDS | | (90 | ) | | – | | | 34 | | | – | | | 388 | | | 30 | | | – | | | – | | | 362 | | | (33 | ) | | 329 | |
| Amortisation of acquired value of in-force business | | (8 | ) | | – | | | (18 | ) | | – | | | (14 | ) | | (7 | ) | | – | | | – | | | (47 | ) | | (127 | ) | | (174 | ) |
| Impairment of goodwill and other intangibles, depreciation and other amortisation expense | | (83 | ) | | (43 | ) | | (2 | ) | | (26 | ) | | (34 | ) | | (10 | ) | | (10 | ) | | – | | | (208 | ) | | (93 | ) | | (301 | ) |
| Other operating expenses | | (1,463 | ) | | (1,779 | ) | | (852 | ) | | (701 | ) | | (605 | ) | | (373 | ) | | (385 | ) | | (1,200 | ) | | (7,358 | ) | | (1,364 | ) | | (8,722 | ) |
| Impairment losses on AVIF and tangible assets1 | | – | | | (3 | ) | | – | | | – | | | – | | | – | | | – | | | – | | | (3 | ) | | (204 | ) | | (207 | ) |
| Inter-segment expenses | | (134 | ) | | (3 | ) | | – | | | (4 | ) | | – | | | (6 | ) | | – | | | – | | | (147 | ) | | (67 | ) | | (214 | ) |
| Finance costs | | (194 | ) | | (51 | ) | | (2 | ) | | (10 | ) | | (2 | ) | | – | | | (3 | ) | | (420 | ) | | (682 | ) | | (740 | ) | | (1,422 | ) |
| Segmental expenses | | (17,070 | ) | | (4,836 | ) | | (8,359 | ) | | (2,029 | ) | | (6,138 | ) | | (1,692 | ) | | (628 | ) | | (1,620 | ) | | (42,372 | ) | | (13,409 | ) | | (55,781 | ) |
| (Loss)/profit before tax | | 1,221 | | | 348 | | | 387 | | | 223 | | | 224 | | | 168 | | | 32 | | | (813 | ) | | 1,790 | | | 1,044 | | | 2,834 | |
| Tax attributable to policyholders' returns | | (387 | ) | | – | | | – | | | – | | | – | | | (7 | ) | | – | | | – | | | (394 | ) | | – | | | (394 | ) |
| Profit/(loss) before tax attributable to shareholders | | 834 | | | 348 | | | 387 | | | 223 | | | 224 | | | 161 | | | 32 | | | (813 | ) | | 1,396 | | | 1,044 | | | 2,440 | |
| Reclassification of corporate costs and unallocated interest | | 99 | | | 148 | | | 2 | | | – | | | 5 | | | – | | | 12 | | | (266 | ) | | – | | | – | | | – | |
| Investment return variances and economic assumption changes | | 149 | | | – | | | 10 | | | – | | | 80 | | | (10 | ) | | – | | | – | | | 229 | | | (1,020 | ) | | (791 | ) |
| Short term fluctuation in return on investments backing non-long-term business | | – | | | 10 | | | (21 | ) | | (44 | ) | | 27 | | | – | | | – | | | 227 | | | 199 | | | 44 | | | 243 | |
| Economic assumption changes on general insurance and health business | | – | | | 61 | | | – | | | – | | | – | | | – | | | – | | | – | | | 61 | | | – | | | 61 | |
| Impairment of goodwill, associates and joint ventures | | 4 | | | – | | | – | | | – | | | 9 | | | 1 | | | – | | | 9 | | | 23 | | | 1 | | | 24 | |
| Amortisation and impairment of intangibles | | 70 | | | 7 | | | – | | | 21 | | | 31 | | | 5 | | | 5 | | | – | | | 139 | | | 77 | | | 216 | |
| (Profit)/loss on the disposal of subsidiaries and associates | | (128 | ) | | (5 | ) | | (25 | ) | | (1 | ) | | (1 | ) | | – | | | – | | | (3 | ) | | (163 | ) | | 4 | | | (159 | ) |
| Integration and restructuring costs | | 51 | | | 48 | | | 8 | | | 20 | | | 6 | | | 15 | | | 28 | | | 40 | | | 216 | | | 27 | | | 243 | |
| Exceptional items | | (99 | ) | | (157 | ) | | – | | | 10 | | | – | | | – | | | (11 | ) | | (19 | ) | | (276 | ) | | 549 | | | 273 | |
| Share of Delta Lloyd's non-operating items (before tax), as an associate | | – | | | – | | | – | | | – | | | – | | | – | | | – | | | – | | | – | | | – | | | – | |
| Share of Delta Lloyd's tax expense, as an associate | | – | | | – | | | – | | | – | | | – | | | – | | | – | | | – | | | – | | | – | | | – | |
| Adjusted operating profit/(loss) before tax attributable to shareholders5 | | 980 | | | 460 | | | 361 | | | 229 | | | 381 | | | 172 | | | 66 | | | (825 | ) | | 1,824 | | | 726 | | | 2,550 | |
| 1 | Impairment losses, and reversal of such losses, recognised directly in other comprehensive income were £nil and £nil respectively. |
| 2 | Discontinued operations represent the operations of the United States Life assurance and related asset management activities, and the results of Delta Lloyd. |
| 3 | Aviva Investors adjusted operating profit includes £3 million profit relating to the Aviva Investors Pooled Pension business. |
| 4 | Following a review of the classification of contracts issued by the Group’s Italian long-term business, certain portfolios have been reclassified from participating insurance to participating investment contracts for all years presented. There is no impact on the result for any year presented as a result of this reclassification. |
| 5 | Adjusted operating profit is a non-GAAP measure as defined in the glossary. |
4 – Segmental information continued
a (iv) Segmental statement of financial position as at 31 December 2012
| | Developed Markets | | | | | | | | | |
| | United Kingdom & Ireland | | | | | | | | | | | | | | | | | |
| | | Life £m | | | GI £m | | | France £m | | | United States £m | | | Canada £m | | | Italy, Spain and Other £m | | | Higher growth markets £m | | | Aviva Investors £m | | | Other Group activities £m | | | Total £m | |
| Goodwill | | – | | | 1,037 | | | – | | | – | | | 50 | | | 342 | | | 64 | | | 27 | | | – | | | 1,520 | |
| Acquired value of in-force business and intangible assets | | 140 | | | 58 | | | 133 | | | – | | | 49 | | | 633 | | | 15 | | | 56 | | | – | | | 1,084 | |
| Interests in, and loans to, joint ventures and associates | | 1,185 | | | – | | | 148 | | | – | | | – | | | – | | | 371 | | | 4 | | | – | | | 1,708 | |
| Property and equipment | | 91 | | | 34 | | | 220 | | | – | | | 21 | | | 5 | | | 11 | | | 5 | | | 4 | | | 391 | |
| Investment property | | 7,650 | | | 8 | | | 1,342 | | | – | | | – | | | 2 | | | – | | | 1,093 | | | 720 | | | 10,815 | |
| Loans | | 23,193 | | | 299 | | | 848 | | | – | | | 83 | | | 14 | | | 30 | | | – | | | 70 | | | 24,537 | |
| Financial investments | | 90,064 | | | 3,127 | | | 60,001 | | | – | | | 3,766 | | | 21,900 | | | 5,761 | | | 759 | | | 3,700 | | | 189,078 | |
| Deferred acquisition costs | | 1,422 | | | 519 | | | 211 | | | – | | | 275 | | | 106 | | | 35 | | | – | | | – | | | 2,568 | |
| Other assets | | 16,883 | | | 4,122 | | | 11,304 | | | – | | | 1,053 | | | 2,828 | | | 699 | | | 436 | | | 4,060 | | | 41,385 | |
| Assets of operations classified as held for sale | | 3,490 | | | – | | | – | | | 36,187 | | | – | | | 2,631 | | | 267 | | | 28 | | | – | | | 42,603 | |
| Total assets | | 144,118 | | | 9,204 | | | 74,207 | | | 36,187 | | | 5,297 | | | 28,461 | | | 7,253 | | | 2,408 | | | 8,554 | | | 315,689 | |
| Insurance liabilities | | | | | | | | | | | | | | | | | | | | | | | | | | | | | | |
| Long term business and outstanding claims provisions | | 71,282 | | | 5,789 | | | 14,194 | | | – | | | 2,494 | | | 9,730 | | | 4,913 | | | – | | | – | | | 108,402 | |
| Unearned premiums | | 238 | | | 2,274 | | | 369 | | | – | | | 1,127 | | | 280 | | | 153 | | | – | | | – | | | 4,441 | |
| Other insurance liabilities | | – | | | 86 | | | 61 | | | – | | | 98 | | | 2 | | | 1 | | | – | | | – | | | 248 | |
| Liability for investment contracts | | 49,719 | | | – | | | 46,952 | | | – | | | – | | | 11,893 | | | 47 | | | 1,883 | | | – | | | 110,494 | |
| Unallocated divisible surplus | | 2,055 | | | – | | | 4,591 | | | – | | | – | | | 38 | | | 247 | | | – | | | – | | | 6,931 | |
| Net asset value attributable to unitholders | | 1,375 | | | – | | | 3,383 | | | – | | | – | | | 205 | | | – | | | – | | | 6,183 | | | 11,146 | |
| External borrowings | | 2,949 | | | 3 | | | – | | | – | | | – | | | 101 | | | – | | | – | | | 5,141 | | | 8,194 | |
| Other liabilities, including inter-segment liabilities | | 7,114 | | | (2,545 | ) | | 2,562 | | | – | | | 467 | | | 931 | | | 346 | | | 255 | | | 3,932 | | | 13,062 | |
| Liabilities of operations classified as held for sale | | 3,257 | | | – | | | – | | | 35,835 | | | – | | | 2,188 | | | 118 | | | 13 | | | – | | | 41,411 | |
| Total liabilities | | 137,989 | | | 5,607 | | | 72,112 | | | 35,835 | | | 4,186 | | | 25,368 | | | 5,825 | | | 2,151 | | | 15,256 | | | 304,329 | |
| Total equity | | | | | | | | | | | | | | | | | | | | | | | | | | | | | 11,360 | |
| Total equity and liabilities | | | | | | | | | | | | | | | | | | | | | | | | | | | | | 315,689 | |
| Capital expenditure (excluding business combinations) | | 63 | | | 42 | | | 176 | | | 29 | | | 21 | | | 15 | | | 7 | | | 24 | | | – | | | 377 | |
External borrowings by holding companies within the Group which are not allocated to operating companies are included in ‘Other Group activities’.
4 – Segmental information continued
a (v) Segmental statement of financial position as at 31 December 2011
| | Developed Markets | | | | | | | | | | | | | |
| | | United Kingdom & Ireland | | | | | | | | | | | | | | | | | | | | | | | | | |
| | | Life £m | | | GI £m | | | France £m | | | United States £m | | | Canada £m | | | Restated2 Italy, Spain and Other £m | | | Higher growth markets £m | | | Aviva Investors £m | | | Other Group activities1 £m | | | Restated2 Total £m | |
| Goodwill | | – | | | 1,040 | | | – | | | 800 | | | 50 | | | 650 | | | 71 | | | 29 | | | – | | | 2,640 | |
| Acquired value of in-force business and intangible assets | | 326 | | | 67 | | | 155 | | | 681 | | | 47 | | | 678 | | | 23 | | | 44 | | | – | | | 2,021 | |
| Interests in, and loans to, joint ventures and associates | | 1,274 | | | – | | | 152 | | | 1 | | | – | | | – | | | 600 | | | 15 | | | 776 | | | 2,818 | |
| Property and equipment | | 228 | | | 45 | | | 50 | | | 113 | | | 19 | | | 18 | | | 13 | | | 16 | | | 8 | | | 510 | |
| Investment property | | 8,431 | | | 20 | | | 1,246 | | | 6 | | | – | | | 2 | | | – | | | 1,133 | | | 800 | | | 11,638 | |
| Loans | | 23,440 | | | 524 | | | 949 | | | 3,067 | | | 80 | | | 16 | | | 40 | | | – | | | – | | | 28,116 | |
| Financial investments | | 90,165 | | | 3,268 | | | 55,074 | | | 30,613 | | | 3,683 | | | 23,895 | | | 5,398 | | | 884 | | | 3,078 | | | 216,058 | |
| Deferred acquisition costs | | 1,594 | | | 566 | | | 207 | | | 1,950 | | | 274 | | | 129 | | | 35 | | | – | | | – | | | 4,755 | |
| Other assets | | 16,864 | | | 3,828 | | | 11,856 | | | 1,752 | | | 1,183 | | | 2,366 | | | 507 | | | 579 | | | 4,459 | | | 43,394 | |
| Assets of operations classified as held for sale | | – | | | – | | | – | | | – | | | – | | | 414 | | | 12 | | | – | | | – | | | 426 | |
| Total assets | | 142,322 | | | 9,358 | | | 69,689 | | | 38,983 | | | 5,336 | | | 28,168 | | | 6,699 | | | 2,700 | | | 9,121 | | | 312,376 | |
| Insurance liabilities | | | | | | | | | | | | | | | | | | | | | | | | | | | | | | |
| Long term business and outstanding claims provisions | | 72,513 | | | 6,048 | | | 13,679 | | | 30,697 | | | 2,538 | | | 12,408 | | | 4,732 | | | – | | | – | | | 142,615 | |
| Unearned premiums | | 350 | | | 2,209 | | | 353 | | | – | | | 1,122 | | | 296 | | | 153 | | | – | | | – | | | 4,483 | |
| Other insurance liabilities | | – | | | 95 | | | 85 | | | – | | | 100 | | | 1 | | | – | | | – | | | – | | | 281 | |
| Liability for investment contracts | | 48,456 | | | – | | | 47,346 | | | 2,833 | | | – | | | 12,543 | | | 51 | | | 2,137 | | | – | | | 113,366 | |
| Unallocated divisible surplus | | 1,712 | | | – | | | 249 | | | – | | | – | | | (1,435 | ) | | 124 | | | – | | | – | | | 650 | |
| Net asset value attributable to unitholders | | 1,279 | | | – | | | 3,362 | | | – | | | – | | | 18 | | | – | | | – | | | 5,693 | | | 10,352 | |
| External borrowings | | 2,945 | | | 2 | | | – | | | 159 | | | – | | | 89 | | | – | | | – | | | 5,255 | | | 8,450 | |
| Other liabilities, including inter-segment liabilities | | 8,829 | | | (3,280 | ) | | 2,538 | | | 2,188 | | | 456 | | | 1,059 | | | 232 | | | 309 | | | 4,122 | | | 16,453 | |
| Liabilities of operations classified as held for sale | | – | | | – | | | – | | | – | | | – | | | 363 | | | – | | | – | | | – | | | 363 | |
| Total liabilities | | 136,084 | | | 5,074 | | | 67,612 | | | 35,877 | | | 4,216 | | | 25,342 | | | 5,292 | | | 2,446 | | | 15,070 | | | 297,013 | |
| Total equity | | | | | | | | | | | | | | | | | | | | | | | | | | | | | 15,363 | |
| Total equity and liabilities | | | | | | | | | | | | | | | | | | | | | | | | | | | | | 312,376 | |
| Capital expenditure (excluding business combinations) | | 55 | | | 79 | | | 5 | | | 21 | | | 8 | | | 17 | | | 9 | | | 20 | | | – | | | 214 | |
| 1 | Other group activities include Delta Lloyd as an associate. |
| 2. | Following a review of the classification of contracts issued by the Group’s Italian long-term business, certain portfolios have been reclassified from participating insurance to participating investment contracts for all years presented. There is no impact on the result for any year presented as a result of this reclassification. |
(b) Further analysis by products and services
The Group’s results can be further analysed by products and services which comprise long-term business, general insurance and health, fund management and other activities.
Long-term business
Our long-term business comprises life insurance, long-term health and accident insurance, savings, pensions and annuity business written by our life insurance subsidiaries, including managed pension fund business and our share of the other life and related business written in our associates and joint ventures, as well as lifetime mortgage business written in the UK.
General insurance and health
Our general insurance and health business provides insurance cover to individuals and to small and medium sized businesses, for risks associated mainly with motor vehicles, property and liability, such as employers’ liability and professional indemnity liability, and medical expenses.
Fund management
Our fund management business invests policyholders’ and shareholders’ funds, provides investment management services for institutional pension fund mandates and manages a range of retail investment products, including investment funds, unit trusts, OEICs and ISAs. Clients include Aviva Group businesses and third-party financial institutions, pension funds, public sector organisations, investment professionals and private investors.
Other
Other includes the RAC non-insurance operations (up to the disposal date of 30 September 2011), service companies, head office expenses, such as Group treasury and finance functions, and certain financing costs and taxes not allocated to business segments.
Discontinued operations and Delta Lloyd
In the products and services analysis, the results of US Life (including the related internal asset management business) for all periods presented and Delta Lloyd up to 6 May 2011 are presented as discontinued operations. Between 6 May 2011 and 5 July 2012, the Group’s share of the results of its interest in Delta Lloyd as an associate and, from 5 July 2012 to the year-end, as a financial investment, are shown only within other activities within continuing operations.
4 – Segmental information continued
b (i) Segmental income statement – products and services for the year ended 31 December 2012
| | Long-term
business
£m | | General insurance and health2 £m | | Fund
management
£m | | Other3 £m | | Total
£m | |
| Gross written premiums1 | | 13,209 | | | 9,535 | | | – | | | – | | | 22,744 | |
| Premiums ceded to reinsurers | | (930 | ) | | (641 | ) | | – | | | – | | | (1,571 | ) |
| Net written premiums | | 12,279 | | | 8,894 | | | – | | | – | | | 21,173 | |
| Net change in provision for unearned premiums | | – | | | (16 | ) | | – | | | – | | | (16 | ) |
| Net earned premiums | | 12,279 | | | 8,878 | | | – | | | – | | | 21,157 | |
| Fee and commission income | | 632 | | | 65 | | | 331 | | | 245 | | | 1,273 | |
| | | 12,911 | | | 8,943 | | | 331 | | | 245 | | | 22,430 | |
| Net investment income/(expense) | | 20,295 | | | 823 | | | 6 | | | (18 | ) | | 21,106 | |
| Inter-segment revenue | | – | | | – | | | 127 | | | – | | | 127 | |
| Share of (loss)/profit of joint ventures and associates | | (27 | ) | | 1 | | | 3 | | | (254 | ) | | (277 | ) |
| (Loss)/profit on the disposal and remeasurement of subsidiaries and associates | | (6 | ) | | (21 | ) | | – | | | (137 | ) | | (164 | ) |
| Segmental income | | 33,173 | | | 9,746 | | | 467 | | | (164 | ) | | 43,222 | |
| Claims and benefits paid, net of recoveries from reinsurers | | (17,839 | ) | | (5,762 | ) | | – | | | – | | | (23,601 | ) |
| Change in insurance liabilities, net of reinsurance | | (359 | ) | | (71 | ) | | – | | | – | | | (430 | ) |
| Change in investment contract provisions | | (4,450 | ) | | – | | | – | | | – | | | (4,450 | ) |
| Change in unallocated divisible surplus | | (6,316 | ) | | – | | | – | | | – | | | (6,316 | ) |
| Amortisation of acquired value of in-force business | | (43 | ) | | – | | | – | | | – | | | (43 | ) |
Impairment of goodwill and other intangibles, depreciation and other
amortisation expense | | (236 | ) | | (25 | ) | | (10 | ) | | (65 | ) | | (336 | ) |
| Other operating expenses | | (2,477 | ) | | (3,170 | ) | | (390 | ) | | (821 | ) | | (6,858 | ) |
| Impairment losses on AVIF and tangible assets | | (37 | ) | | (43 | ) | | – | | | – | | | (80 | ) |
| Inter-segment expenses | | (116 | ) | | (11 | ) | | – | | | – | | | (127 | ) |
| Finance costs | | (215 | ) | | (29 | ) | | (56 | ) | | (435 | ) | | (735 | ) |
| Segmental expenses | | (32,088 | ) | | (9,111 | ) | | (456 | ) | | (1,321 | ) | | (42,976 | ) |
| Profit/(loss) before tax from continuing operations | | 1,085 | | | 635 | | | 11 | | | (1,485 | ) | | 246 | |
| Tax attributable to policyholder returns | | (221 | ) | | – | | | – | | | – | | | (221 | ) |
| Profit/(loss) before tax attributable to shareholders | | 864 | | | 635 | | | 11 | | | (1,485 | ) | | 25 | |
| Adjusted for: | | | | | | | | | | | | | | | |
| Non-operating items from continuing operations (excluding Delta Lloyd as an associate) | | 967 | | | 258 | | | 40 | | | 182 | | | 1,447 | |
| Share of Delta Lloyd's non-operating items (before tax), as an associate | | – | | | – | | | – | | | 523 | | | 523 | |
| Share of Delta Lloyd's tax expense, as an associate | | – | | | – | | | – | | | (107 | ) | | (107 | ) |
Adjusted operating profit/(loss) before tax attributable to shareholders’ profits from continuing operations4 | | 1,831 | | | 893 | | | 51 | | | (887 | ) | | 1,888 | |
Adjusted operating profit/(loss) before tax attributable to shareholders’ profits from discontinued operations5 | | 200 | | | – | | | 55 | | | (16 | ) | | 239 | |
| Adjusted operating profit/(loss) before tax attributable to shareholders’ profits | | 2,031 | | | 893 | | | 106 | | | (903 | ) | | 2,127 | |
| 1 | Gross written premiums includes inward reinsurance premiums assumed from other companies amounting to £370 million, of which £130 million relates to property and liability insurance and £240 million relates to long-term business. |
| 2 | General insurance and health business segment includes gross written premiums of £1,164 million relating to health business. The remaining business relates to property and liability insurance. |
| 3 | Other includes Delta Lloyd as an associate to 5 July 2012, head office expenses such as group treasury and finance functions, and certain financing costs and taxes not allocated to business segments. |
| 4 | Adjusted operating profit is a non-GAAP measure as defined in the glossary. |
| 5 | Discontinued operations represent the operations of the United States Life business and related internal asset management activities. |
4 – Segmental information continued
b (ii) Segmental income statement – products and services for the year ended 31 December 2011
| | Restated5 Long-term Business £m | | General insurance and health2 £m | | Fund
management
£m | | Other3 £m | | Restated6 Total £m | |
| Gross written premiums1 | | 16,505 | | | 9,750 | | | – | | | – | | | 26,255 | |
| Premiums ceded to reinsurers | | (960 | ) | | (588 | ) | | – | | | – | | | (1,548 | ) |
| Net written premiums | | 15,545 | | | 9,162 | | | – | | | – | | | 24,707 | |
| Net change in provision for unearned premiums | | – | | | (236 | ) | | – | | | – | | | (236 | ) |
| Net earned premiums | | 15,545 | | | 8,926 | | | – | | | – | | | 24,471 | |
| Fee and commission income | | 705 | | | 54 | | | 373 | | | 333 | | | 1,465 | |
| | | 16,250 | | | 8,980 | | | 373 | | | 333 | | | 25,936 | |
| Net investment income/(expense) | | 3,811 | | | 725 | | | 4 | | | (199 | ) | | 4,341 | |
| Inter-segment revenue | | – | | | – | | | 156 | | | – | | | 156 | |
| Share of (loss)/profit of joint venture and associates | | (10 | ) | | – | | | (2 | ) | | (111 | ) | | (123 | ) |
| (Loss)/profit on the disposal and remeasurement of subsidiaries and associates | | – | | | (28 | ) | | 24 | | | 569 | | | 565 | |
| Segmental income | | 20,051 | | | 9,677 | | | 555 | | | 592 | | | 30,875 | |
| Claims and benefits paid, net of recoveries from reinsurers | | (18,435 | ) | | (5,945 | ) | | – | | | – | | | (24,380 | ) |
| Change in insurance liabilities, net of reinsurance | | (2,281 | ) | | (3 | ) | | – | | | – | | | (2,284 | ) |
| Change in investment contract provisions | | 1,478 | | | – | | | – | | | – | | | 1,478 | |
| Change in unallocated divisible surplus | | 2,721 | | | – | | | – | | | – | | | 2,721 | |
| Amortisation of acquired value of in-force business on insurance contracts | | (70 | ) | | – | | | – | | | – | | | (70 | ) |
| Impairment of goodwill and other intangibles, depreciation and other amortisation expense | | (277 | ) | | (19 | ) | | (16 | ) | | (64 | ) | | (376 | ) |
| Other operating expenses | | (2,293 | ) | | (2,994 | ) | | (443 | ) | | (833 | ) | | (6,563 | ) |
| Impairment losses on AVIF and tangible assets | | (17 | ) | | (60 | ) | | – | | | (19 | ) | | (96 | ) |
| Inter-segment expenses | | (145 | ) | | (11 | ) | | – | | | – | | | (156 | ) |
| Finance costs | | (205 | ) | | (36 | ) | | (51 | ) | | (484 | ) | | (776 | ) |
| Segmental expenses | | (19,524 | ) | | (9,068 | ) | | (510 | ) | | (1,400 | ) | | (30,502 | ) |
| Profit/(loss) before tax from continuing operations | | 527 | | | 609 | | | 45 | | | (808 | ) | | 373 | |
| Tax attributable to policyholder returns | | 178 | | | – | | | – | | | – | | | 178 | |
| Profit/(loss) before tax attributable to shareholders from continuing operations | | 705 | | | 609 | | | 45 | | | (808 | ) | | 551 | |
| Adjusted for: | | | | | | | | | | | | | | | |
| Non-operating items from continuing operations (excluding Delta Lloyd as an associate) | | 1,221 | | | 326 | | | 16 | | | (49 | ) | | 1,514 | |
| Share of Delta Lloyd's non-operating items (before tax), as an associate | | – | | | – | | | – | | | (10 | ) | | (10 | ) |
| Share of Delta Lloyd's tax expense, as an associate | | – | | | – | | | – | | | 34 | | | 34 | |
| Adjusted operating profit/(loss) before tax attributable to shareholders’ profits from continuing operations4 | | 1,926 | | | 935 | | | 61 | | | (833 | ) | | 2,089 | |
| Adjusted operating profit/(loss) before tax attributable to shareholders’ profits from discontinued operations5 | | 382 | | | 1 | | | 49 | | | (18 | ) | | 414 | |
| Adjusted operating profit/(loss) before tax attributable to shareholders’ profits | | 2,308 | | | 936 | | | 110 | | | (851 | ) | | 2,503 | |
| 1 | Gross written premiums includes inward reinsurance premiums assumed from other companies amounting to £226 million, of which £110 million relates to property and liability insurance and £116 million relates to long-term business. |
| 2 | General insurance and health business segment includes gross written premiums of £1,107 million relating to health business. The remaining business relates to property and liability insurance. |
| 3 | Other includes the RAC, up to the date of disposal, Delta Lloyd as an associate from 6 May 2011, head office expenses, such as group treasury and finance functions, and certain financing costs and taxes not allocated to business segments. |
| 4 | Adjusted operating profit is a non-GAAP measure as defined in the glossary. |
| 5 | Discontinued operations represent the operations of the United States Life business and related internal asset management activities and the results of Delta Lloyd up until its deconsolidation in May 2011. |
| 6 | Following a review of the classification of contracts issued by the Group’s Italian long-term business, certain portfolios have been reclassified from participating insurance to participating investment contracts for all years presented. There is no impact on the result for any year presented as a result of this reclassification. |
4 – Segmental information continued
b (iii) Segmental income statement – products and services for the year ended 31 December 2010
| | Restated5 Long-term Business £m | | General insurance and health2 £m | | Fund
management
£m | | Other3 £m | | Restated6 Total £m | |
| Gross written premiums1 | | 17,987 | | | 9,205 | | | – | | | – | | | 27,192 | |
| Premiums ceded to reinsurers | | (923 | ) | | (683 | ) | | – | | | – | | | (1,606 | ) |
| Net written premiums | | 17,064 | | | 8,522 | | | – | | | – | | | 25,586 | |
| Net change in provision for unearned premiums | | – | | | (72 | ) | | – | | | – | | | (72 | ) |
| Net earned premiums | | 17,064 | | | 8,450 | | | – | | | – | | | 25,514 | |
| Fee and commission income | | 627 | | | 94 | | | 387 | | | 343 | | | 1,451 | |
| | | 17,691 | | | 8,544 | | | 387 | | | 343 | | | 26,965 | |
| Net investment income/(expense) | | 15,175 | | | 500 | | | 7 | | | 1,064 | | | 16,746 | |
| Inter-segment revenue | | – | | | – | | | 147 | | | – | | | 147 | |
| Share of (loss)/profit of joint venture and associates | | 180 | | | – | | | (5 | ) | | (34 | ) | | 141 | |
| (Loss)/profit on the disposal and remeasurement of subsidiaries and associates | | 130 | | | 1 | | | – | | | 32 | | | 163 | |
| Segmental income | | 33,176 | | | 9,045 | | | 536 | | | 1,405 | | | 44,162 | |
| Claims and benefits paid, net of recoveries from reinsurers | | (16,231 | ) | | (6,009 | ) | | – | | | – | | | (22,240 | ) |
| Change in insurance liabilities, net of reinsurance | | (3,226 | ) | | 389 | | | – | | | – | | | (2,837 | ) |
| Change in investment contract provisions | | (9,212 | ) | | – | | | – | | | – | | | (9,212 | ) |
| Change in unallocated divisible surplus | | 362 | | | – | | | – | | | – | | | 362 | |
| Amortisation of acquired value of in-force business on insurance contracts | | (47 | ) | | – | | | – | | | – | | | (47 | ) |
| Impairment of goodwill and other intangibles, depreciation and other amortisation expense | | (121 | ) | | (27 | ) | | (10 | ) | | (50 | ) | | (208 | ) |
| Other operating expenses | | (2,479 | ) | | (2,788 | ) | | (430 | ) | | (1,661 | ) | | (7,358 | ) |
| Impairment losses on AVIF and tangible assets | | (1 | ) | | (3 | ) | | – | | | 1 | | | (3 | ) |
| Inter-segment expenses | | (139 | ) | | (8 | ) | | – | | | – | | | (147 | ) |
| Finance costs | | (140 | ) | | (48 | ) | | (65 | ) | | (429 | ) | | (682 | ) |
| Segmental expenses | | (31,234 | ) | | (8,494 | ) | | (505 | ) | | (2,139 | ) | | (42,372 | ) |
| Profit/(loss) before tax from continuing operations | | 1,942 | | | 551 | | | 31 | | | (734 | ) | | 1,790 | |
| Tax attributable to policyholder returns | | (394 | ) | | – | | | – | | | – | | | (394 | ) |
| Profit/(loss) before tax attributable to shareholders from continuing operations | | 1,548 | | | 551 | | | 31 | | | (734 | ) | | 1,396 | |
| Adjusted for: | | | | | | | | | | | | | | | |
| Non-operating items from continuing operations (excluding Delta Lloyd as an associate) | | 266 | | | 354 | | | 33 | | | (225 | ) | | 428 | |
| Share of Delta Lloyd's non-operating items (before tax), as an associate | | – | | | – | | | – | | | – | | | – | |
| Share of Delta Lloyd's tax expense, as an associate | | – | | | – | | | – | | | – | | | – | |
| Adjusted operating profit/(loss) before tax attributable to shareholders’ profits from continuing operations4 | | 1,814 | | | 905 | | | 64 | | | (959 | ) | | 1,824 | |
| Adjusted operating profit/(loss) before tax attributable to shareholders’ profits from discontinued operations5 | | 504 | | | 146 | | | 135 | | | (59 | ) | | 726 | |
| Adjusted operating profit/(loss) before tax attributable to shareholders’ profits | | 2,318 | | | 1,051 | | | 199 | | | (1,018 | ) | | 2,550 | |
| 1 | Gross written premiums includes inward reinsurance premiums assumed from other companies amounting to £243 million, of which £113 million relates to property and liability insurance and £133 million relates to long-term business. |
| 2 | General insurance and health business segment includes gross written premiums of £942 million relating to health business. The remaining business relates to property and liability insurance. |
| 3 | Other includes the RAC, Delta Lloyd, head office expenses, such as group treasury and finance functions, and certain financing costs and taxes not allocated to business segments. |
| 4 | Adjusted operating profit is a non-GAAP measure as defined in the glossary. |
| 5 | Discontinued operations represent the operations of the United States Life business and related internal asset management activities and the results of Delta Lloyd. |
| 6 | Following a review of the classification of contracts issued by the Group’s Italian long-term business, certain portfolios have been reclassified from participating insurance to participating investment contracts for all years presented. There is no impact on the result for any year presented as a result of this reclassification. |
4 – Segmental information continued
b (iv) Segmental statement of financial position – products and services as at 31 December 2012
| | Long-term
business
£m | | General
insurance
and health
£m | | Fund
management
£m | | Other
£m | | Total
£m | |
| Goodwill | | 361 | | | 1,060 | | | 27 | | | 72 | | | 1,520 | |
| Acquired value of in-force business and intangible assets | | 799 | | | 146 | | | 56 | | | 83 | | | 1,084 | |
| Interests in, and loans to, joint ventures and associates | | 1,699 | | | 5 | | | 4 | | | – | | | 1,708 | |
| Property and equipment | | 253 | | | 94 | | | 5 | | | 39 | | | 391 | |
| Investment property | | 9,956 | | | 139 | | | – | | | 720 | | | 10,815 | |
| Loans | | 24,085 | | | 433 | | | – | | | 19 | | | 24,537 | |
| Financial investments | | 175,846 | | | 9,266 | | | 39 | | | 3,927 | | | 189,078 | |
| Deferred acquisition costs | | 1,615 | | | 939 | | | 14 | | | – | | | 2,568 | |
| Other assets | | 29,307 | | | 7,237 | | | 453 | | | 4,388 | | | 41,385 | |
| Assets of operations classified as held for sale | | 42,564 | | | 11 | | | 28 | | | – | | | 42,603 | |
| Total assets | | 286,485 | | | 19,330 | | | 626 | | | 9,248 | | | 315,689 | |
| Gross insurance liabilities | | 98,086 | | | 15,005 | | | – | | | – | | | 113,091 | |
| Gross liabilities for investment contracts | | 110,494 | | | – | | | – | | | – | | | 110,494 | |
| Unallocated divisible surplus | | 6,931 | | | – | | | – | | | – | | | 6,931 | |
| Net asset value attributable to unitholders | | 4,963 | | | – | | | – | | | 6,183 | | | 11,146 | |
| External borrowings | | 3,034 | | | – | | | – | | | 5,160 | | | 8,194 | |
| Other liabilities, including inter-segment liabilities | | 8,778 | | | (2,661 | ) | | 334 | | | 6,611 | | | 13,062 | |
| Liabilities of operations classified as held for sale | | 41,237 | | | 2 | | | 13 | | | 159 | | | 41,411 | |
| Total liabilities | | 273,523 | | | 12,346 | | | 347 | | | 18,113 | | | 304,329 | |
| Total equity | | | | | | | | | | | | | | 11,360 | |
| Total equity and liabilities | | | | | | | | | | | | | | 315,689 | |
b (v) Segmental statement of financial position – products and services as at 31 December 2011
| | Restated2 Long-term Business £m | | General
insurance
and health
£m | | Fund
management
£m | | Other1 £m | | Restated2 Total £m | |
| Goodwill | | 1,466 | | | 1,067 | | | 29 | | | 78 | | | 2,640 | |
| Acquired value of in-force business and intangible assets | | 1,742 | | | 145 | | | 44 | | | 90 | | | 2,021 | |
| Interests in, and loans to, joint ventures and associates | | 2,035 | | | 5 | | | – | | | 778 | | | 2,818 | |
| Property and equipment | | 395 | | | 34 | | | 16 | | | 65 | | | 510 | |
| Investment property | | 10,686 | | | 152 | | | – | | | 800 | | | 11,638 | |
| Loans | | 27,511 | | | 605 | | | – | | | – | | | 28,116 | |
| Financial investments | | 203,247 | | | 9,391 | | | 43 | | | 3,377 | | | 216,058 | |
| Deferred acquisition costs | | 3,755 | | | 986 | | | 14 | | | – | | | 4,755 | |
| Other assets | | 31,023 | | | 6,717 | | | 495 | | | 5,159 | | | 43,394 | |
| Assets of operations classified as held for sale | | 426 | | | – | | | – | | | – | | | 426 | |
| Total assets | | 282,286 | | | 19,102 | | | 641 | | | 10,347 | | | 312,376 | |
| Gross insurance liabilities | | 132,138 | | | 15,241 | | | – | | | – | | | 147,379 | |
| Gross liabilities for investment contracts | | 113,366 | | | – | | | – | | | – | | | 113,366 | |
| Unallocated divisible surplus | | 650 | | | – | | | – | | | – | | | 650 | |
| Net asset value attributable to unitholders | | 4,659 | | | – | | | – | | | 5,693 | | | 10,352 | |
| External borrowings | | 3,016 | | | – | | | – | | | 5,434 | | | 8,450 | |
| Other liabilities, including inter-segment liabilities | | 12,430 | | | (3,170 | ) | | 374 | | | 6,819 | | | 16,453 | |
| Liabilities of operations classified as held for sale | | 363 | | | – | | | – | | | – | | | 363 | |
| Total liabilities | | 266,622 | | | 12,071 | | | 374 | | | 17,946 | | | 297,013 | |
| Total equity | | | | | | | | | | | | | | 15,363 | |
| Total equity and liabilities | | | | | | | | | | | | | | 312,376 | |
| 1 | Other includes Delta Lloyd as an associate. |
| 2 | Following a review of the classification of contracts issued by the Group’s Italian long-term business, certain portfolios have been reclassified from participating insurance to participating investment contracts for all years presented. There is no impact on the result for any year presented as a result of this reclassification. |
5 – Details of income
This note gives further detail on the items appearing in the income section of the consolidated income statement.
| Continuing operations | 2012
£m | | Restated1 2011 £m | | Restated1 2010 £m | |
| Gross written premiums (note 4a and 4b) | | | | | | | | | |
| Long-term: | | | | | | | | | |
| Insurance contracts | | 9,683 | | | 11,671 | | | 10,096 | |
| Participating investment contracts | | 3,526 | | | 4,834 | | | 7,891 | |
| General insurance and health | | 9,535 | | | 9,750 | | | 9,205 | |
| | | 22,744 | | | 26,255 | | | 27,192 | |
| Less: Premiums ceded to reinsurers (note 4a and 4b) | | (1,571 | ) | | (1,548 | ) | | (1,611 | ) |
| Internal reinsurance revenue | | – | | | – | | | 5 | |
| Gross change in provision for unearned premiums | | (21 | ) | | (189 | ) | | (42 | ) |
| Reinsurers’ share of change in provision for unearned premiums | | 5 | | | (47 | ) | | (30 | ) |
| Net change in provision for unearned premiums | | (16 | ) | | (236 | ) | | (72 | ) |
| Net earned premiums | | 21,157 | | | 24,471 | | | 25,514 | |
| Fee and commission income | | | | | | | | | |
| Fee income from investment contract business | | 461 | | | 519 | | | 438 | |
| Fund management fee income | | 330 | | | 368 | | | 392 | |
| Other fee income | | 304 | | | 445 | | | 449 | |
| Reinsurance commissions receivable | | 92 | | | 71 | | | 110 | |
| Other commission income | | 41 | | | 33 | | | 37 | |
| Net change in deferred revenue | | 45 | | | 29 | | | 25 | |
| | | 1,273 | | | 1,465 | | | 1,451 | |
| Total revenue | | 22,430 | | | 25,936 | | | 26,965 | |
| Net investment income | | | | | | | | | |
| Interest and similar income | | | | | | | | | |
| From financial instruments designated as trading and other than trading | | 5,737 | | | 6,088 | | | 5,863 | |
| From AFS investments and financial instruments at amortised cost | | 83 | | | 83 | | | 77 | |
| | | 5,820 | | | 6,171 | | | 5,940 | |
| Dividend income | | 1,652 | | | 1,627 | | | 1,322 | |
| Other income from investments designated as trading | | | | | | | | | |
| Realised (losses)/gains on disposals | | (667 | ) | | (388 | ) | | 133 | |
| Unrealised gains and losses (policy J) | | | | | | | | | |
| (Losses)/gains arising in the year | | (697 | ) | | (319 | ) | | 200 | |
| Losses/(gains) recognised in prior periods and now realised | | 667 | | | 388 | | | (133 | ) |
| | | (30 | ) | | 69 | | | 67 | |
| | | (697 | ) | | (319 | ) | | 200 | |
| Other income from investments designated as other than trading | | | | | | | | | |
| Realised gains on disposals | | 1,844 | | | 1,729 | | | 1,296 | |
| Unrealised gains and losses (see policy J) | | | | | | | | | |
| Gains/(losses) arising in the year | | 14,239 | | | (3,827 | ) | | 8,171 | |
| (Gains) recognised in prior periods and now realised | | (1,844 | ) | | (1,729 | ) | | (1,296 | ) |
| | | 12,395 | | | (5,556 | ) | | 6,875 | |
| | | 14,239 | | | (3,827 | ) | | 8,171 | |
| Realised gains and losses on AFS investments | | | | | | | | | |
| (Gains)/losses recognised in prior periods as unrealised in equity | | (1 | ) | | (1 | ) | | 2 | |
| | | | | | | | | | |
| Net income from investment properties | | | | | | | | | |
| Rent | | 648 | | | 690 | | | 778 | |
| Expenses relating to these properties | | (57 | ) | | (39 | ) | | (22 | ) |
| Realised gains on disposal | | 7 | | | 8 | | | 41 | |
| Fair value (losses)/gains on investment properties | | (492 | ) | | 148 | | | 465 | |
| | | 106 | | | 807 | | | 1,262 | |
| Realised (losses)/gains on loans | | (9 | ) | | – | | | 1 | |
| Foreign exchange gains and losses on investments other than trading | | 132 | | | (12 | ) | | (52 | ) |
| Other investment (expenses) | | (136 | ) | | (105 | ) | | (100 | ) |
| Net investment income | | 21,106 | | | 4,341 | | | 16,746 | |
| Share of (loss)/profit after tax of joint ventures | | (38 | ) | | (38 | ) | | 149 | |
| Share of (loss) after tax of associates | | (239 | ) | | (85 | ) | | (8 | ) |
| Share of (loss)/profit after tax of joint ventures and associates | | (277 | ) | | (123 | ) | | 141 | |
| (Loss)/profit on disposal of subsidiaries and associates (note 3b) | | (164 | ) | | 565 | | | 163 | |
| Income from continuing operations | | 43,095 | | | 30,719 | | | 44,015 | |
| Income from discontinued operations | | 3,494 | | | 7,800 | | | 14,386 | |
| Total income | | 46,589 | | | 38,519 | | | 58,401 | |
| 1 | Following a review of the classification of contracts issued by the Group’s Italian long-term business, certain portfolios have been reclassified from participating insurance to participating investment contracts for all years presented. There is no impact on the result for any year presented as a result of this reclassification. |
6 – Details of expenses
This note gives further detail on the items appearing in the expenses section of the consolidated income statement.
| Continuing operations | 2012
£m | | Restated1 2011 £m | | Restated1 2010 £m | |
| Claims and benefits paid | | | | | | | | | |
| Claims and benefits paid to policyholders on long-term business | | | | | | | | | |
| Insurance contracts | | 12,382 | | | 12,250 | | | 11,591 | |
| Participating investment contracts | | 6,500 | | | 6,835 | | | 5,185 | |
| Non-participating investment contracts | | 33 | | | 38 | | | 39 | |
| Claims and benefits paid to policyholders on general insurance and health business | | 6,050 | | | 6,264 | | | 6,381 | |
| | | 24,965 | | | 25,387 | | | 23,196 | |
| Less: Claim recoveries from reinsurers | | | | | | | | | |
| Insurance contracts | | (1,197 | ) | | (832 | ) | | (806 | ) |
| Participating investment contracts | | (167 | ) | | (175 | ) | | (150 | ) |
| Claims and benefits paid, net of recoveries from reinsurers | | 23,601 | | | 24,380 | | | 22,240 | |
| Change in insurance liabilities | | | | | | | | | |
| Change in insurance liabilities | | 663 | | | 2,583 | | | 1,955 | |
| Change in reinsurance asset for insurance provisions | | (233 | ) | | (299 | ) | | 882 | |
| Change in insurance liabilities, net of reinsurance | | 430 | | | 2,284 | | | 2,837 | |
| Change in investment contract provisions | | | | | | | | | |
| Investment income allocated to investment contracts | | 3,178 | | | (363 | ) | | 3,772 | |
| Other changes in provisions | | | | | | | | | |
| Participating investment contracts (note 37) | | 759 | | | (944 | ) | | 5,493 | |
| Non-participating investment contracts | | 525 | | | (174 | ) | | (53 | ) |
| Change in reinsurance asset for investment contract provisions | | (12 | ) | | 3 | | | – | |
| Change in investment contract provisions | | 4,450 | | | (1,478 | ) | | 9,212 | |
| Change in unallocated divisible surplus (note 41) | | 6,316 | | | (2,721 | ) | | (362 | ) |
| Fee and commission expense | | | | | | | | | |
| Acquisition costs | | | | | | | | | |
| Commission expenses for insurance and participating investment contracts | | 2,393 | | | 2,476 | | | 2,222 | |
| Change in deferred acquisition costs for insurance and participating investment contracts | | 131 | | | (2 | ) | | 85 | |
| Deferrable costs for non-participating investment contracts | | 126 | | | 66 | | | 140 | |
| Other acquisition costs | | 970 | | | 1,113 | | | 1,058 | |
| Change in deferred acquisition costs for non-participating investment contracts | | 85 | | | 46 | | | (29 | ) |
| Investment income attributable to unitholders | | 456 | | | 252 | | | 1,586 | |
| Reinsurance commissions and other fee and commission expense | | 311 | | | 375 | | | 438 | |
| | | 4,472 | | | 4,326 | | | 5,500 | |
| Other expenses | | | | | | | | | |
| Other operating expenses | | | | | | | | | |
| Staff costs (note 8b) | | 1,122 | | | 1,160 | | | 1,148 | |
| Central costs and sharesave schemes | | 136 | | | 138 | | | 144 | |
| Depreciation (note 17) | | 42 | | | 54 | | | 63 | |
| Impairment of goodwill on subsidiaries (note 13) | | 109 | | | 160 | | | 3 | |
| Amortisation of acquired value of in-force business on insurance contracts (note 14) | | 43 | | | 70 | | | 47 | |
| Amortisation of intangible assets (note 14) | | 96 | | | 111 | | | 124 | |
| Impairment of acquired value of in-force business (note 14) | | 73 | | | – | | | – | |
| Impairment of intangible assets (note 14) | | 49 | | | 49 | | | 16 | |
| Integration and restructuring costs (see below) | | 461 | | | 261 | | | 216 | |
| Exceptional items | | – | | | – | | | (286 | ) |
| Other expenses | | 664 | | | 657 | | | 729 | |
| | | 2,795 | | | 2,660 | | | 2,204 | |
| Impairments | | | | | | | | | |
| Net impairment on loans | | 43 | | | 62 | | | 6 | |
| Net impairment on financial investments | | – | | | 2 | | | (1 | ) |
| Net impairment on receivables and other financial assets | | 3 | | | 31 | | | (4 | ) |
| Net impairment on non-financial assets | | – | | | 1 | | | (1 | ) |
| | | 46 | | | 96 | | | – | |
| Other net foreign exchange (gains)/losses | | 4 | | | 23 | | | (88 | ) |
| Finance costs (note 7) | | 735 | | | 776 | | | 682 | |
| Expenses from continuing operations | | 42,849 | | | 30,346 | | | 42,225 | |
| Expenses from discontinued operations | | 6,190 | | | 8,264 | | | 13,342 | |
| Total expenses | | 49,039 | | | 38,610 | | | 55,567 | |
| 1 | Following a review of the classification of contracts issued by the Group’s Italian long-term business, certain portfolios have been reclassified from participating insurance to participating investment contracts for all years presented. There is no impact on the result for any year presented as a result of this reclassification. |
6 – Details of expenses continued
Integration and restructuring costs
Integration and restructuring costs from continuing operations are £461 million (2011: £261 million; 2010: £216 million). This includes restructuring and transformation activity that has been taken to align our business operations with our strategy, including the Group’s Simplify programme (£165 million), Ireland transformation (£130 million) including the merger of our UK and Ireland businesses, £24 million in relation to the transformation of Aviva Investors and £25 million in respect of other restructuring activities. This also includes a cost of £117 million relating to preparing the business for the implementation of Solvency II.
7 – Finance costs
This note analyses the interest costs on our borrowings (which are described in note 45) and similar charges.
Finance costs comprise:
| Continuing operations | 2012
£m | | 2011
£m | | 2010
£m | |
| Interest expense on core structural borrowings | | | | | | | | | |
| Subordinated debt | | 294 | | | 302 | | | 290 | |
| Long term senior debt | | 19 | | | 19 | | | 19 | |
| Commercial paper | | 4 | | | 3 | | | 1 | |
| | | 317 | | | 324 | | | 310 | |
| Interest expense on operational borrowings | | | | | | | | | |
| Amounts owed to financial institutions | | 111 | | | 125 | | | 55 | |
| Securitised mortgage loan notes at fair value | | 90 | | | 88 | | | 88 | |
| | | 201 | | | 213 | | | 143 | |
| Interest on collateral received | | 27 | | | 33 | | | 20 | |
| Net finance charge on pension schemes (note 44e(iv)) | | 82 | | | 87 | | | 127 | |
| Unwind of discount on GI reserves | | 21 | | | 24 | | | 22 | |
| Other similar charges | | 87 | | | 95 | | | 60 | |
| Total finance costs from continuing operations | | 735 | | | 776 | | | 682 | |
| Total finance costs from discontinued operations | | 21 | | | 284 | | | 740 | |
| Total finance costs | | 756 | | | 1,060 | | | 1,422 | |
8 – Employee information
This note shows where our staff are employed throughout the world, excluding staff employed by our joint ventures and associates, and analyses the total staff costs.
(a) Employee numbers
The number of persons employed by the Group, including directors under a service contract, was:
| | At 31 December | | | | Average for the year | | | |
| Continuing operations | 2012
Number | | 2011
Number | | 2010
Number | | 2012
Number | | 2011
Number | | 2010
Number | |
| United Kingdom & Ireland | | 17,580 | | | 19,176 | | | 22,630 | | | 18,695 | | | 21,835 | | | 22,987 | |
| France | | 4,272 | | | 4,347 | | | 4,414 | | | 4,261 | | | 4,380 | | | 4,340 | |
| Spain | | 570 | | | 578 | | | 581 | | | 570 | | | 580 | | | 581 | |
| Italy | | 641 | | | 618 | | | 594 | | | 641 | | | 606 | | | 594 | |
| Canada | | 3,758 | | | 3,599 | | | 3,532 | | | 3,729 | | | 3,552 | | | 3,685 | |
| Other | | 24 | | | 422 | | | 452 | | | 217 | | | 503 | | | 444 | |
| Developed markets | | 26,845 | | | 28,740 | | | 32,203 | | | 28,113 | | | 31,456 | | | 32,631 | |
| Higher Growth markets | | 2,669 | | | 3,607 | | | 3,469 | | | 3,509 | | | 3,516 | | | 3,141 | |
| Aviva Investors | | 1,056 | | | 1,152 | | | 1,386 | | | 1,134 | | | 1,179 | | | 1,285 | |
| Group other | | 641 | | | 1,109 | | | 741 | | | 833 | | | 887 | | | 718 | |
| Employees in continuing operations | | 31,211 | | | 34,608 | | | 37,799 | | | 33,639 | | | 37,038 | | | 37,775 | |
| Employees in discontinued operations | | 1,911 | | | 1,954 | | | 7,343 | | | 1,941 | | | 3,802 | | | 7,566 | |
| Total employee numbers | | 33,122 | | | 36,562 | | | 45,142 | | | 35,580 | | | 40,840 | | | 45,341 | |
(b) Staff costs
| Continuing operations | 2012
£m | | 2011
£m | | 2010
£m | |
| Wages and salaries | | 1,324 | | | 1,421 | | | 1,415 | |
| Social security costs | | 205 | | | 219 | | | 207 | |
| Post-retirement obligations | | | | | | | | | |
| Defined benefit schemes (note 44d) | | 19 | | | 58 | | | (219 | ) |
| Defined contribution schemes (note 44d) | | 102 | | | 86 | | | 70 | |
| Profit sharing and incentive plans | | 112 | | | 126 | | | 118 | |
| Equity compensation plans (note 27d) | | 47 | | | 58 | | | 50 | |
| Termination benefits | | 41 | | | 21 | | | 12 | |
| Staff costs from continuing operations | | 1,850 | | | 1,989 | | | 1,653 | |
| Staff costs from discontinued operations | | 145 | | | 343 | | | 586 | |
| Total staff costs | | 1,995 | | | 2,332 | | | 2,239 | |
Staff costs are charged within:
| Continuing operations | 2012
£m | | 2011
£m | | 2010
£m | |
| Acquisition costs | | 522 | | | 597 | | | 563 | |
| Claims handling expenses | | 158 | | | 222 | | | 235 | |
| Central costs and sharesave schemes | | 48 | | | 10 | | | (6 | ) |
| Other operating expenses | | 1,122 | | | 1,160 | | | 1,147 | |
| Exceptional items* | | – | | | – | | | (286 | ) |
| Staff costs from continuing operations | | 1,850 | | | 1,989 | | | 1,653 | |
| Staff costs from discontinued operations | | 145 | | | 343 | | | 586 | |
| Total staff costs | | 1,995 | | | 2,332 | | | 2,239 | |
* The credit disclosed in exceptional items in 2010 arose from the £286 million gain on the closure of the UK schemes to future accrual.
9 – Auditors’ remuneration
This note shows the total remuneration payable by the Group to our auditors. PricewaterhouseCoopers LLP (PwC) replaced Ernst & Young LLP (E&Y) as the Group’s principal auditor for the 2012 financial year.
The total remuneration payable by the Group, excluding VAT and any overseas equivalent thereof, to its principal auditors and their associates is shown below.
| Continuing operations | 2012
£m | |
| Fees payable to PwC LLP and its associates for the statutory audit of the Aviva Group and Company financial statements | | 2.2 | |
Fees payable to PwC LLP and its associates for other services
Audit of Group subsidiaries | | 9.6 | |
| Total audit fees | | 11.8 | |
| Audit related assurance | | 2.3 | |
| Other assurance services | | 7.2 | |
| Total audit and assurance fees | | 21.3 | |
| Tax compliance services | | 0.4 | |
| Tax advisory services | | 0.1 | |
| Services relating to corporate finance transactions | | 0.3 | |
| Other non-audit services not covered above | | 7.7 | |
| Fees payable to PwC LLP and its associates for services to Group companies classified as continuing operations | | 29.8 | |
| Discontinued operations | | | |
| Fees payable to PwC LLP and its associates for Audit of Group subsidiaries | | 1.7 | |
| Fees payable to PwC LLP and its associates for other non-audit services to Group subsidiaries | | 0.3 | |
| Total fees payable to PwC LLP and its associates for services to Group companies | | 31.8 | |
| Continuing operations | 2011
£m | |
| Fees payable to E&Y LLP and its associates for the statutory audit of the Aviva Group and Company financial statements | | 2.5 | |
Fees payable to E&Y LLP and its associates for other services:
Audit of Group subsidiaries | | 10.3 | |
| Additional fees related to the prior year audit of Group subsidiaries | | 0.9 | |
| Total audit fees | | 13.7 | |
| Audit related assurance | | 2.7 | |
| Other assurance services | | 5.6 | |
| Total audit and assurance fees | | 22.0 | |
| Tax compliance services | | 0.2 | |
| Other non audit services not covered above | | 2.0 | |
| Fees payable to E&Y LLP and its associates for services to Group companies classified as continuing operations | | 24.2 | |
| Discontinued operations | | | |
| Fees payable to E&Y LLP and its associates for audit of Group subsidiaries | | 3.6 | |
| Fees payable to E&Y LLP and its associates for other assurance services to Group subsidiaries | | 0.5 | |
| Fees payable to E&Y LLP and its associates for other non-audit services to Group subsidiaries | | 0.2 | |
| Total fees payable to E&Y LLP and its associates for services to Group companies | | 28.5 | |
9 – Auditors’ remuneration continued
| Continuing operations | 2010
£m | |
| Fees payable to E&Y LLP and its associates for the statutory audit of the Aviva Group and Company financial statements | | 1.8 | |
Fees payable to E&Y LLP and its associates for other services:
Audit of Group subsidiaries | | 8.7 | |
| Additional fees related to the prior year audit of Group subsidiaries | | 0.6 | |
| Total audit fees | | 11.1 | |
| Audit related assurance | | 2.5 | |
| Other assurance services | | 4.3 | |
| Total audit and assurance fees | | 17.9 | |
| Tax advisory services | | 0.1 | |
| Services relating to corporate finance transactions | | 0.5 | |
| Other non audit services not covered above | | 0.2 | |
| Fees payable to E&Y LLP and its associates for services to Group companies classified as continuing operations | | 18.7 | |
| Discontinued operations | | | |
| Fees payable to E&Y LLP and its associates for audit of Group subsidiaries | | 5.0 | |
| Fees payable to E&Y LLP and its associates for other assurance services to Group subsidiaries | | 0.9 | |
| Fees payable to E&Y LLP and its associates for other non-audit services to Group subsidiaries | | 0.9 | |
| Total fees payable to E&Y LLP and its associates for services to Group companies* | | 25.5 | |
*In addition to the fees for 2010 shown above, during 2010 the Group paid E&Y £0.1 million in relation to the audit of Group occupational pension schemes.
The tables above reflect the disclosure requirements of SI2011/2198 – The Companies (Disclosure of Auditor Remuneration and Liability Limitation Agreements) (Amendment) Regulations 2011. Comparatives for 2011 have been adjusted accordingly.
In addition to the fees for 2012 shown above, during 2012 the Group paid PwC £0.2 million in relation to the audit of Group occupational pension schemes and paid E&Y £1.0 million in relation to the 2011 audit of group subsidiaries.
Fees payable for the audit of the Group’s subsidiaries include fees for the statutory audit of the subsidiaries, both inside and outside the UK, and for the work performed by the principal auditors in respect of the subsidiaries for the purpose of the consolidated financial statements of the Group.
Audit related assurance comprises services in relation to statutory and regulatory filings. These include audit services for the audit of FSA returns in the UK and review of interim financial information under the Listing Rules of the UK Listing Authority.
Fees for other assurance services comprise non statutory assurance work which is customarily performed by the external auditor, including the audit of the Group’s MCEV reporting. Although embedded value is a primary management reporting basis and our disclosures require a full audit, the relevant fees are not classified as being for statutory audit.
As noted above PwC replaced E&Y as the group’s principal auditor for the 2012 year. Prior to 2012, PwC was a significant provider of consulting services to the Group. The level of 2012 fees for non-audit services therefore includes fees billed in the year relating to projects that commenced prior to PwC’s appointment as auditor. All of these services are in compliance with applicable UK, US and IFAC independence rules. We do not expect PwC’s non-audit fees to continue at this level in the future.
Other assurance services in 2012 payable to PwC LLP includes fees relating to the audit of the Group’s MCEV reporting of £1.3 million, £1.8 million for examination of the Group Individual Capital Assessment and Economic Capital, and £3.4 million associated with assurance services to prepare the businesses for Solvency II implementation.
Other assurance services in 2011 payable to E&Y LLP includes fees relating to the audit of the Group’s MCEV reporting of £1.8 million(2010: £1.8 million); £0.5 million(2010: £0.4 million)for assurance services in connection with the Group’s Financial Reporting Control Framework; £1.6 million(2010: £1.1 million)for examination of the Group’s Individual Capital Assessment (ICA) and Economic Capital and £1.7 million(2010: £1.0 million) for other services.
The 2012 fees payable to PwC LLP for other non-audit services for continuing operations of £7.7 million includes advice to our European businesses in relation to the risk management aspects of Solvency II (£1.9 million), £1.9 million relating to four regulatory advice engagements, £0.7 million relating to restructuring at Aviva Investors, £0.3 million for risk training, £0.3 million supporting an industry-wide competition review, £0.3 million for an additional claims reserves review and £2.3 million for other services. The 2012 fees for tax compliance services of £0.4 million includes fees for one engagement in Higher Growth markets of £0.3 million, and fees for corporate finance transactions of £0.3 million relates to an engagement for an Aviva Investors property fund.
The 2011 fees payable to E&Y LLP for other non-audit services of £2.0 million(2010: £0.2 million) includes £0.9 million relating to two risk management effectiveness reviews.
Details of the Group’s process for safeguarding and supporting the independence and objectivity of the external auditors are given in the Audit Committee report.
10 – Tax
This note analyses the tax charge/(credit) for the year and explains the factors that affect it.
(a) Tax charged/(credited) to the income statement
(i) The total tax charge/(credit) comprises:
| | 2012
£m | | 2011
£m | | 2010
£m | |
| Current tax | | | | | | | | | |
| For this year | | 516 | | | 535 | | | 578 | |
| Prior year adjustments | | (47 | ) | | (10 | ) | | (49 | ) |
| Total current tax from continuing operations | | 469 | | | 525 | | | 529 | |
| Deferred tax | | | | | | | | | |
| Origination and reversal of temporary differences | | (52 | ) | | (599 | ) | | 244 | |
| Changes in tax rates or tax laws | | (12 | ) | | (28 | ) | | (35 | ) |
| Write-down of deferred tax assets | | 43 | | | 58 | | | 1 | |
| Total deferred tax from continuing operations | | (21 | ) | | (569 | ) | | 210 | |
| Total tax charged/(credited) to income statement from continuing operations | | 448 | | | (44 | ) | | 739 | |
| Total tax charged/(credited) to income statement from discontinued operations | | 152 | | | (107 | ) | | 203 | |
| Total tax charged/(credited) to income statement | | 600 | | | (151 | ) | | 942 | |
(ii) The Group, as a proxy for policyholders in the UK, Ireland and Singapore, is required to record taxes on investment income and gains each year. Accordingly, the tax benefit or expense attributable to UK, Irish and Singapore life insurance policyholder returns is included in the tax charge/(credit). The tax charge attributable to policyholders’ returns included in the charge above is £221 million(2011: £178 million credit; 2010: £394 million charge).
(iii) The tax charge/(credit) can be analysed as follows:
| | 2012
£m | | 2011
£m | | 2010
£m | |
| UK tax | | (34 | ) | | (304 | ) | | 447 | |
| Overseas tax | | 634 | | | 153 | | | 495 | |
| | | 600 | | | (151 | ) | | 942 | |
(iv) Unrecognised tax losses and temporary differences of previous years were used to reduce the current tax expense and deferred tax expense by £7 million and £11 million(2011: £25 million and £108 million; 2010: £34 million and £88 million),respectively.
(v) Deferred tax charged/(credited) to the income statement represents movements on the following items:
| | 2012
£m | | 2011
£m | | 2010
£m | |
| Long-term business technical provisions and other insurance items | | (1,868 | ) | | 916 | | | 218 | |
| Deferred acquisition costs | | 254 | | | (3 | ) | | – | |
| Unrealised gains/(losses) on investments | | 2,312 | | | (1,265 | ) | | 175 | |
| Pensions and other post-retirement obligations | | (7 | ) | | 6 | | | 23 | |
| Unused losses and tax credits | | (30 | ) | | 22 | | | 20 | |
| Subsidiaries, associates and joint ventures | | – | | | 1 | | | 2 | |
| Intangibles and additional value of in-force long-term business | | (12 | ) | | (10 | ) | | (51 | ) |
| Provisions and other temporary differences | | (670 | ) | | (236 | ) | | (177 | ) |
| Deferred tax (credited)/charged to income statement from continuing operations | | (21 | ) | | (569 | ) | | 210 | |
| Deferred tax charged to income statement from discontinued operations | | 143 | | | 56 | | | 188 | |
| Total deferred tax charged/(credited) to income statement | | 122 | | | (513 | ) | | 398 | |
(b) Tax (credited)/charged to other comprehensive income
(i) The total tax (credit)/charge comprises:
| | 2012
£m | | 2011
£m | | 2010
£m | |
| Current tax from continuing operations | | | | | | |
| In respect of pensions and other post-retirement obligations | | (14 | ) | | (88 | ) | | (29 | ) |
| In respect of foreign exchange movements | | (17 | ) | | (8 | ) | | (5 | ) |
| | | (31 | ) | | (96 | ) | | (34 | ) |
| Deferred tax from continuing operations | | | | | | | | | |
| In respect of pensions and other post-retirement obligations | | (140 | ) | | 260 | | | (3 | ) |
| In respect of fair value gains on owner-occupied properties | | (1 | ) | | (1 | ) | | 2 | |
| In respect of unrealised gains on investments | | 9 | | | (3 | ) | | – | |
| | | (132 | ) | | 256 | | | (1 | ) |
| Tax (credited)/charged to other comprehensive income arising from continuing operations | | (163 | ) | | 160 | | | (35 | ) |
| Tax charged to other comprehensive income arising from discontinued operations | | 107 | | | 98 | | | 147 | |
| Total tax (credited)/charged to other comprehensive income | | (56 | ) | | 258 | | | 112 | |
10 – Tax continued
| (ii) | The tax charge attributable to policyholders’ returns included above is £nil(2011: £nil; 2010: £nil). |
(c) Tax credited to equity
Tax credited directly to equity in the year amounted to £18 million(2011: £16 million; 2010: £17 million), and is wholly in respect of coupon payments on the direct capital instruments and fixed rate tier 1 notes.
(d) Tax reconciliation
The tax on the Group’s (loss)/profit before tax differs from the theoretical amount that would arise using the tax rate of the home country of the Company as follows:
| | | | | | 2012 | | | | | | 2011 | | | | | | 2010 | |
| | Shareholder
£m | | Policyholder
£m | | Total
£m | | Shareholder
£m | | Policyholder
£m | | Total
£m | | Shareholder
£m | | Policyholder
£m | | Policyholder
£m | |
| Total (loss)/profit before tax | | (2,671 | ) | | 221 | | | (2,450 | ) | | 87 | | | (178 | ) | | (91 | ) | | 2,440 | | | 394 | | | 2,834 | |
| Tax calculated at standard UK corporation tax rate of 24.5% (2011: 26.5%; 2010: 28%) | | (654 | ) | | 54 | | | (600 | ) | | 23 | | | (47 | ) | | (24 | ) | | 684 | | | 110 | | | 794 | |
| Reconciling items | | | | | | | | | | | | | | | | | | | | | | | | | | | |
| Different basis of tax – policyholders | | – | | | 170 | | | 170 | | | – | | | (129 | ) | | (129 | ) | | – | | | 272 | | | 272 | |
| Adjustment to tax charge in respect of prior years | | (20 | ) | | – | | | (20 | ) | | (25 | ) | | – | | | (25 | ) | | (28 | ) | | – | | | (28 | ) |
| Non-assessable income | | (86 | ) | | – | | | (86 | ) | | (60 | ) | | – | | | (60 | ) | | (93 | ) | | – | | | (93 | ) |
| Non-taxable loss/(profit) on sale of subsidiaries and associates | | 872 | | | – | | | 872 | | | (135 | ) | | – | | | (135 | ) | | (44 | ) | | – | | | (44 | ) |
| Disallowable expenses | | 418 | | | – | | | 418 | | | 215 | | | – | | | 215 | | | 142 | | | – | | | 142 | |
| Different local basis of tax on overseas profits | | (141 | ) | | (3 | ) | | (144 | ) | | 84 | | | (2 | ) | | 82 | | | 95 | | | – | | | 95 | |
| Change in future local statutory tax rates | | (12 | ) | | – | | | (12 | ) | | (32 | ) | | – | | | (32 | ) | | (26 | ) | | – | | | (26 | ) |
| Movement in deferred tax not recognised | | (69 | ) | | – | | | (69 | ) | | (5 | ) | | – | | | (5 | ) | | (156 | ) | | – | | | (156 | ) |
| Tax effect of loss/(profit) from associates and joint ventures | | 75 | | | – | | | 75 | | | (41 | ) | | – | | | (41 | ) | | (4 | ) | | – | | | (4 | ) |
| Other | | (4 | ) | | – | | | (4 | ) | | 3 | | | – | | | 3 | | | (22 | ) | | 12 | | | (10 | ) |
Total tax charged/(credited) to
income statement | | 379 | | | 221 | | | 600 | | | 27 | | | (178 | ) | | (151 | ) | | 548 | | | 394 | | | 942 | |
The tax charge/(credit) attributable to policyholders' returns is removed from the Group’s total (loss)/profit before tax in arriving at the Group’s (loss)/profit before tax attributable to shareholders' profits. As the net of tax profits attributable to with-profit and unit-linked policyholders is zero, the Group’s pre-tax profit/(loss) attributable to policyholders is an amount equal and opposite to the tax charge/(credit) attributable to policyholders included in the total tax charge/(credit). The difference between the policyholder tax charge/(credit) and the impact of this item in the tax reconciliation can be explained as follows:
| | 2012
£m | | 2011
£m | | 2010
£m | |
| Tax attributable to policyholder returns | | 221 | | | (178 | ) | | 394 | |
| UK corporation tax at a rate of 24.5% (2011: 26.5%; 2010: 28%) in respect of the policyholder tax deduction | | (54 | ) | | 47 | | | (110 | ) |
| Other life insurance regime impacts | | – | | | – | | | (12 | ) |
| Different local basis of tax of overseas profits | | 3 | | | 2 | | | – | |
| Different basis of tax – policyholders per tax reconciliation | | 170 | | | (129 | ) | | 272 | |
The UK corporation tax rate reduced to 24% from 1 April 2012. A subsequent reduction in the UK corporation tax rate to 23% was substantively enacted on 3 July 2012 and will apply from 1 April 2013. The substantively enacted rate of 23% has been used in the calculation of the UK’s deferred tax assets and liabilities.
As confirmed in the 2013 Budget, the rate is expected to reduce further to 21% from 1 April 2014 and then to 20% from 1 April 2015. The aggregate impact of the reduction in rate from 23% to 20% would reduce the deferred tax assets and liabilities and increase IFRS net assets by approximately £47 million and will be recognised when the relevant legislation is substantively enacted.
Finance Act 2012 included initial legislation introducing considerable changes to the regime for taxing UK life insurance companies applicable from 1 January 2013. The impact of the legislation has been included in the results of the Group for the year ended
31 December 2012 but has not had a material impact.
11 – (Loss)/earnings per share
This note shows how we calculate (loss)/earnings per share, based both on the present shares in issue (the basic (loss)/earnings per share) and the potential future shares in issue, including conversion of share options granted to employees (the diluted earnings per share).
(a) Basic (loss)/earnings per share
| (i) | The (loss)/profit attributable to ordinary shareholders is: |
| | 2012 | | 2011 | | 2010 | |
| Continuing operations | £m | | £m | | £m | |
| Profit/(loss) before tax attributable to shareholders' profits | | (82 | ) | | 585 | | | 1,396 | |
| Share of Delta Lloyd's tax expense as an associate | | 107 | | | (34 | ) | | – | |
| Profit/(loss) before tax | | 25 | | | 551 | | | 1,396 | |
| Tax attributable to shareholders' profit/(loss) | | (227 | ) | | (134 | ) | | (345 | ) |
| Profit/(loss) for the year | | (202 | ) | | 417 | | | 1,051 | |
| Amount attributable to non-controlling interests | | (168 | ) | | (41 | ) | | (117 | ) |
| Cumulative preference dividends for the year | | (17 | ) | | (17 | ) | | (17 | ) |
| Coupon payments in respect of direct capital instruments (DCI) and fixed rate tier 1 notes (net of tax) | | (55 | ) | | (43 | ) | | (42 | ) |
| Profit/(loss) attributable to ordinary shareholders from continuing operations | | (442 | ) | | 316 | | | 875 | |
| Profit/(loss) attributable to ordinary shareholders from discontinued operations | | (2,848 | ) | | (151 | ) | | 529 | |
| Profit/(loss) attributable to ordinary shareholders | | (3,290 | ) | | 165 | | | 1,404 | |
(ii) The calculation of basic (loss)/earnings per share uses a weighted average of 2,910 million (2011: 2,845 million; 2010: 2,784 million) ordinary shares in issue, after deducting shares owned by the employee share trusts. The actual number of shares in issue at 31 December 2012 was 2,946 million (2011: 2,906 million; 2010: 2,820 million) and 2,936 million (2011: 2,892 million; 2010: 2,812 million) excluding shares owned by the employee share trusts.
(b) Diluted earnings per share
(i) Diluted earnings per share is calculated as follows:
| | | | | | 2012 | | | | | | 2011 | | | | | | 2010 | |
| | Total
£m | | Weighted
average
number of
shares
million | | Per share
p | | Total
£m | | Weighted
average
number of
shares
million | | Per share
p | | Total
£m | | Weighted
average
number of
shares
million | | Per share
p | |
| (Loss)/profit attributable to ordinary shareholders | | (442 | ) | | 2,910 | | | (15.2 | ) | | 316 | | | 2,845 | | | 11.1 | | | 875 | | | 2,784 | | | 31.4 | |
| Dilutive effect of share awards and options | | – | | | 44 | | | – | | | – | | | 50 | | | (0.2 | ) | | – | | | 47 | | | (0.5 | ) |
| Diluted (loss)/earnings per share from continuing operations1 | | (442 | ) | | 2,954 | | | (15.2 | ) | | 316 | | | 2,895 | | | 10.9 | | | 875 | | | 2,831 | | | 30.9 | |
| (Loss)/profit attributable to ordinary shareholders | | (2,848 | ) | | 2,910 | | | (97.9 | ) | | (151 | ) | | 2,845 | | | (5.3 | ) | | 529 | | | 2,784 | | | 19.0 | |
| Dilutive effect of share awards and options | | – | | | 44 | | | – | | | – | | | 50 | | | – | | | – | | | 47 | | | (0.3 | ) |
| Diluted (loss)/earnings per share from discontinued operations1 | | (2,848 | ) | | 2,954 | | | (97.9 | ) | | (151 | ) | | 2,895 | | | (5.3 | ) | | 529 | | | 2,831 | | | 18.7 | |
| Diluted (loss)/earnings per share1 | | (3,290 | ) | | 2,954 | | | (113.1 | ) | | 165 | | | 2,895 | | | 5.7 | | | 1,404 | | | 2,831 | | | 49.6 | |
| 1 | Losses have an anti-dilutive effect. Therefore the basic and diluted earnings for 2012 and the diluted earnings for 2011, have remained the same. |
12 – Dividends and appropriations
This note analyses the total dividends and other appropriations we paid during the year. The table below does not include the final dividend proposed after the year end because it is not accrued in these financial statements. The impact of shares issued in lieu of dividends is shown separately in note 33.
| | 2012
£m | | 2011
£m | | 2010
£m | |
| Ordinary dividends declared and charged to equity in the year | | | | | | | | | |
| Final 2011 – 16.00 pence per share, paid on 17 May 2012 | | 465 | | | – | | | – | |
| Final 2010 – 16.00 pence per share, paid on 17 May 2011 | | – | | | 451 | | | – | |
| Final 2009 – 15.00 pence per share, paid on 17 May 2010 | | – | | | – | | | 415 | |
| Interim 2012 – 10.00 pence per share, paid on 16 November 2012 | | 292 | | | – | | | – | |
| Interim 2011 – 10.00 pence per share, paid on 17 November 2011 | | – | | | 287 | | | – | |
| Interim 2010 – 09.50 pence per share, paid on 17 November 2010 | | – | | | – | | | 266 | |
| | | 757 | | | 738 | | | 681 | |
| Preference dividends declared and charged to equity in the year | | 17 | | | 17 | | | 17 | |
| Coupon payments on direct capital instruments and fixed rate tier 1 notes | | 73 | | | 58 | | | 59 | |
| | | 847 | | | 813 | | | 757 | |
Subsequent to 31 December 2012, the directors proposed a final dividend for 2012 of 9.0 pence per ordinary share(2011: 16.0 pence; 2010: 16.0 pence), amounting to £265 million(2011: £465 million; 2010: £451 million) in total. Subject to approval by shareholders at the AGM, the dividend will be paid on 17 May 2013 and will be accounted for as an appropriation of retained earnings in the year ending 31 December 2013.
Interest payments on the direct capital instruments issued in November 2004 and the fixed rate tier 1 notes issued in May 2012 are treated as an appropriation of retained profits and, accordingly, are accounted for when paid. Tax relief is obtained at a rate of 24.5%(2011: 26.5%; 2010: 28.0%).
13 – Goodwill
This note analyses the changes to the carrying amount of goodwill during the year, and details the results of our impairment testing on both goodwill and intangible assets with indefinite lives.
(a) Carrying amount
| | 2012
£m | | 2011
£m | |
| Gross amount | | | | | | |
| At 1 January | | 2,850 | | | 3,671 | |
| Acquisitions and additions | | 1 | | | 13 | |
| Disposals | | (13 | ) | | (284 | ) |
| Deconsolidation of Delta Lloyd | | – | | | (542 | ) |
| Foreign exchange rate movements | | (64 | ) | | (8 | ) |
| At 31 December | | 2,774 | | | 2,850 | |
| Accumulated impairment | | | | | | |
| At 1 January | | (210 | ) | | (280 | ) |
| Impairment losses charged to expenses | | (891 | ) | | (160 | ) |
| Disposals | | 10 | | | – | |
| Deconsolidation of Delta Lloyd | | – | | | 226 | |
| Foreign exchange rate movements | | 20 | | | 4 | |
| At 31 December | | (1,071 | ) | | (210 | ) |
| Carrying amount at 1 January | | 2,640 | | | 3,391 | |
| Carrying amount at 31 December | | 1,703 | | | 2,640 | |
| Less: Assets classified as held for sale | | (183 | ) | | – | |
| Carrying amount at 31 December | | 1,520 | | | 2,640 | |
Goodwill on acquisitions and additions arose on the acquisition of a small long-term insurance business in Spain and a small general insurance business in Canada.
Goodwill impairment charges of £891 million have been recognised as expenses. Together with impairment charges of £9 million recognised in respect of goodwill within interests in joint ventures (note 15), and impairment charges of £147 million recognised in respect of goodwill within interests in associates (note 16) the goodwill write down for the year was £1,047 million. After a reversal of a previously recognised impairment of the Delta Lloyd associate of £205 million (note 16) the total charge for impairment of goodwill, joint ventures and associates for the year was £842 million.
Goodwill disposed of during the year relates to the Group’s Sri Lanka subsidiary (see note 3(b)).
Goodwill classified as held for sale consists of £180 million relating to Aseval, a Spanish long-term business, and £3 million relating to the Russian long-term business (see note 3(c)).
(b) Goodwill allocation and impairment testing
A summary of the goodwill and intangibles with indefinite useful lives allocated to cash-generating units is presented below.
| | Carrying amount of goodwill | | Carrying amount of intangibles with indefinite useful lives
(detailed in note 14) | | Total | |
| | 2012
£m | | 2011
£m | | 2012
£m | | 2011
£m | | 2012
£m | | 2011
£m | |
| United Kingdom – general insurance and health | | 924 | | | 924 | | | – | | | – | | | 924 | | | 924 | |
| Ireland – general insurance and health | | 112 | | | 116 | | | – | | | – | | | 112 | | | 116 | |
| France – long-term business | | – | | | – | | | 51 | | | 52 | | | 51 | | | 52 | |
| Italy | | | | | | | | | | | | | | | | | | |
| Long-term business | | 35 | | | 64 | | | – | | | – | | | 35 | | | 64 | |
| General insurance and health | | 37 | | | 44 | | | – | | | – | | | 37 | | | 44 | |
| Spain – long-term business | | 450 | | | 542 | | | – | | | – | | | 450 | | | 542 | |
| United States | | | | | | | | | | | | | | | | | | |
| Long-term business | | – | | | 800 | | | – | | | – | | | – | | | 800 | |
| Fund management | | 27 | | | 29 | | | – | | | – | | | 27 | | | 29 | |
| Canada | | 50 | | | 50 | | | – | | | – | | | 50 | | | 50 | |
| Other developed markets | | – | | | – | | | – | | | – | | | – | | | – | |
| Higher growth markets | | 68 | | | 71 | | | – | | | – | | | 68 | | | 71 | |
| | | 1,703 | | | 2,640 | | | 51 | | | 52 | | | 1,754 | | | 2,692 | |
Goodwill in all business units is tested for impairment by comparing the carrying value of the cash generating unit to which the goodwill relates to the recoverable value of that cash generating unit. The recoverable amount is the value in use of the cash generating unit unless otherwise stated.
Long-term business
Value in use is calculated as an actuarially determined appraisal value, based on the embedded value of the business calculated in accordance with market consistent embedded value (‘MCEV’) principles, together with the present value of expected profits from future new business. If the embedded value of the business tested is sufficient to demonstrate goodwill recoverability on its own, then it is not necessary to estimate the present value of expected profits from future new business.
If required, the present value of expected profits arising from future new business written over a given period is calculated on an MCEV basis, using profit projections based on the most recent three year business plans approved by management. These plans reflect management’s best estimate of future profits based on both historical experience and expected growth rates for the relevant cash
13 – Goodwill continued
generating unit. The underlying assumptions of these projections include market share, customer numbers, mortality, morbidity and persistency.
Future new business profits for the remainder of the given period beyond the initial three years are extrapolated using a steady growth rate. Growth rates and expected future profits are set with regards to management estimates, past experience and relevant available market statistics.
Expected profits from future new business are discounted using a risk adjusted discount rate. The discount rate is a combination of a risk-free rate and a risk margin to make prudent allowance for the risk that experience in future years for new business may differ from that assumed.
See results of impairment testing for US long-term cash generating unit. For other businesses classified as held for sale the recoverable amount was assessed based on the fair value less costs to sell of the business, based on the expected net disposal proceeds of the businesses.
Key Assumptions
| | Embedded value basis | | Future new business
profits growth rate | | Future new business
profits discount rate | |
| | 2012 | | 2011 | | 2012
% | | 2011
% | | 2012
% | | 2011
% | |
| Italy long-term business | | MCEV | | | MCEV | | | 2.0 | | | 3.0 | | | 10.6 | | | 10.8 | |
| Spain long-term business | | MCEV | | | MCEV | | | 0.0 | | | 3.0 | | | 7.9 | | | 5.3 | |
General insurance, health, fund management and other businesses
Value in use is calculated as the discounted value of expected future profits of each business. The calculation uses cash flow projections based on business plans approved by management covering a three-year period. These plans reflect management’s best estimate of future profits based on both historical experience and expected growth rates for the relevant cash generating unit. The underlying assumptions of these projections include market share, customer numbers, premium rate and fee income changes, claims inflation and commission rates.
Cash flows beyond that three-year period are extrapolated using a steady growth rate. Growth rates and expected future profits are set with regards to past experience and relevant available market statistics.
Future profits are discounted using a risk adjusted discount rate.
Key assumptions
| | Extrapolated future profits growth rate | | | Future profits discount rate | |
| | | 2012
% | | | 2011
% | | | 2012
% | | | 2011
% | |
| United Kingdom general insurance and health | | 1.3 | | | 1.3 | | | 8.0 | | | 8.2 | |
| Ireland general insurance and health | | 2.0 | | | 2.0 | | | 10.6 | | | 13.7 | |
| Italy general insurance and health | | 2.0 – 3.0 | | | 2.0 – 3.0 | | | 9.0 – 11.4 | | | 9.2 – 10.3 | |
| United States (fund management) | | 3.0 | | | 3.0 | | | 17.0 | | | 17.0 | |
France – indefinite life intangible asset
The recoverable amount of the indefinite life intangible asset has been assessed based on the fair value less costs to sell of the cash-generating unit to which it relates. The fair value less costs to sell was determined based on the quoted market value of the share of interest in the subsidiary to which it relates.
Results of impairment testing
Following the impairment business review conducted during the year the US long-term cash generating unit was tested for impairment and the Directors concluded that the goodwill associated with this cash generating unit was no longer recoverable. As a result, an impairment of £782 million was recognised during the period, reducing the carrying value of goodwill to £nil. Subsequently, the US business was classified as held for sale and recorded at its fair value less costs to sell (see Note 3).
Management concluded that the goodwill associated with the Spanish long-term cash generating unit, excluding Aseval which is held for sale, is no longer fully recoverable. An impairment of £76 million has been recognised reducing the carrying value of this cash generating unit to its recoverable amount as a result of a reduction to management’s estimates for future profitability due to current economic circumstances.
Similarly, as a result of the test of the Italian long-term and general businesses, impairments of £27 million and £6 million respectively have been recognised.
Other than the CGUs noted above, the recoverable amount exceeds the carrying value of the cash generating units
including goodwill.
14 – Acquired value of in-force business (AVIF) and intangible assets
This note shows the movements in cost and amortisation of the in-force business and intangible assets acquired when we have purchased subsidiaries.
| | AVIF on insurance contracts1 £m | | AVIF on investment contracts2 £m | | Other
intangible
assets
with finite
useful lives
£m | | Intangible
assets with
indefinite
useful
lives (a)
£m | | Total
£m | |
| Gross amount | | | | | | | | | | | | | | | |
| At 1 January 2011 | | 2,724 | | | 308 | | | 1,842 | | | 323 | | | 5,197 | |
| Additions | | – | | | – | | | 151 | | | – | | | 151 | |
| Acquisition of subsidiaries | | – | | | – | | | 3 | | | – | | | 3 | |
| Disposals | | – | | | – | | | (63 | ) | | (204 | ) | | (267 | ) |
| Movement in shadow adjustment | | (123 | ) | | – | | | – | | | – | | | (123 | ) |
| Deconsolidation of Delta Lloyd | | (126 | ) | | – | | | (158 | ) | | – | | | (284 | ) |
| Foreign exchange rate movements | | (11 | ) | | (9 | ) | | (10 | ) | | (2 | ) | | (32 | ) |
| At 31 December 2011 | | 2,464 | | | 299 | | | 1,765 | | | 117 | | | 4,645 | |
| Additions | | – | | | – | | | 143 | | | – | | | 143 | |
| Acquisition of subsidiaries | | – | | | – | | | 2 | | | – | | | 2 | |
| Disposals | | (160 | ) | | (5 | ) | | (134 | ) | | – | | | (299 | ) |
| Movement in shadow adjustment | | 45 | | | – | | | – | | | – | | | 45 | |
| Transfers from property and equipment | | – | | | – | | | 3 | | | – | | | 3 | |
| Foreign exchange rate movements | | (88 | ) | | (6 | ) | | (42 | ) | | (3 | ) | | (139 | ) |
| At 31 December 2012 | | 2,261 | | | 288 | | | 1,737 | | | 114 | | | 4,400 | |
| Accumulated amortisation | | | | | | | | | | | | | | | |
| At 1 January 2011 | | (1,362 | ) | | (113 | ) | | (663 | ) | | – | | | (2,138 | ) |
| Amortisation for the year | | (271 | ) | | (45 | ) | | (125 | ) | | – | | | (441 | ) |
| Disposals | | – | | | – | | | 25 | | | – | | | 25 | |
| Deconsolidation of Delta Lloyd | | 98 | | | – | | | 117 | | | – | | | 215 | |
| Foreign exchange rate movements | | – | | | 3 | | | (4 | ) | | – | | | (1 | ) |
| At 31 December 2011 | | (1,535 | ) | | (155 | ) | | (650 | ) | | – | | | (2,340 | ) |
| Amortisation for the year | | (226 | ) | | (20 | ) | | (107 | ) | | – | | | (353 | ) |
| Disposals | | 154 | | | 5 | | | 59 | | | – | | | 218 | |
| Foreign exchange rate movements | | 60 | | | 5 | | | 16 | | | – | | | 81 | |
| At 31 December 2012 | | (1,547 | ) | | (165 | ) | | (682 | ) | | – | | | (2,394 | ) |
| Accumulated Impairment | | | | | | | | | | | | | | | |
| At 1 January 2011 | | (108 | ) | | – | | | (76 | ) | | (69 | ) | | (253 | ) |
| Impairment losses charged to expenses (note 6) | | (7 | ) | | – | | | (50 | ) | | – | | | (57 | ) |
| Reversal of impairment losses | | – | | | – | | | 2 | | | – | | | 2 | |
| Disposals | | 2 | | | – | | | 9 | | | 3 | | | 14 | |
| Deconsolidation of Delta Lloyd | | – | | | – | | | 10 | | | – | | | 10 | |
| Foreign exchange rate movements | | (1 | ) | | – | | | – | | | 1 | | | – | |
| At 31 December 2011 | | (114 | ) | | – | | | (105 | ) | | (65 | ) | | (284 | ) |
| Impairment losses charged to expenses (note 6) | | (34 | ) | | (39 | ) | | (152 | ) | | – | | | (225 | ) |
| Disposals | | 3 | | | – | | | 70 | | | – | | | 73 | |
| Foreign exchange rate movements | | 1 | | | – | | | 2 | | | 2 | | | 5 | |
| At 31 December 2012 | | (144 | ) | | (39 | ) | | (185 | ) | | (63 | ) | | (431 | ) |
| Carrying amount | | | | | | | | | | | | | | | |
| At 1 January 2011 | | 1,254 | | | 195 | | | 1,103 | | | 254 | | | 2,806 | |
| At 31 December 2011 | | 815 | | | 144 | | | 1,010 | | | 52 | | | 2,021 | |
| At 31 December 2012 | | 570 | | | 84 | | | 870 | | | 51 | | | 1,575 | |
| Less: Assets classified as held for sale | | (443 | ) | | (39 | ) | | (9 | ) | | – | | | (491 | ) |
| | | 127 | | | 45 | | | 861 | | | 51 | | | 1,084 | |
| 1 | On insurance and participating investment contracts. |
| 2 | On non-participating investment contracts. |
| (a) | Intangible assets with indefinite useful lives comprise the value of the Union Financière de France Banque distribution channel, where the existing lives of the assets and their competitive position in, and the stability of, their respective markets support this classification. Impairment testing of these intangibles is covered in note 13(b). |
| (b) | Other intangible assets with finite useful lives consist primarily of the value of bancassurance and other distribution agreements. |
| | Acquisitions of intangible assets with finite lives relate to Canadian broker businesses. |
| | Disposals include the derecognition of exhausted assets which are fully amortised or impaired with nil carrying value. |
| | Impairment losses on intangible assets with finite lives of £152 million arise from impairments of capitalised software in US long-term operations, UK long-term operations and UK general insurance operations of £102 million, £25 million and £22 million respectively, and £3 million in relation to other businesses. Impairment tests were conducted as described in note 13(b). |
| | Excluding assets classified as held for sale, AVIF on insurance and investment contracts is generally recoverable in more than one year. Of the total AVIF of £172 million (£127 million on insurance contracts, £45 million on investment contracts), £131 million (2011: £713 million) is expected to be recovered more than one year after the statement of financial position date. |
15– Interests in, and loans to, joint ventures
In several business units, Group companies and other parties jointly control certain entities. This note analyses these interests and describes the principal joint ventures in which we are involved.
(a) Carrying amount
(i) The movements in the carrying amount comprised:
| | | | | | | | 2012 | | | | | | | | 2011 | |
| | Goodwill
and
intangibles
£m | | Equity
interests
£m | | Loans
£m | | Total
£m | | Goodwill
and
intangibles
£m | | Equity
interests
£m | | Loans
£m | | Total
£m | |
| At 1 January | | 147 | | | 1,465 | | | 100 | | | 1,712 | | | 187 | | | 1,446 | | | 375 | | | 2,008 | |
| Share of results before tax | | – | | | (19 | ) | | – | | | (19 | ) | | – | | | (14 | ) | | – | | | (14 | ) |
| Share of tax | | – | | | (4 | ) | | – | | | (4 | ) | | – | | | (3 | ) | | – | | | (3 | ) |
| Share of results after tax | | – | | | (23 | ) | | – | | | (23 | ) | | – | | | (17 | ) | | – | | | (17 | ) |
| Impairment of goodwill | | (9 | ) | | – | | | – | | | (9 | ) | | (15 | ) | | – | | | – | | | (15 | ) |
| Amortisation of intangibles1 | | (6 | ) | | – | | | – | | | (6 | ) | | (6 | ) | | – | | | – | | | (6 | ) |
| Share of profit/loss after tax | | (15 | ) | | (23 | ) | | – | | | (38 | ) | | (21 | ) | | (17 | ) | | – | | | (38 | ) |
| Acquisitions | | – | | | – | | | – | | | – | | | – | | | 12 | | | – | | | 12 | |
| Additions | | – | | | 89 | | | 4 | | | 93 | | | – | | | 59 | | | 18 | | | 77 | |
| Reclassification to subsidiary | | – | | | (107 | ) | | – | | | (107 | ) | | – | | | – | | | (282 | ) | | (282 | ) |
| Reduction in Group interest | | – | | | – | | | – | | | – | | | – | | | (1 | ) | | – | | | (1 | ) |
| Disposals | | – | | | (41 | ) | | – | | | (41 | ) | | – | | | (37 | ) | | – | | | (37 | ) |
| Share of gains taken to other comprehensive income | | – | | | 21 | | | – | | | 21 | | | – | | | 7 | | | – | | | 7 | |
| Loans repaid | | – | | | – | | | (12 | ) | | (12 | ) | | – | | | – | | | (17 | ) | | (17 | ) |
| Dividend received | | – | | | (5 | ) | | – | | | (5 | ) | | – | | | – | | | – | | | – | |
| Foreign exchange rate movements | | – | | | (4 | ) | | – | | | (4 | ) | | (19 | ) | | (4 | ) | | 6 | | | (17 | ) |
| At 31 December | | 132 | | | 1,395 | | | 92 | | | 1,619 | | | 147 | | | 1,465 | | | 100 | | | 1,712 | |
| Less: Amounts classified as held for sale | | (54 | ) | | (72 | ) | | – | | | (126 | ) | | – | | | (12 | ) | | – | | | (12 | ) |
| | | 78 | | | 1,323 | | | 92 | | | 1,493 | | | 147 | | | 1,453 | | | 100 | | | 1,700 | |
| 1 | Comprises amortisation of AVIF on insurance contracts of £3 million(2011: £3 million) and other intangibles of £3 million(2011: £3 million). |
During 2010, the Group’s Taiwan joint venture, First-Aviva Life Insurance Co., Ltd., was classified as held for sale following the decision of management to seek to dispose of the business. A sale of this business was not completed in 2012 and management have reviewed its classification as held for sale and determined that the classification remains appropriate. The disposal is expected to be completed within 12 months of the balance sheet date.
During 2012, the Group’s Malaysian joint ventures, CIMB Aviva Assurance Berhad and CIMB Aviva Takaful Berhad, were classified as held for sale following the decision of management to seek to dispose of the businesses. On 17 January 2013 agreement was reached to sell Aviva’s interests in these businesses to Sun Life Assurance Company of Canada. Upon receipt of regulatory approval the parties will work to close the proposed transaction during the first half of 2013. The expected proceeds of this transaction are £152 million. These businesses have been included in the statement of financial position at their carrying value.
Additions and disposals relate to the increase and reduction of investments in property management undertakings. The Group’s principal interests in property management joint ventures are listed below.
(ii) The balances at 31 December comprised:
| | | | | | | | 2012 | | | | | | | | 2011 | |
| | Goodwill
and
intangibles
£m | | Equity
interests
£m | | Loans
£m | | Total
£m | | Goodwill
and
intangibles
£m | | Equity
interests
£m | | Loans
£m | | Total
£m | |
| Property management undertakings | | – | | | 1,050 | | | 92 | | | 1,142 | | | – | | | 1,145 | | | 100 | | | 1,245 | |
| Long-term business undertakings | | 132 | | | 339 | | | – | | | 471 | | | 147 | | | 315 | | | – | | | 462 | |
| General insurance undertakings | | – | | | 6 | | | – | | | 6 | | | – | | | 5 | | | – | | | 5 | |
| Total | | 132 | | | 1,395 | | | 92 | | | 1,619 | | | 147 | | | 1,465 | | | 100 | | | 1,712 | |
The loans are not secured and no guarantees were received in respect thereof. They are interest-bearing and are repayable on termination of the relevant partnership.
(b) Property management undertakings
The principal joint ventures are as follows:
| Company | GP proportion held | | PLP proportion held | |
| Airport Property Partnership | | 50.00% | | | 50.00% | |
| The Ashtenne Industrial Fund Limited Partnership | | 67.70% | | | 43.66% | |
| The Mall Limited Partnership | | 50.00% | | | 50.52% | |
| Paddington Central IV Unit Trust | | 50.00% | | | 50.00% | |
| Queensgate Limited Partnership | | 50.00% | | | 50.00% | |
| Quercus Healthcare Property Partnership Limited | | 50.00% | | | 29.33% | |
| The Southgate Limited Partnership | | 50.00% | | | 50.00% | |
All the above entities perform property ownership and management activities, and are incorporated and operate in the UK. All these investments are held by subsidiary entities.
15 – Interests in, and loans to, joint ventures continued
(c) Long-term business undertakings
The principal joint ventures are as follows:
| Company | Proportion held | | Country of
incorporation and operation |
| Aviva-COFCO Life Insurance Co. Limited | | 50.00% | | China |
| AvivaSA Emeklilik ve Hayat A.S. | | 49.83% | | Turkey |
| CIMB Aviva Assurance Berhad | | 49.00% | | Malaysia |
| CIMB Aviva Takaful Berhad | | 49.00% | | Malaysia |
| First-Aviva Life Insurance Co., Ltd. | | 49.00% | | Taiwan |
| Vietinbank Aviva Life Insurance Limited | | 49.99% | | Vietnam |
| Woori Aviva Life insurance Co. Ltd | | 47.31% | | Korea |
All investments in the above companies are unlisted and are held by subsidiaries, except for the shares in Aviva-COFCO Life Insurance Co. Limited which are held by the Company. The Group’s share of net assets of that company is £141 million(2011: £150 million) which have a fair value of £141 million(2011: £150 million).
(d) Impairment testing
Joint ventures are tested for impairment by comparing the carrying value of the cash generating unit to which the goodwill relates to the recoverable value of that cash generating unit.
The recoverable amount of long-term business undertakings is the value in use of the joint venture. This is calculated according to the methodology for the calculation of the value in use of long-term business cash generating units for the impairment testing of goodwill, as set out in note 13(b).
The recoverable amount for joint ventures classified as held for sale (CIMB Aviva Assurance Berhad, CIMB Aviva Takaful Berhad & First-Aviva Life Insurance Co., Ltd.) is the fair value less costs to sell for each entity, based on the expected net disposal proceeds. The recoverable amount of property management undertakings is the fair value less costs to sell of the joint venture, measured in accordance with the Groups accounting policy for Investment Property (See: Accounting Policy P).
Key Assumptions for the calculation of value in use for long-term business undertakings
All interests in joint ventures have been tested for impairment but only the material items are detailed below.
| | Embedded value basis | | Future new business profits growth rate | | Future new business profits
discount rate | |
| | 2012 | | 2011 | | 2012
% | | 2011
% | | 2012
% | | 2011
% | |
| Aviva-COFCO Life Insurance Co. Limited | | MCEV | | | MCEV | | | n/a1 | | | n/a1 | | | n/a1 | | | n/a1 | |
| AvivaSA Emeklilik ve Hayat A.S. | | MCEV | | | MCEV | | | 9.2 | | | 4.0 | | | 18.0 | | | 12.8 | |
| Woori Aviva Life insurance Co. Ltd | | MCEV | | | MCEV | | | 4.0 | | | 4.0 | | | 13.1 | | | 13.6 | |
| 1 | Projection of future new business not required as MCEV exceeds carrying value. |
Results of impairment testing
Following the impairment test of Woori Aviva Life Insurance Co. Ltd an impairment of £9 million has been recognised fully impairing the goodwill to £nil, reflecting local economic conditions.
(e) Additional information
Summarised aggregate financial information on the Group’s interests in its joint ventures is as follows:
| | 2012
£m | | 2011
£m | |
| Income, including unrealised gains/(losses) on investments | | 808 | | | 763 | |
| Expenses | | (827 | ) | | (777 | ) |
| Share of results before tax | | (19 | ) | | (14 | ) |
| Long-term assets | | 2,731 | | | 1,831 | |
| Current assets | | 1,676 | | | 2,534 | |
| Share of total assets | | 4,407 | | | 4,365 | |
| Long-term liabilities | | (1,778 | ) | | (1,634 | ) |
| Current liabilities | | (1,234 | ) | | (1,266 | ) |
| Share of total liabilities | | (3,012 | ) | | (2,900 | ) |
| Share of net assets | | 1,395 | | | 1,465 | |
The joint ventures have no significant contingent liabilities to which the Group is exposed. The Group has capital commitments to property management joint ventures of £157 million (2011: £258 million).
16 – Interests in, and loans to, associates
This note analyses our interests in entities which we do not control but where we have significant influence.
(a) Carrying amount
| | | | | | 2012 | | | | | | 2011 | |
| | Goodwill
and
intangibles
£m | | Equity
interests
£m | | Total
£m | | Goodwill
and
intangibles
£m | | Equity
interests
£m | | Total
£m | |
| At 1 January | | 115 | | | 1,003 | | | 1,118 | | | 80 | | | 563 | | | 643 | |
| Share of results before tax | | – | | | (295 | ) | | (295 | ) | | – | | | 196 | | | 196 | |
| Share of tax | | – | | | (2 | ) | | (2 | ) | | – | | | (36 | ) | | (36 | ) |
| Share of results after tax | | – | | | (297 | ) | | (297 | ) | | – | | | 160 | | | 160 | |
| Impairment – see notes (i) and (ii) below | | (147 | ) | | 205 | | | 58 | | | – | | | (217 | ) | | (217 | ) |
| Share of loss after tax | | (147 | ) | | (92 | ) | | (239 | ) | | – | | | (57 | ) | | (57 | ) |
| Acquisitions | | – | | | – | | | – | | | – | | | 1,116 | | | 1,116 | |
| Additions – see note (iii) below | | 32 | | | – | | | 32 | | | 35 | | | – | | | 35 | |
| Reduction in Group interest | | – | | | (601 | ) | | (601 | ) | | – | | | (3 | ) | | (3 | ) |
| Share of losses taken to other comprehensive income | | – | | | (7 | ) | | (7 | ) | | – | | | (143 | ) | | (143 | ) |
| Dividends received | | – | | | (43 | ) | | (43 | ) | | – | | | (71 | ) | | (71 | ) |
| Deconsolidation of Delta Lloyd | | – | | | – | | | – | | | – | | | (359 | ) | | (359 | ) |
| Foreign exchange rate movements | | – | | | (45 | ) | | (45 | ) | | – | | | (43 | ) | | (43 | ) |
| Movements in carrying amount | | (115 | ) | | (788 | ) | | (903 | ) | | 35 | | | 440 | | | 475 | |
| At 31 December | | – | | | 215 | | | 215 | | | 115 | | | 1,003 | | | 1,118 | |
The Group had no loans to associates as at 31 December 2012(2011: £nil).
(i) Disposal of Delta Lloyd
On 5 July 2012, the Group sold 37.2 million shares in Delta Lloyd for £313 million (net of costs), reducing the Group’s holding to 19.8% of Delta Lloyd’s ordinary share capital, representing 18.6% of shareholder voting rights. As the Group no longer has significant influence over Delta Lloyd, the Group ceased to account for that company as an associate from 5 July 2012. From that date, our holding was classified as a financial investment, held at fair value through profit and loss.
Prior to sale, the Group’s share of Delta Lloyd’s net asset value declined to a value below its quoted market value and therefore the impairment recognised in 2011 to reduce the carrying value of the associate to the quoted market value was redundant and no longer required. The amount previously recognised as an impairment of £205 million has therefore been reversed during the current period, through the Group’s share of loss after tax of associates, after exchange movements on the opening balance of £12 million.
(ii) Impairment testing
Following the business review, management have determined that the goodwill in Aviva Life Insurance Company India Limited is fully impaired. An impairment of £147 million has been recognised in respect of this associate, reducing its goodwill to nil.
The recoverable amount of property management undertakings is the fair value less costs to sell of the joint venture, measured
in accordance with the Groups accounting policy for Investment Property (See: Accounting Policy P).
(iii) Additions
Additions in 2012 relate to Aviva Life Insurance Company India Limited.
(b) Principal associates
The Group’s principal associates are as follows:
| Company | Type of business | Proportion held | Country of
incorporation and operation |
| Aviva Life Insurance Company India Limited | Insurance | 26.00% | India |
| SCPI Logipierre 1 | Property management | 44.46% | France |
| SCPI Selectipierre 2 | Property management | 22.16% | France |
| SCPI Ufifrance Immobilier | Property management | 20.40% | France |
All investments in principal associates are held by subsidiaries.
(c) Additional information
Summarised aggregate financial information on the Group’s interests in its associates is as follows:
| | 2012
Total
£m | | 2011
Total
£m | |
| Share of revenues | | 1,990 | | | 2,244 | |
| Share of results before tax | | (295 | ) | | 196 | |
| Share of assets | | 458 | | | 25,957 | |
| Share of liabilities | | (243 | ) | | (24,954 | ) |
| Share of net assets | | 215 | | | 1,003 | |
The Group’s share of associated companies’ contingent liabilities amounted to £nil million at 31 December 2012(2011: £173 million).
17 – Property and equipment
This note analyses our property and equipment, which are primarily properties occupied by Group companies, properties under construction and computer equipment.
| | Properties
under
construction
£m | | Owner-
occupied
properties
£m | | Motor
vehicles
£m | | Computer
equipment
£m | | Other
assets
£m | | Total
£m | |
| Cost or valuation | | | | | | | | | | | | | | | | | | |
| At 1 January 2011 | | 126 | | | 440 | | | 9 | | | 723 | | | 409 | | | 1,707 | |
| Additions | | 45 | | | – | | | 1 | | | 38 | | | 20 | | | 104 | |
| Disposals | | – | | | (44 | ) | | (3 | ) | | (66 | ) | | (51 | ) | | (164 | ) |
| Transfers from/(to) investment property (note 18) | | – | | | (1 | ) | | – | | | – | | | – | | | (1 | ) |
| Fair value gains | | 32 | | | – | | | – | | | – | | | – | | | 32 | |
| Deconsolidation of Delta Lloyd | | (29 | ) | | (184 | ) | | – | | | (63 | ) | | (128 | ) | | (404 | ) |
| Foreign exchange rate movements | | 1 | | | 4 | | | – | | | (2 | ) | | (3 | ) | | – | |
| At 31 December 2011 | | 175 | | | 215 | | | 7 | | | 630 | | | 247 | | | 1,274 | |
| Additions | | 16 | | | 171 | | | – | | | 27 | | | 20 | | | 234 | |
| Disposals | | – | | | (13 | ) | | (4 | ) | | (46 | ) | | (41 | ) | | (104 | ) |
| Transfers (to) investment property (note 18) | | (111 | ) | | (32 | ) | | – | | | – | | | – | | | (143 | ) |
| Fair value gains | | (6 | ) | | (3 | ) | | – | | | – | | | – | | | (9 | ) |
| Transfer to intangible assets (note 14) | | – | | | – | | | – | | | (3 | ) | | – | | | (3 | ) |
| Foreign exchange rate movements | | – | | | (1 | ) | | – | | | – | | | (7 | ) | | (8 | ) |
| At 31 December 2012 | | 74 | | | 337 | | | 3 | | | 608 | | | 219 | | | 1,241 | |
| Depreciation and impairment | | | | | | | | | | | | | | | | | | |
| At 1 January 2011 | | – | | | – | | | (7 | ) | | (640 | ) | | (310 | ) | | (957 | ) |
| Charge for the year | | – | | | – | | | (1 | ) | | (36 | ) | | (24 | ) | | (61 | ) |
| Disposals | | – | | | – | | | 2 | | | 52 | | | 35 | | | 89 | |
| Deconsolidation of Delta Lloyd | | – | | | – | | | – | | | 54 | | | 108 | | | 162 | |
| Impairment losses charged to restructuring costs | | – | | | – | | | – | | | – | | | – | | | – | |
| Foreign exchange rate movements | | – | | | – | | | 1 | | | 3 | | | (1 | ) | | 3 | |
| At 31 December 2011 | | – | | | – | | | (5 | ) | | (567 | ) | | (192 | ) | | (764 | ) |
| Charge for the year | | – | | | – | | | 1 | | | (28 | ) | | (19 | ) | | (46 | ) |
| Disposals | | – | | | – | | | 2 | | | 38 | | | 20 | | | 60 | |
| Impairment charge (see below) | | – | | | (91 | ) | | – | | | (5 | ) | | (10 | ) | | (106 | ) |
| Foreign exchange rate movements | | – | | | (1 | ) | | – | | | 3 | | | 6 | | | 8 | |
| At 31 December 2012 | | – | | | (92 | ) | | (2 | ) | | (559 | ) | | (195 | ) | | (848 | ) |
| | | | | | | | | | | | | | | | | | | |
| Carrying amount | | | | | | | | | | | | | | | | | | |
| At 31 December 2011 | | 175 | | | 215 | | | 2 | | | 63 | | | 55 | | | 510 | |
| At 31 December 2012 | | 74 | | | 245 | | | 1 | | | 49 | | | 24 | | | 393 | |
| Less: Assets classified as held for sale | | – | | | (2 | ) | | – | | | – | | | – | | | (2 | ) |
| | | 74 | | | 243 | | | 1 | | | 49 | | | 24 | | | 391 | |
Fair value losses of £3 million(2011: £2 million gains) have been charged to other comprehensive income, with the net reversal of losses previously charged to the income statement now being credited there.
Owner-occupied properties are stated at their revalued amounts, as assessed by qualified external valuers. These values are assessed in accordance with the relevant parts of the current RICS Appraisal and Valuation Standards in the UK, and with current localvaluation practices in other countries. This assessment, on the basis of Existing Use Value and in accordance with UK Valuations Standards (“Red book”), is the estimated amount for which a property should exchange on the date of valuation between a willing buyer and a willing seller in an arm’s-length transaction, after proper marketing wherein the parties had acted knowledgeably, prudently and without compulsion, assuming that the buyer is granted vacant possession of all parts of the property required by the business and disregarding potential alternative uses. The valuation assessment adopts market-based evidence and is in line with guidance from the International Valuation Standards Committee and the requirements of IAS 16,Property, Plant and Equipment.
Similar considerations apply to properties under construction, where an estimate is made of valuation when complete, adjusted for anticipated costs to completion, profit and risk, reflecting market conditions at the valuation date.
The £106 million impairment loss charged to the income statement mainly relates to Aviva USA’s property and equipment, the carrying value of which has been reduced to nil as set out in note 3c(i).
If owner-occupied properties were stated on a historical cost basis, the carrying amount would be £275 million(2011: £189 million).
The Group has no material finance leases for property and equipment.
18 – Investment property
This note gives details of the properties we hold for long-term rental yields or capital appreciation.
| | | | | | 2012 | | | | | | 2011 | |
| | Freehold
£m | | Leasehold
£m | | Total
£m | | Freehold
£m | | Leasehold
£m | | Total
£m | |
| Carrying value | | | | | | | | | | | | | | | | | | |
| At 1 January | | 9,848 | | | 1,790 | | | 11,638 | | | 11,241 | | | 1,823 | | | 13,064 | |
| Additions | | 536 | | | 194 | | | 730 | | | 1,107 | | | 85 | | | 1,192 | |
| Capitalised expenditure on existing properties | | 103 | | | 8 | | | 111 | | | 52 | | | 9 | | | 61 | |
| Fair value (losses) / gains | | (416 | ) | | (76 | ) | | (492 | ) | | 92 | | | 6 | | | 98 | |
| Disposals | | (940 | ) | | (207 | ) | | (1,147 | ) | | (694 | ) | | (17 | ) | | (711 | ) |
| Transfers (to)/from property and equipment (note 17) | | 89 | | | 54 | | | 143 | | | 1 | | | – | | | 1 | |
| Deconsolidation of Delta Lloyd | | – | | | – | | | – | | | (2,015 | ) | | (116 | ) | | (2,131 | ) |
| Foreign exchange rate movements | | (145 | ) | | (5 | ) | | (150 | ) | | 64 | | | – | | | 64 | |
| At 31 December | | 9,075 | | | 1,758 | | | 10,833 | | | 9,848 | | | 1,790 | | | 11,638 | |
| Less: Assets classified as held for sale | | (18 | ) | | – | | | (18 | ) | | – | | | – | | | – | |
| | | 9,057 | | | 1,758 | | | 10,815 | | | 9,848 | | | 1,790 | | | 11,638 | |
Investment property in the UK is valued at least annually by external chartered surveyors at open market values in accordance with the guidance issued by The Royal Institution of Chartered Surveyors or using internal valuations and estimates during the intervening period. Outside the UK, valuations are produced by local qualified staff of the Group or external qualified professional valuers in the countries concerned. In the event of a material change in market conditions between the valuation date and balance sheet date, adjustments are made to reflect any material changes in fair value. Values are calculated using a discounted cash flow approach and are based on current rental income plus anticipated uplifts at the next rent review, lease expiry, or break option taking into consideration lease incentives and assuming no future growth in the estimated rental value of the property. This uplift and the discount rate are derived from rates implied by recent market transactions on similar properties.
The fair value of investment properties leased to third parties under operating leases at 31 December 2012 was £10,822 million(2011: £11,552million). Future contractual aggregate minimum lease rentals receivable under the non-cancellable portion of these leases are given in note 49(b)(i).
19 – Fair value methodology
This note explains the methodology for valuing our financial assets and liabilities carried at fair value, and provides an analysis of these according to a ‘fair value hierarchy’, determined by the market observability of valuation inputs.
(a) Basis for determining fair value hierarchy of financial instruments
For financial assets and liabilities carried at fair value, we have categorised the measurement basis into a ‘fair value hierarchy’ as follows:
Quoted market prices in active markets – (‘Level 1’)
Inputs to Level 1 fair values are quoted prices (unadjusted) in active markets for identical assets and liabilities. An active market is one in which transactions for the asset or liability occur with sufficient frequency and volume to provide pricing information on an ongoing basis. Examples are listed equities in active markets, listed debt securities in active markets and quoted unit trusts in active markets.
Modelled with significant observable market inputs – (‘Level 2’)
Inputs to Level 2 fair values are inputs other than quoted prices included within Level 1 that are observable for the asset or liability, either directly or indirectly. If the asset or liability has a specified (contractual) term, a Level 2 input must be observable for substantially the full term of the instrument. Level 2 inputs include the following:
| n | Quoted prices for similar (i.e. not identical) assets and liabilities in active markets. |
| n | Quoted prices for identical or similar assets and liabilities in markets that are not active, the prices are not current, or price quotations vary substantially either over time or among market makers, or in which little information is released publicly. |
| n | Inputs other than quoted prices that are observable for the asset or liability (for example, interest rates and yield curves observable at commonly quoted intervals, volatilities, prepayment spreads, loss severities, credit risks, current property values and default rates). |
| n | Inputs that are derived principally from, or corroborated by, observable market data by correlation or other means (market-corroborated inputs). |
Examples of these are securities measured using discounted cash flow models based on market observable swap yields, and listed debt or equity securities in a market that is inactive. Valuations, whether sourced from internal models or third parties include credit risk by adjusting the spread above the yield curve for government treasury securities for the appropriate amount of credit risk for each issuer, based on observed market transactions. To the extent observed market spreads are either not used in valuing a security, or do not fully reflect liquidity risk, our valuation methodology, whether sourced from internal models or third parties, reflects a liquidity premium.
Where we use broker quotes and no information as to the observability of inputs is provided by the broker, we generally validate the price quoted by the broker by using internal models with observable inputs. When the price obtained from the broker and internal model are similar, we look to the inputs used in our internal model to understand the observability of the inputs used by the broker. In circumstances where internal models are not used to validate broker prices, and the observability of inputs used by brokers is unavailable, the investment is classified as Level 3. Broker quotes are usually non-binding.
19 – Fair value methodology continued
Modelled with significant unobservable market inputs – (‘Level 3’)
Inputs to Level 3 fair values are unobservable inputs for the asset or liability. Unobservable inputs may have been used to measure fair value to the extent that observable inputs are not available, thereby allowing for situations in which there is little, if any, market activity for the asset or liability at the measurement date (or market information for the inputs to any valuation models). As such, unobservable inputs reflect the assumptions the business unit considers that market participants would use in pricing the asset or liability. Examples are certain private equity investments and private placements.
The majority of the Group’s financial assets and certain financial liabilities are valued based on quoted market information or observable market data. A small percentage (5.5%) of total financial assets recorded at fair value are based on estimates and recorded as Level 3 investments. Where estimates are used, these are based on a combination of independent third-party evidence and internally developed models, calibrated to market observable data where possible.
Third-party valuations using significant unobservable inputs validated against Level 2 internally modelled valuations are classified as Level 3, where there is a significant difference between the third-party price and the internally modelled value. Where the difference is insignificant, the instrument would be classified as Level 2.
(b) Fair value hierarchy analysis
An analysis of financial assets and liabilities according to fair value hierarchy is given below:
| | Fair value hierarchy | | | | | | | | | |
| 2012 | Level 1
£m | | Level 2
£m | | Level 3
£m | | Sub-total
fair value
£m | | Amortised
cost
£m | | Less:
Assets of
operations
classified
as held
for sale
£m | | Statement
of financial
position
Total
£m | |
| Financial investments and loans (notes 20 & 22) | | | | | | | | | | | | | | | | | | | | | |
| Loans | | – | | | 18,973 | | | – | | | 18,973 | | | 8,961 | | | (3,397 | ) | | 24,537 | |
| Fixed maturity securities | | 107,953 | | | 43,588 | | | 10,082 | | | 161,623 | | | – | | | (33,617 | ) | | 128,006 | |
| Equity securities | | 33,074 | | | 230 | | | 473 | | | 33,777 | | | – | | | (1,248 | ) | | 32,529 | |
| Other investments (including derivatives) | | 21,704 | | | 5,510 | | | 2,879 | | | 30,093 | | | – | | | (1,550 | ) | | 28,543 | |
| Total | | 162,731 | | | 68,301 | | | 13,434 | | | 244,466 | | | 8,961 | | | (39,812 | ) | | 213,615 | |
| Financial Liabilities | | | | | | | | | | | | | | | | | | | | | |
| Non-participating investment contracts | | 45,032 | | | 825 | | | 442 | | | 46,299 | | | 1,400 | | | (3,958 | ) | | 43,741 | |
| Borrowings (note 45) | | – | | | 1,332 | | | – | | | 1,332 | | | 7,007 | | | (145 | ) | | 8,194 | |
| Derivative liabilities (note 46) | | 132 | | | 1,570 | | | 59 | | | 1,761 | | | – | | | (108 | ) | | 1,653 | |
| Total | | 45,164 | | | 3,727 | | | 501 | | | 49,392 | | | 8,407 | | | (4,211 | ) | | 53,588 | |
Discussion on the valuation techniques applied to value financial liabilities carried at fair value is included in the relevant footnote disclosure for the financial liability.
For the year to 31 December 2012, transfers of financial assets from fair value hierarchy Level 1 to Level 2 amounted to £1.3 billion(2011: £2.2 billion), and £0.3 billion(2011: £9 million)from Level 2 to Level 1. The transfers from Level 1 to Level 2 arose primarily in France (£1.0 billion) and the UK (£0.3 billion) as a result of changes in the level of activity and environment in the markets from which prices are sourced.
For the year to 31 December 2012, there were no transfers of financial liabilities between fair value hierarchy levels(2011:
no transfers).
| | Fair value hierarchy | | | | | | | | | |
| 2011 | Level 1
£m | | Level 2
£m | | Level 3
£m | | Sub-total
fair value
£m | | Amortised
cost
£m | | Less:
Assets of
operations
classified
as held
for sale
£m | | Statement
of financial
position
Total
£m | |
| Financial investments and loans (notes 20 & 22) | | | | | | | | | | | | | | | | | | | | | |
| Loans | | – | | | 18,486 | | | – | | | 18,486 | | | 9,630 | | | – | | | 28,116 | |
| Fixed maturity securities | | 103,183 | | | 42,222 | | | 7,940 | | | 153,345 | | | – | | | (93 | ) | | 153,252 | |
| Equity securities | | 31,556 | | | 644 | | | 483 | | | 32,683 | | | – | | | (37 | ) | | 32,646 | |
| Other investments (including derivatives) | | 21,902 | | | 5,530 | | | 2,945 | | | 30,377 | | | – | | | (217 | ) | | 30,160 | |
| Total | | 156,641 | | | 66,882 | | | 11,368 | | | 234,891 | | | 9,630 | | | (347 | ) | | 244,174 | |
| Financial Liabilities | | | | | | | | | | | | | | | | | | | | | |
| Non-participating investment contracts (note 37) | | 42,523 | | | 1,219 | | | 248 | | | 43,990 | | | 1,669 | | | – | | | 45,659 | |
| Borrowings (note 45) | | – | | | 1,306 | | | – | | | 1,306 | | | 7,144 | | | – | | | 8,450 | |
| Derivative liabilities (note 46) | | 446 | | | 1,360 | | | 44 | | | 1,850 | | | – | | | – | | | 1,850 | |
| Total | | 42,969 | | | 3,885 | | | 292 | | | 47,146 | | | 8,813 | | | – | | | 55,959 | |
19 – Fair value methodology continued
(c) Further information on Level 3 financial instruments
(i) The table below shows movements in the Level 3 financial assets and liabilities measured at fair value.
| | | | | | | | | | 2012 | | | | | | | | | | 2011 | |
| | Fixed
maturity
securities
£m | | Equity
securities
£m | | Other
investments
£m | | Financial
Investments
Total
£m | | Financial
liabilities
Total
£m | | Fixed
maturity
securities
£m | | Equity
securities
£m | | Other
investments
£m | | Financial
Investments
Total
£m | | Financial
liabilities
Total
£m | |
| Total funds | | | | | | | | | | | | | | | | | | | | | | | | | | | | | | |
| Balance at 1 January | | 7,940 | | | 483 | | | 2,945 | | | 11,368 | | | 292 | | | 8,709 | | | 972 | | | 2,668 | | | 12,349 | | | 208 | |
| Total net (losses)/gains recognised in the income statement | | 934 | | | 7 | | | 18 | | | 959 | | | (4 | ) | | (466 | ) | | (35 | ) | | 114 | | | (387 | ) | | 5 | |
| Total net gains/(losses) recognised in other comprehensive income | | 113 | | | – | | | 17 | | | 130 | | | – | | | 33 | | | – | | | (10 | ) | | 23 | | | – | |
| Purchases | | 1,826 | | | 27 | | | 646 | | | 2,499 | | | 18 | | | 876 | | | 85 | | | 680 | | | 1,641 | | | 30 | |
| Issuances | | – | | | – | | | 1 | | | 1 | | | 23 | | | – | | | – | | | 1 | | | 1 | | | 46 | |
| Disposals | | (767 | ) | | (29 | ) | | (755 | ) | | (1,551 | ) | | – | | | (960 | ) | | (12 | ) | | (582 | ) | | (1,554 | ) | | – | |
| Transfers into Level 3 | | 443 | | | 2 | | | 56 | | | 501 | | | 184 | | | 167 | | | 6 | | | 119 | | | 292 | | | – | |
| Transfers out of Level 3 | | (149 | ) | | (3 | ) | | (12 | ) | | (164 | ) | | – | | | (234 | ) | | (3 | ) | | (24 | ) | | (261 | ) | | – | |
| Deconsolidation of Delta Lloyd | | – | | | – | | | – | | | – | | | – | | | (1 | ) | | (518 | ) | | – | | | (519 | ) | | – | |
| Foreign exchange rate movements | | (258 | ) | | (14 | ) | | (37 | ) | | (309 | ) | | (12 | ) | | (184 | ) | | (12 | ) | | (21 | ) | | (217 | ) | | 3 | |
| Balance at 31 December | | 10,082 | | | 473 | | | 2,879 | | | 13,434 | | | 501 | | | 7,940 | | | 483 | | | 2,945 | | | 11,368 | | | 292 | |
| Less: Amounts classified as held for sale | | (120 | ) | | – | | | (396 | ) | | (516 | ) | | – | | | – | | | – | | | – | | | – | | | – | |
| | | 9,962 | | | 473 | | | 2,483 | | | 12,918 | | | 501 | | | 7,940 | | | 483 | | | 2,945 | | | 11,368 | | | 292 | |
Total net gains recognised in the income statement in the year in respect of Level 3 financial investments amounted to £959 million (2011: £387 million net losses). Included in this balance are £1,030 million net gains (2011: £354 million net losses) attributable to assets still held at the end of the year.
The Group assesses the fair value hierarchy of its financial investments biannually at 30 June and 31 December. Transfers between fair value hierarchy levels are deemed to have occurred at the assessment date.
Transfers into and out of Level 3 for the year arose for the following reasons:
| n | Changes in the market observability of valuation inputs. |
| n | Changes in the market observability of inputs used to validate valuations. |
| n | Significant differences between third-party prices used for valuations and validation prices either sourced from third parties or internal models. |
The transfers into and out of Level 3 in 2012 were predominantly in our business in France and related principally to changes in the market liquidity of certain debt securities resulting in changes to the availability of observable market inputs.
Of the £959 million net gains(2011: £387 million net losses) recognised in the income statement during the year, a £968 million gain(2011: £390 million losses) is recognised in net investment income and £9 million losses(2011: £3 million gains) relates to impairments and is included in other expenses.
(ii) The principal investments classified as Level 3, and the valuation techniques applied to them, are:
| n | Structured bond-type products held by our business in France amounting to £8.6 billion(2011: £6.1 billion), for which there is no active market. These bonds are valued either using third-party counterparty or broker quotes. These bonds are validated against internal or third-party models. These bonds have been classified as Level 3 because either (i) the third-party models included a significant unobservable liquidity adjustment or (ii) differences between the valuation provided by the counterparty and broker quotes and the validation model were sufficiently significant to result in a Level 3 classification. At 31 December 2012, the values reported in respect of these products were the lower of counterparty and broker quotes and modelled valuations. |
| n | Notes issued by loan partnerships held by our UK Life business amounting to £1.0 billion(2011: £1.2 billion), for which there is no active market. These are valued using counterparty quotes which are corroborated against index information obtained for similar asset classes, taking into further consideration the quality of the underlying loan portfolio, leverage structure, credit rating, illiquidity margins, market spreads and duration. |
| n | Private equity investment funds amounting to £1.3 billion(2011: £1.5 billion), of which £1.1 billion(2011: £0.9 billion) is held by our UK business. In valuing our interest in these funds, we rely on investment valuation reports received from the fund manager, making adjustments for items such as subsequent draw-downs and distributions between the date of the report and the balance sheet date and the fund manager’s carried interest. In addition, an indexation adjustment is made to reflect changes in appropriate equity market indices between the valuation report date and balance sheet date. |
| n | External hedge funds held principally by businesses in the UK, the US and France amounting to £1.3 billion(2011: £1.3 billion). Valuations received from fund managers are based on net asset values. However, insufficient information is provided on the underlying fund assets to support a classification other than Level 3. |
| n | Certain strategic interests in banking partners held by our Italian business amounting to £0.3 billion(2011: £0.3 billion). Valuations are based on third-party independent appraisals, or where internally modelled, transactions in similar entities, discounted cash flow techniques and valuation multiples, using public and internal management information. |
| n | Other Level 3 investments amount to £0.9 billion(2011: £1.0 billion) and relate to a diverse range of different types of securities held by a number of businesses throughout the Group. |
19 – Fair value methodology continued
(iii) Where possible, the Group tests the sensitivity of the fair values of Level 3 investments to changes in unobservable inputs to reasonable alternatives. 99%(2011: 99%)of valuations for Level 3 investments are sourced from independent third parties and, where appropriate, validated against internally-modelled valuations, third-party models or broker quotes. Where third-party pricing sources are unwilling to provide a sensitivity analysis for their valuations, the Group undertakes, where feasible, sensitivity analysis on the following basis:
| n | For third-party valuations validated against internally-modelled valuations using significant unobservable inputs, the sensitivity of the internally modelled valuation to changes in unobservable inputs to a reasonable alternative is determined. |
| n | For third-party valuations either not validated or validated against a third-party model or broker quote, the third-party valuation in its entirety is considered an unobservable input. Sensitivities are determined by flexing to a reasonable alternative the yield, NAV multiple, IRR or other suitable valuation multiples of the financial instrument implied by the third-party valuation. For example, for a fixed income security the implied yield would be the rate of return which discounts the security’s contractual cash flows to equal the third-party valuation. |
On the basis of the methodology outlined above, the Group is able to perform sensitivity analysis for £12.3 billion of the Group’s Level 3 investments. For these Level 3 investments, changing unobservable valuation inputs to a reasonable alternative would result in a change in fair value in the range of £558 million positive impact and £623 million adverse impact.
Of the £1.1 billion Level 3 investments for which sensitivity analysis is not provided, £0.8 billion relates to investments held in unit-linked and participating funds mainly in France where investment risk is predominantly borne by policyholders and therefore shareholder profit before tax is insensitive to reasonable changes in fair value of these investments. The remaining £0.3 billion of Level 3 investments are held to back non-linked shareholder business and it is estimated that a 10% change in valuation of these investments would reduce shareholder profit before tax by £30 million.
20 – Loans
This note analyses the loans our Group companies have made, the majority of which are mortgage loans.
(a) Carrying amounts
The carrying amounts of loans at 31 December 2012 and 2011 were as follows:
| | | | | | 2012 | | | | | | 2011 | |
| | At fair value
through
profit or
loss other
than trading
£m | | At amortised
cost
£m | | Total
£m | | At fair value
through
profit or
loss other
than trading
£m | | At amortised
cost
£m | | Total
£m | |
| Policy loans | | 2 | | | 1,309 | | | 1,311 | | | 3 | | | 1,465 | | | 1,468 | |
| Loans to banks | | – | | | 4,250 | | | 4,250 | | | – | | | 4,988 | | | 4,988 | |
| UK securitised mortgage loans (see note 21) | | 2,218 | | | – | | | 2,218 | | | 2,154 | | | – | | | 2,154 | |
| Non-securitised mortgage loans | | 16,753 | | | 3,211 | | | 19,964 | | | 16,329 | | | 2,905 | | | 19,234 | |
| Loans to brokers and other intermediaries | | – | | | 89 | | | 89 | | | – | | | 96 | | | 96 | |
| Other loans | | – | | | 102 | | | 102 | | | – | | | 176 | | | 176 | |
| Total | | 18,973 | | | 8,961 | | | 27,934 | | | 18,486 | | | 9,630 | | | 28,116 | |
| Less: Amounts classified as held for sale | | (56 | ) | | (3,341 | ) | | (3,397 | ) | | – | | | – | | | – | |
| | | 18,917 | | | 5,620 | | | 24,537 | | | 18,486 | | | 9,630 | | | 28,116 | |
Loans to banks include cash collateral received under stock lending arrangements (see note 22(d)). The obligation to repay this collateral is included in payables and other financial liabilities (note 46).
Of the above loans, £19,179 million(2011: £21,626million) are due to be recovered in more than one year after the statement of financial position date.
Loans at fair value
Fair values have been calculated by discounting the future cash flows using appropriate current interest rates for each portfolio of mortgages. Further details of the fair value methodology are given in note 19.
The change in fair value of these loans during the year, attributable to a change in credit risk, was £491 million loss(2011: £555 million loss). The cumulative change attributable to changes in credit risk to 31 December 2012 was £2,665 million loss(2011: £2,174 million loss).
Non-securitised mortgage loans include £4.1 billion(2011: £3.7 billion) relating to UK primary healthcare and PFI businesses which are secured against General Practitioner premises, other primary health-related premises or other emergency services related premises. For all such loans, government support is provided through either direct funding or reimbursement of rental payments to the tenants to meet income service and provide for the debt to be reduced substantially over the term of the loan. Although the loan principal is not government-guaranteed, the nature of these businesses and premises provides considerable comfort of an ongoing business model and low risk of default.
20 – Loans continued
Loans at amortised cost
The fair value of these loans at 31 December 2012 was £8,735 million(2011: £9,532million).
(b) Analysis of loans carried at amortised cost
| | | | | | 2012 | | | | | | 2011 | |
| | Amortised
Cost
£m | | Impairment
£m | | Carrying
Value
£m | | Amortised
Cost
£m | | Impairment
£m | | Carrying
Value
£m | |
| Policy loans | | 1,309 | | | – | | | 1,309 | | | 1,465 | | | – | | | 1,465 | |
| Loans to banks | | 4,250 | | | – | | | 4,250 | | | 4,988 | | | – | | | 4,988 | |
| Non-securitised mortgage loans | | 3,335 | | | (124 | ) | | 3,211 | | | 2,995 | | | (90 | ) | | 2,905 | |
| Loans to brokers and other intermediaries | | 89 | | | – | | | 89 | | | 96 | | | – | | | 96 | |
| Other loans | | 106 | | | (4 | ) | | 102 | | | 180 | | | (4 | ) | | 176 | |
| Total | | 9,089 | | | (128 | ) | | 8,961 | | | 9,724 | | | (94 | ) | | 9,630 | |
The movements in the impairment provisions on these loans for the years ended 31 December 2011 and 2012 were as follows:
| | 2012
£m | | 2011
£m | |
| At 1 January | | (94 | ) | | (141 | ) |
| Increase during the year | | (45 | ) | | (66 | ) |
| Write back following sale or reimbursement | | 2 | | | 2 | |
| Write back following recovery in value | | 9 | | | 39 | |
| Deconsolidation of Delta Lloyd | | – | | | 72 | |
| Foreign exchange rate movements | | – | | | – | |
| At 31 December | | (128 | ) | | (94 | ) |
(c) Collateral
The Group holds collateral in respect of loans where it is considered appropriate in order to reduce the risk of non-recovery. This collateral generally takes the form of liens or charges over properties and, in the case of policy loans, the underlying policy for the majority of the loan balances above. In all other situations, the collateral must be in a readily realisable form, such as listed securities, and is held in segregated accounts. Transfer of title for the collateral received always occurs in such cases, although no market risk or benefit is taken. In the event of a default, the Group is able to sell or repledge the collateral.
The amount of collateral received with respect to loans which the Group is permitted to sell or repledge in the absence of default was £4,560 million(2011: £4,601million). No collateral was actually sold or repledged in the absence of default during the year(2011: £nil).
21 – Securitised mortgages and related assets
The Group, in our UK Life business has loans receivable, secured by mortgages, which have then been securitised through non-recourse borrowings. This note gives details of the relevant transactions.
(a) Description of current arrangements
In a UK long-term business subsidiary, Aviva Equity Release UK Limited (AER), the beneficial interest in certain portfolios of lifetime mortgages has been transferred to five special purpose securitisation companies (the ERF companies), in return for initial consideration and, at later dates, deferred consideration. The deferred consideration represents receipts accrued within the ERF companies after meeting all their obligations to the note holders, loan providers and other third parties in the priority of payments. The purchases of the mortgages were funded by the issue of fixed and floating rate notes by the ERF companies.
All the shares in the ERF companies are held by independent companies, whose shares are held on trust. Although AER does not own, directly or indirectly, any of the share capital of the ERF companies or their parent companies, it retains control of the majority of the residual or ownership risks and rewards related to the assets of the securitisation companies, and they have therefore been treated as subsidiaries in the consolidated financial statements. AER has no right to repurchase the benefit of any of the securitised mortgage loans, other than in certain circumstances where AER is in breach of warranty or loans are substituted in order to effect a further advance.
AER has purchased subordinated notes and granted subordinated loans to some of the ERF companies. In addition, Group companies have invested in loan notes issued by the ERF companies. These have been eliminated on consolidation through offset against the borrowings of the ERF companies in the consolidated statement of financial position.
In all of the above transactions, the Company and its subsidiaries are not obliged to support any losses that may be suffered by the note holders and do not intend to provide such support. Additionally, the notes were issued on the basis that note holders are only entitled to obtain payment, of both principal and interest, to the extent that the available resources of the respective special purpose securitisation companies, including funds due from customers in respect of the securitised loans, are sufficient and that note holders have no recourse whatsoever to other companies in the Aviva Group.
(b) Carrying values
The following table summarises the securitisation arrangements:
| | | | 2012 | | | | 2011 | |
| | Securitised
assets
£m | | Securitised
borrowings
£m | | Securitised
assets
£m | | Securitised
borrowings
£m | |
| Securitised mortgage loans | | | | | | | | | | | | |
| At fair value (note 20) | | 2,218 | | | (1,515 | ) | | 2,154 | | | (1,486 | ) |
| Other securitisation assets/(liabilities) | | 351 | | | (1,054 | ) | | 191 | | | (859 | ) |
| | | 2,569 | | | (2,569 | ) | | 2,345 | | | (2,345 | ) |
Loan notes held by third parties are as follows:
| | 2012
£m | | 2011
£m | |
| Total loan notes issued, as above | | 1,515 | | | 1,486 | |
| Less: Loan notes held by Group companies | | (183 | ) | | (180 | ) |
| Loan notes held by third parties (note 45(c)(i)) | | 1,332 | | | 1,306 | |
22 – Financial investments
This note analyses our financial investments by type and shows their cost and fair value. These will change from one period to the next as a result of new business written, claims paid and market movements.
(a) Carrying amount
Financial investments comprise:
| | | | | | | | 2012 | | | | | | | | 2011 | |
| | At fair value through
profit or loss | | | | At fair value through
profit or loss | | | |
| | | Trading £m | | | Other than trading £m | | | Available for sale £m | | | Total £m | | | Trading £m | | | Other than trading £m | | | Available for sale £m | | | Total £m | |
| Fixed maturity securities | | | | | | | | | | | | | | | | | | | | | | | | |
| Debt securities | | | | | | | | | | | | | | | | | | | | | | | | |
| UK government | | – | | | 18,348 | | | – | | | 18,348 | | | 115 | | | 18,129 | | | – | | | 18,244 | |
| UK local authorities | | – | | | 18 | | | – | | | 18 | | | – | | | 18 | | | – | | | 18 | |
| Non-UK government (note 22e) | | – | | | 44,118 | | | 2,258 | | | 46,376 | | | – | | | 39,686 | | | 1,888 | | | 41,574 | |
| Corporate bonds | | | | | | | | | | | | | | | | | | | | | | | | |
| Public utilities | | – | | | 6,259 | | | 2,881 | | | 9,140 | | | – | | | 6,064 | | | 2,951 | | | 9,015 | |
| Other corporate | | – | | | 54,942 | | | 21,449 | | | 76,391 | | | – | | | 54,602 | | | 19,991 | | | 74,593 | |
| Convertibles and bonds with warrants attached | | – | | | 465 | | | 6 | | | 471 | | | – | | | 418 | | | 17 | | | 435 | |
| Other | | – | | | 5,528 | | | 3,301 | | | 8,829 | | | – | | | 3,371 | | | 4,168 | | | 7,539 | |
| | | – | | | 129,678 | | | 29,895 | | | 159,573 | | | 115 | | | 122,288 | | | 29,015 | | | 151,418 | |
| Certificates of deposit | | – | | | 2,047 | | | 3 | | | 2,050 | | | 100 | | | 1,822 | | | – | | | 1,922 | |
| Redeemable preference shares | | – | | | – | | | – | | | – | | | – | | | – | | | 5 | | | 5 | |
| | | – | | | 131,725 | | | 29,898 | | | 161,623 | | | 215 | | | 124,110 | | | 29,020 | | | 153,345 | |
| Equity securities | | | | | | | | | | | | | | | | | | | | | | | | |
| Ordinary shares | | | | | | | | | | | | | | | | | | | | | | | | |
| Public utilities | | – | | | 3,684 | | | – | | | 3,684 | | | – | | | 4,133 | | | – | | | 4,133 | |
| Banks, trusts and insurance companies | | – | | | 7,196 | | | 62 | | | 7,258 | | | – | | | 6,184 | | | 81 | | | 6,265 | |
| Industrial, miscellaneous and all other | | – | | | 22,397 | | | 1 | | | 22,398 | | | – | | | 21,857 | | | 1 | | | 21,858 | |
| | | – | | | 33,277 | | | 63 | | | 33,340 | | | – | | | 32,174 | | | 82 | | | 32,256 | |
| Non-redeemable preference shares | | – | | | 437 | | | – | | | 437 | | | – | | | 426 | | | 1 | | | 427 | |
| | | – | | | 33,714 | | | 63 | | | 33,777 | | | – | | | 32,600 | | | 83 | | | 32,683 | |
| Other investments | | | | | | | | | | | | | | | | | | | | | | | | |
| Unit trusts and other investment vehicles | | – | | | 26,315 | | | 441 | | | 26,756 | | | – | | | 26,775 | | | 485 | | | 27,260 | |
| Derivative financial instruments (note 54) | | 1,590 | | | – | | | – | | | 1,590 | | | 1,498 | | | – | | | – | | | 1,498 | |
| Deposits with credit institutions | | – | | | 739 | | | – | | | 739 | | | – | | | 427 | | | – | | | 427 | |
| Minority holdings in property management undertakings | | – | | | 584 | | | – | | | 584 | | | – | | | 617 | | | – | | | 617 | |
| Other investments – long-term | | – | | | 370 | | | 54 | | | 424 | | | – | | | 515 | | | 60 | | | 575 | |
| Other investments – short-term | | – | | | – | | | – | | | – | | | – | | | – | | | – | | | – | |
| | | 1,590 | | | 28,008 | | | 495 | | | 30,093 | | | 1,498 | | | 28,334 | | | 545 | | | 30,377 | |
| Total financial investments | | 1,590 | | | 193,447 | | | 30,456 | | | 225,493 | | | 1,713 | | | 185,044 | | | 29,648 | | | 216,405 | |
| Less assets classified as held for sale | | | | | | | | | | | | | | | | | | | | | | | | |
| Fixed maturity securities | | – | | | (4,236 | ) | | (29,381 | ) | | (33,617 | ) | | – | | | (93 | ) | | – | | | (93 | ) |
| Equity securities | | – | | | (1,187 | ) | | (61 | ) | | (1,248 | ) | | – | | | (37 | ) | | – | | | (37 | ) |
| Other investments | | – | | | (1,072 | ) | | (478 | ) | | (1,550 | ) | | – | | | (217 | ) | | – | | | (217 | ) |
| | | – | | | (6,495 | ) | | (29,920 | ) | | (36,415 | ) | | – | | | (347 | ) | | – | | | (347 | ) |
| | | 1,590 | | | 186,952 | | | 536 | | | 189,078 | | | 1,713 | | | 184,697 | | | 29,648 | | | 216,058 | |
Of the above total, £129,448 million(2011: £154,116 million) is due to be recovered in more than one year after the statement
of financial position date.
Other debt securities of £8,829 million(2011: £7,539 million) primarily include residential and commercial mortgage-backed securities, as well as other structured credit securities.
22 – Financial investments continued
(b) Cost, unrealised gains and fair value
The following is a summary of the cost/amortised cost, gross unrealised gains and losses and fair value of financial investments:
| | | | | | | | 2012 | | | | | | | | 2011 | |
| | Cost/ amortised cost £m | | Unrealised
gains
£m | | Unrealised
losses and
impairments
£m | | Fair value
£m | | Cost/
amortised
cost
£m | | Unrealised
gains
£m | | Unrealised
losses and
impairments
£m | | Fair value
£m | |
| Fixed maturity securities | | 147,220 | | | 16,433 | | | (2,030 | ) | | 161,623 | | | 147,537 | | | 12,395 | | | (6,587 | ) | | 153,345 | |
| Equity securities | | 30,898 | | | 5,043 | | | (2,164 | ) | | 33,777 | | | 33,055 | | | 3,637 | | | (4,009 | ) | | 32,683 | |
| Other investments | | | | | | | | | | | | | | | | | | | | | | | | |
| Unit trusts and specialised investment vehicles | | 25,966 | | | 1,647 | | | (857 | ) | | 26,756 | | | 27,416 | | | 74 | | | (230 | ) | | 27,260 | |
| Derivatives financial instruments | | 1,201 | | | 518 | | | (129 | ) | | 1,590 | | | 1,228 | | | 336 | | | (66 | ) | | 1,498 | |
| Deposits with credit institutions | | 739 | | | – | | | – | | | 739 | | | 427 | | | – | | | – | | | 427 | |
| Minority holdings in property management undertakings | | 599 | | | 123 | | | (138 | ) | | 584 | | | 639 | | | 124 | | | (146 | ) | | 617 | |
| Other long-term investments | | 434 | | | 20 | | | (30 | ) | | 424 | | | 652 | | | 19 | | | (96 | ) | | 575 | |
| | | 207,057 | | | 23,784 | | | (5,348 | ) | | 225,493 | | | 210,954 | | | 16,585 | | | (11,134 | ) | | 216,405 | |
| These are further analysed as follows: | | | | | | | | | | | | | | | | | | | | | | | | |
| At fair value through profit or loss | | 180,006 | | | 20,202 | | | (5,171 | ) | | 195,037 | | | 183,959 | | | 13,555 | | | (10,757 | ) | | 186,757 | |
| Available for sale | | 27,051 | | | 3,582 | | | (177 | ) | | 30,456 | | | 26,995 | | | 3,030 | | | (377 | ) | | 29,648 | |
| | | 207,057 | | | 23,784 | | | (5,348 | ) | | 225,493 | | | 210,954 | | | 16,585 | | | (11,134 | ) | | 216,405 | |
All unrealised gains and losses and impairments on financial investments classified as fair value through profit or loss have been recognised in the income statement.
Gains and losses on financial investments from continuing operations classified as at fair value through profit or loss recognised in the income statement in the year were a net gain of £12,365 million(2011: £5,487 million net loss). Of this, £30 million net loss(2011: £69 million net gain) related to financial investments designated as trading and £12,395 million net gain(2011: £5,556 million net loss) related to investments designated as other than trading.
The movement in the unrealised gain/loss position reported in the statement of financial position during the year, shown in the table above, includes foreign exchange movements on the translation of unrealised gains and losses on financial investments held by foreign subsidiaries, which are recognised in other comprehensive income, as well as transfers due to the realisation of gains and losses on disposal and the recognition of impairment losses.
Total impairments of financial investments classified as AFS in the income statement in the year were £14 million (2011: £21 million). The total accumulated impairment provision for financial investments classified as available-for-sale included in the table above within unrealised losses and impairments was £97 million(2011: £138 million). Movements in this AFS provision are shown in section (c) below.
(c) Impairment of financial investments
The movements in impairment provisions on available-for-sale financial investments for the years ended 31 December 2011 and 2012 were as follows:
| | | | | | | | 2012 | | | | | | | | 2011 | |
| | Fixed
maturity
securities
£m | | Equity
securities
£m | | Other
Investments
£m | | Total
£m | | Fixed
maturity
securities
£m | | Equity
securities
£m | | Other
Investments
£m | | Total
£m | |
| At 1 January | | (126 | ) | | (5 | ) | | (7 | ) | | (138 | ) | | (151 | ) | | (825 | ) | | (7 | ) | | (983 | ) |
| Charge for the year taken to the income statement | | (12 | ) | | – | | | (2 | ) | | (14 | ) | | (19 | ) | | (2 | ) | | – | | | (21 | ) |
| Write back following sale or reimbursement | | 49 | | | – | | | – | | | 49 | | | 28 | | | – | | | – | | | 28 | |
| Write back following recovery in value | | – | | | 1 | | | – | | | 1 | | | – | | | – | | | – | | | – | |
| Deconsolidation of Delta Lloyd | | – | | | – | | | – | | | – | | | 16 | | | 822 | | | – | | | 838 | |
| Foreign exchange rate movements | | 5 | | | – | | | – | | | 5 | | | – | | | – | | | – | | | – | |
| At 31 December | | (84 | ) | | (4 | ) | | (9 | ) | | (97 | ) | | (126 | ) | | (5 | ) | | (7 | ) | | (138 | ) |
(d) Financial investment arrangements
(i) Stock lending arrangements
The Group has entered into stock lending arrangements in the UK and overseas in accordance with established market conventions. The majority of the Group’s stock lending transactions occur in the UK, where investments are lent to EEA-regulated, locally domiciled counterparties and governed by agreements written under English law.
Non-cash collateral received
The Group receives collateral in order to reduce the credit risk of these arrangements. Collateral must be in a readily realisable form, such as listed securities, and is held in segregated accounts. Transfer of title always occurs for collateral received, although no market risk or economic benefit is taken. The level of collateral held is monitored regularly, with further collateral obtained where this is considered necessary to manage the Group’s risk exposure.
In certain markets, the Group or the Group’s appointed stock lending managers obtain legal ownership of the collateral received and can re-pledge it as collateral elsewhere or sell outright in the absence of default. The carrying amount of financial assets received
22 – Financial investments continued
in this manner at 31 December 2012 was £16,043 million(2011:£20,053million). The value of collateral that was actually sold in the absence of default was £nil(2011: £150 million).
Cash collateral received
In addition to the above, the Group has received cash collateral under stock lending arrangements that has been recognised in the statement of financial position with a corresponding obligation for its return. The latter balance is included in note 46.
(ii) Other arrangements
In carrying on its bulk purchase annuity business, the Group’s UK Life operation is required to place certain investments in trust on behalf of the policyholders. Amounts become payable from the trust funds to the trustees if the Group were to be in breach of its payment obligations in respect of policyholder benefits. At 31 December 2012 £1,208 million(2011: £1,044 million) of financial investments were restricted in this way.
Certain financial investments are also required to be deposited under local laws in various overseas countries as security for the holders of policies issued in those countries. Other investments are pledged as security collateral for bank letters of credit.
(e) Non UK Government Debt Securities (gross of non-controlling interests)
The following is a summary of non UK government debt by issuer as at 31 December 2012 analysed by policyholder, participating and shareholder funds.
| Policyholder | | | Participating | | Shareholder | | Total | |
| Non UK Government Debt Securities | | 2012 £m | | | 2011 £m | | | 2012 £m | | | 2011 £m | | | 2012 £m | | | 2011 £m | | | 2012 £m | | | 2011 £m | |
| Austria | | 14 | | | 28 | | | 634 | | | 512 | | | 123 | | | 58 | | | 771 | | | 598 | |
| Belgium | | 45 | | | 30 | | | 1,342 | | | 1,029 | | | 172 | | | 176 | | | 1,559 | | | 1,235 | |
| France | | 189 | | | 215 | | | 9,072 | | | 7,529 | | | 1,944 | | | 1,634 | | | 11,205 | | | 9,378 | |
| Germany | | 217 | | | 239 | | | 2,389 | | | 1,751 | | | 957 | | | 792 | | | 3,563 | | | 2,782 | |
| Greece | | – | | | – | | | – | | | 46 | | | – | | | 2 | | | – | | | 48 | |
| Ireland | | 34 | | | 33 | | | 363 | | | 378 | | | 26 | | | 216 | | | 423 | | | 627 | |
| Italy | | 263 | | | 273 | | | 8,517 | | | 9,670 | | | 617 | | | 1,056 | | | 9,397 | | | 10,999 | |
| Netherlands | | 65 | | | 63 | | | 1,193 | | | 1,284 | | | 228 | | | 136 | | | 1,486 | | | 1,483 | |
| Poland | | 672 | | | 509 | | | 1,012 | | | 720 | | | 445 | | | 329 | | | 2,129 | | | 1,558 | |
| Portugal | | – | | | – | | | 257 | | | 204 | | | – | | | 8 | | | 257 | | | 212 | |
| Spain | | 36 | | | 46 | | | 1,317 | | | 1,046 | | | 854 | | | 639 | | | 2,207 | | | 1,731 | |
| European Supranational debt | | 136 | | | 114 | | | 2,928 | | | 2,376 | | | 1,470 | | | 856 | | | 4,534 | | | 3,346 | |
| Other European countries | | 235 | | | 125 | | | 634 | | | 410 | | | 421 | | | 91 | | | 1,290 | | | 626 | |
| Europe | | 1,906 | | | 1,675 | | | 29,658 | | | 26,955 | | | 7,257 | | | 5,993 | | | 38,821 | | | 34,623 | |
| Canada | | 18 | | | 18 | | | 195 | | | 195 | | | 2,517 | | | 2,342 | | | 2,730 | | | 2,555 | |
| United States | | 131 | | | 129 | | | 40 | | | 66 | | | 1,665 | | | 1,631 | | | 1,836 | | | 1,826 | |
| North America | | 149 | | | 147 | | | 235 | | | 261 | | | 4,182 | | | 3,973 | | | 4,566 | | | 4,381 | |
| Singapore | | 7 | | | 8 | | | 453 | | | 309 | | | 276 | | | 211 | | | 736 | | | 528 | |
| Sri Lanka | | 2 | | | 21 | | | 2 | | | 2 | | | – | | | 139 | | | 4 | | | 162 | |
| Other | | 604 | | | 391 | | | 1,252 | | | 1,262 | | | 393 | | | 227 | | | 2,249 | | | 1,880 | |
| Asia Pacific and other | | 613 | | | 420 | | | 1,707 | | | 1,573 | | | 669 | | | 577 | | | 2,989 | | | 2,570 | |
| Total | | 2,668 | | | 2,242 | | | 31,600 | | | 28,789 | | | 12,108 | | | 10,543 | | | 46,376 | | | 41,574 | |
| Less: assets of operations classified as held for sale | | 197 | | | 34 | | | 556 | | | 9 | | | 2,274 | | | 19 | | | 3,027 | | | 62 | |
| Total (excluding assets held for sale) | | 2,471 | | | 2,208 | | | 31,044 | | | 28,780 | | | 9,834 | | | 10,524 | | | 43,349 | | | 41,512 | |
At 31 December 2012, the Group’s total government (non-UK) debt securities stood at £46.4 billion(2011: £41.6 billion), an increase of £4.8 billion. The significant majority of these holdings are within our participating funds where the risk to our shareholders is governed by the nature and extent of our participation within those funds.
Our direct shareholder asset exposure to government (non-UK) debt securities amounts to £12.1 billion(2011: £10.5 billion). The primary exposures, relative to total shareholder (non-UK) government debt exposure, are to French (16%), German (8%), Spanish (7%) and Italian (5%) (non-UK) government debt securities.
The participating funds exposure to (non-UK) government debt amounts to £31.6 billion (2011: £28.8 billion), an increase of £2.8 billion. The primary exposures, relative to total (non-UK) government debt exposures included within our participating funds, are to the (non-UK) government debt securities of France (29%), Italy (27%), Germany (8%), Belgium (4%), Spain (4%), Netherlands (4%) and Poland (3%).
22 – Financial investments continued
(f) Exposure to worldwide banks – debt securities
Direct shareholder and participating fund assets exposures to worldwide bank debt securities (net of non-controlling interests, excluding policyholder assets)
| | Shareholder assets | | | | | | Participating fund assets | |
| 2012 | | Total senior debt £bn | | | Total subordinated debt £bn | | | Total debt £bn | | | Total senior debt £bn | | | Total subordinated debt £bn | | | Total debt £bn | |
| Austria | | – | | | – | | | – | | | 0.3 | | | – | | | 0.3 | |
| France | | 0.1 | | | – | | | 0.1 | | | 3.5 | | | 0.8 | | | 4.3 | |
| Germany | | 0.1 | | | 0.1 | | | 0.2 | | | 0.5 | | | 0.5 | | | 1.0 | |
| Ireland | | – | | | 0.1 | | | 0.1 | | | – | | | – | | | – | |
| Italy | | 0.1 | | | 0.1 | | | 0.2 | | | 0.3 | | | 0.1 | | | 0.4 | |
| Netherlands | | 0.4 | | | 0.2 | | | 0.6 | | | 1.9 | | | 0.3 | | | 2.2 | |
| Portugal | | – | | | – | | | – | | | 0.1 | | | – | | | 0.1 | |
| Spain | | 0.8 | | | 0.1 | | | 0.9 | | | 1.1 | | | 0.1 | | | 1.2 | |
| United Kingdom | | 0.8 | | | 0.5 | | | 1.3 | | | 1.0 | | | 1.2 | | | 2.2 | |
| United States | | 1.3 | | | 0.8 | | | 2.1 | | | 1.0 | | | 0.1 | | | 1.1 | |
| Other | | 0.6 | | | 0.4 | | | 1.0 | | | 2.0 | | | 0.8 | | | 2.8 | |
| Total | | 4.2 | | | 2.3 | | | 6.5 | | | 11.7 | | | 3.9 | | | 15.6 | |
| Less: assets of operations classified as held for sale | | 1.3 | | | 1.0 | | | 2.3 | | | 0.1 | | | 0.1 | | | 0.2 | |
| Total (excluding assets held for sale) | | 2.9 | | | 1.3 | | | 4.2 | | | 11.6 | | | 3.8 | | | 15.4 | |
| 2011 Total | | 3.7 | | | 2.2 | | | 5.9 | | | 10.6 | | | 3.6 | | | 14.2 | |
Net of non-controlling interests, our direct shareholder assets exposure to worldwide bank debt securities is £6.5 billion. The majority of our holding (65%) is in senior debt. The primary exposures are to US (32%) and UK (20%) banks. Net of non-controlling interests, our direct shareholder asset exposure to worldwide bank equity securities is £0.2 billion. Our holdings include strategic holdings in Italian banks of £148 million.
Net of non-controlling interests, the participating fund exposures to worldwide bank debt securities, where the risk to our shareholders is governed by the nature and extent of our participation within those funds, is £15.6 billion. The majority of the exposure (75%) is in senior debt. Participating funds are the most exposed to French (28%), UK (14%) and Dutch (14%) banks.
Direct shareholder and participating fund assets exposures to worldwide bank debt securities (gross of non-controlling interests, excluding policyholder assets)
| | Shareholder assets | | | | | | Participating fund assets | |
| 2012 | | Total senior debt £bn | | | Total subordinated debt £bn | | | Total debt £bn | | | Total senior debt £bn | | | Total subordinated debt £bn | | | Total debt £bn | |
| Austria | | – | | | – | | | – | | | 0.3 | | | – | | | 0.3 | |
| France | | 0.1 | | | – | | | 0.1 | | | 4.0 | | | 0.9 | | | 4.9 | |
| Germany | | 0.1 | | | 0.1 | | | 0.2 | | | 0.5 | | | 0.5 | | | 1.0 | |
| Ireland | | – | | | 0.1 | | | 0.1 | | | – | | | – | | | – | |
| Italy | | 0.2 | | | 0.1 | | | 0.3 | | | 0.5 | | | 0.2 | | | 0.7 | |
| Netherlands | | 0.4 | | | 0.2 | | | 0.6 | | | 2.0 | | | 0.3 | | | 2.3 | |
| Portugal | | – | | | – | | | – | | | 0.1 | | | – | | | 0.1 | |
| Spain | | 1.2 | | | 0.1 | | | 1.3 | | | 1.5 | | | 0.2 | | | 1.7 | |
| United Kingdom | | 0.8 | | | 0.6 | | | 1.4 | | | 1.1 | | | 1.3 | | | 2.4 | |
| United States | | 1.4 | | | 0.8 | | | 2.2 | | | 1.1 | | | 0.1 | | | 1.2 | |
| Other | | 0.7 | | | 0.4 | | | 1.1 | | | 2.2 | | | 0.9 | | | 3.1 | |
| Total | | 4.9 | | | 2.4 | | | 7.3 | | | 13.3 | | | 4.4 | | | 17.7 | |
| Less: assets of operations classified as held for sale | | 1.4 | | | 1.1 | | | 2.5 | | | 0.2 | | | 0.1 | | | 0.3 | |
| Total (excluding assets held for sale) | | 3.5 | | | 1.3 | | | 4.8 | | | 13.1 | | | 4.3 | | | 17.4 | |
| 2011 Total | | 4.3 | | | 2.3 | | | 6.6 | | | 12.0 | | | 3.9 | | | 15.9 | |
Gross of non-controlling interests, our direct shareholder assets exposure to worldwide bank debt securities is £7.3 billion. The majority of our holding (67%) is in senior debt. The primary exposures are to US (30%) and UK (19%) banks. Gross of non-controlling interests, our direct shareholder asset exposure to worldwide bank equity securities is £0.4 billion. Our holdings include strategic holdings in Italian banks of £289 million.
Gross of non-controlling interests, the participating fund exposures to worldwide bank debt securities, where the risk to our shareholders is governed by the nature and extent of our participation within those funds, is £17.7 billion. The majority of the exposure (75%) is in senior debt. Participating funds are the most exposed to French (28%), UK (14%) and Dutch (13%) banks.
23 – Receivables
This note analyses our total receivables.
| | 2012
£m | | 2011
£m | |
| Amounts owed by contract holders | | 1,693 | | | 1,838 | |
| Amounts owed by intermediaries | | 1,398 | | | 1,139 | |
| Deposits with ceding undertakings | | 1,395 | | | 1,426 | |
| Amounts due from reinsurers | | 367 | | | 339 | |
| Amounts due from brokers for investment sales | | 444 | | | 270 | |
| Amounts receivable for cash collateral pledged | | 241 | | | 26 | |
| Amounts due from government, social security and taxes | | 521 | | | 467 | |
| Corporate owned life insurance | | 162 | | | 156 | |
| Dividends receivable | | 6 | | | 109 | |
| Finance lease receivables | | 141 | | | 200 | |
| Other receivables | | 1,662 | | | 1,978 | |
| Total | | 8,030 | | | 7,948 | |
| Less: Amounts classified as held for sale | | (413 | ) | | (11 | ) |
| | | 7,617 | | | 7,937 | |
| Expected to be recovered in less than one year | | 7,525 | | | 7,713 | |
| Expected to be recovered in more than one year | | 92 | | | 224 | |
| | | 7,617 | | | 7,937 | |
Concentrations of credit risk with respect to receivables are limited due to the size and spread of the Group’s trading base. No further credit risk provision is therefore required in excess of the normal provision for doubtful receivables.
24 – Deferred acquisition costs, other assets, prepayments and accrued income
(a) Deferred acquisition costs and other assets – carrying amount
The carrying amount comprises:
| | 2012
£m | | 2011
£m | |
| Deferred acquisition costs in respect of: | | | | | | |
| Insurance contracts – Long-term business | | 2,122 | | | 2,733 | |
| Insurance contracts – General insurance and health business | | 939 | | | 986 | |
| Participating investment contracts – Long-term business | | 30 | | | 21 | |
| Non-participating investment contracts – Long-term business | | 936 | | | 1,024 | |
| Retail fund management business | | 14 | | | 14 | |
| Total deferred acquisition costs | | 4,041 | | | 4,778 | |
| Surpluses in the staff pension schemes (note 44 (e) (vii)) | | 1,257 | | | 1,670 | |
| Other assets | | 56 | | | 19 | |
| Total | | 5,354 | | | 6,467 | |
| Less: Amounts classified as held for sale | | (1,555 | ) | | (23 | ) |
| | | 3,799 | | | 6,444 | |
Deferrable acquisition costs (DAC) on long-term business are generally recoverable in more than one year whereas such costs on general insurance and health business are generally recoverable within one year. Of the above total, £1,351 million (2011: £3,148 million) is expected to be recovered more than one year after the statement of financial position date; the reduction in this amount reflects that the DAC balance for the US is included in amounts classified as held for sale at 31 December 2012. For long-term business where amortisation of the DAC balance depends on projected profits, the amount expected to be recovered is estimated and actual experience will differ.
Surpluses in the staff pension schemes are recoverable more than one year after the statement of financial position date.
24 – Deferred acquisition costs, other assets, prepayments and accrued income continued
(b) Deferred acquisition costs – movements in the year
The movements in deferred acquisition costs (DAC) during the year were:
| | | | | | | | 2012 | | | | | | | | 2011 | |
| | Long-term
business
£m | | General
insurance
and health
business
£m | | Retail fund
management
business
£m | | Total
£m | | Long-term
business
£m | | General
insurance
and health
business
£m | | Retail fund
management
business
£m | | Total
£m | |
| Carrying amount at 1 January | | 3,778 | | | 986 | | | 14 | | | 4,778 | | | 4,261 | | | 1,141 | | | 14 | | | 5,416 | |
| Acquisition costs deferred during the year | | 841 | | | 2,221 | | | 4 | | | 3,066 | | | 1,012 | | | 2,414 | | | 5 | | | 3,431 | |
| Amortisation | | (804 | ) | | (2,257 | ) | | (4 | ) | | (3,065 | ) | | (735 | ) | | (2,467 | ) | | (5 | ) | | (3,207 | ) |
| Impact of assumption changes | | (201 | ) | | – | | | – | | | (201 | ) | | (48 | ) | | – | | | – | | | (48 | ) |
| Effect of portfolio transfers, acquisitions and disposals | | (15 | ) | | (1 | ) | | – | | | (16 | ) | | – | | | (18 | ) | | – | | | (18 | ) |
| Foreign exchange rate movements | | (89 | ) | | (10 | ) | | – | | | (99 | ) | | (3 | ) | | (5 | ) | | – | | | (8 | ) |
| Shadow adjustment | | (422 | ) | | – | | | – | | | (422 | ) | | (593 | ) | | – | | | – | | | (593 | ) |
| Deconsolidation of Delta Lloyd | | – | | | – | | | – | | | – | | | (116 | ) | | (79 | ) | | – | | | (195 | ) |
| Carrying amount at 31 December | | 3,088 | | | 939 | | | 14 | | | 4,041 | | | 3,778 | | | 986 | | | 14 | | | 4,778 | |
| Less: Amounts classified as held for sale | | (1,538 | ) | | – | | | – | | | (1,538 | ) | | (23 | ) | | – | | | – | | | (23 | ) |
| | | 1,550 | | | 939 | | | 14 | | | 2,503 | | | 3,755 | | | 986 | | | 14 | | | 4,755 | |
The balance of deferred acquisition costs for long-term business decreased by £0.7 billion in 2012, reflecting the impact of assumption changes and shadow adjustment in the US.
Where amortisation of the DAC balance depends on projected profits, changes to economic conditions may lead to a movement in the DAC balance and a corresponding impact on profit. It is estimated that the movement in the DAC balance would reduce profit by £30 million(2011: £145 million) if market yields on fixed income investments were to increase by 1% and increase profit by £50 million(2011: £170 million)if yields were to reduce by 1%. The reduction in sensitivities for 2012 reflects that the US business is held for sale and carried at fair value less cost to sell.
The shadow adjustments relate to deferred acquisition costs on business in the US backed by investments classified as AFS. As explained in accounting policy K, unrealised gains and losses on the AFS investments and the shadow adjustments above are both recognised directly in other comprehensive income.
(c) Other assets
Other assets include £3 million(2011: £6 million) that is expected to be recovered more than one year after the statement of financial position date.
(d) Prepayments and accrued income
Prepayments and accrued income of £3,104 million including assets classified as held for sale(2011:£3,235million), includes £108 million(2011: £90 million) that is expected to be recovered more than one year after the statement of financial position date.
25 – Assets held to cover linked liabilities
Certain unit-linked products have been classified as investment contracts, while some are included within the definition of an insurance contract. The assets backing these unit-linked liabilities are included within the relevant balances in the consolidated statement of financial position, while the liabilities are included within insurance and investment contract provisions. This note analyses the carrying values of assets backing these liabilities.
| | 2012
£m | | 2011
£m | |
| Loans | | 605 | | | 917 | |
| Debt securities | | 16,472 | | | 15,295 | |
| Equity securities | | 22,500 | | | 20,602 | |
| Reinsurance assets | | 1,576 | | | 1,454 | |
| Cash and cash equivalents | | 4,305 | | | 3,980 | |
| Other | | 28,512 | | | 28,119 | |
| | | 73,970 | | | 70,367 | |
| Less: Assets classified as held for sale | | (3,048 | ) | | – | |
| | | 70,922 | | | 70,367 | |
26 – Ordinary share capital
This note gives details of Aviva plc’s ordinary share capital and shows the movements during the year.
(a) Details of the Company’s ordinary share capital are as follows:
| | 2012
£m | | 2011
£m | |
| The allotted, called up and fully paid share capital of the Company at 31 December 2012 was: 2,945,972,261(2011: 2,905,712,938) ordinary shares of 25 pence each | | 736 | | | 726 | |
(b) During2012, a total of40,259,323 ordinary shares of 25 pence each were allotted and issued by the Company as follows:
| | 2012 | | 2011 | |
| | Number
of shares | | Share
Capital
£m | | Share
Premium
£m | | Number
of shares | | Share
Capital
£m | | Share
Premium
£m | |
| At 1 January 2012 | | 2,905,712,938 | | | 726 | | | 1,173 | | | 2,820,148,642 | | | 705 | | | 1,194 | |
| Shares issued under the Group’s Employee and Executive Share Option Schemes | | 3,335,566 | | | 1 | | | 1 | | | 1,574,706 | | | – | | | – | |
| Shares issued in lieu of dividends | | 36,923,757 | | | 9 | | | (9 | ) | | 83,989,590 | | | 21 | | | (21 | ) |
| At 31 December 2012 | | 2,945,972,261 | | | 736 | | | 1,165 | | | 2,905,712,938 | | | 726 | | | 1,173 | |
Ordinary shares in issue in the Company rank pari passu with any new ordinary shares issued in the Company. All the ordinary shares in issue carry the same right to receive all dividends and other distributions declared, made or paid by the Company.
The issue of shares in lieu of cash dividends is considered a bonus issue under the terms of the Companies Act 2006 and the nominal value of the shares is charged to the share premium account.
27 – Group’s share plans
This note describes the Group’s various equity compensation plans, and shows how the Group values the options and awards of shares in the Company.
(a) Description of the plans
The Group maintains a number of active share option and award plans and schemes (the Group’s Share Plans). These are as follows:
(i) Savings-related options
These are options granted under the HMRC-approved Save As You Earn (SAYE) share option schemes in the UK and Irish Revenue-approved SAYE share option scheme in Ireland. Options are normally exercisable during the six-month period following either the third, fifth or seventh anniversary of the start of the relevant savings contract. Options granted in 2012 are normally exercisable following the third or fifth anniversary.
(ii) Executive share options
These are options granted on various dates until 2004 under the Aviva Executive Share Option Plan and in 2010, under the Aviva Executive Share Option Plan 2005. Options granted between 2001 and 2004 were subject to the satisfaction of conditions relating to both the Company’s Return on Equity (ROE) and its relative Total Shareholder Return (TSR). The performance was measured over
a three-year performance period and the options are normally exercisable between the third and tenth anniversary of their grant. The options granted in 2010 are described in the Directors’ Remuneration Report.
(iii) Long-term incentive plan awards
These awards have been made under the Aviva Long Term Incentive Plan 2005 and Aviva Long Term Incentive Plan 2011, and are described in section (b) below and in the Directors’ Remuneration Report.
(iv) Annual bonus plan awards
These awards have been made under the Aviva Annual Bonus Plan 2005 and Aviva Annual Bonus Plan 2011, and are described in section (b) below and in the Directors’ Remuneration Report.
(v) One Aviva, twice the value bonus plan awards
These are conditional awards granted under the Aviva Annual Bonus Plan 2005 between 2008 and 2010, and are described in section (b) below and in the Directors’ Remuneration Report.
(vi) Recruitment and retention share award plan awards
These are conditional awards granted under the Aviva Recruitment and Retention Share Award Plan in relation to the recruitment or retention of senior managers excluding Executive Directors. The awards vest in tranches on various dates and vesting is conditional upon the participant being employed by the Group on the vesting date and not having served notice of resignation. If a participant’s employment is terminated due to resignation or dismissal, any tranche of the award which has vested within the 12 months prior to the termination date will be subject to clawback and any unvested tranches of the award will lapse in full. No new Aviva plc ordinary shares will be issued or transferred from treasury to satisfy vested awards under this plan.
27 – Group’s share plans continued
(vii) CFO recruitment share awards plan awards
The following awards were granted to Patrick Regan under the CFO Recruitment Share Awards Plan following his recruitment in 2010: the Replacement Restricted Share Award (RRSA), the Bonus Replacement Deferred Share Award (BRDSA) and the One Aviva Twice the Value (OATTV) Award. The RRSA was awarded to compensate Mr Regan for the loss of share awards granted by his previous employer and the BRDSA was awarded to compensate Mr Regan for the loss of bonus from his previous employer. The awards are described in section (b) below and in the Directors’ Remuneration Report. No further awards will be made under this plan.
(viii) Conditional share award granted to Trevor Matthews
A conditional share award was awarded to Trevor Matthews as compensation for the loss of share awards granted by his previous employer. The awards are described in section (b) below and in the Directors’ Remuneration Report.
(b) Outstanding options and awards
(i) Share options
At 31 December 2012, options to subscribe for ordinary shares of 25 pence each in the Company were outstanding as follows:
Aviva Savings Related
Share Option Scheme | Option price
p | Number
of shares | Normally
exercisable | Option price
p | Number
of shares | Normally
exercisable |
| 491 | 13,228 | 2012 | 316 | 2,337,854 | 2012, 2014 or 2016 |
| 593 | 39,615 | 2013 | 310 | 2,421,083 | 2013, 2015 or 2017 |
| 563 | 139,960 | 2012 or 2014 | 268 | 10,302,920 | 2014, 2016 or 2018 |
| 410 | 502,299 | 2013 or 2015 | 266 | 5,892,828 | 2015 or 2017 |
Aviva Ireland Savings Related
Share Option Scheme (in euros) | Option price
c | Number
of shares | Normally
exercisable | Option price
c | Number
of shares | Normally
exercisable |
| 830 | 32,130 | 2012 | 374 | 140,085 | 2013 or 2015 |
| 509 | 49,387 | 2013 | 304 | 507,254 | 2014 or 2016 |
| 360 | 362,066 | 2012 or 2014 | 336 | 268,003 | 2015 or 2017 |
| Aviva Executive Share Option Plan | Option price
p | Number
of shares | Normally
exercisable |
| 512 | 533,707 | 2006 to 2013 |
| 526 | 361,010 | 2007 to 2014 |
| 386 | 1,308,781 | 2013 |
The following table summarises information about options outstanding at 31 December 2012:
| Range of exercise prices | Outstanding
options
Number | | Weighted average
remaining
contractual life
Years | | Weighted average
exercise price
p | |
| £2.66 – £4.29 | | 24,092,560 | | | 3 | | | 287.77 | |
| £4.30 – £5.89 | | 1,080,035 | | | 1 | | | 524.55 | |
| £5.90 – £10.35 | | 39,615 | | | 1 | | | 593.00 | |
The comparative figures as at 31 December 2011 were:
| Range of exercise prices | Outstanding
options
Number | | Weighted average
remaining
contractual life
Years | | Weighted average
exercise price
p | |
| £2.68 – £4.29 | | 27,743,093 | | | 3 | | | 303.84 | |
| £4.30 – £5.89 | | 2,052,537 | | | 2 | | | 524.03 | |
| £5.90 – £10.35 | | 278,354 | | | 1 | | | 593.00 | |
27 – Group’s share plans continued
(ii) Share awards
At 31 December 2012, awards issued under the Company’s executive incentive plans over ordinary shares of 25 pence each in the Company were outstanding as follows:
| Aviva Long Term Incentive Plan 2005 | Number of shares | | Vesting period |
| | 5,458,500 | | 2010 to 2012 |
| Aviva Long Term Incentive Plan 2011 | Number of shares | | Vesting period |
| | 7,391,026 | | 2011 to 2013 |
| | | 11,321,800 | | 2012 to 2014 |
| One Aviva, twice the value bonus plan | Number of shares | | Vesting period |
| | 1,422,544 | | 2010 to 2012 |
| Aviva Annual Bonus Plan 2005 | Number of shares | | Vesting period |
| | 2,762,731 | | 2010 to 2012 |
| Aviva Annual Bonus Plan 2011 | | Number of shares | | Vesting period |
| | | 2,496,279 | | 2011 to 2013 |
| | | 4,476,090 | | 2012 to 2014 |
| CFO Recruitment Share Awards Plan | Award type | Number of shares | | Vesting period |
| RRSA | | 85,197 | | 2013 |
| | BRDSA | | 43,231 | | 2010 to 2012 |
| | OATTV | | 55,051 | | 2010 to 2012 |
| Conditional Share Award granted to Trevor Matthews | Number of shares | | Vesting period |
| | 435,814 | | 2013 and 2014 |
| Recruitment and Retention Share Award Plan | Number of shares | | Vesting period |
| | 19,481 | | 2013 |
| | 166,921 | | 2013 and 2014 |
| | 39,122 | | 2013, 2014 and 2015 |
| | 78,167 | | 2015 |
The vesting of awards under the Aviva Long Term Incentive Plan 2005, the Aviva Long Term Incentive Plan 2011, the OATTV bonus plan and the OATTV Award under the CFO Recruitment Share Awards Plan is subject to the attainment of performance conditions as described in the Directors’ Remuneration Report. Shares which do not vest will lapse.
(iii) Shares to satisfy awards and options
Since July 2008, it has been the Company’s practice to satisfy all awards and options using shares purchased in the market and held by employee trusts except where local regulations make it necessary to issue new shares. Further details are given in note 28.
(c) Movements in the year
A summary of the status of the option plans as at 31 December 2011 and 2012, and changes during the years ended on those dates, is shown below.
| | | | 2012 | | | | 2011 | |
| Number of options | | Weighted average
exercise price
p | | Number of options | | Weighted
average
exercise
price
p | |
| Outstanding at 1 January | | 30,073,984 | | | 321.55 | | | 27,256,640 | | | 367.51 | |
| Granted during the year | | 6,236,944 | | | 269.02 | | | 13,486,990 | | | 268.00 | |
| Exercised during the year | | (2,862,952 | ) | | 315.24 | | | (182,907 | ) | | 353.26 | |
| Forfeited during the year | | (2,187,371 | ) | | 337.96 | | | (1,089,738 | ) | | 347.58 | |
| Cancelled during the year | | (3,282,095 | ) | | 300.34 | | | (7,142,132 | ) | | 320.36 | |
| Expired during the year | | (2,766,300 | ) | | 432.85 | | | (2,254,869 | ) | | 539.48 | |
| Outstanding at 31 December | | 25,212,210 | | | 298.40 | | | 30,073,984 | | | 321.55 | |
| Exercisable at 31 December | | 1,943,130 | | | 424.99 | | | 3,460,979 | | | 471.26 | |
27 – Group’s share plans continued
(d) Expense charged to the income statement
The total expense recognised for the year arising from equity compensation plans was as follows:
| | 2012
£m | | 2011
£m | | 2010
£m | |
| Equity-settled expense | | 42 | | | 48 | | | 41 | |
| Cash-settled expense | | 5 | | | 10 | | | 9 | |
| Total (note 8b) | | 47 | | | 58 | | | 50 | |
(e) Fair value of options and awards granted after 7 November 2002
The weighted average fair values of options and awards granted during the year, estimated by using the Binomial option pricing model, were £0.70 and £2.61(2011: £0.99 and £4.20) respectively.
(i) Share options
The fair value of the options was estimated on the date of grant, based on the following weighted average assumptions:
| Weighted average assumption | 2012 | 2011 |
| Share price | 326p | 312p |
| Exercise price | 266p | 268p |
| Expected volatility | 41% | 58% |
| Expected life | 3.71 years | 3.64 years |
| Expected dividend yield | 7.98% | 6.40% |
| Risk-free interest rate | 0.37% | 0.89% |
The expected volatility used was based on the historical volatility of the share price over a period equivalent to the expected life of the option prior to its date of grant. The risk-free interest rate was based on the yields available on UK government bonds as at the date of grant. The bonds chosen were those with a similar remaining term to the expected life of the options. 2,862,952 options granted after 7 November 2002 were exercised during the year (2011:182,907).
(ii) Share awards
The fair value of the awards was estimated on the date of grant based on the following weighted average assumptions:
| Weighted average assumption | 2012 | 2011 |
| Share price | 331.54p | 435.70p |
| Expected volatility1 | 37% | 66% |
| Expected volatility of comparator companies’ share price1 | 38% | 65% |
| Correlation between Aviva and competitors’ share price1 | 63% | 57% |
| Expected life | 3.00 years | 3.00 years |
| Expected dividend yield2 | n/a | n/a |
| Risk-free interest rate1 | 0.42% | 1.79% |
| 1 | For awards with market-based performance conditions. |
| 2 | The long term incentive plan awards granted in 2011 and 2012 include additional shares being provided to employees equal to dividend rights before vesting. As a result, no dividend yield assumption is required for these awards. |
The expected volatility used was based on the historical volatility of the share price over a period equivalent to the expected life of the share award prior to its date of grant. The risk-free interest rate was basedon the yields available on UK government bonds as at the date of grant. The bonds chosen were those with a similar remaining term to the expected life of the share awards.
28 – Shares held by employee trusts
We satisfy awards and options granted under the Group’s share plans primarily through shares purchased in the market and held by employee share trusts. This note gives details of the shares held in these trusts. Movements in the carrying value of shares held by employee trusts comprise:
| | | | 2012 | | | | 2011 | | | | 2010 | |
| | Number | | £m | | Number | | £m | | Number | | £m | |
| Cost debited to shareholders’ funds | | | | | | | | | | | | | | | | | | |
| At 1 January | | 13,284,476 | | | 43 | | | 8,415,487 | | | 32 | | | 17,979,232 | | | 68 | |
| Acquired in the year | | 10,269,904 | | | 33 | | | 9,396,602 | | | 29 | | | 3,500,000 | | | 14 | |
| Distributed in the year | | (13,500,865 | ) | | (44 | ) | | (4,527,613 | ) | | (18 | ) | | (13,063,745 | ) | | (50 | ) |
| Balance at 31 December | | 10,053,515 | | | 32 | | | 13,284,476 | | | 43 | | | 8,415,487 | | | 32 | |
The shares are owned by employee share trusts with an undertaking to satisfy awards of shares in the Company under the Company’s share plans and schemes. Details of the features of the plans can be found in the Directors’ Remuneration Report and in note 27.
These shares were purchased in the market and are carried at cost. At 31 December 2012, they had an aggregate nominal value of £2,513,379(2011:£3,321,119) and a market value of £37,499,611(2011:£39,959,704). The trustees have waived their rights to dividends on the shares held in the trusts.
29 – Preference share capital
This note gives details of Aviva plc’s preference share capital.
The preference share capital of the Company at 31 December 2012 was:
| | 2012
£m | | 2011
£m | |
| Issued and paid up | | | | | | |
| 100,000,000 8.375% cumulative irredeemable preference shares of £1 each | | 100 | | | 100 | |
| 100,000,000 8.75% cumulative irredeemable preference shares of £1 each | | 100 | | | 100 | |
| | | 200 | | | 200 | |
Under its articles of association, the Company may issue and allot Sterling New Preference Shares and Euro New Preference Shares, which, if issued and allotted, would rank, as to payment of a dividend and capital, ahead of the Company’s ordinary share capital but behind the cumulative irredeemable preference shares currently in issue. The issued preference shares are non-voting except where their dividends are in arrears, on a winding up or where their rights are altered.
On a winding up, they carry a preferential right of return of capital ahead of the ordinary shares. The Company does not have a contractual obligation to deliver cash or other financial assets to the preference shareholders and therefore the directors may make dividend payments at their discretion.
30 – Direct capital instruments and fixed rate tier 1 notes
| Notional amount | 2012
£m | | 2011
£m | |
| 5.9021% £500 million direct capital instrument | | 500 | | | 500 | |
| 4.7291% €700 million direct capital instrument | | 490 | | | 490 | |
| | | 990 | | | 990 | |
| Issued May 2012 | | | | | | |
| 8.25% US $650 million fixed rate tier 1 notes | | 392 | | | – | |
| | | 1,382 | | | 990 | |
The euro and sterling direct capital instruments (the DCIs) were issued on 25 November 2004 and qualify as Innovative Tier 1 capital, as defined by the Financial Services Authority in GENPRU Annex 1 ‘Capital Resources’. They have no fixed redemption date but the Company may, at its sole option, redeem all (but not part) of the euro and sterling DCIs at their principal amounts on 28 November 2014 and 27 July 2020 respectively, at which dates the interest rates change to variable rates, or on any respective coupon payment date thereafter. In the case of the sterling DCI this variable rate will be the six month sterling deposit rate plus margin while the euro DCI variable rate will be the three month euro deposit rate plus margin.
The fixed rate tier 1 notes (the FxdRNs) were issued on 3 May 2012 and also qualify as Innovative Tier 1 capital. The FxdRNs are perpetual but are subject to a mandatory exchange into non-cumulative preference shares in the Company after 99 years. The Company may, at its sole option, redeem all (but not part) of the FxdRNs at their principal amounts on 3 November 2017, or on any respective coupon payment date thereafter.
On the occurrence of a Capital Disqualification Event as defined in the terms and conditions of the issue for both the DCIs and FxdRNs, the Company may at its sole option substitute at any time not less than all of the DCIs or FxdRNs for, or vary the terms of the DCIs so that they become, Qualifying Tier 1 Securities or Qualifying Upper Tier 2 Securities.
In addition, on the occurrence of a Substitution Event as defined in the terms and conditions of the issue for the DCIs, the Company may at its sole option substitute not less than all of the DCIs for fully paid non-cumulative preference shares in the Company. These preference shares can only be redeemed on 28 November 2014 in the case of the euro DCIs and on 27 July 2020 in the case of the sterling DCIs, or in each case on any dividend payment date thereafter. For the FxdRNs, having given the required notice, the Company has the right to substitute not less than all of the notes for fully paid non-cumulative preference shares at any time. These preference shares can only be redeemed on 3 November 2017, or on any dividend payment date thereafter. The Company has the right to choose whether or not to pay any dividend on the new shares, and any such dividend payment will be non-cumulative.
The Company has the option to defer coupon payments on the DCIs or FxdRNs on any relevant payment date.
In relation to the DCIs, deferred coupons shall be satisfied only in the following circumstances, all of which occur at the sole option of the Company:
| n | Substitution by, or variation so they become, alternative Qualifying Tier 1 Securities or Qualifying Upper Tier 2 Securities; or |
| n | Substitution by preference shares. |
In relation to the FxdRNs, deferred coupons may be satisfied at any time, at the sole option of the Company. The Company is required to satisfy deferred coupons on the FxdRNs only in the following circumstances:
| n | Substitution by preference shares. |
No interest will accrue on any deferred coupon. Deferred coupons will be satisfied by the issue and sale of ordinary shares in the Company at their prevailing market value, to a sum as near as practicable to (and at least equal to) the relevant deferred coupons. In the event of any coupon deferral, the Company will not declare or pay any dividend on its ordinary or preference share capital.
These instruments have been treated as equity. Please refer to accounting policy AD.
31 – Merger reserve
This note describes the use of the merger reserve.
Prior to 1 January 2004, certain significant business combinations were accounted for using the ‘pooling of interests method’ (or merger accounting), which treats the merged groups as if they had been combined throughout the current and comparative accounting periods. Merger accounting principles for these combinations gave rise to a merger reserve in the consolidated statement of financial position, being the difference between the nominal value of new shares issued by the Parent Company for the acquisition of the shares of the subsidiary and the subsidiary’s own share capital and share premium account.
The merger reserve is also used where more than 90% of the shares in a subsidiary are acquired and the consideration includes the issue of new shares by the Company, thereby attracting merger relief under the Companies Act 1985 and, from 1 October 2009, the Companies Act 2006.
The balance on the reserve of £3,271 million(2011: £3,271million) has arisen through the mergers of Commercial Union, General Accident and Norwich Union companies, forming Aviva plc in 2000, together with the acquisition of RAC plc (“RAC”) in 2005. Because RAC ownership was immediately transferred from Aviva plc to a subsidiary company, this reserve is unaffected by the disposal of RAC in 2011.
32 – Other reserves
This note gives details of the various reserves forming part of the Group’s consolidated equity and shows the movements during the year net of non-controlling interests:
| | Currency
translation
reserve
(see
accounting
policy E)
£m | | Owner
occupied
properties
reserve
(see
accounting
policy O)
£m | | Investment
valuation
reserve
(see
accounting
policy S)
£m | | Hedging
instruments
reserve
(see
accounting
policy T)
£m | | Equity
compensa-
tion reserve
(see
accounting
policy AA)
£m | | Total
£m | |
| Balance at 1 January 2010 | | 2,224 | | | 104 | | | 163 | | | (771 | ) | | 109 | | | 1,829 | |
| Arising in the year: | | | | | | | | | | | | | | | | | | |
| Fair value gains/(losses) | | – | | | (25 | ) | | 579 | | | – | | | – | | | 554 | |
| Fair value gains/(losses) transferred to profit on disposals | | – | | | – | | | (123 | ) | | – | | | – | | | (123 | ) |
| Transfer to profit on disposal of subsidiary | | (2 | ) | | – | | | – | | | – | | | – | | | (2 | ) |
| Share of fair value changes in joint ventures and associates taken to other comprehensive income (note 15a & 16a) | | – | | | – | | | (15 | ) | | – | | | – | | | (15 | ) |
| Impairment losses on assets previously revalued directly through other comprehensive income now taken to income statement | | – | | | – | | | 136 | | | – | | | – | | | 136 | |
| Reserves credit for equity compensation plans | | – | | | – | | | – | | | – | | | 41 | | | 41 | |
| Shares issued under equity compensation plans (note 33) | | – | | | – | | | – | | | – | | | (51 | ) | | (51 | ) |
| Transfer to non-controlling interests following Delta Lloyd IPO | | (3 | ) | | – | | | (1 | ) | | – | | | – | | | (4 | ) |
| Foreign exchange rate movements | | (41 | ) | | – | | | – | | | 78 | | | – | | | 37 | |
| Aggregate tax effect – shareholders’ tax | | 5 | | | 4 | | | (166 | ) | | – | | | – | | | (157 | ) |
| Balance at 1 January 2011 | | 2,183 | | | 83 | | | 573 | | | (693 | ) | | 99 | | | 2,245 | |
| Arising in the year: | | | | | | | | | | | | | | | | | | |
| Fair value gains | | – | | | 2 | | | 424 | | | – | | | – | | | 426 | |
| Fair value gains transferred to profit on disposals | | – | | | – | | | (189 | ) | | – | | | – | | | (189 | ) |
| Transfer to profit on disposal of subsidiary | | (3 | ) | | – | | | – | | | – | | | – | | | (3 | ) |
| Fair value gains transferred to retained earnings on disposals (note 33) | | – | | | (6 | ) | | – | | | – | | | – | | | (6 | ) |
| Share of fair value changes in joint ventures and associates taken to other comprehensive income (note 15a & 16a) | | – | | | 1 | | | (86 | ) | | – | | | – | | | (85 | ) |
| Impairment losses on assets previously revalued directly through other comprehensive income now taken to income statement | | – | | | – | | | 21 | | | – | | | – | | | 21 | |
| Reserves credit for equity compensation plans | | – | | | – | | | – | | | – | | | 48 | | | 48 | |
| Shares issued under equity compensation plans (note 33) | | – | | | – | | | – | | | – | | | (61 | ) | | (61 | ) |
| Transfer to profit on deconsolidation of Delta Lloyd | | (485 | ) | | – | | | (115 | ) | | – | | | – | | | (600 | ) |
| Transfer to retained earnings on deconsolidation of Delta Lloyd | | – | | | (2 | ) | | – | | | – | | | – | | | (2 | ) |
| Foreign exchange rate movements | | (174 | ) | | – | | | – | | | 30 | | | – | | | (144 | ) |
| Aggregate tax effect – shareholders’ tax | | 9 | | | 1 | | | (98 | ) | | – | | | – | | | (88 | ) |
| Balance at 31 December 2011 | | 1,530 | | | 79 | | | 530 | | | (663 | ) | | 86 | | | 1,562 | |
| Arising in the year: | | | | | | | | | | | | | | | | | | |
| Fair value gains | | – | | | (3 | ) | | 554 | | | – | | | – | | | 551 | |
| Fair value gains transferred to profit on disposals | | – | | | – | | | (234 | ) | | – | | | – | | | (234 | ) |
| Transfer to profit on disposal of subsidiaries, joint ventures and associates | | 91 | | | – | | | 96 | | | – | | | – | | | 187 | |
| Share of fair value changes in joint ventures and associates taken to other comprehensive income (note 15a & 16a) | | – | | | – | | | 14 | | | – | | | – | | | 14 | |
| Impairment losses on assets previously revalued directly through other comprehensive income now taken to income statement | | – | | | – | | | 12 | | | – | | | – | | | 12 | |
| Reserves credit for equity compensation plans | | – | | | – | | | – | | | – | | | 42 | | | 42 | |
| Shares issued under equity compensation plans (note 33) | | – | | | – | | | – | | | – | | | (68 | ) | | (68 | ) |
| Foreign exchange rate movements | | (367 | ) | | – | | | – | | | 74 | | | – | | | (293 | ) |
| Aggregate tax effect – shareholders’ tax | | 18 | | | 1 | | | (117 | ) | | – | | | – | | | (98 | ) |
| Balance at 31 December 2012 | | 1,272 | | | 77 | | | 855 | | | (589 | ) | | 60 | | | 1,675 | |
Included in the above are £1.0 billion of currency translation and investment valuation reserves at 31 December 2012 relating to discontinued operations.
33 – Retained earnings
This note analyses the movements in the consolidated retained earnings during the year.
| | 2012
£m | | 2011
£m | | 2010
£m | |
| Balance at 1 January | | 5,954 | | | 5,411 | | | 3,425 | |
| (Loss)/profit for the year attributable to equity shareholders | | (3,218 | ) | | 225 | | | 1,463 | |
| Actuarial (losses)/gains on pension schemes (note 44 (e) (iv)) | | (830 | ) | | 1,002 | | | 1,033 | |
| Other pension scheme movements | | – | | | (22 | ) | | (18 | ) |
| Dividends and appropriations (note 12) | | (847 | ) | | (813 | ) | | (757 | ) |
| Shares issued in lieu of dividends | | 127 | | | 307 | | | 209 | |
| Shares issued under equity compensation plans (note 32) | | 67 | | | 61 | | | 51 | |
| Shares distributed by employee trusts (note 28) | | (36 | ) | | (18 | ) | | (50 | ) |
| Fair value gains realised from reserves (note 32) | | – | | | 6 | | | – | |
| Effect of deconsolidation of Delta Lloyd | | – | | | 2 | | | – | |
| Transfer tominority interest following Delta Lloyd IPO | | – | | | – | | | (4 | ) |
| Share of other comprehensive income of joint ventures and associates | | – | | | (51 | ) | | – | |
| Aggregate tax effect | | 172 | | | (156 | ) | | 59 | |
| Balance at 31 December | | 1,389 | | | 5,954 | | | 5,411 | |
The shares issued in lieu of dividends are in respect of the transfer to retained earnings from the ordinary dividend account, arising from the treatment of these shares explained in note 26(b).
The Group’s regulated subsidiaries are required to hold sufficient capital to meet acceptable solvency levels based on applicable local regulations. Their ability to transfer retained earnings to the UK parent companies is therefore restricted to the extent these earnings form part of local regulatory capital.
34 – Non-controlling interests
This note gives details of the Group’s non-controlling interests and shows the movements during the year.
Non-controlling interests at 31 December comprised:
| | 2012
£m | | 2011
£m | | 2010
£m | |
| Equity shares in subsidiaries | | 424 | | | 480 | | | 2,055 | |
| Share of earnings | | 643 | | | 501 | | | 1,057 | |
| Share of other reserves | | 257 | | | 299 | | | 377 | |
| | | 1,324 | | | 1,280 | | | 3,489 | |
| Preference shares in General Accident plc | | 250 | | | 250 | | | 250 | |
| Preference shares in other subsidiaries | | – | | | – | | | 2 | |
| Total | | 1,574 | | | 1,530 | | | 3,741 | |
Movements in the year comprised:
| | 2012
£m | | 2011
£m | | 2010
£m | |
| Balance at 1 January | | 1,530 | | | 3,741 | | | 3,540 | |
| (Loss)/profit for the year attributable to non-controlling interests | | 168 | | | (165 | ) | | 429 | |
| Non-controlling interests share of movements in other reserves | | 1 | | | (16 | ) | | 57 | |
| Foreign exchange rate movements | | (37 | ) | | 14 | | | (113 | ) |
| Total comprehensive income attributable to non-controlling interests | | 132 | | | (167 | ) | | 373 | |
| Capital contributions from non-controlling interests | | 20 | | | 68 | | | 42 | |
| Increase in non-controlling interests following Delta Lloyd IPO | | – | | | – | | | 8 | |
| Non-controlling interests share of dividends declared in the year | | (102 | ) | | (126 | ) | | (187 | ) |
| Non-controlling interest in acquired subsidiaries | | – | | | – | | | 3 | |
| Changes in non-controlling interests in existing subsidiaries | | (6 | ) | | (11 | ) | | (38 | ) |
| Reclassification to financial liabilities (see below) | | – | | | (205 | ) | | – | |
| Effect of deconsolidation of Delta Lloyd | | – | | | (1,770 | ) | | – | |
| Balance at 31 December | | 1,574 | | | 1,530 | | | 3,741 | |
As explained in note 3, the minority shareholder in an Irish subsidiary has an option requiring the Group to purchase its shares. As a result of this obligation, the Group has reclassified this non-controlling interest to financial liabilities in the consolidated statement of financial position. This option was exercised on 17 January 2012, with completion expected in 2013.
35 – Contract liabilities and associated reinsurance
The following notes explain how the Group calculates its liabilities to policyholders for insurance and investment products it has sold to them. Notes 36 and 37 cover these liabilities, and note 38 details the financial guarantees and options given for some of these products. Note 39 details the reinsurance recoverables on these liabilities while note 40 shows the effects of changes in the assumptions.
The following is a summary of the contract provisions and related reinsurance assets as at 31 December.
| | | | | | 2012 | | | | | | 2011 | |
| | Gross
provisions
£m | | Reinsurance
assets
£m | | Net
£m | | Restated1 Gross provisions £m | | Reinsurance
assets
£m | | Restated1 Net £m | |
| Long-term business | | | | | | | | | | | | | | | | | | |
| Insurance contracts | | (131,190 | ) | | 4,291 | | | (126,899 | ) | | (131,171 | ) | | 3,747 | | | (127,424 | ) |
| Participating investment contracts | | (66,849 | ) | | 3 | | | (66,846 | ) | | (67,707 | ) | | – | | | (67,707 | ) |
| Non-participating investment contracts | | (47,699 | ) | | 1,678 | | | (46,021 | ) | | (45,659 | ) | | 1,626 | | | (44,033 | ) |
| | | (245,738 | ) | | 5,972 | | | (239,766 | ) | | (244,537 | ) | | 5,373 | | | (239,164 | ) |
| Outstanding claims provisions | | | | | | | | | | | | | | | | | | |
| Long-term business | | (1,342 | ) | | 93 | | | (1,249 | ) | | (1,311 | ) | | 126 | | | (1,185 | ) |
| General insurance and health | | (7,711 | ) | | 900 | | | (6,811 | ) | | (8,099 | ) | | 974 | | | (7,125 | ) |
| | | (9,053 | ) | | 993 | | | (8,060 | ) | | (9,410 | ) | | 1,100 | | | (8,310 | ) |
| Provisions for claims incurred but not reported | | (2,843 | ) | | 354 | | | (2,489 | ) | | (2,646 | ) | | 395 | | | (2,251 | ) |
| | | (257,634 | ) | | 7,319 | | | (250,315 | ) | | (256,593 | ) | | 6,868 | | | (249,725 | ) |
| Provision for unearned premiums | | (4,441 | ) | | 248 | | | (4,193 | ) | | (4,483 | ) | | 245 | | | (4,238 | ) |
| Provision arising from liability adequacy tests | | (11 | ) | | – | | | (11 | ) | | (13 | ) | | – | | | (13 | ) |
| Totals | | (262,086 | ) | | 7,567 | | | (254,519 | ) | | (261,089 | ) | | 7,113 | | | (253,976 | ) |
| Less: Amounts classified as held for sale | | 38,501 | | | (883 | ) | | 37,618 | | | 344 | | | (1 | ) | | 343 | |
| | | (223,585 | ) | | 6,684 | | | (216,901 | ) | | (260,745 | ) | | 7,112 | | | (253,633 | ) |
| 1 | Following a review of the classification of contracts issued by the Group’s Italian long-term business, there has been a reallocation from participating insurance liabilities at 31 December 2011 to participating investment contract liabilities of £2,722 million. |
36 – Insurance liabilities
This note analyses the Group insurance contract liabilities by type of product and describes how the Group calculates these liabilities and the assumptions the Group used.
(a) Carrying amount
Insurance liabilities at 31 December comprise:
| | | | | | 2012 | | | | | | 2011 | |
| | Long-term
business
£m | | General
insurance
and health
£m | | Total
£m | | Restated1 Long-term business £m | | General
insurance
and health
£m | | Restated1 Total £m | |
| Long-term business provisions | | | | | | | | | | | | | | | | | | |
| Participating | | 49,473 | | | – | | | 49,473 | | | 52,872 | | | – | | | 52,872 | |
| Unit-linked non-participating | | 9,936 | | | – | | | 9,936 | | | 10,168 | | | – | | | 10,168 | |
| Other non-participating | | 71,781 | | | – | | | 71,781 | | | 68,131 | | | – | | | 68,131 | |
| | | 131,190 | | | – | | | 131,190 | | | 131,171 | | | – | | | 131,171 | |
| Outstanding claims provisions | | 1,342 | | | 7,711 | | | 9,053 | | | 1,311 | | | 8,099 | | | 9,410 | |
| Provision for claims incurred but not reported | | – | | | 2,843 | | | 2,843 | | | – | | | 2,646 | | | 2,646 | |
| | | 1,342 | | | 10,554 | | | 11,896 | | | 1,311 | | | 10,745 | | | 12,056 | |
| Provision for unearned premiums | | – | | | 4,441 | | | 4,441 | | | – | | | 4,483 | | | 4,483 | |
| Provision arising from liability adequacy tests | | – | | | 11 | | | 11 | | | – | | | 13 | | | 13 | |
| Other technical provisions | | – | | | – | | | – | | | – | | | – | | | – | |
| Total | | 132,532 | | | 15,006 | | | 147,538 | | | 132,482 | | | 15,241 | | | 147,723 | |
| Less: Amounts classified as held for sale | | (34,446 | ) | | (1 | ) | | (34,447 | ) | | (344 | ) | | – | | | (344 | ) |
| | | 98,086 | | | 15,005 | | | 113,091 | | | 132,138 | | | 15,241 | | | 147,379 | |
| 1 | Following a review of the classification of contracts issued by the Group’s Italian long-term business, there has been a reallocation from participating insurance liabilities at 31 December 2011 to participating investment contract liabilities of £2,722 million. |
36 – Insurance liabilities continued
(b) Long-term business liabilities
(i) Business description
The Group underwrites long-term business in a number of countries as follows:
New With-Profits sub-fund (NWPSF) of Aviva Life & Pensions UK (UKLAP), where the with-profit policyholders are entitled to at least 90% of the distributed profits, the shareholders receiving the balance. Any surplus or deficit emerging in NWPSF that is not distributed as bonus will be transferred from this sub-fund to the Reattributed Inherited Estate External Support Account (RIEESA) (see below).
| – | Old With-Profits sub-fund (OWPSF), With-Profits sub-fund (WPSF) and Provident Mutual sub-fund (PMSF) of UKLAP, where the with-profit policyholders are entitled to at least 90% of the distributed profits, the shareholders receiving the balance. |
| – | ‘Non-profit’ funds of Aviva Annuity UK and UKLAP, where shareholders are entitled to 100% of the distributed profits. Shareholder profits on unitised with-profit business written by WPSF and on stakeholder unitised with-profit business are derived from management fees and policy charges, and emerge in the non-profit funds. |
| – | The RIEESA of UKLAP, which is a non-profit fund where shareholders are entitled to 100% of the distributed profits, but these cannot be distributed until the ‘lock-in’ criteria set by the Reattribution Scheme have been met. RIEESA will be used to write non-profit business and also to provide capital support to NWPSF. |
| n | In France, where the majority of policyholders’ benefits are determined by investment performance, subject to certain guarantees, and shareholders’ profits are derived largely from management fees. In addition, a substantial number of policies participate in investment returns, with the balance being attributable to shareholders. |
| n | In the US, there are two main types of business – protection products and accumulation products. Protection products include interest-sensitive whole life, term life, universal life and indexed life insurance policies. The accumulation product segment includes traditional fixed and indexed deferred annuities for individuals and funding agreements for business customers. In addition, there are two closed blocks of participating contracts arising from demutualisations of subsidiary companies. All products are classified as insurance contracts except for the funding agreements and term certain immediate annuities, which are classified as non-participating investment contracts. |
| n | In other operations in Europe and Asia, a range of long-term insurance and savings products are written. |
(ii) Group practice
The long-term business provision is calculated separately for each of the Group’s life operations. The provisions for overseas subsidiaries have generally been included on the basis of local regulatory requirements, modified where necessary to reflect the requirements of the Companies Act 2006.
Material judgement is required in calculating the provisions and is exercised particularly through the choice of assumptions where discretion is permitted. In turn, the assumptions used depend on the circumstances prevailing in each of the life operations. Provisions are most sensitive to assumptions regarding discount rates and mortality/morbidity rates. Where discount rate assumptions are based on current market yields on fixed interest securities, allowance is made for default risk implicit in the yields on the underlying assets.
In 2010, a test case was taken to the European Court of Justice to rule on the current law and practice whereby insurers may take into account a person’s gender in the assessment of risk and consequently the pricing of insurance products. The ruling was issued on 1 March 2011 and required gender equality for pricing from 21 December 2012. The impact of the ruling on existing long-term business provisions in our UK and European businesses is not considered to be material.
Bonuses paid during the year are reflected in claims paid, whereas those allocated as part of the bonus declaration are included in the movements in the long-term business provision.
For UK with-profit life funds falling within the scope of the FSA realistic capital regime, and hence FRS 27, an amount may be recognised for the present value of future profits (PVFP) on non-participating business written in a with-profit fund where the determination of the realistic value of liabilities in that with-profit fund takes account, directly or indirectly, of this value. For our UK with-profit funds, no adjustment for this value is made to the participating insurance and investment contract liabilities or the unallocated divisible surplus.
(iii) Methodology and assumptions
There are two main methods of actuarial valuation of liabilities arising under long-term insurance contracts – the net premium method and the gross premium method – both of which involve the discounting of projected premiums and claims.
Under the net premium method, the premium taken into account in calculating the provision is determined actuarially, based on the valuation assumptions regarding discount rates, mortality and disability. The difference between this premium and the actual premium payable provides a margin for expenses. This method does not allow for voluntary early termination of the contract by the policyholder, and so no assumption is required for persistency.
The gross premium method uses the amount of contractual premiums payable and includes explicit assumptions for interest and discount rates, mortality and morbidity, persistency and future expenses. These assumptions can vary by contract type and reflect current and expected future experience.
36 – Insurance liabilities continued
(a) UK
With-profit business
The valuation of with-profit business uses the methodology developed for the Realistic Balance Sheet, adjusted to remove the shareholders’ share of future bonuses. The key elements of the Realistic Balance Sheet methodology are the with-profit benefit reserve (WPBR) and the present value of the expected cost of any payments in excess of the WPBR (referred to as the cost of future policy-related liabilities). The realistic liability for any contract is equal to the sum of the WPBR and the cost of future policy-related liabilities. The WPBR for an individual contract is generally calculated on a retrospective basis, and represents the accumulation of the premiums paid on the contract, allowing for investment return, taxation, expenses and any other charges levied on the contract.
For a small proportion of business, a prospective valuation approach is used, including allowance for anticipated future regular and final bonuses.
The items included in the cost of future policy-related liabilities include:
| n | Guaranteed Annuity Options; |
| n | GMP underpin on Section 32 transfers; and |
| n | Expected payments under Mortgage Endowment Promise. |
In the Provident Mutual and With-Profits sub-funds in UKLAP, this is offset by the expected cost of charges to WPBR to be made in respect of guarantees.
The cost of future policy-related liabilities is determined using a market-consistent approach and, in the main, this is based on a stochastic model calibrated to market conditions at the end of the reporting period. Non-market-related assumptions (for example, persistency, mortality and expenses) are based on experience, adjusted to take into account future trends.
The principal assumptions underlying the cost of future policy-related liabilities are as follows:
Future investment return
A ‘risk-free’ rate equal to the spot yield on UK swaps was used. This replaced the use of a spot yield on UK government securities plus a margin of 0.1%, which was used at 31 December 2011. The rates vary according to the outstanding term of the policy, with a typical rate as at 31 December 2012 of 1.92%(2011: 2.20%) for a policy with ten years outstanding.
Volatility of investment return
Volatility assumptions are set with reference to implied volatility data on traded market instruments, where available, or on a best estimate basis where not.
| Volatility | 2012 | | 2011 | |
| Equity returns | | 26.3% | | | 26.4% | |
| Property returns | | 15.0% | | | 15.0% | |
| Fixed interest yields | | 17.1% | | | 18.0% | |
The equity volatility used depends on term, money-ness and region. The figure shown is for a sample UK equity, at the money, with a ten-year term. Fixed interest yield volatility is also dependent on term and money-ness. The figure shown is for a ten-year swap option with ten-year team, currently at the money.
Future regular bonuses
Annual bonus assumptions for 2012 have been set consistently with the year-end 2011 declaration. Future annual bonus rates reflect the principles and practices of the fund. In particular, the level is set with regard to the projected margin for final bonus and the change from one year to the next is limited to a level consistent with past practice.
Mortality
Mortality assumptions for with-profit business are set with regard to recent Company experience and general industry trends. The mortality tables used in the valuation are summarised below:
| Mortality table used | 2012 | 2011 |
| Assurances, pure endowments and deferred annuities before vesting | Nil or Axx00 adjusted | Nil or Axx00 adjusted |
| | | |
| Pensions business after vesting and pensions annuities in payment | PCMA00/PCFA00 adjusted plus allowance for future mortality improvement | PCMA00/PCFA00 adjusted plus allowance for future mortality improvement |
Non-profit business
The valuation of non-profit business is based on regulatory requirements, adjusted to remove certain regulatory reserves and margins in assumptions, notably for annuity business. Conventional non-profit contracts, including those written in the with-profit funds, are valued using gross premium methods which discount projected future cash flows. The cash flows are calculated using the amount of contractual premiums payable, together with explicit assumptions for investment returns, inflation, discount rates, mortality, morbidity, persistency and future expenses. These assumptions vary by contract type and reflect current and expected future experience.
For unit-linked and some unitised with-profit business, the provisions are valued by adding a prospective non-unit reserve to the bid value of units. The prospective non-unit reserve is calculated by projecting the future non-unit cash flows on the assumption that future premiums cease, unless it is more onerous to assume that they continue. Where appropriate, allowance for persistency is based on actual experience.
Valuation discount rate assumptions are set with regard to yields on the supporting assets and the general level of long-term interest rates as measured by gilt yields. An explicit allowance for risk is included by restricting the yields for equities and properties with reference to a margin over long-term interest rates or by making an explicit deduction from the yields on corporate bonds, mortgages and deposits, based on historical default experience of each asset class. A further margin for risk is then deducted for all asset classes.
36 – Insurance liabilities continued
The provisions held in respect of guaranteed annuity options are a prudent assessment of the additional liability incurred under the option on a basis and method consistent with that used to value basic policy liabilities, and includes a prudent assessment of the proportion of policyholders who will choose to exercise the option.
Valuation discount rates for business in the non-profit funds are as follows:
| Valuation discount rates | 2012 | | 2011 | |
| Assurances | | | | | | |
| Life conventional non-profit | | 1.8% | | | 1.8% to 1.9% | |
| Pensions conventional non-profit | | 2.2% | | | 2.6% | |
| Annuities | | | | | | |
| Conventional immediate and deferred annuities | | 2.6% to 4.1% | | | 2.2% to 4.3% | |
| Non-unit reserves on Unit Linked business | | | | | | |
| Life | | 2.1% | | | 1.8% to 2.2% | |
| Pensions | | 2.5% | | | 2.2% to 2.7% | |
| Income Protection | | | | | | |
| Active lives | | 2.2% | | | 2.4% | |
| Claims in payment – level | | 3.1% | | | 3.6% | |
| Claims in payment – index linked | | (0.7)% | | | (1.0)% | |
The above valuation discount rates are after reduction for investment expenses and credit risk. For conventional immediate annuity business the allowance for credit risk comprises long-term assumptions for default and downgrades, which vary by the credit ratings for bonds and mortgages, and short-term supplementary allowances for higher expected defaults during the current economic conditions. The credit risk allowance made for corporate bonds and commercial mortgages, including healthcare mortgages, held by Aviva Annuity UK Limited equated to 56 bps and 89 bps respectively at 31 December 2012(2011: 60 bps and 69 bps respectively). For corporate bonds, the allowance represented 30% of the average credit spread for the portfolio(2011: 26%). The total valuation allowance held by Aviva Annuity UK Limited in respect of corporate bonds and mortgages, including healthcare mortgages, was £1.8 billion(2011: £1.6 billion) over the remaining term of the UK Life corporate bond and commercial mortgage portfolio. Total liabilities for annuity business were £30 billion at 31 December 2012(2011: £27 billion).
Mortality assumptions for non-profit business are set with regard to recent Company experience and general industry trends. The mortality tables used in the valuation are summarised below:
| Mortality tables used | 2012 | 2011 |
| Assurances | | |
| Non-profit | AM00/AF00 or TM00/TF00 adjusted for smoker status and age/sex specific factors | AM00/AF00 or TM00/TF00 adjusted for smoker status and age/sex specific factors |
| | | |
| Pure endowments and deferred annuities before vesting | AM00/AF00 adjusted | AM00/AF00 adjusted |
| | | |
| Annuities in payment | | |
| Pensions business | PCMA00/PCFA00 adjusted plus allowance for future mortality improvement | PCMA00/PCFA00 adjusted plus allowance for future mortality improvement |
| | | |
| General annuity business | IML00/IFL00 adjusted plus allowance for future mortality improvement | IML00/IFL00 adjusted plus allowance for future mortality improvement |
For pensions annuity business in 2012, the underlying mortality assumptions for Males are 100.5% of PCMA00 with base year 2000, improvements based on CMI_2011 with a long-term improvement rate of 1.5% and an addition of 0.5% to all future annual improvements; for Females the underlying mortality assumptions are 95.5% of PCFA00 with base year 2000, improvements based on CMI_2011 with a long-term improvement rate of 1.0% and an addition of 0.5% to all future annual improvements. Year-specific adjustments are made to allow for selection effects due to the development of the Enhanced Annuity market.
(b) France
The majority of reserves arise from single premium savings products and are based on the accumulated fund values, adjusted to maintain consistency with the value of the assets backing the policyholder liabilities. For traditional business the net premium method is used for prospective valuations, in accordance with local regulation, where the valuation assumptions depend on the date of issue of the contract. The valuation discount rate also depends on the original duration of the contract and mortality rates are based on industry tables.
| | Valuation discount rates | Mortality tables used |
| | 2012 and 2011 | 2012 and 2011 |
| Life assurances | 0% to 4.5% | TD73-77, TD88-90, TH00-02,TF00-02 |
| Annuities | 0% to 4.5% | TGF05/TGH05 |
36 – Insurance liabilities continued
(c) United States
For the major part of our US business, insurance liabilities are measured in accordance with US GAAP as at the date of acquisition.
The liability for future policy benefits for traditional life insurance is computed using the net level method, based on guaranteed interest and mortality rates as used in calculating cash surrender values. Reserve interest assumptions ranged from 2.00% to 7.50% in 2012(2011: 2.00% to 7.50%). The weighted average interest rate for all traditional life policy reserves in 2012 was 4.50%(2011: 4.50%).
Future policy benefit reserves for universal life insurance, deferred annuity products and funding agreements are computed under a retrospective deposit method and represent policy account balances before applicable surrender charges. For the indexed products, the liability held is calculated based on the option budget method and is equal to the host contract and the calculated value of the derivative. The value of the derivative is based on the present value of the difference between the projected fund value and the underlying fund guarantee. The range of interest crediting rates for deferred annuity products, the largest component of the US business, excluding sales inducement payouts, was 1.00% to 5.20% in 2012(2011: 1.00% to 5.20%). An additional liability is established for universal life contracts with death or other insurance benefit features, which is determined using an equally weighted range of scenarios with respect to investment returns, policyholder lapses, benefit election rates, premium payout patterns and mortality. The additional liability represents the present value of future expected benefits based on current product assumptions.
The indexed life and annuity products guarantee the return of principal to the customer, and credit interest based on certain indices. A portion of the premium from each customer is invested in fixed income securities and is intended to cover the minimum guaranteed value. A further portion of the premium is used to purchase derivatives to hedge the growth in interest credited to the customer as a direct result of increases in the related indices. Both the derivatives and the options embedded in the policy are valued at their fair value.
Deferred income reserves are established for fees charged for insurance benefit features which are assessed in a manner that is expected to result in higher profits in earlier years, followed by lower profits or losses in subsequent years. The excess charges are deferred and amortised using the same assumptions and factors used to amortise deferred acquisition costs. Deferred income reserves of £85 million in respect of insurance contracts in the United States are included under Other liabilities – Deferred income in note 47. Shadow adjustments may be made to deferred acquisition costs, acquired value of in-force business, deferred income reserves and contract liabilities. The shadow adjustments are recognised directly in other comprehensive income so that unrealised gains or losses on investments that are recognised directly in other comprehensive income affect the measurement of the liability, or related assets, in the same way as realised gains or losses.
(d) Other countries
In all other countries, local generally accepted interest rates and published standard mortality tables are used for different categories
of business as appropriate. The tables are based on relevant experience and show mortality rates, by age, for specific groupings of people.
(iv) Movements
The following movements have occurred in the long-term business provisions during the year:
| | 2012
£m | | Restated1 2011 £m | |
| Carrying amount at 1 January | | 131,171 | | | 157,988 | |
| Provisions in respect of new business | | 8,631 | | | 10,894 | |
| Expected change in existing business provisions | | (8,362 | ) | | (8,541 | ) |
| Variance between actual and expected experience | | 943 | | | (2,279 | ) |
| Impact of other operating assumption changes | | (718 | ) | | (61 | ) |
| Impact of economic assumption changes | | 1,726 | | | 5,663 | |
| Other movements | | (109 | ) | | (623 | ) |
| Change in liability recognised as an expense | | 2,111 | | | 5,053 | |
| Effect of portfolio transfers, acquisitions and disposals | | (214 | ) | | (6 | ) |
| Deconsolidation of Delta Lloyd | | – | | | (32,159 | ) |
| Foreign exchange rate movements | | (1,878 | ) | | 295 | |
| Carrying amount at 31 December | | 131,190 | | | 131,171 | |
| 1 | Following a review of the classification of contracts issued by the Group’s Italian long-term business, there has been a reallocation from participating insurance liabilities at 31 December 2011 to participating investment contract liabilities of £2,722 million. |
The variance between actual and expected experience of £0.9 billion in 2012 was primarily due to the impact of favourable investment returns on liabilities for unit-linked insurance contracts. For many types of long-term business, including unit-linked and participating funds, movements in asset values are offset by corresponding changes in liabilities, limiting the net impact on profit. Minor variances arise from differences between actual and expected experience for persistency, mortality and other demographic factors.
The impact of assumption changes in the above analysis shows the resulting movement in the carrying value of insurance liabilities. The £1.7 billion impact of economic assumption changes reflects reductions in valuation interest rates, primarily in respect of immediate annuity and participating insurance contracts in the UK. The £0.7 billion impact of operating assumption changes mainly relates to mortality assumption in the UK, with the net impact reduced by movements in corresponding reinsurance assets. For participating business, a movement in liabilities is generally offset by a corresponding adjustment to the unallocated divisible surplus and does not impact on profit. Where assumption changes do impact on profit, these are included in the effect of changes in assumptions and estimates during the year shown in note 40, together with the impact of movements in related non-financial assets.
36 – Insurance liabilities continued
(c) General insurance and health liabilities
(i) Provisions for outstanding claims
Delays occur in the notification and settlement of claims and a substantial measure of experience and judgement is involved in assessing outstanding liabilities, the ultimate cost of which cannot be known with certainty at the statement of financial position date. The reserves for general insurance and health business are based on information currently available. However, it is inherent in the nature of the business written that the ultimate liabilities may vary as a result of subsequent developments.
Provisions for outstanding claims are established to cover the outstanding expected ultimate liability for losses and loss adjustment expenses (LAE) in respect of all claims that have already occurred. The provisions established cover reported claims and associated LAE, as well as claims incurred but not yet reported and associated LAE.
The Group only establishes loss reserves for losses that have already occurred. The Group therefore does not establish catastrophe equalisation reserves that defer a share of income in respect of certain lines of business from years in which a catastrophe does not occur to future periods in which catastrophes may occur. When calculating reserves, the Group takes into account estimated future recoveries from salvage and subrogation, and a separate asset is recorded for expected future recoveries from reinsurers after considering their collectability.
The table below shows the split of total general insurance and health outstanding claim provisions and IBNR provisions, gross of reinsurance, by major line of business.
| | As at 31 December 2012 | | As at 31 December 2011 | |
| | | Outstanding claim provisions £m | | | IBNR provisions £m | | | Total claim provisions £m | | | Outstanding claim provisions £m | | | IBNR provisions £m | | | Total claim provisions £m | |
| Motor | | 3,737 | | | 1,051 | | | 4,788 | | | 3,960 | | | 995 | | | 4,955 | |
| Property | | 1,408 | | | 212 | | | 1,620 | | | 1,392 | | | 155 | | | 1,547 | |
| Liability | | 2,003 | | | 1,394 | | | 3,397 | | | 2,206 | | | 1,321 | | | 3,527 | |
| Creditor | | 54 | | | 13 | | | 67 | | | 59 | | | 19 | | | 78 | |
| Other | | 509 | | | 173 | | | 682 | | | 482 | | | 156 | | | 638 | |
| | | 7,711 | | | 2,843 | | | 10,554 | | | 8,099 | | | 2,646 | | | 10,745 | |
(ii) Discounting
Outstanding claims provisions are based on undiscounted estimates of future claim payments, except for the following classes of business for which discounted provisions are held:
| | Rate | | Mean term of liabilities |
| Class | 2012 | | 2011 | | 2012 | 2011 |
| Reinsured London Market business | | 2.0% | | | 2.20% | | 11 years | 13 years |
| Latent claims | | 0.33% to 3.35% | | | 0.75% to 3.25% | | 6 to 15 years | 7 to 16 years |
| Structured settlements | | 2.60% | | | 2.70% | | 33 years | 31 years |
The gross outstanding claims provision before discounting was £11,004 million(2011: £11,420million). The period of time which will elapse before the liabilities are settled has been estimated by modelling the settlement patterns of the underlying claims.
The discount rate that has been applied to latent claims reserves is based on the relevant swap curve in the relevant currency having regard to the expected settlement dates of the claims. The range of discount rates used depends on the duration of the claims and is given in the table above. The duration of the claims span over 35 years, with the average duration being between 6 and 15 years depending on the geographical region. Any change in discount rates between the start and the end of the accounting period is reflected below adjusted operating profit as an economic assumption change.
During 2012, the Group has seen a levelling off in the number of new bodily injury claims settled by periodic payment orders (PPOs) or structured settlements, which are reserved for on a discounted basis.
(iii) Assumptions
Outstanding claims provisions are estimated based on known facts at the date of estimation. Case estimates are set by skilled claims technicians and established case setting procedures. Claim technicians apply their experience and knowledge to the circumstances of individual claims. They take into account all available information and correspondence regarding the circumstances of the claim, such as medical reports, investigations and inspections. Claims technicians set case estimates according to documented claims department policies and specialise in setting estimates for certain lines of business or types of claim. Claims above certain limits are referred to senior claims handlers for authorisation.
No adjustments are made to the claims technicians’ case estimates included in booked claim provisions, except for rare occasions when the estimated ultimate cost of individual large or unusual claims may be adjusted, subject to internal reserve committee approval, to allow for uncertainty regarding, for example, the outcome of a court case. The ultimate cost of outstanding claims is then estimated by using a range of standard actuarial claims projection techniques, such as the Chain Ladder and Bornhuetter-Ferguson methods. The main assumption underlying these techniques is that a company’s past claims development experience can be used to project future claims development and hence ultimate claims costs. As such, these methods extrapolate the development of paid and incurred losses, average costs per claim and claim numbers based on the observed development of earlier years and expected loss ratios. Historical claims development is mainly analysed by accident period, although underwriting or notification period is also used where this is considered appropriate.
Claim development is separately analysed for each geographic area, as well as by each line of business. Certain lines of business are also further analysed by claim type or type of coverage. In addition, large claims are usually separately addressed, either by being reserved at the face value of loss adjuster estimates or separately projected in order to reflect their future development.
36 – Insurance liabilities continued
The assumptions used in most non-life actuarial projection techniques, including future rates of claims inflation or loss ratio assumptions, are implicit in the historical claims development data on which the projections are based. Additional qualitative judgement is used to assess the extent to which past trends may not apply in the future, for example, to reflect one-off occurrences, changes in external or market factors such as public attitudes to claiming, economic conditions, levels of claims inflation, judicial decisions and legislation, as well as internal factors such as portfolio mix, policy conditions and claims handling procedures in order
to arrive at a point estimate for the ultimate cost of claims that represents the likely outcome, from a range of possible outcomes, taking account of all the uncertainties involved. The range of possible outcomes does not, however, result in the quantification of a reserve range.
As noted in section in section (b)(ii) – Group Practice, an area of judgement is the impact of a European Court of Justice ruling in March 2011 on gender equality for the pricing of insurance products. At 31 December 2012, the impact of the ruling on existing general business provisions was not considered to be material.
The following explicit assumptions are made which could materially impact the level of booked net reserves:
UK mesothelioma claims
The level of uncertainty associated with latent claims is considerable due to the relatively small number of claims and the long-tail nature of the liabilities. UK mesothelioma claims account for a large proportion of the Group’s latent claims. The key assumptions underlying the estimation of these claims include claim numbers, the base average cost per claim, future inflation in the average cost of claims and legal fees.
The best estimate of the liabilities reflects the latest available market information and studies. Many different scenarios can be derived by flexing these key assumptions and applying different combinations of the different assumptions. An upper and lower scenario can be derived by making reasonably likely changes to these assumptions, resulting in an estimate £240 million greater than the best estimate, or £65 million lower than the best estimate. These scenarios do not, however, constitute an upper or lower bound on these liabilities.
Interest rates used to discount latent claim liabilities
The discount rates used in determining our latent claim liabilities are based on the relevant swap curve in the relevant currency at the reporting date, having regard to the duration of the expected settlement of latent claims. The range of discount rates used is shown in section (ii) above and depends on the duration of the claim and the reporting date. At 31 December 2012, it is estimated that a 1% fall in the discount rates used would increase net claim reserves by approximately £95 million, excluding the offsetting effect on asset values as assets are not hypothecated across classes of business. The impact of a 1% fall in interest rates across all assets and liabilities of our general insurance and health businesses is shown in note 53.
Allowance for risk and uncertainty
The uncertainties involved in estimating loss reserves are allowed for in the reserving process and by the estimation of explicit reserve uncertainty distributions. The reserve estimation basis for non-life claims requires all non-life businesses to calculate booked claim provisions as the best estimate of the cost of future claim payments, plus an explicit allowance for risk and uncertainty. The allowance for risk and uncertainty is calculated by each business unit in accordance with the requirements of the Group non-life reserving policy, taking into account the risks and uncertainties specific to each line of business and type of claim in that territory. The requirements of the Group non-life reserving policy also seek to ensure that the allowance for risk and uncertainty is set consistently across both business units and reporting periods.
Changes to claims development patterns can materially impact the results of actuarial projection techniques. However, allowance for the inherent uncertainty in the assumptions underlying reserving projections is automatically allowed for in the explicit allowance for risk and uncertainty included when setting booked reserves.
Lump sum payments in settlement of bodily injury claims decided by the UK courts are calculated in accordance with the Ogden Tables. The Ogden Tables contain a discount rate that is set by the Lord Chancellor and that is applied when calculating the present value of loss of earnings for claims settlement purposes. The process for setting this discount rate is currently under review. The timing of the conclusion of this review is unclear and it is still uncertain whether or by how much the rate will change. However an allowance has been included in provisions for a reduction in the Ogden discount rates. A reduction in the Ogden discount rates will increase lump sum payments to UK bodily injury claimants.
36 – Insurance liabilities continued
(iv) Movements
The following changes have occurred in the general insurance and health claims provisions during the year:
| | 2012
£m | | 2011
£m | |
| Carrying amount at 1 January | | 10,745 | | | 12,263 | |
| Impact of changes in assumptions | | 61 | | | 149 | |
| Claim losses and expenses incurred in the current year | | 6,291 | | | 6,520 | |
| Decrease in estimated claim losses and expenses incurred in prior years | | (199 | ) | | (140 | ) |
| Exceptional strengthening of general insurance latent claims provisions | | – | | | 45 | |
| Incurred claims losses and expenses | | 6,153 | | | 6,574 | |
| Less: | | | | | | |
| Payments made on claims incurred in the current year | | (3,243 | ) | | (3,393 | ) |
| Payments made on claims incurred in prior years | | (3,104 | ) | | (3,514 | ) |
| Recoveries on claim payments | | 297 | | | 313 | |
| Claims payments made in the year, net of recoveries | | (6,050 | ) | | (6,594 | ) |
| Unwind of discounting | | 35 | | | 47 | |
| Other movements in the claims provisions | | 2 | | | (12 | ) |
| Changes in claims reserve recognised as an expense | | 140 | | | 15 | |
| Effect of portfolio transfers, acquisitions and disposals | | (171 | ) | | – | |
| Deconsolidation of Delta Lloyd | | – | | | (1,445 | ) |
| Foreign exchange rate movements | | (158 | ) | | (87 | ) |
| Other movements | | (2 | ) | | (1 | ) |
| Carrying amount at 31 December | | 10,554 | | | 10,745 | |
The effect of changes in the main assumptions is given in note 40.
(d) Loss development tables
(i) Description of tables
The tables that follow present the development of claim payments and the estimated ultimate cost of claims for the accident years 2003 to 2012. The upper half of the tables shows the cumulative amounts paid during successive years related to each accident year. For example, with respect to the accident year 2003, by the end of 2012 £5,727 million had actually been paid in settlement of claims. In addition, as reflected in the lower section of the table, the original estimated ultimate cost of claims of £6,385 million was re-estimated to be £5,791 million at 31 December 2012.
The original estimates will be increased or decreased, as more information becomes known about the individual claims and overall claim frequency and severity.
The Group aims to maintain strong reserves in respect of its general insurance and health business in order to protect against adverse future claims experience and development. As claims develop and the ultimate cost of claims become more certain, the absence of adverse claims experience will result in a release of reserves from earlier accident years, as shown in the loss development tables and movements table (c)(iv) above. However, in order to maintain overall reserve adequacy, the Group establishes strong reserves in respect of the current accident year (2012) where the development of claims is less mature and there is much greater uncertainty attaching to the ultimate cost of claims. Releases from prior accident year reserves are also due to an improvement in the estimated cost of claims.
Key elements of the movement in prior accident year general insurance and health net provisions during 2012 were:
| n | £47 million release from UK & Ireland, including Group reinsurance business, due to favourable development in Group reinsurance, health and across a number of lines of business in Ireland. |
| n | £51 million release from Europe mainly due to favourable development of personal motor and commercial property claims in France. |
| n | £122 million release from Canada mainly due to continued favourable experience on motor, following the legislative changes in Ontario. |
Key elements of the release from prior accident year general insurance and health net provisions during 2011 were:
| n | £42 million strengthening from UK & Ireland, including Group reinsurance business, mainly due to unfavourable development on commercial motor, commercial liability and December 2010 freeze claims in the UK offset by favourable development of personal and commercial motor claims in Ireland. |
| n | £6 million release from Europe mainly due to favourable development of personal and commercial motor claims in France offset by adverse development in Italy and Delta Lloyd. |
| n | £92 million release from Canada mainly due to favourable experience on motor, following the legislative changes in Ontario, and commercial liability. |
36 – Insurance liabilities continued
(ii) Gross figures
Before the effect of reinsurance, the loss development table is:
| Accident year | All prior
years
£m | | 2003
£m | | 2004
£m | | 2005
£m | | 2006
£m | | 2007
£m | | 2008
£m | | 2009
£m | | 2010
£m | | 2011
£m | | 2012
£m | | Total
£m | |
| Gross cumulative claim payments | | | | | | | | | | | | | | | | | | | | | | | | | | | | | | | | | | | | |
| At end of accident year | | | | | (2,819 | ) | | (2,971 | ) | | (3,345 | ) | | (3,653 | ) | | (4,393 | ) | | (4,915 | ) | | (3,780 | ) | | (3,502 | ) | | (3,420 | ) | | (3,055 | ) | | | |
| One year later | | | | | (4,190 | ) | | (4,561 | ) | | (5,011 | ) | | (5,525 | ) | | (6,676 | ) | | (7,350 | ) | | (5,464 | ) | | (5,466 | ) | | (4,765 | ) | | | | | | |
| Two years later | | | | | (4,613 | ) | | (4,981 | ) | | (5,449 | ) | | (5,971 | ) | | (7,191 | ) | | (7,828 | ) | | (6,102 | ) | | (5,875 | ) | | | | | | | | | |
| Three years later | | | | | (4,972 | ) | | (5,263 | ) | | (5,784 | ) | | (6,272 | ) | | (7,513 | ) | | (8,304 | ) | | (6,393 | ) | | | | | | | | | | | | |
| Four years later | | | | | (5,258 | ) | | (5,448 | ) | | (6,001 | ) | | (6,531 | ) | | (7,836 | ) | | (8,607 | ) | | | | | | | | | | | | | | | |
| Five years later | | | | | (5,409 | ) | | (5,617 | ) | | (6,156 | ) | | (6,736 | ) | | (8,050 | ) | | | | | | | | | | | | | | | | | | |
| Six years later | | | | | (5,527 | ) | | (5,725 | ) | | (6,311 | ) | | (6,936 | ) | | | | | | | | | | | | | | | | | | | | | |
| Seven years later | | | | | (5,594 | ) | | (5,792 | ) | | (6,467 | ) | | | | | | | | | | | | | | | | | | | | | | | | |
| Eight years later | | | | | (5,660 | ) | | (5,826 | ) | | | | | | | | | | | | | | | | | | | | | | | | | | | |
| Nine years later | | | | | (5,727 | ) | | | | | | | | | | | | | | | | | | | | | | | | | | | | | | |
| Estimate of gross ultimate claims | | | | | | | | | | | | | | | | | | | | | | | | | | | | | | | | | | | | |
| At end of accident year | | | | | 6,385 | | | 6,891 | | | 7,106 | | | 7,533 | | | 8,530 | | | 9,508 | | | 7,364 | | | 6,911 | | | 6,428 | | | 6,201 | | | | |
| One year later | | | | | 6,172 | | | 6,557 | | | 6,938 | | | 7,318 | | | 8,468 | | | 9,322 | | | 7,297 | | | 7,006 | | | 6,330 | | | | | | | |
| Two years later | | | | | 6,124 | | | 6,371 | | | 6,813 | | | 7,243 | | | 8,430 | | | 9,277 | | | 7,281 | | | 6,950 | | | | | | | | | | |
| Three years later | | | | | 6,036 | | | 6,178 | | | 6,679 | | | 7,130 | | | 8,438 | | | 9,272 | | | 7,215 | | | | | | | | | | | | | |
| Four years later | | | | | 5,932 | | | 6,008 | | | 6,603 | | | 7,149 | | | 8,409 | | | 9,235 | | | | | | | | | | | | | | | | |
| Five years later | | | | | 5,853 | | | 6,003 | | | 6,605 | | | 7,167 | | | 8,446 | | | | | | | | | | | | | | | | | | | |
| Six years later | | | | | 5,813 | | | 5,953 | | | 6,591 | | | 7,167 | | | | | | | | | | | | | | | | | | | | | | |
| Seven years later | | | | | 5,792 | | | 5,933 | | | 6,596 | | | | | | | | | | | | | | | | | | | | | | | | | |
| Eight years later | | | | | 5,798 | | | 5,926 | | | | | | | | | | | | | | | | | | | | | | | | | | | | |
| Nine years later | | | | | 5,791 | | | | | | | | | | | | | | | | | | | | | | | | | | | | | | | |
| Estimate of gross ultimate claims | | | | | 5,791 | | | 5,926 | | | 6,596 | | | 7,167 | | | 8,446 | | | 9,235 | | | 7,215 | | | 6,950 | | | 6,330 | | | 6,201 | | | | |
| Cumulative payments | | | | | (5,727 | ) | | (5,826 | ) | | (6,467 | ) | | (6,936 | ) | | (8,050 | ) | | (8,607 | ) | | (6,393 | ) | | (5,875 | ) | | (4,765 | ) | | (3,055 | ) | | | |
| | | 2,798 | | | 64 | | | 100 | | | 129 | | | 231 | | | 396 | | | 628 | | | 822 | | | 1,075 | | | 1,565 | | | 3,146 | | | 10,954 | |
| Effect of discounting | | (479 | ) | | (4 | ) | | – | | | 18 | | | 8 | | | 5 | | | 2 | | | – | | | – | | | – | | | – | | | (450 | ) |
| Present value | | 2,319 | | | 60 | | | 100 | | | 147 | | | 239 | | | 401 | | | 630 | | | 822 | | | 1,075 | | | 1,565 | | | 3,146 | | | 10,504 | |
| Cumulative effect of foreign exchange movements | | – | | | 14 | | | 18 | | | 24 | | | 39 | | | 37 | | | (19 | ) | | (14 | ) | | (34 | ) | | (22 | ) | | – | | | 43 | |
| Effect of acquisitions | | – | | | 1 | | | 1 | | | 1 | | | 4 | | | – | | | – | | | – | | | – | | | – | | | – | | | 7 | |
| Present value recognised in the statement of financial position | | 2,319 | | | 75 | | | 119 | | | 172 | | | 282 | | | 438 | | | 611 | | | 808 | | | 1,041 | | | 1,543 | | | 3,146 | | | 10,554 | |
36 – Insurance liabilities continued
(iii) Net of reinsurance
After the effect of reinsurance, the loss development table is:
| Accident year | All prior
years
£m | | 2003
£m | | 2004
£m | | 2005
£m | | 2006
£m | | 2007
£m | | 2008
£m | | 2009
£m | | 2010
£m | | 2011
£m | | 2012
£m | | Total
£m | |
| Net cumulative claim payments | | | | | | | | | | | | | | | | | | | | | | | | | | | | | | | | | | | | |
| At end of accident year | | | | | (2,819 | ) | | (2,870 | ) | | (3,281 | ) | | (3,612 | ) | | (4,317 | ) | | (4,808 | ) | | (3,650 | ) | | (3,386 | ) | | (3,300 | ) | | (2,925 | ) | | | |
| One year later | | | | | (4,158 | ) | | (4,378 | ) | | (4,925 | ) | | (5,442 | ) | | (6,542 | ) | | (7,165 | ) | | (5,286 | ) | | (5,242 | ) | | (4,578 | ) | | | | | | |
| Two years later | | | | | (4,565 | ) | | (4,712 | ) | | (5,344 | ) | | (5,881 | ) | | (7,052 | ) | | (7,638 | ) | | (5,885 | ) | | (5,637 | ) | | | | | | | | | |
| Three years later | | | | | (4,924 | ) | | (4,986 | ) | | (5,671 | ) | | (6,181 | ) | | (7,356 | ) | | (8,094 | ) | | (6,177 | ) | | | | | | | | | | | | |
| Four years later | | | | | (5,180 | ) | | (5,163 | ) | | (5,892 | ) | | (6,434 | ) | | (7,664 | ) | | (8,356 | ) | | | | | | | | | | | | | | | |
| Five years later | | | | | (5,325 | ) | | (5,327 | ) | | (6,039 | ) | | (6,625 | ) | | (7,852 | ) | | | | | | | | | | | | | | | | | | |
| Six years later | | | | | (5,442 | ) | | (5,430 | ) | | (6,188 | ) | | (6,724 | ) | | | | | | | | | | | | | | | | | | | | | |
| Seven years later | | | | | (5,502 | ) | | (5,491 | ) | | (6,245 | ) | | | | | | | | | | | | | | | | | | | | | | | | |
| Eight years later | | | | | (5,567 | ) | | (5,524 | ) | | | | | | | | | | | | | | | | | | | | | | | | | | | |
| Nine years later | | | | | (5,592 | ) | | | | | | | | | | | | | | | | | | | | | | | | | | | | | | |
| Estimate of net ultimate claims | | | | | | | | | | | | | | | | | | | | | | | | | | | | | | | | | | | | |
| At end of accident year | | | | | 6,218 | | | 6,602 | | | 6,982 | | | 7,430 | | | 8,363 | | | 9,262 | | | 7,115 | | | 6,650 | | | 6,202 | | | 5,941 | | | | |
| One year later | | | | | 6,093 | | | 6,266 | | | 6,818 | | | 7,197 | | | 8,302 | | | 9,104 | | | 7,067 | | | 6,751 | | | 6,103 | | | | | | | |
| Two years later | | | | | 6,037 | | | 6,082 | | | 6,688 | | | 7,104 | | | 8,244 | | | 9,028 | | | 7,036 | | | 6,685 | | | | | | | | | | |
| Three years later | | | | | 5,942 | | | 5,882 | | | 6,544 | | | 6,996 | | | 8,249 | | | 9,007 | | | 6,978 | | | | | | | | | | | | | |
| Four years later | | | | | 5,851 | | | 5,709 | | | 6,476 | | | 6,980 | | | 8,210 | | | 8,962 | | | | | | | | | | | | | | | | |
| Five years later | | | | | 5,772 | | | 5,699 | | | 6,448 | | | 6,992 | | | 8,221 | | | | | | | | | | | | | | | | | | | |
| Six years later | | | | | 5,683 | | | 5,639 | | | 6,397 | | | 6,939 | | | | | | | | | | | | | | | | | | | | | | |
| Seven years later | | | | | 5,663 | | | 5,624 | | | 6,372 | | | | | | | | | | | | | | | | | | | | | | | | | |
| Eight years later | | | | | 5,667 | | | 5,613 | | | | | | | | | | | | | | | | | | | | | | | | | | | | |
| Nine years later | | | | | 5,649 | | | | | | | | | | | | | | | | | | | | | | | | | | | | | | | |
| Estimate of net ultimate claims | | | | | 5,649 | | | 5,613 | | | 6,372 | | | 6,939 | | | 8,221 | | | 8,962 | | | 6,978 | | | 6,685 | | | 6,103 | | | 5,941 | | | | |
| Cumulative payments | | | | | (5,592 | ) | | (5,524 | ) | | (6,245 | ) | | (6,724 | ) | | (7,852 | ) | | (8,356 | ) | | (6,177 | ) | | (5,637 | ) | | (4,578 | ) | | (2,925 | ) | | | |
| | | 1,695 | | | 57 | | | 89 | | | 127 | | | 215 | | | 369 | | | 606 | | | 801 | | | 1,048 | | | 1,525 | | | 3,016 | | | 9,548 | |
| Effect of discounting | | (330 | ) | | 1 | | | – | | | 19 | | | 9 | | | 5 | | | 3 | | | – | | | – | | | – | | | – | | | (293 | ) |
| Present value | | 1,365 | | | 58 | | | 89 | | | 146 | | | 224 | | | 374 | | | 609 | | | 801 | | | 1,048 | | | 1,525 | | | 3,016 | | | 9,255 | |
| Cumulative effect of foreign exchange movements | | – | | | 12 | | | 16 | | | 21 | | | 37 | | | 35 | | | (19 | ) | | (12 | ) | | (32 | ) | | (20 | ) | | – | | | 38 | |
| Effect of acquisitions | | – | | | 1 | | | 1 | | | 1 | | | 4 | | | – | | | – | | | – | | | – | | | – | | | – | | | 7 | |
| Present value recognised in the statement of financial position | | 1,365 | | | 71 | | | 106 | | | 168 | | | 265 | | | 409 | | | 590 | | | 789 | | | 1,016 | | | 1,505 | | | 3,016 | | | 9,300 | |
In the loss development tables shown above, the cumulative claim payments and estimates of cumulative claims for each accident year are translated into sterling at the exchange rates that applied at the end of that accident year. The impact of using varying exchange rates is shown at the bottom of each table. Disposals are dealt with by treating all outstanding and IBNR claims of the disposed entity as ‘paid’ at the date of disposal.
The loss development tables above include information on asbestos and environmental pollution claims provisions from business written before 2003. The undiscounted claim provisions for continuing operations, net of reinsurance, in respect of this business at 31 December 2012 were £1,003 million(2011: £929 million). The movement in the year reflects strengthening of provisions by £8 million in the UK(2011: exceptional strengthening of £35 million), other increases in undiscounted provisions of £51 million(2011: £23 million), reclassification of commercial liability provisions of £55 million, claim payments, reinsurance recoveries and foreign exchange rate movements.
(e) Provision for unearned premiums
Movements
The following changes have occurred in the provision for unearned premiums (UPR) during the year:
| | 2012
£m | | 2011
£m | |
| Carrying amount at 1 January | | 4,483 | | | 4,855 | |
| Premiums written during the year | | 9,535 | | | 10,364 | |
| Less: Premiums earned during the year | | (9,514 | ) | | (10,099 | ) |
| Change in UPR recognised as income | | 21 | | | 265 | |
| Gross portfolio transfers and acquisitions | | (6 | ) | | (161 | ) |
| Deconsolidation of Delta Lloyd | | – | | | (424 | ) |
| Foreign exchange rate movements | | (57 | ) | | (52 | ) |
| Carrying amount at 31 December | | 4,441 | | | 4,483 | |
37 – Liability for investment contracts
This note analyses our investment contract liabilities by type of product and describes how the Group calculates these liabilities and the assumptions used.
(a) Carrying amount
The liability for investment contracts at 31 December comprised:
| Long-term business | 2012
£m | | Restated1 2011 £m | |
| Participating contracts | | 66,849 | | | 67,707 | |
| Non-participating contracts at fair value | | 46,299 | | | 43,990 | |
| Non-participating contracts at amortised cost | | 1,400 | | | 1,669 | |
| | | 47,699 | | | 45,659 | |
| Total | | 114,548 | | | 113,366 | |
| Less: Amounts classified as held for sale | | (4,054 | ) | | – | |
| | | 110,494 | | | 113,366 | |
| 1 | Following a review of the classification of contracts issued by the Group’s Italian long-term business, there has been a reallocation from participating insurance liabilities at 31 December 2011 to participating investment contract liabilities of £2,722 million. |
(b) Long-term business investment liabilities
Investment contracts are those that do not transfer significant insurance risk from the contract holder to the issuer, and are therefore treated as financial instruments under IFRS.
Many investment contracts contain a discretionary participation feature in which the contract holder has a contractual right to receive additional benefits as a supplement to guaranteed benefits. These are referred to as participating contracts and are measured according to the methodology and Group practice for long-term business liabilities as described in note 36. They are not measured at fair value as there is currently no agreed definition of fair valuation for discretionary participation features under IFRS. In the absence
of such a definition, it is not possible to provide a range of estimates within which a fair value is likely to fall. The IASB has deferred consideration of participating contracts to Phase II of its insurance contracts project.
For participating business, the discretionary participation feature is recognised separately from the guaranteed element and is classified as a liability, referred to as unallocated divisible surplus. Guarantees on long-term investment products are discussed in note 38.
Investment contracts that do not contain a discretionary participation feature are referred to as non-participating contracts and the liability is measured at either fair value or amortised cost.
Of the non-participating investment contracts measured at fair value, £45,087 million in 2012 are unit linked in structure and the fair value liability is equal to the unit reserve plus additional non-unit reserves, if required, on a fair value basis. These contracts are generally classified as ‘Level 1’ in the fair value hierarchy, as the unit reserve is calculated as the publicly quoted unit price multiplied by the number units in issue, and any non-unit reserve is insignificant.
For unit-linked business, a deferred acquisition cost asset and deferred income reserve liability are recognised in respect of transaction costs and front-end fees respectively, that relate to the provision of investment management services, and which are amortised on a systematic basis over the contract term. The amount of the related deferred acquisition cost asset is shown in note 24 and the deferred income liability is shown in note 47.
In the US, funding agreements consist of one to ten year fixed rate contracts. These contracts may not be cancelled by the holders unless there is a default under the agreement, but may, subject to a call premium, be terminated by Aviva at any time. Aviva issued no new funding agreements in 2012. The weighted average interest rates for fixed-rate and floating-rate funding agreements as at 31 December 2012 were 4.688% and 0.305% respectively. Funding agreements issued before 2008 are measured at fair value equal to the present value of contractual cash flows and, for business issued since 2008, are measured at amortised cost. Most funding agreements are fully collateralised and therefore their fair values are not adjusted for own credit risk. Funding agreements carried at fair value total £0.6 billion and are classified as ‘Level 2’ in the fair value hierarchy.
There is a small volume of annuity certain business for which the liability is measured at amortised cost using the effective interest method.
The fair value of contract liabilities measured at amortised cost is not materially different from the amortised cost liability.
(c) Movements in the year
The following movements have occurred in the year:
(i) Participating investment contracts
| | 2012
£m | | Restated1 2011 £m | |
| Carrying amount at 1 January | | 67,707 | | | 72,440 | |
| Provisions in respect of new business | | 2,695 | | | 3,688 | |
| Expected change in existing business provisions | | (2,039 | ) | | (2,618 | ) |
| Variance between actual and expected experience | | 102 | | | (2,708 | ) |
| Impact of operating assumption changes | | 9 | | | (72 | ) |
| Impact of economic assumption changes | | 74 | | | 631 | |
| Other movements | | (82 | ) | | 211 | |
| Change in liability recognised as an expense | | 759 | | | (868 | ) |
| Foreign exchange rate movements | | (1,610 | ) | | (1,352 | ) |
| Deconsolidation of Delta Lloyd | | – | | | (2,523 | ) |
| Other movements | | (7 | ) | | 10 | |
| Carrying amount at 31 December | | 66,849 | | | 67,707 | |
| 1 | Following a review of the classification of contracts issued by the Group’s Italian long-term business, there has been a reallocation from participating insurance liabilities at 31 December 2011 to participating investment contract liabilities of £2,722 million. |
37 – Liability for investment contracts continued
For many types of long-term business, including unit-linked and participating funds, movements in asset values are offset by corresponding changes in liabilities, limiting the net impact on profit. Minor variances arise from differences between actual and expected experience for persistency, mortality and other demographic factors.
The impact of assumption changes in the above analysis shows the resulting movement in the carrying value of participating investment contract liabilities. For participating business, a movement in liabilities is generally offset by a corresponding adjustment to the unallocated divisible surplus and does not impact on profit. Where assumption changes do impact on profit, these are included in the effect of changes in assumptions and estimates during the year shown in note 40, together with the impact of movements in related non-financial assets.
(ii) Non-participating investment contracts
| | 2012
£m | | 2011
£m | |
| Carrying amount at 1 January | | 45,659 | | | 48,305 | |
| Provisions in respect of new business | | 3,851 | | | 3,863 | |
| Expected change in existing business provisions | | (2,531 | ) | | (2,558 | ) |
| Variance between actual and expected experience | | 982 | | | (2,796 | ) |
| Impact of operating assumption changes | | 14 | | | 1 | |
| Impact of economic assumption changes | | 4 | | | 7 | |
| Other movements | | 104 | | | (123 | ) |
| Change in liability | | 2,424 | | | (1,606 | ) |
| Effect of portfolio transfers, acquisitions and disposals | | 25 | | | – | |
| Deconsolidation of Delta Lloyd | | – | | | (832 | ) |
| Foreign exchange rate movements | | (404 | ) | | (206 | ) |
| Other movements | | (5 | ) | | (2 | ) |
| Carrying amount at 31 December | | 47,699 | | | 45,659 | |
The variance between actual and expected experience of £1.0 billion was primarily driven by favourable movements in investment markets in 2012. The rise in investment markets increased the value of unit linked contracts, which comprise the vast majority of the non-participating investment contract liabilities. For unit-linked investment contracts, movements in asset values are offset by corresponding changes in liabilities, limiting the net impact on profit. Minor variances arise from differences between actual and expected experience for persistency, mortality and other demographic factors.
The impact of assumption changes in the above analysis shows the resulting movement in the carrying value of non-participating investment contract liabilities. The impact of assumption changes on profit are included in the effect of changes in assumptions and estimates during the year shown in note 40, which combines participating and non-participating investment contracts together with the impact of movements in related non-financial assets.
38 – Financial guarantees and options
This note details the financial guarantees and options that the Group has given for some of our insurance and investment products.
As a normal part of their operating activities, various Group companies have given guarantees and options, including investment return guarantees, in respect of certain long-term insurance and fund management products. Further information on assumptions is given in notes 36 and 37.
(a) UK Life with-profit business
In the UK, life insurers are required to comply with the FSA’s realistic reporting regime for their with-profit funds for the calculation of FSA liabilities. Under the FSA’s rules, provision for guarantees and options within realistic liabilities must be measured at fair value, using market-consistent stochastic models. A stochastic approach includes measuring the time value of guarantees and options, which represents the additional cost arising from uncertainty surrounding future economic conditions.
The material guarantees and options to which this provision relates are:
(i) Maturity value guarantees
Substantially all of the conventional with-profit business and a significant proportion of unitised with-profit business have minimum maturity values reflecting the sums assured plus declared annual bonus. In addition, the guarantee fund has offered maturity value guarantees on certain unit-linked products. For some unitised with-profit life contracts the amount paid after the fifth policy anniversary is guaranteed to be at least as high as the premium paid increased in line with the rise in RPI/CPI.
(ii) No market valuation reduction (MVR) guarantees
For unitised business, there are a number of circumstances where a ‘no MVR’ guarantee is applied, for example on certain policy anniversaries, guaranteeing that no market value reduction will be applied to reflect the difference between the accumulated value of units and the market value of the underlying assets.
38 – Financial guarantees and options continued
(iii) Guaranteed annuity options
The Group’s UK with-profit funds have written individual and group pension contracts which contain guaranteed annuity rate options (GAOs), where the policyholder has the option to take the benefits from a policy in the form of an annuity based on guaranteed conversion rates. The Group also has exposure to GAOs and similar options on deferred annuities.
Realistic liabilities for GAOs in the UK with-profit funds were £1,156 million at 31 December 2012(2011: £1,170 million). With the exception of the New With-Profits Sub Fund (NWPSF), movements in the realistic liabilities in the with-profit funds are offset by a corresponding movement in the unallocated divisible surplus, with no net impact on IFRS profit. Realistic liabilities for GAOs in the NWPSF were £180 million at 31 December 2012(2011: £193 million).
(iv) Guaranteed minimum pension
The Group’s UK with-profit funds also have certain policies that contain a guaranteed minimum level of pensions as part of the condition of the original transfer from state benefits to the policy.
In addition, the with-profit fund companies have made promises to certain policyholders in relation to their with-profit mortgage endowments. Top-up payments will be made on these policies at maturity to meet the mortgage value up to a maximum of the 31 December 1999 illustrated shortfall. For UKLAP WP policyholders, these payments are subject to certain conditions.
(b) UK Life non-profit business
The Group’s UK non-profit funds are evaluated by reference to statutory reserving rules, including changes introduced in 2006 under FSA Policy Statement 06/14,Prudential Changes for Insurers.
(i) Guaranteed annuity options
Similar options to those written in the with-profit fund have been written in relation to non-profit products. Provision for these guarantees does not materially differ from a provision based on a market-consistent stochastic model, and amounts to £35 million at 31 December 2012(2011: £35 million).
(ii) Guaranteed unit price on certain products
Certain unit-linked pension products linked to long-term life insurance funds provide policyholders with guaranteed benefits at retirement or death. No additional provision is made for this guarantee as the investment management strategy for these funds is designed to ensure that the guarantee can be met from the fund, mitigating the impact of large falls in investment values and interest rates.
(c) Overseas life businesses
In addition to guarantees written in the Group’s UK life businesses, our overseas businesses have also written contracts containing guarantees and options. Details of the significant guarantees and options provided by overseas life businesses are set out below.
(i) France
Guaranteed surrender value and guaranteed minimum bonuses
Aviva France has written a number of contracts with such guarantees. The guaranteed surrender value is the accumulated value of the contract including accrued bonuses. Bonuses are based on accounting income from amortised bond portfolios, where the duration of bond portfolios is set in relation to the expected duration of the policies, plus income and releases from realised gains on equity-type investments. Policy reserves are equal to guaranteed surrender values. Local statutory accounting envisages the establishment of a reserve, ‘Provision pour Aléas Financiers’ (PAF), when accounting income is less than 125% of guaranteed minimum credited returns. No PAF was established at the end of 2012.
The most significant of these contracts is the AFER Eurofund which has total liabilities of £33 billion at 31 December 2012(2011: £33billion). The guaranteed minimum bonus is agreed between Aviva France and the AFER association at the end of each year, in respect of the following year. The bonus was 3.45% for 2012 (2011: 3.43%) compared with an accounting income from the fund of 3.94% (2011: 3.92%).
Non-AFER contracts with guaranteed surrender values had liabilities of £14 billion at 31 December 2012(2011: £14 billion) and all guaranteed annual bonus rates are between 0% and 4.5%.
Guaranteed death and maturity benefits
In France, the Group has also sold unit-linked policies where the death and/or maturity benefit is guaranteed to be at least equal to the premiums paid. The reserve held in the Group’s consolidated statement of financial position at the end of 2012 for this guarantee is £101 million(2011: £130 million). The reserve is calculated on a prudent basis and is in excess of the economic liability. At the end of 2012, total sums at risk for these contracts were £223 million(2011: £631 million) out of total unit-linked funds of £12 billion(2011:£12 billion). The average age of policyholders was approximately 54. It is estimated that this liability would increase by £88 million(2011: £96 million) if yields were to decrease by 1% per annum and by £21 million(2011: £26 million) if equity markets were to decline by 10% from year end 2012 levels. These figures do not reflect our ability to review the tariff for this option.
(ii) Ireland
Guaranteed annuity options
Products with similar GAOs to those offered in the UK have been issued in Ireland. The current net of reinsurance provision for such options is £256 million(2011: £271 million). This has been calculated on a deterministic basis, making conservative assumptions for the factors which influence the cost of the guarantee, principally annuitant mortality option take-up and long-term interest rates.
These GAOs are ‘in the money’ at current interest rates but the exposure to interest rates under these contracts has been hedged through the use of reinsurance, using derivatives (swaptions). The swaptions effectively guarantee that an interest rate of 5% will be available at the vesting date of these benefits so there is reduced exposure to a further decrease in interest rates.
38 – Financial guarantees and options continued
‘No MVR’ guarantees
Certain unitised with-profit policies containing ‘no MVR’ guarantees, similar to those in the UK, have been sold in Ireland.
These guarantees are currently ‘in-the-money’ by £0.4 million(2011: £5.5 million). This has been calculated on a deterministic basis as the excess of the current policy surrender value over the discounted value (excluding terminal bonus) of the guarantees. The value of these guarantees is usually sensitive to the performance of investments held in the with-profit fund. Amounts payable under these guarantees are determined by the bonuses declared on these policies. There is no sensitivity to either interest rates or equity markets since there is no longer any exposure to equity in these funds and a matching strategy has been implemented for bonds.
Return of premium guarantee
Until 2005, Aviva Life and Pensions Ireland wrote two tranches of linked bonds with a return of premium guarantee, or a price floor guarantee, after five or six years. The first tranche expired before the end of the previous financial reporting period. The second tranche expired during the last quarter of the current reporting period.As a result there is no provision held for this business(2011: £7 million).
(iii) Spain and Italy
Guaranteed investment returns and guaranteed surrender values
The Group has also written contracts containing guaranteed investment returns and guaranteed surrender values in both Spain and Italy. Traditional profit-sharing products receive an appropriate share of the investment return, assessed on a book value basis, subject to a guaranteed minimum annual return of up to 6% in Spain and 4% in Italy on existing business, while on new business the maximum guaranteed rate is lower. Liabilities are generally taken as the face value of the contract plus, if required, an explicit provision for guarantees calculated in accordance with local regulations. At 31 December 2012, total liabilities for the Spanish business were £3 billion(2011: £3 billion) with a further reserve of £0.1 million(2011: £5.1 million) for guarantees. Total liabilities for the Italian business were £10 billion(2011: £11 billion), with a further provision of £45 million(2011: £43 million) for guarantees. Liabilities are most sensitive to changes in the level of interest rates. It is estimated that provisions for guarantees would need to increase by £5 million(2011: £18 million) in Spain and £1 million(2011: £5 million) in Italy if interest rates fell by 1% from end 2012 values. Under this sensitivity test, the guarantee provision in Spain is calculated conservatively, assuming a long-term market interest rate of 1.89% and no lapses or premium discontinuances.
(iv) United States
Indexed and total return strategy products
In the United States, the Group writes indexed life and deferred annuity products. These products guarantee the return of principal to the policyholder and credit interest based on certain indices, primarily the Standard & Poor’s 500 Composite Stock Price Index. A portion of each premium is used to purchase derivatives to hedge the growth in interest credited to the policyholder. The derivatives held by the Group and the options embedded in the policy are both carried at fair value.
The US Treasury swap curve plus a risk adjustment of 1.06%(2011: 2.48%) for indexed life and 1.57% (2011: 2.51%) for indexed deferred annuities is used as the discount rate to calculate the fair value of the embedded options.
The risk adjustment calculation is based on market spreads on senior long-term unsecured Aviva plc debt with a reduction to reflect policyholder priority over other creditors in case of default. The amount of change in the fair value of these embedded options resulting from the risk adjustment in 2012 is an increase of £269 million(2011: £453 million), and is principally attributable to market factors rather than instrument specific credit risk. At 31 December 2012, the total liabilities for indexed products were £23 billion(2011: £22 billion), including liabilities for the embedded option of £2.7 billion(2011: £2.6 billion).If interest rates were to increase by 1%, the provision for embedded options would decrease by £151 million(2011: £152 million) and, if interest rates were to decrease by 1%, the provision would increase by £167 million(2011: £167 million).
The Group has certain products that credit interest based on a total return strategy, whereby policyholders are allowed to allocate their premium payments to different asset classes within the general account. The Group guarantees a minimum return of premium plus approximately 3% interest over the term of the contracts. The linked general account assets are fixed maturity securities, and both the securities and the contract liabilities are carried at fair value. At 31 December 2012, the liabilities for total return strategy products were £0.8 billion(2011: £0.9 billion).
The Group offers an optional lifetime guaranteed income benefit focused on the retirement income segment of the deferred annuity marketplace to help customers manage income during both the accumulation stage and the distribution stage of their financial life. At 31 December 2012, a total of £11.0 billion(2011: £10.1 billion) in indexed deferred annuities have elected this benefit, taking steps to guarantee retirement income.
(d) Sensitivity
In providing these guarantees and options, the Group’s capital position is sensitive to fluctuations in financial variables including foreign currency exchange rates, interest rates, real estate prices and equity prices. Interest rate guaranteed returns, such as those available on GAOs, are sensitive to interest rates falling below the guaranteed level. Other guarantees, such as maturity value guarantees and guarantees in relation to minimum rates of return, are sensitive to fluctuations in the investment return below the level assumed when the guarantee was made.
39 – Reinsurance assets
This note details the reinsurance recoverables on our insurance and investment contract liabilities.
(a) Carrying amounts
The reinsurance assets at 31 December comprised:
| | 2012
£m | | 2011
£m | |
| Long-term business | | | | | | |
| Insurance contracts | | 4,291 | | | 3,747 | |
| Participating investment contracts | | 3 | | | – | |
| Non-participating investment contracts1 | | 1,678 | | | 1,626 | |
| | | 5,972 | | | 5,373 | |
| Outstanding claims provisions | | 93 | | | 126 | |
| | | 6,065 | | | 5,499 | |
| General insurance and health | | | | | | |
| Outstanding claims provisions | | 900 | | | 974 | |
| Provisions for claims incurred but not reported | | 354 | | | 395 | |
| | | 1,254 | | | 1,369 | |
| Provisions for unearned premiums | | 248 | | | 245 | |
| | | 1,502 | | | 1,614 | |
| | | 7,567 | | | 7,113 | |
| Less: Amounts classified as held for sale | | (883 | ) | | (1 | ) |
| Total | | 6,684 | | | 7,112 | |
| 1 | Balances in respect of all reinsurance treaties are included under reinsurance assets, regardless of whether they transfer significant insurance risk. |
Of the above total, £5,251 million(2011: £5,086 million) is expected to be recovered more than one year after the statement of financial position date.
(b) Assumptions
The assumptions, including discount rates, used for reinsurance contracts follow those used for insurance contracts. Reinsurance assets are valued net of an allowance for their recoverability.
(c) Movements
The following movements have occurred in the reinsurance asset during the year:
(i) In respect of long-term business provisions
| | 2012
£m | | 2011
£m | |
| Carrying amount at 1 January | | 5,373 | | | 5,115 | |
| Asset in respect of new business | | 387 | | | 187 | |
| Expected change in existing business asset | | 166 | | | 7 | |
| Variance between actual and expected experience | | 197 | | | 290 | |
| Impact of operating assumption changes | | (306 | ) | | (9 | ) |
| Impact of economic assumption changes | | 143 | | | 433 | |
| Other movements | | (137 | ) | | (260 | ) |
| Change in asset | | 450 | | | 648 | |
| Effect of portfolio transfers, acquisitions and disposals | | 197 | | | (2 | ) |
| Deconsolidation of Delta Lloyd | | – | | | (375 | ) |
| Foreign exchange rate movements | | (48 | ) | | (13 | ) |
| Carrying amount at 31 December | | 5,972 | | | 5,373 | |
The impact of assumption changes in the above analysis shows the resulting movement in the carrying value of reinsurance assets. The changes to the reinsurance asset from assumption changes mainly relates to business in the UK and Ireland, with corresponding movements in gross insurance contract liabilities. For participating businesses, a movement in reinsurance assets is generally offset by a corresponding adjustment to the unallocated divisible surplus and does not impact on profit. Where assumption changes do impact profit, these are included in the effect of changes in assumptions and estimates during the year shown in note 40, together with the impact of movements in related liabilities and other non-financial assets.
39 – Reinsurance assets continued
(ii) In respect of general insurance and health outstanding claims provisions and IBNR
| | 2012
£m | | 2011
£m | |
| Carrying amount at 1 January | | 1,369 | | | 1,558 | |
| Impact of changes in assumptions | | 22 | | | 87 | |
| Reinsurers’ share of claim losses and expenses | | | | | | |
| Incurred in current year | | 286 | | | 247 | |
| Incurred in prior years | | 13 | | | (84 | ) |
| Exceptional strengthening of general insurance latent claims provisions | | – | | | 10 | |
| Reinsurers’ share of incurred claim losses and expenses | | 299 | | | 173 | |
| Less: | | | | | | |
| Reinsurance recoveries received on claims | | | | | | |
| Incurred in current year | | (138 | ) | | (138 | ) |
| Incurred in prior years | | (150 | ) | | (196 | ) |
| Reinsurance recoveries received in the year | | (288 | ) | | (334 | ) |
| Unwind of discounting | | 13 | | | 19 | |
| Other movements | | – | | | (1) | |
| Change in reinsurance asset recognised as income | | 46 | | | (56 | ) |
| Effect of portfolio transfers, acquisitions and disposals | | (136 | ) | | 28 | |
| Deconsolidation of Delta Lloyd | | – | | | (153 | ) |
| Foreign exchange rate movements | | (26 | ) | | (2 | ) |
| Other movements | | 1 | | | (6 | ) |
| Carrying amount at 31 December | | 1,254 | | | 1,369 | |
(iii) Reinsurers’ share of the provision for UPR
| | 2012
£m | | 2011
£m | |
| Carrying amount at 1 January | | 245 | | | 307 | |
| Premiums ceded to reinsurers in the year | | 641 | | | 650 | |
| Less: Reinsurers’ share of premiums earned during the year | | (636 | ) | | (678 | ) |
| Change in reinsurance asset recognised as income | | 5 | | | (28 | ) |
| Reinsurers’ share of portfolio transfers and acquisitions | | 3 | | | – | |
| Deconsolidation of Delta Lloyd | | – | | | (30 | ) |
| Foreign exchange rate movements | | (5 | ) | | (4 | ) |
| Other movements | | – | | | – | |
| Carrying amount at 31 December | | 248 | | | 245 | |
40 – Effect of changes in assumptions and estimates during the year
Certain estimates and assumptions used in determining our liabilities for insurance and investment contract business were changed from 2011 to 2012, affecting the profit recognised for the year with an equivalent effect on liabilities. This note analyses the effect of the changes. This note only allows for the impact on liabilities and related assets, such as unallocated divisible surplus, reinsurance, deferred acquisition costs and AVIF, and does not allow for offsetting movements in the value of backing financial assets.
| | Effect on
profit
2012
£m | | Effect on
profit
2011
£m | | Effect on
profit
2010
£m | |
| Assumptions | | | | | | | | | |
| Long-term insurance business | | | | | | | | | |
| Interest rates | | (515 | ) | | (2,403 | ) | | (796 | ) |
| Expenses | | 11 | | | 5 | | | (1 | ) |
| Persistency rates | | – | | | (4 | ) | | 2 | |
| Mortality for assurance contracts | | – | | | 35 | | | 71 | |
| Mortality for annuity contracts | | 241 | | | (21 | ) | | (637 | ) |
| Tax and other assumptions | | (207 | ) | | 99 | | | 167 | |
| Investment contracts | | | | | | | | | |
| Interest rates | | (2 | ) | | (82 | ) | | 1 | |
| Expenses | | (1 | ) | | – | | | 1 | |
| Persistency rates | | – | | | – | | | (21 | ) |
| Tax and other assumptions | | – | | | 28 | | | (3) | |
| General insurance and health business | | | | | | | | | |
| Change in loss ratio assumptions | | – | | | 5 | | | (4 | ) |
| Change in discount rate assumptions | | (21 | ) | | (90 | ) | | (61 | ) |
| Change in expense ratio and other assumptions | | (21 | ) | | 22 | | | 38 | |
| Total | | (515 | ) | | (2,406 | ) | | (1,243 | ) |
The impact of interest rates for long-term business relates primarily to the UK and Ireland driven by the reduction in valuation interest rates. This had the effect of increasing liabilities and hence a negative impact on profit. The overall impact on profit also depends on movements in the value of assets backing the liabilities, which is not included in this disclosure. The impact of tax and other assumptions relates mainly to strengthening of credit default assumptions for commercial mortgages backing UK annuity business.
41 – Unallocated divisible surplus
An unallocated divisible surplus (UDS) is established where the nature of policy benefits is such that the division between shareholder reserves and policyholder liabilities is uncertain at the reporting date. Therefore the expected duration for settlement of the UDS is not defined.
The following movements have occurred in the year:
| | 2012
£m | | 2011
£m | |
| Carrying amount at 1 January | | 650 | | | 3,428 | |
| Change in participating contract assets | | 6,140 | | | (3,016 | ) |
| Change in participating contract liabilities | | 253 | | | 244 | |
| Other movements | | (77 | ) | | 70 | |
| Change in liability recognised as an expense | | 6,316 | | | (2,702 | ) |
| Effect of portfolio transfers, acquisitions and disposal | | 1 | | | – | |
| Deconsolidation of Delta Lloyd | | – | | | (144 | ) |
| Foreign exchange rate movements | | 24 | | | 60 | |
| Other movements | | (5 | ) | | 8 | |
| Carrying amount at 31 December | | 6,986 | | | 650 | |
| Less: Amounts classified as held for sale | | (55 | ) | | – | |
| | | 6,931 | | | 650 | |
In Italy, the UDS balance was £2 million negative at 31 December 2012(2011: £1,449 million negative). In Spain, certain participating funds had negative UDS balances at 31 December 2012, although in aggregate the UDS balance was £95 million positive(2011: £13 million positive).
Negative UDS balances result from an accounting mismatch between participating assets carried at market value and participating liabilities measured using local practice. The negative balances were tested for recoverability using embedded value methodology and in line with local accounting practice. Testing is conducted at a participating fund-level within each life entity. The negative balances are considered to be recoverable from margins in the existing participating business liabilities.
In Italy, there was a loss of £9 million for negative UDS considered irrecoverable(2011: £17 million loss), and in Spain a reversal of £33 million of previous losses(2011: £49 million loss).
In Italy the estimation of the recoverable negative UDS balance uses a real-world embedded value method, with a risk-discount rate of 6.25%.(2011: 7.05%). The embedded value method includes implicit allowance for the time value of options and guarantees. If the risk discount rate were increased by 1% it is estimated that the recoverable negative UDS balance would be unchanged.
In Spain, the estimation of the recoverable negative UDS balance uses a market-consistent embedded value method.
42 – Tax assets and liabilities
This note analyses the tax assets and liabilities that appear in the statement of financial position and explains the movements in these balances in the year.
(a) Current tax
Current tax assets recoverable and liabilities payable in more than one year are £37 million and £8 million(2011: £29 million and £48 million),respectively.
(b) Deferred tax
(i) The balances at 31 December comprise:
| | 2012
£m | | 2011
£m | |
| Deferred tax assets | | 220 | | | 238 | |
| Deferred tax liabilities | | (1,227 | ) | | (1,171 | ) |
| Net deferred tax liability | | (1,007 | ) | | (933 | ) |
| Less: Amounts classified as held for sale | | 648 | | | – | |
| | | (359 | ) | | (933 | ) |
Amounts classified as held for sale include £32 million of deferred tax assets(2011: £nil) and £680 million of deferred tax liabilities(2011: £nil).
(ii) The net deferred tax liability arises on the following items:
| | 2012
£m | | 2011
£m | |
| Long-term business technical provisions and other insurance items | | 2,067 | | | 455 | |
| Deferred acquisition costs | | (681 | ) | | (598 | ) |
| Unrealised gains on investments | | (2,869 | ) | | (347 | ) |
| Pensions and other post-retirement obligations | | (135 | ) | | (245 | ) |
| Unused losses and tax credits | | 535 | | | 462 | |
| Subsidiaries, associates and joint ventures | | (10 | ) | | (10 | ) |
| Intangibles and additional value of in-force long-term business | | (363 | ) | | (445 | ) |
| Provisions and other temporary differences | | 449 | | | (205 | ) |
| Net deferred tax liability | | (1,007 | ) | | (933 | ) |
| Less: Amounts classified as held for sale | | 648 | | | – | |
| | | (359 | ) | | (933 | ) |
(iii) The movement in the net deferred tax liability was as follows:
| | 2012
£m | | 2011
£m | |
| Net liability at 1 January | | (933 | ) | | (1,470 | ) |
| Acquisition and disposal of subsidiaries | | – | | | 53 | |
| Amounts (charged)/credited to income statement (note 10a) | | (122 | ) | | 513 | |
| Amounts credited/(charged) to other comprehensive income (note 10b) | | 24 | | | (354 | ) |
| Deconsolidation of Delta Lloyd | | – | | | 326 | |
| Foreign exchange rate movements | | 27 | | | (6 | ) |
| Other movements | | (3 | ) | | 5 | |
| Net liability at 31 December | | (1,007 | ) | | (933 | ) |
Deferred tax assets are recognised to the extent that it is probable that future taxable profits will be available against which the temporary differences can be utilised. In countries where there is a history of tax losses, deferred tax assets are only recognised in excess of deferred tax liabilities if there is convincing evidence that future profits will be available. Where this is the case, the directors have relied on business plans supporting future profits.
The Group has unrecognised tax losses and other temporary differences of £1,005 million(2011: £910 million) to carry forward against future taxable income of the necessary category in the companies concerned. Of these, trading losses of £278 million will expire within the next 20 years. The remaining losses have no expiry date.
In addition, the Group has unrecognised capital losses of £652 million(2011: £418 million). These have no expiry date.
There are no temporary differences in respect of unremitted overseas retained earnings for which deferred tax liabilities have not been recognised at 31 December 2012 (2011: £nil).
43 – Provisions
This note details the non-insurance provisions that the Group holds, and shows the movements in these during the year.
(a) Carrying amounts
| | 2012
£m | | 2011
£m | |
| Total IAS 19 obligations to main staff pension schemes (note 44(e)(vii)) | | 651 | | | 406 | |
| Deficits in other staff pension schemes | | 88 | | | 86 | |
| Total IAS 19 obligations to staff pension schemes | | 739 | | | 492 | |
| Restructuring provisions | | 144 | | | 106 | |
| Other provisions | | 423 | | | 398 | |
| Total provisions | | 1,306 | | | 996 | |
| Less: Amounts classified as held for sale | | (187 | ) | | (4 | ) |
| | | 1,119 | | | 992 | |
Other provisions comprise many small provisions throughout the Group for obligations such as costs of compensation, litigation, staff entitlements and reorganisation.
Of the total, £901 million(2011: £605 million) is expected to be settled more than one year after the statement of financial position date.
(b) Movements on restructuring and other provisions
| | | | | | 2012 | | | | | | 2011 | |
| | Restructuring
provisions
£m | | Other
provisions
£m | | Total
£m | | Restructuring
provisions
£m | | Other
provisions
£m | | Total
£m | |
| At 1 January | | 106 | | | 398 | | | 504 | | | 152 | | | 690 | | | 842 | |
| Additional provisions | | 236 | | | 120 | | | 356 | | | 82 | | | 69 | | | 151 | |
| Unused amounts reversed | | – | | | (30 | ) | | (30 | ) | | (5 | ) | | (40 | ) | | (45 | ) |
| Change in the discounted amount arising from passage of time | | – | | | 5 | | | 5 | | | – | | | 3 | | | 3 | |
| Charge to income statement | | 236 | | | 95 | | | 331 | | | 77 | | | 32 | | | 109 | |
| Utilised during the year | | (197 | ) | | (53 | ) | | (250 | ) | | (50 | ) | | (124 | ) | | (174 | ) |
| Disposal of subsidiaries | | – | | | (3 | ) | | (3 | ) | | – | | | (6 | ) | | (6 | ) |
| Effect of deconsolidation of Delta Lloyd | | – | | | – | | | – | | | (55 | ) | | (177 | ) | | (232 | ) |
| Foreign exchange rate movements | | (1 | ) | | (14) | | | (15 | ) | | (18 | ) | | (17 | ) | | (35 | ) |
| At 31 December | | 144 | | | 423 | | | 567 | | | 106 | | | 398 | | | 504 | |
44 – Pension obligations
(a) Introduction
The Group operates a large number of defined benefit and defined contribution pension schemes. The material defined benefit schemes are in the UK, Canada and Ireland with the main UK scheme being the largest. This note gives full IAS 19 disclosures for these schemes. The smaller ones, while still measured under IAS 19, are included as one total within Provisions (see note 43). Similarly, while the charges to the income statement for the main schemes are shown in section (e)(iv) below, the total charges for all pension schemes are disclosed in section (d) below.
The assets of the UK, Irish and Canadian schemes are held in separate trustee-administered funds to meet long-term pension liabilities to past and present employees. In all schemes, the appointment of trustees of the funds is determined by their trust documentation, and they are required to act in the best interests of the schemes’ beneficiaries. The long-term investment objectives of the trustees and the employers are to limit the risk of the assets failing to meet the liabilities of the schemes over the long term, and to maximise returns consistent with an acceptable level of risk so as to control the long-term costs of these schemes.
A full actuarial valuation of each of the defined benefit schemes is carried out at least every three years for the benefit of scheme trustees and members. Actuarial reports have been submitted for each scheme within this period, using appropriate methods for the respective countries on local funding bases.
(b) Membership
The number of scheme members was as follows:
| | | United Kingdom | | | | | | Ireland | | | | | | Canada | |
| | | 2012
Number | | | 2011
Number | | | 2012
Number | | | 2011
Number | | | 2012
Number | | | 2011
Number | |
| Active members | | – | | | – | | | 791 | | | 1,063 | | | – | | | – | |
| Deferred members | | 56,825 | | | 57,328 | | | 1,246 | | | 998 | | | 1,022 | | | 1,213 | |
| Pensioners | | 30,647 | | | 30,447 | | | 723 | | | 707 | | | 1,344 | | | 1,284 | |
| Total members | | 87,472 | | | 87,775 | | | 2,760 | | | 2,768 | | | 2,366 | | | 2,497 | |
As noted below, the final salary sections of both the UK schemes were closed to future accrual with effect from 1 April 2011. The Canadian scheme closed to future accrual on 31 December 2011.
(c) UK schemes
In the UK, the Group operates two main pension schemes, the Aviva Staff Pension Scheme (ASPS) and the smaller RAC (2003) Pension Scheme which was retained after the sale of RAC Limited in September 2011.
The Group confirmed its decision to close the final salary sections of both UK schemes with effect from 1 April 2011, with entry into the defined contribution sections being offered to the staff members affected. New entrants join the defined contribution section of the ASPS. Closure of the schemes has removed the volatility associated with adding future accrual for active members, and has also led to lower service costs and their cash funding since April 2011.
(i) Defined benefit section of the ASPS
This scheme is operated by a trustee company, with 11 trustee directors, comprising representatives of the employers, staff, pensioners and an independent trustee (referred to as the trustees). The Company works closely with the trustees who are required to consult it on the funding of the scheme and its investment strategy. Following each actuarial valuation, the Company and the trustees agree the level of contributions needed and funding levels are then monitored on an annual basis.
At 31 March 2009, the date of the last actuarial valuation, this section of the scheme had an excess of obligations over available assets, on a funding basis, which uses more prudent assumptions than are required for reporting under IAS 19, of £3.0 billion. As a result of that valuation, the Company and the trustees have agreed a long-term funding plan where contributions, together with anticipated growth in scheme investments, are expected to eliminate the funding deficit over time. Under this agreement, deficit funding payments of £378 million were made in 2010, £178 million in 2011 and £128 million in 2012. Further funding payments of £144 million are expected in 2013. Funding payments along with the rise in gilt yields and return on invested scheme assets have resulted in a reduced deficit which is estimated to have fallen by £1.3 billion to £1.0 billion at 31 December 2012. The Company is currently undergoing a triennial actuarial valuation as at 31 March 2012, which is expected to be finalised by 30 June 2013.
(ii) Defined contribution (money purchase) section of the ASPS
The trustees have responsibility for selecting a range of suitable funds in which the members can choose to invest and for monitoring the performance of the available investment funds. Members are responsible for reviewing the level of contributions they pay and the choice of investment fund to ensure these are appropriate to their attitude to risk and their retirement plans. Members of this section contribute at least 2% of their pensionable salaries and, depending on the percentage chosen, the Company contributes up to a maximum 14%, together with the cost of the death-in-service benefits. These contribution rates are unchanged for 2013.
44 – Pension obligations continued
(d) Charge to staff costs in the income statement
The total pension charge to staff costs of all the Group’s defined benefit and defined contribution schemes were:
| | 2012
£m | | 2011
£m | | 2010
£m | |
| Continuing operations | | | | | | | | | |
| UK defined benefit schemes | | 12 | | | 36 | | | (227 | ) |
| Overseas defined benefit schemes | | 7 | | | 22 | | | 8 | |
| Total defined benefit schemes (note 8b) | | 19 | | | 58 | | | (219 | ) |
| UK defined contribution schemes | | 91 | | | 75 | | | 53 | |
| Overseas defined contribution schemes | | 11 | | | 11 | | | 17 | |
| Total defined contribution schemes (note 8b) | | 102 | | | 86 | | | 70 | |
| Total charge/(credit) from continuing operations | | 121 | | | 144 | | | (149 | ) |
| Total charge from discontinued operations | | 5 | | | 16 | | | 44 | |
| Total charge/(credit) for pension schemes | | 126 | | | 160 | | | (105 | ) |
The gains in curtailments in 2010 principally arose from closure of the UK schemes to future accruals. There were no significant contributions outstanding or prepaid as at either 31 December 2012 or 2011.
(e) IAS 19 disclosures
Disclosures under IAS 19 for the material defined benefit schemes in the UK, Ireland and Canada, are given below. Where schemes provide both defined benefit and defined contribution pensions, the assets and liabilities shown exclude those relating to defined contribution pensions. Total employer contributions for these schemes in 2013, including the ASPS deficit funding, are currently expected to be £230 million.
(i) Assumptions on scheme liabilities
The projected unit credit method
The inherent uncertainties affecting the measurement of scheme liabilities require these to be measured on an actuarial basis. This involves discounting the best estimate of future cash flows to be paid out by the scheme using the projected unit credit method. This is an accrued benefits valuation method which calculates the past service liability to members and makes allowance for their projected future earnings. It is based on a number of actuarial assumptions, which vary according to the economic conditions of the countries in which the relevant businesses are situated, and changes in these assumptions can materially affect the measurement of the pension obligations.
Alternative measurement methods
There are alternative methods of measuring liabilities, for example by calculating an accumulated benefit obligation (the present value of benefits for service already rendered but with no allowance for future salary increases) or on a solvency basis, using the cost of securing the benefits at a particular date with an insurance company or one of the growing market of alternative buy-out providers. This could take the form of a buy-out, in which the entire liability will be settled in one payment with all obligations transferred to an insurance company or buy-out provider, or a buy-in, in which annuities or other insurance products are purchased to cover a part or all of the liability. A valuation of the liabilities in either of these cases will almost always result in a higher estimate of the pension deficit than under an on-going approach, as they assume that the sponsor immediately transfers the majority, if not all, of the risk to another provider who would be seeking to make a profit on the transaction. However there is no active market of organisations that would be able to offer a full buy-out option for schemes of the size of our main UK scheme.
There is a small buy-out market in Ireland, largely restricted to pensions currently in payment and it is not clear whether current capacity would enable an immediate buy-out of our Irish pension liabilities at present. The Canadian defined benefit plan’s liabilities represent the likely limit on what the Canadian group annuity market could absorb at normal competitive group annuity prices if the entire plan were subject to a buy-out valuation. There is in fact a reasonably high chance that only a portion of the plan’s liabilities could be absorbed in one tranche.
IAS 19 requires us to use the projected unit credit method to measure our pension scheme liabilities. Neither of the alternative methods is considered appropriate in presenting fairly the Group’s obligations to the members of its pension schemes on an ongoing basis, so they are not considered further.
Valuations and assumptions
The valuations used for accounting under IAS 19 have been based on the most recent full actuarial valuations, updated to take account of that standard’s requirements in order to assess the liabilities of the material schemes at 31 December 2012. Scheme assets are stated at their fair values at 31 December 2012.
44 – Pension obligations continued
The main actuarial assumptions used to calculate scheme liabilities under IAS 19 are:
| | | UK | | Ireland | | Canada |
| | 2012 | 2011 | 2012 | 2011 | 2012 | 2011 |
| Inflation rate | 3.0% | 3.1% | 2.0% | 2.0% | 2.5% | 2.5% |
| General salary increases | 4.8% | 4.9% | 3.5% | 3.5% | 3.0% | 3.75% |
| Pension increases | 3.0% | 3.1% | 2.0% | 2.0% | 1.25% | 1.25% |
| Deferred pension increases | 3.0% | 3.1% | 2.0% | 2.0% | — | — |
| Discount rate | 4.5% | 4.9% | 3.5% | 5.7% | 3.75% | 4.5% |
| Basis of discount rate | AA-rated corporate bonds | AA-rated corporate bonds | AA-rated corporate bonds |
The discount rate and pension increase rate are the two assumptions that have the largest impact on the value of the liabilities, with the difference between them being known as the net discount rate. For each country, the discount rate is based on current average yields of high-quality debt instruments taking account of the maturities of the defined benefit obligations. A 1% increase in this rate (and therefore the net discount rate) would reduce the liabilities by £2.0 billion and the service cost for the year by £2 million. It would also increase the interest cost on the liabilities by £1 million.
Mortality assumptions
Mortality assumptions are significant in measuring the Group’s obligations under its defined benefit schemes, particularly given the maturity of these obligations in the material schemes. The assumptions used are summarised in the table below and have been selected to reflect the characteristics and experience of the membership of these schemes.
The mortality tables, average life expectancy and pension duration used at 31 December 2012 for scheme members are as follows:
| | | Life expectancy/(pension
duration) at NRA of a male | | Life expectancy/(pension
duration) at NRA of a female | |
| Mortality table | | | Normal
retirement
age (NRA) | | |
Currently
aged NRA | | | 20 years
younger
than NRA | | |
Currently
aged NRA | | | 20 years younger
than NRA | |
| UK – ASPS | Club Vita pooled experience, including an allowance for future improvements | | 60 | | | 90.1 | | | 93.3 | | | 90.1 | | | 92.2 | |
| | | | | | | (30.1 | ) | | (33.3 | ) | | (30.1 | ) | | (32.2 | ) |
| – RAC | SAPS series 1, including allowances for future improvement | | 65 | | | 87.9 | | | 90.9 | | | 89.9 | | | 91.9 | |
| | | | | | | (22.9 | ) | | (25.9 | ) | | (24.9 | ) | | (26.9 | ) |
| Ireland | 94% PNA00 with allowance for future improvements | | 61 | | | 87.0 | | | 90.2 | | | 89.9 | | | 93.0 | |
| | | | | | | (26.0 | ) | | (29.2 | ) | | (28.9 | ) | | (32.0 | ) |
| Canada | UP1994, with Projection Scale AA applied on a generational basis | | 65 | | | 84.7 | | | 86.2 | | | 87.1 | | | 87.9 | |
| | | | | | | (19.7 | ) | | (21.2 | ) | | (22.1 | ) | | (22.9 | ) |
The assumptions above are based on commonly used mortality tables and, in the UK, are those used by both schemes’ trustees in the most recently completed full actuarial valuations. The tables make allowance for observed variations in such factors as age, gender, pension amount, salary and postcode-based lifestyle group, and have been adjusted to reflect recent research into mortality experience. However, the extent of future improvements in longevity is subject to considerable uncertainty and judgement is required in setting this assumption. In the UK schemes, which are the most material to the Group, the assumptions include an allowance for future mortality improvement, based on the actuarial profession’s long and medium cohort projection tables (for the ASPS and RAC schemes respectively) and incorporating underpins to the rate of future improvement equal to 1.5% pa for males and 1.0% pa for females. The effect of assuming all members were one year younger would increase the liabilities in all the schemes by £293 million and would not significantly impact the service cost for the year.
The discounted scheme liabilities have an average duration of 20 years in the main UK scheme, 21 years in the RAC scheme, 22 years in the Irish scheme and 13 years in the Canadian scheme. The undiscounted benefits payable from the main UK defined benefit scheme are expected to be as shown in the chart below:
44 – Pension obligations continued

(ii) Assumptions on scheme assets
The expected rates of return on the schemes’ assets are:
| | | UK | | Ireland | | Canada |
| | 2012 | 2011 | 2012 | 2011 | 2012 | 2011 |
| Equities | 5.8% | 7.2% | 5.9% | 6.9% | 5.8% | 7.0% |
| Bonds | 3.4% | 4.4% | 3.2% | 2.7% | 3.2% | 3.2% |
| Property | 4.3% | 5.7% | 4.4% | 5.4% | n/a | n/a |
| Cash | 0.7% | 0.6% | 0.9% | 2.7% | 0.8% | 1.0% |
The expected rates of return on the schemes’ assets presented above are as at the beginning of the year. The overall rates of return are based on the expected returns within each asset category and on current asset allocations. The expected returns for equities and properties are aligned with the rates used for the Group’s longer-term investment return assumptions. The figures for the total expected return on scheme assets in the following section are stated after deducting investment expenses and, in Ireland, the government levy on pension fund assets. The amended IAS 19,Employee Benefits, which is effective from 1 January 2013, will replace the concept of expected return on scheme assets with interest on scheme assets, which will be calculated using the same interest rate as applied for the purpose of discounting the defined benefit obligation.
(iii) Investments in Group-managed funds and insurance policies
Plan assets include investments in Group-managed funds in the consolidated statement of financial position of £62 million(2011: £112 million) and insurance policies with other Group companies of £179 million(2011: £163 million) in the main UK scheme.
(iv) Pension expense
The total pension expense comprises:
Recognised in the income statement
| | 2012
£m | | 2011
£m | | 2010
£m | |
| Continuing operations | | | | | | | | | |
| Current service cost | | (19 | ) | | (51 | ) | | (126 | ) |
| Past service cost | | – | | | – | | | (10 | ) |
| Gains on curtailments | | 15 | | | – | | | 347 | |
| Total pension cost from continuing operations | | (4 | ) | | (51 | ) | | 211 | |
| Total pension cost from discontinued operations | | – | | | (7 | ) | | (34 | ) |
| Total pension cost charged to net operating expenses | | (4 | ) | | (58 | ) | | 177 | |
| Expected return on scheme assets | | 427 | | | 452 | | | 457 | |
| Interest charge on scheme liabilities | | (509 | ) | | (539 | ) | | (584 | ) |
| Charge to finance costs from continuing operations | | (82 | ) | | (87 | ) | | (127 | ) |
| Charge to finance costs from discontinued operations | | – | | | (26 | ) | | (68 | ) |
| Total charge to finance costs | | (82 | ) | | (113 | ) | | (195 | ) |
| Total charge to income arising from continuing operations | | (86 | ) | | (138 | ) | | 84 | |
| Total charge to income arising from discontinued operations | | – | | | (33 | ) | | (102 | ) |
| Total charge to income | | (86 | ) | | (171 | ) | | (18 | ) |
The gains on curtailments in 2012 arose from restructuring activities in Ireland, and in 2010 principally arose from closure of the UK schemes to future accrual.
44 – Pension obligations continued
Recognised in the statement of comprehensive income
| | 2012
£m | | 2011
£m | | 2010
£m | |
| Continuing operations | | | | | | | | | |
| Expected return on scheme assets | | (427 | ) | | (452 | ) | | (457 | ) |
| Actual return on these assets | | 611 | | | 1,815 | | | 1,001 | |
| Actuarial gains on scheme assets | | 184 | | | 1,363 | | | 544 | |
| Experience losses arising on scheme liabilities | | (100 | ) | | (46 | ) | | 382 | |
| Changes in assumptions underlying the present value of the scheme liabilities | | (914 | ) | | (321 | ) | | 152 | |
| Actuarial (losses)/gains from continuing operations | | (830 | ) | | 996 | | | 1,078 | |
| Actuarial gains from discontinued operations | | – | | | 11 | | | (79 | ) |
| Total actuarial (losses)/gains recognised in other comprehensive income | | (830 | ) | | 1,007 | | | 999 | |
| Attributable to equity shareholders of Aviva plc | | (830 | ) | | 1,002 | | | 1,033 | |
| Attributable to non-controlling interests | | – | | | 5 | | | (34 | ) |
| | | (830 | ) | | 1,007 | | | 999 | |
The loss arising from changes in assumptions in 2012 primarily reflects the impact of lower discount rates for liabilities.
The cumulative amount of actuarial gains and losses on the pension schemes recognised in other comprehensive income since 1 January 2004 (the date of transition to IFRS) is a loss of £1,054 million at 31 December 2012(2011: cumulative loss of £224 million).
(v) Experience gains and losses
The following disclosures of experience gains and losses give a five-year history. Scheme assets exclude insurance policies with Group companies and income on the assets underlying them.
| | 2012
£m | | 2011
£m | | 2010
£m | | 2009
£m | | 2008
£m | |
| Fair value of scheme assets at the end of the year | | 12,281 | | | 11,791 | | | 9,971 | | | 8,754 | | | 7,936 | |
| Present value of scheme liabilities at the end of the year | | (11,675 | ) | | (10,527 | ) | | (11,419 | ) | | (11,812 | ) | | (9,951 | ) |
| Net surplus/(deficits) in the schemes | | 606 | | | 1,264 | | | (1,448 | ) | | (3,058 | ) | | (2,015 | ) |
| Difference between the expected and actual return | | | | | | | | | | | | | | | |
| on scheme assets | | | | | | | | | | | | | | | |
| Amount of gains/(losses) | | 184 | | | 1,363 | | | 5471 | | | 5611 | | | (1,893 | )1 |
| Percentage of the scheme assets at the end of the year | | 1.5% | | | 11.6% | | | 5.5% | | | 6.4% | | | 23.8% | |
| Experience (losses)/gains on scheme liabilities | | | | | | | | | | | | | | | |
| (excluding changes in assumptions) | | | | | | | | | | | | | | | |
| Amount of (losses)/gains | | (100 | ) | | (46 | ) | | 4501 | | | 771 | | | 1051 | |
| Percentage of the present value of scheme liabilities | | 0.9% | | | 0.4% | | | 3.9% | | | 0.7% | | | 1.1% | |
| 1 | Including gains and losses from discontinued operations. |
(vi) Risk management and asset allocation strategy
As noted above, the long-term investment objectives of the trustees and the employers are to limit the risk of the assets failing to meet the liabilities of the schemes over the long term, and to maximise returns consistent with an acceptable level of risk so as to control the long-term costs of these schemes. To meet these objectives, each scheme’s assets are invested in a diversified portfolio, consisting primarily of debt securities, equity securities and property.
Main UK scheme
Both the Group and the trustees regularly review the asset/liability management of the main UK scheme. It is fully understood that, whilst the current asset mix is designed to produce appropriate long-term returns, this introduces a material risk of volatility in the scheme’s surplus or deficit of assets compared with its liabilities.
The principal risks to which the scheme is exposed are interest rate, inflation and equity markets. These are actively mitigated for example, by using inflation and interest rate swaps. Additionally, the exposure to equities has been reduced over time. There is also an exposure to currency risk where assets are not denominated in the same currency as the liabilities. The majority of this exposure has been removed by the use of hedging instruments.
Other schemes
The other schemes are considerably less material but their risks are managed in a similar way to those in the main UK scheme.
44 – Pension obligations continued
(vii) Recognition in the statement of financial position
The assets and liabilities of the schemes attributable to defined benefit members at 31 December 2012 were:
| | 2012 | | 2011 | |
| | | UK
£m | | | Ireland
£m | | | Canada
£m | | | Total
£m | | | UK
£m | | | Ireland
£m | | | Canada
£m | | | Total
£m | |
| Equities | | 909 | | | 87 | | | 92 | | | 1,088 | | | 735 | | | 46 | | | 76 | | | 857 | |
| Bonds | | 8,867 | | | 260 | | | 121 | | | 9,248 | | | 8,663 | | | 233 | | | 129 | | | 9,025 | |
| Property | | 914 | | | 12 | | | – | | | 926 | | | 657 | | | 13 | | | – | | | 670 | |
| Other | | 957 | | | 47 | | | 15 | | | 1,019 | | | 1,135 | | | 90 | | | 14 | | | 1,239 | |
| Total fair value of assets | | 11,647 | | | 406 | | | 228 | | | 12,281 | | | 11,190 | | | 382 | | | 219 | | | 11,791 | |
| Present value of scheme liabilities | | (10,501 | ) | | (777 | ) | | (397 | ) | | (11,675 | ) | | (9,606 | ) | | (539 | ) | | (382 | ) | | (10,527 | ) |
| Net surplus/(deficits) in the schemes | | 1,146 | | | (371 | ) | | (169 | ) | | 606 | | | 1,584 | | | (157 | ) | | (163 | ) | | 1,264 | |
| | | | | | | | | | | | | | | | | | | | | | | | | |
| Surplus included in other assets (note 24) | | 1,257 | | | – | | | – | | | 1,257 | | | 1,670 | | | – | | | – | | | 1,670 | |
| Deficits included in provisions (note 43) | | (111 | ) | | (371 | ) | | (169 | ) | | (651 | ) | | (86 | ) | | (157 | ) | | (163 | ) | | (406 | ) |
| | | 1,146 | | | (371 | ) | | (169 | ) | | 606 | | | 1,584 | | | (157 | ) | | (163 | ) | | 1,264 | |
Other assets comprise cash at bank, derivative financial instruments, receivables and payables.
Plan assets in the table above include investments in Group-managed funds and insurance policies, as described in section (iii) above. Where the investment and insurance policies are in segregated funds with specific asset allocations, they are included in the appropriate line in the table above, otherwise they appear in ‘Other’.
The present value of unfunded post-retirement benefit obligations included in the table above is£127 million at 31 December 2012(2011: £116 million).
(viii) Movements in the scheme deficits and surpluses
Movements in the pension schemes’ surpluses and deficits comprise:
| 2012 | Scheme
assets
£m | | Scheme
liabilities
£m | | Pension
scheme net
surplus/
(deficit)
£m | | Adjust for
Group
insurance
policies
£m | | IAS 19
pensions net
surplus/
(deficit)
£m | |
| Net surplus in the schemes at 1 January | | 11,791 | | | (10,527 | ) | | 1,264 | | | – | | | 1,264 | |
| Employer contributions | | 250 | | | – | | | 250 | | | – | | | 250 | |
| Employee contributions | | 2 | | | (2 | ) | | – | | | – | | | – | |
| Benefits paid | | (357 | ) | | 357 | | | – | | | – | | | – | |
| Current and past service cost (see (iv) above) | | – | | | (19 | ) | | (19 | ) | | – | | | (19 | ) |
| Gain on curtailments and settlements (see (iv) above) | | – | | | 15 | | | 15 | | | – | | | 15 | |
| Credit/(charge) to finance costs (see (iv) above) | | 427 | | | (509 | ) | | (82 | ) | | – | | | (82 | ) |
| Actuarial gains/(losses) (see (iv) above) | | 184 | | | (1,014 | ) | | (830 | ) | | – | | | (830 | ) |
| Exchange rate movements on foreign plans | | (16 | ) | | 24 | | | 8 | | | – | | | 8 | |
| Net surplus in the schemes at 31 December | | 12,281 | | | (11,675 | ) | | 606 | | | – | | | 606 | |
| 2011 | Scheme
assets
£m | | Scheme
liabilities
£m | | Pension
scheme net
surplus/
(deficit)
£m | | Adjust for Group insurance policies1 £m | | IAS 19
pensions net
surplus/
(deficit)
£m | |
| Net deficits in the schemes at 1 January | | 11,416 | | | (11,419 | ) | | (3 | ) | | (1,445 | ) | | (1,448 | ) |
| Employer contributions | | 452 | | | – | | | 452 | | | (66 | ) | | 386 | |
| Employee contributions | | 12 | | | (12 | ) | | – | | | (9) | | | (9 | ) |
| Benefits paid | | (356 | ) | | 356 | | | – | | | 15 | | | 15 | |
| Current and past service cost (see (iv) above) | | – | | | (58 | ) | | (58 | ) | | – | | | (58 | ) |
| Credit/(charge) to finance costs (see (iv) above) | | 465 | | | (565 | ) | | (100 | ) | | (13 | ) | | (113 | ) |
| Actuarial gains/(losses) (see (iv) above) | | 1,347 | | | (356 | ) | | 991 | | | 16 | | | 1,007 | |
| Disposals | | (23 | ) | | 30 | | | 7 | | | – | | | 7 | |
| Deconsolidation of Delta Lloyd | | (1,589 | ) | | 1,558 | | | (31 | ) | | 1,582 | | | 1,551 | |
| Exchange rate movements on foreign plans | | 67 | | | (61 | ) | | 6 | | | (80 | ) | | (74 | ) |
| Net surplus in the schemes at 31 December | | 11,791 | | | (10,527 | ) | | 1,264 | | | – | | | 1,264 | |
| 1 | Relates to non-transferrable insurance policies treated as other obligations to staff pension schemes in the Delta Lloyd subsidiary, which was deconsolidated in 2011. |
The fall in the pension schemes’ net surplus during 2012 is mainly attributable to losses arising from changes in actuarial assumptions, which primarily reflect the impact of lower discount rates for liabilities.
45 – Borrowings
Our borrowings are either core structural borrowings or operational borrowings. This note shows the carrying values and contractual maturity amounts of each type, and explains their main features and movements during the year.
(a) Analysis of total borrowings
Total borrowings comprise:
| | 2012
£m | | 2011
£m | |
| Core structural borrowings, at amortised cost | | 5,139 | | | 5,255 | |
| Operational borrowings, at amortised cost | | 1,868 | | | 1,889 | |
| Operational borrowings, at fair value | | 1,332 | | | 1,306 | |
| | | 3,200 | | | 3,195 | |
| | | 8,339 | | | 8,450 | |
| Less: Amounts classified as held for sale | | (145 | ) | | – | |
| | | 8,194 | | | 8,450 | |
(b) Core structural borrowings
(i) The carrying amounts of these borrowings are:
| | | | | | | | 2012 | | | | | | | | 2011 | |
| | Upper
Tier 2
£m | | Lower
Tier 2
£m | | Senior
£m | | Total
£m | | Upper
Tier 2
£m | | Lower
Tier 2
£m | | Senior
£m | | Total
£m | |
| Subordinated debt | | | | | | | | | | | | | | | | | | | | | | | | |
| 6.125% £700 million subordinated notes 2036 | | – | | | 691 | | | – | | | 691 | | | – | | | 690 | | | – | | | 690 | |
| 5.250% €650 million subordinated notes 2023 | | – | | | 527 | | | – | | | 527 | | | – | | | 510 | | | – | | | 510 | |
| 5.700% €500 million undated subordinated notes | | 404 | | | – | | | – | | | 404 | | | 416 | | | – | | | – | | | 416 | |
| 6.125% £800 million undated subordinated notes | | 792 | | | – | | | – | | | 792 | | | 792 | | | – | | | – | | | 792 | |
| Floating rate US$300 million subordinated notes 2017 | | – | | | – | | | – | | | – | | | – | | | 193 | | | – | | | 193 | |
| 6.875% £400 million subordinated notes 2058 | | – | | | 395 | | | – | | | 395 | | | – | | | 398 | | | – | | | 398 | |
| 6.875% £200 million subordinated notes 2058 | | – | | | 199 | | | – | | | 199 | | | – | | | 199 | | | – | | | 199 | |
| 6.875% €500 million subordinated notes 2018 | | – | | | 404 | | | – | | | 404 | | | – | | | 416 | | | – | | | 416 | |
| 10.6726% £200 million subordinated notes 2019 | | – | | | 200 | | | – | | | 200 | | | – | | | 200 | | | – | | | 200 | |
| 10.464% €50m subordinated notes 2019 | | – | | | 40 | | | – | | | 40 | | | – | | | 42 | | | – | | | 42 | |
| 8.25% $400 million subordinated notes 2041 | | – | | | 239 | | | – | | | 239 | | | – | | | 248 | | | – | | | 248 | |
| 6.625% £450 million subordinated notes 2041 | | – | | | 446 | | | – | | | 446 | | | – | | | 446 | | | – | | | 446 | |
| | | 1,196 | | | 3,141 | | | – | | | 4,337 | | | 1,208 | | | 3,342 | | | – | | | 4,550 | |
| Debenture Loans | | | | | | | | | | | | | | | | | | | | | | | | |
| 9.5% guaranteed bonds 2016 | | – | | | – | | | 199 | | | 199 | | | – | | | – | | | 199 | | | 199 | |
| | | – | | | – | | | 199 | | | 199 | | | – | | | – | | | 199 | | | 199 | |
| Commercial paper | | – | | | – | | | 603 | | | 603 | | | – | | | – | | | 506 | | | 506 | |
| Total | | 1,196 | | | 3,141 | | | 802 | | | 5,139 | | | 1,208 | | | 3,342 | | | 705 | | | 5,255 | |
The classifications between Upper Tier 2, Lower Tier 2 and Senior debt shown above are as defined by the FSA in GENPRU Annex 1 ‘Capital Resources’.
Subordinated debt is stated net of notes held by Group companies which were £nil(2011: £32 million). All the above borrowings are stated at amortised cost.
As described in note 54, the Group has designated a portion of its euro and US dollar denominated debt as a hedge of the net investment in its European and American subsidiaries. The carrying value of the debt, included in the table above, at 31 December 2012 was £1,741 million(2011: £1,815 million).
(ii) The contractual maturity dates of undiscounted cash flows for these borrowings are:
| | | | | | 2012 | | | | | | 2011 | |
| | Principal
£m | | Interest
£m | | Total
£m | | Principal
£m | | Interest
£m | | Total
£m | |
| Within one year | | 603 | | | 307 | | | 910 | | | 506 | | | 312 | | | 818 | |
| 1 to 5 years | | 200 | | | 1,197 | | | 1,397 | | | 200 | | | 1,237 | | | 1,437 | |
| 5 to 10 years | | 241 | | | 1,342 | | | 1,583 | | | 435 | | | 1,395 | | | 1,830 | |
| 10 to 15 years | | 527 | | | 1,192 | | | 1,719 | | | 510 | | | 1,236 | | | 1,746 | |
| Over 15 years | | 3,608 | | | 2,610 | | | 6,218 | | | 3,643 | | | 2,859 | | | 6,502 | |
| Total contractual undiscounted cash flows | | 5,179 | | | 6,648 | | | 11,827 | | | 5,294 | | | 7,039 | | | 12,333 | |
Borrowings are considered current if the contractual maturity dates are within a year. Where subordinated debt is undated or loan notes are perpetual, the interest payments have not been included beyond 15 years. Annual interest payments for these borrowings are £72 million(2011: £73 million).
45 – Borrowings continued
Contractual undiscounted interest payments are calculated based on underlying fixed interest rates or prevailing market floating rates as applicable. Year-end exchange rates have been used for interest projections on loans in foreign currencies.
(c) Operational borrowings
(i) The carrying amounts of these borrowings are:
| | 2012
£m | | 2011
£m | |
| Amounts owed to financial institutions | | | | |
| Loans | | 1,868 | | | 1,889 | |
| Securitised mortgage loan notes | | | | | | |
| UK lifetime mortgage business | | 1,332 | | | 1,306 | |
| Total | | 3,200 | | | 3,195 | |
All the above borrowings are stated at amortised cost, except for the loan notes issued in connection with the UK lifetime mortgage business of £1,332 million(2011: £1,306 million). These loan notes are carried at fair value, their values are modelled on risk-adjusted cash flows for defaults discounted at a risk-free rate plus a market-determined liquidity premium, and are therefore classified as ‘Level 2’ in the fair value hierarchy. These have been designated at fair value through profit and loss in order to present the relevant mortgages, borrowings and derivative financial instruments at fair value, since they are managed as a portfolio on a fair value basis. This presentation provides more relevant information and eliminates any accounting mismatch.
The securitised mortgage loan notes are at various fixed, floating and index-linked rates. Further details about these notes are given in note 21.
(ii) The contractual maturity dates of undiscounted cash flows for these borrowings are:
| | | | | | 2012 | | | | | | 2011 | |
| | Principal
£m | | Interest
£m | | Total
£m | | Principal
£m | | Interest
£m | | Total
£m | |
| Within one year | | 725 | | | 64 | | | 789 | | | 677 | | | 39 | | | 716 | |
| 1 to 5 years | | 951 | | | 259 | | | 1,210 | | | 995 | | | 124 | | | 1,119 | |
| 5 to 10 years | | 399 | | | 364 | | | 763 | | | 247 | | | 82 | | | 329 | |
| 10 to 15 years | | 611 | | | 284 | | | 895 | | | 510 | | | 64 | | | 574 | |
| Over 15 years | | 940 | | | 291 | | | 1,231 | | | 1,008 | | | 439 | | | 1,447 | |
| Total contractual undiscounted cash flows | | 3,626 | | | 1,262 | | | 4,888 | | | 3,437 | | | 748 | | | 4,185 | |
Contractual undiscounted interest payments are calculated based on underlying fixed interest rates or prevailing market floating rates as applicable. Year-end exchange rates have been used for interest projections on loans in foreign currencies.
(d) Description and features
(i) Subordinated debt
A description of each of the subordinated notes is set out in the table below:
| Notional amount | Issue date | Redemption date | Callable at par at option of the Company from | In the event the Company does not call the notes, the coupon will reset at each applicable reset date to |
| £700 million | 14 Nov 2001 | 14 Nov 2036 | 16 Nov 2026 | 5 year Benchmark Gilt + 2.85% |
| €650 million | 29 Sep 2003 | 02 Oct 2023 | 02 Oct 2013 | 3 month Euribor + 2.08% |
| €500 million | 29 Sep 2003 | Undated | 29 Sep 2015 | 3 month Euribor + 2.35% |
| £800 million | 29 Sep 2003 | Undated | 29 Sep 2022 | 5 year Benchmark Gilt + 2.40% |
| £400 million | 20 May 2008 | 20 May 2058 | 20 May 2038 | 3 month LIBOR + 3.26% |
| £200 million | 8 Aug 2008 | 20 May 2058 | 20 May 2038 | 3 month LIBOR + 3.26% |
| €500 million | 20 May 2008 | 22 May 2038 | 22 May 2018 | 3 month Euribor + 3.35% |
| £200 million | 1 Apr 2009 | 1 Apr 2019 | 1 Apr 2014 | 3 month LIBOR + 8.10% |
| €50 million | 30 Apr 2009 | 30 Apr 2019 | 30 Apr 2014 | 3 month Euribor + 8.25% |
| £450 million | 26 May 2011 | 3 June 2041 | 3 June 2021 | 6 Month LIBOR + 4.136% |
| $400 million | 22 November 2011 | 1 December 2041 | 1 December 2016 | 8.25%(fixed) |
Subordinated notes issued by the Company rank below its senior obligations and ahead of its preference shares and ordinary share capital. The dated subordinated notes rank ahead of the undated subordinated notes. The fair value of these notes at 31 December 2012 was £4,435 million(2011: £3,814 million), calculated with reference to quoted prices.
(ii) Debenture loans
The 9.5% guaranteed bonds were issued by the Company at a discount of £1.1 million. This discount and the issue expenses are being amortised over the full term of the bonds. Although these bonds were issued in sterling, the loans have effectively been converted into euro liabilities through the use of financial instruments in a subsidiary.
All these borrowings are at fixed rates and their fair value at 31 December 2012 was £246 million(2011: £246 million), calculated with reference to quoted prices.
(iii) Commercial paper
The commercial paper consists of £603 million issued by the Company(2011: £506 million) and is considered core structural funding.
All commercial paper is repayable within one year and is issued in a number of different currencies, primarily sterling, euros and US dollars. Its fair value is considered to be the same as its carrying value.
45 – Borrowings continued
(iv) Loans
Loans comprise:
| | 2012
£m | | 2011
£m | |
| Non-recourse | | | | | | |
| Loans to property partnerships (see (a) below) | | 1,004 | | | 1,128 | |
| Loans to Irish investment funds (see (b) below) | | 20 | | | 33 | |
| UK Life reassurance (see (c) below) | | 257 | | | 254 | |
| Other non-recourse loans (d) | | 336 | | | 224 | |
| | | 1,617 | | | 1,639 | |
| Other loans (see (e) below) | | 251 | | | 250 | |
| | | 1,868 | | | 1,889 | |
(a) As explained in accounting policy D, the UK long-term business policyholder funds have invested in a number of property limited partnerships (PLPs). The PLPs have raised external debt, secured on their respective property portfolios, and the lenders are only entitled to obtain payment of both interest and principal to the extent there are sufficient resources in the respective PLPs. The lenders have no recourse whatsoever to the policyholder or shareholders’ funds of any companies in the Group. Loans of £1,004 million(2011: £1,128 million) included in the table relate to those PLPs which have been consolidated as subsidiaries.
(b) Certain Irish policyholder investment funds and unit trusts, which have been fully consolidated in accordance with accounting policy D, have raised borrowings with external credit institutions. The borrowings are secured on the funds, with the only recourse on default being the underlying investments in these funds and unit trusts. The lenders have no recourse whatsoever to the shareholders’ funds of any companies in the Aviva Group. These loans run for a period of five years, with interest rates fixed monthly and based on a fixed margin above the euro inter-bank rate.
(c) The UK long-term business entered into a financial reassurance agreement with Swiss Re in 2008, under which up-front payments are received from Swiss Re in return for 90% of future surpluses arising. The loan will be repaid as profits emerge on the business. The UK long-term business entered into an additional financial reassurance agreement with BNP Paribas in 2012 in return for 100% of future surpluses arising. The loan will be repaid as profits emerge on the business.
(d) Other non-recourse loans include external debt raised by special purpose vehicles in the UK long-term business. The lenders have no recourse whatsoever to the shareholders’ funds of any companies in the Group. It also includes an operational loan from Delta Lloyd to the UK Life Belgian branch.
(e) Other loans include external debt raised by overseas long-term businesses to fund operations, which includes £145 million(2011: £158 million) of external debt held by the Group’s US business.
(v) Securitised mortgage loan notes
Loan notes have been issued by special purpose securitisation companies in the UK. Details are given in note 21.
(e) Movements during the year
Movements in borrowings during the year were:
| | | | | | 2012 | | | | | | 2011 | |
| | Core
Structural
£m | | Operational
£m | | Total
£m | | Core
Structural
£m | | Operational
£m | | Total
£m | |
| New borrowings drawn down, including commercial paper, net of expenses | | 2,200 | | | 452 | | | 2,652 | | | 3,853 | | | 1,042 | | | 4,895 | |
| Repayment of borrowings, including commercial paper | | (2,295 | ) | | (347 | ) | | (2,642 | ) | | (3,848 | ) | | (1,283 | ) | | (5,131 | ) |
| Net cash outflow/(inflow) | | (95 | ) | | 105 | | | 10 | | | 5 | | | (241 | ) | | (236 | ) |
| Foreign exchange rate movements | | (54 | ) | | (130 | ) | | (184 | ) | | 9 | | | 193 | | | 202 | |
| Borrowings acquired for non-cash consideration | | – | | | – | | | – | | | – | | | 34 | | | 34 | |
| Fair value movements | | – | | | 43 | | | 43 | | | – | | | 8 | | | 8 | |
| Amortisation of discounts and other non-cash items | | 1 | | | (13 | ) | | (12 | ) | | 3 | | | – | | | 3 | |
| Deconsolidation of Delta Lloyd | | – | | | – | | | – | | | (816 | ) | | (5,683 | ) | | (6,499 | ) |
| Movements in debt held by Group companies1 | | 32 | | | – | | | 32 | | | (12 | ) | | 1 | | | (11 | ) |
| Movements in the year | | (116 | ) | | 5 | | | (111 | ) | | (811 | ) | | (5,688 | ) | | (6,499 | ) |
| Balance at 1 January | | 5,255 | | | 3,195 | | | 8,450 | | | 6,066 | | | 8,883 | | | 14,949 | |
| Balance at 31 December | | 5,139 | | | 3,200 | | | 8,339 | | | 5,255 | | | 3,195 | | | 8,450 | |
| 1 | Certain subsidiary companies have purchased issued subordinated notes and securitised loan notes as part of their investment portfolios. In the consolidated statement of financial position, borrowings are shown net of these holdings but movements in such holdings over the year are reflected in the tables above. |
All movements in fair value in 2011 and 2012 on securitised mortgage loan notes designated as fair value through profit or loss were attributable to changes in market conditions.
(f) Undrawn borrowings
The Group and Company have the following undrawn committed central borrowing facilities available to them, of which £750 million(2011: £750 million) is used to support the commercial paper programme:
| | 2012
£m | | 2011
£m | |
| Expiring within one year | | 420 | | | 955 | |
| Expiring beyond one year | | 1,725 | | | 1,160 | |
| | | 2,145 | | | 2,115 | |
46 – Payables and other financial liabilities
This note analyses our payables and other financial liabilities at the end of the year.
| | 2012
£m | | 2011
£m | |
| Payables arising out of direct insurance | | 1,234 | | | 1,098 | |
| Payables arising out of reinsurance operations | | 426 | | | 360 | |
| Deposits and advances received from reinsurers | | 318 | | | 346 | |
| Bank overdrafts | | 566 | | | 668 | |
| Derivative liabilities | | 1,761 | | | 1,850 | |
| Amounts due to brokers for investment purchases | | 135 | | | 60 | |
| Obligations for repayment of cash collateral received (notes 22d(i) & 54c) | | 4,460 | | | 5,229 | |
| Other financial liabilities | | 1,649 | | | 1,628 | |
| Total | | 10,549 | | | 11,239 | |
| Less: Amounts classified as held for sale | | (1,108 | ) | | (9 | ) |
| | | 9,441 | | | 11,230 | |
| Expected to be settled within one year | | 8,613 | | | 10,253 | |
| Expected to be settled in more than one year | | 828 | | | 977 | |
| | | 9,441 | | | 11,230 | |
Bank overdrafts arise substantially from un-presented cheques and amount to £194 million(2011: £211 million) in long-term business operations and £372 million(2011: £457 million) in general business and other operations.
All payables and other financial liabilities are carried at cost, which approximates to fair value, except for derivative liabilities, which are carried at their fair values.
47 – Other liabilities
This note analyses our other liabilities at the end of the year.
| | 2012
£m | | 2011
£m | |
| Deferred income | | 319 | | | 359 | |
| Reinsurers’ share of deferred acquisition costs | | 11 | | | 12 | |
| Accruals | | 1,138 | | | 1,336 | |
| Other liabilities | | 1,110 | | | 1,128 | |
| Total | | 2,578 | | | 2,835 | |
| Less: Amounts classified as held for sale | | (735 | ) | | (7 | ) |
| | | 1,843 | | | 2,828 | |
| Expected to be settled within one year | | 1,458 | | | 2,195 | |
| Expected to be settled in more than one year | | 385 | | | 633 | |
| | | 1,843 | | | 2,828 | |
48 – Contingent liabilities and other risk factors
This note sets out the main areas of uncertainty over the calculation of our liabilities.
(a) Uncertainty over claims provisions
Note 36 gives details of the estimation techniques used by the Group to determine the general business outstanding claims provisions and of the methodology and assumptions used in determining the long-term business provisions. These approaches are designed to allow for the appropriate cost of policy-related liabilities, with a degree of prudence, to give a result within the normal range of outcomes. To the extent that the ultimate cost falls outside this range, for example where experience is worse than that assumed, or future general business claims inflation differs from that expected, there is uncertainty in respect of these liabilities.
(b) Asbestos, pollution and social environmental hazards
In the course of conducting insurance business, various companies within the Group receive general insurance liability claims, and become involved in actual or threatened related litigation arising there from, including claims in respect of pollution and other environmental hazards. Amongst these are claims in respect of asbestos production and handling in various jurisdictions, including Europe, Canada and Australia. Given the significant delays that are experienced in the notification of these claims, the potential number of incidents which they cover and the uncertainties associated with establishing liability and the availability of reinsurance, the ultimate cost cannot be determined with certainty. However, on the basis of current information having regard to the level of provisions made for general insurance claims, the directors consider that any additional costs arising are not likely to have a material impact on the financial position of the Group.
48 – Contingent liabilities and other risk factors continued
(c) Guarantees on long-term savings products
As a normal part of their operating activities, various Group companies have given guarantees and options, including interest rate guarantees, in respect of certain long-term insurance and fund management products. Note 38 gives details of these guarantees and options. In providing these guarantees and options, the Group’s capital position is sensitive to fluctuations in financial variables including foreign currency exchange rates, interest rates, property values and equity prices. Interest rate guaranteed returns, such as those available on GAOs, are sensitive to interest rates falling below the guaranteed level. Other guarantees, such as maturity value guarantees and guarantees in relation to minimum rates of return, are sensitive to fluctuations in the investment return below the level assumed when the guarantee was made. The directors continue to believe that the existing provisions for such guarantees and options are sufficient.
(d) Regulatory compliance
The Group’s insurance and investment business is subject to local regulation in each of the countries in which it operates. The FSA regulates the Group’s UK business (from 1 April 2013, the FSA will split into two new regulatory bodies: the Prudential Regulation Authority (PRA), which will be a subsidiary of the Bank of England, and the Financial Conduct Authority (FCA)) and will monitor the financial resources and organisation of the Group as a whole. The FSA has broad powers including the authority to grant, vary the terms of, or cancel a regulated firm’s authorisation; to investigate marketing and sales practices; and to require the maintenance of adequate financial resources. The Group’s regulators outside the UK typically have similar powers, but in some cases they also operate a system of ‘prior product approval’.
The Group’s regulated businesses have compliance resources to respond to regulatory enquiries in a constructive way, and take corrective action when warranted. However, all regulated financial services companies face the risk that their regulator could find that they have failed to comply with applicable regulations or have not undertaken corrective action as required.
The impact of any such finding (whether in the UK or overseas) could have a negative impact on the Group’s reported results or on its relations with current and potential customers. Regulatory action against a member of the Group could result in adverse publicity for, or negative perceptions regarding, the Group, or could have a material adverse effect on the business of the Group, its results of operations and/or financial condition and divert management’s attention from the day-to-day management of the business.
(e) Payment protection insurance (PPI) mis-selling
In September 2009, the FSA launched an investigation into sales practices for payment protection insurance (PPI). On 10 August 2010, the FSA announced that mis-selling of PPI policies had been widespread and that consumers who could prove mis-selling would be entitled to financial redress from distributors of the policies. The directors do not consider that the Group is liable for mis-selling in its role as underwriter and so no provision is currently necessary.
(f) Structured settlements
The Company has purchased annuities from licensed Canadian life insurers to provide for fixed and recurring payments to claimants. As a result of these arrangements, the Company is exposed to credit risk to the extent that any of the life insurers fail to fulfil their obligations. The Company’s maximum exposure to credit risk for these types of arrangements is approximately $1,145 million as at 31 December 2012 (2011: $1,085 million, 2010: $1,063 million). Credit risk is managed by acquiring annuities from a diverse portfolio of life insurers with proven financial stability. This risk is reduced to the extent of coverage provided by Assuris, the life insurance industry compensation plan. As at 31 December 2012, no information has come to the Company’s attention that would suggest any weakness or failure in life insurers from which it has purchased annuities and consequently no provision for credit risk is required.
(g) Other
In the course of conducting insurance and investment business, various Group companies receive liability claims, and become involved in actual or threatened related litigation. In the opinion of the directors, adequate provisions have been established for such claims and no material loss will arise in this respect.
At 31 December 2012, the Company and several of its subsidiaries have guaranteed the overdrafts and borrowings of certain other Group companies. At 31 December 2012, the Group and Company had no exposure(2011: £nil and £334 million respectively).
In addition, in line with standard business practice, various Group companies have given guarantees, indemnities and warranties in connection with disposals in recent years of subsidiaries and associates to parties outside the Aviva Group. In the opinion of the directors, no material loss will arise in respect of these guarantees, indemnities and warranties.
There are a number of charges registered over the assets of Group companies in favour of other Group companies or third parties. In addition, certain of the Company’s assets are charged in favour of certain or its subsidiaries as security for intra Group loans.
The Group’s insurance subsidiaries pay contributions to levy schemes in several countries in which we operate. Given the economic environment, there is a heightened risk that the levy contributions will need to be increased to protect policyholders if an insurance company falls into financial difficulties. The directors continue to monitor the situation but are not aware of any need to increase provisions at the statement of financial position date.
49 – Commitments
This note gives details of our commitments to capital expenditure and under operating leases.
(a) Capital commitments
Contractual commitments for acquisitions or capital expenditures of investment property and property and equipment, which have not been recognised in the financial statements, are as follows:
| | 2012
£m | | 2011
£m | |
| Investment property | | 6 | | | 23 | |
| Property and equipment | | 36 | | | 36 | |
| | | 42 | | | 59 | |
Contractual obligations for future repairs and maintenance on investment properties are £nil(2011: £nil).
The Group has capital commitments to its joint ventures of £157 million(2011: £258 million) and to other investment vehicles of £nil(2011: £nil).
(b) Operating lease commitments
(i) Future contractual aggregate minimum lease rentals receivable under non-cancellable operating leases are as follows:
| | 2012
£m | | 2011
£m | |
| Within 1 year | | 269 | | | 313 | |
| Later than 1 year and not later than 5 years | | 832 | | | 562 | |
| Later than 5 years | | 1,570 | | | 1,738 | |
| | | 2,671 | | | 2,613 | |
(ii) Future contractual aggregate minimum lease payments under non-cancellable operating leases are as follows:
| | 2012
£m | | 2011
£m | |
| Within 1 year | | 136 | | | 120 | |
| Later than 1 year and not later than 5 years | | 421 | | | 400 | |
| Later than 5 years | | 587 | | | 667 | |
| | | 1,144 | | | 1,187 | |
| Total future minimum sub-lease payments expected to be received under non-cancellable sub-leases | | 53 | | | 56 | |
50 – Group capital structure
The Group maintains an efficient capital structure from a combination of equity shareholders’ funds, preference capital, subordinated debt and borrowings, consistent with our overall risk profile and the regulatory and market requirements of our business. This note shows where this capital is employed.
Accounting basis and capital employed by segment
The table below shows how our capital, on an IFRS basis, is deployed by segment and how that capital is funded.
| | 2012
£m | | 2011
£m | |
| Long-term savings | | 11,467 | | | 11,237 | |
| General insurance and health | | 6,089 | | | 5,875 | |
| Fund management | | 225 | | | 184 | |
| Other business | | (1,059 | ) | | (1,102 | ) |
| Corporate1 | | (588 | ) | | 508 | |
| Delta Lloyd | | – | | | 776 | |
| United States | | 365 | | | 3,140 | |
| Total capital employed | | 16,499 | | | 20,618 | |
| Financed by | | | | | | |
| Equity shareholders’ funds | | 8,204 | | | 12,643 | |
| Non-controlling interests | | 1,574 | | | 1,530 | |
| Direct capital instruments and fixed rate tier 1 notes | | 1,382 | | | 990 | |
| Preference shares | | 200 | | | 200 | |
| Subordinated debt | | 4,337 | | | 4,550 | |
| External debt | | 802 | | | 705 | |
| Total capital employed | | 16,499 | | | 20,618 | |
| 1 | Corporate includes centrally held tangible net assets, the staff pension scheme surplus and also reflects internal lending arrangements. These internal lending arrangements, which net out on consolidation, arise in relation to the following: – |
| a. | Aviva Insurance Limited (AI) acts as both a UK general insurer and as the primary holding company for our foreign subsidiaries. Internal capital management mechanisms in place allocate a portion of the total capital of the company to the UK general insurance operations, giving rise to notional lending between the general insurance and holding company activities. These mechanisms also allow for some of the assets of the general insurance business to be made available for use across the Group. |
| b. | Subsequent to the year end, the Group has taken action to improve its access to dividends from the Group’s insurance and asset management business by undertaking a corporate restructure. This will see the Group’s interest in the majority of its overseas businesses move to Aviva Group Holdings Limited from Aviva Insurance Limited. |
| c. | Certain subsidiaries, subject to continuing to satisfy stand-alone capital and liquidity requirements, loan funds to corporate and holding entities. These loans satisfy arm’s length criteria and all interest payments are made when due. |
Total capital employed is financed by a combination of equity shareholders’ funds, preference capital, subordinated debt and borrowings.
At the end of 2012 we had £16.5 billion (2011: £20.6 billion) of total capital employed in our trading operations measured on an IFRS basis. The decrease is primarily driven by the Group’s loss after tax, actuarial losses on staff pension schemes and the payment of dividend.
In May 2012 we issued US$650 million of hybrid Tier 1 Notes. The Notes are perpetual and may be called from November 2017. The Notes qualify as Innovative Tier 1 capital under current regulatory rules and are expected to be treated as Fixed Rate Tier 1 capital under Solvency II transitional rules. The transaction had a positive impact on Group IGD solvency and Economic Capital measures.
In June 2012 US$300 million of Lower Tier 2 floating rate notes were redeemed at first call.
At the end of 2012 the market value of our external debt, subordinated debt, preference shares (including both Aviva plc preference shares of £200 million and General Accident plc preference shares, within non-controlling interests, of £250 million), and direct capital instruments and fixed rate tier 1 notes was £7,260 million(2011: £5,782 million), with a weighted average cost, post tax, of 4.4%(2011: 6.6%). The Group Weighted Average Cost of Capital (WACC) is 6.3%(2011: 7.1%)and has been calculated by reference to the cost of equity and the cost of debt at the relevant date. The cost of equity at 2012 was 7.5%(2011: 7.4%) based on a risk free rate of 1.9%(2011: 2.0%), an equity risk premium of 4.0%(2011: 4.0%) and a market beta of 1.4(2011: 1.3).
51 – Statement of cash flows
This note gives further detail behind the figures in the statement of cash flows.
(a) The reconciliation of profit before tax to the net cash inflow from operating activities is:
| | 2012
£m | | 2011
£m | | 2010
£m | |
| Profit before tax from continuing operations | | 246 | | | 373 | | | 1,790 | |
| Adjustments for: | | | | | | | | | |
| Share of loss of joint ventures and associates | | 277 | | | 123 | | | (141 | ) |
| Dividends received from joint ventures and associates | | 48 | | | 71 | | | 16 | |
| (Profit)/loss on sale of: | | | | | | | | | |
| Investment property | | (7 | ) | | (8 | ) | | (41 | ) |
| Property and equipment | | – | | | (4 | ) | | 5 | |
| Subsidiaries, joint ventures and associates | | 164 | | | (565 | ) | | (163 | ) |
| Investments | | (1,167 | ) | | (1,340 | ) | | (1,432 | ) |
| | | (1,010 | ) | | (1,917 | ) | | (1,631 | ) |
| Fair value (gains)/losses on: | | | | | | | | | |
| Investment property | | 492 | | | (148 | ) | | (465 | ) |
| Investments | | (12,402 | ) | | 5,488 | | | (6,945 | ) |
| Borrowings | | 43 | | | 1 | | | 12 | |
| | | (11,867 | ) | | 5,341 | | | (7,398 | ) |
| Depreciation of property and equipment | | 42 | | | 54 | | | 63 | |
| Equity compensation plans, equity settled expense | | 42 | | | 48 | | | 50 | |
| Impairment and expensing of: | | | | | | | | | |
| Goodwill on subsidiaries | | 109 | | | 160 | | | 3 | |
| Financial Investments, loans and other assets | | 46 | | | 95 | | | 1 | |
| Acquired value of in-force business and intangibles | | 122 | | | 49 | | | 16 | |
| Non-financial assets | | – | | | 1 | | | (1 | ) |
| | | 277 | | | 305 | | | 19 | |
| Amortisation of: | | | | | | | | | |
| Premium or discount on debt securities | | 105 | | | 82 | | | 84 | |
| Premium or discount on borrowings | | (12 | ) | | 3 | | | 2 | |
| Premium or discount on non-participating investment contracts | | 20 | | | 45 | | | 17 | |
| Financial instruments | | 64 | | | 7 | | | 82 | |
| Acquired value of in-force business and intangibles | | 121 | | | 137 | | | 155 | |
| | | 298 | | | 274 | | | 340 | |
| Change in unallocated divisible surplus | | 6,316 | | | (2,721 | ) | | (362 | ) |
| Interest expense on borrowings | | 653 | | | 689 | | | 559 | |
| Net finance charge on pension schemes | | 82 | | | 87 | | | 127 | |
| Foreign currency exchange (gains)/losses | | (128 | ) | | 35 | | | (36 | ) |
| | | | | | | | | | |
| Changes in working capital | | | | | | | | | |
| (Increase)/decrease in reinsurance assets | | (416 | ) | | (611 | ) | | 623 | |
| Decrease in deferred acquisition costs | | 216 | | | 45 | | | 56 | |
| Increase in insurance liabilities and investment contracts | | 4,325 | | | 550 | | | 10,966 | |
| Increase in other assets and liabilities | | 1,742 | | | 1,123 | | | 1,557 | |
| | | 5,867 | | | 1,107 | | | 13,202 | |
| Net purchases of operating assets | | | | | | | | | |
| Purchases of investment property | | (839 | ) | | (1,211 | ) | | (1,070 | ) |
| Proceeds on sale of investment property | | 1,141 | | | 717 | | | 798 | |
| Net purchases/(sales) of financial investments | | 1,231 | | | (3,264 | ) | | (4,907 | ) |
| | | 1,533 | | | (3,758 | ) | | (5,179 | ) |
| Cash generated from operating activities – continuing operations | | 2,676 | | | 111 | | | 1,419 | |
| Cash generated from operating activities – discontinued operations | | 46 | | | 27 | | | 794 | |
| Total cash generated from operating activities | | 2,722 | | | 138 | | | 2,213 | |
Operating cash flows reflect the movement in both policyholder and shareholder controlled cash and cash equivalent balances. Around two thirds of the Group’s balances relate to unit-linked or participating policyholder funds. As such, the asset mix and the level of cash held by these funds are determined from a policyholder perspective and can move significantly from one year to another. Shareholder cash at 31 December 2012 is at £9.0 billion (2011: £8.6 billion).
Purchases and sales of operating assets, including financial investments, are included within operating cash flows as the purchases are funded from cash flows associated with the origination of insurance and investment contracts, net of payments of related benefits and claims. During the year, the net operating cash inflow reflects a number of factors, including changes in the investment strategy of funds to hold a lower weighting of cash and higher levels of financial investments, the level of premium income and the timing of receipts of premiums and the payment of creditors, claims and surrenders. It also includes changes in the size and value of consolidated cash investment funds and changes in the Group participation in these funds.
51 – Statement of cash flows continued
(b) Cash flows in respect of, and additions to, the acquisition of subsidiaries, joint ventures and associates comprised:
| | 2012
£m | | 2011
£m | | 2010
£m | |
| Cash consideration for subsidiaries, joint ventures and associates acquired and additions | | 136 | | | 114 | | | 239 | |
| Less: Cash and cash equivalents acquired with subsidiaries | | (7 | ) | | – | | | (781 | ) |
| Cash flows on acquisitions and additions – continuing operations | | 129 | | | 114 | | | (542 | ) |
| Cash flows on acquisitions and additions – discontinued operations | | – | | | – | | | 65 | |
| Cash flows on acquisitions and additions | | 129 | | | 114 | | | (477 | ) |
(c) Cash flows in respect of the disposal of subsidiaries, joint ventures and associates comprised:
| | 2012
£m | | 2011
£m | | 2010
£m | |
| Cash proceeds from disposal of subsidiaries, joint ventures and associates | | 442 | | | 988 | | | 241 | |
| Less: Net cash and cash equivalents divested with subsidiaries | | (21 | ) | | (111 | ) | | (19 | ) |
| Cash flows on disposals – continuing operations | | 421 | | | 877 | | | 222 | |
| Cash flows on disposals – discontinued operations | | – | | | (502 | ) | | 29 | |
| Cash flows on disposals | | 421 | | | 375 | | | 251 | |
The above figures form part of cash flows from investing activities.
(d) Cash and cash equivalents in the statement of cash flows at 31 December comprised:
| | 2012
£m | | 2011
£m | | 2010
£m | |
| Cash at bank and in hand | | 13,020 | | | 8,854 | | | 9,740 | |
| Cash equivalents | | 10,794 | | | 14,215 | | | 15,715 | |
| | | 23,814 | | | 23,069 | | | 25,455 | |
| Bank overdrafts | | (566 | ) | | (668 | ) | | (760 | ) |
| | | 23,248 | | | 22,401 | | | 24,695 | |
Cash and cash equivalents reconciles to the statement of financial position as follows:
| | 2012
£m | | 2011
£m | | 2010
£m | |
| Cash and cash equivalents (excluding bank overdrafts) | | 23,814 | | | 23,069 | | | 25,455 | |
| Less: Assets classified as held for sale | | (917 | ) | | (26 | ) | | – | |
| | | 22,897 | | | 23,043 | | | 25,455 | |
52 �� Capital statement
This statement sets out the financial strength of our Group entities and provides an analysis of the disposition and constraints over the availability of capital to meet risks and regulatory requirements. The capital statement also provides a reconciliation of shareholders’ funds to regulatory capital.
The analysis below sets out the Group’s available capital resources, which includes available capital resources of subsidiaries classified as held for sale in the Group IFRS statement of financial position still included in the Group’s available capital resources at 31 December 2012.
Available capital resources
| | Old
with-profit
sub-fund
£m | | New
with-profit
sub-fund
£m | | With-profit sub-fund5 £m | | Total
UK life
with-profit
funds
£m | | Other
UK life
operations
£m | | Total
UK life
operations
£m | | Overseas
life
operations
£m | | Total life
operations
£m | | Other operations6 £m | | 2012
Total
£m | | Restated
2011
Total
£m | |
| Total shareholders' funds | | 3 | | | (310 | ) | | 31 | | | (276 | ) | | 5,170 | | | 4,894 | | | 7,449 | | | 12,343 | | | (983 | ) | | 11,360 | | | 15,363 | |
| Other sources of capital1 | | – | | | – | | | – | | | – | | | 200 | | | 200 | | | 43 | | | 243 | | | 4,137 | | | 4,380 | | | 4,824 | |
| Unallocated divisible surplus2 | | 263 | | | – | | | 1,693 | | | 1,956 | | | 18 | | | 1,974 | | | 5,012 | | | 6,986 | | | – | | | 6,986 | | | 650 | |
| Adjustments onto a regulatory basis: | | | | | | | | | | | | | | | | | | | | | | | | | | | | | | | | | |
| Shareholders' share of accrued bonus | | (23 | ) | | (95 | ) | | (186 | ) | | (304 | ) | | – | | | (304 | ) | | – | | | (304 | ) | | – | | | (304 | ) | | (351 | ) |
| Goodwill and other intangibles3 | | – | | | – | | | – | | | – | | | (136 | ) | | (136 | ) | | (1,759 | ) | | (1,895 | ) | | (1,515 | ) | | (3,410 | ) | | (4,923 | ) |
| Regulatory valuation and admissibility restrictions4 | | 48 | | | 1,312 | | | 298 | | | 1,658 | | | (2,564 | ) | | (906 | ) | | 1,615 | | | 709 | | | (686 | ) | | 23 | | | (3,279 | ) |
| Total available capital resources | | 291 | | | 907 | | | 1,836 | | | 3,034 | | | 2,688 | | | 5,722 | | | 12,360 | | | 18,082 | | | 953 | | | 19,035 | | | 12,284 | |
| Analysis of liabilities: | | | | | | | | | | | | | | | | | | | | | | | | | | | | | | | | | |
| Participating insurance liabilities7 | | 1,909 | | | 14,078 | | | 11,228 | | | 27,215 | | | 8 | | | 27,223 | | | 22,250 | | | 49,473 | | | – | | | 49,473 | | | 52,872 | |
| Unit-linked liabilities | | – | | | – | | | – | | | – | | | 3,693 | | | 3,693 | | | 6,243 | | | 9,936 | | | – | | | 9,936 | | | 10,168 | |
| Other non-participating life insurance | | 359 | | | 2,758 | | | 483 | | | 3,600 | | | 33,889 | | | 37,489 | | | 35,634 | | | 73,123 | | | – | | | 73,123 | | | 69,442 | |
| Amounts classified as held for sale | | – | | | – | | | – | | | – | | | – | | | – | | | (34,446 | ) | | (34,446 | ) | | – | | | (34,446 | ) | | (344 | ) |
| Total insurance liabilities | | 2,268 | | | 16,836 | | | 11,711 | | | 30,815 | | | 37,590 | | | 68,405 | | | 29,681 | | | 98,086 | | | – | | | 98,086 | | | 132,138 | |
| Participating investment liabilities7 | | 651 | | | 3,097 | | | 5,967 | | | 9,715 | | | 2,453 | | | 12,168 | | | 54,681 | | | 66,849 | | | – | | | 66,849 | | | 67,707 | |
| Non-participating investment liabilities | | (3 | ) | | (24 | ) | | – | | | (27 | ) | | 33,851 | | | 33,824 | | | 13,875 | | | 47,699 | | | – | | | 47,699 | | | 45,659 | |
| Amounts classified as held for sale | | – | | | – | | | – | | | – | | | – | | | – | | | (4,054 | ) | | (4,054 | ) | | – | | | (4,054 | ) | | – | |
| Total investment liabilities | | 648 | | | 3,073 | | | 5,967 | | | 9,688 | | | 36,304 | | | 45,992 | | | 64,502 | | | 110,494 | | | – | | | 110,494 | | | 113,366 | |
| Total liabilities | | 2,916 | | | 19,909 | | | 17,678 | | | 40,503 | | | 73,894 | | | 114,397 | | | 94,183 | | | 208,580 | | | – | | | 208,580 | | | 245,504 | |
| 1 | Other sources of capital include Subordinated debt of £4,337 million issued by Aviva and £43 million of other qualifying capital issued by Italian and Spanish subsidiary and associate undertakings. |
| 2 | Unallocated divisible surplus for overseas life operations is included gross of minority interest and amounts disclosed include balances classified as held for sale. 2012 includes a negative balance of £2 million in Italy (2011: £1,449 million negative). |
| 3 | Goodwill and other intangibles includes goodwill of £132 million in joint ventures and associates including amounts classified as held for sale. |
| 4 | Includes an adjustment for minorities (except for other sources of capital that are reflected net of minority interest). |
| 5 | Includes the Provident Mutual with-profit fund. |
| 6 | Other operations include general insurance and fund management business. |
| 7 | Following review of the classification of contracts issued by the Group’s Italian business, there has been a reallocation from participating insurance liabilities at 31 December 2011 to participating investment contract liabilities of £2,722 million. |
Analysis of movements in capital of long-term businesses
For the year ended 31 December 2012
| | Old
with-profit
sub-fund
£m | | New
with-profit
sub-fund
£m | | With-profit
sub-fund
£m | | Total UK
life with-
profit
funds
£m | | Other
UK life
operations
£m | | Total
UK life
operations
£m | | Overseas
life
operations
£m | | Total life
operations
£m | |
| Available capital resources at 1 January | | 240 | | | 1,159 | | | 1,629 | | | 3,028 | | | 2,779 | | | 5,807 | | | 3,745 | | | 9,552 | |
| Effect of new business | | – | | | (194 | ) | | (12 | ) | | (206 | ) | | 107 | | | (99 | ) | | (398 | ) | | (497 | ) |
| Expected change in available capital resources | | 18 | | | 196 | | | 235 | | | 449 | | | 283 | | | 732 | | | 1,343 | | | 2,075 | |
| Variance between actual and expected experience1 | | 58 | | | (20) | | | 50 | | | 88 | | | (20 | ) | | 68 | | | 7,596 | | | 7,664 | |
| Effect of operating assumption changes | | 2 | | | (13 | ) | | 21 | | | 10 | | | 26 | | | 36 | | | – | | | 36 | |
| Effect of economic assumption changes | | (19 | ) | | (103 | ) | | (69 | ) | | (191 | ) | | – | | | (191 | ) | | 79 | | | (112 | ) |
| Effect of changes in management policy | | – | | | – | | | (23 | ) | | (23 | ) | | – | | | (23 | ) | | 7 | | | (16 | ) |
| Effect of changes in regulatory requirements | | – | | | – | | | – | | | – | | | – | | | – | | | (10 | ) | | (10 | ) |
| Transfers, acquisitions and disposals | | – | | | – | | | – | | | – | | | – | | | – | | | (43 | ) | | (43 | ) |
| Foreign exchange movements | | – | | | – | | | – | | | – | | | – | | | – | | | (127 | ) | | (127 | ) |
| Other movements | | (8 | ) | | (118 | ) | | 5 | | | (121 | ) | | (487 | ) | | (608 | ) | | 168 | | | (440 | ) |
| Available capital resources at 31 December | | 291 | | | 907 | | | 1,836 | | | 3,034 | | | 2,688 | | | 5,722 | | | 12,360 | | | 18,082 | |
| 1 | The positive variance between actual and expected experience is driven by increases in the market value of assets backing participating funds in continental Europe, and consequential increases in unallocated divisible surplus. |
Further analysis of the movement in the liabilities of the long-term business can be found in notes 36 and 37.
The analysis of movements in capital provides an explanation of the movement in available capital of the Group’s life business for the year. This analysis is intended to give an understanding of the underlying causes of changes in the available capital of the Group’s life business, and provides a distinction between some of the key factors affecting the available capital.
The negative shareholders’ funds balance within the UK with-profit funds arises in NWPSF as a result of regulatory valuation and admissibility differences in the reattributed estate which is valued on a realistic regulatory basis compared to the disclosure on an IFRS basis.
NWPSF is fully supported by the reattributed estate of £748 million (this is known as RIEESA) at 31 December 2012(31December 2011: £1,113 million) held within NPSF1 (a non-profit fund within UKLAP included within other UK life operations) in the form of a capital support arrangement. This support arrangement will provide capital to NWPSF to ensure that the value of assets of NWPSF are at least equal to the value of liabilities calculated on a realistic regulatory basis, therefore it forms part of the NWPSF available capital resources.
52 – Capital statement continued
The with-profit funds and the RIEESA use internal hedging to limit the impacts of equity market volatility.
In aggregate, the Group has at its disposal total available capital of £19.0 billion(2011: £12.3 billion), representing the aggregation of the solvency capital of all of our businesses.
This capital is available to meet risks and regulatory requirements set by reference to local guidance and EU directives.
After effecting the year-end transfers to shareholders, the UK with-profit funds have available capital of £3.0 billion(2011: ��3.0 billion) (including amounts held in RIEESA). Subject to certain conditions, the RIEESA capital can be used to write new non-profit business, but the primary purpose of this capital is to provide support for the UK with-profit business. The capital is comfortably in excess of the required capital margin, and therefore the shareholders are not required to provide further support.
For the remaining life and general insurance operations, the total available capital amounting to £16.0 billion(2011: £9.3 billion) is higher than the minimum requirements established by regulators and, in principle, the excess is available to shareholders. In practice, management will hold higher levels of capital within each business operation to provide appropriate cover for risk.
The total available capital of £19.0 billion is arrived at on the basis of local regulatory guidance, which evaluates assets and liabilities prudently and includes the Group’s unallocated divisible surplus of overseas life operations. This is a limitation of the Group Capital Statement which, to be more meaningful, needs to evaluate available capital on an economic basis and compare it with the risk capital required for each individual operation, after allowing for the considerable diversification benefits that exist in our Group.
Within the Aviva Group there exist intra-group arrangements to provide capital to particular business units. Included in these arrangements is a subordinated loan of £200 million from Aviva Life Holdings UK Limited to Aviva Annuity Limited to provide capital to support the writing of new business.
The available capital of the Group’s with-profit funds is determined in accordance with the ‘Realistic balance sheet’ regime prescribed by the FSA’s regulations, under which liabilities to policyholders include both declared bonuses and the constructive obligation for future bonuses not yet declared. The available capital resources include an estimate of the value of their respective estates, included as part of the unallocated divisible surplus. The estate represents the surplus in the fund that is in excess of any constructive obligation to policyholders. It represents capital resources of the individual with-profit fund to which it relates and is available to meet regulatory and other solvency requirements of the fund and, in certain circumstances, additional liabilities may arise.
The liabilities included in the balance sheet for the with-profit funds do not include the amount representing the shareholders’ portion of future bonuses. However, the shareholders’ portion is treated as a deduction from capital that is available to meet regulatory requirements and is therefore shown as a separate adjustment in the capital statement.
In accordance with the FSA’s regulatory rules under its realistic capital regime, the Group is required to hold sufficient capital in its UK life with-profit funds to meet the FSA capital requirements, based on the risk capital margin (RCM). The determination of the RCM depends on various actuarial and other assumptions about potential changes in market prices, and the actions management would take in the event of particular adverse changes in market conditions.
| | | | | | | | | | | | 31 December 2012 | | 31 December
2011 | |
| | Estimated
realistic
assets
£bn | | Estimated realistic liabilities1 £bn | | Estimated realistic inherited estate2 £bn | | Capital support arrangement3 £bn | | Estimated
risk capital
margin
£bn | | Estimated
excess
available
capital
£bn | | Estimated excess
available capital
£bn | |
| NWPSF | | 17.3 | | | (17.3 | ) | | – | | | 0.7 | | | (0.4 | ) | | 0.3 | | | 0.7 | |
| OWPSF | | 2.9 | | | (2.6 | ) | | 0.3 | | | – | | | (0.1 | ) | | 0.2 | | | 0.2 | |
| WPSF4 | | 18.3 | | | (16.5 | ) | | 1.8 | | | – | | | (0.5 | ) | | 1.3 | | | 1.0 | |
| Aggregate | | 38.5 | | | (36.4 | ) | | 2.1 | | | 0.7 | | | (1.0 | ) | | 1.8 | | | 1.9 | |
| 1 | These realistic liabilities include the shareholders’ share of future bonuses of £0.3 billion (31 December 2011: £0.3 billion).Realistic liabilities adjusted to eliminate the shareholders’ share of future bonuses are £36.0 billion (31 December 2011: £38.8 billion). These realistic liabilities make provision for guarantees, options and promises on a market consistent stochastic basis. The value of the provision included within realistic liabilities is £1.8 billion, £0.3 billion and £3.5 billion for NWPSF, OWPSF and WPSF respectively(31 December 2011: £1.9 billion, £0.3 billion and £3.1 billion for NWPSF, OWPSF and WPSF respectively). |
| 2 | Estimated realistic inherited estate at 31 December 2011 was £nil, £0.3 billion and £1.6 billion for NWPSF, OWPSF and WPSF respectively. |
| 3 | This represents the reattributed estate of £0.7 billion at 31 December 2012(31 December 2011: £1.1 billion) held within NPSF1 (a non-profit fund within UKLAP included within other UK life operations). |
| 4 | The WPSF fund includes the Provident Mutual (PM) fund, which has realistic assets and liabilities of £1.7 billion and therefore does not impact the realistic inherited estate. |
Under the FSA regulatory regime, UK life with-profits business is required to hold capital equivalent to the greater of their regulatory requirement based on EU directives (regulatory peak) and the FSA realistic bases (realistic peak) described above.
For UK non-participating business, the relevant capital requirement is the minimum solvency requirement determined in accordance with FSA regulations. The available capital reflects the excess of regulatory basis assets over liabilities before deduction of capital resources requirement.
For UK general insurance businesses, the relevant capital requirement is the minimum solvency requirement determined in accordance with the FSA requirements.
For overseas businesses in the European Economic Area (EEA), US, Canada, Hong Kong and Singapore, the available capital and the minimum requirement are calculated under the locally applicable regulatory regimes. The businesses outside these territories are subject to the FSA rules for the purposes of calculation of available capital and capital resource requirement.
For fund management and other businesses, the relevant capital requirement is the minimum solvency requirement determined in accordance with the local regulator’s requirements for the specific class of business.
52 – Capital statement continued
The available capital resources in each regulated entity are generally subject to restrictions as to their availability to meet requirements that may arise elsewhere in the Group. The principal restrictions are:
| n | (i) UK with-profits fund – (NWPSF, OWPSF and WPSF) – any available surplus held in each fund can be used to meet the requirements of the fund itself, be distributed to policyholders and shareholders or in the case of NWPSF and OWPSF, transferred via the capital support arrangement explained above (for OWPSF only to the extent support has been provided in the past). In most cases, with-profit policyholders are entitled to at least 90% of the distributed profits while the shareholders receive the balance. The latter distribution would be subject to a tax charge, which is met by the fund. |
| n | (ii) UK non-participating funds – any available surplus held in these is attributable to shareholders. Capital in the non-profit funds may be made available to meet requirements elsewhere in the Group subject to meeting the regulatory requirements of the fund. Any transfer of the surplus may give rise to a tax charge subject to availability of tax relief elsewhere in the Group. |
| n | (iii) Overseas life operations – the capital requirements and corresponding regulatory capital held by overseas businesses are calculated using the locally applicable regulatory regime. The available capital resources in all these businesses are subject to local regulatory restrictions which may constrain management’s ability to utilise these in other parts of the Group. In several business units, Group companies and other parties jointly control certain entities; these joint venture operations may constrain management’s ability to utilise the capital in other parts of the Group. Any transfer of available capital may give rise to a tax charge subject to availability of tax relief elsewhere in the Group. |
| n | (iv) General insurance operations – the capital requirements and corresponding regulatory capital held by overseas businesses are calculated using the locally applicable regulatory regime. The available capital resources in all these businesses are subject to local regulatory restrictions which may constrain management’s ability to utilise these in other parts of the Group. Any transfer of available capital may give rise to a tax charge, subject to availability of tax relief elsewhere in the Group. |
53 – Risk management
This note sets out the major risks our businesses and its shareholders face and describes the Group’s approach to managing these.
It also gives sensitivity analyses around the major economic and non-economic assumptions that can cause volatility in the Group’s earnings and capital position.
(a) Risk management framework
The risk management framework (RMF) in Aviva forms an integral part of the management and Board processes and decision-making framework across the Group. The key elements of our risk management framework comprise risk appetite; risk governance, including risk policies and business standards, risk oversight committees and roles and responsibilities; and the processes we use to identify, measure, manage, monitor and report (IMMMR) risks, including the use of our risk models and stress and scenario testing.
For the purposes of risk identification and measurement, and aligned to Aviva’s risk policies, risks are usually grouped by risk type: credit, market, liquidity, life insurance, general insurance, asset management and operational risk. Risks falling within these types may affect a number of metrics including those relating to balance sheet strength, liquidity and profit. They may also affect the performance of the products we deliver to our customers and the service to our customers and distributors, which can be categorised as risks to our brand and reputation.
To promote a consistent and rigorous approach to risk management across all businesses we have a set of risk policies and business standards which set out the risk strategy, appetite, framework and minimum requirements for the Group’s worldwide operations. On a semi-annual basis the business chief executive officers and chief risk officers sign-off compliance with these policies and standards, providing assurance to the relevant oversight committees that there is a consistent framework for managing our business and the associated risks.
A regular top-town key risk identification and assessment process is carried out by the risk function. This includes the consideration of emerging risks and is supported by deeper thematic reviews. This process is replicated at the business unit level. The risk assessment processes are used to generate risk reports which are shared with the relevant risk committees.
Risk models are an important tool in our measurement of risks and are used to support the monitoring and reporting of the risk profile and in the consideration of the risk management actions available. We carry out a range of stress (where one risk factor, such as equity returns, is assumed to vary) and scenario (where combinations of risk factors are assumed to vary) tests to evaluate their impact on the business and the management actions available to respond to the conditions envisaged.
Roles and responsibilities for risk management in Aviva are based around the ‘three lines of defence model’ where ownership for risk is taken at all levels in the Group. Line management in the business is accountable for risk management, including the implementation of the risk management framework and embedding of the risk culture. The risk function is accountable for quantitative and qualitative oversight and challenge of the IMMMR process and for developing the risk management framework. Internal Audit provides an independent assessment of the risk framework and internal control processes.
Board oversight of risk and risk management across the Group is maintained on a regular basis through its Risk Committee. The Board has overall responsibility for determining risk appetite, which is an expression of the risk the business is willing to take. Risk appetites are set relative to capital, liquidity and franchise value at Group and in the business units. Economic capital risk appetites are also set for each risk type. The Group’s position against risk appetite is monitored and reported to the Board on a regular basis. The oversight of risk and risk management at the Group level is supported by the Asset Liability Committee (ALCO), which focuses on business and financial risks, and the Operational Risk Reputation Committee (ORRC) which focuses on operational and reputational risks. Similar committee structures with equivalent terms of reference exist in the business units.
53 – Risk management continued
Further information on the types and management of specific risk types is given in sections (b) - (j) below.
The risk management framework of a small number of our joint ventures and strategic equity holdings differs from the Aviva framework outlined in this note. We work with these entities to understand how risks are managed and to align them, where possible, with Aviva’s framework.
(b) Credit risk
Credit risk is the risk of financial loss as a result of the default or failure of third parties to meet their payment obligations to Aviva, or variations in market values as a result of changes in expectations related to these risks. Credit risk is an area where we can provide the returns required to satisfy policyholder liabilities and to generate returns for our shareholders. In general we prefer to take credit risk over equity and property risks, due to the better expected risk adjusted return, our credit risk analysis capability and the structural investment advantages conferred to insurers with long-dated, relatively illiquid liabilities.
Our approach to managing credit risk recognises that there is a risk of adverse financial impact resulting from fluctuations in credit quality of third parties including default, rating transition and credit spread movements.Our credit risks arise principally through exposures to debt security investments, structured asset investments, bank deposits, derivative counterparties, mortgage lending and reinsurance counterparties.
The Group manages its credit risk at business unit and Group level. All business units are required to implement credit risk management processes (including limits frameworks), operate specific risk management committees, and ensure detailed reporting and monitoring of their exposures against pre-established risk criteria. At Group level, we manage and monitor all exposures across our business units on a consolidated basis, and operate a Group limit framework that must be adhered to by all.
A detailed breakdown of the Group’s current credit exposure by credit quality is shown below.
(i) Financial exposures by credit ratings
Financial assets are graded according to current external credit ratings issued. AAA is the highest possible rating. Investment grade financial assets are classified within the range of AAA to BBB ratings. Financial assets which fall outside this range are classified as sub-investment grade. The following table provides information regarding the aggregated credit risk exposure of the Group for financial assets with external credit ratings, excluding assets ‘held for sale’. ‘Not rated’ assets capture assets not rated by external ratings agencies.
| As at 31 December 2012 | | AAA | | AA | | A | | BBB | | Speculative grade | | Not rated | | Carrying
value including
held for
sale | | Less assets classified as held for sale | | Carrying
value
£m |
| Debt securities | | 24.4% | | 16.9% | | 23.8% | | 25.4% | | 4.2% | | 5.3% | | 161,623 | | (33,617) | | 128,006 |
| Reinsurance assets | | 0.4% | | 63.4% | | 30.1% | | 0.7% | | 0.1% | | 5.3% | | 7,567 | | (883) | | 6,684 |
| Other investments | | 0.1% | | 0.2% | | 2.3% | | 2.0% | | 1.5% | | 93.9% | | 30,093 | | (1,550) | | 28,543 |
| Loans | | 5.8% | | 8.2% | | 1.2% | | 0.1% | | 0.7% | | 84.0% | | 27,934 | | (3,397) | | 24,537 |
| Total | | | | | | | | | | | | | | 227,217 | | (39,447) | | 187,770 |
| As at 31 December 2011 | | AAA | | AA | | A | | BBB | | Speculative
grade | | Not rated | | Carrying
value including
held for
sale | | Less assets classified as held for sale | | Carrying
value
£m |
| Debt securities | | 32.3% | | 13.2% | | 29.9% | | 16.3% | | 2.8% | | 5.4% | | 153,345 | | (93) | | 153,252 |
| Reinsurance assets | | 0.0% | | 70.1% | | 23.2% | | 0.0% | | 0.4% | | 6.3% | | 7,113 | | (1) | | 7,112 |
| Other investments | | 0.2% | | 0.8% | | 1.4% | | 2.3% | | 0.4% | | 94.9% | | 30,377 | | (217) | | 30,160 |
| Loans | | 0.9% | | 1.3% | | 1.2% | | 0.2% | | 0.8% | | 95.6% | | 28,116 | | — | | 28,116 |
| Total | | | | | | | | | | | | | | 218,951 | | (311) | | 218,640 |
The carrying amount of assets included in the statement of financial position represents the maximum credit exposure.
The impact of collateral held on the net credit exposure is shown below.
| | 2012 | | Restated 2011 | |
| At 31 December 2012 | Carrying value in the statement of financial position
£m | | Collateral held
£m | | Net credit exposure
£m | | Carrying
value in the statement of financial position
£m | | Collateral
held
£m | | Net credit exposure
£m | |
| Debt securities | | 161,623 | | | (33 | ) | | 161,590 | | | 153,345 | | | (31 | ) | | 153,314 | |
| Reinsurance assets | | 7,567 | | | (21 | ) | | 7,546 | | | 7,113 | | | (443 | ) | | 6,670 | |
| Other investments | | 30,093 | | | (1,224 | ) | | 28,869 | | | 30,377 | | | (465 | ) | | 29,912 | |
| Loans | | 27,934 | | | (26,893 | ) | | 1,041 | | | 28,116 | | | (26,957 | ) | | 1,159 | |
| Total | | 227,217 | | | (28,171 | ) | | 199,046 | | | 218,951 | | | (27,896 | ) | | 191,055 | |
| Less: Assets classified as held for sale | | (39,447 | ) | | 3,958 | | | (35,489 | ) | | (311 | ) | | – | | | (311 | ) |
| Total (excluding held for sale) | | 187,770 | | | (24,213 | ) | | 163,557 | | | 218,640 | | | (27,896 | ) | | 190,744 | |
Following a review of the collateral reported, the total net credit exposure (excluding assets classified as held for sale) at 31 December 2011 has decreased by £1,045 million.
Additional information in respect to collateral is provided in notes 20(c) and notes 22(d)(i).
To the extent that collateral held is greater than the amount receivable that it is securing, the table above shows only an amount equal to the latter. In the event of default, any over-collateralised security would be returned to the relevant counterparty.
53 – Risk management continued
(ii) Financial exposures to peripheral European countries
Included in our debt securities and other financial assets, are exposures to peripheral European countries. Gross of non-controlling interests, our direct shareholder assets exposure to the governments (and local authorities and agencies) of Greece, Ireland, Portugal, Italy and Spain has reduced since 2011 and is detailed in 25 (e). We continue to monitor closely the situation in the eurozone and have had additional restrictions on further investment in place since late 2009 as well as taking actions to reduce exposure to higher risk assets.
(iii) Other investments
Other investments (including assets of operations classified as held for sale) include unit trusts and other investment vehicles; derivative financial instruments, representing positions to mitigate the impact of adverse market movements; and other assets includes deposits with credit institutions and minority holdings in property management undertakings.
The credit quality of the underlying debt securities within investment vehicles is managed by the safeguards built into the investment mandates for these funds which determine the funds’ risk profiles. At the Group level, we also monitor the asset quality of unit trusts and other investment vehicles against Group set limits.
A proportion of the assets underlying these investments are represented by equities and so credit ratings are not generally applicable. Equity exposures are managed against agreed benchmarks that are set with reference to overall appetite for market risk.
(iv) Loans
The Group loan portfolio principally comprises:
| n | Policy loans which are generally collateralised by a lien or charge over the underlying policy; |
| n | Loans and advances to banks which primarily relate to loans of cash collateral received in stock lending transactions. These loans are fully collateralised by other securities; and |
| n | Mortgage loans collateralised by property assets. |
We use loan to value; interest and debt service cover; and diversity and quality of the tenant base metrics to internally monitor our exposures to mortgage loans. We use credit quality, based on dynamic market measures, and collateralisation rules to manage our stock lending activities. Policy loans are loans and advances made to policyholders, and are collateralised by the underlying policies.
(v) Credit concentration risk
The long-term and general insurance businesses are generally not individually exposed to significant concentrations of credit risk due to the regulations applicable in most markets and the Group credit policy and limits framework, which limit investments in individual assets and asset classes. Credit concentrations are monitored as part of the regular credit monitoring process and are reported to Group ALCO. With the exception of government bonds the largest aggregated counterparty exposure within shareholder assets is approximately 1.5% of the total shareholder assets (gross of ‘held for sale’).
(vi) Reinsurance credit exposures
The Group is exposed to concentrations of risk with individual reinsurers due to the nature of the reinsurance market and the restricted range of reinsurers that have acceptable credit ratings. The Group operates a policy to manage its reinsurance counterparty exposures, by limiting the reinsurers that may be used and applying strict limits to each reinsurer. Reinsurance exposures are aggregated with other exposures to ensure that the overall risk is within appetite. The Group risk function has an active monitoring role with escalation to the Chief Financial Officer (CFO), Group ALCO and the Board Risk Committee as appropriate.
The Group’s largest reinsurance counterparty is Swiss Reinsurance Company Ltd (including subsidiaries). At 31 December 2012, the reinsurance asset recoverable, including debtor balances, from Swiss Reinsurance Company Ltd was £1,717 million.
(vii) Securities finance
The Group has significant securities financing operations within the UK and smaller operations in some other businesses. The risks within this activity are mitigated by over-collateralisation and minimum counterparty credit quality requirements which are designed to minimise residual risk. The Group operates strict standards around counterparty quality, collateral management, margin calls and controls.
(viii) Derivative credit exposures
The Group is exposed to counterparty credit risk through derivative trades. This risk is mitigated through collateralising almost all trades (the exception being certain foreign exchange trades where it has historically been the market norm not to collateralise). Residual exposures are captured within the Group’s credit management framework.
(ix) Unit-linked business
In unit-linked business the policyholder bears the direct market risk and credit risk on investment assets in the unit funds and the shareholders’ exposure to credit risk is limited to the extent of the income arising from asset management charges based on the value of assets in the fund.
53 – Risk management continued
(x) Impairment of financial assets
In assessing whether financial assets are impaired, due consideration is given to the factors outlined in accounting policy (S). The following table provides information regarding the carrying value of financial assets that have been impaired and the ageing of financial assets that are past due but not impaired. The table excludes assets ‘held for sale’.
| Financial assets that are past due but not impaired | | | | | | | |
| At 31 December 2012 | | Neither past due nor impaired £m | | | 0–3 months £m | | | 3–6 months £m | | | 6 months– 1 year £m | | | Greater than 1 year £m | | | Financial assets that have been impaired £m | | | Carrying value £m | |
| Debt securities | | 128,006 | | | – | | | – | | | – | | | – | | | – | | | 128,006 | |
| Reinsurance assets | | 6,684 | | | – | | | – | | | – | | | – | | | – | | | 6,684 | |
| Other investments | | 28,535 | | | – | | | – | | | – | | | – | | | 8 | | | 28,543 | |
| Loans | | 23,770 | | | 85 | | | – | | | – | | | – | | | 682 | | | 24,537 | |
| Receivables and other financial assets | | 7,518 | | | 46 | | | 13 | | | 14 | | | 26 | | | – | | | 7,617 | |
| Financial assets that are past due but not impaired | | | | | | | |
| At 31 December 2011 | | Neither past due nor impaired £m | | | 0–3 months £m | | | 3–6 months £m | | | 6 months– 1 year £m | | | Greater than 1 year £m | | | Financial assets that have been impaired £m | | | Carrying value £m | |
| Debt securities | | 152,988 | | | – | | | – | | | – | | | – | | | 264 | | | 153,252 | |
| Reinsurance assets | | 7,112 | | | – | | | – | | | – | | | – | | | – | | | 7,112 | |
| Other investments | | 30,152 | | | – | | | – | | | – | | | – | | | 8 | | | 30,160 | |
| Loans | | 27,582 | | | 6 | | | – | | | – | | | – | | | 528 | | | 28,116 | |
| Receivables and other financial assets | | 7,650 | | | 134 | | | 148 | | | 2 | | | 3 | | | – | | | 7,937 | |
Where assets have been classed as ‘past due and impaired’, an analysis is made of the risk of default and a decision is made whether to seek to mitigate the risk. There were no material financial assets that would have been past due or impaired had the terms not been renegotiated.
(c) Market risk
Market risk is the risk of adverse financial impact resulting, directly or indirectly from fluctuations in interest rates, foreign currency exchange rates, equity and property prices. Market risk arises in business units due to fluctuations in both the value of liabilities and the value of investments held. At Group level, it also arises in relation to the overall portfolio of international businesses and in the value of investment assets owned directly by the shareholders. We actively seek some market risks as part of our investment and product strategy however have limited appetite for interest rate risk as we do not believe it is adequately rewarded.
The management of market risk is undertaken at business unit and at Group level. Businesses manage market risks locally using the Group market risk framework and within local regulatory constraints. Group Risk is responsible for monitoring and managing market risk at Group level and has an established criteria for matching assets and liabilities to limit the impact of mismatches due to market movements.
In addition, where the Group’s long-term savings businesses have written insurance and investment products where the majority of investment risks are borne by its policyholders, these risks are managed in line with local regulations and marketing literature, in order to satisfy the policyholders’ risk and reward objectives. The Group writes unit-linked business in a number of its operations. The shareholders’ exposure to market risk on this business is limited to the extent that income arising from asset management charges is based on the value of assets in the fund.
The most material types of market risk that the Group is exposed to are described below.
(i) Equity price risk
The Group is subject to equity price risk arising from changes in the market values of its equity securities portfolio.
We continue to limit our direct equity exposure in line with our risk preferences. The reduction of the shareholding in Delta Lloyd has decreased the Group’s equity price risk and, in particular, has led to a fall in equity exposures. Our equity hedging programme during 2012 has further reduced our equity exposures. At a business unit level, investment limits and local asset admissibility regulations require that business units hold diversified portfolios of assets thereby reducing exposure to individual equities. The Group does not have material holdings of unquoted equity securities.
Equity risk is also managed using a variety of derivative instruments, including futures and options. Businesses actively model the performance of equities through the use of risk models, in particular to understand the impact of equity performance on guarantees, options and bonus rates. At 31 December 2012 the Group’s shareholder funds held £3 billion notional of equity hedges, with up to 12 months to maturity with an average strike of 88% of the prevailing market levels on 31 December 2012.
Sensitivity to changes in equity prices is given in section ‘(j) risk and capital management’ below.
(ii) Property price risk
The Group is subject to property price risk directly due to holdings of investment properties in a variety of locations worldwide and indirectly through investments in mortgages and mortgage backed securities. Investment in property is managed at business unit level, and is subject to local regulations on asset admissibility, liquidity requirements and the expectations of policyholders.
As at 31 December 2012, no material derivative contracts had been entered into to mitigate the effects of changes in property prices.
Sensitivity to changes in property prices is given in section ‘(j) risk and capital management’ below.
53 – Risk management continued
(iii) Interest rate risk
Interest rate risk arises primarily from the Group’s investments in long-term debt and fixed income securities and their movement relative to the value placed on the insurance liabilities. A number of policyholder product features have an influence on the Group’s interest rate risk. The major features include guaranteed surrender values, guaranteed annuity options, and minimum surrender and maturity values. Details of material guarantees and options are given in note 38.
Exposure to interest rate risk is monitored through several measures that include duration, economic capital modelling, sensitivity testing and stress and scenario testing. The impact of exposure to sustained low interest rates is considered within our scenario testing.
The Group typically manages interest rate risk by investing in fixed interest securities which closely match the interest rate sensitivity of the liabilities where this is available. Interest rate risk is also managed in some business units using a variety of derivative instruments, including futures, options, swaps, caps and floors.
Sensitivity to changes in interest rates is given in section ‘(j) risk and capital management’ below. Further information on borrowings is included in note 45.
(iv) Inflation risk
Inflation risk arises primarily from the Group’s exposure to general insurance claims inflation, to inflation linked benefits within the defined benefit staff pension schemes and within the UK annuity portfolio and to expense inflation. Increases in long-term inflation expectations are closely linked to long-term interest rates and so are frequently considered with interest rate risk. Exposure to inflation risk is monitored through economic capital modelling, sensitivity testing and stress and scenario testing. The Group typically manages inflation risk through its investment strategy and, in particular, by investing in inflation linked securities and through a variety of derivative instruments, including inflation linked swaps.
(v) Currency risk
The Group has minimal exposure to currency risk from financial instruments held by business units in currencies other than their functional currencies, as nearly all such holdings are backing either by unit-linked or with-profit contract liabilities or hedging.
The Group operates internationally and as a result is exposed to foreign currency exchange risk arising from fluctuations in exchange rates of various currencies. Approximately half of the Group’s premium income arises in currencies other than sterling and the Group’s net assets are denominated in a variety of currencies, of which the largest are euro, sterling and US dollars. The Group does not hedge foreign currency revenues as these are substantially retained locally to support the growth of the Group’s business and meet local regulatory and market requirements.
Businesses aim to maintain sufficient assets in local currency to meet local currency liabilities, however movements may impact the value of the Group’s consolidated shareholders’ equity which is expressed in sterling. This aspect of foreign exchange risk is monitored and managed centrally, against pre-determined limits. These exposures are managed by aligning the deployment of regulatory capital by currency with the Group’s regulatory capital requirements by currency. Currency borrowings and derivatives are used to manage exposures within the limits that have been set.
At 31 December 2012 and 2011, the Group’s total equity deployment by currency including assets ‘held for sale’ was:
| | Sterling
£m | | Euro
£m | | US$
£m | | Other
£m | | Total
£m | |
| Capital 31 December 2012 | | 4,445 | | | 4,648 | | | (51 | ) | | 2,318 | | | 11,360 | |
| Capital 31 December 2011 | | 3,427 | | | 6,442 | | | 3,237 | | | 2,257 | | | 15,363 | |
A 10% change in sterling to euro/US$ foreign exchange rates would have had the following impact on total equity.
| | 10%
increase
in sterling/
euro rate
£m | | 10%
decrease
in sterling/
euro rate
£m | | 10%
increase in
sterling/
US$ rate
£m | | 10%
decrease
in sterling/
US$ rate
£m | |
| Net assets at 31 December 2012 | | (386 | ) | | 411 | | | 34 | | | (5 | ) |
| Net assets at 31 December 2011 | | (524 | ) | | 632 | | | (323 | ) | | 323 | |
A 10% change in sterling to euro/US$ foreign exchange rates would have had the following impact on profit before tax, excluding ‘discontinued operations’.
| | 10% increase
in sterling/ euro rate
£m | | | 10% decrease
in sterling/ euro rate
£m | | | 10% increase
in sterling/ US$ rate
£m | | | 10% decrease
in sterling/ US$ rate
£m | |
| Impact on profit before tax 31 December 2012 | | (32 | ) | | 32 | | | 1 | | | (1 | ) |
| Impact on profit before tax 31 December 2011 | | (84 | ) | | 11 | | | (4 | ) | | 17 | |
The balance sheet changes arise from retranslation of business unit statements of financial position from their functional currencies into sterling, with above movements being taken through the currency translation reserve. These balance sheet movements in exchange rates therefore have no impact on profit. Net asset and profit before tax figures are stated after taking account of the effect of currency hedging activities.
53 – Risk management continued
(vi) Derivatives risk
Derivatives are used by a number of the businesses. Activity is overseen by the Group risk function, who monitors exposure levels and approves large or complex transactions. Derivatives are primarily used for efficient investment management, risk hedging purposes, or to structure specific retail savings products.
The Group applies strict requirements to the administration and valuation processes it uses, and has a control framework that is consistent with market and industry practice for the activity that is undertaken.
(vii) Correlation risk
The Group recognises that lapse behaviour and potential increases in consumer expectations are sensitive to and interdependent with market movements and interest rates. These interdependencies are taken into consideration in the internal economic capital model and in scenario analysis.
(d) Liquidity risk
Liquidity risk is the risk of not being able to make payments as they become due because there are insufficient assets in cash form. The relatively illiquid nature of insurance liabilities is a potential source of additional investment return by allowing us to invest in higher yielding, but less liquid assets such as commercial mortgages. The Group seeks to ensure that it maintains sufficient financial resources to meet its obligations as they fall due through the application of a Group liquidity risk policy and business standard. At Group and business unit level, there is a liquidity risk appetite which requires that sufficient liquid resources be maintained to cover net outflows in a stress scenario. The Company’s main sources of liquidity are liquid assets held within the Company and Aviva Group Holdings Limited (AGH), and dividends received from the Group’s insurance and asset management businesses. Sources of liquidity in normal markets also includes a variety of short and long-term instruments including commercial papers and medium and long-term debt. For 2012 and prior years, the Company’s main sources of liquidity also included intercompany loans from Aviva Insurance Limited and Aviva International Insurance Limited, subject to regulatory constraints. In addition to the existing liquid resources and expected inflows, the Group and Company maintain significant undrawn committed borrowing facilities (£2.1 billion) from a range of leading international banks to further mitigate this risk.
Maturity analyses
The following tables show the maturities of our insurance and investment contract liabilities, and of the financial and reinsurance assets to meet them. A maturity analysis of the contractual amounts payable for borrowings and derivatives is given in notes 45 and 54, respectively. Contractual obligations under operating leases and capital commitments are given in note 49.
(i) Analysis of maturity of insurance and investment contract liabilities
For non-linked insurance business, the following table shows the gross liability at 31 December 2012 and 2011 analysed by remaining duration. The total liability is split by remaining duration in proportion to the cash-flows expected to arise during that period, as permitted under IFRS 4,Insurance Contracts.
Almost all linked business and non-linked investment contracts may be surrendered or transferred on demand. For such contracts, the earliest contractual maturity date is therefore the current statement of financial position date, for a surrender amount approximately equal to the current statement of financial position liability. We expect surrenders, transfers and maturities to occur over many years, and the tables reflect the expected cash flows for these contracts. However, contractually, the total liability for linked business and non-linked investment contracts would be shown in the ‘within 1 year’ column below, and previously the total liability for linked business was shown in the ‘within 1 year’ column. Changes in durations between 2011 and 2012 reflect evolution of the portfolio, and changes to the models for projecting cash-flows.
| At 31 December 2012 | Total
£m | | On demand
or within
1 year
£m | | 1-5 years
£m | | 5-15 years
£m | | Over 15
years
£m | |
| Long-term business | | | | | | | | | | | | | | | |
| Insurance contracts – non-linked | | 117,602 | | | 8,303 | | | 31,894 | | | 44,455 | | | 32,950 | |
| Investment contracts – non-linked | | 59,788 | | | 2,491 | | | 12,390 | | | 16,679 | | | 28,228 | |
| Linked business | | 69,690 | | | 5,667 | | | 18,203 | | | 21,590 | | | 24,230 | |
| General insurance and health | | 15,006 | | | 6,166 | | | 5,763 | | | 2,456 | | | 621 | |
| Total contract liabilities | | 262,086 | | | 22,627 | | | 68,250 | | | 85,180 | | | 86,029 | |
| At 31 December 2011 | Total
£m | | On demand
or within
1 year
£m | | 1-5 years
£m | | 5-15 years
£m | | Over 15
years
£m | |
| Long-term business | | | | | | | | | | | | | | | |
| Insurance contracts – non-linked (restated)1 | | 117,442 | | | 9,693 | | | 35,403 | | | 45,829 | | | 26,517 | |
| Investment contracts – non-linked (restated)1 | | 62,412 | | | 6,240 | | | 20,208 | | | 26,252 | | | 9,712 | |
| Linked business (restated)2 | | 65,994 | | | 7,297 | | | 20,614 | | | 24,324 | | | 13,759 | |
| General insurance and health | | 15,241 | | | 5,645 | | | 5,967 | | | 2,913 | | | 716 | |
| Total contract liabilities | | 261,089 | | | 28,875 | | | 82,192 | | | 99,318 | | | 50,704 | |
| 1 | Following a review of the classification of contracts issued by the Group’s Italian long-term business, certain portfolios have been reclassified from participating insurance to participating investment contracts for all years presented. There is no impact on the result for any year presented as a result of this classification. |
| 2 | Linked business maturity profile has been restated to reflect an expected rather than contractual basis. Contractually, the total liability for linked business would be shown in the ‘within 1 year column’. |
53 – Risk management continued
(ii) Analysis of maturity of financial assets
The following table provides an analysis, by maturity date of the principal, of the carrying value of financial assets which are available to fund the repayment of liabilities as they crystallise. This table excludes assets held for sale.
| At 31 December 2012 | Total
£m | | On demand
or within
1 year
£m | | 1-5 years
£m | | Over
5 years
£m | | No fixed
term
(perpetual)
£m | |
| Debt securities | | 128,006 | | | 16,796 | | | 36,009 | | | 75,198 | | | 3 | |
| Equity securities | | 32,529 | | | – | | | – | | | – | | | 32,529 | |
| Other investments | | 28,543 | | | 12,638 | | | 866 | | | 12,508 | | | 2,531 | |
| Loans | | 24,537 | | | 5,358 | | | 1,780 | | | 17,329 | | | 70 | |
| Cash and cash equivalents | | 22,897 | | | 22,897 | | | – | | | – | | | – | |
| | | 236,512 | | | 57,689 | | | 38,655 | | | 105,035 | | | 35,133 | |
| At 31 December 2011 | Total
£m | | On demand
or within
1 year
£m | | 1-5 years
£m | | Over
5 years
£m | | No fixed
term
(perpetual)
£m | |
| Debt securities | | 153,252 | | | 18,698 | | | 39,079 | | | 95,460 | | | 15 | |
| Equity securities | | 32,646 | | | – | | | – | | | – | | | 32,646 | |
| Other investments | | 30,160 | | | 21,007 | | | 1,192 | | | 1,016 | | | 6,945 | |
| Loans | | 28,116 | | | 6,490 | | | 2,800 | | | 18,825 | | | 1 | |
| Cash and cash equivalents | | 23,043 | | | 23,043 | | | – | | | – | | | – | |
| | | 267,217 | | | 69,238 | | | 43,071 | | | 115,301 | | | 39,607 | |
The assets above are analysed in accordance with the earliest possible redemption date of the instrument at the initiation of the Group. Where an instrument is transferable back to the issuer on demand, such as most unit trusts or similar types of investment vehicle, it is included in the ‘On demand or within 1 year’ column. Debt securities with no fixed contractual maturity date are generally callable at the option of the issuer at the date the coupon rate is reset under the contractual terms of the instrument. The terms for resetting the coupon are such that we expect the securities to be redeemed at this date, as it would be uneconomic for the issuer not to do so, and for liquidity management purposes we manage these securities on this basis. The first repricing and call date is normally ten years or more after the date of issuance. Most of the Group’s investments in equity securities and fixed maturity securities are market traded and therefore, if required, can be liquidated for cash at short notice.
(e) Life insurance risk
Life insurance risk in the Group arises through its exposure to mortality and morbidity risks and exposure to worse than anticipated operating experience on factors such as persistency levels and management and administration expenses. The Group chooses to take measured amounts of life insurance risk provided that the relevant business has the appropriate core skills to assess and price the risk and adequate returns are available.
The underlying risk profile of our life insurance risks, primarily persistency, longevity, mortality and expense risk, has remained stable during 2012, although the current low levels of interest rates have increased our sensitivity to longevity shocks. Persistency risk remains significant and continues to have a volatile outlook with underlying performance linked to some degree to economic conditions. However, businesses across the Group have continued to make progress with a range of customer retention activities. The Group has continued to write strong volumes of life protection business, and to utilise reinsurance to reduce exposure to potential losses. More generally, life insurance risks are believed to benefit from a significant diversification against other risks in the portfolio. Life insurance risks are modelled within the internal economic capital model and subject to sensitivity and stress and scenario testing. The assumption and management of life insurance risks is governed by the group-wide business standards covering underwriting, pricing, product design and management, in-force management, claims handling, and reinsurance. The individual life insurance risks are managed as follows:
| n | Mortality and morbidity risks are mitigated by use of reinsurance. The Group allows businesses to select reinsurers, from those approved by the Group, based on local factors, but retains oversight of the overall exposures and monitor that the aggregation of risk ceded is within credit risk appetite. |
| n | Longevity risk and internal experience analysis are monitored against the latest external industry data and emerging trends. Whilst individual businesses are responsible for reserving and pricing for annuity business, the Group monitors the exposure to this risk and any associated capital implications. The Group has used reinsurance solutions to reduce the risks from longevity and continually monitors and evaluates emerging market solutions to mitigate this risk further. |
| n | Persistency risk is managed at a business unit level through frequent monitoring of company experience, and benchmarked against local market information. Generally, persistency risk arises from customers lapsing their policies earlier than has been assumed. Where possible the financial impact of lapses is reduced through appropriate product design. Businesses also implement specific initiatives to improve retention of policies which may otherwise lapse. The Group has developed guidelines on persistency management. |
| n | Expense risk is primarily managed by the business units through the assessment of business unit profitability and frequent monitoring of expense levels. |
Embedded derivatives
The Group has exposure to a variety of embedded derivatives in its long-term savings business due to product features offering varying degrees of guaranteed benefits at maturity or on early surrender, along with options to convert their benefits into different products on pre-agreed terms. The extent of the impact of these embedded derivatives differs considerably between business units and exposes Aviva to changes in policyholder behaviour in the exercise of options as well as market risk.
53 – Risk management continued
Examples of each type of embedded derivative affecting the Group are:
| n | Options: call, put, surrender and maturity options, guaranteed annuity options, options to cease premium payment, options for withdrawals free of market value adjustment, annuity options, and guaranteed insurability options. |
| n | Guarantees: embedded floor (guaranteed return), maturity guarantee, guaranteed death benefit, and guaranteed minimum rate of annuity payment. |
| n | Other: indexed interest or principal payments, maturity value, loyalty bonus. |
The impact of these is reflected in the economic capital model and MCEV reporting and managed as part of the asset liability framework.
(f) General insurance risk
Types of risk
General insurance risk in the Group arises from:
| n | Fluctuations in the timing, frequency and severity of claims and claim settlements relative to expectations; |
| n | Unexpected claims arising from a single source or cause; |
| n | Inaccurate pricing of risks or inappropriate underwriting of risks when underwritten; and |
| n | Inadequate reinsurance protection or other risk transfer techniques. |
Aviva has a preference for general insurance risk in measured amounts for explicit reward, in line with our core skills in underwriting and pricing. The majority of the general insurance business underwritten by the Group continues to be short tail in nature such as motor, household and commercial property insurances. The Group’s underwriting strategy and appetite is communicated via specific policy statements, related business standards and guidelines. General insurance risk is managed primarily at business unit level with oversight at the Group level. Claims reserving is undertaken by local actuaries in the various general insurance businesses and is also subject to periodic external reviews. Reserving processes are further detailed in note 36 ‘insurance liabilities’.
The vast majority of the Group’s general insurance business is managed and priced in the same country as the domicile of the customer.
Management of general insurance risks
Significant insurance risks will be reported under the risk management framework. Additionally, the economic capital model is used to assess the risks that each general insurance business unit, and the Group as a whole, is exposed to, quantifying their impact and calculating appropriate capital requirements.
Business units have developed mechanisms that identify, quantify and manage accumulated exposures to contain them within the limits of the appetite of the Group. The business units are assisted by a Business Capability team who provide technical input for major decisions which fall outside individual delegated limits or escalations outside group risk preferences, group risk accumulation, concentration and profitability limits.
Reinsurance strategy
Significant reinsurance purchases are reviewed annually at both business unit and Group level to verify that the levels of protection being bought reflect any developments in exposure and the risk appetite of the Group. The basis of these purchases is underpinned by analysis of economic capital, economic gain, earnings volatility, liquidity, retained risk exposure profile and the Group’s franchise value.
Detailed actuarial analysis is used to calculate the Group’s extreme risk profile and then design cost and capital efficient reinsurance programmes to mitigate these risks to within agreed appetites. For businesses writing general insurance we analyse the natural catastrophe exposure using external probabilistic catastrophe models widely used by the rest of the (re)insurance industry.
The Group cedes much of its worldwide catastrophe risk to third-party reinsurers but retains a pooled element for its own account gaining diversification benefit. The total Group potential loss from its most concentrated catastrophe exposure zone (Northern Europe) is approximately £260 million, for a one in ten year annual loss scenario, compared to approximately £460 million when measured on a one in a hundred year annual loss scenario.
In our 2011 Annual Report & Accounts we reported our participation in a share of Hiscox’s US property catastrophe portfolio.
This arrangement expired on the 31 December 2012 and remaining exposure will run off during 2013.
(g) Asset management risk
Asset Management risk arises through exposure to negative investment performance, fund liquidity, and factors that influence franchise value such as product development appropriateness and capability, and client retention. The Group’s exposure to asset management risk is informed through regular assessment of the investment management capabilities and proven track record of the investment funds.
Aviva is directly exposed to the risks associated with operating an asset management business through its ownership of Aviva Investors. The underlying risk profile of our asset management risk is derived from investment performance, specialist investment professionals and leadership, product development capabilities, fund liquidity, margin, client retention, regulatory developments, fiduciary and contractual responsibilities. Investment performance has remained strong over 2012 despite some positions being impacted by the volatility of global markets.
53 – Risk management continued
Action has been taken during the year to improve the operational infrastructure and enhance the quality of the customer experience including; progressing towards the implementation of the Blackrock Aladdin platform to support our investment process; review of our Business Development capability; and a continued drive to work closely with clients.
(h) Operational risk
Operational risk is the risk of direct or indirect loss, arising from inadequate or failed internal processes, people and systems, or external events including changes in the regulatory environment. We have limited appetite for operational risk and aim to reduce these risks as far as is commercially sensible.
Our business units are primarily responsible for identifying and managing operational risks within their businesses, within the group-wide operational risk framework including the risk and control self-assessment process. Businesses must be satisfied that all material risks falling outside our risk tolerances are being mitigated, monitored and reported to an appropriate level. Any risks with a high potential impact are monitored centrally on a regular basis. Businesses use key indicator data to help monitor the status of the risk and control environment. They also identify and capture loss events, taking appropriate action to address actual control breakdowns and promote internal learning.
(i) Brand and reputation risk
We are exposed to the risk that litigation, employee misconduct, operational failures, the outcome of regulatory investigations, media speculation and negative publicity, disclosure of confidential client information, inadequate services, whether or not founded, could impact our brands or reputation. Any of our brands or our reputation could also be affected if products or services recommended by us (or any of our intermediaries) do not perform as expected (whether or not the expectations are founded) or the customer’s expectations for the product change. We seek to reduce this risk to as low a level as commercially sensible.
The FSA regularly considers whether we are meeting the requirement to treat our customers fairly and we make use of various metrics to assess our own performance, including customer advocacy, retention and complaints. Failure to meet these requirements could also impact our brands or reputation.
If we do not manage the perception of our brands and reputation successfully, it could cause existing customers or agents to withdraw from our business and potential customers or agents to choose not to do business with us.
(j) Risk and capital management
(i) Sensitivity test analysis
The Group uses a number of sensitivity tests to understand the volatility of earnings, the volatility of its capital requirements, and to manage its capital more efficiently. Sensitivities to economic and operating experience are regularly produced on the Group’s key financial performance metrics to inform the Group’s decision making and planning processes, and as part of the framework for identifying and quantifying the risks to which each of its business units, and the Group as a whole, are exposed.
For long-term business in particular, sensitivities of market consistent performance indicators to changes in both economic and non-economic experience are continually used to manage the business and to inform the decision making process.
(ii) Life insurance and investment contracts
The nature of long-term business is such that a number of assumptions are made in compiling these financial statements. Assumptions are made about investment returns, expenses, mortality rates and persistency in connection with the in-force policies for each business unit. Assumptions are best estimates based on historic and expected experience of the business. A number of the key assumptions for the Group’s central scenario are disclosed elsewhere in these statements for both IFRS reporting and reporting under MCEV methodology.
(iii) General insurance and health business
General insurance and health claim liabilities are estimated by using standard actuarial claims projection techniques. These methods extrapolate the claims development for each accident year based on the observed development of earlier years. In most cases, no explicit assumptions are made as projections are based on assumptions implicit in the historic claims.
(iv) Sensitivity test results
Illustrative results of sensitivity testing for long-term business, general insurance and health business and the fund management and non-insurance business are set out below. For each sensitivity test the impact of a reasonably possible change in a single factor is shown, with other assumptions left unchanged.
53 – Risk management continued
| Sensitivity factor | Description of sensitivity factor applied |
| Interest rate and investment return | The impact of a change in market interest rates by a 1% increase or decrease. The test allows consistently for similar changes to investment returns and movements in the market value of backing fixed interest securities. |
| Credit spreads | The impact of a 0.5% increase in credit spreads over risk-free interest rates on corporate bonds and other non-sovereign credit assets. The test allows for any consequential impact on liability valuations |
| Equity/property market values | The impact of a change in equity/property market values by ± 10%. |
| Expenses | The impact of an increase in maintenance expenses by 10%. |
| Assurance mortality/morbidity (life insurance only) | The impact of an increase in mortality/morbidity rates for assurance contracts by 5%. |
| Annuitant mortality (life insurance only) | The impact of a reduction in mortality rates for annuity contracts by 5%. |
| Gross loss ratios (non-life insurance only) | The impact of an increase in gross loss ratios for general insurance and health business by 5%. |
Long-term business
Sensitivities as at 31 December 2012
2012
Impact on profit before tax
£m | Interest
rates
+1% | | Interest
rates
-1% | | Credit
spreads
+0.5% | | Equity/
property
+10% | | Equity/
property
-10% | | Expenses
+10% | | Assurance
mortality
+5% | | Annuitant
mortality
-5% | |
| Insurance Participating | | (45 | ) | | (15 | ) | | (110 | ) | | 60 | | | (95 | ) | | (25 | ) | | (5 | ) | | (50 | ) |
| Insurance non-participating | | (160 | ) | | 130 | | | (430 | ) | | – | | | – | | | (75 | ) | | (45 | ) | | (470 | ) |
| Investment participating | | (55 | ) | | 45 | | | – | | | 5 | | | (10 | ) | | (10 | ) | | – | | | – | |
| Investment non-participating | | (40 | ) | | 35 | | | (5 | ) | | 10 | | | (15 | ) | | (20 | ) | | – | | | – | |
| Assets backing life shareholders’ funds | | 10 | | | (15 | ) | | (40 | ) | | 45 | | | (45 | ) | | – | | | – | | | – | |
| Total excluding Delta Lloyd and United States | | (290 | ) | | 180 | | | (585 | ) | | 120 | | | (165 | ) | | (130 | ) | | (50 | ) | | (520 | ) |
| United States | | 880 | | | (640 | ) | | 495 | | | – | | | – | | | – | | | – | | | – | |
| Total excluding Delta Lloyd | | 590 | | | (460 | ) | | (90 | ) | | 120 | | | (165 | ) | | (130 | ) | | (50 | ) | | (520 | ) |
2012
Impact on shareholders' equity before tax
£m | Interest
rates
+1% | | Interest
rates
-1% | | Credit
spreads
+0.5% | | Equity/
property
+10% | | Equity/
property
-10% | | Expenses
+10% | | Assurance
mortality
+5% | | Annuitant
mortality
-5% | |
| Insurance Participating | | (45 | ) | | (15 | ) | | (110 | ) | | 60 | | | (95 | ) | | (25 | ) | | (5 | ) | | (50 | ) |
| Insurance non-participating | | (165 | ) | | 125 | | | (430 | ) | | – | | | – | | | (75 | ) | | (45 | ) | | (470 | ) |
| Investment participating | | (55 | ) | | 45 | | | – | | | 5 | | | (10 | ) | | (10 | ) | | – | | | – | |
| Investment non-participating | | (45 | ) | | 40 | | | – | | | 10 | | | (15 | ) | | (20 | ) | | – | | | – | |
| Assets backing life shareholders' funds | | (5 | ) | | – | | | (45 | ) | | 50 | | | (50 | ) | | – | | | – | | | – | |
| Total excluding Delta Lloyd and United States | | (315 | ) | | 195 | | | (585 | ) | | 125 | | | (170 | ) | | (130 | ) | | (50 | ) | | (520 | ) |
| United States | | – | | | – | | | – | | | – | | | – | | | – | | | – | | | – | |
| Total excluding Delta Lloyd | | (315 | ) | | 195 | | | (585 | ) | | 125 | | | (170 | ) | | (130 | ) | | (50 | ) | | (520 | ) |
Sensitivities as at 31 December 2011
2011
Impact on profit before tax
£m | Interest
rates
+1% | | Interest
rates
-1% | | Credit
spreads
+0.5% | | Equity/
property
+10% | | Equity/
property
-10% | | Expenses
+10% | | Assurance
mortality
+5% | | Annuitant
mortality
-5% | |
| Insurance Participating | | (45 | ) | | (155 | ) | | (20 | ) | | 5 | | | (95 | ) | | (45 | ) | | (10 | ) | | (50 | ) |
| Insurance non-participating | | (180 | ) | | 130 | | | (385 | ) | | 30 | | | (35 | ) | | (65 | ) | | (45 | ) | | (470 | ) |
| Investment participating | | (35 | ) | | 40 | | | (30 | ) | | 50 | | | (75 | ) | | (10 | ) | | – | | | – | |
| Investment non-participating | | (15 | ) | | 20 | | | (5 | ) | | 15 | | | (15 | ) | | (20 | ) | | – | | | – | |
| Assets backing life shareholders' funds | | 135 | | | (15 | ) | | (10 | ) | | 10 | | | (10 | ) | | – | | | – | | | – | |
| Total excluding Delta Lloyd and United States | | (140 | ) | | 20 | | | (450 | ) | | 110 | | | (230 | ) | | (140 | ) | | (55 | ) | | (520 | ) |
| United States | | 45 | | | (50 | ) | | 10 | | | 50 | | | (35 | ) | | (10 | ) | | (15 | ) | | – | |
| Total excluding Delta Lloyd | | (95 | ) | | (30 | ) | | (440 | ) | | 160 | | | (265 | ) | | (150 | ) | | (70 | ) | | (520 | ) |
2011
Impact on shareholders' equity before tax
£m | Interest
rates
+1% | | Interest
rates
-1% | | Credit
spreads
+0.5% | | Equity/
property
+10% | | Equity/
property
-10% | | Expenses
+10% | | Assurance
mortality
+5% | | Annuitant
mortality
-5% | |
| Insurance Participating | | (45 | ) | | (155 | ) | | (25 | ) | | 5 | | | (95 | ) | | (45 | ) | | (10 | ) | | (50 | ) |
| Insurance non-participating | | (180 | ) | | 130 | | | (385 | ) | | 30 | | | (35 | ) | | (65 | ) | | (45 | ) | | (470 | ) |
| Investment participating | | (35 | ) | | 40 | | | (30 | ) | | 50 | | | (75 | ) | | (10 | ) | | – | | | – | |
| Investment non-participating | | (15 | ) | | 20 | | | (5 | ) | | 15 | | | (15 | ) | | (20 | ) | | – | | | – | |
| Assets backing life shareholders' funds | | 125 | | | – | | | (15 | ) | | 15 | | | (15 | ) | | – | | | – | | | – | |
| Total excluding Delta Lloyd and United States | | (150 | ) | | 35 | | | (460 | ) | | 115 | | | (235 | ) | | (140 | ) | | (55 | ) | | (520 | ) |
| United States | | (540 | ) | | 455 | | | (350 | ) | | 50 | | | (35 | ) | | (10 | ) | | (15 | ) | | – | |
| Total excluding Delta Lloyd | | (690 | ) | | 490 | | | (810 | ) | | 165 | | | (270 | ) | | (150 | ) | | (70 | ) | | (520 | ) |
53 – Risk management continued
Changes in sensitivities between 2012 and 2011 reflect movements in market interest rates, portfolio growth, changes to asset mix and the relative durations of assets and liabilities and asset liability management actions.
The sensitivities to economic movements (excluding the United States) relate mainly to business in the UK. In general, a fall in market interest rates has a beneficial impact on non-participating business, due to the increase in market value of fixed interest securities and the relative durations of assets and liabilities; similarly a rise in interest rates has a negative impact. The mortality sensitivities also relate primarily to the UK.
In the United States, most debt securities are classified as AFS for which movements in unrealised gains or losses are taken directly to shareholders’ equity. This limited the overall sensitivity of IFRS profit to interest rate and credit spread movements. Following the classification of the business as held for sale in 2012 it was remeasured to fair value less costs to sell. It has been assumed that economic movements would not materially impact the fair value less costs to sell and the impact on shareholders’ equity is therefore reported as £nil. As a result, were economic movements to occur, the corresponding movements in AFS assets which would be taken directly to shareholders’ equity, are reversed out through profit before tax in order to maintain the remeasurement value of the US at fair value less costs to sell.
General insurance and health business
Sensitivities as at 31 December 2012
2012
Impact on profit before tax
£m | Interest
rates
+1% | | Interest
rates
-1% | | Credit
spreads
+0.5% | | Equity/
property
+10% | | Equity/
property
-10% | | Expenses
+10% | | Gross loss
ratios
+5% | |
| Gross of reinsurance excluding Delta Lloyd | | (260 | ) | | 235 | | | (125 | ) | | 45 | | | (50 | ) | | (120 | ) | | (300 | ) |
| | | | | | | | | | | | | | | | | | | | | | |
| Net of reinsurance excluding Delta Lloyd | | (300 | ) | | 285 | | | (125 | ) | | 45 | | | (50 | ) | | (120 | ) | | (285 | ) |
2012
Impact on shareholders' equity before tax
£m | Interest
rates
+1% | | Interest
rates
-1% | | Credit
spreads
+0.5% | | Equity/
property
+10% | | Equity/
property
-10% | | Expenses
+10% | | Gross loss
ratios
+5% | |
| Gross of reinsurance excluding Delta Lloyd | | (260 | ) | | 235 | | | (125 | ) | | 50 | | | (50 | ) | | (25 | ) | | (300 | ) |
| | | | | | | | | | | | | | | | | | | | | | |
| Net of reinsurance excluding Delta Lloyd | | (300 | ) | | 285 | | | (125 | ) | | 50 | | | (50 | ) | | (25 | ) | | (285 | ) |
Sensitivities as at 31 December 2011
2011
Impact on profit before tax
£m | Interest
rates
+1% | | Interest
rates
-1% | | Credit
spreads
+0.5% | | Equity/
property
+10% | | Equity/
property
-10% | | Expenses
+10% | | Gross loss
ratios
+5% | |
| Gross of reinsurance excluding Delta Lloyd | | (205 | ) | | 180 | | | (125 | ) | | 50 | | | (55 | ) | | (130 | ) | | (300 | ) |
| | | | | | | | | | | | | | | | | | | | | | |
| Net of reinsurance excluding Delta Lloyd | | (275 | ) | | 275 | | | (125 | ) | | 50 | | | (55 | ) | | (130 | ) | | (290 | ) |
2011
Impact on shareholders' equity before tax
£m | Interest
rates
+1% | | Interest
rates
-1% | | Credit
spreads
+0.5% | | Equity/
property
+10% | | Equity/
property
-10% | | Expenses
+10% | | Gross loss
ratios
+5% | |
| Gross of reinsurance excluding Delta Lloyd | | (205 | ) | | 180 | | | (125 | ) | | 50 | | | (55 | ) | | (30 | ) | | (300 | ) |
| | | | | | | | | | | | | | | | | | | | | | |
| Net of reinsurance excluding Delta Lloyd | | (275 | ) | | 275 | | | (125 | ) | | 50 | | | (55 | ) | | (30 | ) | | (290 | ) |
For general insurance, the impact of the expense sensitivity on profit also includes the increase in ongoing administration expenses, in addition to the increase in the claims handling expense provision.
Fund management and non-insurance business
Sensitivities as at 31 December 2012
2012
Impact on profit before tax
£m | Interest
rates
+1% | | Interest
rates
-1% | | Credit
spreads
+0.5% | | Equity/
property
+10% | | Equity/
property
-10% | |
| Total excluding Delta Lloyd | | (5 | ) | | – | | | 30 | | | (90 | ) | | 10 | |
2012
Impact on shareholders' equity before tax
£m | Interest
rates
+1% | | Interest
rates
-1% | | Credit
spreads
+0.5% | | Equity/
property
+10% | | Equity/
property
-10% | |
| Total excluding Delta Lloyd | | (5 | ) | | – | | | 30 | | | (90 | ) | | 10 | |
53 – Risk management continued
Sensitivities as at 31 December 2011
2011
Impact on profit before tax
£m | Interest
rates
+1% | | Interest
rates
-1% | | Credit
spreads
+0.5% | | Equity/
property
+10% | | Equity/
property
-10% | |
| Total excluding Delta Lloyd | | (10 | ) | | 10 | | | – | | | (40 | ) | | 75 | |
2011
Impact on shareholders' equity before tax
£m | Interest
rates
+1% | | Interest
rates
-1% | | Credit
spreads
+0.5% | | Equity/
property
+10% | | Equity/
property
-10% | |
| Total excluding Delta Lloyd | | (10 | ) | | 10 | | | – | | | (40 | ) | | 75 | |
Limitations of sensitivity analysis
The above tables demonstrate the effect of a change in a key assumption while other assumptions remain unchanged. In reality, there is a correlation between the assumptions and other factors. It should also be noted that these sensitivities are non-linear, and larger or smaller impacts should not be interpolated or extrapolated from these results.
The sensitivity analyses do not take into consideration that the Group’s assets and liabilities are actively managed. Additionally, the financial position of the Group may vary at the time that any actual market movement occurs. For example, the Group’s financial risk management strategy aims to manage the exposure to market fluctuations.
As investment markets move past various trigger levels, management actions could include selling investments, changing investment portfolio allocation, adjusting bonuses credited to policyholders, and taking other protective action.
A number of the business units use passive assumptions to calculate their long-term business liabilities. Consequently, a change in the underlying assumptions may not have any impact on the liabilities, whereas assets held at market value in the statement of financial position will be affected. In these circumstances, the different measurement bases for liabilities and assets may lead to volatility in shareholder equity. Similarly, for general insurance liabilities, the interest rate sensitivities only affect profit and equity where explicit assumptions are made regarding interest (discount) rates or future inflation.
Other limitations in the above sensitivity analyses include the use of hypothetical market movements to demonstrate potential risk that only represent the Group’s view of possible near-term market changes that cannot be predicted with any certainty, and the assumption that all interest rates move in an identical fashion.
54 – Derivative financial instruments and hedging
This note gives details of the various instruments we use to mitigate risk.
The Group uses a variety of derivative financial instruments, including both exchange traded and over-the-counter instruments, in line with our overall risk management strategy. The objectives include managing exposure to price, foreign currency and / or interest rate risk on existing assets or liabilities, as well as planned or anticipated investment purchases.
In the narrative and tables below, figures are given for both the notional amounts and fair values of these instruments. The notional amounts reflect the aggregate of individual derivative positions on a gross basis and so give an indication of the overall scale of the derivative transaction. They do not reflect current market values of the open positions. The fair values represent the gross carrying values at the year end for each class of derivative contract held (or issued) by the Group.
The fair values do not provide an indication of credit risk, as many over-the-counter transactions are contracted and documented under ISDA (International Swaps and Derivatives Association, Inc.) master agreements or their equivalent. Such agreements are designed to provide a legally enforceable set-off in the event of default, which reduces credit exposure. In addition, the Group has collateral agreements in place between the individual Group entities and relevant counterparties.
(a) Instruments qualifying for hedge accounting
The Group has formally assessed and documented the effectiveness of its instruments qualifying for hedge accounting in accordance with IAS 39,Financial Instruments: Recognition and Measurement. To aid discussion and analysis, these instruments are analysed into cash flow, fair value and net investment hedges, as detailed below.
(i) Cash flow hedges
At the end of 2012 the Group entered into two cash flow hedges, using foreign exchange forward and option contracts, to hedge the currency exposure on expected proceeds in 2013 of businesses held for sale as at 31 December 2012. The fair value of the cash flow hedges as of 31 December 2012 was a £5 million derivative asset. No amounts in respect of the cash flow hedges have been recognised in the income statement for the year. All cash flows being hedged upon transaction completion are expected to occur and movements in the fair value will be recycled to the income statement in 2013. These hedges were fully effective in the year.
(ii) Fair value hedges
The Group entered into a number of interest rate swaps in order to hedge fluctuations in the fair value part of its portfolio of mortgage loans and debt securities in the US. The notional value of these swaps was £765 million at 31 December 2012(2011: £844 million) and their fair value was £54 million liability(2011: £77 million liability). During 2012, there were hedging relationships that became ineffective. The amount of ineffectiveness included in the income statement as a result was £14 million. The related hedges were re-designated and are expected to be effective in future periods.
(iii) Net investment hedges
To reduce its exposure to foreign currency risk, the Group has entered into the following net investment hedges:
The Group has designated a portion of its euro and US dollar denominated debt as a hedge of the net investment in its European and American subsidiaries. The carrying value of the debt at 31 December 2012 was £1,741 million(2011: £1,815 million) and its fair value at that date was £1,785 million(2011: £1,694million).
The foreign exchange gain of £74 million(2011: gain of £30 million) on translation of the debt to sterling at the statement of financial position date has been recognised in the hedging instruments reserve in shareholders’ equity. This hedge was fully effective throughout the current and prior years.
54 – Derivative financial instruments and hedging continued
(b) Derivatives not qualifying for hedge accounting
Certain derivatives either do not qualify for hedge accounting under IAS 39 or the option to hedge account has not been taken. These are referred to below as non-hedge derivatives.
(i) The Group’s non-hedge derivative activity at 31 December 2012 and 2011 was as follows:
| | | | | | 2012 | | | | | | Restated
2011 | |
| | Contract/
notional
amount
£m | | Fair value
asset
£m | | Fair value
liability
£m | | Contract/
notional
amount
£m | | Fair value
asset
£m | | Fair value
liability
£m | |
| Foreign exchange contracts | | | | | | | | | | | | | | | | | | |
| OTC | | | | | | | | | | | | | | | | | | |
| Forwards | | 8,123 | | | 71 | | | (7 | ) | | 6,727 | | | 41 | | | (38 | ) |
| Interest rate and currency swaps | | 611 | | | 64 | | | (21 | ) | | 502 | | | 83 | | | (3 | ) |
| Options | | 4,600 | | | 6 | | | (5 | ) | | 4,600 | | | 33 | | | (9 | ) |
| Total | | 13,334 | | | 141 | | | (33 | ) | | 11,829 | | | 157 | | | (50 | ) |
| Interest rate contracts | | | | | | | | | | | | | | | | | | |
| OTC | | | | | | | | | | | | | | | | | | |
| Swaps | | 25,889 | | | 135 | | | (925 | ) | | 13,931 | | | 247 | | | (986 | ) |
| Options | | 32,656 | | | 272 | | | (4 | ) | | 2,604 | | | 208 | | | (2 | ) |
| Exchange traded | | | | | | | | | | | | | | | | | | |
| Futures | | 3,725 | | | 58 | | | (14 | ) | | 2,794 | | | 46 | | | (25 | ) |
| Total | | 62,270 | | | 465 | | | (943 | ) | | 19,329 | | | 501 | | | (1,013 | ) |
| Equity/Index contracts | | | | | | | | | | | | | | | | | | |
| OTC | | | | | | | | | | | | | | | | | | |
| Options | | 2,765 | | | 650 | | | (10 | ) | | 2,864 | | | 531 | | | (5 | ) |
| Exchange traded | | | | | | | | | | | | | | | | | | |
| Futures | | 5,468 | | | 45 | | | (123 | ) | | 3,805 | | | 52 | | | (452 | ) |
| Options | | 11,880 | | | 228 | | | (139 | ) | | 7,405 | | | 242 | | | (161 | ) |
| Total | | 20,113 | | | 923 | | | (272 | ) | | 14,074 | | | 825 | | | (618 | ) |
| Credit contracts | | 6,277 | | | 41 | | | (53 | ) | | 5,478 | | | 2 | | | (17 | ) |
| Other | | 3,163 | | | 15 | | | (406 | ) | | 3,309 | | | 13 | | | (75 | ) |
| Totals at 31 December | | 105,157 | | | 1,585 | | | (1,707 | ) | | 54,019 | | | 1,498 | | | (1,773 | ) |
| Less: Amounts classified as held for sale | | (4,403 | ) | | (679 | ) | | 54 | | | – | | | – | | | – | |
| | | 100,754 | | | 906 | | | (1,653 | ) | | 54,019 | | | 1,498 | | | (1,773 | ) |
The 2011 figures have been restated in respect of the notional values of the exchange traded equity option contracts. £5,478 million notional of credit derivatives (and their related fair values) have been reclassified out of the ‘other’ and ‘interest rate swap’ categories to the ‘credit’ contracts category. Additionally £3,156 million notional of inflation linked swaps have been reclassified out of the ‘interest rate swap’ category to the ‘other’ category.
Fair value assets are recognised as ‘Derivative financial instruments’ in note 22(a), while fair value liabilities are recognised as ‘Derivative liabilities’ in note 46. Fair value assets in note 22(a) of £1,590 million represent non-hedge derivative assets of £1,585 million per the table above plus £5 million of cash flow hedges. Fair value liabilities in note 46 of £1,761 million represent non-hedge derivative liabilities of £1,707 million per the table above plus £54 million of fair value hedges.
The Group’s derivative risk management policies are outlined in note 53.
(ii) The contractual undiscounted cash flows in relation to non-hedge derivative liabilities have the following maturities:
| | 2012
£m | | 2011
£m | |
| Within 1 year | | 534 | | | 226 | |
| Between 1 and 2 years | | 434 | | | 144 | |
| Between 2 and 3 years | | 158 | | | 135 | |
| Between 3 and 4 years | | 387 | | | 123 | |
| Between 4 and 5 years | | 113 | | | 355 | |
| After 5 years | | 1,787 | | | 1,911 | |
| | | 3,413 | | | 2,894 | |
(c) Collateral
Certain derivative contracts, primarily interest rate and currency swaps, involve the receipt or pledging of cash and non-cash collateral. The amounts of cash collateral receivable or repayable are included in notes 23 and 46 respectively.
55 – Assets under management
In addition to the assets included in the consolidated statement of financial position, the Group manages funds for third parties. This note details the total assets under management.
| | 2012
£m | | 2011
£m | |
| Total IFRS assets included in the consolidated statement of financial position | | 315,689 | | | 312,376 | |
| Less: Third-party funds included within consolidated IFRS assets | | (13,525 | ) | | (11,814 | ) |
| | | 302,164 | | | 300,562 | |
| Third-party funds under management | | 73,114 | | | 67,557 | |
| | | 375,278 | | | 368,119 | |
| Non-managed assets | | (26,137 | ) | | (31,558 | ) |
| Funds under management | | 349,141 | | | 336,561 | |
| Discontinued operations | | (38,148 | ) | | (37,110 | ) |
| Funds under management (excluding discontinued operations) | | 310,993 | | | 299,451 | |
| Managed by: | | | | | | |
| Aviva Investors | | 274,484 | | | 262,506 | |
| Other Aviva and external managers | | 74,657 | | | 74,055 | |
| | | 349,141 | | | 336,561 | |
56 – Related party transactions
This note gives details of the transactions between Group companies and related parties which comprise our joint ventures, associates and staff pension schemes.
The Group undertakes transactions with related parties in the normal course of business. Loans to related parties are made on normal arm’s-length commercial terms.
Services provided to, and by related parties
| | | | | | | | 2012 | | | | | | | | 2011 | | | | | | | | 2010 | |
| | Income
earned
in period
£m | | Expenses
incurred
in period
£m | | Payable
at period
end
£m | | Receivable
at period
end
£m | | Income
earned
in period
£m | | Expenses
incurred
in period
£m | | Payable
at period
end
£m | | Receivable
at period
end
£m | | Income
earned
in period
£m | | Expenses
incurred
in period
£m | | Payable
at period
end
£m | | Receivable
at period
end
£m | |
| Associates | | – | | | (4 | ) | | – | | | – | | | – | | | (3 | ) | | (49 | ) | | – | | | 47 | | | – | | | – | | | – | |
| Joint ventures | | 23 | | | (1 | ) | | – | | | 103 | | | 23 | | | – | | | – | | | 125 | | | 18 | | | – | | | – | | | 375 | |
| Employee pension schemes | | 12 | | | – | | | – | | | 6 | | | 13 | | | – | | | – | | | 9 | | | 10 | | | – | | | – | | | 2 | |
| | | 35 | | | (5 | ) | | – | | | 109 | | | 36 | | | (3 | ) | | (49 | ) | | 134 | | | 75 | | | – | | | – | | | 377 | |
Transactions with joint ventures in the UK relate to the property management undertakings, the most material of which are listed in note 15(b). Our interest in these joint ventures comprises a mix of equity and loans, together with the provision of administration services and financial management to many of them. Our UK life insurance companies earn interest on loans advanced to these entities, movements in which may be found in note 15(a).
Our fund management companies also charge fees to these joint ventures for administration services and for arranging external finance.
Our UK fund management companies manage most of the assets held by the Group’s main UK staff pension scheme, for which they charge fees based on the level of funds under management. The main UK scheme holds investments in Group-managed funds and insurance policies with other Group companies, as explained in note 44(e)(iii).
The related parties’ receivables are not secured and no guarantees were received in respect thereof. The receivables will be settled in accordance with normal credit terms. Details of guarantees, indemnities and warranties provided on behalf of related parties are given in note 48(g).
Key management compensation
The total compensation to those employees classified as key management, being those having authority and responsibility for planning, directing and controlling the activities of the Group, including the executive and non-executive directors is as follows:
| | 2012
£m | | 2011
£m | | 2010
£m | |
| Salary and other short-term benefits1 | | 4.7 | | | 6.7 | | | 8.1 | |
| Other long-term benefits | | 0.4 | | | 2.8 | | | 2.5 | |
| Post-employment benefits1 | | 1.9 | | | 1.7 | | | 1.6 | |
| Equity compensation plans1 | | 4.8 | | | 5.9 | | | 6.4 | |
| Termination benefits1 | | 1.5 | | | 0.7 | | | – | |
| Total | | 13.3 | | | 17.8 | | | 18.6 | |
| 1 | Following a review of the composition of key management in the current year, comparative amounts have been restated from the amounts previously reported. The total key management compensation reported in 2011 was £65 million and in 2010 was £66 million. |
Information concerning individual directors’ emoluments, interests and transactions is given in the Directors’ Remuneration Report.
Financial statements of the Company
Income statement
For the years ended 31 December 2012, 2011 and 2010:
| | 2012
£m | | 2011
£m | | 2010
£m | |
| Income | | | | | | | | | |
| Dividends received from subsidiaries | | 1,585 | | | 1,068 | | | 1,110 | |
| Interest receivable from Group companies | | 107 | | | 143 | | | 150 | |
| Net investment expense | | 28 | | | (8 | ) | | (14 | ) |
| | | 1,720 | | | 1,203 | | | 1,246 | |
| Expenses | | | | | | | | | |
| Operating expenses | | (333 | ) | | (184 | ) | | (176 | ) |
| Interest payable to Group companies | | (402 | ) | | (460 | ) | | (458 | ) |
| Interest payable on borrowings | | (347 | ) | | (353 | ) | | (340 | ) |
| Impairment of subsidiaries | | (254 | ) | | – | | | – | |
| | | (1,336 | ) | | (997 | ) | | (974 | ) |
| Profit before tax | | 384 | | | 206 | | | 272 | |
| Tax credit | | 232 | | | 25 | | | 228 | |
| Profit after tax | | 616 | | | 231 | | | 500 | |
Statement of comprehensive income
For the years ended 31 December 2012, 2011 and 2010:
| | 2012
£m | | Restated 2011 £m | | Restated 2010 £m | |
| Profit for the year | | 616 | | | 231 | | | 500 | |
| Other comprehensive income | | | | | | | | | |
| Fair value (losses)/gains on investments in subsidiaries and joint ventures | | 2,126 | | | (2,389 | ) | | 150 | |
| Impairment losses on assets previously revalued through other comprehensive income now taken to income statement | | 254 | | | – | | | – | |
| Actuarial gains on pension provision | | – | | | 1 | | | 1 | |
| Other comprehensive income, net of tax | | 2,380 | | | (2,388 | ) | | 151 | |
| Total comprehensive income for the year | | 2,996 | | | (2,157 | ) | | 651 | |
Where applicable, the accounting policies of the Company are the same as those of the Group on pages 108 to 119. The notes identified alphabetically on pages 234 to 237 are an integral part of these separate financial statements. Where the same items appear in the Group financial statements, reference is made to the notes (identified numerically) on pages 127 to 229.
Statement of changes in equity
For the year ended 31 December 2012
| | Note | Ordinary share
capital
£m | | Preference share
capital
£m | | Share premium
£m | | Merger reserve
£m | | Investment valuation reserve
£m | | Equity compen-
sation
reserve
£m | | Retained earnings
£m | | Equity
£m | | DCI and fixed rate tier 1 notes
£m | | Total
equity
£m | |
| Balance at 1 January Restated | | | 726 | | | 200 | | | 1,173 | | | 735 | | | 4,414 | | | 86 | | | 3,116 | | | 10,450 | | | 990 | | | 11,440 | |
| Profit for the year | | | – | | | – | | | – | | | – | | | – | | | – | | | 616 | | | 616 | | | – | | | 616 | |
| Other comprehensive income | | | – | | | – | | | – | | | – | | | 2,380 | | | – | | | – | | | 2,380 | | | – | | | 2,380 | |
| Total comprehensive income for the year | | | – | | | – | | | – | | | – | | | 2,380 | | | – | | | 616 | | | 2,996 | | | – | | | 2,996 | |
| Dividends and appropriations | 12 | | – | | | – | | | – | | | – | | | – | | | – | | | (847 | ) | | (847 | ) | | – | | | (847 | ) |
| Shares issued in lieu of dividends | 26 & 33 | | 9 | | | – | | | (9 | ) | | – | | | – | | | – | | | 127 | | | 127 | | | – | | | 127 | |
| Employee trust shares distributed in the year | 28 | | – | | | – | | | – | | | – | | | – | | | – | | | (44 | ) | | (44 | ) | | – | | | (44 | ) |
| Reserves credit for equity compensation plans | | | – | | | – | | | – | | | – | | | – | | | 42 | | | – | | | 42 | | | – | | | 42 | |
| Shares issued under equity compensation plans | | | 1 | | | – | | | 1 | | | – | | | – | | | (68 | ) | | 74 | | | 8 | | | – | | | 8 | |
| Issue of fixed rate tier 1 notes | | | – | | | – | | | – | | | – | | | – | | | – | | | – | | | – | | | 392 | | | 392 | |
| Aggregate tax effect | | | – | | | – | | | – | | | – | | | – | | | – | | | 18 | | | 18 | | | – | | | 18 | |
| Balance at 31 December | | | 736 | | | 200 | | | 1,165 | | | 735 | | | 6,794 | | | 60 | | | 3,060 | | | 12,750 | | | 1,382 | | | 14,132 | |
For the year ended 31 December 2011
| | Note | Ordinary share
capital
£m | | Preference share
capital
£m | | Share premium
£m | | Merger reserve
£m | | Investment valuation reserve
£m | | Equity
compen-
sation
reserve
£m | | Retained earnings
£m | | Equity
£m | | Direct
capital instrument
£m | | Total
equity
£m | |
| Balance at 1 January Restated | | | 705 | | | 200 | | | 1,194 | | | 735 | | | 6,803 | | | 99 | | | 3,331 | | | 13,067 | | | 990 | | | 14,057 | |
| Profit for the year | | | – | | | – | | | – | | | – | | | – | | | – | | | 231 | | | 231 | | | – | | | 231 | |
| Other comprehensive income | | | – | | | – | | | – | | | – | | | (2,389 | ) | | – | | | 1 | | | (2,388 | ) | | – | | | (2,388 | ) |
| Total comprehensive income for the year | | | – | | | – | | | – | | | – | | | (2,389 | ) | | – | | | 232 | | | (2,157 | ) | | – | | | (2,157 | ) |
| Dividends and appropriations | 12 | | – | | | – | | | – | | | – | | | – | | | – | | | (813 | ) | | (813 | ) | | – | | | (813 | ) |
| Shares issued in lieu of dividends | 26 & 33 | | 21 | | | – | | | (21 | ) | | – | | | – | | | – | | | 307 | | | 307 | | | – | | | 307 | |
| Employee trust shares distributed in the year | 28 | | – | | | – | | | – | | | – | | | – | | | – | | | (18 | ) | | (18 | ) | | – | | | (18 | ) |
| Reserves credit for equity compensation plans | | | – | | | – | | | – | | | – | | | – | | | 48 | | | – | | | 48 | | | – | | | 48 | |
| Shares issued under equity compensation plans | | | – | | | – | | | – | | | – | | | – | | | (61 | ) | | 61 | | | – | | | – | | | – | |
| Aggregate tax effect | | | – | | | – | | | – | | | – | | | – | | | – | | | 16 | | | 16 | | | – | | | 16 | |
| Balance at 31 December Restated | | | 726 | | | 200 | | | 1,173 | | | 735 | | | 4,414 | | | 86 | | | 3,116 | | | 10,450 | | | 990 | | | 11,440 | |
For the year ended 31 December 2010
| | Note | Ordinary share
capital
£m | | Preference share
capital
£m | | Share premium
£m | | Merger reserve
£m | | Investment valuation reserve
£m | | Equity
compen-
sation
reserve
£m | | Retained earnings
£m | | Equity
£m | | Direct
capital instrument
£m | | Total
equity
£m | |
| Balance at 1 January Restated | | | 692 | | | 200 | | | 1,207 | | | 735 | | | 6,653 | | | 109 | | | 3,360 | | | 12,956 | | | 990 | | | 13,946 | |
| Profit for the year | | | – | | | – | | | – | | | – | | | – | | | – | | | 500 | | | 500 | | | – | | | 500 | |
| Other comprehensive income | | | – | | | – | | | – | | | – | | | 150 | | | – | | | 1 | | | 151 | | | – | | | 151 | |
| Total comprehensive income for the year | | | – | | | – | | | – | | | – | | | 150 | | | – | | | 501 | | | 651 | | | – | | | 651 | |
| Dividends and appropriations | 12 | | – | | | – | | | – | | | – | | | – | | | – | | | (757 | ) | | (757 | ) | | – | | | (757 | ) |
| Shares issued in lieu of dividends | 26 & 33 | | 13 | | | – | | | (13 | ) | | – | | | – | | | – | | | 209 | | | 209 | | | – | | | 209 | |
| Employee trust shares distributed in the year | 28 | | – | | | – | | | – | | | – | | | – | | | – | | | (50 | ) | | (50 | ) | | – | | | (50 | ) |
| Reserves credit for equity compensation plans | | | – | | | – | | | – | | | – | | | – | | | 41 | | | – | | | 41 | | | – | | | 41 | |
| Shares issued under equity compensation plans | | | – | | | – | | | – | | | – | | | – | | | (51 | ) | | 51 | | | – | | | – | | | – | |
| Aggregate tax effect | | | – | | | – | | | – | | | – | | | – | | | – | | | 17 | | | 17 | | | – | | | 17 | |
| Balance at 31 December Restated | | | 705 | | | 200 | | | 1,194 | | | 735 | | | 6,803 | | | 99 | | | 3,331 | | | 13,067 | | | 990 | | | 14,057 | |
Where applicable, the accounting policies of the Company are the same as those of the Group on pages 108 to 119. The notes identified alphabetically on pages 234 to 237 are an integral part of these separate financial statements. Where the same items appear in the Group financial statements, reference is made to the notes (identified numerically) on pages 127 to 229.
Statement of financial position
At 31 December 2012 and 2011 and 2010
| | Note | 2012
£m | | Restated
2011
£m | | Restated
2010
£m | |
| Assets | | | | | | | | | | |
| Non-current assets | | | | | | | | | | |
| Investments in subsidiaries | B | | 31,023 | | | 28,889 | | | 31,284 | |
| Investment in joint venture | 15c | | 141 | | | 150 | | | 115 | |
| Loans owed by subsidiaries | H | | 1,054 | | | 2,375 | | | 2,411 | |
| Deferred tax assets | C | | 180 | | | – | | | – | |
| Current tax assets | C | | 50 | | | 261 | | | 388 | |
| | | | 32,448 | | | 31,675 | | | 34,198 | |
| Current assets | | | | | | | | | | |
| Loans owed by subsidiaries | H | | 1,240 | | | – | | | 691 | |
| Other amounts owed by subsidiaries | H | | 3,019 | | | 2,280 | | | 2,334 | |
| Other assets | | | 49 | | | 61 | | | 74 | |
| Cash and cash equivalents | | | 152 | | | 17 | | | 1 | |
| Total assets | | | 36,908 | | | 34,033 | | | 37,298 | |
| Equity | | | | | | | | | | |
| Ordinary share capital | 26 | | 736 | | | 726 | | | 705 | |
| Preference share capital | 29 | | 200 | | | 200 | | | 200 | |
| Called up capital | | | 936 | | | 926 | | | 905 | |
| Share premium account | 26b | | 1,165 | | | 1,173 | | | 1,194 | |
| Merger reserve | D | | 735 | | | 735 | | | 735 | |
| Investment valuation reserve | D | | 6,794 | | | 4,414 | | | 6,803 | |
| Equity compensation reserve | D | | 60 | | | 86 | | | 99 | |
| Retained earnings | D | | 3,060 | | | 3,116 | | | 3,331 | |
| Direct capital instruments and fixed rate tier 1 notes | 30 | | 1,382 | | | 990 | | | 990 | |
| Total equity | | | 14,132 | | | 11,440 | | | 14,057 | |
| Liabilities | | | | | | | | | | |
| Non-current liabilities | | | | | | | | | | |
| Borrowings | E | | 4,536 | | | 4,781 | | | 4,805 | |
| Loans owed to subsidiaries | H | | 13,153 | | | 13,306 | | | 14,067 | |
| Provisions | | | 36 | | | 35 | | | 46 | |
| | | | 17,725 | | | 18,122 | | | 18,918 | |
| Current liabilities | | | | | | | | | | |
| Borrowings | E | | 603 | | | 506 | | | 504 | |
| Loans owed to subsidiaries | H | | 794 | | | 502 | | | 514 | |
| Other amounts owed to subsidiaries | H | | 3,569 | | | 3,366 | | | 3,184 | |
| Other creditors | | | 85 | | | 97 | | | 121 | |
| Total liabilities | | | 22,776 | | | 22,593 | | | 23,241 | |
| Total equity and liabilities | | | 36,908 | | | 34,033 | | | 37,298 | |
Approved by the Board on 22 March 2013.
Patrick Regan
Chief Financial Officer
Company number: 2468686
Where applicable, the accounting policies of the Company are the same as those of the Group on pages 108 to 119. The notes identified alphabetically on pages 234 to 237 are an integral part of these separate financial statements. Where the same items appear in the Group financial statements, reference is made to the notes (identified numerically) on pages 127 to 229.
Statement of cash flows
For the years ended 31 December 2012, 2011 and 2010
All the Company’s operating and investing cash requirements are met by subsidiary companies and settled through intercompany loan accounts. As the direct method of presentation has been adopted for these activities, no further disclosure is required. In respect of financing activities, the following items pass through the Company’s own bank accounts.
| | 2012
£m | | 2011
£m | | 2010
£m | |
| Cash flows from financing activities | | | | | | |
| Funding provided by subsidiaries | | 868 | | | 847 | | | 866 | |
| New borrowings, net of expenses | | 2,200 | | | 3,319 | | | 2,251 | |
| Repayment of borrowings | | (2,295 | ) | | (3,326 | ) | | (2,272 | ) |
| Net repayment of borrowings | | (95 | ) | | (7 | ) | | (21 | ) |
| Proceeds from issue of fixed rate tier 1 notes, net of expenses | | 392 | | | – | | | – | |
| Preference dividends paid | | (17 | ) | | (17 | ) | | (17 | ) |
| Ordinary dividends paid | | (630 | ) | | (431 | ) | | (472 | ) |
| Interest paid on borrowings | | (383 | ) | | (376 | ) | | (359 | ) |
| Net cash from financing activities | | 135 | | | 16 | | | (3 | ) |
| Net increase in cash and cash equivalents | | 135 | | | 16 | | | (3 | ) |
| Cash and cash equivalents at 1 January | | 17 | | | 1 | | | 4 | |
| Cash and cash equivalents at 31 December | | 152 | | | 17 | | | 1 | |
Where applicable, the accounting policies of the Company are the same as those of the Group on pages 108 to 119. The notes identified alphabetically on pages 234 to 237 are an integral part of these separate financial statements. Where the same items appear in the Group financial statements, reference is made to the notes (identified numerically) on pages 127 to 229.
Notes to the Company’s
financial statements
A – Presentation changes
During 2012, the Company reviewed the presentation of its investment in its subsidiary General Accident plc (‘GA’) which was previously shown net of an intercompany liability in the statement of financial position and determined that the investment should be presented gross of the intercompany liability. The result of this has been to increase the value of investments in subsidiaries at 31 December 2011 by £13,659 million, intercompany loan liabilities by £13,919 million, and the investment valuation reserve by £260 million. The value of investments in subsidiaries at 31 December 2010 has been restated by £13,661 million, intercompany loan liabilities by £13,919 million, and the investment valuation reserve by £258 million.
B – Investments in subsidiaries
(i) Movements in the Company’s investments in its subsidiaries are as follows:
| | 2012
£m | | Restated
2011
£m | | Restated
2010
£m | |
| Fair value as at 1 January | | 28,889 | | | 31,284 | | | 30,897 | |
| Movement in fair value | | 2,134 | | | (2,395 | ) | | 387 | |
| At 31 December | | 31,023 | | | 28,889 | | | 31,284 | |
Fair values are estimated using applicable valuation models underpinned by the Company’s market capitalisation, and are classified as Level 2 in the fair value hierarchy described in note 19 to the Group consolidated financial statements.
(ii) At 31 December 2012, the Company has two wholly owned subsidiaries, both incorporated in the UK. These are General Accident plc and Aviva Group Holdings Limited. Aviva Group Holdings Limited is an intermediate holding company, whilst General Accident plc no longer carries out this function. The principal subsidiaries of the Aviva Group at 31 December 2012 are listed on pages 25 and 26.
C – Tax
(i) Tax credited to equity
Tax credited to equity comprises £18 million(2011: £16 million; 2010: £17 million) in respect of coupon payments on the direct capital instruments and fixed rate tier 1 notes.
(ii) Deferred tax
The UK corporation tax rate reduced to 24% from 1 April 2012. A subsequent reduction in the UK corporation tax rate to 23% was substantively enacted on 3 July 2012 and will apply from 1 April 2013. The substantively enacted rate of 23% has been used in the calculation of the company’s deferred tax assets.
As confirmed in the 2013 Budget, the rate is expected to reduce to 21% from 1 April 2014 and to 20% from 1 April 2015. The aggregate impact of the reduction in the rate from 23% to 20% would reduce the deferred tax asset from £180 million to £156 million.
The company has gross unrecognised tax losses of £nil (2011:£296 million) and other temporary differences of £50 million (2011: £245 million).
(iii) Current tax assets
Amounts due in respect of current tax assets are expected to be recovered in more than 12 months.
D – Reserves
| | Merger
reserve
£m | | Investment valuation
reserve
£m | | Equity
compen-
sation
reserve
£m | | Retained
earnings
£m | |
| Balance at 1 January 2010 Restated | | 735 | | | 6,653 | | | 109 | | | 3,360 | |
| Arising in the year: | | | | | | | | | | | | |
| Profit for the year | | – | | | – | | | – | | | 500 | |
| Fair value losses on investments in subsidiaries and joint ventures | | – | | | 150 | | | – | | | – | |
| Actuarial gains on pension provisions | | – | | | – | | | – | | | 1 | |
| Dividends and appropriations | | – | | | – | | | – | | | (757 | ) |
| Reserves credit for equity compensation plans | | – | | | – | | | 41 | | | – | |
| Shares issued in lieu of dividends | | – | | | – | | | – | | | 209 | |
| Trust shares distributed in the year | | – | | | – | | | – | | | (50 | ) |
| Issue of share capital under equity compensation scheme | | – | | | – | | | (51 | ) | | 51 | |
| Aggregate tax effect | | – | | | – | | | – | | | 17 | |
| Balance at 1 January 2011 Restated | | 735 | | | 6,803 | | | 99 | | | 3,331 | |
| Arising in the year: | | | | | | | | | | | | |
| Profit for the year | | – | | | – | | | – | | | 231 | |
| Fair value losses on investments in subsidiaries and joint ventures | | – | | | (2,389 | ) | | – | | | – | |
| Actuarial gains on pension provisions | | – | | | – | | | – | | | 1 | |
| Dividends and appropriations | | – | | | – | | | – | | | (813 | ) |
| Reserves credit for equity compensation plans | | – | | | – | | | 48 | | | – | |
| Shares issued in lieu of dividends | | – | | | – | | | – | | | 307 | |
| Trust shares distributed in the year | | – | | | – | | | – | | | (18 | ) |
| Issue of share capital under equity compensation scheme | | – | | | – | | | (61 | ) | | 61 | |
| Aggregate tax effect | | – | | | – | | | – | | | 16 | |
| Balance at 31 December 2011 Restated | | 735 | | | 4,414 | | | 86 | | | 3,116 | |
| Arising in the year: | | | | | | | | | | | | |
| Profit for the year | | – | | | – | | | – | | | 616 | |
| Fair value gains on investments in subsidiaries and joint ventures | | – | | | 2,126 | | | – | | | – | |
| Impairment losses on assets previously revalued through other comprehensive income now taken to the income statement | | – | | | 254 | | | – | | | – | |
| Dividends and appropriations | | – | | | – | | | – | | | (847 | ) |
| Reserves credit for equity compensation plans | | – | | | – | | | 42 | | | – | |
| Shares issued in lieu of dividends | | – | | | – | | | – | | | 127 | |
| Trust shares distributed in the year | | – | | | – | | | – | | | (44 | ) |
| Issue of share capital under equity compensation scheme | | – | | | – | | | (68 | ) | | 74 | |
| Aggregate tax effect | | – | | | – | | | – | | | 18 | |
| Balance at 31 December 2012 | | 735 | | | 6,794 | | | 60 | | | 3,060 | |
Tax of £18 million(2011: £16 million; 2010: £17 million) is deductible in respect of coupon payments of £73 million(2011: £58 million; 2010: £61 million) on the direct capital instruments and fixed rate tier 1 notes.
E – Borrowings
The Company’s borrowings comprise:
| | 2012
£m | | 2011
£m | |
| Subordinated debt | | 4,337 | | | 4,582 | |
| 9.5% guaranteed bonds 2016 | | 199 | | | 199 | |
| Commercial paper | | 603 | | | 506 | |
| Total | | 5,139 | | | 5,287 | |
Maturity analysis of contractual undiscounted cash flows:
| | | | | | 2012 | | | | | | 2011 | |
| | Principal
£m | | Interest
£m | | Total
£m | | Principal
£m | | Interest
£m | | Total
£m | |
| Within 1 year | | 603 | | | 307 | | | 910 | | | 506 | | | 314 | | | 820 | |
| 1 to 5 years | | 200 | | | 1,197 | | | 1,397 | | | 200 | | | 1,244 | | | 1,444 | |
| 5 to 10 years | | 241 | | | 1,342 | | | 1,583 | | | 435 | | | 1,404 | | | 1,839 | |
| 10 to 15 years | | 527 | | | 1,192 | | | 1,719 | | | 543 | | | 1,240 | | | 1,783 | |
| Over 15 years | | 3,608 | | | 2,610 | | | 6,218 | | | 3,643 | | | 2,859 | | | 6,502 | |
| Total contractual undiscounted cash flows | | 5,179 | | | 6,648 | | | 11,827 | | | 5,327 | | | 7,061 | | | 12,388 | |
Where subordinated debt is undated, the interest payments have not been included beyond 15 years. Annual interest payments for these borrowings are £72 million(2011: £73 million).
The fair value of the subordinated debt at 31 December 2012 was £4,435 million(2011:£3,814million). The fair value of the 9.5% guaranteed bonds 2016 at 31 December 2012 was £246 million(2011: £246 million). The fair value of the commercial paper is considered to be the same as its carrying value.
Further details of these borrowings and undrawn committed facilities can be found in the Group consolidated financial statements, note 45.
F – Contingent liabilities
Details of the Company’s contingent liabilities are given in the Group consolidated financial statements, note 48(g).
G – Risk management
Risk management in the context of the Group is considered in the Group consolidated financial statements, note 53.
The business of the Company is managing its investments in subsidiary and joint venture operations. Its risks are considered to be the same as those in the operations themselves and full details of the major risks and the Group’s approach to managing these are given in the Group consolidated financial statements, note 53. Such investments are held by the Company at fair value in accordance with accounting policy D.
The fair values of the subsidiaries and joint venture are estimated using applicable valuation models, underpinned by the Company’s market capitalisation. This uses the Company’s closing share price at year end. Given that the key input into the valuation model is based on an observable current share price, and therefore sensitive to movements in that price, the valuation process is not sensitive to non-observable market assumptions.
Financial assets, other than investments in subsidiaries and the joint venture, largely consist of amounts due from subsidiaries. As at the balance sheet date, these receivable amounts were neither past due nor impaired.
Financial liabilities owed by the Company as at the balance sheet date are largely in respect of borrowings (details of which are provided in note E and the Group consolidated financial statements, note 45) and loans owed to subsidiaries. Loans owed to subsidiaries were within agreed credit terms as at the balance sheet date.
Interest rate risk
Loans to and from subsidiaries are at either fixed or floating rates of interest, with the latter being exposed to fluctuations in these rates. The choice of rates is designed to match the characteristics of financial investments (which are also exposed to interest rate fluctuations) held in both the Company and the relevant subsidiary, to mitigate as far as possible each company’s net exposure.
The majority of the Company’s external borrowings are at fixed rates of interest and are therefore not exposed to changes in these rates. However, for those borrowings that are at floating rates, the Company is affected by changes in these rates. Further details of the Company’s borrowings are provided in note E and the Group consolidated financial statements, note 45.
Currency risk
The Company’s direct subsidiaries are exposed to foreign currency risk arising from fluctuations in exchange rates during the course of providing insurance and asset management services around the world. The exposure of the subsidiaries to currency risk is considered from a Group perspective in the Group consolidated financial statements, note 53.
The Company faces exposure to foreign currency risk through some of its borrowings which are denominated in Euros and US dollars. However, most of these borrowings have been on-lent to a subsidiary which holds investments in these currencies, generating the net investment hedge described in the Group consolidated financial statements, note 54(a)(iii).
H – Related party transactions
The Company receives dividend and interest income from subsidiaries and pays interest and fee expense to those subsidiaries in the normal course of business. These activities are reflected in the table below.
Loans to and from subsidiaries are made on normal arm’s-length commercial terms. The maturity analysis of the related party loans is as follows:
Loans owed by subsidiaries
| Maturity analysis | 2012
£m | | 2011
£m | | 2010
£m | |
| Within 1 year | | 1,240 | | | – | | | 691 | |
| 1 to 5 years | | 446 | | | 1,749 | | | 1,769 | |
| Over 5 years | | 608 | | | 626 | | | 642 | |
| Total | | 2,294 | | | 2,375 | | | 3,102 | |
Loans owed to subsidiaries
| | 2012 | | Restated 2011 | | Restated 2010 | |
| Maturity analysis of contractual undiscounted cash flows | Principal
£m | | Interest
£m | | Total
£m | | Principal
£m | | Interest
£m | | Total
£m | | Principal
£m | | Interest
£m | | Total
£m | |
| Within 1 year | | 794 | | | 336 | | | 1,130 | | | 502 | | | 365 | | | 867 | | | 514 | | | 424 | | | 938 | |
| 1 to 5 years | | 11,333 | | | 506 | | | 11,839 | | | 11,564 | | | 810 | | | 12,374 | | | 12,325 | | | 362 | | | 12,687 | |
| Over 5 years | | 1,820 | | | 83 | | | 1,903 | | | 1,742 | | | 128 | | | 1,870 | | | 1,742 | | | 180 | | | 1,922 | |
| Total | | 13,947 | | | 925 | | | 14,872 | | | 13,808 | | | 1,303 | | | 15,111 | | | 14,581 | | | 966 | | | 15,547 | |
Other related party balances comprise dividends and interest receivable and payable, as well as inter-company balances for fees and other transactions in the normal course of business.
Dividends, loans, interest
Services provided to related parties
| | | | 2012 | | | | 2011 | | | | 2010 | |
| | Income earned
in year
£m | | Receivable
at year end
£m | | Income earned
in year
£m | | Receivable
at year end
£m | | Income earned
in year
£m | | Receivable
at year end
£m | |
| Subsidiaries | | 1,692 | | | 5,313 | | | 1,211 | | | 4,655 | | | 1,260 | | | 5,436 | |
The related parties’ receivables are not secured and no guarantees were received in respect thereof. The receivables will be settled in accordance with normal credit terms. Details of guarantees, indemnities and warranties given by the Company on behalf of related parties are given in note 48(g).
Services provided by related parties
| | | | 2012 | | | | Restated 2011 | | | | Restated 2010 | |
| | Expense incurred
in year
£m | | Payable
at year end
£m | | Expense incurred
in year
£m | | Payable
at year end
£m | | Expense incurred
in year
£m | | Payable
at year end
£m | |
| Subsidiaries | | 402 | | | 17,516 | | | 460 | | | 17,174 | | | 458 | | | 17,765 | |
The related parties’ payables are not secured and no guarantees were received in respect thereof. The payables will be settled in accordance with normal credit terms.
The directors and key management of the Company are considered to be the same as for the Group. Information on both the Company and Group key management compensation can be found in note 56.
I – Equity compensation plans
All transactions in the Group’s equity compensation plans involve options and awards for ordinary shares of the Company. Full disclosure of these plans is given in the Group consolidated financial statements, note 27. The cost of such options and awards is borne by all participating businesses and, where relevant, the Company bears an appropriate charge. As the majority of the charge
to the Company relates to directors’ options and awards, for which full disclosure is made in the Directors’ Remuneration Report, no further disclosure is given here on the grounds of materiality.
J – Subsequent event
On 21 January 2013 the Company provided a guarantee to its subsidiary, Aviva Group Holdings Limited, on a short term external borrowing of £200 million which will be repaid from disposal proceeds.
Additional disclosures for SEC
| In this section | |
| Exchange rate information | 239 |
| Record holders | 239 |
| Listing and markets | 239 |
| Major shareholders | 239 |
| Significant changes | 239 |
| General insurance and health claims reserves | 240 |
| IFRS critical accounting policies | 244 |
| Articles of Association | 248 |
| Exchange controls and other limitations affecting security holders | 252 |
| Taxation | 253 |
| Dividends and paying agents | 255 |
| Where you can find more information | 255 |
| Description of securities other than equity securities | 255 |
| Purchase of equity securities by Aviva plc and affiliated purchasers | 256 |
| Statement of differences from NYSE corporate governance practices | 256 |
| Legal proceedings | 256 |
| Employees | 256 |
| Controls and procedures | 256 |
Additional disclosures for SEC
Exchange rate information
The following table sets forth the average exchange rate as quoted by Bloomberg for pounds sterling expessed in US dollars per pound sterling for each of the five most recent fiscal years. The average exchange rate is calculated by using the average of the exchange rates on the last day of each month during the period. We have not used these rates to prepare our consolidated financial statements.
| Year ended 31 December | | | |
| 2008 | | | 1.8519 | |
| 2009 | | | 1.5662 | |
| 2010 | | | 1.5458 | |
| 2011 | | | 1.6043 | |
| 2012 | | | 1.6255 | |
The following table sets forth the high and low exchange rates for pounds sterling expressed in US dollars per pound sterling for the last six months:
| | | High | | | Low | |
| September 2012 | | | 1.6271 | | | | 1.5883 | |
| October 2012 | | | 1.6195 | | | | 1.5938 | |
| November 2012 | | | 1.6143 | | | | 1.5843 | |
| December 2012 | | | 1.6272 | | | | 1.6018 | |
| January 2013 | | | 1.6286 | | | | 1.5704 | |
| February 2013 | | | 1.5839 | | | | 1.5107 | |
On 20 March 2013, the average exchange rate as quoted by Bloomberg was £1.00 = $1.5108.
Record holders
On 20 March 2013, 492,934 of the Company’s ordinary shares, representing 0.02 per cent of the issued and outstanding ordinary shares as of such date, were held by 1,544 ordinary shareholders of record in the United States. In addition, 19,608,472 ordinary shares, representing 0.67 per cent of the issued and outstanding ordinary shares of such date, were held by 24 registered American Depositary Receipt holders.
Listing and markets
The principal trading market for the Company’s ordinary shares and preference shares is the London Stock Exchange. The Company’s American Depositary Shares (ADSs) are listed on the NYSE, each representing the right to receive two ordinary shares under the symbol “AV” deposited pursuant to the deposit agreement with Citibank N.A. and the registered holders from time to time of the ADSs. For a detailed description of the rights and obligations attached to Aviva plc ADSs, see “Description of securities other than equity securities”.
The following table sets forth, for the periods indicated, the reported highest and lowest closing prices for the Company’s ordinary shares on the London Stock Exchange and ADSs on the NYSE:
| | | Ordinary Shares
(pence) | | | Aviva ADS
(US dollars) | |
| Year | | | High | | | | Low | | | | High | | | | Low | |
| 2008 | | | 670.0 | | | | 245.3 | | | | n/a | | | | n/a | |
| 2009 | | | 467.5 | | | | 163.3 | | | | 14.80 | | | | 11.94 | |
| 2010 | | | 423.5 | | | | 294.2 | | | | 13.95 | | | | 8.74 | |
| 2011 | | | 477.9 | | | | 275.3 | | | | 15.80 | | | | 8.60 | |
| 2012 | | | 384.0 | | | | 255.3 | | | | 12.63 | | | | 7.86 | |
| | | Ordinary shares
(pence) | | Aviva ADS
(US dollars) | |
| Pence | | | Quarter 1 | | | Quarter 2 | | | Quarter 3 | | | Quarter 4 | | | Quarter 1 | | | Quarter 2 | | | Quarter 3 | | | Quarter 4 | |
| 2010 | High | | 422.0 | | | 389.5 | | | 423.5 | | | 423.1 | | | 13.95 | | | 12.18 | | | 13.38 | | | 13.77 | |
| | Low | | 344.5 | | | 294.2 | | | 305.8 | | | 354.6 | | | 11.02 | | | 8.74 | | | 9.45 | | | 11.23 | |
| 2011 | High | | 477.9 | | | 452.7 | | | 446.3 | | | 375.5 | | | 15.8 | | | 15.2 | | | 14.6 | | | 12.1 | |
| | Low | | 393.0 | | | 414.7 | | | 276.1 | | | 275.3 | | | 12.4 | | | 13.6 | | | 8.6 | | | 8.6 | |
| 2012 | High | | 382.6 | | | 333.1 | | | 363.1 | | | 384.0 | | | 11.95 | | | 10.73 | | | 11.85 | | | 12.63 | |
| | Low | | 299.0 | | | 255.3 | | | 268.3 | | | 320.0 | | | 9.23 | | | 7.86 | | | 8.39 | | | 10.33 | |
Ordinary
shares (pence) | September
2012 | | October
2012 | | November
2012 | | December
2012 | | January
2013 | | February
2013 | |
| High | | 363.1 | | | 345.0 | | | 350.6 | | | 384.0 | | | 388.4 | | | 369.2 | |
| Low | | 318.7 | | | 322.4 | | | 320.0 | | | 350.8 | | | 366.2 | | | 348.7 | |
| Aviva ADS (US dollars) | September
2012 | | October
2012 | | November
2012 | | December
2012 | | January
2013 | | February
2013 | |
| High | | 11.85 | | | 11.28 | | | 11.40 | | | 12.63 | | | 12.63 | | | 11.65 | |
| Low | | 10.41 | | | 10.41 | | | 10.33 | | | 11.36 | | | 11.66 | | | 10.62 | |
Major shareholders
The Financial Services Authority Disclosure and Transparency Rules (DTRs) provide that a person or corporate entity that acquires an interest of 3% or more in Aviva ordinary shares is required to notify us of that interest, whether it is held beneficially or not. Any subsequent increase or decrease of 1% or more must also be notified. Similarly, a notification is required once the interest falls below 3%.
We have set out in the tables below the holdings of each major shareholder as notified to the Company under the DTRs or filed with the SEC as at the latest practicable date for the last three financial years. Our major shareholders as listed below have the same voting rights as all our ordinary shareholders.
| As at 20 March 2013 | Total number of shares held | | % of total issued shares/
% of voting rights | |
| Franklin Resources, Inc and its subsidiaries and affiliates | | 196,288,968 | | | 6.80% | |
| BlackRock, Inc and its subsidiaries | | 149,521,223 | | | 5.15% | |
| Legal & General Group plc | | 110,128,385 | | | 3.98% | |
| AXA S.A. and its Group companies | | 106,788,176 | | | 3.86% | |
| As at 7 March 2012 | Total number of shares held | | % of total issued shares/
% of voting rights | |
| Franklin Resources, Inc and its subsidiaries and affiliates | | 196,144,458 | | | 7.0% | |
| BlackRock, Inc and its subsidiaries | | 149,521,223 | | | 5.15% | |
| Legal & General Group plc | | 110,128,385 | | | 3.98% | |
| AXA S.A. and its Group companies | | 106,788,176 | | | 3.86% | |
| As at 2 March 2011 | Total number of shares held | | % of total issued shares/
% of voting rights | |
| Franklin Resources, Inc and its subsidiaries and affiliates | | 192,678,120 | | | 6.80% | |
| BlackRock, Inc and its subsidiaries | | 149,521,223 | | | 5.09% | |
| Legal & General Group plc | | 110,128,385 | | | 3.98% | |
| AXA S.A. and its Group companies | | 106,788,176 | | | 3.86% | |
Significant changes
No significant changes have occurred since the balance sheet date, other than as disclosed in the financial statements.
General insurance and health claims reserves
Provisions for outstanding claims
We establish provisions for outstanding claims to cover the outstanding expected ultimate liability for losses and loss adjustment expenses (“LAE”) in respect of all claims that have already occurred. The provisions established cover reported claims and associated LAE, as well as claims incurred but not yet reported and associated LAE.
Delays occur in the notification and settlement of claims and a substantial measure of experience and judgement is involved in assessing outstanding liabilities, the ultimate cost of which cannot be known with certainty at the statement of financial position date. Additionally, we are required by applicable insurance laws and regulations and generally accepted accounting principles to establish reserves for outstanding claims (claims which have not yet been settled) and associated claims expenses from our insurance operations. The reserves for general insurance and health are based on information currently available; however, it is inherent in the nature of the business written that the ultimate liabilities may vary as a result of subsequent developments.
Outstanding claims provisions are based on undiscounted estimates of future claim payments, except for the following classes of business for which discounted provisions are held:
| | | | | | Rate | | | | | | Mean term of liabilities |
| Class | | 2012 | | | 2011 | | | 2012 | | | 2011 |
| Reinsured London Market business | | | 2.0% | | | | 2.20% | | | | 11 years | | | 13 years |
| Latent claims | | | 0.33% to 3.35% | | | | 0.75% to 3.25% | | | | 6 to 15 years | | | 7 to 16 years |
| Structured settlements | | | 2.60% | | | | 2.70% | | | | 33 years | | | 31 years |
The gross outstanding claims provision before discounting was £11,004 million(2011: £11,420million) and after discounting was £10,554 million(2011: £10,745million). The period of time which will elapse before the liabilities are settled has been estimated by modelling the settlement patterns of the underlying claims.
The discount rate that has been applied to latent claims reserves is based on the swap rate in the relevant currency having regard to the expected settlement dates of the claims. The range of discount rates used depends on the duration of the claims and is given in the table above. The duration of the claims span over 35 years, with the average duration between 6 and 15 years depending on the geographical region.
During 2012, the Group has seen a levelling off in the number of new bodily injury claims settled by periodic payment orders (PPOs) or structured settlements, which are reserved for on a discounted basis.
The uncertainties involved in estimating loss reserves are allowed for in the reserving process and by the estimation of explicit reserve uncertainty distributions. We have adopted a reserve estimation basis for non-life claims at 31 December 2012 that is calculated as the best estimate of the cost of future claim payments, plus an explicit allowance for risk and uncertainty. The allowance for risk and uncertainty targets a minimum confidence level that provisions will be sufficient for all business in each country. The adequacy of loss reserves is assessed and reported locally and is aggregated and reported to the Chief Financial Officer on a quarterly basis.
For additional information on the assumptions and changes that have occurred related to the general insurance and health claims provisions, see ”Financial statements IFRS – Note 36 – Insurance liabilities”. The effect on profit of changes in the main assumptions for the general insurance and health business can be found within “Financial statements IFRS – Note 40 – Effect of changes in assumptions and estimates during the year”.
Reinsurance
We reinsure a portion of the risks we underwrite to control our exposure to losses and stabilise earnings. We use reinsurance to help reduce the financial impact of large or unusually hazardous risks and to manage the volatility of our earnings.
Our reinsurance strategy is to purchase reinsurance in the most cost-effective manner from reinsurers who meet our established security standards. The level of reinsurance sought is determined by using extensive financial modelling and analysis to ensure we understand the large or unusually hazardous risks and to ensure we get maximum benefit for the cost of the reinsurance cover provided.
At 31 December 2012, the total reinsurance asset recoverable in respect of life, general and health insurance was £6,684 million, representing 3.0% of the total gross technical provisions of £223,585 million. In respect of premium income written during 2012, £1,778 million was ceded to reinsurers, representing 6.7% of the total gross written premium of £26,540 million. In respect of premium income written during 2012 for continuing operations, £1,571 million was ceded to reinsurers, representing 6.9% of total gross written premiums of £22,744 million.
The Group is exposed to concentrations of risk with individual reinsurers due to the nature of the reinsurance market and the restricted range of reinsurers that have acceptable credit ratings. The Group operates a policy to manage its reinsurance counterparty exposures by limiting the reinsurers that may be used and applying strict limits to each reinsurer. Reinsurance exposures are aggregated with other exposures to ensure that the overall risk is within appetite. The Credit Approvals Committee has a monitoring role over this risk.
Our largest reinsurance counterparty is Swiss Reinsurance Company Ltd (including subsidiaries). At 31 December 2012 the amount ceded to Swiss Reinsurance Company Ltd was £1,717 million out of the total reinsurance asset recoverable of £6,684 million. Through the reinsurance of our London Market business, we also have significant exposure to the Berkshire Hathaway Group and its subsidiaries. At 31 December 2012 the amount ceded to the Berkshire Hathaway Group and its subsidiaries was £729 million out of the total reinsurance asset recoverable of £6,684 million. These figures give an indication of the potential losses to the Group following the default of the relevant counterparty, assuming no post-default recovery is possible.
Additional information on our reinsurance strategy and a discussion on concentration risk and reinsurance credit risk can be found within “Financial statements IFRS – Note 53 – Risk management”.
Loss Reserve Development
The loss reserve development tables below present the historical development of the property & casualty reserves that we established in 2003 and subsequent years.
The top line of the tables shows the reserves for unpaid losses and LAE as at each statement of financial position date. These reserves are the estimated future payments to be made for losses and LAE in respect of claims occurring in that year and all prior years.
The “Paid (cumulative)” data represents the cumulative amounts paid as at each subsequent year end against the reserves for losses and LAE held at each statement of financial position date. The “Reserve re-estimated” shows the re-estimate of the reserves, as initially recorded at each statement of financial position date, as at each subsequent year end. The re-estimated reserve changes as a greater proportion of the actual losses for which the initial reserves were set up are paid and more information becomes known about those claims still outstanding.
The “Cumulative redundancy/(deficiency)” line represents the overall change in the estimate since the initial reserve was established, and is equal to the initial reserve less the re-estimated liability as at 31 December 2012. Reserves for losses and LAE at each statement of financial position date represent the amounts necessary to settle all outstanding claims as at that date. The year-end balances in the tables should not be added as they include amounts in respect of both the current and prior years.
In our non-UK property & casualty operations, reserves are established and monitored in the local currency in which the property & casualty entity operates. For the purpose of the tables, claims reserves and payments with respect to each year are translated into pounds sterling at the rates that applied when the initial reserves on the statement of financial position for each year were established. The only exception to this are reserves established in currencies other than an operation’s local currency, for which claims reserves are converted to pounds sterling at year-end exchange rates and claims payments are converted at the average of the exchange rates that applied during the relevant year.
The following table presents our consolidated loss development before reinsurance of reserves measured on an IFRS basis for the last ten financial years.
| 31 December | 2003
£m | | 2004
£m | | 2005
£m | | 2006
£m | | 2007
£m | | 2008
£m | | 2009
£m | | 2010
£m | | 20111 £m | | 2012
£m | |
| Initial net reserves per statement of financial position | | 9,627 | | | 10,288 | | | 10,773 | | | 10,788 | | | 11,277 | | | 12,594 | | | 11,053 | | | 10,705 | | | 9,376 | | | 9,300 | |
| Effect of discounting | | 119 | | | 196 | | | 204 | | | 223 | | | 216 | | | 447 | | | 451 | | | 501 | | | 302 | | | 293 | |
| Initial net reserves for unpaid losses and LAE | | 9,746 | | | 10,484 | | | 10,977 | | | 11,011 | | | 11,493 | | | 13,041 | | | 11,504 | | | 11,206 | | | 9,678 | | | 9,593 | |
| Initial retroceded reserves | | 2,626 | | | 2,316 | | | 2,159 | | | 2,050 | | | 1,946 | | | 2,020 | | | 2,072 | | | 1,973 | | | 1,742 | | | 1,411 | |
| Initial gross reserves for unpaid losses and LAE | | 12,372 | | | 12,800 | | | 13,136 | | | 13,061 | | | 13,439 | | | 15,061 | | | 13,576 | | | 13,179 | | | 11,420 | | | 11,004 | |
| | | | | | | | | | | | | | | | | | | | | | | | | | | | | | | |
| Paid (cumulative) as of: | | | | | | | | | | | | | | | | | | | | | | | | | | | | | | |
| One year later | | 3,254 | | | 3,361 | | | 3,327 | | | 3,433 | | | 4,017 | | | 4,474 | | | 3,645 | | | 4,579 | | | 3,421 | | | | |
| Two years later | | 5,097 | | | 4,977 | | | 4,925 | | | 5,053 | | | 5,836 | | | 6,462 | | | 6,274 | | | 6,673 | | | | | | | |
| Three years later | | 6,290 | | | 6,116 | | | 6,111 | | | 6,275 | | | 7,190 | | | 8,535 | | | 7,939 | | | | | | | | | | |
| Four years later | | 7,146 | | | 6,950 | | | 7,057 | | | 7,240 | | | 8,470 | | | 9,917 | | | | | | | | | | | | | |
| Five years later | | 7,793 | | | 7,664 | | | 7,792 | | | 8,087 | | | 9,494 | | | | | | | | | | | | | | | | |
| Six years later | | 8,336 | | | 8,222 | | | 8,449 | | | 8,875 | | | | | | | | | | | | | | | | | | | |
| Seven years later | | 8,784 | | | 8,726 | | | 9,047 | | | | | | | | | | | | | | | | | | | | | | |
| Eight years later | | 9,214 | | | 9,162 | | | | | | | | | | | | | | | | | | | | | | | | | |
| Nine years later | | 9,614 | | | | | | | | | | | | | | | | | | | | | | | | | | | | |
| | | | | | | | | | | | | | | | | | | | | | | | | | | | | | | |
| Reserve re-estimated as of: | | | | | | | | | | | | | | | | | | | | | | | | | | | | | | |
| One year later | | 12,218 | | | 12,600 | | | 12,667 | | | 12,146 | | | 13,349 | | | 14,653 | | | 13,380 | | | 13,110 | | | 11,368 | | | | |
| Two years later | | 12,341 | | | 12,290 | | | 11,992 | | | 12,114 | | | 13,149 | | | 14,505 | | | 13,213 | | | 13,156 | | | | | | | |
| Three years later | | 12,216 | | | 11,736 | | | 12,007 | | | 12,006 | | | 13,086 | | | 14,343 | | | 13,314 | | | | | | | | | | |
| Four years later | | 11,855 | | | 11,882 | | | 12,013 | | | 11,956 | | | 12,974 | | | 14,509 | | | | | | | | | | | | | |
| Five years later | | 12,171 | | | 11,961 | | | 11,952 | | | 11,893 | | | 13,178 | | | | | | | | | | | | | | | | |
| Six years later | | 12,255 | | | 11,891 | | | 11,867 | | | 12,069 | | | | | | | | | | | | | | | | | | | |
| Seven years later | | 12,236 | | | 11,818 | | | 12,046 | | | | | | | | | | | | | | | | | | | | | | |
| Eight years later | | 12,183 | | | 11,989 | | | | | | | | | | | | | | | | | | | | | | | | | |
| Nine years later | | 12,360 | | | | | | | | | | | | | | | | | | | | | | | | | | | | |
| | | | | | | | | | | | | | | | | | | | | | | | | | | | | | | |
| Cumulative redundancy/(deficiency) | | 12 | | | 811 | | | 1,090 | | | 992 | | | 261 | | | 552 | | | 262 | | | 23 | | | 52 | | | | |
| 1. | Delta Lloyd not consolidated from financial year 2011 onwards following the partial disposal on 6 May 2011. |
Tables showing the consolidated gross loss development for the last ten individual accident years, as opposed to loss development of total gross reserves for claims at the end of each of the last ten financial years above, are provided within “Financial statements IFRS – Note 36 – Insurance liabilities”.
The following table presents our consolidated loss development after reinsurance of reserves measured on an IFRS basis for the last ten financial years.
| 31 December | 2003
£m | | 2004
£m | | 2005
£m | | 2006
£m | | 2007
£m | | 2008
£m | | 2009
£m | | 2010
£m | | 20111 £m | | 2012
£m | |
| Initial net reserves per statement of financial position | | 9,627 | | | 10,288 | | | 10,773 | | | 10,788 | | | 11,277 | | | 12,594 | | | 11,053 | | | 10,705 | | | 9,376 | | | 9,300 | |
| Effect of discounting | | 119 | | | 196 | | | 204 | | | 223 | | | 216 | | | 447 | | | 451 | | | 501 | | | 302 | | | 293 | |
| Initial net reserves for unpaid losses and LAE | | 9,746 | | | 10,484 | | | 10,977 | | | 11,011 | | | 11,493 | | | 13,041 | | | 11,504 | | | 11,206 | | | 9,678 | | | 9,593 | |
| | | | | | | | | | | | | | | | | | | | | | | | | | | | | | | |
| Paid (cumulative) as of: | | | | | | | | | | | | | | | | | | | | | | | | | | | | | | |
| One year later | | 2,968 | | | 3,050 | | | 3,030 | | | 3,221 | | | 3,783 | | | 4,267 | | | 3,386 | | | 4,232 | | | 2,811 | | | | |
| Two years later | | 4,558 | | | 4,414 | | | 4,452 | | | 4,674 | | | 5,485 | | | 6,041 | | | 5,773 | | | 5,779 | | | | | | | |
| Three years later | | 5,585 | | | 5,402 | | | 5,476 | | | 5,795 | | | 6,647 | | | 7,900 | | | 6,908 | | | | | | | | | | |
| Four years later | | 6,299 | | | 6,084 | | | 6,317 | | | 6,595 | | | 7,771 | | | 8,751 | | | | | | | | | | | | | |
| Five years later | | 6,801 | | | 6,691 | | | 6,888 | | | 7,315 | | | 8,306 | | | | | | | | | | | | | | | | |
| Six years later | | 7,242 | | | 7,097 | | | 7,427 | | | 7,643 | | | | | | | | | | | | | | | | | | | |
| Seven years later | | 7,544 | | | 7,496 | | | 7,665 | | | | | | | | | | | | | | | | | | | | | | |
| Eight years later | | 7,874 | | | 7,673 | | | | | | | | | | | | | | | | | | | | | | | | | |
| Nine years later | | 8,018 | | | | | | | | | | | | | | | | | | | | | | | | | | | | |
| | | | | | | | | | | | | | | | | | | | | | | | | | | | | | | |
| Reserve re-estimated as of: | | | | | | | | | | | | | | | | | | | | | | | | | | | | | | |
| One year later | | 9,779 | | | 10,216 | | | 10,368 | | | 10,115 | | | 11,334 | | | 12,480 | | | 11,264 | | | 11,112 | | | 9,465 | | | | |
| Two years later | | 9,836 | | | 9,765 | | | 9,728 | | | 10,055 | | | 10,959 | | | 12,269 | | | 11,076 | | | 10,999 | | | | | | | |
| Three years later | | 9,569 | | | 9,256 | | | 9,733 | | | 9,786 | | | 10,848 | | | 12,104 | | | 11,033 | | | | | | | | | | |
| Four years later | | 9,262 | | | 9,400 | | | 9,572 | | | 9,678 | | | 10,744 | | | 12,118 | | | | | | | | | | | | | |
| Five years later | | 9,577 | | | 9,304 | | | 9,483 | | | 9,628 | | | 10,804 | | | | | | | | | | | | | | | | |
| Six years later | | 9,492 | | | 9,245 | | | 9,420 | | | 9,679 | | | | | | | | | | | | | | | | | | | |
| Seven years later | | 9,498 | | | 9,230 | | | 9,525 | | | | | | | | | | | | | | | | | | | | | | |
| Eight years later | | 9,497 | | | 9,357 | | | | | | | | | | | | | | | | | | | | | | | | | |
| Nine years later | | 9,634 | | | | | | | | | | | | | | | | | | | | | | | | | | | | |
| | | | | | | | | | | | | | | | | | | | | | | | | | | | | | | |
| Cumulative redundancy/(deficiency) | | 112 | | | 1,127 | | | 1,452 | | | 1,332 | | | 689 | | | 923 | | | 471 | | | 207 | | | 213 | | | | |
| 1. | Delta Lloyd not consolidated from financial year 2011 onwards following the partial disposal on 6 May 2011. |
Tables showing the consolidated loss development, net of reinsurance, for the last ten individual accident years, as opposed to loss development of total net reserves for claims at the end of each of the last ten financial years above, are provided under “Financial statements IFRS – Note 36 – Insurance liabilities”.
The loss development tables above include information on asbestos and environmental pollution claims provisions from business written before 2003. The undiscounted claim provisions for continuing operations, net of reinsurance, in respect of this business at 31 December 2012 were £1,003 million(2011: £929 million). The movement in the year reflects strengthening of provisions by £8 million in the UK(2011:exceptional strengthening of £35 million), other increases in undiscounted provisions of £51 million(2011: £23 million), reclassification of commercial liability provisions of £55 million, claim payments, reinsurance recoveries and foreign exchange rate movements.
In 2008 the Institute of Actuaries’ Asbestos Working Party report contributed to our view that experience variances, which we had previously perceived as normal short-term volatility, reflected a real worsening of expected ultimate claims experience. The market trend in mesothelioma claims was fully reflected as a significant one-off strengthening of gross latent claims reserves in 2008 of £356 million, with a corresponding increase of £52 million in reinsurance recoverable. The net increase of £304 million comprised £668 million on an undiscounted basis and discounting of £364 million.
During 2003 reserve strength was significantly increased, and has been maintained by establishing strong reserves for each new year. This has resulted in the reserve releases for 2003 to 2011 shown above.
Following the partial disposal on 6 May 2011, Delta Lloyd was not consolidated in the loss reserve development tables shown above for financial years 2011 onwards. At 31 December 2012 the Group’s share of Delta Lloyd’s loss reserves made up less than 5% of total Group loss reserves.
Reserves for Asbestos and Environmental Losses
The tables below show the historical development of the asbestos and environmental (“A&E”) reserves as at 31 December 2010 and subsequent years. The tables include all indemnity claims arising from injuries and diseases due to asbestos and all claims arising from injuries due to toxic waste, hazardous substances and other environmental pollutants, including damages in respect of hazardous waste site clean-up costs. Litigation costs in relation to these claims are also included in the tables. Claims relating to smoking, physical abuse, silicon implants and other health hazards and latent injuries are not included as our exposure is not material.
We have exposure to liabilities for A&E claims arising from the sale of commercial liability and multi-peril policies prior to 1987. After 1987 policy terms and conditions in many cases excluded these types of claims, thereby considerably reducing our potential for loss.
Reserving for A&E claims is subject to many uncertainties, such as very long reporting delays, unresolved legal issues and the number and identity of insureds, and these uncertainties are generally much greater than those present on other types of claims. As a result, traditional loss reserving techniques cannot be entirely relied upon. We therefore employ special techniques to determine reserves using all available information. However, new legislation or legal precedents could result in ultimate outstanding losses being adversely affected in future periods.
A large proportion of our gross A&E liabilities relate to the London Market business we wrote and are therefore covered by our reinsurance with National Indemnity. As of 31 December 2000, management of these claims transferred to Berkshire Hathaway. Our net A&E reserves mainly relate to asbestos production and handling in various jurisdictions, including the United Kingdom, Canada, Ireland and Australia.
The following table presents the development of our asbestos and environmental reserves before reinsurance measured on an IFRS basis.
| 31 December | | 2012
£m | | | 2011
£m | | | 2010
£m | |
| Initial net reserves per statement of financial position | | | 684 | | | | 631 | | | | 551 | |
| Effect of discounting | | | 319 | | | | 298 | | | | 388 | |
| Initial net reserves for unpaid losses and LAE | | | 1,003 | | | | 929 | | | | 939 | |
| Initial retroceded reserves | | | 531 | | | | 596 | | | | 674 | |
| Initial gross reserves for unpaid losses and LAE | | | 1,534 | | | | 1,525 | | | | 1,613 | |
| | | | | | | | | | | | | |
| Paid (cumulative) as of: | | | | | | | | | | | | |
| One year later | | | | | | | 29 | | | | 98 | |
| Two years later | | | | | | | | | | | 127 | |
| | | | | | | | | | | | | |
| Reserve re-estimated as of: | | | | | | | | | | | | |
| One year later | | | | | | | 1,565 | | | | 1,623 | |
| Two years later | | | | | | | | | | | 1,663 | |
| | | | | | | | | | | | | |
| Cumulative redundancy/(deficiency) | | | | | | | (40 | ) | | | (50 | ) |
| 1. | Delta Lloyd not consolidated from financial year 2011 onwards following the partial disposal on 6 May 2011. |
The following table presents the development of our A&E reserves after reinsurance measured on an IFRS basis.
| 31 December | | 2012
£m | | | 2011
£m | | | 2010
£m | |
| Initial net reserves per statement of financial position | | | 684 | | | | 631 | | | | 551 | |
| Effect of discounting | | | 319 | | | | 298 | | | | 388 | |
| Initial net reserves for unpaid losses and LAE | | | 1,003 | | | | 929 | | | | 939 | |
| | | | | | | | | | | | | |
| Paid (cumulative) as of: | | | | | | | | | | | | |
| One year later | | | | | | | 40 | | | | 69 | |
| Two years later | | | | | | | | | | | 109 | |
| | | | | | | | | | | | | |
| Reserve re-estimated as of: | | | | | | | | | | | | |
| One year later | | | | | | | 1,043 | | | | 999 | |
| Two years later | | | | | | | | | | | 1,114 | |
| | | | | | | | | | | | | |
| Cumulative redundancy/(deficiency) | | | | | | | (114 | ) | | | (175 | ) |
| 1. | Delta Lloyd not consolidated from financial year 2011 onwards following the partial disposal on 6 May 2011. |
IFRS critical accounting policies
Our discussion and analysis of our financial condition and results of operations are based upon our consolidated financial statements, which have been prepared in accordance with International Financial Reporting Standards (‘‘IFRS’’) as issued by the International Accounting Standards Board.
In preparing our financial statements, we are required to make estimates and judgements that affect the reported amounts of assets, liabilities, revenues and expenses, and related disclosure of contingent assets and liabilities. On an ongoing basis, we evaluate these estimates, including those related to life insurance business and non-life and health business provisioning, the fair value of assets and the declaration of with-profits business bonus rates. We base our estimates on historical experience and on various other assumptions that we believe to be reasonable under the current circumstances. These estimates form the basis for making judgements about the carrying values of assets and liabilities that are not readily apparent from other sources. Actual results may differ from these estimates to the extent that actual conditions arising deviate from assumed conditions.
Critical accounting policies are those that reflect significant judgements and uncertainties and potentially may lead to materially different results under different assumptions and conditions.
Critical accounting policies
The major areas of judgement on policy application are summarised below:
| Item | Critical accounting judgement assumption | Accounting policy |
| Consolidation | Assessment of whether the Group controls the underlying entities | D |
| Insurance and participating investment contract liabilities | Assessment of the significance of insurance risk passed | K |
| Financial investments | Classification of investments | S |
Use of estimates
All estimates are based on management’s knowledge of current facts and circumstances, assumptions based on that knowledge and their predictions of future events and actions. Actual results may differ from those estimates, possibly significantly. The table below sets out those items we consider particularly susceptible to changes in estimates and assumptions, and the relevant accounting policy.These policies and notes can be found in the Financial Statements IFRS section.
| Item | Accounting policy | IFRS Note |
| Insurance and participating investment contract liabilities | F & K | 36, 37 & 41 |
| Goodwill, AVIF and intangible assets | N | 13 & 14 |
| Fair values of financial investments | S | 19 |
| Impairment of financial investments | S | 19, 22 & 53 |
| Fair value of derivative financial instruments | T | 54 |
| Deferred acquisition costs and other assets | W | 24 |
| Provisions and contingent liabilities | Z | 43 & 48 |
| Pension obligations | AA | 44 |
| Deferred income taxes | AB | 10 |
| Operations held for sale | B | 3 |
Additional information on Investments
For an overview of our investments, see “Performance review – Analysis of investments”.
Where estimates are used, these are based on a combination of independent third party evidence and internally developed models, calibrated to market observable data where possible. Whilst such valuations are sensitive to estimates, we believe that changing one or more of the assumptions for reasonably possible alternative assumptions would not change fair value significantly.
Valuations obtained from third party sources are generally the proprietary information of the third party provider, and therefore, while the third party providers may discuss with us their methodologies and sources of inputs, we are unable to re-perform their valuations. We do, however, validate third party valuations against other third party pricing providers, broker quotes or our own internal models where we believe there is uncertainty over the reliability of the third party valuation.
The fair values of our financial investments are subject to market risk and credit risks, primarily interest rate, equity price and foreign currency exchange risks. “Financial statements IFRS – Note 53 – Risk Management” provides disclosure and discussion of the impact of changes in market assumptions such as interest rates, exchange rates, equity and property prices, as well as providing information regarding the aggregated credit risk exposure of the Group’s financial assets with external credit ratings.
Fixed maturity securities – Valuation techniques
The table below provides an analysis at 31 December 2012 of debt securities by pricing source.
| | | Fair value hierarchy | |
| 2012 | | Level 1
£m | | | Level 2
£m | | | Level 3
£m | | | Total
£m | |
| Third party sources | | | 107,953 | | | | 37,696 | | | | 9,974 | | | | 155,623 | |
| Internal models | | | – | | | | 5,892 | | | | 108 | | | | 6,000 | |
| | | | 107,953 | | | | 43,588 | | | | 10,082 | | | | 161,623 | |
We use a variety of valuation techniques to fair value debt securities included in fair value hierarchy Level 2 and Level 3. Techniques include internal models using observable market inputs, broker quotes and third party pricing vendor services. 94% of Level 2 fixed maturity securities are held by our businesses in North America, Spain, the UK and Italy, of which North America represents 76%. Variations in the proportion of securities classified as Levels 1, 2 and 3 between different countries reflect different levels of liquidity in the markets in which these securities are traded and the different valuation sources used.
Valuations sourced from third parties
To determine the appropriate fair value hierarchy, where we use third-party pricing vendor services, we ascertain from the vendors their valuation methodology, the market inputs into their models and how they calibrated and tested their model outputs. Further validation is performed against broker quotes or internal models. Valuations obtained from third party sources, disclosed in the table above, are unadjusted.
Where we use broker quotes and no information as to the observability of inputs is provided by the broker, we generally validate the price quoted by the broker by using internal models with observable inputs. When the price obtained from the broker and internal model are similar, we look to the inputs used in our internal model to understand the observability of the inputs used by the broker. In circumstances where internal models are not used to validate broker prices and the observability of inputs used by brokers is unavailable, the investment is classified as Level 3. Broker quotes are usually non-binding. The valuation techniques applied to the principal fixed maturity securities are described below.
Prices sourced from third parties for certain US corporate securities are based on a consensus valuation by polling banks and trading desks of market makers in these instruments. The collection of quotes is adjusted to remove outliers and stale data. Such securities are classified as Level 3, as these inputs represent prices at which banks are holding these securities in their trading portfolios.
Structured bond-type products held by our business in France amounting to £8.6 billion for which there is no active market. These bonds are valued either using third-party counterparty or broker quotes. These bonds are validated against internal or third-party models. These bonds have been classified as Level 3 because either (i) the third-party models included a significant unobservable liquidity adjustment or (ii) differences between the valuation provided by the counterparty and broker quotes and the validation model were sufficiently significant to result in a Level 3 classification. At 31 December 2012, the values reported in respect of these products were the lower of counterparty and broker quotes and modelled valuations.
The other principal Level 3 debt securities are notes issued by loan partnerships held by our UK Life business amounting to £1.0 billion for which there is no active market. These are valued using counterparty quotes which are corroborated against index information obtained for similar asset classes, taking into further consideration the quality of the underlying loan portfolio, leverage structure, credit rating, illiquidity margins, market spreads and duration.
Internal valuation models
In our Spanish business, we use internal models to value illiquid corporate bonds as the prices obtainable from third party pricing services are solely based on the last observed market transaction and are considered stale. Models use discounted cash flows incorporating the interest rate swap curve for the same currency of the instrument and a spread for credit and liquidity risk. The credit and liquidity spread is determined using market quotes of other bonds of the same issuer factored by the liquidity of asset or market. Similarly in our UK Life business, we use internal models for private placement notes, for which third party valuations are unavailable. Models use discounted cash flows incorporating the market swap curve for sovereign government securities for the same currency of the instrument and a spread for credit and liquidity risk. The credit and liquidity spread is derived by matching the credit and maturity profile of the security to a third party pricing matrix grid based on observed market transactions in private placement notes of other issuers. At 31 December 2012, bonds valued on this basis amounted to £3.5 billion in our Spanish business and £2.3 billion in our UK Life business.
For US mortgage-backed securities validated using internal models, credit risk is reflected in determining the expected cash flows and the discount rate used. The discount rate is adjusted for the spread from the corresponding CMBX index, while inputs included in determining expected cash flows are debt service coverage ratios, loan-to-value ratios, interest rate protection, amortisation type, number of properties per loan, location and property type. A liquidity premium is added which is the difference between AAA rated credit card bonds and the average of AAA rated corporate bonds and agency debentures.
The internal models used to validate complex structured bond-type products in France and Italy are based on a discounted cash flow model incorporating the specific characteristics of the bond, such as issue date, credit risk of issuer, form of payout and reference indices. These represent most of the debt securities validated using internal models.
Adjustments for credit and liquidity risk
Our internal models and the models used by third-party pricing vendor services incorporate credit risk by adjusting the spread above the yield curve for government treasury securities for the appropriate amount of credit risk for each issuer, based on observed market transactions.
To the extent observed market spreads are either not used in valuing a security, or do not fully reflect liquidity risk, our valuation methodology, whether sourced from internal models or third parties, reflects a liquidity premium.
Equity securities – Valuation techniques
The table below provides an analysis at 31 December 2012 of equity securities by pricing source.
| | | Fair value hierarchy | |
| 2012 | | Level 1
£m | | | Level 2
£m | | | Level 3
£m | | | Total
£m | |
| Third party sources | | | 33,074 | | | | 230 | | | | 465 | | | | 33,769 | |
| Internal models | | | – | | | | – | | | | 8 | | | | 8 | |
| | | | 33,074 | | | | 230 | | | | 473 | | | | 33,777 | |
Valuations obtained from third party sources, disclosed above, are unadjusted.
Equity securities classified as Level 3 are principally strategic interests in banking partners held by our Italian business. Level 3 valuations are based on third-party independent appraisals, or where internally modelled, transactions in similar entities, discounted cash flow techniques and valuation multiples, using public and internal management information.
Other investments (including derivatives) – Valuation techniques
The table below provides an analysis at 31 December 2012 of other investments by pricing source.
| | | Fair value hierarchy | |
| 2012 | | Level 1
£m | | | Level 2
£m | | | Level 3
£m | | | Total
£m | |
| Third party sources | | | 21,704 | | | | 5,327 | | | | 2,853 | | | | 29,884 | |
| Internal models | | | – | | | | 183 | | | | 26 | | | | 209 | |
| | | | 21,704 | | | | 5,510 | | | | 2,879 | | | | 30,093 | |
Valuations obtained from third party sources, disclosed above, are unadjusted, except for third party valuations of private equity funds as noted below.
Other investments classified as Level 2 principally relate to unit trusts and other investment vehicles amounting to £3.7 billion, and derivatives amounting to £1.2 billion.
Other investments classified as Level 3 are principally private equity funds and hedge funds each amounting to £1.3 billion. 66% of the Group’s holdings in these funds are held by our UK Life business, with the remainder primarily held by our businesses in France and the US.
Our UK Life business values its interest in private equity funds utilising investment valuation reports received from the fund managers, making adjustments for items such as subsequent draw downs and distributions between the date of the report and the balance sheet date and the fund managers’ carried interest.
In valuing its interest in hedge funds, the Group utilises valuations received from fund managers, which are based on the market value of the underlying fund assets. In certain instances, the market values of the underlying assets may be determined by the hedge fund managers using internal, proprietary models. Such investments are classified as Level 3.
Of the internally modelled valuations for other investments disclosed above, all included in Level 2 relate to investments by our UK Life business in investment funds which are valued on a “look through basis” to the underlying investments in the fund. The underlying investments are valued using quoted market prices and other observable market inputs which support the classification. A similar valuation approach is adopted by third parties where we have utilised them as a source of valuations.
The internal model inputs are based on observable market date, except for a small number of deposits placed with credit institutions to back structured products, with a fair value of £26 million at 31 December 2012, which are classified as Level 3 since the interest rates used in the model are based on locked in rates offered on the structured product rather than observable market inputs.
All valuations for derivatives are sourced from third parties. For most non-exchange traded derivatives, we either obtain prices from derivative counterparties and corroborate these prices using internal models, or source prices from a third-party vendor utilising industry standard models and corroborate these prices to non-binding broker quotes. Credit risk is considered, but the presence of collateral usually mitigates any non-performance risk related to the derivatives.
Duration and amount of unrealised losses on available-for-sale securities
| | | 0 - 6 months | | | 7 - 12 months | | | more than 12 months | | | Total | |
| 2012 | | Fair value1 £m | | | Gross
unrealised
£m | | | Fair value1 £m | | | Gross
unrealised
£m | | | Fair value1 £m | | | Gross
unrealised
£m | | | Fair value1 £m | | | Gross
unrealised
£m | |
| Less than 20% loss position: | | | | | | | | | | | | | | | | | | | | | | | | | | | | | | | | |
| Debt securities | | | 2,006 | | | | (14 | ) | | | 53 | | | | (3 | ) | | | 534 | | | | (11 | ) | | | 2,593 | | | | (28 | ) |
| Equity securities | | | – | | | | – | | | | – | | | | – | | | | 2 | | | | – | | | | 2 | | | | – | |
| Other investments | | | 8 | | | | – | | | | 8 | | | | – | | | | 20 | | | | (3 | ) | | | 36 | | | | (3 | ) |
| | | | 2,014 | | | | (14 | ) | | | 61 | | | | (3 | ) | | | 556 | | | | (14 | ) | | | 2,631 | | | | (31 | ) |
| 20%-50% loss position: | | | | | | | | | | | | | | | | | | | | | | | | | | | | | | | | |
| Debt securities | | | – | | | | – | | | | – | | | | – | | | | 70 | | | | (34 | ) | | | 70 | | | | (34 | ) |
| Equity securities | | | – | | | | – | | | | – | | | | – | | | | – | | | | – | | | | – | | | | – | |
| Other investments | | | – | | | | – | | | | 2 | | | | (1 | ) | | | 2 | | | | (1 | ) | | | 4 | | | | (2 | ) |
| | | | – | | | | – | | | | 2 | | | | (1 | ) | | | 72 | | | | (35 | ) | | | 74 | | | | (36 | ) |
| Greater than 50% loss position: | | | | | | | | | | | | | | | | | | | | | | | | | | | | | | | | |
| Debt securities | | | – | | | | – | | | | – | | | | – | | | | 7 | | | | (12 | ) | | | 7 | | | | (12 | ) |
| Equity securities | | | – | | | | – | | | | – | | | | – | | | | – | | | | – | | | | – | | | | – | |
| Other investments | | | – | | | | – | | | | – | | | | – | | | | – | | | | – | | | | – | | | | – | |
| | | | – | | | | – | | | | – | | | | – | | | | 7 | | | | (12 | ) | | | 7 | | | | (12 | ) |
| Total | | | | | | | | | | | | | | | | | | | | | | | | | | | | | | | | |
| Debt securities | | | 2,006 | | | | (14 | ) | | | 53 | | | | (3 | ) | | | 611 | | | | (57 | ) | | | 2,670 | | | | (74 | ) |
| Equity securities | | | – | | | | – | | | | – | | | | – | | | | 2 | | | | – | | | | 2 | | | | – | |
| Other investments | | | 8 | | | | – | | | | 10 | | | | (1 | ) | | | 22 | | | | (4 | ) | | | 40 | | | | (5 | ) |
| | | | 2,014 | | | | (14 | ) | | | 63 | | | | (4 | ) | | | 635 | | | | (61 | ) | | | 2,712 | | | | (79 | ) |
| Assets of operations classified as held for sale | | | 2,014 | | | | (14 | ) | | | 63 | | | | (4 | ) | | | 231 | | | | (58 | ) | | | 2,308 | | | | (76 | ) |
| Total (excluding assets held for sale) | | | – | | | | – | | | | – | | | | – | | | | 404 | | | | (3 | ) | | | 404 | | | | (3 | ) |
| 1 | Only includes AFS classified securities that are in an unrealised loss position. |
| | | 0 - 6 months | | | 7 - 12 months | | | more than 12 months | | | Total | |
| 2011 | | Fair value1 £m | | | Gross
unrealised
£m | | | Fair value1 £m | | | Gross
unrealised
£m | | | Fair value1 £m | | | Gross
unrealised
£m | | | Fair value1 £m | | | Gross
unrealised
£m | |
| Less than 20% loss position: | | | | | | | | | | | | | | | | | | | | | | | | | | | | | | | | |
| Debt securities | | | 1,781 | | | | (52 | ) | | | 353 | | | | (23 | ) | | | 540 | | | | (33 | ) | | | 2,674 | | | | (108 | ) |
| Equity securities | | | – | | | | – | | | | – | | | | – | | | | 2 | | | | – | | | | 2 | | | | – | |
| Other investments | | | 50 | | | | (2 | ) | | | 150 | | | | (8 | ) | | | 8 | | | | – | | | | 208 | | | | (10 | ) |
| | | | 1,831 | | | | (54 | ) | | | 503 | | | | (31 | ) | | | 550 | | | | (33 | ) | | | 2,884 | | | | (118 | ) |
| 20%-50% loss position: | | | | | | | | | | | | | | | | | | | | | | | | | | | | | | | | |
| Debt securities | | | 14 | | | | (7 | ) | | | 15 | | | | (5 | ) | | | 168 | | | | (76 | ) | | | 197 | | | | (88 | ) |
| Equity securities | | | – | | | | – | | | | – | | | | – | | | | – | | | | – | | | | – | | | | – | |
| Other investments | | | – | | | | – | | | | – | | | | – | | | | – | | | | – | | | | – | | | | – | |
| | | | 14 | | | | (7 | ) | | | 15 | | | | (5 | ) | | | 168 | | | | (76 | ) | | | 197 | | | | (88 | ) |
| Greater than 50% loss position: | | | | | | | | | | | | | | | | | | | | | | | | | | | | | | | | |
| Debt securities | | | 1 | | | | (2 | ) | | | 1 | | | | (2 | ) | | | 16 | | | | (29 | ) | | | 18 | | | | (33 | ) |
| Equity securities | | | – | | | | – | | | | – | | | | – | | | | – | | | | – | | | | – | | | | – | |
| Other investments | | | – | | | | – | | | | – | | | | – | | | | – | | | | – | | | | – | | | | – | |
| | | | 1 | | | | (2 | ) | | | 1 | | | | (2 | ) | | | 16 | | | | (29 | ) | | | 18 | | | | (33 | ) |
| Total | | | | | | | | | | | | | | | | | | | | | | | | | | | | | | | | |
| Debt securities | | | 1,796 | | | | (61 | ) | | | 369 | | | | (30 | ) | | | 724 | | | | (138 | ) | | | 2,889 | | | | (229 | ) |
| Equity securities | | | – | | | | – | | | | – | | | | – | | | | 2 | | | | – | | | | 2 | | | | – | |
| Other investments | | | 50 | | | | (2 | ) | | | 150 | | | | (8 | ) | | | 8 | | | | – | | | | 208 | | | | (10 | ) |
| | | | 1,846 | | | | (63 | ) | | | 519 | | | | (38 | ) | | | 734 | | | | (138 | ) | | | 3,099 | | | | (239 | ) |
| Assets of operations classified as held for sale | | | – | | | | – | | | | – | | | | – | | | | – | | | | – | | | | – | | | | – | |
| Total (excluding assets held for sale) | | | 1,846 | | | | (63 | ) | | | 519 | | | | (38 | ) | | | 734 | | | | (138 | ) | | | 3,099 | | | | (239 | ) |
| 1 | Only includes AFS classified securities that are in an unrealised loss position. |
We have not recognised any impairment charge in respect of these unrealised losses as we believe the decline in fair value of these securities relative to their amortised cost to be temporary.
At 31 December 2012, 98% of AFS debt securities were held by our US business. In respect of debt securities in an unrealised loss position, our businesses intend to hold these securities for a sufficient period to recover their value in full and to hold them to maturity, as they are held to match long-term policyholder liabilities of the same or longer duration. In the US, the decrease in unrealised losses experienced during 2012 reflects a decrease in the US government treasury yield curve, partially offset by widening credit spreads. Where factors specific to an issuer have resulted in an unrealised loss, we have considered whether the security is impaired and recognised an impairment charge where necessary.
Of the AFS debt security impairment expense for 2012, £12 million relates to our US business, of which £7 million relates to corporate bonds and £5 million to commercial mortgage backed securities. These securities are not yet in default but showed continued deterioration in market value from the previous impairment value.
Receivables and other financial assets
We manage the credit quality of receivables and other financial assets at the level of each subsidiary entity. Each subsidiary entity reviews the carrying value of its receivables at each reporting period. If the carrying value of a receivable or other financial asset is greater than the recoverable amount, the carrying value is reduced through a charge to the income statement in the period of impairment.
Where assets classed as “past due and impaired” are of material value thereby exceeding local credit limits, and are also deemed at sufficiently high risk of default, an analysis of the asset is performed and a decision is made whether to seek sufficient collateral from the counterparty or to write down the value of the asset as impaired. The factors to determine whether there is a high risk of default include evidence of significant financial difficulties of the counterparty, evidence of a high probability of bankruptcy or other financial reorganisation of the counterparty. We also consider specific knowledge of the individual counterparty which is experiencing difficulties, the age of the receivable or other financial asset balance, and any general credit ratings available.
Financial liabilities fair valued through profit or loss
We have made use of the fair value option under IAS 39 to carry at fair value through profit or loss investment contracts of £46,299 million(2011: £43,990million) and securitised borrowings of £1,332 million(2010: £1,306million), as these are managed with associated financial assets and derivatives as a portfolio on a fair value basis. We believe such a presentation provides more relevant information and eliminates any accounting mismatch. In addition, IFRS requires us to fair value derivative liabilities through profit or loss.
Under IFRS, we are required to reflect own credit risk in valuations for those financial liabilities fair valued through profit or loss where this risk would be considered by market participants. Other than the embedded option in indexed life and annuity contracts, we have not included own credit risk as a factor in fair valuing these liabilities for the following reasons:
| n | In the case of funding agreements and derivative contracts, they are mostly fully collaterised; |
| n | In the case of investment contracts which are unit-linked in structure, our liability to policyholders is linked to a segregated pool of assets, and have priority over other creditors in event of default; and |
| n | In the case of securitised borrowing, the issued loan notes are secured on ring-fenced mortgage assets which effectively act as collateral. Noteholders are only entitled to obtain payment, of both principle and interest, to the extent that the available resources of the special purpose securitisation companies are sufficient. Noteholders have no recourse whatsoever to other companies in the Aviva Group. |
The embedded options in indexed and life annuity contracts are valued using a risk-adjusted discount rate based on market spreads on senior long-term unsecured Aviva plc debt. The change in fair value resulting from the risk adjustment in 2012 was an increase of £269 million(2011: £453 million), and is principally attributable to market perception of the instruments’ credit risk. If interest rates were to increase by 1%, the provision for embedded options would decrease by £151 million(2010: £152 million) and, if interest rates were to decrease by 1%, the provision would increase by £167 million(2011: £167 million).
Articles of Association
The Company adopted a new set of articles of association with effect from the conclusion of the annual general meeting held on 3 May 2012. The following is a summary of the rights of the holders of our shares and of certain significant provisions of our articles of association and relevant laws and regulations of various regulatory bodies. Because it is a summary, it does not contain all the information that may be important to you. For more complete information you should read our articles of association. A complete copy of our articles of association can be obtained from our website on www.aviva.com/investor-relations/corporate-governance/articles-of-association.
The deposit agreement between us, Citibank and the registered holders from time to time of the ADSs, will govern the rights of holders of ADSs as described in “Description of securities other than equity securities” below. You should be aware that these rights are different from the rights of the holders of our ordinary shares.
Organisation and Register
Our registered company number in England is 2468686. The various entities that comprise Aviva have histories of considerable duration. Hand in Hand was established in 1696, Commercial Union was established in 1861, General Accident was founded in 1885 and Norwich Union was founded in 1797. However, the Group’s current structure dates back to February 9, 1990, when Commercial Union plc was incorporated as the listed holding company for the Commercial Union Group.
Directors
The number of our directors is not less than six, nor more than twenty. We may, in a general meeting by ordinary resolution, increase or reduce the maximum and the minimum number of the directors. Our articles of association do not contain an age restriction applicable to directors.
Powers of our Board and Election of Directors
Our Board manages the business and affairs of the Company. However, our shareholders must approve certain matters, such as changes to the share capital and the election of directors. Directors are appointed subject to our articles of association. At every annual general meeting, all the directors will be subject to re-election as provided in the UK Corporate Governance Code.
Under English law, shareholders of a public company may, by ordinary resolution, appoint a person who is willing to be a director either to fill a vacancy or, subject to any limit provided in the company’s articles of association, as an additional director. Shareholders may also remove any director before the end of his or her term of office by ordinary resolution and may appoint another person in his or her place. In addition, under our articles of association, our Board also has the power to appoint a director to fill a vacancy on our Board or to serve as an additional director, provided that a director so elected may only serve until the next following AGM of the company, at which time the director may be elected by shareholders.
Directors’ Interests
Section 177 of the UK Companies Act 2006 provides that a director who is directly or indirectly interested in a contract or proposed contract or arrangement or proposed arrangement connected to us or any of our subsidiaries must declare the nature of his interest at a meeting of our Board. In the case of a proposed contract or proposed arrangement, the declaration must be made at the meeting of our Board at which the question of entering into the contract or arrangement is first taken into consideration or, if the director was not at the date of the meeting interested in the proposed contract or arrangement, at the next meeting of our Board held after he became so interested. In a case where the director becomes interested in a contract after it is entered into or an arrangement after it is made, the declaration must be made at the first meeting of our Board held after the director becomes so interested.
If the contract was entered into or the arrangement made or the proposed contract or arrangement was considered before the director was appointed or elected, the declaration must be made at the first meeting of our Board following the appointment or election of the director or, if the director was not then aware of the existence of the contract or arrangement or proposed contract or arrangement, at the next meeting following the director becoming so aware.
A director may hold any other office (other than that of auditor) in any other company in which he is in any way interested in conjunction with his office of director for such period and on such terms (as to remuneration and otherwise) as our Board may determine, and no person is disqualified from appointment or election as a director by reason of his holding any office (other than that of auditor).
No director or director candidate is disqualified by his or her office from contracting either with regard to his or her tenure of any such office, nor is any such contract to be avoided, nor is any director so contracting or being so interested to be liable to account to us for any profit realised by any such contract or arrangement by reason of such director holding that office or of the fiduciary relationship established by his directorship.
Directors’ Remuneration
A director is not required to hold any shares by way of qualification. However, under internal guidelines the Group CEO is required to build up a shareholding in the Company equivalent to 200% of annual base salary, executive directors are required to build up a shareholding in the Company equivalent to 150% of annual base salary and other Group Executive members are required to build up a shareholding in the Company equivalent to 50% of annual base salary. In addition, the executive directors, including the Group CEO, are required to retain 50% of the net shares released from deferred annual bonuses and Long Term Incentive Plan awards until the shareholding requirements have been met. There is no target date for meeting the share ownership requirements.
The non-executive directors as a body are remunerated for their services in an amount not exceeding £2,000,000 per annum in aggregate, to be determined by our Board, or at such other rate that the Company, in general meeting, may determine by ordinary resolution. Such remuneration is to be divided amongst the directors in such proportions and manner that the Board determines and, in default of such determination, equally. The remuneration payable accrues from day to day. A director is entitled to be repaid all reasonable travelling, hotel and other expenses incurred by such director in or about the performance of his or her duties as director, including any expenses incurred in attending meetings of our Board or of Committees of our Board or general meetings, whether incurred in the UK or in any overseas country.
The remuneration of the Chairman and executive directors is recommended to the Board by the Remuneration Committee. The remuneration of the non-executive directors is determined by the Board. For further details see “Governance – Directors’ Remuneration Report”.
Proceedings of our Board and Committees
Our Board may meet together for the dispatch of business, adjourn and otherwise regulate its meetings as it thinks fit and decide the quorum necessary for the transaction of business. Unless and until otherwise decided, the quorum is four directors. No business may be transacted without the requisite quorum. Questions arising at any meeting are decided by a majority of votes. In case of an equality of votes, the chairman of the meeting has a second or casting vote.
Two directors may and, upon request of two directors, the secretary shall summon a Board meeting at any time, by notice given to all of the directors. Notice of a meeting of our Board is deemed to be duly given to a director if it is given to him personally, by word of mouth, by electronic communication to an address given by him for that purpose or sent in writing to him at his last-known address or another address given by him for that purpose. A director absent from the United Kingdom is not entitled to receive notice of any meeting of our Board unless they have requested that notices of Board meetings be sent to an address they supply.
Our Board may from time to time appoint one or more directors as Managing Director, Executive Director, joint Managing Directors or joint Executive Directors either for a fixed or an indefinite term and may from time to time, without prejudice to the terms of any agreement entered into in any particular case, remove or dismiss any directors so appointed from office and appoint another director in his or her place.
Liabilities of Directors and Officers
English law does not permit a company to exempt any director or other officer of the company, or any person employed by the company as auditor, from any liability that by virtue of any rule of law would otherwise attach to him or her in respect of any negligence, default, breach of duty or breach of trust of which he or she may be guilty in relation to the company. English law enables companies to purchase and maintain insurance for directors, officers and auditors against any such liability. We maintain such insurance for our directors and executive officers. Our articles of association provide that our directors and officers, among others, are entitled to indemnification by Aviva out of our own funds against all costs, charges, losses, expenses and liabilities incurred by such person in connection with the discharge of his or her duties or the exercise of his or her powers.
Debt Limitations
Our articles of association grant our Board authority to exercise our power to borrow money and to mortgage or charge our undertaking, property and uncalled capital, or any part thereof, and to issue debentures and other securities, whether outright or as security for any debt, liability or obligation of ours or of any third party. The aggregate amount of debt borrowed or secured by us or any of our subsidiaries (to the extent our Board can procure through voting and other powers of control and excluding borrowings between subsidiary undertakings and between the Company and its subsidiary undertakings) must not, without the prior approval of the shareholders in a general meeting, exceed twice the aggregate of our share capital and consolidated reserves, subject to certain adjustments set forth in our articles of association.
Special Share Rights
Subject to any special rights previously conferred on the holders of any shares or class of shares, we may issue any share with such preferred, deferred or other special rights or such restrictions, whether in regard to dividend, voting, return of capital or otherwise.
If any class of shares has any preferential right to dividend or return of capital, the conferring on other shares of rights to either dividend or return of capital ranking either before orpari passu with that class is generally deemed a variation of the rights attached to that class of shares.
Subject to legislation and unless otherwise expressly provided by the terms on which shares of that class are held, any of the rights attached to any class of shares may be varied or abrogated with the written consent of the holders of not less than three-fourths in nominal value of the issued shares of that class or with the sanction of a special resolution passed at a separate general meeting of the holders of such shares. The provisions of the articles of association as to general meetings of the Company apply, with any necessary modifications, to a variation of class rights meeting, except that the necessary quorum is two persons present holding at least one-third in nominal value of the issued shares of the class or, for an adjourned meeting, one person present holding shares of the class in question, and where a person is present by proxy or by proxies, that person is treated as holding only the shares in respect of which those proxies are authorised to exercise voting rights.
We may issue and allot new preference shares in one or more separate series, each of which may constitute a separate class, and the new preference shares comprising each such series or class will rankpari passu and have such rights and terms as may be attached by our Board prior to allotment. Sterling new preference shares, new preference shares and euro new preference shares will have such rights and terms as the Board may determine in accordance with the terms of their respective capital instruments as well as such further rights and terms as may be determined by the Board prior to their issue. For details on the rights of our preference shares, see “Financial statements IFRS – Note 29 – Preference share capital”.
Allotment of Securities
Our Board has the general power to allot equity securities for cash pursuant to the general authority for the first period and each subsequent period.
Our Board may at any time after the allotment of a share, but before a person has been entered in the register as the holder of the share, recognise a renunciation of the share by the allottee in favour of another person and may grant to an allottee a right to effect a renunciation on the terms and conditions our Board thinks fit.
Pre-emptive Rights
Under English law, the issue for cash of equity securities or rights to subscribe for or convert into equity securities must be offered in the first instance to the existing equity shareholders in proportion to the respective nominal values of their holdings in the class of equity securities being offered, unless a special resolution has been passed in a general meeting of shareholders dis-applying (whether generally or specifically) this requirement. As is the custom of many companies listed on the Official List of the UK Listing Authority, we generally obtain authority annually from our shareholders to allot up to a specified amount of equity share capital for cash, instead of allotting pro rata to our existing shareholders.
Share Warrants to Bearer
Subject to any statutory restrictions, we may issue share warrants with respect to any shares which are fully paid up upon a request in writing by the relevant shareholder. The request should be in the form, and authenticated by the statutory declaration or other evidence as to identity of the person making the same, as our Board may require.
Calls on Shares
Our Board may from time to time make calls on the shareholders in respect of any monies unpaid on their shares or on any class of their shares, whether on account of the nominal value of the shares or by way of premium, and not by the conditions of allotment thereof made payable at fixed times. Each shareholder will be required, subject to the shareholder having been given at least fourteen days’ notice specifying the time or times and place of payment, to pay at the time and place so specified the amount called on such shareholder’s shares. A call may be made payable by instalments, may be revoked by our Board before receipt of any sum due or postponed as our Board may decide and be deemed to have been made at the time when the resolution of our Board authorising the call was passed. A person upon whom a call is made remains liable for calls made upon him or her notwithstanding the subsequent transfer of the shares.
Forfeiture of Shares
If the whole or any part of any call or instalment of a call in regard to a share is not paid on forfeiture notice or before the day appointed for payment, our Board may, at any time thereafter during such time as any part of the call or instalment remains unpaid, serve a notice on the shareholder in whose name the share is registered requiring payment of so much of the call or instalment as is unpaid, together with any interest and expenses which may have accrued by reason of such non-payment.
Lien on Shares
We have a first and paramount lien and charge on every share that has not been fully paid for all monies, whether presently payable or not, called or payable at a fixed time in respect of that share.
Transfer of Shares
Subject to such restrictions in our articles of association as may apply, any shareholder may, without payment of any fee, transfer all or any of his or her certificated shares by written instrument, in any usual common form or in any other form which our Board may approve, executed by or on behalf of the transferor and, in the case of a transfer of a share not fully paid, by or on behalf of the transferee.
Transmission of Shares
In case of the death of a shareholder, the survivor or survivors where the deceased was a joint holder, and the legal personal representatives of the deceased where such person was a sole or only surviving holder, will be the only persons recognised by us as having any title to such shares, but nothing in the articles of association shall release the estate of the deceased shareholder from any liability, whether sole or joint, in respect of any share which has been solely or jointly held by the deceased shareholder.
Any person becoming entitled to a share as a result of the death or bankruptcy of a shareholder may, upon production of sufficient evidence of his or her right, either elect to be registered as a shareholder or to nominate some person as a registered shareholder in respect of the share.
Shareholders Resident Abroad
If a shareholder has not provided us with an address in the UK, we are not required to send notices to such shareholder directly. Notices to such shareholders may be posted in our registered office and are then deemed to be given to those shareholders on the date when they are first posted. Unless otherwise required by law or our articles of association, we may also give notices by advertisement published once in at least one leading UK daily newspaper. Alternatively, so long as a shareholder has so agreed, we may give notice of a general meeting by posting on our website, provided we have notified the shareholder of the posting in a manner agreed with us. There are no limitations on non-resident or foreign shareholders’ rights to own our securities or exercise voting rights where such rights are given under English company law. For holders of ADSs, please see “- Description of securities other than equity securities”.
Equity Share Capital – Rights of Purchase and Redemption
Under English law, a company may issue redeemable shares if authorised by its articles of association and subject to the conditions stated therein. Our articles of association authorise the issue of redeemable shares. Although our cumulative irredeemable preference shares are not subject to redemption like our ordinary shares, our articles of association permit the purchase of our own shares and we may purchase our cumulative irredeemable preference shares. An English company may purchase its own shares, including any redeemable shares, if so authorised by its articles of association and provided that the purchase must be previously approved by a general or specific ordinary resolution of its shareholders in the case of an on-market purchase (although the Association of British Insurers prefers a special resolution), or a special resolution in the case of an off-market purchase. The shares may be redeemed or repurchased only if fully paid and, in the case of public companies such as us, only out of distributable profits or the proceeds of a new issue of shares issued for the purpose of the purchase or redemption.
As with many other companies listed on the Official List of the UK Listing Authority, we regularly seek authority at annual general meetings to approve on-market purchases of our ordinary shares subject to specified limitations. When a company purchases its own shares wholly out of profits, an amount equal to the nominal amount of the shares purchased and subsequently cancelled must be transferred to the capital redemption reserve, which is generally treated as paid-up share capital. In addition, any amount payable by the company on purchase of its shares in excess of the par value may be paid out of the proceeds of a new issue of shares up to an amount equal to whichever is the lesser of (i) the aggregate of the original premiums received by the company on the issue of those shares or (ii) the amount of the company’s share premium account as at the time of the repurchase, including any sum transferred to that account in respect of premiums on the new issue. The UK Listing Authority usually requires that on-market purchases of 15% or more of a company’s equity share capital pursuant to a general shareholder authority must be made through either a tender or partial offer to all shareholders (or to all shareholders of the relevant class), and in the case of a tender offer, at a stated maximum or fixed price. Purchases pursuant to a general shareholder authority below the 15% threshold may be made through the market in the ordinary way, provided that the price is not more than 5% above the average of the market value of the company’s shares for the five business days before the purchase date.
Winding Up
In the event of a winding up, holders of preference shares have priority over holders of ordinary shares. This applies to all types of preference shares. We are subject to the general insolvency law applicable to UK companies, which is described within “Shareholder Information – Regulation”.
Dividends and Reserves
Our dividends are based on our profits and are paid out to shareholders for each share they hold, and do not generally have any restrictions. Our dividends are usually paid as cash to both UK and overseas shareholders. Our dividends can be paid by cheque or as a direct bank transfer.
We generally pay any dividends on our ordinary shares twice a year following the announcement of our full year and half year results. We normally pay a final dividend in May and an interim dividend in November on our ordinary shares. Lost dividend cheques can be re-issued. A shareholder may obtain a replacement cheque from our registrar. We may declare dividends but no dividend may exceed the amount recommended by our Board. Our Board may pay to the shareholders such interim dividends (including the fixed dividends payable on any preference or other shares) as appear to our Board to be justified by our profits and, provided that our Board acts in good faith, it shall not incur any responsibility to the holders of any shares conferring a preference which may at any time be issued for any damage they may suffer by reason of the lawful payment of an interim dividend on any shares ranking after such preference shares. No dividend payable in respect of a share shall bear interest against the Company. Any dividend unclaimed after a period of twelve years from the date fixed for payment will be forfeited and revert to the Company. All dividends unclaimed may be invested or otherwise made use of by the Board for the benefit of the Company until claimed and the Company is not a trustee in respect of this. Our articles of association do not contain any sinking fund provisions. Further details regarding dividends for our ADSs are set out in “- Description of securities other than equity securities” and for our preference shares within “Financial statements IFRS – Note 29 – Preference Share Capital”.
General Meetings
We hold an annual general meeting within six months following our accounting reference date. English company law provides for shareholders to exercise their power to decide on corporate matters at general meetings. Our articles of association require that we hold a general meeting annually to declare dividends, to receive and consider the statutory accounts and the reports by the auditor and the directors, to elect directors, approve the appointment and remuneration of the auditor and approve the Directors’ Remuneration Report. The quorum required for a general meeting is ten shareholders present in person or by proxy.
Convening and Notice of Meetings
Our Board may convene a general meeting as our annual general meeting. Our Board may convene a general meeting whenever it thinks fit. The time and place of any annual general meeting or other general meeting called by our Board shall be decided by our Board.
Our Board will convene a general meeting upon receiving requests to do so from shareholders representing at least five percent of such of the paid-up capital of the Company as carries the right of voting at general meetings (excluding any paid-up capital held as treasury shares). A request to call a general meeting must state the general nature of the business to be dealt with at the proposed meeting. A request may include the text of a resolution, which may be properly moved at the proposed meeting. A request must be in hard copy or electronic form and must be authenticated by the person or persons making it.
Our Board will call any annual general meeting by at least twenty one days' notice in accordance with our articles of association. Any other general meeting will be called by at least fourteen days’ notice also in accordance with our articles of association. The notice period calculation under our articles of association excludes the day of the relevant meeting and the day on which the notice of meeting is given. Notice of every general meeting will be given in any manner authorised by our articles of association to every shareholder holding shares conferring the right to attend and vote at the meeting who, at the time of the convening of the meeting, has paid all calls or other sums presently payable by such shareholder in respect of all shares held by such shareholder, the auditor and the directors.
Constitution of Meetings
No business is transacted at a general meeting unless the requisite quorum is present at the commencement of the business. The quorum for all purposes of a general meeting is ten persons present and entitled to vote upon the business to be transacted, each being a shareholder, a person authorised to act as a representative (in relation to the meeting) of a corporation that is a shareholder or a person appointed as a proxy of a shareholder in relation to the meeting, except that two persons only acting as representatives of a single corporation that is a shareholder or two persons only appointed as proxies of a single shareholder does not constitute a requisite quorum.
Voting
Under English law, the voting rights of shareholders are governed by the Company’s articles of association, and are subject to the statutory rights of shareholders, including the right to demand a poll. Voting at any meeting of shareholders is by a show of hands unless a poll is demanded. On a show of hands, each shareholder present in person or by a corporate representative or proxy has one vote. On a poll, each shareholder who is present in person or by a corporate representative or by proxy has one vote for every ordinary share held. Subject to any special rights or restrictions attached to any class of shares and to the provisions of our articles of association, on a show of hands every shareholder present in person or by proxy will have one vote and on a poll every shareholder present in person or by proxy will have one vote for each 25 pence in nominal amount of share capital held by such shareholder. A person entitled to more than one vote on a poll need not use all his or her votes or cast all his or her votes in the same way. Cumulative irredeemable preference shares entitle their holders to attend and vote at general meetings only when dividends on such shares are in arrears, however this does not apply to holders of Sterling New Preference Shares and Euro New Preference Shares. Only the holders of ordinary shares on which all sums payable have been paid are entitled to attend meetings and vote. If more than one joint holder votes, only the vote of the shareholder whose name appears first in the register is counted. Any shareholder who is entitled to attend and vote at a meeting is entitled to appoint one or more proxies to attend and vote at the meeting on his or her behalf.
Shareholder Proposals
Under English law, shareholders may requisition a resolution to be voted on at a general meeting if:
| n | the requisition is made by a holder or the holders of shares that represent not less than 5% of the total voting rights of all shareholders having at the date of the requisition a right to vote at the meeting to which the requisition relates; or |
| n | the requisition is made by not less than 100 shareholders holding shares on which there has been paid up an average sum, per shareholder, of not less than £100. |
The requisition must be deposited at the company’s registered office not less than one week before the general meeting to which it relates unless the general meeting is called after the requisition is deposited. At any general meeting, the appointment of two or more persons as directors of a public company (such as us) by a single resolution (and not by a separate resolution for each proposed director) may not be proposed unless a resolution approving its proposal is passed by the general meeting with no dissenting votes.
Proxies
A shareholder may appoint more than one proxy in relation to a general meeting, provided that each proxy is appointed to exercise the rights attached to a different share or shares held by that shareholder. A form of proxy is, unless otherwise stated, valid for any adjournment of the meeting to which it relates. When two or more valid but differing forms of proxy are delivered or received for the same share for use at the same meeting, the one which is last validly delivered or received (regardless of its date or the date of its execution) is be treated as replacing and revoking the other or others as regards that share. If we are unable to determine which form of proxy was last validly delivered or received, none of them is treated as valid.
Accounts
Our Board decides whether and to what extent the accounts and books or any of them are to be open to the inspection of shareholders who are not directors. No shareholder who is not a director or an officer has any right of inspecting any account or book or document except as conferred by statute or authorised by our Board or by us in general meeting.
A copy of our annual accounts and reports is, not less than twenty-one days before the date of the meeting, sent or supplied to every shareholder and to every holder of debentures or debenture or loan stock and every person entitled to receive notice of general meeting. The required number of printed copies of every such document is at the same time sent to the London Stock Exchange and to any other stock exchange which has granted a quotation for, or a listing of, any of the shares, as required by their regulations.
Notices
A notice, document or other information may be given to any shareholder either personally or by sending it in hard copy form by post to the shareholder at his or her registered address or, if the shareholder has no registered address within the UK to the address (if any) in the UK supplied by the shareholder for the giving of notices to such shareholder or by advertisement or by giving notice in electronic form to an address supplied to us by the shareholder for that purpose or by any other means authorised in writing by the shareholder concerned.
Change of Control
There is no specific provision in our articles of association that would have an effect of delaying, deferring or preventing a change in control and that would operate only with respect to a merger, acquisition or corporate restructuring involving us or any of or any of our subsidiaries.
However, English law provides for schemes of arrangement. These are arrangements or compromises between a company and its shareholders, creditors, any class of its shareholders, or any class of its creditors, and are used for certain types of reconstructions, amalgamations, capital reorganisations or takeovers. They require sanction of the court and the approval at a meeting of the company convened by an order of the court of a majority of the shareholders or creditors or class of shareholders or creditors representing not less than 75% in value of the capital or debt held by the shareholders or creditors or class present and voting, either in person or by proxy. Once the scheme becomes effective, all shareholders or creditors (or, if it applies to a class, the shareholders or creditors of the relevant class) are bound by the terms of the scheme.
Under the rules of the UK Listing Authority, shareholder approval is required for an acquisition or disposal by a listed company if the gross assets of the company or the business to be acquired or disposed of represent 25% or more of the gross assets of the company or if various other size ratios prescribed by the Listing Rules of the UK Listing Authority are satisfied. Shareholder approval is also required in some circumstances relating to the giving by the listed company of indemnities and similar arrangements. Where the size of the acquisition or disposal falls below the 25% threshold, information may nevertheless be required to be published. Shareholder approval may also be required for an acquisition or disposal of assets between a listed company and related parties including:
| n | directors of the company or its subsidiaries; |
| n | holders of 10% or more of the nominal value of any class of the company’s or any holding company’s or subsidiary’s shares having the right to vote in all circumstances at general meetings of the relevant company; or |
| n | any associate of persons described in the two preceding bullet points above. |
English law also provides that where a takeover offer is made for the shares of a company incorporated in the UK and the offeror has acquired or unconditionally contracted to acquire not less than nine-tenths in value of the shares of any class to which the offer relates and, where the shares to which the offer relates are voting shares, not less than nine-tenths of the voting rights carried by those shares, the offeror may, within three months of the last day on which the offer could be accepted, by notice require shareholders who have not accepted the offer to transfer their shares to the offeror on the terms of the offer. A dissenting shareholder may apply to the court within six weeks of the date on which the notice was given objecting to the transfer or its proposed terms. The court is unlikely, absent unfair treatment, fraud or oppression, to exercise its discretion to order that the transfer shall not take effect, but it may specify the terms of the transfer as it finds appropriate. Where an offeror has reached such nine-tenths level, a minority shareholder is also entitled to require the offeror to acquire his shares on the terms of the offer ("sell-out right") within three months of the last day on which the offer could be accepted or, if later, three months from the date on which the offeror served notice on the minority shareholder notifying him of the sell-out right.
Mergers are sometimes effected through the use of a members' voluntary liquidation of a company pursuant to the Insolvency Act 1986, which provides for the transfer of the whole or part of the assets of that company to another company in return for shares in the transferee company. To effect the transfer, a resolution must be passed by at least 75% of shareholders conferring authority on the liquidator. Any shareholder who does not vote in favour of the resolution may express his dissent by writing to the liquidator within seven days after the passing of the resolution, requiring the liquidator either to abstain from carrying the resolution into effect or to purchase the shareholder’s interest at a price to be determined by agreement or by arbitration under the Insolvency Act 1986. The liquidator may apply to the court if it disputes the shareholder’s contention and the court may make such an order on the application as it thinks just.
Major Shareholding and Disclosure of Interests
Our articles of association do not contain any provisions requiring disclosure of shareholdings over and above that which is required by English law. Further details are available under “Major shareholders”.
The basic disclosure requirement under English law and the Disclosure and Transparency Rules promulgated by the FSA imposes an obligation on a person to notify the FSA and us of the percentage of the voting rights in Aviva such person holds or controls directly or indirectly. The Disclosure and Transparency Rules set out the circumstances in which an obligation of disclosure arises as well as certain exemptions from those obligations for specified persons. This obligation is triggered if the percentage of voting rights reaches, exceeds or falls below three percent and any subsequent whole percentage figure as a result of an acquisition or disposal reaches, exceeds or falls below any such threshold as a result of any change in the number of voting rights attached to our shares. The Disclosure and Transparency Rules also deal with the disclosure by certain persons including directors, of interests in shares of the listed companies of which they are directors, and in derivatives and other financial instruments relating to those shares. We may, under English law require a person that we know or have cause to believe is or was during the three years preceding the date of notice interested in our shares to indicate whether or not that is the case and to provide certain information as is permitted under the law.
The City Code on Takeovers and Mergers also imposes strict disclosure requirements with regard to dealings in the securities of an offeror or offeree company on all parties to a takeover and also on their respective associates during the course of an offer period.
Shareholder approval of equity compensation plans
The NYSE rules for U.S companies require that shareholders must be given the opportunity to vote on all equity-compensation plans and material revisions to those plans. We comply with UK requirements, which are similar to the NYSE rules. As a result, the Board does not explicitly take into consideration the NYSE’s detailed definition of what are considered “material revisions”.
Exchange controls and other limitations affecting security holders
Other than requirements to report designated events and transactions under sanctions and other laws in effect from time to time, there are currently no UK laws, decrees or regulations that restrict the export or import of capital, including, but not limited to, foreign exchange controls, or that affect the remittance of dividends or other payments to non-UK residents or to US holders of our securities except as otherwise set forth in “–Taxation” below. There are no limitations under our articles of association restricting voting or shareholding.
Taxation
This section discusses certain material US federal income tax and UK tax consequences to a US Holder that owns Aviva ordinary shares and ADSs.
For purposes of this description, a “US Holder” includes any beneficial owner of the Aviva ordinary shares or ADSs that is, for US federal income tax purposes:
| n | a citizen or individual resident of the United States; |
| n | a corporation (or other entity treated as a corporation for US federal income tax purposes) created or organised in or under the laws of the United States or organised under the laws of any state thereof, or the District of Columbia; or |
| n | an estate the income of which is subject to US federal income taxation regardless of its source; or a trust if (1) a court within the United States is able to exercise primary supervision over its administration and one or more United States persons have the authority to control all of the substantial decisions of such trust; or (2) such trust has a valid election in effect to be treated as a United States person for US federal income tax purposes. |
A “Non-US Holder” is any beneficial owner of the Aviva ordinary shares or ADSs that is not a US Holder.
This section does not purport to be a comprehensive description of all of the tax considerations that may be relevant to any particular investor. This discussion assumes that you are familiar with the tax rules applicable to investments in securities generally, and with any special rules to which you may be subject. In particular, the discussion deals only with investors that will hold Aviva ordinary shares or ADSs as capital assets, and does not address the tax treatment of investors that are subject to special rules, such as banks, financial institutions, insurance companies, dealers or traders in securities or currencies, persons that elect mark-to-market treatment, tax-exempt entities (including 401 pensions plans), real estate investment trusts, regulated investment companies or grantor trusts, individual retirement and other tax-deferred accounts, persons that received Aviva ordinary shares or ADSs as compensation for the performance of services, persons who own, directly, indirectly through non-US entities or by attribution by application of the constructive ownership rules of section 958(b) of the US Internal Revenue Code, 10% or more of Aviva voting shares, persons that are residents of the United Kingdom for UK tax purposes or that conduct a business or have a permanent establishment in the United Kingdom, persons that hold Aviva ordinary shares or ADSs as a position in a straddle, hedging, conversion, integration, constructive sale, or other risk reduction transaction, certain former citizens or long-term residents of the United States, partnerships and their partners and persons whose functional currency is not the US dollar. The discussion is based on laws, treaties, judicial decisions, and regulatory interpretations in effect on the date hereof, all of which are subject to change. Beneficial owners of ADSs will be treated as owners of the underlying shares for US federal income tax purposes and for purposes of the double tax treaty between the United States and the United Kingdom which came into effect on 31 March 2003 (the “Treaty”). Deposits and withdrawals of shares in exchange for ADSs will not result in the realisation of gain or loss for US federal income tax purposes.
You are urged to consult with your own advisers regarding the tax consequences of the acquisition, ownership, and disposition of Aviva ordinary shares or ADSs in the light of your particular circumstances, including the effect of any state, local, or other national laws.
UK Taxation of Dividends
Under current UK tax law, no tax is required to be withheld in the United Kingdom at source from cash dividends paid to US resident holders.
UK Taxation of Capital Gains
Subject to the comments in the following paragraph, a holder of Aviva ordinary shares or ADSs who, for UK tax purposes, is neither resident nor, in the case of an individual, ordinarily resident, in the UK will not be liable for UK taxation on capital gains realised on the disposal of Aviva ordinary shares or ADSs unless at the time of the disposal:
| n | the holder carries on a trade, or in the case of an individual, a profession or vocation in the United Kingdom through, in the case of an individual, a branch or agency, or, in the case of a company, a permanent establishment, and |
| n | the Aviva ordinary shares or ADSs are or have been used, held, or acquired for the purpose of such trade, profession, vocation, branch, agency or permanent establishment. |
A holder of Aviva ordinary shares or ADSs who (1) is an individual who has ceased to be resident or ordinarily resident for UK tax purposes in the United Kingdom, (2) was resident or ordinarily resident for UK tax purposes in the United Kingdom for at least four out of the seven UK tax years immediately preceding the year in which he or she ceased to be both resident and ordinarily resident in the United Kingdom, (3) only remains non-resident and non-ordinarily resident in the United Kingdom for a period of less than five tax years and (4) disposes of his or her Aviva ordinary shares or ADSs during that period may also be liable, upon returning to the United Kingdom, for UK tax on capital gains, subject to any available exemption or relief, even though he or she was not resident or ordinarily resident in the United Kingdom at the time of the disposal.
UK Inheritance Tax
Aviva ordinary shares are assets situated in the United Kingdom for the purposes of UK inheritance tax (the equivalent of US estate and gift tax). Aviva ADSs are likely to be treated in the same manner. Subject to the discussion of the UK-US estate tax treaty below, UK inheritance tax may apply if an individual who holds Aviva ordinary shares or ADSs gifts them or dies even if he or she is neither domiciled in the United Kingdom nor deemed to be domiciled there under UK law. For inheritance tax purposes, a transfer of Aviva ordinary shares or ADSs at less than full market value may be treated as a gift for these purposes.
Special inheritance tax rules apply (1) to gifts if the donor retains some benefit, (2) to close companies and (3) to trustees of settlements.
However, as a result of the UK-US estate tax treaty, Aviva ordinary shares or ADSs held by an individual who is domiciled in the United States for the purposes of the UK-US estate tax treaty and who is not a UK national will not be subject to UK inheritance tax on that individual’s death or on a gift of the Aviva ordinary shares or ADSs unless the ordinary shares or ADSs:
| n | are part of the business property of a permanent establishment in the United Kingdom, or |
| n | pertain to a fixed base in the United Kingdom used for the performance of independent personal services. |
The UK-US estate tax treaty provides a credit mechanism if the Aviva ordinary shares or ADSs are subject to both UK inheritance tax and to US estate and gift tax.
UK Stamp Duty and Stamp Duty Reserve Tax
UK stamp duty is payable on the transfer of Aviva ordinary shares to a nominee or agent of the depositary in exchange for Aviva ADRs representing ADSs.
Furthermore, UK stamp duty reserve tax is payable upon the transfer of Aviva ordinary shares to a nominee or agent of the depositary in exchange for Aviva ADRs representing ADSs. For this purpose, the current rate of stamp duty and stamp duty reserve tax is 1.5% (rounded up, in the case of stamp duty, to the nearest £5). The rate is applied, in each case, to the amount or value of the consideration given for the Aviva ordinary shares or, in some circumstances, to the value of the Aviva ordinary shares at the time of transfer or issue. To the extent that such stamp duty is paid on any such transfer of Aviva ordinary shares, no stamp duty reserve tax should be payable on that transfer. Provided that the instrument of transfer is not executed in the United Kingdom and remains at all subsequent times outside the United Kingdom, no UK stamp duty will be required to be paid on any transfer of Aviva ADRs representing ADSs. An agreement to transfer Aviva ADRs will not give rise to a liability to stamp duty reserve tax.
The transfer for value of Aviva ordinary shares, as opposed to Aviva ADRs, will generally give rise to a charge to UK stamp duty or stamp duty reserve tax at the rate of 0.5% (rounded up, in the case of stamp duty, to the nearest £5, with transfers for a value not exceeding £1,000 being exempt). The rate is applied to the price payable for the relevant Aviva ordinary shares. Stamp duty reserve tax is generally the liability of the purchaser and UK stamp duty is usually paid by the purchaser.
US Taxation of Distributions
The gross amount of any distributions made by us to a US Holder will generally be subject to US federal income tax as dividend income to the extent paid or deemed paid out of our current or accumulated earnings and profits, as determined under US federal income tax principles. Such dividends will not be eligible for the dividends received deduction generally allowed to US corporations with respect to dividends received from other US corporations. To the extent that an amount received by a US Holder exceeds its allocable share of our current and accumulated earnings and profits, such excess would, subject to the discussion below, be treated first as a tax-free return of capital which will reduce such US Holder’s tax basis in his Aviva ordinary shares or ADSs and then, to the extent such distribution exceeds such US Holder’s tax basis, it will be treated as capital gain.
Subject to applicable holding period and other limitations, the US dollar amount of dividends received on the Aviva ordinary shares or ADSs in taxable years beginning prior to January 1, 2013 by certain non-corporate US Holders will be subject to taxation at a maximum rate of 15% if the dividends are “qualified dividends” and certain other requirements are met. Dividends paid on the Aviva ordinary shares or ADSs will be treated as qualified dividends if: (i) we are eligible for the benefits of the Treaty or the ADSs are readily tradeable on an established US securities market and (ii) we were not, in the year prior to the year in which the dividend was paid, and are not, in the year in which the dividend is paid, a passive foreign investment company (“PFIC”). Although we currently believe that distributions on the Aviva ordinary shares or ADSs that are treated as dividends for US federal income tax purposes should constitute qualified dividends, no assurance can be given that this will be the case. US Holders should consult their tax advisers regarding the tax rate applicable to dividends received by them with respect to the Aviva ordinary shares or ADSs, as well as the potential treatment of any loss on a disposition of Aviva ordinary shares or ADSs as long-term capital loss regardless of the US Holders’ actual holding period for the Aviva ordinary shares or ADSs.
We have not maintained and do not plan to maintain calculations of earnings and profits under US federal income tax principles. Accordingly, it is unlikely that US Holders will be able to establish whether a distribution by us is in excess of our accumulated earnings and profits (as computed under US federal income tax principles). If US Holders are unable to establish that distributions are in excess of our accumulated earnings and profits as determined under US federal income tax principles, any distribution by us may be treated as taxable in its entirety as a dividend to US Holders for US federal income tax purposes.
For foreign tax credit computation purposes, dividends will generally constitute foreign source income, and with certain exceptions, will constitute “passive category income”.
US Taxation of Capital Gains
Gain or loss realised by a US Holder on the sale or other disposition of Aviva ordinary shares or ADSs will be subject to US federal income taxation as capital gain or loss in an amount equal to the difference between the US Holder’s adjusted tax basis in the Aviva ordinary shares or ADSs and the amount realised on the disposition. Such gain or loss generally will be treated as long-term capital gain or loss if the Aviva ordinary shares or ADSs have been held for more than one year. Any such gain or loss realised will generally be treated as US source gain or loss. In the case of a US Holder who is an individual, capital gains are currently subject to federal income tax at preferential rates if specified minimum holding requirements are met. The deductibility of capital losses is subject to significant limitations.
Passive Foreign Investment Company Considerations
We believe that we should not be treated as a PFIC for US federal income tax purposes for the current taxable year and do not expect to become a PFIC in future years. However, because PFIC status is determined on an annual basis and because our income and assets and the nature of our activities may vary from time to time, we cannot assure US Holders that we will not be considered a PFIC for any taxable year.
We would be a PFIC for US federal income tax purposes in any taxable year if 75% or more of our gross income would be passive income, or on average at least 50% of the gross value of our assets is held for the production of, or produces, passive income. In making the above determination, we are treated as earning our proportionate share of any income and owning our proportionate share of any asset of any company in which we are considered to own, directly or indirectly, 25% or more of the shares by value. If we were considered a PFIC at any time when a US Holder held the Aviva ordinary shares or ADSs, we generally should continue to be treated as a PFIC with respect to that US Holder, and the US Holder generally will be subject to special rules with respect to (a) any gain realised on the disposition of the Aviva ordinary shares or ADSs and (b) any “excess distribution” by us to the US Holder in respect of the Aviva ordinary shares or ADSs. Under the PFIC rules: (i) the gain or excess distribution would be allocated ratably over the US Holder’s holding period for the Aviva ordinary shares or ADSs, (ii) the amount allocated to the taxable year in which the gain or excess distribution was realised or to any year before we became a PFIC would be taxable as ordinary income and (iii) the amount allocated to each other taxable year would be subject to tax at the highest tax rate in effect in that year and an interest charge generally applicable to underpayments of tax would be imposed in respect of the tax attributable to each such year. Because a US Holder that is a direct (and in certain cases indirect) shareholder of a PFIC is deemed to own its proportionate share of interests in any lower-tier PFICs, US Holders should be subject to the foregoing rules with respect to any of our subsidiaries characterised as PFICs, if we are deemed a PFIC. A US Holder may be able to avoid many of these adverse tax consequences if it elects to mark the Aviva ordinary shares or ADSs to market on an annual basis. However, any such mark to market election would not be available for a lower-tier PFIC. US Holders are urged to consult their tax advisers about the PFIC rules, including the advisability, procedure and timing of making a mark-to-market election and the US Holder’s eligibility to file such an election (including whether the Aviva ordinary shares or ADSs are treated as ‘‘publicly traded’’ for such purpose).
Dividends and paying agents
A US Holder may be subject to information reporting to the IRS and possible backup withholding with respect to dividends paid on, or proceeds of the sale or other disposition of, Aviva ordinary shares or ADSs unless such US Holder qualifies within certain categories of exempt recipients or provides a taxpayer identification number and certifies as to no loss of exemption from backup withholding and otherwise complies with applicable requirements of the backup withholding rules. Amounts withheld under these rules may be credited against the US Holder’s US federal income tax liability and a US Holder may obtain a refund of any excess amounts withheld under the backup withholding rules by filing the appropriate IRS forms and furnishing any required information. A US Holder who does not provide a correct taxpayer identification number may be subject to penalties imposed by the IRS.
A non-US Holder generally will not be subject to information reporting or backup withholding with respect to dividends on Aviva ordinary shares or ADSs, unless payment is made through a paying agent (or office) in the United States or through certain US-related financial intermediaries. However, a Non-US Holder generally may be subject to information reporting and backup withholding with respect to the payment within the United States of dividends on Aviva ordinary shares or ADSs, unless such non-US Holder provides a taxpayer identification number, certifies under penalties of perjury as to its foreign status, or otherwise establishes an exemption
Where you can find more information
As a result of filing a registration statement with respect to our ADSs and ordinary shares, we are subject to the informational requirements of the Securities Exchange Act of 1934, as amended, and file reports and other information with the Securities and Exchange Commission. You may read and copy this information at the following location: Public Reference Room, 100 F Street, N.E., Room 1580, Washington, D.C. 20549. Please call the SEC at 1-800-SEC-0330 for further information on the public reference room. Copies of these materials can also be obtained by mail at prescribed rates from the Public Reference Room and are available on the Securities and Exchange Commission’s website at http://www.sec.gov.
Our ADSs are listed on the NYSE, and consequently, our periodic reports and other information filed by us with the SEC can be inspected at the offices of the New York Stock Exchange, 20 Broad Street, New York, New York 10005, and on the NYSE’s website at http://www.nyse.com.
We also file reports and other documents with the London Stock Exchange. This information may be viewed on the London Stock Exchange’s website at http://www.londonstockexchange.com and those reports and documents not filed electronically may be viewed at the Document Viewing Facility, UK Listing Authority, Financial Services Authority, 25 The North Colonnade, Canary Wharf, London E14 5HS, UK. All reports and other documents filed with the London Stock Exchange are also published on our website at http://www.aviva.com.
Description of securities other than equity securities
The ordinary shares underlying our “ADSs” were registered under the Securities Exchange Act of 1934, as amended, in October 2009. The ADSs are represented by “ADRs” for trading on the NYSE under the symbol “AV”. One ADR represents two ordinary shares.
Fees and expenses for ADS holders
ADS holders will be required to pay the following service fees to the depositary bank:
| Service | Fees |
| Issuance of ADSs | Up to US 5c per ADS issued |
| Cancellation of ADSs | Up to US 5c per ADS cancelled |
| Distribution of cash dividends or other cash distributions | Up to US 5c per ADS held |
| Distribution of ADSs pursuant to stock dividends, free stock distributions or exercise of rights. | Up to US 5c per ADS held |
| Distribution of securities other than ADSs or rights to purchase additional ADSs | Up to US 5c per ADS held |
| Depositary Services | Up to US 5c per ADS held on the applicable record date(s) established by the Depositary |
ADS holders will also be responsible for paying certain fees and expenses incurred by the depositary bank and certain taxes and governmental charges such as:
| n | Fees for the transfer and registration of ordinary shares charged by the registrar and transfer agent for the ordinary shares in England and Wales (i.e., upon deposit and withdrawal of ordinary shares); |
| n | Expenses incurred for converting foreign currency into US dollars; |
| n | Expenses for cable, telex and fax transmissions and for delivery of securities; |
| n | Taxes and duties upon the transfer of securities (i.e., when ordinary shares are deposited or withdrawn from deposit); |
| n | Fees and expenses incurred in connection with compliance with exchange control regulations or other regulatory requirements applicable to the ordinary shares; and |
| n | Fees and expenses incurred in connection with the delivery or servicing of ordinary shares on deposit. |
Depositary fees payable upon the issuance and cancellation of ADSs are typically paid to the depositary bank by the brokers (on behalf of their clients) receiving the newly issued ADSs from the depositary bank and by the brokers (on behalf of their clients) delivering the ADSs to the depositary bank for cancellation. The brokers in turn charge these fees to their clients. Depositary fees payable in connection with distributions of cash or securities to holders and the depositary services fee are charged by the depositary bank to the holders of record of ADSs as of the applicable ADS record date.
The Depositary fees payable for cash distributions are generally deducted from the cash being distributed. In the case
of distributions other than cash (i.e., stock dividend, rights), the depositary bank charges the applicable fee to the ADS record date holders concurrent with the distribution. In the case of ADSs registered in the name of the investor (whether certificated or uncertificated in direct registration), the depositary bank sends invoices to the applicable record date ADS holders. In the case of ADSs held in brokerage and custodian accounts (via DTC), the depositary bank generally collects its fees through the systems provided by DTC (whose nominee is the registered holder of the ADSs held in DTC) from the brokers and custodians holding ADSs in their DTC accounts. The brokers and custodians who hold their clients’ ADSs in DTC accounts in turn charge their clients’ accounts the amount of the fees paid to the depositary banks.
In the event of refusal to pay the depositary fees, the depositary bank may, under the terms of the deposit agreement, refuse the requested service until payment is received or may set off the amount of the depositary fees from any distribution to be made to the ADS holder.
Note that the fees and charges ADS holders may be required to pay may vary over time and may be changed by us and by the depositary bank. ADS holders will receive prior notice of such changes.
The depositary bank may reimburse us for certain expenses incurred by us in respect of the ADR programme established pursuant to the deposit agreement upon such terms and conditions as we and the depositary bank may agree from time to time.
Depositary payment to Aviva plc
The depositary bank may reimburse us for certain expenses incurred by us in respect of the ADR programme established pursuant to the deposit agreement upon such terms and conditions as we and the depositary bank may agree from time to time. From 1 January 2012 to 31 December 2012, we received from the depositary bank $354,567.69 for standard out-of-pocket maintenance costs for the ADRs (consisting of the expenses of postage and envelopes for mailing for our annual general meeting, calculation of dividend payments, printing and distributing dividend cheques, electronic filing of US Federal tax information, mailing required tax forms, stationery, postage, facsimile, and telephone calls) and legal fees.
The depositary bank has agreed to reimburse us for expenses as they occur in the future that are related to establishment and maintenance expenses of the ADR programme. The depositary bank has also agreed to pay the standard out-of-pocket maintenance costs for the ADRs, which consist of the expenses of postage and envelopes for mailing for the annual general meeting, calculation of dividend payments, printing and distributing dividend cheques, electronic filing of US Federal tax information, mailing required tax forms, stationery, postage, facsimile, and telephone calls.
There are limits on the amount of expenses for which the depositary will reimburse us, but the amount of reimbursement available to us is not necessarily tied to the amount of fees the depositary collects from investors.
Purchase of equity securities by Aviva plc and affiliated purchasers
The following table sets forth information with respect to purchases made by or on behalf of Aviva plc or any ‘‘affiliated purchasers’’ (as that term is defined in Rule 10b-18(a)(3) under the Securities Exchange Act of 1934, as amended) of Aviva’s ordinary shares or ADSs for the year ended 31 December 2012.
| Period | | Total Number
of Shares Purchased1,2 | | Average
Price Paid
per Share £ | | Total Number of Shares Purchased as Part of Publicly Announced Plans
or Programmes | | Maximum Number of Shares that May Yet be Purchased Under the Plans
or Programmes |
| January | | 53,764 | | 3.61 | | n/a | | n/a |
| February | | 51,121 | | 3.75 | | n/a | | n/a |
| March | | 754,939 | | 3.54 | | n/a | | n/a |
| April | | 63,529 | | 3.00 | | n/a | | n/a |
| May | | 70,005 | | 2.71 | | n/a | | n/a |
| June | | 68,430 | | 2.76 | | n/a | | n/a |
| July | | 69,269 | | 2.80 | | n/a | | n/a |
| August | | 58,080 | | 3.32 | | n/a | | n/a |
| September | | 1,658,467 | | 3.24 | | n/a | | n/a |
| October | | 4,455,118 | | 3.27 | | n/a | | n/a |
| November | | 3,555,210 | | 3.30 | | n/a | | n/a |
| December | | 47,435 | | 3.84 | | n/a | | n/a |
| 1. | The shares listed in this column were acquired by employee benefit trusts during the year to satisfy future obligations to deliver shares under the Company’s executive and employee share plans. |
| 2. | This table excludes Aviva plc shares purchased by investment funds managed by Aviva Investors in accordance with investment strategies that are established by Aviva Investors acting independently of Aviva plc. |
Statement of differences from NYSE corporate governance practices
Under Section 303(A) of the NYSE Listed Company Manual, the Company must provide a brief description of any significant differences between its corporate governance practices, which are informed by UK law in the case of the Company, and those followed by US companies under the NYSE listing standards. The description need not set forth all differences between UK law and US law; rather, the focus is on the Company’s practices.
The Company’s statement of differences is set out in the Governance section of this report on page 54.
Legal proceedings
We are involved in litigation in the ordinary course of business, including litigation in which plaintiffs seek compensatory or punitive damages and mass or class relief. Information on various legal proceedings is set out in “Financial Statements – Note 48 – Contingent liabilities and other risk factors”.
The directors do not believe that any current pending or threatened litigation or dispute will have a material adverse effect on the Group’s financial position, although there can be no assurance that losses resulting from any pending or threatened litigation or dispute will not materially affect the Group’s financial position for any period.
Employees
Membership of our employees in trade unions varies from country to country, and we have entered into various collective bargaining agreements or appropriate employee consultation arrangements, or both, in most of the countries in which we operate where required. It is our practice to renew or replace our various labour arrangements relating to continuing operations as and when they expire and we are not aware of any material arrangement whose expiry is pending and which is not expected to be satisfactorily renewed or replaced in a timely manner. We have not experienced any significant work stoppages or strikes in the past three years. We believe that relations with our employees are generally good.
Controls and procedures
Disclosure controls and procedures
Management has evaluated, with the participation of Aviva’s Group chief executive officer and chief financial officer, the effectiveness of the disclosure controls and procedures as at
31 December 2012. Based upon Aviva’s evaluation, the Group chief executive officer and chief financial officer concluded that, as of 31 December 2012, Aviva’s disclosure controls and procedures were effective to provide reasonable assurance that information required to be disclosed by Aviva in the reports which Aviva files and submits under the US Securities Exchange Act of 1934, as amended, is recorded, processed, summarised and reported, within the time periods specified in the applicable rules and forms and that it is accumulated and communicated to Aviva’s management, including the Group chief executive officer and chief financial officer, as appropriate to allow timely decisions regarding required disclosure.
Management’s annual report on internal control over financial reporting
Management, including Aviva’s Group chief executive officer and chief financial officer, is responsible for establishing and maintaining adequate internal control over financial reporting. Internal control over financial reporting is a process designed to provide reasonable assurance regarding the reliability of financial reporting and the preparation of its financial statements for external purposes in accordance with IFRS.
Internal control over financial reporting includes policies and procedures that (i) pertain to the maintenance of records that, in reasonable detail, accurately and fairly reflect the transactions and dispositions of assets; (ii) provide reasonable assurance that transactions are recorded as necessary to permit the preparation of financial statements in accordance with IFRS; (iii) provide reasonable assurance that receipts and expenditures are being made only in accordance with the authorisation of management and directors of Aviva Group; and (iv) provide reasonable assurance regarding prevention or timely detection of unauthorised acquisition, use or disposition of Aviva Group’s assets that could have a material effect on the financial statements.
Due to its inherent limitations, internal control over financial reporting may not prevent or detect all misstatements. Also, projections of any evaluation of effectiveness of future periods are subject to the risk that controls may become inadequate because of changes in conditions, or that the degree of compliance with policies and procedures may deteriorate.
Aviva Group’s management assessed the effectiveness of the internal control over financial reporting as at 31 December 2012 using the criteria set forth by the Committee of Sponsoring Organisations of the Treadway Commission (COSO) in its report ‘Internal Control – Integrated Framework’. Based on its assessment, management concluded that, as at 31 December 2012, Aviva Group’s internal control over financial reporting was effective based on the COSO criteria.
The effectiveness of Aviva Group’s internal control over financial reporting as at 31 December 2012 has been audited by PricewaterhouseCoopers LLP, an independent registered public accounting firm, as stated in their report which is included on page 106.
Changes in internal control over financial reporting
There have been no significant changes in Aviva Group’s internal control over financial reporting that occurred during the period covered by this annual report that has materially affected, or is reasonably likely to materially affect, Aviva Group’s internal control over financial reporting.
Other information
| In this section | |
| Glossary | 259 |
| Signatures | 261 |
| Exhibits | 262 |
Glossary
Product definitions
Annuities
A type of policy that pays out regular amounts of benefit, either immediately and for the remainder of a person’s lifetime, or deferred to commence from a future date. Immediate annuities may be purchased for an individual and his or her dependants or on a bulk purchase basis for groups of people. Deferred annuities are accumulation contracts, which may be used to provide benefits in retirement, and may be guaranteed, unit-linked or index-linked.
Bonds and savings
These are accumulation products with single or regular premiums and unit-linked or guaranteed investment returns.
Critical illness cover
Pays out a lump sum if the insured person is diagnosed with a serious illness that meets the plan definition.
Deferred annuities
An annuity (or pension) due to be paid from a future date or when the policyholder reaches a specified age. A deferred annuity may be funded by a policyholder by payment of a series of regular contributions or by a capital sum.
Group pensions
A pension plan that covers a group of people, which is typically purchased by a company and offered to their employees.
Guaranteed annuities
A policy that pays out a fixed regular amount of benefit for a defined period.
Income drawdown
The policyholder can transfer money from any pension fund to an income drawdown plan from which they receive an income. The remainder of the pension fund continues to be invested, giving it the potential for growth.
Investment sales
Comprise retail sales of mutual fund-type products such as unit trusts, individual savings accounts (ISAs) and open ended investment companies (OEICs).
ISAs
Individual savings accounts – Tax-efficient plans for investing in stocks and shares, cash deposits or life insurance investment funds, subject to certain limits.
Mortgage endowment
An insurance contract combining savings and protection elements which is designed to repay the principal of a loan or mortgage.
Mortgage life insurance
A protection contract designed to pay off the outstanding amount of a mortgage or loan in the event of death of the insured.
OEIC (Open ended investment company)
An collective investment fund structured as a limited company in which investors can buy and sell shares.
Pensions
A means of providing income in retirement for an individual and possibly his/her dependants.
Personal pensions
A pension plan tailored to the individual policyholder, which includes the options to stop, start or change their payments.
Protection
An insurance contract that protects the policyholder or his/her dependants against financial loss on death or ill-health.
Regular premium
A series of payments are made by the policyholder, typically monthly or annually, for part of or all of the duration of the contract.
SICAVs
This is an open-ended investment fund, structured as a legally independent joint stock company, whose units are issued in the form of shares.
Single premium
A single lump sum is paid by the policyholder at commencement of the contract.
Stakeholder pensions
Low cost and flexible pension plans available in the UK, governed by specific regulations.
Term assurance
A simple form of life insurance, offering cover over a fixed number of years during which a lump sum will be paid out if the life insured dies.
Unit trusts
A form of open ended collective investment constituted under a trust deed, in which investors can buy and sell units.
Unit-linked annuities
A type of deferred annuity which is invested in units of investment funds, whose value depends directly on the market value of assets in those funds.
Whole life
A protection policy that remains in force for the insured’s whole life. Traditional whole life contracts have fixed premium payments that typically cannot be missed without lapsing the policy. Flexible whole life contracts allow the policyholder to vary the premium and/or amount of life cover, within certain limits.
With-profits
A type of long-term savings and insurance product sold in the UK under with profits policies premiums are paid into a separate fund. Policyholders receive a return on their policies through bonuses, which “smooth” the investment return from the assets which premiums are invested in. Bonuses are declared on an annual and terminal basis. Shareholders have a participating interest in the with-profit funds and any declared bonuses. Generally, policyholder and shareholder participation in with-profit funds in the UK is split 90:10.
General terms
Adjusted operating profit
From continuing operations based on expected investment returns, stated before tax attributable to shareholders’ profits and before non-operating items including, impairment of goodwill, exceptional and other items.
Available for sale (AFS)
Securities that have been acquired neither for short-term sale nor to be held to maturity. These are shown at fair value on the statement of financial position and changes in value are taken straight to equity instead of the income statement.
Association of British Insurers (ABI)
A major trade association for UK insurance companies, established in July 1985.
Acquired value of in force (AVIF)
The present value of future profits on a portfolio of long-term insurance and investment contracts, acquired either directly or through the purchase of a subsidiary.
Bancassurance
An arrangement whereby banks and building societies sell insurance and investment products to their customers on behalf of other financial providers.
UK Corporate Governance Code
The code sets out guidance in the form of principles and provisions on how companies should be directed and controlled to follow good governance practice.
Deferred acquisition costs (DAC)
The costs directly attributable to the acquisition of new business for insurance and investment contracts may be deferred to the extent that they are expected to be recoverable out of future margins in revenue on these contracts.
Fair value
The amount for which an asset can be exchanged, or a liability settled, between knowledgeable, willing parties in an arm’s length transaction.
FSA
The UK’s Financial Services Authority – Main regulatory body appointed by the government to oversee financial services industry in the UK. Since December 2001 it has been the single statutory regulator responsible for savings, insurance and investment business. From 1 April 2013, the FSA will split into two new regulatory bodies: the Prudential Regulation Authority (PRA), which will be a subsidiary of the Bank of England, and the Financial Conduct Authority (FCA).
Funds under management
Represents all assets actively managed or administered by or on behalf of the Group including those funds managed by third parties.
Funds under management by Aviva
Represents all assets actively managed or administered by the fund management operations of the Group.
General insurance
Also known as non-life or property and casualty insurance. Property insurance covers loss or damage through fire, theft, flood, storms and other specified risks. Casualty insurance primarily covers losses arising from accidents that cause injury to other people or damage the property of others.
Gross written premiums
The total earnings or revenue generated by sales of insurance products, before any reinsurance is taken into account. Not all premiums written will necessarily be treated as income in the current financial year, because some of them could relate to insurance cover for a subsequent period.
Independent Financial Advisers (IFAs)
A person or organisation authorised to give advice on financial matters and to sell the products of all financial service providers.
IFRS
International Financial Reporting Standards. These are accounting regulations designed to ensure comparable statement of financial position preparation and disclosure, and are the standards that all publicly listed companies in the European Union are required to use.
Inherited estate
In the UK, the assets of the long-term with-profit funds less the realistic reserves for non-profit policies written within the with-profit funds, less asset shares aggregated across the with-profit policies and any additional amounts expected at the valuation date to be paid to in-force policyholders in the future in respect of smoothing costs and guarantees.
Long-term and savings business
Collective term for life insurance, pensions, savings, investments and related business.
Net written premiums
Total gross written premiums for the given period, minus premiums paid over or ‘ceded’ to reinsurers.
Net asset value per ordinary share
Net asset value divided by the number of ordinary shares in issue. Net asset value is based on equity shareholders’ funds.
Present value of new business (PVNBP)
Present value of new regular premiums plus 100% of single premiums, calculated using assumptions consistent with those used to determine the value of new business under Market Consistent Embedded Value (MCEV) principles published by the CFO Forum.
Turnbull Guidance on Internal Control
The Turnbull Guidance sets out best practice on internal controls for UK listed companies, and provides additional guidance in applying certain sections of the UKCorporate Governance Code.
Signatures
The registrant hereby certifies that it meets all of the requirements for filing on Form 20-F and that it has duly caused and authorised the undersigned to sign this annual report on its behalf.
Aviva plc
(Registrant)
Dated 22 March 2013
………………………..………………………
Mark Wilson
Group chief executive officer
Exhibits
The following exhibits have been filed as part of this Annual Report:
| Exhibit 1.1 | Articles of Association of Aviva plc adopted by special resolution passed on 3 May 2012 |
| | |
| Exhibit 2.1 | Form of Deposit Agreement among Aviva plc, Citibank, as depositary, and holders and beneficial owners from time to time of ADRs issued thereunder, including the form of ADR (incorporated by reference to Exhibit 2. 1 of the Aviva plc Registration Statement on Form 20-F filed on 7 October 2009) |
| | |
| Exhibit 2.2 | The total amount of long term debt securities of Aviva plc authorised under any instrument does not exceed 10 percent of the total assets of the Company on a consolidated basis. Aviva plc hereby agrees to furnish to the Securities and Exchange Commission, upon its request, a copy of any instrument defining the rights of holders of long-term debt of Aviva plc or of its subsidiaries for which consolidated or unconsolidated financial statements are required to be filed. |
| | |
| Exhibit 4.1 | Aviva Capital Accumulation plan rules (incorporated by reference to Exhibit 4.1 of the Aviva plc Registration Statement on Form 20-F filed on 7 October 2009 |
| | |
| Exhibit 4.1.1 | Addendum Aviva Capital Accumulation plan rules (22 December 2010) |
| | |
| Exhibit 4.1.2 | Addendum Aviva Capital Accumulation plan rules (8 December 2010) |
| | |
| Exhibit 4.2 | Aviva Executive Long Term Incentive plan 2011 rules (amended 2012) |
| | |
| Exhibit 4.2.1 | Rules of the Aviva Investors Holdings Limited 2009 Long term incentive plan (amended 2013) |
| | |
| Exhibit 4.3 | Aviva Executive Annual Bonus 2011 plan rules (amended 2012) |
| | |
| Exhibit 4.4 | Aviva Executive Share Option plan rules (incorporated by reference to Exhibit 4.7 of the Aviva plc of the 2009 Annual Report filed on Form 20-F on 30 March 2010) |
| | |
| Exhibit 4.5 | Rules of the Aviva recruitment and retention share award plan CFO |
| | |
| Exhibit 4.6 | Conditional Share Award Terms and Conditions – Trevor Matthews |
| | |
| Exhibit 4.7 | Rules of the Aviva recruitment and retention share award plan (amended 2012) |
| | |
| Exhibit 8.1 | Schedule of subsidiaries of Aviva plc |
| | |
| Exhibit 11.1 | Code of ethics (incorporated by reference to Exhibit 11.1 of the Aviva plc Registration Statement on Form 20-F filed on 7 October 2009) |
| | |
| Exhibit 12.1 | Certification of the Company's Chief Executive Officer pursuant to Section 302 of the Sarbanes-Oxley Act of 2002 |
| | |
| Exhibit 12.2 | Certification of the Company’s Chief Financial Officer pursuant to Section 302 of the Sarbanes-Oxley Act of 2002 |
| | |
| Exhibit 13.1 | Certification of the Company's Chief Executive Officer pursuant to Section 18 U.S.C. Section 1350, as adopted pursuant to Section 906 of the Sarbanes-Oxley Act of 2002 |
| | |
| Exhibit 13.2 | Certification of the Company's Chief Financial Officer pursuant to Section 18 U.S.C. Section 1350, as adopted pursuant to Section 906 of the Sarbanes-Oxley Act of 2002 |