UNITED STATES
SECURITIES AND EXCHANGE COMMISSION
Washington, D.C. 20549
FORM N-CSRS
CERTIFIED SHAREHOLDER REPORT OF REGISTERED MANAGEMENT
INVESTMENT COMPANIES
Investment Company Act file number 811-10381
PIMCO New York Municipal Income Fund
(Exact name of registrant as specified in charter)
1345 Avenue of the Americas, New York, NY | | 10105 |
(Address of principal executive offices) | | (Zip code) |
Lawrence G. Altadonna - 1345 Avenue of the Americas, New York, NY 10105
(Name and address of agent for service)
Registrant’s telephone number, including area code: 212-739-3371
Date of fiscal year end: April 30, 2008
Date of reporting period: October 31, 2007
Form N-CSRS is to be used by management investment companies to file reports with the Commission not later than 10 days after the transmission to stockholders of any report that is required to be transmitted to stockholders under Rule 30e-1 under the Investment Company Act of 1940 (17 CFR 270.30e -1). The Commission may use the information provided on Form N-CSRS in its regulatory, disclosure review, inspection, and policymaking roles.
A registrant is required to disclose the information specified by Form N-CSRS, and the Commission will make this information public. A registrant is not required to respond to the collection of information contained in Form N-CSRS unless the Form displays a currently valid Office of Management and Budget (“OMB”) control number. Please direct comments concerning the accuracy of the information collection burden estimate and any suggestions for reducing the burden to Secretary, Securities and Exchange Commission, 450 Fifth Street, NW, Washington, DC 20549-0609. The OMB has reviewed this collection of information under the clearance requirements of 44 U.S.C. § 3507.
ITEM 1. REPORT TO SHAREHOLDERS
PIMCO Municipal Income Fund
PIMCO California Municipal Income Fund
PIMCO New York Municipal Income Fund
Semi-Annual Report
October 31, 2007
Contents
| Fund Insights/Performance & Statistics | 2-5 |
| Schedules of Investments | 6-22 |
| Statements of Assets and Liabilities | 23 |
| Statements of Operations | 24 |
| Statements of Changes in Net Assets | 26-27 |
| Statement of Cash Flows | 28 |
| Notes to Financial Statements | 29-34 |
| Financial Highlights | 35-37 |
Matters Relating to the Trustees Consideration
of the Investment Management & Portfolio
Management Agreements | 38-40 |
PIMCO Municipal Income Funds
Letter to Shareholders
December 5, 2007
Dear Shareholder:
We are pleased to provide you with the semi-annual report for the PIMCO Municipal Income Fund, PIMCO California Municipal Income Fund and PIMCO New York Municipal Income Fund (the ‘‘Funds’’) for the six-months ended October 31, 2007.
The U.S. bond market delivered modest returns in the period as economic growth continued despite weakness in the U.S. housing and mortgage markets. In response to lower liquidity, the Federal Reserve reduced the Federal Funds rate twice late in the six-month period, reducing the key rate from 5.25% to 4.50% even as inflation levels continued to track higher than the central bank’s stated comfort level. Municipal bonds underperformed the broad U.S. credit market throughout the six-month period on sharply lower liquidity.
For specific information on the Funds and their performance during the reporting period please review the following pages. If you have any questions regarding the information provided, we encourage you to contact your financial advisor or call the Funds’ shareholder servicing agent at (800) 331-1710. In addition, a wide range of information and resources is available on our Web site, www.allianzinvestors.com/closedendfunds.
Together with Allianz Global Investors Fund Management LLC, the Fund’s investment manager, and Pacific Investment Management Company LLC, the Funds’ sub-adviser, we thank you for investing with us.
We remain dedicated to serving your investment needs.
Sincerely,

| | | | | | |
 | |  |
Hans W. Kertess
Chairman | | Brian S. Shlissel
President & Chief Executive Officer |
|
10.31.07 | PIMCO Municipal Income Funds Semi-Annual Report 1
PIMCO Municipal Income Fund
Fund Insights/Performance & Statistics
| |
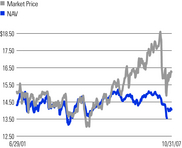
| • | For the fiscal six-month period ended October 31, 2007, PIMCO Municipal Income Fund returned (2.11)% on net asset value (‘‘NAV’’) and (6.86)% on market price, compared with (0.97)% and (7.29)%, respectively, for the Lipper Analytical General Municipal Debt Funds (Leveraged) average. |
| |
| • | Intermediate- and longer-maturity municipal bond yields increased for the six-month period ending October 31, 2007. |
| |
| • | Interest rates for Treasuries and London Inter-bank Offered Rate (‘‘LIBOR’’) Swaps outperformed municipal bonds, moving lower across all maturities. |
| |
| • | Municipal bond issuance increased significantly from last year’s levels. For the six-month period, supply levels were at $227.2 billion versus $199.2 billion for the same six-month period during 2006. |
| |
| • | The municipal yield curve steepened during the period. The 10-year, 20-year and 30-year maturity AAA General Obligation yields increased 6, 22 and 31 basis points, respectively. |
| |
| • | Municipal to Treasury yield ratios tightened during the reporting period. The 10-year ratio increased to 85.18% and 30-year ratio increased to 92.69%. |
| |
| • | Long Municipals underperformed long Treasuries and the taxable debt sector during the reporting period. The Lehman Long Municipal Bond Index returned (0.57)% while the Long Government/Credit and the Long Lehman Treasury Indices returned 2.24% and 3.5%, respectively. |
| |
| • | Tobacco securitization sector holdings detracted from performance due to increased issuance by California, New Jersey and anticipation of a large Ohio issue toward the end of the period. |
| |
| • | Exposure to zero coupon municipals was negative for performance. The Lehman Zero Coupon Index returned (1.61)% for the six-month period. |
| | | | | | | | | | |
| Total Return(1): | | Market Price | | Net Asset Value (‘‘NAV’’) |
| Six Months | | (6.86)% | | (2.11)% |
| 1 Year | | 2.72% | | (0.08)% |
| 3 Year | | 10.62% | | 6.13% |
| 5 Year | | 9.09% | | 6.65% |
| Commencement of Operations (6/29/01) to 10/31/07 | | 8.08% | | 6.57% |
|
Common Share Market Price/NAV Performance:
Commencement of Operations (6/29/01) to 10/31/07
2 PIMCO Municipal Income Funds Semi-Annual Report | 10.31.07
PIMCO California Municipal Income Fund
Fund Insights/Performance & Statistics
| |
| • | For the fiscal six-month period ended October 31, 2007, PIMCO California Municipal Income Fund returned 0.04% on net asset value (‘‘NAV’’) and (5.65)% on market price, compared with 0.69% and (7.02)%, respectively, for the Lipper Analytical California Municipal Debt Funds average. |
| |
| • | Intermediate- and longer-maturity municipal bond yields increased during the six-month period ended October 31, 2007. |
| |
| • | Interest rates for Treasuries and London Inter-bank Offered Rate (‘‘LIBOR’’) Swaps outperformed municipal bonds, moving lower across all maturities. |
| |
| • | Municipal bond issuance increased significantly from last year’s levels. For the six-month period, supply levels were at $227.2 billion versus $199.2 billion for the same six-month period in 2006. |
| |
| • | The municipal yield curve steepened during the period. The 10-year, 20-year and 30-year maturity AAA General Obligation yields increased 6, 22 and 31 basis points, respectively. |
| |
| • | Municipal to Treasury yield ratios tightened during the period. The 10-year ratio increased to 85.18% and 30-year ratio increased to 92.69%. |
| |
| • | Long Municipals underperformed long Treasuries and the taxable debt sector during the period. The Lehman Long Municipal Bond Index returned (0.57)% while the Long Government/Credit and the Long Lehman Treasury Indices returned 2.24% and 3.5%, respectively. |
| |
| • | Exposure to zero coupon municipals was negative for performance. The Lehman Zero Coupon Index returned (1.61)% for the six-month period. |
| |
| • | Municipal bonds within California underperformed on the long end of the curve for the period. Year-to-date, California continues to lead all other states in new issuance. The state’s issuance increased 63.6% from $37.1 billion in the first ten months of 2006 to $60.7 billion during the same period of 2007. |
| |
| • | The shape of the California State AAA insured municipal yield curve steepened during the period. Five-year maturity credits decreased 13 basis points, 10-year maturities increased 4 basis points, and 30-year maturities increased 32 basis points. |
| | | | | | | | | | |
| Total Return(1): | | Market Price | | Net Asset Value (‘‘NAV’’) |
| Six Months | | (5.65)% | | 0.04% |
| 1 Year | | 3.04% | | 2.15% |
| 3 Year | | 11.53% | | 6.74% |
| 5 Year | | 8.60% | | 6.96% |
| Commencement of Operations (6/29/01) to 10/31/07 | | 7.75% | | 6.58% |
|
Common Share Market Price/NAV Performance:
Commencement of Operations (6/29/01) to 10/31/07
10.31.07 | PIMCO Municipal Income Funds Semi-Annual Report 3
PIMCO New York Municipal Income Fund
Fund Insights/Performance & Statistics
| |
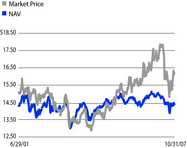
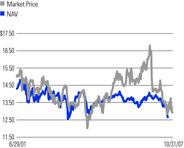
| • | For the fiscal six-month period ended October 31, 2007, PIMCO New York Municipal Income Fund returned (1.28)% on net asset value (‘‘NAV’’) and (11.67)% on market price, compared with (0.47)% and (6.46)%, respectively, for the Lipper Analytical New York Municipal Debt Funds average. |
| |
| • | Intermediate- and longer-maturity municipal bond yields increased during the six-month period ended October 31, 2007. |
| |
| • | Interest rates for Treasuries and London Inter-bank Offered Rate (‘‘LIBOR’’) Swaps outperformed municipal bonds, moving lower across all maturities. |
| |
| • | Municipal bond issuance increased significantly from last year’s levels. For the six-month period, supply levels were at $227.2 billion versus $199.2 billion for the same six-month period in 2006. |
| |
| • | The municipal yield curve steepened during the period. The 10-year, 20-year and 30-year maturity AAA General Obligation yields increased 6, 22 and 31 basis points, respectively. |
| |
| • | Municipal to Treasury yield ratios tightened during the period. The 10-year ratio increased to 85.18% and 30-year ratio increased to 92.69% |
| |
| • | Long Municipals underperformed long Treasuries and the taxable debt sector during the period. The Lehman Long Municipal Bond Index returned (0.57)% while the Long Government/Credit and the Long Lehman Treasury Indices returned 2.24% and 3.5%, respectively. |
| |
| • | Exposure to zero coupon municipals was negative for performance. The Lehman Zero Coupon Index returned (1.61)% for the six-month period. |
| |
| • | Municipal bonds within New York were in line with the national index for the period. Year-to-date, New York State issued $25.3 billion of bonds, 7.8% higher than the comparable period last year. At October 31, 2007, New York State ranked third in terms of bond issuance. |
| |
| • | The shape of the New York Insured AAA municipal yield curve steepened during the period. Five-year maturity AAA credits decreased 15 basis points, 10-year maturities increased 3 basis points, and 30-year maturities increased 29 basis points. |
| | | | | | | | | | |
| Total Return(1): | | Market Price | | Net Asset Value (‘‘NAV’’) |
| Six Months | | (11.67)% | | (1.28)% |
| 1 Year | | (14.14)% | | 0.06% |
| 3 Year | | 3.57% | | 5.23% |
| 5 Year | | 4.26% | | 5.37% |
| Commencement of Operations (6/29/01) to 10/31/07 | | 3.92% | | 5.11% |
|
Common Share Market Price/NAV Performance:
Commencement of Operations (6/29/01) to 10/31/07
4 PIMCO Municipal Income Funds Semi-Annual Report | 10.31.07
PIMCO Municipal Income Funds
Fund Insights/Performance & Statistics
| | |
| (1) | | Past performance is no guarantee of future results. Total return is determined by subtracting the initial investment from the value at the end of the period and dividing the remainder by the initial investment and expressing the result as a percentage. The calculation assumes that all of each Fund’s income dividends and capital gain distributions have been reinvested. Total return does not reflect broker commissions or sales charges. Total return for a period of less than one year is not annualized. Total return for a period of more than one year represents the average annual total return. |
| | |
| | An investment in the Fund involves risk, including the loss of principal. Total return, market price, yield and net asset value will fluctuate with changes in market conditions. This data is provided for information only and is not intended for trading purposes. A portion of the income generated by the Fund may be subject to federal, state and local taxes, and may at times be subject to the alternative minimum tax. Closed-end funds, unlike open-end funds, are not continuously offered. There is a one-time public offering and once issued, shares of closed-end funds are sold in the open market through a stock exchange. Net asset value is equal to total assets attributable to common shareholders less total liabilities divided by the number of common shares outstanding. Holdings are subject to change daily. |
| | |
| (2) | | Market Price Yield is determined by dividing the annualized current monthly per share dividend (comprised from net investment income) payable to common shareholders by the market price per common share at October 31, 2007. |
10.31.07 | PIMCO Municipal Income Funds Semi-Annual Report 5
PIMCO Municipal Income Fund
Schedule of Investments
| | | | | | | | | | | | | | |
Principal
Amount
(000) | | | | Credit Rating
(Moody’s/S&P) | | Value |
MUNICIPAL BONDS & NOTES–95.9% |
| | | | | Alabama–2.8% | | | | | | |
| $ | 2,500 | | | Birmingham Baptist Medical Centers Special Care Facs. Financing Auth. Rev., 5.875%, 11/15/24, Ser. A | | Baa1/NR | | $ | 2,595,025 | |
| | 8,000 | | | Huntsville Health Care Auth. Rev., 5.75%, 6/1/31, Ser. A, (Pre-refunded @ $101, 6/1/11) (a) | | A2/NR | | | 8,653,120 | |
| | | | | Huntsville-Redstone Village Special Care Facs. Financing Auth. Rev., | | | | | | |
| | 250 | | | 5.50%, 1/1/28 | | NR/NR | | | 239,985 | |
| | 885 | | | 5.50%, 1/1/43 | | NR/NR | | | 821,616 | |
| | 1,350 | | | Montgomery Medical Clinic Board, Jackson Hospital & Clinic Rev., 5.25%, 3/1/31 | | Baa2/BBB− | | | 1,314,482 | |
| | 2,900 | | | Tuscaloosa Educational Building Auth. Rev., 5.00%, 6/1/26 | | NR/BBB− | | | 2,729,277 | |
| | | | | | | | | | 16,353,505 | |
| | | | | Alaska–1.6% | | | | | | |
| | 900 | | | Industrial Dev. & Export Auth., Boys & Girls Home Rev.,
6.00%, 12/1/36 | | NR/NR | | | 904,068 | |
| | | | | Northern Tobacco Securitization Corp. Rev., | | | | | | |
| | 2,400 | | | 5.00%, 6/1/46, Ser. A | | Baa3/NR | | | 2,056,776 | |
| | 6,000 | | | 5.50%, 6/1/29, (Pre-refunded @ $100, 6/1/11) (a) | | Aaa/AAA | | | 6,387,060 | |
| | | | | | | | | | 9,347,904 | |
| | | | | Arizona–0.7% | | | | | | |
| | 2,000 | | | Apache Cnty. Industrial Dev. Auth., Pollution Control Rev.,
Tucson Electric Power Co., 5.875%, 3/1/33, Ser. B | | Baa3/B+ | | | 2,006,820 | |
| | 1,000 | | | Health Facs. Auth. Rev., Beatitudes Project, 5.20%, 10/1/37 | | NR/NR | | | 907,340 | |
| | 1,260 | | | Pima Cnty. Industrial Dev. Auth. Rev., 5.00%, 6/1/37 | | NR/BBB− | | | 1,171,888 | |
| | | | | | | | | | 4,086,048 | |
| | | | | Arkansas–0.5% | | | | | | |
| | 8,500 | | | Arkansas Dev. Finance Auth. Rev., zero coupon, 7/1/36, (AMBAC) | | Aaa/NR | | | 2,010,505 | |
| | | | | Little Rock Municipal Property Owners Multipurpose Improvement Dist., Special Tax, Ser. A, | | | | | | |
| | 425 | | | 5.00%, 3/1/16 | | NR/NR | | | 427,270 | |
| | 500 | | | 5.25%, 3/1/23 | | NR/NR | | | 501,055 | |
| | | | | | | | | | 2,938,830 | |
| | | | | California–2.9% | | | | | | |
| | | | | Golden State Tobacco Securitization Corp. Tobacco Settlement Rev., | | | | | | |
| | 6,000 | | | 5.00%, 6/1/33, Ser. A-1 | | Baa3/BBB | | | 5,400,780 | |
| | 10,000 | | | 6.75%, 6/1/39, Ser. 2003-A-1, (Pre-refunded @ $100, 6/1/13) (a) | | Aaa/AAA | | | 11,566,300 | |
| | | | | | | | | | 16,967,080 | |
| | | | | Colorado–2.7% | | | | | | |
| | 600 | | | Black Hawk Rev., 5.00%, 12/1/18 | | NR/NR | | | 596,952 | |
| | 500 | | | Confluence Metropolitan Dist. Rev, 5.45%, 12/1/34 | | NR/NR | | | 477,535 | |
| | | | | Denver Health & Hospital Auth. Healthcare Rev., Ser. A (a), | | | | | | |
| | 2,000 | | | 5.375%, 12/1/28, (Pre-refunded @ $101, 12/1/08) | | NR/BBB | | | 2,059,840 | |
| | 1,000 | | | 6.00%, 12/1/23, (Pre-refunded @ $100, 12/1/11) | | NR/BBB | | | 1,089,730 | |
|
6 PIMCO Municipal Income Funds Semi-Annual Report | 10.31.07
PIMCO Municipal Income Fund
Schedule of Investments
| | | | | | | | | | | | | | |
Principal
Amount
(000) | | | | Credit Rating
(Moody’s/S&P) | | Value |
| | | | | Colorado (continued) | | | | | | |
| $ | 12,400 | | | Health Facs. Auth. Rev., Liberty Heights, zero coupon, 7/15/24 | | Aaa/AAA | | $ | 5,746,904 | |
| | 4,965 | | | Northwest Parkway Public Highway Auth. Rev., 7.125%, 6/15/41, Ser. D | | B3/CCC | | | 5,310,614 | |
| | | | | | | | | | 15,281,575 | |
| | | | | Connecticut–0.2% | | | | | | |
| | 1,000 | | | State Dev. Auth. Pollution Control Rev., 5.85%, 9/1/28 | | Baa1/BBB− | | | 1,030,110 | |
| | | | | District of Columbia–0.9% | | | | | | |
| | 5,010 | | | Tobacco Settlement Financing Corp. Rev., 6.25%, 5/15/24 | | Baa3/BBB | | | 5,182,995 | |
| | | | | Florida–2.1% | | | | | | |
| | 1,000 | | | Beacon Lakes Community Dev. Dist., Special Assessment,
6.00%, 5/1/38, Ser. A | | NR/NR | | | 964,800 | |
| | 940 | | | Dev. Finance Corp. Rev., Learning Gate Community School,
6.00%, 2/15/37 | | NR/BBB− | | | 953,245 | |
| | 9,000 | | | Highlands Cnty. Health Facs. Auth. Rev., Adventist/Sunbelt,
6.00%, 11/15/31, Ser. A, (Pre-refunded @ $101, 11/15/11) (a) | | A1/NR | | | 9,895,230 | |
| | 500 | | | Lee Cnty. Industrial Dev. Auth. Rev., 5.375%, 6/15/37, Ser. A | | NR/BB | | | 462,770 | |
| | | | | | | | | | 12,276,045 | |
| | | | | Georgia–0.4% | | | | | | |
| | 2,300 | | | Medical Center Hospital Auth. Rev., 5.25%, 7/1/37 | | NR/NR | | | 2,121,727 | |
| | | | | Illinois–12.4% | | | | | | |
| | | | | Chicago, GO, Ser. A (FGIC), | | | | | | |
| | 2,935 | | | 5.375%, 1/1/34 | | Aaa/AAA | | | 3,013,042 | |
| | 6,145 | | | 5.375%, 1/1/34, (Pre-refunded @ $101, 1/1/09) (a) | | Aaa/AAA | | | 6,341,640 | |
| | 10,115 | | | Chicago Board of Education, GO, zero coupon, 12/1/31, Ser. A (FGIC) | | Aaa/AAA | | | 3,221,526 | |
| | 2,000 | | | Chicago Water Rev., 5.25%, 11/1/27,
(Pre-refunded @ $102, 11/1/07) (FGIC) (a) | | Aaa/AAA | | | 2,040,000 | |
| | | | | Educational Facs. Auth. Rev., | | | | | | |
| | 1,115 | | | Midwestern Univ., 5.50%, 5/15/18, Ser. B | | NR/AAA | | | 1,133,085 | |
| | | | | Univ. of Chicago, | | | | | | |
| | 5,000 | | | 5.125%, 7/1/38, Ser. A (f) | | Aa1/AA | | | 5,070,500 | |
| | 190 | | | 5.25%, 7/1/41 | | Aa1/AA | | | 197,289 | |
| | 4,810 | | | 5.25%, 7/1/41, (Pre-refunded @ $101, 7/1/11) (a) | | Aa1/AA | | | 5,136,992 | |
| | | | | Finance Auth. Rev., (Pre-refunded @ $101, 11/15/09) (a), | | | | | | |
| | 5,000 | | | 5.50%, 11/15/29 | | A1/NR | | | 5,245,700 | |
| | 1,260 | | | 5.65%, 11/15/24 | | A1/NR | | | 1,325,583 | |
| | | | | Health Facs. Auth. Rev., | | | | | | |
| | 3,000 | | | Decatur Memorial Hospital, 5.75%, 10/1/24 | | A2/A | | | 3,125,160 | |
| | 5,425 | | | Health Facs. Auth. Rev., Silver Cross Hospital, 5.50%, 8/15/25, (Pre-refunded @ $101, 8/15/09) (a) | | NR/A | | | 5,670,698 | |
| | | | | Lake Cnty. Community High School Dist., GO, Ser. B (FGIC), | | | | | | |
| | 5,000 | | | zero coupon, 2/1/19 | | Aaa/AAA | | | 3,089,450 | |
| | 5,000 | | | zero coupon, 2/1/20 | | Aaa/AAA | | | 2,938,700 | |
| | 5,690 | | | zero coupon, 2/1/22 | | Aaa/AAA | | | 3,006,824 | |
| | 7,345 | | | Regional Transportation Auth. Rev., 5.50%, 6/1/23, Ser. B (FGIC) | | Aaa/AAA | | | 8,373,741 | |
|
10.31.07 | PIMCO Municipal Income Funds Semi-Annual Report 7
PIMCO Municipal Income Fund
Schedule of Investments
| | | | | | | | | | | | | | |
Principal
Amount
(000) | | | | Credit Rating
(Moody’s/S&P) | | Value |
| | | | | Illinois (continued) | | | | | | |
| $ | 3,000 | | | State Sales Tax Rev., 5.125%, 6/15/20, Ser. 1 | | Aa3/AAA | | $ | 3,124,590 | |
| | | | | Univ. Rev., (FGIC), | | | | | | |
| | 1,495 | | | 5.25%, 4/1/32 | | Aaa/AAA | | | 1,552,931 | |
| | 3,505 | | | 5.25%, 4/1/32, (Pre-refunded @ $100, 4/1/11) (a) | | Aaa/AAA | | | 3,701,350 | |
| | | | | Winnebago-Boone ETC Cntys, Rock Valley Community College Dist. No 511, GO, (FGIC), | | | | | | |
| | 470 | | | 5.30%, 10/1/18 | | Aaa/NR | | | 489,336 | |
| | 3,530 | | | 5.30%, 10/1/18, (Pre-refunded @ $100, 10/1/10) (a) | | Aaa/NR | | | 3,712,960 | |
| | | | | | | | | | 71,511,097 | |
| | | | | Indiana–2.2% | | | | | | |
| | 500 | | | Anderson Rev., 5.00%, 10/1/32 | | NR/NR | | | 476,710 | |
| | 6,500 | | | Carmel School Building Corp. Rev., 5.00%, 7/15/22,
(Pre-refunded @ $101, 7/15/11) (MBIA) (a) | | Aaa/AAA | | | 6,894,290 | |
| | 4,000 | | | Health & Educational Facs. Financing Auth. Rev., Community Foundation of Northwest Indiana, 5.50%, 3/1/37 | | NR/BBB− | | | 3,970,840 | |
| | 1,225 | | | Richland-Bean Blossom School Building Corp. Rev.,
5.00%, 1/15/22, (FGIC) | | Aaa/AAA | | | 1,256,029 | |
| | | | | | | | | | 12,597,869 | |
| | | | | Iowa–0.3% | | | | | | |
| | 2,000 | | | Finance Auth. Rev., Wedum Walnut Ridge LLC, 5.625%, 12/1/45, Ser. A | | NR/NR | | | 1,928,600 | |
| | | | | Kansas–3.8% | | | | | | |
| | 1,000 | | | Lenexa, City Center East Tax Allocation, 6.00%, 4/1/27 | | NR/NR | | | 1,003,000 | |
| | 500 | | | Lenexa Rev., 5.50%, 5/15/39, Ser. A | | NR/BBB− | | | 490,450 | |
| | | | | Wichita Hospital Rev., | | | | | | |
| | 5,000 | | | 5.625%, 11/15/31, Ser. III | | NR/A+ | | | 5,180,000 | |
| | 14,370 | | | 6.25%, 11/15/24, Ser. XI | | NR/A+ | | | 15,054,443 | |
| | | | | | | | | | 21,727,893 | |
| | | | | Kentucky–0.2% | | | | | | |
| | 860 | | | Economic Dev. Finance Auth., Hospital Facs. Rev., St. Luke’s Hospital, 6.00%, 10/1/19, Ser. B | | A3/A | | | 868,841 | |
| | | | | Louisiana–5.6% | | | | | | |
| | 4,300 | | | Local Gov’t Environmental Facs. & Community Dev. Auth. Rev., 6.55%, 9/1/25, (ACA) | | NR/A | | | 4,639,872 | |
| | 27,895 | | | Tobacco Settlement Financing Corp. Rev., 5.875%, 5/15/39,
Ser. 2001-B | | Baa3/BBB | | | 27,922,895 | |
| | | | | | | | | | 32,562,767 | |
| | | | | Maryland–0.2% | | | | | | |
| | 1,150 | | | Baltimore Water Project Rev., 5.125%, 7/1/42, Ser. A (FGIC) | | Aaa/AAA | | | 1,177,393 | |
| | | | | Massachusetts–1.9% | | | | | | |
| | 550 | | | State Dev. Finance Agcy. Rev., Linden Ponds, 5.75%, 11/15/35,
Ser. A | | NR/NR | | | 546,959 | |
| | 10,000 | | | State Health & Educational Facs. Auth., Partners Healthcare Systems Rev., 5.75%, 7/1/32, Ser. C (f) | | Aa2/AA | | | 10,661,500 | |
| | | | | | | | | | 11,208,459 | |
|
8 PIMCO Municipal Income Funds Semi-Annual Report | 10.31.07
PIMCO Municipal Income Fund
Schedule of Investments
| | | | | | | | | | | | | | |
Principal
Amount
(000) | | | | Credit Rating
(Moody’s/S&P) | | Value |
| | | | | Michigan–3.0% | | | | | | |
| | | | | Detroit, GO, Ser. A-1 (MBIA), | | | | | | |
| $ | 1,000 | | | 5.375%, 4/1/15 | | Aaa/AAA | | $ | 1,058,120 | |
| | 1,000 | | | 5.375%, 4/1/17 | | Aaa/AAA | | | 1,055,510 | |
| | 775 | | | East Lansing Economic Corp., Burcham Hills Rev., 5.25%, 7/1/37 | | NR/NR | | | 706,792 | |
| | 4,550 | | | Garden City Hospital Finance Auth. Rev., 5.00%, 8/15/38, Ser. A | | NR/NR | | | 4,120,389 | |
| | 3,000 | | | Mount Clemens Community School Dist., GO, 5.00%, 5/1/31, (Pre-refunded @ $100, 11/1/11) (Q-SBLF) (a) | | Aa3/AA− | | | 3,165,030 | |
| | 50 | | | Royal Oak Hospital Finance Auth. Rev., William Beaumont Hospital, 5.25%, 11/15/35, Ser. M (MBIA) | | Aaa/AAA | | | 51,311 | |
| | 460 | | | Star International Academy, CP, 6.125%, 3/1/37 | | NR/BB+ | | | 467,402 | |
| | 4,000 | | | State Hospital Finance Auth. Rev., Detroit Medical Center, 6.25%, 8/15/13 | | Ba3/BB− | | | 4,010,160 | |
| | 775 | | | State Public Educational Facs. Auth. Rev., 5.00%, 9/1/22 | | NR/BBB− | | | 754,377 | |
| | 2,000 | | | State Strategic Fund Ltd. Obligation Rev., Detroit Edison Pollution Control Co., 5.45%, 9/1/29 | | A3/A− | | | 2,045,460 | |
| | | | | | | | | | 17,434,551 | |
| | | | | Minnesota–0.9% | | | | | | |
| | | | | Agricultural & Economic Dev. Board Rev., Health Care System, | | | | | | |
| | 95 | | | 6.375%, 11/15/29 | | A2/A | | | 100,818 | |
| | 2,905 | | | 6.375%, 11/15/29, (Pre-refunded @ $101, 11/15/10) (a) | | A2/A | | | 3,170,836 | |
| | | | | North Oaks, Presbyterian Homes Rev., | | | | | | |
| | 1,070 | | | 6.00%, 10/1/33 | | NR/NR | | | 1,091,132 | |
| | 620 | | | 6.125%, 10/1/39 | | NR/NR | | | 632,171 | |
| | 100 | | | Rochester Rev., 5.30%, 4/1/37, Ser. A | | NR/NR | | | 94,729 | |
| | | | | | | | | | 5,089,686 | |
| | | | | Missouri–0.7% | | | | | | |
| | 750 | | | Branson Regional Airport Transportation Dev. Dist. Rev., 6.00%, 7/1/37, Ser. A | | NR/NR | | | 746,835 | |
| | 2,500 | | | Interstate 470 & 350 Transportation Dev. Dist. Rev., 6.35%, 5/1/22, (Pre-refunded @ $100, 5/1/08) (a) | | NR/NR | | | 2,535,075 | |
| | 1,000 | | | Joplin Industrial Dev. Auth. Rev., 5.75%, 5/15/26, Ser. F | | NR/NR | | | 1,010,940 | |
| | | | | | | | | | 4,292,850 | |
| | | | | Nevada–3.5% | | | | | | |
| | 3,000 | | | Clark Cnty. Rev., 5.25%, 7/1/34, Ser. B,
(Pre-refunded @ $100, 7/1/11) (FGIC) (a) | | Aaa/AAA | | | 3,179,610 | |
| | 4,250 | | | Truckee Meadows Water Auth. Rev., 5.25%, 7/1/34, Ser. A, (Pre-refunded @ $100, 7/1/11) (FSA) (a) | | Aaa/AAA | | | 4,504,447 | |
| | 12,185 | | | Washoe Cnty., GO, 5.00%, 1/1/35, (MBIA) (f) | | NR/NR | | | 12,596,366 | |
| | | | | | | | | | 20,280,423 | |
| | | | | New Hampshire–0.5% | | | | | | |
| | 3,000 | | | State Business Finance Auth. Pollution Control Rev., Light & Power Co., 5.85%, 12/1/22 | | Baa1/BBB− | | | 3,095,190 | |
|
10.31.07 | PIMCO Municipal Income Funds Semi-Annual Report 9
PIMCO Municipal Income Fund
Schedule of Investments
| | | | | | | | | | | | | | |
Principal
Amount
(000) | | | | Credit Rating
(Moody’s/S&P) | | Value |
| | | | | New Jersey–5.0% | | | | | | |
| $ | 16,550 | | | Economic Dev. Auth., Kapkowski Road Landfill,
Special Assessment, 5.75%, 4/1/31 | | Baa3/NR | | $ | 17,204,883 | |
| | | | | Economic Dev. Auth. Rev., Arbor Glen, | | | | | | |
| | 2,510 | | | 5.875%, 5/15/16 | | NR/NR | | | 2,576,917 | |
| | 450 | | | 5.875%, 5/15/16, Ser. A, (Pre-refunded @ $102, 5/15/09) (a) | | NR/NR | | | 474,642 | |
| | 1,000 | | | Health Care Facs. Financing Auth. Rev., Trinitas Hospital, 5.25%, 7/1/30, Ser. A | | Baa3/BBB− | | | 967,770 | |
| | 9,100 | | | Tobacco Settlement Financing Corp. Rev., 5.00%, 6/1/41, Ser. 1A | | Baa3/BBB | | | 7,810,712 | |
| | | | | | | | | | 29,034,924 | |
| | | | | New Mexico–0.4% | | | | | | |
| | 2,500 | | | Farmington Pollution Control Rev., 5.80%, 4/1/22 | | Baa2/BBB | | | 2,511,700 | |
| | | | | New York–1.2% | | | | | | |
| | | | | New York City Municipal Water Finance Auth., Water & Sewer System Rev., | | | | | | |
| | 1,120 | | | 5.00%, 6/15/37, Ser. D (f) | | Aa2/AA+ | | | 1,152,794 | |
| | 3,000 | | | 5.00%, 6/15/39, Ser. A | | Aa2/AA+ | | | 3,076,200 | |
| | 2,875 | | | Westchester Cnty. Healthcare Corp. Rev., 5.875%, 11/1/25, Ser. A | | Ba2/BBB− | | | 2,939,227 | |
| | | | | | | | | | 7,168,221 | |
| | | | | North Carolina–0.6% | | | | | | |
| | | | | Capital Facs. Finance Agcy., Duke Univ. Rev., Ser. A, | | | | | | |
| | 570 | | | 5.125%, 10/1/41 | | Aa1/AA+ | | | 583,013 | |
| | 2,430 | | | 5.125%, 10/1/41, (Pre-refunded @ $100, 10/1/11) (a) | | Aaa/AAA | | | 2,573,808 | |
| | | | | | | | | | 3,156,821 | |
| | | | | Ohio–3.0% | | | | | | |
| | 11,000 | | | Buckeye Tobacco Settlement Financing Auth. Rev., 5.875%, 6/1/47, Ser. A-2 | | Baa3/BBB | | | 10,678,800 | |
| | | | | Lorain Cnty. Hospital Rev., Catholic Healthcare, | | | | | | |
| | 2,500 | | | 5.625%, 10/1/17 | | A1/AA− | | | 2,646,400 | |
| | 2,565 | | | 5.75%, 10/1/18 | | A1/AA− | | | 2,720,926 | |
| | 1,235 | | | State Turnpike Commission Rev., 5.50%, 2/15/15 | | Aa3/AA | | | 1,306,865 | |
| | | | | | | | | | 17,352,991 | |
| | | | | Pennsylvania–5.9% | | | | | | |
| | | | | Allegheny Cnty. Hospital Dev. Auth. Rev., | | | | | | |
| | 8,600 | | | 5.375%, 11/15/40, Ser. A | | Ba2/BB | | | 8,247,744 | |
| | 5,780 | | | 9.25%, 11/15/30, Ser. B, (Pre-refunded @ $102, 11/15/10) (a) | | Ba3/AAA | | | 6,816,238 | |
| | 1,000 | | | Allegheny Cnty. Industrial Dev. Auth. Rev., 5.60%, 9/1/30 | | Baa1/BBB+ | | | 1,023,160 | |
| | 1,095 | | | Allegheny Cnty. Port Auth. Rev., 5.25%, 3/1/20, (FGIC) | | Aaa/AAA | | | 1,149,520 | |
| | 2,575 | | | Delaware Cnty. Auth. College Rev., Neumann College, 5.80%, 10/1/17 | | NR/BBB− | | | 2,680,446 | |
| | 2,000 | | | Harrisburg Auth. Rev., 6.00%, 9/1/36 | | NR/NR | | | 2,019,000 | |
| | 6,200 | | | Higher Educational Facs. Auth. Rev., 6.00%, 1/15/31, Ser. A | | Aa3/AA− | | | 6,530,956 | |
| | 1,000 | | | Higher Educational Facs. Auth. Rev., LaSalle Univ., 5.00%, 5/1/37, Ser. A | | NR/BBB | | | 978,850 | |
| | 4,610 | | | Philadelphia Hospitals & Higher Education Facs. Auth. Hospital Rev., Temple Univ. Hospital, 6.625%, 11/15/23, Ser. A | | Baa3/BBB | | | 4,616,270 | |
| | | | | | | | | | 34,062,184 | |
|
10 PIMCO Municipal Income Funds Semi-Annual Report | 10.31.07
PIMCO Municipal Income Fund
Schedule of Investments
| | | | | | | | | | | | | | |
Principal
Amount
(000) | | | | Credit Rating
(Moody’s/S&P) | | Value |
| | | | | Puerto Rico–1.3% | | | | | | |
| $ | 350 | | | Commonwealth of Puerto Rico, GO, 5.00%, 7/1/35, Ser. B | | Baa3/BBB− | | $ | 349,975 | |
| | 1,600 | | | Electric Power Auth. Power Rev., 5.125%, 7/1/29, Ser. NN, (Pre-refunded @ $100, 7/1/13) (a) | | A3/BBB+ | | | 1,726,320 | |
| | | | | Puerto Rico Sales Tax Financing Corp., Rev., Ser. A, | | | | | | |
| | 32,550 | | | zero coupon, 8/1/54, (AMBAC) | | Aaa/AAA | | | 3,092,576 | |
| | 29,200 | | | zero coupon, 8/1/56 | | A1/A+ | | | 2,403,452 | |
| | | | | | | | | | 7,572,323 | |
| | | | | Rhode Island–4.2% | | | | | | |
| | 23,800 | | | Tobacco Settlement Financing Corp. Rev., 6.25%, 6/1/42, Ser. A | | Baa3/BBB | | | 24,033,478 | |
| | | | | South Carolina–4.4% | | | | | | |
| | | | | Greenwood Cnty. Hospital Rev., Self Memorial Hospital, | | | | | | |
| | 3,500 | | | 5.50%, 10/1/21 | | A2/A | | | 3,634,085 | |
| | 2,000 | | | 5.50%, 10/1/26 | | A2/A | | | 2,062,140 | |
| | 3,000 | | | Jobs Economic Dev. Auth. Hospital Facs. Rev., Georgetown Memorial Hospital, 5.375%, 2/1/30, (Radian) | | NR/AA | | | 3,035,640 | |
| | 450 | | | Jobs Economic Dev. Auth. Rev., 5.50%, 5/1/28 | | NR/NR | | | 430,817 | |
| | 15,600 | | | Tobacco Settlement Rev. Management Auth. Rev., 6.375%, 5/15/30, Ser. B | | Baa3/BBB | | | 16,258,008 | |
| | | | | | | | | | 25,420,690 | |
| | | | | Tennessee–0.1% | | | | | | |
| | 940 | | | Memphis Health Educational & Housing Fac. Rev., Wesley Housing Corp. Project, 6.95%, 1/1/20 (h) (i) | | Aaa/AAA | | | 472,350 | |
| | | | | Texas–11.3% | | | | | | |
| | 1,750 | | | Austin Convention Enterprises, Inc. Rev., 5.75%, 1/1/32, Ser. B, (Pre-refunded @ $100, 1/1/11) (a) | | Aaa/NR | | | 1,866,042 | |
| | 4,000 | | | Austin Rev., 5.25%, 5/15/31, Ser. A & B (FSA) | | Aaa/AAA | | | 4,121,800 | |
| | 2,935 | | | Bell Cnty. Health Fac. Dev. Corp. Rev.,
5.25%, 11/15/19, (Pre-refunded @ $101, 11/15/08) (a) | | NR/AAA | | | 3,018,912 | |
| | 10,000 | | | Coppell Independent School Dist., GO, zero coupon, 8/15/29, (PSF-GTD) | | Aaa/AAA | | | 3,529,300 | |
| | 1,125 | | | Corpus Christi Refinance & Improvement, GO, 5.375%, 3/1/18, (FSA) | | Aaa/AAA | | | 1,176,525 | |
| | | | | Duncanville Independent School Dist., GO, Ser. B, (PSF-GTD), | | | | | | |
| | 20 | | | 5.25%, 2/15/32 | | Aaa/AAA | | | 20,750 | |
| | 3,660 | | | 5.25%, 2/15/32, (Pre-refunded @ $100, 2/15/12) (a) | | Aaa/AAA | | | 3,906,208 | |
| | | | | Harris Cnty. Health Facs. Dev. Corp. Rev., (a) | | | | | | |
| | 5,000 | | | Christus Health, 5.375%, 7/1/29, Ser. A, (Pre-refunded @ $101, 7/1/09) (MBIA) | | Aaa/AAA | | | 5,204,700 | |
| | 7,000 | | | Memorial Hermann Healthcare, 6.375%, 6/1/29,
(Pre-refunded @ $101, 6/1/11) | | A2/A+ | | | 7,717,010 | |
| | 8,500 | | | St. Lukes Episcopal Hospital Rev., 5.375%, 2/15/26, Ser. A, (Pre-refunded @ $100, 8/15/11) (f) | | NR/AAA | | | 9,055,815 | |
| | | | | Mansfield Independent School Dist., GO, (PSF-GTD), | | | | | | |
| | 285 | | | 5.25%, 2/15/23 | | Aaa/AAA | | | 295,115 | |
| | 1,715 | | | 5.25%, 2/15/23, (Pre-refunded @ $100, 2/15/11) (a) | | Aaa/AAA | | | 1,807,627 | |
|
10.31.07 | PIMCO Municipal Income Funds Semi-Annual Report 11
PIMCO Municipal Income Fund
Schedule of Investments
| | | | | | | | | | | | | | |
Principal
Amount
(000) | | | | Credit Rating
(Moody’s/S&P) | | Value |
| | | | | Texas (continued) | | | | | | |
| $ | 4,380 | | | Southlake Park Dev. Corp. Rev.,
5.60%, 8/15/31, (Pre-refunded @ $100, 2/15/11) (AMBAC) (a) | | Aaa/AAA | | $ | 4,575,173 | |
| | 400 | | | State Public Finance Auth. Rev., 5.875%, 12/1/36, Ser. A | | Baa3/BBB− | | | 405,288 | |
| | 19,990 | | | State Turnpike Auth. Rev., zero coupon, 8/15/25, Ser. A (AMBAC) | | Aaa/AAA | | | 8,752,621 | |
| | 4,530 | | | State Water Financial Assistance, GO, 5.30%, 8/1/18, Ser. A | | Aa1/AA | | | 4,695,345 | |
| | 4,920 | | | Univ. Rev., 5.00%, 7/1/26, Ser. B, (Pre-refunded @ $100, 7/1/14) (a) | | Aaa/AAA | | | 5,306,072 | |
| | | | | | | | | | 65,454,303 | |
| | | | | Utah–1.4% | | | | | | |
| | 7,000 | | | Salt Lake Cnty. Hospital Rev., IHC Health Services, 5.125%, 2/15/33, (AMBAC) | | Aaa/AAA | | | 7,261,800 | |
| | 600 | | | Utah Cnty. Lincoln Academy Charter School, GO, 5.875%, 6/15/37, Ser. A (b) | | NR/NR | | | 603,234 | |
| | | | | | | | | | 7,865,034 | |
| | | | | Virginia–0.4% | | | | | | |
| | 2,000 | | | Peninsula Town Center Community Dev. Auth. Rev., 6.45%, 9/1/37 | | NR/NR | | | 2,056,880 | |
| | | | | Washington–2.5% | | | | | | |
| | 1,225 | | | Cowlitz Cnty. School Dist. No. 458 Kelso, GO, 5.625%, 12/1/16, (Pre-refunded @ $100, 12/1/11) (FSA) (a) | | Aaa/NR | | | 1,323,453 | |
| | 3,415 | | | Kent, GO, 5.375%, 12/1/20, (MBIA) | | Aaa/AAA | | | 3,598,864 | |
| | 5,420 | | | King Cnty. School Dist. No. 1 Seattle,
GO, 5.25%, 12/1/21, Ser. A (MBIA) | | Aaa/AAA | | | 5,676,257 | |
| | | | | State Housing Finance Commission Rev., Skyline at First Hill,
Ser. A, | | | | | | |
| | 275 | | | 5.25%, 1/1/17 | | NR/NR | | | 278,168 | |
| | 3,600 | | | 5.625%, 1/1/38 | | NR/NR | | | 3,520,476 | |
| | | | | | | | | | 14,397,218 | |
| | | | | Wisconsin–4.2% | | | | | | |
| | | | | Badger Tobacco Asset Securitization Corp. Rev., | | | | | | |
| | 5,000 | | | 5.75%, 6/1/12 | | Baa3/BBB | | | 5,283,000 | |
| | 9,785 | | | 6.00%, 6/1/17 | | Baa3/BBB | | | 10,241,079 | |
| | 2,250 | | | Health & Educational Facs. Auth. Rev., Divine Savior Heathcare Rev., 5.00%, 5/1/32 | | NR/BBB | | | 2,116,890 | |
| | 2,230 | | | Health & Educational Facs. Auth. Rev., Kenosha Hospital & Medical Center, 5.625%, 5/15/29 | | NR/A | | | 2,260,551 | |
| | 550 | | | Milwaukee Redev. Auth. Rev., 5.65%, 8/1/37, Ser. A | | NR/NR | | | 533,769 | |
| | 3,515 | | | State, GO, 5.00%, 5/1/22, Ser. A (FGIC) | | Aaa/AAA | | | 3,640,591 | |
| | | | | | | | | | 24,075,880 | |
| | | | | Total Municipal Bonds & Notes (cost–$528,063,716) | | | | | 553,996,435 | |
VARIABLE RATE NOTES (b)(c)–3.6% |
| | | | | Hawaii–0.3% | | | | | | |
| | 1,388 | | | City & Cnty. of Honolulu Rev., 10.12%, 7/1/23, Ser. 400 (FGIC) (g)(h) | | Aaa/NR | | | 1,565,447 | |
| | | | | Illinois–0.6% | | | | | | |
| | 2,902 | | | Cook Cnty., GO, 10.12%, 11/15/28, Ser. 458 (FGIC) (g)(h) | | Aaa/NR | | | 3,212,458 | |
|
12 PIMCO Municipal Income Funds Semi-Annual Report | 10.31.07
PIMCO Municipal Income Fund
Schedule of Investments
| | | | | | | | | | | | | | |
Principal
Amount
(000) | | | | Credit Rating
(Moody’s/S&P) | | Value |
| | | | | New York–1.7% | | | | | | |
| | | | | New York City Municipal Water Finance Auth., Water & Sewer System Rev., | | | | | | |
| $ | 2,600 | | | 7.958%, 6/15/26 (g)(h) | | NR/AA+ | | $ | 2,962,050 | |
| | 6,000 | | | 9.138%, 6/15/39 (h) | | Aa2/NR | | | 6,687,120 | |
| | | | | | | | | | 9,649,170 | |
| | | | | Texas–0.7% | | | | | | |
| | 3,595 | | | Harris Cnty. Health Facs. Dev. Corp. Rev., 12.00%, 7/1/29, Ser. 357 (MBIA) (g)(h) | | Aaa/NR | | | 4,330,896 | |
| | | | | Washington–0.3% | | | | | | |
| | 1,800 | | | Seattle, GO, 10.75%, 12/15/28, Ser. 348 (g)(h) | | Aa1/NR | | | 1,971,540 | |
| | | | | Total Variable Rate Notes (cost–$17,848,363) | | | | | 20,729,511 | |
VARIABLE RATE DEMAND NOTES (c)(d)–0.2% |
| | | | | Missouri–0.2% | | | | | | |
| | 1,400 | | | State Health & Educational Facs. Auth. Rev., BJC Health Systems, 3.58%, 11/1/07, Ser. B (cost–$1,400,000) | | VMIG1/A-1+ | | | 1,400,000 | |
U.S. TREASURY BILLS (e)–0.3% |
| | 1,545 | | | 3.81%-4.62%,11/29/07-12/13/07 (cost–$1,538,341) | | | | | 1,538,341 | |
| | | | | Total Investments (cost–$548,850,420)–100.0% | | | | $ | 577,664,287 | |
|
See accompanying Notes to Financial Statements | 10.31.07 | PIMCO Municipal Income Funds Semi-Annual Report 13
PIMCO California Municipal Income Fund
Schedule of Investments
| | | | | | | | | | | | | | |
Principal
Amount
(000) | | | | Credit Rating
(Moody’s/S&P) | | Value |
CALIFORNIA MUNICIPAL BONDS & NOTES–87.3% |
| $ | 1,000 | | | ABAG Finance Auth. for Nonprofit Corps., CP, 5.375%, 2/15/19 | | NR/BBB | | $ | 1,015,050 | |
| | 1,000 | | | ABAG Finance Auth. for Nonprofit Corps., Rev.,
5.375%, 11/15/25, (CA Mtg. Ins.) | | NR/A+ | | | 1,031,050 | |
| | 1,385 | | | Alvord Unified School Dist., GO, 5.375%, 8/1/29, Ser. C (FSA) | | Aaa/NR | | | 1,394,501 | |
| | 6,405 | | | Campbell Union High School Dist., GO, 5.50%, 8/1/30, (FSA) | | Aaa/NR | | | 6,693,930 | |
| | 2,250 | | | Capistrano Unified School Dist., Special Tax,
5.75%, 9/1/29, (Pre-refunded @ $102, 9/1/09) (a) | | NR/NR | | | 2,386,912 | |
| | 5,250 | | | Central JT Powers Health Financing Auth., CP,
5.75%, 2/1/31, (Pre-refunded @ $101, 2/1/11) (a) | | Baa2/AAA | | | 5,673,780 | |
| | 4,140 | | | Charter Oak Unified School Dist., GO, 5.00%, 7/1/28, Ser. B, (Pre-refunded @ $100, 7/1/13) (FSA) (a) | | Aaa/AAA | | | 4,455,965 | |
| | | | | Contra Costa Cnty. Public Financing Auth., Tax Allocation, | | | | | | |
| | 2,150 | | | 5.125%, 8/1/19 | | NR/BBB | | | 2,179,369 | |
| | 600 | | | 5.125%, 8/1/19, (Pre-refunded @ $102, 8/1/09) (a) | | NR/BBB | | | 629,142 | |
| | 350 | | | 5.85%, 8/1/33 | | NR/NR | | | 362,887 | |
| | 4,650 | | | 5.85%, 8/1/33, (Pre-refunded @ $100, 8/1/13) (a) | | NR/BBB | | | 5,195,492 | |
| | 2,750 | | | CSUCI Financing Auth. Rev., 5.00%, 9/1/31, Ser. A,
(Pre-refunded @ $100, 9/1/11) (MBIA) (a) | | Aaa/AAA | | | 2,907,355 | |
| | 3,635 | | | Cucamonga Cnty. Water Dist., CP, 5.125%, 9/1/35, (FGIC) | | Aaa/AAA | | | 3,746,558 | |
| | | | | East Side Union High School Dist., Santa Clara Cnty.,
GO, Ser. E (XLCA), | | | | | | |
| | 1,985 | | | zero coupon, 8/1/21 | | Aaa/AAA | | | 1,035,912 | |
| | 1,490 | | | zero coupon, 8/1/22 | | Aaa/AAA | | | 725,809 | |
| | | | | El Monte, CP (AMBAC), | | | | | | |
| | 10,790 | | | 4.75%, 6/1/30 | | Aaa/AAA | | | 10,849,453 | |
| | 14,425 | | | 5.25%, 1/1/34 | | Aaa/AAA | | | 14,888,908 | |
| | | | | Foothill Eastern Corridor Agcy. Toll Road Rev., | | | | | | |
| | 5,000 | | | zero coupon, 1/15/33 | | Baa3/BBB− | | | 1,128,900 | |
| | 5,000 | | | zero coupon, 1/15/34 | | Baa3/BBB− | | | 1,060,650 | |
| | | | | Fremont Community Dist., Special Tax, | | | | | | |
| | 165 | | | 6.00%, 9/1/18 | | NR/NR | | | 169,808 | |
| | 505 | | | 6.00%, 9/1/19 | | NR/NR | | | 519,539 | |
| | 3,500 | | | 6.30%, 9/1/31 | | NR/NR | | | 3,594,045 | |
| | | | | Golden State Tobacco Securitization Corp. Rev., | | | | | | |
| | 9,000 | | | 5.00%, 6/1/33, Ser. A-1 | | Baa3/BBB | | | 8,101,170 | |
| | 8,000 | | | 5.00%, 6/1/38, Ser. A (FGIC) (f) | | Aaa/AAA | | | 8,151,120 | |
| | 17,500 | | | 6.25%, 6/1/33, Ser. 2003-A-1 | | Aaa/AAA | | | 19,210,975 | |
| | 10,155 | | | 6.75%, 6/1/39, Ser. 2003-A-1,
(Pre-refunded @ $100, 6/1/13) (a) | | Aaa/AAA | | | 11,745,578 | |
| | 540 | | | 7.875%, 6/1/42, Ser. A-3, (Pre-refunded @ $100, 6/1/13) (a) | | Aaa/AAA | | | 654,988 | |
| | | | | Health Facs. Finance Auth. Rev., | | | | | | |
| | 130 | | | 5.00%, 7/1/18, (Pre-refunded @ $101, 7/1/08) (a) | | A2/A | | | 132,705 | |
| | 1,980 | | | 5.00%, 7/1/18 | | A2/A | | | 2,006,591 | |
| | 5,315 | | | 5.125%, 7/1/18 | | NR/BBB+ | | | 5,328,394 | |
|
14 PIMCO Municipal Income Funds Semi-Annual Report | 10.31.07
PIMCO California Municipal Income Fund
Schedule of Investments
| | | | | | | | | | | | | | |
Principal
Amount
(000) | | | | Credit Rating
(Moody’s/S&P) | | Value |
| $ | 3,000 | | | 5.25%, 10/1/14, Ser. B | | NR/AAA | | $ | 3,076,710 | |
| | | | | Health Facs. Finance Auth. Rev., Catholic Healthcare West, | | | | | | |
| | 125 | | | 5.00%, 7/1/28, (Pre-refunded @ $101, 7/1/08) (a) | | A2/A | | | 127,601 | |
| | 875 | | | 5.00%, 7/1/28, (Partially pre-refunded @ $101, 7/1/08) (a) | | A2/A | | | 877,310 | |
| | 6,250 | | | Infrastructure & Economic Dev. Bank Rev., Bay Area Toll Bridges,
5.00%, 7/1/36, (Pre-refunded @ $100, 1/1/28) (AMBAC) (a) | | Aaa/AAA | | | 6,800,062 | |
| | | | | La Quinta Redev. Agcy., Tax Allocation (AMBAC), | | | | | | |
| | 3,000 | | | 5.00%, 9/1/21 | | Aaa/AAA | | | 3,130,530 | |
| | 10,000 | | | 5.10%, 9/1/31 | | Aaa/AAA | | | 10,347,700 | |
| | 1,000 | | | 5.125%, 9/1/32 | | Aaa/AAA | | | 1,040,470 | |
| | 1,495 | | | Lincoln Public Financing Auth. Rev., Twelve Bridges Ltd.,
6.125%, 9/2/27 | | NR/NR | | | 1,512,895 | |
| | 6,250 | | | Los Angeles Cnty. Metropolitan Transportation Auth. Rev.,
4.75%, 7/1/28, Ser. B, (Pre-refunded @ $101, 7/1/09) (FSA) (a) | | Aaa/AAA | | | 6,455,812 | |
| | | | | Los Angeles Community Redev. Agcy., Tax Allocation, | | | | | | |
| | 520 | | | 5.875%, 9/1/26 | | NR/NR | | | 507,978 | |
| | 325 | | | 6.00%, 9/1/31 | | NR/NR | | | 325,302 | |
| | 5,000 | | | Los Angeles Department of Water & Power Rev.,
4.75%, 7/1/30, (FSA) (f) | | Aaa/AAA | | | 5,034,800 | |
| | 3,250 | | | Los Angeles Unified School Dist., GO, 5.125%, 7/1/21, Ser. E, (Pre-refunded @ $100, 7/1/12) (MBIA) (a) | | Aaa/AAA | | | 3,480,685 | |
| | 3,500 | | | Metropolitan Water Dist. of Southern California Rev., Water Works Rev., 5.00%, 7/1/26, Ser. A, (Pre-refunded @ $101, 1/1/08) (a) | | Aa2/AAA | | | 3,543,930 | |
| | 5,820 | | | Montclair Redev. Agcy., Tax Allocation, 5.30%, 10/1/30, (MBIA) | | Aaa/AAA | | | 6,160,470 | |
| | | | | Murrieta Valley Unified School Dist., Special Tax,
(Pre-refunded @ $102, 9/1/09) (a) | | | | | | |
| | 195 | | | 6.30%, 9/1/18 | | NR/NR | | | 208,746 | |
| | 3,535 | | | 6.50%, 9/1/31 | | NR/NR | | | 3,796,590 | |
| | 6,255 | | | Orange Cnty. Sanitation Dist., CP, 5.25%, 2/1/30,
(Pre-refunded @ $100, 8/1/13) (FGIC) (a) | | Aaa/AAA | | | 6,819,326 | |
| | 1,080 | | | Palm Springs Community Redev. Agcy., Tax Allocation,
5.50%, 8/1/21 | | NR/A | | | 1,135,166 | |
| | 1,690 | | | Rancho Etiwanda Public Facs., Special Tax, 6.375%, 9/1/24 | | NR/NR | | | 1,749,454 | |
| | | | | Rancho Mirage Redev. Agcy., Tax Allocation, | | | | | | |
| | 1,190 | | | 5.50%, 4/1/24 | | Baa1/BBB+ | | | 1,236,541 | |
| | 1,580 | | | 5.625%, 4/1/33 | | Baa1/BBB+ | | | 1,641,288 | |
| | | | | Riverside, Improvement Board Act 1915, Special Assessment, | | | | | | |
| | 500 | | | 6.15%, 9/2/19 | | NR/NR | | | 521,120 | |
| | 1,350 | | | 6.375%, 9/2/26 | | NR/NR | | | 1,410,561 | |
| | 8,305 | | | Riverside Cnty., CP, 5.125%, 11/1/30, (MBIA) | | Aaa/AAA | | | 8,636,702 | |
| | 575 | | | Roseville, Woodcreek Community Facs. Dist., Special Tax, 6.375%, 9/1/27, (Pre-refunded @ $102, 9/1/10) (a) | | NR/NR | | | 631,413 | |
| | | | | Sacramento, Special Tax, | | | | | | |
| | 2,945 | | | 5.70%, 9/1/23 | | NR/NR | | | 2,961,993 | |
| | 1,000 | | | 6.10%, 9/1/21 | | NR/NR | | | 1,024,900 | |
|
10.31.07 | PIMCO Municipal Income Funds Semi-Annual Report 15
PIMCO California Municipal Income Fund
Schedule of Investments
| | | | | | | | | | | | | | |
Principal
Amount
(000) | | | | Credit Rating
(Moody’s/S&P) | | Value |
| $ | 1,895 | | | 6.15%, 9/1/26 | | NR/NR | | $ | 1,939,514 | |
| | 2,000 | | | Sacramento Health Fac. Rev., 5.30%, 1/1/24, Ser. A
(CA Mtg. Ins.) | | NR/A+ | | | 2,042,240 | |
| | 1,000 | | | San Diego Cnty. Water Auth., CP, 5.00%, 5/1/32, Ser. A (MBIA) | | Aaa/AAA | | | 1,032,420 | |
| | 545 | | | San Diego Cnty., CP, 5.25%, 10/1/28 | | A2/NR | | | 559,862 | |
| | | | | San Francisco Bay Area Transit Financing Auth. Rev. (AMBAC), | | | | | | |
| | 880 | | | 5.125%, 7/1/36 | | Aaa/AAA | | | 903,663 | |
| | 2,450 | | | 5.125%, 7/1/36, (Pre-refunded @ $100, 7/1/11) (a) | | Aaa/AAA | | | 2,594,893 | |
| | 720 | | | San Francisco City & Cnty. Redev. Agcy. Rev., Special Tax, 6.125%, 8/1/31 | | NR/NR | | | 733,781 | |
| | 5,065 | | | San Joaquin Cnty., CP, 5.00%, 9/1/20, (MBIA) (b)(h) | | Aaa/AAA | | | 5,200,894 | |
| | | | | San Joaquin Hills Transportation Corridor Agcy. Toll Road Rev., | | | | | | |
| | 5,000 | | | 5.50%, 1/15/28, Ser. A | | Ba2/BB− | | | 5,003,000 | |
| | 5,000 | | | 5.70%, 1/15/19, Ser. A | | Ba2/BB− | | | 5,201,850 | |
| | 5,000 | | | San Jose Unified School Dist., Santa Clara Cnty., GO, 5.125%,
8/1/25, Ser. D, (Pre-refunded @ $101, 8/1/10) (FSA) (a) | | Aaa/AAA | | | 5,281,200 | |
| | 230 | | | San Jose, Improvement Board Act 1915, Special Assessment, 5.60%, 9/2/17, Ser. Q | | NR/NR | | | 237,183 | |
| | | | | San Juan Unified School Dist., GO (FSA), | | | | | | |
| | 9,445 | | | zero coupon, 8/1/22 | | Aaa/AAA | | | 4,873,526 | |
| | 10,895 | | | zero coupon, 8/1/25 | | Aaa/AAA | | | 4,828,882 | |
| | 6,110 | | | zero coupon, 8/1/26 | | Aaa/AAA | | | 2,572,493 | |
| | 600 | | | Santa Ana Financing Auth. Rev., 5.60%, 9/1/19 | | NR/BBB | | | 618,180 | |
| | 1,815 | | | Santa Clara, CP, 5.00%, 2/1/32, (AMBAC) | | Aaa/AAA | | | 1,866,201 | |
| | 1,435 | | | Santa Maria JT Union High School Dist., GO,
5.25%, 8/1/25, Ser. A, (Pre-refunded @ $102, 8/1/15) (FSA) (a) | | Aaa/AAA | | | 1,610,199 | |
| | 5,675 | | | Statewide Community Dev. Auth., CP, 6.50%, 7/1/20, (Pre-refunded @ $101, 7/1/10) (a) | | A2/NR | | | 6,172,698 | |
| | | | | Statewide Community Dev. Auth. Rev., | | | | | | |
| | 900 | | | Baptist Univ., 5.50%, 11/1/38, Ser. A | | NR/NR | | | 893,637 | |
| | 5,420 | | | Gillispie School, 6.625%, 10/1/31 | | NR/NR | | | 5,470,406 | |
| | 15,250 | | | Henry Mayo Newhall Memorial Hospital, 5.125%, 10/1/30
(CA Mtg. Ins.) | | NR/A+ | | | 15,522,822 | |
| | 3,000 | | | Jewish Home, 5.50%, 11/15/33, (CA St. Mtg.) | | NR/A+ | | | 3,132,660 | |
| | 2,445 | | | St. Marks School, 6.75%, 6/1/28 (b)(h) | | NR/NR | | | 2,529,059 | |
| | 4,000 | | | Sutter Health, 5.50%, 8/15/34, Ser. B | | Aa3/AA− | | | 4,142,120 | |
| | 4,240 | | | Tehiy Day School, 6.625%, 11/1/31 | | NR/NR | | | 4,283,290 | |
| | 910 | | | Windrush School, 5.50%, 7/1/37 | | NR/NR | | | 909,927 | |
| | | | | Statewide Community Dev. Auth., CP, | | | | | | |
| | 2,325 | | | Catholic West, 6.50%, 7/1/20, (Pre-refunded @ $101,
7/1/10) (a) | | A2/NR | | | 2,525,857 | |
| | 8,000 | | | Internext Group 5.375%, 4/1/30, CP | | NR/BBB | | | 8,015,600 | |
| | 8,000 | | | Tobacco Securitization Agcy. Rev., Los Angeles Cnty., 5.45%, 6/1/28, (Converts to 5.45% on 12/1/10) | | Baa3/NR | | | 6,268,400 | |
|
16 PIMCO Municipal Income Funds Semi-Annual Report | 10.31.07
PIMCO California Municipal Income Fund
Schedule of Investments
| | | | | | | | | | | | | | |
Principal
Amount
(000) | | | | Credit Rating
(Moody’s/S&P) | | Value |
| | | | | Tobacco Securitization Auth. Rev., Ser. A,
(Pre-refunded @ $100, 6/1/11) (a) | | | | | | |
| $ | 1,500 | | | 5.25%, 6/1/31 | | Aaa/AAA | | $ | 1,592,055 | |
| | 9,300 | | | 5.375%, 6/1/41 | | Aaa/AAA | | | 9,909,522 | |
| | 1,650 | | | Town of Apple Valley, CP, 5.375%, 6/1/21, (CA Mtg. Ins.) | | NR/A+ | | | 1,736,757 | |
| | | | | Tustin Unified School Dist., Special Tax, | | | | | | |
| | 2,345 | | | 5.50%, 9/1/22 | | NR/NR | | | 2,298,288 | |
| | 2,520 | | | 5.60%, 9/1/29 | | NR/NR | | | 2,505,636 | |
| | 2,000 | | | 5.625%, 9/1/32 | | NR/NR | | | 2,005,220 | |
| | | | | Univ. Rev., | | | | | | |
| | 8,000 | | | 4.75%, 5/15/35, Ser. F (FSA) (f) | | Aaa/AAA | | | 8,022,160 | |
| | 10,000 | | | 5.00%, 5/15/36, Ser. A (AMBAC) | | Aaa/AAA | | | 10,252,000 | |
| | 7,000 | | | 5.125%, 9/1/31, Ser. O, (Pre-refunded @ $101, 9/1/10)
(FGIC) (a) | | Aaa/AAA | | | 7,403,130 | |
| | 3,750 | | | West Kern Cnty. Water Dist., CP, 5.625%, 6/1/31,
(Pre-refunded @ $101, 6/1/10) (a) | | Baa2/NR | | | 3,990,037 | |
| | | | | Total California Municipal Bonds & Notes (cost–$346,823,799) | | | | | 367,853,853 | |
OTHER MUNICIPAL BONDS & NOTES–9.5% |
| | | | | Illinois–1.3% | | | | | | |
| | | | | Educational Facs. Auth. Rev., Univ. of Chicago, | | | | | | |
| | 5,260 | | | 5.00%, 7/1/33 | | Aa1/AA | | | 5,395,024 | |
| | 240 | | | 5.00%, 7/1/33, (Pre-refunded @ $100, 7/1/13) (a) | | Aa1/AA | | | 257,043 | |
| | | | | | | | | | 5,652,067 | |
| | | | | Iowa–1.9% | | | | | | |
| | 8,700 | | | Tobacco Settlement Auth. Rev., zero coupon, 6/1/34, Ser. B
(Converts to 5.6% on 12/1/07) | | Baa3/BBB | | | 8,074,731 | |
| | | | | Louisiana–0.4% | | | | | | |
| | 1,750 | | | Tobacco Settlement Financing Corp. Rev.,
5.875%, 5/15/39, Ser. 2001-B | | Baa3/BBB | | | 1,751,750 | |
| | | | | New Jersey–1.7% | | | | | | |
| | | | | Tobacco Settlement Financing Corp. Rev., | | | | | | |
| | 1,685 | | | 6.00%, 6/1/37, (Pre-refunded @ $100, 6/1/12) (a) | | Aaa/AAA | | | 1,853,281 | |
| | 2,210 | | | 6.125%, 6/1/42, (Pre-refunded @ $100, 6/1/12) (a) | | Aaa/AAA | | | 2,442,271 | |
| | 2,315 | | | 6.375%, 6/1/32 (a) | | Aaa/AAA | | | 2,604,931 | |
| | | | | | | | | | 6,900,483 | |
| | | | | New York–0.5% | | | | | | |
| | 1,990 | | | State Dormitory Auth. Hospital Rev., 6.25%, 8/15/15, (FHA) | | Aa2/AAA | | | 2,186,453 | |
| | | | | Puerto Rico–3.2% | | | | | | |
| | 1,250 | | | Electric Power Auth. Power Rev., 5.125%, 7/1/29, Ser. NN,
(Pre-refunded @ $100, 7/1/13) (a) | | A3/BBB+ | | | 1,348,688 | |
| | 5,000 | | | Electric Power Auth., Power Rev., 5.25%, 7/1/29, Ser. HH,
(Pre-refunded @ $101, 7/1/10) (FSA) (a) | | Aaa/AAA | | | 5,286,300 | |
|
10.31.07 | PIMCO Municipal Income Funds Semi-Annual Report 17
PIMCO California Municipal Income Fund
Schedule of Investments
| | | | | | | | | | | | | | |
Principal
Amount
(000) | | | | Credit Rating
(Moody’s/S&P) | | Value |
| | | | | Puerto Rico (continued) | | | | | | |
| | | | | Puerto Rico Sales Tax Financing Corp., Rev., | | | | | | |
| $ | 19,200 | | | zero coupon, 8/1/47, Ser. A (AMBAC) | | Aaa/AAA | | $ | 2,729,280 | |
| | 24,000 | | | zero coupon, 8/1/54, Ser. A (AMBAC) | | Aaa/AAA | | | 2,280,240 | |
| | 21,600 | | | zero coupon, 8/1/56, Ser. A | | A1/A+ | | | 1,777,896 | |
| | | | | | | | | | 13,422,404 | |
| | | | | Rhode Island–0.4% | | | | | | |
| | 1,500 | | | Tobacco Settlement Financing Corp. Rev., 6.125%, 6/1/32, Ser. A | | Baa3/BBB | | | 1,513,875 | |
| | | | | South Carolina–0.1% | | | | | | |
| | 340 | | | Tobacco Settlement Rev. Management Auth. Rev.,
6.375%, 5/15/30, Ser. B | | Baa3/BBB | | | 354,341 | |
| | | | | Total Other Municipal Bonds & Notes (cost–$37,558,099) | | | | | 39,856,103 | |
CALIFORNIA VARIABLE RATE NOTES (b)(c)(g)(h)–1.3% |
| | 4,001 | | | Los Angeles Wastewater System Rev.,
10.21%, 6/1/28, Ser. 318 (FGIC) | | Aaa/NR | | | 4,392,698 | |
| | 1,000 | | | Sacramento Cnty. Sanitation Dist. Rev.,
10.184%, 8/1/13, Ser. 1034 (MBIA) | | NR/AAA | | | 1,207,950 | |
| | | | | Total California Variable Rate Notes (cost–$4,885,642) | | | | | 5,600,648 | |
OTHER VARIABLE RATE NOTES (b)(c)(h)–1.1% |
| | | | | Illinois–1.1% | | | | | | |
| | 4,000 | | | Chicago Rev., 10.171%, 5/1/14, Ser. 1419 (AMBAC) (cost–$4,378,588) | | NR/AAA | | | 4,672,800 | |
CALIFORNIA VARIABLE RATE DEMAND NOTES (c)(d)–0.5% |
| | 540 | | | Health Facs. Financing Auth. Rev., 3.37%, 11/1/07, Ser. A (MBIA) | | VMIG1/A-1+ | | | 540,000 | |
| | 1,500 | | | State Department of Water Resources Rev.,
3.37%, 11/1/07, Ser. B-5 | | VMIG1/A-1+ | | | 1,500,000 | |
| | | | | Total California Variable Rate Demand Notes (cost–$2,040,000) | | | | | 2,040,000 | |
OTHER VARIABLE RATE DEMAND NOTES (c)(d)–0.2% |
| | | | | Virginia–0.2% | | | | | | |
| | 1,000 | | | Loudoun Cnty. Industrial Dev. Auth., Howard Hughes Medical Institute Rev., 3.56%, 11/1/07, Ser. A (cost–$1,000,000) | | VMIG1/A-1+ | | | 1,000,000 | |
U.S. TREASURY BILLS (e)–0.1% |
| | 595 | | | 3.81%-4.62%,11/29/07-12/13/07 (cost–$592,471) | | | | | 592,471 | |
| | | | | Total Investments (cost–$397,278,599)–100.0% | | | | $ | 421,615,875 | |
|
18 PIMCO Municipal Income Funds Semi-Annual Report | 10.31.07 | See accompanying Notes to Financial Statements
PIMCO New York Municipal Income Fund
Schedule of Investments
| | | | | | | | | | | | | | |
Principal
Amount
(000) | | | | Credit Rating
(Moody’s/S&P) | | Value |
NEW YORK MUNICIPAL BONDS & NOTES–90.1% |
| $ | 3,265 | | | Albany Industrial Dev. Agcy. Civic Fac. Rev., 5.30%, 4/1/29, Ser. A | | Baa3/NR | | $ | 3,301,274 | |
| | 1,600 | | | Erie Cnty. Industrial Dev. Agcy., Orchard Park Rev., 6.00%, 11/15/36 | | NR/NR | | | 1,590,816 | |
| | | | | Liberty Dev. Corp. Rev., | | | | | | |
| | 11,290 | | | 5.25%, 10/1/35 (f) | | Aa3/NR | | | 12,030,060 | |
| | 1,150 | | | 5.50%, 10/1/37 | | Aa3/AA− | | | 1,271,187 | |
| | 1,000 | | | Long Island Power Auth. Electric System Rev., | | | | | | |
| | | | | 5.375%, 5/1/33, Ser. L, (Pre-refunded @ $100, 5/1/11) (a)(f) | | Aaa/AAA | | | 1,063,780 | |
| | | | | Metropolitan Transportation Auth. Rev., | | | | | | |
| | 6,040 | | | 5.00%, 7/1/25, Ser. A (FGIC) | | Aaa/AAA | | | 6,260,158 | |
| | 8,150 | | | 5.00%, 7/1/30, Ser. A (AMBAC) | | Aaa/AAA | | | 8,401,835 | |
| | 1,375 | | | 5.125%, 1/1/29, Ser. A | | A1/AA− | | | 1,419,976 | |
| | 1,500 | | | Monroe Tobacco Asset Securitization Corp., Tobacco Settlement Rev., | | | | | | |
| | | | | 6.375%, 6/1/35, (Pre-refunded @ $101, 6/1/10) (a) | | Aaa/AAA | | | 1,625,055 | |
| | | | | New York City, GO, Ser. J, | | | | | | |
| | 2,595 | | | 5.125%, 5/15/29, (MBIA) | | Aaa/AAA | | | 2,655,645 | |
| | 2,405 | | | 5.125%, 5/15/29, (Pre-refunded @ $101, 5/15/09) (MBIA) (a) | | Aaa/AAA | | | 2,492,350 | |
| | 5 | | | 5.25%, 6/1/28 | | Aa3/AA | | | 5,266 | |
| | 185 | | | 5.25%, 6/1/28, (Pre-refunded @ $100, 6/1/13) (a) | | Aa3/AA | | | 200,573 | |
| | 1,000 | | | New York City Industrial Dev. Agcy. Rev., Liberty Interactive Corp., | | | | | | |
| | | | | 5.00%, 9/1/35 | | Baa3/BBB− | | | 960,740 | |
| | 1,820 | | | New York City Industrial Dev. Agcy. Rev., Vaughn College Aeronautics, | | | | | | |
| | | | | 5.25%, 12/1/36, Ser. B | | NR/BB+ | | | 1,699,389 | |
| | | | | New York City Municipal Water Finance Auth., Water & Sewer System Rev., | | | | | | |
| | 7,605 | | | 4.75%, 6/15/31, Ser. A (FGIC) | | Aaa/AAA | | | 7,624,545 | |
| | 7,000 | | | 5.125%, 6/15/21, Ser. A (AMBAC-TCRS) | | Aaa/AAA | | | 7,070,070 | |
| | 5,000 | | | 5.125%, 6/15/33, Ser. C | | Aa2/AA+ | | | 5,160,100 | |
| | 5,000 | | | 5.25%, 6/15/25, Ser. D | | Aa2/AA+ | | | 5,254,800 | |
| | | | | New York City Transitional Finance Auth. Rev., | | | | | | |
| | 2,050 | | | 4.75%, 11/15/23 | | Aa1/AAA | | | 2,071,853 | |
| | 200 | | | 4.75%, 11/15/23, (Pre-refunded @ $101, 5/15/08) (a) | | Aa1/AAA | | | 203,480 | |
| | | | | New York Cntys. Tobacco Trust II Rev., (f) | | | | | | |
| | 8,000 | | | 5.625%, 6/1/35 | | NR/AA+ | | | 8,087,840 | |
| | 13,130 | | | 5.75%, 6/1/43 | | NR/AA+ | | | 13,308,043 | |
| | 1,000 | | | Niagara Falls Public Water Auth., | | | | | | |
| | | | | Water & Sewer System Rev., 5.00%, 7/15/34, Ser. A (MBIA) | | Aaa/AAA | | | 1,034,960 | |
| | | | | Port Auth. of New York & New Jersey Rev., | | | | | | |
| | 3,000 | | | 5.00%, 9/1/29, Ser. 132 | | A1/AA− | | | 3,108,420 | |
| | 5,000 | | | 5.00%, 9/1/38, Ser. 132 | | A1/AA− | | | 5,133,150 | |
| | 4,515 | | | Sachem Central School Dist. of Holbrook, GO, | | | | | | |
| | | | | 5.00%, 10/15/30, Ser. B (MBIA) | | Aaa/AAA | | | 4,862,971 | |
| | 6,550 | | | State Dormitory Auth. Lease Rev., 4.75%, 1/15/29, Ser. 1 (FSA) | | Aaa/AAA | | | 6,580,392 | |
|
10.31.07 | PIMCO Municipal Income Funds Semi-Annual Report 19
PIMCO New York Municipal Income Fund
Schedule of Investments
| | | | | | | | | | | | | | |
Principal
Amount
(000) | | | | Credit Rating
(Moody’s/S&P) | | Value |
| $ | 2,315 | | | State Dormitory Auth. Rev. State Univ., GO, 4.75%, 5/15/28, Ser. B, (Pre-refunded @ $101, 5/15/08) (FSA-CR) (a) | | Aaa/AAA | | $ | 2,355,281 | |
| | | | | State Dormitory Auth. Rev., | | | | | | |
| | | | | Augustana Lutheran Home for the Aged, Inc. (MBIA-FHA), | | | | | | |
| | 100 | | | 5.40%, 2/1/31 | | Aaa/AAA | | | 105,367 | |
| | 1,435 | | | 5.50%, 2/1/41 | | Aaa/AAA | | | 1,510,682 | |
| | 1,500 | | | Hospital Center, 5.00%, 7/1/26, Ser. A | | Ba2/BB | | | 1,481,985 | |
| | 3,850 | | | Lenox Hill Hospital, 5.50%, 7/1/30 | | Ba2/NR | | | 3,895,353 | |
| | | | | Mental Health Services Facs., Improvement, Ser. D (MBIA), | | | | | | |
| | 7,980 | | | 4.75%, 2/15/25 | | Aaa/AAA | | | 8,001,865 | |
| | 15 | | | 4.75%, 2/15/25, (Pre-refunded @ $100, 8/15/08) (a) | | Aaa/AAA | | | 15,166 | |
| | 5 | | | 4.75%, 2/15/25, (Pre-refunded @ 101, 08/15/08) (a) | | Aaa/AAA | | | 5,055 | |
| | 1,825 | | | Mount Sinai Health, 6.50%, 7/1/25, Ser. A | | Baa1/NR | | | 1,942,329 | |
| | 7,000 | | | NY & Presbyterian Hospital, | | | | | | |
| | | | | 4.75%, 8/1/27 (AMBAC-FHA) | | Aaa/AAA | | | 7,037,870 | |
| | 445 | | | NY Univ., 5.50%, 7/1/21, Ser. 2 (AMBAC) | | Aaa/AAA | | | 471,504 | |
| | 4,000 | | | Sloan-Kettering Center Memorial, 5.00%, 7/1/34, Ser. 1 | | Aa2/AA | | | 4,090,640 | |
| | 1,275 | | | Winthrop Univ. Hospital Assoc., 5.25%, 7/1/31, Ser. A (AMBAC) | | Aaa/AAA | | | 1,334,338 | |
| | 5,000 | | | State Thruway Auth. General Rev., | | | | | | |
| | | | | 4.75%, 1/1/19, Ser. E, (Pre-refunded @ $101, 1/1/08) (a) | | Aa3/AA− | | | 5,060,650 | |
| | 3,975 | | | State Urban Dev. Corp., Correctional Facs. Service, | | | | | | |
| | | | | 4.75%, 1/1/28, Ser. B, (Pre-refunded @ $101, 1/1/09) (AMBAC) (a) | | Aaa/AAA | | | 4,077,476 | |
| | | | | Triborough Bridge & Tunnel Auth. Rev., | | | | | | |
| | 2,000 | | | 5.00%, 1/1/27, Ser. A | | Aa2/AA− | | | 2,058,780 | |
| | 755 | | | 5.00%, 1/1/32, Ser. A | | Aa2/AA− | | | 771,414 | |
| | 1,225 | | | Ulster Cnty. Industrial Dev. Agcy. Rev., 6.00%, 9/15/37, Ser. A | | NR/NR | | | 1,218,152 | |
| | 2,945 | | | Warren & Washington Cntys. Industrial Dev. Agcy. Rev., | | | | | | |
| | | | | Glens Falls Hospital, 5.00%, 12/1/27, Ser. C (FSA) | | Aaa/AAA | | | 3,074,845 | |
| | | | | Total New York Municipal Bonds & Notes (cost–$158,005,527) | | | | | 162,987,480 | |
OTHER MUNICIPAL BONDS & NOTES–7.8% |
| | | | | California–0.9% | | | | | | |
| | 2,000 | | | Tobacco Securitization Agcy. Rev., Los Angeles Cnty., | | | | | | |
| | | | | 5.45%, 6/1/28, (converts to 5.45% on 12/1/10) | | Baa3/NR | | | 1,567,100 | |
| | | | | Illinois–2.3% | | | | | | |
| | | | | Educational Facs. Auth. Rev., Univ. of Chicago, | | | | | | |
| | 3,825 | | | 5.00%, 7/1/33 | | Aa1/AA | | | 3,923,188 | |
| | 175 | | | 5.00%, 7/1/33, (Pre-refunded @ $100, 7/1/13) (a) | | Aa1/AA | | | 187,427 | |
| | | | | | | | | | 4,110,615 | |
| | | | | Louisiana–0.4% | | | | | | |
| | 750 | | | Tobacco Settlement Financing Corp. Rev., 5.875%, 5/15/39,
Ser. 2001-B | | Baa3/BBB | | | 750,750 | |
|
20 PIMCO Municipal Income Funds Semi-Annual Report | 10.31.07
PIMCO New York Municipal Income Fund
Schedule of Investments
| | | | | | | | | | | | | | |
Principal
Amount
(000) | | | | Credit Rating
(Moody’s/S&P) | | Value |
| | | | | Nevada–3.0% | | | | | | |
| $ | 5,500 | | | Truckee Meadows Water Auth. Rev., 4.75%, 7/1/31, Ser. A (MBIA) | | Aaa/AAA | | $ | 5,548,895 | |
| | | | | Puerto Rico–1.2% | | | | | | |
| | 1,500 | | | Commonwealth Highway & Transportation Auth. Rev., | | | | | | |
| | | | | 5.25%, 7/1/38, Ser. D, (Pre-refunded @ $100, 7/1/12) (a) | | Baa3/AAA | | | 1,612,470 | |
| | 500 | | | Electric Power Auth. Power Rev., | | A3/BBB+ | | | 539,475 | |
| | | | | | | | | | 2,151,945 | |
| | | | | Total Other Municipal Bonds & Notes (cost–$13,765,022) | | | | | 14,129,305 | |
NEW YORK VARIABLE RATE NOTES (b)(d)(g)(h)–1.3% |
| | 2,173 | | | New York City Transitional Finance Auth. Rev., | | | | | | |
| | | | | 8.67%, 11/1/23, Ser. 362 (cost–$1,971,747) | | Aa1/NR | | | 2,321,772 | |
OTHER VARIABLE RATE NOTES (c)–0.7% |
| | | | | Puerto Rico–0.7% | | | | | | |
| | 1,300 | | | Public Finance Corp. Rev., 5.75%, 8/1/27, Ser. A (cost–$1,363,176) | | Ba1/BBB− | | | 1,379,482 | |
U.S. TREASURY BILLS (e)–0.1% |
| | 100 | | | 3.81%-4.25%,11/29/07-12/13/07 (cost–$99,615) | | | | | 99,615 | |
| | | | | Total Investments (cost–$175,205,087)–100.0% | | | | $ | 180,917,654 | |
|
See accompanying Notes to Financial Statements | 10.31.07 | PIMCO Municipal Income Funds Semi-Annual Report 21
PIMCO Municipal Income Funds
Footnotes to Schedules of Investments
Notes to Schedules of Investments:
| | |
| (a) | | Pre-refunded bonds are collateralized by U.S. Government or other eligible securities which are held in escrow and used to pay principal and interest and retire the bonds at the earliest refunding date (payment date) and/or whose interest rates vary with changes in a designated base rate (such as the prime interest rate). |
| | |
| (b) | | 144A Security – Security exempt from registration, under Rule 144A of the Securities Act of 1933. These securities may be resold in transactions exempt from registration, typically only to qualified institutional buyers. Unless otherwise indicated, these securities are not considered to be illiquid. |
| | |
| (c) | | Variable Rate Notes – instruments whose interest rates change on specified date (such as a coupon date or interest payment date) and/or whose interest rates vary with changes in a designated base rate (such as the prime interest rate). The interest rate disclosed reflects the rate in effect on October 31, 2007. |
| | |
| (d) | | Maturity date shown is date of next put. |
| | |
| (e) | | All or partial amount segregated as collateral for futures contracts. |
| | |
| (f) | | Residual Interest Bonds held in trust-securities represent underlying bonds transferred to a separate securitization trust established in a tender option bond transaction in which the Funds acquired the residual interest certificates. These securities serve as collateral in a financing transaction. |
| | |
| (g) | | Inverse Floater – The interest rate shown bears an inverse relationship to the interest rate on another security or the value of an index. |
| | |
| (h) | | Private Placement – restricted as to resale and may not have a readily available market. Securities with an aggregate value of $21,201,861, representing 3.7% of total investments in Municipal Income. Securities with an aggregate value of $18,003,401, representing 4.3% of total investments in California Municipal Income. Securities with an aggregate value of $2,321,772, representing 1.3% of total investments in New York Municipal Income. |
Glossary:
| |
| ACA – insured by American Capital Access Holding Ltd. |
| |
| AMBAC – insured by American Municipal Bond Assurance Corp. |
| |
| CA Mtg. Ins. – insured by California Mortgage Insurance |
| |
| CP – Certificates of Participation |
| |
| CR – Custodian Receipt |
| |
| FGIC – insured by Financial Guaranty Insurance Co. |
| |
| FHA – insured by Federal Housing Administration |
| |
| FSA – insured by Financial Security Assurance, Inc. |
| |
| GO – General Obligation Bond |
| |
| GTD – Guaranteed |
| |
| IBC – Insurance Bond Certificate |
| |
| MBIA – insured by Municipal Bond Investors Assurance |
| |
| NR – Not Rated |
| |
| PSF – Public School Fund |
| |
| Q-SBLF – Qualified School Bond Loan Fund |
| |
| Radian – insured by Radian Guaranty, Inc. |
| |
| TCRS – Temporary Custodian Receipts |
| |
| XLCA – insured by XL Capital Assurance |
22 PIMCO Municipal Income Funds Semi-Annual Report | 10.31.07 | See accompanying Notes to Financial Statements
PIMCO Municipal Income Funds
Statements of Assets and Liabilities
| | | | | | | | | | | | | | |
| | | Municipal | | California
Municipal | | New York
Municipal |
| Assets: | | | | | | | | | | | | |
| Investments, at value (cost–$548,850,420, $397,278,599 and $175,205,087 respectively) | | $ | 577,664,287 | | | $ | 421,615,875 | | | $ | 180,917,654 | |
| Interest receivable | | | 10,326,590 | | | | 6,145,089 | | | | 2,851,679 | |
| Receivable for variation margin on futures contracts | | | 678,172 | | | | 192,391 | | | | 64,000 | |
| Prepaid expenses and other assets | | | 1,954,396 | | | | 433,598 | | | | 563,308 | |
| Total Assets | | | 590,623,445 | | | | 428,386,953 | | | | 184,396,641 | |
| Liabilities: | | | | | | | | | | | | |
| Payable for floating rate notes | | | 29,419,234 | | | | 16,800,000 | | | | 19,576,494 | |
| Payable for investments purchased | | | 10,695,401 | | | | — | | | | — | |
| Dividends payable to common and preferred shareholders | | | 2,079,656 | | | | 1,438,646 | | | | 434,414 | |
| Interest payable | | | 416,783 | | | | 288,749 | | | | 211,101 | |
| Investment management fees payable | | | 255,131 | | | | 190,958 | | | | 75,771 | |
| Payable to custodian for cash overdraft | | | 220,680 | | | | 30,294 | | | | 1,566,793 | |
| Accrued expenses and other payables | | | 202,945 | | | | 113,967 | | | | 50,599 | |
| Total Liabilities | | | 43,289,830 | | | | 18,862,614 | | | | 21,915,172 | |
| Preferred shares ($25,000 net asset and liquidation value per share applicable to an aggregate of 8,000, 6,000 and 2,520 shares issued and outstanding, respectively) | | | 200,000,000 | | | | 150,000,000 | | | | 63,000,000 | |
| Net Assets Applicable to Common Shareholders | | $ | 347,333,615 | | | $ | 259,524,339 | | | $ | 99,481,469 | |
| Composition of Net Assets Applicable to Common Shareholders: | | | | | | | | | | | | |
| Common Stock (no par value): | | | | | | | | | | | | |
| Paid-in-capital | | $ | 351,498,995 | | | $ | 256,396,305 | | | $ | 106,230,487 | |
| Undistributed (dividends in excess of) net investment income | | | (32,547 | ) | | | 564,976 | | | | (583,280 | ) |
| Accumulated net realized loss on investments | | | (32,092,954 | ) | | | (21,414,487 | ) | | | (11,690,559 | ) |
| Net unrealized appreciation of investments and futures contracts | | | 27,960,121 | | | | 23,977,545 | | | | 5,524,821 | |
| Net Assets Applicable to Common Shareholders | | $ | 347,333,615 | | | $ | 259,524,339 | | | $ | 99,481,469 | |
| Common Shares Outstanding | | | 24,716,760 | | | | 18,049,491 | | | | 7,522,894 | |
| Net Asset Value Per Common Share | | $ | 14.05 | | | $ | 14.38 | | | $ | 13.22 | |
|
See accompanying Notes to Financial Statements | 10.31.07 | PIMCO Municipal Income Funds Semi-Annual Report 23
PIMCO Municipal Income Funds
Statements of Operations
| | | | | | | | | | | | | | |
| | | Municipal | | California
Municipal | | New York
Municipal |
| Investment Income: | | | | | | | | | | | | |
| Interest | | $ | 15,625,689 | | | $ | 11,364,061 | | | $ | 4,571,679 | |
| Expenses: | | | | | | | | | | | | |
| Investment management fees | | | 1,802,997 | | | | 1,340,283 | | | | 531,866 | |
| Interest expense | | | 589,359 | | | | 387,862 | | | | 375,455 | |
| Auction agent fees and commissions | | | 252,343 | | | | 189,257 | | | | 79,488 | |
| Custodian and accounting agent fees | | | 189,439 | | | | 50,046 | | | | 37,321 | |
| Shareholder communications | | | 33,212 | | | | 19,910 | | | | 11,764 | |
| Audit and tax services | | | 29,904 | | | | 27,561 | | | | 20,210 | |
| Trustees’ fees and expenses | | | 19,104 | | | | 17,390 | | | | 8,102 | |
| Transfer agent fees | | | 16,512 | | | | 16,539 | | | | 16,548 | |
| New York Stock Exchange listing fees | | | 12,567 | | | | 12,418 | | | | 12,332 | |
| Legal fees | | | 11,870 | | | | 9,257 | | | | 6,458 | |
| Insurance expense | | | 4,954 | | | | 3,729 | | | | 1,724 | |
| Miscellaneous | | | 12,830 | | | | 14,842 | | | | 10,010 | |
| Total expenses | | | 2,975,091 | | | | 2,089,094 | | | | 1,111,278 | |
| Less: investment management fees waived | | | (324,071 | ) | | | (240,651 | ) | | | (95,523 | ) |
| custody credits earned on cash balances | | | (17,985 | ) | | | (12,853 | ) | | | (6,053 | ) |
| Net expenses | | | 2,633,035 | | | | 1,835,590 | | | | 1,009,702 | |
| Net Investment Income | | | 12,992,654 | | | | 9,528,471 | | | | 3,561,977 | |
| Realized and Change In Unrealized Gain (Loss) | | | | | | | | | | | | |
| Net realized gain (loss) on: | | | | | | | | | | | | |
| Investments | | | (4,030,418 | ) | | | 449,250 | | | | 107,279 | |
| Futures contracts | | | 12,372 | | | | 42,697 | | | | 43,962 | |
| Net change in unrealized appreciation/depreciation of: | | | | | | | | | | | | |
| Investments | | | (12,259,949 | ) | | | (7,182,599 | ) | | | (3,793,949 | ) |
| Futures contracts | | | (939,050 | ) | | | (276,344 | ) | | | (88,426 | ) |
Net realized and change in unrealized loss on investments
and futures contracts | | | (17,217,045 | ) | | | (6,966,996 | ) | | | (3,731,134 | ) |
| Net Increase (Decrease) in Net Assets Resulting from Investment Operations | | | (4,224,391 | ) | | | 2,561,475 | | | | (169,157 | ) |
| Dividends on Preferred Shares from Net Investment Income | | | (3,623,076 | ) | | | (2,555,509 | ) | | | (1,110,869 | ) |
| Net Increase (Decrease) in Net Assets Applicable to Common Shareholders Resulting from Investment Operations | | $ | (7,847,467 | ) | | $ | 5,966 | | | $ | (1,280,026 | ) |
|
24 PIMCO Municipal Income Funds Semi-Annual Report | 10.31.07 | See accompanying Notes to Financial Statements
(This page intentionally left blank)
10.31.07 | PIMCO Municipal Income Funds Semi-Annual Report 25
PIMCO Municipal Income Funds
Statements of Changes in Net Assets
Applicable to Common Shareholders
| | | | | | | | | | |
| | | Municipal |
| | | Six Months
ended
October 31, 2007
(unaudited) | | Year ended
April 30, 2007 |
| Investment Operations: | | | | | | | | |
| Net investment income | | $ | 12,992,654 | | | $ | 26,280,189 | |
| Net realized gain (loss) on investments and futures contracts | | | (4,018,046 | ) | | | (770,521 | ) |
Net change in unrealized appreciation/depreciation of investments and
future contracts | | | (13,198,999 | ) | | | 12,701,370 | |
| Net increase (decrease) in net assets resulting from investment operations | | | (4,224,391 | ) | | | 38,211,038 | |
| Dividends to Preferred Shares from: net investment income | | | (3,623,076 | ) | | | (6,842,737 | ) |
Net increase (decrease) in net assets applicable to common shareholders
resulting from investment operations | | | (7,847,467 | ) | | | 31,368,301 | |
| Dividends to Common Shareholders from: net investment income | | | (12,033,613 | ) | | | (23,952,391 | ) |
| Capital Share Transactions: | | | | | | | | |
| Reinvestment of dividends | | | 1,231,032 | | | | 2,690,939 | |
| Total increase (decrease) in net assets applicable to common shareholders | | | (18,650,048 | ) | | | 10,106,849 | |
| Net Assets Applicable to Common Shareholders: | | | | | | | | |
| Beginning of period | | | 365,983,663 | | | | 355,876,814 | |
| End of period (including undistributed (dividends in excess of) net investment income of $(32,547) and $2,631,488; $564,976 and $1,920,741; $(583,280) and $(464,828); respectively) | | $ | 347,333,615 | | | $ | 365,983,663 | |
| Common Shares Issued in Reinvestment of Dividends | | | 77,632 | | | | 166,027 | |
|
26 PIMCO Municipal Income Funds Semi-Annual Report | 10.31.07 | See accompanying Notes to Financial Statements
| | | | | | | | | | | | | | |
| California Municipal | | New York Municipal |
Six Months
ended
October 31, 2007
(unaudited) | | Year ended
April 30, 2007 | | Six Months
ended
October 31, 2007
(unaudited) | | Year ended
April 30, 2007 |
| | | | | | | | | | | | | | | |
| $ | 9,528,471 | | | $ | 19,801,729 | | | $ | 3,561,977 | | | $ | 7,223,788 | |
| | 491,947 | | | | 190,454 | | | | 151,241 | | | | 242,222 | |
| | (7,458,943 | ) | | | 7,711,078 | | | | (3,882,375 | ) | | | 2,489,355 | |
| | 2,561,475 | | | | 27,703,261 | | | | (169,157 | ) | | | 9,955,365 | |
| | (2,555,509 | ) | | | (4,720,601 | ) | | | (1,110,869 | ) | | | (2,099,830 | ) |
| | 5,966 | | | | 22,982,660 | | | | (1,280,026 | ) | | | 7,855,535 | |
| | (8,328,727 | ) | | | (16,589,531 | ) | | | (2,569,560 | ) | | | (5,893,650 | ) |
| | 786,247 | | | | 1,540,300 | | | | 296,043 | | | | 705,924 | |
| | (7,536,514 | ) | | | 7,933,429 | | | | (3,553,543 | ) | | | 2,667,809 | |
| | | | | | | | | | | | | | | |
| | 267,060,853 | | | | 259,127,424 | | | | 103,035,012 | | | | 100,367,203 | |
| $ | 259,524,339 | | | $ | 267,060,853 | | | $ | 99,481,469 | | | $ | 103,035,012 | |
| | 51,110 | | | | 97,824 | | | | 22,080 | | | | 48,810 | |
|
See accompanying Notes to Financial Statements | 10.31.07 | PIMCO Municipal Income Funds Semi-Annual Report 27
PIMCO New York Municipal Income Fund
Statement of Cash Flows
| | | | | | |
| Cash Flows provided by Operating Activities: | | | | |
| Purchases of long-term investments | | $ | (3,367,614 | ) |
| Proceeds from sales of long-term investments | | | 1,704,310 | |
| Interest received | | | 4,121,667 | |
| Operating expenses paid | | | (664,841 | ) |
| Net cash provided by for futures transactions | | | (120,445 | ) |
| Net decrease in short-term investments | | | 72,272 | |
| Net cash provided by operating activities | | | 1,745,349 | |
| Cash Flows from Financing Activities: | | | | |
| Cash dividends paid (excluding reinvestment of dividends of $296,043) | | | (3,414,801 | ) |
| Cash overdraft | | | 1,566,793 | |
| Net cash used for financing activities* | | | (1,848,008 | ) |
| Net decrease in cash | | | (102,659 | ) |
| Cash at beginning of period | | | 102,659 | |
| Cash at end of period | | | — | |
Reconciliation of Net Increase in Net Assets From Investment Operations to
Net Cash Provided by Operating Activities: | | | | |
| Net decrease in net assets resulting from investment operations | | | (169,157 | ) |
| Decrease in interest receivable | | | 10,685 | |
| Decrease in prepaid expenses and other assets | | | 10,791 | |
| Increase in investment management fees payable | | | 7,647 | |
| Decrease in variation margin payable on futures contracts | | | (22,781 | ) |
| Decrease in variation margin receivable on futures contracts | | | (53,200 | ) |
| Decrease in accrued expenses and other payables | | | (49,032 | ) |
| Net decrease in investments | | | 2,010,396 | |
| Net cash provided by operating activities | | $ | 1,745,349 | |
|
| |
| * | Non-cash operating activity not included consists of interest expense on floating rate notes issued of $375,455. |
28 PIMCO Municipal Income Funds Semi-Annual Report | 10.31.07 | See accompanying Notes to Financial Statements
PIMCO Municipal Income Funds
Notes to Financial Statements
1. Organization and Significant Accounting Policies
PIMCO Municipal Income Fund (‘‘Municipal’’), PIMCO California Municipal Income Fund (‘‘California Municipal’’) and PIMCO New York Municipal Income Fund (‘‘New York Municipal’’), collectively referred to as the ‘‘Funds’’ or ‘‘PIMCO Municipal Income Funds’’, were organized as Massachusetts business trusts on May 10, 2001. Prior to commencing operations on June 29, 2001, the Funds had no operations other than matters relating to their organization and registration as non-diversified, closed-end management investment companies registered under the Investment Company Act of 1940 and the rules and regulations the re under, as amended. Allianz Global Investors Fund Management LLC (the ‘‘Investment Manager’’), serves as the investment manager and is an indirect, wholly-owned subsidiary of Allianz Global Investors of America L.P. (‘‘Allianz Global’’). Allianz Global is an indirect majority-owned subsidiary of Allianz SE, a publicly traded European insurance and financial services company. The Funds have an unlimited amount of no par value common stock authorized.
Under normal market conditions, Municipal invests substantially all of its assets in a portfolio of municipal bonds, the interest from which is exempt from federal income taxes. Under normal market conditions, California Municipal invests substantially all of its assets in municipal bonds which pay interest that is exempt from federal and California state income taxes. Under normal market conditions, New York Municipal invests substantially all of its assets in municipal bonds which pay interest that is exempt from federal, New York State and New York City income taxes. The Funds will seek to avoid bonds generating interest income which could potentially subject individuals to alternative minimum tax. The issuers’ abilitie s to meet their obligations may be affected by economic and political developments in a specific state or region.
The preparation of the financial statements in accordance with accounting principles generally accepted in the United States of America requires management to make estimates and assumptions that affect the reported amounts and disclosures in the financial statements. Actual results could differ from those estimates.
In the normal course of business the Funds enter into contracts that contain a variety of representations which provide general indemnifications. The Funds’ maximum exposure under these arrangements is unknown as this would involve future claims that may be made against the Funds based upon events that have not been asserted. However, the Funds expect the risk of any loss to be remote.
In July 2006, the Financial Accounting Standards Board issued interpretation No. 48, ‘‘Accounting for Uncertainty in Income Taxes – an Interpretation of FASB Statement No. 109’’ (the ‘‘Interpretation’’). The Interpretation establishes for all entities, including pass-through entities such as the Funds, a minimum threshold for financial statement recognition of the benefit of positions taken in filing tax returns (including whether an entity is taxable in a particular jurisdiction), and requires certain expanded tax disclosures. Fund management has determined that its evaluation of the Interpretation has resulted in no impact to the Funds’ financial statements at Octobe r 31, 2007.
In September 2006, the Financial Accounting Standards Board issued Statement of Financial Accounting Standards (‘‘SFAS’’) 157, Fair Value Measurements, which clarifies the definition of fair value and requires companies to expand their disclosure about the use of fair value to measure assets and liabilities in interim and annual periods subsequent to initial recognition. Adoption of SFAS 157 requires the use of the price that would be received to sell an asset or paid to transfer a liability in an orderly transaction between market participants at the measurement date. SFAS 157 is effective for financial statements issued for fiscal years beginning after November 15, 2007, and interim periods within th ose fiscal years. At this time, the Funds are in the process of reviewing the Standard against its current valuation policies to determine future applicability.
The following is a summary of significant accounting policies consistently followed by the Funds:
(a) Valuation of Investments
Portfolio securities and other financial instruments for which market quotations are readily available are stated at market value. Portfolio securities and other financial instruments for which market quotations are not readily available or if a development/event occurs that may significantly impact the value of a security are fair-valued, in good faith, pursuant to guidelines established by the Board of Trustees. The Funds’ investments are valued daily using prices supplied by an independent pricing service or dealer quotations, or by using the last sale price on the exchange that is the primary market for such securities, or the last quoted mean price for those securities for which the over-the-counter market is the prim ary market or for listed securities in which there were no sales. Independent pricing services use information provided by market makers or estimates of market values obtained from yield data relating to investments or securities with similar characteristics. Exchange traded options and futures are valued at the settlement price determined by the relevant exchange. Securities purchased on a when-issued or delayed-delivery
10.31.07 | PIMCO Municipal Income Funds Semi-Annual Report 29
PIMCO Municipal Income Funds
Notes to Financial Statements
1. Organization and Significant Accounting Policies (continued)
basis are marked to market daily until settlement at the forward settlement date. Short-term securities maturing in 60 days or less are valued at amortized cost, if their original term to maturity was 60 days or less, or by amortizing their value on the 61st day prior to maturity, if the original term to maturity exceeded 60 days. The prices used by the Funds to value securities may differ from the value that would be realized if the securities were sold and these differences could be material to the financial statements of the Funds. Each Fund’s net asset value is normally determined as of the close of regular trading (normally, 4:00 p.m. Eastern time) on the New York Stock Exchange (‘‘NYSE’’) on each day the NYSE is open for business.
(b) Investment Transactions and Investment Income
Investment transactions are accounted for on the trade date. Securities purchased and sold on a when-issued or delayed-delivery basis may be settled a month or more after the trade date. Realized gains and losses on investments are determined on the identified cost basis. Interest income is recorded on an accrual basis. Discounts or premiums on debt securities purchased are accreted or amortized to interest income over the lives of the respective securities using the effective interest method. Dividend income is recorded on the ex-dividend date.
(c) Federal Income Taxes
The Funds intend to distribute all of their taxable income and to comply with the other requirements of the U.S. Internal Revenue Code of 1986, as amended, applicable to regulated investment companies. Accordingly, no provision for U.S. federal income taxes is required.
(d) Dividends and Distributions – Common Stock
The Funds declare dividends from net investment income monthly to common shareholders. Distributions of net realized capital gains, if any, are paid at least annually. The Funds record dividends and distributions to its shareholders on the ex-dividend date. The amount of dividends and distributions from net investment income and net realized capital gains are determined in accordance with federal income tax regulations, which may differ from generally accepted accounting principles. These ‘‘book-tax’’ differences are considered either temporary or permanent in nature. To the extent these differences are permanent in nature, such amounts are reclassified within the capital accounts based on their federal i ncome tax treatment; temporary differences do not require reclassification. To the extent dividends and/or distributions exceed current and accumulated earnings and profits for federal income tax purposes; they are reported as dividends and/or distributions of paid-in capital.
(e) Futures Contracts
A futures contract is an agreement between two parties to buy and sell a financial instrument at a set price on a future date. Upon entering into such a contract, the Funds are required to pledge to the broker an amount of cash or securities, equal to the minimum ‘‘initial margin’’ requirements of the exchange. Pursuant to the contracts, the Funds agree to receive from or pay to the broker an amount of cash or securities equal to the daily fluctuation in the value of the contracts. Such receipts or payments are known as ‘‘variation margin’’ and are recorded by the Funds as unrealized appreciation or depreciation. When the contracts are closed, the Funds record a realized gain or lo ss equal to the difference between the value of the contracts at the time they were opened and the value at the time they were closed. Any unrealized appreciation or depreciation recorded is simultaneously reversed. The use of futures transactions involves the risk of an imperfect correlation in the movements in the price of futures contracts, interest rates and the underlying hedged assets, and the possible inability of counterparties to meet the terms of their contracts.
(f) Option Transactions
The Funds may purchase and write (sell) put and call options on securities for hedging purposes, risk management purposes or as part of its investment strategy. The risk associated with purchasing an option is that the Funds pay a premium whether or not the option is exercised. Additionally, the Funds bear the risk of loss of premium and change in market value should the counterparty not perform under the contract. Put and call options purchased are accounted for in the same manner as portfolio securities. The cost of securities acquired through the exercise of call options is increased by the premiums paid. The proceeds from securities sold through the exercise of put options is decreased by the premiums paid.
When an option is written, the premium received is recorded as an asset with an equal liability which is subsequently marked to market to reflect the current market value of the option written. These liabilities are reflected as options
30 PIMCO Municipal Income Funds Semi-Annual Report | 10.31.07
PIMCO Municipal Income Funds
Notes to Financial Statements
1. Organization and Significant Accounting Policies (continued)
written in the Statements of Assets and Liabilities. Premiums received from writing options which expire unexercised are recorded on the expiration date as a realized gain. The difference between the premium received and the amount paid on effecting a closing purchase transaction, including brokerage commissions, is also treated as a realized gain, or if the premium is less than the amount paid for the closing purchased transactions, as a realized loss. If a call option written by the Funds is exercised, the premium is added to the proceeds from the sale of the underlying security in determining whether there has been a realized gain or loss. If a put option written by the Funds is exercised, the premium reduces the cost basis of the security. In writing an option, the Funds bear the market risk of an unfavorable change in the price of the security underlying the written option. Exercise of a written option could result in the Funds purchasing a security at a price different from the current market value.
(g) Inverse Floating Rate Transactions – Residual Interest Municipal Bonds (‘‘RIBs’’) / Residual Interest Tax Exempt Bonds (‘‘RITEs’’)
The Funds invest in RIBs and RITEs (‘‘Inverse Floaters’’) whose interest rates bear an inverse relationship to the interest rate on another security or the value of an index. In these transactions, the Funds sell a fixed rate municipal bond (‘‘Fixed Rate Bond’’) to a broker who places the Fixed Rate Bond in a special purpose trust (‘‘Trust’’) from which floating rate bonds (‘‘Floating Rate Notes’’) and Inverse Floaters are issued. The Funds simultaneously or within a short period of time purchase the Inverse Floaters from the broker. The Inverse Floaters held by the Funds provide the Funds with the right to: (1) cause the holders of t he Floating Rate Notes to tender their notes at par, and (2) cause the broker to transfer the Fixed-Rate Bond held by the Trust to the Funds, thereby collapsing the Trust. Pursuant to Statement of Financial Accounting Standards No. 140 (‘‘FASB Statement No. 140’’), the Funds account for the transaction described above as a secured borrowing by including the Fixed-Rate Bond in their Schedules of Investments, and account for the Floating Rate Notes as a liability under the caption ‘‘Payable for floating rate notes’’ in the Funds’ Statements of Assets and Liabilities. The Floating Rate Notes have interest rates that generally reset weekly and their holders have the option to tender their notes to the broker for redemption at par at each reset date.
The Funds may also invest in Inverse Floaters without transferring a fixed rate municipal bond into a special purpose trust, which are not accounted for as secured borrowings.
The Inverse Floaters are created by dividing the income stream provided by the underlying bonds to create two securities, one short-term and one long-term. The interest rate on the short-term component is reset by an index or auction process typically every 7 to 35 days. After income is paid on the short-term securities at current rates, the residual income from the underlying bond (s) goes to the long-term securities. Therefore, rising short-term rates result in lower income for the long-term component and visa versa. The longer-term bonds may be more volatile and less liquid than other municipal bonds of comparable maturity. Investments in Inverse Floaters typically will involve greater risk than an in investment in Fixed Rate Bonds. The Funds may also invest in Inverse Floaters for the purpose of increasing leverage.
The Funds’ restrictions on borrowings do not apply to the secured borrowings deemed to have occurred for accounting purposes pursuant to FASB Statement No. 140. Inverse Floaters held by the Funds are exempt from registration under Rule 144A of the Securities Act of 1933.
(h) When-Issued/Delayed-Delivery Transactions
When-issued or delayed-delivery basis transactions involve a commitment to purchase or sell securities for a predetermined price or yield, with payment and delivery taking place beyond the customary settlement period. When delayed-delivery purchases are outstanding, the Funds will set aside and maintain until the settlement date in a designated account, liquid assets in an amount sufficient to meet the purchase price. When purchasing a security on a delayed-delivery basis, the Funds assume the rights and risks of ownership of the security, including the risk of price and yield fluctuations, consequently, such fluctuations are taken into account when determining net asset value. The Funds may dispose of or renegotiate a delayed-d elivery transaction after it is entered into, and may sell when-issued securities before they are delivered, which may result in a realized gain or loss. When a security on a delayed-delivery basis is sold, the Funds do not participate in future gains and losses with respect to the security.
(i) Custody Credits Earned on Cash Balances
The Funds benefit from an expense offset arrangement with its custodian bank whereby uninvested cash balances earn credits which reduce monthly custodian and accounting agent expenses. Had these cash balances been invested in income producing securities, they would have generated income for the Funds.
10.31.07 | PIMCO Municipal Income Funds Semi-Annual Report 31
PIMCO Municipal Income Funds
Notes to Financial Statements
1. Organization and Significant Accounting Policies (continued)
(j) Interest Expense
Relates to the Funds’ liability in connection with floating rate notes held by third parties in conjunction with Inverse Floater transactions.
2. Investment Manager/Sub-Adviser
Each Fund has entered into an Investment Management Agreement (collectively the ‘‘Agreements’’) with the Investment Manager. Subject to the supervision by each Fund’s Board of Trustees, the Investment Manager is responsible for managing, either directly or through others selected by it, each Fund’s investment activities, business affairs and administrative matters. Pursuant to the Agreements, the Investment Manager receives an annual fee, payable monthly, at an annual rate of 0.65% of each Fund’s average daily net assets, inclusive of net assets attributable to any preferred shares that may be outstanding. In order to reduce each Fund’s expenses, the Investment Manager has contract ually agreed to waive a portion of its investment management fee for each Fund at the annual rate of 0.10% of each Fund’s average daily net assets, including net assets attributable to any preferred shares that may be outstanding through June 30, 2008 and waive 0.05% of its investment management fee thereafter through June 30, 2009.
The Investment Manager has retained its affiliate, Pacific Investment Management Company LLC (the ‘‘Sub-Adviser’’), to manage each Fund’s investments. Subject to the supervision of the Investment Manager, the Sub-Adviser is responsible for making all investment decisions for the Funds. The Investment Manager, not the Funds, pays a portion of the fees it receives to the Sub-Adviser in return for its services.
3. Investments in Securities
For the six months ended October 31, 2007, purchases and sales of investments, other than short-term securities and U.S. government obligations, were:
| | | | | | | | | | | | | | |
| | | Municipal | | California
Municipal | | New York
Municipal |
| Purchases | | $80,180,472 | | $13,584,544 | | $3,367,614 |
| Sales | | 71,999,054 | | 15,450,793 | | 1,704,300 |
|
(a) Futures contracts outstanding at October 31, 2007:
| | | | | | | | | | | | | | | | | | | | | | |
| Fund | | Type | | Contracts | | Market
Value
(000) | | Expiration
Date | | Unrealized
Depreciation |
| Municipal | | Short: U.S. Treasury Bond Futures | | | (420 | ) | | $ | (47,289 | ) | | 12/19/07 | | $ | (559,047 | ) |
| | | U.S. Treasury Notes 5 yr. Futures | | | (533 | ) | | | (57,214 | ) | | 12/31/07 | | | (549,656 | ) |
| | | | | | | | | | | | | | | | (1,108,703 | ) |
| California Municipal | | Short: U.S. Treasury Bond Futures | | | (96 | ) | | $ | (10,809 | ) | | 12/19/07 | | | (135,000 | ) |
| | | U.S. Treasury Notes 5 yr. Futures | | | (199 | ) | | | (21,361 | ) | | 12/31/07 | | | (205,219 | ) |
| | | | | | | | | | | | | | | | (340,219 | ) |
| New York Municipal | | Short: U.S. Treasury Bond Futures | | | (64 | ) | | $ | (7,206 | ) | | 12/19/07 | | | (78,742 | ) |
|
32 PIMCO Municipal Income Funds Semi-Annual Report | 10.31.07
PIMCO Municipal Income Funds
Notes to Financial Statements
4. Income Tax Information
The Funds’ cost of investments for federal income tax purposes and financial reporting purposes is substantially the same. Gross unrealized appreciation and gross unrealized depreciation of investments at October 31, 2007 were:
| | | | | | | | | | | | | | | | | | |
| | | Cost of
Investments | | Gross
Unrealized
Appreciation | | Gross
Unrealized
Depreciation | | Net
Unrealized
Appreciation |
| Municipal | | $ | 548,850,420 | | | $ | 30,400,841 | | | $ | 1,586,974 | | | $ | 28,813,867 | |
| California Municipal | | | 397,278,599 | | | | 25,901,794 | | | | 1,564,518 | | | | 24,337,276 | |
| New York Municipal | | | 175,205,087 | | | | 6,601,903 | | | | 889,336 | | | | 5,712,567 | |
|
5. Auction Preferred Shares
Municipal has issued 1,600 shares of Preferred Shares Series A, 1,600 shares of Preferred Shares Series B, 1,600 shares of Preferred Shares Series C, 1,600 shares of Preferred Shares Series D and 1,600 shares of Preferred Shares Series E, each with a net asset and liquidation value of $25,000 per share plus accrued dividends.
California Municipal has issued 2,000 shares of Preferred Shares Series A, 2,000 shares of Preferred Shares Series B, and 2,000 shares of Preferred Shares Series C, each with a net asset and liquidation value of $25,000 per share plus accrued dividends.
New York Municipal has issued 2,520 shares of Preferred Shares Series A with a net asset and liquidation value of $25,000 per share plus accrued dividends.
Dividends are accumulated daily at an annual rate (typically re-set every seven days) through auction procedures. Distributions of net realized capital gains, if any, are paid annually.
For the six months ended October 31, 2007, the annualized dividend rates ranged from:
| | | | | | | | | | | | | | |
| | | High | | Low | | At October 31, 2007 |
| Municipal: | | | | | | |
| Series A | | 5.32% | | 3.00% | | 3.54% |
| Series B | | 5.32% | | 2.18% | | 3.54% |
| Series C | | 4.00% | | 3.10% | | 3.55% |
| Series D | | 4.05% | | 3.00% | | 3.20% |
| Series E | | 5.32% | | 3.00% | | 3.50% |
| California Municipal: | | | | | | |
| Series A | | 5.32% | | 2.11% | | 3.00% |
| Series B | | 5.25% | | 2.95% | | 3.95% |
| Series C | | 5.32% | | 2.11% | | 3.00% |
| New York Municipal: | | | | | | |
| Series A | | 5.32% | | 3.00% | | 3.25% |
|
The Funds are subject to certain limitations and restrictions while Preferred Shares are outstanding. Failure to comply with these limitations and restrictions could preclude the Funds from declaring any dividends or distributions to common shareholders or repurchasing common shares and/or could trigger the mandatory redemption of Preferred Shares at their liquidation value.
6. Subsequent Common Dividend Declarations
On November 1, 2007, the following dividends were declared to common shareholders payable December 3, 2007 to shareholders of record on November 12, 2007:
| | | | | | |
| Municipal | | $0.08125 per common share |
| California Municipal | | $0.077 per common share |
| New York Municipal | | $0.057 per common share |
|
10.31.07 | PIMCO Municipal Income Funds Semi-Annual Report 33
PIMCO Municipal Income Funds
Notes to Financial Statements
6. Subsequent Common Dividend Declarations (continued)
On December 3, 2007 the following dividends were declared to common shareholders payable December 31, 2007 to shareholders of record on December 13, 2007:
| | | | | | |
| Municipal | | $0.08125 per common share |
| California Municipal | | $0.077 per common share |
| New York Municipal | | $0.057 per common share |
|
7. Legal Proceedings
In June and September 2004, the Investment Manager, certain of its affiliates (including PEA Capital LLC (‘‘PEA’’) (Allianz Global Investors Distributors LLC and Allianz Global), agreed to settle, without admitting or denying the allegations, claims brought by the New Jersey Attorney General, SEC and violations of federal and state securities laws with respect to certain open-end funds for which the Investment Manager serves as investment adviser. The settlements (with the Commission and New Jersey) related to an alleged ‘‘market timing’’ arrangement in certain open-end funds sub-advised by PEA. Two settlements (with the Commission and California) related to the alleged use of cas h and fund portfolio commissions, to finance ‘‘shelf-space’’ arrangements with broker-dealers for open-end funds. The Investment Manager and its affiliates agreed to pay a total of $68 million to settle the claims related to market timing and $20.6 million to settle the claims. In addition to monetary payments, the settling parties agreed to undertake certain corporate governance, compliance and disclosure reforms related to market timing, brokerage commissions, revenue sharing and shelf space arrangements, and consented to cease and desist orders and censures. Subsequent to these events PEA Capital LLC deregistered and dissolved. None of the settlements alleged that any inappropriate activity took place with respect to the Fund.
Since February 2004, the Investment Manager and certain of its affiliates and their employees have been named as defendants in a number of pending lawsuits concerning ‘‘market timing,’’ which allege the same or similar conduct underlying the regulatory settlements discussed above. The market timing lawsuits have been consolidated in a multi-district litigation proceeding in the U.S. District Court for the District of Maryland, and the revenue sharing/shelf-space/directed brokerage lawsuits have been consolidated in the United States District Court for the District of Connecticut. Any potential resolution of these matters may include, but not be limited to, judgments or settlements for damages against the Investment Manager or its affiliates or related injunctions.
The Investment Manager and the Sub-Adviser believe that these matters are not likely to have a material adverse effect on the Funds or on their ability to perform their respective investment advisory activities relating to the Fund.
The foregoing speaks only as of the date hereof.
34 PIMCO Municipal Income Funds Semi-Annual Report | 10.31.07
PIMCO Municipal Income Fund
Financial Highlights
| | | | | | | | | | | | | | | | | | | | | | | | | | |
| | | Six Months
ended
October 31, 2007
(unaudited) | | Year Ended |
| | | 2007 | | 2006 | | 2005 | | 2004 | | 2003 |
| Net asset value, beginning of period | | | $14.85 | | | | $14.54 | | | | $14.84 | | | | $14.11 | | | | $14.03 | | | | $14.22 | |
| Investment Operations: | | | | | | | | | | | | | | | | | | | | | | | | |
| Net investment income | | | 0.53 | | | | 1.07 | | | | 1.10 | | | | 1.15 | | | | 1.16 | | | | 1.19 | |
| Net realized and change in unrealized gain (loss) on investments, and futures contracts | | | (0.69 | ) | | | 0.50 | | | | (0.21 | ) | | | 0.68 | | | | (0.03 | ) | | | (0.26 | ) |
| Total from investment operations | | | (0.16 | ) | | | 1.57 | | | | 0.89 | | | | 1.83 | | | | 1.13 | | | | 0.93 | |
| Dividends and Distributions on Preferred Shares from: | | | | | | | | | | | | | | | | | | | | | | | | |
| Net investment income | | | (0.15 | ) | | | (0.28 | ) | | | (0.21 | ) | | | (0.12 | ) | | | (0.07 | ) | | | (0.10 | ) |
| Net realized gains | | | — | | | | — | | | | — | | | | — | | | | — | | | | (0.00 | )† |
Total dividends and distributions on
preferred shares | | | (0.15 | ) | | | (0.28 | ) | | | (0.21 | ) | | | (0.12 | ) | | | (0.07 | ) | | | (0.10 | ) |
Net increase (decrease) in net assets
applicable to common shareholders resulting from investment operations | | | (0.31 | ) | | | 1.29 | | | | 0.68 | | | | 1.71 | | | | 1.06 | | | | 0.83 | |
| Dividends and Distributions to Common Shareholders from: | | | | | | | | | | | | | | | | | | | | | | | | |
| Net investment income | | | (0.49 | ) | | | (0.98 | ) | | | (0.98 | ) | | | (0.98 | ) | | | (0.98 | ) | | | (0.98 | ) |
| Net realized gains | | | — | | | | — | | | | — | | | | — | | | | — | | | | (0.04 | ) |
| Total dividends and distributions to common shareholders | | | (0.49 | ) | | | (0.98 | ) | | | (0.98 | ) | | | (0.98 | ) | | | (0.98 | ) | | | (1.02 | ) |
| Net asset value, end of period | | | $14.05 | | | | $14.85 | | | | $14.54 | | | | $14.84 | | | | $14.11 | | | | $14.03 | |
| Market price, end of period | | | $16.25 | | | | $18.00 | | | | $16.22 | | | | $14.64 | | | | $13.55 | | | | $14.22 | |
| Total Investment Return (1) | | | (6.86 | )% | | | 17.77 | % | | | 18.13 | % | | | 15.68 | % | | | 2.15 | % | | | 3.79 | % |
| RATIOS/SUPPLEMENTAL DATA: | | | | | | | | | | | | | | | | | | | | | | | | |
Net assets applicable to common
shareholders, end of period (000) | | | $347,334 | | | | $365,984 | | | | $355,877 | | | | $360,699 | | | | $341,784 | | | | $337,688 | |
| Ratio of expenses to average net assets, including interest expense (2)(3)(4)(5) | | | 1.50 | %* | | | 1.32 | % | | 1.18%†† | | 1.06%†† | | 1.04%†† | | 1.05%†† |
| Ratio of expenses to average net assets, excluding interest expense (2)(3)(5) | | | 1.17 | %* | | | 1.00 | % | | | 0.98 | % | | | 0.97 | % | | | 0.98 | % | | | 1.00 | % |
| Ratio of net investment income to average net assets (2)(5) | | | 7.35 | %* | | | 7.23 | % | | | 7.41 | % | | | 7.97 | % | | | 8.22 | % | | | 8.21 | % |
| Preferred shares asset coverage per share | | | $68,401 | | | | $70,727 | | | | $69,462 | | | | $70,077 | | | | $67,719 | | | | $67,206 | |
| Portfolio turnover | | | 12 | % | | | 6 | % | | | 13 | % | | | 11 | % | | | 16 | % | | | 27 | % |
|
| | |
| † | | Less than $0.005 per share. |
| | |
| †† | | Previously reported in prior years’ financials as 0.98%, 0.97%, and 0.98% and 1.00% for the fiscal years ended April 30, 2006, April 30, 2005, April 30, 2004 and April 30, 2003, respectively. Revised due to the impact of inverse floater transactions. |
| | |
| (1) | | Total investment return is calculated assuming a purchase of a share of common stock at the current market price on the first day of each period and a sale of a share of common stock at the current market price on the last day of each period reported. Dividends and distributions are assumed, for purposes of this calculation, to be reinvested at prices obtained under the Fund’s dividend reinvestment plan. Total investment return does not reflect brokerage commissions or sales charges. Total investment return for a period of less than one year is not annualized. |
| | |
| (2) | | Calculated on the basis of income and expenses applicable to both common and preferred shares relative to the average net assets of common shareholders. |
| | |
| (3) | | Inclusive of expenses offset by custody credits earned on cash balances at the custodian bank. (See note 1(i) in Notes to Financial Statements). |
| | |
| (4) | | Interest expense relates to the liability for floating rate notes issued in connection with inverse floater transactions. |
| | |
| (5) | | During the periods indicated above, the Investment manager waived a portion of its investment management fee. The effect of such waiver relative to the average net assets of common shareholders was 0.18% (annualized), 0.24%, 0.32%, 0.31%, 0.32% and 0.32% for the six months ended October 31, 2007, and the years ended April 30, 2007, April 30, 2006, April 30, 2005, April 30, 2004 and April 30, 2003, respectively. |
See accompanying Notes to Financial Statements | 10.31.07 | PIMCO Municipal Income Funds Semi-Annual Report 35
PIMCO California Municipal Income Fund
Financial Highlights
| | | | | | | | | | | | | | | | | | | | | | | | | | |
| | | Six Months
ended
October 31, 2007
(unaudited) | | Year Ended |
| | | 2007 | | 2006 | | 2005 | | 2004 | | 2003 |
| Net asset value, beginning of period | | | $14.84 | | | | $14.48 | | | | $14.60 | | | | $13.92 | | | | $14.17 | | | | $14.00 | |
| Investment Operations: | | | | | | | | | | | | | | | | | | | | | | | | |
| Net investment income | | | 0.52 | | | | 1.10 | | | | 1.05 | | | | 1.07 | | | | 1.05 | | | | 1.12 | |
| Net realized and change in unrealized gain (loss) on investments, futures contracts, and options written | | | (0.38 | ) | | | 0.44 | | | | (0.05 | ) | | | 0.64 | | | | (0.31 | ) | | | 0.07 | |
| Total from investment operations | | | 0.14 | | | | 1.54 | | | | 1.00 | | | | 1.71 | | | | 0.74 | | | | 1.19 | |
| Dividends on Preferred Shares from net investment income | | | (0.14 | ) | | | (0.26 | ) | | | (0.20 | ) | | | (0.11 | ) | | | (0.07 | ) | | | (0.10 | ) |
Net increase in net assets
applicable to common shareholders resulting from investment operations | | | — | | | | 1.28 | | | | 0.80 | | | | 1.60 | | | | 0.67 | | | | 1.09 | |
| Dividends to Common Shareholders from net investment income | | | (0.46 | ) | | | (0.92 | ) | | | (0.92 | ) | | | (0.92 | ) | | | (0.92 | ) | | | (0.92 | ) |
| Net asset value, end of period | | | $14.38 | | | | $14.84 | | | | $14.48 | | | | $14.60 | | | | $13.92 | | | | $14.17 | |
| Market price, end of period | | | $16.20 | | | | $17.70 | | | | $15.87 | | | | $14.20 | | | | $13.19 | | | | $14.15 | |
| Total Investment Return (1) | | | (5.65 | )% | | | 18.20 | % | | | 18.93 | % | | | 15.05 | % | | | (0.28 | )% | | | 2.64 | % |
| RATIOS/SUPPLEMENTAL DATA: | | | | | | | | | | | | | | | | | | | | | | | | |
| Net assets applicable to common shareholders, end of period (000) | | | $259,524 | | | | $267,061 | | | | $259,127 | | | | $259,978 | | | | $247,857 | | | | $251,831 | |
| Ratio of expenses to average net assets, including interest expense (2)(3)(4)(5) | | | 1.41 | %* | | | 1.26 | % | | 1.08%† | | 1.00%† | | 1.03%† | | 1.20%† |
| Ratio of expenses to average net assets, excluding interest expense (2)(3)(5) | | | 1.12 | %* | | | 1.05 | % | | | 0.99 | % | | | 1.00 | % | | | 1.01 | % | | | 1.03 | % |
| Ratio of net investment income to average net assets (2)(5) | | | 7.29 | %* | | | 7.48 | % | | | 7.19 | % | | | 7.56 | % | | | 7.53 | % | | | 7.89 | % |
| Preferred shares asset coverage per share | | | $68,240 | | | | $69,491 | | | | $68,164 | | | | $68,319 | | | | $66,306 | | | | $66,967 | |
| Portfolio turnover | | | 3 | % | | | 4 | % | | | 8 | % | | | 5 | % | | | 25 | % | | | 15 | % |
|
| |
| * | Annualized. |
| |
| † | Previously reported in prior years’ financials as 0.99%, 1.00%, 1.01% and 1.03% for the fiscal years ended April 30, 2006, April 30, 2005, April 30, 2004 and April 30, 2003, respectively. Revised due to the impact of inverse floater transactions. |
| |
| (1) | Total investment return is calculated assuming a purchase of a share of common stock at the current market price on the first day of each period and a sale of a share of common stock at the current market price on the last day of each period reported. Dividends and distributions are assumed, for purposes of this calculation, to be reinvested at prices obtained under the Fund’s dividend reinvestment plan. Total investment return does not reflect brokerage commissions or sales charges. Total investment return for a period of less than one year is not annualized. |
| |
| (2) | Calculated on the basis of income and expenses applicable to both common and preferred shares relative to the average net assets of common shareholders. |
| |
| (3) | Inclusive of expenses offset by custody credits earned on cash balances at the custodian bank. (See note 1(i) in Notes to Financial Statements). |
| |
| (4) | Interest expense relates to the liability for floating rate notes issued in connection with inverse floater transactions. |
| |
| (5) | During the periods indicated above, the Investment manager waived a portion of its investment management fee. The effect of such waiver relative to the average net assets of common shareholders was 0.18% (annualized), 0.25%, 0.32%, 0.31%, 0.32% and 0.31% for the six months ended October 31, 2007, and the years ended April 30, 2007, April 30, 2006, April 30, 2005, April 30, 2004 and April 30, 2003, respectively. |
36 PIMCO Municipal Income Funds Semi-Annual Report | 10.31.07 | See accompanying Notes to Financial Statements
PIMCO New York Municipal Income Fund
Financial Highlights
| | | | | | | | | | | | | | | | | | | | | | | | | | |
| | | Six Months
ended
October 31, 2007
(unaudited) | | Year Ended |
| | | 2007 | | 2006 | | 2005 | | 2004 | | 2003 |
| Net asset value, beginning of period | | | $13.74 | | | | $13.47 | | | | $13.83 | | | | $13.44 | | | | $13.49 | | | | $13.92 | |
| Investment Operations: | | | | | | | | | | | | | | | | | | | | | | | | |
| Net investment income | | | 0.47 | | | | 0.97 | | | | 0.98 | | | | 1.01 | | | | 1.00 | | | | 1.04 | |
| Net realized and change in unrealized gain (loss) on investments, futures contracts, and options written | | | (0.50 | ) | | | 0.37 | | | | (0.23 | ) | | | 0.40 | | | | (0.08 | ) | | | (0.47 | ) |
| Total from investment operations | | | (0.03 | ) | | | 1.34 | | | | 0.75 | | | | 1.41 | | | | 0.92 | | | | 0.57 | |
| Dividends on Preferred Shares from net investment income | | | (0.15 | ) | | | (0.28 | ) | | | (0.22 | ) | | | (0.12 | ) | | | (0.07 | ) | | | (0.10 | ) |
| Net increase (decrease) in net assets applicable to common shareholders resulting from investment operations | | | (0.18 | ) | | | 1.06 | | | | 0.53 | | | | 1.29 | | | | 0.85 | | | | 0.47 | |
| Dividends to Common Shareholders from net investment income | | | (0.34 | ) | | | (0.79 | ) | | | (0.89 | ) | | | (0.90 | ) | | | (0.90 | ) | | | (0.90 | ) |
| Net asset value, end of period | | | $13.22 | | | | $13.74 | | | | $13.47 | | | | $13.83 | | | | $13.44 | | | | $13.49 | |
| Market price, end of period | | | $12.93 | | | | $15.02 | | | | $14.56 | | | | $13.90 | | | | $12.70 | | | | $13.55 | |
| Total Investment Return (1) | | | (11.67 | )% | | | 8.89 | % | | | 11.45 | % | | | 17.04 | % | | | 0.21 | % | | | 1.82 | % |
| RATIOS/SUPPLEMENTAL DATA: | | | | | | | | | | | | | | | | | | | | | | | | |
Net assets applicable to common
shareholders, end of period (000) | | | $99,481 | | | | $103,035 | | | | $100,367 | | | | $102,112 | | | | $98,922 | | | | $98,323 | |
| Ratio of expenses to average net assets, including interest expense (2)(3)(4)(5) | | | 2.03 | %* | | | 1.94 | % | | | 1.57 | % | | | 1.44 | % | | | 1.27 | % | | | 1.35 | % |
| Ratio of expenses to average net assets, excluding interest expense (2)(3)(5) | | | 1.28 | %* | | | 1.23 | % | | | 1.09 | % | | | 1.12 | % | | | 1.10 | % | | | 1.13 | % |
Ratio of net investment income to
average net assets (2)(5) | | | 7.10 | %* | | | 7.06 | % | | | 7.04 | % | | | 7.48 | % | | | 7.41 | % | | | 7.46 | % |
| Preferred shares asset coverage per share | | | $64,473 | | | | $65,863 | | | | $64,809 | | | | $65,509 | | | | $64,251 | | | | $64,016 | |
| Portfolio turnover | | | 1 | % | | | 2 | % | | | 15 | % | | | 6 | % | | | 39 | % | | | 23 | % |
|
| |
| * | Annualized. |
| |
| (1) | Total investment return is calculated assuming a purchase of a share of common stock at the current market price on the first day of each period and a sale of a share of common stock at the current market price on the last day of each period reported. Dividends and distributions are assumed, for purposes of this calculation, to be reinvested at prices obtained under the Fund’s dividend reinvestment plan. Total investment return does not reflect brokerage commissions or sales charges. Total investment Return for a period of less than one year is not annualized. |
| |
| (2) | Calculated on the basis of income and expenses applicable to both common and preferred shares relative to the average net assets of common shareholders. |
| |
| (3) | Inclusive of expenses offset by custody credits earned on cash balances at the custodian bank. (See note 1(i) in Notes to Financial Statements). |
| |
| (4) | Interest expense relates to the liability for floating rate notes issued in connection with inverse floater transactions. |
| |
| (5) | During the periods indicated above, the Investment manager waived a portion of its investment management fee. The Effect of such waiver relative to the average net assets of common shareholders was 0.19% (annualized), 0.26%, 0.33%, 0.33%, 0.33% and 0.32% for the six months ended October 31, 2007, and the years ended April 30, 2007, April 30, 2006, April 30, 2005, April 30, 2004 and April 30, 2003, respectively. |
See accompanying Notes to Financial Statements | 10.31.07 | PIMCO Municipal Income Funds Semi-Annual Report 37
PIMCO Municipal Income Funds
Matters Relating to the Trustees
Consideration of the Investment
Management & Portfolio Management Agreements
(unaudited)
The Investment Company Act of 1940 requires that both the full Board of Trustees (the ‘‘Trustees’’) and a majority of the non-interested (‘‘Independent’’) Trustees, voting separately, approve the Funds’ Management Agreements (the ‘‘Advisory Agreements’’) with the Investment Manager and Portfolio Management Agreements (the ‘‘Sub-Advisory Agreements’’, and together with the Advisory Agreements, the ‘‘Agreements’’) between the Investment Manager and the Sub-Adviser. The Trustees met on June 13, 2007 (the ‘‘contract review meeting’’) for the specific purpose of considering whether to approve the Advisory Agreements and the Sub-Advisory Agreements. The Independent Trustees were assisted in their evaluation of the Agreements by independent legal counsel, from whom they received separate legal advice and with whom they met separately from Fund management during the contract review meeting.
Based on their evaluation of factors that they deemed to be material, including those factors described below, the Board of Trustees, including a majority of the Independent Trustees, concluded that the Funds’ Advisory Agreements and the Sub-Advisory Agreements should be approved for a one-year period commencing July 1, 2007.
In connection with their deliberations regarding the continuation of the Agreements, the Trustees, including the Independent Trustees, considered such information and factors as they believed, in light of the legal advice furnished to them and their own business judgment, to be relevant. As described below, the Trustees considered the nature, quality, and extent of the various investment management, administrative and other services performed by the Investment Manager and the Sub-Adviser under the Agreements.
In connection with their contract review meeting, the Trustees received and relied upon materials provided by the Investment Manager which included, among other items: (i) information provided by Lipper Analytical Services, Inc. (‘‘Lipper’’) on the total return investment performance (based on net assets) of the Funds for various time periods and the investment performance of a group of funds with substantially similar investment classifications/objectives identified by Lipper, (ii) information provided by Lipper on the Funds’ management fees and other expenses and the management fees and other expenses of comparable funds identified by Lipper, (iii) information regarding the investment performance and management fees of comparable portfolios of other clients of the Sub-Adviser, including institutional separate accounts and other clients, (iv) an estimate of the profitability to the Investment Manager from its relationship with the Funds for the twelve months ended March 31, 2007, (v) descriptions of various functions performed by the Investment Manager and the Sub-Adviser for the Funds, such as portfolio management, compliance monitoring and portfolio trading practices, and (vi) information regarding the overall organization of the Investment Manager and the Sub-Adviser, including information regarding senior management, portfolio managers and other personnel providing investment management, administrative and other services to the Funds.
The Trustees’ conclusions as to the continuation of the Agreements were based on a comprehensive consideration of all information provided to the Trustees and not the result of any single factor. Some of the factors that figured particularly in the Trustees’ deliberations are described below, although individual Trustees may have evaluated the information presented differently from one another, giving different weights to various factors.
As part of their review, the Trustees examined the Investment Manager’s and the Sub-Adviser’s ability to provide high quality investment management and other services to the Funds. The Trustees considered the investment philosophy and research and decision-making processes of the Sub-Adviser; the experience of key advisory personnel of the Sub-Adviser responsible for portfolio management of the Funds; the ability of the Investment Manager and the Sub-Adviser to attract and retain capable personnel; the capability and integrity of the senior management and staff of the Investment Manager and the Sub-Adviser; and the level of skill required to manage the Funds. In addition, the Trustees reviewed the quality of the Inve stment Manager’s and the Sub-Adviser’s services with respect to regulatory compliance and compliance with the investment policies of the Funds; the nature and quality of certain administrative services the Investment Manager is responsible for providing to the Funds; and conditions that might affect the Investment Manager’s or the Sub-Adviser’s ability to provide high quality services to the Funds in the future under the Agreements, including each organization’s respective business reputation, financial condition and operational stability. Based on the foregoing, the Trustees concluded that the Sub-Adviser’s investment process, research capabilities and philosophy were well suited to the Funds given their investment objectives and policies, and that the Investment Manager and the Sub-Adviser would be able to continue to meet any reasonably foreseeable obligations under the Agreements.
38 PIMCO Municipal Income Funds Semi-Annual Report | 10.31.07
PIMCO Municipal Income Funds
Matters Relating to the Trustees
Consideration of the Investment
Management & Portfolio Management Agreements
(unaudited)
Based on information provided by Lipper, the Trustees also reviewed each Fund’s total return investment performance as well as the performance of comparable funds identified by Lipper. In the course of their deliberations, the Trustees took into account information provided by the Investment Manager in connection with the contract review meeting, as well as during investment review meetings conducted with portfolio management personnel during the course of the year regarding each Fund’s performance.
In assessing the reasonableness of each Fund’s fees under the Agreements, the Trustees considered, among other information, each Fund’s management fee and the total expense ratio as a percentage of average net assets attributable to common shares and the management fee and total expense ratios of comparable funds identified by Lipper.
For each of the Funds, the Trustees specifically took note of how each Fund compared to its Lipper peers as to performance and total expense ratio. The Trustees noted that, while the Funds are not charged a separate administration fee, it was not clear whether the peer funds in the Lipper categories were charged such a fee by their investment managers. Thus, the Trustees, at the recommendation of the Investment Manager, considered the total expenses of the Funds compared to the total expenses of the peer funds, recognizing that the fees for management and administrative services would be subsumed within the total expense ratio.
Municipal Income
The Trustees noted that PMF had outperformed the median for its peer group for the one-year, three-year and five-year periods ended March 31, 2007. The Trustees noted that for the one- and three-year periods, PMF’s total return ranked in the top quintile in its Lipper category for its asset class. The Trustees also noted that PMF’s expense ratio (after taking into account waivers) was less than the median for its peer group.
California Municipal
The Trustees noted that PCQ had outperformed the median for its peer group for the one-year, three-year and five-year periods ended March 31, 2007. The Trustees noted that in the one-year period, PCQ’s total return was ranked fourth among twenty-two funds in its Lipper category for its asset class. The Trustees also noted that PCQ’s expense ratio (after taking into account waivers) was less than the median for its peer group.
New York Municipal
The Trustees noted that PNF had outperformed the median for its peer group for the one-year and three-year periods ended March 31, 2007. The Trustees also noted that PNF had underperformed the median for its peer group for the five-year period ended March 31, 2007. The Trustees also noted that PNF’s expense ratio (after taking into account waivers) was less than the median for its peer group.
After reviewing these and related factors, the Trustees concluded, within the context of their overall conclusions regarding the Agreements, that they were satisfied with the Investment Manager’s and the Sub-Adviser’s responses and efforts relating to investment performance and the comparative positioning of each Fund with respect to the management fee paid to the Investment Manager.
The Trustees also considered the management fees charged by the Sub-Adviser to other clients, including institutional separate accounts with investment strategies similar to those of the Funds. Regarding the institutional separate accounts, they noted that the management fees paid by the Funds are generally higher than the fees paid by these other clients of the Sub-Adviser, but were advised that the administrative burden for the Investment Manager and the Sub-Adviser with respect to the Funds is also relatively higher, due in part to the more extensive regulatory regime to which the Funds are subject in comparison to institutional separate accounts. The Trustees noted that the management fees paid by the Funds were generally hi gher than the fees paid by the open-end funds but were advised that there are additional portfolio management challenges in managing the Funds, such as the use of leverage and meeting a regular dividend.
10.31.07 | PIMCO Municipal Income Funds Semi-Annual Report 39
PIMCO Municipal Income Funds
Matters Relating to the Trustees
Consideration of the Investment
Management & Portfolio Management Agreements
(unaudited)
The Trustees also took into account that the Funds have preferred shares outstanding, which increases the amount of fees received by the Investment Manager and the Sub-Adviser under the Agreements (because the fees are calculated based on either the Fund’s net assets or total managed assets, including assets attributable to preferred shares and other forms of leverage outstanding but not deducting any liabilities connected to the leverage). In this regard, the Trustees took into account that the Investment Manager and the Sub-Adviser have a financial incentive for the Funds to continue to have preferred shares outstanding, which may create a conflict of interest between the Investment Manager and the Sub-Adviser, on the o ne hand, and the Fund’s common shareholders, on the other. In this regard, the Trustees considered information provided by the Investment Manager and the Sub-Adviser indicating that each Fund’s use of leverage through preferred shares continues to be appropriate and in the interests of the Fund’s common shareholders.
Based on a profitability analysis provided by the Investment Manager, the Trustees also considered the profitability of the Investment Manager from its relationship with each Fund and determined that such profitability was not unreasonable in light of the nature, scope and quality of services provided to the Fund.
The Trustees also took into account that, as closed-end investment companies, the Funds do not currently intend to raise additional assets, so the assets of the Funds will grow (if at all) only through investment performance. Therefore, the Trustees did not consider potential economies of scale as a principal factor in assessing the fee rates payable under the Agreements.
Additionally, the Trustees considered so-called ‘‘fall-out benefits’’ to the Investment Manager and the Sub-Adviser, such as reputational value derived from serving as Investment Manager and Sub-Adviser to the Funds.
After reviewing these and other factors described herein, the Trustees concluded, within the context of their overall conclusions regarding the Agreements, that the fees payable under the Agreements represent reasonable compensation in light of the nature and quality of the services being provided by the Investment Manager and Sub-Adviser to the Funds.
40 PIMCO Municipal Income Funds Semi-Annual Report | 10.31.07
Trustees and Principal Officers
| | | | | | |
Hans W. Kertess
Trustee, Chairman of the Board of Trustees | | Brian S. Shlissel
President & Chief Executive Officer |
Paul Belica
Trustee | | Lawrence G. Altadonna
Treasurer, Principal & Accounting Officer |
Robert E. Connor
Trustee | | Thomas J. Fuccillo
Vice President, Secretary & Chief Legal Officer |
John J. Dalessandro II
Trustee | | Scott Whisten
Assistant Treasurer |
John C. Maney
Trustee | | Youse E. Guia
Chief Compliance Officer |
William B. Ogden, IV
Trustee | | William V. Healey
Assistant Secretary |
R. Peter Sullivan III
Trustee | | Richard H. Kirk
Assistant Secretary |
| | | Kathleen A. Chapman
Assistant Secretary |
| | | Lagan Srivastava
Assistant Secretary |
|
Investment Manager
Allianz Global Investors Fund Management LLC
1345 Avenue of the Americas
New York, NY 10105
Sub-Adviser
Pacific Investment Management Company LLC
840 Newport Center Drive
Newport Beach, CA 92660
Custodian & Accounting Agent
State Street Bank & Trust Co.
225 Franklin Street
Boston, MA 02110
Transfer Agent, Dividend Paying Agent and Registrar
PFPC Inc.
P.O. Box 43027
Providence, RI 02940-3027
Independent Registered Public Accounting Firm
PricewaterhouseCoopers LLP
300 Madison Avenue
New York, NY 10017
Legal Counsel
Ropes & Gray LLP
One International Place
Boston, MA 02110-2624
This report, including the financial information herein, is transmitted to the shareholders of PIMCO Municipal Income Fund, PIMCO California Municipal Income Fund and PIMCO New York Municipal Income Fund for their information. It is not a prospectus, circular or representation intended for use in the purchase of shares of the Funds or any securities mentioned in this report.
The financial information included herein is taken from the records of the Funds without examination by an independent registered accounting firm, who did not express an opinion hereon.
Notice is hereby given in accordance with Section 23(c) of the Investment Company Act of 1940, as amended, that from time to time the Fund may purchase shares of its common stock in the open market.
The Funds file their complete schedules of portfolio holdings with the Securities and Exchange Commission (‘‘SEC’’) for the first and third quarter of its fiscal year on Form N-Q. The Funds’ Form N-Qs are available on the SEC’s website at www.sec.gov, and may be reviewed and copied at the SEC’s Public Reference Room in Washington, DC. Information on the operation of the Public Reference Room may be obtained by calling (800) SEC-0330. The information on Form N-Q is also available on the Fund’s website at www.allianzinvestors.com/closedendfunds.
On January 8, 2007, the Funds submitted a CEO annual certification to the New York Stock Exchange (‘‘NYSE’’) on which the Funds’ principal executive officer certified that he was not aware, as of that date, of any violation by the Fund of the NYSE’s Corporate Governance listing standards. In addition, as required by Section 302 of the Sarbanes-Oxley Act of 2002 and related SEC rules each Fund’s principal executive and principal financial officer made quarterly certifications, included in filings with the SEC on Forms N-CSR and N-Q, relating to, among other things, the Funds’ disclosure controls and procedures and internal control over financial reporting, as applicable.
Information on the Funds is available at www.allianzinvestors.com/closedendfunds or by calling the Funds’ shareholder servicing agent at (800) 331-1710.
ITEM 2. CODE OF ETHICS
Not required in this filing.
ITEM 3. AUDIT COMMITTEE FINANCIAL EXPERT
Not required in this filing.
ITEM 4. PRINCIPAL ACCOUNTANT FEES AND SERVICES
Not required in this filing.
ITEM 5. AUDIT COMMITTEE OF LISTED REGISTRANT
Not required in this filing.
ITEM 6. SCHEDULE OF INVESTMENTS
Schedule of Investments is included as part of the report to shareholders filed under Item 1 of this form.
ITEM 7. DISCLOSURE OF PROXY VOTING POLICIES AND PROCEDURES FOR CLOSED-END MANAGEMENT INVESTMENT COMPANIES.
Not required in this filing.
ITEM 8. PORTFOLIO MANAGERS OF CLOSED-END MANAGEMENT INVESTMENT COMPANIES
Not required in this filing.
ITEM 9. PURCHASES OF EQUITY SECURITIES BY CLOSED-END MANAGEMENT INVESTMENT COMPANY AND AFFILIATED COMPANIES
Period | | Total Number
of Shares
Purchased | | Average
Price Paid
Per Share | | Total Number
of Shares Purchased
as Part of Publicly
Announced Plans or
Programs | | Maximum Number of
Shares that May yet Be
Purchased Under the Plans
or Programs | |
May 2007 | | N/A | | 14.24 | | 3,217 | | N/A | |
June 2007 | | N/A | | 13.53 | | 3,581 | | N/A | |
July 2007 | | N/A | | 13.38 | | 3,666 | | N/A | |
August 2007 | | N/A | | 13.27 | | 3,844 | | N/A | |
September 2007 | | N/A | | 12.95 | | 3,945 | | N/A | |
October 2007 | | N/A | | 13.23 | | 3,827 | | N/A | |
ITEM 10. SUBMISSION OF MATTERS TO A VOTE OF SECURITY HOLDERS
There have been no material changes to the procedures by which shareholders may recommend nominees to the Fund’s Board of Trustees since the Fund last provided disclosure in response to this item.
ITEM 11. CONTROLS AND PROCEDURES
(a) The registrant’s President and Chief Executive Officer and Principal Financial Officer have concluded that the registrant’s disclosure controls and procedures (as defined in Rule 30a-2(c) under the Act (17 CFR 270.30a -3(c))), as amended are effective based on their evaluation of these controls and procedures as of a date within 90 days of the filing date of this document.
(b) There were no significant changes over financial reporting (as defined in Rule 30a-3(d) under the Act (17 CFR 270.30a -3(d))) that occurred during the second fiscal quarter of the period covered by this report that has materially affected, or is reasonably likely to materially affect, the registrants control over financial reporting.
ITEM 12. EXHIBITS
(a) | Exhibit 99 Cert. - Certification pursuant to Section 302 of the Sarbanes-Oxley Act of 2002 |
(b) | Exhibit 99.906 Cert. - Certification pursuant to Section 906 of the Sarbanes-Oxley Act of 2002 |
Signature
Pursuant to the requirements of the Securities Exchange Act of 1934 and the Investment Company Act of 1940, the registrant has duly caused this report to be signed on its behalf by the undersigned, thereunto duly authorized.
(Registrant) PIMCO New York Municipal Income Fund
By |
/s/ Brian S. Shlissel
| | | |
President and Chief Executive Officer | | | |
Date January 7, 2008
By |
/s/ Lawrence G. Altadonna
| | | |
Treasurer, Principal Financial & Accounting Officer | | | |
Date January 7, 2008
Pursuant to the requirements of the Securities Exchange Act of 1934 and the Investment Company Act of 1940, this report has been signed below by the following persons on behalf of the registrant and in the capacities and on the dates indicated.
By |
/s/ Brian S. Shlissel
| | | |
President and Chief Executive Officer | | | |
Date January 7, 2008
By |
/s/ Lawrence G. Altadonna
| | | |
Treasurer, Principal Financial & Accounting Officer | | | |
Date January 7, 2008