UNITED STATES
SECURITIES AND EXCHANGE COMMISSION
Washington, D.C. 20549
FORM N-CSR
CERTIFIED SHAREHOLDER REPORT OF REGISTERED
MANAGEMENT INVESTMENT COMPANIES
Investment Company Act file number: 811-10399
______________________________________________
HENDERSON GLOBAL FUNDS
______________________________________________________________________________
(Exact name of registrant as specified in charter)
737 NORTH MICHIGAN AVENUE, SUITE 1700
CHICAGO, ILLINOIS 60611
______________________________________________________________________________
(Address of principal executive offices)(Zip code)
| (Name and Address of Agent for Service) | Copy to: |
CHRISTOPHER K. YARBROUGH 737 NORTH MICHIGAN AVENUE, SUITE 1700 CHICAGO, ILLINOIS 60611 | CATHY G. O’KELLY VEDDER PRICE P.C. 222 NORTH LASALLE STREET CHICAGO, ILLINOIS 60601 |
Registrant’s telephone number, including area code: (312) 397-1122
Date of fiscal year end: December 31
Date of reporting period: December 31, 2010
Item 1: Report to Shareholders.
| | |
Table of contents | |
LETTER TO SHAREHOLDERS | 1 |
WORLDWIDE INCOME FUND | |
Commentary | 2 |
Performance summary | 3 |
PORTFOLIOS OF INVESTMENTS | 4 |
STATEMENTS OF ASSETS AND LIABILITIES | 9 |
STATEMENTS OF OPERATIONS | 10 |
STATEMENTS OF CHANGES IN NET ASSETS | 11 |
STATEMENTS OF CHANGES - CAPITAL STOCK ACTIVITY | 13 |
FINANCIAL HIGHLIGHTS | 16 |
NOTES TO FINANCIAL STATEMENTS | 18 |
REPORT OF INDEPENDENT REGISTERED PUBLIC ACCOUNTING FIRM | 27 |
OTHER INFORMATION | 28 |
TRUSTEES AND OFFICERS | 30 |
MASTER PORTFOLIO FINANCIAL STATEMENTS AND NOTES | 33 |
The Henderson Money Market Fund is a feeder fund that invests substantially all of its assets in the State Street Money Market Portfolio. The financial statements of the State Street Money Market Portfolio, including its investment portfolio, are included elsewhere within this report and should be read in conjunction with the Henderson Money Market Fund’s financial statements.
The Henderson Worldwide Income Fund may invest in high yield, lower rated (junk) bonds which involve a greater degree of risk than investment grade bonds. As such, securities rated below investment grade generally entail greater credit, market, issuer and liquidity risk than investment grade securities. Moreover, the Fund is subject to interest rate risk which is the risk that debt securities in the Fund’s portfolio will decline in value because of increases in market interest rates. The Fund may borrow money which may adversely affect the return to shareholders of the Fund, also known as leverage risk.
The views in this report were those of the Fund managers as of December 31, 2010 and may not reflect the views of the managers on the date this report is first published or anytime thereafter. These views are intended to assist shareholders of the Funds in understanding their investment in the Funds and do not constitute investment advice.
| | |
Henderson Global Funds | Letter to shareholders |
Dear shareholder,
We are pleased to provide the annual report for the Henderson Worldwide Income Fund and the Henderson Money Market Fund, which covers the year ended December 31, 2010.
Global equities continued to make gains in 2010 on further evidence that the global economic recovery continues. There is a growing expectation that the more robust economic growth will be reflected in corporate earnings and analysts' forecasts are being revised upwards. Equity valuations as a result remain either around fair value or even cheaper than average in most developed markets, which should offer the potential for good returns in line with earnings growth as we move through 2011.
Emerging markets performed very strongly last year (with the notable exceptions of China and Brazil) and, consequently, we have more concerns about valuation support in some developing regions - particularly in light of increasing inflationary pressures and the likelihood of central bank actions to combat this. However, when it becomes clear that we are close to or at the end of the tightening cycle in emerging markets, this is an area that we believe will generate excellent returns over the long term.
The policy measures undertaken by global governments over the past three years will continue to have an impact on bond markets in 2011. European sovereign debt in particular is likely to remain hostage to investor confidence and political constraints. We therefore expect the avoidance of peripheral European exposure and the risk of contagion to be a continued theme for bond investors to navigate in 2011.
In other news, we are pleased to announce that on December 31, 2010 the Henderson Global Funds launched two new portfolios for our retail investors: Emerging Markets Opportunities Fund (HEMAX) and the International All Cap Equity Fund (HFNAX). The Emerging Markets Opportunities Fund seeks to participate in the long term growth of the developing economies and their capital markets. In addition, we expect the Fund to be a truly differentiated offering through its utilization of a specialized regional sub-portfolio structure with a strategic asset allocation overlay. The International All Cap Equity Fund has added retail share classes. The Class I Shares (HIEIX) were launched on January 31, 2008, and was the first Henderson mutual fund offered to US institutional investors. The Fund follows a bottom-up all cap growth strategy and focuses primarily on the developed markets of Europe, Australasia and the Far East (EAFE).
We believe that these Funds are key additions to the Henderson Global Funds family as we seek to provide you with further options to diversify clients’ portfolios with Funds that are truly differentiated from the competition. It’s our goal to continue to serve your financial needs successfully in the years to come, and we appreciate your trust and support in our Funds.
/s/ James O’Brien
James O’Brien
President, Henderson Global Funds
1
| | |
Henderson Global Funds | Commentary |
| | |
Worldwide Income Fund | |
Bond markets were volatile during the year but ultimately posted total returns above income yields as some capital appreciation was experienced. Rapidly falling default rates supported the lower end of the corporate bond market as investors sought out the higher yields offered in this space. However, government bonds also performed well as a slowdown in economic data in the summer of 2010 and a second round of quantitative easing from the Federal Reserve in November increased the attraction of this asset class.
| | | |
Worldwide Income Fund | |
Top 10 long term holdings | |
| | as a percentage |
Security | of net assets |
United States | | |
Treasury Note | | 6.6% |
FS Funding AS | | 2.9 |
Arran Corporate Loans | |
B.V., Class E3 | | 2.9 |
Service Corp International | 2.9 |
Impress Holdings B.V. | 2.9 |
AXA S.A. | | 2.8 |
Daily Mail & General Trust | 2.6 |
UPC Holding B.V. | | 2.4 |
ITV plc | | 2.4 |
Iron Mountain, Inc. | | 2.4 |
For the reporting period ended December 31, 2010, the Fund returned 10.17% (Class A shares at NAV) versus the benchmark, 50% ML Global High Yield Index (USD hedged) /50% ML Global Broad Market Corp Index (USD hedged), which posted a return of 11.39%.
The Fund maintained a position of long credit risk and short sovereign risk throughout the year. The long credit risk position was expressed through holdings in high yield bonds and subordinated financial bonds (issued by banks and insurance companies). There were changes in the overall composition of these holdings, aimed at diversifying the names within the Fund. In contrast, the Fund continued to steer away from investment grade bonds that have a very high sensitivity to government bond yields.
Mid year, the Fund invested in high yielding equities where the dividend yield was substantially higher than the yield on the corresponding corporate bond. This was an opportunistic asset allocation following weakness in the equity market during the spring and summer of 2010.
The Fund had substantial repayments during December as a number of its larger high yield holdings were repaid earlier than the final maturity date at the issuer’s option. We recycled some of the proceeds into other high yield names. This also reflected a move to increase the US domiciled holdings in order to diversify somewhat away from Europe. In addition, the Fund reduced some of its holdings in UK banks in a move to reduce its subordinated financial weighting.
Cash and short dated higher yielding bonds have continued to be preferred to longer dated investment grade or government bond holdings where we see further risk to capital in 2011 from rising yields. During the year interest rate derivatives were used to hedge out exposure to rising government bond yields. Expectation for 2011 is for risk assets to follow on from 2010 and continue to outperform government bonds and cash. The backdrop of exceptionally low default rates, markets open to refinancing, improving economic data and company balance sheets continuing to strengthen gives us confidence in the sustainability of the recovery.
2
| | |
Henderson Global Funds | Performance Summary |
| | |
Worldwide Income Fund | |
Investment comparison
Value of $10,000
Total returns as of December 31, 2010†
| | | | | | | | | | | | | | |
| | | | | | | | | | | | | Since | |
| | NASDAQ | | One | | | Three | | | Five | | | inception | |
At NAV | symbol | | year | | | years* | | | years* | | | (9/30/03)* | |
Class A | HFAAX | | | 10.17 | % | | | 0.60 | % | | | 3.04 | % | | | 5.28 | % |
Class B | HFABX | | | 9.21 | | | | -0.04 | | | | 2.32 | | | | 4.52 | |
Class C | HFACX | | | 9.39 | | | | -0.27 | | | | 2.20 | | | | 4.46 | |
With sales charge | | | | | | | | | | | | | | | | | |
Class A | | | | 4.95 | % | | | -1.01 | % | | | 2.04 | % | | | 4.58 | % |
Class B | | | | 5.21 | | | | -1.05 | | | | 2.14 | | | | 4.52 | |
Class C | | | | 9.39 | | | | -0.27 | | | | 2.20 | | | | 4.46 | |
Index | | | | | | | | | | | | | | | | | |
50% ML Global High Yield / 50% ML Global Corporate | | | | | | | | | | | | | | | | | |
Index (USD-hedged) | | | | 11.39 | % | | | 8.79 | % | | | 7.33 | % | | | 7.12 | % |
Barclays Capital Global Aggregate Bond (Ex US MBS) Index | | | 5.52 | % | | | 5.57 | % | | | 6.68 | % | | | 5.77 | % |
| * | Average annual return. |
| † | Effective August 1, 2009, the Worldwide Income Fund changed its fiscal year end from July 31 to December 31. |
Performance data quoted represents past performance and is no guarantee of future results. Performance results with sales charges reflect the deduction of the maximum front end sales charge or the deduction of the applicable contingent deferred sales charge (“CDSC”). Class A shares are subject to a maximum front-end sales charge of 4.75%. Class B shares are subject to a CDSC which declines from 5% the 1st year to 0% at the beginning of the 7th year. Class C shares are subject to a CDSC of up to 1% on certain redemptions made within 12 months of purchase. Performance presented at Net Asset Value (NAV), which does not include a sales charge, would be lower if this charge were reflected. NAV is the value of one share of the Fund excluding any sales charges. Current performance may be lower or higher than the performance data quoted. Investment return and principal value will fluctuate so that an investor’s shares, when redeemed, may be worth more or less than original cost. As stated in the current prospectus, the Fund’s annual operating expense ratios (gross) for Class A, B and C shares are 1.64%, 2.39% and 2.39%, respectively. However, the Fund’s adviser has agreed to contractually waive a portion of its fees and/or reimburse expenses such that total ordinary operating expenses (other than Acquired Fund Fees and Expenses allocated from unaffiliated investment companies) do not exceed 1.30%, 2.05% and 2.05%, for Class A, B and C shares, which is in effect until July 31, 2020. For the most recent month-end performance, please call 1.866.443.6337 or visit the Funds’ website at www.hendersonglobalinvestors.com.
Performance results also reflect expense subsidies and waivers in effect during the periods shown. Absent these waivers, results would have been less favorable. All results assume the reinvestment of dividends and capital gains.
The investment comparison graph above reflects the change in value of a $10,000 hypothetical investment since the Fund’s inception, including reinvested dividends and distributions, compared to a broad based securities market index. Effective May 19, 2006, the Henderson Income Advantage Fund changed its name, investment objective and policies and became the Henderson Worldwide Income Fund. The Fund’s historical performance may not represent current investment policies. Effective as of March 31, 2010, the Funds’s benchmark was changed from the Barclays Capital Global Aggregate Bond Index (ex US MBS) to 50% Merrill Lynch Global High Yield Index (USD Hedged) and 50% Merrill Lynch Global Broad market Corporate Index (USD Hedged). The adviser has determined that the blended index is a more appropriate broad based index. Results in the table and graph do not reflect the deduction of taxes that a shareholder would pay on Fund distributions or the redemption of Fund shares.
3
| | |
Henderson Global Funds | Portfolio of Investments |
Money Market Fund | |
December 31, 2010 | |
Mutual Funds – 99.74% | |
| | |
| | Value |
Investments in State Street Money Market Portfolio - 99.74% | $81,578,281 |
Total Investments: 99.74% | |
(cost $81,578,281) | 81,578,281 |
Other assets and liabilities, net: 0.26% | 215,866 |
Total net assets: 100.00% | $81,794,147 |
Henderson Money Market Fund invests substantially all of its investable assets into State Street Money Market Portfolio. At December 31, 2010, Henderson Money Market Fund owned 0.31% of the State Street Money Market Portfolio.
| | |
Maturities ladder as of December 31, 2010* | |
1 Day | 32.9% |
2-30 Days | 22.1 |
31-60 Days | 13.1 |
61-90 Days | 17.9 |
Over 90 Days | 14.0 |
Average Maturity | 29 Days |
| * | Portfolio construction and maturities ladder represents the composition of the underlying holdings in the State Street Money Market Portfolio, whose financial statements are included elsewhere in this report. An investment in the Henderson Money Market Fund is not insured or guaranteed by the Federal Deposit Insurance Corporation or any other government agency. Although the Fund seeks to preserve the value of your investment at $1.00 per share, it is possible to lose money by investing in the Fund. |
See Notes to Financial Statements.
4
| | | | | | | |
Henderson Global Funds | | Portfolio of Investments |
| | | |
Worldwide Income Fund | | | |
December 31, 2010 | | | |
| | | | |
| | Face | | | | | Value |
| | amount | | | Coupon | Maturity | (note 2) |
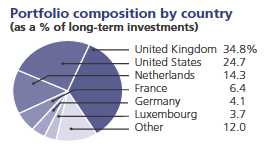
Corporate Bonds – 80.01% | | | |
| | | | Canada – 2.22% | | | |
EUR | 1,000,000 | | Bombardier, Inc | 7.250% | 11/15/16 | $ 1,416,478 |
| | | | Denmark – 2.95% | | | |
EUR | 1,350,000 | | FS Funding AS | 8.875 | 5/15/16 | 1,876,165 |
| | | | France – 5.89% | | | |
USD | 2,000,000 | | AXA S.A. (a) (b) | 6.463 | 12/14/18 | 1,805,000 |
EUR | 550,000 | | Crown European Holdings S.A | 7.125 | 8/15/18 | 769,876 |
EUR | 550,000 | | Rexel S.A | 8.250 | 12/15/16 | 808,609 |
EUR | 275,228 | | Rhodia S.A. (c) | 3.735 | 10/15/13 | 367,787 |
| | | | | | | 3,751,272 |
| | | | Germany – 3.76% | | | |
EUR | 650,000 | | Fresenius Medical Care Capital Trust V | 7.375 | 6/15/11 | 890,310 |
EUR | 240,000 | | HeidelbergCement AG | 8.500 | 10/31/19 | 353,174 |
USD | 1,100,000 | | UPC Germany GmbH (a) | 8.125 | 12/1/17 | 1,155,000 |
| | | | | | | 2,398,484 |
| | | | Ireland – 1.57% | | | |
EUR | 750,000 | | Ardagh Glass Finance plc | 8.750 | 2/1/20 | 997,214 |
| | | | Italy – 1.85% | | | |
EUR | 900,000 | | Lottomatica SpA | 8.250 | 3/31/16 | 1,175,610 |
| | | | Luxembourg – 3.41% | | | |
GBP | 400,000 | | Glencore Finance Europe S.A | 6.500 | 2/27/19 | 639,149 |
EUR | 1,100,000 | | UPC Holding BV | 8.000 | 11/1/16 | 1,536,077 |
| | | | | | | 2,175,226 |
| | | | Netherlands – 13.10% | | | |
EUR | 500,000 | | Ahold Finance USA LLC | 5.875 | 3/14/12 | 705,299 |
USD | 625,000 | | Allianz Finance II B.V. (b) | 7.250 | 6/10/11 | 631,875 |
USD | 2,000,000 | | Arran Corporate Loans B.V., Class E3 (c) (d) (e) | 3.554 | 6/20/25 | 1,850,000 |
GBP | 500,000 | | Heineken N.V | 7.250 | 3/10/15 | 882,124 |
USD | 500,000 | | Impress Holdings B.V. (a) (c) | 3.414 | 9/15/13 | 500,000 |
EUR | 1,000,000 | | Impress Holdings B.V. (c) | 4.110 | 9/15/13 | 1,332,959 |
EUR | 690,000 | | ING Verzekeringen N.V. | 6.250 | 6/21/21 | 834,452 |
EUR | 500,000 | | OI European Group B.V | 6.750 | 9/15/20 | 674,831 |
EUR | 675,000 | | Ziggo Bond Co. B.V. (a) | 8.000 | 5/15/18 | 933,573 |
| | | | | | | 8,345,113 |
| | | | Switzerland – 2.26% | | | |
USD | 1,500,000 | | Swiss Re Capital I LP (a) (b) (f) | 6.854 | 5/25/16 | 1,440,409 |
See Notes to Financial Statements.
5
| | | | | | | |
Henderson Global Funds | | Portfolio of Investments |
| | | |
Worldwide Income Fund | | | |
December 31, 2010 (continued) | | | |
| | | | |
| | Face | | | | | Value |
| | amount | | | Coupon | Maturity | (note 2) |
| | | | United Kingdom – 27.74% | | | |
GBP | 1,100,000 | | Aviva plc (b) | 6.125% | 9/29/22 | $ 1,389,157 |
EUR | 700,000 | | BAA Funding, Ltd | 4.600 | 2/15/18 | 932,019 |
USD | 1,150,000 | | Barclays Bank plc (a) (b) | 5.926 | 9/29/49 | 1,035,000 |
USD | 1,000,000 | | Catlin Insurance Co., Ltd. (a) (b) | 7.249 | 1/19/17 | 885,000 |
EUR | 250,000 | | Co-Operative Bank plc (c) | 1.326 | 5/18/16 | 298,169 |
GBP | 1,000,000 | | Daily Mail & General Trust | 5.750 | 12/7/18 | 1,497,562 |
GBP | 100,000 | | Daily Mail & General Trust | 6.375 | 6/21/27 | 135,174 |
GBP | 125,000 | | EGG Banking plc | 6.875 | 12/29/21 | 186,240 |
GBP | 400,000 | | F&C Finance plc | 9.000 | 12/20/16 | 644,976 |
EUR | 800,000 | | Investec Tier I UK LP plc (b) | 7.075 | 6/24/15 | 924,720 |
GBP | 1,002,000 | | ITV plc | 5.375 | 10/19/15 | 1,523,162 |
GBP | 1,100,000 | | Legal & General Group plc (b) | 6.385 | 5/2/17 | 1,490,343 |
USD | 1,100,000 | | Lloyds TSB Group plc (a) (b) (g) | 6.267 | 11/14/16 | 772,750 |
EUR | 1,000,000 | | Rexam plc (b) | 6.750 | 6/29/17 | 1,302,879 |
USD | 1,000,000 | | Royal Bank of Scotland Group plc (b) (f) (g) | 7.640 | 9/29/17 | 670,000 |
USD | 1,100,000 | | Standard Chartered plc (b) (f) | 6.409 | 1/30/17 | 1,026,912 |
GBP | 1,000,000 | | Standard Life plc (b) | 6.750 | 7/12/27 | 1,383,701 |
GBP | 650,000 | | Virgin Media Finance plc | 8.875 | 10/15/19 | 1,155,293 |
GBP | 250,000 | | WPP plc | 6.000 | 4/4/17 | 418,142 |
| | | | | | | 17,671,199 |
| | | | United States – 15.26% | | | |
USD | 1,250,000 | | Constellation Brands, Inc | 7.250 | 5/15/17 | 1,329,687 |
USD | 560,000 | | Digicel Group, Ltd. (a) | 10.500 | 4/15/18 | 618,800 |
USD | 1,000,000 | | DISH DBS Corp | 7.125 | 2/1/16 | 1,037,500 |
USD | 600,000 | | HCA Holdings , Inc. (a) | 7.750 | 5/15/21 | 601,500 |
USD | 1,500,000 | | Iron Mountain, Inc | 6.625 | 1/1/16 | 1,513,125 |
EUR | 2,500,000 | | Lehman Brothers UK Capital Funding IV LP (b) (d) (e) (g) | 5.750 | 4/25/12 | — |
EUR | 525,000 | | Levi Strauss & Co | 7.750 | 5/15/18 | 717,343 |
USD | 400,000 | | Nalco Co. (a) | 6.625 | 1/15/19 | 411,000 |
USD | 1,740,000 | | Service Corp International (f) | 7.625 | 10/1/18 | 1,835,700 |
USD | 500,000 | | Sungard Data Systems, Inc | 10.250 | 8/15/15 | 526,875 |
USD | 1,000,000 | | Yum! Brands, Inc | 6.250 | 3/15/18 | 1,130,752 |
| | | | | | | 9,722,282 |
| | | | Total Corporate Bonds | | | |
| | | | (Cost $52,690,929) | | | 50,969,452 |
See Notes to Financial Statements.
6
| | | | | | |
Henderson Global Funds | | Portfolio of Investments |
Worldwide Income Fund | | | |
| | | | |
December 31, 2010 (continued) | | | |
Face | | | | | Value |
amount | | | Coupon | Maturity | (note 2) |
U.S. Government Obligation – 6.59% | | | |
| | | United States - 6.59% | | | |
USD 4,200,000 | | United States Treasury Note | 0.500% | 11/30/12 | $ 4,195,241 |
| | | Total U.S. Government Obligation | | | |
| | | (Cost $4,196,031) | | | 4,195,241 |
| | | Total Corporate Bond and | | | |
| | | U.S. Government Obligations | | | |
| | | (Cost $56,886,960) | | | 55,164,693 |
Common Stocks – 4.14% | | | |
Shares | | | | | |
| | | United Kingdom – 4.14% | | | |
12,800 | | British American Tobacco plc | | | 491,628 |
20,000 | | GlaxoSmithKline plc | | | 386,656 |
56,000 | | National Grid plc | | | 482,822 |
23,000 | | Scottish & Southern Energy plc | | | 439,276 |
325,000 | | Vodafone Group plc | | | 840,120 |
| | | | | | 2,640,502 |
| | | Total Common Stock | | | |
| | | (Cost $2,281,758) | | | 2,640,502 |
Preferred Stock – 0.75% | | | |
| | | United States - 0.75% | | | |
500 | | Bank of America Corp | | | 478,485 |
| | | Total Preferred Stock | | | |
| | | (Cost $500,000) | | | 478,485 |
| | | Total Long Term Investments | | | |
| | | (Cost $59,668,718) | | | 58,283,680 |
Short Term Investment - 7.63% | | | |
4,862,580 | | Fidelity Institutional Treasury Portfolio | | | 4,862,580 |
| | | Total Short Term Investment | | | |
| | | (Cost $4,862,580) | | | 4,862,580 |
See Notes to Financial Statements.
7
| | | | |
| | Henderson Global Funds | | Portfolio of Investments |
| | | | |
| | Worldwide Income Fund | | |
| | December 31, 2010 (continued) | | |
| | | | Value |
| | | | (note 2) |
| | Total Investments - 99.12% | | |
| | (Cost $64,531,298) | | $63,146,260 |
| | Net Other Assets and Liabilities – 0.88% | | 560,089 |
| | Total Net Assets – 100.00% | | $63,706,349 |
| (a) | Restricted security, purchased under Rule 144A, section 4(2)g which is exempt registration under the securities Act of 1933 as amended. At December 31, 2010 the securities had an aggregate value of $10,158,032, which represents 16.0% of net assets. |
| (b) | Maturity date is perpetual. Maturity date presented represents the next call date. |
| (c) | Security is a floating rate bond. |
| (d) | The security has been deemed illiquid according to the policies and procedures adopted by the Board of Trustees. |
| (e) | Fair valued at December 31, 2010 as determined in good faith using procedures approved by the Trustees of the Trust. |
| (f) | Security is segregated as collateral to cover margin requirements on open futures contracts. |
| (g) | Security is in default. |
| | | | |
Other Information: | | | |
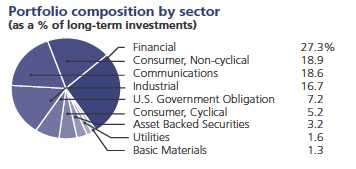
Industry concentration as | % of Net | Industry concentration as | % of Net |
a percentage of net assets: | Assets | a percentage of net assets: | Assets |
Life & Health Insurance | 6.69% | Brewers | 1.38% |
Government | 6.59 | Wireless Telecommunication Services | 1.32 |
Telecommunication Services | 6.07 | Electronics | 1.27 |
Commercial Banks Non- U.S | 6.05 | Diversified Banking Institution | 1.22 |
Multi-line Insurance | 5.21 | Apparel/Textiles | 1.13 |
Containers - Metal/Glass | 4.93 | Food & Staples Retailing | 1.11 |
Packaging | 3.84 | Banking | 1.05 |
Building Maintenance & Services | 2.95 | Diversified Financial Services | 1.01 |
Other - ABS | 2.90 | Natural Resources | 1.00 |
Funeral Services & Related Items | 2.88 | Health Services | 0.94 |
Publishing | 2.56 | Computer Services | 0.83 |
Cable TV | 2.41 | Tobacco | 0.77 |
Television | 2.39 | Electric Utilities | 0.76 |
Commercial Services & Supply | 2.38 | Electric - Integrated | 0.69 |
Special Purpose Entity | 2.26 | Multimedia | 0.66 |
Diversified Manufacturing Operations | 2.22 | Chemicals | 0.64 |
Beverages - Wine & Spirits | 2.09 | Pharmaceuticals | 0.60 |
Lottery Services | 1.85 | Chemicals Specialty | 0.58 |
Restaurants | 1.77 | Building Products | 0.55 |
Cable and Satellite | 1.63 | Long Term Investments | 91.49 |
Airport Development & Maintenance | 1.46 | Short Term Investment | 7.63 |
Finance - Commercial | 1.45 | Total Investments | 99.12 |
Medical Products | 1.40 | Net Other Assets and Liabilities | 0.88 |
| | | | 100.00% |
See Notes to Financial Statements.
8
| | | | | | | |
Henderson Global Funds | | Financial Statements | |
| | | | |
Statement of Assets and Liabilities | | | | | | |
December 31 , 2010 | | | | | | |
| | | Money | | | Worldwide | |
| | | Market | | | Income | |
| | | Fund | | | Fund | |
ASSETS: | | | | | | |
Investments in State Street Money Market Portfolio, at value | | $ | 81,578,281 | | | $ | — | |
Investment in securities, at value | | | — | | | | 58,283,680 | |
Short term investments | | | — | | | | 4,862,580 | |
Total investments, at value | | | 81,578,281 | | | | 63,146,260 | |
Foreign cash, at value | | | — | | | | 1,471,383 | |
Dividends and interest receivable | | | — | | | | 988,169 | |
Receivable for fund shares sold | | | 254,119 | | | | 43,816 | |
Unrealized appreciation on open futures contracts | | | — | | | | 64,313 | |
Prepaid expenses and other assets | | | 19,372 | | | | 90,802 | |
Total Assets | | | 81,851,772 | | | | 65,804,743 | |
LIABILITIES: | | | | | | | | |
Payable for investment securities purchased | | | — | | | | 1,597,648 | |
Payable for fund shares redeemed | | | 34,852 | | | | 268,119 | |
Payable for dividends | | | 206 | | | | — | |
Payable for open forward foreign currency contracts | | | — | | | | 58,832 | |
Payable to investment adviser | | | — | | | | 47,736 | |
Payable for 12b-1 distribution and service fees | | | — | | | | 36,635 | |
Due to broker for open futures contracts | | | — | | | | 31,545 | |
Accrued expenses and other payables | | | 22,567 | | | | 57,879 | |
Total Liabilities | | | 57,625 | | | | 2,098,394 | |
NET ASSETS | | $ | 81,794,147 | | | $ | 63,706,349 | |
NET ASSETS consist of: | | | | | | | | |
Paid-in capital | | $ | 81,792,849 | | | $ | 102,411,409 | |
Accumulated undistributed net investment income (loss) | | | 1,298 | | | | (600,093 | ) |
Accumulated net realized gain (loss) on investments, futures, options and foreign currency transactions | | | — | | | | (36,731,974 | ) |
Net unrealized appreciation (depreciation) of investments, futures and foreign currencies | | | — | | | | (1,372,993 | ) |
| | | $ | 81,794,147 | | | $ | 63,706,349 | |
NET ASSETS: | | | | | | | | |
Class A Shares | | $ | 3,069,201 | | | $ | 28,171,439 | |
Class B Shares | | $ | 702,544 | | | $ | 8,537,422 | |
Class C Shares | | $ | 3,019,217 | | | $ | 26,997,488 | |
Class Z Shares | | $ | 75,003,185 | | | | N/A | |
SHARES OUTSTANDING: | | | | | | | | |
Class A Shares (unlimited number of shares authorized) | | | 3,069,201 | | | | 3,193,910 | |
Class B Shares (unlimited number of shares authorized) | | | 702,544 | | | | 966,406 | |
Class C Shares (unlimited number of shares authorized) | | | 3,019,217 | | | | 3,072,948 | |
Class Z Shares (unlimited number of shares authorized) | | | 75,003,185 | | | | N/A | |
CLASS A SHARES: | | | | | | | | |
Net asset value and redemption price per share | | $ | 1.00 | | | $ | 8.82 | |
Maximum sales charge* | | | N/A | | | | 4.75 | % |
Maximum offering price per share | | | N/A | | | $ | 9.26 | |
CLASS B SHARES: | | | | | | | | |
Net asset value and offering price per share | | $ | 1.00 | | | $ | 8.83 | |
CLASS C SHARES: | | | | | | | | |
Net asset value and offering price per share | | $ | 1.00 | | | $ | 8.79 | |
CLASS Z SHARES: | | | | | | | | |
Net asset value and offering price per share | | $ | 1.00 | | | | N/A | |
Investments, at cost | | $ | 81,578,281 | | | | 64,531,298 | |
Foreign cash, at cost | | $ | — | | | $ | 1,467,137 | |
*On sales of $50,000 or more, the sales charge will be reduced. | | | | | | | | |
See Notes to Financial Statements. |
9
| | | | | | | |
Henderson Global Funds | | Financial Statements | |
| | | | |
Statement of Operations | | | | | | |
For the Year Ended December 31, 2010 | | | | | | |
| | | Money | | | Worldwide | |
| | | Market | | | Income | |
| | | Fund | | | Fund | |
INVESTMENT INCOME: | | | | | | |
Dividends | | $ | — | | | $ | 78,651 | |
Interest allocated from State Street Money Market Portfolio | | | 218,209 | | | | — | |
Interest | | | — | | | | 4,570,507 | |
Foreign taxes withheld | | | — | | | | (6,792 | ) |
Expenses allocated from State Street Money Market Portfolio | | | (81,457 | ) | | | — | |
Total Investment Income | | | 136,752 | | | | 4,642,366 | |
EXPENSES: | | | | | | | | |
Investment Advisory fees | | | — | | | | 527,355 | |
12b-1 distribution and service fees: | | | | | | | | |
Class A Shares | | | 9,928 | | | | 80,374 | |
Class B Shares | | | 7,826 | | | | 84,578 | |
Class C Shares | | | 39,574 | | | | 297,068 | |
Registration and filing fees | | | 35,310 | | | | 36,886 | |
Audit fees | | | 30,200 | | | | 38,428 | |
Legal fees | | | 26,894 | | | | 10,526 | |
Printing and postage fees | | | 25,834 | | | | 46,577 | |
Administrative fees | | | 23,976 | | | | 18,410 | |
Transfer agent fees | | | 16,344 | | | | 90,813 | |
Accounting fees | | | 11,802 | | | | 47,391 | |
Trustees’ fees and expenses | | | 2,249 | | | | 3,039 | |
Compliance Officer fees | | | 1,991 | | | | 2,298 | |
Custodian fees | | | — | | | | 17,426 | |
Miscellaneous fees | | | 8,096 | | | | 70,434 | |
Total Expenses | | | 240,024 | | | | 1,371,603 | |
Fees waived and expenses reimbursed by investment adviser | | | (92,537 | ) | | | (171,286 | ) |
Fees waived by distributor | | | (57,328 | ) | | | — | |
Net Expenses | | | 90,159 | | | | 1,200,317 | |
NET INVESTMENT INCOME | | | 46,593 | | | | 3,442,049 | |
NET REALIZED AND UNREALIZED GAIN/(LOSS): | | | | | | | | |
Net realized gain/(loss) from : | | | | | | | | |
Investment transactions | | | — | | | | (2,948,698 | ) |
Futures contracts | | | — | | | | (676,350 | ) |
Options | | | — | | | | (96,753 | ) |
Foreign currency transactions | | | — | | | | 2,757,470 | |
Net change in unrealized appreciation/(depreciation) of: | | | | | | | | |
Investments | | | — | | | | 4,653,368 | |
Futures contracts | | | — | | | | 37,352 | |
Translation of other assets and liabilities | | | — | | | | (622,349 | ) |
Net Realized and Unrealized Gain/(Loss) | | | — | | | | 3,104,040 | |
NET INCREASE IN NET ASSETS RESULTING FROM OPERATIONS | | $ | 46,593 | | | $ | 6,546,089 | |
See Notes to Financial Statements.
10
| | | | | | | |
Henderson Global Funds | | Financial Statements | |
| | | | |
Statement of Changes in Net Assets | | | | | | |
Money Market Fund | | | | | | |
| | | Year Ended | | | Period Ended | |
| | | December 31, | | | December 31, | |
| | | 2010 | | | | 2009 | * |
Net investment income | | $ | 46,593 | | | $ | 49,628 | |
Net increase in net assets resulting from operations | | | 46,593 | | | | 49,628 | |
Distributions to shareholders from net investment income: | | | | | | | | |
Class A Shares | | | (2,578 | ) | | | (3,496 | ) |
Class B Shares | | | (493 | ) | | | (772 | ) |
Class C Shares | | | (2,573 | ) | | | (4,188 | ) |
Class Z Shares | | | (40,949 | ) | | | (41,172 | ) |
| | | | (46,593 | ) | | | (49,628 | ) |
Net increase (decrease) in Fund share transactions: | | | | | | | | |
Class A Shares | | | (654,423 | ) | | | 3,723,624 | |
Class B Shares | | | (98,526 | ) | | | 801,070 | |
Class C Shares | | | (1,003,062 | ) | | | 4,022,278 | |
Class Z Shares | | | 30,001,329 | | | | 45,001,857 | |
| | | | 28,245,318 | | | | 53,548,829 | |
Net increase in net assets | | | 28,245,318 | | | | 53,548,829 | |
NET ASSETS: | | | | | | | | |
Beginning of year | | | 53,548,829 | | | | — | |
End of year | | $ | 81,794,147 | | | $ | 53,548,829 | |
Accumulated undistributed net investment income | | $ | 1,298 | | | | — | |
* Inception date for the Henderson Money Market Fund was April 20, 2009. | | | | | | | | |
See Notes to Financial Statements.
11
| | | | | | | | | | |
Henderson Global Funds | | | | | Financial Statements | |
| | | | | | | |
| Statement of Changes in Net Assets | | | | | | | |
Worldwide Income Fund | | | | | | | | | |
| | | Year Ended | | | Period Ended | | | Year Ended | |
| | | December 31, | | | December 31, | | | July 31, | |
| | | 2010 | | | | 2009 | * | | | 2009 | |
Net investment income | | $ | 3,442,049 | | | $ | 1,691,151 | | | $ | 6,009,580 | |
Net realized loss on investments, options, futures contacts and | | | | | | | | | | | | |
foreign currency transactions | | | (964,331 | ) | | | (4,229,777 | ) | | | (26,890,647 | ) |
Net change in unrealized appreciation (depreciation) of investments, | | | | | | | | | | | | |
futures contracts and foreign currency translations | | | 4,068,371 | | | | 11,194,007 | | | | (2,469,006 | ) |
Net increase (decrease) in net assets resulting from operations | | | 6,546,089 | | | | 8,655,381 | | | | (23,350,073 | ) |
Distributions to shareholders from net investment income: | | | | | | | | | | | | |
Class A Shares | | | (1,212,447 | ) | | | — | | | | (3,333,354 | ) |
Class B Shares | | | (276,642 | ) | | | — | | | | (402,379 | ) |
Class C Shares | | | (971,551 | ) | | | — | | | | (3,075,858 | ) |
| | | | (2,460,640 | ) | | | — | | | | (6,811,591 | ) |
Return of Capital: | | | | | | | | | | | | |
Class A Shares | | | (466,804 | ) | | | (801,752 | ) | | | — | |
Class B Shares | | | (106,510 | ) | | | (154,980 | ) | | | — | |
Class C Shares | | | (374,056 | ) | | | (653,057 | ) | | | — | |
| | | | (947,370 | ) | | | (1,609,789 | ) | | | — | |
Net increase (decrease) in Fund share transactions: | | | | | | | | | | | | |
Class A Shares | | | (8,886,617 | ) | | | 3,476,090 | | | | (21,459,603 | ) |
Class B Shares | | | 356,139 | | | | 780,723 | | | | 1,352,785 | |
Class C Shares | | | (4,533,368 | ) | | | (1,413,126 | ) | | | (19,370,764 | ) |
| | | | (13,063,846 | ) | | | 2,843,687 | | | | (39,477,582 | ) |
Net increase (decrease) in net assets | | | (9,925,767 | ) | | | 9,889,279 | | | | (69,639,246 | ) |
NET ASSETS: | | | | | | | | | | | | |
Beginning of year | | | 73,632,116 | | | | 63,742,837 | | | | 133,382,083 | |
End of year | | $ | 63,706,349 | | | $ | 73,632,116 | | | $ | 63,742,837 | |
Accumulated undistributed net investment loss | | $ | (600,093 | ) | | $ | (180,351 | ) | | $ | (3,456,697 | ) |
| * The Henderson Worldwide Income Fund changed its fiscal year end from July 31 to December 31. | | | | | | | | | |
See Notes to Financial Statements.
12
| | | | | | | |
Henderson Global Funds | | Financial Statements | |
| | | | |
| Statement of Changes - Capital Stock Activity | | | | |
Money Market Fund | | | | | | |
| | | Year Ended | | | Period Ended | |
| | | December 31, | | | December 31, | |
| | | 2010 | | | | 2009 | * |
Amount | | | | | | | |
Class A Shares: | | | | | | | |
Sold | | $ | 5,981,792 | | | $ | 8,080,751 | |
Issued as reinvestment of dividends | | | 1,954 | | | | 2,402 | |
Redeemed | | | (6,638,169 | ) | | | (4,359,529 | ) |
Net increase (decrease) | | $ | (654,423 | ) | | $ | 3,723,624 | |
Class B Shares: | | | | | | | | |
Sold | | $ | 618,535 | | | $ | 1,540,372 | |
Issued as reinvestment of dividends | | | 452 | | | | 650 | |
Redeemed | | | (717,513 | ) | | | (739,952 | ) |
Net increase (decrease) | | $ | (98,526 | ) | | $ | 801,070 | |
Class C Shares: | | | | | | | | |
Sold | | $ | 3,861,888 | | | $ | 7,276,083 | |
Issued as reinvestment of dividends | | | 2,359 | | | | 3,905 | |
Redeemed | | | (4,867,309 | ) | | | (3,257,710 | ) |
Net increase (decrease) | | $ | (1,003,062 | ) | | $ | 4,022,278 | |
Class Z Shares | | | | | | | | |
Sold | | $ | 426,552,955 | | | $ | 281,851,911 | |
Issued as reinvestment of dividends | | | 40,949 | | | | 40,973 | |
Redeemed | | | (396,592,575 | ) | | | (236,891,027 | ) |
Net increase | | $ | 30,001,329 | | | $ | 45,001,857 | |
* Inception date for the Henderson Money Market Fund was April 20, 2009. | | | | | | | | |
| The number of shares sold, issued as reinvestment of dividends and redeemed approximates the dollar amount of transactions. | | | | | |
See Notes to Financial Statements.
13
| | | | | | | | | | |
Henderson Global Funds | | | | | Financial Statements | |
| | | | | | | |
| Statement of Changes - Capital Stock Activity | | | | |
Worldwide Income Fund | | | | | | | | | |
| | | Year Ended | | | Period Ended | | | Year Ended | |
| | | December 31, | | | December 31, | | | July 31, | |
| | | 2010 | | | | 2009 | * | | | 2009 | |
Amount | | | | | | | | | | | |
Class A Shares: | | | | | | | | | | | |
Sold | | $ | 7,504,819 | | | $ | 7,706,649 | | | $ | 6,436,688 | |
Issued as reinvestment of dividends | | | 1,143,214 | | | | 520,375 | | | | 1,831,377 | |
Redeemed ** | | | (17,534,650 | ) | | | (4,750,934 | ) | | | (29,727,668 | ) |
Net increase (decrease) | | $ | (8,886,617 | ) | | $ | 3,476,090 | | | $ | (21,459,603 | ) |
Class B Shares: | | | | | | | | | | | | |
Sold | | $ | 2,190,741 | | | $ | 1,366,280 | | | $ | 2,618,316 | |
Issued as reinvestment of dividends | | | 149,698 | | | | 59,580 | | | | 131,962 | |
Redeemed ** | | | (1,984,300 | ) | | | (645,137 | ) | | | (1,397,493 | ) |
Net increase | | $ | 356,139 | | | $ | 780,723 | | | $ | 1,352,785 | |
Class C Shares: | | | | | | | | | | | | |
Sold | | $ | 5,339,610 | | | $ | 2,595,652 | | | $ | 8,507,174 | |
Issued as reinvestment of dividends | | | 772,516 | | | | 372,443 | | | | 1,467,617 | |
Redeemed ** | | | (10,645,494 | ) | | | (4,381,221 | ) | | | (29,345,555 | ) |
Net decrease | | $ | (4,533,368 | ) | | $ | (1,413,126 | ) | | $ | (19,370,764 | ) |
Shares | | | | | | | | | | | | |
Class A Shares: | | | | | | | | | | | | |
Sold | | | 860,440 | | | | 937,535 | | | | 859,802 | |
Issued as reinvestment of dividends | | | 131,056 | | | | 63,260 | | | | 272,218 | |
Redeemed | | | (2,020,264 | ) | | | (579,442 | ) | | | (4,173,888 | ) |
Net increase (decrease) | | | (1,028,768 | ) | | | 421,353 | | | | (3,041,868 | ) |
Class B Shares: | | | | | | | | | | | | |
Sold | | | 250,158 | | | | 165,584 | | | | 388,884 | |
Issued as reinvestment of dividends | | | 17,136 | | | | 7,229 | | | | 19,879 | |
Redeemed | | | (226,079 | ) | | | (78,220 | ) | | | (191,616 | ) |
Net increase | | | 41,215 | | | | 94,593 | | | | 217,147 | |
Class C Shares: | | | | | | | | | | | | |
Sold | | | 616,491 | | | | 315,836 | | | | 1,183,055 | |
Issued as reinvestment of dividends | | | 88,911 | | | | 45,479 | | | | 219,085 | |
Redeemed | | | (1,216,752 | ) | | | (533,051 | ) | | | (4,302,763 | ) |
Net decrease | | | (511,350 | ) | | | (171,736 | ) | | | (2,900,623 | ) |
| * | The Henderson Worldwide Income Fund changed its fiscal year end from July 31 to December 31. |
| ** | Amounts shown are inclusive of redemption fees. |
See Notes to Financial Statements.
14
This page deliberately left blank.
15
| | | | | | | | | | | | | | | | | | | | | | | | | |
| Henderson Global Funds | | | | | | | | | | | | Financial Highlights | |
| | | | | | | | | | | | | | |
| For a Share Outstanding Throughout the Periods Indicated | | | | | | | | | | | | | |
| | | | | | Income (loss) from investment operations: | | | Less distributions: |
| | | | | | | | | Net | | | | | | Dividends Distributions | | | | |
| | | | | | | | | realized and | | | | | | | | | | | | | | | | |
| | | Net asset | | | Net | | | unrealized | | | Total | | | from | | | from net | | | | | | | |
| | | value, | | | investment | | | gain | | | from | | | net | | | realized | | | Return | | | | |
| | | beginning | | | income | | | | | | investment | | | investment | | | capital | | | of | | | Total | |
| | | of period | | | (loss) (c) | | | investments | | | operations | | | income | | | gains | | | capital | | | distributions | |
| Henderson Money Market Fund (b) | | | | | | | | | | | | | | | | | | | | | | |
Class A | | | | | | | | | | | | | | | | | | | | | | | | |
Year Ended 12/31/2010 | | $ | 1.00 | | | | 0.00 | (d) | | | 0.00 | | | | 0.00 | (d) | | | 0.00 | (d) | | | 0.00 | | | | 0.00 | | | | 0.00 | (d) |
Period Ended 12/31/2009 (a) | | | 1.00 | | | | 0.00 | (d) | | | 0.00 | | | | 0.00 | (d) | | | 0.00 | (d) | | | 0.00 | | | | 0.00 | | | | 0.00 | (d) |
Class B | | | | | | | | | | | | | | | | | | | | | | | | | | | | | | | | |
Year Ended 12/31/2010 | | $ | 1.00 | | | | 0.00 | (d) | | | 0.00 | | | | 0.00 | (d) | | | 0.00 | (d) | | | 0.00 | | | | 0.00 | | | | 0.00 | (d) |
Period Ended 12/31/2009 (a) | | | 1.00 | | | | 0.00 | (d) | | | 0.00 | | | | 0.00 | (d) | | | 0.00 | (d) | | | 0.00 | | | | 0.00 | | | | 0.00 | (d) |
Class C | | | | | | | | | | | | | | | | | | | | | | | | | | | | | | | | |
Year Ended 12/31/2010 | | $ | 1.00 | | | | 0.00 | (d) | | | 0.00 | | | | 0.00 | (d) | | | 0.00 | (d) | | | 0.00 | | | | 0.00 | | | | 0.00 | (d) |
Period Ended 12/31/2009 (a) | | | 1.00 | | | | 0.00 | (d) | | | 0.00 | | | | 0.00 | (d) | | | 0.00 | (d) | | | 0.00 | | | | 0.00 | | | | 0.00 | (d) |
Class Z | | | | | | | | | | | | | | | | | | | | | | | | | | | | | | | | |
Year Ended 12/31/2010 | | $ | 1.00 | | | | 0.00 | (d) | | | 0.00 | | | | 0.00 | (d) | | | 0.00 | (d) | | | 0.00 | | | | 0.00 | | | | 0.00 | (d) |
Period Ended 12/31/2009 (a) | | | 1.00 | | | | 0.00 | (d) | | | 0.00 | | | | 0.00 | (d) | | | 0.00 | (d) | | | 0.00 | | | | 0.00 | | | | 0.00 | (d) |
Worldwide Income Fund | | | | | | | | | | | | | | | | | | | | | | | | | | | | | | | | |
Class A | | | | | | | | | | | | | | | | | | | | | | | | | | | | | | | | |
Year Ended 12/31/2010 | | $ | 8.44 | | | | 0.46 | | | | 0.38 | | | | 0.84 | | | | (0.33 | ) | | | 0.00 | | | | (0.13 | ) | | | (0.46 | ) |
Period Ended 12/31/2009(a) | | | 7.60 | | | | 0.21 | | | | 0.83 | | | | 1.04 | | | | 0.00 | | | | 0.00 | | | | (0.20 | ) | | | (0.20 | ) |
Year Ended 7/31/2009 | | | 9.45 | | | | 0.63 | | | | (1.78 | ) | | | (1.15 | ) | | | (0.70 | ) | | | 0.00 | | | | 0.00 | | | | (0.70 | ) |
Year Ended 7/31/2008 | | | 10.87 | | | | 0.71 | | | | (1.37 | ) | | | (0.66 | ) | | | (0.76 | ) | | | 0.00 | | | | 0.00 | | | | (0.76 | ) |
Year Ended 7/31/2007 | | | 10.78 | | | | 0.66 | | | | 0.08 | | | | 0.74 | | | | (0.65 | ) | | | 0.00 | | | | 0.00 | | | | (0.65 | ) |
Year Ended 7/31/2006 | | | 11.03 | | | | 0.71 | | | | (0.22 | ) | | | 0.49 | | | | (0.74 | ) | | | 0.00 | | | | 0.00 | | | | (0.74 | ) |
Class B | | | | | | | | | | | | | | | | | | | | | | | | | | | | | | | | |
Year Ended 12/31/2010 | | $ | 8.46 | | | | 0.40 | | | | 0.37 | | | | 0.77 | | | | (0.29 | ) | | | 0.00 | | | | (0.11 | ) | | | (0.40 | ) |
Period Ended 12/31/2009(a) | | | 7.61 | | | | 0.19 | | | | 0.84 | | | | 1.03 | | | | 0.00 | | | | 0.00 | | | | (0.18 | ) | | | (0.18 | ) |
Year Ended 7/31/2009 | | | 9.44 | | | | 0.56 | | | | (1.75 | ) | | | (1.19 | ) | | | (0.64 | ) | | | 0.00 | | | | 0.00 | | | | (0.64 | ) |
Year Ended 7/31/2008 | | | 10.84 | | | | 0.64 | | | | (1.36 | ) | | | (0.72 | ) | | | (0.68 | ) | | | 0.00 | | | | 0.00 | | | | (0.68 | ) |
Year Ended 7/31/2007 | | | 10.76 | | | | 0.57 | | | | 0.07 | | | | 0.64 | | | | (0.56 | ) | | | 0.00 | | | | 0.00 | | | | (0.56 | ) |
Year Ended 7/31/2006 | | | 11.00 | | | | 0.62 | | | | (0.20 | ) | | | 0.42 | | | | (0.66 | ) | | | 0.00 | | | | 0.00 | | | | (0.66 | ) |
Class C | | | | | | | | | | | | | | | | | | | | | | | | | | | | | | | | |
Year Ended 12/31/2010 | | $ | 8.41 | | | | 0.40 | | | | 0.38 | | | | 0.78 | | | | (0.29 | ) | | | 0.00 | | | | (0.11 | ) | | | (0.40 | ) |
Period Ended 12/31/2009(a) | | | 7.59 | | | | 0.19 | | | | 0.81 | | | | 1.00 | | | | 0.00 | | | | 0.00 | | | | (0.18 | ) | | | (0.18 | ) |
Year Ended 7/31/2009 | | | 9.45 | | | | 0.57 | | | | (1.79 | ) | | | (1.22 | ) | | | (0.64 | ) | | | 0.00 | | | | 0.00 | | | | (0.64 | ) |
Year Ended 7/31/2008 | | | 10.86 | | | | 0.64 | | | | (1.37 | ) | | | (0.73 | ) | | | (0.68 | ) | | | 0.00 | | | | 0.00 | | | | (0.68 | ) |
Year Ended 7/31/2007 | | | 10.78 | | | | 0.57 | | | | 0.07 | | | | 0.64 | | | | (0.56 | ) | | | 0.00 | | | | 0.00 | | | | (0.56 | ) |
Year Ended 7/31/2006 | | | 11.02 | | | | 0.63 | | | | (0.21 | ) | | | 0.42 | | | | (0.66 | ) | | | 0.00 | | | | 0.00 | | | | (0.66 | ) |
| (a) | The Henderson Money Market Fund commenced operations on April 20, 2009. The Henderson Worldwide Income Fund changed its fiscal year end from July 31 to December 31. |
| (b) | The per share amounts and percentages include the Fund's proportionate share of income, expenses and net realized and unrealized gains or losses of the State Street Money Market Portfolio. |
| (c) | Per share data was calculated using average shares outstanding during the period. |
| (d) | Amount represents less than $0.01. |
| (e) | Total returns are historical and assume changes in share price, reinvestment of all dividends and distributions and no sales charge. Had certain expenses not been reduced during the periods shown, total returns would have been lower. Total returns for periods of less than one year are not annualized. |
See Notes to Financial Statements.
16
| | | | | | | | | | | | | | | | | | | | | | | |
| | | | Henderson Global Funds | | | | | | | | | Financial Highlights | |
| | | | | | | | | | | | | Ratios to average net assets: | | | |
| | | | | | | | | | | | | | | | | | | Annualized ratio of | | | | |
| | | | | | | | | | | | | Annualized | | | Annualized | | | operating expenses | | | | |
| | | | | | | | | | | | | ratio of | | | ratio of | | | to average net | | | | |
| | | | Net asset | | | | | | Net assets, | | | operating | | | net investment | | | assets without | | | | |
| | | | value, | | | | | | end of | | | expenses to | | | income/(loss) | | | waivers and/or | | | Portfolio | |
| Redemption | | | end of | | | Total | | | period | | | average | | | to average | | | expenses | | | turnover | |
| fees | | | period | | | return (e) | | | | (000 | ) | | net assets | | | net assets | | | reimbursed | | | rate | |
| | 0.00 | | | $ | 1.00 | | | | 0.06 | % | | $ | 3,069 | | | | 0.25 | % | | | 0.06 | % | | | 0.63 | % | | | N/A | |
| | 0.00 | | | | 1.00 | | | | 0.09 | | | | 3,724 | | | | 0.35 | | | | 0.13 | | | | 0.78 | | | | N/A | |
| | | | | | | | | | | | | | | | | | | | | | | | | | | | | | | |
| | 0.00 | | | $ | 1.00 | | | | 0.06 | % | | $ | 703 | | | | 0.25 | % | | | 0.06 | % | | | 1.38 | % | | | N/A | |
| | 0.00 | | | | 1.00 | | | | 0.09 | | | | 801 | | | | 0.35 | | | | 0.13 | | | | 1.53 | | | | N/A | |
| | | | | | | | | | | | | | | | | | | | | | | | | | | | | | | |
| | 0.00 | | | $ | 1.00 | | | | 0.06 | % | | $ | 3,019 | | | | 0.25 | % | | | 0.06 | % | | | 1.38 | % | | | N/A | |
| | 0.00 | | | | 1.00 | | | | 0.09 | | | | 4,022 | | | | 0.35 | | | | 0.13 | | | | 1.53 | | | | N/A | |
| | | | | | | | | | | | | | | | | | | | | | | | | | | | | | | |
| | 0.00 | | | $ | 1.00 | | | | 0.06 | % | | $ | 75,003 | | | | 0.25 | % | | | 0.06 | % | | | 0.38 | % | | | N/A | |
| | 0.00 | | | | 1.00 | | | | 0.09 | | | | 45,002 | | | | 0.35 | | | | 0.13 | | | | 0.53 | | | | N/A | |
| | | | | | | | | | | | | | | | | | | | | | | | | | | | | | | |
| | | | | | | | | | | | | | | | | | | | | | | | | | | | | | | |
| | 0.00 | (d) | | $ | 8.82 | | | | 10.17 | % | | $ | 28,171 | | | | 1.30 | % | | | 5.30 | % | | | 1.54 | % | | | 38 | % |
| | 0.00 | (d) | | | 8.44 | | | | 13.82 | | | | 35,656 | | | | 1.30 | | | | 6.19 | | | | 1.63 | | | | 11 | |
| | 0.00 | (d) | | | 7.60 | | | | (10.71 | ) | | | 28,905 | | | | 1.30 | | | | 8.69 | | | | 1.62 | | | | 53 | |
| | 0.00 | (d) | | | 9.45 | | | | (6.47 | ) | | | 64,687 | | | | 1.30 | | | | 6.87 | | | | 1.45 | | | | 41 | |
| | 0.00 | | | | 10.87 | | | | 6.71 | | | | 39,470 | | | | 1.30 | | | | 5.89 | | | | 1.77 | | | | 73 | |
| | 0.00 | | | | 10.78 | | | | 4.70 | | | | 17,927 | | | | 1.30 | | | | 6.61 | | | | 1.93 | | | | 161 | |
| | | | | | | | | | | | | | | | | | | | | | | | | | | | | | | |
| | 0.00 | (d) | | $ | 8.83 | | | | 9.21 | % | | $ | 8,537 | | | | 2.05 | % | | | 4.55 | % | | | 2.29 | % | | | 38 | % |
| | 0.00 | (d) | | | 8.46 | | | | 13.59 | | | | 7,824 | | | | 2.05 | | | | 5.44 | | | | 2.38 | | | | 11 | |
| | 0.00 | (d) | | | 7.61 | | | | (11.23 | ) | | | 6,325 | | | | 2.05 | | | | 8.02 | | | | 2.37 | | | | 53 | |
| | 0.00 | (d) | | | 9.44 | | | | (7.00 | ) | | | 5,789 | | | | 2.05 | | | | 6.13 | | | | 2.20 | | | | 41 | |
| | 0.00 | | | | 10.84 | | | | 5.93 | | | | 5,003 | | | | 2.05 | | | | 5.17 | | | | 2.52 | | | | 73 | |
| | 0.00 | | | | 10.76 | | | | 3.93 | | | | 5,210 | | | | 2.05 | | | | 5.77 | | | | 2.68 | | | | 161 | |
| | | | | | | | | | | | | | | | | | | | | | | | | | | | | | | |
| | 0.00 | (d) | | $ | 8.79 | | | | 9.39 | % | | $ | 26,997 | | | | 2.05 | % | | | 4.55 | % | | | 2.29 | % | | | 38 | % |
| | 0.00 | (d) | | | 8.41 | | | | 13.22 | | | | 30,152 | | | | 2.05 | | | | 5.45 | | | | 2.38 | | | | 11 | |
| | 0.00 | (d) | | | 7.59 | | | | (11.55 | ) | | | 28,513 | | | | 2.05 | | | | 7.96 | | | | 2.37 | | | | 53 | |
| | 0.00 | (d) | | | 9.45 | | | | (7.09 | ) | | | 62,906 | | | | 2.05 | | | | 6.17 | | | | 2.20 | | | | 41 | |
| | 0.00 | | | | 10.86 | | | | 5.92 | | | | 29,752 | | | | 2.05 | | | | 5.11 | | | | 2.52 | | | | 73 | |
| | 0.00 | | | | 10.78 | | | | 3.92 | | | | 13,150 | | | | 2.05 | | | | 5.78 | | | | 2.68 | | | | 161 | |
See Notes to Financial Statements.
17
Henderson Global Funds
Notes to Financial Statements
Note 1. Organization
Henderson Global Funds (the “Trust”) was organized on May 11, 2001, as a Delaware business trust and is registered under the Investment Company Act of 1940, as amended (the “1940 Act”), as an open-end management investment company. The Trust has an unlimited number of authorized shares that are divided among ten series: seven series of the Trust, Henderson Emerging Market Opportunities, Henderson European Focus Fund, Henderson Global Equity Income Fund, Henderson Global Opportunities Fund, Henderson Global Technology Fund, Henderson International Opportunities Fund and Henderson Japan-Asia Focus Fund are not included in this report because their fiscal year end is July 31. Henderson International All Cap Equity Fund (formerly known as “International Equity”) has a fiscal year ending December 31, and is not included in this report. The Henderson Money Market Fund (“Money Market”) and Henderson Worldwide Income Fund (“Worldwide Income”) (collectively, the “Funds”), have fiscal years ending December 31, are both diversified and included in this report.
Money Market began operations, including recording income and expenses (“commencement of operations”) on April 20, 2009. Money Market is a feeder fund that invests substantially all of its assets in the State Street Money Market Portfolio, (the “Master Portfolio”), a series of State Street Master Funds. The investment objective and policies of Master Portfolio are substantially similar to those of Money Market. The value of Money Market’s investment in Master Portfolio reflects its proportionate interest of the net assets of Master Portfolio (0.31% at December 31, 2010). The performance of Money Market is directly affected by the performance of the Master Portfolio. The financial statements of Master Portfolio are included elsewhere in this report and should be read in conjunction with Money Market’s financial statements. The investment objective of Money Market is to seek to maximize current income while providing liquidity, preservation of capital, and a stable $1.00 per share price.
The Funds offer Class A shares, Class B shares and Class C shares. Money Market also offers Class Z shares. Class A shares provide for a front-end sales charge for Worldwide Income only, and Class B shares and Class C shares provide for a contingent deferred sales charge. Each class of shares has exclusive voting rights with respect to matters that affect just that class. Income, expenses (other than expenses attributable to a specific class), and realized and unrealized gains and losses on investments are allocated to each class of shares based on its relative net assets. Class B shares automatically convert to Class A shares at the end of the month following the eighth anniversary of issuance. Class Z shares are only available for purchase by other series of the Trust. Effective November 30, 2010, the Funds will not accept new or additional investments in Class B shares of the Funds with the limited exception that current Class B shareholders may continue to have their dividends automatically reinvested in Class B shares of their Fund. As described in the prospectus, Class B shares of the Fund may continue to be exchanged with Class B shares of other Henderson Global Funds.
Note 2. Significant Accounting Policies
Security Valuation
Money Market records its investments in Master Portfolio at NAV which approximates fair market value. The valuation policies of Master Portfolio are discussed in Note 2 of Master Portfolio’s Notes to Financial Statements, which are included elsewhere within this report.
Securities and derivatives traded on a recognized exchange or market are generally valued at the last reported sale price or at the official closing price. Listed securities for which no sale was reported on that date and other securities traded in the over-the-counter market are valued at the mean between the last bid and asked price.
Debt securities are valued at the last sales price or market value by independent pricing services approved by the Trustees of the Trust. If the pricing services are unable to provide valuations, the securities are valued at the mean between the last bid and asked price or if no ask is available, then the last bid price obtained from one or more broker dealers. Such pricing services may use various pricing techniques, which take into account appropriate factors such as yield, quality, coupon rate, maturity, type of issue, trading characteristics and other data, as well as broker quotes.
Short-term investments purchased with an original or remaining maturity of 60 days or less are valued at amortized cost, which approximates market value.
Investments in Registered Investment Companies are valued at NAV which approximates fair market value.
Forward foreign currency contracts are valued daily at the applicable forward rate.
If market quotations are not readily available, or if the investment adviser determines that a quotation of a security does not represent a fair value, then the security is valued at a fair value as determined in good faith using procedures approved by the Trustees of the Trust. The Trustees of the Trust, or its designee, may also establish fair value using a wide variety of market data including yields or prices of investments of comparable quality, type of issue, coupon, maturity and rating, market quotes or indications of value from security dealers, evaluations of anticipated cash flows or collateral, general market conditions and other information and
18
| | |
Henderson Global Funds | Notes to Financial Statements |
analysis, including the obligor’s credit characteristics considered relevant.
The Trust has retained an independent statistical fair value pricing service to assist in the fair valuation process for securities principally traded in a foreign market in order to adjust for possible changes in value that may occur between the close of the foreign exchange and the time at which Fund shares are priced. If a security is valued at a “fair value”, that value may be different from the last quoted market price for the security. As a result, it is possible that fair value prices will be used by the Funds.
Various inputs are used in determining the value of the Funds’ investments. The Funds established a three-tier hierarchy of inputs to establish classification of fair value measurements for disclosure purposes. These inputs may be observable or unobservable. Observable inputs are inputs that reflect the assumptions market participants would use in pricing the asset or liability developed based on market data obtained from sources independent of the reporting entity. Unobservable inputs are inputs that reflect the reporting entity’s own assumptions about the assumptions market participants would use in pricing the asset or liability developed based on the best information available under the circumstances. The inputs used for valuing securities are not necessarily an indication of the risk associated with investing in those securities. The three-tier hierarchy of inputs is summarized in the three broad levels listed below.
| · | Level 1 – quoted prices in active markets for identical investments |
| · | Level 2 – other significant observable inputs (including quoted prices for similar investments, interest rates, prepayment speeds, credit risk, etc.) |
| · | Level 3 – significant unobservable inputs (including the Fund’s own assumptions in determining the fair value of investments) |
On January 21, 2010, the Financial Accounting Standards Board (“FASB”) issued an Accounting Standards Update (“ASU”), Fair Value Measurements and Disclosures – Accounting Standards Codification 820 (“ASC 820”): Improving Disclosures about Fair Value Measurements which provides guidance on how investment assets and liabilities are to be valued and disclosed. Specifically, the amendment requires reporting entities to disclose: i) the input and valuation techniques used to measure fair value for both recurring and nonrecurring fair value measurements, for Level 2 or Level 3 positions: ii) transfers between all levels (including Level 1 and Level 2) will be required to be disclosed on a gross basis (i.e. transfers out must be disclosed separately from transfers in) as well as the reason(s) for the transfer and iii) purchases, sales, issuances and settlements must be shown on a gross basis in the Level 3 rollforward rather than as one net number. The effective date of the amendment is for interim and annual periods beginning after December 15, 2009, however, the requirement to provide the Level 3 activity for purchases, sales, issuances and settlements on a gross basis will be effective for interim and annual periods beginning after December 15, 2010. Fund management has implemented part (i) and (ii) and is evaluating the implications of part (iii) of ASC 820 and the impact to the financial statements.
The following is a summary of the inputs used as of December 31, 2010 in valuing the Funds’ investments carried at value:
| | | | | | | | | | | | | |
Money Market | | | | | | | | | | | | |
| | | Quoted Prices | | | Significant | | | | | | | |
| | | in Active | | | Other | | | Significant | | | | |
| | | Markets for | | | Observable | | | Unobservable | | | | |
| | | Identical Assets | | | Inputs | | | Inputs | | | | |
Description | | (Level 1) | | | (Level 2) | | | (Level 3) | | | Total | |
Mutual Funds | | $ | — | | | $ | 81,578,281 | | | $ | — | | | $ | 81,578,281 | |
Total | | $ | — | | | $ | 81,578,281 | | | $ | — | | | $ | 81,578,281 | |
19
| | | | | | | | | | | | | |
Henderson Global Funds | | | | | | | | Notes to Financial Statements | |
| | | | | | | | | | |
Worldwide Income | | | | | | | | | | | | |
| | | Quoted Prices | | | Significant | | | | | | | |
| | | in Active | | | Other | | | Significant | | | | |
| | | Markets for | | | Observable | | | Unobservable | | | | |
| Identical Assets | | | Inputs | | | Inputs | | | | |
Description | | (Level 1) | | | (Level 2) | | | (Level 3) | | | Total | |
Assets | | | | | | | | | | | | |
Corporate Bonds | | | | | | | | | | | | |
Canada | | $ | — | | | $ | 1,416,478 | | | $ | — | | | $ | 1,416,478 | |
Denmark | | | — | | | | 1,876,165 | | | | — | | | | 1,876,165 | |
France | | | — | | | | 3,751,272 | | | | — | | | | 3,751,272 | |
Germany | | | — | | | | 2,398,484 | | | | — | | | | 2,398,484 | |
Ireland | | | — | | | | 997,214 | | | | — | | | | 997,214 | |
Italy | | | — | | | | 1,175,610 | | | | — | | | | 1,175,610 | |
Luxembourg | | | — | | | | 2,175,226 | | | | — | | | | 2,175,226 | |
Netherlands | | | — | | | | 6,495,113 | | | | 1,850,000 | | | | 8,345,113 | |
Switzerland | | | — | | | | 1,440,409 | | | | — | | | | 1,440,409 | |
United Kingdom | | | — | | | | 17,671,199 | | | | — | | | | 17,671,199 | |
United States | | | — | | | | 9,722,282 | | | | — | | | | 9,722,282 | |
Total Corporate Bonds | | | — | | | | 49,119,452 | | | | 1,850,000 | | | | 50,969,452 | |
U.S. Government Agency Obligation | | | | | | | | | | | | | | | | |
United States | | | — | | | | 4,195,241 | | | | — | | | | 4,195,241 | |
Total U.S. Government Agency Obligation | | | — | | | | 4,195,241 | | | | — | | | | 4,195,241 | |
Common Stocks | | | | | | | | | | | | | | | | |
United Kingdom | | | 2,640,502 | | | | — | | | | — | | | | 2,640,502 | |
Total Common Stock | | | 2,640,502 | | | | — | | | | — | | | | 2,640,502 | |
Preferred Stock | | | | | | | | | | | | | | | | |
United States | | | 478,485 | | | | — | | | | — | | | | 478,485 | |
Total Preferred Stock | | | 478,485 | | | | — | | | | — | | | | 478,485 | |
Short Term Investment | | | 4,862,580 | | | | — | | | | — | | | | 4,862,580 | |
Total Investments | | | 7,981,567 | | | | 53,314,693 | | | | 1,850,000 | | | | 63,146,260 | |
Financial Derivative Instruments | | | | | | | | | | | | | | | | |
Forward Foreign Currency Exchange Contracts | | | — | | | | 159,676 | | | | — | | | | 159,676 | |
Interest Rate Futures Contracts | | | 64,313 | | | | — | | | | — | | | | 64,313 | |
Liabilities | | | | | | | | | | | | | | | | |
Financial Derivative Instruments | | | | | | | | | | | | | | | | |
Forward Foreign Currency Exchange Contracts | | | — | | | | (218,508 | ) | | | — | | | | (218,508 | ) |
Total Financial Derivative Instruments | | $ | 64,313 | | | $ | (58,832 | ) | | $ | — | | | $ | 5,481 | |
During the year ended December 31, 2010, there were no transfers in or out of security levels as a result of the fair value pricing procedures utilized by the Fund.
20
| | |
Henderson Global Funds | Notes to Financial Statements |
Following is a reconciliation of investments in which significant unobservable inputs (Level 3) were used in determining fair value:
| | | | | | | | | | | | | | | | | | | | | | | | | | | Balance | |
| | | | | | | | | | | | Change in | | | | | | | | | Gross | | | Gross | | | | |
| | | Balance as of | | | Accrued | | | | | | Unrealized | | | | | | | | | transfers | | | transfers | | | December | |
Investments in | | January 1, | | | Discounts/ | | | Realized | | | Appreciation | | | Gross | | | Gross | | | in to | | | out of | | | 31, | |
Securities | | 2010 | | | Premiums | | | Gain/(Loss) | | | (Depreciation) | | | Purchases | | | Sales | | | Level 3 | | | Level 3 | | | 2010 | |
Corporate Bonds | | | | | | | | | | | | | | | | | | | | | | | | | | | |
| Netherlands Arran | | | | | | | | | | | | | | | | | | | | | | | | | | | |
Corporate Loans B.V., Class E3 | | $ | 1,330,000 | | | $ | 2,960 | | | $ | 0 | | | $ | 517,040 | | | $ | 0 | | | $ | 0 | | | $ | 0 | | | $ | 0 | | | $ | 1,850,000 | |
United States | | | | | | | | | | | | | | | | | | | | | | | | | | | | | | | | | | | | |
Lehman Brothers UK Capital | | | | | | | | | | | | | | | | | | | | | | | | | | | | | | | | | | | | |
Funding IV LP | | $ | 0 | | | $ | 0 | | | $ | 0 | | | $ | 0 | | | $ | 0 | | | $ | 0 | | | $ | 0 | | | $ | 0 | | | $ | 0 | |
Total | | $ | 1,330,000 | | | $ | 2,960 | | | $ | 0 | | | $ | 517,040 | | | $ | 0 | | | $ | 0 | | | $ | 0 | | | $ | 0 | | | $ | 1,850,000 | |
The total change in unrealized appreciation depreciation included in the Statement of Operations attributable to level 3 investments still held at December 31, 2010 was $517,040.
Security Transactions and Investment Income
Investment transactions are accounted for on trade date basis. Interest income is recorded on an accrual basis. Dividend income is recorded on the ex-dividend date. Bond premium is amortized and discount is accreted over the expected life of each applicable security. Corporate actions involving foreign securities, including dividends, are recorded as soon as the information becomes available. Withholding taxes on foreign dividends are accrued in accordance with the applicable country’s tax rules and rates. Securities gains and losses are determined on the specific identified cost basis, which is the same basis used for federal income tax purposes.
In addition to the types of income noted above, Money Market also has a pro-rata share in the net investment income and gains or losses of the Master Portfolio. Net investment income for Money Market consists of the Money Market’s pro-rata share of the investment income of the Master Portfolio less all expenses of the Money Market. Realized gains and losses from security transactions consist of the Money Market’s pro-rata share of the realized gains and losses of the Master Portfolio.
Futures Contracts
Worldwide Income is subject to interest rate risk and foreign currency risk in the normal course of pursuing investment objectives. The Fund may invest in futures contracts to gain exposure to, or hedge against changes in the value of interest rates or foreign currencies. A futures contract represents a commitment for the future purchase or sale of an asset at a specified price and date. Upon entering into such contracts, the Fund is required to deposit with the broker either in cash or securities an initial margin in an amount equal to a certain percentage of the contract amount. Subsequent payments, known as "variation margin," are made or received by the Fund, depending on the fluctuations in the fair value of the position. The Fund recognizes a gain or loss equal to the variation margin. Should market conditions move unexpectedly, the Fund may not achieve the anticipated benefits of the futures contracts and may realize a loss. The use of futures transactions involves the risk of imperfect correlation in movements in the price of futures contracts, interest rates, and the underlying hedged assets. With futures, there is minimal counterparty credit risk to the Fund since futures are exchange traded and the exchange’s clearing house, as counterparty to all exchange traded futures, guarantees the futures against default.
The Worldwide Income held the following open interest rate futures contracts at December 31, 2010:
| | | | | |
| | Number | | Aggregate | |
| | of | Expiration | Notional | Unrealized |
| | contracts | Date | Value | appreciation |
5 Year | | | | |
U.S. | | | | |
Treasury | | | | |
Note | | | | |
(Short) | 28 | 3/31/11 | $3,296,125 | $64,313 |
During the year ended December 31, 2010 the Fund’s average notional value related to Interest Rate Futures Contracts was $4 million or 6.6% of net assets.
Options
Worldwide Income may purchase options on futures indexes to create investment exposure consistent with its investment objective or to hedge or limit exposure of its positions. Options are valued daily and unrealized appreciation or depreciation is recorded. The Fund will realize a gain or loss upon the expiration or closing of the option transaction. Options are subject to substantial risks. The primary risks include the risk
21
| | |
Henderson Global Funds | Notes to Financial Statements |
of imperfect correlation between the option price and the value of the underlying futures indexes, the possibility of an illiquid market for the option or the inability of counterparties to perform.
Forward Foreign Currency Contracts
Worldwide Income may enter into forward foreign currency contracts primarily to hedge against foreign currency exchange rate risks on their non-U.S. dollar denominated investment securities. When entering into forward foreign currency contracts, the Fund agrees to receive or deliver a fixed quantity of foreign currency for an agreed-upon price on an agreed future date. Realized gains or losses on forward foreign currency contracts include net gains or losses on contracts that have matured or which the Fund has terminated by entering into offsetting closing transactions. Forward foreign currency contracts are valued daily and the unrealized appreciation or depreciation is included in the Statements of Assets and Liabilities. These instruments involve market risk, credit risk, or both kinds of risks, in excess of the amount recognized in the Statements of Operations. These risks arise from the possible inability of counterparties to meet the terms of their contracts and from unfavorable currency fluctuations.
Worldwide Income held the following open forward foreign currency contracts at December 31, 2010:
| | | | |
| | | | Unrealized |
| | Value | Local | Current | appreciation/ |
| | date | amount | value | (depreciation) |
British | | | |
Pound | | | |
| Short | 1/21/11 | 10,585,078 | $16,501,237 | $ 159,676 |
Euro | | | |
| Short | 1/21/11 | 18,116,116 | 24,207,869 | (218,508) |
During the year ended December 31, 2010 the Fund’s average notional value related to forward foreign currency contracts was 19 million or 29.3% of net assets.
Derivative Instruments
The following table summarizes the Worldwide Income fair value of derivative instruments held at December 31, 2010 and the related location on the accompanying Statement of Assets and Liabilities, presented by primary underlying risk exposure:
| | | |
| | Location on Statement of | |
| | Assets and Liabilities | Fair Value |
Assets | | |
Foreign currency | Payable for open | |
contracts | forward foreign | |
| | currency contracts | $159,676 |
| | | |
Interest rate | Unrealized appreciation | |
futures | on open | |
| | futures contracts | $64,313 |
Liabilities | | |
Foreign currency | Payable for open | |
contracts | forward foreign | |
| | currency contracts | $218,508 |
Additionally, the amount of gains and losses on derivative instruments recognized in Worldwide Income’s earnings during the year and the related location on the accompanying Statement of Operations is summarized in the following table by primary risk exposure:
| | | |
| | Location on Statement | |
| | of Operations | |
| | | Realized |
| | | Gain (Loss) |
Interest rate | Realized gain (loss) | |
futures | from futures | |
| | contracts | $ (676,350) |
| | | |
Foreign currency | Realized gain (loss) | |
contracts | from foreign currency | |
| | transactions | 2,862,859 |
| | | |
Options on | Realized gain (loss) | |
interest rate | from options | |
futures | | (96,753) |
| | | |
| | Change in unrealized |
| | | Gain (Loss) |
Interest rate | Unrealized gain (loss) | |
futures | from futures | |
| | contracts | $ 37,352 |
| | | |
Foreign currency | Unrealized gain (loss) | |
contracts | from foreign currency | |
| | transactions | (645,886) |
Foreign Currency Translation
Worldwide Income’s investment securities and other assets and liabilities denominated in foreign currencies are translated into U.S. dollar amounts at the date of valuation. Purchases and sales of investment securities and income and expense items denominated in foreign currencies are translated into U.S. dollar amounts on the respective dates of such transactions.
Worldwide Income does not isolate that portion of the results of operations resulting from changes in foreign exchange rates on investments from the fluctuations arising from
22
| | |
Henderson Global Funds | Notes to Financial Statements |
changes in market prices of securities held. Such fluctuations are included with the net realized and unrealized gain or loss from investments on the Statement of Operations.
Reported net realized foreign exchange gains or losses arise from sales of foreign currencies, currency gains or losses realized between the trade date and settlement date on securities transactions, and the difference between the amounts of dividends, interest, and foreign withholding taxes recorded on the Fund’s books and the U.S. dollar equivalent of the amounts actually received or paid. Net unrealized foreign exchange gains and losses arise from changes in the fair values of assets and liabilities, other than investments in securities at fiscal period end, resulting from changes in exchange rates.
Indemnifications
Under the Trust’s organizational documents, its Officers and Trustees are indemnified against certain liabilities arising out of the performance of their duties to the Trust. In addition, in the normal course of business the Trust enters into contracts that provide general indemnifications to other parties. The Trust’s maximum exposure under these arrangements is unknown as this would involve future claims that may be made against the Trust that have not yet been asserted.
Use of Estimates
The preparation of financial statements, in conformity with United States generally accepted accounting principles (“GAAP”), requires management to make estimates and assumptions that affect the reported amounts and disclosures in the financial statements. Actual results may differ from those estimates.
Expenses
Expenses are recorded on an accrual basis. Expenses of the Trust that are directly attributable to a specific Fund are charged to that Fund. Other expenses are allocated proportionately among each Fund within the Trust based on average daily net assets or on another reasonable basis. Money Market indirectly bears a pro-rata share of the fees and expenses of the underlying portfolio in which the Fund invests.
Federal Income Taxes
The Trust’s policy is that each Fund continue to comply with the requirements of Subchapter M of the Internal Revenue Code of 1986, as amended, that are applicable to regulated investment companies and to distribute substantially all its taxable income to shareholders. Therefore, no federal income tax provision is required. Management has concluded that there are no significant uncertain tax positions that would require recognition in the financial statements. Management of the Funds is also not aware of any tax positions for which it is reasonably possible that the total amount of unrecognized tax benefits will significantly change in the next twelve months. The Funds intend to file tax returns with the U.S. Internal Revenue Service and various states. Generally, the tax authorities can examine all tax returns filed for the last three years.
Worldwide Income intends to utilize provisions of the federal income tax laws which allows it to carry a realized capital loss forward for eight years following the year of loss and offset such losses against any future realized capital gains. At December 31, 2010 Worldwide Income had the following capital loss carryforwards:
| | | | |
Expiring | Expiring | Expiring | Expiring |
on | on | on | on |
July 31, | July 31, | July 31, | July 31, |
2014 | 2015 | 2016 | 2017 |
Worldwide | | | |
| Income | $341,836 | $207,447 | $477,632 | $1,001,344 |
| | | Expiring | Expiring |
| | | on | on |
| | | December 31, | December 31, |
| | | 2017 | 2018 |
Worldwide Income | $34,174,962 | $336,160 |
At December 31, 2010, Worldwide Income deferred post-October losses which will be recognized on the first day of the following year:
| | |
| | Currency |
| | loss |
| | deferred |
Worldwide income | $497,346 |
Distributions to Shareholders
Money Market distributions of net investment income are declared daily and distributed monthly. Net realized capital gains, if any, are distributed at least annually after the fiscal year in which the capital gains were earned or more frequently to seek to maintain a net asset value of $1.00 per share, unless offset by any available capital loss carryforward. Income distributions and capital and gain distributions are determined in accordance with federal income tax regulations which may differ from GAAP.
Worldwide Income distributions to shareholders are recorded on the ex-dividend date. Distributions from net investment income and net realized capital gains are determined in accordance with federal income tax regulations, which may differ from GAAP. These book/tax differences are either temporary or permanent in nature. To the extent these
23
| | |
Henderson Global Funds | Notes to Financial Statements |
differences are permanent, they are reclassified within the capital accounts based on their federal tax-basis treatment.
Accordingly, at December 31, 2010, the Funds reclassified the following amounts between paid-in capital, undistributed net investment income (loss) and accumulated net realized gain (loss):
| | | | |
| | | Accumulated | |
| | | undistributed | Accumulated |
| | | net | net |
| | Paid-in | investment | realized |
| | capital | income/(loss) | gain/(loss) |
Money Market | $(1,298) | $1,298 | $— |
Worldwide | | | |
Income | (947,370) | (453,781) | 1,401,151 |
These reclassifications relate to the deductibility of certain expenses, the character of realized gain/losses on foreign currency transactions and the return of capital distributions in Worldwide Income. The reclassifications had no impact on the net asset value of the Funds.
The tax character of distributions paid during the period ended December 31, 2009 and the year ended December 31, 2010, were as follows:
| | | |
Period ended | Ordinary | Return of |
December 31, 2009 | income | Capital |
Money Market | $49,628 | $— |
Worldwide | | |
Income | — | 1,609,789 |
Year ended | Ordinary | Return of |
December 31, 2010 | income | Capital |
Money Market | $46,593 | $— |
Worldwide | | |
Income | 2,460,640 | 947,370 |
As of December 31, 2010, the components of distributable earnings on a tax basis were as follows:
| | | |
| | Undistributed | Unrealized |
| | ordinary | appreciation |
| | income | (depreciation) |
Money Market | $32,707 | $— |
Worldwide Income | — | (1,667,476) |
Note 3. Investment Advisory Fees and Other Transactions with Affiliates
Pursuant to an Investment Advisory Agreement, Henderson Global Investors (North America) Inc. (“HGINA”) acts as the Funds’ investment adviser. HGINA is an indirect wholly owned subsidiary of Henderson Group plc. HGINA supervises the investments for Money Market and no fee is payable to HGINA at any time Money Market invests substantially all its assets in a master-feeder structure. For Worldwide Income HGINA receives a fee for its services, paid based on the Fund’s average daily managed assets as set forth below.
| | | |
Worldwide Income1 | First $1 billion | 0.75% |
| | Next $500 million | 0.70% |
| | Over $1.5 billion | 0.65% |
1 Managed assets mean the total assets of the Fund (including any assets attributable to any leverage that may be outstanding) minus the sum of accrued liabilities (other than debt representing financial leverage). Since the Fund pays HGINA based on the Fund’s average daily managed assets, HGINA’s fee will be higher if the Fund is leveraged.
Pursuant to separate contractual Expense Limitation Agreements for Money Market, HGINA has agreed to waive or limit the Fund’s expenses, including its pro-rata allocation of expense from the Master Portfolio, and, if necessary, to reimburse other operating expenses of the Fund in order to limit total annual expenses, less distribution and service fees, to 0.40% of the Fund’s average daily net assets through July 31, 2012. For Worldwide Income, HGINA has also agreed to waive or limit its advisory fee and, if necessary, to reimburse other operating expenses of Worldwide Income in order to limit total annual ordinary operating expenses, to 1.05% of average daily net assets through July 31, 2020.
HGINA may limit expenses to the extent it deems appropriate to enhance the yield of Money Market during periods when fixed expenses have a significant impact on the yield of the Fund because of low interest rates. This expense limitation policy is voluntary and temporary and may be revised or terminated by HGINA at any time without notice.
24
| | |
Henderson Global Funds | Notes to Financial Statements |
HGINA is a direct subsidiary of Henderson International Inc. (“HII”). At December 31, 2010 HII owned the following number of shares in the Funds:
| | |
| | Shares |
Money Market Class A | 24,972 |
On December 31, 2010, the Henderson International Opportunities Fund, a separate series of the Henderson Global Funds, owned 91.9% of Money Market. The Henderson International Opportunities Fund invests a portion of its un-invested cash in Money Market to assist with short-term cash management.
Note 4. Compensation of Trustees and Officers
Certain officers and trustees of the Trust are also officers of HGINA. None of the Trust’s officers, other than the compliance officers are compensated by the Trust. The Trust makes no direct payment to trustees affiliated with HGINA. Fees paid to Trustees are reflected as Trustees’ fees and expenses in the Statements of Operations.
The Funds bear a portion of the compensation paid to the compliance officers who perform services for the Trust. This compensation is reflected as Compliance Officer fees in the Statements of Operations.
Note 5. Distribution
The Trust has adopted a distribution plan for Class A, Class B and Class C shares of the Funds in accordance with Rule 12b-1 under the 1940 Act (the “12b-1 Plan”). Under the 12b-1 Plan, the Funds pay the distributor an annual fee of 0.25% of the average daily net assets attributable to its Class A shares, an annual fee of 1.00% of the average daily net assets attributable to its Class B and C shares. The 12b-1 Plan is used to induce or compensate financial intermediaries (including brokerage firms, depository institutions and other firms) to provide distribution and/or services to the Funds and their shareholders. In accordance with a waiver agreement, the distributor has agreed to waive all distribution and service fees for Money Market from the commencement of operations through April 30, 2011.
Note 6. Investment Transactions
Purchases and sales of investment securities, excluding short-term investments and U.S. government securities, for Worldwide Income during the year ended December 31, 2010, were as follows:
| | | |
| | Purchases | Sales |
Worldwide Income | $24,135,371 | $29,194,210 |
The U.S. federal income tax basis of the Worldwide Income’s investments excluding foreign currency, forward currency contracts and futures at December 31, 2010, and the gross unrealized appreciation and depreciation, were as follows:
| | |
| | Worldwide |
| | Income |
Cost | $64,820,369 |
Gross unrealized appreciation | 3,208,497 |
Gross unrealized depreciation | (4,882,606) |
Net unrealized depreciation | (1,674,109) |
Tax cost and book cost are the same for Money Market.
Note 7. Significant Concentrations
Worldwide Income invests a substantial percentage of its assets in securities of foreign issuers. Worldwide Income may also invest a substantial percentage of its net assets in securities of emerging market countries. These investments may involve certain considerations and risks not typically associated with investments in the United States as a result of, among other factors, the possibility of future political and economic developments and the level of governmental supervision and regulation of securities markets in the respective countries. Some countries in which the Fund invests may require government approval for repatriation of investment income, capital or the proceeds for sales of securities by foreign investors. In addition, if there is deterioration in a country’s balance of payments or for other reasons, a country may impose temporary restrictions on foreign capital remittances abroad. In addition, changes in currency exchange rates will affect the value of investments denominated in a foreign currency, as well as investment income derived from those securities.
Worldwide Income invests primarily in income producing securities with a focus on foreign investment grade debt. It may also invest in lower quality high yield securities. Investing in high yield securities may involve greater risks and considerations not typically associated with investing in U.S. Government bonds and other high quality fixed-income securities. These securities are non-investment grade securities, often referred to as “junk bonds”. Economic downturns may disrupt the high yield market and impair the ability of issuers to repay principal and interest. Also, an increase in interest rates would likely have an adverse impact on the value of such obligations. More over, high yield securities may be less liquid due to the extent that there is no established secondary market and because of a decline in value of such securities.
25
| | |
Henderson Global Funds | Notes to Financial Statements |
Worldwide Income may invest a high percentage of their net assets in specific sectors of the market in order to achieve a potentially greater investment return. As a result, the economic, political and regulatory developments in a particular sector of the market, positive or negative, have a greater impact on a Fund’s net assets and will cause the value of its shares to fluctuate more than if the Fund did not concentrate its investments in a particular sector.
Note 8. Borrowing Arrangements
The Trust has a $100 million credit facility for Worldwide Income to facilitate portfolio liquidity. Interest is charged to each participating fund based on its borrowings at a rate per annum equal to the Federal Funds rate plus 1.25%. In addition, a commitment fee of 0.125% per annum is accrued and apportioned among the participating funds. The commitment fee is included in Miscellaneous fees on the Statements of Operations. No amounts were borrowed under this facility during the year ended December 31, 2010.
Note 9. Redemption Fee
From January 1 through June 30, 2010, Worldwide Income imposed a redemption fee of 2.00% on Class A, Class B and Class C shares redeemed within 30 days of purchase. This fee was eliminated as of July 1, 2010. The fee, which was not a sales charge, was retained by the Fund and not paid to HGINA or its affiliates. Redemption fees are included in Amount Redeemed on the Statements of Changes – Capital Stock Activity. Redemption fees during the period were as follows:
| | |
| | Redemption |
| | fees |
Worldwide Income | $933 |
26
Henderson Global Funds
REPORT OF INDEPENDENT REGISTERED PUBLIC
ACCOUNTING FIRM
The Board of Trustees and Shareholders
Henderson Global Funds
We have audited the accompanying statements of assets and liabilities, including the portfolios of investments, of Henderson Money Market Fund and Henderson Worldwide Income Fund (collectively, the Funds), two of the Funds constituting the Henderson Global Funds, as of December 31, 2010, and the related statements of operations for the year then ended, the statements of changes in net assets and the financial highlights for the periods indicated therein. These financial statements and financial highlights are the responsibility of the Funds’ management. Our responsibility is to express an opinion on these financial statements and financial highlights based on our audits.
We conducted our audits in accordance with the standards of the Public Company Accounting Oversight Board (United States). Those standards require that we plan and perform the audit to obtain reasonable assurance about whether the financial statements and financial highlights are free of material misstatement. We were not engaged to perform an audit of the Funds’ internal control over financial reporting. Our audits included consideration of internal control over financial reporting as a basis for designing audit procedures that are appropriate in the circumstances, but not for the purpose of expressing an opinion on the effectiveness of the Funds' internal control over financial reporting. Accordingly, we express no such opinion. An audit also includes examining, on a test basis, evidence supporting the amounts and disclosures in the financial statements and financial highlights, assessing the accounting principles used and significant estimates made by management, and evaluating the overall financial statement presentation. Our procedures included confirmation of securities owned as of December 31, 2010, by correspondence with the custodian and brokers or by other appropriate auditing procedures where replies from brokers were not received. We believe that our audits provide a reasonable basis for our opinion.
In our opinion, the financial statements and financial highlights referred to above present fairly, in all material respects, the financial positions of Henderson Money Market Fund and Henderson Worldwide Income Fund of the Henderson Global Funds at December 31, 2010, the results of their operations for the year then ended, the changes in their net assets and the financial highlights for the periods indicated therein in conformity with US generally accepted accounting principles.
/s/ Ernst & Young LLP
Chicago, Illinois
February 28, 2011
27
| | |
Henderson Global Funds | Other Information |
| | (unaudited) |
Proxy Voting Policies
The Funds have filed with the Securities and Exchange Commission their proxy voting records for the twelve months ended June 30, 2010 on Form N-PX, which must be filed each year by August 31. Form N-PX is available on the Securities and Exchange Commission’s website at www.sec.gov. The Funds’ proxy voting records and proxy voting policies and procedures are also available without charge, upon request, by calling 866.443.6337 or by visiting the Funds’ website at www.hendersonglobalinvestors.com.
Quarterly Portfolio of Investments
A Portfolio of Investments is filed as of the end of the first and third quarter of each fiscal year on Form N-Q. The Funds have filed with the Securities and Exchange Commission the Form N-Q and it is available on the Securities and Exchange Commission’s website at www.sec.gov. Additionally, the Portfolio of Investments may be reviewed and copied at the Commission’s Public Reference Room in Washington, DC. Information on the operation of the Public Reference Room may be obtained by calling 1.800.SEC.0330. The quarterly Portfolio of Investments are also available without charge, upon request, by calling 866.443.6337 or by visiting the Funds’ website at www.hendersonglobalinvestors.com.
Statement Pursuant to Section 19(a) of the Investment Company Act of 1940
The exact source of aggregate fund distributions for each fiscal year can only be determined as of the end of each Fund’s fiscal year, December 31. However, under Section 19(a) of the Investment Company Act of 1940, the Funds are required to indicate the source of each distribution to shareholders at the time of payment if the distribution is made from any source other than accumulated undistributed net income. For purposes of this disclosure, the source of each distribution is based on U.S. Generally Accepted Accounting Principles (“GAAP”) and will differ from federal income tax-based reporting provided to shareholders due to certain tax adjustments. For federal income tax purposes, the Funds will send you a Form 1099-DIV for each calendar year that will tell you how to report these distributions.
During the fiscal year ended December 31, 2010, Worldwide Income paid the following monthly distribution which was paid in part from sources other than accumulated undistributed net income as measured at the time of payment:
| | | | % from | % from | |
| | | | Accumulated | Accumulated | % from |
Ex- and | | | Undistributed | Realized | Paid-In |
Pay Date | Record Date | Amount | Net Income | Gains | Capital |
Jan. 28, 2010 | Jan. 27, 2010 | Class A: $0.037667 | 45.6% | 0.0% | 54.4% |
| | | Class B: $0.032910 | 45.6% | 0.0% | 54.4% |
| | | Class C: $0.032910 | 45.6% | 0.0% | 54.4% |
All other monthly distributions paid by Worldwide Income were paid exclusively from accumulated undistributed net income. In aggregate, approximately 4.9% or $168,714 of distributions paid by Worldwide Income during the fiscal year ended December, 31 were paid from paid-in capital.
Federal Tax Information
Certain tax information for the Funds is required to be provided to shareholders based on the Funds’ income and distributions for the taxable year ending December 31, 2011. In February 2012, shareholders will receive Form 1099-DIV which will include their share of foreign tax credit, qualified dividends and capital gains distributed during the calendar year 2011. Shareholders are advised to check with their tax advisors for information on the treatment of these amounts on their individual income tax returns.
For corporate shareholders, 1.47% of ordinary income dividends paid by Worldwide Income Fund qualified for the dividend deduction during the year ended December 31, 2010.
Under Section 854(b)(2) of the Code, the Fund’s designated qualified dividends for the fiscal year ended December 31, 2010 as follows:
Shareholder Expense
As a shareholder of the Funds, you incur two types of costs: (1) transaction costs, including sales charges (loads) on purchase payments and redemption fees and (2) ongoing costs, including management fees, distribution (12b-1) fees, shareholder services fees and other Fund expenses. The example in Table 1 and Table 2 is intended to help you understand your ongoing costs of investing in the Funds and to compare these costs with ongoing costs of investing in other mutual funds. It is based on an investment of $1,000 invested at the beginning of the period and held for the year ended December 31, 2010.
28
| | |
Henderson Global Funds | Other Information |
| | (unaudited) |
Actual Expenses
Table 1 provides information about actual account values and actual expenses. You may use the information in this line, together with the amount invested, to estimate the expenses that you incurred over the period. Simply divide your account value at the end of the period by $1,000 (for example, an $8,600 account value divided by $1,000 = 8.6), then multiply the result by the number under the heading entitled “Expenses Paid During Period” to estimate the expenses attributable to your investment during this period.
Hypothetical Example for Comparison Purposes
Table 2 provides information about hypothetical account values and hypothetical expenses based on the Funds’ actual expense ratios and an assumed rate of return of 5% per year before expenses, which is not the Funds’ actual return. Thus you should not use the hypothetical account values and expenses to estimate your actual ending account balance or the expense attributable to your investment during the period. Rather, these figures are provided to enable you to compare the ongoing costs of investing in the Funds and other funds. To do so, compare the 5% hypothetical examples with the 5%
hypothetical examples that appear in the shareholder reports of other funds.
Expenses paid during the period include amounts reflected in the Funds Statement of Operations net of reimbursements by the investment advisor. The annualized expense ratios used in the example are as follows:
| | | | | |
| | Class A | Class B | Class C | Class Z |
Money | | | | |
Market | 0.31% | 0.31% | 0.31% | 0.31% |
Worldwide | | | | |
Income | 1.30 | 2.05 | 2.05 | N/A |
Please note that the expenses do not reflect shareowner transaction costs such as front end sales charges and redemption fees. These fees are described for each Fund and share class in the Performance summary of this report on page 2. Table 2 is useful in comparing ongoing costs only, and will not help you determine the relative total costs of owning different funds. In addition, if these transaction costs were included, your costs would have been higher.
| | | | | | | | | |
Table 1 | | | | | Table 2 | | | |
| | Beginning | Ending | | | | Beginning | Ending | |
| | Account | Account | Expenses | | Hypothetical | Account | Account | Expenses |
| | Value | Value | Paid | | (assuming a | Value | Value | Paid |
| | July 1, | December 31, | During | | 5% return | July 1, | December 31, | During |
Actual | 2010 | 2010 | the Period* | | before expenses) | 2010 | 2010 | the Period* |
Money Market | | | | | Money Market | | | |
Class A | $1,000.00 | $1,000.25 | $1.56 | | Class A | $1,000.00 | $1,023.44 | $1.58 |
Class B | 1,000.00 | 1,000.25 | 1.56 | | Class B | 1,000.00 | 1,023.44 | 1.58 |
Class C | 1,000.00 | 1,000.25 | 1.56 | | Class C | 1,000.00 | 1,023.44 | 1.58 |
Class Z | 1,000.00 | 1,000.25 | 1.56 | | Class Z | 1,000.00 | 1,023.44 | 1.58 |
Worldwide Income | | | | Worldwide Income | | |
Class A | $1,000.00 | $1,077.09 | $6.81 | | Class A | $1,000.00 | $1,018.45 | $6.61 |
Class B | 1,000.00 | 1,072.92 | 10.71 | | Class B | 1,000.00 | 1,014.67 | 10.41 |
Class C | 1,000.00 | 1,073.29 | 10.71 | | Class C | 1,000.00 | 1,014.67 | 10.41 |
| * | Expenses are equal to the Funds annualized net expense ratio multiplied by the average account value over the period multiplied by 184 days in the period, and divided by 365 (to reflect the one-half year period). |
29
| | |
Henderson Global Funds | Trustees and Officers |
| | (unaudited) |
| | | | | |
| | Position(s) | Term of | | Other |
Name, address and | with | Office and | Principal Occupations | Directorships |
age1 | the Trust2 | Time Served3 | During Past Five Years | Held |
Independent Trustees | | | | |
C . Gary Gerst, 71 | Chairman and | Since 2001 | General Partner, Cornelius & Lothian LP | Formerly, Trustee, Harris |
| | Trustee | | (private partnership investing in non-public | Insight Funds Trust. |
| | | | investments), since 1993; Member of the | |
| | | | Governing Council of the Independent | |
| | | | Directors Council (IDC), since 2004; | |
| | | | Board Member of the Investment Company | |
| | | | Institute, since 2004. | |
| | | | | |
Roland C. Baker, 71 | Trustee | Since 2001 | Consultant to financial services industry. | Director, Sammons |
| | | | | Financial Enterprises, Inc. |
| | | | | and its life insurance sub- |
| | | | | sidiaries, North American |
| | | | | Company for Life and |
| | | | | Health Insurance (a |
| | | | | provider of life insurance, |
| | | | | health insurance and |
| | | | | annuities), and Midland |
| | | | | National Life Insurance |
| | | | | Company (an affiliate of |
| | | | | North American Company |
| | | | | for Life and Health |
| | | | | Insurance); Director, |
| | | | | People’s Trust Insurance |
| | | | | Company (a Florida |
| | | | | provider of homeowner’s |
| | | | | insurance); formerly, |
| | | | | Trustee, Scottish Widows |
| | | | | Investment Partnership |
| | | | | Trust; formerly Trustee, |
| | | | | Allstate Financial |
| | | | | Investment Trust; and |
| | | | | formerly, Director, Quanta |
| | | | | Capital Holdings, Inc. |
| | | | | (provider of property and |
| | | | | casualty reinsurance). |
| | | | | |
Faris F. Chesley, 71 | Trustee | Since 2002 | Chairman, Chesley, Taft & Associates, LLC, | Chairman of the |
| | | | Since 2001; Vice Chairman, ABN-AMRO, Inc. | Investment Committee, |
| | | | (a financial services company), 1998-2001. | Presbyterian Homes. |
Interested Trustees and Officers of the Trust | | | |
James G. O’Brien, 50 | President | Since 2010 | Managing Director, HGINA, Since 2008 | N/A |
| | | | and Director, Corporate Services, HGINA, | |
| | | | 2001-2008. | |
| | | | | |
Kenneth A. Kalina, 50 | Chief | Since 2005 | Chief Compliance Officer, HGINA, 2005; Chief | N/A |
| | Compliance | | Compliance Officer, Columbia Wanger Asset | |
| | Officer | | Management, L.P., 2004-2005; Compliance | |
| | | | Officer, Treasurer and Chief Financial Officer | |
| | | | Columbia Wanger Asset Management, L.P., | |
| | | | 2000-2005. | |
| | | | | |
Alanna P. Nensel, 34 | Vice President | Since 2002 | Director, Retail Marketing and Product | N/A |
| | | | Management, HGINA. | |
| | | | | |
Charles Thompson II, 40 | Vice President | Since 2010 | Director of US Retail Since 2010, Director | N/A |
| | | | of National Sales 2007-2010, Divisional | |
| | | | Director-Central Region 2002-2007. | |
30
| | |
Henderson Global Funds | Trustees and Officers |
| | (unaudited) |
| | | | | |
| | Position(s) | Term of | | Other |
Name, address and | with | Office and | Principal Occupations | Directorships |
age1 | the Trust2 | Time Served3 | during Past Five Years | Held |
Interested Trustees and Officers of the Trust | | | |
Scott E. Volk, 39 | Vice President | Since 2001 | Director, Retail Finance and Operations, | N/A |
| | | | HGINA. | |
| | | | | |
Christopher K. | Secretary | Since 2004 | Legal Counsel, HGINA. | N/A |
Yarbrough, 35 | | | | |
| | | | | |
Troy M. Statczar, 38 | Treasurer | Since | Head of US Fund Administration and | N/A |
| | | September 2008 | Accounting, HGINA, since July 2008, | |
| | | | Senior Vice President, Citigroup 2005-2008. | |
| | | | | |
Richard J. Mitchell, 46 | Assistant | Since 2007 | Assistant Treasurer, HGINA, since 2007; | N/A |
| | Treasurer | | Assistant Treasurer, Bank of New York, | |
| | | | 2006-2007; Supervisor, The BISYS Group; | |
| | | | 2002-2006. | |
| 1. | Each person’s address is 737 North Michigan Avenue, Suite 1700, Chicago, IL 60611. Age is as of July 31, 2010. |
| 2. | Currently, all Trustees oversee all ten series of the Trust. |
| 3. | A Trustee may serve until his death, resignation, removal or until the end of the calendar year in which the Trustee reaches 75 years of age. The officers of the Trust are elected annually by the Board. |
| 4. | This Trustee is an interested person of the Trust because of his employment relationship with Henderson Global Investors (North America) Inc., the investment adviser to the Funds. |
| | |
| | Unless otherwise noted, this information is as of July 31, 2010. The Statement of Additional Information for Henderson Global Funds includes additional information about the Trustees and is available without charge by calling 1.866.4HENDERSON (1.866.443.6337). |
31
Henderson Global Funds
| | |
Trustees C. Gary Gerst, Chairman Roland C. Baker Faris F. Chesley Officers James O’Brien, President Alanna P. Nensel, Vice President Charles Thompson II, Vice President Scott E. Volk, Vice President Christopher K. Yarbrough, Secretary Kenneth A. Kalina, Chief Compliance Officer Troy M. Statczar, Treasurer Richard J. Mitchell, Assistant Treasurer | Investment Adviser Henderson Global Investors (North America) Inc. 737 North Michigan Avenue, Suite 1700 Chicago, IL 60611 Transfer Agent State Street Bank & Trust Company State Street Financial Center One Lincoln Street Boston, MA 02111 For More Information Please call 1.866.4HENDERSON (1.866.443.6337) or visit our website: www.hendersonglobalinvestors.com |
The views expressed in this report and information about the Funds’ portfolio holdings are for the period covered by this report and are subject to change hereafter. This report is submitted for the general information of the shareholders of the Funds. It is not authorized for distribution to prospective investors unless preceded or accompanied by an effective prospectus, which includes information regarding the Funds’ risks, objectives, fees and expenses, experience of its management, and other information. Henderson Global Investors is the name under which various subsidiaries of Henderson Group plc, a UK limited company, provide investment products and services.
Foreside Fund Services, LLC, Distributor
32
STATE STREET MONEY MARKET PORTFOLIO
ANNUAL REPORT
December 31, 2010
State Street Money Market Portfolio (Unaudited)
EXPENSE EXAMPLE
As a shareholder of the State Street Money Market Portfolio (the “Portfolio”), you incur ongoing costs, which include costs for portfolio management and administrative services, among others. This example is intended to help you understand your ongoing costs (in dollars) of investing in the Portfolio and to compare these costs with the ongoing costs of investing in other mutual funds.
The example is based on an investment of $1,000 made at the beginning of the period shown and held for the entire period from July 1, 2010 to December 31, 2010.
The table below illustrates your Portfolio’s costs in two ways:
| · | Based on actual fund return. This section helps you to estimate the actual expenses that you paid over the period. The “Ending Account Value” shown is derived from the Portfolio’s actual return, and the third column shows the dollar amount that would have been paid by an investor who started with $1,000 in the Portfolio. You may use the information here, together with the amount you invested, to estimate the expenses that you paid over the period. |
| | To do so, simply divide your account value by $1,000 (for example, an $8,600 account value divided by $1,000 = 8.6), then multiply the result by the number given for the Portfolio under the heading “Expenses Paid During Period”. |
| · | Based on hypothetical 5% return. This section is intended to help you compare your Portfolio’s costs with those of other mutual funds. It assumes that the Portfolio had a yearly return of 5% before expenses, but that the expense ratio is unchanged. In this case, because the return used is not the Portfolio’s actual return, the results do not apply to your investment. The example is useful in making comparisons because the Securities and Exchange Commission requires all mutual funds to calculate expenses based on a 5% return. You can assess your Portfolio’s costs by comparing this hypothetical example with the hypothetical examples that appear in shareholder reports of other funds. |
| | | | |
| Six Months Ended December 31, 2010 | | | |
| | Beginning | Ending | Expenses Paid |
| | Account Value | Account Value | During |
| | July 1, 2010 | December 31, 2010 | Period * |
| Based on Actual Portfolio Return | $1,000.00 | $1,001.20 | $0.61 |
| Based on Hypothetical (5% return before | | | |
| expenses) | $1,000.00 | $1,024.60 | $0.61 |
| * | The calculations are based on expenses incurred in the most recent six month period of the Portfolio. The annualized average weighted expense ratio as of December 31, 2010 was 0.12%. The dollar amounts shown as “Expenses Paid” are equal to the annualized average weighted expense ratio multiplied by the average account value over the period, multiplied by 184/365 (the most recent six month period). |
34
| | |
| State Street Money Market Portfolio | |
| Portfolio Statistics (Unaudited) | |
| | |
| Portfolio Composition* | December 31, 2010 |
| Certificates of Deposit | 43.1% |
| Government Agency Repurchase Agreements | 17.5 |
| Treasury Repurchase Agreements | 16.3 |
| Asset Backed Commercial Paper | 7.7 |
| Financial Company Commercial Paper | 7.7 |
| Other Notes | 7.7 |
| Other Assets In Excess of Liabilities | 0.0 |
| Total | 100.0% |
| | |
| Maturity Ladder* | December 31, 2010 |
| Overnight (1 Day) | 35.7% |
| 2-30 Days | 22.1 |
| 31-60 Days | 13.1 |
| 61-90 Days | 17.9 |
| Over 90 Days | 11.2 |
| Total | 100.0% |
| Average days to maturity | 29 |
| Weighted average life | 45 |
* As a percentage of net assets as of the date indicated. The Portfolio’s composition will vary over time.
See Notes to Financial Statements.
35
| | | | | | |
| State Street Money Market Portfolio |
| Portfolio of Investments |
| December 31, 2010 |
| |
| Name of Issuer | Interest | Next Rate | Maturity | Principal | Amortized |
| and Title of Issue | Rate | Reset Date | Date | Amount | Cost |
| ASSET BACKED COMMERCIAL | | | | | |
| PAPER – 7.7% | | | | | |
Alpine Securitization Corp.(a) | 0.280% | 01/05/2011 | 01/05/2011 | $275,000,000 | $274,991,445 |
Argento Variable Funding Co. LLC(a) | 0.325% | 01/18/2011 | 01/18/2011 | 100,000,000 | 99,984,889 |
Argento Variable Funding Co. LLC(a) | 0.325% | 02/02/2011 | 02/02/2011 | 175,000,000 | 174,950,222 |
Aspen Funding Corp.(a) | 0.284% | 01/07/2011 | 01/07/2011 | 175,000,000 | 174,991,833 |
Gemini Securitization Corp. LLC(a) | 0.284% | 01/26/2011 | 01/26/2011 | 175,000,000 | 174,965,972 |
Newport Funding Corp.(a) | 0.284% | 01/10/2011 | 01/10/2011 | 150,000,000 | 149,989,500 |
Royal Park Investments Funding Corp.(a) | 0.325% | 01/07/2011 | 01/07/2011 | 72,500,000 | 72,496,133 |
Royal Park Investments Funding Corp.(a) | 0.325% | 01/11/2011 | 01/11/2011 | 120,000,000 | 119,989,333 |
Solitaire Funding LLC(a) | 0.304% | 01/04/2011 | 01/04/2011 | 112,000,000 | 111,997,200 |
Solitaire Funding LLC(a) | 0.304% | 01/12/2011 | 01/12/2011 | 56,000,000 | 55,994,867 |
Solitaire Funding LLC(a) | 0.300% | 01/18/2011 | 01/18/2011 | 60,000,000 | 59,991,500 |
Solitaire Funding LLC(a) | 0.304% | 01/19/2011 | 01/19/2011 | 125,000,000 | 124,981,250 |
Solitaire Funding LLC(a) | 0.304% | 01/24/2011 | 01/24/2011 | 199,000,000 | 198,961,859 |
Solitaire Funding LLC(a) | 0.325% | 03/07/2011 | 03/07/2011 | 50,000,000 | 49,971,111 |
Straight-A Funding LLC(a) | 0.264% | 01/24/2011 | 01/24/2011 | 25,874,000 | 25,869,702 |
Straight-A Funding LLC(a) | 0.264% | 01/25/2011 | 01/25/2011 | 173,382,000 | 173,351,947 |
| TOTAL ASSET BACKED COMMERCIAL | | | | | |
| PAPER | | | | | 2,043,478,763 |
| FINANCIAL COMPANY | | | | | |
| COMMERCIAL PAPER – 7.7% | | | | | |
| Credit Suisse | 0.274% | 01/27/2011 | 01/27/2011 | 600,000,000 | 599,883,000 |
DnB NOR Bank ASA(a) | 0.381% | 01/04/2011 | 01/04/2011 | 148,500,000 | 148,495,360 |
DnB NOR Bank ASA(a) | 0.345% | 03/28/2011 | 03/28/2011 | 300,000,000 | 299,756,333 |
| General Electric Capital Corp. | 0.406% | 01/27/2011 | 01/27/2011 | 225,000,000 | 224,935,000 |
| General Electric Capital Corp. | 0.270% | 03/09/2011 | 03/09/2011 | 100,000,000 | 99,949,750 |
| General Electric Capital Corp. | 0.320% | 04/11/2011 | 04/11/2011 | 50,000,000 | 49,955,556 |
| General Electric Capital Corp. | 0.325% | 04/13/2011 | 04/13/2011 | 100,000,000 | 99,909,333 |
Nationwide Building Society(a) | 0.360% | 03/01/2011 | 03/01/2011 | 150,000,000 | 149,913,958 |
| Societe Generale North America, Inc. | 0.508% | 02/01/2011 | 02/01/2011 | 175,000,000 | 174,924,653 |
| Svenska Handelsbanken, Inc. | 0.284% | 01/10/2011 | 01/10/2011 | 200,000,000 | 199,986,000 |
| TOTAL FINANCIAL COMPANY | | | | | |
| COMMERCIAL PAPER | | | | | 2,047,708,943 |
| CERTIFICATES OF DEPOSIT – 43.1% | | | | | |
| Bank of Montreal | 0.270% | 01/24/2011 | 01/24/2011 | 135,000,000 | 135,000,000 |
Bank of Nova Scotia(b) | 0.354% | 02/16/2011 | 12/16/2011 | 38,000,000 | 38,000,000 |
Barclays Bank(b) | 0.491% | 01/19/2011 | 01/19/2011 | 250,000,000 | 250,000,000 |
Barclays Bank(b) | 0.592% | 01/13/2011 | 06/13/2011 | 100,000,000 | 100,000,000 |
Barclays Bank(b) | 0.580% | 01/18/2011 | 07/15/2011 | 450,000,000 | 450,000,000 |
| BNP Paribas | 0.480% | 01/10/2011 | 01/10/2011 | 175,000,000 | 175,000,000 |
| BNP Paribas | 0.335% | 03/02/2011 | 03/02/2011 | 150,000,000 | 150,000,000 |
| BNP Paribas | 0.410% | 05/19/2011 | 05/19/2011 | 250,000,000 | 250,000,000 |
Canadian Imperial Bank of Commerce(b) | 0.307% | 01/13/2011 | 02/14/2011 | 200,000,000 | 200,000,000 |
| Commonwealth Bank of Australia | 0.270% | 02/14/2011 | 02/14/2011 | 200,000,000 | 200,000,000 |
| | | | | | |
| See Notes to Financial Statements. |
36
| | | | | | |
| State Street Money Market Portfolio |
| Portfolio of Investments — (continued) |
| December 31, 2010 |
| |
| Name of Issuer | Interest | Next Rate | Maturity | Principal | Amortized |
| and Title of Issue | Rate | Reset Date | Date | Amount | Cost |
| CERTIFICATES OF DEPOSIT (continued) | | | | |
| Credit Agricole Corporate and | | | | | |
Investment Bank(b) | 0.471% | 01/26/2011 | 02/28/2011 | $ 200,000,000 | $ 200,000,000 |
| Credit Agricole Corporate and | | | | | |
| Investment Bank | 0.500% | 03/02/2011 | 03/02/2011 | 200,000,000 | 200,000,000 |
| Credit Agricole Corporate and | | | | | |
Investment Bank(b) | 0.365% | 01/04/2011 | 03/03/2011 | 200,000,000 | 200,000,000 |
| Credit Agricole Corporate and | | | | | |
| Investment Bank | 0.330% | 03/10/2011 | 03/10/2011 | 200,000,000 | 200,000,000 |
| Credit Agricole Corporate and | | | | | |
| Investment Bank | 0.350% | 04/01/2011 | 04/01/2011 | 200,000,000 | 200,000,000 |
Deutsche Bank AG(b) | 0.468% | 01/10/2011 | 01/10/2011 | 100,000,000 | 99,999,890 |
| Deutsche Bank AG | 0.280% | 01/13/2011 | 01/13/2011 | 75,000,000 | 75,000,000 |
| Deutsche Bank AG | 0.400% | 02/14/2011 | 02/14/2011 | 100,000,000 | 100,000,000 |
| Deutsche Bank AG | 0.280% | 03/04/2011 | 03/04/2011 | 200,000,000 | 200,000,000 |
DnB NOR Bank ASA(b) | 0.355% | 01/04/2011 | 03/03/2011 | 90,000,000 | 90,000,000 |
| DnB NOR Bank ASA | 0.340% | 03/14/2011 | 03/14/2011 | 500,000,000 | 500,000,000 |
| HSBC Bank PLC | 0.330% | 03/23/2011 | 03/23/2011 | 150,000,000 | 150,000,000 |
| ING Bank NV | 0.560% | 01/11/2011 | 01/11/2011 | 100,000,000 | 100,000,000 |
| ING Bank NV | 0.590% | 02/11/2011 | 02/11/2011 | 175,000,000 | 175,000,000 |
| ING Bank NV | 0.550% | 03/01/2011 | 03/01/2011 | 150,000,000 | 150,000,000 |
| ING Bank NV | 0.470% | 03/28/2011 | 03/28/2011 | 225,000,000 | 225,000,000 |
| ING Bank NV | 0.390% | 04/05/2011 | 04/05/2011 | 400,000,000 | 400,000,000 |
| Lloyds TSB Bank | 0.500% | 01/19/2011 | 01/19/2011 | 200,000,000 | 200,000,000 |
| Lloyds TSB Bank | 0.350% | 01/28/2011 | 01/28/2011 | 500,000,000 | 500,000,000 |
| Lloyds TSB Bank | 0.390% | 04/11/2011 | 04/11/2011 | 200,000,000 | 200,000,000 |
| National Australia Bank Ltd. | 0.270% | 01/28/2011 | 01/28/2011 | 200,000,000 | 200,000,000 |
| National Australia Bank Ltd. | 0.275% | 03/11/2011 | 03/11/2011 | 350,000,000 | 350,003,351 |
| Nordea Bank Finland | 0.280% | 02/11/2011 | 02/11/2011 | 350,000,000 | 350,000,000 |
| Nordea Bank Finland | 0.280% | 03/17/2011 | 03/17/2011 | 150,000,000 | 150,000,000 |
| Rabobank Nederland NV | 0.520% | 01/21/2011 | 01/21/2011 | 100,000,000 | 100,000,000 |
Rabobank Nederland NV(b) | 0.345% | 01/07/2011 | 12/07/2011 | 250,000,000 | 250,000,000 |
Royal Bank of Canada(b) | 0.261% | 01/24/2011 | 03/23/2011 | 180,000,000 | 180,000,213 |
| Royal Bank of Scotland | 0.560% | 02/15/2011 | 02/15/2011 | 300,000,000 | 300,000,000 |
| Royal Bank of Scotland | 0.550% | 02/16/2011 | 02/16/2011 | 200,000,000 | 200,000,000 |
| Royal Bank of Scotland | 0.425% | 03/14/2011 | 03/14/2011 | 175,000,000 | 175,000,000 |
Royal Bank of Scotland(b) | 0.439% | 01/18/2011 | 04/15/2011 | 200,000,000 | 200,000,000 |
Societe Generale(b) | 0.360% | 01/14/2011 | 01/14/2011 | 54,000,000 | 54,000,000 |
Societe Generale(b) | 0.365% | 01/04/2011 | 03/03/2011 | 250,000,000 | 250,000,000 |
| Societe Generale | 0.420% | 03/21/2011 | 03/21/2011 | 375,000,000 | 375,000,000 |
| Svenska Handelsbanken AB | 0.270% | 02/07/2011 | 02/07/2011 | 200,000,000 | 200,000,000 |
Toronto Dominion Bank(b) | 0.266% | 01/04/2011 | 02/04/2011 | 50,000,000 | 50,000,000 |
Toronto Dominion Bank(b) | 0.263% | 01/10/2011 | 03/10/2011 | 44,000,000 | 44,000,000 |
Toronto Dominion Bank(b) | 0.331% | 01/28/2011 | 10/28/2011 | 72,000,000 | 72,000,000 |
| UBS AG | 0.340% | 03/17/2011 | 03/17/2011 | 270,000,000 | 270,000,000 |
| UBS AG | 0.350% | 03/18/2011 | 03/18/2011 | 230,000,000 | 230,000,000 |
| |
| See Notes to Financial Statements. |
37
| | | | | | |
| State Street Money Market Portfolio |
| Portfolio of Investments — (continued) |
| December 31, 2010 |
| |
| Name of Issuer | Interest | Next Rate | Maturity | Principal | Amortized |
| and Title of Issue | Rate | Reset Date | Date | Amount | Cost |
| CERTIFICATES OF DEPOSIT (continued) | | | | | |
| UBS AG | 0.350% | 03/28/2011 | 03/28/2011 | $ 250,000,000 | $ 250,000,000 |
| UBS AG | 0.380% | 04/11/2011 | 04/11/2011 | 250,000,000 | 250,000,000 |
| UniCredit SpA | 0.380% | 01/10/2011 | 01/10/2011 | 200,000,000 | 200,000,000 |
| UniCredit SpA | 0.380% | 01/14/2011 | 01/14/2011 | 350,000,000 | 350,000,000 |
| UniCredit SpA | 0.380% | 01/18/2011 | 01/18/2011 | 250,000,000 | 250,000,000 |
| TOTAL CERTIFICATES OF DEPOSIT | | | | | 11,413,003,454 |
| OTHER NOTES – 7.7% | | | | | |
Bank of America NA(b) | 0.361% | 01/27/2011 | 01/27/2011 | 171,000,000 | 171,000,000 |
| Bank of America NA | 0.600% | 02/04/2011 | 02/04/2011 | 227,000,000 | 227,000,000 |
| Bank of America NA | 0.300% | 02/24/2011 | 02/24/2011 | 500,000,000 | 500,000,000 |
| Bank of America NA | 0.360% | 03/14/2011 | 03/14/2011 | 100,000,000 | 100,000,000 |
Bank of America NA(b) | 0.588% | 01/24/2011 | 05/20/2011 | 8,526,000 | 8,526,000 |
| BNP Paribas | 0.040% | 01/03/2011 | 01/03/2011 | 200,000,000 | 200,000,000 |
| Citibank NA | 0.150% | 01/03/2011 | 01/03/2011 | 76,043,000 | 76,043,000 |
Commonwealth Bank of Australia(b)(c) | 0.358% | 01/27/2011 | 01/27/2012 | 31,000,000 | 31,000,000 |
Nordea Bank AB(b)(c) | 0.314% | 02/18/2011 | 01/18/2012 | 174,000,000 | 174,000,000 |
| PNC Bank NA | 0.030% | 01/03/2011 | 01/03/2011 | 250,000,000 | 250,000,000 |
Rabobank Nederland NV(b)(c) | 0.354% | 02/16/2011 | 12/16/2011 | 107,000,000 | 107,000,000 |
Svenska Handelsbanken AB(b)(c) | 0.319% | 01/15/2011 | 02/11/2011 | 123,000,000 | 123,000,000 |
Svenska Handelsbanken AB(b)(c) | 0.386% | 02/09/2011 | 02/10/2012 | 40,000,000 | 40,000,000 |
Westpac Banking Corp.(b) | 0.358% | 01/28/2011 | 01/27/2012 | 35,000,000 | 35,000,000 |
| TOTAL OTHER NOTES | | | | | 2,042,569,000 |
| | | | | | |
| | | | | | Market |
| | | | | | Value |
| GOVERNMENT AGENCY | | | | | |
| REPURCHASE AGREEMENTS – 17.5% | | | | | |
| Agreement with Barclays Capital, Inc. and | | | | | |
| The Bank of New York Mellon | | | | | |
| (Tri-Party), dated 12/31/10 (collateralized | | | | | |
| by a Federal Home Loan Bank, 0.500% | | | | | |
| due 06/30/11 valued at $20,498,124); | | | | | |
| proceeds $20,094,435 | 0.260% | 01/03/2011 | 01/03/2011 | 20,094,000 | 20,094,000 |
| Agreement with Barclays Capital, Inc. and | | | | | |
| The Bank of New York Mellon | | | | | |
| (Tri-Party), dated 12/31/10 (collateralized | | | | | |
| by Federal Home Loan Mortgage | | | | | |
| Corporations, 4.000% – 5.000% due | | | | | |
| 03/01/38 – 12/01/40 and Federal National | | | | | |
| Mortgage Associations, 3.500% – 5.500% | | | | | |
| due 04/01/24 – 11/01/40 valued at | | | | | |
| $2,040,000,001); proceeds | | | | | |
| $2,000,043,333 | 0.260% | 01/03/2011 | 01/03/2011 | 2,000,000,000 | 2,000,000,000 |
See Notes to Financial Statements.
38
| | | | | | |
| State Street Money Market Portfolio |
| Portfolio of Investments — (continued) |
| December 31, 2010 |
| |
| Name of Issuer | Interest | Next Rate | Maturity | Principal | Market |
| and Title of Issue | Rate | Reset Date | Date | Amount | Value |
| GOVERNMENT AGENCY REPURCHASE AGREEMENTS (continued) | | |
| Agreement with Deutsche Bank Securities, | | | | | |
| Inc. and The Bank of New York Mellon | | | | | |
| (Tri-Party), dated 12/31/10 (collateralized | | | | | |
| by Federal National Mortgage | | | | | |
| Associations, 0.685% – 23.719% due | | | | | |
| 10/25/27 – 01/25/41 valued at | | | | | |
| $510,000,000); proceeds $500,011,667 | 0.280% | 01/03/2011 | 01/03/2011 | $ 500,000,000 | $ 500,000,000 |
| Agreement with Goldman Sachs & Co. and | | | | | |
| The Bank of New York Mellon | | | | | |
| (Tri-Party), dated 12/31/10 (collateralized | | | | | |
| by a Government National Mortgage | | | | | |
| Association, 6.250% due 12/20/39 valued | | | | | |
| at $408,000,000); proceeds $400,005,333 | 0.160% | 01/03/2011 | 01/03/2011 | 400,000,000 | 400,000,000 |
| Agreement with Merrill Lynch Government | | | | | |
| Securities, Inc. and JP Morgan Chase & | | | | | |
| Co. (Tri-Party), dated 12/31/10 | | | | | |
| (collateralized by Federal Home Loan | | | | | |
| Mortgage Corporations, 4.000% – | | | | | |
| 6.000% due 08/01/20 – 12/01/40 and | | | | | |
| Federal National Mortgage Associations, | | | | | |
| 4.000% – 4.500% due 01/01/26 – | | | | | |
| 11/01/40 valued at $208,404,360); | | | | | |
| proceeds $204,322,257 | 0.250% | 01/03/2011 | 01/03/2011 | 204,318,000 | 204,318,000 |
| Agreement with Morgan Stanley and Co., | | | | | |
| Inc. and The Bank of New York Mellon | | | | | |
| (Tri-Party), dated 12/31/10 (collateralized | | | | | |
| by Federal National Mortgage | | | | | |
| Associations, 0.000% – 7.269% due | | | | | |
| 03/15/11 – 05/15/29 valued at | | | | | |
| $765,000,750); proceeds $750,012,500 | 0.200% | 01/03/2011 | 01/03/2011 | 750,000,000 | 750,000,000 |
| Agreement with Morgan Stanley and Co., | | | | | |
| Inc. and The Bank of New York Mellon | | | | | |
| (Tri-Party), dated 12/31/10 (collateralized | | | | | |
| by Federal National Mortgage | | | | | |
| Associations, 0.800% – 3.200% due | | | | | |
| 11/18/13 – 09/10/20 valued at | | | | | |
| $255,000,014); proceeds $250,003,750 | 0.180% | 01/03/2011 | 01/03/2011 | 250,000,000 | 250,000,000 |
| Agreement with Societe Generale and | | | | | |
| The Bank of New York Mellon | | | | | |
| (Tri-Party), dated 12/31/10 (collateralized | | | | | |
| by Federal Home Loan Mortgage | | | | | |
| Corporations, 4.000% – 6.500% due | | | | | |
| 08/01/17 – 09/01/40 and Federal National | | | | | |
| Mortgage Associations, 4.000% – 6.000% | | | | | |
| due 12/01/17 – 05/01/40 valued at | | | | | |
| $510,000,000); proceeds $500,010,417 | 0.250% | 01/03/2011 | 01/03/2011 | 500,000,000 | 500,000,000 |
| TOTAL GOVERNMENT AGENCY | | | | | |
| REPURCHASE AGREEMENTS | | | | | 4,624,412,000 |
See Notes to Financial Statements.
39
| | | | | | |
| State Street Money Market Portfolio |
| Portfolio of Investments — (continued) |
| December 31, 2010 |
| |
| Name of Issuer | Interest | Next Rate | Maturity | Principal | Market |
| and Title of Issue | Rate | Reset Date | Date | Amount | Value |
| TREASURY REPURCHASE | | | | | |
| AGREEMENTS – 16.3% | | | | | |
| Agreement with BNP Paribas Securities | | | | | |
| Corp. and The Bank of New York | | | | | |
| Mellon (Tri-Party), dated 12/31/10 | | | | | |
| (collateralized by U.S. Treasury Strips, | | | | | |
| 1.250% – 4.875% due 03/31/11 – | | | | | |
| 10/31/15 valued at $688,500,036); | | | | | |
| proceeds $675,008,438 | 0.150% | 01/03/2011 | 01/03/2011 | $ 675,000,000 | $ 675,000,000 |
| Agreement with Credit Agricole | | | | | |
| Corporate & Investment Bank and The | | | | | |
| Bank of New York Mellon (Tri-Party), | | | | | |
| dated 12/31/10 (collateralized by U.S. | | | | | |
| Treasury Strips, 0.750% – 4.875% due | | | | | |
| 08/31/11 – 05/15/20 valued at | | | | | |
| $714,000,087); proceeds $700,010,500 | 0.180% | 01/03/2011 | 01/03/2011 | 700,000,000 | 700,000,000 |
| Agreement with ING Financial Markets, | | | | | |
| LLC and JP Morgan Chase & Co. | | | | | |
| (Tri-Party), dated 12/31/10 (collateralized | | | | | |
| by U.S. Treasury Bills, 0.000% due | | | | | |
| 06/23/11 – 11/17/11 valued at | | | | | |
| $204,000,010); proceeds $200,001,667 | 0.100% | 01/03/2011 | 01/03/2011 | 200,000,000 | 200,000,000 |
| Agreement with RBS Securities, Inc. and | | | | | |
| JP Morgan Chase & Co. (Tri-Party), | | | | | |
| dated 12/31/10 (collateralized by a U.S. | | | | | |
| Treasury Bond, 4.250% due 05/15/39 and | | | | | |
| U.S Treasury Notes, 0.750% – 4.125% | | | | | |
| due 03/15/12 – 05/15/15 valued at | | | | | |
| $765,004,722); proceeds $750,012,500 | 0.200% | 01/03/2011 | 01/03/2011 | 750,000,000 | 750,000,000 |
| Agreement with UBS Securities, LLC and | | | | | |
| The Bank of New York Mellon | | | | | |
| (Tri-Party), dated 12/31/10 (collateralized | | | | | |
| by U.S. Treasury Strips, 1.000% – | | | | | |
| 6.250% due 10/31/11 – 05/15/30 valued | | | | | |
| at $2,040,000,069); proceeds | | | | | |
| $2,000,033,333 | 0.200% | 01/03/2011 | 01/03/2011 | 2,000,000,000 | 2,000,000,000 |
| TOTAL TREASURY REPURCHASE | | | | | |
| AGREEMENTS | | | | | 4,325,000,000 |
TOTAL INVESTMENTS(d) † – 100.0% | | | | | 26,496,172,160 |
| Other Assets in Excess of | | | | | |
| Liabilities – 0.00% | | | | | 7,653,493 |
| NET ASSETS – 100.0% | | | | | $26,503,825,653 |
| (a) | Rule 144A, Section 4(2) or other security which is restricted as to resale to institutional investors. The Fund’s Portfolio Manager has deemed this security to be liquid based upon procedures approved by the Board of Trustees. These securities represent $2,641,644,414 or 9.97% of net assets as of December 31, 2010. |
| (b) | Variable Rate Security – Interest rate is in effect as of December 31, 2010. |
See Notes to Financial Statements.
40
State Street Money Market Portfolio
Portfolio of Investments — (continued)
December 31, 2010
| (c) | Security subject to restrictions on resale under federal securities laws, which may only be resold upon registration under the Securities Act of 1933, as amended (“1933 Act”) or in transactions exempt from registration, including sales to qualified institutional buyers pursuant to Rule 144A of the 1933 Act. The Portfolio does not have the right to demand that this security be registered. These securities represent $475,000,000 or 1.79% of net assets as of December 31, 2010. |
| (d) | Unless otherwise indicated, the values of the Securities of the Portfolio are determined based on Level 2 inputs established by provisions surrounding Fair Value Measurements and Disclosures. (Note 2) |
| † | See Note 2 of the Notes to Financial Statements. |
See Notes to Financial Statements.
41
| | | | |
| State Street Money Market Portfolio | |
| Statement of Assets and Liabilities | |
| December 31, 2010 | |
| Assets | | | |
| Investments in unaffiliated issuers, at amortized cost (Note 2) | | $ | 17,546,760,160 | |
| Repurchase Agreements, at market value and cost (Note 2) | | | 8,949,412,000 | |
| Total investments | | | 26,496,172,160 | |
| Cash | | | 1 | |
| Interest receivable | | | 10,355,506 | |
| Prepaid expense and other assets | | | 9,686 | |
| Total assets | | | 26,506,537,353 | |
| Liabilities | | | | |
| Management fee (Note 3) | | | 2,357,663 | |
| Administration and custody fees (Note 3) | | | 328,256 | |
| Professional fees | | | 24,301 | |
| Accrued expenses and other liabilities | | | 1,480 | |
| Total liabilities | | | 2,711,700 | |
| Net Assets | | $ | 26,503,825,653 | |
See Notes to Financial Statements.
42
| | | | |
| State Street Money Market Portfolio | |
| Statement of Operations | |
| Year Ended December 31, 2010 | |
| Investment Income | | | |
| Interest | | $ | 65,752,620 | |
| Expenses | | | | |
| Management fees (Note 3) | | | 20,689,317 | |
| Administration and custody fees (Note 3) | | | 3,196,865 | |
| Professional fees | | | 37,399 | |
| Trustees’ fees (Note 4) | | | 62,759 | |
| Printing fees | | | 1,968 | |
| Other expenses | | | 75,372 | |
| Total expenses | | | 24,063,680 | |
| Net Investment Income | | $ | 41,688,940 | |
| Realized Gain | | | | |
| Net realized gain on investments | | $ | 65,219 | |
| Net Increase in Net Assets Resulting from Operations | | $ | 41,754,159 | |
| See Notes to Financial Statements. | |
43
| | | | | | | |
| State Street Money Market Portfolio | |
| Statements of Changes in Net Assets | |
| | |
| | | Year Ended | | | Year Ended | |
| | | December 31, 2010 | | | December 31, 2009 | |
| Increase (Decrease) in Net Assets from: | | | | | | |
| Operations: | | | | | | |
| Net investment income | | $ | 41,688,940 | | | $ | 48,751,157 | |
| Net realized gain on investments | | | 65,219 | | | | 37,660 | |
| Net increase in net assets from operations | | | 41,754,159 | | | | 48,788,817 | |
| Capital Transactions: | | | | | | | | |
| Contributions | | | 57,811,748,486 | | | | 26,809,693,228 | |
| Withdrawals | | | (46,837,758,144 | ) | | | (19,976,306,032 | ) |
| Net increase in net assets from capital transactions | | | 10,973,990,342 | | | | 6,833,387,196 | |
| Net Increase in Net Assets | | | 11,015,744,501 | | | | 6,882,176,013 | |
| Net Assets | | | | | | | | |
| Beginning of year | | | 15,488,081,152 | | | | 8,605,905,139 | |
| End of year | | $ | 26,503,825,653 | | | $ | 15,488,081,152 | |
See Notes to Financial Statements.
44
| | | | | | |
| State Street Money Market Portfolio |
| Financial Highlights |
| |
| | | Ratios to Average Net Assets | Net Assets |
| | | Gross | Net | Net | End of |
| | Total | Operating | Operating | Investment | Period |
| Period Ended December 31, | Return (a) | Expenses | Expenses | Income | (000s omitted) |
| 2010 | 0.20% | 0.12% | 0.12% | 0.20% | $26,503,826 |
| 2009 | 0.52% | 0.12% | 0.11%(b) | 0.46%(b) | $15,488,081 |
| 2008 | 2.75% | 0.12% | 0.10% | 2.79% | $ 8,605,905 |
| 2007 | 5.30% | 0.12% | 0.10% | 5.14% | $ 6,918,263 |
| 2006 | 5.09% | 0.13% | 0.10% | 5.08% | $ 6,197,117 |
| (a) | Results represent past performance and are not indicative of future results. Total return for periods of less than one year are not annualized. |
| (b) | Results reflect the effect of expense waivers. Without these waivers, net investment income would have been 0.01% lower. |
See Notes to Financial Statements.
45
State Street Money Market Portfolio
Notes to Financial Statements
December 31, 2010
1. Organization
The State Street Master Funds (the “Trust”) is registered under the Investment Company Act of 1940, as amended (the “1940 Act”), as an open-end management investment company, and was organized as a business trust under the laws of the Commonwealth of Massachusetts on July 27, 1999. The Trust comprises eleven investment portfolios: the State Street Equity 500 Index Portfolio, the State Street Equity 400 Index Portfolio, the State Street Equity 2000 Index Portfolio, the State Street Aggregate Bond Index Portfolio, the State Street Money Market Portfolio, the State Street Tax Free Money Market Portfolio, the State Street Limited Duration Bond Portfolio, the State Street Short-Term Tax Exempt Bond Portfolio, the State Street U.S. Government Money Market Portfolio, the State Street Treasury Money Market Portfolio and the State Street Treasury Plus Money Market Portfolio. At December 31, 2010, the following Portfolios were in operation: the State Street Equity 500 Index Portfolio, the State Street Money Market Portfolio, the State Street Tax Free Money Market Portfolio, the State Street Short-Term Tax Free Bond Portfolio, the State Street U.S. Government Money Market Portfolio, the State Street Treasury Money Market Portfolio and the State Street Treasury Plus Money Market Portfolio. Information presented in these financial statements pertains only to the State Street Money Market Portfolio, (the “Portfolio”). The Portfolio commenced operations on August 12, 2004. The Portfolio is authorized to issue an unlimited number of non-transferable beneficial interests.
The Portfolio’s investment objective is to seek to maximize current income, to the extent consistent with the preservation of capital and liquidity and the maintenance of a stable $1.00 per share net asset value by investing in U.S. dollar-denominated money market securities.
2. Significant Accounting Policies
The following is a summary of the significant accounting policies consistently followed by the Portfolio in the preparation of its financial statements.
Security valuation – As permitted under Rule 2a-7 of the 1940 Act and certain conditions therein, securities of the Portfolio are valued initially at cost and thereafter assume a constant amortization to maturity of any discount or premium.
The Portfolio adopted provisions surrounding Fair Value Measurements and Disclosures that define fair value, establish a framework for measuring fair value in generally accepted accounting principles and expand disclosures about fair value measurements. This applies to fair value measurements that are already required or permitted by other accounting standards and is intended to increase consistency of those measurements and applies broadly to securities and other types of assets and liabilities. In accordance with these provisions, fair value is defined as the price that a Portfolio would receive upon selling an investment in a timely transaction to an independent buyer in the principal or most advantageous market of the investment. Various inputs are used in determining the value of the Portfolio’s investments.
The three tier hierarchy of inputs is summarized below:
| · | Level 1 — quoted prices in active markets for identical securities |
| · | Level 2 — other significant observable inputs (including quoted prices for similar securities, interest rates, prepayment speeds, credit risk, etc.) |
46
State Street Money Market Portfolio
Notes to Financial Statements (continued)
December 31, 2010
| · | Level 3 — significant unobservable inputs (including a Portfolio’s own assumptions in determining the fair value of investments) |
The inputs or methodology used for valuing securities are not an indication of the risk associated with investing in those securities.
The following is a summary of the inputs used, as of December 31, 2010, in valuing the Portfolio’s assets carried at fair value:
| | |
| | Investments in |
| Valuation Inputs | Securities |
| Level 1 — Quoted Prices | $ — |
| Level 2 — Other Significant Observable Inputs | 26,496,172,160 |
| Level 3 — Significant Unobservable Inputs | — |
| Total Investments | $26,496,172,160 |
The type of inputs used to value each security under the provisions surrounding Fair Value Measurement and Disclosures is identified in the Portfolio of Investments, which also includes a breakdown of the Portfolio’s investments by category.
The Portfolio adopted updated provisions surrounding fair value measurements and disclosures effective March 31, 2010. This update applies to the Portfolio’s disclosures about transfers in and out of Level 1 and Level 2 of the fair value hierarchy and the reasons for the transfers as well as to disclosures about the valuation techniques and inputs used to measure fair value for investments that fall in either Level 2 or Level 3 fair value hierarchy.
As of the year ended December 31, 2010, there were no securities transferred from Level 1 to Level 2 and no securities transferred from Level 2 to Level 1.
Securities transactions, investment income and expenses: Securities transactions are recorded on a trade date basis for financial statement purposes. Interest income is recorded daily on the accrual basis and includes amortization of premium and accretion of discount on investments. Realized gains and losses from securities transactions are recorded on the basis of identified cost. Expenses are accrued daily.
All of the net investment income and realized gains and losses from the security transactions of the Portfolio are allocated pro rata among the partners in the Portfolio based on each partner’s daily ownership percentage.
Federal income taxes: The Portfolio is not required to pay federal income taxes on its net investment income and net capital gains because it is treated as a partnership for federal income tax purposes. All interest, gains and losses of the Portfolio is deemed to have been “passed through” to the Portfolio’s partners in proportion to their holdings in the Portfolio, regardless of whether such items have been distributed by the Portfolio. Each partner is responsible for tax liability based on its distributive share; therefore, no provision has been made for federal income taxes.
The Portfolio has reviewed the tax positions for open years as of December 31, 2010, and determined it did not have a liability for any unrecognized tax expenses. The Portfolio recognizes interest and penalties, if any, related to tax liabilities as income tax expense in the Statement of Operations. As of December 31, 2010, tax years 2007 through 2010 remain subject to examination by the Portfolio’s major tax jurisdictions, which include the United States of America and the Commonwealth of Massachusetts.
47
State Street Money Market Portfolio
Notes to Financial Statements (continued)
December 31, 2010
At December 31, 2010, the cost of investments for federal income tax purposes was substantially the same as the cost for financial reporting purposes.
Repurchase Agreements: A repurchase agreement customarily obligates the seller at the time it sells securities to a Portfolio to repurchase the securities at a mutually agreed upon price and time which, in the case of the Portfolio’s transactions, is generally within seven days. The total amount received by a Portfolio on repurchase is calculated to exceed the price paid by the Portfolio, reflecting an agreed-upon market rate of interest for the period of time to the settlement date, and is not necessarily related to the interest rate on the underlying securities. The underlying securities are ordinarily United States Government securities, but may consist of other securities in which the Portfolio is permitted to invest. Repurchase agreements are fully collateralized at all times. The use of repurchase agreements involves certain risks. For example, if the seller of securities under a repurchase agreement defaults on its obligation to repurchase the underlying securities (as a result of its bankruptcy or otherwise) the Portfolio will seek to dispose of such securities; this action could involve costs or delays. In addition, the proceeds of any such disposition may be less than the amount the Portfolio is owed under the repurchase agreement. The Portfolio may enter into repurchase agreements maturing within seven days with domestic dealers, banks and other financial institutions deemed to be creditworthy by SSgA Funds Management, Inc. (“SSgA FM” or the “Adviser”), a subsidiary of State Street Corporation and an affiliate of State Street Bank and Trust Company (“State Street”).
Expense allocation: Certain expenses are applicable to multiple Portfolios. Expenses directly attributable to a Portfolio are charged to that Portfolio. Expenses of the Trust that are not directly attributed to a Portfolio are allocated among the Portfolios, on the basis of relative net assets, except where a more appropriate allocation of expenses to each of the Portfolios can otherwise be made fairly.
Use of estimates: The Portfolio’s financial statements are prepared in accordance with U.S. generally accepted accounting principles, which require the use of management estimates. Actual results could differ from those estimates.
3. Related Party Fees
The Portfolio has entered into an investment advisory agreement with the Adviser. The Adviser directs the investments of the Portfolio in accordance with its investment objectives, policies, and limitations. In compensation for the Adviser’s investment advisory services, until January 31, 2011, the Portfolio paid the Adviser a management fee at an annual rate of 0.10% of the Portfolio’s average daily net assets. Effective February 1, 2011, SSgA FM agreed to contractually waive 0.05% of the 0.10% payable by the Portfolio for investment advisory services through January 31, 2012. On February 18, 2011, the Board of Trustees approved a revised investment advisory agreement of the Portfolio to amend the management fee payable by a Portfolio to an annual rate of 0.05% of the Portfolio’s average daily net assets. Pursuant to the agreements of February 1, 2011 and February 18, 2011, the Portfolio will pay a fee at an annual rate of 0.05% of its average daily net assets for investment advisory services received from the Adviser.
State Street is the administrator, custodian and transfer agent for the Portfolio. In compensation for State Street’s services as administrator, custodian and transfer agent beginning February 1, 2007, the Trust pays State Street an annual fee, which is accrued daily, and payable monthly at the applicable fee rate
48
State Street Money Market Portfolio
Notes to Financial Statements (continued)
December 31, 2010
described below, of the following annual percentages of the Trust’s average aggregate daily net assets during the month as follows:
| | | |
| | | Annual percentage of |
| | Asset Levels | average aggregate daily net assets |
| | First $400 million | 0.03% |
| | Next $15 billion | 0.02% |
| | Thereafter | 0.01% |
| | Minimum annual fee | $150,000 |
| | | |
The Trust pays each Trustee who is not an officer or employee of SSgA FM or State Street $2,500 for each in-person meeting of the Board of Trustees and an additional $500 for each telephonic meeting attended. The Trust also pays each Trustee an annual retainer of $30,000. Each Trustee is reimbursed for out-of-pocket and travel expenses.
5. Indemnifications
The Trust’s organizational documents provide that its officers and trustees are indemnified against certain liabilities arising out of the performance of their duties to the Trust. In addition, both in some of its principal service contracts and in the normal course of its business, the Trust enters into contracts that provide indemnifications to other parties for certain types of losses or liabilities. The Trust’s maximum exposure under these arrangements in unknown as this could involve future claims against the Trust. Management does not expect any significant claims.
6. Subsequent Events
In accordance with provisions surrounding Subsequent Events adopted by the Portfolio, management has evaluated the possibility of subsequent events existing in the Portfolio’s financial statements.
Effective February 1, 2011, SSgA FM agreed to contractually waive 0.05% of the 0.10% of the average daily net assets paid by the Portfolio for investment advisory services through January 31, 2012. On February 18, 2011, the Board of Trustees approved a revised investment advisory agreement with the Portfolio to amend the management fee paid by the Portfolio to an annual rate of 0.05% of the Portfolio’s average daily net assets. Pursuant to the agreements of February 1, 2011 and February 18, 2011, the Portfolio will pay the Adviser a fee at an annual rate of 0.05% of its average daily net assets for investment advisory services received from the Adviser.
49
State Street Money Market Portfolio
Report of Independent Registered Public Accounting Firm
To the Board of Trustees of State Street Master Funds and
Owners of Beneficial Interest of State Street Money Market Portfolio:
We have audited the accompanying statement of assets and liabilities of State Street Money Market Portfolio (one of the portfolios constituting State Street Master Funds) (the “Portfolio”), including the portfolio of investments, as of December 31, 2010, and the related statement of operations for the year then ended, the statements of changes in net assets for each of the two years in the period then ended, and the financial highlights for each of the five years in the period then ended. These financial statements and financial highlights are the responsibility of the Portfolio’s management. Our responsibility is to express an opinion on these financial statements and financial highlights based on our audits.
We conducted our audits in accordance with the standards of the Public Company Accounting Oversight Board (United States). Those standards require that we plan and perform the audit to obtain reasonable assurance about whether the financial statements and financial highlights are free of material misstatement. We were not engaged to perform an audit of the Portfolio’s internal control over financial reporting. Our audits included consideration of internal control over financial reporting as a basis for designing audit procedures that are appropriate in the circumstances, but not for the purpose of expressing an opinion on the effectiveness of the Portfolio’s internal control over financial reporting. Accordingly, we express no such opinion. An audit also includes examining, on a test basis, evidence supporting the amounts and disclosures in the financial statements and financial highlights, assessing the accounting principles used and significant estimates made by management, and evaluating the overall financial statement presentation. Our procedures included confirmation of securities owned as of December 31, 2010, by correspondence with the custodian and brokers. We believe that our audits provide a reasonable basis for our opinion.
In our opinion, the financial statements and financial highlights referred to above present fairly, in all material respects, the financial position of State Street Money Market Portfolio of State Street Master Funds at December 31, 2010, the results of its operations for the year then ended, the changes in its net assets for each of the two years in the period then ended, and the financial highlights for each of the five years in the period then ended, in conformity with U.S. generally accepted accounting principles.
/s/ Ernst & Young LLP
Boston, Massachusetts
February 22, 2011
50
State Street Money Market Portfolio
General Information
December 31, 2010 (Unaudited)
Proxy Voting Policies and Procedures and Record
The Trust has adopted proxy voting procedures relating to portfolio securities held by the Portfolio. A description of the policies and procedures is available (i) without charge, upon request, by calling (877) 521-4083 or (ii) on the website of the Securities Exchange Commission (the “SEC”) at www.sec.gov. Information on how the Portfolio voted proxies relating to portfolio securities during the most recent 12-month period ending June 30 is available by August 31 (i) without charge, upon request, by calling (877) 521-4083 or (ii) on the SEC’s website at www.sec.gov.
Quarterly Portfolio Schedule
The Trust files its complete schedule of portfolio holdings with the SEC for the first and third quarters of its fiscal year (as of March and September of each year) on Form N-Q. The Trust’s Forms N-Q are available on the SEC’s website at www.sec.gov. The Trust’s Forms N-Q may be reviewed and copied at the SEC’s Public Reference Room in Washington, D.C. and information on the operation of the Public Reference Room may be obtained by calling 1-800-SEC-0330. The most recent Form N-Q is available without charge, upon request, by calling (877) 521-4083.
Advisory Agreement Renewal
The Board of Trustees of the Trust met on November 19, 2010 (the “Meeting”) to consider the approval of the investment advisory agreement (the “Advisory Agreement”) for State Street Money Market Portfolio (the “Portfolio”). In preparation for considering the Advisory Agreement, the Trustees had reviewed the renewal materials provided by the investment adviser, which they had requested through independent counsel. In deciding whether to renew the Advisory Agreement, the Trustees considered various factors, including (i) the nature, extent and quality of the services provided by the SSgA Funds Management, Inc. (the “Adviser”) under the Advisory Agreement, (ii) the investment performance of the Portfolio, (iii) the costs to the Adviser of its services and the profits realized by the Adviser and its affiliates from their relationship with the Trust, (iv) the extent to which economies of scale would be realized if and as the Trust grows and whether the fee levels in the Advisory Agreement reflect these economies of scale, and (v) any additional benefits to the Adviser from its relationship with the Trust.
In considering the nature, extent and quality of the services provided by the Adviser, the Trustees relied on their prior direct experience as Trustees of the Trust as well as on the materials provided at the Meeting. The Trustees reviewed the Adviser’s responsibilities under the Advisory Agreement and noted the experience and expertise that would be appropriate to expect of an adviser to the Portfolio, which is a money market fund. The Trustees reviewed the background and experience of the Adviser’s senior management, including those individuals responsible for the investment and compliance operations relating to the investments of the Portfolio, and the responsibilities of the latter with respect to the Portfolio. They also considered the resources, operational structures and practices of the Adviser in managing the Portfolio’s investments, in monitoring and securing the Portfolio’s compliance with its investment objectives and policies with respect to its investments and with applicable laws and regulations, and in seeking best execution of portfolio transactions. The Trustees also considered information about the Adviser’s overall investment management business, noting that the Adviser manages assets for a variety of institutional investors and that the Adviser and its affiliates had over $1.90 trillion in assets under management as of September 30, 2010, including over $183.40 billion managed
51
State Street Money Market Portfolio
General Information (continued)
December 31, 2010 (Unaudited)
Advisory Agreement Renewal (continued)
by the Adviser. They reviewed information regarding State Street’s business continuity and disaster recovery program. Drawing upon the materials provided and their general knowledge of the business of the Adviser, the Trustees determined that the experience, resources and strength of the Adviser in the management of money market products are exceptional. As discussed more fully below, they also determined that the advisory fee for the Portfolio was fair and reasonable and that its performance and expense ratio were acceptable. On the basis of this review, the Trustees determined that the nature and extent of the services provided by the Adviser to the Portfolio were appropriate and had been of good quality.
The Trustees noted that, in view of the investment objectives of the Portfolio and the available data, the investment performance was acceptable. The Trustees noted that materials provided by Lipper Inc. at the Meeting indicated that the performance of the Portfolio’s feeder fund’s Institutional Shares relative to its Lipper peer groups have been above average for almost all of the applicable reported periods (five years, three years, one year and year-to-date as applicable) ended September 30, 2010, although the performance of the feeder fund’s Investor Shares was generally below average. The Trustees determined that the reported performance of the feeder fund, and, by implication, the Portfolio supported a finding that the performance was acceptable, albeit subject to ongoing review at future meetings.
The Trustees considered the profitability to the Adviser and its affiliate, State Street, of the advisory relationships to the Trust. (They noted at the outset that the issue of profitability would not arise with respect to State Street Global Markets LLC (“SSGM”), also an affiliate of the Adviser, because of the fact that SSGM receives no compensation from the feeder fund and, by implication, the Portfolio.) The Trustees had been provided with data regarding the profitability to the Adviser and State Street with respect to the Portfolio and on an aggregate basis, for the year ended June 30, 2010, with additional data relating to prior years. Having discussed with representatives of the Adviser the methodologies used in computing the costs that formed the bases of the profitability calculations, they concluded that these methodologies were reasonable and turned to the data provided. After discussion and analysis they concluded that, to the extent that the Adviser’s and State Street’s relationships with the Trust had been profitable to either or both those entities during the period for which information had been provided, the profitability was in no case such as to render the advisory fees excessive.
In order better to evaluate the Portfolio’s advisory fee, the Trustees had requested comparative information from Lipper Inc. with respect to fees paid by, and expense ratios of, similar funds not managed by the Adviser. The Trustees found that the Portfolio’s advisory fee and total expense ratio were all lower than the average for its Lipper peer group; after discussion, they concluded that the data available provided confirmation of the reasonableness of the Adviser’s fees. The Trustees also considered that to help limit expenses of the Portfolio, the Adviser had reduced its advisory fee or otherwise reimbursed expenses for the Portfolio.
In addition, the Trustees considered other advisory fees paid to the Adviser. They noted that as a general matter fees paid to the Adviser by other, closely similar mutual funds sponsored by State Street were significantly higher than the fees paid by the Portfolio and, indirectly, by the feeder fund. As to fees paid by mutual funds for which the Adviser acted as sub-adviser and by institutional accounts managed by the Adviser, the Trustees noted that these were generally lower than those paid by the Portfolio; in
52
State Street Money Market Portfolio
General Information (continued)
December 31, 2010 (Unaudited)
Advisory Agreement Renewal (continued)
considering these fees, the Trustees reviewed and discussed a memorandum prepared by the Adviser discussing the differences between the services provided to the Portfolio by the Adviser and those provided to the other two types of clients. The Trustees determined that, in light of these significant differences, in both cases the fees were of doubtful utility for purposes of comparison with that of the Portfolio, but that to the extent that meaningful comparison was practicable the differences in services satisfactorily accounted for differences in the fees. The Trustees determined that the Adviser’s fee was fair and reasonable.
In considering whether the Adviser benefits in other ways from its relationship with the Trust, the Trustees also considered whether the Adviser’s affiliates may benefit from the Trust’s relationship with State Street as fund administrator, custodian and transfer agent. They noted, among other things, that the Adviser utilizes no soft-dollar arrangements in connection with the Portfolio’s brokerage transactions to obtain third-party (non-proprietary research) services. The Trustees concluded that, to the extent that the Adviser or its affiliates derive other benefits from their relationships with the Trust, those benefits are not so significant as to render the Adviser’s fee excessive.
The Trustees also considered the extent to which economies of scale may be realized by the Portfolio as assets grow and whether the Portfolio’s fee level reflects such economies of scale, if any, for the benefit of investors. In considering the matter, the Trustees determined that, to the extent economies of scale were in fact realized, such economies of scale were shared with the Portfolio by virtue of an advisory fee of comparatively low level that subsumed economies of scale in the fee itself. The Trustees also recognized, however, that should sustained, substantial asset growth be realized in the future, it might be appropriate to consider additional measures.
On the basis of the foregoing discussions and determinations, without any one factor being dispositive, the Trustees decided to approve the continuance of the Advisory Agreement.
53
Trustees and Executive Officers (Unaudited)
The table below includes information about the Trustees and Executive Officers of the State Street Master Funds, including their:
| · | business addresses and ages; |
| · | principal occupations during the past five years; and |
| · | other directorships of publicly traded companies or funds. |
| | | | | | |
| | | | | Number of | |
| Name, Address, | Position(s) | Term of Office | Principal | Funds in Fund | |
| and Date of Birth | Held with | and Length of | Occupation During | Complex Overseen | Other Directorships |
| (“DOB”) | Trust | Time Served | Past Five Years | by Trustee* | Held by Trustee |
| Independent Trustees | | | | | |
| Michael F. Holland | Trustee and Chairman | Term: Indefinite | Chairman, Holland & | 22 | Trustee, State Street |
| Holland & Company, | of the Board | Elected: 7/99 | Company L.L.C. | | Institutional Investment |
| LLC | | | (investment adviser) | | Trust; Director, the |
| 375 Park Avenue | | | (1995 – present). | | Holland Series Fund, |
| New York, NY 10152 | | | | | Inc.; Director, The |
| | | | | | China Fund, Inc.; |
| DOB: 1944 | | | | | Director, The Taiwan |
| | | | | | Fund, Inc.; and |
| | | | | | Director, Reaves Utility |
| | | | | | Income Fund |
| | | | | | |
| William L. Boyan | Trustee | Term: Indefinite | President and Chief | 22 | Trustee, State Street |
| State Street Master | | Elected: 7/99 | Operations Officer, | | Institutional Investment |
| Funds | | | John Hancock | | Trust; Former Trustee |
| P.O. Box 5049 | | | Financial Services | | of Old Mutual South |
| Boston, MA 02206 | | | (1959 – 1999) Mr. | | Africa Master Trust; |
| | | | Boyan retired in 1999. | | Trustee, Children’s |
| DOB: 1937 | | | Chairman Emeritus, | | Hospital, Boston, MA; |
| | | | Children’s Hospital, | | and Trustee, Florida |
| | | | Boston, MA (1984 – | | Stage. |
| | | | present); Former | | |
| | | | Trustee of Old Mutual | | |
| | | | South Africa Master | | |
| | | | Trust (investments) | | |
| | | | (1995 – 2008); Former | | |
| | | | Chairman, Boston Plan | | |
| | | | For Excellence, Boston | | |
| | | | Public Schools (1994 – | | |
| | | | 2008). | | |
| | | | | | |
| Rina K. Spence State | Trustee | Term: Indefinite | President of | 22 | Trustee, State Street |
| Street Master | | Elected: 7/99 | SpenceCare | | Institutional Investment |
| Funds | | | International LLC | | Trust; Director, |
| P.O. Box 5049 | | | (international | | Berkshire Life |
| Boston, MA 02206 | | | healthcare consulting) | | Insurance Company of |
| | | | (1998 – present); Chief | | America 1993-2009; |
| DOB: 1948 | | | Executive Officer, | | Director, IEmily.com, |
| | | | IEmily.com (internet | | Inc. 2000-present; and |
| | | | company) (2000 – | | Trustee, National |
| | | | 2001); Chief Executive | | Osteoporosis |
| | | | Officer of Consensus | | Foundation 2005-2008 |
| | | | Pharmaceutical, Inc. | | |
| | | | (1998 – 1999); | | |
| | | | Founder, President and | | |
| | | | Chief Executive Officer | | |
| | | | of Spence Center for | | |
| | | | Women’s Health | | |
| | | | (1994 – 1998); | | |
| | | | President and CEO | | |
| | | | Emerson Hospital | | |
| | | | (1984-1994); Trustee, | | |
| | | | Eastern Enterprise | | |
| | | | (utilities) (1988 – | | |
| | | | 2000). | | |
| | | | | | |
| Douglas T. Williams | Trustee | Term: Indefinite | Executive Vice | 22 | Trustee, State Street |
| State Street Master | | Elected: 7/99 | President of Chase | | Institutional Investment |
| Funds | | | Manhattan Bank | | Trust; Treasurer, |
| P.O. Box 5049 | | | (1987 – 1999). Mr. | | Nantucket Educational |
| Boston, MA 02206 | | | Williams retired in | | Trust, 2002-2007 |
| | | | 1999. | | |
| DOB: 1940 | | | | | |
* The “Fund Complex” consists of eleven series of the Trust and eleven series of State Street Institutional Investment Trust.
54
| | | | | | |
| | | | | Number of | |
| Name, Address, | Position(s) | Term of Office | Principal | Funds in Fund | |
| and Date of Birth | Held with | and Length of | Occupation During | Complex Overseen | Other Directorships |
| (“DOB”) | Trust | Time Served | Past Five Years | by Trustee* | Held by Trustee |
Interested Trustees(1) | | | | | |
| James E. Ross | Trustee President | Term: Indefinite | President, SSgA Funds | 22 | Trustee, State Street |
| SSgA Funds | | Elected Trustee: 2/07 | Management Inc. | | Institutional Investment |
| Management, Inc. | | Elected President: 4/05 | (2005 – present); | | Trust;Trustee, SPDR® |
| State Street Financial | | | Principal, SSgA Funds | | Series Trust; Trustee, |
| Center | | | Management, Inc. | | SPDR® Index Shares |
| One Lincoln Street | | | (2001 – 2005); Senior | | Trust and Trustee, |
| Boston, MA | | | Managing Director, | | Select Sector SPDR® |
| 02111-2900 | | | State Street Global | | Trust |
| | | | Advisors (2006 – | | |
| DOB: 1965 | | | present); Principal, | | |
| | | | State Street Global | | |
| | | | Advisors (2000 – | | |
| | | | 2006). | | |
| Officers: | | | | | |
| Ellen M. Needham | Vice President | Term: Indefinite | Vice President, SSgA | — | — |
| SSgA Funds | | Elected: 09/09 | Funds Management, | | |
| Management, Inc. | | | Inc. (investment | | |
| State Street Financial | | | adviser); July 2007 to | | |
| Center | | | Present, Managing | | |
| One Lincoln Street | | | Director (June 2006 to | | |
| Boston, MA | | | July 2007, Vice | | |
| 02111-2900 | | | President; 2000 to June | | |
| | | | 2006, Principal), State | | |
| DOB: 1967 | | | Street Global Advisors. | | |
| | | | | | |
| Laura F. Healy | | Term: Indefinite | Vice President of State | — | — |
| State Street Bank and | Treasurer | Elected: 11/10 | Street Bank and Trust | | |
| Trust Company | | | Company (prior to | | |
| 4 Copley Place | Assistant Treasurer | 11/08-11/10 | July 2, 2008, Investors | | |
| 5th floor | | | Financial Corporation) | | |
| Boston, MA 02116 | | | since 2002. | | |
| | | | | | |
| DOB: 1964 | | | | | |
| | | | | | |
| Brian D. O’Sullivan | Assistant Treasurer | Term: Indefinite | Vice President of State | — | — |
| State Street Bank and | | Elected: 11/08 | Street Bank and Trust | | |
| Trust Company | | | Company (2007 – | | |
| 801 Pennsylvania | | | present) with which he | | |
| Avenue | | | has been affiliated with | | |
| Kansas City, MO 64105 | | | since 1997. | | |
| | | | | | |
| DOB: 1975 | | | | | |
| | | | | | |
| Peter T. Sattelmair | Assistant Treasurer | Term: Indefinite | Director of Fund | — | — |
| State Street Bank and | | Elected: 11/08 | Administration of State | | |
| Trust Company | | | Street Bank and Trust | | |
| 801 Pennsylvania | | | Company (2007 – | | |
| Avenue | | | present) with which he | | |
| Kansas City, MO | | | has been affiliated with | | |
| 64105 | | | since 1999. | | |
| | | | | | |
| DOB: 1977 | | | | | |
| * | The “Fund Complex” consists of eleven series of the Trust and eleven series of State Street Institutional Investment Trust. |
| (1) | Mr. Ross is an Interested Trustee because of his employment by SSgA Funds Management, Inc., an affiliate of the Trust. |
55
| | | | | | |
| | | | | Number of | |
| Name, Address, | Position(s) | Term of Office | Principal | Funds in Fund | |
| and Date of Birth | Held with | and Length of | Occupation During | Complex Overseen | Other Directorships |
| (“DOB”) | Trust | Time Served | Past Five Years | by Trustee* | Held by Trustee |
| Officers: (continued) | | | | | |
| David James | Secretary | Term: Indefinite | Vice President and | — | — |
| State Street Bank and | | Elected: 11/09 | Managing Counsel, | | |
| Trust Company | | | State Street Bank and | | |
| 4 Copley Place | | | Trust Company, 2009 | | |
| 5th Floor | | | to present; Vice | | |
| Boston, MA 02116 | | | President and Counsel, | | |
| | | | PNC Global Investment | | |
| DOB: 1970 | | | Servicing (US), Inc. | | |
| | | | 2006 to 2009; Assistant | | |
| | | | Vice President and | | |
| | | | Counsel, State Street | | |
| | | | Bank and Trust | | |
| | | | Company, October | | |
| | | | 2000 to December | | |
| | | | 2004 and was retired in | | |
| | | | 2005. | | |
| | | | | | |
| Cuan Coulter | Chief Compliance | Term: Indefinite | Senior Vice President, | — | — |
| State Street Financial | Officer | Elected: 12/2010 | SSgA Global Chief | | |
| Center One Lincoln | | | Compliance Officer | | |
| Street | | | (2009 – present); | | |
| Boston, MA 02111- | | | Senior Vice President, | | |
| 2900 | | | SSgA U.S. Senior | | |
| | | | Compliance Officer | | |
| DOB: 1972 | | | (2008 – 2009); Partner, | | |
| | | | Pricewaterhouse | | |
| | | | Coopers, LLP (1999 – | | |
| | | | 2008) | | |
* The “Fund Complex” consists of eleven series of the Trust and eleven series of State Street Institutional Investment Trust.
The Statement of Additional Information includes additional information about the Trustees and is available, without charge, upon request, by calling (toll free) 877-521-4083.
56
This page deliberately left blank.
This page deliberately left blank.
This page deliberately left blank.
Trustees
Michael F. Holland
William L. Boyan
Rina K. Spence
Douglas T. Williams
James E. Ross
Investment Adviser
SSgA Funds Management, Inc.
State Street Financial Center
One Lincoln Street
Boston, MA 02111
Custodian
State Street Bank and Trust Company
State Street Financial Center
One Lincoln Street
Boston, MA 02111
Administrator
State Street Bank and Trust Company
801 Pennsylvania Avenue
Kansas City, MO 64105
Independent Registered Public Accounting Firm
Ernst & Young LLP
200 Clarendon Street
Boston, MA 02116
Legal Counsel
Ropes & Gray LLP
One International Place
Boston, MA 02110
This report is for shareholder information. This is not a prospectus intended for use in the purchase or sale of shares of beneficial interest.
State Street Master Funds
State Street Bank and Trust Company
P.O. Box 5049
Boston, MA 02206
Privacy Notice
Henderson Global Funds
This notice describes the privacy practices followed by Henderson Global Funds.
Your privacy is our top priority. Our policy is to respect the privacy of current and former shareholders and to protect personal information entrusted to us. We do not share any nonpublic personal information of shareholders or former shareholders with any nonaffiliated third parties, except as permitted by law or as authorized by our shareholders.
In the course of providing products and services to you, we collect nonpublic personal information about you from various sources such as account applications or agreements, other account forms, transactions in your account, and from information captured on our website, including any information captured through our use of “cookies.” Such information may include your name, address, account or tax identification number, the types and amounts of investments, and bank account information. More detailed information about our Internet policy is available on our website, www.hendersonglobalinvestors.com.
In the normal course of serving shareholders, we may share information we collect with entities that help us process information or service your request, such as transfer agents, custodians, broker-dealers and marketing service firms, as well as with other financial institutions with whom we have joint marketing agreements. We may share information in connection with servicing accounts or to inform shareholders of products and services that we believe may be of interest to them. The organizations that receive shareholder information will use that information only for the services required and as allowed by applicable law or regulation, and are not permitted to share or use this information for any other purpose. We will disclose your personal information to government agencies, law enforcement officials, and others in the limited circumstances where we believe, in good faith, that such disclosure is required or permitted by law. For example, we will disclose your personal information in order to comply with a court order, to cooperate with government or industry regulators, or law enforcement authorities.
Access to customers’ nonpublic personal information is restricted to employees who need to access that information. To guard shareholder’s nonpublic personal information, we use industry standard physical, electronic, and procedural safeguards. A shareholder’s right to privacy extends to all forms of contact with us, including telephone, written correspondence, and electronic media, such as the Internet.
For questions concerning this policy, please contact us by writing to: Alanna Nensel, Henderson Global Investors (North America) Inc., 737 North Michigan Avenue, Suite 1700, Chicago, Illinois 60611.
| | |
| Table of contents | |
| LETTER TO SHAREHOLDERS | 1 |
| INTERNATIONAL ALL CAP EQUITY FUND | |
| Commentary | 2 |
| Performance summary | 3 |
| PORTFOLIO OF INVESTMENTS | 4 |
| STATEMENT OF ASSETS AND LIABILITIES | 7 |
| STATEMENT OF OPERATIONS | 8 |
| STATEMENT OF CHANGES IN NET ASSETS | 9 |
| STATEMENT OF CHANGES - CAPITAL STOCK ACTIVITY | 10 |
| FINANCIAL HIGHLIGHTS | 11 |
| NOTES TO FINANCIAL STATEMENTS | 13 |
| REPORT OF INDEPENDENT REGISTERED PUBLIC ACCOUNTING FIRM | 18 |
| OTHER INFORMATION | 19 |
| TRUSTEES AND OFFICERS | 21 |
International investing involves certain risks and increased volatility not associated with investing solely in the US. These risks include currency fluctuations, economic or financial insolvency, lack of timely or reliable financial information, possible imposition of foreign withholding tax or unfavorable political or legal developments. The Fund may invest in securities issued by smaller companies and less seasoned issuers, which typically involves greater risk than investing in larger companies. Also, the Fund may invest in limited geographic areas and/or sectors which may result in greater losses and market volatility. In addition, the Fund is non-diversified meaning it may invest in a smaller number of issuers. As such, investing in the Fund may involve greater risk and volatility than investing in a more diversified fund.
The views in this report were those of the Fund manager as of December 31, 2010 and may not reflect the views of the manager on the date this report is first published or anytime thereafter. These views are intended to assist shareholders of the Fund in understanding their investment in the Fund and do not constitute investment advice.
| | |
| Henderson Global Funds | Letter to shareholders |
Dear shareholder,
We are pleased to provide the annual report for the Henderson International All Cap Equity Fund which covers the year ended December 31, 2010.
Global equities continued to make gains in 2010 on further evidence that the global economic recovery continues. There is a growing expectation that the more robust economic growth will be reflected in corporate earnings and analysts’ forecasts are being revised upwards. Equity valuations as a result remain either around fair value or even cheaper than average in most developed markets, which should offer the potential for good returns in line with earnings growth as we move through 2011.
Emerging markets performed very strongly last year (with the notable exceptions of China and Brazil) and, consequently, we have more concerns about valuation support in some developing regions - particularly in light of increasing inflationary pressures and the likelihood of central bank actions to combat this. However, when it becomes clear that we are close to or at the end of the tightening cycle in emerging markets, this is an area that we believe will generate excellent returns over the long term.
The policy measures undertaken by global governments over the past three years will continue to have an impact on bond markets in 2011. European sovereign debt in particular is likely to remain hostage to investor confidence and political constraints. We therefore expect the avoidance of peripheral European exposure and the risk of contagion to be a continued theme for bond investors to navigate in 2011.
In other news, we are pleased to announce that on December 31, 2010 the Henderson Global Funds launched two new portfolios for our retail investors: Emerging Markets Opportunities Fund (HEMAX) and the International All Cap Equity Fund (HFNAX). The Emerging Markets Opportunities Fund seeks to participate in the long term growth of the developing economies and their capital markets. In addition, we expect the Fund to be a truly differentiated offering through its utilization of a specialized regional sub-portfolio structure with a strategic allocation overlay. The International All Cap Equity Fund has added retail share classes. The Class I Shares (HIEIX) were launched on January 31, 2008, and was the first Henderson mutual fund offered to US institutional investors. The Fund follows a bottom-up all cap growth strategy and focuses primarily on the developed markets of Europe, Australasia and the Far East (EAFE).
We believe that these Funds are key additions to the Henderson Global Funds family as we seek to provide you with further options to diversify clients’ portfolios with Funds that are truly differentiated from the competition. It’s our goal to continue to serve your financial needs successfully in the years to come, and we appreciate your trust and support in our Funds.
James O’Brien
President, Henderson Global Funds
1
| | |
| Henderson Global Funds | Commentary |
International All Cap Equity Fund
International equity markets made a robust start to 2010 as global economic growth gained momentum due to strong domestic demand in emerging countries. However, investor sentiment turned sharply negative as macroeconomic data from all regions showed signs of weakness. Moving from west to east, governments wound down stimulus packages (US), announced fiscal austerity measures (Europe) and implemented tightening policies to curb inflation (China), leading to heightened concerns over the sustainability and trajectory of economic growth. Towards the end of the summer fresh fears over a ‘double-dip’ recession triggered a significant sell-off in global markets. This prompted further action from Western governments which underpinned a strong rally in equities during the second half of the year, despite continued concerns over Eurozone sovereign debt and rising inflation in Asia and Emerging markets. Overall macroeconomic data generally surprised on the upside, supporting the growth recovery theme and reducing fears of the ‘double-dip’ scenario.
For the reporting period ended December 31, 2010, the Fund returned 13.74% (Class I shares) versus the benchmark, MSCI EAFE Index, which posted a return of 8.21%. Stock selection in Consumer Discretionary, Industrials and Energy contributed positively to returns, more than offsetting negative contributions from Consumer Staples and Materials. Within Consumer Discretionary, Sands China and Genting Singapore were strong and in the Energy sector, Essar Energy benefitted from Indian Energy demand. On the negative side, Barclays was the biggest drag to performance due to concerns over increased regulation and separation of banking operations.
While our long-term outlook remains biased towards growth in Asian and emerging markets, we are more cautious over valuations and the general ‘crowded consensus’ nature of this positioning in the near term and have tactically reduced exposure to such markets and added to positions in developed markets. We have become more positive on companies in Japan as export-orientated manufacturers increased profits significantly during 2010 but have underperformed industrials globally. Additionally, a strengthening US economy could lead to a weakening in the yen.
We continue to remain positive on equity markets overall driven by improving economic data, strong earnings growth and continued loose fiscal policy by Western governments. That said, we expect the volatility that characterized market movements in 2010 to remain. In Asia, authorities are struggling to contain inflation and there are increasing concerns over how much tightening will need to be implemented to slow down overheating economies and curb rising inflation. We are concerned that, in the near term, growth expectations are factored into valuations and have reduced positions. Within Japan, the improvements in Japanese gross domestic product and rising bonds yields elsewhere are starting to have an impact on Japanese government bonds, which is positive for Japanese equities. Within Europe, we expect the marked performance differential between the ‘core’ and ‘peripheral’ Eurozone countries to continue into the first half of 2011 as investors remain concerned about the government debt in peripheral Eurozone countries.
| International All Cap Equity Fund |
| Top 10 long term holdings |
| | as a percentage |
| Security | of net assets |
| Rio Tinto plc | 3.2% |
| Unilever plc | 2.9 |
| Sands China, Ltd. | 2.8 |
| Keppel Corp., Ltd. | 2.7 |
| Tesco plc | 2.7 |
| Essar Energy plc | 2.6 |
| Saipem SpA | 2.5 |
| Bank of China, Ltd., | |
| Class H | 2.5 |
| Makita Corp. | 2.5 |
| Canon, Inc. | 2.2 |
2
| | |
| Henderson Global Funds | Performance Summary |
International All Cap Equity Fund
| | | | | | | | | | | |
| Total returns as of December 31, 2010 | | | | | | | | | | |
| | | | | | | | | | Since | |
| | NASDAQ | | Three | | | One | | | inception | |
| At NAV | symbol | | months | | | year | | | (9/30/03)* | |
| Class A | HFNAX | | | 6.34 | % | | | 13.39 | % | | | -2.07 | % |
| Class C | HFNCX | | | 6.21 | | | | 12.67 | | | | -2.81 | |
| Class I | HIEIX | | | 6.45 | | | | 13.74 | | | | -1.82 | |
| With sales charge | | | | | | | | | | | | | |
| Class A | HFNAX | | | 0.23 | % | | | 6.85 | % | | | -4.51 | % |
| Class C | HFNCX | | | 5.21 | | | | 12.67 | | | | -2.81 | |
| Index | | | | | | | | | | | | | |
| MSCI EAFE Index | | | | 6.65 | % | | | 8.21 | % | | | -3.58 | % |
Class A and C shares commenced operations on December 31, 2010. For periods prior to December 31, 2010, rates of return for Class A and C shares are based on Class I NAVs adjusted for the higher expenses associated with Class A and C shares. Performance for Class A and C shares would be similar because the shares are invested in the same portfolio of securities and have the same portfolio management. Class I shares are not subject to a front-end sales charge or a distribution fee.
Performance data quoted represents past performance and is no guarantee of future results. Due to the Fund’s relatively small asset base, performance was favorably impacted by IPOs to a greater degree than it may be in the future. IPO investments are not an integral component of the Fund’s investment process and may not be utilized to the same extent in the future. Performance results with sales charges reflect the deduction of the maximum front-end sales charge or the deduction of the applicable contingent deferred sales charge (“CDSC”). Class A shares are subject to a maximum front-end sales charge of 5.75%. Class C shares are subject to a CDSC of up to 1% on certain redemptions made within 12 months of purchase. Performance presented at Net Asset Value (NAV), which does not include a sales charge, would be lower if this charge were reflected. NAV is the value of one share of the Fund excluding any sales charges. Current performance may be lower or higher than the performance data quoted. Investment return and principal value will fluctuate so that an investor’s shares, when redeemed, may be worth more or less than original cost. As stated in the current prospectus, the Fund’s annual operating expense ratios (gross) for Class A, C and I shares are 1.43%, 2.18% and 1.18% respectively. In addition, the Fund’s adviser has agreed to contractually waive a portion of its fees and/or reimburse expenses such that total ordinary operating expenses (other than Acquired Fund Fees and Expenses allocated from unaffiliated investment companies) do not exceed 1.40%, 2.15% and 1.15% for Class A, C and I Shares, respectively, which is in effect until July 31, 2020. For the most recent month-end performance, please call 1.866.443.6337 or visit the Funds’ website at www.hendersonglobalinvestors.com.
Performance results also reflect expense subsidies and waivers in effect during certain periods shown. Absent these waivers, results would have been less favorable for certain periods. All results assume the reinvestment of dividends and capital gains.
The investment comparison graph above reflects the change in value of a $10,000 hypothetical investment since the Fund’s inception, including reinvested dividends and distributions, compared to a broad based securities market index. The MSCI EAFE Index is a capitalization-weighted index that monitors the performance of stocks from Europe, Australasia and The Far East. The Fund is professionally managed while the Index is unmanaged and not available for Investment. Results in the table and graph do not reflect the deduction of taxes that a shareholder would pay on Fund distributions or the redemption of Fund shares.
3
| | |
| Henderson Global Funds | Portfolio of Investments |
International All Cap Equity Fund
December 31, 2010 | |
| | | | Value |
| Shares | | | (note 2) |
| Common Stocks - 95.79% | | | |
| | | Austria - 2.04% | |
| 16,244 | | Andritz AG | $ 1,493,215 |
| 14,211 | | Schoeller-Bleckmann Oilfield | |
| | | Equipment AG | 1,224,865 |
| | | | 2,718,080 |
| | | Belgium - 0.86% | |
| 17,810 | | EVS Broadcast Equipment, | |
| | | S.A. | 1,139,996 |
| | | | |
| | | Brazil - 3.04% | |
| 89,505 | | Banco Santander Brasil S.A. | 1,215,866 |
| 74,900 | | Petroleo Brasileiro S.A., | |
| | | ADR | 2,834,216 |
| | | | 4,050,082 |
| | | China – 6.00% | |
| 6,305,400 | | Bank of China, Ltd., Class H | 3,334,087 |
| 2,146,500 | | China Rongsheng Heavy | |
| | | Industries Group Holdings, | |
| | | Ltd. * | 1,817,102 |
| 149,800 | | Ping An Insurance (Group) Co. | |
| | | of China, Ltd., Class H | 1,670,911 |
| 1,330,500 | | Yingde Gases Group Co. * | 1,172,541 |
| | | | 7,994,641 |
| | | France - 1.15% | |
| 21,392 | | Compagnie Generale des | |
| | | Etablissements Michelin, | |
| | | Class B | 1,535,075 |
| | | | |
| | | Germany - 3.29% | |
| 14,928 | | Bauer AG | 704,175 |
| 16,437 | | Bilfinger Berger AG | 1,388,173 |
| 26,478 | | Gerresheimer AG * | 1,167,270 |
| 82,316 | | Wirecard AG | 1,127,488 |
| | | | 4,387,106 |
| | | Hong Kong – 4.42% | |
| 2,972,000 | | 361 Degrees International, | |
| | | Ltd. | 2,137,387 |
| 1,696,800 | | Sands China, Ltd. * | 3,754,755 |
| | | | 5,892,142 |
| | | India - 0.81% | |
| 35,501 | | Axis Bank, Ltd. GDR | 1,083,136 |
| | | | |
| | | Indonesia - 0.46% | |
| 4,110,500 | | PT Borneo Lumbung Energi & | |
| | | Metal Tbk * | 611,329 |
| | | | |
| | | | Value |
| Shares | | | (note 2) |
| | | Israel - 1.57% | |
| 40,152 | | Teva Pharmaceutical Industries, | |
| | | Ltd., ADR | $ 2,093,124 |
| | | | |
| | | Italy - 4.73% | |
| 108,291 | | Autogrill SpA * | 1,529,577 |
| 66,793 | | Fiat SpA | 1,377,212 |
| 68,969 | | Saipem SpA | 3,395,295 |
| | | | 6,302,084 |
| | | Japan - 19.06% | |
| 56,900 | | Canon, Inc. | 2,950,474 |
| 24,600 | | Cocokara Fine Holdings, Inc. | 522,360 |
| 526,000 | | Daiwa Securities Group, Inc. | 2,708,067 |
| 26,900 | | H.I.S. Co., Ltd. | 669,932 |
| 30,000 | | Hikari Tsushin, Inc. | 655,499 |
| 72,200 | | HOYA Corp. | 1,753,644 |
| 34,400 | | IT Holdings Corp. | 458,441 |
| 143,000 | | Itoham Foods, Inc. | 514,300 |
| 9,568 | | Keyence Corp. | 2,771,762 |
| 25,700 | | Kissei Pharmaceutical Co., Ltd. | 505,200 |
| 216,000 | | Kubota Corp. | 2,045,868 |
| 79,900 | | Makita Corp. | 3,267,250 |
| 38,500 | | Sanei-International Co., Ltd. | 492,216 |
| 64,200 | | Showa Shell Sekiyu K.K. | 588,309 |
| 12,300 | | SMC Corp. | 2,107,316 |
| 7,510 | | USS Co., Ltd. | 614,194 |
| 21,700 | | Xebio Co., Ltd. | 469,601 |
| 33,790 | | Yamada Denki Co., Ltd. | 2,305,661 |
| | | | 25,400,094 |
| | | Luxembourg - 1.60% | |
| 41,051 | | AZ Electronic Materials S.A. * | 198,408 |
| 20,262 | | Millicom International Cellular S.A. | 1,937,047 |
| | | | 2,135,455 |
| | | Netherlands - 2.80% | |
| 1,016,481 | | Jubilant Energy N.V. * | 1,053,889 |
| 50,644 | | Randstad Holding N.V. * | 2,673,185 |
| | | | 3,727,074 |
| | | Singapore - 8.91% | |
| 185,000 | | DBS Group Holdings, Ltd. | 2,064,285 |
| 404,000 | | Keppel Corp., Ltd. | 3,563,549 |
| 1,827,000 | | Mapletree Industrial Trust * | 1,551,743 |
| 760,000 | | Overseas Union | |
| | | Enterprise, Ltd. | 1,948,338 |
| 573,000 | | SC Global Developments, Ltd. | 741,170 |
| 1,380,000 | | Tiger Airways Holdings, Ltd. * | 2,000,078 |
| | | | 11,869,163 |
| | | Spain - 2.10% | |
| 123,455 | | Telefonica S.A. | 2,798,765 |
See Notes to Financial Statements.
4
| | |
| Henderson Global Funds | Portfolio of Investments |
International All Cap Equity Fund
December 31, 2010 (continued)
| | | | |
| | | | Value |
| Shares | | | (note 2) |
| | | Sweden - 0.70% | |
| 80,041 | | Telefonaktiebolaget | |
| | | LM Ericsson, B Shares | $ 930,052 |
| | | | |
| | | Switzerland - 8.54% | |
| 127,997 | | ABB, Ltd. * | 2,851,527 |
| 48,566 | | Compagnie Financiere | |
| | | Richemont S.A. | 2,856,823 |
| 52,540 | | Credit Suisse Group AG | 2,116,772 |
| 9,440 | | Roche Holding AG | 1,383,187 |
| 1,294 | | SGS S.A. | 2,171,429 |
| | | | 11,379,738 |
| | | Taiwan - 0.96% | |
| 70,005 | | Epistar Corp., | |
| | | GDR (a) (b) | 1,278,537 |
| | | | |
| | | United Kingdom - 22.75% | |
| 45,292 | | Autonomy Corp., plc * | 1,062,752 |
| 526,149 | | Barclays plc | 2,146,363 |
| 191,925 | | Cairn Energy plc * | 1,256,767 |
| 362,749 | | Eros International plc * | 1,269,686 |
| 380,853 | | Essar Energy plc * | 3,443,968 |
| 338,544 | | International Power plc | 2,309,756 |
| 60,641 | | Rio Tinto plc | 4,241,776 |
| 187,444 | | Serco Group plc | 1,623,414 |
| 97,129 | | Shire plc | 2,336,623 |
| 81,098 | | Spectris plc | 1,657,626 |
| 536,139 | | Tesco plc | 3,552,549 |
| 124,433 | | Unilever plc | 3,808,287 |
| 41,063 | | Vedanta Resources plc | 1,611,416 |
| | | | 30,320,983 |
| | | Total Common Stock | $127,646,656 |
| | | (Cost $111,710,855) | |
| | | | |
| | | | Value |
| Shares | | | (note 2) |
| Preferred Stock - 2.16% | | | |
| | | Germany - 2.16% | |
| 33,655 | | Fresenius SE | $ 2,881,431 |
| | | | |
| | | Total Preferred Stock | 2,881,431 |
| | | (Cost $2,518,752) | |
| | | | |
| | | Total Long Term | |
| | | Investments | 130,528,087 |
| | | (Cost $114,229,607) | |
| Short Term Investment - 6.22% | |
| 8,284,355 | | Fidelity Institutional | |
| | | Treasury Portfolio | 8,284,355 |
| | | | |
| | | Total Short Term | |
| | | Investment | 8,284,355 |
| | | (Cost $8,284,355) | |
| Total Investments - 104.17% | 138,812,442 |
| | | (Cost $122,513,962) | |
| Net Other Assets and | |
| | | Liabilities – (4.17)% | (5,559,732) |
| Total Net Assets – 100.00% | $133,252,710 |
| * | Non income producing security |
| (a) | Fair valued at December 31, 2010 as determined in good faith using procedures adopted by Board of Trustees. |
| (b) | Restricted security, purchased under Rule 144A, section 4(2)g which is exempt registration under the securities Act of 1933 as amended. At December 31, 2010 the securities had an aggregate value of $1,278,537, which represents 0.96% of net assets. |
| ADR | American Depositary Receipts |
| GDR | Global Depositary Receipts |
See Notes to Financial Statements.
5
| | |
| Henderson Global Funds | Portfolio of Investments |
International All Cap Equity Fund
| December 31, 2010 (continued) | | | |
| Other Information: | | | |
| | | | |
| Industry concentration as | | % of Net | |
| a percentage of net assets: | | Assets | |
| Diversified Banks | | | 6.76 | % |
| Industrial Machinery | | | 5.15 | |
| Pharmaceuticals | | | 4.74 | |
| Diversified Metals & Mining | | | 4.39 | |
| Oil & Gas Exploration & Production | | | 4.32 | |
| Apparel, Accessories & Luxury Goods | | | 4.11 | |
| Industrial Conglomerates | | | 3.63 | |
| Oil & Gas Equipment & Services | | | 3.47 | |
| Electronic Equipment & Instruments | | | 3.32 | |
| Packaged Foods & Meats | | | 3.25 | |
| Construction & Farm Machinery & | | | | |
| Heavy Trucks | | | 2.90 | |
| Casinos & Gaming | | | 2.82 | |
| Food Retail | | | 2.67 | |
| Computer & Electronics Retail | | | 2.22 | |
| Office Electronics | | | 2.22 | |
| Health Care Equipment | | | 2.16 | |
| Heavy Electrical Equipment | | | 2.14 | |
| Integrated Oil & Gas | | | 2.13 | |
| Integrated Telecommunication Services | | | 2.10 | |
| Investment Banking & Brokerage | | | 2.03 | |
| Human Resource & Employment Services | | | 2.01 | |
| Hotels, Resorts & Cruise Lines | | | 1.96 | |
| Independent Power Producers & Energy Traders | | | 1.73 | |
| Research & Consulting Services | | | 1.63 | |
| Diversified Capital Markets | | | 1.59 | |
| Construction & Engineering | | | 1.57 | |
| Communications Equipment | | | 1.56 | |
| | | | |
| Industry concentration as | | % of Net | |
| a percentage of net assets: | | Assets | |
| Airlines | | | 1.50 | % |
| Wireless Telecommunication Services | | | 1.45 | |
| Electronic Components | | | 1.32 | |
| Life & Health Insurance | | | 1.26 | |
| Environmental & Facilities Services | | | 1.22 | |
| Industrial REITs | | | 1.17 | |
| Tires & Rubber | | | 1.15 | |
| Restaurants | | | 1.15 | |
| Automobile Manufacturers | | | 1.03 | |
| Movies & Entertainment | | | 0.95 | |
| Industrial Gases | | | 0.88 | |
| Life Sciences Tools & Services | | | 0.87 | |
| Data Processing & Outsourced Services | | | 0.85 | |
| Application Software | | | 0.80 | |
| Regional Banks | | | 0.62 | |
| Real Estate Development | | | 0.56 | |
| Automotive Retail | | | 0.46 | |
| Coal & Consumable Fuels | | | 0.46 | |
| Oil & Gas Refining & Marketing | | | 0.44 | |
| Drug Retail | | | 0.39 | |
| Specialty Stores | | | 0.35 | |
| IT Consulting & Other Services | | | 0.34 | |
| Semiconductor Equipment | | | 0.15 | |
| Long Term Investments | | | 97.95 | |
| Short Term Investment | | | 6.22 | |
| Total Investments | | | 104.17 | |
| Net Other Assets and Liabilities | | | (4.17 | ) |
| | | | 100.00 | % |
See Notes to Financial Statements.
6
| | |
| Henderson Global Funds | Financial Statements |
Statement of Assets and Liabilities
December 31, 2010
| | | | |
| | | International | |
| | | All Cap | |
| | | Equity Fund | |
| ASSETS: | | | |
| Investments, at value | | | |
| Securities | | $ | 130,528,087 | |
| Short term investments | | | 8,284,355 | |
| Total investments, at value | | | 138,812,442 | |
| Foreign cash, at value | | | 21 | |
| Dividends and interest receivable | | | 152,306 | |
| Receivable for fund shares sold | | | 135,800 | |
| Prepaid expenses and other assets | | | 44,520 | |
| Total Assets | | | 139,145,089 | |
| LIABILITIES: | | | | |
| Payable for investment securities purchased | | | 5,660,782 | |
| Payable for fund shares redeemed | | | 90,098 | |
| Payable to investment adviser | | | 88,828 | |
| Accrued expenses and other payables | | | 52,671 | |
| Total Liabilities | | | 5,892,379 | |
| NET ASSETS | | $ | 133,252,710 | |
| NET ASSETS consist of: | | | | |
| Paid-in capital | | $ | 117,580,510 | |
| Accumulated undistributed net investment loss | | | (700,065 | ) |
| Accumulated net realized gain on investments and foreign currency transactions | | | 82,212 | |
| Net unrealized appreciation of investments and foreign currencies | | | 16,290,053 | |
| | | $ | 133,252,710 | |
| NET ASSETS: | | | | |
| Class A Shares | | $ | 10,000 | |
| Class C Shares | | $ | 10,000 | |
| Class I Shares | | $ | 133,232,710 | |
| SHARES OUTSTANDING: | | | | |
| Class A Shares (unlimited number of shares authorized) | | | 1,125 | |
| Class C Shares (unlimited number of shares authorized) | | | 1,125 | |
| Class I Shares (unlimited number of shares authorized) | | | 14,981,216 | |
| CLASS A SHARES: | | | | |
| Net asset value and redemption price per share | | $ | 8.89 | |
| Maximum sales charge * | | | 5.75 | % |
| Maximum offering price per share | | $ | 9.43 | |
| CLASS C SHARES: | | | | |
| Net asset value and offering price per share | | $ | 8.89 | |
| CLASS I SHARES: | | | | |
| Net asset value and offering price per share | | $ | 8.89 | |
| Investments, at cost | | $ | 122,513,962 | |
| Foreign cash, at cost | | $ | 21 | |
See Notes to Financial Statements.
7
| | |
| Henderson Global Funds | Financial Statements |
Statement of Operations
For the Year Ended December 31, 2010
| | | | |
| | | International | |
| | | All Cap | |
| | | Equity Fund | |
| INVESTMENT INCOME: | | | |
| Dividends | | $ | 1,559,817 | |
| Foreign taxes withheld | | | (120,546 | ) |
| Total Investment Income | | | 1,439,271 | |
| EXPENSES: | | | | |
| Investment advisory fees | | | 770,772 | |
| Custodian fees | | | 60,968 | |
| Accounting fees | | | 49,685 | |
| Audit fees | | | 36,587 | |
| Registration and filing fees | | | 26,289 | |
| Administrative fees | | | 24,018 | |
| Printing and postage fees | | | 17,484 | |
| Legal fees | | | 13,213 | |
| Transfer agent fees | | | 9,421 | |
| Trustees’ fees and expenses | | | 4,376 | |
| Compliance Officer fees | | | 3,187 | |
| Miscellaneous fees | | | 14,137 | |
| Total Expenses | | | 1,030,137 | |
| Fees waived and expenses reimbursed by investment adviser | | | (36,539 | ) |
| Net Expenses | | | 993,598 | |
| NET INVESTMENT INCOME | | | 445,673 | |
| NET REALIZED AND UNREALIZED GAIN/(LOSS): | | | | |
| Net realized gain (loss) from : | | | | |
| Investment transactions | | | 2,567,377 | |
| Foreign currency transactions | | | (107,864 | ) |
| Net change in unrealized appreciation (depreciation) of: | | | | |
| Investments | | | 12,150,053 | |
| Translation of other assets and liabilities | | | (6,490 | ) |
| Net Realized and Unrealized Gain | | | 14,603,076 | |
| NET INCREASE IN NET ASSETS RESULTING FROM OPERATIONS | | $ | 15,048,749 | |
See Notes to Financial Statements.
8
| | |
| Henderson Global Funds | Financial Statements |
Statement of Changes in Net Assets
International All Cap Equity Fund
| | | | | | | |
| | | Year Ended | | | Year Ended | |
| | | December 31, | | | December 31, | |
| | | 2010 | | | 2009 | |
| Net investment income | | $ | 445,673 | | | $ | 5,878 | |
| Net realized gain (loss) on investments and foreign currency transactions | | | 2,459,513 | | | | (777,368 | ) |
| Net change in unrealized appreciation of investments and foreign | | | | | | | | |
| currency translations | | | 12,143,563 | | | | 4,890,388 | |
| Net increase in net assets resulting from operations | | | 15,048,749 | | | | 4,118,898 | |
| Distributions to shareholders from net investment income: | | | | | | | | |
| Class I Shares | | | (1,175,408 | ) | | | (54,276 | ) |
| | | | (1,175,408 | ) | | | (54,276 | ) |
| Net increase in Fund share transactions: | | | | | | | | |
| Class A Shares * | | | 10,000 | | | | — | |
| Class C Shares * | | | 10,000 | | | | — | |
| Class I Shares | | | 49,857,938 | | | | 63,658,147 | |
| | | | 49,877,938 | | | | 63,658,147 | |
| Net increase in net assets | | | 63,751,279 | | | | 67,722,769 | |
| NET ASSETS: | | | | | | | | |
| Beginning of year | | | 69,501,431 | | | | 1,778,662 | |
| End of year | | $ | 133,252,710 | | | $ | 69,501,431 | |
| Accumulated undistributed net investment loss | | $ | (700,065 | ) | | $ | (69,124 | ) |
| | | | | | | | | |
| * Inception date for Class A & Class C Shares was December 31, 2010. | | | | | | | | |
See Notes to Financial Statements.
9
| | |
| Henderson Global Funds | Financial Statements |
Statement of Changes - Capital Stock Activity
International All Cap Equity Fund
| | | | | | | |
| | | Year Ended | | | Year Ended | |
| | | December 31, | | | December 31, | |
| | | 2010 | | | 2009 | |
| Amount | | | | | | |
| Class A Shares: * | | | | | | |
| Sold | | $ | 10,000 | | | $ | — | |
| Net increase | | $ | 10,000 | | | $ | — | |
| Class C Shares: * | | | | | | | | |
| Sold | | $ | 10,000 | | | $ | — | |
| Net increase | | $ | 10,000 | | | $ | — | |
| Class I Shares: | | | | | | | | |
| Sold | | $ | 56,629,019 | | | $ | 64,595,673 | |
| Issued as reinvestment of dividends | | | 521,616 | | | | 24,296 | |
| Redeemed | | | (7,292,697 | ) | | | (961,822 | )** |
| Net increase | | $ | 49,857,938 | | | $ | 63,658,147 | |
| Shares | | | | | | | | |
| Class A Shares: * | | | | | | | | |
| Sold | | | 1,125 | | | | — | |
| Net increase | | | 1,125 | | | | — | |
| Class C Shares: * | | | | | | | | |
| Sold | | | 1,125 | | | | — | |
| Net increase | | | 1,125 | | | | — | |
| Class I Shares: | | | | | | | | |
| Sold | | | 6,989,101 | | | | 8,625,861 | |
| Issued as reinvestment of dividends | | | 58,940 | | | | 3,079 | |
| Redeemed | | | (879,196 | ) | | | (130,288 | ) |
| Net increase | | | 6,168,845 | | | | 8,498,652 | |
| * | Inception date for Class A & Class C Shares was December 31, 2010. |
| ** | Amounts shown are inclusive of redemption fees. |
See Notes to Financial Statements.
10
| | |
| Henderson Global Funds | Financial Highlights |
For a Share Outstanding Throughout the Periods Indicated
| | | | | | | | | | | | | | | | | | | | | | |
| | | | | | Income (loss) from investment operations: | | | Less distributions: | |
| | | | | | | | | Net | | | | | | Dividends | | | Distributions | | | | |
| | | Net asset | | | | | | realized and | | | Total | | | from | | | from net | | | | |
| | | value, | | | Net | | | unrealized gain | | | from | | | net | | | realized | | | | |
| | | beginning | | | investment | | | (loss) on | | | investment | | | investment | | | capital | | | Total | |
| | | of period | | | income | | | investments | | | operations | | | income | | | gains | | | distributions | |
| International All Cap Equity Fund | | | | | | | | | | | | | | | | | | | |
| Class A | | | | | | | | | | | | | | | | | | | | | |
| Period Ended 12/31/2010(a) | | $ | 8.89 | | | | 0.00 | | | | 0.00 | | | | 0.00 | | | | 0.00 | | | | 0.00 | | | | 0.00 | |
| Class C | | | | | | | | | | | | | | | | | | | | | | | | | | | | |
| Period Ended 12/31/2010(a) | | $ | 8.89 | | | | 0.00 | | | | 0.00 | | | | 0.00 | | | | 0.00 | | | | 0.00 | | | | 0.00 | |
| Class I | | | | | | | | | | | | | | | | | | | | | | | | | | | | |
| Year Ended 12/31/2010 | | $ | 7.89 | | | | 0.04 | (c) | | | 1.04 | | | | 1.08 | | | | (0.08 | ) | | | 0.00 | | | | (0.08 | ) |
| Year Ended 12/31/2009 | | | 5.67 | | | | 0.00 | *(c) | | | 2.23 | | | | 2.23 | | | | (0.01 | ) | | | 0.00 | | | | (0.01 | ) |
| Period Ended 12/31/2008(b) | | | 10.00 | | | | 0.11 | (c) | | | (4.13 | ) | | | (4.02 | ) | | | (0.31 | ) | | | 0.00 | | | | (0.31 | ) |
| (a) | Inception date for Class A & Class C shares was December 31, 2010. |
| (b) | The Fund commenced operations on January 31, 2008. |
| (c) | Per share data was calculated using average shares outstanding during the period. |
| (d) | Total returns are historical and assume changes in share price, reinvestment of all dividends and distributions and no sales charge. Had certain expenses not been reduced during the periods shown, total returns would have been lower. Total returns for periods of less than one year are not annualized. |
| * | Amount represents less than $0.01. |
See Notes to Financial Statements.
11
| | |
| Henderson Global Funds | Financial Highlights |
| | | | | | | | | | | | | | | | | | | | | | | |
| | | | | | | | | | | | | Ratios to average net assets: | | | | |
| | | | | | | | | | | | | | | | | | | Annualized ratio of | | | | |
| | | | | | | | | | | | | Annualized | | | Annualized | | | operating expenses | | | | |
| | | | | | | | | | | | | ratio of | | | ratio of | | | to average net | | | | |
| | | | Net asset | | | | | | Net assets, | | | operating | | | net investment | | | assets without | | | | |
| | | | value, | | | | | | end of | | | expenses to | | | income/(loss) | | | waivers and/or | | | Portfolio | |
| Redemption | | | end of | | | Total | | | period | | | average | | | to average | | | expenses | | | turnover | |
| fees | | | period | | | return (d) | | | | (000) | | | net assets | | | net assets | | | reimbursed | | | rate | |
| | 0.00 | | | $ | 8.89 | | | | 0.00 | % | | $ | 10 | | | | 0.00 | % | | | 0.00 | % | | | 0.00 | % | | | 57 | % |
| | 0.00 | | | $ | 8.89 | | | | 0.00 | % | | $ | 10 | | | | 0.00 | % | | | 0.00 | % | | | 0.00 | % | | | 57 | % |
| | 0.00 | | | $ | 8.89 | | | | 13.74 | % | | $ | 133,233 | | | | 1.10 | % | | | 0.49 | % | | | 1.14 | % | | | 57 | % |
| | 0.00 | * | | | 7.89 | | | | 39.26 | | | | 69,501 | | | | 1.15 | | | | 0.03 | | | | 2.31 | | | | 64 | |
| | 0.00 | | | | 5.67 | | | | (40.15 | ) | | | 1,779 | | | | 1.15 | | | | 1.36 | | | | 6.40 | | | | 114 | |
See Notes to Financial Statements.
12
| | |
| Henderson Global Funds | Notes to Financial Statements |
Note 1. Organization
Henderson Global Funds (the “Trust”) was organized on May 11, 2001 as a Delaware business trust and is registered under the Investment Company Act of 1940, as amended (the “1940 Act”), as an open-end management investment company. The Trust has an unlimited number of authorized shares that are divided among ten series of the Trust: Henderson Emerging Market Opportunities Fund, Henderson European Focus Fund, Henderson Global Equity Income Fund, Henderson Global Opportunities Fund, Henderson Global Technology Fund, Henderson International Opportunities Fund and Henderson Japan-Asia Focus Fund are not included in this report because their fiscal year end is July 31. Henderson Money Market Fund and Henderson Worldwide Income Fund are included in a separate shareholder report and have fiscal years ending December 31. The Henderson International All Cap Equity Fund (formerly known as “International Equity”) (the “Fund”) is the only series included in this report and has a fiscal year ending December 31. The Fund is non-diversified and offers Class A, Class C and Class I shares. Effective December 31, 2010 the Fund’s name changed from Henderson International Equity Fund to Henderson International All Cap Equity Fund and is authorized to offer Class A shares and Class C shares. Class A shares generally provide for a front-end sales charge and Class C shares provide for a contingent deferred sales charge.
Each class of shares has exclusive voting rights with respect to matters that affect just that class. Income, expenses (other than expenses attributable to a specific class), and realized and unrealized gains and losses on investments are allocated to each class of shares based on its relative net assets.
Note 2. Significant Accounting Policies
Security Valuation
Securities traded on a recognized exchange or market are generally valued at the last reported sale price or at the official closing price. Listed securities for which no sale was reported on that date and other securities traded in the over-the-counter market are valued at the mean between the last bid and asked prices.
Debt securities are valued at the last sales price or market value by independent pricing services approved by the Trustees of the Trust. If the pricing services are unable to provide valuations, the securities are valued at the mean between the last bid and asked prices or if no ask is available, then the last bid price obtained from one or more broker dealers. Such pricing services may use various pricing techniques, which take into account appropriate factors such as yield, quality, coupon rate, maturity, type of issue, trading characteristics and other data, as well as broker quotes.
Short-term investments purchased with an original or remaining maturity of 60 days or less are valued at amortized cost, which approximates market value.
Investments in Registered Investment Companies are valued at NAV which approximates fair market value.
If market quotations are not readily available, or if the investment adviser determines that a quotation of a security does not represent a fair value, then the security is valued at a fair value as determined in good faith using procedures approved by the Trustees of the Trust. The Trustees of the Trust, or its designee, may also establish fair value using a wide variety of market data including yields or prices of investments of comparable quality, type of issue, coupon, maturity and rating, market quotes or indications of value from security dealers, evaluations of anticipated cash flows or collateral, general market conditions and other information and analysis, including the obligor’s credit characteristics considered relevant. The Trust has retained an independent statistical fair value pricing service to assist in the fair valuation process for securities principally traded in a foreign market in order to adjust for possible changes in value that may occur between the close of the foreign exchange and the time at which the Fund shares are priced. If a security is valued at a “fair value”, that value may be different from the last quoted market price for the security. As a result, it is possible that fair value prices will be used by the Fund.
Various inputs are used in determining the value of the Fund’s investments. The Fund established a three-tier hierarchy of inputs to establish classification of fair value measurements for disclosure purposes. These inputs may be observable or unobservable. Observable inputs are inputs that reflect the assumptions market participants would use in pricing the asset or liability developed based on market data obtained from sources independent of the reporting entity. Unobservable inputs are inputs that reflect the reporting entity’s own assumptions about the assumptions market participants would use in pricing the asset or liability developed based on the best information available under the circumstances. The inputs used for valuing securities are not necessarily an indication of the risk associated with investing in those securities. The three-tier hierarchy of inputs is summarized in the three broad levels listed below.
| · | Level 1 – quoted prices in active markets for identical investments |
| · | Level 2 – other significant observable inputs (including quoted prices for similar investments, interest rates, prepayment speeds, credit risk, etc.) |
| · | Level 3 – significant unobservable inputs (including the management’s own assumptions in determining the fair value of investments) |
On January 21, 2010, the Financial Accounting Standards Board (“FASB”) issued an Accounting Standards Update
13
| | |
| Henderson Global Funds | Notes to Financial Statements |
(“ASU”), Fair Value Measurements and Disclosures – Accounting Standards Codification 820 (“ASC 820”): Improving Disclosures about Fair Value Measurements which provides guidance on how investment assets and liabilities are to be valued and disclosed. Specifically, the amendment requires reporting entities to disclose: i) the input and valuation techniques used to measure fair value for both recurring and nonrecurring fair value measurements, for Level 2 or Level 3 positions: ii) transfers between all levels (including Level 1 and Level 2) will be required to be disclosed on a gross basis (i.e. transfers out must be disclosed separately from transfers in) as well as the reason(s) for the transfer and iii) purchases, sales, issuances and settlements must be shown on a gross basis in the Level 3 rollforward rather than as one net number. The effective date of the amendment is for interim and annual periods beginning after December 15, 2009 however, the requirement to provide the Level 3 activity for purchases, sales, issuances and settlements on a gross basis will be effective for interim and annual periods beginning after December 15, 2010. Fund management has implemented part (i) and (ii) and is evaluating the implications of part (iii) of ASC 820 and the impact to the financial statements.
The following is a summary of the inputs used as of December 31, 2010 in valuing the Fund’s investments carried at value:
| | | | | | | | | | | | | |
| | | Quoted Prices | | | Significant | | | | | | | |
| | | in Active | | | Other | | | Significant | | | | |
| | | Markets for | | | Observable | | | Unobservable | | | | |
| | | Identical Assets | | | Inputs | | | Inputs | | | | |
| Description | | (Level 1) | | | (Level 2) | | | (Level 3) | | | Total | |
| Common Stocks | | | | | | | | | | | | |
| Austria | | $ | 2,718,080 | | | $ | — | | | $ | — | | | $ | 2,718,080 | |
| Belgium | | | 1,139,996 | | | | — | | | | — | | | | 1,139,996 | |
| Brazil | | | 4,050,082 | | | | — | | | | — | | | | 4,050,082 | |
| China | | | 7,994,641 | | | | — | | | | — | | | | 7,994,641 | |
| France | | | 1,535,075 | | | | — | | | | — | | | | 1,535,075 | |
| Germany | | | 4,387,106 | | | | — | | | | — | | | | 4,387,106 | |
| Hong Kong | | | 5,892,142 | | | | — | | | | — | | | | 5,892,142 | |
| India | | | 1,083,136 | | | | — | | | | — | | | | 1,083,136 | |
| Indonesia | | | 611,329 | | | | — | | | | — | | | | 611,329 | |
| Israel | | | 2,093,124 | | | | — | | | | — | | | | 2,093,124 | |
| Italy | | | 6,302,084 | | | | — | | | | — | | | | 6,302,084 | |
| Japan | | | 25,400,094 | | | | — | | | | — | | | | 25,400,094 | |
| Luxembourg | | | 2,135,455 | | | | — | | | | — | | | | 2,135,455 | |
| Netherlands | | | 3,727,074 | | | | — | | | | — | | | | 3,727,074 | |
| Singapore | | | 11,869,163 | | | | — | | | | — | | | | 11,869,163 | |
| Spain | | | 2,798,765 | | | | — | | | | — | | | | 2,798,765 | |
| Sweden | | | 930,052 | | | | — | | | | — | | | | 930,052 | |
| Switzerland | | | 11,379,738 | | | | — | | | | — | | | | 11,379,738 | |
| Taiwan | | | — | | | | 1,278,537 | | | | — | | | | 1,278,537 | |
| United Kingdom | | | 30,320,983 | | | | — | | | | — | | | | 30,320,983 | |
| Total Common Stock | | | 126,368,119 | | | | 1,278,537 | | | | — | | | | 127,646,656 | |
| Preferred Stock | | | | | | | | | | | | | | | | |
| Germany | | | 2,881,431 | | | | — | | | | — | | | | 2,881,431 | |
| Total Preferred Stock | | | 2,881,431 | | | | — | | | | — | | | | 2,881,431 | |
| Short Term Investment | | | 8,284,355 | | | | — | | | | — | | | | 8,284,355 | |
| Total | | $ | 137,533,905 | | | $ | 1,278,537 | | | $ | — | | | $ | 138,812,442 | |
During the year ended December 31, 2010, there were no transfers in or out of security levels as a result of the fair value pricing procedures utilized by the Fund.
14
| | |
| Henderson Global Funds | Notes to Financial Statements |
Security Transactions and Investment Income
Investment transactions are accounted for on trade date basis. Interest income is recorded on an accrual basis. Dividend income is recorded on the ex-dividend date. Bond premium is amortized and discount is accreted over the expected life of each applicable security. Corporate actions involving foreign securities, including dividends, are recorded as soon as the information becomes available. Withholding taxes on foreign dividends are accrued in accordance with the applicable country’s tax rules and rates. Securities gains and losses are determined on the identified cost basis, which is the same basis used for federal income tax purposes.
Foreign Currency Translation
Investment securities and other assets and liabilities denominated in foreign currencies are translated into U.S. dollar amounts at the date of valuation. Purchases and sales of investment securities and income and expense items denominated in foreign currencies are translated into U.S. dollar amounts on the respective dates of such transactions.
The Fund does not isolate that portion of the results of operations resulting from changes in foreign exchange rates on investments from the fluctuations arising from changes in market prices of securities held. Such fluctuations are included with the net realized and unrealized gain or loss from investments on the Statement of Operations.
Reported net realized foreign exchange gains or losses arise from sales of foreign currencies, currency gains or losses realized between the trade date and settlement date on securities transactions, and the difference between the amounts of dividends, interest, and foreign withholding taxes recorded on the Fund’s books and the U.S. dollar equivalent of the amounts actually received or paid. Net unrealized foreign exchange gains and losses arise from changes in the fair values of assets and liabilities, other than investments in securities at fiscal period end, resulting from changes in exchange rates.
Indemnifications
Under the Trust’s organizational documents, its Officers and Trustees are indemnified against certain liabilities arising out of the performance of their duties to the Trust. In addition, in the normal course of business the Trust enters into contracts that provide general indemnifications to other parties. The Trust’s maximum exposure under these arrangements is unknown as this would involve future claims that may be made against the Trust that have not yet been asserted.
Use of Estimates
The preparation of financial statements, in conformity with United States generally accepted accounting principles, requires management to make estimates and assumptions that affect the reported amounts and disclosures in the financial statements. Actual results may differ from those estimates.
Expenses
Expenses are recorded on an accrual basis. Expenses of the Trust that are directly attributable to the Fund are charged to the Fund. Other expenses are allocated proportionately among each series of the Trust based on average daily net assets or on another reasonable basis.
Federal Income Taxes
The Trust’s policy is that the Fund continues to comply with the requirements of Subchapter M of the Internal Revenue Code of 1986 that are applicable to regulated investment companies and to distribute substantially all its taxable income to shareholders. Therefore, no federal income tax provision is required. Management has concluded that there are no significant uncertain tax positions that would require recognition in the financial statements. Management of the Fund is not aware of any tax positions for which it is reasonably possible that the total amount of unrecognized tax benefits will significantly change in the next twelve months. The Fund intends to file tax returns with the U.S. Internal Revenue Service and various states. Generally, the tax authorities can examine all tax returns filed for the last three years.
The Fund intends to utilize provisions of the federal income tax laws which allow it to carry a realized capital loss forward for eight years following the year of loss and offset such losses against any future realized capital gains. During the year ended December 31, 2010 the Fund utilized $1,855,254 in capital loss carryforwards.
Distributions to Shareholders
Distributions to shareholders are recorded on the ex-dividend date. Distributions from net investment income and net realized capital gains are determined in accordance with federal income tax regulations, which may differ from United States generally accepted accounting principles. These book/tax differences are either temporary or permanent in nature. To the extent these differences are permanent, they are reclassified within the capital accounts based on their federal tax-basis treatment.
Accordingly, at December 31, 2010, the Fund reclassified the following amounts between paid-in capital, undistributed
15
| | |
| Henderson Global Funds | Notes to Financial Statements |
net investment income (loss) and accumulated net realized gain (loss):
| | | | |
| | | Accumulated | |
| | | undistributed | Accumulated |
| | | net | net |
| | Paid-in | investment | realized |
| | capital | income (loss) | gain (loss) |
| International | | | |
| All Cap Equity | | | |
| Fund | $(9,826) | $98,794 | $(88,968) |
These reclassifications relate to the deductibility of certain expenses and the character of realized gain/losses on foreign currency transactions and PFIC transactions for tax purposes and had no impact on the net asset value of the Fund.
The tax character of distributions paid during the year ended December 31, 2009 and December 31, 2010 were as follows:
| Year ended | Ordinary |
| December 31, 2009 | income |
| International All Cap Equity Fund | $54,279 |
| | |
| Year ended | Ordinary |
| December 31, 2010 | income |
| International All Cap Equity Fund | $1,175,408 |
As of December 31, 2010, the components of distributable earnings on a tax basis were as follows:
| | | Undistributed | |
| | Undistributed | long-term | Unrealized |
| | ordinary | capital | appreciation |
| | income | gain | (depreciation) |
| International | | | |
| All Cap | | | |
| Equity Fund | $135,818 | $164,722 | $15,373,579 |
Ordinary income and net realized gains/losses may differ for book and tax basis reporting purposes due to post-October losses, which are not recognized for tax purposes until the first day of the following fiscal year, tax deferral on wash sales and PFIC transactions.
Note 3. Investment Advisory Fees and Other Transactions with Affiliates
Pursuant to an Investment Advisory Agreement, Henderson Global Investors (North America) Inc. (“HGINA”) acts as the Fund’s investment adviser. HGINA is an indirect wholly owned subsidiary of Henderson Group plc. HGINA supervises the investments of the Fund and receives a management fee for such services, based on the Fund’s average daily net assets as set forth below.
| | | |
| International Equity | First $250 million | 0.85% |
| All Cap Fund | Next $250 million | 0.80% |
| | Next $500 million | 0.75% |
| | Over $1 billion | 0.65% |
Pursuant to a separate contractual Expense Limitation Agreement, HGINA has agreed to waive or limit its advisory fee and, if necessary, to reimburse other operating expenses of the Fund in order to limit total annual expenses, less distribution and service fees, to 1.15% of average daily net assets. This agreement is effective through July 31, 2020. Under the Expense Limitation Agreements, the annual expense limit including distribution and service fees as a percentage of average daily net assets was as follows:
| | | | |
| | Class A | Class C | Class I |
| International Equity | | | |
| All Cap Fund | 1.40% | 2.15% | 1.15% |
Henderson Investment Management Limited (“HIML”) is the sub-adviser for the Fund pursuant to a Sub-Advisory Agreement. HIML is also an indirect wholly owned subsidiary of Henderson Group plc.
HIML receives a fee for its services, paid by HGINA from its management fee, based on the Fund’s average daily net assets as set forth below:
| | | |
| International All Cap | First $250 million | 0.35% |
| Equity Fund | Next $250 million | 0.30% |
| | Next $500 million | 0.25% |
| | Over $1 billion | 0.20% |
At December 31, 2010, HGINA owned the following number of shares and total percentage of ownership of the Fund:
| | Shares | % |
| International All Cap Equity Fund | 106,630 | 0.71% |
Note 4. Compensation of Trustees and Officers
Certain officers and trustees of the Trust are also officers of HGINA. None of the Trust’s officers, other than the compliance officers are compensated by the Trust. The Trust makes no direct payment to trustees affiliated with HGINA. Fees paid to Trustees are reflected as Trustees’ fees and expenses in the Statements of Operations.
The Fund bears a portion of the compensation paid to the compliance officers who perform services for the Trust. This
16
| | |
| Henderson Global Funds | Notes to Financial Statements |
compensation is reflected as Compliance Officer Fees in the Statement of Operations.
Note 5. Distribution
The Trust has adopted a distribution plan for Class A and Class C shares of the Funds in accordance with Rule 12b-1 under the 1940 Act (the “12b-1 Plan”). Under the 12b-1 Plan, the Fund pays the distributor an annual fee of 0.25% of the average daily net assets attributable to its Class A shares, and an annual fee of 1.00% of the average daily net assets attributable to its Class C shares. The 12b-1 Plan is used to induce or compensate financial intermediaries (including brokerage firms, depository institutions and other firms) to provide distribution and/or services to the Fund and its shareholders.
Note 6. Investment Transactions
Purchases and sales of investment securities, excluding short-term investments and U.S. government securities, for the Fund during the year ended December 31, 2010, were as follows:
| | Purchases | Sales |
| International All Cap | | |
| Equity Fund | $99,691,453 | $50,872,059 |
The U.S. federal income tax basis of the Fund’s investments excluding foreign currency and foreign currency contracts at December 31, 2010, and the gross unrealized appreciation and depreciation, were as follows:
| | | International | |
| | | Equity | |
| Cost | | $ | 123,413,425 | |
| Gross unrealized appreciation | | | 17,330,027 | |
| Gross unrealized depreciation | | | (1,931,010 | ) |
| Net unrealized depreciation | | | 15,399,017 | |
Identified cost may differ for book and tax basis reporting purposes primarily due to tax deferral of losses on wash sales, PFIC transactions and amortization of premiums reflected as of December 31, 2010.
Note 7. Significant Concentrations
The Fund invests a substantial percentage of its assets in securities of foreign issuers. These investments may involve certain considerations and risks not typically associated with investments in the United States as a result of, among other factors, the possibility of future political and economic developments and the level of governmental supervision and regulation of securities markets in the respective countries. Some countries in which the Fund invests may require government approval for repatriation of investment income, capital or the proceeds for sales of securities by foreign investors. In addition, if there is deterioration in a country’s balance of payments or for other reasons, a country may impose temporary restrictions on foreign capital remittances abroad. In addition, changes in currency exchange rates will affect the value of investments denominated in a foreign currency, as well as investment income derived from those securities.
The Fund may invest a high percentage of its net assets in specific sectors of the market in order to achieve a potentially greater investment return. As a result, the economic, political and regulatory developments in a particular sector of the market, positive or negative, have a greater impact on a Fund’s net assets and will cause the value of its shares to fluctuate more than if the Fund did not concentrate its investments in a particular sector.
Note 8. Borrowing Arrangements
The Trust has a $100 million credit facility that was entered on June 25, 2010 to facilitate portfolio liquidity. Interest is charged to each participating fund based on its borrowings at a rate per annum equal to the Federal Funds rate plus 1.25%. In addition, a commitment fee of 0.125% per annum is accrued and apportioned among the participating funds. The commitment fee is included in Miscellaneous fees on the Statement of Operations. No amounts were borrowed under this facility during the year ended December 31, 2010.
Note 9. Redemption Fee
From January 1 through June 30, 2010, the Fund imposed a redemption fee of 2.00% on certain shares redeemed within 30 days of purchase. This fee was eliminated as of July 1, 2010. The fee, which was not a sales charge, was retained by the Fund and not paid to HGINA or its affiliates. Redemption fees are included in Amount Redeemed on the Statements of Changes – Capital Stock Activity. There were no redemption fees charged during the period ended December 31, 2010.
17
| | |
| Henderson Global Funds | Notes to Financial Statements |
REPORT OF INDEPENDENT REGISTERED PUBLIC
ACCOUNTING FIRM
The Board of Trustees and Shareholders
Henderson Global Funds
We have audited the accompanying statement of assets and liabilities, including the portfolio of investments, of Henderson International All Cap Equity Fund (the Fund) (formerly known as Henderson International Equity Fund), one of the funds constituting Henderson Global Funds, as of December 31, 2010, and the related statement of operations for the year then ended, the statement of changes in net assets for each of the two years in the period then ended, and the financial highlights for the two years in the period then ended and for the period from January 31, 2008 (inception) toDecember 31, 2008. These financial statements and financial highlights are the responsibility of the Fund’s management. Our responsibility is to express an opinion on these financial statements and financial highlights based on our audits.
We conducted our audits in accordance with the standards of the Public Company Accounting Oversight Board (United States). Those standards require that we plan and perform the audit to obtain reasonable assurance about whether the financial statements and financial highlights are free of material misstatement. We were not engaged to perform an audit of the Fund’s internal control over financial reporting. Our audits included consideration of internal control over financial reporting as a basis for designing audit procedures that are appropriate in the circumstances, but not for the purpose of expressing an opinion on the effectiveness of the Fund’s internal control over financial reporting. Accordingly, we express no such opinion. An audit also includes examining, on a test basis, evidence supporting the amounts and disclosures in the financial statements and financial highlights, assessing the accounting principles used and significant estimates made by management, and evaluating the overall financial statement presentation. Our procedures included confirmation of securities owned as of December 31, 2010, by correspondence with the custodian and brokers or by other appropriate auditing procedures where replies from brokers were not received. We believe that our audits provide a reasonable basis for our opinion.
In our opinion, the financial statements and financial highlights referred to above present fairly, in all material respects, the financial position of the Henderson International All Cap Equity Fund, one of the funds constituting Henderson Global Funds at December 31, 2010, the results of its operations for the year then ended, the changes in its net assets for each of the two years in the period then ended and the financial highlights for the two years in the period then ended and for the period from January 31, 2008 (inception) to December 31, 2008 in conformity with US generally accepted accounting principles.
Chicago, Illinois
February 28, 2011
18
| | |
| Henderson Global Funds | Other Information (unaudited) |
Proxy Voting Policies
The Funds have filed with the Securities and Exchange Commission their proxy voting records for the twelve months ended June 30, 2010 on Form N-PX, which must be filed each year by August 31. Form N-PX is available on the Securities and Exchange Commission’s website at www.sec.gov. The Funds’ proxy voting records and proxy voting policies and procedures are also available without charge, upon request, by calling 866.443.6337 or by visiting the Funds’ website at www.henderson.com.
Quarterly Portfolio of Investments
A Portfolio of Investments is filed as of the end of the first and third quarter of each fiscal year on Form N-Q. The Fund has filed with the Securities and Exchange Commission the Form N-Q and it is available on the Securities and Exchange Commission’s website at www.sec.gov. Additionally, the Portfolio of Investments may be reviewed and copied at the Commission’s Public Reference Room in Washington, DC. Information on the operation of the Public Reference Room may be obtained by calling 1.800.SEC.0330. The quarterly Portfolio of Investments are also available without charge, upon request, by calling 866.443.6337 or by visiting the Funds’ website at www.henderson.com.
Statement Pursuant to Section 19(a) of the Investment Company Act of 1940
The exact source of aggregate fund distributions for each fiscal year can only be determined as of the end of each Fund’s fiscal year, December 31. However, under Section 19(a) of the Investment Company Act of 1940, the Funds are required to indicate the source of each distribution to shareholders at the time of payment if the distribution is made from any source other than accumulated undistributed net income. For purposes of this disclosure, the source of each distribution is based on U.S. Generally Accepted Accounting Principles (“GAAP”) and will differ from federal income tax-based reporting provided to shareholders due to certain tax adjustments. For federal income tax purposes, the Funds will send you a Form 1099-DIV for each calendar year that will tell you how to report these distributions.
During the fiscal year ended December, 31 2010, the Henderson International All Cap Equity Fund paid the following distributions which were paid in part from sources other than accumulated undistributed net income as measured at the time of payment:
| | | | | % from | | | % from | | | | |
| | | | | Accumulated | | | Accumulated | | | % from | |
| | | | | Undistributed | | | Realized | | | Paid-In | |
| Pay Date | Ex-Date | Amount | | Net Income | | | Gains | | | Capital | |
| Dec. 30, 2010 | Dec. 29, 2010 | Class I: $0.08359 | | | 32.9 | % | | | 0.0 | % | | | 67.1 | % |
The Henderson International All Cap Equity Fund typically distributes its income on an annual basis. There were no other distributions during the year ended December 31, 2010.
Federal Tax Information
Certain tax information for the Funds is required to be provided to shareholders based on the Fund’s income and distributions for the taxable year ended December 31, 2011. In February 2012, shareholders will receive Form 1099-DIV which will include their share of foreign tax credit, qualified dividends and capital gains distributed during the calendar year 2011. Shareholders are advised to check with their tax advisors for information on the treatment of these amounts on their individual income tax returns.
Under Section 853 of the Internal Revenue Code of 1986, as amended (the “Code”), the Fund designated foreign taxes paid and foreign source income for the fiscal year ended December 31, 2010 and were as follows:
| | Foreign | Foreign |
| | taxes | source |
| | paid | income |
| International All Cap Equity Fund | $118,166 | $1,293,574 |
Under Section 854 (b)(2) of the Code, the Fund designated qualified dividends for the fiscal year ended December 31, 2010 as follows:
| International All Cap Equity Fund | | $ | 1,246,219 | |
Shareholder Expense
As a shareholder of the Fund, you incur two types of costs: (1) transaction costs, including sales charges (loads) on purchase payments and redemption fees and (2) ongoing costs, including management fees, distribution (12b-1) fees, shareholder services fees and other Fund expenses. The example in Table 1 and Table 2 is intended to help you understand your ongoing costs of investing in the Fund and to compare these costs with ongoing costs of investing in other mutual funds. It is based on an investment of $1,000 invested at the beginning of the period and held for the year ended December 31, 2010.
19
| | |
| Henderson Global Funds | Other Information (unaudited) |
Actual Expenses
Table 1 provides information about actual account values and actual expenses. You may use the information in this line, together with the amount invested, to estimate the expenses that you incurred over the period. Simply divide your account value at the end of the period by $1,000 (for example, an $8,600 account value divided by $1,000 = 8.6), then multiply the result by the number under the heading entitled “Expenses Paid During Period” to estimate the expenses attributable to your investment during this period.
Hypothetical Example for Comparison Purposes
Table 2 provides information about hypothetical account values and hypothetical expenses based on the Fund’s actual expense ratios and an assumed rate of return of 5% per year before expenses, which is not the Fund’s actual return. Thus you should not use the hypothetical account values and expenses to estimate your actual ending account balance or the expense attributable to your investment during the period. Rather, these figures are provided to enable you to compare the ongoing costs of investing in the Fund and other funds. To do so, compare the 5% hypothetical examples with the 5% hypothetical examples that appear in the shareholder reports of other funds.
Expenses paid during the period include amounts reflected in the Fund Statement of Operations net of reimbursements by the investment advisor. The annualized expense ratios used in the example are as follows:
| International All Cap Equity Class I | 1.07% |
Please note that the expenses do not reflect shareowner transaction costs such as front end sales charges and redemption fees. These fees are described for the Fund and share class in the Performance summary of this report on page 3. Table 2 is useful in comparing ongoing costs only, and will not help you determine the relative total costs of owning different funds. In addition, if these transaction costs were included, your costs would have been higher.
| Table 1 | | | |
| | Beginning | Ending | |
| | Account | Account | Expenses |
| | Value | Value | Paid |
| | July 1, | December 31, | During |
| Actual | 2010 | 2010 | the Period* |
| International | | | |
| All Cap Equity | | | |
| Fund | | | |
| Class I | $1,000.00 | $1,231.00 | $6.02 |
| Table 2 | | | |
| | Beginning | Ending | |
| Hypothetical | Account | Account | Expenses |
| (assuming a | Value | Value | Paid |
| 5% return | July 1, | December 31, | During |
| before expenses) | 2010 | 2010 | the Period* |
| International | | | |
| All Cap Equity | | | |
| Fund | | | |
| Class I | $1,000.00 | $1,019.61 | $5.45 |
| * | Expenses are equal to the Funds Class I shares annualized net expense ratio multiplied by the average account value over the period multiplied by 184 days in the period, and divided by 365 (to reflect the one-half year period). |
20
| | |
| Henderson Global Funds | Trustees and Officers (Unaudited) |
| | | | | |
| | Position(s) | Term of | | Other |
| Name, address and | with | Office and | Principal Occupations | Directorships |
age1 | the Trust2 | Time Served3 | During Past Five Years | Held |
| Independent Trustees | | | | |
| C . Gary Gerst, 71 | Chairman and | Since 2001 | General Partner, Cornelius & Lothian LP | Formerly, Trustee, Harris |
| | Trustee | | (private partnership investing in non-public | Insight Funds Trust. |
| | | | investments), since 1993; Member of the | |
| | | | Governing Council of the Independent | |
| | | | Directors Council (IDC), since 2004; | |
| | | | Board Member of the Investment Company | |
| | | | Institute, since 2004. | |
| | | | | |
| Roland C. Baker, 71 | Trustee | Since 2001 | Consultant to financial services industry. | Director, Sammons |
| | | | | Financial Enterprises, Inc. |
| | | | | and its life insurance sub- |
| | | | | sidiaries, North American |
| | | | | Company for Life and |
| | | | | Health Insurance (a |
| | | | | provider of life insurance, |
| | | | | health insurance and |
| | | | | annuities), and Midland |
| | | | | National Life Insurance |
| | | | | Company (an affiliate of |
| | | | | North American Company |
| | | | | for Life and Health |
| | | | | Insurance); Director, |
| | | | | People’s Trust Insurance |
| | | | | Company (a Florida |
| | | | | provider of homeowner’s |
| | | | | insurance); formerly, |
| | | | | Trustee, Scottish Widows |
| | | | | Investment Partnership |
| | | | | Trust; formerly Trustee, |
| | | | | Allstate Financial |
| | | | | Investment Trust; and |
| | | | | formerly, Director, Quanta |
| | | | | Capital Holdings, Inc. |
| | | | | (provider of property and |
| | | | | casualty reinsurance). |
| | | | | |
| Faris F. Chesley, 71 | Trustee | Since 2002 | Chairman, Chesley, Taft & Associates, LLC, | Chairman of the |
| | | | Since 2001; Vice Chairman, ABN-AMRO, Inc. | Investment Committee, |
| | | | (a financial services company), 1998-2001. | Presbyterian Homes. |
| | | |
| Interested Trustees and Officers of the Trust | | |
| James G. O’Brien, 50 | President | Since 2010 | Managing Director, HGINA, Since 2008 and | N/A |
| | | | Director, Corporate Services, HGINA, | |
| | | | 2001-2008. | |
| | | | | |
| Kenneth A. Kalina, 50 | Chief | Since 2005 | Chief Compliance Officer, HGINA, 2005; Chief | N/A |
| | Compliance | | Compliance Officer, Columbia Wanger Asset | |
| | Officer | | Management, L.P., 2004-2005; Compliance | |
| | | | Officer, Treasurer and Chief Financial Officer | |
| | | | Columbia Wanger Asset Management, L.P., | |
| | | | 2000-2005. | |
| | | | | |
| Alanna P. Nensel, 34 | Vice President | Since 2002 | Director, Retail Marketing and Product | N/A |
| | | | Management, HGINA. | |
| | | | | |
| Charles Thompson II, 40 | Vice President | Since 2010 | Director of US Retail Since 2010, Director | N/A |
| | | | of National Sales 2007-2010, Divisional | |
| | | | Director-Central Region 2002-2007. | |
| | | | | |
| Scott E. Volk, 39 | Vice President | Since 2001 | Director, Retail Finance and Operations, | N/A |
| | | | HGINA. | |
21
| | |
| Henderson Global Funds | Trustees and Officers (Unaudited) |
| | | | | |
| | Position(s) | Term of | | Other |
| Name, address and | with | Office and | Principal Occupations | Directorships |
age1 | the Trust2 | Time Served3 | during Past Five Years | Held |
| Interested Trustees and Officers of the Trust | | |
| Christopher K. | Secretary | Since 2004 | Legal Counsel, HGINA. | N/A |
| Yarbrough, 35 | | | | |
| | | | | |
| Troy M. Statczar, 38 | Treasurer | Since | Head of US Fund Administration and | N/A |
| | | September 2008 | Accounting, HGINA, since July 2008, | |
| | | | Senior Vice President, Citigroup 2005-2008. | |
| | | | | |
| Richard J. Mitchell, 46 | Assistant | Since 2007 | Assistant Treasurer, HGINA, since 2007; | N/A |
| | Treasurer | | Assistant Treasurer, Bank of New York, | |
| | | | 2006-2007; Supervisor, The BISYS Group; | |
| | | | 2002-2006. | |
| 1. | Each person’s address is 737 North Michigan Avenue, Suite 1700, Chicago, IL 60611. Age is as of July 31, 2010. |
| 2. | Currently, all Trustees oversee all ten series of the Trust. |
| 3. | A Trustee may serve until his death, resignation, removal or until the end of the calendar year in which the Trustee reaches 75 years of age. The officers of the Trust are elected annually by the Board. |
| 4. | This Trustee is an interested person of the Trust because of his employment relationship with Henderson Global Investors (North America) Inc., the investment adviser to the Funds. |
| | |
| | Unless otherwise noted, this information is as of July 31, 2010. The Statement of Additional Information for Henderson Global Funds includes additional information about the Trustees and is available without charge by calling 1.866.4HENDERSON (1.866.443.6337). |
22
Henderson Global Funds
Trustees
C. Gary Gerst, Chairman
Roland C. Baker
Faris F. Chesley
Officers
Jim O’Brien, President
Alanna P. Nensel, Vice President
Charles Thompson II, Vice President
Scott E. Volk, Vice President
Christopher K. Yarbrough, Secretary
Kenneth A. Kalina, Chief Compliance Officer
Troy M. Statczar, Treasurer
Richard J. Mitchell, Assistant Treasurer
Investment Adviser
Henderson Global Investors (North America) Inc.
737 North Michigan Avenue, Suite 1700
Chicago, IL 60611
Transfer Agent
State Street Bank & Trust Company
State Street Financial Center
One Lincoln Street
Boston, MA 02111
For More Information
Please call 1.800.657.1493
or visit our website:
www.henderson.com
The views expressed in this report and information about the Fund’s portfolio holdings are for the period covered by this report and are subject to change hereafter. This report is submitted for the general information of the shareholders of the Fund. It is not authorized for distribution to prospective investors unless preceded or accompanied by an effective prospectus, which includes information regarding the Fund’s risks, objectives, fees and expenses, experience of its management, and other information. Henderson Global Investors is the name under which various subsidiaries of Henderson Group plc, a UK limited company, provide investment products and services.
Foreside Fund Services, LLC, Distributor (August, 2010)
23
| |
| Privacy Notice |
| Henderson Global Funds |
This notice describes the privacy practices followed by Henderson Global Funds.
Your privacy is our top priority. Our policy is to respect the privacy of current and former shareholders and to protect personal information entrusted to us. We do not share any nonpublic personal information of shareholders or former shareholders with any nonaffiliated third parties, except as permitted by law or as authorized by our shareholders.
In the course of providing products and services to you, we collect nonpublic personal information about you from various sources such as account applications or agreements, other account forms, transactions in your account, and from information captured on our website, including any information captured through our use of “cookies.” Such information may include your name, address, account or tax identification number, the types and amounts of investments, and bank account information. More detailed information about our Internet policy is available on our website, www.henderson.com.
In the normal course of serving shareholders, we may share information we collect with entities that help us process information or service your request, such as transfer agents, custodians, broker-dealers and marketing service firms, as well as with other financial institutions with whom we have joint marketing agreements. We may share information in connection with servicing accounts or to inform shareholders of products and services that we believe may be of interest to them. The organizations that receive shareholder information will use that information only for the services required and as allowed by applicable law or regulation, and are not permitted to share or use this information for any other purpose. We will disclose your personal information to government agencies, law enforcement officials, and others in the limited circumstances where we believe, in good faith, that such disclosure is required or permitted by law. For example, we will disclose your personal information in order to comply with a court order, to cooperate with government or industry regulators, or law enforcement authorities.
Access to customers’ nonpublic personal information is restricted to employees who need to access that information. To guard shareholder’s nonpublic personal information, we use industry standard physical, electronic, and procedural safeguards. A shareholder’s right to privacy extends to all forms of contact with us, including telephone, written correspondence, and electronic media, such as the Internet.
For questions concerning this policy, please contact us by writing to: Alanna Nensel, Henderson Global Investors (North America) Inc., 737 North Michigan Avenue, Suite 1700, Chicago, Illinois 60611.
Item 2. Code of Ethics.
| (a) | Henderson Global Funds (the “Trust” or the “registrant”) has adopted a Code of Ethics that applies to the Trust’s principal executive officer and principal financial officer (the “Code”). |
| (b) | No disclosures are required by this Item 2(b). |
| (c) | There have been no amendments to the Code during the reporting period for Form N-CSR. |
| (d) | There have been no waivers granted by the Trust to individuals covered by the Code during the reporting period for Form N-CSR. |
| (f) | A copy of the Code may be obtained free of charge by calling 866-343-6337. |
Item 3. Audit Committee Financial Expert.
| (a) | (1) | The Board of Trustees of the Trust has determined that it has three audit committee financial experts serving on the Trust’s Audit Committee that possess the attributes identified in Item 3(b) to Form N-CSR. |
| | (2) | The names of the audit committee financial experts are: |
Roland C. Baker
Faris F. Chesley
C. Gary Gerst
Each audit committee financial expert has been deemed to be “independent” as that term is defined in Item 3(a)(2) of Form N-CSR.
Item 4. Principal Accountant Fees and Services.
As of December 31, 2010, the registrant had ten series. The following series of the registrant have a fiscal year ended December 31: Henderson Money Market Fund, Henderson Worldwide Income Fund and Henderson International All Cap Equity Fund (the “12/31 Henderson Funds”). The following series of the registrant have a fiscal year ended July 31: Henderson Emerging Markets Opportunities Fund, Henderson European Focus Fund, Henderson Global Technology Fund, Henderson Global Equity Income Fund, Henderson Global Opportunities Fund, Henderson International Opportunities Fund, and Henderson Japan-Asia Focus Fund (the “7/31 Henderson Funds”). The Henderson Emerging Markets Opportunities Fund did not commence operations until December 31, 2010 and therefore will not be included in the fees set forth below.
Information provided in response to Item 4 includes amounts billed during the applicable fiscal years for services rendered by the registrant’s principal accountant to the 12/31 Henderson Funds and the 7/31 Henderson Funds.
(a) Audit Fees - The aggregate fees billed for the last two fiscal years ended July 31 for the 7/31 Henderson Funds and for the fiscal years ended December 31 for the 12/31 Henderson Funds for professional services rendered by the principal accountant to the registrant for the audit of the registrant’s annual financial statements or services normally provided by the accountant in connection with statutory and regulatory filings or engagements for the those fiscal years are set forth below.
| | 12/31 Henderson Funds | 7/31 Henderson Funds |
| Year ended 12/31/10 | $83,900 | N/A |
| Year ended 7/31/10 | N/A | $167,000 |
| Year ended 12/31/09 | $81,400 | N/A |
| Year ended 7/31/09 | N/A | $221,700 |
Please note that the Henderson Worldwide Income Fund changed its fiscal year end to December 31 on October 1, 2009. Therefore the audit fee for the year ended July 31, 2009 includes fee for the Henderson Worldwide Income Fund since the Fund had a fiscal year ended July 31 at that time.
(b) Audit Related Fees – There were no fees billed for the last two fiscal years ended July 31 for the 7/31 Henderson Funds and the fiscal years ended December 31 for the 12/31 Henderson Funds for assurance and related services rendered by the principal accountant to the registrant that are reasonably related to the performance of the audit of the registrant’s financial statements and are not reported under paragraph (a) of this Item 4.
There were no fees billed for the last two fiscal years ended July 31 for the 7/31 Henderson Funds and the fiscal years ended December 31 for the 12/31 Henderson Funds for assurance and related services rendered by the principal accountant to the investment adviser that are reasonably related to the performance of the audit of the registrant’s financial statements that were required to be pre-approved by the Audit Committee as described in paragraph (e)(1) of this Item 4.
(c) Tax Fees - The aggregate fees billed for the last two fiscal years ended July 31 for the 7/31 Henderson Funds and for the fiscal years ended December 31 for the 12/31 Henderson Funds for professional services rendered by the principal accountant to the registrant for tax compliance, tax advice, tax planning and tax return preparation are set forth below. These services consisted of the principal accountant reviewing the registrant’s excise tax returns, distribution requirements and RIC tax returns, as well as consults regarding the tax consequences of specific investments.
| | 12/31 Henderson Funds | 7/31 Henderson Funds |
| Year ended 12/31/10 | $20,941 | N/A |
| Year ended 7/31/10 | N/A | $46,672 |
| Year ended 12/31/09 | $20,325 | N/A |
| Year ended 7/31/09 | N/A | $67,408 |
Please note that the Henderson Worldwide Income Fund changed its fiscal year end to December 31 on October 1, 2009. Therefore the tax fee for the year ended July 31, 2009 includes fee for the Henderson Worldwide Income Fund since the Fund had a fiscal year ended July 31 at that time.
The aggregate fees billed for the last two fiscal years ended July 31 for the 7/31 Henderson Funds and for the fiscal years ended December 31 for the 12/31 Henderson Funds for professional services rendered by the principal accountant to the investment adviser for tax compliance, tax advice and tax planning that were required to be pre-approved by the Audit Committee as described in paragraph (e)(1) of this Item 4 are set forth below.
| | 12/31 Henderson Funds | 7/31 Henderson Funds |
| Year ended 12/31/10 | $0 | N/A |
| Year ended 7/31/10 | N/A | $0 |
| Year ended 12/31/09 | $0 | N/A |
| Year ended 7/31/09 | N/A | $0 |
(d) All Other Fees – There were no fees billed for the last two fiscal years ended July 31 for the 7/31 Henderson Funds and for the fiscal years ended December 31 for the 12/31 Henderson Funds for products and services provided by the principal accountant to the registrant, other than the services reported in paragraph (a) – (c) of this Item 4.
There were no fees billed for the last two fiscal years ended July 31 for the 7/31 Henderson Funds and for the fiscal years ended December 31 for the 12/31 Henderson Funds for products and services provided by the principal accountant to the investment adviser that were required to be pre-approved by the Audit Committee as described in paragraph (e)(1) of this Item 4.
(e) Pre-Approval Policies and Procedures
(1) Pursuant to the registrant’s Audit Committee Charter, the Audit Committee shall pre-approve any engagement of the independent auditors to provide any services (other than prohibited non-audit services) to the Trust, the investment adviser and any entity controlling, controlled by, or under common control with the investment adviser that provides ongoing services to the Trust (if the engagement relates directly to the operations and financial reporting of the Trust) (collectively, the “Adviser”), including the fees and other compensation to be paid to the independent auditors. Any member of the Audit Committee may grant such pre-approval. Any such delegated pre-approval shall be presented to the Audit Committee by the member who approved the engagement. Pre-approval of non-audit services is not required, if: (a) the aggregate amount of all non-audit services provided to the Trust is less than 5% of the total fees paid by the Trust to its independent auditors during the fiscal year in which the non-audit services are provided; (b) the services were not recognized by management at the time of the engagement as non-audit services; and (c) such services are promptly brought to the attention of the Audit Committee by management and the Audit Committee approves them (which may be by delegation as provided for above) prior to the completion of the audit.
The independent auditors shall not perform any of the following non-audit services for the Trust (“prohibited non-audit services”): (a) bookkeeping or other services related to the accounting records or financial statements of the Trust; (b) financial information systems design and implementation; (c) appraisal or valuation services, fairness opinions, or contribution-in-kind reports; (d) actuarial services; (e) internal audit outsourcing services; (f) management functions or human resources; (g) broker or dealer, investment adviser, or investment banking services; (h) legal services and expert services unrelated to the audit; and (i) any other services that the Public Company Accounting Oversight Board determines are impermissible.
(2) None of the services provided to the registrant described in paragraphs (b)-(d) of Item 4 were pre-approved by the Audit Committee pursuant to paragraph (c)(7)(i)(C) of Rule 2-01 of Regulation S-X. All of the fees billed for services provided to the Adviser described in paragraphs (b)-(d) of Item 4 were required to be pre-approved by the Audit Committee as described in paragraph (e)(1) of Item 4.
(f) No disclosures are required by this Item 4(f).
(g) The approximate aggregate non-audit fees billed for the last two fiscal years ended July 31 for the 7/31 Henderson Funds and for the fiscal years ended December 31 for the 12/31 Henderson Funds for services rendered by the principal accountant to the registrant are set forth below.
| | 12/31 Henderson Funds | 7/31 Henderson Funds |
| Year ended 12/31/10 | $20,941 | N/A |
| Year ended 7/31/10 | N/A | $46,672 |
| Year ended 12/31/09 | $20,325 | N/A |
| Year ended 7/31/09 | N/A | $67,408 |
The approximate aggregate non-audit fees billed for the last two fiscal years ended July 31 for the 7/31 Henderson Funds and for the fiscal years ended December 31 for the 12/31 Henderson Funds for services rendered by the principal accountant to the Adviser and its affiliates that provide ongoing services to the registrant are set forth below.
| | 12/31 Henderson Funds | 7/31 Henderson Funds |
| Year ended 12/31/10 | $681,795 | N/A |
| Year ended 7/31/10 | N/A | $266,319 |
| Year ended 12/31/09 | $612,924 | N/A |
| Year ended 7/31/09 | N/A | $604,488 |
(h) The registrant’s Audit Committee has determined that the non-audit services the principal accountant has rendered to the Adviser that were not required to be pre-approved by the Audit Committee because they did not relate directly to the operations and financial reporting of the registrant were compatible with maintaining the principal accountant’s independence.
Item 5. Audit Committee of Listed Registrants.
Not applicable.
Item 6. Investments.
(a) Schedule of Investments is included as a part of the report to shareholders filed under Item 1 of this Form N-CSR.
(b) Not applicable.
Item 7. Disclosure of Proxy Voting Policies and Procedures for Closed-End Management Investment Companies.
Not applicable.
Item 8. Portfolio Managers of Closed-End Management Investment Companies.
Not applicable.
Item 9. Purchases of Equity Securities by Closed-End Management Investment Company and Affiliated Purchasers.
Not applicable.
Item 10. Submission of Matters to a Vote of Security Holders.
There have been no material changes to the procedures by which the shareholders may recommend nominees to the registrant’s board of trustees, where those changes were implemented after the registrant last provided disclosure in response to this Item.
Item 11. Controls and Procedures.
| (a) | The registrant’s principal executive officer and principal financial officer have evaluated the registrant’s disclosure controls and procedures within 90 days of this filing and have concluded that the registrant’s disclosure controls and procedures were effective, as of that date, in ensuring that information required to be disclosed by the registrant in this Form N-CSR was recorded, processed, summarized and reported timely. |
| (b) | There were no changes in the registrant’s internal controls over financial reporting (as defined in Rule 30a-3(d) under the Investment Company Act of 1940) that occurred during the registrant’s second fiscal quarter of the period covered by this report that has materially affected, or is reasonably likely to materially affect, the registrant’s internal controls over financial reporting. |
Item 12. Exhibits.
(a)(1) Not applicable.
(a)(2) The certifications required by Rule 30a-2(a) under the 1940 Act (17 CFR 270.30a-2(a)) are attached hereto.
(a)(3) Not applicable.
(b) The certifications required by Rule 30a-2(b) under the 1940 Act (17 CFR 270.30a-2(b)) and Section 906 of the Sarbanes-Oxley Act of 2002 are attached hereto.
SIGNATURES
Pursuant to the requirements of the Securities Exchange Act of 1934 and the Investment Company Act of 1940, the registrant has duly caused this report to be signed on its behalf by the undersigned, thereunto duly authorized.
HENDERSON GLOBAL FUNDS
By: /s/ James G. O’Brien
James G. O’Brien
President (principal executive officer) of Henderson Global Funds
Date: March 7, 2011
Pursuant to the requirements of the Securities Exchange Act of 1934 and the Investment Company Act of 1940, this report has been signed below by the following persons on behalf of the registrant and in the capacities and on the dates indicated.
By: /s/ James G. O’Brien
James G. O’Brien
President (principal executive officer) of Henderson Global Funds
Date: March 7, 2011
By: /s/ Troy Statczar
Troy Statczar
Treasurer (principal financial officer) of Henderson Global Funds
Date: March 7, 2011