UNITED STATES
SECURITIES AND EXCHANGE COMMISSION
Washington, D.C. 20549
FORM N-CSR
CERTIFIED SHAREHOLDER REPORT OF REGISTERED
MANAGEMENT INVESTMENT COMPANIES
Investment Company Act file number: 811-10399
______________________________________________
HENDERSON GLOBAL FUNDS
____________________________________________________________________________
(Exact name of registrant as specified in charter)
737 NORTH MICHIGAN AVENUE, SUITE 1700
CHICAGO, ILLINOIS 60611
____________________________________________________________________________
(Address of principal executive offices)(Zip code)
| (Name and Address of Agent for Service) | Copy to: |
CHRISTOPHER K. YARBROUGH 737 NORTH MICHIGAN AVENUE, SUITE 1700 CHICAGO, ILLINOIS 60611 | CATHY G. O’KELLY VEDDER PRICE P.C. 222 NORTH LASALLE STREET CHICAGO, ILLINOIS 60601 |
Registrant’s telephone number, including area code: (312) 397-1122
Date of fiscal year end: July 31
Date of reporting period: July 31, 2012
Item 1: Report to Shareholders.
Annual Report
July 31, 2012
All Asset Fund
Emerging Markets Opportunities Fund
European Focus Fund
Global Equity Income Fund
Global Leaders Fund
Global Technology Fund
International Opportunities Fund
Japan Focus Fund
Table of contents
| Letter to shareholders | 1 |
| All Asset Fund | |
| Commentary | 2 |
| Performance summary | 3 |
| Emerging Markets Opportunities Fund | |
| Commentary | 4 |
| Performance summary | 5 |
| European Focus Fund | |
| Commentary | 6 |
| Performance summary | 7 |
| Global Equity Income Fund | |
| Commentary | 8 |
| Performance summary | 9 |
| Global Leaders Fund | |
| Commentary | 10 |
| Performance summary | 11 |
| Global Technology Fund | |
| Commentary | 12 |
| Performance summary | 13 |
| International Opportunities Fund | |
| Commentary | 14 |
| Performance summary | 15 |
| Japan Focus Fund | |
| Commentary | 16 |
| Performance summary | 17 |
| Portfolios of investments | 18 |
| Statements of assets and liabilities | 38 |
| Statements of operations | 42 |
| Statements of changes in net assets | 44 |
| Statements of changes - capital stock activity | 52 |
| Financial highlights | 60 |
| Notes to financial statements | 72 |
| Report of independent registered public accounting firm | 91 |
| Other information. | 92 |
| Trustees and officers | 98 |
International investing involves certain risks and increased volatility not associated with investing solely in the US. These risks include currency fluctuations, economic or financial instability, lack of timely or reliable financial information or unfavorable political or legal developments. The Funds may invest in securities issued by smaller companies, which typically involves greater risk than investing in larger companies. Also, the Funds may invest in limited geographic areas and/or sectors which may result in greater market volatility. In addition some of the Funds may invest in derivatives. Derivatives involve special risks different from, and potentially greater than, the risks associated with investing directly in securities and may result in greater losses.
The All Asset Fund invests in a smaller number of securities than the average mutual fund and the change in value of a single holding may have a more pronounced effect on the Fund’s net asset value and performance. The Fund may invest in derivatives and commodities. Investing in commodities entails additional risks including instability regarding control and jurisdiction of governments, international companies and other entities. Asset allocation strategies do not assure profit nor protect against loss. The Fund may be subject to frequent trading which may result in a turnover rate of 100% or more. The Fund is subject to investment company and pooled vehicles risk, allocation risk, leverage risk, interest rate risk and high yield securities risk. An investment in pooled vehicles, including closed-end funds, trusts, and ETFs, may involve paying a premium at the time of purchase or receiving a discounted price at the time of sale. The Fund (and indirectly its shareholders) is responsible for a proportional share of the underlying investment company’s expenses, in addition to its own. Investments in high yield securities may offer more attractive returns than higher-rated securities, but the potentially higher yield is a function of the greater risk that a particular security may default.
Technology companies may react similarly to certain market pressure and events. This may be significantly affected by short product cycles, aggressive pricing of products and services, competition from new market entrants, and obsolescence of existing technology. As a result, the Global Technology Fund’s returns may be considerably more volatile than a fund that does not invest in technology companies.
The views in this report were those of the Funds’ Portfolio Managers as of July 31, 2012, and may not reflect the views of the portfolio managers on the date this report is first published or anytime thereafter. These views are intended to assist shareholders of the Funds in understanding their investment in the Funds and do not constitute investment advice.
| Henderson Global Funds | Letter to shareholders |
Dear shareholder,
We are pleased to provide the annual report for the Henderson Emerging Markets Opportunities, European Focus, Global Equity Income, Global Leaders, Global Technology, International Opportunities and Japan Focus Funds, which covers the year ended July 31, 2012, and the annual report for the Henderson All Asset Fund, which covers the fiscal period ended July 31, 2012.
Global markets finished the first half of the year in positive territory as measured by the MSCI World Index, but the outlook for the global economy remains uncertain as risks persist.
Within Europe, Spain’s banking sector worries, the elections in Greece and the Eurozone summit kept markets on edge. The €100bn Spanish bank bailout and election victory by pro-austerity parties eased fears of a Greek Eurozone exit and restored some of the confidence eroded in the last couple of months. June ended with an unexpectedly successful European Summit as leaders agreed to stabilize the region’s debt markets and recapitalize its banks, easing the funding strains on Spain and Italy. A key outcome from the summit was a new roadmap for European banking supervision via the European Central Bank, which is the first step towards a full banking union.
As the Eurozone crisis continues and economic data continues to point to a softening outlook, the pressure for further quantitative easing (“QE”) appears to be building. June revealed that Eurozone manufacturing output fell at the fastest pace in the last three years and US job growth slowed along with poor retail sales. The weaker economic data failed to prompt the US Federal Reserve into a third round of QE; instead Federal Reserve chairman Ben Bernanke and the Federal Open Markets Committee agreed to extend Operation Twist (a strategy to reduce long-term interest rates) to boost confidence amid falling consumer demand and a drop in output growth in recent months.
Emerging markets lagged other regions as fears of a hard landing resurfaced. Continuing softness in Chinese economic data drove commodities into bear market territory as Brent crude oil sank below the $90 a barrel level for the first time in 18 months. The Chinese central bank subsequently cut its benchmark interest rate by 0.25% in June in a bid to boost growth in the near term.
Looking forward, the expectation of further stimulus by global central banks is likely to provide short-term support for markets, which are currently pricing in exceptionally low interest rates for an extended period of time across developed regions. However, recent economic data continues to point towards a slowdown in global growth, which may provide a headwind later this year.
At Henderson we remain focused on seeking attractive global investment opportunities which may be created by these uncertain markets. It is our goal to continue to create differentiated portfolios for our shareholders, and we appreciate your trust in and support of our Funds.
James G. O’Brien
President, Henderson Global Funds
Investors should consider the investment objectives, risks, charges and expenses of a mutual fund carefully before investing. For a free Prospectus, which contains this and other important information about the Funds, visit www.hendersonglobalinvestors.com. The Prospectus should be read carefully before investing.
| Henderson Global Funds | Commentary |
Henderson All Asset Fund
Global equity markets have been volatile with investors largely focused on Europe’s sovereign debt crisis and slowing growth in China. This story has not changed materially in a year; however, at the end of July most regional equity markets rebounded (Japan excepted) as Mario Draghi, President of the European Central Bank (ECB), promised that he would do “whatever it takes” to preserve the euro. His comments came in a speech that appeared to define some of the rise in Italian and Spanish government bond yields as reflecting the risk of Eurozone breakup. His pledge has been interpreted as a step up in the government bond buying program and was enough to stall the pace of rising peripheral bond yields.
| All Asset Fund |
| Top 10 long-term holdings* |
| (at July 31, 2012) |
| | As a percentage | |
| Security | of net assets | |
| iShares iBoxx Investment Grade Corporate Bond Fund | 6.3 | % |
| iShares MSCI Pacific ex-Japan Index Fund | 4.8 | |
| BlueCrest AllBlue Fund, Ltd. | 3.3 | |
| BH Global, Ltd. | 3.2 | |
| Sprott Physical Gold Trust | 3.0 | |
| Calamos Market Neutral Income Fund | 2.9 | |
| Gateway Fund | 2.9 | |
| iShares JP Morgan USD Emerging Markets Bond Fund | 2.8 | |
| Vanguard Dividend Appreciation ETF | 2.8 | |
| Legg Mason BW Global Opportunities Bond Fund | 2.8 | |
The Fund was successfully launched on March 30, 2012. For the four month period to July 31, 2012, the Fund returned -0.70% (Class A at NAV) versus the benchmark, 3-month LIBOR USD, which posted a return of 0.16%. For a majority of the period, negative developments of the European debt crisis and worries over weaker economic data were the key drivers of performance. Within this environment, the Fund’s allocation to fixed income was beneficial to performance. Commodities entered bear market territory as there was a continuing softness in Chinese economic data; Brent crude oil sank below the $90 a barrel level for the first time in 18 months. Consequently, the Fund’s holding in SPDR S&P Oil and Gas Exploration & Production ETF contributed negatively to performance. Additionally, as equity markets performed poorly, the Fund’s equity holdings were detrimental to performance.
The Fund made investments in the SPDR S&P 500 ETF and the Vanguard Dividend Appreciation ETF gaining exposure to US Equities. Within Japanese equities, the Fund initiated a position in the Henderson Japan Focus Fund and in Asia gained exposure through the iShares MSCI Pacific ex-Japan Index Fund.
The Fund invested in government bonds including US treasuries, German bunds and the iShares Barclays TIPS Bond Fund. The Fund also initiated positions in the iShares iBoxx Investment Grade Corporate Bond Fund, Henderson Strategic Income Fund and the iShares iBoxx High Yield Corporate Bond Fund. In the absolute return funds space, the Fund invested in the Franklin Templeton Hard Currency Fund, BlueCrest All Blue, BH Global, ASG Global Alternatives Fund and the Gateway Fund. Within commodities, the Fund initiated positions in oil and physical gold.
In the current environment there are strong headwinds to global economic growth from Europe, China and the US. Weaker than expected economic data seen from China and the US are not helpful in contributing to the growth outlook. The Eurozone crisis remains unresolved and surveys reveal that the region’s economy remains sluggish. If the ECB can deliver a policy that lowers the risk of a Eurozone breakup, this may restore some confidence to investors and the recent rally in stock prices could continue for the near term.
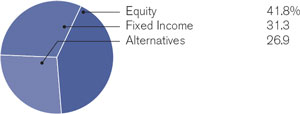
Given the uncertain economic environment ahead, the Fund’s asset allocation remains tilted towards fixed income (27.4%); equities (17.2%); cash (32.4%); absolute return funds (17.1%); private equity (3.0%); and commodities (2.9%).
* For further detail about these holdings, please refer to the section entitled “Portfolio of Investments.” Fund holdings are as of the date given, are subject to change at any time, and are not recommendations to buy or sell any security.
| Henderson Global Funds | Performance summary |
Henderson All Asset Fund
| Portfolio composition by country | | Portfolio composition by sector |
| (as a % of long-term investments) | | (as a % of long-term investments) |
| | |
Investment comparison
Value of $10,000
Total returns as of July 31, 2012
| | | | | | | Since |
| | | | NASDAQ | | | inception |
| At NAV | | | symbol | | | (3/30/2012) |
| Class A | | | HGAAX | | | -0.70 | % |
| Class C | | | HGACX | | | -0.90 | |
| Class I | | | HGAIX | | | -0.60 | |
| With sales charge | | | | | | | |
| Class A | | | | | | -6.41 | % |
| Class C | | | | | | -1.90 | |
| Index | | | | | | | |
| 3-month LIBOR USD | | | | | | 0.16 | % |
| MSCI World Index | | | | | | -3.61 | |
Performance data quoted represents past performance and is no guarantee of future results. Performance results with sales charges reflect the deduction of the maximum front-end sales charge or the deduction of the applicable contingent deferred sales charge (“CDSC”). Class A shares are subject to a maximum front-end sales charge of 5.75%. Class C shares are subject to a CDSC of up to 1% on certain redemptions made within 12 months of purchase. Performance presented at Net Asset Value (NAV), which does not include a sales charge, would be lower if this charge were reflected. NAV is the value of one share of the Fund excluding any sales charges. Current performance may be lower or higher than the performance data quoted. Investment return and principal value will fluctuate so that an investor’s shares, when redeemed, may be worth more or less than original cost. As stated in the current prospectus, the Fund’s annual operating expense ratios (gross) for Class A, C and I shares are estimated to be 2.23%, 2.98% and 1.98%, respectively, for the Fund’s first full fiscal year. However, the Fund’s adviser has agreed to contractually waive a portion of its fees and/or reimburse expenses such that total ordinary operating expenses do not exceed 1.65%, 2.40% and 1.40% for Class A, C and I shares, respectively, which is in effect until July 31, 2015. For the most recent month-end performance, please call 1.866.443.6337 or visit the Funds’ website at www.hendersonglobalinvestors.com.
Performance results also reflect expense subsidies and waivers in effect during periods shown. Absent these waivers, results would have been less favorable. All results assume the reinvestment of dividends and capital gains.
The investment comparison graph above reflects the change in value of a $10,000 hypothetical investment since the Fund’s inception, including reinvested dividends and distributions, compared to a broad based securities market index. The MSCI World Index is a free float-adjusted market capitalization weighted index that is designed to measure the equity market performance of developed markets. 3-month LIBOR (London Interbank Offered Rate) USD is the interest rate participating banks offer to other banks for loans on the London market. The Fund is professionally managed while the Index is unmanaged and not available for investment. Results in the table and graph do not reflect the deduction of taxes that a shareholder would pay on Fund distributions or the redemption of Fund shares.
| Henderson Global Funds | Commentary |
Emerging Markets Opportunities Fund
The reporting year has been dominated by events surrounding the Eurozone sovereign debt crisis leading to high levels of price volatility. Markets began 2012 on a positive note as fears about the European Union subsided somewhat and subsequently experienced an abrupt reversal in risk appetite. This was followed by yet another period of investor aversion to risk assets as investors feared that policymakers in Europe would continue to “speak” of solutions rather than “act.” Also, Asian data disappointed and Chinese growth continued to slow.
| Emerging Markets Opportunities Fund |
| Top 10 long-term holdings* |
| (at July 31, 2012) |
| | As a percentage | |
| Security | of net assets | |
| Samsung Electronics Co., Ltd. | 3.3 | % |
| PetroChina Co., Ltd., Class H | 2.9 | |
| GT Capital Holdings, Inc. | 2.7 | |
| SK Innovation Co., Ltd. | 2.7 | |
| Baidu, Inc., ADR | 2.5 | |
| Prada SpA | 2.4 | |
| Robinson Department Store pcl | 2.4 | |
| Hyundai Glovis Co., Ltd. | 2.3 | |
| Fomento Economico Mexicano, S.A.B. de C.V., ADR | 2.3 | |
| Petroleo Brasileiro S.A., ADR | 2.3 | |
Towards the end of the period, emerging markets equities moved higher, supported by positive news of policy support in Asia where policymakers took a more aggressive stance, and in Latin America where the Brazilian central bank cut rates again and talked of additional fiscal stimulus measures. The European Central Bank also made further moves to address the European sovereign debt crisis. This was viewed positively by the market and once again helped risk assets move forward.
For the year ended July 31, 2012, the Fund returned -16.70% (Class A at NAV) versus the benchmark MSCI Emerging Markets Index, which posted a return of -13.64%. For most of the period, investors avoided anything deemed to be a “risky asset” and a number of the Fund’s higher beta¹ names were punished, in particular, the pro-cyclical names of the Europe, Middle East and Africa (EMEA) sub-portfolio. Conversely, when markets had moments of “risk-on” appetite, EMEA powered performance forward, especially in African Petroleum and Gulf Keystone Petroleum. In the Latin America sub-portfolio, performance was boosted by the positions in the Mexican stocks, FEMSA and Bank Grupo Financiero Banorte. Both companies reported strong results and were beneficiaries of the continued outperformance of the Mexican market versus other regional markets. The main positive contributors in Asia were Prada, the Hong Kong-listed luxury goods retailer, and Robinson Department Store in Thailand which performed well on a recovery in sales following last year’s devastating floods and new store openings outside Bangkok.
Over the period, the Fund maintained its allocation of an overweight to EMEA, underweight to Latin America and even-weight to Asia. At the end of the period, the Fund increased its cash position to 10% to mitigate against further market falls and to provide the Portfolio Managers with the capital to move quickly should opportunities present themselves. In Asia, the Fund has continued to have a strong bias to shares focused on the growth and strength of the Asian domestic consumer. In Latin America the Fund increased its weighting in Mexico to an overweight as both a defensive measure relative to the large index weighting in Brazil and as a reflection of the growing Mexican industrial renaissance. In the EMEA sub-portfolio, we made no changes to the overall theme and remain overweight commodity-related equities.
We expect markets to remain volatile over the next few months. The main positive is valuation; many shares in the emerging markets are trading on historic price-to-book value multiples close to the lows experienced during the global financial crisis in 2008. Going forward we believe the market will see both an improvement in China and some marked progress within Europe. Both would improve investor risk appetite and thus improve the outlook for emerging markets equities.
¹Beta measures a fund’s risk relative to its benchmark, and also indicates an individual stock’s risk and volatility relative to the market as a whole. A beta of 1.00 indicates that the fund is as volatile as its benchmark.
* For further detail about these holdings, please refer to the section entitled “Portfolio of Investments.” Fund holdings are as of the date given, are subject to change at any time, and are not recommendations to buy or sell any security.
| Henderson Global Funds | Performance summary |
Emerging Markets Opportunities Fund
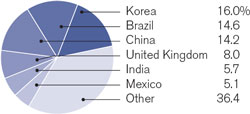
| Portfolio composition by country | | Portfolio composition by sector |
| (as a % of long-term investments) | | (as a % of long-term investments) |
| | |
Investment comparison
Value of $10,000
Total returns as of July 31, 2012
| | | | | | | | | Since |
| | | | NASDAQ | | | One | | inception |
| At NAV | | | symbol | | | year | | (12/31/10)* |
| Class A | | | HEMAX | | | -16.70 | % | | -12.36 | % |
| Class C | | | HEMCX | | | -17.31 | | | -12.99 | |
| Class I | | | HEMIX | | | -16.38 | | | -12.09 | |
| With sales charge | | | | | | | | | | |
| Class A | | | | | | -21.45 | % | | -15.57 | % |
| Class C | | | | | | -17.31 | | | -12.99 | |
| Index | | | | | | | | | | |
| MSCI Emerging Markets Index | | | | | | -13.64 | % | | -8.47 | % |
* Average annual return.
Performance data quoted represents past performance and is no guarantee of future results. Due to the Fund’s relatively small asset base, performance may be impacted by IPOs to a greater degree than it may be in the future. IPO investments are not an integral component of the Fund’s investment process and may not be utilized to the same extent in the future. Performance results with sales charges reflect the deduction of the maximum front-end sales charge or the deduction of the applicable contingent deferred sales charge (“CDSC”). Class A shares are subject to a maximum front-end sales charge of 5.75%. Class C shares are subject to a CDSC of up to 1% on certain redemptions made within 12 months of purchase. Performance presented at Net Asset Value (NAV), which does not include a sales charge, would be lower if this charge were reflected. NAV is the value of one share of the Fund excluding any sales charges. Current performance may be lower or higher than the performance data quoted. Investment return and principal value will fluctuate so that an investor’s shares, when redeemed, may be worth more or less than original cost. As stated in the current prospectus, the Fund’s annual operating expense ratios (gross) for Class A, C and I shares are estimated to be 3.98%, 4.73% and 3.73%, respectively, for the Fund’s first full fiscal year. However, the Fund’s adviser has agreed to contractually waive a portion of its fees and/or reimburse expenses such that total ordinary operating expenses do not exceed 1.79%, 2.54% and 1.54% for Class A, C and I shares, respectively, which is in effect until July 31, 2015. For the most recent month-end performance, please call 1.866.443.6337 or visit the Funds’ website at www.hendersonglobalinvestors.com.
Performance results also reflect expense subsidies and waivers in effect during periods shown. Absent these waivers, results would have been less favorable. All results assume the reinvestment of dividends and capital gains.
The investment comparison graph above reflects the change in value of a $10,000 hypothetical investment since the Fund’s inception, including reinvested dividends and distributions, compared to a broad based securities market index. The MSCI Emerging Markets Index is a free float-adjusted market capitalization weighted index that is designed to measure the equity market performance of emerging markets. The Fund is professionally managed while the Index is unmanaged and not available for investment. Results in the table and graph do not reflect the deduction of taxes that a shareholder would pay on Fund distributions or the redemption of Fund shares.
| Henderson Global Funds | Commentary |
European Focus Fund
European equity markets were volatile during the reporting period. In addition to concerns over the sustainability of sovereign debt in the Eurozone, the region was also affected by worries of slowing global economic growth, particularly in China. During the latter part of 2011, contagion worries were rife as issues centered on measures to try and deal with the Eurozone crisis, including haircuts to Greek bonds, recapitalization of the banks and a plan to leverage the European Financial Stability Facility. The new year began with one of the strongest starts since 1998 as risk assets were buoyed by the increased liquidity from the European Central Bank (ECB) and positive earnings and banking stress test results in the US. However, the second quarter of 2012 proved to be challenging for European markets as woes continued to center on the need for political action to resolve sovereign debt problems, softening macroeconomic data from China and the US, as well as falling commodities prices. July saw a slight improvement in investor sentiment and with it a broad-based rally in risk assets after signs of a global easing in monetary policy and growing expectations for further action from the ECB. Commodity and oil prices rose and European markets outperformed other global markets.
| European Focus Fund |
| Top 10 long-term holdings* |
| (at July 31, 2012) |
| | As a percentage | |
| Security | of net assets | |
| BP plc | 5.8 | % |
| African Petroleum Corp., Ltd. | 4.7 | |
| African Minerals, Ltd. | 3.6 | |
| Continental AG | 2.9 | |
| Sky Deutschland AG | 2.9 | |
| Providence Resources plc | 2.8 | |
| Svenska Cellulosa AB, B Shares | 2.8 | |
| Zhaikmunai LP, GDR | 2.8 | |
| Renault S.A. | 2.7 | |
| Smith & Nephew plc | 2.5 | |
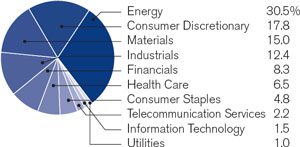
For the year ended July 31, 2012, the Fund returned -18.35% (Class A at NAV) versus the benchmark MSCI Europe Index, which posted a return of -11.97%. Although underweight, exposure to financials was the most detrimental to performance and industrial and materials companies struggled in the “risk-off” environment and outweighed positive returns from consumer staples and healthcare.
However, recent performance has been relatively strong and possibly indicates that the sell-off in cyclically exposed shares had become too extreme and that selected, good quality companies had reached attractive levels compared to more defensive areas of the market. On a stock level, resource related names suffered the most, including African Minerals, Northland Resources, Exillon Energy and Borders & Southern. On a positive note, Providence Resources is currently appraising its Ballyroe oil field in the Celtic Sea and recently upgraded its ‘oil in place’ estimate at the field, and African Petroleum benefited from its successful offshore-Liberia drilling campaign.
The Fund initiated a number of positions in stocks believed to be oversold and offering attractive entry points; for instance, Russian oil producer RusPetro at its London initial public offering, GKN, the automotive components and aerospace equipment producer, and G4S, after the shares fell due to the company struggling to meet their staffing commitments for the London Olympics contract. Key sales included European Goldfields and Kalahari Minerals; both of which had performed well for the Fund and were in the process of being acquired.
Materials and energy-related stocks are two cyclical areas of the market that have remained sluggish even as the broader market has made some ground. We are hopeful that over the coming months we will see both an improvement in sentiment towards China and some progress within Europe; both of which could help the Fund’s performance. We see significant value in the Fund’s current holdings and are optimistic of realizing this value over time.
* For further detail about these holdings, please refer to the section entitled “Portfolio of Investments.” Fund holdings are as of the date given, are subject to change at any time, and are not recommendations to buy or sell any security.
| Henderson Global Funds | Performance summary |
European Focus Fund
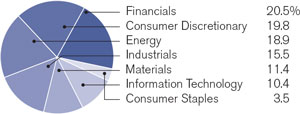
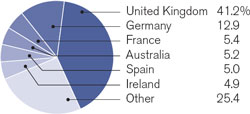
| Portfolio composition by country | | Portfolio composition by sector |
| (as a % of long-term investments) | | (as a % of long-term investments) |
| | |
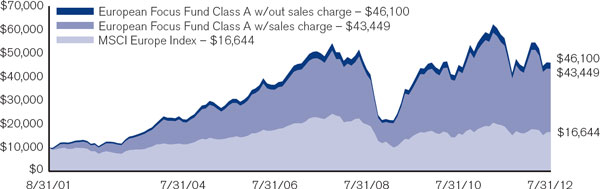
Investment comparison
Value of $10,000
Total returns as of July 31, 2012
| | | | | | | | | | | | | | | Since |
| | | | NASDAQ | | | One | | Three | | Five | | Ten | | inception |
| At NAV | | | symbol | | | year | | years* | | years* | | years* | | (8/31/2001)* |
| Class A | | | HFEAX | | | -18.35 | % | | 7.32 | % | | -1.64 | % | | 14.79 | % | | 15.03 | % |
| Class B | | | HFEBX | | | -19.01 | | | 6.49 | | | -2.39 | | | 14.11 | | | 14.41 | |
| Class C | | | HFECX | | | -18.98 | | | 6.49 | | | -2.39 | | | 13.94 | | | 14.18 | |
| Class I** | | | HFEIX | | | -18.08 | | | 7.61 | | | -1.46 | | | 14.89 | | | 15.12 | |
| With sales charge | | | | | | | | | | | | | | | | | | | |
| Class A | | | | | | -23.04 | % | | 5.22 | % | | -2.80 | % | | 14.11 | % | | 14.40 | % |
| Class B | | | | | | -23.01 | | | 5.60 | | | -2.61 | | | 14.11 | | | 14.41 | |
| Class C | | | | | | -18.98 | | | 6.49 | | | -2.39 | | | 13.94 | | | 14.18 | |
| Index | | | | | | | | | | | | | | | | | | | |
| MSCI Europe Index | | | | | | -11.97 | % | | 3.84 | % | | -5.75 | % | | 7.04 | % | | 4.77 | % |
* Average annual return.
** Class I (formerly Class W) shares commenced operations on March 31, 2009. The performance for Class I shares for the period prior to March 31, 2009 is based on the performance of Class A shares. Performance for Class I shares would be similar because the shares are invested in the same portfolio of securities and have the same portfolio management. Class I shares are not subject to a front-end sales charge or a distribution fee.
Performance data quoted represents past performance and is no guarantee of future results. Performance results with sales charges reflect the deduction of the maximum front-end sales charge or the deduction of the applicable contingent deferred sales charge (“CDSC”). Class A shares are subject to a maximum front-end sales charge of 5.75%. Class B shares are subject to a CDSC, which declines from 5% the 1st year to 0% at the beginning of the 7th year. Class C shares are subject to a CDSC of up to 1% on certain redemptions made within 12 months of purchase. Performance presented at Net Asset Value (NAV), which does not include a sales charge, would be lower if this charge were reflected. NAV is the value of one share of the Fund excluding any sales charges. Current performance may be lower or higher than the performance data quoted. Investment return and principal value will fluctuate so that an investor’s shares, when redeemed, may be worth more or less than original cost. As stated in the current prospectus, the Fund’s annual operating expense ratios (gross) for Class A, B, C and I shares are 1.54%, 2.29%, 2.29% and 1.29% respectively. As stated in the Statement of Additional Information (SAI), the Fund’s adviser has agreed to contractually waive a portion of its fees and/or reimburse expenses such that total ordinary operating expenses do not exceed 2.00%, 2.75%, 2.75% and 1.75% for Class A, B, C and I shares, respectively, which is in effect until July 31, 2020. For the most recent month-end performance, please call 1.866.443.6337 or visit the Funds’ website at www.hendersonglobalinvestors.com.
Performance results also reflect expense subsidies and waivers in effect during certain periods shown. Absent these waivers, results would have been less favorable for certain periods. All results assume the reinvestment of dividends and capital gains.
The investment comparison graph above reflects the change in value of a $10,000 hypothetical investment since the Fund’s inception, including reinvested dividends and distributions, compared to a broad based securities market index. The MSCI Europe Index is a free float-adjusted market capitalization weighted index that is designed to measure the equity market performance of the developed markets in Europe. The Fund is professionally managed while the Index is unmanaged and not available for investment. Results in the table and graph do not reflect the deduction of taxes that a shareholder would pay on Fund distributions or the redemption of Fund shares.
| Henderson Global Funds | Commentary |
Global Equity Income Fund
Global equity markets finished down during the period amidst continued macroeconomic uncertainty. While at the company level earnings and dividend growth remained strong, mixed economic data and ongoing fears surrounding the sovereign debt crisis in the Eurozone led to volatility in the equity markets.
For the year ended July 31, 2012, the Fund returned 1.59% (Class A at NAV) versus the benchmark MSCI World Index, which posted a return of -1.40%. The Fund also continued to meet its income objectives over the period. Strong relative performance was largely driven by positive stock selection in shares with a defensive bias and lower beta1, which fared well during periods of high volatility and declining markets. At the stock level, among the top performers during the period was Pfizer, the global pharmaceutical company, which announced an increase to its quarterly dividend and a new share repurchase program that was met with a positive reaction by the market. Verizon Communications was also an outperformer, benefitting from rising margins in the wireless division as customers used more data on their smartphones, driving up average revenue per customer. Among the emerging market positions, CCR, the Brazilian toll road operator, also performed well on strong traffic growth.
| Global Equity Income Fund |
| Top 10 long-term holdings* |
| (at July 31, 2012) |
| | As a percentage | |
| Security | of net assets | |
| Vodafone Group plc | 3.5 | % |
| Pfizer, Inc. | 3.3 | |
| Merck & Co., Inc. | 3.2 | |
| Centrica plc | 2.9 | |
| Royal Dutch Shell plc, Class B | 2.7 | |
| ENI SpA | 2.7 | |
| Telstra Corp., Ltd. | 2.5 | |
| British American Tobacco plc | 2.4 | |
| United Utilities Group plc | 2.2 | |
| BAE Systems plc | 2.1 | |
The Fund’s geographic exposure varied throughout the period in accordance with the investment process and regional rotation strategy. For example, the weighting within the Eurozone was reduced, in particular among the peripheral Eurozone countries which are more vulnerable to debt crises. During the period we took advantage of market volatility to reduce positions in holdings that had performed well and/or paid their annual dividend in order to invest in new positions where we see the potential for better opportunities from income and capital growth over the medium-term.
The Fund initiated a new position in SJM Holdings, the Macau casino operator, following strong gaming growth in the region, which could lead to earnings upgrades and strong cash generation. A new position was also added in Cinemark, the US and Latin American cinema operator, which we believe can benefit from structural growth in the Latin American region.
While there are currently a number of uncertainties surrounding the future of the Eurozone and a potential slowdown in global economic growth, we believe that at current valuation levels, there are strong opportunities for capital and dividend growth within the equity markets over the long-term. We see particularly attractive opportunities in equities with an above-average level of yield relative to, for example, government bond yields, which are at or near historic lows.
¹Beta measures a fund’s risk relative to its benchmark, and also indicates an individual stock’s risk and volatility relative to the market as a whole. A beta of 1.00 indicates that the fund is as volatile as its benchmark.
* For further detail about these holdings, please refer to the section entitled “Portfolio of Investments.” Fund holdings are as of the date given, are subject to change at any time, and are not recommendations to buy or sell any security.
| Henderson Global Funds | Performance summary |
Global Equity Income Fund
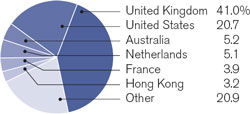
| Portfolio composition by country | | Portfolio composition by sector |
| (as a % of long-term investments) | | (as a % of long-term investments) |
| | |
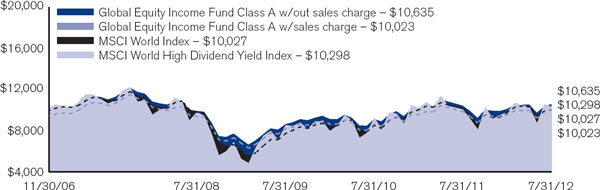
Investment comparison
Value of $10,000
Total returns as of July 31, 2012
| | | | | | | | | | | | | Since |
| | | | NASDAQ | | | One | | Three | | Five | | inception |
| At NAV | | | symbol | | | year | | years* | | years* | | (11/30/06)* |
| Class A | | | HFQAX | | | 1.59 | % | | 7.03 | % | | -0.79 | % | | 1.09 | % |
| Class C | | | HFQCX | | | 0.82 | | | 6.27 | | | -1.53 | | | 0.34 | |
| Class I** | | | HFQIX | | | 1.87 | | | 7.30 | | | -0.60 | | | 1.27 | |
| With sales charge | | | | | | | | | | | | | | | | |
| Class A | | | | | | -4.20 | % | | 4.96 | % | | -1.96 | % | | 0.04 | % |
| Class C | | | | | | 0.82 | | | 6.27 | | | -1.53 | | | 0.34 | |
| Index | | | | | | | | | | | | | | | | |
| MSCI World Index | | | | | | -1.40 | % | | 9.05 | % | | -1.71 | % | | 0.05 | % |
| MSCI World High Dividend Yield Index | | | | | | 3.94 | | | 11.37 | | | -1.38 | | | 0.43 | |
* Average annual return.
** Class I (formerly Class W) shares commenced operations on March 31, 2009. The performance for Class I shares for the period prior to March 31, 2009 is based on the performance of Class A shares. Performance for Class I shares would be similar because the shares are invested in the same portfolio of securities and have the same portfolio management. Class I shares are not subject to a front-end sales charge or a distribution fee.
Performance data quoted represents past performance and is no guarantee of future results. Performance results with sales charges reflect the deduction of the maximum front-end sales charge or the deduction of the applicable contingent deferred sales charge (“CDSC”). Class A shares are subject to a maximum front-end sales charge of 5.75%. Class C shares are subject to a CDSC of up to 1% on certain redemptions made within 12 months of purchase. Performance presented at Net Asset Value (NAV), which does not include a sales charge, would be lower if this charge were reflected. NAV is the value of one share of the Fund excluding any sales charges. Current performance may be lower or higher than the performance data quoted. Investment return and principal value will fluctuate so that an investor’s shares, when redeemed, may be worth more or less than original cost. As stated in the current prospectus, the Fund’s annual operating expense ratios (gross) for Class A, C and I shares are 1.32%, 2.07% and 1.07%, respectively. As stated in the Statement of Additional Information (SAI), the Fund’s adviser has agreed to contractually waive a portion of its fees and/or reimburse expenses such that total ordinary operating expenses do not exceed 1.40%, 2.15% and 1.15% for Class A, C and I shares, respectively, which is in effect until July 31, 2020. For the most recent month-end performance, please call 1.866.443.6337 or visit the Funds’ website at www.hendersonglobalinvestors.com.
Performance results also reflect expense subsidies and waivers in effect during certain periods shown. Absent these waivers during those periods, results would have been less favorable. All results assume the reinvestment of dividends and capital gains.
The investment comparison graph above reflects the change in value of a $10,000 hypothetical investment since the Fund’s inception, including reinvested dividends and distributions, compared to a broad based securities market index. The MSCI World Index is a free float-adjusted market capitalization weighted index that is designed to measure the equity market performance of developed markets. The MSCI World High Dividend Yield Index aims to objectively reflect the high dividend yield opportunity set within select MSCI World Index. The Fund is professionally managed while the Index is unmanaged and not available for investment. Results in the table and graph do not reflect the deduction of taxes that a shareholder would pay on Fund distributions or the redemption of Fund shares.
| Henderson Global Funds | Commentary |
Global Leaders Fund
The second half of 2011 was volatile for global equity markets. The declines and rallies were driven not by changes in company fundamentals but rather political indecision and rhetoric from central bankers and ratings agencies. The picture improved somewhat at the start of 2012 as risk assets found favor. Growth sensitive sectors such as consumer discretionary, materials, industrials and information technology delivered some of the strongest returns as demand proved robust and earnings resilient. Rather predictably however, the second quarter in 2012 witnessed a sharp reversal with the Eurozone at the epicenter of concern. Investors were becoming increasingly frustrated with politicians and the lack of a permanent solution to sovereign debt levels and stagnation in economic growth, which was combined with weakened news flow from the US and China. However, June proved a little stronger, extending into July.
| Global Leaders Fund |
| Top 10 long-term holdings* |
| (at July 31, 2012) |
| | As a percentage | |
| Security | of net assets | |
| Apple, Inc. | 4.5 | % |
| Occidental Petroleum Corp. | 4.3 | |
| Dollar General Corp. | 4.0 | |
| United Parcel Service, Inc., Class B | 3.9 | |
| Bayer AG | 3.7 | |
| Microsoft Corp. | 3.4 | |
| Unilever plc | 3.4 | |
| VF Corp. | 3.3 | |
| Pfizer, Inc. | 3.3 | |
| National Oilwell Varco, Inc. | 3.3 | |
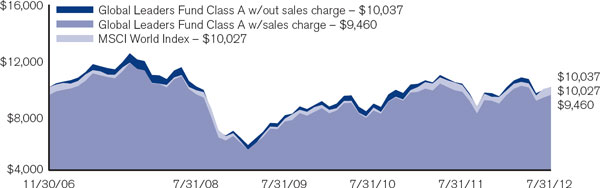
For the year ended July 31, 2012, the Fund returned -2.37% (Class A at NAV) versus the benchmark MSCI World Index, which posted a return of -1.40%. By sector, stock selection in energy and consumer staples detracted the most from performance and outweighed positive returns from information technology and materials. By region, holdings in North America and Europe were positive but were held back by selections in Asia Pacific. On the downside, Tempur-Pedic was the worst performer after the luxury mattress maker cut its full-year profit and revenue forecasts amid lower-than-expected sales in North America. Makita, the Japanese tool manufacturer, and Bank of China also performed poorly. Positive performers included Apple, which soared through $600 per share for the first time on the back of strong demand for its next generation iPad and its intention to return $45 billion to shareholders. American Tower also performed well. The company generates business through renting antenna infrastructure to mobile phone operators and has benefitted from industry growth in various areas such as data provision.
Sales included the long-held position in Sands China after the company valuation had reached its target. The Fund added a position in Japanese multi-line insurer Tokyo Marine Holdings. The company has been well capitalized, has demonstrated strong risk management and could benefit from potential premium growth. German healthcare company Bayer was also added due to the promising pipeline of drugs in its pharmaceutical division and targeted growth in its crop science division to bring it in line with peers. The Fund also purchased Google, attractive as a pivotal market player and on the success of its ‘Android’ devices.
Investors have reacted positively to the prospect of a banking union in the Eurozone though political negotiations are still at an early stage. That said, we believe valuations are attractive in Europe and forward-looking investors may begin to put cash to work, even though we are likely to see further weakness in economic growth globally in the near-term. The drop in inflation levels, however, is a positive sign; in Asia it allows authorities to loosen monetary policy and in Western economies it allows central banks scope to consider further stimulus should economic growth stagnate or weaken further. We believe that focusing on corporate valuations and fundamentals will allow us to seek investments to deliver on shareholder goals.
* For further detail about these holdings, please refer to the section entitled “Portfolio of Investments.” Fund holdings are as of the date given, are subject to change at any time, and are not recommendations to buy or sell any security.
| Henderson Global Funds | Performance summary |
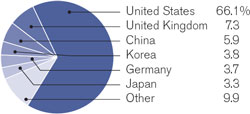
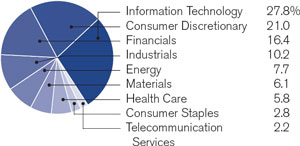
Global Leaders Fund
| Portfolio composition by country | | Portfolio composition by sector |
| (as a % of long-term investments) | | (as a % of long-term investments) |
| | |
Investment comparison
Value of $10,000
Total returns as of July 31, 2012
| | | | | | | | | | | | | Since |
| | | | NASDAQ | | | One | | Three | | Five | | inception |
| At NAV | | | symbol | | | year | | years* | | years* | | (11/30/06)* |
| Class A | | | HFPAX | | | -2.37 | % | | 7.90 | % | | -2.53 | % | | 0.07 | % |
| Class C | | | HFPCX | | | -3.09 | | | 7.12 | | | -3.25 | | | -0.41 | |
| Class I** | | | HFPIX | | | -2.07 | | | 8.05 | | | -2.45 | | | 0.14 | |
| With sales charge | | | | | | | | | | | | | | | | |
| Class A | | | | | | -7.99 | % | | 5.80 | % | | -3.69 | % | | -0.97 | % |
| Class C | | | | | | -3.09 | | | 7.12 | | | -3.25 | | | -0.41 | |
| Index | | | | | | | | | | | | | | | | |
| MSCI World Index | | | | | | -1.40 | % | | 9.05 | % | | -1.71 | % | | 0.05 | % |
* Average annual return
** Class I shares commenced operations on May 31, 2011. The performance for Class I shares for the period prior to May 31, 2011 is based on the performance of Class A shares. Performance for Class I shares would be similar because the shares are invested in the same portfolio of securities and have the same portfolio management. Class I shares are not subject to a front-end sales charge or a distribution fee.
Performance data quoted represents past performance and is no guarantee of future results. Due to the Fund’s relatively small asset base, performance may be impacted by IPOs to a greater degree than it may be in the future. IPO investments are not an integral component of the Fund’s investment process and may not be utilized to the same extent in the future. Performance results with sales charges reflect the deduction of the maximum front-end sales charge or the deduction of the applicable contingent deferred sales charge (“CDSC”). Class A shares are subject to a maximum front-end sales charge of 5.75%. Class C shares are subject to a CDSC of up to 1% on certain redemptions made within 12 months of purchase. Performance presented at Net Asset Value (NAV), which does not include a sales charge, would be lower if this charge were reflected. NAV is the value of one share of the Fund excluding any sales charges. Current performance may be lower or higher than the performance data quoted. Investment return and principal value will fluctuate so that an investor’s shares, when redeemed, may be worth more or less than original cost. As stated in the current prospectus, the Fund’s annual operating expense ratios (gross) for Class A, C and I shares are 2.09%, 2.84% and 1.84%, respectively. However, the Fund’s adviser has agreed to contractually waive a portion of its fees and/or reimburse expenses such that the total ordinary operating expenses do not exceed 1.40%, 2.15% and 1.15% for Class A, C and I shares, respectively, which is in effect until July 31, 2020. For the most recent month-end performance, please call 1.866.443.6337 or visit the Funds’ website at www.hender-songlobalinvestors. com.
Performance results also reflect expense subsidies and waivers in effect during periods shown. Absent these waivers, results would have been less favorable. All results assume the reinvestment of dividends and capital gains.
The investment comparison graph above reflects the change in value of a $10,000 hypothetical investment since the Fund’s inception, including reinvested dividends and distributions, compared to a broad based securities market index. Effective June 1, 2011, the Henderson Global Opportunities Fund changed its name, investment objective and policies and became the Henderson Global Leaders Fund. The Fund’s historical performance may not represent current investment policies. The MSCI World Index is a free float-adjusted market capitalization weighted index that is designed to measure the equity market performance of developed markets. The Fund is professionally managed while the Index is unmanaged and not available for investment. Results in the table and graph do not reflect the deduction of taxes that a shareholder would pay on Fund distributions or the redemption of Fund shares.
| Henderson Global Funds | Commentary |
Global Technology Fund
The reporting year has been characterized by continued market volatility as Eurozone debt issues continued to cause concern. Increasing capital ratios and toxic debt caused the financial sector to reduce lending and, coupled with low confidence, stalled global growth. The US started to show some promise towards the back end of 2011 after political spatting over the debt ceiling was resolved. Data in 2012 spurred the market into a rally that lasted a few months and the technology sector performed particularly well during this period. However, in the second quarter of 2012, retraction seemed inevitable as Europe’s woes failed to receive a permanent solution, dovetailing with soft releases from the US and China. In this environment, the technology sector underperformed the wider market as news flow emerged from many technology companies that growth rates were under pressure.
| Global Technology Fund |
| Top 10 long-term holdings* |
| (at July 31, 2012) |
| | As a percentage | |
| Security | of net assets | |
| Apple, Inc. | 8.0 | % |
| Samsung Electronics Co., Ltd. | 3.5 | |
| Google, Inc., Class A | 3.3 | |
| Cadence Design Systems, Inc. | 3.2 | |
| MasterCard, Inc., Class A | 3.2 | |
| Microsoft Corp. | 3.1 | |
| Cisco Systems, Inc. | 3.0 | |
| Cognizant Technology Solutions Corp. | 3.0 | |
| Nuance Communications, Inc. | 2.8 | |
| VeriFone Systems, Inc. | 1.8 | |
For the year ended July 31, 2012, the Fund returned -4.18% (Class A at NAV) versus the benchmark MSCI AC World IT Index, which posted a return of 5.91%. Apple’s substantial size in the index (approximately 15%) and strong stock performance hindered the Fund’s performance versus the index (Apple is the Fund’s largest position but given the Fund’s construction process, the position is structurally underweight relative to the index). At the sector level, the main drag to relative performance was weakness in internet software & services and internet & catalog retail. The biggest stock specific drags included Netflix, OpenTable and NetApp. The biggest positive contributors to relative performance were the communications equipment and office electronics sectors. At the stock level, Telecity, ASML and Priceline all contributed positively to performance. MasterCard also performed very well as it continued to gain market share over traditional payment methods of cash and checks.
The Fund added a number of positions including some in its core themes. Within e-commerce, the Fund bought eBay following a reacceleration in growth trends as a result of smartphone popularity. eBay also owns PayPal, an electronic payment company that falls into the paperless payment theme. This theme was bolstered with purchases of Verifone and Cielo. Within online advertising, LinkedIn was also amongst the new positions added. LinkedIn operates a social networking website used for professional networking. Elsewhere, the Fund bought Tibco Software, a leading provider of middleware and infrastructure software, and social networker Mail.ru Group, a Russian site that has leveraged its consumer base in free e-mail to generate additional revenue in gaming and recruitment.
Economic factors will continue to dominate going forward, although technology companies again showed in the latest reporting season that they remain resistant. The Fund will continue to be biased towards our favored long term secular growth themes of e-commerce, online advertising, data growth, connectivity and paperless payment. There will continue to be an overall bias towards companies with strong barriers to entry. We believe that these characteristics, combined with the gradual increase of technology’s share of spending within the overall economy, offer a strong risk/reward proposition for investors relative to the world equity market.
* For further detail about these holdings, please refer to the section entitled “Portfolio of Investments.” Fund holdings are as of the date given, are subject to change at any time, and are not recommendations to buy or sell any security.
| Henderson Global Funds | Performance summary |
Global Technology Fund
| Portfolio composition by country | | Portfolio composition by industry |
| (as a % of long-term investments) | | (as a % of long-term investments) |
| | |
Investment comparison
Value of $10,000
Total returns as of July 31, 2012
| | | | | | | | | | | | | | | Since |
| | | | NASDAQ | | | One | | Three | | Five | | Ten | | inception |
| At NAV | | | symbol | | | year | | years* | | years* | | years* | | (8/31/01)* |
| Class A | | | HFGAX | | | -4.18 | % | | 13.91 | % | | 4.00 | % | | 11.38 | % | | 7.32 | % |
| Class B | | | HFGBX | | | -4.97 | | | 13.03 | | | 3.21 | | | 10.77 | | | 6.78 | |
| Class C | | | HFGCX | | | -4.87 | | | 13.06 | | | 3.23 | | | 10.58 | | | 6.54 | |
| Class I** | | | HFGIX | | | -3.87 | | | 14.22 | | | 4.20 | | | 11.49 | | | 7.42 | |
| With sales charge | | | | | | | | | | | | | | | | | | | |
| Class A | | | | | | -9.68 | % | | 11.70 | % | | 2.78 | % | | 10.72 | % | | 6.74 | % |
| Class B | | | | | | -8.97 | | | 12.24 | | | 3.04 | | | 10.77 | | | 6.78 | |
| Class C | | | | | | -4.87 | | | 13.06 | | | 3.23 | | | 10.58 | | | 6.54 | |
| Index | | | | | | | | | | | | | | | | | | | |
| MSCI AC World IT Index | | | | | | 5.91 | % | | 11.58 | % | | 1.76 | % | | 7.57 | % | | 3.66 | % |
| S&P 500 | | | | | | 9.13 | | | 14.11 | | | 1.13 | | | 6.33 | | | 3.82 | |
* Average annual return.
** Class I (formerly Class W) shares commenced operations on March 31, 2009. The performance for Class I shares for the period prior to March 31, 2009 is based on the performance of Class A shares. Performance for Class I shares would be similar because the shares are invested in the same portfolio of securities and have the same portfolio management. Class I shares are not subject to a front-end sales charge or a distribution fee.
Performance data quoted represents past performance and is no guarantee of future results. Performance results with sales charges reflect the deduction of the maximum front-end sales charge or the deduction of the applicable contingent deferred sales charge (“CDSC”). Class A shares are subject to a maximum front-end sales charge of 5.75%. Class B shares are subject to a CDSC which declines from 5% the 1st year to 0% at the beginning of the 7th year. Class C shares are subject to a CDSC of up to 1% on certain redemptions made within 12 months of purchase. Performance presented at Net Asset Value (NAV), which does not include a sales charge, would be lower if this charge were reflected. NAV is the value of one share of the Fund excluding any sales charges. Current performance may be lower or higher than the performance data quoted. Investment return and principal value will fluctuate so that an investor’s shares, when redeemed, may be worth more or less than original cost. As stated in the current prospectus, the Fund’s annual operating expense ratios (gross) for Class A, B, C and I shares are 1.55%, 2.30%, 2.30% and 1.30%, respectively. As stated in the Statement of Additional Information (SAI), the Fund’s adviser has agreed to contractually waive a portion of its fees and/or reimburse expenses such that total ordinary operating expenses do not exceed 2.00%, 2.75%, 2.75% and 1.75% for Class A, B, C and I shares, respectively, which is in effect until July 31, 2020. For the most recent month-end performance, please call 1.866.443.6337 or visit the Funds’ website at www.hendersonglobalinvestors.com.
Performance results also reflect expense subsidies and waivers in effect during certain periods shown. Absent these waivers, results would have been less favorable for certain periods. All results assume the reinvestment of dividends and capital gains.
The investment comparison graph above reflects the change in value of a $10,000 hypothetical investment since the Fund’s inception, including reinvested dividends and distributions, compared to a broad based securities market index and an industry focused index. The MSCI AC World IT Index is a free float-adjusted market capitalization weighted index designed to measure the equity market performance of the Information Technology stocks within the MSCI AC World Index. The S&P 500 Index is a broad based measurement of changes in stock market conditions based on the average of 500 widely held common stocks. The Fund is professionally managed while the Indices are unmanaged and not available for investment. Results in the table and graph do not reflect the deduction of taxes that a shareholder would pay on Fund distributions or the redemption of Fund shares.
| Henderson Global Funds | Commentary |
International Opportunities Fund
The period was volatile for risk assets and dominated by worries over slowing global economic growth, particularly in China, and the sustainability of sovereign debt in the Eurozone. Concerns in the latter part of 2011 centered on contagion worries in the Eurozone and, after three months of gains in 2012, the second quarter proved more uncertain as global equities fell amid resumed sovereign debt issues, primarily with Greece. Softening macroeconomic releases from the US and China as well as falling commodities added to the bearish sentiment, although this did spur policymakers to become more accommodative by initiating easing policies where possible. After the Greeks elected a “pro-Euro” government, politics and macroeconomics dominated the overall market direction with investors wavering between whether or not policymakers would increase stimulus measures. Although markets trended upwards at the end of the period, significant volatility remained as weak economic data was released by the US and China. A mixed second quarter earnings reporting season added further uncertainty, although overall, earnings were generally ahead of downbeat expectations.
| International Opportunities Fund |
| Top 10 long-term holdings* |
| (at July 31, 2012) |
| | As a percentage | |
| Security | of net assets | |
Samsung Electronics Co., Ltd. | 3.1 | % |
| Fresenius SE & Co., KGaA | 2.9 | |
| Capita Group plc | 2.8 | |
| ASML Holding N.V. | 2.8 | |
| Telefonaktiebolaget LM Ericsson, B Shares | 2.8 | |
| Deutsche Post AG | 2.7 | |
| Roche Holding AG | 2.7 | |
| Continental AG | 2.6 | |
| SAP AG | 2.6 | |
| Daiwa Securities Group, Inc. | 2.5 | |
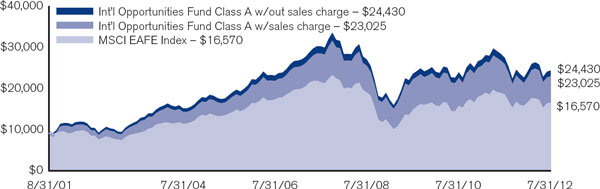
For the year ended July 31, 2012, the Fund returned -11.17% (Class A at NAV) versus the benchmark MSCI EAFE Index, which posted a return of -10.99%. Three of the Fund’s sub-portfolios (which focus on certain regions or sectors) underperformed in a year dominated by volatility within global equity markets, but performance was bolstered by returns from the European growth and technology sub-portfolios. There was a wide dispersion in performance, with financials and the more cyclical stocks bearing the brunt of the falls, including AXA and Banco Santander (financials), Indian-focused energy company Essar Energy, the French Telecom equipment maker Alcatel Lucent and Japanese retailer Yamada Denki (cyclical stocks). On the positive side, more stable growth positions drove the performance of the European growth sub-portfolio, such as Essilor and Inditex, with Baidu and Samsung Electronics making gains for both the technology and Asia sub-portfolios.
Trading activity was spread between the sub-portfolios and included buying a stake in African Petroleum, an oil and gas exploration company focused on offshore West Africa. Deutsche Telekom was also purchased as the company is set to benefit from a change in the European Union telecommunications regulatory environment. PTT, the Thai state-owned oil and gas company, and Kuhne & Nagel, the global transportation and logistics company, were sold and positions were initiated in AIA, a Pan Asian life insurer and Kasikornbank, Thailand’s third-largest commercial bank and second largest private bank. The Fund also bought a position in ASML, a world leader in the provision of lithography systems for the semiconductor industry.
Second quarter earnings results were generally ahead of downbeat expectations; however, margins tended to outperform while revenues were weaker. This has added to the view that while demand is generally lackluster, in line with weak economic data, companies are continuing to manage their businesses well during this difficult environment. Company management teams are cautious in their outlooks for the second half of the year and overall equity market performance is likely to be dominated by political rhetoric and government action to stabilize finance and/or stimulate growth. Given this backdrop we continue to believe that focusing on the long-term fundamentals of a company has the potential to deliver positive shareholder returns.
* For further detail about these holdings, please refer to the section entitled “Portfolio of Investments.” Fund holdings are as of the date given, are subject to change at any time, and are not recommendations to buy or sell any security.
| Henderson Global Funds | Performance summary |
International Opportunities Fund
| Portfolio composition by country | | Portfolio composition by sector |
| (as a % of long-term investments) | | (as a % of long-term investments) |
| | |
Investment comparison
Value of $10,000
Total returns as of July 31, 2012
| | | | | | | | | | | | | | | Since |
| | | | NASDAQ | | | One | | Three | | Five | | Ten | | inception |
| At NAV | | | symbol | | | year | | years* | | years* | | years* | | (8/31/01) * |
| Class A | | | HFOAX | | | -11.17 | % | | 1.16 | % | | -4.20 | % | | 8.80 | % | | 8.53 | % |
| Class B | | | HFOBX | | | -11.90 | | | 0.39 | | | -4.93 | | | 8.17 | | | 7.95 | |
| Class C | | | HFOCX | | | -11.87 | | | 0.39 | | | -4.92 | | | 7.99 | | | 7.72 | |
| Class R** | | | HFORX | | | -11.60 | | | 0.84 | | | -4.48 | | | 8.51 | | | 8.24 | |
| Class I*** | | | HFOIX | | | -10.93 | | | 1.43 | | | -4.02 | | | 8.90 | | | 8.62 | |
| With sales charge | | | | | | | | | | | | | | | | | | | |
| Class A | | | | | | -16.29 | % | | -0.82 | % | | -5.33 | % | | 8.16 | % | | 7.94 | % |
| Class B | | | | | | -15.90 | | | -0.61 | | | -5.17 | | | 8.17 | | | 7.95 | |
| Class C | | | | | | -11.87 | | | 0.39 | | | -4.92 | | | 7.99 | | | 7.72 | |
| Index | | | | | | | | | | | | | | | | | | | |
| MSCI EAFE Index | | | | | | -10.99 | % | | 3.78 | % | | -5.13 | % | | 6.84 | % | | 4.73 | % |
* Average annual return.
** Class R shares commenced operations on September 30, 2005. The performance for Class R shares for the period prior to September 30, 2005 is based on the performance of Class A shares, adjusted for the higher expenses applicable to R shares. Class R shares are not subject to a front-end sales charge but are subject to a distribution fee of 0.50%.
*** Class I (formerly Class W) shares commenced operations on March 31, 2009. The performance for Class I shares for the period prior to March 31, 2009 is based on the performance of Class A shares. Performance for Class I shares would be similar because the shares are invested in the same portfolio of securities and have the same portfolio management. Class I shares are not subject to a front-end sales charge or a distribution fee.
Performance data quoted represents past performance and is no guarantee of future results. Performance results with sales charges reflect the deduction of the maximum front-end sales charge or the deduction of the applicable contingent deferred sales charge (“CDSC”). Class A shares are subject to a maximum front-end sales charge of 5.75%. Class B shares are subject to a CDSC, which declines from 5% the 1st year to 0% at the beginning of the 7th year. Class C shares are subject to a CDSC of up to 1% on certain redemptions made within 12 months of purchase. Class R shares have no front-end sales charge or CDSC. Performance presented at Net Asset Value (NAV), which does not include a sales charge, would be lower if this charge were reflected. NAV is the value of one share of the Fund excluding any sales charges. Current performance may be lower or higher than the performance data quoted. Investment return and principal value will fluctuate so that an investor’s shares, when redeemed, may be worth more or less than original cost. As stated in the current prospectus, the Fund’s annual operating expense ratios (gross) for Class A, B, C, R and I shares are 1.44%, 2.19%, 2.19%, 1.69% and 1.19% respectively. As stated in the Statement of Additional Information (SAI), the Fund’s adviser has agreed to contractually waive a portion of its fees and/or reimburse expenses such that total ordinary operating expenses do not exceed 2.00%, 2.75%, 2.75%, 2.25% and 1.75% for Class A, B, C, R and I shares, respectively, which is in effect until July 31, 2020. For the most recent month-end performance, please call 1.866.443.6337 or visit the Funds’ website at www.hendersonglobalinvestors.com.
Performance results also reflect expense subsidies and waivers in effect during certain periods shown. Absent these waivers, results would have been less favorable for certain periods. All results assume the reinvestment of dividends and capital gains.
The investment comparison graph above reflects the change in value of a $10,000 hypothetical investment since the Fund’s inception, including reinvested dividends and distributions, compared to a broad based securities market index. The MSCI EAFE Index is a free float-adjusted market capitalization weighted index that is designed to measure the equity market performance of developed markets, excluding the US and Canada. The Fund may invest in emerging markets while the Index only consists of companies in developed markets. The Fund is professionally managed while the Index is unmanaged and not available for investment. Results in the table and graph do not reflect the deduction of taxes that a shareholder would pay on Fund distributions or the redemption of Fund shares.
| Henderson Global Funds | Commentary |
Japan Focus Fund
Japanese equities disappointed over the period reflecting the trend seen in markets elsewhere. While the sovereign issues within Europe dominated global attention, Japan had its own issues to contend with, notably a stronger yen and bond yields hitting fresh lows. Not that newsflow within the Japanese economy was poor. On the contrary, some figures have been encouraging as reflected in the stronger than expected housing starts. Nonetheless, with scant domestic support for equities and foreign investors looking to retrench, the stockmarket retreated.
| Japan Focus Fund |
| Top 10 long-term holdings* |
| (at July 31, 2012) |
| | As a percentage | |
| Security | of net assets | |
| Mitsubishi UFJ Financial Group, Inc. | 6.2 | % |
| Yamada Denki Co., Ltd. | 5.9 | |
| Rakuten, Inc. | 4.9 | |
| Sumitomo Mitsui Financial Group, Inc. | 4.7 | |
| Daiwa Securities Group, Inc. | 4.5 | |
| Mizuho Financial Group, Inc. | 4.3 | |
| Keyence Corp. | 4.1 | |
| Canon, Inc. | 4.0 | |
| Tokio Marine Holdings, Inc. | 3.8 | |
| Credit Saison Co., Ltd. | 3.6 | |
For the year ended July 31, 2012, the Fund returned -6.22% (Class A at NAV) versus the benchmark MSCI Japan Index, which posted a return of -12.39%. Within the Fund it was the emphasis on the financial and consumer discretionary sectors that propelled relative outperformance. Among the strongest contributors was the Japanese financial services company Credit Saison, which witnessed an improvement in the more problematic areas of its business while underlying demand recovered. Hakuhodo, the advertising and public relations company, benefitted from an upturn in corporate spending while contributions from Benesse, a company that focuses on correspondence education and publishing, and information technology company Oracle Japan were a further indication that domestic activity had begun to recover. Less impressive performance came from Yamada Denki, the consumer electronics retailer, Nintendo, the multinational consumer electronics company, and Mitsui OSK, an international shipping company, which suffered from weaker than expected profits.
The Fund retains a domestic bias favoring financials and domestic services versus companies more dependent on demand overseas. Japanese banks are in robust shape and have been increasing business in overseas markets as incumbent banks retreat due to capital constraints. Domestic service companies are benefitting as the country recovers from the natural disasters in 2011. Investment activity within the portfolio centered around taking advantage of opportunities during periods of market volatility.
Markets have grinded higher over the past couple of months despite the backdrop of general uncertainty with regard to the economic outlook and investor sentiment, which remains fragile. There is always the possibility, if not probability, of further quantitative easing (QE) from various central banks. We believe investors want to know what life after QE is going to look like and how economies will progress. Japan is less influenced by the events playing out overseas, and investments within the Fund will concentrate on companies that are either focused on the domestic economy or are of the highest quality, which we believe can weather conditions abroad.
* For further detail about these holdings, please refer to the section entitled “Portfolio of Investments.” Fund holdings are as of the date given, are subject to change at any time, and are not recommendations to buy or sell any security.
| Henderson Global Funds | Performance summary |
Japan Focus Fund
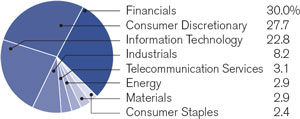
| Portfolio composition by country | | Portfolio composition by sector |
| (as a % of long-term investments) | | (as a % of long-term investments) |
| | |
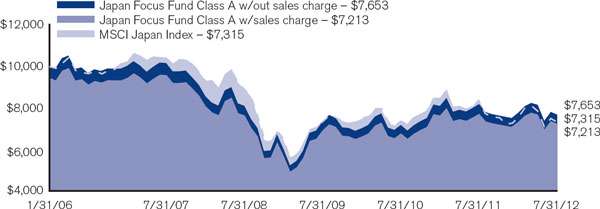
Investment comparison
Value of $10,000
Total returns as of July 31, 2012
| | | | | | | | | | | | | Since |
| | | | NASDAQ | | | One | | Three | | Five | | inception |
| At NAV | | | symbol | | | year | | years* | | years* | | (1/31/06) * |
| Class A | | | HFJAX | | | -6.22 | % | | 1.46 | % | | -5.45 | % | | -4.03 | % |
| Class C | | | HFJCX | | | -6.92 | | | 0.73 | | | -6.18 | | | -4.74 | |
| Class I** | | | HFJIX | | | -5.89 | | | 1.58 | | | -5.39 | | | -3.98 | |
| With sales charge | | | | | | | | | | | | | | | | |
| Class A | | | | | | -11.65 | % | | -0.53 | % | | -6.57 | % | | -4.90 | % |
| Class C | | | | | | -6.92 | | | 0.73 | | | -6.18 | | | -4.74 | |
| Index | | | | | | | | | | | | | | | | |
| MSCI Japan Index | | | | | | -12.39 | % | | -0.23 | % | | -6.79 | % | | -4.70 | % |
* Average annual return.
** Class I shares commenced operations on May 31, 2011. The performance for Class I shares for the period prior to May 31, 2011 is based on the performance of Class A shares. Performance for Class I shares would be similar because the shares are invested in the same portfolio of securities and have the same portfolio management. Class I shares are not subject to a front-end sales charge or a distribution fee.
Performance data quoted represents past performance and is no guarantee of future results. Due to the Fund’s relatively small asset base, performance may be impacted by IPOs to a greater degree than it may be in the future. IPO investments are not an integral component of the Fund’s investment process and may not be utilized to the same extent in the future. Performance results with sales charges reflect the deduction of the maximum front-end sales charge or the deduction of the applicable contingent deferred sales charge (“CDSC”). Class A shares are subject to a maximum front-end sales charge of 5.75%. Class C shares are subject to a CDSC of up to 1% on certain redemptions made within 12 months of purchase. Performance presented at Net Asset Value (NAV), which does not include a sales charge, would be lower if this charge were reflected. NAV is the value of one share of the Fund excluding any sales charges. Current performance may be lower or higher than the performance data quoted. Investment return and principal value will fluctuate so that an investor’s shares, when redeemed, may be worth more or less than original cost. As stated in the current prospectus, the Fund’s annual operating expense ratio (gross) for Class A, C and I shares are 1.79%, 2.54% and 1.54%, respectively. However, the Fund’s adviser has agreed to contractually waive a portion of its fees and/or reimburse expenses such that total ordinary operating expenses do not exceed 1.35%, 2.10% and 1.10% for Class A, C and I shares, respectively, which is in effect until July 31, 2020. For the most recent month-end performance, please call 1.866.443.6337 or visit the Funds’ web-site at www.hendersonglobalinvestors.com.
Performance results also reflect expense subsidies and waivers in effect during certain periods shown. Absent these waivers, results would have been less favorable for certain periods. All results assume the reinvestment of dividends and capital gains.
The investment comparison graph above reflects the change in value of a $10,000 hypothetical investment since the Fund’s inception, including reinvested dividends and distributions, compared to a broad based securities market index. Effective June 1, 2011, the Henderson Japan – Asia Focus Fund changed its name, investment objective and policies and became the Henderson Japan Focus Fund. The Fund’s historical performance may not represent current investment policies. The MSCI Japan Index is a free float-adjusted market capitalization weighted index designed to measure equity market performance in Japan. The Fund may invest in emerging markets while the Index only consists of companies in developed markets. The Fund is professionally managed while the Index is unmanaged and not available for investment. Results in the table and graph do not reflect the deduction of taxes that a shareholder would pay on Fund distributions or the redemption of Fund shares.
| Henderson Global Funds | Portfolio of investments |
All Asset Fund
July 31, 2012
| Shares | | | | | Value (note 2) | |
| | | | | | | |
| Investment companies - 55.70% | | | | |
| | | | | | | |
| Alternatives - 14.99% | | | | |
| 96,789 | | ASG Global Alternatives | | | | |
| | | Fund | | $ | 987,250 | |
| 63,497 | | BH Global, Ltd. * | | | 1,144,869 | |
| 451,354 | | BlueCrest AllBlue Fund, Ltd. * | | | 1,164,093 | |
| 105,152 | | Franklin Templeton Hard | | | | |
| | | Currency Fund | | | 987,382 | |
| 75,227 | | Sprott Physical Gold | | | | |
| | | Trust * | | | 1,056,940 | |
| | | | | | 5,340,534 | |
| | | | | | | |
| Equity - 23.25% | | | | |
| 82,685 | | Calamos Market Neutral | | | | |
| | | Income Fund | | | 1,032,733 | |
| 37,613 | | Gateway Fund | | | 1,026,471 | |
| 86,367 | | Graphite Enterprise | | | | |
| | | Trust plc | | | 521,161 | |
| 80,282 | | HarbourVest Global Private | | | | |
| | | Equity (a) * | | | 576,826 | |
| 32,186 | | Henderson Global Technology | | | | |
| | | Fund (b) * | | | 639,861 | |
| 116,377 | | Henderson Japan Focus | | | | |
| | | Fund (b) | | | 850,717 | |
| 39,719 | | iShares MSCI Pacific ex-Japan | | | | |
| | | Index Fund | | | 1,700,768 | |
| 6,694 | | SPDR S&P 500 ETF Trust | | | 921,831 | |
| 17,546 | | Vanguard Dividend | | | | |
| | | Appreciation ETF | | | 1,014,159 | |
| | | | | | 8,284,527 | |
| | | | | | | |
| Fixed income - 17.46% | | | | |
| 73,785 | | Henderson Strategic Income | | | | |
| | | Fund (b) | | | 653,737 | |
| 5,458 | | iShares Barclays TIPS Bond | | | | |
| | | Fund | | | 662,820 | |
| 6,879 | | iShares iBoxx $High Yield | | | | |
| | | Corporate Bond Fund | | | 630,804 | |
| 18,588 | | iShares iBoxx Investment | | | | |
| | | Grade Corporate Bond Fund | | | 2,254,353 | |
| 8,570 | | iShares JP Morgan USD | | | | |
| | | Emerging Markets Bond | | | | |
| | | Fund | | | 1,015,973 | |
| 87,851 | | Legg Mason BW Global | | | | |
| | | Opportunities Bond Fund | | | 1,002,382 | |
| | | | | | 6,220,069 | |
| | | | | | | |
| | | Total investment companies | | | | |
| | | (Cost $19,903,451) | | | 19,845,130 | |
| Short-term investments - 43.69% | | | | |
| 10,046,657 | | Federated Obligations | | | | |
| | | Fund (c) | | $ | 10,046,657 | |
| 5,520,165 | | Fidelity Institutional | | | | |
| | | Treasury Portfolio | | | 5,520,165 | |
| | | | | | | |
| | | Total short-term investments | | | | |
| | | (Cost $15,566,822) | | | 15,566,822 | |
| | | | | | | |
| Total investments - 99.39% | | | | |
| | | (Cost $35,470,273) | | | 35,411,952 | |
| | | | | | | |
| Net other assets and liabilities – 0.61% | | | 216,644 | |
| Total net assets – 100.00% | | $ | 35,628,596 | |
| ETF | | Exchange-traded fund |
| * | | Non income producing security |
| (a) | | This security has been deemed illiquid according to the policies and procedures adopted by the Board of Trustees. |
| (b) | | Affiliated holding, see notes to financial statements for further information. |
| (c) | | A portion of this security is segregated as collateral for futures contracts. |
The Fund held the following open forward foreign currency contracts at July 31, 2012:
| | Value date | Local amount (000’s) | | Current notional value | | Unrealized appreciation/ (depreciation) | |
| Euro | | | | | | | | | | |
| Short | 9/04/12 | | 263 | | $ | 323,116 | | $ | 6,884 | |
| British | | | | | | | | | | |
| Pound | | | | | | | | | | |
| Short | 9/04/12 | | 1,586 | | | 2,487,066 | | | (39,709 | ) |
| Japanese | | | | | | | | | | |
| Yen | | | | | | | | | | |
| Short | 9/04/12 | | 56,620 | | | 724,973 | | | 410 | |
| Total | | | | | | | | $ | (32,415 | ) |
During the four month period ended July 31, 2012, average monthly notional value related to forward foreign currency contracts was $1.0 million or 2.8% of net assets.
See notes to financial statements
| Henderson Global Funds | Portfolio of investments |
All Asset Fund
July 31, 2012 (continued)
The Fund held the following open futures contracts at July 31, 2012:
| | | Number of contracts | | Expiration date | | Aggregate notional value | | Unrealized appreciation/ (depreciation) | |
| Australian Treasury 10 Year Bond (Long) | | | 8 | | | 9/17/12 | | $ | 1,056,817 | | $ | (4,073 | ) |
| Euro STOXX 50 Index (Long) | | | 63 | | | 9/21/12 | | | 1,804,553 | | | (5,301 | ) |
| Hang Seng Index (Short) | | | 7 | | | 8/30/12 | | | 889,770 | | | (40,286 | ) |
| Nikkei 225 Index (Long) | | | 3 | | | 9/13/12 | | | 333,312 | | | 4,971 | |
| UK Gilt Bond (Long) | | | 4 | | | 9/26/12 | | | 764,358 | | | 1,814 | |
| US Treasury 10 Year Note (Long) | | | 16 | | | 9/19/12 | | | 2,154,500 | | | 29,775 | |
| Total | | | | | | | | | | | $ | (13,100 | ) |
During the four month period ended July 31, 2012, average notional value related to futures contracts was $1.1 million or 3.0% of net assets.
See notes to financial statements
| Henderson Global Funds | Portfolio of investments |
Emerging Markets Opportunities Fund
July 31, 2012
| Shares | | | | | Value (note 2) | |
| | | | | | | |
| Common stocks - 89.48% | | | | |
| | | | | | | |
| | | Australia - 4.09% | | | | |
| 300,234 | | African Petroleum | | | | |
| | | Corp., Ltd. * | | $ | 384,930 | |
| 899,209 | | Cape Lambert Resources, | | | | |
| | | Ltd. * | | | 311,843 | |
| | | | | | 696,773 | |
| | | | | | | |
| | | Brazil - 10.20% | | | | |
| 25,400 | | BR Malls Participacoes | | | | |
| | | S.A | | | 296,490 | |
| 44,900 | | CCR S.A. | | | 374,678 | |
| 9,000 | | Embraer S.A., ADR | | | 228,420 | |
| 25,100 | | OGX Petroleo e Gas | | | | |
| | | Participacoes S.A. * | | | 69,205 | |
| 19,900 | | Petroleo Brasileiro S.A., | | | | |
| | | ADR | | | 390,637 | |
| 21,000 | | Vale S.A., ADR | | | 379,050 | |
| | | | | | 1,738,480 | |
| | | | | | | |
| | | Canada - 0.20% | | | | |
| 169,161 | | Shamaran Petroleum | | | | |
| | | Corp. * | | | 33,736 | |
| | | | | | | |
| | | China - 13.22% | | | | |
| 116,000 | | Anhui Conch Cement Co., | | | | |
| | | Ltd., Class H | | | 305,905 | |
| 3,480 | | Baidu, Inc., ADR * | | | 419,410 | |
| 125,000 | | China Life Insurance Co., | | | | |
| | | Ltd., Class H | | | 344,952 | |
| 190,500 | | CITIC Securities Co., Ltd., | | | | |
| | | Class H | | | 334,094 | |
| 390,000 | | PetroChina Co., Ltd., | | | | |
| | | Class H | | | 488,839 | |
| 151,000 | | Zhuzhou CSR Times Electric | | | | |
| | | Co., Ltd., Class H | | | 360,233 | |
| | | | | | 2,253,433 | |
| | | | | | | |
| | | Hong Kong - 3.64% | | | | |
| 286,000 | | Agile Property Holdings, | | | | |
| | | Ltd | | | 340,779 | |
| 94,800 | | Sands China, Ltd | | | 279,949 | |
| | | | | | 620,728 | |
| | | | | | | |
| | | India - 5.32% | | | | |
| 84,501 | | DLF, Ltd. | | | 317,553 | |
| 14,352 | | Jubilant Foodworks, Ltd. * | | | 289,801 | |
| 14,845 | | Tata Motors, Ltd., ADR | | | 299,869 | |
| | | | | | 907,223 | |
| | | Indonesia - 4.73% | | | | |
| 1,659,000 | | PT Adaro Energy Tbk | | $ | 255,905 | |
| 392,404 | | PT Bank Mandiri Tbk | | | 344,105 | |
| 269,500 | | PT Mitra Adiperkasa Tbk | | | 205,008 | |
| | | | | | 805,018 | |
| | | | | | | |
| | | Italy - 2.44% | | | | |
| 60,100 | | Prada SpA | | | 415,795 | |
| | | | | | | |
| | | Kazakhstan - 1.86% | | | | |
| 955,965 | | International Petroleum, | | | | |
| | | Ltd. * | | | 100,462 | |
| 26,132 | | Zhaikmunai LP, GDR * | | | 215,589 | |
| | | | | | 316,051 | |
| | | | | | | |
| | | Korea - 14.83% | | | | |
| 5,210 | | Gamevil, Inc. * | | | 358,969 | |
| 2,060 | | Hyundai Glovis Co., Ltd | | | 395,374 | |
| 26,040 | | Hyundai Greenfood | | | | |
| | | Co., Ltd. | | | 365,049 | |
| 1,837 | | Hyundai Motor Co. | | | 385,069 | |
| 488 | | Samsung Electronics | | | | |
| | | Co., Ltd. | | | 564,990 | |
| 3,327 | | SK Innovation Co., Ltd. | | | 457,578 | |
| | | | | | 2,527,029 | |
| | | | | | | |
| | | Luxembourg - 1.06% | | | | |
| 4,700 | | Tenaris S.A., ADR | | | 179,916 | |
| | | | | | | |
| | | Malaysia - 2.25% | | | | |
| 320,800 | | AirAsia Berhad | | | 383,381 | |
| | | | | | | |
| | | Mexico - 4.73% | | | | |
| 134,902 | | Alsea de Mexico S.A.B. | | | | |
| | | de C.V. * | | | 185,942 | |
| 4,600 | | Fomento Economico Mexicano, | | | | |
| | | S.A.B. de C.V., ADR | | | 392,932 | |
| 42,400 | | Grupo Financiero Banorte | | | | |
| | | S.A.B. de C.V | | | 227,647 | |
| | | | | | 806,521 | |
| | | | | | | |
| | | Panama - 1.02% | | | | |
| 2,250 | | Copa Holdings S.A., Class A | | | 174,443 | |
| | | | | | | |
| | | Philippines - 2.71% | | | | |
| 35,360 | | GT Capital Holdings, Inc. * | | | 462,488 | |
| | | | | | | |
| | | Russia - 1.26% | | | | |
| 94,476 | | RusPetro plc * | | | 214,780 | |
See notes to financial statements
| Henderson Global Funds | Portfolio of investments |
Emerging Markets Opportunities Fund
July 31, 2012 (continued)
| Shares | | | | | Value (note 2) | |
| | | | | | | |
| | | South Africa - 0.98% | | | | |
| 87,957 | | Hummingbird Resources | | | | |
| | | plc * | | $ | 119,287 | |
| 123,923 | | Ncondezi Coal Co. * | | | 48,087 | |
| | | | | | 167,374 | |
| | | | | | | |
| | | Switzerland - 1.34% | | | | |
| 4,307 | | DKSH Holding, Ltd. * | | | 228,519 | |
| | | | | | | |
| | | Taiwan - 1.78% | | | | |
| 79,348 | | Advanced Semiconductor | | | | |
| | | Engineering, Inc., ADR | | | 302,316 | |
| | | | | | | |
| | | Thailand - 2.36% | | | | |
| 206,684 | | Robinson Department | | | | |
| | | Store pcl | | | 402,269 | |
| | | | | | | |
| | | Ukraine - 0.93% | | | | |
| 16,231 | | Avangardco Investments | | | | |
| | | Public, Ltd. * | | | 158,090 | |
| | | | | | | |
| | | United Kingdom – 7.42% | | | | |
| 65,258 | | African Minerals, Ltd. * | | | 299,526 | |
| 85,866 | | Allied Gold Mining plc * | | | 184,436 | |
| 31,110 | | Inchcape plc | | | 183,738 | |
| 67,503 | | InternetQ plc * | | | 240,774 | |
| 478,045 | | Madagascar Oil, Ltd. * | | | 157,396 | |
| 1,332,086 | | Sable Mining Africa, Ltd. * | | | 198,409 | |
| | | | | | 1,264,279 | |
| | | | | | | |
| | | United States - 1.11% | | | | |
| 4,700 | | First Cash Financial | | | | |
| | | Services, Inc. * | | | 188,470 | |
| | | | | | | |
| | | Total common stocks | | | | |
| | | (Cost $15,905,078) | | | 15,247,112 | |
| | | | | | | |
| Preferred stocks - 3.31% | | | | |
| | | Brazil - 3.31% | | | | |
| 30,410 | | Alpargatas S.A.I.C | | | 180,750 | |
| 24,200 | | Itau Unibanco | | | | |
| | | Holding S.A. | | | 383,454 | |
| | | | | | 564,204 | |
| | | | | | | |
| | | Total preferred stocks | | | | |
| | | (Cost $682,718) | | | 564,204 | |
| | | | | | | |
| | | Total long-term investments | | | | |
| | | (Cost $16,587,796) | | | 15,811,316 | |
| Short-term investment - 10.18% | | | | |
| 1,735,130 | | Fidelity Institutional | | | | |
| | | Treasury Portfolio | | $ | 1,735,130 | |
| | | | | | | |
| | | Total short-term investment | | | | |
| | | (Cost $1,735,130) | | | 1,735,130 | |
| | | | | | | |
| Total investments - 102.97% | | | | |
| | | (Cost $18,322,926) | | | 17,546,446 | |
| | | | | | | |
| Net other assets and liabilities – (2.97)% | | | (505,482 | ) |
| Total net assets – 100.00% | | $ | 17,040,964 | |
| * | | Non income producing security |
| ADR | | American Depositary Receipts |
| GDR | | Global Depositary Receipts |
See notes to financial statements
| Henderson Global Funds | Portfolio of investments |
Emerging Markets Opportunities Fund
July 31, 2012 (continued)
| Other information: | | | | |
| | | | | |
| Industry concentration as a percentage of net assets: | | | % of net assets |
| Oil & Gas Exploration & Production | | | 6.90 | % |
| Diversified Banks | | | 5.61 | |
| Integrated Oil & Gas | | | 5.16 | |
| Semiconductors | | | 5.09 | |
| Steel | | | 4.06 | |
| Airlines | | | 3.27 | |
| Restaurants | | | 2.79 | |
| Asset Management & Custody Banks | | | 2.71 | |
| Oil & Gas Refining & Marketing | | | 2.69 | |
| Internet Software & Services | | | 2.46 | |
| Apparel, Accessories & Luxury Goods | | | 2.44 | |
| Apparel Retail | | | 2.36 | |
| Air Freight & Logistics | | | 2.32 | |
| Soft Drinks | | | 2.31 | |
| Automobile Manufacturers | | | 2.26 | |
| Highways & Railtracks | | | 2.20 | |
| Department Stores | | | 2.14 | |
| Electrical Components & Equipment | | | 2.11 | |
| Home Entertainment Software | | | 2.11 | |
| Life & Health Insurance | | | 2.03 | |
| Real Estate Development | | | 2.00 | |
| Investment Banking & Brokerage | | | 1.96 | |
| Diversified Real Estate Activities | | | 1.86 | |
| Construction Materials | | | 1.80 | |
| Coal & Consumable Fuels | | | 1.78 | |
| Gold | | | 1.78 | |
| Construction & Farm Machinery &Heavy Trucks | | | 1.76 | |
| Precious Metals & Minerals | | | 1.76 | |
| Real Estate Operating Companies | | | 1.74 | |
| Casinos & Gaming | | | 1.64 | |
| Advertising | | | 1.41 | |
| Research & Consulting Services | | | 1.34 | |
| Aerospace & Defense | | | 1.34 | |
| General Merchandise Stores | | | 1.20 | |
| Diversified Metals & Mining | | | 1.16 | |
| Consumer Finance | | | 1.11 | |
| Distributors | | | 1.08 | |
| Footwear | | | 1.06 | |
| Oil & Gas Equipment & Services | | | 1.06 | |
| Packaged Foods & Meats | | | 0.93 | |
| Long-Term Investments | | | 92.79 | |
| Short-Term Investment | | | 10.18 | |
| Total Investments | | | 102.97 | |
| Net Other Assets and Liabilities | | | (2.97 | ) |
| | | | 100.00 | % |
See notes to financial statements
| Henderson Global Funds | Portfolio of investments |
European Focus Fund
July 31, 2012
| Shares | | | | | Value (note 2) | |
| | | | | | | |
| Common stocks - 89.16% | | | | |
| | | | | | | |
| | | Australia - 4.65% | | | | |
| 16,872,214 | | African Petroleum | | | | |
| | | Corp., Ltd. * | | $ | 21,631,839 | |
| | | | | | | |
| | | Canada - 0.94% | | | | |
| 574,646 | | Africa Oil Corp. * | | | 4,349,168 | |
| | | | | | | |
| | | France - 4.91% | | | | |
| 155,421 | | Alstom S.A. | | | 5,170,858 | |
| 406,202 | | AXA S.A. | | | 4,972,919 | |
| 289,328 | | Renault S.A. | | | 12,669,652 | |
| | | | | | 22,813,429 | |
| | | | | | | |
| | | Germany - 11.66% | | | | |
| 149,985 | | Continental AG | | | 13,615,472 | |
| 66,349 | | Fresenius SE & Co., KGaA | | | 7,085,987 | |
| 132,872 | | HeidelbergCement AG | | | 6,189,568 | |
| 35,059 | | Linde AG | | | 5,221,684 | |
| 406,250 | | Rhoen Klinikum AG | | | 8,747,373 | |
| 4,365,037 | | Sky Deutschland AG * | | | 13,373,143 | |
| | | | | | 54,233,227 | |
| | | | | | | |
| | | Greece - 1.28% | | | | |
| 600,575 | | Hellenic Telecommunications | | | | |
| | | Organization S.A. * | | | 1,492,673 | |
| 336,150 | | JUMBO S.A. * | | | 1,253,205 | |
| 439,683 | | Motor Oil (Hellas) Corinth | | | | |
| | | Refineries S.A. | | | 2,596,732 | |
| 226,640 | | Public Power Corp. S.A. * | | | 599,544 | |
| | | | | | 5,942,154 | |
| | | | | | | |
| | | Ireland - 4.40% | | | | |
| 57,341,521 | | Petroceltic International | | | | |
| | | plc * | | | 7,232,690 | |
| 1,299,948 | | Providence Resources | | | | |
| | | plc * | | | 13,217,233 | |
| | | | | | 20,449,923 | |
| | | | | | | |
| | | Italy - 2.16% | | | | |
| 2,954,046 | | UniCredit SpA * | | | 10,060,732 | |
| | | | | | | |
| | | Kazakhstan - 2.77% | | | | |
| 1,564,272 | | Zhaikmunai LP, GDR (b) * | | | 12,905,244 | |
| | | | | | | |
| | | Luxembourg - 2.27% | | | | |
| 393,617 | | ArcelorMittal | | | 6,327,461 | |
| 741,587 | | SAF-Holland S.A. * | | | 4,242,885 | |
| | | | | | 10,570,346 | |
| | | Netherlands – 0.00% | | | | |
| 414,902 | | Amtel Vredestein | | | | |
| | | N.V., GDR (a) (b) * | | $ | — | |
| | | | | | | |
| | | Norway - 1.37% | | | | |
| 7,668,834 | | Northland Resources | | | | |
| | | S.A. * | | | 6,386,931 | |
| | | | | | | |
| | | Portugal - 2.38% | | | | |
| 817,512 | | Galp Energia, SGPS, S.A., | | | | |
| | | B Shares | | | 11,064,532 | |
| | | | | | | |
| | | Russia – 3.89% | | | | |
| 580,570 | | Phosagro OAO, GDR | | | 7,210,679 | |
| 4,795,000 | | RusPetro plc * | | | 10,900,871 | |
| | | | | | 18,111,550 | |
| | | | | | | |
| | | Spain - 4.53% | | | | |
| 1,034,243 | | Banco Santander S.A. | | | 6,299,035 | |
| 44,736 | | Banco Santander S.A. | | | | |
| | | (rights shares) (a) | | | 272,464 | |
| 707,879 | | Indra Sistemas S.A. | | | 6,282,336 | |
| 418,145 | | Obrascon Huarte Lain S.A. | | | 8,231,768 | |
| | | | | | 21,085,603 | |
| | | | | | | |
| | | Sweden - 2.79% | | | | |
| 761,443 | | Svenska Cellulosa AB, | | | | |
| | | B Shares | | | 12,965,687 | |
| | | | | | | |
| | | Switzerland - 3.02% | | | | |
| 137,484 | | Aryzta AG * | | | 6,836,882 | |
| 69,849 | | DKSH Holding, Ltd. * | | | 3,706,011 | |
| 13,208 | | Kuoni Reisen | | | | |
| | | Holding AG * | | | 3,483,622 | |
| | | | | | 14,026,515 | |
| | | | | | | |
| | | United Kingdom – 36.14% | | | | |
| 3,631,357 | | African Minerals, Ltd. * | | | 16,667,499 | |
| 955,783 | | Aviva plc | | | 4,369,698 | |
| 1,035,673 | | BAE Systems plc | | | 5,015,857 | |
| 4,027,359 | | BP plc | | | 26,838,915 | |
| 3,501,600 | | Bwin.Party Digital | | | | |
| | | Entertainment plc | | | 5,643,704 | |
| 3,226,012 | | Carphone Warehouse | | | | |
| | | Group plc | | | 6,410,893 | |
| 1,226,610 | | Centamin plc * | | | 1,280,812 | |
| 484,183 | | Chemring Group plc | | | 2,196,153 | |
| 2,269,342 | | Cobham plc | | | 8,272,323 | |
| 616,882 | | Edwards Group Ltd. * | | | 4,163,954 | |
| 4,188,429 | | Essar Energy, Ltd. * | | | 7,564,988 | |
| 1,688,372 | | Exillon Energy plc * | | | 2,567,701 | |
| 2,281,212 | | G4S plc | | | 8,866,389 | |
| 400,000 | | Genel Energy plc * | | | 4,016,832 | |
| 2,882,354 | | GKN plc | | | 9,508,186 | |
See notes to financial statements
| Henderson Global Funds | Portfolio of investments |
European Focus Fund
July 31, 2012 (continued)
| Shares | | | | | Value (note 2) | |
| | | | | | | |
| | | United Kingdom (continued) | | | | |
| 973,599 | | Gulf Keystone Petroleum, | | | | |
| | | Ltd. * | | $ | 2,919,350 | |
| 192,530 | | Imperial Tobacco Group | | | | |
| | | plc | | | 7,483,065 | |
| 3,806,648 | | ITV plc | | | 4,506,032 | |
| 686,467 | | Juridica Investments, | | | | |
| | | Ltd. (b) | | | 831,424 | |
| 4,350,000 | | Mytrah Energy, Ltd. * (b) | | | 3,537,952 | |
| 4,936,156 | | Rentokil Initial plc | | | 5,576,060 | |
| 1,112,498 | | Smith & Nephew plc | | | 11,398,545 | |
| 2,883,706 | | TalkTalk Telecom Group plc | | | 7,848,837 | |
| 1,155,549 | | Tesco plc | | | 5,763,106 | |
| 1,056,687 | | Tullett Prebon plc | | | 4,522,865 | |
| 311,500 | | Zanaga Iron Ore Co., Ltd. * | | | 327,218 | |
| | | | | | 168,098,358 | |
| | | | | | | |
| | | Total common stocks | | | | |
| | | (Cost $455,983,344) | | | 414,695,238 | |
| | | | | | | |
| REITs - 0.93% | | | | |
| | | United Kingdom - 0.93% | | | | |
| 509,518 | | Shaftesbury plc | | | 4,349,727 | |
| | | | | | | |
| | | Total REITs | | | | |
| | | (Cost $2,384,954) | | | 4,349,727 | |
| | | | | | | |
| Contracts | | | | | | |
| | | | | |
| Options purchased - 0.00% | | | | |
| | | United Kingdom – 0.00% | | | | |
| 4,761 | | BP plc, Call @ $719 | | | | |
| | | Expires 12/21/12 | | | — | |
| | | | | | | |
| | | Total options purchased | | | | |
| | | (Cost $319,726) | | | — | |
| | | | | | | |
| | | Total long-term investments | | | | |
| | | (Cost $458,688,024) | | | 419,044,965 | |
| | | | | | | |
| Shares | | | | | | |
| | | | | | | |
| Short-term investment - 9.61% | | | | |
| 44,690,683 | | Fidelity Institutional | | | | |
| | | Treasury Portfolio | | | 44,690,683 | |
| | | | | | | |
| | | Total short-term investment | | | | |
| | | (Cost $44,690,683) | | | 44,690,683 | |
| | | | | | | |
| | | | | | Value | |
| | | | | | (note 2) | |
| Total investments - 99.70% | | | | |
| | | (Cost $503,378,707) | | $ | 463,735,648 | |
| | | | | | | |
| Net other assets and liabilities – 0.30% | | | 1,374,066 | |
| Total net assets – 100.00% | | $ | 465,109,714 | |
| * | | Non income producing security |
| (a) | | Fair valued at July 31, 2012 as determined in good faith using procedures approved by the Board of Trustees. |
| (b) | | This security has been deemed illiquid according to the policies and procedures adopted by the Board of Trustees. |
| GDR | | Global Depositary Receipts |
| REIT | | Real Estate Investment Trust |
The Fund held the following open forward foreign currency contracts at July 31, 2012:
| | | | | | | Local | | | Current | | | Unrealized | |
| | | | Value | | | amount | | | notional | | | appreciation/ | |
| | | | date | | | (000’s | ) | | value | | | (depreciation | ) |
| Euro | | | | | | | | | | | | | |
| Short | | | 8/17/12 | | | 35,651 | | $ | 43,872,813 | | $ | 1,127,187 | |
During the year ended July 31, 2012, average monthly notional value related to forward foreign currency contracts was $22.2 million or 4.8% of net assets.
See notes to financial statements
| Henderson Global Funds | Portfolio of investments |
European Focus Fund
July 31, 2012 (continued)
Other information:
| | | | | |
| Industry concentration as a percentage of net assets: | | | % of net assets |
| Oil & Gas Exploration & Production | | | 18.77 | % |
| Integrated Oil & Gas | | | 8.15 | |
| Precious Metals & Minerals | | | 3.58 | |
| Diversified Banks | | | 3.58 | |
| Aerospace & Defense | | | 3.33 | |
| Auto Parts & Equipment | | | 2.96 | |
| Tires & Rubber | | | 2.93 | |
| Cable & Satellite | | | 2.87 | |
| Paper Products | | | 2.79 | |
| Automobile Manufacturers | | | 2.72 | |
| Health Care Equipment | | | 2.45 | |
| Multi-line Insurance | | | 2.01 | |
| Security & Alarm Services | | | 1.91 | |
| Health Care Facilities | | | 1.88 | |
| Construction & Engineering | | | 1.77 | |
| Alternative Carriers | | | 1.69 | |
| Tobacco | | | 1.61 | |
| Fertilizers & Agricultural Chemicals | | | 1.55 | |
| Health Care Services | | | 1.52 | |
| Packaged Foods & Meats | | | 1.47 | |
| Steel | | | 1.43 | |
| Computer & Electronics Retail | | | 1.38 | |
| Diversified Metals & Mining | | | 1.37 | |
| IT Consulting & Other Services | | | 1.35 | |
| Construction Materials | | | 1.33 | |
| Food Retail | | | 1.24 | |
| Casinos & Gaming | | | 1.21 | |
| Environmental & Facilities Services | | | 1.20 | |
| Industrial Gases | | | 1.12 | |
| Heavy Electrical Equipment | | | 1.11 | |
| Investment Banking & Brokerage | | | 0.97 | |
| Broadcasting | | | 0.97 | |
| Diversified REIT’s | | | 0.93 | |
| Industrial Machinery | | | 0.89 | |
| Research & Consulting Services | | | 0.80 | |
| Independent Power Producers & Energy Traders | | | 0.76 | |
| Hotels, Resorts & Cruise Lines | | | 0.75 | |
| Oil & Gas Refining & Marketing | | | 0.56 | |
| Integrated Telecommunication Services | | | 0.32 | |
| Gold | | | 0.28 | |
| Specialty Stores | | | 0.27 | |
| Industrial Conglomerates | | | 0.18 | |
| Electric Utilities | | | 0.13 | |
| Long-Term Investments | | | 90.09 | |
| Short-Term Investment | | | 9.61 | |
| Total Investments | | | 99.70 | |
| Net Other Assets and Liabilities | | | 0.30 | |
| | | | 100.00 | % |
See notes to financial statements
| Henderson Global Funds | Portfolio of investments |
Global Equity Income Fund
July 31, 2012
| | | | | | Value | |
| Shares | | | | | (note 2) | |
| | | | | | | |
| Common stocks - 96.70% | | | | |
| | | | | | | |
| | | Australia - 5.09% | | | | |
| 1,351,427 | | Amcor, Ltd. | | $ | 10,708,422 | |
| 1,133,091 | | Crown, Ltd. | | | 10,061,971 | |
| 4,251,189 | | DUET Group | | | 9,292,558 | |
| 6,920,385 | | Telstra Corp., Ltd | | | 29,090,540 | |
| | | | | | 59,153,491 | |
| | | | | | | |
| | | Brazil - 2.85% | | | | |
| 1,459,528 | | CCR S.A. | | | 12,179,352 | |
| 424,902 | | Cielo S.A., ADR | | | 12,670,578 | |
| 468,708 | | Vale S.A., ADR | | | 8,310,193 | |
| | | | | | 33,160,123 | |
| | | | | | | |
| | | Canada - 2.03% | | | | |
| 331,508 | | Bank of Montreal | | | 18,987,704 | |
| 116,332 | | Crescent Point | | | | |
| | | Energy Corp. | | | 4,623,816 | |
| | | | | | 23,611,520 | |
| | | | | | | |
| | | China - 0.95% | | | | |
| 28,961,000 | | Bank of China, Ltd., | | | | |
| | | Class H | | | 11,054,529 | |
| | | | | | | |
| | | Cyprus - 1.07% | | | | |
| 1,700,867 | | ProSafe SE | | | 12,458,342 | |
| | | | | | | |
| | | France - 3.80% | | | | |
| 1,700,000 | | France Telecom S.A | | | 22,778,390 | |
| 133,237 | | Neopost S.A. | | | 7,603,295 | |
| 300,000 | | Total S.A | | | 13,880,754 | |
| | | | | | 44,262,439 | |
| | | | | | | |
| | | Germany - 2.36% | | | | |
| 1,218,546 | | Deutsche Post AG | | | 21,949,733 | |
| 487,267 | | Deutsche Telekom AG | | | 5,501,916 | |
| | | | | | 27,451,649 | |
| | | | | | | |
| | | Hong Kong - 3.12% | | | | |
| 885,000 | | Cheung Kong Holdings, Ltd. | | | 11,640,682 | |
| 3,452,000 | | NWS Holdings, Ltd. | | | 5,288,375 | |
| 5,248,000 | | SJM Holdings, Ltd | | | 9,379,767 | |
| 830,500 | | Swire Pacific, Ltd., | | | | |
| | | Class A | | | 9,959,960 | |
| | | | | | 36,268,784 | |
| | | | | | | |
| | | Israel - 0.51% | | | | |
| 500,786 | | Israel Chemicals, Ltd. | | | 5,927,094 | |
| | | | | | | |
| | | Italy - 2.70% | | | | |
| 1,513,337 | | ENI SpA | | | 31,356,239 | |
| | | Netherlands - 5.01% | | | | |
| 1,000,000 | | Delta Lloyd N.V. | | $ | 13,060,693 | |
| 893,899 | | Royal Dutch Shell plc, | | | | |
| | | Class B | | | 31,526,738 | |
| 392,359 | | Unilever N.V. | | | 13,640,339 | |
| | | | | | 58,227,770 | |
| | | | | | | |
| | | Norway - 1.07% | | | | |
| 316,508 | | Seadrill, Ltd. | | | 12,413,417 | |
| | | | | | | |
| | | Singapore - 2.74% | | | | |
| 1,773,200 | | Keppel Corp., Ltd. | | | 15,930,871 | |
| 2,346,000 | | SembCorp Industries, Ltd. | | | 9,972,951 | |
| 1,005,000 | | Venture Corp., Ltd. | | | 6,024,831 | |
| | | | | | 31,928,653 | |
| | | | | | | |
| | | South Africa - 1.07% | | | | |
| 200,585 | | Kumba Iron Ore, Ltd. | | | 12,485,132 | |
| | | | | | | |
| | | Taiwan - 3.12% | | | | |
| 550,000 | | Asustek Computer, Inc | | | 5,107,110 | |
| 7,836,000 | | CTCI Corp | | | 14,604,731 | |
| 1,184,856 | | Taiwan Semiconductor | | | | |
| | | Manufacturing Co., | | | | |
| | | Ltd., ADR | | | 16,552,439 | |
| | | | | | 36,264,280 | |
| | | | | | | |
| | | United Kingdom - 38.95% | | | | |
| 3,080,760 | | Amlin plc | | | 18,209,743 | |
| 5,034,211 | | BAE Systems plc | | | 24,381,135 | |
| 2,311,548 | | Balfour Beatty plc | | | 10,506,443 | |
| 512,820 | | British American | | | | |
| | | Tobacco plc | | | 27,316,749 | |
| 6,704,205 | | BT Group plc | | | 22,840,815 | |
| 6,839,413 | | Centrica plc | | | 33,992,467 | |
| 1,000,000 | | Dairy Crest Group plc | | | 5,293,063 | |
| 877,353 | | De La Rue plc | | | 14,044,449 | |
| 4,470,960 | | GKN plc | | | 14,748,611 | |
| 495,021 | | GlaxoSmithKline plc | | | 11,397,305 | |
| 742,247 | | ICAP plc | | | 3,705,323 | |
| 448,218 | | Imperial Tobacco | | | | |
| | | Group plc | | | 17,420,893 | |
| 1,611,304 | | Inmarsat plc | | | 12,419,209 | |
| 507,873 | | Johnson Matthey plc | | | 17,358,661 | |
| 10,776,087 | | Legal & General | | | | |
| | | Group plc | | | 21,541,496 | |
| 734,058 | | Phoenix Group Holdings | | | 5,586,435 | |
| 660,082 | | Provident Financial plc | | | 13,308,939 | |
| 86,650 | | Rio Tinto plc | | | 4,002,945 | |
| 13,366,272 | | RSA Insurance Group plc | | | 22,821,425 | |
| 576,242 | | Scottish & Southern | | | | |
| | | Energy plc | | | 11,862,445 | |
See notes to financial statements
| Henderson Global Funds | Portfolio of investments |
Global Equity Income Fund
July 31, 2012 (continued)
| | | | | | | |
| | | | | | Value | |
| Shares | | | | | (note 2) | |
| | | | | | | |
| | | United Kingdom (continued) | | | | |
| 599,747 | | Severn Trent plc | | $ | 16,220,408 | |
| 772,324 | | Smiths Group plc | | | 12,920,179 | |
| 4,757,753 | | Smiths News plc | | | 8,559,712 | |
| 3,135,885 | | Standard Life plc | | | 11,893,251 | |
| 1,627,147 | | Tate & Lyle plc | | | 16,837,411 | |
| 1,732,885 | | Tullett Prebon plc | | | 7,417,149 | |
| 2,412,562 | | United Utilities Group plc | | | 25,834,721 | |
| 14,193,813 | | Vodafone Group plc | | | 40,635,391 | |
| | | | | | 453,076,773 | |
| | | | | | | |
| | | United States - 20.26% | | | | |
| 276,006 | | Abbott Laboratories | | | 18,301,958 | |
| 381,864 | | AGL Resources, Inc. | | | 15,465,492 | |
| 351,341 | | Cinemark Holdings, Inc. | | | 8,214,353 | |
| 277,690 | | Johnson & Johnson | | | 19,221,702 | |
| 180,000 | | Mattel, Inc. | | | 6,330,600 | |
| 241,719 | | McGraw-Hill Cos., Inc. | | | 11,351,124 | |
| 853,773 | | Merck & Co., Inc. | | | 37,711,153 | |
| 500,388 | | Microsoft Corp. | | | 14,746,434 | |
| 1,046,481 | | New York Community | | | | |
| | | Bancorp, Inc. | | | 13,583,323 | |
| 442,841 | | NYSE Euronext | | | 11,283,589 | |
| 1,575,277 | | Pfizer, Inc | | | 37,869,659 | |
| 374,247 | | Pitney Bowes, Inc | | | 4,999,940 | |
| 423,573 | | Reynolds American, Inc | | | 19,598,723 | |
| 376,500 | | Verizon Communications, | | | | |
| | | Inc. | | | 16,995,210 | |
| | | | | | 235,673,260 | |
| | | | | | | |
| | | Total common stocks | | | | |
| | | (Cost $1,068,285,064) | | | 1,124,773,495 | |
| | | | | | | |
| REITs - 1.12% | | | | | | |
| | | | | | | |
| | | United Kingdom - 1.12% | | | | |
| 1,554,616 | | British Land Co., plc | | | 13,027,931 | |
| | | | | | | |
| | | Total REITs | | | | |
| | | (Cost $12,259,822) | | | 13,027,931 | |
| | | | | | | |
| | | Total long-term investments | | | | |
| | | (Cost $1,080,544,886) | | | 1,137,801,426 | |
| | | | | | | |
| Short-term investments - 2.04% | | | | |
| | | | | | | |
| 3,492,301 | | Federated Obligations | | | | |
| | | Fund | | | 3,492,301 | |
| 20,235,899 | | Fidelity Institutional | | | | |
| | | Treasury Portfolio | | | 20,235,899 | |
| | | | | | | |
| | | Total short-term investments | | | | |
| | | (Cost $23,728,200) | | | 23,728,200 | |
| | | | | | | |
| | | | | | Value | |
| | | | | | (note 2) | |
| Total investments - 99.86% | | | | |
| | | (Cost $1,104,273,086) | | $ | 1,161,529,626 | |
| | | | | | | |
| Net other assets and liabilities – 0.14% | | | 1,586,143 | |
| Total net assets – 100.00% | | $ | 1,163,115,769 | |
| ADR | | American Depositary Receipts |
| REIT | | Real Estate Investment Trust |
The Fund held the following open forward foreign currency contracts at July 31, 2012:
| | | | | | | | | | | | | | |
| | | | | | | Local | | | Current | | | Unrealized | |
| | | | Value | | | amount | | | notional | | | appreciation/ | |
| | | | date | | | (000’s | ) | | value | | | (depreciation | ) |
| Australian | | | | | | | | | | | | | |
| Dollar | | | | | | | | | | | | | |
| Short | | | 10/12/12 | | | 23,000 | | $ | 24,015,123 | | $ | (671,273 | ) |
| British | | | | | | | | | | | | | |
| Pound | | | | | | | | | | | | | |
| Short | | | 10/12/12 | | | 140,000 | | | 219,492,943 | | | (2,191,943 | ) |
| Total | | | | | | | | | | | $ | (2,863,216 | ) |
During the year ended July 31, 2012, average monthly notional value related to forward foreign currency contracts was $117.4 million or 10.1% of net assets.
See notes to financial statements
| Henderson Global Funds | Portfolio of investments |
Global Equity Income Fund
July 31, 2012 (continued)
| | | | | |
| Other information: | | | | |
| | | | | |
| | | | % of net |
| Industry concentration as a percentage of net assets: | | | assets |
| Pharmaceuticals | | | 10.70 | % |
| Integrated Telecommunication Services | | | 8.36 | |
| Integrated Oil & Gas | | | 6.60 | |
| Tobacco | | | 5.53 | |
| Life & Health Insurance | | | 4.48 | |
| Industrial Conglomerates | | | 3.79 | |
| Multi-Utilities | | | 3.72 | |
| Water Utilities | | | 3.61 | |
| Wireless Telecommunication Services | | | 3.49 | |
| Packaged Foods & Meats | | | 3.07 | |
| Diversified Banks | | | 2.58 | |
| Construction & Engineering | | | 2.16 | |
| Aerospace & Defense | | | 2.10 | |
| Multi-line Insurance | | | 1.96 | |
| Air Freight & Logistics | | | 1.89 | |
| Steel | | | 1.79 | |
| Casinos & Gaming | | | 1.67 | |
| Property & Casualty Insurance | | | 1.56 | |
| Specialty Chemicals | | | 1.49 | |
| Semiconductors | | | 1.42 | |
| Gas Utilities | | | 1.33 | |
| Auto Parts & Equipment | | | 1.27 | |
| Systems Software | | | 1.27 | |
| Commercial Printing | | | 1.21 | |
| Thrifts & Mortgage Finance | | | 1.17 | |
| Consumer Finance | | | 1.14 | |
| Diversified REIT’s | | | 1.12 | |
| Data Processing & Outsourced Services | | | 1.09 | |
| Oil & Gas Equipment & Services | | | 1.07 | |
| Alternative Carriers | | | 1.07 | |
| Oil & Gas Drilling | | | 1.07 | |
| Highways & Railtracks | | | 1.05 | |
| Electric Utilities | | | 1.02 | |
| Real Estate Development | | | 1.00 | |
| Publishing | | | 0.98 | |
| Specialized Finance | | | 0.97 | |
| Investment Banking & Brokerage | | | 0.96 | |
| Paper Packaging | | | 0.92 | |
| Diversified Real Estate Activities | | | 0.86 | |
| Distributors | | | 0.74 | |
| Movies & Entertainment | | | 0.71 | |
| Office Electronics | | | 0.65 | |
| Leisure Products | | | 0.54 | |
| Electronic Manufacturing Services | | | 0.52 | |
| Fertilizers & Agricultural Chemicals | | | 0.51 | |
| Computer Hardware | | | 0.44 | |
| Office Services & Supplies | | | 0.43 | |
| Oil & Gas Exploration & Production | | | 0.40 | |
| Diversified Metals & Mining | | | 0.34 | |
| Long-Term Investments | | | 97.82 | |
| Short-Term Investments | | | 2.04 | |
| Total Investments | | | 99.86 | |
| Net Other Assets and Liabilities | | | 0.14 | |
| | | | 100.00 | % |
See notes to financial statements
| Henderson Global Funds | Portfolio of investments |
Global Leaders Fund
July 31, 2012
| | | | | | | |
| | | | | | Value | |
| Shares | | | | | (note 2) | |
| | | | | | | |
| Common stocks - 98.90% | | | | |
| | | | | | | |
| | | Germany - 7.63% | | | | |
| 6,714 | | Bayer AG | | $ | 511,432 | |
| 2,051 | | Fresenius SE & | | | | |
| | | Co., KGaA | | | 219,044 | |
| 46,000 | | Infineon Technologies AG | | | 335,572 | |
| | | | | | 1,066,048 | |
| | | | | | | |
| | | Indonesia - 2.68% | | | | |
| 427,000 | | PT Bank Mandiri Tbk | | | 374,443 | |
| | | | | | | |
| | | Japan - 9.05% | | | | |
| 37,000 | | Kubota Corp. | | | 353,779 | |
| 7,900 | | Makita Corp | | | 267,564 | |
| 1,800 | | SMC Corp | | | 305,280 | |
| 14,500 | | Tokio Marine Holdings, Inc | | | 336,307 | |
| | | | | | 1,262,930 | |
| | | | | | | |
| | | Switzerland - 5.97% | | | | |
| 213 | | SGS S.A. | | | 426,742 | |
| 1,190 | | Syngenta AG | | | 406,743 | |
| | | | | | 833,485 | |
| | | | | | | |
| | | United Kingdom - 14.28% | | | | |
| 21,146 | | BG Group plc | | | 418,401 | |
| 19,262 | | Standard Chartered plc | | | 442,278 | |
| 13,266 | | Unilever plc | | | 476,507 | |
| 150,600 | | Vodafone Group plc | | | 431,152 | |
| 16,915 | | Xstrata plc | | | 224,918 | |
| | | | | | 1,993,256 | |
| | | | | | | |
| | | United States - 59.29% | | | | |
| 1,018 | | Apple, Inc. * | | | 621,753 | |
| 2,200 | | BorgWarner, Inc. * | | | 147,620 | |
| 12,400 | | Broadcom Corp., Class A* | | | 420,112 | |
| 13,300 | | CBS Corp., Class B | | | 445,018 | |
| 15,900 | | Citigroup, Inc | | | 431,367 | |
| 11,000 | | Dollar General Corp. * | | | 561,110 | |
| 710 | | Google, Inc., Class A * | | | 449,409 | |
| 4,000 | | Kansas City Southern | | | 291,200 | |
| 5,250 | | Mead Johnson | | | | |
| | | Nutrition Co | | | 383,040 | |
| 16,300 | | Microsoft Corp. | | | 480,361 | |
| 6,300 | | National Oilwell Varco, Inc. | | | 455,490 | |
| 6,900 | | Occidental Petroleum Corp. .. | | | 600,507 | |
| 14,000 | | Oracle Corp | | | 422,800 | |
| 19,100 | | Pfizer, Inc | | | 459,164 | |
| 4,362 | | Praxair, Inc. | | | 452,601 | |
| 2,500 | | Ralph Lauren Corp. | | | 360,850 | |
| | | United States (continued) | | | | |
| 5,170 | | Thermo Fisher | | | | |
| | | Scientific, Inc. | | $ | 287,814 | |
| 7,200 | | United Parcel Service, Inc., | | | | |
| | | Class B | | | 544,392 | |
| 3,100 | | VF Corp | | | 462,830 | |
| | | | | | 8,277,438 | |
| | | | | | | |
| | | Total long-term investments | | | | |
| | | (Cost $12,150,582) | | | 13,807,600 | |
| | | | | | | |
| Short-term investment - 1.77% | | | | |
| 247,535 | | Fidelity Institutional | | | | |
| | | Treasury Portfolio | | | 247,535 | |
| | | | | | | |
| | | Total short-term investment | | | | |
| | | (Cost $247,535) | | | 247,535 | |
| | | | | | | |
| Total investments - 100.67% | | | | |
| | | (Cost $12,398,117) | | | 14,055,135 | |
| | | | | | | |
| Net other assets and liabilities – (0.67)% | | | (93,403) | |
| Total net assets – 100.00% | | $ | 13,961,732 | |
| * | | Non income producing security |
See notes to financial statements
| Henderson Global Funds | Portfolio of investments |
| Global Leaders Fund |
| July 31, 2012 (continued) |
| Other information: | | | | |
| | | | | |
| | | | % of net |
| Industry concentration as a percentage of net assets: | | | assets |
| Integrated Oil & Gas | | | 7.30 | % |
| Pharmaceuticals | | | 6.95 | |
| Systems Software | | | 6.47 | |
| Packaged Foods & Meats | | | 6.16 | |
| Apparel, Accessories & Luxury Goods | | | 5.90 | |
| Diversified Banks | | | 5.85 | |
| Semiconductors | | | 5.41 | |
| Computer Hardware | | | 4.45 | |
| Industrial Machinery | | | 4.10 | |
| General Merchandise Stores | | | 4.02 | |
| Air Freight & Logistics | | | 3.90 | |
| Oil & Gas Equipment & Services | | | 3.26 | |
| Industrial Gases | | | 3.24 | |
| Internet Software & Services | | | 3.22 | |
| Broadcasting | | | 3.19 | |
| Other Diversified Financial Services | | | 3.09 | |
| Wireless Telecommunication Services | | | 3.09 | |
| Research & Consulting Services | | | 3.06 | |
| Fertilizers & Agricultural Chemicals | | | 2.91 | |
| Construction & Farm Machinery & Heavy Trucks | | | 2.53 | |
| Property & Casualty Insurance | | | 2.41 | |
| Railroads | | | 2.09 | |
| Life Sciences Tools & Services | | | 2.06 | |
| Diversified Metals & Mining | | | 1.61 | |
| Health Care Services | | | 1.57 | |
| Auto Parts & Equipment | | | 1.06 | |
| Long-Term Investments | | | 98.90 | |
| Short-Term Investment | | | 1.77 | |
| Total Investments | | | 100.67 | |
| Net Other Assets and Liabilities | | | (0.67 | ) |
| | | | 100.00 | % |
See notes to financial statements
| Henderson Global Funds | Portfolio of investments |
Global Technology Fund
July 31, 2012
| | | | | | | |
| | | | | | Value | |
| Shares | | | | | (note 2) | |
| | | | | | | |
| Common stocks - 93.42% | | | | |
| | | | | | | |
| | | Brazil - 1.43% | | | | |
| 145,681 | | Cielo S.A. | | $ | 4,247,015 | |
| | | | | | | |
| | | China - 5.50% | | | | |
| 42,586 | | Baidu, Inc., ADR * | | | 5,132,465 | |
| 677,163 | | China Digital TV Holding | | | | |
| | | Co., Ltd., ADR * | | | 1,841,883 | |
| 85,412 | | NetEase.com, Inc., ADR * | | | 4,510,608 | |
| 162,900 | | Tencent Holdings, Ltd. | | | 4,869,333 | |
| | | | | | 16,354,289 | |
| | | | | | | |
| | | France - 1.78% | | | | |
| 144,630 | | Cap Gemini | | | 5,295,873 | |
| | | | | | | |
| | | Germany - 3.43% | | | | |
| 77,491 | | SAP AG | | | 4,944,587 | |
| 265,327 | | Wirecard AG | | | 5,255,978 | |
| | | | | | 10,200,565 | |
| | | | | | | |
| | | Ireland - 1.52% | | | | |
| 75,082 | | Accenture plc, Class A | | | 4,527,445 | |
| | | | | | | |
| | | Israel - 1.43% | | | | |
| 87,413 | | Check Point Software | | | | |
| | | Technologies, Ltd. * | | | 4,245,649 | |
| | | | | | | |
| | | Japan - 3.05% | | | | |
| 110,500 | | Nippon Telegraph and | | | | |
| | | Telephone Corp. | | | 5,141,344 | |
| 472,900 | | Taiyo Yuden Co., Ltd. | | | 3,928,475 | |
| | | | | | 9,069,819 | |
| | | | | | | |
| | | Korea - 3.53% | | | | |
| 9,066 | | Samsung Electronics | | | | |
| | | Co., Ltd. | | | 10,496,313 | |
| | | | | | | |
| | | Netherlands - 1.64% | | | | |
| 84,121 | | ASML Holding N.V. | | | 4,887,386 | |
| | | | | | | |
| | | Russia – 1.51% | | | | |
| 147,757 | | Mail.ru Group, Ltd. * | | | 4,479,992 | |
| | | | | | | |
| | | United Kingdom – 6.81% | | | | |
| 179,684 | | Rightmove plc | | | 4,203,227 | |
| 1,792,221 | | Spirent Communications | | | | |
| | | plc | | | 4,642,011 | |
| 313,563 | | Telecity Group plc * | | | 4,218,098 | |
| 357,345 | | Velti plc * | | | 1,947,530 | |
| 1,842,068 | | Vodafone Group plc | | | 5,273,647 | |
| | | | | | 20,284,513 | |
| | | United States - 61.79% | | | | |
| 64,751 | | ACI Worldwide, Inc. * | | $ | 2,849,692 | |
| 21,718 | | Amazon.com, Inc. * | | | 5,066,809 | |
| 122,069 | | Analog Devices, Inc. | | | 4,770,457 | |
| 38,926 | | Apple, Inc. * | | | 23,774,444 | |
| 779,530 | | Cadence Design Systems, | | | | |
| | | Inc. * | | | 9,525,857 | |
| 553,597 | | Cisco Systems, Inc. | | | 8,829,872 | |
| 58,787 | | Citrix Systems, Inc. * | | | 4,272,639 | |
| 154,901 | | Cognizant Technology | | | | |
| | | Solutions Corp. * | | | 8,793,730 | |
| 342,642 | | Dell, Inc. * | | | 4,070,587 | |
| 113,191 | | eBay, Inc. * | | | 5,014,361 | |
| 185,890 | | EMC Corp. * | | | 4,872,177 | |
| 45,165 | | F5 Networks, Inc. * | | | 4,217,508 | |
| 82,482 | | Fusion-io, Inc. * | | | 1,577,056 | |
| 15,469 | | Google, Inc., Class A * | | | 9,791,413 | |
| 75,432 | | Intuit, Inc. | | | 4,376,565 | |
| 47,209 | | LinkedIn Corp., Class A * | | | 4,846,004 | |
| 21,569 | | MasterCard, Inc., Class A | | | 9,416,378 | |
| 739,514 | | Micron Technology, Inc. * | | | 4,592,382 | |
| 308,759 | | Microsoft Corp. | | | 9,099,128 | |
| 148,742 | | NetApp, Inc. * | | | 4,859,401 | |
| 412,658 | | Nuance Communications, | | | | |
| | | Inc. * | | | 8,397,590 | |
| 71,779 | | OpenTable, Inc. * | | | 2,609,884 | |
| 7,133 | | Priceline.com, Inc. * | | | 4,720,191 | |
| 145,860 | | Synopsys, Inc. * | | | 4,418,099 | |
| 70,584 | | Teradata Corp. * | | | 4,772,890 | |
| 156,868 | | TIBCO Software, Inc. * | | | 4,406,422 | |
| 55,553 | | Time Warner Cable, Inc. | | | 4,718,116 | |
| 147,930 | | VeriFone Systems, Inc. * | | | 5,368,380 | |
| 38,911 | | Visa, Inc., A Shares | | | 5,022,243 | |
| 52,609 | | VMware, Inc., Class A * | | | 4,774,793 | |
| | | | | | 183,825,068 | |
| | | | | | | |
| | | Total long-term investments | | | | |
| | | (Cost $236,448,766) | | | 277,913,927 | |
| | | | | | | |
| Short-term investment - 3.97% | | | | |
| 11,812,326 | | Fidelity Institutional | | | | |
| | | Treasury Portfolio | | | 11,812,326 | |
| | | | | | | |
| | | Total short-term investment | | | | |
| | | (Cost $11,812,326) | | | 11,812,326 | |
See notes to financial statements
| Henderson Global Funds | Portfolio of investments |
| Global Technology Fund |
| July 31, 2012 (continued) |
| | | | | | | |
| | | | | | Value | |
| | | | | | (note 2) | |
| | | | | |
| Total investments - 97.39% | | | | |
| | | (Cost $248,261,092) | | $ | 289,726,253 | |
| | | | | | | |
| Net other assets and liabilities – 2.61% | | | 7,750,931 | |
| Total net assets – 100.00% | | $ | 297,477,184 | |
| * | | Non income producing security |
| ADR | | American Depositary Receipts |
| Other information: | | | | |
| | | | | |
| | | | % of net |
| Industry concentration as a percentage of net assets: | | | assets |
| Internet Software & Services | | | 15.29 | % |
| Application Software | | | 14.52 | |
| Data Processing & Outsourced Services | | | 9.85 | |
| Computer Hardware | | | 9.36 | |
| IT Consulting & Other Services | | | 7.86 | |
| Systems Software | | | 6.74 | |
| Semiconductors | | | 6.68 | |
| Communications Equipment | | | 5.95 | |
| Computer Storage & Peripherals | | | 4.42 | |
| Internet Retail | | | 3.29 | |
| Wireless Telecommunication Services | | | 1.77 | |
| Integrated Telecommunication Services | | | 1.73 | |
| Semiconductor Equipment | | | 1.64 | |
| Cable & Satellite | | | 1.59 | |
| Publishing | | | 1.41 | |
| Electronic Components | | | 1.32 | |
| Long-Term Investments | | | 93.42 | |
| Short-Term Investment | | | 3.97 | |
| Total Investments | | | 97.39 | |
| Net Other Assets and Liabilities | | | 2.61 | |
| | | | 100.00 | % |
See notes to financial statements
| Henderson Global Funds | Portfolio of investments |
International Opportunities Fund
July 31, 2012
| | | | | | | |
| | | | | | Value | |
| Shares | | | | | (note 2) | |
| | | | | | | |
| Common stocks - 96.80% | | | | |
| | | | | | | |
| | | Australia - 0.88% | | | | |
| 16,500,000 | | African Petroleum | | | | |
| | | Corp., Ltd. * | | $ | 21,154,624 | |
| | | | | | | |
| | | China - 6.30% | | | | |
| 450,284 | | Baidu, Inc., ADR * | | | 54,268,228 | |
| 78,445,900 | | Bank of China, Ltd., | | | | |
| | | Class H | | | 29,943,114 | |
| 24,000,000 | | PetroChina Co., Ltd., | | | | |
| | | Class H | | | 30,082,401 | |
| 4,639,500 | | Ping An Insurance (Group) | | | | |
| | | Co. of China, Ltd., Class H | | | 36,405,480 | |
| | | | | | 150,699,223 | |
| | | | | | | |
| | | France - 8.10% | | | | |
| 1,194,149 | | Alstom S.A. | | | 39,729,348 | |
| 2,911,403 | | AXA S.A. | | | 35,642,785 | |
| 1,384,636 | | Renault S.A. | | | 60,633,109 | |
| 762,778 | | Sodexo | | | 57,653,397 | |
| | | | | | 193,658,639 | |
| | | | | | | |
| | | Germany - 14.52% | | | | |
| 693,417 | | Continental AG | | | 62,947,627 | |
| 3,631,450 | | Deutsche Post AG | | | 65,413,498 | |
| 4,445,092 | | Deutsche Telekom AG | | | 50,191,216 | |
| 641,797 | | Fresenius SE & Co., KGaA | | | 68,543,083 | |
| 830,059 | | HeidelbergCement AG | | | 38,666,583 | |
| 966,373 | | SAP AG | | | 61,662,841 | |
| | | | | | 347,424,848 | |
| | | | | | | |
| | | Hong Kong - 2.93% | | | | |
| 8,700,000 | | AIA Group, Ltd. | | | 30,571,782 | |
| 21,720,000 | | Brilliance China Automotive | | | | |
| | | Holdings, Ltd. * | | | 17,729,584 | |
| 31,344,000 | | Lenovo Group, Ltd | | | 21,786,034 | |
| | | | | | 70,087,400 | |
| | | | | | | |
| | | India - 1.18% | | | | |
| 1,400,000 | | Tata Motors, Ltd., ADR | | | 28,280,000 | |
| | | | | | | |
| | | Israel - 0.37% | | | | |
| 181,830 | | Check Point Software | | | | |
| | | Technologies, Ltd. * | | | 8,831,483 | |
| | | | | | | |
| | | Italy - 1.96% | | | | |
| 3,218,300 | | Prada SpA | | | 22,265,438 | |
| 7,214,381 | | UniCredit SpA * | | | 24,570,353 | |
| | | | | | 46,835,791 | |
| | | Japan - 19.12% | | | | |
| 1,682,500 | | Canon, Inc. | | $ | 57,070,400 | |
| 16,132,000 | | Daiwa Securities | | | | |
| | | Group, Inc. | | | 60,914,432 | |
| 221,100 | | Keyence Corp. | | | 55,497,869 | |
| 339,600 | | Nintendo Co., Ltd. | | | 38,035,200 | |
| 5,721,100 | | Rakuten, Inc. | | | 57,046,232 | |
| 4,600,000 | | Sekisui Chemical Co., Ltd. | | | 39,331,840 | |
| 1,590,300 | | Sumitomo Mitsui Financial | | | | |
| | | Group, Inc. | | | 50,645,330 | |
| 1,109,950 | | Yamada Denki Co., Ltd. | | | 57,894,992 | |
| 2,482,200 | | Yamato Holdings Co., Ltd. | | | 40,890,770 | |
| | | | | | 457,327,065 | |
| | | | | | | |
| | | Korea - 4.75% | | | | |
| 151,186 | | Hyundai Department | | | | |
| | | Store Co., Ltd | | | 17,049,167 | |
| 2,573,225 | | Korean Reinsurance Co. | | | 22,258,610 | |
| 64,117 | | Samsung Electronics | | | | |
| | | Co., Ltd. | | | 74,232,529 | |
| | | | | | 113,540,306 | |
| | | | | | | |
| | | Luxembourg - 1.77% | | | | |
| 2,629,222 | | ArcelorMittal | | | 42,265,197 | |
| | | | | | | |
| | | Netherlands - 2.77% | | | | |
| 1,140,000 | | ASML Holding N.V. | | | 66,233,402 | |
| | | | | | | |
| | | Portugal - 0.86% | | | | |
| 1,515,614 | | Galp Energia, SGPS, S.A. | | | 20,512,922 | |
| | | | | | | |
| | | Russia – 1.54% | | | | |
| 16,250,000 | | RusPetro plc * | | | 36,942,472 | |
| | | | | | | |
| | | Singapore - 1.17% | | | | |
| 2,354,530 | | DBS Group Holdings, Ltd. | | | 27,889,563 | |
| | | | | | | |
| | | Spain - 3.20% | | | | |
| 4,149,218 | | Banco Santander S.A. | | | 25,270,724 | |
| 165,935 | | Banco Santander S.A. | | | | |
| | | (rights shares) (b) | | | 1,010,624 | |
| 486,661 | | Industria de Diseno | | | | |
| | | Textile S.A | | | 50,196,361 | |
| | | | | | 76,477,709 | |
| | | | | | | |
| | | Sweden - 5.27% | | | | |
| 3,539,221 | | Svenska Cellulosa AB, | | | | |
| | | B Shares | | | 60,265,091 | |
| 7,050,000 | | Telefonaktiebolaget LM | | | | |
| | | Ericsson, B Shares | | | 65,724,600 | |
| | | | | | 125,989,691 | |
| | | | | | | |
| | | Switzerland - 2.73% | | | | |
| 368,441 | | Roche Holding AG | | | 65,400,825 | |
See notes to financial statements
| Henderson Global Funds | Portfolio of investments |
International Opportunities Fund
July 31, 2012 (continued)
| | | | | | | |
| | | | | | Value | |
| Shares | | | | | (note 2) | |
| | | | | | | |
| | | Taiwan - 1.28% | | | | |
| 2,200,000 | | Taiwan Semiconductor | | | | |
| | | Manufacturing Co., | | | | |
| | | Ltd., ADR | | $ | 30,734,000 | |
| | | | | | | |
| | | Thailand - 1.47% | | | | |
| 6,333,900 | | Kasikornbank pcl | | | 35,221,878 | |
| | | | | | | |
| | | United Kingdom – 9.47% | | | | |
| 4,866,966 | | BAE Systems plc | | | 23,571,152 | |
| 7,058,156 | | BP plc | | | 47,036,594 | |
| 6,084,352 | | Capita Group plc | | | 67,824,800 | |
| 12,039,871 | | Essar Energy, Ltd. * | | | 21,745,976 | |
| 1,030,151 | | Imperial Tobacco Group | | | | |
| | | plc | | | 40,038,888 | |
| 5,241,598 | | Tesco plc | | | 26,141,588 | |
| | | | | | 226,358,998 | |
| | | | | | | |
| | | United States - 5.16% | | | | |
| 51,783 | | Apple, Inc. * | | | 31,626,985 | |
| 298,621 | | Cognizant Technology | | | | |
| | | Solutions Corp., Class A * | | | 16,952,714 | |
| 30,035 | | Google, Inc., Class A * | | | 19,011,254 | |
| 60,626 | | MasterCard, Inc., Class A | | | 26,467,493 | |
| 453,705 | | NetApp, Inc. * | | | 14,822,542 | |
| 21,863 | | Priceline.com, Inc. * | | | 14,467,622 | |
| | | | | | 123,348,610 | |
| | | | | | | |
| | | Total common stocks | | | | |
| | | (Cost $2,237,592,784) | | | 2,315,214,646 | |
| | | | | | | |
| Contracts | | | | | | |
| | | | | |
| Options purchased - 0.00% | | | | |
| | | | | | | |
| | | United Kingdom - 0.00% | | | | |
| 7,401 | | BP plc, Call @ $719 | | | | |
| | | Expires 12/21/12 | | | — | |
| | | | | | | |
| | | Total options purchased | | | | |
| | | (Cost $497,016) | | | — | �� |
| | | | | | | |
| | | Total long-term investments | | | | |
| | | (Cost $2,238,089,800) | | | 2,315,214,646 | |
| Short-term investments - 2.65% | | | | |
| 2,448,818 | | Fidelity Institutional | | | | |
| | | Treasury Portfolio | | $ | 2,448,818 | |
| 60,977,723 | | Henderson Money | | | | |
| | | Market Fund (a) | | | 60,977,723 | |
| | | | | | | |
| | | Total short-term investments | | | | |
| | | (Cost $63,426,541) | | | 63,426,541 | |
| Total investments - 99.45% | | | | |
| | | | | | | |
| | | (Cost $2,301,516,341) | | | 2,378,641,187 | |
| | | | | | | |
| Net other assets and liabilities – 0.55% | | | 13,127,156 | |
| | | | | |
| Total net assets – 100.00% | | $ | 2,391,768,343 | |
| * | | Non income producing security |
| (a) | | Affiliated holding, see notes to financial statements for further information. |
| (b) | | Fair valued at July 31, 2012 as determined in good faith using procedures approved by the Board of Trustees. |
| ADR | | American Depositary Receipts |
The Fund held the following open forward foreign currency contracts at July 31, 2012:
| | | | | | | | | | | | | | |
| | | | | | | Local | | | Current | | | Unrealized | |
| | | | Value | | | amount | | | notional | | | appreciation/ | |
| | | | date | | | (000’s | ) | | value | | | (depreciation | ) |
| Euro | | | | | | | | | | | | | |
| Short | | | 8/17/12 | | | 195,655 | | $ | 240,774,349 | | $ | 6,225,651 | |
During the year ended July 31, 2012, average monthly notional value related to forward foreign currency contracts was $121.8 million or 5.1% of net assets.
See notes to financial statements
| Henderson Global Funds | Portfolio of investments |
International Opportunities Fund
July 31, 2012 (continued)
| | | | | |
| Other information: | | | | |
| | | | | |
| | | | % of net |
| Industry concentration as a percentage of net assets: | | | assets |
| Diversified Banks | | | 8.13 | % |
| Air Freight & Logistics | | | 4.44 | |
| Semiconductors | | | 4.39 | |
| Integrated Oil & Gas | | | 4.08 | |
| Oil & Gas Exploration & Production | | | 3.34 | |
| Automobile Manufacturers | | | 3.28 | |
| Internet Software & Services | | | 3.06 | |
| Internet Retail | | | 2.99 | |
| Health Care Equipment | | | 2.87 | |
| Human Resource & Employment Services | | | 2.84 | |
| Life & Health Insurance | | | 2.80 | |
| Semiconductor Equipment | | | 2.77 | |
| Communications Equipment | | | 2.75 | |
| Pharmaceuticals | | | 2.73 | |
| Auto Parts & Equipment | | | 2.63 | |
| Application Software | | | 2.58 | |
| Investment Banking & Brokerage | | | 2.55 | |
| Paper Products | | | 2.52 | |
| Computer & Electronics Retail | | | 2.42 | |
| Restaurants | | | 2.41 | |
| Office Electronics | | | 2.39 | |
| Electronic Equipment & Instruments | | | 2.32 | |
| Computer Hardware | | | 2.23 | |
| Apparel Retail | | | 2.10 | |
| Integrated Telecommunication Services | | | 2.10 | |
| Steel | | | 1.77 | |
| Tobacco | | | 1.67 | |
| Heavy Electrical Equipment | | | 1.66 | |
| Homebuilding | | | 1.64 | |
| Construction Materials | | | 1.62 | |
| Home Entertainment Software | | | 1.59 | |
| Multi-line Insurance | | | 1.49 | |
| Construction & Farm Machinery & Heavy Trucks | | | 1.18 | |
| Data Processing & Outsourced Services | | | 1.11 | |
| Food Retail | | | 1.09 | |
| Aerospace & Defense | | | 0.99 | |
| Apparel, Accessories & Luxury Goods | | | 0.93 | |
| Reinsurance | | | 0.93 | |
| Department Stores | | | 0.71 | |
| IT Consulting & Other Services | | | 0.71 | |
| Computer Storage & Peripherals | | | 0.62 | |
| Systems Software | | | 0.37 | |
| Long-Term Investments | | | 96.80 | |
| Short-Term Investments | | | 2.65 | |
| Total Investments | | | 99.45 | |
| Net Other Assets and Liabilities | | | 0.55 | |
| | | | 100.00 | % |
See notes to financial statements
| Henderson Global Funds | Portfolio of investments |
Japan Focus Fund
July 31, 2012
| | | | | | | |
| | | | | | Value | |
| Shares | | | | | (note 2) | |
| | | | | | | |
| Common stocks - 100.05% | | | | |
| | | | | | | |
| | | Japan - 100.05% | | | | |
| 11,400 | | Benesse Holdings, Inc. | | | $539,174 | |
| 29,100 | | Canon, Inc | | | 987,072 | |
| 38,100 | | Credit Saison Co., Ltd | | | 872,947 | |
| 51,000 | | Daiwa House Industry | | | | |
| | | Co., Ltd. | | | 729,830 | |
| 291,000 | | Daiwa Securities | | | | |
| | | Group, Inc. | | | 1,098,816 | |
| 127 | | INPEX Corp | | | 713,638 | |
| 4,000 | | Keyence Corp. | | | 1,004,032 | |
| 312,600 | | Mitsubishi UFJ Financial | | | | |
| | | Group, Inc. | | | 1,524,488 | |
| 227,000 | | Mitsui OSK Lines, Ltd | | | 694,438 | |
| 644,100 | | Mizuho Financial Group, | | | | |
| | | Inc. | | | 1,063,538 | |
| 13,500 | | Murata Manufacturing | | | | |
| | | Co., Ltd. | | | 678,240 | |
| 6,600 | | Nintendo Co., Ltd. | | | 739,200 | |
| 16,600 | | Nippon Telegraph and | | | | |
| | | Telephone Corp | | | 772,365 | |
| 4,420 | | Nippon Television | | | | |
| | | Network Corp. | | | 680,044 | |
| 6,850 | | Nitori Holdings Co., Ltd | | | 641,818 | |
| 38,700 | | NS Solutions Corp | | | 755,424 | |
| 14,700 | | Oracle Corp., Japan | | | 661,382 | |
| 121,100 | | Rakuten, Inc. | | | 1,207,512 | |
| 12,100 | | SANKYO Co., Ltd | | | 602,483 | |
| 11,600 | | Secom Co., Ltd. | | | 540,467 | |
| 79,000 | | Sekisui Chemical Co., Ltd. | | | 675,482 | |
| 18,500 | | Seven & I Holdings | | | | |
| | | Co., Ltd. | | | 588,448 | |
| 13,800 | | Shin-Etsu Chemical | | | | |
| | | Co., Ltd. | | | 703,027 | |
| 36,200 | | Sony Corp | | | 446,216 | |
| 36,300 | | Sumitomo Mitsui Financial | | | | |
| | | Group, Inc. | | | 1,156,024 | |
| 20,100 | | TDK Corp. | | | 771,840 | |
| 40,600 | | Tokio Marine Holdings, Inc | | | 941,660 | |
| 50,400 | | Tokyo Broadcasting | | | | |
| | | System, Inc | | | 583,834 | |
| 27,760 | | Yamada Denki Co., Ltd. | | | 1,447,962 | |
| 46,800 | | Yamato Holdings Co., Ltd. | | | 770,965 | |
| | | | | | 24,592,366 | |
| | | | | | | |
| | | Total long-term investments | | | | |
| | | (Cost $24,844,597) | | | 24,592,366 | |
| Total investments - 100.05% | | | | |
| | | (Cost $24,844,597) | | $ | 24,592,366 | |
| | | | | | | |
| Net other assets and liabilities – (0.05)% | | | (11,761) | |
| | | | | |
| Total net assets – 100.00% | | $ | 24,580,605 | |
See notes to financial statements
| Henderson Global Funds | Portfolio of investments |
| Japan Focus Fund |
| July 31, 2012 (continued) |
| Other information: | | | | |
| | | | | |
| | | | % of net |
| Industry concentration as a percentage of net assets: | | | assets |
| Diversified Banks | | | 15.23 | % |
| Electronic Components | | | 5.90 | |
| Computer & Electronics Retail | | | 5.89 | |
| Broadcasting | | | 5.14 | |
| Internet Retail | | | 4.91 | |
| Investment Banking & Brokerage | | | 4.47 | |
| Electronic Equipment & Instruments | | | 4.09 | |
| Office Electronics | | | 4.02 | |
| Property & Casualty Insurance | | | 3.83 | |
| Consumer Finance | | | 3.55 | |
| Integrated Telecommunication Services | | | 3.14 | |
| Air Freight & Logistics | | | 3.14 | |
| IT Consulting & Other Services | | | 3.07 | |
| Home Entertainment Software | | | 3.01 | |
| Diversified Real Estate Activities | | | 2.97 | |
| Oil & Gas Exploration & Production | | | 2.90 | |
| Specialty Chemicals | | | 2.86 | |
| Marine | | | 2.83 | |
| Homebuilding | | | 2.75 | |
| Systems Software | | | 2.69 | |
| Homefurnishing Retail | | | 2.61 | |
| Leisure Products | | | 2.45 | |
| Food Retail | | | 2.39 | |
| Security & Alarm Services | | | 2.20 | |
| Education Services | | | 2.19 | |
| Consumer Electronics | | | 1.82 | |
| Total Investments | | | 100.05 | |
| Net Other Assets and Liabilities | | | (0.05 | ) |
| | | | 100.00 | % |
See notes to financial statements
| Henderson Global Funds | Financial statements |
Statements of assets and liabilities
July 31, 2012
| | | | | | | | | | | |
| | | | | | | Emerging | | | | |
| | | | All | | | Markets | | | European | |
| | | | Asset | | | Opportunities | | | Focus | |
| | | | Fund | | | Fund | | | Fund | |
Assets: | | | | | | | | | | |
| Investments, at fair value | | | | | | | | | | |
| Securities | | $ | 17,700,815 | | $ | 15,811,316 | | $ | 419,044,965 | |
| Affiliated companies, at fair value | | | 2,144,315 | | | — | | | — | |
| Affiliated short-term investments, at fair value | | | — | | | — | | | — | |
| Unaffiliated short-term investments, at fair value | | | 15,566,822 | | | 1,735,130 | | | 44,690,683 | |
| Total investments | | | 35,411,952 | | | 17,546,446 | | | 463,735,648 | |
| Foreign cash, at value | | | — | | | 238,658 | | | — | |
| Foreign cash at broker for open futures contracts | | | 232,213 | | | — | | | — | |
| Dividends and interest receivable | | | 2,727 | | | 17,791 | | | 996,989 | |
| Receivable for investment securities sold | | | — | | | 5,972 | | | 2,077,955 | |
| Receivable for fund shares sold | | | 207,632 | | | 72,473 | | | 1,057,404 | |
| Receivable from investment adviser | | | 2,496 | | | — | | | — | |
| Unrealized appreciation on open futures contracts | | | 36,560 | | | — | | | — | |
| Receivable for open forward foreign currency contracts | | | 7,294 | | | — | | | 1,127,187 | |
| Prepaid expenses and other assets | | | 58,298 | | | 11,423 | | | 37,428 | |
| Total Assets | | | 35,959,172 | | | 17,892,763 | | | 469,032,611 | |
| Liabilities: | | | | | | | | | | |
| Payable for investment securities purchased | | | 100,791 | | | 772,670 | | | 2,128,474 | |
| Payable for fund shares redeemed | | | 5,952 | | | 1,562 | | | 937,760 | |
| Payable to custodian | | | — | | | — | | | — | |
| Unrealized depreciation on open futures contracts | | | 49,660 | | | — | | | — | |
| Payable for open forward foreign currency contracts | | | 39,709 | | | — | | | — | |
| Payable to investment adviser | | | — | | | 9,524 | | | 396,048 | |
| Payable for 12b-1 distribution and service fees | | | 1,577 | | | 3,455 | | | 142,802 | |
| Accrued expenses and other payables | | | 132,887 | | | 64,588 | | | 317,813 | |
| Total Liabilities | | | 330,576 | | | 851,799 | | | 3,922,897 | |
| Net assets | | $ | 35,628,596 | | $ | 17,040,964 | | $ | 465,109,714 | |
| Net assets consist of: | | | | | | | | | | |
| Paid-in capital | | $ | 35,693,867 | | $ | 21,355,578 | | $ | 788,866,914 | |
| Accumulated/undistributed net investment income (loss) | | | 122,985 | | | (33,071 | ) | | (728,786 | ) |
| Accumulated net realized loss on investments, futures, options and foreign currency transactions | | | (86,171 | ) | | (3,473,529 | ) | | (284,495,084 | ) |
| Net unrealized appreciation/(depreciation) of investments, futures, options and foreign currencies | | | (102,085 | ) | | (808,014 | ) | | (38,533,330 | ) |
| | | $ | 35,628,596 | | $ | 17,040,964 | | $ | 465,109,714 | |
See notes to financial statements
| Henderson Global Funds | Financial statements |
Statements of assets and liabilities
July 31, 2012 (continued)
| | | | | | | | | | | | | | | | | |
| | | | Global Equity | | | Global | | | Global | | | International | | | Japan | |
| | | | Income | | | Leaders | | | Technology | | | Opportunities | | | Focus | |
| | | | Fund | | | Fund | | | Fund | | | Fund | | | Fund | |
| | | | | | | | | | | | | | | | | |
| | | $ | 1,137,801,426 | | $ | 13,807,600 | | $ | 277,913,927 | | $ | 2,315,214,646 | | $ | 24,592,366 | |
| | | | — | | | — | | | — | | | — | | | — | |
| | | | — | | | — | | | — | | | 60,977,723 | | | — | |
| | | | 23,728,200 | | | 247,535 | | | 11,812,326 | | | 2,448,818 | | | — | |
| | | | 1,161,529,626 | | | 14,055,135 | | | 289,726,253 | | | 2,378,641,187 | | | 24,592,366 | |
| | | | 987,893 | | | — | | | 8,193,097 | | | 165,525 | | | — | |
| | | | — | | | — | | | — | | | — | | | — | |
| | | | 8,111,600 | | | 9,313 | | | 209,764 | | | 6,758,862 | | | 33,999 | |
| | | | 8,122,914 | | | — | | | 568,606 | | | 18,998,084 | | | 262,055 | |
| | | | 6,952,741 | | | — | | | 468,813 | | | 2,107,568 | | | 2,359 | |
| | | | — | | | 2,717 | | | — | | | — | | | — | |
| | | | — | | | — | | | — | | | — | | | — | |
| | | | — | | | — | | | — | | | 6,225,651 | | | — | |
| | | | 30,134 | | | 13,865 | | | 33,356 | | | 77,337 | | | 15,899 | |
| | | | 1,185,734,908 | | | 14,081,030 | | | 299,199,889 | | | 2,412,974,214 | | | 24,906,678 | |
| | | | | | | | | | | | | | | | | |
| | | | 16,370,983 | | | 50,380 | | | 491,190 | | | 9,999,801 | | | 167,333 | |
| | | | 1,748,893 | | | 30,946 | | | 722,299 | | | 5,551,053 | | | 89,594 | |
| | | | — | | | — | | | — | | | 877,558 | | | 15,332 | |
| | | | — | | | — | | | — | | | — | | | — | |
| | | | 2,863,216 | | | — | | | — | | | — | | | — | |
| | | | 791,464 | | | — | | | 247,802 | | | 1,982,458 | | | 4,896 | |
| | | | 400,962 | | | 6,378 | | | 99,415 | | | 657,531 | | | 10,528 | |
| | | | 443,621 | | | 31,594 | | | 161,999 | | | 2,137,470 | | | 38,390 | |
| | | | 22,619,139 | | | 119,298 | | | 1,722,705 | | | 21,205,871 | | | 326,073 | |
| | | $ | 1,163,115,769 | | $ | 13,961,732 | | $ | 297,477,184 | | $ | 2,391,768,343 | | $ | 24,580,605 | |
| | | | | | | | | | | | | | | | | |
| | | $ | 1,344,898,688 | | $ | 16,362,618 | | $ | 286,500,204 | | $ | 3,177,988,241 | | $ | 53,421,968 | |
| | | | (2,834,783 | ) | | (21,275 | ) | | (1,611,159 | ) | | 16,188,583 | | | 193,188 | |
| | | | | | | | | | | | | | | | | |
| | | | (233,270,413 | ) | | (4,036,081 | ) | | (28,768,735 | ) | | (885,158,788 | ) | | (28,783,003 | ) |
| | | | | | | | | | | | | | | | | |
| | | | 54,322,277 | | | 1,656,470 | | | 41,356,874 | | | 82,750,307 | | | (251,548 | ) |
| | | $ | 1,163,115,769 | | $ | 13,961,732 | | $ | 297,477,184 | | $ | 2,391,768,343 | | $ | 24,580,605 | |
See notes to financial statements
| Henderson Global Funds | Financial statements |
Statements of assets and liabilities
July 31, 2012 (continued)
| | | | | | | | | | | |
| | | | | | | Emerging | | | | |
| | | | All | | | Markets | | | European | |
| | | | Asset | | | Opportunities | | | Focus | |
| | | | Fund | | | Fund | | | Fund | |
| Net assets: | | | | | | | | | | |
| Class A Shares | | $ | 5,739,981 | | $ | 7,011,390 | | $ | 236,974,412 | |
| Class B Shares | | | N/A | | | N/A | | $ | 19,727,732 | |
| Class C Shares | | $ | 1,013,388 | | $ | 2,305,198 | | $ | 88,015,203 | |
| Class I Shares | | $ | 28,875,227 | | $ | 7,724,376 | | $ | 120,392,367 | |
| Class R Shares | | | N/A | | | N/A | | | N/A | |
| Shares outstanding: | | | | | | | | | | |
| Class A Shares (unlimited number of shares authorized) | | | 578,187 | | | 879,579 | | | 10,558,117 | |
| Class B Shares (unlimited number of shares authorized) | | | N/A | | | N/A | | | 928,385 | |
| Class C Shares (unlimited number of shares authorized) | | | 102,286 | | | 292,119 | | | 4,141,143 | |
| Class I Shares (unlimited number of shares authorized) | | | 2,905,365 | | | 967,391 | | | 5,359,706 | |
| Class R Shares (unlimited number of shares authorized) | | | N/A | | | N/A | | | N/A | |
| Class A shares: | | | | | | | | | | |
| Net asset value and redemption price per share | | $ | 9.93 | | $ | 7.97 | | $ | 22.44 | |
| Maximum sales charge* | | | 5.75 | % | | 5.75 | % | | 5.75 | % |
| Maximum offering price per share | | $ | 10.54 | | $ | 8.46 | | $ | 23.81 | |
| Class B shares: | | | | | | | | | | |
| Net asset value and offering price per share | | | N/A | | | N/A | | $ | 21.25 | |
| Class C shares: | | | | | | | | | | |
| Net asset value and offering price per share | | $ | 9.91 | | $ | 7.89 | | $ | 21.25 | |
| Class I shares: | | | | | | | | | | |
| Net asset value and offering price per share | | $ | 9.94 | | $ | 7.98 | | $ | 22.46 | |
| Class R shares: | | | | | | | | | | |
| Net asset value and offering price per share | | | N/A | | | N/A | | | N/A | |
| Investments, at cost | | $ | 35,470,273 | | $ | 18,322,926 | | $ | 503,378,707 | |
| Foreign cash, at cost | | $ | 230,185 | | $ | 239,422 | | $ | — | |
| * | On purchases of $50,000 or more, the sales charge will be reduced. |
See notes to financial statements
| Henderson Global Funds | Financial statements |
Statements of assets and liabilities
July 31, 2012 (continued)
| | | | | | | | | | | | | | | | | |
| | | | Global Equity | | | Global | | | Global | | | International | | | Japan | |
| | | | Income | | | Leaders | | | Technology | | | Opportunities | | | Focus | |
| | | | Fund | | | Fund | | | Fund | | | Fund | | | Fund | |
| | | | | | | | | | | | | | | | | |
| | | $ | 467,317,505 | | $ | 7,124,661 | | $ | 156,947,735 | | $ | 1,263,648,217 | | $ | 13,612,435 | |
| | | | N/A | | | N/A | | $ | 9,750,915 | | $ | 48,771,288 | | | N/A | |
| | | $ | 363,750,604 | | $ | 5,794,240 | | $ | 69,286,287 | | $ | 416,582,285 | | $ | 8,898,529 | |
| | | $ | 332,047,660 | | $ | 1,042,831 | | $ | 61,492,247 | | $ | 656,312,816 | | $ | 2,069,641 | |
| | | | N/A | | | N/A | | | N/A | | $ | 6,453,737 | | | N/A | |
| | | | | | | | | | | | | | | | | |
| | | | 66,187,563 | | | 719,625 | | | 7,969,764 | | | 65,731,180 | | | 1,864,560 | |
| | | | N/A | | | N/A | | | 536,380 | | | 2,690,582 | | | N/A | |
| | | | 51,743,121 | | | 596,915 | | | 3,818,033 | | | 22,988,974 | | | 1,272,827 | |
| | | | 46,968,592 | | | 104,945 | | | 3,093,812 | | | 34,089,059 | | | 283,140 | |
| | | | N/A | | | N/A | | | N/A | | | 340,847 | | | N/A | |
| | | | | | | | | | | | | | | | | |
| | | $ | 7.06 | | $ | 9.90 | | $ | 19.69 | | $ | 19.22 | | $ | 7.30 | |
| | | | 5.75 | % | | 5.75 | % | | 5.75 | % | | 5.75 | % | | 5.75 | % |
| | | $ | 7.49 | | $ | 10.50 | | $ | 20.89 | | $ | 20.39 | | $ | 7.75 | |
| | | | | | | | | | | | | | | | | |
| | | | N/A | | | N/A | | $ | 18.18 | | $ | 18.13 | | | N/A | |
| | | | | | | | | | | | | | | | | |
| | | $ | 7.03 | | $ | 9.71 | | $ | 18.15 | | $ | 18.12 | | $ | 6.99 | |
| | | | | | | | | | | | | | | | | |
| | | $ | 7.07 | | $ | 9.94 | | $ | 19.88 | | $ | 19.25 | | $ | 7.31 | |
| | | | | | | | | | | | | | | | | |
| | | | N/A | | | N/A | | | N/A | | $ | 18.93 | | | N/A | |
| | | $ | 1,104,273,086 | | $ | 12,398,117 | | $ | 248,261,092 | | $ | 2,301,516,341 | | $ | 24,844,597 | |
| | | $ | 988,215 | | $ | — | | $ | 8,298,929 | | $ | 165,466 | | $ | — | |
See notes to financial statements
| Henderson Global Funds | Financial statements |
Statements of operations
For the year ended July 31, 2012
| | | | | | | | | | | |
| | | | | | | Emerging | | | | |
| | | | All | | | Markets | | | European | |
| | | | Asset | | | Opportunities | | | Focus | |
| | | | Fund | * | | Fund | | | Fund | |
| Investment income: | | | | | | | | | | |
| Dividends | | $ | 103,658 | | $ | 254,165 | | $ | 14,267,262 | |
| Dividends from affiliated companies | | | 10,413 | | | — | | | — | |
| Interest | | | — | | | 4 | | | 91 | |
| Foreign taxes withheld | | | (743 | ) | | (26,780 | ) | | (620,971 | ) |
| Total Investment Income | | | 113,328 | | | 227,389 | | | 13,646,382 | |
| Expenses: | | | | | | | | | | |
| Investment advisory fees | | | 40,099 | | | 150,680 | | | 4,883,419 | |
| 12b-1 distribution and service fees: | | | | | | | | | | |
| Class A Shares | | | 1,320 | | | 19,202 | | | 654,878 | |
| Class B Shares | | | — | | | — | | | 243,169 | |
| Class C Shares | | | 1,235 | | | 18,290 | | | 989,409 | |
| Class R Shares | | | — | | | — | | | — | |
| Sub-accounting fees: | | | | | | | | | | |
| Class A Shares | | | 1,968 | | | 8,350 | | | 296,448 | |
| Class B Shares | | | — | | | — | | | 46,076 | |
| Class C Shares | | | 1,968 | | | 1,284 | | | 155,180 | |
| Class I Shares | | | 1,968 | | | 1,104 | | | 65,584 | |
| Class R Shares | | | — | | | — | | | — | |
| Transfer agent fees: | | | | | | | | | | |
| Class A Shares | | | 644 | | | 2,941 | | | 116,453 | |
| Class B Shares | | | — | | | — | | | 11,666 | |
| Class C Shares | | | 644 | | | 953 | | | 42,691 | |
| Class I Shares | | | 644 | | | 1,588 | | | 35,200 | |
| Class R Shares | | | — | | | — | | | — | |
| Audit fees | | | 34,071 | | | 33,649 | | | 32,847 | |
| Deferred offering costs | | | 28,498 | | | 29,811 | | | — | |
| Organization expense | | | 14,171 | | | — | | | — | |
| Registration and filing fees | | | 9,840 | | | 38,739 | | | 87,033 | |
| Custodian fees | | | 3,910 | | | 33,395 | | | 108,450 | |
| Administrative fees | | | 2,506 | | | 3,780 | | | 122,801 | |
| Printing and postage fees | | | 1,845 | | | 2,970 | | | 71,253 | |
| Trustees’ fees and expenses | | | 770 | | | 1,296 | | | 43,505 | |
| Legal fees | | | 738 | | | 1,114 | | | 41,000 | |
| Compliance officer fees | | | 381 | | | 684 | | | 22,968 | |
| Accounting fees | | | 185 | | | 10,473 | | | 15,965 | |
| Miscellaneous fees | | | 1,293 | | | 11,387 | | | 50,647 | |
| Total Expenses | | | 148,698 | | | 371,690 | | | 8,136,642 | |
| Fees waived and/or expenses reimbursed by investment adviser | | | (85,993 | ) | | (102,436 | ) | | — | |
| Net Expenses | | | 62,705 | | | 269,254 | | | 8,136,642 | |
| Net investment income/(loss) | | | 50,623 | | | (41,865 | ) | | 5,509,740 | |
| Realized and unrealized gain/(loss): | | | | | | | | | | |
| Net realized gain/(loss) from: | | | | | | | | | | |
| Investment transactions | | | (136,482 | ) | | (2,863,758 | ) | | (3,555,157 | ) |
| Futures contracts | | | 38,769 | | | — | | | — | |
| Option contracts | | | — | | | — | | | (1,564,288 | ) |
| Foreign currency transactions | | | 55,406 | | | (68,308 | ) | | (426,611 | ) |
| Net change in unrealized appreciation/depreciation of: | | | | | | | | | | |
| Investments | | | (58,321 | ) | | (1,066,468 | )(a) | | (121,127,456 | ) |
| Futures contracts | | | (13,100 | ) | | — | | | — | |
| Option contracts | | | — | | | — | | | 28,049 | |
| Translation of other assets and liabilities | | | (30,664 | ) | | 1,347 | | | 987,447 | |
| Net Realized and Unrealized Loss | | | (144,392 | ) | | (3,997,187 | ) | | (125,658,016 | ) |
| Net increase/(decrease) in net assets resulting from operations | | $ | (93,769 | ) | $ | (4,039,052 | ) | $ | (120,148,276 | ) |
| (a) | Includes foreign capital gains tax of $(30,983) and $(792,361) for Emerging Markets Opportunities Fund and International Opportunities Fund, respectively. |
| * | Fund commenced operations on March 30, 2012. |
See notes to financial statements
| Henderson Global Funds | Financial statements |
Statements of operations
(continued)
| | | | | | | | | | | | | | | | | |
| | | | Global Equity | | | Global | | | Global | | | International | | | Japan | |
| | | | Income | | | Leaders | | | Technology | | | Opportunities | | | Focus | |
| | | | Fund | | | Fund | | | Fund | | | Fund | | | Fund | |
| | | | | | | | | | | | | | | | | |
| | | $ | 92,131,635 | | $ | 219,097 | | $ | 2,370,791 | | $ | 66,466,843 | | $ | 722,320 | |
| | | | — | | | — | | | — | | | 33,158 | | | — | |
| | | | 622 | | | — | | | 72 | | | 868 | | | — | |
| | | | (5,107,276 | ) | | (9,208 | ) | | (106,868 | ) | | (5,185,749 | ) | | (50,561 | ) |
| | | | 87,024,981 | | | 209,889 | | | 2,263,995 | | | 61,315,120 | | | 671,759 | |
| | | | | | | | | | | | | | | | | |
| | | | 8,799,158 | | | 115,382 | | | 3,028,072 | | | 26,544,516 | | | 233,429 | |
| | | | | | | | | | | | | | | | | |
| | | | 1,108,243 | | | 18,073 | | | 412,623 | | | 3,667,562 | | | 48,140 | |
| | | | — | | | — | | | 103,022 | | | 586,495 | | | — | |
| | | | 3,459,953 | | | 61,661 | | | 718,589 | | | 4,834,585 | | | 101,453 | |
| | | | — | | | — | | | — | | | 32,205 | | | — | |
| | | | | | | | | | | | | | | | | |
| | | | 314,676 | | | 6,048 | | | 135,126 | | | 1,618,028 | | | 19,332 | |
| | | | — | | | — | | | 19,202 | | | 113,748 | | | — | |
| | | | 300,404 | | | 5,300 | | | 85,312 | | | 813,436 | | | 15,010 | |
| | | | 128,740 | | | 368 | | | 37,154 | | | 641,958 | | | 1,908 | |
| | | | — | | | — | | | — | | | 20,396 | | | — | |
| | | | | | | | | | | | | | | | | |
| | | | 143,660 | | | 2,597 | | | 55,422 | | | 444,378 | | | 7,588 | |
| | | | — | | | — | | | 4,219 | | | 25,607 | | | — | |
| | | | 96,506 | | | 2,200 | | | 25,416 | | | 180,399 | | | 4,278 | |
| | | | 61,487 | | | 463 | | | 13,616 | | | 165,673 | | | 1,744 | |
| | | | — | | | — | | | — | | | 2,411 | | | — | |
| | | | 36,700 | | | 36,697 | | | 36,699 | | | 38,875 | | | 36,700 | |
| | | | — | | | — | | | — | | | — | | | — | |
| | | | — | | | — | | | — | | | — | | | — | |
| | | | 106,175 | | | 45,010 | | | 63,246 | | | 189,555 | | | 46,860 | |
| | | | 172,085 | | | 12,520 | | | 64,795 | | | 471,050 | | | 19,200 | |
| | | | 263,141 | | | 3,617 | | | 75,947 | | | 680,192 | | | 7,812 | |
| | | | 138,580 | | | 9,561 | | | 42,560 | | | 479,490 | | | 19,965 | |
| | | | 93,193 | | | 1,290 | | | 26,842 | | | 245,450 | | | 2,721 | |
| | | | 80,705 | | | 1,144 | | | 28,660 | | | 233,660 | | | 2,502 | |
| | | | 49,681 | | | 748 | | | 14,480 | | | 117,877 | | | 1,569 | |
| | | | 10,855 | | | 15,840 | | | 15,426 | | | 15,965 | | | 13,108 | |
| | | | 97,610 | | | 5,603 | | | 36,409 | | | 296,987 | | | 5,877 | |
| | | | 15,461,552 | | | 344,122 | | | 5,042,837 | | | 42,460,498 | | | 589,196 | |
| | | | — | | | (98,517 | ) | | — | | | — | | | (97,229 | ) |
| | | | 15,461,552 | | | 245,605 | | | 5,042,837 | | | 42,460,498 | | | 491,967 | |
| | | | 71,563,429 | | | (35,716 | ) | | (2,778,842 | ) | | 18,854,622 | | | 179,792 | |
| | | | | | | | | | | | | | | | | |
| | | | (87,575,158 | ) | | 1,105,235 | | | 16,973,960 | | | (51,373,091 | ) | | (270,342 | ) |
| | | | — | | | — | | | — | | | — | | | — | |
| | | | — | | | — | | | — | | | (2,426,375 | ) | | — | |
| | | | 2,209,160 | | | 4,244 | | | (598,885 | ) | | (2,733,538 | ) | | 10,768 | |
| | | | 27,414,216 | | | (1,497,368 | ) | | (30,687,399 | ) | | (365,507,322 | )(a) | | (2,612,598 | ) |
| | | | — | | | — | | | — | | | — | | | — | |
| | | | — | | | — | | | — | | | 42,975 | | | — | |
| | | | 2,493,303 | | | (4,200 | ) | | (106,708 | ) | | 6,202,731 | | | 936 | |
| | | | (55,458,479 | ) | | (392,089 | ) | | (14,419,032 | ) | | (415,794,620 | ) | | (2,871,236 | ) |
| | | $ | 16,104,950 | | $ | (427,805 | ) | $ | (17,197,874 | ) | $ | (396,939,998 | ) | $ | (2,691,444 | ) |
See notes to financial statements
| Henderson Global Funds | Financial statements |
Statements of changes in net assets
All Asset Fund
| | | | | |
| | | | Period ended | |
| | | | July 31, 2012* | |
| Net investment income | | $ | 50,623 | |
| Net realized loss on investments, futures contracts and foreign currency transactions | | | (42,307 | ) |
| Net change in unrealized appreciation/depreciation of investments, futures contracts and foreign currency translations | | | (102,085 | ) |
| Net decrease in net assets resulting from operations | | | (93,769 | ) |
| | | | | |
| Increase from Fund share transactions: | | | | |
| Class A Shares | | | 5,683,730 | |
| Class C Shares | | | 1,005,845 | |
| Class I Shares | | | 29,032,790 | |
| Net increase from Fund share transactions | | | 35,722,365 | |
| Net increase in net assets | | | 35,628,596 | |
| | | | | |
| Net assets: | | | | |
| Beginning of period | | | — | |
| End of period | | $ | 35,628,596 | |
| Accumulated undistributed net investment income | | $ | 122,985 | |
| * Fund commenced operations on March 30, 2012. | | | | |
See notes to financial statements
| Henderson Global Funds | Financial statements |
Statements of changes in net assets
Emerging Markets Opportunities Fund
| | | | | | | | |
| | | | Year ended | | | Period ended | |
| | | | July 31, 2012 | | | July 31, 2011 | * |
| Net investment loss | | $ | (41,865 | ) | $ | (9,396 | ) |
| Net realized loss on investments and foreign currency transactions | | | (2,932,066 | ) | | (398,669 | ) |
| Net change in unrealized appreciation/depreciation of investments and foreign currency translations | | | (1,065,121 | ) | | 257,107 | |
| Net decrease in net assets resulting from operations | | | (4,039,052 | ) | | (150,958 | ) |
| | | | | | | | |
| Distributions to shareholders from net investment income: | | | | | | | |
| Class A Shares | | | (83,851 | ) | | — | |
| Class C Shares | | | (24,898 | ) | | — | |
| Class I Shares | | | (88,994 | ) | | — | |
| Total distributions to shareholders from net investment income | | | (197,743 | ) | | — | |
| | | | | | | | |
| Increase/(decrease) from Fund share transactions: | | | | | | | |
| Class A Shares | | | (5,906,361 | ) | | 15,906,432 | |
| Class C Shares | | | 1,250,313 | | | 1,397,250 | |
| Class I Shares | | | 5,326,961 | | | 3,454,122 | |
| Net increase from Fund share transactions | | | 670,913 | | | 20,757,804 | |
| Net increase/(decrease) in net assets | | | (3,565,882 | ) | | 20,606,846 | |
| | | | | | | | |
| Net assets: | | | | | | | |
| Beginning of year | | | 20,606,846 | | | — | |
| End of year | | $ | 17,040,964 | | $ | 20,606,846 | |
| Accumulated undistributed net investment income/(loss) | | $ | (33,071 | ) | $ | 3,893 | |
| * Fund commenced operations on December 31, 2010. | | | | | | | |
See notes to financial statements
| Henderson Global Funds | Financial statements |
| Statements of changes in net assets |
| European Focus Fund |
| | | | Year ended | | | Year ended | |
| | | | July 31, 2012 | | | July 31, 2011 | |
| Net investment income | | $ | 5,509,740 | | $ | 366,925 | |
| Net realized gain/(loss) on investments, options and foreign currency transactions | | | (5,546,056 | ) | | 40,854,097 | |
| Net change in unrealized appreciation/depreciation of investments, options and foreign currency translations | | | (120,111,960 | ) | | 71,834,784 | |
| Net increase/(decrease) in net assets resulting from operations | | | (120,148,276 | ) | | 113,055,806 | |
| | | | | | | | |
| Distributions to shareholders from net investment income: | | | | | | | |
| Class A Shares | | | (12,721,862 | ) | | (8,404,896 | ) |
| Class B Shares | | | (1,055,757 | ) | | (809,421 | ) |
| Class C Shares | | | (4,115,335 | ) | | (2,843,741 | ) |
| Class I Shares | | | (5,056,593 | ) | | (2,296,854 | ) |
| Total distributions to shareholders from net investment income | | | (22,949,547 | ) | | (14,354,912 | ) |
| | | | | | | | |
| Increase/(decrease) from Fund share transactions: | | | | | | | |
| Class A Shares | | | (20,232,625 | ) | | 25,752,966 | |
| Class B Shares | | | (7,474,864 | ) | | (4,291,281 | ) |
| Class C Shares | | | (14,828,072 | ) | | (6,569,118 | ) |
| Class I Shares | | | 21,334,266 | | | 41,796,011 | |
| Net increase/(decrease) from Fund share transactions | | | (21,201,295 | ) | | 56,688,578 | |
| Net increase/(decrease) in net assets | | | (164,299,118 | ) | | 155,389,472 | |
| | | | | | | | |
| Net assets: | | | | | | | |
| Beginning of year | | | 629,408,832 | | | 474,019,360 | |
| End of year | | $ | 465,109,714 | | $ | 629,408,832 | |
| Accumulated undistributed net investment loss | | $ | (728,786 | ) | $ | (1,535,762 | ) |
See notes to financial statements
| Henderson Global Funds | Financial statements |
| Statements of changes in net assets |
| Global Equity Income Fund |
| | | | Year ended | | | Year ended | |
| | | | July 31, 2012 | | | July 31, 2011 | |
| Net investment income | | $ | 71,563,429 | | $ | 53,721,409 | |
| Net realized gain/(loss) on investments and foreign currency transactions | | | (85,365,998 | ) | | 7,200,996 | |
| Net change in unrealized appreciation/(depreciation) of investments and foreign currency translations | | | 29,907,519 | | | 44,800,122 | |
| Net increase in net assets resulting from operations | | | 16,104,950 | | | 105,722,527 | |
| | | | | | | | |
| Distributions to shareholders from net investment income: | | | | | | | |
| Class A Shares | | | (30,797,395 | ) | | (30,747,095 | ) |
| Class C Shares | | | (21,569,191 | ) | | (20,406,974 | ) |
| Class I Shares | | | (19,485,873 | ) | | (9,909,354 | ) |
| Total distributions to shareholders from net investment income | | | (71,852,459 | ) | | (61,063,423 | ) |
| | | | | | | | |
| Increase from Fund share transactions: | | | | | | | |
| Class A Shares | | | 5,394,507 | | | 115,896,955 | |
| Class C Shares | | | 20,054,724 | | | 71,398,231 | |
| Class I Shares | | | 142,343,109 | | | 100,954,434 | |
| Net increase from Fund share transactions | | | 167,792,340 | | | 288,249,620 | |
| Net increase in net assets | | | 112,044,831 | | | 332,908,724 | |
| | | | | | | | |
| Net assets: | | | | | | | |
| Beginning of year | | | 1,051,070,938 | | | 718,162,214 | |
| End of year | | $ | 1,163,115,769 | | $ | 1,051,070,938 | |
| Accumulated undistributed net investment loss | | $ | (2,834,783 | ) | $ | (257,623 | ) |
See notes to financial statements
| Henderson Global Funds | Financial statements |
| Statements of changes in net assets |
| Global Leaders Fund |
| | | | Year ended | | | Year ended | |
| | | | July 31, 2012 | | | July 31, 2011 | |
| Net investment loss | | $ | (35,716 | ) | $ | (30,947 | ) |
| Net realized gain on investments and foreign currency transactions | | | 1,109,479 | | | 1,744,669 | |
| Net change in unrealized appreciation/depreciation of investments and foreign currency translations | | | (1,501,568 | ) | | 784,418 | |
| Net increase/(decrease) in net assets resulting from operations | | | (427,805 | ) | | 2,498,140 | |
| | | | | | | | |
| Increase/(decrease) from Fund share transactions: | | | | | | | |
| Class A Shares | | | (678,567 | ) | | (1,875,489 | ) |
| Class C Shares | | | (606,367 | ) | | (1,558,642 | ) |
| Class I Shares | | | (6,656 | ) | | 1,058,415 | |
| Net decrease from Fund share transactions | | | (1,291,590 | ) | | (2,375,716 | ) |
| Net increase/(decrease) in net assets | | | (1,719,395 | ) | | 122,424 | |
| | | | | | | | |
| Net assets: | | | | | | | |
| Beginning of year | | | 15,681,127 | | | 15,558,703 | |
| End of year | | $ | 13,961,732 | | $ | 15,681,127 | |
| Accumulated undistributed net investment loss | | $ | (21,275 | ) | $ | (109 | ) |
See notes to financial statements
| Henderson Global Funds | Financial statements |
| Statements of changes in net assets |
| Global Technology Fund |
| | | | Year ended | | | Year ended | |
| | | | July 31, 2012 | | | July 31, 2011 | |
| Net investment loss | | $ | (2,778,842 | ) | $ | (1,735,280 | ) |
| Net realized gain on investments and foreign currency transactions | | | 16,375,075 | | | 19,497,707 | |
| Net change in unrealized appreciation/depreciation of investments and foreign currency translations | | | (30,794,107 | ) | | 39,225,466 | |
| Net increase/(decrease) in net assets resulting from operations | | | (17,197,874 | ) | | 56,987,893 | |
| | | | | | | | |
| Increase/(decrease) from Fund share transactions: | | | | | | | |
| Class A Shares | | | (24,119,142 | ) | | 39,801,892 | |
| Class B Shares | | | (1,470,200 | ) | | 50,052 | |
| Class C Shares | | | (5,676,837 | ) | | 11,042,229 | |
| Class I Shares | | | 10,918,238 | | | 28,352,951 | |
| Net increase/(decrease) from Fund share transactions | | | (20,347,941 | ) | | 79,247,124 | |
| Net increase/(decrease) in net assets | | | (37,545,815 | ) | | 136,235,017 | |
| | | | | | | | |
| Net assets: | | | | | | | |
| Beginning of year | | | 335,022,999 | | | 198,787,982 | |
| End of year | | $ | 297,477,184 | | $ | 335,022,999 | |
| Accumulated undistributed net investment loss | | $ | (1,611,159 | ) | $ | (2,047 | ) |
See notes to financial statements
| Henderson Global Funds | Financial statements |
| Statements of changes in net assets |
| International Opportunities Fund |
| | | | Year ended | | | Year ended | |
| | | | July 31, 2012 | | | July 31, 2011 | |
| Net investment income | | $ | 18,854,622 | | $ | 17,699,302 | |
| Net realized gain/(loss) on investments, options and foreign currency transactions | | | (56,533,004 | ) | | 90,913,574 | |
| Net change in unrealized appreciation/(depreciation) of investments, options and foreign currency translations | | | (359,261,616 | ) | | 378,161,511 | |
| Net increase/(decrease) in net assets resulting from operations | | | (396,939,998 | ) | | 486,774,387 | |
| | | | | | | | |
| Distributions to shareholders from net investment income: | | | | | | | |
| Class A Shares | | | (8,152,193 | ) | | (13,496,413 | ) |
| Class I Shares | | | (6,959,597 | ) | | (6,054,467 | ) |
| Class R Shares | | | (24,972 | ) | | (35,981 | ) |
| Total distributions to shareholders from net investment income | | | (15,136,762 | ) | | (19,586,861 | ) |
| | | | | | | | |
| Increase/(decrease) from Fund share transactions: | | | | | | | |
| Class A Shares | | | (445,329,246 | ) | | (426,438,592 | ) |
| Class B Shares | | | (20,729,867 | ) | | (16,915,987 | ) |
| Class C Shares | | | (145,084,044 | ) | | (160,419,391 | ) |
| Class I Shares | | | (58,088,592 | ) | | 159,481,457 | |
| Class R Shares | | | 94,728 | | | (1,022,454 | ) |
| Net decrease from Fund share transactions | | | (669,137,021 | ) | | (445,314,967 | ) |
| Net increase/(decrease) in net assets | | | (1,081,213,781 | ) | | 21,872,559 | |
| | | | | | | | |
| Net assets: | | | | | | | |
| Beginning of year | | | 3,472,982,124 | | | 3,451,109,565 | |
| End of year | | $ | 2,391,768,343 | | $ | 3,472,982,124 | |
| Accumulated undistributed net investment income | | $ | 16,188,583 | | $ | 15,210,196 | |
See notes to financial statements
| Henderson Global Funds | Financial statements |
| Statements of changes in net assets |
| Japan Focus Fund |
| | | | Year ended | | | Year ended | |
| | | | July 31, 2012 | | | July 31, 2011 | |
| Net investment income/(loss) | | $ | 179,792 | | $ | (59,365 | ) |
| Net realized gain/(loss) on investments and foreign currency transactions | | | (259,574 | ) | | 480,637 | |
| Net change in unrealized appreciation/depreciation of investments and foreign currency translations | | | (2,611,662 | ) | | 2,913,783 | |
| Net increase/(decrease) in net assets resulting from operations | | | (2,691,444 | ) | | 3,335,055 | |
| | | | | | | | |
| Distributions to shareholders from net investment income: | | | | | | | |
| Class A Shares | | | (91,862 | ) | | (16,007 | ) |
| Class I Shares | | | (7,672 | ) | | — | |
| Total distributions to shareholders from net investment income | | | (99,534 | ) | | (16,007 | ) |
| | | | | | | | |
| Increase/(decrease) from Fund share transactions: | | | | | | | |
| Class A Shares | | | (10,600,760 | ) | | 9,432,233 | |
| Class C Shares | | | (1,905,761 | ) | | 423,215 | |
| Class I Shares | | | (4,302,988 | ) | | 6,684,817 | |
| Net increase/(decrease) from Fund share transactions | | | (16,809,509 | ) | | 16,540,265 | |
| Net increase/(decrease) in net assets | | | (19,600,487 | ) | | 19,859,313 | |
| | | | | | | | |
| Net assets: | | | | | | | |
| Beginning of year | | | 44,181,092 | | | 24,321,779 | |
| End of year | | $ | 24,580,605 | | $ | 44,181,092 | |
| Accumulated undistributed net investment income/(loss) | | $ | 193,188 | | $ | (180,765 | ) |
See notes to financial statements
| Henderson Global Funds | Financial statements |
| Statements of changes - capital stock activity |
| All Asset Fund |
| | | | Period ended | |
| | | | July 31, 2012 | * |
| Amount | | | | |
| Class A shares: | | | | |
| Sold | | $ | 6,002,209 | |
| Redeemed | | | (318,479 | ) |
| Net increase | | $ | 5,683,730 | |
| | | | | |
| Class C shares: | | | | |
| Sold | | $ | 1,005,845 | |
| Net increase | | $ | 1,005,845 | |
| | | | | |
| Class I shares: | | | | |
| Sold | | $ | 29,112,241 | |
| Redeemed | | | (79,451 | ) |
| Net increase | | $ | 29,032,790 | |
| | | | | |
| Shares | | | | |
| Class A shares: | | | | |
| Sold | | | 610,452 | |
| Redeemed | | | (32,265 | ) |
| Net increase | | | 578,187 | |
| | | | | |
| Class C shares: | | | | |
| Sold | | | 102,286 | |
| Net increase | | | 102,286 | |
| | | | | |
| Class I shares: | | | | |
| Sold | | | 2,913,463 | |
| Redeemed | | | (8,098 | ) |
| Net increase | | | 2,905,365 | |
| * Fund commenced operations on March 30, 2012. | | | | |
See notes to financial statements
| Henderson Global Funds | Financial statements |
| Statements of changes - capital stock activity |
| Emerging Markets Opportunities Fund |
| | | | Year ended | | | Period ended | |
| | | | July 31, 2012 | | | July 31, 2011* | |
| Amount | | | | | | | |
| Class A shares: | | | | | | | |
| Sold | | $ | 5,894,896 | | $ | 16,401,954 | |
| Issued as reinvestment of dividends | | | 83,356 | | | — | |
| Redeemed | | | (11,884,613 | ) | | (495,522 | ) |
| Net increase/(decrease) | | $ | (5,906,361 | ) | $ | 15,906,432 | |
| | | | | | | | |
| Class C shares: | | | | | | | |
| Sold | | $ | 1,557,603 | | $ | 1,607,140 | |
| Issued as reinvestment of dividends | | | 24,898 | | | — | |
| Redeemed | | | (332,188 | ) | | (209,890 | ) |
| Net increase | | $ | 1,250,313 | | $ | 1,397,250 | |
| | | | | | | | |
| Class I shares: | | | | | | | |
| Sold | | $ | 8,037,262 | | $ | 3,703,159 | |
| Issued as reinvestment of dividends | | | 88,994 | | | — | |
| Redeemed | | | (2,799,295 | ) | | (249,037 | ) |
| Net increase | | $ | 5,326,961 | | $ | 3,454,122 | |
| | | | | | | | |
| Shares | | | | | | | |
| Class A shares: | | | | | | | |
| Sold | | | 678,617 | | | 1,677,853 | |
| Issued as reinvestment of dividends | | | 11,482 | | | — | |
| Redeemed | | | (1,437,081 | ) | | (51,292 | ) |
| Net increase/(decrease) | | | (746,982 | ) | | 1,626,561 | |
| | | | | | | | |
| Class C shares: | | | | | | | |
| Sold | | | 187,748 | | | 164,436 | |
| Issued as reinvestment of dividends | | | 3,448 | | | — | |
| Redeemed | | | (41,768 | ) | | (21,745 | ) |
| Net increase | | | 149,428 | | | 142,691 | |
| | | | | | | | |
| Class I shares: | | | | | | | |
| Sold | | | 941,717 | | | 372,249 | |
| Issued as reinvestment of dividends | | | 12,241 | | | — | |
| Redeemed | | | (333,349 | ) | | (25,467 | ) |
| Net increase | | | 620,609 | | | 346,782 | |
| * Fund commenced operations on December 31, 2010. | | | | | | | |
See notes to financial statements
| Henderson Global Funds | Financial statements |
| Statements of changes - capital stock activity |
| European Focus Fund |
| | | | Year ended | | | Year ended | |
| | | | July 31, 2012 | | | July 31, 2011 | |
| Amount | | | | | | | |
| Class A shares: | | | | | | | |
| Sold | | $ | 96,674,950 | | $ | 144,802,616 | |
| Issued as reinvestment of dividends | | | 11,509,356 | | | 7,464,432 | |
| Redeemed | | | (128,416,931 | ) | | (126,514,082 | ) |
| Net increase/(decrease) | | $ | (20,232,625 | ) | $ | 25,752,966 | |
| | | | | | | | |
| Class B shares: | | | | | | | |
| Sold | | $ | 387,634 | | $ | 2,597,302 | |
| Issued as reinvestment of dividends | | | 885,458 | | | 665,995 | |
| Redeemed | | | (8,747,956 | ) | | (7,554,578 | ) |
| Net decrease | | $ | (7,474,864 | ) | $ | (4,291,281 | ) |
| | | | | | | | |
| Class C shares: | | | | | | | |
| Sold | | $ | 15,673,190 | | $ | 23,840,005 | |
| Issued as reinvestment of dividends | | | 3,064,881 | | | 2,142,756 | |
| Redeemed | | | (33,566,143 | ) | | (32,551,879 | ) |
| Net decrease | | $ | (14,828,072 | ) | $ | (6,569,118 | ) |
| | | | | | | | |
| Class I shares: | | | | | | | |
| Sold | | $ | 81,457,024 | | $ | 74,636,213 | |
| Issued as reinvestment of dividends | | | 3,173,670 | | | 960,053 | |
| Redeemed | | | (63,296,428 | ) | | (33,800,255 | ) |
| Net increase | | $ | 21,334,266 | | $ | 41,796,011 | |
| | | | | | | | |
| Shares | | | | | | | |
| Class A shares: | | | | | | | |
| Sold | | | 3,996,219 | | | 4,962,029 | |
| Issued as reinvestment of dividends | | | 549,373 | | | 266,777 | |
| Redeemed | | | (5,435,117 | ) | | (4,385,428 | ) |
| Net increase/(decrease) | | | (889,525 | ) | | 843,378 | |
| | | | | | | | |
| Class B shares: | | | | | | | |
| Sold | | | 17,431 | | | 96,832 | |
| Issued as reinvestment of dividends | | | 44,406 | | | 25,037 | |
| Redeemed | | | (389,800 | ) | | (277,613 | ) |
| Net decrease | | | (327,963 | ) | | (155,744 | ) |
| | | | | | | | |
| Class C shares: | | | | | | | |
| Sold | | | 674,482 | | | 860,201 | |
| Issued as reinvestment of dividends | | | 153,782 | | | 80,555 | |
| Redeemed | | | (1,509,611 | ) | | (1,204,005 | ) |
| Net decrease | | | (681,347 | ) | | (263,249 | ) |
| | | | | | | | |
| Class I shares: | | | | | | | |
| Sold | | | 3,444,771 | | | 2,536,473 | |
| Issued as reinvestment of dividends | | | 151,632 | | | 34,312 | |
| Redeemed | | | (2,684,962 | ) | | (1,191,210 | ) |
| Net increase | | | 911,441 | | | 1,379,575 | |
See notes to financial statements
| Henderson Global Funds | Financial statements |
| Statements of changes - capital stock activity |
| Global Equity Income Fund |
| | | | Year ended | | | Year ended | |
| | | | July 31, 2012 | | | July 31, 2011 | |
| Amount | | | | | | | |
| Class A shares: | | | | | | | |
| Sold | | $ | 202,957,252 | | $ | 236,903,318 | |
| Issued as reinvestment of dividends | | | 25,108,694 | | | 24,446,523 | |
| Redeemed | | | (222,671,439 | ) | | (145,452,886 | ) |
| Net increase | | $ | 5,394,507 | | $ | 115,896,955 | |
| | | | | | | | |
| Class C shares: | | | | | | | |
| Sold | | $ | 94,723,998 | | $ | 128,218,476 | |
| Issued as reinvestment of dividends | | | 14,695,471 | | | 12,082,487 | |
| Redeemed | | | (89,364,745 | ) | | (68,902,732 | ) |
| Net increase | | $ | 20,054,724 | | $ | 71,398,231 | |
| | | | | | | | |
| Class I shares: | | | | | | | |
| Sold | | $ | 225,533,396 | | $ | 149,030,283 | |
| Issued as reinvestment of dividends | | | 13,401,383 | | | 5,114,924 | |
| Redeemed | | | (96,591,670 | ) | | (53,190,773 | ) |
| Net increase | | $ | 142,343,109 | | $ | 100,954,434 | |
| | | | | | | | |
| Shares | | | | | | | |
| Class A shares: | | | | | | | |
| Sold | | | 29,136,869 | | | 31,598,537 | |
| Issued as reinvestment of dividends | | | 3,634,363 | | | 3,263,066 | |
| Redeemed | | | (32,307,753 | ) | | (19,445,138 | ) |
| Net increase | | | 463,479 | | | 15,416,465 | |
| | | | | | | | |
| Class C shares: | | | | | | | |
| Sold | | | 13,613,732 | | | 17,191,728 | |
| Issued as reinvestment of dividends | | | 2,136,658 | | | 1,619,035 | |
| Redeemed | | | (13,013,872 | ) | | (9,251,847 | ) |
| Net increase | | | 2,736,518 | | | 9,558,916 | |
| | | | | | | | |
| Class I shares: | | | | | | | |
| Sold | | | 32,412,472 | | | 19,835,260 | |
| Issued as reinvestment of dividends | | | 1,934,854 | | | 680,761 | |
| Redeemed | | | (13,964,719 | ) | | (7,106,631 | ) |
| Net increase | | | 20,382,607 | | | 13,409,390 | |
See notes to financial statements
| Henderson Global Funds | Financial statements |
| Statements of changes - capital stock activity |
| Global Leaders Fund |
| | | | Year ended | | | Year ended | |
| | | | July 31, 2012 | | | July 31, 2011 | |
| Amount | | | | | | | |
| Class A shares: | | | | | | | |
| Sold | | $ | 1,036,385 | | $ | 1,539,730 | |
| Redeemed | | | (1,714,952 | ) | | (3,415,219 | ) |
| Net decrease | | $ | (678,567 | ) | $ | (1,875,489 | ) |
| | | | | | | | |
| Class C shares: | | | | | | | |
| Sold | | $ | 1,105,052 | | $ | 1,574,694 | |
| Redeemed | | | (1,711,419 | ) | | (3,133,336 | ) |
| Net decrease | | $ | (606,367 | ) | $ | (1,558,642 | ) |
| | | | | | | | |
| Class I shares:* | | | | | | | |
| Sold | | $ | 61,107 | | $ | 1,058,420 | |
| Redeemed | | | (67,763 | ) | | (5 | ) |
| Net increase/(decrease) | | $ | (6,656 | ) | $ | 1,058,415 | |
| | | | | | | | |
| Shares | | | | | | | |
| Class A shares: | | | | | | | |
| Sold | | | 111,206 | | | 157,721 | |
| Redeemed | | | (181,235 | ) | | (341,374 | ) |
| Net decrease | | | (70,029 | ) | | (183,653 | ) |
| | | | | | | | |
| Class C shares: | | | | | | | |
| Sold | | | 120,900 | | | 160,104 | |
| Redeemed | | | (182,587 | ) | | (317,920 | ) |
| Net decrease | | | (61,687 | ) | | (157,816 | ) |
| | | | | | | | |
| Class I shares:* | | | | | | | |
| Sold | | | 6,584 | | | 105,477 | |
| Redeemed | | | (7,115 | ) | | (1 | ) |
| Net increase/(decrease) | | | (531 | ) | | 105,476 | |
| * Class I commenced operations on May 31, 2011. | | | | | | | |
See notes to financial statements
| Henderson Global Funds | Financial statements |
| Statements of changes - capital stock activity |
| Global Technology Fund |
| | | | Year ended | | | Year ended | |
| | | | July 31, 2012 | | | July 31, 2011 | |
| Amount | | | | | | | |
| Class A shares: | | | | | | | |
| Sold | | $ | 55,789,167 | | $ | 111,012,192 | |
| Redeemed | | | (79,908,309 | ) | | (71,210,300 | ) |
| Net increase/(decrease) | | $ | (24,119,142 | ) | $ | 39,801,892 | |
| | | | | | | | |
| Class B shares: | | | | | | | |
| Sold | | $ | 409,911 | | $ | 1,480,531 | |
| Redeemed | | | (1,880,111 | ) | | (1,430,479 | ) |
| Net increase/(decrease) | | $ | (1,470,200 | ) | $ | 50,052 | |
| | | | | | | | |
| Class C shares: | | | | | | | |
| Sold | | $ | 12,239,550 | | $ | 25,537,724 | |
| Redeemed | | | (17,916,387 | ) | | (14,495,495 | ) |
| Net increase/(decrease) | | $ | (5,676,837 | ) | $ | 11,042,229 | |
| | | | | | | | |
| Class I shares: | | | | | | | |
| Sold | | $ | 39,980,276 | | $ | 48,433,546 | |
| Redeemed | | | (29,062,038 | ) | | (20,080,595 | ) |
| Net increase | | $ | 10,918,238 | | $ | 28,352,951 | |
| | | | | | | | |
| Shares | | | | | | | |
| Class A shares: | | | | | | | |
| Sold | | | 2,844,623 | | | 5,611,178 | |
| Redeemed | | | (4,201,131 | ) | | (3,546,750 | ) |
| Net increase/(decrease) | | | (1,356,508 | ) | | 2,064,428 | |
| | | | | | | | |
| Class B shares: | | | | | | | |
| Sold | | | 23,165 | | | 81,583 | |
| Redeemed | | | (104,706 | ) | | (78,280 | ) |
| Net increase/(decrease) | | | (81,541 | ) | | 3,303 | |
| | | | | | | | |
| Class C shares: | | | | | | | |
| Sold | | | 679,548 | | | 1,368,913 | |
| Redeemed | | | (1,013,156 | ) | | (788,245 | ) |
| Net increase/(decrease) | | | (333,608 | ) | | 580,668 | |
| | | | | | | | |
| Class I shares: | | | | | | | |
| Sold | | | 2,089,534 | | | 2,367,168 | |
| Redeemed | | | (1,527,146 | ) | | (999,626 | ) |
| Net increase | | | 562,388 | | | 1,367,542 | |
See notes to financial statements
| Henderson Global Funds | Financial statements |
| Statements of changes - capital stock activity |
| International Opportunities Fund |
| | | | Year ended | | | Year ended | |
| | | | July 31, 2012 | | | July 31, 2011 | |
| Amount | | | | | | | |
| Class A shares: | | | | | | | |
| Sold | | $ | 216,540,569 | | $ | 445,919,849 | |
| Issued as reinvestment of dividends | | | 7,320,292 | | | 11,008,482 | |
| Redeemed | | | (669,190,107 | ) | | (883,366,924 | ) |
| Net decrease | | $ | (445,329,246 | ) | $ | (426,438,593 | ) |
| | | | | | | | |
| Class B shares: | | | | | | | |
| Sold | | $ | 153,634 | | $ | 745,478 | |
| Redeemed | | | (20,883,501 | ) | | (17,661,465 | ) |
| Net decrease | | $ | (20,729,867 | ) | $ | (16,915,987 | ) |
| | | | | | | | |
| Class C shares: | | | | | | | |
| Sold | | $ | 24,418,799 | | $ | 46,962,649 | |
| Redeemed | | | (169,502,843 | ) | | (207,382,040 | ) |
| Net decrease | | $ | (145,084,044 | ) | $ | (160,419,391 | ) |
| | | | | | | | |
| Class I shares: | | | | | | | |
| Sold | | $ | 391,238,384 | | $ | 422,383,359 | |
| Issued as reinvestment of dividends | | | 3,555,101 | | | 2,142,597 | |
| Redeemed | | | (452,882,077 | ) | | (265,044,499 | ) |
| Net increase/(decrease) | | $ | (58,088,592 | ) | $ | 159,481,457 | |
| | | | | | | | |
| Class R shares: | | | | | | | |
| Sold | | $ | 2,906,544 | | $ | 3,554,689 | |
| Issued as reinvestment of dividends | | | 11,418 | | | 17,317 | |
| Redeemed | | | (2,823,234 | ) | | (4,594,460 | ) |
| Net increase/(decrease) | | $ | 94,728 | | $ | (1,022,454 | ) |
| | | | | | | | |
| Shares | | | | | | | |
| Class A shares: | | | | | | | |
| Sold | | | 11,289,890 | | | 20,780,395 | |
| Issued as reinvestment of dividends | | | 416,399 | | | 520,249 | |
| Redeemed | | | (35,550,456 | ) | | (41,510,948 | ) |
| Net decrease | | | (23,844,167 | ) | | (20,210,304 | ) |
| | | | | | | | |
| Class B shares: | | | | | | | |
| Sold | | | 8,536 | | | 39,247 | |
| Redeemed | | | (1,161,953 | ) | | (877,093 | ) |
| Net decrease | | | (1,153,417 | ) | | (837,846 | ) |
| | | | | | | | |
| Class C shares: | | | | | | | |
| Sold | | | 1,359,110 | | | 2,343,374 | |
| Redeemed | | | (9,457,781 | ) | | (10,359,494 | ) |
| Net decrease | | | (8,098,671 | ) | | (8,016,120 | ) |
| | | | | | | | |
| Class I shares: | | | | | | | |
| Sold | | | 20,725,159 | | | 19,980,812 | |
| Issued as reinvestment of dividends | | | 202,339 | | | 101,162 | |
| Redeemed | | | (23,362,646 | ) | | (12,565,717 | ) |
| Net increase/(decrease) | | | (2,435,148 | ) | | 7,516,257 | |
| | | | | | | | |
| Class R shares: | | | | | | | |
| Sold | | | 153,649 | | | 167,098 | |
| Issued as reinvestment of dividends | | | 658 | | | 828 | |
| Redeemed | | | (151,106 | ) | | (216,221 | ) |
| Net increase/(decrease) | | | 3,201 | | | (48,295 | ) |
See notes to financial statements
| Henderson Global Funds | Financial statements |
| Statements of changes - capital stock activity |
| Japan Focus Fund |
| | | | Year ended | | | Year ended | |
| | | | July 31, 2012 | | | July 31, 2011 | |
| Amount | | | | | | | |
| Class A shares: | | | | | | | |
| Sold | | $ | 4,304,286 | | $ | 27,487,979 | |
| Issued as reinvestment of dividends | | | 80,195 | | | 12,129 | |
| Redeemed | | | (14,985,241 | ) | | (18,067,875 | ) |
| Net increase/(decrease) | | $ | (10,600,760 | ) | $ | 9,432,233 | |
| | | | | | | | |
| Class C shares: | | | | | | | |
| Sold | | $ | 967,728 | | $ | 4,799,711 | |
| Redeemed | | | (2,873,489 | ) | | (4,376,496 | ) |
| Net increase/(decrease) | | $ | (1,905,761 | ) | $ | 423,215 | |
| | | | | | | | |
| Class I shares:* | | | | | | | |
| Sold | | $ | 1,891,455 | | $ | 6,719,955 | |
| Issued as reinvestment of dividends | | | 7,672 | | | — | |
| Redeemed | | | (6,202,115 | ) | | (35,138 | ) |
| Net increase/(decrease) | | $ | (4,302,988 | ) | $ | 6,684,817 | |
| | | | | | | | |
| Shares | | | | | | | |
| Class A shares: | | | | | | | |
| Sold | | | 587,111 | | | 3,635,009 | |
| Issued as reinvestment of dividends | | | 11,489 | | | 1,549 | |
| Redeemed | | | (2,030,131 | ) | | (2,420,910 | ) |
| Net increase/(decrease) | | | (1,431,531 | ) | | 1,215,648 | |
| | | | | | | | |
| Class C shares: | | | | | | | |
| Sold | | | 134,758 | | | 660,728 | |
| Redeemed | | | (407,683 | ) | | (622,791 | ) |
| Net increase/(decrease) | | | (272,925 | ) | | 37,937 | |
| | | | | | | | |
| Class I shares:* | | | | | | | |
| Sold | | | 253,021 | | | 875,670 | |
| Issued as reinvestment of dividends | | | 1,099 | | | — | |
| Redeemed | | | (842,187 | ) | | (4,463 | ) |
| Net increase/(decrease) | | | (588,067 | ) | | 871,207 | |
| * Class I commenced operations on May 31, 2011. | | | | | | | |
See notes to financial statements
| Henderson Global Funds | Financial highlights |
For a share outstanding throughout the periods indicated
| | | | | | Income (loss) from investment operations: | | Less distributions: |
| | | | | | | | | | | | | | | | |
| | | | Net asset value, beginning of period | | Net investment income (loss) (b) | | Net realized and unrealized gain (loss) on investments | | Total from investment operations | | Dividends from net investment income | | Distributions from net realized capital gains | | Total distributions |
| All Asset Fund | | | | | | | | | | | | | | | | | | | | | | |
| Class A | | | | | | | | | | | | | | | | | | | | | | |
| Period Ended 7/31/2012(a) | | $ | 10.00 | | | 0.01 | | | (0.08 | ) | | (0.07 | ) | | 0.00 | | | 0.00 | | | 0.00 | |
| Class C | | | | | | | | | | | | | | | | | | | | | | |
| Period Ended 7/31/2012(a) | | $ | 10.00 | | | (0.01 | ) | | (0.08 | ) | | (0.09 | ) | | 0.00 | | | 0.00 | | | 0.00 | |
| Class I | | | | | | | | | | | | | | | | | | | | | | |
| Period Ended 7/31/2012(a) | | $ | 10.00 | | | 0.02 | | | (0.08 | ) | | (0.06 | ) | | 0.00 | | | 0.00 | | | 0.00 | |
Emerging Markets Opportunities Fund | | | | | | | | | | | | | | | | | | |
| Class A | | | | | | | | | | | | | | | | | | | | | | |
| Year Ended 7/31/2012 | | $ | 9.74 | | | (0.02 | ) | | (1.62 | ) | | (1.64 | ) | | (0.13 | ) | | 0.00 | | | (0.13 | ) |
| Period Ended 7/31/2011(a) | | | 10.00 | | | 0.00 | * | | (0.26 | ) | | (0.26 | ) | | 0.00 | | | 0.00 | | | 0.00 | |
| Class C | | | | | | | | | | | | | | | | | | | | | | |
| Year Ended 7/31/2012 | | $ | 9.70 | | | (0.09 | ) | | (1.60 | ) | | (1.69 | ) | | (0.12 | ) | | 0.00 | | | (0.12 | ) |
| Period Ended 7/31/2011(a) | | | 10.00 | | | (0.06 | ) | | (0.24 | ) | | (0.30 | ) | | 0.00 | | | 0.00 | | | 0.00 | |
| Class I | | | | | | | | | | | | | | | | | | | | | | |
| Year Ended 7/31/2012 | | $ | 9.75 | | | (0.00 | )* | | (1.62 | ) | | (1.62 | ) | | (0.15 | ) | | 0.00 | | | (0.15 | ) |
| Period Ended 7/31/2011(a) | | | 10.00 | | | (0.01 | ) | | (0.24 | ) | | (0.25 | ) | | 0.00 | | | 0.00 | | | 0.00 | |
| (a) | The All Asset Fund commenced operations on March 30, 2012 and the Emerging Markets Opportunities Fund commenced operations on December 31, 2010. |
| (b) | Per share data was calculated using average shares outstanding during the period. |
| (c) | Total returns are historical and assume changes in share price, reinvestment of all dividends and distributions and no sales charge. Had certain expenses not been reduced during the periods shown, total returns would have been lower. Total returns for periods of less than one year are not annualized. |
| * | Amount represents less than $0.01. |
See notes to financial statements
| Henderson Global Funds | Financial highlights |
| | | | | | | | | | Ratios to average net assets: | | |
| | | | Net asset value, end of period | | Total return (c) | | Net assets, end of period (000) | | Annualized ratio of operating expenses to average net assets | | Annualized ratio of net investment income/(loss) to average net assets | | Annualized ratio of operating expenses to average net assets without waivers and/or expenses reimbursed | | Portfolio turnover rate |
| | | | | | | | | | | | | | | | | | | | | | | |
| | | $ | 9.93 | | | (0.70 | )% | $ | 5,740 | | | 0.85 | % | | 0.43 | % | | 2.13 | % | | 7 | % |
| | | | | | | | | | | | | | | | | | | | | | | |
| | | $ | 9.91 | | | (0.90 | )% | $ | 1,013 | | | 1.60 | % | | (0.24 | )% | | 4.49 | % | | 7 | % |
| | | | | | | | | | | | | | | | | | | | | | | |
| | | $ | 9.94 | | | (0.60 | )% | $ | 28,875 | | | 0.60 | % | | 0.52 | % | | 1.41 | % | | 7 | % |
| | | | | | | | | | | | | | | | | | | | | | | |
| | | | | | | | | | | | | | | | | | | | | | | |
| | | $ | 7.97 | | | (16.70 | )% | $ | 7,011 | | | 1.79 | % | | (0.25 | )% | | 2.51 | % | | 110 | % |
| | | | 9.74 | | | (2.60 | ) | | 15,841 | | | 1.79 | | | 0.04 | | | 3.97 | | | 35 | |
| | | | | | | | | | | | | | | | | | | | | | | |
| | | $ | 7.89 | | | (17.31 | )% | $ | 2,305 | | | 2.54 | % | | (1.08 | )% | | 3.23 | % | | 110 | % |
| | | | 9.70 | | | (3.00 | ) | | 1,384 | | | 2.54 | | | (1.06 | ) | | 4.72 | | | 35 | |
| | | | | | | | | | | | | | | | | | | | | | | |
| | | $ | 7.98 | | | (16.49 | )% | $ | 7,724 | | | 1.54 | % | | (0.06 | )% | | 2.16 | % | | 110 | % |
| | | | 9.75 | | | (2.50 | ) | | 3,382 | | | 1.54 | | | (0.26 | ) | | 3.72 | | | 35 | |
See notes to financial statements
| Henderson Global Funds | Financial highlights |
For a share outstanding throughout the periods indicated
| | | | | | Income (loss) from investment operations: | | Less distributions: |
| | | | Net asset value, beginning of period | | Net investment income (loss) (b) | | Net realized and unrealized gain (loss) on investments | | Total from investment operations | | Dividends from net investment income | | Distributions from net realized capital gains | | Total distributions |
| European Focus Fund | | | | | | | | | | | | | | | | | | | | | | |
| Class A | | | | | | | | | | | | | | | | | | | | | | |
| Year Ended 7/31/2012 | | $ | 29.07 | | | 0.30 | | | (5.71 | ) | | (5.41 | ) | | (1.22 | ) | | 0.00 | | | (1.22 | ) |
| Year Ended 7/31/2011 | | | 23.90 | | | 0.07 | | | 5.89 | | | 5.96 | | | (0.79 | ) | | 0.00 | | | (0.79 | ) |
| Year Ended 7/31/2010 | | | 20.32 | | | (0.03 | ) | | 4.31 | | | 4.28 | | | (0.70 | ) | | 0.00 | | | (0.70 | ) |
| Year Ended 7/31/2009 | | | 28.57 | | | 0.26 | | | (6.20 | ) | | (5.94 | ) | | (0.60 | ) | | (1.71 | ) | | (2.31 | ) |
| Year Ended 7/31/2008 | | | 37.04 | | | 0.28 | | | (4.64 | ) | | (4.36 | ) | | (0.87 | ) | | (3.25 | ) | | (4.12 | ) |
| Class B | | | | | | | | | | | | | | | | | | | | | | |
| Year Ended 7/31/2012 | | $ | 27.51 | | | 0.09 | | | (5.37 | ) | | (5.28 | ) | | (0.98 | ) | | 0.00 | | | (0.98 | ) |
| Year Ended 7/31/2011 | | | 22.65 | | | (0.16 | ) | | 5.62 | | | 5.46 | | | (0.60 | ) | | 0.00 | | | (0.60 | ) |
| Year Ended 7/31/2010 | | | 19.33 | | | (0.20 | ) | | 4.09 | | | 3.89 | | | (0.57 | ) | | 0.00 | | | (0.57 | ) |
| Year Ended 7/31/2009 | | | 27.17 | | | 0.10 | | | (5.83 | ) | | (5.73 | ) | | (0.40 | ) | | (1.71 | ) | | (2.11 | ) |
| Year Ended 7/31/2008 | | | 35.46 | | | 0.04 | | | (4.43 | ) | | (4.39 | ) | | (0.66 | ) | | (3.25 | ) | | (3.91 | ) |
| Class C | | | | | | | | | | | | | | | | | | | | | | |
| Year Ended 7/31/2012 | | $ | 27.50 | | | 0.10 | | | (5.37 | ) | | (5.27 | ) | | (0.98 | ) | | 0.00 | | | (0.98 | ) |
| Year Ended 7/31/2011 | | | 22.65 | | | (0.15 | ) | | 5.60 | | | 5.45 | | | (0.60 | ) | | 0.00 | | | (0.60 | ) |
| Year Ended 7/31/2010 | | | 19.33 | | | (0.20 | ) | | 4.09 | | | 3.89 | | | (0.57 | ) | | 0.00 | | | (0.57 | ) |
| Year Ended 7/31/2009 | | | 27.17 | | | 0.12 | | | (5.85 | ) | | (5.73 | ) | | (0.40 | ) | | (1.71 | ) | | (2.11 | ) |
| Year Ended 7/31/2008 | | | 35.46 | | | 0.03 | | | (4.42 | ) | | (4.39 | ) | | (0.66 | ) | | (3.25 | ) | | (3.91 | ) |
| Class I | | | | | | | | | | | | | | | | | | | | | | |
| Year Ended 7/31/2012 | | $ | 29.10 | | | 0.39 | | | (5.73 | ) | | (5.34 | ) | | (1.30 | ) | | 0.00 | | | (1.30 | ) |
| Year Ended 7/31/2011 | | | 23.92 | | | 0.16 | | | 5.88 | | | 6.04 | | | (0.86 | ) | | 0.00 | | | (0.86 | ) |
| Year Ended 7/31/2010 | | | 20.34 | | | 0.04 | | | 4.30 | | | 4.34 | | | (0.76 | ) | | 0.00 | | | (0.76 | ) |
| Period Ended 7/31/2009(a) | | | 13.35 | | | 0.05 | | | 6.94 | | | 6.99 | | | 0.00 | | | 0.00 | | | 0.00 | |
| (a) | The European Focus Fund Class W commenced operations on March 31, 2009. Class W shares were converted to Class I shares on January 18, 2011. |
| (b) | Per share data was calculated using average shares outstanding during the period. |
| (c) | Total returns are historical and assume changes in share price, reinvestment of all dividends and distributions and no sales charge. Had certain expenses not been reduced during the periods shown, total returns would have been lower. Total returns for periods of less than one year are not annualized. |
| * | Amount represents less than $0.01. |
See notes to financial statements
| Henderson Global Funds | Financial highlights |
| | | | | | | | | | | | Ratios to average net assets: | | |
| | | | Redemption fees | | Net asset value, end of period | | Total return (c) | | Net assets, end of period (000) | | Annualized ratio of operating expenses to average net assets | | Annualized ratio of net investment income/(loss) to average net assets | | Annualized ratio of operating expenses to average net assets without waivers and/or expenses reimbursed | | Portfolio turnover rate |
| | | | | | | | | | | | | | | | | | | | | | | | | | |
| | | | N/A | | $ | 22.44 | | | (18.32 | )% | $ | 236,974 | | | 1.53 | % | | 1.24 | % | | 1.53 | % | | 69 | % |
| | | | N/A | | | 29.07 | | | 25.08 | | | 332,755 | | | 1.54 | | | 0.25 | | | 1.54 | | | 67 | |
| | | | 0.00* | | | 23.90 | | | 20.97 | | | 253,421 | | | 1.61 | | | (0.14 | ) | | 1.61 | | | 86 | |
| | | | 0.00* | | | 20.32 | | | (14.12 | ) | | 299,183 | | | 1.72 | | | 1.52 | | | 1.72 | | | 51 | |
| | | | 0.01 | | | 28.57 | | | (13.28 | ) | | 719,752 | | | 1.46 | | | 0.85 | | | 1.49 | | | 70 | |
| | | | | | | | | | | | | | | | | | | | | | | | | | |
| | | | N/A | | $ | 21.25 | | | (18.97 | )% | $ | 19,728 | | | 2.36 | % | | 0.38 | % | | 2.36 | % | | 69 | % |
| | | | N/A | | | 27.51 | | | 24.18 | | | 34,561 | | | 2.29 | | | (0.58 | ) | | 2.29 | | | 67 | |
| | | | 0.00* | | | 22.65 | | | 20.07 | | | 31,989 | | | 2.36 | | | (0.88 | ) | | 2.36 | | | 86 | |
| | | | 0.00* | | | 19.33 | | | (14.75 | ) | | 31,555 | | | 2.47 | | | 0.64 | | | 2.47 | | | 51 | |
| | | | 0.01 | | | 27.17 | | | (13.92 | ) | | 50,949 | | | 2.21 | | | 0.11 | | | 2.24 | | | 70 | |
| | | | | | | | | | | | | | | | | | | | | | | | | | |
| | | | N/A | | $ | 21.25 | | | (18.94 | )% | $ | 88,015 | | | 2.32 | % | | 0.45 | % | | 2.32 | % | | 69 | % |
| | | | N/A | | | 27.50 | | | 24.13 | | | 132,641 | | | 2.29 | | | (0.56 | ) | | 2.29 | | | 67 | |
| | | | 0.00* | | | 22.65 | | | 20.07 | | | 115,197 | | | 2.36 | | | (0.88 | ) | | 2.36 | | | 86 | |
| | | | 0.00* | | | 19.33 | | | (14.75 | ) | | 114,401 | | | 2.47 | | | 0.72 | | | 2.47 | | | 51 | |
| | | | 0.01 | | | 27.17 | | | (13.92 | ) | | 250,126 | | | 2.21 | | | 0.10 | | | 2.24 | | | 70 | |
| | | | | | | | | | | | | | | | | | | | | | | | | | |
| | | | N/A | | $ | 22.46 | | | (18.04 | )% | $ | 120,392 | | | 1.21 | % | | 1.65 | % | | 1.21 | % | | 69 | % |
| | | | N/A | | | 29.10 | | | 25.40 | | | 129,452 | | | 1.29 | | | 0.57 | | | 1.29 | | | 67 | |
| | | | 0.00* | | | 23.92 | | | 21.30 | | | 73,412 | | | 1.36 | | | 0.19 | | | 1.36 | | | 86 | |
| | | | 0.00 | | | 20.34 | | | 52.36 | | | 8,954 | | | 1.60 | | | 0.78 | | | 1.60 | | | 51 | |
See notes to financial statements
| Henderson Global Funds | Financial highlights |
For a share outstanding throughout the periods indicated
| | | | | | Income (loss) from investment operations: | | Less distributions: |
| | | | | | | | | | | | | | | | |
| | | | Net asset value, beginning of period | | Net investment income (loss) (b) | | Net realized and unrealized gain (loss) on investments | | Total from investment operations | | Dividends from net investment income | | Distributions from net realized capital gains | | Total distributions |
| Global Equity Income Fund | | | | | | | | | | | | | | | | | | | |
| Class A | | | | | | | | | | | | | | | | | | | | | | |
| Year Ended 7/31/2012 | | $ | 7.45 | | | 0.48 | | | (0.39 | ) | | 0.09 | | | (0.48 | ) | | 0.00 | | | (0.48 | ) |
| Year Ended 7/31/2011 | | | 6.99 | | | 0.46 | | | 0.51 | | | 0.97 | | | (0.51 | ) | | 0.00 | | | (0.51 | ) |
| Year Ended 7/31/2010 | | | 7.11 | | | 0.57 | | | (0.17 | ) | | 0.40 | | | (0.52 | ) | | 0.00 | | | (0.52 | ) |
| Year Ended 7/31/2009 | | | 8.85 | | | 0.58 | | | (1.77 | ) | | (1.19 | ) | | (0.55 | ) | | 0.00 | | | (0.55 | ) |
| Year Ended 7/31/2008 | | | 10.65 | | | 0.89 | | | (1.88 | ) | | (0.99 | ) | | (0.78 | ) | | (0.03 | ) | | (0.81 | ) |
| Class C | | | | | | | | | | | | | | | | | | | | | | |
| Year Ended 7/31/2012 | | $ | 7.42 | | | 0.43 | | | (0.39 | ) | | 0.04 | | | (0.43 | ) | | 0.00 | | | (0.43 | ) |
| Year Ended 7/31/2011 | | | 6.96 | | | 0.40 | | | 0.52 | | | 0.92 | | | (0.46 | ) | | 0.00 | | | (0.46 | ) |
| Year Ended 7/31/2010 | | | 7.08 | | | 0.52 | | | (0.17 | ) | | 0.35 | | | (0.47 | ) | | 0.00 | | | (0.47 | ) |
| Year Ended 7/31/2009 | | | 8.82 | | | 0.51 | | | (1.76 | ) | | (1.25 | ) | | (0.49 | ) | | 0.00 | | | (0.49 | ) |
| Year Ended 7/31/2008 | | | 10.62 | | | 0.82 | | | (1.88 | ) | | (1.06 | ) | | (0.71 | ) | | (0.03 | ) | | (0.74 | ) |
| Class I | | | | | | | | | | | | | | | | | | | | | | |
| Year Ended 7/31/2012 | | $ | 7.46 | | | 0.51 | | | (0.40 | ) | | 0.11 | | | (0.50 | ) | | 0.00 | | | (0.50 | ) |
| Year Ended 7/31/2011 | | | 6.99 | | | 0.48 | | | 0.52 | | | 1.00 | | | (0.53 | ) | | 0.00 | | | (0.53 | ) |
| Year Ended 7/31/2010 | | | 7.12 | | | 0.62 | | | (0.21 | ) | | 0.41 | | | (0.54 | ) | | 0.00 | | | (0.54 | ) |
| Period Ended 7/31/2009(a) | | | 6.08 | | | 0.32 | | | 1.00 | | | 1.32 | | | (0.28 | ) | | 0.00 | | | (0.28 | ) |
| Global Leaders Fund | | | | | | | | | | | | | | | | | | | | | | |
| Class A | | | | | | | | | | | | | | | | | | | | | | |
| Year Ended 7/31/2012 | | $ | 10.14 | | | 0.01 | | | (0.25 | ) | | (0.24 | ) | | 0.00 | | | 0.00 | | | 0.00 | |
| Year Ended 7/31/2011 | | | 8.71 | | | 0.02 | | | 1.41 | | | 1.43 | | | 0.00 | | | 0.00 | | | 0.00 | |
| Year Ended 7/31/2010 | | | 7.88 | | | (0.06 | ) | | 0.89 | | | 0.83 | | | 0.00 | | | 0.00 | | | 0.00 | |
| Year Ended 7/31/2009 | | | 10.00 | | | 0.02 | | | (2.10 | ) | | (2.08 | ) | | (0.04 | ) | | 0.00 | | | (0.04 | ) |
| Year Ended 7/31/2008 | | | 11.41 | | | 0.08 | | | (1.39 | ) | | (1.31 | ) | | (0.04 | ) | | (0.06 | ) | | (0.10 | ) |
| Class C | | | | | | | | | | | | | | | | | | | | | | |
| Year Ended 7/31/2012 | | $ | 10.02 | | | (0.07 | ) | | (0.24 | ) | | (0.31 | ) | | 0.00 | | | 0.00 | | | 0.00 | |
| Year Ended 7/31/2011 | | | 8.67 | | | (0.06 | ) | | 1.41 | | | 1.35 | | | 0.00 | | | 0.00 | | | 0.00 | |
| Year Ended 7/31/2010 | | | 7.90 | | | (0.13 | ) | | 0.90 | | | 0.77 | | | 0.00 | | | 0.00 | | | 0.00 | |
| Year Ended 7/31/2009 | | | 10.07 | | | (0.03 | ) | | (2.13 | ) | | (2.16 | ) | | (0.01 | ) | | 0.00 | | | (0.01 | ) |
| Year Ended 7/31/2008 | | | 11.53 | | | (0.01 | ) | | (1.39 | ) | | (1.40 | ) | | 0.00 | | | (0.06 | ) | | (0.06 | ) |
| Class I | | | | | | | | | | | | | | | | | | | | | | |
| Year Ended 7/31/2012 | | $ | 10.16 | | | 0.03 | | | (0.25 | ) | | (0.22 | ) | | 0.00 | | | 0.00 | | | 0.00 | |
| Period Ended 7/31/2011(a) | | | 10.50 | | | (0.01 | ) | | (0.33 | ) | | (0.34 | ) | | 0.00 | | | 0.00 | | | 0.00 | |
| (a) | The Global Equity Income Fund Class W commenced operations on March 31, 2009. Class W shares converted to Class I shares on January 18, 2011. The Global Leaders Fund Class I commenced operations on May 31, 2011. |
| (b) | Per share data was calculated using average shares outstanding during the period. |
| (c) | Total returns are historical and assume changes in share price, reinvestment of all dividends and distributions and no sales charge. Had certain expenses not been reduced during the periods shown, total returns would have been lower. Total returns for periods of less than one year are not annualized. |
| * | Amount represents less than $0.01. |
See notes to financial statements
| Henderson Global Funds | Financial highlights |
| | | | | | | | | | | | Ratios to average net assets: | | |
| | | | Redemption fees | | Net asset value, end of period | | Total return (c) | | Net assets, end of period (000) | | Annualized ratio of operating expenses to average net assets | | Annualized ratio of net investment income/(loss) to average net assets | | Annualized ratio of operating expenses to average net assets without waivers and/or expenses reimbursed | | Portfolio turnover rate |
| | | | | | | | | | | | | | | | | | | | | | | | | | |
| | | | N/A | | $ | 7.06 | | | 1.59 | % | $ | 467,318 | | | 1.29 | % | | 6.97 | % | | 1.29 | % | | 108 | % |
| | | | N/A | | | 7.45 | | | 14.13 | | | 489,400 | | | 1.32 | | | 6.18 | | | 1.32 | | | 127 | |
| | | | 0.00 | * | | 6.99 | | | 5.76 | | | 351,445 | | | 1.36 | | | 7.89 | | | 1.37 | | | 174 | |
| | | | 0.00 | * | | 7.11 | | | (12.93 | ) | | 186,248 | | | 1.40 | | | 8.45 | | | 1.50 | | | 155 | |
| | | | 0.00 | * | | 8.85 | | | (9.99 | ) | | 189,490 | | | 1.40 | | | 8.83 | | | 1.44 | | | 155 | |
| | | | | | | | | | | | | | | | | | | | | | | | | | |
| | | | N/A | | $ | 7.03 | | | 0.82 | % | $ | 363,751 | | | 2.05 | % | | 6.21 | % | | 2.05 | % | | 108 | % |
| | | | N/A | | | 7.42 | | | 13.35 | | | 363,455 | | | 2.07 | | | 5.36 | | | 2.07 | | | 127 | |
| | | | 0.00 | * | | 6.96 | | | 5.01 | | | 274,571 | | | 2.11 | | | 7.17 | | | 2.12 | | | 174 | |
| | | | 0.00 | * | | 7.08 | | | (13.64 | ) | | 131,990 | | | 2.15 | | | 7.40 | | | 2.25 | | | 155 | |
| | | | 0.00 | | | 8.82 | | | (10.66 | ) | | 166,946 | | | 2.15 | | | 8.12 | | | 2.19 | | | 155 | |
| | | | | | | | | | | | | | | | | | | | | | | | | | |
| | | | N/A | | $ | 7.07 | | | 1.87 | % | $ | 332,048 | | | 1.01 | % | | 7.38 | % | | 1.01 | % | | 108 | % |
| | | | N/A | | | 7.46 | | | 14.55 | | | 198,216 | | | 1.07 | | | 6.35 | | | 1.07 | | | 127 | |
| | | | 0.00 | | | 6.99 | | | 5.87 | | | 92,146 | | | 1.11 | | | 8.60 | | | 1.12 | | | 174 | |
| | | | 0.00 | | | 7.12 | | | 22.03 | | | 9,119 | | | 1.15 | | | 13.83 | | | 1.32 | | | 155 | |
| | | | | | | | | | | | | | | | | | | | | | | | | | |
| | | | N/A | | $ | 9.90 | | | (2.37 | )% | $ | 7,125 | | | 1.40 | % | | 0.06 | % | | 2.09 | % | | 83 | % |
| | | | N/A | | | 10.14 | | | 16.42 | | | 8,010 | | | 1.87 | | | 0.16 | | | 2.26 | | | 63 | |
| | | | 0.00 | * | | 8.71 | | | 10.53 | | | 8,479 | | | 1.95 | | | (0.71 | ) | | 2.27 | | | 67 | |
| | | | 0.00 | * | | 7.88 | | | (20.73 | ) | | 6,329 | | | 1.95 | | | 0.25 | | | 2.74 | | | 234 | |
| | | | 0.00 | * | | 10.00 | | | (11.67 | ) | | 12,291 | | | 1.95 | | | 0.74 | | | 3.12 | | | 135 | |
| | | | | | | | | | | | | | | | | | | | | | | | | | |
| | | | N/A | | $ | 9.71 | | | (3.09 | )% | $ | 5,794 | | | 2.15 | % | | (0.70 | )% | | 2.84 | % | | 83 | % |
| | | | N/A | | | 10.02 | | | 15.57 | | | 6,600 | | | 2.62 | | | (0.60 | ) | | 3.01 | | | 63 | |
| | | | 0.00 | * | | 8.67 | | | 9.75 | | | 7,079 | | | 2.70 | | | (1.46 | ) | | 3.02 | | | 67 | |
| | | | 0.00 | * | | 7.90 | | | (21.41 | ) | | 6,988 | | | 2.70 | | | (0.37 | ) | | 3.49 | | | 234 | |
| | | | 0.00 | * | | 10.07 | | | (12.26 | ) | | 5,282 | | | 2.70 | | | (0.06 | ) | | 4.01 | | | 135 | |
| | | | | | | | | | | | | | | | | | | | | | | | | | |
| | | | N/A | | $ | 9.94 | | | (2.17 | )% | $ | 1,043 | | | 1.15 | % | | 0.31 | % | | 1.80 | % | | 83 | % |
| | | | N/A | | | 10.16 | | | (3.23 | ) | | 1,071 | | | 1.15 | % | | (0.62 | ) | | 2.01 | | | 63 | |
See notes to financial statements
| Henderson Global Funds | Financial highlights |
For a share outstanding throughout the periods indicated
| | | | | | Income (loss) from investment operations: | | | | Less distributions: |
| | | | | | | | | | | | | | | | | | |
| | | | Net asset value, beginning of period | | Net investment income (loss) (b) | | Net realized and unrealized gain (loss) on investments | | Total from investment operations | | Dividends from net investment income | | Distributions from net realized capital gains | | Return of capital | | Total distributions |
| Global Technology Fund | | | | | | | | | | | | | | | | | | | | | | | | | |
| Class A | | | | | | | | | | | | | | | | | | | | | | | | | |
| Year Ended 7/31/2012 | | $ | 20.55 | | | (0.15 | ) | | (0.71 | ) | | (0.86 | ) | | 0.00 | | | 0.00 | | | 0.00 | | | 0.00 | |
| Year Ended 7/31/2011 | | | 16.10 | | | (0.08 | ) | | 4.53 | | | 4.45 | | | 0.00 | | | 0.00 | | | 0.00 | | | 0.00 | |
| Year Ended 7/31/2010 | | | 13.32 | | | (0.17 | ) | | 2.95 | | | 2.78 | | | 0.00 | | | 0.00 | | | 0.00 | | | 0.00 | |
| Year Ended 7/31/2009 | | | 13.88 | | | (0.09 | ) | | (0.47 | ) | | (0.56 | ) | | 0.00 | | | 0.00 | | | 0.00 | | | 0.00 | |
| Year Ended 7/31/2008 | | | 16.43 | | | (0.13 | ) | | (2.15 | ) | | (2.28 | ) | | 0.00 | | | (0.18 | ) | | (0.09 | ) | | (0.27 | ) |
| Class B | | | | | | | | | | | | | | | | | | | | | | | | | |
| Year Ended 7/31/2012 | | $ | 19.13 | | | (0.29 | ) | | (0.66 | ) | | (0.95 | ) | | 0.00 | | | 0.00 | | | 0.00 | | | 0.00 | |
| Year Ended 7/31/2011 | | | 15.10 | | | (0.22 | ) | | 4.25 | | | 4.03 | | | 0.00 | | | 0.00 | | | 0.00 | | | 0.00 | |
| Year Ended 7/31/2010 | | | 12.59 | | | (0.27 | ) | | 2.78 | | | 2.51 | | | 0.00 | | | 0.00 | | | 0.00 | | | 0.00 | |
| Year Ended 7/31/2009 | | | 13.22 | | | (0.17 | ) | | (0.46 | ) | | (0.63 | ) | | 0.00 | | | 0.00 | | | 0.00 | | | 0.00 | |
| Year Ended 7/31/2008 | | | 15.77 | | | (0.23 | ) | | (2.06 | ) | | (2.29 | ) | | 0.00 | | | (0.18 | ) | | (0.09 | ) | | (0.27 | ) |
| Class C | | | | | | | | | | | | | | | | | | | | | | | | | |
| Year Ended 7/31/2012 | | $ | 19.08 | | | (0.28 | ) | | (0.65 | ) | | (0.93 | ) | | 0.00 | | | 0.00 | | | 0.00 | | | 0.00 | |
| Year Ended 7/31/2011 | | | 15.06 | | | (0.22 | ) | | 4.24 | | | 4.02 | | | 0.00 | | | 0.00 | | | 0.00 | | | 0.00 | |
| Year Ended 7/31/2010 | | | 12.56 | | | (0.27 | ) | | 2.77 | | | 2.50 | | | 0.00 | | | 0.00 | | | 0.00 | | | 0.00 | |
| Year Ended 7/31/2009 | | | 13.19 | | | (0.17 | ) | | (0.46 | ) | | (0.63 | ) | | 0.00 | | | 0.00 | | | 0.00 | | | 0.00 | |
| Year Ended 7/31/2008 | | | 15.73 | | | (0.23 | ) | | (2.04 | ) | | (2.27 | ) | | 0.00 | | | (0.18 | ) | | (0.09 | ) | | (0.27 | ) |
| Class I | | | | | | | | | | | | | | | | | | | | | | | | | |
| Year Ended 7/31/2012 | | $ | 20.68 | | | (0.09 | ) | | (0.71 | ) | | (0.80 | ) | | 0.00 | | | 0.00 | | | 0.00 | | | 0.00 | |
| Year Ended 7/31/2011 | | | 16.16 | | | (0.02 | ) | | 4.54 | | | 4.52 | | | 0.00 | | | 0.00 | | | 0.00 | | | 0.00 | |
| Year Ended 7/31/2010 | | | 13.34 | | | (0.13 | ) | | 2.95 | | | 2.82 | | | 0.00 | | | 0.00 | | | 0.00 | | | 0.00 | |
| Period Ended 7/31/2009(a) | | | 9.94 | | | | ) | | | | | | | | 0.00 | | | 0.00 | | | 0.00 | | | 0.00 | |
| (a) | The Global Technology Fund Class W commenced operations on March 31, 2009. Class W shares converted to Class I shares on January 18, 2011. |
| (b) | Per share data was calculated using average shares outstanding during the period. |
| (c) | Total returns are historical and assume changes in share price, reinvestment of all dividends and distributions and no sales charge. Had certain expenses not been reduced during the periods shown, total returns would have been lower. Total returns for periods of less than one year are not annualized. |
| * | Amount represents less than $0.01. |
See notes to financial statements
| Henderson Global Funds | Financial highlights |
| | | | | | | | | Ratios to average net assets: | | |
| Redemption fees | | Net asset value, end of period | | Total return (c) | | Net assets, end of period (000) | | Annualized ratio of operating expenses to average net assets | | Annualized ratio of net investment income (loss) to average net assets | | Annualized ratio of operating expenses to average net assets without waivers and/or expenses reimbursed | | Portfolio turnover rate |
| | | | | | | | | | | | | | | | | | | | | | | |
| N/A | | $ | 19.69 | | | (4.18 | )% | $ | 156,948 | | | 1.50 | % | | (0.75 | )% | | 1.50 | % | | 113 | % |
| N/A | | | 20.55 | | | 27.64 | | | 191,623 | | | 1.55 | | | (0.42 | ) | | 1.55 | | | 93 | |
| 0.00 | * | | 16.10 | | | 20.87 | | | 116,903 | | | 1.64 | | | (1.07 | ) | | 1.64 | | | 76 | |
| 0.00 | * | | 13.32 | | | (4.03 | ) | | 71,472 | | | 1.81 | | | (0.83 | ) | | 1.81 | | | 160 | |
| 0.00 | * | | 13.88 | | | (14.22 | ) | | 123,129 | | | 1.57 | | | (0.80 | ) | | 1.57 | | | 196 | |
| | | | | | | | | | | | | | | | | | | | | | | |
| N/A | | $ | 18.18 | | | (4.97 | )% | $ | 9,751 | | | 2.36 | % | | (1.62 | )% | | 2.36 | % | | 113 | % |
| N/A | | | 19.13 | | | 26.69 | | | 11,821 | | | 2.30 | | | (1.19 | ) | | 2.30 | | | 93 | |
| 0.00 | * | | 15.10 | | | 19.94 | | | 9,283 | | | 2.39 | | | (1.82 | ) | | 2.39 | | | 76 | |
| 0.00 | * | | 12.59 | | | (4.77 | ) | | 5,994 | | | 2.56 | | | (1.65 | ) | | 2.56 | | | 160 | |
| 0.01 | | | 13.22 | | | (14.82 | ) | | 7,465 | | | 2.32 | | | (1.52 | ) | | 2.32 | | | 196 | |
| | | | | | | | | | | | | | | | | | | | | | | |
| N/A | | $ | 18.15 | | | (4.87 | )% | $ | 69,286 | | | 2.29 | % | | (1.54 | )% | | 2.29 | % | | 113 | % |
| N/A | | | 19.08 | | | 26.69 | | | 79,228 | | | 2.30 | | | (1.17 | ) | | 2.30 | | | 93 | |
| 0.00 | * | | 15.06 | | | 19.90 | | | 53,793 | | | 2.39 | | | (1.82 | ) | | 2.39 | | | 76 | |
| 0.00 | * | | 12.56 | | | (4.78 | ) | | 39,330 | | | 2.56 | | | (1.61 | ) | | 2.56 | | | 160 | |
| 0.00 | * | | 13.19 | | | (14.79 | ) | | 61,795 | | | 2.32 | | | (1.52 | ) | | 2.32 | | | 196 | |
| | | | | | | | | | | | | | | | | | | | | | | |
| N/A | | $ | 19.88 | | | (3.87 | )% | $ | 61,492 | | | 1.23 | % | | (0.47 | )% | | 1.23 | % | | 113 | % |
| N/A | | | 20.68 | | | 27.97 | | | 52,351 | | | 1.30 | | | (0.12 | ) | | 1.30 | | | 93 | |
| 0.00 | * | | 16.16 | | | 21.14 | | | 18,810 | | | 1.39 | | | (0.82 | ) | | 1.39 | | | 76 | |
| 0.00 | | | 13.34 | | | 34.21 | | | 2,914 | | | 1.71 | | | (0.74 | ) | | 1.71 | | | 160 | |
See notes to financial statements
| Henderson Global Funds | Financial highlights |
For a share outstanding throughout the periods indicated
| | | | | | Income (loss) from investment operations: | | Less distributions: |
| | | | | | | | | | | | | | | | |
| | | | Net asset value, beginning of period | | Net investment income (loss) (b) | | Net realized and unrealized gain (loss) on investments | | Total from investment operations | | Dividends from net investment income | | Distributions from net realized capital gains | | Total distributions |
| International Opportunities Fund | | | | | | | | | | | | | | | | | | |
| Class A | | | | | | | | | | | | | | | | | | | | | | |
| Year Ended 7/31/2012 | | $ | 21.77 | | | 0.15 | | | (2.59 | ) | | (2.44 | ) | | (0.11 | ) | | 0.00 | | | (0.11 | ) |
| Year Ended 7/31/2011 | | | 19.10 | | | 0.13 | | | 2.68 | | | 2.81 | | | (0.14 | ) | | 0.00 | | | (0.14 | ) |
| Year Ended 7/31/2010 | | | 18.87 | | | 0.16 | | | 0.14 | | | 0.30 | | | (0.07 | ) | | 0.00 | | | (0.07 | ) |
| Year Ended 7/31/2009 | | | 22.11 | | | 0.25 | | | (3.20 | ) | | (2.95 | ) | | (0.20 | ) | | (0.09 | ) | | (0.29 | ) |
| Year Ended 7/31/2008 | | | 26.91 | | | 0.19 | | | (2.63 | ) | | (2.44 | ) | | 0.00 | | | (2.36 | ) | | (2.36 | ) |
| Class B | | | | | | | | | | | | | | | | | | | | | | |
| Year Ended 7/31/2012 | | $ | 20.58 | | | (0.01 | ) | | (2.44 | ) | | (2.45 | ) | | 0.00 | | | 0.00 | | | 0.00 | |
| Year Ended 7/31/2011 | | | 18.07 | | | (0.03 | ) | | 2.54 | | | 2.51 | | | 0.00 | | | 0.00 | | | 0.00 | |
| Year Ended 7/31/2010 | | | 17.92 | | | 0.01 | | | 0.14 | | | 0.15 | | | (0.00 | )* | | 0.00 | | | (0.00 | )* |
| Year Ended 7/31/2009 | | | 21.00 | | | 0.12 | | | (3.02 | ) | | (2.90 | ) | | (0.09 | ) | | (0.09 | ) | | (0.18 | ) |
| Year Ended 7/31/2008 | | | 25.85 | | | (0.02 | ) | | (2.47 | ) | | (2.49 | ) | | 0.00 | | | (2.36 | ) | | (2.36 | ) |
| Class C | | | | | | | | | | | | | | | | | | | | | | |
| Year Ended 7/31/2012 | | $ | 20.56 | | | (0.00 | )* | | (2.44 | ) | | (2.44 | ) | | 0.00 | | | 0.00 | | | 0.00 | |
| Year Ended 7/31/2011 | | | 18.06 | | | (0.03 | ) | | 2.53 | | | 2.50 | | | 0.00 | | | 0.00 | | | 0.00 | |
| Year Ended 7/31/2010 | | | 17.91 | | | 0.01 | | | 0.14 | | | 0.15 | | | (0.00 | )* | | 0.00 | | | (0.00 | )* |
| Year Ended 7/31/2009 | | | 20.99 | | | 0.12 | | | (3.02 | ) | | (2.90 | ) | | (0.09 | ) | | (0.09 | ) | | (0.18 | ) |
| Year Ended 7/31/2008 | | | 25.83 | | | (0.01 | ) | | (2.47 | ) | | (2.48 | ) | | 0.00 | | | (2.36 | ) | | (2.36 | ) |
| Class I | | | | | | | | | | | | | | | | | | | | | | |
| Year Ended 7/31/2012 | | $ | 21.83 | | | 0.21 | | | (2.61 | ) | | (2.40 | ) | | (0.18 | ) | | 0.00 | | | (0.18 | ) |
| Year Ended 7/31/2011 | | | 19.16 | | | 0.19 | | | 2.67 | | | 2.86 | | | (0.19 | ) | | 0.00 | | | (0.19 | ) |
| Year Ended 7/31/2010 | | | 18.89 | | | 0.22 | | | 0.15 | | | 0.37 | | | (0.10 | ) | | 0.00 | | | (0.10 | ) |
| Period Ended 7/31/2009(a) | | | 13.96 | | | 0.11 | | | 4.82 | | | 4.93 | | | 0.00 | | | 0.00 | | | 0.00 | |
| Class R | | | | | | | | | | | | | | | | | | | | | | |
| Year Ended 7/31/2012 | | $ | 21.50 | | | 0.08 | | | (2.58 | ) | | (2.50 | ) | | (0.07 | ) | | 0.00 | | | (0.07 | ) |
| Year Ended 7/31/2011 | | | 18.88 | | | 0.09 | | | 2.64 | | | 2.73 | | | (0.11 | ) | | 0.00 | | | (0.11 | ) |
| Year Ended 7/31/2010 | | | 18.70 | | | 0.14 | | | 0.12 | | | 0.26 | | | (0.08 | ) | | 0.00 | | | (0.08 | ) |
| Year Ended 7/31/2009 | | | 21.94 | | | 0.19 | | | (3.16 | ) | | (2.97 | ) | | (0.18 | ) | | (0.09 | ) | | (0.27 | ) |
| Year Ended 7/31/2008 | | | 26.78 | | | 0.15 | | | (2.63 | ) | | (2.48 | ) | | 0.00 | | | (2.36 | ) | | (2.36 | ) |
| (a) | The International Opportunities Fund Class W commenced operations on March 31, 2009. Class W shares were converted to Class I shares on January 18, 2011. |
| (b) | Per share data was calculated using average shares outstanding during the period. |
| (c) | Total returns are historical and assume changes in share price, reinvestment of all dividends and distributions and no sales charge. Had certain expenses not been reduced during the periods shown, total returns would have been lower. Total returns for periods of less than one year are not annualized. |
| * | Amount represents less than $0.01. |
See notes to financial statements
| Henderson Global Funds | Financial highlights |
| | | | | | | | | Ratios to average net assets: | | |
| Redemption fees | | Net asset value, end of period | | Total return (c) | | Net assets, end of period (000) | | Annualized ratio of operating expenses to average net assets | | Annualized ratio of net investment income/(loss) to average net assets | | Annualized ratio of operating expenses to average net assets without waivers and/or expenses reimbursed | | Portfolio turnover rate |
| | | | | | | | | | | | | | | | | | | | | | | |
| N/A | | $ | 19.22 | | | (11.17 | )% | $ | 1,263,648 | | | 1.47 | % | | 0.78 | % | | 1.47 | % | | 45 | % |
| N/A | | | 21.77 | | | 14.71 | | | 1,950,064 | | | 1.44 | | | 0.62 | | | 1.44 | | | 64 | |
| 0.00 | * | | 19.10 | | | 1.59 | | | 2,097,217 | | | 1.48 | | | 0.81 | | | 1.48 | | | 52 | |
| 0.00 | * | | 18.87 | | | (12.86 | ) | | 2,036,371 | | | 1.61 | | | 1.52 | | | 1.61 | | | 66 | |
| 0.00 | * | | 22.11 | | | (10.54 | ) | | 2,811,488 | | | 1.45 | | | 0.75 | | | 1.45 | | | 83 | |
| | | | | | | | | | | | | | | | | | | | | | | |
| N/A | | $ | 18.13 | | | (11.90 | )% | $ | 48,771 | | | 2.32 | % | | (0.07 | )% | | 2.32 | % | | 45 | % |
| N/A | | | 20.58 | | | 13.89 | | | 79,091 | | | 2.19 | | | (0.14 | ) | | 2.19 | | | 64 | |
| 0.00 | * | | 18.07 | | | 0.84 | | | 84,619 | | | 2.23 | | | 0.03 | | | 2.23 | | | 52 | |
| 0.00 | * | | 17.92 | | | (13.55 | ) | | 91,697 | | | 2.36 | | | 0.77 | | | 2.36 | | | 66 | |
| 0.00 | * | | 21.00 | | | (11.20 | ) | | 126,231 | | | 2.20 | | | (0.08 | ) | | 2.20 | | | 83 | |
| | | | | | | | | | | | | | | | | | | | | | | |
| N/A | | $ | 18.12 | | | (11.87 | )% | $ | 416,582 | | | 2.29 | % | | (0.02 | )% | | 2.29 | % | | 45 | % |
| N/A | | | 20.56 | | | 13.84 | | | 639,252 | | | 2.19 | | | (0.15 | ) | | 2.19 | | | 64 | |
| 0.00 | * | | 18.06 | | | 0.84 | | | 706,332 | | | 2.23 | | | 0.04 | | | 2.23 | | | 52 | |
| 0.00 | * | | 17.91 | | | (13.55 | ) | | 713,020 | | | 2.36 | | | 0.78 | | | 2.36 | | | 66 | |
| 0.00 | * | | 20.99 | | | (11.17 | ) | | 1,155,137 | | | 2.20 | | | (0.06 | ) | | 2.20 | | | 83 | |
| | | | | | | | | | | | | | | | | | | | | | | |
| N/A | | $ | 19.25 | | | (10.93 | )% | $ | 656,313 | | | 1.20 | % | | 1.09 | % | | 1.20 | % | | 45 | % |
| N/A | | | 21.83 | | | 14.96 | | | 797,316 | | | 1.19 | | | 0.87 | | | 1.19 | | | 64 | |
| 0.00 | * | | 19.16 | | | 1.92 | | | 555,653 | | | 1.23 | | | 1.12 | | | 1.23 | | | 52 | |
| 0.00 | * | | 18.89 | | | 35.32 | | | 86,447 | | | 1.43 | | | 1.98 | | | 1.43 | | | 66 | |
| | | | | | | | | | | | | | | | | | | | | | | |
| N/A | | $ | 18.93 | | | (11.60 | )% | $ | 6,454 | | | 1.94 | % | | 0.42 | % | | 1.94 | % | | 45 | % |
| N/A | | | 21.50 | | | 14.45 | | | 7,258 | | | 1.69 | | | 0.44 | | | 1.69 | | | 64 | |
| 0.00 | * | | 18.88 | | | 1.35 | | | 7,288 | | | 1.73 | | | 0.73 | | | 1.73 | | | 52 | |
| 0.00 | * | | 18.70 | | | (13.10 | ) | | 3,093 | | | 1.86 | | | 1.18 | | | 1.86 | | | 66 | |
| 0.00 | * | | 21.94 | | | (10.75 | ) | | 2,053 | | | 1.70 | | | 0.61 | | | 1.70 | | | 83 | |
See notes to financial statements
| Henderson Global Funds | Financial highlights |
For a share outstanding throughout the periods indicated
| | | | | | Income (loss) from investment operations: | | Less distributions: |
| | | | | | | | | | | | | | | | |
| | | | Net asset value, beginning of period | | Net investment income (loss) (b) | | Net realized and unrealized gain (loss) on investments | | Total from investment operations | | Dividends from net investment income | | Distributions from net realized capital gains | | Total distributions |
| Japan Focus Fund | | | | | | | | | | | | | | | | | | | | | | |
| Class A | | | | | | | | | | | | | | | | | | | | | | |
| Year Ended 7/31/2012 | | $ | 7.82 | | | 0.06 | | | (0.55 | ) | | (0.49 | ) | | (0.03 | ) | | 0.00 | | | (0.03 | ) |
| Year Ended 7/31/2011 | | | 6.87 | | | 0.01 | | | 0.95 | | | 0.96 | | | (0.01 | ) | | 0.00 | | | (0.01 | ) |
| Year Ended 7/31/2010 | | | 7.03 | | | 0.01 | | | (0.17 | ) | | (0.16 | ) | | 0.00 | | | 0.00 | | | 0.00 | |
| Year Ended 7/31/2009 | | | 7.75 | | | 0.02 | | | (0.74 | ) | | (0.72 | ) | | 0.00 | | | 0.00 | | | 0.00 | |
| Year Ended 7/31/2008 | | | 10.13 | | | 0.01 | | | (2.02 | ) | | (2.01 | ) | | 0.00 | | | (0.40 | ) | | (0.40 | ) |
| Class C | | | | | | | | | | | | | | | | | | | | | | |
| Year Ended 7/31/2012 | | $ | 7.51 | | | 0.00 | * | | (0.52 | ) | | (0.52 | ) | | 0.00 | | | 0.00 | | | 0.00 | |
| Year Ended 7/31/2011 | | | 6.65 | | | (0.05 | ) | | 0.91 | | | 0.86 | | | 0.00 | | | 0.00 | | | 0.00 | |
| Year Ended 7/31/2010 | | | 6.84 | | | (0.04 | ) | | (0.15 | ) | | (0.19 | ) | | 0.00 | | | 0.00 | | | 0.00 | |
| Year Ended 7/31/2009 | | | 7.60 | | | (0.02 | ) | | (0.74 | ) | | (0.76 | ) | | 0.00 | | | 0.00 | | | 0.00 | |
| Year Ended 7/31/2008 | | | 10.03 | | | (0.06 | ) | | (2.00 | ) | | (2.06 | ) | | 0.00 | | | (0.40 | ) | | (0.40 | ) |
| Class I | | | | | | | | | | | | | | | | | | | | | | |
| Year Ended 7/31/2012 | | $ | 7.82 | | | 0.09 | | | (0.55 | ) | | (0.46 | ) | | (0.05 | ) | | 0.00 | | | (0.05 | ) |
| Period Ended 7/31/2011(a) | | | 7.48 | | | | ) | | | | | | | | 0.00 | | | 0.00 | | | 0.00 | |
| (a) | The Japan Focus Fund Class I commenced operations on May 31, 2011. |
| (b) | Per share data was calculated using average shares outstanding during the period. |
| (c) | Total returns are historical and assume changes in share price, reinvestment of all dividends and distributions and no sales charge. Had certain expenses not been reduced during the periods shown, total returns would have been lower. Total returns for periods of less than one year are not annualized. |
| (d) | Total returns include the payment by affiliates. Absent this payment, results would have been lower. |
| * | Amount represents less than $0.01. |
See notes to financial statements
| Henderson Global Funds | Financial highlights |
| | | | | | | | | | | Ratios to average net assets: | | |
| Redemption fees | | Payment by affiliates | | Net asset value, end of period | | Total return (c) | | Net assets, end of period (000) | | Annualized ratio of operating expenses to average net assets | | Annualized ratio of net investment income/(loss) to average net assets | | Annualized ratio of operating expenses to average net assets without waivers and/or expenses reimbursed | | Portfolio turnover rate |
| | | | | | | | | | | | | | | | | | | | | | | | | | |
| N/A | | | 0.00 | | $ | 7.30 | | | (6.22 | )% | $ | 13,612 | | | 1.35 | % | | 0.80 | % | | 1.64 | % | | 31 | % |
| N/A | | | 0.00 | | | 7.82 | | | 13.95 | | | 25,765 | | | 1.85 | | | 0.08 | | | 1.99 | | | 43 | |
| 0.00 | * | | 0.00 | | | 6.87 | | | (2.28 | ) | | 14,302 | | | 1.97 | | | 0.20 | | | 2.04 | | | 38 | |
| 0.00 | * | | 0.00 | | | 7.03 | | | (9.29 | ) | | 18,031 | | | 1.97 | | | 0.31 | | | 2.13 | | | 68 | |
| 0.00 | * | | 0.03 | | | 7.75 | | | (20.25 | )(d) | | 32,021 | | | 1.75 | | | 0.12 | | | 1.75 | | | 68 | |
| | | | | | | | | | | | | | | | | | | | | | | | | | |
| N/A | | | 0.00 | | $ | 6.99 | | | (6.92 | )% | $ | 8,899 | | | 2.10 | % | | 0.05 | % | | 2.44 | % | | 31 | % |
| N/A | | | 0.00 | | | 7.51 | | | 12.93 | | | 11,605 | | | 2.60 | | | (0.69 | ) | | 2.74 | | | 43 | |
| 0.00 | * | | 0.00 | | | 6.65 | | | (2.78 | ) | | 10,020 | | | 2.73 | | | (0.56 | ) | | 2.79 | | | 38 | |
| 0.00 | * | | 0.00 | | | 6.84 | | | (10.00 | ) | | 12,632 | | | 2.72 | | | (0.39 | ) | | 2.88 | | | 68 | |
| 0.00 | * | | 0.03 | | | 7.60 | | | (20.97 | )(d) | | 19,920 | | | 2.50 | | | (0.71 | ) | | 2.50 | | | 68 | |
| | | | | | | | | | | | | | | | | | | | | | | | | | |
| N/A | | | 0.00 | | $ | 7.31 | | | (5.89 | )% | $ | 2,070 | | | 1.10 | % | | 1.22 | % | | 1.47 | % | | 31 | % |
| N/A | | | 0.00 | | | 7.82 | | | 4.55 | | | 6,811 | | | 1.10 | | | (1.02 | ) | | 1.74 | | | 43 | |
See notes to financial statements
| Henderson Global Funds | Notes to financial statements |
Note 1. Organization
Henderson Global Funds (the “Trust”) was organized on May 11, 2001, as a Delaware statutory trust and is registered under the Investment Company Act of 1940, as amended (the “1940 Act”), as an open-end management investment company. The Trust has an unlimited number of authorized shares that are divided among eleven series. The Henderson All Asset Fund, Henderson Emerging Markets Opportunities Fund, Henderson European Focus Fund, Henderson Global Equity Income Fund, Henderson Global Leaders Fund, Henderson Global Technology Fund, Henderson International Opportunities Fund and Henderson Japan Focus Fund (collectively, the “Funds”) are included in this report and are each a separate series of the Trust and are diversified. The remaining three series of the Trust, Henderson International All Cap Equity Fund, Henderson Money Market Fund and Henderson Strategic Income Fund, are not included in this report as their fiscal year end is December 31.
The Henderson All Asset Fund, which commenced operations on March 30, 2012, is a Fund-of-Funds that seeks to achieve its objective by investing in a portfolio of underlying funds (“underlying funds”) which, in turn, may invest in a variety of US and foreign equity, fixed income, money market and derivative instruments. The Fund-of-Funds does not invest in the underlying funds for the purpose of exercising management or control; however, investments by the Fund-of-Funds, within its principal investment strategies, may represent a significant portion of the underlying funds’ net assets. The Fund-of-Funds “Portfolio of Investments” lists the underlying funds held as an investment of the Fund-of-Funds as of period end, but does not include the holdings of the underlying funds.
| The Funds offer the following share classes: |
| |
| All Asset | Class A |
| | Class C |
| | Class I |
| | |
| Emerging Markets Opportunities | Class A |
| | Class C |
| | Class I |
| | |
| European Focus | Class A |
| | Class B |
| | Class C |
| | Class I |
| | |
| Global Equity Income | Class A |
| | Class C |
| | Class I |
| | |
| Global Leaders | Class A |
| | Class C |
| | Class I |
| | |
| Global Technology | |
| | Class A |
| | Class B |
| | Class C |
| | Class I |
| | |
| International Opportunities | Class A |
| | Class B |
| | Class C |
| | Class I |
| | Class R |
| | |
| Japan Focus | Class A |
| | Class C |
| | Class I |
Class A shares generally provide for a front-end sales charge. Class B and C shares provide for a contingent deferred sales charge. Class R and I shares are not subject to a front-end or contingent deferred sales charge.
Each class of shares has equal rights as to earnings and assets except that each class may bear different distribution and shareholder service expenses. Each class of shares has exclusive voting rights with respect to matters that affect just that class. Income, expenses (other than expenses attributable to a specific class), and realized and unrealized gains and losses on investments are allocated to each class of shares based on its relative net assets. Class B shares automatically convert to Class A shares at the end of the month following the eighth anniversary of issuance.
Note 2. Significant accounting policies
Security valuation
Securities and derivatives traded on a recognized exchange or market are generally valued at the last reported sale price or at the official closing price. Listed securities for which no sale was reported on that date and other securities traded in the over-the-counter market are valued at the mean between the last bid and asked price.
Debt securities are valued at the market value provided by independent pricing services approved by the Board of Trustees of the Trust. If the pricing services are unable to provide valuations, the securities are valued at the mean
| Henderson Global Funds | Notes to financial statements |
between the last bid and asked price, or if no ask is available, then the last bid price obtained from one or more broker dealers. Such pricing services may use various pricing techniques that take into account appropriate factors such as yield, quality, coupon rate, maturity, type of issue, trading characteristics and other data, as well as broker quotes.
Short-term investments purchased with an original or remaining maturity of 60 days or less at time of purchase are valued at amortized cost, which approximates fair market value. Investments in investment companies are valued at its reported net asset value, which approximates fair market value.
Forward foreign currency contracts are valued daily at the applicable quoted forward rate.
If market quotations are not readily available, or if the investment adviser determines that a quotation of a security does not represent a fair value, then the security is valued at a fair value as determined in good faith using procedures approved by the Board of Trustees of the Trust. The Trustees of the Trust, or their designee, may also establish fair value using a wide variety of market data including yields or prices of investments of comparable quality, type of issue, coupon, maturity and rating, market quotes or indications of value from security dealers, evaluations of anticipated cash flows or collateral, general market conditions and other information and analysis, including the obligor’s credit characteristics considered relevant.
For equity securities, the Trust has retained an independent statistical fair value pricing service to assist in the fair valuation process for securities principally traded in a foreign market in order to adjust for possible changes in value that may occur between the close of the foreign exchange and the time at which Fund shares are priced. If a security is valued at a “fair value”, that value may be different from the last quoted market price for the security. As a result, it is possible that fair value prices will be used by the Funds.
Security transactions and investment income
Investment transactions are accounted for on a trade-date basis. Interest income is recorded on an accrual basis. Dividend income is recorded on the ex-dividend date. Bond premium is amortized and discount is accreted over the expected life of each applicable security. Corporate actions involving foreign securities, including dividends, are recorded as soon as the information becomes available. Withholding taxes on foreign dividends are accrued in accordance with the applicable country’s tax rules and rates. Gains and losses realized on sales of securities are determined using the specific identification method by comparing the identified cost of the security lot sold with the net sales proceeds, which is the same basis used for federal income tax purposes.
Foreign currency translation
Investments in securities and other assets and liabilities denominated in foreign currencies are translated into US dollar amounts at the date of valuation. Purchases and sales of investment securities and income and expense items denominated in foreign currencies are translated into US dollar amounts on the respective dates of such transactions.
The Funds do not separate the portion of the results of operations resulting from changes in foreign exchange rates on investments from the fluctuations arising from changes in market prices of securities held. Such fluctuations are included with the net realized and unrealized gain or loss from investments on the Statements of Operations.
Reported net realized foreign exchange gains or losses arise from sales of foreign currencies, currency gains or losses realized between the trade date and settlement date on securities transactions, and the difference between the amounts of dividends, interest, and foreign withholding taxes recorded on the Funds’ books and the US dollar equivalent of the amounts actually received or paid. Net unrealized foreign exchange gains and losses arise from changes in the fair values of assets and liabilities, other than investments in securities at fiscal period end, resulting from changes in exchange rates.
Forward foreign currency contracts
The Funds may enter into forward foreign currency contracts primarily to hedge against foreign currency exchange rate risks on their non-US dollar denominated investment securities. When entering into forward foreign currency contracts, the Fund agrees to receive or deliver a fixed quantity of foreign currency for an agreed-upon price on an agreed future date. Realized gains or losses on forward foreign currency contracts include net gains or losses on contracts that have matured. Forward foreign currency contracts are valued daily and the unrealized appreciation or depreciation is included in the Statements of Assets and Liabilities. These instruments involve market risk, credit risk or both kinds of risks, in excess of the amount recognized in the Statements of Assets and Liabilities. These risks arise from the possible inability of counterparties to meet the terms of their contracts and from unfavorable currency fluctuations. When applicable, open forward foreign currency contracts at the end of the period are listed in each Fund’s Portfolio of Investments.
Futures contracts
The Funds are subject to interest rate risk and foreign currency risk in the normal course of pursuing its investment objectives. The Funds may invest in futures contracts to gain exposure to, or hedge against changes in the value of interest
| Henderson Global Funds | Notes to financial statements |
rates or foreign currencies and to gain exposure to equity indices. A futures contract represents a commitment for the future purchase or sale of an asset at a specified price and date. Upon entering into such contracts, the Funds are required to deposit with the broker either in cash or securities an initial margin in an amount equal to a certain percentage of the contract amount. Subsequent payments, known as “variation margin,” are made or received by the Funds, depending on the fluctuations in the fair value of the underlying security. The Funds realize a gain or loss upon the expiration or closing of the futures contracts. Should market conditions move unexpectedly, the Funds may not achieve the anticipated benefits of the futures contracts and may realize a loss. The use of futures contracts involves the risk of imperfect correlation in movements in the price of futures contracts, interest rates, and the underlying hedged assets. With futures, there is minimal counterparty credit risk to the Funds since futures are exchange-traded and the exchange’s clearinghouse, as counterparty to all exchange-traded futures, guarantees the contracts against default. When applicable, open contracts outstanding at the end of the period are listed in each Fund’s Portfolio of Investments.
Options purchased
The Funds may purchase options to create investment exposure consistent with its investment objective or to hedge or limit exposure of its portfolio holdings. Options are valued daily and unrealized appreciation or depreciation is recorded. The Funds realize a gain or loss upon the expiration or closing of the option transaction. Options are subject to substantial risks. The primary risks include the risk of imperfect correlation between the option price and the value of the underlying instrument, the possibility of an illiquid market for the option or the inability of counterparties to perform. When applicable, option contracts purchased by the Funds and contracts outstanding at the end of the period are listed in each Fund’s Portfolio of Investments.
Options written
Certain Funds may write (sell) put and call options on securities or derivative instruments in order to gain exposure to or protect against changes in the markets. When a Fund writes a call or put option, an amount equal to the premium received by the Fund is included on the Fund’s Statement of Assets and Liabilities as an asset and as an equivalent liability. The amount of the liability is subsequently marked-to-market to reflect the current market value of the option written. If an option which the Fund has written either expires on its stipulated expiration date or the Fund enters into a closing purchase transaction, the Fund realizes a gain (or loss if the cost of a closing purchase transaction exceeds the premium received when the option was written) without regard to any unrealized gain or loss on the underlying security or derivative instrument, and the liability related to such option is extinguished. If a call option which the Fund has written is exercised, the Fund recognizes a realized gain or loss (long-term or short-term, depending on the holding period of the underlying security) from the sale of the underlying security or derivative instrument and the proceeds from the sale are increased by the premium originally received. If a put option which the Fund has written is exercised, the amount of the premium originally received reduces the cost of the security or derivative instrument that the Fund purchases upon exercise of the option.
In writing an option, the Funds bear the market risk of an unfavorable change in the price of the derivative instrument, security or currency underlying the written option. Exercise of an option written by a Fund could result in a Fund selling or buying a derivative instrument, security or currency at a price different from current market value. When applicable, written options at the end of the period are listed in each Fund’s Portfolio of Investments.
Derivative instruments
The following table summarizes each Fund’s fair value of derivative instruments held at July 31, 2012 and the related location on the accompanying Statement of Assets and Liabilities, presented by primary underlying risk exposure:
| All Asset: | | | | | |
| | Location on statement | | | Fair | |
| | of assets and liabilities | | | value | |
| Assets | | | | | |
| | | | | | |
| Interest rate risk | Unrealized appreciation on | | | | |
| | open futures contracts | | $ | 31,589 | |
| | | | | | |
| Equity risk | Unrealized appreciation on | | | | |
| | open futures contracts | | $ | 4,971 | |
| | | | | | |
| Foreign currency | Receivable for open | | | | |
| risk | forward foreign | | | | |
| | currency contracts | | $ | 7,294 | |
| | | | | | |
| Liabilities | | | | | |
| | | | | | |
| Equity | Unrealized depreciation | | | | |
| risk | on open futures contracts | | $ | 45,587 | |
| | | | | | |
| Interest rate | Unrealized depreciation on | | | | |
| risk | open futures contracts | | $ | 4,073 | |
| | | | | | |
| Foreign currency | Payable for open | | | | |
| risk | forward foreign currency | | | | |
| | contracts | | $ | 39,709 | |
| Henderson Global Funds | Notes to financial statements |
| European Focus: | | | | | |
| | Location on statement | | | Fair | |
| | of assets and liabilities | | | value | |
| Assets | | | | | |
| | | | | | |
| Equity | Investments, | | | | |
| risk | at fair value - securities | | $ | 0 | |
| | | | | | |
| Foreign currency | Receivable for open | | | | |
| risk | forward foreign | | | | |
| | currency contracts | | $ | 1,127,187 | |
| | | | | | |
| Global Equity Income: | | | | | |
| | Location on statement | | | Fair | |
| | of assets and liabilities | | | value | |
| Liabilities | | | | | |
| | | | | | |
| Foreign currency | Payable for open | | | | |
| risk | forward foreign | | | | |
| | currency contracts | | $ | 2,863,216 | |
| | | | | | |
| International Opportunities: | | | | | |
| | Location on statement | | | Fair | |
| | of assets and liabilities | | | value | |
| Assets | | | | | |
| | | | | | |
| Equity | Investments, | | | | |
| risk | at fair value - securities | | $ | 0 | |
| | | | | | |
| Foreign currency | Receivable for open | | | | |
| risk | forward foreign | | | | |
| | currency contracts | | $ | 6,225,651 | |
Additionally, the amount of gains and losses on derivative instruments recognized in the Funds’ earnings during the period and the related location on the accompanying Statement of Operations is summarized in the following table by primary risk exposure:
| All Asset: | | | | | |
| | Location on statement | | | Fair | |
| | of operations | | | value | |
| Realized gain (loss) | | | | | |
| | | | | | |
| Equity risk | Net realized gain/(loss) | | | | |
| | from futures contracts | | $ | (31,611 | ) |
| | | | | | |
| Interest rate risk | Net realized gain/(loss) | | | | |
| | from futures contracts | | $ | 70,380 | |
| | | | | | |
| Foreign currency | Net realized gain/(loss) | | | | |
| risk | from foreign currency | | | | |
| | transactions | | $ | 52,353 | |
| | | | | | |
| Change in unrealized appreciation/depreciation | | | | |
| | | | | |
| Equity risk | Net change in unrealized | | | | |
| | appreciation/depreciation | | | | |
| | of futures contracts | | $ | (40,616 | ) |
| | | | | | |
| Interest rate risk | Net change in unrealized | | | | |
| | appreciation/depreciation | | | | |
| | of futures contracts | | $ | 27,516 | |
| | | | | | |
| Foreign currency | Net change in unrealized | | | | |
| risk | appreciation/depreciation | | | | |
| | of translation of other assets | | | | |
| | and liabilities | | $ | (32,415 | ) |
| | | | | | |
| European Focus: | | | | | |
| | Location on statement | | | Fair | |
| | of operations | | | value | |
| Realized gain (loss) | | | | | |
| | | | | | |
| Equity risk | Net realized gain/(loss) | | | | |
| | from option contracts | | $ | (1,564,288 | ) |
| | | | | | |
| Change in unrealized appreciation/depreciation | | | | |
| | | | | | |
| Equity risk | Net change in unrealized | | | | |
| | appreciation/depreciation | | | | |
| | of option contracts | | $ | 28,049 | |
| | | | | | |
| Foreign currency | Net change in unrealized | | | | |
| risk | appreciation/depreciation | | | | |
| | of translation of other assets | | | | |
| | and liabilities | | $ | 1,127,187 | |
| | | | | | |
| Global Equity Income: | | | | | |
| | Location on statement | | | Fair | |
| | of operations | | | value | |
| Realized gain (loss) | | | | | |
| | | | | | |
| Foreign currency | Net realized gain/(loss) | | | | |
| risk | from foreign currency | | | | |
| | transactions | | $ | 4,499,956 | |
| | | | | | |
| Change in unrealized appreciation/depreciation | | | | |
| | | | | | |
| Foreign currency | Net change in unrealized | | | | |
| risk | appreciation/depreciation | | | | |
| | of translation of other | | | | |
| | assets and liabilities | | $ | 2,967,521 | |
| | | | | | |
| International Opportunities: | | | | | |
| | Location on statement | | | Fair | |
| | of operations | | | value | |
| Realized gain (loss) | | | | | |
| | | | | | |
| Equity risk | Net realized gain/(loss) | | | | |
| | from option contracts | | $ | (2,426,375 | ) |
| | | | | | |
| Change in unrealized appreciation/depreciation | | | | |
| | | | | | |
| Equity risk | Net change in unrealized | | | | |
| | appreciation/depreciation | | | | |
| | of option contracts | | $ | 42,975 | |
| | | | | | |
| Foreign currency | Net change in unrealized | | | | |
| risk | appreciation/depreciation | | | | |
| | of translation of other | | | | |
| | assets and liabilities | | $ | 6,225,651 | |
| Henderson Global Funds | Notes to financial statements |
Indemnifications
Under the Trust’s organizational documents, its Officers and Trustees are indemnified against certain liabilities arising out of the performance of their duties to the Trust. In addition, in the normal course of business the Trust enters into contracts that provide general indemnifications to other parties. The Trust’s maximum exposure under these arrangements is unknown as future claims may be made against the Trust that have not yet been asserted.
Use of estimates
The preparation of financial statements in conformity with US generally accepted accounting principles (“GAAP”) requires management to make estimates and assumptions that affect the reported amounts and disclosures in the financial statements. Actual results may differ from those estimates.
Expenses
Expenses are recorded on an accrual basis. Expenses of the Trust that are directly attributable to a specific Fund are charged to that Fund. Expenses attributable to a specific class of shares are charged to that class. Other expenses are allocated proportionately among each Fund within the Trust based on average daily net assets or on another reasonable basis.
Deferred offering costs
Costs incurred in connection with the offering and initial registration of All Asset and Emerging Markets Opportunities have been deferred in conformity with GAAP and are being amortized to expense on a straight-line basis over the first twelve months after commencement of operations.
Federal income taxes
The Trust’s policy is that each Fund seeks to comply with the requirements of Subchapter M of the Internal Revenue Code of 1986, as amended “Subchapter M”, that are applicable to regulated investment companies and to distribute substantially all its taxable income to shareholders. No federal income tax provision is required so long as each Fund operates in a manner that complies with the requirements of Subchapter M. Management has concluded that there are no significant uncertain tax positions that would require recognition in the financial statements. Management of the Funds is also not aware of any tax positions for which it is reasonably possible that the total amount of unrecognized tax benefits will significantly change in the next twelve months. The Funds intend to file tax returns with the US Internal Revenue Service and various states. Generally, the tax authorities can examine all tax returns filed for the last three years.
On December 22, 2010, the Regulated Investment Company Modernization Act of 2010 (the “Act”) was enacted, which changed various technical rules governing the tax treatment of regulated investment companies. One of the more prominent changes addresses capital loss carryforwards. Under the Act, each Fund will be permitted to carry forward capital losses incurred in taxable years beginning after the date of enactment for an unlimited period. However, any losses incurred during those future taxable years will be required to be utilized prior to the losses incurred in pre-enactment taxable years, which carry an expiration date. As a result of this ordering rule, pre-enactment capital loss carryforwards may be more likely to expire unused. Additionally, post-enactment capital loss carryforwards will retain their character as either short-term or long-term capital losses rather than being considered all short-term as permitted under previous regulation.
Finally, the Act contains several provisions aimed at preserving the character of distributions made by a fiscal year registered investment company (“RIC”) during the portion of its taxable year ending after October 31 or December 31, reducing the circumstances under which a RIC might be required to file amended Forms 1099 to restate previously reported distributions. Except for the simplification provisions related to RIC qualification, the Act is effective for taxable years beginning after December 22, 2010. The provisions related to RIC qualification are effective for taxable years for which the extended due date of the tax return is after December 22, 2010.
Losses incurred that will be carried forward under the provisions of the Act are as follows:
| | | | | | | | |
| All Asset | | | | | | | |
| | | Loss carryforward character | |
| Expiration | | | Short-term | | | Long-term | |
| Unlimited losses | | $ | 87,171 | | $ | — | |
| | | | | | | | |
| Emerging Markets Opportunities | | | | | | | |
| | | Loss carryforward character | |
| Expiration | | | Short-term | | | Long-term | |
| Unlimited losses | | $ | 1,808,983 | | $ | — | |
| | | | | | | | |
| European Focus | | | | | | | |
| | | | Loss carryforward character | |
| Expiration | | | Short-term | | | Long-term | |
| Unlimited losses | | | — | | $ | — | |
| 7/31/17 | | $ | 2,773,985 | | | — | |
| 7/31/18 | | | 254,881,395 | | | — | |
| Henderson Global Funds | Notes to financial statements |
| Global Equity Income | | | | | | | |
| | | Loss carryforward character | |
| Expiration | | | Short-term | | | Long-term | |
| Unlimited losses | | $ | 8,506,122 | | $ | — | |
| 7/31/16 | | | 506,123 | | | — | |
| 7/31/17 | | | 40,759,829 | | | — | |
| 7/31/18 | | | 75,631,427 | | | — | |
| 7/31/19 | | | 38,549,435 | | | — | |
| | | | | | | | |
| Global Leaders | | | | | | | |
| | | Loss carryforward character | |
| Expiration | | | Short-term | | | Long-term | |
| Unlimited losses | | | — | | $ | — | |
| 7/31/17 | | $ | 618,872 | | | — | |
| 7/31/18 | | | 3,284,125 | | | — | |
| | | | | | | | |
| Global Technology | | | | | | | |
| | | Loss carryforward character | |
| Expiration | | | Short-term | | | Long-term | |
| Unlimited losses | | | — | | $ | — | |
| 7/31/17 | | $ | 14,628,189 | | | — | |
| 7/31/18 | | | 8,744,623 | | | — | |
| | | | | | | | |
| International Opportunities | | | | | | | |
| | | Loss carryforward character | |
| Expiration | | | Short-term | | | Long-term | |
| Unlimited losses | | | — | | $ | — | |
| 7/31/17 | | $ | 115,817,399 | | | — | |
| 7/31/18 | | | 688,182,842 | | | — | |
| | | | | | | | |
| Japan Focus | | | | | | | |
| | | Loss carryforward character | |
| Expiration | | | Short-term | | | Long-term | |
| Unlimited losses | | | — | | $ | — | |
| 7/31/16 | | $ | 328,868 | | | — | |
| 7/31/17 | | | 8,809,249 | | | — | |
| 7/31/18 | | | 16,954,849 | | | — | |
| 7/31/19 | | | 457,235 | | | — | |
During the year ended July 31, 2012 the Funds utilized the following capital loss carryforwards:
| | | | | |
| All Asset | | | — | |
| Emerging Markets Opportunities | | | — | |
| European Focus | | $ | 3,054,198 | |
| Global Equity Income | | | — | |
| Global Leaders | | | 1,191,987 | |
| Global Technology | | | 21,214,063 | |
| International Opportunities | | | 20,081,788 | |
| Japan Focus | | | 620,558 | |
At July 31, 2012, the following Funds deferred post-October losses, which will be recognized on the first day of the following year:
| | | | | | | | |
| | | | Ordinary | | | Capital | |
| | | | loss | | | loss | |
| | | | deferred | | | deferred | |
| All Asset | | | — | | | — | |
| Emerging Markets Opportunities | | | — | | $ | 1,565,485 | |
| European Focus | | | — | | | 23,809,523 | |
| Global Equity Income | | | — | | | 66,911,212 | |
| Global Leaders | | | — | | | 110,791 | |
| Global Technology | | $ | 1,609,915 | | | 3,376,933 | |
| International Opportunities | | | — | | | 72,271,329 | |
| Japan Focus | | | — | | | 1,132,704 | |
Distributions to shareholders
Distributions to shareholders are recorded on the ex-dividend date. Distributions from net investment income and net realized capital gains are determined in accordance with federal income tax regulations, which may differ from GAAP. These book/tax differences are either temporary or permanent in nature. To the extent these differences are permanent, they are reclassified within the capital accounts based on their federal tax-basis treatment.
| Henderson Global Funds | Notes to financial statements |
Accordingly, at July 31, 2012, the Funds reclassified the following amounts between paid-in capital, undistributed net investment income (loss) and accumulated net realized gain (loss):
| | | | | | | | | | | |
| | | | | | | Accumulated | | | | |
| | | | | | | undistributed | | | | |
| | | | | | | net | | | Accumulated | |
| | | | Paid-in | | | investment | | | net realized | |
| | | | capital | | | income/(loss | ) | | gain/(loss | ) |
| All Asset | | $ | (28,498 | ) | $ | 72,362 | | $ | (43,864 | ) |
| Emerging Markets Opportunities | | | (29,811 | ) | | 202,644 | | | (172,833 | ) |
| European Focus | | | (7,334 | ) | | 18,246,783 | | | (18,239,449 | ) |
| Global Equity Income | | | (2,667 | ) | | (2,288,130 | ) | | 2,290,797 | |
| Global Leaders | | | (23,773 | ) | | 14,550 | | | 9,223 | |
| Global Technology | | | (1,768,614 | ) | | 1,169,730 | | | 598,884 | |
| International Opportunities | | | (4,593 | ) | | (2,739,473 | ) | | 2,744,066 | |
| Japan Focus | | | (38,842 | ) | | 293,695 | | | (254,853 | ) |
These reclassifications relate to the deductibility of certain expenses and the character of realized gains/losses on foreign currency transactions and Passive Foreign Investment Companies (“PFIC”) transactions for tax purposes and had no impact on the net asset value of the Funds.
The tax character of distributions paid during the years ended July 31, 2012 and July 31, 2011 were as follows:
| | | | | |
| Year ended | | | Ordinary | |
| July 31, 2012 | | | income | |
| All Asset | | | — | |
| Emerging Markets Opportunities | | $ | 197,743 | |
| European Focus | | | 22,949,547 | |
| Global Equity Income | | | 71,852,459 | |
| Global Leaders | | | — | |
| Global Technology | | | — | |
| International Opportunities | | | 15,136,762 | |
| Japan Focus | | | 99,534 | |
| | | | | |
| Year ended | | | Ordinary | |
| July 31, 2011 | | | income | |
| All Asset | | | — | |
| Emerging Markets Opportunities | | | — | |
| European Focus | | $ | 14,354,912 | |
| Global Equity Income | | | 61,063,423 | |
| Global Leaders | | | — | |
| Global Technology | | | — | |
| International Opportunities | | | 19,586,861 | |
| Japan Focus | | | 16,007 | |
As of July 31, 2012, the components of distributable earnings on a tax basis were as follows:
| | | | | | | | |
| | | | Undistributed | | | Undistributed | |
| | | | ordinary | | | appreciation | |
| | | | income | | | (depreciation | ) |
| All Asset | | $ | 150,824 | | $ | (119,887 | ) |
| Emerging Markets Opportunities | | | 73,441 | | | (1,011,265 | ) |
| European Focus | | | 7,585,855 | | | (49,873,628 | ) |
| Global Equity Income | | | 922,311 | | | 48,169,060 | |
| Global Leaders | | | — | | | 1,613,065 | |
| Global Technology | | | — | | | 39,337,884 | |
| International Opportunities | | | 16,206,573 | | | 73,858,421 | |
| Japan Focus | | | 506,693 | | | (1,654,116 | ) |
Ordinary income and net realized gains/losses may differ for book and tax basis reporting purposes due to post-October losses (which are not recognized for tax purposes until the first day of the following fiscal year), tax deferral on wash sales and PFIC transactions.
| Henderson Global Funds | Notes to financial statements |
Note 3. Fair value measurements
Various inputs are used in determining the value of the Funds’ investments. The Funds use a three-tier hierarchy of inputs to establish classification of fair value measurements for disclosure purposes. These inputs may be observable or unobservable. Observable inputs are inputs that reflect the assumptions market participants would use in pricing the asset or liability developed based on market data obtained from sources independent of the reporting entity. Unobservable inputs are inputs that reflect the reporting entity’s own assumptions about the assumptions market participants would use in pricing the asset or liability developed based on the best information available under the circumstances. The inputs used for valuing securities are not necessarily an indication of the risk associated with investing in those securities. The three-tier hierarchy of inputs is summarized in the following three broad levels:
| | • | Level 1 – quoted prices (unadjusted) in active markets for identical investments |
| | | |
| | • | Level 2 – other significant observable inputs (including quoted prices for similar investments, interest rates, prepayment speeds, credit risk, etc.) |
| | | |
| | • | Level 3 – significant unobservable inputs (including management’s own assumptions in determining the fair value of investments) |
Any transfers between levels are disclosed, effective at the end of the period, in the table below with the reasons for the transfers disclosed in a note to the table, if applicable.
The following tables summarize the Funds’ investments that are measured at fair value by level within the fair value hierarchy at July 31, 2012:
| | | | | | | | | | | | | | |
| All Asset | | | | | | | | | | | | | |
| | | | Quoted prices | | | Significant | | | | | | | |
| | | | in active | | | other | | | Significant | | | | |
| | | | markets for | | | observable | | | unobservable | | | | |
| | identical assets | | | inputs | | | inputs | | | | |
| Description | | | (level 1 | ) | | (level 2 | ) | | (level 3 | ) | | Total | |
| Investment Companies | | $ | 19,845,130 | | $ | — | | $ | — | | $ | 19,845,130 | |
| Short-Term Investments | | | 15,566,822 | | | — | | | — | | | 15,566,822 | |
| Total | | | 35,411,952 | | | — | | | — | | | 35,411,952 | |
| Liabilities | | | | | | | | | | | | | |
| Financial Derivative Instruments* | | | | | | | | | | | | | |
| Forward Foreign Currency Contracts | | | — | | | (32,415 | ) | | — | | | (32,415 | ) |
| Futures Contracts | | | (13,100 | ) | | — | | | — | | | (13,100 | ) |
| Total Financial Derivative Instruments | | $ | (13,100 | ) | $ | (32,415 | ) | $ | — | | $ | (45,515 | ) |
* These investments are recorded in the financial statements at the unrealized gain or loss on the investment.
During the period ended July 31, 2012, there were no transfers in or out of security levels as a result of the fair value pricing procedures established by the Fund.
| Henderson Global Funds | Notes to financial statements |
| Emerging Markets Opportunities | | | | | | | | | | | | | |
| | | | Quoted prices | | | Significant | | | | | | | |
| | | | in active | | | other | | | Significant | | | | |
| | | | markets for | | | observable | | | unobservable | | | | |
| | identical assets | | | inputs | | | inputs | | | | |
| Description | | | (level 1 | ) | | (level 2 | ) | | (level 3 | ) | | Total | |
| Common Stocks | | | | | | | | | | | | | |
| Australia | | $ | 696,773 | | $ | — | | $ | — | | $ | 696,773 | |
| Brazil | | | 1,738,480 | | | — | | | — | | | 1,738,480 | |
| Canada | | | 33,736 | | | — | | | — | | | 33,736 | |
| China | | | 2,253,433 | | | — | | | — | | | 2,253,433 | |
| Hong Kong | | | 620,728 | | | — | | | — | | | 620,728 | |
| India | | | 907,223 | | | — | | | — | | | 907,223 | |
| Indonesia | | | 805,018 | | | — | | | — | | | 805,018 | |
| Italy | | | 415,795 | | | — | | | — | | | 415,795 | |
| Kazakhstan | | | 316,051 | | | — | | | — | | | 316,051 | |
| Korea | | | 2,527,029 | | | — | | | — | | | 2,527,029 | |
| Luxembourg | | | 179,916 | | | — | | | — | | | 179,916 | |
| Malaysia | | | 383,381 | | | — | | | — | | | 383,381 | |
| Mexico | | | 806,521 | | | — | | | — | | | 806,521 | |
| Panama | | | 174,443 | | | — | | | — | | | 174,443 | |
| Philippines | | | 462,488 | | | — | | | — | | | 462,488 | |
| Russia | | | 214,780 | | | — | | | — | | | 214,780 | |
| South Africa | | | 167,374 | | | — | | | — | | | 167,374 | |
| Switzerland | | | 228,519 | | | — | | | — | | | 228,519 | |
| Taiwan | | | 302,316 | | | — | | | — | | | 302,316 | |
| Thailand | | | 402,269 | | | — | | | — | | | 402,269 | |
| Ukraine | | | 158,090 | | | — | | | — | | | 158,090 | |
| United Kingdom | | | 1,264,279 | | | — | | | — | | | 1,264,279 | |
| United States | | | 188,470 | | | — | | | — | | | 188,470 | |
| Total Common Stocks | | | 15,247,112 | | | — | | | — | | | 15,247,112 | |
| Preferred Stocks | | | | | | | | | | | | | |
| Brazil | | | 564,204 | | | — | | | — | | | 564,204 | |
| Total Preferred Stocks | | | 564,204 | | | — | | | — | | | 564,204 | |
| Short-Term Investment | | | 1,735,130 | | | — | | | — | | | 1,735,130 | |
| Total | | $ | 17,546,446 | | $ | — | | $ | — | | $ | 17,546,446 | |
During the year ended July 31, 2012, there were no transfers in or out of security levels as a result of the fair value pricing procedures established by the Fund.
| Henderson Global Funds | Notes to financial statements |
| European Focus | | | | | | | | | | | | | |
| | | | Quoted prices | | | Significant | | | | | | | |
| | | | in active | | | other | | | Significant | | | | |
| | | | markets for | | | observable | | | unobservable | | | | |
| | identical assets | | | inputs | | | inputs | | | | |
| Description | | | (level 1 | ) | | (level 2 | ) | | (level 3 | ) | | Total | |
| Assets | | | | | | | | | | | | | |
| Common Stocks | | | | | | | | | | | | | |
| Australia | | $ | 21,631,839 | | $ | — | | $ | — | | $ | 21,631,839 | |
| Canada | | | 4,349,168 | | | — | | | — | | | 4,349,168 | |
| France | | | 22,813,429 | | | — | | | — | | | 22,813,429 | |
| Germany | | | 54,233,227 | | | — | | | — | | | 54,233,227 | |
| Greece | | | 5,942,154 | | | — | | | — | | | 5,942,154 | |
| Ireland | | | 20,449,923 | | | — | | | — | | | 20,449,923 | |
| Italy | | | 10,060,732 | | | — | | | — | | | 10,060,732 | |
| Kazakhstan | | | 12,905,244 | | | — | | | — | | | 12,905,244 | |
| Luxembourg | | | 10,570,346 | | | — | | | — | | | 10,570,346 | |
| Netherlands | | | — | | | — | | | — | | | — | |
| Norway | | | 6,386,931 | | | — | | | — | | | 6,386,931 | |
| Portugal | | | 11,064,532 | | | — | | | — | | | 11,064,532 | |
| Russia | | | 18,111,550 | | | — | | | — | | | 18,111,550 | |
| Spain | | | 21,085,603 | | | — | | | — | | | 21,085,603 | |
| Sweden | | | 12,965,687 | | | — | | | — | | | 12,965,687 | |
| Switzerland | | | 14,026,515 | | | — | | | — | | | 14,026,515 | |
| United Kingdom | | | 168,098,358 | | | — | | | — | | | 168,098,358 | |
| Total Common Stocks | | | 414,695,238 | | | — | | | — | | | 414,695,238 | |
| REITs | | | | | | | | | | | | | |
| United Kingdom | | | 4,349,727 | | | — | | | — | | | 4,349,727 | |
| Total REITs | | | 4,349,727 | | | — | | | — | | | 4,349,727 | |
| Options Purchased | | | | | | | | | | | | | |
| United Kingdom | | | — | | | — | | | — | | | — | |
| Total Options Purchased | | | — | | | — | | | — | | | — | |
| Short-Term Investment | | | 44,690,683 | | | — | | | — | | | 44,690,683 | |
| Total | | | 463,735,648 | | | — | | | — | | | 463,735,648 | |
| | | | | | | | | | | | | | |
| Assets | | | | | | | | | | | | | |
| Financial Derivative Instruments* | | | | | | | | | | | | | |
| Forward Foreign Currency Contracts | | | — | | | 1,127,187 | | | — | | | 1,127,187 | |
| Total Financial Derivative Instruments | | $ | — | | $ | 1,127,187 | | $ | — | | $ | 1,127,187 | |
* These investments are recorded in the financial statements at the unrealized gain or loss on the investment.
During the year ended July 31, 2012, there were no transfers in or out of security levels as a result of the fair value pricing procedures established by the Fund.
| Henderson Global Funds | Notes to financial statements |
Following is a reconciliation of investments in which significant unobservable inputs (Level 3) were used in determining fair value:
| | | | | | | | | | | | | | | | | | | | | | | | | | | | | |
| | | Balance | | | | | | Change in | | | | | | | | | | Balance | |
| | | as of | | Accrued | | | | unrealized | | | | | | Transfers | | Transfers | | as of | |
| Investments | | July 31, | | discounts/ | | Realized | | appreciation | | | | | | in to | | out of | | July 31, | |
| in securities | | 2011 | | premiums | | gain/(loss) | | (depreciation) | | Purchases | | Sales | | level 3 | | level 3 | | 2012 | |
| Common Stock | | | | | | | | | | | | | | | | | | | | | | | | | | | | |
| Netherlands | | | | | | | | | | | | | | | | | | | | | | | | | | | | |
| Amtel Vredestein | | | | | | | | | | | | | | | | | | | | | | | | | | | | |
| N.V., GDR | | $ | 0 | | $ | 0 | | $ | 0 | | $ | 0 | | $ | 0 | | $ | 0 | | $ | 0 | | $ | 0 | | $ | 0 | |
| Total | | $ | 0 | | $ | 0 | | $ | 0 | | $ | 0 | | $ | 0 | | $ | 0 | | $ | 0 | | $ | 0 | | $ | 0 | |
The total net change in unrealized appreciation (depreciation) in the Statement of Operations attributable to Level 3 investments held at July 31, 2012 was $0.
The Fund’s management has determined Amstel Vredstein N.V., GDR is a level 3 investment due to the lack of observable inputs that may be used in the determination of fair value. Management has also concluded there is no value for the investment primarily on the basis that the company is bankrupt, has no current operations, and has delisted from the exchange.
| Henderson Global Funds | Notes to financial statements |
| Global Equity Income | | | | | | | | | | | | | |
| | | | Quoted prices | | | Significant | | | | | | | |
| | | | in active | | | other | | | Significant | | | | |
| | | | markets for | | | observable | | | unobservable | | | | |
| | identical assets | | | inputs | | | inputs | | | | |
| Description | | | (level 1 | ) | | (level 2 | ) | | (level 3 | ) | | Total | |
| Common Stocks | | | | | | | | | | | | | |
| Australia | | $ | 59,153,491 | | $ | — | | $ | — | | $ | 59,153,491 | |
| Brazil | | | 33,160,123 | | | — | | | — | | | 33,160,123 | |
| Canada | | | 23,611,520 | | | — | | | — | | | 23,611,520 | |
| China | | | 11,054,529 | | | — | | | — | | | 11,054,529 | |
| Cyprus | | | 12,458,342 | | | — | | | — | | | 12,458,342 | |
| France | | | 44,262,439 | | | — | | | — | | | 44,262,439 | |
| Germany | | | 27,451,649 | | | — | | | — | | | 27,451,649 | |
| Hong Kong | | | 36,268,784 | | | — | | | — | | | 36,268,784 | |
| Israel | | | 5,927,094 | | | — | | | — | | | 5,927,094 | |
| Italy | | | 31,356,239 | | | — | | | — | | | 31,356,239 | |
| Netherlands | | | 58,227,770 | | | — | | | — | | | 58,227,770 | |
| Norway | | | 12,413,417 | | | — | | | — | | | 12,413,417 | |
| Singapore | | | 31,928,653 | | | — | | | — | | | 31,928,653 | |
| South Africa | | | 12,485,132 | | | — | | | — | | | 12,485,132 | |
| Taiwan | | | 36,264,280 | | | — | | | — | | | 36,264,280 | |
| United Kingdom | | | 453,076,773 | | | — | | | — | | | 453,076,773 | |
| United States | | | 235,673,260 | | | — | | | — | | | 235,673,260 | |
| Total Common Stocks | | | 1,124,773,495 | | | — | | | — | | | 1,124,773,495 | |
| REITs | | | | | | | | | | | | | |
| United Kingdom | | | 13,027,931 | | | — | | | — | | | 13,027,931 | |
| Total REITs | | | 13,027,931 | | | — | | | — | | | 13,027,931 | |
| Short-Term Investments | | | 23,728,200 | | | — | | | — | | | 23,728,200 | |
| Total | | | 1,161,529,626 | | | — | | | — | | | 1,161,529,626 | |
| Liabilities | | | | | | | | | | | | | |
| Financial Derivative Instruments* | | | | | | | | | | | | | |
| Forward Foreign Currency Contracts | | | — | | | (2,863,216 | ) | | — | | | (2,863,216 | ) |
| Total Financial Derivative Instruments | | $ | — | | $ | (2,863,216 | ) | $ | — | | $ | (2,863,216 | ) |
* These investments are recorded in the financial statements at the unrealized gain or loss on the investment.
During the year ended July 31, 2012, there were no transfers in or out of security levels as a result of the fair value pricing procedures established by the Fund.
| Henderson Global Funds | Notes to financial statements |
| Global Leaders | | | | | | | | | | | | | |
| | | | Quoted prices | | | Significant | | | | | | | |
| | | | in active | | | other | | | Significant | | | | |
| | | | markets for | | | observable | | | unobservable | | | | |
| | identical assets | | | inputs | | | inputs | | | | |
| Description | | | (level 1 | ) | | (level 2 | ) | | (level 3 | ) | | Total | |
| Common Stocks | | | | | | | | | | | | | |
| Germany | | $ | 1,066,048 | | $ | — | | $ | — | | $ | 1,066,048 | |
| Indonesia | | | 374,443 | | | — | | | — | | | 374,443 | |
| Japan | | | 1,262,930 | | | — | | | — | | | 1,262,930 | |
| Switzerland | | | 833,485 | | | — | | | — | | | 833,485 | |
| United Kingdom | | | 1,993,256 | | | — | | | — | | | 1,993,256 | |
| United States | | | 8,277,438 | | | — | | | — | | | 8,277,438 | |
| Total Common Stocks | | | 13,807,600 | | | — | | | — | | | 13,807,600 | |
| Short-Term Investment | | | 247,535 | | | — | | | — | | | 247,535 | |
| Total | | $ | 14,055,135 | | $ | — | | $ | — | | $ | 14,055,135 | |
During the year ended July 31, 2012, there were no transfers in or out of security levels as a result of the fair value pricing procedures established by the Fund.
| | | | | | | | | | | | | | |
| Global Technology | | | | | | | | | | | | | |
| | | | Quoted prices | | | Significant | | | | | | | |
| | | | in active | | | other | | | Significant | | | | |
| | | | markets for | | | observable | | | unobservable | | | | |
| | identical assets | | | inputs | | | inputs | | | | |
| Description | | | (level 1 | ) | | (level 2 | ) | | (level 3 | ) | | Total | |
| Common Stocks | | | | | | | | | | | | | |
| Brazil | | $ | 4,247,015 | | $ | — | | $ | — | | $ | 4,247,015 | |
| China | | | 16,354,289 | | | — | | | — | | | 16,354,289 | |
| France | | | 5,295,873 | | | — | | | — | | | 5,295,873 | |
| Germany | | | 10,200,565 | | | — | | | — | | | 10,200,565 | |
| Ireland | | | 4,527,445 | | | — | | | — | | | 4,527,445 | |
| Israel | | | 4,245,649 | | | — | | | — | | | 4,245,649 | |
| Japan | | | 9,069,819 | | | — | | | — | | | 9,069,819 | |
| Korea | | | 10,496,313 | | | — | | | — | | | 10,496,313 | |
| Netherlands | | | 4,887,386 | | | — | | | — | | | 4,887,386 | |
| Russia | | | 4,479,992 | | | — | | | — | | | 4,479,992 | |
| United Kingdom | | | 20,284,513 | | | — | | | — | | | 20,284,513 | |
| United States | | | 183,825,068 | | | — | | | — | | | 183,825,068 | |
| Total Common Stocks | | | 277,913,927 | | | — | | | — | | | 277,913,927 | |
| Short-Term Investment | | | 11,812,326 | | | — | | | — | | | 11,812,326 | |
| Total | | $ | 289,726,253 | | $ | — | | $ | — | | $ | 289,726,253 | |
During the year ended July 31, 2012, there were no transfers in or out of security levels as a result of the fair value pricing procedures established by the Fund.
| Henderson Global Funds | Notes to financial statements |
| International Opportunities | | | | | | | | | | | | | |
| | | | Quoted prices | | | Significant | | | | | | | |
| | | | in active | | | other | | | Significant | | | | |
| | | | markets for | | | observable | | | unobservable | | | | |
| | identical assets | | | inputs | | | inputs | | | | |
| Description | | | (level 1 | ) | | (level 2 | ) | | (level 3 | ) | | Total | |
| Common Stocks | | | | | | | | | | | | | |
| Australia | | $ | 21,154,624 | | $ | — | | $ | — | | $ | 21,154,624 | |
| China | | | 150,699,223 | | | — | | | — | | | 150,699,223 | |
| France | | | 193,658,639 | | | — | | | — | | | 193,658,639 | |
| Germany | | | 347,424,848 | | | — | | | — | | | 347,424,848 | |
| Hong Kong | | | 70,087,400 | | | — | | | — | | | 70,087,400 | |
| India | | | 28,280,000 | | | — | | | — | | | 28,280,000 | |
| Israel | | | 8,831,483 | | | — | | | — | | | 8,831,483 | |
| Italy | | | 46,835,791 | | | — | | | — | | | 46,835,791 | |
| Japan | | | 457,327,065 | | | — | | | — | | | 457,327,065 | |
| Korea | | | 113,540,306 | | | — | | | — | | | 113,540,306 | |
| Luxembourg | | | 42,265,197 | | | — | | | — | | | 42,265,197 | |
| Netherlands | | | 66,233,402 | | | — | | | — | | | 66,233,402 | |
| Portugal | | | 20,512,922 | | | — | | | — | | | 20,512,922 | |
| Russia | | | 36,942,472 | | | — | | | — | | | 36,942,472 | |
| Singapore | | | 27,889,563 | | | — | | | — | | | 27,889,563 | |
| Spain | | | 76,477,709 | | | — | | | — | | | 76,477,709 | |
| Sweden | | | 125,989,691 | | | — | | | — | | | 125,989,691 | |
| Switzerland | | | 65,400,825 | | | — | | | — | | | 65,400,825 | |
| Taiwan | | | 30,734,000 | | | — | | | — | | | 30,734,000 | |
| Thailand | | | 35,221,878 | | | — | | | — | | | 35,221,878 | |
| United Kingdom | | | 226,358,998 | | | — | | | — | | | 226,358,998 | |
| United States | | | 123,348,610 | | | — | | | — | | | 123,348,610 | |
| Total Common Stocks | | | 2,315,214,646 | | | — | | | — | | | 2,315,214,646 | |
| Options Purchased | | | | | | | | | | | | | |
| United Kingdom | | | — | | | — | | | — | | | — | |
| Total Options Purchased | | | — | | | — | | | — | | | — | |
| Short-Term Investments | | | 63,426,541 | | | — | | | — | | | 63,426,541 | |
| Total | | | 2,378,641,187 | | | — | | | — | | $ | 2,378,641,187 | |
| | | | | | | | | | | | | | |
| Assets | | | | | | | | | | | | | |
| Financial Derivative Instruments* | | | | | | | | | | | | | |
| Forward Foreign Currency Contracts | | | — | | | 6,225,651 | | | — | | | 6,225,651 | |
| Total Financial Derivative Instruments | | $ | — | | $ | 6,225,651 | | $ | — | | $ | 6,225,651 | |
* These investments are recorded in the financial statements at the unrealized gain or loss on the investment.
During the year ended July 31, 2012, there were no transfers in or out of security levels as a result of the fair value pricing procedures established by the Fund.
| Henderson Global Funds | Notes to financial statements |
| Japan Focus | | | | | | | | | | | | | |
| | | | Quoted prices | | | Significant | | | | | | | |
| | | | in active | | | other | | | Significant | | | | |
| | | | markets for | | | observable | | | unobservable | | | | |
| | identical assets | | | inputs | | | inputs | | | | |
| Description | | | (level 1 | ) | | (level 2 | ) | | (level 3 | ) | | Total | |
| Common Stocks | | | | | | | | | | | | | |
| Japan | | $ | 24,592,366 | | $ | — | | $ | — | | $ | 24,592,366 | |
| Total | | $ | 24,592,366 | | $ | — | | $ | — | | $ | 24,592,366 | |
During the year ended July 31, 2012, there were no transfers in or out of security levels as a result of the fair value pricing procedures established by the Fund.
| Henderson Global Funds | Notes to financial statements |
Note 4. Investment advisory fees and other transactions with affiliates
Pursuant to an Investment Advisory Agreement, Henderson Global Investors (North America) Inc. (“HGINA”) acts as the Funds’ investment adviser. HGINA is an indirect wholly-owned subsidiary of Henderson Group plc. HGINA supervises the investments of the Funds and earns a management fee for such services. HGINA earns a fee for its services based on each Fund’s average daily net assets as set forth below.
| | | |
| All Asset | | 0.40% |
| | | |
| Emerging Markets | First $1 billion | 1.00% |
| Opportunities | Next $1 billion | 0.90% |
| | Over $2 billion | 0.85% |
| | | |
| European Focus | First $500 million | 1.00% |
| | Next $1 billion | 0.90% |
| | Over $1.5 billion | 0.85% |
| | | |
| Global Equity Income | First $1 billion | 0.85% |
| | Next $1 billion | 0.65% |
| | Over $2 billion | 0.60% |
| | | |
| Global Leaders | First $500 million | 0.80% |
| | Next $1 billion | 0.70% |
| | Over $1.5 billion | 0.65% |
| | | |
| Global Technology | First $500 million | 1.00% |
| | Next $500 million | 0.95% |
| | Over $1 billion | 0.90% |
| | | |
| International Opportunities | First $1 billion | 1.10% |
| | Next $1 billion | 0.95% |
| | Over $2 billion | 0.85% |
| | | |
| Japan Focus | First $500 million | 0.75% |
| | Next $1 billion | 0.65% |
| | Over $1.5 billion | 0.60% |
Pursuant to separate contractual Expense Limitation Agreements, HGINA has agreed to waive or limit its investment advisory fee and, if necessary, to reimburse expenses of each Fund in order to limit total annual ordinary operating expenses, including distribution and service fees, as a percentage of average daily net assets as follows:
| | | | | | | | | | | | | | | | | |
| | | | Class | | | Class | | | Class | | | Class | | | Class | |
| | | | A | | | B | | | C | | | I | | | R | |
| All Asset* | | | 1.65 | % | | N/A | | | 2.40 | % | | 1.40 | % | | N/A | |
| | | | | | | | | | | | | | | | | |
| Emerging | | | | | | | | | | | | | | | | |
| Markets | | | | | | | | | | | | | | | | |
| Opportunities | | | 1.79 | % | | N/A | | | 2.54 | % | | 1.54 | % | | N/A | |
| | | | Class | | | Class | | | Class | | | Class | | | Class | |
| | | | A | | | B | | | C | | | I | | | R | |
| | | | | | | | | | | | | | | | | |
| European | | | | | | | | | | | | | | | | |
| Focus | | | 2.00 | % | | 2.75 | % | | 2.75 | % | | 1.75 | % | | N/A | |
| | | | | | | | | | | | | | | | | |
| Global | | | | | | | | | | | | | | | | |
| Equity | | | | | | | | | | | | | | | | |
| Income | | | 1.40 | % | | N/A | | | 2.15 | % | | 1.15 | % | | N/A | |
| | | | | | | | | | | | | | | | | |
| Global | | | | | | | | | | | | | | | | |
| Leaders | | | 1.40 | % | | N/A | | | 2.15 | % | | 1.15 | % | | N/A | |
| | | | | | | | | | | | | | | | | |
| Global | | | | | | | | | | | | | | | | |
| Technology | | | 2.00 | % | | 2.75 | % | | 2.75 | % | | 1.75 | % | | N/A | |
| | | | | | | | | | | | | | | | | |
| International | | | | | | | | | | | | | | | | |
| Opportunities | | | 2.00 | % | | 2.75 | % | | 2.75 | % | | 1.75 | % | | 2.25 | % |
| | | | | | | | | | | | | | | | | |
| Japan | | | | | | | | | | | | | | | | |
| Focus | | | 1.35 | % | | N/A | | | 2.10 | % | | 1.10 | % | | N/A | |
| * | With respect to investments in affiliate Underlying Funds, HGINA has contractually agreed to reduce or waive the Fund’s management fee to limit the combined management fees paid to the adviser for those assets to the greater of 1.00% or the affiliate Underlying Fund’s management fee. In addition, HGINA has contractually agreed to waive its management fee and, if necessary, to reimburse other operating expenses (excluding Acquired Fund Fees and Expenses) in order to limit total annual ordinary operating expenses, less distribution and service fees, to 0.60% of the Fund’s average daily net assets. |
These agreements are effective through July 31, 2020, except the agreement for Emerging Markets Opportunities, which is effective through July 31, 2015. Shares of the Funds are often purchased through financial intermediaries who are agents of the Funds for the limited purpose of completing purchases and sales. These intermediaries may provide certain networking and sub-transfer agent services with respect to Fund shares held by that intermediary for its customers, and the intermediary may charge HGINA for those services. The Funds reimburse HGINA for such fees within limits specified by the Board of Trustees. The fees are included in Sub-Accounting fees in the Statements of Operations.
At July 31, 2012, HGINA owned the following number of shares in the following Funds:
| | Shares |
| All Asset Class A | 450 |
| All Asset Class C | 450 |
| All Asset Class I | 100 |
| Emerging Markets Class A | 25,451 |
| Emerging Markets Class C | 25,415 |
| Emerging Markets Class I | 255,096 |
| Japan Focus Class I | 1,346 |
| Henderson Global Funds | Notes to financial statements |
HGINA is a direct subsidiary of Henderson International Inc. (“HII”). At July 31, 2012, HII owned the following number of shares in the following Funds:
| | Shares |
| Global Leaders Class C | 5,032 |
| Global Leaders Class I | 60,770 |
An affiliated person of a Fund may include any company in which the Fund owns five percent of more of its outstanding voting shares. There were no companies in which a Fund held greater than five percent ownership; however, certain of the Funds held ownership in other Funds within the Trust. At July 31, 2012, the All Asset Fund held 0.2% of the Henderson Global Technology Fund, 3.5% of the Henderson Japan Focus Fund and 1.3% of the Henderson Strategic Income Fund. At July 31, 2012, the International Opportunities Fund held 87.1% of the Henderson Money Market Fund. Transactions in affiliates during the year/period ended July 31, 2012 were as follows:
| | | | | | | | | | | | Change in | | | | | | | | | | |
| | | | | | | | | Proceeds | | Unrealized | | Realized | | | | | | | |
| | | Value | | Purchases | | from | | Appreciation | | Gain | | Value | | Dividend | |
| Affiliate | | 7/31/2011 | | at Cost | | Sales | | (Depreciation) | | (Loss) | | 7/31/2012 | | Income | |
| All Asset | | | | | | | | | | | | | | | | | | | | | | |
| Henderson Global | | | | | | | | | | | | | | | | | | | | | | |
| Technology Fund | | $ | — | | $ | 697,051 | | $ | — | | $ | (57,190 | ) | $ | — | | $ | 639,861 | | $ | — | |
| Henderson Japan | | | | | | | | | | | | | | | | | | | | | | |
| Focus Fund | | | — | | | 911,084 | | | — | | $ | (60,367 | ) | | — | | | 850,717 | | | — | |
| Henderson Strategic | | | | | | | | | | | | | | | | | | | | | | |
| Income Fund | | | — | | | 640,494 | | | — | | $ | 13,243 | | | — | | | 653,737 | | | 10,413 | |
The aggregate cost and value of affiliates at July 31, 2012 is $2,248,629 and $2,144,315, respectively. Investments in affiliates represented 6.02% of the total net assets of the All Asset Fund as of July 31, 2012.
| | | | | | | | | | | | | | | | | | | | | | | |
| | | | | | | | | | | | Change in | | | | | | | | | | |
| | | | | | | | | Proceeds | | Unrealized | | Realized | | | | | | | |
| | | Value | | Purchases | | from | | Appreciation | | Gain | | Value | | Dividend | |
| Affiliate | | 7/31/2011 | | at Cost | | Sales | | (Depreciation) | | (Loss) | | 7/31/2012 | | Income | |
| International Opportunities Fund | | | | | | | | | | | | | | | | |
| Henderson Money | | | | | | | | | | | | | | | | | | | | | | |
| Market Fund | | $ | 67,218,966 | | $ | 900,203,269 | | $ | 906,444,512 | | $ | — | | $ | — | | $ | 60,977,723 | | $ | 33,158 | |
The aggregate cost and value of affiliates at July 31, 2012 is $60,977,723 and $60,977,723, respectively. Investments in affiliates represented 2.55% of the total net assets of International Opportunities Fund as of July 31, 2012.
The Henderson International Opportunities Fund invests a portion of its uninvested cash in the Henderson Money Market Fund to assist with short-term cash management.
Note 5. Compensation of trustees and officers
Certain officers and trustees of the Trust are also officers of HGINA. None of the Trust’s officers, other than the Chief Compliance Officer, are compensated by the Trust. The Trust makes no direct payments to trustees affiliated with HGINA. Fees paid to Trustees are reflected as Trustees’ fees and expenses in the Statements of Operations.
The Funds bear a portion of the compensation paid to the compliance officers who perform services directly related to the Trust. This compensation is reflected as Compliance officer fees in the Statements of Operations.
Note 6. Distribution plan
The Trust has adopted a distribution plan for Class A, Class B, Class C and Class R shares of the Funds in accordance with Rule 12b-1 under the 1940 Act (the “12b-1 Plan”). Under the 12b-1 Plan, the Funds pay the distributor an annual fee of 0.25% of the average daily net assets attributable to its Class A shares, an annual fee of 1.00% of the average daily net assets attributable to its Class B and C shares, and an annual fee of 0.50% of the average daily net assets attributable to its Class R shares. The 12b-1 Plan is used to induce or compensate financial intermediaries (including brokerage firms, depository institutions and other firms) to provide distribution services to the Funds and their shareholders.
| Henderson Global Funds | Notes to financial statements |
Note 7. Investment transactions
Purchases and sales of investment securities, excluding short-term investments and US government securities, for the Funds for the year/period ended July 31, 2012, were as follows:
| | | | | | | | |
| | | | Purchases | | | Sales | |
| All Asset | | $ | 21,208,406 | | $ | 1,168,473 | |
| Emerging Markets Opportunities | | | 16,158,759 | | | 16,297,665 | |
| European Focus | | | 333,074,462 | | | 413,782,188 | |
| Global Equity Income | | | 1,295,228,187 | | | 1,120,333,137 | |
| Global Leaders | | | 11,850,725 | | | 13,127,701 | |
| Global Technology | | | 328,487,258 | | | 352,616,012 | |
| International Opportunities | | | 1,201,481,444 | | | 1,886,614,350 | |
| Japan Focus | | | 9,557,158 | | | 21,485,716 | |
The US federal income tax basis of investments, excluding foreign currency and forward currency contracts, at July 31, 2012, and the gross unrealized appreciation and depreciation, were as follows:
| | | | | | | | |
| | | | | | | Emerging | |
| | | | All | | | Markets | |
| | | | Asset | | | Opportunities | |
| | | | | | | | |
| Cost | | $ | 35,489,075 | | $ | 18,526,190 | |
| Gross unrealized | | | | | | | |
| appreciation | | | 232,950 | | | 1,375,806 | |
| | | | | | | | |
| Gross unrealized | | | | | | | |
| depreciation | | | (310,073 | ) | | (2,355,550 | ) |
| | | | | | | | |
| Net unrealized | | | | | | | |
| appreciation/ | | | | | | | |
| (depreciation) | | | (77,123 | ) | | (979,744 | ) |
| | | | | | | | |
| | | | European | | | Global Equity | |
| | | | Focus | | | Income | |
| | | | | | | | |
| Cost | | $ | 513,590,667 | | $ | 1,113,367,953 | |
| | | | | | | | |
| Gross unrealized | | | | | | | |
| appreciation | | | 36,006,795 | | | 80,009,948 | |
| | | | | | | | |
| Gross unrealized | | | | | | | |
| depreciation | | | (85,861,814 | ) | | (31,848,275 | ) |
| | | | | | | | |
| Net unrealized | | | | | | | |
| appreciation/ | | | | | | | |
| (depreciation) | | | (49,855,019 | ) | | 48,161,673 | |
| | | | | | | | |
| | | | Global | | | Global | |
| | | | Leaders | | | Technology | |
| | | | | | | | |
| Cost | | $ | 12,441,522 | | $ | 250,280,082 | |
| | | | | | | | |
| Gross unrealized | | | | | | | |
| appreciation | | | 1,831,236 | | | 52,166,123 | |
| | | | | | | | |
| Gross unrealized | | | | | | | |
| depreciation | | | (217,623 | ) | | (12,719,952 | ) |
| | | | | | | | |
| Net unrealized | | | | | | | |
| appreciation | | | 1,613,613 | | | 39,446,171 | |
| | | | | | | | |
| | | | International | | | Japan | |
| | | | Opportunities | | | Focus | |
| | | | | | | | |
| Cost | | $ | 2,304,177,907 | | $ | 26,247,636 | |
| | | | | | | | |
| Gross unrealized | | | | | | | |
| appreciation | | | 331,680,179 | | | 1,788,571 | |
| | | | | | | | |
| Gross unrealized | | | | | | | |
| depreciation | | | (257,216,899 | ) | | (3,443,841 | ) |
| | | | | | | | |
| Net unrealized | | | | | | | |
| appreciation/ | | | | | | | |
| (depreciation) | | | 74,463,280 | | | (1,655,270 | ) |
Identified cost may differ for book and tax basis reporting purposes primarily due to tax deferral of losses on wash sales, PFIC transactions and amortization of premiums reflected as of July 31, 2012.
Note 8. Significant concentrations
The Funds may invest a substantial percentage of their assets in securities of foreign issuers. These investments may involve certain considerations and risks not typically associated with investments in the United States as a result of, among other factors, the possibility of future political and economic developments and the level of governmental supervision and regulation of securities markets in the respective countries. Some countries in which the Funds invest may require government approval for repatriation of investment income, capital or the proceeds for sales of securities by foreign investors. In addition, if there is deterioration in a country’s balance of payments or for other reasons, a country may impose temporary restrictions on foreign capital remittances abroad. In addition, changes in currency exchange rates will affect the value of investments denominated in a foreign currency, as well as investment income derived from those securities.
The Funds may invest a high percentage of their net assets in specific sectors of the market in order to achieve a potentially
| Henderson Global Funds | Notes to financial statements |
greater investment return. As a result, the economic, political and regulatory developments in a particular sector of the market, positive or negative, have a greater impact on a Fund’s net assets and will cause the value of its shares to fluctuate more than if the Fund did not concentrate its investments in a particular sector. In particular, Global Technology concentrates its investments in issuers within specific industries of the technology and telecommunications sectors. Valuations of companies in these sectors are typically subject to greater volatility than other sectors.
Note 9. Borrowing arrangements
The Trust has a $100 million credit facility for certain Funds to facilitate portfolio liquidity. Interest is charged to each participating Fund based on its borrowings at a rate per annum equal to the Federal Funds rate plus 1.25%. In addition, a commitment fee of 0.10% per annum is accrued and apportioned among the participating Funds. The commitment fee is included in Miscellaneous fees on the Statements of Operations. No amounts were borrowed by the Funds under this facility during the year ended July 31, 2012.
Note 10. Subsequent event
Effective August 1, 2012, the Henderson Dividend & Income Builder Fund, the twelfth series of the Trust, commenced operations.
Henderson Global Funds
Report of independent registered public accounting firm
The Board of Trustees and Shareholders
Henderson Global Funds
We have audited the accompanying statements of assets and liabilities, including the portfolios of investments, of Henderson All Asset Fund, Henderson Emerging Markets Opportunities Fund, Henderson European Focus Fund, Henderson Global Equity Income Fund, Henderson Global Leaders Fund, Henderson Global Technology Fund, Henderson International Opportunities Fund, and Henderson Japan Focus Fund (collectively, the Funds), eight of the Funds comprising the Henderson Global Funds, as of July 31, 2012, and the related statements of operations, the statements of changes in net assets and the financial highlights for the periods indicated therein. These financial statements and financial highlights are the responsibility of the Funds’ management. Our responsibility is to express an opinion on these financial statements and financial highlights based on our audits.
We conducted our audits in accordance with the standards of the Public Company Accounting Oversight Board (United States). Those standards require that we plan and perform the audit to obtain reasonable assurance about whether the financial statements and financial highlights are free of material misstatement. We were not engaged to perform an audit of the Funds’ internal control over financial reporting. Our audits included consideration of internal control over financial reporting as a basis for designing audit procedures that are appropriate in the circumstances, but not for the purpose of expressing an opinion on the effectiveness of the Funds’ internal control over financial reporting. Accordingly, we express no such opinion. An audit also includes examining, on a test basis, evidence supporting the amounts and disclosures in the financial statements and financial highlights, assessing the accounting principles used and significant estimates made by management, and evaluating the overall financial statement presentation. Our procedures included confirmation of securities owned as of July 31, 2012, by correspondence with the custodian, brokers, and transfer agents of the investment funds or by other appropriate auditing procedures where replies from brokers were not received. We believe that our audits provide a reasonable basis for our opinion.
In our opinion, the financial statements and financial highlights referred to above present fairly, in all material respects, the financial position of each of the respective funds constituting the Henderson Global Funds at July 31, 2012, the results of their operations, changes in their net assets and their financial highlights for the periods indicated therein in conformity with U.S. generally accepted accounting principles.
Chicago, Illinois
September 26, 2012
| Henderson Global Funds | Other information |
| | (unaudited) |
Proxy voting policies
The Funds have filed with the Securities and Exchange Commission their proxy voting records for the twelve months ended June 30, 2012 on Form N-PX, which must be filed each year by August 31. Form N-PX is available on the Securities and Exchange Commission’s website at www.sec.gov. The Funds’ proxy voting records and proxy voting policies and procedures are also available without charge, upon request, by calling 866.443.6337 or by visiting the Funds’ website at www.hendersonglobalinvestors.com.
Quarterly portfolio of investments
A Portfolio of Investments is filed as of the end of the first and third quarter of each fiscal year on Form N-Q. The Funds have filed with the Securities and Exchange Commission the Form N-Q and it is available on the Securities and Exchange Commission’s website at www.sec.gov. Additionally, the Portfolio of Investments may be reviewed and copied at the Commission’s Public Reference Room in Washington, DC. Information on the operation of the Public Reference Room may be obtained by calling 1.800.SEC.0330. The quarterly Portfolio of Investments are also available without charge, upon request, by calling 866.443.6337 or by visiting the Funds’ website at www.hendersonglobalinvestors.com.
Approval of continuation of investment advisory agreements
The Board of Trustees of Henderson Global Funds oversees the management of the Funds and, as required by law, the investment advisory and the sub-advisory agreements for the Funds (the “Advisory Agreements”). In connection with their annual consideration of those agreements for the Funds, the Trustees received and reviewed a substantial amount of information provided by Henderson Global Investors (North America) Inc. (the “Adviser”) and Henderson Investment Management Limited (the “Sub-Adviser”) in response to detailed requests of the Independent Trustees and their independent legal counsel. The Trustees also discussed with representatives of management the operations of the Funds and the nature and quality of the advisory and other services provided to the Funds by the Adviser and the Sub-Adviser. The Independent Trustees also received and reviewed a memorandum from their counsel regarding their responsibilities in considering continuation of the agreements. Throughout their consideration of the agreements, the Independent Trustees were advised by their independent legal counsel. The Independent Trustees met with management to consider the agreements, and at that meeting they also met separately in executive session with their counsel.
May 23, 2012 Meeting
At a meeting held on May 23, 2012, the Trustees reviewed and analyzed various factors that they determined were relevant, including the factors described below.
Nature, extent and quality of services
The Independent Trustees noted the various reports and presentations they had received in connection with their evaluation of the nature, extent and quality of services provided under the Advisory Agreements by the Adviser and Sub-Adviser, addressing the services performed by the Adviser and Sub-Adviser, as well as their expertise, resources and capabilities. The Trustees then reviewed and considered the nature, extent and quality of the services provided to the Funds by the Adviser and the Sub-Adviser (in the case of Sub-Advised Funds), taking into account the investment objective(s) and strategy of each Fund and the knowledge they had gained from their regular and special meetings. In addition, the Trustees reviewed the resources and key personnel of the Adviser and the Sub-Adviser, especially the personnel who provide investment management services to the Funds. Management provided an overview of the Adviser and its parent company and reviewed the Adviser’s capabilities and resources. Management also reviewed the Adviser’s investment approach for the Funds and the qualifications of the Funds’ respective portfolio management teams.
The Trustees considered the methodology the Adviser and the Subadviser use in determining compensation payable to portfolio managers, the very competitive environment for investment management talent and the competitive market for mutual funds in different distribution channels.
The Trustees also considered other services provided to the Funds by the Adviser and the Subadviser, such as managing the execution of portfolio transactions and the selection of broker-dealers for those transactions, monitoring adherence to the Funds’ investment restrictions, producing shareholder reports, providing support services for the Trustees and committees of the Board and overseeing the activities of other service providers, including monitoring compliance with various policies and procedures of the Funds and with applicable securities laws and regulations.
Investment performance and fees
The Independent Trustees noted that a review of investment performance is a key factor in evaluating the nature, extent and quality of services provided under investment management contracts. The Independent Trustees considered, in particular, the detailed reports and analyses performed and compiled by an independent third party, Lipper Inc. (the
| Henderson Global Funds | Other information |
| | (unaudited) |
“Lipper Report”) that show, for each Fund and for various periods, total return performance data ranked within a performance universe and performance group. In addition, for purposes of their review of the reasonableness of the advisory fees, the Independent Trustees considered the expense rankings and quintiles tables, contractual management fees at common asset levels and at various asset levels, expense ratios and various other fees and expenses data and supporting information contained within the Lipper Report.
The Trustees then reviewed the performance and expenses of each Fund, including comparative and percentile ranking information in the Lipper Report.
| • | Henderson Emerging Markets Opportunities Fund: The Board observed that the Fund’s total return was in the first quintile of its peer group for the one-year period and since inception. As compared to its performance universe, the Fund also ranked in the first quintile for the one-year period. The Board also noted that the Fund’s actual management fee ranked in the second quintile and that its total expense ratio ranked in the second quintile of its peer group. |
| | |
| • | Henderson European Focus Fund: The Board considered that, although the Fund’s total return for the one-year period ranked in the fourth quintile against its peer group, its performance over all other periods (year-to-date, three-year, five-year and since inception) ranked in the first quintile of its peer group and performance universe. The Board noted that the Fund’s bottom-up investment approach involves intensive company analysis and fundamental research. The Trustees also considered the uniqueness of the Fund relative to its competitors, noting, for instance, that the Fund’s holdings are consistently differentiated from its peers and with a much higher small- and mid-cap allocation, all of which requires a more rigorous research effort than for large-cap stocks. |
| | |
| • | Henderson Global Equity Income Fund: The Board observed that the Fund’s total return for the one-year, five-year and since inception periods ranked in the first or second quintile of its peer group and underperformed for the three-year period. Performance against the performance universe was similarly ranked. With respect to the Fund’s fees and expenses, the Board noted that the Fund’s actual management fee was competitive within its peer group, although in the fifth quintile as compared to the universe, and the total expense ratio was below the median of its universe and competitive within its peer group. |
| | |
| • | Henderson Global Leaders Fund: The Board noted that the Fund’s performance for the one-year period ranked in the first quintile of its peer group and its broader performance universe. With respect to fees and expenses, the Board observed that the Fund’s actual management fee and total expense ratio were below the median of its peer group. |
| | |
| • | Henderson Global Technology Fund: The Board considered that the Fund’s performance for the year-to-date and one year periods ranked in the second quintile of the Fund’s peer group and in the first quintile of its peer group for performance over the three-year and five-year periods. In assessing the Fund’s above-median actual management fee and total expense ratio as compared to its peer group, the Board noted management’s discussion of the Fund’s investment process, uniqueness and relative performance. The Board considered that the Fund’s fundamental bottom-up investment process and thematic approach requires in-depth company and industry analysis. The Board also noted that the Fund’s performance ranked in the top quintile of its performance universe for the year-to-date, three-year, five-year, ten-year and since inception periods. The Board also considered that the Fund is differentiated relative to other technology funds. |
| | |
| • | Henderson International Opportunities Fund: The Board considered the Fund’s strong longer-term track record for performance relative to its peer group. In particular, the Board observed that the Fund’s total return ranked in the first quintile of its peer group since inception and year-to-date, in the second quintile for the five-year and ten-year periods and in the third quintile for the one-year period. The Board raised various questions with management concerning the Fund’s performance relative to its peer group for the three-year period and its above-median total expense ratio. The Board considered that the Fund’s multi-manager, best ideas approach entails an extensive level of investment research and portfolio management resources. The Board then considered the distinctive features of the Fund relative to its peers, noting, in this regard, that the Fund’s best ideas approach results in a concentrated portfolio of high conviction holdings, while the average international stock fund holds over 300 stocks. In addition, the Board observed information from management suggesting that the Fund’s holdings are consistently differentiated from its competition. Finally, in evaluating the reasonableness of the Fund’s management fees, the Board reviewed the Fund’s actual management fee and total expense ratio in comparison to its peer group and took into account the Fund’s investment process as well as the Fund’s long-term investment performance. In this connection, the Board noted that, in addition to the peer group performance, the Fund ranked in the top quintile of its performance universe over the 10-year and since inception periods and that, since inception, the Fund has outperformed its MSCI EAFE benchmark. |
| | |
| • | Henderson Japan Focus Fund: The Board noted that the Fund’s performance for the one-year period ranked in the top quintile of its peer group and performance universe and in the third and second quintiles, respectively, for the |
| Henderson Global Funds | Other information |
| | (unaudited) |
| | three-year period. The Board also observed that the Fund’s total expense ratio was in the third quintile of its peer group and that the Fund’s actual management fees were the lowest among its peer group. |
The Trustees next reviewed the management fees of the Adviser and the Sub-Adviser for certain affiliated funds and separate accounts and certain non-affiliated sub-advised funds (for which the Adviser or the Sub-Adviser provides only portfolio management services). Although in some instances the fee rates for various investment strategies were lower than management fees for Funds having a similar strategy, the Trustees noted that the Adviser and the Sub-Adviser perform significant additional services for the Funds that they generally do not provide to other clients, including administrative services, oversight of the Funds’ other service providers, Board support, regulatory compliance and numerous other services and that, in serving the Funds, the Adviser assumes many legal risks that it does not generally assume in merely providing portfolio management services to those other clients.
Costs of services provided and the profits realized by Henderson and its affiliates from their relationships with the funds
In considering the reasonableness of investment management service fees, the Independent Trustees also considered the expected profitability of Henderson and its affiliates in connection with Henderson providing investment management services to the Funds.
The Trustees also reviewed the financial information related to the Adviser’s parent company and its corporate structure. The Trustees recognized that profitability comparisons among fund managers are difficult because very little comparative information is publicly available, and the profitability of any manager is affected by numerous factors, including the organizational structure of the particular manager, the types of funds and other accounts it manages, possible other lines of business, the methodology for allocating expenses and the manager’s capital structure and cost of capital.
Economies of scale
The Independent Trustees then considered the economies of scale that might be realized by the Adviser as a Fund grows and took note of the extent to which Fund shareholders might also benefit from such growth. In this connection, it was observed that the fee schedules include various pre-established “breakpoints” in investment management service fees that are triggered as a Fund’s net asset level increases. The Independent Trustees observed that each Fund has remaining breakpoints that have not yet been reached. The Independent Trustees noted that based on the receipt of information showing the breakpoints, they were comfortable that such breakpoints satisfactorily provide for sharing economies of scale, as they allow for adequate opportunity for shareholders to realize benefits (fee breaks) as Fund assets grow.
Other Benefits to the Adviser
The Trustees also considered benefits that accrue to the Adviser and the Sub-Adviser from their relationship with the Funds and their use of commissions paid on portfolio brokerage transactions of the Funds to obtain research products and services benefiting the Fund and/or other clients.
June 13-14, 2012 Meeting
At a meeting held on June 13-14, 2012, it was noted that the Board had met previously in-person on May 23, 2012, to review annual approval related materials. The representatives of the Adviser indicated that there had not been any material changes to the information that had been provided for the May 23, 2012 meeting.
Based on their evaluation of the information provided by the Adviser and the Sub-Adviser and other information, the Trustees determined that the overall arrangements between the Funds and the Adviser were fair and reasonable in light of the nature and quality of the services provided by the Adviser and the Sub-Adviser, the fees charged for those services, and other matters that the Trustees considered relevant in the exercise of their business judgment. In making that determination, the Trustees reviewed and analyzed various factors that they determined were relevant, including the factors described below, none of which by itself was considered paramount or dispositive and each Trustee may have weighed the information differently.
Nature, extent and quality of services
The Trustees reviewed and considered the nature, extent and quality of the services provided to the Funds by the Adviser and the Sub-Adviser, taking into account the investment objective and strategy of the Funds and the knowledge they had gained from their May 23, 2012 meeting and their regular meetings with management on at least a quarterly basis. The Trustees concluded that the nature and extent of the services provided to the Funds by the Adviser and the Sub-Adviser (in the case of Sub-Advised Funds) were appropriate and consistent with the terms of the respective Advisory Agreements, that the quality of those services had been consistent with quality norms in the industry and that the Funds were likely to benefit from the continued provision of those services. They also concluded that the Adviser and the Sub-Adviser had sufficient personnel with the appropriate education and experience to serve the Funds effectively, and
| Henderson Global Funds | Other information |
| | (unaudited) |
had demonstrated their continuing ability to attract and retain well-qualified personnel.
Performance and fees
The Trustees considered the Funds’ investment performance over various time periods in comparison to information for other comparable funds as provided by Lipper. They concluded that the performance of the Funds met or exceeded acceptable levels and that the Funds and their shareholders were benefiting from the current management of the Funds. The Trustees examined information on the fees and other expenses paid by the Funds in comparison to information for other comparable funds as provided by Lipper. The Trustees also reviewed the management fees of the Adviser and the Sub-Adviser for certain affiliated funds and separate accounts and certain non-affiliated sub-advised funds (for which the Adviser or the Sub-Adviser provides only portfolio management services). The Trustees reviewed information on the profitability of (or loss) to the Adviser and its affiliates of their relationships with the Funds and concluded that the Adviser’s profitability level with respect to the Funds in relation to the services rendered was not unreasonable. Finally, the Trustees considered the financial condition of the Adviser and the Sub-Adviser, which they found to be sound. The Trustees concluded that the management fees and other compensation payable by the Funds to the Adviser, as well as the fees paid by the Adviser to the Sub-Adviser, were reasonable in relation to the nature and quality of the services provided, taking into account the fees charged by other advisers for managing comparable mutual funds with similar strategies and the fees the Adviser and the Sub-Adviser charge to other clients. The Trustees also concluded that the overall expense ratio of each Fund was reasonable, taking into account the size of the Fund, the quality of services provided by the Adviser and the Sub-Adviser, the investment performance of the Fund and the expense limitations agreed to by the Adviser.
Economies of scale
The Trustees received and considered information about the potential of the Adviser to experience economies of scale as the assets of the Funds increase. Based on all of the information they reviewed, the Trustees concluded that the current fee structure of the Funds was reasonable and, that those rates of fees are expected to reflect a sharing between the Adviser and the Funds of economies of scale.
Other benefits to the adviser
The Trustees also considered benefits that accrue to the Adviser and the Sub-Adviser from their relationship with the Fund and their use of commissions paid on portfolio brokerage transactions of the Funds to obtain research products and services benefiting the Funds and/or other clients. The Trustees concluded that the use by the Adviser and the Sub-Adviser of commissions paid by the Funds to obtain research products and services was consistent with regulatory requirements and likely benefits the Funds. After full consideration of the above factors as well as other factors that were instructive in analyzing the management arrangements, the Trustees, including all of the Independent Trustees, concluded that the continuation of the investment advisory and sub-advisory agreement for each Fund was in the best interest of the Fund and its shareholders.
Federal tax information
Certain tax information for the Funds is required to be provided to shareholders based on the Funds’ income and distributions for the taxable year ended July 31, 2012. In February 2013, shareholders will receive Form 1099-DIV, which will include their share of foreign tax credit, qualified dividends and capital gains distributed during the calendar year 2012. Shareholders are advised to check with their tax advisors for information on the treatment of these amounts on their individual income tax returns.
For corporate shareholders, 12.43% and 1.69% of ordinary income dividends paid by Global Equity Income Fund and International Opportunities Fund, respectively, qualified for the dividends received deduction during the year ended July 31, 2012.
Under Section 853 of the Internal Revenue Code of 1986, as amended (the “Code”), the Funds designated foreign taxes paid and foreign source income for the fiscal year ended July 31, 2012 were as follows:
| | | | | | | | |
| | | | Foreign | | | Foreign | |
| | | | taxes | | | source | |
| | | | paid | | | income | |
| All Asset | | $ | — | | $ | — | |
| Emerging Markets Opportunities | | | 18,243 | | | 254,115 | |
| European Focus | | | 566,614 | | | 14,265,792 | |
| Global Equity Income | | | 4,424,504 | | | 82,824,458 | |
| Global Leaders | | | — | | | — | |
| Global Technology | | | — | | | — | |
| International Opportunities | | | 4,644,523 | | | 66,300,115 | |
| Japan Focus | | | 50,561 | | | 722,293 | |
| Henderson Global Funds | Other information |
| | (unaudited) |
Under Section 854 (b)(2) of the Code, the Funds designated qualified dividends for the fiscal year ended July 31, 2012 as follows:
| | | | | |
| All Asset | | $ | — | |
| Emerging Markets Opportunities | | | 148,590 | |
| European Focus | | | 13,676,178 | |
| Global Equity Income | | | 77,223,124 | |
| Global Leaders | | | — | |
| Global Technology | | | — | |
| International Opportunities | | | 61,847,147 | |
| Japan Focus | | | 704,821 | |
Shareholder expense
As a shareholder of the Funds, you incur two types of costs: (1) transaction costs, including sales charges (loads) on purchase payments and redemption fees and (2) ongoing costs, including management fees, distribution (12b-1) fees, shareholder services fees and other Fund expenses. The example in Table 1 and Table 2 is intended to help you understand your ongoing costs of investing in the Funds and to compare these costs with ongoing costs of investing in other mutual funds. It is based on an investment of $1,000 invested at the beginning of the period and held for the six months ended July 31, 2012.
Actual expenses
Table 1 provides information about actual account values and actual expenses. You may use the information in this line, together with the amount invested, to estimate the expenses that you incurred over the period. Simply divide your account value at the end of the period by $1,000 (for example, an $8,600 account value divided by $1,000 = 8.6), then multiply the result by the number under the heading entitled “Expenses Paid During the Period” to estimate the expenses attributable to your investment during this period.
Hypothetical example for comparison purposes
Table 2 provides information about hypothetical account values and hypothetical expenses based on the Funds’ actual expense ratios and an assumed rate of return of 5% per year before expenses, which is not the Funds’ actual return. Thus you should not use the hypothetical account values and expenses to estimate your actual ending account balance or the expense attributable to your investment during the period.
Rather, these figures are provided to enable you to compare the ongoing costs of investing in the Funds and other funds. To do so, compare the 5% hypothetical examples with the 5% hypothetical examples that appear in the shareholder reports of other funds.
Expenses paid during the period include amounts reflected in the Funds’ Statement of Operations, net of reimbursements by the investment adviser. The annualized expense ratios used in the example are as follows:
| | | | | | | | | | | | | | | | | |
| | | | Class | | | Class | | | Class | | | Class | | | Class | |
| | | | A | | | B | | | C | | | I | | | R | |
| | | | | | | | | | | | | | | | | |
| All Asset | | | 0.85 | % | | N/A | | | 1.60 | % | | 0.60 | % | | N/A | |
| | | | | | | | | | | | | | | | | |
| Emerging | | | | | | | | | | | | | | | | |
| Markets | | | | | | | | | | | | | | | | |
| Opportunities | | | 1.79 | % | | N/A | | | 2.54 | % | | 1.54 | % | | N/A | |
| | | | | | | | | | | | | | | | | |
| European | | | | | | | | | | | | | | | | |
| Focus | | | 1.47 | % | | 2.35 | % | | 2.29 | % | | 1.14 | % | | N/A | |
| | | | | | | | | | | | | | | | | |
| Global Equity | | | | | | | | | | | | | | | | |
| Income | | | 1.27 | % | | N/A | | | 2.05 | % | | 1.01 | % | | N/A | |
| | | | | | | | | | | | | | | | | |
| Global | | | | | | | | | | | | | | | | |
| Leaders | | | 1.40 | % | | N/A | | | 2.15 | % | | 1.15 | % | | N/A | |
| | | | | | | | | | | | | | | | | |
| Global | | | | | | | | | | | | | | | | |
| Technology | | | 1.48 | % | | 2.39 | % | | 2.30 | % | | 1.20 | % | | N/A | |
| | | | | | | | | | | | | | | | | |
| International | | | | | | | | | | | | | | | | |
| Opportunities | | | 1.45 | % | | 2.35 | % | | 2.31 | % | | 1.15 | % | | 1.92 | % |
| | | | | | | | | | | | | | | | | |
| Japan Focus | | | 1.35 | % | | N/A | | | 2.10 | % | | 1.13 | % | | N/A | |
| Henderson Global Funds | Other information |
| | (unaudited) |
Please note that the expenses do not reflect shareowner transaction costs such as front-end sales charges and redemption fees. These fees are described for each Fund and share class in the Performance summary of this report on pages 3, 5, 7, 9, 11, 13, 15 and 17. Table 2 is useful in comparing ongoing costs only, and will not help you determine the relative total costs of owning different funds. In addition, if these transaction costs were included, your costs would have been higher.
| Table 1 | | | | | | | | | | |
| | | | | | | | | | | |
| | | | Beginning | | | Ending | | | | |
| | | | account | | | account | | | Expenses | |
| | | | value | | | value | | | paid | |
| | | | February 1, | | | July 31, | | | during | |
| Actual | | | 2012 | | | 2012 | | | the period* | |
| | | | | | | | | | | |
| All Asset** | | | | | | | | | | |
| Class A | | $ | 1,000.00 | | $ | 993.00 | | $ | 4.21 | |
| Class C | | | 1,000.00 | | | 991.00 | | | 7.92 | |
| Class I | | | 1,000.00 | | | 994.00 | | | 2.97 | |
| | | | | | | | | | | |
| Emerging Market | | | | | | | | | | |
| Opportunities | | | | | | | | | | |
| Class A | | $ | 1,000.00 | | $ | 967.20 | | $ | 8.76 | |
| Class C | | | 1,000.00 | | | 964.50 | | | 12.41 | |
| Class I | | | 1,000.00 | | | 968.40 | | | 7.54 | |
| | | | | | | | | | | |
| European Focus | | | | | | | | | | |
| Class A | | $ | 1,000.00 | | $ | 933.80 | | $ | 7.07 | |
| Class B | | | 1,000.00 | | | 930.00 | | | 11.32 | |
| Class C | | | 1,000.00 | | | 930.00 | | | 10.99 | |
| Class I | | | 1,000.00 | | | 935.40 | | | 5.49 | |
| | | | | | | | | | | |
| Global Equity | | | | | | | | | | |
| Income | | | | | | | | | | |
| Class A | | $ | 1,000.00 | | $ | 1,047.00 | | $ | 6.46 | |
| Class C | | | 1,000.00 | | | 1,043.20 | | | 10.41 | |
| Class I | | | 1,000.00 | | | 1,048.30 | | | 5.14 | |
| | | | | | | | | | | |
| Global Leaders | | | | | | | | | | |
| Class A | | $ | 1,000.00 | | $ | 1,002.00 | | $ | 6.97 | |
| Class C | | | 1,000.00 | | | 997.90 | | | 10.68 | |
| Class I | | | 1,000.00 | | | 1,003.00 | | | 5.73 | |
| | | | | | | | | | | |
| Global | | | | | | | | | | |
| Technology | | | | | | | | | | |
| Class A | | $ | 1,000.00 | | $ | 1,022.30 | | $ | 7.44 | |
| Class B | | | 1,000.00 | | | 1,017.90 | | | 11.99 | |
| Class C | | | 1,000.00 | | | 1,018.50 | | | 11.54 | |
| Class I | | | 1,000.00 | | | 1,024.20 | | | 6.04 | |
| | | | | | | | | | | |
| International | | | | | | | | | | |
| Opportunities | | | | | | | | | | |
| Class A | | $ | 1,000.00 | | $ | 1,007.90 | | $ | 7.24 | |
| Class B | | | 1,000.00 | | | 1,003.90 | | | 11.71 | |
| Class C | | | 1,000.00 | | | 1,003.90 | | | 11.51 | |
| Class I | | | 1,000.00 | | | 1,009.40 | | | 5.75 | |
| Class R | | | 1,000.00 | | | 1,005.30 | | | 9.57 | |
| | | | | | | | | | | |
| Japan Focus | | | | | | | | | | |
| Class A | | $ | 1,000.00 | | $ | 987.80 | | $ | 6.67 | |
| Class C | | | 1,000.00 | | | 984.50 | | | 10.36 | |
| Class I | | | 1,000.00 | | | 989.20 | | | 5.59 | |
| | | | | | | | | | | |
| Table 2 | | | | | | | | | | |
| | | | | | | | | | | |
| Hypothetical | | | Beginning | | | Ending | | | Expenses | |
| (assuming a | | | account | | | account | | | paid | |
| 5% return | | | value | | | value | | | during | |
| before | | | February 1, | | | July 31, | | | the | |
| expenses) | | | 2012 | | | 2012 | | | period* | |
| | | | | | | | | | | |
| All Asset | | | | | | | | | | |
| Class A | | $ | 1,000.00 | | $ | 1,020.64 | | $ | 4.27 | |
| Class C | | | 1,000.00 | | | 1,016.91 | | | 8.02 | |
| Class I | | | 1,000.00 | | | 1,021.88 | | | 3.02 | |
| | | | | | | | | | | |
| Emerging Market | | | | | | | | | | |
| Opportunities | | | | | | | | | | |
| Class A | | $ | 1,000.00 | | $ | 1,015.96 | | $ | 8.97 | |
| Class C | | | 1,000.00 | | | 1,012.23 | | | 12.71 | |
| Class I | | | 1,000.00 | | | 1,017.21 | | | 7.72 | |
| | | | | | | | | | | |
| European Focus | | | | | | | | | | |
| Class A | | $ | 1,000.00 | | $ | 1,017.55 | | $ | 7.37 | |
| Class B | | | 1,000.00 | | | 1,013.13 | | | 11.81 | |
| Class C | | | 1,000.00 | | | 1,013.48 | | | 11.46 | |
| Class I | | | 1,000.00 | | | 1,019.19 | | | 5.72 | |
| | | | | | | | | | | |
| Global Equity | | | | | | | | | | |
| Income | | | | | | | | | | |
| Class A | | $ | 1,000.00 | | $ | 1,018.55 | | $ | 6.37 | |
| Class C | | | 1,000.00 | | | 1,014.67 | | | 10.27 | |
| Class I | | | 1,000.00 | | | 1,019.84 | | | 5.07 | |
| | | | | | | | | | | |
| Global Leaders | | | | | | | | | | |
| Class A | | $ | 1,000.00 | | $ | 1,017.90 | | $ | 7.02 | |
| Class C | | | 1,000.00 | | | 1,014.17 | | | 10.77 | |
| Class I | | | 1,000.00 | | | 1,019.14 | | | 5.77 | |
| | | | | | | | | | | |
| Global | | | | | | | | | | |
| Technology | | | | | | | | | | |
| Class A | | $ | 1,000.00 | | $ | 1,017.50 | | $ | 7.42 | |
| Class B | | | 1,000.00 | | | 1,012.98 | | | 11.96 | |
| Class C | | | 1,000.00 | | | 1,013.43 | | | 11.51 | |
| Class I | | | 1,000.00 | | | 1,018.90 | | | 6.02 | |
| | | | | | | | | | | |
| International | | | | | | | | | | |
| Opportunities | | | | | | | | | | |
| Class A | | $ | 1,000.00 | | $ | 1,017.65 | | $ | 7.27 | |
| Class B | | | 1,000.00 | | | 1,013.18 | | | 11.76 | |
| Class C | | | 1,000.00 | | | 1,013.38 | | | 11.56 | |
| Class I | | | 1,000.00 | | | 1,019.14 | | | 5.77 | |
| Class R | | | 1,000.00 | | | 1,015.32 | | | 9.62 | |
| | | | | | | | | | | |
| Japan Focus | | | | | | | | | | |
| Class A | | $ | 1,000.00 | | $ | 1,018.15 | | $ | 6.77 | |
| Class C | | | 1,000.00 | | | 1,014.42 | | | 10.52 | |
| Class I | | | 1,000.00 | | | 1,019.24 | | | 5.67 | |
| * | Expenses are equal to the Funds’ annualized net expense ratio multiplied by the average account value over the period multiplied by 182 days in the period, and divided by 366 (to reflect the one-half year period). |
| ** | Expenses are equal to the Fund’s annualized net expense ratio multiplied by the average account value over the period multiplied by 123 days in the period, and divided by 366 (to reflect the one-half year period). |
| Henderson Global Funds | Trustees and officers |
| | (unaudited) |
Name, address1, | | Position(s) | | Term of | | | | Other |
| month and | | with | | Office and | | Principal Occupations | | Directorships |
| year of birth | | the Trust2 | | Time Served3 | | During Past Five Years | | Held |
| Independent Trustees | | | | | | | | |
| | | | | | | | | |
C . Gary Gerst February 1939 | | Chairman and Trustee | | Since 2001 | | General Partner, Cornelius & Lothian LP (private partnership investing in non-public investments), since 1993; Member of the Governing Council of the Independent Directors Council (IDC), since 2004; Board Member of the Investment Company Institute, since 2004. | | Formerly, Trustee, Harris Insight Funds Trust. |
| | | | | | | | | |
Roland C. Baker August 1938 | | Trustee | | Since 2001 | | Consultant to financial services industry. | | Director, Sammons Financial Enterprises, Inc. and its life insurance subsidiaries, North American Company for Life and Health Insurance (a provider of life insurance, health insurance and annuities), and Midland National Life Insurance Company (an affiliate of North American Company for Life and Health Insurance); formerly, Trustee, Scottish Widows Investment Partnership Trust; formerly Trustee, Allstate Financial Investment Trust; and formerly, Director, Quanta Capital Holdings, Inc. (provider of property and casualty reinsurance). |
| | | | | | | | | |
Faris F. Chesley August 1938 | | Trustee | | Since 2002 | | Chairman, Chesley, Taft & Associates, LLC, Since 2001; Vice Chairman, ABN-AMRO, Inc. (a financial services company), 1998-2001. | | None. |
| | | | | | | | | |
James W. Atkinson August 1950 | | Trustee | | Since 2011 | | Commercial Pilot, Atkinson Aviation LLC, since 2009 | | Formerly, Trustee, LaRabida Children’s Hospital: formerly Trustee, Surgeons Diversified Investment Fund. |
| | | | | | | | | |
Richard W. Durkes February 1950 | | Trustee | | Since 2011 | | Managing Director, Sandler O’Neill & Partners, L.P. (a financial services Company), since 2002. | | Trustee, Sankaty Head Foundation. |
| | | | | | | | | |
| Interested Trustees and Officers of the Trust | | | | |
| | | | | | | | | |
James G. O’Brien4 May 1960 | | Trustee and | | Since 2011 | | Managing Director, HGINA, Since 2008 and Director, Corporate Services, HGINA, 2001-2008. | | Director, The Olson Company |
| | | | | | | | | |
Charles Thompson II4 April 1970 | | Trustee and | | Since 2011 | | Director of US Retail, since 2010, Director of National Sales, 2007-2010, Divisional Director – Central Region, 2002 – 2007. | | None. |
| | | | | | | | | |
| Kenneth A. Kalina | | Chief | | Since 2005 | | Chief Compliance Officer, HGINA. | | N/A |
| August 1959 | | Compliance | | | | | | |
| | | Officer | | | | | | |
| Henderson Global Funds | Trustees and officers |
| | (unaudited) |
Name, address1, | | Position(s) | | Term of | | | | Other |
| month and | | with | | Office and | | Principal Occupations | | Directorships |
| year of birth | | the Trust2 | | Time Served3 | | during Past Five Years | | Held |
| Interested Trustees and Officers of the Trust | | | | |
| | | | | | | | | |
Alanna P. Nensel | | Vice President | | Since 2002 | | Director, Retail Marketing and Product Management, HGINA. | | N/A |
| | | | | | | | | |
David Latin | | Vice President | | Since 2012 | | Director of Product Development and Analyst Relations, HGINA. | | N/A |
| | | | | | | | | |
Scott E. Volk | | Vice President | | Since 2001 | | Director, Retail Finance and Operations, HGINA. | | N/A |
| | | | | | | | | |
| Christopher K. | | Secretary | | Since 2004 | | Legal Counsel, HGINA. | | N/A |
| Yarbrough | | | | | | | | |
| October 1974 | | | | | | | | |
| | | | | | | | | |
Troy M. Statczar | | Treasurer | | Since 2008 | | Head of US Fund Administration and Accounting, HGINA, since July 2008, Senior Vice President, Citigroup 2005-2008. | | N/A |
1. | Each person’s address is 737 North Michigan Avenue, Suite 1700, Chicago, IL 60611. |
2. | Currently, all Trustees oversee all eleven series of the Trust. |
3. | A Trustee may serve until his death, resignation, removal or until the end of the calendar year in which the Trustee reaches 75 years of age. The officers of the Trust are elected annually by the Board. |
4. | This Trustee is an interested person of the Trust because of his employment relationship with Henderson Global Investors (North America) Inc., the investment adviser to the Fund. |
| | |
| | Unless otherwise noted, this information is as of July 31, 2012. The Statement of Additional Information for Henderson Global Funds includes additional information about the Trustees and is available without charge by calling 1.866.4HENDERSON (1.866.443.6337). |
Henderson Global Funds
| Trustees | Investment Adviser |
| C. Gary Gerst, Chairman | Henderson Global Investors (North America) Inc. |
| James W. Atkinson | 737 North Michigan Avenue, Suite 1700 |
| Roland C. Baker | Chicago, IL 60611 |
| Faris F. Chesley | |
| Richard W. Durkes | Transfer Agent |
| James G. O’Brien* | State Street Bank & Trust Company |
| Charles Thompson II* | State Street Financial Center |
| | One Lincoln Street |
| Officers | Boston, MA 02111 |
| James G. O’Brien, President | |
| Charles Thompson II, Vice President | For more information |
| Alanna P. Nensel, Vice President | Please call 1.866.4HENDERSON |
| David Latin, Vice President | (1.866.443.6337) |
| Scott E. Volk, Vice President | or visit our website: |
| Christopher K. Yarbrough, Secretary | www.hendersonglobalinvestors.com |
| Kenneth A. Kalina, Chief Compliance Officer | |
| Troy M. Statczar, Treasurer | |
* Trustee is an “interested person” of the Fund as defined in the Investment Company Act of 1940, as amended.
The views expressed in this report and information about the Funds’ portfolio holdings are for the period covered by this report and are subject to change hereafter. This report is submitted for the general information of the shareholders of the Funds. It is not authorized for distribution to prospective investors unless preceded or accompanied by an effective prospectus, which includes information regarding the Funds’ risks, objectives, fees and expenses, experience of its management, and other information. Henderson Global Investors is the name under which various subsidiaries of Henderson Group plc, a UK limited company, provide investment products and services.
Foreside Fund Services, LLC, Distributor
Privacy Notice
Henderson Global Funds
This notice describes the privacy practices followed by Henderson Global Funds.
Your privacy is our top priority. Our policy is to respect the privacy of current and former shareholders and to protect personal information entrusted to us. We do not share any nonpublic personal information of shareholders or former shareholders with any nonaffiliated third parties, except as permitted by law or as authorized by our shareholders.
In the course of providing products and services to you, we collect nonpublic personal information about you from various sources such as account applications or agreements, other account forms, transactions in your account, and from information captured on our website, including any information captured through our use of “cookies.” Such information may include your name, address, account or tax identification number, the types and amounts of investments, and bank account information. More detailed information about our Internet policy is available on our website, www.hendersonglobalinvestors.com.
In the normal course of serving shareholders, we may share information we collect with entities that help us process information or service your request, such as transfer agents, custodians, broker-dealers and marketing service firms, as well as with other financial institutions with whom we have joint marketing agreements. We may share information in connection with servicing accounts or to inform shareholders of products and services that we believe may be of interest to them. The organizations that receive shareholder information will use that information only for the services required and as allowed by applicable law or regulation, and are not permitted to share or use this information for any other purpose. Our affiliates do not use shareholder information that we receive to make marketing solicitations. We will disclose your personal information to government agencies, law enforcement officials, and others in the limited circumstances where we believe, in good faith, that such disclosure is required or permitted by law. For example, we will disclose your personal information in order to comply with a court order, to cooperate with government or industry regulators, or law enforcement authorities.
Access to customers’ nonpublic personal information is restricted to employees who need to access that information. To guard shareholder’s nonpublic personal information, we use industry standard physical, electronic, and procedural safeguards. A shareholder’s right to privacy extends to all forms of contact with us, including telephone, written correspondence, and electronic media, such as the Internet.
For questions concerning this policy, please contact us by writing to: Alanna Nensel, Henderson Global Investors (North America) Inc., 737 North Michigan Avenue, Suite 1700, Chicago, Illinois 60611.


Item 2. Code of Ethics.
| (a) | Henderson Global Funds (the “Trust” or the “registrant”) has adopted a Code of Ethics that applies to the Trust’s principal executive officer and principal financial officer (the “Code”). |
| (b) | No disclosures are required by this Item 2(b). |
| (c) | There have been no amendments to the Code during the reporting period for Form N-CSR. |
| (d) | There have been no waivers granted by the Trust to individuals covered by the Code during the reporting period for Form N-CSR. |
| (f) | A copy of the Code may be obtained free of charge by calling 866-343-6337. |
Item 3. Audit Committee Financial Expert.
| (a) | (1) | The Board of Trustees of the Trust has determined that it has five audit committee financial experts serving on the Trust’s Audit Committee that possess the attributes identified in Item 3(b) to Form N-CSR. |
| | (2) | The names of the audit committee financial experts are: |
James W. Atkinson
Roland C. Baker
Faris F. Chesley
Richard W. Durkes
C. Gary Gerst
Each audit committee financial expert has been deemed to be “independent” as that term is defined in Item 3(a)(2) of Form N-CSR.
Item 4. Principal Accountant Fees and Services.
As of July 31, 2012, the registrant had eleven series. The following series of the registrant have a fiscal year ended December 31: Henderson International All Cap Equity Fund, Henderson Strategic Income Fund and Henderson Money Market Fund (the “12/31 Henderson Funds”). The following series of the registrant have a fiscal year ended July 31: Henderson All Asset Fund, Henderson Emerging Markets Opportunities Fund, Henderson European Focus Fund, Henderson Global Equity Income Fund, Henderson Global Leaders Fund, Henderson Global Technology Fund, Henderson International Opportunities Fund and Henderson Japan Focus Fund (the “7/31 Henderson Funds”).
Information provided in response to Item 4 includes amounts billed during the applicable fiscal years for services rendered by the registrant’s principal accountant to the 12/31 Henderson Funds and the 7/31 Henderson Funds.
(a) Audit Fees – The aggregate fees billed for the last two fiscal years ended July 31 for the 7/31 Henderson Funds and December 31 for the 12/31 Henderson Funds for professional services rendered by the principal accountant to the registrant for the audit of the registrant’s annual financial statements or services normally provided by the accountant in connection with statutory and regulatory filings or engagements for the those fiscal years are set forth below.
| | 12/31 Henderson Funds | 7/31 Henderson Funds |
| Year ended 7/31/12 | N/A | $235,800 |
| Year ended 12/31/11 | $87,300 | N/A |
| Year ended 7/31/11 | N/A | $200,200 |
| Year ended 12/31/10 | $83,900 | N/A |
(b) Audit Related Fees – There were no fees billed for the last two fiscal years ended July 31 for the 7/31 Henderson Funds and December 31 for the 12/31 Henderson Funds for assurance and related services rendered by the principal accountant to the registrant that are reasonably related to the performance of the audit of the registrant’s financial statements and are not reported under paragraph (a) of this Item 4.
There were no fees billed for the last two fiscal years ended July 31 for the 7/31 Henderson Funds and December 31 for the 12/31 Henderson Funds for assurance and related services rendered by the principal accountant to the investment adviser that are reasonably related to the performance of the audit of the registrant’s financial statements that were required to be pre-approved by the Audit Committee as described in paragraph (e)(1) of this Item 4.
(c) Tax Fees – The aggregate fees billed for the last two fiscal years ended July 31 for the 7/31 Henderson Funds and December 31 for the 12/31 Henderson Funds for professional services rendered by the principal accountant to the registrant for tax compliance, tax advice, tax planning and tax return preparation are set forth below. These services consisted of the principal accountant reviewing the registrant’s excise tax returns, distribution requirements and RIC tax returns, as well as consultation regarding the tax consequences of specific investments.
| | 12/31 Henderson Funds | 7/31 Henderson Funds |
| Year ended 7/31/12 | N/A | $115,360 |
| Year ended 12/31/11 | $30,184 | N/A |
| Year ended 7/31/11 | N/A | $61,843 |
| Year ended 12/31/10 | $20,941 | N/A |
The aggregate fees billed for the last two fiscal years ended July 31 for the 7/31 Henderson Funds and December 31 for the 12/31 Henderson Funds for professional services rendered by the principal accountant to the investment adviser for tax compliance, tax advice and tax planning that were required to be pre-approved by the Audit Committee as described in paragraph (e)(1) of this Item 4 are set forth below.
| | 12/31 Henderson Funds | 7/31 Henderson Funds |
| Year ended 7/31/12 | N/A | $0 |
| Year ended 12/31/11 | $0 | N/A |
| Year ended 7/31/11 | N/A | $0 |
| Year ended 12/31/10 | $0 | N/A |
(d) All Other Fees – There were no fees billed for the last two fiscal years ended July 31 for the 7/31 Henderson Funds and December 31 for the 12/31 Henderson Funds for products and services provided by the principal accountant to the registrant, other than the services reported in paragraph (a) – (c) of this Item 4.
There were no fees billed for the last two fiscal years ended July 31 for the 7/31 Henderson Funds and December 31 for the 12/31 Henderson Funds for products and services provided by the principal accountant to the investment adviser that were required to be pre-approved by the Audit Committee as described in paragraph (e)(1) of this Item 4.
(e) Pre-Approval Policies and Procedures
(1) Pursuant to the registrant’s Audit Committee Charter, the Audit Committee shall pre-approve any engagement of the independent auditors to provide any services (other than prohibited non-audit services) to the Trust, the investment adviser and any entity controlling, controlled by, or under common control with the investment adviser that provides ongoing services to the Trust (if the engagement relates directly to the operations and financial reporting of the Trust) (collectively, the “Adviser”), including the fees and other compensation to be paid to the independent auditors. Any member of the Audit Committee may grant such pre-approval. Any such delegated pre-approval shall be presented to the Audit Committee by the member who approved the engagement. Pre-approval of non-audit services is not required, if: (a) the aggregate amount of all non-audit services provided to the Trust is less than 5% of the total fees paid by the Trust to its independent auditors during the fiscal year in which the non-audit services are provided; (b) the services were not recognized by management at the time of the engagement as non-audit services; and (c) such services are promptly brought to the attention of the Audit Committee by management and the Audit Committee approves them (which may be by delegation as provided for above) prior to the completion of the audit.
The independent auditors shall not perform any of the following non-audit services for the Trust (“prohibited non-audit services”): (a) bookkeeping or other services related to the accounting records or financial statements of the Trust; (b) financial information systems design and implementation; (c) appraisal or valuation services, fairness opinions, or contribution-in-kind reports; (d) actuarial services; (e) internal audit outsourcing services; (f) management functions or human resources; (g) broker or dealer, investment adviser, or investment banking services; (h) legal services and expert services unrelated to the audit; and (i) any other services that the Public Company Accounting Oversight Board determines are impermissible.
(2) None of the services provided to the registrant described in paragraphs (b)-(d) of Item 4 were pre-approved by the Audit Committee pursuant to paragraph (c)(7)(i)(C) of Rule 2-01 of Regulation S-X. All of the fees billed for services provided to the Adviser described in paragraphs (b)-(d) of Item 4 were required to be pre-approved by the Audit Committee as described in paragraph (e)(1) of Item 4.
| (f) | No disclosures are required by this Item 4(f). |
(g) The approximate aggregate non-audit fees billed for the last two fiscal years ended July 31 for the 7/31 Henderson Funds and December 31 for the 12/31 Henderson Funds for services rendered by the principal accountant to the registrant are set forth below.
| | 12/31 Henderson Funds | 7/31 Henderson Funds |
| Year ended 7/31/12 | N/A | $115,360 |
| Year ended 12/31/11 | $30,184 | N/A |
| Year ended 7/31/11 | N/A | $61,843 |
| Year ended 12/31/10 | $20,941 | N/A |
The approximate aggregate non-audit fees billed for the last two fiscal years ended July 31 for the 7/31 Henderson Funds and December 31 for the 12/31 Henderson Funds for services rendered by the principal accountant to the Adviser and its affiliates that provide ongoing services to the registrant are set forth below.
| | 12/31 Henderson Funds* | 7/31 Henderson Funds* |
| Year ended 7/31/12 | N/A | $1,179,772 |
| Year ended 12/31/11 | $1,854,159 | N/A |
| Year ended 7/31/11 | N/A | $276,105 |
| Year ended 12/31/10 | $681,795 | N/A |
___________| * Note that as the non-audit services provided to the Adviser and its affiliates are not attributable to the 12/31 or 7/31 Henderson Funds, and due to the different year-ends, certain fees billed during the period may be reflected in both the 12/31 and 7/31 Henderson Funds’ fiscal years. |
(h) The registrant’s Audit Committee has determined that the non-audit services the principal accountant has rendered to the Adviser that were not required to be pre-approved by the Audit Committee because they did not relate directly to the operations and financial reporting of the registrant were compatible with maintaining the principal accountant’s independence.
Item 5. Audit Committee of Listed Registrants.
Not applicable.
Item 6. Schedule of Investments.
(a) Schedule of Investments is included as a part of the report to shareholders filed under Item 1 of this Form N-CSR.
(b) Not applicable.
Item 7. Disclosure of Proxy Voting Policies and Procedures for Closed-End Management Investment Companies.
Not applicable.
Item 8. Portfolio Managers of Closed-End Management Investment Companies.
Not applicable.
Item 9. Purchases of Equity Securities by Closed-End Management Investment Company and Affiliated Purchasers.
Not applicable.
Item 10. Submission of Matters to a Vote of Security Holders.
There have been no material changes to the procedures by which the shareholders may recommend nominees to the registrant’s board of trustees, where those changes were implemented after the registrant last provided disclosure in response to this Item.
Item 11. Controls and Procedures.
(a) The registrant’s principal executive officer and principal financial officer have evaluated the registrant’s disclosure controls and procedures within 90 days of this filing and have concluded that the registrant’s disclosure controls and procedures were effective, as of that date, in ensuring that information required to be disclosed by the registrant in this Form N-CSR was recorded, processed, summarized and reported timely.
(b) There were no changes in the registrant’s internal controls over financial reporting (as defined in Rule 30a-3(d) under the Investment Company Act of 1940) that occurred during the registrant’s second fiscal quarter of the period covered by this report that has materially affected, or is reasonably likely to materially affect, the registrant’s internal controls over financial reporting.
Item 12. Exhibits.
(2) The certifications required by Rule 30a-2(a) under the 1940 Act (17 CFR 270.30a-2(a)) are attached hereto.
(b) The certifications required by Rule 30a-2(b) under the 1940 Act (17 CFR 270.30a-2(b)) and Section 906 of the Sarbanes-Oxley Act of 2002 are attached hereto.
SIGNATURES
Pursuant to the requirements of the Securities Exchange Act of 1934 and the Investment Company Act of 1940, the registrant has duly caused this report to be signed on its behalf by the undersigned, thereunto duly authorized.
HENDERSON GLOBAL FUNDS
By: /s/ James. G. O’Brien
James G. O’Brien
President (principal executive officer) of Henderson Global Funds
Date: October 1, 2012
Pursuant to the requirements of the Securities Exchange Act of 1934 and the Investment Company Act of 1940, this report has been signed below by the following persons on behalf of the registrant and in the capacities and on the dates indicated.
By: /s/ James G. O’Brien
James G. O’Brien
President (principal executive officer) of Henderson Global Funds
Date: October 1, 2012
By: /s/ Troy Statczar
Troy Statczar
Treasurer (principal financial officer) of Henderson Global Funds
Date: October 1, 2012