UNITED STATES
SECURITIES AND EXCHANGE COMMISSION
Washington, D.C. 20549
FORM N-CSR
CERTIFIED SHAREHOLDER REPORT OF REGISTERED
MANAGEMENT INVESTMENT COMPANIES
Investment Company Act file number: 811-10399
______________________________________________
HENDERSON GLOBAL FUNDS
____________________________________________________________________________
(Exact name of registrant as specified in charter)
737 NORTH MICHIGAN AVENUE, SUITE 1700
CHICAGO, ILLINOIS 60611
____________________________________________________________________________
(Address of principal executive offices)(Zip code)
| (Name and Address of Agent for Service) | Copy to: |
CHRISTOPHER K. YARBROUGH 737 NORTH MICHIGAN AVENUE, SUITE 1700 CHICAGO, ILLINOIS 60611 | CATHY G. O’KELLY VEDDER PRICE P.C. 222 NORTH LASALLE STREET CHICAGO, ILLINOIS 60601 |
Registrant’s telephone number, including area code: (312) 397-1122
Date of fiscal year end: July 31
Date of reporting period: July 31, 2013
Item 1: Report to Shareholders.
Annual Report
July 31, 2013
All Asset Fund
Dividend & Income Builder Fund
Emerging Markets Opportunities Fund
European Focus Fund
Global Equity Income Fund
Global Technology Fund
High Yield Opportunities Fund
International Opportunities Fund
Strategic Income Fund
World Select Fund (formerly Global Leaders Fund)
Table of contents
| Letter to shareholders | 1 |
| All Asset Fund | |
| Commentary | 2 |
| Performance summary | 3 |
| Dividend & Income Builder Fund | |
| Commentary | 4 |
| Performance summary | 5 |
| Emerging Markets Opportunities Fund | |
| Commentary | 6 |
| Performance summary | 7 |
| European Focus Fund | |
| Commentary | 8 |
| Performance summary | 9 |
| Global Equity Income Fund | |
| Commentary | 10 |
| Performance summary | 11 |
| Global Technology Fund | |
| Commentary | 12 |
| Performance summary | 13 |
| High Yield Opportunities Fund | |
| Commentary | 14 |
| Performance summary | 15 |
| International Opportunities Fund | |
| Commentary | 16 |
| Performance summary | 17 |
| Strategic Income Fund | |
| Commentary | 18 |
| Performance summary | 19 |
| World Select Fund (formerly Global Leaders Fund)* | |
| Commentary | 20 |
| Performance summary | 21 |
| Portfolios of investments | 22 |
| Statements of assets and liabilities | 66 |
| Statements of operations | 70 |
| Statements of changes in net assets | 73 |
| Statements of changes - capital stock activity | 83 |
| Financial highlights | 94 |
| Notes to financial statements | 108 |
| Report of independent registered public accounting firm | 126 |
| Other information | 127 |
| Trustees and officers | 136 |
International investing involves certain risks and increased volatility not associated with investing solely in the US. These risks include currency fluctuations, economic or financial instability, lack of timely or reliable financial information or unfavorable political or legal developments. The Funds may invest in securities issued by smaller companies, which typically involves greater risk than investing in larger companies. Also, the Funds may invest in limited geographic areas and/or sectors which may result in greater market volatility. This risk is heightened in investments in emerging markets. In addition some of the Funds may invest in derivatives. Derivatives involve special risks different from, and potentially greater than, the risks associated with investing directly in securities and may result in greater losses.
The All Asset Fund invests in a smaller number of securities than the average mutual fund and the change in value of a single holding may have a more pronounced effect on the Fund’s net asset value and performance. The Fund may invest in derivatives and commodities. Investing in commodities entails additional risks including instability regarding control and jurisdiction of governments, international companies and other entities. Asset allocation strategies do not assure profit nor protect against loss. The Fund may be subject to frequent trading which may result in a turnover rate of 100% or more. The Fund is subject to investment company and pooled vehicles risk, allocation risk, leverage risk, interest rate risk and high yield securities risk. An investment in pooled vehicles, including closed-end funds, trusts, and exchange-traded funds (“ETFs”), may involve paying a premium at the time of purchase or receiving a discounted price at the time of sale. The Fund (and indirectly its shareholders) is responsible for a proportional share of the underlying investment company’s expenses, in addition to its own. Investments in high yield securities may offer more attractive returns than higher-rated securities, but the potentially higher yield is a function of the greater risk that a particular security may default.
The Dividend & Income Builder Fund invests in a smaller number of securities than the average mutual fund and the change in value of a single holding may have a more pronounced effect on the Fund’s net asset value and performance. The Fund may invest in illiquid securities and is subject to investment company and pooled vehicles risk, interest rate risk, credit/default risk and high yield securities risk. An investment in pooled vehicles, including closed-end funds, trusts, and ETFs, may involve paying a premium at the time of purchase or receiving a discounted price at the time of sale. The Fund (and indirectly its shareholders) is responsible for a proportional share of the underlying investment company’s expenses, in addition to its own. The Fund’s share price and yield will be affected by interest rate movements, with bond prices generally moving in the opposite direction from interest rates. During periods of rising interest rates, the value of a bond investment is at greater risk than during periods of stable or falling rates. The Fund may be subject to frequent trading which may result in a turnover rate of 100% or more. Credit risk refers to the bond issuer’s ability to make timely payments of principal and interest. Investments in high yield securities may offer more attractive returns than higher-rated securities, but the potentially higher yield is a function of the greater risk that a particular security may default.
Technology companies may react similarly to certain market pressure and events. This may be significantly affected by short product cycles, aggressive pricing of products and services, competition from new market entrants, and obsolescence of existing technology. As a result, the Global Technology Fund’s returns may be considerably more volatile than a fund that does not invest in technology companies.
The views in this report were those of the Funds’ Portfolio Managers as of July 31, 2013, and may not reflect the views of the portfolio managers on the date this report is first published or anytime thereafter. These views are intended to assist shareholders of the Funds in understanding their investment in the Funds and do not constitute investment advice.
* As of December 20, 2012, the Global Leaders Fund changed its name to the World Select Fund.
| Henderson Global Funds | Letter to shareholders |
Dear shareholder,
We are pleased to provide the annual report for the Henderson Global Funds, which covers the year ended July 31, 2013.
Over the past year, we have begun to see many signs of economic recovery and improvement in key markets around the globe. In the US, consumer confidence reached a six-year high in June, while a stable oil price lifted auto sales. The housing recovery continued its upward momentum and labor markets also continued to improve. More recently, however, markets have experienced volatility following Fed chairman Ben Bernanke’s testimony to Congress in May, where he commented on the possibility of slowing down its bond purchase program.
Europe finally seems to be showing signs of improvement as well. Confidence is returning, deals are picking up, supply-side reforms are beginning to take effect, and Gross Domestic Product (GDP), while still shrinking, is shrinking more slowly. The Flash Eurozone Composite Purchasing Managers’ Index (PMI) moved back above 50 in July (a figure above 50 indicates expansion in activity) while German and French PMI releases were also upbeat. In the UK there is firm evidence of an improvement in the economy, with the second quarter GDP up 0.6% and construction and manufacturing boosting Britain’s recovery prospects.
In Japan, the latest quarterly Tankan report revealed that business confidence moved into positive territory for the first time since September 2011. The government upgraded its economic outlook for the third straight month while consumer prices rose in June for the first time in over a year. Additionally, first quarter economic growth was revised from 3.5% to a much stronger 4.1% (annualized), beating expectations and raising hopes that the economy may see a recovery.
In the face of all this positive news, emerging markets have suffered from significant capital outflows. Growth expectations for the region have been falling, possibly due to weak demand from developed economies, lower commodity prices, and Chinese policymakers favoring stability over near-term growth as they try to rebalance their economy. China’s manufacturing sector weakened in June in the latest indication that the slowdown in growth has deepened.
Looking forward, we believe the current global environment offers significant potential rewards for long-term investors. We are encouraged by the signs of economic recovery in Europe, Japan and the US. The risk/reward ratio offered by European companies appears particularly attractive, especially as signs of recovery increase and Europe remains cheap on a relative basis compared to other major developed markets. In Asia and emerging markets we believe that volatility and nervousness will continue, but we also believe that the sheer breadth of these markets will continue to generate investment opportunities for us.
We are pleased to report that we launched two new Funds in the past year: the Henderson Dividend & Income Builder Fund (HDAVX, HDCVX, HDIVX) on August 1, 2012, and the Henderson High Yield Opportunities Fund (HYOAX, HYOCX, HYOIX) on April 30, 2013. The Dividend & Income Builder Fund is a global diversified portfolio of income-producing securities with a focus on growth, seeking high and rising dividends as well as capital appreciation. The High Yield Opportunities Fund offers exposure to US and international high yielding securities representing Portfolio Manager Kevin Loome’s “best ideas.”
These Funds are key additions to the Henderson Global Funds family as we seek to provide you with further options to diversify your portfolios with Funds that we believe are truly differentiated from the competition. We appreciate your trust in, and support of, our Funds, and we look forward to serving your financial needs in the years to come.
James G. O’Brien
President, Henderson Global Funds
Investors should consider the investment objectives, risks, charges and expenses of a mutual fund carefully before investing. For a free Prospectus, which contains this and other important information about the Funds, visit www.hendersonglobalinvestors.com. The Prospectus should be read carefully before investing.
1
| Henderson Global Funds | Commentary |
Henderson All Asset Fund
All Asset Fund
Top 10 long-term holdings*
(at July 31, 2013)
| | | | As a percentage |
| Security | | | of net assets |
| PIMCO Enhanced | | | | |
| Short Maturity ETF | | | 5.1 | % |
| PIMCO Total Return ETF | | | 4.5 | |
| Vanguard Dividend | | | | |
| Appreciation ETF | | | 3.5 | |
| Legg Mason BW Global | | | | |
| Opportunities Bond Fund | | | 3.4 | |
| SPDR S&P 500 ETF Trust | | | 3.4 | |
| iShares MSCI EAFE | | | | |
| Minimum Volatility | | | | |
| Index Fund | | | 2.8 | |
| iShares iBoxx Investment | | | | |
| Grade Corporate | | | | |
| Bond Fund | | | 2.7 | |
| iShares MSCI Pacific | | | | |
| ex-Japan Index Fund | | | 2.6 | |
| iShares High Dividend | | | | |
| Equity Fund | | | 2.5 | |
| iShares MSCI USA Minimum | | | | |
| Volatility Index Fund | | | 2.4 | |
The tremendous rally in markets since summer 2012 – undeniably led by the European Central Bank’s pledge to preserve the Euro and the move towards potentially unlimited quantitative easing as in the US – appears to be grinding to a halt. Economists had been widely predicting a raft of soft data globally into the second quarter of this year, but instead macroeconomic releases have generally been brighter than anticipated, particularly in the US. But the prospect of the return to a more normal environment, one in which policy begins to take a back-seat to growth, has not been well-received by markets addicted to stimulus. The US Federal Reserve has been talking in more definitive terms about an exit strategy from unconventional monetary policy. At its meeting in June it said that it could begin tapering its asset purchases later this year and potentially end them by mid-2014. Volatility returned to markets globally during what became a broad sell-off that has encompassed both equities and bonds. The withdrawal of US ‘easy money’ is something that the world fears – not simply because of the risk of a policy error, but because a return to fundamental-based investing will have to occur if it does work – something that could greatly affect areas of the capital market that have seen substantial inflows, such as emerging market debt. The pace of economic recovery will be inconsistent across economies globally, so greater care will have to be taken with asset allocation decisions.
For the year ended July 31, 2013 the Fund returned 7.05% (Class A at NAV) versus the benchmark, 3-month LIBOR USD, which posted a return of 0.36%. While European equities continued to struggle on poor economic news from the region, both the US and Japan pulled ahead. Within this environment, the Fund’s allocation to bonds as well as to US and Japanese equities was beneficial to performance. It was a changeable environment and as bond yields began to rise, bonds (government in particular) began to detract from performance.
The Fund’s allocation shifted from favoring fixed income, heavy cash, and a defensively positioned portfolio to one that reflects our views of a slightly more optimistic macro environment. The asset allocation of the Fund at the end of the period is equities neutral (preferring Japan and US, neutral UK and cautious on Europe, Asia and emerging markets), fixed income underweight (high levels of cash, underweight duration and long short-maturity ETFs), and a small allocation to gold.
Risk appetite at the end of the reporting period returned after central banks reassured investors that they would continue to keep monetary policy loose until the economy is firmly on an upward trajectory. Economic data in developed markets (US, Japan and recently in Europe) has been improving and this may lead to central banks beginning to withdraw support towards the end of the year. Major policy changes by the Chinese authorities seem unlikely unless we see a significant slowdown in economic growth. We remain constructive on equities and believe there may be a pick-up in growth led by developed economies during the second half of the year.
* For further detail about these holdings, please refer to the section entitled “Portfolios of investments.” Fund holdings are as of the date given, are subject to change at any time, and are not recommendations to buy or sell any security.
2
| Henderson Global Funds | Performance summary |
Henderson All Asset Fund
| Portfolio composition by country | | Portfolio composition by sector |
| (as a % of long-term investments) | | (as a % of long-term investments) |
| | | |
| | |
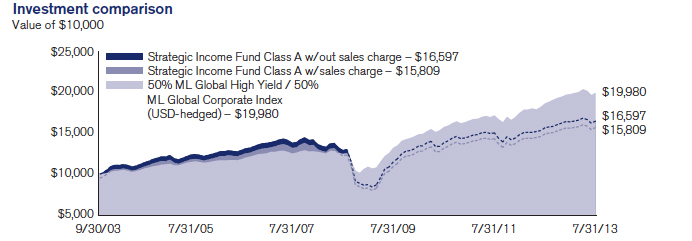
Investment comparison
Value of $10,000
Total returns as of July 31, 2013
| | | NASDAQ | | One | Since inception |
| At NAV | | symbol | | year | (3/30/2012)* |
| Class A | | HGAAX | | 7.05 | % | 4.67 | % |
| Class C | | HGACX | | 6.28 | | 3.95 | |
| Class I | | HGAIX | | 7.28 | | 4.91 | |
| With sales charge | | | | | | | |
| Class A | | | | 0.86 | % | 0.14 | % |
| Class C | | | | 6.28 | | 3.95 | |
| Index | | | | | | | |
| 3-month LIBOR USD | | | | 0.36 | % | 0.39 | % |
| MSCI World Index | | | | 23.96 | | 14.24 | |
* Average annual return.
Performance data quoted represents past performance and is no guarantee of future results. Performance results with sales charges reflect the deduction of the maximum front-end sales charge or the deduction of the applicable contingent deferred sales charge (“CDSC”). Class A shares are subject to a maximum front-end sales charge of 5.75%. Class C shares are subject to a CDSC of up to 1% on certain redemptions made within 12 months of purchase. Performance presented at Net Asset Value (NAV), which does not include a sales charge, would be lower if this charge were reflected. NAV is the value of one share of the Fund excluding any sales charges. Current performance may be lower or higher than the performance data quoted. Investment return and principal value will fluctuate so that an investor’s shares, when redeemed, may be worth more or less than original cost. As stated in the current prospectus, the Fund’s annual operating expense ratios (gross) for Class A, C and I shares are estimated to be 2.54%, 4.90% and 1.82%, respectively, for the Fund’s first full fiscal year. However, the Fund’s adviser has agreed to contractually waive a portion of its fees and/or reimburse expenses such that total ordinary operating expenses do not exceed 0.85%, 1.60% and 0.60% for Class A, C and I shares, respectively, which is in effect until July 31, 2015. With respect to investments in affiliated underlying funds, the Fund’s adviser has contractually agreed to reduce or waive the Fund’s management fee to limit the combined management fees paid to the adviser for those assets to the greater of 1.00% or the affiliated underlying fund’s management fee. Indirect net expenses associated with the Fund’s investments in underlying investment companies are not subject to the contractual waiver. For the most recent month-end performance, please call 1.866.443.6337 or visit the Funds’ website at www.hendersonglobalinvestors.com.
Performance results also reflect expense subsidies and waivers in effect during periods shown. Absent these waivers, results would have been less favorable. All results assume the reinvestment of dividends and capital gains.
The investment comparison graph above reflects the change in value of a $10,000 hypothetical investment since the Fund’s inception, including reinvested dividends and distributions, compared to a broad based securities market index. The MSCI World Index is a free float-adjusted market capitalization weighted index that is designed to measure the equity market performance of developed markets. 3-Month LIBOR (London Interbank Offered Rate) USD is the interest rate participating banks offer to other banks for loans on the London market. The Fund is professionally managed while the Index is unmanaged and not available for investment and does not include fees, expenses or other costs. Results in the table and graph do not reflect the deduction of taxes that a shareholder would pay on Fund distributions or the redemption of Fund shares.
3
| Henderson Global Funds | Commentary |
Dividend & Income Builder Fund
Dividend & Income Builder Fund
Top 10 long-term holdings*
(at July 31, 2013)
| | | | As a percentage |
| Security | | | of net assets |
| HSBC Holdings plc | | | 2.1 | % |
| Lloyds Banking Group plc | | | 2.1 | |
| Prudential plc | | | 1.9 | |
| Novartis AG | | | 1.8 | |
| Nestle S.A. | | | 1.7 | |
| BT Group plc | | | 1.7 | |
| Deutsche Post AG | | | 1.7 | |
| Walgreen Co. | | | 1.6 | |
| Roche Holding AG | | | 1.6 | |
| JPMorgan Chase & Co. | | | 1.6 | |
Global equity markets rose strongly over the reporting period, as supportive monetary policy measures from both the European Central Bank and the US Federal Reserve buoyed investor confidence in the sustainability of a global economic recovery.
While developed market equities, particularly the US and Japan, made strong gains, emerging market equities and fixed income performance was mixed. As economic data from the US showed further signs of improvement, US long bond yields began to steepen from a trough of 1.4% in July 2012 to over 2.5% by the end of the reporting period, a move which was accelerated by statements from the Federal Reserve that they will being scaling back on quantitative easing by the end of 2013. In this environment of sharply rising yields, fixed income, particularly in emerging markets, underperformed as investors feared that the yield compression that had taken place due to excess global liquidity would be unwound. In this environment, the Fund’s performance benefitted from its overweight position in developed markets, and its low weight in fixed income.
Since the Fund’s inception on August 1, 2012, for the period ended July 31, 2013, the Fund returned 16.79% (Class A at NAV) versus the benchmark, MSCI World Index, which posted a return of 24.19%. The Fund successfully met its income objectives over the period. Relative underperformance was largely driven by the Fund’s underweight position in the US and Japan, both of which are lower yielding markets.
At the stock level, amongst the best performers during the year was Swiss pharmaceutical company Roche, which generated strong sales from its existing portfolio of primarily oncological products, as well as successful late stage pipeline results. Another strong performer during the year was Kansas City Southern, a railroad operator between the US and Mexico, which benefitted from growing cross-border trade.
In the equity allocation the Fund continues to seek companies with above-average yield and dividend growth potential. Sectors we have added to over the year include Technology, where we believe sustainable cash generation and already strong balance sheets will lead to increased shareholder returns via dividends in future. Microsoft is held in the Fund and is an example of a large technology company that has the ability to generate very healthy returns on capital and cash. We continue to have a low weighting in the Energy sector, where high capital expenditure requirements in order to maintain an adequate reserve base will put pressure on dividend increases in the future.
Toward the end of the period the Fund increased its allocation to fixed income from 15% to 20%. Within fixed income, the newly allocated funds went into holdings focused on large reliable and predominately non-cyclical businesses. The fixed income sub-portfolio’s duration remains on the shorter end at three to four years.
Second quarter 2013 company earnings reports have been very encouraging and we are seeing signs that sales and earnings growth are filtering through into strong dividend increases for shareholders. Nielsen Holdings for example, a global information services provider, recently announced a 25% increase to their quarterly dividend as they have become more comfortable with their leverage position and continue to generate sustainable cash flow.
* For further detail about these holdings, please refer to the section entitled “Portfolios of investments.” Fund holdings are as of the date given, are subject to change at any time, and are not recommendations to buy or sell any security.
4
| Henderson Global Funds | Performance summary |
Dividend & Income Builder Fund
| Portfolio composition by country | | Portfolio composition by sector |
| (as a % of long-term investments) | | (as a % of long-term investments) |
| | | |
| | |
Investment comparison
Value of $10,000
Total returns as of July 31, 2013
| | | | | Since |
| | | NASDAQ | | inception |
| At NAV | | symbol | | (8/1/2012) |
| Class A | | HDAVX | | 16.79 | % |
| Class C | | HDCVX | | 15.94 | |
| Class I | | HDIVX | | 17.01 | |
| With sales charge | | | | | |
| Class A | | | | 10.91 | % |
| Class C | | | | 15.94 | |
| Index | | | | | |
| MSCI World Index | | | | 24.19 | % |
Performance data quoted represents past performance and is no guarantee of future results. Performance results with sales charges reflect the deduction of the maximum front-end sales charge or the deduction of the applicable contingent deferred sales charge (“CDSC”). Class A shares are subject to a maximum front-end sales charge of 5.00%. Class C shares are subject to a CDSC of up to 1% on certain redemptions made within 12 months of purchase. Performance presented at Net Asset Value (NAV), which does not include a sales charge, would be lower if this charge were reflected. NAV is the value of one share of the Fund excluding any sales charges. Current performance may be lower or higher than the performance data quoted. Investment return and principal value will fluctuate so that an investor’s shares, when redeemed, may be worth more or less than original cost. As stated in the current prospectus, the Fund’s annual operating expense ratios (gross) for Class A, C and I shares are estimated to be 1.73%, 2.48% and 1.48%, respectively, for the Fund’s first full fiscal year. However, the Fund’s adviser has agreed to contractually waive a portion of its fees and/or reimburse expenses such that total ordinary operating expenses do not exceed 1.30%, 2.05% and 1.05% for Class A, C and I shares, respectively, which is in effect until July 31, 2015. For the most recent month-end performance, please call 1.866.443.6337 or visit the Funds’ website at www.hendersonglobalinvestors.com.
Performance results also reflect expense subsidies and waivers in effect during periods shown. Absent these waivers, results would have been less favorable. All results assume the reinvestment of dividends and capital gains.
The investment comparison graph above reflects the change in value of a $10,000 hypothetical investment since the Fund’s inception, including reinvested dividends and distributions, compared to a broad based securities market index. The MSCI World Index is a free float-adjusted market capitalization weighted index that is designed to measure the equity market performance of developed markets.
The Fund is professionally managed while the Index is unmanaged and not available for investment and does not include fees, expenses or other costs. Results in the table and graph do not reflect the deduction of taxes that a shareholder would pay on Fund distributions or the redemption of Fund shares.
5
| Henderson Global Funds | Commentary |
Emerging Markets Opportunities Fund
Emerging Markets Opportunities Fund
Top 10 long-term holdings*
(at July 31, 2013)
| | | | As a percentage |
| Security | | | of net assets |
| Samsung Electronics | | | | |
| Co., Ltd. | | | 3.7 | % |
| Chinatrust Financial | | | | |
| Holding Co., Ltd. | | | 3.0 | |
| Samsonite | | | | |
| International S.A. | | | 2.9 | |
| SK Telecom Co., Ltd. | | | 2.9 | |
| Baidu, Inc., ADR | | | 2.9 | |
| AIA Group, Ltd. | | | 2.8 | |
| Hyundai Motor Co. | | | 2.8 | |
| Kasikornbank pcl | | | 2.8 | |
| SJM Holdings, Ltd. | | | 2.7 | |
| Yum! Brands, Inc. | | | 2.7 | |
Since 2010, emerging markets equities have underperformed developed markets equities. Where the emerging markets in general had been reporting very strong economic data, they now have been running into a host of issues that has taken some of the shine off the asset class. China has shown clear signs of slowing down and we believe that is likely to continue as they make the change from an export-driven economy supported by government projects with explosive growth to a domestic consumer-based economy with a more realistic level of growth. The reverberations of this slowing growth will run through the whole emerging markets supply chain by affecting rates of growth in places like Brazil as a result of less commodity demand from China. Other current issues hitting the emerging markets include inflation rates higher than central banks would like and a reoccurrence of current account deficits for certain countries.
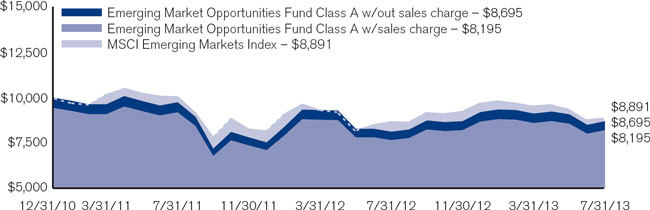
For the year ended July 31, 2013, the Fund returned 7.16% (Class A at NAV) versus the benchmark, MSCI Emerging Markets Index, which posted a return of 2.29%. Strong stock selection in Asia and Latin America contributed to the Fund’s outperformance. In Asia, consumer led shares in Sands China (Macanese casino), Prada (Hong Kong traded luxury retailer), and GT Capital (Philippine bank) made gains. By avoiding large commodity related names, such as Petrobras (Brazil), as well as overweighting Mexico and extending into small companies such as Copa Airlines (Panama) and Alsea (Mexico) the Latin America sub-portfolio strongly outperformed its regional benchmark. The EMEA (Emerging Europe, Middle East and Africa) sub-portfolio provided mixed returns with its commodity related names such as African Petroleum, Sable Mining, Cape Lambert Resources and RusPetro all declined on a reduction of risk appetite in the region, but the best contributors, NMC Health Care and EuroCash, helped to balance the resource allocation performance.
In Asia the Fund continues to have a strong bias to shares focused on the growth and strength of the Asian domestic consumer. In Latin America the Fund found new opportunities in the high growth markets of Peru and Panama. In the EMEA sub-portfolio, the Fund changed it bias from a strong overweight to resources to a mix of consumer-focused shares, including Health Care, Transportation and Consumer Staples. At the end of the period the Fund is even-weighted to Asia, overweight to EMEA and underweight to Latin America.
The economic outlook for the emerging markets continues to look challenging as commodities and government spending have fueled their growth over the last decade and is now under pressure. The emerging markets are making the slow shift to a more consumer-driven economic model and this is where we believe global growth will come in the long term, however in the short term prices will largely be dictated by policymakers’ intervention on inflation in Brazil, rising bond yields in the US causing volatility in Asia and a slowing China leading to less hard asset market demand across the emerging markets bloc. We believe active stock selection will be crucial in such an environment. While valuations are now looking relatively attractive in the emerging markets, we remain cautious and continue to focus on the areas that offer true medium term potential. We suspect that there will be better buying opportunities in broad emerging markets equities in the future.
* For further detail about these holdings, please refer to the section entitled “Portfolios of investments.” Fund holdings are as of the date given, are subject to change at any time, and are not recommendations to buy or sell any security.
6
| Henderson Global Funds | Performance summary |
Emerging Markets Opportunities Fund
| Portfolio composition by country | | Portfolio composition by sector |
| (as a % of long-term investments) | | (as a % of long-term investments) |
| | | |
| | |
Investment comparison
Value of $10,000
Total returns as of July 31, 2013
| | | | | | | Since |
| | | NASDAQ | | One | inception |
| At NAV | | symbol | | year | (12/31/2010)* |
| Class A | | HEMAX | | 7.16 | % | -5.27 | % |
| Class C | | HEMCX | | 6.33 | | -5.97 | |
| Class I | | HEMIX | | 7.25 | | -5.06 | |
| With sales charge | | | | | | | |
| Class A | | | | 0.95 | % | -7.42 | % |
| Class C | | | | 6.33 | | -5.97 | |
| Index | | | | | | | |
| MSCI Emerging Markets Index | | | | 2.29 | % | -4.45 | % |
* Average annual return.
Performance data quoted represents past performance and is no guarantee of future results. Due to the Fund’s relatively small asset base, performance may be impacted by IPOs to a greater degree than it may be in the future. IPO investments are not an integral component of the Fund’s investment process and may not be utilized to the same extent in the future. Performance results with sales charges reflect the deduction of the maximum front-end sales charge or the deduction of the applicable contingent deferred sales charge (“CDSC”). Class A shares are subject to a maximum front-end sales charge of 5.75%. Class C shares are subject to a CDSC of up to 1% on certain redemptions made within 12 months of purchase. Performance presented at Net Asset Value (NAV), which does not include a sales charge, would be lower if this charge were reflected. NAV is the value of one share of the Fund excluding any sales charges. Current performance may be lower or higher than the performance data quoted. Investment return and principal value will fluctuate so that an investor’s shares, when redeemed, may be worth more or less than original cost. As stated in the current prospectus, the Fund’s annual operating expense ratios (gross) for Class A, C and I shares are estimated to be 2.52%, 3.24% and 2.17%, respectively. However, the Fund’s adviser has agreed to contractually waive a portion of its fees and/or reimburse expenses such that total ordinary operating expenses do not exceed 1.79%, 2.54% and 1.54% for Class A, C and I shares, respectively, which is in effect until July 31, 2015. For the most recent month-end performance, please call 1.866.443.6337 or visit the Funds’ website at www.hendersonglobalinvestors.com.
Performance results also reflect expense subsidies and waivers in effect during periods shown. Absent these waivers, results would have been less favorable. All results assume the reinvestment of dividends and capital gains.
The investment comparison graph above reflects the change in value of a $10,000 hypothetical investment since the Fund’s inception, including reinvested dividends and distributions, compared to a broad based securities market index. The MSCI Emerging Markets Index is a free float-adjusted market capitalization weighted index that is designed to measure the equity market performance of emerging markets. The Fund is professionally managed while the Index is unmanaged and not available for investment and does not include fees, expenses or other costs. Results in the table and graph do not reflect the deduction of taxes that a shareholder would pay on Fund distributions or the redemption of Fund shares.
7
| Henderson Global Funds | | Commentary |
European Focus Fund
European Focus Fund
Top 10 long-term holdings*
(at July 31, 2013)
| | | | As a percentage of net assets |
| Security | | |
| European Aeronautic | | | | |
| Defence and | | | | |
| Space Co. N.V. | | | 4.6 | % |
| Investment AB | | | | |
| Kinnevik, B Shares | | | 4.3 | |
| Accor S.A. | | | 3.1 | |
| Continental AG | | | 3.0 | |
| Lloyds Banking Group plc | | | 2.9 | |
| Kingfisher plc | | | 2.8 | |
| Zhaikmunai LP, GDR | | | 2.8 | |
| KION Group AG | | | 2.8 | |
| International | | | | |
| Consolidated Airlines | | | | |
| Group S.A. | | | 2.7 | |
| Vodafone Group plc | | | 2.6 | |
European markets were very challenging early in the reporting period as investor attention was focused on the need for political action to resolve sovereign debt problems, combined with softening macroeconomic data from China and the US. Markets rose strongly during the latter part of 2012 following a significant reduction in European tail-risk, mainly on the back of European Central Bank action and easing global monetary policy. After a positive start to 2013, European markets finished the first quarter nervously; companies announced full year 2012 results broadly in line with market expectations, however most expressed caution about the outlook for the first half of 2013. The following period saw markets rally strongly, however they were interrupted in June as the US Federal Reserve confirmed its intentions to begin tapering its quantitative easing program later this year and over the significant shift in sentiment toward emerging markets.
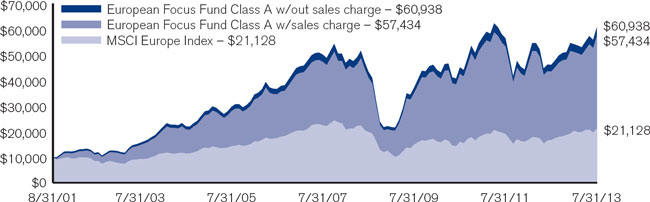
For the year ended July 31, 2013 the Fund returned 32.19% (Class A at NAV) versus the benchmark, MSCI Europe Index, which posted a return of 26.94%. Although the overweight exposure to the Energy sector and stock selection in Materials weighed on performance, this was successfully overcome by the overweight to the Consumer Discretionary sector as stocks such as Sky Deutschland, Renault and Continental performed strongly. In addition, strong performance from a number of the Financials, Consumer Staples and IT positions bolstered returns, such as Lloyds Banking, Investment AB Kinnevik, Svenska Cellulosa and Amadeus Information Technology Holding. African Petroleum was the biggest detractor to performance. The stock initially sold off on little volume and limited news flow but was then severely impacted due to lower than expected reservoir permeability at its Bee Eater-1 Well in offshore Liberia. RusPetro also had a poor run after suffering operational delays surrounding oil extraction as well as a tight funding situation.
New additions to the portfolio have generally been in laggard stocks which have their own ‘special situation’ dynamics. Those additions include hotel chain operator, Accor, shipping conglomerate, AP Moller-Maersk and Spanish utility company, Red Electrica. Shareholder angst created an attractive entry point to Accor which is under new management and is moving from asset-light by way of an expansionary three year strategy. In our view, the market was overly negative to AP Moller-Maersk; management is intent on improving returns to shareholders and the underlying value of the business. Red Electrica was bought in expectation that they would benefit from an on-going regulatory review by the government.
Europe remains cheap on a relative basis compared to other major developed markets. Over the mid to longer term, as member states work out their differences and as the world economy moves forward, the depressed ratings afforded to companies domiciled in the Eurozone should abate. In the meantime, for the forward-looking investor, the risk/reward ratio offered by these stocks appears attractive. Although an emerging markets slowdown rightfully caused nervousness, we remain encouraged about European equity returns going forward. Bond investors have started to feel the pain of rising yields, which will likely prompt capital allocators to look at equities once again. Any such move would be disproportionately helpful to ‘cheap’ assets such as select European stocks.
* For further detail about these holdings, please refer to the section entitled “Portfolios of investments.” Fund holdings are as of the date given, are subject to change at any time, and are not recommendations to buy or sell any security.
8
| Henderson Global Funds | Performance summary |
European Focus Fund
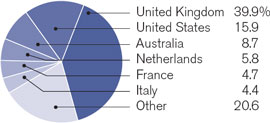
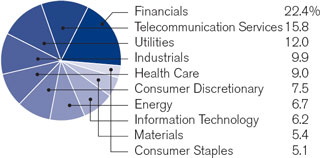
| Portfolio composition by country | | Portfolio composition by sector |
| (as a % of long-term investments) | | (as a % of long-term investments) |
| | | |
| | |
Investment comparison
Value of $10,000
Total returns as of July 31, 2013
| | | | | | | | | | | | | Since |
| | | NASDAQ | | One | Three | Five | Ten | inception |
| At NAV | | symbol | | year | years* | years* | years* | (8/31/2001)* |
| Class A | | HFEAX | | 32.19 | % | 10.53 | % | 7.01 | % | 14.64 | % | 16.38 | % |
| Class B | | HFEBX | | 31.11 | | 9.66 | | 6.18 | | 13.97 | | 15.81 | |
| Class C | | HFECX | | 31.16 | | 9.68 | | 6.19 | | 13.79 | | 15.51 | |
| Class I** | | HFEIX | | 32.60 | | 10.85 | | 7.27 | | 14.78 | | 16.50 | |
| With sales charge | | | | | | | | | | | | | |
| Class A | | | | 24.58 | % | 8.37 | % | 5.75 | % | 13.96 | % | 15.80 | % |
| Class B | | | | 27.11 | | 8.82 | | 6.03 | | 13.97 | | 15.81 | |
| Class C | | | | 31.16 | | 9.68 | | 6.19 | | 13.79 | | 15.51 | |
| Index | | | | | | | | | | | | | |
| MSCI Europe Index | | | | 26.94 | % | 9.78 | % | 1.30 | % | 8.65 | % | 6.47 | % |
* Average annual return.
** Class I (formerly Class W) shares commenced operations on March 31, 2009. The performance for Class I shares for the period prior to March 31, 2009 is based on the performance of Class A shares. Performance for Class I shares would be similar because the shares are invested in the same portfolio of securities and have the same portfolio management. Class I shares are not subject to a front-end sales charge or a distribution fee.
Performance data quoted represents past performance and is no guarantee of future results. Performance results with sales charges reflect the deduction of the maximum front-end sales charge or the deduction of the applicable contingent deferred sales charge (“CDSC”). Class A shares are subject to a maximum front-end sales charge of 5.75%. Class B shares are subject to a CDSC, which declines from 5% the 1st year to 0% at the beginning of the 7th year. Class C shares are subject to a CDSC of up to 1% on certain redemptions made within 12 months of purchase. Performance presented at Net Asset Value (NAV), which does not include a sales charge, would be lower if this charge were reflected. NAV is the value of one share of the Fund excluding any sales charges. Current performance may be lower or higher than the performance data quoted. Investment return and principal value will fluctuate so that an investor’s shares, when redeemed, may be worth more or less than original cost. As stated in the current prospectus, the Fund’s annual operating expense ratios (gross) for Class A, B, C and I shares are 1.53%, 2.36%, 2.32% and 1.21% respectively. As stated in the Statement of Additional Information (SAI), the Fund’s adviser has agreed to contractually waive a portion of its fees and/or reimburse expenses such that total ordinary operating expenses do not exceed 2.00%, 2.75%, 2.75% and 1.75% for Class A, B, C and I shares, respectively, which is in effect until July 31, 2020. For the most recent month-end performance, please call 1.866.443.6337 or visit the Funds’ website at www.hendersonglobalinvestors.com.
Performance results also reflect expense subsidies and waivers in effect during certain periods shown. Absent these waivers, results would have been less favorable for certain periods. All results assume the reinvestment of dividends and capital gains.
The investment comparison graph above reflects the change in value of a $10,000 hypothetical investment since the Fund’s inception, including reinvested dividends and distributions, compared to a broad based securities market index. The MSCI Europe Index is a free float-adjusted market capitalization weighted index that is designed to measure the equity market performance of the developed markets in Europe. The Fund is professionally managed while the Index is unmanaged and not available for investment and does not include fees, expenses or other costs. Results in the table and graph do not reflect the deduction of taxes that a shareholder would pay on Fund distributions or the redemption of Fund shares.
9
| Henderson Global Funds | Commentary |
Global Equity Income Fund
Global Equity Income Fund
Top 10 long-term holdings*
(at July 31, 2013)
| | | | As a percentage of net assets |
| Security | | |
| BT Group plc | | | 3.0 | % |
| Vodafone Group plc | | | 2.9 | |
| GlaxoSmithKline plc | | | 2.5 | |
| Delta Lloyd N.V. | | | 2.4 | |
| Pfizer, Inc. | | | 2.3 | |
| Westfield Retail Trust | | | 2.3 | |
| Merck & Co., Inc. | | | 2.1 | |
| SSE plc | | | 2.1 | |
| Deutsche Post AG | | | 2.1 | |
| Standard Chartered plc | | | 2.0 | |
Global equity markets made solid gains over the reporting period led by the US and Japan. The US market performed strongly on the back of positive economic releases though experienced volatility towards the end of the reporting period after the US Federal Reserve confirmed that it was likely to begin tapering its asset buying program later in the year. Japan experienced a similar strong rise followed by a volatile period. Investors were encouraged by structural reforms (“Abe-nomics”) to generate growth; as a result Japanese equities rallied strongly but then pulled back sharply to a less exuberant, more sustainable level.
Elsewhere, the data coming from Europe has been improving and despite a rally over the last year, European shares remain relatively inexpensive. Company earnings reports from the region have largely been positive, adding to a return of risk appetite amongst investors. Emerging markets equities have struggled, underperforming the developed world markedly on the back of a strong US dollar and the possibility of rising interest rates. China was a particular source of concern as fears grew that a reduction in infrastructure spending would lead to a sharper than anticipated slowdown in economic growth.
For the year ended July 31, 2013, the Fund returned 18.58% (Class A at NAV) versus the benchmark, MSCI World Index, which posted a return of 23.96%. The Fund also continued to meet its high income objectives over the period. The Fund’s structural underweight to the US and Japan, both of which are lower yielding markets, as well as the low beta bias, led to relative underperformance versus the broader market’s rally. Amongst the best performing sectors during the year was Insurance. Life insurers such as Delta Lloyd, AXA and Standard Life were amongst the top contributors to performance, as improved capital positions and a bottoming of bond yields (reducing their long duration liabilities) led to improved confidence in the sustainability of earnings.
At the stock level, amongst the top performers was global pharmaceutical company Pfizer, which benefitted from further rationalization to its portfolio (such as beginning the spin-off of animal health company Zoetis), as well as successful new drug launches. Another top performer was aerospace company BAE, which outperformed strongly towards the end of the period as confidence increased that US “sequestration” would have less of an effect on sales and earnings growth than originally feared.
Following an improved economic forecast, inexpensive valuations and healthy dividend increases allowed the Fund to extend its allocation to Europe. The Fund subsequently reduced its allocation to the US as valuations in some sectors have been getting stretched. On a sector basis the Fund has been reducing its Consumer Staples exposure and adding to Technology companies, including Microsoft and Cisco Systems. Also for the first time in a number of years the Fund has increased its Financials weighting (such as HSBC) as we are seeing better valuations and the possibility of re-ratings.
While there will likely be some uncertainties surrounding the timing of quantitative easing being withdrawn in the US, we see the steepening of bond yields as an encouraging sign that the US economy is returning to sustained economic growth. In this environment we remain confident in the ability of companies held within the portfolio to generate sales and earnings growth in the year ahead.
* For further detail about these holdings, please refer to the section entitled “Portfolios of investments.” Fund holdings are as of the date given, are subject to change at any time, and are not recommendations to buy or sell any security.
10
| Henderson Global Funds | Performance summary |
Global Equity Income Fund
| Portfolio composition by country | | Portfolio composition by sector |
| (as a % of long-term investments) | | (as a % of long-term investments) |
| | | |
| | |
Investment comparison
Value of $10,000
Total returns as of July 31, 2013
| | | | | | | | | | | Since |
| | | NASDAQ | | One | Three | Five | inception |
| At NAV | | symbol | | year | years* | years* | (11/30/06)* |
| Class A | | HFQAX | | 18.58 | % | 11.19 | % | 4.83 | % | 3.54 | % |
| Class C | | HFQCX | | 17.65 | | 10.37 | | 4.04 | | 2.76 | |
| Class I** | | HFQIX | | 18.87 | | 11.53 | | 5.08 | | 3.73 | |
| With sales charge | | | | | | | | | | | |
| Class A | | | | 11.77 | % | 9.00 | % | 3.60 | % | 2.63 | % |
| Class C | | | | 17.65 | | 10.37 | | 4.04 | | 2.76 | |
| Index | | | | | | | | | | | |
| MSCI World Index | | | | 23.96 | % | 13.34 | % | 4.88 | % | 3.31 | % |
| MSCI World High Dividend Yield Index | | | | 19.67 | | 14.53 | | 5.73 | | 3.11 | |
* Average annual return
** Class I (formerly Class W) shares commenced operations on March 31, 2009. The performance for Class I shares for the period prior to March 31, 2009 is based on the performance of Class A shares. Performance for Class I shares would be similar because the shares are invested in the same portfolio of securities and have the same portfolio management. Class I shares are not subject to a front-end sales charge or a distribution fee.
Performance data quoted represents past performance and is no guarantee of future results. Performance results with sales charges reflect the deduction of the maximum front-end sales charge or the deduction of the applicable contingent deferred sales charge (“CDSC”). Class A shares are subject to a maximum front-end sales charge of 5.75%. Class C shares are subject to a CDSC of up to 1% on certain redemptions made within 12 months of purchase. Performance presented at Net Asset Value (NAV), which does not include a sales charge, would be lower if this charge were reflected. NAV is the value of one share of the Fund excluding any sales charges. Current performance may be lower or higher than the performance data quoted. Investment return and principal value will fluctuate so that an investor’s shares, when redeemed, may be worth more or less than original cost. As stated in the current prospectus, the Fund’s annual operating expense ratios (gross) for Class A, C and I shares are 1.29%, 2.05% and 1.01%, respectively. As stated in the Statement of Additional Information (SAI), the Fund’s adviser has agreed to contractually waive a portion of its fees and/or reimburse expenses such that total ordinary operating expenses do not exceed 1.40%, 2.15% and 1.15% for Class A, C and I shares, respectively, which is in effect until July 31, 2020. For the most recent month-end performance, please call 1.866.443.6337 or visit the Funds’ website at www.hendersonglobalinvestors.com.
Performance results also reflect expense subsidies and waivers in effect during certain periods shown. Absent these waivers during those periods, results would have been less favorable. All results assume the reinvestment of dividends and capital gains.
The investment comparison graph above reflects the change in value of a $10,000 hypothetical investment since the Fund’s inception, including reinvested dividends and distributions, compared to a broad based securities market index. The MSCI World Index is a free float-adjusted market capitalization weighted index that is designed to measure the equity market performance of developed markets. The MSCI World High Dividend Yield Index aims to objectively reflect the high dividend yield opportunity set within select MSCI World Index. The Fund is professionally managed while the Indices are unmanaged and not available for investment and do not include fees, expenses or other costs. Results in the table and graph do not reflect the deduction of taxes that a shareholder would pay on Fund distributions or the redemption of Fund shares.
11
| Henderson Global Funds | | Commentary |
Global Technology Fund
Global Technology Fund
Top 10 long-term holdings*
(at July 31, 2013)
| | | | As a percentage of net assets |
| Security | | |
| Cisco Systems, Inc. | | | 3.8 | % |
| ASML Holding N.V. | | | 3.5 | |
| QUALCOMM, Inc. | | | 3.4 | |
| Cognizant Technology | | | | |
| Solutions Corp. | | | 3.4 | |
| MasterCard, Inc., Class A | | | 3.2 | |
| Apple, Inc. | | | 3.2 | |
| Samsung Electronics | | | | |
| Co., Ltd. | | | 3.2 | |
| Priceline.com, Inc. | | | 2.9 | |
| Western Digital Corp. | | | 2.3 | |
| TripAdvisor, Inc. | | | 2.0 | |
After an initial period of nervousness, global equities performed strongly in the second half of 2012, aided by accommodative monetary policies enforced by the world’s central banks. Markets began 2013 brightly, with the S&P 500 posting its best January in a decade. The Technology sector underperformed the wider market as the declining performance of Apple, in particular, significantly affected indices and overall sentiment. Likewise, the relative underperformance in growth-orientated sectors, such as Technology, was partly attributable to what we believe was yield seeking investors purchasing high dividend parts of the equity market as a substitute for bonds.
For the year ended July 31, 2013 the Fund returned 17.93% (Class A at NAV) versus the benchmark, MSCI AC IT World Index, which posted a return of 13.69%. The underweight to the Computers and Peripherals sector was the largest positive contributor to relative outperformance. Stock selection within the Internet and Catalog Retail sector was also a significant contributor. Stock selection within the Software and Electronic Equipment Instruments & Components sectors were the largest detractors from performance. At the stock level, positive contributions came from the underweight in Apple relative to the index, which, at writing stands at approximately 5% versus 10%. The positions in social media companies Facebook and LinkedIn (purchased at low valuations) performed well and were sold after hitting our valuation targets. Online travel research company, TripAdvisor, surged to a record high driven by increasing confidence in their growth trends. OpenTable, the online restaurant reservation site, also performed strongly. Elsewhere, ASML, the Netherlands-based semiconductor equipment manufacturer, performed well as it benefitted from its leadership in the lithography equipment market. Google, which the Fund is underweight, was the largest detractor from relative performance. There were a few disappointments as some earnings fell short of market expectations, including: Verifone, which missed its second quarter profit estimates after suffering execution issues; F5 Networks, due to telecommunications spending being reined in and issues in their product transition; and VMWare, as slowing server virtualization affected their business.
Notable trading activity over the period included sales of Verifone, following its profit warning, and the Chinese internet company, Tencent Holdings, following concerns over margin trends. Fusion-IO was exited as the company’s outlook for first quarter revenues dropped significantly from last year’s fourth quarter. Symantec was purchased in the belief that the company can improve its operating margins through refocusing its product mix, reducing headcount and streamlining its sales teams. The position in ASML was further built out as we became increasingly confident in its competitive position.
While near-term direction will be sensitive to macroeconomic conditions, we believe the fundamental backdrop for Technology equities looks very attractive. Valuation levels look extremely compelling from both an absolute and relative basis: balance sheets are very healthy, cash generation is solid and demand has the potential to recover from below-trend levels. The overall bias of the Fund toward companies with strong barriers to entry should cushion the portfolio from macroeconomic volatility and the valuation-aware process focuses on underappreciated areas of secular growth that offer the potential for strong returns over the long-term. The Fund remains biased to our preferred themes of E-Commerce, Online Advertising, Data Growth, Connectivity and Paperless Payment.
* For further detail about these holdings, please refer to the section entitled “Portfolios of investments.” Fund holdings are as of the date given, are subject to change at any time, and are not recommendations to buy or sell any security.
12
| Henderson Global Funds | Performance summary |
Global Technology Fund
| Portfolio composition by country | | Portfolio composition by sector |
| (as a % of long-term investments) | | (as a % of long-term investments) |
| | | |
| | |
Investment comparison
Value of $10,000
| | | | | | | | | | | | | Since |
| | | NASDAQ | | One | Three | Five | Ten | inception |
| At NAV | | symbol | | year | years* | years* | years* | (8/31/01)* |
| Class A | | HFGAX | | 17.93 | % | 12.98 | % | 10.84 | % | 10.19 | % | 8.17 | % |
| Class B | | HFGBX | | 16.94 | | 12.08 | | 9.97 | | 9.52 | | 7.67 | |
| Class C | | HFGCX | | 16.97 | | 12.13 | | 9.99 | | 9.36 | | 7.38 | |
| Class I** | | HFGIX | | 18.21 | | 13.29 | | 11.11 | | 10.32 | | 8.28 | |
| With sales charge | | | | | | | | | | | | | |
| Class A | | | | 11.15 | % | 10.78 | % | 9.53 | % | 9.54 | % | 7.64 | % |
| Class B | | | | 12.94 | | 11.28 | | 9.83 | | 9.52 | | 7.67 | |
| Class C | | | | 16.97 | | 12.13 | | 9.99 | | 9.36 | | 7.38 | |
| Index | | | | | | | | | | | | | |
| MSCI AC World IT Index | | | | 13.69 | % | 11.90 | % | 6.71 | % | 6.91 | % | 4.46 | % |
| S&P 500 | | | | 25.00 | | 17.72 | | 8.26 | | 7.64 | | 5.45 | |
* Average annual return.
** Class I (formerly Class W) shares commenced operations on March 31, 2009. The performance for Class I shares for the period prior to March 31, 2009 is based on the performance of Class A shares. Performance for Class I shares would be similar because the shares are invested in the same portfolio of securities and have the same portfolio management. Class I shares are not subject to a front-end sales charge or a distribution fee.
Performance data quoted represents past performance and is no guarantee of future results. Performance results with sales charges reflect the deduction of the maximum front-end sales charge or the deduction of the applicable contingent deferred sales charge (“CDSC”). Class A shares are subject to a maximum front-end sales charge of 5.75%. Class B shares are subject to a CDSC which declines from 5% the 1st year to 0% at the beginning of hte 7th year. Class C shares are subject to a CDSC of up to 1% on certain redemptions made within 12 months of purchase. Performance presented at Net Asset Value (NAV), which does not include a sales charge, would be lower if this charge were reflected. NAV is the value of one share of the Fund excluding any sales charges. Current performance may be lower or higher than the performance data quoted. Investment return and principal value will fluctuate so that an investor’s shares, when redeemed, may be worth more or less than original cost. As stated in the current prospectus, the Fund’s annual operating expense ratios (gross) for Class A, B, C and I shares are 1.50%, 2.36%, 2.29% and 1.23%, respectively. As stated in the Statement of Additional Information (SAI), the Fund’s adviser has agreed to contractually waive a portion of its fees and/or reimburse expenses such that total ordinary operating expenses do not exceed 2.00%, 2.75%, 2.75% and 1.75% for Class A, B, C and I shares, respectively, which is in effect until July 31, 2020. For the most recent month-end performance, please call 1.866.443.6337 or visit the Funds’ website at www.hendersonglobalinvestors.com.
Performance results also reflect expense subsidies and waivers in effect during certain periods shown. Absent these waivers, results would have been less favorable for certain periods. All results assume the reinvestment of dividends and capital gains.
The investment comparison graph above reflects the change in value of a $10,000 hypothetical investment since the Fund’s inception, including reinvested dividends and distributions, compared to a broad based securities market index and an industry focused index. The MSCI AC World IT Index is a free float adjusted market capitalization weighted index designed to measure the equity market performance of the Information Technology stocks within the MSCI AC World Index. The S&P 500 Index is a broad based measurement of changes in stock market conditions based on the average of 500 widely held common stocks. The Fund is professionally managed while the Indices are unmanaged and not available for investment and do not include fees, expenses or other costs. Results in the table and graph do not reflect the deduction of taxes that a shareholder would pay on Fund distributions or the redemption of Fund shares.
13
| Henderson Global Funds | | Commentary |
High Yield Opportunities Fund
High Yield Opportunities Fund
Top 10 long-term issuers*
(at July 31, 2013)
| | | As a percentage of net assets |
| Security | |
| Landry’s, Inc. | | | 3.2 | % |
| Wok Acquisition Corp. | | | 2.2 | |
| Univision | | | | |
| Communications, Inc. | | | 2.1 | |
| Digicel Group, Ltd. | | | 2.1 | |
| Radnet Management, Inc. | | | 2.1 | |
| Serta Simmons | | | | |
| Holdings LLC | | | 2.1 | |
| Intelsat Luxembourg S.A. | | | 2.1 | |
| SandRidge Energy, Inc. | | | 2.0 | |
| TPC Group, Inc. | | | 2.0 | |
| Consolidated Container | | | | |
| Co. LLC | | | 2.0 | |
New issuance during May 2013 was an all-time record month in the US high yield market at $56 billion and brought year-to-date new issuance to $188 billion. Despite the frothy demand for high yield bonds, the composition of the new issuance continued to be somewhat conservative with 61% directed at refinancing and only 8% used for leveraged buyout financing. This is compared to only 25% used for refinancing and 33% used for leveraged buyout financing during 2007, which is deemed to be the last peak in the high yield credit cycle when spreads tightened to 250 basis points (2.50%) over Treasuries. Following this, June witnessed the worst sell-off in the US high yield market since September 2011 on the heels of a 50 basis point (0.50%) increase in 5-year Treasury yields. As was the case in May, there was no discernible pattern in the sell-off among the credit tiers, in fact, double-B bonds underperformed both single-B and triple-C rated issuers, suggesting an increasing correlation of the high yield asset class to 5-year Treasuries in a low rate and spread environment. The US high yield market experienced a rebound in July as rate fears stabilized and fund flows returned to positive territory for the asset class.
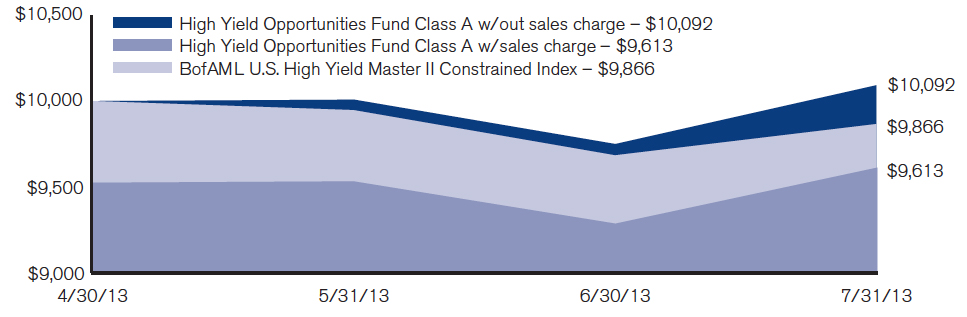
Since the Fund’s inception on April 30, 2013, to the end of the reporting period July 31, 2013, the Fund returned 0.92% (Class A at NAV) versus the benchmark, BofAML US High Yield Master II Constrained Index, which posted a return of -1.33%.
Performance against the peer group in June was hindered by low levels of cash and absence of bank loans in the portfolio, but benefitted by not having to meet large fund redemptions. July saw the Fund post above average performance versus the benchmark and peer group, aided (conversely to June) by low levels of cash, no bank loans and additionally no exposure to utilities. Some ground was given up however by not owning the lower quality triple C issuers which rallied the most during the rebound.
There have not been any major changes to the Fund as far as industry weightings or credit-tier weightings after the sell-off in June or rebound in July. We continue to employ a slight carry1 advantage to the benchmark and peer group by overweighting the lower quality single-B space as well as the higher quality triple-C sector. Credit fundamentals remain positive and most of the companies that we follow have taken advantage of the easy new issuance market to address any lingering liquidity concerns. As a result, we estimate that default rates will remain low, yet secondary market liquidity will remain challenging.
Bank loans offer an attractive investment opportunity to dampen the risk of further increases in interest rates; however, we view the leveraged loan market as slightly overvalued due to the extraordinary inflows to the asset class amid a rising rate environment. Further outperformance of the asset class would depend on further upward shocks in interest rates from this point onward. We expect volatility to remain high for the balance of the year, but will maintain the discipline of managing the portfolio on a credit by credit basis.
1 Carry trade is defined as a strategy in which an investor sells a certain currency with a relatively low interest rate and uses the funds to purchase a different currency yielding a higher interest rate.
* For further details about these issuers, please refer to the section entitled “Portfolios of investments.” Fund holdings are as of the date given, are subject to change at any time, and are not recommendations to buy or sell any security.
14
| Henderson Global Funds | Performance summary |
High Yield Opportunities Fund
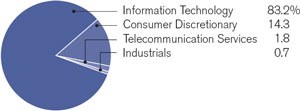
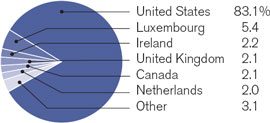
| Portfolio composition by country | | Portfolio composition by sector |
| (as a % of long-term investments) | | (as a % of long-term investments) |
| | | |
| | |
Investment comparison
Value of $10,000
Total returns as of July 31, 2013
| | | | | Since |
| | | NASDAQ | | inception |
| At NAV | | symbol | | (4/30/2013) |
| Class A | | HYOAX | | 0.92 | % |
| Class C | | HYOCX | | 0.81 | |
| Class I | | HYOIX | | 1.06 | |
| With sales charge | | | | | |
| Class A | | | | -3.89 | % |
| Class C | | | | -0.19 | |
| Index | | | | | |
| BofAML U.S. High Yield Master II Constrained Index | | | | -1.33 | % |
Performance data quoted represents past performance and is no guarantee of future results. Performance results with sales charges reflect the deduction of the maximum front-end sales charge or the deduction of the applicable contingent deferred sales charge (“CDSC”). Class A shares are subject to a maximum front-end sales charge of 4.75%. Class C shares are subject to a CDSC of up to 1% on certain redemptions made within 12 months of purchase. Performance presented at Net Asset Value (NAV), which does not include a sales charge, would be lower if this charge were reflected. NAV is the value of one share of the Fund excluding any sales charges. Current performance may be lower or higher than the performance data quoted. Investment return and principal value will fluctuate so that an investor’s shares, when redeemed, may be worth more or less than original cost. As stated in the current prospectus, the Fund’s annual operating expense ratios gross) for Class A, C and I shares are estimated to be 1.83%, 2.58% and 1.58%, respectively, for the Fund’s first full fiscal year. However, the Fund’s adviser has agreed to contractually waive a portion of its fees and/or reimburse expenses such that total ordinary operating expenses do not exceed 1.10%, 1.85% and 0.85% for Class A, C and I shares, respectively, which is in effect until July 31, 2020. For the most recent month-end performance, please call 1.866.443.6337 or visit the Funds’ website at www.hendersonglobalinvestors.com.
Performance results also reflect expense subsidies and waivers in effect during periods shown. Absent these waivers, results would have been less favorable. All results assume the reinvestment of dividends and capital gains.
The investment comparison graph above reflects the change in value of a $10,000 hypothetical investment since the Fund’s inception, including reinvested dividends and distributions, compared to a broad based securities market index. The Bank of America Merrill Lynch U.S. High Yield Master II Constrained Index tracks the performance of below investment grade U.S. dollar-denominated corporate bonds publicly issued in the U.S. domestic market. The Fund is professionally managed while the Index is unmanaged and not available for investment and does not include fees, expenses or other costs. Results in the table and graph do not reflect the deduction of taxes that a shareholder would pay on Fund distributions or the redemption of Fund shares.
15
| Henderson Global Funds | | Commentary |
International Opportunities Fund
International Opportunities Fund
Top 10 long-term holdings*
(at July 31, 2013)
| | | | As a percentage of net assets |
| Security | | |
| European Aeronautic | | | | |
| Defence and Space | | | | |
| Co. N.V. | | | 3.6 | % |
| Deutsche Post AG | | | 3.0 | |
| Continental AG | | | 3.0 | |
| UBS AG | | | 3.0 | |
| Lloyds Banking Group plc | | | 2.9 | |
| Amadeus IT Holding | | | | |
| S.A., A Shares | | | 2.8 | |
| ASML Holding N.V. | | | 2.7 | |
| Capita Group plc | | | 2.6 | |
| Fresenius SE & Co., KGaA | | | 2.6 | |
| Roche Holding AG | | | 2.6 | |
Global equity markets initially struggled for direction amid poor earnings and economic data, with sentiment dominated by central bank action, political rhetoric and stimulus measures enacted by the US Federal Reserve and the European Central Bank. Markets rallied strongly into the year-end due to improving economic data in the US and China, an approved bailout for Greece and Spanish banks and a regime change in Japan. 2013 began with a considerable relief rally, sparked by a last minute compromise by the US Congress to avert the spending cuts and tax increases (the “fiscal cliff”) which threatened continued growth in the US economy. As the year progressed, we started to see improving cash flows into equities as investors began to allocate away from cash and bonds in search of return in the low interest rate environment. Accommodative monetary policy and improving economic data, particularly in the US and Japan, has helped drive markets higher, however, sentiment has been tested along the way by implications of a reduction in the $85 billion monthly stimulus injected by the Federal Reserve through quantitative easing.
For the year ended July 31, 2013 the Fund returned 24.64% (Class A at NAV) versus the benchmark, MSCI EAFE Index, which posted a return of 24.02%.
The Fund’s European Growth sub-portfolio was consistently strong throughout the period as quality growth positions such as Deutsche Post and Capita performed very well. The Japan and Asia portfolios weighed on relative performance and, although initially struggling due to stock specific issues, the Pan-European sub-portfolio – along with European Growth – has driven recent performance. Strong gains have been seen in cyclical positions, such as European Aeronautic Defense and Space Company (EADS) and Renault. RusPetro was the worst performer over the period due to operational delays surrounding oil extraction as well as a tight funding situation. African Petroleum also suffered over lower than expected reservoir permeability at its Bee Eater-1 well in offshore Liberia.
December saw the introduction of a Latin American sub-portfolio. As Brazil and Mexico forecasted to be in the top five global economies, the region represents 9% of the world’s population and 7% of the world’s GDP, this addition was a natural evolution of the portfolio.
Notable trading activity has included the Pan-European sub-portfolio buying a number of laggard stocks that we viewed as compelling recovery stocks with “special situation” dynamics. Those stocks include hotel operator, Accor and shipping conglomerate, AP Moller-Maersk. Apple was sold from the Technology sub-portfolio due to concerns over competitive pressure and the maturity of Apple’s end markets; however, the stock has been a significant positive performer for the Fund over the period of its inclusion. Among the purchases in the Japanese sub-portfolio were H2O Retailing Corp, the operator of railway department stores, and Taiheiyo Cement, which has exposure both domestically and in the US.
Europe remains cheap on a relative basis compared to other major developed markets and Japan is at an interesting point leading us to believe there will be significant rewards for good stock-picking. Asia and emerging markets are currently going through a difficult stage. While we believe that volatility and nervousness will continue, the sheer breadth of these markets should generate opportunities for us. Overall, we retain our faith in equities as an asset class. Bond investors have started to feel the pain of rising yields, which will likely prompt capital allocators to look at equities once again.
* For further detail about these holdings, please refer to the section entitled “Portfolios of investments.” Fund holdings are as of the date given, are subject to change at any time, and are not recommendations to buy or sell any security.
16
| Henderson Global Funds | Performance summary |
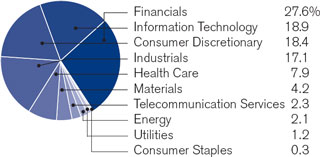
International Opportunities Fund
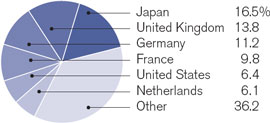
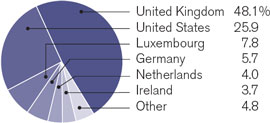
| Portfolio composition by country | | Portfolio composition by sector |
| (as a % of long-term investments) | | (as a % of long-term investments) |
| | | |
| | |
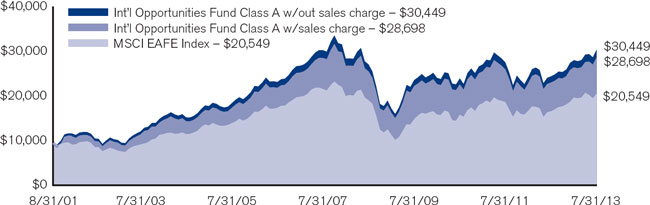
Investment comparison
Value of $10,000
Total returns as of July 31, 2013
| | | | | | | | | | | | | Since |
| | | NASDAQ | | One | Three | Five | Ten | inception |
| At NAV | | symbol | | year | years* | years* | years* | (8/31/01)* |
| Class A | | HFOAX | | 24.64 | % | 8.29 | % | 2.37 | % | 9.70 | % | 9.79 | % |
| Class B | | HFOBX | | 23.55 | | 7.40 | | 1.57 | | 9.05 | | 9.26 | |
| Class C | | HFOCX | | 23.62 | | 7.44 | | 1.57 | | 8.86 | | 8.97 | |
| Class R** | | HFORX | | 24.23 | | 7.90 | | 2.06 | | 9.40 | | 9.50 | |
| Class I*** | | HFOIX | | 25.00 | | 8.57 | | 2.62 | | 9.83 | | 9.90 | |
| With sales charge | | | | | | | | | | | | | |
| Class A | | | | 17.48 | % | 6.17 | % | 1.16 | % | 9.05 | % | 9.25 | % |
| Class B | | | | 19.55 | | 6.53 | | 1.38 | | 9.05 | | 9.26 | |
| Class C | | | | 23.62 | | 7.44 | | 1.57 | | 8.86 | | 8.97 | |
| Index | | | | | | | | | | | | | |
| MSCI EAFE Index | | | | 24.02 | % | 9.11 | % | 1.54 | % | 8.45 | % | 6.23 | % |
* Average annual return.
** Class R shares commenced operations on September 30, 2005. The performance for Class R shares for the period prior to September 30, 2005 is based on the performance of Class A shares, adjusted for the higher expenses applicable to R shares. Class R shares are not subject to a front-end sales charge but are subject to a distribution fee of 0.50%.
*** Class I (formerly Class W) shares commenced operations on March 31, 2009. The performance for Class I shares for the period prior to March 31, 2009 is based on the performance of Class A shares. Performance for Class I shares would be similar because the shares are invested in the same portfolio of securities and have the same portfolio management. Class I shares are not subject to a front-end sales charge or a distribution fee.
Performance data quoted represents past performance and is no guarantee of future results. Performance results with sales charges reflect the deduction of the maximum front-end sales charge or the deduction of the applicable contingent deferred sales charge (“CDSC”). Class A shares are subject to a maximum front-end sales charge of 5.75%. Class B shares are subject to a CDSC, which declines from 5% the 1st year to 0% at the beginning of the 7th year. Class C shares are subject to a CDSC of up to 1% on certain redemptions made within 12 months of purchase. Class R shares have no front-end sales charge or CDSC. Performance presented at Net Asset Value (NAV), which does not include a sales charge, would be lower if this charge were reflected. NAV is the value of one share of the Fund excluding any sales charges. Current performance may be lower or higher than the performance data quoted. Investment return and principal value will fluctuate so that an investor’s shares, when redeemed, may be worth more or less than original cost. As stated in the current prospectus, the Fund’s annual operating expense ratios (gross) for Class A, B, C, R and I shares are 1.47%, 2.32%, 2.29%, 1.94% and 1.20% respectively. As stated in the Statement of Additional Information (SAI), the Fund’s adviser has agreed to contractually waive a portion of its fees and/or reimburse expenses such that total ordinary operating expenses do not exceed 2.00%, 2.75%, 2.75%, 2.25% and 1.75% for Class A, B, C, R and I shares, respectively, which is in effect until July 31, 2020. For the most recent month-end performance, please call 1.866.443.6337 or visit the Funds’ website at www.hendersonglobalinvestors.com.
Performance results also reflect expense subsidies and waivers in effect during certain periods shown. Absent these waivers, results would have been less favorable for certain periods. All results assume the reinvestment of dividends and capital gains.
The investment comparison graph above reflects the change in value of a $10,000 hypothetical investment since the Fund’s inception, including reinvested dividends and distributions, compared to a broad based securities market index. The MSCI EAFE Index is a free float-adjusted market capitalization weighted index that is designed to measure the equity market performance of developed markets, excluding the US and Canada. The Fund may invest in emerging markets while the Index only consists of companies in developed markets. The Fund is professionally managed while the Index is unmanaged and not available for investment and does not include fees, expenses or other costs. Results in the table and graph do not reflect the deduction of taxes that a shareholder would pay on Fund distributions or the redemption of Fund shares.
17
| Henderson Global Funds | | Commentary |
Strategic Income Fund
Strategic Income Fund
Top 10 long-term issuers*
(at July 31, 2013)
| | | | As a percentage of net assets |
| Security | | |
| United States | | | | |
| Treasury Note | | | 5.3 | % |
| Daily Mail & | | | | |
| General Trust | | | 3.7 | |
| Unitymedia Hessen | | | | |
| GmbH & Co. KG | | | 3.3 | |
| Service Corp International | | | 2.9 | |
| United Kingdom Gilt | | | 2.8 | |
| Telenet Finance | | | | |
| Luxembourg SCA | | | 2.6 | |
| Virgin Media Finance plc | | | 2.4 | |
| Standard Chartered plc | | | 2.3 | |
| Ziggo Bond Co. B.V. | | | 2.3 | |
| Levi Strauss & Co. | | | 2.3 | |
The year was characterized by aggressive actions from global central banks keen to stimulate economic growth. Along with the European Central Bank (ECB), the Federal Reserve (the Fed) announced a policy of additional quantitative easing (QE), which was followed up by the Bank of Japan who embarked on its own ultra-stimulatory monetary policy. These policies were welcomed by markets and risk assets rallied strongly.
At the end of the period the driving force was the more dovish guidance in communications from the Fed regarding the market’s overreaction to the original tapering (reduction in QE) messaging earlier in the period. The ECB and the Bank of England both initiated “forward guidance” communication strategies in response to the Fed-induced volatility spike.
For the seven-month period ended July 31, 2013, the Fund returned 0.39% (Class A at NAV) versus the benchmark 50% Merrill Lynch Global High Yield (USD hedged)/50% Merrill Lynch Global Broad Market Corporate (USD hedged), which posted a return of 1.23%. The year began on an optimistic note as the ECB allayed fears of a disorderly Eurozone breakup by pledging to do “whatever it takes” to support peripheral governments, sparking a rally in risk assets and higher beta areas of the credit market. Our preference for UK subordinated financials (banks and insurers) saw the Fund benefit from a significant uplift in the value of its holdings. The high yield rated bonds held in the Fund, particularly in the double and single B space performed well; holdings were focused on cash generative, non-cyclical businesses in sectors such as Cable and Packaging. As a result, debt such as Ardagh Packaging and Virgin Media Finance contributed significantly to the positive performance of the Fund.
Derivatives were primarily used to manage the duration of the Fund, in addition to small positions taken in options and futures on the US stock market as a tail hedge. As economic data improved from the region the risk of a tail event dissipated; leading to a small loss on our net derivatives positions for the period. This improvement in data also led to speculation on when the Fed would begin to taper their asset purchase program, leading to a bond market sell off in the early summer. This particularly affected our investment grade holdings in sovereign bonds and corporates such as Wal-Mart and McDonalds, due to their long maturity and low coupons. However, our increased allocation to high yielding assets ensured that performance remained resilient as markets recovered during July.
The change of tone from the Fed is a notable milestone for bond markets and must be respected. Although we think they will ultimately be proved too optimistic on both their growth and inflation forecasts, the Fed seems to have adopted a third pillar for assessing QE (the performance of risk assets). It would appear that the strong performance of financial markets in 2013 encouraged them to talk of winding down the QE program.
We are encouraged by the progress the US and to a lesser extent European economies have made. However, we are concerned about Chinese growth and some of the imbalances in certain emerging market countries. Credit conditions remain favorable but we remain wary of sovereign bonds.
* For further details about these issuers, please refer to the section entitled “Portfolios of investments.” Fund holdings are as of the date given, are subject to change at any time, and are not recommendations to buy or sell any security.
18
| Henderson Global Funds | Performance summary |
Strategic Income Fund
| Portfolio composition by country | | Portfolio composition by sector |
| (as a % of long-term investments) | | (as a % of long-term investments) |
| | | |
| | |
Investment comparison
Value of $10,000
Total returns as of July 31, 2013†
| | | | | | | | | | | | | Since |
| | | NASDAQ | | Seven | One | Three | Five | inception |
| At NAV | | symbol | | months | year | years* | years* | (9/30/03)* |
| Class A | | HFAAX | | 0.39 | % | 5.20 | % | 6.01 | % | 5.05 | % | 5.29 | % |
| Class B | | HFABX | | -0.07 | | 4.37 | | 5.23 | | 4.30 | | 4.67 | |
| Class C | | HFACX | | -0.06 | | 4.31 | | 5.19 | | 4.17 | | 4.46 | |
| Class I** | | HFAIX | | 0.54 | | 5.39 | | 6.18 | | 5.15 | | 5.34 | |
| With sales charge | | | | | | | | | | | | | |
| Class A | | | | -4.33 | % | 0.23 | % | 4.31 | % | 4.03 | % | 4.76 | % |
| Class B | | | | -5.07 | | 0.37 | | 4.32 | | 4.13 | | 4.67 | |
| Class C | | | | -1.06 | | 4.31 | | 5.19 | | 4.17 | | 4.46 | |
| Index | | | | | | | | | | | | | |
| 50% ML Global High Yield / 50% ML | | | | | | | | | | | | | |
| Global Corporate Index (USD hedged) | | | | 1.23 | % | 7.00 | % | 8.17 | % | 9.83 | % | 7.29 | % |
| Barclays Capital Global Aggregate Bond | | | | | | | | | | | | | |
| (ex US MBS) Index | | | | -3.82 | | -2.09 | | 2.94 | | 3.74 | | 4.86 | |
| Barclays Global Agg Credit USD Hedged | | | | -1.42 | | 1.41 | | 4.76 | | 6.41 | | 4.83 | |
* Average annual return.
** Class I shares commenced operations on April 29, 2011. The performance for Class I shares for the period prior to April 29, 2011 is based on the performance of Class A shares. Performance for Class I shares would be similar because the shares are invested in the same portfolio of securities and have the same portfolio management. Class I shares are not subject to a front-end sales charge or a distribution fee.
† The Strategic Income Fund changed its fiscal year end from December 31 to July 31 effective July 31, 2013.
Performance data quoted represents past performance and is no guarantee of future results. Performance results with sales charges reflect the deduction of the maximum front-end sales charge or the deduction of the applicable contingent deferred sales charge (“CDSC”). Class A shares are subject to a maximum front-end sales charge of 4.75%. Class B shares are subject to a CDSC, which declines from 5% the 1st year to 0% at the beginning of the 7th year. Class C shares are subject to a CDSC of up to 1% on certain redemptions made within 12 months of purchase. Performance presented at Net Asset Value (NAV), which does not include a sales charge, would be lower if this charge were reflected. NAV is the value of one share of the Fund excluding any sales charges. Current performance may be lower or higher than the performance data quoted. Investment return and principal value will fluctuate so that an investor’s shares, when redeemed, may be worth more or less than original cost. As stated in the current prospectus, the Fund’s annual operating expense ratios (gross) for Class A, B, C and I shares are 1.35%, 2.13%, 2.12% and 1.08%, respectively. However, the Fund’s adviser has agreed to contractually waive a portion of its fees and/or reimburse expenses such that the total ordinary operating expenses (other than Acquired Fund Fees and Expenses allocated from unaffiliated investment companies) do not exceed 1.10%, 1.85%, 1.85% and 0.85% for Class A, B, C and I shares, respectively, which will remain in effect until July 31, 2020. For the most recent month-end performance, please call 1.866.443.6337 or visit the Funds’ website at www.hendersonglobalinvestors.com.
Performance results also reflect expense subsidies and waivers in effect during the periods shown. Absent these waivers, results would have been less favorable. All results assume the reinvestment of dividends and capital gains.
The investment comparison graph above reflects the change in value of a $10,000 hypothetical investment since the Fund’s inception, including reinvested dividends and distributions, compared to a broad based securities market index. The Bank of America Merrill Lynch (“ML”) Global Corporate Index (USD-hedged) tracks the performance of developed market investment grade corporate debt publicly issued in the major US and Eurobond markets. The Bank of America Merrill Lynch (“ML”) Global High Yield Index tracks the performance of US dollar, Canadian Dollar, British sterling and euro denominated developed market below investment grade corporate debt publicly issued in the major US or Eurobond markets. The Barclays Capital Global Aggregate Bond (ex US MBS) Index is a broad-based measure of the global investment-grade fixed-rate debt markets, excluding US Mortgage Bonds. The Barclays Capital Global Aggregate Credit (USD hedged) Index is a broad-based measure of the global investment-grade and high yield fixed-rate markets. The Fund is professionally managed while the Indices are unmanaged and not available for investment and do not include fees, expenses or other costs. Results in the table and graphs do not reflect the deduction of taxes that a shareholder would pay on Fund distributions or the redemption of Fund shares.
19
| Henderson Global Funds | | Commentary |
World Select Fund
World Select Fund
Top 10 long-term holdings*
(at July 31, 2013)
| | | | As a percentage of net assets |
| Security | | |
| Sumitomo Mitsui | | | | |
| Financial Group, Inc. | | | 3.6 | % |
| Infineon Technologies AG | | | 3.5 | |
| Praxair, Inc. | | | 3.5 | |
| AIA Group, Ltd. | | | 3.4 | |
| Bed Bath & Beyond, Inc. | | | 3.4 | |
| Pentair, Ltd. | | | 3.4 | |
| Volvo AB, B Shares | | | 3.3 | |
| Parker Hannifin Corp. | | | 3.3 | |
| eBay, Inc. | | | 3.3 | |
| Walgreen Co. | | | 3.3 | |
The declines and rallies experienced by global equity markets over the reporting period were not primarily driven by company fundamentals but rather political indecision and rhetoric from central bankers and ratings agencies. After initially struggling for direction due to poor earnings, weak economic data and sentiment that was dominated by the aforementioned central bank action and political rhetoric, the picture improved for risk assets in late 2012 and early 2013. A considerable relief rally was backed up by solid macroeconomic data, broadly consensus-beating earnings and positive investor and consumer sentiment that led the S&P 500 to all-time highs. However, before equity markets ended the reporting period on a strong footing, a keynote speech by the US Federal Reserve Chairman Ben Bernanke led to a sharp reversal in risk sentiment during June as investors began to contemplate the implications of a reduction in the $85 billion monthly stimulus injected by the US central bank. US bond yields rose (prices fell) in reaction and emerging markets took the brunt of the pain, furthered by weak economic data from China.
For the year ended July 31, 2013 the Fund returned 23.18% (Class A at NAV) versus the benchmark, MSCI World Index, which posted a return of 23.96%. Stock selection in the Energy and Information Technology sectors were the main causes of underperformance. Shares in Apple struggled initially as investors booked some profits following a strong year, and then continued to struggle due to competitive pressure and the maturity of Apple’s end markets. The position was exited during the reporting period. Energy-related BG Group was another of the main detractors due to reduced growth expectations and concerns about reduced drilling activity. Stock selection in the Financials, Consumer Discretionary and Industrials sectors contributed the most to positive performance and key performers included Citigroup; Belgium bank, KBC; UK bank, Lloyds; broadcaster, CBS; and electric power tool manufacturer, Makita.
The Fund underwent significant repositioning over the reporting period and was concentrated into a list with a focus on global equities we consider to be misvalued. Among the new positions taken was US-based pharmacy operator, Walgreens, where we believe significant cost saving synergies have developed from the acquisition of Europe’s Alliance Boots. During the second quarter of 2012, the Fund’s exposure to emerging markets was reduced, both direct and indirect, as tightening Chinese credit conditions and slowing gross domestic product (GDP) growth, along with rising US long-term interest rates led us to be very cautious towards the region.
Perceptions surrounding the changing state of policy across the world’s central banks looks set to drive market conditions and occupy investor sentiment in coming months. Japan’s recent ‘three arrows’ policy approach to boost economic growth is no exception and we remain sanguine about the region. Worries of a slowdown in monetary stimulus from the Federal Reserve have been overshadowing the improving US macroeconomic backdrop, while further Middle East unrest and increasing protests against austerity in Europe could limit market returns in the near term. For stock-specific investors, this environment could see greater significance assigned to individual companies’ earnings growth which, when added to the apparent decoupling of emerging and developing markets, should provide an opportunistic environment to add value.
* For further detail about these holdings, please refer to the section entitled “Portfolios of investments.” Fund holdings are as of the date given, are subject to change at any time, and are not recommendations to buy or sell any security.
20
| Henderson Global Funds | Performance summary |
World Select Fund
| Portfolio composition by country | | Portfolio composition by sector |
| (as a % of long-term investments) | | (as a % of long-term investments) |
| | | |
| | |
Investment comparison
Value of $10,000
Total returns as of July 31, 2013
| At NAV | | | NASDAQ symbol | | One year | | Three years* | | Five years* | | Since inception (11/30/06)* |
| Class A | | | HFPAX | | | 23.18 | % | | 11.87 | % | | 4.17 | % | | 3.23 | % |
| Class C | | | HFPCX | | | 22.19 | | | 11.02 | | | 3.37 | | | 2.70 | |
| Class I** | | | HFPIX | | | 23.49 | | | 12.12 | | | 4.31 | | | 3.33 | |
| With sales charge | | | | | | | | | | | | | | | | |
| Class A | | | | | | 16.14 | % | | 9.69 | % | | 2.94 | % | | 2.32 | % |
| Class C | | | | | | 22.19 | | | 11.02 | | | 3.37 | | | 2.70 | |
| Index | | | | | | | | | | | | | | | | |
| MSCI World Index | | | | | | 23.96 | % | | 13.34 | % | | 4.88 | % | | 3.31 | % |
* Average annual return.
** Class I shares commenced operations on May 31, 2011. The performance for Class I shares for the period prior to May 31, 2011 is based on the performance of Class A shares. Performance for Class I shares would be similar because the shares are invested in the same portfolio of securities and have the same portfolio management. Class I shares are not subject to a front-end sales charge or a distribution fee.
Performance data quoted represents past performance and is no guarantee of future results. Due to the Fund’s relatively small asset base, performance may be impacted by IPOs to a greater degree than it may be in the future. IPO investments are not an integral component of the Fund’s investment process and may not be utilized to the same extent in the future. Performance results with sales charges reflect the deduction of the maximum front-end sales charge or the deduction of the applicable contingent deferred sales charge (“CDSC”). Class A shares are subject to a maximum front-end sales charge of 5.75%. Class C shares are subject to a CDSC of up to 1% on certain redemptions made within 12 months of purchase. Performance presented at Net Asset Value (NAV), which does not include a sales charge, would be lower if this charge were reflected. NAV is the value of one share of the Fund excluding any sales charges. Current performance may be lower or higher than the performance data quoted. Investment return and principal value will fluctuate so that an investor’s shares, when redeemed, may be worth more or less than original cost. As stated in the current prospectus, the Fund’s annual operating expense ratios (gross) for Class A, C and I shares are 2.09%, 2.84% and 1.80%, respectively. However, the Fund’s adviser has agreed to contractually waive a portion of its fees and/or reimburse expenses such that the total ordinary operating expenses do not exceed 1.40%, 2.15% and 1.15% for Class A, C and I shares, respectively, which is in effect until July 31, 2020. For the most recent month-end performance, please call 1.866.443.6337 or visit the Funds’ website at www.hendersonglobalinvestors.com.
Performance results also reflect expense subsidies and waivers in effect during periods shown. Absent these waivers, results would have been less favorable. All results assume the reinvestment of dividends and capital gains.
The investment comparison graph above reflects the change in value of a $10,000 hypothetical investment since the Fund’s inception, including reinvested dividends and distributions, compared to a broad based securities market index. Effective December 20, 2012, the Henderson Global Leaders Fund changed its name and became the Henderson World Select Fund. The Fund’s historical performance may not represent current investment policies. The MSCI World Index is a free float-adjusted market capitalization weighted index that is designed to measure the equity market performance of developed markets. The Fund is professionally managed while the Index is unmanaged and not available for investment and does not include fees, expenses or other costs. Results in the table and graph do not reflect the deduction of taxes that a shareholder would pay on Fund distributions or the redemption of Fund shares.
21
| Henderson Global Funds | Portfolio of investments |
All Asset Fund
July 31, 2013
| | | | | Value |
| Shares | | | | (note 2) |
| | | |
| Investment companies - 60.78% | | |
| | | |
| Alternatives - 6.06% | | |
| 126,155 | | ASG Global Alternatives | | |
| | | Fund | $ | 1,441,947 |
| 135,077 | | Franklin Templeton Hard | | |
| | | Currency Fund | | 1,253,512 |
| 111,122 | | Sprott Physical Gold Trust * | | 1,224,009 |
| | | | | 3,919,468 |
| | | |
| Equity - 27.52% | | |
| 106,965 | | Calamos Market Neutral | | |
| | | Income Fund | | 1,369,153 |
| 48,737 | | Gateway Fund | | 1,375,835 |
| 86,367 | | Graphite Enterprise Trust plc | | 642,477 |
| 80,282 | | HarbourVest Global Private | | |
| | | Equity (a)* | | 770,707 |
| 43,902 | | Henderson Global Technology | | |
| | | Fund (b) * | | 1,031,701 |
| 23,363 | | iShares High Dividend Equity | | |
| | | Fund | | 1,602,468 |
| 31,006 | | iShares MSCI EAFE Minimum | | |
| | | Volatility Index Fund | | 1,823,153 |
| 37,551 | | iShares MSCI Pacific ex-Japan | | |
| | | Index Fund | | 1,676,652 |
| 46,432 | | iShares MSCI USA Minimum | | |
| | | Volatility Index Fund | | 1,568,008 |
| 89,503 | | PowerShares International | | |
| | | Dividend Achievers Portfolio | | 1,504,545 |
| 12,921 | | SPDR S&P 500 ETF Trust | | 2,179,256 |
| 32,032 | | Vanguard Dividend | | |
| | | Appreciation ETF | | 2,235,193 |
| | | | | 17,779,148 |
| | | |
| Fixed income - 27.20% | | |
| 81,971 | | Henderson Strategic Income | | |
| | | Fund (b) | | 730,359 |
| 24,950 | | iShares Global High Yield | | |
| | | Corporate Bond Fund | | 1,316,611 |
| 8,347 | | iShares iBoxx $High Yield | | |
| | | Corporate Bond Fund | | 776,104 |
| 15,216 | | iShares iBoxx Investment | | |
| | | Grade Corporate Bond Fund | | 1,742,536 |
| 9,082 | | iShares JP Morgan USD | | |
| | | Emerging Markets | | |
| | | Bond Fund | | 992,663 |
| 199,555 | | Legg Mason BW Global | | |
| | | Opportunities Bond Fund | | 2,185,131 |
| 66,563 | | MSIF Multi-Asset Portfolio | | 786,109 |
| 32,210 | | PIMCO Enhanced Short | | |
| | | Maturity ETF | | 3,266,094 |
| 110,120 | | PIMCO Income Fund | | 1,347,870 |
| 27,574 | | PIMCO Total Return ETF | | 2,905,748 |
| | | | | Value |
| Shares | | | | (note 2) |
| | | |
| Fixed income (continued) | | |
| 60,890 | | PowerShares Senior | | |
| | | Loan Portfolio | $ | 1,519,205 |
| | | | | 17,568,430 |
| | | | | |
| | | Total investment companies | | |
| | | (Cost $38,309,518) | | 39,267,046 |
| | | | | |
| Principal | | | | |
| | | |
| Sovereign debt obligation - 2.04% | | |
| 824,960 | | United Kingdom Inflation- | | |
| | | Linked Gilt 0.125%, | | |
| | | 3/22/24 (c) | | 1,316,401 |
| | | | | |
| | | Total sovereign debt obligation | | |
| | | (Cost $1,340,966) | | 1,316,401 |
| | | | | |
| Shares | | | | |
| | | |
| Short-term investment - 35.96% | | |
| 23,229,110 | | Fidelity Institutional Treasury | | |
| | | Portfolio (d) | | 23,229,110 |
| | | | | |
| | | Total short-term investment | | |
| | | (Cost $23,229,110) | | 23,229,110 |
| | | | | |
| Total investments - 98.78% | | |
| | | (Cost $62,879,594) | | 63,812,557 |
| | | | | |
| Net other assets and liabilities – 1.22% | | 788,261 |
| | | |
| Total net assets – 100.00% | $ | 64,600,818 |
| * | | Non income producing security |
| (a) | | The security has been deemed illiquid according to the policies and procedures adopted by the Board of Trustees. |
| (b) | | Affiliated holding, see notes to financial statements for further information. |
| (c) | | Indexed security in which both the coupon and principal are adjusted in-line with movements in the General Index of Retail Prices in the United Kingdom. |
| (d) | | A portion of this security is segregated as collateral for futures contracts. |
| ETF | | Exchange-traded fund |
See notes to financial statements
22
| Henderson Global Funds | Portfolio of investments |
All Asset Fund
July 31, 2013 (continued)
The Fund held the following open forward foreign currency contracts at July 31, 2013:
| | | | | Local | | | Current | | | Unrealized | |
| | | Value | | amount | | | notional | | | appreciation/ | |
| | Counterparty | date | | | (000’s | ) | | value | | | (depreciation | ) |
| Japanese Yen (Long) | State Street Bank, London | 8/22/13 | | | 220,231 | | | $ | 2,249,556 | | | $ | 98,556 | |
| Euro (Short) | State Street Bank, London | 8/22/13 | | | 840 | | | | 1,117,567 | | | | (32,213 | ) |
| British Pound (Short) | State Street Bank, London | 8/22/13 | | | 1,365 | | | | 2,076,208 | | | | (6,979 | ) |
| Total | | | | | | | | | | | | $ | 59,364 | |
During the year ended July 31, 2013, average monthly notional value related to forward foreign currency contracts was $1.6 million or 2.6% of net assets.
The Fund held the following open futures contracts at July 31, 2013:
| | | | | | | Current | | | Unrealized | |
| | | Number of | | Expiration | | notional | | | appreciation/ | |
| | | contracts | | date | | value | | | (depreciation | ) |
| Euro STOXX 50 Index (Long) | | | 36 | | 9/20/13 | | $ | 1,319,920 | | | $ | (1,497 | ) |
| FTSE 100 Index (Long) | | | 41 | | 9/20/13 | | | 4,093,738 | | | | 153,386 | |
| Hang Seng Index (Long) | | | 7 | | 8/29/13 | | | 986,693 | | | | 1,476 | |
| Nikkei 225 Index (Long) | | | 36 | | 9/12/13 | | | 5,000,511 | | | | 199,387 | |
| Russell 2000 Index Mini (Long) | | | 14 | | 9/20/13 | | | 1,460,060 | | | | 79,940 | |
| Total | | | | | | | | | | | $ | 432,692 | |
During the year ended July 31, 2013, average notional value related to futures contracts was $1.9 million or 3.1% of net assets.
The following table summarizes the Fund’s investments that are measured at fair value by level within the fair value hierarchy at July 31, 2013:
| | | Quoted prices | | | Significant | | | | | | | |
| | | in active | | | other | | | Significant | | | | |
| | | markets for | | | observable | | | unobservable | | | | |
| | | identical assets | | | inputs | | | inputs | | | | |
| Description | | (level 1 | ) | | (level 2 | ) | | (level 3 | ) | | Total | |
| Assets | | | | | | | | | | | | |
| Investment Companies | | $ | 39,267,046 | | | $ | – | | | $ | – | | | $ | 39,267,046 | |
| Sovereign Debt Obligation | | | – | | | | 1,316,401 | | | | – | | | | 1,316,401 | |
| Short-Term Investment | | | 23,229,110 | | | | – | | | | – | | | | 23,229,110 | |
| Total Investments | | | 62,496,156 | | | | 1,316,401 | | | | – | | | | 63,812,557 | |
| Financial Derivative Instruments* | | | | | | | | | | | | | | | | |
| Forward Foreign Currency Contracts | | | – | | | | 98,556 | | | | – | | | | 98,556 | |
| Futures Contracts | | | 434,189 | | | | – | | | | – | | | | 434,189 | |
| Total Financial Derivative Contracts | | $ | 434,189 | | | $ | 98,556 | | | $ | – | | | $ | 532,745 | |
| Liabilities | | | | | | | | | | | | | | | | |
| Financial Derivative Instruments* | | | | | | | | | | | | | | | | |
| Forward Foreign Currency Contracts | | | – | | | | (39,192 | ) | | | – | | | | (39,192 | ) |
| Futures Contracts | | | (1,497 | ) | | | – | | | | – | | | | (1,497 | ) |
| Total Financial Derivative Instruments | | $ | (1,497 | ) | | $ | (39,192 | ) | | $ | – | | | $ | (40,689 | ) |
* These investments are recorded at the unrealized gain or loss on the investment.
During the year ended July 31, 2013, there were no transfers in or out of security levels as a result of the fair value pricing procedures established by the Board.
See notes to financial statements
23
| Henderson Global Funds | Portfolio of investments |
Dividend & Income Builder Fund
July 31, 2013
Shares | | | | Value |
| | | |
| Common stocks - 72.58% | | |
| | | |
| | | Australia - 1.98% | | |
| 2,163 | | Suncorp Group, Ltd. | $ | 24,925 |
| 10,603 | | Toll Holdings, Ltd. | | 50,797 |
| | | | | 75,722 |
| | | | | |
| | | Brazil - 0.52% | | |
| 922 | | Telefonica Brasil S.A., ADR | | 19,795 |
| | | | | |
| | | Canada - 1.70% | | |
| 366 | | Bank of Montreal | | 22,759 |
| 1,020 | | BCE, Inc. | | 42,256 |
| | | | | 65,015 |
| | | | | |
| | | Colombia - 0.40% | | |
| 268 | | Bancolombia S.A., ADR | | 15,397 |
| | | | | |
| | | France - 3.87% | | |
| 500 | | Sanofi | | 53,327 |
| 1,110 | | Total S.A. | | 59,215 |
| 446 | | Valeo S.A. | | 35,375 |
| | | | | 147,917 |
| | | | | |
| | | Germany - 5.10% | | |
| 665 | | BASF SE | | 58,973 |
| 367 | | Bayerische Motoren | | |
| | | Werke AG | | 35,930 |
| 496 | | Deutsche Boerse AG | | 35,091 |
| 2,308 | | Deutsche Post AG | | 64,694 |
| | | | | 194,688 |
| | | | | |
| | | Hong Kong - 2.47% | | |
| 12,000 | | Shanghai Industrial Holdings, | | |
| | | Ltd. | | 37,289 |
| 11,000 | | SJM Holdings, Ltd. | | 27,686 |
| 2,500 | | Swire Pacific, Ltd., Class A | | 29,495 |
| | | | | 94,470 |
| | | | | |
| | | Italy - 1.06% | | |
| 1,826 | | ENI SpA | | 40,349 |
| | | | | |
| | | Luxembourg - 0.86% | | |
| 369 | | RTL Group S.A. | | 32,993 |
| | | | | Value |
| Shares | | | | (note 2) |
| | | | | |
| | | Netherlands - 3.86% | | |
| 1,047 | | Delta Lloyd N.V. | $ | 22,662 |
| 981 | | Nielsen Holdings N.V. | | 32,785 |
| 2,925 | | Reed Elsevier N.V. | | 56,034 |
| 1,480 | | Wolters Kluwer N.V. | | 35,726 |
| | | | | 147,207 |
| | | | | |
| | | Norway - 0.70% | | |
| 1,223 | | Statoil ASA | | 26,524 |
| | | | | |
| | | Sweden - 0.95% | | |
| 1,243 | | Electrolux AB, Series B | | 36,214 |
| | | | | |
| | | Switzerland - 6.44% | | |
| 2,265 | | ABB, Ltd. | | 50,026 |
| 968 | | Nestle S.A. | | 65,583 |
| 942 | | Novartis AG | | 67,791 |
| 254 | | Roche Holding AG | | 62,577 |
| | | | | 245,977 |
| | | | | |
| | | Taiwan - 2.60% | | |
| 4,000 | | Asustek Computer, Inc. | | 34,949 |
| 2,163 | | Taiwan Semiconductor | | |
| | | Manufacturing Co., Ltd., ADR | | 36,728 |
| 12,500 | | United Microelectronics | | |
| | | Corp., ADR | | 27,500 |
| | | | | 99,177 |
| | | | | |
| | | United Kingdom - 16.82% | | |
| 8,117 | | Amlin plc | | 49,651 |
| 2,686 | | Antofagasta plc | | 36,039 |
| 1,240 | | BHP Billiton plc | | 35,445 |
| 12,494 | | BT Group plc | | 64,755 |
| 4,667 | | Centrica plc | | 27,760 |
| 1,676 | | Greene King plc | | 22,309 |
| 2,732 | | Hiscox, Ltd. | | 27,014 |
| 7,092 | | HSBC Holdings plc | | 80,678 |
| 12,250 | | ITV plc | | 31,419 |
| 25,000 | | Lloyds Banking Group plc* | | 26,040 |
| 3,990 | | Prudential plc | | 70,835 |
| 799 | | Rio Tinto plc | | 35,917 |
| 1,901 | | Standard Chartered plc | | 44,087 |
| 9,525 | | Vodafone Group plc | | 28,618 |
| 3,429 | | WPP plc | | 61,762 |
| | | | | 642,329 |
See notes to financial statements
24
| Henderson Global Funds | Portfolio of investments |
Dividend & Income Builder Fund
July 31, 2013 (continued)
| | | | | Value |
| Shares | | | | (note 2) |
| | | | | |
| | | United States - 23.25% | | |
| 718 | | Baxter International, Inc. | $ | 52,443 |
| 2,383 | | Cisco Systems, Inc. | | 60,886 |
| 338 | | Cummins, Inc. | | 40,962 |
| 394 | | Duke Energy Corp. | | 27,974 |
| 2,051 | | General Electric Co. | | 49,983 |
| 1,119 | | JPMorgan Chase & Co. | | 62,362 |
| 548 | | Kinder Morgan, Inc. | | 20,692 |
| 568 | | L Brands, Inc. | | 31,677 |
| 414 | | Lockheed Martin Corp. | | 49,730 |
| 760 | | Mattel, Inc. | | 31,943 |
| 1,780 | | Microsoft Corp. | | 56,657 |
| 1,829 | | Pfizer, Inc. | | 53,462 |
| 564 | | PNC Financial Services | | |
| | | Group, Inc. | | 42,892 |
| 769 | | QUALCOMM, Inc. | | 49,639 |
| 659 | | Reynolds American, Inc. | | 32,574 |
| 900 | | Six Flags Entertainment Corp. | | 33,111 |
| 366 | | Stanley Black & Decker, Inc. | | 30,971 |
| 1,202 | | Texas Instruments, Inc. | | 47,118 |
| 436 | | Time Warner Cable, Inc. | | 49,735 |
| 1,248 | | Walgreen Co. | | 62,712 |
| | | | | 887,523 |
| | | Total common stocks | | |
| | | (Cost $2,624,259) | 2,771,297 |
Face amount | | | | | | Coupon | | Maturity | | | Value (note 2) |
| | | | | | | | | | |
| Corporate bonds – 10.90% | | | | | | | | | |
| | | | | | | | | | | | |
| | | | | United Kingdom - 3.53% | | | | | | | |
| USD | | 25,000 | | AstraZeneca plc | | 4.000% | | 9/18/42 | | $ | 22,606 |
| USD | | 60,000 | | Lloyds Banking Group plc (a) (b) | | 6.657% | | 5/21/37 | | | 54,600 |
| USD | | 25,000 | | Royal Bank of Scotland Group plc | | 6.100% | | 6/10/23 | | | 24,018 |
| USD | | 25,000 | | WPP Finance 2010 | | 4.750% | | 11/21/21 | | | 26,010 |
| USD | | 8,000 | | WPP Finance 2010 | | 3.625% | | 9/7/22 | | | 7,604 |
| | | | | | | | | | | | 134,838 |
| | | | | | | | | | | | |
| | | | | United States - 7.37% | | | | | | | |
| USD | | 25,000 | | CenturyLink, Inc. | | 7.600% | | 9/15/39 | | | 23,875 |
| USD | | 25,000 | | Constellation Brands, Inc. | | 4.250% | | 5/1/23 | | | 23,625 |
| USD | | 25,000 | | HCA, Inc. | | 8.000% | | 10/1/18 | | | 28,875 |
| USD | | 25,000 | | Health Management Associates, Inc. | | 7.375% | | 1/15/20 | | | 28,437 |
| USD | | 25,000 | | Iron Mountain, Inc. | | 5.750% | | 8/15/24 | | | 23,750 |
| USD | | 25,000 | | NIKE, Inc. | | 2.250% | | 5/1/23 | | | 23,089 |
| USD | | 25,000 | | Regal Entertainment Group | | 5.750% | | 2/1/25 | | | 24,125 |
| USD | | 25,000 | | SBA Telecommunications, Inc. | | 5.750% | | 7/15/20 | | | 25,687 |
| USD | | 50,000 | | Taminco Global Chemical Corp. (a) (c) | | 9.750% | | 3/31/20 | | | 56,625 |
| USD | | 25,000 | | Wal-Mart Stores, Inc. | | 4.000% | | 4/11/43 | | | 23,156 |
| | | | | | | | | | | | 281,244 |
| | | | | | | | | | | | |
| | | | | Total corporate bonds | | | | | | | |
| | | | | (Cost $431,109) | | | | | | | 416,082 |
See notes to financial statements
25
| Henderson Global Funds | | Portfolio of investments |
Dividend & Income Builder Fund
July 31, 2013 (continued)
| | | | | Value |
| Shares | | | | (note 2) |
| | | |
| Investment companies - 7.47% | | |
| | | |
| Fixed income - 7.47% | | |
| 2,750 | | Highland/iBoxx Senior | | |
| | | Loan ETF | $ | 55,385 |
| 200 | | iShares Barclays Credit | | |
| | | Bond Fund | | 21,588 |
| 250 | | PIMCO 0-5 Year High-Yield | | |
| | | Corporate Bond Index Fund | | 26,175 |
| 235 | | PIMCO Investment Grade | | |
| | | Corporate Bond Index ETF | | 24,022 |
| 1,417 | | PowerShares Fundamental | | |
| | | High Yield Corporate | | |
| | | Bond Portfolio | | 26,951 |
| 1,690 | | PowerShares Senior Loan | | |
| | | Portfolio | | 42,165 |
| 680 | | SPDR Blackstone/GSO Senior | | |
| | | Loan ETF | | 34,082 |
| 300 | | Vanguard Intermediate-Term | | |
| | | Bond ETF | | 25,095 |
| 355 | | Vanguard Intermediate-Term | | |
| | | Corporate Bond ETF | | 29,717 |
| | | | | 285,180 |
| | | | | |
| | | Total investment companies | | |
| | | (Cost $287,025) | | 285,180 |
| | | | | |
| REITs - 0.63% | | |
| | | |
| Mexico - 0.63% | | |
| 7,497 | | Fibra Uno Administracion | | |
| | | SA de C.V. | | 23,948 |
| | | | | |
| | | Total REITs | | |
| | | (Cost $23,160) | | 23,948 |
| | | | | |
| | | Total long-term investments | | |
| | | (Cost $3,365,553) | | 3,496,507 |
| | | | | Value |
| Shares | | | | (note 2) |
| | | |
| Short-term investment - 4.61% | | |
| 176,084 | | Fidelity Institutional | | |
| | | Treasury Portfolio | $ | 176,084 |
| | | | | |
| | | Total short-term investment | | |
| | | (Cost $176,084) | | 176,084 | |
| | | |
| Total investments - 96.19% | | |
| (Cost $3,541,637) | | | | 3,672,591 |
| | | |
| Net other assets and liabilities – 3.81% | | 145,383 |
| | | | | |
| Total net assets – 100.00% | $ | 3,817,974 |
| * | | Non income producing security |
| (a) | | Restricted security, purchased pursuant to Rule 144A under the Securities Act of 1933, as amended, and which is exempt from registration under that Act. At July 31, 2013, the restricted securities held by the Fund had an aggregate value of $111,225, which represented 2.9% of net assets. |
| (b) | | Maturity date is perpetual. Maturity date presented represents the next call date. |
| (c) | | The security has been deemed illiquid according to the policies and procedures adopted by the Board of Trustees. |
| ADR | | American Depositary Receipts |
| ETF | | Exchange-traded fund |
| REIT | | Real Estate Investment Trust |
See notes to financial statements
26
| Henderson Global Funds | Portfolio of investments |
Dividend & Income Builder Fund
July 31, 2013 (continued)
Other information:
Industry concentration as a percentage of net assets: | | | % of net assets |
| Investment Companies | | | 7.47 | % |
| Diversified Banks | | | 7.01 | |
| Pharmaceuticals | | | 6.80 | |
| Integrated Telecommunication Services | | | 3.95 | |
| Integrated Oil & Gas | | | 3.30 | |
| Air Freight & Logistics | | | 3.03 | |
| Semiconductors | | | 2.92 | |
| Communications Equipment | | | 2.90 | |
| Diversified Metals & Mining | | | 2.81 | |
| Property & Casualty Insurance | | | 2.66 | |
| Life & Health Insurance | | | 2.45 | |
| Publishing | | | 2.40 | |
| Industrial Conglomerates | | | 2.29 | |
| Packaged Foods & Meats | | | 1.72 | |
| Broadcasting | | | 1.69 | |
| Drug Retail | | | 1.64 | |
| Other Diversified Financial Services | | | 1.63 | |
| Advertising | | | 1.62 | |
| Diversified Chemicals | | | 1.54 | |
| Systems Software | | | 1.48 | |
| Chemicals - Other | | | 1.48 | |
| Health Care Equipment | | | 1.37 | |
| Heavy Electrical Equipment | | | 1.31 | |
| Cable & Satellite | | | 1.30 | |
| Aerospace & Defense | | | 1.30 | |
| Regional Banks | | | 1.12 | |
| Construction & Farm Machinery &Heavy Trucks | | | 1.07 | |
| Household Appliances | | | 0.95 | |
| Automobile Manufacturers | | | 0.94 | |
| Auto Parts & Equipment | | | 0.93 | |
| Specialized Finance | | | 0.92 | |
| Computer Hardware | | | 0.92 | |
| Advertising Services | | | 0.88 | |
| Leisure Facilities | | | 0.87 | |
| Research & Consulting Services | | | 0.86 | |
| Tobacco | | | 0.85 | |
| Leisure Products | | | 0.84 | |
| Apparel Retail | | | 0.83 | |
| Industrial Machinery | | | 0.81 | |
| Diversified Real Estate Activities | | | 0.77 | |
| Health Care Services | | | 0.76 | |
| Wireless Telecommunication Services | | | 0.75 | |
| Health Care Facilities | | | 0.75 | |
| Electric Utilities | | | 0.73 | |
| Multi-Utilities | | | 0.73 | |
| Casinos & Gaming | | | 0.73 | |
| Telecommunication Services | | | 0.67 | |
| Movies & Entertainment | | | 0.63 | |
| Diversified REITs | | | 0.63 | |
| Diversified Support Services | | | 0.62 | |
| Distillers & Vintners | | | 0.62 | |
| Hypermarkets & Super Centers | | | 0.61 | |
| Athletic Footwear | | | 0.60 | |
| Restaurants | | | 0.58 | |
| Oil & Gas Storage & Transportation | | | 0.54 | |
| Long-Term Investments | | | 91.58 | |
| Short-Term Investment | | | 4.61 | |
| Total Investments | | | 96.19 | |
| Net Other Assets and Liabilities | | | 3.81 | |
| | | | 100.00 | % |
See notes to financial statements
27
| Henderson Global Funds | Portfolio of investments |
Dividend & Income Builder Fund
July 31, 2013 (continued)
The following table summarizes the Fund’s investments that are measured at fair value by level within the fair value hierarchy at July 31, 2013:
| | | Quoted prices | | | Significant | | | | | | | |
| | | in active | | | other | | | Significant | | | | |
| | | markets for | | | observable | | | unobservable | | | | |
| | | identical assets | | | inputs | | | inputs | | | | |
| Description | | (level 1 | ) | | (level 2 | ) | | (level 3 | ) | | Total | |
| Assets | | | | | | | | | | | | |
| Common Stocks | | | | | | | | | | | | |
| Australia | | $ | 75,722 | | | $ | — | | | $ | — | | | $ | 75,722 | |
| Brazil | | | 19,795 | | | | — | | | | — | | | | 19,795 | |
| Canada | | | 65,015 | | | | — | | | | — | | | | 65,015 | |
| Colombia | | | 15,397 | | | | — | | | | — | | | | 15,397 | |
| France | | | 147,917 | | | | — | | | | — | | | | 147,917 | |
| Germany | | | 194,688 | | | | — | | | | — | | | | 194,688 | |
| Hong Kong | | | 94,470 | | | | — | | | | — | | | | 94,470 | |
| Italy | | | 40,349 | | | | — | | | | — | | | | 40,349 | |
| Luxembourg | | | 32,993 | | | | — | | | | — | | | | 32,993 | |
| Netherlands | | | 147,207 | | | | — | | | | — | | | | 147,207 | |
| Norway | | | 26,524 | | | | — | | | | — | | | | 26,524 | |
| Sweden | | | 36,214 | | | | — | | | | — | | | | 36,214 | |
| Switzerland | | | 245,977 | | | | — | | | | — | | | | 245,977 | |
| Taiwan | | | 99,177 | | | | — | | | | — | | | | 99,177 | |
| United Kingdom | | | 642,329 | | | | — | | | | — | | | | 642,329 | |
| United States | | | 887,523 | | | | — | | | | — | | | | 887,523 | |
| Total Common Stocks | | | 2,771,297 | | | | — | | | | — | | | | 2,771,297 | |
| Corporate Bonds | | | | | | | | | | | | | | | | |
| United Kingdom | | | — | | | | 134,838 | | | | — | | | | 134,838 | |
| United States | | | — | | | | 281,244 | | | | — | | | | 281,244 | |
| Total Corporate Bonds | | | — | | | | 416,082 | | | | — | | | | 416,082 | |
| Investment Companies | | | 285,180 | | | | — | | | | — | | | | 285,180 | |
| REITs | | | | | | | | | | | | | | | | |
| Mexico | | | 23,948 | | | | — | | | | — | | | | 23,948 | |
| Total REITs | | | 23,948 | | | | — | | | | — | | | | 23,948 | |
| Short-Term Investment | | | 176,084 | | | | — | | | | — | | | | 176,084 | |
| Total | | $ | 3,256,509 | | | $ | 416,082 | | | $ | — | | | $ | 3,672,591 | |
During the year ended July 31, 2013, there were no transfers in or out of security levels as a result of the fair value pricing procedures established by the Board.
See notes to financial statements
28
| Henderson Global Funds | | Portfolio of investments |
Emerging Markets Opportunities Fund
July 31, 2013
| | | | | Value |
| Shares | | | | (note 2) |
| | | |
| Common stocks - 91.20% | | |
| | | | | |
| | | Australia - 0.29% | | |
| 446,325 | | Cape Lambert | | |
| | | Resources, Ltd. * | $ | 66,194 |
| | | | | |
| | | Brazil - 8.14% | | |
| 97,199 | | BM&FBoveSpA S.A. | | 524,053 |
| 48,400 | | BR Malls Participacoes S.A. | | 428,978 |
| 10,436 | | Embraer S.A., ADR | | 354,511 |
| 25,000 | | Kroton Educacional S.A. | | 356,149 |
| 11,900 | | Linx S.A. | | 197,120 |
| | | | | 1,860,811 |
| | | | | |
| | | China - 17.48% | | |
| 5,007 | | Baidu, Inc., ADR * | | 662,476 |
| 792,000 | | China Construction Bank Corp., | | |
| | | Class H | | 591,273 |
| 54,000 | | China Mobile, Ltd. | | 573,727 |
| 200,000 | | China Oilfield Services, Ltd., | | |
| | | Class H | | 453,350 |
| 420,000 | | Huaneng Power International, | | |
| | | Inc., Class H | | 438,651 |
| 244,800 | | Samsonite International S.A. | | 670,741 |
| 8,342 | | Yum! Brands, Inc. | | 608,299 |
| | | | | 3,998,517 |
| | | | | |
| | | Greece - 1.52% | | |
| 71,543 | | InternetQ plc * | | 348,816 |
| | | | | |
| | | Hong Kong - 2.67% | | |
| 243,000 | | SJM Holdings, Ltd. | | 611,605 |
| | | | | |
| | | India - 4.36% | | |
| 32,000 | | Reliance Industries, Ltd. | | 460,778 |
| 22,357 | | Tata Motors, Ltd., ADR | | 537,462 |
| | | | | 998,240 |
| | | | | |
| | | Indonesia - 2.72% | | |
| 380,500 | | PT Bank Rakyat | | |
| | | Indonesia Tbk | | 305,437 |
| 550,000 | | PT Perusahaan Gas Negara | | |
| | | Persero Tbk | | 315,738 |
| | | | | 621,175 |
| | | | | |
| | | Kazakhstan - 2.21% | | |
| 955,965 | | International Petroleum, | | |
| | | Ltd. (a) (b)* | | 46,725 |
| 40,059 | | Zhaikmunai LP, GDR | | 457,875 |
| | | | | 504,600 |
| | | | | Value |
| Shares | | | | (note 2) |
| | | | | |
| | | Korea - 9.23% | | |
| 3,058 | | Hyundai Motor Co. | $ | 632,873 |
| 230 | | Samsung Electronics | | |
| | | Co., Ltd. | | 262,056 |
| 22,620 | | SK Hynix, Inc. * | | 547,668 |
| 3,400 | | SK Telecom Co., Ltd. | | 667,334 |
| | | | | 2,109,931 |
| | | | | |
| | | Liberia - 0.80% | | |
| 276,792 | | African Petroleum | | |
| | | Corp., Ltd. * | | 39,807 |
| 1,662,478 | | Sable Mining Africa, Ltd. * | | 142,259 |
| | | | | 182,066 |
| | | | | |
| | | Luxembourg - 3.18% | | |
| 5,000 | | Millicom International | | |
| | | Cellular S.A. | | 399,270 |
| 7,400 | | Tenaris S.A., ADR | | 328,930 |
| | | | | 728,200 |
| | | | | |
| | | Malaysia - 2.35% | | |
| 170,000 | | Malayan Banking Bhd | | 537,669 |
| | | | | |
| | | Mexico - 6.21% | | |
| 5,396 | | First Cash Financial | | |
| | | Services, Inc. * | | 288,146 |
| 4,339 | | Fomento Economico Mexicano, | | |
| | | S.A.B. de C.V., ADR | | 431,687 |
| 50,000 | | Grupo Aeroportuario del Centro | | |
| | | Norte, S.A.B. de C.V. * | | 171,694 |
| 172,000 | | Grupo Mexico S.A.B. de C.V., | | |
| | | Series B | | 528,009 |
| | | | | 1,419,536 |
| | | | | |
| | | Panama – 2.45% | | |
| 9,224 | | Banco Latinoamericano de | | |
| | | Comercio Exterior S.A., | | |
| | | Class E | | 232,353 |
| 2,350 | | Copa Holdings S.A., Class A | | 327,049 |
| | | | | 559,402 |
| | | | | |
| | | Peru - 1.09% | | |
| 2,100 | | Credicorp, Ltd. | | 249,459 |
| | | | | |
| | | Philippines - 3.76% | | |
| 837,000 | | LT Group, Inc | | 400,866 |
| 160,800 | | Universal Robina Corp | | 460,222 |
| | | | | 861,088 |
| | | | | |
| | | Poland - 0.74% | | |
| 9,036 | | Eurocash S.A | | 168,213 |
See notes to financial statements
29
| Henderson Global Funds | Portfolio of investments |
Emerging Markets Opportunities Fund
July 31, 2013 (continued)
| | | | | Value |
| Shares | | | | (note 2) |
| | | | | |
| | | Russia - 1.57% | | |
| 85,000 | | RusPetro plc * | $ | 40,085 |
| 110,279 | | Sberbank of Russia | | 318,706 |
| | | | | 358,791 |
| | | | | |
| | | South Africa - 2.73% | | |
| 106,696 | | Life Healthcare Group Holdings | | |
| | | Pte, Ltd. | | 389,342 |
| 12,555 | | MTN Group, Ltd. | | 235,752 |
| | | | | 625,094 |
| | | | | |
| | | Taiwan - 7.48% | | |
| 1,050,000 | | Chinatrust Financial Holding | | |
| | | Co., Ltd. | | 693,312 |
| 169,000 | | Taiwan Semiconductor | | |
| | | Manufacturing Co., Ltd. | | 577,677 |
| 200,000 | | United Microelectronics | | |
| | | Corp., ADR | | 440,000 |
| | | | | 1,710,989 |
| | | | | |
| | | Thailand - 5.57% | | |
| 135,600 | | AIA Group, Ltd. | | 642,542 |
| 105,700 | | Kasikornbank pcl | | 631,498 |
| | | | | 1,274,040 |
| | | | | |
| | | Ukraine - 1.56% | | |
| 39,772 | | Avangardco Investments | | |
| | | Public, Ltd. * | | 357,948 |
| | | | | |
| | | United Arab Emirates - 1.64% | | |
| 83,269 | | NMC Health plc | | 375,585 |
| | | | | |
| | | United Kingdom - 1.45% | | |
| 38,151 | | Inchcape plc | | 331,102 |
| | | | | |
| | | Total common stocks | | |
| | | (Cost $21,070,546) | | 20,859,071 |
| | | | | |
| Preferred stocks - 6.29% | | |
| | | | | |
| | | Brazil - 3.77% | | |
| 55,051 | | Alpargatas S.A.I.C. | | 338,074 |
| 41,050 | | Itau Unibanco Holding S.A. | | 524,337 |
| | | | | 862,411 |
| | | | | |
| | | Korea - 2.52% | | |
| 790 | | Samsung Electronics Co., Ltd. | | 574,520 |
| | | | | |
| | | Total preferred stocks | | |
| | | (Cost $1,635,110) | | 1,436,931 |
| | | | | Value |
| Shares | | | | (note 2) |
| | | | | |
| | | Total long-term investments | | |
| | | (Cost $22,705,656) | $ | 22,296,002 |
| | | | | |
| Short-term investment - 1.56% | | |
| 357,444 | | Fidelity Institutional | | |
| | | Treasury Portfolio | | 357,444 |
| | | | | |
| Total short-term investment | | |
| (Cost $357,444) | | | | 357,444 |
| | | | | |
| Total investments - 99.05% | | |
| | | (Cost $23,063,100) | | 22,653,446 |
| | | | | |
| Net other assets and liabilities – 0.95% | | 217,740 |
| | | |
| Total net assets – 100.00% | $ | 22,871,186 |
| * | | Non income producing security |
| (a) | | The security has been deemed illiquid according to the policies and procedures adopted by the Board of Trustees. |
| (b) | | Fair valued at July 31, 2013 as determined in good faith using procedures approved by the Board of Trustees. |
| ADR | | American Depositary Receipts |
| GDR | | Global Depositary Receipts |
See notes to financial statements
30
| Henderson Global Funds | Portfolio of investments |
Emerging Markets Opportunities Fund
July 31, 2013 (continued)
Other information:
Industry concentration as a percentage of net assets: | | | % of net assets |
| Diversified Banks | | | 17.86 | % |
| Semiconductors | | | 10.50 | |
| Wireless Telecommunication Services | | | 8.20 | |
| Packaged Foods & Meats | | | 3.58 | |
| Health Care Facilities | | | 3.34 | |
| Apparel, Accessories & Luxury Goods | | | 2.93 | |
| Diversified Metals & Mining | | | 2.93 | |
| Internet Software & Services | | | 2.90 | |
| Life & Health Insurance | | | 2.81 | |
| Automobile Manufacturers | | | 2.77 | |
| Casinos & Gaming | | | 2.67 | |
| Restaurants | | | 2.66 | |
| Oil & Gas Exploration & Production | | | 2.56 | |
| Construction & Farm Machinery & Heavy Trucks | | | 2.35 | |
| Specialized Finance | | | 2.29 | |
| Oil & Gas Refining & Marketing | | | 2.01 | |
| Oil & Gas Drilling | | | 1.98 | |
| Independent Power Producers & Energy Traders | | | 1.92 | |
| Soft Drinks | | | 1.89 | |
| Real Estate Operating Companies | | | 1.88 | |
| Distillers & Vintners | | | 1.75 | |
| Education Services | | | 1.56 | |
| Aerospace & Defense | | | 1.55 | |
| Advertising | | | 1.52 | |
| Footwear | | | 1.48 | |
| Distributors | | | 1.45 | |
| Oil & Gas Equipment & Services | | | 1.44 | |
| Airlines | | | 1.43 | |
| Gas Utilities | | | 1.38 | |
| Consumer Finance | | | 1.26 | |
| Application Software | | | 0.86 | |
| Airport Services | | | 0.75 | |
| Food Retail | | | 0.74 | |
| Steel | | | 0.29 | |
| Long-Term Investments | | | 97.49 | |
| Short-Term Investment | | | 1.56 | |
| Total Investments | | | 99.05 | |
| Net Other Assets and Liabilities | | | 0.95 | |
| | | | 100.00 | % |
See notes to financial statements
31
| Henderson Global Funds | Portfolio of investments |
Emerging Markets Opportunities Fund
July 31, 2013 (continued)
The following table summarizes the Fund’s investments that are measured at fair value by level within the fair value hierarchy at July 31, 2013:
| | | Quoted prices | | | Significant | | | | | | | |
| | | in active | | | other | | | Significant | | | | |
| | | markets for | | | observable | | | unobservable | | | | |
| | | identical assets | | | inputs | | | inputs | | | | |
| Description | | (level 1 | ) | | (level 2 | ) | | (level 3 | ) | | Total | |
| Assets | | | | | | | | | | | | |
| Common Stocks | | | | | | | | | | | | |
| Australia | | $ | 66,194 | | | $ | – | | | $ | – | | | $ | 66,194 | |
| Brazil | | | 1,860,811 | | | | – | | | | – | | | | 1,860,811 | |
| China | | | 3,998,517 | | | | – | | | | – | | | | 3,998,517 | |
| Greece | | | 348,816 | | | | – | | | | – | | | | 348,816 | |
| Hong Kong | | | 611,605 | | | | – | | | | – | | | | 611,605 | |
| India | | | 998,240 | | | | – | | | | – | | | | 998,240 | |
| Indonesia | | | 621,175 | | | | – | | | | – | | | | 621,175 | |
| Kazakhstan | | | 457,875 | | | | 46,725 | | | | – | | | | 504,600 | |
| Korea | | | 2,109,931 | | | | – | | | | – | | | | 2,109,931 | |
| Liberia | | | 182,066 | | | | – | | | | – | | | | 182,066 | |
| Luxembourg | | | 728,200 | | | | – | | | | – | | | | 728,200 | |
| Malaysia | | | 537,669 | | | | – | | | | – | | | | 537,669 | |
| Mexico | | | 1,419,536 | | | | – | | | | – | | | | 1,419,536 | |
| Panama | | | 559,402 | | | | – | | | | – | | | | 559,402 | |
| Peru | | | 249,459 | | | | – | | | | – | | | | 249,459 | |
| Philippines | | | 861,088 | | | | – | | | | – | | | | 861,088 | |
| Poland | | | 168,213 | | | | – | | | | – | | | | 168,213 | |
| Russia | | | 358,791 | | | | – | | | | – | | | | 358,791 | |
| South Africa | | | 625,094 | | | | – | | | | – | | | | 625,094 | |
| Taiwan | | | 1,710,989 | | | | – | | | | – | | | | 1,710,989 | |
| Thailand | | | 1,274,040 | | | | – | | | | – | | | | 1,274,040 | |
| Ukraine | | | 357,948 | | | | – | | | | – | | | | 357,948 | |
| United Arab Emirates | | | 375,585 | | | | – | | | | – | | | | 375,585 | |
| United Kingdom | | | 331,102 | | | | – | | | | – | | | | 331,102 | |
| Total Common Stocks | | | 20,812,346 | | | | 46,725 | | | | – | | | | 20,859,071 | |
| Preferred Stocks | | | | | | | | | | | | | | | | |
| Brazil | | | 862,411 | | | | – | | | | – | | | | 862,411 | |
| Korea | | | 574,520 | | | | – | | | | – | | | | 574,520 | |
| Total Preferred Stocks | | | 1,436,931 | | | | – | | | | – | | | | 1,436,931 | |
| Short-Term Investment | | | 357,444 | | | | – | | | | – | | | | 357,444 | |
| Total | | $ | 22,606,721 | | | $ | 46,725 | | | $ | – | | | $ | 22,653,446 | |
During the year ended July 31, 2013, there was one transfer into Level 2 out of Level 1 as a result of the fair value pricing procedures established by the Board. On April 24, 2013, Range Resources, Ltd. issued a press release indicating its intention to merge with International Petroleum - a position for which the Fund holds. Accordingly, in accordance with policies and procedures established by the Board of Trustees, the Adviser priced this security based on the known value of the Range Resources, Ltd. common share price, adjusted for the impact to each outstanding share as a result of the planned merger.
See notes to financial statements
32
| Henderson Global Funds | Portfolio of investments |
European Focus Fund
July 31, 2013
| | | | | Value |
| Shares | | | | (note 2) |
| | |
| Common stocks - 94.56% | |
| | | | | |
| | | Australia - 0.34% | | |
| 16,593,203 | | African Petroleum | | |
| | | Corp., Ltd. * | $ | 2,386,367 |
| | | | | |
| | | Austria - 1.23% | | |
| 284,746 | | Erste Group Bank AG | | 8,648,273 |
| | | | | |
| | | Canada - 3.51% | | |
| 1,384,541 | | Africa Oil Corp. * | | 10,541,438 |
| 574,622 | | Africa Oil Corp. (a) * | | 4,374,982 |
| 2,500,000 | | Lundin Mining Corp. * | | 9,857,852 |
| | | | | 24,774,272 |
| | | | | |
| | | Denmark - 3.62% | | |
| 2,182 | | AP Moeller-Maersk A/S, | | |
| | | Class B | | 17,115,711 |
| 106,880 | | FLSmidth & Co. A/S | | 5,076,764 |
| 154,639 | | Matas A/S * | | 3,366,366 |
| | | | | 25,558,841 |
| | | | | |
| | | Finland - 2.26% | | |
| 1,425,648 | | UPM-Kymmene Oyj | | 15,903,079 |
| | | | | |
| | | France - 10.09% | | |
| 585,403 | | Accor S.A. | | 22,086,506 |
| 480,000 | | AXA S.A. | | 10,584,263 |
| 51,902 | | Christian Dior S.A. | | 9,190,264 |
| 222,646 | | Renault S.A. | | 17,525,980 |
| 148,373 | | Valeo S.A. | | 11,768,272 |
| | | | | 71,155,285 |
| | | | | |
| | | Germany - 13.99% | | |
| 134,190 | | Continental AG | | 21,136,725 |
| 93,655 | | Deutsche Annington | | |
| | | Immobilien SE * | | 2,261,380 |
| 362,319 | | Deutsche Post AG | | 10,155,972 |
| 60,000 | | Fresenius SE & Co., KGaA | | 7,573,415 |
| 1,811,276 | | Infineon Technologies AG | | 15,985,490 |
| 587,767 | | KION Group AG * | | 19,556,212 |
| 138,948 | | MTU Aero Engines AG | | 12,662,187 |
| 41,008 | | Volkswagen AG | | 9,337,086 |
| | | | | 98,668,467 |
| | | | | |
| | | Ireland - 1.69% | | |
| 2,293,660 | | Petroceltic International | | |
| | | plc * | | 4,745,354 |
| 1,180,952 | | Providence Resources | | |
| | | plc * | | 7,204,060 |
| | | | | 11,949,414 |
| | | | | Value |
| Shares | | | | (note 2) |
| | | | | |
| | | Italy - 0.84% | | |
| 2,303,715 | | Moleskine SpA * | $ | 5,905,767 |
| | | | | |
| | | Kazakhstan - 2.78% | | |
| 1,716,557 | | Zhaikmunai LP, | | |
| | | GDR (b) | | 19,620,246 |
| | | | | |
| | | Luxembourg - 1.26% | | |
| 67,854 | | RTL Group S.A. | | 6,067,017 |
| 243,122 | | SAF-Holland S.A. * | | 2,813,904 |
| | | | | 8,880,921 |
| | | | | |
| | | Netherlands - 4.57% | | |
| 414,902 | | Amtel Vredestein N.V., | | |
| | | GDR (a) (b)* | | — |
| 540,097 | | European Aeronautic | | |
| | | Defence and Space | | |
| | | Co. N.V. | | 32,250,678 |
| | | | | 32,250,678 |
| | | | | |
| | | Norway - 1.92% | | |
| 329,417 | | Algeta ASA * | | 13,505,829 |
| | | | | |
| | | Russia - 0.28% | | |
| 4,169,668 | | RusPetro plc * | | 1,966,364 |
| | | | | |
| | | Spain - 10.30% | | |
| 481,010 | | Amadeus IT Holding S.A., | | |
| | | A Shares | | 16,522,516 |
| 3,885,355 | | CaixaBank | | 14,328,139 |
| 193,039 | | Fomento de Construcciones | | |
| | | y Contratas S.A. * | | 2,668,250 |
| 568,775 | | Indra Sistemas S.A. | | 7,718,031 |
| 4,361,775 | | International Consolidated | | |
| | | Airlines Group S.A. * | | 19,315,509 |
| 217,126 | | Red Electrica Corp., S.A. | | 12,118,850 |
| | | | | 72,671,295 |
| | | | | |
| | | Sweden - 6.16% | | |
| 1,000,000 | | Investment AB Kinnevik, | | |
| | | B Shares | | 30,192,616 |
| 501,805 | | Svenska Cellulosa AB, | | |
| | | B Shares | | 13,280,051 |
| | | | | 43,472,667 |
| | | | | |
| | | Switzerland - 2.00% | | |
| 715,028 | | UBS AG * | | 14,084,997 |
See notes to financial statements
33
| Henderson Global Funds | Portfolio of investments |
European Focus Fund
July 31, 2013 (continued)
| | | | | Value |
| Shares | | | | (note 2) |
| | | | | |
| | | United Kingdom - 27.72% | | |
| 1,525,832 | | Aviva plc | $ | 8,623,156 |
| 2,603,508 | | Bwin.Party Digital | | |
| | | Entertainment plc | | 5,548,783 |
| 717,923 | | Edwards Group, Ltd. | | |
| | | ADR (b)* | | 5,994,657 |
| 6,730,160 | | Essar Energy, Ltd. * | | 13,678,313 |
| 882,370 | | Fenner plc | | 4,636,324 |
| 5,856,284 | | FirstGroup plc | | 8,904,420 |
| 829,855 | | Genel Energy plc * | | 12,106,581 |
| 2,390,190 | | GKN plc | | 12,729,907 |
| 541,083 | | GlaxoSmithKline plc | | 13,861,386 |
| 1,896,551 | | HellermannTyton | | |
| | | Group plc * | | 7,212,822 |
| 650,000 | | Inchcape plc | | 5,641,177 |
| 3,267,652 | | Kingfisher plc | | 19,759,394 |
| 19,788,525 | | Lloyds Banking | | |
| | | Group plc * | | 20,611,730 |
| 4,350,000 | | Mytrah Energy, Ltd. (b)* | | 7,097,203 |
| 629,213 | | Partnership Assurance | | |
| | | Group plc * | | 4,776,380 |
| 750,000 | | Phoenix Group Holdings | | 8,357,369 |
| 579,033 | | Prudential plc | | 10,279,568 |
| 1,401,163 | | Tullett Prebon plc | | 7,095,829 |
| 6,191,629 | | Vodafone Group plc | | 18,602,560 |
| | | | | 195,517,559 |
| | | | | |
| | | Total common stocks | | |
| | | (Cost $594,630,469) | | 666,920,321 |
| | | | | |
| Preferred stock - 0.76% | | |
| | | |
| | | Germany - 0.76% | | |
| 132,153 | | ProSiebenSat.1 Media AG | | 5,421,972 |
| | | | | |
| | | Total preferred stock | | |
| | | (Cost $4,175,651) | | 5,421,972 |
| | | | | Value |
| Shares | | | | (note 2) |
| | | | | |
| Rights - 0.04% | | | | |
| | | | | |
| | | Spain - 0.04% | | |
| 3,885,355 | | CaixaBank (expires | | |
| | | 8/13/13) * | $ | 273,951 |
| | | | | |
| | | Total rights | | |
| | | (Cost $257,716) | | 273,951 |
| | | | | |
| | | Total long-term | | |
| | | investments | | |
| | | (Cost $599,063,836) | | 672,616,244 |
| | | | | |
| Short-term investment - 3.42% | | |
| 24,108,024 | | Fidelity Institutional | | |
| | | Treasury Portfolio | | 24,108,024 |
| | | | | |
| | | Total short-term investment | | |
| | | (Cost $24,108,024) | | 24,108,024 |
| | | | | |
| Total investments - 98.78% | | |
| | | (Cost $623,171,860) | | 696,724,268 |
| | | | | |
| Net other assets and liabilities – 1.22% | | 8,569,387 |
| | | |
| Total net assets – 100.00% | $ | 705,293,655 |
| * | | Non income producing security |
| (a) | | Fair valued at July 31, 2013 as determined in good faith using procedures approved by the Board of Trustees. |
| (b) | | The security has been deemed illiquid according to the policies and procedures adopted by the Board of Trustees. |
| ADR | | American Depositary Receipts |
| GDR | | Global Depositary Receipts |
The Fund held the following open forward foreign currency contracts at July 31, 2013:
| | | | | | | Local | | Current | | Unrealized |
| | | | | Value | | amount | | notional | | appreciation/ |
| | | Counterparty | | date | | (000’s) | | value | | (depreciation) |
| Euro (Short) | | Deutsche Bank AG | | 8/16/13 | | 43,906 | | $58,413,458 | | $(1,404,390) |
During the year ended July 31, 2013, average monthly notional value related to forward foreign currency contracts was $53.3 million or 7.6% of net assets.
See notes to financial statements
34
| Henderson Global Funds | Portfolio of investments |
European Focus Fund
July 31, 2013 (continued)
Other information:
Industry concentration as a percentage of net assets: | | | % of net assets |
| Oil & Gas Exploration & Production | | | 10.86 | % |
| Aerospace & Defense | | | 6.37 | |
| Diversified Banks | | | 6.22 | |
| Multi-Sector Holdings | | | 4.28 | |
| Paper Products | | | 4.14 | |
| Auto Parts & Equipment | | | 3.87 | |
| Automobile Manufacturers | | | 3.81 | |
| Life & Health Insurance | | | 3.32 | |
| Hotels, Resorts & Cruise Lines | | | 3.13 | |
| Tires & Rubber | | | 3.00 | |
| Home Improvement Retail | | | 2.80 | |
| Material Handling Machinery Manufacturing | | | 2.77 | |
| Airlines | | | 2.74 | |
| Multi-line Insurance | | | 2.72 | |
| Wireless Telecommunication Services | | | 2.64 | |
| Marine | | | 2.43 | |
| Data Processing & Outsourced Services | | | 2.34 | |
| Semiconductors | | | 2.27 | |
| Diversified Capital Markets | | | 2.00 | |
| Pharmaceuticals | | | 1.96 | |
| Biotechnology | | | 1.91 | |
| Electric Utilities | | | 1.72 | |
| Broadcasting | | | 1.63 | |
| Industrial Machinery | | | 1.51 | |
| Air Freight & Logistics | | | 1.44 | |
| Diversified Metals & Mining | | | 1.40 | |
| Apparel, Accessories & Luxury Goods | | | 1.30 | |
| Trucking | | | 1.26 | |
| Construction & Engineering | | | 1.10 | |
| IT Consulting & Other Services | | | 1.09 | |
| Health Care Services | | | 1.07 | |
| Wire & Cable Products | | | 1.02 | |
| Independent Power Producers & Energy Traders | | | 1.01 | |
| Investment Banking & Brokerage | | | 1.00 | |
| Retail Office Supplies | | | 0.84 | |
| Distributors | | | 0.80 | |
| Casinos & Gaming | | | 0.79 | |
| Cosmetics & Beauty Stores | | | 0.48 | |
| Real Estate Operating Companies | | | 0.32 | |
| Long-Term Investments | | | 95.36 | |
| Short-Term Investment | | | 3.42 | |
| Total Investments | | | 98.78 | |
| Net Other Assets and Liabilities | | | 1.22 | |
| | | | 100.00 | % |
See notes to financial statements
35
| Henderson Global Funds | Portfolio of investments |
European Focus Fund
July 31, 2013 (continued)
The following table summarizes the Fund’s investments that are measured at fair value by level within the fair value hierarchy at July 31, 2013:
| Description | | | Quoted prices
in active
markets for
identical assets
(level 1 | ) | | Significant
other
observable
inputs
(level 2 | ) | | Significant
unobservable
inputs
(level 3 | ) | | Total | |
| Assets | | | | | | | | | | | | | |
| Common Stocks | | | | | | | | | | | | | |
| Australia | | $ | 2,386,367 | | $ | — | | $ | — | | $ | 2,386,367 | |
| Austria | | | 8,648,273 | | | — | | | — | | | 8,648,273 | |
| Canada | | | 20,399,290 | | | 4,374,982 | | | — | | | 24,774,272 | |
| Denmark | | | 25,558,841 | | | — | | | — | | | 25,558,841 | |
| Finland | | | 15,903,079 | | | — | | | — | | | 15,903,079 | |
| France | | | 71,155,285 | | | — | | | — | | | 71,155,285 | |
| Germany | | | 98,668,467 | | | — | | | — | | | 98,668,467 | |
| Ireland | | | 11,949,414 | | | — | | | — | | | 11,949,414 | |
| Italy | | | 5,905,767 | | | — | | | — | | | 5,905,767 | |
| Kazakhstan | | | 19,620,246 | | | — | | | — | | | 19,620,246 | |
| Luxembourg | | | 8,880,921 | | | — | | | — | | | 8,880,921 | |
| Netherlands | | | 32,250,678 | | | — | | | — | | | 32,250,678 | |
| Norway | | | 13,505,829 | | | — | | | — | | | 13,505,829 | |
| Russia | | | 1,966,364 | | | — | | | — | | | 1,966,364 | |
| Spain | | | 72,671,295 | | | — | | | — | | | 72,671,295 | |
| Sweden | | | 43,472,667 | | | — | | | — | | | 43,472,667 | |
| Switzerland | | | 14,084,997 | | | — | | | — | | | 14,084,997 | |
| United Kingdom | | | 195,517,559 | | | — | | | — | | | 195,517,559 | |
| Total Common Stocks | | | 662,545,339 | | | 4,374,982 | | | — | | | 666,920,321 | |
| Preferred Stock | | | | | | | | | | | | | |
| Germany | | | 5,421,972 | | | — | | | — | | | 5,421,972 | |
| Total Preferred Stock | | | 5,421,972 | | | — | | | — | | | 5,421,972 | |
| Rights | | | | | | | | | | | | | |
| Spain | | | 273,951 | | | — | | | — | | | 273,951 | |
| Total Rights | | | 273,951 | | | — | | | — | | | 273,951 | |
| Short-Term Investment | | | 24,108,024 | | | — | | | — | | | 24,108,024 | |
| Total Investments | | $ | 692,349,286 | | $ | 4,374,982 | | $ | — | | $ | 696,724,268 | |
| Liabilities | | | | | | | | | | | | | |
| Financial Derivative Instruments* | | | | | | | | | | | | | |
| Forward Currency Contracts | | | — | | | (1,404,390 | ) | | — | | | (1,404,390 | ) |
| Total Financial Derivative Instruments | | $ | — | | $ | (1,404,390 | ) | $ | — | | $ | (1,404,390 | ) |
* These investments are recorded at the unrealized gain or loss on the investment.
During the year ended July 31, 2013, there were no transfers in or out of security levels as a result of the fair value pricing procedures established by the Board. However, the Fund increased its position in Africa Oil Corp. through the purchase of 574,622 shares in a private placement offering. These particular shares were subject to a lock-up provision whereby the shares could convert and trade pari passu with the listed common equity shares at the end of April 2013 should the Fund wish to transact. Accordingly, in accordance with the policies and procedures established by the Board of Trustees, these private placement shares were priced in-line with the common equity shares since that time.
See notes to financial statements
| Henderson Global Funds | Portfolio of investments |
European Focus Fund
July 31, 2013 (continued)
Following is a reconciliation of investments in which significant unobservable inputs (Level 3) were used in determining fair value:
Investments
in
securities | | Balance
as of
July 31,
2012 | | Accrued discounts/ premiums | | Realized
gain/(loss | ) | | Change in unrealized appreciation (depreciation | ) | | Purchases | | Sales | | Transfers
in to
level 3 | | Transfers
out of
level 3 | | Balance
as of
July 31,
2013 | |
| Common Stock | | | | | | | | | | | | | | | | | | | | | |
| Netherlands | | | | | | | | | | | | | | | | | | | | | |
| Amtel Vredestein | | | | | | | | | | | | | | | | | | | | | |
| N.V., GDR | | $0 | | $0 | | $0 | | | $0 | | | $0 | | $0 | | $0 | | $0 | | $0 | |
| Total | | $0 | | $0 | | $0 | | | $0 | | | $0 | | $0 | | $0 | | $0 | | $0 | |
The total net change in unrealized appreciation (depreciation) in the Statement of Operations attributable to Level 3 investments held at July 31, 2013 was $0.
The Fund’s Adviser has determined that Amtel Vredestein N.V., GDR is a level 3 investment due to the lack of observable inputs that may be used in the determination of fair value. Management has also concluded there is no value for the investment primarily on the basis that the company is bankrupt, has no current operations, and has delisted from the exchange.
See notes to financial statements
37
| Henderson Global Funds | Portfolio of investments |
Global Equity Income Fund
July 31, 2013
| | | | | Value |
| Shares | | | | (note 2) |
| | | | | |
| Common stocks - 91.03% | | |
| | | | | |
| | | Australia - 6.06% | | |
| 2,820,159 | | Amcor, Ltd. | $ | 26,844,583 |
| 18,424,507 | | Spark Infrastructure | | |
| | | Group | | 29,561,141 |
| 2,500,000 | | Suncorp Group, Ltd. | | 28,808,134 |
| 6,093,282 | | Telstra Corp., Ltd. | | 27,329,955 |
| 1,300,000 | | Toll Holdings, Ltd. | | 6,228,130 |
| | | | | 118,771,943 |
| | | | | |
| | | Brazil - 0.58% | | |
| 1,459,528 | | CCR S.A. | | 11,451,794 |
| | | | | |
| | | Canada - 1.28% | | |
| 331,508 | | Bank of Montreal | | 20,614,756 |
| 116,332 | | Crescent Point | | |
| | | Energy Corp. | | 4,411,578 |
| | | | | 25,026,334 |
| | | | | |
| | | China - 1.58% | | |
| 54,818,000 | | Bank of China, Ltd., | | |
| | | Class H | | 22,900,913 |
| 7,750,000 | | Jiangsu Expressway Co., | | |
| | | Ltd., Class H | | 8,014,209 |
| | | | | 30,915,122 |
| | | | | |
| | | Cyprus - 1.10% | | |
| 2,152,546 | | ProSafe SE | | 21,643,081 |
| | | | | |
| | | Denmark - 0.98% | | |
| 2,200,000 | | TDC A/S | | 19,251,104 |
| | | | | |
| | | France - 4.45% | | |
| 695,000 | | GDF Suez | | 14,580,833 |
| 1,800,000 | | Orange S.A. | | 17,693,918 |
| 900,000 | | SCOR SE | | 28,765,489 |
| 491,324 | | Total S.A. | | 26,210,675 |
| | | | | 87,250,915 |
| | | | | |
| | | Germany - 3.29% | | |
| 242,866 | | Bayerische Motoren | | |
| | | Werke AG | | 23,776,689 |
| 1,450,000 | | Deutsche Post AG | | 40,644,182 |
| | | | | 64,420,871 |
| | | | | |
| | | Hong Kong - 3.55% | | |
| 885,000 | | Cheung Kong | | |
| | | Holdings, Ltd. | | 12,426,698 |
| 5,086,000 | | NWS Holdings, Ltd. | | 7,738,254 |
| 6,285,000 | | Shanghai Industrial | | |
| | | Holdings, Ltd. | | 19,530,210 |
| 7,972,000 | | SJM Holdings, Ltd. | | 20,064,655 |
| 830,500 | | Swire Pacific, Ltd., Class A | | 9,798,178 |
| | | | | 69,557,995 |
| | | | | |
| | | Israel - 0.24% | | |
| 591,630 | | Israel Chemicals, Ltd. | $ | 4,727,662 |
| | | | | |
| | | Italy - 4.20% | | |
| 1,680,200 | | ENI SpA | | 37,127,564 |
| 4,639,550 | | Snam SpA | | 21,899,052 |
| 5,216,209 | | Terna - Rete Elettrica | | |
| | | Nazionale SpA | | 23,246,932 |
| | | | | 82,273,548 |
| | | | | |
| | | Japan - 1.78% | | |
| 694,300 | | Nippon Telegraph and | | |
| | | Telephone Corp. | | 34,995,103 |
| | | | | |
| | | Luxembourg - 0.78% | | |
| 518,279 | | SES | | 15,237,781 |
| | | | | |
| | | Netherlands - 5.51% | | |
| 2,203,860 | | Delta Lloyd N.V. | | 47,702,090 |
| 392,359 | | Unilever N.V. | | 15,784,515 |
| 700,000 | | Wolters Kluwer N.V. | | 16,897,438 |
| 693,690 | | Ziggo N.V. | | 27,556,312 |
| | | | | 107,940,355 |
| | | | | |
| | | New Zealand - 1.45% | | |
| 15,871,424 | | Telecom Corp. of | | |
| | | New Zealand, Ltd. | | 28,460,721 |
| | | | | |
| | | Norway - 0.88% | | |
| 404,016 | | Seadrill, Ltd. | | 17,339,066 |
| | | | | |
| | | Singapore - 0.30% | | |
| 1,005,000 | | Venture Corp., Ltd. | | 5,788,724 |
| | | | | |
| | | Taiwan - 1.49% | | |
| 2,513,000 | | Asustek Computer, Inc. | | 21,956,747 |
| 4,054,000 | | CTCI Corp. | | 7,300,485 |
| | | | | 29,257,232 |
| | | | | |
| | | Thailand - 0.38% | | |
| 8,251,600 | | Charoen Pokphand | | |
| | | Foods pcl | | 7,381,623 |
| | | | | |
| | | United Kingdom - 36.66% | | |
| 2,959,354 | | Amlin plc | | 18,102,213 |
| 1,250,000 | | Antofagasta plc | | 16,771,785 |
| 635,000 | | AstraZeneca plc | | 32,215,899 |
| 5,034,211 | | BAE Systems plc | | 34,148,338 |
| 11,278,505 | | BT Group plc | | 58,455,363 |
| 4,177,610 | | Centrica plc | | 24,848,795 |
| 1,806,175 | | Dairy Crest Group plc | | 14,012,986 |
| 1,262,295 | | De La Rue plc | | 18,981,836 |
| 1,626,926 | | Drax Group plc | | 15,876,880 |
| 4,572,090 | | Electrocomponents plc | | 17,116,977 |
| 1,933,931 | | GlaxoSmithKline plc | | 49,543,166 |
See notes to financial statements
38
| Henderson Global Funds | Portfolio of investments |
Global Equity Income Fund
July 31, 2013 (continued)
| | | | | Value |
| Shares | | | | (note 2) |
| | | | | |
| | | United Kingdom (continued) | | |
| 570,000 | | Greene King plc | $ | 7,587,236 |
| 1,352,277 | | Hiscox, Ltd. | | 13,371,487 |
| 3,447,200 | | HSBC Holdings plc | | 38,758,554 |
| 2,606,197 | | ICAP plc | | 16,128,310 |
| 600,000 | | Imperial Tobacco Group plc | | 20,135,270 |
| 2,500,000 | | Moneysupermarket.com | | |
| | | Group plc | | 6,883,658 |
| 2,286,649 | | National Grid plc | | 27,358,918 |
| 2,386,034 | | Pennon Group plc | | 25,244,946 |
| 2,093,846 | | Phoenix Group Holdings | | 23,332,058 |
| 369,874 | | Rio Tinto plc | | 16,626,927 |
| 550,000 | | Royal Dutch Shell plc, A | | |
| | | Shares | | 18,727,667 |
| 4,757,753 | | Smiths News plc | | 12,304,147 |
| 1,706,858 | | SSE plc | | 40,895,794 |
| 1,673,660 | | Standard Chartered plc | | 38,814,622 |
| 1,627,147 | | Tate & Lyle plc | | 20,767,750 |
| 3,965,259 | | The Sage Group plc | | 21,142,691 |
| 2,636,284 | | Tullett Prebon plc | | 13,350,781 |
| 18,974,576 | | Vodafone Group plc | | 57,008,534 |
| | | | | 718,513,588 |
| | | | | |
| | | United States - 14.49% | | |
| 750,733 | | Cisco Systems, Inc. | | 19,181,228 |
| 320,000 | | Kohl’s Corp. | | 16,953,600 |
| 180,000 | | Mattel, Inc. | | 7,565,400 |
| 853,773 | | Merck & Co., Inc. | | 41,126,246 |
| 500,388 | | Microsoft Corp. | | 15,927,350 |
| 1,575,277 | | Pfizer, Inc. | | 46,045,347 |
| 351,698 | | Reynolds American, Inc. | | 17,384,432 |
| 520,203 | | Six Flags Entertainment | | |
| | | Corp. | | 19,138,268 |
| 220,000 | | Texas Instruments, Inc. | | 8,624,000 |
| 1,040,000 | | The Dow Chemical Co. | | 36,441,600 |
| 350,746 | | United Parcel Service, Inc., | | |
| | | Class B | | 30,444,753 |
| 509,521 | | Verizon | | |
| | | Communications, Inc. | | 25,211,099 |
| | | | | 284,043,323 |
| | | | | |
| | | Total common stocks | | |
| | | (Cost $1,655,099,261) | | 1,784,247,885 |
| | | |
| Partnerships - 0.71% | | |
| | | | | |
| | | United States - 0.71% | | |
| 1,230,766 | | Och-Ziff Capital Management | | |
| | | Group LLC, Class A | $ | 13,907,656 |
| | | | | |
| | | Total partnerships | | |
| | | (Cost $12,314,215) | | 13,907,656 |
| | | | | |
| REITs - 3.68% | | |
| | | | | |
| | | Australia - 2.28% | | |
| 16,541,554 | | Westfield Retail Trust | | 44,753,798 |
| | | | | |
| | | United Kingdom - 1.40% | | |
| 5,794,755 | | Segro plc | | 27,397,869 |
| | | | | |
| | | Total REITs | | |
| | | (Cost $69,620,969) | | 72,151,667 |
| | | | | |
| | | Total long-term investments | | |
| | | (Cost $1,737,034,445) | | 1,870,307,208 |
| | | | | |
| | | Short-term investment - 2.43% | | |
| 47,651,463 | | Fidelity Institutional | | |
| | | Treasury Portfolio | | 47,651,463 |
| | | | | |
| | | Total short-term investment | | |
| | | (Cost $47,651,463) | | 47,651,463 |
| | | | | |
| Total investments - 97.85% | | |
| | | (Cost $1,784,685,908) | $ | 1,917,958,671 |
| | | | | |
| Net other assets and liabilities – 2.15% | | 42,175,352 |
| | | | | |
| Total net assets – 100.00% | $ | 1,960,134,023 |
| REIT | | Real Estate Investment Trust | | |
The Fund held the following open forward foreign currency contracts at July 31, 2013:
| | | | | | | | | | Local | | | Current | | | Unrealized | |
| | | | | | | Value | | | amount | | | notional | | | appreciation/ | |
| | | | Counterparty | | | date | | | (000’s | ) | | value | | | (depreciation | ) |
| British Pound (Short) | | | JPMorgan Chase Bank, N.A. | | | 10/11/13 | | | 100,000 | | $ | 152,056,124 | | $ | (2,898,124 | ) |
| British Pound (Short) | | | Deutsche Bank AG | | | 10/11/13 | | | 40,000 | | | 60,822,450 | | | (1,148,210 | ) |
| Total | | | | | | | | | | | | | | $ | (4,046,334 | ) |
During the year ended July 31, 2013, average monthly notional value related to forward foreign currency contracts was $135.9 million or 6.9% of net assets.
See notes to financial statements
39
| Henderson Global Funds | Portfolio of investments |
Global Equity Income Fund
July 31, 2013 (continued)
Other information:
Industry concentration as a percentage of net assets: | | | % of net assets |
| Integrated Telecommunication Services | | | 10.78 | % |
| Pharmaceuticals | | | 8.62 | |
| Diversified Banks | | | 6.18 | |
| Electric Utilities | | | 4.78 | |
| Integrated Oil & Gas | | | 4.19 | |
| Air Freight & Logistics | | | 3.94 | |
| Life & Health Insurance | | | 3.62 | |
| Multi-Utilities | | | 3.41 | |
| Property & Casualty Insurance | | | 3.08 | |
| Packaged Foods & Meats | | | 2.96 | |
| Wireless Telecommunication Services | | | 2.91 | |
| Retail REIT’s | | | 2.28 | |
| Tobacco | | | 1.91 | |
| Diversified Chemicals | | | 1.86 | |
| Aerospace & Defense | | | 1.74 | |
| Diversified Metals & Mining | | | 1.70 | |
| Investment Banking & Brokerage | | | 1.50 | |
| Reinsurance | | | 1.47 | |
| Alternative Carriers | | | 1.41 | |
| Industrial REITs | | | 1.40 | |
| Industrial Conglomerates | | | 1.39 | |
| Paper Packaging | | | 1.37 | |
| Water Utilities | | | 1.29 | |
| Automobile Manufacturers | | | 1.21 | |
| Computer Hardware | | | 1.12 | |
| Gas Utilities | | | 1.12 | |
| Oil & Gas Equipment & Services | | | 1.10 | |
| Application Software | | | 1.08 | |
| Casinos & Gaming | | | 1.02 | |
| Highways & Railtracks | | | 0.99 | |
| Communications Equipment | | | 0.98 | |
| Leisure Facilities | | | 0.98 | |
| Commercial Printing | | | 0.97 | |
| Oil & Gas Drilling | | | 0.88 | |
| Technology Distributors | | | 0.87 | |
| Department Stores | | | 0.87 | |
| Publishing | | | 0.86 | |
| Systems Software | | | 0.81 | |
Independent Power Producers & Energy Traders | | | 0.81 | |
| Cable & Satellite | | | 0.78 | |
| Asset Management & Custody Banks | | | 0.71 | |
| Real Estate Development | | | 0.63 | |
| Distributors | | | 0.63 | |
| Diversified Real Estate Activities | | | 0.50 | |
| Semiconductors | | | 0.44 | |
| Restaurants | | | 0.39 | |
| Leisure Products | | | 0.39 | |
| Construction & Engineering | | | 0.37 | |
| Internet Software & Services | | | 0.35 | |
| Electronic Manufacturing Services | | | 0.30 | |
| Fertilizers & Agricultural Chemicals | | | 0.24 | |
| Oil & Gas Exploration & Production | | | 0.23 | |
| Long-Term Investments | | | 95.42 | |
| Short-Term Investment | | | 2.43 | |
| Total Investments | | | 97.85 | |
| Net Other Assets and Liabilities | | | 2.15 | |
| | | | 100.00 | % |
See notes to financial statements
40
| Henderson Global Funds | Portfolio of investments |
Global Equity Income Fund
July 31, 2013 (continued)
The following table summarizes the Fund’s investments that are measured at fair value by level within the fair value hierarchy at July 31, 2013:
| Description | | | Quoted prices
in active
markets for
identical assets
(level 1 | ) | | Significant
other
observable
inputs
(level 2 | ) | | Significant
unobservable
inputs
(level 3 | ) | | Total | |
| Assets | | | | | | | | | | | | | |
| Common Stocks | | | | | | | | | | | | | |
| Australia | | $ | 118,771,943 | | $ | — | | $ | — | | $ | 118,771,943 | |
| Brazil | | | 11,451,794 | | | — | | | — | | | 11,451,794 | |
| Canada | | | 25,026,334 | | | — | | | — | | | 25,026,334 | |
| China | | | 30,915,122 | | | — | | | — | | | 30,915,122 | |
| Cyprus | | | 21,643,081 | | | — | | | — | | | 21,643,081 | |
| Denmark | | | 19,251,104 | | | — | | | — | | | 19,251,104 | |
| France | | | 87,250,915 | | | — | | | — | | | 87,250,915 | |
| Germany | | | 64,420,871 | | | — | | | — | | | 64,420,871 | |
| Hong Kong | | | 69,557,995 | | | — | | | — | | | 69,557,995 | |
| Israel | | | 4,727,662 | | | — | | | — | | | 4,727,662 | |
| Italy | | | 82,273,548 | | | — | | | — | | | 82,273,548 | |
| Japan | | | 34,995,103 | | | — | | | — | | | 34,995,103 | |
| Luxembourg | | | 15,237,781 | | | — | | | — | | | 15,237,781 | |
| Netherlands | | | 107,940,355 | | | — | | | — | | | 107,940,355 | |
| New Zealand | | | 28,460,721 | | | — | | | — | | | 28,460,721 | |
| Norway | | | 17,339,066 | | | — | | | — | | | 17,339,066 | |
| Singapore | | | 5,788,724 | | | — | | | — | | | 5,788,724 | |
| Taiwan | | | 29,257,232 | | | — | | | — | | | 29,257,232 | |
| Thailand | | | 7,381,623 | | | — | | | — | | | 7,381,623 | |
| United Kingdom | | | 718,513,588 | | | — | | | — | | | 718,513,588 | |
| United States | | | 284,043,323 | | | — | | | — | | | 284,043,323 | |
| Total Common Stocks | | | 1,784,247,885 | | | — | | | — | | | 1,784,247,885 | |
| Partnerships | | | | | | | | | | | | | |
| United States | | | 13,907,656 | | | — | | | — | | | 13,907,656 | |
| Total Partnerships | | | 13,907,656 | | | — | | | — | | | 13,907,656 | |
| REITs | | | | | | | | | | | | | |
| Australia | | | 44,753,798 | | | — | | | — | | | 44,753,798 | |
| United Kingdom | | | 27,397,869 | | | — | | | — | | | 27,397,869 | |
| Total REITs | | | 72,151,667 | | | — | | | — | | | 72,151,667 | |
| Short-Term Investment | | | 47,651,463 | | | — | | | — | | | 47,651,463 | |
| Total Investments | | $ | 1,917,958,671 | | $ | — | | $ | — | | $ | 1,917,958,671 | |
| Liabilities | | | | | | | | | | | | | |
| Financial Derivative Instruments* | | | | | | | | | | | | | |
| Forward Foreign Currency Contracts | | | — | | | (4,046,334 | ) | | — | | | (4,046,334 | ) |
| Total Financial Derivative Instruments | | $ | — | | $ | (4,046,334 | ) | $ | — | | $ | (4,046,334 | ) |
* These investments are recorded at the unrealized gain or loss on the investment.
During the year ended July 31, 2013, there were no transfers in or out of security levels as a result of the fair value pricing procedures established by the Board.
See notes to financial statements
41
| Henderson Global Funds | Portfolio of investments |
Global Technology Fund
July 31, 2013
| | | | | Value |
| Shares | | | | (note 2) |
| | | |
| Common stocks - 97.83% | | |
| | | China - 2.93% | | |
| 38,341 | | 51job, Inc., ADR * | $ | 2,549,676 |
| 677,163 | | China Digital TV Holding | | |
| | | Co., Ltd., ADR | | 1,015,745 |
| 103,807 | | NetEase.com, Inc., ADR | | 6,613,544 |
| | | | | 10,178,965 |
| | | | | |
| | | Germany - 1.66% | | |
| 187,245 | | Wirecard AG | | 5,779,151 |
| | | | | |
| | | Ireland - 1.76% | | |
| 83,000 | | Accenture plc, Class A | | 6,126,230 |
| | | | | |
| | | Japan - 0.69% | | |
| 191 | | Nuflare Technology, Inc. | | 2,397,498 |
| | | | | |
| | | Korea - 3.18% | | |
| 9,700 | | Samsung Electronics | | |
| | | Co., Ltd. | | 11,051,917 |
| | | | | |
| | | Netherlands - 5.41% | | |
| 135,203 | | ASML Holding N.V. | | 12,159,028 |
| 205,097 | | Yandex N.V., Class A * | | 6,665,653 |
| | | | | 18,824,681 |
| | | | | |
| | | Taiwan - 1.66% | | |
| 341,260 | | Taiwan Semiconductor | | |
| | | Manufacturing Co., | | |
| | | Ltd., ADR | | 5,794,595 |
| | | | | |
| | | United Kingdom - 5.56% | | |
| 196,231 | | Mail.ru Group, Ltd., GDR | | 6,269,580 |
| 189,635 | | Rightmove plc | | 7,013,005 |
| 2,014,465 | | Vodafone Group plc | | 6,052,399 |
| | | | | 19,334,984 |
| | | | | |
| | | United States - 74.98% | | |
| 124,586 | | ACI Worldwide, Inc. * | | 5,899,147 |
| 18,890 | | Amazon.com, Inc. * | | 5,690,046 |
| 24,624 | | Apple, Inc. | | 11,142,360 |
| 335,771 | | Cadence Design | | |
| | | Systems, Inc. * | | 4,895,541 |
| 523,118 | | Cisco Systems, Inc. | | 13,365,665 |
| 82,384 | | Citrix Systems, Inc. * | | 5,933,296 |
| 161,863 | | Cognizant Technology | | |
| | | Solutions Corp. * | | 11,717,263 |
| 140,111 | | Comcast Corp., Class A | | 6,316,204 |
| 313,909 | | Corning, Inc. | | 4,768,278 |
| 88,661 | | eBay, Inc. * | | 4,582,887 |
| 224,954 | | EMC Corp. | | 5,882,547 |
| 29,526 | | Equinix, Inc. * | | 5,295,488 |
| 52,203 | | F5 Networks, Inc. * | | 4,581,335 |
| 132,593 | | Facebook, Inc., Class A * | | 4,883,400 |
| | | | | |
| | | United States (continued) | | |
| 66,758 | | Fiserv, Inc. * | $ | 6,424,790 |
| 77,081 | | FleetCor Technologies, | | |
| | | Inc. * | | 6,919,561 |
| 7,639 | | Google, Inc., Class A * | | 6,780,376 |
| 202,244 | | Hewlett-Packard Co. | | 5,193,626 |
| 188,347 | | HomeAway, Inc. * | | 5,671,128 |
| 100,569 | | KLA-Tencor Corp. | | 5,896,360 |
| 18,466 | | MasterCard, Inc., Class A | | 11,275,524 |
| 55,435 | | MercadoLibre, Inc. | | 6,509,732 |
| 148,525 | | NetApp, Inc. | | 6,107,348 |
| 209,029 | | Nuance Communications, | | |
| | | Inc. * | | 3,921,384 |
| 58,844 | | OpenTable, Inc. * | | 3,747,186 |
| 184,700 | | Oracle Corp. | | 5,975,045 |
| 338,290 | | Pandora Media, Inc. * | | 6,204,239 |
| 11,603 | | Priceline.com, Inc. * | | 10,160,399 |
| 182,155 | | QUALCOMM, Inc. | | 11,758,105 |
| 92,032 | | Red Hat, Inc. * | | 4,764,497 |
| 96,604 | | SanDisk Corp. * | | 5,324,813 |
| 237,222 | | Symantec Corp. | | 6,329,083 |
| 163,752 | | Synopsys, Inc. * | | 6,065,374 |
| 58,403 | | Time Warner Cable, Inc. | | 6,662,030 |
| 93,751 | | TripAdvisor, Inc. * | | 7,033,200 |
| 32,912 | | Visa, Inc., A Shares | | 5,825,753 |
| 122,063 | | Western Digital Corp. | | 7,858,416 |
| 76,592 | | WEX, Inc. * | | 6,658,909 |
| 240,716 | | Yahoo!, Inc. * | | 6,761,712 |
| | | | | 260,782,047 |
| | | | | |
| | | Total common stocks | | |
| | | (Cost $263,735,828) | | 340,270,068 |
| | | | | |
| | | Total long-term investments | | |
| | | (Cost $263,735,828) | | 340,270,068 |
| | | | | |
| Short-term investment - 3.16% | | |
| | | |
| 10,973,450 | | Fidelity Institutional | | |
| | | Treasury Portfolio | | 10,973,450 |
| | | | | |
| | | Total short-term investment | | |
| | | (Cost $10,973,450) | | 10,973,450 |
| | | | | |
| | | Total investments - 100.99% | | |
| | | (Cost $274,709,278) | | 351,243,518 |
| | | | | |
| Net other assets and liabilities – (0.99)% | | (3,432,271) |
| | | | | |
| Total net assets – 100.00% | $ | 347,811,247 |
| * | | Non income producing security |
| ADR | | American Depositary Receipts |
| GDR | | Global Depositary Receipts |
See notes to financial statements
42
| Henderson Global Funds | Portfolio of investments |
Global Technology Fund
July 31, 2013 (continued)
Other information:
| Industry concentration as | | | % of net |
| a percentage of net assets: | | | assets |
| Internet Software & Services | | | 18.49 | % |
| Data Processing & Outsourced Services | | | 12.33 | |
| Communications Equipment | | | 8.54 | |
| Internet Retail | | | 8.21 | |
| Application Software | | | 7.68 | |
| Computer Storage & Peripherals | | | 7.53 | |
| Semiconductor Equipment | | | 5.88 | |
| IT Consulting & Other Services | | | 5.13 | |
| Systems Software | | | 4.91 | |
| Semiconductors | | | 4.84 | |
| Computer Hardware | | | 4.70 | |
| Cable & Satellite | | | 3.73 | |
| Publishing | | | 2.02 | |
| Wireless Telecommunication Services | | | 1.74 | |
| Electronic Components | | | 1.37 | |
| Human Resource & Employment Services | | | 0.73 | |
| Long-Term Investments | | | 97.83 | |
| Short-Term Investment | | | 3.16 | |
| Total Investments | | | 100.99 | |
| Net Other Assets and Liabilities | | | (0.99 | ) |
| | | | 100.00 | % |
See notes to financial statements
43
| Henderson Global Funds | Portfolio of investments |
Global Technology Fund
July 31, 2013 (continued)
The following table summarizes the Fund’s investments that are measured at fair value by level within the fair value hierarchy at July 31, 2013:
| Description | | | Quoted prices
in active
markets for
identical assets
(level 1 | ) | | Significant
other
observable
inputs
(level 2 | ) | | Significant
unobservable
inputs
(level 3 | ) | | Total | |
| Assets | | | | | | | | | | | | | |
| Common Stocks | | | | | | | | | | | | | |
| China | | $ | 10,178,965 | | $ | — | | $ | — | | $ | 10,178,965 | |
| Germany | | | 5,779,151 | | | — | | | — | | | 5,779,151 | |
| Ireland | | | 6,126,230 | | | — | | | — | | | 6,126,230 | |
| Japan | | | 2,397,498 | | | — | | | — | | | 2,397,498 | |
| Korea | | | 11,051,917 | | | — | | | — | | | 11,051,917 | |
| Netherlands | | | 18,824,681 | | | — | | | — | | | 18,824,681 | |
| Taiwan | | | 5,794,595 | | | — | | | — | | | 5,794,595 | |
| United Kingdom | | | 19,334,984 | | | — | | | — | | | 19,334,984 | |
| United States | | | 260,782,047 | | | — | | | — | | | 260,782,047 | |
| Total Common Stocks | | | 340,270,068 | | | — | | | — | | | 340,270,068 | |
| Short-Term Investment | | | 10,973,450 | | | — | | | — | | | 10,973,450 | |
| Total | | $ | 351,243,518 | | $ | — | | $ | — | | $ | 351,243,518 | |
During the year ended July 31, 2013, there were no transfers in or out of security levels as a result of the fair value pricing procedures established by the Board.
See notes to financial statements
44
| Henderson Global Funds | Portfolio of investments |
High Yield Opportunities Fund
July 31, 2013
Face amount | | | | Coupon | | Maturity | | | Value (note 2) |
| | | | | | | | |
| Corporate bonds – 92.92% | | | | | | | |
| | | | | | | | | | | |
| | | | Canada – 1.97% | | | | | | | |
| USD | 250,000 | | Garda World Security Corp. (a) | | 9.750 | | 3/15/17 | | $ | 269,375 |
| USD | 250,000 | | New Gold, Inc. (a) | | 6.250 | | 11/15/22 | | | 238,750 |
| | | | | | | | | | | 508,125 |
| | | | | | | | | | | |
| | | | Germany – 0.53% | | | | | | | |
| EUR | 100,000 | | Faenza GmbH (a) | | 8.250 | | 8/15/21 | | | 135,363 |
| | | | | | | | | | | |
| | | | Ireland – 2.08% | | | | | | | |
| USD | 250,000 | | Ardagh Packaging Finance plc (a) | | 9.125 | | 10/15/20 | | | 271,250 |
| USD | 250,000 | | Nara Cable Funding, Ltd. (a) | | 8.875 | | 12/1/18 | | | 263,750 |
| | | | | | | | | | | 535,000 |
| | | | | | | | | | | |
| | | | Luxembourg – 5.16% | | | | | | | |
| USD | 263,906 | | ARD Finance S.A. (a) | | 11.125 | | 6/1/18 | | | 287,658 |
| USD | 500,000 | | Intelsat Luxembourg S.A. (a) | | 7.750 | | 6/1/21 | | | 528,125 |
| USD | 250,000 | | International Automotive Components Group S.A. (a) | | 9.125 | | 6/1/18 | | | 253,750 |
| USD | 250,000 | | Wind Acquisition Finance S.A. (a) | | 7.250 | | 2/15/18 | | | 257,500 |
| | | | | | | | | | | 1,327,033 |
| | | | | | | | | | | |
| | | | Netherlands – 1.94% | | | | | | | |
| USD | 500,000 | | ING Groep N.V. (c) | | 5.775 | | 12/8/15 | | | 500,000 |
| | | | | | | | | | | |
| | | | South Africa – 1.36% | | | | | | | |
| USD | 355,000 | | AngloGold Ashanti Holdings plc | | 8.500 | | 7/30/20 | | | 351,024 |
| | | | | | | | | | | |
| | | | Sweden – 1.01% | | | | | | | |
| USD | 250,000 | | Perstorp Holding AB (a) | | 8.750 | | 5/15/17 | | | 258,750 |
| | | | | | | | | | | |
| | | | United Kingdom – 2.01% | | | | | | | |
| USD | 500,000 | | Algeco Scotsman Global Finance plc (a) | | 8.500 | | 10/15/18 | | | 517,500 |
| | | | | | | | | | | |
| | | | United States – 76.86% | | | | | | | |
| USD | 250,000 | | Alta Mesa Holdings LP | | 9.625 | | 10/15/18 | | | 263,750 |
| USD | 250,000 | | Cablevision Systems Corp. | | 8.000 | | 4/15/20 | | | 283,750 |
| USD | 250,000 | | Caesars Entertainment Operating Co., Inc. (b) | | 9.000 | | 2/15/20 | | | 235,000 |
| USD | 500,000 | | Chassix, Inc. (a) | | 9.250 | | 8/1/18 | | | 523,750 |
| USD | 200,000 | | CIT Group, Inc. | | 5.375 | | 5/15/20 | | | 210,000 |
| USD | 500,000 | | Claire’s Stores, Inc. (a) | | 7.750 | | 6/1/20 | | | 506,250 |
| USD | 250,000 | | Clear Channel Communications, Inc. | | 9.000 | | 3/1/21 | | | 247,500 |
| USD | 250,000 | | Clear Channel Worldwide Holdings, Inc., Series B | | 7.625 | | 3/15/20 | | | 265,000 |
| USD | 500,000 | | Coeur d’Alene Mines Corp. (a) | | 7.875 | | 2/1/21 | | | 501,250 |
| USD | 250,000 | | CommScope Holding Co., Inc. (a) | | 6.625 | | 6/1/20 | | | 250,000 |
| USD | 500,000 | | Consolidated Container Co. LLC (a) | | 10.125 | | 7/15/20 | | | 525,000 |
| USD | 500,000 | | Digicel Group, Ltd. (a) | | 8.250 | | 9/30/20 | | | 540,000 |
| USD | 250,000 | | DISH DBS Corp. | | 6.750 | | 6/1/21 | | | 266,250 |
| USD | 250,000 | | Eagle Midco, Inc. (a) | | 9.000 | | 6/15/18 | | | 253,125 |
| USD | 500,000 | | Endo Health Solutions, Inc. | | 7.250 | | 1/15/22 | | | 523,750 |
| USD | 250,000 | | First Data Corp. | | 11.250 | | 3/31/16 | | | 250,000 |
| USD | 500,000 | | Griffey Intermediate, Inc. (a) | | 7.000 | | 10/15/20 | | | 490,000 |
| USD | 250,000 | | Halcon Resources Corp. | | 9.750 | | 7/15/20 | | | 260,625 |
| USD | 500,000 | | HBOS Capital Funding LP (a) (c) | | 6.071 | | 6/30/14 | | | 482,500 |
| USD | 250,000 | | HD Supply, Inc. (a) | | 7.500 | | 7/15/20 | | | 265,625 |
See notes to financial statements
45
| Henderson Global Funds | Portfolio of investments |
High Yield Opportunities Fund
July 31, 2013 (continued)
Face amount | | | | Coupon | | Maturity | | | Value (note 2) |
| | | | | | | | | | | |
| | | | United States (continued) | | | | | | | |
| USD | 250,000 | | Hot Topic, Inc. (a) | | 9.250 | | 6/15/21 | | $ | 261,250 |
| USD | 250,000 | | IASIS Healthcare LLC | | 8.375 | | 5/15/19 | | | 263,750 |
| USD | 200,000 | | j2 Global, Inc. | | 8.000 | | 8/1/20 | | | 216,000 |
| USD | 250,000 | | Jefferies LoanCore LLC (a) | | 6.875 | | 6/1/20 | | | 251,250 |
| USD | 250,000 | | Jones Group, Inc. | | 6.875 | | 3/15/19 | | | 259,375 |
| USD | 750,000 | | Landry’s, Inc. (a) | | 9.375 | | 5/1/20 | | | 815,625 |
| USD | 500,000 | | Legacy Reserves LP (a) | | 6.625 | | 12/1/21 | | | 482,500 |
| USD | 250,000 | | Magnachip Semiconductor Corp. (a) | | 6.625 | | 7/15/21 | | | 250,000 |
| USD | 500,000 | | Michael Foods Holdings, Inc. (a) | | 8.500 | | 7/15/18 | | | 521,250 |
| USD | 500,000 | | Michaels FinCo Holdings LLC (a) | | 7.500 | | 8/1/18 | | | 507,500 |
| USD | 500,000 | | MPH Intermediate Holding Co., 2 (a) | | 8.375 | | 8/1/18 | | | 512,500 |
| USD | 250,000 | | Murray Energy Corp. (a) | | 8.625 | | 6/15/21 | | | 255,000 |
| USD | 250,000 | | Nortek, Inc. | | 8.500 | | 4/15/21 | | | 271,875 |
| USD | 250,000 | | Nuveen Investments, Inc. (a) | | 9.500 | | 10/15/20 | | | 254,375 |
| USD | 500,000 | | Onex USI Acquisition Corp. (a) | | 7.750 | | 1/15/21 | | | 505,000 |
| USD | 500,000 | | PC Nextco Holdings LLC (a) | | 8.750 | | 8/15/19 | | | 500,000 |
| USD | 250,000 | | PQ Corp. (a) | | 8.750 | | 5/1/18 | | | 265,000 |
| USD | 250,000 | | Quiksilver, Inc. (a) | | 7.875 | | 8/1/18 | | | 262,500 |
| USD | 500,000 | | Radnet Management, Inc. | | 10.375 | | 4/1/18 | | | 534,375 |
| USD | 500,000 | | Renaissance Acquisition Corp. (a) | | 6.875 | | 8/15/21 | | | 498,750 |
| USD | 250,000 | | Reynolds Group Issuer, Inc. | | 9.875 | | 8/15/19 | | | 271,250 |
| USD | 250,000 | | Rite Aid Corp. (a) | | 6.750 | | 6/15/21 | | | 251,875 |
| USD | 250,000 | | Sanchez Energy Corp. (a) | | 7.750 | | 6/15/21 | | | 249,375 |
| USD | 500,000 | | SandRidge Energy, Inc. | | 8.750 | | 1/15/20 | | | 527,500 |
| USD | 500,000 | | Select Medical Corp. (a) | | 6.375 | | 6/1/21 | | | 487,500 |
| USD | 500,000 | | Serta Simmons Holdings LLC (a) | | 8.125 | | 10/1/20 | | | 532,500 |
| USD | 250,000 | | Snoqualmie Entertainment Authority (a) | | 9.125 | | 2/1/15 | | | 249,219 |
| USD | 250,000 | | Sugarhouse HSP Gaming Prop Mezz LP (a) | | 6.375 | | 6/1/21 | | | 239,687 |
| USD | 500,000 | | Swift Energy Co. | | 7.875 | | 3/1/22 | | | 497,500 |
| USD | 500,000 | | TPC Group, Inc. (a) | | 8.750 | | 12/15/20 | | | 527,500 |
| USD | 500,000 | | Univision Communications, Inc. (a) | | 8.500 | | 5/15/21 | | | 552,500 |
| USD | 500,000 | | Wok Acquisition Corp. (a) | | 10.250 | | 6/30/20 | | | 562,500 |
| | | | | | | | | | | 19,779,906 |
| | | | | | | | | | | |
| | | | Total corporate bonds | | | | | | | |
| | | | (Cost $24,109,876) | | | | | | | 23,912,701 |
| | | | | | | | | | | |
| Shares | | | | | | | | | |
| | | | | | | |
| Preferred stock – 1.93% | | | | | | |
| | | | | | | | | | | |
| | | | United States - 1.93% | | | | | | | |
| | 500 | | Ally Financial, Inc. 7%, 8/30/13 (a) | | | | | | | 495,312 |
| | | | | | | | | | | |
| | | | Total preferred stock | | | | | | | |
| | | | (Cost $488,125) | | | | | | | 495,312 |
| | | | | | | | | | | |
| | | | Total long-term investments | | | | | | | |
| | | | (Cost $24,598,001) | | | | | | | 24,408,013 |
See notes to financial statements
46
| Henderson Global Funds | Portfolio of investments |
High Yield Opportunities Fund
July 31, 2013 (continued)
| | | | | Value |
| Shares | | | | (note 2) |
| | | |
| Short-term investment - 1.19% | | |
| 305,899 | | Fidelity Institutional Treasury Portfolio | $ | 305,899 |
| | | | | |
| | | Total short-term investment | | |
| | | (Cost $305,899) | | 305,899 |
| | | | | |
| Total investments - 96.04% | | |
| | | (Cost $24,903,900) | | 24,713,912 |
| Net other assets and liabilities – 3.96% | | 1,019,685 |
| Total net assets – 100.00% | $ | 25,733,597 |
| (a) | Restricted security, purchased pursuant to Rule 144A under the Securities Act of 1933, as amended, and which is exempt from registration under that Act. At July 31, 2013, the restricted securities held by the Fund had an aggregate value of $17,909,739, which represented 69.6% of net assets. |
| (b) | Security is purchased on a delayed delivery basis. |
| (c) | Maturity date is perpetual. Maturity date presented represents the next call date. |
The Fund held the following credit default swap contracts at July 31, 2013:
| Counterparty | | | Reference
entity | | | Rates
received/
(paid | ) | | Termination
date | | | Implied
credit
spread | | | Notional
amount
(000s | ) | | Market
value | | | Upfront premiums paid/ (received | ) | | Unrealized appreciation/ (depreciation | ) |
| Protection sold: | | | | | | | | | | | | | | | | | | | | | | | | | |
| Citibank, N.A. | | | ArcelorMittal | | | 1.00 | % | | 9/20/18 | | | 3.87 | % | | EUR 250 | | $ | (43,482 | ) | $ | (47,390 | ) | $ | 3,908 | |
| Deutsche Bank AG | | | ArcelorMittal | | | 1.00 | % | | 9/20/18 | | | 3.87 | % | | EUR 50 | | | (8,697 | ) | | (11,375 | ) | | 2,678 | |
| Total | | | | | | | | | | | | | | | | | $ | (52,179 | ) | $ | (58,765 | ) | $ | 6,586 | |
During the year ended July 31, 2013, average notional value related to swap contracts was $170,000 or 0.7% of net assets.
See notes to financial statements
47
| Henderson Global Funds | Portfolio of investments |
High Yield Opportunities Fund
July 31, 2013 (continued)
Other information:
| Industry concentration as | | | % of net |
| a percentage of net assets: | | | assets |
| Oil & Gas Exploration & Production | | | 8.85 | % |
| Retail - Restaurants | | | 5.36 | |
| Cable TV | | | 3.16 | |
| Auto/Truck Parts & Equipment-Original | | | 3.03 | |
| Medical-Hospitals | | | 2.91 | |
| Gold Mining | | | 2.29 | |
| Containers - Metal/Glass | | | 2.17 | |
| Television | | | 2.15 | |
| Cellular Telecommunications | | | 2.10 | |
| MRI/Medical Diagnostic Imaging | | | 2.08 | |
| Retail - Bedding | | | 2.07 | |
| Petrochemicals | | | 2.05 | |
| Satellite Telecommunications | | | 2.05 | |
| Containers-Paper/Plastic | | | 2.04 | |
| Medical - Drugs | | | 2.04 | |
| Apparel Manufacturers | | | 2.03 | |
| Food-Miscellaneous/Diversified | | | 2.03 | |
| Storage/Warehousing | | | 2.01 | |
| Broadcast Services/Programs | | | 1.99 | |
| Special Purpose Entity | | | 1.99 | |
| Retail - Arts & Crafts | | | 1.97 | |
| Retail-Jewelry | | | 1.97 | |
| Insurance Brokers | | | 1.96 | |
| Precious Metals | | | 1.95 | |
| Life/Health Insurance | | | 1.94 | |
| Retail-Leisure Products | | | 1.94 | |
| Specified Purpose Acquisition | | | 1.94 | |
| Diversified Banking Institution | | | 1.93 | |
| Advertising Services | | | 1.90 | |
| Money Center Banks | | | 1.88 | |
| Casino Hotels | | | 1.84 | |
Building & Construction Products - Miscellaneous | | | 1.06 | |
| Consumer Products - Miscellaneous | | | 1.05 | |
| Security Services | | | 1.04 | |
| Chemicals - Specialty | | | 1.03 | |
| Distribution/Wholesale | | | 1.03 | |
| Retail - Apparel/Shoe | | | 1.02 | |
| Chemicals - Other | | | 1.01 | |
| Telecommunication Services | | | 1.00 | |
| Coal | | | 0.99 | |
| Investment Management & Advising Services | | | 0.99 | |
| Enterprise Software/Services | | | 0.98 | |
| Finance-Commercial | | | 0.98 | |
| Retail-Drug Store | | | 0.98 | |
| Casino Services | | | 0.97 | |
| Data Processing/Management | | | 0.97 | |
| Semiconductor Equipment | | | 0.97 | |
| Telecommunication Equipment | | | 0.97 | |
| Computer Services | | | 0.84 | |
| Commercial Banks-Eastern US | | | 0.82 | |
| Diversified Operations | | | 0.53 | |
| Long-Term Investments | | | 94.85 | |
| Short-Term Investment | | | 1.19 | |
| Total Investments | | | 96.04 | |
| Net Other Assets and Liabilities | | | 3.96 | |
| | | | 100.00 | % |
See notes to financial statements
48
| Henderson Global Funds | Portfolio of investments |
High Yield Opportunities Fund
July 31, 2013 (continued)
The following table summarizes the Fund’s investments that are measured at fair value by level within the fair value hierarchy at July 31, 2013:
| Description | | | Quoted prices
in active
markets for
identical assets
(level 1 | ) | | Significant
other
observable
inputs
(level 2 | ) | | Significant
unobservable
inputs
(level 3 | ) | | Total | |
| Assets | | | | | | | | | | | | | |
| Corporate Bonds | | | | | | | | | | | | | |
| Canada | | $ | — | | $ | 508,125 | | $ | — | | $ | 508,125 | |
| Germany | | | — | | | 135,363 | | | — | | | 135,363 | |
| Ireland | | | — | | | 535,000 | | | — | | | 535,000 | |
| Luxembourg | | | — | | | 1,327,033 | | | — | | | 1,327,033 | |
| Netherlands | | | — | | | 500,000 | | | — | | | 500,000 | |
| South Africa | | | — | | | 351,024 | | | — | | | 351,024 | |
| Sweden | | | — | | | 258,750 | | | — | | | 258,750 | |
| United Kingdom | | | — | | | 517,500 | | | — | | | 517,500 | |
| United States | | | — | | | 19,779,906 | | | — | | | 19,779,906 | |
| Total Corporate Bonds | | | — | | | 23,912,701 | | | — | | | 23,912,701 | |
| Preferred Stock | | | | | | | | | | | | | |
| United States | | | — | | | 495,312 | | | — | | | 495,312 | |
| Total Preferred Stock | | | — | | | 495,312 | | | — | | | 495,312 | |
| Short-Term Investment | | | 305,899 | | | — | | | — | | | 305,899 | |
| Total Investments | | | 305,899 | | | 24,408,013 | | | — | | | 24,713,912 | |
| Financial Derivative Instruments* | | | | | | | | | | | | | |
| Credit Default Swap Contracts | | | — | | | 6,586 | | | — | | | 6,586 | |
| Total Financial Derivative Instruments | | $ | — | | $ | 6,586 | | $ | — | | $ | 6,586 | |
* These investments are recorded at the unrealized gain or loss on the investment.
During the period ended July 31, 2013, there were no transfers in or out of security levels as a result of the fair value pricing procedures established by the Board.
See notes to financial statements
49
| Henderson Global Funds | Portfolio of investments |
International Opportunities Fund
July 31, 2013
| | | | | Value |
| Shares | | | | (note 2) |
| | | |
| Common stocks - 96.37% | | |
| | | |
| | | Australia - 1.24% | | |
| 16,236,499 | | African Petroleum | | |
| | | Corp., Ltd. * | $ | 2,335,068 |
| 1,160,000 | | National Australia | | |
| | | Bank, Ltd. | | 32,562,450 |
| | | | | 34,897,518 |
| | | | | |
| | | Austria - 1.13% | | |
| 1,048,545 | | Erste Group Bank AG | | 31,846,289 |
| | | | | |
| | | Brazil - 0.86% | | |
| 1,980,000 | | BM&FBOVESPA S.A. | | 10,675,258 |
| 862,000 | | BR Malls | | |
| | | Participacoes S.A. | | 7,640,055 |
| 171,000 | | Embraer S.A., ADR | | 5,808,870 |
| | | | | 24,124,183 |
| | | | | |
| | | China - 3.19% | | |
| 322,200 | | Baidu, Inc., ADR * | | 42,630,282 |
| 49,560,000 | | China Construction Bank | | |
| | | Corp., Class H | | 36,999,381 |
| 4,478,000 | | China Oilfield Services, | | |
| | | Ltd., Class H | | 10,150,503 |
| | | | | 89,780,166 |
| | | | | |
| | | Denmark - 1.70% | | |
| 6,075 | | AP Moeller-Maersk A/S, | | |
| | | Class B | | 47,652,585 |
| | | | | |
| | | France - 9.53% | | |
| 1,770,786 | | Accor S.A. | | 66,809,490 |
| 3,000,000 | | AXA S.A. | | 66,151,644 |
| 837,510 | | Renault S.A. | | 65,926,105 |
| 755,126 | | Sodexo | | 68,974,581 |
| | | | | 267,861,820 |
| | | | | |
| | | Germany - 10.91% | | |
| 538,784 | | Continental AG | | 84,865,709 |
| 3,049,918 | | Deutsche Post AG | | 85,490,636 |
| 575,965 | | Fresenius SE & Co., KGaA | | 72,700,369 |
| 867,162 | | SAP AG | | 63,784,136 |
| | | | | 306,840,850 |
| | | | | |
| | | Hong Kong - 3.77% | | |
| 8,479,000 | | AIA Group, Ltd. | | 40,177,839 |
| 2,994,000 | | Cheung Kong | | |
| | | Holdings, Ltd. | | 42,040,152 |
| 9,500,000 | | SJM Holdings, Ltd. | | 23,910,465 |
| | | | | 106,128,456 |
| | | | | |
| | | India - 1.08% | | |
| 1,267,940 | | Tata Motors, Ltd., ADR | | 30,481,278 |
| | | | | |
| | | Indonesia - 0.73% | | |
| 25,618,000 | | PT Bank Rakyat | | |
| | | Indonesia Tbk | $ | 20,564,194 |
| | | | | |
| | | Japan - 16.01% | | |
| 6,463,000 | | Ebara Corp. | | 35,579,175 |
| 4,091,000 | | H2O Retailing Corp. | | 36,058,962 |
| 9,317,000 | | Hitachi, Ltd. | | 62,614,503 |
| 1,313,900 | | Mitsui & Co., Ltd. | | 17,646,599 |
| 28,625,300 | | Mizuho Financial Group, Inc. | | 59,349,769 |
| 1,933,200 | | NKSJ Holdings, Inc. | | 48,631,106 |
| 7,144,000 | | Obayashi Corp. | | 38,233,643 |
| 981,900 | | Sumitomo Mitsui Financial | | |
| | | Group, Inc. | | 44,978,261 |
| 12,979,000 | | Taiheiyo Cement Corp. | | 43,744,970 |
| 108,100 | | Toyota Motor Corp. | | 6,591,329 |
| 1,402,400 | | Yamada Denki Co., Ltd. | | 56,863,732 |
| | | | | 450,292,049 |
| | | | | |
| | | Korea - 2.09% | | |
| 115,213 | | Hyundai Motor Co. | | 23,844,068 |
| 30,622 | | Samsung Electronics | | |
| | | Co., Ltd. | | 34,889,877 |
| | | | | 58,733,945 |
| | | | | |
| | | Mexico - 0.73% | | |
| 82,000 | | Fomento Economico | | |
| | | Mexicano, S.A.B. de | | |
| | | C.V., ADR | | 8,158,180 |
| 550,000 | | Grupo Aeroportuario del | | |
| | | Centro Norte, S.A.B. de | | |
| | | C.V. * | | 1,888,630 |
| 3,450,000 | | Grupo Mexico S.A.B. de | | |
| | | C.V., Series B | | 10,590,867 |
| | | | | 20,637,677 |
| | | | | |
| | | Netherlands - 6.27% | | |
| 829,101 | | ASML Holding N.V. | | 74,562,418 |
| 1,705,206 | | European Aeronautic | | |
| | | Defence and Space | | |
| | | Co. N.V. | | 101,822,541 |
| | | | | 176,384,959 |
| | | | | |
| | | Panama - 0.30% | | |
| 61,200 | | Copa Holdings S.A., | | |
| | | Class A | | 8,517,204 |
| | | | | |
| | | Russia - 0.27% | | |
| 16,000,000 | | RusPetro plc * | | 7,545,402 |
| | | | | |
| | | Singapore - 1.39% | | |
| 2,970,000 | | DBS Group Holdings, Ltd. | | 39,028,209 |
See notes to financial statements
50
| Henderson Global Funds | Portfolio of investments |
International Opportunities Fund
July 31, 2013 (continued)
| | | | | Value |
| Shares | | | | (note 2) |
| | | | | |
| | | Spain - 5.86% | | |
| 2,315,000 | | Amadeus IT Holding S.A., A | | |
| | | Shares | $ | 79,519,398 |
| 11,787,679 | | International Consolidated | | |
| | | Airlines Group S.A. * | | 52,200,083 |
| 592,722 | | Red Electrica Corp., S.A. | | 33,082,675 |
| | | | | 164,802,156 |
| | | | | |
| | | Sweden - 2.17% | | |
| 2,300,000 | | Svenska Cellulosa AB, | | |
| | | B Shares | | 60,868,498 |
| | | | | |
| | | Switzerland - 5.60% | | |
| 294,929 | | Roche Holding AG | | 72,660,664 |
| 4,300,000 | | UBS AG * | | 84,703,658 |
| | | | | 157,364,322 |
| | | | | |
| | | Taiwan - 1.21% | | |
| 2,000,000 | | Taiwan Semiconductor | | |
| | | Manufacturing Co., | | |
| | | Ltd., ADR | | 33,960,000 |
| | | | | |
| | | Thailand - 0.96% | | |
| 4,648,300 | | Kasikornbank pcl | | 27,102,708 |
| | | | | |
| | | United Kingdom - 13.48% | | |
| 4,639,098 | | Capita Group plc | | 73,606,903 |
| 17,852,977 | | Essar Energy, Ltd. * | | 36,284,220 |
| 2,056,805 | | GlaxoSmithKline plc | | 52,690,934 |
| 79,029,212 | | Lloyds Banking Group plc * .. | | 82,316,836 |
| 12,450,000 | | Standard Life plc | | 71,837,777 |
| 20,737,180 | | Vodafone Group plc | | 62,304,224 |
| | | | | 379,040,894 |
| | | | | |
| | | United States - 5.89% | | |
| 65,250 | | Amazon.com, Inc. * | | 19,654,605 |
| 305,914 | | AmerisourceBergen Corp. | | 17,825,609 |
| 879,371 | | Cadence Design | | |
| | | Systems, Inc. * | | 12,821,229 |
| 867,962 | | Cisco Systems, Inc. | | 22,176,429 |
| 268,807 | | Cognizant Technology | | |
| | | Solutions Corp., Class A * | | 19,458,939 |
| 16,047 | | Google, Inc., Class A * | | 14,243,317 |
| 40,464 | | MasterCard, Inc., Class A | | 24,707,723 |
| 22,719 | | Priceline.com, Inc. * | | 19,894,347 |
| 230,366 | | QUALCOMM, Inc. | | 14,870,126 |
| | | | | 165,652,324 |
| | | | | |
| | | Total common stocks | | |
| | | (Cost $2,231,555,479) | | 2,710,107,686 |
| | | |
| Preferred stocks - 0.95% | | |
| | | |
| | | Brazil - 0.31% | | |
| 681,500 | | Itau Unibanco Holding | | |
| | | S.A. | $ | 8,704,894 |
| | | | | |
| | | Korea - 0.64% | | |
| 24,750 | | Samsung Electronics | | |
| | | Co., Ltd. | | 17,999,199 |
| | | | | |
| | | Total preferred stocks | | |
| | | (Cost $30,230,671) | | 26,704,093 |
| | | | | |
| Total long-term investments | | |
| | | (Cost $2,261,786,150) | | 2,736,811,779 |
| | | | | |
| Short-term investment - 3.49% | | |
| 98,311,815 | | Fidelity Institutional | | |
| | | Treasury Portfolio | | 98,311,815 |
| | | | | |
| | | Total short-term investment | | |
| | | (Cost $98,311,815) | | 98,311,815 |
| | | | | |
| Total investments - 100.81% | | |
| | | (Cost $2,360,097,965) | | 2,835,123,594 |
| | | | | |
| Net other assets and liabilities – (0.81)% | | (22,826,576) |
| | | | | |
| Total net assets – 100.00% | $ | 2,812,297,018 |
| * | | Non income producing security |
| ADR | | American Depositary Receipts |
See notes to financial statements
51
| Henderson Global Funds | Portfolio of investments |
International Opportunities Fund
July 31, 2013 (continued)
The Fund held the following open forward foreign currency contracts at July 31, 2013:
| | | | | | | | | | Local | | | Current | | | Unrealized | |
| | | | | | | Value | | | amount | | | notional | | | appreciation/ | |
| | | | Counterparty | | | date | | | (000’s | ) | | value | | | (depreciation | ) |
| Euro (Short) | | | State Street Bank, London | | | 8/16/13 | | | 85,251 | | | $113,419,145 | | | $ (2,773,226 | ) |
| Euro (Short) | | | State Street Bank, London | | | 8/16/13 | | | 100,000 | | | 133,041,105 | | | (3,273,005 | ) |
| Japanese Yen (Short) | | | State Street Bank, London | | | 9/6/13 | | | 10,012,000 | | | 102,275,549 | | | (2,275,549 | ) |
| Japanese Yen (Short) | | | State Street Bank, London | | | 9/6/13 | | | 8,610,320 | | | 87,956,972 | | | (1,956,972 | ) |
| Japanese Yen (Short) | | | State Street Bank, London | | | 9/6/13 | | | 2,923,260 | | | 29,861,968 | | | 138,032 | |
| Total | | | | | | | | | | | | | | | $(10,140,720 | ) |
During the year ended July 31, 2013, average monthly notional value related to forward foreign currency contracts was $150.1 million or 5.3% of net assets.
See notes to financial statements
52
| Henderson Global Funds | Portfolio of investments |
International Opportunities Fund
July 31, 2013 (continued)
Other information:
| Industry concentration as | | % of net |
| a percentage of net assets: | | assets |
| Diversified Banks | | 13.63 | % |
| Pharmaceuticals | | 4.46 | |
| Life & Health Insurance | | 3.98 | |
| Aerospace & Defense | | 3.83 | |
| Data Processing & Outsourced Services | | 3.71 | |
| Automobile Manufacturers | | 3.43 | |
| Semiconductors | | 3.09 | |
| Air Freight & Logistics | | 3.04 | |
| Auto Parts & Equipment | | 3.02 | |
| Diversified Capital Markets | | 3.01 | |
| Application Software | | 2.72 | |
| Semiconductor Equipment | | 2.65 | |
| Human Resource & Employment Services | | 2.62 | |
| Health Care Equipment | | 2.58 | |
| Restaurants | | 2.45 | |
| Hotels, Resorts & Cruise Lines | | 2.38 | |
| Multi-line Insurance | | 2.35 | |
| Electronic Equipment & Instruments | | 2.23 | |
| Wireless Telecommunication Services | | 2.22 | |
| Paper Products | | 2.16 | |
| Airlines | | 2.16 | |
| Internet Software & Services | | 2.02 | |
| Computer & Electronics Retail | | 2.02 | |
| Property & Casualty Insurance | | 1.73 | |
| Marine | | 1.69 | |
| Oil & Gas Exploration & Production | | 1.64 | |
| Construction Materials | | 1.56 | |
| Real Estate Development | | 1.49 | |
| Internet Retail | | 1.41 | |
| Construction & Engineering | | 1.36 | |
| Communications Equipment | | 1.32 | |
| Department Stores | | 1.28 | |
| Industrial Machinery | | 1.27 | |
| Electric Utilities | | 1.18 | |
Construction & Farm Machinery & Heavy Trucks | | 1.08 | |
| Casinos & Gaming | | 0.85 | |
| IT Consulting & Other Services | | 0.69 | |
| Health Care Distributors | | 0.63 | |
| Trading Companies & Distributors | | 0.63 | |
| Specialized Finance | | 0.38 | |
| Diversified Metals & Mining | | 0.38 | |
| Oil & Gas Drilling | | 0.36 | |
| Soft Drinks | | 0.29 | |
| Real Estate Operating Companies | | 0.27 | |
| Airport Services | | 0.07 | |
| Long-Term Investments | | 97.32 | |
| Short-Term Investment | | 3.49 | |
| Total Investments | | 100.81 | |
| Net Other Assets and Liabilities | | (0.81 | ) |
| | | 100.00 | % |
See notes to financial statements
53
| Henderson Global Funds | Portfolio of investments |
International Opportunities Fund
July 31, 2013 (continued)
The following table summarizes the Fund’s investments that are measured at fair value by level within the fair value hierarchy at July 31, 2013:
| Description | | | Quoted prices
in active
markets for
identical assets
(level 1 | ) | | Significant
other
observable
inputs
(level 2 | ) | | Significant
unobservable
inputs
(level 3 | ) | | Total | |
| Assets | | | | | | | | | | | | | |
| Common Stocks | | | | | | | | | | | | | |
| Australia | | $ | 34,897,518 | | $ | — | | $ | — | | $ | 34,897,518 | |
| Austria | | | 31,846,289 | | | — | | | — | | | 31,846,289 | |
| Brazil | | | 24,124,183 | | | — | | | — | | | 24,124,183 | |
| China | | | 89,780,166 | | | — | | | — | | | 89,780,166 | |
| Denmark | | | 47,652,585 | | | — | | | — | | | 47,652,585 | |
| France | | | 267,861,820 | | | — | | | — | | | 267,861,820 | |
| Germany | | | 306,840,850 | | | — | | | — | | | 306,840,850 | |
| Hong Kong | | | 106,128,456 | | | — | | | — | | | 106,128,456 | |
| India | | | 30,481,278 | | | — | | | — | | | 30,481,278 | |
| Indonesia | | | 20,564,194 | | | — | | | — | | | 20,564,194 | |
| Japan | | | 450,292,049 | | | — | | | — | | | 450,292,049 | |
| Korea | | | 58,733,945 | | | — | | | — | | | 58,733,945 | |
| Mexico | | | 20,637,677 | | | — | | | — | | | 20,637,677 | |
| Netherlands | | | 176,384,959 | | | — | | | — | | | 176,384,959 | |
| Panama | | | 8,517,204 | | | — | | | — | | | 8,517,204 | |
| Russia | | | 7,545,402 | | | — | | | — | | | 7,545,402 | |
| Singapore | | | 39,028,209 | | | — | | | — | | | 39,028,209 | |
| Spain | | | 164,802,156 | | | — | | | — | | | 164,802,156 | |
| Sweden | | | 60,868,498 | | | — | | | — | | | 60,868,498 | |
| Switzerland | | | 157,364,322 | | | — | | | — | | | 157,364,322 | |
| Taiwan | | | 33,960,000 | | | — | | | — | | | 33,960,000 | |
| Thailand | | | 27,102,708 | | | — | | | — | | | 27,102,708 | |
| United Kingdom | | | 379,040,894 | | | — | | | — | | | 379,040,894 | |
| United States | | | 165,652,324 | | | — | | | — | | | 165,652,324 | |
| Total Common Stocks | | | 2,710,107,686 | | | — | | | — | | | 2,710,107,686 | |
| Preferred Stocks | | | | | | | | | | | | | |
| Brazil | | | 8,704,894 | | | — | | | — | | | 8,704,894 | |
| Korea | | | 17,999,199 | | | — | | | — | | | 17,999,199 | |
| Total Preferred Stocks | | | 26,704,093 | | | — | | | — | | | 26,704,093 | |
| Short-Term Investment | | | 98,311,815 | | | — | | | — | | | 98,311,815 | |
| Total Investments | | | 2,835,123,594 | | | — | | | — | | | 2,835,123,594 | |
| Financial Derivative Instruments* | | | | | | | | | | | | | |
| Forward Foreign Currency Contracts | | | — | | | 138,032 | | | — | | | 138,032 | |
| Total Financial Derivative Instruments | | $ | — | | $ | 138,032 | | $ | — | | $ | 138,032 | |
| Liabilities | | | | | | | | | | | | | |
| Financial Derivative Instruments* | | | | | | | | | | | | | |
| Forward Foreign Currency Contracts | | | — | | | (10,278,752 | ) | | — | | | (10,278,752 | ) |
| Total Financial Derivative Instruments | | $ | — | | $ | (10,278,752 | ) | $ | — | | $ | (10,278,752 | ) |
* These investments are recorded at the unrealized gain or loss on the investment.
During the year ended July 31, 2013, there were no transfers in or out of security levels as a result of the fair value pricing procedures established by the Board.
See notes to financial statements
54
| Henderson Global Funds | Portfolio of investments |
Strategic Income Fund
July 31, 2013
Face
amount | | | | Coupon | | Maturity | | | Value (note 2) |
| | | | | | | | |
| Corporate bonds – 83.28% | | | | | | | |
| | | | | | | | | | | |
| | | | France – 1.63% | | | | | | | |
| EUR | 550,000 | | Crown European Holdings S.A. | | 7.125 | | 8/15/18 | | $ | 789,701 |
| | | | | | | | | | | |
| | | | Germany – 5.25% | | | | | | | |
| EUR | 400,000 | | Kabel Deutschland Vertrieb und Service GmbH | | 6.500 | | 6/29/18 | | | 570,720 |
| EUR | 250,000 | | Techem Energy Metering Service GmbH & Co. KG | | 7.875 | | 10/1/20 | | | 365,015 |
| USD | 500,000 | | Unitymedia Hessen GmbH & Co. KG (a) | | 7.500 | | 3/15/19 | | | 542,500 |
| USD | 1,100,000 | | Unitymedia Hessen GmbH & Co. KG (a) | | 5.500 | | 1/15/23 | | | 1,075,250 |
| | | | | | | | | | | 2,553,485 |
| | | | | | | | | | | |
| | | | Ireland – 3.35% | | | | | | | |
| EUR | 595,000 | | Ardagh Glass Finance plc | | 8.750 | | 2/1/20 | | | 829,157 |
| EUR | 50,000 | | Ardagh Glass Finance plc | | 9.250 | | 7/1/16 | | | 70,061 |
| EUR | 500,000 | | Smurfit Kappa Acquisitions | | 7.750 | | 11/15/19 | | | 729,750 |
| | | | | | | | | | | 1,628,968 |
| | | | | | | | | | | |
| | | | Jamaica – 1.53% | | | | | | | |
| USD | 710,000 | | Digicel, Ltd. (a) | | 8.250 | | 9/1/17 | | | 743,725 |
| | | | | | | | | | | |
| | | | Luxembourg – 7.11% | | | | | | | |
| GBP | 230,000 | | Cabot Financial Luxembourg S.A. | | 10.375 | | 10/1/19 | | | 388,375 |
| USD | 120,000 | | ConvaTec Healthcare (a) | | 10.500 | | 12/15/18 | | | 135,600 |
| EUR | 400,000 | | ConvaTec Healthcare | | 10.875 | | 12/15/18 | | | 592,671 |
| USD | 465,000 | | Dufry Finance SCA (a) | | 5.500 | | 10/15/20 | | | 479,022 |
| EUR | 200,000 | | Numericable Finance & Co. SCA | | 12.375 | | 2/15/19 | | | 317,288 |
| EUR | 800,000 | | Telenet Finance Luxembourg SCA | | 6.375 | | 11/15/20 | | | 1,124,944 |
| EUR | 100,000 | | Telenet Finance V Luxembourg SCA (a) | | 6.250 | | 8/15/22 | | | 137,691 |
| EUR | 200,000 | | Wind Acquisition Finance S.A. | | 11.750 | | 7/15/17 | | | 282,699 |
| | | | | | | | | | | 3,458,290 |
| | | | | | | | | | | |
| | | | Netherlands – 3.65% | | | | | | | |
| EUR | 150,000 | | Linde Finance B.V. | | 7.375 | | 7/14/16 | | | 228,549 |
| EUR | 100,000 | | TMF Group Holding B.V. | | 9.875 | | 12/1/19 | | | 137,367 |
| EUR | 93,000 | | UPC Holding B.V. | | 8.375 | | 8/15/20 | | | 136,713 |
| USD | 150,000 | | UPCB Finance III, Ltd. (a) | | 6.625 | | 7/1/20 | | | 161,250 |
| EUR | 775,000 | | Ziggo Bond Co. B.V. (a) | | 8.000 | | 5/15/18 | | | 1,108,348 |
| | | | | | | | | | | 1,772,227 |
| | | | | | | | | | | |
| | | | Sweden – 1.23% | | | | | | | |
| EUR | 417,000 | | Norcell Sweden Holding 2 AB | | 10.750 | | 9/29/19 | | | 599,680 |
| | | | | | | | | | | |
| | | | United Kingdom – 41.19% | | | | | | | |
| GBP | 200,000 | | Arqiva Broadcast Finance plc | | 9.500 | | 3/31/20 | | | 327,829 |
| GBP | 205,000 | | Arqiva Broadcast Finance plc (a) | | 9.500 | | 3/31/20 | | | 336,025 |
| USD | 132,000 | | AstraZeneca plc | | 4.000 | | 9/18/42 | | | 119,360 |
| EUR | 700,000 | | BAA Funding, Ltd. | | 4.600 | | 2/15/18 | | | 1,050,766 |
| GBP | 500,000 | | Barclays Bank plc | | 10.000 | | 5/21/21 | | | 1,002,373 |
| GBP | 150,000 | | BAT International Finance plc | | 6.000 | | 6/29/22 | | | 277,948 |
| USD | 490,000 | | British Sky Broadcasting Group plc (a) (b) | | 3.125 | | 11/26/22 | | | 461,006 |
| GBP | 1,000,000 | | Daily Mail & General Trust | | 5.750 | | 12/7/18 | | | 1,662,194 |
| GBP | 100,000 | | Daily Mail & General Trust | | 6.375 | | 6/21/27 | | | 158,811 |
| USD | 1,000,000 | | Diageo Capital plc | | 1.500 | | 5/11/17 | | | 996,488 |
| GBP | 400,000 | | F&C Finance plc | | 9.000 | | 12/20/16 | | | 660,841 |
See notes to financial statements
55
| Henderson Global Funds | Portfolio of investments |
Strategic Income Fund
July 31, 2013 (continued)
Face amount | | | | Coupon | | Maturity | | | Value (note 2) |
| | | | | | | | | | | |
| | | | United Kingdom (continued) | | | | | | | |
| GBP | 200,000 | | Gala Electric Casinos plc | | 11.500 | | 6/1/19 | | $ | 329,363 |
| GBP | 500,000 | | Gala Group Finance plc | | 8.875 | | 9/1/18 | | | 821,285 |
| EUR | 320,000 | | Global Switch Holdings, Ltd. | | 5.500 | | 4/18/18 | | | 476,800 |
| USD | 200,000 | | Imperial Tobacco Finance plc (a) | | 3.500 | | 2/11/23 | | | 189,587 |
| EUR | 635,903 | | INEOS Group Holdings S.A. | | 7.875 | | 2/15/16 | | | 857,606 |
| GBP | 501,000 | | ITV plc | | 5.375 | | 10/19/15 | | | 807,715 |
| GBP | 100,000 | | Ladbrokes Group Finance plc | | 7.625 | | 3/5/17 | | | 171,331 |
| GBP | 500,000 | | Legal & General Group plc (c) | | 6.385 | | 5/2/17 | | | 794,853 |
| USD | 1,100,000 | | Lloyds Banking Group plc (a) (c) | | 6.267 | | 11/14/16 | | | 929,500 |
| GBP | 250,000 | | Marks & Spencer plc | | 4.750 | | 6/12/25 | | | 383,131 |
| USD | 200,000 | | Pearson Funding Five plc (a) | | 3.250 | | 5/8/23 | | | 184,934 |
| GBP | 150,000 | | Priory Group No 3 plc | | 7.000 | | 2/15/18 | | | 234,577 |
| EUR | 510,000 | | Rexam plc | | 6.750 | | 6/29/67 | | | 712,402 |
| USD | 800,000 | | Royal Bank of Scotland Group plc (c) | | 7.640 | | 9/29/17 | | | 730,000 |
| USD | 1,100,000 | | Standard Chartered plc (c) | | 6.409 | | 1/3/17 | | | 1,121,863 |
| GBP | 50,000 | | Tesco plc | | 5.500 | | 12/13/19 | | | 87,734 |
| GBP | 89,000 | | Tesco plc | | 6.125 | | 2/24/22 | | | 159,813 |
| GBP | 50,000 | | Tesco plc | | 5.000 | | 3/24/23 | | | 83,265 |
| GBP | 50,000 | | Tesco plc | | 4.875 | | 3/24/42 | | | 72,425 |
| GBP | 67,000 | | Thames Water Utilities Finance, Ltd. | | 5.375 | | 7/21/25 | | | 112,572 |
| GBP | 450,000 | | Towergate Finance plc | | 8.500 | | 2/15/18 | | | 725,636 |
| GBP | 100,000 | | Towergate Finance plc | | 10.500 | | 2/15/19 | | | 160,492 |
| GBP | 710,000 | | Virgin Media Finance plc | | 8.875 | | 10/15/19 | | | 1,188,097 |
| GBP | 500,000 | | William Hill plc | | 7.125 | | 11/11/16 | | | 848,097 |
| USD | 595,000 | | WPP Finance 2010 | | 4.750 | | 11/21/21 | | | 619,027 |
| GBP | 100,000 | | WPP 2012 Ltd. | | 6.000 | | 4/4/17 | | | 173,617 |
| | | | | | | | | | | 20,029,363 |
| | | | | | | | | | | |
| | | | United States – 18.34% | | | | | | | |
| USD | 400,000 | | CenturyLink, Inc. | | 5.800 | | 3/15/22 | | | 401,000 |
| USD | 420,000 | | CenturyLink, Inc. | | 7.600 | | 9/15/39 | | | 401,100 |
| GBP | 300,000 | | Citigroup, Inc. | | 4.500 | | 3/3/31 | | | 420,490 |
| USD | 600,000 | | HCA Holdings, Inc. | | 7.750 | | 5/15/21 | | | 654,000 |
| USD | 300,000 | | HCA, Inc. | | 8.000 | | 10/1/18 | | | 346,500 |
| EUR | 600,000 | | Infor (US), Inc. | | 10.000 | | 4/1/19 | | | 890,004 |
| USD | 950,000 | | Iron Mountain, Inc. | | 5.750 | | 8/15/24 | | | 902,500 |
| EUR | 2,500,000 | | Lehman Brothers UK Capital Funding | | | | | | | |
| | | | IV LP (c) (d) (e) (f) | | 5.750 | | 4/25/14 | | | — |
| EUR | 775,000 | | Levi Strauss & Co. | | 7.750 | | 5/15/18 | | | 1,103,193 |
| USD | 400,000 | | Mcdonald’ s Corp. | | 3.625 | | 5/1/43 | | | 354,306 |
| USD | 220,000 | | NIKE, Inc. | | 3.625 | | 5/1/43 | | | 195,204 |
| USD | 140,000 | | Regal Entertainment Group | | 9.125 | | 8/15/18 | | | 155,400 |
| USD | 160,000 | | Regal Entertainment Group | | 5.750 | | 2/1/25 | | | 154,400 |
| USD | 205,000 | | Regal Entertainment Group | | 5.750 | | 6/15/23 | | | 200,644 |
| USD | 250,000 | | Reynolds Group Issuer, Inc. | | 5.750 | | 10/15/20 | | | 255,000 |
| USD | 400,000 | | Reynolds Group Issuer, Inc. | | 9.875 | | 8/15/19 | | | 434,000 |
| USD | 85,000 | | SBA Telecommunications, Inc. | | 5.750 | | 7/15/20 | | | 87,337 |
| USD | 1,240,000 | | Service Corp International | | 7.625 | | 10/1/18 | | | 1,429,100 |
| USD | 113,000 | | Taminco Global Chemical Corp. (a) (f) | | 9.750 | | 3/31/20 | | | 127,973 |
| USD | 440,000 | | Wal-Mart Stores, Inc. | | 4.000 | | 4/11/43 | | | 407,543 |
| | | | | | | | | | | 8,919,694 |
| | | | | | | | | | | |
| | | | Total corporate bonds | | | | | | | |
| | | | (Cost $41,513,317) | | | | | | | 40,495,133 |
See notes to financial statements
56
| Henderson Global Funds | Portfolio of investments |
Strategic Income Fund
July 31, 2013 (continued)
| Face | | | | | | | | | Value |
| amount | | | | Coupon | | Maturity | | | (note 2) |
| | | | | | | | |
| Foreign government obligation – 2.81% | | | | | | | |
| | | | | | | | | | | |
| | | | United Kingdom – 2.81% | | | | | | | |
| GBP | 900,000 | | United Kingdom Gilt | | 1.250 | | 7/22/18 | | $ | 1,368,490 |
| | | | | | | | | | | |
| | | | Total Foreign government obligation | | | | | | | |
| | | | (Cost $1,389,263) | | | | | | | 1,368,490 |
| | | | | | | | |
| US government obligations – 5.31% | | | | | | | |
| | | | | | | | |
| | | | United States - 5.31% | | | | | | | |
| USD | 1,000,000 | | United States Treasury Note | | 3.625 | | 2/15/21 | | | 1,106,289 |
| USD | 1,500,000 | | United States Treasury Note | | 0.875 | | 1/31/18 | | | 1,476,328 |
| | | | | | | | | | | 2,582,617 |
| | | | | | | | | | | |
| | | | Total US government obligations | | | | | | | |
| | | | (Cost $2,599,922) | | | | | | | 2,582,617 |
| | | | | | | | | | | |
| | | | Total long-term investments | | | | | | | |
| | | | (Cost $45,502,502) | | | | | | | 44,446,240 |
| | | | | | | | | | | |
| Shares | | | | | | | | | |
| | | | | | | | |
| Short-term investment - 6.58% | | | | | | | |
| | 3,197,012 | | Fidelity Institutional Treasury Portfolio (b) | | | | | | | 3,197,012 |
| | | | | | | | | | | |
| | | | Total short-term investment | | | | | | | |
| | | | (Cost $3,197,012) | | | | | | | 3,197,012 |
| | | | | | | | | | | |
| | | | Total investments - 97.98% | | | | | | | |
| | | | (Cost $48,699,514) | | | | | | | 47,643,252 |
| | | | | | | | | | | |
| | | | Net other assets and liabilities – 2.02% | | | | | | | 984,332 |
| | | | | | | | | | | |
| | | | Total net assets – 100.00% | | | | | | $ | 48,627,584 |
| (a) | Restricted security, purchased pursuant to Rule 144A under the Securities Act of 1933, as amended, and which is exempt from registration under that Act. At July 31, 2013, the restricted securities held by the Fund had an aggregate value of $6,612,411, which represented 13.6% of net assets. |
| (b) | A portion of this security is segregated as collateral for derivative contracts. |
| (c) | Maturity date is perpetual. Maturity date presented represents the next call date. |
| (d) | Security is in default. |
| (e) | Fair valued at July 31, 2013 as determined in good faith using procedures approved by the Board of Trustees. |
| (f) | The security has been deemed illiquid according to the policies and procedures adopted by the Board of Trustees. |
See notes to financial statements
57
| Henderson Global Funds | Portfolio of investments |
Strategic Income Fund
July 31, 2013 (continued)
The Fund held the following open forward foreign currency contracts at July 31, 2013:
| | | | Counterparty | | | Value date | | | Local amount (000’s | ) | | Current notional value | | | Unrealized appreciation/ (depreciation | ) |
| Euro (Short) | | | Deutsche Bank AG | | | 8/22/13 | | | 10,921 | | $ | 14,530,333 | | $ | (200,303 | ) |
| British Pound (Short) | | | Deutsche Bank AG | | | 8/16/13 | | | 584 | | | 887,883 | | | (6,730 | ) |
| British Pound (Short) | | | Citibank N.A. | | | 8/22/13 | | | 9,708 | | | 14,765,826 | | | (129,245 | ) |
| Total | | | | | | | | | | | | | | $ | (336,278 | ) |
During the seven months ended July 31, 2013, average monthly notional value related to forward foreign currency contracts was $9.4 million or 19.4% of net assets.
The Fund held the following open futures contracts at July 31, 2013:
| | | | Number of contracts | | | Expiration date | | | Current notional value | | | Unrealized appreciation/ (depreciation | ) |
| German Euro Bund (Long) | | | 8 | | | 9/06/13 | | $ | 1,515,215 | | $ | (19,767 | ) |
| UK Long Gilt Bond (Long) | | | 8 | | | 9/26/13 | | | 1,371,316 | | | (7,244 | ) |
| Total | | | | | | | | | | | $ | (27,011 | ) |
During the seven months ended July 31, 2013, average notional value related to futures contracts was $1.9 million or 3.9% of net assets.
The Fund held the following credit default swap contracts at July 31, 2013:
| Counterparty | | Reference
entity | | | Rates
received/
(paid | ) | | Termination
date | | | Implied
credit
spread | | | Notional
amount
(000s | ) | | Market
value | | | Upfront premiums
paid/
(received | ) | | Unrealized appreciation/ (depreciation | ) |
| Protection purchased: | | | | | | | | | | | | | | | | | | | | | | | | |
| J.P. Morgan | | Hewlett | | | | | | | | | | | | | | | | | | | | | | |
| Chase Bank, N.A. | | Packard Co. | | | (1.00% | ) | | 9/20/18 | | | 1.51 | % | | USD 150 | | $ | 3,516 | | $ | 3,639 | | $ | (123 | ) |
| Deutsche | | International | | | | | | | | | | | | | | | | | | | | | | |
| Bank AG | | Business | | | | | | | | | | | | | | | | | | | | | | |
| | | Machines Corp. | | | (1.00% | ) | | 9/20/18 | | | 0.39 | % | | USD 850 | | | (25,848 | ) | | (24,458 | ) | | (1,390 | ) |
| J.P. Morgan | | Legal & | | | | | | | | | | | | | | | | | | | | | | |
| Chase Bank, N.A. | | General | | | | | | | | | | | | | | | | | | | | | | |
| | | Group plc | | | (1.00% | ) | | 6/20/17 | | | 1.40 | % | | EUR 450 | | | 8,707 | | | 40,165 | | | (31,458 | ) |
| Citibank, N.A. | | Portugal Telecom | | | | | | | | | | | | | | | | | | | | | | |
| | | International | | | | | | | | | | | | | | | | | | | | | | |
| | | Finance BV | | | (5.00% | ) | | 6/20/18 | | | 4.59 | % | | EUR 400 | | | (10,638 | ) | | (24,182 | ) | | 13,544 | |
| Protection sold: | | | | | | | | | | | | | | | | | | | | | | | | |
| J.P. Morgan | | ConvaTec | | | | | | | | | | | | | | | | | | | | | | |
| Chase Bank, N.A. | | Healthcare | | | 5.00 | % | | 12/20/17 | | | 4.12 | % | | EUR 50 | | | 2,438 | | | (1,637 | ) | | 4,075 | |
| Total | | | | | | | | | | | | | | | | $ | (21,825 | ) | $ | (6,473 | ) | $ | (15,352 | ) |
During the seven months ended July 31, 2013, average notional value related to swap contracts was $458,000 or 0.9% of net assets.
See notes to financial statements
58
| Henderson Global Funds | Portfolio of investments |
Strategic Income Fund
July 31, 2013 (continued)
Other information:
| Industry concentration as | | | % of net |
| a percentage of net assets: | | | assets |
| Cable TV | | | 7.73 | % |
| Commercial Banks Non-US | | | 6.28 | |
| Telecommunication Services | | | 5.49 | |
| US Government Obligation | | | 5.31 | |
| Containers - Metal/Glass | | | 4.95 | |
| Telephone-Integrated | | | 4.09 | |
| Publishing-Newspapers | | | 3.75 | |
| Finance-Other Services | | | 3.14 | |
| Funeral Services & Related Items | | | 2.94 | |
| Sovereign | | | 2.81 | |
| Medical-Hospitals | | | 2.54 | |
| Diversified Banking Institution | | | 2.36 | |
| Apparel Manufacturers | | | 2.27 | |
| Airport Development & Maintenance | | | 2.16 | |
| Gambling (Non-Hotel) | | | 2.09 | |
| Beverages - Wine & Spirits | | | 2.05 | |
| Commercial Services | | | 1.86 | |
| Enterprise Software/Services | | | 1.83 | |
| Insurance Brokers | | | 1.82 | |
| Chemicals - Diversified | | | 1.76 | |
| Television | | | 1.66 | |
| Life/Health Insurance | | | 1.64 | |
| Disposable Medical Products | | | 1.50 | |
| Paper & Related Products | | | 1.50 | |
| Consumer Products - Miscellaneous | | | 1.41 | |
| Broadcast Services/Programs | | | 1.36 | |
| Investment Management & Advising Services | | | 1.36 | |
| Advertising Services | | | 1.27 | |
| Wire & Cable Products | | | 1.23 | |
| Theaters | | | 1.05 | |
| Retail-Miscellaneous/Diversified | | | 0.99 | |
| Computer Data Security | | | 0.98 | |
| Tobacco | | | 0.96 | |
| Retail-Discount | | | 0.84 | |
| Food-Retail | | | 0.83 | |
| Retail-Major Department Store | | | 0.79 | |
| Electronic Measurement Instruments | | | 0.75 | |
| Retail – Restaurants | | | 0.73 | |
| Diversified Operations | | | 0.68 | |
| Industrial Gases | | | 0.47 | |
| Athletic Footwear | | | 0.40 | |
| Multimedia | | | 0.38 | |
| Consulting Services | | | 0.36 | |
| Commercial Services-Finance | | | 0.29 | |
| Chemicals – Other | | | 0.26 | |
| Medical – Drugs | | | 0.25 | |
| Water | | | 0.23 | |
| Finance - Investment Banking & Brokerage | | | — | |
| Long-Term Investments | | | 91.40 | |
| Short-Term Investment | | | 6.58 | |
| Total Investments | | | 97.98 | |
| Net Other Assets and Liabilities | | | 2.02 | |
| | | | 100.00 | % |
See notes to financial statements
59
| Henderson Global Funds | Portfolio of investments |
Strategic Income Fund
July 31, 2013 (continued)
The following table summarizes the Fund’s investments that are measured at fair value by level within the fair value hierarchy at July 31, 2013:
| Description | | | Quoted prices
in active
markets for
identical assets
(level 1 | ) | | Significant
other
observable
inputs
(level 2 | ) | | Significant
unobservable
inputs
(level 3 | ) | | Total | |
| Assets | | | | | | | | | | | | | |
| Corporate Bonds | | | | | | | | | | | | | |
| France | | $ | — | | $ | 789,701 | | $ | — | | $ | 789,701 | |
| Germany | | | — | | | 2,553,485 | | | — | | | 2,553,485 | |
| Ireland | | | — | | | 1,628,968 | | | — | | | 1,628,968 | |
| Jamaica | | | — | | | 743,725 | | | — | | | 743,725 | |
| Luxembourg | | | — | | | 3,458,290 | | | — | | | 3,458,290 | |
| Netherlands | | | — | | | 1,772,227 | | | — | | | 1,772,227 | |
| Sweden | | | — | | | 599,680 | | | — | | | 599,680 | |
| United Kingdom | | | — | | | 20,029,363 | | | — | | | 20,029,363 | |
| United States | | | — | | | 8,919,694 | | | — | | | 8,919,694 | |
| Total Corporate Bonds | | | — | | | 40,495,133 | | | — | | | 40,495,133 | |
| Foreign Government Obligation | | | | | | | | | | | | | |
| United Kingdom | | | — | | | 1,368,490 | | | — | | | 1,368,490 | |
| Total Foreign Government Obligation | | | — | | | 1,368,490 | | | — | | | 1,368,490 | |
| US Government Obligations | | | | | | | | | | | | | |
| United States | | | — | | | 2,582,617 | | | — | | | 2,582,617 | |
| Total US Government Obligations | | | — | | | 2,582,617 | | | — | | | 2,582,617 | |
| Short-Term Investment | | | 3,197,012 | | | — | | | — | | | 3,197,012 | |
| Total Investments | | | 3,197,012 | | | 44,446,240 | | | — | | | 47,643,252 | |
| Financial Derivative Instruments* | | | | | | | | | | | | | |
| Credit Default Swap Contracts | | | — | | | 17,619 | | | — | | | 17,619 | |
| Total Financial Derivative Instruments | | $ | — | | $ | 17,619 | | $ | — | | $ | 17,619 | |
| | | | | | | | | | | | | | |
| Liabilities | | | | | | | | | | | | | |
| Financial Derivative Instruments* | | | | | | | | | | | | | |
| Credit Default Swap Contracts | | | — | | | (32,971 | ) | | — | | | (32,971 | ) |
| Forward Foreign Currency Contracts | | | — | | | (336,278 | ) | | — | | | (336,278 | ) |
| Futures Contracts | | | (27,011 | ) | | — | | | — | | | (27,011 | ) |
| Total Financial Derivative Instruments | | $ | (27,011 | ) | $ | (369,249 | ) | $ | — | | $ | (396,260 | ) |
* These investments are recorded at the unrealized gain or loss on the investment.
During the seven months ended July 31, 2013, there were no transfers in or out of security levels as a result of the fair value pricing procedures established by the Board.
See notes to financial statements
60
| Henderson Global Funds | Portfolio of investments |
Strategic Income Fund
July 31, 2013 (continued)
Following is a reconciliation of investments in which significant unobservable inputs (Level 3) were used in determining fair value:
Investments
in
securities | | Balance
as of
December
31, 2012 | | Accrued
discounts/ premiums | | Realized
gain/(loss | ) | Change in unrealized appreciation (depreciation | ) | Purchases | | Sales | | Transfers
in to
level 3 | | Transfers
out of
level 3 | | Balance
as of
July 31,
2013 | |
| Corporate Bonds | | | | | | | | | | | | | | | | | | | |
| United States | | | | | | | | | | | | | | | | | | | |
| Lehman Brothers | | | | | | | | | | | | | | | | | | | |
| UK Capital Funding | | | | | | | | | | | | | | | | | | | |
| IV LP | | $0 | | $0 | | $0 | | $0 | | $0 | | $0 | | $0 | | $0 | | $0 | |
| Total | | $0 | | $0 | | $0 | | $0 | | $0 | | $0 | | $0 | | $0 | | $0 | |
The total net change in unrealized depreciation included in the Statement of Operations attributable to Level 3 investments held at July 31, 2013 was $0.
The Fund’s management has determined that Lehman Brothers UK Capital Funding IV LP is a Level 3 investment due to the lack of observable inputs that may be used in the determination of fair value. Management has also concluded there is no value for the investment on the basis that the company has filed for bankruptcy, the position is currently in default and is highly subordinated.
See notes to financial statements
61
| Henderson Global Funds | Portfolio of investments |
World Select Fund
July 31, 2013
| Shares | | | | Value (note 2) |
| | | |
| Common stocks - 98.36% | | |
| | | | | |
| | | Australia - 1.49% | | |
| 36,400 | | Treasury Wine Estates, Ltd. | $ | 156,065 |
| | | | | |
| | | Belgium - 3.13% | | |
| 8,170 | | KBC Groep N.V. | | 327,699 |
| | | | | |
| | | Germany - 3.52% | | |
| 41,750 | | Infineon Technologies AG | | 368,466 |
| | | | | |
| | | Hong Kong - 3.38% | | |
| 74,600 | | AIA Group, Ltd. | | 353,493 |
| | | | | |
| | | Japan - 11.12% | | |
| 5,000 | | Don Quijote Co., Ltd. | | 261,975 |
| 4,700 | | Makita Corp. | | 245,297 |
| 3,194 | | Ryohin Keikaku Co., Ltd. | | 280,221 |
| 8,200 | | Sumitomo Mitsui Financial | | |
| | | Group, Inc. | | 375,621 |
| | | | | 1,163,114 |
| | | | | |
| | | Korea - 1.98% | | |
| 182 | | Samsung Electronics | | |
| | | Co., Ltd. | | 207,366 |
| | | | | |
| | | Sweden - 3.34% | | |
| 23,650 | | Volvo AB, B Shares | | 348,683 |
| | | | | |
| | | Switzerland - 5.24% | | |
| 2,904 | | Nestle S.A. | | 196,748 |
| 5,745 | | Pentair, Ltd. | | 350,905 |
| | | | | 547,653 |
| | | | | |
| | | United Kingdom - 7.05% | | |
| 29,175 | | Centrica plc | | 173,536 |
| 91,000 | | ITV plc | | 233,399 |
| 317,070 | | Lloyds Banking | | |
| | | Group plc * | | 330,260 |
| | | | | 737,195 |
| | | | | |
| | | United States - 58.11% | | |
| 4,595 | | Bed Bath & Beyond, Inc. * | $ | 351,380 |
| 3,415 | | BorgWarner, Inc. * | | 325,894 |
| 6,390 | | CBS Corp., Class B | | 337,648 |
| 4,560 | | Citrix Systems, Inc. * | | 328,411 |
| 2,735 | | Cummins, Inc. | | 331,455 |
| 6,680 | | eBay, Inc. * | | 345,289 |
| 965 | | Expedia, Inc. | | 45,480 |
| 8,075 | | Fortune Brands Home & | | |
| | | Security, Inc. | | 333,578 |
| 350 | | Google, Inc., Class A * | | 310,660 |
| 5,880 | | L Brands, Inc. | | 327,928 |
| 6,480 | | Microsoft Corp. | | 206,258 |
| 4,690 | | National Oilwell | | |
| | | Varco, Inc. | | 329,097 |
| 3,600 | | Occidental Petroleum | | |
| | | Corp. | | 320,580 |
| 3,365 | | Parker Hannifin Corp. | | 347,537 |
| 11,410 | | Pfizer, Inc. | | 333,514 |
| 3,037 | | Praxair, Inc. | | 364,956 |
| 298 | | Priceline.com, Inc. * | | 260,950 |
| 2,340 | | PVH Corp. | | 308,389 |
| 10,330 | | The Charles Schwab | | |
| | | Corp. | �� | 228,190 |
| 6,765 | | Walgreen Co. | | 339,941 |
| | | | | 6,077,135 |
| | | | | |
| | | Total common stocks | | |
| | | (Cost $8,554,010) | | 10,286,869 |
| | | | | |
| | | Total long-term investments | | |
| | | (Cost $8,554,010) | | 10,286,869 |
| | | | | |
| Short-term investment - 4.67% | |
| 488,509 | | Fidelity Institutional | | |
| | | Treasury Portfolio | | 488,509 |
| | | | | |
| | | Total short-term investment | | |
| | | (Cost $488,509) | | 488,509 |
| | | | | |
| Total investments - 103.03% | | |
| | | (Cost $9,042,519) | | 10,775,378 |
| | | | | |
| Net other assets and liabilities – (3.03)% | | (316,712) |
| | | | | |
| Total net assets – 100.00% | $ | 10,458,666 |
| * | | Non income producing security |
See notes to financial statements
62
| Henderson Global Funds | Portfolio of investments |
World Select Fund
July 31, 2013 (continued)
Other information:
| Industry concentration as | | | % of net |
| a percentage of net assets: | | | assets |
| Diversified Banks | | | 9.88 | % |
| Industrial Machinery | | | 9.02 | |
| Construction & Farm Machinery & | | | | |
| Heavy Trucks | | | 6.50 | |
| Internet Software & Services | | | 6.27 | |
| Semiconductors | | | 5.51 | |
| Broadcasting | | | 5.46 | |
| General Merchandise Stores | | | 5.18 | |
| Industrial Gases | | | 3.49 | |
| Life & Health Insurance | | | 3.38 | |
| Home Furnishing Retail | | | 3.36 | |
| Drug Retail | | | 3.25 | |
| Building Products | | | 3.19 | |
| Pharmaceuticals | | | 3.19 | |
| Oil & Gas Equipment & Services | | | 3.15 | |
| Application Software | | | 3.14 | |
| Apparel Retail | | | 3.14 | |
| Auto Parts & Equipment | | | 3.12 | |
| Integrated Oil & Gas | | | 3.07 | |
| Apparel, Accessories & Luxury Goods | | | 2.95 | |
| Internet Retail | | | 2.93 | |
| Investment Banking & Brokerage | | | 2.18 | |
| Systems Software | | | 1.97 | |
| Packaged Foods & Meats | | | 1.88 | |
| Multi-Utilities | | | 1.66 | |
| Distillers & Vintners | | | 1.49 | |
| Long-Term Investments | | | 98.36 | |
| Short-Term Investment | | | 4.67 | |
| Total Investments | | | 103.03 | |
| Net Other Assets and Liabilities | | | (3.03 | ) |
| | | | 100.00 | % |
See notes to financial statements
63
| Henderson Global Funds | Portfolio of investments |
World Select Fund
July 31, 2013 (continued)
The following table summarizes the Fund’s investments that are measured at fair value by level within the fair value hierarchy at July 31, 2013:
| Description | | | Quoted prices
in active
markets for
identical assets
(level 1 | ) | | Significant
other
observable
inputs
(level 2 | ) | | Significant
unobservable
inputs
(level 3 | ) | | Total | |
| Assets | | | | | | | | | | | | | |
| Common Stocks | | | | | | | | | | | | | |
| Australia | | $ | 156,065 | | $ | — | | $ | — | | $ | 156,065 | |
| Belgium | | | 327,699 | | | — | | | — | | | 327,699 | |
| Germany | | | 368,466 | | | — | | | — | | | 368,466 | |
| Hong Kong | | | 353,493 | | | — | | | — | | | 353,493 | |
| Japan | | | 1,163,114 | | | — | | | — | | | 1,163,114 | |
| Korea | | | 207,366 | | | — | | | — | | | 207,366 | |
| Sweden | | | 348,683 | | | — | | | — | | | 348,683 | |
| Switzerland | | | 547,653 | | | — | | | — | | | 547,653 | |
| United Kingdom | | | 737,195 | | | — | | | — | | | 737,195 | |
| United States | | | 6,077,135 | | | — | | | — | | | 6,077,135 | |
| Total Common Stocks | | | 10,286,869 | | | — | | | — | | | 10,286,869 | |
| Short-Term Investment | | | 488,509 | | | — | | | — | | | 488,509 | |
| Total | | $ | 10,775,378 | | $ | — | | $ | — | | $ | 10,775,378 | |
During the year ended July 31, 2013, there were no transfers in or out of security levels as a result of the fair value pricing procedures established by the Board.
See notes to financial statements
64
This page intentionally left blank.
65
| Henderson Global Funds | Financial statements |
Statements of assets and liabilities
July 31, 2013
| | | | | | | Dividend | | | Emerging | |
| | | | All | | | & Income | | | Markets | |
| | | | Asset | | | Builder | | | Opportunities | |
| | | | Fund | | | Fund | | | Fund | |
| Assets: | | | | | | | | | | |
| Investments, at fair value | | | | | | | | | | |
| Securities | | $ | 38,821,387 | | $ | 3,496,507 | | $ | 22,296,002 | |
| Affiliated investments, at fair value | | | 1,762,060 | | | — | | | — | |
| Short-term investment, at fair value | | | 23,229,110 | | | 176,084 | | | 357,444 | |
| Total investments | | | 63,812,557 | | | 3,672,591 | | | 22,653,446 | |
| Cash | | | — | | | 36,713 | | | 8,622 | |
| Foreign cash, at value | | | 128,364 | | | 49,454 | | | 4,465 | |
| Cash at broker for open futures contracts | | | 300,815 | | | — | | | — | |
| Dividends and interest receivable | | | 20,969 | | | 13,901 | | | 44,582 | |
| Receivable for investment securities sold | | | — | | | — | | | 251,541 | |
| Receivable for fund shares sold | | | 36,643 | | | 399,549 | | | 275,088 | |
| Receivable from investment adviser | | | — | | | 17,291 | | | 4,746 | |
| Unrealized appreciation on open futures contracts | | | 434,189 | | | — | | | — | |
| Unrealized appreciation on forward foreign currency contracts | | | 98,556 | | | — | | | — | |
| Receivable for credit default swap agreements terminated | | | — | | | — | | | — | |
| Unrealized appreciation on open swap contracts | | | — | | | — | | | — | |
| Credit default swap contracts premiums paid | | | — | | | — | | | — | |
| Prepaid expenses and other assets | | | 12,939 | | | 7,812 | | | 7,781 | |
| Total Assets | | | 64,845,032 | | | 4,197,311 | | | 23,250,271 | |
| Liabilities: | | | | | | | | | | |
| Payable for investment securities purchased | | | — | | | 339,987 | | | 278,505 | |
| Payable for fund shares redeemed | | | 134,251 | | | 1,205 | | | 56,259 | |
| Credit default swap contracts premiums received | | | — | | | — | | | — | |
| Unrealized depreciation on open futures contracts | | | 1,497 | | | — | | | — | |
| Unrealized depreciation on open swap contracts | | | — | | | — | | | — | |
| Unrealized depreciation on forward foreign currency contracts | | | 39,192 | | | — | | | — | |
| Payable to investment adviser | | | 19,046 | | | — | | | — | |
| Payable for 12b-1 distribution and service fees | | | 10,430 | | | 568 | | | 4,686 | |
| Accrued expenses and other payables | | | 39,798 | | | 37,577 | | | 39,635 | |
| Total Liabilities | | | 244,214 | | | 379,337 | | | 379,085 | |
| Net assets | | $ | 64,600,818 | | $ | 3,817,974 | | $ | 22,871,186 | |
| Net assets consist of: | | | | | | | | | | |
| Paid-in capital | | $ | 61,918,288 | | $ | 3,546,741 | | $ | 26,518,654 | |
| Accumulated undistributed net investment income (loss) | | | 70,523 | | | 104,711 | | | (40,212 | ) |
| Accumulated net realized gain/(loss) on investments, futures, options contracts, swaps and foreign currency transactions | | | 1,183,605 | | | 37,466 | | | (3,197,682 | ) |
| Net unrealized appreciation of investments, futures, options contracts, swaps and foreign currencies | | | 1,428,402 | | | 129,056 | | | (409,574 | ) |
| | | $ | 64,600,818 | | $ | 3,817,974 | | $ | 22,871,186 | |
See notes to financial statements
66
| Henderson Global Funds | Financial statements |
Statements of assets and liabilities
July 31, 2013 (continued)
| | | European | | | Global Equity | | | Global | | | High Yield | | | International | | | Strategic | | | World | |
| | | Focus | | | Income | | | Technology | | | Opportunities | | | Opportunities | | | Income | | | Select | |
| | | Fund | | | Fund | | | Fund | | | Fund | | | Fund | | | Fund | | | Fund | |
| | | | | | | | | | | | | | | | | | | | | | |
| | | | | | | | | | | | | | | | | | | | | | |
| | $ | 672,616,244 | | $ | 1,870,307,208 | | $ | 340,270,068 | | $ | 24,408,013 | | $ | 2,736,811,779 | | $ | 44,446,240 | | $ | 10,286,869 | |
| | | — | | | — | | | — | | | — | | | — | | | | | | | |
| | | 24,108,024 | | | 47,651,463 | | | 10,973,450 | | | 305,899 | | | 98,311,815 | | | 3,197,012 | | | 488,509 | |
| | | 696,724,268 | | | 1,917,958,671 | | | 351,243,518 | | | 24,713,912 | | | 2,835,123,594 | | | 47,643,252 | | | 10,775,378 | |
| | | — | | | — | | | — | | | — | | | — | | | — | | | — | |
| | | 136,228 | | | 1,731,103 | | | 1,067,781 | | | — | | | 6,352,701 | | | 17,827 | | | — | |
| | | — | | | — | | | — | | | — | | | — | | | 112,167 | | | — | |
| | | 1,021,623 | | | 10,248,852 | | | 251,826 | | | 420,399 | | | 3,684,586 | | | 848,003 | | | 13,195 | |
| | | 20,193,534 | | | 36,070,996 | | | 1,530,085 | | | 2,040,575 | | | 39,338,362 | | | 489,825 | | | 44,375 | |
| | | 8,976,993 | | | 16,013,541 | | | 588,459 | | | — | | | 8,066,416 | | | 41,575 | | | — | |
| | | — | | | — | | | — | | | — | | | — | | | — | | | — | |
| | | — | | | — | | | — | | | — | | | — | | | — | | | — | |
| | | — | | | — | | | — | | | — | | | 138,032 | | | — | | | — | |
| | | — | | | — | | | — | | | — | | | — | | | 3,963 | | | — | |
| | | — | | | — | | | — | | | 6,586 | | | — | | | 17,619 | | | — | |
| | | — | | | — | | | — | | | — | | | — | | | 43,804 | | | — | |
| | | 14,149 | | | 29,304 | | | 10,664 | | | 56,869 | | | 38,646 | | | 16,298 | | | 8,770 | |
| | | 727,066,795 | | | 1,982,052,467 | | | 354,692,333 | | | 27,238,341 | | | 2,892,742,337 | | | 49,234,333 | | | 10,841,718 | |
| | | | | | | | | | | | | | | | | | | | | | |
| | | 18,140,209 | | | 13,343,090 | | | 5,231,720 | | | 1,389,007 | | | 61,898,471 | | | 123 | | | 290,089 | |
| | | 1,249,892 | | | 2,228,453 | | | 1,114,245 | | | — | | | 3,847,030 | | | 31,192 | | | 55,155 | |
| | | — | | | — | | | — | | | 58,765 | | | — | | | 50,277 | | | — | |
| | | — | | | — | | | — | | | — | | | — | | | 27,011 | | | — | |
| | | — | | | — | | | — | | | — | | | — | | | 32,971 | | | — | |
| | | 1,404,390 | | | 4,046,334 | | | — | | | — | | | 10,278,752 | | | 336,278 | | | — | |
| | | 542,444 | | | 1,200,521 | | | 287,670 | | | 16,056 | | | 2,260,165 | | | 35,480 | | | 366 | |
| | | 162,334 | | | 627,006 | | | 103,369 | | | 1,076 | | | 695,633 | | | 25,601 | | | 5,413 | |
| | | 273,871 | | | 473,040 | | | 144,082 | | | 39,840 | | | 1,465,268 | | | 67,816 | | | 32,029 | |
| | | 21,773,140 | | | 21,918,444 | | | 6,881,086 | | | 1,504,744 | | | 80,445,319 | | | 606,749 | | | 383,052 | |
| | $ | 705,293,655 | | $ | 1,960,134,023 | | $ | 347,811,247 | | $ | 25,733,597 | | $ | 2,812,297,018 | | $ | 48,627,584 | | $ | 10,458,666 | |
| | | | | | | | | | | | | | | | | | | | | | |
| | $ | 880,267,036 | | $ | 1,995,195,469 | | $ | 284,035,102 | | $ | 25,801,354 | | $ | 3,055,916,115 | | $ | 86,071,137 | | $ | 10,346,502 | |
| | | 2,278,208 | | | 1,365,501 | | | (796,393 | ) | | 79,616 | | | 12,677,670 | | | 27,186 | | | 7,712 | |
| | | (249,365,780 | ) | | (165,518,144 | ) | | (11,920,822 | ) | | 35,718 | | | (720,543,285 | ) | | (36,037,167 | ) | | (1,627,890 | ) |
| | | 72,114,191 | | | 129,091,197 | | | 76,493,360 | | | (183,091 | ) | | 464,246,518 | | | (1,433,572 | ) | | 1,732,342 | |
| | $ | 705,293,655 | | $ | 1,960,134,023 | | $ | 347,811,247 | | $ | 25,733,597 | | $ | 2,812,297,018 | | $ | 48,627,584 | | $ | 10,458,666 | |
See notes to financial statements
67
| Henderson Global Funds | Financial statements |
Statements of assets and liabilities
July 31, 2013 (continued)
| | | | All
Asset
Fund | | | Dividend
& Income
Builder
Fund | | | Emerging
Markets
Opportunities
Fund | |
| Net assets: | | | | | | | | | | |
| Class A Shares | | $ | 12,022,614 | | $ | 1,891,260 | | $ | 8,929,919 | |
| Class B Shares | | | N/A | | | N/A | | | N/A | |
| Class C Shares | | $ | 9,357,022 | | $ | 463,258 | | $ | 3,168,523 | |
| Class I Shares | | $ | 43,221,182 | | $ | 1,463,456 | | $ | 10,772,744 | |
| Class R Shares | | | N/A | | | N/A | | | N/A | |
| Shares outstanding: | | | | | | | | | | |
| Class A Shares (unlimited number of shares authorized) | | | 1,143,074 | | | 165,896 | | | 1,052,210 | |
| Class B Shares (unlimited number of shares authorized) | | | N/A | | | N/A | | | N/A | |
| Class C Shares (unlimited number of shares authorized) | | | 896,703 | | | 40,823 | | | 378,617 | |
| Class I Shares (unlimited number of shares authorized) | | | 4,099,518 | | | 128,489 | | | 1,268,213 | |
| Class R Shares (unlimited number of shares authorized) | | | N/A | | | N/A | | | N/A | |
| Class A shares: | | | | | | | | | | |
| Net asset value and redemption price per share | | $ | 10.52 | | $ | 11.40 | | $ | 8.49 | |
| Maximum sales charge* | | | 5.75 | % | | 5.00 | % | | 5.75 | % |
| Maximum offering price per share | | $ | 11.16 | | $ | 12.00 | | $ | 9.01 | |
| Class B shares: | | | | | | | | | | |
| Net asset value and offering price per share | | | N/A | | | N/A | | | N/A | |
| Class C share | | | | | | | | | | |
| Net asset value and offering price per share | | $ | 10.43 | | $ | 11.35 | | $ | 8.37 | |
| Class I shares: | | | | | | | | | | |
| Net asset value and offering price per share | | $ | 10.54 | | $ | 11.39 | | $ | 8.49 | |
| Class R shares: | | | | | | | | | | |
| Net asset value and offering price per share | | | N/A | | | N/A | | | N/A | |
| Investments, at cost | | $ | 62,879,594 | | $ | 3,541,637 | | $ | 23,063,100 | |
| Foreign cash, at cost | | $ | 124,815 | | $ | 49,584 | | $ | 4,491 | |
| * | On purchases of $50,000 or more, the sales charge will be reduced. |
See notes to financial statements
68
| Henderson Global Funds | Financial statements |
Statements of assets and liabilities
July 31, 2013 (continued)
| | | European
Focus
Fund | | | Global Equity
Income
Fund | | | Global
Technology
Fund | | | High Yield
Opportunities
Fund | | | International Opportunities
Fund | | | Strategic
Income
Fund | | | World
Select
Fund | |
| | | | | | | | | | | | | | | | | | | | | | |
| | $ | 317,547,409 | | $ | 707,252,139 | | $ | 169,278,704 | | $ | 1,127,221 | | $ | 1,467,583,128 | | $ | 15,655,624 | | $ | 3,421,773 | |
| | $ | 17,023,214 | | | N/A | | $ | 9,249,397 | | | N/A | | $ | 40,022,534 | | $ | 6,197,830 | | | N/A | |
| | $ | 104,206,205 | | $ | 587,376,495 | | $ | 71,400,766 | | $ | 998,506 | | $ | 424,537,978 | | $ | 19,483,172 | | $ | 4,799,348 | |
| | $ | 266,516,827 | | $ | 665,505,389 | | $ | 97,882,380 | | $ | 23,607,870 | | $ | 872,973,754 | | $ | 7,290,958 | | $ | 2,237,545 | |
| | | N/A | | | N/A | | | N/A | | | N/A | | $ | 7,179,624 | | | N/A | | | N/A | |
| | | | | | | | | | | | | | | | | | | | | | |
| | | 10,862,686 | | | 90,105,948 | | | 7,291,580 | | | 112,907 | | | 61,694,837 | | | 1,753,891 | | | 281,831 | |
| | | 613,737 | | | N/A | | | 435,133 | | | N/A | | | 1,786,968 | | | 692,748 | | | N/A | |
| | | 3,765,494 | | | 75,194,503 | | | 3,363,299 | | | 100,000 | | | 18,953,982 | | | 2,192,044 | | | 405,203 | |
| | | 9,113,017 | | | 84,670,513 | | | 4,166,077 | | | 2,368,974 | | | 36,652,129 | | | 818,441 | | | 183,453 | |
| | | N/A | | | N/A | | | N/A | | | N/A | | | 306,241 | | | N/A | | | N/A | |
| | | | | | | | | | | | | | | | | | | | | | |
| | $ | 29.23 | | $ | 7.85 | | $ | 23.22 | | $ | 9.98 | | $ | 23.79 | | $ | 8.93 | | $ | 12.14 | |
| | | 5.75 | % | | 5.75 | % | | 5.75 | % | | 4.75 | % | | 5.75 | % | | 4.75 | % | | 5.75 | % |
| | $ | 31.01 | | $ | 8.33 | | $ | 24.64 | | $ | 10.48 | | $ | 25.24 | | $ | 9.38 | | $ | 12.88 | |
| | | | | | | | | | | | | | | | | | | | | | |
| | $ | 27.74 | | | N/A | | $ | 21.26 | | | N/A | | $ | 22.40 | | $ | 8.95 | | | N/A | |
| | | | | | | | | | | | | | | | | | | | | | |
| | $ | 27.67 | | $ | 7.81 | | $ | 21.23 | | $ | 9.99 | | $ | 22.40 | | $ | 8.89 | | $ | 11.84 | |
| | | | | | | | | | | | | | | | | | | | | | |
| | $ | 29.25 | | $ | 7.86 | | $ | 23.50 | | $ | 9.97 | | $ | 23.82 | | $ | 8.91 | | $ | 12.20 | |
| | | | | | | | | | | | | | | | | | | | | | |
| | | N/A | | | N/A | | | N/A | | | N/A | | $ | 23.44 | | | N/A | | | N/A | |
| | $ | 623,171,860 | | $ | 1,784,685,908 | | $ | 274,709,278 | | $ | 24,903,900 | | $ | 2,360,097,965 | | $ | 48,699,514 | | $ | 9,042,519 | |
| | $ | 135,844 | | $ | 1,742,670 | | $ | 1,102,165 | | $ | — | | $ | 6,338,308 | | $ | 17,316 | | $ | — | |
See notes to financial statements
69
| Henderson Global Funds | Financial statements |
Statements of operations
For the year ended July 31, 2013
| | | | All
Asset
Fund | | | Dividend &
Income
Builder
Fund* | | | Emerging
Markets
Opportunities
Fund | |
| Investment income: | | | | | | | | | | |
| Dividends | | $ | 759,049 | | $ | 124,045 | | $ | 506,822 | |
| Dividends from affiliated investments | | | 98,891 | | | — | | | — | |
| Interest | | | 25,178 | | | 4,591 | | | — | |
| Foreign taxes withheld | | | — | | | (6,871 | ) | | (56,256 | ) |
| Total Investment Income | | | 883,118 | | | 121,765 | | | 450,566 | |
| Expenses: | | | | | | | | | | |
| Investment advisory fees | | | 206,606 | | | 18,055 | | | 238,880 | |
| 12b-1 distribution and service fees: | | | | | | | | | | |
| Class A Shares | | | 26,552 | | | 799 | | | 21,861 | |
| Class B Shares | | | — | | | — | | | — | |
| Class C Shares | | | 53,029 | | | 1,261 | | | 30,416 | |
| Class R Shares | | | — | | | — | | | — | |
| Sub-accounting fees: | | | | | | | | | | |
| Class A Shares | | | 8,203 | | | 199 | | | 11,952 | |
| Class B Shares | | | — | | | — | | | — | |
| Class C Shares | | | 2,209 | | | 129 | | | 3,100 | |
| Class I Shares | | | 7,032 | | | 868 | | | 4,970 | |
| Class R Shares | | | — | | | — | | | — | |
| Transfer agent fees: | | | | | | | | | | |
| Class A Shares | | | 2,367 | | | 111 | | | 2,737 | |
| Class B Shares | | | — | | | — | | | — | |
| Class C Shares | | | 736 | | | 80 | | | 946 | |
| Class I Shares | | | 8,055 | | | 1,141 | | | 2,824 | |
| Class R Shares | | | — | | | — | | | — | |
| Deferred offering costs | | | 56,070 | | | 60,452 | | | — | |
| Registration and filing fees | | | 38,463 | | | 6,188 | | | 40,603 | |
| Audit fees | | | 37,942 | | | 39,349 | | | 38,113 | |
| Administrative fees | | | 12,947 | | | 602 | | | 5,987 | |
| Legal fees | | | 9,225 | | | 1,098 | | | 1,899 | |
| Custodian fees | | | 7,755 | | | 13,744 | | | 46,305 | |
| Printing and postage fees | | | 5,490 | | | 2,110 | | | 4,259 | |
| Trustees’ fees and expenses | | | 4,095 | | | 732 | | | 1,933 | |
| Compliance officer fees | | | 1,967 | | | 277 | | | 937 | |
| Accounting fees | | | 1,122 | | | 16,003 | | | 15,385 | |
| Organization expense | | | — | | | 4,507 | | | — | |
| Miscellaneous fees | | | 4,357 | | | 5,521 | | | 20,337 | |
| Total Expenses | | | 494,222 | | | 173,226 | | | 493,444 | |
| Fees waived and/or expenses reimbursed by investment adviser | | | (104,677 | ) | | (145,890 | ) | | (73,307 | ) |
| Net Expenses | | | 389,545 | | | 27,336 | | | 420,137 | |
| Net investment income/(loss) | | | 493,573 | | | 94,429 | | | 30,429 | |
| Net realized and unrealized gain/(loss): | | | | | | | | | | |
| Net realized gain/(loss) from: | | | | | | | | | | |
| Investment transactions | | | (190,079 | )(a) | | 37,003 | | | 290,535 | |
| Distributions from investment companies | | | 42,108 | | | 215 | | | — | |
| Futures contracts | | | 1,430,900 | | | — | | | — | |
| Options contracts | | | — | | | — | | | — | |
| Swap contracts | | | — | | | 1,936 | | | — | |
| Foreign currency transactions | | | (72,653 | ) | | 1,562 | | | (38,454 | ) |
| Net change in unrealized appreciation/(depreciation) of: | | | | | | | | | | |
| Investments | | | 991,285 | | | 132,127 | (b) | | 436,164 | (b) |
| Futures contracts | | | 445,792 | | | — | | | — | |
| Options contracts | | | — | | | — | | | — | |
| Swap contracts | | | — | | | — | | | — | |
| Translation of other assets and liabilities | | | 93,410 | | | (3,071 | ) | | (37,724 | ) |
| Net Realized and Unrealized Gain/(Loss) | | | 2,740,763 | | | 169,772 | | | 650,521 | |
| Net increase in net assets resulting from operations | | $ | 3,234,336 | | $ | 264,201 | | $ | 680,950 | |
| (a) | Affiliated companies accounted for $(140,087) of the net realized gain/(loss) from investment transactions. |
| (b) | Includes foreign capital gains tax of $(1,173), $(38,355) and $(564,784) for Dividend Income Builder Fund, Emerging Markets Opportunities Fund and International Opportunities Fund, respectively. |
| * | Fund commenced operations on August 1, 2012. |
| ** | Fund commenced operations on April 30, 2013. |
See notes to financial statements
70
| Henderson Global Funds | Financial statements |
Statements of operations
(continued)
| | | European Focus Fund | | | Global Equity Income Fund | | | Global Technology Fund | | | High Yield Opportunities Fund | ** | | International Opportunities Fund | |
| | | | | | | | | | | | | | | | |
| | $ | 16,058,417 | | $ | 125,393,346 | | $ | 5,870,377 | | $ | 13,175 | | $ | 59,430,672 | |
| | | — | | | — | | | — | | | — | | | — | |
| | | — | | | 409 | | | — | | | 408,042 | | | — | |
| | | (1,386,384 | ) | | (7,353,233 | ) | | (109,998 | ) | | — | | | (5,157,638 | ) |
| | | 14,672,033 | | | 118,040,522 | | | 5,760,379 | | | 421,217 | | | 54,273,034 | |
| | | | | | | | | | | | | | | | |
| | | 5,620,095 | | | 11,796,860 | | | 3,267,507 | | | 41,917 | | | 25,159,668 | |
| | | | | | | | | | | | | | | | |
| | | 677,263 | | | 1,439,581 | | | 405,015 | | | 669 | | | 3,340,106 | |
| | | 184,433 | | | — | | | 95,718 | | | — | | | 441,773 | |
| | | 952,331 | | | 4,553,140 | | | 700,975 | | | 2,503 | | | 4,148,679 | |
| | | — | | | — | | | — | | | — | | | 34,031 | |
| | | | | | | | | | | | | | | | |
| | | 283,370 | | | 377,890 | | | 147,925 | | | 920 | | | 1,277,800 | |
| | | 30,590 | | | — | | | 14,861 | | | — | | | 76,605 | |
| | | 120,925 | | | 335,945 | | | 76,630 | | | 920 | | | 582,400 | |
| | | 113,590 | | | 240,065 | | | 64,120 | | | 920 | | | 375,250 | |
| | | — | | | — | | | — | | | — | | | 9,315 | |
| | | | | | | | | | | | | | | | |
| | | 90,436 | | | 148,279 | | | 44,771 | | | 1,196 | | | 324,210 | |
| | | 6,941 | | | — | | | 2,892 | | | — | | | 14,145 | |
| | | 29,653 | | | 101,490 | | | 19,626 | | | 1,196 | | | 114,462 | |
| | | 42,530 | | | 106,435 | | | 17,850 | | | 1,196 | | | 150,155 | |
| | | — | | | — | | | — | | | — | | | 2,289 | |
| | | — | | | — | | | — | | | 18,889 | | | — | |
| | | 96,438 | | | 200,965 | | | 67,984 | | | 2,829 | | | 128,510 | |
| | | 38,113 | | | 38,112 | | | 38,113 | | | 26,000 | | | 40,263 | |
| | | 142,687 | | | 377,820 | | | 81,947 | | | 1,612 | | | 639,066 | |
| | | 42,853 | | | 103,145 | | | 22,436 | | | 1,920 | | | 212,790 | |
| | | 174,790 | | | 260,720 | | | 55,190 | | | 3,810 | | | 629,820 | |
| | | 86,132 | | | 168,135 | | | 46,075 | | | 1,240 | | | 353,530 | |
| | | 41,584 | | | 92,532 | | | 23,877 | | | 920 | | | 181,190 | |
| | | 22,832 | | | 60,908 | | | 13,107 | | | 2,304 | | | 102,847 | |
| | | 15,711 | | | 21,238 | | | 15,196 | | | 465 | | | 15,620 | |
| | | — | | | — | | | — | | | 10,389 | | | — | |
| | | 58,324 | | | 138,497 | | | 39,750 | | | 2,705 | | | 284,533 | |
| | | 8,871,621 | | | 20,561,757 | | | 5,261,565 | | | 124,520 | | | 38,639,057 | |
| | | — | | | — | | | — | | | (66,534 | ) | | — | |
| | | 8,871,621 | | | 20,561,757 | | | 5,261,565 | | | 57,986 | | | 38,639,057 | |
| | | 5,800,412 | | | 97,478,765 | | | 498,814 | | | 363,231 | | | 15,633,977 | |
| | | | | | | | | | | | | | | | |
| | | | | | | | | | | | | | | | |
| | | 41,990,408 | | | 68,347,162 | | | 16,847,912 | | | 74,079 | | | 170,751,650 | |
| | | — | | | — | | | — | | | — | | | — | |
| | | — | | | — | | | — | | | — | | | — | |
| | | (319,726 | ) | | — | | | — | | | — | | | (497,016 | ) |
| | | — | | | — | | | — | | | 506 | | | — | |
| | | (1,749,086 | ) | | 3,971,327 | | | (123,939 | ) | | (1,370 | ) | | (8,579,836 | ) |
| | | 112,875,741 | | | 76,016,223 | | | 35,069,079 | | | (189,988 | ) | | 398,760,912 | (b) |
| | | | | | | | | | | | | | | | |
| | | — | | | — | | | — | | | — | | | — | |
| | | 319,726 | | | — | | | — | | | — | | | 497,016 | |
| | | — | | | — | | | — | | | 6,586 | | | — | |
| | | (2,547,946 | ) | | (1,247,303 | ) | | 67,407 | | | 311 | | | (17,761,717 | ) |
| | | 150,569,117 | | | 147,087,409 | | | 51,860,459 | | | (109,876 | ) | | 543,171,009 | |
| | $ | 156,369,529 | | $ | 244,566,174 | | $ | 52,359,273 | | $ | 253,355 | | $ | 558,804,986 | |
See notes to financial statements
71
| Henderson Global Funds | Financial statements |
Statements of operations
(continued)
| | | | Strategic Income Fund* | | | | |
| | | | 7 months ended 7/31/2013 | | | 12 months ended | | | World Select Fund | |
| Investment income: | | | | | | | | | | |
| Dividends | | $ | 5,864 | | $ | 18,067 | | $ | 288,434 | |
| Interest | | | 1,692,865 | | | 2,714,561 | | | — | |
| Foreign taxes withheld | | | — | | | — | | | (7,128 | ) |
| Total Investment Income | | | 1,698,729 | | | 2,732,628 | | | 281,306 | |
| Expenses: | | | | | | | | | | |
| Investment advisory fees | | | 171,081 | | | 267,705 | | | 101,839 | |
| 12b-1 distribution and service fees: | | | | | | | | | | |
| Class A Shares | | | 27,251 | | | 40,071 | | | 13,905 | |
| Class B Shares | | | 39,059 | | | 74,038 | | | — | |
| Class C Shares | | | 123,230 | | | 222,224 | | | 58,017 | |
| Sub-accounting fees: | | | | | | | | | | |
| Class A Shares | | | 7,420 | | | 10,745 | | | 4,745 | |
| Class B Shares | | | 4,240 | | | 7,366 | | | — | |
| Class C Shares | | | 11,980 | | | 21,237 | | | 4,473 | |
| Class I Shares | | | 1,952 | | | 1,752 | | | 410 | |
| Transfer agent fees: | | | | | | | | | | |
| Class A Shares | | | 3,300 | | | 5,577 | | | 1,718 | |
| Class B Shares | | | 1,061 | | | 2,261 | | | — | |
| Class C Shares | | | 3,033 | | | 5,441 | | | 1,525 | |
| Class I Shares | | | 945 | | | 1,098 | | | 454 | |
| Registration and filing fees | | | 33,180 | | | 56,810 | | | 39,893 | |
| Printing and postage fees | | | 7,909 | | | 24,396 | | | 3,030 | |
| Audit fees | | | 41,965 | | | 34,710 | | | 38,117 | |
| Administrative fees | | | 7,776 | | | 12,208 | | | 3,194 | |
| Accounting fees | | | 465 | | | 7,320 | | | 15,263 | |
| Legal fees | | | 6,167 | | | 3,840 | | | 1,019 | |
| Trustees’ fees and expenses | | | 1,696 | | | 5,592 | | | 940 | |
| Compliance officer fees | | | 1,703 | | | 2,138 | | | 486 | |
| Custodian fees | | | 26,790 | | | 17,345 | | | 12,960 | |
| Miscellaneous fees | | | 37,417 | | | 47,388 | | | 3,498 | |
| Total Expenses | | | 559,620 | | | 871,262 | | | 305,486 | |
| Fees waived and/or expenses reimbursed by investment adviser | | | (105,685 | ) | | (121,190 | ) | | (87,171 | ) |
| Net Expenses | | | 453,935 | | | 750,072 | | | 218,315 | |
| Net investment income | | | 1,244,794 | | | 1,982,556 | | | 62,991 | |
| Net realized and unrealized gain/(loss): | | | | | | | | | | |
| Net realized gain/(loss) from: | | | | | | | | | | |
| Investment transactions | | | 571,535 | | | 125,239 | | | 2,426,389 | |
| Futures contracts | | | (135,638 | ) | | 235,355 | | | — | |
| Options contracts | | | (9,386 | ) | | (165,906 | ) | | — | |
| Swap contracts | | | (173,463 | ) | | 20,086 | | | — | |
| Foreign currency transactions | | | 1,233,143 | | | (614,689 | ) | | (9,975 | ) |
| Net change in unrealized appreciation/(depreciation) of: | | | | | | | | | | |
| Investments | | | (2,174,994 | ) | | 4,677,561 | | | 75,841 | |
| Futures contracts | | | (27,011 | ) | | — | | | — | |
| Swap contracts | | | (2,346 | ) | | (13,006 | ) | | — | |
| Translation of other assets and liabilities | | | (449,467 | ) | | (174,912 | ) | | 31 | |
| Net Realized and Unrealized Gain/(Loss) | | | (1,167,627 | ) | | 4,089,728 | | | 2,492,286 | |
| Net increase in net assets resulting from operations | | $ | 77,167 | | $ | 6,072,284 | | $ | 2,555,277 | |
| * | The Strategic Income Fund changed its fiscal year end from December 31 to July 31. |
See notes to financial statements
72
| Henderson Global Funds | Financial statements |
Statements of changes in net assets
All Asset Fund
| | | | Year Ended July 31, 2013 | | | Period ended July 31, 2012 | * |
| Net investment income | | $ | 493,573 | | $ | 50,623 | |
| Net realized gain/(loss) on investments, distributions from investment companies, futures contracts and foreign currency transactions | | | 1,210,276 | | | (42,307 | ) |
| Net change in unrealized appreciation/(depreciation) of investments, futures contracts and foreign currency translations | | | 1,530,487 | | | (102,085 | ) |
| Net increase/(decrease) in net assets resulting from operations | | | 3,234,336 | | | (93,769 | ) |
| | | | | | | | |
| Distributions to shareholders from net investment income: | | | | | | | |
| Class A Shares | | | (94,424 | ) | | — | |
| Class C Shares | | | (30,321 | ) | | — | |
| Class I Shares | | | (342,009 | ) | | — | |
| Total distributions to shareholders from net investment income | | | (466,754 | ) | | — | |
| | | | | | | | |
| Distributions to shareholders from net realized gains: | | | | | | | |
| Class A Shares | | | (16,634 | ) | | — | |
| Class C Shares | | | (6,285 | ) | | — | |
| Class I Shares | | | (52,932 | ) | | — | |
| Total distributions to shareholders from net realized gains | | | (75,851 | ) | | — | |
| | | | | | | | |
| Increase from Fund share transactions: | | | | | | | |
| Class A Shares | | | 5,709,941 | | | 5,683,730 | |
| Class C Shares | | | 8,148,340 | | | 1,005,845 | |
| Class I Shares | | | 12,422,210 | | | 29,032,790 | |
| Net increase from Fund share transactions: | | | 26,280,491 | | | 35,722,365 | |
| Net increase in net assets | | | 28,972,222 | | | 35,628,596 | |
| | | | | | | | |
| Net assets: | | | | | | | |
| Beginning of period | | | 35,628,596 | | | — | |
| End of period | | $ | 64,600,818 | | $ | 35,628,596 | |
| Accumulated undistributed net investment income | | $ | 70,523 | | $ | 122,985 | |
| * | Fund commenced operations on March 30, 2012. |
See notes to financial statements
73
| Henderson Global Funds | Financial statements |
Statements of changes in net assets
Dividend & Income Builder Fund
| | | | Period ended July 31, 2013 | * |
| Net investment income | | $ | 94,429 | |
| Net realized gain on investments, distributions from investment companies, swap contracts and foreign currency transactions | | | 40,716 | |
| Net change in unrealized appreciation/(depreciation) of investments and foreign currency translations | | | 129,056 | |
| Net increase in net assets resulting from operations | | | 264,201 | |
| | | | | |
| Distributions to shareholders from net investment income: | | | | |
| Class A Shares | | | (10,916 | ) |
| Class C Shares | | | (3,446 | ) |
| Class I Shares | | | (40,177 | ) |
| Total distributions to shareholders from net investment income | | | (54,539 | ) |
| | | | | |
| Increase from Fund share transactions: | | | | |
| Class A Shares | | | 1,865,786 | |
| Class C Shares | | | 450,282 | |
| Class I Shares | | | 1,292,244 | |
| Net increase from Fund share transactions: | | | 3,608,312 | |
| Net increase in net assets | | | 3,817,974 | |
| | | | | |
| Net assets: | | | | |
| Beginning of period | | | — | |
| End of period | | $ | 3,817,974 | |
| Accumulated undistributed net investment income | | $ | 104,711 | |
| * | Fund commenced operations on August 1, 2012. |
See notes to financial statements
74
| Henderson Global Funds | Financial statements |
Statements of changes in net assets
Emerging Markets Opportunities Fund
| | | | Year Ended July 31, 2013 | | | Year Ended July 31, 2012 | |
| Net investment income/(loss) | | $ | 30,429 | | $ | (41,865 | ) |
| Net realized gain/(loss) on investments and foreign currency transactions | | | 252,081 | | | (2,932,066 | ) |
| Net change in unrealized appreciation/(depreciation) of investments and foreign currency translations | | | 398,440 | | | (1,065,121 | ) |
| Net increase/(decrease) in net assets resulting from operations | | | 680,950 | | | (4,039,052 | ) |
| | | | | | | | |
| Distributions to shareholders from net investment income: | | | | | | | |
| Class A Shares | | | (50,326 | ) | | (83,851 | ) |
| Class C Shares | | | (6,619 | ) | | (24,898 | ) |
| Class I Shares | | | (106,840 | ) | | (88,994 | ) |
| Total distributions to shareholders from net investment income | | | (163,785 | ) | | (197,743 | ) |
| | | | | | | | |
| Increase/(decrease) from Fund share transactions: | | | | | | | |
| Class A Shares | | | 1,592,717 | | | (5,906,361 | ) |
| Class C Shares | | | 805,110 | | | 1,250,313 | |
| Class I Shares | | | 2,915,230 | | | 5,326,961 | |
| Net increase from Fund share transactions: | | | 5,313,057 | | | 670,913 | |
| Net increase/(decrease) in net assets | | | 5,830,222 | | | (3,565,882 | ) |
| | | | | | | | |
| Net assets: | | | | | | | |
| Beginning of year | | | 17,040,964 | | | 20,606,846 | |
| End of year | | $ | 22,871,186 | | $ | 17,040,964 | |
| Accumulated undistributed net investment loss | | $ | (40,212 | ) | $ | (33,071 | ) |
See notes to financial statements
75
| Henderson Global Funds | Financial statements |
Statements of changes in net assets
European Focus Fund
| | | | Year Ended July 31, 2013 | | | Year Ended July 31, 2012 | |
| Net investment income | | $ | 5,800,412 | | $ | 5,509,740 | |
| Net realized gain/(loss) on investments, options contracts and foreign currency transactions | | | 39,921,596 | | | (5,546,056 | ) |
| Net change in unrealized appreciation/(depreciation) of investments, options contracts and foreign currency translations | | | 110,647,521 | | | (120,111,960 | ) |
| Net increase/(decrease) in net assets resulting from operations | | | 156,369,529 | | | (120,148,276 | ) |
| | | | | | | | |
| Distributions to shareholders from net investment income: | | | | | | | |
| Class A Shares | | | (3,862,742 | ) | | (12,721,862 | ) |
| Class B Shares | | | (77,089 | ) | | (1,055,757 | ) |
| Class C Shares | | | (655,390 | ) | | (4,115,335 | ) |
| Class I Shares | | | (2,990,865 | ) | | (5,056,593 | ) |
| Total distributions to shareholders from net investment income | | | (7,586,086 | ) | | (22,949,547 | ) |
| | | | | | | | |
| Increase/(decrease) from Fund share transactions: | | | | | | | |
| Class A Shares | | | 10,265,885 | | | (20,232,625 | ) |
| Class B Shares | | | (7,619,811 | ) | | (7,474,864 | ) |
| Class C Shares | | | (8,815,524 | ) | | (14,828,072 | ) |
| Class I Shares | | | 97,569,948 | | | 21,334,266 | |
| Net increase/(decrease) from Fund share transactions: | | | 91,400,498 | | | (21,201,295 | ) |
| Net increase/(decrease) in net assets | | | 240,183,941 | | | (164,299,118 | ) |
| | | | | | | | |
| Net assets: | | | | | | | |
| Beginning of year | | | 465,109,714 | | | 629,408,832 | |
| End of year | | $ | 705,293,655 | | $ | 465,109,714 | |
| Accumulated undistributed net investment income (loss) | | $ | 2,278,208 | | $ | (728,786 | ) |
See notes to financial statements
76
| Henderson Global Funds | Financial statements |
Statements of changes in net assets
Global Equity Income Fund
| | | | Year Ended July 31, 2013 | | | Year Ended July 31, 2012 | |
| Net investment income | | $ | 97,478,765 | | $ | 71,563,429 | |
| Net realized gain/(loss) on investments and foreign currency transactions | | | 72,318,489 | | | (85,365,998 | ) |
| Net change in unrealized appreciation/(depreciation) of investments and foreign currency translations | | | 74,768,920 | | | 29,907,519 | |
| Net increase in net assets resulting from operations | | | 244,566,174 | | | 16,104,950 | |
| | | | | | | | |
| Distributions to shareholders from net investment income: | | | | | | | |
| Class A Shares | | | (37,792,159 | ) | | (30,797,395 | ) |
| Class C Shares | | | (26,916,004 | ) | | (21,569,191 | ) |
| Class I Shares | | | (33,218,170 | ) | | (19,485,873 | ) |
| Total distributions to shareholders from net investment income | | | (97,926,333 | ) | | (71,852,459 | ) |
| | | | | | | | |
| Increase from Fund share transactions: | | | | | | | |
| Class A Shares | | | 182,850,123 | | | 5,394,507 | |
| Class C Shares | | | 179,088,816 | | | 20,054,724 | |
| Class I Shares | | | 288,439,474 | | | 142,343,109 | |
| Net increase from Fund share transactions: | | | 650,378,413 | | | 167,792,340 | |
| Net increase in net assets | | | 797,018,254 | | | 112,044,831 | |
| | | | | | | | |
| Net assets: | | | | | | | |
| Beginning of year | | | 1,163,115,769 | | | 1,051,070,938 | |
| End of year | | $ | 1,960,134,023 | | $ | 1,163,115,769 | |
| Accumulated undistributed net investment income (loss) | | $ | 1,365,501 | | $ | (2,834,783 | ) |
See notes to financial statements
77
| Henderson Global Funds | Financial statements |
Statements of changes in net assets
Global Technology Fund
| | | | Year Ended July 31, 2013 | | | Year Ended July 31, 2012 | |
| Net investment income/(loss) | | $ | 498,814 | | $ | (2,778,842 | ) |
| Net realized gain on investments and foreign currency transactions | | | 16,723,973 | | | 16,375,075 | |
| Net change in unrealized appreciation/(depreciation) of investments and foreign currency translations | | | 35,136,486 | | | (30,794,107 | ) |
| Net increase/(decrease) in net assets resulting from operations | | | 52,359,273 | | | (17,197,874 | ) |
| | | | | | | | |
| Increase/(decrease) from Fund share transactions: | | | | | | | |
| Class A Shares | | | (14,144,029 | ) | | (24,119,142 | ) |
| Class B Shares | | | (1,971,719 | ) | | (1,470,200 | ) |
| Class C Shares | | | (8,905,587 | ) | | (5,676,837 | ) |
| Class I Shares | | | 22,996,125 | | | 10,918,238 | |
| Net decrease from Fund share transactions: | | | (2,025,210 | ) | | (20,347,941 | ) |
| Net increase/(decrease) in net assets | | | 50,334,063 | | | (37,545,815 | ) |
| | | | | | | | |
| Net assets: | | | | | | | |
| Beginning of year | | | 297,477,184 | | | 335,022,999 | |
| End of year | | $ | 347,811,247 | | $ | 297,477,184 | |
| Accumulated undistributed net investment loss | | $ | (796,393 | ) | $ | (1,611,159 | ) |
See notes to financial statements
78
| Henderson Global Funds | Financial statements |
Statements of changes in net assets
High Yield Opportunities Fund
| | | | Period ended July 31, 2013 | * |
| Net investment income | | $ | 363,231 | |
| Net realized gain on investments, swap contracts and foreign currency transactions | | | 73,215 | |
| Net change in unrealized appreciation/(depreciation) of investments, swap contracts and foreign currency translations | | | (183,091 | ) |
| Net increase in net assets resulting from operations | | | 253,355 | |
| | | | | |
| Distributions to shareholders from net investment income: | | | | |
| Class A Shares | | | (12,054 | ) |
| Class C Shares | | | (9,024 | ) |
| Class I Shares | | | (318,923 | ) |
| Total distributions to shareholders from net investment income | | | (340,001 | ) |
| | | | | |
| Increase from Fund share transactions: | | | | |
| Class A Shares | | | 1,127,699 | |
| Class C Shares | | | 1,000,000 | |
| Class I Shares | | | 23,692,544 | |
| Net increase from Fund share transactions: | | | 25,820,243 | |
| Net increase in net assets | | | 25,733,597 | |
| | | | | |
| Net assets: | | | | |
| Beginning of period | | | — | |
| End of period | | $ | 25,733,597 | |
| Accumulated undistributed net investment income | | $ | 79,616 | |
| * | Fund commenced operations on April 30, 2013. |
See notes to financial statements
79
| Henderson Global Funds | Financial statements |
Statements of changes in net assets
International Opportunities Fund
| | | | Year Ended July 31, 2013 | | | Year Ended July 31, 2012 | |
| Net investment income | | $ | 15,633,977 | | $ | 18,854,622 | |
| Net realized gain/(loss) on investments, options contracts and foreign currency transactions | | | 161,674,798 | | | (56,533,004 | ) |
| Net change in unrealized appreciation/(depreciation) of investments, options contracts and foreign currency translations | | | 381,496,211 | | | (359,261,616 | ) |
| Net increase/(decrease) in net assets resulting from operations | | | 558,804,986 | | | (396,939,998 | ) |
| | | | | | | | |
| Distributions to shareholders from net investment income: | | | | | | | |
| Class A Shares | | | (9,051,310 | ) | | (8,152,193 | ) |
| Class I Shares | | | (7,133,469 | ) | | (6,959,597 | ) |
| Class R Shares | | | (21,816 | ) | | (24,972 | ) |
| Total distributions to shareholders from net investment income | | | (16,206,595 | ) | | (15,136,762 | ) |
| | | | | | | | |
| Increase/(decrease) from Fund share transactions: | | | | | | | |
| Class A Shares | | | (81,695,905 | ) | | (445,329,246 | ) |
| Class B Shares | | | (18,077,030 | ) | | (20,729,867 | ) |
| Class C Shares | | | (79,871,934 | ) | | (145,084,044 | ) |
| Class I Shares | | | 58,283,653 | | | (58,088,592 | ) |
| Class R Shares | | | (708,500 | ) | | 94,728 | |
| Net decrease from Fund share transactions: | | | (122,069,716 | ) | | (669,137,021 | ) |
| Net increase/(decrease) in net assets | | | 420,528,675 | | | (1,081,213,781 | ) |
| | | | | | | | |
| Net assets: | | | | | | | |
| Beginning of year | | | 2,391,768,343 | | | 3,472,982,124 | |
| End of year | | $ | 2,812,297,018 | | $ | 2,391,768,343 | |
| Accumulated undistributed net investment income | | $ | 12,677,670 | | $ | 16,188,583 | |
See notes to financial statements
80
| Henderson Global Funds | Financial statements |
Statements of changes in net assets
Strategic Income Fund
| | | | Period ended July 31, 2013 | * | | Year Ended December 31, 2012 | | | Year Ended December 31, 2011 | |
| Net investment income | | $ | 1,244,794 | | $ | 1,982,556 | | $ | 2,511,927 | |
| Net realized gain/(loss) on investments, futures contracts, options contracts, swap contracts and foreign currency transactions | | | 1,486,191 | | | (399,915 | ) | | (552,328 | ) |
| Net change in unrealized appreciation/(depreciation) of investments, futures contracts, swap contracts and foreign currency translations | | | (2,653,818 | ) | | 4,489,643 | | | (1,907,519 | ) |
| Net increase in net assets resulting from operations | | | 77,167 | | | 6,072,284 | | | 52,080 | |
| | | | | | | | | | | |
| Distributions to shareholders from net investment income: | | | | | | | | | | |
| Class A Shares | | | (465,226 | ) | | (727,166 | ) | | (911,392 | ) |
| Class B Shares | | | (134,459 | ) | | (276,825 | ) | | (285,116 | ) |
| Class C Shares | | | (428,408 | ) | | (842,201 | ) | | (852,217 | ) |
| Class I Shares | | | (177,910 | ) | | (148,305 | ) | | (43,932 | ) |
| Total distributions to shareholders from net investment income | | | (1,206,003 | ) | | (1,994,497 | ) | | (2,092,657 | ) |
| | | | | | | | | | | |
| Return of capital: | | | | | | | | | | |
| Class A Shares | | | — | | | — | | | (177,404 | ) |
| Class B Shares | | | — | | | — | | | (55,499 | ) |
| Class C Shares | | | — | | | — | | | (165,886 | ) |
| Class I Shares | | | — | | | — | | | (8,552 | ) |
| Total return of capital: | | | — | | | — | | | (407,341 | ) |
| | | | | | | | | | | |
| Increase/(decrease) from Fund share transactions: | | | | | | | | | | |
| Class A Shares | | | (1,525,748 | ) | | (963,804 | ) | | (10,081,550 | ) |
| Class B Shares | | | (627,272 | ) | | (1,070,745 | ) | | (747,916 | ) |
| Class C Shares | | | (2,413,031 | ) | | (1,784,747 | ) | | (3,698,882 | ) |
| Class I Shares | | | 3,531,507 | | | 1,781,274 | | | 2,021,116 | |
| Net decrease from Fund share transactions: | | | (1,034,544 | ) | | (2,038,022 | ) | | (12,507,232 | ) |
| Net increase/(decrease) in net assets | | | (2,163,380 | ) | | 2,039,765 | | | (14,955,150 | ) |
| | | | | | | | | | | |
| Net assets: | | | | | | | | | | |
| Beginning of period | | | 50,790,964 | | | 48,751,199 | | | 63,706,349 | |
| End of period | | $ | 48,627,584 | | $ | 50,790,964 | | $ | 48,751,199 | |
| Accumulated undistributed net investment income/(loss) | | $ | 27,186 | | $ | (31,774 | ) | $ | (124,959 | ) |
| * | The Strategic Income Fund changed its fiscal year end from December 31 to July 31. |
See notes to financial statements
81
| Henderson Global Funds | Financial statements |
Statements of changes in net assets
World Select Fund
| | | | Year Ended July 31, 2013 | | | Year Ended July 31, 2012 | |
| Net investment income/(loss) | | $ | 62,991 | | $ | (35,716 | ) |
| Net realized gain on investments and foreign currency transactions | | | 2,416,414 | | | 1,109,479 | |
| Net change in unrealized appreciation/(depreciation) of investments and foreign currency translations | | | 75,872 | | | (1,501,568 | ) |
| Net increase/(decrease) in net assets resulting from operations | | | 2,555,277 | | | (427,805 | ) |
| | | | | | | | |
| Distributions to shareholders from net investment income: | | | | | | | |
| Class A Shares | | | (22,827 | ) | | — | |
| Class C Shares | | | (12,169 | ) | | — | |
| Class I Shares | | | (6,529 | ) | | — | |
| Total distributions to shareholders from net investment income | | | (41,525 | ) | | — | |
| | | | | | | | |
| Increase/(decrease) from Fund share transactions: | | | | | | | |
| Class A Shares | | | (4,768,810 | ) | | (678,567 | ) |
| Class C Shares | | | (2,148,421 | ) | | (606,367 | ) |
| Class I Shares | | | 900,413 | | | (6,656 | ) |
| Net decrease from Fund share transactions: | | | (6,016,818 | ) | | (1,291,590 | ) |
| Net decrease in net assets | | | (3,503,066 | ) | | (1,719,395 | ) |
| | | | | | | | |
| Net assets: | | | | | | | |
| Beginning of year | | | 13,961,732 | | | 15,681,127 | |
| End of year | | $ | 10,458,666 | | $ | 13,961,732 | |
| Accumulated undistributed net investment income/(loss) | | $ | 7,712 | | $ | (21,275 | ) |
See notes to financial statements
82
| Henderson Global Funds | Financial statements |
Statements of changes - capital stock activity
All Asset Fund
| | | | Year Ended July 31, 2013 | | | Period ended July 31, 2012 | * |
| Amount | | | | | | | |
| Class A shares: | | | | | | | |
| Sold | | $ | 8,842,297 | | $ | 6,002,209 | |
| Issued as reinvestment of dividends | | | 106,782 | | | — | |
| Redeemed | | | (3,239,138 | ) | | (318,479 | ) |
| Net increase | | $ | 5,709,941 | | $ | 5,683,730 | |
| Class C shares: | | | | | | | |
| Sold | | $ | 8,715,037 | | $ | 1,005,845 | |
| Issued as reinvestment of dividends | | | 35,786 | | | — | |
| Redeemed | | | (602,483 | ) | | — | |
| Net increase | | $ | 8,148,340 | | $ | 1,005,845 | |
| Class I shares: | | | | | | | |
| Sold | | $ | 17,659,642 | | $ | 29,112,241 | |
| Issued as reinvestment of dividends | | | 393,440 | | | — | |
| Redeemed | | | (5,630,872 | ) | | (79,451 | ) |
| Net increase | | $ | 12,422,210 | | $ | 29,032,790 | |
| Shares | | | | | | | |
| Class A shares: | | | | | | | |
| Sold | | | 867,856 | | | 610,452 | |
| Issued as reinvestment of dividends | | | 10,507 | | | — | |
| Redeemed | | | (313,476 | ) | | (32,265 | ) |
| Net increase | | | 564,887 | | | 578,187 | |
| Class C shares: | | | | | | | |
| Sold | | | 849,679 | | | 102,286 | |
| Issued as reinvestment of dividends | | | 3,536 | | | — | |
| Redeemed | | | (58,798 | ) | | — | |
| Net increase | | | 794,417 | | | 102,286 | |
| Class I shares: | | | | | | | |
| Sold | | | 1,697,899 | | | 2,913,463 | |
| Issued as reinvestment of dividends | | | 38,671 | | | — | |
| Redeemed | | | (542,417 | ) | | (8,098 | ) |
| Net increase | | | 1,194,153 | | | 2,905,365 | |
| * | Fund commenced operations on March 30, 2012. |
See notes to financial statements
83
| Henderson Global Funds | Financial statements |
Statements of changes - capital stock activity
Dividend & Income Builder Fund
| | | | Period ended July 31, 2013 | * |
| Amount | | | | |
| Class A shares: | | | | |
| Sold | | $ | 1,973,672 | |
| Issued as reinvestment of dividends | | | 8,795 | |
| Redeemed | | | (116,681 | ) |
| Net increase | | $ | 1,865,786 | |
| Class C shares: | | | | |
| Sold | | $ | 450,951 | |
| Issued as reinvestment of dividends | | | 3,197 | |
| Redeemed | | | (3,866 | ) |
| Net increase | | $ | 450,282 | |
| Class I shares: | | | | |
| Sold | | $ | 6,556,447 | |
| Issued as reinvestment of dividends | | | 40,178 | |
| Redeemed | | | (5,304,381 | ) |
| Net increase | | $ | 1,292,244 | |
| Shares | | | | |
| Class A shares: | | | | |
| Sold | | | 175,582 | |
| Issued as reinvestment of dividends | | | 807 | |
| Redeemed | | | (10,493 | ) |
| Net increase | | | 165,896 | |
| Class C shares: | | | | |
| Sold | | | 40,883 | |
| Issued as reinvestment of dividends | | | 296 | |
| Redeemed | | | (356 | ) |
| Net increase | | | 40,823 | |
| Class I shares: | | | | |
| Sold | | | 597,065 | |
| Issued as reinvestment of dividends | | | 3,715 | |
| Redeemed | | | (472,291 | ) |
| Net increase | | | 128,489 | |
| * | Fund commenced operations on August 1, 2012. |
See notes to financial statements
84
| Henderson Global Funds | Financial statements |
Statements of changes - capital stock activity
Emerging Markets Opportunities Fund
| | | | Year ended July 31, 2013 | | | Year ended July 31, 2012 | |
| Amount | | | | | | | |
| Class A shares: | | | | | | | |
| Sold | | $ | 4,365,417 | | $ | 5,894,896 | |
| Issued as reinvestment of dividends | | | 49,943 | | | 83,356 | |
| Redeemed | | | (2,822,643 | ) | | (11,884,613 | ) |
| Net increase/(decrease) | | $ | 1,592,717 | | $ | (5,906,361 | ) |
| Class C shares: | | | | | | | |
| Sold | | $ | 1,550,330 | | $ | 1,557,603 | |
| Issued as reinvestment of dividends | | | 6,388 | | | 24,898 | |
| Redeemed | | | (751,608 | ) | | (332,188 | ) |
| Net increase | | $ | 805,110 | | $ | 1,250,313 | |
| Class I shares: | | | | | | | |
| Sold | | $ | 13,296,073 | | $ | 8,037,262 | |
| Issued as reinvestment of dividends | | | 104,690 | | | 88,994 | |
| Redeemed | | | (10,485,533 | ) | | (2,799,295 | ) |
| Net increase | | $ | 2,915,230 | | $ | 5,326,961 | |
| Shares | | | | | | | |
| Class A shares: | | | | | | | |
| Sold | | | 493,674 | | | 678,617 | |
| Issued as reinvestment of dividends | | | 5,675 | | | 11,482 | |
| Redeemed | | | (326,718 | ) | | (1,437,081 | ) |
| Net increase/(decrease) | | | 172,631 | | | (746,982 | ) |
| Class C shares: | | | | | | | |
| Sold | | | 176,697 | | | 187,748 | |
| Issued as reinvestment of dividends | | | 733 | | | 3,448 | |
| Redeemed | | | (90,932 | ) | | (41,768 | ) |
| Net increase | | | 86,498 | | | 149,428 | |
| Class I shares: | | | | | | | |
| Sold | | | 1,507,812 | | | 941,717 | |
| Issued as reinvestment of dividends | | | 11,910 | | | 12,241 | |
| Redeemed | | | (1,218,900 | ) | | (333,349 | ) |
| Net increase | | | 300,822 | | | 620,609 | |
See notes to financial statements
85
| Henderson Global Funds | Financial statements |
Statements of changes - capital stock activity
European Focus Fund
| | | | Year ended July 31, 2013 | | | Year ended July 31, 2012 | |
| Amount | | | | | | | |
| Class A shares: | | | | | | | |
| Sold | | $ | 96,937,012 | | $ | 96,674,950 | |
| Issued as reinvestment of dividends | | | 3,495,075 | | | 11,509,356 | |
| Redeemed | | | (90,166,202 | ) | | (128,416,931 | ) |
| Net increase/(decrease) | | $ | 10,265,885 | | $ | (20,232,625 | ) |
| Class B shares: | | | | | | | |
| Sold | | $ | 218,831 | | $ | 387,634 | |
| Issued as reinvestment of dividends | | | 62,554 | | | 885,458 | |
| Redeemed | | | (7,901,196 | ) | | (8,747,956 | ) |
| Net decrease | | $ | (7,619,811 | ) | $ | (7,474,864 | ) |
| Class C shares: | | | | | | | |
| Sold | | $ | 16,722,655 | | $ | 15,673,190 | |
| Issued as reinvestment of dividends | | | 495,819 | | | 3,064,881 | |
| Redeemed | | | (26,033,998 | ) | | (33,566,143 | ) |
| Net decrease | | $ | (8,815,524 | ) | $ | (14,828,072 | ) |
| Class I shares: | | | | | | | |
| Sold | | $ | 159,421,762 | | $ | 81,457,024 | |
| Issued as reinvestment of dividends | | | 2,060,013 | | | 3,173,670 | |
| Redeemed | | | (63,911,827 | ) | | (63,296,428 | ) |
| Net increase | | $ | 97,569,948 | | $ | 21,334,266 | |
| Shares | | | | | | | |
| Class A shares: | | | | | | | |
| Sold | | | 3,696,041 | | | 3,996,219 | |
| Issued as reinvestment of dividends | | | 135,521 | | | 549,373 | |
| Redeemed | | | (3,526,993 | ) | | (5,435,117 | ) |
| Net increase/(decrease) | | | 304,569 | | | (889,525 | ) |
| Class B shares: | | | | | | | |
| Sold | | | 8,714 | | | 17,431 | |
| Issued as reinvestment of dividends | | | 2,544 | | | 44,406 | |
| Redeemed | | | (325,906 | ) | | (389,800 | ) |
| Net decrease | | | (314,648 | ) | | (327,963 | ) |
| Class C shares: | | | | | | | |
| Sold | | | 679,593 | | | 674,482 | |
| Issued as reinvestment of dividends | | | 20,213 | | | 153,782 | |
| Redeemed | | | (1,075,455 | ) | | (1,509,611 | ) |
| Net decrease | | | (375,649 | ) | | (681,347 | ) |
| Class I shares: | | | | | | | |
| Sold | | | 6,118,514 | | | 3,444,771 | |
| Issued as reinvestment of dividends | | | 79,969 | | | 151,632 | |
| Redeemed | | | (2,445,172 | ) | | (2,684,962 | ) |
| Net increase | | | 3,753,311 | | | 911,441 | |
See notes to financial statements
86
| Henderson Global Funds | Financial statements |
Statements of changes - capital stock activity
Global Equity Income Fund
| | | | Year ended July 31, 2013 | | | Year ended July 31, 2012 | |
| Amount | | | | | | | |
| Class A shares: | | | | | | | |
| Sold | | $ | 317,859,258 | | $ | 202,957,252 | |
| Issued as reinvestment of dividends | | | 32,882,277 | | | 25,108,694 | |
| Redeemed | | | (167,891,412 | ) | | (222,671,439 | ) |
| Net increase | | $ | 182,850,123 | | $ | 5,394,507 | |
| Class C shares: | | | | | | | |
| Sold | | $ | 225,888,510 | | $ | 94,723,998 | |
| Issued as reinvestment of dividends | | | 20,134,401 | | | 14,695,471 | |
| Redeemed | | | (66,934,095 | ) | | (89,364,745 | ) |
| Net increase | | $ | 179,088,816 | | $ | 20,054,724 | |
| Class I shares: | | | | | | | |
| Sold | | $ | 385,822,562 | | $ | 225,533,396 | |
| Issued as reinvestment of dividends | | | 25,582,449 | | | 13,401,383 | |
| Redeemed | | | (122,965,537 | ) | | (96,591,670 | ) |
| Net increase | | $ | 288,439,474 | | $ | 142,343,109 | |
| Shares | | | | | | | |
| Class A shares: | | | | | | | |
| Sold | | | 41,847,410 | | | 29,136,869 | |
| Issued as reinvestment of dividends | | | 4,334,126 | | | 3,634,363 | |
| Redeemed | | | (22,263,151 | ) | | (32,307,753 | ) |
| Net increase | | | 23,918,385 | | | 463,479 | |
| Class C shares: | | | | | | | |
| Sold | | | 29,728,241 | | | 13,613,732 | |
| Issued as reinvestment of dividends | | | 2,664,089 | | | 2,136,658 | |
| Redeemed | | | (8,940,948 | ) | | (13,013,872 | ) |
| Net increase | | | 23,451,382 | | | 2,736,518 | |
| Class I shares: | | | | | | | |
| Sold | | | 50,592,034 | | | 32,412,472 | |
| Issued as reinvestment of dividends | | | 3,358,207 | | | 1,934,854 | |
| Redeemed | | | (16,248,320 | ) | | (13,964,719 | ) |
| Net increase | | | 37,701,921 | | | 20,382,607 | |
See notes to financial statements
87
| Henderson Global Funds | Financial statements |
Statements of changes - capital stock activity
Global Technology Fund
| | | | Year ended July 31, 2013 | | | Year ended July 31, 2012 | |
| Amount | | | | | | | |
| Class A shares: | | | | | | | |
| Sold | | $ | 49,582,683 | | $ | 55,789,167 | |
| Redeemed | | | (63,726,712 | ) | | (79,908,309 | ) |
| Net decrease | | $ | (14,144,029 | ) | $ | (24,119,142 | ) |
| Class B shares: | | | | | | | |
| Sold | | $ | 64,881 | | $ | 409,911 | |
| Redeemed | | | (2,036,600 | ) | | (1,880,111 | ) |
| Net decrease | | $ | (1,971,719 | ) | $ | (1,470,200 | ) |
| Class C shares: | | | | | | | |
| Sold | | $ | 8,588,077 | | $ | 12,239,550 | |
| Redeemed | | | (17,493,664 | ) | | (17,916,387 | ) |
| Net decrease | | $ | (8,905,587 | ) | $ | (5,676,837 | ) |
| Class I shares: | | | | | | | |
| Sold | | $ | 53,780,464 | | $ | 39,980,276 | |
| Redeemed | | | (30,784,339 | ) | | (29,062,038 | ) |
| Net increase | | $ | 22,996,125 | | $ | 10,918,238 | |
| Shares | | | | | | | |
| Class A shares: | | | | | | | |
| Sold | | | 2,336,620 | | | 2,844,623 | |
| Redeemed | | | (3,014,804 | ) | | (4,201,131 | ) |
| Net decrease | | | (678,184 | ) | | (1,356,508 | ) |
| Class B shares: | | | | | | | |
| Sold | | | 3,345 | | | 23,165 | |
| Redeemed | | | (104,592 | ) | | (104,706 | ) |
| Net decrease | | | (101,247 | ) | | (81,541 | ) |
| Class C shares: | | | | | | | |
| Sold | | | 443,570 | | | 679,548 | |
| Redeemed | | | (898,304 | ) | | (1,013,156 | ) |
| Net decrease | | | (454,734 | ) | | (333,608 | ) |
| Class I shares: | | | | | | | |
| Sold | | | 2,512,271 | | | 2,089,534 | |
| Redeemed | | | (1,440,006 | ) | | (1,527,146 | ) |
| Net increase | | | 1,072,265 | | | 562,388 | |
See notes to financial statements
88
| Henderson Global Funds | Financial statements |
Statements of changes - capital stock activity
High Yield Opportunities Fund
| | | | Period ended July 31, 2013 | * |
| Amount | | | | |
| Class A shares: | | | | |
| Sold | | $ | 1,127,415 | |
| Issued as reinvestment of dividends | | | 398 | |
| Redeemed | | | (114 | ) |
| Net increase | | $ | 1,127,699 | |
| Class C shares: | | | | |
| Sold | | $ | 1,000,000 | |
| Net increase | | $ | 1,000,000 | |
| Class I shares: | | | | |
| Sold | | $ | 23,778,693 | |
| Issued as reinvestment of dividends | | | 68,766 | |
| Redeemed | | | (154,915 | ) |
| Net increase | | $ | 23,692,544 | |
| Shares | | | | |
| Class A shares: | | | | |
| Sold | | | 112,878 | |
| Issued as reinvestment of dividends | | | 40 | |
| Redeemed | | | (11 | ) |
| Net increase | | | 112,907 | |
| Class C shares: | | | | |
| Sold | | | 100,000 | |
| Net increase | | | 100,000 | |
| Class I shares: | | | | |
| Sold | | | 2,377,698 | |
| Issued as reinvestment of dividends | | | 6,893 | |
| Redeemed | | | (15,617 | ) |
| Net increase | | | 2,368,974 | |
| * | Fund commenced operations on April 30, 2013. |
See notes to financial statements
89
| Henderson Global Funds | Financial statements |
Statements of changes - capital stock activity
International Opportunities Fund
| | | | Year ended July 31, 2013 | | | Year ended July 31, 2012 | |
| Amount | | | | | | | |
| Class A shares: | | | | | | | |
| Sold | | $ | 275,251,042 | | $ | 216,540,569 | |
| Issued as reinvestment of dividends | | | 8,147,699 | | | 7,320,292 | |
| Redeemed | | | (365,094,646 | ) | | (669,190,107 | ) |
| Net decrease | | $ | (81,695,905 | ) | $ | (445,329,246 | ) |
| Class B shares: | | | | | | | |
| Sold | | $ | 112,237 | | $ | 153,634 | |
| Redeemed | | | (18,189,267 | ) | | (20,883,501 | ) |
| Net decrease | | $ | (18,077,030 | ) | $ | (20,729,867 | ) |
| Class C shares: | | | | | | | |
| Sold | | $ | 23,024,033 | | $ | 24,418,799 | |
| Redeemed | | | (102,895,967 | ) | | (169,502,843 | ) |
| Net decrease | | $ | (79,871,934 | ) | $ | (145,084,044 | ) |
| Class I shares: | | | | | | | |
| Sold | | $ | 291,900,748 | | $ | 391,238,384 | |
| Issued as reinvestment of dividends | | | 4,735,254 | | | 3,555,101 | |
| Redeemed | | | (238,352,349 | ) | | (452,882,077 | ) |
| Net increase/(decrease) | | $ | 58,283,653 | | $ | (58,088,592 | ) |
| Class R shares: | | | | | | | |
| Sold | | $ | 2,328,347 | | $ | 2,906,544 | |
| Issued as reinvestment of dividends | | | 9,883 | | | 11,418 | |
| Redeemed | | | (3,046,730 | ) | | (2,823,234 | ) |
| Net increase/(decrease) | | $ | (708,500 | ) | $ | 94,728 | |
| Shares | | | | | | | |
| Class A shares: | | | | | | | |
| Sold | | | 12,653,875 | | | 11,289,890 | |
| Issued as reinvestment of dividends | | | 384,688 | | | 416,399 | |
| Redeemed | | | (17,074,906 | ) | | (35,550,456 | ) |
| Net decrease | | | (4,036,343 | ) | | (23,844,167 | ) |
| Class B shares: | | | | | | | |
| Sold | | | 5,284 | | | 8,536 | |
| Redeemed | | | (908,898 | ) | | (1,161,953 | ) |
| Net decrease | | | (903,614 | ) | | (1,153,417 | ) |
| Class C shares: | | | | | | | |
| Sold | | | 1,130,119 | | | 1,359,110 | |
| Redeemed | | | (5,165,111 | ) | | (9,457,781 | ) |
| Net decrease | | | (4,034,992 | ) | | (8,098,671 | ) |
| Class I shares: | | | | | | | |
| Sold | | | 13,635,625 | | | 20,725,159 | |
| Issued as reinvestment of dividends | | | 223,678 | | | 202,339 | |
| Redeemed | | | (11,296,233 | ) | | (23,362,646 | ) |
| Net increase/(decrease) | | | 2,563,070 | | | (2,435,148 | ) |
| Class R shares: | | | | | | | |
| Sold | | | 108,856 | | | 153,649 | |
| Issued as reinvestment of dividends | | | 472 | | | 658 | |
| Redeemed | | | (143,934 | ) | | (151,106 | ) |
| Net increase/(decrease) | | | (34,606 | ) | | 3,201 | |
See notes to financial statements
90
| Henderson Global Funds | Financial statements |
Statements of changes - capital stock activity
Strategic Income Fund
| | | | Period ended July 31, 2013* | | | Year Ended December 31, 2012 | | | Year Ended December 31, 2011 | |
| Amount | | | | | | | | | | |
| Class A shares: | | | | | | | | | | |
| Sold | | $ | 4,311,487 | | $ | 5,603,423 | | $ | 7,474,651 | |
| Issued as reinvestment of dividends | | | 295,530 | | | 532,079 | | | 775,913 | |
| Redeemed | | | (6,132,765 | ) | | (7,099,306 | ) | | (18,332,114 | ) |
| Net decrease | | $ | (1,525,748 | ) | $ | (963,804 | ) | $ | (10,081,550 | ) |
| Class B shares: | | | | | | | | | | |
| Sold | | $ | 159,430 | | $ | 622,043 | | $ | 653,217 | |
| Issued as reinvestment of dividends | | | 94,785 | | | 156,511 | | | 167,269 | |
| Redeemed | | | (881,487 | ) | | (1,849,299 | ) | | (1,568,402 | ) |
| Net decrease | | $ | (627,272 | ) | $ | (1,070,745 | ) | $ | (747,916 | ) |
| Class C shares: | | | | | | | | | | |
| Sold | | $ | 1,068,241 | | $ | 4,068,174 | | $ | 5,674,086 | |
| Issued as reinvestment of dividends | | | 291,254 | | | 551,924 | | | 640,869 | |
| Redeemed | | | (3,772,526 | ) | | (6,404,845 | ) | | (10,013,837 | ) |
| Net decrease | | $ | (2,413,031 | ) | $ | (1,784,747 | ) | $ | (3,698,882 | ) |
| Class I shares: | | | | | | | | | | |
| Sold | | $ | 7,892,375 | | $ | 2,570,614 | | $ | 2,449,572 | |
| Issued as reinvestment of dividends | | | 171,183 | | | 148,178 | | | 52,451 | |
| Redeemed | | | (4,532,051 | ) | | (937,518 | ) | | (480,907 | ) |
| Net increase | | $ | 3,531,507 | | $ | 1,781,274 | | $ | 2,021,116 | |
| Shares | | | | | | | | | | |
| Class A shares: | | | | | | | | | | |
| Sold | | | 472,304 | | | 627,594 | | | 864,388 | |
| Issued as reinvestment of dividends | | | 32,650 | | | 60,353 | | | 88,698 | |
| Redeemed | | | (681,183 | ) | | (809,621 | ) | | (2,095,202 | ) |
| Net decrease | | | (176,229 | ) | | (121,674 | ) | | (1,142,116 | ) |
| Class B shares: | | | | | | | | | | |
| Sold | | | 17,408 | | | 71,281 | | | 76,605 | |
| Issued as reinvestment of dividends | | | 10,460 | | | 17,734 | | | 19,197 | |
| Redeemed | | | (97,398 | ) | | (208,985 | ) | | (179,960 | ) |
| Net decrease | | | (69,530 | ) | | (119,970 | ) | | (84,158 | ) |
| Class C shares: | | | | | | | | | | |
| Sold | | | 118,108 | | | 464,519 | | | 662,914 | |
| Issued as reinvestment of dividends | | | 32,330 | | | 62,861 | | | 73,694 | |
| Redeemed | | | (418,191 | ) | | (730,681 | ) | | (1,146,458 | ) |
| Net decrease | | | (267,753 | ) | | (203,301 | ) | | (409,850 | ) |
| Class I shares: | | | | | | | | | | |
| Sold | | | 874,064 | | | 292,845 | | | 276,243 | |
| Issued as reinvestment of dividends | | | 18,926 | | | 16,777 | | | 6,187 | |
| Redeemed | | | (503,470 | ) | | (105,887 | ) | | (57,244 | ) |
| Net increase | | | 389,520 | | | 203,735 | | | 225,186 | |
| * | The Strategic Income Fund changed its fiscal year end from December 31 to July 31. |
See notes to financial statements
91
| Henderson Global Funds | Financial statements |
Statements of changes - capital stock activity
World Select Fund
| | | | Year ended July 31, 2013 | | | Year ended July 31, 2012 | |
| Amount | | | | | | | |
| Class A shares: | | | | | | | |
| Sold | | $ | 246,147 | | $ | 1,036,385 | |
| Issued as reinvestment of dividends | | | 19,084 | | | — | |
| Redeemed | | | (5,034,041 | ) | | (1,714,952 | ) |
| Net decrease | | $ | (4,768,810 | ) | $ | (678,567 | ) |
| Class C shares: | | | | | | | |
| Sold | | $ | 30,981 | | $ | 1,105,052 | |
| Issued as reinvestment of dividends | | | 9,938 | | | — | |
| Redeemed | | | (2,189,340 | ) | | (1,711,419 | ) |
| Net decrease | | $ | (2,148,421 | ) | $ | (606,367 | ) |
| Class I shares: | | | | | | | |
| Sold | | $ | 1,005,063 | | $ | 61,107 | |
| Issued as reinvestment of dividends | | | 6,529 | | | — | |
| Redeemed | | | (111,179 | ) | | (67,763 | ) |
| Net increase/(decrease) | | $ | 900,413 | | $ | (6,656 | ) |
| Shares | | | | | | | |
| Class A shares: | | | | | | | |
| Sold | | | 23,106 | | | 111,206 | |
| Issued as reinvestment of dividends | | | 1,824 | | | — | |
| Redeemed | | | (462,724 | ) | | (181,235 | ) |
| Net decrease | | | (437,794 | ) | | (70,029 | ) |
| Class C shares: | | | | | | | |
| Sold | | | 2,842 | | | 120,900 | |
| Issued as reinvestment of dividends | | | 970 | | | — | |
| Redeemed | | | (195,524 | ) | | (182,587 | ) |
| Net decrease | | | (191,712 | ) | | (61,687 | ) |
| Class I shares: | | | | | | | |
| Sold | | | 88,289 | | | 6,584 | |
| Issued as reinvestment of dividends | | | 622 | | | — | |
| Redeemed | | | (10,403 | ) | | (7,115 | ) |
| Net increase/(decrease) | | | 78,508 | | | (531 | ) |
See notes to financial statements
92
This page intentionally left blank.
93
| Henderson Global Funds | Financial highlights |
For a share outstanding throughout the periods indicated
| | | | | | | Income (loss) from investment operations: | | Less distributions: |
| | | | | | | | | |
| | | | Net asset value, beginning of period | | Net investment income (loss) (b) | | Net realized and unrealized gain (loss) on investments | | Total from investment operations | | Dividends from net investment income | | Distributions from net realized capital gains | | Total distributions |
| All Asset Fund | | | | | | | | | | | | | | | | | | | | | | |
| Class A | | | | | | | | | | | | | | | | | | | | | | |
| Year Ended 7/31/2013 | | $ | 9.93 | | | 0.09 | | | 0.61 | | | 0.70 | | | (0.09 | ) | | (0.02 | ) | | (0.11 | ) |
| Period Ended 7/31/2012(a) | | | 10.00 | | | 0.01 | | | (0.08 | ) | | (0.07 | ) | | 0.00 | | | 0.00 | | | 0.00 | |
| Class C | | | | | | | | | | | | | | | | | | | | | | |
| Year Ended 7/31/2013 | | $ | 9.91 | | | 0.02 | | | 0.59 | | | 0.61 | | | (0.07 | ) | | (0.02 | ) | | (0.09 | ) |
| Period Ended 7/31/2012(a) | | | 10.00 | | | (0.01 | ) | | (0.08 | ) | | (0.09 | ) | | 0.00 | | | 0.00 | | | 0.00 | |
| Class I | | | | | | | | | | | | | | | | | | | | | | |
| Year Ended 7/31/2013 | | $ | 9.94 | | | 0.11 | | | 0.61 | | | 0.72 | | | (0.10 | ) | | (0.02 | ) | | (0.12 | ) |
| Period Ended 7/31/2012(a) | | | 10.00 | | | 0.02 | | | (0.08 | ) | | (0.06 | ) | | 0.00 | | | 0.00 | | | 0.00 | |
| Dividend & Income Builder Fund | | | | | | | | | | | | | | | | | | | | | | |
| Class A | | | | | | | | | | | | | | | | | | | | | | |
| Period Ended 7/31/2013(a) | | $ | 10.00 | | | 0.33 | | | 1.33 | | | 1.66 | | | (0.26 | ) | | 0.00 | | | (0.26 | ) |
| Class C | | | | | | | | | | | | | | | | | | | | | | |
| Period Ended 7/31/2013(a) | | $ | 10.00 | | | 0.25 | | | 1.33 | | | 1.58 | | | (0.23 | ) | | 0.00 | | | (0.23 | ) |
| Class I | | | | | | | | | | | | | | | | | | | | | | |
| Period Ended 7/31/2013(a) | | $ | 10.00 | | | 0.46 | | | 1.22 | | | 1.68 | | | (0.29 | ) | | 0.00 | | | (0.29 | ) |
| Emerging Markets Opportunities Fund | | | | | | | | | | | | | | | | | | | |
| Class A | | | | | | | | | | | | | | | | | | | | | | |
| Year Ended 7/31/2013 | | $ | 7.97 | | | 0.01 | | | 0.56 | | | 0.57 | | | (0.05 | ) | | 0.00 | | | (0.05 | ) |
| Year Ended 7/31/2012 | | | 9.74 | | | (0.02 | ) | | (1.62 | ) | | (1.64 | ) | | (0.13 | ) | | 0.00 | | | (0.13 | ) |
| Period Ended 7/31/2011(a) | | | 10.00 | | | 0.00 | * | | (0.26 | ) | | (0.26 | ) | | 0.00 | | | 0.00 | | | 0.00 | |
| Class C | | | | | | | | | | | | | | | | | | | | | | |
| Year Ended 7/31/2013 | | $ | 7.89 | | | (0.05 | ) | | 0.55 | | | 0.50 | | | (0.02 | ) | | 0.00 | | | (0.02 | ) |
| Year Ended 7/31/2012 | | | 9.70 | | | (0.09 | ) | | (1.60 | ) | | (1.69 | ) | | (0.12 | ) | | 0.00 | | | (0.12 | ) |
| Period Ended 7/31/2011(a) | | | 10.00 | | | (0.06 | ) | | (0.24 | ) | | (0.30 | ) | | 0.00 | | | 0.00 | | | 0.00 | |
| Class I | | | | | | | | | | | | | | | | | | | | | | |
| Year Ended 7/31/2013 | | $ | 7.98 | | | 0.03 | | | 0.56 | | | 0.59 | | | (0.08 | ) | | 0.00 | | | (0.08 | ) |
| Year Ended 7/31/2012 | | | 9.75 | | | (0.00 | )* | | (1.62 | ) | | (1.62 | ) | | (0.15 | ) | | 0.00 | | | (0.15 | ) |
| Period Ended 7/31/2011(a) | | | 10.00 | | | (0.01 | ) | | (0.24 | ) | | (0.25 | ) | | 0.00 | | | 0.00 | | | 0.00 | |
| (a) | The All Asset Fund commenced operations on March 30, 2012, the Dividend & Income Builder Fund commenced operations on August 1, 2012 and the Emerging Markets Opportunities Fund commenced operations on December 31, 2010. |
| (b) | Per share data was calculated using average shares outstanding during the period. |
| (c) | Total returns are historical and assume changes in share price, reinvestment of all dividends and distributions and no sales charge. Had certain expenses not been reduced during the periods shown, total returns would have been lower. Total returns for periods of less than one year are not annualized. |
| (d) | Not annualized for periods less than one year. |
| (e) | As the Henderson All Asset Fund and Henderson Dividend & Income Builder Fund invest in the shares of other investment companies, the calculation includes only those expenses charged directly to the Fund and does not include expenses charged to the underlying funds in which the Fund invests. |
| * | Amount represents less than $0.01. |
See notes to financial statements
94
| Henderson Global Funds | Financial highlights |
| | | | | | | | | | | | | Ratios to average net assets: | | | |
| | | | Net asset value, end of period | | Total return (c) | | Net assets, end of period (000) | | Annualized ratio of operating expenses to average net assets (e) | | Annualized ratio of net investment income/(loss) to average net assets | | Annualized ratio of operating expenses to average net assets without waivers and/or expenses reimbursed (e) | | Portfolio turnover Rate (d) |
| | | | | | | | | | | | | | | | | | | | | | | |
| | | | | | | | | | | | | | | | | | | | | | | |
| | | $ | 10.52 | | | 7.05 | % | $ | 12,023 | | | 0.85 | % | | 0.86 | % | | 1.10 | % | | 37 | % |
| | | | 9.93 | | | (0.70 | ) | | 5,740 | | | 0.85 | | | 0.43 | | | 2.13 | | | 7 | |
| | | | | | | | | | | | | | | | | | | | | | | |
| | | $ | 10.43 | | | 6.18 | % | $ | 9,357 | | | 1.60 | % | | 0.20 | % | | 1.80 | % | | 37 | % |
| | | | 9.91 | | | (0.90 | ) | | 1,013 | | | 1.60 | | | (0.24 | ) | | 4.49 | | | 7 | |
| | | | | | | | | | | | | | | | | | | | | | | |
| | | $ | 10.54 | | | 7.28 | % | $ | 43,221 | | | 0.60 | % | | 1.10 | % | | 0.79 | % | | 37 | % |
| | | | 9.94 | | | (0.60 | ) | | 28,875 | | | 0.60 | | | 0.52 | | | 1.41 | | | 7 | |
| | | | | | | | | | | | | | | | | | | | | | | |
| | | $ | 11.40 | | | 16.79 | % | $ | 1,891 | | | 1.30 | % | | 2.98 | % | | 7.35 | % | | 188 | % |
| | | | | | | | | | | | | | | | | | | | | | | |
| | | $ | 11.35 | | | 15.94 | % | $ | 463 | | | 2.05 | % | | 2.32 | % | | 8.17 | % | | 188 | % |
| | | | | | | | | | | | | | | | | | | | | | | |
| | | $ | 11.39 | | | 17.01 | % | $ | 1,463 | | | 1.05 | % | | 4.18 | % | | 7.11 | % | | 188 | % |
| | | | | | | | | | | | | | | | | | | | | | | |
| | | | | | | | | | | | | | | | | | | | | | | |
| | | $ | 8.49 | | | 7.16 | % | $ | 8,930 | | | 1.79 | % | | 0.09 | % | | 2.15 | % | | 126 | % |
| | | | 7.97 | | | (16.70 | ) | | 7,011 | | | 1.79 | | | (0.25 | ) | | 2.51 | | | 110 | |
| | | | 9.74 | | | (2.60 | ) | | 15,841 | | | 1.79 | | | 0.04 | | | 3.97 | | | 35 | |
| | | | | | | | | | | | | | | | | | | | | | | |
| | | $ | 8.37 | | | 6.33 | % | $ | 3,169 | | | 2.54 | % | | (0.60 | )% | | 2.87 | % | | 126 | % |
| | | | 7.89 | | | (17.31 | ) | | 2,305 | | | 2.54 | | | (1.08 | ) | | 3.23 | | | 110 | |
| | | | 9.70 | | | (3.00 | ) | | 1,384 | | | 2.54 | | | (1.06 | ) | | 4.72 | | | 35 | |
| | | | | | | | | | | | | | | | | | | | | | | |
| | | $ | 8.49 | | | 7.39 | % | $ | 10,773 | | | 1.54 | % | | 0.34 | % | | 1.80 | % | | 126 | % |
| | | | 7.98 | | | (16.49 | ) | | 7,724 | | | 1.54 | | | (0.06 | ) | | 2.16 | | | 110 | |
| | | | 9.75 | | | (2.50 | ) | | 3,382 | | | 1.54 | | | 0.26 | ) | | 3.72 | | | 35 | |
See notes to financial statements
95
| Henderson Global Funds | Financial highlights |
For a share outstanding throughout the periods indicated
| | | | | | | Income (loss) from investment operations: | | Less distributions: |
| | | | | | | | | |
| | | | Net asset value, beginning of period | | Net investment income (loss) (b) | | Net realized and unrealized gain (loss) on investments | | Total from investment operations | | Dividends from net investment income | | Distributions from net realized capital gains | | Total distributions |
| European Focus Fund | | | | | | | | | | | | | | | | | | | | | | |
| Class A | | | | | | | | | | | | | | | | | | | | | | |
| Year Ended 7/31/2013 | | $ | 22.44 | | | 0.26 | | | 6.90 | | | 7.16 | | | (0.37 | ) | | 0.00 | | | (0.37 | ) |
| Year Ended 7/31/2012 | | | 29.07 | | | 0.30 | | | (5.71 | ) | | (5.41 | ) | | (1.22 | ) | | 0.00 | | | (1.22 | ) |
| Year Ended 7/31/2011 | | | 23.90 | | | 0.07 | | | 5.89 | | | 5.96 | | | (0.79 | ) | | 0.00 | | | (0.79 | ) |
| Year Ended 7/31/2010 | | | 20.32 | | | (0.03 | ) | | 4.31 | | | 4.28 | | | (0.70 | ) | | 0.00 | | | (0.70 | ) |
| Year Ended 7/31/2009 | | | 28.57 | | | 0.26 | | | (6.20 | ) | | (5.94 | ) | | (0.60 | ) | | (1.71 | ) | | (2.31 | ) |
| Class B | | | | | | | | | | | | | | | | | | | | | | |
| Year Ended 7/31/2013 | | $ | 21.25 | | | 0.01 | | | 6.58 | | | 6.59 | | | (0.10 | ) | | 0.00 | | | (0.10 | ) |
| Year Ended 7/31/2012 | | | 27.51 | | | 0.09 | | | (5.37 | ) | | (5.28 | ) | | (0.98 | ) | | 0.00 | | | (0.98 | ) |
| Year Ended 7/31/2011 | | | 22.65 | | | (0.16 | ) | | 5.62 | | | 5.46 | | | (0.60 | ) | | 0.00 | | | (0.60 | ) |
| Year Ended 7/31/2010 | | | 19.33 | | | (0.20 | ) | | 4.09 | | | 3.89 | | | (0.57 | ) | | 0.00 | | | (0.57 | ) |
| Year Ended 7/31/2009 | | | 27.17 | | | 0.10 | | | (5.83 | ) | | (5.73 | ) | | (0.40 | ) | | (1.71 | ) | | (2.11 | ) |
| Class C | | | | | | | | | | | | | | | | | | | | | | |
| Year Ended 7/31/2013 | | $ | 21.25 | | | 0.05 | | | 6.54 | | | 6.59 | | | (0.17 | ) | | 0.00 | | | (0.17 | ) |
| Year Ended 7/31/2012 | | | 27.50 | | | 0.10 | | | (5.37 | ) | | (5.27 | ) | | (0.98 | ) | | 0.00 | | | (0.98 | ) |
| Year Ended 7/31/2011 | | | 22.65 | | | (0.15 | ) | | 5.60 | | | 5.45 | | | (0.60 | ) | | 0.00 | | | (0.60 | ) |
| Year Ended 7/31/2010 | | | 19.33 | | | (0.20 | ) | | 4.09 | | | 3.89 | | | (0.57 | ) | | 0.00 | | | (0.57 | ) |
| Year Ended 7/31/2009 | | | 27.17 | | | 0.12 | | | (5.85 | ) | | (5.73 | ) | | (0.40 | ) | | (1.71 | ) | | (2.11 | ) |
| Class I | | | | | | | | | | | | | | | | | | | | | | |
| Year Ended 7/31/2013 | | $ | 22.46 | | | 0.40 | | | 6.85 | | | 7.25 | | | (0.46 | ) | | 0.00 | | | (0.46 | ) |
| Year Ended 7/31/2012 | | | 29.10 | | | 0.39 | | | (5.73 | ) | | (5.34 | ) | | (1.30 | ) | | 0.00 | | | (1.30 | ) |
| Year Ended 7/31/2011 | | | 23.92 | | | 0.16 | | | 5.88 | | | 6.04 | | | (0.86 | ) | | 0.00 | | | (0.86 | ) |
| Year Ended 7/31/2010 | | | 20.34 | | | 0.04 | | | 4.30 | | | 4.34 | | | (0.76 | ) | | 0.00 | | | (0.76 | ) |
| Period Ended 7/31/2009(a) | | | 13.35 | | | 0.05 | | | 6.94 | | | 6.99 | | | 0.00 | | | 0.00 | | | 0.00 | |
| (a) | The European Focus Fund Class W commenced operations on March 31, 2009. Class W shares were converted to Class I shares on January 18, 2011. |
| (b) | Per share data was calculated using average shares outstanding during the period. |
| (c) | Total returns are historical and assume changes in share price, reinvestment of all dividends and distributions and no sales charge. Had certain expenses not been reduced during the periods shown, total returns would have been lower. Total returns for periods of less than one year are not annualized. |
| (d) | Not annualized for periods less than one year. |
| * | Amount represents less than $0.01. |
See notes to financial statements
96
| Henderson Global Funds | Financial highlights |
| | | | | | | | | | | | | Ratios to average net assets: | | | |
Redemption fees | | Net asset value, end of period | | Total return (c) | | Net assets, end of period (000) | | Annualized ratio of operating expenses to average net assets | | Annualized ratio of net investment income/(loss) to average net assets | | Annualized ratio of operating expenses to average net assets without waivers and/or expenses reimbursed | | Portfolio turnover rate (d) |
| | | | | | | | | | | | | | | | | | | | | | | |
| | | | | | | | | | | | | | | | | | | | | | | |
| N/A | | $ | 29.23 | | | 32.13 | % | $ | 317,547 | | | 1.50 | % | | 1.01 | % | | 1.50 | % | | 115 | % |
| N/A | | | 22.44 | | | (18.32 | ) | | 236,974 | | | 1.53 | | | 1.24 | | | 1.53 | | | 69 | |
| N/A | | | 29.07 | | | 25.08 | | | 332,755 | | | 1.54 | | | 0.25 | | | 1.54 | | | 67 | |
| 0.00 | * | | 23.90 | | | 20.97 | | | 253,421 | | | 1.61 | | | (0.14 | ) | | 1.61 | | | 86 | |
| 0.00 | * | | 20.32 | | | (14.12 | ) | | 299,183 | | | 1.72 | | | 1.52 | | | 1.72 | | | 51 | |
| | | | | | | | | | | | | | | | | | | | | | | |
| N/A | | $ | 27.74 | | | 31.05 | % | $ | 17,023 | | | 2.32 | % | | 0.03 | % | | 2.32 | % | | 115 | % |
| N/A | | | 21.25 | | | (18.97 | ) | | 19,728 | | | 2.36 | | | 0.38 | | | 2.36 | | | 69 | |
| N/A | | | 27.51 | | | 24.18 | | | 34,561 | | | 2.29 | | | (0.58 | ) | | 2.29 | | | 67 | |
| 0.00 | * | | 22.65 | | | 20.07 | | | 31,989 | | | 2.36 | | | (0.88 | ) | | 2.36 | | | 86 | |
| 0.00 | * | | 19.33 | | | (14.75 | ) | | 31,555 | | | 2.47 | | | 0.64 | | | 2.47 | | | 51 | |
| | | | | | | | | | | | | | | | | | | | | | | |
| N/A | | $ | 27.67 | | | 31.10 | % | $ | 104,206 | | | 2.27 | % | | 0.22 | % | | 2.27 | % | | 115 | % |
| N/A | | | 21.25 | | | (18.94 | ) | | 88,015 | | | 2.32 | | | 0.45 | | | 2.32 | | | 69 | |
| N/A | | | 27.50 | | | 24.13 | | | 132,641 | | | 2.29 | | | (0.56 | ) | | 2.29 | | | 67 | |
| 0.00 | * | | 22.65 | | | 20.07 | | | 115,197 | | | 2.36 | | | (0.88 | ) | | 2.36 | | | 86 | |
| 0.00 | * | | 19.33 | | | (14.75 | ) | | 114,401 | | | 2.47 | | | 0.72 | | | 2.47 | | | 51 | |
| | | | | | | | | | | | | | | | | | | | | | | |
| N/A | | $ | 29.25 | | | 32.54 | % | $ | 266,517 | | | 1.20 | % | | 1.55 | % | | 1.20 | % | | 115 | % |
| N/A | | | 22.46 | | | (18.04 | ) | | 120,392 | | | 1.21 | | | 1.65 | | | 1.21 | | | 69 | |
| N/A | | | 29.10 | | | 25.40 | | | 129,452 | | | 1.29 | | | 0.57 | | | 1.29 | | | 67 | |
| 0.00 | * | | 23.92 | | | 21.30 | | | 73,412 | | | 1.36 | | | 0.19 | | | 1.36 | | | 86 | |
| 0.00 | | | 20.34 | | | 52.36 | | | 8,954 | | | 1.60 | | | 0.78 | | | 1.60 | | | 51 | |
See notes to financial statements
97
| Henderson Global Funds | Financial highlights |
For a share outstanding throughout the periods indicated
| | | | | | | Income (loss) from investment operations: | | Less distributions: |
| | | | | | | | | |
| | | | Net asset value, beginning of period | | Net investment income (loss) (b) | | Net realized and unrealized gain (loss) on investments | | Total from investment operations | | Dividends from net investment income | | Distributions from net realized capital gains | | Total distributions |
| Global Equity Income Fund | | | | | | | | | | | | | | | | | | | | |
| Class A | | | | | | | | | | | | | | | | | | | | | | |
| Year Ended 7/31/2013 | | $ | 7.06 | | | 0.50 | | | 0.78 | | | 1.28 | | | (0.49 | ) | | 0.00 | | | (0.49 | ) |
| Year Ended 7/31/2012 | | | 7.45 | | | 0.48 | | | (0.39 | ) | | 0.09 | | | (0.48 | ) | | 0.00 | | | (0.48 | ) |
| Year Ended 7/31/2011 | | | 6.99 | | | 0.46 | | | 0.51 | | | 0.97 | | | (0.51 | ) | | 0.00 | | | (0.51 | ) |
| Year Ended 7/31/2010 | | | 7.11 | | | 0.57 | | | (0.17 | ) | | 0.40 | | | (0.52 | ) | | 0.00 | | | (0.52 | ) |
| Year Ended 7/31/2009 | | | 8.85 | | | 0.58 | | | (1.77 | ) | | (1.19 | ) | | (0.55 | ) | | 0.00 | | | (0.55 | ) |
| Class C | | | | | | | | | | | | | | | | | | | | | | |
| Year Ended 7/31/2013 | | $ | 7.03 | | | 0.44 | | | 0.77 | | | 1.21 | | | (0.43 | ) | | 0.00 | | | (0.43 | ) |
| Year Ended 7/31/2012 | | | 7.42 | | | 0.43 | | | (0.39 | ) | | 0.04 | | | (0.43 | ) | | 0.00 | | | (0.43 | ) |
| Year Ended 7/31/2011 | | | 6.96 | | | 0.40 | | | 0.52 | | | 0.92 | | | (0.46 | ) | | 0.00 | | | (0.46 | ) |
| Year Ended 7/31/2010 | | | 7.08 | | | 0.52 | | | (0.17 | ) | | 0.35 | | | (0.47 | ) | | 0.00 | | | (0.47 | ) |
| Year Ended 7/31/2009 | | | 8.82 | | | 0.51 | | | (1.76 | ) | | (1.25 | ) | | (0.49 | ) | | 0.00 | | | (0.49 | ) |
| Class I | | | | | | | | | | | | | | | | | | | | | | |
| Year Ended 7/31/2013 | | $ | 7.07 | | | 0.53 | | | 0.77 | | | 1.30 | | | (0.51 | ) | | 0.00 | | | (0.51 | ) |
| Year Ended 7/31/2012 | | | 7.46 | | | 0.51 | | | (0.40 | ) | | 0.11 | | | (0.50 | ) | | 0.00 | | | (0.50 | ) |
| Year Ended 7/31/2011 | | | 6.99 | | | 0.48 | | | 0.52 | | | 1.00 | | | (0.53 | ) | | 0.00 | | | (0.53 | ) |
| Year Ended 7/31/2010 | | | 7.12 | | | 0.62 | | | (0.21 | ) | | 0.41 | | | (0.54 | ) | | 0.00 | | | (0.54 | ) |
| Period Ended 7/31/2009(a) | | | 6.08 | | | 0.32 | | | 1.00 | | | 1.32 | | | (0.28 | ) | | 0.00 | | | (0.28 | ) |
| (a) | The Global Equity Income Fund Class W commenced operations on March 31, 2009. Class W shares converted to Class I shares on January 18, 2011. |
| (b) | Per share data was calculated using average shares outstanding during the period. |
| (c) | Total returns are historical and assume changes in share price, reinvestment of all dividends and distributions and no sales charge. Had certain expenses not been reduced during the periods shown, total returns would have been lower. Total returns for periods of less than one year are not annualized. |
| (d) | Not annualized for periods less than one year. |
| * | Amount represents less than $0.01. |
See notes to financial statements
98
| Henderson Global Funds | Financial highlights |
| | | | | | | | | | | | | Ratios to average net assets: | | | |
Redemption fees | | Net asset value, end of period | | Total return (c) | | Net assets, end of period (000) | | Annualized ratio of operating expenses to average net assets | | Annualized ratio of net investment income/(loss) to average net assets | | Annualized ratio of operating expenses to average net assets without waivers and/or expenses reimbursed | | Portfolio turnover rate (d) |
| | | | | | | | | | | | | | | | | | | | | | | |
| | | | | | | | | | | | | | | | | | | | | | | |
| N/A | | $ | 7.85 | | | 18.58 | % | $ | 707,252 | | | 1.22 | % | | 6.56 | % | | 1.22 | % | | 130 | % |
| N/A | | | 7.06 | | | 1.59 | | | 467,318 | | | 1.29 | | | 6.97 | | | 1.29 | | | 108 | |
| N/A | | | 7.45 | | | 14.13 | | | 489,400 | | | 1.32 | | | 6.18 | | | 1.32 | | | 127 | |
| 0.00 | * | | 6.99 | | | 5.76 | | | 351,445 | | | 1.36 | | | 7.89 | | | 1.37 | | | 174 | |
| 0.00 | * | | 7.11 | | | (12.93 | ) | | 186,248 | | | 1.40 | | | 8.45 | | | 1.50 | | | 155 | |
| | | | | | | | | | | | | | | | | | | | | | | |
| N/A | | $ | 7.81 | | | 17.65 | % | $ | 587,376 | | | 1.98 | % | | 5.85 | % | | 1.98 | % | | 130 | % |
| N/A | | | 7.03 | | | 0.82 | | | 363,751 | | | 2.05 | | | 6.21 | | | 2.05 | | | 108 | |
| N/A | | | 7.42 | | | 13.35 | | | 363,455 | | | 2.07 | | | 5.36 | | | 2.07 | | | 127 | |
| 0.00 | * | | 6.96 | | | 5.01 | | | 274,571 | | | 2.11 | | | 7.17 | | | 2.12 | | | 174 | |
| 0.00 | * | | 7.08 | | | (13.64 | ) | | 131,990 | | | 2.15 | | | 7.40 | | | 2.25 | | | 155 | |
| | | | | | | | | | | | | | | | | | | | | | | |
| N/A | | $ | 7.86 | | | 18.87 | % | $ | 665,505 | | | 0.95 | % | | 6.95 | % | | 0.95 | % | | 130 | % |
| N/A | | | 7.07 | | | 1.87 | | | 332,048 | | | 1.01 | | | 7.38 | | | 1.01 | | | 108 | |
| N/A | | | 7.46 | | | 14.55 | | | 198,216 | | | 1.07 | | | 6.35 | | | 1.07 | | | 127 | |
| 0.00 | | | 6.99 | | | 5.87 | | | 92,146 | | | 1.11 | | | 8.60 | | | 1.12 | | | 174 | |
| 0.00 | | | 7.12 | | | 22.03 | | | 9,119 | | | 1.15 | | | 13.83 | | | 1.32 | | | 155 | |
See notes to financial statements
99
| Henderson Global Funds | Financial highlights |
For a share outstanding throughout the periods indicated
| | | | | | | Income (loss) from investment operations: | | Less distributions: |
| | | | | | | | | |
| | | | Net asset value, beginning of period | | Net investment income (loss) (c) | | Net realized and unrealized gain (loss) on investments | | Total from investment operations | | Dividends from net investment income | | Distributions from net realized capital gains | | Total distributions |
| Global Technology Fund | | | | | | | | | | | | | | | | | | | | | | |
| Class A | | | | | | | | | | | | | | | | | | | | | | |
| Year Ended 7/31/2013 | | $ | 19.69 | | | 0.06 | | | 3.47 | | | 3.53 | | | 0.00 | | | 0.00 | | | 0.00 | |
| Year Ended 7/31/2012 | | | 20.55 | | | (0.15 | ) | | (0.71 | ) | | (0.86 | ) | | 0.00 | | | 0.00 | | | 0.00 | |
| Year Ended 7/31/2011 | | | 16.10 | | | (0.08 | ) | | 4.53 | | | 4.45 | | | 0.00 | | | 0.00 | | | 0.00 | |
| Year Ended 7/31/2010 | | | 13.32 | | | (0.17 | ) | | 2.95 | | | 2.78 | | | 0.00 | | | 0.00 | | | 0.00 | |
| Year Ended 7/31/2009 | | | 13.88 | | | (0.09 | ) | | (0.47 | ) | | (0.56 | ) | | 0.00 | | | 0.00 | | | 0.00 | |
| Class B | | | | | | | | | | | | | | | | | | | | | | |
| Year Ended 7/31/2013 | | $ | 18.18 | | | (0.10 | ) | | 3.18 | | | 3.08 | | | 0.00 | | | 0.00 | | | 0.00 | |
| Year Ended 7/31/2012 | | | 19.13 | | | (0.29 | ) | | (0.66 | ) | | (0.95 | ) | | 0.00 | | | 0.00 | | | 0.00 | |
| Year Ended 7/31/2011 | | | 15.10 | | | (0.22 | ) | | 4.25 | | | 4.03 | | | 0.00 | | | 0.00 | | | 0.00 | |
| Year Ended 7/31/2010 | | | 12.59 | | | (0.27 | ) | | 2.78 | | | 2.51 | | | 0.00 | | | 0.00 | | | 0.00 | |
| Year Ended 7/31/2009 | | | 13.22 | | | (0.17 | ) | | (0.46 | ) | | (0.63 | ) | | 0.00 | | | 0.00 | | | 0.00 | |
| Class C | | | | | | | | | | | | | | | | | | | | | | |
| Year Ended 7/31/2013 | | $ | 18.15 | | | (0.09 | ) | | 3.17 | | | 3.08 | | | 0.00 | | | 0.00 | | | 0.00 | |
| Year Ended 7/31/2012 | | | 19.08 | | | (0.28 | ) | | (0.65 | ) | | (0.93 | ) | | 0.00 | | | 0.00 | | | 0.00 | |
| Year Ended 7/31/2011 | | | 15.06 | | | (0.22 | ) | | 4.24 | | | 4.02 | | | 0.00 | | | 0.00 | | | 0.00 | |
| Year Ended 7/31/2010 | | | 12.56 | | | (0.27 | ) | | 2.77 | | | 2.50 | | | 0.00 | | | 0.00 | | | 0.00 | |
| Year Ended 7/31/2009 | | | 13.19 | | | (0.17 | ) | | (0.46 | ) | | (0.63 | ) | | 0.00 | | | 0.00 | | | 0.00 | |
| Class I | | | | | | | | | | | | | | | | | | | | | | |
| Year Ended 7/31/2013 | | $ | 19.88 | | | 0.11 | | | 3.51 | | | 3.62 | | | 0.00 | | | 0.00 | | | 0.00 | |
| Year Ended 7/31/2012 | | | 20.68 | | | (0.09 | ) | | (0.71 | ) | | (0.80 | ) | | 0.00 | | | 0.00 | | | 0.00 | |
| Year Ended 7/31/2011 | | | 16.16 | | | (0.02 | ) | | 4.54 | | | 4.52 | | | 0.00 | | | 0.00 | | | 0.00 | |
| Year Ended 7/31/2010 | | | 13.34 | | | (0.13 | ) | | 2.95 | | | 2.82 | | | 0.00 | | | 0.00 | | | 0.00 | |
| Period Ended 7/31/2009(a) | | | 9.94 | | | (0.03 | ) | | 3.43 | | | 3.40 | | | 0.00 | | | 0.00 | | | 0.00 | |
| High Yield Opportunities Fund | | | | | | | | | | | | | | | | | | | |
| Class A | | | | | | | | | | | | | | | | | | | | | | |
| Period Ended 7/31/2013(b) | | $ | 10.00 | | | 0.15 | | | (0.06 | ) | | 0.09 | | | (0.11 | ) | | 0.00 | | | (0.11 | ) |
| Class C | | | | | | | | | | | | | | | | | | | | | | |
| Period Ended 7/31/2013(b) | | $ | 10.00 | | | 0.13 | | | (0.05 | ) | | 0.08 | | | (0.09 | ) | | 0.00 | | | (0.09 | ) |
| Class I | | | | | | | | | | | | | | | | | | | | | | |
| Period Ended 7/31/2013(b) | | $ | 10.00 | | | 0.16 | | | (0.06 | ) | | 0.10 | | | (0.13 | ) | | 0.00 | | | (0.13 | ) |
| (a) | The Global Technology Fund Class W commenced operations on March 31, 2009. Class W shares converted to Class I shares on January 18, 2011. |
| (b) | The High Yield Opportunities Fund commenced operations on April 30, 2013. |
| (c) | Per share data was calculated using average shares outstanding during the period. |
| (d) | Total returns are historical and assume changes in share price, reinvestment of all dividends and distributions and no sales charge. Had certain expenses not been reduced during the periods shown, total returns would have been lower. Total returns for periods of less than one year are not annualized. |
| (e) | Not annualized for periods less than one year. |
| * | Amount represents less than $0.01. |
See notes to financial statements
100
| Henderson Global Funds | Financial highlights |
| | | | | | | | | | | | | Ratios to average net assets: | | | |
Redemption fees | | Net asset value, end of period | | Total return (d) | | Net assets, end of period (000) | | Annualized ratio of operating expenses to average net assets | | Annualized ratio of net investment income (loss) to average net assets | | Annualized ratio of operating expenses to average net assets without waivers and/or expenses reimbursed | | Portfolio turnover rate (e) |
| | | | | | | | | | | | | | | | | | | | | | | |
| | | | | | | | | | | | | | | | | | | | | | | |
| N/A | | | $ | 23.22 | | | | 17.93 | % | | $ | 169,279 | | | | 1.49 | % | | | 0.28 | % | | | 1.49 | % | | | 83 | % |
| N/A | | | | 19.69 | | | | (4.18 | ) | | | 156,948 | | | | 1.50 | | | | (0.75 | ) | | | 1.50 | | | | 113 | |
| N/A | | | | 20.55 | | | | 27.64 | | | | 191,623 | | | | 1.55 | | | | (0.42 | ) | | | 1.55 | | | | 93 | |
| 0.00 | * | | | 16.10 | | | | 20.87 | | | | 116,903 | | | | 1.64 | | | | (1.07 | ) | | | 1.64 | | | | 76 | |
| 0.00 | * | | | 13.32 | | | | (4.03 | ) | | | 71,472 | | | | 1.81 | | | | (0.83 | ) | | | 1.81 | | | | 160 | |
| | | | | | | | | | | | | | | | | | | | | | | | | | | | | | |
| N/A | | | $ | 21.26 | | | | 16.94 | % | | $ | 9,249 | | | | 2.31 | % | | | (0.52 | )% | | | 2.31 | % | | | 83 | % |
| N/A | | | | 18.18 | | | | (4.97 | ) | | | 9,751 | | | | 2.36 | | | | (1.62 | ) | | | 2.36 | | | | 113 | |
| N/A | | | | 19.13 | | | | 26.69 | | | | 11,821 | | | | 2.30 | | | | (1.19 | ) | | | 2.30 | | | | 93 | |
| 0.00 | * | | | 15.10 | | | | 19.94 | | | | 9,283 | | | | 2.39 | | | | (1.82 | ) | | | 2.39 | | | | 76 | |
| 0.00 | * | | | 12.59 | | | | (4.77 | ) | | | 5,994 | | | | 2.56 | | | | (1.65 | ) | | | 2.56 | | | | 160 | |
| | | | | | | | | | | | | | | | | | | | | | | | | | | | | | |
| N/A | | | $ | 21.23 | | | | 16.97 | % | | $ | 71,401 | | | | 2.26 | % | | | (0.49 | )% | | | 2.26 | % | | | 83 | % |
| N/A | | | | 18.15 | | | | (4.87 | ) | | | 69,286 | | | | 2.29 | | | | (1.54 | ) | | | 2.29 | | | | 113 | |
| N/A | | | | 19.08 | | | | 26.69 | | | | 79,228 | | | | 2.30 | | | | (1.17 | ) | | | 2.30 | | | | 93 | |
| 0.00 | * | | | 15.06 | | | | 19.90 | | | | 53,793 | | | | 2.39 | | | | (1.82 | ) | | | 2.39 | | | | 76 | |
| 0.00 | * | | | 12.56 | | | | (4.78 | ) | | | 39,330 | | | | 2.56 | | | | (1.61 | ) | | | 2.56 | | | | 160 | |
| | | | | | | | | | | | | | | | | | | | | | | | | | | | | | |
| N/A | | | $ | 23.50 | | | | 18.21 | % | | $ | 97,882 | | | | 1.22 | % | | | 0.51 | % | | | 1.22 | % | | | 83 | % |
| N/A | | | | 19.88 | | | | (3.87 | ) | | | 61,492 | | | | 1.23 | | | | (0.47 | ) | | | 1.23 | | | | 113 | |
| N/A | | | | 20.68 | | | | 27.97 | | | | 52,351 | | | | 1.30 | | | | (0.12 | ) | | | 1.30 | | | | 93 | |
| 0.00 | * | | | 16.16 | | | | 21.14 | | | | 18,810 | | | | 1.39 | | | | (0.82 | ) | | | 1.39 | | | | 76 | |
| 0.00 | | | | 13.34 | | | | 34.21 | | | | 2,914 | | | | 1.71 | | | | (0.74 | ) | | | 1.71 | | | | 160 | |
| | | | | | | | | | | | | | | | | | | | | | | | | | | | | | |
| | | | | | | | | | | | | | | | | | | | | | | | | | | | | | |
| N/A | | | $ | 9.98 | | | | 0.92 | % | | $ | 1,127 | | | | 1.10 | % | | | 6.07 | % | | | 2.82 | % | | | 136 | % |
| | | | | | | | | | | | | | | | | | | | | | | | | | | | | | |
| N/A | | | $ | 9.99 | | | | 0.81 | % | | $ | 999 | | | | 1.85 | % | | | 5.27 | % | | | 3.63 | % | | | 136 | % |
| | | | | | | | | | | | | | | | | | | | | | | | | | | | | | |
| N/A | | | $ | 9.97 | | | | 1.06 | % | | $ | 23,608 | | | | 0.85 | % | | | 6.27 | % | | | 1.82 | % | | | 136 | % |
See notes to financial statements
101
| Henderson Global Funds | Financial highlights |
For a share outstanding throughout the periods indicated
| | | | | | Income (loss) from investment operations: | | Less distributions: |
| | | | | | | | | Net | | | | | Dividends | | Distributions | | | |
| | | Net asset | | Net | | realized and | | Total | | from | | from net | | | |
| | | value, | | investment | | unrealized gain | | from | | net | | realized | | | |
| | | beginning | | income | | (loss) on | | investment | | investment | | capital | | Total |
| | | of period | | (loss) (b) | | investments | | operations | | income | | gains | | distributions |
| International Opportunities Fund | | | | | | | | | | | | | | | | | | | |
| Class A | | | | | | | | | | | | | | | | | | | | | |
| Year Ended 7/31/2013 | | $ | 19.22 | | | | 0.14 | | | | 4.58 | | | | 4.72 | | | | (0.15 | ) | | | 0.00 | | | | (0.15 | ) |
| Year Ended 7/31/2012 | | | 21.77 | | | | 0.15 | | | | (2.59 | ) | | | (2.44 | ) | | | (0.11 | ) | | | 0.00 | | | | (0.11 | ) |
| Year Ended 7/31/2011 | | | 19.10 | | | | 0.13 | | | | 2.68 | | | | 2.81 | | | | (0.14 | ) | | | 0.00 | | | | (0.14 | ) |
| Year Ended 7/31/2010 | | | 18.87 | | | | 0.16 | | | | 0.14 | | | | 0.30 | | | | (0.07 | ) | | | 0.00 | | | | (0.07 | ) |
| Year Ended 7/31/2009 | | | 22.11 | | | | 0.25 | | | | (3.20 | ) | | | (2.95 | ) | | | (0.20 | ) | | | (0.09 | ) | | | (0.29 | ) |
| Class B | | | | | | | | | | | | | | | | | | | | | | | | | | | | |
| Year Ended 7/31/2013 | | $ | 18.13 | | | | (0.06 | ) | | | 4.33 | | | | 4.27 | | | | 0.00 | | | | 0.00 | | | | 0.00 | |
| Year Ended 7/31/2012 | | | 20.58 | | | | (0.01 | ) | | | (2.44 | ) | | | (2.45 | ) | | | 0.00 | | | | 0.00 | | | | 0.00 | |
| Year Ended 7/31/2011 | | | 18.07 | | | | (0.03 | ) | | | 2.54 | | | | 2.51 | | | | 0.00 | | | | 0.00 | | | | 0.00 | |
| Year Ended 7/31/2010 | | | 17.92 | | | | 0.01 | | | | 0.14 | | | | 0.15 | | | | (0.00 | )* | | | 0.00 | | | | (0.00 | )* |
| Year Ended 7/31/2009 | | | 21.00 | | | | 0.12 | | | | (3.02 | ) | | | (2.90 | ) | | | (0.09 | ) | | | (0.09 | ) | | | (0.18 | ) |
| Class C | | | | | | | | | | | | | | | | | | | | | | | | | | | | |
| Year Ended 7/31/2013 | | $ | 18.12 | | | | (0.04 | ) | | | 4.32 | | | | 4.28 | | | | 0.00 | | | | 0.00 | | | | 0.00 | |
| Year Ended 7/31/2012 | | | 20.56 | | | | (0.00 | )* | | | (2.44 | ) | | | (2.44 | ) | | | 0.00 | | | | 0.00 | | | | 0.00 | |
| Year Ended 7/31/2011 | | | 18.06 | | | | (0.03 | ) | | | 2.53 | | | | 2.50 | | | | 0.00 | | | | 0.00 | | | | 0.00 | |
| Year Ended 7/31/2010 | | | 17.91 | | | | 0.01 | | | | 0.14 | | | | 0.15 | | | | (0.00 | )* | | | 0.00 | | | | (0.00 | )* |
| Year Ended 7/31/2009 | | | 20.99 | | | | 0.12 | | | | (3.02 | ) | | | (2.90 | ) | | | (0.09 | ) | | | (0.09 | ) | | | (0.18 | ) |
| Class I | | | | | | | | | | | | | | | | | | | | | | | | | | | | |
| Year Ended 7/31/2013 | | $ | 19.25 | | | | 0.22 | | | | 4.57 | | | | 4.79 | | | | (0.22 | ) | | | 0.00 | | | | (0.22 | ) |
| Year Ended 7/31/2012 | | | 21.83 | | | | 0.21 | | | | (2.61 | ) | | | (2.40 | ) | | | (0.18 | ) | | | 0.00 | | | | (0.18 | ) |
| Year Ended 7/31/2011 | | | 19.16 | | | | 0.19 | | | | 2.67 | | | | 2.86 | | | | (0.19 | ) | | | 0.00 | | | | (0.19 | ) |
| Year Ended 7/31/2010 | | | 18.89 | | | | 0.22 | | | | 0.15 | | | | 0.37 | | | | (0.10 | ) | | | 0.00 | | | | (0.10 | ) |
| Period Ended 7/31/2009(a) | | | 13.96 | | | | 0.11 | | | | 4.82 | | | | 4.93 | | | | 0.00 | | | | 0.00 | | | | 0.00 | |
| Class R | | | | | | | | | | | | | | | | | | | | | | | | | | | | |
| Year Ended 7/31/2013 | | $ | 18.93 | | | | 0.07 | | | | 4.51 | | | | 4.58 | | | | (0.07 | ) | | | 0.00 | | | | (0.07 | ) |
| Year Ended 7/31/2012 | | | 21.50 | | | | 0.08 | | | | (2.58 | ) | | | (2.50 | ) | | | (0.07 | ) | | | 0.00 | | | | (0.07 | ) |
| Year Ended 7/31/2011 | | | 18.88 | | | | 0.09 | | | | 2.64 | | | | 2.73 | | | | (0.11 | ) | | | 0.00 | | | | (0.11 | ) |
| Year Ended 7/31/2010 | | | 18.70 | | | | 0.14 | | | | 0.12 | | | | 0.26 | | | | (0.08 | ) | | | 0.00 | | | | (0.08 | ) |
| Year Ended 7/31/2009 | | | 21.94 | | | | 0.19 | | | | (3.16 | ) | | | (2.97 | ) | | | (0.18 | ) | | | (0.09 | ) | | | (0.27 | ) |
| (a) | The International Opportunities Fund Class W commenced operations on March 31, 2009. Class W shares were converted to Class I shares on January 18, 2011. |
| (b) | Per share data was calculated using average shares outstanding during the period. |
| (c) | Total returns are historical and assume changes in share price, reinvestment of all dividends and distributions and no sales charge. Had certain expenses not been reduced during the periods shown, total returns would have been lower. Total returns for periods of less than one year are not annualized. |
| (d) | Not annualized for periods less than one year. |
| * | Amount represents less than $0.01. |
See notes to financial statements
102
| Henderson Global Funds | Financial highlights |
| | | | | | | | | | | | | Ratios to average net assets: | | | |
| | | | | | | | | | | | | | | | | | | Annualized ratio | | | |
| | | | | | | | | | | | | Annualized | | Annualized | | of operating expenses | | | |
| | | | | | | | | | | | | ratio of | | ratio of | | to average net | | | |
| | | | Net asset | | | | | Net assets, | | operating | | net investment | | assets without | | | |
| | | | value, | | | | | end of | | expenses to | | income/(loss) | | waivers and/or | | Portfolio |
| Redemption | | end of | | Total | | period | | average | | to average | | expenses | | turnover |
| fees | | period | | return (c) | | (000) | | net assets | | net assets | | reimbursed | | rate (d) |
| | | | | | | | | | | | | | | | | | | | | | | | |
| | | | | | | | | | | | | | | | | | | | | | | | |
| N/A | | | $ | 23.79 | | | | 24.64 | % | | $ | 1,467,583 | | | | 1.46 | % | | | 0.66 | % | | | 1.46 | % | | | 129 | % |
| N/A | | | | 19.22 | | | | (11.17 | ) | | | 1,263,648 | | | | 1.47 | | | | 0.78 | | | | 1.47 | | | | 45 | |
| N/A | | | | 21.77 | | | | 14.71 | | | | 1,950,064 | | | | 1.44 | | | | 0.62 | | | | 1.44 | | | | 64 | |
| 0.00 | * | | | 19.10 | | | | 1.59 | | | | 2,097,217 | | | | 1.48 | | | | 0.81 | | | | 1.48 | | | | 52 | |
| 0.00 | * | | | 18.87 | | | | (12.86 | ) | | | 2,036,371 | | | | 1.61 | | | | 1.52 | | | | 1.61 | | | | 66 | |
| | | | | | | | | | | | | | | | | | | | | | | | | | | | | | |
| N/A | | | $ | 22.40 | | | | 23.55 | % | | $ | 40,023 | | | | 2.29 | % | | | (0.30 | )% | | | 2.29 | % | | | 129 | % |
| N/A | | | | 18.13 | | | | (11.90 | ) | | | 48,771 | | | | 2.32 | | | | (0.07 | ) | | | 2.32 | | | | 45 | |
| N/A | | | | 20.58 | | | | 13.89 | | | | 79,091 | | | | 2.19 | | | | (0.14 | ) | | | 2.19 | | | | 64 | |
| 0.00 | * | | | 18.07 | | | | 0.84 | | | | 84,619 | | | | 2.23 | | | | 0.03 | | | | 2.23 | | | | 52 | |
| 0.00 | * | | | 17.92 | | | | (13.55 | ) | | | 91,697 | | | | 2.36 | | | | 0.77 | | | | 2.36 | | | | 66 | |
| | | | | | | | | | | | | | | | | | | | | | | | | | | | | | |
| N/A | | | $ | 22.40 | | | | 23.62 | % | | $ | 424,538 | | | | 2.26 | % | | | (0.18 | )% | | | 2.26 | % | | | 129 | % |
| N/A | | | | 18.12 | | | | (11.87 | ) | | | 416,582 | | | | 2.29 | | | | (0.02 | ) | | | 2.29 | | | | 45 | |
| N/A | | | | 20.56 | | | | 13.84 | | | | 639,252 | | | | 2.19 | | | | (0.15 | ) | | | 2.19 | | | | 64 | |
| 0.00 | * | | | 18.06 | | | | 0.84 | | | | 706,332 | | | | 2.23 | | | | 0.04 | | | | 2.23 | | | | 52 | |
| 0.00 | * | | | 17.91 | | | | (13.55 | ) | | | 713,020 | | | | 2.36 | | | | 0.78 | | | | 2.36 | | | | 66 | |
| | | | | | | | | | | | | | | | | | | | | | | | | | | | | | |
| N/A | | | $ | 23.82 | | | | 25.00 | % | | $ | 872,974 | | | | 1.16 | % | | | 1.04 | % | | | 1.16 | % | | | 129 | % |
| N/A | | | | 19.25 | | | | (10.93 | ) | | | 656,313 | | | | 1.20 | | | | 1.09 | | | | 1.20 | | | | 45 | |
| N/A | | | | 21.83 | | | | 14.96 | | | | 797,316 | | | | 1.19 | | | | 0.87 | | | | 1.19 | | | | 64 | |
| 0.00 | * | | | 19.16 | | | | 1.92 | | | | 555,653 | | | | 1.23 | | | | 1.12 | | | | 1.23 | | | | 52 | |
| 0.00 | * | | | 18.89 | | | | 35.32 | | | | 86,447 | | | | 1.43 | | | | 1.98 | | | | 1.43 | | | | 66 | |
| | | | | | | | | | | | | | | | | | | | | | | | | | | | | | |
| N/A | | | $ | 23.44 | | | | 24.23 | % | | $ | 7,180 | | | | 1.76 | % | | | 0.34 | % | | | 1.76 | % | | | 129 | % |
| N/A | | | | 18.93 | | | | (11.60 | ) | | | 6,454 | | | | 1.94 | | | | 0.42 | | | | 1.94 | | | | 45 | |
| N/A | | | | 21.50 | | | | 14.45 | | | | 7,258 | | | | 1.69 | | | | 0.44 | | | | 1.69 | | | | 64 | |
| 0.00 | * | | | 18.88 | | | | 1.35 | | | | 7,288 | | | | 1.73 | | | | 0.73 | | | | 1.73 | | | | 52 | |
| 0.00 | * | | | 18.70 | | | | (13.10 | ) | | | 3,093 | | | | 1.86 | | | | 1.18 | | | | 1.86 | | | | 66 | |
See notes to financial statements
103
| Henderson Global Funds | Financial highlights |
For a share outstanding throughout the periods indicated
| | | | | | Income (loss) from investment operations: | | Less distributions: |
| | | | | | | | | Net | | | | | Dividends | | Distributions | | | | |
| | | Net asset | | Net | | realized and | | Total | | from | | from net | | | | | | |
| | | value, | | investment | unrealized gain | from | | net | | realized | | Return | | | |
| | | beginning | | income | | (loss) on | | investment | | investment | | capital | | of | | Total |
| | | of period | | (loss) (c) | | investments | | operations | | income | | gains | | capital | | distributions |
| Strategic Income Fund | | | | | | | | | | | | | | | | | | | | | | | | |
| Class A | | | | | | | | | | | | | | | | | | | | | | | | |
| Period Ended | | | | | | | | | | | | | | | | | | | | | | | | |
| 7/31/2013(a) | | $ | 9.12 | | | | 0.23 | | | | (0.19 | ) | | | 0.04 | | | | (0.23 | ) | | | 0.00 | | | | 0.00 | | | | (0.23 | ) |
| Year Ended 12/31/2012 | | | 8.39 | | | | 0.40 | | | | 0.73 | | | | 1.13 | | | | (0.40 | ) | | | 0.00 | | | | 0.00 | | | | (0.40 | ) |
| Year Ended 12/31/2011 | | | 8.82 | | | | 0.44 | | | | (0.43 | ) | | | 0.01 | | | | (0.37 | ) | | | 0.00 | | | | (0.07 | ) | | | (0.44 | ) |
| Year Ended 12/31/2010 | | | 8.44 | | | | 0.46 | | | | 0.38 | | | | 0.84 | | | | (0.33 | ) | | | 0.00 | | | | (0.13 | ) | | | (0.46 | ) |
| Period Ended | | | | | | | | | | | | | | | | | | | | | | | | | | | | | | | | |
| 12/31/2009(b) | | | 7.60 | | | | 0.21 | | | | 0.83 | | | | 1.04 | | | | 0.00 | | | | 0.00 | | | | (0.20 | ) | | | (0.20 | ) |
| Year Ended 7/31/2009 | | | 9.45 | | | | 0.63 | | | | (1.78 | ) | | | (1.15 | ) | | | (0.70 | ) | | | 0.00 | | | | 0.00 | | | | (0.70 | ) |
| Year Ended 7/31/2008 | | | 10.87 | | | | 0.71 | | | | (1.37 | ) | | | (0.66 | ) | | | (0.76 | ) | | | 0.00 | | | | 0.00 | | | | (0.76 | ) |
| Class B | | | | | | | | | | | | | | | | | | | | | | | | | | | | | | | | |
| Period Ended | | | | | | | | | | | | | | | | | | | | | | | | | | | | | | | | |
| 7/31/2013(a) | | $ | 9.14 | | | | 0.19 | | | | (0.20 | ) | | | (0.01 | ) | | | (0.18 | ) | | | 0.00 | | | | 0.00 | | | | (0.18 | ) |
| Year Ended 12/31/2012 | | | 8.40 | | | | 0.33 | | | | 0.74 | | | | 1.07 | | | | (0.33 | ) | | | 0.00 | | | | 0.00 | | | | (0.33 | ) |
| Year Ended 12/31/2011 | | | 8.83 | | | | 0.38 | | | | (0.43 | ) | | | (0.05 | ) | | | (0.32 | ) | | | 0.00 | | | | (0.06 | ) | | | (0.38 | ) |
| Year Ended 12/31/2010 | | | 8.46 | | | | 0.40 | | | | 0.37 | | | | 0.77 | | | | (0.29 | ) | | | 0.00 | | | | (0.11 | ) | | | (0.40 | ) |
| Period Ended | | | | | | | | | | | | | | | | | | | | | | | | | | | | | | | | |
| 12/31/2009(b) | | | 7.61 | | | | 0.19 | | | | 0.84 | | | | 1.03 | | | | 0.00 | | | | 0.00 | | | | (0.18 | ) | | | (0.18 | ) |
| Year Ended 7/31/2009 | | | 9.44 | | | | 0.56 | | | | (1.75 | ) | | | (1.19 | ) | | | (0.64 | ) | | | 0.00 | | | | 0.00 | | | | (0.64 | ) |
| Year Ended 7/31/2008 | | | 10.84 | | | | 0.64 | | | | (1.36 | ) | | | (0.72 | ) | | | (0.68 | ) | | | 0.00 | | | | 0.00 | | | | (0.68 | ) |
| Class C | | | | | | | | | | | | | | | | | | | | | | | | | | | | | | | | |
| Period Ended | | | | | | | | | | | | | | | | | | | | | | | | | | | | | | | | |
| 7/31/2013(a) | | $ | 9.08 | | | | 0.19 | | | | (0.20 | ) | | | (0.01 | ) | | | (0.18 | ) | | | 0.00 | | | | 0.00 | | | | (0.18 | ) |
| Year Ended 12/31/2012 | | | 8.35 | | | | 0.33 | | | | 0.73 | | | | 1.06 | | | | (0.33 | ) | | | 0.00 | | | | 0.00 | | | | (0.33 | ) |
| Year Ended 12/31/2011 | | | 8.79 | | | | 0.37 | | | | (0.43 | ) | | | (0.06 | ) | | | (0.32 | ) | | | 0.00 | | | | (0.06 | ) | | | (0.38 | ) |
| Year Ended 12/31/2010 | | | 8.41 | | | | 0.40 | | | | 0.38 | | | | 0.78 | | | | (0.29 | ) | | | 0.00 | | | | (0.11 | ) | | | (0.40 | ) |
| Period Ended | | | | | | | | | | | | | | | | | | | | | | | | | | | | | | | | |
| 12/31/2009(b) | | | 7.59 | | | | 0.19 | | | | 0.81 | | | | 1.00 | | | | 0.00 | | | | 0.00 | | | | (0.18 | ) | | | (0.18 | ) |
| Year Ended 7/31/2009 | | | 9.45 | | | | 0.57 | | | | (1.79 | ) | | | (1.22 | ) | | | (0.64 | ) | | | 0.00 | | | | 0.00 | | | | (0.64 | ) |
| Year Ended 7/31/2008 | | | 10.86 | | | | 0.64 | | | | (1.37 | ) | | | (0.73 | ) | | | (0.68 | ) | | | 0.00 | | | | 0.00 | | | | (0.68 | ) |
| Class I | | | | | | | | | | | | | | | | | | | | | | | | | | | | | | | | |
| Period Ended | | | | | | | | | | | | | | | | | | | | | | | | | | | | | | | | |
| 7/31/2013(a) | | $ | 9.10 | | | | 0.24 | | | | (0.19 | ) | | | 0.05 | | | | (0.24 | ) | | | 0.00 | | | | 0.00 | | | | (0.24 | ) |
| Year Ended 12/31/2012 | | | 8.37 | | | | 0.42 | | | | 0.73 | | | | 1.15 | | | | (0.42 | ) | | | 0.00 | | | | 0.00 | | | | (0.42 | ) |
| Period Ended | | | | | | | | | | | | | | | | | | | | | | | | | | | | | | | | |
| 12/31/2011(d) | | | 9.06 | | | | 0.29 | | | | (0.66 | ) | | | (0.37 | ) | | | (0.27 | ) | | | 0.00 | | | | (0.05 | ) | | | (0.32 | ) |
| (a) | Strategic Income Fund changed its fiscal year end from December 31 to July 31 effective July 31, 2013. |
| (b) | Strategic Income Fund changed its fiscal year end from July 31 to December 31 effective December 31, 2009. |
| (c) | Per share data was calculated using the average shares outstanding during the period. |
| (d) | Class I commenced operations on April 29, 2011. |
| (e) | Total returns are historical and assume changes in share price, reinvestment of all dividends and distributions and no sales charge. Had certain expenses not been reduced during the periods shown, total returns would have been lower. Total returns for periods of less than one year are not annualized. |
| (f) | Not annualized for periods less than one year. |
| * | Amount represents less than $0.01. |
See notes to financial statements
104
| Henderson Global Funds | Financial highlights |
| | | | | | | | | | | | | Ratios to average net assets: | | | |
| | | | | | | | | | | | | | | | | | | Annualized ratio | | | |
| | | | | | | | | | | | | Annualized | | Annualized | | of operating expenses | | | |
| | | | | | | | | | | | | ratio of | | ratio of | | to average net | | | |
| | | | Net asset | | | | | Net assets, | | operating | | net investment | | assets without | | | |
| | | | value, | | | | | end of | | expenses to | | income/(loss) | | waivers and/or | | Portfolio |
| Redemption | | end of | | Total | | period | | average | | to average | | expenses | | turnover |
| fees | | period | | return (e) | | (000) | | net assets | | net assets | | reimbursed | | rate (f) |
| | | | | | | | | | | | | | | | | | | | | | | | |
| | | | | | | | | | | | | | | | | | | | | | | | |
| | | | | | | | | | | | | | | | | | | | | | | | |
| N/A | | | $ | 8.93 | | | | 0.39 | % | | $ | 15,656 | | | | 1.10 | % | | | 4.36 | % | | | 1.44 | % | | | 50 | % |
| N/A | | | | 9.12 | | | | 13.75 | | | | 17,596 | | | | 1.10 | | | | 4.51 | | | | 1.34 | | | | 47 | |
| N/A | | | | 8.39 | | | | 0.06 | | | | 17,210 | | | | 1.20 | | | | 5.04 | | | | 1.51 | | | | 41 | |
| 0.00 | * | | | 8.82 | | | | 10.17 | | | | 28,171 | | | | 1.30 | | | | 5.30 | | | | 1.54 | | | | 38 | |
| | | | | | | | | | | | | | | | | | | | | | | | | | | | | | |
| 0.00 | * | | | 8.44 | | | | 13.82 | | | | 35,656 | | | | 1.30 | | | | 6.19 | | | | 1.63 | | | | 11 | |
| 0.00 | * | | | 7.60 | | | | (10.71 | ) | | | 28,905 | | | | 1.30 | | | | 8.69 | | | | 1.62 | | | | 53 | |
| 0.00 | * | | | 9.45 | | | | (6.47 | ) | | | 64,687 | | | | 1.30 | | | | 6.87 | | | | 1.45 | | | | 41 | |
| | | | | | | | | | | | | | | | | | | | | | | | | | | | | | |
| | | | | | | | | | | | | | | | | | | | | | | | | | | | | | |
| N/A | | | $ | 8.95 | | | | (0.07 | )% | | $ | 6,198 | | | | 1.85 | % | | | 3.62 | % | | | 2.21 | % | | | 50 | % |
| N/A | | | | 9.14 | | | | 12.97 | | | | 6,963 | | | | 1.85 | | | | 3.77 | | | | 2.12 | | | | 47 | |
| N/A | | | | 8.40 | | | | (0.69 | ) | | | 7,412 | | | | 1.94 | | | | 4.29 | | | | 2.27 | | | | 41 | |
| 0.00 | * | | | 8.83 | | | | 9.21 | | | | 8,537 | | | | 2.05 | | | | 4.55 | | | | 2.29 | | | | 38 | |
| | | | | | | | | | | | | | | | | | | | | | | | | | | | | | |
| 0.00 | * | | | 8.46 | | | | 13.59 | | | | 7,824 | | | | 2.05 | | | | 5.44 | | | | 2.38 | | | | 11 | |
| 0.00 | * | | | 7.61 | | | | (11.23 | ) | | | 6,325 | | | | 2.05 | | | | 8.02 | | | | 2.37 | | | | 53 | |
| 0.00 | * | | | 9.44 | | | | (7.00 | ) | | | 5,789 | | | | 2.05 | | | | 6.13 | | | | 2.20 | | | | 41 | |
| | | | | | | | | | | | | | | | | | | | | | | | | | | | | | |
| | | | | | | | | | | | | | | | | | | | | | | | | | | | | | |
| N/A | | | $ | 8.89 | | | | (0.06 | )% | | $ | 19,483 | | | | 1.85 | % | | | 3.62 | % | | | 2.20 | % | | | 50 | % |
| N/A | | | | 9.08 | | | | 12.95 | | | | 22,328 | | | | 1.85 | | | | 3.77 | | | | 2.11 | | | | 47 | |
| N/A | | | | 8.35 | | | | (0.80 | ) | | | 22,244 | | | | 1.94 | | | | 4.29 | | | | 2.26 | | | | 41 | |
| 0.00 | * | | | 8.79 | | | | 9.39 | | | | 26,997 | | | | 2.05 | | | | 4.55 | | | | 2.29 | | | | 38 | |
| | | | | | | | | | | | | | | | | | | | | | | | | | | | | | |
| 0.00 | * | | | 8.41 | | | | 13.22 | | | | 30,152 | | | | 2.05 | | | | 5.45 | | | | 2.38 | | | | 11 | |
| 0.00 | * | | | 7.59 | | | | (11.55 | ) | | | 28,513 | | | | 2.05 | | | | 7.96 | | | | 2.37 | | | | 53 | |
| 0.00 | * | | | 9.45 | | | | (7.09 | ) | | | 62,906 | | | | 2.05 | | | | 6.17 | | | | 2.20 | | | | 41 | |
| | | | | | | | | | | | | | | | | | | | | | | | | | | | | | |
| | | | | | | | | | | | | | | | | | | | | | | | | | | | | | |
| N/A | | | $ | 8.91 | | | | 0.54 | % | | $ | 7,291 | | | | 0.85 | % | | | 4.59 | % | | | 1.16 | % | | | 50 | % |
| N/A | | | | 9.10 | | | | 14.06 | | | | 3,903 | | | | 0.85 | | | | 4.79 | | | | 1.07 | | | | 47 | |
| | | | | | | | | | | | | | | | | | | | | | | | | | | | | | |
| N/A | | | | 8.37 | | | | (4.10 | ) | | | 1,885 | | | | 0.85 | | | | 5.16 | | | | 1.25 | | | | 41 | |
See notes to financial statements
105
| Henderson Global Funds | Financial highlights |
For a share outstanding throughout the periods indicated
| | | | | | Income (loss) from investment operations: | | Less distributions: |
| | | | | | | | | Net | | | | | Dividends | | Distributions | | | |
| | | Net asset | | Net | | realized and | | Total | | from | | from net | | | |
| | | value, | | investment | | unrealized gain | | from | | net | | realized | | | |
| | | beginning | | income | | (loss) on | | investment | | investment | | capital | | Total |
| | | of period | | (loss) (b) | | investments | | operations | | income | | gains | | distributions |
| World Select Fund | | | | | | | | | | | | | | | | | | | | | |
| Class A | | | | | | | | | | | | | | | | | | | | | |
| Year Ended 7/31/2013 | | $ | 9.90 | | | | 0.09 | | | | 2.20 | | | | 2.29 | | | | (0.05 | ) | | | 0.00 | | | | (0.05 | ) |
| Year Ended 7/31/2012 | | | 10.14 | | | | 0.01 | | | | (0.25 | ) | | | (0.24 | ) | | | 0.00 | | | | 0.00 | | | | 0.00 | |
| Year Ended 7/31/2011 | | | 8.71 | | | | 0.02 | | | | 1.41 | | | | 1.43 | | | | 0.00 | | | | 0.00 | | | | 0.00 | |
| Year Ended 7/31/2010 | | | 7.88 | | | | (0.06 | ) | | | 0.89 | | | | 0.83 | | | | 0.00 | | | | 0.00 | | | | 0.00 | |
| Year Ended 7/31/2009 | | | 10.00 | | | | 0.02 | | | | (2.10 | ) | | | (2.08 | ) | | | (0.04 | ) | | | 0.00 | | | | (0.04 | ) |
| Class C | | | | | | | | | | | | | | | | | | | | | | | | | | | | |
| Year Ended 7/31/2013 | | $ | 9.71 | | | | 0.01 | | | | 2.14 | | | | 2.15 | | | | (0.02 | ) | | | 0.00 | | | | (0.02 | ) |
| Year Ended 7/31/2012 | | | 10.02 | | | | (0.07 | ) | | | (0.24 | ) | | | (0.31 | ) | | | 0.00 | | | | 0.00 | | | | 0.00 | |
| Year Ended 7/31/2011 | | | 8.67 | | | | (0.06 | ) | | | 1.41 | | | | 1.35 | | | | 0.00 | | | | 0.00 | | | | 0.00 | |
| Year Ended 7/31/2010 | | | 7.90 | | | | (0.13 | ) | | | 0.90 | | | | 0.77 | | | | 0.00 | | | | 0.00 | | | | 0.00 | |
| Year Ended 7/31/2009 | | | 10.07 | | | | (0.03 | ) | | | (2.13 | ) | | | (2.16 | ) | | | (0.01 | ) | | | 0.00 | | | | (0.01 | ) |
| Class I | | | | | | | | | | | | | | | | | | | | | | | | | | | | |
| Year Ended 7/31/2013 | | $ | 9.94 | | | | 0.11 | | | | 2.21 | | | | 2.32 | | | | (0.06 | ) | | | 0.00 | | | | (0.06 | ) |
| Year Ended 7/31/2012 | | | 10.16 | | | | 0.03 | | | | (0.25 | ) | | | (0.22 | ) | | | 0.00 | | | | 0.00 | | | | 0.00 | |
| Period Ended 7/31/2011(a) | | | 10.50 | | | | (0.01 | ) | | | (0.33 | ) | | | (0.34 | ) | | | 0.00 | | | | 0.00 | | | | 0.00 | |
| (a) | The World Select Fund Class I commenced operations on May 31, 2011. |
| (b) | Per share data was calculated using average shares outstanding during the period. |
| (c) | Total returns are historical and assume changes in share price, reinvestment of all dividends and distributions and no sales charge. Had certain expenses not been reduced during the periods shown, total returns would have been lower. Total returns for periods of less than one year are not annualized. |
| (d) | Not annualized for periods less than one year. |
| * | Amount represents less than $0.01. |
See notes to financial statements
106
| Henderson Global Funds | Financial highlights |
| | | | | | | | | | | | | | Ratios to average net assets: | | | |
| | | | | | | | | | | | | | | | | | | | Annualized ratio | | | |
| | | | | | | | | | | | | | Annualized | | Annualized | | of operating expenses | | | |
| | | | | | | | | | | | | | ratio of | | ratio of | | to average net | | | |
| | | | | Net asset | | | | | Net assets, | | operating | | net investment | | assets without | | | |
| | | | | value, | | | | | end of | | expenses to | | income/(loss) | | waivers and/or | | Portfolio |
| Redemption | | end of | | Total | | period | | average | | to average | | expenses | | turnover |
| fees | | period | | return (c) | | (000) | | net assets | | net assets | | reimbursed | | rate (d) |
| | | | | | | | | | | | | | | | | | | | | | | | | |
| | | | | | | | | | | | | | | | | | | | | | | | | |
| | N/A | | | $ | 12.14 | | | | 23.18 | % | | $ | 3,422 | | | | 1.40 | % | | | 0.85 | % | | | 2.10 | % | | | 97 | % |
| | N/A | | | | 9.90 | | | | (2.37 | ) | | | 7,125 | | | | 1.40 | | | | 0.06 | | | | 2.09 | | | | 83 | |
| | N/A | | | | 10.14 | | | | 16.42 | | | | 8,010 | | | | 1.87 | | | | 0.16 | | | | 2.26 | | | | 63 | |
| | 0.00 | * | | | 8.71 | | | | 10.53 | | | | 8,479 | | | | 1.95 | | | | (0.71 | ) | | | 2.27 | | | | 67 | |
| | 0.00 | * | | | 7.88 | | | | (20.73 | ) | | | 6,329 | | | | 1.95 | | | | 0.25 | | | | 2.74 | | | | 234 | |
| | | | | | | | | | | | | | | | | | | | | | | | | | | | | | | |
| | N/A | | | $ | 11.84 | | | | 22.19 | % | | $ | 4,799 | | | | 2.15 | % | | | 0.05 | % | | | 2.83 | % | | | 97 | % |
| | N/A | | | | 9.71 | | | | (3.09 | ) | | | 5,794 | | | | 2.15 | | | | (0.70 | ) | | | 2.84 | | | | 83 | |
| | N/A | | | | 10.02 | | | | 15.57 | | | | 6,600 | | | | 2.62 | | | | (0.60 | ) | | | 3.01 | | | | 63 | |
| | 0.00 | * | | | 8.67 | | | | 9.75 | | | | 7,079 | | | | 2.70 | | | | (1.46 | ) | | | 3.02 | | | | 67 | |
| | 0.00 | * | | | 7.90 | | | | (21.41 | ) | | | 6,988 | | | | 2.70 | | | | (0.37 | ) | | | 3.49 | | | | 234 | |
| | | | | | | | | | | | | | | | | | | | | | | | | | | | | | | |
| | N/A | | | $ | 12.20 | | | | 23.49 | % | | $ | 2,238 | | | | 1.15 | % | | | 0.96 | % | | | 1.79 | % | | | 97 | % |
| | N/A | | | | 9.94 | | | | (2.17 | ) | | | 1,043 | | | | 1.15 | | | | 0.31 | | | | 1.80 | | | | 83 | |
| | N/A | | | | 10.16 | | | | (3.23 | ) | | | 1,071 | | | | 1.15 | | | | (0.62 | ) | | | 2.01 | | | | 63 | |
See notes to financial statements
107
| Henderson Global Funds | Notes to financial statements |
Note 1. Organization
Henderson Global Funds (the “Trust”) was organized on May 11, 2001, as a Delaware statutory trust and is registered under the Investment Company Act of 1940, as amended (the “1940 Act”), as an open-end management investment company. The Trust has an unlimited number of authorized shares that are divided among ten series. The Henderson All Asset Fund, Henderson Dividend & Income Builder Fund, Henderson Emerging Markets Opportunities Fund, Henderson European Focus Fund, Henderson Global Equity Income Fund, Henderson Global Technology Fund, Henderson High Yield Opportunities Fund, Henderson International Opportunities Fund, Henderson Strategic Income Fund and Henderson World Select Fund (formerly Henderson Global Leaders Fund) (collectively, the “Funds”) are included in this report and are each a separate series of the Trust and are diversified. The Henderson Dividend & Income Builder Fund commenced operations on August 1, 2012. The Henderson High Yield Opportunities Fund commenced operations on April 30, 2013.
The Henderson All Asset Fund is a Fund-of-Funds that seeks to achieve its objective by investing in a portfolio of underlying funds (“underlying funds”) which, in turn, may invest in a variety of US and foreign equity, fixed income, money market and derivative instruments. The Fund-of-Funds does not invest in the underlying funds for the purpose of exercising management or control; however, investments by the Fund-of-Funds, within its principal investment strategies, may represent a significant portion of the underlying funds’ net assets. The Fund-of-Funds’ “Portfolio of Investments” lists the underlying funds held as an investment of the Fund-of-Funds as of period end, but does not include the holdings of the underlying funds.
The Funds offer the following share classes:
| | Share Classes |
| Fund | A | B | C | I | R |
| All Asset | X | n/a | X | X | n/a |
| Dividend & | | | | | |
| Income Builder | X | n/a | X | X | n/a |
| Emerging Markets | | | | | |
| Opportunities | X | n/a | X | X | n/a |
| European Focus | X | X | X | X | n/a |
| Global Equity Income | X | n/a | X | X | n/a |
| Global Technology | X | X | X | X | n/a |
| High Yield | | | | | |
| Opportunities | X | n/a | X | X | n/a |
| International | | | | | |
| Opportunities | X | X | X | X | X |
| Strategic Income | X | X | X | X | n/a |
| World Select | X | n/a | X | X | n/a |
Class A shares generally provide for a front-end sales charge. Class B and C shares provide for a contingent deferred sales charge. Class R and I shares are not subject to a front-end or contingent deferred sales charge.
Each class of shares has equal rights as to earnings and assets except that each class may bear different distribution and shareholder service expenses. Each class of shares has exclusive voting rights with respect to matters that affect just that class. Income, expenses (other than expenses attributable to a specific class), and realized and unrealized gains and losses on investments are allocated to each class of shares based on its relative net assets. Class B shares automatically convert to Class A shares at the end of the month following the eighth anniversary of issuance. The Funds do not accept new or additional investments in Class B shares of the Funds with the limited exception that current Class B shareholders may continue to have their dividends automatically reinvested in Class B shares of the Funds. As described in the prospectus, Class B shares of a particular Fund may continue to be exchanged with Class B shares of other Henderson Global Funds.
The Strategic Income Fund changed its fiscal year-end from December 31 to July 31 effective July 31, 2013. Accordingly, the statement of operations, the statement of changes in net assets and the financial highlights for the 2013 fiscal year reflect the seven month period from January 1, 2013 through July 31, 2013.
On June 20, 2013, the Board of Trustees of the Trust approved an Agreement and Plan of Liquidation and Termination for Henderson World Select Fund (“the Fund”) pursuant to which the Fund would liquidate on August 30, 2013 through the sale of the Fund’s securities and forced
108
| Henderson Global Funds | Notes to financial statements |
redemption of all remaining shareholders. The financial statements for the Fund as of July 31, 2013 are included in the annual report for the Trust and are presented on a going concern basis as management elected to early adopt the provisions of Accounting Standards Update 2013-07 Presentation of Financial Statements (Topic 205): Liquidation Basis of Accounting (“ASU 2013-07”) which preclude investment companies registered with the Securities Exchange Commission from utilizing the liquidation basis of accounting.
Note 2. Significant accounting policies
The following is a summary of significant accounting policies followed by each Fund in preparation of its financial statements. These policies are in conformity with US generally accepted accounting principles (“GAAP”). The preparation of financial statements in accordance with GAAP requires management to make estimates and assumptions that affect the reported amounts. The actual results could differ from those estimates.
Security valuation
Securities and derivatives traded on a recognized exchange or market are generally valued at the last reported sale price. Listed securities for which no sale was reported on that date and other securities traded in the over-the-counter market are valued at the mean between the last bid and asked price.
Debt securities are valued at the market value provided by independent pricing services approved by the Board of Trustees of the Trust. If the pricing services are unable to provide valuations, the securities are valued at the mean between the last bid and asked price, or if no ask is available, then the last bid price obtained from one or more broker-dealers. Such pricing services may use various pricing techniques that take into account appropriate factors such as yield, quality, coupon rate, maturity, type of issue, trading characteristics and other data, as well as broker quotes.
Short-term investments purchased with an original or remaining maturity of 60 days or less at the time of purchase are valued at amortized cost, which approximates fair market value. Investments in investment companies are valued at its reported net asset value, which approximates fair market value.
Forward foreign currency contracts are valued daily at the applicable forward rate.
Swap agreements are valued using independent values provided by independent pricing services when available, otherwise, fair values are estimated on the basis of pricing models that incorporate current market measures for interest rates, currency exchange rates, equity prices and indices, credit spreads, corresponding market volatility levels and other market-based pricing factors.
If market quotations are not readily available, or if the investment adviser determines that a quotation of a security does not represent a fair value, then the security is valued at a fair value as determined in good faith using procedures approved by the Board of Trustees of the Trust. The Trustees of the Trust, or their designee, may also establish fair value using a wide variety of market data including yields or prices of investments of comparable quality, type of issue, coupon, maturity and rating, market quotes or indications of value from security dealers, evaluations of anticipated cash flows or collateral, general market conditions and other information and analysis, including the obligor’s credit characteristics considered relevant.
For equity securities, the Trust has retained an independent statistical fair value pricing service to assist in the fair valuation process for securities principally traded in a foreign market in order to adjust for possible changes in value that may occur between the close of the foreign exchange and the time at which Fund shares are priced. If a security is valued at a “fair value,” that value may be different from the last quoted market price for the security. As a result, it is possible that fair value prices will be used by the Funds.
Security transactions and investment income
Investment transactions are accounted for on a trade-date basis. Interest income is recorded on an accrual basis. Dividend income is recorded on the ex-dividend date. Bond premium is amortized and discount is accreted over the expected life of each applicable security. Corporate actions involving foreign securities, including dividends, are recorded as soon as the information becomes available. Withholding taxes on foreign dividends are accrued in accordance with the applicable country’s tax rules and rates. Gains and losses realized on sales of securities are determined using the specific identification method by comparing the identified cost of the security lot sold with the net sales proceeds, which is the same basis used for federal income tax purposes.
Foreign currency translation
Investments in securities and other assets and liabilities denominated in foreign currencies are translated into US dollar amounts at the date of valuation. Purchases and sales of investment securities and income and expense items denominated in foreign currencies are translated into US dollar amounts on the respective dates of such transactions.
The Funds do not separate the portion of the results of operations resulting from changes in foreign exchange rates on investments from the fluctuations arising from changes in market prices of securities held. Such fluctuations are included with the net realized and unrealized gain or loss from investments on the Statements of Operations.
109
| Henderson Global Funds | Notes to financial statements |
Reported net realized foreign exchange gains or losses arise from sales of foreign currencies, currency gains or losses realized between the trade date and settlement date on securities transactions, and the difference between the amounts of dividends, interest, and foreign withholding taxes recorded on the Funds’ books and the US dollar equivalent of the amounts actually received or paid. Net unrealized foreign exchange gains and losses arise from changes in the fair values of assets and liabilities, other than investments in securities at fiscal period end, resulting from changes in exchange rates.
Forward foreign currency contracts
The Funds may enter into forward foreign currency contracts primarily to hedge against foreign currency exchange rate risks on its non-US dollar denominated investment securities. Alternatively, a Fund may enter into a forward foreign currency contract for speculative purposes of gaining exposure to particular foreign currency markets. When entering into forward foreign currency contracts, a Fund agrees to receive or deliver a fixed quantity of foreign currency for an agreed-upon price on an agreed future date. Realized gains or losses on forward foreign currency contracts include net gains or losses on contracts that have matured. Forward foreign currency contracts are valued daily and the unrealized appreciation or depreciation is included in the Statements of Assets and Liabilities. These instruments involve market risk, credit risk or both kinds of risks, in excess of the amount recognized in the Statements of Assets and Liabilities. These risks arise from the possible inability of counterparties to meet the terms of their contracts and from unfavorable currency fluctuations. When applicable, open forward foreign currency contracts at the end of the period are listed in each Fund’s Portfolio of Investments.
Futures contracts
The Funds are subject to interest rate risk, equity risk and foreign currency risk in the normal course of pursuing their investment objectives. Accordingly, the Funds may invest in futures contracts to gain exposure to, or hedge against, changes in the value of interest rates or foreign currencies and to gain exposure to equity indices. A futures contract represents a commitment for the future purchase or sale of an asset at a specified price and date. Upon entering into such contracts, a Fund is required to deposit with the broker, either in cash or securities, an initial margin in an amount equal to a certain percentage of the contract amount. Subsequent payments, known as “variation margin,” are made or received by the Fund, depending on the fluctuations in the fair value of the underlying asset. The Funds realize a gain or loss upon the expiration or closing of the futures contracts. Should market conditions move unexpectedly, the Funds may not achieve the anticipated benefits of the futures contracts and may realize a loss. The use of futures contracts involves the risk of imperfect correlation in movements in the price of futures contracts, interest rates, and the underlying hedged assets. With futures contracts, there is minimal counterparty credit risk to the Funds as futures contracts are exchange-traded and the exchange’s clearinghouse acts as counterparty to all exchange-traded futures transactions. When applicable, open futures contracts outstanding at the end of the period are listed in each Fund’s Portfolio of Investments.
Options purchased
The Funds may purchase options to create investment exposure consistent with their investment objectives or to hedge or limit exposure of their portfolio holdings. Options are valued daily and unrealized appreciation or depreciation is recorded. The Funds realize a gain or loss upon the expiration or closing of the option transaction. The primary risks of investing in purchased options include the risk of imperfect correlation between the option price and the value of the underlying instrument and the possibility of an illiquid market for the option. Purchased options are generally exchange-traded with limited counterparty risk as settlement is facilitated through a central clearinghouse. When applicable, option contracts purchased by the Funds and contracts outstanding at the end of the period are listed in each Fund’s Portfolio of Investments.
Options written
Certain Funds may write (sell) put and call options on securities or derivative instruments in order to gain exposure to, or protect against, changes in the markets. When a Fund writes a call or put option, an amount equal to the premium received by the Fund is included on the Fund’s Statement of Assets and Liabilities as a liability. The amount of the liability is subsequently marked-to-market to reflect the current market value of the option written. If an option which the Fund has written either expires on its stipulated expiration date or the Fund enters into a closing purchase transaction, the Fund realizes a gain (or loss if the cost of a closing purchase transaction exceeds the premium received when the option was written) without regard to any unrealized gain or loss on the underlying security or derivative instrument, and the liability related to such option is extinguished. If a call option which the Fund has written is exercised, the Fund recognizes a realized gain or loss (long-term or short-term, depending on the holding period of the underlying security) from the sale of the underlying security or derivative instrument and the proceeds from the sale are increased by the premium originally received. If a put option which the Fund has written
110
| Henderson Global Funds | Notes to financial statements |
is exercised, the amount of the premium originally received reduces the cost of the security or derivative instrument that the Fund purchases upon exercise of the option.
Written options are subject to substantial risks. In writing an option, the Funds bear the market risk of an unfavorable change in the price of the derivative instrument, security or currency underlying the written option. Exercise of an option written by a Fund could result in a Fund selling or buying a derivative instrument, security or currency at a price different from current market value. When applicable, written options at the end of the period are listed in each Fund’s Portfolio of Investments.
The number of options contracts written and the premiums received by the Strategic Income Fund during the seven months ended July 31, 2013 were as follows:
| | | | Number of | | | Premiums | |
| | | | Contracts | | | Received | |
| Options outstanding, | | | | | | | |
| beginning of period | | | — | | $ | — | |
| Options written | | | | | | | |
| during period | | | 19 | | | 9,462 | |
| Options closed | | | | | | | |
| during period | | | (19 | ) | | (9,462 | ) |
| Options outstanding, | | | | | | | |
| end of period | | | — | | | — | |
Swap contracts
The Funds may enter into swap contracts. Swap contracts involve two parties that agree to exchange the returns (or the differential in rates of return) earned or realized on particular pre-determined investments, instruments, indices or other measures. The gross returns to be exchanged or “swapped” between parties are generally calculated with respect to a “notional amount” for a pre-determined period of time. The Funds may enter into interest rate, total return, credit default, currency and other swap agreements. Risks may arise upon entering into swap agreements from the potential inability of the counterparties to meet the terms of their contract or from unanticipated changes in the value of the swap agreement.
The Funds use credit default swaps to manage exposure to a given issuer or sector by either selling protection to increase exposure, or buying protection to reduce exposure. The “buyer” in a credit default swap is obligated to pay the “seller” a periodic stream of payments over the term of the contract provided that no event of default on an underlying reference obligation has occurred. If an event of default occurs, the seller must pay the buyer the full notional value, or the “par value,” of the reference obligation in exchange for the reference obligation. In connection with these agreements, securities may be identified as collateral in accordance with the terms of the respective swap agreements to provide assets of value and recourse in the event of default or bankruptcy/insolvency. Recovery values are assumed by market makers considering either industry standard recovery rates or entity specific factors and considerations until a credit event occurs. If a credit event has occurred, the recovery value is typically determined by a facilitated auction whereby a minimum number of allowable broker bids, together with a specific valuation method, are used to calculate the settlement value. The Funds’ maximum risk of loss from counterparty credit risk as the protection buyer is limited to the market value, or the current unrealized appreciation/depreciation on the contract plus/minus any upfront premiums paid/received. Alternatively, as the protection seller, the maximum risk of loss is equivalent to the notional or par value of the contract plus/minus any upfront premiums paid/received. At July 31, 2013, notional outstanding for credit protection sold, translated to US dollar amounts, equated to $399,105 and $66,517 for High Yield Opportunities and Strategic Income, respectively. The risk that a counterparty is unable to perform on its obligations in situations when the Funds are in an appreciated position is mitigated by having master netting arrangements between the Funds and their counterparties and, in certain scenarios dictated by the agreements, the posting of collateral by the counterparty to the Funds to cover the Funds’ exposure to the counterparty.
Upfront payments received or paid by the Funds are reflected as a liability or an asset, respectively, on the Statements of Assets and Liabilities. Changes in the value of swap contracts are included in unrealized appreciation/(depreciation) on the Statements of Assets and Liabilities, and periodic payments are reported as Net realized gain (loss) on swap contracts in the Statements of Operations. When applicable, open swap contracts at the end of the period are listed in each Fund’s Portfolio of Investments.
Derivative instruments
The FASB requires companies (including the Trust) to disclose information intended to enable financial statement users to understand how derivative instruments impact the Statements of Assets and Liabilities as well as the effect of derivative instruments on the Statements of Operations during the reporting period, in the context of each entity’s risk exposure. Further, in January 2013, FASB issued Accounting Standard Update (“ASU”) 2013-01 Clarifying the Scope of Disclosures about Offsetting Assets and Liabilities. The update clarifies the scope of ASU 2011-11 which requires enhanced disclosures around financial instruments and derivative instruments that are either offset in accordance with US GAAP or are subject to an enforceable master netting arrangement (“MNA”) or similar agreement. The updates
111
| Henderson Global Funds | Notes to financial statements |
mandate that entities disclose both gross and net information about such financial instruments and transactions eligible for offset on the Statement of Assets and Liabilities, in addition to required disclosure of collateral received and posted in connection with MNAs or similar agreements. Adoption of the updates has no effect on the Funds’ net assets. Accordingly, the following tables summarize each Fund’s fair value of derivative instruments held at July 31, 2013 and the related location on the accompanying Statements of Assets and Liabilities, presented by primary underlying risk exposure, in addition to supplementary information regarding gross and net values and the impact of any collateral posted for those transactions subject to MNAs. Note that all over-the-counter instruments (forward foreign currency contracts and credit default swap contracts) with Deutsche Bank AG, JPMorgan Chase Bank, N.A. and Citibank N.A. are all subject to MNAs.
| All Asset: | | | | |
| | Location on Statement of | | Fair | |
| | Assets and Liabilities | | value | |
| Assets | | | | |
| Equity risk | Unrealized appreciation on | | | |
| | open futures contracts | $ | 434,189 | |
| Foreign currency | Unrealized appreciation | | | |
| risk | on forward foreign | | | |
| | currency contracts | $ | 98,556 | |
| Liabilities | | | | |
| Equity risk | Unrealized depreciation on | | | |
| | open futures contracts | $ | 1,497 | |
| Foreign currency | Unrealized depreciation | | | |
| risk | on forward foreign | | | |
| | currency contracts | $ | 39,192 | |
| European Focus: | | | | |
| | Location on Statement of | | Fair | |
| | Assets and Liabilities | | value | |
| Liabilities | | | | |
| Foreign currency | Unrealized depreciation on | | | |
| risk | forward foreign | | | |
| | currency contracts | $ | 1,404,390 | |
| Global Equity Income: | | | | |
| | Location on Statement of | | Fair | |
| | Assets and Liabilities | | value | |
| Liabilities | | | | |
| Foreign currency | Unrealized depreciation | | | |
| risk | on forward foreign | | | |
| | currency contracts | $ | 4,046,334 | |
| High Yield Opportunities: | | | |
| | Location on Statement of | | Fair | |
| | Assets and Liabilities | | value | |
| Assets | | | | |
| Credit risk | Unrealized appreciation | | | |
| | on open credit default | | | |
| | swap contracts | $ | 6,586 | |
| International Opportunities: | | | |
| | Location on Statement of | | Fair | |
| | Assets and Liabilities | | value | |
| Assets | | | | |
| Foreign currency | Unrealized appreciation | | | |
| risk | on forward foreign | | | |
| | currency contracts | $ | 138,032 | |
| Liabilities | | | | |
| Foreign currency | Unrealized depreciation | | | |
| risk | on forward foreign | | | |
| | currency contracts | $ | 10,278,752 | |
| Strategic Income: | | | | |
| | Location on Statement of | | Fair | |
| | Assets and Liabilities | | value | |
| Assets | | | | |
| Credit risk | Unrealized appreciation | | | |
| | on open credit default | | | |
| | swap contracts | $ | 17,619 | |
| Liabilities | | | | |
| Interest rate risk | Unrealized depreciation | | | |
| | on open futures contracts | $ | 27,011 | |
| Credit risk | Unrealized depreciation | | | |
| | on open credit default | | | |
| | swap contracts | $ | 32,971 | |
| Foreign currency | Unrealized depreciation | | | |
| risk | on forward foreign | | | |
| | currency contracts | $ | 336,278 | |
112
| Henderson Global Funds | Notes to financial statements |
ALL ASSET FUND
Gross Amounts not Offset in the Statement of Assets & Liabilities
| | Gross Amounts of Assets | | | Net Amount | |
| | Presented in Statement | Financial | Collateral | (not less | |
| Counterparty | of Assets & Liabilities (a) | Instrument | Received | than 0 | ) |
| Amounts not subject to a master netting or similar arrangement: | | | | |
| State Street Bank, London* | 98,556 | – | – | 98,556 | |
| Total | 98,556 | – | – | 98,556 | |
| | | | | | |
| | Gross Amounts of Liabilities | | | Net Amount | |
| | Presented in Statement | Financial | Collateral | (not less | |
| Counterparty | of Assets & Liabilities (a) | Instrument | Pledged | than 0 | ) |
| Amounts not subject to a master netting or similar arrangement: | | | | |
| State Street Bank, London* | 39,192 | – | – | 39,192 | |
| Total | 39,192 | – | – | 39,192 | |
| (a) | Absent an event of default or early termination, OTC derivative assets and liabilities are presented gross and not offset in the Statement of Assets & Liabilities. All futures contracts are exchange traded for which their settlement is guaranteed by the clearinghouse and not subject to arrangements with particular counterparties. |
| * | Forward currency contracts with State Street Bank, London are not subject to a legally enforceable MNA or other similar agreements that provide legally enforceable right of offset. |
EUROPEAN FOCUS
Gross Amounts not Offset in the Statement of Assets & Liabilities
| | Gross Amounts of Assets | | | Net Amount | |
| | Presented in Statement | Financial | Collateral | (not less | |
| Counterparty | of Assets & Liabilities (a) | Instrument | Received | than 0 | ) |
| – | – | – | – | – | |
| Total | – | – | – | – | |
| | | | | | |
| | Gross Amounts of Liabilities | | | Net Amount | |
| | Presented in Statement | Financial | Collateral | (not less | |
| Counterparty | of Assets & Liabilities (a) | Instrument | Pledged | than 0 | ) |
| Amounts subject to a master netting or similar arrangement: | | | | |
| Deutsche Bank AG | 1,404,390 | – | – | 1,404,390 | |
| Total | 1,404,390 | – | – | 1,404,390 | |
| (a) | Absent an event of default or early termination, OTC derivative assets and liabilities are presented gross and not offset in the Statement of Assets & Liabilities. |
113
| Henderson Global Funds | Notes to financial statements |
GLOBAL EQUITY INCOME
Gross Amounts not Offset in the Statement of Assets & Liabilities
| | Gross Amounts of Assets | | | Net Amount | |
| | Presented in Statement | Financial | Collateral | (not less | |
| Counterparty | of Assets & Liabilities (a) | Instrument | Received | than 0 | ) |
| – | – | – | – | – | |
| Total | – | – | – | – | |
| | | | | | |
| | Gross Amounts of Liabilities | | | Net Amount | |
| | Presented in Statement | Financial | Collateral | (not less | |
| Counterparty | of Assets & Liabilities (a) | Instrument | Pledged | than 0 | ) |
| Amounts subject to a master netting or similar arrangement: | | | | |
| Deutsche Bank AG | 1,148,210 | – | – | 1,148,210 | |
| JPMorgan Chase Bank, N.A. | 2,898,124 | – | – | 2,898,124 | |
| Total | 4,046,334 | – | – | 4,046,334 | |
| (a) | Absent an event of default or early termination, OTC derivative assets and liabilities are presented gross and not offset in the Statement of Assets & Liabilities. |
HIGH YIELD OPPORTUNITIES
Gross Amounts not Offset in the Statement of Assets & Liabilities
| | Gross Amounts of Assets | | | Net Amount | |
| | Presented in Statement | Financial | Collateral | (not less | |
| Counterparty | of Assets & Liabilities (a) | Instrument | Received | than 0 | ) |
| Amounts subject to a master netting or similar arrangement: | | | | |
| Citibank, N.A. | 3,908 | – | – | 3,908 | |
| Deutsche Bank AG | 2,678 | – | – | 2,678 | |
| Total | 6,586 | – | – | 6,586 | |
| | | | | | |
| | Gross Amounts of Liabilities | | | Net Amount | |
| | Presented in Statement | Financial | Collateral | (not less | |
| Counterparty | of Assets & Liabilities (a) | Instrument | Pledged | than 0 | ) |
| – | – | – | – | – | |
| Total | – | – | – | – | |
| (a) | Absent an event of default or early termination, OTC derivative assets and liabilities are presented gross and not offset in the Statement of Assets & Liabilities. The gross amounts presented above reflect only unrealized appreciation/(depreciation) on credit default swaps and do not contemplate upfront premiums received or paid. |
114
| Henderson Global Funds | Notes to financial statements |
INTERNATIONAL OPPORTUNITIES
Gross Amounts not Offset in the Statement of Assets & Liabilities
| | Gross Amounts of Assets | | | Net Amount | |
| | Presented in Statement | Financial | Collateral | (not less | |
| Counterparty | of Assets & Liabilities (a) | Instrument | Received | than 0 | ) |
| Amounts not subject to a master netting or similar arrangement: | | | | |
| State Street Bank, London* | 138,032 | – | – | 138,032 | |
| Total | 138,032 | – | – | 138,032 | |
| | | | | | |
| | Gross Amounts of Liabilities | | | Net Amount | |
| | Presented in Statement | Financial | Collateral | (not less | |
| Counterparty | of Assets & Liabilities (a) | Instrument | Pledged | than 0 | ) |
| Amounts not subject to a master netting or similar arrangement: | | | | |
| State Street Bank, London* | 10,278,752 | – | – | 10,278,752 | |
| Total | 10,278,752 | – | – | 10,278,752 | |
| (a) | Absent an event of default or early termination, OTC derivative assets and liabilities are presented gross and not offset in the Statement of Assets & Liabilities. |
| * | Forward currency contracts with State Street Bank, London are not subject to a legally enforceable MNA or other similar agreements that provide legally enforceable right of offset. |
STRATEGIC INCOME
Gross Amounts not Offset in the Statement of Assets & Liabilities
| | Gross Amounts of Assets | | | Net Amount | |
| | Presented in Statement | Financial | Collateral | (not less | |
| Counterparty | of Assets & Liabilities (a) | Instrument | Received | than 0 | ) |
| Amounts subject to a master netting or similar arrangement: | | | | |
| Citibank, N.A. | 13,544 | (13,544) | – | – | |
| JPMorgan Chase Bank, N.A. | 4,075 | (4,075) | – | – | |
| Total | 17,619 | (17,619) | – | – | |
| | | | | | |
| | Gross Amounts of Liabilities | | | Net Amount | |
| | Presented in Statement | Financial | Collateral | (not less | |
| Counterparty | of Assets & Liabilities (a) | Instrument | Pledged | than 0 | ) |
| Amounts subject to a master netting or similar arrangement: | | | | |
| Citibank, N.A. | 129,245 | (13,544) | – | 115,701 | |
| Deutsche Bank AG | 208,423 | — | – | 208,423 | |
| JPMorgan Chase Bank, N.A. | 31,581 | (4,075) | – | 27,506 | |
| Total | 369,249 | (17,619) | – | 351,630 | |
| (a) | Absent an event of default or early termination, OTC derivative assets and liabilities are presented gross and not offset in the Statement of Assets & Liabilities. All futures contracts are exchange traded for which their settlement is guaranteed by the clearinghouse and not subject to arrangements with particular counterparties. The gross amounts presented above reflect only unrealized appreciation/(depreciation) on credit default swaps and do not contemplate upfront premiums received or paid. |
115
| Henderson Global Funds | Notes to financial statements |
Additionally, the amount of gains and losses on derivative instruments recognized in the Funds’ earnings during the period and the related location on the accompanying Statements of Operations is summarized in the following table by primary risk exposure:
| All Asset: | | | | |
| | Location on Statement | | | |
| | of Operations | | | |
| Realized gain/(loss) | | | |
| Equity risk | Net realized gain/(loss) | | | |
| | from futures contracts | $ | 1,519,707 | |
| Interest rate | Net realized gain/(loss) | | | |
| risk | from futures contracts | $ | (88,807 | ) |
| Foreign currency | Net realized gain/(loss) | | | |
| risk | from foreign | | | |
| | currency transactions | $ | (48,252 | ) |
| Change in unrealized appreciation/(depreciation) | |
| Equity risk | Net change in unrealized | | | |
| | appreciation/(depreciation) | |
| | of futures contracts | $ | 473,308 | |
| Interest rate | Net change in unrealized | | | |
| risk | appreciation/(depreciation) | |
| | of futures contracts | $ | (27,516 | ) |
| Foreign currency | Net change in unrealized | | | |
| risk | appreciation/(depreciation) | |
| | of translation of other | | | |
| | assets and liabilities | $ | 91,779 | |
| Dividend & Income Builder: | | | |
| | Location on Statement | | | |
| | of Operations | | | |
| Realized gain/(loss) | | | |
| Credit risk | Net realized gain (loss) | | | |
| | from credit default | | | |
| | swap contracts | $ | 1,936 | |
| European Focus: | | | | |
| | Location on Statement | | | |
| | of Operations | | | |
| Realized gain/(loss) | | | |
| Equity risk | Net realized gain/(loss) | | | |
| | from option contracts | $ | (319,726 | ) |
| Foreign currency | Net realized gain/(loss) | | | |
| risk | from foreign | | | |
| | currency transactions | $ | (1,034,287 | ) |
| Change in unrealized appreciation/(depreciation) | |
| Equity risk | Net change in unrealized | | | |
| | appreciation/(depreciation) | |
| | of options contracts | $ | 319,726 | |
| Foreign currency | Net change in unrealized | | | |
| risk | appreciation/(depreciation) | |
| | of translation of other | | | |
| | assets and liabilities | $ | (2,531,577 | ) |
| Global Equity Income: | | | | |
| | Location on Statement | | | |
| | of Operations | | | |
| Realized gain/(loss) | | | |
| Foreign currency | Net realized gain/(loss) | | | |
| risk | from foreign | | | |
| | currency transactions | $ | 5,241,490 | |
| Change in unrealized appreciation/(depreciation) | |
| Foreign currency | Net change in unrealized | | | |
| risk | appreciation/(depreciation) | |
| | of translation of other | | | |
| | assets and liabilities | $ | (1,183,118 | ) |
| High Yield Opportunities: | | | |
| | Location on Statement | | | |
| | of Operations | | | |
| Realized gain/(loss) | | | |
| Credit risk | Net realized gain (loss) | | | |
| | from credit default | | | |
| | swap contracts | $ | 506 | |
| Change in unrealized appreciation/(depreciation) | |
| Credit risk | Net change in unrealized | | | |
| | appreciation/(depreciation) | |
| | of credit default | | | |
| | swap contracts | $ | 6,586 | |
| International Opportunities: | | | |
| | Location on Statement | | | |
| | of Operations | | | |
| Realized gain/(loss) | | | |
| Equity risk | Net realized gain/(loss) | | | |
| | from option contracts | $ | (497,016 | ) |
| Foreign currency | Net realized gain/(loss) | | | |
| risk | from foreign | | | |
| | currency transactions | $ | (5,989,840 | ) |
| Change in unrealized appreciation/(depreciation) | |
| Equity risk | Net change in unrealized | | | |
| | appreciation/(depreciation) | |
| | of options contracts | $ | 497,016 | |
| Foreign currency | Net change in unrealized | | | |
| risk | appreciation/(depreciation) | |
| | of translation of other | | | |
| | assets and liabilities | $ | (16,366,371 | ) |
116
| Henderson Global Funds | Notes to financial statements |
| Strategic Income (seven months ending July 31, 2013): | | | |
| | Location on Statement | | | |
| | of Operations | | | |
| Realized gain/(loss) | | | |
| Interest rate risk | Net realized gain/(loss) | | | |
| | from futures contracts | $ | (135,638 | ) |
| Equity risk | Net realized gain (loss) | | | |
| | from options contracts | $ | (9,386 | ) |
| Credit risk | Net realized gain (loss) | | | |
| | from swap contracts | $ | (173,463 | ) |
| Foreign currency | Net realized gain/(loss) | | | |
| risk | from foreign | | | |
| | currency transactions | $ | 1,248,147 | |
| Change in unrealized appreciation/(depreciation) | |
| Interest rate risk | Net change in unrealized | | | |
| | appreciation/(depreciation) | | | |
| | of futures contracts | $ | (27,011 | ) |
| Credit risk | Net change in unrealized | | | |
| | appreciation/(depreciation) | | | |
| | of swap contracts | $ | (2,346 | ) |
| Foreign currency | Net change in unrealized | | | |
| risk | appreciation/(depreciation) | | | |
| | of translation of other | | | |
| | assets and liabilities | $ | (439,507 | ) |
| Strategic Income (year ended December 31, 2012): | |
| | Location on Statement | | | |
| | of Operations | | | |
| Realized gain (loss) | | | |
| Interest rate risk | Net realized gain (loss) | | | |
| | from futures contracts | $ | 377,675 | |
| Equity risk | Net realized gain (loss) | | | |
| | from futures contracts | $ | (142,320 | ) |
| Equity risk | Net realized gain (loss) | | | |
| | from options contracts | $ | (165,906 | ) |
| Credit risk | Net realized gain (loss) | | | |
| | from swap contracts | $ | 20,086 | |
| Foreign currency | Net realized gain (loss) | | | |
| risk | from foreign currency | | | |
| | transactions | $ | (614,869 | ) |
| Change in unrealized appreciation/(depreciation) | |
| Credit risk | Net change in unrealized | | | |
| | appreciation/(depreciation) | | | |
| | of swap contracts | $ | (13,006 | ) |
| Foreign currency | Net change in unrealized | | | |
| risk | appreciation/(depreciation) | | | |
| | of translation of other | | | |
| | assets and liabilities | $ | (203,858 | ) |
Indemnifications
Under the Trust’s organizational documents, its officers and trustees are indemnified against certain liabilities arising out of the performance of their duties to the Trust. In addition, in the normal course of business the Trust enters into contracts that provide general indemnifications to other parties. The Trust’s maximum exposure under these arrangements is unknown as future claims may be made against the Trust that have not yet been asserted.
Use of estimates
The preparation of financial statements in conformity with US GAAP requires management to make estimates and assumptions that affect the reported amounts and disclosures in the financial statements. Actual results may differ from those estimates.
Expenses
Expenses are recorded on an accrual basis. Expenses of the Trust that are directly attributable to a specific Fund are charged to that Fund. Expenses attributable to a specific class of shares are charged to that class. Other expenses are allocated proportionately among each Fund within the Trust based on average daily net assets or on another reasonable basis.
Deferred offering costs
Costs incurred in connection with the offering and initial registration of Dividend & Income Builder and High Yield Opportunities have been deferred in conformity with US GAAP and are being amortized to expense on a straight-line basis over the first twelve months after commencement of operations.
Federal income taxes
The Trust’s policy is that each Fund seeks to comply with the requirements of Subchapter M of the Internal Revenue Code of 1986, as amended (“Subchapter M”), that are applicable to regulated investment companies and to distribute substantially all its taxable income to shareholders. No federal income tax provision is required so long as each Fund operates in a manner that complies with the requirements of Subchapter M. Management has concluded that there are no significant uncertain tax positions that would require recognition in the financial statements. Management of the Funds is also not aware of any tax positions for which it is reasonably possible that the total amount of unrecognized tax benefits will significantly change in the next twelve months. The Funds intend to file tax returns with the US Internal Revenue Service and various states. Generally, the tax authorities can examine all tax returns filed for the last three years.
On December 22, 2010, the Regulated Investment Company Modernization Act of 2010 (the “Act”) was enacted, which changed various technical rules governing the tax treatment of regulated investment companies. One of the more prominent changes addresses capital loss carryforwards.
117
| Henderson Global Funds | Notes to financial statements |
Under the Act, each Fund is permitted to carry forward capital losses incurred in taxable years beginning after the date of enactment for an unlimited period. However, any losses incurred during those future taxable years are required to be utilized prior to the losses incurred in pre-enactment taxable years, which carry an expiration date. As a result of this ordering rule, pre-enactment capital loss carryforwards may be more likely to expire unused. Additionally, post-enactment capital loss carryforwards will retain their character as either short-term or long-term capital losses rather than being considered all short-term as permitted under previous regulation.
Finally, the Act contained several provisions aimed at preserving the character of distributions made by a fiscal year registered investment company (“RIC”) during the portion of its taxable year ending after October 31 or December 31, reducing the circumstances under which a RIC might be required to file amended Forms 1099 to restate previously reported distributions. Except for the simplification provisions related to RIC qualification, the Act became effective for taxable years beginning after December 22, 2010. The provisions related to RIC qualification are effective for taxable years for which the extended due date of the tax return is after December 22, 2010.
Losses incurred that will be carried forward under the provisions of the Act are as follows:
| | | | | | | | |
| Emerging Markets Opportunities | | | | | | | |
| | | Loss carryforward character | |
| Expiration | | | Short-term | | | Long-term | |
| Unlimited losses | | $ | 2,860,357 | | $ | 67,296 | |
| | | | | | | | |
| European Focus | | | | | | | |
| | | Loss carryforward character | |
| Expiration | | | Short-term | | | Long-term | |
| Unlimited losses | | $ | — | | $ | — | |
| 7/31/18 | | | 248,276,050 | | | — | |
| | | | | | | | |
| Global Equity Income | | | | | | | |
| | | Loss carryforward character | |
| Expiration | | | Short-term | | | Long-term | |
| Unlimited losses | | $ | 11,842,447 | | $ | — | |
| 7/31/16 | | | 506,123 | | | — | |
| 7/31/17 | | | 40,759,829 | | | — | |
| 7/31/18 | | | 75,631,427 | | | — | |
| 7/31/19 | | | 38,549,435 | | | — | |
| | | | | | | | |
| Global Technology | | | | | | | |
| | | Loss carryforward character | |
| Expiration | | | Short-term | | | Long-term | |
| Unlimited losses | | $ | — | | $ | — | |
| 7/31/17 | | | 2,312,696 | | | — | |
| 7/31/18 | | | 8,744,622 | | | — | |
| | | | | | | | |
| International Opportunities | | | | | | | |
| | | Loss carryforward character | |
| Expiration | | | Short-term | | | Long-term | |
| Unlimited losses | | $ | — | | $ | — | |
| 7/31/17 | | | 40,548,387 | | | — | |
| 7/31/18 | | | 688,182,842 | | | — | |
| | | | | | | | |
| Strategic Income | | | | | | | |
| | | Loss carryforward character | |
| Expiration | | | Short-term | | | Long-term | |
| Unlimited losses | | $ | 58,763 | | $ | — | |
| 7/31/14 | | | 207,447 | | | — | |
| 7/31/15 | | | 477,632 | | | — | |
| 7/31/16 | | | 1,001,344 | | | — | |
| 7/31/17 | | | 34,174,962 | | | — | |
| 7/31/18 | | | 336,160 | | | — | |
| | | | | | | | |
| World Select | | | | | | | |
| | | Loss carryforward character | |
| Expiration | | | Short-term | | | Long-term | |
| Unlimited losses | | $ | — | | $ | — | |
| 7/31/18 | | | 1,620,160 | | | — | |
Note that the All Asset Fund, Dividend & Income Builder Fund and High Yield Opportunities Fund do not have any capital loss carryforwards to apply against future earnings.
118
| Henderson Global Funds | Notes to financial statements |
During the year ended July 31, 2013 the Funds utilized the following capital loss carryforwards:
| | | | | |
| All Asset | | $ | 86,853 | |
| Dividend & Income Builder | | | — | |
| Emerging Markets Opportunities | | | — | |
| European Focus | | | 9,379,330 | |
| Global Equity Income | | | — | |
| Global Technology | | | 12,315,494 | |
| High Yield Opportunities | | | — | |
| International Opportunities | | | 75,269,012 | |
| Strategic Income* | | | 971,714 | |
| World Select | | | 2,282,837 | |
| * | For seven months ended July 31, 2013. During the seven months ended July 31, 2013, Strategic Income Fund had $341,836 of capital loss carryforward expire. During the year ended December 31, 2012, the Strategic Income Fund utilized no capital loss carryforwards. |
At July 31, 2013, the following Funds deferred capital post-October losses and/or late year ordinary losses, which will be recognized on the first day of the following year:
| | | | Ordinary | | | Capital | |
| | | | loss | | | loss | |
| | | | deferred | | | deferred | |
| All Asset | | $ | — | | $ | — | |
| Dividend & Income Builder | | | — | | | — | |
| Emerging Markets Opportunities | | | — | | | 131,190 | |
| European Focus | | | — | | | 2,484,450 | |
| Global Equity Income | | | — | | | — | |
| Global Technology | | | 794,719 | | | — | |
| High Yield Opportunities | | | — | | | — | |
| International Opportunities | | | — | | | — | |
| Strategic Income | | | — | | | — | |
| World Select | | | — | | | — | |
Distributions to shareholders
Distributions to shareholders are recorded on the ex-dividend date. Distributions from net investment income and net realized capital gains are determined in accordance with federal income tax regulations, which may differ from US GAAP. These book/tax differences are either temporary or permanent in nature. To the extent these differences are permanent, they are reclassified within the capital accounts based on their federal tax-basis treatment.
Accordingly, at July 31, 2013, the Funds reclassified the following amounts between paid-in capital, accumulated undistributed net invested income (loss) and accumulated net realized gain (loss):
| | | | | | | | | | | |
| | | | | | | Accumulated | | | | |
| | | | | | | undistributed | | | Accumulated | |
| | | | Paid-in | | | net investment | | | net realized | |
| | | | Capital | | | income/(loss | ) | | gain/(loss | ) |
| All Asset | | $ | (56,070 | ) | $ | (79,281 | ) | $ | 135,351 | |
| Dividend & | | | | | | | | | | |
| Income | | | | | | | | | | |
| Builder | | | (61,571 | ) | | 64,821 | | | (3,250 | ) |
| Emerging | | | | | | | | | | |
| Markets | | | | | | | | | | |
| Opportunities | | | (149,981 | ) | | 126,215 | | | 23,766 | |
| European Focus | | | (376 | ) | | 4,792,668 | | | (4,792,292 | ) |
| Global Equity | | | | | | | | | | |
| Income | | | (81,632 | ) | | 4,647,852 | | | (4,566,220 | ) |
| Global | | | | | | | | | | |
| Technology | | | (439,892 | ) | | 315,952 | | | 123,940 | |
| High Yield | | | | | | | | | | |
| Opportunities | | | (18,889 | ) | | 56,386 | | | (37,497 | ) |
| International | | | | | | | | | | |
| Opportunities | | | (2,410 | ) | | (2,938,295 | ) | | 2,940,705 | |
| Strategic Income | | | (341,837 | ) | | 20,169 | | | 321,668 | |
| World Select | | | 702 | | | 7,521 | | | (8,223 | ) |
These reclassifications relate to the deductibility of certain expenses, different tax treatments of certain securities, amortization of bond premium, character of realized gains/losses on foreign currency transactions, taxable overdistributions, capital loss carryforward expiration, net operating losses and Passive Foreign Investment Companies (“PFIC”) transactions for tax purposes and had no impact on the net asset value of the Funds.
119
| Henderson Global Funds | Notes to financial statements |
The tax character of distributions paid during the years ended July 31, 2013 and July 31, 2012 were as follows:
| Year ended | | | Ordinary | | | Capital | |
| July 31, 2013 | | | income | | | gains | |
| All Asset | | $ | 542,605 | | $ | — | |
| Dividend & Income Builder | | | 54,539 | | | — | |
| Emerging Markets | | | | | | | |
| Opportunities | | | 163,785 | | | — | |
| European Focus | | | 7,586,086 | | | — | |
| Global Equity Income | | | 97,926,333 | | | — | |
| Global Technology | | | — | | | — | |
| High Yield Opportunities | | | 340,001 | | | — | |
| International Opportunities | | | 16,206,595 | | | — | |
| Strategic Income* | | | 1,206,003 | | | — | |
| World Select | | | 41,525 | | | — | |
| * | For seven months ended July 31, 2013. |
| Year ended | | | Ordinary | |
| July 31, 2012 | | | income | |
| All Asset | | | — | |
| Emerging Markets Opportunities | | $ | 197,743 | |
| European Focus | | | 22,949,547 | |
| Global Equity Income | | | 71,852,459 | |
| Global Technology | | | — | |
| International Opportunities | | | 15,136,762 | |
| Strategic Income* | | | 1,994,497 | |
| World Select | | | — | |
| * | For year ended December 31, 2012. The tax character of distributions paid by the Strategic Income Fund for the year ended December 31, 2011 was ordinary income of $2,092,657 and return of capital of $407,341. |
As of July 31, 2013, the components of distributable earnings on a tax basis were as follows:
| | | | Undistributed | | | Undistributed | | | Undistributed | |
| | | | ordinary | | | capital | | | appreciation | |
| | | | income | | | gains/(losses | ) | | (depreciation | ) |
| All Asset | | $ | 1,442,738 | | $ | 392,324 | | $ | 856,013 | |
| Dividend & | | | | | | | | | | |
| Income | | | | | | | | | | |
| Builder | | | 143,672 | | | — | | | 127,694 | |
| Emerging | | | | | | | | | | |
| Markets | | | | | | | | | | |
| Opportunities | | | — | | | — | | | (586,430 | ) |
| European | | | | | | | | | | |
| Focus | | | 3,871,366 | | | — | | | 71,921,219 | |
| Global Equity | | | | | | | | | | |
| Income | | | 1,493,762 | | | — | | | 130,747,777 | |
| Global | | | | | | | | | | |
| Technology | | | — | | | — | | | 75,629,856 | |
| High Yield | | | | | | | | | | |
| Opportunities | | | 157,661 | | | — | | | (220,096 | ) |
| International | | | | | | | | | | |
| Opportunities | | | 12,685,873 | | | — | | | 472,443,119 | |
| Strategic | | | | | | | | | | |
| Income | | | 107,200 | | | — | | | (1,293,693 | ) |
| World Select | | | 7,875 | | | — | | | 1,724,612 | |
Ordinary income and net realized gains/losses may differ for book and tax basis reporting purposes due to post-October losses (which are not recognized for tax purposes until the first day of the following fiscal year), tax deferral on wash sales and PFIC transactions.
Note 3. Fair value measurements
Various inputs are used in determining the value of the Funds’ investments. The Funds use a three-tier hierarchy of inputs to establish classification of fair value measurements for disclosure purposes. These inputs may be observable or unobservable. Observable inputs are inputs that reflect the assumptions market participants would use in pricing the asset or liability developed based on market data obtained from sources independent of the reporting entity. Unobservable inputs are inputs that reflect the reporting entity’s own assumptions about the assumptions market participants would use in pricing the asset or liability developed based on the best information available under the circumstances. The inputs used for valuing securities are not necessarily an indication of the risk associated with investing
120
| Henderson Global Funds | Notes to financial statements |
in those securities. The three-tier hierarchy of inputs is summarized in the following three broad levels:
| | • | Level 1 – quoted prices (unadjusted) in active markets for identical investments |
| | | |
| | • | Level 2 – other significant observable inputs (including quoted prices for similar investments, interest rates, prepayment speeds, credit risk, etc.) |
| | | |
| | • | Level 3 – significant unobservable inputs (including the Fund’s own assumptions in determining the fair value of investments) |
Tables summarizing each Fund’s investments that are measured at fair value by level within the fair value hierarchy at July 31, 2013 have been listed after each Fund’s Portfolio of Investments.
Any transfers between levels are disclosed, effective at the end of the period, in each Fund’s table with the reasons for the transfers disclosed in a note to the table, if applicable.
Note 4. Investment advisory fees and other transactions with affiliates
Pursuant to an Investment Advisory Agreement, Henderson Global Investors (North America) Inc. (“HGINA”) acts as the Funds’ investment adviser. HGINA is an indirect wholly-owned subsidiary of Henderson Group plc. HGINA supervises the investments of the Funds and earns a management fee for such services. HGINA earns a fee for its services based on each Fund’s average daily net assets as set forth below.
| All Asset | | 0.40% |
| Dividend & Income Builder | First $1 billion | 0.75% |
| | Next $1 billion | 0.65% |
| | Over $2 billion | 0.55% |
| Emerging Markets | First $1 billion | 1.00% |
| Opportunities | Next $1 billion | 0.90% |
| | Over $2 billion | 0.85% |
| European Focus | First $500 million | 1.00% |
| | Next $1 billion | 0.90% |
| | Over $1.5 billion | 0.85% |
| Global Equity Income | First $1 billion | 0.85% |
| | Next $1 billion | 0.65% |
| | Over $2 billion | 0.60% |
| Global Technology | First $500 million | 1.00% |
| | Next $500 million | 0.95% |
| | Over $1 billion | 0.90% |
| High Yield Opportunities | First $1 billion | 0.65% |
| | Next $1 billion | 0.55% |
| | Over $2 billion | 0.50% |
| International | First $1 billion | 1.10% |
| Opportunities | Next $1 billion | 0.95% |
| | Over $2 billion | 0.85% |
| Strategic Income* | First $1 billion | 0.55% |
| | Next $500 million | 0.50% |
| | Over $1.5 billion | 0.45% |
| World Select | First $500 million | 0.80% |
| | Next $1 billion | 0.70% |
| | Over $1.5 billion | 0.65% |
| * | Based on average daily managed assets of the Fund. Managed assets mean the total assets of the Fund (including any assets attributable to any leverage that may be outstanding) minus the sum of accrued liabilities (other than debt representing financial leverage). Since the Fund pays HGINA based on the Fund’s average daily managed assets, HGINA’s fee will be higher if the Fund is leveraged. |
HGINA has engaged Henderson Investment Management Limited (“HIML”), also an indirect wholly-owned subsidiary of Henderson Group plc, to act as the investment sub-adviser to the Funds, except for Strategic Income and High Yield Opportunities. Under a separate Sub-Advisory Agreement, the sub-adviser provides research, advice and recommendations with respect to the purchase and sale of securities and makes investment decisions regarding assets of the Funds subject to the oversight of the Board and the Adviser. No additional advisory fees are charged to the Funds for the services of the sub-adviser as these fees are paid from the fees earned by HGINA.
Pursuant to a separate contractual Expense Limitation Agreement, HGINA has agreed to waive or limit its investment advisory fee and, if necessary, to reimburse expenses of each Fund in order to limit total annual ordinary operating expenses, including distribution and service fees, as a percentage of average daily net assets as follows:
121
| Henderson Global Funds | Notes to financial statements |
| | | | Class | | | Class | | | Class | | | Class | | | Class | |
| | | | A | | | B | | | C | | | I | | | R | |
| All Asset* | | | 0.85 | % | | N/A | | | 1.60 | % | | 0.60 | % | | N/A | |
| Dividend & | | | | | | | | | | | | | | | | |
| Income | | | | | | | | | | | | | | | | |
| Builder | | | 1.30 | % | | N/A | | | 2.05 | % | | 1.05 | % | | N/A | |
| Emerging | | | | | | | | | | | | | | | | |
| Markets | | | | | | | | | | | | | | | | |
| Opportunities | | | 1.79 | % | | N/A | | | 2.54 | % | | 1.54 | % | | N/A | |
| European | | | | | | | | | | | | | | | | |
| Focus | | | 2.00 | % | | 2.75 | % | | 2.75 | % | | 1.75 | % | | N/A | |
| Global Equity | | | | | | | | | | | | | | | | |
| Income | | | 1.40 | % | | N/A | | | 2.15 | % | | 1.15 | % | | N/A | |
| Global | | | | | | | | | | | | | | | | |
| Technology | | | 2.00 | % | | 2.75 | % | | 2.75 | % | | 1.75 | % | | N/A | |
| High Yield | | | | | | | | | | | | | | | | |
| Opportunities | | | 1.10 | % | | N/A | | | 1.85 | % | | 0.85 | % | | N/A | |
| International | | | | | | | | | | | | | | | | |
| Opportunities | | | 2.00 | % | | 2.75 | % | | 2.75 | % | | 1.75 | % | | 2.25 | % |
| Strategic | | | | | | | | | | | | | | | | |
| Income | | | 1.10 | % | | 1.85 | % | | 1.85 | % | | 0.85 | % | | N/A | |
| World Select | | | 1.40 | % | | N/A | | | 2.15 | % | | 1.15 | % | | N/A | |
| * | With respect to investments in affiliate Underlying Funds, HGINA has contractually agreed to reduce or waive the Fund’s management fee to limit the combined management fees paid to the adviser for those assets to the greater of 1.00% or the affiliate Underlying Fund’s management fee. In addition, HGINA has contractually agreed to waive its management fee and, if necessary, to reimburse other operating expenses (excluding Acquired Fund Fees and Expenses) in order to limit total annual ordinary operating expenses, less distribution and service fees, to 0.60% of the Fund’s average daily net assets. |
These agreements will remain in effect through July 31, 2020, except the agreement for All Asset, Dividend & Income Builder and Emerging Markets Opportunities, which are effective through July 31, 2015. Shares of the Funds are often purchased through financial intermediaries who are agents of the Funds for the limited purpose of completing purchases and sales. These intermediaries may provide certain networking and sub-transfer agent services with respect to Fund shares held by that intermediary for its customers, and the intermediary may charge HGINA for those services. The Funds reimburse HGINA for such fees within limits specified by the Board of Trustees. The fees are incurred at the class level based on activity, asset levels and/or number of accounts and are included in Sub-accounting fees in the Statements of Operations.
At July 31, 2013, HGINA owned the following number of shares in the following Funds:
| | Shares | |
| All Asset Class A | 455 | |
| All Asset Class C | 454 | |
| All Asset Class I | 101 | |
| Dividend & Income Builder Class A | 2,561 | |
| Dividend & Income Builder Class C | 2,554 | |
| Dividend & Income Builder Class I | 20,546 | |
| High Yield Opportunities Class A | 100,000 | |
| High Yield Opportunities Class C | 100,000 | |
| High Yield Opportunities Class I | 584,383 | |
| Strategic Income Class I | 1,234 | |
HGINA is a direct subsidiary of Henderson International Inc. (“HII”). At July 31, 2013, HII owned the following number of shares in the following Funds:
| | Shares | |
| World Select Class C | 5,043 | |
| World Select Class I | 61,145 | |
122
| Henderson Global Funds | Notes to financial statements |
An affiliated entity of a Fund may include any company in which the Fund owns five percent or more of its outstanding voting shares. During the year, the All Asset Fund held greater than five percent ownership of the MSIF Multi-Asset Portfolio, although it was not considered an affiliate as of period end. Additionally, certain of the Funds held ownership in other Funds within the Trust. At July 31, 2013, the All Asset Fund held 0.3% of the Henderson Global Technology Fund and 1.5% of the Henderson Strategic Income Fund. Transactions in affiliates during the year ended July 31, 2013 were as follows:
| | | | | | | | | | | | Change in | | | | | | | | | | |
| | | | | | | | | Proceeds | | | Unrealized | | | Realized | | | | | | | |
| | | Value | | | Purchases | | | from | | | Appreciation/ | | | Gain/ | | | Value | | | Dividend | |
| Affiliate | | 7/31/2012 | | | at Cost | | | Sales | | | (Depreciation) | | | (Loss) | | | 7/31/2013 | | | Income | |
| All Asset Fund | | | | | | | | | | | | | | | | | | | | | |
| Henderson Global | | | | | | | | | | | | | | | | | | | | | |
| Technology Fund | | $ | 639,861 | | | $ | 254,845 | | | $ | – | | | $ | 136,995 | | | $ | – | | | $ | 1,031,701 | | | $ | – | |
| Henderson Japan | | | | | | | | | | | | | | | | | | | | | | | | | | | | |
| Focus Fund* | | | 850,717 | | | | 457,524 | | | | 1,228,521 | | | | 60,367 | | | | (140,087 | ) | | | – | | | | 65,934 | |
| Henderson Strategic | | | | | | | | | | | | | | | | | | | | | | | | | | | | |
| Income Fund | | | 653,737 | | | | 74,457 | | | | – | | | | 2,165 | | | | – | | | | 730,359 | | | | 32,957 | |
| MSIF Multi-Asset | | | | | | | | | | | | | | | | | | | | | | | | | | | | |
| Portfolio** | | | — | | | | 2,317,747 | | | | 1,763,901 | | | | 374,000 | | | | 141,737 | | | | 786,109 | | | | — | |
| * | As of July 31, 2013, the Henderson Japan Focus Fund is no longer an affiliate of the Henderson All Asset Fund. Effective December 28, 2012 the Henderson Japan Focus Fund liquidated. |
| ** | As of July 31, 2013, MSIF Multi-Asset Portfolio is no longer an affiliate of the Henderson All Asset Fund. |
The aggregate cost and value of affiliates at July 31, 2013 is $1,666,847 and $1,762,060, respectively. Investments in affiliates represented 2.7% of the total net assets of the All Asset Fund as of July 31, 2013.
| Affiliate | | Value 7/31/2012 | | Purchases at Cost | | Proceeds from Sales | | Change in Unrealized Appreciation/ (Depreciation) | | Realized Gain/ (Loss) | | Value 7/31/2013 | | Dividend Income | |
| International Opportunities Fund | | | | | | | | | | | | | | | | | | | |
| Henderson Money | | | | | | | | | | | | | | | | | | | | | | |
| Market Fund* | | $ | 60,977,723 | | $ | 201,600,654 | | $ | 262,578,377 | | $ | — | | $ | — | | $ | — | | $ | 14,339 | |
| * | As of July 31, 2013, the Henderson Money Market Fund is no longer an affiliate of the Henderson International Opportunities Fund. The Henderson International Opportunities Fund invested a portion of its un-invested cash in the Henderson Money Market Fund to assist with short-term cash management. Effective December 28, 2012 the Henderson Money Market Fund liquidated. |
Note 5. Compensation of trustees and officers
Certain officers and trustees of the Trust are also officers of HGINA. None of the Trust’s officers, other than the Chief Compliance Officer, are compensated by the Trust. The Trust makes no direct payments to trustees affiliated with HGINA. Fees paid to the independent trustees are reflected as Trustees’ fees and expenses in the Statements of Operations.
The Funds bear a portion of the compensation paid to the Chief Compliance Officer who performs services directly related to the Trust. This compensation is reflected as Compliance officer fees in the Statements of Operations.
Note 6. Distribution plan
The Trust has adopted a distribution plan for Class A, Class B, Class C and Class R shares of the Funds in accordance with Rule 12b-1 under the 1940 Act (the “12b-1 Plan”). Under the 12b-1 Plan, the Funds pay the distributor an annual fee of 0.25% of the average daily net assets attributable to its Class A shares, an annual fee of 1.00% of the average daily net assets attributable to its Class B and C shares, and an annual fee of 0.50% of the average daily net assets attributable to its Class R shares. The 12b-1 Plan is used to induce or compensate financial intermediaries (including brokerage firms, depository institutions and other firms) to provide distribution services to the Funds and their shareholders.
123
| Henderson Global Funds | Notes to financial statements |
Note 7. Investment transactions
Purchases and sales of investment securities, excluding short-term investments and US government securities, for the Funds for the year/period ended July 31, 2013, were as follows:
| | | | Purchases | | | Sales | |
| All Asset | | $ | 31,716,698 | | $ | 11,796,708 | |
| Dividend & Income Builder | | | 7,661,171 | | | 4,333,221 | |
| Emerging Markets | | | | | | | |
| Opportunities | | | 34,158,457 | | | 28,320,417 | |
| European Focus | | | 733,080,176 | | | 634,370,899 | |
| Global Equity Income | | | 2,493,487,166 | | | 1,905,344,737 | |
| Global Technology | | | 269,601,991 | | | 257,913,583 | |
| High Yield Opportunities | | | 55,535,198 | | | 30,973,375 | |
| International | | | | | | | |
| Opportunities | | | 3,194,390,761 | | | 3,329,322,279 | |
| Strategic Income* | | | 24,393,304 | | | 24,359,287 | |
| World Select | | | 11,891,656 | | | 17,914,478 | |
| * | For seven months ended July 31, 2013. Purchases and sales of investment securities, excluding short-term investments and US government securities, for the Strategic Income Fund for the year ended December 31, 2012, were $18,556,711 and $12,909,224, respectively. |
The US federal income tax basis of investments excluding foreign currency and forward currency contracts, at July 31, 2013, and the gross unrealized appreciation and depreciation, were as follows:
| | | | | | | Dividend | |
| | | | All | | | & Income | |
| | | | Asset | | | Builder | |
| Cost | | $ | 63,159,400 | | $ | 3,542,866 | |
| Gross unrealized | | | | | | | |
| appreciation | | | 1,347,765 | | | 192,802 | |
| Gross unrealized | | | | | | | |
| depreciation | | | (694,608 | ) | | (63,077 | ) |
| Net unrealized | | | | | | | |
| appreciation/ | | | | | | | |
| depreciation | | | 653,157 | | | 129,725 | |
| | | | | | | | |
| | | Emerging Markets | | | European | |
| | | | Opportunities | | | Focus | |
| Cost | | $ | 23,240,620 | | $ | 624,794,535 | |
| Gross unrealized | | | | | | | |
| appreciation | | | 1,545,993 | | | 116,831,917 | |
| Gross unrealized | | | | | | | |
| depreciation | | | (2,133,167 | ) | | (44,902,184 | ) |
| Net unrealized | | | | | | | |
| appreciation/ | | | | | | | |
| depreciation | | | (587,174 | ) | | 71,929,733 | |
| | | | | | | | |
| | | | Global Equity | | | Global | |
| | | | Income | | | Technology | |
| Cost | | $ | 1,787,100,306 | | $ | 275,572,782 | |
| Gross unrealized | | | | | | | |
| appreciation | | | 173,777,967 | | | 82,158,740 | |
| Gross unrealized | | | | | | | |
| depreciation | | | (42,919,602 | ) | | (6,488,004 | ) |
| Net unrealized | | | | | | | |
| appreciation/ | | | | | | | |
| depreciation | | | 130,858,365 | | | 75,670,736 | |
| | | | | | | | |
| | | | High Yield | | | International | |
| | | | Opportunities | | | Opportunities | |
| Cost | | $ | 24,933,830 | | $ | 2,362,050,741 | |
| Gross unrealized | | | | | | | |
| appreciation | | | 200,004 | | | 575,997,764 | |
| Gross unrealized | | | | | | | |
| depreciation | | | (419,922 | ) | | (102,924,911 | ) |
| Net unrealized | | | | | | | |
| appreciation/ | | | | | | | |
| depreciation | | | (219,918 | ) | | 473,072,853 | |
| | | | | | | | |
| | | | Strategic | | | World | |
| | | | Income | | | Select | |
| Cost | | $ | 48,940,290 | | $ | 9,050,249 | |
| Gross unrealized | | | | | | | |
| appreciation | | | 2,494,395 | | | 1,812,558 | |
| Gross unrealized | | | | | | | |
| depreciation | | | (3,791,433 | ) | | (87,429 | ) |
| Net unrealized | | | | | | | |
| appreciation/ | | | | | | | |
| depreciation | | | (1,297,038 | ) | | 1,725,129 | |
Identified cost may differ for book and tax basis reporting purposes primarily due to tax deferral of losses on wash sales, PFIC transactions, different book and tax treatment on certain debt instruments and amortization of premiums reflected as of July 31, 2013.
Note 8. Significant concentrations
The Funds may invest a substantial percentage of their assets in securities of foreign issuers. These investments may involve certain considerations and risks not typically associated with investments in the United States as a result of, among other factors, the possibility of future political and economic developments and the level of governmental supervision and regulation of securities markets in the respective countries. Some countries in which the Funds invest may require government approval for repatriation of investment income,
124
| Henderson Global Funds | Notes to financial statements |
capital or the proceeds for sales of securities by foreign investors. In addition, if there is deterioration in a country’s balance of payments or for other reasons, a country may impose temporary restrictions on foreign capital remittances abroad. In addition, changes in currency exchange rates will affect the value of investments denominated in a foreign currency, as well as investment income derived from those securities. These risks may be heightened in less developed countries, which are sometimes referred to as emerging markets. For example, political and economic structures in these countries may be changing rapidly, which can cause instability and greater risk of loss. These countries are also more likely to experience higher levels of inflation, deflation or currency devaluation, which could hurt their economies and securities markets. For these and other reasons, investments in emerging markets, particularly by the Emerging Markets Opportunities Fund, are often considered speculative. Further, the Funds maintain many of their investments in issuers domiciled in the Eurozone. The private and public sectors’ debt problems of a single Eurozone country may pose significant risks to the Eurozone as a whole. As a result, the Funds may be more susceptible to volatility generated by currency devaluations or other general uncertainties than more geographically diversified funds that do not concentrate in this region of the world.
The Funds may invest a high percentage of their net assets in specific sectors of the market in order to achieve a potentially greater investment return. As a result, the economic, political and regulatory developments in a particular sector of the market, positive or negative, have a greater impact on a Fund’s net assets and will cause the value of its shares to fluctuate more than if the Fund did not concentrate its investments in a particular sector. In particular, Global Technology concentrates its investments in issuers within specific industries of the technology and telecommunications sectors. Valuations of companies in these sectors are typically subject to greater volatility than other sectors.
The Strategic Income Fund invests primarily in income producing securities with a focus on foreign investment grade debt, which may be subject to the previously described foreign issuer risk. It may also invest in lower quality high yield securities, which is also the principal investment strategy of the High Yield Opportunities Fund. Investing in high yield securities may involve greater risks and considerations not typically associated with investing in US Government bonds and other high quality fixed-income securities. These securities are non-investment grade securities, often referred to as “junk bonds”. Economic downturns may disrupt the high yield market and impair the ability of issuers to repay principal and interest. Also, an increase in interest rates would likely have an adverse impact on the value of such obligations. Moreover, high yield securities may be less liquid due to the extent that there is no established secondary market and because of a decline in the value of such securities.
Note 9. Borrowing arrangements
The Trust maintains a $100 million credit facility to facilitate portfolio liquidity. Interest is charged to each Fund based on its borrowings at a rate per annum equal to the Federal Funds rate plus 1.25%. In addition, a commitment fee of 0.10% per annum is accrued and apportioned among the Funds in the Trust. The commitment fee is included in Miscellaneous fees on the Statements of Operations. No amounts were borrowed by the Funds under this facility during the year/period ended July 31, 2013, or for the year ended December 31, 2012.
Note 10. Recently issued accounting pronouncements
In June 2013, the FASB issued ASU 2013-08 Financials Services – Investment Companies (Topic 946): Amendments to the Scope, Measurement, and Disclosure Requirements, which sets forth a new approach for determining whether a public or private company is an Investment Company and sets certain measurement and disclosure requirements for an Investment Company. The amendments are effective for fiscal years beginning on or after December 15, 2013. An entity regulated under the 1940 Act would automatically qualify as an Investment Company for accounting purposes under Topic 946 and thus the Funds’ management believes the release will have no impact to the Funds.
Note 11. Subsequent event
The Henderson World Select Fund (the “Fund”) liquidated on August 30, 2013 through the sale of the Fund’s securities and forced redemption of all remaining shareholders. The Fund’s income distribution requirement was paid on August 27, 2013 to shareholders of record on August 26, 2013. All expenses incurred by the Fund outside of its standard operating expenses in the course of liquidating the Fund were paid for by the Adviser.
125
| Henderson Global Funds | Notes to financial statements |
Report of independent registered public accounting firm
The Board of Trustees and Shareholders
Henderson Global Funds
We have audited the accompanying statements of assets and liabilities, including the portfolios of investments, of the Henderson Global Funds, comprising the Henderson All Asset Fund, Henderson Dividend & Income Builder Fund, Henderson Emerging Markets Opportunities Fund, Henderson European Focus Fund, Henderson Global Equity Income Fund, Henderson Global Technology Fund, Henderson High Yield Opportunities Fund, Henderson International Opportunities Fund, Henderson Strategic Income Fund, and Henderson World Select Fund (collectively, the Funds), ten of the Funds comprising the Henderson Global Funds, as of July 31, 2013, and the related statements of operations, the statements of changes in net assets and the financial highlights for the periods indicated therein. These financial statements and financial highlights are the responsibility of the Funds’ management. Our responsibility is to express an opinion on these financial statements and financial highlights based on our audits.
We conducted our audits in accordance with the standards of the Public Company Accounting Oversight Board (United States). Those standards require that we plan and perform the audit to obtain reasonable assurance about whether the financial statements and financial highlights are free of material misstatement. We were not engaged to perform an audit of the Funds’ internal control over financial reporting. Our audits included consideration of internal control over financial reporting as a basis for designing audit procedures that are appropriate in the circumstances, but not for the purpose of expressing an opinion on the effectiveness of the Funds’ internal control over financial reporting. Accordingly, we express no such opinion. An audit also includes examining, on a test basis, evidence supporting the amounts and disclosures in the financial statements and financial highlights, assessing the accounting principles used and significant estimates made by management, and evaluating the overall financial statement presentation. Our procedures included confirmation of securities owned as of July 31, 2013, by correspondence with the custodian, brokers, and transfer agents or by other appropriate auditing procedures where replies from brokers and transfer agents were not received. We believe that our audits provide a reasonable basis for our opinion.
In our opinion, the financial statements and financial highlights referred to above present fairly, in all material respects, the financial position of each of the respective funds constituting the Henderson Global Funds at July 31, 2013, the results of their operations, changes in net assets and their financial highlights for the periods indicated therein, in conformity with U.S. generally accepted accounting principles.
Chicago, Illinois
September 12, 2013
126
| Henderson Global Funds | Other information |
| | (unaudited) |
Proxy voting policies
The Funds have filed with the Securities and Exchange Commission their proxy voting records for the twelve months ended June 30, 2013 on Form N-PX, which must be filed each year by August 31. Form N-PX is available on the Securities and Exchange Commission’s website at www.sec.gov. The Funds’ proxy voting records and proxy voting policies and procedures are also available without charge, upon request, by calling 866.443.6337 or by visiting the Funds’ website at www.hendersonglobalinvestors.com.
Quarterly portfolio of investments
A Portfolio of Investments is filed as of the end of the first and third quarter of each fiscal year on Form N-Q. The Funds have filed with the Securities and Exchange Commission the Form N-Q and it is available on the Securities and Exchange Commission’s website at www.sec.gov. Additionally, the Portfolio of Investments may be reviewed and copied at the Commission’s Public Reference Room in Washington, DC. Information on the operation of the Public Reference Room may be obtained by calling 1.800.SEC.0330. The quarterly Portfolio of Investments are also available without charge, upon request, by calling 866.443.6337 or by visiting the Funds’ website at www.hendersonglobalinvestors.com.
Approval of continuation of investment advisory agreements
The Board of Trustees of Henderson Global Funds oversees the management of the Funds and, as required by law, the investment advisory and the sub-advisory agreements for the Funds (the “Advisory Agreements”). In connection with their annual consideration of those agreements for the Funds, the Trustees received and reviewed a substantial amount of information provided by Henderson Global Investors (North America) Inc. (the “Adviser”) and Henderson Investment Management Limited (the “Sub-Adviser”) in response to detailed requests of the Independent Trustees and their independent legal counsel. The Trustees also discussed with representatives of management the operations of the Funds and the nature and quality of the advisory and other services provided to the Funds by the Adviser and the Sub-Adviser. The Independent Trustees also received and reviewed a memorandum from their counsel regarding their responsibilities in considering continuation of the agreements. Throughout their consideration of the agreements, the Independent Trustees were advised by their independent legal counsel. The Independent Trustees met with management to consider the agreements, and at that meeting they also met separately in executive session with their counsel.
May 15, 2013 Meeting
At a meeting held on May 15, 2013, the Trustees reviewed and analyzed various factors that they determined were relevant, including the factors described below.
Nature, extent and quality of services
The Independent Trustees noted the various reports and presentations they had received in connection with their evaluation of the nature, extent and quality of services provided under the Advisory Agreements by the Adviser and Sub-Adviser, addressing the services performed by the Adviser and Sub-Adviser, as well as their expertise, resources and capabilities. The Trustees then reviewed and considered the nature, extent and quality of the services provided to the Funds by the Adviser and the Sub-Adviser (in the case of Sub-Advised Funds), taking into account the investment objective(s) and strategy of each Fund and the knowledge they had gained from their regular and special meetings. In addition, the Trustees reviewed the resources and key personnel of the Adviser and the Sub-Adviser, especially the personnel who provide investment management services to the Funds. Management provided an overview of the Adviser and its parent company and reviewed the Adviser’s capabilities, resources and financial condition. Management also reviewed the Adviser’s investment approach for the Funds and the qualifications of the Funds’ respective portfolio management teams. Management then discussed the personnel responsible for performing services for the Funds.
The Trustees considered the methodology the Adviser and the Sub-Adviser use in determining compensation payable to portfolio managers, the very competitive environment for investment management talent and the competitive market for mutual funds in different distribution channels.
The Trustees also considered other services provided to the Funds by the Adviser and the Sub-Adviser, such as managing the execution of portfolio transactions and the selection of broker-dealers for those transactions, monitoring adherence to the Funds’ investment restrictions, producing shareholder reports, providing support services for the Trustees and committees of the Board and overseeing the activities of other service providers, including monitoring compliance with various policies and procedures of the Funds and with applicable securities laws and regulations.
Investment performance and fees
The Independent Trustees noted that a review of investment performance is a key factor in evaluating the nature, extent and quality of services provided under investment management contracts. The Independent Trustees considered,
127
| Henderson Global Funds | Other information |
| | (unaudited) |
in particular, the detailed reports and analyses performed and compiled by an independent third party, Lipper Inc. (the “Lipper Report”) that show, for each Fund and for various periods, total return performance data ranked within a performance universe and performance group. In addition, for purposes of their review of the reasonableness of the advisory fees, the Independent Trustees considered the expense rankings and quintiles tables, contractual management fees at common asset levels and at various asset levels, expense ratios and various other fees and expenses data and supporting information contained within the Lipper Report.
The Trustees then reviewed the performance and expenses of each Fund, including comparative and percentile ranking information in the Lipper Report.
| • | Henderson All Asset Fund: The Board observed that the Fund’s performance for the year-to-date period ranked in the third quintile of the Fund’s peer group and performance universe and in the fourth quintile of its peer group and performance universe over the one-year period. The Board considered the Fund’s relatively brief period of operation and noted management’s explanation of the Fund’s defensive posture, which is expected to impede the Fund’s performance in “up” markets, but outperform in volatile markets. The Board also noted that the Fund’s actual management fee ranked in the fourth quintile and that its total expense ratio ranked in the first quintile of its peer group and performance universe. The Board also took into account the Adviser’s contractual agreement to waive its management fee and, if necessary, to reimburse other operating expenses in order to limit total annual ordinary operating expenses, less distribution and service fees, to 0.60% of the Fund’s average daily assets and that, as a result of such agreement, the actual management fees received by the Adviser were just 0.13%. In addition, the Board considered management’s view that the Fund’s above-median management fee was justified by the Adviser’s approach to asset allocation, differentiation from peers and portfolio manager experience and skill. The Board noted management’s view that the Fund’s asset allocation approach allows the portfolio managers the flexibility to make strategic and tactical decisions and requires a high level of active management, while many competitor funds use a more traditional approach to asset allocation based on long-term time horizons and predetermined allocations. |
| | |
| • | Henderson Emerging Markets Opportunities Fund: The Board observed that the Fund’s total return was in the third quintile of its peer group for the year-to-date and since inception periods and in the fifth quintile for the one-year period. As compared to its performance universe, the Fund also ranked in the third quintile for the year-to-date period, and the fifth quintile for the one-year period and the fourth quintile for the since inception period. With respect to the Fund’s underperformance, the Board took into account management’s view that the underperformance was attributable, to a significant extent, to investment decisions that were reasonable and consistent with the Fund’s investment strategy and policies, but did not perform as expected. The Board also discussed the performance of the various sleeves within the Fund, and which sleeves’ performance had detracted from the overall performance. In addition, the Board considered the relatively brief period since the Fund’s inception and management’s conviction in the stock selection expertise of the Fund’s managers, as well as management’s confidence in the Fund’s performance prospects over the long-term. The Board also noted that the Fund’s actual management fee ranked in the third quintile and that its total expense ratio ranked in the second quintile of its peer group. |
| | |
| • | Henderson European Focus Fund: The Board considered that, although the Fund’s total return for the year-to-date, one-year and three-year periods ranked in the fifth quintile against its peer group, its longer-term performance over the five-year, ten-year, and since inception periods ranked in the first or second quintile of its peer group and performance universe. The Board noted that the Fund’s bottom-up investment approach involves intensive company analysis and fundamental research. The Trustees also considered the perceived uniqueness of the Fund relative to its competitors, noting, for instance, that the Fund’s holdings are consistently differentiated from its peers and with a much higher small- and mid-cap allocation, all of which requires a more rigorous research effort than for large-cap stocks. |
| | |
| • | Henderson Global Equity Income Fund: The Board observed that the Fund’s total return for the one-year, five-year and since inception periods ranked in the first or second quintile of its performance universe and underperformed for the year-to-date period. The Board also observed that the Fund’s total return for the one-year and five-year periods ranked in the first and second quintile, respectfully, of its peer universe, though the Fund had underperformed its peer universe for the year-to-date and three-year periods. With respect to the Fund’s fees and expenses, the Board noted that the Fund’s actual management fee was in the fifth quintile as compared to its peer group and the universe, but that the total expense ratio was competitive within its peer group. |
| | |
| • | Henderson Global Technology Fund: The Board considered that the Fund’s performance for the year-to-date period ranked in the fifth quintile of the Fund’s peer group and in the fourth quintile of its peer group for performance over the one-year and three-year periods. The Board also observed that the Fund’s performance for the |
128
| Henderson Global Funds | Other information |
| | (unaudited) |
| | one-year and three-year periods ranked in the third quintile of the Fund’s performance universe, and it ranked in the first or second quintile for the five-year, ten-year and since inception periods. The Board also noted that the Fund had outperformed its benchmark, the MSCI AC World IT Index. In assessing the Fund’s above-median actual management fee and total expense ratio as compared to its peer group, the Board noted management’s discussion of the Fund’s investment process, perceived uniqueness and relative performance. The Board considered that the Fund’s fundamental bottom-up investment process and thematic approach requires in-depth company and industry analysis. The Board also noted that the Fund’s performance ranked in the first or second quintile of its performance universe for the five-year, ten-year and since inception periods. The Board also considered that the Fund is differentiated relative to other technology funds. |
| | |
| • | Henderson International Opportunities Fund: The Board considered the Fund’s strong longer-term track record for performance relative to its peer group and performance universe. In particular, the Board observed that the Fund’s total return ranked in the first quintile of its peer group since inception, in the second quintile for the ten-year and five-year periods, in the fourth quintile for the three-year period and in the fifth quintile for the one-year period. The Board raised various questions with management concerning the Fund’s performance relative to its peer group and universe for the year-to-date, one-year and three-year periods and its above median total expense ratio. The Board considered management’s discussion of the negative impact of certain sleeves within the Fund on the overall Fund’s performance.The Board considered that the Fund’s multi-manager, “best ideas” approach entails an extensive level of investment research and portfolio management resources. The Board then considered the distinctive features of the Fund relative to its peers, noting, in this regard, that the Fund’s “best ideas” approach results in a concentrated portfolio of 60 to 70 high conviction holdings, while the average international stock fund holds over 300 stocks. In addition, the Board observed information from management suggesting that the Fund’s holdings are differentiated from its competition. Finally, in evaluating the reasonableness of the Fund’s management fees, the Board reviewed the Fund’s actual management fee and total expense ratio in comparison to its peer group and took into account the Fund’s investment process as well as the Fund’s long-term investment performance. In this connection, the Board noted that, in addition to the peer group performance, the Fund has outperformed its MSCI EAFE benchmark since inception. |
| | |
| • | Henderson Strategic Income Fund: The Board considered the Fund’s performance in light of the particular management style involved, with performance ranking in the second quintile of its peer group for the year-to-date and one-year periods and in the fourth quintile for the three-year, five-year and since inception periods, noting the improvement in performance following the change in portfolio managers. The Board also observed that the Fund’s performance ranked in the second quintile of its performance universe for the one-year period, an improvement from its longer-term ranking. The Board noted, in this regard, management’s view that, as a result of its investment program, the Fund traditionally underperforms in “risk-off” markets due to its larger weighting in high yield securities relative to its Lipper peers. In assessing the Fund’s actual management fee and total expenses, the Board observed that the Fund’s actual management fee was in the first quintile of its peer group and performance universe and that the total expense ratio was competitive in comparison to its peer group. The Board took into account that the Fund’s investment process encompasses active asset allocation among fixed income sectors and individual security selection driven by bottom-up credit research. The Board also considered that, in addition to the Fund’s portfolio managers, the Fund leverages the research and expertise of Henderson’s wider fixed income team. |
| | |
| • | Henderson World Select Fund: The Board noted that the Fund’s performance for the year-to-date, one-year, three-year, five-year and since inception periods ranked in the fourth or fifth quintile of its peer group and its performance universe. With respect to fees and expenses, the Board observed that the Fund’s actual management fee and total expense ratio were below the median of its peer group. The Board raised several questions concerning the investment performance of the Fund. The Board considered that the Fund employs a rigorous investment process that involves a multi-factor growth and valuation-based screening practice, in addition to proprietary fundamental research, to construct a concentrated portfolio of 30-40 stocks. Management noted that the Fund’s current portfolio manager only recently took over management of the portfolio in June 2012. |
The Trustees next reviewed the management fees of the Adviser and the Sub-Adviser for certain affiliated funds. Although in some instances the fee rates for various investment strategies were lower than management fees for Funds having a similar strategy, the Trustees noted that the Adviser and the Sub-Adviser perform significant additional services for the Funds that they generally do not provide to other funds.
Costs of services provided and the profits realized by Henderson and its affiliates from their relationships with the funds
In considering the reasonableness of investment management fees, the Independent Trustees also considered the expected profitability of Henderson and its affiliates in connection with Henderson providing investment management services to the Funds.
129
| Henderson Global Funds | Other information |
| | (unaudited) |
The Trustees also reviewed the financial information related to the Adviser’s parent company and its corporate structure. The Trustees recognized that profitability comparisons among fund managers are difficult because very little comparative information is publicly available, and the profitability of any manager is affected by numerous factors, including the organizational structure of the particular manager, the types of funds and other accounts it manages, possible other lines of business, the methodology for allocating expenses and the manager’s capital structure and cost of capital.
Economies of scale
The Independent Trustees then considered the economies of scale that might be realized by the Adviser as a Fund grows and took note of the extent to which Fund shareholders might also benefit from such growth. In this connection, it was observed that the fee schedules for each Fund, with the exception of the All Asset Fund, include various pre-established “breakpoints” in investment management service fees that are triggered as a Fund’s net asset level increases. The Independent Trustees observed that each Fund (with the exception of Henderson All Asset Fund) has remaining breakpoints that have not yet been reached. The Independent Trustees noted that based on the receipt of information showing the breakpoints, they were comfortable that such breakpoints satisfactorily provide for sharing economies of scale, as they allow for adequate opportunity for shareholders to realize benefits (fee breaks) as Fund assets grow. With respect to the All Asset Fund, while the Fund’s fee schedule does not include breakpoints, the Independent Trustees considered that an appropriately structured total expense limitation can provide an acceptable sharing of economies of scale to substitute for a breakpoint in the advisory fee. In this regard, the Independent Trustees took into account the Adviser’s expense limitation agreement with respect to the All Asset Fund.
Other Benefits to the Adviser
The Trustees also considered benefits that accrue to the Adviser and the Sub-Adviser from their relationship with the Funds and their use of commissions paid on portfolio brokerage transactions of the Funds to obtain research products and services benefiting the Fund and/or other clients.
June 20, 2013 Meeting
At a meeting held on June 20, 2013, it was noted that the Board had met previously in-person on May 15, 2013 to review annual approval related materials. The representatives of the Adviser indicated that there had not been any material changes to the information that had been provided for the May 15, 2013 meeting.
Based on their evaluation of the information provided by the Adviser and the Sub-Adviser and other information, the Trustees determined that the overall arrangements between the Funds and the Adviser were fair and reasonable in light of the nature and quality of the services provided by the Adviser and the Sub-Adviser, the fees charged for those services, and other matters that the Trustees considered relevant in the exercise of their business judgment. In making that determination, the Trustees reviewed and analyzed various factors that they determined were relevant, including the factors described below, none of which by itself was considered paramount or dispositive and each Trustee may have weighed the information differently.
Nature, extent and quality of services
The Trustees reviewed and considered the nature, extent and quality of the services provided to the Funds by the Adviser and the Sub-Adviser, taking into account the investment objective and strategy of each Fund and the knowledge they had gained from their May 15, 2013 and June 20, 2013 meetings and their regular meetings with management on at least a quarterly basis. The Trustees concluded that the nature and extent of the services provided to each Fund by the Adviser and the Sub-Adviser (in the case of Sub-Advised Funds) were appropriate and consistent with the terms of the respective Advisory Agreements, that the quality of those services had been consistent with quality norms in the industry and that the Funds were likely to benefit from the continued provision of those services. They also concluded that the Adviser and the Sub-Adviser had sufficient personnel with the appropriate education and experience to serve the Funds effectively, and had demonstrated their continuing ability to attract and retain well-qualified personnel.
Performance and fees
The Trustees considered the Funds’ investment performance over various time periods in comparison to information for other comparable funds as provided by Lipper. They concluded that the performance of each Fund met or exceeded acceptable levels and that each Fund and its shareholders were benefiting from the current management of the Fund. The Trustees examined information on the fees and other expenses paid by each Fund in comparison to information for other comparable funds as provided by Lipper. The Trustees also reviewed the management fees of the Adviser and the Sub-Adviser for certain affiliated funds. The Trustees reviewed information on the profitability of (or loss) to the Adviser and its affiliates of their relationships with each Fund and concluded that the Adviser’s profitability level with
130
| Henderson Global Funds | Other information |
| | (unaudited) |
respect to each Fund in relation to the services rendered was not unreasonable. Finally, the Trustees considered the financial condition of the Adviser and the Sub-Adviser, which they found to be sound. The Trustees concluded that the management fees and other compensation payable by each Fund to the Adviser, as well as the fees paid by the Adviser to the Sub-Adviser, were reasonable in relation to the nature and quality of the services provided, taking into account the fees charged by other advisers for managing comparable mutual funds with similar strategies and the fees the Adviser and the Sub-Adviser charge to other clients. The Trustees also concluded that the overall expense ratio of each Fund was reasonable, taking into account the size of the Fund, the quality of services provided by the Adviser and the Sub-Adviser, the investment performance of the Fund and the expense limitations agreed to by the Adviser.
Economies of scale
The Trustees received and considered information about the potential of the Adviser to experience economies of scale as the assets of the Funds increase. Based on all of the information they reviewed, the Trustees concluded that the current fee structure of the Funds was reasonable and, that those rates of fees are expected to reflect a sharing between the Adviser and the Funds of economies of scale.
Other benefits to the adviser
The Trustees also considered benefits that accrue to the Adviser and the Sub-Adviser from their relationship with the Fund and their use of commissions paid on portfolio brokerage transactions of the Funds to obtain research products and services benefiting the Funds and/or other clients. The Trustees concluded that the use by the Adviser and the Sub-Adviser of commissions paid by the Funds to obtain research products and services was consistent with regulatory requirements and likely benefits the Funds.
After full consideration of the above factors as well as other factors that were instructive in analyzing the management arrangements, the Trustees, including all of the Independent Trustees, concluded that the continuation of the investment advisory and sub-advisory agreement for each Fund was in the best interest of the Fund and its shareholders.
Statement Pursuant to Section 19(a) of the Investment Company Act of 1940
The exact source of aggregate fund distributions for each fiscal year can only be determined as of the end of each Fund’s fiscal year, July 31. However, under Section 19(a) of the Investment Company Act of 1940, the Funds are required to indicate the source of each distribution to shareholders at the time of payment if the distribution is made from any source other than accumulated undistributed net income. For purposes of this disclosure, the source of each distribution is based on US Generally Accepted Accounting Principles (“GAAP”) and will differ from federal income tax-based reporting provided to shareholders due to certain tax adjustments. For federal income tax purposes, the Funds will send you a Form 1099-DIV for each calendar year that will tell you how to report these distributions.
The Funds are making the following disclosures pursuant to Section 19(a).
During the seven-month period ended July 31, 2013, Strategic Income paid the following distribution, in part from sources other than accumulated undistributed net income as measured at the time of payment. No other Funds paid distributions from sources other than accumulated undistributed net income, other than those previously disclosed in the Funds’ January 31, 2013 Semi-Annual Report to Shareholders.
| Strategic Income | | | | | | | |
| | | | | | % from | | |
| | | | | | accumulated | % from | % from |
| Ex and | Record | | | | undistributed | accumulated | paid-in |
| Pay Date | Date | | Amount | | net income | realized gains | capital |
| 1/30/13 | 1/29/13 | | Class A: | $0.030351 | 91.7% | 0.0% | 8.3% |
| | | | Class B: | $0.023492 | 91.7% | 0.0% | 8.3% |
| | | | Class C: | $0.023656 | 91.7% | 0.0% | 8.3% |
| | | | Class I: | $0.032404 | 91.7% | 0.0% | 8.3% |
131
| Henderson Global Funds | Other information |
| | (unaudited) |
All other monthly distributions paid by Strategic Income were paid exclusively from accumulated undistributed net income. Approximately 8.3% or $12,872 of the $155,000 January 2013 distribution was from paid-in capital.
Federal tax information
Certain tax information for the Funds is required to be provided to shareholders based on the Funds’ income and distributions for the taxable year ending July 31, 2013. In February 2014, shareholders will receive Form 1099-DIV, which will include their share of foreign tax credit, qualified dividends and capital gains distributed during the calendar year 2013. Shareholders are advised to check with their tax advisors for information on the treatment of these amounts on their individual income tax returns.
For corporate shareholders, ordinary income dividends qualified for the dividends received deduction during the year ended July 31, 2013:
| | Dividends | |
| | received | |
| | deduction | |
| All Asset | —% | |
| Dividend & Income Builder | 10.17% | |
| Emerging Markets Opportunities | —% | |
| European Focus | —% | |
| Global Equity Income | 11.69% | |
| Global Technology | —% | |
| High Yield Opportunities | 2.64% | |
| International Opportunities | 1.73% | |
| Strategic Income | —% | |
| World Select | 100.00% | |
Under Section 853 of the Internal Revenue Code of 1986, as amended (the “Code”), the Funds designated foreign taxes paid and foreign source income for the fiscal year ended July 31, 2013 were as follows:
| | | | | | | | |
| | | | Foreign | | | Foreign | |
| | | | taxes | | | source | |
| | | | paid | | | income | |
| All Asset | | $ | — | | $ | — | |
| Dividend & Income Builder | | | — | | | 95,208 | |
| Emerging Markets Opportunities | | | 37,925 | | | 496,994 | |
| European Focus | | | 1,096,417 | | | 15,987,225 | |
| Global Equity Income | | | 5,375,353 | | | 111,935,428 | |
| Global Technology | | | — | | | — | |
| High Yield Opportunities | | | — | | | — | |
| International Opportunities | | | 3,784,153 | | | 58,473,931 | |
| Strategic Income | | | — | | | — | |
| World Select | | | — | | | 136,470 | |
Under Section 854 (b)(2) of the Code, the Funds designated qualified dividends for the fiscal year ended July 31, 2013 as follows:
| | | | | |
| All Asset | | $ | 166,005 | |
| Dividend & Income Builder | | | 91,493 | |
| Emerging Markets Opportunities | | | 305,663 | |
| European Focus | | | 14,439,289 | |
| Global Equity Income | | | 105,585,894 | |
| Global Technology | | | 5,786,644 | |
| High Yield Opportunities | | | — | |
| International Opportunities | | | 53,626,062 | |
| Strategic Income | | | — | |
| World Select | | | 281,370 | |
Shareholder expense
As a shareholder of the Funds, you incur two types of costs: (1) transaction costs, including sales charges (loads) on purchase payments and redemption fees and (2) ongoing costs, including management fees, distribution (12b-1) fees, shareholder services fees and other Fund expenses. The example in Table 1 and Table 2 is intended to help you understand your ongoing costs of investing in the Funds and to compare these costs with ongoing costs of investing in other mutual funds. It is based on an investment of $1,000 invested at the beginning of the period and held for the six months ended July 31, 2013.
132
| Henderson Global Funds | Other information |
| | (unaudited) |
Actual expenses
Table 1 provides information about actual account values and actual expenses. You may use the information in this line, together with the amount invested, to estimate the expenses that you incurred over the period. Simply divide your account value at the end of the period by $1,000 (for example, an $8,600 account value divided by $1,000 = 8.6), then multiply the result by the number under the heading entitled “Expenses Paid During the Period” to estimate the expenses attributable to your investment during this period.
Hypothetical example for comparison purposes
Table 2 provides information about hypothetical account values and hypothetical expenses based on the Funds’ actual expense ratios and an assumed rate of return of 5% per year before expenses, which is not the Funds’ actual return. Thus you should not use the hypothetical account values and expenses to estimate your actual ending account balance or the expense attributable to your investment during the period. Rather, these figures are provided to enable you to compare the ongoing costs of investing in the Funds and other funds. To do so, compare the 5% hypothetical examples with the 5% hypothetical examples that appear in the shareholder reports of other funds.
Expenses paid during the period include amounts reflected in the Funds’ Statement of Operations, net of reimbursements by the investment adviser. The annualized expense ratios used in the example are as follows:
| | | | Class | | | Class | | | Class | | | Class | | | Class | |
| | | | A | | | B | | | C | | | I | | | R | |
| All Asset | | | 0.85 | % | | N/A | | | 1.60 | % | | 0.60 | % | | N/A | |
| Dividend & | | | | | | | | | | | | | | | | |
| Income | | | | | | | | | | | | | | | | |
| Builder | | | 1.30 | % | | N/A | | | 2.05 | % | | 1.05 | % | | N/A | |
| Emerging | | | | | | | | | | | | | | | | |
| Markets | | | | | | | | | | | | | | | | |
| Opportunities | | | 1.79 | % | | N/A | | | 2.54 | % | | 1.54 | % | | N/A | |
| European | | | | | | | | | | | | | | | | |
| Focus | | | 1.48 | % | | 2.30 | % | | 2.24 | % | | 1.18 | % | | N/A | |
| Global Equity | | | | | | | | | | | | | | | | |
| Income | | | 1.20 | % | | N/A | | | 1.96 | % | | 0.93 | % | | N/A | |
| Global | | | | | | | | | | | | | | | | |
| Technology | | | 1.49 | % | | 2.30 | % | | 2.26 | % | | 1.23 | % | | N/A | |
| High Yield | | | | | | | | | | | | | | | | |
| Opportunities | | | 1.10 | % | | N/A | | | 1.85 | % | | 0.85 | % | | N/A | |
| International | | | | | | | | | | | | | | | | |
| Opportunities | | | 1.44 | % | | 2.28 | % | | 2.24 | % | | 1.75 | % | | 1.15 | % |
| Strategic | | | | | | | | | | | | | | | | |
| Income | | | 1.10 | % | | 1.85 | % | | 1.85 | % | | 0.85 | % | | N/A | |
| World Select | | | 1.40 | % | | N/A | | | 2.15 | % | | 1.15 | % | | N/A | |
133
| | |
| Other information (unaudited) |
Please note that the expenses do not reflect shareowner transaction costs such as front-end sales charges and redemption fees. These fees are described for each Fund and share class in the Performance summary of this report on pages 3, 5, 7, 9, 11, 13, 15, 17, 19 and 21. Table 2 is useful in comparing ongoing costs only, and will not help you determine the relative total costs of owning different funds. In addition, if these transaction costs were included, your costs would have been higher.
| Table 1 | | | | | | | | |
| | |
| | Beginning | | | Ending | | | | |
| | account | | | account | | | Expenses | |
| | value | | | value | | | paid | |
| | February 1, | | | July 31, | | | during | |
| Actual | 2013 | | | 2013 | | | the period* | |
| All Asset | | | | | | | | |
| Class A | $ | 1,000.00 | | | $ | 1,016.40 | | | $ | 4.25 | |
| Class C | | 1,000.00 | | | | 1,011.60 | | | | 7.98 | |
| Class I | | 1,000.00 | | | | 1,017.40 | | | | 3.00 | |
| Dividend & | | | | | | | | | | | |
| Income Builder | | | | | | | | | | | |
| Class A | $ | 1,000.00 | | | $ | 1,049.70 | | | $ | 6.61 | |
| Class C | | 1,000.00 | | | | 1,045.80 | | | | 10.40 | |
| Class I | | 1,000.00 | | | | 1,050.50 | | | | 5.34 | |
| Emerging Market | | | | | | | | | |
| Opportunities | | | | | | | | | | | |
| Class A | $ | 1,000.00 | | | $ | 930.90 | | | $ | 8.57 | |
| Class C | | 1,000.00 | | | | 926.90 | | | | 12.14 | |
| Class I | | 1,000.00 | | | | 930.90 | | | | 7.37 | |
| European Focus | | | | | | | | | | | |
| Class A | $ | 1,000.00 | | | $ | 1,125.10 | | | $ | 7.80 | |
| Class B | | 1,000.00 | | | | 1,120.80 | | | | 12.09 | |
| Class C | | 1,000.00 | | | | 1,120.70 | | | | 11.78 | |
| Class I | | 1,000.00 | | | | 1,126.70 | | | | 6.22 | |
| Global Equity | | | | | | | | | | | |
| Income | | | | | | | | | | | |
| Class A | $ | 1,000.00 | | | $ | 1,054.20 | | | $ | 6.11 | |
| Class C | | 1,000.00 | | | | 1,039.30 | | | | 9.91 | |
| Class I | | 1,000.00 | | | | 1,055.50 | | | | 4.74 | |
| Global Technology | | | | | | | | | |
| Class A | $ | 1,000.00 | | | $ | 1,100.00 | | | $ | 7.76 | |
| Class B | | 1,000.00 | | | | 1,095.30 | | | | 11.95 | |
| Class C | | 1,000.00 | | | | 1,095.50 | | | | 11.74 | |
| Class I | | 1,000.00 | | | | 1,101.20 | | | | 6.41 | |
| High Yield | | | | | | | | | | | |
| Opportunities** | | | | | | | | | | | |
| Class A | $ | 1,000.00 | | | $ | 1,009.20 | | | $ | 2.79 | |
| Class C | | 1,000.00 | | | | 1,008.10 | | | | 4.68 | |
| Class I | | 1,000.00 | | | | 1,010.60 | | | | 2.15 | |
| International | | | | | | | | | | | |
| Opportunities | | | | | | | | | | | |
| Class A | $ | 1,000.00 | | | $ | 1,085.80 | | | $ | 7.45 | |
| Class B | | 1,000.00 | | | | 1,081.10 | | | | 11.76 | |
| Class C | | 1,000.00 | | | | 1,081.60 | | | | 11.56 | |
| Class I | | 1,000.00 | | | | 1,083.70 | | | | 9.04 | |
| Class R | | 1,000.00 | | | | 1,083.20 | | | | 5.95 | |
| Table 2 | | | | | | | | |
| | |
| Hypothetical | Beginning | | | Ending | | | Expenses | |
| (assuming a | account | | | account | | | paid | |
| 5% return | value | | | value | | | during | |
| before | February 1, | | | July 31, | | | the | |
| expenses) | 2013 | | | 2013 | | | period* | |
| All Asset | | | | | | | | |
| Class A | $ | 1,000.00 | | | $ | 1,020.58 | | | $ | 4.26 | |
| Class C | | 1,000.00 | | | | 1,016.86 | | | | 8.00 | |
| Class I | | 1,000.00 | | | | 1,021.82 | | | | 3.01 | |
| Dividend & | | | | | | | | | | | |
| Income Builder | | | | | | | | | | | |
| Class A | $ | 1,000.00 | | | $ | 1,018.35 | | | $ | 6.51 | |
| Class C | | 1,000.00 | | | | 1,014.63 | | | | 10.24 | |
| Class I | | 1,000.00 | | | | 1,019.59 | | | | 5.26 | |
| Emerging Market | | | | | | | | | |
| Opportunities | | | | | | | | | | | |
| Class A | $ | 1,000.00 | | | $ | 1,015.92 | | | $ | 8.95 | |
| Class C | | 1,000.00 | | | | 1,012.20 | | | | 12.67 | |
| Class I | | 1,000.00 | | | | 1,017.16 | | | | 7.70 | |
| European Focus | | | | | | | | | | | |
| Class A | $ | 1,000.00 | | | $ | 1,017.46 | | | $ | 7.40 | |
| Class B | | 1,000.00 | | | | 1,013.39 | | | | 11.48 | |
| Class C | | 1,000.00 | | | | 1,013.69 | | | | 11.18 | |
| Class I | | 1,000.00 | | | | 1,018.94 | | | | 5.91 | |
| Global Equity | | | | | | | | | | | |
| Income | | | | | | | | | | | |
| Class A | $ | 1,000.00 | | | $ | 1,018.84 | | | $ | 6.01 | |
| Class C | | 1,000.00 | | | | 1,015.08 | | | | 9.79 | |
| Class I | | 1,000.00 | | | | 1,020.18 | | | | 4.66 | |
| Global Technology | | | | | | | | | |
| Class A | $ | 1,000.00 | | | $ | 1,017.41 | | | $ | 7.45 | |
| Class B | | 1,000.00 | | | | 1,013.39 | | | | 11.48 | |
| Class C | | 1,000.00 | | | | 1,013.59 | | | | 11.28 | |
| Class I | | 1,000.00 | | | | 1,018.70 | | | | 6.16 | |
| High Yield | | | | | | | | | | | |
| Opportunities | | | | | | | | | | | |
| Class A | $ | 1,000.00 | | | $ | 1,009.83 | | | $ | 2.79 | |
| Class C | | 1,000.00 | | | | 1,007.94 | | | | 4.68 | |
| Class I | | 1,000.00 | | | | 1,010.46 | | | | 2.15 | |
| International | | | | | | | | | | | |
| Opportunities | | | | | | | | | | | |
| Class A | $ | 1,000.00 | | | $ | 1,017.65 | | | $ | 7.20 | |
| Class B | | 1,000.00 | | | | 1,013.49 | | | | 11.38 | |
| Class C | | 1,000.00 | | | | 1,013.69 | | | | 11.18 | |
| Class I | | 1,000.00 | | | | 1,016.12 | | | | 8.75 | |
| Class R | | 1,000.00 | | | | 1,019.09 | | | | 5.76 | |
134
| | |
| Other information (unaudited) |
| Table 1 | | | | | | | | |
| | |
| | Beginning | | | Ending | | | | |
| | account | | | account | | | Expenses | |
| | value | | | value | | | paid | |
| | February 1, | | | July 31, | | | during | |
| Actual | 2013 | | | 2013 | | | the period* | |
| Strategic Income | | | | | | | |
| Class A | $ | 1,000.00 | | | $ | 1,006.00 | | | $ | 5.47 | |
| Class B | | 1,000.00 | | | | 1,002.20 | | | | 9.18 | |
| Class C | | 1,000.00 | | | | 1,002.30 | | | | 9.18 | |
| Class I | | 1,000.00 | | | | 1,007.40 | | | | 4.23 | |
| World Select | | | | | | | | | | | |
| Class A | $ | 1,000.00 | | | $ | 1,092.70 | | | $ | 7.26 | |
| Class C | | 1,000.00 | | | | 1,088.20 | | | | 11.13 | |
| Class I | | 1,000.00 | | | | 1,094.20 | | | | 5.97 | |
| | | | | | | | | |
| Table 2 | | | | | | | | |
| | |
| Hypothetical | Beginning | | | Ending | | | Expenses | |
| (assuming a | account | | | account | | | paid | |
| 5% return | value | | | value | | | during | |
| before | February 1, | | | July 31, | | | the | |
| expenses) | 2013 | | | 2013 | | | period* | |
| Strategic Income | | | | | | | |
| Class A | $ | 1,000.00 | | | $ | 1,019.34 | | | $ | 5.51 | |
| Class B | | 1,000.00 | | | | 1,015.62 | | | | 9.25 | |
| Class C | | 1,000.00 | | | | 1,015.62 | | | | 9.25 | |
| Class I | | 1,000.00 | | | | 1,020.58 | | | | 4.26 | |
| World Select | | | | | | | | | | | |
| Class A | $ | 1,000.00 | | | $ | 1,017.85 | | | $ | 7.00 | |
| Class C | | 1,000.00 | | | | 1,014.13 | | | | 10.74 | |
| Class I | | 1,000.00 | | | | 1,019.09 | | | | 5.76 | |
| * | Expenses are equal to the Funds’ annualized net expense ratio multiplied by the average account value over the period multiplied by 181 days in the period, and divided by 365 (to reflect the one-half year period). |
| ** | Expenses are equal to the Fund’s annualized net expense ratio multiplied by the average account value over the period multiplied by 93 days in the period, and divided by 365 (to reflect the one-half year period). |
135
| Henderson Global Funds | Trustees and officers |
| | (unaudited) |
Name, address1, | Position(s) | Term of | | | Other |
| month and | with | Office and | Principal Occupations | | Directorships |
| year of birth | the Trust2 | Time Served3 | During Past Five Years | | Held |
| Independent Trustees | | | | | |
C . Gary Gerst February 1939 | Chairman and Trustee | Since 2001 | General Partner, Cornelius & Lothian LP (private partnership investing in non-public investments), since 1993; Member of the Governing Council of the Independent Directors Council (IDC), since 2004; Board Member of the Investment Company Institute, since 2004. | | Formerly, Trustee, Harris Insight Funds Trust. |
| | | | | | |
Roland C. Baker August 1938 | Trustee | Since 2001 | Consultant to financial services industry. | | Director, Sammons Financial Enterprises, Inc. and its life insurance subsidiaries, North American Company for Life and Health Insurance (a provider of life insurance, health insurance and annuities), and Midland National Life Insurance Company (an affiliate of North American Company for Life and Health Insurance); formerly, Trustee, Scottish Widows Investment Partnership Trust; formerly Trustee, Allstate Financial Investment Trust; and formerly, Director, Quanta Capital Holdings, Inc. (provider of property and casualty reinsurance); and formerly, Director, People’s Trust Insurance Company (a Florida provider of homeowner’s insurance). |
| | | | | | |
Faris F. Chesley August 1938 | Trustee | Since 2002 | Chairman, Chesley, Taft & Associates, LLC, Since 2001; Vice Chairman, ABN-AMRO, Inc. (a financial services company), 1998-2001. | | Chairman of the Investment Committee of the Presbyterian Homes. |
| | | | | | |
James W. Atkinson August 1950 | Trustee | Since 2011 | Commercial Pilot, Atkinson Aviation LLC, since 2009 | | Formerly, Trustee, LaRabida Children’s Hospital: formerly Trustee, Surgeons Diversified Investment Fund. |
| | | | | | |
Richard W. Durkes February 1950 | Trustee | Since 2011 | Managing Director, Sandler O’Neill & Partners, L.P. (a financial services Company), since 2002. | | Trustee, Sankaty Head Foundation; Partner, Serve UP LLC (private company that holds the rights to certain intellectual property). |
| Interested Trustees and Officers of the Trust | | | |
James G. O’Brien4 May 1960 | Trustee and President | Since 2011 Since 2010 | Managing Director, HGINA, Since 2008 and Director, Corporate Services, HGINA, 2001-2008. | | Director, The Olson Company |
| | | | | | |
Charles Thompson II4 April 1970 | Trustee and Vice President | Since 2011 Since 2010 | Director of US Retail, since 2010, Director of National Sales, 2007-2010, Divisional Director – Central Region, 2002 – 2007. | | None. |
136
| Henderson Global Funds | Trustees and officers |
| | (unaudited) |
Name, address1, | Position(s) | Term of | | | Other |
| month and | with | Office and | Principal Occupations | | Directorships |
| year of birth | the Trust2 | Time Served3 | during Past Five Years | | Held |
| Interested Trustees and Officers of the Trust | | | |
Kenneth A. Kalina August 1959 | Chief Compliance Officer | Since 2005 | Chief Compliance Officer, HGINA. | | N/A |
| | | | | | |
Alanna P. Nensel July 1975 | Vice President | Since 2002 | Director, Retail Marketing and Product Management, HGINA. | | N/A |
| | | | | | |
David Latin September 1981 | Vice President | Since 2012 | Director of Product Development and Analyst Relations, HGINA. | | N/A |
| | | | | | |
Scott E. Volk May 1971 | Vice President | Since 2001 | Director, Retail Finance and Operations, HGINA. | | N/A |
| | | | | | |
Christopher K. Yarbrough October 1974 | Secretary | Since 2004 | Legal Counsel, HGINA. | | N/A |
| | | | | | |
Troy M. Statczar August 1971 | Treasurer | Since 2008 | Head of US Fund Administration and Accounting, HGINA, since July 2008, Senior Vice President, Citigroup 2005-2008. | | N/A |
| | | | | | |
Adam T. Reich August 1983 | Assistant Treasurer | Since 2012 | Manager of US Fund Administration and Accounting, HGINA, since August 2012; Manager, PricewaterhouseCoopers LLP2006-2012. | | N/A |
1. | Each person’s address is 737 North Michigan Avenue, Suite 1700, Chicago, IL 60611. |
| 2. | Currently, all Trustees oversee all ten series of the Trust. |
| 3. | A Trustee may serve until his death, resignation, removal or until the end of the calendar year in which the Trustee reaches 75 years of age, subject to amendment by the Board. The Trustees have determined to extend the retirement age of Messrs. Gerst, Baker and Chesley to the end of the calendar year in which these Trustees reach 76 years of age. The officers of the Trust are elected annually by the Board. |
| 4. | This Trustee is an interested person of the Trust because of his employment relationship with Henderson Global Investors (North America) Inc., the investment adviser to the Fund. |
| | |
| | Unless otherwise noted, this information is as of July 31, 2013. The Statement of Additional Information for Henderson Global Funds includes additional information about the Trustees and is available without charge by calling 1.866.4HENDERSON (1.866.443.6337). |
137
This page intentionally left blank.
138
This page intentionally left blank.
139
Henderson Global Funds
| Trustees | Investment Adviser |
| C. Gary Gerst, Chairman | Henderson Global Investors (North America) Inc. |
| James W. Atkinson | 737 North Michigan Avenue, Suite 1700 |
| Roland C. Baker | Chicago, IL 60611 |
| Faris F. Chesley | |
| Richard W. Durkes | Transfer Agent |
| James G. O’Brien* | State Street Bank & Trust Company |
| Charles Thompson II* | State Street Financial Center |
| | One Lincoln Street |
| Officers | Boston, MA 02111 |
| James G. O’Brien, President | |
| Charles Thompson II, Vice President | Auditors |
| Alanna P. Nensel, Vice President | Ernst & Young LLP |
| David Latin, Vice President | 155 North Wacker Drive |
| Scott E. Volk, Vice President | Chicago, IL 60606 |
| Christopher K. Yarbrough, Secretary | |
| Kenneth A. Kalina, Chief Compliance Officer | For more information |
| Troy M. Statczar, Treasurer | Please call 1.866.4HENDERSON |
| Adam T. Reich, Assistant Treasurer | (1.866.443.6337) |
| | or visit our website: |
| | www.hendersonglobalinvestors.com |
| * | Trustee is an “interested person” of the Trust as defined in the Investment Company Act of 1940, as amended. |
The views expressed in this report and information about the Funds’ portfolio holdings are for the period covered by this report and are subject to change hereafter. This report is submitted for the general information of the shareholders of the Funds. It is not authorized for distribution to prospective investors unless preceded or accompanied by an effective prospectus, which includes information regarding the Funds’ risks, objectives, fees and expenses, experience of its management, and other information. Henderson Global Investors is the name under which various subsidiaries of Henderson Group plc, a UK limited company, provide investment products and services.
Foreside Fund Services, LLC, Distributor
140
Privacy Notice
Henderson Global Funds
This notice describes the privacy practices followed by Henderson Global Funds.
Your privacy is our top priority. Our policy is to respect the privacy of current and former shareholders and to protect personal information entrusted to us. We do not share any nonpublic personal information of shareholders or former shareholders with any nonaffiliated third parties, except as permitted by law or as authorized by our shareholders.
In the course of providing products and services to you, we collect nonpublic personal information about you from various sources such as account applications or agreements, other account forms, transactions in your account, and from information captured on our website, including any information captured through our use of “cookies.” Such information may include your name, address, account or tax identification number, the types and amounts of investments, and bank account information. More detailed information about our Internet policy is available on our website, www.hendersonglobalinvestors.com.
In the normal course of serving shareholders, we may share information we collect with entities that help us process information or service your request, such as transfer agents, custodians, broker-dealers and marketing service firms, as well as with other financial institutions with whom we have joint marketing agreements. We may share information in connection with servicing accounts or to inform shareholders of products and services that we believe may be of interest to them. The organizations that receive shareholder information will use that information only for the services required and as allowed by applicable law or regulation, and are not permitted to share or use this information for any other purpose. Our affiliates do not use shareholder information that we receive to make marketing solicitations. We will disclose your personal information to government agencies, law enforcement officials, and others in the limited circumstances where we believe, in good faith, that such disclosure is required or permitted by law. For example, we will disclose your personal information in order to comply with a court order, to cooperate with government or industry regulators, or law enforcement authorities.
Access to customers’ nonpublic personal information is restricted to employees who need to access that information. To guard shareholder’s nonpublic personal information, we use industry standard physical, electronic, and procedural safeguards. A shareholder’s right to privacy extends to all forms of contact with us, including telephone, written correspondence, and electronic media, such as the Internet.
For questions concerning this policy, please contact us by writing to: Alanna Nensel, Henderson Global Investors (North America) Inc., 737 North Michigan Avenue, Suite 1700, Chicago, Illinois 60611.
Item 2. Code of Ethics.
| (a) | Henderson Global Funds (the “Trust” or the “registrant”) has adopted a Code of Ethics that applies to the Trust’s principal executive officer and principal financial officer (the “Code”). |
| No disclosures are required by this Item 2(b). |
| (c) | There have been no amendments to the Code during the reporting period for Form N-CSR. |
| (d) | There have been no waivers granted by the Trust to individuals covered by the Code during the reporting period for Form N-CSR. |
| A copy of the Code may be obtained free of charge by calling 866-343-6337. |
Item 3. Audit Committee Financial Expert.
| (a) | (1) | The Board of Trustees of the Trust has determined that it has five audit committee financial experts serving on the Trust’s Audit Committee that possess the attributes identified in Item 3(b) to Form N-CSR. |
| | (2) | The names of the audit committee financial experts are: |
James W. Atkinson
Roland C. Baker
Faris F. Chesley
Richard W. Durkes
C. Gary Gerst
Each audit committee financial expert has been deemed to be “independent” as that term is defined in Item 3(a)(2) of Form N-CSR.
Item 4. Principal Accountant Fees and Services.
As of July 31, 2013, the registrant had ten series. All of the series of the registrant currently have a fiscal year ended July 31 (the “7/31 Henderson Funds”). The Henderson Strategic Income Fund changed its fiscal year end from December 31 to July 31 effective July 31, 2013.
For purposes of Item 4 disclosure below, the “12/31 Henderson Funds” for the fiscal year ended December 31, 2011 include the Henderson International All Cap Equity Fund, Henderson Strategic Income Fund and Henderson Money Market Fund. The Henderson International All Cap Equity Fund and Henderson Money Market Fund each liquidated on December 28, 2012, prior to the December 31, 2012 fiscal year end. Therefore, the 12/31 Henderson Funds for the fiscal year ended December 31, 2012 include only the Henderson Strategic Income Fund. For the fiscal year ended July 31, 2013, the Henderson Strategic Income Fund is included in the 7/31 Henderson Funds categorization.
Information provided in response to Item 4 includes amounts billed during the applicable fiscal years for services rendered by the registrant’s principal accountant to the 12/31 Henderson Funds and the 7/31 Henderson Funds, as defined above.
(a) Audit Fees – The aggregate fees billed for the last two fiscal years ended July 31 for the 7/31 Henderson Funds and December 31 for the 12/31 Henderson Funds for professional services rendered by the principal accountant to the registrant for the audit of the registrant’s annual financial statements or services normally provided by the accountant in connection with statutory and regulatory filings or engagements for the those fiscal years are set forth below.
| | 12/31 Henderson Funds | 7/31 Henderson Funds |
| Year ended 7/31/13 | N/A | $302,000 |
| Year ended 12/31/12 | $32,300 | N/A |
| Year ended 7/31/12 | N/A | $235,800 |
| Year ended 12/31/11 | $87,300 | N/A |
(b) Audit Related Fees – There were no fees billed for the last two fiscal years ended July 31 for the 7/31 Henderson Funds and December 31 for the 12/31 Henderson Funds for assurance and related services rendered by the principal accountant to the registrant that are reasonably related to the performance of the audit of the registrant’s financial statements and are not reported under paragraph (a) of this Item 4.
There were no fees billed for the last two fiscal years ended July 31 for the 7/31 Henderson Funds and December 31 for the 12/31 Henderson Funds for assurance and related services rendered by the principal accountant to the investment adviser that are reasonably related to the performance of the audit of the registrant’s financial statements that were required to be pre-approved by the Audit Committee as described in paragraph (e)(1) of this Item 4.
(c) Tax Fees – The aggregate fees billed for the last two fiscal years ended July 31 for the 7/31 Henderson Funds and December 31 for the 12/31 Henderson Funds for professional services rendered by the principal accountant to the registrant for tax compliance, tax advice, tax planning and tax return preparation are set forth below. These services consisted of the principal accountant reviewing the registrant’s excise tax returns, distribution requirements and RIC tax returns, as well as consultation regarding the tax consequences of specific investments and facilitation of the change of the Henderson Strategic Income Fund’s tax year end change with the Internal Revenue Service.
| | 12/31 Henderson Funds | 7/31 Henderson Funds |
| Year ended 7/31/13 | N/A | $87,792 |
| Year ended 12/31/12 | $8,742 | N/A |
| Year ended 7/31/12 | N/A | $115,360 |
| Year ended 12/31/11 | $30,184 | N/A |
The aggregate fees billed for the last two fiscal years ended July 31 for the 7/31 Henderson Funds and December 31 for the 12/31 Henderson Funds for professional services rendered by the principal accountant to the investment adviser for tax compliance, tax advice and tax planning that were required to be pre-approved by the Audit Committee as described in paragraph (e)(1) of this Item 4 are set forth below.
| | 12/31 Henderson Funds | 7/31 Henderson Funds |
| Year ended 7/31/13 | N/A | $0 |
| Year ended 12/31/12 | $0 | N/A |
| Year ended 7/31/12 | N/A | $0 |
| Year ended 12/31/11 | $0 | N/A |
(d) All Other Fees – There were no fees billed for the last two fiscal years ended July 31 for the 7/31 Henderson Funds and December 31 for the 12/31 Henderson Funds for products and services provided by the principal accountant to the registrant, other than the services reported in paragraph (a) – (c) of this Item 4.
There were no fees billed for the last two fiscal years ended July 31 for the 7/31 Henderson Funds and December 31 for the 12/31 Henderson Funds for products and services provided by the principal accountant to the investment adviser that were required to be pre-approved by the Audit Committee as described in paragraph (e)(1) of this Item 4.
(e) Pre-Approval Policies and Procedures
(1) Pursuant to the registrant’s Audit Committee Charter, the Audit Committee shall pre-approve any engagement of the independent auditors to provide any services (other than prohibited non-audit services) to the Trust, the investment adviser and any entity controlling, controlled by, or under common control with the investment adviser that provides ongoing services to the Trust (if the engagement relates directly to the operations and financial reporting of the Trust) (collectively, the “Adviser”), including the fees and other compensation to be paid to the independent auditors. Any member of the Audit Committee may grant such pre-approval. Any such delegated pre-approval shall be presented to the Audit Committee by the member who approved the engagement. Pre-approval of non-audit services is not required, if: (a) the aggregate amount of all non-audit services provided to the Trust is less than 5% of the total fees paid by the Trust to its independent auditors during the fiscal year in which the non-audit services are provided; (b) the services were not recognized by management at the time of the engagement as non-audit services; and (c) such services are promptly brought to the attention of the Audit Committee by management and the Audit Committee approves them (which may be by delegation as provided for above) prior to the completion of the audit.
The independent auditors shall not perform any of the following non-audit services for the Trust (“prohibited non-audit services”): (a) bookkeeping or other services related to the accounting records or financial statements of the Trust; (b) financial information systems design and implementation; (c) appraisal or valuation services, fairness opinions, or contribution-in-kind reports; (d) actuarial services; (e) internal audit outsourcing services; (f) management functions or human resources; (g) broker or dealer, investment adviser, or investment banking services; (h) legal services and expert services unrelated to the audit; and (i) any other services that the Public Company Accounting Oversight Board determines are impermissible.
(2) None of the services provided to the registrant described in paragraphs (b)-(d) of Item 4 were pre-approved by the Audit Committee pursuant to paragraph (c)(7)(i)(C) of Rule 2-01 of Regulation S-X. All of the fees billed for services provided to the Adviser described in paragraphs (b)-(d) of Item 4 were required to be pre-approved by the Audit Committee as described in paragraph (e)(1) of Item 4.
| (f) | No disclosures are required by this Item 4(f). |
(g) The approximate aggregate non-audit fees billed for the last two fiscal years ended July 31 for the 7/31 Henderson Funds and December 31 for the 12/31 Henderson Fund for services rendered by the principal accountant to the registrant are set forth below.
| | 12/31 Henderson Funds | 7/31 Henderson Funds |
| Year ended 7/31/13 | N/A | $87,792 |
| Year ended 12/31/12 | $8,742 | N/A |
| Year ended 7/31/12 | N/A | $115,360 |
| Year ended 12/31/11 | $30,184 | N/A |
The approximate aggregate non-audit fees billed for the last two fiscal years ended July 31 for the 7/31 Henderson Funds and December 31 for the 12/31 Henderson Funds for services rendered by the principal accountant to the Adviser and its affiliates that provide ongoing services to the registrant are set forth below.
| | 12/31 Henderson Funds* | 7/31 Henderson Funds* |
| Year ended 7/31/13 | N/A | $1,567,671 |
| Year ended 12/31/12 | $1,275,972 | N/A |
| Year ended 7/31/12 | N/A | $1,179,772 |
| Year ended 12/31/11 | $1,854,159 | N/A |
___________
| * | Note that as the non-audit services provided to the Adviser and its affiliates are not attributable to the 12/31 Henderson Funds or 7/31 Henderson Funds, and due to the different year-ends prior to 7/31/2013, certain fees billed during the period may be reflected in both the 12/31 Henderson Funds’ and 7/31 Henderson Funds’ fiscal years. |
(h) The registrant’s Audit Committee has determined that the non-audit services the principal accountant has rendered to the Adviser that were not required to be pre-approved by the Audit Committee because they did not relate directly to the operations and financial reporting of the registrant were compatible with maintaining the principal accountant’s independence.
Item 5. Audit Committee of Listed Registrants.
Not applicable.
Item 6. Schedule of Investments.
(a) Schedule of Investments is included as a part of the report to shareholders filed under Item 1 of this Form N-CSR.
(b) Not applicable.
Item 7. Disclosure of Proxy Voting Policies and Procedures for Closed-End Management Investment Companies.
Not applicable.
Item 8. Portfolio Managers of Closed-End Management Investment Companies.
Not applicable.
Item 9. Purchases of Equity Securities by Closed-End Management Investment Company and Affiliated Purchasers.
Not applicable.
Item 10. Submission of Matters to a Vote of Security Holders.
There have been no material changes to the procedures by which the shareholders may recommend nominees to the registrant’s board of trustees, where those changes were implemented after the registrant last provided disclosure in response to this Item.
Item 11. Controls and Procedures.
(a) The registrant’s principal executive officer and principal financial officer have evaluated the registrant’s disclosure controls and procedures within 90 days of this filing and have concluded that the registrant’s disclosure controls and procedures were effective, as of that date, in ensuring that information required to be disclosed by the registrant in this Form N-CSR was recorded, processed, summarized and reported timely.
(b) There were no changes in the registrant’s internal controls over financial reporting (as defined in Rule 30a-3(d) under the Investment Company Act of 1940) that occurred during the four-month period from March 29, 2013 through July 31, 2013 covered by this report that has materially affected, or is reasonably likely to materially affect, the registrant’s internal controls over financial reporting.
Item 12. Exhibits.
| | | The certifications required by Rule 30a-2(a) under the 1940 Act (17 CFR 270.30a-2(a)) are attached hereto. |
| (b) | The certifications required by Rule 30a-2(b) under the 1940 Act (17 CFR 270.30a-2(b)) and Section 906 of the Sarbanes-Oxley Act of 2002 are attached hereto. |
SIGNATURES
Pursuant to the requirements of the Securities Exchange Act of 1934 and the Investment Company Act of 1940, the registrant has duly caused this report to be signed on its behalf by the undersigned, thereunto duly authorized.
HENDERSON GLOBAL FUNDS
| By: | | /s/ James. G. O’Brien |
| | | James G. O’Brien |
| | | President (principal executive officer) of Henderson Global Funds |
Date: September 13, 2013
Pursuant to the requirements of the Securities Exchange Act of 1934 and the Investment Company Act of 1940, this report has been signed below by the following persons on behalf of the registrant and in the capacities and on the dates indicated.
| By: | | /s/ James. G. O’Brien |
| | | James G. O’Brien |
| | | President (principal executive officer) of Henderson Global Funds |
Date: September 13, 2013
| By: | | /s/ Troy Statczar |
| | | Troy Statczar |
| | | Treasurer (principal financial officer) of Henderson Global Funds |
Date: September 13, 2013