UNITED STATES
SECURITIES AND EXCHANGE COMMISSION
Washington, D.C. 20549
FORM N-CSR
CERTIFIED SHAREHOLDER REPORT OF REGISTERED
MANAGEMENT INVESTMENT COMPANIES
Investment Company Act file number: 811-10399
______________________________________________
HENDERSON GLOBAL FUNDS
____________________________________________________________________________
(Exact name of registrant as specified in charter)
737 NORTH MICHIGAN AVENUE, SUITE 1700
CHICAGO, ILLINOIS 60611
____________________________________________________________________________
(Address of principal executive offices)(Zip code)
| (Name and Address of Agent for Service) | Copy to: |
CHRISTOPHER GOLDEN 737 NORTH MICHIGAN AVENUE, SUITE 1700 CHICAGO, ILLINOIS 60611 | CATHY G. O’KELLY VEDDER PRICE P.C. 222 NORTH LASALLE STREET CHICAGO, ILLINOIS 60601 |
Registrant’s telephone number, including area code: (312) 871-6200
Date of fiscal year end: July 31
Date of reporting period: July 31, 2016
Item 1: Report to Shareholders.

| Letter to shareholders | 1 |
| Commentaries and Performance summaries | |
| All Asset Fund | 4 |
| Dividend & Income Builder Fund | 6 |
| Emerging Markets Fund | 8 |
| European Focus Fund | 10 |
| Global Equity Income Fund | 12 |
| Global Technology Fund | 14 |
| High Yield Opportunities Fund | 16 |
| International Long/Short Equity Fund | 18 |
| International Opportunities Fund | 20 |
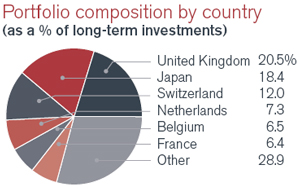
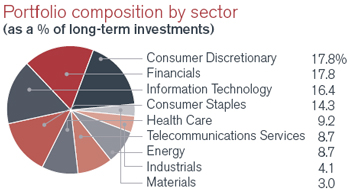
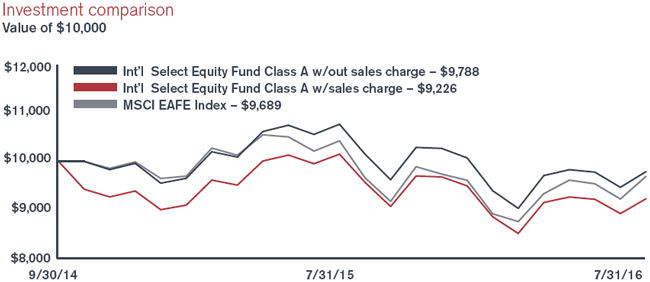
| International Select Equity Fund | 22 |
| Strategic Income Fund | 24 |
| Unconstrained Bond Fund | 26 |
| US Growth Opportunities Fund | 28 |
| Portfolios of investments | 30 |
| Statements of assets and liabilities | 120 |
| Statements of operations | 128 |
| Statements of changes in net assets | 136 |
| Statements of changes – capital stock activity | 149 |
| Statement of cash flows | 174 |
| Financial highlights | 176 |
| Notes to financial statements | 202 |
| Report of independent registered public accounting firm | 218 |
| Other information | 219 |
| Trustees and officers | 226 |
International and emerging markets investing involves certain risks and increased volatility not associated with investing solely in the US. These risks include currency fluctuations, economic or financial instability, lack of timely or reliable financial information or unfavorable political or legal developments. The Funds may invest in securities issued by smaller companies which typically involve greater risk than investing in larger companies. Certain of the Funds are non-diversified and therefore the change in value of a single holding may have a more pronounced effect on a Fund's performance. Also, the Funds may invest in limited geographic areas and/or sectors which may result in greater market volatility. In addition, the Funds may invest in derivatives. Derivatives involve special risks different from, and potentially greater than, the risks associated with investing directly in securities and may result in greater losses. The Funds may be subject to frequent trading which may result in a turnover rate of 100% or more. Additional fund-specific risk is described in more detail in the Prospectus and Statement of Additional Information.
Investors should consider the investment objectives, risks, charges and expenses of a mutual fund carefully before investing. For a free Prospectus, which contains these items and other important information about the Funds, visit www.henderson.com. The Prospectus should be read carefully before investing.
Dear shareholder,
We are pleased to provide the annual report for the Henderson Global Funds, which covers the year ended July 31, 2016.
It would be very difficult to cover the events of this time period without mentioning "Brexit" (British exit): the UK's referendum vote to leave the European Union (EU). The (now former) Prime Minister, David Cameron, called for a referendum on continued EU membership as part of his re-election campaign in 2015 due to concerns over the UK's sovereignty, the free movement of people, and the EU's call for an "ever closer union." In the vote on June 23, 2016, the UK voted to leave the EU. The impact of the UK's vote is likely to be felt across Europe's political and investment landscape for years to come.
The next part of the process of exiting the EU will take a minimum of two years and the details have yet to be established. In the meantime, some have wondered whether Brexit will cause a recession in the UK, especially as recent UK industrial data has shown a marked slowing. We do believe business investment will fall, but a recession would be surprising against a backdrop of stable financial conditions and a growing global economy. Additionally, on August 4, 2016, the Bank of England implemented dual stimulus measures, cutting the base interest rate to 0.25% and announcing a quantitative easing program of £70 billion, further reducing the likelihood of a recession.
In Europe, aside from various reactions to the Brexit vote, there have been some positive signs of growth. The unemployment rate fell to 10.1% in May, the lowest rate since 2011 and down from a 2013 peak of 12.1%. Recent German economic news has been upbeat, and European consumer prices rose by an annual 0.1% in June, the first positive reading since January. However, looking forward, there are several political risks on the horizon. Italy will hold a referendum on constitutional reform in October, and elections in Germany and France may discourage necessary decision-making on Brexit and other issues.
Moving outside of Europe, the Chinese government has been working to stabilize growth through infrastructure projects, reducing red tape and maintaining a loose monetary policy. Economic news so far this year has suggested these policies are helping: industrial output rose by an annual 6.0% in May, little changed from 5.9% in Q1. However, exports and imports both fell in July on weak demand, highlighting the headwinds that China is facing.
In Japan, economic pessimism has increased as the yen continued to surge. Prime Minister Abe scrapped a planned 2017 sales tax hike and promised a fiscal stimulus package after July upper house elections. So far, the Bank of Japan has held steady on any big monetary stimulus this year. However, "core" consumer price inflation fell back to 0.8% in May from 1.3% in December, boosting expectations of future monetary easing.
US profits are stabilizing, as the national accounts measure of economic profits recovered by 2% in Q1 after a 16% slide over the previous five quarters. Brexit should have minimal impact on the US economy, and a recovery in profits may encourage investment and hiring. All eyes are on the Federal Reserve as domestic strength could prompt higher interest rates despite global risks.
Looking forward, we believe that the direct impact of Brexit on the world economy is likely to be modest, but it is still expected to weigh on investor confidence at a time when the global recovery remains fragile. Regardless of how the situation plays out, Brexit-related uncertainties will take some time to dispel and in these conditions it will be more important than ever to remain flexible from an investment perspective. We continue to believe that volatility and uncertainty can create attractive investment opportunities, and we are focused on seeking out these opportunities across the globe. We appreciate your trust in, and support of, our Funds, and we look forward to serving your financial needs in the years to come.
James G. O'Brien
President, Henderson Global Funds
Investors should consider the investment objectives, risks, charges and expenses of a mutual fund carefully before investing. For a free Prospectus, which contains this and other important information about the Funds, visit www.henderson.com. The Prospectus should be read carefully before investing.
1
| Multi-Asset Team: Market review and forecast |
It has unquestionably been a turbulent year for markets. Significant financial and geopolitical events have been commonplace and long standing themes such as the omnipotence of central banks have been challenged. Here we review some of the recent market drivers and offer our view on the important developments that are likely to shape the next six months.
While a quick glance at the 2016 scoreboard might suggest broad-based investor confidence, the underlying picture is more nuanced. We believe that four main themes explain much of this year's price action, two bearish and two bullish:
1. Policy fatigue in Japan
With economists forecasting real gross domestic product (GDP) growth of 0.5% this year and consumer price index inflation of zero, it is not surprising that some investors are losing faith in "Abenomics"*.
Japan real effective exchange rate
Source: Bloomberg, August 2016. †Quantitative easing is a monetary policy used by central banks to stimulate the economy when standard monetary policy has become ineffective.
Given the historically strong negative correlation between Japanese stock prices and the currency, the move has led Japanese markets to materially underperform global peers over the first half of 2016.
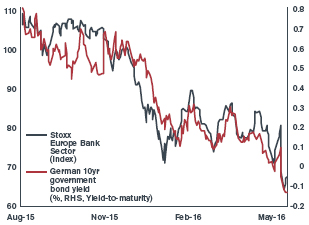
2. Frail financials
The combined impact of low or negative interest rates, flat yield curves, and mounting regulation has weighed heavily on the financial sector. Indeed, the performance of bank stocks has become increasingly correlated to bond yields over the last 12 months.
European banks and German bund yields
Source: Bloomberg, August 2016. The STOXX Sector indices are available for global markets as well as for Europe, the Eurozone and Eastern Europe. Using the market standard ICB Industry Classification Benchmark, companies are categorized according to their primary source of revenue. This categorization guarantees a professional and accurate classification of companies in their respective business environments. There are four levels of classification ranging from broad to very detailed: 10 industries are broken down into 19 supersectors, 41 sectors and 114 subsectors.
Such concerns were encapsulated by the financials panic at the start of the year, in which investors began to worry about banks' abilities to service coupon payments on low quality debt.
3. The prevailing global hunt for yield
Further expansionary monetary policy measures in Europe, Japan and the UK have driven global bond yields to new historic lows. This has been a significant tailwind for fixed income assets and has forced investors to find income elsewhere.
2
4. The rehabilitation of emerging markets
Emerging markets (EM) have been out of favor for some time, as falling commodity prices and weak developed market demand adversely affected growth. However, of late, the relative momentum has shifted. Market forces have also been supportive as the benefits from weak currencies and recovering commodity markets have eased financial tensions. As a result, EM debt and equities have outperformed their developed peers thus far in 2016.
Where next for global markets?
The macroeconomic picture remains challenging. Analysts continue to downgrade GDP, inflation and earnings forecasts and nominal growth remains subdued. Although the global economy is moving forwards, the recovery remains fragile, policy-dependent and vulnerable to adverse shocks.
Consensus forecasts for GDP growth
| | 2015 | 2016F | 2017F | Rvs 2016 |
| G10 | 1.9 | 1.6 | 1.7 | -0.6 |
| US | 2.4 | 1.9 | 2.2 | -0.9 |
| Eurozone | 1.5 | 1.5 | 1.2 | -0.2 |
| UK | 2.2 | 1.5 | 0.5 | -0.9 |
| Japan | 0.5 | 0.5 | 0.8 | -0.9 |
Source: Bloomberg consensus forecasts, 8/5/16
Note: Revisions (Rvs) refers to the change between the 2016 forecasts taken as of June 2015 and present.
Policy remains critical. Growth and inflation continue to trundle along below trend and many structural dynamics remain apparent. In Europe, corporate profitability is ebbing away and the financial sector is the key vulnerability opening a potential path to further political instability. In Japan, investors are keenly awaiting the Bank of Japan's review of monetary policy in September, to see whether they have exhausted their policy options. For the UK, the outlook is clouded by the uncertainty of its future relationship with the European Union and the path to get there. A short-term recession looks likely, however, monetary and fiscal assistance should limit the extent of a slowdown to a prolonged period of weak growth.
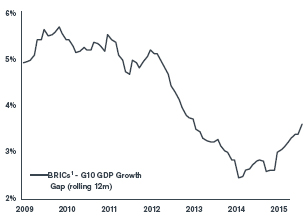
The era of EM underperformance looks to be coming to an end, with both top-down and bottom-up data suggesting a relative improvement in momentum versus developed markets. While it is not hard to identify frailties in the region, we see just as many threats facing the developed economies and correlations between EM equities and other assets that have fallen.
Emerging vs Developed markets GDP growth
Source: Bloomberg, August 2016. 1BRICs: Brazil, Russia, India and China
From monetary to fiscal easing
As the returns to monetary policy dwindle, we expect to see a greater role for fiscal policy. This theme does not appear to have affected financial markets thus far, however, large fiscal programs will undoubtedly face institutional constraints in some countries. Notwithstanding this, we believe that the shifting policy mix is beginning to gather some global momentum. While we believe that 'helicopter money' in its literal form (cash handouts) remains unlikely, further coordination between fiscal and monetary policy appears to be gaining traction with macroeconomists.
Outlook
It is not hard to imagine that the remainder of 2016 will be as eventful and surprising for investors as the year has been so far. In fact, we expect further surprises. Against this backdrop, it is important to remain vigilant, flexible and diversified and avoid taking significant bets on binary events.
| * Abenomics refers to the economic policies advocated by Shinzo Abe and is based upon the "three arrows" of fiscal stimulus, monetary easing and structural reforms. |
3
All Asset Fund
It has unquestionably been a turbulent year for markets. Significant financial and geopolitical events have been commonplace and long standing themes, such as the omnipotence of central banks, have been challenged. Over the period, market volatility increased substantially – with periods of relative calm punctuated by short episodic sell-offs such as those seen in August 2015 and January 2016. Furthermore, the easy gains from expansionary monetary policy have been made, leaving policy-makers increasingly bereft of ideas for new stimulus.
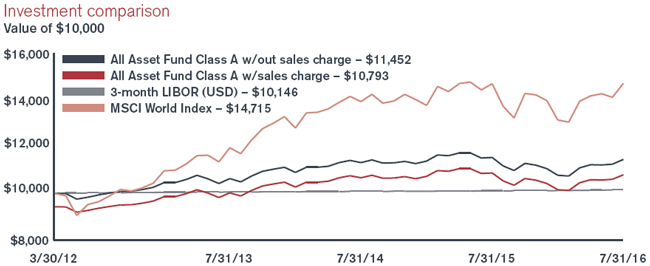
For the year ended July 31, 2016, the Fund returned (0.71)% (Class A at NAV) versus the benchmark, 3-month LIBOR (USD), which posted a return of 0.43%. The Fund's equity allocations were the largest detractor from performance accentuated by a strong dollar, which eroded returns from a domestic currency perspective. Performance was predominantly driven by the Fund's hedging assets with allocations to gold and investment-grade credit providing effective downside protection during setbacks.
Over the period, we dynamically adjusted the Fund's composition to reflect the fluid market environment. From a broad thematic perspective, we reduced the Fund's aggregate level of risk-exposure at the start of the period – primarily through sales of equity positions into cash and gold. Our above average cash balance has proven an effective buffer against market volatility in an environment where traditional
| Top 10 long-term holdings* |
| (at July 31, 2016) |
| | | | As a percentage |
| Security | | | of net assets |
| iShares TIPS Bond ETF | | | 4.6 | % |
| Henderson Unconstrained Bond Fund | | | 4.5 | |
| iShares Edge MSCI Minimum Volatility EAFE ETF | | | 4.0 | |
| TIAA-CREF Asset Management Core Property Fund LP | | | 3.8 | |
| iShares Core MSCI Emerging Markets ETF | | | 3.4 | |
| ASG Global Alternatives Fund | | | 3.4 | |
| PowerShares Senior Loan Portfolio | | | 3.2 | |
| Henderson High Yield Opportunities Fund | | | 3.2 | |
| AQR Managed Futures Strategy Fund | | | 3.1 | |
| iShares iBoxx Investment Grade Corporate Bond Fund | | | 3.1 | |
hedges, such as government bonds, appear expensive; we therefore retain a defensive stance in the Fund looking ahead.
As the period progressed, we slowly began to increase our emerging market (EM) equity and debt exposure at the expense of developed market assets. The change was spurred by improving absolute and relative macroeconomic fundamentals in the region – which we have largely disdained since the collapse in the oil price 18 months ago. The Fund also made an effective tactical investment in high yield (Henderson High Yield Opportunities Fund) at the start of 2016, when spreads were pricing a global recessionary scenario. We have since taken some profits on the trade, rotating into dollar-denominated EM debt, which is heavily supported by investor inflows.
We also diversified our US equity exposure by replacing a position in the S&P 500 with two equity-style ETFs. The two strategies increase our control over the equity-style bias of our US holdings and ensure the Fund's US exposure remains diversified. Finally, we added two new alternative strategies from Applied Quantitative Research, which bolster the diversifying sub-portfolio of the Fund by providing an attractive source of uncorrelated returns.
Looking forward, nominal growth remains subdued providing sustained support for global bond yields. That said, the increasing propensity to implement fiscal over monetary policy could begin to reverse this relationship to some degree. We remain overweight to equities relative to duration assets and see credit as more attractive than government bonds in our fixed income allocations. Our cash levels remain above average and we continue to underweight sterling relative to other international currencies.
* For further detail about these holdings, please refer to the section entitled "Portfolios of investments." Fund holdings are as of the date given, are subject to change at any time, and are not recommendations to buy or sell any security.
4
All Asset Fund
| Total returns as of July 31, 2016 | | | | | | | | | | | Since |
| | | | NASDAQ | | One | | Three | | inception |
| At NAV | | | symbol | | year | | years* | | (3/30/2012)* |
| Class A | | | HGAAX | | -0.71 | % | | 2.51 | % | | 3.17 | % |
| Class C | | | HGACX | | -1.46 | | | 1.72 | | | 2.40 | |
| Class I | | | HGAIX | | -0.45 | | | 2.78 | | | 3.43 | |
| Class R6** | | | HGARX | | -0.44 | | | 2.78 | | | 3.44 | |
| With sales charge | | | | | | | | | | | | | |
| Class A | | | | | | -6.39 | % | | 0.51 | % | | 1.78 | % |
| Class C | | | | | | -1.46 | | | 1.72 | | | 2.40 | |
| Index | | | | | | | | | | | | | |
| 3-month LIBOR (USD) | | | | | | 0.43 | % | | 0.31 | % | | 0.34 | % |
| MSCI World Index | | | | | | 0.13 | | | 7.19 | | | 9.44 | |
* Average annual return.
** Class R6 shares commenced operations on November 30, 2015. The performance for Class R6 shares for periods prior to November 30, 2015 is based on the performance of Class I shares. Performance for Class R6 shares would be similar because the shares are invested in the same portfolio of investments, and like Class I shares, Class R6 shares are not subject to a front-end sales charge or a distribution fee.
Performance data quoted represents past performance and is no guarantee of future results. Performance results with sales charges reflect the deduction of the maximum front-end sales charge or the deduction of the applicable contingent deferred sales charge ("CDSC"). Class A shares are subject to a maximum front-end sales charge of 5.75%. Class C shares are subject to a CDSC of up to 1% on certain redemptions made within 12 months of purchase. Performance presented at Net Asset Value (NAV), which does not include a sales charge, would be lower if this charge were reflected. NAV is the value of one share of the Fund excluding any sales charges. Performance quoted is based on the transacted NAV at each period end, which may differ from the US Generally Accepted Accounting Principles ("GAAP")-adjusted NAV and the total return presented in the Financial Highlights. Current performance may be lower or higher than the performance data quoted. Investment return and principal value will fluctuate so that an investor's shares, when redeemed, may be worth more or less than original cost. As stated in the current prospectus, the Fund's annual operating expense ratios (gross) for Class A, C, I and R6 shares are 1.41%, 2.18%, 1.13% and 1.10% (estimated), respectively. However, the Fund's adviser has contractually agreed to waive its management fee and, if necessary, to reimburse other operating expenses (excluding Acquired Fund Fees and Expenses from underlying investment companies) in order to limit total annual ordinary operating expenses, less distribution and service fees, to 0.60% of the Fund's average daily net assets, which is in effect until July 31, 2020. With respect to investments in affiliated underlying funds, the Fund's adviser has contractually agreed to reduce or waive the Fund's management fee to limit the combined management fees paid to the adviser for those assets to the greater of 1.00% or the affiliated underlying fund's management fee. Indirect net expenses associated with the Fund's investments in underlying investment companies are not subject to the contractual waiver. For the most recent month-end performance, please call 1.866.443.6337 or visit the Funds' website at www.henderson.com.
Performance results also reflect expense subsidies and waivers in effect during periods shown. Absent these waivers, results would have been less favorable. All results assume the reinvestment of dividends and capital gains.
The investment comparison graph above reflects the change in value of a $10,000 hypothetical investment since the Fund's inception, including reinvested dividends and distributions, compared to a broad based securities market index. The MSCI World Index is a free float-adjusted market capitalization weighted index that is designed to measure the equity market performance of developed markets. 3-Month LIBOR (London Interbank Offered Rate) (USD) is the interest rate participating banks offer to other banks for loans on the London market. The Fund is professionally managed while the Indices are unmanaged and not available for investment and do not include fees, expenses or other costs. Results in the table and graph do not reflect the deduction of taxes that a shareholder would pay on Fund distributions or the redemption of Fund shares.
5
Dividend & Income Builder Fund
The global equity market (as measured by the MSCI World Index) was almost unchanged over the period to the end of July, though geographic and sector performance was widely dispersed. At the country level the US outperformed as the economy continued to modestly recover, giving the Federal Reserve the confidence to raise interest rates in December. In contrast, the UK market underperformed. This was partly a function of currency movements, as sterling fell sharply following the UK's vote to leave the European Union in June ("Brexit"). At the sector level, in an uncertain environment for global economic growth and continually low interest rates, financials were among the weakest performing sectors globally.
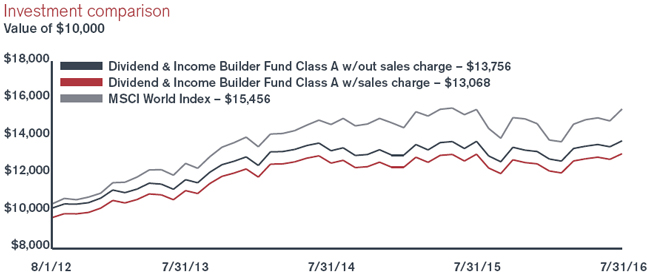
For the year ended July 31, 2016, the Fund returned 0.19% (Class A at NAV) versus the benchmark, MSCI World Index, which posted a return of 0.13%. Within this, the fixed income allocation was a positive contributor to returns. The Fund continued to meet its objectives for earning and distributing income over the period.
During the period, the Fund benefitted from its relatively defensive positioning, including an overweight position in the tobacco and telecommunications sectors. This was also reflected at the stock level where it tended to be the more defensive holdings such as Reynolds American, Lockheed Martin and Imperial Brands that performed well, while more cyclical positions such as BHP Billiton and Royal Dutch Shell detracted from performance. The outlier to this trend was the Fund's holding in pharmaceutical company Novartis. For a number of quarters Novartis has had problems with a slowdown in growth and lower margins from its eye care division, Alcon. While the results were disappointing, they have taken measures to improve performance, such as a reinvestment in research & development and putting in place a new head of the division.
Over the period, the Fund used currency hedges to protect against volatility in British pound sterling and
| Top 10 long-term holdings* |
| (at July 31, 2016) |
| | | | As a percentage |
| Security/Issuer | | | of net assets |
| Nestle S.A. | | | 2.6 | % |
| Microsoft Corp. | | | 2.6 | |
| Pfizer, Inc. | | | 2.4 | |
| Novartis AG | | | 2.2 | |
| Verizon Communications, Inc. | | | 2.1 | |
| Imperial Brands plc | | | 2.1 | |
| Roche Holding AG | | | 2.1 | |
| RELX N.V. | | | 2.1 | |
| Reynolds American, Inc. | | | 2.0 | |
| Chevron Corp. | | | 1.8 | |
the euro. The sterling hedge significantly reduced the impact of Brexit on the portfolio. We continue to see volatility in currencies as investors question the outlook for economic growth and interest rates across the world. We will seek to protect against currency volatility when the Fund has a significant overweight position versus the benchmark in higher dividend yielding markets.
In its equity allocation, the Fund continues to seek companies with both above-average yield and dividend growth. The equity allocation remained over 80% of the Fund, reflecting our current bias towards equities over bonds. While corporate earnings growth has remained mixed in recent years, dividend growth has proven more consistent. In comparison to other asset classes such as government or corporate bonds, it is our view that equities continue to offer good value, especially given the prospects for ongoing dividend growth. In the fixed income allocation, we prefer credit over interest rate risk and continue to invest in high quality names with attractive coupons.
The outlook for global dividend growth remains modestly positive. Within the portfolio we have seen this across many of our holdings. Taiwan Semiconductor, for example, recently increased its dividend by 33% as a result of the strength of its free cash flow generation. This is particularly positive as Taiwan historically has been a low pay-out ratio market. Within Europe we have also seen double-digit dividend increases from holdings such as AXA, and French homebuilder Nexity. There are some sectors where we are more cautious on the ability for dividend growth – integrated oil companies, for example, are on the whole struggling to generate sufficient free cash flow to cover their dividends despite steep capital expenditure cuts and disposals. Looking at the market as a whole, in our view, dividend growth rates remain positive but the rate of growth has declined to reflect the more cautious economic outlook.
In the context of lower global economic growth, we are comfortable with the defensive positioning of the equity allocation among good quality, global companies. The Fund continues to have an underweight position among cyclical sectors such as industrials, technology and basic materials. Within fixed income, the post-Brexit rally in bond prices across the credit spectrum has left us with a general sense that the returns we expected for the remainder of 2016 have been pulled forward to the month of July. That being said, the backdrop of low growth, low inflation and low default rates in Europe remains supportive of the asset class.
* For further detail about these holdings, please refer to the section entitled "Portfolios of investments." Fund holdings are as of the date given, are subject to change at any time, and are not recommendations to buy or sell any security.
6
Dividend & Income Builder Fund
| Total returns as of July 31, 2016 | | | | | | | | | | | Since |
| | | | NASDAQ | | One | | Three | | inception |
| At NAV | | | symbol | | year | | years* | | (8/1/2012)* |
| Class A | | | HDAVX | | | 0.19 | % | | 5.61 | % | | 8.30 | % |
| Class C | | | HDCVX | | | -0.58 | | | 4.81 | | | 7.49 | |
| Class I | | | HDIVX | | | 0.48 | | | 5.86 | | | 8.54 | |
| Class R6** | | | HDRVX | | | 0.66 | | | 5.92 | | | 8.59 | |
| With sales charge | | | | | | | | | | | | | |
| Class A | | | | | | -4.84 | % | | 3.82 | % | | 6.91 | % |
| Class C | | | | | | -0.58 | | | 4.81 | | | 7.49 | |
| Index | | | | | | | | | | | | | |
| MSCI World Index | | | | | | 0.13 | % | | 7.19 | % | | 11.21 | % |
* Average annual return.
** Class R6 shares commenced operations on November 30, 2015. The performance for Class R6 shares for periods prior to November 30, 2015 is based on the performance of Class I shares. Performance for Class R6 shares would be similar because the shares are invested in the same portfolio of investments, and like Class I shares, Class R6 shares are not subject to a front-end sales charge or a distribution fee.
Performance data quoted represents past performance and is no guarantee of future results. Performance results with sales charges reflect the deduction of the maximum front-end sales charge or the deduction of the applicable contingent deferred sales charge ("CDSC"). Class A shares are subject to a maximum front-end sales charge of 5.00%. Class C shares are subject to a CDSC of up to 1% on certain redemptions made within 12 months of purchase. Performance presented at Net Asset Value (NAV), which does not include a sales charge, would be lower if this charge were reflected. NAV is the value of one share of the Fund excluding any sales charges. Performance quoted is based on the transacted NAV at each period end, which may differ from the US Generally Accepted Accounting Principles ("GAAP")-adjusted NAV and the total return presented in the Financial Highlights. Current performance may be lower or higher than the performance data quoted. Investment return and principal value will fluctuate so that an investor's shares, when redeemed, may be worth more or less than original cost. As stated in the current prospectus, the Fund's annual operating expense ratios (gross) for Class A, C, I and R6 shares are 1.47%, 2.24%, 1.25% and 1.19% (estimated), respectively. However, the Fund's adviser has contractually agreed to waive its management fee and, if necessary, to reimburse other operating expenses (excluding Acquired Fund Fees and Expenses from underlying investment companies) in order to limit total annual ordinary operating expenses, less distribution and service fees, to 1.05% of the Fund's average daily net assets, which is in effect until July 31, 2020. For the most recent month-end performance, please call 1.866.443.6337 or visit the Funds' website at www.henderson.com.
Performance results also reflect expense subsidies and waivers in effect during periods shown. Absent these waivers, results would have been less favorable. All results assume the reinvestment of dividends and capital gains.
The investment comparison graph above reflects the change in value of a $10,000 hypothetical investment since the Fund's inception, including reinvested dividends and distributions, compared to a broad based securities market index. The MSCI World Index is a free float- adjusted market capitalization weighted index that is designed to measure the equity market performance of developed markets. The Fund is professionally managed while the Index is unmanaged and not available for investment and does not include fees, expenses or other costs. Results in the table and graph do not reflect the deduction of taxes that a shareholder would pay on Fund distributions or the redemption of Fund shares.
7
Emerging Markets Fund
It was a year of two halves for emerging markets (EM) equities after a weak first half of the period was followed by a strong rebound in the second half. The initial weakness was driven by sustained investor bearishness on the asset class which was aided by concerns relating to the slowing Chinese economy, low commodity prices and continuing geopolitical issues. This was compounded by US dollar strength and the speculation surrounding the path for interest rates in the US. As the year progressed, many of these fears receded and appetite for EM equities resurfaced. Thus far in 2016, EM equities have outperformed their developed markets peers, in which the growing risks have featured heavily in news flow.
For the year ended July 31, 2016, the Fund returned 6.07% (Class A at NAV) versus the benchmark, MSCI Emerging Markets Index, which posted a return of (0.38)%. The Fund has benefitted from this year's rebound in Brazilian equities from what were quite distressed valuations. While on a short-term view valuations are no longer so attractive, on our five-year outlook we believe businesses such as Duratex, Mahle-Metal Leve and Banco Bradesco, which all contributed to performance over the period, are well positioned to enjoy a cyclical recovery when it comes. The Fund's exposure to South African equities was also a positive with consumer staples firms Shoprite and Tiger Brands performing well. We are excited by how many high-quality companies are currently trading at reasonable valuations. Many of these also have growing operations across sub-Saharan Africa
| Top 10 long-term holdings* |
| (at July 31, 2016) |
| | | | As a percentage |
| Security | | | of net assets |
| Standard Bank Group, Ltd. | | | 3.5 | % |
| Shoprite Holdings, Ltd. | | | 3.4 | |
| Mahle-Metal Leve S.A. | | | 3.2 | |
| Inversiones Aguas Metropolitanas S.A. | | | 3.1 | |
| Fuyao Glass Industry Group Co., Ltd. | | | 3.1 | |
| Uni-President Enterprises Corp. | | | 3.1 | |
| Housing Development Finance Corp., Ltd. | | | 3.1 | |
| Duratex S.A. | | | 2.9 | |
| Grupo Herdez SAB de CV | | | 2.8 | |
| Cia Cervecerias Unidas S.A., ADR | | | 2.7 | |
meaning they should be able to deliver long-term growth. The Fund's relative underexposure to information technology businesses detracted from performance while on a stock level the Fund's principal detractors were Idea Cellular, the Indian mobile networks company, and Grupo Herdez, a Mexican foods firm.
Over the period the Fund added Chinese auto-glass manufacturer Fuyao Glass. Fuyao continues to be managed by its founder and has expanded into the US and Europe. The Fund also added brand-building Taiwanese businesses Stella International, a footwear company, and Merida, a leading bike manufacturer. Many Taiwanese companies are expanding into China where the consumer base is growing more and more discerning. A position in UltraTech, an Indian cement company, was also taken. Cement consumption in some less developed markets shares the same fundamental driver as basic fast moving consumer goods: namely improving living standards. Indian cement sales are conducted mostly in cash and demand is largely driven by the need for improved housing. A unique feature of Ultratech is its network of over 50,000 dealers throughout India selling "Ultratech" branded cement. This network is far larger than any of its competitors and has enabled the company to reach an almost 40% market share in rural India. SABMiller was sold after the 'MegaBrew' merger was announced. Other sales over the period included Pick n Pay, Baidu and Astra International.
Weak rule of law combined with many undesirable political and business leaders mean there are parts of the EM universe that are cheap for a reason. We are not deep value investors and aim to avoid being seduced by low-quality companies trading cheaply. Neither are we outright growth investors and we continue to avoid what we believe are overvalued but growing Indian and South East Asian consumer businesses. Instead, as "bottom-up" stock pickers, our focus is on combing unpopular markets for good-quality companies trading at reasonable valuations.
* For further detail about these holdings, please refer to the section entitled "Portfolios of investments." Fund holdings are as of the date given, are subject to change at any time, and are not recommendations to buy or sell any security.
8
Emerging Markets Fund
| Total returns as of July 31, 2016 | | | | | | | | | | | | | | Since |
| | | | NASDAQ | | One | | Three | | Five | | inception |
| At NAV | | | symbol | | year | | years* | | years* | | (12/31/2010)* |
| Class A | | | HEMAX | | | 6.07 | % | | 2.42 | % | | -0.83 | % | | -1.21 | % |
| Class C | | | HEMCX | | | 5.27 | | | 1.65 | | | -1.58 | | | -1.95 | |
| Class I | | | HEMIX | | | 6.41 | | | 2.70 | | | -0.58 | | | -0.97 | |
| Class R6** | | | HEMRX | | | 7.59 | | | 3.08 | | | -0.36 | | | -0.77 | |
| With sales charge | | | | | | | | | | | | | | | | |
| Class A | | | | | | 0.03 | % | | 0.41 | % | | -1.99 | % | | -2.25 | % |
| Class C | | | | | | 5.27 | | | 1.65 | | | -1.58 | | | -1.95 | |
| Index | | | | | | | | | | | | | | | | |
| MSCI Emerging Markets Index | | | | | | -0.38 | % | | 0.07 | % | | -2.41 | % | | -1.96 | % |
* Average annual return.
** Class R6 shares commenced operations on November 30, 2015. The performance for Class R6 shares for periods prior to November 30, 2015 is based on the performance of Class I shares. Performance for Class R6 shares would be similar because the shares are invested in the same portfolio of investments, and like Class I shares, Class R6 shares are not subject to a front-end sales charge or a distribution fee.
Performance data quoted represents past performance and is no guarantee of future results. Due to the Fund's relatively small asset base, performance may be impacted by portfolio turnover to a greater degree than it may be in the future. Performance results with sales charges reflect the deduction of the maximum front-end sales charge or the deduction of the applicable contingent deferred sales charge ("CDSC"). Class A shares are subject to a maximum front-end sales charge of 5.75%. Class C shares are subject to a CDSC of up to 1% on certain redemptions made within 12 months of purchase. Performance presented at Net Asset Value (NAV), which does not include a sales charge, would be lower if this charge were reflected. NAV is the value of one share of the Fund excluding any sales charges. Performance quoted is based on the transacted NAV at each period end, which may differ from the US Generally Accepted Accounting Principles ("GAAP")-adjusted NAV and the total return presented in the Financial Highlights. Current performance may be lower or higher than the performance data quoted. Investment return and principal value will fluctuate so that an investor's shares, when redeemed, may be worth more or less than original cost. As stated in the current prospectus, the Fund's annual operating expense ratios (gross) for Class A, C, I and R6 shares are 2.14%, 2.91%, 1.86% and 1.78% (estimated), respectively. However, the Fund's adviser has contractually agreed to waive its management fee and, if necessary, to reimburse other operating expenses (excluding Acquired Fund Fees and Expenses from underlying investment companies) in order to limit total annual ordinary operating expenses, less distribution and service fees, to 1.54% of the Fund's average daily net assets, which is in effect until July 31, 2020. For the most recent month-end performance, please call 1.866.443.6337 or visit the Funds' website at www.henderson.com.
Performance results also reflect expense subsidies and waivers in effect during periods shown. Absent these waivers, results would have been less favorable. All results assume the reinvestment of dividends and capital gains.
The investment comparison graph above reflects the change in value of a $10,000 hypothetical investment since the Fund's inception, including reinvested dividends and distributions, compared to a broad based securities market index. The MSCI Emerging Markets Index is a free float-adjusted market capitalization weighted index that is designed to measure the equity market performance of emerging markets. The Fund is professionally managed while the Index is unmanaged and not available for investment and does not include fees, expenses or other costs. Results in the table and graph do not reflect the deduction of taxes that a shareholder would pay on Fund distributions or the redemption of Fund shares.
9
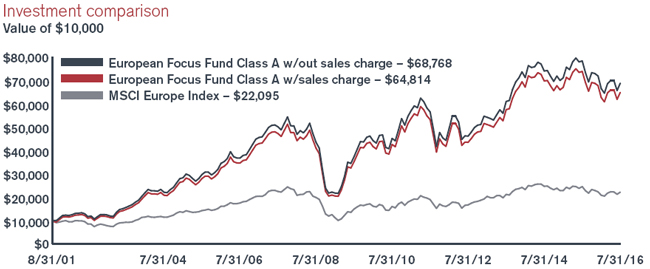
European Focus Fund
Market volatility which began in August dominated the third quarter of 2015, with European equities suffering in tandem with equities worldwide. Concerns over global implications of a slowing Chinese economy precipitated a global sell-off which extended to Europe. German equities, in particular, were hit quite hard due to their export relationship with China. The third quarter also saw a new bailout agreement between Greece and the European Union (EU); a snap election was called shortly afterwards with the incumbent Syriza party remaining as the largest party in the Greek parliament. European equities did produce a strong final quarter of the year - European Central Bank President Mario Draghi announced the extension of their quantitative easing program in December while also cutting the deposit rate to a historic low. After a turbulent start to 2016, including one of the worst Januarys in recent memory, March saw a significant rebound for the vast majority of risk assets with the positive momentum which started midway through February continuing through much of March. Market movements in the second quarter were dominated by the lead up to, and the fallout from, the UK's decision to leave the EU. This outcome caused much volatility in equity markets and currencies.
For the year ended July 31, 2016, the Fund returned (12.20)% (Class A at NAV) versus the benchmark, MSCI Europe Index, which posted a return of (9.75)%. The overweight exposure to consumer discretionary was the main detractor to performance.
| Top 10 long-term holdings* |
| (at July 31, 2016) |
| | | | As a percentage |
| Security | | | of net assets |
| Nokia Oyj | | | 8.6 | % |
| Teva Pharmaceutical Industries, Ltd., ADR | | | 8.1 | |
| Royal Dutch Shell plc, B Shares | | | 5.6 | |
| Dufry AG | | | 3.9 | |
| Roche Holding AG | | | 3.8 | |
| ARM Holdings plc | | | 3.2 | |
| Sanofi | | | 3.1 | |
| Renault S.A. | | | 3.1 | |
| ASML Holding N.V. | | | 3.0 | |
| Continental AG | | | 2.7 | |
Health care exposure led positive returns, while energy and IT exposure was also beneficial.
During the second half of 2015, the Fund took advantage of the adverse price movements in emerging markets-exposed companies such as asset managers Aberdeen and Ashmore. Shire, the pharmaceuticals company, was also added as the Fund increased its health care exposure, while German pharmaceutical company Bayer was also added at the start of 2016. Exposure to financials was increased towards the end of 2015 before being reduced during 2016. The second quarter of 2016 saw the Fund undertake significant trimming within the portfolio in order to focus in on high conviction holdings. This concentration of the portfolio has led to the Fund adding to positions such as Teva Pharmaceutical and Dufry.
In terms of currency hedging, the Fund initiated a hedge on the euro in the third quarter of 2015 in case of any adverse movements versus the US dollar. The Fund closed the hedge on the euro in the early part of 2016. The Fund introduced a British pound sterling hedge in July. There are material risks of a lower sterling; with markets potentially showing a lot of sensitivity to central bank commentary, data releases, political crises and news flow regarding the timeline on when negotiations for the UK's exit from the EU may begin, we believed that some protection was warranted.
The UK's vote to leave the EU adds a layer of uncertainty for global equities over the short to medium term as we wait to find out how the UK's future relationship with the EU manifests itself. As with any major market event, sentiment often goes too far and this presents opportunities for the stock picker. We remain vigilant for new opportunities and continue to believe Europe and international markets, more broadly, offer value for investors.
* For further detail about these holdings, please refer to the section entitled "Portfolios of investments." Fund holdings are as of the date given, are subject to change at any time, and are not recommendations to buy or sell any security.
10
European Focus Fund
| Total returns as of July 31, 2016 | | | | | | | | | | | | | | | | | Since |
| | | | NASDAQ | | One | | Three | | Five | | Ten | | inception |
| At NAV | | | symbol | | year | | years* | | years* | | years* | | (8/31/2001)* |
| Class A | | | HFEAX | | | -12.20 | % | | 4.10 | % | | 4.02 | % | | 6.48 | % | | 13.80 | % |
| Class C | | | HFECX | | | -12.91 | | | 3.29 | | | 3.21 | | | 5.67 | | | 12.94 | |
| Class I** | | | HFEIX | | | -12.01 | | | 4.35 | | | 4.30 | | | 6.69 | | | 13.95 | |
| Class R6*** | | | HFERX | | | -11.99 | | | 4.36 | | | 4.31 | | | 6.69 | | | 13.95 | |
| With sales charge | | | | | | | | | | | | | | | | | | | |
| Class A | | | | | | -17.25 | % | | 2.07 | % | | 2.80 | % | | 5.85 | % | | 13.35 | % |
| Class C | | | | | | -12.91 | | | 3.29 | | | 3.21 | | | 5.67 | | | 12.94 | |
| Index | | | | | | | | | | | | | | | | | | | |
| MSCI Europe Index | | | | | | -9.75 | % | | 1.50 | % | | 3.17 | % | | 2.39 | % | | 5.47 | % |
* Average annual return.
** Class I (formerly Class W) shares commenced operations on March 31, 2009. The performance for Class I shares for periods prior to March 31, 2009 is based on the performance of Class A shares. Performance for Class I shares would be similar because the shares are invested in the same portfolio of investments. Class I shares are not subject to a front-end sales charge or a distribution fee.
*** Class R6 shares commenced operations on November 30, 2015. The performance for Class R6 shares for periods prior to November 30, 2015 is based on the performance of Class I shares. Performance for Class R6 shares would be similar because the shares are invested in the same portfolio of investments, and like Class I shares, Class R6 shares are not subject to a front-end sales charge or a distribution fee.
Performance data quoted represents past performance and is no guarantee of future results. Performance results with sales charges reflect the deduction of the maximum front-end sales charge or the deduction of the applicable contingent deferred sales charge ("CDSC"). Class A shares are subject to a maximum front-end sales charge of 5.75%. Class C shares are subject to a CDSC of up to 1% on certain redemptions made within 12 months of purchase. Performance presented at Net Asset Value (NAV), which does not include a sales charge, would be lower if this charge were reflected. NAV is the value of one share of the Fund excluding any sales charges. Performance quoted is based on the transacted NAV at each period end, which may differ from the US Generally Accepted Accounting Principles ("GAAP")-adjusted NAV and the total return presented in the Financial Highlights. Current performance may be lower or higher than the performance data quoted. Investment return and principal value will fluctuate so that an investor's shares, when redeemed, may be worth more or less than original cost. As stated in the current prospectus, the Fund's annual operating expense ratios (gross) for Class A, C, I and R6 shares are 1.31%, 2.10%, 1.08% and 1.01% (estimated), respectively. As stated in the Statement of Additional Information (SAI), the Fund's adviser has contractually agreed to waive its management fee and, if necessary, to reimburse other operating expenses (excluding Acquired Fund Fees and Expenses from underlying investment companies) in order to limit total annual ordinary operating expenses, less distribution and service fees, to 1.75% of the Fund's average daily net assets, which is in effect until July 31, 2020. For the most recent month-end performance, please call 1.866.443.6337 or visit the Funds' website at www.henderson.com.
Performance results also reflect expense subsidies and waivers in effect during certain periods shown. Absent these waivers, results would have been less favorable for certain periods. All results assume the reinvestment of dividends and capital gains.
The investment comparison graph above reflects the change in value of a $10,000 hypothetical investment since the Fund's inception, including reinvested dividends and distributions, compared to a broad based securities market index. The MSCI Europe Index is a free float-adjusted market capitalization weighted index that is designed to measure the equity market performance of the developed markets in Europe. The Fund is professionally managed while the Index is unmanaged and not available for investment and does not include fees, expenses or other costs. Results in the table and graph do not reflect the deduction of taxes that a shareholder would pay on Fund distributions or the redemption of Fund shares.
11
Global Equity Income Fund
The global equity market (as measured by the MSCI World Index) was almost unchanged over the period to the end of July, though geographic performance was widely dispersed. The US market outperformed as the economy continued to modestly recover, giving the Federal Reserve the confidence in December to raise interest rates. In contrast, the UK was among the weaker performing markets globally. This was partly as a result of currency moves, as sterling fell sharply against the US dollar following the UK vote to leave the European Union (EU) in June. The other notable move during the year was the oil price, which fell sharply to under $30/barrel as a result of supply increases before increasing to just above $40/barrel at year end.
For the year ended July 31, 2016, the Fund returned (1.05)% (Class A at NAV) versus the benchmark, MSCI World Index, which posted a return of 0.13%. The Fund continued to meet its objectives for earning and distributing income over the period. The Fund underperformed the benchmark largely as a result of geographic allocation, in particular the overweight position in the higher-yielding UK and European markets and underweight position in the structurally lower-yielding US market.
Investments for the Fund continued to be focused on those companies we believe to be capable of delivering earnings and free cash flow growth, subsequently leading to dividend growth. A good example of this would be the telecommunications sector. For several years telecom companies have
| Top 10 long-term holdings* |
| (at July 31, 2016) |
| | | | As a percentage |
| Security | | | of net assets |
| Royal Dutch Shell plc, A Shares | | | 3.2 | % |
| British American Tobacco plc | | | 3.1 | |
| BP plc | | | 2.9 | |
| BT Group plc | | | 2.6 | |
| Legal & General Group plc | | | 2.4 | |
| ING Groep N.V. | | | 2.4 | |
| Singapore Telecommunications, Ltd. | | | 2.4 | |
| SSE plc | | | 2.2 | |
| Sumitomo Mitsui Financial Group, Inc. | | | 2.1 | |
| Pfizer, Inc. | | | 2.0 | |
been investing heavily in expanding fourth generation ('4G') coverage for customers, and this capital expenditure is beginning to subside (boosting cash generation) at the same time as data usage among customers is increasing.
Over the period, the Fund used currency hedges to protect against volatility in the following currencies: British pound sterling, the euro and the Australian dollar. The sterling hedge significantly reduced the impact of the UK referendum to leave the EU on the portfolio.
We continue to see volatility in currencies as investors question the outlook for economic growth and interest rates across the world. We use currency hedges to protect against currency volatility when we have a significant overweight position versus the benchmark in higher dividend-yielding markets, such as the UK and Australia.
The outlook for global dividend growth remains modestly positive. Within the portfolio we have seen this across our holdings – Cisco, for example, raised its quarterly dividend 24% earlier this year as a result of its strong free cash flow generation. There are some sectors where we are more cautious on the ability for dividend growth – integrated oil companies, for example, are on the whole struggling to generate sufficient free cash flow to cover their dividends despite steep capital expenditure cuts and disposals. Looking at the market as a whole, in our view, dividend growth rates have declined to reflect the more cautious economic outlook, but remain positive.
The Fund's focus on high quality, income-generating investments has provided support during the volatile markets seen during the period. We will seek to benefit from periods of volatility by opportunistically adding to any attractively valued companies that offer healthy long-term income and capital appreciation prospects. We believe the portfolio is attractively valued versus the benchmark and we see potential for capital and income returns for investors. Low prevailing interest rates around the world mean that investors will continue to look for income generating assets, such as those held by the Fund.
* For further detail about these holdings, please refer to the section entitled "Portfolios of investments." Fund holdings are as of the date given, are subject to change at any time, and are not recommendations to buy or sell any security.
12
Global Equity Income Fund
| Total returns as of July 31, 2016 | | | | | | | | | | | | | | Since |
| | | | NASDAQ | | One | | Three | | Five | | inception |
| At NAV | | | symbol | | year | | years* | | years* | | (11/30/2006)* |
| Class A | | | HFQAX | | | -1.05 | % | | 3.70 | % | | 6.08 | % | | 3.59 | % |
| Class C | | | HFQCX | | | -1.76 | | | 2.92 | | | 5.27 | | | 2.81 | |
| Class I** | | | HFQIX | | | -0.83 | | | 3.94 | | | 6.34 | | | 3.79 | |
| Class R6*** | | | HFQRX | | | -0.54 | | | 4.04 | | | 6.40 | | | 3.82 | |
| With sales charge | | | | | | | | | | | | | | | | |
| Class A | | | | | | -6.74 | % | | 1.67 | % | | 4.84 | % | | 2.96 | % |
| Class C | | | | | | -1.76 | | | 2.92 | | | 5.27 | | | 2.81 | |
| Index | | | | | | | | | | | | | | | | |
| MSCI World Index | | | | | | 0.13 | % | | 7.19 | % | | 8.52 | % | | 4.54 | % |
| MSCI World High Dividend Yield Index | | | | | | 5.81 | | | 6.56 | | | 8.52 | | | 4.18 | |
* Average annual return
** Class I (formerly Class W) shares commenced operations on March 31, 2009. The performance for Class I shares for periods prior to March 31, 2009 is based on the performance of Class A shares. Performance for Class I shares would be similar because the shares are invested in the same portfolio of investments. Class I shares are not subject to a front-end sales charge or a distribution fee.
*** Class R6 shares commenced operations on November 30, 2015. The performance for Class R6 shares for periods prior to November 30, 2015 is based on the performance of Class I shares. Performance for Class R6 shares would be similar because the shares are invested in the same portfolio of investments, and like Class I shares, Class R6 shares are not subject to a front-end sales charge or a distribution fee.
Performance data quoted represents past performance and is no guarantee of future results. Performance results with sales charges reflect the deduction of the maximum front-end sales charge or the deduction of the applicable contingent deferred sales charge ("CDSC"). Class A shares are subject to a maximum front-end sales charge of 5.75%. Class C shares are subject to a CDSC of up to 1% on certain redemptions made within 12 months of purchase. Performance presented at Net Asset Value (NAV), which does not include a sales charge, would be lower if this charge were reflected. NAV is the value of one share of the Fund excluding any sales charges. Performance quoted is based on the transacted NAV at each period end, which may differ from the US Generally Accepted Accounting Principles ("GAAP")-adjusted NAV and the total return presented in the Financial Highlights. Current performance may be lower or higher than the performance data quoted. Investment return and principal value will fluctuate so that an investor's shares, when redeemed, may be worth more or less than original cost. As stated in the current prospectus, the Fund's annual operating expense ratios (gross) for Class A, C, I and R6 shares are 1.19%, 1.96%, 0.96% and 0.89% (estimated), respectively. As stated in the Statement of Additional Information (SAI), the Fund's adviser has contractually agreed to waive its management fee and, if necessary, to reimburse other operating expenses (excluding Acquired Fund Fees and Expenses from underlying investment companies) in order to limit total annual ordinary operating expenses, less distribution and service fees, to 1.15% of the Fund's average daily net assets, which is in effect until July 31, 2020. For the most recent month-end performance, please call 1.866.443.6337 or visit the Funds' website at www.henderson.com.
Performance results also reflect expense subsidies and waivers in effect during certain periods shown. Absent these waivers during those periods, results would have been less favorable. All results assume the reinvestment of dividends and capital gains.
The investment comparison graph above reflects the change in value of a $10,000 hypothetical investment since the Fund's inception, including reinvested dividends and distributions, compared to a broad based securities market index. The MSCI World Index is a free float-adjusted market capitalization weighted index that is designed to measure the equity market performance of developed markets. The MSCI World High Dividend Yield Index aims to objectively reflect the high dividend yield opportunity set within the MSCI World Index. The Fund is professionally managed while the Indices are unmanaged and not available for investment and do not include fees, expenses or other costs. Results in the table and graph do not reflect the deduction of taxes that a shareholder would pay on Fund distributions or the redemption of Fund shares.
13
Global Technology Fund
It was a volatile period for the technology market which initially underperformed during the third quarter of 2015 as international equity market sell-offs, which began in China, spread globally. The final quarter of the year saw international equity markets bounce back; central banks dominated the news flow as the European Central Bank extended their quantitative easing program and the Federal Reserve hiked interest rates for the first time this cycle. Technology outperformed the broader market against this backdrop. The start of 2016 saw heightened volatility and fears of a macro slowdown which led the technology market lower. The second quarter of 2016 saw international equity markets finishing down after the UK's vote to leave the European Union ("Brexit") in late June prompted a sell off. Technology underperformed the wider market against this backdrop.
For the year ended July 31, 2016, the Fund returned 2.03% (Class A at NAV) versus the benchmark, the MSCI AC World IT Index, which posted a return of 8.66%. This was a weaker period for technology funds with the Morningstar Technology category average also underperforming the index. The technology hardware storage & peripherals sector contributed positively to performance, while semiconductors and IT services were the main detractors. At the stock level, among the main detractors were Microsoft, Vipshop Holdings and Web.com. Apple (on a relative basis), Amazon and Activision Blizzard were among the positives.
| Top 10 long-term holdings* |
| (at July 31, 2016) |
| | | | As a percentage |
| Security | | | of net assets |
| Facebook, Inc., Class A | | | 7.3 | % |
| Apple, Inc. | | | 6.3 | |
| Alphabet, Inc. Class A | | | 5.6 | |
| Alphabet, Inc. Class C | | | 5.4 | |
| Visa, Inc., A Shares | | | 4.4 | |
| Samsung Electronics Co., Ltd. | | | 4.3 | |
| Tencent Holdings, Ltd. | | | 3.7 | |
| Cisco Systems, Inc. | | | 3.7 | |
| Broadcom, Ltd. | | | 3.2 | |
| MasterCard, Inc., Class A | | | 3.0 | |
Notable activity over the latter part of 2015 included the sale of Oracle and switch into Adobe. We increased our holding in Facebook given its dominant position in internet advertising and sold Netflix as we believed the valuation had gotten excessive following a strong run. We also reduced more macro-sensitive names such as Cisco, HP Enterprise and Ciena. We actively reduced our higher beta positions, increased our cash position and tried to position the portfolio more defensively. The start of 2016 began with significant market volatility and we used this to opportunistically buy strong franchises at relatively attractive prices. For example, we initiated a new position in PayPal given the company's exposure to paperless payments, its strong platform and reasonably attractive valuation. We also added to other names such as Electronic Arts, Qualcomm and Alphabet over the period. The second quarter of 2016 included the purchase of a stake in Alibaba given its dominant franchise in Chinese e-commerce and relatively attractive valuation. We reduced Microsoft following the acquisition of LinkedIn, a deal where we questioned the rationale.
The long term drivers of technology remain intact, as it continues to take share versus the old economy, driven by demographics and innovation. The relative valuation of the sector is attractive, especially given the balance sheet strength. The headwinds from a strengthening dollar in 2015 are now abating, which should benefit the sector, although some currency volatility is expected post-Brexit. However, the sector faces significant secular changes in enterprise demand, due to a move toward cloud infrastructure, coupled with the maturation of the personal computer and smartphone markets. This may result in moderating outperformance by the sector. We continue to focus "bottom up" on powerful secular themes and growth at a reasonable price.
* For further detail about these holdings, please refer to the section entitled "Portfolios of investments." Fund holdings are as of the date given, are subject to change at any time, and are not recommendations to buy or sell any security.
14
Global Technology Fund
| Total returns as of July 31, 2016 | | | | | | | | | | | | | | | | | Since |
| | | | NASDAQ | | One | | Three | | Five | | Ten | | inception |
| At NAV | | | symbol | | year | | years* | | years* | | years* | | (8/31/2001)* |
| Class A | | | HFGAX | | | 2.03 | % | | 9.69 | % | | 8.32 | % | | 9.83 | % | | 8.48 | % |
| Class C | | | HFGCX | | | 1.23 | | | 8.85 | | | 7.49 | | | 8.99 | | | 7.68 | |
| Class I** | | | HFGIX | | | 2.27 | | | 9.95 | | | 8.60 | | | 10.03 | | | 8.62 | |
| Class R6*** | | | HFGRX | | | 2.53 | | | 10.04 | | | 8.65 | | | 10.06 | | | 8.64 | |
| With sales charge | | | | | | | | | | | | | | | | | | | |
| Class A | | | | | | -3.82 | % | | 7.54 | % | | 7.05 | % | | 9.18 | % | | 8.05 | % |
| Class C | | | | | | 1.23 | | | 8.85 | | | 7.49 | | | 8.99 | | | 7.68 | |
| Index | | | | | | | | | | | | | | | | | | | |
| MSCI AC World IT Index | | | | | | 8.66 | % | | 14.63 | % | | 12.65 | % | | 9.23 | % | | 6.47 | % |
| S&P 500 | | | | | | 5.61 | | | 11.16 | | | 13.38 | | | 7.75 | | | 6.60 | |
* Average annual return.
** Class I (formerly Class W) shares commenced operations on March 31, 2009. The performance for Class I shares for the periods prior to March 31, 2009 is based on the performance of Class A shares. Performance for Class I shares would be similar because the shares are invested in the same portfolio of investments. Class I shares are not subject to a front-end sales charge or a distribution fee.
*** Class R6 shares commenced operations on November 30, 2015. The performance for Class R6 shares for periods prior to November 30, 2015 is based on the performance of Class I shares. Performance for Class R6 shares would be similar because the shares are invested in the same portfolio of investments, and like Class I shares, Class R6 shares are not subject to a front-end sales charge or a distribution fee.
Performance data quoted represents past performance and is no guarantee of future results. Performance results with sales charges reflect the deduction of the maximum front-end sales charge or the deduction of the applicable contingent deferred sales charge ("CDSC"). Class A shares are subject to a maximum front-end sales charge of 5.75%. Class C shares are subject to a CDSC of up to 1% on certain redemptions made within 12 months of purchase. Performance presented at Net Asset Value (NAV), which does not include a sales charge, would be lower if this charge were reflected. NAV is the value of one share of the Fund excluding any sales charges. Performance quoted is based on the transacted NAV at each period end, which may differ from the US Generally Accepted Accounting Principles ("GAAP")-adjusted NAV and the total return presented in the Financial Highlights. Current performance may be lower or higher than the performance data quoted. Investment return and principal value will fluctuate so that an investor's shares, when redeemed, may be worth more or less than original cost. As stated in the current prospectus, the Fund's annual operating expense ratios (gross) for Class A, C, I and R6 shares are 1.35%, 2.13%, 1.12% and 1.04% (estimated), respectively. As stated in the Statement of Additional Information (SAI), the Fund's adviser has contractually agreed to waive its management fee and, if necessary, to reimburse other operating expenses (excluding Acquired Fund Fees and Expenses from underlying investment companies) in order to limit total annual ordinary operating expenses, less distribution and service fees, to 1.75% of the Fund's average daily net assets, which is in effect until July 31, 2020. For the most recent month-end performance, please call 1.866.443.6337 or visit the Funds' website at www.henderson.com.
Performance results also reflect expense subsidies and waivers in effect during certain periods shown. Absent these waivers, results would have been less favorable for certain periods. All results assume the reinvestment of dividends and capital gains.
The investment comparison graph above reflects the change in value of a $10,000 hypothetical investment since the Fund's inception, including reinvested dividends and distributions, compared to a broad based securities market index and an industry focused index. The MSCI AC World IT Index is a free float adjusted market capitalization weighted index designed to measure the equity market performance of the Information Technology stocks within the MSCI AC World Index. The S&P 500 Index is a broad based measurement of changes in stock market conditions based on the average of 500 widely held common stocks. The Fund is professionally managed while the Indices are unmanaged and not available for investment and do not include fees, expenses or other costs. Results in the table and graph do not reflect the deduction of taxes that a shareholder would pay on Fund distributions or the redemption of Fund shares.
15
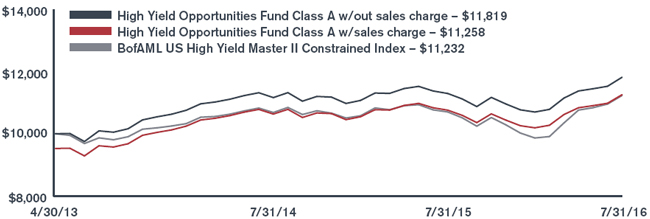
High Yield Opportunities Fund
Declining global government bond yields continue to force investors further out on the credit risk spectrum in the search for income. The US high yield market suffered steep declines over the reporting period driven by unclear Federal Reserve expectations, languishing commodity prices, persistent retail outflows and emerging markets growth concerns. For most of the period higher quality rated bonds (double-B) outperformed lower quality rated bonds (triple-C) and both energy and metals/mining were the worst performing sectors. The energy sector now represents over 26% of the emerging market high yield segment as compared to 14% for US high yield and only 5% for European high yield. By region, European high yield outperformed US high yield and emerging market high yield over the reporting period.
Throughout 2016, retail fund flows were negative and new bond issuance fell below last year's amount. Over the same period, approximately 73% of all defaults and distressed debt exchanges occurred in the energy and metals/mining (mostly coal) sectors; excluding the energy and metals and mining (mostly coal) sectors, the trailing 12-month default rate was only 0.56%.
For the year ended July 31, 2016, the Fund returned 4.63% (Class A at NAV) versus the benchmark, Bank of America Merrill Lynch US High Yield Master II Constrained Index, which posted a return of 4.95%.
| Top 10 long-term holdings* |
| (at July 31, 2016) |
| | | | As a percentage |
| Security/Issuer | | | of net assets |
| Prime Security Services Borrower LLC | | | 2.4 | % |
| Herc Rentals, Inc. | | | 1.8 | |
| Frontier Communications Corp. | | | 1.7 | |
| BWAY Holding Co. | | | 1.5 | |
| Popular, Inc. | | | 1.5 | |
| Intelsat Jackson Holdings S.A. | | | 1.5 | |
| Sunoco LP/Sunoco Finance Corp. | | | 1.5 | |
| Signode Industrial Group Lux S.A. | | | 1.4 | |
| Hot Topic, Inc. | | | 1.4 | |
| Argos Merger Sub, Inc. | | | 1.4 | |
Over the period, the Fund benefitted from maintaining a higher quality bias within the lower rating tiers. While an underweight allocation to double-B rated bonds was maintained, the Fund outperformed on strong credit selection, an allocation to loans and an underweight stance in the energy sector. While the Fund incurred some losses in the energy sector, it benefitted from a higher quality bias in this space. The Fund's best sector and company contributors were in defensive industries like healthcare and media, while the worst detractors were almost exclusively in the energy and metals/mining segments.
The Fund is now positioned closer to the benchmark as far as credit risk (as measured by yield) and in line as far as weighted average credit rating. Within the energy sector, we decreased our underweight position during the second quarter of 2016 and have focused on higher quality exploration & production companies as well as midstream companies. We continue to be selective in the new issue market. We have made a conscious effort to add risk to the portfolio over the last three months but have found it difficult given the challenging secondary market liquidity and the higher quality bias of the new issue calendar.
Our energy outlook has improved given the fact that oil has moved from $25 to $50 per barrel (and recently back to $40); furthermore, most of the defaults and distressed exchanges that we expected to occur in the energy sector have taken place. We will look to move the portfolio more in line with the benchmark as far as yield and spread and rely on credit selection as the main driver of alpha over the next few months and quarters. Low global government bond yields continue to drive strong demand for high yield bonds and leveraged loans on both the retail and institutional side.
* For further detail about these holdings, please refer to the section entitled "Portfolios of investments." Fund holdings are as of the date given, are subject to change at any time, and are not recommendations to buy or sell any security.
16
High Yield Opportunities Fund
| Total returns as of July 31, 2016 | | | | | | | | | | | Since |
| | | | NASDAQ | | One | | Three | | inception |
| At NAV | | | symbol | | year | | year* | | (4/30/2013)* |
| Class A | | | HYOAX | | | 4.63 | % | | 5.41 | % | | 5.27 | % |
| Class C | | | HYOCX | | | 3.88 | | | 4.58 | | | 4.47 | |
| Class I | | | HYOIX | | | 4.76 | | | 5.60 | | | 5.49 | |
| Class R6** | | | HYORX | | | 4.70 | | | 5.58 | | | 5.47 | |
| With sales charge | | | | | | | | | | | | | |
| Class A | | | | | | -0.31 | % | | 3.70 | % | | 3.70 | % |
| Class C | | | | | | 3.88 | | | 4.58 | | | 4.47 | |
| Index | | | | | | | | | | | | | |
| BofAML US High Yield Master II Constrained Index | | | | | | 4.95 | % | | 4.41 | % | | 3.64 | % |
* Average annual return.
** Class R6 shares commenced operations on November 30, 2015. The performance for Class R6 shares for periods prior to November 30, 2015 is based on the performance of Class I shares. Performance for Class R6 shares would be similar because the shares are invested in the same portfolio of investments, and like Class I shares, Class R6 shares are not subject to a front-end sales charge or a distribution fee.
Performance data quoted represents past performance and is no guarantee of future results. Due to the Fund's relatively small asset base, performance may be impacted by portfolio turnover to a greater degree than it may be in the future. Performance results with sales charges reflect the deduction of the maximum front-end sales charge or the deduction of the applicable contingent deferred sales charge ("CDSC"). Class A shares are subject to a maximum front-end sales charge of 4.75%. Class C shares are subject to a CDSC of up to 1% on certain redemptions made within 12 months of purchase. Performance presented at Net Asset Value (NAV), which does not include a sales charge, would be lower if this charge were reflected. NAV is the value of one share of the Fund excluding any sales charges. Performance quoted is based on the transacted NAV at each period end, which may differ from the US Generally Accepted Accounting Principles ("GAAP")-adjusted NAV and the total return presented in the Financial Highlights. Current performance may be lower or higher than the performance data quoted. Investment return and principal value will fluctuate so that an investor's shares, when redeemed, may be worth more or less than original cost. As stated in the current prospectus, the Fund's annual operating expense ratios (gross) for Class A, C, I and R6 shares are 1.24%, 1.86%, 1.01% and 1.01% (estimated), respectively. However, the Fund's adviser has contractually agreed to waive its management fee and, if necessary, to reimburse other operating expenses (excluding Acquired Fund Fees and Expenses from underlying investment companies) in order to limit total annual ordinary operating expenses, less distribution and service fees, to 0.68% of the Fund's average daily net assets, which is in effect until July 31, 2020. Prior to March 31, 2016, this contractual expense limitation was set at 0.85%. For the most recent month-end performance, please call 1.866.443.6337 or visit the Funds' website at www.henderson.com.
Performance results also reflect expense subsidies and waivers in effect during periods shown. Absent these waivers, results would have been less favorable. All results assume the reinvestment of dividends and capital gains.
The investment comparison graph above reflects the change in value of a $10,000 hypothetical investment since the Fund's inception, including reinvested dividends and distributions, compared to a broad based securities market index. The Bank of America Merrill Lynch U.S. High Yield Master II Constrained Index tracks the performance of below investment grade U.S. dollar-denominated corporate bonds publicly issued in the U.S. domestic market. The Fund is professionally managed while the Index is unmanaged and not available for investment and does not include fees, expenses or other costs. Results in the table and graph do not reflect the deduction of taxes that a shareholder would pay on Fund distributions or the redemption of Fund shares.
17
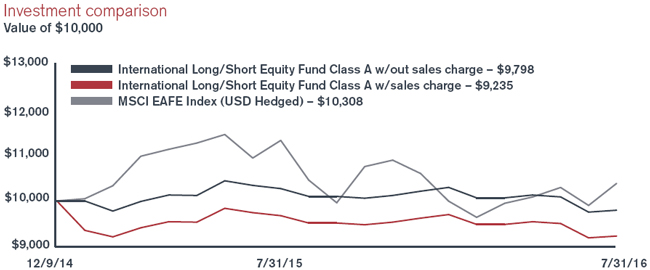
International Long/Short Equity Fund
During the third quarter of 2015, the heightened volatility which began in China, spread globally. After the surprise devaluation of the yuan by the Chinese central bank and fears over slowing economic growth in China, Asia Pacific markets and emerging markets tumbled. European markets followed suit, where price falls were particularly evident in Germany. International equity markets rebounded during the fourth quarter; central banks dominated the news flow as the European Central Bank extended their quantitative easing program while the Federal Reserve increased interest rates for the first time this cycle. The start of 2016 saw a sharp and indiscriminate sell-off with China once again the main area of concern, where authorities intervened with trading halts and liquidity injections, which further weakened the Chinese currency. A further slump in oil and other commodity prices raised fears of deflation. Both developed and emerging equity markets were caught up in the sell-off as investors grew increasingly concerned about the path of global economic growth. A strengthening US dollar compounded this decline for local investors. The second quarter was dominated by the UK's vote to leave the European Union (EU) in late June, ushering in a period of prolonged uncertainty as the
| Top 5 "Long" Holdings (including equity swaps)* |
| (at July 31, 2016) |
| | | | As a percentage |
| Security | | | of net assets |
| Teva Pharmaceutical Industries, Ltd., ADR | | | 3.5 | % |
| Dufry AG | | | 3.1 | |
| Auto Trader Group plc | | | 2.5 | |
| Inmarsat plc | | | 2.5 | |
| DJI Holdings plc | | | 2.5 | |
| | | | |
| Top 5 "Short" Holdings (including equity swaps)* |
| (at July 31, 2016) |
| | | | As a percentage |
| Security | | | of net assets |
| SSE plc | | | (2.1 | )% |
| Airbus Group NV | | | (1.4 | ) |
| Mitie Group plc | | | (1.2 | ) |
| Carillion plc | | | (1.2 | ) |
| Fenner plc | | | (1.1 | ) |
market waits to see how the UK manages the fallout from the referendum and also how the relationship between the UK and the EU will manifest itself.
For the year ended July 31, 2016, the Fund returned (4.59)% (class A at NAV) versus the benchmark, MSCI EAFE Index (USD Hedged), which posted a return of (8.29)%. Performance was driven by the short books of each of the geographic strategies, with the Japan and UK strategies' short books performing well. In particular, the UK strategy's short position in Avanti Communications was a strong contributor, as was the Japan strategy's short position in Sumitomo Chemical. Weaker performance was mainly derived from the long books of the Fund with the Europe and Japan strategies suffering the most from the volatility. Long positions in Volkswagen, Sumitomo Mitsui Financial Group and Nokia were notable detractors.
Notable activity during the latter part of 2015 saw the UK strategy exit short positions in Genus and Qinetiq and its long position in Thomas Cook. The Asia strategy closed out a short position in Prada and exited its long position in Dongfeng Motor Group. During the first quarter of 2016, the Europe strategy added positions in British asset manager Aberdeen and Barclays Bank after both fell foul of market sell-offs. The Japan strategy exited long positions in robotics and automation firm Fanuc and telecoms company NTT DoCoMo, adding positions in Mitsui Fudosan, the property developer, and GLP J-REIT, a logistics properties real estate investment trust. The Asia strategy sold its long position in Cheung Kong Property, a Hong Kong-listed property developer.
The UK's vote to leave the EU places an additional layer of uncertainty on markets. However, we believe this is a political crisis and not an economic one. While volatility may continue, we continue to believe that international equities, sitting lower in the cycle relative to their US counterparts, offer value.
* For further detail about these holdings, please refer to the section entitled "Portfolios of investments." Fund holdings are as of the date given, are subject to change at any time, and are not recommendations to buy or sell any security.
18
International Long/Short Equity Fund
| Total returns as of July 31, 2016 | | | | | | | | Since |
| | | | NASDAQ | | One | | inception |
| At NAV | | | symbol | | year | | (12/9/2014)* |
| Class A | | | HLNAX | | | -4.59 | % | | -1.23 | % |
| Class C | | | HLNCX | | | -5.39 | | | -2.03 | |
| Class I | | | HLNIX | | | -4.27 | | | -0.97 | |
| Class R6** | | | HLNRX | | | -4.26 | | | -0.96 | |
| With sales charge | | | | | | | | | | |
| Class A | | | | | | -10.11 | % | | -4.73 | % |
| Class C | | | | | | -5.39 | | | -2.03 | |
| Index | | | | | | | | | | |
| MSCI EAFE Index (USD Hedged) | | | | | | -8.29 | % | | 1.86 | % |
* Average annual return.
** Class R6 shares commenced operations on November 30, 2015. The performance for Class R6 shares for periods prior to November 30, 2015 is based on the performance of Class I shares. Performance for Class R6 shares would be similar because the shares are invested in the same portfolio of investments, and like Class I shares, Class R6 shares are not subject to a front-end sales charge or a distribution fee.
Performance data quoted represents past performance and is no guarantee of future results. Due to the Fund's relatively small asset base, performance may be impacted by portfolio turnover to a greater degree than it may be in the future. Performance results with sales charges reflect the deduction of the maximum front-end sales charge or the deduction of the applicable contingent deferred sales charge ("CDSC"). Class A shares are subject to a maximum front-end sales charge of 5.75%.Class C shares are subject to a CDSC of up to 1% on certain redemptions made within 12 months of purchase. Performance presented at Net Asset Value (NAV), which does not include a sales charge, would be lower if this charge were reflected. NAV is the value of one share of the Fund excluding any sales charges. Performance quoted is based on the transacted NAV at each period end, which may differ from the US Generally Accepted Accounting Principles ("GAAP")-adjusted NAV and the total return presented in the Financial Highlights. Current performance may be lower or higher than the performance data quoted. Investment return and principal value will fluctuate so that an investor's shares, when redeemed, may be worth more or less than original cost. As stated in the current prospectus, the Fund's annual operating expense ratios (gross) for Class A, C, I and R6 shares excluding dividends and interest expenses on securities sold short are 7.97%, 8.71%, 7.68% and 7.67% (estimated), respectively. However, the Fund's adviser has agreed to contractually waive its management fee and, if necessary, reimburse other operating expenses (excluding Acquired Fund Fees and Expenses from underlying investment companies and dividends and interest expense on securities sold short) in order to limit total annual ordinary operating expenses, less distribution and service fees, to 1.50% of the Fund's average daily net assets, which is in effect until July 31, 2020. For the most recent month-end performance, please call 1.866.443.6337 or visit the Funds' website at www.henderson.com.
Performance results also reflect expense subsidies and waivers in effect during periods shown. Absent these waivers, results would have been less favorable. All results assume the reinvestment of dividends and capital gains.
The investment comparison graph above reflects the change in value of a $10,000 hypothetical investment since the Fund's inception, including reinvested dividends and distributions, compared to a broad based securities market index. The MSCI EAFE Index (USD Hedged) is a free float-adjusted market capitalization weighted index that is designed to measure the equity market performance of developed markets, excluding the US and Canada and excluding the effect of currency translations. The Fund may invest in emerging markets while the Index only consists of companies in developed markets. The Fund is professionally managed while the Index is unmanaged and not available for investment and does not include fees, expenses or other costs. Results in the table and graph do not reflect the deduction of taxes that a shareholder would pay on Fund distributions or the redemption of Fund shares.
19
International Opportunities Fund
During the third quarter of 2015, the heightened volatility which began in China, spread globally. After the surprise devaluation of the yuan by the Chinese central bank and fears over slowing economic growth in China, Asia Pacific markets and emerging markets tumbled. European markets followed suit, where price falls were particularly evident in Germany.International equity markets rebounded during the final quarter; central banks dominated the news flow as the European Central Bank extended their quantitative easing program while the Federal Reserve increased interest rates for the first time this cycle. The start of 2016 saw a sharp and indiscriminate sell-off with China once again the main area of concern, where authorities intervened with trading halts and liquidity injections, which further weakened the Chinese currency. A further slump in oil and other commodity prices raised fears of deflation. Both developed and emerging equity markets were caught up in the sell-off as investors grew increasingly concerned about the path of global economic growth. A strengthening US dollar compounded this decline for local investors. The second quarter was dominated by the UK's vote to leave the European Union (EU) in late June, ushering in a period of prolonged uncertainty as the market waits to see how the UK manages the fallout from the referendum and also how the relationship between the UK and the EU will manifest itself.
For the year ended July 31, 2016, the Fund returned (7.15)% (Class A at NAV) versus the benchmark, MSCI EAFE Index, which posted a return of (7.07)%. The Europe-2, Emerging Markets and Asia Pacific
| Top 10 long-term holdings* |
| (at July 31, 2016) |
| | | | As a percentage |
| Security | | | of net assets |
| Teva Pharmaceutical Industries, Ltd., ADR | | | 3.4 | % |
| Nokia Oyj | | | 3.2 | |
| Renault S.A. | | | 2.9 | |
| Royal Dutch Shell plc, B Shares | | | 2.9 | |
| Continental AG | | | 2.8 | |
| SAP SE | | | 2.7 | |
| Sodexo | | | 2.7 | |
| ARM Holdings plc | | | 2.6 | |
| Deutsche Post AG | | | 2.6 | |
| Amadeus IT Holding S.A., A Shares | | | 2.6 | |
sub-portfolios all outperformed on a relative basis, while the Europe-1, Japan and Global Growth sub-portfolios underperformed.
The Fund's sub-portfolio structure was altered during the period, with the Latin America sub-portfolio broadening to become an Emerging Markets sub-portfolio in order to strengthen the investment potential of the Fund. The allocation of the Fund was also altered during the first quarter of 2016 by adding to the Emerging Markets, Asia Pacific and Global Growth sub-portfolios, and shifting allocations away from the Europe-2 and Japan sub-portfolios.
Towards the end of 2015, the Fund placed a partial hedge on the euro to protect against any adverse moves against the US dollar, which was subsequently closed in the early part of 2016. A yen hedge has been maintained throughout the period as an insurance against possible future moves by the Bank of Japan. The Fund introduced a British pound sterling hedge in July. There are material risks of a lower sterling; with markets potentially showing a lot of sensitivity to central bank commentary, data releases, political crises and news flow regarding the timeline on when negotiations for the UK's exit from the EU may begin, we believed that some protection was warranted.
Another layer of uncertainty is placed on markets with the UK's vote to leave the EU. We believe while this is a political crisis, it is not an economic one. We continue to believe that international equities, sitting lower in the cycle relative to their US counterparts, continue to offer value despite the probability of ongoing volatility.
* For further detail about these holdings, please refer to the section entitled "Portfolios of investments." Fund holdings are as of the date given, are subject to change at any time, and are not recommendations to buy or sell any security.
20
International Opportunities Fund
| Total returns as of July 31, 2016 | | | | | | | | | | | | | | | | | Since |
| | | | NASDAQ | | One | | Three | | Five | | Ten | | inception |
| At NAV | | | symbol | | year | | years* | | years* | | years* | | (8/31/2001)* |
| Class A | | | HFOAX | | | -7.15 | % | | 3.96 | % | | 4.46 | % | | 3.98 | % | | 8.59 | % |
| Class C | | | HFOCX | | | -7.88 | | | 3.16 | | | 3.65 | | | 3.18 | | | 7.78 | |
| Class I** | | | HFOIX | | | -6.91 | | | 4.24 | | | 4.75 | | | 4.19 | | | 8.74 | |
| Class R*** | | | HFORX | | | -7.41 | | | 3.68 | | | 4.12 | | | 3.69 | | | 8.30 | |
| Class R6**** | | | HFOSX | | | -6.75 | | | 4.30 | | | 4.79 | | | 4.20 | | | 8.75 | |
| Class IF***** | | | HFITX | | | -6.64 | | | 4.15 | | | 4.58 | | | 4.03 | | | 8.63 | |
| With sales charge | | | | | | | | | | | | | | | | | | | |
| Class A | | | | | | -12.48 | % | | 1.93 | % | | 3.23 | % | | 3.36 | % | | 8.16 | % |
| Class C | | | | | | -7.88 | | | 3.16 | | | 3.65 | | | 3.18 | | | 7.78 | |
| Index | | | | | | | | | | | | | | | | | | | |
| MSCI EAFE Index | | | | | | -7.07 | % | | 2.45 | % | | 3.49 | % | | 2.46 | % | | 5.45 | % |
* Average annual return.
** Class I (formerly Class W) shares commenced operations on March 31, 2009. The performance for Class I shares for periods prior to March 31, 2009 is based on the performance of Class A shares. Performance for Class I shares would be similar because the shares are invested in the same portfolio of investments. Class I shares are not subject to a front-end sales charge or a distribution fee.
*** Class R shares commenced operations on September 30, 2005. The performance for Class R shares for periods prior to September 30, 2005 is based on the performance of Class A shares, adjusted for the higher expenses applicable to R shares. Performance for Class R shares would be similar because the shares are invested in the same portfolio of investments. Class R shares are not subject to a front-end sales charge but are subject to a distribution fee of 0.50%.
**** Class R6 shares commenced operations on November 30, 2015. The performance for Class R6 shares for periods prior to November 30, 2015 is based on the performance of Class I shares. Performance for Class R6 shares would be similar because the shares are invested in the same portfolio of investments, and like Class I shares, Class R6 shares are not subject to a front-end sales charge or a distribution fee.
***** Class IF shares commenced operations on March 31, 2016. The performance for Class IF shares for periods prior to March 31, 2016 is based on the performance of Class A shares. Performance for Class IF shares would be similar because the shares are invested in the same portfolio of investments. Class IF shares are not subject to a front-end sales charge but are subject to a distribution fee of 0.05%.
Performance data quoted represents past performance and is no guarantee of future results. Performance results with sales charges reflect the deduction of the maximum front-end sales charge or the deduction of the applicable contingent deferred sales charge ("CDSC"). Class A shares are subject to a maximum front-end sales charge of 5.75%. Class C shares are subject to a CDSC of up to 1% on certain redemptions made within 12 months of purchase. Class R shares have no front-end sales charge or CDSC. Performance presented at Net Asset Value (NAV), which does not include a sales charge, would be lower if this charge were reflected. NAV is the value of one share of the Fund excluding any sales charges. Performance quoted is based on the transacted NAV at each period end, which may differ from the US Generally Accepted Accounting Principles ("GAAP")-adjusted NAV and the total return presented in the Financial Highlights. Current performance may be lower or higher than the performance data quoted. Investment return and principal value will fluctuate so that an investor's shares, when redeemed, may be worth more or less than original cost. As stated in the current prospectus, the Fund's annual operating expense ratios (gross) for Class A, C, R, I, R6 and IF shares are 1.37%, 2.14%, 1.64%, 1.11%, 1.03% (estimated), and 1.06% (estimated), respectively. As stated in the Statement of Additional Information (SAI), the Fund's adviser has contractually agreed to waive its management fee and, if necessary, to reimburse other operating expenses (excluding Acquired Fund Fees and Expenses from underlying investment companies) in order to limit total annual ordinary operating expenses, less distribution and service fees, to 1.75% of the Fund's average daily net assets, which is in effect until July 31, 2020. For the most recent month-end performance, please call 1.866.443.6337 or visit the Funds' website at www.henderson.com.
Performance results also reflect expense subsidies and waivers in effect during certain periods shown. Absent these waivers, results would have been less favorable for certain periods. All results assume the reinvestment of dividends and capital gains.
The investment comparison graph above reflects the change in value of a $10,000 hypothetical investment since the Fund's inception, including reinvested dividends and distributions, compared to a broad based securities market index. The MSCI EAFE Index is a free float-adjusted market capitalization weighted index that is designed to measure the equity market performance of developed markets, excluding the US and Canada. The Fund may invest in emerging markets while the Index only consists of companies in developed markets. The Fund is professionally managed while the Index is unmanaged and not available for investment and does not include fees, expenses or other costs. Results in the table and graph do not reflect the deduction of taxes that a shareholder would pay on Fund distributions or the redemption of Fund shares.
21
International Select Equity Fund
Global equity markets declined over the period, driven by uncertain economic growth. Markets oscillated between: believing that central banks can boost economic growth; fearing the return to normalization for monetary policy remains a distant hope; and believing that central banks are running out of ammunition. Despite the US raising interest rates for the first time in a decade, tightening has been postponed as US and global economic data has weakened. Concurrently, global earnings have been downgraded across many sectors. Geopolitical risk has also increased materially: from terrorist attacks and the migrant crisis in Europe, to the UK's recent decision to leave the European Union (EU) ("Brexit") and the upcoming US elections. In Japan, the central bank's purchase of exchange traded funds is accelerating; it's projected to be the largest shareholder of a quarter of the constituents of the Nikkei 225 Index by 2017. In this environment, Japanese equities proved a relative safe haven, helped by currency strength. Europe suffered from Brexit and Asian equities were dragged lower by Chinese macroeconomic concerns. By sector, defensive consumer staples and IT stocks performed well, while financials and consumer discretionary underperformed.
For the year ended July 31, 2016, the Fund returned (9.11)% (Class A at NAV) versus the benchmark, MSCI EAFE Index, which posted a return of (7.07)%. The Fund underperformed its benchmark as the strengthening US dollar weighed on returns.
In addition to currency fluctuations, Brexit was detrimental to European holdings, as markets largely expected the opposite outcome. UK free-to-air broadcaster ITV plunged nearly 17% the day after the vote on concerns that UK advertising spend would collapse post-Brexit. We had already reduced the
| Top 10 long-term holdings* |
| (at July 31, 2016) |
| | | | As a percentage |
| Security | | | of net assets |
| KBC Groep N.V. | | | 3.6 | % |
| Tokio Marine Holdings, Inc. | | | 3.4 | |
| SAP SE | | | 3.3 | |
| Rentokil Initial plc | | | 3.2 | |
| Coca-Cola HBC AG | | | 3.1 | |
| Teva Pharmaceutical Industries, Ltd., ADR | | | 3.1 | |
| ASML Holding N.V. | | | 3.1 | |
| Shinhan Financial Group Co., Ltd. | | | 3.1 | |
| Nokia Oyj | | | 3.0 | |
| Julius Baer Group, Ltd. | | | 3.0 | |
position as our investment thesis had largely played out, and subsequently sold the position. By sector, financials across Europe have performed poorly, as interest rates seem to be staying lower for longer. Negative sentiment towards banks increased when the European Central Bank introduced a negative interest rate policy to encourage lending. Belgian bank KBC, one of the more defensive European banks, was not immune from the industry-wide sell-off. However, we expect the bank to start paying a dividend in the medium term, which should act as a tailwind for the shares. In Italy, concerns over the capital position of Italian banks and their potential need to raise capital led to the position in UniCredit being the weakest performer. After concluding that investors might force a capital raise we decided to sell the position.
There were, however, some positive stock specific stories in Europe. Shares in Dutch semiconductor equipment manufacturer ASML were strong, as the firm reported that orders are starting to be placed in a key growth area: Extreme Ultraviolet Lithography systems. The system can produce smaller, faster chips, with a greater capacity. In the UK, pest-control business Rentokil continued to see acceleration in organic growth. Further offsetting poor performance was stock selection in Japan across a variety of sectors. The pharmacy chain Tsuruha added the most to returns as it continued to report earnings ahead of consensus, receiving further upgrades from store launches and the prospect of additional acquisitions. Insurer Tokio Marine has benefitted from continued revenue growth in its domestic non-life business, a low, stable combined ratio and profitable organic growth. The shares rallied in July as the Bank of Japan left interest rates unchanged given fears over the potential for deeper negative interest rates.
During the period we added to higher growth (SAP, Yandex), energy (Galp Energia), emerging market-exposed consumer (Coca-Cola HBC, Ontex) and defensive consumer staples (Ahold Delhaize). Portfolio sales mainly reduced economically-sensitive financials and industrials. We believe these trades better position the Fund for a continued low-growth, low interest rate environment, but one where equities, notwithstanding an exogenous shock, could grind higher as there are few alternatives for investors. We remain wary of potential slowing growth while the UK negotiates its exit from the EU, and that equities, on a standalone basis, are reasonably expensive.
* For further detail about these holdings, please refer to the section entitled "Portfolios of investments." Fund holdings are as of the date given, are subject to change at any time, and are not recommendations to buy or sell any security.
22
International Select Equity Fund
| Total returns as of July 31, 2016 | | | | | | | | Since |
| | | | NASDAQ | | One | | inception |
| At NAV | | | symbol | | year | | (9/30/2014)* |
| Class A | | | HSQAX | | | -9.11 | % | | -1.16 | % |
| Class C | | | HSQCX | | | -9.83 | | | -1.93 | |
| Class I | | | HSQIX | | | -8.99 | | | -0.99 | |
| Class R6** | | | HSQRX | | | -8.76 | | | -0.85 | |
| With sales charge | | | | | | | | | | |
| Class A | | | | | | -14.36 | % | | -4.30 | % |
| Class C | | | | | | -9.83 | | | -1.93 | |
| Index | | | | | | | | | | |
| MSCI EAFE Index | | | | | | -7.07 | % | | -1.77 | % |
* Average annual return.
** Class R6 shares commenced operations on November 30, 2015. The performance for Class R6 shares for periods prior to November 30, 2015 is based on the performance of Class I shares. Performance for Class R6 shares would be similar because the shares are invested in the same portfolio of investments, and like Class I shares, Class R6 shares are not subject to a front-end sales charge or a distribution fee.
Performance data quoted represents past performance and is no guarantee of future results. Due to the Fund's relatively small asset base, performance may be impacted by portfolio turnover to a greater degree than it may be in the future. Performance results with sales charges reflect the deduction of the maximum front-end sales charge or the deduction of the applicable contingent deferred sales charge ("CDSC"). Class A shares are subject to a maximum front-end sales charge of 5.75%. Class C shares are subject to a CDSC of up to 1% on certain redemptions made within 12 months of purchase. Performance presented at Net Asset Value (NAV), which does not include a sales charge, would be lower if this charge were reflected. NAV is the value of one share of the Fund excluding any sales charges. Performance quoted is based on the transacted NAV at each period end, which may differ from the US Generally Accepted Accounting Principles ("GAAP")-adjusted NAV and the total return presented in the Financial Highlights. Current performance may be lower or higher than the performance data quoted. Investment return and principal value will fluctuate so that an investor's shares, when redeemed, may be worth more or less than original cost. As stated in the current prospectus, the Fund's annual operating expense ratios (gross) for Class A, C, I and R6 shares are 4.16%, 5.09%, 3.98% and 3.98% (estimated), respectively. However, the Fund's adviser has contractually agreed to waive its management fee and, if necessary, to reimburse other operating expenses (excluding Acquired Fund Fees and Expenses from underlying investment companies) in order to limit total annual ordinary operating expenses, less distribution and service fees, to 0.89% of the Fund's average daily net assets, which is in effect until July 31, 2020. For the most recent month-end performance, please call 1.866.443.6337 or visit the Funds' website at www.henderson.com.
Performance results also reflect expense subsidies and waivers in effect during periods shown. Absent these waivers, results would have been less favorable. All results assume the reinvestment of dividends and capital gains.
The investment comparison graph above reflects the change in value of a $10,000 hypothetical investment since the Fund's inception, including reinvested dividends and distributions, compared to a broad based securities market index. The MSCI EAFE Index is a free float-adjusted market capitalization weighted index that is designed to measure the equity market performance of developed markets, excluding the US and Canada. The Fund may invest in emerging markets while the Index only consists of companies in developed markets. The Fund is professionally managed while the Index is unmanaged and not available for investment and does not include fees, expenses or other costs. Results in the table and graph do not reflect the deduction of taxes that a shareholder would pay on Fund distributions or the redemption of Fund shares.
23
Strategic Income Fund
Many of the themes from the prior year still hold true for this year's missive. Starting with developed government bond markets, performance remained strong driven by yield curve flattening as investors priced in the low growth, low inflation environment that characterizes today's global economy. The Federal Reserve's attempt to raise interest rates was underwhelming with just one rate hike to date, while in contrast, the Bank of England which had previously also talked up the chances of a rate hike, has cut rates in response to slowing growth. Perhaps the dominant force in bond markets in recent times has been the effect of the dramatic collapse in longer dated Japanese government bond yields driven by exceptional levels of bond buying by the Bank of Japan and an unexpected move to negative interest rates.
In contrast, corporate bond markets experienced considerable volatility over the course of the year. In the US, energy exposure in the high yield market drove a mini-default cycle that proved the source of this volatility. In addition, record numbers of investment grade bond issuance from companies looking to buy back shares or make acquisitions saturated the US investment grade market at points during the year. In Europe, default rates remained at exceptionally low levels and issuance of debt from European companies was far more muted. This provided for a better fundamental backdrop for European credit markets despite the considerable headline risk emanating from the UK's vote to leave the European Union and concerns about the profitability of European banks. The real game changer for European bond markets proved to be the unexpected announcement by the European
| Top 10 long-term holdings* |
| (at July 31, 2016) |
| | | | As a percentage |
| Security/Issuer | | | of net assets |
| United Kingdom Gilt | | | 4.1 | % |
| Deutsche Telekom International | | | | |
| Finance B.V. | | | 2.4 | |
| Ardagh Packaging Finance plc | | | 2.1 | |
| Anheuser-Busch InBev S.A. | | | 2.0 | |
| Orange S.A. | | | 1.8 | |
| BNP Paribas S.A. | | | 1.6 | |
| UBS Group A.G. | | | 1.5 | |
| Imperial Brands Finance plc | | | 1.5 | |
| AXA S.A. | | | 1.4 | |
| Philip Morris International, Inc. | | | 1.4 | |
Central Bank in March that it would buy certain eligible investment grade corporate bonds. The effect of this announcement was to drive a substantial and continued rally in these bonds.
For the year ended July 31, 2016, the Fund returned 5.46% (Class A at NAV) versus the benchmark, 3-month LIBOR (USD), which posted a return of 0.43%. Contribution across all bond asset classes was positive reflecting the overall strength of fixed income markets. The Fund benefited from our decision to increase duration over the year. We did this by tactically adding longer dated government bond exposure at certain points as well making the decision to structurally increase the exposure to longer dated investment grade bonds. Bond selection was solid with no notable underperformers to report and no defaults. In large part this reflected a style bias that shies away from troubled cyclical sectors such as commodities. The allocation to European financials (UK insurers, UK and European banks) did add volatility to the Fund, particularly during the February 2016 sell-off but no lasting damage was done as these holdings recovered strongly towards the end of the period as systemic fears calmed. In addition, the theme of legacy banking bonds being bought back by the banks themselves continued and we would highlight the example of Barclays making a particularly attractive offer for the Fund's holding in its 6.86% coupon bond at $1.1575 on the dollar which we chose to accept.
A number of macroeconomic trends continue to drive the construction of the Fund. Firstly, the global backdrop remains one of low growth and low inflation with the recent pronounced slowdown across emerging markets only exacerbating these trends. As a result we remain constructive on most government bond markets and view any rate hikes in the US and UK as more of a token policy adjustment than a rate hiking cycle to be feared. Our approach to corporate bonds in this environment is to focus on income return and to exercise caution by lending to large non-cyclical high yield rated businesses. In the last year we have generated a considerable portion of the Fund's return from capital by extending the duration of the Fund. This has worked well but at current valuations we are debating the merits of a move back to higher yielding areas and shorter maturity areas of the bond market. A 5% additional allocation to floating rate loans in July 2016 was one such small move in that direction.
* For further detail about these holdings, please refer to the section entitled "Portfolios of investments." Fund holdings are as of the date given, are subject to change at any time, and are not recommendations to buy or sell any security.
24
Strategic Income Fund
| Total returns as of July 31, 2016 | | | | | | | | | | | | | | | | | Since |
| | | | NASDAQ | | One | | Three | | Five | | Ten | | inception |
| At NAV | | | symbol | | year | | years* | | years* | | years* | | (9/30/2003)* |
| Class A | | | HFAAX | | | 5.46 | % | | 5.57 | % | | 5.21 | % | | 4.15 | % | | 5.35 | % |
| Class C | | | HFACX | | | 4.70 | | | 4.76 | | | 4.39 | | | 3.33 | | | 4.53 | |
| Class I** | | | HFAIX | | | 5.70 | | | 5.80 | | | 5.44 | | | 4.27 | | | 5.45 | |
| Class R6*** | | | HFARX | | | 5.73 | | | 5.81 | | | 5.45 | | | 4.28 | | | 5.45 | |
| With sales charge | | | | | | | | | | | | | | | | | | | |
| Class A | | | | | | 0.49 | % | | 3.85 | % | | 4.20 | % | | 3.64 | % | | 4.95 | % |
| Class C | | | | | | 4.70 | | | 4.76 | | | 4.39 | | | 3.33 | | | 4.53 | |
| Index | | | | | | | | | | | | | | | | | | | |
| 3-month LIBOR (USD) | | | | | | 0.43 | % | | 0.31 | % | | 0.34 | % | | 1.48 | % | | 1.74 | % |
| Barclays Global Agg Credit | | | | | | | | | | | | | | | | | | | |
| USD Hedged | | | | | | 7.41 | | | 5.35 | | | 5.13 | | | 5.42 | | | 5.00 | |
* Average annual return.
** Class I shares commenced operations on April 29, 2011. The performance for Class I shares for periods prior to April 29, 2011 is based on the performance of Class A shares. Performance for Class I shares would be similar because the shares are invested in the same portfolio of investments. Class I shares are not subject to a front-end sales charge or a distribution fee.
*** Class R6 shares commenced operations on November 30, 2015. The performance for Class R6 shares for periods prior to November 30, 2015 is based on the performance of Class I shares. Performance for Class R6 shares would be similar because the shares are invested in the same portfolio of investments, and like Class I shares, Class R6 shares are not subject to a front-end sales charge or a distribution fee.
Performance data quoted represents past performance and is no guarantee of future results. Performance results with sales charges reflect the deduction of the maximum front-end sales charge or the deduction of the applicable contingent deferred sales charge ("CDSC"). Class A shares are subject to a maximum front-end sales charge of 4.75%. Class C shares are subject to a CDSC of up to 1% on certain redemptions made within 12 months of purchase. Performance presented at Net Asset Value (NAV), which does not include a sales charge, would be lower if this charge were reflected. NAV is the value of one share of the Fund excluding any sales charges. Performance quoted is based on the transacted NAV at each period end, which may differ from the US Generally Accepted Accounting Principles ("GAAP")-adjusted NAV and the total return presented in the Financial Highlights. Current performance may be lower or higher than the performance data quoted. Investment return and principal value will fluctuate so that an investor's shares, when redeemed, may be worth more or less than original cost. As stated in the current prospectus, the Fund's annual operating expense ratios (gross) for Class A, C, I and R6 shares are 1.17%, 1.94%, 0.94% and 0.86% (estimated), respectively. However, the Fund's adviser has contractually agreed to waive its management fee and, if necessary, to reimburse other operating expenses (excluding Acquired Fund Fees and Expenses from underlying investment companies) in order to limit total annual ordinary operating expenses, less distribution and service fees, to 0.85% of the Fund's average daily net assets, which will remain in effect until July 31, 2020. For the most recent month-end performance, please call 1.866.443.6337 or visit the Funds' website at www.henderson.com.
Performance results also reflect expense subsidies and waivers in effect during the periods shown. Absent these waivers, results would have been less favorable. All results assume the reinvestment of dividends and capital gains.
The investment comparison graph above reflects the change in value of a $10,000 hypothetical investment since the Fund's inception, including reinvested dividends and distributions, compared to a broad based securities market index. The Barclays Capital Global Aggregate Credit (USD) Hedged Index is a broad-based measure of the global investment-grade and high yield fixed-rate markets. 3-Month LIBOR (London Interbank Offered Rate) (USD) is the interest rate participating banks offer to other banks for loans on the London market. The Fund is professionally managed while the Indices are unmanaged and not available for investment and do not include fees, expenses or other costs. Results in the table and graphs do not reflect the deduction of taxes that a shareholder would pay on Fund distributions or the redemption of Fund shares.
25
Unconstrained Bond Fund
The last few years have been characterized by unprecedented events, policy measures and market movements and this year was no different. Developed market central bank policies diverged materially with the US Federal Reserve eventually raising interest rates in December while the European Central Bank (ECB) announced further easing measures, including cutting its deposit rate further into negative territory. The Bank of Japan joined the ECB in moving official interest rates below zero. Substantial proportions of government bonds in both Europe and Japan now trade with a negative yield, guaranteeing investors a loss if they hold the issues to their maturity. Late in the period, financial markets were affected by the outcome of the UK referendum to leave the European Union (EU), with a narrow margin in favor of "Leave". Against this background, returns from government bond markets have been very strong with investment grade corporates benefitting from the government bond tailwind, albeit underperforming. Sub-investment grade (high yield) corporate bonds have been volatile, especially in the US where the vulnerability of energy companies to the collapsing oil price undermined returns. Emerging markets also saw volatility with political turmoil in Brazil and slowing Chinese economic activity. Inflation continues to be absent from most developed markets, as previous sharp falls in commodity prices and lackluster growth continue to exert a downward pressure on prices.
For the year ended July 31, 2016, the Fund returned 1.35% (Class A at NAV) versus the benchmark, 3-month LIBOR (USD), which posted a return of
| Top 10 long-term holdings* |
| (at July 31, 2016) |
| | | | As a percentage |
| Security/Issuer | | | of net assets |
| United States Treasury Inflation Indexed Bonds | | | 9.2 | % |
| Italy Buoni Poliennali Del Tesoro | | | 6.7 | |
| Japan Treasury Discount Bill | | | 4.5 | |
| Spain Government Bond | | | 3.1 | |
| British Telecommunications plc | | | 1.2 | |
| Discover Card Execution Note Trust | | | 1.0 | |
| Barclays Dryrock Issuance Trust | | | 1.0 | |
| Business Mortgage Finance 3 plc | | | 1.0 | |
| German Residential Funding plc | | | 1.0 | |
| Eurosail 2006-1 plc | | | 1.0 | |
0.43%. Holdings in corporate bonds and inflation-linked Treasuries were the main positive drivers. While the interest rate sensitivity of the Fund was increased towards the end of the period, the Fund did not benefit significantly from the fall in longer maturity government bond yields which boosted broad market returns.
Government bond exposure was held at low levels during the period with holdings focused on inflation-linked debt issued by the Italian and US governments, plus some exposure to fixed rate Mexican bonds. The former two delivered positive returns. Mexican debt however was affected by the broad based sell-off in emerging markets that also impacted high quality issuers such as Mexico. Overall interest rate risk (duration) of the Fund started the period at relatively low levels but was increased during 2016 so that by period end it was around four years.
Corporate bond exposures (both investment grade and high yield) provided the bulk of the Fund returns. Over the period, high yield holdings were biased towards Europe, given our concerns regarding the energy sector that is heavily represented in the US high yield market and the ongoing hunt for yield in Europe as a result of the ECB's quantitative easing and negative interest rate policy. This proved successful for most of the year, but detracted in the second half of the period. The allocation to floating rate asset-backed securities and currency both had little impact on performance overall.
Risk management strategies applied to reduce the interest rate sensitivity of the Fund detracted from returns overall. We removed the interest rate hedge held against investment grade corporate bond holdings in early 2016, which resulted in an increase in the duration (interest rate sensitivity) of the Fund.
Overall, the market reaction since the UK's referendum to leave the EU has been more positive than expected. Unconventional central bank policy continues to dominate and support the "grab for yield", despite a number of macro risks. In today's low yield environment, credit markets provide an opportunity to lock in higher income streams, but we expect volatility to remain elevated given the maturity of the cycle and the fragile macro environment. As a result, we retain a more defensive bias.
* For further detail about these holdings, please refer to the section entitled "Portfolios of investments." Fund holdings are as of the date given, are subject to change at any time, and are not recommendations to buy or sell any security.
26
Unconstrained Bond Fund
| Total returns as of July 31, 2016 | | | | | | | | Since |
| | | | NASDAQ | | One | | inception |
| At NAV | | | symbol | | year | | (12/20/2013)* |
| Class A | | | HUNAX | | | 1.35 | % | | 1.10 | % |
| Class C | | | HUNCX | | | 0.64 | | | 0.33 | |
| Class I | | | HUNIX | | | 1.60 | | | 1.31 | |
| Class R6** | | | HUNRX | | | 1.61 | | | 1.32 | |
| With sales charge | | | | | | | | | | |
| Class A | | | | | | -3.42 | % | | -0.77 | % |
| Class C | | | | | | 0.64 | | | 0.33 | |
| Index | | | | | | | | | | |
| 3-month LIBOR (USD) | | | | | | 0.43 | % | | 0.31 | % |
| Barclays Multiverse Index | | | | | | 9.37 | | | 2.56 | |
* Average annual return
** Class R6 shares commenced operations on November 30, 2015. The performance for Class R6 shares for periods prior to November 30, 2015 is based on the performance of Class I shares. Performance for Class R6 shares would be similar because the shares are invested in the same portfolio of investments, and like Class I shares, Class R6 shares are not subject to a front-end sales charge or a distribution fee.
Performance data quoted represents past performance and is no guarantee of future results. Performance results with sales charges reflect the deduction of the maximum front-end sales charge or the deduction of the applicable contingent deferred sales charge ("CDSC"). Class A shares are subject to a maximum front-end sales charge of 4.75%. Class C shares are subject to a CDSC of up to 1% on certain redemptions made within 12 months of purchase. Performance presented at Net Asset Value (NAV), which does not include a sales charge, would be lower if this charge were reflected. NAV is the value of one share of the Fund excluding any sales charges. Performance quoted is based on the transacted NAV at each period end, which may differ from the US Generally Accepted Accounting Principles ("GAAP")-adjusted NAV and the total return presented in the Financial Highlights. Current performance may be lower or higher than the performance data quoted. Investment return and principal value will fluctuate so that an investor's shares, when redeemed, may be worth more or less than original cost. As stated in the current prospectus, the Fund's annual operating expense ratios (gross) for Class A, C, I and R6 shares are 2.05%, 2.80%, 1.79% and 1.79% (estimated), respectively. However, the Fund's adviser has contractually agreed to waive its management fee and, if necessary, to reimburse other operating expenses (excluding Acquired Fund Fees and Expenses from underlying investment companies) in order to limit total annual ordinary operating expenses, less distribution and service fees, to 0.90% of the Fund's average daily net assets, which is in effect until July 31, 2020. For the most recent month-end performance, please call 1.866.443.6337 or visit the Funds' website at www.henderson.com.
Performance results also reflect expense subsidies and waivers in effect during periods shown. Absent these waivers, results would have been less favorable. All results assume the reinvestment of dividends and capital gains.
The investment comparison graph above reflects the change in value of a $10,000 hypothetical investment since the Fund's inception, including reinvested dividends and distributions, compared to a broad based securities market index. The Barclays Multiverse Index is a broad-based measure of the global fixed-income bond market. The index captures investment grade and high yield securities in all eligible currencies. 3-Month LIBOR (London Interbank Offered Rate) (USD) is the interest rate participating banks offer to other banks for loans on the London market. The Fund is professionally managed while the Indices are unmanaged and not available for investment and do not include fees, expenses or other costs. Results in the table and graph do not reflect the deduction of taxes that a shareholder would pay on Fund distributions or the redemption of Fund shares.
27
US Growth Opportunities Fund
During the year, US equity markets performed relatively well with value-biased equities slightly outperforming growth-biased equities and large cap growth companies outperforming small cap growth companies. The divergence in performance of large cap to small cap was largely due to the underperformance in the biotechnology sector, which is an important component of the small cap index, as well as the underperformance of small and mid cap consumer discretionary companies. Further, over the period, low quality companies (rated B or worse as defined by S&P) outperformed high quality companies (rated B+ or better).
For the year ended July 31, 2016, the Fund returned (0.45)% (Class A at NAV) versus the benchmark, Russell 3000 Growth Index, which posted a return of 3.57%. The underperformance was the result of low quality headwinds and the Fund's structural bias towards growth companies. The Fund may invest in equities across the market cap spectrum and currently has been overweight small and mid cap equities relative to the benchmark; this overweight allocation contributed negatively to performance. Outperformance of companies that paid a dividend also weighed on performance as the Fund favors companies with high growth rates, regardless of yield. During the first half of 2016, the outperformance of high yield stocks accelerated with telecommunications and real estate investment trusts significantly outperforming, to which the Fund has little to no exposure.
Stock selection in consumer discretionary and consumer staples were the greatest detractors to performance; specifically Walgreens Boots Alliance,
| Top 10 long-term holdings* |
| (at July 31, 2016) |
| | | | As a percentage |
| Security | | | of net assets |
| Fiserv, Inc. | | | 4.0 | % |
| The TJX Companies, Inc. | | | 3.8 | |
| The JM Smucker Co. | | | 3.8 | |
| Starbucks Corp. | | | 3.6 | |
| Costco Wholesale Corp. | | | 3.5 | |
| Henry Schein, Inc. | | | 3.4 | |
| Intuit, Inc. | | | 3.2 | |
| Tractor Supply Co. | | | 3.2 | |
| Microchip Technology, Inc. | | | 3.1 | |
| Adobe Systems, Inc. | | | 3.1 | |
Under Armour and VF Corp. Walgreens was in line with the broader drug and grocery store industry, and the company continues to execute on its long-term strategy. The broader relative underperformance within consumer staples was the result of not owning companies in the beverage and tobacco sectors, which increased 13% and 25%, respectively. Weakness in consumer discretionary was primarily focused on the apparel industry, which had experienced increased pressure over the past year as retailers, specifically department stores, had trouble adapting to changing spending habits. Contributing to positive performance was stock selection in the health care and materials & processing sectors. Within health care, performance was led by Cantel Medical and Henry Schein, which both benefitted from their stable growth rates within the sector.
Looking out over the remainder of the year it's impossible to prognosticate what will happen to markets. With the US Presidential election, uncertainty at the Federal Reserve (Fed) and the still developing "Brexit" situation (the UK's decision to leave the European Union (EU)) unfolding, investors should expect greater volatility. As it relates to Brexit, the process of negotiation between the UK and EU will most likely take years. The impact on global gross domestic product (GDP) growth should be modest, but as the situation is still very fluid, it's difficult to forecast the true impact with any certainty. Here in the US we are largely isolated from a slowdown in UK growth but the possibility of a meaningful slowdown in continental Europe could have broader implications. US economic data continues to confuse investors as GDP growth remains disappointing but employment figures surprise to the upside, leaving investors unsure of the Fed's next move. The Fund's strategy is geared towards domestic growth in the US and has been typically less exposed to a slowdown in Europe. The high quality nature of our companies, specifically companies with recurring revenue, earnings visibility and high organic growth rates, are what we believe to be the types of companies that investors should have exposure to in this environment of uncertainty and slow global growth.
* For further detail about these holdings, please refer to the section entitled "Portfolios of investments." Fund holdings are as of the date given, are subject to change at any time, and are not recommendations to buy or sell any security.
28
US Growth Opportunities Fund
| Total returns as of July 31, 2016 | | | | | | | | Since |
| | | | NASDAQ | | One | | inception |
| At NAV | | | symbol | | year | | (12/18/2014)* |
| Class A | | | HGRAX | | | -0.45 | % | | 6.89 | % |
| Class C | | | HGRCX | | | -1.17 | | | 6.12 | |
| Class I | | | HGRIX | | | -0.18 | | | 7.19 | |
| Class R6** | | | HGRRX | | | 0.45 | | | 7.61 | |
| With sales charge | | | | | | | | | | |
| Class A | | | | | | -6.15 | % | | 3.06 | % |
| Class C | | | | | | -1.17 | | | 6.12 | |
| Index | | | | | | | | | | |
| Russell 3000 Growth Index | | | | | | 3.57 | % | | 6.89 | % |
* Average annual return
** Class R6 shares commenced operations on November 30, 2015. The performance for Class R6 shares for periods prior to November 30, 2015 is based on the performance of Class I shares. Performance for Class R6 shares would be similar because the shares are invested in the same portfolio of investments, and like Class I shares, Class R6 shares are not subject to a front-end sales charge or a distribution fee.
Performance data quoted represents past performance and is no guarantee of future results. Due to the Fund's relatively small asset base, performance may be impacted by portfolio turnover to a greater degree than it may be in the future. Performance results with sales charges reflect the deduction of the maximum front-end sales charge or the deduction of the applicable contingent deferred sales charge ("CDSC"). Class A shares are subject to a maximum front-end sales charge of 5.75%. Class C shares are subject to a CDSC of up to 1% on certain redemptions made within 12 months of purchase. Performance presented at Net Asset Value (NAV), which does not include a sales charge, would be lower if this charge were reflected. NAV is the value of one share of the Fund excluding any sales charges. Performance quoted is based on the transacted NAV at each period end, which may differ from the US Generally Accepted Accounting Principles ("GAAP")-adjusted NAV and the total return presented in the Financial Highlights. Current performance may be lower or higher than the performance data quoted. Investment return and principal value will fluctuate so that an investor's shares, when redeemed, may be worth more or less than original cost. As stated in the current prospectus, the Fund's annual operating expense ratios (gross) for Class A, C, I and R6 shares are 3.22%, 4.65%, 3.40% and 3.40% (estimated), respectively. However, the Fund's adviser has contractually agreed to waive its management fee and, if necessary, to reimburse other operating expenses (excluding Acquired Fund Fees and Expenses from underlying investment companies) in order to limit total annual ordinary operating expenses, less distribution and service fees, to 0.95% of the Fund's average daily net assets, which is in effect until July 31, 2020. For the most recent month-end performance, please call 1.866.443.6337 or visit the Funds' website at www.henderson.com.
Performance results also reflect expense subsidies and waivers in effect during periods shown. Absent these waivers, results would have been less favorable. All results assume the reinvestment of dividends and capital gains.
The investment comparison graph above reflects the change in value of a $10,000 hypothetical investment since the Fund's inception, including reinvested dividends and distributions, compared to a broad based securities market index. The Russell 3000 Growth Index comprises companies that display signs of above average growth. The Index is used to provide a gauge of the performance of growth stocks in the US. The Fund is professionally managed while the Index is unmanaged and not available for investment and does not include fees, expenses or other costs. Results in the table and graph do not reflect the deduction of taxes that a shareholder would pay on Fund distributions or the redemption of Fund shares.
29
All Asset Fund
July 31, 2016
| | | | Value | |
| Shares | | | | (note 2) | |
| |
| Investment companies – 59.94% |
| | | | | | |
| | | Alternatives – 12.06% | | | |
| 114,918 | | AQR Equity Market Neutral | $ | 1,327,298 | |
| | | Fund | | | |
| 158,315 | | AQR Managed Futures Strategy Fund | | 1,652,804 | |
| 186,847 | | ASG Global Alternatives Fund * | | 1,814,280 | |
| 142,051 | | Sprott Physical Gold Trust * | | 1,600,915 | |
| | | | | 6,395,297 | |
| | | | | | |
| | | Equity – 23.20% | | | |
| 21,471 | | HarbourVest Global Private | | | |
| | | Equity Ltd * | | 261,994 | |
| 216,229 | | Henderson Global Equity | | | |
| | | Income Fund (a) | | 1,578,473 | |
| 32,947 | | ICG Enterprise Trust plc | | 258,134 | |
| 41,389 | | iShares Core MSCI Emerging | | | |
| | | Markets ETF | | 1,819,874 | |
| 31,415 | | iShares Edge MSCI Minimum | | | |
| | | Volatility EAFE ETF | | 2,130,251 | |
| 29,566 | | iShares Edge MSCI Minimum | | | |
| | | Volatility Emerging Markets ETF | | 1,569,659 | |
| 17,497 | | iShares Edge MSCI USA | | | |
| | | Momentum Factor ETF | | 1,372,640 | |
| 20,455 | | iShares Edge MSCI USA | | | |
| | | Quality Factor ETF | | 1,391,145 | |
| 16,354 | | iShares High Dividend ETF | | 1,353,293 | |
| 27,005 | | NB Private Equity Partners Ltd | | 282,607 | |
| 15,000 | | Pantheon International plc * | | 285,865 | |
| | | | | 12,303,935 | |
| | | | | | |
| | | Fixed income – 24.68% | | | |
| 174,852 | | Henderson High Yield | | | |
| | | Opportunities Fund (a) | | 1,671,584 | |
| 137,900 | | Henderson Strategic Income | | | |
| | | Fund (a) | | 1,285,225 | |
| 258,996 | | Henderson Unconstrained | | | |
| | | Bond Fund (a) | | 2,374,991 | |
| 13,216 | | iShares iBoxx Investment | | | |
| | | Grade Corporate Bond Fund | | 1,638,652 | |
| 9,324 | | iShares JP Morgan USD | | | |
| | | Emerging Markets Bond Fund | | 1,083,355 | |
| 20,641 | | iShares TIPS Bond ETF | | 2,412,933 | |
| 9,217 | | PIMCO Enhanced Short | | | |
| | | Maturity ETF | | 933,406 | |
| 72,639 | | PowerShares Senior Loan | | | |
| | | Portfolio | | 1,685,225 | |
| | | | | 13,085,371 | |
| | | Total investment companies | | | |
| | | (Cost $31,034,448) | | 31,784,603 | |
| | | | | |
| | | | | Value | |
| Shares | | | | (note 2) | |
| | | | |
| Partnerships – 3.81% | | | |
| 3,628 | | TIAA-CREF Asset Management | | | |
| | | Core Property Fund LP (b) (c) | $ | 2,020,258 | |
| | | Total partnerships | | | |
| | | (Cost $1,792,316) | | 2,020,258 | |
| | | Total long term investments | | | |
| | | (Cost $32,826,764) | | 33,804,861 | |
| | | | |
| Short-term investment – 35.05% | | | |
| 18,588,047 | | Fidelity Investments Money | | | |
| | | Market Treasury Portfolio (d) | | 18,588,047 | |
| | | | | | |
| | | Total short-term investment | | | |
| | | (Cost $18,588,047) | | 18,588,047 | |
| | | | |
| Total investments – 98.80% | | | |
| | | (Cost $51,414,811) | | 52,392,908 | |
| Financial Derivative Instruments (e) | | | |
(Cost or Premiums, net $0) – 1.11% | | 589,086 | |
| Net other assets and liabilities – 0.09% | | 46,328 | |
| | | | |
| Total net assets – 100.00% | $ | 53,028,322 | |
| * | | Non-income producing security |
| (a) | | Affiliated holding, see note 4 to the financial statements for further information. |
| (b) | | The security has been deemed illiquid by the Adviser according to the policies and procedures adopted by the Board of Trustees. |
| (c) | | Fair valued at July 31, 2016 as determined in good faith using procedures approved by the Board of Trustees. |
| (d) | | This short-term investment has been segregated for open futures contracts and forward foreign currency contracts at July 31, 2016. |
| (e) | | Information with respect to financial derivative instruments is disclosed in the following tables. |
| ETF | | Exchange-traded fund |
See notes to financial statements
30
All Asset Fund
July 31, 2016 (continued)
(e) FINANCIAL DERIVATIVE INSTRUMENTS
FUTURES CONTRACTS |
| | | | | | | | | | | | | Unrealized
appreciation/
(depreciation) | |
| | | | | | | | | | | | | |
| | | | | | | | | | | | | |
| | | | | | | | | | Current | | | |
| | | | Number of | | | Expiration | | | notional | | | |
| | | | contracts | | | date | | | value | | | Asset | | | Liability | |
| EURO STOXX 50 Index (Long) | | | 60 | | | 9/16/16 | | $ | 2,000,997 | | $ | 132,848 | | $ | — | |
| FTSE 100 Index (Long) | | | 40 | | | 9/16/16 | | | 3,534,405 | | | 366,970 | | | — | |
| Nikkei 225 Index (Long) | | | 8 | | | 9/8/16 | | | 1,302,298 | | | — | | | (496 | ) |
| US Treasury 10 Year Note (Long) | | | 8 | | | 9/21/16 | | | 1,064,375 | | | 18,484 | | | — | |
| Total | | | | | | | | | | | $ | 518,302 | | $ | (496 | ) |
During the year ended July 31, 2016, average monthly notional value related to futures contracts was approximately $10.0 million or 18.9% of ending net assets.
FINANCIAL DERIVATIVE INSTRUMENTS: EXCHANGE-TRADED OR CENTRALLY-CLEARED SUMMARY
The following is a summary of the value of exchange-traded or centrally-cleared financial derivative instruments as of July 31, 2016:
| | | Unrealized
Appreciation | | | | | Unrealized
Depreciation | | | | |
| | | | | | | | | | |
| | | | Futures Contracts | | | Total | | | Futures Contracts | | | Total | |
| Total Exchange-Traded or Centrally Cleared | | $ | 518,302 | | $ | 518,302 | | $ | (496 | ) | $ | (496 | ) |
OVER-THE-COUNTER FINANCIAL DERIVATIVE INSTRUMENTS
FORWARD FOREIGN CURRENCY CONTRACTS
| | | | | | | | | | | | | | | | Unrealized
appreciation/
(depreciation) | |
| | | | | | | | | | Local | | | Current | | | |
| | | | | | | Value | | | amount | | | notional | | | |
| | | | Counterparty | | | date | | | (000's) | | | value | | | Asset | | | Liability | |
| British Pound (Short) | | | BNP Paribas Securities Services | | | 8/24/16 | | | 819 | | $ | 1,084,580 | | $ | — | | $ | (4,094 | ) |
| Euro (Long) | | | BNP Paribas Securities Services | | | 8/24/16 | | | 1,841 | | | 2,060,032 | | | 20,300 | | | — | |
| Japanese Yen (Long) | | | BNP Paribas Securities Services | | | 8/24/16 | | | 154,727 | | | 1,517,511 | | | 55,074 | | | — | |
| Total | | | | | | | | | | | | | | $ | 75,374 | | $ | (4,094 | ) |
During the year ended July 31, 2016, average monthly notional value related to forward foreign currency contracts was approximately $7.5 million or 14.2% of ending net assets.
See notes to financial statements
31
All Asset Fund
July 31, 2016 (continued)
FINANCIAL DERIVATIVE INSTRUMENTS: OVER-THE-COUNTER SUMMARY
The following is a summary by counterparty of the value of over-the-counter financial derivative instruments and collateral (received)/pledged as of July 31, 2016:
| | | Financial Derivative Assets | | Financial Derivative Liabilities | | | | | | | | | |
| | | | Unrealized | | | | | | Unrealized | | | | | | | | | | | | | |
| | | | Appreciation | | | | | | Depreciation | | | | | | | | | | | | | |
| | | | Forward | | | | | | Forward | | | | | | | | | | | | | |
| | | | Foreign | | | Total | | | Foreign | | | Total | | | Net Value | | | Collateral | | | | |
| | | | Currency | | | Over-the- | | | Currency | | | Over-the- | | | of OTC | | | (Received) / | | | Net | |
| | | | Contracts | | | Counter | | | Contracts | | | Counter | | | Derivatives | | | Pledged | | | Exposure(1) | |
| Amounts subject to a master netting or similar agreement: | | | | | | | | | | | | |
| BNP Paribas | | | | | | | | | | | | | | | | | | | | | | |
| Securities Services | | $ | 75,374 | | $ | 75,374 | | $ | (4,094 | ) | $ | (4,094 | ) | $ | 71,280 | | $ | — | | $ | 71,280 | |
| | | $ | 75,374 | | $ | 75,374 | | $ | (4,094 | ) | $ | (4,094 | ) | $ | 71,280 | | $ | — | | $ | 71,280 | |
| (1) | Net Exposure represents the net receivable/(payable) that would be due from/to the counterparty in the event of default. Exposure from over-the-counter financial derivative instruments can only be netted across transactions governed under the same master agreement with the same legal entity. See Note 2, Significant Accounting Policies, "Derivative instruments," in the Notes to Financial Statements for more information regarding master netting arrangements. |
| | Cost or Premiums, Net | | Asset | | | Liability | |
| TOTAL FINANCIAL DERIVATIVE INSTRUMENTS | | $ | — | | $ | 593,676 | | $ | (4,590 | ) |
| | | | | | | | | | | |
Other information:
| Currency exposure of portfolio assets before | | | |
| any currency hedging, if applicable. | | | % of total |
| Excludes derivatives: | | | investments |
| US Dollar | | | 98 | % |
| British Pound | | | 2 | |
| | | | 100 | % |
See notes to financial statements
32
All Asset Fund
July 31, 2016 (continued)
Fair Value Measurement
The following table summarizes the Fund's investments that are measured at fair value by level within the fair value hierarchy at July 31, 2016:
| | | | Quoted prices | | | Significant | | | | | | | |
| | | | in active | | | other | | | Significant | | | | |
| | | | markets for | | | observable | | | unobservable | | | | |
| | | | identical assets | | | inputs | | | inputs | | | | |
| Description | | | (level 1 | ) | | (level 2 | ) | | (level 3 | ) | | Total | |
| | | | | | | | | | | | | | |
| Assets | | | | | | | | | | | | | |
| Investment Companies | | $ | 31,784,603 | | $ | — | | $ | — | | $ | 31,784,603 | |
| Partnerships | | | — | | | — | | | 2,020,258 | | | 2,020,258 | |
| Short-term Investment | | | 18,588,047 | | | — | | | — | | | 18,588,047 | |
| Total Investments | | $ | 50,372,650 | | $ | — | | $ | 2,020,258 | | $ | 52,392,908 | |
| | | | | | | | | | | | | | |
| Financial Derivative Instruments – Assets | | | | | | | | | | | | | |
| Exchange-traded or centrally-cleared | | $ | 518,302 | | $ | — | | $ | — | | $ | 518,302 | |
| Over-the-counter | | | — | | | 75,374 | | | — | | | 75,374 | |
| Total Financial Derivative Instruments - Assets | | $ | 518,302 | | $ | 75,374 | | $ | — | | $ | 593,676 | |
| Liabilities | | | | | | | | | | | | | |
| Financial Derivative Instruments – Liabilities | | | | | | | | | | | | | |
| Exchange-traded or centrally-cleared | | $ | (496 | ) | $ | — | | $ | — | | $ | (496 | ) |
| Over-the-counter | | | — | | | (4,094 | ) | | — | | | (4,094 | ) |
| Total Financial Derivative Instruments - Liabilities | | $ | (496 | ) | $ | (4,094 | ) | $ | — | | $ | (4,590 | ) |
During the year ended July 31, 2016, there were no transfers in or out of security levels.
Following is a reconciliation of investments in which significant unobservable inputs (Level 3) were used in determining fair value:
| | | | Balance | | | | | | | | | Change in | | | | | | | | | | | | | | | Balance | |
| | | | as of | | | Accrued | | | | | | unrealized | | | | | | | | | Transfers | | | Transfers | | | as of | |
| | | | July 31, | | | discounts/ | | | Realized | | | appreciation | | | | | | | | | in to | | | out of | | | July 31, | |
| Investments in securities | | | 2015 | | | premiums | | gain/(loss) | | | (depreciation) | | | Purchases | | | Sales | | | level 3 | | | level 3 | | | 2016 | |
| Investment Companies | | | | | | | | | | | | | | | | | | | | | | | | | | | | |
| TIAA-CREF Asset | | | | | | | | | | | | | | | | | | | | | | | | | | | | |
| Management Core | | | | | | | | | | | | | | | | | | | | | | | | | | | | |
| Property Fund LP | | $ | 2,684,523 | | $ | 0 | | $ | 96,913 | | $ | 77,768 | | $ | 20,004 | | $ | (858,950 | ) | $ | 0 | | $ | 0 | | $ | 2,020,258 | |
| Total | | $ | 2,684,523 | | $ | 0 | | $ | 96,913 | | $ | 77,768 | | $ | 20,004 | | $ | (858,950 | ) | $ | 0 | | $ | 0 | | $ | 2,020,258 | |
The total net change in unrealized appreciation (depreciation) attributable to level 3 investments held at July 31, 2016 was $77,768.The Fund's Adviser has determined that TIAA-CREF Asset Management Core Property Fund LP ("CPF") is a Level 3 investment due to the lack of observable inputs that may be used in the determination of fair value. The CPF is a private Delaware limited partnership that provides monthly liquidity to its investors with 45 days written notice and invests its contributed capital in a TIAA-CREF Real Estate Investment Trust (REIT). The REIT is a limited partnership which in turn invests in a TIAA-CREF operating partnership. The investments of the operating partnership include a diversified portfolio of real property assets. As a result, the monthly valuations prepared by CPF and assignment of a net asset value per share are ultimately driven by changes in the valuation of the underlying real property assets in the operating partnership. All of the investments in real estate are appraised annually by an independent third party appraiser. The CPF's policy is to report all such investments, as well as related debt, at fair value under US Generally Accepted Accounting Principles based on the appraised value. The annual appraisals are conducted on a rolling basis such that approximately 25% of the portfolio receives an annual full appraisal each quarter. In addition, each appraisal is updated quarterly under the direction of an independent, third-party appraisal firm.
The significant unobservable inputs used by CPF in the fair value measurement and appraisal of the real property assets include: a) an extensive market study, including a thorough analysis of current market conditions and trends as they impact supply, demand and absorption of the relevant property type; b) thorough description of the site and improvements, including a site plan and renderings of the improvements if available; c) estimate of the value of the land; d) estimate of the value of the property using a cost approach; e) estimate of the market value of the property using a sales comparison approach; and f) estimate of the value of the property using a detailed income capitalization approach that includes several diagnostic inputs. Significant changes in any of those inputs in isolation would result in a significant change in the fair value measurement, and ultimately the value ascribed to All Asset Fund's limited partnership interests in CPF.
Due to the factors above, and consistent with a fair valuation policy approved by the Board of Trustees, the All Asset Fund values this investment monthly upon receipt of the limited partner statement and in-line with the capital balance allocated to its limited partnership interests, less the undistributed net income accrued within the capital balance. Separately, a daily income accrual is recognized by the Fund to account for the net income that is accrued and allocated to its limited partnership interests and distributed quarterly. The value assigned to the investment is revised monthly upon receipt of the limited partner statement. The value may be revised more frequently if, in the determination of the Adviser and/or the Board of Trustees, market or investment-specific developments warrant re-assessment.
See notes to financial statements
33
All Asset Fund
July 31, 2016 (continued)
Fair Value of Financial Derivative Instruments
The following is a summary of the fair valuation of the Fund's financial derivative instruments categorized by risk exposure:
Fair Values of Financial Derivative Instruments on the Statement of Assets and Liabilities as of July 31, 2016
| | | Derivatives not accounted for as hedging instruments |
| | | | Foreign | | | | | | | | | | | | | | | | |
| | | | Currency | | | Equity | | | Interest | | | Credit | | | Inflation | | | | |
| | | | Risk | | | Risk | | | Rate Risk | | | Risk | | | Risk | | | Total | |
| Financial Derivative Instruments – Assets | | | | | | | | | | | | | | | | | | | |
| Exchange-Traded or Centrally Cleared | | | | | | | | | | | | | | | | | | | |
| Futures | | $ | — | | $ | 499,818 | | $ | 18,484 | | $ | — | | $ | — | | $ | 518,302 | |
| Over-the-Counter | | | | | | | | | | | | | | | | | | | |
| Forward Foreign Currency Contracts | | $ | 75,374 | | $ | — | | $ | — | | $ | — | | $ | — | | $ | 75,374 | |
| Total | | $ | 75,374 | | $ | 499,818 | | $ | 18,484 | | $ | — | | $ | — | | $ | 593,676 | |
| Financial Derivative Instruments – Liabilities | | | | | | | | | | | | | | | | | | | |
| Exchange-Traded or Centrally Cleared | | | | | | | | | | | | | | | | | | | |
| Futures | | $ | — | | $ | (496 | ) | $ | — | | $ | — | | $ | — | | $ | (496 | ) |
| Over-the-Counter | | | | | | | | | | | | | | | | | | | |
| Forward Foreign Currency Contracts | | $ | (4,094 | ) | $ | — | | $ | — | | $ | — | | $ | — | | $ | (4,094 | ) |
| Total | | $ | (4,094 | ) | $ | (496 | ) | $ | — | | $ | — | | $ | — | | $ | (4,590 | ) |
| Net | | $ | 71,281 | | $ | 499,322 | | $ | 18,484 | | $ | — | | $ | — | | $ | 589,086 | |
Effect of Financial Derivative Instruments on the Statement of Operations for the Year Ended July 31, 2016
| | | Derivatives not accounted for as hedging instruments |
| | | | Foreign | | | | | | | | | | | | | | | | |
| | | | Currency | | | Equity | | | Interest | | | Credit | | | Inflation | | | | |
| | | | Risk | | | Risk | | | Rate Risk | | | Risk | | | Risk | | | Total | |
| Net realized gain/(loss) from | | | | | | | | | | | | | | | | | | | |
| financial derivative instruments: | | | | | | | | | | | | | | | | | | | |
| Futures Contracts | | $ | — | | $ | (1,874,359 | ) | $ | 30,928 | | $ | — | | $ | — | | $ | (1,843,431 | ) |
| Forward Foreign Currency Contracts | | $ | 267,751 | | $ | — | | $ | — | | $ | — | | $ | — | | $ | 267,751 | |
| Total | | $ | 267,751 | | $ | (1,874,359 | ) | $ | 30,928 | | $ | — | | $ | — | | $ | (1,575,680 | ) |
| | | Derivatives not accounted for as hedging instruments |
| | | | Foreign | | | | | | | | | | | | | | | | |
| | | | Currency | | | Equity | | | Interest | | | Credit | | | Inflation | | | | |
| | | | Risk | | | Risk | | | Rate Risk | | | Risk | | | Risk | | | Total | |
Net change in unrealized appreciation/(depreciation) of financial derivative instruments | | | | | | | | | | | | | | | | | | | |
| Futures Contracts | | $ | — | | $ | 398,504 | | $ | 10,969 | | $ | — | | $ | — | | $ | 409,473 | |
| Forward Foreign Currency Contracts | | $ | 271,246 | | $ | — | | $ | — | | $ | — | | $ | — | | $ | 271,246 | |
| Total | | $ | 271,246 | | $ | 398,504 | | $ | 10,969 | | $ | — | | $ | — | | $ | 680,719 | |
See notes to financial statements
34
Dividend & Income Builder Fund
July 31, 2016
| | | | | Value | |
| Shares | | | | (note 2) | |
| | | | |
| Common stocks – 78.40% | | | |
| | | | | | |
| | | Australia – 1.15% | | | |
| 136,105 | | Suncorp Group, Ltd. | $ | 1,389,105 | |
| | | | | | |
| | | Canada – 1.25% | | | |
| 31,630 | | BCE, Inc. | | 1,514,819 | |
| | | | | | |
| | | China – 1.24% | | | |
| 2,654,000 | | Industrial & Commercial Bank of China, Ltd., Class H | | 1,501,735 | |
| | | | | | |
| | | France – 7.84% | | | |
| 43,404 | | AXA S.A. | | 884,623 | |
| 26,607 | | BNP Paribas S.A. | | 1,319,412 | |
| 270,730 | | Natixis S.A. | | 1,115,362 | |
| 16,441 | | Nexity S.A. * | | 874,019 | |
| 143,183 | | Orange S.A. | | 2,191,477 | |
| 10,746 | | Sanofi | | 914,869 | |
| 32,547 | | SCOR SE | | 950,989 | |
| 25,841 | | Total S.A. | | 1,235,347 | |
| | | | | 9,486,098 | |
| | | | | | |
| | | Germany – 4.91% | | | |
| 12,866 | | Bayer AG | | 1,384,047 | |
| 12,929 | | Deutsche Boerse AG * | | 1,081,206 | |
| 58,373 | | Deutsche Post AG | | 1,741,817 | |
| 102,368 | | Deutsche Telekom AG | | 1,742,463 | |
| | | | | 5,949,533 | |
| | | | | | |
| | | Hong Kong – 1.45% | | | |
| 116,000 | | Cheung Kong Property | | | |
| | | Holdings, Ltd. | | 828,315 | |
| 79,000 | | CK Hutchison Holdings, Ltd. | | 924,572 | |
| | | | | 1,752,887 | |
| | | | | | |
| | | Israel – 1.07% | | | |
| 657,184 | | Bezeq The Israeli | | | |
| | | Telecommunication Corp, Ltd. | | 1,299,478 | |
| | | | | | |
| | | Italy – 1.65% | | | |
| 433,130 | | Enel SpA | | 1,994,099 | |
| | | | | Value | |
| Shares | | | | (note 2) | |
| | | | | | |
| | | Japan – 2.06% | | | |
| 29,700 | | Nippon Telegraph and | | | |
| | | Telephone Corp. | $ | 1,420,745 | |
| 108,000 | | Panasonic Corp. | | 1,070,103 | |
| | | | | 2,490,848 | |
| | | | | | |
| | | Netherlands – 5.24% | | | |
| 126,809 | | ING Groep N.V. | | 1,417,725 | |
| 137,275 | | RELX N.V. | | 2,482,434 | |
| 28,265 | | Unilever N.V. | | 1,309,358 | |
| 26,905 | | Wolters Kluwer N.V. | | 1,131,753 | |
| | | | | 6,341,270 | |
| | | | | | |
| | | Norway – 1.02% | | | |
| 73,935 | | Telenor ASA | | 1,234,711 | |
| | | | | | |
| | | Portugal – 1.20% | | | |
| 217,851 | | NOS SGPS S.A. | | 1,459,153 | |
| | | | | | |
| | | Switzerland – 7.65% | | | |
| 12,537 | | Cembra Money Bank AG * | | 900,305 | |
| 39,099 | | Nestle S.A. | | 3,134,536 | |
| 32,582 | | Novartis AG | | 2,699,478 | |
| 9,908 | | Roche Holding AG | | 2,530,159 | |
| | | | | 9,264,478 | |
| | | | | | |
| | | Taiwan – 1.25% | | | |
| 54,345 | | Taiwan Semiconductor | | | |
| | | Manufacturing Co., Ltd., ADR | | 1,509,704 | |
| | | | | | |
| | | United Kingdom – 16.44% | | | |
| 25,688 | | AstraZeneca plc | | 1,716,157 | |
| 22,672 | | British American Tobacco plc | | 1,447,603 | |
| 292,875 | | Centrica plc | | 934,517 | |
| 56,678 | | Diageo plc | | 1,620,977 | |
| 403,292 | | GKN plc | | 1,544,634 | |
| 48,287 | | Imperial Brands plc | | 2,545,672 | |
| 457,280 | | ITV plc | | 1,186,167 | |
| 100,998 | | National Grid plc | | 1,447,600 | |
| 34,994 | | Nielsen Holdings plc | | 1,884,777 | |
| 62,692 | | Prudential plc | | 1,107,646 | |
| 74,155 | | Royal Dutch Shell plc, A Shares | | 1,921,745 | |
| 216,120 | | Standard Life plc | | 866,367 | |
| 553,086 | | Vodafone Group plc | | 1,680,264 | |
| | | | | 19,904,126 | |
See notes to financial statements
35
Dividend & Income Builder Fund
July 31, 2016 (continued)
| | | | | Value | |
| Shares | | | | (note 2) | |
| | | | | | |
| | | United States – 22.98% | | | |
| 21,779 | | Chevron Corp. | $ | 2,231,912 | |
| 65,748 | | Cisco Systems, Inc. | | 2,007,286 | |
| 41,516 | | General Electric Co. | | 1,292,808 | |
| 9,842 | | Johnson & Johnson | | 1,232,514 | |
| 24,532 | | JPMorgan Chase & Co. | | 1,569,312 | |
| 19,169 | | Las Vegas Sands Corp. | | 970,910 | |
| 4,586 | | Lockheed Martin Corp. | | 1,159,020 | |
| 55,053 | | Microsoft Corp. | | 3,120,404 | |
| 78,947 | | Pfizer, Inc. | | 2,912,355 | |
| 15,190 | | Philip Morris International, Inc. | | 1,522,949 | |
| 33,676 | | Reynolds American, Inc. | | 1,685,820 | |
| 21,488 | | Six Flags Entertainment Corp. | | 1,211,708 | |
| 37,309 | | Synchrony Financial * | | 1,040,175 | |
| | | | | | |
| | | | | Value | |
| Shares | | | | (note 2) | |
| | | | | | |
| | | United States (continued) | | | |
| 24,090 | | The Coca-Cola Co. | $ | 1,051,047 | |
| 13,837 | | United Parcel Service, Inc., | | | |
| | | Class B | | 1,495,780 | |
| 32,548 | | Verizon Communications, Inc. | | 1,803,485 | |
| 31,437 | | Wells Fargo & Co. | | 1,508,033 | |
| | | | | 27,815,518 | |
| | | | | | |
| | | Total common stocks | | | |
| | | (Cost $91,667,575) | | 94,907,562 | |
| Face | | | | | | | | Value | |
| amount | | | Coupon | | | Maturity | | (note 2) | |
| Corporate bonds – 13.16% | | | | | | | |
| | | | | | | | | | | |
| | | | France – 0.55% | | | | | | | |
| USD | 600,000 | | BNP Paribas S.A. (a) (b) | 7.195 | % | | 6/25/37 | $ | 665,925 | |
| | | | | | | | | | | |
| | | | Germany – 0.43% | | | | | | | |
| USD | 500,000 | | Unitymedia Hessen GmbH & Co. KG (a) | 5.000 | % | | 1/15/25 | | 520,000 | |
| | | | | | | | | | | |
| | | | Ireland – 0.50% | | | | | | | |
| USD | 600,000 | | Ardagh Packaging Finance plc/Ardagh MP Holding USA, Inc. (a) | 4.625 | % | | 5/15/23 | | 606,750 | |
| | | | | | | | | | | |
| | | | Netherlands – 1.00% | | | | | | | |
| USD | 500,000 | | Deutsche Telekom International Finance B.V. (a) | 4.875 | % | | 3/6/42 | | 593,786 | |
| USD | 600,000 | | Teva Pharmaceutical Finance Netherlands III B.V. | 4.100 | % | | 10/1/46 | | 620,515 | |
| | | | | | | | | | 1,214,301 | |
| | | | | | | | | | | |
| | | | Spain – 0.32% | | | | | | | |
| USD | 386,000 | | BBVA International Preferred SAU (b) | 5.919 | % | | 4/18/17 | | 386,965 | |
See notes to financial statements
36
Dividend & Income Builder Fund
July 31, 2016 (continued)
| Face | | | | | | | Value | |
| amount | | | Coupon | | Maturity | | (note 2) | |
| | | | | | | | | | |
| | | | United Kingdom – 3.78% | | | | | | |
| USD | 300,000 | | Barclays Bank plc (b) | 6.278% | | 12/15/34 | $ | 314,574 | |
| USD | 600,000 | | Imperial Brands Finance plc (a) | 4.250% | | 7/21/25 | | 661,261 | |
| USD | 550,000 | | International Game Technology plc (a) | 6.250% | | 2/15/22 | | 578,875 | |
| USD | 700,000 | | Lloyds Banking Group plc (a) (b) | 6.657% | | 5/21/37 | | 770,000 | |
| USD | 100,000 | | Prudential plc (b) | 6.500% | | 9/23/16 | | 102,307 | |
| USD | 500,000 | | Royal Bank of Scotland Group plc | 6.100% | | 6/10/23 | | 525,801 | |
| USD | 550,000 | | Sky plc (a) | 3.750% | | 9/16/24 | | 584,935 | |
| USD | 1,000,000 | | Virgin Media Finance plc (a) | 6.375% | | 4/15/23 | | 1,032,500 | |
| | | | | | | | | 4,570,253 | |
| | | | | | | | | | |
| | | | United States – 6.58% | | | | | | |
| USD | 600,000 | | Altria Group, Inc. | 4.250% | | 8/9/42 | | 686,423 | |
| USD | 215,000 | | Aramark Services, Inc. | 5.125% | | 1/15/24 | | 222,525 | |
| USD | 291,000 | | Aramark Services, Inc. (a) | 4.750% | | 6/1/26 | | 294,638 | |
| USD | 550,000 | | AT&T, Inc. | 4.750% | | 5/15/46 | | 584,779 | |
| USD | 447,000 | | Ball Corp. | 5.000% | | 3/15/22 | | 480,525 | |
| USD | 450,000 | | CCO Holdings LLC (a) | 5.875% | | 5/1/27 | | 475,875 | |
| USD | 100,000 | | Constellation Brands, Inc. | 4.250% | | 5/1/23 | | 106,500 | |
| USD | 360,000 | | Diamond 1 Finance Corp. (a) | 8.100% | | 7/15/36 | | 411,264 | |
| USD | 250,000 | | Dresdner Funding Trust I (a) | 8.151% | | 6/30/31 | | 295,363 | |
| USD | 100,000 | | HBOS Capital Funding LP (b) | 6.850% | | 9/23/16 | | 101,125 | |
| USD | 250,000 | | Iron Mountain, Inc. | 6.000% | | 8/15/23 | | 266,875 | |
| USD | 140,000 | | Philip Morris International, Inc. | 4.250% | | 11/10/44 | | 159,578 | |
| USD | 600,000 | | Reynolds American, Inc. | 5.850% | | 8/15/45 | | 792,154 | |
| USD | 200,000 | | Sealed Air Corp. (a) | 5.250% | | 4/1/23 | | 212,750 | |
| USD | 200,000 | | Service Corp. International | 8.000% | | 11/15/21 | | 237,500 | |
| USD | 550,000 | | Sirius XM Radio, Inc. (a) | 6.000% | | 7/15/24 | | 586,437 | |
| USD | 550,000 | | Verizon Communications, Inc. | 6.550% | | 9/15/43 | | 751,056 | |
| USD | 650,000 | | Wachovia Capital Trust III (b) | 5.570% | | 8/29/16 | | 650,812 | |
| USD | 600,000 | | Walgreens Boots Alliance, Inc. | 3.800% | | 11/18/24 | | 646,252 | |
| | | | | | | | | 7,962,431 | |
| | | | | | | | | | |
| | | | Total corporate bonds | | | | | | |
| | | | (Cost $15,122,798) | | | | | 15,926,625 | |
See notes to financial statements
37
Dividend & Income Builder Fund
July 31, 2016 (continued)
| | | | | Value | |
| Shares | | | | (note 2) | |
| | | | |
| REITs – 2.37% | | | |
| | | | | | |
| | | France – 0.66% | | | |
| 10,322 | | ICADE | $ | 795,568 | |
| | | | | | |
| | | Netherlands – 0.88% | | | |
| 24,149 | | Eurocommercial Properties N.V. | | 1,069,144 | |
| | | | | | |
| | | United States – 0.83% | | | |
| 24,424 | | Iron Mountain, Inc. | | 1,006,513 | |
| | | | | | |
| | | Total REITs | | | |
| | | (Cost $2,574,080) | | 2,871,225 | |
| | | | |
| Partnerships – 0.69% | | | |
| | | | | | |
| | | United States – 0.69% | | | |
| 57,630 | | KKR & Co., L.P. | | 832,177 | |
| | | | | | |
| | | Total partnerships | | | |
| | | (Cost $1,074,976) | | 832,177 | |
| | | | | | |
| | | Total long-term investments | | | |
| | | (Cost $110,439,429) | | 114,537,589 | |
| | | | | | |
| | | | | Value | |
| Shares | | | | (note 2) | |
| | | | |
| Short-term investment – 4.08% | | | |
| 4,943,739 | | Fidelity Investments Money | | | |
| | | Market Treasury Portfolio | $ | 4,943,739 | |
| | | | | | |
| | | Total Short-term investment | | | |
| | | (Cost $4,943,739) | | 4,943,739 | |
| | | | |
| Total investments – 98.70% | | | |
| | | (Cost $115,383,168) | | 119,481,328 | |
| | | | |
| Financial Derivative Instruments (c) | | | |
(Cost or Premiums, net $0) – (0.10)% | | (126,383 | ) |
| Net other assets and liabilities – 1.40% | | 1,697,987 | |
| | | | |
| Total net assets – 100.00% | $ | 121,052,932 | |
| * | | Non-income producing security |
| (a) | | Restricted security, purchased pursuant to Rule 144A under the Securities Act of 1933, as amended, and which is exempt from registration under that Act. At July 31, 2016, the restricted securities held by the Fund had an aggregate value of $8,290,359, which represented 6.9% of net assets. |
| (b) | | Maturity date is perpetual. Maturity date presented represents the next call date. |
| (c) | | Information with respect to financial derivative instruments is disclosed in the following tables. |
| | | |
| ADR | | American Depositary Receipt |
| REIT | | Real Estate Investment Trust |
See notes to financial statements
38
Dividend & Income Builder Fund
July 31, 2016 (continued)
(c) FINANCIAL DERIVATIVE INSTRUMENTS
OVER-THE-COUNTER FINANCIAL DERIVATIVE INSTRUMENTS
FORWARD FOREIGN CURRENCY CONTRACTS
| | | | | | | | | | | | | | | | Unrealized |
| | | | | | | | | | Local | | | Current | | | appreciation/ |
| | | | | | | Value | | | amount | | | notional | | | (depreciation) |
| | | | Counterparty | | | date | | | (000's | ) | | value | | | Asset | | | Liability | |
| British Pound (Short) | | | Morgan Stanley | | | | | | | | | | | | | | | | |
| | | | Capital Services LLC | | | 10/07/16 | | | 5,278 | | $ | 6,992,994 | | $ | — | | $ | (92,188 | ) |
| Euro (Short) | | | Citibank, N.A. | | | 10/07/16 | | | 7,099 | | | 7,959,198 | | | — | | | (34,195 | ) |
| Total | | | | | | | | | | | | | | $ | — | | $ | (126,383 | ) |
During the year ended July 31, 2016, average monthly notional value related to forward foreign currency contracts was approximately $6.3 million or 5.2% of ending net assets.
FINANCIAL DERIVATIVE INSTRUMENTS: OVER-THE-COUNTER SUMMARY
The following is a summary by counterparty of the value of over-the-counter financial derivative instruments and collateral (received)/pledged as of July 31, 2016.
| | | Financial Derivative Assets | | Financial Derivative Liabilities | | | | | | | | | |
| | | | Unrealized | | | | | | Unrealized | | | | | | | | | | | | | |
| | | | Appreciation | | | | | | Depreciation | | | | | | | | | | | | | |
| | | | Forward | | | | | | Forward | | | | | | | | | | | | | |
| | | | Foreign | | | Total | | | Foreign | | | Total | | | Net Value | | | Collateral | | | | |
| | | | Currency | | | Over-the- | | | Currency | | | Over-the- | | | of OTC | | | (Received) / | | | Net | |
| | | | Contracts | | | Counter | | | Contracts | | | Counter | | | Derivatives | | | Pledged | | | Exposure(1) | |
| Amounts subject to a master netting or similar agreement: | | | | | | | | | | | | | | | |
| Citibank, N.A. | | $ | — | | $ | — | | $ | (34,195 | ) | $ | (34,195 | ) | $ | (34,195 | ) | $ | — | | $ | (34,195 | ) |
| Morgan Stanley | | | | | | | | | | | | | | | | | | | | | | |
| Capital Services LLC | | | — | | | — | | | (92,188 | ) | | (92,188 | ) | | (92,188 | ) | | — | | | (92,188 | ) |
| | | $ | — | | $ | — | | $ | (126,383 | ) | $ | (126,383 | ) | $ | (126,383 | ) | $ | — | | $ | (126,383 | ) |
| | (1) | Net Exposure represents the net receivable/(payable) that would be due from/to the counterparty in the event of default. Exposure from over-the-counter financial derivative instruments can only be netted across transactions governed under the same master agreement with the same legal entity. See Note 2, Significant Accounting Policies, "Derivative instruments," in the Notes to Financial Statements for more information regarding master netting arrangements. |
| | Cost or Premiums, Net | | | Asset | | | Liability | |
| TOTAL FINANCIAL DERIVATIVE INSTRUMENTS | | $ | — | | $ | — | | $ | (126,383 | ) |
| Other information: | | |
| Currency exposure of portfolio assets before | | |
| any currency hedging, if applicable. | % of total |
| Excludes derivatives: | investments |
| US Dollar | 45 | % |
| Euro | 24 | |
| British Pound | 14 | |
| Swiss Franc | 8 | |
| Hong Kong Dollar | 3 | |
| Japanese Yen | 2 | |
| Canadian Dollar | 1 | |
| | | |
| Currency exposure of portfolio assets before | |
| any currency hedging, if applicable. | % of total |
| Excludes derivatives: | investments |
| Australian Dollar | 1 | % |
| Israeli Shekel | 1 | |
| Norwegian Krone | 1 | |
| | 100 | % |
See notes to financial statements
39
Dividend & Income Builder Fund
July 31, 2016 (continued)
| Industry concentration as | % of net |
| a percentage of net assets: | assets |
| | | |
| Pharmaceuticals | 11.06 | % |
| Integrated Telecommunication Services | 9.74 | |
| Tobacco | 7.85 | |
| Diversified Banks | 7.63 | |
| Integrated Oil & Gas | 4.45 | |
| Publishing | 2.99 | |
| Air Freight & Logistics | 2.67 | |
| Packaged Foods & Meats | 2.59 | |
| Systems Software | 2.58 | |
| Multi-Utilities | 1.97 | |
| Telephone-Integrated | 1.96 | |
| Industrial Conglomerates | 1.83 | |
| Life & Health Insurance | 1.71 | |
| Cable & Satellite | 1.69 | |
| Communications Equipment | 1.66 | |
| Electric Utilities | 1.65 | |
| Consumer Finance | 1.60 | |
| Research & Consulting Services | 1.56 | |
| Distillers & Vintners | 1.43 | |
| Wireless Telecommunication Services | 1.39 | |
| Other Diversified Financial Services | 1.30 | |
| Auto Parts & Equipment | 1.28 | |
| Semiconductors | 1.25 | |
| Specialized Finance | 1.23 | |
| Property & Casualty Insurance | 1.15 | |
| Personal Products | 1.08 | |
| Leisure Facilities | 1.00 | |
| Broadcasting | 0.98 | |
| Aerospace & Defense | 0.96 | |
| Consumer Electronics | 0.88 | |
| Industry concentration as | % of net |
| a percentage of net assets: | assets |
| | | |
| Retail REITs | 0.88 | % |
| Soft Drinks | 0.87 | |
| Specialized REITs | 0.83 | |
| Cable TV | 0.82 | |
| Casinos & Gaming | 0.80 | |
| Reinsurance | 0.79 | |
| Multi-line Insurance | 0.73 | |
| Homebuilding | 0.72 | |
| Asset Management & Custody Banks | 0.69 | |
| Real Estate Development | 0.68 | |
| Diversified REITs | 0.66 | |
| Money Center Banks | 0.56 | |
| Super-Regional Banks-US | 0.54 | |
| Drug Retail | 0.53 | |
| Medical - Drugs | 0.51 | |
| Containers - Metal/Glass | 0.50 | |
| Radio | 0.48 | |
| Gambling (Non-Hotel) | 0.48 | |
| Food-Catering | 0.43 | |
| Metal & Glass Containers | 0.40 | |
| Diversified Support Services | 0.22 | |
| Funeral Services & Related Items | 0.20 | |
| Paper Packaging | 0.18 | |
| Total Long-Term Investments | 94.62 | |
| Short-Term Investment | 4.08 | |
| Total Investments | 98.70 | |
| Financial Derivative Instruments | (0.10 | ) |
| Net Other Assets and Liabilities | 1.40 | |
| | 100.00 | % |
See notes to financial statements
40
Dividend & Income Builder Fund
July 31, 2016 (continued)
Fair Value Measurement
The following table summarizes the Fund's investments that are measured at fair value by level within the fair value hierarchy at July 31, 2016:
| | | | Quoted prices | | | Significant | | | | | | | |
| | | | in active | | | other | | | Significant | | | | |
| | | | markets for | | | observable | | | unobservable | | | | |
| | | | identical assets | | | inputs | | | inputs | | | | |
| Description | | | (level 1 | ) | | (level 2 | ) | | (level 3 | ) | | Total | |
| Assets | | | | | | | | | | | | | |
| Common Stocks | | | | | | | | | | | | | |
| Australia | | $ | 1,389,105 | | $ | — | | $ | — | | $ | 1,389,105 | |
| Canada | | | 1,514,819 | | | — | | | — | | | 1,514,819 | |
| China | | | 1,501,735 | | | — | | | — | | | 1,501,735 | |
| France | | | 9,486,098 | | | — | | | — | | | 9,486,098 | |
| Germany | | | 5,949,533 | | | — | | | — | | | 5,949,533 | |
| Hong Kong | | | 1,752,887 | | | — | | | — | | | 1,752,887 | |
| Israel | | | 1,299,478 | | | — | | | — | | | 1,299,478 | |
| Italy | | | 1,994,099 | | | — | | | — | | | 1,994,099 | |
| Japan | | | 2,490,848 | | | — | | | — | | | 2,490,848 | |
| Netherlands | | | 6,341,270 | | | — | | | — | | | 6,341,270 | |
| Norway | | | 1,234,711 | | | — | | | — | | | 1,234,711 | |
| Portugal | | | 1,459,153 | | | — | | | — | | | 1,459,153 | |
| Switzerland | | | 9,264,478 | | | — | | | — | | | 9,264,478 | |
| Taiwan | | | 1,509,704 | | | — | | | — | | | 1,509,704 | |
| United Kingdom | | | 19,904,126 | | | — | | | — | | | 19,904,126 | |
| United States | | | 27,815,518 | | | — | | | — | | | 27,815,518 | |
| Total Common Stocks | | | 94,907,562 | | | — | | | — | | | 94,907,562 | |
| | | | | | | | | | | | | | |
| Corporate Bonds | | | | | | | | | | | | | |
| France | | | — | | | 665,925 | | | — | | | 665,925 | |
| Germany | | | — | | | 520,000 | | | — | | | 520,000 | |
| Ireland | | | — | | | 606,750 | | | — | | | 606,750 | |
| Netherlands | | | — | | | 1,214,301 | | | — | | | 1,214,301 | |
| Spain | | | — | | | 386,965 | | | — | | | 386,965 | |
| United Kingdom | | | — | | | 4,570,253 | | | — | | | 4,570,253 | |
| United States | | | — | | | 7,962,431 | | | — | | | 7,962,431 | |
| Total Corporate Bonds | | | — | | | 15,926,625 | | | — | | | 15,926,625 | |
| | | | | | | | | | | | | | |
| REITs | | | | | | | | | | | | | |
| France | | | 795,568 | | | — | | | — | | | 795,568 | |
| Netherlands | | | 1,069,144 | | | — | | | — | | | 1,069,144 | |
| United States | | | 1,006,513 | | | — | | | — | | | 1,006,513 | |
| Total Reits | | | 2,871,225 | | | — | | | — | | | 2,871,225 | |
| | | | | | | | | | | | | | |
| Partnerships | | | | | | | | | | | | | |
| United States | | | 832,177 | | | — | | | — | | | 832,177 | |
| Total Partnerships | | | 832,177 | | | — | | | — | | | 832,177 | |
| Short-term Investment | | | 4,943,739 | | | — | | | — | | | 4,943,739 | |
| Total Short-term Investment | | | 4,943,739 | | | — | | | — | | | 4,943,739 | |
Total Investments | | $ | 103,554,703 | | $ | 15,926,625 | | $ | — | | $ | 119,481,328 | |
See notes to financial statements
41
Dividend & Income Builder Fund
July 31, 2016 (continued)
Fair Value Measurements (continued)
| | | | Quoted prices | | | Significant | | | | | | | |
| | | | in active | | | other | | | Significant | | | | |
| | | | markets for | | | observable | | | unobservable | | | | |
| | | | identical assets | | | inputs | | | inputs | | | | |
| Description | | | (level 1 | ) | | (level 2 | ) | | (level 3 | ) | | Total | |
| Liabilities | | | | | | | | | | | | | |
| Financial Derivative Instruments – Liabilities | | | | | | | | | | | | | |
| Over-the-counter | | $ | — | | $ | (126,383 | ) | $ | — | | $ | (126,383 | ) |
| Total Financial Derivative Instruments – Liabilities | | $ | — | | $ | (126,383 | ) | $ | — | | $ | (126,383 | ) |
During the year ended July 31, 2016, there were no transfers in or out of security levels.
Fair Value of Financial Derivative Instruments
The following is a summary of the fair valuation of the Fund's financial derivative instruments categorized by risk exposure:
Fair Values of Financial Derivative Instruments on the Statement of Assets and Liabilities as of July 31, 2016
| | | Derivatives not accounted for as hedging instruments |
| | | | Foreign | | | | | | | | | | | | | | | | |
| | | | Currency | | | Equity | | | Interest | | | Credit | | | Inflation | | | | |
| | | | Risk | | | Risk | | | Rate Risk | | | Risk | | | Risk | | | Total | |
| Financial Derivative Instruments – Liabilities | | | | | | | | | | | | | | | | |
| Over-the-Counter | | | | | | | | | | | | | | | | | | | |
| Forward Foreign Currency Contracts | | $ | (126,383 | ) | $ | — | | $ | — | | $ | — | | $ | — | | $ | (126,383 | ) |
| Total | | $ | (126,383 | ) | $ | — | | $ | — | | $ | — | | $ | — | | $ | (126,383 | ) |
Effect of Financial Derivative Instruments on the Statement of Operations for the Year Ended July 31, 2016
| | | Derivatives not accounted for as hedging instruments |
| | | | Foreign | | | | | | | | | | | | | | | | |
| | | | Currency | | | Equity | | | Interest | | | Credit | | | Inflation | | | | |
| | | | Risk | | | Risk | | | Rate Risk | | | Risk | | | Risk | | | Total | |
| Net realized gain/(loss) from | | | | | | | | | | | | | | | | | | | |
| financial derivative instruments: | | | | | | | | | | | | | | | | | | | |
| Forward Foreign Currency Contracts | | $ | 1,011,874 | | $ | — | | $ | — | | $ | — | | $ | — | | $ | 1,011,874 | |
| Total | | $ | 1,011,874 | | $ | — | | $ | — | | $ | — | | | — | | $ | 1,011,874 | |
| | | | | | | | | | | | | | | | | | | | |
| Net change in unrealized | | | | | | | | | | | | | | | | | | | |
| appreciation/(depreciation) | | | | | | | | | | | | | | | | | | | |
| of financial derivative instruments | | | | | | | | | | | | | | | | | | | |
| Forward Foreign Currency Contracts | | $ | (126,383 | ) | $ | — | | $ | — | | $ | — | | $ | — | | $ | (126,383 | ) |
| Total | | $ | (126,383 | ) | $ | — | | $ | — | | $ | — | | $ | — | | $ | (126,383 | ) |
See notes to financial statements
42
Emerging Markets Fund
July 31, 2016
| | | | | Value | |
| Shares | | | | (note 2) | |
| | | | | | |
| Common stocks – 91.45% | | | |
| | | | | | |
| | | Australia – 2.73% | | | |
| 67,725 | | Newcrest Mining, Ltd. * | $ | 1,286,690 | |
| | | | | | |
| | | Brazil – 11.97% | | | |
| 107,240 | | Banco Bradesco S.A. | | 966,099 | |
| 442,594 | | Duratex S.A. | | 1,352,735 | |
| 34,404 | | Engie Brasil Energia S.A. | | 447,876 | |
| 185,135 | | Mahle-Metal Leve S.A. | | 1,524,520 | |
| 57,981 | | Natura Cosmeticos S.A. | | 595,475 | |
| 162,186 | | WEG S.A. | | 763,811 | |
| | | | | 5,650,516 | |
| | | | | | |
| | | Chile – 11.91% | | | |
| 102,833 | | Antofagasta plc | | 681,152 | |
| 56,499 | | Cia Cervecerias Unidas | | | |
| | | S.A., ADR | | 1,292,132 | |
| 16,199,769 | | Cia Sud Americana de | | | |
| | | Vapores S.A. * | | 295,216 | |
| 98,075 | | Empresa Nacional de | | | |
| | | Telecomunicaciones S.A. * | | 966,278 | |
| 866,352 | | Inversiones Aguas | | | |
| | | Metropolitanas S.A. | | 1,484,702 | |
| 459,849 | | Quinenco S.A. | | 902,629 | |
| | | | | 5,622,109 | |
| | | | | | |
| | | China – 8.16% | | | |
| 302,800 | | China Mengniu Dairy Co., Ltd. | | 505,811 | |
| 180,000 | | China Resources Gas | | | |
| | | Group, Ltd. | | 527,815 | |
| 581,600 | | Fuyao Glass Industry Group | | | |
| | | Co., Ltd. (a) | | 1,469,293 | |
| 257,000 | | Stella International | | | |
| | | Holdings, Ltd. | | 439,905 | |
| 744,000 | | Uni-President China | | | |
| | | Holdings, Ltd. | | 570,581 | |
| 82,800 | | Yue Yuen Industrial | | | |
| | | Holdings, Ltd. | | 336,178 | |
| | | | | 3,849,583 | |
| | | | | | |
| | | Czech Republic – 1.26% | | | |
| 15,104 | | Komercni banka AS | | 594,167 | |
| | | | | | |
| | | Egypt – 0.68% | | | |
| 84,721 | | Commercial International | | | |
| | | Bank Egypt SAE | | 321,093 | |
| | | | | Value | |
| Shares | | | | (note 2) | |
| | | | | | |
| | | India – 12.37% | | | |
| 124,972 | | City Union Bank, Ltd. | $ | 240,672 | |
| 8,568 | | Cognizant Technology | | | |
| | | Solutions Corp., Class A * | | 492,574 | |
| 9,054 | | Dr Reddy's Laboratories, Ltd. | | 396,032 | |
| 70,702 | | Housing Development | | | |
| | | Finance Corp., Ltd. | | 1,451,299 | |
| 407,981 | | Idea Cellular, Ltd. | | 638,298 | |
| 48,903 | | Infosys, Ltd. | | 784,814 | |
| 22,006 | | Mahindra & Mahindra, Ltd. | | 481,957 | |
| 673,835 | | Tata Power Co., Ltd. | | 724,283 | |
| 40,100 | | Tech Mahindra, Ltd. | | 289,144 | |
| 6,140 | | UltraTech Cement, Ltd. | | 341,167 | |
| | | | | 5,840,240 | |
| | | | | | |
| | | Indonesia – 1.41% | | | |
| 697,400 | | Hero Supermarket Tbk PT * | | 61,229 | |
| 2,140,575 | | XL Axiata Tbk PT * | | 606,293 | |
| | | | | 667,522 | |
| | | | | | |
| | | Kazakhstan – 0.00% | | | |
| 955,965 | | International Petroleum, | | | |
| | | Ltd. (b) (c) * | | — | |
| | | | | | |
| | | Korea – 2.42% | | | |
| 14,088 | | LG Corp. | | 798,632 | |
| 1,445 | | Samsung Fire & Marine | | | |
| | | Insurance Co., Ltd. | | 343,787 | |
| | | | | 1,142,419 | |
| | | | | | |
| | | Malaysia – 0.86% | | | |
| 288,835 | | Axiata Group Bhd | | 403,752 | |
| | | | | | |
| | | Mexico – 3.58% | | | |
| 340,016 | | Genomma Lab Internacional | | | |
| | | S.A.B de C.V., Class B * | | 390,973 | |
| 628,578 | | Grupo Herdez SAB de CV | | 1,298,726 | |
| | | | | 1,689,699 | |
| | | | | | |
| | | Nigeria – 3.59% | | | |
| 512,000 | | Guaranty Trust Bank plc | | 38,691 | |
| 185,862 | | Guaranty Trust Bank plc, GDR | | 799,207 | |
| 190,669 | | PZ Cussons plc | | 857,202 | |
| | | | | 1,695,100 | |
| | | | | | |
| | | Philippines – 1.29% | | | |
| 1,104,700 | | Manila Water Co., Inc. | | 608,511 | |
See notes to financial statements
43
Emerging Markets Fund
July 31, 2016 (continued)
| | | | | Value | |
| Shares | | | | (note 2) | |
| | | | | | |
| | | Poland – 2.18% | | | |
| 32,462 | | Bank Pekao S.A. | $ | 1,027,532 | |
| | | | | | |
| | | South Africa – 11.44% | | | |
| 255,994 | | African Oxygen, Ltd. | | 368,834 | |
| 230,102 | | Grindrod, Ltd. | | 191,624 | |
| 34,107 | | Pioneer Foods Group, Ltd. | | 439,813 | |
| 110,848 | | Shoprite Holdings, Ltd. | | 1,623,442 | |
| 167,357 | | Standard Bank Group, Ltd. | | 1,670,405 | |
| 39,353 | | Tiger Brands, Ltd. | | 1,105,243 | |
| | | | | 5,399,361 | |
| | | | | | |
| | | Taiwan – 9.82% | | | |
| 25,000 | | Asustek Computer, Inc. | | 217,320 | |
| 86,000 | | Chroma ATE, Inc. | | 216,866 | |
| 124,465 | | Delta Electronics, Inc. | | 655,017 | |
| 138,000 | | Merida Industry Co., Ltd. | | 637,628 | |
| 520,100 | | Standard Foods Corp. | | 1,291,982 | |
| 29,000 | | Taiwan Semiconductor | | | |
| | | Manufacturing Co., Ltd. | | 156,705 | |
| 715,280 | | Uni-President Enterprises Corp. | | 1,460,898 | |
| | | | | 4,636,416 | |
| | | | | | |
| | | Thailand – 2.83% | | | |
| 209,700 | | Delta Electronics Thailand pcl | | 428,973 | |
| 78,300 | | Kasikornbank pcl | | 448,488 | |
| 969,800 | | Mega Lifesciences pcl | | 456,639 | |
| | | | | 1,334,100 | |
| | | | | | |
| | | Turkey – 0.36% | | | |
| 43,272 | | Yazicilar Holding AS, Class A | | 168,456 | |
| | | | | | |
| | | United Kingdom – 2.59% | | | |
| 135,434 | | Cairn Energy plc * | | 321,019 | |
| 19,271 | | Unilever plc | | 901,191 | |
| | | | | 1,222,210 | |
| | | | | | |
| | | Total common stocks | | | |
| | | (Cost $39,060,576) | | 43,159,476 | |
| | | | | Value | |
| Shares | | | | (note 2) | |
| | | | |
| Preferred stock – 1.20% | | | |
| | | | | | |
| | | Chile – 1.20% | | | |
| 160,764 | | Embotelladora Andina S.A. | $ | 564,817 | |
| | | | | | |
| | | Total preferred stock | | | |
| | | (Cost $459,639) | | 564,817 | |
| | | | | | |
| | | Total long-term investments | | | |
| | | (Cost $39,520,215) | | 43,724,293 | |
| | | | |
| Short-term investment – 3.37% | | | |
| 1,591,916 | | Fidelity Investments Money | | | |
| | | Market Treasury Portfolio | | 1,591,916 | |
| | | | | | |
| | | Total short-term investment | | | |
| | | (Cost $1,591,916) | | 1,591,916 | |
| | | |
| Total investments – 96.02% | | |
| | | (Cost $41,112,131) | | 45,316,209 | |
| | | | |
| Net other assets and liabilities – 3.98% | | 1,879,902 | |
| | | | |
| Total net assets – 100.00% | $ | 47,196,111 | |
| * | | Non-income producing security |
| (a) | | Restricted security, purchased pursuant to Rule 144A under the Securities Act of 1933, as amended, and which is exempt from registration under that Act. At July 31, 2016, the restricted securities held by the Fund had an aggregate value of $1,469,293, which represented 3.1% of net assets. |
| (b) | | The security has been deemed illiquid by the Adviser according to the policies and procedures adopted by the Board of Trustees. |
| (c) | | Fair valued at July 31, 2016 as determined in good faith using procedures approved by the Board of Trustees. |
| ADR | | American Depositary Receipt |
| GDR | | Global Depositary Receipt |
See notes to financial statements
44
Emerging Markets Fund
July 31, 2016 (continued)
Other information:
| Currency exposure of portfolio assets | | |
| before any currency hedging, if applicable. | % of total |
| Excludes derivatives: | investments |
| Brazilian Real | 12 | % |
| South African Rand | 12 | |
| Indian Rupee | 12 | |
| Taiwan Dollar | 10 | |
| US Dollar | 10 | |
| Chilean Peso | 9 | |
| Hong Kong Dollar | 9 | |
| British Pound | 6 | |
| Mexican Peso | 4 | |
| Thai Baht | 3 | |
| Australian Dollar | 3 | |
| Korean Won | 3 | |
| Polish Zloty | 2 | |
| Indonesian Rupiah | 2 | |
| Philippine Peso | 1 | |
| Czech Koruna | 1 | |
| Malaysian Ringgit | 1 | |
| Turkish Lira | 0 | * |
| Nigerian Naira | 0 | * |
| | 100 | % |
* Less than 0.05% of total investments.
| Industry concentration as | % of net |
| a percentage of net assets: | assets |
| Packaged Foods & Meats | 14.14 | % |
| Diversified Banks | 12.94 | |
| Auto Parts & Equipment | 6.34 | |
| Water Utilities | 4.44 | |
| Wireless Telecommunication Services | 4.26 | |
| Industrial Conglomerates | 3.96 | |
| Household Products | 3.73 | |
| Food Retail | 3.57 | |
| IT Consulting & Other Services | 3.32 | |
| Thrifts & Mortgage Finance | 3.08 | |
| Forest Products | 2.87 | |
| Brewers | 2.74 | |
| Gold | 2.73 | |
| Pharmaceuticals | 2.64 | |
| Electronic Components | 2.30 | |
| Footwear | 1.64 | |
| Industrial Machinery | 1.62 | |
| Electric Utilities | 1.53 | |
| Diversified Metals & Mining | 1.44 | |
| Leisure Products | 1.35 | |
| Integrated Telecommunication Services | 1.29 | |
| Personal Products | 1.26 | |
| Soft Drinks | 1.20 | |
| Gas Utilities | 1.12 | |
| Marine | 1.03 | |
| Automobile Manufacturers | 1.02 | |
| Renewable Electricity | 0.95 | |
| Industrial Gases | 0.78 | |
| Property & Casualty Insurance | 0.73 | |
| Construction Materials | 0.72 | |
| Oil & Gas Exploration & Production | 0.68 | |
| Technology Hardware, Storage and Peripherals | 0.46 | |
| Electronic Equipment & Instruments | 0.46 | |
| Semiconductors | 0.31 | |
| Total Long-Term Investments | 92.65 | |
| Short-Term Investment | 3.37 | |
| Total Investments | 96.02 | |
| Net Other Assets and Liabilities | 3.98 | |
| | 100.00 | % |
See notes to financial statements
45
Emerging Markets Fund
July 31, 2016 (continued)
Fair Value Measurement
The following table summarizes the Fund's investments that are measured at fair value by level within the fair value hierarchy at July 31, 2016:
| | | | Quoted prices | | | Significant | | | | | | | |
| | | | in active | | | other | | | Significant | | | | |
| | | | markets for | | | observable | | | unobservable | | | | |
| | | | identical assets | | | inputs | | | inputs | | | | |
| Description | | | (level 1 | ) | | (level 2 | ) | | (level 3 | ) | | Total | |
| Assets | | | | | | | | | | | | | |
| Common Stocks | | | | | | | | | | | | | |
| Australia | | $ | 1,286,690 | | $ | — | | $ | — | | $ | 1,286,690 | |
| Brazil | | | 5,650,516 | | | — | | | — | | | 5,650,516 | |
| Chile | | | 5,622,109 | | | — | | | — | | | 5,622,109 | |
| China | | | 3,849,583 | | | — | | | — | | | 3,849,583 | |
| Czech Republic | | | 594,167 | | | — | | | — | | | 594,167 | |
| Egypt | | | 321,093 | | | — | | | — | | | 321,093 | |
| India | | | 5,840,240 | | | — | | | — | | | 5,840,240 | |
| Indonesia | | | 667,522 | | | — | | | — | | | 667,522 | |
| Kazakhstan | | | — | | | — | | | —* | | | — | |
| Korea | | | 1,142,419 | | | — | | | — | | | 1,142,419 | |
| Malaysia | | | 403,752 | | | — | | | — | | | 403,752 | |
| Mexico | | | 1,689,699 | | | — | | | — | | | 1,689,699 | |
| Nigeria | | | 1,695,100 | | | — | | | — | | | 1,695,100 | |
| Philippines | | | 608,511 | | | — | | | — | | | 608,511 | |
| Poland | | | 1,027,532 | | | — | | | — | | | 1,027,532 | |
| South Africa | | | 5,399,361 | | | — | | | — | | | 5,399,361 | |
| Taiwan | | | 4,636,416 | | | — | | | — | | | 4,636,416 | |
| Thailand | | | 1,334,100 | | | — | | | — | | | 1,334,100 | |
| Turkey | | | 168,456 | | | — | | | — | | | 168,456 | |
| United Kingdom | | | 1,222,210 | | | — | | | — | | | 1,222,210 | |
| Total Common Stocks | | | 43,159,476 | | | — | | | — | | | 43,159,476 | |
| | | | | | | | | | | | | | |
| Preferred Stock | | | | | | | | | | | | | |
| Chile | | | 564,817 | | | — | | | — | | | 564,817 | |
| Total Preferred Stock | | | 564,817 | | | — | | | — | | | 564,817 | |
| Short-term Investments | | | 1,591,916 | | | — | | | — | | | 1,591,916 | |
| Total Investments | | $ | 45,316,209 | | $ | — | | $ | — | | $ | 45,316,209 | |
| * Fund held a level 3 security that was fair valued at $0 at July 31, 2016. |
During the year ended July 31, 2016, there were no transfers in or out of security levels.
See notes to financial statements
46
Emerging Markets Fund
July 31, 2016 (continued)
Following is a reconciliation of investments in which significant unobservable inputs (Level 3) were used in determining fair value:
| | | | Balance | | | | | | | | | Change in | | | | | | | | | | | | | | | Balance | |
| | | | as of | | | Accrued | | | | | | unrealized | | | | | | | | | Transfers | | | Transfers | | | as of | |
| | | | July 31, | | | discounts/ | | | Realized | | | appreciation | | | | | | | | | in to | | | out of | | | July 31, | |
| Investments in Securities | | | 2015 | | | premiums | | gain/(loss | ) | | (depreciation | ) | | Purchases | | | Sales | | | level 3 | | | level 3 | | | 2016 | |
| Common Stock | | | | | | | | | | | | | | | | | | | | | | | | | | | | |
| International Petroleum, Ltd. | | $ | 0 | | $ | 0 | | $ | 0 | | $ | 0 | | $ | 0 | | $ | 0 | | $ | 0 | | $ | 0 | | $ | 0 | |
The total net change in unrealized appreciation (depreciation) attributable to level 3 investments held at July 31, 2016 was $0.
The Fund's Adviser has determined that International Petroleum, Ltd. is a Level 3 investment due to the lack of observable inputs that may be used in the determination of fair value. The fair valuation reflects that the early-stage exploration company has been suspended from trading since October 2013 due to significant doubt about its ability to sell its Russian-based assets and failed merger with Range Resources, Ltd.
See notes to financial statements
47
European Focus Fund
July 31, 2016
| | | | | Value | |
| Shares | | | | (note 2) | |
| | | | | | |
| Common stocks – 98.55% | | | |
| | | | | | |
| | | Australia – 0.06% | | | |
| 5,200,000 | | African Petroleum Corp., | | | |
| | | Ltd. (a) * | $ | 1,713,375 | |
| | | | | | |
| | | Canada – 0.72% | | | |
| 10,752,083 | | Africa Energy Corp. (a) * | | 905,855 | |
| 2,235,878 | | Africa Oil Corp. (b) * | | 2,996,811 | |
| 574,622 | | Africa Oil Corp. (c) * | | 770,182 | |
| 10,925,000 | | Africa Oil Corp. * | | 14,861,166 | |
| | | | | 19,534,014 | |
| | | | | | |
| | | Denmark – 1.00% | | | |
| 150,000 | | Genmab A/S (b) * | | 27,188,493 | |
| | | | | | |
| | | Finland – 9.09% | | | |
| 40,600,000 | | Nokia Oyj | | 233,308,812 | |
| 2,500,000 | | Outokumpu Oyj (b) * | | 14,380,281 | |
| | | | | 247,689,093 | |
| | | | | | |
| | | France – 8.15% | | | |
| 1,000,000 | | Accor S.A. | | 41,841,168 | |
| 950,000 | | Renault S.A. | | 83,109,361 | |
| 1,000,000 | | Sanofi | | 85,135,736 | |
| 600,000 | | Vivendi S.A. | | 11,796,023 | |
| | | | | 221,882,288 | |
| | | | | | |
| | | Germany – 8.34% | | | |
| 600,000 | | Bayer AG | | 64,544,404 | |
| 350,000 | | Continental AG | | 73,368,781 | |
| 525,000 | | ProSiebenSat.1 Media SE | | 24,000,396 | |
| 5,000,000 | | TUI AG | | 65,146,817 | |
| | | | | 227,060,398 | |
| | | | | | |
| | | Ireland – 0.14% | | | |
| 24,300,000 | | Providence Resources plc (a) * | | 3,818,980 | |
| | | | | | |
| | | Israel – 8.05% | | | |
| 4,100,000 | | Teva Pharmaceutical | | | |
| | | Industries, Ltd., ADR | | 219,350,000 | |
| | | | | | |
| | | Italy – 3.24% | | | |
| 10,000,000 | | Intesa Sanpaolo SpA | | 22,024,610 | |
| 9,500,000 | | Poste Italiane SpA (b) (d) | | 66,115,754 | |
| | | | | 88,140,364 | |
| | | | | Value | |
| Shares | | | | (note 2) | |
| | | | | | |
| | | Netherlands – 7.11% | | | |
| 750,000 | | ASML Holding N.V. (b) | $ | 82,961,225 | |
| 2,823,529 | | Koninklijke Ahold Delhaize N.V. | | 67,427,257 | |
| 1,350,000 | | Nostrum Oil & Gas plc (b) * | | 5,359,972 | |
| 1,000,000 | | Sensata Technologies | | | |
| | | Holding N.V. * | | 37,920,000 | |
| | | | | 193,668,454 | |
| | | | | | |
| | | Nigeria – 0.05% | | | |
| 5,873,780 | | Lekoil, Ltd. (b) * | | 1,302,087 | |
| | | | | | |
| | | Panama – 1.72% | | | |
| 1,000,000 | | Carnival Corp. | | 46,720,000 | |
| | | | | | |
| | | Spain – 4.14% | | | |
| 14,000,000 | | NH Hotel Group S.A. * | | 63,703,667 | |
| 3,370,000 | | Parques Reunidos Servicios | | | |
| | | Centrales SAU (a) (d) * | | 48,979,601 | |
| | | | | 112,683,268 | |
| | | | | | |
| | | Sweden – 2.00% | | | |
| 3,300,000 | | Lundin Petroleum AB * | | 54,607,923 | |
| | | | | | |
| | | Switzerland – 9.04% | | | |
| 925,000 | | Dufry AG (b) * | | 106,510,524 | |
| 4,000,000 | | OC Oerlikon Corp. AG * | | 37,432,934 | |
| 400,000 | | Roche Holding AG | | 102,146,100 | |
| | | | | 246,089,558 | |
| | | | | | |
| | | United Kingdom – 33.46% | | | |
| 1,100,000 | | AA, Ltd. | | 3,608,915 | |
| 14,000,000 | | Aberdeen Asset Management | | | |
| | | plc (b) | | 59,012,627 | |
| 4,000,000 | | ARM Holdings plc | | 88,512,323 | |
| 10,300,000 | | Ashmore Group plc (b) | | 45,393,005 | |
| 11,750,000 | | Aviva plc | | 60,818,144 | |
| 26,000,000 | | Barclays plc | | 53,180,184 | |
| 10,125,000 | | DJI Holdings plc (a) (b) * | | 13,399,929 | |
| 1,800,000 | | IMI plc | | 25,537,288 | |
| 4,750,000 | | Informa plc | | 44,884,800 | |
| 5,375,000 | | Inmarsat plc | | 55,627,904 | |
| 5,901,217 | | Just Eat plc * | | 41,939,510 | |
| 10,500,000 | | Kingfisher plc | | 46,732,998 | |
| 1,750,000 | | Liberty Global plc, Class A * | | 55,492,500 | |
| 8,500,000 | | Merlin Entertainments plc (d) | | 53,231,798 | |
| 4,350,000 | | Mytrah Energy, Ltd. (a) * | | 2,820,933 | |
| 5,750,000 | | Royal Dutch Shell plc, B Shares | | 152,348,925 | |
| 6,000,000 | | Royal Mail plc | | 40,457,861 | |
See notes to financial statements
48
European Focus Fund
July 31, 2016 (continued)
| | | | | Value | |
| Shares | | | | (note 2) | |
| | | | | | |
| | | United Kingdom (continued) | | | |
| 23,632,992 | | Saga plc | $ | 63,648,855 | |
| 12,515,000 | | Savannah Petroleum plc (a) * | | 4,720,448 | |
| | | | | 911,368,947 | |
| | | | | | |
| | | United States – 2.24% | | | |
| 300,000 | | Norwegian Cruise Line | | | |
| | | Holdings, Ltd. * | | 12,780,000 | |
| 750,000 | | Shire plc | | 48,348,930 | |
| | | | | 61,128,930 | |
| | | | | | |
| | | Total common stocks | | | |
| | | (Cost $2,840,306,327) | | 2,683,946,172 | |
| | | | |
| Preferred stock – 1.42% | | | |
| | | | | | |
| | | Italy – 1.42% | | | |
| 18,600,000 | | Intesa Sanpaolo SpA | | 38,761,524 | |
| | | | | | |
| | | Total preferred stock | | | |
| | | (Cost $52,704,948) | | 38,761,524 | |
| | | | |
| Warrants – —% | | | |
| | | | | | |
| | | Norway – —% | | | |
| 2,388,950 | | African Petroleum Corp., Ltd. | | | |
| | | (expires 3/16/17) (a) (c) * | | — | |
| | | | | | |
| | | Total Warrants | | | |
| | | (Cost $—) | | — | |
| | | | | | |
| | | Total long-term investments | | | |
| | | (Cost $2,893,011,275) | | 2,722,707,696 | |
| | | | |
| Short-term investment – 0.26% | | | |
| 7,087,168 | | Fidelity Investments Money | | | |
| | | Market Treasury Portfolio | | 7,087,168 | |
| | | | | | |
| | | Total Short-term investment | | | |
| | | (Cost $7,087,168) | | 7,087,168 | |
| | | | | Value | |
| Shares | | | | (note 2) | |
| | | | |
| Other securities – 1.25% | | | |
| 34,011,720 | | State Street Navigator | | | |
| | | Securities Lending | | | |
| | | Prime Portfolio (e) | $ | 34,011,720 | |
| | | | | | |
| | | Total other securities | | | |
| | | (Cost $34,011,720) | | 34,011,720 | |
| | | | | | |
| Total investments – 101.48% | | | |
| | | (Cost $2,934,110,163) | | 2,763,806,584 | |
| | | | |
| Financial Derivative Instruments(f) | | | |
(Cost or Premiums, net $0) – (0.12)% | | (3,196,129 | ) |
| | | | |
| Net other assets and liabilities – (1.36)% | | (37,036,144 | ) |
| | | | |
| Total net assets – 100.00% | $ | 2,723,574,311 | |
| * | | Non-income producing security |
| (a) | | The security has been deemed illiquid by the Adviser according to the policies and procedures adopted by the Board of Trustees. |
| (b) | | All or a portion of this security is on loan on an overnight and continuous basis; see notes to financial statements for further information. |
| (c) | | Fair valued at July 31, 2016 as determined in good faith using procedures approved by the Board of Trustees. |
| (d) | | Restricted security, purchased pursuant to Rule 144A under the Securities Act of 1933, as amended, and which is exempt from registration under that Act. At July 31, 2016, the restricted securities held by the Fund had an aggregate value of $168,327,153, which represented 6.2% of net assets. |
| (e) | | Represents cash collateral received from securities lending transactions; see notes to financial statements for further information. |
| (f) | | Information with respect to financial derivative instruments is disclosed in the following tables. |
| ADR | | American Depositary Receipt |
See notes to financial statements
49
European Focus Fund
July 31, 2016 (continued)
(f) FINANCIAL DERIVATIVE INSTRUMENTS
OVER-THE-COUNTER FINANCIAL DERIVATIVE INSTRUMENTS
FORWARD FOREIGN CURRENCY CONTRACTS
| | | | | | | | | | | | | | | | Unrealized |
| | | | | | | | | | Local | | | Current | | | appreciation/ |
| | | | | | | Value | | | amount | | | notional | | | (depreciation) |
| | | �� | Counterparty | | | date | | | (000's | ) | | value | | | Asset | | | Liability | |
| British Pound (Short) | | | Citibank, N.A. | | | 10/05/16 | | | 153,364 | | $ | 203,196,129 | | $ | — | | $ | (3,196,129 | ) |
| Total | | | | | | | | | | | | | | $ | — | | $ | (3,196,129 | ) |
During the year ended July 31, 2016, average monthly notional value related to forward foreign currency contracts was approximately $266.4 million or 9.8% of ending net assets.
FINANCIAL DERIVATIVE INSTRUMENTS: OVER-THE-COUNTER SUMMARY
The following is a summary by counterparty of the value of over-the-counter financial derivative instruments and collateral (received)/pledged as of July 31, 2016.
| | | Financial Derivative Assets | | Financial Derivative Liabilities | | | | | | | | | |
| | | | Unrealized | | | | | | Unrealized | | | | | | | | | | | | | |
| | | | Appreciation | | | | | | Depreciation | | | | | | | | | | | | | |
| | | | Forward | | | | | | Forward | | | | | | | | | | | | | |
| | | | Foreign | | | Total | | | Foreign | | | Total | | | Net Value | | | Collateral | | | | |
| | | | Currency | | | Over-the- | | | Currency | | | Over-the- | | | of OTC | | | (Received) / | | | Net | |
| | | | Contracts | | | Counter | | | Contracts | | | Counter | | | Derivatives | | | Pledged | | | Exposure(1) | |
| Amounts subject to a master netting agreement: | | | | | | | | | | | | |
| Citibank, N.A. | | $ | — | | $ | — | | $ | (3,196,129 | ) | $ | (3,196,129 | ) | $ | (3,196,129 | ) | $ | — | | $ | (3,196,129 | ) |
| | | $ | — | | $ | — | | $ | (3,196,129 | ) | $ | (3,196,129 | ) | $ | (3,196,129 | ) | $ | — | | $ | (3,196,129 | ) |
| | (1) | Net Exposure represents the net receivable/(payable) that would be due from/to the counterparty in the event of default. Exposure from over-the-counter financial derivative instruments can only be netted across transactions governed under the same master agreement with the same legal entity. See Note 2, Significant Accounting Policies, "Derivative instruments," in the Notes to Financial Statements for more information regarding master netting arrangements. |
| | Cost or Premiums, Net | | | Asset | | | Liability | |
| TOTAL FINANCIAL DERIVATIVE INSTRUMENTS | | $ | — | | $ | — | | $ | (3,196,129 | ) |
See notes to financial statements
50
* Less than 0.05% of total investments.
The following table summarizes the Fund's investments that are measured at fair value by level within the fair value hierarchy at July 31, 2016:
*Fund held a Level 2 security that was fair valued at $0 at July 31, 2016.
During the year ended July 31, 2016, there were no transfers in or out of security levels.
The following is a summary of the fair valuation of the Fund's financial derivative instruments categorized by risk exposure:
Fair Values of Financial Derivative Instruments on the Statement of Assets and Liabilities as of July 31, 2016
Effect of Financial Derivative Instruments on the Statement of Operations for the Year Ended July 31, 2016
During the year ended July 31, 2016, average monthly notional value related to forward foreign currency contracts was approximately $786.9 million or 19.6% of ending net assets.
The following is a summary by counterparty of the value of over-the-counter financial derivative instruments and collateral (received)/pledged as of July 31, 2016.
The following table summarizes the Fund's investments that are measured at fair value by level within the fair value hierarchy at July 31, 2016:
During the year ended July 31, 2016, there were no transfers in or out of security levels.
The following is a summary of the fair valuation of the Fund's financial derivative instruments categorized by risk exposure:
Fair Values of Financial Derivative Instruments on the Statement of Assets and Liabilities as of July 31, 2016
Effect of Financial Derivative Instruments on the Statement of Operations for the Year Ended July 31, 2016
The following table summarizes the Fund's investments that are measured at fair value by level within the fair value hierarchy at July 31, 2016:
During the year ended July 31, 2016, there were no transfers in or out of security levels.
During the year ended July 31, 2016, average monthly notional value related to swap contracts, including both centrally-cleared and over-the-counter, was approximately $278,784 or 0.7% of ending net assets.
The following is a summary by counterparty of the value of over-the-counter financial derivative instruments and collateral (received)/pledged as of July 31, 2016.
The following table summarizes the Fund's investments that are measured at fair value by level within the fair value hierarchy at July 31, 2016:
During the year ended July 31, 2016, there were no transfers in or out of security levels.
Following is a reconciliation of investments in which significant unobservable inputs (Level 3) were used in determining fair value:
The total net change in unrealized appreciation (depreciation) attributable to Level 3 investments held at July 31, 2016 was $0.
The Fund's Adviser has determined that MPM Escrow LLC is a Level 3 investment due to the lack of observable inputs in its valuation. In 2014, Momentive Performance Materials, Inc. defaulted on a debt obligation which was restructured into a new debt offering, which the Fund has purchased (Momentive Performance Materials, Inc. 3.88% 10/24/21). Attached to the purchase, the Fund received MPM Escrow LLC, which is the vehicle through which any recovery of the defaulted debt would take place. At July 31, 2016, this escrow stub was fair valued at $0 as it is unlikely to ever have value in the marketplace.
The following is a summary of the fair valuation of the Fund's financial derivative instruments categorized by risk exposure:
Fair Values of Financial Derivative Instruments on the Statement of Assets and Liabilities as of July 31, 2016
Effect of Financial Derivative Instruments on the Statement of Operations for the Year Ended July 31, 2016
During the year ended July 31, 2016, average monthly notional value related to futures contracts was approximately $1.7 million or 5.1% of ending net assets.
The following is a summary of the value of exchange-traded or centrally-cleared financial derivative instruments as of July 31, 2016:
During the year ended July 31, 2016, average monthly notional value related to forward foreign currency contracts was approximately $9.0 million or 27.1% of ending net assets.
The following is a summary by counterparty of the value of over-the-counter financial derivative instruments and collateral (received)/pledged as of July 31, 2016.
* Less than 0.5% of total investments.
The following table summarizes the Fund's investments that are measured at fair value by level within the fair value hierarchy at July 31, 2016:
* Fund held a level 2 security that was fair valued at $0 at July 31, 2016.
During the year ended July 31, 2016, there were no transfers in or out of security levels other than the following. On July 31, 2015, all of the equity swaps held by the Fund were valued based upon the last reported sale price or official closing price on the underlying equity, plus/minus accrued dividends. At July 31, 2016, the short equity swap on Afren plc was valued based upon a fair value price ascribed by the Adviser in accordance with fair value pricing procedures approved by the Board of Trustees. Accordingly, using the end of the reporting period method for determining when transfers between levels are recognized, equity swaps valued at $54,764 on July 31, 2016 were transferred from Level 2 to Level 3.
Following is a reconciliation of investments in which significant unobservable inputs (Level 3) were used in determining fair value:
The Fund's Adviser has determined that the short equity swap on the underlying referenced security Afren plc ("Afren") is a Level 3 investment due to the lack of observable inputs that may be used in the determination of fair value. In accordance with the pricing procedures approved by the Board of Trustees, equity swap contracts are valued using the last traded exchange price on the underlying equity security. Afren was an international oil exploration and production company that traded on the London Stock Exchange. In July 2015, Afren's stock was suspended from trading at a last traded price of 0.01785 GBP as the result of management's announcement that it was unable to accurately assess its financial position due to reduced production levels and inability to raise capital. Subsequently, in August 2015, the stock was formally delisted from the exchange as the company was taken into bankruptcy proceedings. As the Fund's position is "short," it benefitted from the ultimate decline in the company's value and eventual delisting. Accordingly, pending the company's liquidation and given the likelihood that the sale of the company's assets will not be sufficient to cover its outstanding debt, the fair valuation of the security underlying the equity swap reflects only inconsequential final costs associated with the termination of the contract but which is otherwise deemed worthless.
The following is a summary of the fair valuation of the Fund's financial derivative instruments categorized by risk exposure:
Fair Values of Financial Derivative Instruments on the Statement of Assets and Liabilities as of July 31, 2016
Effect of Financial Derivative Instruments on the Statement of Operations for the Year Ended July 31, 2016
During the year ended July 31, 2016, average monthly notional value related to forward foreign currency contracts was approximately $409.9 million or 8.4% of net assets.
The following is a summary by counterparty of the value of over-the-counter financial derivative instruments and collateral (received)/pledged as of July 31, 2016.
* Less than 0.5% of total investments.
The following table summarizes the Fund's investments that are measured at fair value by level within the fair value hierarchy at July 31, 2016:
During the year ended July 31, 2016, there were no transfers in or out of security levels.
The following is a summary of the fair valuation of the Fund's financial derivative instruments categorized by risk exposure:
Fair Values of Financial Derivative Instruments on the Statement of Assets and Liabilities as of July 31, 2016
Effect of Financial Derivative Instruments on the Statement of Operations for the Year Ended July 31, 2016
The following table summarizes the Fund's investments that are measured at fair value by level within the fair value hierarchy at July 31, 2016:
During the year ended July 31, 2016, there were no transfers in or out of security levels.
During the year ended July 31, 2016, average monthly notional value related to futures contracts was approximately $7.1 million or 1.6% of ending net assets.
The following is a summary of the value of exchange-traded or centrally-cleared financial derivative instruments as of July 31, 2016:
During the year ended July 31, 2016, average monthly notional value related to forward foreign currency contracts was approximately $189.9 million or 42.9% of ending net assets.
During the year ended July 31, 2016, average monthly notional value related to swap contracts, including both centrally-cleared and over-the-counter, was approximately $13.2 million or 3.0% of net assets.
The following is a summary by counterparty of the value of over-the-counter financial derivative instruments and collateral (received)/pledged as of July 31, 2016.
The following table summarizes the Fund's investments that are measured at fair value by level within the fair value hierarchy at July 31, 2016:
During the year ended July 31, 2016, there were no transfers in or out of security levels.
The following is a summary of the fair valuation of the Fund's financial derivative instruments categorized by risk exposure:
Fair Values of Financial Derivative Instruments on the Statement of Assets and Liabilities as of July 31, 2016
Effect of Financial Derivative Instruments on the Statement of Operations for the Year Ended July 31, 2016