UNITED STATES
SECURITIES AND EXCHANGE COMMISSION
Washington, D.C. 20549
FORM N-CSR
CERTIFIED SHAREHOLDER REPORT OF REGISTERED
MANAGEMENT INVESTMENT COMPANIES
Investment Company Act file number: 811-10399
______________________________________________
HENDERSON GLOBAL FUNDS
____________________________________________________________________________
(Exact name of registrant as specified in charter)
737 NORTH MICHIGAN AVENUE, SUITE 1700
CHICAGO, ILLINOIS 60611
____________________________________________________________________________
(Address of principal executive offices)(Zip code)
(Name and Address of Agent for Service) | Copy to: |
CHRISTOPHER K. YARBROUGH 737 NORTH MICHIGAN AVENUE, SUITE 1700 CHICAGO, ILLINOIS 60611 | CATHY G. O’KELLY VEDDER PRICE P.C. 222 NORTH LASALLE STREET CHICAGO, ILLINOIS 60601 |
Registrant’s telephone number, including area code: (312) 397-1122
Date of fiscal year end: July 31
Date of reporting period: July 31, 2015
Item 1: Report to Shareholders.
| Letter to shareholders | 1 |
| Commentaries and Performance summaries | |
| All Asset Fund | 4 |
| Dividend & Income Builder Fund | 6 |
| Emerging Markets Fund | 8 |
| European Focus Fund | 10 |
| Global Equity Income Fund | 12 |
| Global Technology Fund | 14 |
| High Yield Opportunities Fund | 16 |
| International Long/Short Equity Fund | 18 |
| International Opportunities Fund | 20 |
| International Select Equity Fund | 22 |
| Strategic Income Fund | 24 |
| Unconstrained Bond Fund | 26 |
| US Growth Opportunities Fund | 28 |
| Portfolios of investments | 30 |
| Statements of assets and liabilities | 118 |
| Statements of operations | 126 |
| Statements of changes in net assets | 134 |
| Statements of changes – capital stock activity | 147 |
| Statement of cash flows | 161 |
| Financial highlights | 162 |
| Notes to financial statements | 182 |
| Report of independent registered public accounting firm | 197 |
| Other information | 198 |
| Trustees and officers | 204 |
International and emerging markets investing involves certain risks and increased volatility not associated with investing solely in the US. These risks include currency fluctuations, economic or financial instability, lack of timely or reliable financial information or unfavorable political or legal developments. The Funds may invest in securities issued by smaller companies which typically involve greater risk than investing in larger companies. Certain of the Funds are non-diversified and therefore the change in value of a single holding may have a more pronounced effect on a Fund’s performance. Also, the Funds may invest in limited geographic areas and/or sectors which may result in greater market volatility. In addition, the Funds may invest in derivatives. Derivatives involve special risks different from, and potentially greater than, the risks associated with investing directly in securities and may result in greater losses. The Funds may be subject to frequent trading which may result in a turnover rate of 100% or more. Additional fund-specific risk is described in more detail in the Prospectus and Statement of Additional Information.
Investors should consider the investment objectives, risks, charges and expenses of a mutual fund carefully before investing. For a free Prospectus, which contains these items and other important information about the Funds, visit www.henderson.com. The Prospectus should be read carefully before investing.
Dear shareholder,
We are pleased to provide the annual report for the Henderson Global Funds, which covers the year ended July 31, 2015.
In our last shareholder letter, we wrote that there were positive global economic signs already emerging in 2015. Now, over halfway through the year, we have seen many of those positive signs continue, but we note that some negative data has begun to emerge as well.
On the positive side, European economies have been improving despite the headlines of an ongoing crisis in Greece. The tailwinds provided by a lower euro currency, cheaper oil and the European Central Bank’s quantitative easing program have provided a solid platform for recovery. European markets have also recently been buoyed by the news that the Greek government secured interim financing and agreed to a new bailout program with its creditors. Finally, positive signs such as improvements in Purchasing Managers’ Indices, auto and retail sales and bank lending are filtering down to the corporate level and have translated into higher earnings growth forecasts across Europe. After 210 weeks of consecutive earnings downgrades, Europe recently returned to seeing consensus earnings upgrades for the first time since March 2011.
Japanese markets have also moved forward in 2015 despite disappointing macro numbers, including a downturn in second quarter household spending and weaker manufacturing output. With the Bank of Japan continuing its comprehensive asset purchase program, Japanese equity markets remain the best performing dollar-adjusted market in 2015.
In the US, a healthy 223,000 jobs were added in June and the unemployment rate fell from 6.2% in July 2014 to 5.3% in July 2015. Improvements in the economy and the Federal Reserve’s official communications increased expectations for an interest rate hike in the near term.
On a more negative note, ongoing concern over the health of China’s economy has led to further declines in commodity prices, and the Chinese market overall has been weak. In fact, extreme volatility in the Chinese market recently prompted the Chinese government to intervene in an attempt to quell frenetic selling by retail investors. The government’s measures included suspending trading on over 50% of listed A-shares, banning short-sales and initial public offerings, and prohibiting major shareholders from selling their stakes.
The effect of China’s macroeconomic slowdown has significantly affected other emerging markets, both directly and through its impact on the price of major commodities. Many emerging market economies rely on revenues from commodity exports and there have been knock-on effects on currency and stock markets across Latin America, Africa and parts of Asia. Latin American markets generally have struggled in 2015, with Brazil particularly beset by low commodity prices and political scandal.
Looking forward, as the Greek debt crisis moves towards a full resolution, we believe diverging monetary policy and economic momentum will return as a dominant theme. Investors will be particularly interested in when, and how quickly, the Federal Reserve and Bank of England raise interest rates and the impact this will have on the global economy. The slowing of the emerging market business cycle will also be important, notably in local equity markets, commodities, and emerging market currencies.
At Henderson, we marked the three-year anniversaries of the All Asset Fund on March 30, 2015 and the Dividend & Income Builder Fund on August 1, 2015. We are also pleased to report that Henderson won the “Global Group of the Year” award1 at Investment Week’s 2015 Fund Manager of the Year Awards in the UK, in recognition of Henderson’s strong fund performance, its new brand and strategic acquisitions that widen the investment skillset. We appreciate your trust in, and support of, our Funds, and we look forward to serving your financial needs in the years to come.
James G. O’Brien
President, Henderson Global Funds
| 1 | The Investment Week Global Group of the Year award took into consideration the new Henderson global brand, fund flows including those into US products and strategic acquisitions including that of Geneva Capital Management in the US. |
1
| The need for income – looking beyond fixed income |
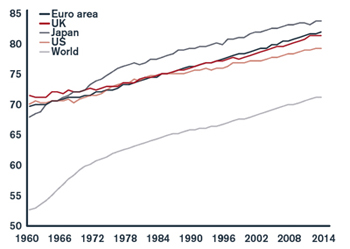
With baby boomers entering retirement age and people living longer, the need for income has never been greater
| • | The World Bank projects the world’s population will continue to shift upward in age and, by 2050, 15% of the world’s population will be over the age of 65 |
| | |
| • | Life expectancy around the world is also projected to grow continually due to advances in healthcare and technology |
| | |
| • | This global shift in population age and life expectancy will create greater demand in the future for diversified sources of inco ome me to meet basic living needs |
Life expectancy
Source: World Bank Economic Data as of 7/31/15
Population statistics
| World | 2005 | 2015 | 2035 | 2050 |
| Population Growth | 1.3% | | 1.1% | | 0.7% | | 0.5% | |
| Population: Age 0-14 | 28.0% | | 26.1% | | 22.8% | | 21.6% | |
| Population: Age 15-64 | 64.7% | | 65.7% | | 64.5% | | 63.2% | |
| Population: Age 65 & above | 7.3% | | 8.2% | | 12.7% | | 15.5% | |
Source: World Bank Economic Data as of 7/31/15
Falling rates have driven a search for other sources of income
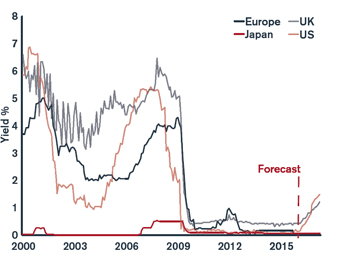
| • | Government interest rates and fixed income yields have been on the decline worldwide since the financial crisis of 2008 due to slowing global growth and unprecedented global monetary policy, leaving investors with few options for high income sources |
| | |
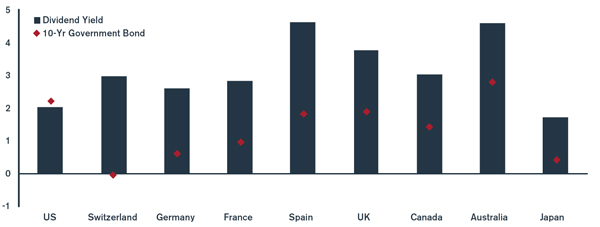
| • | On the other hand, dividends for global equities have been steadily rising and offer investors a diversified source for income with the potential for a much more attractive yield |
Expected path for interest rates remains low
Source: Bloomberg as of 7/31/15
Dividend yields
Source: Thompson Datastream as of 7/31/15. The MSCI Indices are free float-adjusted market capitalization indices that are designated to measure market equity performance within their specific geographic region.
2
There’s more than one path to income
International dividends currently offer larger yields when compared to fixed income
Source: Thompson Datastream as of 7/31/15
Further, in many markets we’re seeing dividend yields higher than corporate bond yields. For example, more than 50% of European companies have a dividend yield greater than their corporate bond yield.
Percent of European companies with dividend yield > corporate bond yield
Source: Goldman Sachs, as of 6/30/15 Note: Indices used are DJ Stoxx 600 and iBoxx EUR/GBP corporate bond yields. CY= corporate bond yield, DY= dividend yield
Dividend growth outlook
2015 has been a strong year for dividend growth with the MSCI World Index as a whole forecasted to grow 6%. Regionally, Japan and the US are forecast to be the fastest countries for dividend growth with some companies growing dividends at double-digit rates. We have also seen an ongoing theme of companies returning cash via special dividends and share buybacks. Looking long-term, we remain encouraged by the prospects for dividend growth. Many sectors and countries, previously often outside the realm of dividend investors, have become more focused on consistently returning cash to shareholders.
Relative to other asset classes, dividend paying equities look attractively valued, particularly in a world where income is scarce; dividend yields are, in the majority of cases, above corporate bond yields with the added benefit that we believe those dividends are capable of growing.
It remains our view that the outlook for dividend paying equities is favorable - in particular those capable of generating sustained dividend growth backed by earnings and cash flow.
3
All Asset Fund
There are a number of macroeconomic forces that suggest 2016 will see the return of market volatility. We retain a positive view on equity markets relative to bonds in this environment; however, we expect the divergence in global monetary policy and growing pains in the major emerging market economies to provide plenty of potential pitfalls for increasingly macro-driven global markets.
While the declining oil price has been beneficial for many emerging economies, the fall in the price of broader commodity markets may begin to have a detrimental effect on growth in 2016. For those countries that rely heavily on raw material exports, the slowdown of the Chinese economy, coupled with an advancing US dollar, will likely dampen the demand for industrial inputs. The “China effect” is unlikely to be confined to emerging markets, as exports of luxury goods and automobiles from developed markets also come under pressure.
Monetary policy and geopolitics could potentially be the most important influence on markets over the next 12 months. Investors will be particularly interested in when, and how quickly, the Federal Reserve and Bank of England raise interest rates and the impact this will have on the global economy. In a rising interest rate environment, we retain a positive but watchful outlook on risk assets as
| Top 10 long-term holdings* |
| (at July 31, 2015) |
| | As a percentage |
| Security | of net assets |
| Henderson Unconstrained Bond Fund | 4.8 | % |
iShares MSCI EAFE Minimum Volatility Index Fund | 4.5 | |
TIAA-CREF Asset Management Core Property Fund LP | 4.4 | |
| iShares TIPS Bond ETF | 4.1 | |
| ASG Global Alternatives Fund | 3.5 | |
| MSIF Multi-Asset Portfolio | 3.2 | |
| iShares Russell 1000 Value ETF | 2.8 | |
| iShares Russell 2000 Value ETF | 2.8 | |
| Gateway Fund | 2.8 | |
| Calamos Market Neutral Income Fund | 2.7 | |
markets adapt to falling liquidity and increasing volatility. The pace of tightening and the subsequent effect on bond yields will be particularly significant.
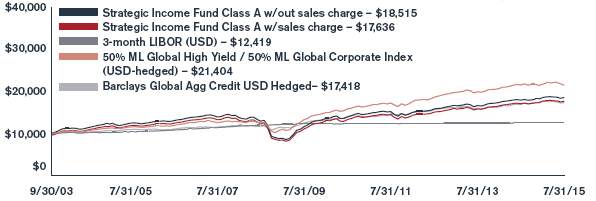
For the year ended July 31, 2015, the Fund returned 1.94% (Class A at NAV) versus the benchmark, 3-month LIBOR (USD), which posted a return of 0.24%. Performance was largely driven by the allocation to equities, particularly in the US and Japan. The fixed income allocation was broadly flat while the allocation to property and private equity modestly added to performance.
Towards the end of the period, we took the opportunity to increase the Fund’s European equity exposure as uncertainty surrounding the Greek debt crisis began to abate. Our medium term view on Europe remains positive given the European Central Bank’s quantitative easing program; however, the increased threat of a Greek exit from the euro had severely damaged short-term investor sentiment and allowed us to increase the allocation at an attractive price.
The allocation to US Treasuries was also increased. The rationale behind the decision was two-fold: in the short-term, we believe that there is still sufficient uncertainty in the global macroeconomic environment to potentially delay the first Federal Reserve interest rate hike, while from a longer-term perspective, the position adds a degree of insurance should any of the current macroeconomic uncertainties develop into a more serious concern for global economic growth.
As the Greek debt crisis moves towards a full resolution, diverging monetary policy and economic momentum will return to the fore as a dominant theme. Investors will be particularly interested in the Federal Reserve Bank’s and Bank of England’s approach to interest rates and the impact this will have on the global economy. The slowing of the emerging market business cycle will also be important, notably in local equity markets, commodities, and emerging market currencies.
* For further detail about these holdings, please refer to the section entitled “Portfolios of investments.” Fund holdings are as of the date given, are subject to change at any time, and are not recommendations to buy or sell any security.
4
All Asset Fund
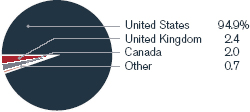
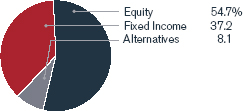
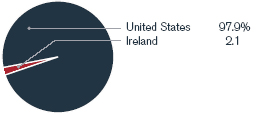
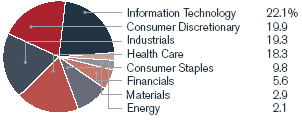
Portfolio composition by country (as a % of long-term investments) | Portfolio composition by sector (as a % of long-term investments) |
| |
Value of $10,000
| Total returns as of July 31, 2015 | | | | | | | | | | Since |
| | | | NASDAQ | | | One | | Three | | inception |
| At NAV | | | symbol | | | year | | years* | | (3/30/2012)* |
| Class A | | | HGAAX | | | 1.94 | % | | 5.12 | % | | 4.37 | % |
| Class C | | | HGACX | | | 1.23 | | | 4.32 | | | 3.59 | |
| Class I | | | HGAIX | | | 2.20 | | | 5.37 | | | 4.63 | |
| With sales charge | | | | | | | | | | | | | |
| Class A | | | | | | -3.95 | % | | 3.05 | % | | 2.53 | % |
| Class C | | | | | | 1.23 | | | 4.32 | | | 3.59 | |
| Index | | | | | | | | | | | | | |
| 3-month LIBOR (USD) | | | | | | 0.24 | % | | 0.28 | % | | 0.31 | % |
| MSCI World Index | | | | | | 5.49 | | | 15.09 | | | 12.24 | |
Performance data quoted represents past performance and is no guarantee of future results. Performance results with sales charges reflect the deduction of the maximum front-end sales charge or the deduction of the applicable contingent deferred sales charge (“CDSC”). Class A shares are subject to a maximum front-end sales charge of 5.75%. Class C shares are subject to a CDSC of up to 1% on certain redemptions made within 12 months of purchase. Performance presented at Net Asset Value (NAV), which does not include a sales charge, would be lower if this charge were reflected. NAV is the value of one share of the Fund excluding any sales charges. Performance quoted is based on the transacted NAV at each period end, which may differ from the US Generally Accepted Accounting Principles (“GAAP”)-adjusted NAV and the total return presented in the Financial Highlights. Current performance may be lower or higher than the performance data quoted. Investment return and principal value will fluctuate so that an investor’s shares, when redeemed, may be worth more or less than original cost. As stated in the current prospectus, the Fund’s annual operating expense ratios (gross) for Class A, C and I shares are 1.33%, 2.07% and 1.02%, respectively. However, the Fund’s adviser has contractually agreed to waive its management fee and, if necessary, to reimburse other operating expenses (excluding Acquired Fund Fees and Expenses from underlying investment companies) in order to limit total annual ordinary operating expenses, less distribution and service fees, to 0.60% of the Fund’s average daily net assets, which is in effect until July 31, 2020. With respect to investments in affiliated underlying funds, the Fund’s adviser has contractually agreed to reduce or waive the Fund’s management fee to limit the combined management fees paid to the adviser for those assets to the greater of 1.00% or the affiliated underlying fund’s management fee. Indirect net expenses associated with the Fund’s investments in underlying investment companies are not subject to the contractual waiver. For the most recent month-end performance, please call 1.866.443.6337 or visit the Funds’ website at www.henderson.com.
Performance results also reflect expense subsidies and waivers in effect during periods shown. Absent these waivers, results would have been less favorable. All results assume the reinvestment of dividends and capital gains.
The investment comparison graph above reflects the change in value of a $10,000 hypothetical investment since the Fund’s inception, including reinvested dividends and distributions, compared to a broad based securities market index. The MSCI World Index is a free float-adjusted market capitalization weighted index that is designed to measure the equity market performance of developed markets. 3-Month LIBOR (London Interbank Offered Rate) (USD) is the interest rate participating banks offer to other banks for loans on the London market. The Fund is professionally managed while the Indices are unmanaged and not available for investment and do not include fees, expenses or other costs. Results in the table and graph do not reflect the deduction of taxes that a shareholder would pay on Fund distributions or the redemption of Fund shares.
5
Dividend & Income Builder Fund
2015 has been a strong year (so far) for dividend growth. Many of the companies held in the portfolio have increased dividends, some substantially, in local currency terms. Globally, as measured by the MSCI World Index, dividends are forecast to grow 6% in 2015. Regionally, the US and Japan are forecast to have the most potential for dividend growth and we have seen this reflected in the portfolio, with companies such as NTT and Las Vegas Sands growing dividends at double digit rates. We have also seen an ongoing theme of companies returning cash via special dividends and share buybacks. Certain sectors, such as technology, and countries, such as Japan, typically outside the realm of dividend investors, have become more focused on consistently returning cash to shareholders.
For the year ended July 31, 2015, the Fund returned 3.81% (Class A at NAV) versus the benchmark, MSCI World Index, which posted a return of 5.49%. The Fund continued to meet its objectives for earning and distributing income over the period. Overall, the fixed income sub-portfolio was a negative contributor to returns. Performance relative to the equity benchmark was held back by a structural underweight to the US (where dividends are typically lower) as well as disappointing stock selection in Hong Kong. The Fund made gains in UK and Swiss holdings, particularly in the financials sector as well as in European telecommunications holdings.
Top 10 long-term holdings* (at July 31, 2015) |
| | As a percentage |
| Security/Issuer | of net assets |
| Novartis AG | 2.9 | % |
| Pfizer, Inc. | 2.7 | |
| Roche Holding AG | 2.0 | |
| Verizon Communications, Inc. | 1.8 | |
| Vodafone Group plc | 1.7 | |
| Orange S.A. | 1.7 | |
| Imperial Tobacco Group plc | 1.7 | |
| Royal Dutch Shell plc, A Shares | 1.7 | |
| WPP plc | 1.7 | |
| Reynolds American, Inc. | 1.6 | |
Among the best performers at the stock level were tobacco firms Reynolds American and British American Tobacco, both of which reported better than expected results in which volumes were higher than expected. The largest individual detractor from performance was Tokyo Electron, a semiconductor equipment manufacturer, where the company lowered earnings guidance for the second half of the year as lower than expected personal computer sales have resulted in less demand for semiconductors.
In the equity allocation, the Fund continued to seek companies with both above-average yield and dividend growth. The equity allocation remained over 85% of the Fund, reflecting our current bias towards equities over bonds. In terms of the Fund’s positioning, the portfolio at the end of the period was underweight in some of the larger-yielding areas of the markets such as energy and mining stocks. Due to oversupply in many commodities and falling prices, we believe the pressure on free cash flow will reduce the dividends these companies may pay in the future. Another underweight sector is utilities, where again we see market pressures that may lead to dividend cuts.
In contrast, we continue to see opportunities and attractive investments in pharmaceutical companies. We have seen positive growth reported in both developed and emerging markets as well as some promising new drugs in the pipeline. We are also quite favorable towards European financial companies. Many have been rebuilding their capital levels from the credit crisis and we see the potential for higher dividends in the future.
In our view, the outlook for dividend paying companies remains favorable. Investors around the world are seeking income and the dividend yield of many companies has remained above their corporate bond yield. Equally, we see companies in a low growth environment increasingly paying free cash flow back to shareholders through special dividends, share buybacks and ordinary dividends.
* For further detail about these holdings, please refer to the section entitled “Portfolios of investments.” Fund holdings are as of the date given, are subject to change at any time, and are not recommendations to buy or sell any security.
6
Dividend & Income Builder Fund
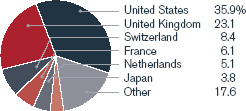
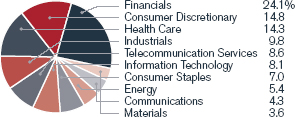
Portfolio composition by country (as a % of long-term investments) | Portfolio composition by sector (as a % of long-term investments) |
| |
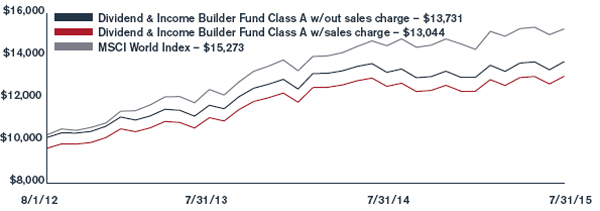
Investment comparison
Value of $10,000
| | | | | | | | | | | |
| Total returns as of July 31, 2015 | | | | | | | | | Since |
| | | | NASDAQ | | | One | | inception |
| At NAV | | | symbol | | | year | | (8/1/2012)* |
| Class A | | | HDAVX | | | 3.81 | % | | 11.15 | % |
| Class C | | | HDCVX | | | 3.00 | | | 10.32 | |
| Class I | | | HDIVX | | | 3.97 | | | 11.37 | |
| With sales charge | | | | | | | | | | |
| Class A | | | | | | -1.37 | % | | 9.25 | % |
| Class C | | | | | | 3.00 | | | 10.32 | |
| Index | | | | | | | | | | |
| MSCI World Index | | | | | | 5.49 | % | | 15.09 | % |
* Average annual return.
Performance data quoted represents past performance and is no guarantee of future results. Performance results with sales charges reflect the deduction of the maximum front-end sales charge or the deduction of the applicable contingent deferred sales charge (“CDSC”). Class A shares are subject to a maximum front-end sales charge of 5.00%. Class C shares are subject to a CDSC of up to 1% on certain redemptions made within 12 months of purchase. Performance presented at Net Asset Value (NAV), which does not include a sales charge, would be lower if this charge were reflected. NAV is the value of one share of the Fund excluding any sales charges. Performance quoted is based on the transacted NAV at each period end, which may differ from the US Generally Accepted Accounting Principles (“GAAP”)-adjusted NAV and the total return presented in the Financial Highlights. Current performance may be lower or higher than the performance data quoted. Investment return and principal value will fluctuate so that an investor’s shares, when redeemed, may be worth more or less than original cost. As stated in the current prospectus, the Fund’s annual operating expense ratios (gross) for Class A, C and I shares are 1.95%, 2.69% and 1.67%, respectively. However, the Fund’s adviser has contractually agreed to waive its management fee and, if necessary, to reimburse other operating expenses (excluding Acquired Fund Fees and Expenses from underlying investment companies) in order to limit total annual ordinary operating expenses, less distribution and service fees, to 1.05% of the Fund’s average daily net assets, which is in effect until July 31, 2020. For the most recent month-end performance, please call 1.866.443.6337 or visit the Funds’ website at www.henderson.com.
Performance results also reflect expense subsidies and waivers in effect during periods shown. Absent these waivers, results would have been less favorable. All results assume the reinvestment of dividends and capital gains.
The investment comparison graph above reflects the change in value of a $10,000 hypothetical investment since the Fund’s inception, including reinvested dividends and distributions, compared to a broad based securities market index. The MSCI World Index is a free float-adjusted market capitalization weighted index that is designed to measure the equity market performance of developed markets. The Fund is professionally managed while the Index is unmanaged and not available for investment and does not include fees, expenses or other costs. Results in the table and graph do not reflect the deduction of taxes that a shareholder would pay on Fund distributions or the redemption of Fund shares.
7
Emerging Markets Fund
On March 31, 2015, the Fund’s management team was changed and many of the Fund’s holdings were turned over to match the new team’s global emerging markets process.
Over the period, emerging markets equities underperformed developed market equities. A sharp drop in the price of oil and a steep rise in the US dollar led to a general lack of investor confidence in commodity demand and the performance of the asset class fell into negative territory. The strength of the US dollar and expectations of rising US interest rates had a significant impact on emerging markets currencies. Latin American equities had a particularly difficult time over the period, underperforming their emerging market counterparts as declining commodity prices and a stronger US Dollar raised questions over the region’s economic growth outlook. Elsewhere, continued geopolitical concerns in the Middle East and Ukraine dominated news flow in the emerging Europe, Middle East and Africa (EMEA) region. The Asia-Pacific region has been dominated by volatility in China. A strong Chinese equity market rally was seen as the Chinese government stimulated the economy through interest rate and reserve requirement cuts to offset slowing economic growth. The Chinese government then attempted to restrict leveraged trading accounts to curb the stock market rally and there followed a sharp sell-off in Chinese equities.
Top 10 long-term holdings* (at July 31, 2015) |
| | As a percentage |
| Security | of net assets |
| Grupo Herdez SAB de CV | 3.5 | % |
| Inversiones Aguas Metropolitanas S.A. | 3.5 | |
| SABMiller plc | 3.4 | |
| Unilever plc | 3.4 | |
| Tiger Brands, Ltd. | 3.0 | |
| Cia Cervecerias Unidas S.A., ADR | 3.0 | |
| Standard Bank Group, Ltd. | 2.7 | |
| Bank Pekao S.A. | 2.7 | |
| Standard Foods Corp. | 2.7 | |
| Uni-President Enterprises Corp. | 2.6 | |
For the year ended July 31, 2015, the Fund returned -12.42% (Class A at NAV) versus the benchmark, MSCI Emerging Markets Index, which posted a return of -13.07%. Over the period, the Fund’s overweight exposure to consumer staples led the positive returns. Our bias against the cyclical energy and materials sectors helped in a period that included a broad sell-off of emerging market assets. At the stock level, our developed world-listed holdings Unilever, SABMiller, PZ Cussons and Jeronimo Martins performed well, as did Mexican food producer Grupo Herdez. Brazilian stocks, Petrobras and Companhia Brasileira de Distribuicao, were among the main underperformers.
As a result of the change of fund manager towards the end of the period, and a consolidation of the multi-managed, geographic portfolio approach, there were significant adjustments made to the Fund’s positioning. Going forward, the team will take a bottom-up, long-term approach to investing, focusing on quality companies with proven track records, strong franchises and management teams with a history of integrity. From a portfolio perspective, this resulted in a reduction of the Fund’s exposure to Chinese financials, popular internet companies and Korea. These sales were offset by increases in exposure to privately owned Chilean companies and a number of developed world-listed businesses which have greater than 50% economic exposure to developing markets; these include Unilever PLC and Jeronimo Martins, a family controlled Portuguese company with two-thirds of its revenue generated in Poland.
Some quality emerging market companies have become considerably less popular than they once were. This follows a sustained period of poor stock and currency market performance relative to much of the developed world. As bottom-up stock pickers, we relish this opportunity to comb less popular markets for quality companies trading at reasonable valuations.
* For further detail about these holdings, please refer to the section entitled “Portfolios of investments.” Fund holdings are as of the date given, are subject to change at any time, and are not recommendations to buy or sell any security.
8
Emerging Markets Fund
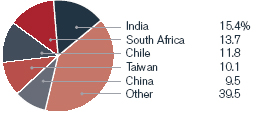
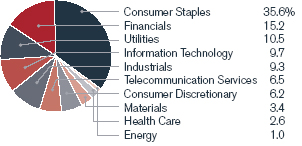
Portfolio composition by country (as a % of long-term investments) | Portfolio composition by sector (as a % of long-term investments) |
| |
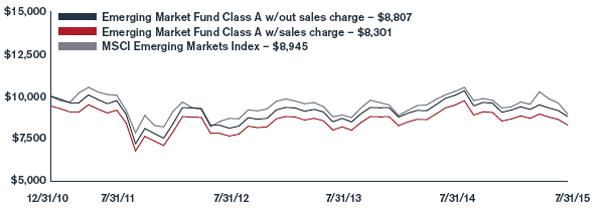
Investment comparison
Value of $10,000
| Total returns as of July 31, 2015 | | | | | | | | | | Since |
| | | | NASDAQ | | | One | | Three | | inception |
| At NAV | | | symbol | | | year | | years* | | (12/31/2010)* |
| Class A | | | HEMAX | | | -12.42 | % | | 2.77 | % | | -2.73 | % |
| Class C | | | HEMCX | | | -13.11 | | | 1.99 | | | -3.46 | |
| Class I | | | HEMIX | | | -12.34 | | | 2.97 | | | -2.51 | |
| With sales charge | | | | | | | | | | | | | |
| Class A | | | | | | -17.47 | % | | 0.75 | % | | -3.98 | % |
| Class C | | | | | | -13.11 | | | 1.99 | | | -3.46 | |
| Index | | | | | | | | | | | | | |
| MSCI Emerging Markets Index | | | | | | -13.07 | % | | 0.96 | % | | -2.30 | % |
Performance data quoted represents past performance and is no guarantee of future results. Due to the Fund’s relatively small asset base, performance may be impacted by IPOs to a greater degree than it may be in the future. IPO investments are not an integral component of the Fund’s investment process and may not be utilized to the same extent in the future. Performance results with sales charges reflect the deduction of the maximum front-end sales charge or the deduction of the applicable contingent deferred sales charge (“CDSC”). Class A shares are subject to a maximum front-end sales charge of 5.75%. Class C shares are subject to a CDSC of up to 1% on certain redemptions made within 12 months of purchase. Performance presented at Net Asset Value (NAV), which does not include a sales charge, would be lower if this charge were reflected. NAV is the value of one share of the Fund excluding any sales charges. Performance quoted is based on the transacted NAV at each period end, which may differ from the US Generally Accepted Accounting Principles (“GAAP”)-adjusted NAV and the total return presented in the Financial Highlights. Current performance may be lower or higher than the performance data quoted. Investment return and principal value will fluctuate so that an investor’s shares, when redeemed, may be worth more or less than original cost. As stated in the current prospectus, the Fund’s annual operating expense ratios (gross) for Class A, C and I shares are 1.97%, 2.74% and 1.66%, respectively. However, the Fund’s adviser has contractually agreed to waive its management fee and, if necessary, to reimburse other operating expenses (excluding Acquired Fund Fees and Expenses from underlying investment companies) in order to limit total annual ordinary operating expenses, less distribution and service fees, to 1.54% of the Fund’s average daily net assets, which is in effect until July 31, 2020. For the most recent month-end performance, please call 1.866.443.6337 or visit the Funds’ website at www.henderson.com.
Performance results also reflect expense subsidies and waivers in effect during periods shown. Absent these waivers, results would have been less favorable. All results assume the reinvestment of dividends and capital gains.
The investment comparison graph above reflects the change in value of a $10,000 hypothetical investment since the Fund’s inception, including reinvested dividends and distributions, compared to a broad based securities market index. The MSCI Emerging Markets Index is a free float-adjusted market capitalization weighted index that is designed to measure the equity market performance of emerging markets. The Fund is professionally managed while the Index is unmanaged and not available for investment and does not include fees, expenses or other costs. Results in the table and graph do not reflect the deduction of taxes that a shareholder would pay on Fund distributions or the redemption of Fund shares.
9
European Focus Fund
It was a volatile period for European equity markets where the general trend of European recovery was persistently tested by issues such as deflationary fears, slowing German growth and the re-emergence of a possible Greek exit from the euro. The prolonged negotiations between Greece and its creditors dominated headlines and eventually culminated in a deal. Reassuringly, there was little contagion and peripheral bond yields saw only a muted response. The precipitous fall in the price of oil weighed heavily on the energy sector; however, companies took heart from the prospect of lower prices, helping consumers and reducing costs for many industries (although being clearly bad for producers). Currency - in particular the volatility of the euro - played a significant role in market returns declining from a level around 1.33 versus the US Dollar at the start of the reporting period, to 1.04 by mid-March. The second quarter proved more stable in terms of currency moves and the euro / USD rate levelled out in the 1.10 - 1.15 range, proving resilient despite the ongoing Greek debt crisis.
Other notable events included the Swiss National Bank jettisoning its currency peg to the euro in January. The market correctly assumed that this was in readiness for the European Central Bank (ECB) finally delivering on the promise of formal quantitative easing (QE). Although the ECB announcement of QE in January was not a surprise, the scale of the program, in addition to the tailwinds of lower currency and oil prices, resulted in a larger than expected market impact.
Top 10 long-term holdings* (at July 31, 2015) |
| | As a percentage |
| Security | of net assets |
| BG Group plc | 4.0 | % |
| Alcatel-Lucent | 3.7 | |
| Barclays plc | 3.7 | |
| Nokia Oyj | 3.7 | |
| Roche Holding AG | 3.3 | |
| Intesa Sanpaolo SpA | 3.2 | |
| Lloyds Banking Group plc | 3.0 | |
| Teva Pharmaceutical Industries, Ltd., ADR | 2.6 | |
| NH Hotel Group S.A. | 2.3 | |
| Novo Nordisk A/S | 2.3 | |
Positive signs, such as improvements in Purchasing Managers’ Indices, auto and retail sales and bank lending, are filtering down to the corporate level and have translated into higher earnings growth forecasts. Europe recently returned to seeing consensus earnings upgrades for the first time since March 2011. Gross domestic product projections have been encouraging with France and Italy returning to growth while Spain looks to be the real growth story this year. An inflation improvement (from 0% to 1.3% next year) is a particularly positive sign as this allays fears of deflation and the concerns that Europe would follow the Japanese experience.
For the year ended July 31, 2015, the Fund returned 5.83% (Class A at NAV) versus the benchmark, MSCI Europe Index, which posted a return of -0.51%. The overweight exposure to the consumer discretionary sector drove returns with key stocks being Taylor Wimpey, Carnival Corp and Renault. Health care and industrial exposure was also beneficial as a result of investment in Teva Pharmaceutical, Indivior and AA.
While maintaining a bias towards ‘recovery’ positions, the overweight to the consumer discretionary sector has been reduced and we have been looking at selected stocks which have been ignored or discarded in favor of more recovery-like stocks. There have been opportunities presented by mergers and acquisition activity; for instance Nokia and the deal with Alcatel Lucent, and BG Group, which has been bid for by Royal Dutch Shell.
In terms of currency hedging, the euro hedge was reduced during the latter part of 2014 and subsequently closed in March. The sterling hedge that was introduced due to uncertainty over the outcome of May’s UK general election was closed following its comprehensive conclusion. The Fund was unhedged in its currency exposure at the period end.
A slowdown in asset flows to Europe would not be unexpected, but, given that profits are only just starting to recover, we do expect flows to continue to remain positive. Our view is that Europe’s economy will sustain a recovery with investors ultimately focusing once again on the weaker euro, lower oil price, as well as earnings recovery. We believe increased currency stability and the ECB’s QE program are helping to provide a positive environment for European equity progression.
* For further detail about these holdings, please refer to the section entitled “Portfolios of investments.” Fund holdings are as of the date given, are subject to change at any time, and are not recommendations to buy or sell any security.
10
European Focus Fund
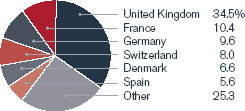
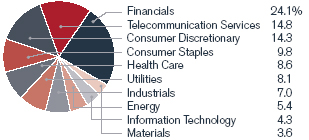
Portfolio composition by country (as a % of long-term investments) | Portfolio composition by sector (as a % of long-term investments) |
| |
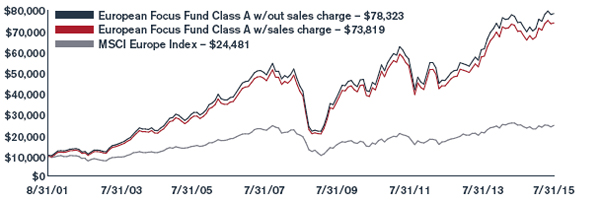
Investment comparison
Value of $10,000
| Total returns as of July 31, 2015 | | | | | | Since |
| | | | NASDAQ | | | One | | Three | | Five | | Ten | | inception |
| At NAV | | | symbol | | | year | | years* | | years* | | years* | | (8/31/2001)* |
| Class A | | | HFEAX | | | 5.83 | % | | 19.32 | % | | 11.66 | % | | 10.20 | % | | 15.94 | % |
| Class B | | | HFEBX | | | 4.92 | | | 18.32 | | | 10.75 | | | 9.53 | | | 15.45 | |
| Class C | | | HFECX | | | 4.99 | | | 18.40 | | | 10.79 | | | 9.37 | | | 15.07 | |
| Class I** | | | HFEIX | | | 6.10 | | | 19.64 | | | 11.96 | | | 10.39 | | | 16.08 | |
| With sales charge |
| Class A | | | | | | -0.26 | % | | 16.98 | % | | 10.34 | % | | 9.55 | % | | 15.45 | % |
| Class B | | | | | | 0.92 | | | 17.60 | | | 10.61 | | | 9.53 | | | 15.45 | |
| Class C | | | | | | 4.99 | | | 18.40 | | | 10.79 | | | 9.37 | | | 15.07 | |
| Index | | | | | | | | | | | | | | | | | | | |
| MSCI Europe Index | | | | | | -0.51 | % | | 13.73 | % | | 8.92 | % | | 5.59 | % | | 6.65 | % |
* Average annual return.
** Class I (formerly Class W) shares commenced operations on March 31, 2009. The performance for Class I shares for the period prior to March 31, 2009 is based on the performance of Class A shares. Performance for Class I shares would be similar because the shares are invested in the same portfolio of securities and have the same portfolio management. Class I shares are not subject to a front-end sales charge or a distribution fee.
Performance data quoted represents past performance and is no guarantee of future results. Performance results with sales charges reflect the deduction of the maximum front-end sales charge or the deduction of the applicable contingent deferred sales charge (“CDSC”). Class A shares are subject to a maximum front-end sales charge of 5.75%. Class B shares are subject to a CDSC, which declines from 5% the 1st year to 0% at the beginning of the 7th year. Class C shares are subject to a CDSC of up to 1% on certain redemptions made within 12 months of purchase. Performance presented at Net Asset Value (NAV), which does not include a sales charge, would be lower if this charge were reflected. NAV is the value of one share of the Fund excluding any sales charges. Performance quoted is based on the transacted NAV at each period end, which may differ from the US Generally Accepted Accounting Principles (“GAAP”)-adjusted NAV and the total return presented in the Financial Highlights. Current performance may be lower or higher than the performance data quoted. Investment return and principal value will fluctuate so that an investor’s shares, when redeemed, may be worth more or less than original cost. As stated in the current prospectus, the Fund’s annual operating expense ratios (gross) for Class A, B, C and I shares are 1.37%, 2.19%, 2.14% and 1.11%, respectively. As stated in the Statement of Additional Information (SAI), the Fund’s adviser has contractually agreed to waive its management fee and, if necessary, to reimburse other operating expenses (excluding Acquired Fund Fees and Expenses from underlying investment companies) in order to limit total annual ordinary operating expenses, less distribution and service fees, to 1.75% of the Fund’s average daily net assets, which is in effect until July 31, 2020. For the most recent month-end performance, please call 1.866.443.6337 or visit the Funds’ website at www.henderson.com.
Performance results also reflect expense subsidies and waivers in effect during certain periods shown. Absent these waivers, results would have been less favorable for certain periods. All results assume the reinvestment of dividends and capital gains.
The investment comparison graph above reflects the change in value of a $10,000 hypothetical investment since the Fund’s inception, including reinvested dividends and distributions, compared to a broad based securities market index. The MSCI Europe Index is a free float-adjusted market capitalization weighted index that is designed to measure the equity market performance of the developed markets in Europe. The Fund is professionally managed while the Index is unmanaged and not available for investment and does not include fees, expenses or other costs. Results in the table and graph do not reflect the deduction of taxes that a shareholder would pay on Fund distributions or the redemption of Fund shares.
11
Global Equity Income Fund
Global dividend growth has continued to be strong, with global dividends forecast to rise 6% in 2015. Companies are increasingly recognizing the value in returning cash to shareholders, particularly in countries such as the US where dividends grew 11% in 2014. We have also seen evidence of this at the portfolio level. For example, Cisco, which prior to 2011 chose not to pay a dividend, increased its dividend a further 12% in 2014.
Inflation has reached record lows in many developed economies, with government bond yields remaining low as investors “price-in” monetary stimulus in Europe and delays to interest rate increases elsewhere. Therefore, we believe equities remain an attractive source of income for investors in many markets. In addition, over the long term, dividends and dividend growth have provided a significant portion of an investor’s total equity return.
For the year ended July 31, 2015, the Fund returned -0.21% (Class A at NAV) versus the benchmark, MSCI World Index, which posted a return of 5.49%. The Fund continued to meet its objectives for earning and distributing income over the period. The Fund’s structural underweight to low yielding markets such as the US and Japan were the main drivers of underperformance. The overweight to Hong Kong also detracted from performance. Over the period, the Fund had a headwind in terms of the
Top 10 long-term holdings* (at July 31, 2015) |
| | As a percentage |
| Security | of net assets |
| British American Tobacco plc | 3.3 | % |
| AstraZeneca plc | 2.8 | |
| Diageo plc | 2.4 | |
| SSE plc | 2.1 | |
| Pfizer, Inc. | 2.1 | |
| Royal Dutch Shell plc, A Shares | 2.1 | |
| Reynolds American, Inc. | 2.0 | |
| BT Group plc | 2.0 | |
| HSBC Holdings plc | 2.0 | |
| BP plc | 2.0 | |
strengthening of the US dollar relative to most other currencies. The Fund is global with a foreign bias and, therefore, has the majority of its assets outside the US. Underlying that, however, the Fund had strong performance (in local terms) from UK holdings, which significantly outperformed the domestic indices there.
There has been broad sector exposure across the portfolio. A favored area currently is in telecommunications where we are finding not only a strong secular theme but also relatively attractive valuations and dividend yields. In telecommunications, the trends are fairly global where more users are adopting smart phones and therefore using the internet more heavily. Data usage has been increasing and this creates the opportunity to increase revenue per customer. The Fund decreased exposure to energy and mining towards the end of 2014 as a result of the falling commodity price environment. Regionally we increased the allocation to Europe, nearly doubling the weighting from the end of 2014 to the end of the period. We are seeing improvement in the macro data from the region and corporations are benefitting from a low oil price, a cheap euro and the implementation of quantitative easing.
We continue to find dividend paying equities attractive; many companies have dividend yields above their corporate bond yields, forecasted dividend growth remains strong and companies are increasingly focused on returning cash back to shareholders via dividends and share buybacks. We believe the key in managing the Fund remains stock selection, and we continue to use a bottom-up selection process with a focus on balance sheet strength and cash generation. This allows us to avoid ‘value traps’ while striving to maintain a high yield in order to avoid dividends that are unsustainable or stocks that are overvalued.
* For further detail about these holdings, please refer to the section entitled “Portfolios of investments.” Fund holdings are as of the date given, are subject to change at any time, and are not recommendations to buy or sell any security.
12
Global Equity Income Fund
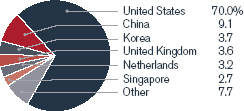
Portfolio composition by country (as a % of long-term investments) | Portfolio composition by sector (as a % of long-term investments) |
| |
Investment comparison
Value of $10,000
| Total returns as of July 31, 2015 | | | | | | | | | Since |
| | | | NASDAQ | | | One | | Three | | Five | | inception |
| At NAV | | | symbol | | | year | | years* | | years* | | (11/30/2006)* |
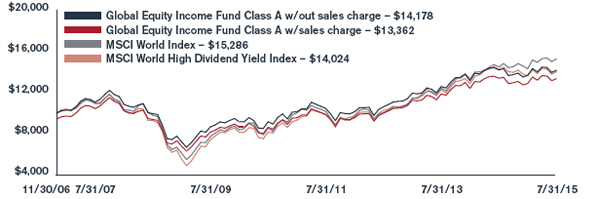
| Class A | | | HFQAX | | | -0.21 | % | | 10.15 | % | | 9.15 | % | | 4.14 | % |
| Class C | | | HFQCX | | | -1.09 | | | 9.29 | | | 8.33 | | | 3.35 | |
| Class I** | | | HFQIX | | | -0.10 | | | 10.41 | | | 9.45 | | | 4.34 | |
| With sales charge | | | | | | | | | | | | | | | | |
| Class A | | | | | | -5.95 | % | | 8.00 | % | | 7.86 | % | | 3.43 | % |
| Class C | | | | | | -1.09 | | | 9.29 | | | 8.33 | | | 3.35 | |
| Index | | | | | | | | | | | | | | | | |
| MSCI World Index | | | | | | 5.49 | % | | 15.09 | % | | 12.36 | % | | 5.04 | % |
| MSCI World High Dividend Yield Index | | | | | | -1.58 | | | 11.02 | | | 11.44 | | | 3.99 | |
* Average annual return
** Class I (formerly Class W) shares commenced operations on March 31, 2009. The performance for Class I shares for the period prior to March 31, 2009 is based on the performance of Class A shares. Performance for Class I shares would be similar because the shares are invested in the same portfolio of securities and have the same portfolio management. Class I shares are not subject to a front-end sales charge or a distribution fee.
Performance data quoted represents past performance and is no guarantee of future results. Performance results with sales charges reflect the deduction of the maximum front-end sales charge or the deduction of the applicable contingent deferred sales charge (“CDSC”). Class A shares are subject to a maximum front-end sales charge of 5.75%. Class C shares are subject to a CDSC of up to 1% on certain redemptions made within 12 months of purchase. Performance presented at Net Asset Value (NAV), which does not include a sales charge, would be lower if this charge were reflected. NAV is the value of one share of the Fund excluding any sales charges. Performance quoted is based on the transacted NAV at each period end, which may differ from the US Generally Accepted Accounting Principles (“GAAP”)-adjusted NAV and the total return presented in the Financial Highlights. Current performance may be lower or higher than the performance data quoted. Investment return and principal value will fluctuate so that an investor’s shares, when redeemed, may be worth more or less than original cost. As stated in the current prospectus, the Fund’s annual operating expense ratios (gross) for Class A, C and I shares are 1.18%, 1.93% and 0.92%, respectively. As stated in the Statement of Additional Information (SAI), the Fund’s adviser has contractually agreed to waive its management fee and, if necessary, to reimburse other operating expenses (excluding Acquired Fund Fees and Expenses from underlying investment companies) in order to limit total annual ordinary operating expenses, less distribution and service fees, to 1.15% of the Fund’s average daily net assets, which is in effect until July 31, 2020. For the most recent month-end performance, please call 1.866.443.6337 or visit the Funds’ website at www.henderson.com.
Performance results also reflect expense subsidies and waivers in effect during certain periods shown. Absent these waivers during those periods, results would have been less favorable. All results assume the reinvestment of dividends and capital gains.
The investment comparison graph above reflects the change in value of a $10,000 hypothetical investment since the Fund’s inception, including reinvested dividends and distributions, compared to a broad based securities market index. The MSCI World Index is a free float-adjusted market capitalization weighted index that is designed to measure the equity market performance of developed markets. The MSCI World High Dividend Yield Index aims to objectively reflect the high dividend yield opportunity set within the MSCI World Index. The Fund is professionally managed while the Indices are unmanaged and not available for investment and do not include fees, expenses or other costs. Results in the table and graph do not reflect the deduction of taxes that a shareholder would pay on Fund distributions or the redemption of Fund shares.
13
Global Technology Fund
Global equity markets experienced high levels of volatility over the period. In the second half of 2014 there were fears over deflationary pressures in Europe, sluggish global growth and the possibility of Greece exiting the euro. The decline in commodity prices, particularly oil, played an important role in share price action and currency volatility played a significant role in market returns, although there was stabilization during the second quarter of 2015. Equity markets have made progress during 2015; however, there has been a significant disparity between developed and emerging market performance with market leadership shifting to Europe and Japan. US equities have been dull but the region has seen a strengthening in economic data. Volatility in Chinese equity markets has marred Asian and emerging market equities as a whole. Against this backdrop, the technology sector outperformed the wider market.
For the year ended July 31, 2015, the Fund returned 10.61% (Class A at NAV) versus the benchmark, the MSCI AC World Information Technology Index, which posted a return of 8.43%. The internet and information technology services sectors contributed positively to performance, while hardware was the main detractor. At the stock level, Netflix was an outperformer; the company reported a very encouraging quarter of growth in key metrics, with new subscriber additions above expectations both
Top 10 long-term holdings* (at July 31, 2015) |
| | As a percentage |
| Security | of net assets |
| Apple, Inc. | 8.1 | % |
| Google, Inc., Class C | 5.0 | |
| Facebook, Inc., Class A | 4.2 | |
| Google, Inc., Class A | 4.2 | |
| Cisco Systems, Inc. | 3.7 | |
| Visa, Inc., A Shares | 3.4 | |
| MasterCard, Inc., Class A | 2.9 | |
| Avago Technologies, Ltd. | 2.8 | |
| NXP Semiconductor N.V. | 2.4 | |
| Tencent Holdings, Ltd. | 2.4 | |
domestically and internationally. Netease, a Chinese online game developer and publisher, outperformed following strong results and the company’s new mobile game, Fantasy Westward Journey, is now the number one mobile game in China. Amazon contributed positively to performance as the company reported strong growth in its North American business, and levels of profitability within its Web Services division continued to surprise the market. Personal computer-related stocks were generally weak. We continue to be positive on Apple but given that the Fund’s position is structurally underweight the benchmark, continued outperformance hurt the Fund’s performance and was the largest relative detractor versus the benchmark over the period.
Notable activity during the period included the purchase of a stake in Activision Blizzard, the video game developer, in light of its strong release slate. Positions were also added in security software providers Palo Alto Networks and Check Point Software Technologies in light of a strong security spend environment. A purchase was also made in EPAM Systems, the specialist high-tech IT services vendor, given its strong growth outlook, and we sold out of our position in Accenture as it hit our price target.
While further rounds of global quantitative easing are occurring, the uncertain economic environment continues to curtail capital spending, including technology expenditure. In addition, the strengthening Dollar is proving an increasing headwind for US technology companies. While we think technology stocks remain attractive relative to the overall market, these headwinds may mean that in the short-term they could struggle to outperform. Longer term, however, we believe the technology sector is attractive given its structurally higher earnings growth rate and strong balance sheets.
* For further detail about these holdings, please refer to the section entitled “Portfolios of investments.” Fund holdings are as of the date given, are subject to change at any time, and are not recommendations to buy or sell any security.
14
Global Technology Fund
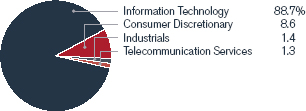
Portfolio composition by country (as a % of long-term investments) | Portfolio composition by sector (as a % of long-term investments) |
| |
Investment comparison
Value of $10,000
| Total returns as of July 31, 2015 | | | | | | | | | | | | Since |
| | | | NASDAQ | | | One | | Three | | Five | | Ten | | inception |
| At NAV | | | symbol | | | year | | years* | | years* | | years* | | (8/31/2001)* |
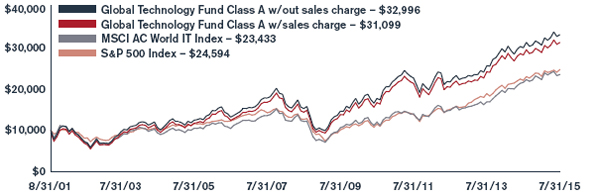
| Class A | | | HFGAX | | | 10.61 | % | | 15.12 | % | | 13.28 | % | | 10.23 | % | | 8.96 | % |
| Class B | | | HFGBX | | | 9.74 | | | 14.19 | | | 12.38 | | | 9.55 | | | 8.52 | |
| Class C | | | HFGCX | | | 9.75 | | | 14.22 | | | 12.42 | | | 9.40 | | | 8.15 | |
| Class I** | | | HFGIX | | | 10.88 | | | 15.39 | | | 13.58 | | | 10.41 | | | 9.09 | |
| With sales charge | | | | | | | | | | | | | | | | | | | |
| Class A | | | | | | 4.24 | % | | 12.87 | % | | 11.95 | % | | 9.58 | % | | 8.49 | % |
| Class B | | | | | | 5.74 | | | 13.42 | | | 12.26 | | | 9.55 | | | 8.52 | |
| Class C | | | | | | 9.75 | | | 14.22 | | | 12.42 | | | 9.40 | | | 8.15 | |
| Index | | | | | | | | | | | | | | | | | | | |
| MSCI AC World IT Index | | | | | | 8.43 | % | | 16.37 | % | | 14.20 | % | | 8.30 | % | | 6.31 | % |
| S&P 500 | | | | | | 11.21 | | | 17.58 | | | 16.24 | | | 7.72 | | | 6.68 | |
* Average annual return.
** Class I (formerly Class W) shares commenced operations on March 31, 2009. The performance for Class I shares for the period prior to March 31, 2009 is based on the performance of Class A shares. Performance for Class I shares would be similar because the shares are invested in the same portfolio of securities and have the same portfolio management. Class I shares are not subject to a front-end sales charge or a distribution fee.
Performance data quoted represents past performance and is no guarantee of future results. Performance results with sales charges reflect the deduction of the maximum front-end sales charge or the deduction of the applicable contingent deferred sales charge (“CDSC”). Class A shares are subject to a maximum front-end sales charge of 5.75%. Class B shares are subject to a CDSC which declines from 5% the 1st year to 0% at the beginning of the 7th year. Class C shares are subject to a CDSC of up to 1% on certain redemptions made within 12 months of purchase. Performance presented at Net Asset Value (NAV), which does not include a sales charge, would be lower if this charge were reflected. NAV is the value of one share of the Fund excluding any sales charges. Performance quoted is based on the transacted NAV at each period end, which may differ from the US Generally Accepted Accounting Principles (“GAAP”)-adjusted NAV and the total return presented in the Financial Highlights. Current performance may be lower or higher than the performance data quoted. Investment return and principal value will fluctuate so that an investor’s shares, when redeemed, may be worth more or less than original cost. As stated in the current prospectus, the Fund’s annual operating expense ratios (gross) for Class A, B, C and I shares are 1.35%, 2.16%, 2.12% and 1.10%, respectively. As stated in the Statement of Additional Information (SAI), the Fund’s adviser has contractually agreed to waive its management fee and, if necessary, to reimburse other operating expenses (excluding Acquired Fund Fees and Expenses from underlying investment companies) in order to limit total annual ordinary operating expenses, less distribution and service fees, to 1.75% of the Fund’s average daily net assets, which is in effect until July 31, 2020. For the most recent month-end performance, please call 1.866.443.6337 or visit the Funds’ website at www.henderson.com.
Performance results also reflect expense subsidies and waivers in effect during certain periods shown. Absent these waivers, results would have been less favorable for certain periods. All results assume the reinvestment of dividends and capital gains.
The investment comparison graph above reflects the change in value of a $10,000 hypothetical investment since the Fund’s inception, including reinvested dividends and distributions, compared to a broad based securities market index and an industry focused index. The MSCI AC World IT Index is a free float adjusted market capitalization weighted index designed to measure the equity market performance of the Information Technology stocks within the MSCI AC World Index. The S&P 500 Index is a broad based measurement of changes in stock market conditions based on the average of 500 widely held common stocks. The Fund is professionally managed while the Indices are unmanaged and not available for investment and do not include fees, expenses or other costs. Results in the table and graph do not reflect the deduction of taxes that a shareholder would pay on Fund distributions or the redemption of Fund shares.
15
High Yield Opportunities Fund
The US high yield (HY) bond market was broadly flat over the period and underperformed most other fixed income asset classes such as loans, 10-year Treasuries and investment grade corporates. While Treasury yields dropped slightly over the period amid plenty of volatility, US HY spreads widened steadily. BB-rated bonds significantly outperformed CCC-rated bonds. Defensive industries such as healthcare and food and beverage significantly outperformed the cyclical commodity sectors, in particular energy, mining and metals. While overall default rates remain low at around 2% of the market, the energy, metals and mining sectors account for over 70% of the default volume. The majority of the volatility in the HY market over this time period can also be attributed to the energy, metals and mining sectors. Excluding these sectors, strategists estimate that HY bonds would have performed in line with leveraged loans over the 12-month period.
New issuance over the last twelve months has approximated a very healthy $350 billion. Just over $50 billion of this issuance was concentrated among 7 of the top 20 largest HY issues ever. We have noticed a changing trend in new issuance whereby proceeds are being diverted away from refinancing toward more aggressive uses such as leveraged buyouts and dividends. Roughly $78 billion of the new issuance total was non-US dollar issuance. We are experiencing a trend of increasing new issuance by non-US companies into the HY market.
Top 10 long-term holdings* (at July 31, 2015) |
| | As a percentage |
| Security/Issuer | of net assets |
| ILFC E-Capital Trust II | 3.4 | % |
| Argos Merger Sub, Inc. | 2.2 | |
Infor Software Parent LLC/Infor Software Parent, Inc. | 2.2 | |
| Post Holdings, Inc. | 2.1 | |
| RCN Telecom Services LLC | 2.1 | |
| CCO Holdings LLC | 2.0 | |
| Digicel Group, Ltd. | 2.0 | |
| Koppers, Inc. Term Loan A | 1.9 | |
| KLX, Inc. | 1.8 | |
| Tenet Healthcare Corp. | 1.7 | |
For the year ended July 31, 2015, the Fund returned 1.19% (Class A at NAV) versus the benchmark, Bank of America Merrill Lynch US High Yield Master II Constrained Index, which posted a return of 0.17%. Over the period, the Fund benefitted from maintaining a higher quality bias within the lower rating tiers. While an underweight allocation to BB-rated bonds was maintained, the Fund outperformed on strong credit selection, an allocation to loans and an underweight stance in the energy sector. While the Fund incurred some losses in the energy sector, it benefitted from a higher quality bias in this space. The Fund’s best sector and company contributors were in defensive industries like healthcare and media, while the worst detractors were almost exclusively in the energy and mining segments.
After upgrading the credit quality of the portfolio during the fourth quarter of 2014, the Fund is positioned slightly below the benchmark with respect to credit risk as measured by yield, spread and weighted average credit rating. Within the energy sector, the underweight positioning has been gradually reduced by selectively adding higher quality exploration and production companies. We continue to remain underweight in the energy service and pipeline sectors.
We are also cautious on the metals and mining industry, including the steel sector, on a credit quality basis. We continue to view default risk in excess of consensus expectations (2-3%) as highly dependent on what happens in the energy space.
We continue to be selective in the new issue calendar as we are witnessing declining credit quality in the new issue market as measured by higher leverage, less robust covenants and smaller equity contributions in leveraged buyout deals. We are not seeing much value in the US leveraged loan market at the moment and have pared back our exposure.
* For further detail about these holdings, please refer to the section entitled “Portfolios of investments.” Fund holdings are as of the date given, are subject to change at any time, and are not recommendations to buy or sell any security.
16
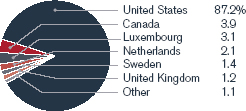
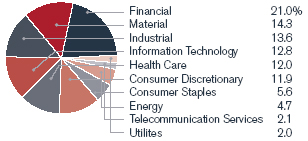
High Yield Opportunities Fund
Portfolio composition by country (as a % of long-term investments) | Portfolio composition by sector (as a % of long-term investments) |
| |
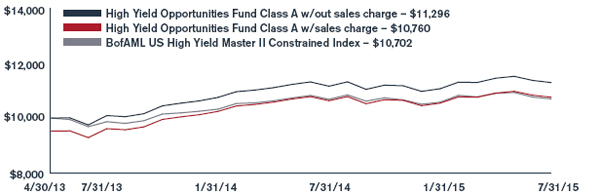
Investment comparison
Value of $10,000
| Total returns as of July 31, 2015 | | | | | | | | | Since |
| | | | NASDAQ | | | One | | inception |
| At NAV | | | symbol | | | year | | (4/30/2013)* |
| Class A | | | HYOAX | | | 1.19 | % | | 5.55 | % |
| Class C | | | HYOCX | | | 0.39 | | | 4.73 | |
| Class I | | | HYOIX | | | 1.48 | | | 5.82 | |
| With sales charge | | | | | | | | | | |
| Class A | | | | | | -3.64 | % | | 3.29 | % |
| Class C | | | | | | 0.39 | | | 4.73 | |
| Index | | | | | | | | | | |
| BofAML US High Yield Master II Constrained Index | | | | | | 0.17 | % | | 3.14 | % |
* Average annual return.
Performance data quoted represents past performance and is no guarantee of future results. Due to the Fund’s relatively small asset base, performance may be impacted by portfolio turnover to a greater degree than it may be in the future. Performance results with sales charges reflect the deduction of the maximum front-end sales charge or the deduction of the applicable contingent deferred sales charge (“CDSC”). Class A shares are subject to a maximum front-end sales charge of 4.75%. Class C shares are subject to a CDSC of up to 1% on certain redemptions made within 12 months of purchase. Performance presented at Net Asset Value (NAV), which does not include a sales charge, would be lower if this charge were reflected. NAV is the value of one share of the Fund excluding any sales charges. Performance quoted is based on the transacted NAV at each period end, which may differ from the US Generally Accepted Accounting Principles (“GAAP”)-adjusted NAV and the total return presented in the Financial Highlights. Current performance may be lower or higher than the performance data quoted. Investment return and principal value will fluctuate so that an investor’s shares, when redeemed, may be worth more or less than original cost. As stated in the current prospectus, the Fund’s annual operating expense ratios (gross) for Class A, C and I shares are 1.68%, 2.45% and 1.38%, respectively. However, the Fund’s adviser has contractually agreed to waive its management fee and, if necessary, to reimburse other operating expenses (excluding Acquired Fund Fees and Expenses from underlying investment companies) in order to limit total annual ordinary operating expenses, less distribution and service fees, to 0.85% of the Fund’s average daily net assets, which is in effect until July 31, 2020. For the most recent month-end performance, please call 1.866.443.6337 or visit the Funds’ website at www.henderson.com.
Performance results also reflect expense subsidies and waivers in effect during periods shown. Absent these waivers, results would have been less favorable. All results assume the reinvestment of dividends and capital gains.
The investment comparison graph above reflects the change in value of a $10,000 hypothetical investment since the Fund’s inception, including reinvested dividends and distributions, compared to a broad based securities market index. The Bank of America Merrill Lynch U.S. High Yield Master II Constrained Index tracks the performance of below investment grade U.S. dollar-denominated corporate bonds publicly issued in the U.S. domestic market. The Fund is professionally managed while the Index is unmanaged and not available for investment and does not include fees, expenses or other costs. Results in the table and graph do not reflect the deduction of taxes that a shareholder would pay on Fund distributions or the redemption of Fund shares.
17
International Long/Short Equity Fund
The Fund commenced operations on December 9, 2014 against a volatile market backdrop, with December seeing heightened unease in international equity markets and investor concerns about the resilience of global growth, European deflation and the end of quantitative easing (QE) in the US. Economic data in Japan was negative and disappointed again in January with weaker than expected gross domestic product numbers. In emerging markets, weak economic data in China led to the first interest rate cut in two years as well as capital injections into the banking system.
Global equity markets have made progress during 2015; however, there has been significant disparity between developed and emerging market performance with market leadership shifting to Europe and Japan. European stock markets were underpinned by a larger than expected European Central Bank QE program, in addition to the tailwinds of a lower currency and oil price. Europe proved generally resilient in the face of the ongoing negotiations between Greece and its creditors and the region responded well after a deal was eventually reached. There has been a strengthening in economic data and emergence of investor confidence in Japan, which was the leading developed market over the period, helped by further yen weakness. Top-down and bottom-up structural
Top 5 “Long” Holdings (including equity swaps)* (at July 31, 2015) |
| | As a percentage |
| Security | of net assets |
| Alcatel Lucent | 5.0 | % |
| Roche Holding AG | 4.6 | |
| BG Group Plc | 4.1 | |
| Kingfisher Plc | 3.6 | |
| Deutsche Annington Inmobilien SE | 3.6 | |
Top 5 “Short” Holdings (including equity swaps)* (at July 31, 2015) |
| | As a percentage |
| Security | of net assets |
| ICA Gruppen AB | (4.9) | % |
| CNH Industrial N.V. | (3.0) | |
| Hargreaves Lansdown Plc | (3.0) | |
| Woodford Patient Capital Trust | (2.9) | |
| Kuehne & Nagel International AG | (2.6) | |
reforms are continuing and at the corporate level there is a focus on optimizing balance sheets and an increasing focus on corporate governance. Earnings upgrades for Japanese companies have been the strongest globally and we have finally started to see wages rise which has provided support to equities. The Asia Pacific region has been dominated by extreme volatility in China. A strong Chinese equity market rally was seen as the Chinese government stimulated the economy through interest rate and reserve requirement cuts to offset slowing economic growth. The Chinese government attempted to restrict leveraged trading accounts to curb the stock market rally and there followed a sharp sell-off in Chinese equities.
For the reporting period (since inception) ended July 31, 2015, the Fund returned 2.70% (class A at NAV) versus the benchmark, MSCI EAFE Index (US Hedged), which posted a return of 11.99%. The biggest overall drag on performance was the Asia Pacific strategy which was impacted most heavily by Tata Motors, Samsung Electronics and Baidu; all positions held on the long-book. The long-books of the remaining strategies - UK, Europe and Japan - all produced positive returns, and among the highlights were NMC Health, Nippon Telegraph and Telephone Corporation, Virgin Money and CK Hutchison. There were also positives from the short-books, in particular from the UK sub-portfolio’s short position in Afren, a company which has now gone into administration. However, all sub-portfolio short-books weighed on performance, with the UK and Japan strategies particularly impacted through positions such as Yamato Holdings, Taisei Corporation, and Quindell, which was the single largest stock specific drag to overall Fund performance.
We remain broadly positive on the outlook for equities. In this low inflation, low growth, low interest rate environment, equities have been offering attractive return opportunities. Various European tailwinds and the sustained political momentum behind the Japanese recovery are further positive signs. Heightened volatility means that stock selection remains key; however, we believe there remain many long and short investment opportunities from a bottom-up perspective.
* For further detail about these holdings, please refer to the section entitled “Portfolios of investments.” Fund holdings are as of the date given, are subject to change at any time, and are not recommendations to buy or sell any security.
18
International Long/Short Equity Fund
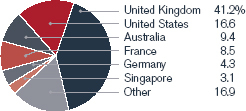
Portfolio composition by country (as a % of long-term investments) | Portfolio composition by sector (as a % of long-term investments) |
| |
Investment comparison
Value of $10,000
| Total returns as of July 31, 2015 | | | | | | Since |
| | | | NASDAQ | | | inception |
| At NAV | | | symbol | | | (12/9/2014) |
| Class A | | | HLNAX | | | 2.70 | % |
| Class C | | | HLNCX | | | 2.20 | |
| Class I | | | HLNIX | | | 2.80 | |
| With sales charge | | | | | | | |
| Class A | | | | | | -3.20 | % |
| Class C | | | | | | 1.20 | |
| Index | | | | | | | |
| MSCI EAFE Index (USD Hedged) | | | | | | 11.99 | % |
Performance data quoted represents past performance and is no guarantee of future results. Due to the Fund’s relatively small asset base, performance may be impacted by portfolio turnover to a greater degree than it may be in the future. Performance results with sales charges reflect the deduction of the maximum front-end sales charge or the deduction of the applicable contingent deferred sales charge (“CDSC”). Class A shares are subject to a maximum front-end sales charge of 5.75%. Class C shares are subject to a CDSC of up to 1% on certain redemptions made within 12 months of purchase. Performance presented at Net Asset Value (NAV), which does not include a sales charge, would be lower if this charge were reflected. NAV is the value of one share of the Fund excluding any sales charges. Performance quoted is based on the transacted NAV at each period end, which may differ from the US Generally Accepted Accounting Principles (“GAAP”)-adjusted NAV and the total return presented in the Financial Highlights. Current performance may be lower or higher than the performance data quoted. Investment return and principal value will fluctuate so that an investor’s shares, when redeemed, may be worth more or less than original cost. As stated in the current prospectus, the Fund’s annual operating expense ratios (gross) for Class A, C and I shares, inclusive of distribution and service fees and dividends and interest expense on securities sold short, are estimated to be 5.25%, 6.00% and 5.00%, respectively, for the Fund’s first full fiscal year. However, the Fund’s adviser has agreed to contractually waive its management fee and, if necessary, reimburse other operating expenses (excluding Acquired Fund Fees and Expenses from underlying investment companies and dividends and interest expense on securities sold short) in order to limit total annual ordinary operating expenses, less distribution and service fees, to 1.50% of the Fund’s average daily net assets, which is in effect until July 31, 2020. For the most recent month-end performance, please call 1.866.443.6337 or visit the Funds’ website at www.henderson.com.
Performance results also reflect expense subsidies and waivers in effect during periods shown. Absent these waivers, results would have been less favorable. All results assume the reinvestment of dividends and capital gains.
The investment comparison graph above reflects the change in value of a $10,000 hypothetical investment since the Fund’s inception, including reinvested dividends and distributions, compared to a broad based securities market index. The MSCI EAFE Index (USD Hedged) is a free float-adjusted market capitalization weighted index that is designed to measure the equity market performance of developed markets, excluding the US and Canada, excluding the effect of currency translations. The Fund may invest in emerging markets while the Index only consists of companies in developed markets. The Fund is professionally managed while the Index is unmanaged and not available for investment and does not include fees, expenses or other costs. Results in the table and graph do not reflect the deduction of taxes that a shareholder would pay on Fund distributions or the redemption of Fund shares.
19
International Opportunities Fund
Global equity market volatility was high throughout the period; the second half of 2014 was dominated by concerns over global growth, European deflation and re-emergence of a possible Greek exit from the euro. The decline in commodity prices, particularly oil, played an important role in share price action, leading most energy-related stocks down, and currency - in particular the volatility of the euro - played a significant role in market returns. However, the second quarter of 2015 proved more stable in terms of currency moves and the euro / USD exchange rate, which levelled out in the 1.10 - 1.15 range, proved resilient despite the ongoing Greek debt crisis.
Market leadership transferred to continental Europe and Japan during 2015. European stock markets were underpinned by a larger than expected European Central Bank quantitative easing program, in addition to the tailwinds of a lower currency and oil price. Encouragingly, Europe proved generally resilient in the face of the ongoing negotiations between Greece and its creditors, which eventually culminated in a deal. There was a strengthening in economic data and an emergence of investor confidence in Japan which was the leading developed market over the period, helped by further yen weakness. Top-down and bottom-up structural reforms are continuing in Japan; at the corporate level there is a focus on optimizing balance sheets and an increasing focus on corporate governance. Earnings upgrades for Japanese companies have been the strongest globally and we have finally started to see wages rise which has provided support to equities. The Asia Pacific region has been dominated by extreme volatility in China. A strong Chinese equity market rally was seen as the Chinese
Top 10 long-term holdings* (at July 31, 2015) |
| | As a percentage |
| Security | of net assets |
| Roche Holding AG | 3.9 | % |
| Barclays plc | 3.4 | |
| Fresenius SE & Co., KGaA | 3.1 | |
| Vodafone Group plc | 3.0 | |
| Credit Agricole S.A. | 2.8 | |
| BG Group plc | 2.8 | |
| ING Groep N.V. | 2.8 | |
| Amadeus IT Holding S.A., A Shares | 2.8 | |
| L’Oreal S.A. | 2.7 | |
| Deutsche Post AG | 2.6 | |
government stimulated the economy through interest rate and reserve requirement cuts to offset slowing economic growth. Authorities attempted to restrict leveraged trading accounts to curb the stock market rally and there followed a sharp sell-off in Chinese equities. Latin America has continued to weaken due to lower commodity prices and specific political issues.
For the year ended July 31, 2015, the Fund returned 6.30% (Class A at NAV) versus the benchmark, MSCI EAFE Index, which posted a return of 0.15%. Both European sub-portfolios and the Global Growth sub-portfolio produced strong absolute and relative returns; outweighing poor periods for the Japan and Asia sub-portfolios.
The positioning of the Fund was altered towards the end of 2014 and into 2015 as allocation to the Japan, Asia and Global Growth sub-portfolios were all reduced in favor of Europe sub-portfolios and specifically the more cyclically-biased pan-European sub-portfolio due to the prospect of eventual growth and being conscious that the Fund was light versus the benchmark. There was a slight shift from the pan-European sub-portfolio to the Japan sub-portfolio in March to take profits after the market embraced European recovery and to take advantage of the spring round of Japanese wage negotiations.
In terms of currency hedging, the euro hedge was exited in January and the sterling hedge that had been introduced due to uncertainty over the outcome of the UK general election was removed after its comprehensive conclusion. The yen hedge was reduced but we have maintained a smaller position as an insurance against possible future moves by the Bank of Japan.
Despite a number of political and macroeconomic challenges, we remain broadly positive on the outlook for equities. In this low inflation, low growth, low interest rate environment, equities are offering attractive return opportunities. Various European tailwinds and the sustained political momentum behind the Japanese recovery are further positive signs. Heightened volatility moving into the second half of the year means that stock selection remains key; however, we believe there remain many investment opportunities from a bottom-up perspective.
* For further detail about these holdings, please refer to the section entitled “Portfolios of investments.” Fund holdings are as of the date given, are subject to change at any time, and are not recommendations to buy or sell any security.
20
International Opportunities Fund
Portfolio composition by country (as a % of long-term investments) | Portfolio composition by sector (as a % of long-term investments) |
| |
Investment comparison
Value of $10,000
| Total returns as of July 31, 2015 | | | | | | | | | Since |
| | | | NASDAQ | | | One | | Three | | Five | | Ten | | inception |
| At NAV | | | symbol | | | year | | years* | | years* | | years* | | (8/31/2001)* |
| Class A | | | HFOAX | | | 6.30 | % | | 14.68 | % | | 8.97 | % | | 7.20 | % | | 9.82 | % |
| Class B | | | HFOBX | | | 5.46 | | | 13.73 | | | 8.08 | | | 6.53 | | | 9.36 | |
| Class C | | | HFOCX | | | 5.47 | | | 13.79 | | | 8.13 | | | 6.39 | | | 9.00 | |
| Class R** | | | HFORX | | | 6.01 | | | 14.35 | | | 8.62 | | | 6.90 | | | 9.53 | |
| Class I*** | | | HFOIX | | | 6.60 | | | 15.00 | | | 9.27 | | | 7.39 | | | 9.96 | |
| With sales charge | | | | | | | | | | | | | | | | | | | |
| Class A | | | | | | 0.17 | % | | 12.44 | % | | 7.69 | % | | 6.57 | % | | 9.36 | % |
| Class B | | | | | | 1.46 | | | 12.95 | | | 7.94 | | | 6.53 | | | 9.36 | |
| Class C | | | | | | 5.47 | | | 13.79 | | | 8.13 | | | 6.39 | | | 9.00 | |
| Index | | | | | | | | | | | | | | | | | | | |
| MSCI EAFE Index | | | | | | 0.15 | % | | 12.80 | % | | 8.50 | % | | 5.50 | % | | 6.42 | % |
* Average annual return.
** Class R shares commenced operations on September 30, 2005. The performance for Class R shares for the period prior to September 30, 2005 is based on the performance of Class A shares, adjusted for the higher expenses applicable to R shares. Class R shares are not subject to a front-end sales charge but are subject to a distribution fee of 0.50%.
*** Class I (formerly Class W) shares commenced operations on March 31, 2009. The performance for Class I shares for the period prior to March 31, 2009 is based on the performance of Class A shares. Performance for Class I shares would be similar because the shares are invested in the same portfolio of securities and have the same portfolio management. Class I shares are not subject to a front-end sales charge or a distribution fee.
Performance data quoted represents past performance and is no guarantee of future results. Performance results with sales charges reflect the deduction of the maximum front-end sales charge or the deduction of the applicable contingent deferred sales charge (“CDSC”). Class A shares are subject to a maximum front-end sales charge of 5.75%. Class B shares are subject to a CDSC, which declines from 5% the 1st year to 0% at the beginning of the 7th year. Class C shares are subject to a CDSC of up to 1% on certain redemptions made within 12 months of purchase. Class R shares have no front-end sales charge or CDSC. Performance presented at Net Asset Value (NAV), which does not include a sales charge, would be lower if this charge were reflected. NAV is the value of one share of the Fund excluding any sales charges. Performance quoted is based on the transacted NAV at each period end, which may differ from the US Generally Accepted Accounting Principles (“GAAP”)-adjusted NAV and the total return presented in the Financial Highlights. Current performance may be lower or higher than the performance data quoted. Investment return and principal value will fluctuate so that an investor’s shares, when redeemed, may be worth more or less than original cost. As stated in the current prospectus, the Fund’s annual operating expense ratios (gross) for Class A, B, C, R and I shares are 1.39%, 2.20%, 2.16%, 1.67% and 1.11% respectively. As stated in the Statement of Additional Information (SAI), the Fund’s adviser has contractually agreed to waive its management fee and, if necessary, to reimburse other operating expenses (excluding Acquired Fund Fees and Expenses from underlying investment companies) in order to limit total annual ordinary operating expenses, less distribution and service fees, to 1.75% of the Fund’s average daily net assets, which is in effect until July 31, 2020. For the most recent month-end performance, please call 1.866.443.6337 or visit the Funds’ website at www.henderson.com.
Performance results also reflect expense subsidies and waivers in effect during certain periods shown. Absent these waivers, results would have been less favorable for certain periods. All results assume the reinvestment of dividends and capital gains.
The investment comparison graph above reflects the change in value of a $10,000 hypothetical investment since the Fund���s inception, including reinvested dividends and distributions, compared to a broad based securities market index. The MSCI EAFE Index is a free float-adjusted market capitalization weighted index that is designed to measure the equity market performance of developed markets, excluding the US and Canada. The Fund may invest in emerging markets while the Index only consists of companies in developed markets. The Fund is professionally managed while the Index is unmanaged and not available for investment and does not include fees, expenses or other costs. Results in the table and graph do not reflect the deduction of taxes that a shareholder would pay on Fund distributions or the redemption of Fund shares.
21
International Select Equity Fund
Global equity markets started 2015 buoyed by strengthening economic data in the US and Japan, a pick-up in merger and acquisition activity and better-than-expected first quarter US earnings. Federal Reserve chair Janet Yellen caused jitters with her comments that “equity-market valuations at this point generally are quite high” and also that bond yields could “see a sharp jump” when they start to raise rates. By June, however, the prospect of Greece defaulting on its debt and possibly exiting from the Eurozone led to markets correcting sharply. Japan delivered the strongest return of the developed markets aided by further yen weakness. Further, structural reforms are continuing in Japan with corporations making headway in optimizing their balance sheets. Earnings revisions for both Japan and the Eurozone are in positive territory.
Despite European volatility, the US market made gains over the period, supported by strong housing, credit and jobs data, although consumer data remained subdued. Within emerging markets, the Chinese stock market roller-coaster took a sharp dive following its strong rally since the middle of 2014. The Chinese government made multiple attempts to halt the negative trend in the Chinese stock market, with limited success.
The Fund commenced operations on September 30, 2014. For the reporting period (since inception) ended July 31, 2015, the Fund returned 7.70%
Top 10 long-term holdings* (at July 31, 2015) |
| | | | As a percentage |
| Security | | | of net assets |
| FUJIFILM Holdings Corp. | | | 3.3 | % |
| Alcatel-Lucent | | | 3.2 | |
| Japan Tobacco, Inc. | | | 3.1 | |
| Bayer AG | | | 3.1 | |
Cognizant Technology Solutions Corp., Class A | | | 3.1 | |
| UniCredit SpA | | | 3.1 | |
| ITV plc | | | 3.0 | |
| Sumitomo Mitsui Financial Group, Inc. | | | 3.0 | |
| Vodafone Group plc | | | 3.0 | |
| Novartis AG | | | 3.0 | |
(Class A at NAV) versus the benchmark, MSCI EAFE Index, which posted a return of 4.15%. By region, the UK and Australia were the strongest performers. By sector, positive stock selection was more dominant in the materials and consumer staples sectors. At the stock level, notable performance came from Tsuhurha Holdings, ITV and Teva Pharmaceuticals. Ebara, a Japanese pump manufacturer, showed disappointing returns as the oil price decline put pressure on the company, although its business is more downstream focused. These losses were in recovery at the end of the period as Ebara benefitted from a rise in the oil price.
We continue to focus on companies that may be mis-valued by the market and undergoing a significant change. New positions added towards the end of the period included: BMW (German auto manufacturer) and Cognizant Technology (global IT outsourcing company). BMW is attractive as we believe investors are not paying attention to multiple longer-term growth prospects for the auto maker including underexploited pricing power, peaking capital expenditure, improving productivity, and US dollar foreign exchange exposure. Cognizant’s strategic direction is shifting away from IT-outsourcing towards business process-outsourcing and the development of platforms. We think the current valuation is discounting a sharper fade in returns than we forecast. We believe a “sticky” customer base and the firm’s customer acquisition policy of ‘penetrate and radiate’ is effective.
While there are increasing signs of economic growth across Europe, a possible Greek exit from the euro has rattled nerves. Though European banks are certainly better capitalized than a few years ago, it is the unknown linkages with banks’ home economies and the prospect of contagion to other austerity-stricken countries that investors fear the most. Should authorities be able to navigate a smooth transition either way, then we would expect markets to recover strongly.
* For further detail about these holdings, please refer to the section entitled “Portfolios of investments.” Fund holdings are as of the date given, are subject to change at any time, and are not recommendations to buy or sell any security.
22
International Select Equity Fund
Portfolio composition by country (as a % of long-term investments) | Portfolio composition by sector (as a % of long-term investments) |
| |
Investment comparison
Value of $10,000
| Total returns as of July 31, 2015 | | | | | | Since |
| | | | NASDAQ | | | inception |
| At NAV | | | symbol | | | (9/30/2014) |
| Class A | | | HSQAX | | | 7.70 | % |
| Class C | | | HSQCX | | | 7.00 | |
| Class I | | | HSQIX | | | 7.90 | |
| With sales charge | | | | | | | |
| Class A | | | | | | 1.51 | % |
| Class C | | | | | | 6.00 | |
| Index | | | | | | | |
| MSCI EAFE Index | | | | | | 4.15 | % |
Performance data quoted represents past performance and is no guarantee of future results. Due to the Fund’s relatively small asset base, performance may be impacted by portfolio turnover to a greater degree than it may be in the future. Performance results with sales charges reflect the deduction of the maximum front-end sales charge or the deduction of the applicable contingent deferred sales charge (“CDSC”). Class A shares are subject to a maximum front-end sales charge of 5.75%. Class C shares are subject to a CDSC of up to 1% on certain redemptions made within 12 months of purchase. Performance presented at Net Asset Value (NAV), which does not include a sales charge, would be lower if this charge were reflected. NAV is the value of one share of the Fund excluding any sales charges. Performance quoted is based on the transacted NAV at each period end, which may differ from the US Generally Accepted Accounting Principles (“GAAP”)-adjusted NAV and the total return presented in the Financial Highlights. Current performance may be lower or higher than the performance data quoted. Investment return and principal value will fluctuate so that an investor’s shares, when redeemed, may be worth more or less than original cost. As stated in the current prospectus, the Fund’s annual operating expense ratios (gross) for Class A, C and I shares are estimated to be 2.63%, 3.38% and 2.38%, respectively, for the Fund’s first full fiscal year. However, the Fund’s adviser has contractually agreed to waive its management fee and, if necessary, to reimburse other operating expenses (excluding Acquired Fund Fees and Expenses from underlying investment companies) in order to limit total annual ordinary operating expenses, less distribution and service fees, to 0.89% of the Fund’s average daily net assets, which is in effect until July 31, 2020. For the most recent month-end performance, please call 1.866.443.6337 or visit the Funds’ website at www.henderson.com.
Performance results also reflect expense subsidies and waivers in effect during periods shown. Absent these waivers, results would have been less favorable. All results assume the reinvestment of dividends and capital gains.
The investment comparison graph above reflects the change in value of a $10,000 hypothetical investment since the Fund’s inception, including reinvested dividends and distributions, compared to a broad based securities market index. The MSCI EAFE Index is a free float-adjusted market capitalization weighted index that is designed to measure the equity market performance of developed markets, excluding the US and Canada. The Fund may invest in emerging markets while the Index only consists of companies in developed markets. The Fund is professionally managed while the Index is unmanaged and not available for investment and does not include fees, expenses or other costs. Results in the table and graph do not reflect the deduction of taxes that a shareholder would pay on Fund distributions or the redemption of Fund shares.
23
Strategic Income Fund
The backdrop for government bond markets remained constructive during the period driven by the twin forces of low global growth and inflation. This triggered the announcement of quantitative easing in Europe and rate cuts in other developed and emerging markets. In contrast, the Federal Reserve remained more focused on falling unemployment and signaled it was considering rate hikes in the autumn of 2015. Such a divergent monetary policy backdrop between the US and the rest of the world catalyzed the US dollar in what was a remarkable appreciation. In contrast, credit markets in the US suffered considerably as spreads widened in both investment grade and high yield markets while European corporate bond markets proved more robust. Hence, it was government bonds rather than credit spreads which boosted capital returns across bond markets.
For the year ended July 31, 2015, the Fund returned 3.71% (Class A at NAV) versus the benchmark, 3-month LIBOR (USD), which posted a return of 0.24%. Contribution across all asset classes was positive reflecting the overall strength of fixed income markets. Turning to security attribution, it was the long-dated financial bonds which performed particularly well. Standard corporate investment grade bonds also performed well. There were only a couple notable corporate bond underperformers, one being Iceland, a supermarket chain which suffered from heightened competition in the UK, and the other being Towergate Insurance where we took a small loss in order to get
Top 10 long-term holdings* (at July 31, 2015) |
| | As a percentage |
| Security/Issuer | of net assets |
| United States Treasury Note | 7.8 | % |
| Barclays Bank plc | 1.9 | |
| Lloyds Banking Group plc | 1.8 | |
| HSBC Bank Capital Funding Sterling 1 LP | 1.8 | |
| Virgin Media Secured Finance plc | 1.7 | |
| CCO Holdings LLC | 1.5 | |
| BNP Paribas S.A. | 1.5 | |
| RBS Capital Trust II | 1.5 | |
| Orange S.A. | 1.4 | |
| Verizon Communications, Inc. | 1.4 | |
out of bonds which eventually fell to much lower levels and defaulted. Overall, bond selection was a strong contributor to performance, mostly attributed to troubled sectors such as energy, mining and emerging markets being avoided entirely.
A number of macroeconomic trends continue to drive the construction of the Fund. Firstly, the global backdrop remains one of low growth and low inflation with the recent pronounced slowdown across emerging markets only exacerbating these trends. As a result we remain constructive on most government bond markets and view any rate hikes in the US and UK as more of a token policy adjustment than a rate-hiking cycle to be feared. Our approach to corporate bonds in this environment is to focus on income return and to exercise caution by lending to large non-cyclical high yield rated businesses. New high yield deals have been well received but the new issue premium is waning. We remain very selective when considering new deals as we perceive it to be somewhat late in an elongated credit cycle. In addition, we continue to favor the banking and insurance industries, which, although cyclical, are becoming heavily regulated to the benefit of bondholders.
We have become more concerned about credit risk recently, noting the significant pickup in distressed bonds in the US high yield market (and to a lesser extent Europe) across a range of sectors. In addition, the widening in US investment grade credit spreads is primarily a result of an excessive supply of bonds being issued to fund mergers and acquisitions and share buybacks, which in itself is a reliable late cycle indicator albeit again mainly an issue for the US market and not Europe. As a result we continue to take a relatively cautious approach to credit selection and run an elevated cash balance. In contrast, we believe the outlook for government bond yields has improved as a result of the deflationary global forces in motion and any rate hikes in the US and the UK in this context are likely to prove limited.
* For further detail about these holdings, please refer to the section entitled “Portfolios of investments.” Fund holdings are as of the date given, are subject to change at any time, and are not recommendations to buy or sell any security.
24
Strategic Income Fund
Portfolio composition by country (as a % of long-term investments) | Portfolio composition by sector (as a % of long-term investments) |
| |
Investment comparison
Value of $10,000
| Total returns as of July 31, 2015 | | | | | | | | | | | | | | | | | | Since |
| | | | NASDAQ | | | One | | Three | | Five | | Ten | | inception |
| At NAV | | | symbol | | | year | | years* | | years* | | years* | | (9/30/2003)* |
| Class A | | | HFAAX | | | 3.71 | % | | 5.48 | % | | 5.85 | % | | 4.08 | % | | 5.34 | % |
| Class B | | | HFABX | | | 2.84 | | | 4.65 | | | 5.05 | | | 3.50 | | | 4.83 | |
| Class C | | | HFACX | | | 2.84 | | | 4.63 | | | 5.03 | | | 3.26 | | | 4.52 | |
| Class I** | | | HFAIX | | | 3.86 | | | 5.70 | | | 6.05 | | | 4.17 | | | 5.43 | |
| With sales charge | | | | | | | | | | | | | | | | | | | |
| Class A | | | | | | -1.26 | % | | 3.79 | % | | 4.83 | % | | 3.57 | % | | 4.91 | % |
| Class B | | | | | | -1.16 | | | 3.73 | | | 4.89 | | | 3.50 | | | 4.83 | |
| Class C | | | | | | 2.84 | | | 4.63 | | | 5.03 | | | 3.26 | | | 4.52 | |
| Index | | | | | | | | | | | | | | | | | | | |
| 50% ML Global High Yield / | | | | | | | | | | | | | | | | | | | |
| 50% ML Global Corporate Index | | | | | | | | | | | | | | | | | | | |
| (USD hedged) | | | | | | 1.57 | % | | 5.20 | % | | 6.41 | % | | 6.42 | % | | 6.64 | % |
| Barclays Global Agg Credit USD Hedged | | | | | | 2.48 | | | 3.35 | | | 4.59 | | | 4.79 | | | 4.80 | |
| 3-month LIBOR (USD) | | | | | | 0.24 | | | 0.28 | | | 0.32 | | | 1.87 | | | 1.85 | |
* Average annual return.
** Class I shares commenced operations on April 29, 2011. The performance for Class I shares for the period prior to April 29, 2011 is based on the performance of Class A shares. Performance for Class I shares would be similar because the shares are invested in the same portfolio of securities and have the same portfolio management. Class I shares are not subject to a front-end sales charge or a distribution fee.
Performance data quoted represents past performance and is no guarantee of future results. Performance results with sales charges reflect the deduction of the maximum front-end sales charge or the deduction of the applicable contingent deferred sales charge (“CDSC”). Class A shares are subject to a maximum front-end sales charge of 4.75%. Class B shares are subject to a CDSC, which declines from 5% the 1st year to 0% at the beginning of the 7th year. Class C shares are subject to a CDSC of up to 1% on certain redemptions made within 12 months of purchase. Performance presented at Net Asset Value (NAV), which does not include a sales charge, would be lower if this charge were reflected. NAV is the value of one share of the Fund excluding any sales charges. Performance quoted is based on the transacted NAV at each period end, which may differ from the US Generally Accepted Accounting Principles (“GAAP”)-adjusted NAV and the total return presented in the Financial Highlights. Current performance may be lower or higher than the performance data quoted. Investment return and principal value will fluctuate so that an investor’s shares, when redeemed, may be worth more or less than original cost. As stated in the current prospectus, the Fund’s annual operating expense ratios (gross) for Class A, B, C and I shares are 1.36%, 2.16%, 2.12% and 1.08%, respectively. However, the Fund’s adviser has contractually agreed to waive its management fee and, if necessary, to reimburse other operating expenses (excluding Acquired Fund Fees and Expenses from underlying investment companies) in order to limit total annual ordinary operating expenses, less distribution and service fees, to 0.85% of the Fund’s average daily net assets, which will remain in effect until July 31, 2020. For the most recent month-end performance, please call 1.866.443.6337 or visit the Funds’ website at www.henderson.com.
Performance results also reflect expense subsidies and waivers in effect during the periods shown. Absent these waivers, results would have been less favorable. All results assume the reinvestment of dividends and capital gains.
The investment comparison graph above reflects the change in value of a $10,000 hypothetical investment since the Fund’s inception, including reinvested dividends and distributions, compared to a broad based securities market index. The Bank of America Merrill Lynch (“ML”) Global Corporate Index (USD-hedged) tracks the performance of developed market investment grade corporate debt publicly issued in the major US and Eurobond markets. The Bank of America Merrill Lynch (“ML”) Global High Yield Index tracks the performance of US dollar, Canadian Dollar, British sterling and euro denominated developed market below investment grade corporate debt publicly issued in the major US or Eurobond markets. The Barclays Capital Global Aggregate Credit (USD) Hedged Index is a broad-based measure of the global investment-grade and high yield fixed-rate markets. 3-Month LIBOR (London Interbank Offered Rate) (USD) is the interest rate participating banks offer to other banks for loans on the London market. The Fund is professionally managed while the Indices are unmanaged and not available for investment and do not include fees, expenses or other costs. Results in the table and graphs do not reflect the deduction of taxes that a shareholder would pay on Fund distributions or the redemption of Fund shares.
25
Unconstrained Bond Fund
The period was characterized by a substantial rise in government bond prices (fall in yields) across developed markets through April 2015, after which a significant reversal occurred. The halving in the price of oil during the second half of 2014 saw expectations of inflation (and therefore prospects for interest rate increases in the US and UK) scaled back materially, and consequently government bonds rallied. European government bond prices were also driven substantially higher as the European Central Bank signaled that it would commence full blown quantitative easing in March 2015. In early April, 10-year German government bonds reached a yield trough of 0.07% with approximately two-thirds of outstanding German government debt having a negative effective yield which was unprecedented in the history of major bond markets. Investment grade corporate bond prices also rallied during this bull market period, on the coat tails of government bonds, although significant supply of new corporate bonds hampered relative performance. High yield corporate bonds provided more mixed returns. The US high yield market suffered from its large exposure to the energy sector where the collapsing oil price (and other commodities) negatively impacted company profits and creditworthiness. In European high yield, the minimal exposure to the energy sector and demand from investors faced with negative bank deposit rates and minimal yield on government bonds resulted in stronger relative performance.
Top 10 long-term holdings* (at July 31, 2015) |
| | As a percentage |
| Security/Issuer | of net assets |
| Italy Buoni Poliennali Del Tesoro | 9.1 | % |
| United States Treasury Bill | 3.0 | |
| Spain Government Bond | 3.0 | |
| Mexican Bonos | 1.9 | |
| New Zealand Government Bond | 1.6 | |
Warwick Finance Residential Mortgages Number One plc | 1.1 | |
| Eurosail 2006-1 plc | 1.1 | |
| Driver Thirteen UG | 1.1 | |
| Dalradian European CLO III BV | 1.0 | |
| Discover Card Execution Note Trust | 1.0 | |
For the year ended July 31, 2015, the Fund returned -0.23% (Class A at NAV) versus the benchmark, 3-month LIBOR (USD), which posted a return of 0.24%. The Fund benefitted from its significant holdings of investment grade and European high yield corporate bonds. However, the absence of government bond holdings (outside of Italian inflation-linked debt and sensitivity to Mexican government bonds) meant that the Fund did not benefit strongly from the bull market. The decision to maintain the overall interest rate exposure (duration) of the Fund at relatively low levels was also a detractor to returns. In particular, interest rate strategies expecting to benefit from higher government bond yields, a rise in long-term inflation expectations and steeper yield curves (long maturity bonds to underperform those of short maturity) detracted.
In currencies, the US dollar rose versus most major competitors, with the move against the euro being particularly noteworthy. The Fund benefitted materially from currency positioning, holding a positive view on the US dollar for much of the year, against negative views on the euro, the New Zealand dollar, sterling and the Japanese yen.
We remain cautious on government bond markets and seek to position the Fund with low interest rate sensitivity (duration). The asset allocation of the Fund remains more heavily weighted to corporate bonds and floating rate asset-backed securities, with exposure to government bond markets limited to issuers such as Italy and Mexico. Based on our belief that the US economy is performing robustly and closer to normalizing monetary policy than other developed market central banks, we continue to position the Fund in an effort to benefit from a stronger US dollar.
* For further detail about these holdings, please refer to the section entitled “Portfolios of investments.” Fund holdings are as of the date given, are subject to change at any time, and are not recommendations to buy or sell any security.
26
Unconstrained Bond Fund
Portfolio composition by country (as a % of long-term investments) | Portfolio composition by sector (as a % of long-term investments) |
| |
Investment comparison
Value of $10,000
| Total returns as of July 31, 2015 | | | | | | | | | Since |
| | | | NASDAQ | | | One | | inception |
| At NAV | | | symbol | | | year | | (12/20/2013)* |
| Class A | | | HUNAX | | | -0.23 | % | | 0.94 | % |
| Class C | | | HUNCX | | | -1.04 | | | 0.15 | |
| Class I | | | HUNIX | | | -0.07 | | | 1.14 | |
| With sales charge | | | | | | | | | | |
| Class A | | | | | | -4.95 | % | | -2.07 | % |
| Class C | | | | | | -1.04 | | | 0.15 | |
| Index | | | | | | | | | | |
| 3-month LIBOR (USD) | | | | | | 0.24 | % | | 0.24 | % |
| Barclays Multiverse Index | | | | | | -6.09 | | | -1.38 | |
* Average annual return
Performance data quoted represents past performance and is no guarantee of future results. Performance results with sales charges reflect the deduction of the maximum front-end sales charge or the deduction of the applicable contingent deferred sales charge (“CDSC”). Class A shares are subject to a maximum front-end sales charge of 4.75%. Class C shares are subject to a CDSC of up to 1% on certain redemptions made within 12 months of purchase. Performance presented at Net Asset Value (NAV), which does not include a sales charge, would be lower if this charge were reflected. NAV is the value of one share of the Fund excluding any sales charges. Performance quoted is based on the transacted NAV at each period end, which may differ from the US Generally Accepted Accounting Principles (“GAAP”)-adjusted NAV and the total return presented in the Financial Highlights. Current performance may be lower or higher than the performance data quoted. Investment return and principal value will fluctuate so that an investor’s shares, when redeemed, may be worth more or less than original cost. As stated in the current prospectus, the Fund’s annual operating expense ratios (gross) for Class A, C and I shares are 2.34%, 3.08% and 2.08%, respectively. However, the Fund’s adviser has contractually agreed to waive its management fee and, if necessary, to reimburse other operating expenses (excluding Acquired Fund Fees and Expenses from underlying investment companies) in order to limit total annual ordinary operating expenses, less distribution and service fees, to 0.90% of the Fund’s average daily net assets, which is in effect until July 31, 2020. For the most recent month-end performance, please call 1.866.443.6337 or visit the Funds’ website at www.henderson.com.
Performance results also reflect expense subsidies and waivers in effect during periods shown. Absent these waivers, results would have been less favorable. All results assume the reinvestment of dividends and capital gains.
The investment comparison graph above reflects the change in value of a $10,000 hypothetical investment since the Fund’s inception, including reinvested dividends and distributions, compared to a broad based securities market index. The Barclays Multiverse Index is a broad-based measure of the global fixed-income bond market. The index captures investment grade and high yield securities in all eligible currencies. 3-Month LIBOR (London Interbank Offered Rate) (USD) is the interest rate participating banks offer to other banks for loans on the London market. The Fund is professionally managed while the Indices are unmanaged and not available for investment and do not include fees, expenses or other costs. Results in the table and graph do not reflect the deduction of taxes that a shareholder would pay on Fund distributions or the redemption of Fund shares.
27
US Growth Opportunities Fund
The Fund commenced operations on December 18, 2014. During the period, US equity markets continued to trend higher with growth-biased and small cap equities leading the way. Small cap growth companies (as measured by the Russell 2000 Growth Index) outperformed large cap growth companies (as measured by the Russell 1000 Growth Index) by 2.69%. Weaker global growth and a strengthening US dollar put pressure on multinational corporations as evidenced by the relative weakness in large cap stocks versus small cap. With the majority of small companies’ revenue based in the US, this provided a tailwind and helped small cap equities outperform the broader US market. The Fund’s unconstrained strategy with respect to US equities allows for investment across the market cap spectrum. At the end of the period, the Fund was overweight small and mid cap equities relative to the benchmark; this overweight allocation contributed positively to performance.
Last year, investors tended to overlook the fundamentals of high quality growth companies (rated B+ or better as defined by S&P), focusing instead on low quality companies (rated B or worse). Recently, investors have allocated capital away from these low quality companies and have rewarded companies which have exhibited fiscal prudence, stable earnings and organic growth. These characteristics of sustainable growth and fiscal conservatism, form the foundation of the Fund’s investment philosophy.
Top 10 long-term holdings* (at July 31, 2015) |
| | As a percentage |
| Security | of net assets |
| Fiserv, Inc. | 4.0 | % |
| Walgreens Boots Alliance, Inc. | 3.8 | |
| Starbucks Corp. | 3.6 | |
| The Middleby Corp. | 3.4 | |
| Under Armour, Inc., Class A | 3.3 | |
| The TJX Companies, Inc. | 3.3 | |
| Tractor Supply Co. | 3.3 | |
| VF Corp. | 3.2 | |
| Intuit, Inc. | 3.1 | |
| Costco Wholesale Corp. | 3.1 | |
For the reporting period (since inception) ended July 31, 2015, the Fund returned 11.90% (Class A at NAV) versus the benchmark, Russell 3000 Growth Index, which posted a return of 7.56%. Performance was led by strong stock selection as well as the Fund’s structural bias to high quality companies.
Stock selection in consumer discretionary companies, such as Starbucks and Under Armour, was the greatest contributor to performance. Starbucks’ stock price increased approximately 45% over the period as a result of improved employee training, offering new breakfast items, lower coffee prices and an increase in their mobile app usage. Under Armour beat earnings and reported sales growth of 29%. Also, the company plans to increase marketing spend in the third quarter to take advantage of the momentum behind their athletes (Steph Curry, Jordan Spieth and Misty Copeland). The largest detractors over the period came from consumer staples company TreeHouse Foods and producer durables company Genesee & Wyoming. TreeHouse Foods missed earnings on revenue, attributing weakness in single serve coffee as the reason for the underperformance. Genesee & Wyoming was down over 18% during the period reflecting broader weakness in the transportation sector. Additionally, stock selection within the technology sector, particularly EMC Corporation, detracted from performance.
In the near to medium term we expect the rally in high quality companies to continue; however, we are conscious of possible volatility from geopolitical events, especially Greece, and potential unanticipated actions of the Federal Reserve. On balance, these markets are ones in which active management and investing in high quality, growth companies are rewarded. We maintain our investment philosophy to identify and select companies that are capable of generating consistent revenue and earnings growth. We are encouraged by the ongoing improvement of the US economy and optimistic that investors will continue to be rewarded by companies that have the potential to deliver strong, sustainable growth.
* For further detail about these holdings, please refer to the section entitled “Portfolios of investments.” Fund holdings are as of the date given, are subject to change at any time, and are not recommendations to buy or sell any security.
28
US Growth Opportunities Fund
Portfolio composition by country (as a % of long-term investments) | Portfolio composition by sector (as a % of long-term investments) |
| |
Investment comparison
Value of $10,000
| Total returns as of July 31, 2015 | | | | | | Since |
| | | | NASDAQ | | | inception |
| At NAV | | | symbol | | | (12/18/2014) |
| Class A | | | HGRAX | | | 11.90 | % |
| Class C | | | HGRCX | | | 11.40 | |
| Class I | | | HGRIX | | | 12.10 | |
| With sales charge | | | | | | | |
| Class A | | | | | | 5.47 | % |
| Class C | | | | | | 10.40 | |
| Index | | | | | | | |
| Russell 3000 Growth Index | | | | | | 7.56 | % |
Performance data quoted represents past performance and is no guarantee of future results. Due to the Fund’s relatively small asset base, performance may be impacted by portfolio turnover to a greater degree than it may be in the future. Performance results with sales charges reflect the deduction of the maximum front-end sales charge or the deduction of the applicable contingent deferred sales charge (“CDSC”). Class A shares are subject to a maximum front-end sales charge of 5.75%. Class C shares are subject to a CDSC of up to 1% on certain redemptions made within 12 months of purchase. Performance presented at Net Asset Value (NAV), which does not include a sales charge, would be lower if this charge were reflected. NAV is the value of one share of the Fund excluding any sales charges. Performance quoted is based on the transacted NAV at each period end, which may differ from the US Generally Accepted Accounting Principles (“GAAP”)-adjusted NAV and the total return presented in the Financial Highlights. Current performance may be lower or higher than the performance data quoted. Investment return and principal value will fluctuate so that an investor’s shares, when redeemed, may be worth more or less than original cost. As stated in the current prospectus, the Fund’s annual operating expense ratios (gross) for Class A, C and I shares are estimated to be 2.78%, 3.53% and 2.53%, respectively, for the Fund’s first full fiscal year. However, the Fund’s adviser has contractually agreed to waive its management fee and, if necessary, to reimburse other operating expenses (excluding Acquired Fund Fees and Expenses from underlying investment companies) in order to limit total annual ordinary operating expenses, less distribution and service fees, to 0.95% of the Fund’s average daily net assets, which is in effect until July 31, 2020. For the most recent month-end performance, please call 1.866.443.6337 or visit the Funds’ website at www.henderson.com.
Performance results also reflect expense subsidies and waivers in effect during periods shown. Absent these waivers, results would have been less favorable. All results assume the reinvestment of dividends and capital gains.
The investment comparison graph above reflects the change in value of a $10,000 hypothetical investment since the Fund’s inception, including reinvested dividends and distributions, compared to a broad based securities market index. The Russell 3000 Growth Index comprises companies that display signs of above average growth. The Index is used to provide a gauge of the performance of growth stocks in the US. The Fund is professionally managed while the Index is unmanaged and not available for investment and does not include fees, expenses or other costs. Results in the table and graph do not reflect the deduction of taxes that a shareholder would pay on Fund distributions or the redemption of Fund shares.
29
All Asset Fund
July 31, 2015
| | | | | Value | |
| Shares | | | | (note 2) | |
| | | | | | |
| Investment companies – 67.49% | | | |
| | | | | | |
| | | Alternatives – 9.84% | | | |
| 186,847 | | ASG Global Alternatives Fund | $ | 2,130,050 | |
| 138,324 | | Sprott Physical Gold Trust * | | 1,243,533 | |
| 5,128 | | TIAA-CREF Asset | | | |
| | | Management Core Property | | | |
| | | Fund LP (a) (b) | | 2,684,523 | |
| | | | | 6,058,106 | |
| | | | | | |
| | | Equity – 32.54% | | | |
| 125,573 | | Calamos Market Neutral | | | |
| | | Income Fund | | 1,633,702 | |
| 56,105 | | Gateway Fund | | 1,694,384 | |
| 45,856 | | Graphite Enterprise Trust plc | | 422,505 | |
| 42,112 | | HarbourVest Global Private | | | |
| | | Equity Ltd * | | 573,776 | |
| 202,201 | | Henderson Global Equity | | | |
| | | Income Fund (c) | | 1,591,319 | |
| 55,502 | | Henderson Global | | | |
| | | Technology Fund (c) * | | 1,486,901 | |
| 16,354 | | iShares Core High | | | |
| | | Dividend ETF | | 1,220,662 | |
| 40,852 | | iShares MSCI EAFE Minimum | | | |
| | | Volatility Index Fund | | 2,754,242 | |
| 15,032 | | iShares MSCI Emerging | | | |
| | | Markets Index Fund | | 557,988 | |
| 22,014 | | iShares MSCI Emerging | | | |
| | | Markets Minimum Volatility ETF | | 1,221,557 | |
| 17,037 | | iShares Russell 1000 | | | |
| | | Value ETF | | 1,753,278 | |
| 17,361 | | iShares Russell 2000 | | | |
| | | Value ETF | | 1,710,406 | |
| 37,401 | | NB Private Equity Partners Ltd | | 438,527 | |
| 21,000 | | Pantheon International | | | |
| | | Participation plc * | | 429,282 | |
| 75,545 | | PowerShares International | | | |
| | | Dividend Achievers Portfolio | | 1,248,759 | |
| 16,036 | | Vanguard Dividend | | | |
| | | Appreciation ETF | | 1,287,370 | |
| | | | | 20,024,658 | |
| | | | | | |
| | | Fixed income – 25.11% | | | |
| 134,016 | | Henderson Strategic | | | |
| | | Income Fund (c) | | 1,214,183 | |
| 313,570 | | Henderson Unconstrained | | | |
| | | Bond Fund (c) | | 2,978,911 | |
| 13,709 | | iShares Global High Yield | | | |
| | | Corporate Bond Fund | | 667,903 | |
| 10,757 | | iShares iBoxx $High Yield | | | |
| | | Corporate Bond Fund | | 946,293 | |
| 7,451 | | iShares iBoxx Investment | | | |
| | | Grade Corporate Bond Fund | | 866,924 | |
| 11,483 | | iShares JP Morgan USD | | | |
| | | Emerging Markets Bond Fund | | 1,259,226 | |
| 22,240 | | iShares TIPS Bond ETF | | 2,505,336 | |
| 182,521 | | MSIF Multi-Asset Portfolio | | 1,958,455 | |
| 14,379 | | PIMCO Enhanced Short | | | |
| | | Maturity ETF | | 1,453,717 | |
| 67,780 | | PowerShares Senior | | | |
| | | Loan Portfolio | | 1,605,708 | |
| | | | | 15,456,656 | |
| | | Total investment companies | | | |
| | | (Cost $40,127,918) | | 41,539,420 | |
| | | | | | |
| Short-term investment – 30.83% | | | |
| 18,978,659 | | Fidelity Institutional | | | |
| | | Treasury Portfolio (d) | | 18,978,659 | |
| | | | | | |
| | | Total short-term investment | | | |
| | | (Cost $18,978,659) | | 18,978,659 | |
| | | | | | |
| Total investments – 98.32% | | | |
| | | (Cost $59,106,577) | | 60,518,079 | |
| | | | | | |
| Financial Derivative Instruments, net (e) | | | |
(Cost or Premiums, net $0) – (0.15)% | | (91,633 | ) |
| Net other assets and liabilities – 1.83% | | 1,126,477 | |
| | | | | | |
| Total net assets – 100.00% | $ | 61,552,923 | |
| * | | Non-income producing security |
| (a) | | The security has been deemed illiquid by the Adviser according to the policies and procedures adopted by the Board of Trustees. |
| (b) | | Fair valued at July 31, 2015 as determined in good faith using procedures approved by the Board of Trustees. |
| (c) | | Affiliated holding, see notes to financial statements for further information. |
| (d) | | This short-term investment has been segregated for open futures contracts and forward foreign currency contracts at July 31, 2015. |
| (e) | | Information with respect to financial derivative instruments is disclosed in the following tables. |
| ETF | | Exchange-traded fund |
See notes to financial statements
30
All Asset Fund
July 31, 2015 (continued)
(e) FINANCIAL DERIVATIVE INSTRUMENTS
EXCHANGE-TRADED OR CENTRALLY-CLEARED FINANCIAL DERIVATIVE INSTRUMENTS
FUTURES CONTRACTS
| | | | | | | | | | | | | Unrealized | |
| | | | | | | | | | Current | | | appreciation/ | |
| | | | Number of | | | Expiration | | | notional | | | (depreciation) | |
| | | | contracts | | | date | | | value | | | Asset | | | Liability | |
| EURO STOXX 50 Index (Long) | | | 102 | | | 9/18/15 | | $ | 4,030,536 | | $ | 137,037 | | $ | — | |
| FTSE 100 Index (Long) | | | 20 | | | 9/18/15 | | | 2,078,245 | | | — | | | (1,093 | ) |
| KOSPI 200 Index (Long) | | | 14 | | | 9/10/15 | | | 1,456,053 | | | — | | | (65,205 | ) |
| Nikkei 225 Index (Long) | | | 22 | | | 9/10/15 | | | 3,651,430 | | | 23,254 | | | — | |
| E-mini S&P 500 Index (Long) | | | 6 | | | 9/18/15 | | | 629,520 | | | 6,825 | | | — | |
| US Treasury 10 Year Note (Long) | | | 15 | | | 9/21/15 | | | 1,911,563 | | | 7,515 | | | — | |
| Total | | | | | | | | | | | $ | 174,631 | | $ | (66,298 | ) |
During the year ended July 31, 2015, average monthly notional value related to futures contracts was approximately $11.5 million, or 18.7% of net assets.
FINANCIAL DERIVATIVE INSTRUMENTS: EXCHANGE-TRADED OR CENTRALLY-CLEARED SUMMARY
The following is a summary of the value of exchange-traded or centrally-cleared financial derivative instruments as of July 31, 2015:
| | | | Unrealized | | | | | | Unrealized | | | | |
| | | | Appreciation | | | | | | Depreciation | | | | |
| | | Futures Contracts | | | Total | | Futures Contracts | | | Total | |
| Total Exchange-Traded or Centrally Cleared | | $ | 174,631 | | $ | 174,631 | | $ | (66,298 | ) | $ | (66,298 | ) |
OVER-THE-COUNTER FINANCIAL DERIVATIVE INSTRUMENTS
FORWARD FOREIGN CURRENCY CONTRACTS
| | | | | | | | | | | | | | | Unrealized | |
| | | | | | | | | Local | | | Current | | | appreciation/ | |
| | | | | | Value | | | amount | | | notional | | | (depreciation) | |
| | | Counterparty | | | date | | | (000’s | ) | | value | | | Asset | | | Liability | |
| British Pound (Long) | | State Street Bank | | | | | | | | | | | | | | | | |
| | and Trust Company | | | 8/26/15 | | | 662 | | $ | 1,033,836 | | $ | — | | $ | (34,929 | ) |
| Euro (Long) | State Street Bank | | | | | | | | | | | | | | | | |
| | and Trust Company | | | 8/26/15 | | | 3,523 | | | 3,869,661 | | | — | | | (98,669 | ) |
| Japanese Yen (Long) | | State Street Bank | | | | | | | | | | | | | | | | |
| | and Trust Company | | | 8/26/15 | | | 460,010 | | | 3,712,456 | | | — | | | (66,368 | ) |
| Total | | | | | | | | | | | | | $ | — | | $ | (199,966 | ) |
During the year ended July 31, 2015, average monthly notional value related to forward foreign currency contracts was approximately $5.7 million, or 9.4% of net assets.
See notes to financial statements
31
All Asset Fund
July 31, 2015 (continued)
FINANCIAL DERIVATIVE INSTRUMENTS: OVER-THE-COUNTER SUMMARY
The following is a summary by counterparty of the value of over-the-counter financial derivative instruments and collateral (received)/pledged as of July 31, 2015.
| | | Financial Derivative Assets | | Financial Derivative Liabilities | | | | | | | |
| | | Unrealized Appreciation | | | | Unrealized Depreciation | | | | | | | | | |
| | | Forward Foreign Currency Contracts | | Total Over-the- Counter | | Forward Foreign Currency Contracts | | Total Over-the- Counter | | Net Value of OTC Derivatives | | Collateral (Received) / Pledged | | Net Exposure(1) | |
| Amounts subject to a master netting or similar agreement: | | | | |
| | | $ | — | | $ | — | | $ | — | | $ | — | | $ | — | | $ | — | | $ | — | |
| | | $ | — | | $ | — | | $ | — | | $ | — | | $ | — | | $ | — | | $ | — | |
| Amounts NOT subject to a master netting or similar agreement: |
| State Street | | | | | | | | | | | | | | | | | | | | | | |
| Bank and | | | | | | | | | | | | | | | | | | | | | | |
Trust Company (2) | | $ | — | | $ | — | | $ | (199,966 | ) | $ | (199,966 | ) | | | | | | | | | |
| | | $ | — | | $ | — | | $ | (199,966 | ) | $ | (199,966 | ) | | | | | | | | | |
| Total Over- | | | | | | | | | | | | | | | | | | | | | | |
| the-Counter | | $ | — | | $ | — | | $ | (199,966 | ) | $ | (199,966 | ) | | | | | | | | | |
| | (1) | Net Exposure represents the net receivable/(payable) that would be due from/to the counterparty in the event of default. Exposure from over-the-counter financial derivative instruments can only be netted across transactions governed under the same master agreement with the same legal entity. See Note 2, Significant Accounting Policies, “Derivative instruments,” in the Notes to Financial Statements for more information regarding master netting arrangements. |
| | | |
| | (2) | Forward foreign currency contracts with State Street Bank and Trust Company are not subject to a legally enforceable master netting arrangement or other similar agreements that provide legally enforceable right of offset. |
| | | Cost or Premiums, Net | | Asset | | | Liability | |
| TOTAL FINANCIAL DERIVATIVE INSTRUMENTS | | $ | — | | $ | 174,631 | | $ | (266,264 | ) |
Other information:
| | | |
Currency exposure of portfolio assets before
any currency hedging, if applicable.
Excludes derivatives. | % of total investments |
| US Dollar | 98 | % |
| British Pound | 2 | |
| | 100 | % |
See notes to financial statements
32
All Asset Fund
July 31, 2015 (continued)
Fair Value Measurements
The following table summarizes the Fund’s investments that are measured at fair value by level within the fair value hierarchy at July 31, 2015:
| | | | Quoted prices | | | Significant | | | | | | | |
| | | | in active | | | other | | | Significant | | | | |
| | | | markets for | | | observable | | | unobservable | | | | |
| | | identical assets | | | inputs | | | inputs | | | | |
| Description | | | (level 1 | ) | | (level 2 | ) | | (level 3 | ) | | Total | |
| Assets | | | | | | | | | | | | | |
| Investment Companies | | $ | 38,854,897 | | $ | — | | $ | 2,684,523 | | $ | 41,539,420 | |
| Short-Term Investment | | | 18,978,659 | | | — | | | — | | | 18,978,659 | |
| Total Investments | | $ | 57,833,556 | | $ | — | | $ | 2,684,523 | | $ | 60,518,079 | |
| | | | | | | | | | | | | | |
| Financial Derivative Instruments – Assets | | | | | | | | | | | | | |
| Exchange-traded or centrally-cleared | | $ | 174,631 | | $ | — | | $ | — | | $ | 174,631 | |
| Over-the-counter | | | — | | | — | | | — | | | — | |
| Total Financial Derivative Investments – Assets | | $ | 174,631 | | $ | — | | $ | — | | $ | 174,631 | |
| Liabilities | | | | | | | | | | | | | |
| | | | | | | | | | | | | | |
| Financial Derivative Instruments – Liabilities | | | | | | | | | | | | | |
| Exchange-traded or centrally-cleared | | $ | (66,298 | ) | $ | — | | $ | — | | $ | (66,298 | ) |
| Over-the-counter | | | — | | | (199,966 | ) | | | | | (199,966 | ) |
| Total Financial Derivative Investments - Liabilities | | $ | (66,298 | ) | $ | (199,966 | ) | $ | — | | $ | (266,264 | ) |
During the year ended July 31, 2015, there were no transfers in or out of security levels.
See notes to financial statements
33
All Asset Fund
July 31, 2015 (Continued)
Following is a reconciliation of investments in which significant unobservable inputs (Level 3) were used in determining fair value:
| | | | | | | | | | | | | | | | | | | | | | | | | | | | | |
| | | | Balance | | | | | | | | | Change in | | | | | | | | | | | | | | | Balance | |
| | | | as of | | | Accrued | | | | | | unrealized | | | | | | | | | Transfers | | | Transfers | | | as of | |
| | | | July 31, | | | discounts/ | | | Realized | | | appreciation | | | | | | | | | in to | | | out of | | January 31, | |
| Investments in securities | | | 2014 | | | premiums | | | gain/(loss | ) | (depreciation | ) | | Purchases | | | Sales | | | level 3 | | | level 3 | | | 2015 | |
| Investment Companies | | | | | | | | | | | | | | | | | | | | | | | | | | | | |
| TIAA-CREF Asset | | | | | | | | | | | | | | | | | | | | | | | | | | | | |
| Management Core | | | | | | | | | | | | | | | | | | | | | | | | | | | | |
| Property Fund LP | | $ | 0 | | $ | 0 | | $ | 0 | | $ | 150,174 | | $ | 2,534,349 | | $ | 0 | | $ | 0 | | $ | 0 | | $ | 2,684,523 | |
| Total | | $ | 0 | | $ | 0 | | $ | 0 | | $ | 150,174 | | $ | 2,534,349 | | $ | 0 | | $ | 0 | | $ | 0 | | $ | 2,684,523 | |
The total net change in unrealized appreciation (depreciation) attributable to Level 3 investments held at July 31, 2015 was $150,174.
The Fund’s Adviser has determined that TIAA-CREF Asset Management Core Property Fund LP (“CPF”) is a Level 3 investment due to the lack of observable inputs that may be used in the determination of fair value. The CPF is a private Delaware limited partnership that provides monthly liquidity to its investors with 45 days written notice and invests its contributed capital in a TIAA-CREF REIT. The REIT is a limited partnership which in turn invests in a TIAA-CREF operating partnership. The investments of the operating partnership include a diversified portfolio of real property assets. As a result, the monthly valuations prepared by CPF and assignment of a net asset value per share are ultimately driven by changes in the valuation of the underlying real property assets in the operating partnership. All of the investments in real estate are appraised annually by an independent third-party appraiser. The CPF’s policy is to report all such investments, as well as related debt at fair value under US Generally Accepted Accounting Principles based on the appraised value. The annual appraisals are conducted on a rolling basis such that approximately 25% of the portfolio receives an annual full appraisal each quarter. In addition, each appraisal is updated quarterly under the direction of an independent, third-party appraisal firm.
The significant unobservable inputs used by CPF in the fair value measurement and appraisal of the real property assets include: a) an extensive market study, including a thorough analysis of current market conditions and trends as they impact supply, demand and absorption of the relevant property type; b) thorough description of the site and improvements, including a site plan and renderings of the improvements if available; c) estimate of the value of the land; d) estimate of the value of the property using a cost approach; e) estimate of the market value of the property using a sales comparison approach; and f) estimate of the value of the property using a detailed income capitalization approach that includes several diagnostic inputs. Significant changes in any of those inputs in isolation would result in a significant change in the fair value measurement, and ultimately the value ascribed to All Asset Fund’s limited partnership interests in CPF.
Due to the factors above, and as approved by the Valuation Committee of the Board of Trustees, the All Asset Fund values this investment monthly upon receipt of the limited partner statement and in line with the capital balance allocated to its limited partnership interests, less the undistributed net income accrued within the capital balance. Separately, a daily income accrual is recognized by the Fund to account for the net income that is accrued and allocated to its limited partnership interests and distributed quarterly. The value assigned to the investment is revised monthly upon receipt of the limited partner statement. The value may be revised more frequently if, in the determination of the Adviser and Valuation Committee, market or investment-specific developments warrant re-assessment.
See notes to financial statements
34
July 31, 2015 (continued)
Fair Value of Financial Derivative Instruments
The following is a summary of the fair valuation of the Fund’s financial derivative instruments categorized by risk exposure:
Fair Values of Financial Derivative Instruments on the Statement of Assets and Liabilities as of July 31, 2015
| Derivatives not accounted for as hedging instruments |
| | | | Foreign | | | | | | | | | | | | | | | | |
| | | | Currency | | | Equity | | | Interest | | | Credit | | | Inflation | | | | |
| | | | Risk | | | Risk | | | Rate Risk | | | Risk | | | Risk | | | Total | |
| Financial Derivative Instruments – Assets | | | | | | | | | | | | | | | | | | | |
| Exchange-Traded or Centrally-Cleared | | | | | | | | | | | | | | | | | | | |
| Futures Contracts | | $ | — | | $ | 167,116 | | $ | 7,515 | | $ | — | | $ | — | | $ | 174,631 | |
| | | $ | — | | $ | 167,116 | | $ | 7,515 | | $ | — | | $ | — | | $ | 174,631 | |
| | | | | | | | | | | | | | | | | | | | |
| Over-the-Counter | | | | | | | | | | | | | | | | | | | |
| Forward Foreign Currency Contracts | | $ | — | | $ | — | | $ | — | | $ | — | | $ | — | | $ | — | |
| | | $ | — | | $ | — | | $ | — | | $ | — | | $ | — | | $ | — | |
| Total | | $ | — | | $ | 167,116 | | $ | 7,515 | | $ | — | | $ | — | | $ | 174,631 | |
| | | | | | | | | | | | | | | | | | | | |
| Financial Derivative Instruments – Liabilities | | | | | | | | | | | | | | | | | | | |
| Exchange-Traded or | | | | | | | | | | | | | | | | | | | |
| Centrally-Cleared | | | | | | | | | | | | | | | | | | | |
| Futures Contracts | | $ | — | | $ | (66,298 | ) | $ | — | | $ | — | | $ | — | | $ | (66,298 | ) |
| | | $ | — | | $ | (66,298 | ) | $ | — | | $ | — | | $ | — | | $ | (66,298 | ) |
| | | | | | | | | | | | | | | | | | | | |
| Over-the-Counter | | | | | | | | | | | | | | | | | | | |
| Forward Foreign Currency Contracts | | $ | (199,966 | ) | $ | — | | $ | — | | $ | — | | $ | — | | $ | (199,966 | ) |
| | | $ | (199,966 | ) | $ | — | | $ | — | | $ | — | | $ | — | | $ | (199,966 | ) |
| Total | | $ | (199,966 | ) | $ | (66,298 | ) | $ | — | | $ | — | | $ | — | | $ | (266,264 | ) |
| | | | | | | | | | | | | | | | | | | | |
| Net | | $ | (199,966 | ) | $ | 108,333 | | $ | — | | $ | — | | $ | — | | $ | (91,633 | ) |
Effect of Financial Derivative Instruments on the Statement of Operations for the Year Ended July 31, 2015
| Derivatives not accounted for as hedging instruments |
| | | | Foreign | | | | | | | | | | | | | | | | |
| | | | Currency | | | Equity | | | Interest | | | Credit | | | Inflation | | | | |
| | | | Risk | | | Risk | | | Rate Risk | | | Risk | | | Risk | | | Total | |
| Net realized gain/(loss) from financial derivative instruments: | | | | | | | | | | | | | | | | | | | |
| Futures Contracts | | $ | — | | $ | 1,385,962 | | $ | 2,751 | | $ | — | | $ | — | | $ | 1,388,713 | |
| Forward Foreign Currency Contracts | | | (99,802 | ) | | — | | | — | | | — | | | — | | | (99,802 | ) |
| Total | | $ | (99,802 | ) | $ | 1,385,962 | | $ | 2,751 | | $ | — | | $ | — | | $ | 1,288,911 | |
| | | | | | | | | | | | | | | | | | | | |
| Net change in unrealized appreciation/(depreciation)of financial derivative instruments | | | | | | | | | | | | | | | | | | | |
| Futures Contracts | | $ | — | | $ | (9,764 | ) | $ | 7,515 | | $ | — | | $ | — | | $ | (2,249 | ) |
| Forward Foreign Currency Contracts | | | (141,947 | ) | | — | | | — | | | — | | | — | | | (141,947 | ) |
| Total | | $ | (141,947 | ) | $ | (9,764 | ) | $ | 7,515 | | $ | — | | $ | — | | $ | (144,196 | ) |
See notes to financial statements
35
Dividend & Income Builder Fund
July 31, 2015
| | | | | Value | |
| Shares | | | | (note 2) | |
| | | | | | |
| Common stocks – 81.37% | | | |
| | | | | | |
| | | Australia – 1.59% | | | |
| 38,932 | | Amcor, Ltd. | $ | 410,070 | |
| 43,003 | | Suncorp Group, Ltd. | | 448,550 | |
| | | | | 858,620 | |
| | | | | | |
| | | Canada – 1.38% | | | |
| 18,153 | | BCE, Inc. | | 747,162 | |
| | | | | | |
| | | France – 4.90% | | | |
| 10,083 | | Nexity S.A. | | 444,607 | |
| 55,689 | | Orange S.A. | | 913,432 | |
| 13,960 | | Rexel S.A. | | 220,085 | |
| 5,185 | | Sanofi | | 557,883 | |
| 10,439 | | Total S.A. | | 516,769 | |
| | | | | 2,652,776 | |
| | | | | | |
| | | Germany – 2.88% | | | |
| 5,530 | | Deutsche Boerse AG | | 501,839 | |
| 24,393 | | Deutsche Post AG | | 737,250 | |
| 1,748 | | Muenchener | | | |
| | | Rueckversicherungs- | | | |
| | | Gesellschaft AG | | 321,173 | |
| | | | | 1,560,262 | |
| | | | | | |
| | | Hong Kong – 3.52% | | | |
| 58,500 | | Cheung Kong Property | | | |
| | | Holdings, Ltd. * | | 487,481 | |
| 42,500 | | CK Hutchison Holdings, Ltd. | | 631,006 | |
| 98,000 | | Shanghai Industrial | | | |
| | | Holdings, Ltd. | | 288,856 | |
| 39,000 | | Swire Pacific, Ltd., Class A | | 500,310 | |
| | | | | 1,907,653 | |
| | | | | | |
| | | Ireland – 1.03% | | | |
| 11,009 | | Seagate Technology plc | | 557,055 | |
| | | | | | |
| | | Israel – 0.89% | | | |
| 261,984 | | Bezeq The Israeli | | | |
| | | Telecommunication Corp, Ltd. | | 483,064 | |
| | | | | | |
| | | Italy – 1.65% | | | |
| 120,117 | | Enel SpA | | 565,403 | |
| 18,567 | | ENI SpA | | 325,444 | |
| | | | | 890,847 | |
| | | Japan – 3.78% | | | |
| 12,000 | | Canon, Inc. | | 384,589 | |
| 84,000 | | Daiwa Securities Group, Inc. | | 653,171 | |
| 16,600 | | Nippon Telegraph and | | | |
| | | Telephone Corp. | | 638,029 | |
| 6,700 | | Tokyo Electron, Ltd. | | 369,829 | |
| | | | | 2,045,618 | |
| | | | | | |
| | | Luxembourg – 0.75% | | | |
| 4,474 | | RTL Group S.A. | | 407,777 | |
| | | | | | |
| | | Netherlands – 3.92% | | | |
| 14,620 | | Nielsen N.V. | | 708,485 | |
| 41,093 | | RELX N.V. | | 684,629 | |
| 11,945 | | Unilever N.V. | | 535,370 | |
| 5,888 | | Wolters Kluwer N.V. | | 195,159 | |
| | | | | 2,123,643 | |
| | | | | | |
| | | Portugal – 1.03% | | | |
| 66,056 | | NOS SGPS S.A. | | 559,765 | |
| | | | | | |
| | | Switzerland – 7.84% | | | |
| 6,974 | | Cembra Money Bank AG * | | 424,372 | |
| 6,656 | | Nestle S.A. | | 504,211 | |
| 15,208 | | Novartis AG | | 1,580,134 | |
| 3,661 | | Roche Holding AG | | 1,057,420 | |
| 2,240 | | Zurich Insurance Group AG * | | 682,223 | |
| | | | | 4,248,360 | |
| | | | | | |
| | | Taiwan – 0.93% | | | |
| 22,746 | | Taiwan Semiconductor | | | |
| | | Manufacturing Co., Ltd., ADR | | 502,914 | |
| | | | | | |
| | | United Kingdom – 20.84% | | | |
| 12,904 | | AstraZeneca plc | | 870,547 | |
| 113,070 | | Barclays plc | | 510,216 | |
| 24,132 | | BHP Billiton plc | | 445,634 | |
| 14,729 | | British American Tobacco plc | | 874,289 | |
| 40,389 | | Centrica plc | | 168,091 | |
| 121,915 | | GKN plc | | 606,388 | |
| 30,152 | | Hiscox, Ltd. | | 435,789 | |
| 67,869 | | HSBC Holdings plc | | 614,411 | |
| 17,331 | | Imperial Tobacco Group plc | | 910,736 | |
| 160,921 | | ITV plc | | 705,406 | |
| 124,060 | | Legal & General Group plc | | 505,076 | |
| 16,679 | | Persimmon plc * | | 533,177 | |
| 18,264 | | Prudential plc | | 429,969 | |
| 11,303 | | Rio Tinto plc | | 438,901 | |
| 31,612 | | Royal Dutch Shell plc, A Shares | | 908,915 | |
| 72,741 | | Standard Life plc | | 516,180 | |
| 243,416 | | Vodafone Group plc | | 919,346 | |
| 38,944 | | WPP plc | | 894,009 | |
| | | | | 11,287,080 | |
See notes to financial statements
36
Dividend & Income Builder Fund
July 31, 2015 (continued)
| | | | | Value | |
| Shares | | | | (note 2) | |
| | | | | | |
| | | United States – 24.44% | | | |
| | | | | | |
| 14,351 | | Baxalta, Inc. * | $ | 471,143 | |
| 22,822 | | Cisco Systems, Inc. | | 648,601 | |
| 2,632 | | Cummins, Inc. | | 340,923 | |
| 4,306 | | Deere & Co. | | 407,218 | |
| 5,472 | | Eaton Corp., plc | | 331,494 | |
| 20,427 | | General Electric Co. | | 533,145 | |
| 11,611 | | JPMorgan Chase & Co. | | 795,702 | |
| 17,977 | | KKR & Co., L.P. | | 429,650 | |
| 6,103 | | L Brands, Inc. | | 492,634 | |
| 5,659 | | Las Vegas Sands Corp. | | 317,130 | |
| 2,813 | | Lockheed Martin Corp. | | 582,572 | |
| 18,335 | | Microsoft Corp. | | 856,245 | |
| 40,428 | | Pfizer, Inc. | | 1,457,834 | |
| 8,264 | | PNC Financial Services | | | |
| | | Group, Inc. | | 811,360 | |
| 9,840 | | QUALCOMM, Inc. | | 633,598 | |
| 10,327 | | Reynolds American, Inc. | | 885,953 | |
| 14,299 | | Six Flags Entertainment Corp. | | 666,905 | |
| 5,171 | | Stanley Black & Decker, Inc. | | 545,489 | |
| 4,288 | | United Parcel Service, Inc., | | | |
| | | Class B | | 438,920 | |
| 1,149 | | Verizon Communications, Inc. | | 54,038 | |
| 15,999 | | Verizon Communications, Inc. | | 748,593 | |
| 13,600 | | Wells Fargo & Co. | | 787,032 | |
| | | | | 13,236,179 | |
| | | | | | |
| | | Total common stocks | | | |
| | | (Cost $42,229,563) | | 44,068,775 | |
| Face | | | | | | | Value | |
| amount | | | Coupon | | Maturity | | (note 2) | |
| | | | | | | | | | |
| Corporate bonds – 10.49% |
| | | | | | | | | | |
| | | | Canada – 0.01% | | | | | | |
| USD | 7,000 | | Valeant Pharmaceuticals International, Inc. (a) | 7.500% | | 7/15/21 | $ | 7,613 | |
| | | | | | | | | | |
| | | | France – 0.44% | | | | | | |
| USD | 200,000 | | BNP Paribas S.A. (a) (b) | 7.195% | | 6/25/37 | | 236,250 | |
| | | | | | | | | | |
| | | | Germany – 0.36% | | | | | | |
| USD | 200,000 | | Unitymedia Hessen GmbH & Co. KG (a) | 5.000% | | 1/15/25 | | 197,500 | |
| | | | | | | | | | |
| | | | Jersey – 0.19% | | | | | | |
| USD | 100,000 | | HBOS Capital Funding LP (b) | 6.850% | | 9/23/15 | | 102,639 | |
| | | | | | | | | | |
| | | | Luxembourg – 0.85% | | | | | | |
| USD | 200,000 | | Altice S.A. (a) | 7.750% | | 5/15/22 | | 202,000 | |
| USD | 250,000 | | Wind Acquisition Finance S.A. (a) | 4.750% | | 7/15/20 | | 256,250 | |
| | | | | | | | | 458,250 | |
| | | | | | | | | | |
| | | | Netherlands – 0.36% | | | | | | |
| USD | 200,000 | | Ziggo Bond Finance BV (a) | 5.875% | | 1/15/25 | | 197,500 | |
| | | | | | | | | | |
| | | | Spain – 0.48% | | | | | | |
| USD | 250,000 | | BBVA International Preferred SAU (b) | 5.919% | | 4/18/17 | | 257,500 | |
| | | | | | | | | | |
| | | | Switzerland – 0.39% | | | | | | |
| USD | 200,000 | | Credit Suisse Group AG (a) (b) | 7.500% | | 12/11/23 | | 213,400 | |
See notes to financial statements
37
Dividend & Income Builder Fund
July 31, 2015 (continued)
| Face | | | | | | | Value | |
| amount | | | Coupon | | Maturity | | (note 2) | |
| | | | | | | | | | |
| | | | United Kingdom – 1.92% | | | | | | |
| USD | 250,000 | | Barclays Bank plc (b) | 6.860% | | 6/15/32 | $ | 284,627 | |
| USD | 200,000 | | Lloyds Banking Group plc (a) (b) | 6.657% | | 5/21/37 | | 225,750 | |
| USD | 100,000 | | Prudential plc (b) | 6.500% | | 9/23/15 | | 101,925 | |
| USD | 200,000 | | Royal Bank of Scotland Group plc | 6.100% | | 6/10/23 | | 216,311 | |
| USD | 200,000 | | Virgin Media Finance plc (a) | 6.375% | | 4/15/23 | | 209,750 | |
| | | | | | | | | 1,038,363 | |
| | | | | | | | | | |
| | | | United States – 5.49% | | | | | | |
| USD | 250,000 | | Avis Budget Car Rental LLC | 5.500% | | 4/1/23 | | 252,187 | |
| USD | 100,000 | | CCO Holdings LLC | 7.375% | | 6/1/20 | | 106,021 | |
| USD | 150,000 | | CCO Holdings LLC (a) | 5.875% | | 5/1/27 | | 148,969 | |
| USD | 7,000 | | CHS/Community Health Systems, Inc. | 6.875% | | 2/1/22 | | 7,508 | |
| USD | 100,000 | | CHS/Community Health Systems, Inc. | 7.125% | | 7/15/20 | | 106,750 | |
| USD | 100,000 | | CHS/Community Health Systems, Inc. | 8.000% | | 11/15/19 | | 105,374 | |
| USD | 100,000 | | Constellation Brands, Inc. | 4.250% | | 5/1/23 | | 100,250 | |
| USD | 250,000 | | Dresdner Funding Trust I (a) | 8.151% | | 6/30/31 | | 314,375 | |
| USD | 149,000 | | First Data Corp. | 10.625% | | 6/15/21 | | 166,507 | |
| USD | 250,000 | | HCA, Inc. | 5.875% | | 5/1/23 | | 269,375 | |
| USD | 240,000 | | Infor (US), Inc. (a) | 6.500% | | 5/15/22 | | 246,000 | |
| USD | 250,000 | | Iron Mountain, Inc. | 6.000% | | 8/15/23 | | 260,937 | |
| USD | 100,000 | | Post Holdings, Inc. (a) | 6.750% | | 12/1/21 | | 101,000 | |
| USD | 150,000 | | Regal Entertainment Group | 5.750% | | 2/1/25 | | 146,250 | |
| USD | 200,000 | | Service Corp. International | 8.000% | | 11/15/21 | | 234,000 | |
| USD | 250,000 | | Sirius XM Radio, Inc. (a) | 6.000% | | 7/15/24 | | 261,250 | |
| USD | 125,000 | | Verizon Communications, Inc. | 6.550% | | 9/15/43 | | 148,195 | |
| | | | | | | | | 2,974,948 | |
| | | | | | | | | | |
| | | | Total corporate bonds | | | | | | |
| | | | (Cost $5,594,039) | | | | | 5,683,963 | |
See notes to financial statements
38
Dividend & Income Builder Fund
July 31, 2015 (continued)
| | | | | Value | |
| Shares | | | | (note 2) | |
| | | | | | |
| REITs – 1.88% | | | |
| | | | | | |
| | | France – 0.71% | | | |
| 5,179 | | ICADE | $ | 384,043 | |
| | | | | | |
| | | Netherlands – 0.76% | | | |
| 9,491 | | Eurocommercial Properties N.V. | | 409,591 | |
| | | | | | |
| | | United States – 0.41% | | | |
| 7,471 | | Iron Mountain, Inc. | | 224,504 | |
| | | | | | |
| | | Total REITs | | | |
| | | (Cost $1,118,462) | | 1,018,138 | |
| | | | | | |
| | | Total long-term investments | | | |
| | | (Cost $48,942,064) | | 50,770,876 | |
| | | | | | |
| Short-term investment – 4.90% | | | |
| 2,651,739 | | Fidelity Institutional | | | |
| | | Treasury Portfolio | | 2,651,739 | |
| | | | | | |
| | | Total short-term investment | | | |
| | | (Cost $2,651,739) | | 2,651,739 | |
| | | | | | |
| Total investments – 98.64% | | | |
| | | (Cost $51,593,803) | | 53,422,615 | |
| | | | | | |
| Net other assets and liabilities – 1.36% | | 738,552 | |
| | | | | | |
| Total net assets – 100.00% | $ | 54,161,167 | |
| * | | Non-income producing security |
| (a) | | Restricted security, purchased pursuant to Rule 144A under the Securities Act of 1933, as amended, and which is exempt from registration under that Act. At July 31, 2015, the restricted securities held by the Fund had an aggregate value of $2,817,607, which represented 5.2% of net assets. |
| (b) | | Maturity date is perpetual. Maturity date presented represents the next call date. |
| ADR | | American Depositary Receipts |
| REIT | | Real Estate Investment Trust |
Other information:
| | | |
Currency exposure of portfolio assets before
any currency hedging, if applicable. | % of total |
| Excludes derivatives. | investments |
| US Dollar | 44 | % |
| British Pound | 19 | |
| Euro | 17 | |
| Swiss Franc | 8 | |
| Japanese Yen | 4 | |
| Hong Kong Dollar | 4 | |
| Australian Dollar | 2 | |
| Canadian Dollar | 1 | |
| Israeli Shekel | 1 | |
| | 100 | % |
See notes to financial statements
39
Dividend & Income Builder Fund
July 31, 2015 (continued)
Other information:
| Industry concentration as | % of net |
| a percentage of net assets: | assets |
| Pharmaceuticals | 10.20 | % |
| Integrated Telecommunication Services | 6.62 | |
| Diversified Banks | 5.50 | |
| Tobacco | 4.93 | |
| Integrated Oil & Gas | 3.23 | |
| Life & Health Insurance | 2.87 | |
| Communications Equipment | 2.37 | |
| Air Freight & Logistics | 2.17 | |
| Real Estate Development | 2.06 | |
| Broadcasting | 2.05 | |
| Packaged Foods & Meats | 1.92 | |
| Homebuilding | 1.81 | |
| Wireless Telecommunication Services | 1.70 | |
| Advertising | 1.65 | |
| Diversified Metals & Mining | 1.63 | |
| Property & Casualty Insurance | 1.63 | |
| Publishing | 1.62 | |
| Systems Software | 1.58 | |
| Industrial Conglomerates | 1.52 | |
| Regional Banks | 1.50 | |
| Other Diversified Financial Services | 1.47 | |
| Construction & Farm Machinery & Heavy Trucks | 1.38 | |
| Research & Consulting Services | 1.31 | |
| Multi-line Insurance | 1.26 | |
| Leisure Facilities | 1.23 | |
| Investment Banking & Brokerage | 1.21 | |
| Cable TV | 1.20 | |
| Auto Parts & Equipment | 1.12 | |
| Aerospace & Defense | 1.08 | |
| Money Center Banks | 1.06 | |
| Electric Utilities | 1.04 | |
| Cable & Satellite | 1.03 | |
| Computers-Memory Devices | 1.03 | |
| Industrial Machinery | 1.01 | |
| Semiconductors | 0.93 | |
| Specialized Finance | 0.93 | |
| Diversified Real Estate Activities | 0.92 | |
| Apparel Retail | 0.91 | |
| Biotechnology | 0.87 | |
| Telecommunication Services | 0.85 | |
| Asset Management & Custody Banks | 0.79 | |
| Consumer Finance | 0.78 | |
| Paper Packaging | 0.76 | |
| Retail REITs | 0.76 | |
| Technology Hardware, Storage & Peripherals | 0.71 | |
| Diversified REITs | 0.71 | |
| Semiconductor Equipment | 0.68 | |
| Telephone-Integrated | 0.66 | |
| Electrical Components & Equipment | 0.61 | |
| Reinsurance | 0.59 | |
| Casinos & Gaming | 0.59 | |
| Health Care Services | 0.50 | |
| Radio | 0.48 | |
| Diversified Support Services | 0.48 | |
| Rental Auto/Equipment | 0.47 | |
| Enterprise Software/Services | 0.45 | |
| Funeral Services & Related Items | 0.43 | |
| Specialized REITs | 0.41 | |
| Trading Companies & Distributors | 0.41 | |
| Medical-Hospitals | 0.41 | |
| Diversified Banking Institution | 0.39 | |
| Multi-Utilities | 0.31 | |
| Data Processing/Management | 0.31 | |
| Movies & Entertainment | 0.27 | |
| Food-Flour & Grain | 0.19 | |
| Distillers & Vintners | 0.18 | |
| Medical – Drugs | 0.01 | |
| Long-Term Investments | 93.74 | |
| Short-Term Investment | 4.90 | |
| Total Investments | 98.64 | |
| Net Other Assets and Liabilities | 1.36 | |
| | 100.00 | % |
See notes to financial statements
40
Dividend & Income Builder Fund
July 31, 2015 (continued)
Fair Value Measurements
The following table summarizes the Fund’s investments that are measured at fair value by level within the fair value hierarchy at July 31, 2015:
| | | Quoted prices | | | Significant | | | | | | | |
| | | | in active | | | other | | | Significant | | | | |
| | | | markets for | | | observable | | | unobservable | | | | |
| | | identical assets | | | inputs | | | inputs | | | | |
| Description | | | (level 1 | ) | | (level 2 | ) | | (level 3 | ) | | Total | |
| Assets | | | | | | | | | | | | | |
| Common Stocks | | | | | | | | | | | | | |
| Australia | | $ | 858,620 | | $ | — | | $ | — | | $ | 858,620 | |
| Canada | | | 747,162 | | | — | | | — | | | 747,162 | |
| France | | | 2,652,776 | | | — | | | — | | | 2,652,776 | |
| Germany | | | 1,560,262 | | | — | | | — | | | 1,560,262 | |
| Hong Kong | | | 1,907,653 | | | — | | | — | | | 1,907,653 | |
| Ireland | | | 557,055 | | | — | | | — | | | 557,055 | |
| Israel | | | 483,064 | | | — | | | — | | | 483,064 | |
| Italy | | | 890,847 | | | — | | | — | | | 890,847 | |
| Japan | | | 2,045,618 | | | — | | | — | | | 2,045,618 | |
| Luxembourg | | | 407,777 | | | — | | | — | | | 407,777 | |
| Netherlands | | | 2,123,643 | | | — | | | — | | | 2,123,643 | |
| Portugal | | | 559,765 | | | — | | | — | | | 559,765 | |
| Switzerland | | | 4,248,360 | | | — | | | — | | | 4,248,360 | |
| Taiwan | | | 502,914 | | | — | | | — | | | 502,914 | |
| United Kingdom | | | 11,287,080 | | | — | | | — | | | 11,287,080 | |
| United States | | | 13,236,179 | | | — | | | — | | | 13,236,179 | |
| Total Common Stocks | | | 44,068,775 | | | — | | | — | | | 44,068,775 | |
| | | | | | | | | | | | | | |
| Corporate Bonds | | | | | | | | | | | | | |
| Canada | | | — | | | 7,613 | | | — | | | 7,613 | |
| France | | | — | | | 236,250 | | | — | | | 236,250 | |
| Germany | | | — | | | 197,500 | | | — | | | 197,500 | |
| Jersey | | | — | | | 102,639 | | | — | | | 102,639 | |
| Luxembourg | | | — | | | 458,250 | | | — | | | 458,250 | |
| Netherlands | | | — | | | 197,500 | | | — | | | 197,500 | |
| Spain | | | — | | | 257,500 | | | — | | | 257,500 | |
| Switzerland | | | — | | | 213,400 | | | — | | | 213,400 | |
| United Kingdom | | | — | | | 1,038,363 | | | — | | | 1,038,363 | |
| United States | | | — | | | 2,974,948 | | | — | | | 2,974,948 | |
| Total Corporate Bonds | | | — | | | 5,683,963 | | | — | | | 5,683,963 | |
| | | | | | | | | | | | | | |
| REITs | | | | | | | | | | | | | |
| France | | | 384,043 | | | — | | | — | | | 384,043 | |
| Netherlands | | | 409,591 | | | — | | | — | | | 409,591 | |
| United States | | | 224,504 | | | — | | | — | | | 224,504 | |
| Total REITs | | | 1,018,138 | | | — | | | — | | | 1,018,138 | |
| Short-term investment | | | 2,651,739 | | | — | | | — | | | 2,651,739 | |
| Total Investments | | $ | 47,738,652 | | $ | 5,683,963 | | $ | — | | $ | 53,422,615 | |
During the year ended July 31, 2015, there were no transfers in or out of security levels.
See notes to financial statements
41
Emerging Markets Fund
July 31, 2015
| | | | | Value | |
| Shares | | | | (note 2) | |
| | | | | | |
| Common stocks – 94.35% | | | |
| | | | | | |
| | | Brazil – 8.26% | | | |
| 237,888 | | Duratex S.A. | $ | 483,564 | |
| 78,900 | | Mahle-Metal Leve S.A. | | 475,850 | |
| 34,861 | | Natura Cosmeticos S.A. | | 259,221 | |
| 18,285 | | Totvs S.A. | | 187,232 | |
| 32,810 | | Tractebel Energia S.A. | | 347,366 | |
| 41,466 | | WEG S.A. | | 227,679 | |
| | | | | 1,980,912 | |
| | | | | | |
| | | Chile – 11.04% | | | |
| 34,368 | | Antofagasta plc | | 304,314 | |
| 34,200 | | Cia Cervecerias Unidas | | | |
| | | S.A., ADR | | 721,620 | |
| 42,207 | | Empresa Nacional de | | | |
| | | Telecomunicaciones S.A. | | 434,584 | |
| 570,050 | | Inversiones Aguas | | | |
| | | Metropolitanas S.A. | | 828,610 | |
| 180,700 | | Quinenco S.A. | | 356,468 | |
| | | | | 2,645,596 | |
| | | | | | |
| | | China – 9.43% | | | |
| 1,373 | | Baidu, Inc., ADR * | | 237,062 | |
| 122,400 | | China Mengniu Dairy Co., Ltd. | | 554,978 | |
| 79,400 | | China Merchants Holdings | | | |
| | | International Co., Ltd. | | 291,388 | |
| 120,900 | | China Resources | | | |
| | | Enterprise, Ltd. | | 392,224 | |
| 106,000 | | China Resources Gas | | | |
| | | Group, Ltd. | | 324,059 | |
| 38,700 | | Minth Group, Ltd. | | 77,577 | |
| 117,800 | | Yue Yuen Industrial | | | |
| | | Holdings, Ltd. | | 383,686 | |
| | | | | 2,260,974 | |
| | | | | | |
| | | India – 14.76% | | | |
| 160,168 | | City Union Bank, Ltd. | | 252,674 | |
| 4,087 | | Cognizant Technology | | | |
| | | Solutions Corp., Class A * | | 257,890 | |
| 5,587 | | Dr Reddy’s Laboratories, Ltd. | | 356,038 | |
| 25,800 | | Housing Development | | | |
| | | Finance Corp., Ltd. | | 537,985 | |
| 222,400 | | Idea Cellular, Ltd. | | 601,107 | |
| 8,925 | | Lupin, Ltd. | | 236,362 | |
| 18,499 | | Mahindra & Mahindra, Ltd. | | 392,018 | |
| 22,377 | | Persistent Systems, Ltd. | | 232,117 | |
| 405,551 | | Tata Power Co., Ltd. | | 432,950 | |
| 28,888 | | Tech Mahindra, Ltd. | | 238,562 | |
| | | | | 3,537,703 | |
| | | | | | |
| | | Indonesia – 0.67% | | | |
| 191,100 | | Astra International Tbk PT | | 93,943 | |
| 564,400 | | Hero Supermarket Tbk PT * | | 66,965 | |
| | | | | 160,908 | |
| | | | | | |
| | | Kazakhstan – 0.00% | | | |
| 955,965 | | International Petroleum, | | | |
| | | Ltd. (a) (b) * | | — | |
| | | | | | |
| | | Korea – 3.26% | | | |
| 9,303 | | LG Corp. | | 461,115 | |
| 1,339 | | Samsung Fire & Marine | | | |
| | | Insurance Co., Ltd. | | 320,404 | |
| | | | | 781,519 | |
| | | | | | |
| | | Malaysia – 1.91% | | | |
| 275,300 | | Axiata Group Bhd | | 458,533 | |
| | | | | | |
| | | Mexico – 4.51% | | | |
| 137,400 | | Grupo Financiero Santander | | | |
| | | Mexico SAB de CV, Class B | | 245,252 | |
| 312,800 | | Grupo Herdez SAB de CV | | 836,139 | |
| | | | | 1,081,391 | |
| | | | | | |
| | | Nigeria – 3.42% | | | |
| 187,000 | | Guaranty Trust Bank plc | | 21,582 | |
| 64,400 | | Guaranty Trust Bank plc, GDR | | 386,400 | |
| 76,019 | | PZ Cussons plc | | 412,060 | |
| | | | | 820,042 | |
| | | | | | |
| | | Philippines – 2.08% | | | |
| 914,600 | | Manila Water Co., Inc. | | 498,945 | |
| | | | | | |
| | | Poland – 4.33% | | | |
| 15,269 | | Bank Pekao S.A. | | 644,220 | |
| 26,417 | | Jeronimo Martins SGPS S.A. | | 392,539 | |
| | | | | 1,036,759 | |
| | | | | | |
| | | South Africa – 13.20% | | | |
| 222,255 | | Grindrod, Ltd. | | 234,900 | |
| 76,900 | | Pick n Pay Stores, Ltd. | | 359,447 | |
| 15,660 | | SABMiller plc | | 822,804 | |
| 27,295 | | Shoprite Holdings, Ltd. | | 362,919 | |
| 54,662 | | Standard Bank Group, Ltd. | | 658,005 | |
| 32,215 | | Tiger Brands, Ltd. | | 725,473 | |
| | | | | 3,163,548 | |
See notes to financial statements
42
Emerging Markets Fund
July 31, 2015 (continued)
| | | | | Value | |
| Shares | | | | (note 2) | |
| | | | | | |
| | | Taiwan – 9.72% | | | |
| 27,000 | | Airtac International Group | $ | 124,004 | |
| 24,000 | | Asustek Computer, Inc. | | 216,651 | |
| 104,000 | | Chroma ATE, Inc. | | 210,823 | |
| 61,000 | | Delta Electronics, Inc. | | 300,445 | |
| 211,000 | | Standard Foods Corp. | | 637,582 | |
| 48,000 | | Taiwan Semiconductor | | | |
| | | Manufacturing Co., Ltd. | | 212,090 | |
| 357,000 | | Uni-President | | | |
| | | Enterprises Corp. | | 628,706 | |
| | | | | 2,330,301 | |
| | | | | | |
| | | Thailand – 1.50% | | | |
| 59,000 | | Delta Electronics Thailand pcl | | 134,757 | |
| 44,100 | | Kasikornbank pcl | | 223,346 | |
| | | | | 358,103 | |
| | | | | | |
| | | Turkey – 1.92% | | | |
| 64,136 | | Yazicilar Holding AS, Class A | | 460,578 | |
| | | | | | |
| | | United Kingdom – 4.34% | | | |
| 88,400 | | Cairn Energy plc * | | 222,813 | |
| 18,030 | | Unilever plc | | 818,511 | |
| | | | | 1,041,324 | |
| | | | | | |
| | | Total common stocks | | | |
| | | (Cost $23,929,609) | | 22,617,136 | |
| | | | | | |
| Preferred stock – 1.82% | | | |
| | | | | | |
| | | Brazil – 0.90% | | | |
| 27,162 | | Banco Bradesco S.A. | | 216,411 | |
| | | | | | |
| | | Chile – 0.92% | | | |
| 77,869 | | Embotelladora Andina S.A., | | | |
| | | Class B | | 219,955 | |
| | | | | | |
| | | Total preferred stock | | | |
| | | (Cost $445,801) | | 436,366 | |
| | | | | | |
| | | Total long-term investments | | | |
| | | (Cost $24,375,410) | | 23,053,502 | |
| | | | | | |
| Short-term investment – 4.00% | | | |
| 959,477 | | Fidelity Institutional | | | |
| | | Treasury Portfolio | | 959,477 | |
| | | | | | |
| | | Total short-term investment | | | |
| | | (Cost $959,477) | | 959,477 | |
| | | | | | |
| Total investments – 100.17% | | | |
| | | (Cost $25,334,887) | | 24,012,979 | |
| | | | | | |
| Net other assets and liabilities – (0.17%) | | (39,619 | ) |
| | | | | | |
| Total net assets – 100.00% | $ | 23,973,360 | |
| * | Non-income producing security |
| (a) | The security has been deemed illiquid by the Adviser according to the policies and procedures adopted by the Board of Trustees. |
| (b) | Fair valued at July 31, 2015 as determined in good faith using procedures approved by the Board of Trustees. |
| ADR | American Depositary Receipts |
| GDR | Global Depositary Receipts |
See notes to financial statements
43
Emerging Markets Fund
July 31, 2015 (continued)
Other information:
Currency exposure of portfolio assets before
any currency hedging, if applicable. | % of total |
| Excludes derivatives. | investments |
| Indian Rupee | 14 | % |
| British Pound | 11 | |
| US Dollar | 11 | |
| South African Rand | 10 | |
| Taiwan Dollar | 10 | |
| Brazilian Real | 9 | |
| Hong Kong Dollar | 8 | |
| Chilean Peso | 8 | |
| Mexican Peso | 4 | |
| South Korean Won | 3 | |
| Polish Zloty | 3 | |
| Albanian Lek | 2 | |
| Turkish Lira | 2 | |
| Malaysian Ringgit | 2 | |
| Euro | 1 | |
| Thai Baht | 1 | |
| Brazilian Real | 1 | |
| Indonesian Rupiah | 0 | * |
| Nigerian Naira | 0 | * |
| | 100 | % |
| * Less than 0.05% of total investments. | | |
| | | |
| Industry concentration as | % of net |
| a percentage of net assets: | assets |
| Packaged Foods & Meats | 14.11 | % |
| Diversified Banks | 11.04 | |
| Food Retail | 6.57 | |
| Brewers | 6.44 | |
| Wireless Telecommunication Services | 6.23 | |
| Water Utilities | 5.54 | |
| Industrial Conglomerates | 5.33 | |
| Household Products | 5.13 | |
| IT Consulting & Other Services | 3.04 | |
| Pharmaceuticals | 2.47 | |
| Auto Parts & Equipment | 2.31 | |
| Thrifts & Mortgage Finance | 2.24 | |
| Automobile Manufacturers | 2.03 | |
| Forest Products | 2.02 | |
| Electronic Components | 1.82 | |
| Electric Utilities | 1.81 | |
| Footwear | 1.60 | |
| Industrial Machinery | 1.47 | |
| Renewable Electricity | 1.45 | |
| Gas Utilities | 1.35 | |
| Property & Casualty Insurance | 1.34 | |
| Diversified Metals & Mining | 1.27 | |
| Marine Ports & Services | 1.22 | |
| Personal Products | 1.08 | |
| Internet Software & Services | 0.99 | |
| Marine | 0.98 | |
| Oil & Gas Exploration & Production | 0.93 | |
| Soft Drinks | 0.92 | |
| Computer Hardware | 0.90 | |
| Semiconductors | 0.88 | |
| Electronic Equipment & Instruments | 0.88 | |
| Systems Software | 0.78 | |
| Long-Term Investments | 96.17 | |
| Short-Term Investment | 4.00 | |
| Total Investments | 100.17 | |
| Net Other Assets and Liabilities | (0.17 | ) |
| | 100.00 | % |
See notes to financial statements
44
Emerging Markets Fund
July 31, 2015 (continued)
Fair Value Measurements
The following table summarizes the Fund’s investments that are measured at fair value by level within the fair value hierarchy at July 31, 2015:
| | | Quoted prices | | | Significant | | | | | | | |
| | | | in active | | | other | | | Significant | | | | |
| | | | markets for | | | observable | | | unobservable | | | | |
| | | identical assets | | | inputs | | | inputs | | | | |
| Description | | | (level 1 | ) | | (level 2 | ) | | (level 3 | ) | | Total | |
| Assets | | | | | | | | | | | | | |
| Common Stocks | | | | | | | | | | | | | |
| Brazil | | $ | 1,980,912 | | $ | — | | $ | — | | $ | 1,980,912 | |
| Chile | | | 2,645,596 | | | — | | | — | | | 2,645,596 | |
| China | | | 2,260,974 | | | — | | | — | | | 2,260,974 | |
| India | | | 3,537,703 | | | — | | | — | | | 3,537,703 | |
| Indonesia | | | 160,908 | | | — | | | — | | | 160,908 | |
| Kazakhstan | | | — | | | — | | | —* | | | — | |
| Korea | | | 781,519 | | | — | | | — | | | 781,519 | |
| Malaysia | | | 458,533 | | | — | | | — | | | 458,533 | |
| Mexico | | | 1,081,391 | | | — | | | — | | | 1,081,391 | |
| Nigeria | | | 820,042 | | | — | | | — | | | 820,042 | |
| Philippines | | | 498,945 | | | — | | | — | | | 498,945 | |
| Poland | | | 1,036,759 | | | — | | | — | | | 1,036,759 | |
| South Africa | | | 3,163,548 | | | — | | | — | | | 3,163,548 | |
| Taiwan | | | 2,330,301 | | | — | | | — | | | 2,330,301 | |
| Thailand | | | 358,103 | | | — | | | — | | | 358,103 | |
| Turkey | | | 460,578 | | | — | | | — | | | 460,578 | |
| United Kingdom | | | 1,041,324 | | | — | | | — | | | 1,041,324 | |
| Total Common Stocks | | | 22,617,136 | | | — | | | — | | | 22,617,136 | |
| | | | | | | | | | | | | | |
| Preferred Stock | | | | | | | | | | | | | |
| Brazil | | | 216,411 | | | — | | | — | | | 216,411 | |
| Chile | | | 219,955 | | | — | | | — | | | 219,955 | |
| Total Preferred Stock | | | 436,366 | | | — | | | — | | | 436,366 | |
| Short-term investment | | | 959,477 | | | — | | | — | | | 959,477 | |
| Total Investments | | $ | 24,012,979 | | $ | — | | $ | — | | $ | 24,012,979 | |
* Fund held a level 3 security that was fair valued at $0 at July 31, 2015.
On July 31, 2014, substantially all of the common stocks held by the Fund in the Asian and Australian markets were fair valued using the independent statistical fair value pricing service as described in Note 2 in accordance with the fair value pricing procedures approved by the Board, and were therefore valued using Level 2 inputs. On July 31, 2015, substantially all of the common stocks in the Fund were valued at the last reported sale price or official closing price as the Trust’s fair value pricing procedures did not require the use of the independent statistical fair value pricing service. Accordingly, using the end of the reporting period method for determining when transfers between levels are recognized, common stocks valued at $755,840 on July 31, 2015 were transferred from Level 2 to Level 1.
See notes to financial statements
45
Emerging Markets Fund
July 31, 2015 (continued)
Following is a reconciliation of investments in which significant unobservable inputs (Level 3) were used in determining fair value:
| | | | | | | | | | | | | | | | | | | | | | | | | | | | | |
| | | | Balance | | | | | | | | | Change in | | | | | | | | | | | | | | | Balance | |
| | | | as of | | | Accrued | | | | | | unrealized | | | | | | | | | Transfers | | | Transfers | | | as of | |
| | | | July 31, | | | discounts/ | | | Realized | | | appreciation | | | | | | | | | in to | | | out of | | | July 31, | |
| Investments in Securities | | | 2014 | | | premiums | | | gain/(loss | ) | | (depreciation | ) | | Purchases | | | Sales | | | level 3 | | | level 3 | | | 2015 | |
| Common Stock | | | | | | | | | | | | | | | | | | | | | | | | | | | | |
| International Petroleum, Ltd. | | $ | 0 | | $ | 0 | | $ | 0 | | $ | 0 | | $ | 0 | | $ | 0 | | $ | 0 | | $ | 0 | | $ | 0 | |
The Fund’s Adviser has determined that International Petroleum, Ltd. is a Level 3 investment due to the lack of observable inputs that may be used in the determination of fair value. The fair valuation reflects that the early-stage exploration company has been suspended from trading since October 2013 due to significant doubt about its ability to sell its Russian-based assets and its failed merger with Range Resources, Ltd.
See notes to financial statements
46
European Focus Fund
July 31, 2015
| | | | | Value | |
| Shares | | | | (note 2) | |
| | | | | | |
| Common stocks – 94.83% | | | |
| | | | | | |
| | | Canada – 1.46% | | | |
| 5,000,000 | | Africa Energy Corp. (c) * | $ | 344,076 | |
| 2,235,878 | | Africa Oil Corp. * | | 3,384,974 | |
| 574,622 | | Africa Oil Corp. (a) * | | 869,940 | |
| 10,925,000 | | Africa Oil Corp. * | | 16,551,975 | |
| 4,000,000 | | First Quantum Minerals, Ltd. | | 31,960,852 | |
| | | | | 53,111,817 | |
| | | | | | |
| | | Denmark – 6.59% | | | |
| 250,000 | | Coloplast A/S | | 18,028,360 | |
| 2,500,000 | | Danske Bank A/S | | 78,073,835 | |
| 650,000 | | Genmab A/S * | | 61,175,008 | |
| 1,400,000 | | Novo Nordisk A/S | | 82,085,697 | |
| | | | | 239,362,900 | |
| | | | | | |
| | | Finland – 4.20% | | | |
| 19,000,000 | | Nokia Oyj | | 134,173,275 | |
| 4,000,000 | | Outokumpu Oyj * | | 18,503,326 | |
| | | | | 152,676,601 | |
| | | | | | |
| | | France – 10.42% | | | |
| 907,865 | | Accor S.A. | | 44,543,802 | |
| 35,893,379 | | Alcatel-Lucent * | | 135,486,282 | |
| 2,750,000 | | Peugeot S.A. * | | 55,103,351 | |
| 781,750 | | Renault S.A. | | 71,929,939 | |
| 4,526,952 | | Rexel S.A. | | 71,369,152 | |
| | | | | 378,432,526 | |
| | | | | | |
| | | Germany – 9.59% | | | |
| 225,000 | | Continental AG | | 50,298,505 | |
| 1,400,000 | | Deutsche Annington | | | |
| | | Immobilien SE | | 43,666,444 | |
| 1,000,000 | | Fresenius SE & Co., KGaA | | 69,003,085 | |
| 1,200,000 | | KION Group AG * | | 54,752,185 | |
| 1,550,000 | | ProSiebenSat.1 Media SE | | 79,241,526 | |
| 3,000,000 | | TUI AG | | 51,628,177 | |
| | | | | 348,589,922 | |
| | | | | | |
| | | Ireland – 2.22% | | | |
| 190,000,000 | | Bank of Ireland * | | 79,919,696 | |
| 2,790,000 | | Providence Resources plc * | | 860,509 | |
| | | | | 80,780,205 | |
| | | | | | |
| | | Israel – 2.56% | | | |
| 1,350,000 | | Teva Pharmaceutical | | | |
| | | Industries, Ltd., ADR | | 93,177,000 | |
| | | | | | |
| | | Italy – 2.38% | | | |
| 14,000,000 | | Intesa Sanpaolo SpA | | 53,845,030 | |
| 5,650,000 | | Salini Impregilo SpA | | 26,979,844 | |
| 2,008,420 | | Sorin SpA * | | 5,796,707 | |
| | | | | 86,621,581 | |
| | | | | | |
| | | Netherlands – 4.30% | | | |
| 500,000 | | ASML Holding N.V. | | 49,772,717 | |
| 1,900,000 | | Koninklijke Ahold N.V. | | 37,821,005 | |
| 1,500,000 | | Nostrum Oil & Gas plc | | 12,134,027 | |
| 1,100,000 | | Sensata Technologies | | | |
| | | Holding N.V. * | | 56,452,000 | |
| | | | | 156,179,749 | |
| | | | | | |
| | | Norway – 0.13% | | | |
| 47,779,000 | | African Petroleum Corp., Ltd. * | | 1,696,272 | |
| 3,250,000 | | DNO ASA * | | 3,021,840 | |
| | | | | 4,718,112 | |
| | | | | | |
| | | Panama – 1.61% | | | |
| 1,100,000 | | Carnival Corp. | | 58,619,000 | |
| | | | | | |
| | | Russia – 0.11% | | | |
| 1,500,000 | | TCS Group Holding plc, GDR (b) | | 4,042,500 | |
| | | | | | |
| | | Spain – 5.58% | | | |
| 2,453,602 | | Atresmedia Corp de Medios | | | |
| | | de Comunicacion S.A. | | 36,809,190 | |
| 3,000,000 | | Banco Santander S.A. | | 20,704,220 | |
| 13,500,000 | | CaixaBank S.A. | | 60,180,289 | |
| 14,000,000 | | NH Hotel Group S.A. * | | 84,872,806 | |
| | | | | 202,566,505 | |
| | | | | | |
| | | Sweden – 1.20% | | | |
| 3,000,000 | | Lundin Petroleum AB * | | 43,504,216 | |
| | | | | | |
| | | Switzerland – 8.05% | | | |
| 450,000 | | Dufry AG * | | 62,449,550 | |
| 945,000 | | LafargeHolcim, Ltd. * | | 65,446,620 | |
| 3,750,000 | | OC Oerlikon Corp. AG * | | 45,987,271 | |
| 410,000 | | Roche Holding AG | | 118,421,815 | |
| | | | | 292,305,256 | |
| | | | | | |
| | | United Kingdom – 34.43% | | | |
| 4,000,000 | | AA, Ltd. * | | 22,800,102 | |
| 2,750,000 | | Amec Foster Wheeler plc | | 35,215,227 | |
| 3,500,000 | | ARM Holdings plc | | 55,040,384 | |
| 7,500,000 | | Ashmore Group plc | | 31,190,072 | |
| 6,000,000 | | Aviva plc | | 48,723,507 | |
| 30,000,000 | | Barclays plc | | 135,371,704 | |
| 8,500,000 | | BG Group plc | | 145,018,802 | |
See notes to financial statements
47
European Focus Fund
July 31, 2015 (continued)
| | | | | Value | |
| Shares | | | | (note 2) | |
| | | | | | |
| | | United Kingdom (continued) | | | |
| 2,250,000 | | CSR plc | $ | 31,553,155 | |
| 200,000 | | Drax Group plc | | 931,681 | |
| 3,000,000 | | Genel Energy plc * | | 17,404,599 | |
| 2,750,000 | | IMI plc | | 45,565,068 | |
| 13,000,000 | | Indivior plc * | | 53,555,254 | |
| 4,750,000 | | Informa plc | | 44,210,336 | |
| 3,099,994 | | Inmarsat plc | | 42,989,041 | |
| 3,200,000 | | Just Eat plc * | | 21,788,153 | |
| 12,000,000 | | Kingfisher plc | | 67,594,495 | |
| 55,000 | | Liberty Global plc LiLAC, | | | |
| | | Class A * | | 2,351,800 | |
| 1,100,000 | | Liberty Global plc, Class A * | | 57,706,000 | |
| 84,000,000 | | Lloyds Banking Group plc | | 109,140,655 | |
| 6,400,000 | | Merlin Entertainments plc | | 41,527,419 | |
| 4,350,000 | | Mytrah Energy, Ltd. (c) * | | 5,230,750 | |
| 1,650,000 | | Phoenix Group Holdings | | 21,979,455 | |
| 6,300,000 | | Royal Mail plc | | 49,683,922 | |
| 15,000,000 | | Saga plc | | 48,489,259 | |
| 9,276,000 | | Savannah Petroleum plc (c) * | | 5,758,135 | |
| 15,000,000 | | Taylor Wimpey plc | | 45,537,739 | |
| 4,000,000 | | Virgin Money Holdings UK plc * | | 26,548,064 | |
| 6,000,000 | | William Hill plc | | 37,938,746 | |
| | | | | 1,250,843,524 | |
| | | | | | |
| | | Total common stocks | | | |
| | | (Cost $3,269,261,409) | | 3,445,531,414 | |
| | | | | | |
| Preferred stock – 1.70% | | | |
| | | | | | |
| | | Italy – 1.70% | | | |
| 18,500,000 | | Intesa Sanpaolo SpA | | 61,806,249 | |
| | | | | | |
| | | Total preferred stock | | | |
| | | (Cost $52,441,990) | | 61,806,249 | |
| | | | | | |
| Warrants – —% | | | |
| | | | | | |
| | | Norway – —% | | | |
| 23,889,500 | | African Petroleum | | | |
| | | Corp., Ltd. (expires 3/16/17) (a) (c) * | | — | |
| | | | | | |
| | | Total Warrants | | | |
| | | (Cost $—) | | — | |
| | | | | | |
| | | Total long-term investments | | | |
| | | (Cost $3,321,703,399) | | 3,507,337,663 | |
| | | | | | |
| Short-term investment – 3.37% | | | |
| 122,502,268 | | Fidelity Institutional | | | |
| | | Treasury Portfolio | | 122,502,268 | |
| | | | | | |
| | | Total short-term investment | | | |
| | | (Cost $122,502,268) | | 122,502,268 | |
| | | | | | |
| Total investments – 99.90% | | | |
| | | (Cost $3,444,205,667) | | 3,629,839,931 | |
| | | | | | |
| Net other assets and liabilities – 0.10% | | 3,537,503 | |
| | | | | | |
| Total net assets – 100.00% | $ | 3,633,377,434 | |
| * | | Non-income producing security |
| (a) | | Fair valued at July 31, 2015 as determined in good faith using procedures approved by the Board of Trustees. |
| (b) | | Restricted security, purchased pursuant to Rule 144A under the Securities Act of 1933, as amended, and which is exempt from registration under that Act. At July 31, 2015, the restricted securities held by the Fund had an aggregate value of $4,042,500, which represented 0.1% of net assets. |
| (c) | | The security has been deemed illiquid by the Adviser according to the policies and procedures adopted by the Board of Trustees. |
| ADR | | American Depositary Receipts |
| GDR | | Global Depositary Receipts |
See notes to financial statements
48
European Focus Fund
July 31, 2015 (continued)
Other information:
| Currency exposure of portfolio assets before | | |
| any currency hedging, if applicable. | % of total |
| Excludes derivatives. | investments |
| Euro | 39 | % |
| British Pound | 34 | |
| US Dollar | 11 | |
| Danish Krone | 7 | |
| Swiss Franc | 6 | |
| Swedish Krona | 2 | |
| Canadian Dollar | 1 | |
| Norwegian Krone | 0 | * |
| | 100 | % |
* Less than 0.05% of total investments.
| Industry concentration as | % of net |
| a percentage of net assets: | assets |
| Diversified Banks | 16.49 | % |
| Pharmaceuticals | 9.56 | |
| Communications Equipment | 7.42 | |
| Hotels, Resorts & Cruise Lines | 6.60 | |
| Integrated Oil & Gas | 3.99 | |
| Automobile Manufacturers | 3.50 | |
| Broadcasting | 3.19 | |
| Oil & Gas Exploration & Production | 2.91 | |
| Multi-line Insurance | 2.68 | |
| Industrial Machinery | 2.52 | |
| Semiconductors | 2.38 | |
| Trading Companies & Distributors | 1.96 | |
| Health Care Services | 1.90 | |
| Home Improvement Retail | 1.86 | |
| Construction Materials | 1.80 | |
| Specialty Stores | 1.72 | |
| Biotechnology | 1.68 | |
| Cable & Satellite | 1.65 | |
| Electrical Components & Equipment | 1.55 | |
| Material Handling Machinery Manufacturing | 1.51 | |
| Tires & Rubber | 1.38 | |
| Semiconductor Equipment | 1.37 | |
| Air Freight & Logistics | 1.37 | |
| Homebuilding | 1.25 | |
| Publishing | 1.22 | |
| Real Estate Operating Companies | 1.20 | |
| Alternative Carriers | 1.18 | |
| Leisure Facilities | 1.14 | |
| Casinos & Gaming | 1.04 | |
| Food Retail | 1.04 | |
| Oil & Gas Equipment & Services | 0.97 | |
| Diversified Metals & Mining | 0.88 | |
| Asset Management & Custody Banks | 0.86 | |
| Regional Banks | 0.84 | |
| Construction & Engineering | 0.74 | |
| Diversified Support Services | 0.63 | |
| Life & Health Insurance | 0.61 | |
| Internet Software & Services | 0.60 | |
| Steel | 0.51 | |
| Health Care Supplies | 0.50 | |
| Independent Power Producers & Energy Traders | 0.17 | |
| Health Care Equipment | 0.16 | |
| Long-Term Investments | 96.53 | |
| Short-Term Investment | 3.37 | |
| Total Investments | 99.90 | |
| Net Other Assets and Liabilities | 0.10 | |
| | 100.00 | % |
See notes to financial statements
49
European Focus Fund
July 31, 2015 (continued)
Fair Value Measurements
The following table summarizes the Fund’s investments that are measured at fair value by level within the fair value hierarchy at July 31, 2015:
| | | Quoted prices | | | Significant | | | | | | | |
| | | | in active | | | other | | | Significant | | | | |
| | | | markets for | | | observable | | | unobservable | | | | |
| | | identical assets | | | inputs | | | inputs | | | | |
| Description | | | (level 1 | ) | | (level 2 | ) | | (level 3 | ) | | Total | |
| Assets | | | | | | | | | | | | | |
| | | | | | | | | | | | | | |
| Common Stocks | | | | | | | | | | | | | |
| Canada | | $ | 52,241,877 | | $ | 869,940 | | $ | — | | $ | 53,111,817 | |
| Denmark | | | 239,362,900 | | | — | | | — | | | 239,362,900 | |
| Finland | | | 152,676,601 | | | — | | | — | | | 152,676,601 | |
| France | | | 378,432,526 | | | — | | | — | | | 378,432,526 | |
| Germany | | | 348,589,922 | | | — | | | — | | | 348,589,922 | |
| Ireland | | | 80,780,205 | | | — | | | — | | | 80,780,205 | |
| Israel | | | 93,177,000 | | | — | | | — | | | 93,177,000 | |
| Italy | | | 86,621,581 | | | — | | | — | | | 86,621,581 | |
| Netherlands | | | 156,179,749 | | | — | | | — | | | 156,179,749 | |
| Norway | | | 4,718,112 | | | — | | | — | | | 3,021,840 | |
| Panama | | | 58,619,000 | | | — | | | — | | | 58,619,000 | |
| Russia | | | 4,042,500 | | | — | | | — | | | 4,042,500 | |
| Spain | | | 202,566,505 | | | — | | | — | | | 202,566,505 | |
| Sweden | | | 43,504,216 | | | — | | | — | | | 43,504,216 | |
| Switzerland | | | 292,305,256 | | | — | | | — | | | 292,305,256 | |
| United Kingdom | | | 1,250,843,524 | | | — | | | — | | | 1,250,843,524 | |
| Total common stocks | | | 3,444,661,474 | | | 869,940 | | | — | | | 3,445,531,414 | |
| | | | | | | | | | | | | | |
| Preferred stock | | | | | | | | | | | | | |
| Italy | | | 61,806,249 | | | — | | | — | | | 61,806,249 | |
| Total preferred stock | | | 61,806,249 | | | — | | | — | | | 61,806,249 | |
| | | | | | | | | | | | | | |
| Warrants | | | | | | | | | | | | | |
| Norway | | | — | | | —* | | | — | | | — | |
| Total Warrants | | | — | | | — | | | — | | | — | |
| Short-term investment | | | 122,502,268 | | | — | | | — | | | 122,502,268 | |
| Total investments | | $ | 3,628,969,991 | | | 869,940 | | | — | | $ | 3,629,839,931 | |
* Fund held a Level 2 security that was fair valued at $0 on July 31, 2015.
During the year ended July 31, 2015, there were no transfers in or out of security levels.
See notes to financial statements
50
European Focus Fund
July 31, 2015 (continued)
Fair Value of Financial Derivative Instruments
The following is a summary of the fair valuation of the Fund’s financial derivative instruments categorized by risk exposure:
Fair Values of Financial Derivative Instruments on the Statement of Assets and Liabilities as of July 31, 2015
| | | | | | | Derivatives not accounted for as hedging instruments | | |
| | | | Foreign Currency Risk | | | Equity Risk | | | Interest Rate Risk | | | Credit Risk | | | Inflation Risk | | | Total | |
| Financial Derivative Instruments – Assets | | | | | | | | | | | | | | | | |
| Over-the-Counter | | | | | | | | | | | | | | | | | | | |
| Forward Foreign Currency Contracts | | $ | — | | $ | — | | $ | — | | $ | — | | $ | — | | $ | — | |
| Total | | $ | — | | $ | — | | $ | — | | $ | — | | $ | — | | $ | — | |
| | | | | | | | | | | | | | | | | | | | |
| Financial Derivative Instruments – Liabilities | | | | | | | | | | | | | | | | |
| Over-the-Counter | | | | | | | | | | | | | | | | | | | |
| Forward Foreign Currency Contracts | | $ | — | | $ | — | | $ | — | | $ | — | | $ | — | | $ | — | |
| Total | | $ | — | | $ | — | | $ | — | | $ | — | | $ | — | | $ | — | |
| Net | | $ | — | | $ | — | | $ | — | | $ | — | | $ | — | | $ | — | |
Effect of Financial Derivative Instruments on the Statement of Operations for the Year Ended July 31, 2015
| | | | | | | Derivatives not accounted for as hedging instruments | | | | |
| | | | Foreign Currency Risk | | | Equity Risk | | | Interest Rate Risk | | | Credit Risk | | | Inflation Risk | | | Total | |
Net realized gain/(loss) from financial derivative instruments: | | | | | | | | | | | | | | | | | | | |
| Forward Foreign Currency Contracts | | $ | 72,361,140 | | $ | — | | $ | — | | $ | — | | $ | — | | $ | 72,361,140 | |
| Total | | $ | 72,361,140 | | $ | — | | $ | — | | $ | — | | $ | — | | $ | 72,361,140 | |
| | | | | | | | | | | | | | | | | | | | |
Net change in unrealized appreciation/(depreciation) of financial derivative instruments | | | | | | | | | | | | | | | | | | | |
| Forward Foreign Currency Contracts | | $ | (14,730,450 | ) | $ | — | | $ | — | | $ | — | | $ | — | | $ | (14,730,450 | ) |
| Total | | $ | (14,730,450 | ) | $ | — | | $ | — | | $ | — | | $ | — | | $ | (14,730,450 | ) |
See notes to financial statements
51
Global Equity Income Fund
July 31, 2015
| | | | | Value |
| Shares | | | | (note 2) |
| | | | |
| Common stocks – 90.90% | | | |
| | | | | | |
| | | Australia – 9.40% | | | |
| 3,676,452 | | Amcor, Ltd. | $ | 38,724,020 | |
| 1,584,688 | | Australia & New Zealand Banking Group, Ltd. | | 37,854,139 | |
| 38,930,533 | | DUET Group | | 62,603,784 | |
| 2,171,357 | | National Australia Bank, Ltd. | | 55,185,309 | |
| 2,591,610 | | Premier Investments, Ltd. | | 25,270,453 | |
| 3,767,719 | | Sonic Healthcare, Ltd. | | 56,925,458 | |
| 6,868,677 | | Suncorp Group, Ltd. | | 71,644,791 | |
| | | | | 348,207,954 | |
| | | | | | |
| | | Canada – 1.02% | | | |
| 451,221 | | Bank of Montreal | | 25,178,812 | |
| 833,849 | | Crescent Point Energy Corp. | | 12,630,308 | |
| | | | | 37,809,120 | |
| | | | | | |
| | | China – 0.45% | | | |
| 13,410,000 | | Jiangsu Expressway Co., | | | |
| | | Ltd., Class H | | 16,796,447 | |
| | | | | | |
| | | France – 6.03% | | | |
| 137,688 | | Casino Guichard | | | |
| | | Perrachon S.A. | | 10,223,709 | |
| 1,702,313 | | Lagardere SCA | | 50,880,246 | |
| 155,500 | | Neopost S.A. | | 6,251,328 | |
| 2,224,126 | | Orange S.A. | | 36,480,943 | |
| 2,444,665 | | Rexel S.A. | | 38,541,091 | |
| 664,348 | | Sanofi | | 71,480,929 | |
| 506,550 | | Suez Environnement Co. | | 9,710,545 | |
| | | | | 223,568,791 | |
| | | | | | |
| | | Germany – 4.35% | | | |
| 1,759,338 | | Deutsche Post AG | | 53,173,979 | |
| 579,486 | | HUGO BOSS AG | | 69,879,009 | |
| 6,140,514 | | Telefonica Deutschland | | | |
| | | Holding AG | | 38,136,320 | |
| | | | | 161,189,308 | |
| | | | | | |
| | | Hong Kong – 1.95% | | | |
| 13,000,000 | | HKT Trust and HKT, Ltd., | | | |
| | | Class SS | | 15,830,141 | |
| 9,894,000 | | Shanghai Industrial | | | |
| | | Holdings, Ltd. | | 29,162,687 | |
| 23,433,000 | | SJM Holdings, Ltd. | | 27,325,351 | |
| | | | | 72,318,179 | |
| | | | | | |
| | | Israel – 0.92% | | | |
| 18,464,761 | | Bezeq The Israeli | | | |
| | | Telecommunication Corp, Ltd. | | 34,046,552 | |
| | | Italy – 1.88% | | | |
| 7,895,601 | | Enel SpA | | 37,165,399 | |
| 1,865,033 | | ENI SpA | | 32,690,447 | |
| | | | | 69,855,846 | |
| | | | | | |
| | | Korea – 1.41% | | | |
| 2,171,988 | | SK Telecom Co., Ltd., ADR | | 52,105,992 | |
| | | | | | |
| | | Luxembourg – 0.96% | | | |
| 340,472 | | RTL Group S.A. | | 31,031,918 | |
| 50,000 | | RTL Group S.A. | | 4,548,954 | |
| | | | | 35,580,872 | |
| | | | | | |
| | | Malaysia – 0.54% | | | |
| 8,254,800 | | Malayan Banking Bhd | | 19,857,278 | |
| | | | | | |
| | | Netherlands – 1.42% | | | |
| 833,249 | | Delta Lloyd N.V. | | 14,792,853 | |
| 874,475 | | Eurocommercial Properties N.V. | | 37,738,631 | |
| | | | | 52,531,484 | |
| | | | | | |
| | | New Zealand – 1.81% | | | |
| 5,000,000 | | Fletcher Building, Ltd. | | 26,139,960 | |
| 20,753,506 | | Spark New Zealand, Ltd. | | 40,806,684 | |
| | | | | 66,946,644 | |
| | | | | | |
| | | Singapore – 1.85% | | | |
| 23,029,500 | | Singapore | | | |
| | | Telecommunications, Ltd. | | 68,659,587 | |
| | | | | | |
| | | Spain – 0.95% | | | |
| 440,441 | | Red Electrica Corp., S.A. | | 35,199,911 | |
| | | | | | |
| | | Switzerland – 0.09% | | | |
| 5,667 | | Swisscom AG | | 3,295,927 | |
| | | | | | |
| | | Taiwan – 1.95% | | | |
| 2,056,000 | | MediaTek, Inc. | | 21,620,512 | |
| 2,295,967 | | Taiwan Semiconductor | | | |
| | | Manufacturing Co., Ltd., ADR | | 50,763,831 | |
| | | | | 72,384,343 | |
| | | | | | |
| | | Thailand – 1.09% | | | |
| 17,353,600 | | Intouch Holdings pcl | | 40,251,292 | |
| | | | | | |
| | | United Kingdom – 40.73% | | | |
| 6,347,749 | | Amlin plc | | 50,605,700 | |
| 1,516,402 | | AstraZeneca plc | | 102,301,509 | |
| 146,747 | | Berkeley Group Holdings plc | | 7,720,656 | |
See notes to financial statements
52
Global Equity Income Fund
July 31, 2015 (continued)
| | | | | Value |
| Shares | | | | (note 2) |
| | | | | | |
| | | United Kingdom (continued) | | | |
| 1,686,090 | | BHP Billiton plc | $ | 31,136,217 | |
| 11,810,297 | | BP plc | | 72,935,060 | |
| 2,050,289 | | British American Tobacco plc | | 121,701,770 | |
| 10,182,198 | | BT Group plc | | 73,852,372 | |
| 2,000,000 | | Compass Group plc | | 32,013,842 | |
| 10,645,272 | | Connect Group plc (a) | | 24,645,374 | |
| 2,242,371 | | De La Rue plc | | 17,701,602 | |
| 3,198,956 | | Diageo plc | | 89,397,199 | |
| 1,082,499 | | Galliford Try plc | | 30,006,117 | |
| 4,051,420 | | Greene King plc | | 54,664,446 | |
| 8,113,600 | | HSBC Holdings plc | | 72,948,405 | |
| 677,723 | | Imperial Tobacco Group plc | | 35,614,039 | |
| 5,226,589 | | Investec plc | | 47,789,137 | |
| 17,708,599 | | Legal & General Group plc | | 72,095,669 | |
| 5,219,294 | | National Grid plc | | 69,533,749 | |
| 2,344,192 | | Pearson plc | | 44,039,537 | |
| 2,890,925 | | Phoenix Group Holdings | | 38,509,670 | |
| 909,775 | | Rio Tinto plc | | 35,326,971 | |
| 2,660,116 | | Royal Dutch Shell plc, A Shares | | 76,484,189 | |
| 3,839,582 | | Royal Mail plc | | 30,280,237 | |
| 3,310,451 | | SSE plc | | 78,321,995 | |
| 3,963,752 | | Standard Life plc | | 28,127,345 | |
| 2,320,169 | | Tate & Lyle plc | | 19,746,952 | |
| 20,811,397 | | Taylor Wimpey plc | | 63,180,264 | |
| 5,050,400 | | Tullett Prebon plc | | 31,981,629 | |
| 14,959,283 | | Vodafone Group plc | | 56,499,007 | |
| | | | | 1,509,160,659 | |
| | | | | | |
| | | United States – 12.10% | | | |
| 1,841,086 | | Ares Capital Corp. | | 29,623,074 | |
| 1,076,418 | | Cisco Systems, Inc. | | 30,591,800 | |
| 563,138 | | Kohl’s Corp. | | 34,531,622 | |
| 183,082 | | Lockheed Martin Corp. | | 37,916,282 | |
| 940,399 | | Microsoft Corp. | | 43,916,633 | |
| 2,155,668 | | Pfizer, Inc. | | 77,733,388 | |
| 883,251 | | Reynolds American, Inc. | | 75,774,103 | |
| 1,006,054 | | Six Flags Entertainment Corp. | | 46,922,359 | |
| 1,528,539 | | Verizon Communications, Inc. | | 71,520,340 | |
| | | | | 448,529,601 | |
| | | | | | |
| | | Total common stocks | | | |
| | | (Cost $3,430,502,785) | | 3,368,295,787 | |
| | | | |
| Partnerships – 0.99% | | | |
| | | | | | |
| | | United States – 0.99% | | | |
| 3,182,918 | | Och-Ziff Capital Management | | | |
| | | Group LLC, Class A | | 36,890,019 | |
| | | | | | |
| | | Total partnerships | | | |
| | | (Cost $40,482,224) | | 36,890,019 | |
| REITs – 4.88% | | | |
| | | | | | |
| | | France – 2.49% | | | |
| 613,177 | | ICADE | | 45,469,454 | |
| 175,770 | | Unibail-Rodamco SE | | 46,773,473 | |
| | | | | 92,242,927 | |
| | | | | | |
| | | Singapore – 1.27% | | | |
| 26,672,700 | | Ascendas Real Estate | | | |
| | | Investment Trust | | 47,051,743 | |
| | | | | | |
| | | United Kingdom – 0.64% | | | |
| 3,403,644 | | Segro plc | | 23,855,082 | |
| | | | | | |
| | | United States – 0.48% | | | |
| 589,134 | | Iron Mountain, Inc. | | 17,703,477 | |
| | | | | | |
| | | Total REITs | | | |
| | | (Cost $179,861,917) | | 180,853,229 | |
| | | | |
| Investment companies – 0.48% | | | |
| | | | | | |
| | | Thailand – 0.48% | | | |
| 49,043,900 | | TRUE Telecommunication | | | |
| | | Growth Infrastructure Fund | | 17,672,224 | |
| | | | | | |
| | | Total investment companies | | | |
| | | (Cost $17,809,015) | | 17,672,224 | |
| | | | | | |
| | | Total long-term investments | | | |
| | | (Cost $3,668,655,941) | | 3,603,711,259 | |
| | | | |
| Short-term investment – 3.11% | | | |
| 115,260,135 | | Fidelity Institutional Treasury | | | |
| | | Portfolio | | 115,260,135 | |
| | | Total short-term investment | | | |
| | | (Cost $115,260,135) | | 115,260,135 | |
| | | | |
| Total investments – 100.36% | | | |
| | | (Cost $3,783,916,076) | | 3,718,971,394 | |
| | | | |
| Financial Derivative Instruments(b) | | | |
| (Cost or Premiums, net $0) – 0.11% | | 4,210,443 | |
| | | | |
| Net other assets and liabilities – (0.47%) | | (17,535,638 | ) |
| | | | |
| Total net assets – 100.00% | $ | 3,705,646,199 | |
| (a) | | This security has been deemed illiquid by the Adviser in accordance to the policies and procedures adopted by the Board of Trustees. |
| (b) | | Information with respect to financial derivative instruments is disclosed in the following tables. |
| ADR | | American Depositary Receipts |
| REIT | | Real Estate Investment Trust |
See notes to financial statements
53
Global Equity Income Fund
July 31, 2015 (continued)
(b) FINANCIAL DERIVATIVE INSTRUMENTS
OVER-THE-COUNTER FINANCIAL DERIVATIVE INSTRUMENTS
FORWARD FOREIGN CURRENCY CONTRACTS
| | | | | | | Value | | | Local amount | | | Current notional | | | Unrealized appreciation/ (depreciation) | |
| | | | Counterparty | | | date | | | | ) | | value | | | Asset | | | Liability | |
| Australian | | | State Street Bank | | | | | | | | | | | | | | | | |
| Dollar (Short) | | | and Trust Company | | | 10/08/15 | | | 59,000 | | $ | 42,977,588 | | $ | 1,145,857 | | $ | — | |
| Australian | | | | | | | | | | | | | | | | | | | |
| Dollar (Short) | | | Citibank, N.A. | | | 10/08/15 | | | 181,000 | | | 131,846,498 | | | 3,692,152 | | | — | |
| British Pound (Short) | | | JP Morgan | | | | | | | | | | | | | | | | |
| | | | Chase Bank, N.A. | | | 10/08/15 | | | 67,000 | | | 104,583,774 | | | — | | | (162,485 | ) |
| British Pound (Short) | | | Citibank, N.A. | | | 10/08/15 | | | 200,373 | | | 312,772,332 | | | — | | | (465,081 | ) |
| Total | | | | | | | | | | | | | | $ | 4,838,009 | | $ | (627,566 | ) |
During the year ended July 31, 2015, average monthly notional value related to forward foreign currency contracts was approximately $563.5 million, or 15.2% of net assets.
FINANCIAL DERIVATIVE INSTRUMENTS: OVER-THE-COUNTER SUMMARY
The following is a summary by counterparty of the value of over-the-counter financial derivative instruments and collateral (received)/pledged as of July 31, 2015.
| | | Financial Derivative Assets | | Financial Derivative Liabilities | | | | | | | | | |
| | | Unrealized Appreciation | | | | | Unrealized Depreciation | | | | | | | | | | | | | |
| | | | Foreign Currency Contracts | | | Total Over-the- Counter | | | Foreign Currency Contracts | | | Total Over-the- Counter | | | Net Value of OTC Derivatives | | | Collateral (Received) / Pledged | | | Net Exposure(1) | |
| Amounts subject to a master netting or similar agreement: | | | | | | | |
| | | | | | | | | | | | | | | | | | | | | | | |
| Citibank, N.A. | | $ | 3,692,152 | | $ | 3,692,152 | | $ | (465,081 | ) | $ | (465,081 | ) | $ | 3,227,071 | | $ | — | | $ | 3,227,071 | |
| JP Morgan | | | | | | | | | | | | | | | | | | | | | | |
| Chase Bank, N.A. | | | — | | | | | | (162,485 | ) | | (162,485 | ) | | (162,485 | ) | | — | | | (162,485 | ) |
| | | $ | 3,692,152 | | $ | 3,692,152 | | $ | (627,566 | ) | $ | (627,566 | ) | $ | 3,064,586 | | $ | — | | $ | 3,064,586 | |
| Amounts NOT subject to a master netting or similar agreement: | | | | | | | | | | | | | |
| | | | | | | | | | | | | | | | | | | | | | | |
| State Street Bank | | | | | | | | | | | | | | | | | | | | | | |
and Trust Company(2) | | $ | 1,145,857 | | $ | 1,145,857 | | $ | — | | | — | | | | | | | | | | |
| | | $ | 1,145,857 | | $ | 1,145,857 | | | — | | $ | — | | | | | | | | | | |
| Total Over- | | | | | | | | | | | | | | | | | | | | | | |
| the-Counter | | $ | 4,838,009 | | $ | 4,838,009 | | $ | (627,566 | ) | $ | (627,566 | ) | | | | | | | | | |
| (1) | | Net Exposure represents the net receivable/(payable) that would be due from/to the counterparty in the event of default. Exposure from over-the-counter financial derivative instruments can only be netted across transactions governed under the same master |
| | | agreement with the same master agreement with the same legal entity. See Note 2, Significant Accounting Policies, “Derivative instruments,” in the Notes to Financial Statements for more information regarding master netting arrangements. |
| (2) | | Forward foreign currency contracts with State Street Bank and Trust Company are not subject to a legally enforceable master netting arrangement or other similar agreements that provide legally enforceable right of offset. |
| | | Cost or Premiums, Net | | | Asset | | | Liability | |
| TOTAL FINANCIAL DERIVATIVE INSTRUMENTS | | $ | — | | $ | 4,838,009 | | $ | (627,566 | ) |
See notes to financial statements
54
Global Equity Income Fund
July 31, 2015 (continued)
Other information:
Currency exposure of portfolio assets beforeany currency hedging, if applicable.Excludes derivatives. | % of total investments |
| British Pound | 37 | % |
| Euro | 20 | |
| US Dollar | 19 | |
| Australian Dollar | 10 | |
| Hong Kong Dollar | 4 | |
| Singapore Dollar | 3 | |
| Thai Baht | 2 | |
| Canadian Dollar | 1 | |
| New Israeli Sheqel | 1 | |
| New Zealand Dollar | 1 | |
| Taiwan Dollar | 1 | |
| Malaysian Ringgit | 1 | |
| Swiss Franc | 0 | * |
| | 100 | % |
* Less than 0.05% of total investments.
Industry concentration asa percentage of net assets: | % of net assets |
| Integrated Telecommunication Services | 10.81 | % |
| Pharmaceuticals | 6.79 | |
| Tobacco | 6.29 | |
| Diversified Banks | 5.69 | |
| Integrated Oil & Gas | 4.91 | |
| Life & Health Insurance | 4.14 | |
| Electric Utilities | 4.07 | |
| Wireless Telecommunication Services | 4.02 | |
| Multi-Utilities | 3.83 | |
| Property & Casualty Insurance | 3.30 | |
| Publishing | 2.56 | |
| Distillers & Vintners | 2.41 | |
| Restaurants | 2.34 | |
| Retail REITs | 2.28 | |
| Air Freight & Logistics | 2.25 | |
| Semiconductors | 1.95 | |
| Industrial REIT’s | 1.91 | |
| Homebuilding | 1.91 | |
| Apparel, Accessories & Luxury Goods | 1.89 | |
| Asset Management & Custody Banks | 1.79 | |
| Diversified Metals & Mining | 1.79 | |
| Health Care Services | 1.54 | |
| Diversified Capital Markets | 1.29 | |
| Leisure Facilities | 1.27 | |
| Diversified REITs | 1.23 | |
| Systems Software | 1.18 | |
| Paper Packaging | 1.04 | |
| Trading Companies & Distributors | 1.04 | |
| Aerospace & Defense | 1.02 | |
| Broadcasting | 0.96 | |
| Department Stores | 0.93 | |
| Investment Banking & Brokerage | 0.86 | |
| Communications Equipment | 0.83 | |
| Construction & Engineering | 0.81 | |
| Industrial Conglomerates | 0.79 | |
| Casinos & Gaming | 0.74 | |
| Construction Materials | 0.71 | |
| Apparel Retail | 0.68 | |
| Distributors | 0.67 | |
| Packaged Foods & Meats | 0.53 | |
| Specialized REITs | 0.48 | |
| Commercial Printing | 0.48 | |
| Highways & Railtracks | 0.45 | |
| Oil & Gas Exploration & Production | 0.34 | |
| Food Retail | 0.28 | |
| Office Electronics | 0.17 | |
| Long-Term Investments | 97.25 | |
| Short-Term Investment | 3.11 | |
| Total Investments | 100.36 | |
| Financial Derivative Instruments | 0.11 | |
| Net Other Assets and Liabilities | (0.47 | ) |
| | 100.00 | % |
See notes to financial statements
55
Global Equity Income Fund
July 31, 2015 (continued)
Fair Value Measurements
The following table summarizes the Fund’s investments that are measured at fair value by level within the fair value hierarchy at July 31, 2015:
| Description | | | Quoted prices in active markets for identical assets (level 1 | ) | | Significant other observable inputs (level 2 | ) | | Significant unobservable inputs (level 3 | ) | | Total | |
| Assets | | | | | | | | | | | | | |
| Common Stocks | | | | | | | | | | | | | |
| Australia | | $ | 348,207,954 | | $ | — | | $ | — | | $ | 348,207,954 | |
| Canada | | | 37,809,120 | | | — | | | — | | | 37,809,120 | |
| China | | | 16,796,447 | | | — | | | — | | | 16,796,447 | |
| France | | | 223,568,791 | | | — | | | — | | | 223,568,791 | |
| Germany | | | 161,189,308 | | | — | | | — | | | 161,189,308 | |
| Hong Kong | | | 72,318,179 | | | — | | | — | | | 72,318,179 | |
| Israel | | | 34,046,552 | | | — | | | — | | | 34,046,552 | |
| Italy | | | 69,855,846 | | | — | | | — | | | 69,855,846 | |
| Korea | | | 52,105,992 | | | — | | | — | | | 52,105,992 | |
| Luxembourg | | | 35,580,872 | | | — | | | — | | | 35,580,872 | |
| Malaysia | | | 19,857,278 | | | — | | | — | | | 19,857,278 | |
| Netherlands | | | 52,531,484 | | | — | | | — | | | 52,531,484 | |
| New Zealand | | | 66,946,644 | | | — | | | — | | | 66,946,644 | |
| Singapore | | | 68,659,587 | | | — | | | — | | | 68,659,587 | |
| Spain | | | 35,199,911 | | | — | | | — | | | 35,199,911 | |
| Switzerland | | | 3,295,927 | | | — | | | — | | | 3,295,927 | |
| Taiwan | | | 72,384,343 | | | — | | | — | | | 72,384,343 | |
| Thailand | | | 40,251,292 | | | — | | | — | | | 40,251,292 | |
| United Kingdom | | | 1,509,160,659 | | | — | | | — | | | 1,509,160,659 | |
| United States | | | 448,529,601 | | | — | | | — | | | 448,529,601 | |
| Total common stocks | | | 3,368,295,787 | | | — | | | — | | | 3,368,295,787 | |
| Partnerships | | | | | | | | | | | | | |
| United States | | | 36,890,019 | | | — | | | — | | | 36,890,019 | |
| Total partnerships | | | 36,890,019 | | | — | | | — | | | 36,890,019 | |
| REITs | | | | | | | | | | | | | |
| France | | | 92,242,927 | | | — | | | — | | | 92,242,927 | |
| Singapore | | | 47,051,743 | | | — | | | — | | | 47,051,743 | |
| United Kingdom | | | 23,855,082 | | | — | | | — | | | 23,855,082 | |
| United States | | | 17,703,477 | | | — | | | — | | | 17,703,477 | |
| Total REITs | | | 180,853,229 | | | — | | | — | | | 180,853,229 | |
| Investment companies | | | | | | | | | | | | | |
| Thailand | | | 17,672,224 | | | — | | | — | | | 17,672,224 | |
| Total investment companies | | | 17,672,224 | | | — | | | — | | | 17,672,224 | |
| Short-term investment | | | 115,260,135 | | | — | | | — | | | 115,260,135 | |
| Total investments | | $ | 3,718,971,394 | | $ | — | | $ | — | | $ | 3,718,971,394 | |
| Financial Derivative Instruments – Assets | | | | | | | | | | | | | |
| Over-the-counter | | | — | | $ | 4,838,009 | | | — | | $ | 4,838,009 | |
| Total Financial Derivative Instruments – Assets | | | — | | $ | 4,838,009 | | | — | | $ | 4,838,009 | |
| Financial Derivative Instruments – Liabilities | | | | | | | | | | | | | |
| Over-the-counter | | | — | | $ | (627,566 | ) | | — | | $ | (627,566 | ) |
| Total Financial Derivative Instruments – Liabilities | | | — | | $ | (627,566 | ) | | — | | $ | (627,566 | ) |
During the year ended July 31, 2015, there were no transfers in or out of security levels.
See notes to financial statements
56
Global Equity Income Fund
July 31, 2015 (continued)
Fair Value of Financial Derivative Instruments
The following is a summary of the fair valuation of the Fund’s financial derivative instruments categorized by risk exposure:
Fair Values of Financial Derivative Instruments on the Statement of Assets and Liabilities as of July 31, 2015
| | | | | | | Derivatives not accounted for as hedging instruments | | | | |
| | | | Foreign Currency Risk | | | Equity Risk | | | Interest Rate Risk | | | Credit Risk | | | Inflation Risk | | | Total | |
| | | | | | | | | | | | | | | | | | | | |
| Financial Derivative Instruments – Assets | | | | | | | | | | | | | | | | | | | |
| Over-the-Counter | | | | | | | | | | | | | | | | | | | |
| Forward Foreign Currency Contracts | | $ | 4,838,009 | | $ | — | | $ | — | | $ | — | | $ | — | | $ | 4,838,009 | |
| Total | | $ | 4,838,009 | | $ | — | | $ | — | | $ | — | | $ | — | | $ | 4,838,009 | |
| | | | | | | | | | | | | | | | | | | | |
| Financial Derivative Instruments – Liabilities | | | | | | | | | | | | | | | | | | | |
| Over-the-Counter | | | | | | | | | | | | | | | | | | | |
| Forward Foreign Currency Contracts | | $ | (627,566 | ) | $ | — | | $ | — | | $ | — | | $ | — | | $ | (627,566 | ) |
| Total | | $ | (627,566 | ) | $ | — | | $ | — | | $ | — | | $ | — | | $ | (627,566 | ) |
| | | | | | | | | | | | | | | | | | | | |
| Net | | $ | 4,210,443 | | $ | — | | $ | — | | $ | — | | $ | — | | $ | 4,210,443 | |
Effect of Financial Derivative Instruments on the Statement of Operations for the Year Ended July 31, 2015
| | | | | | | Derivatives not accounted for as hedging instruments | | | |
| | | | Foreign Currency Risk | | | Equity Risk | | | Interest Rate Risk | | | Credit Risk | | | Inflation Risk | | | Total | |
| | | | | | | | | | | | | | | | | | | | |
Net realized gain/(loss) from financial derivative instruments: | | | | | | | | | | | | | | | | | | | |
| Forward Foreign Currency Contracts | | $ | 55,885,815 | | $ | — | | $ | — | | $ | — | | $ | — | | $ | 55,885,815 | |
| Total | | $ | 55,885,815 | | $ | — | | $ | — | | $ | — | | $ | — | | $ | 55,885,815 | |
| | | | | | | | | | | | | | | | | | | | |
Net change in unrealized appreciation/(depreciation) of financial derivative instruments | | | | | | | | | | | | | | | | | | | |
| Forward Foreign Currency Contracts | | $ | 2,253,013 | | $ | — | | $ | — | | $ | — | | $ | — | | $ | 2,253,013 | |
| Total | | $ | 2,253,013 | | $ | — | | $ | — | | $ | — | | $ | — | | $ | 2,253,013 | |
See notes to financial statements
57
Global Technology Fund
July 31, 2015
| | | | | Value |
| Shares | | | | (note 2) |
| | | | |
| Common stocks – 98.81% | | | |
| | | | | | |
| | | China – 9.19% | | | |
| 28,267 | | Baidu, Inc., ADR * | $ | 4,880,580 | |
| 45,836 | | NetEase.com, Inc., ADR | | 6,354,245 | |
| 358,500 | | Tencent Holdings, Ltd. | | 6,677,683 | |
| 188,089 | | Vipshop Holdings, Ltd. ADR * | | 3,665,854 | |
| 72,900 | | YY, Inc., ADR * | | 4,309,119 | |
| | | | | 25,887,481 | |
| | | | | | |
| | | Finland – 0.50% | | | |
| 200,228 | | Nokia Oyj | | 1,413,960 | |
| | | | | | |
| | | France – 1.30% | | | |
| 43,815 | | Criteo S.A., ADR * | | 2,332,272 | |
| 81,349 | | Orange S.A. | | 1,334,317 | |
| | | | | 3,666,589 | |
| | | | | | |
| | | Germany – 0.60% | | | |
| 46,641 | | Siltronic AG * | | 1,685,253 | |
| | | | | | |
| | | Israel – 1.22% | | | |
| 42,457 | | Check Point Software | | | |
| | | Technologies, Ltd. * | | 3,429,252 | |
| | | | | | |
| | | Italy – 0.26% | | | |
| 559,216 | | Telecom Italia SpA * | | 740,062 | |
| | | | | | |
| | | Japan – 0.86% | | | |
| 76,800 | | Alps Electric Co., Ltd. | | 2,426,046 | |
| | | | | | |
| | | Korea – 3.73% | | | |
| 4,462 | | Samsung Electronics Co., Ltd. | | 4,518,626 | |
| 147,273 | | SK Hynix, Inc. | | 4,669,340 | |
| 127,374 | | Wonik IPS Co., Ltd. * | | 1,333,446 | |
| | | | | 10,521,412 | |
| | | | | | |
| | | Netherlands – 3.21% | | | |
| 49,092 | | ASM International N.V. | | 2,209,719 | |
| 70,448 | | NXP Semiconductor N.V. * | | 6,832,752 | |
| | | | | 9,042,471 | |
| | | | | | |
| | | Singapore – 2.75% | | | |
| 61,993 | | Avago Technologies, Ltd. | | 7,757,804 | |
| | | | | | |
| | | Switzerland – 1.34% | | | |
| 61,787 | | TE Connectivity, Ltd. | | 3,764,064 | |
| | | Taiwan – 1.64% | | | |
| 157,000 | | Catcher Technology Co., Ltd. | | 1,730,548 | |
| 275,000 | | MediaTek, Inc. | | 2,891,849 | |
| | | | | 4,622,397 | |
| | | | | | |
| | | United Kingdom – 3.56% | | | |
| 227,110 | | BT Group plc | | 1,647,249 | |
| 532,806 | | Just Eat plc * | | 3,627,768 | |
| 83,745 | | Rightmove plc | | 4,765,639 | |
| | | | | 10,040,656 | |
| | | | | | |
| | | United States – 68.65% | | | |
| 215,440 | | Activision Blizzard, Inc. | | 5,556,198 | |
| 10,971 | | Amazon.com, Inc. * | | 5,882,102 | |
| 187,484 | | Apple, Inc. | | 22,741,809 | |
| 271,016 | | Applied Materials, Inc. | | 4,704,838 | |
| 34,885 | | Arrow Electronics, Inc. * | | 2,028,563 | |
| 78,418 | | Broadcom Corp., Class A | | 3,968,735 | |
| 86,309 | | CDW Corp. | | 3,101,082 | |
| 124,038 | | Ciena Corp. * | | 3,156,767 | |
| 365,051 | | Cisco Systems, Inc. | | 10,374,749 | |
| 61,607 | | Cognex Corp. | | 2,788,949 | |
| 95,480 | | Cognizant Technology | | | |
| | | Solutions Corp., Class A * | | 6,024,788 | |
| 43,053 | | EPAM Systems, Inc. * | | 3,190,658 | |
| 31,825 | | F5 Networks, Inc. * | | 4,269,005 | |
| 126,428 | | Facebook, Inc., Class A * | | 11,885,496 | |
| 69,870 | | Fidelity National Information | | | |
| | | Services, Inc. | | 4,571,594 | |
| 18,662 | | FleetCor Technologies, Inc. * | | 2,889,251 | |
| 17,901 | | Google, Inc., Class A * | | 11,769,907 | |
| 22,488 | | Google, Inc., Class C * | | 14,068,718 | |
| 45,529 | | Juniper Networks, Inc. | | 1,293,934 | |
| 63,056 | | Lam Research Corp. | | 4,847,115 | |
| 8,434 | | LinkedIn Corp., Class A * | | 1,714,295 | |
| 83,156 | | MasterCard, Inc., Class A | | 8,099,394 | |
| 166,007 | | Mentor Graphics Corp. | | 4,331,123 | |
| 224,707 | | Micron Technology, Inc. * | | 4,159,327 | |
| 38,504 | | Netflix, Inc. * | | 4,401,392 | |
| 19,855 | | Palo Alto Networks, Inc. * | | 3,689,655 | |
| 59,935 | | Red Hat, Inc. * | | 4,739,660 | |
| 50,628 | | SanDisk Corp. | | 3,052,362 | |
| 4,188 | | The Priceline Group, Inc. * | | 5,208,071 | |
| 30,725 | | Towers Watson & Co., Class A | | 3,895,316 | |
| 125,476 | | Visa, Inc., A Shares | | 9,453,362 | |
| 207,617 | | Web.com Group, Inc. * | | 5,167,587 | |
| 45,521 | | Western Digital Corp. | | 3,917,537 | |
| 24,682 | | WEX, Inc. * | | 2,518,551 | |
| | | | | 193,461,890 | |
| | | | | | |
| | | Total common stocks | | | |
| | | (Cost $200,599,717) | | 278,459,337 | |
| | | | | | |
| | | Total long-term investments | | | |
| | | (Cost $200,599,717) | | 278,459,337 | |
See notes to financial statements
58
Global Technology Fund
July 31, 2015 (continued)
| | | | | Value |
| Shares | | | | (note 2) |
| | | | |
| Short-term investment – 1.66% | | | |
| 4,671,462 | | Fidelity Institutional | | | |
| | | Treasury Portfolio | $ | 4,671,462 | |
| | | Total short-term investment | | | |
| | | (Cost $4,671,462) | | 4,671,462 | |
| Total investments – 100.47% | | | |
| | | (Cost $205,271,179) | | 283,130,799 | |
| Net other assets and liabilities – (0.47%) | | (1,330,364 | ) |
| Total net assets – 100.00% | $ | 281,800,435 | |
| * | | Non-income producing security |
| ADR | | American Depositary Receipts |
Other information:
Currency exposure of portfolio assets beforeany currency hedging, if applicable.Excludes derivatives. | % of total investments |
| US Dollar | 85 | % |
| Korean Won | 4 | |
| British Pound | 3 | |
| Euro | 3 | |
| Hong Kong Dollar | 2 | |
| Taiwan Dollar | 2 | |
| Japanese Yen | 1 | |
| | 100 | % |
Industry concentration as a percentage of net assets: | % of net assets |
| Internet Software & Services | 25.83 | % |
| Semiconductors | 10.74 | |
| Data Processing & Outsourced Services | 9.77 | |
| Communications Equipment | 8.59 | |
| Computer Hardware | 8.07 | |
| Internet Retail | 6.80 | |
| Semiconductor Equipment | 5.24 | |
| IT Consulting & Other Services | 3.27 | |
| Systems Software | 2.90 | |
| Computer Storage & Peripherals | 2.47 | |
| Technology Hardware, Storage & Peripherals | 2.22 | |
| Home Entertainment Software | 1.97 | |
| Technology Distributors | 1.82 | |
| Publishing | 1.69 | |
| Application Software | 1.54 | |
| Human Resource & Employment Services | 1.38 | |
| Electronic Manufacturing Services | 1.34 | |
| Integrated Telecommunication Services | 1.32 | |
| Electronic Equipment & Instruments | 0.99 | |
| Electronic Components | 0.86 | |
| Long-Term Investments | 98.81 | |
| Short-Term Investment | 1.66 | |
| Total Investments | 100.47 | |
| Net Other Assets and Liabilities | (0.47 | ) |
| | 100.00 | % |
See notes to financial statements
59
Global Technology Fund
July 31, 2015 (continued)
Fair Value Measurements
The following table summarizes the Fund’s investments that are measured at fair value by level within the fair value hierarchy at July 31, 2015:
| Description | | | Quoted prices in active markets for identical assets (level 1 | ) | | Significant other observable inputs (level 2 | ) | | Significant unobservable inputs (level 3 | ) | | Total | |
| Assets | | | | | | | | | | | | | |
| | | | | | | | | | | | | | |
| Common Stocks | | | | | | | | | | | | | |
| China | | $ | 25,887,481 | | $ | — | | $ | — | | $ | 25,887,481 | |
| Finland | | | 1,413,960 | | | — | | | — | | | 1,413,960 | |
| France | | | 3,666,589 | | | — | | | — | | | 3,666,589 | |
| Germany | | | 1,685,253 | | | — | | | — | | | 1,685,253 | |
| Israel | | | 3,429,252 | | | — | | | — | | | 3,429,252 | |
| Italy | | | 740,062 | | | — | | | — | | | 740,062 | |
| Japan | | | 2,426,046 | | | — | | | — | | | 2,426,046 | |
| Korea | | | 10,521,412 | | | — | | | — | | | 10,521,412 | |
| Netherlands | | | 9,042,471 | | | — | | | — | | | 9,042,471 | |
| Singapore | | | 7,757,804 | | | — | | | — | | | 7,757,804 | |
| Switzerland | | | 3,764,064 | | | — | | | — | | | 3,764,064 | |
| Taiwan | | | 4,622,397 | | | — | | | — | | | 4,622,397 | |
| United Kingdom | | | 10,040,656 | | | — | | | — | | | 10,040,656 | |
| United States | | | 193,461,890 | | | — | | | — | | | 193,461,890 | |
| Total Common Stocks | | | 278,459,337 | | | — | | | — | | | 278,459,337 | |
| Short-Term Investment | | | 4,671,462 | | | — | | | — | | | 4,671,462 | |
| Total Investments | | $ | 283,130,799 | | $ | — | | $ | — | | $ | 283,130,799 | |
During the year ended July 31, 2015, there were no transfers in or out of security levels.
See notes to financial statements
60
High Yield Opportunities Fund
July 31, 2015
Face amount | | | Coupon | | Maturity | | Value (note 2) | |
| | | | | | | |
| Bank Loans(a) (b) – 1.86% | | | | | | |
| | | | | | | | | | |
| | | | United States – 1.86% | | | | | | |
| USD | 500,000 | | Koppers, Inc. Term Loan A | 3.250% | | 8/15/19 | $ | 470,000 | |
| | | | | | | | | | |
| | | | Total bank loans | | | | | | |
| | | | (Cost $472,003) | | | | | 470,000 | |
| | | | | | | |
| Corporate bonds – 89.00% | | | | | | |
| | | | | | | | | | |
| | | | Canada – 3.89% | | | | | | |
| USD | 275,000 | | Baytex Energy Corp. (c) | 5.625% | | 6/1/24 | | 237,875 | |
| USD | 250,000 | | Garda World Security Corp. (c) | 7.250% | | 11/15/21 | | 235,000 | |
| USD | 275,000 | | Masonite International Corp. (c) | 5.625% | | 3/15/23 | | 284,625 | |
| USD | 250,000 | | New Gold, Inc. (c) | 6.250% | | 11/15/22 | | 223,750 | |
| | | | | | | | | 981,250 | |
| | | | | | | | | | |
| | | | Luxembourg – 3.04% | | | | | | |
| USD | 269,000 | | ConvaTec Finance International S.A. (c) | 8.250% | | 1/15/19 | | 266,647 | |
| USD | 291,000 | | Intelsat Luxembourg S.A. | 7.750% | | 6/1/21 | | 232,436 | |
| USD | 250,000 | | Wind Acquisition Finance S.A. (c) | 7.375% | | 4/23/21 | | 265,625 | |
| | | | | | | | | 764,708 | |
| | | | | | | | | | |
| | | | Netherlands – 2.10% | | | | | | |
| USD | 275,000 | | Playa Resorts Holding B.V. (c) | 8.000% | | 8/15/20 | | 286,688 | |
| USD | 250,000 | | UPCB Finance IV, Ltd. (c) | 5.375% | | 1/15/25 | | 243,125 | |
| | | | | | | | | 529,813 | |
| | | | | | | | | | |
| | | | Puerto Rico – 1.05% | | | | | | |
| USD | 275,000 | | Popular, Inc. | 7.000% | | 7/1/19 | | 265,031 | |
| | | | | | | | | | |
| | | | Sweden – 1.36% | | | | | | |
| USD | 325,000 | | Perstorp Holding AB (c) | 11.000% | | 8/15/17 | | 342,875 | |
| | | | | | | | | | |
| | | | United Kingdom – 1.24% | | | | | | |
| USD | 315,000 | | International Game Technology plc (c) | 6.250% | | 2/15/22 | | 311,456 | |
| | | | | | | | | | |
| | | | United States – 76.32% | | | | | | |
| USD | 265,000 | | Alere, Inc. (c) (d) | 6.375% | | 7/1/23 | | 276,262 | |
| USD | 535,000 | | Argos Merger Sub, Inc. (c) | 7.125% | | 3/15/23 | | 567,100 | |
| USD | 400,000 | | Blue Racer Midstream LLC (c) | 6.125% | | 11/15/22 | | 409,000 | |
| USD | 400,000 | | BlueLine Rental Finance Corp. (c) | 7.000% | | 2/1/19 | | 400,000 | |
| USD | 235,000 | | Cable One, Inc. (c) | 5.750% | | 6/15/22 | | 240,875 | |
| USD | 275,000 | | Calpine Corp. (d) | 5.750% | | 1/15/25 | | 269,156 | |
| USD | 500,000 | | CCO Holdings LLC (c) | 5.875% | | 5/1/27 | | 496,562 | |
| USD | 275,000 | | Century Intermediate Holding Co. 2 (c) | 9.750% | | 2/15/19 | | 287,719 | |
| USD | 250,000 | | CenturyLink, Inc. | 5.800% | | 3/15/22 | | 243,750 | |
| USD | 380,000 | | Chesapeake Energy Corp. | 5.750% | | 3/15/23 | | 323,000 | |
See notes to financial statements
61
High Yield Opportunities Fund
July 31, 2015 (continued)
Face
amount | | | Coupon | | Maturity | | Value
(note 2) | |
| | | | | | | | | | |
| | | | United States (continued) | | | | | | |
| USD | 235,000 | | CHS/Community Health Systems, Inc. | 6.875% | | 2/1/22 | $ | 252,038 | |
| USD | 250,000 | | CommScope Technologies Finance LLC (c) | 6.000% | | 6/15/25 | | 247,500 | |
| USD | 300,000 | | CONSOL Energy, Inc. (c) | 8.000% | | 4/1/23 | | 249,750 | |
| USD | 235,000 | | Dean Foods Co. (c) | 6.500% | | 3/15/23 | | 241,169 | |
| USD | 395,000 | | Diamond Foods, Inc. (c) | 7.000% | | 3/15/19 | | 404,875 | |
| USD | 500,000 | | Digicel Group, Ltd. (c) (d) | 8.250% | | 9/30/20 | | 496,250 | |
| USD | 250,000 | | DISH DBS Corp. | 5.875% | | 11/15/24 | | 243,125 | |
| USD | 275,000 | | E*TRADE Financial Corp. | 5.375% | | 11/15/22 | | 287,375 | |
| USD | 285,000 | | Eco Services Operations LLC (c) | 8.500% | | 11/1/22 | | 284,287 | |
| USD | 245,000 | | EP Energy LLC (c) | 6.375% | | 6/15/23 | | 229,994 | |
| USD | 285,000 | | ESH Hospitality, Inc. (c) | 5.250% | | 5/1/25 | | 278,944 | |
| USD | 250,000 | | Frontier Communications Corp. | 8.500% | | 4/15/20 | | 259,375 | |
| USD | 250,000 | | GCI, Inc. | 6.875% | | 4/15/25 | | 255,625 | |
| USD | 400,000 | | Genworth Holdings, Inc. (e) | 6.150% | | 11/15/66 | | 239,000 | |
| USD | 125,000 | | Halcon Resources Corp. (c) | 8.625% | | 2/1/20 | | 119,844 | |
| USD | 275,000 | | Hexion, Inc. | 6.625% | | 4/15/20 | | 253,344 | |
| USD | 250,000 | | Hot Topic, Inc. (c) | 9.250% | | 6/15/21 | | 257,500 | |
| USD | 265,000 | | HUB International, Ltd. (c) | 7.875% | | 10/1/21 | | 271,294 | |
| USD | 875,000 | | ILFC E-Capital Trust II (c) (e) | 6.250% | | 12/21/65 | | 861,875 | |
| USD | 550,000 | | Infor Software Parent LLC/Infor Software Parent, Inc. (c) | 7.125% | | 5/1/21 | | 542,437 | |
| USD | 250,000 | | j2 Global, Inc. | 8.000% | | 8/1/20 | | 270,313 | |
| USD | 250,000 | | Kindred Healthcare, Inc. (c) | 8.750% | | 1/15/23 | | 276,562 | |
| USD | 440,000 | | KLX, Inc. (c) | 5.875% | | 12/1/22 | | 444,400 | |
| USD | 275,000 | | MarkWest Energy Partners LP | 4.875% | | 12/1/24 | | 269,500 | |
| USD | 275,000 | | Midas Intermediate Holdco II LLC (c) | 7.875% | | 10/1/22 | | 276,375 | |
| USD | 275,000 | | Multi-Color Corp. (c) | 6.125% | | 12/1/22 | | 281,875 | |
| USD | 300,000 | | NeuStar, Inc. | 4.500% | | 1/15/23 | | 256,500 | |
| USD | 275,000 | | Nexstar Broadcasting, Inc. (c) | 6.125% | | 2/15/22 | | 282,562 | |
| USD | 250,000 | | Parsley Energy LLC (c) | 7.500% | | 2/15/22 | | 251,875 | |
| USD | 272,000 | | Penn Virginia Corp. | 8.500% | | 5/1/20 | | 129,200 | |
| USD | 250,000 | | Pinnacle Operating Corp. (c) | 9.000% | | 11/15/20 | | 249,375 | |
| USD | 275,000 | | Plastipak Holdings, Inc. (c) | 6.500% | | 10/1/21 | | 277,750 | |
| USD | 250,000 | | Platform Specialty Products Corp. (c) | 6.500% | | 2/1/22 | | 260,000 | |
| USD | 555,000 | | Post Holdings, Inc. (c) | 6.000% | | 12/15/22 | | 540,431 | |
| USD | 500,000 | | RCN Telecom Services LLC (c) | 8.500% | | 8/15/20 | | 524,375 | |
| USD | 270,000 | | RHP Hotel Properties LP (c) | 5.000% | | 4/15/23 | | 270,000 | |
| USD | 275,000 | | Rice Energy, Inc. (c) | 7.250% | | 5/1/23 | | 271,563 | |
| USD | 250,000 | | Rite Aid Corp. | 6.750% | | 6/15/21 | | 266,250 | |
| USD | 250,000 | | Sophia Holding Finance LP (c) | 9.625% | | 12/1/18 | | 253,438 | |
| USD | 275,000 | | Sprint Corp. | 7.125% | | 6/15/24 | | 252,313 | |
| USD | 200,000 | | SS&C Technologies Holdings, Inc. (c) | 5.875% | | 7/15/23 | | 207,500 | |
| USD | 285,000 | | Steel Dynamics, Inc. | 5.125% | | 10/1/21 | | 285,712 | |
| USD | 275,000 | | SunCoke Energy Partners LP (c) | 7.375% | | 2/1/20 | | 270,875 | |
| USD | 275,000 | | Sunoco LP (c) | 6.375% | | 4/1/23 | | 283,937 | |
| USD | 250,000 | | Talen Energy Supply LLC (c) | 6.500% | | 6/1/25 | | 245,313 | |
| USD | 385,000 | | Tenet Healthcare Corp. | 8.125% | | 4/1/22 | | 432,886 | |
| USD | 250,000 | | TMS International Corp. (c) | 7.625% | | 10/15/21 | | 243,617 | |
| USD | 375,000 | | TransDigm, Inc. | 6.000% | | 7/15/22 | | 375,937 | |
| USD | 310,000 | | Tribune Media Co. (c) | 5.875% | | 7/15/22 | | 320,850 | |
| USD | 265,000 | | West Corp. (c) | 5.375% | | 7/15/22 | | 252,744 | |
See notes to financial statements
62
High Yield Opportunities Fund
July 31, 2015 (continued)
Face
amount | | | Coupon | | Maturity | | Value
(note 2) | |
| | | | | | | | | | |
| | | | United States (continued) | | | | | | |
| USD | 370,000 | | XPO Logistics, Inc. (c) | 6.500% | | 6/15/22 | $ | 364,912 | |
| USD | 240,000 | | Zebra Technologies Corp. (c) | 7.250% | | 10/15/22 | | 263,400 | |
| | | | | | | | | 19,241,365 | |
| | | | | | | | | | |
| | | | Total corporate bonds | | | | | | |
| | | | (Cost $22,721,943) | | | | | 22,436,498 | |
| | | | | | | | | | |
| | | | Total long-term investments | | | | | | |
| | | | (Cost $23,193,946) | | | | $ | 22,906,498 | |
| Shares | | | | | |
| | | | | | |
| Short-term investment – 7.85% | | | |
| 1,979,897 | | Fidelity Institutional Treasury | | | |
| | | Portfolio (d) | | 1,979,897 | |
| | | | | | |
| | | Total short-term investment | | | |
| | | (Cost $1,979,897) | | 1,979,897 | |
| | | | |
| Total investments – 98.71% | | | |
| | | (Cost $25,173,843) | | 24,886,395 | |
| | | | |
| Financial Derivative Instruments, net(f) | | | |
(Cost or Premiums, net $23,807) – 0.10% | | 24,236 | |
| Net other assets and liabilities – 1.19% | | 300,107 | |
| | | | |
| Total net assets – 100.00% | $ | 25,210,738 | |
| (a) | | Bank loan interests are, at present, not readily marketable, not registered under the Securities Act of 1933, as amended, and may be subject to contractual and legal restrictions on sale. Bank loan interests in the Fund’s portfolio generally have variable rates that adjust to a base, such as the London Inter-Bank Offered Rate (“LIBOR”), on set dates, typically every 30 days but not greater than one year; and/or have interest rates that float at a margin above a widely recognized base lending rate such as the Prime Rate of a designated U.S. bank. |
| (b) | | Bank loan interests often require prepayments from excess cash flow or permit the borrower to repay at its election. The degree to which borrowers repay, whether as a contractual requirement or at their election, cannot be predicted with accuracy. As a result, the actual remaining maturity may be substantially less than the stated maturities shown. |
| (c) | | Restricted security, purchased pursuant to Rule 144A under the Securities Act of 1933, as amended, and which is exempt from registration under that Act. At July 31, 2015, the restricted securities held by the Fund had an aggregate value of $16,774,632, which represented 66.5% of net assets. |
| (d) | | This investment was segregated for open swap contracts and delayed delivery purchases at July 31, 2015. |
| (e) | | Variable or floating rate interest rate security. Includes fixed-to-floating rate corporate bond securities that currently pay a fixed coupon that will move to a floating rate coupon if the bond is not redeemed at the call date. Rate presented represents rate at July 31, 2015. |
| (f) | | Information with respect to financial derivative instruments is disclosed in the following tables. |
See notes to financial statements
63
High Yield Opportunities Fund
July 31, 2015 (continued)
(f) FINANCIAL DERIVATIVE INSTRUMENTS
OVER-THE-COUNTER FINANCIAL DERIVATIVE INSTRUMENTS
CREDIT DEFAULT SWAP CONTRACTS
| | | Reference | | | Rates received/ | | Termination | | Implied credit | | | Notional | | | Upfront premiums paid/ | | Unrealized appreciation/ | | | Value | |
| Counterparty | | entity | | | (paid | ) | | date | | | spread | | amount (000s | ) | | (received | ) | (depreciation | ) | | Asset | | | Liability | |
| Protection sold: | | | | | | | | | | | | | | | | | | | | | | | | | | | | |
| JP Morgan Chase | | | | | | | | | | | | | | | | | | | | | | | | | | | | |
| Bank, N.A. | | Delta Airlines, Inc. | | 5.00 | % | | 9/20/20 | | | 2.91 | % | $ | 250 | | $ | 23,807 | | $ | 429 | | $ | 24,236 | | $ | — | |
| | | | Cost or Premiums, net | | | Asset | | | Liability | |
| TOTAL SWAP CONTRACTS | | $ | 23,807 | | $ | 24,236 | | $ | — | |
During the year ended July 31, 2015, average notional value related to swap contracts, including both centrally-cleared and over-the-counter, was approximately $433,450, or 1.7% of net assets.
FINANCIAL DERIVATIVE INSTRUMENTS: OVER-THE-COUNTER SUMMARY
The following is a summary by counterparty of the value of over-the-counter financial derivative instruments and collateral (received)/pledged as of July 31, 2015.
| | | | Financial Derivative Assets | | Financial Derivative Liabilities | | | | | | | | | |
| | | | Value(1) | | | | | | Value(1) | | | | | | | | | | | | | |
| | | | Swap Contracts | | | Total Over-the- Counter | | | Swap Contracts | | | Total Over-the- Counter | | | Net Value of OTC Derivatives | | | Collateral (Received) / Pledged | | | Net Exposure(2) | |
| Amounts subject to a master netting or similar agreement: | | | | | | | | | | | | | | | | | | | |
| JP Morgan | | | | | | | | | | | | | | | | | | | | | | |
| Chase Bank, N.A. | | $ | 24,236 | | $ | 24,236 | | $ | — | | $ | — | | $ | 24,236 | | $ | — | | $ | 24,236 | |
| (1) | | Value on swap contracts is represented by “value” on credit default swaps, which is inclusive of upfront premiums paid/(received). |
| (2) | | Net Exposure represents the net receivable/(payable) that would be due from/to the counterparty in the event of default. Exposure from over-the-counter financial derivative instruments can only be netted across transactions governed under the same master agreement with the same legal entity. See Note 2, Significant Accounting Policies, “Derivative instruments,” in the Notes to Financial Statements for more information regarding master netting arrangements. |
| | | Cost or Premiums, net | | | Asset | | | Liability | |
| TOTAL FINANCIAL DERIVATIVE INSTRUMENTS | | $ | 23,807 | | $ | 24,236 | | $ | — | |
See notes to financial statements
64
High Yield Opportunities Fund
July 31, 2015 (continued)
Other information:
| Industry concentration as | % of net |
| a percentage of net assets: | assets |
| Oil & Gas Exploration & Production | 7.82 | % |
| Cable TV | 5.97 | |
| Telecommunication Services | 5.05 | |
| Chemicals - Diversified | 4.00 | |
| Finance-Leasing Company | 3.42 | |
| Aerospace/Defense-Equipment | 3.25 | |
| Cellular Telecommunications | 2.97 | |
| Medical-Hospitals | 2.72 | |
| Specified Purpose Acquisition | 2.25 | |
| REITS-Hotels | 2.18 | |
| Enterprise Software/Services | 2.15 | |
| Food-Flour & Grain | 2.14 | |
| Coal | 2.06 | |
| Telephone-Integrated | 1.99 | |
| Food-Miscellaneous/Diversified | 1.61 | |
| Machinery-Construction & Mining | 1.59 | |
| Transport-Services | 1.45 | |
| Chemicals - Other | 1.36 | |
| Television | 1.27 | |
| Gambling (Non-Hotel) | 1.23 | |
| Consumer Products - Miscellaneous | 1.14 | |
| Finance - Investment Banking & Brokerage | 1.14 | |
| Hotels & Motels | 1.14 | |
| Building Products-Doors & Windows | 1.13 | |
| Oil & Gas Refining & Marketing | 1.13 | |
| Steel-Producers | 1.13 | |
| Broadcast Services/Programs | 1.12 | |
| Printing-Commercial | 1.12 | |
| Auto Repair Centers | 1.10 | |
| Containers-Paper/Plastic | 1.10 | |
| Diagnostic Kits | 1.10 | |
| Medical-Nursing Homes | 1.10 | |
| Insurance Brokers | 1.08 | |
| Computer Services | 1.07 | |
| Independent Power Producer | 1.07 | |
| Pipelines | 1.07 | |
| Disposable Medical Products | 1.06 | |
| Retail-Drug Store | 1.06 | |
| Commercial Banks-Southern US | 1.05 | |
| Machinery-General Industrials | 1.04 | |
| Chemicals - Specialty | 1.03 | |
| Retail - Apparel/Shoe | 1.02 | |
| Commercial Banks Non-US | 1.00 | |
| Agricultural Operations | 0.99 | |
| Telecommunication Equipment | 0.98 | |
| Commercial Services | 0.97 | |
| Electric-Integrated | 0.97 | |
| Food-Dairy Products | 0.96 | |
| Multi-line Insurance | 0.95 | |
| Security Services | 0.93 | |
| Satellite Telecommunications | 0.92 | |
| Gold Mining | 0.89 | |
| Computer Software | 0.82 | |
| Long-Term Investments | 90.86 | |
| Short-Term Investment | 7.85 | |
| Total Investments | 98.71 | |
| Financial Derivative Instruments | 0.10 | |
| Net Other Assets and Liabilities | 1.19 | |
| | 100.00 | % |
| Currency exposure of portfolio assets before | |
| any currency hedging, if applicable. | % of total |
| Excludes derivatives. | investments |
| US Dollar | 100 | % |
See notes to financial statements
65
High Yield Opportunities Fund
July 31, 2015 (continued)
Fair Value Measurements
The following table summarizes the Fund’s investments that are measured at fair value by level within the fair value hierarchy at July 31, 2015:
| Description | | | Quoted prices in active markets for identical assets (level 1 | ) | | Significant other observable inputs (level 2 | ) | | Significant unobservable inputs (level 3 | ) | | Total | |
| Assets | | | | | | | | | | | | | |
| | | | | | | | | | | | | | |
| Bank Loans | | | | | | | | | | | | | |
| United States | | $ | — | | $ | 470,000 | | $ | — | | $ | 470,000 | |
| Total Bank Loans | | | — | | | 470,000 | | | — | | | 470,000 | |
| | | | | | | | | | | | | | |
| Corporate Bonds | | | | | | | | | | | | | |
| Canada | | | — | | | 981,250 | | | — | | | 981,250 | |
| Luxembourg | | | — | | | 764,708 | | | — | | | 764,708 | |
| Netherlands | | | — | | | 529,813 | | | — | | | 529,813 | |
| Puerto Rico | | | — | | | 265,031 | | | — | | | 265,031 | |
| Sweden | | | — | | | 342,875 | | | — | | | 342,875 | |
| United Kingdom | | | — | | | 311,456 | | | — | | | 311,456 | |
| United States | | | — | | | 19,241,365 | | | — | | | 19,241,365 | |
| Total Corporate Bonds | | | — | | | 22,436,498 | | | — | | | 22,436,498 | |
| Short-term investment | | | 1,979,897 | | | — | | | — | | | 1,979,897 | |
| Total Investments | | $ | 1,979,897 | | $ | 22,906,498 | | $ | — | | $ | 24,886,395 | |
| | | | | | | | | | | | | | |
| Financial Derivative Instruments - Assets | | | | | | | | | | | | | |
| Over-the-counter | | | — | | | 24,236 | | | — | | | 24,236 | |
| Total Financial Derivative Instruments - Assets | | $ | — | | $ | 24,236 | | $ | — | | $ | 24,236 | |
During the year ended July 31, 2015, there were no transfers in or out of security levels.
See notes to financial statements
66
High Yield Opportunities Fund
July 31, 2015 (continued)
Fair Value of Financial Derivative Instruments
The following is a summary of the fair valuation of the Fund’s financial derivative instruments categorized by risk exposure:
Fair Values of Financial Derivative Instruments on the Statement of Assets and Liabilities as of July 31, 2015
| | | | | | | Derivatives not accounted for as hedging instruments | | | |
| | | | Foreign Currency Risk | | | Equity Risk | | | Interest Rate Risk | | | Credit Risk | | | Inflation Risk | | | Total | |
| Financial Derivative Instruments – Assets | | | | | | | | | | | | | | | | | | | |
| Over-the-Counter | | | | | | | | | | | | | | | | | | | |
| Swap Contracts | | $ | — | | $ | — | | $ | — | | $ | 24,236 | | $ | — | | $ | 24,236 | |
| Total | | $ | — | | $ | — | | $ | — | | $ | 24,236 | | $ | — | | $ | 24,236 | |
| Financial Derivative Instruments – Liabilities | | | | | | | | | | | | | | | | |
| Over-the-Counter | | | | | | | | | | | | | | | | | | | |
| Swap Contracts | | $ | — | | $ | — | | $ | — | | $ | — | | $ | — | | $ | — | |
| Total | | $ | — | | $ | — | | $ | — | | $ | — | | $ | — | | $ | — | |
| Net | | $ | — | | $ | — | | $ | — | | $ | 24,236 | | $ | — | | $ | 24,236 | |
Effect of Financial Derivative Instruments on the Statement of Operations for the Year Ended July 31, 2015
| | | | | | | Derivatives not accounted for as hedging instruments | | | | |
| | | | Foreign Currency Risk | | | Equity Risk | | | Interest Rate Risk | | | Credit Risk | | | Inflation Risk | | | Total | |
| Net realized gain/(loss) from financial derivative instruments: | | | | | | | | | | | | | | | | | | | |
| Swap Contracts | | $ | — | | $ | — | | $ | — | | $ | 10,151 | | $ | — | | $ | 10,151 | |
| Total | | $ | — | | $ | — | | $ | — | | $ | 10,151 | | $ | — | | $ | 10,151 | |
| | | | | | Derivatives not accounted for as hedging instruments | |
| | | | Foreign Currency Risk | | | Equity Risk | | | Interest Rate Risk | | | Credit Risk | | | Inflation Risk | | | Total | |
| Net change in unrealized appreciation/(depreciation) of financial derivative instruments | | | | | | | | | | | | | | | | | | | |
| Swap Contracts | | $ | — | | $ | — | | $ | — | | $ | 3,134 | | $ | — | | $ | 3,134 | |
| Total | | $ | — | | $ | — | | $ | — | | $ | 3,134 | | $ | — | | $ | 3,134 | |
See notes to financial statements
67
International Long/Short Equity Fund
July 31, 2015
| | | | | Value |
| Shares | | | | (note 2) |
| | | | |
| Common stocks – 54.30% | | | |
| | | | | | |
| | | Australia – 3.46% | | | |
| 4,500,000 | | African Petroleum Corp., Ltd. * | $ | 159,761 | |
| 800 | | CSL, Ltd. | | 57,868 | |
| | | | | 217,629 | |
| | | Canada – 2.18% | | | |
| 17,132 | | First Quantum Minerals, Ltd. (a) | | 136,888 | |
| | | | | | |
| | | China – 2.69% | | | |
| 325 | | Baidu, Inc., ADR (a) * | | 56,114 | |
| 38,000 | | Dongfeng Motor Group Co., | | | |
| | | Ltd., Class H | | 43,724 | |
| 3,700 | | Tencent Holdings, Ltd. | | 68,919 | |
| | | | | 168,757 | |
| | | Germany – 6.68% | | | |
| 7,223 | | Deutsche Annington | | | |
| | | Immobilien SE (a) | | 225,288 | |
| 3,800 | | ProSiebenSat.1 Media SE (a) | | 194,269 | |
| | | | | 419,557 | |
| | | Hong Kong – 3.74% | | | |
| 11,000 | | AIA Group, Ltd. | | 71,798 | |
| 7,500 | | Cheung Kong Property | | | |
| | | Holdings, Ltd. * | | 62,498 | |
| 20,000 | | China Resources Land, Ltd. | | 56,241 | |
| 3,000 | | CK Hutchison Holdings, Ltd. | | 44,542 | |
| | | | | 235,079 | |
| | | India – 1.16% | | | |
| 616 | | HDFC Bank, Ltd., ADR | | 38,481 | |
| 1,160 | | Tata Motors, Ltd., ADR | | 34,406 | |
| | | | | 72,887 | |
| | | Japan – 24.21% | | | |
| 3,000 | | Ajinomoto Co., Inc. (a) | | 69,036 | |
| 17,000 | | Asahi Kasei Corp. (a) | | 129,240 | |
| 1,400 | | East Japan Railway Co. (a) | | 138,379 | |
| 2,000 | | Electric Power Development | | | |
| | | Co., Ltd. (a) | | 69,149 | |
| 500 | | Fanuc, Ltd. | | 83,431 | |
| 13,000 | | Fujitsu, Ltd. (a) | | 68,244 | |
| 5,900 | | Hino Motors, Ltd. (a) | | 76,502 | |
| 12,000 | | Hitachi, Ltd. (a) | | 77,886 | |
| 5,000 | | NH Foods, Ltd. (a) | | 121,636 | |
| 1,900 | | Nippon Telegraph and | | | |
| | | Telephone Corp. (a) | | 73,028 | |
| 900 | | NTT Data Corp. | | 43,063 | |
| 1,200 | | Shin-Etsu Chemical Co., Ltd. | | 71,815 | |
| 3,200 | | Sumitomo Mitsui Financial | | | |
| | | Group, Inc. (a) | | 143,146 | |
| 45,000 | | Taiheiyo Cement Corp. (a) | | 148,505 | |
| 1,800 | | Tokio Marine Holdings, Inc. (a) | | 75,015 | |
| 2,000 | | Toyota Motor Corp. (a) | | 133,183 | |
| | | | | 1,521,258 | |
| | | Korea – 0.84% | | | |
| 52 | | Samsung Electronics Co., Ltd. | | 52,660 | |
| | | Spain – 2.63% | | | |
| 16,000 | | Fomento de Construcciones y | | | |
| | | Contratas S.A. (a) * | | 164,983 | |
| | | Switzerland – 4.60% | | | |
| 1,000 | | Roche Holding AG (a) | | 288,834 | |
| | | Taiwan – 1.12% | | | |
| 16,000 | | Taiwan Semiconductor | | | |
| | | Manufacturing Co., Ltd. | | 70,697 | |
| | | United Kingdom – 0.99% | | | |
| 5,406 | | Clinigen Group plc | | 62,431 | |
| | | | | | |
| | | Total common stocks | | | |
| | | (Cost $3,455,419) | | 3,411,660 | |
| | | | |
| Warrants – —% | | | |
| | | | | | |
| | | Norway – —% | | | |
| 2,250,000 | | African Petroleum Corp., Ltd. | | | |
| | | (expires 3/16/17) * (b) (c) | | — | |
| | | Total Warrants | | | |
| | | (Cost $0) | | — | |
| | | Total long-term investments | | | |
| | | (Cost $3,455,419) | | 3,411,660 | |
See notes to financial statements
68
International Long/Short Equity Fund
July 31, 2015 (continued)
| | | | | Value |
| Shares | | | | (note 2) |
| | | | |
| Short-term investment – 53.88% | | | |
| 3,385,039 | | Fidelity Institutional | | | |
| | | Treasury Portfolio | $ | 3,385,039 | |
| | | | | | |
| | | Total short-term investment | | | |
| | | (Cost $3,385,039) | | 3,385,039 | |
| | | | | | |
| Total investments – 108.18%(d) | | | |
| | | (Cost $6,840,458) | | 6,796,699 | |
| | | | | | |
| | | Securities sold short(e) – (19.49)% | | | |
| | | (Proceeds $1,250,365) | | (1,224,711 | ) |
| | | | |
| Financial Derivative Instruments, net(f) – 2.46% | | | |
| (Cost or Premiums, net $0) | | 154,786 | |
| | | | |
| Net other assets and liabilities – 8.85% | | 555,974 | |
| | | | | | |
| Total net assets – 100.00% | $ | 6,282,748 | |
| * | | Non-income producing security |
| (a) | | All or a portion of the security is pledged as collateral for securities sold short. |
| (b) | | The security has been deemed illiquid by the Adviser according to the policies and procedures adopted by the Board of Trustees. |
| (c) | | Fair valued at July 31, 2015 as determined in good faith using procedures approved by the Board of Trustees. |
| (d) | | All or a portion of these securities and short-term investments were segregated for open futures contracts, securities sold short and swap contracts. |
| (e) | | The portfolio of securities sold short is disclosed below. |
| (f) | | Information with respect to financial derivative instruments is disclosed in the tables following the portfolio of securities sold short. |
| ADR | | American Depositary Receipts |
| | | | | Value |
| Shares | | | | (note 2) |
| | | | |
| Securities Sold Short – (19.49)% | | | |
| | | | | | |
| | | Australia – (0.69)% | | | |
| (1,400) | | Wesfarmers, Ltd. | $ | (43,440) | |
| | | | | | |
| | | Finland – (2.10)% | | | |
| (7,500) | | Fortum Oyj | | (131,790) | |
| | | | | | |
| | | Italy – (0.55)% | | | |
| (7,500) | | Prada SpA | | (34,538) | |
| | | | | | |
| | | Japan – (5.59)% | | | |
| (1,000) | | Daikin Industries, Ltd. | | (64,711) | |
| (59,000) | | Nippon Steel & Sumitomo | | | |
| | | Metal Corp. | | (139,532) | |
| (3,000) | | Shiseido Co., Ltd. | | (72,631) | |
| (13,000) | | Sumitomo Chemical Co., Ltd. | | (74,265) | |
| | | | | (351,139) | |
| | | Netherlands – (2.99)% | | | |
| (21,000) | | CNH Industrial N.V. | | (187,966) | |
| | | | | | |
| | | Sweden – (4.94)% | | | |
| (8,500) | | ICA Gruppen AB | | (310,175) | |
| | | | | | |
| | | Switzerland – (2.63)% | | | |
| (1,200) | | Kuehne & Nagel | | | |
| | | International AG | | (165,663) | |
| | | | | | |
| Total Securities Sold Short | | | |
| (Cost $(1,250,365)) | $ | (1,224,711) | |
See notes to financial statements
69
International Long/Short Equity Fund
July 31, 2015 (continued)
(f) FINANCIAL DERIVATIVE INSTRUMENTS
EXCHANGE-TRADED OR CENTRALLY-CLEARED FINANCIAL DERIVATIVE INSTRUMENTS
FUTURES CONTRACTS
| | | Number of | | | Expiration | | | Current notional | | | Unrealized appreciation/ (depreciation) | |
| | | | contracts | | | date | | | value | | | Asset | | | Liability | |
| Hang Seng Index (Short) | | | (1 | ) | | 8/28/15 | | $ | 158,185 | | $ | — | | $ | (1,036 | ) |
| MSCI Taiwan Index (Short) | | | (2 | ) | | 8/28/15 | | | 64,360 | | | — | | | (767 | ) |
| MSCI Indonesian Index (Short) | | | (4 | ) | | 8/28/15 | | | 44,720 | | | 142 | | | — | |
| S&P CNX Nifty Index (Short) | | | (3 | ) | | 8/27/15 | | | 51,438 | | | — | | | (487 | ) |
| TOPIX Index (Short) | | | (8 | ) | | 9/10/15 | | | 1,071,529 | | | — | | | (7,883 | ) |
| Total | | | | | | | | | | | $ | 142 | | $ | (10,173 | ) |
During the period ended July 31, 2015, average monthly notional value related to futures contracts was approximately $1.0 million, or 15.4% of net assets.
FINANCIAL DERIVATIVE INSTRUMENTS: EXCHANGE-TRADED OR CENTRALLY-CLEARED SUMMARY
The following is a summary of the value of exchange-traded or centrally-cleared financial derivative instruments as of July 31, 2015.
| | | Unrealized Appreciation | | | | | Unrealized
Depreciation | | | | |
| | | Futures Contracts | | | Total | | Futures Contracts | | | Total | |
| Total Exchange-Traded or Centrally Cleared | | $ | 142 | | $ | 142 | | $ | (10,173 | ) | $ | (10,173 | ) |
OVER-THE-COUNTER FINANCIAL DERIVATIVE INSTRUMENTS
FORWARD FOREIGN CURRENCY CONTRACTS
| | | | | | | Value | | | Local amount | | | Current notional | | | Unrealized appreciation/ (depreciation) |
| | | | Counterparty | | | date | | | | ) | | | | | Asset | | | Liability | |
| Australian Dollar (Short) | | | BNP Paribas Securities Services | | | 8/26/15 | | | 20 | | $ | 14,237 | | $ | 164 | | $ | — | |
| British Pound (Short) | | | BNP Paribas Securities Services | | | 8/26/15 | | | 146 | | | 227,771 | | | — | | | (1,390 | ) |
| Canadian Dollar (Short) | | | BNP Paribas Securities Services | | | 8/26/15 | | | 170 | | | 129,959 | | | 5,006 | | | — | |
| Euro (Short) | | | BNP Paribas Securities Services | | | 8/26/15 | | | 216 | | | 237,149 | | | 4,067 | | | — | |
| Hong Kong Dollar (Short) | | | BNP Paribas Securities Services | | | 8/26/15 | | | 2,565 | | | 330,882 | | | 22 | | | — | |
| Japanese Yen (Short) | | | BNP Paribas Securities Services | | | 8/26/15 | | | 147,795 | | | 1,192,759 | | | 3,216 | | | — | |
| New Taiwan Dollar (Short) | | | Citibank, N.A. | | | 9/18/15 | | | 2,229 | | | 70,350 | | | 2,277 | | | — | |
| Norwegian Krone (Short) | | | BNP Paribas Securities Services | | | 8/26/15 | | | 1,301 | | | 159,187 | | | 2,245 | | | — | |
| South Korean Won (Short) | | | Credit Suisse Securities | | | | | | | | | | | | | | | | |
| | | | (Europe) Limited | | | 9/18/15 | | | 59,025 | | | 50,537 | | | 2,677 | | | — | |
| Swedish Krona (Long) | | | BNP Paribas Securities Services | | | 8/26/15 | | | 2,554 | | | 296,210 | | | — | | | (6,119 | ) |
| Swiss Franc (Short) | | | BNP Paribas Securities Services | | | 8/26/15 | | | 119 | | | 123,015 | | | 2,693 | | | — | |
| Total | | | | | | | | | | | | | | $ | 22,367 | | $ | (7,509 | ) |
During the period ended July 31, 2015, average monthly notional value related to forward foreign currency contracts was approximately $3.6 million, or 57.8% of net assets.
See notes to financial statements
70
International Long/Short Equity Fund
July 31, 2015 (continued)
EQUITY SWAPS
| | | Pay/ | | Underlying | # of | | Financing | | Termination | | Notional | | Unrealized appreciation/ (depreciation) | |
| Counterparty | | Receive(1) | | Reference | Shares | | Rate | | Date | | amount | | Asset | | Liability | |
| Credit Suisse Securities (Europe) Limited | | Receives | | Alcatel Lucent | 84,000 | | 1-month USD LIBOR plus a specified amount | | 6/13/16 | | 317,074 | | | $ | (21,695 | ) |
| Credit Suisse Securities (Europe) Limited | | Receives | | Balfour Beatty Plc | 17,000 | | 1-month USD LIBOR plus a specified amount | | 6/13/16 | | 62,574 | | | | (87 | ) |
| Credit Suisse Securities (Europe) Limited | | Receives | | BG Group Plc | 15,000 | | 1-month USD LIBOR plus a specified amount | | 6/13/16 | | 255,916 | | | | (22,029 | ) |
| Credit Suisse Securities (Europe) Limited | | Receives | | Clinigen Group Plc | 1,094 | | 1-month USD LIBOR plus a specified amount | | 6/13/16 | | 12,634 | $ | 1,771 | | | |
| Credit Suisse Securities (Europe) Limited | | Receives | | E2V Technologies Plc | 25,000 | | 1-month USD LIBOR plus a specified amount | | 6/13/16 | | 87,452 | | 20,878 | | | |
| Credit Suisse Securities (Europe) Limited | | Receives | | Grainger Plc | 23,000 | | 1-month USD LIBOR plus a specified amount | | 6/13/16 | | 85,808 | | 13,873 | | | |
| Credit Suisse Securities (Europe) Limited | | Receives | | Inmarsat Plc | 16,038 | | 1-month USD LIBOR plus a specified amount | | 6/13/16 | | 222,406 | | 17,563 | | | |
| Credit Suisse Securities (Europe) Limited | | Receives | | Interserve Plc | 8,000 | | 1-month USD LIBOR plus a specified amount | | 6/13/16 | | 80,644 | | 8,227 | | | |
| Credit Suisse Securities (Europe) Limited | | Receives | | Kingfisher Plc | 40,000 | | 1-month USD LIBOR plus a specified amount | | 6/13/16 | | 225,315 | | 22,433 | | | |
| Credit Suisse Securities (Europe) Limited | | Receives | | Laird Plc | 13,000 | | 1-month USD LIBOR plus a specified amount | | 6/13/16 | | 80,008 | | 17,254 | | | |
| Credit Suisse Securities (Europe) Limited | | Receives | | NMC Health Plc | 6,000 | | 1-month USD LIBOR plus a specified amount | | 6/13/16 | | 82,361 | | 33,485 | | | |
| Credit Suisse Securities (Europe) Limited | | Receives | | Optimal Payments Plc | 17,000 | | 1-month USD LIBOR plus a specified amount | | 6/13/16 | | 70,087 | | | | (6,533 | ) |
| Credit Suisse Securities (Europe) Limited | | Receives | | Paragon Group Companies Plc | 10,500 | | 1-month USD LIBOR plus a specified amount | | 6/13/16 | | 67,131 | | 219 | | | |
| Credit Suisse Securities (Europe) Limited | | Receives | | Playtech Plc | 6,000 | | 1-month USD LIBOR plus a specified amount | | 6/13/16 | | 84,938 | | 22,207 | | | |
| Credit Suisse Securities (Europe) Limited | | Receives | | Rexel SA | 10,700 | | 1-month USD LIBOR plus a specified amount | | 6/13/16 | | 168,690 | | 658 | | | |
| Credit Suisse Securities (Europe) Limited | | Receives | | Talktalk Telecom Group | 35,000 | | 1-month USD LIBOR plus a specified amount | | 6/13/16 | | 164,739 | | | | (1,035 | ) |
| Credit Suisse Securities (Europe) Limited | | Receives | | Victrex Plc | 2,500 | | 1-month USD LIBOR plus a specified amount | | 6/13/16 | | 75,584 | | | | (862 | ) |
| Credit Suisse Securities (Europe) Limited | | Pays | | Afren Plc (a)(b) | (950,000 | ) | 1-month USD LIBOR less a specified amount | | 6/13/16 | | (26,482 | ) | 39,622 | | | |
| Credit Suisse Securities (Europe) Limited | | Pays | | AO World Plc | (37,000 | ) | 1-month USD LIBOR less a specified amount | | 6/13/16 | | (71,937 | ) | 31,228 | | | |
| Credit Suisse Securities (Europe) Limited | | Pays | | Avanti Communications Group | (15,500 | ) | 1-month USD LIBOR less a specified amount | | 6/13/16 | | (49,742 | ) | 10,161 | | | |
| Credit Suisse Securities (Europe) Limited | | Pays | | Carillion Plc | (16,000 | ) | 1-month USD LIBOR less a specified amount | | 6/13/16 | | (86,403 | ) | | | (1,853 | ) |
| Credit Suisse Securities (Europe) Limited | | Pays | | Fenner Plc | (22,000 | ) | 1-month USD LIBOR less a specified amount | | 6/13/16 | | (57,375 | ) | 12,054 | | | |
| Credit Suisse Securities (Europe) Limited | | Pays | | Game Digital Plc | (15,000 | ) | 1-month USD LIBOR less a specified amount | | 6/13/16 | | (60,904 | ) | 1,558 | | | |
| Credit Suisse Securities (Europe) Limited | | Pays | | Hargreaves Lansdown Plc | (10,000 | ) | 1-month USD LIBOR less a specified amount | | 6/13/16 | | (187,086 | ) | | | (37,454 | ) |
| Credit Suisse Securities (Europe) Limited | | Pays | | Mitie Group Plc | (16,000 | ) | 1-month USD LIBOR less a specified amount | | 6/13/16 | | (80,456 | ) | | | (12,487 | ) |
| Credit Suisse Securities (Europe) Limited | | Pays | | Serco Group Plc | (10,000 | ) | 1-month USD LIBOR less a specified amount | | 6/13/16 | | (20,130 | ) | 7,765 | | | |
| Credit Suisse Securities (Europe) Limited | | Pays | | Utilitywise Plc | (10,000 | ) | 1-month USD LIBOR less a specified amount | | 6/13/16 | | (35,410 | ) | | | (2,970 | ) |
| Credit Suisse Securities (Europe) Limited | | Pays | | Woodford Patient Capital Trust | (100,000 | ) | 1-month USD LIBOR less a specified amount | | 6/13/16 | | (179,590 | ) | | | (3,992 | ) |
| Total | | | | | | | | | | | | $ | 260,956 | $ | (110,997 | ) |
| (1) | | Receive indicates the Fund receives payments for any positive return on the underlying reference. The Fund makes payments for any negative return on such underlying reference. Pay indicates the Fund receives payments for any negative return on the underlying reference. The Fund makes payments for any positive return on such underlying reference. |
| (a) | | The contract has been deemed illiquid by the Adviser according to policies and procedures adopted by the Board of Trustees. |
| (b) | | Fair valued at July 31, 2015 as determined in good faith using procedures approved by the Board of Trustees. |
See notes to financial statements
71
International Long/Short Equity Fund
July 31, 2015 (continued)
FINANCIAL DERIVATIVE INSTRUMENTS: OVER-THE-COUNTER SUMMARY
The following is a summary by counterparty of the value of over-the-counter financial derivative instruments and collateral (received)/pledged as of July 31, 2015.
| | | Financial Derivative Assets | | Financial Derivative Liabilities | | | | | | | | | | |
| | | Unrealized Appreciation | | | Value(1) | | | | | Unrealized Depreciation | | | Value(1) | | | | | | | | | | | | | |
| | | | Forward Foreign Currency Contracts | | | Swap Contracts | | | Total Over-the- Counter | | | Forward Foreign Currency Contracts | | | Swap Contracts | | | Total Over-the- Counter | | | Net Value of OTC Derivatives | | | Collateral (Received) / Pledged(3) | | | Net Exposure(2) | |
| Amounts subject to a master netting or similar agreement: | | | | | | | | | | | | | | | | |
| BNP Paribas | | | | | | | | | | | | | | | | | | | | | | | | | | | | |
| Securities Services | | $ | 17,413 | | $ | — | | $ | 17,413 | | $ | (7,509 | ) | $ | — | | $ | (7,509 | ) | $ | 9,904 | | $ | — | | $ | 9,904 | |
| Citibank, N.A. | | | 2,277 | | | — | | | 2,277 | | | — | | | — | | | — | | | 2,277 | | | — | | | 2,277 | |
| Credit Suisse Securities | | | | | | | | | | | | | | | | | | | | | | | | | | | | |
| (Europe) Limited | | | 2,677 | | | 260,956 | | | 263,633 | | | — | | | (110,997 | ) | | (110,997 | ) | | 152,636 | | | 230,000 | | | 382,636 | |
| | | $ | 22,367 | | $ | 260,956 | | $ | 283,323 | | $ | (7,509 | ) | $ | (110,997 | ) | $ | (118,506 | ) | $ | 164,817 | | $ | 230,000 | | $ | 394,817 | |
| (1) | | Value on swap contracts is represented by “unrealized appreciation/(depreciation)” on equity swaps. |
| (2) | | Net Exposure represents the net receivable/(payable) that would be due from/to the counterparty in the event of default. Exposure from over-the-counter financial derivative instruments can only be netted across transactions governed under the same master agreement with the same legal entity. See Note 2, Significant Accounting Policies, “Derivative instruments,” in the Notes to Financial Statements for more information regarding master netting arrangements. |
| (3) | | Cash collateral (received)/pledged is included on the Statement of Assets and Liabilities. |
| | | Cost or Premiums, net | | | Asset | | | Liability | |
| TOTAL FINANCIAL DERIVATIVE INSTRUMENTS | | $ | — | | $ | 283,465 | | $ | (128,679 | ) |
See notes to financial statements
72
International Long/Short Equity Fund
July 31, 2015 (continued)
Other information:
| Currency exposure of portfolio assets before | | |
| any currency hedging, if applicable. | % of net |
| Excludes derivatives. | investments |
| US Dollar | 52 | % |
| Japanese Yen | 22 | |
| Euro | 9 | |
| Hong Kong Dollar | 5 | |
| Swiss Franc | 4 | |
| Norwegian Krona | 2 | |
| Canadian Dollar | 2 | |
| Taiwan Dollar | 1 | |
| British Pound | 1 | |
| Australian Dollar | 1 | |
| South Korean Won | 1 | |
| | 100 | % |
| Industry concentration as | % of net |
| a percentage of net assets: | assets |
| Pharmaceuticals | 4.60 | % |
| Real Estate Operating Companies | 3.59 | |
| Automobile Manufacturers | 3.36 | |
| Broadcasting | 3.09 | |
| Packaged Foods & Meats | 3.04 | |
| Diversified Banks | 2.89 | |
| Construction & Engineering | 2.63 | |
| Real Estate Development | 2.60 | |
| Oil & Gas Exploration & Production | 2.54 | |
| Construction Materials | 2.36 | |
| Railroads | 2.20 | |
| Diversified Metals & Mining | 2.18 | |
| Commodity Chemicals | 2.06 | |
| Internet Software & Services | 1.99 | |
| IT Consulting & Other Services | 1.77 | |
| Industrial Machinery | 1.33 | |
| Electronic Equipment & Instruments | 1.24 | |
| Construction & Farm Machinery & Heavy Trucks | 1.22 | |
| Property & Casualty Insurance | 1.19 | |
| Integrated Telecommunication Services | 1.16 | |
| Specialty Chemicals | 1.14 | |
| Life & Health Insurance | 1.14 | |
| Semiconductors | 1.13 | |
| Independent Power Producers & Energy Traders | 1.10 | |
| Life Sciences Tools & Services | 0.99 | |
| Biotechnology | 0.92 | |
| Technology Hardware, Storage & Peripherals | 0.84 | |
| Long-Term Investments | 54.30 | |
| Short-Term Investment | 53.88 | |
| Total Investments | 108.18 | |
| Securities Sold Short | | |
| Building Products | (1.03 | ) |
| Chemicals | (1.18 | ) |
| Electric Utilities | (2.10 | ) |
| Food & Staples Retailing | (5.63 | ) |
| Machinery | (2.99 | ) |
| Marine | (2.64 | ) |
| Metals & Mining | (2.22 | ) |
| Personal Products | (1.15 | ) |
| Textiles, Apparel & Luxury Goods | (0.55 | ) |
| Financial Derivative Instruments | 2.46 | |
| Net Other Assets and Liabilities | 8.85 | |
| | 100.00 | % |
See notes to financial statements
73
International Long/Short Equity Fund
July 31, 2015 (continued)
Fair Value Measurements
The following table summarizes the Fund’s investments that are measured at fair value by level within the fair value hierarchy at July 31, 2015:
| Description | | Quoted prices in active markets for identical assets (level 1 | ) | | Significant other observable inputs (level 2) | | Significant unobservable inputs (level 3 | ) | | Total | |
| Assets | | | | | | | | | | | | | |
| Common Stocks | | | | | | | | | | | | | |
| Australia | | $ | 217,629 | | $ | — | | $ | — | | $ | 217,629 | |
| Canada | | | 136,888 | | | — | | | — | | | 136,888 | |
| China | | | 168,757 | | | — | | | — | | | 168,757 | |
| Germany | | | 419,557 | | | — | | | — | | | 419,557 | |
| Hong Kong | | | 235,079 | | | — | | | — | | | 235,079 | |
| India | | | 72,887 | | | — | | | — | | | 72,887 | |
| Japan | | | 1,521,258 | | | — | | | — | | | 1,521,258 | |
| Korea | | | 52,660 | | | — | | | — | | | 52,660 | |
| Spain | | | 164,983 | | | — | | | — | | | 164,983 | |
| Switzerland | | | 288,834 | | | — | | | — | | | 288,834 | |
| Taiwan | | | 70,697 | | | — | | | — | | | 70,697 | |
| United Kingdom | | | 62,431 | | | — | | | — | | | 62,431 | |
| Total common stocks | | | 3,411,660 | | | — | | | — | | | 3,411,660 | |
| Warrants | | | | | | | | | | | | | |
| Norway | | | — | | | — | * | | — | | | — | |
| Total Warrants | | | — | | | — | | | — | | | — | |
| Short-Term Investment | | | 3,385,039 | | | — | | | — | | | 3,385,039 | |
| Total Investments | | $ | 6,796,699 | | $ | — | | $ | — | | $ | 6,796,699 | |
| Liabilities | | | | | | | | | | | | | |
| Securities Sold Short | | | | | | | | | | | | | |
| Australia | | $ | (43,440 | ) | $ | — | | $ | — | | $ | (43,440 | ) |
| Finland | | | (131,790 | ) | | — | | | — | | | (131,790 | ) |
| Italy | | | (34,538 | ) | | — | | | — | | | (34,538 | ) |
| Japan | | | (351,139 | ) | | — | | | — | | | (351,139 | ) |
| Netherlands | | | (187,966 | ) | | — | | | — | | | (187,966 | ) |
| Sweden | | | (310,175 | ) | | — | | | — | | | (310,175 | ) |
| Switzerland | | | (165,663 | ) | | — | | | — | | | (165,663 | ) |
| Total Securities Sold Short | | | (1,224,711 | ) | | — | | | — | | | (1,224,711 | ) |
| Financial Derivative Instruments – Assets | | | | | | | | | | | | | |
| Exchange-traded or centrally-cleared | | $ | 142 | | $ | — | | $ | — | | $ | 142 | |
| Over-the-counter | | | — | | | 283,323 | | | — | | | 283,323 | |
| Total Financial Derivative Instruments – Assets | | $ | 142 | | $ | 283,323 | | $ | — | | $ | 283,465 | |
| Financial Derivative Instruments – Liabilities | | | | | | | | | | | | | |
| Exchange-traded or centrally-cleared | | $ | (10,173 | ) | $ | — | | $ | — | | $ | (10,173 | ) |
| Over-the-counter | | | — | | | (118,506 | ) | | — | | | (118,506 | ) |
| Total Financial Derivative Instruments – Liabilities | | $ | (10,173 | ) | $ | (118,506 | ) | $ | — | | $ | (128,679 | ) |
| * | Fund held a level 2 security that was fair valued at $0 at July 31, 2015. |
During the period ended July 31, 2015, there were no transfers in or out of security levels.
See notes to financial statements
74
International Long/Short Equity Fund
July 31, 2015 (continued)
Fair Value of Financial Derivative Instruments
The following is a summary of the fair valuation of the Fund’s financial derivative instruments categorized by risk exposure:
Fair Values of Financial Derivative Instruments on the Statement of Assets and Liabilities as of July 31, 2015
| | | | | | Derivatives not accounted for as hedging instruments | | |
| | | | Foreign Currency Risk | | | Equity Risk | | | Interest Rate Risk | | | Credit Risk | | | Inflation Risk | | | Total | |
| Financial Derivative Instruments – Assets | | | | | | | | | | | | | | | | |
| Exchange-Traded or Centrally-Cleared | | | | | | | | | | | | | | | | | | | |
| Futures | | $ | — | | $ | 142 | | $ | — | | $ | — | | $ | — | | $ | 142 | |
| | | $ | — | | $ | 142 | | $ | — | | $ | — | | $ | — | | $ | 142 | |
| Over-the-Counter | | | | | | | | | | | | | | | | | | | |
| Forward Foreign Currency Contracts | | $ | 22,367 | | $ | — | | $ | — | | $ | — | | $ | — | | $ | 22,367 | |
| Swap Contracts | | | — | | | 260,956 | | | — | | | — | | | — | | | 260,956 | |
| | | $ | 22,367 | | $ | 260,956 | | $ | — | | $ | — | | $ | — | | $ | 283,323 | |
| Total | | $ | 22,367 | | $ | 261,098 | | $ | — | | $ | — | | $ | — | | $ | 283,465 | |
| Financial Derivative Instruments – Liabilities | | | | | | | | | | | | | | | | |
| Exchange-Traded or Centrally-Cleared | | | | | | | | | | | | | | | | | | | |
| Futures Contracts | | $ | — | | $ | (10,173 | ) | $ | — | | $ | — | | $ | — | | $ | (10,173 | ) |
| | | $ | — | | $ | (10,173 | ) | $ | — | | $ | — | | $ | — | | $ | (10,173 | ) |
| Over-the-Counter | | | | | | | | | | | | | | | | | | | |
| Forward Foreign Currency Contracts | | $ | (7,509 | ) | $ | — | | $ | — | | $ | — | | $ | — | | $ | (7,509 | ) |
| Swap Contracts | | | — | | | (110,997 | ) | | — | | | — | | | — | | | (110,997 | ) |
| | | $ | (7,509 | ) | $ | (110,997 | ) | $ | — | | $ | — | | $ | — | | $ | (118,506 | ) |
| Total | | $ | (7,509 | ) | $ | (121,170 | ) | $ | — | | $ | — | | $ | — | | $ | (128,679 | ) |
| Net | | $ | 14,858 | | $ | 139,928 | | $ | — | | $ | — | | $ | — | | $ | 154,786 | |
Effect of Financial Derivative Instruments on the Statement of Operations for the Period Ended July 31, 2015
| | | | | | | Derivatives not accounted for as hedging instruments | | | |
| | | | Foreign Currency Risk | | | Equity Risk | | | Interest Rate Risk | | | Credit Risk | | | Inflation Risk | | | Total | |
| Net realized gain/(loss) on financial derivative instruments | | | | | | | | | | | | | | | | | | | |
| Futures Contracts | | $ | — | | $ | (76,919 | ) | $ | — | | $ | — | | $ | — | | $ | (76,919 | ) |
| Forward Foreign Currency Contracts | | | 34,909 | | | — | | | — | | | — | | | — | | | 34,909 | |
| Swap Contracts | | | — | | | 106,452 | | | — | | | — | | | — | | | 106,452 | |
| | | $ | 34,909 | | $ | 29,533 | | $ | — | | $ | — | | $ | — | | $ | 64,442 | |
Net change in unrealized appreciation/(depreciation) on financial derivative instruments | | | | | | | | | | | | | | | | | | | |
| Futures Contracts | | $ | — | | $ | (10,031 | ) | $ | — | | $ | — | | $ | — | | $ | (10,031 | ) |
| Forward Foreign Currency Contracts | | | 14,858 | | | — | | | — | | | — | | | — | | | 14,858 | |
| Swap Contracts | | | — | | | 149,959 | | | — | | | — | | | — | | | 149,959 | |
| | | $ | 14,858 | | $ | 139,928 | | $ | — | | $ | — | | $ | — | | $ | 154,786 | |
See notes to financial statements
75
International Opportunities Fund
July 31, 2015
| | | | | Value |
| Shares | | | | (note 2) |
| Common stocks – 92.84% | | | |
| | | | | | |
| | | Australia – 0.79% | | | |
| 494,872 | | CSL, Ltd. | $ | 35,796,463 | |
| | | | | | |
| | | Brazil – 0.54% | | | |
| 291,420 | | Embraer S.A., ADR | | 8,116,047 | |
| 987,000 | | Localiza Rent a Car S.A. | | 8,100,206 | |
| 827,000 | | TOTVS S.A. | | 8,468,178 | |
| | | | | 24,684,431 | |
| | | Chile – 0.11% | | | |
| 505,000 | | Empresa Nacional de | | | |
| | | Telecomunicaciones S.A. | | 5,199,732 | |
| | | | | | |
| | | China – 2.03% | | | |
| 346,034 | | Baidu, Inc., ADR * | | 59,746,231 | |
| 28,172,000 | | Dongfeng Motor Group | | | |
| | | Co., Ltd., Class H | | 32,415,443 | |
| | | | | 92,161,674 | |
| | | | | | |
| | | Colombia – 0.15% | | | |
| 793,605 | | Grupo Aval Acciones y | | | |
| | | Valores S.A. | | 6,864,683 | |
| | | | | | |
| | | Finland – 2.02% | | | |
| 13,000,000 | | Nokia Oyj | | 91,802,767 | |
| | | | | | |
| | | France – 15.48% | | | |
| 1,613,983 | | Accor S.A. | | 79,189,019 | |
| 20,393,378 | | Alcatel-Lucent * | | 76,978,625 | |
| 8,180,601 | | Credit Agricole S.A. | | 128,880,500 | |
| 648,789 | | L’Oreal S.A. | | 121,379,981 | |
| 1,106,750 | | Renault S.A. | | 101,833,656 | |
| 4,948,064 | | Rexel S.A. | | 78,008,145 | |
| 1,249,369 | | Sodexo | | 116,438,124 | |
| | | | | 702,708,050 | |
| | | | | | |
| | | Germany – 10.83% | | | |
| 510,812 | | Continental AG | | 114,191,465 | |
| 3,972,380 | | Deutsche Post AG | | 120,060,643 | |
| 2,066,348 | | Fresenius SE & Co., KGaA | | 142,584,387 | |
| 2,250,000 | | ProSiebenSat.1 Media SE | | 115,028,022 | |
| | | | | 491,864,517 | |
| | | Hong Kong – 3.92% | | | |
| 5,685,400 | | AIA Group, Ltd. | | 37,109,147 | |
| 5,004,000 | | Cheung Kong Property | | | |
| | | Holdings, Ltd. * | | 41,698,386 | |
| 2,522,500 | | China Mobile, Ltd. | | 32,961,734 | |
| 10,572,000 | | China Resources Land, Ltd. | | 29,729,190 | |
| 2,461,000 | | CK Hutchison Holdings, Ltd. | | 36,538,976 | |
| | | | | 178,037,433 | |
| | | | | | |
| | | India – 1.34% | | | |
| 1,352,905 | | Housing Development | | | |
| | | Finance Corp., Ltd. | | 28,210,929 | |
| 1,095,287 | | Tata Motors, Ltd., ADR | | 32,486,212 | |
| | | | | 60,697,141 | |
| | | | | | |
| | | Ireland – 0.71% | | | |
| 398,178 | | ICON plc * | | 32,172,782 | |
| | | | | | |
| | | Japan – 19.00% | | | |
| 708,500 | | Chugai Pharmaceutical | | | |
| | | Co., Ltd. | | 25,782,346 | |
| 1,691,700 | | Denso Corp. | | 83,946,867 | |
| 463,600 | | East Japan Railway Co. | | 45,823,214 | |
| 782,500 | | Electric Power Development | | | |
| | | Co., Ltd. | | 27,054,605 | |
| 272,100 | | Fanuc, Ltd. | | 45,403,058 | |
| 5,579,000 | | Fujitsu, Ltd. | | 29,287,105 | |
| 11,974,000 | | Hitachi, Ltd. | | 77,717,236 | |
| 14,771,000 | | Mitsubishi Heavy | | | |
| | | Industries, Ltd. | | 78,208,175 | |
| 1,267,800 | | Nippon Telegraph & | | | |
| | | Telephone Corp. | | 48,728,489 | |
| 1,501,500 | | NTT Data Corp. | | 71,843,265 | |
| 2,146,300 | | Seven & I Holdings Co., Ltd. | | 99,127,940 | |
| 1,908,000 | | Sompo Japan Nipponkoa | | | |
| | | Holdings, Inc. | | 67,307,669 | |
| 2,992,000 | | Sumitomo Electric | | | |
| | | Industries, Ltd. | | 44,650,051 | |
| 2,014,200 | | Sumitomo Mitsui Financial | | | |
| | | Group, Inc. | | 90,101,463 | |
| 547,000 | | Takeda Pharmaceutical | | | |
| | | Co., Ltd. | | 27,540,888 | |
| | | | | 862,522,371 | |
| | | | | | |
| | | Korea – 1.40% | | | |
| 39,344 | | Samsung Electronics | | | |
| | | Co., Ltd. | | 39,843,302 | |
| 742,270 | | SK Hynix, Inc. | | 23,533,921 | |
| | | | | 63,377,223 | |
| | | | | | |
| | | Mexico – 0.40% | | | |
| 5,225,000 | | Grupo Financiero Santander | | | |
| | | Mexico S.A.B. de C.V., Class B | | 9,326,361 | |
| 3,230,000 | | Grupo Mexico S.A.B. de C.V., | | | |
| | | Series B | | 8,822,486 | |
| | | | | 18,148,847 | |
See notes to financial statements
76
International Opportunities Fund
July 31, 2015 (continued)
| | | | | Value |
| Shares | | | | (note 2) |
| | | | | | |
| | | Netherlands – 4.76% | | | |
| 7,429,194 | | ING Groep N.V. | $ | 126,384,719 | |
| 4,500,000 | | Koninklijke Ahold N.V. | | 89,576,064 | |
| | | | | 215,960,783 | |
| | | | | | |
| | | Panama – 0.12% | | | |
| 73,700 | | Copa Holdings S.A., Class A | | 5,566,561 | |
| | | | | | |
| | | Philippines – 0.49% | | | |
| 1,300,000 | | Ayala Corp. | | 22,171,204 | |
| | | | | | |
| | | Russia – 0.03% | | | |
| 550,000 | | TCS Group Holdings | | | |
| | | plc, GDR (a) | | 1,482,250 | |
| | | | | | |
| | | Singapore – 0.67% | | | |
| 2,072,000 | | DBS Group Holdings, Ltd. | | 30,479,251 | |
| | | | | | |
| | | Spain – 3.38% | | | |
| 2,890,374 | | Amadeus IT Holding | | | |
| | | S.A., A Shares | | 126,053,636 | |
| 4,000,000 | | Banco Santander S.A. | | 27,605,627 | |
| | | | | 153,659,263 | |
| | | | | | |
| | | Sweden – 1.20% | | | |
| 3,750,000 | | Lundin Petroleum AB * | | 54,380,271 | |
| | | | | | |
| | | Switzerland – 4.96% | | | |
| 620,785 | | Roche Holding AG | | 179,303,625 | |
| 2,000,000 | | UBS Group AG * | | 46,051,951 | |
| | | | | 225,355,576 | |
| | | | | | |
| | | Taiwan – 1.09% | | | |
| 2,241,860 | | Taiwan Semiconductor | | | |
| | | Manufacturing Co., | | | |
| | | Ltd., ADR | | 49,567,525 | |
| | | | | | |
| | | United Kingdom – 14.24% | | | |
| 34,000,000 | | Barclays plc | | 153,421,265 | |
| 7,500,000 | | BG Group plc | | 127,957,767 | |
| 199,733 | | Delphi Automotive plc | | 15,595,153 | |
| 17,000,000 | | Kingfisher plc | | 95,758,868 | |
| 16,604,420 | | Standard Life plc | | 117,827,313 | |
| 35,963,773 | | Vodafone Group plc | | 135,829,869 | |
| | | | | 646,390,235 | |
| | | | | | |
| | | United States – 3.18% | | | |
| 228,289 | | Apple, Inc. | | 27,691,456 | |
| 312,722 | | Cardinal Health, Inc. | | 26,575,115 | |
| 571,418 | | Cognizant Technology | | | |
| | | Solutions Corp., Class A * | | 36,056,476 | |
| 338,411 | | MasterCard, Inc., Class A | | 32,961,231 | |
| 17,047 | | The Priceline Group, Inc. * | | 21,199,138 | |
| | | | | 144,483,416 | |
| | | | | | |
| | | Total common stocks | | | |
| | | (Cost $3,584,405,706) | | 4,215,534,449 | |
| | | | |
| Preferred stock – 0.46% | | | |
| | | | |
| | | Brazil – 0.46% | | | |
| 425,000 | | Cia Brasileira de Distribuicao | | 9,309,423 | |
| 1,321,265 | | Itau Unibanco Holding S.A. | | 11,607,544 | |
| | | | | 20,916,967 | |
| | | | | | |
| | | Total preferred stock | | | |
| | | (Cost $35,076,003) | | 20,916,967 | |
| | | | | | |
| | | Total long-term investments | | | |
| | | (Cost $3,619,481,709) | | 4,236,451,416 | |
| | | | |
| Short-term investment – 6.04% | | | |
| 274,277,510 | | Fidelity Institutional | | | |
| | | Treasury Portfolio | | 274,277,510 | |
| | | Total short-term investment | | | |
| | | (Cost $274,277,510) | | 274,277,510 | |
| | | | |
| Total investments – 99.34% | | | |
| | | (Cost $3,893,759,219) | | 4,510,728,926 | |
| | | | |
| Financial Derivative Instruments, net (b) | | | |
| (Cost or Premiums, net $0) – 0.12% | | 5,472,041 | |
| | | | |
| Net other assets and liabilities – 0.54% | | 24,703,605 | |
| | | | |
| Total net assets – 100.00% | $ | 4,540,904,572 | |
| * | | Non-income producing security |
| (a) | | Restricted security, purchased pursuant to Rule 144A under the Securities Act of 1933, as amended, and which is exempt from registration under that Act. At July 31, 2015, the restricted securities held by the Fund had an aggregate value of $1,482,250, which represented 0.0% of net assets. |
| (b) | | Information with respect to financial derivative instruments is disclosed in the following tables. |
| ADR | | American Depositary Receipts |
| GDR | | Global Depositary Receipts |
See notes to financial statements
77
International Opportunities Fund
July 31, 2015 (continued)
(b) FINANCIAL DERIVATIVE INSTRUMENTS
OVER-THE-COUNTER FINANCIAL DERIVATIVE INSTRUMENTS
FORWARD FOREIGN CURRENCY CONTRACTS
| | | | | | | Value | | | Local amount | | | Current notional | | | Unrealized appreciation/ (depreciation) | |
| | | | Counterparty | | | date | | | | ) | | | | | Asset | | | Liability | |
| Japanese Yen (Short) | | | JP Morgan | | | | | | | | | | | | | | | | |
| | | | Chase Bank, N.A. | | | 8/13/15 | | | 9,573,400 | | $ | 77,251,488 | | $ | 2,748,512 | | $ | — | |
| Japanese Yen (Short) | | | Barclays Bank plc | | | 8/13/15 | | | 9,576,496 | | | 77,276,471 | | | 2,723,529 | | | — | |
| Total | | | | | | | | | | | | | | $ | 5,472,041 | | $ | — | |
During the year ended July 31, 2015, average monthly notional value related to forward foreign currency contracts was approximately $486.4 million, or 10.7% of net assets.
FINANCIAL DERIVATIVE INSTRUMENTS: OVER-THE-COUNTER SUMMARY
The following is a summary by counterparty of the value of over-the-counter financial derivative instruments and collateral (received)/pledged as of July 31, 2015.
| | | Financial Derivative Assets | | Financial Derivative Liabilities | | | | | | | | | |
| | | Unrealized Appreciation | | | | | Unrealized Depreciation | | | | | | | | | | | | | | |
| | | | Forward Foreign Currency Contracts | | | Total Over-the- Counter | | | Forward Foreign Currency Contracts | | | Total Over-the- Counter | | | | Net Value of Over-the- Counter Derivatives | | | Collateral (Received) / Pledged | | | Net Exposure(1) | |
| Amounts subject to a master netting agreement: | | | | | | | | | | | | | | | | | | | | |
| Barclays Bank plc | | $ | 2,723,529 | | $ | 2,723,529 | | $ | — | | $ | | | | $ | 2,723,529 | | $ | — | | $ | 2,723,529 | |
| JP Morgan Chase | | | | | | | | | | | | | | | | | | | | | | | |
| Bank, N.A. | | | 2,748,512 | | | 2,748,512 | | | — | | | | | | | 2,748,512 | | | — | | | 2,748,512 | |
| | | $ | 5,472,041 | | $ | 5,472,041 | | $ | — | | $ | | | | $ | 5,472,041 | | $ | — | | $ | 5,472,041 | |
| (1) | | Net Exposure represents the net receivable/(payable) that would be due from/to the counterparty in the event of default. Exposure from over-the-counter financial derivative instruments can only be netted across transactions governed under the same master agreement with the same legal entity. See Note 2, Significant Accounting Policies, “Derivative instruments,” in the Notes to Financial Statements for more information regarding master netting arrangements. |
| | | Cost or Premiums, net | | | Asset | | | Liability | |
| TOTAL FINANCIAL DERIVATIVE INSTRUMENTS | | $ | — | | $ | 5,472,041 | | $ | — | |
See notes to financial statements
78
International Opportunities Fund
July 31, 2015 (continued)
Other information:
| Currency exposure of portfolio assets before | | |
| any currency hedging, if applicable. | % of total |
| Excludes derivatives. | investments |
| Euro | 37 | % |
| Japanese Yen | 19 | |
| British Pound | 14 | |
| US Dollar | 14 | |
| Swiss Franc | 5 | |
| Hong Kong Dollar | 5 | |
| South Korean Won | 1 | |
| Swedish Krona | 1 | |
| Brazilian Real | 1 | |
| Australian Dollar | 1 | |
| Singapore Dollar | 1 | |
| Indian Rupee | 1 | |
| Philippine Peso | 0 | * |
| Mexican Peso | 0 | * |
| Chilean Peso | 0 | * |
| | 100 | % |
| * | Less than 0.05% of total investments. |
| Industry concentration as | % of net |
| a percentage of net assets: | assets |
| Diversified Banks | 12.88 | % |
| Auto Parts & Equipment | 5.69 | |
| Pharmaceuticals | 5.12 | |
| Food Retail | 4.16 | |
| Wireless Telecommunication Services | 3.83 | |
| Communications Equipment | 3.72 | |
| Data Processing & Outsourced Services | 3.50 | |
| Life & Health Insurance | 3.41 | |
| Health Care Equipment | 3.14 | |
| IT Consulting & Other Services | 3.02 | |
| Automobile Manufacturers | 2.96 | |
| Integrated Oil & Gas | 2.82 | |
| Industrial Machinery | 2.72 | |
| Personal Products | 2.67 | |
| Air Freight & Logistics | 2.64 | |
| Restaurants | 2.56 | |
| Broadcasting | 2.53 | |
| Real Estate Development | 2.38 | |
| Home Improvement Retail | 2.11 | |
| Hotels, Resorts & Cruise Lines | 1.74 | |
| Trading Companies & Distributors | 1.72 | |
| Electronic Equipment & Instruments | 1.71 | |
| Semiconductors | 1.61 | |
| Technology Hardware, Storage & Peripherals | 1.49 | |
| Property & Casualty Insurance | 1.48 | |
| Internet Software & Services | 1.32 | |
| Oil & Gas Exploration & Production | 1.20 | |
| Integrated Telecommunication Services | 1.07 | |
| Diversified Capital Markets | 1.01 | |
| Railroads | 1.01 | |
| Biotechnology | 0.79 | |
| Construction & Farm Machinery & Heavy Trucks | 0.72 | |
| Life Sciences Tools & Services | 0.71 | |
| Thrifts & Mortgage Finance | 0.62 | |
| Independent Power Producers & Energy Traders | 0.60 | |
| Health Care Distributors | 0.59 | |
| Multi-Sector Holdings | 0.49 | |
| Internet Retail | 0.47 | |
| Hypermarkets & Super Centers | 0.20 | |
| Diversified Metals & Mining | 0.19 | |
| Systems Software | 0.19 | |
| Aerospace & Defense | 0.18 | |
| Rental Auto/Equipment | 0.18 | |
| Airlines | 0.12 | |
| Regional Banks | 0.03 | |
| Long-Term Investments | 93.30 | |
| Short-Term Investment | 6.04 | |
| Total Investments | 99.34 | |
| Financial Derivative Instruments | 0.12 | |
| Net Other Assets and Liabilities | 0.54 | |
| | 100.00 | % |
See notes to financial statements
79
International Opportunities Fund
July 31, 2015 (continued)
Fair Value Measurements
The following table summarizes the Fund’s investments that are measured at fair value by level within the fair value hierarchy at July 31, 2015:
| Description | | | Quoted prices in active markets for identical assets (level 1 | ) | | Significant other observable inputs (level 2 | ) | | Significant unobservable inputs (level 3 | ) | | Total | |
| Assets | | | | | | | | | | | | | |
| Common Stocks | | | | | | | | | | | | | |
| Australia | | $ | 35,796,463 | | $ | — | | $ | — | | $ | 35,796,463 | |
| Brazil | | | 24,684,431 | | | — | | | — | | | 24,684,431 | |
| Chile | | | 5,199,732 | | | — | | | — | | | 5,199,732 | |
| China | | | 92,161,674 | | | — | | | — | | | 92,161,674 | |
| Colombia | | | 6,864,683 | | | — | | | — | | | 6,864,683 | |
| Finland | | | 91,802,767 | | | — | | | — | | | 91,802,767 | |
| France | | | 702,708,050 | | | — | | | — | | | 702,708,050 | |
| Germany | | | 491,864,517 | | | — | | | — | | | 491,864,517 | |
| Hong Kong | | | 178,037,433 | | | — | | | — | | | 178,037,433 | |
| India | | | 60,697,141 | | | — | | | — | | | 60,697,141 | |
| Ireland | | | 32,172,782 | | | — | | | — | | | 32,172,782 | |
| Japan | | | 862,522,371 | | | — | | | — | | | 862,522,371 | |
| Korea | | | 63,377,223 | | | — | | | — | | | 63,377,223 | |
| Mexico | | | 18,148,847 | | | — | | | — | | | 18,148,847 | |
| Netherlands | | | 215,960,783 | | | — | | | — | | | 215,960,783 | |
| Panama | | | 5,566,561 | | | — | | | — | | | 5,566,561 | |
| Philippines | | | 22,171,204 | | | — | | | — | | | 22,171,204 | |
| Russia | | | 1,482,250 | | | — | | | — | | | 1,482,250 | |
| Singapore | | | 30,479,251 | | | — | | | — | | | 30,479,251 | |
| Spain | | | 153,659,263 | | | — | | | — | | | 153,659,263 | |
| Sweden | | | 54,380,271 | | | — | | | — | | | 54,380,271 | |
| Switzerland | | | 225,355,576 | | | — | | | — | | | 225,355,576 | |
| Taiwan | | | 49,567,525 | | | — | | | — | | | 49,567,525 | |
| United Kingdom | | | 646,390,235 | | | — | | | — | | | 646,390,235 | |
| United States | | | 144,483,416 | | | — | | | — | | | 144,483,416 | |
| Total Common Stocks | | | 4,215,534,449 | | | — | | | — | | | 4,215,534,449 | |
| Preferred stock | | | | | | | | | | | | | |
| Brazil | | | 20,916,967 | | | — | | | — | | | 20,916,967 | |
| Total Preferred Stock | | | 20,916,967 | | | — | | | — | | | 20,916,967 | |
| Short-term investment | | | 274,277,510 | | | — | | | — | | | 274,277,510 | |
| Total Investments | | $ | 4,510,728,926 | | $ | — | | $ | — | | $ | 4,510,728,926 | |
| Financial Derivative Instruments – Assets | | | | | | | | | | | | | |
| Over-the-Counter | | | — | | | 5,472,041 | | | — | | | 5,472,041 | |
| Total Financial Derivative Instruments – Assets | | $ | — | | $ | 5,472,041 | | $ | — | | $ | 5,472,041 | |
On July 31, 2014, substantially all of the common stocks held by the Fund in the Asian and Australian markets were fair valued using the independent statistical fair value pricing service as described in Note 2 in accordance with the fair value pricing procedures approved by the Board, and were therefore valued using Level 2 inputs. On July 31, 2015, substantially all of the common stocks in the Fund were valued at the last reported sale price or official closing price as the Trust’s fair value pricing procedures did not require the use of the independent statistical fair value pricing service. Accordingly, using the end of the reporting period method for determining when transfers between levels are recognized, common stocks valued at $556,653,971 on July 31, 2015 were transferred from Level 2 to Level 1.
See notes to financial statements
80
International Opportunities Fund
July 31, 2015 (continued)
Fair Value of Financial Derivative Instruments
The following is a summary of the fair valuation of the Fund’s financial derivative instruments categorized by risk exposure:
Fair Values of Financial Derivative Instruments on the Statement of Assets and Liabilities as of July 31, 2015
| | | | | | Derivatives not accounted for as hedging instruments | | | |
| | | | Foreign Currency Risk | | | Equity Risk | | | Interest Rate Risk | | | Credit Risk | | | Inflation Risk | | | Total | |
| Financial Derivative Instruments – Assets | | | | | | | | | | | | | | | | | | | |
| Over-the-Counter | | | | | | | | | | | | | | | | | | | |
| Forward Foreign Currency Contracts | | $ | 5,472,041 | | $ | — | | $ | — | | $ | — | | $ | — | | $ | 5,472,041 | |
| Total | | $ | 5,472,041 | | $ | — | | $ | — | | $ | — | | $ | — | | $ | 5,472,041 | |
| Financial Derivative Instruments – Liabilities | | | | | | | | | | | | | | | | | | | |
| Over-the-Counter | | | | | | | | | | | | | | | | | | | |
| Forward Foreign Currency Contracts | | $ | — | | $ | — | | $ | — | | $ | — | | $ | — | | $ | — | |
| Total | | $ | — | | $ | — | | $ | — | | $ | — | | $ | — | | $ | — | |
| Net | | $ | 5,472,041 | | $ | — | | $ | — | | $ | — | | $ | — | | $ | 5,472,041 | |
Effect of Financial Derivative Instruments on the Statement of Operations for the Year Ended July 31, 2015
| | | | | | Derivatives not accounted for as hedging instruments | | |
| | | | Foreign Currency Risk | | | Equity Risk | | | Interest Rate Risk | | | Credit Risk | | | Inflation Risk | | | Total | |
| Net realized gain/(loss) from financial derivative instruments: | | | | | | | | | | | | | | | | | | | |
| Forward Foreign Currency Contracts | | $ | 88,556,113 | | $ | — | | $ | — | | $ | — | | $ | — | | $ | 88,556,113 | |
| Total | | $ | 88,556,113 | | $ | — | | $ | — | | $ | — | | $ | — | | $ | 88,556,113 | |
Net change in unrealized appreciation/(depreciation) of financial derivative instruments | | | | | | | | | | | | | | | | | | | |
| Forward Foreign Currency Contracts | | $ | (9,840,716 | ) | $ | — | | $ | — | | $ | — | | $ | — | | $ | (9,840,716 | ) |
| Total | | $ | (9,840,716 | ) | $ | — | | $ | — | | $ | — | | $ | — | | $ | (9,840,716 | ) |
See notes to financial statements
81
International Select Equity Fund
July 31, 2015
| | | | | Value |
| Shares | | | | (note 2) |
| Common stocks – 95.07% | | | |
| | | | | | |
| | | Belgium – 2.99% | | | |
| 2,408 | | KBC Groep N.V. | $ | 167,826 | |
| | | | | | |
| | | Canada – 2.76% | | | |
| 4,800 | | Gildan Activewear, Inc. | | 154,807 | |
| | | | | | |
| | | France – 11.64% | | | |
| 46,892 | | Alcatel-Lucent * | | 177,003 | |
| 9,945 | | Orange S.A. | | 163,121 | |
| 10,103 | | Rexel S.A. | | 159,278 | |
| 3,100 | | Total S.A. | | 153,461 | |
| | | | | 652,863 | |
| | | | | | |
| | | Germany – 5.95% | | | |
| 1,175 | | Bayer AG | | 173,307 | |
| 1,600 | | Bayerische Motoren | | | |
| | | Werke AG | | 160,432 | |
| | | | | 333,739 | |
| | | | | | |
| | | Hong Kong – 2.92% | | | |
| 25,101 | | AIA Group, Ltd. | | 163,837 | |
| | | | | | |
| | | India – 1.46% | | | |
| 8,154 | | ICICI Bank, Ltd. | | 82,111 | |
| | | | | | |
| | | Israel – 2.89% | | | |
| 2,350 | | Teva Pharmaceutical Industries, | | | |
| | | Ltd., ADR | | 162,197 | |
| | | | | | |
| | | Italy – 4.05% | | | |
| 11,000 | | Mediaset SpA | | 55,741 | |
| 25,847 | | UniCredit SpA | | 171,312 | |
| | | | | 227,053 | |
| | | | | | |
| | | Japan – 20.79% | | | |
| 35,390 | | Ebara Corp. | | 160,766 | |
| 4,700 | | FUJIFILM Holdings Corp. | | 186,563 | |
| 4,500 | | Japan Tobacco, Inc. | | 174,775 | |
| 6,916 | | NTT DoCoMo, Inc. | | 145,898 | |
| 3,000 | | SoftBank Group Corp. | | 166,563 | |
| 3,800 | | Sumitomo Mitsui Financial | | | |
| | | Group, Inc. | | 169,986 | |
| 1,842 | | Tsuruha Holdings, Inc. | | 161,854 | |
| | | | | 1,166,405 | |
| | | | | | |
| | | Korea – 2.11% | | | |
| 3,300 | | Shinhan Financial Group | | | |
| | | Co., Ltd. | | 118,446 | |
| | | Netherlands – 2.95% | | | |
| 1,660 | | ASML Holding N.V. | | 165,245 | |
| | | | | | |
| | | Portugal – 1.97% | | | |
| 10,700 | | CTT-Correios de Portugal S.A. | | 110,462 | |
| | | | | | |
| | | Spain – 2.95% | | | |
| 5,100 | | Grifols S.A., ADR | | 165,495 | |
| | | | | | |
| | | Switzerland – 6.09% | | | |
| 4,113 | | Clariant AG * | | 82,064 | |
| 659 | | Dufry AG * | | 91,454 | |
| 1,620 | | Novartis AG | | 168,320 | |
| | | | | 341,838 | |
| | | | | | |
| | | United Kingdom – 20.49% | | | |
| 9,800 | | BG Group plc | | 167,198 | |
| 26,550 | | DS Smith plc | | 166,055 | |
| 39,000 | | ITV plc | | 170,959 | |
| 123,000 | | Lloyds Banking Group plc | | 159,813 | |
| 69,130 | | Rentokil Initial plc | | 158,589 | |
| 45,000 | | Vodafone Group plc | | 169,958 | |
| 6,849 | | WPP plc | | 157,227 | |
| | | | | 1,149,799 | |
| | | | | | |
| | | United States – 3.06% | | | |
| 2,725 | | Cognizant Technology | | | |
| | | Solutions Corp., Class A * | | 171,948 | |
| | | Total common stocks | | | |
| | | (Cost $5,008,709) | | 5,334,071 | |
| | | Total long-term investments | | | |
| | | (Cost $5,008,709) | | 5,334,071 | |
| Short-term investment – 3.61% | | | |
| | | | | | |
| 202,749 | | Fidelity Institutional | | | |
| | | Treasury Portfolio | | 202,749 | |
| | | Total short-term investment | | | |
| | | (Cost $202,749) | | 202,749 | |
| Total investments – 98.68% | | | |
| | | (Cost $5,211,458) | | 5,536,820 | |
| Net other assets and liabilities – 1.32% | | 73,863 | |
| Total net assets – 100.00% | $ | 5,610,683 | |
| * | | Non-income producing security |
| ADR | | American Depositary Receipts |
See notes to financial statements
82
International Select Equity Fund
July 31, 2015 (continued)
Other information:
| Currency exposure of portfolio assets | | |
| before any currency hedging, if applicable. | % of total |
| Excludes derivatives. | investments |
| Euro | 30 | % |
| Japanese Yen | 21 | |
| British Pound | 21 | |
| US Dollar | 14 | |
| Swiss Franc | 6 | |
| Hong Kong Dollar | 3 | |
| Canadian Dollar | 3 | |
| South Korean Won | 2 | |
| | 100 | % |
| Industry concentration as | % of net |
| a percentage of net assets: | assets |
| | | |
| Diversified Banks | 15.50 | % |
| Pharmaceuticals | 8.98 | |
| Wireless Telecommunication Services | 8.60 | |
| Integrated Oil & Gas | 5.72 | |
| Broadcasting | 4.04 | |
| Electronic Equipment & Instruments | 3.32 | |
| Communications Equipment | 3.15 | |
| Tobacco | 3.11 | |
| IT Consulting & Other Services | 3.06 | |
| Paper Packaging | 2.96 | |
| Biotechnology | 2.95 | |
| Semiconductor Equipment | 2.95 | |
| Life & Health Insurance | 2.92 | |
| Integrated Telecommunication Services | 2.91 | |
| Drug Retail | 2.88 | |
| Industrial Machinery | 2.87 | |
| Automobile Manufacturers | 2.86 | |
| Trading Companies & Distributors | 2.84 | |
| Environmental & Facilities Services | 2.83 | |
| Advertising | 2.80 | |
| Apparel, Accessories & Luxury Goods | 2.76 | |
| Air Freight & Logistics | 1.97 | |
| Specialty Stores | 1.63 | |
| Specialty Chemicals | 1.46 | |
| Long-Term Investments | 95.07 | |
| Short-Term Investment | 3.61 | |
| Total Investments | 98.68 | |
| Net Other Assets and Liabilities | 1.32 | |
| | 100.00 | % |
See notes to financial statements
83
International Select Equity Fund
July 31, 2015 (continued)
Fair Value Measurements
The following table summarizes the Fund’s investments that are measured at fair value by level within the fair value hierarchy at July 31, 2015:
| Description | | | Quoted prices in active markets for identical assets (level 1 | ) | | Significant other observable inputs (level 2 | ) | | Significant unobservable inputs (level 3 | ) | | Total | |
| Assets | | | | | | | | | | | | | |
| Common Stocks | | | | | | | | | | | | | |
| Belgium | | $ | 167,826 | | $ | — | | $ | — | | $ | 167,826 | |
| Canada | | | 154,807 | | | — | | | — | | | 154,807 | |
| France | | | 652,863 | | | — | | | — | | | 652,863 | |
| Germany | | | 333,739 | | | — | | | — | | | 333,739 | |
| Hong Kong | | | 163,837 | | | — | | | — | | | 163,837 | |
| India | | | 82,111 | | | — | | | — | | | 82,111 | |
| Israel | | | 162,197 | | | — | | | — | | | 162,197 | |
| Italy | | | 227,053 | | | — | | | — | | | 227,053 | |
| Japan | | | 1,166,405 | | | — | | | — | | | 1,166,405 | |
| Korea | | | 118,446 | | | — | | | — | | | 118,446 | |
| Netherlands | | | 165,245 | | | — | | | — | | | 165,245 | |
| Portugal | | | 110,462 | | | — | | | — | | | 110,462 | |
| Spain | | | 165,495 | | | — | | | — | | | 165,495 | |
| Switzerland | | | 341,838 | | | — | | | — | | | 341,838 | |
| United Kingdom | | | 1,149,799 | | | — | | | — | | | 1,149,799 | |
| United States | | | 171,948 | | | — | | | — | | | 171,948 | |
| Total Common Stocks | | | 5,334,071 | | | — | | | — | | | 5,334,071 | |
| Short-term investment | | | 202,749 | | | — | | | — | | | 202,749 | |
| Total Investments | | $ | 5,536,820 | | $ | — | | $ | — | | $ | 5,536,820 | |
During the period ended July 31, 2015, there were no transfers in or out of security levels.
See notes to financial statements
84
Strategic Income Fund
July 31, 2015
Face
amount | | | Coupon | | Maturity | | Value
(note 2) | |
| | | | | | | |
| Bank Loans(a) (b) – 4.14% | | | | | | |
| | | | | | | | | | |
| | | | Austria – 0.60% | | | | | | |
| USD | 162,588 | | Constantia Flexibles Group GmbH, Term Loan B | 4.750% | | 4/29/22 | $ | 163,046 | |
| USD | 834,912 | | Constantia Flexibles Group GmbH, Term Loan B-2 | 4.750% | | 4/29/22 | | 837,262 | |
| | | | | | | | | 1,000,308 | |
| | | | | | | | | | |
| | | | France – 0.65% | | | | | | |
| EUR | 995,238 | | Horizon Holdings III SASU, Term Loan B (c) | 5.000% | | 7/24/22 | | 1,094,956 | |
| | | | | | | | | | |
| | | | Germany – 0.80% | | | | | | |
| EUR | 317,647 | | Kirk Beauty Zero GmbH, Term Loan B (c) | 6.000% | | 8/13/22 | | 350,544 | |
| USD | 997,500 | | Siemens Audiology Solutions, Term Loan B | 5.500% | | 1/17/22 | | 1,001,655 | |
| | | | | | | | | 1,352,199 | |
| | | | | | | | | | |
| | | | Switzerland – 0.60% | | | | | | |
| USD | 1,000,000 | | Intertrust Group Holding B.V., Second Lien Term Loan | 8.000% | | 4/15/22 | | 1,004,690 | |
| | | | | | | | | | |
| | | | United States – 1.49% | | | | | | |
| USD | 1,000,000 | | Delta 2 Lux Sarl, Term Loan B-3 | 4.750% | | 7/30/21 | | 999,690 | |
| USD | 1,492,500 | | Travelport Finance (Luxembourg) Sarl, Term Loan B | 6.000% | | 9/2/21 | | 1,499,649 | |
| | | | | | | | | 2,499,339 | |
| | | | Total bank loans | | | | | | |
| | | | (Cost $6,920,281) | | | | | 6,951,492 | |
| | | | | | | | | | |
| | | | | | | |
| Corporate bonds – 71.18% | | | | | | |
| | | | | | | | | | |
| | | | Canada – 0.68% | | | | | | |
| USD | 83,000 | | Valeant Pharmaceuticals International, Inc. (d) | 7.500% | | 7/15/21 | | 90,263 | |
| USD | 273,000 | | Valeant Pharmaceuticals International, Inc. (d) | 6.125% | | 4/15/25 | | 285,967 | |
| USD | 320,000 | | Valeant Pharmaceuticals International, Inc. (d) | 5.500% | | 3/1/23 | | 328,000 | |
| EUR | 405,000 | | Valeant Pharmaceuticals International, Inc. (d) | 4.500% | | 5/15/23 | | 438,787 | |
| | | | | | | | | 1,143,017 | |
| | | | | | | | | | |
| | | | France – 6.92% | | | | | | |
| GBP | 600,000 | | AXA S.A. (e) | 6.686% | | 7/6/26 | | 1,058,425 | |
| GBP | 800,000 | | AXA S.A. (f) | 5.625% | | 1/16/54 | | 1,334,830 | |
| USD | 82,000 | | BNP Paribas S.A. (e) | 6.250% | | 10/17/15 | | 83,424 | |
| USD | 34,000 | | BNP Paribas S.A. (e) | 6.500% | | 9/6/15 | | 34,553 | |
| USD | 2,000,000 | | BNP Paribas S.A. (d) (e) | 7.195% | | 6/25/37 | | 2,362,500 | |
| EUR | 120,000 | | Loxam SAS (d) | 7.000% | | 7/23/22 | | 135,903 | |
| EUR | 416,000 | | Loxam SAS | 7.000% | | 7/23/22 | | 471,131 | |
| USD | 520,000 | | Numericable-SFR SAS (d) | 6.000% | | 5/15/22 | | 530,400 | |
| USD | 770,000 | | Numericable-SFR SAS (d) | 6.250% | | 5/15/24 | | 784,977 | |
| EUR | 700,000 | | Oberthur Technologies Holding SAS | 9.250% | | 4/30/20 | | 833,160 | |
| EUR | 1,800,000 | | Orange S.A. (e) | 4.250% | | 2/7/20 | | 2,100,404 | |
| GBP | 200,000 | | Orange S.A. (e) | 5.750% | | 4/1/23 | | 322,812 | |
| EUR | 1,340,000 | | Sodexo | 2.500% | | 6/24/26 | | 1,573,750 | |
| | | | | | | | | 11,626,269 | |
See notes to financial statements
85
Strategic Income Fund
July 31, 2015 (continued)
Face
amount | | | Coupon | | Maturity | | Value
(note 2) | |
| | | | | | | | | | |
| | | | Germany – 0.98% | | | | | | |
| EUR | 300,000 | | Trionista TopCo GmbH | 6.875% | | 4/30/21 | $ | 349,949 | |
| EUR | 850,000 | | Unitymedia GmbH (d) | 3.750% | | 1/15/27 | | 890,245 | |
| USD | 200,000 | | Unitymedia Hessen GmbH & Co. KG (d) | 5.000% | | 1/15/25 | | 197,500 | |
| EUR | 200,000 | | Unitymedia Hessen GmbH & Co. KG (d) | 3.500% | | 1/15/27 | | 212,264 | |
| | | | | | | | | 1,649,958 | |
| | | | | | | | | | |
| | | | Ireland – 1.96% | | | | | | |
| EUR | 850,000 | | Ardagh Packaging Finance plc | 9.250% | | 10/15/20 | | 989,524 | |
| USD | 223,000 | | Ardagh Packaging Finance plc (d) | 6.000% | | 6/30/21 | | 223,279 | |
| GBP | 900,000 | | PGH Capital, Ltd. | 5.750% | | 7/7/21 | | 1,524,659 | |
| GBP | 350,000 | | PGH Capital, Ltd. | 6.625% | | 12/18/25 | | 558,394 | |
| | | | | | | | | 3,295,856 | |
| | | | | | | | | | |
| | | | Italy – 1.18% | | | | | | |
| GBP | 1,000,000 | | Assicurazioni Generali SpA (e) | 6.269% | | 6/16/26 | | 1,620,603 | |
| EUR | 300,000 | | Cerved Group SpA | 8.000% | | 1/15/21 | | 357,448 | |
| | | | | | | | | 1,978,051 | |
| | | | | | | | | | |
| | | | Jersey – 0.60% | | | | | | |
| GBP | 645,000 | | BSREP II Center Parks Jersey 2, Ltd. (d) (g) | 7.000% | | 2/28/42 | | 1,007,265 | |
| | | | | | | | | | |
| | | | Luxembourg – 3.15% | | | | | | |
| USD | 970,000 | | Altice S.A. (d) | 7.750% | | 5/15/22 | | 979,700 | |
| EUR | 290,000 | | Auris Luxembourg II S.A. (d) | 8.000% | | 1/15/23 | | 347,396 | |
| EUR | 400,000 | | Auris Luxembourg II S.A. | 8.000% | | 1/15/23 | | 479,167 | |
| GBP | 175,000 | | Cabot Financial Luxembourg S.A. | 10.375% | | 10/1/19 | | 298,404 | |
| EUR | 420,000 | | Matterhorn Telecom S.A. (d) | 3.875% | | 5/1/22 | | 435,054 | |
| EUR | 700,000 | | Play Finance 1 S.A. | 6.500% | | 8/1/19 | | 808,175 | |
| EUR | 175,000 | | Wind Acquisition Finance S.A. | 7.000% | | 4/23/21 | | 205,167 | |
| USD | 580,000 | | Wind Acquisition Finance S.A. (d) | 7.375% | | 4/23/21 | | 616,250 | |
| EUR | 1,000,000 | | Wind Acquisition Finance S.A. | 4.000% | | 7/15/20 | | 1,124,334 | |
| | | | | | | | | 5,293,647 | |
| | | | | | | | | | |
| | | | Netherlands – 2.18% | | | | | | |
| EUR | 1,435,000 | | Deutsche Telekom International Finance B.V. | 3.250% | | 1/17/28 | | 1,828,517 | |
| USD | 400,000 | | ING Bank N.V. (f) | 4.125% | | 11/21/23 | | 412,000 | |
| EUR | 175,000 | | LGE HoldCo VI B.V. (d) | 7.125% | | 5/15/24 | | 213,364 | |
| EUR | 150,000 | | Linde Finance B.V. (f) | 7.375% | | 7/14/66 | | 174,793 | |
| EUR | 860,000 | | TMF Group Holding B.V. | 9.875% | | 12/1/19 | | 1,022,416 | |
| | | | | | | | | 3,651,090 | |
| | | | | | | | | | |
| | | | Norway – 0.49% | | | | | | |
| EUR | 700,000 | | Lock A.S. | 7.000% | | 8/15/21 | | 823,489 | |
| | | | | | | | | | |
| | | | Spain – 1.75% | | | | | | |
| USD | 800,000 | | Banco Bilbao Vizcaya Argentaria S.A. (e) | 9.000% | | 5/9/18 | | 870,000 | |
| USD | 2,000,000 | | BBVA International Preferred SAU (e) | 5.919% | | 4/18/17 | | 2,060,000 | |
| | | | | | | | | 2,930,000 | |
See notes to financial statements
86
Strategic Income Fund
July 31, 2015 (continued)
Face
amount | | | Coupon | | Maturity | | Value
(note 2) | |
| | | | | | | | | | |
| | | | Switzerland – 1.36% | | | | | | |
| USD | 1,000,000 | | Credit Suisse Group AG (d) (e) | 7.500% | | 12/11/23 | $ | 1,067,000 | |
| USD | 400,000 | | Credit Suisse Group AG (e) | 6.250% | | 12/18/24 | | 390,500 | |
| USD | 800,000 | | UBS Group AG (e) | 7.000% | | 2/19/25 | | 828,235 | |
| | | | | | | | | 2,285,735 | |
| | | | | | | | | | |
| | | | United Kingdom – 32.02% | | | | | | |
| GBP | 940,000 | | AA Bond Co., Ltd. (d) | 5.500% | | 7/31/22 | | 1,461,566 | |
| GBP | 205,000 | | Arqiva Broadcast Finance plc (d) | 9.500% | | 3/31/20 | | 353,903 | |
| GBP | 560,000 | | Arqiva Broadcast Finance plc | 9.500% | | 3/31/20 | | 966,761 | |
| GBP | 1,100,000 | | Aviva plc (f) | 6.875% | | 5/20/58 | | 2,046,426 | |
| GBP | 400,000 | | Barclays Bank plc (e) | 14.000% | | 6/15/19 | | 823,771 | |
| USD | 966,000 | | Barclays Bank plc (e) | 6.860% | | 6/15/32 | | 1,099,801 | |
| USD | 1,250,000 | | Barclays Bank plc (e) | 6.278% | | 12/15/34 | | 1,350,522 | |
| GBP | 800,000 | | BAT International Finance plc | 6.000% | | 6/29/22 | | 1,500,247 | |
| GBP | 1,200,000 | | Brakes Capital | 7.125% | | 12/15/18 | | 1,947,066 | |
| GBP | 800,000 | | BUPA Finance plc | 5.000% | | 4/25/23 | | 1,301,200 | |
| GBP | 500,000 | | Co-operative Group Holdings 2011, Ltd. | 6.875% | | 7/8/20 | | 842,315 | |
| EUR | 1,600,000 | | Compass Group plc | 1.875% | | 1/27/23 | | 1,830,026 | |
| GBP | 650,000 | | Daily Mail & General Trust | 5.750% | | 12/7/18 | | 1,122,529 | |
| EUR | 760,000 | | Ephios Bondco plc (d) | 6.250% | | 7/1/22 | | 854,703 | |
| GBP | 100,000 | | Gala Electric Casinos plc | 11.500% | | 6/1/19 | | 167,140 | |
| GBP | 270,000 | | Gala Group Finance plc | 8.875% | | 9/1/18 | | 444,410 | |
| GBP | 500,000 | | Galaxy Bidco, Ltd. | 6.375% | | 11/15/20 | | 796,512 | |
| GBP | 800,000 | | Hastings Insurance Group Finance plc | 8.000% | | 10/21/20 | | 1,329,932 | |
| GBP | 1,000,000 | | Heathrow Funding, Ltd. | 6.000% | | 3/20/20 | | 1,769,091 | |
| GBP | 1,785,000 | | HSBC Bank Capital Funding Sterling 1 LP (e) | 5.844% | | 11/5/31 | | 3,073,270 | |
| EUR | 1,395,000 | | Imperial Tobacco Finance plc | 2.250% | | 2/26/21 | | 1,608,258 | |
| USD | 545,000 | | International Game Technology plc (d) | 6.500% | | 2/15/25 | | 525,244 | |
| GBP | 1,190,000 | | Iron Mountain Europe plc | 6.125% | | 9/15/22 | | 1,932,699 | |
| GBP | 501,000 | | ITV plc | 5.375% | | 10/19/15 | | 788,631 | |
| GBP | 600,000 | | Legal & General Group plc (f) | 5.500% | | 6/27/64 | | 1,004,613 | |
| GBP | 500,000 | | Legal & General Group plc (e) | 6.385% | | 5/2/17 | | 819,008 | |
| USD | 900,000 | | Lloyds Banking Group plc (e) | 7.500% | | 6/27/24 | | 940,500 | |
| USD | 900,000 | | Lloyds Banking Group plc (d) (e) | 6.657% | | 5/21/37 | | 1,015,875 | |
| USD | 1,100,000 | | Lloyds Banking Group plc (d) (e) | 6.267% | | 11/14/16 | | 1,117,875 | |
| GBP | 700,000 | | Nationwide Building Society (e) | 10.250% | | 12/6/99 | | 1,415,352 | |
| GBP | 600,000 | | Prudential plc (f) | 5.700% | | 12/19/63 | | 1,028,212 | |
| USD | 800,000 | | Prudential plc (e) | 6.500% | | 9/23/15 | | 815,400 | |
| EUR | 258,000 | | Rexam plc (f) | 6.750% | | 6/29/67 | | 289,370 | |
| EUR | 500,000 | | Royal Bank of Scotland Group plc (e) | 5.500% | | 9/30/15 | | 551,239 | |
| USD | 180,000 | | Royal Bank of Scotland Group plc (e) | 7.648% | | 9/30/31 | | 227,700 | |
| USD | 400,000 | | Royal Bank of Scotland Group plc (e) | 7.640% | | 9/30/17 | | 429,000 | |
| GBP | 1,400,000 | | RSA Insurance Group plc (f) | 5.125% | | 10/10/45 | | 2,288,834 | |
| GBP | 1,000,000 | | Scottish Widows plc | 7.000% | | 6/16/43 | | 1,905,968 | |
| GBP | 400,000 | | Standard Life plc (f) | 5.500% | | 12/4/42 | | 673,041 | |
| GBP | 500,000 | | Standard Life plc (e) | 6.750% | | 7/12/27 | | 897,949 | |
| EUR | 675,000 | | Tesco Corporate Treasury Services plc | 2.125% | | 11/12/20 | | 736,774 | |
| GBP | 300,000 | | Tesco plc | 5.500% | | 1/13/33 | | 471,180 | |
| GBP | 295,298 | | Tesco Property Finance 3 plc | 5.744% | | 4/13/40 | | 457,939 | |
| GBP | 67,000 | | Thames Water Utilities Finance, Ltd. (f) | 5.375% | | 7/21/25 | | 110,686 | |
| GBP | 48,000 | | Thomas Cook Group plc | 7.750% | | 6/22/17 | | 79,832 | |
See notes to financial statements
87
Strategic Income Fund
July 31, 2015 (continued)
Face
amount | | | Coupon | | Maturity | | Value
(note 2) | |
| | | | | | | | | | |
| | | | United Kingdom (continued) | | | | | | |
| GBP | 712,000 | | Virgin Media Finance plc | 7.000% | | 4/15/23 | $ | 1,191,118 | |
| GBP | 1,775,000 | | Virgin Media Secured Finance plc | 6.250% | | 3/28/29 | | 2,901,809 | |
| GBP | 500,000 | | William Hill plc | 7.125% | | 11/11/16 | | 828,651 | |
| GBP | 100,000 | | WPP 2012 Ltd. | 6.000% | | 4/4/17 | | 167,495 | |
| USD | 700,000 | | WPP Finance 2010 | 4.750% | | 11/21/21 | | 763,133 | |
| EUR | 580,000 | | WPP Finance 2013 | 3.000% | | 11/20/23 | | 707,830 | |
| | | | | | | | | 53,772,406 | |
| | | | | | | | | | |
| | | | United States – 17.91% | | | | | | |
| USD | 1,560,000 | | AT&T, Inc. | 4.750% | | 5/15/46 | | 1,444,409 | |
| USD | 1,500,000 | | Avis Budget Car Rental LLC | 5.500% | | 4/1/23 | | 1,513,125 | |
| USD | 113,000 | | Avis Budget Car Rental LLC (d) | 5.250% | | 3/15/25 | | 108,056 | |
| USD | 1,775,000 | | CCO Holdings LLC | 7.375% | | 6/1/20 | | 1,881,867 | |
| USD | 690,000 | | CCO Holdings LLC (d) | 5.875% | | 5/1/27 | | 685,256 | |
| USD | 300,000 | | Cequel Communications Holdings I LLC (d) | 6.375% | | 9/15/20 | | 303,375 | |
| USD | 500,000 | | Cequel Communications Holdings I LLC (d) | 5.125% | | 12/15/21 | | 466,250 | |
| USD | 600,000 | | CHS/Community Health Systems, Inc. | 7.125% | | 7/15/20 | | 640,500 | |
| USD | 600,000 | | CHS/Community Health Systems, Inc. | 8.000% | | 11/15/19 | | 632,243 | |
| USD | 444,000 | | CHS/Community Health Systems, Inc. | 6.875% | | 2/1/22 | | 476,190 | |
| USD | 1,806,000 | | Dresdner Funding Trust I (d) | 8.151% | | 6/30/31 | | 2,271,045 | |
| USD | 46,000 | | First Data Corp. | 12.625% | | 1/15/21 | | 53,360 | |
| USD | 73,000 | | First Data Corp. | 11.250% | | 1/15/21 | | 81,213 | |
| USD | 1,031,000 | | First Data Corp. | 10.625% | | 6/15/21 | | 1,152,143 | |
| USD | 137,000 | | HCA, Inc. | 5.000% | | 3/15/24 | | 142,994 | |
| USD | 400,000 | | HCA, Inc. | 6.500% | | 2/15/20 | | 448,250 | |
| USD | 1,100,000 | | HCA, Inc. | 5.375% | | 2/1/25 | | 1,127,500 | |
| GBP | 215,000 | | Health Care REIT, Inc. | 4.500% | | 12/1/34 | | 349,482 | |
| USD | 388,000 | | Infor (US), Inc. (d) | 6.500% | | 5/15/22 | | 397,700 | |
| USD | 1,650,000 | | Iron Mountain, Inc. | 6.000% | | 8/15/23 | | 1,722,188 | |
| USD | 232,000 | | Levi Strauss & Co. | 5.000% | | 5/1/25 | | 225,040 | |
| EUR | 1,315,000 | | Philip Morris International, Inc. | 2.750% | | 3/19/25 | | 1,585,257 | |
| USD | 440,000 | | Post Holdings, Inc. (d) | 6.750% | | 12/1/21 | | 444,400 | |
| EUR | 1,360,000 | | Procter & Gamble Co. | 2.000% | | 8/16/22 | | 1,595,456 | |
| USD | 2,216,000 | | RBS Capital Trust II (e) | 6.425% | | 1/3/34 | | 2,470,840 | |
| USD | 1,400,000 | | Service Corp. International | 5.375% | | 5/15/24 | | 1,491,000 | |
| USD | 540,000 | | Service Corp. International | 7.625% | | 10/1/18 | | 617,625 | |
| USD | 1,250,000 | | Sirius XM Radio, Inc. (d) | 5.375% | | 4/15/25 | | 1,250,000 | |
| USD | 60,000 | | Tenet Healthcare Corp. | 6.000% | | 10/1/20 | | 65,400 | |
| USD | 125,000 | | Tenet Healthcare Corp. | 8.000% | | 8/1/20 | | 130,625 | |
| USD | 1,450,000 | | Verizon Communications, Inc. | 5.150% | | 9/15/23 | | 1,598,567 | |
| USD | 675,000 | | Verizon Communications, Inc. | 6.550% | | 9/15/43 | | 800,252 | |
| USD | 1,915,000 | | Wachovia Capital Trust III (e) | 5.570% | | 8/31/15 | | 1,897,047 | |
| | | | | | | | | 30,068,655 | |
| | | | Total corporate bonds | | | | | | |
| | | | (Cost $120,983,709) | | | | | 119,525,438 | |
See notes to financial statements
88
Strategic Income Fund
July 31, 2015 (continued)
Face amount | | | Coupon | | Maturity | | Value
(note 2) | |
| | | | | | | | | | |
| US government obligations – 7.77% | | | | | | |
| | | | | | | | | | |
| | | | United States – 7.77% | | | | | | |
| USD | 4,000,000 | | United States Treasury Note | 0.875% | | 1/31/18 | $ | 4,003,436 | |
| USD | 6,000,000 | | United States Treasury Note | 1.500% | | 5/31/19 | | 6,049,218 | |
| USD | 3,000,000 | | United States Treasury Note | 0.250% | | 4/15/16 | | 3,000,468 | |
| | | | | | | | | 13,053,122 | |
| | | | Total US government obligations | | | | | | |
| | | | (Cost $12,961,702) | | | | | 13,053,122 | |
| | | | | | | | | | |
| Shares | | | | | | | | |
| | | | | | | | | | |
| Preferred stock – 0.35% | | | | | | |
| | | | | | | | | | |
| | | | United States – 0.35% | | | | | | |
| | 24,000 | | RBS Capital Funding Trust V (e) | | | | | 591,360 | |
| | | | Total preferred stock | | | | | | |
| | | | (Cost $581,200) | | | | | 591,360 | |
| | | | | | | | | | |
| Investment companies – 0.68% | | | | | | |
| | | | | | | | | | |
| | | | United States – 0.68% | | | | | | |
| | 30,000 | | SPDR Barclays Capital High Yield Bond ETF | | | | | 1,139,100 | |
| | | | Total investment companies | | | | | | |
| | | | (Cost $1,219,810) | | | | | 1,139,100 | |
| | | | Total long-term investments | | | | | | |
| | | | (Cost $142,666,702) | | | | | 141,260,512 | |
| | | | | | | | | | |
| Short-term investment – 14.67% | | | | | | |
| | 24,628,927 | | Fidelity Institutional Treasury Portfolio (h) | | | | | 24,628,927 | |
| | | | Total short-term investment | | | | | | |
| | | | (Cost $24,628,927) | | | | | 24,628,927 | |
| | | | | | | | | | |
| Total investments – 98.79% | | | | | | |
| | | | (Cost $167,295,629) | | | | | 165,889,439 | |
Financial derivative instruments, net (Cost or Premiums, net $(29,878)) (i) – 0.02% | | | | | 26,467 | |
| Net other assets and liabilities – 1.19% | | | | | 2,004,363 | |
| Total net assets – 100.00% | | | | $ | 167,920,269 | |
| (a) | | Bank loan interests are, at present, not readily marketable, not registered under the Securities Act of 1933, as amended (the “1933 Act”), and may be subject to contractual and legal restrictions on sale. Bank loan interests in the Fund’s portfolio generally have variable rates which adjust to a base, such as the London Inter-Bank Offered Rate (“LIBOR”), on set dates, typically every 30 days but not greater than one year; and/or have interest rates that float at a margin above a widely recognized base lending rate such as the Prime Rate of a designated U.S. bank. |
| (b) | | Bank loan interests often require prepayments from excess cash flow or permit the borrower to repay at its election. The degree to which borrowers repay, whether as a contractual requirement or at their election, cannot be predicted with accuracy. As a result, the actual remaining maturity may be substantially less than the stated maturities shown. |
| (c) | | Security is purchased on a delayed delivery basis. |
| (d) | | Restricted security, purchased pursuant to Rule 144A under the Securities Act of 1933, as amended, and which is exempt from registration under that Act. At July 31, 2015, the restricted securities held by the Fund had an aggregate value of $22,401,362, which represented 13.3% of net assets. |
| (e) | | Maturity date is perpetual. Maturity date presented represents the next call date. |
See notes to financial statements
89
Strategic Income Fund
July 31, 2015 (continued)
| (f) | | Variable or floating rate interest rate security. Includes fixed-to-floating rate corporate bond securities that currently pay a fixed coupon that will move to a floating rate coupon if the bond is not redeemed at the call date. Rate presented represents rate at July 31, 2015. |
| (g) | | Fair valued at July 31, 2015 as determined in good faith using procedures approved by the Board of Trustees. |
| (h) | | This short-term investment has been segregated for open futures contracts, open forward foreign currency contracts, delayed delivery purchases and swap contracts at July 31, 2015. |
| (i) | | Information with respect to financial derivative instruments is disclosed in the following tables. |
(i) FINANCIAL DERIVATIVE INSTRUMENTS
EXCHANGE-TRADED OR CENTRALLY-CLEARED FINANCIAL DERIVATIVE INSTRUMENTS
FUTURES CONTRACTS
| | | | Number of | | | Expiration | | | Current notional | | | Unrealized appreciation/ (depreciation) |
| | | | contracts | | | date | | | value | | | Asset | | | Liability | |
| Euro-Bund (Long) | | | 16 | | | 9/8/15 | | $ | 2,713,118 | | $ | 9,050 | | $ | — | |
| US Treasury Long Bond (Long) | | | 22 | | | 9/21/15 | | | 3,430,625 | | | 27,226 | | | — | |
| Total | | | | | | | | | | | $ | 36,276 | | $ | — | |
During the year ended July 31, 2015, average monthly notional value related to futures contracts was approximately $0.9 million, or 0.6% of net assets.
FINANCIAL DERIVATIVE INSTRUMENTS: EXCHANGE-TRADED OR CENTRALLY-CLEARED SUMMARY
The following is a summary of the value of exchange-traded or centrally-cleared financial derivative instruments as of July 31, 2015:
| | | | Unrealized Appreciation Futures Contracts | | | Total | | | Unrealized Depreciation Futures Contracts | | | Total | |
| Total Exchange-Traded or Centrally-Cleared | | $ | 36,276 | | $ | 36,276 | | $ | — | | $ | — | |
See notes to financial statements
90
Strategic Income Fund
July 31, 2015 (continued)
OVER-THE-COUNTER FINANCIAL DERIVATIVE INSTRUMENTS
FORWARD FOREIGN CURRENCY CONTRACTS
| | | | | | | Value | | | Local
amount | | | Current
notional | | Unrealized appreciation/(depreciation) |
| | | | Counterparty | | | date | | | | ) | | | | | Asset | | | Liability | |
| British Pound (Short) | | | BNP Paribas | | | | | | | | | | | | | | | | |
| | | | Securities Services | | | 8/26/15 | | | 31,011 | | | 48,420,082 | | | — | | | (325,081 | ) |
| Euro (Short) | | | Citibank, N.A. | | | 8/14/15 | | | 2,500 | | | 2,745,955 | | | 47,126 | | | — | |
| Euro (Short) | | | BNP Paribas | | | | | | | | | | | | | | | | |
| | | | Securities Services | | | 8/26/15 | | | 23,952 | | | 26,311,903 | | | 278,204 | | | — | |
| Total | | | | | | | | | | | | | | $ | 325,330 | | $ | (325,081 | ) |
During the year ended July 31, 2015, average monthly notional value related to forward foreign currency contracts was approximately $63.6 million or 37.9% of net assets.
CREDIT DEFAULT SWAP CONTRACTS
| | | | | | | Rates received/ | | | Termination | | | Implied
credit | | | Notional
amount | | | Upfront
premiums
paid/ | | Unrealized appreciation/ | | | Value | |
| Counterparty | | | | | | | | | date | | | | | | | | | | | (depreciation) | | | Asset | | | Liability | |
| Protection purchased: | | | | | | | | | | | | | | | | | | | | | | | | | | | | |
| Deutsche Bank AG | | | International Business | | | | | | | | | | | | | | | | | | | | | | | | | |
| | | | Machines Corp. | | | (1.00 | )% | | 6/20/19 | | | 0.31 | % | $ | 850 | | $ | (26,707 | ) | $ | 4,159 | | $ | — | | $ | (22,548 | ) |
| Protection sold: | | | | | | | | | | | | | | | | | | | | | | | | | | | | |
| Citibank, N.A. | | | Cerved Group SpA | | | 5.00 | % | | 12/20/18 | | | 1.18 | % | | 55 | | $ | (1,533 | ) | $ | 8,610 | | $ | 7,077 | | $ | — | |
| JPMorgan Chase | | | | | | | | | | | | | | | | | | | | | | | | | | | | |
| Bank, N.A. | | | ConvaTec Healthcare | | | 5.00 | % | | 12/20/17 | | | 0.88 | % | | 55 | | | (1,638 | ) | | 7,051 | | | 5,413 | | | — | |
| Total | | | | | | | | | | | | | | | | | $ | (29,878 | ) | $ | 19,820 | | $ | 12,490 | | $ | (22,548 | ) |
During the year ended July 31, 2015, average monthly notional value related to swap contracts, including both centrally-cleared and over-the-counter, was approximately $1.6 million, or 1.0% of net assets.
See notes to financial statements
91
Strategic Income Fund
July 31, 2015 (continued)
FINANCIAL DERIVATIVE INSTRUMENTS: OVER-THE-COUNTER SUMMARY
The following is a summary by counterparty of the value of over-the-counter financial derivative instruments and collateral (received)/pledged as of July 31, 2015.
| | | Unrealized Appreciation | | Value(1) | | | | | Unrealized Depreciation | | Value(1) | | | | | | | | | | | | | |
| | | Forward Foreign Currency Contracts | | | Swap Contracts | | | Total Over-the Counter | | | Forward Foreign Currency Contracts | | | Swap Contracts | | | Total Over-the Counter | | Net Value of OTC Derivatives | | Collateral (Received) / Pledged | | Net Exposure(2) | |
| Amounts subject to a master netting agreement: | | | | | | | | | | | | | | | | |
| BNP Paribas | | | | | | | | | | | | | | | | | | | | | | | | | | | | |
| Securities Services | | $ | 278,204 | | $ | — | | $ | 278,204 | | $ | (325,081 | ) | $ | — | | $ | (325,081 | ) | $ | (46,877 | ) | $ | — | | $ | (46,877 | ) |
| Citibank, N.A. | | | 47,126 | | | 7,077 | | | 54,203 | | | — | | | — | | | — | | | 54,203 | | | — | | | 54,203 | |
| Deutsche Bank AG | | | — | | | — | | | — | | | — | | | (22,548 | ) | | (22,548 | ) | | (22,548 | ) | | — | | | (22,548 | ) |
| JPMorgan Chase Bank, N.A. | | | — | | | 5,413 | | | 5,413 | | | — | | | — | | | — | | | 5,413 | | | — | | | 5,413 | |
| | | $ | 325,330 | | $ | 12,490 | | $ | 337,820 | | $ | (325,081 | ) | $ | (22,548 | ) | $ | (347,629 | ) | $ | (9,809 | ) | $ | — | | $ | (9,809 | ) |
| (1) | | Value on swap contracts is represented by “unrealized appreciation/(depreciation)” on interest rate swaps, and “value” on credit default swaps, which is inclusive of upfront premiums paid/(received). |
| (2) | | Net Exposure represents the net receivable/(payable) that would be due from/to the counterparty in the event of default. Exposure from over-the-counter financial derivative instruments can only be netted across transactions governed under the same master agreement with the same legal entity. See Note 2, Significant Accounting Policies, “Derivative instruments,” in the Notes to Financial Statements for more information regarding master netting arrangements. |
| | | Cost or Premiums, net | | | Asset | | | Liability | |
| TOTAL FINANCIAL DERIVATIVE INSTRUMENTS | | $ | (29,878 | ) | $ | 374,096 | | $ | (347,629 | ) |
See notes to financial statements
92
Strategic Income Fund
July 31, 2015 (continued)
Other information:
| Currency exposure of portfolio assets before | | | |
| any currency hedging, if applicable. | | % of total |
| Excludes derivatives. | | investments |
| US Dollar | | 56 | % |
| British Pound | | 28 | |
| Euro | | 16 | |
| | | 100 | % |
| Industry concentration as | | % of net |
| a percentage of net assets: | | assets |
| U.S. government obligations | | 7.77 | % |
| Commercial Banks Non-US | | 6.37 | |
| Life/Health Insurance | | 6.21 | |
| Telephone-Integrated | | 5.53 | |
| Diversified Banking Institution | | 4.16 | |
| Money Center Banks | | 4.05 | |
| Telecommunication Services | | 3.95 | |
| Multi-line Insurance | | 3.69 | |
| Cable TV | | 3.67 | |
| Food-Catering | | 3.19 | |
| Tobacco | | 2.79 | |
| Commercial Services | | 2.18 | |
| Medical-Hospitals | | 2.18 | |
| Property/Casualty Insurance | | 1.84 | |
| Containers - Metal/Glass | | 1.55 | |
| Diversified Operations | | 1.49 | |
| Rental Auto/Equipment | | 1.33 | |
| Finance-Other Services | | 1.28 | |
| Funeral Services & Related Items | | 1.25 | |
| Super-Regional Banks-US | | 1.13 | |
| Medical Products | | 1.09 | |
| Airport Development & Maintenance | | 1.05 | |
| Cosmetics & Toiletries | | 0.95 | |
| Advertising Services | | 0.88 | |
| Auto Repair Centers | | 0.87 | |
| Real Estate Operations/Development | | 0.87 | |
| Building Societies | | 0.84 | |
| Gambling (Non-Hotel) | | 0.81 | |
| Broadcast Services/Programs | | 0.79 | |
| Data Processing/Management | | 0.77 | |
| Medical-HMO | | 0.77 | |
| Radio | | 0.74 | |
| Food-Retail | | 0.72 | |
| Corporate/Preferred-High Yield | | 0.68 | |
| Medical - Drugs | | 0.68 | |
| Publishing-Newspapers | | 0.67 | |
| Commercial Services-Finance | | 0.61 | |
| Containers-Paper/Plastic | | 0.60 | |
| Auto Racing | | 0.59 | |
| Medical Labs & Testing Services | | 0.51 | |
| Computer Data Security | | 0.50 | |
| Television | | 0.47 | |
| Consulting Services | | 0.31 | |
| Cellular Telecommunications | | 0.26 | |
| Food-Flour & Grain | | 0.26 | |
| Enterprise Software/Services | | 0.24 | |
| Electronic Measurement Instruments | | 0.21 | |
| REITS-Health Care | | 0.21 | |
| Specialty Stores | | 0.21 | |
| Apparel Manufacturers | | 0.13 | |
| Industrial Gases | | 0.10 | |
| Water | | 0.07 | |
| Travel Services | | 0.05 | |
| Long-Term Investments | | 84.12 | |
| Short-Term Investment | | 14.67 | |
| Total investments | | 98.79 | |
| Financial Derivative Instruments | | 0.02 | |
| Net other assets and liabilities | | 1.19 | |
| | | 100.00 | % |
See notes to financial statements
93
Strategic Income Fund
July 31, 2015 (continued)
Fair Value Measurements
The following table summarizes the Fund’s investments that are measured at fair value by level within the fair value hierarchy at July 31, 2015:
| Description | | | Quoted prices in active markets for identical assets (level 1 | ) | | Significant other observable inputs (level 2 | ) | | Significant unobservable inputs (level 3 | ) | | Total | |
| Assets | | | | | | | | | | | | | |
| Bank Loans | | | | | | | | | | | | | |
| Austria | | $ | — | | $ | 1,000,308 | | $ | — | | $ | 1,000,308 | |
| France | | | — | | | 1,094,956 | | | — | | | 1,094,956 | |
| Germany | | | — | | | 1,352,199 | | | — | | | 1,352,199 | |
| Switzerland | | | — | | | 1,004,690 | | | — | | | 1,004,690 | |
| United States | | | — | | | 2,499,339 | | | — | | | 2,499,339 | |
| Total Bank Loans | | | — | | | 6,951,492 | | | — | | | 6,951,492 | |
| Corporate Bonds | | | | | | | | | | | | | |
| Canada | | | — | | | 1,143,017 | | | — | | | 1,143,017 | |
| France | | | — | | | 11,626,269 | | | — | | | 11,626,269 | |
| Germany | | | — | | | 1,649,958 | | | — | | | 1,649,958 | |
| Ireland | | | — | | | 3,295,856 | | | — | | | 3,295,856 | |
| Italy | | | — | | | 1,978,051 | | | — | | | 1,978,051 | |
| Jersey | | | — | | | 1,007,265 | | | — | | | 1,007,265 | |
| Luxembourg | | | — | | | 5,293,647 | | | — | | | 5,293,647 | |
| Netherlands | | | — | | | 3,651,090 | | | — | | | 3,651,090 | |
| Norway | | | — | | | 823,489 | | | — | | | 823,489 | |
| Spain | | | — | | | 2,930,000 | | | — | | | 2,930,000 | |
| Switzerland | | | — | | | 2,285,735 | | | — | | | 2,285,735 | |
| United Kingdom | | | — | | | 53,772,406 | | | — | | | 53,772,406 | |
| United States | | | — | | | 30,068,655 | | | — | | | 30,068,655 | |
| Total Corporate Bonds | | | — | | | 119,525,438 | | | — | | | 119,525,438 | |
| US Government Obligations | | | | | | | | | | | | | |
| United States | | | — | | | 13,053,122 | | | — | | | 13,053,122 | |
| Total US Government Obligations | | | — | | | 13,053,122 | | | — | | | 13,053,122 | |
| Preferred Stock | | | | | | | | | | | | | |
| United States | | | 591,360 | | | — | | | — | | | 591,360 | |
| Total Preferred Stock | | | 591,360 | | | — | | | — | | | 591,360 | |
| Investment Companies | | | | | | | | | | | | | |
| United States | | | 1,139,100 | | | — | | | — | | | 1,139,100 | |
| Total Investment Companies | | | 1,139,100 | | | — | | | — | | | 1,139,100 | |
| Short-term Investment | | | 24,628,927 | | | — | | | — | | | 24,628,927 | |
| Total Investments | | | 26,359,387 | | | 139,530,052 | | | — | | | 165,889,439 | |
See notes to financial statements
94
Strategic Income Fund
July 31, 2015 (continued)
| Description | | | Quoted prices in active markets for identical assets (level 1 | ) | | Significant other observable inputs (level 2 | ) | | Significant unobservable inputs (level 3 | ) | | Total | |
| Financial Derivatives – Assets | | | | | | | | | | | | | |
| Exchange-traded or centrally-cleared | | $ | 36,276 | | $ | — | | $ | — | | $ | 36,276 | |
| Over-the-counter | | | — | | | 337,820 | | | — | | | 337,820 | |
| Total Financial Derivative Instruments – Assets | | $ | — | | $ | 337,820 | | $ | — | | $ | 374,096 | |
| Liabilities | | | | | | | | | | | | | |
| Financial Derivatives – Liabilities | | | | | | | | | | | | | |
| Exchange-traded or centrally-cleared | | | — | | | — | | | — | | | — | |
| Over-the-counter | | | — | | | (347,629 | ) | | — | | | (347,629 | ) |
| Total Financial Derivative Instruments – Liabilities | | $ | — | | $ | (347,629 | ) | $ | — | | $ | (347,629 | ) |
During the period ended July 31, 2015, there were no transfers in or out of security levels.
Fair Value of Financial Derivative Instruments
The following is a summary of the fair valuation of the Fund’s financial derivative instruments categorized by risk exposure:
Fair Values of Financial Derivative Instruments on the Statement of Assets and Liabilities as of July 31, 2015
| | | | | | | Derivatives not accounted for as hedging instruments | | |
| | | | Foreign Currency Risk | | | Equity Risk | | | Interest Rate Risk | | | Credit Risk | | | Inflation Risk | | | Total | |
| Financial Derivative Instruments – Assets | | | | | | | | | | | | | | | | |
| Exchange-Traded or Centrally-Cleared | | $ | — | | $ | — | | $ | — | | $ | — | | $ | — | | $ | — | |
| Futures Contracts | | | — | | | — | | | 36,276 | | | — | | | — | | | 36,276 | |
| | | $ | — | | $ | — | | $ | 36,276 | | $ | — | | $ | — | | $ | 36,276 | |
| Over-the-Counter | | | | | | | | | | | | | | | | | | | |
| Forward Foreign Currency Contracts | | $ | 325,330 | | $ | — | | $ | — | | $ | — | | $ | — | | $ | 325,330 | |
| Swap Contracts | | | — | | | — | | | — | | | 12,490 | | | — | | | 12,490 | |
| | | $ | 325,330 | | $ | — | | $ | — | | $ | 12,490 | | $ | — | | $ | 337,820 | |
| Total | | $ | 325,330 | | $ | — | | $ | 36,276 | | $ | 12,490 | | $ | — | | $ | 374,096 | |
| Financial Derivative Instruments – Liabilities | | | | | | | | | | | | | | | |
| Exchange-Traded or Centrally-Cleared | | $ | — | | $ | — | | $ | — | | $ | — | | $ | — | | $ | — | |
| Futures Contracts | | | — | | | — | | | — | | | — | | | — | | | — | |
| | | $ | — | | $ | — | | $ | — | | $ | — | | $ | — | | $ | — | |
| | | | | | | | | | | | | | | | | | | | |
| Over-the-Counter | | | | | | | | | | | | | | | | | | | |
| Forward Foreign Currency Contracts | | $ | (325,081 | ) | $ | — | | $ | — | | $ | — | | $ | — | | $ | (325,081 | ) |
| Swap Contracts | | | — | | | — | | | — | | | (22,548 | ) | | — | | | (22,548 | ) |
| | | $ | (325,081 | ) | $ | — | | $ | — | | $ | (22,548 | ) | $ | — | | $ | (347,629 | ) |
| Total | | $ | (325,081 | ) | $ | — | | $ | — | | $ | (22,548 | ) | $ | — | | $ | (347,629 | ) |
| Net | | $ | 249 | | $ | — | | $ | 36,276 | | $ | (10,058 | ) | $ | — | | $ | 26,467 | |
See notes to financial statements
95
Strategic Income Fund
July 31, 2015 (continued)
Effect of Financial Derivative Instruments on the Statement of Operations for the Year Ended July 31, 2015
| | | | | | Derivatives not accounted for as hedging instruments | | | |
| | | | Foreign Currency Risk | | | Equity Risk | | | Interest Rate Risk | | | Credit Risk | | | Inflation Risk | | | Total | |
| Net realized gain/(loss) from financial derivative instruments: | | | | | | | | | | | | | | | | | | | |
| Forward Foreign Currency Contracts | | $ | 4,845,503 | | $ | — | | $ | — | | $ | — | | $ | — | | $ | 4,845,503 | |
| Futures Contracts | | | — | | | — | | | (43,980 | ) | | — | | | — | | | (43,980 | ) |
| Swap Contracts | | | — | | | — | | | — | | | 76,931 | | | — | | | 76,931 | |
| | | $ | 4,845,503 | | $ | — | | $ | (43,980 | ) | $ | 76,931 | | $ | — | | $ | 4,878,454 | |
Net change in unrealized appreciation/(depreciation) of financial derivative instruments | | | | | | | | | | | | | | | | | | | |
| Forward Foreign Currency Contracts | | $ | (221,966 | ) | $ | — | | $ | — | | $ | — | | $ | — | | $ | (221,966 | ) |
| Futures Contracts | | | — | | | — | | | 36,276 | | | — | | | — | | | 36,276 | |
| Swap Contracts | | | — | | | — | | | — | | | (80,053 | ) | | — | | | (80,053 | ) |
| | | $ | (221,966 | ) | $ | — | | $ | 36,276 | | $ | (80,053 | ) | $ | — | | $ | (265,743 | ) |
See notes to financial statements
96
Unconstrained Bond Fund
July 31, 2015
Face
amount | | | Coupon | | Maturity | | Value
(note 2) | |
| | | | | | |
| Auto loan receivables – 1.92% | | | | | |
| | | | | | | | | | |
| | | | Germany – 1.10% | | | | | | |
| EUR | 268,291 | | Driver Thirteen UG (b) | 0.178% | | 2/22/21 | $ | 294,877 | |
| | | | | | | | | | |
| | | | | | | | | | |
| | | | Luxembourg – 0.82% | | | | | | |
| EUR | 200,000 | | Bavarian Sky S.A. (b) (d) | 0.141% | | 8/22/22 | | 219,650 | |
| | | | | | | | | | |
| | | | Total auto loan receivables | | | | | | |
| | | | (Cost $514,550) | | | | | 514,527 | |
| | | | | | | |
| Corporate bonds – 39.52% | | | | | | |
| | | | | | | | | | |
| | | | Austria – 0.39% | | | | | | |
| EUR | 100,000 | | Sappi Papier Holding GmbH | 3.375% | | 4/1/22 | | 105,158 | |
| | | | | | | | | | |
| | | | France – 2.90% | | | | | | |
| USD | 90,000 | | Banque PSA Finance S.A. | 5.750% | | 4/4/21 | | 97,563 | |
| EUR | 100,000 | | BNP Paribas Cardif S.A. (a) (b) | 4.032% | | 11/25/25 | | 110,280 | |
| EUR | 100,000 | | Dry Mix Solutions Investissements SAS (b) | 4.236% | | 6/15/21 | | 109,666 | |
| EUR | 100,000 | | HomeVi SAS (c) | 6.875% | | 8/15/21 | | 115,523 | |
| EUR | 100,000 | | Loxam SAS | 4.875% | | 7/23/21 | | 113,383 | |
| EUR | 100,000 | | Oberthur Technologies Holding SAS | 9.250% | | 4/30/20 | | 119,023 | |
| EUR | 100,000 | | Paprec Holding | 7.375% | | 4/1/23 | | 113,943 | |
| | | | | | | | | 779,381 | |
| | | | Germany – 1.72% | | | | | | |
| EUR | 100,000 | | Heidelberger Druckmaschinen AG | 8.000% | | 5/15/22 | | 112,356 | |
| EUR | 120,000 | | Kirk Beauty One GmbH | 8.750% | | 7/15/23 | | 134,076 | |
| EUR | 100,000 | | Paternoster Holding III GmbH | 8.500% | | 2/15/23 | | 105,432 | |
| EUR | 100,000 | | Rapid Holding GmbH | 6.625% | | 11/15/20 | | 111,044 | |
| | | | | | | | | 462,908 | |
| | | | Ireland – 0.45% | | | | | | |
| EUR | 100,000 | | Eircom Finance, Ltd. | 9.250% | | 5/15/20 | | 119,709 | |
| | | | | | | | | | |
| | | | Italy – 0.40% | | | | | | |
| EUR | 100,000 | | Intesa Sanpaolo SpA | 1.125% | | 3/4/22 | | 106,360 | |
| | | | | | | | | | |
| | | | Jersey – 0.58% | | | | | | |
| GBP | 100,000 | | BSREP II Center Parks Jersey 2, Ltd. (c) (g) | 7.000% | | 2/28/42 | | 156,165 | |
| | | | | | | | | | |
| | | | Luxembourg – 2.30% | | | | | | |
| EUR | 100,000 | | Cerberus Nightingale 1 SARL | 8.250% | | 2/1/20 | | 113,943 | |
| EUR | 100,000 | | Dufry Finance SCA (c) | 4.500% | | 8/1/23 | | 113,120 | |
| EUR | 100,000 | | Grand City Properties S.A. (a) (b) | 3.750% | | 2/18/22 | | 105,664 | |
See notes to financial statements
97
Unconstrained Bond Fund
July 31, 2015 (continued)
Face
amount | | | Coupon | | Maturity | | Value
(note 2) | |
| | | | | | | | | | |
| | | | Luxembourg (continued) | | | | | | |
| EUR | 160,000 | | Trafigura Funding S.A. | 5.000% | | 4/27/20 | $ | 175,764 | |
| EUR | 100,000 | | Wind Acquisition Finance S.A. (b) (c) | 5.229% | | 4/30/19 | | 111,009 | |
| | | | | | | | | 619,500 | |
| | | | | | | | | | |
| | | | Netherlands – 2.58% | | | | | | |
| EUR | 130,000 | | ABN AMRO Bank N.V. | 1.000% | | 4/16/25 | | 135,065 | |
| EUR | 100,000 | | Grupo Antolin Dutch BV | 5.125% | | 6/30/22 | | 113,820 | |
| EUR | 100,000 | | InterXion Holding N.V. | 6.000% | | 7/15/20 | | 117,473 | |
| EUR | 100,000 | | NN Group N.V. (a) (b) | 4.500% | | 1/15/26 | | 111,921 | |
| EUR | 100,000 | | Schaeffler Finance BV | 3.250% | | 5/15/25 | | 105,185 | |
| EUR | 100,000 | | TMF Group Holding BV (b) | 5.362% | | 12/1/18 | | 111,253 | |
| | | | | | | | | 694,717 | |
| | | | Singapore – 0.29% | | | | | | |
| USD | 80,000 | | Flextronics International, Ltd. (c) | 4.750% | | 6/15/25 | | 78,300 | |
| | | | | | | | | | |
| | | | Spain – 0.41% | | | | | | |
| EUR | 100,000 | | ACS Actividades de Construccion y Servicios S.A. | 2.875% | | 4/1/20 | | 109,276 | |
| | | | | | | | | | |
| | | | United Kingdom – 13.58% | | | | | | |
| GBP | 130,000 | | AA Bond Co, Ltd. | 5.500% | | 7/31/22 | | 202,132 | |
| GBP | 100,000 | | Admiral Group plc | 5.500% | | 7/25/24 | | 159,076 | |
| GBP | 26,400 | | Annington Finance No 4 plc (b) | 1.548% | | 1/10/23 | | 40,918 | |
| EUR | 100,000 | | Atrium European Real Estate, Ltd. | 3.625% | | 10/17/22 | | 114,081 | |
| USD | 45,000 | | BP Capital Markets plc | 3.506% | | 3/17/25 | | 44,576 | |
| GBP | 165,000 | | Broadgate Financing plc (b) | 2.178% | | 10/5/23 | | 256,613 | |
| EUR | 105,000 | | Ephios Bondco plc | 6.250% | | 7/1/22 | | 118,199 | |
| GBP | 50,000 | | Firstgroup plc | 8.125% | | 9/19/18 | | 90,344 | |
| GBP | 100,000 | | Galaxy Bidco, Ltd. (b) (c) | 5.567% | | 11/15/19 | | 156,751 | |
| GBP | 100,000 | | Hastings Insurance Group Finance plc (b) (c) | 6.581% | | 10/21/19 | | 157,533 | |
| GBP | 50,000 | | HBOS Capital Funding LP (a) (b) | 6.461% | | 11/29/49 | | 83,568 | |
| GBP | 50,000 | | HSBC Holdings plc | 7.000% | | 4/7/38 | | 102,564 | |
| USD | 200,000 | | Imperial Tobacco Finance plc (c) | 3.750% | | 7/21/22 | | 199,168 | |
| GBP | 100,000 | | Investec plc | 4.500% | | 5/5/22 | | 160,677 | |
| GBP | 100,000 | | Keystone Financing plc | 9.500% | | 10/15/19 | | 165,145 | |
| EUR | 100,000 | | Nationwide Building Society (b) | 4.125% | | 3/20/23 | | 117,261 | |
| GBP | 100,000 | | Old Mutual plc | 8.000% | | 6/3/21 | | 177,867 | |
| GBP | 100,000 | | Pension Insurance Corp., plc | 6.500% | | 7/3/24 | | 160,768 | |
| GBP | 100,000 | | Prudential plc (b) | 5.000% | | 7/20/55 | | 156,139 | |
| GBP | 50,000 | | RSA Insurance Group plc (b) | 9.375% | | 5/20/39 | | 93,678 | |
| GBP | 100,000 | | Scottish Widows plc | 5.500% | | 6/16/23 | | 166,087 | |
| GBP | 100,000 | | Standard Chartered plc | 5.125% | | 6/6/34 | | 157,883 | |
| GBP | 100,000 | | Standard Life plc (b) | 5.500% | | 12/4/42 | | 168,260 | |
| GBP | 70,000 | | Tesco plc | 6.000% | | 12/14/29 | | 118,401 | |
| EUR | 50,000 | | The Royal Bank of Scotland plc (b) | 4.625% | | 11/30/18 | | 56,409 | |
| EUR | 100,000 | | Thomas Cook Finance plc | 7.750% | | 6/15/20 | | 117,856 | |
| EUR | 100,000 | | Vougeot Bidco plc (b) (c) | 5.231% | | 7/15/20 | | 110,542 | |
| | | | | | | | | 3,652,496 | |
See notes to financial statements
98
Unconstrained Bond Fund
July 31, 2015 (continued)
Face
amount | | | Coupon | | Maturity | | Value
(note 2) | |
| | | | | | | | | | |
| | | | United States – 13.92% | | | | | | |
| USD | 70,000 | | Amgen, Inc. | 3.625% | | 5/22/24 | $ | 70,060 | |
| USD | 90,000 | | Apple, Inc. | 2.500% | | 2/9/25 | | 84,618 | |
| GBP | 50,000 | | AT&T, Inc. | 7.000% | | 4/30/40 | | 106,708 | |
| EUR | 100,000 | | Bank of America Corp. | 2.375% | | 6/19/24 | | 114,923 | |
| EUR | 115,000 | | Berkshire Hathaway, Inc. | 1.125% | | 3/16/27 | | 116,295 | |
| USD | 100,000 | | BlueLine Rental Finance Corp. (c) | 7.000% | | 2/1/19 | | 100,000 | |
| USD | 36,000 | | Burlington Northern Santa Fe LLC | 4.150% | | 4/1/45 | | 34,034 | |
| USD | 200,000 | | Calpine Corp. | 5.750% | | 1/15/25 | | 195,750 | |
| USD | 40,000 | | CCO Safari II LLC (c) | 4.908% | | 7/23/25 | | 40,151 | |
| USD | 200,000 | | Chesapeake Energy Corp. | 5.750% | | 3/15/23 | | 170,000 | |
| USD | 200,000 | | CHS/Community Health Systems, Inc. | 6.875% | | 2/1/22 | | 214,500 | |
| USD | 100,000 | | Citigroup, Inc. | 1.750% | | 5/1/18 | | 99,534 | |
| USD | 110,000 | | CONSOL Energy, Inc. (c) | 8.000% | | 4/1/23 | | 91,575 | |
| USD | 200,000 | | Digicel Group, Ltd. (c) | 8.250% | | 9/30/20 | | 198,500 | |
| USD | 70,000 | | DIRECTV Holdings LLC/DIRECTV Financing Co., Inc. | 6.000% | | 8/15/40 | | 72,708 | |
| USD | 200,000 | | Ford Motor Credit Co. LLC | 2.459% | | 3/27/20 | | 195,824 | |
| USD | 100,000 | | ILFC E-Capital Trust I (b) (c) | 4.690% | | 12/21/65 | | 97,750 | |
| USD | 100,000 | | Kindred Healthcare, Inc. (c) | 8.750% | | 1/15/23 | | 110,625 | |
| USD | 165,000 | | KLX, Inc. (c) | 5.875% | | 12/1/22 | | 166,650 | |
| USD | 130,000 | | Meccanica Holdings USA, Inc. (c) (e) | 6.250% | | 1/15/40 | | 127,725 | |
| USD | 65,000 | | Medtronic, Inc. (c) | 3.150% | | 3/15/22 | | 65,496 | |
| USD | 80,000 | | Merck & Co., Inc. | 2.750% | | 2/10/25 | | 76,671 | |
| EUR | 100,000 | | PPG Industries, Inc. | 1.400% | | 3/13/27 | | 102,520 | |
| USD | 130,000 | | QUALCOMM, Inc. | 4.800% | | 5/20/45 | | 117,701 | |
| USD | 200,000 | | RCN Telecom Services LLC (c) | 8.500% | | 8/15/20 | | 209,750 | |
| USD | 50,000 | | Sprint Corp. | 7.125% | | 6/15/24 | | 45,875 | |
| EUR | 50,000 | | The Goldman Sachs Group, Inc. | 2.000% | | 7/27/23 | | 55,595 | |
| USD | 40,000 | | The Priceline Group, Inc. | 3.650% | | 3/15/25 | | 39,255 | |
| USD | 150,000 | | TransDigm, Inc. | 6.000% | | 7/15/22 | | 150,375 | |
| USD | 140,000 | | Trinity Industries, Inc. | 4.550% | | 10/1/24 | | 137,186 | |
| USD | 27,000 | | Verizon Communications, Inc. | 5.012% | | 8/21/54 | | 25,060 | |
| USD | 28,000 | | Verizon Communications, Inc. | 6.550% | | 9/15/43 | | 33,196 | |
| USD | 100,000 | | West Corp. (c) | 5.375% | | 7/15/22 | | 95,375 | |
| USD | 57,000 | | Weyerhaeuser Co. | 7.375% | | 3/15/32 | | 72,564 | |
| USD | 100,000 | | Zebra Technologies Corp. (c) | 7.250% | | 10/15/22 | | 109,750 | |
| | | | | | | | | 3,744,299 | |
| | | | | | | | | | |
| | | | Total corporate bonds | | | | | | |
| | | | (Cost $10,737,768) | | | | | 10,628,269 | |
| | | | | | | | | | |
| Commercial mortgage-backed securities – 4.83% | | | | | | |
| | | | | | | | | | |
| | | | Germany – 1.44% | | | | | | |
| EUR | 241,990 | | German Residential Funding plc (b) | 1.588% | | 8/27/24 | | 267,759 | |
| EUR | 109,682 | | Juno Eclipse 2007-2, Ltd. (b) | 0.169% | | 11/20/22 | | 118,471 | |
| | | | | | | | | 386,230 | |
| | | | United Kingdom – 2.46% | | | | | | |
| GBP | 99,447 | | Business Mortgage Finance 3 plc (b) | 1.967% | | 11/15/38 | | 158,986 | |
| GBP | 71,000 | | Business Mortgage Finance 3 plc (b) | 4.217% | | 11/15/38 | | 108,127 | |
See notes to financial statements
99
Unconstrained Bond Fund
July 31, 2015 (continued)
Face
amount | | | Coupon | | Maturity | | Value
(note 2) | |
| | | | | | | | | | |
| | | | United Kingdom (continued) | | | | | | |
| GBP | 48,702 | | Business Mortgage Finance 4 plc (b) | 0.967% | | 8/15/45 | $ | 76,004 | |
| GBP | 49,386 | | DECO 12-UK 4 plc (b) | 0.771% | | 1/27/20 | | 73,718 | |
| GBP | 50,000 | | Eddystone Finance plc (b) | 1.344% | | 4/19/21 | | 75,857 | |
| GBP | 108,956 | | Taurus CMBS UK 2014-1, Ltd. (b) | 1.968% | | 5/1/22 | | 169,768 | |
| | | | | | | | | 662,460 | |
| | | | | | | | | | |
| | | | United States – 0.93% | | | | | | |
| USD | 100,000 | | Invitation Homes 2015-SFR2 Trust (b) (c) | 2.186% | | 6/17/32 | | 100,029 | |
| USD | 150,000 | | Progress Residential Series 2014-SFR1 Trust (b) (c) | 1.286% | | 10/17/31 | | 149,250 | |
| | | | | | | | | 249,279 | |
| | | | | | | | | | |
| | | | Total commercial mortgage-backed securities | | | | | | |
| | | | (Cost $1,344,724) | | | | | 1,297,969 | |
| | | | | | | | | | |
| | | | | | | |
| Credit card receivables – 1.78% | | | | | | |
| | | | | | | | | | |
| | | | United Kingdom – 0.77% | | | | | | |
| GBP | 133,000 | | Gracechurch Card Funding plc (b) | 1.009% | | 7/15/21 | | 207,433 | |
| | | | | | | | | | |
| | | | United States – 1.01% | | | | | | |
| USD | 270,000 | | Discover Card Execution Note Trust (b) | 0.617% | | 7/15/21 | | 270,510 | |
| | | | | | | | | | |
| | | | Total credit card receivables | | | | | | |
| | | | (Cost $403,000) | | | | | 477,943 | |
| | | | | | | | | | |
| | | | | | | |
| Collateralized loan obligations – 4.15% | | | | | | |
| | | | | | | | | | |
| | | | Ireland – 1.04% | | | | | | |
| EUR | 127,000 | | Bacchus Series 2006-2 plc (b) | 0.777% | | 8/17/22 | | 137,962 | |
| EUR | 130,000 | | Clavos Euro CDO Ltd. (b) | 1.481% | | 4/18/23 | | 142,901 | |
| | | | | | | | | 280,863 | |
| | | | | | | | | | |
| | | | Luxembourg – 0.52% | | | | | | |
| EUR | 130,000 | | Harvest CLO II-A S.A. (b) | 0.707% | | 5/21/20 | | 139,600 | |
| | | | | | | | | | |
| | | | Netherlands – 2.59% | | | | | | |
| EUR | 250,000 | | Dalradian European CLO III BV (b) | 0.631% | | 4/11/23 | | 271,281 | |
| EUR | 100,000 | | Highlander Euro CDO II BV (b) | 0.636% | | 12/14/22 | | 102,399 | |
| EUR | 100,000 | | Hyde Park CDO BV (b) | 0.699% | | 6/14/22 | | 106,752 | |
| EUR | 100,000 | | Jubilee BV (b) | 2.969% | | 7/12/28 | | 110,201 | |
| EUR | 100,000 | | Jubilee CDO VI BV (b) | 0.696% | | 9/20/22 | | 105,704 | |
| | | | | | | | | 696,337 | |
| | | | | | | | | | |
| | | | Total collateralized loan obligations | | | | | | |
| | | | (Cost $1,498,779) | | | | | 1,116,800 | |
See notes to financial statements
100
Unconstrained Bond Fund
July 31, 2015 (continued)
| Face | | | | | | | | Value | |
| amount | | | Coupon | | Maturity | | | (note 2) | |
| | | | | | | | | | | |
| Residential mortgage-backed securities – 9.14% | | | | | | | |
| | | | | | | | | | | |
| | | | Australia – 0.91% | | | | | | | |
| EUR | 113,538 | | Interstar Millennium Series 2004-1E Trust (b) | 0.452% | | 5/7/36 | | $ | 122,017 | |
| GBP | 81,943 | | Interstar Millennium Series 2004-4E Trust (b) | 0.927% | | 11/14/36 | | | 123,533 | |
| | | | | | | | | | 245,550 | |
| | | | | | | | | | | |
| | | | Netherlands – 1.67% | | | | | | | |
| EUR | 200,000 | | Dolphin Master Issuer BV (b) | 0.835% | | 9/28/99 | | | 224,559 | |
| EUR | 200,000 | | Storm 2015 – IV BV (b) | 1.238% | | 8/22/54 | | | 224,451 | |
| | | | | | | | | | 449,010 | |
| | | | | | | | | | | |
| | | | United Kingdom – 6.56% | | | | | | | |
| GBP | 119,000 | | Eurosail 2006-1 plc (b) | 0.829% | | 6/10/44 | | | 163,843 | |
| EUR | 140,000 | | Eurosail 2006-1 plc (b) | 0.237% | | 6/10/44 | | | 135,510 | |
| GBP | 140,871 | | Eurosail 2006-2bl plc (b) | 0.731% | | 12/15/44 | | | 212,348 | |
| GBP | 50,000 | | Eurosail-UK 2007-2np plc (b) | 0.821% | | 3/13/45 | | | 61,755 | |
| EUR | 100,464 | | Granite Master Issuer plc (b) | 0.149% | | 12/20/54 | | | 109,926 | |
| USD | 157,576 | | Granite Master Issuer plc (b) | 0.268% | | 12/20/54 | | | 156,584 | |
| GBP | 147,091 | | Money Partners Securities 4 plc (b) | 0.951% | | 3/15/40 | | | 218,432 | |
| GBP | 85,850 | | Newgate Funding 2007-1 (b) | 0.698% | | 12/1/50 | | | 131,563 | |
| GBP | 142,067 | | RMAC 2005-NS3 plc (b) | 0.931% | | 6/12/43 | | | 207,340 | |
| GBP | 40,995 | | Southern Pacific Financing 05-B plc (b) | 0.749% | | 6/10/43 | | | 59,954 | |
| GBP | 104,000 | | Warwick Finance Residential Mortgages | | | | | | | |
| | | | Number One plc Class B (b) | 1.834% | | 9/21/49 | | | 156,171 | |
| GBP | 100,000 | | Warwick Finance Residential Mortgages | | | | | | | |
| | | | Number one plc Class C (b) | 2.134% | | 9/21/49 | | | 149,896 | |
| | | | | | | | | | 1,763,322 | |
| | | | | | | | | | | |
| | | | Total residential mortgage-backed securities | | | | | | | |
| | | | (Cost $2,674,238) | | | | | | 2,457,882 | |
| | | | | | | | | | | |
| Sovereign debt obligations – 16.53% | | | | | | | |
| CAD | 138,927 | | Canadian Government Bond (f) | 1.250% | | 12/1/47 | | | 131,107 | |
| EUR | 2,043,378 | | Italy Buoni Poliennali Del Tesoro (f) | 2.350% | | 9/15/19 | | | 2,448,919 | |
| MXN | 6,566,100 | | Mexican Bonos | 10.000% | | 12/5/24 | | | 523,313 | |
| NZD | 434,000 | | New Zealand Government Bond (f) | 4.500% | | 2/15/16 | | | 437,069 | |
| RON | 390,000 | | Romania Government Bond | 5.950% | | 6/11/21 | | | 111,421 | |
| EUR | 718,000 | | Spain Government Bond | 0.500% | | 10/31/17 | | | 794,182 | |
| | | | | | | | | | | |
| | | | Total sovereign debt obligations | | | | | | | |
| | | | (Cost $4,848,068) | | | | | | 4,446,011 | |
See notes to financial statements
101
Unconstrained Bond Fund
July 31, 2015 (continued)
| Face | | | | | | | | Value | |
| amount | | | Coupon | | Maturity | | | (note 2) | |
| | | | | | | | | | | |
| US government obligations – 3.03% | | | | | | | |
| | | | | | | | | | | |
| | | | United States – 3.03% | | | | | | | |
| USD | 815,000 | | United States Treasury Bill | 0.010% | | 10/22/15 | | $ | 814,914 | |
| | | | | | | | | | | |
| | | | Total US government obligations | | | | | | | |
| | | | (Cost $814,939) | | | | | | 814,914 | |
| | | | | | | | | | | |
| | | | Total long-term investments | | | | | | | |
| | | | (Cost $22,836,066) | | | | | | 21,754,316 | |
| | | | | | | | | | |
| Shares | | | | | | | | | |
| | | | | | | | | | | |
| Short-term investment – 13.46% | | | | | | | |
| | 3,620,316 | | Fidelity Institutional Treasury Portfolio | | | | | | 3,620,316 | |
| | | | | | | | | | | |
| | | | Total short-term investment | | | | | | | |
| | | | (Cost $3,620,316) | | | | | | 3,620,316 | |
| Total investments (h) – 94.37% | | | | | | | |
| | | | (Cost $26,456,382) | | | | | | 25,374,632 | |
Financial Derivative Instruments, net (Cost or Premiums, net $154,756) (i) – 0.72% | | | 194,421 | |
| Net other assets and liabilities – 4.91% | | | | | | 1,320,947 | |
| Total net assets – 100.00% | | | | | $ | 26,890,000 | |
| | (a) | Maturity date is perpetual. Maturity date presented represents the next call date. |
| | (b) | Variable or floating rate interest rate security. Includes fixed-to-floating rate corporate bond securities that currently pay a fixed coupon that will move to a floating rate coupon if the bond is not redeemed at the call date. Rate presented represents rate at July 31, 2015. |
| | (c) | Restricted security, purchased pursuant to Rule 144A under the Securities Act of 1933, as amended, and which is exempt from registration under that Act. At July 31, 2015, the restricted securities held by the Fund had an aggregate value of $2,860,737, which represented 10.6% of net assets. |
| | (d) | Delayed delivery security. Rate shown is in effect at August 21, 2015 (dated date). |
| | (e) | The security has been deemed illiquid by the Adviser according to the policies and procedures adopted by the Board of Trustees. |
| | (f) | Indexed security in which both the coupon and principal are adjusted in line with movements in the inflation index in that sovereign market. |
| | (g) | Fair valued at July 31, 2015 as determined in good faith using procedures approved by the Board of Trustees. |
| | (h) | All or a portion of these securities and short-term investments were segregated for open futures contracts, forward foreign currency contracts, options and swap contracts at July 31, 2015. |
| | (i) | Information with respect to financial derivative instruments is disclosed in the following tables. |
See notes to financial statements
102
Unconstrained Bond Fund
July 31, 2015 (continued)
(i) FINANCIAL DERIVATIVE INSTRUMENTS
EXCHANGE-TRADED OR CENTRALLY-CLEARED FINANCIAL DERIVATIVE INSTRUMENTS
FUTURES CONTRACTS
| | | | | | | | | | Current | | Unrealized |
| | | | Number of | | | Expiration | | | notional | | appreciation/(depreciation) |
| | | | contracts | | | date | | | value | | | Asset | | | Liability | |
| Canadian 10 Year Bond (Short) | | | (4 | ) | | 09/21/15 | | $ | 437,604 | | $ | — | | $ | (13,038 | ) |
| Euro-BOBL (Short) | | | (4 | ) | | 09/08/15 | | | 572,452 | | | — | | | (4,353 | ) |
| UK Long Gilt (Short) | | | (6 | ) | | 09/28/15 | | | 1,099,090 | | | — | | | (4,637 | ) |
| US Treasury 10 Year Note (Short) | | | (11 | ) | | 09/21/15 | | | 1,401,813 | | | — | | | (3,798 | ) |
| US Treasury Long Bond (Short) | | | (5 | ) | | 09/21/15 | | | 779,688 | | | — | | | (10,789 | ) |
| Total | | | | | | | | | | | $ | — | | $ | (36,615 | ) |
During the year ended July 31, 2015, average monthly notional value related to futures contracts was approximately $7.0 million, or 26.0% of net assets.
PURCHASED OPTIONS
| | | | | | | | | | | | | | | | Unrealized | | | | | | | | |
| | | | # of | | | Put/ | | | Exercise | | | Expiration | | | appreciation/ | | | | | | | | |
| Description | | | Contracts | | | Call | | | Price | | | Date | | | (depreciation) | | | | Cost | | | Value | |
| 30 Year US Treasury | | | | | | | | | | | | | | | | | | | | | | | |
| Bond Future | | | 10 | | | Put | | $ | 143 | | | 08/21/15 | | $ | (12,520 | ) | | $ | 12,676 | | $ | 156 | |
| 30 Year US Treasury | | | | | | | | | | | | | | | | | | | | | | | |
| Bond Future | | | 9 | | | Put | | $ | 140 | | | 09/25/15 | | | (10,284 | ) | | | 10,988 | | | 703 | |
| Total | | | | | | | | | | | | | | $ | (22,804 | ) | | $ | 23,664 | | $ | 859 | |
SWAP CONTRACTS
Interest Rate Swap Contracts
| | | | Notional | | | Fund | | | | | | Annual | | | | | | Unrealized | |
| | | amounts | | Pays/Receives | | | | | | Fixed | | | Termination | | appreciation/(depreciation) | |
| Exchange | | | (000s) | | | Floating Rate | | | Floating Rate Index | | | Rate | | | Date | | | Asset | | | Liability | |
| LCH | | $ | 430 | | | Receives | | | 3-month USD LIBOR | | | 3.2500 | % | | 05/14/35 | | $ | — | | $ | (4,072 | ) |
| LCH | | | 999 | | | Pays | | | 6-month EURIBOR | | | 0.4700 | % | | 05/05/20 | | | — | | | (2,142 | ) |
| LCH | | | 920 | | | Pays | | | 3-month USD LIBOR | | | 3.1035 | % | | 05/14/45 | | | 4,692 | | | — | |
| LCH | | | 637 | | | Receives | | | 6-month EURIBOR | | | 1.3387 | % | | 05/05/35 | | | 35,839 | | | — | |
| LCH | | | 4,201 | | | Receives | | | 6-month GBP LIBOR | | | 1.9700 | % | | 06/19/19 | | | — | | | (4,024 | ) |
| LCH | | | 1,351 | | | Pays | | | 6-month EURIBOR | | | 0.3950 | % | | 06/02/19 | | | — | | | (2,341 | ) |
| LCH | | | 2,372 | | | Pays | | | 6-month EURIBOR | | | 0.5830 | % | | 06/08/19 | | | 4,596 | | | — | |
| LCH | | | 588 | | | Receives | | | 6-month EURIBOR | | | 1.9160 | % | | 12/31/34 | | | 4,716 | | | — | |
| LCH | | | 990 | | | Receives | | | 3-month USD LIBOR | | | 3.4270 | % | | 09/22/26 | | | — | | | (73,950 | ) |
| LCH | | | 1,840 | | | Pays | | | 3-month USD LIBOR | | | 3.1000 | % | | 09/22/21 | | | 80,842 | | | — | |
| LCH | | | 895 | | | Pays | | | 6-month EURIBOR | | | 0.4750 | % | | 12/31/19 | | | 697 | | | — | |
| LCH | | | 1,800 | | | Receives | | | 3-month USD LIBOR | | | 3.6300 | % | | 10/06/34 | | | — | | | (65,961 | ) |
| LCH | | | 2,140 | | | Pays | | | 3-month USD LIBOR | | | 3.4630 | % | | 10/06/44 | | | 51,627 | | | — | |
| LCH | | | 4,248 | | | Receives | | | 6-month GBP LIBOR | | | 2.2300 | % | | 06/18/20 | | | — | | | (6,663 | ) |
| LCH | | | 3,965 | | | Pays | | | 6-month EURIBOR | | | 0.6200 | % | | 06/19/19 | | | 15,505 | | | — | |
| LCH | | | 4,154 | | | Pays | | | 6-month GBP LIBOR | | | 1.5600 | % | | 06/17/18 | | | 2,048 | | | — | |
| LCH | | | 875 | | | Pays | | | 6-month GBP LIBOR | | | 2.2400 | % | | 07/28/22 | | | 2,469 | | | — | |
| LCH | | | 453 | | | Receives | | | 6-month GBP LIBOR | | | 2.4040 | % | | 07/28/27 | | | — | | | (2,777 | ) |
| Total | | | | | | | | | | | | | | | | | $ | 203,031 | | $ | (161,930 | ) |
LCH London Clearing House
See notes to financial statements
103
Unconstrained Bond Fund
July 31, 2015 (continued)
Credit Default Swap Contracts
| | | | | | | | | | | | | | | | | | | Upfront | | | | | | | | | | |
| | | | | | | Rates | | | | | | Implied | | | Notional | | premiums | | Unrealized | | | | | | | |
| | | Reference | | received/ | | Termination | | | credit | | | amount | | | paid/ | | appreciation/ | | | Value | |
| Counterparty | | | entity | | | (paid | ) | | date | | | spread | | | (000s) | | (received) | | (depreciation) | | | Asset | | | Liability | |
| | | | | | | | | | | | | | | | | | | | | | | | | | | | | |
| Protection purchased: | | | | | | | | | | | | | | | | | | | | | | | | | | | | |
| ICE | | | North America | | | | | | | | | | | | | | | | | | | | | | | | | |
| | | | High Yield 5-Year | | | | | | | | | | | | | | | | | | | | | | | | | |
| | | | Index, Series 24 | | | (5.00 | )% | | 06/20/20 | | | 3.53 | % | | 1,520 | | $ | (107,540 | ) | $ | 12,168 | | $ | — | | $ | (95,372 | ) |
| Total | | | | | | | | | | | | | | | | | $ | (107,540 | ) | $ | 12,168 | | $ | — | | $ | (95,372 | ) |
ICE InterContinental Exchange
| | | Cost or Premiums, net | | | Asset | | | Liability | |
| TOTAL CENTRALLY-CLEARED SWAP CONTRACTS | | $ | (107,540 | ) | $ | 203,031 | | $ | (257,302 | ) |
FINANCIAL DERIVATIVE INSTRUMENTS: EXCHANGE-TRADED OR CENTRALLY-CLEARED SUMMARY
The following is a summary of the value of exchange-traded or centrally-cleared financial derivative instruments as of July 31, 2015.
| | | | Unrealized | | | | | | | | | | | | Unrealized | | | | | | | | | | |
| | | | Appreciation | | | Value | | | Value(1) | | | | | | Depreciation | | | Value | | | Value(1) | | | | |
| | | | Futures | | | Purchased | | | Swap | | | | | | Futures | | | Written | | | Swap | | | | |
| | | | Contracts | | | Options | | | Contracts | | | Total | | | Contracts | | | Options | | | Contracts | | | Total | |
| Total Exchange-Traded or | | | | | | | | | | | | | | | | | | | | | | | | | |
| Centrally Cleared | | $ | — | | $ | 859 | | $ | 203,031 | | $ | 203,890 | | $ | (36,615 | ) | $ | — | | $ | (257,302 | ) | $ | (293,917 | ) |
| | (1) | Value on swap contracts is represented by “unrealized appreciation/(depreciation)” on interest rate swaps, and “value” on credit default swaps, which is inclusive of upfront premiums paid/(received). |
See notes to financial statements
104
Unconstrained Bond Fund
July 31, 2015 (continued)
OVER-THE-COUNTER FINANCIAL DERIVATIVE INSTRUMENTS
FORWARD FOREIGN CURRENCY CONTRACTS
| | | | | | | | | | | | | | | Unrealized | |
| | | | | | | | | Local | | Current | | appreciation/ | |
| | | | | | Value | | amount | | notional | | (depreciation) | |
| | | Counterparty | | date | | (000’s | ) | value | | Asset | | Liability | |
| British Pound (Long) | | | Citibank, N.A. | | | 9/11/15 | | | 308 | | $ | 481,384 | | $ | 2,156 | | $ | — | |
| British Pound (Long) | | | Deutsche Bank AG | | | 9/11/15 | | | 88 | | | 137,876 | | | 3,915 | | | — | |
| British Pound (Short) | | | Morgan Stanley | | | | | | | | | | | | | | | | |
| | | | Capital Services LLC | | | 9/11/15 | | | 4,190 | | | 6,540,811 | | | — | | | (128,636 | ) |
| Canadian Dollar (Short) | | | Morgan Stanley | | | | | | | | | | | | | | | | |
| | | | Capital Services LLC | | | 9/11/15 | | | 197 | | | 150,399 | | | 8,933 | | | — | |
| Euro (Short) | | | Citibank, N.A. | | | 9/11/15 | | | 4,845 | | | 5,323,313 | | | 122,203 | | | — | |
| Euro (Short) | | | Deutsche Bank AG | | | 9/11/15 | | | 87 | | | 96,051 | | | 2,409 | | | — | |
| Euro (Short) | | | Morgan Stanley | | | | | | | | | | | | | | | | |
| | | | Capital Services LLC | | | 9/11/15 | | | 5,276 | | | 5,797,201 | | | 146,451 | | | — | |
| Indian Rupee (Long) | | | Deutsche Bank AG | | | 9/11/15 | | | 6,602 | | | 102,558 | | | 1,286 | | | — | |
| Japanese Yen (Long) | | | Morgan Stanley | | | | | | | | | | | | | | | | |
| | | | Capital Services LLC | | | 9/11/15 | | | 32,777 | | | 264,582 | | | — | | | (2,268 | ) |
| Mexican Peso (Long) | | | Citibank, N.A. | | | 9/11/15 | | | 1,584 | | | 98,035 | | | 3,229 | | | — | |
| New Zealand Dollar (Short) | | | Citibank, N.A. | | | 9/11/15 | | | 631 | | | 414,927 | | | 32,118 | | | — | |
| New Zealand Dollar (Short) | | | Morgan Stanley | | | | | | | | | | | | | | | | |
| | | | Capital Services LLC | | | 9/11/15 | | | 59 | | | 38,515 | | | 1,485 | | | — | |
| Romanian Leu (Short) | | | Citibank, N.A. | | | 9/11/15 | | | 467 | | | 116,309 | | | 774 | | | — | |
| Total | | | | | | | | | | | | | | $ | 324,959 | | $ | (130,904 | ) |
During the year ended July 31, 2015, average monthly notional value related to forward foreign currency contracts was approximately $24.5 million or 91.3% of net assets.
See notes to financial statements
105
Unconstrained Bond Fund
July 31, 2015 (continued)
PURCHASED OPTIONS
Currency Options
| | | | | | | | | | | | | | | | | | | Unrealized | | | | | | | |
| | | | | | | Notional/ | | | Put/ | | | Exercise | | | Expiration | | | appreciation/ | | | | | | | |
| Description | | | Counterparty | | | Contracts | | | Call | | | Rate | | | Date | | | (depreciation | ) | | Cost | | | Value | |
| US Dollar vs. Korean Won | | | Barclays Bank plc | | | 630,000 USD | | | Call | | | 1,175 | | | 12/23/15 | | $ | (1,335 | ) | $ | 15,328 | | $ | 13,993 | |
| US Dollar vs. Korean Won | | | JP Morgan Chase | | | | | | | | | | | | | | | | | | | | | | |
| | | | Bank, N.A. | | | 580,000 USD | | | Call | | | 1,125 | | | 11/12/15 | | | 13,330 | | | 11,440 | | | 24,770 | |
| Euro vs. US Dollar | | | Barclays Bank plc | | | 910,000 EUR | | | Put | | | 1.050 | | | 12/03/15 | | | (2,589 | ) | | 10,957 | | | 8,368 | |
| New Zealand Dollar | | | JP Morgan Chase | | | | | | | | | | | | | | | | | | | | | | |
| vs. US Dollar | | | Bank, N.A. | | | 810,000 NZD | | | Put | | | 0.675 | | | 08/11/15 | | | 4,400 | | | 10,311 | | | 14,711 | |
| Total | | | | | | | | | | | | | | | | | $ | 13,806 | | $ | 48,036 | | $ | 61,842 | |
Interest Rate Swaptions
| | | | | | | | | | | | | | | | | | | Unrealized | | | | | | | |
| | | | | | | Notional/ | | | Put/ | | | Exercise | | | Expiration | | | appreciation/ | | | | | | | |
| Description | | | Counterparty | | | Contracts | | | Call | | | Rate | | | Date | | | (depreciation | ) | | Cost | | | Value | |
| OTC 10-Year Interest | | | | | | | | | | | | | | | | | | | | | | | | | |
| Rate Swap (Pay 4%, | | | Deutsche | | | | | | | | | | | | | | | | | | | | | | |
| Receive 3-month LIBOR) | | | Bank AG | | | 4,100,000 USD | | | Put | | | 4 | % | | 4/18/16 | | $ | (97,263 | ) | $ | 101,680 | | $ | 4,417 | |
| OTC 30-Year Interest | | | | | | | | | | | | | | | | | | | | | | | | | |
| Rate Swap (Pay 3%, | | | | | | | | | | | | | | | | | | | | | | | | | |
| Receive 6-month | | | | | | | | | | | | | | | | | | | | | | | | | |
| EURIBOR) | | | Citibank, N.A. | | | 1,000,000 EUR | | | Put | | | 3 | % | | 4/17/19 | | | (91,600 | ) | | 130,537 | | | 38,937 | |
| OTC 5-Year Interest | | | | | | | | | | | | | | | | | | | | | | | | | |
| Rate Swap (Pay 2.75%, | | | Deutsche | | | | | | | | | | | | | | | | | | | | | | |
| Receive 3-month LIBOR) | | | Bank AG | | | 6,200,000 USD | | | Put | | | 2.75 | % | | 12/18/15 | | | (49,007 | ) | | 54,250 | | | 5,243 | |
| OTC 30-Year Interest | | | | | | | | | | | | | | | | | | | | | | | | | |
| Rate Swap (Pay 4%, | | | JP Morgan | | | | | | | | | | | | | | | | | | | | | | |
| Receive 3-month LIBOR) | | | Chase Bank | | | 1,510,000 USD | | | Put | | | 4 | % | | 6/20/16 | | | (5,363 | ) | | 13,002 | | | 7,639 | |
| OTC 2-Year Interest Rate | | | | | | | | | | | | | | | | | | | | | | | | | |
| Swap (Pay 1.55%, | | | | | | | | | | | | | | | | | | | | | | | | | |
| Receive 3-month LIBOR) | | | Citibank, N.A. | | | 5,400,000 USD | | | Put | | | 1.55 | % | | 12/7/15 | | | (7,606 | ) | | 12,420 | | | 4,814 | |
| Total | | | | | | | | | | | | | | | | | $ | (250,839 | ) | $ | 311,889 | | $ | 61,050 | |
| | | | Cost | | | Value | |
| TOTAL OVER-THE-COUNTER PURCHASED OPTIONS | | $ | 359,925 | | $ | 122,892 | |
WRITTEN OPTIONS
Currency Options
| | | | | | | | | | | | | | | | | | | | | | | | | | |
| | | | | | | | | | | | | | | | | | | Unrealized | | | | | | | |
| | | | | | | Notional/ | | | Put/ | | | Exercise | | | Expiration | | | appreciation/ | | | Premiums | | | | |
| Description | | | Counterparty | | | Contracts | | | Call | | | Rate | | | Date | | | (depreciation | ) | | Received | | | Value | |
| US Dollar vs. Korean Won | | | Barclays Bank plc | | (630,000) USD | | | Call | | | 1,250 | | | 12/23/15 | | $ | 2,924 | | $ | (7,566 | ) | $ | (4,642 | ) |
| US Dollar vs. Korean Won | | | JP Morgan Chase | | | | | | | | | | | | | | | | | | | | | |
| | | | Bank, N.A. | | | (580,000) USD | | | Call | | | 1,200 | | | 11/12/15 | | | (2,279 | ) | | (4,219 | ) | | (6,498 | ) |
| New Zealand Dollar | | | JP Morgan Chase | | | | | | | | | | | | | | | | | | | | | |
| vs. US Dollar | | | Bank, N.A. | | | (810,000) NZD | | | Put | | | 0.625 | | | 08/11/15 | | | 3,690 | | | (3,828 | ) | | (138 | ) |
| Total | | | | | | | | | | | | | | | | | $ | 4,335 | | $ | (15,613 | ) | $ | (11,278 | ) |
See notes to financial statements
106
Unconstrained Bond Fund
July 31, 2015 (continued)
Interest Rate Swaptions
| | | | | | | | | | | | | | | | | | | Unrealized | | | | | | | |
| | | | | | | Notional/ | | | Put/ | | | Exercise | | | Expiration | | | appreciation/ | | | Premiums | | | | |
| Description | | | Counterparty | | | Contracts | | | Call | | | Rate | | | Date | | | (depreciation | ) | | Received | | | Value | |
| OTC 10-Year Interest | | | | | | | | | | | | | | | | | | | | | | | | | |
| Rate Swap (Pay 3-month | | | Deutsche | | | | | | | | | | | | | | | | | | | | | | |
| LIBOR, Receive 5%) | | | Bank AG | | | (4,100,000) USD | | | Put | | | 5 | % | | 4/18/16 | | $ | 31,772 | | $ | (32,390 | ) | $ | (618 | ) |
| OTC 30-Year Interest Rate | | | | | | | | | | | | | | | | | | | | | | | | | |
| Swap (Pay 6-month | | | | | | | | | | | | | | | | | | | | | | | | | |
| EURIBOR, Receive 4%) | | | Citibank, N.A. | | | (1,000,000) EUR | | | Put | | | 4 | % | | 4/17/19 | | | 45,439 | | | (57,671 | ) | | (12,232 | ) |
| OTC 5-Year Interest Rate | | | | | | | | | | | | | | | | | | | | | | | | | |
| Swap (Pay 3-month | | | Deutsche | | | | | | | | | | | | | | | | | | | | | | |
| LIBOR, Receive 3.75%) | | | Bank AG | | | (6,200,000) USD | | | Put | | | 4 | % | | 12/18/15 | | | 8,908 | | | (9,300 | ) | | (392 | ) |
| OTC 30-Year Interest Rate | | | | | | | | | | | | | | | | | | | | | | | | | |
| Swap (Pay 3-month | | | JP Morgan Chase | | | | | | | | | | | | | | | | | | | | | | |
| EURIBOR, Receive 2.82%) | | | Bank, N.A. | | | (1,120,000) EUR | | | Put | | | 2.82 | % | | 6/20/16 | | | 7,384 | | | (13,034 | ) | | (5,649 | ) |
| Total | | | | | | | | | | | | | | | | | $ | 93,503 | | $ | (112,395 | ) | $ | (18,891 | ) |
| | | | Premiums Received | | | Value | |
| TOTAL OVER-THE-COUNTER WRITTEN OPTIONS | | $ | (128,008 | ) | $ | (30,169 | ) |
SWAP CONTRACTS
Interest Rate Swap Contracts
| | | | Notional | | | Fund | | | | | | Annual | | | | | Unrealized | |
| | | | amounts | | | Pays/Receives | | | | | | Fixed | | | Termination | | appreciation/(depreciation) | |
| Counterparty | | | (000s | ) | | Floating Rate | | | Floating Rate Index | | | Rate | | | Date | | | Asset | | | Liability | |
| Citibank N.A. | | $ | 222 | | | Receives | | | 3-month CAD CDOR | | | 2.128 | % | | 10/20/20 | | $ | — | | $ | (2,546 | ) |
| Citibank N.A. | | | 256 | | | Pays | | | 1-month MXN – TIIE - Banxico | | | 6.428 | | | | | | | | | — | |
| Total | | | | | | | | | | | | | | | | | $ | 1,583 | | $ | (2,546 | ) |
Inflation Swap Contracts
| | | | Notional | | | Fund | | | | | | Annual | | | | | Unrealized | |
| | | | amounts | | | Pays/Receives | | | | | | Fixed | | | Termination | | appreciation/(depreciation) | |
| Counterparty | | | (000s | ) | | Floating Rate | | | Floating Rate Index | | | Rate | | | Date | | | Asset | | | Liability | |
| Barclays Bank plc | | $ | 280 | | | Receives | | | US Consumer Price Index | | | 2.1975 | % | | 02/12/45 | | $ | — | | $ | (6,372 | ) |
| Barclays Bank plc | | | 796 | | | Pays | | | UK Retail Price Index | | | 2.9100 | | | 07/15/20 | | | 1,252 | | | — | |
| JP Morgan Chase Bank, N.A. | | | 140 | | | Receives | | | US Consumer Price Index | | | 2.2250 | | | 02/24/45 | | | — | | | (3,717 | ) |
| JP Morgan Chase Bank, N.A. | | | 796 | | | Pays | | | UK Retail Price Index | | | 2.8900 | | | 07/15/20 | | | 417 | | | — | |
| Citibank N.A. | | | 340 | | | Receives | | | US Consumer Price Index | | | 2.1750 | | | 05/29/45 | | | — | | | (2,864 | ) |
| Citibank N.A. | | | 187 | | | Pays | | | UK Retail Price Index | | | 3.4850 | | | 05/15/45 | | | 1,155 | | | — | |
| Total | | | | | | | | | | | | | | | | | $ | 2,824 | | $ | (12,953 | ) |
See notes to financial statements
107
Unconstrained Bond Fund
July 31, 2015 (continued)
Credit Default Swap Contracts
| | | | | | | | | | | | | | | | | | Upfront | | | | | | | | | | |
| | | | | | | Rates | | | | | | | | Notional | | premiums | | Unrealized | | | | | | | |
| | | | | | | received/ | | Termination | | | credit | | | amount | | | paid/ | | appreciation/ | | Value | |
| Counterparty | | | | | | (paid | ) | | date | | | spread | | | (000s | ) | | (received | ) | (depreciation | ) | | Asset | | | Liability | |
| Protection sold: | | | | | | | | | | | | | | | | | | | | | | | | | | | | |
| Citibank N.A. | | | ConvaTec | | | | | | | | | | | | | | | | | | | | | | | | | |
| | | | Healthcare | | | 5.00 | % | | 9/20/20 | | | 1.75 | % | $ | 55 | | $ | 6,715 | | $ | 2,047 | | $ | 8,762 | | $ | — | |
| Total | | | | | | | | | | | | | | | | | $ | 6,715 | | $ | 2,047 | | $ | 8,762 | | $ | — | |
| | | | Cost or Premiums, net | | | Asset | | | Liability | |
| TOTAL OVER-THE-COUNTER SWAP CONTRACTS | | $ | 6,715 | | $ | 13,169 | | $ | (15,499 | ) |
During the year ended July 31, 2015, average monthly notional value related to swap contracts, including both centrally-cleared and over-the-counter, was approximately $40.6 million or 150.9% of net assets.
FINANCIAL DERIVATIVE INSTRUMENTS: OVER-THE-COUNTER SUMMARY
The following is a summary by counterparty of the value of over-the-counter financial derivative instruments and collateral (received)/pledged as of July 31, 2015.
| | | Unrealized | | | | | | | | | | | Unrealized | | | | | | | | | | | | | | | | | | | |
| | | Appreciation | | Value | | | | | | | | Depreciation | | | Value | | Value(1) | | | | | | | | | | | | | |
| | | Forward | | | | | | | | | | | Forward | | | | | | | | | | | Net | | | | | | | |
| | | Foreign | | | | | | | | Total | | Foreign | | | | | | | | Total | | Value | | Collateral | | | | |
| | | Currency | | Purchased | | Swap | | Over-the | | Currency | | Written | | Swap | | Over-the | | of OTC | | (Received) / | | Net | |
| | | Contracts | | Options | | Contracts | | Counter | | Contracts | | Options | | Contracts | | Counter | | Derivatives | | Pledged | | Exposure(2) | |
| | | | | |
| Amounts subject to a master netting agreement: | | | | |
| Barclays Bank plc | | $ | — | | $ | 22,361 | | $ | 1,252 | | $ | 23,613 | | $ | — | | $ | (4,642 | ) | $ | (6,372 | ) | $ | (11,014 | ) | $ | 12,599 | | $ | — | | $ | 12,599 | |
| Citibank, N.A. | | | 160,480 | | | 43,751 | | | 11,500 | | | 215,731 | | | — | | | (12,232 | ) | | (5,410 | ) | | (17,642 | ) | | 198,089 | | | — | | | 198,089 | |
| Deutsche Bank AG | | | 7,610 | | | 9,660 | | | — | | | 17,270 | | | — | | | (1,010 | ) | | — | | | (1,010 | ) | | 16,260 | | | — | | | 16,260 | |
| JP Morgan Chase Bank, N.A. | | | — | | | 47,120 | | | 417 | | | 47,537 | | | — | | | (12,285 | ) | | (3,717 | ) | | (16,002 | ) | | 31,535 | | | — | | | 31,535 | |
| Morgan Stanley Capital | | | | | | | | | | | | | | | | | | | | | | | | | | | | | | | | | | |
| Services LLC | | | 156,869 | | | — | | | — | | | 156,869 | | | (130,904 | ) | | — | | | — | | | (130,904 | ) | | 25,965 | | | — | | | 25,965 | |
| | | $ | 324,959 | | $ | 122,892 | | $ | 13,169 | | $ | 461,020 | | $ | (130,904 | ) | $ | (30,169 | ) | $ | (15,499 | ) | $ | (176,572 | ) | $ | 284,448 | | $ | — | | $ | 284,448 | |
| | (1) | Value on swap contracts is represented by “unrealized appreciation/(depreciation)” on interest rate and inflation swaps, and “value” on credit default swaps, which is inclusive of upfront premiums paid/(received). |
| | (2) | Net Exposure represents the net receivable/(payable) that would be due from/to the counterparty in the event of default. Exposure from over-the-counter financial derivative instruments can only be netted across transactions governed under the same master agreement with the same legal entity. See Note 2, Significant Accounting Policies, “Derivative instruments,” in the Notes to Financial Statements for more information regarding master netting arrangements. |
| | | Cost or Premiums, net | | | Asset | | | Liability | |
| TOTAL FINANCIAL DERIVATIVE INSTRUMENTS | | $ | 154,756 | | $ | 664,910 | | $ | (470,489 | ) |
See notes to financial statements
108
Unconstrained Bond Fund
July 31, 2015 (continued)
Other information:
| Industry concentration as | % of net |
| a percentage of net assets: | assets |
| | | |
| Sovereign | 19.57 | % |
| Whole Loan CMO Other | 6.66 | |
| Other ABS | 5.08 | |
| CMBS Other | 3.90 | |
| Whole Loan CMO Mezzanine | 2.48 | |
| Multi-line Insurance | 2.21 | |
| Real Estate Operations/Development | 2.08 | |
| Life/Health Insurance | 1.62 | |
| Diversified Banking Institution | 1.60 | |
| Property/Casualty Insurance | 1.52 | |
| Telecommunication Services | 1.21 | |
| Cable TV | 1.20 | |
| Aerospace/Defense-Equipment | 1.18 | |
| Finance-Leasing Company | 1.18 | |
| Automobile ABS Other | 1.10 | |
| Auto-Cars/Light Trucks | 1.09 | |
| Credit Card Bullet | 1.01 | |
| Commercial Banks Non-US | 0.98 | |
| Cellular Telecommunications | 0.91 | |
| Medical Labs & Testing Services | 0.86 | |
| Auto/Truck Parts & Equipment-Original | 0.81 | |
| Money Center Banks | 0.81 | |
| Medical-Hospitals | 0.80 | |
| Credit Card Other | 0.77 | |
| Auto Repair Centers | 0.75 | |
| Tobacco | 0.74 | |
| Independent Power Producer | 0.73 | |
| Investment Management & Advising Services | 0.66 | |
| Oil & Gas Refining & Marketing | 0.65 | |
| Oil & Gas Exploration & Production | 0.63 | |
| Building & Construction-Miscellaneous | 0.61 | |
| Telephone-Integrated | 0.61 | |
| Diversified Financial Services | 0.60 | |
| Diversified Manufacturing Operations | 0.51 | |
| Retail-Perfume & Cosmetics | 0.50 | |
| Aerospace/Defense | 0.48 | |
| Applications Software | 0.44 | |
| Building Societies | 0.44 | |
| Computer Data Security | 0.44 | |
| Food-Retail | 0.44 | |
| Semiconductor Components-Integrated Circuits | 0.44 | |
| Travel Services | 0.44 | |
| Reinsurance | 0.43 | |
| Retirement/Aged Care | 0.43 | |
| Machinery-Print Trade | 0.42 | |
| Real Estate Management/Services | 0.42 | |
| Recycling | 0.42 | |
| Rental Auto/Equipment | 0.42 | |
| Retail-Misc/Diversified | 0.42 | |
| Building Products-Cement Aggregates | 0.41 | |
| Building-Heavy Construction | 0.41 | |
| Commercial Services-Finance | 0.41 | |
| Machinery-General Industrials | 0.41 | |
| Medical-Nursing Homes | 0.41 | |
| Power Conversion/Supply Equipment | 0.41 | |
| Theaters | 0.41 | |
| Machinery-Electrical | 0.39 | |
| Paper & Related Products | 0.39 | |
| Chemicals - Diversified | 0.38 | |
| Machinery-Construction & Mining | 0.37 | |
| Coal | 0.34 | |
| Transport-Services | 0.34 | |
| Computers | 0.32 | |
| Electronic Components-Miscellaneous | 0.29 | |
| Medical - Drugs | 0.29 | |
| REITS-Diversified | 0.27 | |
| Medical-Biomedical/Gene | 0.26 | |
| Medical Instruments | 0.24 | |
| Oil Comp-Integrated | 0.17 | |
| E-Commerce/Services | 0.15 | |
| Transport-Rail | 0.13 | |
| Long-Term Investments | 80.90 | |
| Short-Term Investment | 13.46 | |
| Total investments | 94.37 | |
| Financial Derivative Instruments | 0.72 | |
| Net other assets and liabilities | 4.91 | |
| | 100.00 | % |
See notes to financial statements
109
Unconstrained Bond Fund
July 31, 2015 (continued)
Other information:
| Currency exposure of portfolio assets before | | |
| any currency hedging, if applicable. | % of total |
| Excludes derivatives. | investments |
| | | |
| Euro | 39 | % |
| US Dollar | 35 | |
| British Pound | 21 | |
| Mexican Peso | 2 | |
| New Zealand Dollar | 2 | |
| Canadian Dollar | 1 | |
| Romanian Leu | 0 | * |
| | 100 | % |
* Less than 0.05% of total investments.
See notes to financial statements
110
Unconstrained Bond Fund
July 31, 2015 (continued)
Fair Value Measurements
The following table summarizes the Fund’s investments that are measured at fair value by level within the fair value hierarchy at July 31, 2015:
| | | Quoted prices | | | Significant | | | | | | | |
| | | | in active | | | other | | | Significant | | | | |
| | | | markets for | | | observable | | | unobservable | | | | |
| | | identical assets | | | inputs | | | inputs | | | | |
| Description | | | (level 1 | ) | | (level 2 | ) | | (level 3 | ) | | Total | |
| Assets | | | | | | | | | | | | | |
| Auto loan receivables | | | | | | | | | | | | | |
| Germany | | $ | — | | $ | 294,877 | | $ | — | | $ | 219,650 | |
| Luxembourg | | | — | | | 219,650 | | | — | | | 219,650 | |
| Total auto loan receivables | | | — | | | 514,527 | | | — | | | 514,527 | |
| | | | | | | | | | | | | | |
| Corporate bonds | | | | | | | | | | | | | |
| Austria | | | — | | | 105,158 | | | — | | | 105,158 | |
| France | | | — | | | 779,381 | | | — | | | 779,381 | |
| Germany | | | — | | | 462,908 | | | — | | | 462,908 | |
| Ireland | | | — | | | 119,709 | | | — | | | 119,709 | |
| Italy | | | — | | | 106,360 | | | — | | | 106,360 | |
| Jersey | | | — | | | 156,165 | | | — | | | 156,165 | |
| Luxembourg | | | — | | | 619,500 | | | — | | | 619,500 | |
| Netherlands | | | — | | | 694,717 | | | — | | | 694,717 | |
| Singapore | | | — | | | 78,300 | | | — | | | 78,300 | |
| Spain | | | — | | | 109,276 | | | — | | | 109,276 | |
| United Kingdom | | | — | | | 3,652,496 | | | — | | | 3,652,496 | |
| United States | | | — | | | 3,744,299 | | | — | | | 3,744,299 | |
| Total corporate bonds | | | — | | | 10,628,269 | | | — | | | 10,628,269 | |
| | | | | | | | | | | | | | |
| Commercial mortgage-backed securities | | | | | | | | | | | | | |
| Germany | | | — | | | 386,230 | | | — | | | 386,230 | |
| United Kingdom | | | — | | | 662,460 | | | — | | | 662,460 | |
| United States | | | — | | | 249,279 | | | — | | | 249,279 | |
| Total commercial mortgage-backed securities | | | — | | | 1,297,969 | | | — | | | 1,297,969 | |
| | | | | | | | | | | | | | |
| Collateralized loan obligations | | | | | | | | | | | | | |
| Ireland | | | — | | | 280,863 | | | — | | | 280,863 | |
| Luxembourg | | | — | | | 139,600 | | | — | | | 139,600 | |
| Netherlands | | | — | | | 696,337 | | | — | | | 696,337 | |
| Total collateralized loan obligations | | | — | | | 1,116,800 | | | — | | | 1,116,800 | |
| | | | | | | | | | | | | | |
| Credit Card Receivables | | | | | | | | | | | | | |
| United Kingdom | | | — | | | 207,433 | | | — | | | 207,433 | |
| United States | | | — | | | 270,510 | | | — | | | 270,510 | |
| Total Credit Card Receivables | | | — | | | 477,943 | | | — | | | 477,943 | |
See notes to financial statements
111
Unconstrained Bond Fund
July 31, 2015 (continued)
| | | Quoted prices | | | Significant | | | | | | | |
| | | | in active | | | other | | | Significant | | | | |
| | | | markets for | | | observable | | unobservable | | | | |
| | | identical assets | | | inputs | | | inputs | | | | |
| Description | | | (level 1 | ) | | (level 2 | ) | | (level 3 | ) | | Total | |
| Residential mortgage-backed securities | | | | | | | | | | | | | |
| Australia | | $ | — | | $ | 245,550 | | $ | — | | $ | 245,550 | |
| Netherlands | | | — | | | 449,010 | | | — | | | 449,010 | |
| United Kingdom | | | — | | | 1,763,322 | | | — | | | 1,763,322 | |
| Total residential mortgage-backed securities | | | — | | | 2,457,882 | | | — | | | 2,457,882 | |
| | | | | | | | | | | | | | |
| Sovereign debt obligations | | | — | | | 4,446,011 | | | — | | | 4,446,011 | |
| | | | | | | | | | | | | | |
| US government obligations | | | | | | | | | | | | | |
| United States | | | — | | | 814,914 | | | — | | | 814,914 | |
| Total US government obligations | | | — | | | 814,914 | | | — | | | 814,914 | |
| | | | | | | | | | | | | | |
| Short-term investment | | | 3,620,316 | | | — | | | — | | | 3,620,316 | |
| | | | | | | | | | | | | | |
| Total investments | | $ | 3,620,316 | | $ | 21,754,316 | | $ | — | | $ | 25,374,632 | |
| | | | | | | | | | | | | | |
| Financial Derivative Instruments – Assets | | | | | | | | | | | | | |
| Exchange-traded or centrally-cleared | | | 859 | | | 203,031 | | | — | | | 203,890 | |
| Over-the-counter | | | — | | | 461,020 | | | — | | | 461,020 | |
| Total Financial Derivative Instruments – Assets | | | 859 | | | 664,051 | | | — | | | 664,910 | |
| | | | | | | | | | | | | | |
| Financial Derivative Instruments – Liabilities | | | | | | | | | | | | | |
| Exchange-traded or centrally-cleared | | | (36,615 | ) | | (257,302 | ) | | — | | | (293,917 | ) |
| Over-the-counter | | | — | | | (176,572 | ) | | — | | | (176,572 | ) |
| Total Financial Derivative Instruments – Liabilities | | | (36,615 | ) | | (433,874 | ) | | — | | | (470,489 | ) |
During the year ended July 31, 2015, there were no transfers in or out of security levels.
See notes to financial statements
112
Unconstrained Bond Fund
July 31, 2015 (continued)
Fair Value of Financial Derivative Instruments
The following is a summary of the fair valuation of the Fund’s financial derivative instruments categorized by risk exposure:
Fair Values of Financial Derivative Instruments on the Statement of Assets and Liabilities as of July 31, 2015
| | | Derivatives not accounted for as hedging instruments | |
| | | | Foreign | | | | | | | | | | | | | | | | |
| | | | Currency | | | Equity | | | Interest | | | Credit | | | Inflation | | | | |
| | | | Risk | | | Risk | | | Rate Risk | | | Risk | | | Risk | | | Total | |
| Financial Derivative Instruments – Assets | | | | | | | | | | | | | | | | | | | |
| Exchange-Traded or Centrally-Cleared | | | | | | | | | | | | | | | | | | | |
| Futures | | $ | — | | $ | — | | $ | — | | $ | — | | $ | — | | $ | — | |
| Purchased Options | | | — | | | — | | | 859 | | | — | | | — | | | 859 | |
| Swap Contracts | | | — | | | — | | | 203,031 | | | — | | | — | | | 203,031 | |
| | | $ | — | | $ | — | | $ | 203,890 | | $ | — | | $ | — | | $ | 203,890 | |
| | | | | | | | | | | | | | | | | | | | |
| Over-the-Counter | | | | | | | | | | | | | | | | | | | |
| Forward Foreign Currency Contracts | | $ | 324,959 | | $ | — | | $ | — | | $ | — | | $ | — | | $ | 324,959 | |
| Purchased Options | | | 61,842 | | | — | | | 61,050 | | | — | | | — | | | 122,892 | |
| Swap Contracts | | | — | | | — | | | 1,583 | | | 8,762 | | | 2,824 | | | 13,169 | |
| | | $ | 386,801 | | $ | — | | $ | 62,633 | | $ | 8,762 | | $ | 2,824 | | $ | 461,020 | |
| Total | | $ | 386,801 | | $ | — | | $ | 266,523 | | $ | 8,762 | | $ | 2,824 | | $ | 664,910 | |
| | | | | | | | | | | | | | | | | | | | |
| Financial Derivative Instruments – Liabilities | | | | | | | | | | | | | | | | | | | |
| Exchange-Traded or Centrally-Cleared | | | | | | | | | | | | | | | | | | | |
| Futures Contracts | | $ | — | | $ | — | | $ | (36,615 | ) | $ | — | | $ | — | | $ | (36,615 | ) |
| Written Options | | | — | | | — | | | — | | | — | | | — | | | — | |
| Swap Contracts | | | — | | | — | | | (161,930 | ) | | (95,372 | ) | | — | | | (257,302 | ) |
| | | $ | — | | $ | — | | $ | (198,545 | ) | $ | (95,372 | ) | $ | — | | $ | (293,917 | ) |
| | | | | | | | | | | | | | | | | | | | |
| Over-the-Counter | | | | | | | | | | | | | | | | | | | |
| Forward Foreign Currency Contracts | | $ | (130,904 | ) | $ | — | | $ | — | | $ | — | | $ | — | | $ | (130,904 | ) |
| Written Options | | | (11,278 | ) | | — | | | (18,891 | ) | | — | | | — | | | (30,169 | ) |
| Swap Contracts | | | — | | | — | | | (2,546 | ) | | — | | | (12,953 | ) | | (15,499 | ) |
| | | $ | (142,182 | ) | $ | — | | $ | (21,437 | ) | $ | — | | $ | (12,953 | ) | $ | (176,572 | ) |
| Total | | $ | (142,182 | ) | $ | — | | $ | (219,982 | ) | $ | (95,372 | ) | $ | (12,953 | ) | $ | (470,489 | ) |
| Net | | $ | 244,619 | | $ | — | | $ | 46,541 | | $ | (86,610 | ) | $ | (10,129 | ) | $ | 194,421 | |
See notes to financial statements
113
Unconstrained Bond Fund
July 31, 2015 (continued)
Effect of Financial Derivative Instruments on the Statement of Operations for the Year Ended July 31, 2015
| | | Derivatives not accounted for as hedging instruments | |
| | | | Foreign | | | | | | | | | | | | | | | | |
| | | | Currency | | | Equity | | | Interest | | | Credit | | | Inflation | | | | |
| | | | Risk | | | Risk | | | Rate Risk | | | Risk | | | Risk | | | Total | |
Net realized gain/(loss) from financial derivative instruments: | | | | | | | | | | | | | | | | | | | |
| Futures Contracts | | $ | — | | $ | — | | $ | (345,445 | ) | $ | — | | $ | — | | $ | (345,445 | ) |
| Options | | | 136,690 | | | — | | | (29,945 | ) | | — | | | — | | | 106,745 | |
| Forward Foreign Currency Contracts | | | 3,029,714 | | | — | | | — | | | — | | | — | | | 3,029,714 | |
| Swap Contracts | | | — | | | — | | | (405,735 | ) | | (20,211 | ) | | 3,100 | | | (422,846 | ) |
| | | $ | 3,166,404 | | $ | — | | $ | (781,125 | ) | $ | (20,211 | ) | $ | 3,100 | | $ | 2,368,168 | |
Net change in unrealized appreciation/(depreciation) of financial derivative instruments | | | | | | | | | | | | | | | | | | | |
| Futures Contracts | | $ | — | | $ | — | | $ | (22,048 | ) | $ | — | | $ | — | | $ | (22,048 | ) |
| Options | | | 30,506 | | | — | | | (121,045 | ) | | — | | | — | | | (90,539 | ) |
| Forward Foreign Currency Contracts | | | (39,221 | ) | | — | | | — | | | — | | | — | | | (39,221 | ) |
| Swap Contracts | | | — | | | — | | | 120,832 | | | 25,625 | | | (7,120 | ) | | 139,337 | |
| | | $ | (8,715 | ) | $ | — | | $ | (22,261 | ) | $ | 25,625 | | $ | (7,120 | ) | $ | (12,471 | ) |
See notes to financial statements
114
US Growth Opportunities Fund
July 31, 2015
| | | | | | Value | |
| Shares | | | | | (note 2) | |
| | | | | |
| Common stocks – 97.59% | | | | |
| | | | | | | |
| | | Ireland – 2.10% | | | | |
| 808 | | Perrigo Co plc | | $ | 155,298 | |
| | | | | | | |
| | | United States – 95.49% | | | | |
| 795 | | Acuity Brands, Inc. | | | 159,946 | |
| 2,716 | | Adobe Systems, Inc. * | | | 222,685 | |
| 2,968 | | Amphenol Corp., Class A | | | 167,425 | |
| 4,487 | | Bank of the Ozarks, Inc. | | | 197,966 | |
| 1,785 | | Bio-Techne Corp. | | | 195,243 | |
| 776 | | C.R. Bard, Inc. | | | 152,600 | |
| 3,905 | | Cantel Medical Corp. | | | 214,306 | |
| 1,494 | | Celgene Corp. * | | | 196,088 | |
| 2,871 | | Cerner Corp. * | | | 205,908 | |
| 3,388 | | Cognizant Technology Solutions | | | | |
| | | Corp., Class A * | | | 213,783 | |
| 1,410 | | Concho Resources, Inc. * | | | 150,250 | |
| 1,558 | | Costco Wholesale Corp. | | | 226,377 | |
| 2,418 | | Danaher Corp. | | | 221,392 | |
| 1,817 | | Ecolab, Inc. | | | 210,427 | |
| 3,388 | | Fiserv, Inc. * | | | 294,282 | |
| 1,688 | | Genesee & Wyoming, Inc., | | | | |
| | | Class A * | | | 120,219 | |
| 1,371 | | Henry Schein, Inc. * | | | 202,881 | |
| 1,739 | | Illinois Tool Works, Inc. | | | 155,588 | |
| 2,147 | | Intuit, Inc. | | | 227,088 | |
| 4,170 | | Microchip Technology, Inc. | | | 178,643 | |
| 3,530 | | Raymond James Financial, Inc. | | | 208,270 | |
| 1,752 | | Red Hat, Inc. * | | | 138,548 | |
| 918 | | Snap-on, Inc. | | | 151,286 | |
| 4,565 | | Starbucks Corp. | | | 264,451 | |
| 1,817 | | The JM Smucker Co. | | | 202,941 | |
| 2,017 | | The Middleby Corp. * | | | 247,486 | |
| 3,466 | | The TJX Companies, Inc. | | | 241,996 | |
| 1,739 | | The Walt Disney Co. | | | 208,680 | |
| 2,593 | | Tractor Supply Co. | | | 239,904 | |
| 2,463 | | Under Armour, Inc., Class A * | | | 244,650 | |
| 3,020 | | VF Corp. | | | 232,812 | |
| 2,069 | | Visa, Inc., A Shares | | | 155,879 | |
| 1,849 | | Wabtec Corp. | | | 187,100 | |
| 2,890 | | Walgreens Boots Alliance, Inc. | | | 279,261 | |
| 647 | | WW Grainger, Inc. | | | 147,975 | |
| | | | | | 7,064,336 | |
| | | | | | | |
| | | Total common stocks | | | | |
| | | (Cost $6,495,628) | | | 7,219,634 | |
| | | | | | | |
| | | Total long-term investments | | | | |
| | | (Cost $6,495,628) | | | 7,219,634 | |
| | | | | | | |
| Short-term investment – 2.19% | | | | |
| 161,919 | | Fidelity Institutional | | | | |
| | | Treasury Portfolio | | $ | 161,919 | |
| | | | | | | |
| | | Total short-term investment | | | | |
| | | (Cost $161,919) | | | 161,919 | |
| | | | | | | |
| Total investments – 99.78% | | | | |
| | | (Cost $6,657,547) | | | 7,381,553 | |
| | | | | | | |
| Net other assets and liabilities – 0.22% | | | 16,246 | |
| | | | | | | |
| Total net assets – 100.00% | | $ | 7,397,799 | |
* Non-income producing security
See notes to financial statements
115
US Growth Opportunities Fund
July 31, 2015 (continued)
Other information:
| Industry concentration as | | % of net |
| a percentage of net assets: | | assets |
| | | | |
| Industrial Machinery | | 7.49 | % |
| Apparel, Accessories & Luxury Goods | | 6.45 | |
| Data Processing & Outsourced Services | | 6.09 | |
| Application Software | | 6.08 | |
| Health Care Equipment | | 4.96 | |
| Drug Retail | | 3.78 | |
| Restaurants | | 3.58 | |
| Apparel Retail | | 3.27 | |
| Specialty Stores | | 3.24 | |
| Hypermarkets & Super Centers | | 3.06 | |
| Industrial Conglomerates | | 2.99 | |
| IT Consulting & Other Services | | 2.89 | |
| Specialty Chemicals | | 2.84 | |
| Movies & Entertainment | | 2.82 | |
| Investment Banking & Brokerage | | 2.82 | |
| Health Care Technology | | 2.78 | |
| Packaged Foods & Meats | | 2.74 | |
| Health Care Distributors | | 2.74 | |
| Regional Banks | | 2.68 | |
| Biotechnology | | 2.65 | |
| Life Sciences Tools & Services | | 2.64 | |
| Construction & Farm Machinery & Heavy Trucks | | 2.53 | |
| Semiconductors | | 2.42 | |
| Electronic Components | | 2.26 | |
| Electrical Components & Equipment | | 2.16 | |
| Pharmaceuticals | | 2.10 | |
| Oil & Gas Exploration & Production | | 2.03 | |
| Trading Companies & Distributors | | 2.00 | |
| Systems Software | | 1.87 | |
| Railroads | | 1.63 | |
| Long-Term Investments | | 97.59 | |
| Short-Term Investment | | 2.19 | |
| Total Investments | | 99.78 | |
| Net Other Assets and Liabilities | | 0.22 | |
| | | 100.00 | % |
| Currency exposure of portfolio assets before | | | |
| any currency hedging, if applicable. | | % of total |
| Excludes derivatives. | | investments |
| | | | |
| US Dollar | | 100 | % |
See notes to financial statements
116
US Growth Opportunities Fund
July 31, 2015 (continued)
Fair Value Measurements
The following table summarizes the Fund’s investments that are measured at fair value by level within the fair value hierarchy at July 31, 2015:
| | | Quoted prices | | | Significant | | | | | | | |
| | | | in active | | | other | | | Significant | | | | |
| | | | markets for | | | observable | | | unobservable | | | | |
| | | identical assets | | | inputs | | | inputs | | | | |
| Description | | | (level 1 | ) | | (level 2 | ) | | (level 3 | ) | | Total | |
| | | | | | | | | | | | | | |
| Assets | | | | | | | | | | | | | |
| Common Stocks | | | | | | | | | | | | | |
| Ireland | | $ | 155,298 | | $ | — | | $ | — | | $ | 155,298 | |
| United States | | | 7,064,336 | | | — | | | — | | | 7,064,336 | |
| Total Common Stocks | | | 7,219,634 | | | — | | | — | | | 7,219,634 | |
| | | | | | | | | | | | | | |
| Short-Term Investment | | | 161,919 | | | — | | | — | | | 161,919 | |
| Total investments | | $ | 7,381,553 | | $ | — | | $ | — | | $ | 7,381,553 | |
During the period ended July 31, 2015, there were no transfers in or out of security levels.
See notes to financial statements
117
Statements of assets and liabilities
July 31, 2015
| | | | | | | Dividend | |
| | | | All | | | & Income | |
| | | | Asset | | | Builder | |
| | | | Fund | | | Fund | |
| | | | | | | | |
| Assets: | | | | | | | |
| Investments, at fair value | | | | | | | |
| Securities | | $ | 34,268,106 | | $ | 50,770,876 | |
| Affiliated companies | | | 7,271,314 | | | — | |
| Short-term investment | | | 18,978,659 | | | 2,651,739 | |
| Total investments | | | 60,518,079 | | | 53,422,615 | |
| Cash | | | — | | | 16,420 | |
| Foreign cash, at value | | | — | | | 177,575 | |
| Cash at broker for open futures contracts | | | 1,260,069 | | | — | |
| Dividends and interest receivable | | | 51,778 | | | 173,580 | |
| Receivable for investment securities sold | | | — | | | — | |
| Receivable for fund shares sold | | | 50,944 | | | 491,283 | |
| Receivable from investment adviser | | | — | | | — | |
| Financial Derivative Instruments | | | | | | | |
| Exchange-traded or centrally cleared | | | 174,631 | | | — | |
| Over-the-counter | | | — | | | — | |
| Prepaid expenses and other assets | | | 15,015 | | | 25,639 | |
| Total Assets | | | 62,070,516 | | | 54,307,112 | |
| | | | | | | | |
| Liabilities: | | | | | | | |
| Foreign cash overdraft, at value | | | 114,634 | | | — | |
| Payable for investment securities purchased | | | 14,055 | | | 38 | |
| Payable for fund shares redeemed | | | 51,062 | | | 55,167 | |
| Financial Derivative Instruments | | | | | | | |
| Exchange-traded or centrally-cleared | | | 66,298 | | | — | |
| Over-the-counter | | | 199,966 | | | — | |
| Payable to investment adviser | | | 20,412 | | | 31,851 | |
| Payable for 12b-1 distribution and service fees | | | 10,702 | | | 14,756 | |
| Accrued expenses and other payables | | | 40,464 | | | 44,133 | |
| Total Liabilities | | | 517,593 | | | 145,945 | |
| Net assets | | $ | 61,552,923 | | $ | 54,161,167 | |
| | | | | | | | |
| Net assets consist of: | | | | | | | |
| Paid-in capital | | $ | 58,607,034 | | $ | 52,393,128 | |
| Accumulated undistributed net investment income/(loss) | | | (96,704 | ) | | 314,188 | |
| Accumulated net realized gain/(loss) on investments, financial derivative instruments, short sales and foreign currency transactions | | | 1,760,859 | | | (372,971 | ) |
| Net unrealized appreciation/(depreciation) of investments, financial derivative instruments, short sales and foreign currencies | | | 1,281,734 | | | 1,826,822 | |
| | | $ | 61,552,923 | | $ | 54,161,167 | |
See notes to financial statements
118
Statements of assets and liabilities
July 31, 2015 (continued)
| | | Emerging | | | European | | | Global Equity | | | Global | | | High Yield | |
| | | Markets | | | Focus | | | Income | | | Technology | | | Opportunities | |
| | | Fund | | | Fund | | | Fund | | | Fund | | | Fund | |
| | | | | | | | | | | | | | | | |
| | $ | 23,053,502 | | $ | 3,507,337,663 | | $ | 3,603,711,259 | | $ | 278,459,337 | | $ | 22,906,498 | |
| | | — | | | — | | | — | | | — | | | — | |
| | | 959,477 | | | 122,502,268 | | | 115,260,135 | | | 4,671,462 | | | 1,979,897 | |
| | | 24,012,979 | | | 3,629,839,931 | | | 3,718,971,394 | | | 283,130,799 | | | 24,886,395 | |
| | | — | | | — | | | — | | | — | | | — | |
| | | — | | | 4,648,468 | | | 17,338,649 | | | 3 | | | — | |
| | | — | | | — | | | — | | | — | | | — | |
| | | 57,175 | | | 2,269,208 | | | 20,013,112 | | | 184,842 | | | 431,349 | |
| | | 28,464 | | | 21,544,878 | | | 46,100,059 | | | 2,980,571 | | | 994,806 | |
| | | 28,704 | | | 34,718,843 | | | 15,136,452 | | | 305,640 | | | — | |
| | | 30,347 | | | — | | | — | | | — | | | — | |
| | | | | | | | | | | | | | | | |
| | | — | | | — | | | — | | | — | | | — | |
| | | — | | | — | | | 4,838,009 | | | — | | | 24,236 | |
| | | 20,467 | | | 97,697 | | | 87,677 | | | 21,483 | | | 15,835 | |
| | | 24,178,136 | | | 3,693,119,025 | | | 3,822,485,352 | | | 286,623,338 | | | 26,352,621 | |
| | | | | | | | | | | | | | | | |
| | | | | | | | | | | | | | | | |
| | | — | | | — | | | — | | | — | | | — | |
| | | 49,890 | | | 54,113,578 | | | 107,526,446 | | | 4,165,052 | | | 1,023,450 | |
| | | 78,095 | | | 1,572,462 | | | 4,292,451 | | | 211,292 | | | 68,120 | |
| | | | | | | | | | | | | | | | |
| | | — | | | — | | | — | | | — | | | — | |
| | | — | | | — | | | 627,566 | | | — | | | — | |
| | | — | | | 2,599,646 | | | 2,107,353 | | | 212,968 | | | 7,402 | |
| | | 4,444 | | | 496,439 | | | 1,104,314 | | | 93,831 | | | 1,588 | |
| | | 72,347 | | | 959,466 | | | 1,181,023 | | | 139,760 | | | 41,323 | |
| | | 204,776 | | | 59,741,591 | | | 116,839,153 | | | 4,822,903 | | | 1,141,883 | |
| | $ | 23,973,360 | | $ | 3,633,377,434 | | $ | 3,705,646,199 | | $ | 281,800,435 | | $ | 25,210,738 | |
| | | | | | | | | | | | | | | | |
| | | | | | | | | | | | | | | | |
| | $ | 27,255,527 | | $ | 3,508,640,485 | | $ | 3,813,209,180 | | $ | 173,916,330 | | $ | 26,023,423 | |
| | | (79,162 | ) | | 23,999,273 | | | 4,483,650 | | | (320,317 | ) | | 70,270 | |
| | | (1,846,694 | ) | | (84,890,717 | ) | | (50,983,264 | ) | | 30,346,473 | | | (595,871 | ) |
| | | (1,356,311 | ) | | 185,628,393 | | | (61,063,367 | ) | | 77,857,949 | | | (287,084 | ) |
| | $ | 23,973,360 | | $ | 3,633,377,434 | | $ | 3,705,646,199 | | $ | 281,800,435 | | $ | 25,210,738 | |
See notes to financial statements
119
Statements of assets and liabilities
July 31, 2015 (continued)
| | | | | | | Dividend | |
| | | | All | | | & Income | |
| | | | Asset | | | Builder | |
| | | | Fund | | | Fund | |
| | | | | | | | |
| Net assets: | | | | | | | |
| Class A Shares | | $ | 6,396,358 | | $ | 15,959,495 | |
| Class B Shares | | | N/A | | | N/A | |
| Class C Shares | | $ | 10,823,907 | | $ | 13,845,865 | |
| Class I Shares | | $ | 44,332,658 | | $ | 24,355,807 | |
| | | | | | | | |
| Shares outstanding: | | | | | | | |
| Class A Shares (unlimited number of shares authorized) | | | 606,251 | | | 1,277,059 | |
| Class B Shares (unlimited number of shares authorized) | | | N/A | | | N/A | |
| Class C Shares (unlimited number of shares authorized) | | | 1,041,328 | | | 1,117,044 | |
| Class I Shares (unlimited number of shares authorized) | | | 4,203,241 | | | 1,949,445 | |
| | | | | | | | |
| Class A shares: | | | | | | | |
| Net asset value and redemption price per share | | $ | 10.55 | | $ | 12.50 | |
| Maximum sales charge* | | | 5.75 | % | | 5.00 | % |
| Maximum offering price per share | | $ | 11.19 | | $ | 13.16 | |
| | | | | | | | |
| Class B shares: | | | | | | | |
| Net asset value and offering price per share | | | N/A | | | N/A | |
| | | | | | | | |
| Class C shares: | | | | | | | |
| Net asset value and offering price per share | | $ | 10.39 | | $ | 12.40 | |
| | | | | | | | |
| Class I shares: | | | | | | | |
| Net asset value and offering price per share | | $ | 10.55 | | $ | 12.49 | |
| | | | | | | | |
| Investments, at cost | | $ | 59,106,577 | | $ | 51,593,803 | |
| Cost or Premiums of Financial Derivative Instruments, net | | $ | — | | $ | — | |
| Foreign cash, at cost | | $ | (76,664 | ) | $ | 177,559 | |
* On purchases of $50,000 or more, the sales charge may be reduced as outlined in the Prospectus.
See notes to financial statements
120
Statements of assets and liabilities
July 31, 2015 (continued)
| | | Emerging | | | European | | | Global Equity | | | Global | | | High Yield | |
| | | Markets | | | Focus | | | Income | | | Technology | | | Opportunities | |
| | | Fund | | | Fund | | | Fund | | | Fund | | | Fund | |
| | | | | | | | | | | | | | | | |
| | $ | 8,271,540 | | $ | 905,597,820 | | $ | 702,840,963 | | $ | 99,902,632 | | $ | 1,955,049 | |
| | | N/A | | $ | 5,098,575 | | | N/A | | $ | 6,273,529 | | | N/A | |
| | $ | 3,049,416 | | $ | 365,135,352 | | $ | 1,138,357,432 | | $ | 79,666,595 | | $ | 1,373,416 | |
| | $ | 12,652,404 | | $ | 2,357,545,687 | | $ | 1,864,447,804 | | $ | 95,957,679 | | $ | 21,882,273 | |
| | | | | | | | | | | | | | | | |
| | | | | | | | | | | | | | | | |
| | | 962,083 | | | 24,536,115 | | | 89,467,912 | | | 3,799,015 | | | 201,934 | |
| | | N/A | | | 145,533 | | | N/A | | | 268,813 | | | N/A | |
| | | 365,185 | | | 10,563,598 | | | 145,746,347 | | | 3,415,589 | | | 141,988 | |
| | | 1,465,331 | | | 63,889,513 | | | 236,955,511 | | | 3,580,486 | | | 2,268,384 | |
| | | | | | | | | | | | | | | | |
| | | | | | | | | | | | | | | | |
| | $ | 8.60 | | $ | 36.91 | | $ | 7.86 | | $ | 26.30 | | $ | 9.68 | |
| | | 5.75 | % | | 5.75 | % | | 5.75 | % | | 5.75 | % | | 4.75 | % |
| | $ | 9.12 | | $ | 39.16 | | $ | 8.34 | | $ | 27.90 | | $ | 10.16 | |
| | | | | | | | | | | | | | | | |
| | | | | | | | | | | | | | | | |
| | | N/A | | $ | 35.03 | | | N/A | | $ | 23.34 | | | N/A | |
| | | | | | | | | | | | | | | | |
| | | | | | | | | | | | | | | | |
| | $ | 8.35 | | $ | 34.57 | | $ | 7.81 | | $ | 23.32 | | $ | 9.67 | |
| | | | | | | | | | | | | | | | |
| | | | | | | | | | | | | | | | |
| | $ | 8.63 | | $ | 36.90 | | $ | 7.87 | | $ | 26.80 | | $ | 9.65 | |
| | | | | | | | | | | | | | | | |
| | $ | 25,334,887 | | $ | 3,444,205,667 | | $ | 3,783,916,076 | | $ | 205,271,179 | | $ | 25,173,843 | |
| | $ | — | | $ | — | | $ | — | | $ | — | | $ | 23,807 | |
| | $ | — | | $ | 4,661,707 | | $ | 17,477,455 | | $ | 3 | | $ | — | |
See notes to financial statements
121
Statements of assets and liabilities
July 31, 2015 (continued)
| | | | International | |
| | | | Long/Short | |
| | | | Equity | |
| | | | Fund | |
| | | | | |
| Assets: | | | | |
| Investments, at fair value | | | | |
| Securities | | $ | 3,411,660 | |
| Short-term investment | | | 3,385,039 | |
| Total investments | | | 6,796,699 | |
| Cash | | | 8,761 | |
| Foreign cash, at value | | | 1,952 | |
| Cash at broker for open futures contracts | | | 106,304 | |
| Cash at broker for open swap contracts | | | — | |
| Cash segregated as collateral on equity swap contracts | | | 230,000 | |
| Dividends and interest receivable | | | 5,525 | |
| Receivable for investment securities sold | | | 156,809 | |
| Receivable for fund shares sold | | | 18,000 | |
| Receivable from investment adviser | | | 27,562 | |
| Financial Derivative Instruments | | | | |
| Exchange-traded or centrally cleared | | | 142 | |
| Over-the-counter | | | 283,323 | |
| Prepaid expenses and other assets | | | 40,469 | |
| Total Assets | | | 7,675,546 | |
| | | | | |
| Liabilities: | | | | |
| Foreign cash overdraft, at value | | | — | |
| Payable to custodian | | | — | |
| Payable for investment securities purchased | | | — | |
| Securities sold short, at value | | | 1,224,711 | |
| Payable for fund shares redeemed | | | — | |
| Payable for short sale financing | | | 2,253 | |
| Financial Derivative Instruments | | | | |
| Exchange-traded or centrally-cleared | | | 10,173 | |
| Over-the-counter | | | 118,506 | |
| Payable for periodic payments on equity swap contracts | | | 4,087 | |
| Payable to investment adviser | | | — | |
| Payable for 12b-1 distribution and service fees | | | 126 | |
| Dividends payable for short sales | | | 588 | |
| Accrued expenses and other payables | | | 32,354 | |
| Total Liabilities | | | 1,392,798 | |
| Net assets | | $ | 6,282,748 | |
| | | | | |
| Net assets consist of: | | | | |
| Paid-in capital | | $ | 6,150,058 | |
| Accumulated undistributed net investment income/(loss) | | | (69,800 | ) |
| Accumulated net realized gain/(loss) on investments, financial derivative instruments, short sales and foreign currency transactions | | | 65,566 | |
| Net unrealized appreciation/(depreciation) of investments, financial derivative instruments, short sales and foreign currencies | | | 136,924 | |
| | | $ | 6,282,748 | |
See notes to financial statements
122
Statements of assets and liabilities
July 31, 2015 (continued)
| | | International | | | International | | | Strategic | | | Unconstrained | | | US Growth | |
| | | Opportunities | | | Select Equity | | | Income | | | Bond | | | Opportunities | |
| | | Fund | | | Fund | | | Fund | | | Fund | | | Fund | |
| | | | | | | | | | | | | | | | |
| | $ | 4,236,451,416 | | $ | 5,334,071 | | $ | 141,260,512 | | $ | 21,754,316 | | $ | 7,219,634 | |
| | | 274,277,510 | | | 202,749 | | | 24,628,927 | | | 3,620,316 | | | 161,919 | |
| | | 4,510,728,926 | | | 5,536,820 | | | 165,889,439 | | | 25,374,632 | | | 7,381,553 | |
| | | — | | | 25 | | | — | | | — | | | — | |
| | | 2,952 | | | — | | | 1,254,357 | | | — | | | — | |
| | | — | | | — | | | 175,549 | | | 203,573 | | | — | |
| | | — | | | — | | | 15,793 | | | 349,675 | | | — | |
| | | — | | | — | | | — | | | — | | | — | |
| | | 8,561,814 | | | 9,968 | | | 1,924,157 | | | 172,670 | | | 103 | |
| | | 32,219,684 | | | 36,895 | | | 27,997 | | | 883,983 | | | — | |
| | | 11,498,867 | | | 18,000 | | | 599,509 | | | — | | | 3,000 | |
| | | — | | | 7,196 | | | — | | | — | | | 7,595 | |
| | | | | | | | | | | | | | | | |
| | | — | | | — | | | 36,276 | | | 203,890 | | | — | |
| | | 5,472,041 | | | — | | | 337,820 | | | 461,020 | | | — | |
| | | 117,068 | | | 24,650 | | | 22,781 | | | 8,218 | | | 28,504 | |
| | | 4,568,601,352 | | | 5,633,554 | | | 170,283,678 | | | 27,657,661 | | | 7,420,755 | |
| | | | | | | | | | | | | | | | |
| | | | | | | | | | | | | | | | |
| | | — | | | — | | | — | | | 18,100 | | | — | |
| | | — | | | — | | | 27,997 | | | — | | | — | |
| | | 19,292,792 | | | — | | | 1,434,668 | | | 219,656 | | | — | |
| | | — | | | — | | | — | | | — | | | — | |
| | | 2,802,570 | | | — | | | 357,728 | | | — | | | — | |
| | | — | | | — | | | — | | | — | | | — | |
| | | | | | | | | | | | | | | | |
| | | — | | | — | | | — | | | 293,917 | | | — | |
| | | — | | | — | | | 347,629 | | | 176,572 | | | — | |
| | | — | | | — | | | — | | | — | | | — | |
| | | 3,415,009 | | | — | | | 59,703 | | | 4,555 | | | — | |
| | | 826,211 | | | 157 | | | 33,676 | | | 1,143 | | | 341 | |
| | | — | | | — | | | — | | | — | | | — | |
| | | 1,360,198 | | | 22,714 | | | 102,008 | | | 53,718 | | | 22,615 | |
| | | 27,696,780 | | | 22,871 | | | 2,363,409 | | | 767,661 | | | 22,956 | |
| | $ | 4,540,904,572 | | $ | 5,610,683 | | $ | 167,920,269 | | $ | 26,890,000 | | $ | 7,397,799 | |
| | | | | | | | | | | | | | | | |
| | | | | | | | | | | | | | | | |
| | $ | 4,178,020,159 | | $ | 5,207,395 | | $ | 205,860,388 | | $ | 28,213,846 | | $ | 6,711,701 | |
| | | 46,489,778 | | | 47,568 | | | (1,157,208 | ) | | (1,063,128 | ) | | (1,964 | ) |
| | | (306,131,924 | ) | | 30,361 | | | (35,444,365 | ) | | 780,245 | | | (35,944 | ) |
| | | 622,526,559 | | | 325,359 | | | (1,338,546 | ) | | (1,040,963 | ) | | 724,006 | |
| | $ | 4,540,904,572 | | $ | 5,610,683 | | $ | 167,920,269 | | $ | 26,890,000 | | $ | 7,397,799 | |
See notes to financial statements
123
Statements of assets and liabilities
July 31, 2015 (continued)
| | | | International | |
| | | | Long/Short | |
| | | | Equity | |
| | | | Fund | |
| | | | | |
| Net assets: | | | | |
| Class A Shares | | $ | 198,647 | |
| Class B Shares | | | N/A | |
| Class C Shares | | $ | 102,190 | |
| Class I Shares | | $ | 5,981,911 | |
| Class R Shares | | | N/A | |
| | | | | |
| Shares outstanding: | | | | |
| Class A Shares (unlimited number of shares authorized) | | | 19,335 | |
| Class B Shares (unlimited number of shares authorized) | | | N/A | |
| Class C Shares (unlimited number of shares authorized) | | | 10,000 | |
| Class I Shares (unlimited number of shares authorized) | | | 581,658 | |
| Class R Shares (unlimited number of shares authorized) | | | N/A | |
| | | | | |
| Class A shares: | | | | |
| Net asset value and redemption price per share | | $ | 10.27 | |
| Maximum sales charge* | | | 5.75 | % |
| Maximum offering price per share | | $ | 10.90 | |
| | | | | |
| Class B shares: | | | | |
| Net asset value and offering price per share | | | N/A | |
| | | | | |
| Class C shares: | | | | |
| Net asset value and offering price per share | | $ | 10.22 | |
| | | | | |
| Class I shares: | | | | |
| Net asset value and offering price per share | | $ | 10.28 | |
| | | | | |
| Class R shares: | | | | |
| Net asset value and offering price per share | | | N/A | |
| | | | | |
| Investments, at cost | | $ | 6,840,458 | |
| Cost or Premiums of Financial Derivative Instruments, net | | $ | — | |
| Foreign cash, at cost | | $ | 1,762 | |
| Proceeds received on short sales | | $ | (1,250,365 | ) |
* On purchases of $50,000 or more, the sales charge may be reduced as outlined in the Prospectus.
See notes to financial statements
124
Statements of assets and liabilities
July 31, 2015 (continued)
| | | International | | | International | | | Strategic | | | Unconstrained | | | US Growth | |
| | | Opportunities | | | Select Equity | | | Income | | | Bond | | | Opportunities | |
| | | Fund | | | Fund | | | Fund | | | Fund | | | Fund | |
| | | | | | | | | | | | | | | | |
| | $ | 1,623,378,774 | | $ | 268,927 | | $ | 28,199,705 | | $ | 957,732 | | $ | 1,616,968 | |
| | $ | 17,164,012 | | | N/A | | $ | 3,142,631 | | | N/A | | | N/A | |
| | $ | 552,629,693 | | $ | 120,069 | | $ | 30,033,526 | | $ | 1,081,781 | | $ | 11,139 | |
| | $ | 2,333,559,285 | | $ | 5,221,687 | | $ | 106,544,407 | | $ | 24,850,487 | | $ | 5,769,692 | |
| | $ | 14,172,808 | | | N/A | | | N/A | | | N/A | | | N/A | |
| | | | | | | | | | | | | | | | |
| | | | | | | | | | | | | | | | |
| | | 57,084,864 | | | 24,959 | | | 3,102,522 | | | 100,747 | | | 144,490 | |
| | | 643,420 | | | N/A | | | 344,533 | | | N/A | | | N/A | |
| | | 20,773,051 | | | 11,217 | | | 3,320,824 | | | 113,853 | | | 1,000 | |
| | | 82,011,647 | | | 483,757 | | | 11,757,978 | | | 2,614,851 | | | 514,783 | |
| | | 506,745 | | | N/A | | | N/A | | | N/A | | | N/A | |
| | | | | | | | | | | | | | | | |
| | | | | | | | | | | | | | | | |
| | $ | 28.44 | | $ | 10.77 | | $ | 9.09 | | $ | 9.51 | | $ | 11.19 | |
| | | 5.75 | % | | 5.75 | % | | 4.75 | % | | 4.75 | % | | 5.75 | % |
| | $ | 30.18 | | $ | 11.43 | | $ | 9.54 | | $ | 9.98 | | $ | 11.87 | |
| | | | | | | | | | | | | | | | |
| | | | | | | | | | | | | | | | |
| | | 26.68 | | | N/A | | $ | 9.12 | | | N/A | | | N/A | |
| | | | | | | | | | | | | | | | |
| | | | | | | | | | | | | | | | |
| | $ | 26.60 | | $ | 10.70 | | $ | 9.04 | | $ | 9.50 | | $ | 11.14 | |
| | | | | | | | | | | | | | | | |
| | | | | | | | | | | | | | | | |
| | $ | 28.45 | | $ | 10.79 | | $ | 9.06 | | $ | 9.50 | | $ | 11.21 | |
| | | | | | | | | | | | | | | | |
| | | | | | | | | | | | | | | | |
| | $ | 27.97 | | | N/A | | | N/A | | | N/A | | | N/A | |
| | | | | | | | | | | | | | | | |
| | $ | 3,893,759,219 | | $ | 5,211,458 | | $ | 167,295,629 | | $ | 26,456,382 | | $ | 6,657,547 | |
| | $ | — | | $ | — | | $ | (29,878 | ) | $ | 154,756 | | $ | — | |
| | $ | 2,952 | | $ | — | | $ | 1,254,624 | | $ | (18,447 | ) | $ | — | |
| | $ | — | | $ | — | | $ | — | | $ | — | | $ | — | |
See notes to financial statements
125
Statements of operations
For the year ended July 31, 2015
| | | | | | | Dividend | |
| | | | All | | | & Income | |
| | | | Asset | | | Builder | |
| | | | Fund | | | Fund | |
| | | | | | | | |
| Investment income: | | | | | | | |
| Dividends | | $ | 876,240 | | $ | 1,455,131 | |
| Dividends from affiliated companies | | | 253,127 | | | — | |
| Interest | | | 446 | | | 282,821 | |
| Foreign taxes withheld(a) | | | — | | | (72,086 | ) |
| Total Investment Income | | | 1,129,813 | | | 1,665,866 | |
| | | | | | | | |
| Expenses: | | | | | | | |
| Investment advisory fees | | | 254,867 | | | 299,691 | |
| 12b-1 distribution and service fees: | | | | | | | |
| Class A Shares | | | 17,827 | | | 37,521 | |
| Class B Shares | | | — | | | — | |
| Class C Shares | | | 115,619 | | | 100,423 | |
| Sub-accounting fees: | | | | | | | |
| Class A Shares | | | 3,870 | | | 4,358 | |
| Class B Shares | | | — | | | — | |
| Class C Shares | | | 8,513 | | | 5,128 | |
| Class I Shares | | | 13,265 | | | 9,078 | |
| Transfer agent fees: | | | | | | | |
| Class A Shares | | | 1,233 | | | 2,992 | |
| Class B Shares | | | — | | | — | |
| Class C Shares | | | 1,883 | | | 2,888 | |
| Class I Shares | | | 6,361 | | | 3,177 | |
| Registration and filing fees | | | 38,599 | | | 44,195 | |
| Audit fees | | | 32,760 | | | 32,760 | |
| Administrative fees | | | 15,736 | | | 9,839 | |
| Custodian fees | | | 9,469 | | | 30,460 | |
| Printing and postage fees | | | 6,275 | | | 5,152 | |
| Legal fees | | | 5,175 | | | 1,964 | |
| Trustees’ fees and expenses | | | 3,173 | | | 1,829 | |
| Compliance officer fees | | | 2,006 | | | 1,262 | |
| Accounting fees | | | 1,213 | | | 15,321 | |
| Miscellaneous fees | | | 6,574 | | | 20,296 | |
| Total Expenses | | | 544,418 | | | 628,334 | |
| Fees waived and/or expenses reimbursed by investment adviser | | | (28,406 | ) | | (70,824 | ) |
| Net Expenses | | | 516,012 | | | 557,510 | |
| Net investment income/(loss) | | $ | 613,801 | | $ | 1,108,356 | |
| (a) | “Foreign taxes withheld” has been reduced as the result of refunds of previously withheld tax, plus interest, based on reclaims filed with Eurozone tax jurisdictions in the amount of $87,592, $411,610, and $6,937, respectively, for European Focus Fund, Global Equity Income Fund and Global Technology Fund. Refer to Note 2, under the heading “Federal Income Taxes.” |
See notes to financial statements
126
Statements of operations
For the year ended July 31, 2015 (continued)
| | | Emerging | | | European | | | Global Equity | | | Global | | | High Yield | |
| | | Markets | | | Focus | | | Income | | | Technology | | | Opportunities | |
| | | Fund | | | Fund | | | Fund | | | Fund | | | Fund | |
| | | | | | | | | | | | | | | | |
| | $ | 582,762 | | $ | 63,552,710 | | $ | 247,011,161 | | $ | 2,709,948 | | $ | 52,236 | |
| | | — | | | — | | | — | | | — | | | — | |
| | | — | | | — | | | 8,114 | | | 976 | | | 1,612,132 | |
| | | (65,513 | ) | | (4,342,380 | ) | | (15,081,036 | ) | | (82,205 | ) | | — | |
| | | 517,249 | | | 59,210,330 | | | 231,938,239 | | | 2,628,719 | | | 1,664,368 | |
| | | | | | | | | | | | | | | | |
| | | | | | | | | | | | | | | | |
| | | 266,650 | | | 23,334,092 | | | 22,435,299 | | | 2,856,985 | | | 173,998 | |
| | | | | | | | | | | | | | | | |
| | | 20,269 | | | 1,671,205 | | | 1,642,458 | | | 293,981 | | | 7,066 | |
| | | — | | | 86,834 | | | — | | | 76,290 | | | — | |
| | | 34,741 | | | 2,874,260 | | | 10,092,386 | | | 810,406 | | | 11,940 | |
| | | | | | | | | | | | | | | | |
| | | 5,049 | | | 342,667 | | | 301,380 | | | 65,747 | | | 439 | |
| | | — | | | 14,673 | | | — | | | 9,736 | | | — | |
| | | 4,014 | | | 261,376 | | | 703,339 | | | 73,427 | | | — | |
| | | 11,495 | | | 1,191,876 | | | 1,073,751 | | | 90,378 | | | — | |
| | | | | | | | | | | | | | | | |
| | | 1,497 | | | 131,232 | | | 119,180 | | | 22,606 | | | — | |
| | | — | | | 2,286 | | | — | | | 1,507 | | | — | |
| | | 856 | | | 52,729 | | | 157,950 | | | 14,032 | | | — | |
| | | 2,830 | | | 235,149 | | | 233,131 | | | 16,489 | | | 3,442 | |
| | | 40,208 | | | 383,642 | | | 344,116 | | | 54,910 | | | 39,211 | |
| | | 32,760 | | | 32,760 | | | 32,760 | | | 32,760 | | | 35,837 | |
| | | 6,588 | | | 643,603 | | | 798,833 | | | 78,474 | | | 6,609 | |
| | | 72,323 | | | 412,652 | | | 455,971 | | | 59,103 | | | 23,591 | |
| | | 13,361 | | | 360,491 | | | 361,478 | | | 48,449 | | | 856 | |
| | | 1,438 | | | 135,682 | | | 169,253 | | | 17,281 | | | 539 | |
| | | 1,320 | | | 121,982 | | | 155,291 | | | 15,943 | | | 1,307 | |
| | | 852 | | | 77,487 | | | 101,689 | | | 10,621 | | | 793 | |
| | | 13,982 | | | 14,428 | | | 14,583 | | | 13,784 | | | 2,897 | |
| | | 22,569 | | | 169,575 | | | 269,561 | | | 28,632 | | | 16,601 | |
| | | 552,802 | | | 32,550,681 | | | 39,462,409 | | | 4,691,541 | | | 325,126 | |
| | | (87,045 | ) | | — | | | — | | | — | | | (78,611 | ) |
| | | 465,757 | | | 32,550,681 | | | 39,462,409 | | | 4,691,541 | | | 246,515 | |
| | $ | 51,492 | | $ | 26,659,649 | | $ | 192,475,830 | | $ | (2,062,822 | ) | $ | 1,417,853 | |
See notes to financial statements
127
Statements of operations
For the year ended July 31, 2015 (continued)
| | | | | | | Dividend | |
| | | | All | | | & Income | |
| | | | Asset | | | Builder | |
| | | | Fund | | | Fund | |
| | | | | | | | |
| Realized and unrealized gain/(loss): | | | | | | | |
| Net realized gain/(loss) from: | | | | | | | |
| Investment transactions(a)(b) | | $ | 933,667 | | $ | (355,777 | ) |
| Distributions from investment companies(c) | | | 316,385 | | | — | |
| Financial Derivative Instruments | | | 1,288,911 | | | — | |
| Foreign currency transactions | | | (51,424 | ) | | (1,779 | ) |
| Net change in unrealized appreciation/(depreciation) of: | | | | | | | |
| Investments(d) | | | (1,672,595 | ) | | 1,060,238 | |
| Financial Derivative Instruments | | | (144,196 | ) | | — | |
| Translation of other assets and liabilities | | | (31,933 | ) | | (1,661 | ) |
| Realized and Unrealized Gain/(Loss) | | | 638,815 | | | 701,021 | |
| Net increase/(decrease) in net assets resulting from operations | | $ | 1,252,616 | | $ | 1,809,377 | |
| (a) | Affiliated companies accounted for $0 of the net realized gain/(loss) from investment transactions for All Asset Fund. |
| (b) | Includes foreign capital gains tax paid of $(22,162) for Emerging Markets Fund. |
| (c) | Includes long-term capital gains distributions from affiliated companies of $226,942 for All Asset Fund. |
| (d) | Includes change in foreign capital gains tax accrued of $(4,614) and $(147,145) for Emerging Markets Fund and Global Equity Income Fund, respectively. |
See notes to financial statements
128
Statements of operations
For the year ended July 31, 2015 (continued)
| | | Emerging | | | European | | | Global Equity | | | Global | | | High Yield | |
| | | Markets | | | Focus | | | Income | | | Technology | | | Opportunities | |
| | | Fund | | | Fund | | | Fund | | | Fund | | | Fund | |
| | | | | | | | | | | | | | | | |
| | $ | 866,844 | | $ | (84,319,244 | ) | $ | (41,008,859 | ) | $ | 46,508,377 | | $ | (537,704 | ) |
| | | — | | | — | | | — | | | — | | | — | |
| | | — | | | 72,361,140 | | | 55,885,815 | | | — | | | 10,151 | |
| | | (85,325 | ) | | (2,031,931 | ) | | (4,016,345 | ) | | (89,397 | ) | | — | |
| | | | | | | | | | | | | | | | |
| | | (4,291,054 | ) | | 142,959,260 | | | (226,309,076 | ) | | (13,472,515 | ) | | (495,083 | ) |
| | | — | | | (14,730,450 | ) | | 2,253,013 | | | — | | | 3,134 | |
| | | 1,400 | | | 38,409 | | | 14,818 | | | (1,724 | ) | | (65 | ) |
| | | (3,508,135 | ) | | 114,277,184 | | | (213,180,634 | ) | | 32,944,741 | | | (1,019,567 | ) |
| | $ | (3,456,643 | ) | $ | 140,936,833 | | $ | (20,704,804 | ) | $ | 30,881,919 | | $ | 398,286 | |
See notes to financial statements
129
Statements of operations
For the year ended July 31, 2015 (continued)
| | | | International | |
| | | | Long/Short | |
| | | | Equity | |
| | | | Fund | * |
| | | | | |
| Investment income: | | | | |
| Dividends | | $ | 49,084 | |
| Interest | | | — | |
| Foreign taxes withheld(a) | | | (5,118 | ) |
| Total Investment Income | | | 43,966 | |
| | | | | |
| Expenses: | | | | |
| Investment advisory fees | | | 43,971 | |
| 12b-1 distribution and service fees: | | | | |
| Class A Shares | | | 227 | |
| Class B Shares | | | — | |
| Class C Shares | | | 649 | |
| Class R Shares | | | — | |
| Sub-accounting fees: | | | | |
| Class A Shares | | | 7 | |
| Class B Shares | | | — | |
| Class C Shares | | | — | |
| Class I Shares | | | 212 | |
| Class R Shares | | | — | |
| Transfer agent fees: | | | | |
| Class A Shares | | | 56 | |
| Class B Shares | | | — | |
| Class C Shares | | | 56 | |
| Class I Shares | | | 1,228 | |
| Class R Shares | | | — | |
| Registration and filing fees | | | 3,603 | |
| Audit fees | | | 28,110 | |
| Administrative fees | | | 862 | |
| Custodian fees | | | 83,817 | |
| Legal fees | | | 455 | |
| Printing and postage fees | | | 1,175 | |
| Trustees’ fees and expenses | | | 178 | |
| Compliance officer fees | | | 112 | |
| Accounting fees | | | 8,833 | |
| Organization expense | | | 30,948 | |
| Deferred offering costs | | | 57,012 | |
| Miscellaneous fees | | | 5,635 | |
| Total Expenses before expenses on securities sold short | | | 267,146 | |
| Short sale financing fees | | | 31,460 | |
| Dividend expense on securities sold short | | | 43,760 | |
| Total Expenses after expenses on securities sold short | | | 342,366 | |
| Fees waived and/or expenses reimbursed by investment adviser | | | (213,499 | ) |
| Net Expenses | | | 128,867 | |
| Net investment income/(loss) | | $ | (84,901 | ) |
| (a) | “Foreign taxes withheld” has been reduced as the result of refunds of previously withheld tax, plus interest, based on reclaims filed with Eurozone tax jurisdictions in the amount of $968,907 for International Opportunities Fund. Refer to Note 2, under the heading “Federal Income Taxes.” |
| * | Fund commenced operations on December 9, 2014. |
| ** | Fund commenced operations on September 30, 2014. |
| *** | Fund commenced operations on December 18, 2014. |
See notes to financial statements
130
Statements of operations
For the year ended July 31, 2015 (continued)
| | | International | | | International | | | Strategic | | | Unconstrained | | | US Growth | |
| | | Opportunities | | | Select Equity | | | Income | | | Bond | | | Opportunities | |
| | | Fund | | | Fund | ** | | Fund | | | Fund | | | Fund | *** |
| | | | | | | | | | | | | | | | |
| | $ | 108,480,586 | | $ | 96,636 | | $ | 82,728 | | $ | 5,554 | | $ | 35,932 | |
| | | 4,205 | | | — | | | 5,205,421 | | | 607,568 | | | — | |
| | | (6,958,448 | ) | | (9,135 | ) | | — | | | — | | | — | |
| | | 101,526,343 | | | 87,501 | | | 5,287,969 | | | 613,122 | | | 35,932 | |
| | | | | | | | | | | | | | | | |
| | | | | | | | | | | | | | | | |
| | | 37,328,099 | | | 27,888 | | | 630,478 | | | 178,202 | | | 28,907 | |
| | | | | | | | | | | | | | | | |
| | | 4,104,859 | | | 321 | | | 50,120 | | | 2,566 | | | 1,341 | |
| | | 232,870 | | | — | | | 38,907 | | | — | | | — | |
| | | 5,076,554 | | | 902 | | | 251,605 | | | 11,251 | | | 65 | |
| | | 56,027 | | | — | | | — | | | — | | | — | |
| | | | | | | | | | | | | | | | |
| | | 1,520,842 | | | 43 | | | 12,618 | | | 72 | | | 534 | |
| | | 33,648 | | | — | | | 4,386 | | | — | | | — | |
| | | 557,148 | | | 6 | | | 20,754 | | | 35 | | | — | |
| | | 1,419,659 | | | — | | | 54,777 | | | 1 | | | — | |
| | | 11,630 | | | — | | | — | | | — | | | — | |
| | | | | | | | | | | | | | | | |
| | | 272,828 | | | 152 | | | 3,801 | | | 197 | | | 90 | |
| | | 4,606 | | | — | | | 678 | | | — | | | — | |
| | | 90,180 | | | 152 | | | 4,313 | | | 250 | | | 18 | |
| | | 272,527 | | | 1,995 | | | 11,146 | | | 3,625 | | | 1,125 | |
| | | 2,863 | | | — | | | — | | | — | | | — | |
| | | 222,154 | | | 4,879 | | | 90,769 | | | 31,725 | | | 3,474 | |
| | | 34,560 | | | 27,310 | | | 38,241 | | | 48,302 | | | 27,310 | |
| | | 1,001,530 | | | 1,055 | | | 28,179 | | | 6,771 | | | 942 | |
| | | 757,700 | | | 14,934 | | | 42,919 | | | 96,963 | | | 4,034 | |
| | | 211,339 | | | 398 | | | 4,636 | | | 1,498 | | | 380 | |
| | | 496,733 | | | 2,174 | | | 22,711 | | | 943 | | | 805 | |
| | | 195,703 | | | 225 | | | 5,084 | | | 1,352 | | | 195 | |
| | | 132,466 | | | 126 | | | 3,793 | | | 414 | | | 125 | |
| | | 14,447 | | | 10,370 | | | 9,036 | | | 17,492 | | | 740 | |
| | | — | | | 13,389 | | | — | | | — | | | 11,231 | |
| | | — | | | 58,518 | | | — | | | 37,248 | | | 44,419 | |
| | | 379,099 | | | 6,870 | | | 62,435 | | | 56,502 | | | 4,198 | |
| | | 54,430,071 | | | 171,707 | | | 1,391,386 | | | 495,409 | | | 129,933 | |
| | | — | | | — | | | — | | | — | | | — | |
| | | — | | | — | | | — | | | — | | | — | |
| | | — | | | — | | | — | | | — | | | — | |
| | | — | | | (132,299 | ) | | (83,868 | ) | | (234,850 | ) | | (91,912 | ) |
| | | 54,430,071 | | | 39,408 | | | 1,307,518 | | | 260,559 | | | 38,021 | |
| | $ | 47,096,272 | | $ | 48,093 | | $ | 3,980,451 | | $ | 352,563 | | $ | (2,089 | ) |
See notes to financial statements
131
Statements of operations
For the year ended July 31, 2015 (continued)
| | | | International | |
| | | | Long/Short | |
| | | | Equity | |
| | | | Fund | * |
| | | | | |
| Realized and unrealized gain/(loss): | | | | |
| Net realized gain/(loss) from: | | | | |
| Investment transactions | | $ | 216,121 | |
| Financial Derivative Instruments | | | 64,442 | |
| Short sales | | | (198,033 | ) |
| Foreign currency transactions | | | (8,424 | ) |
| Net change in unrealized appreciation/(depreciation) of: | | | | |
| Investments | | | (43,759 | ) |
| Financial Derivative Instruments | | | 154,786 | |
| Short sales | | | 25,654 | |
| Translation of other assets and liabilities | | | 243 | |
| Realized and Unrealized Gain/(Loss) | | | 211,030 | |
| Net increase/(decrease) in net assets resulting from operations | | $ | 126,129 | |
| * | Fund commenced operations on December 9, 2014. |
| ** | Fund commenced operations on September 30, 2014. |
| *** | Fund commenced operations on December 18, 2014. |
See notes to financial statements
132
Statements of operations
For the year ended July 31, 2015 (continued)
| | | International | | | International | | | Strategic | | | Unconstrained | | | US Growth | |
| | | Opportunities | | | Select Equity | | | Income | | | Bond | | | Opportunities | |
| | | Fund | | | Fund | ** | | Fund | | | Fund | | | Fund | *** |
| | | | | | | | | | | | | | | | |
| | $ | 100,539,930 | | $ | 30,361 | | $ | (4,564,956 | ) | $ | (1,289,011 | ) | $ | (35,944 | ) |
| | | 88,556,113 | | | — | | | 4,878,454 | | | 2,368,168 | | | — | |
| | | — | | | — | | | — | | | — | | | — | |
| | | (2,427,718 | ) | | (848 | ) | | (9,991 | ) | | (74,739 | ) | | — | |
| | | | | | | | | | | | | | | | |
| | | 20,706,782 | | | 325,362 | | | (990,073 | ) | | (1,384,509 | ) | | 724,006 | |
| | | (9,840,716 | ) | | — | | | (265,743 | ) | | (12,471 | ) | | — | |
| | | — | | | — | | | — | | | — | | | — | |
| | | 102,546 | | | (3 | ) | | 14,081 | | | 4,612 | | | — | |
| | | 197,636,937 | | | 354,872 | | | (938,228 | ) | | (387,950 | ) | | 688,062 | |
| | $ | 244,733,209 | | $ | 402,965 | | $ | 3,042,223 | | $ | (35,387 | ) | $ | 685,973 | |
See notes to financial statements
133
Statements of changes in net assets
All Asset Fund
| | | | Year Ended | | | Year Ended | |
| | | | July 31, 2015 | | | July 31, 2014 | |
| | | | | | | | |
| Net investment income/(loss) | | $ | 613,801 | | $ | 750,611 | |
| Net realized gain/(loss) from investments, distributions from investment companies, financial derivative instruments and foreign currency transactions | | | 2,487,539 | | | 2,184,573 | |
| Net change in unrealized appreciation/(depreciation) of investments, financial derivative instruments and foreign currency translations | | | (1,848,724 | ) | | 1,702,056 | |
| Net increase/(decrease) in net assets resulting from operations | | | 1,252,616 | | | 4,637,240 | |
| | | | | | | | |
| Distributions to shareholders from net investment income: | | | | | | | |
| Class A Shares | | | (94,558 | ) | | (110,882 | ) |
| Class C Shares | | | (98,042 | ) | | (65,035 | ) |
| Class I Shares | | | (737,517 | ) | | (804,147 | ) |
| Total distributions to shareholders from net investment income | | | (930,117 | ) | | (980,064 | ) |
| | | | | | | | |
| Distributions to shareholders from net realized gains: | | | | | | | |
| Class A Shares | | | (165,496 | ) | | (296,403 | ) |
| Class C Shares | | | (297,564 | ) | | (295,843 | ) |
| Class I Shares | | | (1,153,810 | ) | | (1,507,425 | ) |
| Total distributions to shareholders from net realized gains | | | (1,616,870 | ) | | (2,099,671 | ) |
| | | | | | | | |
| Increase/(decrease) from Fund share transactions | | | | | | | |
| Class A Shares | | | (2,406,158 | ) | | (3,286,278 | ) |
| Class C Shares | | | (46,472 | ) | | 1,520,761 | |
| Class I Shares | | | (1,589,999 | ) | | 2,497,117 | |
| Net increase/(decrease) from Fund share transactions | | | (4,042,629 | ) | | 731,600 | |
| Net increase/(decrease) in net assets | | | (5,337,000 | ) | | 2,289,105 | |
| | | | | | | | |
| Net assets: | | | | | | | |
| Beginning of year | | | 66,889,923 | | | 64,600,818 | |
| End of year | | $ | 61,552,923 | | $ | 66,889,923 | |
| Accumulated undistributed net investment income/(loss) | | $ | (96,704 | ) | $ | (124,131 | ) |
See notes to financial statements
134
Statements of changes in net assets
Dividend & Income Builder Fund
| | | | Year Ended | | | Year Ended | |
| | | | July 31, 2015 | | | July 31, 2014 | |
| | | | | | | | |
| Net investment income/(loss) | | $ | 1,108,356 | | $ | 594,659 | |
| Net realized gain/(loss) from investments and foreign currency transactions | | | (357,556 | ) | | 577,082 | |
| Net change in unrealized appreciation/(depreciation) of investments and foreign currency translations | | | 1,058,577 | | | 639,189 | |
| Net increase/(decrease) in net assets resulting from operations | | | 1,809,377 | | | 1,810,930 | |
| | | | | | | | |
| Distributions to shareholders from net investment income: | | | | | | | |
| Class A Shares | | | (401,124 | ) | | (281,058 | ) |
| Class C Shares | | | (199,615 | ) | | (52,219 | ) |
| Class I Shares | | | (464,983 | ) | | (116,862 | ) |
| Total distributions to shareholders from net investment income | | | (1,065,722 | ) | | (450,139 | ) |
| | | | | | | | |
| Distributions to shareholders from net realized gains: | | | | | | | |
| Class A Shares | | | (223,750 | ) | | (26,820 | ) |
| Class C Shares | | | (157,527 | ) | | (4,620 | ) |
| Class I Shares | | | (188,967 | ) | | (6,478 | ) |
| Total distributions to shareholders from net realized gains | | | (570,244 | ) | | (37,918 | ) |
| | | | | | | | |
| Increase/(decrease) from Fund share transactions: | | | | | | | |
| Class A Shares | | | 1,726,991 | | | 11,439,640 | |
| Class C Shares | | | 9,155,941 | | | 3,936,013 | |
| Class I Shares | | | 16,115,976 | | | 6,472,348 | |
| Net increase/(decrease) from Fund share transactions: | | | 26,998,908 | | | 21,848,001 | |
| Net increase/(decrease) in net assets | | | 27,172,319 | | | 23,170,874 | |
| | | | | | | | |
| Net assets: | | | | | | | |
| Beginning of year | | | 26,988,848 | | | 3,817,974 | |
| End of year | | $ | 54,161,167 | | $ | 26,988,848 | |
| Accumulated undistributed net investment income/(loss) | | $ | 314,188 | | $ | 260,771 | |
See notes to financial statements
135
Statements of changes in net assets
Emerging Markets Fund
| | | | Year Ended | | | Year Ended | |
| | | | July 31, 2015 | | | July 31, 2014 | |
| | | | | | | | |
| Net investment income/(loss) | | $ | 51,492 | | $ | 88,345 | |
| Net realized gain/(loss) from investments and foreign currency transactions | | | 781,519 | | | 413,299 | |
| Net change in unrealized appreciation/(depreciation) of investments and foreign currency translations | | | (4,289,654 | ) | | 3,342,917 | |
| Net increase/(decrease) in net assets resulting from operations | | | (3,456,643 | ) | | 3,844,561 | |
| | | | | | | | |
| Distributions to shareholders from net investment income: | | | | | | | |
| Class I Shares | | | (22,618 | ) | | — | |
| Total distributions to shareholders from net investment income | | | (22,618 | ) | | — | |
| | | | | | | | |
| Increase/(decrease) from Fund share transactions: | | | | | | | |
| Class A Shares | | | 729,488 | | | (1,763,376 | ) |
| Class C Shares | | | (481,012 | ) | | 368,449 | |
| Class I Shares | | | (1,544,468 | ) | | 3,427,793 | |
| Net increase/(decrease) from Fund share transactions: | | | (1,295,992 | ) | | 2,032,866 | |
| Net increase/(decrease) in net assets | | | (4,775,253 | ) | | 5,877,427 | |
| | | | | | | | |
| Net assets: | | | | | | | |
| Beginning of year | | | 28,748,613 | | | 22,871,186 | |
| End of year | | $ | 23,973,360 | | $ | 28,748,613 | |
| Accumulated undistributed net investment income/(loss) | | $ | (79,162 | ) | $ | 2,739 | |
See notes to financial statements
136
Statements of changes in net assets
European Focus Fund
| | | | Year Ended | | | Year Ended | |
| | | | July 31, 2015 | | | July 31, 2014 | |
| | | | | | | | |
| Net investment income/(loss) | | $ | 26,659,649 | | $ | 31,602,394 | |
| Net realized gain/(loss) from investments, financial derivative instruments and foreign currency transactions | | | (13,990,035 | ) | | 182,472,218 | |
| Net change in unrealized appreciation/(depreciation) of investments, financial derivative instruments and foreign currency translations | | | 128,267,219 | | | (14,753,017 | ) |
| Net increase/(decrease) in net assets resulting from operations | | | 140,936,833 | | | 199,321,595 | |
| | | | | | | | |
| Distributions to shareholders from net investment income: | | | | | | | |
| Class A Shares | | | (7,764,091 | ) | | (1,300,114 | ) |
| Class B Shares | | | (5,811 | ) | | — | |
| Class C Shares | | | (3,266,638 | ) | | — | |
| Class I Shares | | | (25,811,654 | ) | | (2,410,152 | ) |
| Total distributions to shareholders from net investment income | | | (36,848,194 | ) | | (3,710,266 | ) |
| | | | | | | | |
| Increase/(decrease) from Fund share transactions: | | | | | | | |
| Class A Shares | | | 127,843,914 | | | 345,472,959 | |
| Class B Shares | | | (8,569,612 | ) | | (6,709,490 | ) |
| Class C Shares | | | 87,256,938 | | | 138,355,083 | |
| Class I Shares | | | 891,481,823 | | | 1,053,252,196 | |
| Net increase/(decrease) from Fund share transactions: | | | 1,098,013,063 | | | 1,530,370,748 | |
| Net increase/(decrease) in net assets | | | 1,202,101,702 | | | 1,725,982,077 | |
| | | | | | | | |
| Net assets: | | | | | | | |
| Beginning of year | | | 2,431,275,732 | | | 705,293,655 | |
| End of year | | $ | 3,633,377,434 | | $ | 2,431,275,732 | |
| Accumulated undistributed net investment income/(loss) | | $ | 23,999,273 | | $ | 37,559,735 | |
See notes to financial statements
137
Statements of changes in net assets
Global Equity Income Fund
| | | | Year Ended | | | Year Ended | |
| | | | July 31, 2015 | | | July 31, 2014 | |
| | | | | | | | |
| Net investment income/(loss) | | $ | 192,475,830 | | $ | 164,005,792 | |
| Net realized gain/(loss) from investments, financial derivative instruments and foreign currency transactions | | | 10,860,611 | | | 100,568,038 | |
| Net change in unrealized appreciation/(depreciation) of investments, financial derivative investments and foreign currency translations | | | (224,041,245 | ) | | 33,886,681 | |
| Net increase/(decrease) in net assets resulting from operations | | | (20,704,804 | ) | | 298,460,511 | |
| | | | | | | | |
| Distributions to shareholders from net investment income: | | | | | | | |
| Class A Shares | | | (39,536,986 | ) | | (51,346,675 | ) |
| Class C Shares | | | (54,265,095 | ) | | (42,762,558 | ) |
| Class I Shares | | | (100,478,175 | ) | | (62,252,861 | ) |
| Total distributions to shareholders from net investment income | | | (194,280,256 | ) | | (156,362,094 | ) |
| | | | | | | | |
| Increase/(decrease) from Fund share transactions: | | | | | | | |
| Class A Shares | | | (55,180,085 | ) | | 46,024,071 | |
| Class C Shares | | | 246,969,235 | | | 327,113,942 | |
| Class I Shares | | | 604,508,415 | | | 648,963,241 | |
| Net increase/(decrease) from Fund share transactions: | | | 796,297,565 | | | 1,022,101,254 | |
| Net increase/(decrease) in net assets | | | 581,312,505 | | | 1,164,199,671 | |
| | | | | | | | |
| Net assets: | | | | | | | |
| Beginning of year | | | 3,124,333,694 | | | 1,960,134,023 | |
| End of year | | $ | 3,705,646,199 | | $ | 3,124,333,694 | |
| Accumulated undistributed net investment income income/(loss) | | $ | 4,483,650 | | $ | 8,690,521 | |
See notes to financial statements
138
Statements of changes in net assets
Global Technology Fund
| | | | Year Ended | | | Year Ended | |
| | | | July 31, 2015 | | | July 31, 2014 | |
| | | | | | | | |
| Net investment income/(loss) | | $ | (2,062,822 | ) | $ | (2,828,781 | ) |
| Net realized gain/(loss) from investments and foreign currency transactions | | | 46,418,980 | | | 43,865,476 | |
| Net change in unrealized appreciation/(depreciation) of investments and foreign currency translations | | | (13,474,239 | ) | | 14,838,828 | |
| Net increase/(decrease) in net assets resulting from operations | | | 30,881,919 | | | 55,875,523 | |
| | | | | | | | |
| Distributions to shareholders from net realized gains: | | | | | | | |
| Class A Shares | | | (14,581,856 | ) | | (1,157,738 | ) |
| Class B Shares | | | (1,117,177 | ) | | (68,522 | ) |
| Class C Shares | | | (10,977,712 | ) | | (575,039 | ) |
| Class I Shares | | | (15,573,789 | ) | | (664,636 | ) |
| Total distributions to shareholders from net realized gains | | | (42,250,534 | ) | | (2,465,935 | ) |
| | | | | | | | |
| Increase/(decrease) from Fund share transactions: | | | | | | | |
| Class A Shares | | | (52,367,855 | ) | | (39,059,663 | ) |
| Class B Shares | | | (1,836,313 | ) | | (2,047,107 | ) |
| Class C Shares | | | 350,215 | | | 426,339 | |
| Class I Shares | | | (15,718,293 | ) | | 2,200,892 | |
| Net increase/(decrease) decrease from Fund share transactions: | | | (69,572,246 | ) | | (38,479,539 | ) |
| Net increase/(decrease) in net assets | | | (80,940,861 | ) | | 14,930,049 | |
| | | | | | | | |
| Net assets: | | | | | | | |
| Beginning of year | | | 362,741,296 | | | 347,811,247 | |
| End of year | | $ | 281,800,435 | | $ | 362,741,296 | |
| Accumulated undistributed net investment income/(loss) | | $ | (320,317 | ) | $ | (1,785,864 | ) |
See notes to financial statements
139
Statements of changes in net assets
High Yield Opportunities Fund
| | | | Year Ended | | | Year Ended | |
| | | | July 31, 2015 | | | July 31, 2014 | |
| Net investment income/(loss) | | $ | 1,417,853 | | $ | 1,604,395 | |
| Net realized gain/(loss) from investments and financial derivative instruments | | | (527,553 | ) | | 740,438 | |
| Net change in unrealized appreciation/(depreciation) of investments and financial derivative instruments | | | (492,014 | ) | | 388,021 | |
| Net increase/(decrease) in net assets resulting from operations | | | 398,286 | | | 2,732,854 | |
| | | | | | | | |
| Distributions to shareholders from net investment income: | | | | | | | |
| Class A Shares | | | (158,365 | ) | | (98,665 | ) |
| Class C Shares | | | (58,762 | ) | | (54,655 | ) |
| Class I Shares | | | (1,337,873 | ) | | (1,506,677 | ) |
| Total distributions to shareholders from net investment income | | | (1,555,000 | ) | | (1,659,997 | ) |
| | | | | | | | |
| Distributions to shareholders from net realized gains: | | | | | | | |
| Class A Shares | | | (37,967 | ) | | (2,814 | ) |
| Class C Shares | | | (27,626 | ) | | (2,548 | ) |
| Class I Shares | | | (587,665 | ) | | (60,291 | ) |
| Total distributions to shareholders from net realized gains | | | (653,258 | ) | | (65,653 | ) |
| | | | | | | | |
| Increase/(decrease) from Fund share transactions: | | | | | | | |
| Class A Shares | | | (90,633 | ) | | 1,001,671 | |
| Class C Shares | | | 263,692 | | | 159,999 | |
| Class I Shares | | | 268,045 | | | (1,322,865 | ) |
| Net increase/(decrease) from Fund share transactions: | | | 441,104 | | | (161,195 | ) |
| Net increase/(decrease) in net assets | | | (1,368,868 | ) | | 846,009 | |
| | | | | | | | |
| Net assets: | | | | | | | |
| Beginning of year | | | 26,579,606 | | | 25,733,597 | |
| End of year | | $ | 25,210,738 | | $ | 26,579,606 | |
| Accumulated undistributed net investment income/(loss) | | $ | 70,270 | | $ | 146,645 | |
See notes to financial statements
140
Statements of changes in net assets
International Long/Short Equity Fund
| | | | Period Ended | |
| | | | July 31, 2015 | * |
| | | | | |
| Net investment income/(loss) | | $ | (84,901 | ) |
| Net realized gain/(loss) from investments, financial derivative instruments, short sales and foreign currency transactions | | | 74,106 | |
| Net change in unrealized appreciation/(depreciation) of investments, financial derivative instruments, short sales and foreign currency translations | | | 136,924 | |
| Net increase/(decrease) in net assets resulting from operations | | | 126,129 | |
| | | | | |
| Increase/(decrease) from Fund share transactions: | | | | |
| Class A Shares | | | 195,737 | |
| Class C Shares | | | 100,122 | |
| Class I Shares | | | 5,860,760 | |
| Net increase/(decrease) from Fund share transactions: | | | 6,156,619 | |
| Net increase/(decrease) in net assets | | | 6,282,748 | |
| | | | | |
| Net assets: | | | | |
| Beginning of period | | | — | |
| End of period | | $ | 6,282,748 | |
| Accumulated undistributed net investment income/(loss) | | $ | (69,800 | ) |
| * | The International Long/Short Equity Fund commenced operations on December 9, 2014. |
See notes to financial statements
141
Statements of changes in net assets
International Opportunities Fund
| | | | Year Ended | | | Year Ended | |
| | | | July 31, 2015 | | | July 31, 2014 | |
| | | | | | | | |
| Net investment income/(loss) | | $ | 47,096,272 | | $ | 40,375,051 | |
| Net realized gain/(loss) from investments, financial derivative instruments and foreign currency transactions | | | 186,668,325 | | | 226,019,491 | |
| Net change in unrealized appreciation/(depreciation) of investments, financial derivative instruments and foreign currency translations | | | 10,968,612 | | | 147,311,429 | |
| Net increase/(decrease) in net assets resulting from operations | | | 244,733,209 | | | 413,705,971 | |
| | | | | | | | |
| Distributions to shareholders from net investment income: | | | | | | | |
| Class A Shares | | | (13,739,334 | ) | | (6,338,907 | ) |
| Class C Shares | | | (1,759,814 | ) | | — | |
| Class I Shares | | | (23,673,060 | ) | | (6,339,779 | ) |
| Class R Shares | | | (79,695 | ) | | (7,898 | ) |
| Total distributions to shareholders from net investment income | | | (39,251,903 | ) | | (12,686,584 | ) |
| | | | | | | | |
| Increase/(decrease) from Fund share transactions: | | | | | | | |
| Class A Shares | | | (447,677,648 | ) | | 311,171,454 | |
| Class B Shares | | | (13,409,043 | ) | | (15,281,526 | ) |
| Class C Shares | | | 36,281,349 | | | 11,836,849 | |
| Class I Shares | | | 845,583,014 | | | 388,149,385 | |
| Class R Shares | | | 3,658,824 | | | 1,794,203 | |
| Net increase/(decrease) from Fund share transactions: | | | 424,436,496 | | | 697,670,365 | |
| Net increase/(decrease) in net assets | | | 629,917,802 | | | 1,098,689,752 | |
| | | | | | | | |
| Net assets: | | | | | | | |
| Beginning of year | | | 3,910,986,770 | | | 2,812,297,018 | |
| End of year | | $ | 4,540,904,572 | | $ | 3,910,986,770 | |
| Accumulated undistributed net investment income/(loss) | | $ | 46,489,778 | | $ | 38,905,502 | |
See notes to financial statements
142
Statements of changes in net assets
International Select Equity Fund
| | | | Period Ended | |
| | | | July 31, 2015 | * |
| | | | | |
| Net investment income/(loss) | | $ | 48,093 | |
| Net realized gain/(loss) from investments and foreign currency transactions | | | 29,513 | |
| Net change in unrealized appreciation/(depreciation) of investments and foreign currency translations | | | 325,359 | |
| Net increase/(decrease) in net assets resulting from operations | | | 402,965 | |
| | | | | |
| Increase/(decrease) from Fund share transactions | | | | |
| Class A Shares | | | 257,531 | |
| Class C Shares | | | 111,850 | |
| Class I Shares | | | 4,838,337 | |
| Net increase/(decrease) from Fund share transactions: | | | 5,207,718 | |
| Net increase/(decrease) in net assets | | | 5,610,683 | |
| | | | | |
| Net assets: | | | | |
| Beginning of period | | | — | |
| End of period | | $ | 5,610,683 | |
| Accumulated undistributed net investment income/(loss) | | $ | 47,568 | |
| * | The International Select Equity Fund commenced operations on September 30, 2014. |
See notes to financial statements
143
Statements of changes in net assets
Strategic Income Fund
| | | | Year Ended | | | Year Ended | |
| | | | July 31, 2015 | | | July 31, 2014 | |
| | | | | | | | |
| Net investment income/(loss) | | $ | 3,980,451 | | $ | 1,989,374 | |
| Net realized gain/(loss) from investments, financial derivative instruments and foreign currency transactions | | | 303,507 | | | (425,027 | ) |
| Net change in unrealized appreciation/(depreciation) of investments, financial derivative instruments and foreign currency translations | | | (1,241,735 | ) | | 1,336,761 | |
| Net increase/(decrease) in net assets resulting from operations | | | 3,042,223 | | | 2,901,108 | |
| | | | | | | | |
| Distributions to shareholders from net investment income: | | | | | | | |
| Class A Shares | | | (814,505 | ) | | (631,894 | ) |
| Class B Shares | | | (126,818 | ) | | (214,577 | ) |
| Class C Shares | | | (848,492 | ) | | (756,111 | ) |
| Class I Shares | | | (2,845,209 | ) | | (412,440 | ) |
| Total distributions to shareholders from net investment income | | | (4,635,024 | ) | | (2,015,022 | ) |
| | | | | | | | |
| Increase/(decrease) from Fund share transactions | | | | | | | |
| Class A Shares | | | 16,935,684 | | | (4,431,989 | ) |
| Class B Shares | | | (1,100,439 | ) | | (2,072,667 | ) |
| Class C Shares | | | 12,458,298 | | | (2,137,210 | ) |
| Class I Shares | | | 89,428,317 | | | 10,919,406 | |
| Net increase/(decrease) from Fund share transactions: | | | 117,721,860 | | | 2,277,540 | |
| Net increase/(decrease) in net assets | | | 116,129,059 | | | 3,163,626 | |
| | | | | | | | |
| Net assets: | | | | | | | |
| Beginning of year | | | 51,791,210 | | | 48,627,584 | |
| End of year | | $ | 167,920,269 | | $ | 51,791,210 | |
| Accumulated undistributed net investment income/(loss) | | $ | (1,157,208 | ) | $ | 743,927 | |
See notes to financial statements
144
Statements of changes in net assets
Unconstrained Bond Fund
| | | | Year Ended | | | Period Ended | |
| | | | July 31, 2015 | | | July 31, 2014 | * |
| | | | | | | | |
| Net investment income/(loss) | | $ | 352,563 | | $ | 339,149 | |
| Net realized gain/(loss) from investments, financial derivative instruments and foreign currency transactions | | | 1,004,418 | | | (191,148 | ) |
| Net change in unrealized appreciation/(depreciation) of investments, financial derivative instruments and foreign currency translations | | | (1,392,368 | ) | | 351,405 | |
| Net increase/(decrease) in net assets resulting from operations | | | (35,387 | ) | | 499,406 | |
| | | | | | | | |
| Distributions to shareholders from net investment income: | | | | | | | |
| Class A Shares | | | (12,886 | ) | | (12,646 | ) |
| Class C Shares | | | (6,200 | ) | | (6,896 | ) |
| Class I Shares | | | (385,916 | ) | | (330,459 | ) |
| Total distributions to shareholders from net investment income | | | (405,002 | ) | | (350,001 | ) |
| | | | | | | | |
| Distributions to shareholders from net realized gains: | | | | | | | |
| Class A Shares | | | (42,783 | ) | | — | |
| Class C Shares | | | (48,979 | ) | | — | |
| Class I Shares | | | (1,040,174 | ) | | — | |
| Total distributions to shareholders from net realized gains | | | (1,131,936 | ) | | — | |
| | | | | | | | |
| Increase/(decrease) from Fund share transactions | | | | | | | |
| Class A Shares | | | (117,696 | ) | | 1,129,457 | |
| Class C Shares | | | 142,884 | | | 1,000,000 | |
| Class I Shares | | | 170,411 | | | 25,987,864 | |
| Net increase/(decrease) from Fund share transactions: | | | 195,599 | | | 28,117,321 | |
| Net increase/(decrease) in net assets | | | (1,376,726 | ) | | 28,266,726 | |
| | | | | | | | |
| Net assets: | | | | | | | |
| Beginning of year | | | 28,266,726 | | | — | |
| End of year | | $ | 26,890,000 | | $ | 28,266,726 | |
| Accumulated undistributed net investment income/(loss) | | $ | (1,063,128 | ) | $ | (9,629 | ) |
| * | The Unconstrained Bond Fund commenced operations on December 20, 2013. |
See notes to financial statements
145
Statements of changes in net assets
US Growth Opportunities Fund
| | | | Period Ended | |
| | | | July 31, 2015 | * |
| | | | | |
| Net investment loss/(loss) | | $ | (2,089 | ) |
| Net realized gain/(loss) from investments and foreign currency transactions | | | (35,944 | ) |
| Net change in unrealized appreciation/(depreciation) of investments and foreign currency translations | | | 724,006 | |
| Net increase/(decrease) in net assets resulting from operations | | | 685,973 | |
| | | | | |
| Increase/(decrease) from Fund share transactions: | | | | |
| Class A Shares | | | 1,546,643 | |
| Class C Shares | | | 10,000 | |
| Class I Shares | | | 5,155,183 | |
| Net increase/(decrease) from Fund share transactions: | | | 6,711,826 | |
| Net increase/(decrease) in net assets | | | 7,397,799 | |
| | | | | |
| Net assets: | | | | |
| Beginning of period | | | — | |
| End of period | | $ | 7,397,799 | |
| Accumulated undistributed net investment income/(loss) | | $ | (1,964 | ) |
| * | The US Growth Opportunities Fund commenced operations on December 18, 2014. |
See notes to financial statements
146
Statements of changes – capital stock activity
All Asset Fund
| | | | Year Ended | | | Year Ended | |
| | | | July 31, 2015 | | | July 31, 2014 | |
| | | | | | | | |
| Amount | | | | | | | |
| | | | | | | | |
| Class A shares: | | | | | | | |
| Sold | | $ | 2,554,231 | | $ | 4,695,681 | |
| Issued as reinvestment of dividends | | | 243,890 | | | 393,801 | |
| Redeemed | | | (5,204,279 | ) | | (8,375,760 | ) |
| Net increase/(decrease) | | $ | (2,406,158 | ) | $ | (3,286,278 | ) |
| | | | | | | | |
| Class C shares: | | | | | | | |
| Sold | | $ | 4,904,804 | | $ | 5,911,056 | |
| Issued as reinvestment of dividends | | | 347,023 | | | 354,883 | |
| Redeemed | | | (5,298,299 | ) | | (4,745,178 | ) |
| Net increase/(decrease) | | $ | (46,472 | ) | $ | 1,520,761 | |
| | | | | | | | |
| Class I shares: | | | | | | | |
| Sold | | $ | 7,046,213 | | $ | 20,022,331 | |
| Issued as reinvestment of dividends | | | 1,876,370 | | | 2,273,522 | |
| Redeemed | | | (10,512,582 | ) | | (19,798,736 | ) |
| Net increase/(decrease) | | $ | (1,589,999 | ) | $ | 2,497,117 | |
| | | | | | | | |
| Shares | | | | | | | |
| | | | | | | | |
| Class A shares: | | | | | | | |
| Sold | | | 241,338 | | | 438,661 | |
| Issued as reinvestment of dividends | | | 23,272 | | | 37,508 | |
| Redeemed | | | (487,973 | ) | | (789,629 | ) |
| Net increase/(decrease) | | | (223,363 | ) | | (313,460 | ) |
| | | | | | | | |
| Class C shares: | | | | | | | |
| Sold | | | 470,507 | | | 562,782 | |
| Issued as reinvestment of dividends | | | 33,502 | | | 34,190 | |
| Redeemed | | | (506,063 | ) | | (450,293 | ) |
| Net increase/(decrease) | | | (2,054 | ) | | 146,679 | |
| | | | | | | | |
| Class I shares: | | | | | | | |
| Sold | | | 660,704 | | | 1,889,605 | |
| Issued as reinvestment of dividends | | | 179,159 | | | 216,107 | |
| Redeemed | | | (987,950 | ) | | (1,853,902 | ) |
| Net increase/(decrease) | | | (148,087 | ) | | 251,810 | |
See notes to financial statements
147
Statements of changes – capital stock activity
Dividend & Income Builder Fund
| | | | Year Ended | | | Year Ended | |
| | | | July 31, 2015 | | | July 31, 2014 | |
| | | | | | | | |
| Amount | | | | | | | |
| | | | | | | | |
| Class A shares: | | | | | | | |
| Sold | | $ | 8,893,558 | | $ | 20,231,888 | |
| Issued as reinvestment of dividends | | | 562,190 | | | 274,381 | |
| Redeemed | | | (7,728,757 | ) | | (9,066,629 | ) |
| Net increase/(decrease) | | $ | 1,726,991 | | $ | 11,439,640 | |
| | | | | | | | |
| Class C shares: | | | | | | | |
| Sold | | $ | 10,821,649 | | $ | 3,935,196 | |
| Issued as reinvestment of dividends | | | 302,228 | | | 42,943 | |
| Redeemed | | | (1,967,936 | ) | | (42,126 | ) |
| Net increase/(decrease) | | $ | 9,155,941 | | $ | 3,936,013 | |
| | | | | | | | |
| Class I shares: | | | | | | | |
| Sold | | $ | 20,292,092 | | $ | 7,009,246 | |
| Issued as reinvestment of dividends | | | 632,260 | | | 117,107 | |
| Redeemed | | | (4,808,376 | ) | | (654,005 | ) |
| Net increase/(decrease) | | $ | 16,115,976 | | $ | 6,472,348 | |
| | | | | | | | |
| Shares | | | | | | | |
| | | | | | | | |
| Class A shares: | | | | | | | |
| Sold | | | 724,925 | | | 1,670,747 | |
| Issued as reinvestment of dividends | | | 45,920 | | | 21,869 | |
| Redeemed | | | (631,636 | ) | | (720,662 | ) |
| Net increase/(decrease) | | | 139,209 | | | 971,954 | |
| | | | | | | | |
| Class C shares: | | | | | | | |
| Sold | | | 891,229 | | | 321,543 | |
| Issued as reinvestment of dividends | | | 24,863 | | | 3,433 | |
| Redeemed | | | (161,375 | ) | | (3,472 | ) |
| Net increase/(decrease) | | | 754,717 | | | 321,504 | |
| | | | | | | | |
| Class I shares: | | | | | | | |
| Sold | | | 1,643,065 | | | 563,711 | |
| Issued as reinvestment of dividends | | | 51,690 | | | 9,317 | |
| Redeemed | | | (394,096 | ) | | (52,731 | ) |
| Net increase/(decrease) | | | 1,300,659 | | | 520,297 | |
See notes to financial statements
148
Statements of changes – capital stock activity
Emerging Markets Fund
| | | | Year Ended | | | Year Ended | |
| | | | July 31, 2015 | | | July 31, 2014 | |
| | | | | | | | |
| Amount | | | | | | | |
| | | | | | | | |
| Class A shares: | | | | | | | |
| Sold | | $ | 3,259,975 | | $ | 6,983,615 | |
| Redeemed | | | (2,530,487 | ) | | (8,746,991 | ) |
| Net increase/(decrease) | | $ | 729,488 | | $ | (1,763,376 | ) |
| | | | | | | | |
| Class C shares: | | | | | | | |
| Sold | | $ | 404,342 | | $ | 941,289 | |
| Redeemed | | | (885,354 | ) | | (572,840 | ) |
| Net increase/(decrease) | | $ | (481,012 | ) | $ | 368,449 | |
| | | | | | | | |
| Class I shares: | | | | | | | |
| Sold | | $ | 6,847,431 | | $ | 11,969,854 | |
| Issued as reinvestment of dividends | | | 22,603 | | | — | |
| Redeemed | | | (8,414,502 | ) | | (8,542,061 | ) |
| Net increase/(decrease) | | $ | (1,544,468 | ) | $ | 3,427,793 | |
| | | | | | | | |
| Shares | | | | | | | |
| | | | | | | | |
| Class A shares: | | | | | | | |
| Sold | | | 351,593 | | | 787,040 | |
| Redeemed | | | (270,545 | ) | | (958,215 | ) |
| Net increase/(decrease) | | | 81,048 | | | (171,175 | ) |
| | | | | | | | |
| Class C shares: | | | | | | | |
| Sold | | | 45,128 | | | 106,739 | |
| Redeemed | | | (99,689 | ) | | (65,610 | ) |
| Net increase/(decrease) | | | (54,561 | ) | | 41,129 | |
| | | | | | | | |
| Class I shares: | | | | | | | |
| Sold | | | 737,844 | | | 1,310,559 | |
| Issued as reinvestment of dividends | | | 2,537 | | | — | |
| Redeemed | | | (904,039 | ) | | (949,783 | ) |
| Net increase/(decrease) | | | (163,658 | ) | | 360,776 | |
See notes to financial statements
149
Statements of changes – capital stock activity
European Focus Fund
| | | | Year Ended | | | Year Ended | |
| | | | July 31, 2015 | | | July 31, 2014 | |
| | | | | | | | |
| Amount | | | | | | | |
| | | | | | | | |
| Class A shares: | | | | | | | |
| Sold | | $ | 540,366,997 | | $ | 706,629,609 | |
| Issued as reinvestment of dividends | | | 7,076,371 | | | 1,220,840 | |
| Redeemed | | | (419,599,454 | ) | | (362,377,490 | ) |
| Net increase/(decrease) | | $ | 127,843,914 | | $ | 345,472,959 | |
| | | | | | | | |
| Class B shares: | | | | | | | |
| Sold | | $ | 307,812 | | $ | 328,861 | |
| Issued as reinvestment of dividends | | | 5,174 | | | — | |
| Redeemed | | | (8,882,598 | ) | | (7,038,351 | ) |
| Net increase/(decrease) | | $ | (8,569,612 | ) | $ | (6,709,490 | ) |
| | | | | | | | |
| Class C shares: | | | | | | | |
| Sold | | $ | 142,444,369 | | $ | 160,116,060 | |
| Issued as reinvestment of dividends | | | 2,448,975 | | | — | |
| Redeemed | | | (57,636,406 | ) | | (21,760,977 | ) |
| Net increase/(decrease) | | $ | 87,256,938 | | $ | 138,355,083 | |
| | | | | | | | |
| Class I shares: | | | | | | | |
| Sold | | $ | 1,520,198,059 | | $ | 1,224,030,882 | |
| Issued as reinvestment of dividends | | | 20,822,276 | | | 1,901,500 | |
| Redeemed | | | (649,538,512 | ) | | (172,680,186 | ) |
| Net increase/(decrease) | | $ | 891,481,823 | | $ | 1,053,252,196 | |
| | | | | | | | |
| Shares | | | | | | | |
| | | | | | | | |
| Class A shares: | | | | | | | |
| Sold | | | 15,300,709 | | | 20,525,045 | |
| Issued as reinvestment of dividends | | | 212,440 | | | 34,801 | |
| Redeemed | | | (12,167,081 | ) | | (10,232,485 | ) |
| Net increase/(decrease) | | | 3,346,068 | | | 10,327,361 | |
| | | | | | | | |
| Class B shares: | | | | | | | |
| Sold | | | 9,255 | | | 10,215 | |
| Issued as reinvestment of dividends | | | 163 | | | — | |
| Redeemed | | | (268,215 | ) | | (219,622 | ) |
| Net increase/(decrease) | | | (258,797 | ) | | (209,407 | ) |
| | | | | | | | |
| Class C shares: | | | | | | | |
| Sold | | | 4,266,432 | | | 4,905,273 | |
| Issued as reinvestment of dividends | | | 78,142 | | | — | |
| Redeemed | | | (1,785,160 | ) | | (666,583 | ) |
| Net increase/(decrease) | | | 2,559,414 | | | 4,238,690 | |
| | | | | | | | |
| Class I shares: | | | | | | | |
| Sold | | | 42,855,950 | | | 35,197,450 | |
| Issued as reinvestment of dividends | | | 626,046 | | | 54,204 | |
| Redeemed | | | (19,060,749 | ) | | (4,896,405 | ) |
| Net increase/(decrease) | | | 24,421,247 | | | 30,355,249 | |
See notes to financial statements
150
| Notes to financial statements |
The number of options/swaptions written and the premiums received, including both exchange-traded and OTC options, by the Unconstrained Bond Fund during the year ended July 31, 2015 were as follows:
| | | | Number of Contracts | | | Premiums Received | |
| Options outstanding, beginning of period | | | 7,460,012 | | $ | 114,725 | |
| Options written during period | | | 15,910,265 | | | 229,547 | |
| Options bought back during period | | | (5,520,109 | ) | | (93,686 | ) |
| Options expired during the period | | | (3,410,168 | ) | | (122,778 | ) |
| Options outstanding,end of period | | | 14,440,000 | | | 128,008 | |
Swap contracts
The Funds may enter into interest rate, credit default, inflation, equity, total return, currency and other swap contracts. Swap contracts are bilaterally negotiated agreements between the Funds and a counterparty to exchange or swap the returns (or the differential in rates of return) earned or realized on particular investments, instruments, indices or other measures for a defined series of cash flows at a predetermined rate at specified, future intervals. Swap contracts are privately negotiated in the OTC market (“OTC swaps”), or may be executed on a multi-lateral or other trade facility platform, such as a registered exchange (“centrally-cleared swaps”). The gross returns to be exchanged or “swapped” between parties are generally calculated with respect to a “notional amount” for a pre-determined period of time.
Certain Funds use credit default swaps to manage exposure to a given issuer or sector by either selling protection to increase exposure (i.e., leverage), or buying protection to reduce exposure. The “buyer” in a credit default swap is obligated to pay the “seller” a periodic stream of payments over the term of the contract provided that no event of default on an underlying reference obligation has occurred. If an event of default occurs, the seller must either pay the buyer the full notional value, or the “par value,” of the reference obligation in exchange for the reference obligation or pay a net amount equal to the par value of the defaulted reference entity less its recovery value. In connection with these contracts, securities may be identified as collateral in accordance with the terms of the respective swap contracts to provide assets of value and recourse in the event of default or bankruptcy/insolvency. Recovery values are assumed by market makers considering either industry standard recovery rates or entity specific factors and considerations until a credit event occurs. If a credit event has occurred, the recovery value is typically determined by a facilitated auction whereby a minimum number of allowable broker bids, together with a specific valuation method, are used to calculate the settlement value. Implied credit spreads, represented in absolute terms, utilized in determining the market value of credit default swap contracts as of period end are disclosed in the Portfolios of Investments, as applicable. Implied credit spreads serve as an indicator of the current status of the payment/performance risk and represent the likelihood or risk of default for the credit derivative. The implied credit spread of a particular referenced entity reflects the cost of buying/selling protection and may include upfront payments required to be made to enter into the contract. Wider credit spreads represent a deterioration of the referenced entity’s credit soundness and a greater likelihood or risk of default or other credit event occurring as defined under the terms of the contract.
Certain Funds hold fixed-rate and/or floating-rate bonds. Accordingly, the Funds are subject to interest rate risk exposure in the normal course of pursuing its investment objectives as the value of these bonds may decrease if interest rates rise, or vice versa. To hedge against this risk and/or to generate income at prevailing market rates, the Funds may enter into interest rate swap contracts. Interest rate swap contracts involve the exchange by the Fund with another party for their respective commitment to pay or receive a fixed or variable interest rate on the notional amount.
The International Long/Short Equity Fund may enter into equity swaps for purposes of establishing long or short exposure to underlying individual securities. Equity swaps may be used in lieu of direct stock investment or short sale to enhance liquidity, synthetically enter markets with high barriers to entry or establish short positions in markets where short selling is disallowed. Equity swaps involve commitments where cash flows are exchanged based on a variable interest rate. At maturity, or upon reset or termination, a net cash flow is exchanged equivalent to the return, inclusive of dividends declared, on the underlying equity.
Changes in market value, if any, are reflected as a component of net change in unrealized appreciation/(depreciation) on the Statements of Operations. Daily changes in the valuation of centrally-cleared swaps are recorded as a receivable or payable for the change in value (“variation margin”) on the Statements of Assets and Liabilities. Swap payments received or made at the beginning of the measurement period are included on the Statements of Assets and Liabilities and represent premiums paid or received upon entering into the swap contract to compensate for differences between the stated terms of the swap contract and prevailing market conditions (credit spreads, currency exchange rates, interest rates, and other relevant factors). Upfront premiums received (paid) are initially recorded
186
| Notes to financial statements |
as liabilities (assets) and subsequently marked to market to reflect the current value of the swap. These upfront premiums are recorded as realized gains or losses on the Statements of Operations upon termination or maturity of the swap. A liquidation payment received or made at the termination of the swap is recorded as realized gain or loss on the Statements of Operations. Net periodic payments received or paid by the Funds are included as part of realized gains or losses on the Statements of Operations.
Entering into these contracts involves, to varying degrees, elements of counterparty, interest, credit and market risk in excess of the amounts recognized on the Statements of Assets and Liabilities. Such risks involve the potential inability of the counterparties to meet the terms of their contract (which is limited with respect to centrally-cleared swaps as described below), unanticipated changes in the value of the swap contract, the possibility that there will be no liquid market for the contract, and that there may be unfavorable changes in interest rates. The risk that a counterparty is unable to perform on its obligations in situations when the Funds are in an appreciated position is mitigated with respect to OTC swaps by having master netting arrangements between the Funds and their counterparties and, in certain scenarios dictated by the contracts, the posting of collateral by the counterparty to the Funds to cover the Funds’ exposure to the counterparty. There is limited counterparty credit risk with respect to centrally-cleared swaps as the transaction is facilitated through a central clearinghouse, much like an exchange-traded futures contract. Upon entering into a centrally-cleared swap transaction, the Fund is required to deposit with its clearing broker an amount of cash or securities as an initial margin. Subsequent variation margin payments or receipts are made or received by the Fund, depending on the fluctuations in the fair value of the reference entity. The magnitude of counterparty credit risk is different depending on the type of swap. Under a credit default swap, the Funds’ maximum risk of loss as the protection buyer is limited to the market value, or the current unrealized appreciation/depreciation on the contract plus/minus any upfront premiums paid/received. Alternatively, as the protection seller, the maximum risk of loss is equivalent to the notional or par value of the contract plus/minus any upfront premiums paid/received. At July 31, 2015, notional outstanding for credit protection sold, translated into US Dollar amounts, equated to $250,000 for the High Yield Opportunities Fund, $109,825 for the Strategic Income Fund and $54,913 for the Unconstrained Bond Fund. Alternatively, under an interest rate, inflation, or equity swap, as notional is not exchanged, the Funds’ maximum risk of loss is limited to the unrealized loss on the contracts. When applicable, open swap contracts at the end of the period are listed in each Fund’s Portfolio of Investments.
Derivative instruments
The FASB requires companies (including the Trust) to disclose information intended to enable financial statement users to understand how derivative instruments impact the Statements of Assets and Liabilities as well as the effect of derivative instruments on the Statements of Operations during the reporting period, in the context of each entity’s risk exposure. Further, in January 2013, the FASB issued Accounting Standard Update (“ASU”) 2013-01 Clarifying the Scope of Disclosures about Offsetting Assets and Liabilities. The update clarifies the scope of ASU 2011-11, which requires enhanced disclosures around financial instruments and derivative instruments that are either off-set in accordance with US GAAP or are subject to an enforceable master netting arrangement (“MNA”) or similar agreement. The updates mandate that entities disclose both gross and net information about such financial instruments and transactions eligible for off-set on the Statements of Assets and Liabilities, in addition to required disclosure of collateral received and posted in connection with MNAs or similar agreements. The updates have no effect on the Funds’ net assets. Accordingly, the tables included under the heading “Fair Value of Financial Derivative Instruments” in the Funds’ Portfolios of Investments summarize each Fund’s fair value of derivative instruments held at July 31, 2015 and the related location on the accompanying Statements of Assets and Liabilities, as well as the amount of gains and losses on derivative instruments recognized in the Funds’ earnings and the related location on the accompanying Statements of Operations, presented by primary underlying risk exposure. Supplementary information regarding gross and net values and the impact of any collateral posted for those transactions subject to MNAs is presented in the Funds’ Portfolios of Investments under the heading “Financial Derivative Instruments: Over-the-Counter Summary.” Note that all OTC instruments (forward foreign currency contracts, OTC credit default, equity, inflation and interest rate swap contracts, swaptions and certain options) with Barclays Bank plc, BNP Paribas Securities Services, Citibank, N.A., Credit Suisse Securities (Europe) Limited, Deutsche Bank AG, JPMorgan Chase Bank, N.A. and Morgan Stanley Capital Services LLC are all subject to MNAs. The settlement of all futures contracts, exchange-traded options and centrally-cleared swap contracts (credit default and interest rate) is guaranteed by the clearinghouse or exchange the instrument is traded on and is not subject to arrangements with particular counterparties. For that reason, these types of investments are excluded from such disclosures.
187
| Notes to financial statements |
Indemnifications
Under the Trust’s organizational documents, its officers and trustees are indemnified against certain liabilities arising out of the performance of their duties to the Trust. In addition, in the normal course of business the Trust enters into contracts that provide general indemnifications to other parties. The Trust’s maximum exposure under these arrangements is unknown as future claims may be made against the Trust that have not yet been asserted.
Use of estimates
The preparation of financial statements in conformity with US GAAP requires management to make estimates and assumptions that affect the reported amounts and disclosures in the financial statements. Actual results may differ from those estimates.
Expenses
Expenses are recorded on an accrual basis. Expenses of the Trust that are directly attributable to a specific Fund are charged to that Fund. Expenses attributable to a specific class of shares are charged to that class. Other expenses are allocated proportionately among each Fund within the Trust based on average daily net assets or on another reasonable basis.
Deferred offering costs
Costs incurred in connection with the offering and initial registration of International Long/Short Equity, International Select Equity and US Growth Opportunities have been deferred in conformity with US GAAP and are being amortized to expense on a straight-line basis over the first twelve months after commencement of operations. The deferred offering costs incurred by Unconstrained Bond were fully amortized to expense as of December 20, 2014.
Federal income taxes
The Trust’s policy is that each Fund seeks to comply with the requirements of Subchapter M of the Internal Revenue Code of 1986, as amended (“Subchapter M”), that are applicable to regulated investment companies (“RICs”) and to distribute substantially all its taxable income to shareholders. No federal income tax provision is required so long as each Fund operates in a manner that complies with the requirements of Subchapter M.
FASB ASC 740-10 “Income Taxes – Overall” sets forth a minimum threshold for financial statement recognition of the benefit of a tax position taken or expected to be taken in a tax return. Management of the Funds has concluded there are no significant uncertain tax positions that would require recognition in the financial statements. Management is also not aware of any tax positions for which it is reasonably possible that the total amount of unrecognized tax benefits will significantly change in the next twelve months. The Funds intend to file tax returns with the US Internal Revenue Service and various states. Generally, each of the tax years in the four-year period ended July 31, 2015 remains subject to examination by taxing authorities.
The Funds may be subject to taxes imposed by countries in which they invest. Such taxes are generally based on income and/or capital gains earned or repatriated. Taxes are accrued based on net investment income, net realized gains and net unrealized appreciation as such income and/or gains are earned. Taxes may also be based on transactions in foreign currency and are accrued based on the value of investments denominated in such currency. With respect to withholding taxes on certain foreign dividends and interest, the Funds file withholding tax reclaims in certain jurisdictions to recover a portion of amounts previously withheld. The Funds record a reclaim receivable based on, among other things, a jurisdiction’s legal obligation to pay reclaims under double taxation agreements or treaties with the United States, as well as payment history and market convention.
In consideration of recent decisions rendered by European courts with respect to discriminatory taxation, and based on relative exposure, the European Focus Fund, Global Equity Income Fund, Global Technology Fund and International Opportunities Fund pursued additional reclaims related to prior years in certain jurisdictions in accordance with European Union law. However, the relevant tax authorities and the administrative courts within the various jurisdictions have been, to date, inconsistent in the approach, interpretation and rulings related to US RIC claimants. As a result, with the exception of reclaims in Finland, consistent with US GAAP accrual requirements, these Funds have not recorded a corresponding receivable amount for these reclaim filings given the significant uncertainty in their ultimate recovery. In Finland, however, the Funds received confirmation from the Finnish tax authority that the reclaims lodged for previously withheld amounts from 2009-2013 were accepted, and payment, plus interest, was made to the Funds in June 2015. The payments, recognized on the Statements of Operations as a reduction of current period withholding tax expense, resulted in an increase in the net asset value of each Fund. Absent formal guidance, it is management’s approach to offset the current period foreign tax credit with these payments.
As of July 31, 2015, the total amount of additional reclaims being pursued in France, Germany, Spain and Sweden with respect to withholdings amounts during the respective statute of limitations periods (generally 2009-2013) represent less
188
| Notes to financial statements |
than 0.50% of the net assets of European Focus, Global Equity Income and International Opportunities; however, the recovery of any or all of these amounts and timing of recovery, if any, is uncertain. The total amount of potential 2014 reclaims in the same jurisdictions represent less than 0.25% of the net assets of the three above named Funds. Management is pursuing reclaim of 2014 Finnish amounts in each of the three above named Funds, and is contemplating further filings in the other listed jurisdictions. However, due to the relative uncertainty of success, no additional accruals have been recognized for potential refunds.
To the extent that capital loss carryforwards incurred in current and prior years are used to offset any future capital gains realized during the carryover period as provided by US Federal income tax regulations, no capital gains tax liability will be incurred by the Funds for gains realized and not distributed. To the extent that capital gains are offset, such gains will not be distributed to the shareholders. Carryforwards not subject to expiration must be utilized prior to losses that carry an expiration; as a result, certain carryforwards may expire unused. Losses incurred that will be carried forward under the provisions of the regulations are as follows:
Dividend & Income Builder
| | | Loss carryforward character | |
| Expiration | | | Short-term | | | Long-term | |
| Unlimited losses | | $ | 3,115 | | $ | — | |
Emerging Markets
| | | Loss carryforward character | |
| Expiration | | | Short-term | | | Long-term | |
| Unlimited losses | | $ | 1,804,491 | | $ | — | |
European Focus
| | | Loss carryforward character | |
| Expiration | | | Short-term | | | Long-term | |
| 7/31/18 | | $ | 46,255,302 | | $ | — | |
High Yield Opportunities
| | | Loss carryforward character | |
| Expiration | | | Short-term | | | Long-term | |
| Unlimited losses | | $ | 498,592 | | $ | 56,380 | |
International Opportunities
| | | Loss carryforward character | |
| Expiration | | | Short-term | | | Long-term | |
| 7/31/18 | | $ | 298,194,218 | | $ | — | |
Strategic Income
| | | Loss carryforward character | |
| Expiration | | | Short-term | | | Long-term | |
| 7/31/16 | | $ | 559,583 | | $ | — | |
| 7/31/17 | | | 34,174,962 | | | — | |
| 7/31/18 | | | 336,160 | | | — | |
| Total | | | 35,070,705 | | | — | |
US Growth Opportunities
| | | Loss carryforward character | |
| Expiration | | | Short-term | | | Long-term | |
| Unlimited losses | | $ | 35,944 | | $ | — | |
Note that All Asset, Global Equity Income, Global Technology, International Long/Short Equity, International Select Equity and Unconstrained Bond do not have any capital loss carryforwards to apply against future earnings.
During the year ended July 31, 2015 the Funds utilized the following capital loss carryforwards:
| All Asset | | $ | — | |
| Dividend & Income Builder | | | — | |
| Emerging Markets | | | 782,742 | |
| European Focus | | | 11,482,117 | |
| Global Equity Income | | | 61,176,852 | |
| Global Technology | | | — | |
| High Yield Opportunities | | | — | |
| International Long/Short Equity | | | — | |
| International Opportunities | | | 176,074,558 | |
| International Select Equity | | | — | |
| Strategic Income | | | 1,593,726 | |
| Unconstrained Bond | | | — | |
| US Growth Opportunities | | | — | |
189
| Notes to financial statements |
At July 31, 2015, the following Funds deferred post-October losses and/or late year ordinary losses, which will be recognized on the first day of the following year:
| | | | Ordinary loss deferred | | | Capital loss deferred | |
| All Asset | | $ | — | | $ | — | |
| Dividend & | | | | | | | |
| Income Builder | | | — | | | 344,431 | |
| Emerging Markets | | | 58,760 | | | — | |
| European Focus | | | — | | | 35,109,167 | |
| Global Equity Income | | | — | | | 47,394,203 | |
| Global Technology | | | 318,764 | | | — | |
| High Yield | | | | | | | |
| Opportunities | | | — | | | — | |
| International Long/ | | | | | | | |
| Short Equity | | | — | | | — | |
| International | | | | | | | |
| Opportunities | | | — | | | — | |
| International | | | | | | | |
| Select Equity | | | — | | | — | |
| Strategic Income | | | 962,675 | | | — | |
| Unconstrained Bond | | | 1,030,499 | | | — | |
| US Growth | | | | | | | |
| Opportunities | | | 1,963 | | | — | |
Distributions to shareholders
Distributions to shareholders are recorded on the ex-dividend date. Distributions from net investment income and net realized capital gains are determined in accordance with federal income tax regulations, which may differ from US GAAP. These book/tax differences are either temporary or permanent in nature. To the extent these differences are permanent, they are reclassified within the capital accounts based on their federal tax-basis treatment.
Accordingly, at July 31, 2015, the Funds reclassified the following amounts between paid-in capital, accumulated undistributed net investment income (loss) and accumulated net realized gain (loss):
| | | | Paid-in capital | | Accumulated undistributed net investment income/(loss) | | | Accumulated net realized gain/(loss) | |
| All Asset | | $ | – | | $ | 343,743 | | $ | (343,743 | ) |
| Dividend & | | | | | | | | | | |
| Income Builder | | | (418 | ) | | 10,783 | | | (10,365 | ) |
| Emerging Markets | | | — | | | (110,775 | ) | | 110,775 | |
| European Focus | | | (1,068 | ) | | (3,371,917 | ) | | 3,372,985 | |
| Global Equity | | | | | | | | | | |
| Income | | | (76,842 | ) | | (2,402,445 | ) | | 2,479,287 | |
| Global | | | | | | | | | | |
| Technology | | | (12,817 | ) | | 3,528,369 | | | (3,515,552 | ) |
| High Yield | | | | | | | | | | |
| Opportunities | | | — | | | 60,772 | | | (60,772 | ) |
| International Long/ | | | | | | | | | | |
| Short Equity | | | (6,561 | ) | | 15,101 | | | (8,540 | ) |
| International | | | | | | | | | | |
| Opportunities | | | (1,913 | ) | | (260,093 | ) | | 262,006 | |
| International | | | | | | | | | | |
| Select Equity | | | (323 | ) | | (525 | ) | | 848 | |
| Strategic Income | | | — | | | (1,246,562 | ) | | 1,246,562 | |
| Unconstrained | | | | | | | | | | |
| Bond | | | (37,247 | ) | | (1,001,060 | ) | | 1,038,307 | |
| US Growth | | | | | | | | | | |
| Opportunities | | | (125 | ) | | 125 | | | — | |
These reclassifications relate to the deductibility of certain expenses, different tax treatments of certain securities, amortization of bond premium, character of realized gains/losses on foreign currency transactions, net operating losses and Passive Foreign Investment Companies (“PFIC”) transactions for tax purposes and had no impact on the net asset value of the Funds.
190
| Notes to financial statements |
The tax character of distributions paid during the years ended July 31, 2015 and 2014 were as follows:
| Year ended | | | Ordinary | | | Capital | |
| July 31, 2015 | | | income | | | gains | |
| All Asset | | $ | 1,698,896 | | $ | 848,091 | |
| Dividend & | | | | | | | |
| Income Builder | | | 1,358,317 | | | 277,649 | |
| Emerging Markets | | | 22,618 | | | — | |
| European Focus | | | 36,848,194 | | | — | |
| Global Equity Income | | | 194,280,256 | | | — | |
| Global Technology | | | — | | | 42,250,534 | |
| High Yield | | | | | | | |
| Opportunities | | | 2,208,258 | | | — | |
| International Long/ | | | | | | | |
| Short Equity | | | — | | | — | |
| International | | | | | | | |
| Opportunities | | | 39,251,903 | | | — | |
| International | | | | | | | |
| Select Equity | | | — | | | — | |
| Strategic Income | | | 4,635,024 | | | — | |
| Unconstrained Bond | | | 958,626 | | | 578,312 | |
| US Growth | | | | | | | |
| Opportunities | | | — | | | — | |
| Year ended | | | Ordinary | | | Capital | |
| July 31, 2014 | | | income | | | gains | |
| All Asset | | $ | 2,546,811 | | $ | 532,924 | |
| Dividend & | | | | | | | |
| Income Builder | | | 488,048 | | | 9 | |
| Emerging Markets | | | — | | | — | |
| European Focus | | | 3,710,266 | | | — | |
| Global Equity Income | | | 156,362,094 | | | — | |
| Global Technology | | | — | | | 2,465,935 | |
| High Yield | | | | | | | |
| Opportunities | | | 1,725,650 | | | — | |
| International | | | | | | | |
| Opportunities | | | 12,686,584 | | | — | |
| Strategic Income | | | 2,015,022 | | | — | |
| Unconstrained Bond | | | 350,001 | | | — | |
As of July 31, 2015, the components of distributable earnings on a tax basis were as follows:
| | | | Undistributed | | | Undistributed | | | Undistributed | |
| | | | ordinary | | | capital gains/ | | | appreciation/ | |
| | | | income | | | (losses | ) | | (depreciation | ) |
| All Asset | | $ | 1,377,364 | | $ | 700,399 | | $ | 875,564 | |
| Dividend & | | | | | | | | | | |
| Income Builder | | | 422,448 | | | — | | | 1,693,376 | |
| Emerging Markets | | | — | | | — | | | (1,417,071 | ) |
| European Focus | | | 28,658,545 | | | — | | | 177,460,148 | |
| Global Equity | | | | | | | | | | |
| Income | | | 4,569,061 | | | — | | | (64,715,471 | ) |
| Global Technology | | | — | | | 31,479,250 | | | 76,725,042 | |
| High Yield | | | | | | | | | | |
| Opportunities | | | 75,405 | | | — | | | (328,413 | ) |
| International Long/ | | | | | | | | | | |
| Short Equity | | | 184,888 | | | 28,480 | | | (80,678 | ) |
| International | | | | | | | | | | |
| Opportunities | | | 70,143,876 | | | — | | | 590,959,397 | |
| International | | | | | | | | | | |
| Select Equity | | | 82,501 | | | — | | | 320,789 | |
| Strategic Income | | | — | | | — | | | (1,905,827 | ) |
| Unconstrained Bond | | | 160,809 | | | 928,592 | | | (1,362,741 | ) |
| US Growth | | | | | | | | | | |
| Opportunities | | | — | | | — | | | 724,006 | |
Ordinary income and net realized gains/losses may differ for book and tax basis reporting purposes due to post-October losses (which are not recognized for tax purposes until the first day of the following fiscal year), tax deferral on wash sales and PFIC transactions.
The US federal income tax basis of investments, including proceeds from securities sold short but excluding financial derivative instruments, at July 31, 2015, and the gross unrealized appreciation and depreciation, were as follows:
| | | | All Asset | | | Dividend & Income Builder | |
| Cost | | $ | 59,562,436 | | $ | 51,727,249 | |
| Gross unrealized appreciation | | | 1,771,524 | | | 3,505,524 | |
| Gross unrealized depreciation | | | (815,881 | ) | | (1,810,158 | ) |
| Net unrealized appreciation (depreciation) | | | 955,643 | | | 1,695,366 | |
191
| Notes to financial statements |
| | | | Emerging | | | European | |
| | | | Markets | | | Focus | |
| Cost | | $ | 25,395,718 | | $ | 3,452,373,096 | |
| Gross unrealized appreciation | | | 607,534 | | | 371,100,722 | |
| Gross unrealized depreciation | | | (1,990,273 | ) | | (193,633,887 | ) |
| Net unrealized appreciation (depreciation) | | | (1,382,739 | ) | | 177,466,835 | |
| | | | Global Equity | | | Global | |
| | | | Income | | | Technology | |
| Cost | | $ | 3,783,357,737 | | $ | 206,403,956 | |
| Gross unrealized appreciation | | | 202,845,947 | | | 83,576,234 | |
| Gross unrealized depreciation | | | (267,232,290 | ) | | (6,849,391 | ) |
| Net unrealized appreciation (depreciation) | | | (64,386,343 | ) | | 76,726,843 | |
| | | | | | | International | |
| | | | High Yield | | | Long/Short | |
| | | | Opportunities | | | Equity | |
| Cost | | $ | 25,214,808 | | $ | 5,645,429 | |
| Gross unrealized appreciation | | | 324,737 | | | 228,224 | |
| Gross unrealized depreciation | | | (653,150 | ) | | (301,665 | ) |
| Net unrealized appreciation (depreciation) | | | (328,413 | ) | | (73,441 | ) |
| | | | International | | | International | |
| | | | Opportunities | | | Select Equity | |
| Cost | | $ | 3,919,857,413 | | $ | 5,215,999 | |
| Gross unrealized appreciation | | | 710,921,834 | | | 527,892 | |
| Gross unrealized depreciation | | | (120,050,321 | ) | | (207,071 | ) |
| Net unrealized appreciation (depreciation) | | | 590,871,513 | | | 320,821 | |
| | | | Strategic | | | Unconstrained | |
| | | | Income | | | Bond | |
| Cost | | $ | 167,806,365 | | $ | 26,616,324 | |
| Gross unrealized appreciation | | | 1,765,187 | | | 121,714 | |
| Gross unrealized depreciation | | | (3,682,113 | ) | | (1,363,406 | ) |
| Net unrealized appreciation (depreciation) | | | (1,916,926 | ) | | (1,241,692 | ) |
| | | | US Growth | |
| | | | Opportunities | |
| Cost | | $ | 6,657,547 | |
| Gross unrealized appreciation | | | 787,077 | |
| Gross unrealized depreciation | | | (63,071 | ) |
| Net unrealized appreciation (depreciation) | | | 724,006 | |
Identified cost may differ for book and tax basis reporting purposes primarily due to tax deferral of losses on wash sales, PFIC transactions, different book and tax treatment on certain debt instruments and amortization of premiums reflected as of July 31, 2015.
Note 3. Fair value measurements
US GAAP defines fair market value as the price that a Fund would receive to sell an asset or pay to transfer a liability in an orderly transaction between market participants at the measurement date. Various inputs are used in determining the value of the Funds’ investments. The Funds use a three-tier hierarchy of inputs to establish classification of fair value measurements for disclosure purposes. These inputs may be observable or unobservable. Observable inputs are inputs that reflect the assumptions market participants would use in pricing the asset or liability developed based on market data obtained from sources independent of the reporting entity. Unobservable inputs are inputs that reflect the reporting entity’s own assumptions about the assumptions market participants would use in pricing the asset or liability developed based on the best information available under the circumstances. The inputs used for valuing securities are not necessarily an indication of the risk associated with investing in those securities. The three-tier hierarchy of inputs is summarized in the following three broad levels:
| | • | Level 1 – quoted prices (unadjusted) in active markets for identical investments |
192
| Notes to financial statements |
| | • | Level 2 – other significant observable inputs (including quoted prices for similar investments, interest rates, prepayment speeds, credit risk, etc.) |
| | | |
| | • | Level 3 – significant unobservable inputs based on the best information available in the circumstances to the extent observable inputs are not available (including the Fund’s own assumptions in determining the fair value of investments) |
Tables included under the heading “Fair value measurements” summarizing each Fund’s investments that are measured at fair value by level within the fair value hierarchy at July 31, 2015 have been listed after each Fund’s Portfolio of Investments.
Any transfers between levels are disclosed, effective at the end of the period, in each Fund’s table with the reasons for the transfers disclosed in a note to the table, if applicable.
Note 4. Investment advisory fees and other transactions with affiliates
Pursuant to an Investment Advisory Agreement, Henderson Global Investors (North America) Inc. (“HGINA,” or “Adviser”) acts as the Funds’ investment adviser. HGINA is an indirect wholly-owned subsidiary of Henderson Group plc. HGINA supervises the investments of the Funds and earns a management fee for such services. HGINA earns a fee for its services based on each Fund’s average daily net assets as set forth below.
| All Asset | | 0.40 | % |
| Dividend & Income Builder | First $1 billion | 0.75 | % |
| | Next $1 billion | 0.65 | % |
| | Over $2 billion | 0.55 | % |
| Emerging Markets | First $1 billion | 1.00 | % |
| | Next $1 billion | 0.90 | % |
| | Over $2 billion | 0.85 | % |
| European Focus | First $500 million | 1.00 | % |
| | Next $1 billion | 0.90 | % |
| | Next $1 billion | 0.85 | % |
| | Over $2.5 billion | 0.80 | % |
| Global Equity Income | First $1 billion | 0.85 | % |
| | Next $1 billion | 0.65 | % |
| | Over $2 billion | 0.60 | % |
| Global Technology | First $1 billion | 0.90 | % |
| | Over $1 billion | 0.80 | % |
| High Yield Opportunities | First $1 billion | 0.65 | % |
| | Next $1 billion | 0.55 | % |
| | Over $2 billion | 0.50 | % |
| International Long/ | | | |
| Short Equity | | 1.25 | % |
| International Opportunities* | First $2 billion | 1.00 | % |
| | Next $1 billion | 0.90 | % |
| | Next $1 billion | 0.80 | % |
| | Next $1 billion | 0.70 | % |
| | Next $5 billion | 0.60 | % |
| | Over $10 billion | 0.50 | % |
| International Select Equity | | 0.65 | % |
| Strategic Income** | First $1 billion | 0.55 | % |
| | Next $500 million | 0.50 | % |
| | Over $1.5 billion | 0.45 | % |
| Unconstrained Bond | First $1 billion | 0.65 | % |
| | Next $1 billion | 0.55 | % |
| | Over $2 billion | 0.50 | % |
| US Growth Opportunities | First $1 billion | 0.75 | % |
| | Next $1 billion | 0.70 | % |
| | Over $2 billion | 0.65 | % |
| * | Prior to July 1, 2015, the management fee tiers on the average daily net assets of the Fund were: 1.00% on the first $2 billion, 0.90% on the next $1 billion, 0.80% on the next $1 billion and 0.70% on any amounts over $4 billion. |
| ** | Based on average daily managed assets of the Fund. Managed assets mean the total assets of the Fund (including any assets attributable to any leverage that may be outstanding) minus the sum of accrued liabilities (other than debt representing financial leverage). Since the Fund pays HGINA based on the Fund’s average daily managed assets, HGINA’s fee will be higher if the Fund is leveraged. |
HGINA has engaged Henderson Investment Management Limited (“HIML”) to act as the investment sub-adviser to the Funds, except for High Yield Opportunities, Strategic Income and US Growth Opportunities. HGINA has engaged Geneva Capital Management (“Geneva”) to act as the investment sub-adviser for US Growth Opportunities, while no sub-adviser has been appointed for High Yield Opportunities or Strategic Income. Both HIML and Geneva are also indirect wholly-owned subsidiaries of Henderson Group plc. Under separate Sub-Advisory Agreements, the sub-advisers provide research, advice and recommendations with respect to the purchase and sale of securities and make investment decisions regarding assets of the Funds subject to the oversight of the Board of Trustees and the Adviser. No additional advisory fees are charged to the Funds for the services of the sub-advisers as these fees are paid from the fees earned by HGINA.
Pursuant to a separate contractual Expense Limitation Agreement, HGINA has agreed to waive or limit its management fee and, if necessary, to reimburse expenses of each Fund in order to limit total annual ordinary operating expenses, including distribution and service fees, but excluding any acquired fund fees and expenses as a result of investing in other funds, as a percentage of average daily net assets as follows:
193
| Notes to financial statements |
| | Class | | Class | | Class | | Class | | Class | |
| | A | | B | | C | | I | | R | |
| All Asset* | 0.85 | % | N/A | | 1.60 | % | 0.60 | % | N/A | |
| Dividend & Income Builder | 1.30 | % | N/A | | 2.05 | % | 1.05 | % | N/A | |
| Emerging Markets | 1.79 | % | N/A | | 2.54 | % | 1.54 | % | N/A | |
| European Focus | 2.00 | % | 2.75 | % | 2.75 | % | 1.75 | % | N/A | |
| Global Equity Income | 1.40 | % | N/A | | 2.15 | % | 1.15 | % | N/A | |
| Global Technology | 2.00 | % | 2.75 | % | 2.75 | % | 1.75 | % | N/A | |
| High Yield Opportunities | 1.10 | % | N/A | | 1.85 | % | 0.85 | % | N/A | |
| International Long/ Short Equity** | 1.75 | % | N/A | | 2.50 | % | 1.50 | % | N/A | |
| International Opportunities | 2.00 | % | 2.75 | % | 2.75 | % | 1.75 | % | 2.25 | % |
| International Select Equity | 1.14 | % | N/A | | 1.89 | % | 0.89 | % | N/A | |
| Strategic Income | 1.10 | % | 1.85 | % | 1.85 | % | 0.85 | % | N/A | |
| Unconstrained Bond | 1.15 | % | N/A | | 1.90 | % | 0.90 | % | N/A | |
| US Growth Opportunities | 1.20 | % | N/A | | 1.95 | % | 0.95 | % | N/A | |
| * | With respect to investments in affiliate underlying funds, HGINA has contractually agreed to reduce or waive the Fund’s management fee to limit the combined management fees paid to the Adviser for those assets to the greater of 1.00% or the affiliate underlying fund’s management fee. Any waiver calculated as a result of limiting these combined management fees is in addition to the general expense limitation highlighted in the table. Indirect net expenses associated with the Fund’s investments in underlying investment companies are not subject to the contractual expense limitation. |
| ** | Dividends and interest expense on securities sold short are excluded from the expense limitation calculation. |
These agreements will remain in effect through July 31, 2020 unless otherwise extended or amended.
Shares of the Funds are often purchased through financial intermediaries who are agents of the Funds for the limited purpose of completing purchases and sales. These intermediaries may provide certain networking and sub-transfer agent services with respect to Fund shares held by that intermediary for its customers, and the intermediary may charge HGINA for those services. The Funds reimburse HGINA for such fees within limits specified by the Board of Trustees. The fees are incurred at the class level based on activity, asset levels and/or number of accounts and are included in “Sub-accounting fees” in the Statements of Operations.
At July 31, 2015, both HGINA and HGI Group Limited, another indirect wholly-owned subsidiary of Henderson Group plc, owned shares in the following Funds. Significant ownership percentages in International Long/Short Equity, International Select Equity and Unconstrained Bond are the result of the initial investments necessary to facilitate commencement of operations and will be redeemed as external shareholders subscribe to the Funds.
| | | | | | | | | | | | Total Value at | | | As a % of | |
| Fund | | | Class A | | | Class C | | | Class I | | July 31, 2015 | | | Net Assets | |
| HGINA | | | | | | | | | | | | | | | | |
| All Asset | | | 492 | | | 487 | | | 110 | | $ | 11,416 | | | 0.0 | % |
| High Yield Opportunities | | | 100,000 | | | 54,371 | | | 66,761 | | $ | 2,138,011 | | | 8.5 | % |
| Strategic Income | | | — | | | — | | | 1,360 | | $ | 12,322 | | | 0.0 | % |
| HGI Group Limited | | | | | | | | | | | | | | | | |
| International Long/Short Equity | | | 10,000 | | | 10,000 | | | 480,000 | | $ | 5,139,300 | | | 81.8 | % |
| International Select Equity | | | 10,000 | | | 10,000 | | | 480,000 | | $ | 5,393,900 | | | 96.1 | % |
| Unconstrained Bond | | | 100,000 | | | 100,000 | | | 2,300,000 | | $ | 23,751,000 | | | 88.3 | % |
| US Growth Opportunities | | | 1,000 | | | 1,000 | | | — | | $ | 22,330 | | | 0.3 | % |
An affiliated entity of a Fund may include any company in which the Fund owns 5% or more of its outstanding voting shares. Additionally, certain of the Funds held ownership in other Funds within the Trust. At July 31, 2015, the All Asset Fund held 0.04% of the Henderson Global Equity Income Fund, 0.53% of the Henderson Global Technology Fund, 0.72% of the Henderson Strategic Income Fund and 11.08% of the Henderson Unconstrained Bond Fund. Transactions in affiliates during the year ended July 31, 2015 were as follows:
194
| Notes to financial statements |
| Affiliate | | | Value 7/31/2014 | | | Purchases at Cost | | | Proceeds from Sales | | | Change in Unrealized Appreciation/ (Depreciation) | | | Realized Gain/ (Loss) | | | Value 7/31/2015 | | | Dividend Income | |
| All Asset | | | | | | | | | | | | | | | | | | | | | | |
| Henderson Global | | | | | | | | | | | | | | | | | | | | | | |
| Equity Income Fund | | $ | 1,592,855 | | $ | 97,631 | | $ | — | | $ | (99,167 | ) | $ | — | | $ | 1,591,319 | | $ | 97,615 | |
| Henderson Global | | | | | | | | | | | | | | | | | | | | | | |
| Technology Fund | | | 1,341,022 | | | 166,034 | | | — | | | (20,155 | ) | | — | | | 1,486,901 | | | — | |
| Henderson Strategic | | | | | | | | | | | | | | | | | | | | | | |
| Income Fund | | | 1,169,018 | | | 51,861 | | | — | | | (6,696 | ) | | — | | | 1,214,183 | | | 51,845 | |
| Henderson | | | | | | | | | | | | | | | | | | | | | | |
| Unconstrained | | | | | | | | | | | | | | | | | | | | | | |
| Bond Fund | | | 2,980,887 | | | 164,586 | | | — | | | (166,562 | ) | | — | | | 2,978,911 | | | 103,667 | |
| Total | | $ | 7,083,782 | | $ | 480,112 | | $ | — | | $ | (292,580 | ) | $ | — | | $ | 7,271,314 | | $ | 253,127 | |
The aggregate cost and value of affiliates at July 31, 2015 is $7,173,361 and $7,271,314, respectively. Investments in affiliates represented 11.81% of total net assets of the All Asset Fund as of July 31, 2015.
Note 5. Compensation of trustees and officers
Certain officers and Trustees of the Trust are also officers of HGINA. None of the Trust’s officers, other than the Chief Compliance Officer, are compensated by the Trust. The Trust makes no direct payments to Trustees affiliated with HGINA. Fees paid to Trustees are reflected as Trustees’ fees and expenses in the Statements of Operations.
Prior to January 1, 2015, the Funds bore only a portion of the compensation paid to the Chief Compliance Officer who performs services directly related to the Trust. Subsequent to January 1, 2015, the Funds bear the full compensation. This compensation, together with other compliance-related costs, is reflected as “Compliance officer fees” in the Statements of Operations.
Note 6. Distribution plan
The Trust has adopted a distribution plan for Class A, Class B, Class C and Class R shares of the Funds in accordance with Rule 12b-1 under the 1940 Act (the “12b-1 Plan”). Under the 12b-1 Plan, the Funds pay the distributor an annual fee of 0.25% of the average daily net assets attributable to its Class A shares, an annual fee of 1.00% of the average daily net assets attributable to its Class B and C shares, and an annual fee of 0.50% of the average daily net assets attributable to its Class R shares. The 12b-1 Plan is used to induce or compensate financial intermediaries (including brokerage firms, depository institutions and other firms) to provide distribution services to the Funds and their shareholders.
Note 7. Investment transactions
Purchases and sales of investment securities, including proceeds from securities sold short but excluding short-term investments, financial derivatives instruments and US government securities, for the Funds for the year ended July 31, 2015, were as follows:
| | | | Purchases | | | Sales | |
| All Asset | | $ | 8,108,796 | | $ | 10,137,981 | |
| Dividend & | | | | | | | |
| Income Builder | | | 34,540,534 | | | 9,938,512 | |
| Emerging Markets | | | 38,236,708 | | | 39,402,963 | |
| European Focus | | | 2,965,035,540 | | | 1,904,484,370 | |
| Global Equity Income | | | 4,747,452,434 | | | 4,031,554,250 | |
| Global Technology | | | 186,845,868 | | | 284,994,708 | |
| High Yield Opportunities | | | 50,707,459 | | | 52,297,819 | |
| International Long/ | | | | | | | |
| Short Equity | | | 14,597,191 | | | 12,410,225 | |
| International | | | | | | | |
| Opportunities | | | 3,173,746,281 | | | 2,777,189,827 | |
| International | | | | | | | |
| Select Equity | | | 6,893,959 | | | 1,915,610 | |
| Strategic Income | | | 153,206,410 | | | 54,617,631 | |
| Unconstrained Bond | | | 27,429,897 | | | 27,384,449 | |
| US Growth Opportunities | | | 7,246,310 | | | 714,738 | |
Note 8. Significant concentrations
The Funds may invest a substantial percentage of their assets in securities of foreign issuers. These investments may involve certain considerations and risks not typically associated with investments in the United States as a result of, among other factors, the possibility of future political and economic developments and the level of governmental supervision and regulation of securities markets in the respective countries. Some countries in which the Funds invest may require government approval for repatriation of investment income, capital or the proceeds for sales of securities by foreign investors. In addition, if there is deterioration in a country’s
195
| Notes to financial statements |
balance of payments or for other reasons, a country may impose temporary restrictions on foreign capital remittances abroad. In addition, changes in currency exchange rates will affect the value of investments denominated in a foreign currency, as well as investment income derived from those securities. These risks may be heightened in less developed countries, which are sometimes referred to as emerging markets. For example, political and economic structures in these countries may be changing rapidly, which can cause instability and greater risk of loss. These countries are also more likely to experience higher levels of inflation, deflation or currency devaluation, which could hurt their economies and securities markets. For these and other reasons, investments in emerging markets, particularly by the Emerging Markets Fund, are often considered speculative. Further, the Funds maintain many of their investments in issuers domiciled in the Eurozone. The private and public sectors’ debt problems of a single Eurozone country may pose significant risks to the Eurozone as a whole. As a result, the Funds may be more susceptible to volatility generated by currency devaluations or other general uncertainties than more geographically diversified funds that do not concentrate in this region of the world.
The Funds may invest a high percentage of their net assets in specific sectors of the market in order to achieve a potentially greater investment return. As a result, the economic, political and regulatory developments in a particular sector of the market, positive or negative, have a greater impact on a Fund’s net assets and will cause the value of its shares to fluctuate more than if the Fund did not concentrate its investments in a particular sector. In particular, the Global Technology Fund concentrates its investments in issuers within specific industries of the technology and telecommunications sectors. Valuations of companies in these sectors are typically subject to greater volatility than other sectors.
The Dividend & Income Builder Fund, High Yield Opportunities Fund, Strategic Income Fund and Unconstrained Bond Fund invest in a variety of income-producing debt instruments of corporate and sovereign issuers. Accordingly, each may be subject to the previously described foreign issuers risk, to varying degrees, in addition to the risk of default by the issuer. As a matter of their investment strategies, the High Yield Opportunities Fund, Strategic Income Fund and Unconstrained Bond Fund are also subject to higher concentrations of investments in lower quality high yield securities or asset-backed/structured securities. Investing in high yield, asset-backed or structured securities may involve greater risks and considerations not typically associated with investing in US Government bonds and other high quality fixed-income securities. High yield securities are non-investment grade securities, often referred to as “junk bonds.” Economic downturns may disrupt the high yield market and impair the ability of issuers to repay principal and interest. Additionally, asset-backed securities are subject to the risk that underlying debt may be prepaid prior to maturity or refinanced causing further volatility in the value. A small change in interest rates would likely have a pronounced adverse impact on the value of such high yield and asset-backed obligations. Moreover, these securities may be less liquid as there is a less-established secondary market and the Funds may not be able to sell the asset timely.
Note 9. Borrowing arrangements
The Trust maintains a $100 million credit facility with State Street Bank and Trust Company to facilitate portfolio liquidity. Interest is charged to each Fund based on its borrowings at a rate per annum equal to the higher of the Federal Funds rate or 1 Month LIBOR plus 1.25%. In addition, a commitment fee of 0.20% per annum is accrued and apportioned among the Funds in the Trust based on relative average net assets (prior to June 19, 2015, the commitment fee was 0.10%). The commitment fee is included in “Miscellaneous fees” on the Statements of Operations. No amounts were borrowed by the Funds under this facility during the year ended July 31, 2015.
Note 10. Recently issued accounting pronouncements
In August 2014, the FASB issued ASU 2014-15 Presentation of Financial Statements - Going Concern (Subtopic 205-40): Disclosure of Uncertainties about an Entity’s Ability to Continue as a Going Concern, which provides guidance in US GAAP about management’s responsibility to evaluate whether there is substantial doubt about an entity’s ability to continue as a going concern and to provide related footnote disclosures. The amendments are effective for annual periods ending after December 15, 2016, and for annual periods and interim periods thereafter, though early adoption is permitted. In management’s evaluation, there are no uncertainties about each Fund’s ability to continue as a going concern.
In May 2015, the FASB issued ASU 2015-07 Fair Value Measurement (Topic 820): Disclosures for Investments in Certain Entities That Calculate Net Asset Value per Share (or Its Equivalent). Topic 820, Fair Value Measurement, permits a reporting entity, as a practical expedient, to measure the fair value of certain investments using the net asset value per share of the investment; however, categorization within the fair value hierarchy based upon redemption characteristics has been diverse. The Update removes the requirement to categorize within the fair value hierarchy all investments for which fair value is measured using the net asset value per share practical expedient and instead requires these investments to be separately disclosed. The amendments are effective for annual periods beginning after December 15, 2015 and interim periods within those fiscal years, though early adoption is permitted. At this time, management is evaluating the implications of these changes on the financial statements.
Note 11. Subsequent Events
Subsequent events occurring after the date of this report have been evaluated for potential impact, for purposes of recognition or disclosure in the financial statements, through the date the report was issued.
196
| Report of independent registered public accounting firm |
The Board of Trustees and Shareholders
Henderson Global Funds
We have audited the accompanying statements of assets and liabilities, including the portfolios of investments, of the Henderson Global Funds, comprising, respectively, Henderson All Asset Fund, Henderson Dividend & Income Builder Fund, Henderson Emerging Markets Fund, Henderson European Focus Fund, Henderson Global Equity Income Fund, Henderson Global Technology Fund, Henderson High Yield Opportunities Fund, Henderson International Long/Short Equity Fund, Henderson International Opportunities Fund, Henderson International Select Equity Fund, Henderson Strategic Income Fund, Henderson Unconstrained Bond Fund, and Henderson US Growth Opportunities Fund (collectively, the Funds), as of July 31, 2015, and the related statements of operations, cash flows for Henderson International Long/Short Equity Fund, changes in net assets and the financial highlights for the periods indicated therein. These financial statements and financial highlights are the responsibility of the Funds’ management. Our responsibility is to express an opinion on these financial statements and financial highlights based on our audits.
We conducted our audits in accordance with the standards of the Public Company Accounting Oversight Board (United States). Those standards require that we plan and perform the audit to obtain reasonable assurance about whether the financial statements and financial highlights are free of material misstatement. We were not engaged to perform an audit of the Funds’ internal control over financial reporting. Our audits included consideration of internal control over financial reporting as a basis for designing audit procedures that are appropriate in the circumstances, but not for the purpose of expressing an opinion on the effectiveness of the Funds’ internal control over financial reporting. Accordingly, we express no such opinion. An audit also includes examining, on a test basis, evidence supporting the amounts and disclosures in the financial statements and financial highlights, assessing the accounting principles used and significant estimates made by management, and evaluating the overall financial statement presentation. Our procedures included confirmation of securities owned as of July 31, 2015, by correspondence with the custodian and brokers or by other appropriate auditing procedures where replies from brokers were not received. We believe that our audits provide a reasonable basis for our opinion.
In our opinion, the financial statements and financial highlights referred to above present fairly, in all material respects, the financial position of each of the respective Funds constituting the Henderson Global Funds at July 31, 2015, the results of their operations, cash flows of Henderson International Long/Short Equity Fund, changes in their net assets, and their financial highlights for the periods indicated therein in conformity with U.S. generally accepted accounting principles.
Chicago, Illinois
September 24, 2015
197
| Other information (unaudited) |
Proxy voting policies
The Funds have filed with the Securities and Exchange Commission their proxy voting records for the twelve months ended June 30, 2015 on Form N-PX, which must be filed each year by August 31. Form N-PX is available on the Securities and Exchange Commission’s website at www.sec.gov. The Funds’ proxy voting records and proxy voting policies and procedures are also available without charge, upon request, by calling 866.443.6337 or by visiting the Funds’ website at www.henderson.com.
Portfolio holdings
A complete listing of each Fund’s holdings is made available monthly at www.henderson.com. Further, the Funds’ Portfolios of Investments are filed as of the end of the first and third quarter of the fiscal year on Form N-Q. The Henderson Global Funds’ Forms N-Q are available at www.sec.gov or may be reviewed and copied at the Commission’s Public Reference Room in Washington, DC. The quarterly Portfolios of Investments are also available without charge, upon request, by calling 866.443.6337.
Approval of continuation of investment advisory agreements
The Board of Trustees of Henderson Global Funds oversees the management of the Funds and, as required by law, the investment advisory and the sub-advisory agreements for the Funds (the “Advisory Agreements”). In connection with their annual consideration of those agreements for the Funds, the Trustees received and reviewed a substantial amount of information provided by Henderson Global Investors (North America) Inc. (the “Adviser”) and Henderson Investment Management Limited (the “Sub-Adviser”) in response to detailed requests of the Independent Trustees and their independent legal counsel (the Adviser, Sub-Adviser and their affiliates may be referred to herein collectively as “Henderson”). The Trustees also discussed with representatives of management the operations of the Funds and the nature, extent and quality of the advisory and other services provided to the Funds by the Adviser and the Sub-Adviser. The Independent Trustees also received and reviewed a memorandum from their counsel regarding their responsibilities in considering the continuation of the agreements. Throughout their consideration of the agreements, the Independent Trustees were advised by their independent legal counsel. The Independent Trustees met with management to consider the Advisory Agreements, and they also met separately in executive session with their counsel several times.
May 15, 2015 Meeting
At a meeting held on May 15, 2015, the Trustees reviewed and analyzed various factors that they determined were relevant, including the factors described below.
Nature, extent and quality of services
The Independent Trustees reviewed the various reports and presentations they had received in connection with their evaluation of the nature, extent and quality of services provided under the Advisory Agreements by the Adviser and Sub-Adviser, and considered the services performed by the Adviser and Sub-Adviser, as well as their expertise, resources and capabilities. The Trustees also considered the nature, extent and quality of the services provided to the Funds by the Adviser and the Sub-Adviser (in the case of Sub-Advised Funds), taking into account the investment objective(s) and strategies of each Fund and the knowledge they had gained throughout the year from their regular and special meetings. In addition, the Trustees reviewed the resources and key personnel of the Adviser and the Sub-Adviser, especially the personnel who provide investment management services to the Funds. Management provided an update on the Adviser and its parent company, and reviewed the Adviser’s capabilities, resources and financial condition. Management also reviewed the Adviser’s investment approach for the Funds and the qualifications of the Funds’ respective portfolio management teams. Management then discussed the personnel responsible for performing services for the Funds.
The Trustees considered the methodology the Adviser and the Sub-Adviser use in determining compensation payable to portfolio managers, the competitive environment for investment management talent and the competitive market for mutual funds in different distribution channels. Management reviewed certain changes in personnel, as well as the capacity of each of the Fund’s portfolio managers.
The Trustees also considered other services provided to the Funds by the Adviser and the Sub-Adviser (in the case of Sub-Advised Funds), such as managing the execution of portfolio transactions and the selection of broker-dealers for those transactions, monitoring adherence to the Funds’ investment restrictions, producing shareholder reports, providing support services for the Trustees and committees of the Board and overseeing the activities of other service providers, including monitoring compliance with various policies and procedures of the Funds and with applicable securities laws and regulations. The Trustees considered sub-transfer agency, networking and revenue sharing fees provided to intermediaries, as well as the fees associated with different types of distribution platforms.
198
| Other information (unaudited) |
Investment performance and fees
The Independent Trustees reviewed the investment performance of the Funds. The Independent Trustees considered, in particular, the detailed reports and analyses performed and compiled by an independent third party, Lipper Inc. (the “Lipper Report”) and that show, for each Fund and for various periods, total return performance data ranked within a peer group and a larger comparative universe of funds. In addition, the Independent Trustees considered the expense rankings and quintiles tables, contractual management fees at common asset levels and at various asset levels, expense ratios and various other fees and expenses data and supporting information contained within the Lipper Report.
The Trustees also reviewed the performance and expenses of each Fund, including comparative and percentile ranking information in the Lipper Report.
Other Benefits to the Adviser
The Trustees also considered benefits that accrue to the Adviser and the Sub-Adviser (in the case of Sub-Advised Funds) from their relationship with the Funds and their use of commissions paid on portfolio brokerage transactions of the Funds to obtain research products and services benefiting the Funds and/or other clients.
June 11, 2015 Meeting
At a meeting held on June 11, 2015, it was noted that the Board had met previously in-person on May 15, 2015 to review annual contract renewal related materials. The representatives of the Adviser indicated that the purpose of the June 11, 2015 meeting was to review certain additional information that had not been provided at the May 15, 2015 meeting.
Costs of services provided and the profits realized by Henderson and its affiliates from their relationships with the funds
In considering the reasonableness of investment management fees, the Independent Trustees considered the profitability of Henderson and its affiliates in connection with Henderson providing investment management services to each Fund, as well as the methodology that Henderson utilized to calculate profitability by Fund.
The Trustees also reviewed the financial information related to the Adviser’s parent company and its corporate structure. The Trustees recognized that profitability comparisons among fund managers are difficult because very little comparative information is publicly available, and the profitability of any manager is affected by numerous factors, including the organizational structure of the particular manager, the types of funds and other accounts it manages, possible other lines of business, the methodology for allocating expenses and the manager’s capital structure and cost of capital.
Economies of scale
The Independent Trustees considered the economies of scale that might be realized by the Adviser as a Fund grows and took note of the extent to which Fund shareholders might also benefit from such growth. In this connection, it was observed that the fee schedules for each Fund, with the exception of the All Asset Fund, include various pre-established “breakpoints” in investment management fees that are triggered as a Fund’s net asset level increases. Representatives of management detailed a proposal to add additional breakpoints for the International Opportunities Fund. The Trustees reviewed each Fund’s current fees, asset levels, performance, capacity and outlook. The Independent Trustees noted that based on the receipt of information showing the breakpoints, at the current time, it appears that such breakpoints satisfactorily provide for sharing economies of scale, as they allow for adequate opportunity for shareholders to realize benefits (fee breaks) as Fund assets grow. With respect to the All Asset Fund, although the Fund’s fee schedule does not include breakpoints, the Independent Trustees considered the Adviser’s view that an appropriately structured advisory fee and/or total expense limitation can provide an acceptable sharing of economies of scale as a substitute for a breakpoint in the advisory fee. In this regard, the Independent Trustees discussed the Adviser’s expense limitation agreement with respect to the All Asset Fund.
June 17, 2015 Meeting
At a meeting held on June 17, 2015, it was noted that the Board had met previously in-person on May 15, 2015 and June 11, 2015 to review annual contract renewal related materials. The representatives of the Adviser indicated that there had not been any material changes to the information that had been provided for the May 15, 2015 and June 11, 2015 meetings.
199
| Other information (unaudited) |
Based on their evaluation of the information provided by the Adviser and the Sub-Adviser and other information, the Trustees determined that the overall arrangements between each Fund and the Adviser and Sub-Adviser were fair and reasonable in light of the nature, extent and quality of the services provided by the Adviser and the Sub-Adviser (in the case of the Sub-Advised Funds), the fees charged for those services, and other matters that the Trustees considered relevant in the exercise of their business judgment. In making that determination, the Trustees reviewed and considered various factors that they determined were relevant, including the factors described below, none of which by itself was considered paramount or dispositive and each Trustee may have weighed the information differently.
Nature, extent and quality of services
The Trustees reviewed and considered the nature, extent and quality of the services provided to the Funds by the Adviser and the Sub-Adviser (in the case of the Sub-Advised Funds), taking into account the investment objective(s) and strategies of each Fund and the knowledge they had gained from their May 15, 2015 and June 11, 2015 meetings and their regular meetings with management on at least a quarterly basis. The Trustees concluded that the nature and extent of the services provided to each Fund by the Adviser and the Sub-Adviser (in the case of Sub-Advised Funds) were appropriate and consistent with the terms of the Advisory Agreements, that the quality of those services had been consistent with quality norms in the industry and that the Funds were likely to benefit from the continued provision of those services. They also concluded that the Adviser and the Sub-Adviser (in the case of Sub-Advised Funds) had sufficient personnel with the appropriate education and experience to serve the Funds effectively, and had demonstrated their continuing ability to attract and retain well-qualified personnel.
Performance and fees
The Trustees considered their extensive review and discussion at the May 15, 2015 meeting of each Fund’s investment performance over various time periods in comparison to information for other comparable funds as provided by Lipper. They concluded that the performance of each Fund met or exceeded acceptable levels or it was satisfied with the steps taken by management to improve investment performance. The Trustees considered their prior review of information on the fees and other expenses paid by each Fund in comparison to information for other comparable funds as discussed at the May 15, 2015 meeting. The Trustees also had reviewed the management fees of the Adviser and the Sub-Adviser for certain affiliated funds. The Trustees reviewed information on the profitability of (or loss) to the Adviser of its relationships with each Fund and concluded that the Adviser’s profitability level with respect to each Fund in relation to the services rendered was not unreasonable. Finally, the Trustees considered the financial condition of the Adviser and the Sub-Adviser. The Trustees concluded that the management fees and other compensation payable by each Fund to the Adviser, as well as the fees paid by the Adviser to the Sub-Adviser, were reasonable in relation to the nature, extent and quality of the services provided, taking into account the fees charged by other advisers for managing comparable mutual funds with similar strategies and the fees the Adviser and the Sub-Adviser charge to other clients. The Trustees also concluded that the overall expense ratio of each Fund was reasonable, taking into account the size of the Fund, the quality of services provided by the Adviser and the Sub-Adviser (in the case of the Sub-Advised Funds), the investment performance of the Fund and the expense limitations agreed to by the Adviser.
Economies of scale
The Trustees received and considered information about the potential of the Adviser to experience economies of scale as the assets of the Funds increase and took note of the extent to which Fund shareholders might also benefit from such growth. In this connection, the Trustees took into account that the fee schedules for each Fund, with the exception of the All Asset Fund, include various pre-established breakpoints in advisory fees that are triggered as a Fund’s net asset level increases. The Trustees also took into account management’s proposed changes to the breakpoint schedule for the International Opportunities Fund, which would have the effect of reducing the advisory fee paid by that Fund to the Adviser. Based on all of the information they reviewed, the Trustees concluded that the advisory fee breakpoints satisfactorily provide for sharing economies of scale, as they allow for adequate opportunity for shareholders to realize benefits (fee breaks) as Fund assets grow. With respect to the All Asset Fund, although the Fund’s fee schedule does not include breakpoints, the Trustees took into account the Adviser’s expense limitation agreement with respect to the All Asset Fund.
Other benefits to the adviser
The Trustees also considered benefits that accrue to the Adviser and the Sub-Adviser (in the case of Sub-Advised Funds) from their relationship with the Funds and their use of commissions paid on portfolio brokerage transactions of the Funds to obtain research products and services benefiting the Funds and/or other clients.
After full consideration of the above factors as well as other factors that were instructive in analyzing the management arrangements, the Trustees, including all of the Independent Trustees, concluded that the continuation of the Advisory Agreements for each Fund was in the best interest of each Fund and its shareholders.
200
| Other information (unaudited) |
Federal tax information
Certain tax information for the Funds is required to be provided to shareholders based on the Funds’ income and distributions for the taxable year ended July 31, 2015. In February 2016, shareholders will receive Form 1099-DIV, which will include their share of foreign tax credit, qualified dividends and capital gains distributed during the calendar year 2015. Shareholders are advised to check with their tax advisors for information on the treatment of these amounts on their individual income tax returns.
For corporate shareholders, a certain percentage of ordinary income dividends paid during the year ended July 31, 2015 qualified for the dividends received deduction as follows:
| All Asset | 4.27 | % |
| Dividend & Income Builder | 20.03 | % |
| Emerging Markets | 2.91 | % |
| Global Equity Income | 8.00 | % |
| High Yield Opportunities | 3.09 | % |
| International Opportunities | 3.54 | % |
| Strategic Income | 0.54 | % |
| Unconstrained Bond | 0.61 | % |
Under Section 853 of the Internal Revenue Code of 1986, as amended (the “Code”), the Funds designated foreign taxes paid and foreign source income for the fiscal year ended July 31, 2015 as follows:
| | | | Foreign | | | Foreign | |
| | | | taxes paid | | source income | |
| All Asset | | $ | — | | $ | — | |
| Dividend & Income Builder | | | 49,767 | | | 1,122,428 | |
| Emerging Markets | | | 46,756 | | | 582,821 | |
| European Focus | | | 2,792,435 | | | 63,550,172 | |
| Global Equity Income | | | 8,904,791 | | | 225,543,498 | |
| Global Technology | | | — | | | — | |
| High Yield Opportunities | | | — | | | — | |
| International Long/Short Equity | | | 4,652 | | | 49,106 | |
| International Opportunities | | | 4,118,901 | | | 107,589,842 | |
| International Select Equity | | | 6,616 | | | 96,615 | |
| Strategic Income | | | — | | | — | |
| Unconstrained Bond | | | — | | | — | |
| US Growth Opportunities | | | — | | | — | |
Under Section 854 (b)(2) of the Code, the Funds designated qualified dividends for the fiscal year ended July 31, 2015 as follows:
| All Asset | | $ | 218,193 | |
| Dividend & Income Builder | | | 1,319,027 | |
| Emerging Markets | | | 307,817 | |
| European Focus | | | 59,809,568 | |
| Global Equity Income | | | 187,179,178 | |
| Global Technology | | | — | |
| High Yield Opportunities | | | 52,043 | |
| International Long/Short Equity | | | 38,063 | |
| International Opportunities | | | 98,847,879 | |
| International Select Equity | | | 95,406 | |
| Strategic Income | | | 25,075 | |
| Unconstrained Bond | | | 4,920 | |
| US Growth Opportunities | | | 35,916 | |
Long-term capital gains dividends were paid from the following Funds during the year ended July 31, 2015:
| All Asset | | $ | 848,091 | |
| Dividend & Income Builder | | | 277,649 | |
| Global Technology | | | 42,250,534 | |
| Unconstrained Bond | | | 578,312 | |
Statement Pursuant to Section 19(a) of the Investment Company Act of 1940
The exact source of aggregate fund distributions for each fiscal year can only be determined as of the end of each Fund’s fiscal year, July 31. However, under Section 19(a) of the 1940 Act, the Funds are required to indicate the source of each distribution to shareholders at the time of payment if the distribution is made from any source other than accumulated undistributed net income. For purposes of this disclosure, the source of each distribution is based on US Generally Accepted Accounting Principles and will differ from federal income tax-based reporting provided to shareholders due to certain tax adjustments.Distributions paid in part from paid-in capital do not necessarily reflect a taxable return of capital. For federal income tax purposes, shareholders will receive a Form 1099-DIV for each calendar year that will tell you how to report these distributions. Accordingly, the Funds are making the following disclosures pursuant to Section 19(a).
201
| Other information (unaudited) |
During the semi-annual period ended July 31, 2015, none of the Henderson Global Funds paid income distributions in part from sources other than accumulated undistributed net income as measured at the time of payment.
Shareholder expense
As a shareholder of the Funds, you incur two types of costs: (1) transaction costs, including upfront or deferred sales charges (loads) on purchases and (2) ongoing costs, including management fees, distribution (12b-1) fees, shareholder services fees and other Fund expenses. The example in Table 1 and Table 2 is intended to help you understand your ongoing costs of investing in the Funds and to compare these costs with ongoing costs of investing in other mutual funds. It is based on an investment of $1,000 invested at the beginning of the period and held for the six months ended July 31, 2015.
Actual expenses
Table 1 provides information about actual account values and actual expenses. You may use the information in this line, together with the amount invested, to estimate the expenses that you incurred over the period. Simply divide your account value at the end of the period by $1,000 (for example, an $8,600 account value divided by $1,000 = 8.6), then multiply the result by the number under the heading entitled “Expenses Paid During the Period” to estimate the expenses attributable to your investment during this period.
Hypothetical example for comparison purposes
Table 2 provides information about hypothetical account values and hypothetical expenses based on the Funds’ actual expense ratios and an assumed rate of return of 5% per year before expenses, which is not the Funds’ actual return. Thus you should not use the hypothetical account values and expenses to estimate your actual ending account balance or the expense attributable to your investment during the period. Rather, these figures are provided to enable you to compare the ongoing costs of investing in the Funds and other funds. To do so, compare the 5% hypothetical examples with the 5% hypothetical examples that appear in the shareholder reports of other funds.
Expenses paid during the period include amounts reflected in the Funds’ Statements of Operations, net of reimbursements by the investment adviser. The annualized expense ratios used in the example are as follows:
| | Class | | Class | | Class | | Class | | Class | |
| | A | | B | | C | | I | | R | |
| All Asset | 0.85 | % | N/A | | 1.60 | % | 0.60 | % | N/A | |
| Dividend & Income Builder | 1.30 | % | N/A | | 2.05 | % | 1.05 | % | N/A | |
| Emerging Markets | 1.79 | % | N/A | | 2.54 | % | 1.54 | % | N/A | |
| European Focus | 1.28 | % | 2.07 | % | 2.08 | % | 1.06 | % | N/A | |
| Global Equity Income | 1.08 | % | N/A | | 1.86 | % | 0.86 | % | N/A | |
| Global Technology | 1.31 | % | 2.16 | % | 2.12 | % | 1.12 | % | N/A | |
| High Yield Opportunities | 1.10 | % | N/A | | 1.85 | % | 0.85 | % | N/A | |
| International Long/Short Equity | 4.75 | % | N/A | | 5.64 | % | 4.60 | % | N/A | |
| International Opportunities | 1.34 | % | 2.13 | % | 2.12 | % | 1.09 | % | 1.62 | % |
| International Select Equity | 1.14 | % | N/A | | 1.89 | % | 0.89 | % | N/A | |
| Strategic Income | 1.09 | % | 1.85 | % | 1.85 | % | 0.84 | % | N/A | |
| Unconstrained Bond | 1.15 | % | N/A | | 1.90 | % | 0.90 | % | N/A | |
| US Growth Opportunities | 1.20 | % | N/A | | 1.95 | % | 0.95 | % | N/A | |
Please note that the expenses do not reflect shareholder transaction costs such as front-end or deferred sales charges. These fees are described for each Fund and share class in the “Commentaries and Performance Summaries” section of this report beginning on page 4. Table 2 is useful in comparing ongoing costs only, and will not help you determine the relative total costs of owning different funds. In addition, if these transaction costs were included, your costs would have been higher.
202
| Other information (unaudited) |
| Table 1 | | | | | | | | | | |
| Actual | | | Beginning account value February 1, 2015 | | | Ending account value July 31, 2015 | | | Expenses paid during the period | * |
| All Asset | | | | | | | | | | |
| Class A | | $ | 1,000.00 | | $ | 1,013.40 | | $ | 4.24 | |
| Class C | | | 1,000.00 | | | 1,008.70 | | | 7.97 | |
| Class I | | | 1,000.00 | | | 1,014.40 | | | 3.00 | |
| Dividend & Income Builder | | | | | | | | | | |
| Class A | | $ | 1,000.00 | | $ | 1,056.50 | | $ | 6.63 | |
| Class C | | | 1,000.00 | | | 1,053.20 | | | 10.44 | |
| Class I | | | 1,000.00 | | | 1,057.70 | | | 5.36 | |
| Emerging Markets | | | | | | | | | | |
| Class A | | $ | 1,000.00 | | $ | 958.80 | | $ | 8.69 | |
| Class C | | | 1,000.00 | | | 955.40 | | | 12.31 | |
| Class I | | | 1,000.00 | | | 960.00 | | | 7.48 | |
| European Focus | | | | | | | | | | |
| Class A | | $ | 1,000.00 | | $ | 1,102.10 | | $ | 6.67 | |
| Class B | | | 1,000.00 | | | 1,097.80 | | | 10.77 | |
| Class C | | | 1,000.00 | | | 1,097.80 | | | 10.82 | |
| Class I | | | 1,000.00 | | | 1,103.50 | | | 5.53 | |
| Global Equity Income | | | | | | | | | | |
| Class A | | $ | 1,000.00 | | $ | 1,036.90 | | $ | 9.09 | |
| Class C | | | 1,000.00 | | | 1,033.20 | | | 9.38 | |
| Class I | | | 1,000.00 | | | 1,038.00 | | | 4.35 | |
| Global Technology | | | | | | | | | | |
| Class A | | $ | 1,000.00 | | $ | 1,083.60 | | $ | 6.77 | |
| Class B | | | 1,000.00 | | | 1,079.10 | | | 11.13 | |
| Class C | | | 1,000.00 | | | 1,078.60 | | | 10.93 | |
| Class I | | | 1,000.00 | | | 1,084.10 | | | 5.79 | |
| High Yield Opportunities | | | | | | | | | | |
| Class A | | $ | 1,000.00 | | $ | 1,020.20 | | $ | 5.51 | |
| Class C | | | 1,000.00 | | | 1,015.00 | | | 9.24 | |
| Class I | | | 1,000.00 | | | 1,021.00 | | | 4.26 | |
| International Long/Short Equity | | | | | | | | | | |
| Class A | | $ | 1,000.00 | | $ | 1,050.10 | | $ | 24.14 | |
| Class C | | | 1,000.00 | | | 1,046.10 | | | 28.61 | |
| Class I | | | 1,000.00 | | | 1,051.10 | | | 23.39 | |
| International Opportunities | | | | | | | | | | |
| Class A | | $ | 1,000.00 | | $ | 1,063.60 | | $ | 6.86 | |
| Class B | | | 1,000.00 | | | 1,059.60 | | | 10.88 | |
| Class C | | | 1,000.00 | | | 1,059.30 | | | 10.82 | |
| Class I | | | 1,000.00 | | | 1,064.70 | | | 5.57 | |
| Class R | | | 1,000.00 | | | 1,062.30 | | | 8.29 | |
| International Select Equity | | | | | | | | | | |
| Class A | | $ | 1,000.00 | | $ | 1,116.10 | | $ | 5.98 | |
| Class C | | | 1,000.00 | | | 1,111.10 | | | 9.89 | |
| Class I | | | 1,000.00 | | | 1,117.00 | | | 4.67 | |
| Strategic Income | | | | | | | | | | |
| Class A | | $ | 1,000.00 | | $ | 1,002.00 | | $ | 5.41 | |
| Class B | | | 1,000.00 | | | 997.80 | | | 9.16 | |
| Class C | | | 1,000.00 | | | 997.10 | | | 9.16 | |
| Class I | | | 1,000.00 | | | 1,002.10 | | | 4.17 | |
Unconstrained Bond | | | | | | | | | | |
| Class A | | $ | 1,000.00 | | $ | 1,011.30 | | $ | 5.73 | |
| Class C | | | 1,000.00 | | | 1,006.70 | | | 9.45 | |
| Class I | | | 1,000.00 | | | 1,011.60 | | | 4.49 | |
| US Growth Opportunities | | | | | | | | | | |
| Class A | | $ | 1,000.00 | | $ | 1,131.40 | | $ | 6.34 | |
| Class C | | | 1,000.00 | | | 1,127.50 | | | 10.34 | |
| Class I | | | 1,000.00 | | | 1,133.50 | | | 5.03 | |
| Table 2 | | | | | | | | | | |
Hypothetical (assuming a 5% return before expenses) | | | Beginning account value February 1, 2015 | | | Ending account value July 31, 2015 | | | Expenses paid during the period* | |
| All Asset | | | | | | | | | | |
| Class A | | $ | 1,000.00 | | $ | 1,020.58 | | $ | 4.26 | |
| Class C | | | 1,000.00 | | | 1,016.86 | | | 8.00 | |
| Class I | | | 1,000.00 | | | 1,021.82 | | | 3.01 | |
| Dividend & Income Builder | | | | | | | | | | |
| Class A | | $ | 1,000.00 | | $ | 1,018.35 | | $ | 6.51 | |
| Class C | | | 1,000.00 | | | 1,014.63 | | | 10.24 | |
| Class I | | | 1,000.00 | | | 1,019.59 | | | 5.26 | |
| Emerging Markets | | | | | | | | | | |
| Class A | | $ | 1,000.00 | | $ | 1,015.92 | | $ | 8.95 | |
| Class C | | | 1,000.00 | | | 1,012.20 | | | 12.67 | |
| Class I | | | 1,000.00 | | | 1,017.16 | | | 7.70 | |
| European Focus | | | | | | | | | | |
| Class A | | $ | 1,000.00 | | $ | 1,018.45 | | $ | 6.41 | |
| Class B | | | 1,000.00 | | | 1,014.53 | | | 10.34 | |
| Class C | | | 1,000.00 | | | 1,014.48 | | | 10.39 | |
| Class I | | | 1,000.00 | | | 1,019.54 | | | 5.31 | |
| Global Equity Income | | | | | | | | | | |
| Class A | | $ | 1,000.00 | | $ | 1,015,87 | | $ | 9.00 | |
| Class C | | | 1,000.00 | | | 1,015.57 | | | 9.30 | |
| Class I | | | 1,000.00 | | | 1,020.53 | | | 4.31 | |
| Global Technology | | | | | | | | | | |
| Class A | | $ | 1,000.00 | | $ | 1,018.30 | | $ | 6.56 | |
| Class B | | | 1,000.00 | | | 1,014.08 | | | 10.79 | |
| Class C | | | 1,000.00 | | | 1,014.28 | | | 10.59 | |
| Class I | | | 1,000.00 | | | 1,019.24 | | | 5.61 | |
| High Yield Opportunities | | | | | | | | | | |
| Class A | | $ | 1,000.00 | | $ | 1,019.34 | | $ | 5.51 | |
| Class C | | | 1,000.00 | | | 1,015.62 | | | 9.25 | |
| Class I | | | 1,000.00 | | | 1,020.58 | | | 4.26 | |
| International Long/Short Equity | | | | | | | | | | |
| Class A | | $ | 1,000.00 | | $ | 1,001.24 | | $ | 23.57 | |
| Class C | | | 1,000.00 | | | 996.83 | | | 27.92 | |
| Class I | | | 1,000.00 | | | 1,001.98 | | | 22.83 | |
| International Opportunities | | | | | | | | | | |
| Class A | | $ | 1,000.00 | | $ | 1,018.15 | | $ | 6.71 | |
| Class B | | | 1,000.00 | | | 1,014.23 | | | 10.64 | |
| Class C | | | 1,000.00 | | | 1,014.28 | | | 10.59 | |
| Class I | | | 1,000.00 | | | 1,019.39 | | | 5.46 | |
| Class R | | | 1,000.00 | | | 1,016.76 | | | 8.10 | |
| International Select Equity | | | | | | | | | | |
| Class A | | $ | 1,000.00 | | $ | 1,019.14 | | $ | 5.71 | |
| Class C | | | 1,000.00 | | | 1,015.42 | | | 9.44 | |
| Class I | | | 1,000.00 | | | 1,020.38 | | | 4.46 | |
| Strategic Income | | | | | | | | | | |
| Class A | | $ | 1,000.00 | | $ | 1,019.39 | | $ | 5.46 | |
| Class B | | | 1,000.00 | | | 1,015.62 | | | 9.25 | |
| Class C | | | 1,000.00 | | | 1,015.62 | | | 9.25 | |
| Class I | | | 1,000.00 | | | 1,020.63 | | | 4.21 | |
| Unconstrained Bond | | | | | | | | | | |
| Class A | | $ | 1,000.00 | | $ | 1,019.09 | | $ | 5.76 | |
| Class C | | | 1,000.00 | | | 1,015.37 | | | 9.49 | |
| Class I | | | 1,000.00 | | | 1,020.33 | | | 4.51 | |
| US Growth Opportunities | | | | | | | | | | |
| Class A | | $ | 1,000.00 | | $ | 1,018.84 | | $ | 6.01 | |
| Class C | | | 1,000.00 | | | 1,015.08 | | | 9.79 | |
| Class I | | | 1,000.00 | | | 1,020.08 | | | 4.76 | |
| * | Expenses are equal to the Funds’ annualized net expense ratio multiplied by the average account value over the period multiplied by 181 days in the period, and divided by 365 (to reflect the one-half year period). |
203
| Trustees and officers (unaudited) |
Name, address1, month and year of birth | | Position(s) with the Trust2 | | Term of Office and Time Served3 | | Principal Occupations During Past Five Years | | Other Directorships Held |
| Independent Trustees | | | | | | |
C. Gary Gerst February 1939 | | Chairman and Trustee | | Since 2001 | | General Partner, Cornelius & Lothian LP (private partnership investing in non-public investments), from 1993 to present. | | Formerly, Trustee, Harris Insight Funds Trust; formerly, member of the Governing Council of the Independent Directors Council (IDC); formerly, Board member of the Investment Company Institute. |
James W. Atkinson August 1950 | | Trustee | | Since 2011 | | Commercial Pilot, Atkinson Aviation LLC, since 2009 | | Formerly, Trustee, LaRabida Children’s Hospital: formerly Trustee, Surgeons Diversified Investment Fund. |
Richard W. Durkes February 1950 | | Trustee | | Since 2011 | | Managing Director, BayBoston LLC (private equity fund) | | Trustee, NT Alpha Strategies Fund and NT Long/Short Equity Fund; Trustee, Sankaty Head Foundation; Partner, Serve Up LLC (private company that holds the rights to certain intellectual property). |
Barbara L. Lamb September 1954 | | Trustee | | Since 2014 | | Managing Director, Cheiron Trading LLC (proprietary trading company). | | Formerly, Director, First Chicago Bancorp; formerly, Director, MAF Bancorp, Inc. |
J. Marshall Peck April 1952 | | Trustee | | Since 2014 | | President, Interpark Holdings, LLC (parking garage owner, developer and operator), since 2011; formerly, Chief Executive Officer, Interpark Holdings, LLC. | | Board Member and Finance Committee Chairman, Presbyterian Homes. |
204
| Trustees and officers (unaudited) |
| | | | | Term of | | | | |
Name, address1, | | Position(s) | | Office and | | | | Other |
| month and | | with | | Time | | Principal Occupations | | Directorships |
| year of birth | | the Trust2 | | Served3 | | During Past Five Years | | Held |
| Interested Trustees and Officers of the Trust | | | | |
James G. O’Brien4 May 1960 | | Trustee and President | | Since 2011 Since 2010 | | Managing Director, HGINA. | | None. |
Charles Thompson II4 April 1970 | | Trustee and Vice President | | Since 2011 Since 2010 | | Director of Distribution (North America), since 2014; Director of US Retail, 2010-2014. | | None. |
Kenneth A. Kalina August 1959 | | Chief Compliance Officer | | Since 2005 | | Chief Compliance Officer, HGINA, until 2015. | | N/A |
Alanna P. Nensel July 1975 | | Vice President | | Since 2002 | | Director, Retail Marketing and Product Management, HGINA. | | N/A |
David Latin September 1981 | | Vice President | | Since 2012 | | Director of Product Development, HGINA. | | N/A |
Scott E. Volk May 1971 | | Vice President | | Since 2001 | | Chief Operating Officer, HGINA, since 2014; Director, Retail Finance and Operations, HGINA, 2002-2014. | | N/A |
Christopher K. Yarbrough October 1974 | | Secretary | | Since 2004 | | Senior Legal Counsel, HGINA. | | N/A |
Troy M. Statczar August 1971 | | Treasurer | | Since 2008 | | Head of US Fund Administration and Accounting, HGINA. | | N/A |
Adam T. Reich August 1983 | | Assistant Treasurer | | Since 2012 | | Manager of US Fund Administration and Accounting, HGINA, since August 2012; Manager, PricewaterhouseCoopers LLP 2006-2012. | | N/A |
| 1. | Each person’s address is 737 North Michigan Avenue, Suite 1700, Chicago, IL 60611. |
| 2. | Currently, all Trustees oversee all thirteen series of the Trust. |
| 3. | A Trustee may serve until his death, resignation, removal or until the end of the calendar year in which the Trustee reaches 75 years of age, subject to change by the Board. The Trustees have determined to extend the retirement age of Mssr. Gerst to the end of the calendar year in which the Trustee reaches 76 years of age. The officers of the Trust are elected annually by the Board. |
| 4. | This Trustee is an interested person of the Trust because of his employment relationship with Henderson Global Investors (North America) Inc., the investment adviser to the Fund. |
| | |
| | Unless otherwise noted, this information is as of July 31, 2015. The Statement of Additional Information for Henderson Global Funds includes additional information about the Trustees and is available without charge by calling 1.866.4HENDERSON (1.866.443.6337). |
205
| Trustees and officers (unaudited) |
Trustees C. Gary Gerst, Chairman James W. Atkinson Richard W. Durkes Barbara L. Lamb J. Marshall Peck James G. O’Brien* Charles Thompson II* Officers James G. O’Brien, President Charles Thompson II, Vice President Alanna P. Nensel, Vice President David Latin, Vice President Scott E. Volk, Vice President Christopher K. Yarbrough, Secretary Kenneth A. Kalina, Chief Compliance Officer Troy M. Statczar, Treasurer Adam T. Reich, Assistant Treasurer | Investment Adviser Henderson Global Investors (North America) Inc. 737 North Michigan Avenue, Suite 1700 Chicago, IL 60611 Transfer Agent State Street Bank & Trust Company State Street Financial Center One Lincoln Street Boston, MA 02111 Administrator and Custodian State Street Bank & Trust Company State Street Financial Center One Lincoln Street Boston, MA 02111 Auditors Ernst & Young LLP 155 North Wacker Drive Chicago, IL 60606 For more information Please call 1.866.4HENDERSON (1.866.443.6337) or visit our website: www.henderson.com |
* Trustee is an “interested person” of the Trust as defined in the1940 Act.
The views expressed in this report and information about the Funds’ portfolio holdings are for the period covered by this report and are subject to change hereafter. This report is submitted for the general information of the shareholders of the Funds. It is not authorized for distribution to prospective investors unless preceded or accompanied by an effective prospectus, which includes information regarding the Funds’ risks, objectives, fees and expenses, experience of its management, and other information. Henderson Global Investors is the name under which various subsidiaries of Henderson Group plc, a UK limited company, provide investment products and services.
Foreside Fund Services, LLC, Distributor
206
This page intentionally left blank.
207
This page intentionally left blank.
208
This page intentionally left blank.
209
This page intentionally left blank.
210
This page intentionally left blank.
211
This page intentionally left blank.
212
This notice describes the privacy practices followed by Henderson Global Funds.
Your privacy is our top priority. Our policy is to respect the privacy of current and former shareholders and to protect personal information entrusted to us. We do not share any nonpublic personal information of shareholders or former shareholders with any nonaffiliated third parties, except as permitted by law or as authorized by our shareholders.
In the course of providing products and services to you, we collect nonpublic personal information about you from various sources such as account applications or agreements, other account forms, transactions in your account, and from information captured on our website, including any information captured through our use of “cookies.” Such information may include your name, address, account or tax identification number, the types and amounts of investments, and bank account information. More detailed information about our Internet policy is available on our website, www.henderson.com.
In the normal course of serving shareholders, we may share information we collect with entities that help us process information or service your request, such as transfer agents, custodians, broker-dealers and marketing service firms, as well as with other financial institutions with whom we have joint marketing agreements. We may share information in connection with servicing accounts or to inform shareholders of products and services that we believe may be of interest to them. The organizations that receive shareholder information will use that information only for the services required and as allowed by applicable law or regulation, and are not permitted to share or use this information for any other purpose. Our affiliates do not use shareholder information that we receive to make marketing solicitations. We will disclose your personal information to government agencies, law enforcement officials, and others in the limited circumstances where we believe, in good faith, that such disclosure is required or permitted by law. For example, we will disclose your personal information in order to comply with a court order, to cooperate with government or industry regulators, or law enforcement authorities.
Access to customers’ nonpublic personal information is restricted to employees who need to access that information. To guard shareholder’s nonpublic personal information, we use industry standard physical, electronic, and procedural safeguards. A shareholder’s right to privacy extends to all forms of contact with us, including telephone, written correspondence, and electronic media, such as the Internet.
For questions concerning this policy, please contact us by writing to: Alanna Nensel, Henderson Global Investors (North America) Inc., 737 North Michigan Avenue, Suite 1700, Chicago, Illinois 60611.