UNITED STATES
SECURITIES AND EXCHANGE COMMISSION
Washington, D.C. 20549
FORM N-CSR
CERTIFIED SHAREHOLDER REPORT OF REGISTERED
MANAGEMENT INVESTMENT COMPANIES
Investment Company Act file number: 811-10399
______________________________________________
HENDERSON GLOBAL FUNDS
______________________________________________________________________________
__
(Exact name of registrant as specified in charter)
737 NORTH MICHIGAN AVENUE, SUITE 1700
CHICAGO, ILLINOIS 60611
______________________________________________________________________________
__
(Address of principal executive offices)(Zip code)
| (Name and Address of Agent for Service) | Copy to: |
CHRISTOPHER K. YARBROUGH 737 NORTH MICHIGAN AVENUE, SUITE 1700 CHICAGO, ILLINOIS 60611 | CATHY G. O’KELLY VEDDER PRICE P.C. 222 NORTH LASALLE STREET CHICAGO, ILLINOIS 60601 |
Registrant’s telephone number, including area code: (312) 397-1122
Date of fiscal year end: December 31
Date of reporting period: December 31, 2012
Item 1: Report to Shareholders.
Annual Report
December 31, 2012
Strategic Income Fund
| | |
Table of contents | |
| |
Letter to shareholders | 1 |
Strategic Income Fund | |
Commentary | 2 |
Performance summary | 3 |
Portfolio of investments | 4 |
Statement of assets and liabilities | 8 |
Statement of operations. | 9 |
Statements of changes in net assets | 10 |
Statements of changes - capital stock activity | 11 |
Financial highlights | 12 |
Notes to financial statements | 14 |
Report of independent registered public accounting firm | 22 |
Other information | 23 |
Trustees and officers | 25 |
The Henderson Strategic Income Fund may invest in high yield, lower rated (junk) bonds which involve a greater degree of risk than investment grade bonds. As such, securities rated below investment grade generally entail greater credit, market, issuer and liquidity risk than investment grade securities. Moreover, the Fund is subject to interest rate risk which is the risk that debt securities in the Fund’s portfolio will decline in value because of increases in market interest rates. The Fund may borrow money which may adversely affect the return to shareholders of the Fund, also known as leverage risk.
The Fund may invest a substantial percentage of its assets in securities of foreign issuers. International investing involves certain risks and increased volatility not associated with investing solely in the US. These risks include currency fluctuations, economic or financial instability, lack of timely or reliable financial information or unfavorable political or legal developments. The Strategic Income Fund may invest in securities issued by smaller companies, which typically involves greater risk than investing in larger companies. Also, the Fund may invest in limited geographic areas and/or sectors which may result in greater market volatility. In addition, the Fund may invest in derivatives. Derivatives involve special risks different from, and potentially greater than, the risks associated with investing directly in securities and may result in greater losses.
The views in this report were those of the Fund’s managers as of December 31, 2012 and may not reflect the views of the managers on the date this report is first published or anytime thereafter. These views are intended to assist shareholders of the Fund in understanding their investment in the Fund and do not constitute investment advice.
| | |
Henderson Global Funds | Letter to shareholders |
Dear shareholder,
We are pleased to provide the annual report for the Henderson Strategic Income Fund, which covers the year ended December 31, 2012.
Global risk appetite strengthened into the tail end of 2012, and investors seemed prepared to start the new year in a more optimistic mood following news that the US had finally made progress on a “fiscal cliff” deal. December showed positive returns in many areas as the fledgling global economic recovery was bolstered by further improvements in data from around the world.
The US economy expanded by 3.1% annualized in the third quarter of 2012, much higher than previously estimated, supported by exports and government spending. In December, Federal Reserve Chairman Ben Bernanke announced that “Operation Twist” would be replaced by monthly purchases of $45 billion of Treasuries starting in January. Although this was largely anticipated, markets were surprised by the Fed setting a numerical threshold for future interest rate policy; near-zero rates appear to be here to stay until US unemployment declines to 6.5% and inflation is contained.
In Europe, a sense of easing tensions prevailed towards the end of 2012 as European policy uncertainty decreased and European leaders agreed to a limited banking union to be introduced in 2014. Credit rating agency Standard & Poor’s upgraded Greek bonds from “junk” to B-, while ?39.5 billion of aid was agreed for Spanish banks. However, there are still considerable challenges for the region, not the least of which is how to grow the economy given the headwind of austerity packages.
In Asia, China’s HSBC manufacturing purchasing managers index produced a 51.5 reading for December, the highest since May 2011, while the new leadership pledged to stabilize exports and boost urbanization. Japan’s general election was won by the Liberal Democratic Party’s Shinzo Abe, paving the way for a more expansionary fiscal and monetary policy stance. This news was welcomed by the markets and the yen weakened against the US dollar, boding well for Japanese exports.
Looking ahead, 2013 may usher in a more upbeat environment for investors as leading indicators signal a possible return of global growth over the next year. Companies have continued to repair their balance sheets, cash balances are strong and we would expect dividend payments to continue to rise. Additionally, consumer confidence is starting to return to levels not seen in over four years, partly due to the stabilization of the housing market. But we believe the largest driver of market direction in 2013 will be the extent to which the global economy can recover, which remains to be seen.
At Henderson we remain focused on seeking attractive global investment opportunities that can bring value to our clients’ portfolios. Now, as much as ever, we believe the “Henderson Difference” is a key factor in helping to create funds that are truly differentiated from the competition. We look forward to serving your financial needs in the years to come, and we appreciate your trust in and support of our Funds.
James G. O’Brien
President, Henderson Global Funds
Investors should consider the investment objectives, risks, charges and expenses of a mutual fund carefully before investing. For a free Prospectus, which contains this and other important information about the Fund, visit www.hendersonglobalinvestors.com. The Prospectus should be read carefully before investing.
| | |
Henderson Global Funds | Commentary |
Strategic Income Fund
Credit risk performed well for the majority of the year with the exception of the month of May as European periphery concerns grew, in particular regarding the Greek elections and Spanish banking solvency. Risk assets rallied even higher following the Autumn central banks’ stimuli. Both the Federal Reserve Bank’s (the Fed) Chairman Bernanke and European Central Bank’s (ECB) President Draghi became even more supportive of risk assets in speeches and dedicated programs. These targeted actions focused on reducing unemployment in the US and underwriting the tail risk of European disintegration (Outright Monetary Transactions program). Credits markets continue to be fuelled by cheap liquidity searching out extra yield. This action has driven the grab for yield, which has pushed credit spreads tighter which, in turn, has been to the benefit of the Fund’s positions.
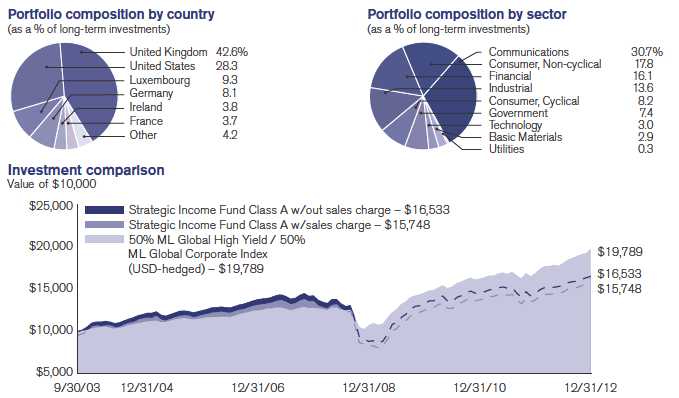
For the reporting period ended December 31, 2012, the Fund returned 13.75% (Class A at NAV) versus the benchmark 50% Merrill Lynch Global High Yield (USD-hedged)/50% Merrill Lynch Global Broad Market Corporate (USD hedged) which posted a return of 15.33%. The majority of the Fund’s return came from bonds with both high yield and investment grade issues serving as strong contributors. The Fund’s high yield holdings have been focused in BB and select B-rated credits in non-cyclical sectors such as cable TV and packaging. Another sector theme that has performed very well is our long held preference for subordinated financials, where for example Legal and General, a UK insurer, was up almost 27 points at year-end from its low in May. There were very few bonds that had a negative impact on performance; the minor negative contribution was from the position in a long-dated UK Gilt that suffered as curves steepened as the inflation outlook started to increase subsequent to the Fed’s unlimited quantitative easing (QE) announcement.
The Fund’s derivatives positions overall contributed a small positive to performance. Some of our hedges were the source of small losses - we had a negative view on Turkey for a number of reasons, one being its current account position. However, the ECB’s commitment to do “whatever it takes” removed tail risk and cost the Fund a moderate loss. The Fund also had some Australian bank short positions taken ostensibly to hedge against a very expensive property market and as a proxy for a China hard landing scenario. However, strong offsetting performance came from opportunistic trading from the Fund’s bond futures and credit derivative indices.
Despite the ongoing uncertainty regarding the US fiscal cliff, credit markets continued to shrug off the possibility of a solution not being reached and performed well over the full year, once again outperforming government bonds, which weakened following the announcement of a further round of QE in the US. Going forward we expect the majority of returns to come from the carry (yield) trade rather than capital growth.
Strategic Income Fund | |
Top 10 long-term holdings* | |
(at December 31, 2012) | |
| |
| | as a percentage |
Security | of net assets |
United States | | |
Treasury Notes | | 6.7% |
Daily Mail & | | |
General Trust | | 3.7 |
Unitymedia Hessen | | |
GmbH & Co. KG | | 3.3 |
Legal & General Group plc | 3.3 |
UPC Holding BV | | 3.0 |
Service Corp International | 2.9 |
Constellation Brands, Inc. | 2.9 |
Virgin Media Finance plc | 2.8 |
Telenet Finance | | |
Luxembourg SCA | | 2.2 |
Standard Chartered plc | 2.2 |
*For further details about these holdings, please refer to the section entitled “Portfolio of Investments.” Fund holdings are as of the date given, are subject to change at any time, and are not recommendations to buy or sell any security.
| | |
| Henderson Global Funds | Performance summary (unaudited) |
Strategic Income Fund
Total Returns as of 12/31/12 | | | | | | | | | | | | Since | |
| | NASDAQ | | One | | | Three | | | Five | | | inception | |
At NAV | symbol | | year | | | years* | | | years* | | | (9/30/03)* | |
Class A | HFAAX | | | 13.75 | % | | | 7.83 | % | | | 2.99 | % | | | 5.58 | % |
Class B | HFABX | | | 12.97 | | | | 7.01 | | | | 2.30 | | | | 4.94 | |
Class C | HFACX | | | 12.95 | | | | 7.02 | | | | 2.13 | | | | 4.76 | |
Class I** | HFAIX | | | 14.06 | | | | 7.95 | | | | 3.06 | | | | 5.62 | |
With sales charge | | | | | | | | | | | | | | | | | |
Class A | | | | 8.32 | % | | | 6.10 | % | | | 2.00 | % | | | 5.03 | % |
Class B | | | | 8.97 | | | | 6.13 | | | | 2.12 | | | | 4.94 | |
Class C | | | | 12.95 | | | | 7.02 | | | | 2.13 | | | | 4.76 | |
Index | | | | | | | | | | | | | | | | | |
50% ML Global High Yield / 50% ML Global | | | | | | | | | | | | | | | | | |
Corporate Index (USD-hedged) | | | | 15.33 | % | | | 10.18 | % | | | 9.11 | % | | | 7.65 | % |
Barclays Capital Global Aggregate Bond (ex US MBS) Index | | | 4.55 | % | | | 5.21 | % | | | 5.37 | % | | | 5.61 | % |
** Class I shares commenced operation on April 29, 2011. The performance for Class I shares prior to April 29, 2011 is based on the performance of Class A shares. Performance for Class I shares would be similar because the shares are invested in the same portfolio of securities and have the same portfolio management. Class I shares are not subject to a front-end sales charge or distribution fee.
Performance data quoted represents past performance and is no guarantee of future results. Performance results with sales charges reflect the deduction of the maximum front-end sales charge or the deduction of the applicable contingent deferred sales charge (“CDSC”). Class A shares are subject to a maximum front-end sales charge of 4.75%. Class B shares are subject to a CDSC, which declines from 5% the 1st year to 0% at the beginning of the 7th year. Class C shares are subject to a CDSC of up to 1% on certain redemptions made within 12 months of purchase. Performance presented at Net Asset Value (NAV), which does not include a sales charge, would be lower if this charge were reflected. NAV is the value of one share of the Fund excluding any sales charges. Current performance may be lower or higher than the performance data quoted. Investment return and principal value will fluctuate so that an investor’s shares, when redeemed, may be worth more or less than original cost. As stated in the current prospectus, the Fund’s annual operating expense ratios (gross) for Class A, B, C and I shares are 1.42%, 2.19%, 2.18% and 1.25%, respectively. However, the Fund’s adviser has agreed to contractually waive a portion of its fees and/or reimburse expenses such that total ordinary operating expenses (other than Acquired Fund Fees and Expenses allocated from unaffiliated investment companies) do not exceed 1.10%, 1.85%, 1.85% and 0.85% for Class A, B, C and I shares, which will remain in effect until July 31, 2020. For the most recent month-end performance, please call 1.866.443.6337 or visit the Fund’s website at www.hendersonglobalinvestors.com.
Performance results also reflect expense subsidies and waivers in effect during the periods shown. Absent these waivers, results would have been less favorable. All results assume the reinvestment of dividends and capital gains.
The investment comparison graph above reflects the change in value of a $10,000 hypothetical investment since the Fund’s inception, including reinvested dividends and distributions, compared to a broad based securities market index. The Fund is professionally managed while the indices are unmanaged and not available for investment. Results in the table and graph do not reflect the deduction of taxes that a shareholder would pay on Fund distributions or the redemption of Fund shares. The Bank of America Merrill Lynch (“ML”) Global Corporate Index (USD-hedged) tracks the performance of developed market investment grade corporate debt publicly issued in the major US and Eurobond markets. The Bank of America Merrill Lynch (“ML”) Global High Yield Index tracks the performance of US dollar, Canadian Dollar, British sterling and euro denominated developed market below investment grade corporate debt publicly issued in the major US or Eurobond markets.
The Barclays Capital Global Aggregate Bond (ex US MBS) Index is a broad-based measure of the global investment-grade fixed-rate debt markets, excluding US Mortgage Bonds.
An investor cannot invest directly in an index. The indexes do not charge management fees or brokerage expenses.
| | |
Henderson Global Funds | Portfolio of investments |
Strategic Income Fund
December 31, 2012
| Face | | | | | Value |
amount | | | Coupon | Maturity | (note 2) |
| |
Corporate bonds – 84.72% | | | |
| |
| | | | Canada – 0.91% | | | |
EUR | 330,000 | | Bombardier, Inc | 7.250% | 11/15/16 | $ 459,541 |
| |
| | | | France – 3.38% | | | |
EUR | 550,000 | | Crown European Holdings S.A | 7.125 | 8/15/18 | 800,385 |
EUR | 450,000 | | Rexel S.A | 8.250 | 12/15/16 | 652,782 |
EUR | 100,000 | | Rexel S.A | 7.000 | 12/17/18 | 145,788 |
GBP | 60,000 | | WPP Finance S.A | 6.375 | 11/6/20 | 119,617 |
| | | | | | | 1,718,572 |
| |
| | | | Germany – 7.39% | | | |
EUR | 600,000 | | HeidelbergCement AG | 8.500 | 10/31/19 | 988,577 |
EUR | 750,000 | | Kabel Deutschland Vertrieb und Service GmbH | 6.500 | 6/29/18 | 1,072,873 |
USD | 500,000 | | Unitymedia Hessen GmbH & Co. KG (a) | 7.500 | 3/15/19 | 552,500 |
USD | 1,100,000 | | Unitymedia Hessen GmbH & Co. KG (a) | 5.500 | 1/15/23 | 1,141,250 |
| | | | | | | 3,755,200 |
| |
| | | | Ireland – 3.49% | | | |
EUR | 750,000 | | Ardagh Glass Finance plc | 8.750 | 2/1/20 | 1,041,441 |
EUR | 500,000 | | Smurfit Kappa Acquisitions | 7.750 | 11/15/19 | 733,233 |
| | | | | | | 1,774,674 |
| |
| | | | Luxembourg – 8.49% | | | |
GBP | 230,000 | | Cabot Financial Luxembourg S.A | 10.375 | 10/1/19 | 413,788 |
USD | 120,000 | | ConvaTec Healthcare (a) | 10.500 | 12/15/18 | 132,900 |
GBP | 400,000 | | Glencore Finance Europe S.A | 6.500 | 2/27/19 | 748,923 |
EUR | 150,000 | | Numericable Finance & Co. SCA | 12.375 | 2/15/19 | 235,116 |
EUR | 800,000 | | Telenet Finance Luxembourg SCA | 6.375 | 11/15/20 | 1,135,157 |
EUR | 100,000 | | Telenet Finance V Luxembourg SCA (a) | 6.250 | 8/15/22 | 141,631 |
| EUR | 1,100,000 | | UPC Holding BV | 8.000 | 11/1/16 | 1,505,668 |
| | | | | | | 4,313,183 |
| |
| | | | Netherlands – 2.40% | | | |
EUR | 150,000 | | Linde Finance B.V | 7.375 | 7/14/16 | 232,384 |
EUR | 675,000 | | Ziggo Bond Co. B.V. (a) | 8.000 | 5/15/18 | 984,518 |
| | | | | | | 1,216,902 |
| |
| | | | Sweden – 0.57% | | | |
EUR | 200,000 | | Norcell Sweden Holding 2 AB | 10.750 | 9/29/19 | 287,749 |
| |
| | | | United Kingdom – 38.98% | | | |
EUR | 700,000 | | BAA Funding, Ltd | 4.600 | 2/15/18 | 1,051,697 |
GBP | 150,000 | | Barclays Bank plc | 10.000 | 5/21/21 | 328,156 |
GBP | 150,000 | | BAT International Finance plc | 6.000 | 6/29/22 | 303,434 |
USD | 245,000 | | British Sky Broadcasting Group plc (a) | 3.125 | 11/26/22 | 244,664 |
GBP | 400,000 | | British Telecommunications plc | 6.625 | 6/23/17 | 772,401 |
GBP | 75,000 | | British Telecommunications plc | 5.750 | 12/7/28 | 145,144 |
GBP | 50,000 | | Care UK Health & Social Care plc | 9.750 | 8/1/17 | 87,314 |
| GBP | 1,000,000 | | Daily Mail & General Trust | 5.750 | 12/7/18 | 1,728,894 |
GBP | 100,000 | | Daily Mail & General Trust | 6.375 | 6/21/27 | 160,871 |
See notes to financial statements
| | |
Henderson Global Funds | Portfolio of investments |
Strategic Income Fund
December 31, 2012 (continued)
| Face | | | | | Value |
amount | | | Coupon | Maturity | (note 2) |
| |
| | | | United Kingdom – (continued) | | | |
USD | 1,000,000 | | Diageo Capital plc | 1.500% | 5/11/17 | $1,015,208 |
GBP | 400,000 | | F&C Finance plc | 9.000 | 12/20/16 | 697,949 |
GBP | 200,000 | | Gala Group Finance plc | 8.875 | 9/1/18 | 346,008 |
EUR | 520,000 | | Global Switch Holdings Ltd | 5.500 | 4/18/18 | 782,189 |
GBP | 450,000 | | Imperial Tobacco Finance plc | 5.500 | 11/22/16 | 823,954 |
GBP | 100,000 | | Imperial Tobacco Finance plc | 5.500 | 9/28/26 | 190,160 |
EUR | 200,000 | | INEOS Group Holdings S.A | 7.875 | 2/15/16 | 262,406 |
GBP | 501,000 | | ITV plc | 5.375 | 10/19/15 | 862,680 |
| GBP | 1,000,000 | | Legal & General Group plc (b) | 6.385 | 5/2/17 | 1,692,677 |
USD | 1,100,000 | | Lloyds Banking Group plc (a) (b) | 6.267 | 11/14/16 | 852,500 |
GBP | 130,000 | | Nationwide Building Society | 5.250 | 2/12/13 | 210,358 |
EUR | 650,000 | | Rexam plc (b) | 6.750 | 6/29/17 | 907,293 |
USD | 1,000,000 | | Royal Bank of Scotland Group plc (b) | 7.640 | 9/29/17 | 910,000 |
USD | 1,100,000 | | Standard Chartered plc (b) | 6.409 | 1/3/17 | 1,123,502 |
GBP | 50,000 | | Tesco plc | 5.500 | 12/13/19 | 94,554 |
GBP | 89,000 | | Tesco plc | 6.125 | 2/24/22 | 175,514 |
GBP | 50,000 | | Tesco plc | 5.000 | 3/24/23 | 91,531 |
GBP | 50,000 | | Tesco plc | 4.875 | 3/24/42 | 81,470 |
GBP | 67,000 | | Thames Water Utilities Finance, Ltd | 5.375 | 7/21/25 | 119,068 |
GBP | 300,000 | | Towergate Finance plc | 8.500 | 2/15/18 | 509,265 |
GBP | 100,000 | | Towergate Finance plc | 10.500 | 2/15/19 | 167,318 |
GBP | 650,000 | | Virgin Media Finance plc | 8.875 | 10/15/19 | 1,202,134 |
USD | 200,000 | | Virgin Media Finance plc | 4.875 | 2/15/22 | 205,500 |
GBP | 500,000 | | William Hill plc | 7.125 | 11/11/16 | 901,570 |
USD | 265,000 | | WPP Finance 2010 | 4.750 | 11/21/21 | 287,544 |
GBP | 250,000 | | WPP 2012 Ltd | 6.000 | 4/4/17 | 465,333 |
| | | | | | | 19,800,260 |
| |
| | | | United States – 19.11% | | | |
USD | 1,250,000 | | Constellation Brands, Inc | 7.250 | 5/15/17 | 1,478,125 |
USD | 710,000 | | Digicel Group, Ltd. (a) | 10.500 | 4/15/18 | 788,100 |
USD | 600,000 | | HCA Holdings, Inc. (a) | 7.750 | 5/15/21 | 654,000 |
USD | 300,000 | | HCA, Inc | 8.000 | 10/1/18 | 348,000 |
EUR | 400,000 | | Infor (US), Inc | 10.000 | 4/1/19 | 596,618 |
USD | 600,000 | | Iron Mountain, Inc | 5.750 | 8/15/24 | 610,500 |
| EUR | 2,500,000 | | Lehman Brothers UK Capital Funding | | | |
| | | | IV LP (b) (c) (d) (e) | 5.750 | 4/25/13 | — |
EUR | 775,000 | | Levi Strauss & Co | 7.750 | 5/15/18 | 1,104,799 |
USD | 738,000 | | Pinnacle Entertainment, Inc | 8.750 | 5/15/20 | 800,730 |
USD | 240,000 | | Regal Entertainment Group | 9.125 | 8/15/18 | 268,800 |
USD | 250,000 | | Reynolds Group Issuer, Inc. (a) | 5.750 | 10/15/20 | 258,750 |
USD | 85,000 | | SBA Telecommunications, Inc. (a) | 5.750 | 7/15/20 | 90,631 |
| USD | 1,240,000 | | Service Corp International | 7.625 | 10/1/18 | 1,481,800 |
USD | 113,000 | | Taminco Global Chemical Corp. (a) | 9.750 | 3/31/20 | 124,300 |
USD | 1,000,000 | | Time Warner Cable, Inc | 4.000 | 9/1/21 | 1,099,691 |
| | | | | | | 9,704,844 |
| | | | Total corporate bonds | | | |
| | | | (Cost $41,990,105) | | | 43,030,925 |
See notes to financial statements
| | |
Henderson Global Funds | Portfolio of investments |
Strategic Income Fund
December 31, 2012 (continued)
| Face | | | | | Value |
| amount | | | Coupon | Maturity | (note 2) |
US government obligations – 6.74% | | | |
| | | | United States - 6.74% | | | |
USD | 1,000,000 | | United States Treasury Note | 3.625% | 2/15/21 | $ 1,173,985 |
USD | 2,250,000 | | United States Treasury Note | 0.250 | 9/15/14 | 2,250,880 |
| | | | | | | 3,424,865 |
| | | | Total US government obligations | | | |
| | | | (Cost $3,346,953) | | | 3,424,865 |
| | | | | | | |
| | | | Total long-term investments | | | |
| | | | (Cost $45,337,058) | | | 46,455,790 |
| Shares | | | | | |
Short-term investment – 6.70% | | | |
| | 3,400,663 | | Fidelity Institutional Treasury Portfolio (f) | | | 3,400,663 |
| | | | | | | |
| | | | Total short-term investment | | | |
| | | | (Cost $3,400,663) | | | 3,400,663 |
| | | | |
Total investments – 98.16% | | | |
| | | | (Cost $48,737,721) | | | 49,856,453 |
| | | | | | | |
Net other assets and liabilities – 1.84% | | | 934,511 |
| | | | |
Total net assets – 100.00% | | | $50,790,964 |
(a) | Restricted security, purchased under Rule 144A, section 4(2)g, which is exempt from registration under the Securities Act of 1933, |
| | as amended. At December 31, 2012, the restricted securities securities held by the Fund had an aggregate value of $5,965,744, |
| | which represented 11.7% of net assets. |
(b) | Maturity date is perpetual. Maturity date presented represents the next call date. |
(c) | Security is in default. |
(d) | Fair valued at December 31, 2012 as determined in good faith using procedures approved by the Board of Trustees. |
(e) | The security has been deemed illiquid according to the policies and procedures adopted by the Board of Trustees. |
(f) | A portion of this security is segregated as collateral for swap contracts. |
The Fund held the following open forward foreign currency contracts at December 31, 2012:
| | | Local | Current | Unrealized |
| | Value | amount | notional | appreciation/ |
| | date | (000’s) | value | (depreciation) |
Euro Short | 1/18/13 | 12,245 | $16,165,312 | $77,017 |
British Pound Short | 1/18/13 | 8,727 | 14,175,323 | 26,212 |
Total | | | | $103,229 |
During the year ended December 31, 2012, average monthly notional value related to forward foreign currency contracts was $8.6 million or 17.0% of net assets.
See notes to financial statements
| | |
Henderson Global Funds | Portfolio of investments |
Strategic Income Fund
December 31, 2012 (continued)
The Fund held the following credit default swap contracts at December 31, 2012:
| | | | | | | | Upfront | |
| | | Rates | | Implied | Notional | | premiums | Unrealized |
| | Reference | received/ | Termination | credit | amount | Market | paid/ | appreciation/ |
Counterparty | entity | (paid) | date | spread | (000s) | value | (received) | (depreciation) |
Protection purchased: | | | | | | | | |
J.P. Morgan | Australia & New Zealand | | | | | | |
Securities Limited | Banking Group Ltd. | (1.00%) | 3/20/18 | 1.74% | USD 400 | $13,433 | $14,557 | $(1,124) |
Deutsche Bank AG | Commonwealth Bank | | | | | | | |
| | of Australia | (1.00%) | 3/20/18 | 1.08% | USD 700 | 2,758 | 2,799 | (41) |
J.P. Morgan | Hewlett | | | | | | | |
Securities Limited | Packard Co. | (1.00%) | 3/20/18 | 3.23% | USD 250 | 25,709 | 25,487 | 222 |
J.P. Morgan | International Business | | | | | | | |
Securities Limited | Machines Corp. | (1.00%) | 3/20/18 | 0.46% | USD 850 | (24,953) | (23,522) | (1,431) |
J.P. Morgan | Legal & | | | | | | | |
Securities Limited | General Group plc | (1.00%) | 6/20/17 | 2.50% | EUR 450 | 14,746 | 40,165 | (25,419) |
Proctection sold: | | | | | | | | |
Deutsche Bank AG | ConvaTec | | | | | | | |
| | Healthcare CDS | 5.00% | 12/20/17 | 4.25% | EUR 50 | (1,323) | (2,758) | 1,435 |
J.P. Morgan | ConvaTec | | | | | | | |
Securities Limited | Healthcare CDS | 5.00% | 12/20/17 | 2.50% | EUR 80 | (2,117) | (2,620) | 503 |
J.P. Morgan | iTraxx-Crossover | | | | | | | |
Securities Limited | CDX Series 18 | 5.00% | 12/20/17 | 4.83% | EUR 500 | 4,616 | (7,578) | 12,194 |
Citigroup | PostNL NV | 1.00% | 9/20/17 | 1.91% | EUR 50 | (2,107) | (2,762) | 655 |
Total | | | | | | $30,762 | $43,768 | $(13,006) |
During the year ended December 31, 2012, average notional value related to swap contracts was $600,000 or 1.09% of net assets.
Other information: | |
| |
Industry concentration as | % of Net |
a percentage of net assets: | assets |
Cable TV | 10.03% |
U.S. government obligation | 6.74 |
Containers-Metal/Glass | 5.42 |
Commercial Banks Non-US | 4.95 |
Beverages - Wine & Spirits | 4.91 |
Telephone-Integrated | 4.58 |
Publishing-Newspapers | 3.72 |
Gambling (Non-Hotel) | 3.35 |
Life/Health Insurance | 3.33 |
Internet Connectivity Services | 2.96 |
Funeral Services & Related Items | 2.92 |
Telecom Services | 2.70 |
Tobacco | 2.59 |
Apparel Manufacturers | 2.18 |
Medical-Hospitals | 2.15 |
Airport Development & Maintenance | 2.07 |
Finance-Other Services | 1.96 |
Building Products - Cement Aggregates | 1.94 |
Diversified Banking Institution | 1.79 |
Television | 1.70 |
Electronic Parts Distribution | 1.57 |
Cellular Telecommunications | 1.55 |
Computer Data Security | 1.54 |
Distribution/Wholesale | 1.47 |
Paper & Related Products | 1.44 |
Investment Management & Advising Services | 1.37 |
Industry concentration as | % of Net |
a percentage of net assets: | assets |
Insurance Brokers | 1.33% |
Commercial Services | 1.20 |
Enterprise Software/Services | 1.17 |
Consulting Services | 0.92 |
Diversified Manufacturing Operations | 0.91 |
Food-Retail | 0.88 |
Advertising Services | 0.57 |
Wire & Cable Products | 0.57 |
Theaters | 0.53 |
Chemicals-Diversified | 0.52 |
Consumer Products-Miscellaneous | 0.51 |
Industrial Gases | 0.46 |
Disposable Medical Products | 0.26 |
Chemicals-Other | 0.24 |
Multimedia | 0.23 |
Water | 0.23 |
Finance – Investment Banking & Brokerage | — |
Long-Term Investments | 91.46 |
Short-Term Investment | 6.70 |
Total Investments | 98.16 |
Net Other Assets and Liabilities | 1.84 |
| | 100.00% |
See notes to financial statements
| | |
Henderson Global Funds | Financial statements |
Statement of assets and liabilities
December 31, 2012
Assets: | | |
Investments, at fair value | | |
Securities | $ | 46,455,790 | |
Short-term investment, at fair value | | 3,400,663 | |
Total investments | | 49,856,453 | |
Cash | | 317 | |
Foreign cash, at value | | 10,231 | |
Unrealized appreciation on open swap contracts | | 15,009 | |
Credit default swap contracts premiums paid | | 83,008 | |
Receivable for credit default swap agreements terminated | | 7,395 | |
Unrealized appreciation on forward foreign currency contracts | | 103,229 | |
Interest receivable | | 744,213 | |
Receivable for fund shares sold | | 325,513 | |
Prepaid expenses and other assets | | 26,845 | |
Total Assets | | 51,172,213 | |
Liabilities: | | | |
Payable for fund shares redeemed | | 191,480 | |
Credit default swap contracts premiums received | | 39,240 | |
Unrealized depreciation on open swap contracts | | 28,015 | |
Payable to investment adviser | | 15,950 | |
Payable for 12b-1 distribution and service fees | | 28,467 | |
Accrued expenses and other payables | | 78,097 | |
Total Liabilities | | 381,249 | |
Net assets | $ | 50,790,964 | |
Net assets consist of: | | | |
Paid-in capital | $ | 87,447,518 | |
Accumulated undistributed net investment loss | | (31,774 | ) |
Accumulated net realized loss on investments, futures, swaps, options and foreign currency transactions | | (37,845,026 | ) |
Net unrealized appreciation of investments, swaps and foreign currencies | | 1,220,246 | |
| | $ | 50,790,964 | |
Net assets: | | | |
Class A Shares | $ | 17,595,689 | |
Class B Shares | $ | 6,963,433 | |
Class C Shares | $ | 22,328,429 | |
Class I Shares | $ | 3,903,413 | |
Shares outstanding: | | | |
Class A Shares (unlimited number of shares authorized) | | 1,930,120 | |
Class B Shares (unlimited number of shares authorized) | | 762,278 | |
Class C Shares (unlimited number of shares authorized) | | 2,459,797 | |
Class I Shares (unlimited number of shares authorized) | | 428,921 | |
Class A shares: | | | |
Net asset value and redemption price per share | $ | 9.12 | |
Maximum sales charge* | | 4.75 | % |
Maximum offering price per share | $ | 9.57 | |
Class B shares: | | | |
Net asset value and offering price per share | $ | 9.14 | |
Class C shares: | | | |
Net asset value and offering price per share | $ | 9.08 | |
Class I shares: | | | |
Net asset value and offering price per share | $ | 9.10 | |
Investments, at cost | $ | 48,737,721 | |
Foreign cash, at cost | $ | 10,246 | |
* On purchases of $50,000 or more, the sales charge will be reduced.
See notes to financial statements
| | |
Henderson Global Funds | Financial statements |
Statement of operations
For the year ended December 31, 2012
Investment income: | | |
Dividends | $ | 18,067 | |
Interest | | 2,714,561 | |
Total Investment Income | | 2,732,628 | |
Expenses: | | | |
Investment advisory fees | | 267,705 | |
12b-1 distribution and service fees: | | | |
Class A Shares | | 40,071 | |
Class B Shares | | 74,038 | |
Class C Shares | | 222,224 | |
Sub-accounting fees: | | | |
Class A Shares | | 10,745 | |
Class B Shares | | 7,366 | |
Class C Shares | | 21,237 | |
Class I Shares | | 1,752 | |
Transfer agent fees: | | | |
Class A Shares | | 5,577 | |
Class B Shares | | 2,261 | |
Class C Shares | | 5,441 | |
Class I Shares | | 1,098 | |
Custodian fees | | 17,345 | |
Printing and postage fees | | 24,396 | |
Registration and filing fees | | 56,810 | |
Audit fees | | 34,710 | |
Accounting fees | | 7,320 | |
Legal fees | | 3,840 | |
Administrative fees | | 12,208 | |
Trustees' fees and expenses | | 5,592 | |
Compliance officer fees | | 2,138 | |
Miscellaneous fees | | 47,388 | |
Total Expenses | | 871,262 | |
Fees waived and/or expenses reimbursed by investment adviser | | (121,190 | ) |
Net Expenses | | 750,072 | |
Net investment income | | 1,982,556 | |
Net realized and unrealized gain/(loss): | | | |
Net realized gain/(loss) from: | | | |
Investment transactions | | 125,239 | |
Futures contracts | | 235,355 | |
Option contracts | | (165,906 | ) |
Swap contracts | | 20,086 | |
Foreign currency transactions | | (614,689 | ) |
Net change in unrealized appreciation/(depreciation) of: | | | |
Investments | | 4,677,561 | |
Swap contracts | | (13,006 | ) |
Translation of other assets and liabilities | | (174,912 | ) |
Net Realized and Unrealized Gain | | 4,089,728 | |
Net increase in net assets resulting from operations | $ | 6,072,284 | |
See notes to financial statements
| | |
Henderson Global Funds | Financial statements |
Statements of changes in net assets
Strategic Income Fund
| | Year ended | | Year ended | |
| | December 31, 2012 | | December 31, 2011* | |
Net investment income | $ | 1,982,556 | | $ | 2,511,927 | |
Net realized loss on investments, futures contracts, swap contracts, | | | | | | |
options and foreign currency transactions | | (399,915 | ) | | (552,328 | ) |
Net change in unrealized appreciation/(depreciation) of investments, | | | | | | |
futures contracts, swap contracts, options and foreign currency translations | | 4,489,643 | | | (1,907,519 | ) |
Net increase in net assets resulting from operations | | 6,072,284 | | | 52,080 | |
| | |
Distributions to shareholders from net investment income: | | | | | | |
Class A Shares | | (727,166 | ) | | (911,392 | ) |
Class B Shares | | (276,825 | ) | | (285,116 | ) |
Class C Shares | | (842,201 | ) | | (852,217 | ) |
Class I Shares | | (148,305 | ) | | (43,932 | ) |
Total distributions to shareholders from net investment income: | | (1,994,497 | ) | | (2,092,657 | ) |
| | |
Return of capital: | | | | | | |
Class A Shares | | — | | | (177,404 | ) |
Class B Shares | | — | | | (55,499 | ) |
Class C Shares | | — | | | (165,886 | ) |
Class I Shares | | — | | | (8,552 | ) |
Total return of capital: | | — | | | (407,341 | ) |
| | |
Increase/(decrease) from Fund share transactions: | | | | | | |
Class A shares | | (963,804 | ) | | (10,081,550 | ) |
Class B shares | | (1,070,745 | ) | | (747,916 | ) |
Class C shares | | (1,784,747 | ) | | (3,698,882 | ) |
Class I shares | | 1,781,274 | | | 2,021,116 | |
Net decrease from Fund share transactions: | | (2,038,022 | ) | | (12,507,232 | ) |
Net increase/(decrease) in net assets | | 2,039,765 | | | (14,955,150 | ) |
| | |
Net assets: | | | | | | |
Beginning of year | | 48,751,199 | | | 63,706,349 | |
End of year | $ | 50,790,964 | | $ | 48,751,199 | |
Accumulated undistributed net investment loss | $ | (31,774 | ) | $ | (124,959 | ) |
* Class I commenced operations on April 29, 2011. | | | | | | |
See notes to financial statements
| | |
Henderson Global Funds | Financial statements |
Statements of changes - capital stock activity
Strategic Income Fund
| | Year ended | | Year ended | |
| | December 31, 2012 | | December 31, 2011* | |
Amount | | | | |
Class A shares: | | | | |
Sold | $ | 5,603,423 | | $ | 7,474,651 | |
Issued as reinvestment of dividends | | 532,079 | | | 775,913 | |
Redeemed | | (7,099,306 | ) | | (18,332,114 | ) |
Net decrease | $ | (963,804 | ) | $ | (10,081,550 | ) |
Class B shares: | | | | | | |
Sold | $ | 622,043 | | $ | 653,217 | |
Issued as reinvestment of dividends | | 156,511 | | | 167,269 | |
Redeemed | | (1,849,299 | ) | | (1,568,402 | ) |
Net decrease | $ | (1,070,745 | ) | $ | (747,916 | ) |
Class C shares: | | | | | | |
Sold | $ | 4,068,174 | | $ | 5,674,086 | |
Issued as reinvestment of dividends | | 551,924 | | | 640,869 | |
Redeemed | | (6,404,845 | ) | | (10,013,837 | ) |
Net decrease | $ | (1,784,747 | ) | $ | (3,698,882 | ) |
Class I shares: | | | | | | |
Sold | $ | 2,570,614 | | $ | 2,449,572 | |
Issued as reinvestment of dividends | | 148,178 | | | 52,451 | |
Redeemed | | (937,518 | ) | | (480,907 | ) |
Net increase | $ | 1,781,274 | | $ | 2,021,116 | |
Shares | | | | | | |
Class A shares: | | | | | | |
Sold | | 627,594 | | | 864,388 | |
Issued as reinvestment of dividends | | 60,353 | | | 88,698 | |
Redeemed | | (809,621 | ) | | (2,095,202 | ) |
Net decrease | | (121,674 | ) | | (1,142,116 | ) |
Class B shares: | | | | | | |
Sold | | 71,281 | | | 76,605 | |
Issued as reinvestment of dividends | | 17,734 | | | 19,197 | |
Redeemed | | (208,985 | ) | | (179,960 | ) |
Net decrease | | (119,970 | ) | | (84,158 | ) |
Class C shares: | | | | | | |
Sold | | 464,519 | | | 662,914 | |
Issued as reinvestment of dividends | | 62,861 | | | 73,694 | |
Redeemed | | (730,681 | ) | | (1,146,458 | ) |
Net decrease | | (203,301 | ) | | (409,850 | ) |
Class I shares: | | | | | | |
Sold | | 292,845 | | | 276,243 | |
Issued as reinvestment of dividends | | 16,777 | | | 6,187 | |
Redeemed | | (105,887 | ) | | (57,244 | ) |
Net increase | | 203,735 | | | 225,186 | |
* Class I commenced operations on April 29, 2011. | |
See notes to financial statements
| | |
Henderson Global Funds | Financial highlights |
For a share outstanding throughout the periods indicated
| | | | | | Income (loss) from investment operations: | | | Less distributions: | |
| | |
| | |
| | | | | | | | | Net | | | | | | | | | | | | | | | | |
| | | | | | | | | realized and | | | | | | Dividends | | | Distributions | | | | | | | |
| | | Net asset | | | Net | | | unrealized | | | Total | | | from | | | from net | | | | | | | |
| | | value, | | | investment | | | gain | | | from | | | net | | | realized | | | Return | | | | |
| | | beginning | | | income | | | (loss) on | | | investment | | | investment | | | capital | | | of | | | Total | |
| | | of period | | | (loss) (b) | | | investments | | | operations | | | income | | | gains | | | capital | | | distributions | |
Strategic Income Fund | | | | | | | | | | | | | | | | | | | | | | | | |
Class A | | | | | | | | | | | | | | | | | | | | | | | | |
Year Ended 12/31/2012 | | $ | 8.39 | | | | 0.40 | | | | 0.73 | | | | 1.13 | | | | (0.40 | ) | | | 0.00 | | | | 0.00 | | | | (0.40 | ) |
Year Ended 12/31/2011 | | | 8.82 | | | | 0.44 | | | | (0.43 | ) | | | 0.01 | | | | (0.37 | ) | | | 0.00 | | | | (0.07 | ) | | | (0.44 | ) |
Year Ended 12/31/2010 | | | 8.44 | | | | 0.46 | | | | 0.38 | | | | 0.84 | | | | (0.33 | ) | | | 0.00 | | | | (0.13 | ) | | | (0.46 | ) |
Period Ended 12/31/2009(a) | | | 7.60 | | | | 0.21 | | | | 0.83 | | | | 1.04 | | | | 0.00 | | | | 0.00 | | | | (0.20 | ) | | | (0.20 | ) |
Year Ended 7/31/2009 | | | 9.45 | | | | 0.63 | | | | (1.78 | ) | | | (1.15 | ) | | | (0.70 | ) | | | 0.00 | | | | 0.00 | | | | (0.70 | ) |
Year Ended 7/31/2008 | | | 10.87 | | | | 0.71 | | | | (1.37 | ) | | | (0.66 | ) | | | (0.76 | ) | | | 0.00 | | | | 0.00 | | | | (0.76 | ) |
Class B | | | | | | | | | | | | | | | | | | | | | | | | | | | | | | | | |
Year Ended 12/31/2012 | | $ | 8.40 | | | | 0.33 | | | | 0.74 | | | | 1.07 | | | | (0.33 | ) | | | 0.00 | | | | 0.00 | | | | (0.33 | ) |
Year Ended 12/31/2011 | | | 8.83 | | | | 0.38 | | | | (0.43 | ) | | | (0.05 | ) | | | (0.32 | ) | | | 0.00 | | | | (0.06 | ) | | | (0.38 | ) |
Year Ended 12/31/2010 | | | 8.46 | | | | 0.40 | | | | 0.37 | | | | 0.77 | | | | (0.29 | ) | | | 0.00 | | | | (0.11 | ) | | | (0.40 | ) |
Period Ended 12/31/2009(a) | | | 7.61 | | | | 0.19 | | | | 0.84 | | | | 1.03 | | | | 0.00 | | | | 0.00 | | | | (0.18 | ) | | | (0.18 | ) |
Year Ended 7/31/2009 | | | 9.44 | | | | 0.56 | | | | (1.75 | ) | | | (1.19 | ) | | | (0.64 | ) | | | 0.00 | | | | 0.00 | | | | (0.64 | ) |
Year Ended 7/31/2008 | | | 10.84 | | | | 0.64 | | | | (1.36 | ) | | | (0.72 | ) | | | (0.68 | ) | | | 0.00 | | | | 0.00 | | | | (0.68 | ) |
Class C | | | | | | | | | | | | | | | | | | | | | | | | | | | | | | | | |
Year Ended 12/31/2012 | | $ | 8.35 | | | | 0.33 | | | | 0.73 | | | | 1.06 | | | | (0.33 | ) | | | 0.00 | | | | 0.00 | | | | (0.33 | ) |
Year Ended 12/31/2011 | | | 8.79 | | | | 0.37 | | | | (0.43 | ) | | | (0.06 | ) | | | (0.32 | ) | | | 0.00 | | | | (0.06 | ) | | | (0.38 | ) |
Year Ended 12/31/2010 | | | 8.41 | | | | 0.40 | | | | 0.38 | | | | 0.78 | | | | (0.29 | ) | | | 0.00 | | | | (0.11 | ) | | | (0.40 | ) |
Period Ended 12/31/2009(a) | | | 7.59 | | | | 0.19 | | | | 0.81 | | | | 1.00 | | | | 0.00 | | | | 0.00 | | | | (0.18 | ) | | | (0.18 | ) |
Year Ended 7/31/2009 | | | 9.45 | | | | 0.57 | | | | (1.79 | ) | | | (1.22 | ) | | | (0.64 | ) | | | 0.00 | | | | 0.00 | | | | (0.64 | ) |
Year Ended 7/31/2008 | | | 10.86 | | | | 0.64 | | | | (1.37 | ) | | | (0.73 | ) | | | (0.68 | ) | | | 0.00 | | | | 0.00 | | | | (0.68 | ) |
Class I | | | | | | | | | | | | | | | | | | | | | | | | | | | | | | | | |
Year Ended 12/31/2012 | | $ | 8.37 | | | | 0.42 | | | | 0.73 | | | | 1.15 | | | | (0.42 | ) | | | 0.00 | | | | 0.00 | | | | (0.42 | ) |
Period Ended 12/31/2011(c) | | | 9.06 | | | | 0.29 | | | | (0.66 | ) | | | (0.37 | ) | | | (0.27 | ) | | | 0.00 | | | | (0.05 | ) | | | (0.32 | ) |
(a) | Strategic Income Fund changed its fiscal year end from July 31 to December 31 in 2009. |
(b) | Per share data was calculated using the average shares outstanding during the period. |
(c) | Class I commenced operations on April 29, 2011. |
(d) | Amount represents less than $0.01. |
(e) | Total returns are historical and assume changes in share price, reinvestment of all dividends and distributions and no sales charge. |
| | Had certain expenses not been reduced during the periods shown, total returns would have been lower. Total returns for periods |
| | of less than one year are not annualized. |
See notes to financial statements
| | |
Henderson Global Funds | Financial highlights |
| | | | | | | | | | | | | | | | | | | | | | | |
| | | | | | | | | | | | | Ratios to average net assets: | | | | |
| | |
| | | | | | | | | | | | | | | | | | | Annualized ratio of | | | | |
| | | | | | | | | | | | | Annualized | | | Annualized | | | operating expenses | | | | |
| | | | | | | | | | | | | ratio of | | | ratio of | | | to average net | | | | |
| | | | Net asset | | | | | | Net assets, | | | operating | | | net investment | | | assets without | | | | |
| | | | value, | | | | | | end of | | | expenses to | | | income/(loss) | | | waivers and/or | | | Portfolio | |
Redemption | | | end of | | | Total | | | period | | | average | | | to average | | | expenses | | | turnover | |
| fees | | | period | | | return (e) | | | (000) | | | net assets | | | net assets | | | reimbursed | | | rate | |
| | |
| | |
| | N/A | | | $ | 9.12 | | | | 13.75 | % | | $ | 17,596 | | | | 1.10 | % | | | 4.51 | % | | | 1.34 | % | | | 47 | % |
| | N/A | | | | 8.39 | | | | 0.06 | | | | 17,210 | | | | 1.20 | | | | 5.04 | | | | 1.51 | | | | 41 | |
| | 0.00 | | | | 8.82 | | | | 10.17 | | | | 28,171 | | | | 1.30 | | | | 5.30 | | | | 1.54 | | | | 38 | |
| | 0.00 | | (d) | | 8.44 | | | | 13.82 | | | | 35,656 | | | | 1.30 | | | | 6.19 | | | | 1.63 | | | | 11 | |
| | 0.00 | | (d) | | 7.60 | | | | (10.71 | ) | | | 28,905 | | | | 1.30 | | | | 8.69 | | | | 1.62 | | | | 53 | |
| | 0.00 | | (d) | | 9.45 | | | | (6.47 | ) | | | 64,687 | | | | 1.30 | | | | 6.87 | | | | 1.45 | | | | 41 | |
| | |
| | N/A | | | $ | 9.14 | | | | 12.97 | % | | $ | 6,963 | | | | 1.85 | % | | | 3.77 | % | | | 2.12 | % | | | 47 | % |
| | N/A | | | | 8.40 | | | | (0.69 | ) | | | 7,412 | | | | 1.94 | | | | 4.29 | | | | 2.27 | | | | 41 | |
| | 0.00 | | (d) | | 8.83 | | | | 9.21 | | | | 8,537 | | | | 2.05 | | | | 4.55 | | | | 2.29 | | | | 38 | |
| | 0.00 | | (d) | | 8.46 | | | | 13.59 | | | | 7,824 | | | | 2.05 | | | | 5.44 | | | | 2.38 | | | | 11 | |
| | 0.00 | | (d) | | 7.61 | | | | (11.23 | ) | | | 6,325 | | | | 2.05 | | | | 8.02 | | | | 2.37 | | | | 53 | |
| | 0.00 | | (d) | | 9.44 | | | | (7.00 | ) | | | 5,789 | | | | 2.05 | | | | 6.13 | | | | 2.20 | | | | 41 | |
| | |
| | N/A | | | $ | 9.08 | | | | 12.95 | % | | $ | 22,328 | | | | 1.85 | % | | | 3.77 | % | | | 2.11 | % | | | 47 | % |
| | N/A | | | | 8.35 | | | | (0.80 | ) | | | 22,244 | | | | 1.94 | | | | 4.29 | | | | 2.26 | | | | 41 | |
| | 0.00 | | (d) | | 8.79 | | | | 9.39 | | | | 26,997 | | | | 2.05 | | | | 4.55 | | | | 2.29 | | | | 38 | |
| | 0.00 | | (d) | | 8.41 | | | | 13.22 | | | | 30,152 | | | | 2.05 | | | | 5.45 | | | | 2.38 | | | | 11 | |
| | 0.00 | | (d) | | 7.59 | | | | (11.55 | ) | | | 28,513 | | | | 2.05 | | | | 7.96 | | | | 2.37 | | | | 53 | |
| | 0.00 | | (d) | | 9.45 | | | | (7.09 | ) | | | 62,906 | | | | 2.05 | | | | 6.17 | | | | 2.20 | | | | 41 | |
| | |
| | N/A | | | $ | 9.10 | | | | 14.06 | % | | $ | 3,903 | | | | 0.85 | % | | | 4.79 | % | | | 1.07 | % | | | 47 | % |
| | N/A | | | | 8.37 | | | | (4.10 | ) | | | 1,885 | | | | 0.85 | | | | 5.16 | | | | 1.25 | | | | 41 | |
See notes to financial statements
| | |
Henderson Global Funds | Notes to financial statements |
Note 1. Organization
Henderson Global Funds (the “Trust”) was organized on May 11, 2001, as a Delaware statutory trust and is registered under the Investment Company Act of 1940, as amended (the“1940 Act”), as an open-end management investment company. The Trust has an unlimited number of authorized shares that are divided among nine series. The Henderson All Asset Fund, Henderson Dividend & Income Builder Fund, Henderson Emerging Markets Opportunities Fund, Henderson European Focus Fund, Henderson Global Equity Income Fund, Henderson Global Technology Fund, Henderson International Opportunities Fund and Henderson World Select Fund (formerly known as Henderson Global Leaders Fund) are not included in this report because their fiscal year-end is July 31. The Henderson Strategic Income Fund (“the Fund”), included in this report, is a separate series of the Trust and is diversified.
The Fund offers Class A, Class B, Class C and Class I share classes.
Class A shares generally provide for a front-end sales charge. Class B and Class C shares provide for a contingent deferred sales charge. Class I shares are not subject to a front-end or contingent deferred sales charge.
Each class of shares has equal rights as to earnings and assets except that each class may bear different distribution and shareholder service expenses. Each class of shares has exclusive voting rights with respect to matters that affect just that class. Income, expenses (other than expenses attributable to a specific class), realized and unrealized gains and losses on investments are allocated to each class of shares based on its relative net assets. Class B shares automatically convert to Class A shares at the end of the month following the eighth anniversary of issuance. The Fund does not accept new or additional investments in Class B shares of the Fund with the limited exception that current Class B shareholders may continue to have their dividends automatically reinvested in Class B shares of the Fund. As described in the prospectus, Class B shares of the Fund may continue to be exchanged with Class B shares of other Henderson Global Funds.
Note 2. Significant accounting policies
Security valuation
Securities and derivatives traded on a recognized exchange or market are generally valued at the last reported sale price or at the official closing price. Listed securities for which no sale was reported on that date and other securities traded in the over-the-counter market are valued at the mean between the last bid and asked price.
Debt securities are valued at the market value provided by independent pricing services approved by the Board of Trustees of the Trust. If the pricing services are unable to provide valuations, the securities are valued at the mean between the last bid and asked price, or if no ask is available, then the last bid price obtained from one or more broker-dealers. Such pricing services may use various pricing techniques that take into account appropriate factors such as yield, quality, coupon rate, maturity, type of issue, trading characteristics and other data, as well as broker quotes.
Short-term investments purchased with an original or remaining maturity of 60 days or less at time of purchase are valued at amortized cost, which approximates fair market value. Investments in registered investment companies are valued at its reported net asset value, which approximates fair market value.
Forward foreign currency contracts are valued daily at the applicable quoted forward rate.
Swap agreements are valued using independent values when available, otherwise, fair values are estimated on the basis of pricing models that incorporate current market measures for interest rates, currency exchange rates, equity prices and indices, credit spreads, corresponding market volatility levels and other market-based pricing factors.
If market quotations are not readily available, or if the investment adviser determines that a quotation of a security does not represent a fair value, then the security is valued at a fair value as determined in good faith using procedures approved by the Board of Trustees of the Trust. The Trustees of the Trust, or their designee, may also establish fair value using a wide variety of market data including yields or prices of investments of comparable quality, type of issue, coupon, maturity and rating, market quotes or indications of value from security dealers, evaluations of anticipated cash flows or collateral, general market conditions and other information and analysis, including the obligor’s credit characteristics considered relevant.
For equity securities, the Trust has retained an independent statistical fair value pricing service to assist in the fair valuation process for securities principally traded in a foreign market in order to adjust for possible changes in value that may occur between the close of the foreign exchange and the time at which Fund shares are priced. If a security is valued at a “fair value”, that value may be different from the last quoted market price for the security. As a result, it is possible that fair value prices will be used by the Fund.
Security transactions and investment income
Investment transactions are accounted for on a trade-date basis. Interest income is recorded on an accrual basis. Dividend income is recorded on the ex-dividend date. Bond
| | |
Henderson Global Funds | Notes to financial statements |
premium is amortized and discount is accreted over the expected life of each applicable security. Corporate actions involving foreign securities, including dividends, are recorded as soon as the information becomes available. Withholding taxes on foreign dividends are accrued in accordance with the applicable country’s tax rules and rates. Gains and losses realized on sales of securities are determined using the specific identification method by comparing the identified cost of the security lot sold with the net sales proceeds, which is the same basis used for federal income tax purposes.
Foreign currency translation
Investments in securities and other assets and liabilities denominated in foreign currencies are translated into US dollar amounts at the date of valuation. Purchases and sales of investment securities and income and expense items denominated in foreign currencies are translated into US dollar amounts on the respective dates of such transactions.
The Fund does not separate the portion of the results of operations resulting from changes in foreign exchange rates on investments from the fluctuations arising from changes in market prices of securities held. Such fluctuations are included with the net realized and unrealized gain or loss from investments on the Statement of Operations.
Reported net realized foreign exchange gains or losses arise from sales of foreign currencies, currency gains or losses realized between the trade date and settlement date on securities transactions, and the difference between the amounts of dividends, interest, and foreign withholding taxes recorded on the Fund’s books and the US dollar equivalent of the amounts actually received or paid. Net unrealized foreign exchange gains and losses arise from changes in the fair values of assets and liabilities, other than investments in securities at fiscal period end, resulting from changes in exchange rates.
Forward foreign currency contracts
The Fund may enter into forward foreign currency contracts primarily to hedge against foreign currency exchange rate risks on its non-US dollar denominated investment securities. When entering into forward foreign currency contracts, the Fund agrees to receive or deliver a fixed quantity of foreign currency for an agreed-upon price on an agreed future date. Realized gains or losses on forward foreign currency contracts include net gains or losses on contracts that have matured. Forward foreign currency contracts are valued daily and the unrealized appreciation or depreciation is included in the Statement of Assets and Liabilities. These instruments involve market risk, credit risk, or both kinds of risks, in excess of the amount recognized in the Statement of Assets and Liabilities. These risks arise from the possible inability of counterparties to meet the terms of their contracts and from unfavorable currency fluctuations. When applicable, open forward foreign currency contracts at the end of the period are listed in the Fund’s Portfolio of Investments.
Futures contracts
The Fund is subject to interest rate risk, equity risk and foreign currency risk in the normal course of pursuing its investment objectives. The Fund may invest in futures contracts to gain exposure to, or hedge against, changes in the value of interest rates or foreign currencies and to gain exposure to equity indices. A futures contract represents a commitment for the future purchase or sale of an asset at a specified price and date. Upon entering into such contracts, the Fund is required to deposit with the broker, either in cash or securities, an initial margin in an amount equal to a certain percentage of the contract amount. Subsequent payments, known as “variation margin,” are made or received by the Fund, depending on the fluctuations in the fair value of the underlying asset. The Fund realizes a gain or loss upon the expiration or closing of the futures contracts. Should market conditions move unexpectedly, the Fund may not achieve the anticipated benefits of the futures contracts and may realize a loss. The use of futures contracts involves the risk of imperfect correlation in movements in the price of futures contracts, interest rates, and the underlying hedged assets. With futures contracts, there is minimal counterparty credit risk to the Fund since futures contracts are exchange-traded and the exchange’s clearinghouse, as counterparty to all exchange-traded futures contracts, guarantees the contracts against default. When applicable, open contracts outstanding at the end of the period are listed in the Fund’s Portfolio of Investments. The Fund did not hold any open contracts at December 31, 2012.
During the year ended December 31, 2012, average monthly notional value related to futures contracts was $2.2 million or 4.3% of net assets.
Options purchased
The Fund may purchase options to create investment exposure consistent with its investment objective or to hedge or limit exposure of its portfolio holdings. Options are valued daily and unrealized appreciation or depreciation is recorded. The Fund realizes a gain or loss upon the expiration or closing of the option transaction. The primary risks of investing in purchased options include the risk of imperfect correlation between the option price and the value of the underlying instrument, and the possibility of an illiquid market for the option. Purchased options are generally exchange-traded with limited counterparty risk as settlement is guaranteed by a central clearinghouse. When applicable, option contracts purchased by the Fund and contracts outstanding at the end of the period are listed in the Fund’s Portfolio of Investments.
| | |
Henderson Global Funds | Notes to financial statements |
Swap contracts
The Fund may enter into swap contracts. Swap contracts involve two parties that agree to exchange the returns (or the differential in rates of return) earned or realized on particular pre-determined investments, instruments, indices or other measures. The gross returns to be exchanged or “swapped” between parties are generally calculated with respect to a “notional amount” for a pre-determined period of time. The Fund may enter into interest rate, total return, credit default, currency and other swap agreements. Risks may arise upon entering into swap agreements from the potential inability of the counterparties to meet the terms of their contract or from unanticipated changes in the value of the swap agreement.
The Fund uses credit default swaps to manage exposure to a given issuer or sector by either selling protection to increase exposure, or buying protection to reduce exposure. The “buyer” in a credit default swap is obligated to pay the “seller” a periodic stream of payments over the term of the contract provided that no event of default on an underlying reference obligation has occurred. If an event of default occurs, the seller must pay the buyer the full notional value, or the “par value”, of the reference obligation in exchange for the reference obligation. In connection with these agreements, securities may be identified as collateral in accordance with the terms of the respective swap agreements to provide assets of value and recourse in the event of default or bankruptcy/insolvency. Recovery values are assumed by market makers considering either industry standard recovery rates or entity specific factors and considerations until a credit event occurs. If a credit event has occurred, the recovery value is typically determined by a facilitated auction whereby a minimum number of allowable broker bids, together with a specific valuation method, are used to calculate the settlement value. The Fund’s maximum risk of loss from counterparty credit risk, either as the protection buyer or as the protection seller, is the fair value of the contract. This risk is mitigated by having a master netting arrangement between the Fund and the counterparty and by the posting of collateral by the counterparty to the Fund to cover the Fund’s exposure to the counterparty.
Upfront payments received or paid by the Fund will be reflected as a liability or an asset on the Statement of Assets and Liabilities. Changes in the value of swap contracts are included in unrealized appreciation/(depreciation) on the Statement of Assets and Liabilities, and periodic payments are reported as Net realized gain (loss) on swap contracts in the Statement of Operations. When applicable, open swap contracts at the end of the period are listed in the Fund’s Portfolio of Investments.
Derivative instruments
The following table summarizes the Fund’s fair value of derivative instruments held at December 31, 2012 and the related location on the accompanying Statement of Assets and Liabilities, presented by primary underlying risk exposure:
| | Location on Statement of | |
| | Assets and Liabilities | |
Assets | | |
| |
Foreign currency risk | Unrealized appreciation | |
| | on forward foreign | |
| | currency contracts | $103,229 |
| |
Credit risk | Unrealized appreciation | |
| | on open credit default | |
| | swap contracts | $15,009 |
| |
Liabilities | | |
| |
Credit risk | Unrealized depreciation | |
| | on open credit default | |
| | swap contracts | $28,015 |
Additionally, the amount of gains and losses on derivative instruments recognized in the Fund’s earnings during the period and the related location on the accompanying Statement of Operations is summarized in the following table by primary risk exposure:
| | Location on Statement of | |
| | Operations | |
Realized gain (loss) | |
Interest rate risk | Net realized gain (loss) | |
| | from futures contracts | $377,675 |
Equity risk | Net realized gain (loss) | |
| | from futures contracts | $(142,320) |
Equity risk | Net realized gain (loss) | |
| | from options contracts | $(165,906) |
Credit risk | Net realized gain (loss) | |
| | from swap contracts | $20,086 |
Foreign currency risk | Net realized gain (loss) | |
| | from foreign currency | |
| | transactions | $(614,869) |
Change in unrealized appreciation/(depreciation)
Credit risk | Net change in unrealized | |
| | appreciation/(depreciation) |
| | of swap contracts | $(13,006) |
| |
Foreign currency risk | Net change in unrealized | |
| | appreciation/(depreciation) |
| | of translation of other | |
| | assets and liabilities | $(203,858) |
On December 16, 2011, the Financial Accounting Standards Board issued Accounting Standards Update (“ASU”) No. 2011-11, Disclosures about Offsetting Assets and Liabilities which enhances disclosures around financial instruments and derivative instruments that are either offset in
| | |
Henderson Global Funds | Notes to financial statements |
accordance with US generally accepted accounting principles (“US GAAP”) or are subject to an enforceable master netting arrangement or similar agreement. The update mandates that entities disclose both gross and net information about such financial instruments and transactions eligible for offset on the statement of assets and liabilities, in addition to required disclosure of collateral received and posted in connection with master netting arrangements or similar agreements. The ASU is effective for annual reporting periods beginning on or after January 1, 2013, and interim periods within those annual periods, and is therefore not effective for the current reporting period. Adoption of ASU No. 2011-11 will have no effect on the Fund’s net assets. Management is evaluating any impact ASU No. 2011-11 may have on the financial statement disclosures.
Indemnifications
Under the Trust’s organizational documents, its officers and trustees are indemnified against certain liabilities arising out of the performance of their duties to the Trust. In addition, in the normal course of business the Trust enters into contracts that provide general indemnifications to other parties. The Trust’s maximum exposure under these arrangements is unknown as future claims may be made against the Trust that have not yet been asserted.
Use of estimates
The preparation of financial statements, in conformity with US GAAP, requires management to make estimates and assumptions that affect the reported amounts and disclosures in the financial statements. Actual results may differ from those estimates.
Expenses
Expenses are recorded on an accrual basis. Expenses of the Trust that are directly attributable to a specific Fund are charged to that Fund. Expenses attributable to a specific class of shares are charged to that class. Other expenses are allocated proportionately among each Fund within the Trust based on average daily net assets or on another reasonable basis.
Federal income taxes
The Trust’s policy is that the Fund continue to comply with the requirements of Subchapter M of the Internal Revenue Code of 1986, as amended (“Subchapter M”), that are applicable to regulated investment companies and to distribute substantially all its taxable income to shareholders. No federal income tax provision is required so long as the Fund operates in a manner that complies with the requirements of Subchapter M. Management has concluded that there are no significant uncertain tax positions that would require recognition in the financial statements. Management of the Fund is also not aware of any tax positions for which it is reasonably possible that the total amount of unrecognized tax benefits will significantly change in the next twelve months. The Fund intends to file tax returns with the US Internal Revenue Service and various states. Generally, the tax authorities can examine all tax returns filed for the last three years.
On December 22, 2010, the Regulated Investment Company Modernization Act of 2010 (the “Act”) was enacted, which changed various technical rules governing the tax treatment of regulated investment companies. One of the more prominent changes addresses capital loss carryforwards. Under the Act, each Fund will be permitted to carry forward capital losses incurred in taxable years beginning after the date of enactment for an unlimited period. However, any losses incurred during those future taxable years will be required to be utilized prior to the losses incurred in pre-enactment taxable years, which carry an expiration date. As a result of this ordering rule, pre-enactment capital loss carryforwards may be more likely to expire unused. Additionally, post-enactment capital loss carryforwards will retain their character as either short-term or long-term capital losses rather than being considered all short-term as permitted under previous regulation.
Finally, the Act contains several provisions aimed at preserving the character of distributions made by a fiscal year registered investment company (“RIC”) during the portion of its taxable year ending after October 31 or December 31, reducing the circumstances under which a RIC might be required to file amended Forms 1099 to restate previously reported distributions. Except for the simplification provisions related to RIC qualification, the Act is effective for taxable years beginning after December 22, 2010. The provisions related to RIC qualification are effective for taxable years for which the extended due date of the tax return is after December 22, 2010.
Losses incurred that will be carried forward under the provisions of the Act are as follows:
| | Loss carryforward character |
Expiration | Short-term | Long-term |
Unlimited losses | $682,439 | $348,038 |
12/31/13 | 341,836 | — |
12/31/14 | 207,447 | — |
12/31/15 | 477,632 | — |
12/31/16 | 1,001,344 | — |
12/31/17 | 34,174,962 | — |
12/31/18 | 336,160 | — |
| | |
Henderson Global Funds | Notes to financial statements |
Distributions to shareholders
Distributions to shareholders are recorded on the ex-dividend date. Distributions from net investment income and net realized capital gains are determined in accordance with federal income tax regulations, which may differ from US GAAP. These book/tax differences are either temporary or permanent in nature. To the extent these differences are permanent, they are reclassified within the capital accounts based on their federal tax-basis treatment.
Accordingly, at December 31, 2012, the Fund reclassified the following amounts between paid-in capital, accumulated undistributed net investment income (loss) and accumulated net realized gain (loss):
Accumulated | |
undistributed | Accumulated |
| Paid-in | net investment | net realized |
| capital | income/(loss) | gain/(loss) |
| $(6) | $105,126 | $(105,120) |
These reclassifications relate to the deductibility of certain expenses, different tax treatments of certain securities, amortization of bond premium, and the character of realized gain/losses on foreign currency, and had no impact on the net asset value of the Fund.
The tax character of distributions paid during the years ended December 31, 2012 and December 31, 2011, were as follows:
| | Year ended | Year ended |
| | December 31, | December 31, |
| | 2012 | 2011 |
Ordinary income | $1,994,497 | $2,092,657 |
Return of capital | — | 407,341 |
As of December 31, 2012, the components of distributable earnings on a tax basis were as follows:
Undistributed | Unrealized |
ordinary | appreciation |
income | (depreciation) |
$29,212 | $884,771 |
Note 3. Fair value measurements
Various inputs are used in determining the value of the Fund’s investments. The Fund uses a three-tier hierarchy of inputs to establish classification of fair value measurements for disclosure purposes. These inputs may be observable or unobservable. Observable inputs are inputs that reflect the assumptions market participants would use in pricing the asset or liability developed based on market data obtained from sources independent of the reporting entity. Unobservable inputs are inputs that reflect the reporting entity’s own assumptions about the assumptions market participants would use in pricing the asset or liability developed based on the best information available under the circumstances. The inputs used for valuing securities are not necessarily an indication of the risk associated with investing in those securities. The three-tier hierarchy of inputs is summarized in the following three broad levels:
| • | Level 1 – quoted prices in active markets for identical investments |
| • | Level 2 – other significant observable inputs (including quoted prices for similar investments, interest rates, prepayment speeds, credit risk, etc.) |
| • | Level 3 – significant unobservable inputs (including the Fund’s own assumptions in determining the fair value of investments) |
Any transfers between levels are disclosed, effective at the end of the period, in the following table with the reasons for the transfers disclosed in a note to the table, if applicable.
| | |
Henderson Global Funds | Notes to financial statements |
The following table summarizes the Fund’s investments that are measured at fair value by level within the fair value hierarchy at December 31, 2012:
Strategic Income | | | | |
| | Quoted prices | Significant | | |
| | in active | other | Significant | |
| | markets for | observable | unobservable | |
| | identical assets | inputs | inputs | |
Description | (level 1) | (level 2) | (level 3) | Total |
Assets | | | | |
Corporate Bonds | | | | |
Canada | $ — | $ 459,541 | $ — | $ 459,541 |
France | — | 1,718,572 | — | 1,718,572 |
Germany | — | 3,755,200 | — | 3,755,200 |
Ireland | — | 1,774,674 | — | 1,774,674 |
Luxembourg | — | 4,313,183 | — | 4,313,183 |
Netherlands | — | 1,216,902 | — | 1,216,902 |
Sweden | — | 287,749 | — | 287,749 |
United Kingdom | — | 19,800,260 | — | 19,800,260 |
United States | — | 9,704,844 | — | 9,704,844 |
Total Corporate Bonds | — | 43,030,925 | — | 43,030,925 |
US Government Obligations | | | | |
United States | — | 3,424,865 | — | 3,424,865 |
Total US Government Obligations | — | 3,424,865 | — | 3,424,865 |
Short-Term Investment | 3,400,663 | — | — | 3,400,663 |
Total Investments | 3,400,663 | 46,455,790 | — | 49,856,453 |
Financial Derivative Instruments* | | | | |
Credit Default Swap Contracts | — | 15,009 | — | 15,009 |
Forward Foreign Currency
Contracts | — | 103,229 | — | 103,229 |
Total Financial Derivative
Instruments | $ — | $ 118,238 | $ — | $ 118,238 |
Liabilities | | | | |
Financial Derivative Instruments* | | | | |
Credit Default Swap Contracts | — | (28,015) | — | (28,015) |
Total Financial Derivative
Instruments | $ — | $ (28,015) | $ — | $ (28,015) |
* These investments are recorded at the unrealized gain or loss on the investment.
During the year ended December 31, 2012, there were no transfers in or out of security levels as a result of the fair value pricing procedures established by the Fund.
Following is a reconciliation of investments in which significant unobservable inputs (Level 3) were used in determining fair value:
| | | | | Change in | | | | | Balance |
| | Balance as of | Accrued | | unrealized | | | Transfers | Transfers | as of |
| Investments in | December 31, | discounts/ | Realized | appreciation/ | | | in to | out of | December |
Securities | 2011 | premiums | gain/(loss) | (depreciation) | Purchases | Sales | level 3 | level 3 | 31, 2012 |
Corporate Bonds | | | | | | | | | |
United States | | | | | | | | | |
Lehman
Brothers | | | | | | | | | |
UK Capital | | | | | | | | | |
Funding IV
LP | $0 | $0 | $0 | $0 | $0 | $0 | $0 | $0 | $0 |
Total | $0 | $0 | $0 | $0 | $0 | $0 | $0 | $0 | $0 |
The total net change in unrealized depreciation included in the Statement of Operations attributable to Level 3 investments held at December 31, 2012 was $0.
The Fund’s management has determined that Lehman Brothers UK Capital Funding IV LP is a Level 3 investment due to the lack of observable inputs that may be used in the determination of fair value. Management has also concluded there is no value for the investment on the basis that the company has filed for bankruptcy, the position is currently in default and is highly subordinated.
| | |
Henderson Global Funds | Notes to financial statements |
Note 4. Investment advisory fees and other transactions with affiliates
Pursuant to an Investment Advisory Agreement, Henderson Global Investors (North America) Inc. (“HGINA”) acts as the Fund’s investment adviser. HGINA is an indirect wholly-owned subsidiary of Henderson Group plc. HGINA supervises the investments of the Fund and earns a management fee for such services. HGINA earns a fee for its services based on the Fund’s average daily managed assets* as set forth below.
| | | | |
| | First $1 billion | 0.55% | |
| | Next $500 million | 0.50% | |
| | Over $1.5 billion | 0.45% | |
*Managed assets mean the total assets of the Fund (including any assets attributable to any leverage that may be outstanding) minus the sum of accrued liabilities (other than debt representing financial leverage). Since the Fund pays HGINA based on the Fund’s average daily managed assets, HGINA’s fee will be higher if the Fund is leveraged.
Pursuant to a separate contractual Expense Limitation Agreement, HGINA has agreed to waive or limit its investment advisory fee and, if necessary, to reimburse expenses of the Fund in order to limit total annual ordinary operating expenses, including distribution and service fees, as a percentage of average daily net assets as follows:
Class A | Class B | Class C | Class I |
1.10% | 1.85% | 1.85% | 0.85% |
This agreement will remain in effect through July 31, 2020. Shares of the Fund are often purchased through financial intermediaries who are agents of the Fund for the limited purpose of completing purchases and sales. These intermediaries may provide certain networking and sub-transfer agent services with respect to Fund shares held by that intermediary for its customers, and the intermediary may charge HGINA for those services. The Fund reimburses HGINA for such fees within limits specified by the Board of Trustees. The fees are incurred at the class level based on activity, asset levels and/or number of accounts and are included in Sub-accounting fees in the Statement of Operations.
At December 31, 2012, HGINA owned the following number of shares in the Fund.
| | Shares |
Strategic Income Class I | 1,202 |
Note 5. Compensation of trustees and officers
Certain officers and trustees of the Trust are also officers of HGINA. None of the Trust’s officers, other than the Chief Compliance Officer, are compensated by the Trust. The Trust makes no direct payment to trustees affiliated with HGINA. Fees paid to trustees are reflected as Trustees’ fees and expenses in the Statement of Operations.
The Fund bears a portion of the compensation paid to the Chief Compliance Officer who performs services directly related to the Trust. This compensation is reflected as Compliance officer fees in the Statement of Operations.
Note 6. Distribution plan
The Trust has adopted a distribution plan for Class A, Class B and Class C shares of the Fund in accordance with Rule 12b-1 under the 1940 Act (the “12b-1 Plan”). Under the 12b-1 Plan, the Fund pays the distributor an annual fee of 0.25% of the average daily net assets attributable to its Class A shares, and an annual fee of 1.00% of the average daily net assets attributable to its Class B and C shares. The 12b-1 Plan is used to induce or compensate financial intermediaries (including brokerage firms, depository institutions and other firms) to provide distribution services to the Fund and its shareholders.
Note 7. Investment transactions
Purchases and sales of investment securities, excluding short-term investments and US government securities, for the Fund for the year ended December 31, 2012, were as follows:
Purchases | Sales |
$18,556,711 | $12,909,224 |
The US federal income tax basis of the Fund’s investments, excluding foreign currency, forward currency contracts and futures contracts at December 31, 2012, and the gross unrealized appreciation and depreciation, were as follows:
Cost | $48,982,972 |
Gross unrealized appreciation | 4,214,091 |
Gross unrealized depreciation | (3,340,610) |
Net unrealized appreciation | 873,481 |
Identified cost may differ for book and tax basis reporting purposes primarily due to different book and tax treatment on certain debt instruments reflected as of December 31, 2012.
Note 8. Significant concentrations
The Fund may invest a substantial percentage of its assets in securities of foreign issuers. These investments may involve certain considerations and risks not typically associated with investments in the United States as a result of, among other factors, the possibility of future political and economic
| | |
Henderson Global Funds | Notes to financial statements |
developments and the level of governmental supervision and regulation of securities markets in the respective countries. Some countries in which the Fund invests may require government approval for repatriation of investment income, capital or the proceeds for sales of securities by foreign investors. In addition, if there is deterioration in a country’s balance of payments or for other reasons, a country may impose temporary restrictions on foreign capital remittances abroad. In addition, changes in currency exchange rates will affect the value of investments denominated in a foreign currency, as well as investment income derived from those securities. Further, the Fund maintains many of its investments in issuers domiciled in the Eurozone. The private and public sectors’ debt problems of a single Eurozone country may pose significant risks to the Eurozone as a whole. As a result, the Fund may be more susceptible to volatility generated by currency devaluations or other general uncertainties than more geographically diversified funds that do not concentrate in this region of the world.
The Fund invests primarily in income producing securities with a focus on foreign investment grade debt. It may also invest in lower quality high yield securities. Investing in high yield securities may involve greater risks and considerations not typically associated with investing in US Government bonds and other high quality fixed-income securities. These securities are non-investment grade securities, often referred to as “junk bonds”. Economic downturns may disrupt the high yield market and impair the ability of issuers to repay principal and interest. Also, an increase in interest rates would likely have an adverse impact on the value of such obligations. Moreover, high yield securities may be less liquid due to the extent that there is no established secondary market and because of a decline in value of such securities.
The Fund may invest a high percentage of its net assets in specific sectors of the market in order to achieve a potentially greater investment return. As a result, the economic, political and regulatory developments in a particular sector of the market, positive or negative, have a greater impact on the Fund’s net assets and will cause the value of its shares to fluctuate more than if the Fund did not concentrate its investments in a particular sector.
Note 9. Borrowing arrangements
The Trust maintains a $100 million credit facility to facilitate portfolio liquidity. Interest is charged to the Fund based on its borrowings at a rate per annum equal to the Federal Funds rate plus 1.25%. In addition, a commitment fee of 0.10% per annum is accrued and apportioned among the Funds in the Trust. The commitment fee is included in Miscellaneous fees on the Statement of Operations. No amounts were borrowed by the Fund under this facility during the year ended December 31, 2012.
| | |
Henderson Global Funds | Notes to financial statements |
Report of independent registered public accounting firm
The Board of Trustees and Shareholders
Henderson Strategic Income Fund
We have audited the accompanying statement of assets and liabilities, including the portfolio of investments, of Henderson Strategic Income Fund as of December 31, 2012, and the related statement of operations for the year then ended, the statement of changes in net assets for each of the two years the ended and the financial highlights for the period indicated therein. These financial statements and financial highlights are the responsibility of the Fund’s management. Our responsibility is to express an opinion on these financial statements and financial highlights based on our audits.
We conducted our audits in accordance with the standards of the Public Company Accounting Oversight Board (United States). Those standards require that we plan and perform the audit to obtain reasonable assurance about whether the financial statements and financial highlights are free of material misstatement. We were not engaged to perform an audit of the Fund’s internal control over financial reporting. Our audits included consideration of internal control over financial reporting as a basis for designing audit procedures that are appropriate in the circumstances, but not for the purpose of expressing an opinion on the effectiveness of the Fund's internal control over financial reporting. Accordingly, we express no such opinion. An audit also includes examining, on a test basis, evidence supporting the amounts and disclosures in the financial statements and financial highlight, assessing the accounting principles used and significant estimates made by management, and evaluating the overall financial statement presentation. Our procedures included confirmation of securities owned as of December 31, 2012, by correspondence with the custodian and brokers or by other appropriate auditing procedures where replies from brokers were not received. We believe that our audits provide a reasonable basis for our opinion.
In our opinion, the financial statements and financial highlights referred to above present fairly, in all material respects, the financial position of Henderson Strategic Income Fund at December 31, 2012, the results of its operations for the year then ended, the changes in its net assets for each of the two years then ended and financial highlights for the periods indicated therein in conformity with US generally accepted accounting principles.
Chicago, Illinois
February 15, 2013
| | |
| Henderson Global Funds | Other information (unaudited) |
Proxy voting policies
The Fund has filed with the Securities and Exchange Commission its proxy voting records for the twelve months ended June 30, 2012 on Form N-PX, which must be filed each year by August 31. Form N-PX is available on the Securities and Exchange Commission’s website at www.sec.gov. The Fund’s proxy voting records and proxy voting policies and procedures are also available without charge, upon request, by calling 866.443.6337 or by visiting the Fund’s website at www.hendersonglobalinvestors.com.
Quarterly portfolio of investments
A Portfolio of Investments is filed as of the end of the first and third quarter of each fiscal year on Form N-Q. The Fund has filed with the Securities and Exchange Commission the Form N-Q and it is available on the Securities and Exchange Commission’s website at www.sec.gov. Additionally, the Portfolio of Investments may be reviewed and copied at the Commission’s Public Reference Room in Washington, DC. Information on the operation of the Public Reference Room may be obtained by calling 1.800.SEC.0330. The quarterly Portfolio of Investments are also available without charge, upon request, by calling 866.443.6337 or by visiting the Fund’s website at www.hendersonglobalinvestors.com.
Federal tax information
Certain tax information for the Fund is required to be provided to shareholders based on the Fund’s income and distributions for the taxable year ended December 31, 2012. In February 2013, shareholders will receive Form 1099-DIV which will include their share of foreign tax credit, qualified dividends and capital gains distributed during the calendar year 2012. Shareholders are advised to check with their tax advisors for information on the treatment of these amounts on their individual income tax returns.
Under Section 854(b)(2) of the Code, the Fund designated qualified dividends for the fiscal year ended December 31, 2012 of $17,815.
Shareholder expense
As a shareholder of the Fund, you incur two types of costs: (1) transaction costs, including sales charges (loads) on purchase payments and redemption fees and (2) ongoing costs, including management fees, distribution (12b-1) fees, shareholder services fees and other Fund expenses. The example in Table 1 and Table 2 is intended to help you understand your ongoing costs of investing in the Fund and to compare these costs with ongoing costs of investing in other mutual funds. It is based on an investment of $1,000 invested at the beginning of the period and held for the six-months ended December 31, 2012.
Actual expenses
Table 1 provides information about actual account values and actual expenses. You may use the information in this line, together with the amount invested, to estimate the expenses that you incurred over the period. Simply divide your account value at the end of the period by $1,000 (for example, an $8,600 account value divided by $1,000 = 8.6), then multiply the result by the number under the heading entitled “Expenses Paid During Period” to estimate the expenses attributable to your investment during this period.
Hypothetical example for comparison purposes
Table 2 provides information about hypothetical account values and hypothetical expenses based on the Fund’s actual expense ratios and an assumed rate of return of 5% per year before expenses, which is not the Fund’s actual return. Thus you should not use the hypothetical account values and expenses to estimate your actual ending account balance or the expense attributable to your investment during the period. Rather, these figures are provided to enable you to compare the ongoing costs of investing in the Fund and other funds. To do so, compare the 5% hypothetical examples with the 5% hypothetical examples that appear in the shareholder reports of other funds.
Expenses paid during the period include amounts reflected in the Fund’s Statement of Operations net of reimbursements by the investment adviser. The annualized expense ratios used in the example are as follows:
Class A | Class B | Class C | Class I |
1.10% | 1.85% | 1.85% | 0.85% |
| | |
| Henderson Global Funds | Other information (unaudited) |
Please note that the expenses do not reflect shareholder transaction costs such as front end sales charges and redemption fees. These fees are described for the Fund and share class in the Performance summary of this report on page 3. Table 2 is useful in comparing ongoing costs only, and will not help you determine the relative total costs of owning different funds. In addition, if these transaction costs were included, your costs would have been higher.
Table 1 | | | |
| |
| | Beginning | Ending | Expenses |
| | account | account | paid |
| | value | value | during |
| | July 1, | December 31, | the |
Actual | 2012 | 2012 | period* |
Class A | $1,000.00 | $1,071.20 | $5.73 |
Class B | 1,000.00 | 1,066.80 | 9.61 |
Class C | 1,000.00 | 1,066.20 | 9.61 |
Class I | 1,000.00 | 1,071.70 | 4.43 |
Table 2 | | | |
| |
Hypothetical | Beginning | Ending | Expenses |
(assuming a | account | account | paid |
5% return | value | value | during |
before | July 1, | December 31, | the |
expenses) | 2012 | 2012 | period* |
Class A | $1,000.00 | $1,019.61 | $5.58 |
Class B | 1,000.00 | 1,015.84 | 9.37 |
Class C | 1,000.00 | 1,015.84 | 9.37 |
Class I | 1,000.00 | 1,020.86 | 4.32 |
* Expenses are equal to the Fund’s annualized net expense ratio multiplied by the average account value over the period multiplied by 184 days in the period, and divided by 366 (to reflect the one-half year period).
| | |
| Henderson Global Funds | Trustees and officers (unaudited) |
Name, address1, | Position(s) | Term of | | Other |
month and | with | Office and | Principal Occupations | Directorships |
year of birth | the Trust2 | Time Served3 | During Past Five Years | Held |
Independent Trustees | | | | |
C . Gary Gerst | Chairman and | Since 2001 | General Partner, Cornelius & Lothian LP | Formerly, Trustee, Harris |
February 1939 | Trustee | | (private partnership investing in non-public | Insight Funds Trust. |
| | | | investments), since 1993; Member of the | |
| | | | Governing Council of the Independent | |
| | | | Directors Council (IDC), since 2004; | |
| | | | Board Member of the Investment Company | |
| | | | Institute, since 2004. | |
| |
Roland C. Baker | Trustee | Since 2001 | Consultant to financial services industry. | Director, Sammons |
August 1938 | | | | Financial Enterprises, Inc. |
| | | | | and its life insurance sub- |
| | | | | sidiaries, North American |
| | | | | Company for Life and |
| | | | | Health Insurance (a |
| | | | | provider of life insurance, |
| | | | | health insurance and |
| | | | | annuities), and Midland |
| | | | | National Life Insurance |
| | | | | Company (an affiliate of |
| | | | | North American Company |
| | | | | for Life and Health |
| | | | | Insurance); formerly, |
| | | | | Trustee, Scottish Widows |
| | | | | Investment Partnership |
| | | | | Trust; formerly Trustee, |
| | | | | Allstate Financial |
| | | | | Investment Trust; |
| | | | | formerly, Director, Quanta |
| | | | | Capital Holdings, Inc. |
| | | | | (provider of property and |
| | | | | casualty reinsurance); |
| | | | | and formerly, Director, |
| | | | | People’s Trust Insurance |
| | | | | Company (a Florida |
| | | | | provider of homeowner’s |
| | | | | insurance). |
| |
Faris F. Chesley | Trustee | Since 2002 | Chairman, Chesley, Taft & Associates, LLC, | Chairman of the |
August 1938 | | | Since 2001; Vice Chairman, ABN-AMRO, Inc. | Investment Committee |
| | | | (a financial services company), 1998-2001. | of the Presbyterian |
| | | | | Homes. |
| |
James W. Atkinson | Trustee | Since 2011 | Commercial Pilot, Atkinson Aviation LLC, | Formerly, Trustee, |
August 1950 | | | since 2009 | LaRabida Children’s |
| | | | | Hospital: formerly Trustee, |
| | | | | Surgeons Diversified |
| | | | | Investment Fund. |
| |
Richard W. Durkes | Trustee | Since 2011 | Managing Director, Sandler O’Neill & Partners, | Trustee, Sankaty Head |
February 1950 | | | L.P. (a financial services Company), since 2002. | Foundation; Partner, Serve |
| | | | | UP LLC (private company |
| | | | | that holds the rights |
| | | | | to certain intellectual |
| | | | | property). |
| | |
| Henderson Global Funds | Trustees and officers (unaudited) |
Name, address1, | Position(s) | Term of | | Other |
month and | with | Office and | Principal Occupations | Directorships |
year of birth | the Trust2 | Time Served3 | During Past Five Years | Held |
Interested Trustees and Officers of the Trust | | |
James G. O’Brien4 | Trustee | Since 2011 | Managing Director, HGINA, Since 2008 | Director, The Olson |
May 1960 | and | | and Director, Corporate Services, HGINA, | Company |
| | President | Since 2010 | 2001-2008. | |
| |
Charles Thompson II4 | Trustee | Since 2011 | Director of US Retail, since 2010, Director | None. |
April 1970 | and | | of National Sales, 2007-2010, Divisional | |
| | Vice President | Since 2010 | Director – Central Region, 2002 – 2007. | |
| |
Kenneth A. Kalina | Chief | Since 2005 | Chief Compliance Officer, HGINA. | N/A |
August 1959 | Compliance | | | |
| | Officer | | | |
| |
Alanna P. Nensel | Vice President | Since 2002 | Director, Retail Marketing and Product | N/A |
July 1975 | | | Management, HGINA. | |
| |
David Latin | Vice President | Since 2012 | Director of Product Development and | N/A |
September 1981 | | | Analyst Relations, HGINA. | |
| |
Scott E. Volk | Vice President | Since 2001 | Director, Retail Finance and Operations, | N/A |
May 1971 | | | HGINA. | |
| |
Christopher K. | Secretary | Since 2004 | Legal Counsel, HGINA. | N/A |
Yarbrough | | | | |
October 1974 | | | | |
| |
Troy M. Statczar | Treasurer | Since 2008 | Head of US Fund Administration and | N/A |
August 1971 | | | Accounting, HGINA, since July 2008, | |
| | | | Senior Vice President, Citigroup 2005-2008. | |
| |
Adam T. Reich | Assistant | Since 2012 | Manager of US Fund Administration and | N/A |
August 1983 | Treasurer | | Accounting, HGINA, since August 2012; | |
| | | | Manager, PricewaterhouseCoopers | |
| | | | LLP 2006-2012. | |
1. Each person’s address is 737 North Michigan Avenue, Suite 1700, Chicago, IL 60611.
2. Currently, all Trustees oversee all nine series of the Trust.
3. A Trustee may serve until his death, resignation, removal or until the end of the calendar year in which the Trustee reaches 75 years of age. The officers of the Trust are elected annually by the Board.
4. This Trustee is an interested person of the Trust because of his employment relationship with Henderson Global Investors (North America) Inc., the investment adviser to the Fund.
Unless otherwise noted, this information is as of December 31, 2012. The Statement of Additional Information for Henderson Global Funds includes additional information about the Trustees and is available without charge by calling 1.866.4HENDERSON (1.866.443.6337).
Privacy Notice
Henderson Global Funds
This notice describes the privacy practices followed by Henderson Global Funds.
Your privacy is our top priority. Our policy is to respect the privacy of current and former shareholders and to protect personal information entrusted to us. We do not share any nonpublic personal information of shareholders or former shareholders with any nonaffiliated third parties, except as permitted by law or as authorized by our shareholders.
In the course of providing products and services to you, we collect nonpublic personal information about you from various sources such as account applications or agreements, other account forms, transactions in your account, and from information captured on our website, including any information captured through our use of “cookies.” Such information may include your name, address, account or tax identification number, the types and amounts of investments, and bank account information. More detailed information about our Internet policy is available on our website, www.hendersonglobalinvestors.com.
In the normal course of serving shareholders, we may share information we collect with entities that help us process information or service your request, such as transfer agents, custodians, broker-dealers and marketing service firms, as well as with other financial institutions with whom we have joint marketing agreements. We may share information in connection with servicing accounts or to inform shareholders of products and services that we believe may be of interest to them. The organizations that receive shareholder information will use that information only for the services required and as allowed by applicable law or regulation, and are not permitted to share or use this information for any other purpose. Our affiliates do not use shareholder information that we receive to make marketing solicitations. We will disclose your personal information to government agencies, law enforcement officials, and others in the limited circumstances where we believe, in good faith, that such disclosure is required or permitted by law. For example, we will disclose your personal information in order to comply with a court order, to cooperate with government or industry regulators, or law enforcement authorities.
Access to customers’ nonpublic personal information is restricted to employees who need to access that information. To guard shareholder’s nonpublic personal information, we use industry standard physical, electronic, and procedural safeguards. A shareholder’s right to privacy extends to all forms of contact with us, including telephone, written correspondence, and electronic media, such as the Internet.
For questions concerning this policy, please contact us by writing to: Alanna Nensel, Henderson Global Investors (North America) Inc., 737 North Michigan Avenue, Suite 1700, Chicago, Illinois 60611.
Henderson Global Funds
Trustees | Investment Adviser |
C. Gary Gerst, Chairman | Henderson Global Investors (North America) Inc. |
James W. Atkinson | 737 North Michigan Avenue, Suite 1700 |
Roland C. Baker | Chicago, IL 60611 |
Faris F. Chesley | |
Richard W. Durkes | Transfer Agent |
James G. O’Brien* | State Street Bank & Trust Company |
Charles Thompson II* | State Street Financial Center |
| | One Lincoln Street |
Officers | Boston, MA 02111 |
James G. O’Brien, President | |
Charles Thompson II, Vice President | For more information |
Alanna P. Nensel, Vice President | Please call 1.866.4HENDERSON |
David Latin, Vice President | (1.866.443.6337) |
Scott E. Volk, Vice President | or visit our website: |
Christopher K. Yarbrough, Secretary | www.hendersonglobalinvestors.com |
Kenneth A. Kalina, Chief Compliance Officer | |
Troy M. Statczar, Treasurer | |
Adam T. Reich, Assistant Treasurer | |
* Trustee is an “interested person” of the Trust as defined in the Investment Company Act of 1940, as amended.
The views expressed in this report and information about the Fund’s portfolio holdings are for the period covered by this report and are subject to change hereafter. This report is submitted for the general information of the shareholders of the Fund. It is not authorized for distribution to prospective investors unless preceded or accompanied by an effective prospectus, which includes information regarding the Fund’s risks, objectives, fees and expenses, experience of its management, and other information. Henderson Global Investors is the name under which various subsidiaries of Henderson Group plc, a UK limited company, provide investment products and services.
Foreside Fund Services, LLC, Distributor

Item 2. Code of Ethics.
| (a) | Henderson Global Funds (the “Trust” or the “registrant”) has adopted a Code of Ethics that applies to the Trust’s principal executive officer and principal financial officer (the “Code”). |
| (b) | No disclosures are required by this Item 2(b). |
| (c) | There have been no amendments to the Code during the reporting period for Form N-CSR. |
| (d) | There have been no waivers granted by the Trust to individuals covered by the Code during the reporting period for Form N-CSR. |
| (f) | A copy of the Code may be obtained free of charge by calling 866-343-6337. |
Item 3. Audit Committee Financial Expert.
| (a) | (1) | The Board of Trustees of the Trust has determined that it has five audit committee financial experts serving on the Trust’s Audit Committee that possess the attributes identified in Item 3(b) to Form N-CSR. |
| | (2) | The names of the audit committee financial experts are: |
James W. Atkinson
Roland C. Baker
Faris F. Chesley
Richard W. Durkes
C. Gary Gerst
Each audit committee financial expert has been deemed to be “independent” as that term is defined in Item 3(a)(2) of Form N-CSR.
Item 4. Principal Accountant Fees and Services.
As of December 31, 2012, the registrant had nine series. At December 31, 2012, the only remaining active series of the registrant with a fiscal year ended December 31 was the Henderson Strategic Income Fund. The Henderson International All Cap Equity Fund and Henderson Money Market Fund (together with the Henderson Strategic Income Fund, the “12/31 Henderson Funds”) each terminated and liquidated on December 28, 2012 prior to the December 31, 2012 fiscal year end. Consequently, though the Henderson Strategic Income Fund is the only remaining December 31 series, the fees reported below for the year ended December 31, 2012 are inclusive of all fees incurred by the 12/31 Henderson Funds, as applicable. The following series of the registrant have a fiscal year ended July 31: Henderson All Asset Fund, Henderson Dividend & Income Builder Fund, Henderson Emerging Markets Opportunities Fund, Henderson European Focus Fund, Henderson Global Technology Fund, Henderson Global Equity Income Fund, Henderson International Opportunities Fund and Henderson World Select Fund (formerly Henderson Global Leaders Fund) (the “7/31 Henderson Funds”).
Information provided in response to Item 4 includes amounts billed during the applicable fiscal years for services rendered by the registrant’s principal accountant to the 12/31 Henderson Funds and the 7/31 Henderson Funds.
(a) Audit Fees - The aggregate fees billed for the last two fiscal years ended July 31 for the 7/31 Henderson Funds and December 31 for the 12/31 Henderson Funds for professional services rendered by the principal accountant to the registrant for the audit of the registrant’s annual financial statements or services normally provided by the accountant in connection with statutory and regulatory filings or engagements for the those fiscal years are set forth below.
| | 12/31 Henderson Funds | 7/31 Henderson Funds |
| Year ended 12/31/12 | $32,300 | N/A |
| Year ended 7/31/12 | N/A | $235,800 |
| Year ended 12/31/11 | $87,300* | N/A |
| Year ended 7/31/11 | N/A | $200,200 |
| | * Reflects the fees billed to three series of the registrant, the Henderson Strategic Income Fund, the Henderson Money Market Fund and the Henderson International All Cap Equity Fund, each with a fiscal year end of December 31. The Henderson International All Cap Equity Fund and Henderson Money Market Fund terminated and liquidated December 28, 2012 and did not require an audit at December 31, 2012. |
(b) Audit Related Fees – There were no fees billed for the last two fiscal years ended July 31 for the 7/31 Henderson Funds and December 31 for the 12/31 Henderson Funds for assurance and related services rendered by the principal accountant to the registrant that are reasonably related to the performance of the audit of the registrant’s financial statements and are not reported under paragraph (a) of this Item 4.
There were no fees billed for the last two fiscal years ended July 31 for the 7/31 Henderson Funds and December 31 for the 12/31 Henderson Funds for assurance and related services rendered by the principal accountant to the investment adviser that are reasonably related to the performance of the audit of the registrant’s financial statements that were required to be pre-approved by the Audit Committee as described in paragraph (e)(1) of this Item 4.
(c) Tax Fees - The aggregate fees billed for the last two fiscal years ended July 31 for the 7/31 Henderson Funds and December 31 for the 12/31 Henderson Funds for professional services rendered by the principal accountant to the registrant for tax compliance, tax advice, tax planning and tax return preparation are set forth below. These services consisted of the principal accountant reviewing the registrant’s excise tax returns, distribution requirements and RIC tax returns, as well as consults regarding the tax consequences of specific investments.
| | 12/31 Henderson Funds | 7/31 Henderson Funds |
| Year ended 12/31/12 | $8,742 | N/A |
| Year ended 7/31/12 | N/A | $115,360 |
| Year ended 12/31/11 | $30,184 | N/A |
| Year ended 7/31/11 | N/A | $61,843 |
The aggregate fees billed for the last two fiscal years ended July 31 for the 7/31 Henderson Funds and December 31 for the 12/31 Henderson Funds for professional services rendered by
the principal accountant to the investment adviser for tax compliance, tax advice and tax planning that were required to be pre-approved by the Audit Committee as described in paragraph (e)(1) of this Item 4 are set forth below.
| | 12/31 Henderson Funds | 7/31 Henderson Funds |
| Year ended 12/31/12 | $0 | N/A |
| Year ended 7/31/12 | N/A | $0 |
| Year ended 12/31/11 | $0 | N/A |
| Year ended 7/31/11 | N/A | $0 |
(d) All Other Fees – There were no fees billed for the last two fiscal years ended July 31 for the 7/31 Henderson Funds and December 31 for the 12/31 Henderson Funds for products and services provided by the principal accountant to the registrant, other than the services reported in paragraph (a) – (c) of this Item 4.
There were no fees billed for the last two fiscal years ended July 31 for the 7/31 Henderson Funds and December 31 for the 12/31 Henderson Funds for products and services provided by the principal accountant to the investment adviser that were required to be pre-approved by the Audit Committee as described in paragraph (e)(1) of this Item 4.
(e) Pre-Approval Policies and Procedures
(1) Pursuant to the registrant’s Audit Committee Charter, the Audit Committee shall pre-approve any engagement of the independent auditors to provide any services (other than prohibited non-audit services) to the Trust, the investment adviser and any entity controlling, controlled by, or under common control with the investment adviser that provides ongoing services to the Trust (if the engagement relates directly to the operations and financial reporting of the Trust) (collectively, the “Adviser”), including the fees and other compensation to be paid to the independent auditors. Any member of the Audit Committee may grant such pre-approval. Any such delegated pre-approval shall be presented to the Audit Committee by the member who approved the engagement. Pre-approval of non-audit services is not required, if: (a) the aggregate amount of all non-audit services provided to the Trust is less than 5% of the total fees paid by the Trust to its independent auditors during the fiscal year in which the non-audit services are provided; (b) the services were not recognized by management at the time of the engagement as non-audit services; and (c) such services are promptly brought to the attention of the Audit Committee by management and the Audit Committee approves them (which may be by delegation as provided for above) prior to the completion of the audit.
The independent auditors shall not perform any of the following non-audit services for the Trust (“prohibited non-audit services”): (a) bookkeeping or other services related to the accounting records or financial statements of the Trust; (b) financial information systems design and implementation; (c) appraisal or valuation services, fairness opinions, or contribution-in-kind reports; (d) actuarial services; (e) internal audit outsourcing services; (f) management functions or human resources; (g) broker or dealer, investment adviser, or investment banking services; (h) legal services and expert services unrelated to the audit; and (i) any other services that the Public Company Accounting Oversight Board determines are impermissible.
(2) None of the services provided to the registrant described in paragraphs (b)-(d) of Item 4 were pre-approved by the Audit Committee pursuant to paragraph (c)(7)(i)(C) of Rule 2-01 of Regulation S-X. All of the fees billed for services provided to the Adviser described in
paragraphs (b)-(d) of Item 4 were required to be pre-approved by the Audit Committee as described in paragraph (e)(1) of Item 4.
(f) No disclosures are required by this Item 4(f).
(g) The approximate aggregate non-audit fees billed for the last two fiscal years ended July 31 for the 7/31 Henderson Funds and December 31 for the 12/31 Henderson Funds for services rendered by the principal accountant to the registrant are set forth below.
| | 12/31 Henderson Funds | 7/31 Henderson Funds |
| Year ended 12/31/12 | $8,742 | N/A |
| Year ended 7/31/12 | N/A | $115,360 |
| Year ended 12/31/11 | $30,184 | N/A |
| Year ended 7/31/11 | N/A | $61,843 |
The approximate aggregate non-audit fees billed for the last two fiscal years ended July 31 for the 7/31 Henderson Funds and December 31 for the 12/31 Henderson Funds for services rendered by the principal accountant to the Adviser and its affiliates that provide ongoing services to the registrant are set forth below.
| | 12/31 Henderson Funds* | 7/31 Henderson Funds* |
| Year ended 12/31/12 | $1,275,972 | N/A |
| Year ended 7/31/12 | N/A | $1,179,772 |
| Year ended 12/31/11 | $1,854,159 | N/A |
| Year ended 7/31/11 | N/A | $276,105 |
| | * Note that as the non-audit services provided to the Adviser and its affiliates are not attributable to the 12/31 Henderson Funds or 7/31 Henderson Funds, and due to the different year-ends, certain fees billed during the period may be reflected in both the 12/31 and 7/31 Henderson Funds’ fiscal years. |
(h) The registrant’s Audit Committee has determined that the non-audit services the principal accountant has rendered to the Adviser that were not required to be pre-approved by the Audit Committee because they did not relate directly to the operations and financial reporting of the registrant were compatible with maintaining the principal accountant’s independence.
Item 5. Audit Committee of Listed Registrants.
Not applicable.
Item 6. Investments.
(a) Schedule of Investments is included as a part of the report to shareholders filed under Item 1 of this Form N-CSR.
(b) Not applicable.
Item 7. Disclosure of Proxy Voting Policies and Procedures for Closed-End Management Investment Companies.
Not applicable.
Item 8. Portfolio Managers of Closed-End Management Investment Companies.
Not applicable.
Item 9. Purchases of Equity Securities by Closed-End Management Investment Company and Affiliated Purchasers.
Not applicable.
Item 10. Submission of Matters to a Vote of Security Holders.
There have been no material changes to the procedures by which the shareholders may recommend nominees to the registrant’s board of trustees, where those changes were implemented after the registrant last provided disclosure in response to this Item.
Item 11. Controls and Procedures.
(a) The registrant’s principal executive officer and principal financial officer have evaluated the registrant’s disclosure controls and procedures within 90 days of this filing and have concluded that the registrant’s disclosure controls and procedures were effective, as of that date, in ensuring that information required to be disclosed by the registrant in this Form N-CSR was recorded, processed, summarized and reported timely.
(b) There were no changes in the registrant’s internal controls over financial reporting (as defined in Rule 30a-3(d) under the Investment Company Act of 1940) that occurred during the registrant’s second fiscal quarter of the period covered by this report that has materially affected, or is reasonably likely to materially affect, the registrant’s internal controls over financial reporting.
(a)(1) Not applicable.
(a)(2) The certifications required by Rule 30a-2(a) under the 1940 Act (17 CFR 270.30a-2(a)) are attached hereto.
(a)(3) Not applicable.
(b) The certifications required by Rule 30a-2(b) under the 1940 Act (17 CFR 270.30a-2(b)) and Section 906 of the Sarbanes-Oxley Act of 2002 are attached hereto.
Pursuant to the requirements of the Securities Exchange Act of 1934 and the Investment Company Act of 1940, the registrant has duly caused this report to be signed on its behalf by the undersigned, thereunto duly authorized.
HENDERSON GLOBAL FUNDS
By: /s/ James G. O’Brien
James G. O’Brien
President (principal executive officer) of Henderson Global Funds
Date: February 25, 2013
Pursuant to the requirements of the Securities Exchange Act of 1934 and the Investment Company Act of 1940, this report has been signed below by the following persons on behalf of the registrant and in the capacities and on the dates indicated.
By: /s/ James G. O’Brien
James G. O’Brien
President (principal executive officer) of Henderson Global Funds
Date: February 25, 2013
By: /s/ Troy Statczar
Troy Statczar
Treasurer (principal financial officer) of Henderson Global Funds
Date: February 25, 2013