Global Equity Income Fund
July 31, 2014 (continued)
Fair Value Measurements
The following table summarizes the Fund’s investments that are measured at fair value by level within the fair value hierarchy at July 31, 2014:
| | | | | | | | | | | | | | |
| | | | Quoted prices | | | Significant | | | | | | | |
| | | | in active | | | other | | | Significant | | | | |
| | | | markets for | | | observable | | | unobservable | | | | |
| | | identical assets | | | inputs | | | inputs | | | | |
| Description | | | (level 1 | ) | | (level 2 | ) | | (level 3 | ) | | Total | |
| Assets | | | | | | | | | | | | | |
| | | | | | | | | | | | | | |
| Common Stocks | | | | | | | | | | | | | |
| Australia | | $ | 365,025,119 | | $ | — | | $ | — | | $ | 365,025,119 | |
| Brazil | | | 41,268,074 | | | — | | | — | | | 41,268,074 | |
| Canada | | | 40,182,895 | | | — | | | — | | | 40,182,895 | |
| China | | | 105,075,451 | | | — | | | — | | | 105,075,451 | |
| Cyprus | | | 21,296,691 | | | — | | | — | | | 21,296,691 | |
| Denmark | | | 47,505,108 | | | — | | | — | | | 47,505,108 | |
| France | | | 119,283,869 | | | — | | | — | | | 119,283,869 | |
| Germany | | | 94,969,038 | | | — | | | — | | | 94,969,038 | |
| Hong Kong | | | 238,051,548 | | | — | | | — | | | 238,051,548 | |
| Italy | | | 53,375,468 | | | — | | | — | | | 53,375,468 | |
| Malaysia | | | 25,518,593 | | | — | | | — | | | 25,518,593 | |
| Netherlands | | | 15,027,156 | | | — | | | — | | | 15,027,156 | |
| New Zealand | | | 50,144,195 | | | — | | | — | | | 50,144,195 | |
| Norway | | | 91,612,627 | | | — | | | — | | | 91,612,627 | |
| Sweden | | | 21,624,571 | | | — | | | — | | | 21,624,571 | |
| Switzerland | | | 29,606,204 | | | — | | | — | | | 29,606,204 | |
| United Kingdom | | | 1,253,167,583 | | | — | | | — | | | 1,253,167,583 | |
United States | | | 436,409,856 | | | — | | | — | | | 436,409,856 | |
Total Common Stocks | | | 3,049,144,046 | | | — | | | — | | | 3,049,144,046 | |
| | | | | | | | | | | | | | |
| Partnerships | | | | | | | | | | | | | |
| United States | | | 35,957,157 | | | — | | | — | | | 35,957,157 | |
Total Partnerships | | | 35,957,157 | | | — | | | — | | | 35,957,157 | |
| | | | | | | | | | | | | | |
| REITs | | | | | | | | | | | | | |
| Australia | | | 28,966,236 | | | — | | | — | | | 28,966,236 | |
| United Kingdom | | | 37,490,441 | | | — | | | — | | | 37,490,441 | |
| Total REITs | | | 66,456,677 | | | — | | | — | | | 66,456,677 | |
| Total Investments | | $ | 3,151,557,880 | | $ | — | | $ | — | | $ | 3,151,557,880 | |
| | | | | | | | | | | | | | |
| Financial Derivative Instruments – Assets | | | | | | | | | | | | | |
| Over-the-counter | | | — | | | 1,957,430 | | | — | | | 1,957,430 | |
| Total Financial Derivative Instruments – Assets | | $ | — | | $ | 1,957,430 | | $ | — | | $ | 1,957,430 | |
During the year ended July 31, 2014, there were no transfers in or out of security levels as a result of the fair value pricing procedures established by the Board.
See notes to financial statements
Global Equity Income Fund
July 31, 2014 (continued)
Fair Value of Financial Derivative Instruments
The following is a summary of the fair valuation of the Fund’s financial derivative instruments categorized by risk exposure:
Fair Values of Financial Derivative Instruments on the Statement of Assets and Liabilities as of July 31, 2014
| | | | | | | | | | | | | | | | | | | | |
| | | Derivatives not accounted for as hedging instruments |
| | | | Foreign | | | | | | | | | | | | | | | | |
| | | | Currency | | | Equity | | | Interest | | | Credit | | | Inflation | | | | |
| | | | Risk | | | Risk | | | Rate Risk | | | Risk | | | Risk | | | Total | |
| Financial Derivative Instruments – Assets |
| Over-the-Counter | | | | | | | | | | | | | | | | | | | |
| Forward Foreign Currency Contracts | | $ | 1,957,430 | | $ | — | | $ | — | | $ | — | | $ | — | | $ | 1,957,430 | |
| Total | | $ | 1,957,430 | | $ | — | | $ | — | | $ | — | | $ | — | | $ | 1,957,430 | |
| | | | | | | | | | | | | | | | | | | | |
| Financial Derivative Instruments– Liabilities |
| Over-the-Counter | | | | | | | | | | | | | | | | | | | |
| Forward Foreign Currency Contracts | | $ | — | | $ | — | | $ | — | | $ | — | | $ | — | | $ | — | |
| Total | | $ | — | | $ | — | | $ | — | | $ | — | | $ | — | | $ | — | |
| Net | | $ | 1,957,430 | | $ | — | | $ | — | | $ | — | | $ | — | | $ | 1,957,430 | |
Effect of Financial Derivative Instruments on the Statement of Operations for the Year Ended July 31, 2014
| | | | | | | | | | | | | | | | | | | | |
| | | Derivatives not accounted for as hedging instruments |
| | | | Foreign | | | | | | | | | | | | | | | | |
| | | | Currency | | | Equity | | | Interest | | | Credit | | | Inflation | | | | |
| | | | Risk | | | Risk | | | Rate Risk | | | Risk | | | Risk | | | Total | |
| Net realized gain/(loss) from financial derivative instruments: | | | | | | | | | | | | | | | | | | | |
| Forward Foreign Currency Contracts | | $ | (37,571,439 | ) | $ | — | | $ | — | | $ | — | | $ | — | | $ | (37,571,439 | ) |
| Total | | $ | (37,571,439 | ) | $ | — | | $ | — | | $ | — | | $ | — | | $ | (37,571,439 | ) |
| | | | | | | | | | | | | | | | | | | | |
| Net change in unrealized appreciation/(depreciation) of financial derivative instruments | | | | | | | | | | | | | | | | | | | |
| Forward Foreign Currency Contracts | | $ | 6,003,764 | | $ | — | | $ | — | | $ | — | | $ | — | | $ | 6,003,764 | |
| Total | | $ | 6,003,764 | | $ | — | | $ | — | | $ | — | | $ | — | | $ | 6,003,764 | |
See notes to financial statements
Global Technology Fund
July 31, 2014
| | | | | Value | |
| Shares | | | | (note 2) | |
| | | | | | |
| Common stocks - 94.72% |
| | | | | | |
| | | China - 5.49% | | | |
| 33,528 | | Baidu, Inc., ADR * | $ | 7,243,725 | |
| 73,377 | | NetEase.com, Inc., ADR | | 6,166,603 | |
| 392,300 | | Tencent Holdings, Ltd. | | 6,494,421 | |
| | | | | 19,904,749 | |
| | | | | | |
| | | Germany - 1.43% | | | |
| 469,393 | | Infineon Technologies AG | | 5,201,175 | |
| | | | | | |
| | | Ireland - 1.61% | | | |
| 73,481 | | Accenture plc, Class A | | 5,825,574 | |
| | | | | | |
| | | Korea - 5.07% | | | |
| 3,926 | | Samsung Electronics Co., Ltd. | | 5,129,754 | |
| 255,991 | | SK Hynix, Inc. * | | 11,319,542 | |
| 174,382 | | Wonik IPS Co., Ltd. * | | 1,951,056 | |
| | | | | 18,400,352 | |
| | | | | | |
| | | Netherlands - 2.40% | | | |
| 63,039 | | ASM International N.V. | | 2,400,266 | |
| 101,123 | | NXP Semiconductor N.V. * | | 6,305,019 | |
| | | | | 8,705,285 | |
| | | | | | |
| | | Russia - 1.15% | | | |
| 138,662 | | Mail.ru Group, Ltd., GDR * | | 4,152,927 | |
| | | | | | |
| | | Singapore - 1.57% | | | |
| 82,090 | | Avago Technologies, Ltd. | | 5,695,404 | |
| | | | | | |
| | | Taiwan - 1.34% | | | |
| 311,000 | | MediaTek, Inc. | | 4,863,669 | |
| | | | | | |
| | | United Kingdom - 1.95% | | | |
| 183,748 | | Rightmove plc | | 7,057,543 | |
| | | | | | |
| | | United States - 72.71% | | | |
| 297,579 | | ACI Worldwide, Inc. * | | 5,576,631 | |
| 18,021 | | Amazon.com, Inc. * | | 5,640,393 | |
| 158,802 | | Apple, Inc. | | 15,176,707 | |
| 270,633 | | Applied Materials, Inc. | | 5,672,468 | |
| 1,090 | | Arista Networks, Inc. * | | 72,071 | |
| | | | | | |
| | | United States (continued) | | | |
| 185,372 | | Arrow Electronics, Inc. * | $ | 10,742,308 | |
| 369,805 | | Cadence Design Systems, Inc. * | | 6,223,818 | |
| 216,147 | | Cisco Systems, Inc. | | 5,453,389 | |
| 144,186 | | Cognizant Technology | | | |
| | | Solutions Corp., Class A * | | 7,072,323 | |
| 104,340 | | Comcast Corp., Class A | | 5,606,188 | |
| 238,435 | | CommScope Holding Co., Inc. * | | 5,875,038 | |
| 91,865 | | CommVault Systems, Inc. * | | 4,411,357 | |
| 30,908 | | Equinix, Inc. * | | 6,630,384 | |
| 50,464 | | F5 Networks, Inc. * | | 5,681,742 | |
| 116,045 | | Facebook, Inc., Class A * | | 8,430,669 | |
| 97,857 | | Fiserv, Inc. * | | 6,034,841 | |
| 56,809 | | FleetCor Technologies, Inc. * | | 7,543,667 | |
| 149,997 | | Gilead Sciences, Inc. * | | 13,732,225 | |
| 10,898 | | Google, Inc., Class A * | | 6,315,936 | |
| 11,058 | | Google, Inc., Class C * | | 6,320,753 | |
| 170,091 | | Hewlett-Packard Co. | | 6,056,941 | |
| 56,770 | | Juniper Networks, Inc. * | | 1,336,366 | |
| 60,619 | | Lam Research Corp. | | 4,243,330 | |
| 84,853 | | MasterCard, Inc., Class A | | 6,291,850 | |
| 285,019 | | Mentor Graphics Corp. | | 5,629,125 | |
| 293,511 | | Micron Technology, Inc. * | | 8,966,761 | |
| 148,660 | | NetApp, Inc. | | 5,773,954 | |
| 14,029 | | NetFlix, Inc. * | | 5,930,339 | |
| 172,563 | | Oracle Corp. | | 6,969,820 | |
| 244,936 | | Pandora Media, Inc. * | | 6,152,792 | |
| 65,823 | | QUALCOMM, Inc. | | 4,851,155 | |
| 49,426 | | Red Hat, Inc. * | | 2,872,639 | |
| 73,044 | | SanDisk Corp. | | 6,698,865 | |
| 126,249 | | Texas Instruments, Inc. | | 5,839,016 | |
| 9,162 | | The Priceline Group, Inc. * | | 11,383,327 | |
| 55,138 | | Towers Watson & Co., Class A | | 5,625,179 | |
| 29,937 | | Visa, Inc., A Shares | | 6,317,006 | |
| 207,617 | | Web.com Group, Inc. * | | 5,512,231 | |
| 58,856 | | Western Digital Corp. | | 5,875,595 | |
| 70,313 | | WEX, Inc. * | | 7,588,179 | |
| 157,459 | | Yahoo!, Inc. * | | 5,638,607 | |
| | | | | 263,765,985 | |
| | | | | | |
| | | Total common stocks | | | |
| | | (Cost $252,240,528) | | 343,572,663 | |
| | | | | | |
| | | Total long-term investments | | | |
| | | (Cost $252,240,528) | | 343,572,663 | |
See notes to financial statements
Global Technology Fund
July 31, 2014 (continued)
| | | | | Value | |
| Shares | | | | (note 2) | |
| | | | | | |
| Short-term investment - 8.66% |
| 31,411,542 | | Fidelity Institutional | | | |
| | | Treasury Portfolio | $ | 31,411,542 | |
| | | | | | |
| | | Total short-term investment | | | |
| | | (Cost $31,411,542) | | 31,411,542 | |
| | | | | | |
| Total investments - 103.38% |
| | | (Cost $283,652,070) | | 374,984,205 | |
| | | | | | |
| Net other assets and liabilities – (3.38)% | | (12,242,909 | ) |
| | | | | | |
| Total net assets – 100.00% | $ | 362,741,296 | |
| * | | Non-income producing security |
| ADR | | American Depositary Receipts |
| GDR | | Global Depositary Receipts |
Other information:
| | | | |
| Industry concentration as | % of net |
| a percentage of net assets: | assets |
| | | | |
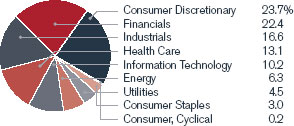
| Internet Software & Services | | 19.04 | % |
| Semiconductors | | 14.70 | |
| Data Processing & Outsourced Services | | 9.31 | |
| Communications Equipment | | 6.41 | |
| Internet Retail | | 6.33 | |
| Computer Hardware | | 5.85 | |
| Computer Storage & Peripherals | | 5.06 | |
| Application Software | | 4.80 | |
| Semiconductor Equipment | | 3.93 | |
| Systems Software | | 3.93 | |
| Biotechnology | | 3.79 | |
| IT Consulting & Other Services | | 3.56 | |
| Technology Distributors | | 2.96 | |
| Publishing | | 1.95 | |
| Human Resource & Employment Services | | 1.55 | |
| Cable & Satellite | | 1.55 | |
| Long-Term Investments | | 94.72 | |
| Short-Term Investment | | 8.66 | |
| Total Investments | | 103.38 | |
| Net Other Assets and Liabilities | | (3.38 | ) |
| | | 100.00 | % |
See notes to financial statements
Global Technology Fund
July 31, 2014 (continued)
Fair Value Measurements
The following table summarizes the Fund’s investments that are measured at fair value by level within the fair value hierarchy at July 31, 2014:
| | | | | | | | | | | | | | |
| | | | Quoted prices | | | Significant | | | | | | | |
| | | | in active | | | other | | | Significant | | | | |
| | | | markets for | | | observable | | | unobservable | | | | |
| | | | identical assets | | | inputs | | | inputs | | | | |
| Description | | | (level 1 | ) | | (level 2 | ) | | (level 3 | ) | | Total | |
| Assets | | | | | | | | | | | | | |
| | | | | | | | | | | | | | |
| Common Stocks | | | | | | | | | | | | | |
| China | | $ | 19,904,749 | | $ | — | | $ | — | | $ | 19,904,749 | |
| Germany | | | 5,201,175 | | | — | | | — | | | 5,201,175 | |
| Ireland | | | 5,825,574 | | | — | | | — | | | 5,825,574 | |
| Korea | | | 18,400,352 | | | — | | | — | | | 18,400,352 | |
| Netherlands | | | 8,705,285 | | | — | | | — | | | 8,705,285 | |
| Russia | | | 4,152,927 | | | — | | | — | | | 4,152,927 | |
| Singapore | | | 5,695,404 | | | — | | | — | | | 5,695,404 | |
| Taiwan | | | 4,863,669 | | | — | | | — | | | 4,863,669 | |
| United Kingdom | | | 7,057,543 | | | — | | | — | | | 7,057,543 | |
| United States | | | 263,765,985 | | | — | | | — | | | 263,765,985 | |
| Total Common Stocks | | | 343,572,663 | | | — | | | — | | | 343,572,663 | |
| | | | | | | | | | | | | | |
| Short-Term Investment | | | 31,411,542 | | | — | | | — | | | 31,411,542 | |
| Total Investments | | $ | 374,984,205 | | $ | — | | $ | — | | $ | 374,984,205 | |
During the year ended July 31, 2014, there were no transfers in or out of security levels as a result of the fair value pricing procedures established by the Board.
See notes to financial statements
High Yield Opportunities Fund
July 31, 2014
| Face | | | | | | | | | Value | |
| amount | | | | Coupon | | Maturity | | | (note 2) | |
| | | | | | | | | | | | |
| Corporate bonds – 93.99% | | | | | | | | |
| | | | | | | | | | | | |
| | | | Barbados – 1.99% | | | | | | | | |
| USD | 500,000 | | Columbus International, Inc. (a) | | 7.375% | | 3/30/21 | | $ | 529,375 | |
| | | | | | | | | | | | |
| | | | Bermuda – 0.92% | | | | | | | | |
| USD | 245,000 | | Seadrill, Ltd. (a) | | 6.625% | | 9/15/20 | | | 244,388 | |
| | | | | | | | | | | | |
| | | | Canada – 3.89% | | | | | | | | |
| USD | 500,000 | | Garda World Security Corp. (a) | | 7.250% | | 11/15/21 | | | 511,250 | |
| USD | 250,000 | | New Gold, Inc. (a) | | 6.250% | | 11/15/22 | | | 264,375 | |
| USD | 249,000 | | Tervita Corp. (a) | | 8.000% | | 11/15/18 | | | 257,715 | |
| | | | | | | | | | | 1,033,340 | |
| | | | | | | | | | | | |
| | | | Luxembourg – 2.91% | | | | | | | | |
| USD | 500,000 | | Intelsat Luxembourg S.A. | | 7.750% | | 6/1/21 | | | 513,125 | |
| USD | 250,000 | | Wind Acquisition Finance S.A. (a) | | 7.375% | | 4/23/21 | | | 261,250 | |
| | | | | | | | | | | 774,375 | |
| | | | | | | | | | | | |
| | | | Puerto Rico – 1.05% | | | | | | | | |
| USD | 275,000 | | Popular, Inc. | | 7.000% | | 7/1/19 | | | 277,887 | |
| | | | | | | | | | | | |
| | | | Sweden – 2.32% | | | | | | | | |
| USD | 250,000 | | Perstorp Holding AB (a) | | 8.750% | | 5/15/17 | | | 268,125 | |
| USD | 325,000 | | Perstorp Holding AB (a) | | 11.000% | | 8/15/17 | | | 347,750 | |
| | | | | | | | | | | 615,875 | |
| | | | | | | | | | | | |
| | | | United Kingdom – 2.92% | | | | | | | | |
| USD | 208,000 | | CEVA Group plc (a) | | 7.000% | | 3/1/21 | | | 213,200 | |
| USD | 275,000 | | Royal Bank of Scotland Group plc | | 6.000% | | 12/19/23 | | | 292,957 | |
| USD | 264,000 | | Tullow Oil plc (a) | | 6.000% | | 11/1/20 | | | 269,280 | |
| | | | | | | | | | | 775,437 | |
| | | | | | | | | | | | |
| | | | United States – 77.99% | | | | | | | | |
| USD | 250,000 | | Advanced Micro Devices, Inc. (a) | | 7.000% | | 7/1/24 | | | 244,375 | |
| USD | 575,000 | | American Energy-Permian Basin LLC/AEPB | | | | | | | | |
| | | | Finance Corp. (a) (b) | | 6.741% | | 8/1/19 | | | 555,594 | |
| USD | 575,000 | | Amsurg Corp. (a) | | 5.625% | | 7/15/22 | | | 580,750 | |
| USD | 610,000 | | Belden, Inc. (a) | | 5.250% | | 7/15/24 | | | 611,525 | |
| USD | 250,000 | | Blackboard, Inc. (a) | | 7.750% | | 11/15/19 | | | 254,375 | |
| USD | 325,000 | | BMC Software Finance, Inc. (a) | | 8.125% | | 7/15/21 | | | 325,000 | |
| USD | 275,000 | | Builders FirstSource, Inc. (a) | | 7.625% | | 6/1/21 | | | 288,062 | |
| USD | 280,000 | | Caesars Growth Properties Holdings LLC/Caesars | | | | | | | | |
| | | | Growth Properties Finance, Inc. (a) | | 9.375% | | 5/1/22 | | | 282,625 | |
| USD | 300,000 | | Calpine Corp. | | 5.750% | | 1/15/25 | | | 293,625 | |
| USD | 530,000 | | Calumet Specialty Products Partners LP (a) | | 6.500% | | 4/15/21 | | | 543,250 | |
| USD | 75,000 | | Cardtronics, Inc. (a) | | 5.125% | | 8/1/22 | | | 75,563 | |
| USD | 275,000 | | Century Intermediate Holding Co. 2 (a) | | 9.750% | | 2/15/19 | | | 291,500 | |
See notes to financial statements
High Yield Opportunities Fund
July 31, 2014 (continued)
| | | | | | | | | | | | |
| Face | | | | | | | | | Value | |
| amount | | | | Coupon | | Maturity | | | (note 2) | |
| | | | | | | | | | | | |
| | | | United States (continued) | | | | | | | | |
| USD | 525,000 | | CHS/Community Health Systems, Inc. (a) | | 6.875% | | 2/1/22 | | $ | 539,437 | |
| USD | 285,000 | | Clear Channel Communications, Inc. | | 10.000% | | 1/15/18 | | | 260,419 | |
| USD | 300,000 | | Clearwater Paper Corp. (a) | | 5.375% | | 2/1/25 | | | 300,000 | |
| USD | 535,000 | | CONSOL Energy, Inc. (a) | | 5.875% | | 4/15/22 | | | 543,359 | |
| USD | 250,000 | | CPG Merger Sub LLC (a) | | 8.000% | | 10/1/21 | | | 259,375 | |
| USD | 375,000 | | Crestview DS Merger Sub II, Inc. | | 10.000% | | 9/1/21 | | | 423,281 | |
| USD | 370,000 | | Crimson Merger Sub, Inc. (a) | | 6.625% | | 5/15/22 | | | 353,812 | |
| USD | 270,000 | | Diamond Foods, Inc. (a) | | 7.000% | | 3/15/19 | | | 278,100 | |
| USD | 250,000 | | Digicel Group, Ltd. (a) | | 8.250% | | 9/30/20 | | | 270,625 | |
| USD | 500,000 | | Endo Finance LLC & Endo Finco, Inc. (a) | | 5.375% | | 1/15/23 | | | 483,750 | |
| USD | 413,000 | | Energy XXI Gulf Coast, Inc. (a) | | 6.875% | | 3/15/24 | | | 411,967 | |
| USD | 525,000 | | Foresight Energy LLC (a) | | 7.875% | | 8/15/21 | | | 556,500 | |
| USD | 250,000 | | Gardner Denver, Inc. (a) | | 6.875% | | 8/15/21 | | | 253,125 | |
| USD | 575,000 | | Gates Global LLC (a) | | 6.000% | | 7/15/22 | | | 563,500 | |
| USD | 500,000 | | Headwaters, Inc. | | 7.250% | | 1/15/19 | | | 525,000 | |
| USD | 500,000 | | Hockey Merger Sub 2, Inc. (a) | | 7.875% | | 10/1/21 | | | 515,000 | |
| USD | 250,000 | | Hot Topic, Inc. (a) | | 9.250% | | 6/15/21 | | | 276,250 | |
| USD | 560,000 | | ILFC E-Capital Trust II (a) (b) | | 6.250% | | 12/21/65 | | | 560,700 | |
| USD | 275,000 | | Infor Software Parent LLC/Infor Software Parent, Inc. (a) | | 7.125% | | 5/1/21 | | | 273,625 | |
| USD | 200,000 | | j2 Global, Inc. | | 8.000% | | 8/1/20 | | | 217,000 | |
| USD | 250,000 | | Jefferies LoanCore LLC (a) | | 6.875% | | 6/1/20 | | | 250,625 | |
| USD | 250,000 | | Landry’s, Inc. (a) | | 9.375% | | 5/1/20 | | | 272,500 | |
| USD | 275,000 | | Light Tower Rentals, Inc. (a) | | 8.125% | | 8/1/19 | | | 281,188 | |
| USD | 290,000 | | MHGE Parent LLC/MHGE Parent Finance, Inc. (a) | | 8.500% | | 8/1/19 | | | 282,388 | |
| USD | 250,000 | | Murray Energy Corp. (a) | | 8.625% | | 6/15/21 | | | 266,250 | |
| USD | 250,000 | | Neiman Marcus Group, Ltd. (a) | | 8.000% | | 10/15/21 | | | 265,000 | |
| USD | 500,000 | | PC Nextco Holdings LLC (a) | | 8.750% | | 8/15/19 | | | 507,500 | |
| USD | 275,000 | | PF Chang’s China Bistro, Inc. (a) | | 10.250% | | 6/30/20 | | | 280,500 | |
| USD | 125,000 | | PHH Corp. | | 6.375% | | 8/15/21 | | | 126,250 | |
| USD | 250,000 | | Pinnacle Operating Corp. (a) | | 9.000% | | 11/15/20 | | | 269,375 | |
| USD | 275,000 | | Post Holdings, Inc. (a) | | 6.000% | | 12/15/22 | | | 272,594 | |
| USD | 162,000 | | Quiksilver, Inc. | | 10.000% | | 8/1/20 | | | 139,320 | |
| USD | 250,000 | | RCN Telecom Services LLC (a) | | 8.500% | | 8/15/20 | | | 267,500 | |
| USD | 285,000 | | Rex Energy Corp. (a) | | 6.250% | | 8/1/22 | | | 282,506 | |
| USD | 250,000 | | Rite Aid Corp. | | 6.750% | | 6/15/21 | | | 261,250 | |
| USD | 250,000 | | Sanchez Energy Corp. | | 7.750% | | 6/15/21 | | | 272,500 | |
| USD | 490,000 | | SandRidge Energy, Inc. | | 8.125% | | 10/15/22 | | | 524,300 | |
| USD | 250,000 | | Select Medical Corp. | | 6.375% | | 6/1/21 | | | 257,500 | |
| USD | 500,000 | | Signode Industrial Group Lux S.A. (a) | | 6.375% | | 5/1/22 | | | 493,750 | |
| USD | 475,000 | | Sinclair Television Group, Inc. (a) | | 5.625% | | 8/1/24 | | | 470,844 | |
| USD | 250,000 | | Sophia Holding Finance LP (a) | | 9.625% | | 12/1/18 | | | 253,750 | |
| USD | 525,000 | | Sprint Corp. (a) | | 7.125% | | 6/15/24 | | | 537,469 | |
| USD | 229,000 | | Tenet Healthcare Corp. | | 8.125% | | 4/1/22 | | | 256,480 | |
| USD | 250,000 | | TMS International Corp. (a) | | 7.625% | | 10/15/21 | | | 266,875 | |
| USD | 375,000 | | TransDigm, Inc. (a) | | 6.000% | | 7/15/22 | | | 377,344 | |
| USD | 250,000 | | USI, Inc. (a) | | 7.750% | | 1/15/21 | | | 249,375 | |
| USD | 550,000 | | West Corp. (a) | | 5.375% | | 7/15/22 | | | 534,875 | |
| | | | | | | | | | | 20,730,877 | |
| | | | | | | | | | | | |
| | | | Total corporate bonds | | | | | | | | |
| | | | (Cost $24,801,513) | | | | | | | 24,981,554 | |
See notes to financial statements
High Yield Opportunities Fund
July 31, 2014 (continued)
| | | | | | Value | |
| Shares | | | | | (note 2) | |
| | | | | | | |
| Preferred stock – 4.14% | | | | |
| | | | | | | |
| | | United States - 4.14% | | | | |
| 1,100 | | Ally Financial, Inc. 7%, | | | | |
| | | 9/2/14 (a) (c) | | $ | 1,100,000 | |
| | | | | | | |
| | | Total preferred stock | | | | |
| | | (Cost $1,072,406) | | | 1,100,000 | |
| | | | | | | |
| | | Total long-term investments | | | | |
| | | (Cost $25,873,919) | | | 26,081,554 | |
| | | | | | | |
| Short-term investment - 4.17% | | | | |
| 1,109,052 | | Fidelity Institutional | | | | |
| | | Treasury Portfolio (d) | | | 1,109,052 | |
| | | | | | | |
| | | Total short-term investment | | | | |
| | | (Cost $1,109,052) | | | 1,109,052 | |
| | | | | | | |
| Total investments - 102.30% | | | | |
| | | (Cost $26,982,971) | | | 27,190,606 | |
| | | | | | | |
| Financial Derivative Instruments(e) | | | | |
| (Cost or Premiums, net $31,851) – 0.11% | | | 29,146 | |
| | | | | | | |
| Net other assets and liabilities – (2.41)% | | | (640,146 | ) |
| | | | | | | |
| Total net assets – 100.00% | | $ | 26,579,606 | |
| (a) | | Restricted security, purchased pursuant to Rule 144A under the Securities Act of 1933, as amended, and which is exempt from registration under that Act. At July 31, 2014, the restricted securities held by the Fund had an aggregate value of $21,440,660, which represented 80.7% of net assets. |
| (b) | | Variable or Floating rate interest rate security. Rate presented represents rate at July 31, 2014. |
| (c) | | Maturity date is perpetual. Maturity date presented represents the next call date. |
| (d) | | This short-term investment was segregated for open swap contracts at July 31, 2014. |
| (e) | | Information with respect to financial derivative instruments is disclosed in the following tables. |
See notes to financial statements
High Yield Opportunities Fund
July 31, 2014 (continued)
(e) FINANCIAL DERIVATIVE INSTRUMENTS
OVER-THE-COUNTER FINANCIAL DERIVATIVE INSTRUMENTS
CREDIT DEFAULT SWAP CONTRACTS
| | Reference | | Rates received/ | | Termination | | Implied credit | | | Notional amount | | | | | | Unrealized appreciation/ | | | Value | |
| Counterparty | entity | | | | | | | | | (000s | ) | | | ) | | (depreciation | ) | | Asset | | | Liability | |
| Protection sold: | | | | | | | | | | | | | | | | | | | | | | | |
| Barclays Bank plc | Delta Airlines, Inc. | | | 5.00 | % | 9/20/19 | | | 2.52 | % | | $ | 250 | | | $ | 31,851 | | | $ | (2,705 | ) | | $ | 29,146 | | | $ | — | |
During the year ended July 31, 2014, average notional value related to swap contracts was approximately $117,406, or 0.4% of net assets.
FINANCIAL DERIVATIVE INSTRUMENTS: OVER-THE-COUNTER SUMMARY
The following is a summary by counterparty of the value of over-the-counter financial derivative instruments and collateral (received)/pledged as of July 31, 2014.
| | | | | | | | | | | | | | | | | | | | | |
| | | Financial Derivative Assets | | | Financial Derivative Liabilities | | | | | | | | | |
| | | Value(1) | | | | | | Value(1) | | | | | | | | | | | | |
| | | | | | | | | | | | | | Net Value of | | | | | | | |
| | | | | Total | | | | | Total | | Over-the- | | Collateral | | | | |
| | | Swap | | Over-the- | | | Swap | | Over-the- | | Counter | | (Received) / | | Net | |
| | | Contracts | | Counter | | | Contracts | | Counter | | Derivatives | | Pledged | | Exposure(2) | |
| Amounts subject to a master netting or similar arrangement: | | | | | | | | | | | | | | | |
| Barclays Bank plc | | $ | 29,146 | | | $ | 29,146 | | | $ | — | | | $ | — | | | $ | 29,146 | | | $ | — | | | $ | 29,146 | |
| | | $ | 29,146 | | | $ | 29,146 | | | $ | — | | | $ | — | | | $ | 29,146 | | | $ | — | | | $ | 29,146 | |
| (1) | | Value on swap contracts is represented by “unrealized appreciation/(depreciation)” on interest rate swaps, and “value” on credit default swaps, which is inclusive of upfront premiums paid/(received) |
| (2) | | Net Exposure represents the net receivable/(payable) that would be due from/to the counterparty in the event of default. Exposure from over-the-counter financial derivative instruments can only be netted across transactions governed under the same master agreement with the same legal entity. See Note 2, Significant Accounting Policies, “Derivative instruments,” in the Notes to Financial Statements for more information regarding master netting arrangements. Absent an event of default or early termination, over-the-counter derivative assets and liabilities are presented gross and not offset in the Statement of Assets and Liabilities. |
| | Cost or Premiums, net | | Asset | | Liability | |
| TOTAL FINANCIAL DERIVATIVE INSTRUMENTS | | $ | 31,851 | | $ | 29,146 | | $ | — | |
See notes to financial statements
High Yield Opportunities Fund
July 31, 2014 (continued)
Other information:
| | | | |
| Industry concentration as | % of net |
| a percentage of net assets: | assets |
| | | | |
| Oil & Gas Exploration & Production | | 8.71 | % |
| Diversified Banking Institution | | 5.24 | |
| Coal | | 5.14 | |
| Medical-Hospitals | | 3.96 | |
| Cellular Telecommunications | | 3.04 | |
| Cable TV | | 3.00 | |
| Telecommunication Services | | 3.00 | |
| Insurance Brokers | | 2.88 | |
| Chemicals - Other | | 2.32 | |
| Wire & Cable Products | | 2.30 | |
| Enterprise Software/Services | | 2.25 | |
| Medical-Outpatient/Home Medical | | 2.19 | |
| Rubber/Plastic Products | | 2.12 | |
| Finance-Leasing Company | | 2.11 | |
| Retail - Restaurants | | 2.08 | |
| Building & Construction Products - Miscellaneous | | 2.06 | |
| Oil & Gas Refining & Marketing | | 2.04 | |
| Building Products-Cement Aggregates | | 1.98 | |
| Satellite Telecommunications | | 1.93 | |
| Security Services | | 1.92 | |
| Retail-Leisure Products | | 1.91 | |
| Steel-Specialty | | 1.86 | |
| Medical - Drugs | | 1.82 | |
| Television | | 1.77 | |
| Beverages-Non-alcoholic | | 1.59 | |
| Commercial Services | | 1.48 | |
| Aerospace/Defense-Equipment | | 1.42 | |
| Diagnostic Equipment | | 1.33 | |
| Paper & Related Products | | 1.13 | |
| Independent Power Producer | | 1.11 | |
| Consumer Products - Miscellaneous | | 1.10 | |
| Casino Hotels | | 1.06 | |
| Publishing-Books | | 1.06 | |
| Rental Auto/Equipment | | 1.06 | |
| Commercial Banks-Southern US | | 1.05 | |
| Food-Miscellaneous/Diversified | | 1.05 | |
| Retail - Apparel/Shoe | | 1.04 | |
| Food-Flour & Grain | | 1.03 | |
| Agricultural Operations | | 1.01 | |
| Industry concentration as | % of net |
| a percentage of net assets: | assets |
| | | | |
| Retail-Major Department Store | | 1.00 | % |
| Gold Mining | | 0.99 | |
| Broadcast Services/Programs | | 0.98 | |
| Retail-Drug Store | | 0.98 | |
| Hazardous Waste Disposal | | 0.97 | |
| Educational Software | | 0.96 | |
| Commercial Banks Non-US | | 0.95 | |
| Specified Purpose Acquisition | | 0.95 | |
| Finance-Commercial | | 0.94 | |
| Electronic Components-Semiconductors | | 0.92 | |
| Oil & Gas Drilling | | 0.92 | |
| Computer Services | | 0.82 | |
| Transport-Services | | 0.80 | |
| Apparel Manufacturers | | 0.52 | |
| Commercial Services-Finance | | 0.28 | |
| Long-Term Investments | | 98.13 | |
| Short-Term Investment | | 4.17 | |
| Total Investments | | 102.30 | |
| Financial Derivative Instruments | | 0.11 | |
| Net Other Assets and Liabilities | | (2.41 | ) |
| | | 100.00 | % |
See notes to financial statements
High Yield Opportunities Fund
July 31, 2014 (continued)
Fair Value Measurements
The following table summarizes the Fund’s investments that are measured at fair value by level within the fair value hierarchy at July 31, 2014:
| | | | | | | | | | | | | | |
| | | | Quoted prices | | | Significant | | | | | | | |
| | | | in active | | | other | | | Significant | | | | |
| | | | markets for | | | observable | | | unobservable | | | | |
| | | | identical assets | | | inputs | | | inputs | | | | |
| Description | | | (level 1 | ) | | (level 2 | ) | | (level 3 | ) | | Total | |
| Assets | | | | | | | | | | | | | |
| | | | | | | | | | | | | | |
| Corporate Bonds | | | | | | | | | | | | | |
| Barbados | | $ | — | | $ | 529,375 | | $ | — | | $ | 529,375 | |
| Bermuda | | | — | | | 244,388 | | | — | | | 244,388 | |
| Canada | | | — | | | 1,033,340 | | | — | | | 1,033,340 | |
| Luxembourg | | | — | | | 774,375 | | | — | | | 774,375 | |
| Puerto Rico | | | — | | | 277,887 | | | — | | | 277,887 | |
| Sweden | | | — | | | 615,875 | | | — | | | 615,875 | |
| United Kingdom | | | — | | | 775,437 | | | — | | | 775,437 | |
| United States | | | — | | | 20,730,877 | | | — | | | 20,730,877 | |
| Total Corporate Bonds | | | — | | | 24,981,554 | | | — | | | 24,981,554 | |
| | | | | | | | | | | | | | |
| Preferred Stock | | | | | | | | | | | | | |
| United States | | | — | | | 1,100,000 | | | — | | | 1,100,000 | |
| Total Preferred Stock | | | — | | | 1,100,000 | | | — | | | 1,100,000 | |
| | | | | | | | | | | | | | |
| Short-Term Investment | | | 1,109,052 | | | — | | | — | | | 1,109,052 | |
| Total Investments | | $ | 1,109,052 | | $ | 26,081,554 | | $ | — | | $ | 27,190,606 | |
| | | | | | | | | | | | | | |
| Financial Derivative Instruments – Assets | | | | | | | | | | | | | |
| Over-the-counter | | | — | | | 29,146 | | | — | | | 29,146 | |
| Total Financial Derivative Instruments – Assets | | $ | — | | $ | 29,146 | | $ | — | | $ | 29,146 | |
During the year ended July 31, 2014, there were no transfers in or out of security levels as a result of fair value pricing procedures established by the Board.
See notes to financial statements
High Yield Opportunities Fund
July 31, 2014 (continued)
Fair Value of Financial Derivative Instruments
The following is a summary of the fair valuation of the Fund’s financial derivative instruments categorized by risk exposure:
Fair Values of Financial Derivative Instruments on the Statement of Assets and Liabilities as of July 31, 2014
| | | Derivatives not accounted for as hedging instruments | |
| | | Foreign | | | | | | | | | | | | | | | | |
| | | Currency | | | Equity | | | Interest | | | Credit | | | Inflation | | | | |
| | | Risk | | | Risk | | | Rate Risk | | | Risk | | | Risk | | | Total | |
| Financial Derivative Instruments – Assets | | | | | | | | | | | | | | | | | | |
| Over-the-Counter | | | | | | | | | | | | | | | | | | |
| Swap Contracts | | $ | — | | | $ | — | | | $ | — | | | $ | 29,146 | | | $ | — | | | $ | 29,146 | |
| Total | | $ | — | | | $ | — | | | $ | — | | | $ | 29,146 | | | $ | — | | | $ | 29,146 | |
| | | | | | | | | | | | | | | | | | | | | | | | | |
| Financial Derivative Instruments – Liabilities | | | | | | | | | | | | | | | | | | | | | | | | |
| Over-the-Counter | | | | | | | | | | | | | | | | | | | | | | | | |
| Swap Contracts | | $ | — | | | $ | — | | | $ | — | | | $ | — | | | $ | — | | | $ | — | |
| Total | | $ | — | | | $ | — | | | $ | — | | | $ | — | | | $ | — | | | $ | — | |
| Net | | $ | — | | | $ | — | | | $ | — | | | $ | 29,146 | | | $ | — | | | $ | 29,146 | |
Effect of Financial Derivative Instruments on the Statement of Operations for the Year Ended July 31, 2014
| | | Derivatives not accounted for as hedging instruments | |
| | | Foreign | | | | | | | | | | | | | | | | |
| | | Currency | | | Equity | | | Interest | | | Credit | | | Inflation | | | | |
| | | Risk | | | Risk | | | Rate Risk | | | Risk | | | Risk | | | Total | |
| Net realized gain/(loss) from | | | | | | | | | | | | | | | | | | |
| financial derivative instruments: | | | | | | | | | | | | | | | | | | |
| Swap Contracts | | $ | — | | | $ | — | | | $ | — | | | $ | 14,382 | | | $ | — | | | $ | 14,382 | |
| Total | | $ | — | | | $ | — | | | $ | — | | | $ | 14,382 | | | $ | — | | | $ | 14,382 | |
| | | | | | | | | | | | | | | | | | | | | | | | | |
| Net change in unrealized | | | | | | | | | | | | | | | | | | | | | | | | |
| appreciation/(depreciation) | | | | | | | | | | | | | | | | | | | | | | | | |
| of financial derivative instruments | | | | | | | | | | | | | | | | | | | | | | | | |
| Swap Contracts | | $ | — | | | $ | — | | | $ | — | | | $ | (9,291 | ) | | $ | — | | | $ | (9,291 | ) |
| Total | | $ | — | | | $ | — | | | $ | — | | | $ | (9,291 | ) | | $ | — | | | $ | (9,291 | ) |
See notes to financial statements
International Opportunities Fund
July 31, 2014
| | | | | | Value | |
| Shares | | | | | (note 2) | |
| | | | | | | |
| Common stocks - 94.62% | | | | |
| | | | | | | |
| | | Australia - 0.70% | | | | |
| 6,089,798 | | Fortescue Metals Group, Ltd. | | $ | 27,347,965 | |
| | | | | | | |
| | | Brazil - 1.17% | | | | |
| 2,280,000 | | BM&FBOVESPA S.A. | | | 12,170,050 | |
| 702,000 | | Cielo S.A. | | | 12,840,992 | |
| 245,000 | | Embraer S.A., ADR | | | 9,319,800 | |
| 600,000 | | Petroleo Brasileiro S.A., ADR | | | 9,564,000 | |
| 166,500 | | Via Varejo S.A. * | | | 1,754,717 | |
| | | | | | 45,649,559 | |
| | | | | | | |
| | | China - 5.76% | | | | |
| 128,421,000 | | Agricultural Bank of China | | | | |
| | | Ltd., Class H | | | 62,564,899 | |
| 254,940 | | Baidu, Inc., ADR * | | | 55,079,787 | |
| 16,596,000 | | Dongfeng Motor Group Co., | | | | |
| | | Ltd., Class H | | | 29,433,799 | |
| 34,942,000 | | PetroChina Co., Ltd., Class H | | | 45,747,439 | |
| 3,800,000 | | Ping An Insurance (Group) | | | | |
| | | Co. of China, Ltd., Class H | | | 32,434,293 | |
| | | | | | 225,260,217 | |
| | | | | | | |
| | | Finland - 1.91% | | | | |
| 9,400,000 | | Nokia Oyj | | | 74,641,335 | |
| | | | | | | |
| | | France - 9.36% | | | | |
| 1,150,000 | | Accor S.A. | | | 55,744,659 | |
| 523,000 | | L’Oreal S.A. | | | 88,520,858 | |
| 500,000 | | Publicis Groupe | | | 36,388,689 | |
| 950,000 | | Renault S.A. | | | 79,340,732 | |
| 1,064,150 | | Sodexo | | | 106,173,044 | |
| | | | | | 366,167,982 | |
| | | | | | | |
| | | Germany - 13.06% | | | | |
| 540,323 | | Continental AG | | | 116,920,769 | |
| 3,107,846 | | Deutsche Post AG | | | 99,939,906 | |
| 754,367 | | Fresenius SE & Co., KGaA | | | 113,034,137 | |
| 2,800,000 | | ProSiebenSat.1 Media AG | | | 117,972,999 | |
| 800,000 | | SAP SE | | | 63,053,195 | |
| | | | | | 510,921,006 | |
| | | | | | | |
| | | Hong Kong - 2.19% | | | | |
| 3,016,000 | | Cheung Kong Holdings, Ltd. | | | 58,622,449 | |
| 10,035,000 | | SJM Holdings, Ltd. | | | 26,893,168 | |
| | | | | | 85,515,617 | |
| | | | | | | |
| | | India - 1.18% | | | | |
| 1,175,143 | | Tata Motors, Ltd., ADR * | | | 46,206,623 | |
| | | | | | Value | |
| Shares | | | | | (note 2) | |
| | | | | | | |
| | | Indonesia - 1.04% | | | | |
| 44,435,500 | | PT Bank Rakyat Indonesia Tbk | | $ | 40,734,466 | |
| | | | | | | |
| | | Ireland - 0.45% | | | | |
| 341,971 | | ICON plc * | | | 17,714,098 | |
| | | | | | | |
| | | Japan - 19.74% | | | | |
| 1,741,600 | | Denso Corp. | | | 80,298,653 | |
| 477,300 | | Fanuc, Ltd. | | | 82,686,801 | |
| 1,651,100 | | FUJIFILM Holdings Corp. | | | 47,151,018 | |
| 12,988,000 | | Hitachi, Ltd. | | | 101,109,618 | |
| 307,900 | | JSR Corp. | | | 5,321,298 | |
| 7,330,000 | | Mitsubishi Heavy Industries Ltd. | | | 47,839,371 | |
| 2,981,800 | | NKSJ Holdings, Inc. | | | 75,619,453 | |
| 4,563,800 | | Sekisui House, Ltd. | | | 59,862,857 | |
| 1,704,700 | | Sony Corp. | | | 31,019,664 | |
| 3,020,600 | | Sumitomo Mitsui Financial | | | | |
| | | Group, Inc. | | | 123,659,554 | |
| 1,016,100 | | Takeda Pharmaceutical | | | | |
| | | Co., Ltd. | | | 46,433,483 | |
| 3,592,000 | | Toray Industries, Inc. | | | 24,352,083 | |
| 790,800 | | Toyota Motor Corp. | | | 46,782,492 | |
| | | | | | 772,136,345 | |
| | | | | | | |
| | | Korea - 2.34% | | | | |
| 138,507 | | Hyundai Motor Co. | | | 32,980,734 | |
| 135,000 | | Samsung Fire & Marine | | | | |
| | | Insurance Co., Ltd. | | | 37,043,778 | |
| 492,270 | | SK Hynix, Inc. * | | | 21,386,126 | |
| | | | | | 91,410,638 | |
| | | | | | | |
| | | Mexico - 0.48% | | | | |
| 82,000 | | Fomento Economico | | | | |
| | | Mexicano, S.A.B. de C.V., ADR | | | 7,698,980 | |
| 3,060,000 | | Grupo Mexico S.A.B. de C.V., | | | | |
| | | Series B | | | 10,888,230 | |
| | | | | | 18,587,210 | |
| | | | | | | |
| | | Netherlands - 2.68% | | | | |
| 1,107,500 | | ASML Holding N.V. | | | 104,936,944 | |
| | | | | | | |
| | | Norway - 0.02% | | | | |
| 5,412,166 | | African Petroleum Corp., | | | | |
| | | Ltd. (a) * | | | 852,330 | |
| | | | | | | |
| | | Panama - 0.23% | | | | |
| 58,200 | | Copa Holdings S.A., Class A | | | 8,838,834 | |
See notes to financial statements
International Opportunities Fund
July 31, 2014 (continued)
| | | | | | Value | |
| Shares | | | | | (note 2) | |
| | | | | | | |
| | | Russia - 0.19% | | | | |
| 15,800,000 | | RusPetro plc (a) * | | $ | 4,268,021 | |
| 550,000 | | TCS Group Holdings plc, | | | | |
| | | GDR (a)(b) * | | | 2,970,000 | |
| | | | | | 7,238,021 | |
| | | | | | | |
| | | Singapore - 0.96% | | | | |
| 2,572,000 | | DBS Group Holdings, Ltd. | | | 37,510,545 | |
| | | | | | | |
| | | Spain - 5.80% | | | | |
| 2,678,650 | | Amadeus IT Holding S.A., | | | | |
| | | A Shares | | | 105,811,980 | |
| 2,750,000 | | Inditex S.A. | | | 80,478,590 | |
| 7,250,000 | | International Consolidated | | | | |
| | | Airlines Group S.A. * | | | 40,490,485 | |
| | | | | | 226,781,055 | |
| | | | | | | |
| | | Switzerland - 5.28% | | | | |
| 1,000,000 | | Cie Financiere Richemont S.A. | | | 95,350,756 | |
| 381,929 | | Roche Holding AG | | | 111,247,985 | |
| | | | | | 206,598,741 | |
| | | | | | | |
| | | Taiwan - 1.23% | | | | |
| 2,412,771 | | Taiwan Semiconductor | | | | |
| | | Manufacturing Co., Ltd., ADR | | | 48,255,420 | |
| | | | | | | |
| | | United Kingdom - 13.74% | | | | |
| 30,000,000 | | Barclays plc | | | 114,314,753 | |
| 5,737,150 | | Capita Group plc | | | 116,426,044 | |
| 3,549,238 | | GlaxoSmithKline plc | | | 86,077,614 | |
| 11,000,000 | | HSBC Holdings plc | | | 118,187,712 | |
| 16,150,000 | | Standard Life plc | | | 102,193,101 | |
| | | | | | 537,199,224 | |
| | | | | | | |
| | | United States - 5.11% | | | | |
| 348,586 | | AmerisourceBergen Corp. | | | 26,809,749 | |
| 571,418 | | Cognizant Technology Solutions | | |
| | | Corp., Class A * | | | 28,028,053 | |
| 543,819 | | Comcast Corp., Class A | | | 29,219,395 | |
| 336,916 | | Gilead Sciences, Inc. * | | | 30,844,660 | |
| 25,967 | | Google, Inc., Class A * | | | 15,049,175 | |
| 25,967 | | Google, Inc., Class C * | | | 14,842,737 | |
| 361,383 | | MasterCard, Inc., Class A | | | 26,796,550 | |
| 22,845 | | Priceline Group, Inc. * | | | 28,383,770 | |
| | | | | | 199,974,089 | |
| | | | | | | |
| | | Total common stocks | | | | |
| | | (Cost $3,105,605,107) | | | 3,700,478,264 | |
| | | | | | Value | |
| Shares | | | | | (note 2) | |
| | | | | | | |
| REITs - 0.09% | | | | |
| | | | | | | |
| | | Mexico - 0.09% | | | | |
| 1,063,173 | | Fibra Uno Administracion | | | | |
| | | S.A. de C.V. | | | $ 3,733,973 | |
| | | | | | | |
| | | Total REITs | | | | |
| | | (Cost $3,345,364) | | | 3,733,973 | |
| | | | | | | |
| Preferred stock - 0.37% | | | | |
| | | | | | | |
| | | Brazil - 0.37% | | | | |
| 931,150 | | Itau Unibanco Holding S.A. | | | 14,405,891 | |
| | | | | | | |
| | | Total preferred stock | | | | |
| | | (Cost $13,404,732) | | | 14,405,891 | |
| | | | | | | |
| | | Total long-term investments | | | | |
| | �� | (Cost $3,122,355,203) | | | 3,718,618,128 | |
| | | | | | | |
| Short-term investment - 2.04% | | | | |
| 79,826,343 | | Fidelity Institutional | | | | |
| | | Treasury Portfolio | | | 79,826,343 | |
| | | | | | | |
| | | Total short-term investment | | | | |
| | | (Cost $79,826,343) | | | 79,826,343 | |
| | | | | | | |
| Total investments - 97.12% | | | | |
| | | (Cost $3,202,181,546) | | | 3,798,444,471 | |
| | | | | | | |
| Financial Derivative Instruments(c) | | | | |
| (Cost or Premiums, net $0) – 0.39% | | | 15,312,757 | |
| | | | | | | |
| Net other assets and liabilities – 2.49% | | | 97,229,542 | |
| | | | | | | |
| Total net assets – 100.00% | | | $ 3,910,986,770 | |
| * | | Non-income producing security |
| (a) | | The security has been deemed illiquid according to the policies and procedures adopted by the Board of Trustees. |
| (b) | | Restricted security, purchased pursuant to Rule 144A under the Securities Act of 1933, as amended, and which is exempt from registration under that Act. At July 31, 2014, the restricted securities held by the Fund had an aggregate value of $2,970,000, which represented 0.1% of net assets. |
| (c) | | Information with respect to financial derivative instruments is disclosed in the following tables. |
| ADR | | American Depositary Receipts |
| GDR | | Global Depositary Receipts |
| REIT | | Real Estate Investment Trust |
See notes to financial statements
International Opportunities Fund
July 31, 2014 (continued)
(c) FINANCIAL DERIVATIVE INSTRUMENTS
OVER-THE-COUNTER FINANCIAL DERIVATIVE INSTRUMENTS
FORWARD FOREIGN CURRENCY CONTRACTS
| | | | | | | | | | | Unrealized | |
| | | | | Local | | | Current | | | appreciation/ | |
| | | Value | | amount | | | notional | | | (depreciation) | |
| | Counterparty | date | | | (000’s | ) | | value | | | Asset | | | Liability | |
| Euro (Short) | State Street Bank, London | 8/14/14 | | | 239,712 | | | $ | 320,996,916 | | | $ | 9,003,084 | | | $ | — | |
| Japanese Yen (Short) | JPMorgan Chase | | | | | | | | | | | | | | | | | |
| | Bank, N.A. | 8/22/14 | | | 17,209,100 | | | | 167,315,104 | | | | 2,684,896 | | | | — | |
| Japanese Yen (Short) | Deutsche Bank AG | 8/22/14 | | | 7,103,139 | | | | 69,060,120 | | | | 939,881 | | | | — | |
| Japanese Yen (Short) | Citibank, N.A. | 8/22/14 | | | 17,209,100 | | | | 167,315,104 | | | | 2,684,896 | | | | — | |
| Total | | | | | | | | | | | | $ | 15,312,757 | | | $ | — | |
During the year ended July 31, 2014, average monthly notional value related to forward foreign currency contracts was approximately $673.7 million, or 17.2% of net assets.
FINANCIAL DERIVATIVE INSTRUMENTS: OVER-THE-COUNTER SUMMARY
The following is a summary by counterparty of the value of over-the-counter financial derivative instruments and collateral (received)/pledged as of July 31, 2014.
| | | Financial Derivative Assets | | Financial Derivative Liabilities | | | | | | | | | | |
| | | Unrealized | | | | | | Unrealized | | | | | | | | | | | | | |
| | | Appreciation | | | | | | Depreciation | | | | | | | | | | | | | |
| | | Forward | | | | | | Forward | | | | | | Net Value of | | | | | | | |
| | | Foreign | | | Total | | | Foreign | | | Total | | | Over-the- | | | Collateral | | | | |
| | | Currency | | | Over-the- | | | Currency | | | Over-the- | | | Counter | | | (Received) / | | | Net | |
| | | Contracts | | | Counter | | | Contracts | | | Counter | | | Derivatives | | | Pledged | | | Exposure(1) | |
| Amounts subject to a master netting or similar arrangement: | | | | | | | | | | | | | | | |
| Citibank, N.A. | | $ | 2,684,896 | | | $ | 2,684,896 | | | $ | — | | | $ | — | | | $ | 2,684,896 | | | $ | — | | | $ | 2,684,896 | |
| Deutsche Bank AG | | | 939,881 | | | | 939,881 | | | | — | | | | — | | | | 939,881 | | | | — | | | | 939,881 | |
JPMorgan Chase Bank, N.A. | | | 2,684,896 | | | | 2,684,896 | | | | — | | | | — | | | | 2,684,896 | | | | — | | | | 2,684,896 | |
| | | $ | 6,309,673 | | | $ | 6,309,673 | | | $ | — | | | $ | — | | | $ | 6,309,673 | | | $ | — | | | $ | 6,309,673 | |
| | | | | | | | | | | | | | | | | | |
| Amounts NOT subject to a master netting or similar arrangement: | | | | | | | | | | | | | | | | | |
| State Street | | | | | | | | | | | | | | | | | | | | | | | | | | | | |
Bank, London(2) | | $ | 9,003,084 | | | $ | 9,003,084 | | | $ | — | | | $ | — | | | $ | — | | | $ | — | | | $ | — | |
| | | $ | 9,003,084 | | | $ | 9,003,084 | | | $ | — | | | $ | — | | | $ | — | | | $ | — | | | $ | — | |
| | $ | 15,312,757 | | | $ | 15,312,757 | | | $ | — | | | $ | — | | | | | | | | | | | | | |
| (1) | | Net Exposure represents the net receivable/(payable) that would be due from/to the counterparty in the event of default. Exposure from over-the-counter financial derivative instruments can only be netted across transactions governed under the same master agreement with the same legal entity. See Note 2, Significant Accounting Policies, “Derivative instruments,” in the Notes to Financial Statements for more information regarding master netting arrangements. Absent an event of default or early termination, over-the-counter derivative assets and liabilities are presented gross and not offset in the Statement of Assets and Liabilities. |
| (2) | | Forward foreign currency contracts with State Street Bank, London are not subject to a legally enforceable master netting arrangement or other similar agreements that provide legally enforceable right of offset. |
| | Cost or Premiums, net | | Asset | | Liability | |
| TOTAL FINANCIAL DERIVATIVE INSTRUMENTS | | $ | — | | $ | 15,312,757 | | $ | — | |
See notes to financial statements
International Opportunities Fund
July 31, 2014 (continued)
Other information:
| | | | |
| Industry concentration as | % of net |
| a percentage of net assets: | assets |
| | | | |
| Diversified Banks | | 13.07 | % |
| Pharmaceuticals | | 6.23 | |
| Auto Parts & Equipment | | 5.04 | |
| Automobile Manufacturers | | 4.82 | |
| Electronic Equipment & Instruments | | 3.79 | |
| Data Processing & Outsourced Services | | 3.72 | |
| Life & Health Insurance | | 3.44 | |
| Industrial Machinery | | 3.34 | |
| Broadcasting | | 3.02 | |
| Human Resource & Employment Services | | 2.98 | |
| Health Care Equipment | | 2.89 | |
| Property & Casualty Insurance | | 2.88 | |
| Restaurants | | 2.71 | |
| Semiconductor Equipment | | 2.68 | |
| Air Freight & Logistics | | 2.56 | |
| Apparel, Accessories & Luxury Goods | | 2.44 | |
| Personal Products | | 2.26 | |
| Internet Software & Services | | 2.17 | |
| Apparel Retail | | 2.06 | |
| Communications Equipment | | 1.91 | |
| Semiconductors | | 1.78 | |
| Application Software | | 1.61 | |
| Homebuilding | | 1.53 | |
| Real Estate Development | | 1.50 | |
| Hotels, Resorts & Cruise Lines | | 1.42 | |
| Integrated Oil & Gas | | 1.41 | |
| Airlines | | 1.26 | |
| Construction & Farm Machinery & Heavy Trucks | | 1.18 | |
| Advertising | | 0.93 | |
| Industry concentration as | % of net |
| a percentage of net assets: | assets |
| | | | |
| Consumer Electronics | | 0.79 | % |
| Biotechnology | | 0.79 | |
| Cable & Satellite | | 0.75 | |
| Internet Retail | | 0.73 | |
| IT Consulting & Other Services | | 0.72 | |
| Steel | | 0.70 | |
| Casinos & Gaming | | 0.69 | |
| Health Care Distributors | | 0.69 | |
| Commodity Chemicals | | 0.62 | |
| Life Sciences Tools & Services | | 0.45 | |
| Specialized Finance | | 0.31 | |
| Diversified Metals & Mining | | 0.28 | |
| Aerospace & Defense | | 0.24 | |
| Soft Drinks | | 0.20 | |
| Specialty Chemicals | | 0.14 | |
| Oil & Gas Exploration & Production | | 0.13 | |
| Diversified REITs | | 0.10 | |
| Regional Banks | | 0.08 | |
| Home Improvement Retail | | 0.04 | |
| Long-Term Investments | | 95.08 | |
| Short-Term Investment | | 2.04 | |
| Total Investments | | 97.12 | |
| Financial Derivative Instruments | | 0.39 | |
| Net Other Assets and Liabilities | | 2.49 | |
| | | 100.00 | % |
See notes to financial statements
International Opportunities Fund
July 31, 2014 (continued)
Fair Value Measurements
The following table summarizes the Fund’s investments that are measured at fair value by level within the fair value hierarchy at July 31, 2014:
| | | | | | | | | | | | | | |
| | | | Quoted prices | | | Significant | | | | | | | |
| | | | in active | | | other | | | Significant | | | | |
| | | | markets for | | | observable | | | unobservable | | | | |
| | | | identical assets | | | inputs | | | inputs | | | | |
| Description | | | (level 1 | ) | | (level 2 | ) | | (level 3 | ) | | Total | |
| Assets | | | | | | | | | | | | | |
| | | | | | | | | | | | | | |
| Common Stocks | | | | | | | | | | | | | |
| Australia | | $ | — | | $ | 27,347,965 | | $ | — | | $ | 27,347,965 | |
| Brazil | | | 45,649,559 | | | — | | | — | | | 45,649,559 | |
| China | | | 55,079,787 | | | 170,180,430 | | | — | | | 225,260,217 | |
| Finland | | | 74,641,335 | | | — | | | — | | | 74,641,335 | |
| France | | | 366,167,982 | | | — | | | — | | | 366,167,982 | |
| Germany | | | 510,921,006 | | | — | | | — | | | 510,921,006 | |
| Hong Kong | | | — | | | 85,515,617 | | | — | | | 85,515,617 | |
| India | | | 46,206,623 | | | — | | | — | | | 46,206,623 | |
| Indonesia | | | — | | | 40,734,466 | | | — | | | 40,734,466 | |
| Ireland | | | 17,714,098 | | | — | | | — | | | 17,714,098 | |
| Japan | | | — | | | 772,136,345 | | | — | | | 772,136,345 | |
| Korea | | | — | | | 91,410,638 | | | — | | | 91,410,638 | |
| Mexico | | | 18,587,210 | | | — | | | — | | | 18,587,210 | |
| Netherlands | | | 104,936,944 | | | — | | | — | | | 104,936,944 | |
| Norway | | | 852,330 | | | — | | | — | | | 852,330 | |
| Panama | | | 8,838,834 | | | — | | | — | | | 8,838,834 | |
| Russia | | | 7,238,021 | | | — | | | — | | | 7,238,021 | |
| Singapore | | | — | | | 37,510,545 | | | — | | | 37,510,545 | |
| Spain | | | 226,781,055 | | | — | | | — | | | 226,781,055 | |
| Switzerland | | | 206,598,741 | | | — | | | — | | | 206,598,741 | |
| Taiwan | | | 48,255,420 | | | — | | | — | | | 48,255,420 | |
| United Kingdom | | | 537,199,224 | | | — | | | — | | | 537,199,224 | |
| United States | | | 199,974,089 | | | — | | | — | | | 199,974,089 | |
| Total Common Stocks | | | 2,475,642,258 | | | 1,224,836,006 | | | — | | | 3,700,478,264 | |
| | | | | | | | | | | | | | |
| REITs | | | | | | | | | | | | | |
| Mexico | | | 3,733,973 | | | — | | | — | | | 3,733,973 | |
| Total REITs | | | 3,733,973 | | | — | | | — | | | 3,733,973 | |
| | | | | | | | | | | | | | |
| Preferred Stocks | | | | | | | | | | | | | |
| Brazil | | | 14,405,891 | | | — | | | — | | | 14,405,891 | |
| Total Preferred Stock | | | 14,405,891 | | | — | | | — | | | 14,405,891 | |
| | | | | | | | | | | | | | |
| Short-Term Investment | | | 79,826,343 | | | — | | | — | | | 79,826,343 | |
| Total Investments | | $ | 2,573,608,465 | | $ | 1,224,836,006 | | $ | — | | $ | 3,798,444,471 | |
| | | | | | | | | | | | | | |
| Financial Derivative Instruments – Assets | | | | | | | | | | | | | |
| Over-the-counter | | $ | — | | $ | 15,312,757 | | $ | — | | $ | 15,312,757 | |
| Total Financial Derivative Instruments – Assets | | $ | — | | $ | 15,312,757 | | $ | — | | $ | 15,312,757 | |
On July 31, 2013, substantially all of the common stocks in the Fund were valued at the last reported sale price or official closing price as the Trust’s fair value pricing procedures did not require the use of the independent statistical fair value pricing service as described in Note 2. On July 31, 2014, substantially all of the common stocks traded in the predominately Asian and Australian markets were fair valued using the independent statistical fair value pricing service in accordance with the fair value pricing procedures approved by the Board, and were therefore valued using Level 2 inputs. Accordingly, using the end of the reporting period method for determining when transfers between levels are recognized, common stocks and preferred stocks valued on July 31, 2014 at $543,912,479 were transferred from Level 1 to Level 2.
See notes to financial statements
International Opportunities Fund
July 31, 2014 (continued)
Fair Value of Financial Derivative Instruments
The following is a summary of the fair valuation of the Fund’s financial derivative instruments categorized by risk exposure:
Fair Values of Financial Derivative Instruments on the Statement of Assets and Liabilities as of July 31, 2014
| | | Derivatives not accounted for as hedging instruments | |
| | | Foreign | | | | | | | | | | | | | | | | |
| | Currency | | | Equity | | | Interest | | | Credit | | | Inflation | | | | |
| | | Risk | | | Risk | | | Rate Risk | | | Risk | | | Risk | | | Total | |
| Financial Derivative Instruments – Assets | | | | | | | | | | | | | | | | | | |
| Over-the-Counter | | | | | | | | | | | | | | | | | | |
| Forward Foreign Currency Contracts | | $ | 15,312,757 | | | $ | — | | | $ | — | | | $ | — | | | $ | — | | | $ | 15,312,757 | |
| Total | | $ | 15,312,757 | | | $ | — | | | $ | — | | | $ | — | | | $ | — | | | $ | 15,312,757 | |
| | | | | | | | | | | | | | | | | | | | | | | | | |
| Financial Derivative Instruments – Liabilities | | | | | | | | | | | | | | | | | | | | | | | | |
| Over-the-Counter | | | | | | | | | | | | | | | | | | | | | | | | |
| Forward Foreign Currency Contracts | | $ | — | | | $ | — | | | $ | — | | | $ | — | | | $ | — | | | $ | — | |
| Total | | $ | — | | | $ | — | | | $ | — | | | $ | — | | | $ | — | | | $ | — | |
| Net | | $ | 15,312,757 | | | $ | — | | | $ | — | | | $ | — | | | $ | — | | | $ | 15,312,757 | |
Effect of Financial Derivative Instruments on the Statement of Operations for the Year Ended July 31, 2014
| | | Derivatives not accounted for as hedging instruments | |
| | | Foreign | | | | | | | | | | | | | | | | |
| | | Currency | | | Equity | | | Interest | | | Credit | | | Inflation | | | | |
| | | Risk | | | Risk | | | Rate Risk | | | Risk | | | Risk | | | Total | |
| Net realized gain/(loss) from | | | | | | | | | | | | | | | | | | |
| financial derivative instruments: | | | | | | | | | | | | | | | | | | |
| Forward Foreign Currency Contracts | | $ | (13,316,949 | ) | | $ | — | | | $ | — | | | $ | — | | | $ | — | | | $ | (13,316,949 | ) |
| Total | | $ | (13,316,949 | ) | | $ | — | | | $ | — | | | $ | — | | | $ | — | | | $ | (13,316,949 | ) |
| | | | | | | | | | | | | | | | | | | | | | | | | |
| Net change in unrealized | | | | | | | | | | | | | | | | | | | | | | | | |
| appreciation/(depreciation) | | | | | | | | | | | | | | | | | | | | | | | | |
| of financial derivative instruments | | | | | | | | | | | | | | | | | | | | | | | | |
| Forward Foreign Currency Contracts | | $ | 25,453,477 | | | $ | — | | | $ | — | | | $ | — | | | $ | — | | | $ | 25,453,477 | |
| Total | | $ | 25,453,477 | | | $ | — | | | $ | — | | | $ | — | | | $ | — | | | $ | 25,453,477 | |
See notes to financial statements
Strategic Income Fund
July 31, 2014
| Face | | | | | | | | | Value | |
| amount | | | | Coupon | | Maturity | | | (note 2) | |
| | | | | | | | | | | | |
| Corporate bonds – 84.33% | | | | | | | | |
| | | | | | | | | | | | |
| | | | France – 3.28% | | | | | | | | |
| USD | 600,000 | | BNP Paribas S.A. (a) (b) | | 7.195% | | 6/25/37 | | $ | 695,250 | |
| USD | 16,000 | | BNP Paribas S.A. (b) | | 6.250% | | 10/17/14 | | | 16,260 | |
| USD | 34,000 | | BNP Paribas S.A. (b) | | 6.500% | | 9/6/14 | | | 34,557 | |
| EUR | 145,000 | | Loxam SAS (a) | | 4.875% | | 7/23/21 | | | 192,706 | |
| EUR | 220,000 | | Loxam SAS (a) | | 7.000% | | 7/23/22 | | | 288,920 | |
| USD | 470,000 | | Numericable Group S.A. (a) | | 6.250% | | 5/15/24 | | | 472,937 | |
| | | | | | | | | | | 1,700,630 | |
| | | | | | | | | | | | |
| | | | Germany – 1.02% | | | | | | | | |
| USD | 500,000 | | Unitymedia Hessen GmbH & Co. KG (a) | | 7.500% | | 3/15/19 | | | 530,000 | |
| | | | | | | | | | | | |
| | | | Ireland – 1.63% | | | | | | | | |
| EUR | 440,000 | | Ardagh Glass Finance plc | | 8.750% | | 2/1/20 | | | 624,533 | |
| EUR | 150,000 | | Ardagh Packaging Finance plc | | 9.250% | | 10/15/20 | | | 219,437 | |
| | | | | | | | | | | 843,970 | |
| | | | | | | | | | | | |
| | | | Italy – 0.93% | | | | | | | | |
| GBP | 150,000 | | Assicurazioni Generali SpA (b) | | 6.269% | | 6/16/26 | | | 263,311 | |
| EUR | 150,000 | | Snai SpA | | 7.625% | | 6/15/18 | | | 216,926 | |
| | | | | | | | | | | 480,237 | |
| | | | | | | | | | | | |
| | | | Jamaica – 1.41% | | | | | | | | |
| USD | 710,000 | | Digicel, Ltd. (a) | | 8.250% | | 9/1/17 | | | 729,525 | |
| | | | | | | | | | | | |
| | | | Luxembourg – 9.10% | | | | | | | | |
| USD | 700,000 | | Altice S.A. (a) | | 7.750% | | 5/15/22 | | | 717,500 | |
| GBP | 175,000 | | Cabot Financial Luxembourg S.A. | | 10.375% | | 10/1/19 | | | 337,554 | |
| GBP | 350,000 | | Cabot Financial Luxembourg S.A. | | 6.500% | | 4/1/21 | | | 583,637 | |
| USD | 465,000 | | Dufry Finance SCA (a) | | 5.500% | | 10/15/20 | | | 483,451 | |
| USD | 86,000 | | Intelsat Jackson Holdings S.A. | | 5.500% | | 8/1/23 | | | 82,883 | |
| USD | 89,000 | | Intelsat Luxembourg S.A. | | 7.750% | | 6/1/21 | | | 91,336 | |
| EUR | 300,000 | | Ontex IV S.A. | | 9.000% | | 4/15/19 | | | 433,852 | |
| EUR | 800,000 | | Telenet Finance Luxembourg SCA | | 6.375% | | 11/15/20 | | | 1,143,828 | |
| USD | 800,000 | | Wind Acquisition Finance S.A. (a) | | 7.375% | | 4/23/21 | | | 836,000 | |
| | | | | | | | | | | 4,710,041 | |
| | | | | | | | | | | | |
| | | | Netherlands – 2.57% | | | | | | | | |
| USD | 400,000 | | ING Bank N.V. (c) | | 4.125% | | 11/21/23 | | | 408,580 | |
| EUR | 150,000 | | Linde Finance B.V. (c) | | 7.375% | | 7/14/66 | | | 224,649 | |
| EUR | 100,000 | | TMF Group Holding B.V. | | 9.875% | | 12/1/19 | | | 146,318 | |
| EUR | 93,000 | | UPC Holding B.V. | | 8.375% | | 8/15/20 | | | 136,204 | |
| USD | 150,000 | | UPCB Finance III, Ltd. (a) | | 6.625% | | 7/1/20 | | | 159,000 | |
| EUR | 175,000 | | Ziggo Bond Co. B.V. (a) | | 8.000% | | 5/15/18 | | | 257,158 | |
| | | | | | | | | | | 1,331,909 | |
See notes to financial statements
Strategic Income Fund
July 31, 2014 (continued)
| Face | | | | | | | | | Value | |
| amount | | | | Coupon | | Maturity | | | (note 2) | |
| | | | | | | | | | | | |
| | | | Spain – 2.02% | | | | | | | | |
| USD | 1,000,000 | | BBVA International Preferred SAU (b) | | 5.919% | | 4/18/17 | | $ | 1,045,000 | |
| | | | | | | | | | | | |
| | | | United Kingdom – 40.84% | | | | | | | | |
| GBP | 700,000 | | AA Bond Co., Ltd. | | 9.500% | | 7/31/19 | | | 1,320,672 | |
| GBP | 205,000 | | Arqiva Broadcast Finance plc (a) | | 9.500% | | 3/31/20 | | | 387,634 | |
| GBP | 200,000 | | Arqiva Broadcast Finance plc | | 9.500% | | 3/31/20 | | | 378,179 | |
| GBP | 600,000 | | Bakkavor Finance 2 plc | | 8.250% | | 2/15/18 | | | 1,068,694 | |
| USD | 470,000 | | Barclays Bank plc (b) | | 6.860% | | 6/15/32 | | | 526,870 | |
| GBP | 150,000 | | BAT International Finance plc | | 6.000% | | 6/29/22 | | | 297,549 | |
| GBP | 650,000 | | Daily Mail & General Trust | | 5.750% | | 12/7/18 | | | 1,214,816 | |
| GBP | 200,000 | | Gala Electric Casinos plc | | 11.500% | | 6/1/19 | | | 368,076 | |
| GBP | 360,000 | | Gala Group Finance plc | | 8.875% | | 9/1/18 | | | 648,510 | |
| GBP | 500,000 | | Hastings Insurance Group Finance plc | | 8.000% | | 10/21/20 | | | 894,482 | |
| GBP | 320,000 | | Heathrow Funding, Ltd. | | 6.000% | | 3/20/20 | | | 602,022 | |
| GBP | 501,000 | | ITV plc | | 5.375% | | 10/19/15 | | | 882,099 | |
| GBP | 500,000 | | Legal & General Group plc (b) | | 6.385% | | 5/2/17 | | | 899,442 | |
| USD | 1,100,000 | | Lloyds Banking Group plc (a) (b) | | 6.267% | | 11/14/16 | | | 1,133,000 | |
| USD | 800,000 | | Prudential plc (b) | | 6.500% | | 9/23/14 | | | 816,000 | |
| EUR | 100,000 | | R&R Ice Cream plc (a) | | 4.750% | | 5/15/20 | | | 135,411 | |
| GBP | 400,000 | | R&R Ice Cream plc | | 5.500% | | 5/15/20 | | | 666,203 | |
| EUR | 510,000 | | Rexam plc (c) | | 6.750% | | 6/29/67 | | | 716,208 | |
| USD | 400,000 | | Royal Bank of Scotland Group plc (b) | | 7.640% | | 9/30/17 | | | 427,000 | |
| USD | 400,000 | | Royal Bank of Scotland Group plc | | 6.125% | | 12/15/22 | | | 431,662 | |
| GBP | 600,000 | | Scottish Widows plc | | 7.000% | | 6/16/43 | | | 1,168,186 | |
| USD | 1,100,000 | | Standard Chartered plc (b) | | 6.409% | | 1/30/17 | | | 1,191,438 | |
| GBP | 145,000 | | Stretford 79 plc (a) | | 6.250% | | 7/15/21 | | | 242,967 | |
| GBP | 67,000 | | Thames Water Utilities Finance, Ltd. (c) | | 5.375% | | 7/21/25 | | | 120,711 | |
| GBP | 500,000 | | Thomas Cook Group plc | | 7.750% | | 6/22/17 | | | 908,516 | |
| GBP | 294,000 | | Towergate Finance plc | | 8.500% | | 2/15/18 | | | 495,119 | |
| GBP | 106,000 | | Virgin Media Finance plc | | 8.875% | | 10/15/19 | | | 189,053 | |
| GBP | 212,000 | | Virgin Media Finance plc | | 7.000% | | 4/15/23 | | | 386,016 | |
| GBP | 700,000 | | Virgin Media Secured Finance plc | | 6.250% | | 3/28/29 | | | 1,234,991 | |
| GBP | 500,000 | | William Hill plc | | 7.125% | | 11/11/16 | | | 920,191 | |
| GBP | 100,000 | | WPP 2012 Ltd. | | 6.000% | | 4/4/17 | | | 185,541 | |
| USD | 270,000 | | WPP Finance 2010 | | 4.750% | | 11/21/21 | | | 295,532 | |
| | | | | | | | | | | 21,152,790 | |
| | | | | | | | | | | | |
| | | | United States – 21.53% | | | | | | | | |
| USD | 1,000,000 | | Avis Budget Car Rental LLC | | 5.500% | | 4/1/23 | | | 1,005,000 | |
| USD | 600,000 | | CHS/Community Health Systems, Inc. | | 7.125% | | 7/15/20 | | | 641,250 | |
| USD | 521,000 | | CHS/Community Health Systems, Inc. (a) | | 6.875% | | 2/1/22 | | | 535,327 | |
| USD | 73,000 | | First Data Corp. | | 11.250% | | 1/15/21 | | | 82,855 | |
| USD | 46,000 | | First Data Corp. | | 12.625% | | 1/15/21 | | | 54,912 | |
| USD | 81,000 | | First Data Corp. | | 10.625% | | 6/15/21 | | | 92,391 | |
| USD | 600,000 | | HCA Holdings, Inc. | | 7.750% | | 5/15/21 | | | 648,750 | |
| USD | 400,000 | | HCA, Inc. | | 6.500% | | 2/15/20 | | | 435,500 | |
| USD | 137,000 | | HCA, Inc. | | 5.000% | | 3/15/24 | | | 136,315 | |
| EUR | 600,000 | | Infor (US), Inc. | | 10.000% | | 4/1/19 | | | 899,842 | |
See notes to financial statements
Strategic Income Fund
July 31, 2014 (continued)
| Face | | | | | | | | | Value | |
| amount | | | | Coupon | | Maturity | | | (note 2) | |
| | | | | | | | | | | | |
| | | | United States (continued) | | | | | | | | |
| USD | 950,000 | | Iron Mountain, Inc. | | 6.000% | | 8/15/23 | | $ | 995,125 | |
| EUR | 2,500,000 | | Lehman Brothers UK Capital Funding IV LP (b) (d) (e) (f) | | 5.750% | | 4/25/15 | | | — | |
| EUR | 387,500 | | Levi Strauss & Co. | | 7.750% | | 5/15/18 | | | 542,367 | |
| USD | 100,000 | | Regal Entertainment Group | | 5.750% | | 6/15/23 | | | 101,000 | |
| USD | 600,000 | | Regal Entertainment Group | | 5.750% | | 2/1/25 | | | 601,500 | |
| USD | 250,000 | | Reynolds Group Issuer, Inc. | | 5.750% | | 10/15/20 | | | 256,250 | |
| USD | 540,000 | | Service Corp. International | | 7.625% | | 10/1/18 | | | 630,450 | |
| USD | 280,000 | | Sprint Corp. (a) | | 7.875% | | 9/15/23 | | | 300,300 | |
| USD | 357,000 | | Sprint Corp. (a) | | 7.125% | | 6/15/24 | | | 365,479 | |
| USD | 38,000 | | T-Mobile USA, Inc. | | 6.633% | | 4/28/21 | | | 40,042 | |
| USD | 460,000 | | T-Mobile USA, Inc. | | 6.125% | | 1/15/22 | | | 474,950 | |
| USD | 125,000 | | Tenet Healthcare Corp. | | 8.000% | | 8/1/20 | | | 133,750 | |
| USD | 60,000 | | Tenet Healthcare Corp. | | 6.000% | | 10/1/20 | | | 62,850 | |
| USD | 800,000 | | Tenet Healthcare Corp. | | 8.125% | | 4/1/22 | | | 896,000 | |
| USD | 1,100,000 | | Verizon Communications, Inc. | | 5.150% | | 9/15/23 | | | 1,219,583 | |
| | | | | | | | | | | 11,151,788 | |
| | | | Total corporate bonds | | | | | | | | |
| | | | (Cost $44,087,279) | | | | | | | 43,675,890 | |
| | | | | | | | | | | | |
| US government obligations – 3.81% | | | | | | | | |
| | | | | | | | | | | | |
| | | | United States – 3.81% | | | | | | | | |
| USD | 2,000,000 | | United States Treasury Note (g) | | 0.875% | | 1/31/18 | | | 1,971,562 | |
| | | | Total US government obligations | | | | | | | | |
| | | | (Cost $1,976,290) | | | | | | | 1,971,562 | |
| | | | Total long-term investments | | | | | | | | |
| | | | (Cost $46,063,569) | | | | | | | 45,647,452 | |
| | | | | | | | | | | | |
| Shares | | | | | | | | | | |
| | | | | | | | | | | | |
| Short-term investment – 10.01% | | | | | | | | |
| | 5,185,117 | | Fidelity Institutional Treasury Portfolio (h) | | | | | | | 5,185,117 | |
| | | | Total short-term investment | | | | | | | | |
| | | | (Cost $5,185,117) | | | | | | | 5,185,117 | |
| | | | | | | | | | | | |
| Total investments – 98.15% | | | | | | | | |
| | | | (Cost $51,248,686) | | | | | | | 50,832,569 | |
| | | | | | | | | | | | |
| Financial Derivative Instruments(i) (Cost or Premiums, net ($1,264)) – 0.62% | | | | | | | 320,824 | |
| Net other assets and liabilities – 1.23% | | | | | | | 637,817 | |
| Total net assets – 100.00% | | | | | | $ | 51,791,210 | |
| (a) | | Restricted security, purchased pursuant to Rule 144A under the Securities Act of 1933, as amended, and which is exempt from registration under that Act. At July 31, 2014, the restricted securities held by the Fund had an aggregate value of $8,462,565, which represented 16.3% of net assets. |
| (b) | | Maturity date is perpetual. Maturity date presented represents the next call date. |
| (c) | | Variable or Floating rate interest rate security. Rate presented represents rate at July 31, 2014. |
| (d) | | Security is in default. |
| (e) | | Fair valued at July 31, 2014 as determined in good faith using procedures approved by the Board of Trustees. |
| (f) | | The security has been deemed illiquid according to the policies and procedures adopted by the Board of Trustees. |
| (g) | | A portion of this security is held at the broker as collateral for swap contracts. |
| (h) | | This short-term investment was segregated for open forward foreign currency contracts and swap contracts at July 31, 2014. |
| (i) | | Information with respect to financial derivative instruments is disclosed in the following tables. |
See notes to financial statements
Strategic Income Fund
July 31, 2014 (continued)
(i) FINANCIAL DERIVATIVE INSTRUMENTS
OVER-THE-COUNTER FINANCIAL DERIVATIVE INSTRUMENTS
FORWARD FOREIGN CURRENCY CONTRACTS
| | | | | | | | | | | Unrealized | |
| | | | | Local | | | Current | | | appreciation/ | |
| | | Value | | amount | | | notional | | | (depreciation) | |
| | Counterparty | date | | | (000’s | ) | | value | | | Asset | | | Liability | |
| British Pound (Short) | State Street Bank, London | 8/22/14 | | | 7,754 | | | $ | 13,089,962 | | | $ | 137,599 | | | $ | — | |
| British Pound (Short) | Citibank, N.A. | 8/22/14 | | | 1,472 | | | | 2,485,385 | | | | 14,615 | | | | — | |
| Euro (Long) | Citibank, N.A. | 8/22/14 | | | 413 | | | | 553,059 | | | | — | | | | (3,295 | ) |
| Euro (Short) | Deutsche Bank AG | 8/22/14 | | | 5,496 | | | | 7,359,775 | | | | 73,296 | | | | — | |
| Total | | | | | | | | | | | | $ | 225,510 | | | $ | (3,295 | ) |
During the year ended July 31, 2014, average monthly notional value related to forward foreign currency contracts was approximately $22.2 million, or 42.9% of net assets.
CREDIT DEFAULT SWAP CONTRACTS
| | | | | | | | | | | | | | Upfront | | | | | | | | | | |
| | | | Rates | | | | Implied | | | Notional | | | premiums | | | Unrealized | | | | | | | |
| | Reference | | received/ | | Termination | | credit | | | amount | | | paid/ | | | appreciation/ | | | Value | |
| Counterparty | entity | | (paid) | | date | | spread | | | | (000s | ) | | (received) | | | (depreciation) | | | Asset | | | Liability | |
| Protection purchased: | | | | | | | | | | | | | | | | | | | | | | | | |
| Deutsche Bank AG | International Business | | | | | | | | | | | | | | | | | | | | | | |
| | Machines Corp. | | (1.00 | )% | 6/20/19 | | | 0.41 | % | | $ | 850 | | | $ | (26,707 | ) | | $ | 2,943 | | | $ | — | | | $ | (23,764 | ) |
| Protection sold: | | | | | | | | | | | | | | | | | | | | | | | | | | | | | | |
| J.P. Morgan Chase | | | | | | | | | | | | | | | | | | | | | | | | | | | | | | |
| Bank, N.A. | ConvaTec Healthcare | | 5.00 | % | 12/20/17 | | | 1.38 | % | | | 67 | | | | (1,637 | ) | | | 9,686 | | | | 8,049 | | | | — | |
| Barclays Bank plc | ConvaTec Healthcare | | 5.00 | % | 12/20/18 | | | 1.75 | % | | | 469 | | | | 2,368 | | | | 61,839 | | | | 64,207 | | | | — | |
| Citibank, N.A. | Cerved Group SpA | | 5.00 | % | 12/20/18 | | | 2.22 | % | | | 134 | | | | (3,066 | ) | | | 18,753 | | | | 15,687 | | | | — | |
| Citibank, N.A. | ConvaTec Healthcare | | 5.00 | % | 3/20/19 | | | 1.84 | % | | | 67 | | | | 4,869 | | | | 4,492 | | | | 9,361 | | | | — | |
| J.P. Morgan Chase | | | | | | | | | | | | | | | | | | | | | | | | | | | | | | |
| Bank, N.A. | Beni Stabili SpA | | 5.00 | % | 6/20/19 | | | 2.29 | % | | | 67 | | | | 7,567 | | | | 789 | | | | 8,356 | | | | — | |
| J.P. Morgan Chase | | | | | | | | | | | | | | | | | | | | | | | | | | | | | | |
| Bank, N.A. | Beni Stabili SpA | | 5.00 | % | 6/20/19 | | | 2,29 | % | | | 134 | | | | 15,342 | | | | 1,371 | | | | 16,713 | | | | — | |
| Total | | | | | | | | | | | | | | | | $ | (1,264 | ) | | $ | 99,873 | | | $ | 122,373 | | | $ | (23,764 | ) |
During the year ended July 31, 2014, average notional value related to swap contracts, including both centrally-cleared and over-the-counter, was approximately $4.4 million, or 8.5% of net assets.
See notes to financial statements
Strategic Income Fund
July 31, 2014 (continued)
FINANCIAL DERIVATIVE INSTRUMENTS: OVER-THE-COUNTER SUMMARY
The following is a summary by counterparty of the value of over-the-counter financial derivative instruments and collateral (received)/pledged as of July 31, 2014.
| | | Financial Derivative Assets | | | Financial Derivative Liabilities | | | | | | | | | | |
| | | Unrealized | | | | | | | | | Unrealized | | | | | | | | | | | | | | | | |
| | | Appreciation | | | Value(1) | | | | | | Depreciation | | | Value(1) | | | | | | | | | | | | | |
| | | Forward | | | | | | | | | Forward | | | | | | | | | Net Value of | | | | | | | |
| | | Foreign | | | | | | Total | | | Foreign | | | | | | Total | | | Over-the- | | | Collateral | | | | |
| | | Currency | | | Swap | | | Over-the- | | | Currency | | | Swap | | | Over-the- | | | Counter | | | (Received) / | | | Net | |
| | | Contracts | | | Contracts | | | Counter | | | Contracts | | | Contracts | | | Counter | | | Derivatives | | | Pledged | | | Exposure(2) | |
| Amounts subject to a master netting or similar arrangement: | | | | | | | | | | | | | | | | |
| Barclays Bank plc | | $ | — | | | $ | 64,207 | | | $ | 64,207 | | | $ | — | | | $ | — | | | $ | — | | | $ | 64,207 | | | $ | — | | | $ | 64,207 | |
| Citibank, N.A. | | | 14,615 | | | | 25,048 | | | | 39,663 | | | | (3,295 | ) | | | — | | | | (3,295 | ) | | | 36,368 | | | | — | | | | 36,368 | |
| Deutsche Bank AG | | 73,296 | | | | — | | | | 73,296 | | | | — | | | | (23,764 | ) | | | (23,764 | ) | | | 49,532 | | | | — | | | | 49,532 | |
| JPMorgan Chase | | | | | | | | | | | | | | | | | | | | | | | | | | | | | | | | | | | | |
| Bank, N.A. | | | — | | | | 33,118 | | | | 33,118 | | | | — | | | | — | | | | — | | | | 33,118 | | | | — | | | | 33,118 | |
| | | $ | 87,911 | | | $ | 122,373 | | | $ | 210,284 | | | $ | (3,295 | ) | | $ | (23,764 | ) | | $ | (27,059 | ) | | $ | 183,225 | | | $ | — | | | $ | 183,225 | |
| | | | | | | | | | | | | | | | | | | | | | |
| Amounts NOT subject to a master netting or similar arrangement: | | | | | | | | | | | | | | | | | | | | | |
| State Street Bank, | | | | | | | | | | | | | | | | | | | | | | | | | | | | | | | | | | | |
London(3) | | $ | 137,599 | | | $ | — | | | $ | 137,599 | | | $ | — | | | $ | — | | | $ | — | | | $ | — | | | $ | — | | | $ | — | |
| | | $ | 137,599 | | | $ | — | | | $ | 137,599 | | | $ | — | | | $ | — | | | $ | — | | | $ | — | | | $ | — | | | $ | — | |
| Total Over- | | | | | | | | | | | | | | | | | | | | | | | | | | | | | | | | | | | | |
| the Counter | | $ | 225,510 | | | $ | 122,373 | | | $ | 347,883 | | | $ | (3,295 | ) | | $ | (23,764 | ) | | $ | (27,059 | ) | | | | | | | | | | | | |
| (1) | | Value on swap contracts is represented by “unrealized appreciation/(depreciation)” on interest rate swaps, and “value” on credit default swaps, which is inclusive of upfront premiums paid/(received) |
| (2) | | Net Exposure represents the net receivable/(payable) that would be due from/to the counterparty in the event of default. Exposure from over-the-counter financial derivative instruments can only be netted across transactions governed under the same master agreement with the same legal entity. See Note 2, Significant Accounting Policies, “Derivative instruments,” in the Notes to Financial Statements for more information regarding master netting arrangements. Absent an event of default or early termination, over-the-counter derivative assets and liabilities are presented gross and not offset in the Statement of Assets and Liabilities. |
| (3) | | Forward foreign currency contracts with State Street Bank, London are not subject to a legally enforceable master netting arrangement or other similar agreements that provide legally enforceable right of offset. |
| | | Cost or Premiums, net | | | Asset | | | Liability | |
| TOTAL FINANCIAL DERIVATIVE INSTRUMENTS | | $ | (1,264 | ) | | $ | 347,883 | | | $ | (27,059 | ) |
See notes to financial statements
Strategic Income Fund
July 31, 2014 (continued)
Other information:
| | | | |
| Industry concentration as | % of net |
| a percentage of net assets: | assets |
| | | | |
| Telecommunication Services | | 9.57 | % |
| Medical-Hospitals | | 6.74 | |
| Commercial Banks Non-US | | 6.29 | |
| Multi-line Insurance | | 4.49 | |
| U.S. Government Obligations | | 3.81 | |
| Telephone-Integrated | | 3.47 | |
| Life/Health Insurance | | 3.31 | |
| Diversified Banking Institution | | 3.10 | |
| Finance-Other Services | | 3.03 | |
| Containers - Metal/Glass | | 3.01 | |
| Rental Auto/Equipment | | 2.87 | |
| Auto Repair Centers | | 2.55 | |
| Cable TV | | 2.43 | |
| Publishing-Newspapers | | 2.35 | |
| Cellular Telecommunications | | 2.28 | |
| Food-Wholesale/Distribution | | 2.06 | |
| Money Center Banks | | 2.02 | |
| Commercial Services | | 1.92 | |
| Gambling (Non-Hotel) | | 1.78 | |
| Travel Services | | 1.75 | |
| Enterprise Software/Services | | 1.74 | |
| Television | | 1.70 | |
| Food-Confectionery | | 1.55 | |
| Broadcast Services/Programs | | 1.48 | |
| Theaters | | 1.36 | |
| Funeral Services & Related Items | | 1.22 | |
| Airport Development & Maintenance | | 1.16 | |
| Apparel Manufacturers | | 1.05 | |
| Insurance Brokers | | 0.96 | |
| Retail-Miscellaneous/Diversified | | 0.93 | |
| Industry concentration as | % of net |
| a percentage of net assets: | assets |
| | | | |
| Feminine Health Care Products | | 0.84 | % |
| Diversified Operations | | 0.71 | |
| Advertising Services | | 0.57 | |
| Tobacco | | 0.57 | |
| Consumer Products - Miscellaneous | | 0.50 | |
| Food-Retail | | 0.47 | |
| Data Processing/Management | | 0.44 | |
| Industrial Gases | | 0.43 | |
| Internet Gambling | | 0.42 | |
| Consulting Services | | 0.36 | |
| Satellite Telecommunications | | 0.34 | |
| Commercial Services-Finance | | 0.28 | |
| Water | | 0.23 | |
| Finance - Investment Banking & Brokerage | | 0.00 | * |
| Long-Term Investments | | 88.14 | |
| Short-Term Investment | | 10.01 | |
| Total Investments | | 98.15 | |
| Financial Derivative Instruments | | 0.62 | |
| Net Other Assets and Liabilities | | 1.23 | |
| | | 100.00 | % |
| | | | |
| * Amount represents less than 0.005% of net assets. | | | |
See notes to financial statements
Strategic Income Fund
July 31, 2014 (continued)
Fair Value Measurements
The following table summarizes the Fund’s investments that are measured at fair value by level within the fair value hierarchy at July 31, 2014:
| | | | | | | | | | | | | | |
| | | | Quoted prices | | | Significant | | | | | | | |
| | | | in active | | | other | | | Significant | | | | |
| | | | markets for | | | observable | | | unobservable | | | | |
| | | | identical assets | | | inputs | | | inputs | | | | |
| Description | | | (level 1 | ) | | (level 2 | ) | | (level 3 | ) | | Total | |
| Assets | | | | | | | | | | | | | |
| | | | | | | | | | | | | | |
| Corporate Bonds | | | | | | | | | | | | | |
| France | | $ | — | | $ | 1,700,630 | | $ | — | | $ | 1,700,630 | |
| Germany | | | — | | | 530,000 | | | — | | | 530,000 | |
| Ireland | | | — | | | 843,970 | | | — | | | 843,970 | |
| Italy | | | — | | | 480,237 | | | — | | | 480,237 | |
| Jamaica | | | — | | | 729,525 | | | — | | | 729,525 | |
| Luxembourg | | | — | | | 4,710,041 | | | — | | | 4,710,041 | |
| Netherlands | | | — | | | 1,331,909 | | | — | | | 1,331,909 | |
| Spain | | | — | | | 1,045,000 | | | — | | | 1,045,000 | |
| United Kingdom | | | — | | | 21,152,790 | | | — | | | 21,152,790 | |
| United States | | | — | | | 11,151,788 | | | —* | | | 11,151,788 | |
| Total Corporate Bonds | | | — | | | 43,675,890 | | | —* | | | 43,675,890 | |
| | | | | | | | | | | | | | |
| US Government Obligations | | | | | | | | | | | | | |
| United States | | | — | | | 1,971,562 | | | — | | | 1,971,562 | |
| Total US Government Obligations | | | — | | | 1,971,562 | | | — | | | 1,971,562 | |
| | | | | | | | | | | | | | |
| Short-Term Investment | | | 5,185,117 | | | — | | | — | | | 5,185,117 | |
| Total Investments | | $ | 5,185,117 | | $ | 45,647,452 | | $ | —* | | $ | 50,832,569 | |
| | | | | | | | | | | | | | |
| Financial Derivative Instruments – Assets | | | | | | | | | | | | | |
| Over-the-counter | | | — | | | 347,883 | | | — | | | 347,883 | |
| Total Financial Derivative Instruments – Assets | | $ | — | | $ | 347,883 | | $ | — | | $ | 347,883 | |
| | | | | | | | | | | | | | |
| Liabilities | | | | | | | | | | | | | |
| | | | | | | | | | | | | | |
| Financial Derivative Instruments – Liabilities | | | | | | | | | | | | | |
| Over-the-counter | | | — | | | (27,059 | ) | | — | | | (27,059 | ) |
| Total Financial Derivative Instruments – Liabilities | | $ | — | | $ | (27,059 | ) | $ | — | | $ | (27,059 | ) |
* Fund held a Level 3 security that was fair valued at $0 at July 31, 2014.
During the period ended July 31, 2014, there were no transfers in or out of security levels as a result of the fair value pricing procedures established by the Board.
See notes to financial statements
Strategic Income Fund
July 31, 2014 (continued)
Following is a reconciliation of investments in which significant unobservable inputs (Level 3) were used in determining fair value:
| | Balance | | | Change in | | | | | Balance |
| | as of | Accrued | | unrealized | | | Transfers | Transfers | as of |
| | July 31, | discounts/ | Realized | appreciation | | | in to | out of | July 31, |
| Investments in securities | 2013 | premiums | gain/(loss) | (depreciation) | Purchases | Sales | level 3 | level 3 | 2014 |
| Corporate Bonds | | | | | | | | | |
| Lehman Brothers UK | | | | | | | | | |
| Capital Funding IV LP | $0 | $0 | $0 | $0 | $0 | $0 | $0 | $0 | $0 |
| Total | $0 | $0 | $0 | $0 | $0 | $0 | $0 | $0 | $0 |
The total net change in unrealized depreciation attributable to Level 3 investments held at July 31, 2014 was $0.
The Fund’s Adviser has determined that Lehman Brothers UK Capital Funding IV LP is a Level 3 investment due to the lack of observable inputs that may be used in the determination of fair value. Management has also concluded there is no value for the investment on the basis that the company has filed for bankruptcy, the position is currently in default and is highly subordinated.
Fair Value of Financial Derivative Instruments
The following is a summary of the fair valuation of the Fund’s financial derivative instruments categorized by risk exposure:
Fair Values of Financial Derivative Instruments on the Statement of Assets and Liabilities as of July 31, 2014
| | | Derivatives not accounted for as hedging instruments | |
| | | Foreign | | | | | | | | | | | | | | | | |
| | | Currency | | | Equity | | | Interest | | | Credit | | | Inflation | | | | |
| | | Risk | | | Risk | | | Rate Risk | | | Risk | | | Risk | | | Total | |
| Financial Derivative Instruments – Assets | | | | | | | | | | | | | | | | | | |
| Over-the-Counter | | | | | | | | | | | | | | | | | | |
| Forward Foreign Currency Contracts | | $ | 225,510 | | | $ | — | | | $ | — | | | $ | — | | | $ | — | | | $ | 225,510 | |
| Swap Contracts | | | — | | | | — | | | | — | | | | 122,373 | | | | — | | | | 122,373 | |
| Total | | $ | 225,510 | | | $ | — | | | $ | — | | | $ | 122,373 | | | $ | — | | | $ | 347,883 | |
| | | | | | | | | | | | | | | | | | | | | | | | | |
| Financial Derivative Instruments – Liabilities | | | | | | | | | | | | | | | | | | | | | | | | |
| Over-the-Counter | | | | | | | | | | | | | | | | | | | | | | | | |
| Forward Foreign Currency Contracts | | $ | (3,295 | ) | | $ | — | | | $ | — | | | $ | — | | | $ | — | | | $ | (3,295 | ) |
| Swap Contracts | | | — | | | | — | | | | — | | | | (23,764 | ) | | | — | | | | (23,764 | ) |
| Total | | $ | (3,295 | ) | | $ | — | | | $ | — | | | $ | (23,764 | ) | | $ | — | | | $ | (27,059 | ) |
| Net | | $ | 222,215 | | | $ | — | | | $ | — | | | $ | 98,609 | | | $ | — | | | $ | 320,824 | |
See notes to financial statements
Strategic Income Fund
July 31, 2014 (continued)
Effect of Financial Derivative Instruments on the Statement of Operations for the Year Ended July 31, 2014
| | | Derivatives not accounted for as hedging instruments | |
| | | Foreign | | | | | | | | | | | | | | | | |
| | | Currency | | | Equity | | | Interest | | | Credit | | | Inflation | | | | |
| | | Risk | | | Risk | | | Rate Risk | | | Risk | | | Risk | | | Total | |
| Net realized gain/(loss) from | | | | | | | | | | | | | | | | | | |
| financial derivative instruments: | | | | | | | | | | | | | | | | | | |
| Forward Foreign Currency Contracts | | $ | (2,333,584 | ) | | $ | — | | | $ | — | | | $ | — | | | $ | — | | | $ | (2,333,584 | ) |
| Futures Contracts | | | — | | | | — | | | | 182,941 | | | | — | | | | — | | | | 182,941 | |
| Swap Contracts | | | — | | | | — | | | | — | | | | 149,944 | | | | — | | | | 149,944 | |
| Total | | $ | (2,333,584 | ) | | $ | — | | | $ | 182,941 | | | $ | 149,944 | | | $ | — | | | $ | (2,000,699 | ) |
| | | | | | | | | | | | | | | | | | | | | | | | | |
| Net change in unrealized | | | | | | | | | | | | | | | | | | | | | | | | |
| appreciation/(depreciation) | | | | | | | | | | | | | | | | | | | | | | | | |
| of financial derivative instruments | | | | | | | | | | | | | | | | | | | | | | | | |
| Forward Foreign Currency Contracts | | $ | 558,493 | | | $ | — | | | $ | — | | | $ | — | | | $ | — | | | $ | 558,493 | |
| Futures Contracts | | | — | | | | — | | | | 27,011 | | | | — | | | | — | | | | 27,011 | |
| Swap Contracts | | | — | | | | — | | | | — | | | | 115,225 | | | | — | | | | 115,225 | |
| Total | | $ | 558,493 | | | $ | — | | | $ | 27,011 | | | $ | 115,225 | | | $ | — | | | $ | 700,729 | |
See notes to financial statements
Unconstrained Bond Fund
July 31, 2014
| Face | | | | | | | | | Value | |
| amount | | | | Coupon | | Maturity | | | (note 2) | |
| | | | | | | | | | | | |
| Corporate bonds – 47.64% | | | | | | | | |
| | | | | | | | | | | | |
| | | | Australia – 1.98% | | | | | | | | |
| USD | 100,000 | | Leighton Finance USA Pty. Ltd. | | 5.950% | | 11/13/22 | | $ | 106,495 | |
| USD | 200,000 | | Origin Energy Finance, Ltd. (a) | | 3.500% | | 10/9/18 | | | 206,423 | |
| EUR | 50,000 | | Santos Finance, Ltd. (b) | | 8.250% | | 9/22/70 | | | 76,159 | |
| GBP | 100,000 | | Scentre Management, Ltd. | | 3.875% | | 7/16/26 | | | 170,592 | |
| | | | | | | | | | | 559,669 | |
| | | | | | | | | | | | |
| | | | Belgium – 0.50% | | | | | | | | |
| EUR | 100,000 | | Anheuser-Busch InBev N.V. | | 2.700% | | 3/31/26 | | | 141,340 | |
| | | | | | | | | | | | |
| | | | Canada – 0.33% | | | | | | | | |
| USD | 90,000 | | Tervita Corp. (a) | | 8.000% | | 11/15/18 | | | 93,150 | |
| | | | | | | | | | | | |
| | | | Denmark – 0.30% | | | | | | | | |
| EUR | 50,000 | | DONG Energy A/S | | 6.500% | | 5/7/19 | | | 84,003 | |
| | | | | | | | | | | | |
| | | | Finland – 0.52% | | | | | | | | |
| EUR | 100,000 | | Citycon OYJ | | 3.750% | | 6/24/20 | | | 147,124 | |
| | | | | | | | | | | | |
| | | | France – 3.28% | | | | | | | | |
| EUR | 100,000 | | Dry Mix Solutions Investissements SAS (b) | | 4.467% | | 6/15/21 | | | 132,579 | |
| GBP | 50,000 | | Electricite de France S.A. | | 6.125% | | 6/2/34 | | | 102,129 | |
| EUR | 100,000 | | Holding Medi-Partenaires SAS | | 7.000% | | 5/15/20 | | | 142,140 | |
| EUR | 100,000 | | Homevi SAS | | 6.875% | | 8/15/21 | | | 133,905 | |
| EUR | 100,000 | | Ingenico | | 2.500% | | 5/20/21 | | | 136,059 | |
| EUR | 100,000 | | Loxam SAS | | 4.875% | | 7/23/21 | | | 132,901 | |
| EUR | 100,000 | | Oberthur Technologies Holding SAS | | 9.250% | | 4/30/20 | | | 147,296 | |
| | | | | | | | | | | 927,009 | |
| | | | | | | | | | | | |
| | | | Germany – 0.20% | | | | | | | | |
| EUR | 40,000 | | Bayer AG | | 1.875% | | 1/25/21 | | | 55,886 | |
| | | | | | | | | | | | |
| | | | Ireland – 1.04% | | | | | | | | |
| EUR | 100,000 | | Ardagh Packaging Finance plc | | 9.250% | | 10/15/20 | | | 146,291 | |
| EUR | 100,000 | | Eircom Finance, Ltd. | | 9.250% | | 5/15/20 | | | 148,133 | |
| | | | | | | | | | | 294,424 | |
| | | | | | | | | | | | |
| | | | Italy – 1.26% | | | | | | | | |
| EUR | 100,000 | | Cooperativa Muratori & Cementisti-CMC di Ravenna SC | | 7.500% | | 8/1/21 | | | 134,240 | |
| EUR | 150,000 | | Intesa Sanpaolo SpA | | 3.500% | | 1/17/22 | | | 220,706 | |
| | | | | | | | | | | 354,946 | |
See notes to financial statements
Unconstrained Bond Fund
July 31, 2014 (continued)
| Face | | | | | | | | | Value | |
| amount | | | | Coupon | | Maturity | | | (note 2) | |
| | | | | | | | | | | | |
| | | | Luxembourg – 3.84% | | | | | | | | |
| EUR | 100,000 | | Altice S.A. | | 7.250% | | 5/15/22 | | $ | 139,261 | |
| GBP | 100,000 | | Cabot Financial Luxembourg S.A. | | 8.375% | | 8/1/20 | | | 182,948 | |
| USD | 200,000 | | Intelsat Luxembourg S.A. | | 7.750% | | 6/1/21 | | | 205,250 | |
| EUR | 100,000 | | Matterhorn Mobile S.A. (a) (b) | | 5.585% | | 5/15/19 | | | 135,914 | |
| EUR | 100,000 | | Telenet Finance Luxembourg SCA | | 6.375% | | 11/15/20 | | | 142,978 | |
| EUR | 100,000 | | Wind Acquisition Finance S.A. (a) (b) | | 5.459% | | 4/30/19 | | | 135,766 | |
| EUR | 100,000 | | Wind Acquisition Finance S.A. | | 7.000% | | 4/23/21 | | | 144,283 | |
| | | | | | | | | | | 1,086,400 | |
| | | | | | | | | | | | |
| | | | Mexico – 0.54% | | | | | | | | |
| EUR | 100,000 | | America Movil SAB de C.V. | | 4.125% | | 10/25/19 | | | 153,499 | |
| | | | | | | | | | | | |
| | | | Netherlands – 4.20% | | | | | | | | |
| EUR | 100,000 | | Cooperatieve Centrale Raiffeisen-Boerenleenbank BA (b) | | 2.500% | | 5/26/26 | | | 133,581 | |
| EUR | 100,000 | | Deutsche Annington Finance BV (b) | | 4.625% | | 4/8/74 | | | 136,683 | |
| GBP | 50,000 | | Enel Finance International N.V. | | 5.750% | | 9/14/40 | | | 92,673 | |
| EUR | 100,000 | | ING Bank N.V. (b) | | 3.625% | | 2/25/26 | | | 140,449 | |
| EUR | 100,000 | | InterXion Holding N.V. | | 6.000% | | 7/15/20 | | | 142,609 | |
| EUR | 100,000 | | NN Group N.V. (c) | | 4.500% | | 1/15/26 | | | 131,881 | |
| EUR | 100,000 | | Redexis Gas Finance BV | | 2.750% | | 4/8/21 | | | 140,044 | |
| EUR | 100,000 | | Schaeffler Finance BV | | 3.500% | | 5/15/22 | | | 133,930 | |
| EUR | 100,000 | | TMF Group Holding BV (b) | | 5.685% | | 12/1/18 | | | 135,914 | |
| | | | | | | | | | | 1,187,764 | |
| | | | | | | | | | | | |
| | | | Spain – 0.50% | | | | | | | | |
| EUR | 100,000 | | ADIF Alta Velocidad | | 3.500% | | 5/27/24 | | | 141,932 | |
| | | | | | | | | | | | |
| | | | United Arab Emirates – 0.48% | | | | | | | | |
| EUR | 100,000 | | Emirates Telecommunications Corp. | | 1.750% | | 6/18/21 | | | 134,759 | |
| | | | | | | | | | | | |
| | | | United Kingdom – 16.48% | | | | | | | | |
| GBP | 100,000 | | Admiral Group plc | | 5.500% | | 7/25/24 | | | 168,895 | |
| GBP | 100,000 | | Arqiva Financing plc | | 4.040% | | 6/30/20 | | | 171,397 | |
| EUR | 100,000 | | Atrium European Real Estate, Ltd. | | 4.000% | | 4/20/20 | | | 142,440 | |
| GBP | 100,000 | | EDU UK BondCo., plc | | 8.875% | | 9/15/18 | | | 176,174 | |
| USD | 200,000 | | EnQuest plc | | 7.000% | | 4/15/22 | | | 200,875 | |
| GBP | 50,000 | | Firstgroup plc | | 8.125% | | 9/19/18 | | | 99,625 | |
| GBP | 100,000 | | Galaxy Bidco, Ltd. (a) (b) | | 5.525% | | 11/15/19 | | | 169,674 | |
| GBP | 100,000 | | Gatwick Funding, Ltd. | | 6.125% | | 3/2/26 | | | 199,963 | |
| GBP | 100,000 | | Hastings Insurance Group Finance plc (a) (b) | | 6.559% | | 10/21/19 | | | 169,974 | |
| GBP | 50,000 | | HBOS Capital Funding LP (c) | | 6.461% | | 11/30/18 | | | 90,556 | |
| GBP | 50,000 | | HSBC Holdings plc | | 7.000% | | 4/7/38 | | | 106,496 | |
| GBP | 50,000 | | Imperial Tobacco Finance plc | | 7.750% | | 6/24/19 | | | 101,854 | |
| EUR | 185,000 | | Leeds Building Society | | 2.625% | | 4/1/21 | | | 257,678 | |
| EUR | 100,000 | | Nationwide Building Society (b) | | 4.125% | | 3/20/23 | | | 143,011 | |
| GBP | 50,000 | | Northern Gas Networks Finance plc | | 4.875% | | 6/30/27 | | | 91,071 | |
| GBP | 100,000 | | Old Mutual plc | | 8.000% | | 6/3/21 | | | 193,545 | |
See notes to financial statements
Unconstrained Bond Fund
July 31, 2014 (continued)
| Face | | | | | | | | | Value | |
| amount | | | | Coupon | | Maturity | | | (note 2) | |
| | | | | | | | | | | | |
| | | | United Kingdom (continued) | | | | | | | | |
| GBP | 100,000 | | Pension Insurance Corp., plc | | 6.500% | | 7/3/24 | | $ | 169,118 | |
| GBP | 100,000 | | PGH Capital, Ltd. | | 5.750% | | 7/7/21 | | | 171,536 | |
| GBP | 50,000 | | RSA Insurance Group plc (b) | | 9.375% | | 5/20/39 | | | 102,373 | |
| GBP | 50,000 | | Southern Gas Networks plc (b) | | 0.846% | | 10/21/15 | | | 83,951 | |
| GBP | 100,000 | | Standard Chartered plc | | 5.125% | | 6/6/34 | | | 163,584 | |
| GBP | 100,000 | | Standard Life plc (b) | | 5.500% | | 12/4/42 | | | 177,354 | |
| GBP | 100,000 | | Stretford 79 plc | | 6.750% | | 7/15/24 | | | 165,875 | |
| GBP | 50,000 | | Tesco plc | | 6.125% | | 2/24/22 | | | 96,871 | |
| GBP | 100,000 | | Thames Water Utilities Cayman Finance, Ltd. | | 4.000% | | 6/19/25 | | | 168,889 | |
| EUR | 50,000 | | The Royal Bank of Scotland plc (b) | | 4.625% | | 9/22/21 | | | 69,254 | |
| EUR | 100,000 | | Thomas Cook Finance plc | | 7.750% | | 6/15/20 | | | 144,098 | |
| GBP | 100,000 | | Towergate Finance plc (a) (b) | | 6.060% | | 2/15/18 | | | 163,343 | |
| EUR | 100,000 | | Vougeot Bidco plc (a) (b) | | 5.453% | | 7/15/20 | | | 135,632 | |
| GBP | 100,000 | | Western Power Distribution West Midlands plc | | 5.750% | | 4/16/32 | | | 197,588 | |
| GBP | 100,000 | | William Hill plc | | 4.250% | | 6/5/20 | | | 165,690 | |
| | | | | | | | | | | 4,658,384 | |
| | | | | | | | | | | | |
| | | | United States – 12.19% | | | | | | | | |
| GBP | 50,000 | | AT&T, Inc. | | 7.000% | | 4/30/40 | | | 114,869 | |
| GBP | 50,000 | | Bank of America Corp. | | 7.750% | | 4/30/18 | | | 99,348 | |
| EUR | 100,000 | | Bank of America Corp. | | 2.375% | | 6/19/24 | | | 135,834 | |
| USD | 200,000 | | BMC Software Finance, Inc. (a) | | 8.125% | | 7/15/21 | | | 200,000 | |
| USD | 200,000 | | Calumet Specialty Products Partners LP (a) | | 6.500% | | 4/15/21 | | | 205,000 | |
| EUR | 100,000 | | Cemex Finance LLC | | 5.250% | | 4/1/21 | | | 139,429 | |
| USD | 100,000 | | Citigroup, Inc. | | 1.750% | | 5/1/18 | | | 98,990 | |
| GBP | 100,000 | | Comcast Corp. | | 5.500% | | 11/23/29 | | | 195,857 | |
| USD | 100,000 | | Crestview DS Merger Sub II, Inc. | | 10.000% | | 9/1/21 | | | 112,875 | |
| USD | 200,000 | | Digicel Group, Ltd. (a) | | 8.250% | | 9/30/20 | | | 216,500 | |
| USD | 70,000 | | DIRECTV Holdings LLC/DIRECTV Financing Co., Inc. | | 6.000% | | 8/15/40 | | | 80,160 | |
| GBP | 100,000 | | Health Care REIT, Inc. | | 4.800% | | 11/20/28 | | | 175,995 | |
| USD | 100,000 | | Hockey Merger Sub 2, Inc. (a) | | 7.875% | | 10/1/21 | | | 103,000 | |
| USD | 200,000 | | Hot Topic, Inc. (a) | | 9.250% | | 6/15/21 | | | 221,000 | |
| USD | 100,000 | | ILFC E-Capital Trust I (a) (b) | | 5.020% | | 12/21/65 | | | 96,500 | |
| USD | 35,000 | | Monsanto Co. | | 2.750% | | 7/15/21 | | | 34,843 | |
| USD | 100,000 | | PF Chang’s China Bistro, Inc. (a) | | 10.250% | | 6/30/20 | | | 102,000 | |
| USD | 130,000 | | Quiksilver, Inc. | | 10.000% | | 8/1/20 | | | 111,800 | |
| USD | 200,000 | | RCN Telecom Services LLC (a) | | 8.500% | | 8/15/20 | | | 214,000 | |
| GBP | 50,000 | | The Goldman Sachs Group, Inc. | | 6.125% | | 5/14/17 | | | 91,963 | |
| USD | 200,000 | | TMS International Corp. (a) | | 7.625% | | 10/15/21 | | | 213,500 | |
| USD | 150,000 | | TransDigm, Inc. (a) | | 6.000% | | 7/15/22 | | | 150,938 | |
| USD | 50,000 | | Verizon Communications, Inc. | | 6.550% | | 9/15/43 | | | 63,022 | |
| USD | 200,000 | | West Corp. (a) | | 5.375% | | 7/15/22 | | | 194,500 | |
| USD | 75,000 | | Williams Partners LP | | 4.900% | | 1/15/45 | | | 75,088 | |
| | | | | | | | | | | 3,447,011 | |
| | | | | | | | | | | | |
| | | | Total corporate bonds | | | | | | | | |
| | | | (Cost $13,299,791) | | | | | | | 13,467,300 | |
See notes to financial statements
For a share outstanding throughout the periods indicated
| | | | | Income (loss) from investment operations: | | Less distributions: |
| | | Net asset value, beginning of period | | Net investment income (loss)(a) | | Net realized and unrealized gain (loss) on investments | | Total from investment operations | | Dividends from net investment income | | Distributions from net realized capital gains | | Total distributions |
| Global Equity Income Fund | | | | | | | | | | | | | | |
| Class A | | | | | | | | | | | | | | | | | | | | | | |
| Year Ended 7/31/2014 | | $ | 7.85 | | | 0.52 | | | 0.48 | | | 1.00 | | | (0.49 | ) | | 0.00 | | | (0.49 | ) |
| Year Ended 7/31/2013 | | | 7.06 | | | 0.50 | | | 0.78 | | | 1.28 | | | (0.49 | ) | | 0.00 | | | (0.49 | ) |
| Year Ended 7/31/2012 | | | 7.45 | | | 0.48 | | | (0.39 | ) | | 0.09 | | | (0.48 | ) | | 0.00 | | | (0.48 | ) |
| Year Ended 7/31/2011 | | | 6.99 | | | 0.46 | | | 0.51 | | | 0.97 | | | (0.51 | ) | | 0.00 | | | (0.51 | ) |
| Year Ended 7/31/2010 | | | 7.11 | | | 0.57 | | | (0.17 | ) | | 0.40 | | | (0.52 | ) | | 0.00 | | | (0.52 | ) |
| Class C | | | | | | | | | | | | | | | | | | | | | | |
| Year Ended 7/31/2014 | | $ | 7.81 | | | 0.46 | | | 0.48 | | | 0.94 | | | (0.43 | ) | | 0.00 | | | (0.43 | ) |
| Year Ended 7/31/2013 | | | 7.03 | | | 0.44 | | | 0.77 | | | 1.21 | | | (0.43 | ) | | 0.00 | | | (0.43 | ) |
| Year Ended 7/31/2012 | | | 7.42 | | | 0.43 | | | (0.39 | ) | | 0.04 | | | (0.43 | ) | | 0.00 | | | (0.43 | ) |
| Year Ended 7/31/2011 | | | 6.96 | | | 0.40 | | | 0.52 | | | 0.92 | | | (0.46 | ) | | 0.00 | | | (0.46 | ) |
| Year Ended 7/31/2010 | | | 7.08 | | | 0.52 | | | (0.17 | ) | | 0.35 | | | (0.47 | ) | | 0.00 | | | (0.47 | ) |
| Class I | | | | | | | | | | | | | | | | | | | | | | |
| Year Ended 7/31/2014 | | $ | 7.86 | | | 0.55 | | | 0.47 | | | 1.02 | | | (0.51 | ) | | 0.00 | | | (0.51 | ) |
| Year Ended 7/31/2013 | | | 7.07 | | | 0.53 | | | 0.77 | | | 1.30 | | | (0.51 | ) | | 0.00 | | | (0.51 | ) |
| Year Ended 7/31/2012 | | | 7.46 | | | 0.51 | | | (0.40 | ) | | 0.11 | | | (0.50 | ) | | 0.00 | | | (0.50 | ) |
| Year Ended 7/31/2011 | | | 6.99 | | | 0.48 | | | 0.52 | | | 1.00 | | | (0.53 | ) | | 0.00 | | | (0.53 | ) |
| Year Ended 7/31/2010 | | | 7.12 | | | 0.62 | | | (0.21 | ) | | 0.41 | | | (0.54 | ) | | 0.00 | | | (0.54 | ) |
| (a) | Per share data was calculated using average shares outstanding during the period. |
| (b) | Total returns are historical and assume changes in share price, reinvestment of all dividends and distributions and no sales charge. Had certain expenses not been reduced during the periods shown, total returns would have been lower. |
| (c) | Not annualized for periods less than one year. |
| * | Amount represents less than $0.01. |
See notes to financial statements
| | | | | | | | Ratios to average net assets: | | |
Redemption fees | | Net asset value, end of period | | Total return(b) | Net assets, end of period (000) | | Annualized ratio of operating expenses to average net assets | | Annualized ratio of net investment income/(loss) to average net assets | | Annualized ratio of operating expenses to average net assets without waivers and/or expenses reimbursed | | Portfolio turnover rate(c) |
| | | | | | | | | | | | | | | | | | | | | | | | |
| | N/A | | $ | 8.36 | | | 12.93 | % | $ | 804,022 | | | 1.13 | % | | 6.31 | % | | 1.13 | % | | 103 | % |
| | N/A | | | 7.85 | | | 18.58 | | | 707,252 | | | 1.22 | | | 6.56 | | | 1.22 | | | 130 | |
| | N/A | | | 7.06 | | | 1.59 | | | 467,318 | | | 1.29 | | | 6.97 | | | 1.29 | | | 108 | |
| | N/A | | | 7.45 | | | 14.13 | | | 489,400 | | | 1.32 | | | 6.18 | | | 1.32 | | | 127 | |
| | 0.00* | | | 6.99 | | | 5.76 | | | 351,445 | | | 1.36 | | | 7.89 | | | 1.37 | | | 174 | |
| | | | | | | | | | | | | | | | | | | | | | | | |
| | N/A | | $ | 8.32 | | | 12.18 | % | $ | 957,099 | | | 1.88 | % | | 5.59 | % | | 1.88 | % | | 103 | % |
| | N/A | | | 7.81 | | | 17.65 | | | 587,376 | | | 1.98 | | | 5.85 | | | 1.98 | | | 130 | |
| | N/A | | | 7.03 | | | 0.82 | | | 363,751 | | | 2.05 | | | 6.21 | | | 2.05 | | | 108 | |
| | N/A | | | 7.42 | | | 13.35 | | | 363,455 | | | 2.07 | | | 5.36 | | | 2.07 | | | 127 | |
| | 0.00* | | | 6.96 | | | 5.01 | | | 274,571 | | | 2.11 | | | 7.17 | | | 2.12 | | | 174 | |
| | | | | | | | | | | | | | | | | | | | | | | | |
| | N/A | | $ | 8.37 | | | 13.19 | % | $ | 1,363,213 | | | 0.87 | % | | 6.60 | % | | 0.87 | % | | 103 | % |
| | N/A | | | 7.86 | | | 18.87 | | | 665,505 | | | 0.95 | | | 6.95 | | | 0.95 | | | 130 | |
| | N/A | | | 7.07 | | | 1.87 | | | 332,048 | | | 1.01 | | | 7.38 | | | 1.01 | | | 108 | |
| | N/A | | | 7.46 | | | 14.55 | | | 198,216 | | | 1.07 | | | 6.35 | | | 1.07 | | | 127 | |
| | 0.00* | | | 6.99 | | | 5.87 | | | 92,146 | | | 1.11 | | | 8.60 | | | 1.12 | | | 174 | |
See notes to financial statements
For a share outstanding throughout the periods indicated
| | | | | | Income (loss) from investment operations: | | Less distributions: |
| | | | Net asset value, beginning of period | | Net investment income (loss)(a) | | Net realized and unrealized gain (loss) on investments | | Total from investment operations | | Dividends from net investment income | | Distributions from net realized capital gains | | Total distributions |
| Global Technology Fund | | | | | | | | | | | | | | | | | | | | | | |
| Class A | | | | | | | | | | | | | | | | | | | | | | |
| Year Ended 7/31/2014 | | $ | | | | (0.17 | ) | | 4.09 | | | 3.92 | | | 0.00 | | | (0.17 | ) | | (0.17 | ) |
| Year Ended 7/31/2013 | | | 19.69 | | | 0.06 | | | 3.47 | | | 3.53 | | | 0.00 | | | 0.00 | | | 0.00 | |
| Year Ended 7/31/2012 | | | 20.55 | | | (0.15 | ) | | (0.71 | ) | | (0.86 | ) | | 0.00 | | | 0.00 | | | 0.00 | |
| Year Ended 7/31/2011 | | | 16.10 | | | (0.08 | ) | | 4.53 | | | 4.45 | | | 0.00 | | | 0.00 | | | 0.00 | |
| Year Ended 7/31/2010 | | | 13.32 | | | (0.17 | ) | | 2.95 | | | 2.78 | | | 0.00 | | | 0.00 | | | 0.00 | |
| Class B | | | | | | | | | | | | | | | | | | | | | | |
| Year Ended 7/31/2014 | | $ | 21.26 | | | (0.34 | ) | | 3.73 | | | 3.39 | | | 0.00 | | | (0.17 | ) | | (0.17 | ) |
| Year Ended 7/31/2013 | | | 18.18 | | | (0.10 | ) | | 3.18 | | | 3.08 | | | 0.00 | | | 0.00 | | | 0.00 | |
| Year Ended 7/31/2012 | | | 19.13 | | | (0.29 | ) | | (0.66 | ) | | (0.95 | ) | | 0.00 | | | 0.00 | | | 0.00 | |
| Year Ended 7/31/2011 | | | 15.10 | | | (0.22 | ) | | 4.25 | | | 4.03 | | | 0.00 | | | 0.00 | | | 0.00 | |
| Year Ended 7/31/2010 | | | 12.59 | | | (0.27 | ) | | 2.78 | | | 2.51 | | | 0.00 | | | 0.00 | | | 0.00 | |
| Class C | | | | | | | | | | | | | | | | | | | | | | |
| Year Ended 7/31/2014 | | $ | 21.23 | | | (0.33 | ) | | 3.73 | | | 3.40 | | | 0.00 | | | (0.17 | ) | | (0.17 | ) |
| Year Ended 7/31/2013 | | | 18.15 | | | (0.09 | ) | | 3.17 | | | 3.08 | | | 0.00 | | | 0.00 | | | 0.00 | |
| Year Ended 7/31/2012 | | | 19.08 | | | (0.28 | ) | | (0.65 | ) | | (0.93 | ) | | 0.00 | | | 0.00 | | | 0.00 | |
| Year Ended 7/31/2011 | | | 15.06 | | | (0.22 | ) | | 4.24 | | | 4.02 | | | 0.00 | | | 0.00 | | | 0.00 | |
| Year Ended 7/31/2010 | | | 12.56 | | | (0.27 | ) | | 2.77 | | | 2.50 | | | 0.00 | | | 0.00 | | | 0.00 | |
| Class I | | | | | | | | | | | | | | | | | | | | | | |
| Year Ended 7/31/2014 | | $ | 23.50 | | | (0.10 | ) | | 4.14 | | | 4.04 | | | 0.00 | | | (0.17 | ) | | (0.17 | ) |
| Year Ended 7/31/2013 | | | 19.88 | | | 0.11 | | | 3.51 | | | 3.62 | | | 0.00 | | | 0.00 | | | 0.00 | |
| Year Ended 7/31/2012 | | | 20.68 | | | (0.09 | ) | | (0.71 | ) | | (0.80 | ) | | 0.00 | | | 0.00 | | | 0.00 | |
| Year Ended 7/31/2011 | | | 16.16 | | | (0.02 | ) | | 4.54 | | | 4.52 | | | 0.00 | | | 0.00 | | | 0.00 | |
| Year Ended 7/31/2010 | | | 13.34 | | | (0.13 | ) | | 2.95 | | | 2.82 | | | 0.00 | | | 0.00 | | | 0.00 | |
| (a) | Per share data was calculated using average shares outstanding during the period. |
| (b) | Total returns are historical and assume changes in share price, reinvestment of all dividends and distributions and no sales charge. Had certain expenses not been reduced during the periods shown, total returns would have been lower. |
| (c) | Not annualized for periods less than one year. |
| * | Amount represents less than $0.01. |
See notes to financial statements
| | | | | | | | | Ratios to average net assets: | | |
Redemption fees | | | Net asset value, end of period | | Total return(b) | Net assets, end of period (000) | | Annualized ratio of operating expenses to average net assets | | Annualized ratio of net investment income/(loss) to average net assets | | Annualized ratio of operating expenses to average net assets without waivers and/or expenses reimbursed | | Portfolio turnover rate(c) |
| | | | | | | | | | | | | | | | | | | | | | | | |
| | N/A | | $ | 26.97 | | | 16.91 | % | $ | 155,708 | | | 1.44 | % | | (0.65 | )% | | 1.44 | % | | 65 | % |
| | N/A | | | 23.22 | | | 17.93 | | | 169,279 | | | 1.49 | | | 0.28 | | | 1.49 | | | 83 | |
| | N/A | | | 19.69 | | | (4.18 | ) | | 156,948 | | | 1.50 | | | (0.75 | ) | | 1.50 | | | 113 | |
| | N/A | | | 20.55 | | | 27.64 | | | 191,623 | | | 1.55 | | | (0.42 | ) | | 1.55 | | | 93 | |
| | 0.00* | | | 16.10 | | | 20.87 | | | 116,903 | | | 1.64 | | | (1.07 | ) | | 1.64 | | | 76 | |
| | | | | | | | | | | | | | | | | | | | | | | | |
| | N/A | | | 24.48 | | | 15.97 | % | $ | 8,518 | | | 2.25 | % | | (1.46 | )% | | 2.25 | % | | 65 | % |
| | N/A | | | 21.26 | | | 16.94 | | | 9,249 | | | 2.31 | | | (0.52 | ) | | 2.31 | | | 83 | |
| | N/A | | | 18.18 | | | (4.97 | ) | | 9,751 | | | 2.36 | | | (1.62 | ) | | 2.36 | | | 113 | |
| | N/A | | | 19.13 | | | 26.69 | | | 11,821 | | | 2.30 | | | (1.19 | ) | | 2.30 | | | 93 | |
| | 0.00* | | | 15.10 | | | 19.94 | | | 9,283 | | | 2.39 | | | (1.82 | ) | | 2.39 | | | 76 | |
| | | | | | | | | | | | | | | | | | | | | | | | |
| | N/A | | $ | 24.46 | | | 16.04 | % | $ | 82,699 | | | 2.21 | % | | (1.42 | )% | | 2.21 | % | | 65 | % |
| | N/A | | | 21.23 | | | 16.97 | | | 71,401 | | | 2.26 | | | (0.49 | ) | | 2.26 | | | 83 | |
| | N/A | | | 18.15 | | | (4.87 | ) | | 69,286 | | | 2.29 | | | (1.54 | ) | | 2.29 | | | 113 | |
| | N/A | | | 19.08 | | | 26.69 | | | 79,228 | | | 2.30 | | | (1.17 | ) | | 2.30 | | | 93 | |
| | 0.00* | | | 15.06 | | | 19.90 | | | 53,793 | | | 2.39 | | | (1.82 | ) | | 2.39 | | | 76 | |
| | | | | | | | | | | | | | | | | | | | | | | | |
| | N/A | | | | | | 17.22 | % | $ | 115,816 | | | 1.19 | % | | (0.40 | )% | | 1.19 | % | | 65 | % |
| | N/A | | | 23.50 | | | 18.21 | | | 97,882 | | | 1.22 | | | 0.51 | | | 1.22 | | | 83 | |
| | N/A | | | 19.88 | | | (3.87 | ) | | 61,492 | | | 1.23 | | | (0.47 | ) | | 1.23 | | | 113 | |
| | N/A | | | 20.68 | | | 27.97 | | | 52,351 | | | 1.30 | | | (0.12 | ) | | 1.30 | | | 93 | |
| | 0.00* | | | 16.16 | | | 21.14 | | | 18,810 | | | 1.39 | | | (0.82 | ) | | 1.39 | | | 76 | |
See notes to financial statements
For a share outstanding throughout the periods indicated
| | | | | Income (loss) from investment operations: | | Less distributions: |
| | | Net asset value, beginning of period | | Net investment income (loss)(b) | | Net realized and unrealized gain (loss) on investments | | Total from investment operations | | Dividends from net investment income | | Distributions from net realized capital gains | | Total distributions |
| High Yield Opportunities Fund | | | | | | | | | | | | | | | | | | | | | | |
| Class A | | | | | | | | | | | | | | | | | | | | | | |
| Year Ended 7/31/2014 | | $ | 9.98 | | | 0.59 | | | 0.45 | | | 1.04 | | | (0.61 | ) | | (0.03 | ) | | (0.64 | ) |
| Period Ended 7/31/2013(a) | | | 10.00 | | | 0.15 | | | (0.06 | ) | | 0.09 | | | (0.11 | ) | | 0.00 | | | (0.11 | ) |
| Class C | | | | | | | | | | | | | | | | | | | | | | |
| Year Ended 7/31/2014 | | $ | 9.99 | | | 0.52 | | | 0.43 | | | 0.95 | | | (0.53 | ) | | (0.03 | ) | | (0.56 | ) |
| Period Ended 7/31/2013(a) | | | 10.00 | | | 0.13 | | | (0.05 | ) | | 0.08 | | | (0.09 | ) | | 0.00 | | | (0.09 | ) |
| Class I | | | | | | | | | | | | | | | | | | | | | | |
| Year Ended 7/31/2014 | | $ | 9.97 | | | 0.62 | | | 0.43 | | | 1.05 | | | (0.64 | ) | | (0.03 | ) | | (0.67 | ) |
| Period Ended 7/31/2013(a) | | | 10.00 | | | 0.16 | | | (0.06 | ) | | 0.10 | | | (0.13 | ) | | 0.00 | | | (0.13 | ) |
| (a) | The High Yield Opportunities Fund commenced operations on April 30, 2013. |
| (b) | Per share data was calculated using average shares outstanding during the period. |
| (c) | Total returns are historical and assume changes in share price, reinvestment of all dividends and distributions and no sales charge. Had certain expenses not been reduced during the periods shown, total returns would have been lower. Total returns for periods of less than one year are not annualized. |
| (d) | Not annualized for periods less than one year. |
See notes to financial statements
| | | | | | | Ratios to average net assets: | | |
| | Net asset value, end of period | | Total return(c) | Net assets, end of period (000) | | Annualized ratio of operating expenses to average net assets | | Annualized ratio of net investment income/(loss) to average net assets | | Annualized ratio of operating expenses to average net assets without waivers and/or expenses reimbursed | | Portfolio turnover rate(d) |
| | | | | | | | | | | | | | | | | | | | | |
| | $ | 10.38 | | | 10.62 | % | $ | 2,148 | | | 1.10 | % | | 5.66 | % | | 1.68 | % | | 340 | % |
| | | 9.98 | | | 0.92 | | | 1,127 | | | 1.10 | | | 6.07 | | | 2.82 | | | 136 | |
| | | | | | | | | | | | | | | | | | | | | | |
| | $ | 10.38 | | | 9.67 | % | $ | 1,196 | | | 1.85 | % | | 5.01 | % | | 2.45 | % | | 340 | % |
| | | 9.99 | | | 0.81 | | | 999 | | | 1.85 | | | 5.27 | | | 3.63 | | | 136 | |
| | | | | | | | | | | | | | | | | | | | | | |
| | $ | 10.35 | | | 10.76 | % | $ | 23,235 | | | 0.85 | % | | 6.02 | % | | 1.38 | % | | 340 | % |
| | | 9.97 | | | 1.06 | | | 23,608 | | | 0.85 | | | 6.27 | | | 1.82 | | | 136 | |
See notes to financial statements
For a share outstanding throughout the periods indicated
| | | | | | Income (loss) from investment operations: | | Less distributions: |
| | | | Net asset value, beginning of period | | Net investment income (loss)(a) | | Net realized and unrealized gain (loss) on investments | | Total from investment operations | | Dividends from net investment income | | Distributions from net realized capital gains | | Total distributions |
| International Opportunities Fund | | | | | | | | | | | | | | | | | | | | | | |
| Class A | | | | | | | | | | | | | | | | | | | | | | |
| Year Ended 7/31/2014 | | $ | | | | 0.31 | | | 2.98 | | | 3.29 | | | (0.09 | ) | | 0.00 | | | (0.09 | ) |
| Year Ended 7/31/2013 | | | 19.22 | | | 0.14 | | | 4.58 | | | 4.72 | | | (0.15 | ) | | 0.00 | | | (0.15 | ) |
| Year Ended 7/31/2012 | | | 21.77 | | | 0.15 | | | (2.59 | ) | | (2.44 | ) | | (0.11 | ) | | 0.00 | | | (0.11 | ) |
| Year Ended 7/31/2011 | | | 19.10 | | | 0.13 | | | 2.68 | | | 2.81 | | | (0.14 | ) | | 0.00 | | | (0.14 | ) |
| Year Ended 7/31/2010 | | | 18.87 | | | 0.16 | | | 0.14 | | | 0.30 | | | (0.07 | ) | | 0.00 | | | (0.07 | ) |
| Class B | | | | | | | | | | | | | | | | | | | | | | |
| Year Ended 7/31/2014 | | $ | 22.40 | | | 0.03 | | | 2.86 | | | 2.89 | | | 0.00 | | | 0.00 | | | 0.00 | |
| Year Ended 7/31/2013 | | | 18.13 | | | (0.06 | ) | | 4.33 | | | 4.27 | | | 0.00 | | | 0.00 | | | 0.00 | |
| Year Ended 7/31/2012 | | | 20.58 | | | (0.01 | ) | | (2.44 | ) | | (2.45 | ) | | 0.00 | | | 0.00 | | | 0.00 | |
| Year Ended 7/31/2011 | | | 18.07 | | | (0.03 | ) | | 2.54 | | | 2.51 | | | 0.00 | | | 0.00 | | | 0.00 | |
| Year Ended 7/31/2010 | | | 17.92 | | | 0.01 | | | 0.14 | | | 0.15 | | | (0.00 | )* | | 0.00 | | | (0.00 | )* |
| Class C | | | | | | | | | | | | | | | | | | | | | | |
| Year Ended 7/31/2014 | | $ | 22.40 | | | 0.08 | | | 2.83 | | | 2.91 | | | 0.00 | | | 0.00 | | | 0.00 | |
| Year Ended 7/31/2013 | | | 18.12 | | | (0.04 | ) | | 4.32 | | | 4.28 | | | 0.00 | | | 0.00 | | | 0.00 | |
| Year Ended 7/31/2012 | | | 20.56 | | | (0.00 | )* | | (2.44 | ) | | (2.44 | ) | | 0.00 | | | 0.00 | | | 0.00 | |
| Year Ended 7/31/2011 | | | 18.06 | | | (0.03 | ) | | 2.53 | | | 2.50 | | | 0.00 | | | 0.00 | | | 0.00 | |
| Year Ended 7/31/2010 | | | 17.91 | | | 0.01 | | | 0.14 | | | 0.15 | | | (0.00 | )* | | 0.00 | | | (0.00 | )* |
| Class I | | | | | | | | | | | | | | | | | | | | | | |
| Year Ended 7/31/2014 | | $ | 23.82 | | | 0.39 | | | 2.98 | | | 3.37 | | | (0.15 | ) | | 0.00 | | | (0.15 | ) |
| Year Ended 7/31/2013 | | | 19.25 | | | 0.22 | | | 4.57 | | | 4.79 | | | (0.22 | ) | | 0.00 | | | (0.22 | ) |
| Year Ended 7/31/2012 | | | 21.83 | | | 0.21 | | | (2.61 | ) | | (2.40 | ) | | (0.18 | ) | | 0.00 | | | (0.18 | ) |
| Year Ended 7/31/2011 | | | 19.16 | | | 0.19 | | | 2.67 | | | 2.86 | | | (0.19 | ) | | 0.00 | | | (0.19 | ) |
| Year Ended 7/31/2010 | | | 18.89 | | | 0.22 | | | 0.15 | | | 0.37 | | | (0.10 | ) | | 0.00 | | | (0.10 | ) |
| Class R | | | | | | | | | | | | | | | | | | | | | | |
| Year Ended 7/31/2014 | | $ | 23.44 | | | 0.22 | | | 2.95 | | | 3.17 | | | (0.02 | ) | | 0.00 | | | (0.02 | ) |
| Year Ended 7/31/2013 | | | 18.93 | | | 0.07 | | | 4.51 | | | 4.58 | | | (0.07 | ) | | 0.00 | | | (0.07 | ) |
| Year Ended 7/31/2012 | | | 21.50 | | | 0.08 | | | (2.58 | ) | | (2.50 | ) | | (0.07 | ) | | 0.00 | | | (0.07 | ) |
| Year Ended 7/31/2011 | | | 18.88 | | | 0.09 | | | 2.64 | | | 2.73 | | | (0.11 | ) | | 0.00 | | | (0.11 | ) |
| Year Ended 7/31/2010 | | | 18.70 | | | 0.14 | | | 0.12 | | | 0.26 | | | (0.08 | ) | | 0.00 | | | (0.08 | ) |
| (a) | Per share data was calculated using average shares outstanding during the period. |
| (b) | Total returns are historical and assume changes in share price, reinvestment of all dividends and distributions and no sales charge. Had certain expenses not been reduced during the periods shown, total returns would have been lower. |
| (c) | Not annualized for periods less than one year. |
| * | Amount represents less than $0.01. |
See notes to financial statements
| | | | | | | | | | Ratios to average net assets: | | |
Redemption fees | | | Net asset value, end of period | | Total return(b) | Net assets, end of period (000) | | Annualized ratio of operating expenses to average net assets | | Annualized ratio of net investment income/(loss) to average net assets | | Annualized ratio of operating expenses to average net assets without waivers and/or expenses reimbursed | | Portfolio turnover rate(c) |
| | | | | | | | | | | | | | | | | | | | | | | | |
| | N/A | | $ | 26.99 | | | 13.84 | % | $ | 1,991,001 | | | 1.40 | % | | 1.18 | % | | 1.40 | % | | 74 | % |
| | N/A | | | 23.79 | | | 24.64 | | | 1,467,583 | | | 1.46 | | | 0.66 | | | 1.46 | | | 129 | |
| | N/A | | | 19.22 | | | (11.17 | ) | | 1,263,648 | | | 1.47 | | | 0.78 | | | 1.47 | | | 45 | |
| | N/A | | | 21.77 | | | 14.71 | | | 1,950,064 | | | 1.44 | | | 0.62 | | | 1.44 | | | 64 | |
| | 0.00* | | | 19.10 | | | 1.59 | | | 2,097,217 | | | 1.48 | | | 0.81 | | | 1.48 | | | 52 | |
| | | | | | | | | | | | | | | | | | | | | | | | |
| | N/A | | $ | 25.29 | | | 12.90 | % | $ | 29,409 | | | 2.21 | % | | 0.10 | % | | 2.21 | % | | 74 | % |
| | N/A | | | 22.40 | | | 23.55 | | | 40,023 | | | 2.29 | | | (0.30 | ) | | 2.29 | | | 129 | |
| | N/A | | | 18.13 | | | (11.90 | ) | | 48,771 | | | 2.32 | | | (0.07 | ) | | 2.32 | | | 45 | |
| | N/A | | | 20.58 | | | 13.89 | | | 79,091 | | | 2.19 | | | (0.14 | ) | | 2.19 | | | 64 | |
| | 0.00* | | | 18.07 | | | 0.84 | | | 84,619 | | | 2.23 | | | 0.03 | | | 2.23 | | | 52 | |
| | | | | | | | | | | | | | | | | | | | | | | | |
| | N/A | | $ | 25.31 | | | 12.99 | % | $ | 491,403 | | | 2.17 | % | | 0.32 | % | | 2.17 | % | | 74 | % |
| | N/A | | | 22.40 | | | 23.62 | | | 424,538 | | | 2.26 | | | (0.18 | ) | | 2.26 | | | 129 | |
| | N/A | | | 18.12 | | | (11.87 | ) | | 416,582 | | | 2.29 | | | (0.02 | ) | | 2.29 | | | 45 | |
| | N/A | | | 20.56 | | | 13.84 | | | 639,252 | | | 2.19 | | | (0.15 | ) | | 2.19 | | | 64 | |
| | 0.00* | | | 18.06 | | | 0.84 | | | 706,332 | | | 2.23 | | | 0.04 | | | 2.23 | | | 52 | |
| | | | | | | | | | | | | | | | | | | | | | | | |
| | N/A | | $ | 27.04 | | | 14.16 | % | $ | 1,389,207 | | | 1.12 | % | | 1.47 | % | | 1.12 | % | | 74 | % |
| | N/A | | | 23.82 | | | 25.00 | | | 872,974 | | | 1.16 | | | 1.04 | | | 1.16 | | | 129 | |
| | N/A | | | 19.25 | | | (10.93 | ) | | 656,313 | | | 1.20 | | | 1.09 | | | 1.20 | | | 45 | |
| | N/A | | | 21.83 | | | 14.96 | | | 797,316 | | | 1.19 | | | 0.87 | | | 1.19 | | | 64 | |
| | 0.00* | | | 19.16 | | | 1.92 | | | 555,653 | | | 1.23 | | | 1.12 | | | 1.23 | | | 52 | |
| | | | | | | | | | | | | | | | | | | | | | | | |
| | N/A | | $ | 26.59 | | | 13.54 | % | $ | 9,966 | | | 1.68 | % | | 0.85 | % | | 1.68 | % | | 74 | % |
| | N/A | | | 23.44 | | | 24.23 | | | 7,180 | | | 1.76 | | | 0.34 | | | 1.76 | | | 129 | |
| | N/A | | | 18.93 | | | (11.60 | ) | | 6,454 | | | 1.94 | | | 0.42 | | | 1.94 | | | 45 | |
| | N/A | | | 21.50 | | | 14.45 | | | 7,258 | | | 1.69 | | | 0.44 | | | 1.69 | | | 64 | |
| | 0.00* | | | 18.88 | | | 1.35 | | | 7,288 | | | 1.73 | | | 0.73 | | | 1.73 | | | 52 | |
See notes to financial statements
For a share outstanding throughout the periods indicated
| | | | | | Income (loss) from investment operations: | | Less distributions: |
| | | | Net asset value, beginning of period | | Net investment income (loss)(c) | | Net realized and unrealized gain (loss) on investments | | Total from investment operations | | Dividends from net investment income | | Distributions from net realized capital gains | | Return of capital |
| Strategic Income Fund | | | | | | | | | | | | | | | |
| Class A | | | | | | | | | | | | | | | | | | | | | | |
| Year Ended 7/31/2014 | | $ | 8.93 | | | 0.46 | | | 0.20 | | | 0.66 | | | (0.46 | ) | | 0.00 | | | 0.00 | |
| Period Ended 7/31/2013(a) | | | 9.12 | | | 0.23 | | | (0.19 | ) | | 0.04 | | | (0.23 | ) | | 0.00 | | | 0.00 | |
| Year Ended 12/31/2012 | | | 8.39 | | | 0.40 | | | 0.73 | | | 1.13 | | | (0.40 | ) | | 0.00 | | | 0.00 | |
| Year Ended 12/31/2011 | | | 8.82 | | | 0.44 | | | (0.43 | ) | | 0.01 | | | (0.37 | ) | | 0.00 | | | (0.07 | ) |
| Year Ended 12/31/2010 | | | 8.44 | | | 0.46 | | | 0.38 | | | 0.84 | | | (0.33 | ) | | 0.00 | | | (0.13 | ) |
| Period Ended 12/31/2009(b) | | | 7.60 | | | 0.21 | | | 0.83 | | | 1.04 | | | 0.00 | | | 0.00 | | | (0.18 | ) |
| Year Ended 7/31/2009 | | | 9.45 | | | 0.63 | | | (1.78 | ) | | (1.15 | ) | | (0.70 | ) | | 0.00 | | | 0.00 | |
| Class B | | | | | | | | | | | | | | | | | | | | | | |
| Year Ended 7/31/2014 | | $ | 8.95 | | | 0.39 | | | 0.21 | | | 0.60 | | | (0.39 | ) | | 0.00 | | | 0.00 | |
| Period Ended 7/31/2013(a) | | | 9.14 | | | 0.19 | | | (0.20 | ) | | (0.01 | ) | | (0.18 | ) | | 0.00 | | | 0.00 | |
| Year Ended 12/31/2012 | | | 8.40 | | | 0.33 | | | 0.74 | | | 1.07 | | | (0.33 | ) | | 0.00 | | | 0.00 | |
| Year Ended 12/31/2011 | | | 8.83 | | | 0.38 | | | (0.43 | ) | | (0.05 | ) | | (0.32 | ) | | 0.00 | | | (0.06 | ) |
| Year Ended 12/31/2010 | | | 8.46 | | | 0.40 | | | 0.37 | | | 0.77 | | | (0.29 | ) | | 0.00 | | | (0.11 | ) |
| Period Ended 12/31/2009(b) | | | 7.61 | | | 0.19 | | | 0.84 | | | 1.03 | | | 0.00 | | | 0.00 | | | (0.18 | ) |
| Year Ended 7/31/2009 | | | 9.44 | | | 0.56 | | | (1.75 | ) | | (1.19 | ) | | (0.64 | ) | | 0.00 | | | 0.00 | |
| Class C | | | | | | | | | | | | | | | | | | | | | | |
| Year Ended 7/31/2014 | | $ | 8.89 | | | 0.39 | | | 0.20 | | | 0.59 | | | (0.39 | ) | | 0.00 | | | 0.00 | |
| Period Ended 7/31/2013(a) | | | 9.08 | | | 0.19 | | | (0.20 | ) | | (0.01 | ) | | (0.18 | ) | | 0.00 | | | 0.00 | |
| Year Ended 12/31/2012 | | | 8.35 | | | 0.33 | | | 0.73 | | | 1.06 | | | (0.33 | ) | | 0.00 | | | 0.00 | |
| Year Ended 12/31/2011 | | | 8.79 | | | 0.37 | | | (0.43 | ) | | (0.06 | ) | | (0.32 | ) | | 0.00 | | | (0.06 | ) |
| Year Ended 12/31/2010 | | | 8.41 | | | 0.40 | | | 0.38 | | | 0.78 | | | (0.29 | ) | | 0.00 | | | (0.11 | ) |
| Period Ended 12/31/2009(b) | | | 7.59 | | | 0.19 | | | 0.81 | | | 1.00 | | | 0.00 | | | 0.00 | | | (0.18 | ) |
| Year Ended 7/31/2009 | | | 9.45 | | | 0.57 | | | (1.79 | ) | | (1.22 | ) | | (0.64 | ) | | 0.00 | | | 0.00 | |
| Class I | | | | | | | | | | | | | | | | | | | | | | |
| Year Ended 7/31/2014 | | $ | 8.91 | | | 0.48 | | | 0.21 | | | 0.69 | | | (0.49 | ) | | 0.00 | | | 0.00 | |
| Period Ended 7/31/2013(a) | | | 9.10 | | | 0.24 | | | (0.19 | ) | | 0.05 | | | (0.24 | ) | | 0.00 | | | 0.00 | |
| Year Ended 12/31/2012 | | | 8.37 | | | 0.42 | | | 0.73 | | | 1.15 | | | (0.42 | ) | | 0.00 | | | 0.00 | |
| Year Ended 12/31/2011(d) | | | 9.06 | | | 0.29 | | | (0.66 | ) | | (0.37 | ) | | (0.27 | ) | | 0.00 | | | (0.05 | ) |
| (a) | Strategic Income Fund changed its fiscal year end from December 31 to July 31 effective July 31, 2013. |
| (b) | Strategic Income Fund changed its fiscal year end from July 31 to December 31 effective December 31, 2009. |
| (c) | Per share data was calculated using average shares outstanding during the period. |
| (d) | Class I commenced operations on April 29, 2011. |
| (e) | Total returns are historical and assume changes in share price, reinvestment of all dividends and distributions and no sales charge. Had certain expenses not been reduced during the periods shown, total returns would have been lower. Total returns for periods of less than one year are not annualized. |
| (f) | Not annualized for periods less than one year. |
| * | Amount represents less than $0.01. |
See notes to financial statements
| | | | | | | | | | | | Ratios to average net assets: | | |
Total distributions | | | Redemption fees | | Net asset value, end of period | | Total return(e) | | Net assets, end of period (000) | | Annualized ratio of operating expenses to average net assets | | Annualized ratio of net investment income/(loss) to average net assets | | Annualized ratio of operating expenses to average net assets without waivers and/or expenses reimbursed | | Portfolio turnover rate(f) |
| | | | | | | | | | | | | | | | | | | | | | | | | | | |
| | (0.46) | | | 0.00 | | $ | 9.13 | | | 7.56 | % | | $11,522 | | | 1.10 | % | | 5.02 | % | | 1.36 | % | | 84 | % |
| | (0.23) | | | 0.00 | | | 8.93 | | | 0.39 | | | 15,656 | | | 1.10 | | | 4.36 | | | 1.44 | | | 50 | |
| | (0.40) | | | 0.00 | | | 9.12 | | | 13.75 | | | 17,596 | | | 1.10 | | | 4.51 | | | 1.34 | | | 47 | |
| | (0.44) | | | 0.00 | | | 8.39 | | | 0.06 | | | 17,210 | | | 1.20 | | | 5.04 | | | 1.51 | | | 41 | |
| | (0.46) | | | 0.00 | * | | 8.82 | | | 10.17 | | | 28,171 | | | 1.30 | | | 5.30 | | | 1.54 | | | 38 | |
| | (0.18) | | | 0.00 | * | | 8.46 | | | 13.82 | | | 35,656 | | | 1.30 | | | 6.19 | | | 1.63 | | | 11 | |
| | (0.70) | | | 0.00 | * | | 7.60 | | | (10.71 | ) | | 28,905 | | | 1.30 | | | 8.69 | | | 1.62 | | | 53 | |
| | | | | | | | | | | | | | | | | | | | | | | | | | | |
| | (0.39) | | | 0.00 | | $ | 9.16 | | | 6.79 | % | | $ 4,254 | | | 1.85 | % | | 4.28 | % | | 2.16 | % | | 84 | % |
| | (0.18) | | | 0.00 | | | 8.95 | | | (0.07 | ) | | 6,198 | | | 1.85 | | | 3.62 | | | 2.21 | | | 50 | |
| | (0.33) | | | 0.00 | | | 9.14 | | | 12.97 | | | 6,963 | | | 1.85 | | | 3.77 | | | 2.12 | | | 47 | |
| | (0.38) | | | 0.00 | | | 8.40 | | | (0.69 | ) | | 7,412 | | | 1.94 | | | 4.29 | | | 2.27 | | | 41 | |
| | (0.40) | | | 0.00 | * | | 8.83 | | | 9.21 | | | 8,537 | | | 2.05 | | | 4.55 | | | 2.29 | | | 38 | |
| | (0.18) | | | 0.00 | * | | 8.46 | | | 13.59 | | | 7,824 | | | 2.05 | | | 5.44 | | | 2.38 | | | 11 | |
| | (0.64) | | | 0.00 | * | | 7.61 | | | (11.23 | ) | | 6,325 | | | 2.05 | | | 8.02 | | | 2.37 | | | 53 | |
| | | | | | | | | | | | | | | | | | | | | | | | | | | |
| | (0.39) | | | 0.00 | | $ | 9.09 | | | 6.78 | % | | $17,744 | | | 1.85 | % | | 4.27 | % | | 2.12 | % | | 84 | % |
| | (0.18) | | | 0.00 | | | 8.89 | | | (0.06 | ) | | 19,483 | | | 1.85 | | | 3.62 | | | 2.20 | | | 50 | |
| | (0.33) | | | 0.00 | | | 9.08 | | | 12.95 | | | 22,328 | | | 1.85 | | | 3.77 | | | 2.11 | | | 47 | |
| | (0.38) | | | 0.00 | | | 8.35 | | | (0.80 | ) | | 22,244 | | | 1.94 | | | 4.29 | | | 2.26 | | | 41 | |
| | (0.40) | | | 0.00 | * | | 8.79 | | | 9.39 | | | 26,997 | | | 2.05 | | | 4.55 | | | 2.29 | | | 38 | |
| | (0.18) | | | 0.00 | * | | 8.41 | | | 13.22 | | | 30,152 | | | 2.05 | | | 5.45 | | | 2.38 | | | 11 | |
| | (0.64) | | | 0.00 | * | | 7.59 | | | (11.55 | ) | | 28,513 | | | 2.05 | | | 7.96 | | | 2.37 | | | 53 | |
| | | | | | | | | | | | | | | | | | | | | | | | | | | |
| | (0.49) | | | N/A | | $ | 9.11 | | | 7.88 | % | | $18,271 | | | 0.85 | % | | 5.29 | % | | 1.08 | % | | 84 | % |
| | (0.24) | | | N/A | | | 8.91 | | | 0.54 | | | 7,291 | | | 0.85 | | | 4.59 | | | 1.16 | | | 50 | |
| | (0.42) | | | N/A | | | 9.10 | | | 14.06 | | | 3,903 | | | 0.85 | | | 4.79 | | | 1.07 | | | 47 | |
| | (0.32) | | | N/A | | | 8.37 | | | (4.10 | ) | | 1,885 | | | 0.85 | | | 5.16 | | | 1.25 | | | 41 | |
See notes to financial statements
For a share outstanding throughout the periods indicated
| | | | | Income (loss) from investment operations: | | Less distributions: |
| | | Net asset value, beginning of period | | Net investment income (loss)(b) | | Net realized and unrealized gain (loss) on investments | | Total from investment operations | | Dividends from net investment income | | Distributions from net realized capital gains | | Total distributions |
| Unconstrained Bond Fund | | | | | | | | | | | | | | | | | | | | | | |
| Class A | | | | | | | | | | | | | | | | | | | | | | |
| Period Ended 7/31/2014(a) | | $ | 10.00 | | | 0.11 | | | 0.06 | | | 0.17 | | | (0.11 | ) | | 0.00 | | | (0.11 | ) |
| Class C | | | | | | | | | | | | | | | | | | | | | | |
| Period Ended 7/31/2014(a) | | $ | 10.00 | | | 0.06 | | | 0.07 | | | 0.13 | | | (0.07 | ) | | 0.00 | | | (0.07 | ) |
| Class I | | | | | | | | | | | | | | | | | | | | | | |
| Period Ended 7/31/2014(a) | | $ | 10.00 | | | 0.13 | | | 0.06 | | | 0.19 | | | (0.13 | ) | | 0.00 | | | (0.13 | ) |
| (a) | The Unconstrained Bond Fund commenced operations on December 20, 2013. |
| (b) | Per share data was calculated using average shares outstanding during the period. |
| (c) | Total returns are historical and assume changes in share price, reinvestment of all dividends and distributions and no sales charge. Had certain expenses not been reduced during the periods shown, total returns would have been lower. Total returns for periods of less than one year are not annualized. |
| (d) | Not annualized for periods less than one year. |
See notes to financial statements
| | | | | | | | | Ratios to average net assets: | | |
Net asset value, end of period | | | Total return(c) | | Net assets, end of period (000) | | Annualized ratio of operating expenses to average net assets | | Annualized ratio of net investment income/(loss) to average net assets | | Annualized ratio of operating expenses to average net assets without waivers and/or expenses reimbursed | | Portfolio turnover rate(d) |
| | | | | | | | | | | | | | | | | | | | | |
| | $10.06 | | | 1.75 | % | $ | 1,136 | | | 1.15 | % | | 1.80 | % | | 2.33 | % | | 97 | % |
| | | | | | | | | | | | | | | | | | | | | |
| | $10.06 | | | 1.29 | % | $ | 1,006 | | | 1.90 | % | | 1.02 | % | | 3.07 | % | | 97 | % |
| | | | | | | | | | | | | | | | | | | | | |
| | $10.06 | | | 1.91 | % | $ | 26,125 | | | 0.90 | % | | 2.04 | % | | 2.07 | % | | 97 | % |
See notes to financial statements
Notes to financial statements
Note 1. Organization
Henderson Global Funds (the “Trust”) was organized on May 11, 2001, as a Delaware statutory trust and is registered under the Investment Company Act of 1940, as amended (the “1940 Act”), as an open-end management investment company. The Trust has an unlimited number of authorized shares that are divided among ten series. The Henderson All Asset Fund, Henderson Dividend & Income Builder Fund, Henderson Emerging Markets Opportunities Fund, Henderson European Focus Fund, Henderson Global Equity Income Fund, Henderson Global Technology Fund, Henderson High Yield Opportunities Fund, Henderson International Opportunities Fund, Henderson Strategic Income Fund and Henderson Unconstrained Bond Fund (collectively, the “Funds”) are included in this report. Each is a separate series of the Trust and each is diversified except for the Henderson All Asset Fund, Henderson Dividend & Income Builder Fund, Henderson High Yield Opportunities Fund and Henderson Unconstrained Bond Fund. The Henderson Unconstrained Bond Fund commenced operations on December 20, 2013.
Though it may invest directly in securities, the Henderson All Asset Fund is primarily a Fund-of-Funds (“FoF”) that seeks to achieve its objective by investing in a portfolio of underlying funds (“underlying funds”) which, in turn, may invest in a variety of US and foreign equity, fixed income, money market and derivative instruments. The FoF does not invest in the underlying funds for the purpose of exercising management or control; however, investments by the FoF, within its principal investment strategies, may represent a significant portion of the underlying funds’ net assets subject to 1940 Act limitations and any exemptive relief provided thereto. The FoF’s “Portfolio of Investments” lists the underlying funds held as an investment of the FoF as of period end, but does not include the holdings of the underlying funds.
The Funds offer the following share classes:
| | | | Share Classes | |
| Fund | | | A | | | B | | | C | | | I | | | R | |
| All Asset | | | ü | | | n/a | | | | | | | | | n/a | |
| Dividend & | | | | | | | | | | | | | | | | |
| Income Builder | | | | | | n/a | | | | | | | | | n/a | |
| Emerging Markets | | | | | | | | | | | | | | | | |
| Opportunities | | | | | | n/a | | | | | | | | | n/a | |
| European Focus | | | | | | | | | | | | | | | n/a | |
| Global Equity Income | | | | | | n/a | | | | | | | | | n/a | |
| Global Technology | | | | | | | | | | | | | | | n/a | |
| High Yield | | | | | | | | | | | | | | | | |
| Opportunities | | | | | | n/a | | | | | | | | | n/a | |
| International | | | | | | | | | | | | | | | | |
| Opportunities | | | | | | | | | | | | | | | | |
| Strategic Income | | | | | | | | | | | | | | | n/a | |
| Unconstrained Bond | | | | | | n/a | | | | | | | | | n/a | |
Class A shares generally provide for a front-end sales charge. Class B and C shares provide for a contingent deferred sales charge. Class R and I shares are not subject to a front-end or contingent deferred sales charge.
Each class of shares has equal rights as to earnings and assets except that each class may bear different distribution and shareholder service expenses. Each class of shares has exclusive voting rights with respect to matters that affect just that class. Income, expenses (other than expenses attributable to a specific class), and realized and unrealized gains and losses on investments are allocated to each class of shares based on its relative net assets. Class B shares automatically convert to Class A shares at the end of the month following the eighth anniversary of issuance. The Funds do not accept new or additional investments in Class B shares of the Funds with the limited exception that current Class B shareholders may continue to have their dividends automatically reinvested in Class B shares of the Funds. As described in the prospectus, Class B shares of a particular Fund may continue to be exchanged with Class B shares of other Henderson Global Funds.
Note 2. Significant accounting policies
The following is a summary of significant accounting policies followed by each Fund in preparation of its financial statements. These policies are in conformity with US generally accepted accounting principles (“GAAP”). The preparation of the financial statements in accordance with GAAP requires management to make estimates and assumptions that affect the reported amounts. The actual results could differ from those estimates.
Security valuation
Securities and derivatives traded on a recognized exchange or market are generally valued at the last reported sale price or at the official closing price. Listed securities for which no sale was reported on that date and other securities traded in the over-the-counter (“OTC”) market are valued at the mean between the last bid and asked price.
Debt securities are valued at the market value provided by independent pricing services approved by the Board of Trustees of the Trust. If the pricing services are unable to provide valuations, the securities are valued at the mean between the last bid and asked price, or if no ask is available, then the last bid price obtained from one or more broker-dealers. Such pricing services may use various pricing techniques that take into account appropriate factors such as yield, quality, coupon rate, maturity, type of issue, trading characteristics and other data, as well as broker quotes.
Short-term investments at time of purchase with an original or remaining maturity of 60 days or less are valued at amortized cost, which approximates fair market value. Investments in investment companies are valued at its reported net asset value, which approximates fair market value.
Notes to financial statements
Forward foreign currency contracts are valued daily at the applicable forward rate.
OTC financial derivatives instruments between the Funds and their counterparties, including swap contracts, options (including swaptions), and centrally-cleared swap contracts listed or traded on a multi-lateral or trade facility platform, such as a registered exchange, are valued using independent values provided by independent pricing services when available, otherwise, fair values are estimated on the basis of pricing models that incorporate current market measures for interest rates, currency exchange rates, equity prices and indices, credit spreads, corresponding market volatility levels and other market-based pricing factors.
If market quotations are not readily available, or if the investment adviser determines that a quotation of a security does not represent a fair value, then the security is valued at a fair value as determined in good faith using procedures approved by the Board of Trustees of the Trust. The Trustees of the Trust, or their designee, may also establish fair value using a wide variety of market data including yields or prices of investments of comparable quality, type of issue, coupon, maturity and rating, market quotes or indications of value from security dealers, evaluations of anticipated cash flows or collateral, general market conditions and other information and analysis, including the obligor’s credit characteristics considered relevant.
For equity securities, the Trust has retained an independent statistical fair value pricing service to assist in the fair valuation process for securities principally traded in a foreign market in order to adjust for possible changes in value that may occur between the close of the foreign exchange and the time at which Fund shares are priced. If a security is valued at a “fair value,” that value may be different from the last quoted market price for the security. As a result, it is possible that fair value prices will be used by the Funds.
Security transactions and investment income
Investment transactions are accounted for on a trade-date basis. Securities purchased or sold on a when-issued or delayed-delivery basis may be settled 15 days or more after the trade date. Interest income is recorded on an accrual basis. Dividend income is recorded on the ex-dividend date. Bond premium is amortized and discount is accreted over the expected life of each applicable security. Paydown gains and losses on mortgage-related and other asset-backed securities are recorded as components of interest income on the Statements of Operations. Income or short-term capital gain distributions received from underlying funds are recorded as dividend income. Long-term capital gain distributions received from underlying funds are recorded as realized gains. Corporate actions involving foreign securities, including dividends, are recorded as soon as the information becomes available. Withholding taxes on foreign dividends are accrued in accordance with the applicable country’s tax rules and rates. Gains and losses realized on sales of securities are determined using the specific identification method by comparing the identified cost of the security lot sold with the net sales proceeds, which is the same basis used for federal income tax purposes.
Foreign currency translation
Investments in securities and other assets and liabilities denominated in foreign currencies are translated into US dollar amounts at the date of valuation. Purchases and sales of investment securities and income and expense items denominated in foreign currencies are translated into US dollar amounts on the respective dates of such transactions.
The Funds do not separate the portion of the results of operations resulting from changes in foreign exchange rates on investments from the fluctuations arising from changes in market prices of securities held. Such fluctuations are included with the net realized and unrealized gain or loss from investments on the Statements of Operations.
Reported net realized foreign exchange gains or losses arise from sales of foreign currencies, currency gains or losses realized between the trade date and settlement date on securities transactions, and the difference between the amounts of dividends, interest, and foreign withholding taxes recorded on the Funds’ books and the US dollar equivalent of the amounts actually received or paid. Net unrealized foreign exchange gains and losses arise from changes in the fair values of assets and liabilities, other than investments in securities and financial derivative instruments at fiscal period end, resulting from changes in exchange rates.
Forward foreign currency contracts
The Funds may enter into forward foreign currency contracts primarily to hedge against foreign currency exchange rate risks on its non-US dollar denominated investment securities. Alternatively, a Fund may enter into a forward foreign currency contract for speculative purposes of gaining exposure to particular foreign currency markets. When entering into forward foreign currency contracts, a Fund agrees to receive or deliver a fixed quantity of foreign currency for an agreed-upon price on an agreed future date. Realized gains or losses on forward foreign currency contracts include net gains or losses on contracts that have matured. Forward foreign currency contracts are valued daily and the unrealized appreciation or depreciation is included in the Statements of Assets and Liabilities as a component of “Financial Derivative Instruments.” These instruments involve market risk, credit risk or both kinds of risks, the extent of which may subject the Fund to loss in excess of the amount recognized as unrealized appreciation or depreciation. These risks arise from the possible inability of counterparties to meet the terms of their contracts and from
| Notes to financial statements |
unfavorable currency fluctuations. When applicable, open forward foreign currency contracts at the end of the period are listed in each Fund’s Portfolio of Investments.
Futures contracts
The Funds are subject to interest rate risk, equity risk and foreign currency risk in the normal course of pursuing their investment objectives. Accordingly, the Funds may invest in futures contracts to gain exposure to, or hedge against, changes in the value of interest rates or foreign currencies and to gain exposure to equity indices. A futures contract represents a commitment for the future purchase or sale of an asset at a specified price and date. Upon entering into such contracts, a Fund is required to deposit with the broker, either in cash or securities, an initial margin in an amount equal to a certain percentage of the contract amount. Subsequent payments, known as “variation margin,” are made or received by the Fund, depending on the fluctuations in the fair value of the underlying asset. Unrealized appreciation or depreciation, reflected as a component of “Financial Derivative Instruments” assets and/or liabilities on the Statements of Assets and Liabilities, is recognized but not considered realized until the contracts expire or are closed. Should market conditions move unexpectedly, the Funds may not achieve the anticipated benefits of the futures contracts and may realize a loss. The use of futures contracts involves the risk of imperfect correlation in movements in the price of futures contracts, interest rates, and/or the underlying hedged assets. With futures contracts, there is limited counterparty credit risk to the Funds as futures contracts are exchange-traded and the exchange’s clearinghouse acts as counterparty to all exchange-traded futures transactions. When applicable, open futures contracts outstanding at the end of the period are listed in each Fund’s Portfolio of Investments.
Options
The Funds may purchase put and call options to create investment exposure consistent with their investment objectives or to hedge or limit the exposure of their portfolio holdings. Alternatively, certain Funds may write (sell) call and put options on securities and financial derivative instruments in order to gain exposure to, or protect against, changes in the markets. The Funds may use options on exchange-traded futures contracts, indices or securities to hedge an existing position or future investment, for speculative purposes, or to manage exposure to market movements. The Funds may also use foreign currency options. Purchasing foreign currency options gives the Fund the right, but not the obligation, to buy or sell the currency and will specify the amount of currency and a rate of exchange that may be exercised by a specified date. These options may be used as a short or long hedge against possible variations in foreign exchange rates or to gain exposure to foreign currencies. The Funds may also use interest rate swaptions in which the underlying instrument is an interest rate swap (discussed below under “Swap contracts”). Swaptions are agreements to enter into a pre-defined swap agreement by some specified date in the future. The writer of a swaption becomes the counterparty to the swap if the buyer exercises. The interest rate swaption agreement will specify whether the buyer of the swaption will be a fixed-rate receiver or a fixed-rate payer upon exercise. These types of options may be used to hedge against unfavorable fluctuations in interest rates.
Purchasing call options tends to increase the Fund’s exposure to the underlying instrument, while purchasing put options tends to decrease the Fund’s exposure to the underlying instrument. The Fund pays a premium when purchasing call options or put options. The option is subsequently valued daily and unrealized appreciation or depreciation is recorded; the asset is reflected as a component of “Financial Derivative Instruments” on the Statement of Assets and Liabilities. The Funds realize a gain or loss upon the expiration or closing of the option transaction. The primary risks of investing in purchased options include the risk of imperfect correlation between the option price and the value of the underlying instrument, and the possibility of an illiquid market for the option. There is limited counterparty risk with respect to exchange-traded purchased options as settlement is facilitated through a central clearinghouse. There is inherently more risk in counterparty non-performance for OTC purchased options, although the risk is generally limited to the premium paid. When applicable, options purchased by the Funds and outstanding at the end of the period are listed in each Fund’s Portfolio of Investments.
Writing put options tends to increase the Fund’s exposure to the underlying instrument. Writing call options tends to decrease the Fund’s exposure to the underlying instrument. When a Fund writes a call or a put option, an amount equal to the premium received by the Fund is recognized as a liability. The amount of the liability is subsequently marked-to-market to reflect the current market value of the option written. These liabilities are reflected as a component of “Financial Derivative Instruments” on the Statement of Assets and Liabilities. If an option which the Fund has written either expires on its stipulated expiration date or the Fund enters into a closing purchase transaction, the Fund realizes a gain (or loss if the cost of a closing purchase transaction exceeds the premium received when the option was written) without regard to any unrealized gain or loss on the underlying security or derivative instrument, and the liability related to such option is extinguished. If a call option which the Fund has written is exercised, the Fund recognizes a realized gain or loss from the sale of the underlying security or derivative instrument and the proceeds from the sale are increased by the premium originally received. If a put option which the Fund has written is exercised, the amount of the premium originally received reduces the cost of the security or derivative instrument that the Fund purchases upon exercise of the option. Written options are subject to substantial risks. The Fund as a writer of an option has no control over whether the underlying instrument
| Notes to financial statements |
may be sold (call) or purchased (put) and, as a result, the Funds bear the market risk of an unfavorable change in the price of the derivative instrument, security or currency underlying the written option. Exercise of an option written by a Fund could result in a Fund selling or buying a derivative instrument, security or currency at a price different from current market value. Further, there is the risk the Fund may not be able to enter into a closing transaction because of an illiquid market. When applicable, open options and swaptions at the end of the period are listed in each Fund’s Portfolio of Investments.
The number of options/swaptions written and the premiums received, including both exchange-traded and OTC options, by the Unconstrained Bond Fund during the period ended July 31, 2014 were as follows:
| | | | Number of | | | Premiums | |
| | | | Contracts | | | Received | |
| Options outstanding, | | | | | | | |
| beginning of period | | | — | | $ | — | |
| Options written | | | | | | | |
| during period | | | 7,460,113 | | | 128,466 | |
| Options closed | | | | | | | |
| during period | | | (101 | ) | | (13,741 | ) |
| Options outstanding, | | | | | | | |
| end of period | | | 7,460,012 | | | 114,725 | |
Swap contracts
The Funds may enter into interest rate, total return, credit default, inflation, currency and other swap contracts. Swap contracts are bilaterally negotiated agreements between the Funds and a counterparty to exchange or swap the returns (or the differential in rates of return) earned or realized on particular investments, instruments, indices or other measures for a defined series of cash flows at a predetermined rate at specified, future intervals. Swap contracts are privately negotiated in the OTC market (“OTC swaps”), or may be executed on a multi-lateral or other trade facility platform, such as a registered exchange (“centrally-cleared swaps”). The gross returns to be exchanged or “swapped” between parties are generally calculated with respect to a “notional amount” for a pre-determined period of time.
Certain Funds use credit default swaps to manage exposure to a given issuer or sector by either selling protection to increase exposure (i.e., leverage), or buying protection to reduce exposure. The “buyer” in a credit default swap is obligated to pay the “seller” a periodic stream of payments over the term of the contract provided that no event of default on an underlying reference obligation has occurred. If an event of default occurs, the seller must either pay the buyer the full notional value, or the “par value,” of the reference obligation in exchange for the reference obligation or pay a net amount equal to the par value of the defaulted reference entity less its recovery value. In connection with these contracts, securities may be identified as collateral in accordance with the terms of the respective swap contracts to provide assets of value and recourse in the event of default or bankruptcy/insolvency. Recovery values are assumed by market makers considering either industry standard recovery rates or entity specific factors and considerations until a credit event occurs. If a credit event has occurred, the recovery value is typically determined by a facilitated auction whereby a minimum number of allowable broker bids, together with a specific valuation method, are used to calculate the settlement value. Implied credit spreads, represented in absolute terms, utilized in determining the market value of credit default swap contracts as of period end are disclosed in the Portfolios of Investments, as applicable. They serve as an indicator of the current status of the payment/performance risk and represent the likelihood or risk of default for the credit derivative. The implied credit spread of a particular referenced entity reflects the cost of buying/selling protection and may include upfront payments required to be made to enter into the contract. Wider credit spreads represent a deterioration of the referenced entity’s credit soundness and a greater likelihood or risk of default or other credit event occurring as defined under the terms of the contract.
Certain Funds hold fixed-rate and/or floating-rate bonds. Accordingly, the Funds are subject to interest rate risk exposure in the normal course of pursuing its investment objectives as the value of these bonds may decrease if interest rates rise, or vice versa. To hedge against this risk and/or to generate income at prevailing market rates, the Funds may enter into interest rate swap contracts. Interest rate swap contracts involve the exchange by the Fund with another party for their respective commitment to pay or receive a fixed or variable interest rate on the notional amount.
Changes in market value, if any, are reflected as a component of net change in unrealized appreciation/(depreciation) on the Statements of Operations. Daily changes in the valuation of centrally-cleared swaps are recorded as a receivable or payable for the change in value (“variation margin”) on the Statements of Assets and Liabilities. Swap payments received or made at the beginning of the measurement period are included on the Statements of Assets and Liabilities and represent premiums paid or received upon entering into the swap contract to compensate for differences between the stated terms of the swap contract and prevailing market conditions (credit spreads, currency exchange rates, interest rates, and other relevant factors). Upfront premiums received (paid) are initially recorded as liabilities (assets) and subsequently marked to market to reflect the current value of the swap. These upfront premiums are recorded as realized gains or losses on the Statements of Operations upon termination or maturity of the swap. A liquidation payment received or made at the termination of the swap is recorded as realized gain or loss on the Statements of Operations. Net periodic payments received or paid by the Funds are included as part of realized gains or losses on the Statements of Operations.
| Notes to financial statements |
Entering into these contracts involves, to varying degrees, elements of counterparty, interest, credit and market risk in excess of the amounts recognized on the Statements of Assets and Liabilities. Such risks involve the potential inability of the counterparties to meet the terms of their contract (which is limited with respect to centrally-cleared swaps as described below), unanticipated changes in the value of the swap contract, the possibility that there will be no liquid market for the contract, and that there may be unfavorable changes in interest rates. The risk that a counterparty is unable to perform on its obligations in situations when the Funds are in an appreciated position is mitigated with respect to OTC swaps by having master netting arrangements between the Funds and their counterparties and, in certain scenarios dictated by the contracts, the posting of collateral by the counterparty to the Funds to cover the Funds’ exposure to the counterparty. There is limited counterparty credit risk with respect to centrally-cleared swaps as the transaction is facilitated through a central clearinghouse, much like an exchange-traded futures contract. Upon entering into a centrally-cleared swap transaction, the Fund is required to deposit with its clearing broker an amount of cash or securities as an initial margin. Subsequent variation margin payments or receipts are made or received by the Fund, depending on the fluctuations in the fair value of the reference entity. The magnitude of counterparty credit risk is different depending on the type of swap. Under a credit default swap, the Funds’ maximum risk of loss as the protection buyer is limited to the market value, or the current unrealized appreciation/depreciation on the contract plus/minus any upfront premiums paid/received. Alternatively, as the protection seller, the maximum risk of loss is equivalent to the notional or par value of the contract plus/minus any upfront premiums paid/received. At July 31, 2014, notional outstanding for credit protection sold, translated into US Dollar amounts, equated to $250,000 for the High Yield Opportunities Fund, $937,335 for the Strategic Income Fund and $1,004,288 for the Unconstrained Bond Fund. Alternatively, under an interest rate or inflation swap, as notional is not exchanged, the Funds’ maximum risk of loss is limited to the unrealized loss on the contracts. When applicable, open swap contracts at the end of the period are listed in each Fund’s Portfolio of Investments.
Derivative instruments
The Financial Accounting Standards Board (“FASB”) requires companies (including the Trust) to disclose information intended to enable financial statement users to understand how derivative instruments impact the Statements of Assets and Liabilities as well as the effect of derivative instruments on the Statements of Operations during the reporting period, in the context of each entity’s risk exposure. Further, in January 2013, the FASB issued Accounting Standard Update (“ASU”) 2013-01 Clarifying the Scope of Disclosures about Offsetting Assets and Liabilities. The update clarifies the scope of ASU 2011-11, which requires enhanced disclosures around financial instruments and derivative instruments that are either off-set in accordance with US GAAP or are subject to an enforceable master netting arrangement (“MNA”) or similar agreement. The updates mandate that entities disclose both gross and net information about such financial instruments and transactions eligible for offset on the Statements of Assets and Liabilities, in addition to required disclosure of collateral received and posted in connection with MNAs or similar agreements. Adoption of the updates has no effect on the Funds’ net assets.
Accordingly, the tables included under the heading “Fair Value of Financial Derivative Instruments” in the Funds’ Portfolios of Investments summarize each Fund’s fair value of derivative instruments held at July 31, 2014 and the related location on the accompanying Statements of Assets and Liabilities, as well as the amount of gains and losses on derivative instruments recognized in the Funds’ earnings and the related location on the accompanying Statements of Operations, presented by primary underlying risk exposure. Supplementary information regarding gross and net values and the impact of any collateral posted for those transactions subject to MNAs is presented in Financial Derivatives Instruments disclosures in the Funds’ Portfolios of Investments under the heading “Financial Derivatives Instruments: Over-the-Counter Summary.” Note that all OTC instruments (forward foreign currency contracts, OTC credit default swap and interest rate swap contracts, inflation swap contracts, swaption contracts and certain options contracts) with Barclays Bank plc, Citibank, N.A., Deutsche Bank AG and JPMorgan Chase Bank, N.A., are all subject to MNAs. The settlement of all futures contracts, exchange-traded options and centrally-cleared swap contracts (credit default and interest rate) is guaranteed by the clearinghouse or exchange the instrument is traded on and is not subject to arrangements with particular counterparties. For that reason, these types of investments are excluded from such disclosures.
Indemnifications
Under the Trust’s organizational documents, its officers and trustees are indemnified against certain liabilities arising out of the performance of their duties to the Trust. In addition, in the normal course of business the Trust enters into contracts that provide general indemnifications to other parties. The Trust’s maximum exposure under these arrangements is unknown as future claims may be made against the Trust that have not yet been asserted.
Use of estimates
The preparation of financial statements in conformity with US GAAP requires management to make estimates and assumptions that affect the reported amounts and disclosures in the financial statements. Actual results may differ from those estimates.
| Notes to financial statements |
Expenses
Expenses are recorded on an accrual basis. Expenses of the Trust that are directly attributable to a specific Fund are charged to that Fund. Expenses attributable to a specific class of shares are charged to that class. Other expenses are allocated proportionately among each Fund within the Trust based on average daily net assets or on another reasonable basis.
Deferred offering costs
Costs incurred in connection with the offering and initial registration of Unconstrained Bond have been deferred in conformity with US GAAP and are being amortized to expense on a straight-line basis over the first twelve months after commencement of operations. The deferred offering costs incurred by the High Yield Opportunities Fund were fully amortized to expense as of April 30, 2014.
Federal income taxes
The Trust’s policy is that each Fund seeks to comply with the requirements of Subchapter M of the Internal Revenue Code of 1986, as amended (“Subchapter M”), that are applicable to regulated investment companies and to distribute substantially all its taxable income to shareholders. No federal income tax provision is required so long as each Fund operates in a manner that complies with the requirements of Subchapter M.
FASB Accounting Standards Codification (“ASC”) 740-10 “Income Taxes – Overall” sets forth a minimum threshold for financial statement recognition of the benefit of a tax position taken or expected to be taken in a tax return. Management of the Funds has concluded there are no significant uncertain tax positions that would require recognition in the financial statements. Management is also not aware of any tax positions for which it is reasonably possible that the total amount of unrecognized tax benefits will significantly change in the next twelve months. The Funds intend to file tax returns with the US Internal Revenue Service and various states. Generally, each of the tax years in the four-year period ended July 31, 2014 remains subject to examination by taxing authorities.
The Funds may be subject to taxes imposed by countries in which they invest. Such taxes are generally based on income and/or capital gains earned or repatriated. Taxes are accrued based on net investment income, net realized gains and net unrealized appreciation as such income and/or gains are earned. Taxes may also be based on transactions in foreign currency and are accrued based on the value of investments denominated in such currency.
To the extent that capital loss carryforwards incurred in current and prior years are used to offset any future capital gains realized during the carryover period as provided by US Federal income tax regulations, no capital gains tax liability will be incurred by the Funds for gains realized and not distributed. To the extent that capital gains are offset, such gains will not be distributed to the shareholders. Carryforwards not subject to expiration must be utilized prior to losses that carry an expiration; as a result, certain carryforwards may expire unused. Losses incurred that will be carried forward under the provisions of the regulations are as follows:
Losses incurred that will be carried forward under the provisions of the Act are as follows:
Emerging Markets Opportunities
| | | | Loss carryforward character | |
| Expiration | | | Short-term | | | Long-term | |
| Unlimited losses | | $ | 2,592,959 | | $ | — | |
European Focus
| | | | Loss carryforward character | |
| Expiration | | | Short-term | | | Long-term | |
| Unlimited losses | | $ | — | | $ | — | |
| 7/31/18 | | | 59,078,473 | | | — | |
Global Equity Income
| | | | Loss carryforward character | |
| Expiration | | | Short-term | | | Long-term | |
| Unlimited losses | | $ | — | | $ | — | |
| 7/31/18 | | | 22,627,417 | | | — | |
| 7/31/19 | | | 38,549,435 | | | — | |
| Total | | | 61,176,852 | | | — | |
International Opportunities
| | | | Loss carryforward character | |
| Expiration | | | Short-term | | | Long-term | |
| Unlimited losses | | $ | — | | $ | — | |
| 7/31/18 | | | 474,268,776 | | | — | |
Strategic Income
| | | | Loss carryforward character | |
| Expiration | | | Short-term | | | Long-term | |
| Unlimited losses | | $ | 674,333 | | $ | — | |
| 7/31/15 | | | 477,632 | | | — | |
| 7/31/16 | | | 1,001,344 | | | — | |
| 7/31/17 | | | 34,174,962 | | | — | |
| 7/31/18 | | | 336,160 | | | — | |
| Total | | | 36,664,431 | | | — | |
| Notes to financial statements |
Note that All Asset, Dividend & Income Builder, Global Technology, High Yield Opportunities and Unconstrained Bond do not have any capital loss carryforward to apply against future earnings.
During the year ended July 31, 2014, the Funds utilized the following capital loss carryforwards:
| All Asset | | $ | — | |
| Dividend & Income Builder | | | — | |
| Emerging Markets Opportunities | | | 334,694 | |
| European Focus | | | 189,056,295 | |
| Global Equity Income | | | 106,112,409 | |
| Global Technology | | | 11,057,318 | |
| High Yield Opportunities | | | — | |
| International Opportunities | | | 254,462,453 | |
| Strategic Income | | | — | |
| Unconstrained Bond | | | — | |
During the year ended July 31, 2014, the Strategic Income Fund had $207,447 of capital loss carryforward expire unused. At July 31, 2014, the following Funds deferred post-October losses and/or late year ordinary losses, which will be recognized on the first day of the following year:
| | | | Ordinary | | | Capital | |
| | | | loss | | | loss | |
| | | | deferred | | | deferred | |
| All Asset | | $ | — | | $ | — | |
| Dividend & Income | | | | | | | |
| Builder | | | — | | | — | |
| Emerging Markets | | | | | | | |
| Opportunities | | | — | | | — | |
| European Focus | | | — | | | — | |
| Global Equity Income | | | — | | | — | |
| Global Technology | | | 1,784,241 | | | — | |
| High Yield Opportunities | | | — | | | — | |
| International Opportunities | | | — | | | — | |
| Strategic Income | | | — | | | — | |
| Unconstrained Bond | | | — | | | — | |
Distributions to shareholders
Distributions to shareholders are recorded on the ex-dividend date. Distributions from net investment income and net realized capital gains are determined in accordance with federal income tax regulations, which may differ from US GAAP. These book/tax differences are either temporary or permanent in nature. To the extent these differences are permanent, they are reclassified within the capital accounts based on their federal tax-basis treatment.
Accordingly, at July 31, 2014, the Funds reclassified the following amounts between paid-in capital, accumulated undistributed net investment income (loss) and accumulated net realized gain (loss):
| | | | Paid-in capital | | | Accumulated undistributed net investment income/(loss) | | | Accumulated net realized gain/(loss) | |
| All Asset | | $ | (225 | ) | $ | 34,799 | | $ | (34,574 | ) |
| Dividend & | | | | | | | | | | |
| Income Builder | | | (104 | ) | | 11,540 | | | (11,436 | ) |
| Emerging Markets | | | | | | | | | | |
| Opportunities | | | (1 | ) | | (45,394 | ) | | 45,395 | |
| European Focus | | | (9,294 | ) | | 7,389,399 | | | (7,380,105 | ) |
| Global Equity | | | | | | | | | | |
| Income | | | (308,266 | ) | | (318,678 | ) | | 626,944 | |
| Global | | | | | | | | | | |
| Technology | | | (2,054,170 | ) | | 1,839,310 | | | 214,860 | |
| High Yield | | | | | | | | | | |
| Opportunities | | | (57,840 | ) | | 122,631 | | | (64,791 | ) |
| International | | | | | | | | | | |
| Opportunities | | | (904 | ) | | (1,460,635 | ) | | 1,461,539 | |
| Strategic Income | | | (210,149 | ) | | 742,389 | | | (532,240 | ) |
| Unconstrained | | | | | | | | | | |
| Bond | | | (61,827 | ) | | 1,223 | | | 60,604 | |
These reclassifications relate to the deductibility of certain expenses, different tax treatments of certain securities, amortization of bond premium, character of realized gains/losses on foreign currency transactions, taxes on capital gains, dividend re-designations, capital loss carryforward expiration, net operating losses and Passive Foreign Investment Companies (“PFIC”) transactions for tax purposes and had no impact on the net asset value of the Funds.
The tax character of distributions paid during the years ended July 31, 2014 and July 31, 2013 were as follows:
| Year ended | | | Ordinary | | | Capital | |
| July 31, 2014 | | | income | | | gains | |
| All Asset | | $ | 2,546,811 | | $ | 532,924 | |
| Dividend & Income | | | | | | | |
| Builder | | | 488,048 | | | 9 | |
| Emerging Markets | | | | | | | |
| Opportunities | | | — | | | — | |
| European Focus | | | 3,710,266 | | | — | |
| Global Equity Income | | | 156,362,094 | | | — | |
| Global Technology | | | — | | | 2,465,935 | |
| High Yield Opportunities | | | 1,725,650 | | | — | |
| International | | | | | | | |
| Opportunities | | | 12,686,584 | | | — | |
| Strategic Income | | | 2,015,022 | | | — | |
| Unconstrained Bond | | | 350,001 | | | — | |
| Notes to financial statements |
| Year ended | | | Ordinary | | | Capital | |
| July 31, 2013 | | | income | | | gains | |
| All Asset | | $ | 542,605 | | $ | — | |
| Dividend & Income | | | | | | | |
| Builder | | | 54,539 | | | — | |
| Emerging Markets | | | | | | | |
| Opportunities | | | 163,785 | | | — | |
| European Focus | | | 7,586,086 | | | — | |
| Global Equity Income | | | 97,926,333 | | | — | |
| Global Technology | | | — | | | — | |
| High Yield Opportunities | | | 340,001 | | | — | |
| International | | | | | | | |
| Opportunities | | | 16,206,595 | | | — | |
| Strategic Income* | | | 1,206,003 | | | — | |
* For the seven months ended July 31, 2013. For the year ended December 31, 2012, the tax character of distributions paid by Strategic Income in the amount of $1,994,497 were comprised entirely of ordinary income.
As of July 31, 2014, the components of distributable earnings on a tax basis were as follows:
| | | | Undistributed | | | Undistributed | | | Undistributed | |
| | | | ordinary | | | capital gains/ | | | appreciation | |
| | | | income | | | (losses | ) | | (depreciation | ) |
| All Asset | | $ | 1,279,122 | | $ | 482,638 | | $ | 2,486,506 | |
| Dividend & | | | | | | | | | | |
| Income Builder | | | 554,473 | | | 277,647 | | | 762,186 | |
| Emerging | | | | | | | | | | |
| Markets | | | | | | | | | | |
| Opportunities | | | 28,333 | | | — | | | 2,763,719 | |
| European Focus | | | 38,188,819 | | | — | | | 41,546,774 | |
| Global Equity | | | | | | | | | | |
| Income | | | 10,289,164 | | | — | | | 158,249,723 | |
| Global | | | | | | | | | | |
| Technology | | | — | | | 30,408,629 | | | 90,616,903 | |
| High Yield | | | | | | | | | | |
| Opportunities | | | 802,236 | | | — | | | 200,095 | |
| International | | | | | | | | | | |
| Opportunities | | | 39,250,551 | | | — | | | 592,436,947 | |
| Strategic Income | | | 962,026 | | | — | | | (644,473 | ) |
| Unconstrained | | | | | | | | | | |
| Bond | | | 172,518 | | | 2,611 | | | 57,853 | |
Ordinary income and net realized gains/losses may differ for book and tax basis reporting purposes due to premium amortization, post-October losses (which are not recognized for tax purposes until the first day of the following fiscal year), tax deferral on wash sales and PFIC transactions.
The US federal income tax basis of investments, excluding financial derivative instruments, at July 31, 2014, and the gross unrealized appreciation and depreciation, were as follows:
| | | | All | | | Dividend & | |
| | | | Asset | | | Income Builder | |
| Cost | | $ | 64,107,624 | | $ | 25,861,081 | |
| Gross unrealized | | | | | | | |
| appreciation | | | 2,432,431 | | | 1,270,904 | |
| Gross unrealized | | | | | | | |
| depreciation | | | 178,592 | | | 508,092 | |
| Net unrealized | | | | | | | |
| appreciation | | | | | | | |
| (depreciation) | | | 2,253,839 | | | 762,812 | |
| | | | Emerging Markets | | | European | |
| | | | Opportunities | | | Focus | |
| Cost | | $ | 25,505,644 | | $ | 2,364,154,166 | |
| Gross unrealized | | | | | | | |
| appreciation | | | 4,437,767 | | | 189,283,434 | |
| Gross unrealized | | | | | | | |
| depreciation | | | 1,637,409 | | | 147,689,255 | |
| Net unrealized | | | | | | | |
| appreciation | | | | | | | |
| (depreciation) | | | 2,800,358 | | | 41,594,179 | |
| | | | Global Equity | | | Global | |
| | | | Income | | | Technology | |
| Cost | | $ | 2,993,105,282 | | $ | 284,367,120 | |
| Gross unrealized | | | | | | | |
| appreciation | | | 223,914,300 | | | 96,037,779 | |
| Gross unrealized | | | | | | | |
| depreciation | | | 65,461,702 | | | 5,420,694 | |
| Net unrealized | | | | | | | |
| appreciation | | | | | | | |
| (depreciation) | | | 158,452,598 | | | 90,617,085 | |
| | | | High Yield | | | International | |
| | | | Opportunities | | | Opportunities | |
| Cost | | $ | 26,990,510 | | $ | 3,206,050,877 | |
| Gross unrealized | | | | | | | |
| appreciation | | | 481,250 | | | 680,587,903 | |
| Gross unrealized | | | | | | | |
| depreciation | | | 281,154 | | | 88,194,309 | |
| Net unrealized | | | | | | | |
| appreciation | | | | | | | |
| (depreciation) | | | 200,096 | | | 592,393,594 | |
| Notes to financial statements |
| | | | Strategic | | | Unconstrained | |
| | | | Income | | | Bond | |
| Cost | | $ | 51,475,569 | | $ | 26,953,607 | |
| Gross unrealized | | | | | | | |
| appreciation | | | 2,668,491 | | | 443,910 | |
| Gross unrealized | | | | | | | |
| depreciation | | | 3,311,491 | | | 214,441 | |
| Net unrealized | | | | | | | |
| appreciation/ | | | | | | | |
| depreciation | | | (643,000 | ) | | 229,469 | |
Identified cost may differ for book and tax basis reporting purposes primarily due to tax deferral of losses on wash sales, PFIC transactions, different book and tax treatment on certain debt instruments and amortization of premiums reflected as of July 31, 2014.
Note 3. Fair value measurements
US GAAP defines fair market value as the price that a Fund would receive to sell an asset or pay to transfer a liability in an orderly transaction between market participants at the measurement date. Various inputs are used in determining the value of the Funds’ investments. The Funds use a three-tier hierarchy of inputs to establish classification of fair value measurements for disclosure purposes. These inputs may be observable or unobservable. Observable inputs are inputs that reflect the assumptions market participants would use in pricing the asset or liability developed based on market data obtained from sources independent of the reporting entity. Unobservable inputs are inputs that reflect the reporting entity’s own assumptions about the assumptions market participants would use in pricing the asset or liability developed based on the best information available under the circumstances. The inputs used for valuing securities are not necessarily an indication of the risk associated with investing in those securities. The three-tier hierarchy of inputs is summarized in the following three broad levels:
| | • | Level 1 – quoted prices (unadjusted) in active markets for identical investments |
| | • | Level 2 – other significant observable inputs (including quoted prices for similar investments, interest rates, prepayment speeds, credit risk, etc.) |
| | • | Level 3 – significant unobservable inputs based on the best information available in the circumstances to the extent observable inputs are not available (including the Fund’s own assumptions in determining the fair value of investments) |
Tables included under the heading “Fair value measurements” summarizing each Fund’s investments that are measured at fair value by level within the fair value hierarchy at July 31, 2014 have been listed after each Fund’s Portfolio of Investments.
Any transfers between levels are disclosed, effective at the end of the period, in each Fund’s table with the reasons for the transfers disclosed in a note to the table, if applicable.
Note 4. Investment advisory fees and other transactions with affiliates
Pursuant to an Investment Advisory Agreement, Henderson Global Investors (North America) Inc. (“HGINA”) acts as the Funds’ investment adviser. HGINA is an indirect wholly-owned subsidiary of Henderson Group plc. HGINA supervises the investments of the Funds and earns a management fee for such services. HGINA earns a fee for its services based on each Fund’s average daily net assets as set forth below.
| All Asset | | | | | | 0.40 | % |
| Dividend & Income Builder | | | First $1 billion | | | 0.75 | % |
| | | | Next $1 billion | | | 0.65 | % |
| | | | Over $2 billion | | | 0.55 | % |
| Emerging Markets | | | First $1 billion | | | 1.00 | % |
| Opportunities | | | Next $1 billion | | | 0.90 | % |
| | | | Over $2 billion | | | 0.85 | % |
| European Focus* | | | First $500 million | | | 1.00 | % |
| | | | Next $1 billion | | | 0.90 | % |
| | | | Next $1 billion | | | 0.85 | % |
| | | | Over $2.5 billion | | | 0.80 | % |
| Global Equity Income | | | First $1 billion | | | 0.85 | % |
| | | | Next $1 billion | | | 0.65 | % |
| | | | Over $2 billion | | | 0.60 | % |
| Global Technology* | | | First $1 billion | | | 0.90 | % |
| | | | Over $1 billion | | | 0.80 | % |
| High Yield Opportunities | | | First $1 billion | | | 0.65 | % |
| | | | Next $1 billion | | | 0.55 | % |
| | | | Over $2 billion | | | 0.50 | % |
| International Opportunities* | | | First $2 billion | | | 1.00 | % |
| | | | Next $1 billion | | | 0.90 | % |
| | | | Next $1 billion | | | 0.80 | % |
| | | | Over $4 billion | | | 0.70 | % |
| Strategic Income** | | | First $1 billion | | | 0.55 | % |
| | | | Next $500 million | | | 0.50 | % |
| | | | Over $1.5 billion | | | 0.45 | % |
| Unconstrained Bond | | | First $1 billion | | | 0.65 | % |
| | | | Next $1 billion | | | 0.55 | % |
| | | | Over $2 billion | | | 0.50 | % |
| * | These rates became effective July 1, 2014 for European Focus, Global Technology and International Opportunities. Prior to July 1, 2014, the fee rates were as follows: |
| European Focus | | | First $500 million | | | 1.00 | % |
| | | | Next $1 billion | | | 0.90 | % |
| | | | Over $1.5 billion | | | 0.85 | % |
| Global Technology | | | First $500 million | | | 1.00 | % |
| | | | Next $500 million | | | 0.95 | % |
| | | | Over $1 billion | | | 0.90 | % |
| International | | | | | | | |
| Opportunities | | | First $1 billion | | | 1.10 | % |
| | | | Next $1 billion | | | 0.95 | % |
| | | | Over $2 billion | | | 0.85 | % |
| ** | Based on average daily managed assets of the Fund. Managed assets mean the total assets of the Fund (including any assets attributable to any leverage that may be outstanding) minus the sum of accrued liabilities (other than debt representing financial leverage). Since the Fund pays HGINA based on the Fund’s average daily managed assets, HGINA’s fee will be higher if the Fund is leveraged. |
| Notes to financial statements |
HGINA has engaged Henderson Investment Management Limited (“HIML”), also an indirect wholly-owned subsidiary of Henderson Group plc, to act as the investment sub-adviser to the Funds, except for Strategic Income and High Yield Opportunities. Under a separate Sub-Advisory Agreement, the sub-adviser provides research, advice and recommendations with respect to the purchase and sale of securities and makes investment decisions regarding assets of the Funds subject to the oversight of the Board and the Adviser. No additional advisory fees are charged to the Funds for the services of the sub-adviser as these fees are paid from the fees earned by HGINA.
Pursuant to a separate contractual Expense Limitation Agreement, HGINA has agreed to waive or limit its investment advisory fee and, if necessary, to reimburse expenses of each Fund in order to limit total annual ordinary operating expenses, including distribution and service fees, as a percentage of average daily net assets as follows:
| | | | Class | | | Class | | | Class | | | Class | | | Class | |
| | | | A | | | B | | | C | | | I | | | R | |
| All Asset* | | | 0.85 | % | | N/A | | | 1.60 | % | | 0.60 | % | | N/A | |
| Dividend & | | | | | | | | | | | | | | | | |
| Income | | | | | | | | | | | | | | | | |
| Builder | | | 1.30 | % | | N/A | | | 2.05 | % | | 1.05 | % | | N/A | |
| Emerging | | | | | | | | | | | | | | | | |
| Markets | | | | | | | | | | | | | | | | |
| Opportunities | | | 1.79 | % | | N/A | | | 2.54 | % | | 1.54 | % | | N/A | |
| European | | | | | | | | | | | | | | | | |
| Focus | | | 2.00 | % | | 2.75 | % | | 2.75 | % | | 1.75 | % | | N/A | |
| Global Equity | | | | | | | | | | | | | | | | |
| Income | | | 1.40 | % | | N/A | | | 2.15 | % | | 1.15 | % | | N/A | |
| Global | | | | | | | | | | | | | | | | |
| Technology | | | 2.00 | % | | 2.75 | % | | 2.75 | % | | 1.75 | % | | N/A | |
| High Yield | | | | | | | | | | | | | | | | |
| Opportunities | | | 1.10 | % | | N/A | | | 1.85 | % | | 0.85 | % | | N/A | |
| International | | | | | | | | | | | | | | | | |
| Opportunities | | | 2.00 | % | | 2.75 | % | | 2.75 | % | | 1.75 | % | | 2.25 | % |
| Strategic | | | | | | | | | | | | | | | | |
| Income | | | 1.10 | % | | 1.85 | % | | 1.85 | % | | 0.85 | % | | N/A | |
| Unconstrained | | | | | | | | | | | | | | | | |
| Bond | | | 1.15 | % | | N/A | | | 1.90 | % | | 0.90 | % | | N/A | |
| * | With respect to investments in affiliate underlying funds, HGINA has contractually agreed to reduce or waive the Fund’s management fee to limit the combined management fees paid to the Adviser for those assets to the greater of 1.00% or the affiliate underlying fund’s management fee. Any waiver calculated as a result of limiting these combined management fees is in addition to the general expense limitation highlighted in the table. Indirect net expenses associated with the Fund’s investments in underlying investment companies are not subject to the contractual expense limitation. |
These agreements will remain in effect through July 31, 2020, except the agreements for All Asset, Dividend & Income Builder and Emerging Markets Opportunities, which are effective through July 31, 2015. Shares of the Funds are often purchased through financial intermediaries who are agents of the Funds for the limited purpose of completing purchases and sales. These intermediaries may provide certain networking and sub-transfer agent services with respect to Fund shares held by that intermediary for its customers, and the intermediary may charge HGINA for those services. The Funds reimburse HGINA for such fees within limits specified by the Board of Trustees. The fees are incurred at the class level based on activity, asset levels and/or number of accounts and are included in Sub-accounting fees in the Statements of Operations.
At July 31, 2014, HGINA owned the following number of shares in the following Funds:
| | | | Shares | |
| All Asset Class A | | | 473 | |
| All Asset Class C | | | 470 | |
| All Asset Class I | | | 106 | |
| Dividend & Income Builder Class A | | | 2,631 | |
| Dividend & Income Builder Class C | | | 2,609 | |
| Dividend & Income Builder Class I | | | 21,141 | |
| High Yield Opportunities Class A | | | 100,000 | |
| High Yield Opportunities Class C | | | 100,000 | |
| High Yield Opportunities Class I | | | 316,573 | |
| Strategic Income Class I | | | 1,302 | |
HGI (Investments) Limited is an indirect wholly-owned subsidiary of Henderson Group plc. At July 31, 2014, HGI (Investments) Limited owned the following number of shares in the following Funds:
| | | | Shares | |
| Unconstrained Bond Class A | | | 100,000 | |
| Unconstrained Bond Class C | | | 100,000 | |
| Unconstrained Bond Class I | | | 2,300,000 | |
| Notes to financial statements |
An affiliated entity of a Fund may include any company in which the Fund owns five percent or more of its outstanding voting shares. Additionally, certain of the Funds held ownership in other Funds within the Trust. At July 31, 2014, the All Asset Fund held 0.05% of the Henderson Global Equity Income Fund, 0.37% of the Henderson Global Technology Fund, 2.26% of the Henderson Strategic Income Fund and 10.55% of the Henderson Unconstrained Bond Fund. Transactions in affiliates during the year ended July 31, 2014 were as follows:
| Affiliate | | | Value 7/31/2013 | | | Purchases at Cost | | | Proceeds from Sales | | | Change in Unrealized Appreciation (Depreciation) | | | Realized Gain/(Loss) | | | Value 7/31/2014 | | | Dividend Income | |
| All Asset | | | | | | | | | | | | | | | | | | | | | | |
| Henderson Global | | | | | | | | | | | | | | | | | | | | | | |
| Equity Income Fund | | $ | — | | $ | 1,508,048 | | $ | — | | $ | 84,807 | | $ | — | | $ | 1,592,855 | | $ | 93,621 | |
| Henderson Global | | | | | | | | | | | | | | | | | | | | | | |
| Technology Fund | | | 1,031,701 | | | 889,927 | | | 884,438 | | | 190,837 | | | 112,995 | | | 1,341,022 | | | — | |
| Henderson Strategic | | | | | | | | | | | | | | | | | | | | | | |
| Income Fund | | | 730,359 | | | 418,882 | | | — | | | 19,777 | | | — | | | 1,169,018 | | | 54,365 | |
| Henderson | | | | | | | | | | | | | | | | | | | | | | |
| Unconstrained | | | | | | | | | | | | | | | | | | | | | | |
| Bond Fund | | | — | | | 2,980,989 | | | — | | | (102 | ) | | — | | | 2,980,887 | | | 30,999 | |
| Total | | $ | 1,762,060 | | $ | 5,797,846 | | $ | 884,438 | | $ | 295,319 | | $ | 112,995 | | $ | 7,083,782 | | $ | 178,985 | |
The aggregate cost and value of affiliates at July 31, 2014 is $6,693,250 and $7,083,782, respectively. Investments in affiliates represented 10.59% of total net assets of the All Asset Fund as of July 31, 2014.
Note 5. Compensation of trustees and officers
Certain officers and trustees of the Trust are also officers of HGINA. None of the Trust’s officers, other than the Chief Compliance Officer, are compensated by the Trust. The Trust makes no direct payments to trustees affiliated with HGINA. Fees paid to trustees are reflected as Trustees’ fees and expenses in the Statements of Operations.
The Funds bear a portion of the compensation paid to the Chief Compliance Officer who performs services directly related to the Trust. This compensation, together with other compliance-related costs, is reflected as Compliance officer fees in the Statements of Operations.
Note 6. Distribution plan
The Trust has adopted a distribution plan for Class A, Class B, Class C and Class R shares of the Funds in accordance with Rule 12b-1 under the 1940 Act (the “12b-1 Plan”). Under the 12b-1 Plan, the Funds pay the distributor an annual fee of 0.25% of the average daily net assets attributable to its Class A shares, an annual fee of 1.00% of the average daily net assets attributable to its Class B and C shares, and an annual fee of 0.50% of the average daily net assets attributable to its Class R shares. The 12b-1 Plan is used to induce or compensate financial intermediaries (including brokerage firms, depository institutions and other firms) to provide distribution services to the Funds and their shareholders.
Note 7. Investment transactions
Purchases and sales of investment securities, excluding short-term investments, derivatives and US government securities, for the Funds for the year ended July 31, 2014, were as follows:
| | | | Purchases | | | Sales | |
| All Asset | | $ | 24,959,186 | | $ | 23,736,561 | |
| Dividend & Income | | | | | | | |
| Builder | | | 34,591,898 | | | 13,930,194 | |
| Emerging Markets | | | | | | | |
| Opportunities | | | 27,057,818 | | | 25,593,123 | |
| European Focus | | | 3,035,596,512 | | | 1,485,056,006 | |
| Global Equity | | | | | | | |
| Income | | | 3,767,392,465 | | | 2,662,828,690 | |
| Global Technology | | | 229,843,742 | | | 285,419,378 | |
| High Yield | | | | | | | |
| Opportunities | | | 87,022,383 | | | 86,392,640 | |
| International | | | | | | | |
| Opportunities | | | 3,096,385,176 | | | 2,487,411,627 | |
| Strategic Income | | | 33,110,421 | | | 33,411,342 | |
| Unconstrained Bond | | | 49,451,471 | | | 23,418,437 | |
| Notes to financial statements |
Note 8. Commitments
In pursuing its investment objective of seeking total return through investment in a broad range of asset classes, the All Asset Fund has committed $2,500,000 in exchange for limited partner interests in the TIAA-CREF Core Property Fund LP (“CPF”). As of July 31, 2014, the General Partner of the CPF has not issued a capital call based on that commitment. As a result, the All Asset Fund has not yet invested any money into the CPF though its unfunded commitment is still outstanding. The Adviser believes the commitment will be funded in full within six months. At July 31, 2014, the full unfunded commitment represents 3.7% of the All Asset Fund’s net assets.
Note 9. Significant concentrations
The Funds may invest a substantial percentage of their assets in securities of foreign issuers. These investments may involve certain considerations and risks not typically associated with investments in the United States as a result of, among other factors, the possibility of future political and economic developments and the level of governmental supervision and regulation of securities markets in the respective countries. Some countries in which the Funds invest may require government approval for repatriation of investment income, capital or the proceeds for sales of securities by foreign investors. In addition, if there is deterioration in a country’s balance of payments or for other reasons, a country may impose temporary restrictions on foreign capital remittances abroad. In addition, changes in currency exchange rates will affect the value of investments denominated in a foreign currency, as well as investment income derived from those securities. These risks may be heightened in less developed countries, which are sometimes referred to as emerging markets. For example, political and economic structures in these countries may be changing rapidly, which can cause instability and greater risk of loss. These countries are also more likely to experience higher levels of inflation, deflation or currency devaluation, which could hurt their economies and securities markets. For these and other reasons, investments in emerging markets, particularly by the Emerging Markets Opportunities Fund, are often considered speculative. Further, the Funds maintain many of their investments in issuers domiciled in the Eurozone. The private and public sectors’ debt problems of a single Eurozone country may pose significant risks to the Eurozone as a whole. As a result, the Funds may be more susceptible to volatility generated by currency devaluations or other general uncertainties than more geographically diversified funds that do not concentrate in this region of the world.
The Funds may invest a high percentage of their net assets in specific sectors of the market in order to achieve a potentially greater investment return. As a result, the economic, political and regulatory developments in a particular sector of the market, positive or negative, have a greater impact on a Fund’s net assets and will cause the value of its shares to fluctuate more than if the Fund did not concentrate its investments in a particular sector. In particular, the Global Technology Fund concentrates its investments in issuers within specific industries of the technology and telecommunications sectors. Valuations of companies in these sectors are typically subject to greater volatility than other sectors.
The Dividend & Income Builder Fund, High Yield Opportunities Fund, Strategic Income Fund and Unconstrained Bond Fund invest in a variety of income-producing debt instruments of corporate and sovereign issuers. Accordingly, each may be subject to the previously described foreign issuers risk, to varying degrees, in addition to the risk of default by the issuer. As a matter of their investment strategies, the High Yield Opportunities Fund, Strategic Income Fund and Unconstrained Bond Fund are also subject to higher concentrations of investments in lower quality high yield securities or asset-backed/structured securities. Investing in high yield, asset-backed or structured securities may involve greater risks and considerations not typically associated with investing in US Government bonds and other high quality fixed-income securities. High yield securities are non-investment grade securities, often referred to as “junk bonds.” Economic downturns may disrupt the high yield market and impair the ability of issuers to repay principal and interest. Additionally, asset-backed securities are subject to the risk that underlying debt may be prepaid prior to maturity or refinanced causing further volatility in the value. A small change in interest rates would likely have a pronounced adverse impact on the value of such high yield and asset-backed obligations. Moreover, these securities may be less liquid as there is a less-established secondary market and the Funds may not be able to sell the asset timely.
| Notes to financial statements |
Note 10. Borrowing arrangements
The Trust maintains a $100 million credit facility to facilitate portfolio liquidity. Interest is charged to each Fund based on its borrowings at a rate per annum equal to the Federal Funds rate plus 1.25%. In addition, a commitment fee of 0.10% per annum is accrued and apportioned among the Funds in the Trust based on relative average net assets. The commitment fee is included in Miscellaneous fees on the Statements of Operations. No amounts were borrowed by the Funds under this facility during the year ended July 31, 2014.
Note 11. Recently issued accounting pronouncements
In June 2013, the FASB issued ASU 2013-08, “Financials Services – Investment Companies (Topic 946): Amendments to the Scope, Measurement, and Disclosure Requirements,” which sets forth a new approach for determining whether a public or private company is an Investment Company and sets certain measurement and disclosure requirements for an Investment Company. The amendments are effective for fiscal years beginning on or after December 15, 2013. An entity regulated under the 1940 Act would automatically qualify as an Investment Company for accounting purposes under Topic 946 and thus the Funds’ management believes the release will have no impact to the Funds.
Note 12. Subsequent Events
Subsequent events occurring after the date of this report have been evaluated for potential impact, for purposes of recognition or disclosure in the financial statements, through the date the report was issued.
| Report of independent registered public accounting firm |
The Board of Trustees and Shareholders
Henderson Global Funds
We have audited the accompanying statements of assets and liabilities, including the portfolios of investments, of the Henderson Global Funds, comprising the Henderson All Asset Fund, Henderson Dividend & Income Builder Fund, Henderson Emerging Markets Opportunities Fund, Henderson European Focus Fund, Henderson Global Equity Income Fund, Henderson Global Technology Fund, Henderson High Yield Opportunities Fund, Henderson International Opportunities Fund, Henderson Strategic Income Fund, and Henderson Unconstrained Bond Fund (collectively, the Funds), ten of the Funds comprising the Henderson Global Funds, as of July 31, 2014, and the related statements of operations, the statements of changes in net assets and the financial highlights for the periods indicated therein. These financial statements and financial highlights are the responsibility of the Funds’ management. Our responsibility is to express an opinion on these financial statements and financial highlights based on our audits.
We conducted our audits in accordance with the standards of the Public Company Accounting Oversight Board (United States). Those standards require that we plan and perform the audit to obtain reasonable assurance about whether the financial statements and financial highlights are free of material misstatement. We were not engaged to perform an audit of the Funds’ internal control over financial reporting. Our audits included consideration of internal control over financial reporting as a basis for designing audit procedures that are appropriate in the circumstances, but not for the purpose of expressing an opinion on the effectiveness of the Funds’ internal control over financial reporting. Accordingly, we express no such opinion. An audit also includes examining, on a test basis, evidence supporting the amounts and disclosures in the financial statements and financial highlights, assessing the accounting principles used and significant estimates made by management, and evaluating the overall financial statement presentation. Our procedures included confirmation of securities owned as of July 31, 2014, by correspondence with the custodian and brokers or by other appropriate auditing procedures where replies from brokers were not received. We believe that our audits provide a reasonable basis for our opinion.
In our opinion, the financial statements and financial highlights referred to above present fairly, in all material respects, the financial position of each of the respective Funds constituting the Henderson Global Funds at July 31, 2014, and the results of their operations, changes in net assets and their financial highlights for the periods indicated therein, in conformity with U.S. generally accepted accounting principles.
Chicago, Illinois
September 25, 2014
| Other information (unaudited) |
Proxy voting policies
The Funds have filed with the Securities and Exchange Commission their proxy voting records for the twelve months ended June 30, 2014 on Form N-PX, which must be filed each year by August 31. Form N-PX is available on the Securities and Exchange Commission’s website at www.sec.gov. The Funds’ proxy voting records and proxy voting policies and procedures are also available without charge, upon request, by calling 866.443.6337 or by visiting the Funds’ website at www.henderson.com.
Quarterly portfolio of investments
A Portfolio of Investments is filed as of the end of the first and third quarter of each fiscal year on Form N-Q. The Funds have filed with the Securities and Exchange Commission the Form N-Q and it is available on the Securities and Exchange Commission’s website at www.sec.gov. Additionally, the Portfolios of Investments may be reviewed and copied at the Commission’s Public Reference Room in Washington, DC. Information on the operation of the Public Reference Room may be obtained by calling 1.800.SEC.0330. The quarterly Portfolios of Investments are also available without charge, upon request, by calling 866.443.6337 or by visiting the Funds’ website at www.henderson.com.
Approval of continuation of investment advisory agreements
The Board of Trustees of Henderson Global Funds oversees the management of the Funds and, as required by law, the investment advisory and the sub-advisory agreements for the Funds (the “Advisory Agreements”). In connection with their annual consideration of those agreements for the Funds, the Trustees received and reviewed a substantial amount of information provided by Henderson Global Investors (North America) Inc. (the “Adviser”) and Henderson Investment Management Limited (the “Sub-Adviser”) in response to detailed requests of the Independent Trustees and their independent legal counsel. The Trustees also discussed with representatives of management the operations of the Funds and the nature and quality of the advisory and other services provided to the Funds by the Adviser and the Sub-Adviser. The Independent Trustees also received and reviewed a memorandum from their counsel regarding their responsibilities in considering continuation of the agreements. Throughout their consideration of the agreements, the Independent Trustees were advised by their independent legal counsel. The Independent Trustees met with management to consider the agreements, and at that meeting they also met separately in executive session with their counsel.
May 14, 2014 Meeting
At a meeting held on May 14, 2014, the Trustees reviewed and analyzed various factors that they determined were relevant, including the factors described below.
Nature, extent and quality of services
The Independent Trustees noted the various reports and presentations they had received in connection with their evaluation of the nature, extent and quality of services provided under the Advisory Agreements by the Adviser and Sub-Adviser, addressing the services performed by the Adviser and Sub-Adviser, as well as their expertise, resources and capabilities. The Trustees then reviewed and considered the nature, extent and quality of the services provided to the Funds by the Adviser and the Sub-Adviser (in the case of Sub-Advised Funds), taking into account the investment objective(s) and strategies of each Fund and the knowledge they had gained throughout the year from their regular and special meetings. In addition, the Trustees reviewed the resources and key personnel of the Adviser and the Sub-Adviser, especially the personnel who provide investment management services to the Funds. Management provided an overview of the Adviser and its parent company and reviewed the Adviser’s capabilities, resources and financial condition. Management also reviewed the Adviser’s investment approach for the Funds and the qualifications of the Funds’ respective portfolio management teams. Management then discussed the personnel responsible for performing services for the Funds.
The Trustees considered the methodology the Adviser and the Sub-Adviser use in determining compensation payable to portfolio managers, the competitive environment for investment management talent and the competitive market for mutual funds in different distribution channels. Management reviewed certain changes in personnel as well as the capacity of each of the Fund’s portfolio managers.
The Trustees also considered other services provided to the Funds by the Adviser and the Sub-Adviser (in the case of Sub-Advised Funds), such as managing the execution of portfolio transactions and the selection of broker-dealers for those transactions, monitoring adherence to the Funds’ investment restrictions, producing shareholder reports, providing support services for the Trustees and committees of the Board and overseeing the activities of other service providers, including monitoring compliance with various policies and procedures of the Funds and with applicable securities laws and regulations.
| Other information (unaudited) |
Investment performance and fees
The Independent Trustees noted that a review of investment performance is a key factor in evaluating the nature, extent and quality of services provided under investment management contracts. The Independent Trustees considered, in particular, the detailed reports and analyses performed and compiled by an independent third party, Lipper Inc. (the “Lipper Report”) and that show, for each Fund and for various periods, total return performance data ranked within a peer group and a larger comparative universe of funds. In addition, for purposes of their review of the reasonableness of the advisory fees, the Independent Trustees considered the expense rankings and quintiles tables, contractual management fees at common asset levels and at various asset levels, expense ratios and various other fees and expenses data and supporting information contained within the Lipper Report.
The Trustees then reviewed the performance and expenses of each Fund, including comparative and percentile ranking information in the Lipper Report.
• Henderson All Asset Fund: The Board noted the Fund’s relatively brief period of operation and observed that the Fund’s performance for the one-year and year-to-date periods ranked in the third and fifth quintile of its performance universe, respectively. The Board considered management’s explanation of the Fund’s defensive posture, which is expected to impede the Fund’s performance in “up” markets, but outperform in volatile markets. The Board also noted that, as compared to its peer group, the Fund’s contractual management fee ranked in the third quintile, the actual management fee ranked in the fifth quintile and its total expense ratio ranked in the second quintile. With respect to the actual management fee, the Board also took into account the Adviser’s contractual agreement to waive its management fee and, if necessary, to reimburse other operating expenses in order to limit total annual ordinary operating expenses, less distribution and service fees, to 0.60% of the Fund’s average daily assets and that, as a result of such agreement, the actual management fees received by the Adviser were just 0.15% for Class A shares. In addition, the Board considered management’s view that the Fund’s management fee was justified by the Adviser’s approach to asset allocation, differentiation from peers and portfolio manager experience and skill. The Board noted management’s view that the Fund’s asset allocation approach allows the portfolio managers the flexibility to make strategic and tactical decisions and requires a high level of active management, while many competitor funds use a more traditional approach to asset allocation based on long-term time horizons and pre-determined allocations.
• Henderson Dividend & Income Builder Fund: The Board observed that the Fund’s total return was in the second quintile of its performance universe for the year-to-date, one-year and since inception periods. With respect to fees and expenses, the Board noted that, relative to the peer group, the Fund’s contractual and actual management fee ranked in the second quintile and that its total expense ratio ranked in the third quintile.
• Henderson Emerging Markets Opportunities Fund: The Board observed that the Fund ranked in the second quintile of its performance universe for the one-year and three-year periods, and in the third quintile for the since inception period. With respect to the Fund’s performance since inception, the Board took into account management’s view that the performance was attributable, to a significant extent, to a concentrated period of underperformance in the first few months subsequent to launch. The Board also discussed the performance of the various sleeves within the Fund, and which sleeves’ performance had detracted from the overall performance. The Board also noted that the Fund’s contractual management fee ranked in the first quintile, the actual management fee ranked in the fifth quintile and that its total expense ratio ranked in the fourth quintile.
• Henderson European Focus Fund: The Board observed that the Fund’s total return was in the first or second quintile against its performance universe for the year-to-date, one-year, five-year, ten-year and since inception periods and in the third quintile for the three-year period. The Board noted management’s view that recent term outperformance can be attributed to stock selection and a strategic positioning of the portfolio. With respect to fees and expenses, the Board noted that the Fund’s contractual and actual management fees ranked in the fifth quintile in its peer group and that its total expense ratio ranked in the second quintile in its peer group. The Board also noted that management was proposing to add a new fee “breakpoint” to pass on additional benefits to shareholders from economies of scale. The Trustees also considered management’s comments on the perceived uniqueness of the Fund relative to its competitors. In addition, the Trustees discussed the capacity of the Fund.
• Henderson Global Equity Income Fund: The Board observed that the Fund’s total return for the one-year, and since inception periods ranked in the second and first quintile of its performance universe, respectively, though the Fund had underperformed for the year-to-date and five-year periods. With respect to the Fund’s fees and expenses, the Board noted that the Fund’s contractual and actual management fees ranked in the second quintile of its peer group and that its total expense ratio ranked in the first quintile of its peer group.
Other information (unaudited)
• Henderson Global Technology Fund: The Board observed that the Fund’s performance for the year-to-date, one-year and three-year periods ranked in the fourth or fifth quintile of the Fund’s performance universe, and it ranked in the second or third quintile for the five-year, ten-year and since inception periods. The Board considered management’s discussion of the impact of particular portfolio holdings on the Fund’s recent performance and the Fund’s defensive posture. The Board also noted that the Fund outperformed its benchmark in ten of twelve calendar years since inception. With respect to fees and expenses, the Board noted that the Fund’s contractual management fees and total expense ratio each ranked in the fourth quintile of its peer group and the actual management fees ranked in the fifth quintile. The Board also noted that management was recommending a reduction in the Fund’s management fees.
• Henderson High Yield Opportunities Fund: The Board considered the Fund’s relatively brief period of operation and observed that the Fund’s performance for the year-to-date and since inception periods ranked in the first quintile of the Fund’s performance universe. The Board also noted that the Fund’s contractual management fee ranked in the second quintile, the actual management fee ranked in the first quintile and its total expense ratio ranked in the third quintile, in each case, as compared to the Fund’s peer group. The Trustees also considered management’s comments on the perceived uniqueness of the Fund relative to its competitors.
• Henderson International Opportunities Fund: With respect to the Fund’s performance universe, the Board noted that the Fund’s total return ranked in the first quintile for the one-year period and since inception, in the second quintile for the three-year and ten-year periods and in the fourth quintile for the year-to-date and five-year periods. With respect to fees and expenses relative to the peer group, the Board noted that the Fund’s contractual and actual management fee ranked in the fifth quintile and the total expense ratio ranked in the fourth quintile. The Board considered management’s discussion regarding the Fund’s investment process, uniqueness and long-term performance. In this connection, the Board discussed the Fund’s “best ideas” approach. The Board then considered the features of the Fund relative to its peers, noting, in this regard, that the Fund’s best ideas approach results in a concentrated portfolio of high conviction holdings. In addition, the Board considered information from management suggesting that the Fund’s holdings are differentiated from its competition. The Board noted that management was proposing to add new breakpoints to lower management fees and pass on additional benefits to shareholders from economies of scale as the Fund grows.
• Henderson Strategic Income Fund: The Board considered the Fund’s performance in light of the particular management style involved, with performance ranking in the first or second quintile of its performance universe for the year-to-date, one-year, three-year and five-year periods and in the fourth or fifth quintile for the ten-year and since inception periods noting the improvement in performance following the change in portfolio managers. In assessing the Fund’s management fee and total expenses relative to its peer group, the Board observed that the Fund’s contractual management fee was in the second quintile, the actual management fee was in the first quintile and that the total expense ratio, although in the fourth quintile, was competitive in comparison to its peer group. The Board took into account that the Fund’s investment process encompasses active asset allocation among fixed income sectors and individual security selection driven by bottom-up credit research.
The Trustees also reviewed the management fees of the Adviser and the Sub-Adviser for certain affiliated funds and management’s explanation of any material differences in the comparative data. Although in some instances the fee rates for various investment strategies were lower than management fees for Funds having a similar strategy, the Trustees noted that the Adviser and the Sub-Adviser may perform significant additional services for the Funds that they do not provide to other funds or strategies.
Costs of services provided and the profits realized by Henderson and its affiliates from their relationships with the funds
In considering the reasonableness of investment management fees, the Independent Trustees also considered the expected profitability of Henderson and its affiliates in connection with Henderson providing investment management services to the Funds.
The Trustees also reviewed the financial information related to the Adviser’s parent company and its corporate structure. The Trustees recognized that profitability comparisons among fund managers are difficult because very little comparative information is publicly available, and the profitability of any manager is affected by numerous factors, including the organizational structure of the particular manager, the types of funds and other accounts it manages, possible other lines of business, the methodology for allocating expenses and the manager’s capital structure and cost of capital.
Economies of scale
The Independent Trustees considered the economies of scale that might be realized by the Adviser as a Fund grows and took note of the extent to which Fund shareholders might also benefit from such growth. In this connection, it was observed that the
| Other information (unaudited) |
fee schedules for each Fund, with the exception of the All Asset Fund, include various pre-established “breakpoints” in investment management service fees that are triggered as a Fund’s net asset level increases. The Independent Trustees observed that, in light of the additional breakpoints proposed by management, each Fund (with the exception of Henderson All Asset Fund) has remaining breakpoints that have not yet been reached. The Independent Trustees noted that based on the receipt of information showing the breakpoints, they were comfortable that such breakpoints satisfactorily provide for sharing economies of scale, as they allow for adequate opportunity for shareholders to realize benefits (fee breaks) as Fund assets grow. With respect to the All Asset Fund, while the Fund’s fee schedule does not include breakpoints, the Independent Trustees considered that an appropriately structured total expense limitation can provide an acceptable sharing of economies of scale to substitute for a breakpoint in the advisory fee. In this regard, the Independent Trustees took into account the Adviser’s expense limitation agreement with respect to the All Asset Fund.
Other Benefits to the Adviser
The Trustees also considered benefits that accrue to the Adviser and the Sub-Adviser (in the case of Sub-Advised Funds) from their relationship with the Funds and their use of commissions paid on portfolio brokerage transactions of the Funds to obtain research products and services benefiting the Funds and/or other clients.
June 18-19, 2014 Meeting
At a meeting held on June 18-19, 2014, it was noted that the Board had met previously in-person on May 14, 2014 to review annual approval related materials. The representatives of the Adviser indicated that there had not been any material changes to the information that had been provided for the May 14, 2014 meeting.
Based on their evaluation of the information provided by the Adviser and the Sub-Adviser and other information, the Trustees determined that the overall arrangements between each Fund and the Adviser and Sub-Advisor were fair and reasonable in light of the nature and quality of the services provided by the Adviser and the Sub-Adviser (in the case of the Sub-Advised Funds), the fees charged for those services, and other matters that the Trustees considered relevant in the exercise of their business judgment. In making that determination, the Trustees reviewed and analyzed various factors that they determined were relevant, including the factors described below, none of which by itself was considered paramount or dispositive and each Trustee may have weighed the information differently.
Nature, extent and quality of services
The Trustees reviewed and considered the nature, extent and quality of the services provided to the Funds by the Adviser and the Sub-Adviser (in the case of the Sub-Advised Funds), taking into account the investment objective and strategy of each Fund and the knowledge they had gained from their May 14, 2014 meeting and their regular meetings with management on at least a quarterly basis. The Trustees concluded that the nature and extent of the services provided to each Fund by the Adviser and the Sub-Adviser (in the case of Sub-Advised Funds) were appropriate and consistent with the terms of the respective Advisory Agreements, that the quality of those services had been consistent with quality norms in the industry and that the Funds were likely to benefit from the continued provision of those services. They also concluded that the Adviser and the Sub-Adviser (in the case of Sub-Advised Funds) had sufficient personnel with the appropriate education and experience to serve the Funds effectively, and had demonstrated their continuing ability to attract and retain well-qualified personnel.
Performance and fees
The Trustees considered their extensive review and discussion at the May 14, 2014 meeting of each Fund’s investment performance over various time periods in comparison to information for other comparable funds as provided by Lipper. They concluded that the performance of each Fund met or exceeded acceptable levels. The Trustees recalled their review of information on the fees and other expenses paid by each Fund in comparison to information for other comparable funds as provided by Lipper at the May 14, 2014 meeting. The Trustees also had reviewed the management fees of the Adviser and the Sub-Adviser for certain affiliated funds. The Trustees reviewed information on the profitability of (or loss) to the Adviser and its affiliates of their relationships with each Fund and concluded that the Adviser’s profitability level with respect to each Fund in relation to the services rendered was not unreasonable. Finally, the Trustees considered the financial condition of the Adviser and the Sub-Adviser, which they found to be sound. The Trustees concluded that the management fees and other compensation payable by each Fund to the Adviser, as well as the fees paid by the Adviser to the Sub-Adviser, were reasonable in relation to the nature, extent and quality of the services provided, taking into account the fees charged by other advisers for managing comparable mutual funds with similar strategies and the fees the Adviser and the Sub-Adviser charge to other clients. The Trustees also concluded that the overall expense ratio of each Fund was reasonable, taking into account the size of the Fund, the quality of services provided by the Adviser and the Sub-Adviser (in the case of the Sub-Advised Funds), the investment performance of the Fund and the expense limitations agreed to by the Adviser.
| Other information (unaudited) |
Economies of scale
The Trustees received and considered information about the potential of the Adviser to experience economies of scale as the assets of the Funds increase and took note of the extent to which Fund shareholders might also benefit from such growth. In this connection, the Trustees recalled their observation at the May 14, 2014 meeting that the fee schedules for each Fund, with the exception of the All Asset Fund, include various pre-established breakpoints in advisory fees that are triggered as a Fund’s net asset level increases. The Trustees further recalled that at the May 14, 2014 meeting management proposed certain changes to the breakpoint schedule for the European Focus Fund, the Global Technology Fund and the International Opportunities Fund which would have the effect of reducing the advisory fee paid by each Fund to the Advisor. Based on all of the information they reviewed, the Trustees concluded that the advisory fee breakpoints satisfactorily provide for sharing economies of scale, as they allow for adequate opportunity for shareholders to realize benefits (fee breaks) as Fund assets grow. With respect to the All Asset Fund, although the Fund’s fee schedule does not include breakpoints, the Trustees considered that an appropriately structured total expense limitation can provide an acceptable sharing of economies of scale to substitute for a breakpoint in the advisory fee. In this regard, the Trustees recalled their consideration at the May 14, 2014 meeting of the Advisor’s expense limitation agreement with respect to the All Asset Fund.
Other benefits to the adviser
The Trustees also considered benefits that accrue to the Adviser and the Sub-Adviser (in the case of Sub-Advised Funds) from their relationship with the Funds and their use of commissions paid on portfolio brokerage transactions of the Funds to obtain research products and services benefiting the Funds and/or other clients. The Trustees concluded that the use by the Adviser and the Sub-Adviser (in the case of Sub-Advised Funds) of commissions paid by the Funds to obtain research products and services was consistent with regulatory requirements and likely benefits the Funds.
After full consideration of the above factors as well as other factors that were instructive in analyzing the management arrangements, the Trustees, including all of the Independent Trustees, concluded that the continuation of the investment advisory and sub-advisory agreement (in the case of the Sub-Advised Funds) for each Fund was in the best interest of each Fund and its shareholders.
Statement Pursuant to Section 19(a) of the Investment Company Act of 1940
The exact source of aggregate fund distributions for each fiscal year can only be determined as of the end of each Fund’s fiscal year, July 31. However, under Section 19(a) of the Investment Company Act of 1940, the Funds are required to indicate the source of each distribution to shareholders at the time of payment if the distribution is made from any source other than accumulated undistributed net income. For purposes of this disclosure, the source of each distribution is based on US Generally Accepted Accounting Principles (“GAAP”) and will differ from federal income tax-based reporting provided to shareholders due to certain tax adjustments. For federal income tax purposes, the Funds will send you a Form 1099-DIV for each calendar year that will tell you how to report these distributions.
The Funds are making the following disclosures pursuant to Section 19(a).
During the semi-annual period ended July 31, 2014, Unconstrained Bond paid the following distribution, in part from sources other than accumulated undistributed net income as measured at the time of payment. No other Funds paid distributions from sources other than accumulated undistributed net income, other than those previously disclosed in the Funds’ January 31, 2014 Semi-Annual Report to Shareholders.
Unconstrained Bond
| Pay Date | | | Ex-Date | | | Amount | | | % from accumulated undistributed net income | | | % from accumulated realized gains | | | % from paid-in capital | |
| 7/30/2014 | | | 7/30/2014 | | | Class A: $ 0.015795 | | | 94.0% | | | 0.0% | | | 6.0% | |
| | | | | | | Class C: $ 0.009067 | | | 94.0% | | | 0.0% | | | 6.0% | |
| | | | | | | Class I: $ 0.018221 | | | 94.0% | | | 0.0% | | | 6.0% | |
| Other information (unaudited) |
All other monthly distributions paid by Unconstrained Bond were paid exclusively from accumulated undistributed net income.
Federal tax information
Certain tax information for the Funds is required to be provided to shareholders based on the Funds’ income and distributions for the taxable year ending July 31, 2014. In February 2015, shareholders will receive Form 1099-DIV, which will include their share of foreign tax credit, qualified dividends and capital gains distributed during the calendar year 2014. Shareholders are advised to check with their tax advisors for information on the treatment of these amounts on their individual income tax returns.
For corporate shareholders, 1.77%, 12.48%, 8.92%, 6.24%, 2.38%, 5.15% and 1.01% of ordinary income dividends paid by All Asset Fund, Dividend & Income Builder Fund, Emerging Market Opportunities Fund, Global Equity Income Fund, High Yield Opportunities Fund, International Opportunities Fund and Unconstrained Bond Fund, respectively, qualified for the dividends received deduction during the year ended July 31, 2014.
Under Section 853 of the Internal Revenue Code of 1986, as amended (the “Code”), the Funds designated foreign taxes paid and foreign source income for the fiscal year ended July 31, 2014 were as follows:
| | | | Foreign | | | Foreign | |
| | | | taxes paid | | | source income | |
| All Asset | | $ | — | | $ | — | |
| Dividend & | | | | | | | |
| Income Builder | | | 30,605 | | | 561,119 | |
| Emerging Markets | | | | | | | |
| Opportunities | | | 45,366 | | | 630,993 | |
| European Focus | | | 3,422,017 | | | 51,811,605 | |
| Global Equity Income | | | 10,234,682 | | | 185,627,264 | |
| Global Technology | | | — | | | — | |
| High Yield | | | | | | | |
| Opportunities | | | — | | | — | |
| International | | | | | | | |
| Opportunities | | | 5,033,790 | | | 85,187,870 | |
| Strategic Income | | | — | | | — | |
| Unconstrained Bond | | | — | | | — | |
Under Section 854 (b)(2) of the Code, the Funds designated qualified dividends for the fiscal year ended July 31, 2014 as follows:
| All Asset | | $ | 208,168 | |
| Dividend & Income Builder | | | 609,173 | |
| Emerging Markets Opportunities | | | 376,373 | |
| European Focus | | | 49,174,335 | |
| Global Equity Income | | | 162,485,790 | |
| Global Technology | | | — | |
| High Yield Opportunities | | | 55,942 | |
| International Opportunities | | | 77,181,815 | |
| Strategic Income | | | — | |
| Unconstrained Bond | | | 5,250 | |
Long term capital gains dividends of $532,924, $9 and $2,465,935 were paid from the All Asset Fund, Dividend & Income Builder Fund and Global Technology Fund, respectively, during the year ended July 31, 2014.
Shareholder expense
As a shareholder of the Funds, you incur two types of costs: (1) transaction costs, including sales charges (loads) on purchase payments and redemption fees and (2) ongoing costs, including management fees, distribution (12b-1) fees, shareholder services fees and other Fund expenses. The example in Table 1 and Table 2 is intended to help you understand your ongoing costs of investing in the Funds and to compare these costs with ongoing costs of investing in other mutual funds. It is based on an investment of $1,000 invested at the beginning of the period and held for the six months ended July 31, 2014.
Actual expenses
Table 1 provides information about actual account values and actual expenses. You may use the information in this line, together with the amount invested, to estimate the expenses that you incurred over the period. Simply divide your account value at the end of the period by $1,000 (for example, an $8,600 account value divided by $1,000 = 8.6), then multiply the result by the number under the heading entitled “Expenses Paid During the Period” to estimate the expenses attributable to your investment during this period.
| Other information (unaudited) |
Hypothetical example for comparison purposes
Table 2 provides information about hypothetical account values and hypothetical expenses based on the Funds’ actual expense ratios and an assumed rate of return of 5% per year before expenses, which is not the Funds’ actual return. Thus you should not use the hypothetical account values and expenses to estimate your actual ending account balance or the expense attributable to your investment during the period. Rather, these figures are provided to enable you to compare the ongoing costs of investing in the Funds and other funds. To do so, compare the 5% hypothetical examples with the 5% hypothetical examples that appear in the shareholder reports of other funds.
Expenses paid during the period include amounts reflected in the Funds’ Statements of Operations, net of reimbursements by the investment adviser. The annualized expense ratios used in the example (inclusive of 12b-1 fees) are as follows:
| | | | Class | | | Class | | | Class | | | Class | | | Class | |
| | | | A | | | B | | | C | | | I | | | R | |
| All Asset | | | 0.85 | % | | N/A | | | 1.60 | % | | 0.60 | % | | N/A | |
| Dividend & | | | | | | | | | | | | | | | | |
| Income | | | | | | | | | | | | | | | | |
| Builder | | | 1.30 | % | | N/A | | | 2.05 | % | | 1.05 | % | | N/A | |
| Emerging | | | | | | | | | | | | | | | | |
| Markets | | | | | | | | | | | | | | | | |
| Opportunities | | | 1.79 | % | | N/A | | | 2.54 | % | | 1.54 | % | | N/A | |
| European | | | | | | | | | | | | | | | | |
| Focus | | | 1.36 | % | | 2.18 | % | | 2.14 | % | | 1.11 | % | | N/A | |
| Global | | | | | | | | | | | | | | | | |
| Equity | | | | | | | | | | | | | | | | |
| Income | | | 1.11 | % | | N/A | | | 1.87 | % | | 0.87 | % | | N/A | |
| Global | | | | | | | | | | | | | | | | |
| Technology | | | 1.44 | % | | 2.23 | % | | 2.20 | % | | 1.19 | % | | N/A | |
| High Yield | | | | | | | | | | | | | | | | |
| Opportunities | | | 1.10 | % | | N/A | | | 1.85 | % | | 0.85 | % | | N/A | |
| International | | | | | | | | | | | | | | | | |
| Opportunities | | | 1.40 | % | | 2.19 | % | | 2.15 | % | | 1.11 | % | | 1.67 | % |
| Strategic | | | | | | | | | | | | | | | | |
| Income | | | 1.10 | % | | 1.85 | % | | 1.85 | % | | 0.85 | % | | N/A | |
| Unconstrained | | | | | | | | | | | | | | | | |
| Bond | | | 1.15 | % | | N/A | | | 1.90 | % | | 0.90 | % | | N/A | |
Please note that the expenses do not reflect shareowner transaction costs such as front-end sales charges and redemption fees. These fees are described for each Fund and share class in the “Commentaries and Performance Summaries” section of this report on beginning on page XX. Table 2 is useful in comparing ongoing costs only, and will not help you determine the relative total costs of owning different funds. In addition, if these transaction costs were included, your costs would have been higher.
| Other information (unaudited) |
| Table 1 | | | | | | | | | | |
| | | | Beginning | | | Ending | | | Expenses | |
| | | | account | | | account | | | paid | |
| | | | value | | | value | | | during | |
| | | | February 1, | | | July 31, | | | the | |
| Actual | | | 2014 | | | 2014 | | | period* | |
| All Asset | | | | | | | | | | |
| Class A | | $ | 1,000.00 | | $ | 1,038.60 | | $ | 4.30 | |
| Class C | | | 1,000.00 | | | 1,035.10 | | | 8.07 | |
| Class I | | | 1,000.00 | | | 1,039.60 | | | 3.03 | |
| Dividend & Income Builder | | | | | | | | | | |
| Class A | | $ | 1,000.00 | | $ | 1,063.20 | | $ | 6.65 | |
| Class C | | | 1,000.00 | | | 1,059.60 | | | 10.47 | |
| Class I | | | 1,000.00 | | | 1,064.50 | | | 5.37 | |
| Emerging Market Opportunities | | | | | | | | | | |
| Class A | | $ | 1,000.00 | | $ | 1,147.20 | | $ | 9.53 | |
| Class C | | | 1,000.00 | | | 1,144.00 | | | 13.50 | |
| Class I | | | 1,000.00 | | | 1,150.50 | | | 8.21 | |
| European Focus | | | | | | | | | | |
| Class A | | $ | 1,000.00 | | $ | 1,039.30 | | $ | 6.88 | |
| Class B | | | 1,000.00 | | | 1,035.00 | | | 11.00 | |
| Class C | | | 1,000.00 | | | 1,035.70 | | | 10.80 | |
| Class I | | | 1,000.00 | | | 1,040.80 | | | 5.62 | |
| Global Equity Income | | | | | | | | | | |
| Class A | | $ | 1,000.00 | | $ | 1,080.40 | | $ | 5.73 | |
| Class C | | | 1,000.00 | | | 1,076.90 | | | 9.63 | |
| Class I | | | 1,000.00 | | | 1,081.60 | | | 4.49 | |
| Global Technology | | | | | | | | | | |
| Class A | | $ | 1,000.00 | | $ | 1,034.90 | | $ | 7.27 | |
| Class B | | | 1,000.00 | | | 1,030.70 | | | 11.23 | |
| Class C | | | 1,000.00 | | | 1,030.80 | | | 11.08 | |
| Class I | | | 1,000.00 | | | 1,036.40 | | | 6.01 | |
| High Yield Opportunities | | | | | | | | | | |
| Class A | | $ | 1,000.00 | | $ | 1,037.90 | | $ | 5.56 | |
| Class C | | | 1,000.00 | | | 1,034.00 | | | 9.33 | |
| Class I | | | 1,000.00 | | | 1,039.10 | | | 4.30 | |
| International Opportunities | | | | | | | | | | |
| Class A | | $ | 1,000.00 | | $ | 1,035.70 | | $ | 7.07 | |
| Class B | | | 1,000.00 | | | 1,031.40 | | | 11.03 | |
| Class C | | | 1,000.00 | | | 1,031.80 | | | 10.83 | |
| Class I | | | 1,000.00 | | | 1,037.20 | | | 5.61 | |
| Class R | | | 1,000.00 | | | 1,034.20 | | | 8.42 | |
| Strategic Income | | | | | | | | | | |
| Class A | | $ | 1,000.00 | | $ | 1,030.10 | | $ | 5.54 | |
| Class B | | | 1,000.00 | | | 1,027.10 | | | 9.30 | |
| Class C | | | 1,000.00 | | | 1,026.40 | | | 9.30 | |
| Class I | | | 1,000.00 | | | 1,032.60 | | | 4.28 | |
| Unconstrained Bond | | | | | | | | | | |
| Class A | | $ | 1,000.00 | | $ | 1,015.50 | | $ | 5.75 | |
| Class C | | | 1,000.00 | | | 1,011.70 | | | 9.48 | |
| Class I | | | 1,000.00 | | | 1,016.80 | | | 4.50 | |
| Table 2 | | | | | | | | | | |
| | | | | | | | | | | |
| Hypothetical | | | Beginning | | | Ending | | | Expenses | |
| (assuming a | | | account | | | account | | | paid | |
| 5% return | | | value | | | value | | | during | |
| before | | | February 1, | | | July 31, | | | the | |
| expenses) | | | 2014 | | | 2014 | | | period* | |
| All Asset | | | | | | | | | | |
| Class A | | $ | 1,000.00 | | $ | 1,020.58 | | $ | 4.26 | |
| Class C | | | 1,000.00 | | | 1,016.86 | | | 8.00 | |
| Class I | | | 1,000.00 | | | 1,021.82 | | | 3.01 | |
| Dividend & Income Builder | | | | | | | | | | |
| Class A | | $ | 1,000.00 | | $ | 1,018.35 | | $ | 6.51 | |
| Class C | | | 1,000.00 | | | 1,014.63 | | | 10.24 | |
| Class I | | | 1,000.00 | | | 1,019.59 | | | 5.26 | |
| Emerging Market Opportunities | | | | | | | | | | |
| Class A | | $ | 1,000.00 | | $ | 1,015.92 | | $ | 8.95 | |
| Class C | | | 1,000.00 | | | 1,012.20 | | | 12.67 | |
| Class I | | | 1,000.00 | | | 1,017.16 | | | 7.70 | |
| European Focus | | | | | | | | | | |
| Class A | | $ | 1,000.00 | | $ | 1,018.05 | | $ | 6.80 | |
| Class B | | | 1,000.00 | | | 1,013.98 | | | 10.89 | |
| Class C | | | 1,000.00 | | | 1,014.18 | | | 10.69 | |
| Class I | | | 1,000.00 | | | 1,019.29 | | | 5.56 | |
| Global Equity Income | | | | | | | | | | |
| Class A | | $ | 1,000.00 | | $ | 1,019.29 | | $ | 5.56 | |
| Class C | | | 1,000.00 | | | 1,015.52 | | | 9.35 | |
| Class I | | | 1,000.00 | | | 1,020.48 | | | 4.36 | |
| Global Technology | | | | | | | | | | |
| Class A | | $ | 1,000.00 | | $ | 1,017.65 | | $ | 7.20 | |
| Class B | | | 1,000.00 | | | 1,013.74 | | | 11.13 | |
| Class C | | | 1,000.00 | | | 1,013.89 | | | 10.99 | |
| Class I | | | 1,000.00 | | | 1,018.89 | | | 5.96 | |
| High Yield Opportunities | | | | | | | | | | |
| Class A | | $ | 1,000.00 | | $ | 1,019.34 | | $ | 5.51 | |
| Class C | | | 1,000.00 | | | 1,015.62 | | | 9.25 | |
| Class I | | | 1,000.00 | | | 1,020.58 | | | 4.26 | |
| International Opportunities | | | | | | | | | | |
| Class A | | $ | 1,000.00 | | $ | 1,017.85 | | $ | 7.00 | |
| Class B | | | 1,000.00 | | | 1,013.94 | | | 10.94 | |
| Class C | | | 1,000.00 | | | 1,014.13 | | | 10.74 | |
| Class I | | | 1,000.00 | | | 1,019.29 | | | 5.56 | |
| Class R | | | 1,000.00 | | | 1,016.51 | | | 8.35 | |
| Strategic Income | | | | | | | | | | |
| Class A | | $ | 1,000.00 | | $ | 1,019.34 | | $ | 5.51 | |
| Class B | | | 1,000.00 | | | 1,015.62 | | | 9.25 | |
| Class C | | | 1,000.00 | | | 1,015.62 | | | 9.25 | |
| Class I | | | 1,000.00 | | | 1,020.58 | | | 4.26 | |
| Unconstrained Bond | | | | | | | | | | |
| Class A | | $ | 1,000.00 | | $ | 1,019.09 | | $ | 5.76 | |
| Class C | | | 1,000.00 | | | 1,015.37 | | | 9.49 | |
| Class I | | | 1,000.00 | | | 1,020.33 | | | 4.51 | |
| * | Expenses are equal to the Funds’ annualized net expense ratio multiplied by the average account value over the period multiplied by 181 days in the period, and divided by 365 (to reflect the one-half year period). |
Trustees and officers (unaudited)
| | | | | Term of | | | | |
Name, address1, | | Position(s) | | Office and | | | | Other |
| month and | | with | | Time | | Principal Occupations | | Directorships |
| year of birth | | the Trust2 | | Served3 | | During Past Five Years | | Held |
| Independent Trustees | | | | | | | | |
C . Gary Gerst February 1939 | | Chairman and Trustee | | Since 2001 | | General Partner, Cornelius & Lothian LP (private partnership investing in non-public investments), from 1993 to present. | | Formerly, Trustee, Harris Insight Funds Trust; formerly, member of the Governing Council of the Independent Directors Council (IDC); formerly, Board member of the Investment Company Institute. |
Roland C. Baker August 1938 | | Trustee | | Since 2001 | | Consultant to financial services industry. | | Director, Sammons Financial Enterprises, Inc. and its life insurance subsidiaries, North American Company for Life and Health Insurance (a provider of life insurance, health insurance and annuities), and Midland National Life Insurance Company (an affiliate of North American Company for Life and Health Insurance). |
Faris F. Chesley August 1938 | | Trustee | | Since 2002 | | Chairman, Chesley, Taft & Associates, LLC, Since 2001; Vice Chairman, ABN-AMRO, Inc. (a financial services company), 1998-2001. | | Chairman of the Investment Committee of the Presbyterian Homes; Director, Rasmussen Inc.; formerly, Trustee, Harris Insight Funds Trust; formerly, Trustee, Selected Funds. |
James W. Atkinson August 1950 | | Trustee | | Since 2011 | | Commercial Pilot, Atkinson Aviation LLC, since 2009 | | Formerly, Trustee, LaRabida Children’s Hospital: formerly Trustee, Surgeons Diversified Investment Fund. |
Richard W. Durkes February 1950 | | Trustee | | Since 2011 | | Managing Director, BayBoston LLC (private equity fund) | | Trustee, NT Alpha Strategies Fund and NT Long/Short Equity Fund; Trustee, Sankaty Head Foundation; Partner, Serve UP LLC (private company that holds the rights to certain intellectual property). |
Barbara L. Lamb September 1954 | | Trustee | | Since 2014 | | Managing Director, Cheiron Trading LLC (proprietary trading company). | | None. |
J. Marshall Peck April 1952 | | Trustee | | Since 2014 | | President, Interpark Holdings, LLC (parking garage owner, developer and operator), since 2011; formerly, Chief Executive Officer, Interpark Holdings, LLC. | | Board Member and Finance Committee Chairman, Presbyterian Homes. |
| Trustees and officers (unaudited) |
| | | | | Term of | | | | |
Name, address1, | | Position(s) | | Office and | | | | Other |
| month and | | with | | Time | | Principal Occupations | | Directorships |
| year of birth | | the Trust2 | | Served3 | | During Past Five Years | | Held |
| Interested Trustees and Officers of the Trust | | | | | | |
James G. O’Brien4 May 1960 | | Trustee and President | | Since 2011 Since 2010 | | Managing Director, HGINA. | | None. |
Charles Thompson II4 April 1970 | | Trustee and Vice President | | Since 2011 Since 2010 | | Director of Distribution (North America), since 2014; Director of US Retail, 2010-2014, Director of National Sales, 2007-2010. | | None. |
Kenneth A. Kalina August 1959 | | Chief Compliance Officer | | Since 2005 | | Chief Compliance Officer, HGINA. | | N/A |
Alanna P. Nensel July 1975 | | Vice President | | Since 2002 | | Director, Retail Marketing and Product Management, HGINA. | | N/A |
David Latin September 1981 | | Vice President | | Since 2012 | | Director of Product Development and Analyst Relations, HGINA. | | N/A |
Scott E. Volk May 1971 | | Vice President | | Since 2001 | | Director, Retail Finance and Operations, HGINA. | | N/A |
Christopher K. Yarbrough October 1974 | | Secretary | | Since 2004 | | Legal Counsel, HGINA. | | N/A |
Troy M. Statczar August 1971 | | Treasurer | | Since 2008 | | Head of US Fund Administration and Accounting, HGINA. | | N/A |
Adam T. Reich August 1983 | | Assistant Treasurer | | Since 2012 | | Manager of US Fund Administration and Accounting, HGINA, since August 2012; Manager, PricewaterhouseCoopers LLP 2006-2012. | | N/A |
| 1. | Each person’s address is 737 North Michigan Avenue, Suite 1700, Chicago, IL 60611. |
| 2. | Currently, all Trustees oversee all ten series of the Trust. |
| 3. | A Trustee may serve until his death, resignation, removal or until the end of the calendar year in which the Trustee reaches 75 years of age, subject to change by the Board. The Trustees have determined to extend the retirement age of Messrs. Gerst, Baker and Chesley to the end of the calendar year in which these Trustees reach 76 years of age. The officers of the Trust are elected annually by the Board. |
| 4. | This Trustee is an interested person of the Trust because of his employment relationship with Henderson Global Investors (North America) Inc., the investment adviser to the Fund. |
| | |
| | Unless otherwise noted, this information is as of July 31, 2014. The Statement of Additional Information for Henderson Global Funds includes additional information about the Trustees and is available without charge by calling 1.866.4HENDERSON (1.866.443.6337). |
Trustees and officers (unaudited)
| Trustees | Investment Adviser |
| C. Gary Gerst, Chairman | Henderson Global Investors (North America) Inc. |
| James W. Atkinson | 737 North Michigan Avenue, Suite 1700 |
| Roland C. Baker | Chicago, IL 60611 |
| Faris F. Chesley | |
| Richard W. Durkes | Transfer Agent |
| Barbara L. Lamb | State Street Bank & Trust Company |
| J. Marshall Peck | State Street Financial Center |
| James G. O’Brien* | One Lincoln Street |
| Charles Thompson II* | Boston, MA 02111 |
| | |
| Officers | Auditors |
| James G. O’Brien, President | Ernst & Young LLP |
| Charles Thompson II, Vice President | 155 North Wacker Drive |
| Alanna P. Nensel, Vice President | Chicago, IL 60606 |
| David Latin, Vice President | |
| Scott E. Volk, Vice President | For more information |
| Christopher K. Yarbrough, Secretary | Please call 1.866.4HENDERSON |
| Kenneth A. Kalina, Chief Compliance Officer | (1.866.443.6337) |
| Troy M. Statczar, Treasurer | or visit our website: |
| Adam T. Reich, Assistant Treasurer | www.henderson.com |
| * | Trustee is an “interested person” of the Trust as defined in the Investment Company Act of 1940, as amended. |
The views expressed in this report and information about the Funds’ portfolio holdings are for the period covered by this report and are subject to change hereafter. This report is submitted for the general information of the shareholders of the Funds. It is not authorized for distribution to prospective investors unless preceded or accompanied by an effective prospectus, which includes information regarding the Funds’ risks, objectives, fees and expenses, experience of its management, and other information. Henderson Global Investors is the name under which various subsidiaries of Henderson Group plc, a UK limited company, provide investment products and services.
Foreside Fund Services, LLC, Distributor
This page intentionally left blank.
This page intentionally left blank.
This notice describes the privacy practices followed by Henderson Global Funds.
Your privacy is our top priority. Our policy is to respect the privacy of current and former shareholders and to protect personal information entrusted to us. We do not share any nonpublic personal information of shareholders or former shareholders with any nonaffiliated third parties, except as permitted by law or as authorized by our shareholders.
In the course of providing products and services to you, we collect nonpublic personal information about you from various sources such as account applications or agreements, other account forms, transactions in your account, and from information captured on our website, including any information captured through our use of “cookies.” Such information may include your name, address, account or tax identification number, the types and amounts of investments, and bank account information. More detailed information about our Internet policy is available on our website, www.henderson.com.
In the normal course of serving shareholders, we may share information we collect with entities that help us process information or service your request, such as transfer agents, custodians, broker-dealers and marketing service firms, as well as with other financial institutions with whom we have joint marketing agreements. We may share information in connection with servicing accounts or to inform shareholders of products and services that we believe may be of interest to them. The organizations that receive shareholder information will use that information only for the services required and as allowed by applicable law or regulation, and are not permitted to share or use this information for any other purpose. Our affiliates do not use shareholder information that we receive to make marketing solicitations. We will disclose your personal information to government agencies, law enforcement officials, and others in the limited circumstances where we believe, in good faith, that such disclosure is required or permitted by law. For example, we will disclose your personal information in order to comply with a court order, to cooperate with government or industry regulators, or law enforcement authorities.
Access to customers’ nonpublic personal information is restricted to employees who need to access that information. To guard shareholder’s nonpublic personal information, we use industry standard physical, electronic, and procedural safeguards. A shareholder’s right to privacy extends to all forms of contact with us, including telephone, written correspondence, and electronic media, such as the Internet.
For questions concerning this policy, please contact us by writing to: Alanna Nensel, Henderson Global Investors (North America) Inc., 737 North Michigan Avenue, Suite 1700, Chicago, Illinois 60611.