 I N S U R A N C E / R E I N S U R A N C E B E R M U D A I R E L A N D U N I T E D S T A T E S MAX CAPITAL GROUP LTD. Nasdaq: MXGL Investor Presentation Quarter Ended – March 31, 2008 Exhibit 99.2 |
 2 INFORMATION CONCERNING FORWARD LOOKING STATEMENTS This presentation includes statements about future economic performance, finances, expectations, plans and prospects of the Company that constitute forward-looking statements for purposes of the safe harbor provisions of the Private Securities Litigation Reform Act of 1995. Such forward-looking statements are subject to certain risks and uncertainties that could cause actual results to differ materially from those suggested by such statements. For further information regarding cautionary statements and factors affecting future results, please refer to the Company’s most recent Annual Report on Form 10-K , Quarterly Reports on Form 10-Q filed subsequent to the Annual Report and other documents filed by the Company with the SEC. The Company undertakes no obligation to update or revise publicly any forward-looking statement whether as a result of new information, future developments or otherwise. |
 3 Max Capital Today Global underwriter of specialty insurance and reinsurance focused on risk adjusted returns and book value growth Operating subsidiaries in Bermuda, Ireland and United States Highly experienced management and underwriting teams with proven track record through all market cycles Over 200 employees worldwide Diversified business mix balanced between insurance and reinsurance, long and short tail exposures and geographic spread of risk Growth through opportunistic expansion and addition of product lines Strategic initiatives focus on value creation through all product cycles Portfolio approach to risk through integration of asset / liabilities for all transactions Culture focused on risk and capital management Custom pricing models for each class of business with emphasis on ROE Total invested assets of $5.2 billion represents a 3.4:1 ratio of invested assets to capital deployed in a risk averse, enhanced return investment strategy $1.5 billion of shareholders’ equity at March 31, 2008 |
 4 First Quarter 2008 Highlights 2008 Underwriting off to strong start Agriculture Reinsurance GPW: $85 million Max Specialty GPW: $29 million Q1 2008 Cat Events – minimal impact to Max Alternative Investments Return: -2.11% HFRI Fund of Fund Index return: -4.27% $99 million returned to Shareholders $94 million Share Repurchases $5 million Dividend March 2008 announced agreement to acquire U.S. Admitted Insurance Company licensed in all 50 states Regulatory approval pending |
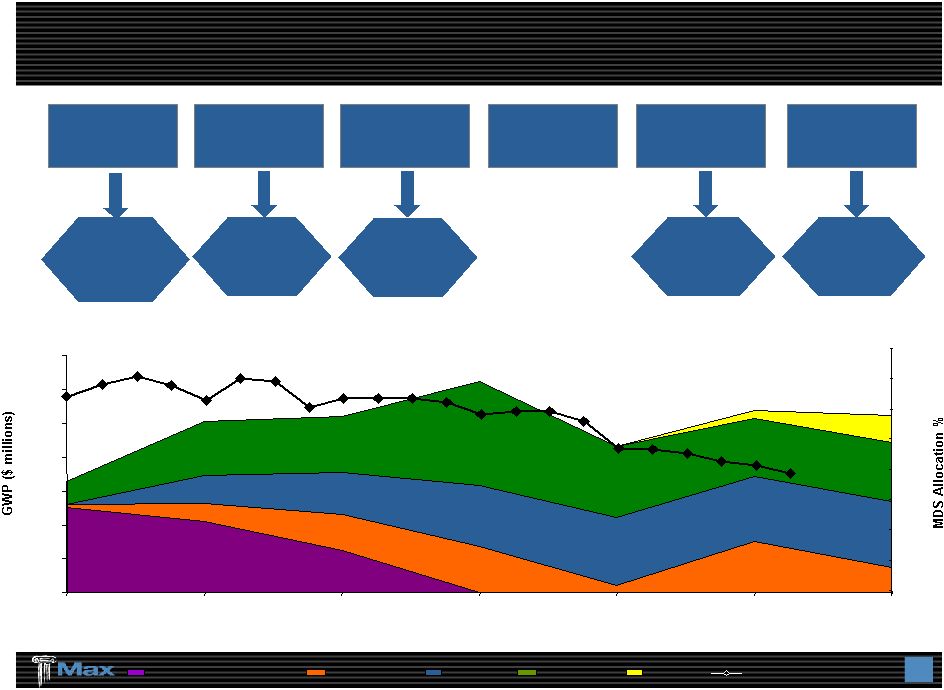 5 Strategic Diversification & Expansion Of The Company Property Insurance 2007 2004 2005 2006 2003 Casualty Insurance Bermuda / Dublin U.S. E&S insurance Max USA $100m Senior Debt Issue 2008 Announced U.S. admitted insurance company Property / Cat Reinsurance $23.50 / share Common Offering Structured & Alternative Life & Annuity Insurance Reinsurance Specialty MDS allocation % 0 200 400 600 800 1,000 1,200 1,400 2003 2004 2005 2006 2007 2008 Plan 32.2% 31.5% 31.8% 29.1% 23.5% 20.7% 19.4% 0% 5% 10% 15% 20% 25% 30% 35% 40% |
 6 Identifying & Recruiting “Franchise Players” Has Been Instrumental In Our Success Experienced & highly quantitative underwriting teams Lead underwriters average over 20 years in the business High percentage of employees hold professional designations 2004 Property 2003 Excess Liability Professional Liability Medical Malpractice Reinsurance 2005 Property / Property - Cat Reinsurance 2006 Aviation 2007 U.S. Excess & Surplus Property Ocean Cargo / Inland Marine U.S. Casualty Multi – peril crop |
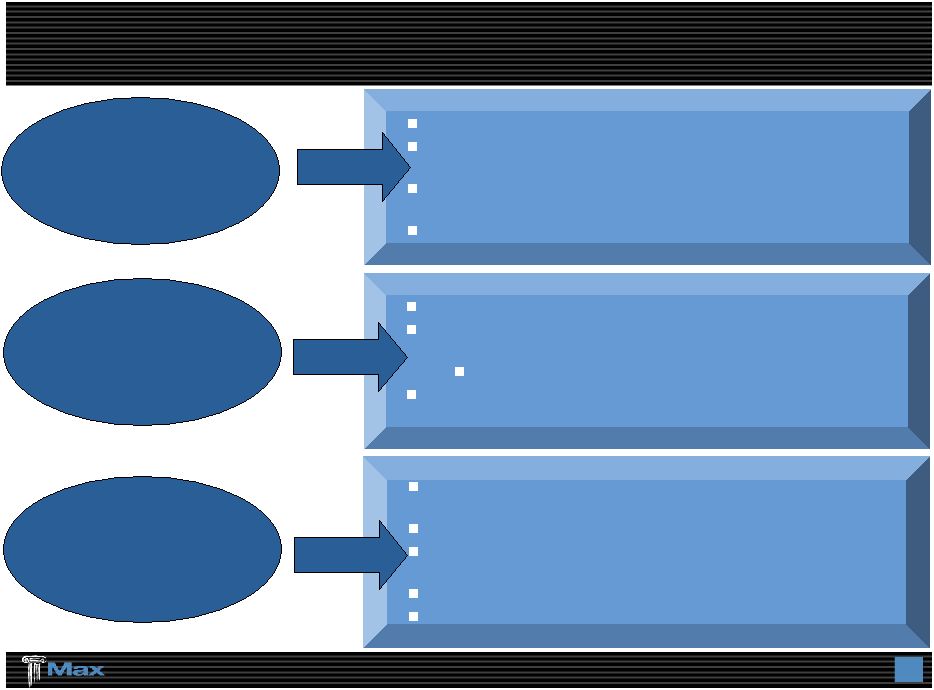 7 Operating Strategy Specialty Lines Underwriting Operations Diversified Product Offering Enterprise Risk Management Focused on niches / specialties Opportunities that reward our specialized knowledge and relationships Marketing and distribution efforts that emphasize building brand awareness Dedication to customer service Expand Excess and Surplus lines business in the U.S. Manage property catastrophe aggregate exposure on a 1:250 year basis not to exceed 25% of beginning year equity 2008 Target – less than 20% Target product classes where we can invest resources and “intellectual capital,” which leads to long–term franchise value Strong balance sheet supported by prudent reserving practices Maintain financial strength ratings and pursue an upgrade Reinsurance purchased to manage exposures and pricing cycles State-of-the-art systems, risk controls Capital allocated to maximize return on every transaction |
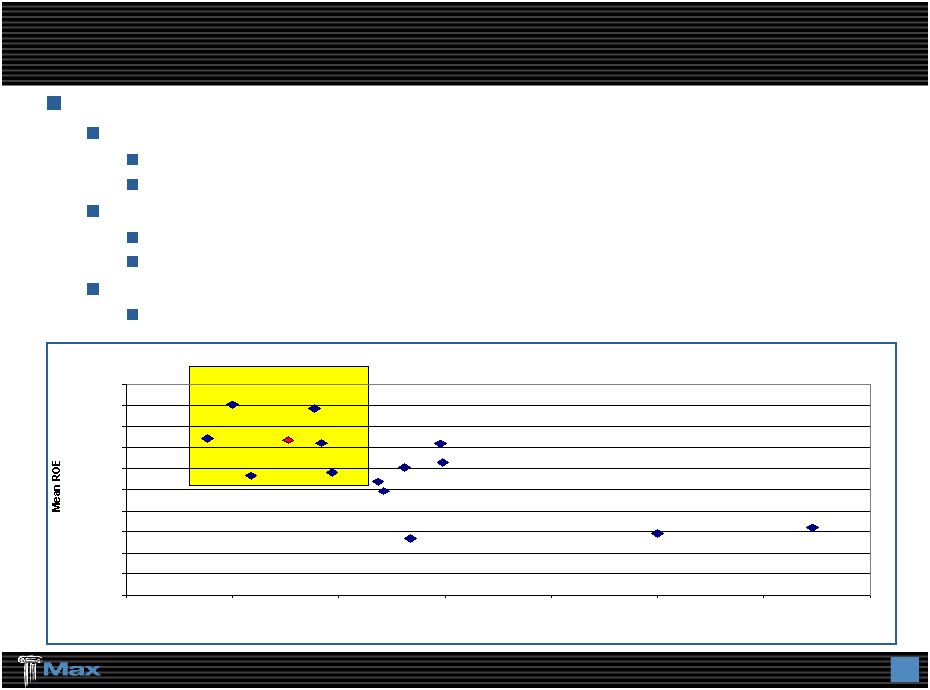 8 Seek to achieve high quality, stable and consistent ROEs Target ROE of 15% over the market cycle Operating ROE > 15% in 4 of last 5 fiscal years, 2005 positive ROE despite Hurricanes KRW Compound annual ROE of 14.9% over last 5 years Lower volatility of ROE Do well in the good years - 15% to 20% ROE Have a positive ROE in the bad years Our most highly respected and valued competitors have high Sharpe ratios Willing to trade some expected ROE for lower volatility of ROE Financial Objective: Grow Book Value / Create Shareholder Value Mean ROE vs Std Dev of ROE Annual Data 2003 to 2007 0.00% 2.00% 4.00% 6.00% 8.00% 10.00% 12.00% 14.00% 16.00% 18.00% 20.00% 0.00% 5.00% 10.00% 15.00% 20.00% 25.00% 30.00% 35.00% Std Deviation of ROE ACGL AXS ACE PRE MXGL TRH RE ENH RNR AWH AHL PTP XL IPCR MRH |
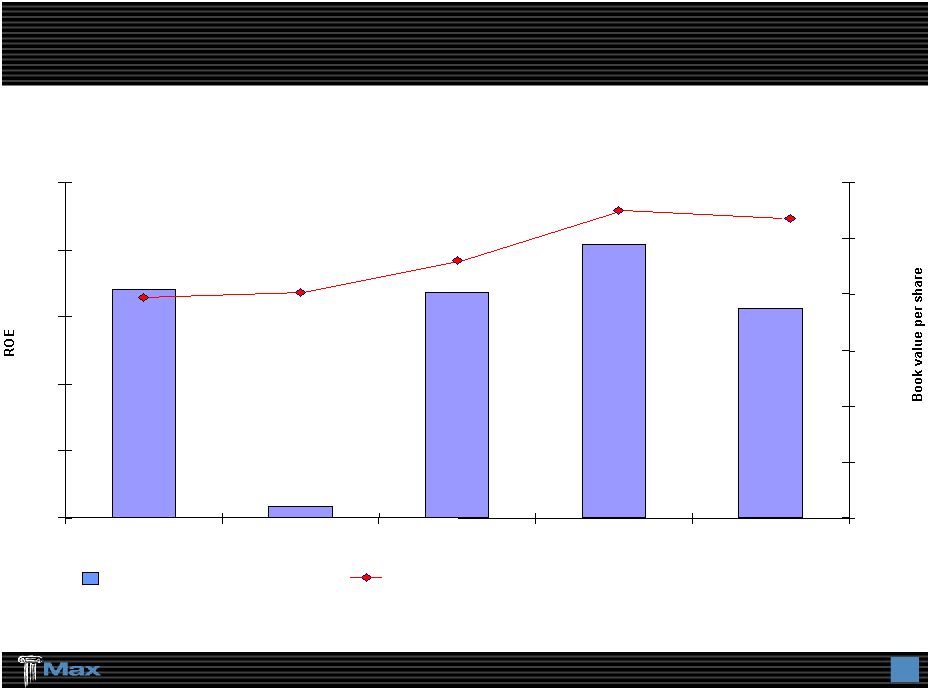 9 5 Years Of Growth: Annualized ROE of 14.9% * Year of Hurricanes KRW. Max was one of the few insurance/reinsurance companies among its peers that were profitable in 2005. 17.0% 0.9% 16.8% 20.4% 15.6% $19.70 $20.16 $23.06 $27.54 $26.78 0% 5% 10% 15% 20% 25% 2004 2005* 2006 2007 Rolling 12 Months at March 31, 2008. $0 $5 $10 $15 $20 $25 $30 Return on Shareholders’ Equity Book Value Per Share |
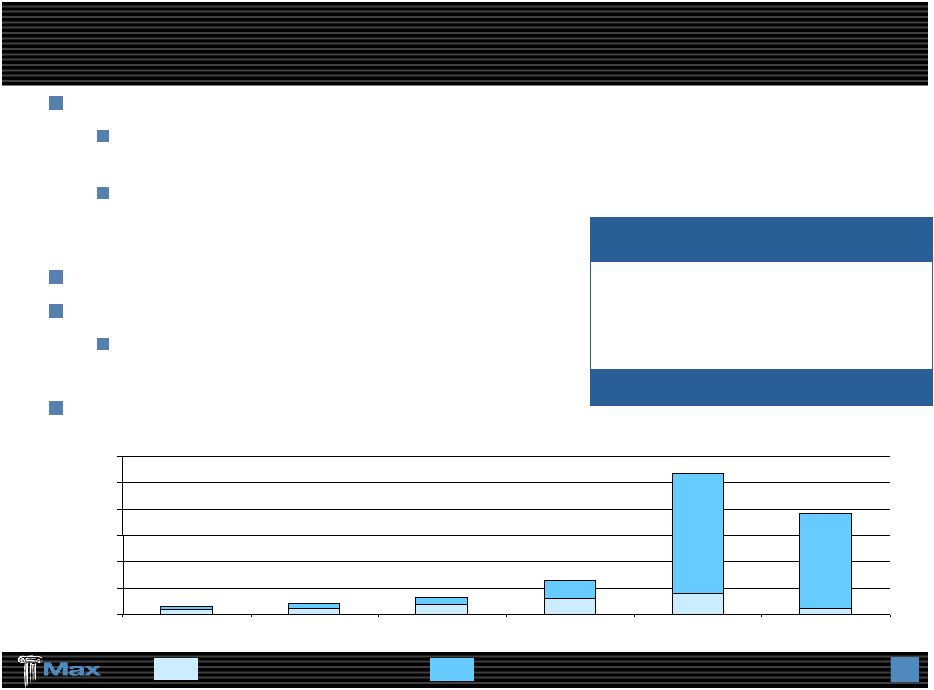 10 Efficient Capital Management Dividends Repurchases ($ in thousands) Strong and flexible capital structure 2005: $258 million Equity Offering - launched Property Cat Reinsurance Operations 2007: Max USA $100 million Senior Debt Offering - launched U.S. Excess and Surplus Lines Insurance Company Manage exposures to preserve capital Opportunistic share repurchases $85.8 million of Repurchase Authorization as of March 31, 2008 Increased dividends each year since inception ($ in thousands) Dividends $ 56,790 Share Repurchases 241,535 Total $298,325 2003- 2008 Summary $3,788 $5,487 $8,955 $14,273 $19,164 $5,123 $3,095 $4,850 $7,360 $17,624 $114,755 $93,851 $0 $25,000 $50,000 $75,000 $100,000 $125,000 $150,000 2003 2004 2005 2006 2007 Q1, 2008 |
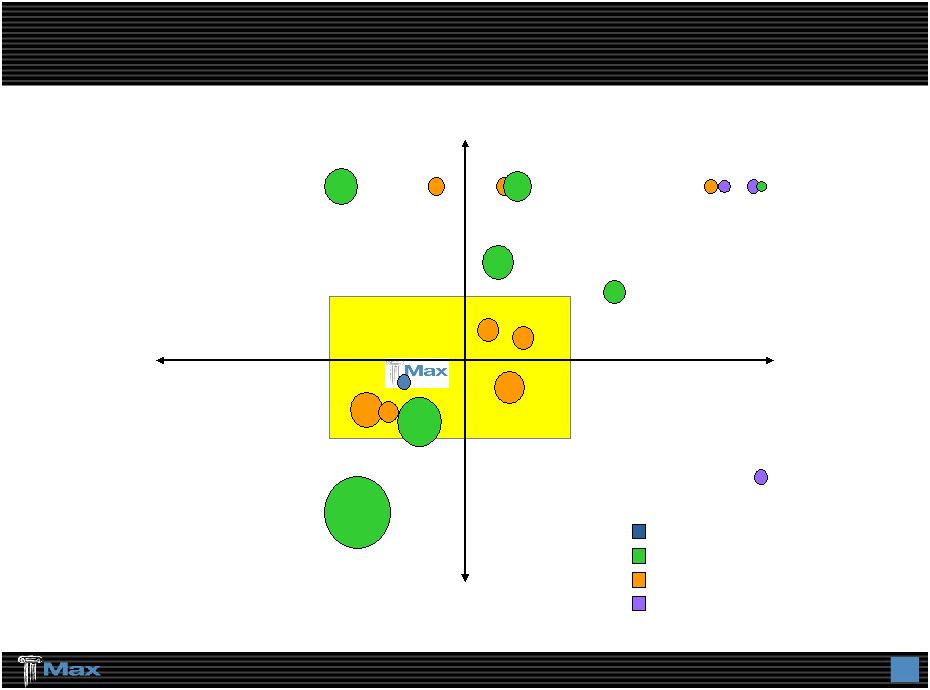 11 Diversified Premium Mix: A Key Differentiator Property Casualty Insurance Reinsurance Incumbent (Re) Insurers Class of 2001 Class of 2005 Max Capital Group Ltd. ACE XL WTM RE TRH PRE AXS ACGL ENH AHL RNR AWH PTP MRH Lancashire VR IPCR FSR Note: Based on 2007 property and casualty gross premiums written. Certain allocations have been estimated. Source: Merrill Lynch |
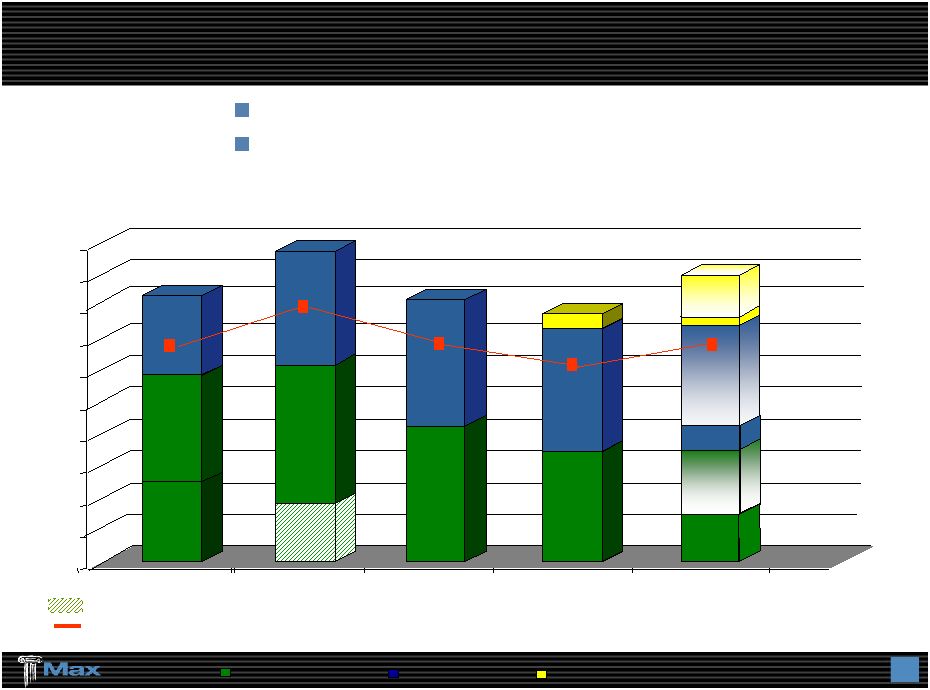 12 Diversified Revenue Sources / Product Lines P&C Annual Gross Premiums Written ($ in millions) Non-recurring additional premiums on prior years’ contracts of $182 million Total P&C Insurance / Reinsurance excluding Alternative Risk and non- recurring additional premiums on prior years’ contracts (year-on-year change) Included in 2004 P&C Reinsurance is GPW of $248m related to Alternative Risk business Max Specialty P&C Insurance P&C Reinsurance Revenue not dependent on single source Capital & risk allocated rationally $971 $820 $776 $895 0 100 200 300 400 500 600 700 800 900 1000 2004 2005 2006 2007 2008 YTD Actual and Plan $831 (+15% to Plan) (+17%) (-16%) (-5%) |
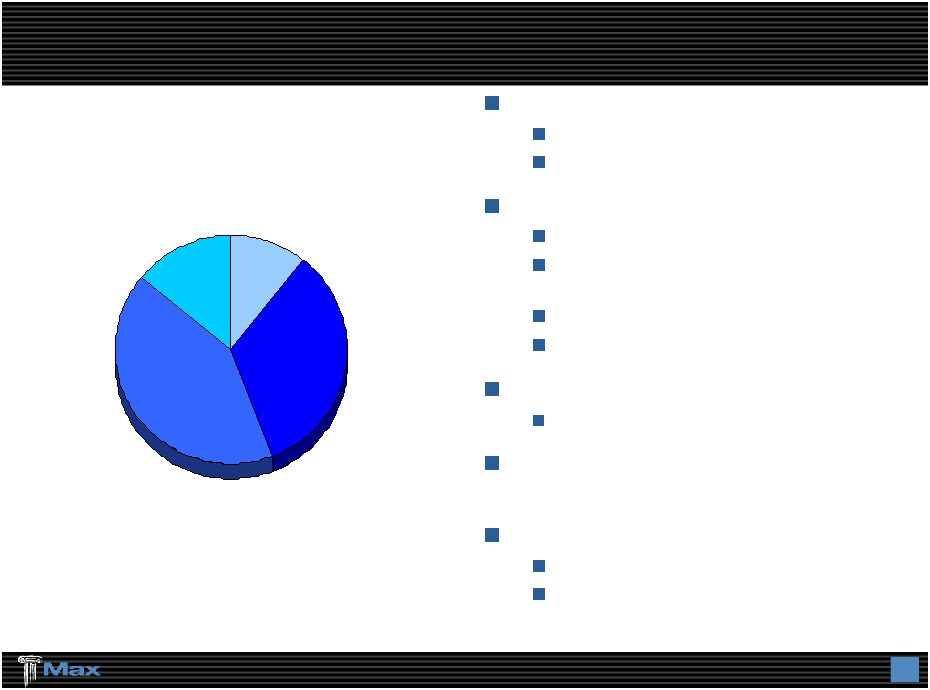 13 P&C Insurance: Bermuda / Dublin Niche – Oriented Focus Target: Working layer excess business Larger customer - Fortune 1000 Customer-oriented approach: Responsive and innovative Consider toughest classes of business Offer multi-year programs Flexible in program attachment points Work with all leading brokers Underwritten in Bermuda and Dublin Sub-prime related reserves - approximately $20 million Combined ratio: YTD 2008: 84% 2007: 86% Gross Premiums Written 2008 Rolling 12 Months at March 31, 2008 $378 million By Exposure Aviation 11% Excess Liability 34% Professional Liability 41% Property 14% |
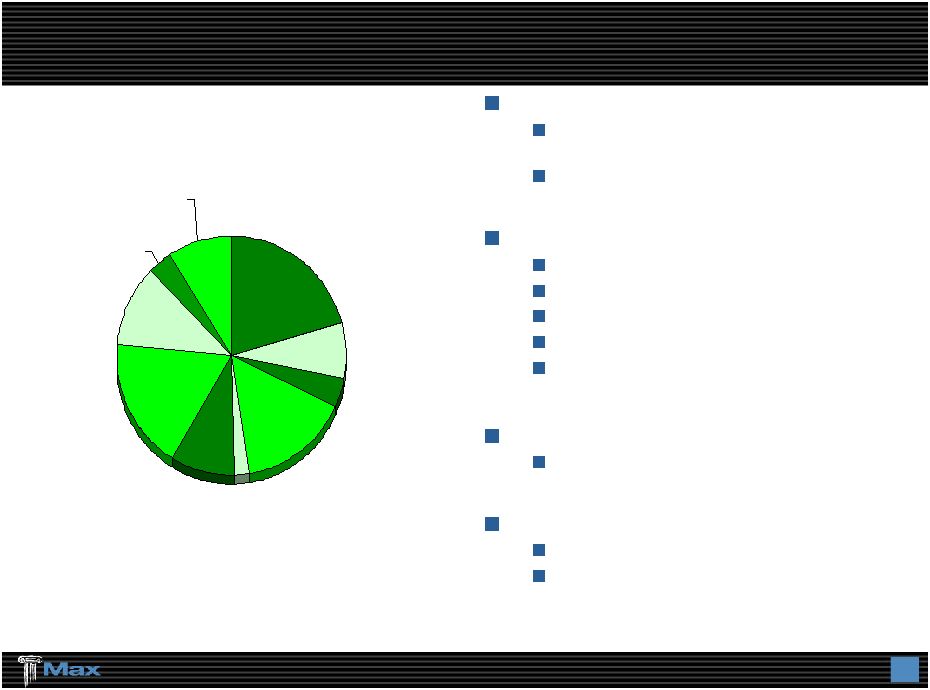 14 P&C Reinsurance: Bermuda / Dublin Diversification & Flexibility Emphasized Target: Working layer excess business / quota share business Specialty / niche focus Customer-oriented approach: Quick turnaround Line-specific expertise Net line underwriter (stability of capacity) Cross-class capability Modeling and structuring capabilities Work with all leading brokers Underwritten in Bermuda and Dublin Combined ratio: YTD 2008: 86% 2007: 84% By Exposure Gross Premiums Written 2008 Rolling 12 Months at March 31, 2008 $413 million Agriculture 21% Aviation 8% General Liability 4% Medical Malpractice 15% Other 2% Professional Liability 9% Property 18% Marine & Energy 11% Whole Account 3% Worker’s Compensation 9% |
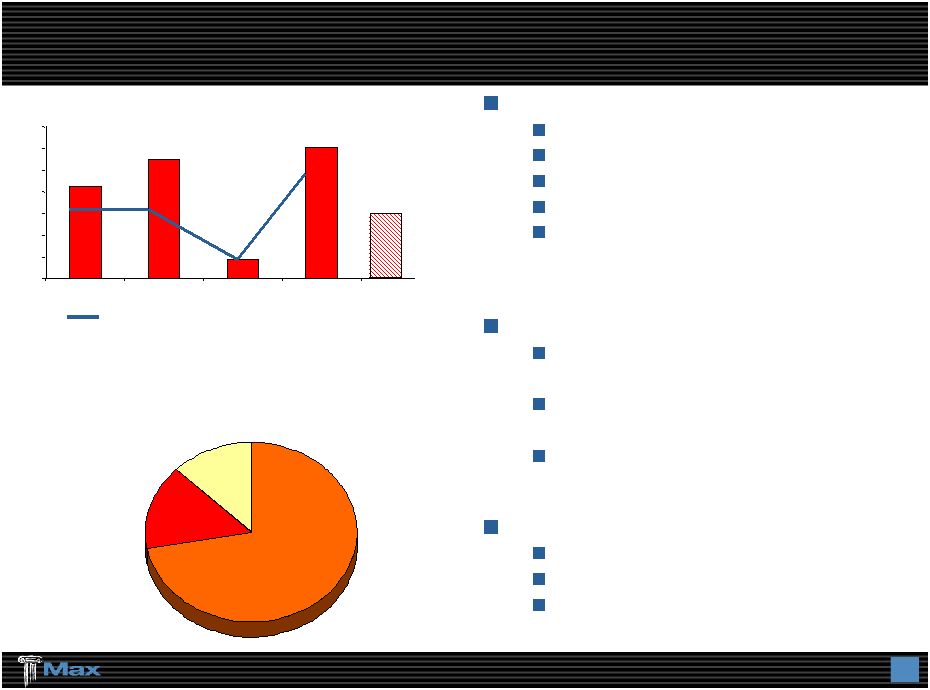
 15 Growth Initiative: Max Specialty Insurance Company 2007 Start-Up: Nationwide underwriter of excess and surplus lines niches based in Richmond, VA Delaware licensed and approved on a non- admitted basis in 46 other states Brokerage and Contract Binding operations Select group of national brokers and regional MGA’s with 20+ years relationships Current Products Property-cat & non cat Umbrella / xs Liability Inland Marine / Ocean Cargo (New 2008) Specialty Casualty (New 2008) 90 employees / 6 U.S. locations Long-term underwriting objectives: Products priced and underwritten so net incurred loss ratios approximate 55% Expense ratio: approximately 35% Combined ratio: approximately 85% March 2008: Announced agreement to acquire admitted insurance company licensed in all 50 states Regulatory approval pending Gross Premiums Written 2008 Rolling 12 Months at March 31, 2008 $76 million By Exposure Property 66% General Casualty 27% Marine 7% |
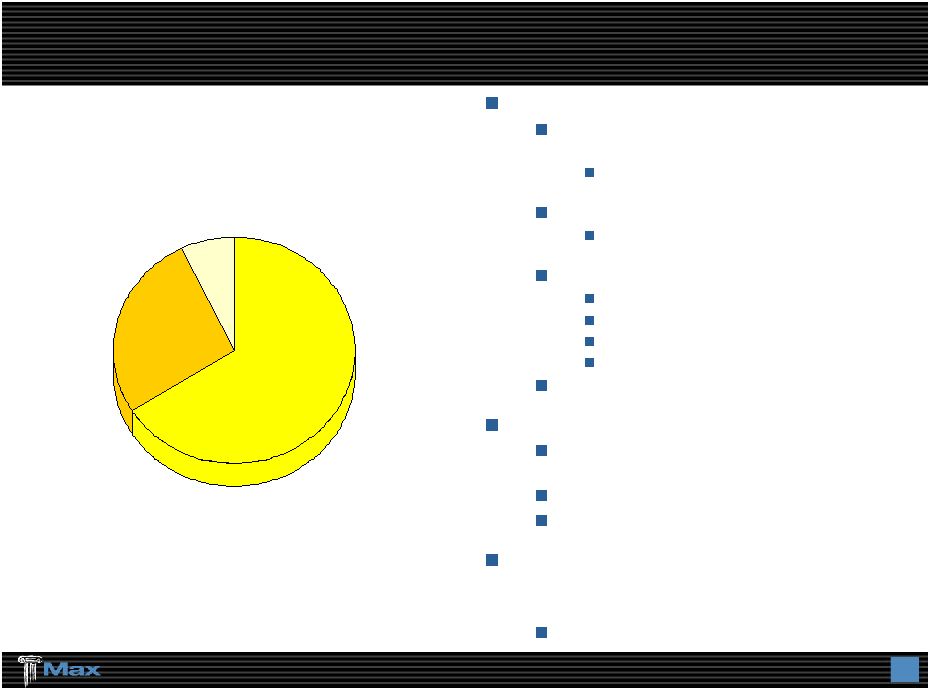
 16 Life Reinsurance: Long-Tail, Reserve Buy-Out Business Specialize in: Investment spread business In force, closed / ring-fenced books Mortality, morbidity & longevity Predictable cash flows Asset heavy – no interest sensitive liabilities Strategy: Leveraging underwriting skills with low volatility alternative investments Focus on closed block reserve buy-out transactions Almost no IBNR Differentiated by: Detailed data focus Strong actuarial analysis Bermuda efficiencies Gross Premiums Written Reserves & Deposits 3/31/2008 $1.3 billion Number of Deals Written Annuity 72% Life 15% Health 13% 2008 YTD And Plan 0 50 100 150 200 250 300 350 2004 2005 2006 2007 $212 $275 $45 $302 3 3 1 6 US$ Millions $150 |
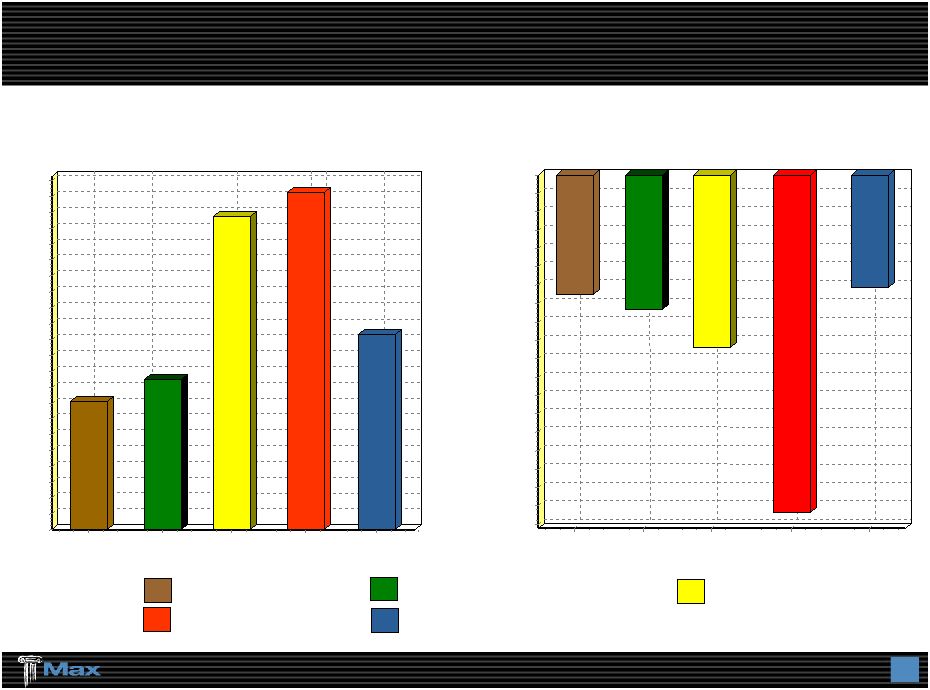
 17 Diversified And Strategic Asset Allocation Average quality of AA / Maximum Baa of 2% Diversification by sector and issuer No CDO’s, CLO’s, SIV’s or other highly structured securities Duration and currency matched to liabilities Portfolio externally managed by investment managers who compete for assets based on performance Diversification by strategy with concentration limits in any particular fund Rapid liquidity required Return objective – 300 bps over risk free rates with bond like volatility Rigorous manager selection and monitoring process Hedge fund accounting requires quarterly mark to market to flow through operating income Alternative investments part of “capital” Fixed maturities portfolio supports reserves Investment Portfolio: Traditional Alternative Allocation 81% 19% Target 80% 20% Opportunistic Distressed Diversified Equity Long / Short Event Driven Arbitrage Global Macro Credit Long / Short Emerging Markets Fixed Income Arbitrage Tsy / Agy Aaa Aa Baa 0% 5% 10% 15% 20% 25% 30% 35% 40% |
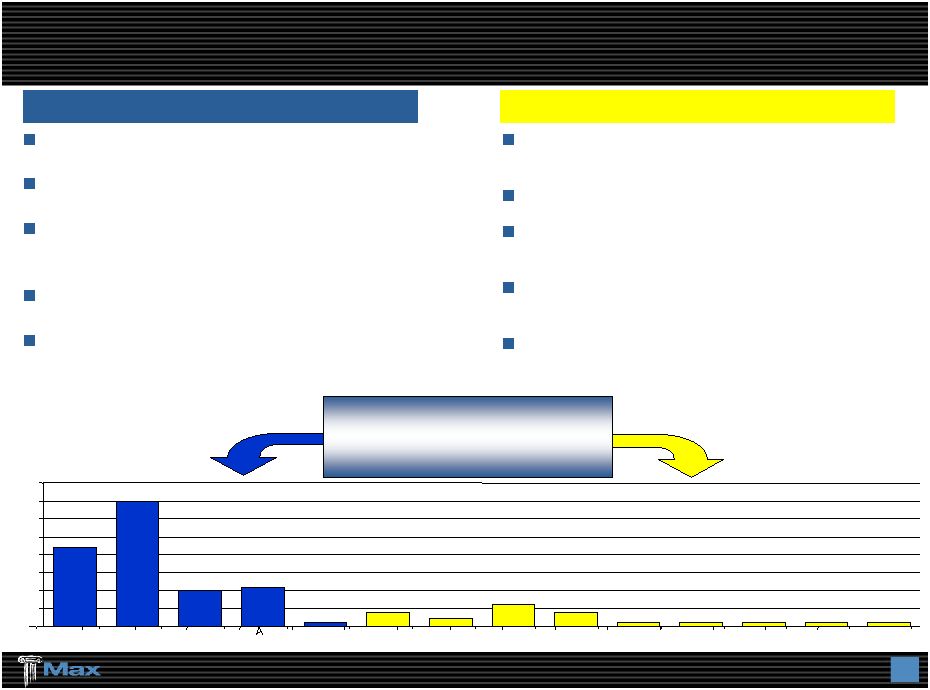
 18 Investment Strategy: Risk Averse Enhanced Returns Standard Deviation 60 Months as of March 31, 2008 Max Fixed Maturities Merrill Lynch Master Bond Index MDS (Max Fund of Funds) Max Total Portfolio S&P 500 Annual Return 60 months as of March 31, 2008 MFIX MLMBI MDS SP500 MAX 0 -0.5 -1 -1.5 -2 -2.5 -3 -3.5 -4 -4.5 -5 -5.5 -6 -6.5 -7 -7.5 -8 -8.5 -9 -9.5 -3.25 -3.67 -4.70 -9.17 -3.07 MFIX MLMBI MDS SP500 MAX 11 10.5 10 9.5 9 8.5 8 7.5 7 6.5 6 5.5 5 4.5 4 3.5 3 2.5 2 1.5 1 0.5 0 4.04 4.72 9.88 10.62 6.14 |
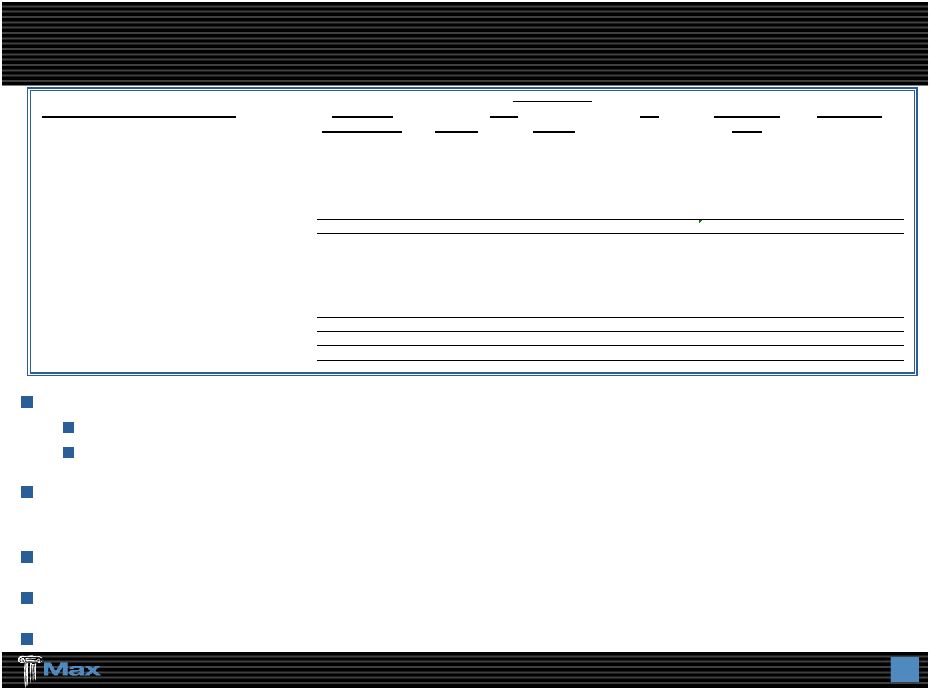 19 Investments With Exposure To Sub-prime And Alt-A Significant and growing over-collateralization Most with 30-50% over-collateralization Over-collateralization on most is growing, and has increased in the last 3 months Through March 31, 2008 default and delinquency rates currently averaging 20% for the entire issue At March 31, 2008, unrealized loss is approximately $5.9 million on subprime holdings Alternative asset portfolio net short sub-prime at March 31, 2008 Based upon stress testing, we expect no principal losses from sub-prime-backed bonds Assets with Subprime content Weighted AA Amortized Fair Value ($ millions) Average Life Senior Junior Cost As at March 31, 2008 Subprime exposure by vintage year Pre-2005 3.3 7.1 $ 0.4 $ 2.1 $ 9.6 $ 9.1 $ 2005 2.6 2.5 $ - $ 3.4 $ 5.9 $ 5.1 $ 2006 2.2 31.4 $ 5.0 $ - $ 36.4 $ 32.2 $ 2007 3.2 2.5 $ - $ - $ 2.5 $ 2.1 $ Total Subprime exposure 2.5 43.5 $ 5.4 $ 5.5 $ 54.4 $ 48.5 $ Alt-A exposure by vintage year Pre-2005 3.9 6.8 $ - $ - $ 6.8 $ 6.5 $ 2005 1.9 - $ 19.5 $ - $ 19.5 $ 14.8 $ 2006 1.0 4.3 $ 8.9 $ - $ 13.2 $ 12.9 $ 2007 2.9 4.3 $ - $ - $ 4.3 $ 4.2 $ Total Alt-A exposure 2.0 15.4 $ 28.4 $ - $ 43.8 $ 38.4 $ Sub-prime and Alt-A exposure 2.3 58.9 $ 33.8 $ 5.5 $ 98.2 $ 86.9 $ Credit rating AAA |
 20 Profitable Financial Trends Despite Hurricanes in 2005 Gross Premiums Written $0 $200 $400 $600 $800 $1,000 $1,200 $1,400 2004 2005 2006 2007 Rolling 12 Months at 3/31/08 $1,044 Life $212 $1,246 Life $275 $865 Life $45 $1,078 Life $302 $1,171 Life $302 P&C Combined Ratio 94% 106% 86% 88% 88% 0% 20% 40% 60% 80% 100% 120% 2004 2005 2006 2007 Rolling 12 Months at 3/31/08 15.8% 1.0% 17.3% 20.7% 15.7% 0.0% 5.0% 10.0% 15.0% 20.0% 25.0% 2004 2005 2006 2007 Rolling 12 Months at 3/31/08 Operating ROE $0.00 $1.00 $2.00 $3.00 $4.00 $5.00 $6.00 Operating Earnings Per Share (Diluted) $2.70 $0.19 $3.52 $4.81 $3.66 2004 2005 2006 2007 Rolling 12 Months at 3/31/08 |
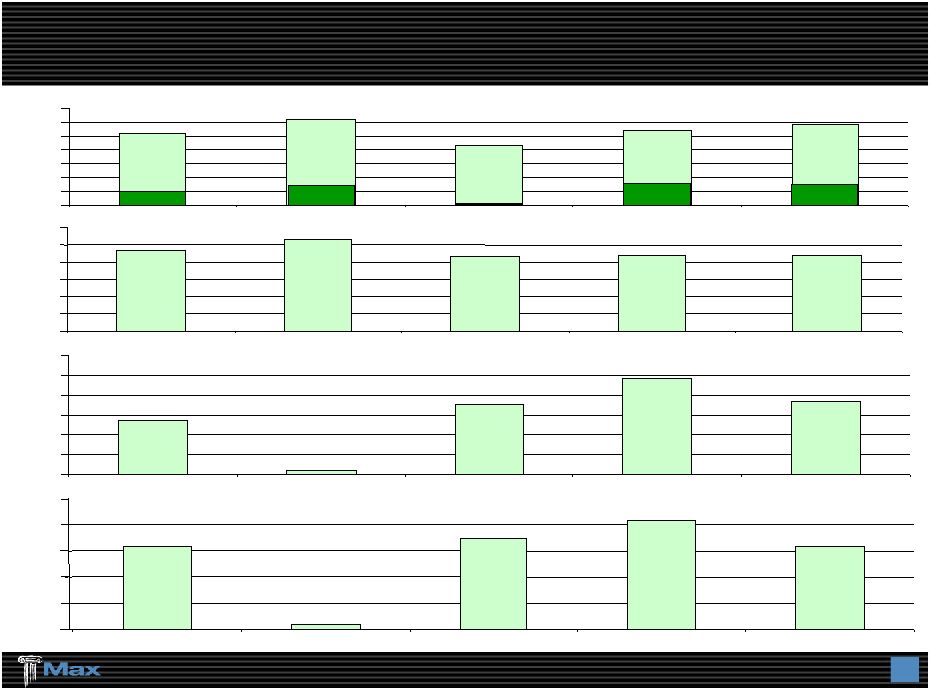
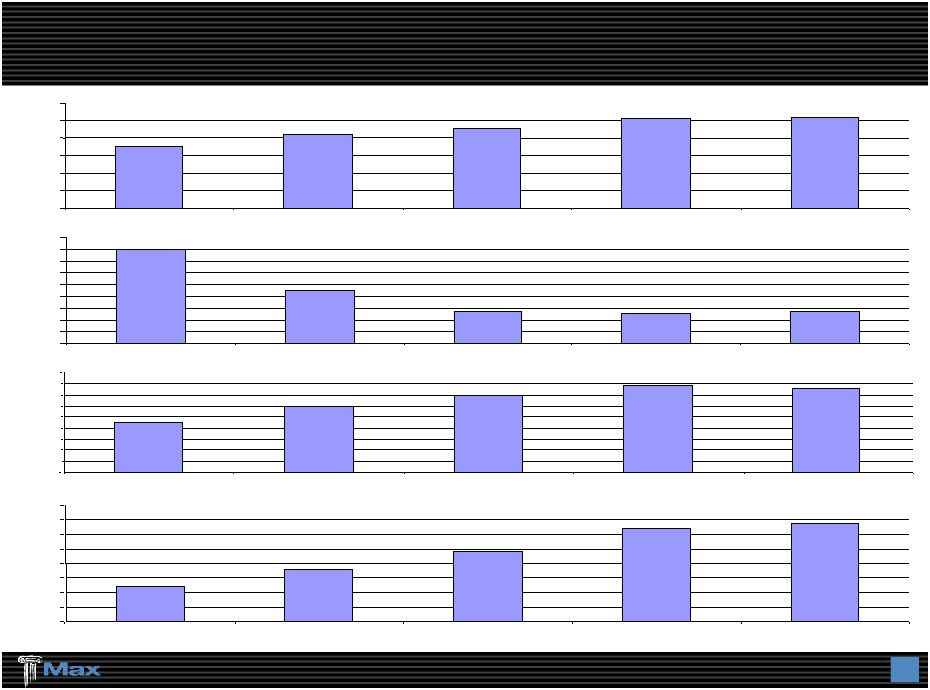 21 $799 $447 $273 $252 $275 $0 $100 $200 $300 $400 $500 $600 $700 $800 $900 2004* 2005* 2006* 2007* Rolling 12 Months at 3/31/08 $903 $1,186 $1,390 $1,584 $1,512 0 $200 $600 $1,000 $1,400 $1,800 2004 2005 2006 2007 3/31/08 ($19.70) ($20.16) ($23.06) ($27.54) ($26.78) A Growing, Global Insurance / Reinsurance Company $3,515 $4,223 $4,536 $5,123 $5,166 $0 $1,000 $2,000 $3,000 $4,000 $5,000 $6,000 2004 2005 2006 2007 3/31/08 Invested Assets (Ratio to Shareholders’ Equity) ($ in millions) Operating Cash Flow Shareholders’ Equity (Book Value Per Share) Dividends Per Share $0.12 $0.18 $0.24 $0.32 $0.34 $0.00 $0.05 $0.10 $0.15 $0.20 $0.25 $0.30 $0.35 $0.40 2004 2005 2006 2007 Rolling 12 Months at 3/31/08 (3.9:1) (3.6:1) (3.3:1) (3.2:1) (3.4:1) *Operating Cash Flow for 2007 and prior years has been adjusted to conform with the current presentation |
 22 Gross Premiums Written - $1,045 billion 2008 Est. 2007 Actual Property & Casualty Insurance $390 million $383 million Property & Casualty Reinsurance $350 million $345 million Max Specialty $155 million $ 48 million Life & Annuity Reinsurance $150 million $302 million Combined Ratio Property & Casualty Insurance 88% 86% Property & Casualty Reinsurance 92% 84% Max Specialty 120% (57% loss ratio) 530% (82% loss ratio) Operating Earnings Per Share (diluted) $3.90 - $4.20 $4.81 Alternative investments return 8% 16.97% Key Assumptions 2008 Guidance No acquisitions Normal catastrophes (P&C combined ratio includes approx. 4%-6% for normally expected catastrophes) No reserve releases/commutations Continued capital management – share repurchases |
 Additional Financial Information |
 24 Gross Premiums Written 307 $ 1,078 $ Net Premiums Earned 136 818 Net Investment Income 50 188 Net (Losses) Gains on Alternative Investments (26) 187 Net Realized Gains (Losses) on Sale of Fixed Maturities 1 (4) Other Income 1 1 Total Revenues 162 1,190 Total Losses, Expenses & Taxes 154 887 Net Income 8 $ 303 $ Property & Casualty Underwriting Loss Ratio 69% 64% Expense Ratio 20% 24% Combined Ratio 89% 88% YTD March 31, 2008 Results And 2007 Year - End Results 2007 ($ in millions) YTD March 31, 2008 |
 25 Cash & Fixed Maturities 4,166 $ 4,061 $ Alternative Investments 1,000 1,062 Premium Receivables 519 433 Losses Recoverable 633 578 Other Assets 401 403 Total Assets 6,719 $ 6,537 $ Property & Casualty Losses 2,435 2,334 Life & Annuity Benefits 1,257 1,204 Deposit Liabilities 221 221 Funds Withheld 171 169 Unearned Premium 538 440 Bank Loan 325 330 Senior Notes 100 100 Other Liabilities 160 155 Total Liabilites 5,207 $ 4,953 $ Shareholders' Equity 1,512 1,584 6,719 $ 6,537 $ Strong Balance Sheet December 31, 2007 March 31, 2008 ($ in millions) |
 26 Supplemental Investment Data – March 31, 2008 Past Performance should not be considered to be a reliable indicator of future performance Fair Investment Last Last Last Value* Distribution 3 Months 12 months 60 months** Cash and Fixed Maturities 4,166,456 $ 80.6% 1.41% 5.35% 4.04% Commodity Trading Advisers - $ 0.0% 0.00% 7.32% 6.69% Distressed Securities 168,069 3.3% -0.56% 9.55% 20.15% Diversified Arbitrage 99,197 1.9% -8.49% 1.40% 5.65% Emerging Markets 64,956 1.3% 0.28% 13.58% 17.62% Event-Driven Arbitrage 166,685 3.2% 1.51% 26.14% 17.97% Fixed Income Arbitrage 36,997 0.7% 14.21% 37.35% 11.08% Global Macro 74,559 1.5% -0.09% 10.55% 9.43% Long / Short Credit 44,890 0.9% 1.69% 1.17% 10.14% Long / Short Equity 270,853 5.2% -7.02% 12.24% 9.62% Opportunistic 69,237 1.3% -2.25% 10.73% 18.83% MDS **** 995,443 19.3% -2.15% 9.08% 9.88% Reinsurance Private Equity 4,362 0.1% 10.67% 105.92% 9.90% Alternative Investments 999,805 $ 19.4% -2.11% 9.31% 9.14% Total Investments 5,166,261 $ 100.0% 0.61% 7.34% 6.14% Alternative Investment Return Data ***: MDS Performance History **** –60 months ended March 31, 2008 Largest monthly gain 4.15% Largest monthly loss (2.58%) Largest quarterly gain 6.07% Largest quarterly loss (2.72%) Average monthly gain 1.40% Average monthly loss (1.02%) Average quarterly gain 3.60% Average quarterly loss (1.14%) Months with a gain 45 Months with a loss 15 Quarters with a gain 15 Quarters with a loss 5 % of months with a gain 75% Quarterly standard deviation 2.68% % of quarters with a gain 75% Annual standard deviation 4.70% Largest drawdown ***** (5.04%) Monthly performance 2003 2004 2005 2006 2007 2008 January 1.75% 0.16% 2.75% 1.28% (1.37%) February 1.28% 1.69% 0.39% 1.50% 1.83% March 1.18% (0.61%) 1.22% 1.90% (2.58%) April 2.03% 0.03% (0.65%) 1.89% 2.30% May 3.02% (0.87%) (0.68%) (1.74%) 2.59% June 0.92% 0.70% 1.20% (0.66%) 0.85% July (0.24%) 0.03% 1.33% (0.71%) 0.99% August 0.96% (0.02%) 0.98% 0.02% (1.62%) September 2.63% 0.04% 1.84% (2.04%) 1.85% October 0.98% 1.04% (1.45%) 1.37% 4.15% November 0.56% 2.54% 0.61% 1.81% 0.10% December 1.85% 1.74% 1.37% 1.96% (0.13%) Quarterly performance Q1 4.27% 1.22% 4.41% 4.75% (2.15%) Q2 6.07% (0.15%) (0.14%) (0.54%) 5.83% Q3 3.37% 0.06% 4.21% (2.72%) 1.18% Q4 3.43% 5.41% 0.51% 5.22% 4.11% Period return 13.41% 9.81% 5.88% 6.30% 16.78% (2.15%) Past performance should not be considered to be a reliable indicator of futureperformance. * Expressed in thousands of United States Dollars ** Annualized *** The percentages shown under the alternative investment return data relate only to the performance of our alternative investments held by MDS. **** Net of all fees ***** Largest drawdown represents the largest decline in value between two NAV peak values. Periodic Rate of Return |
 I N S U R A N C E / R E I N S U R A N C E B E R M U D A I R E L A N D U N I T E D S T A T E S MAX CAPITAL GROUP LTD. Nasdaq: MXGL Investor Presentation Quarter Ended – March 31, 2008 |