 B E R M U D A I R E L A N D U N I T E D S T A T E S LLOYD’S A World Class Specialty Insurer and Reinsurer Investor Presentation Second Quarter 2009 Exhibit 99.1 |
 2 INFORMATION CONCERNING FORWARD LOOKING STATEMENTS CAUTIONARY NOTE REGARDING FORWARD-LOOKING INFORMATION This presentation includes statements about future economic performance, finances, expectations, plans and prospects of the Company that constitute forward-looking statements for purposes of the safe harbor provisions of the Private Securities Litigation Reform Act of 1995. Such forward-looking statements are subject to certain risks and uncertainties that could cause actual results to differ materially from those suggested by such statements. For further information regarding cautionary statements and factors affecting future results, please refer to the Company’s most recent Annual Report on Form 10-K , Quarterly Reports on Form 10-Q filed subsequent to the Annual Report and other documents filed by the Company with the SEC. The Company undertakes no obligation to update or revise publicly any forward-looking statement whether as a result of new information, future developments or otherwise. |
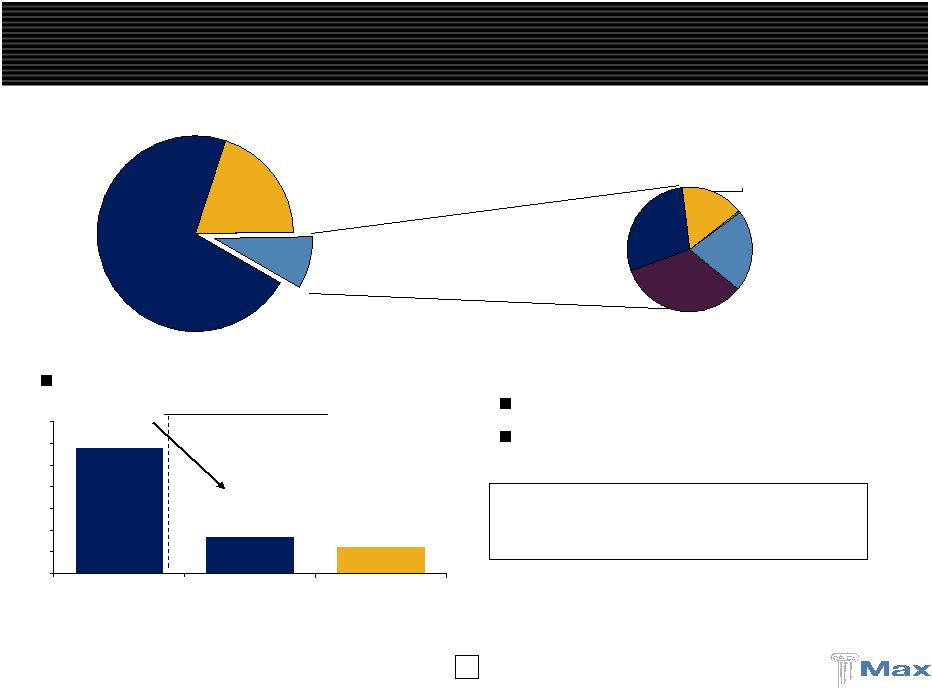
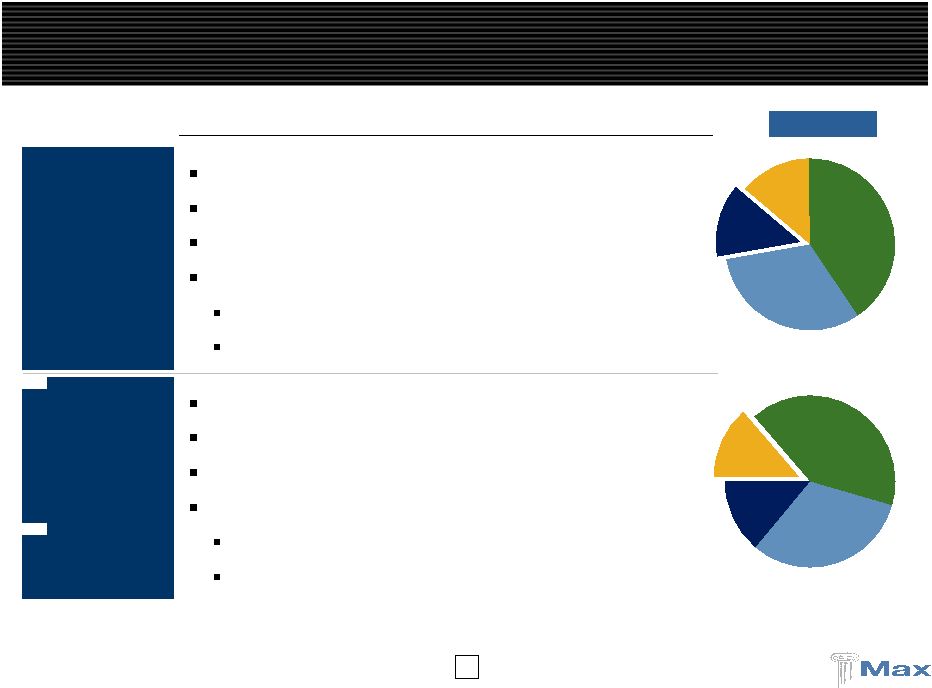
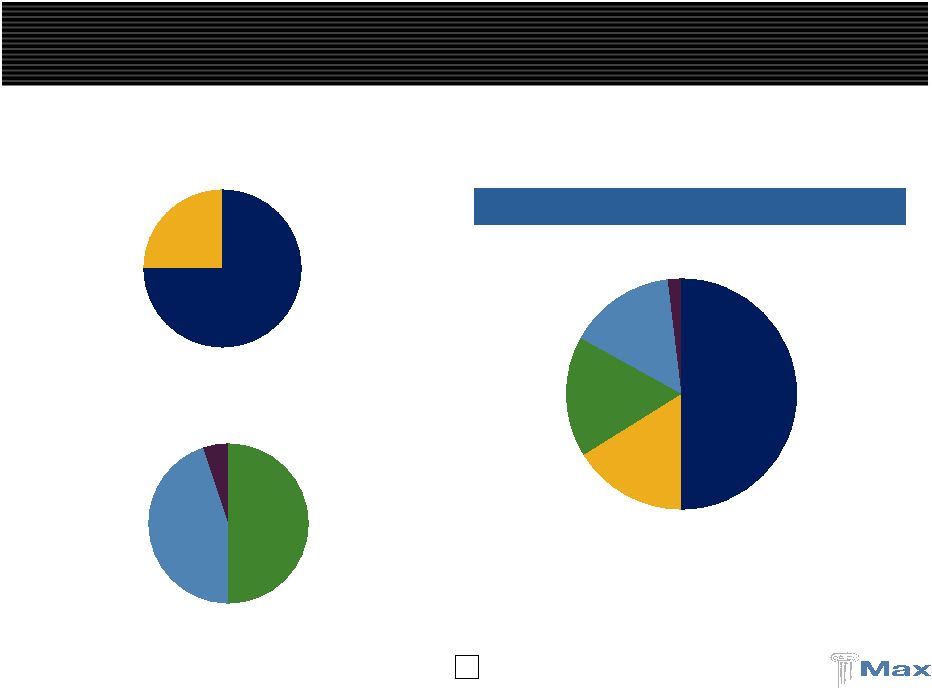
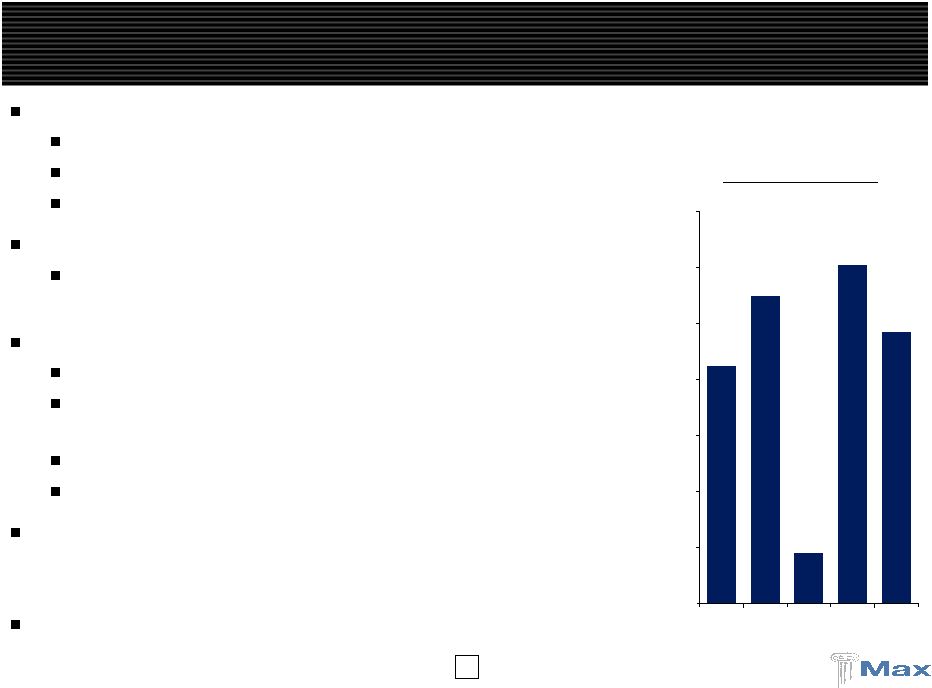
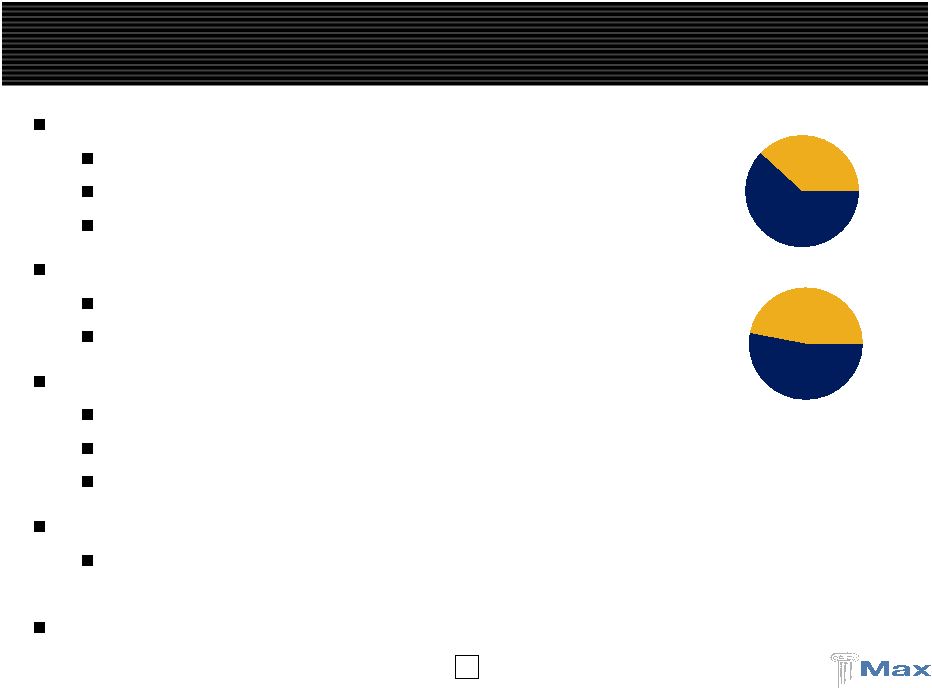 3 Global underwriter of specialty insurance and reinsurance Multiple operating platforms - Bermuda, Dublin, United States, and Lloyd’s Diversified business profile across specialty classes of business Highly experienced management with proven track record Opportunistic and disciplined underwriting strategy Analytical and quantitative underwriting orientation 5 year average combined ratio, with cats, of 93% Strong, liquid balance sheet with conservative reserving track record Gross premiums written (2008) of $1.3 billion and 6/30/09 equity of $1.4 billion Prudent capital management - $305 million in dividends/repurchases over last 5 years Significant expansion of underwriting platforms with minimal goodwill High quality investment portfolio repositioned to reflect traditional underwriting base Hedge funds are now a much smaller part of Max’s asset base at 8.5% and are to be reduced to 5% to 7% by year end 2009 Max has evolved and repositioned itself since its formation in 1999 Max Capital Today Short-Tail Long-Tail 62% 38% Insurance Reinsurance 53% 47% |
 4 Strong First Half 2009 Results Total GPW of $830.8 million, up 22.9% compared to H1’08 Reflects the build-out of the global platform Max Specialty GPW: $150 million Max at Lloyd’s GPW: $90 million Profitable underwriting results - Overall combined ratio 90.8% in the Q2 and 90.3% in the H1 2009 Market conditions improving in 2009 Rate increases on short-tail lines Casualty rates have stabilized Reduction of hedge funds on plan at 8.5% of invested assets at 6/30/09 down from 14.1% at 12/31/08 Total investment portfolio return: 1.62% Max Cash and Fixed Maturities Return: 0.88% Max Hedge Fund Return: 5.23% |
 5 Recent Developments Further Build Out The Platform Underwriting International casualty reinsurance team at Max at Lloyd’s Professional liability team at Max Specialty Geographic The addition of California gives Max a 50 state franchise for admitted Marine products on both Inland and Ocean With Puerto Rico, Max Specialty can now write non-admitted excess and surplus lines business throughout the U.S. and Puerto Rico. |
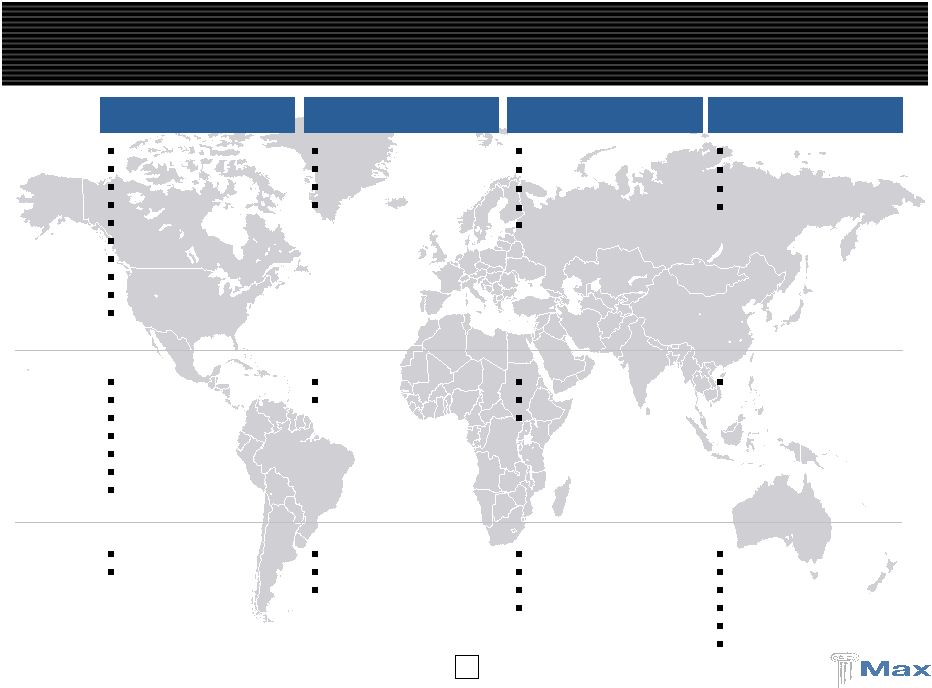 6 Global Reach Through Established Platforms Bermuda / Dublin Reinsurance Bermuda / Dublin Insurance Lloyd’s U.S Specialty Insurance Major Classes Agriculture Aviation Excess liability Medical malpractice Professional liability Property Marine and energy Whole account Workers’ comp Life and annuity Aviation Excess liability Professional liability Property Personal accident Financial institutions Professional liability Property International casualty treaty reinsurance General liability Marine Property Miscellaneous professional liability Operating Regions United States Latin America Canada European Union Japan Australia New Zealand United States European Union United Kingdom Japan Denmark United States Offices Bermuda Dublin Bermuda Dublin Hamburg London Leeds Tokyo Copenhagen New York Philadelphia Richmond Atlanta Dallas San Francisco |
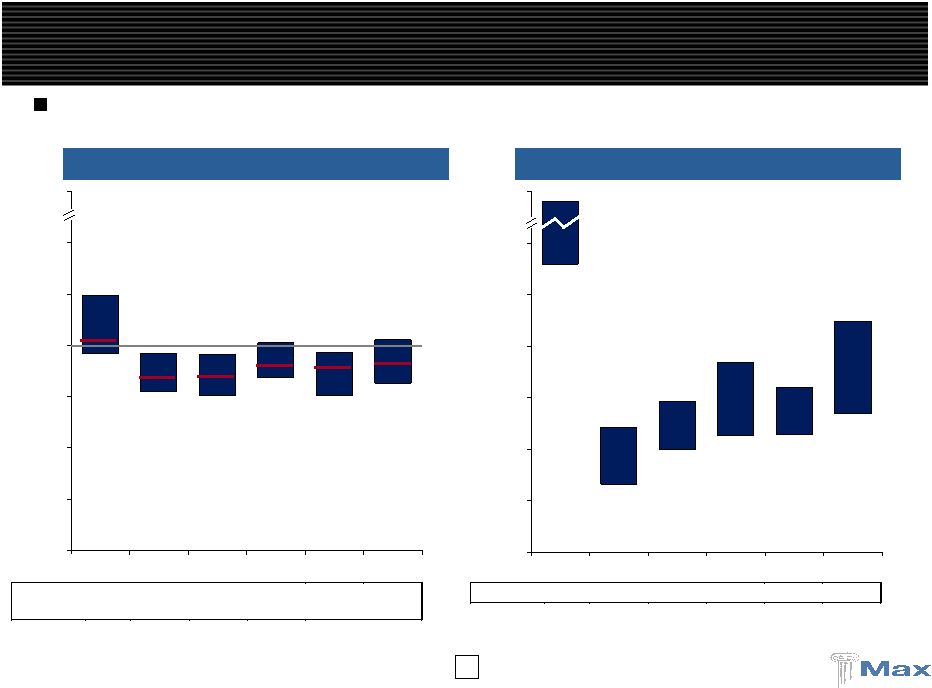 7 140% 33% 50% 56% 57% 67% 252% 60% 73% 92% 80% 112% 0% 25% 50% 75% 100% 125% 150% 300% 2005 2006 2007 2008 Q1'09 Average 82% 75% 84% 75% 77% 96% 103% 97% 101% 96% 96% 124% 0% 25% 50% 75% 100% 125% 150% 300% Average 2005 2006 2007 2008 Q1'09 Median 201% 55% 61% 89% 74% 96% Median 116% 85% 83% 94% 87% 93% Max 106% 86% 88% 92% 90% 92% ____________________ Diversified Platforms Generate More Consistent Margins Diversified Reinsurers Property Focused Reinsurers 7 Max has performed well within its diversified peer group with less volatility than property focused reinsurers Source: Company filings. Property focused reinsurers include RNR, IPC, VR, MRH and FSR. Diversified reinsurers include RE, AXS, ACGL, TRH, PRE, ORH, AWH, ENH, AHL, PTP and MXGL. |
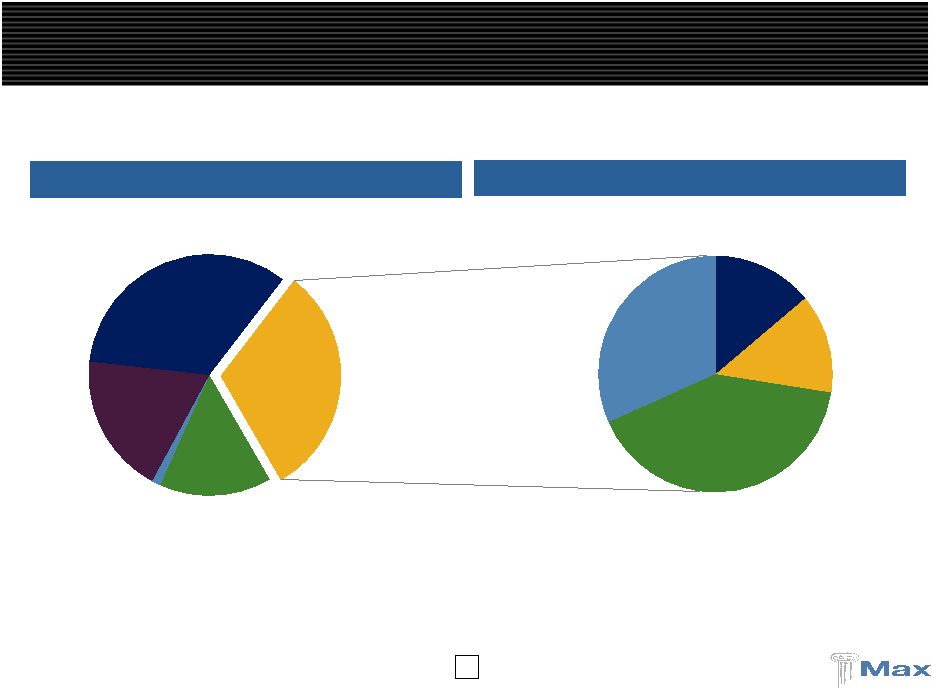
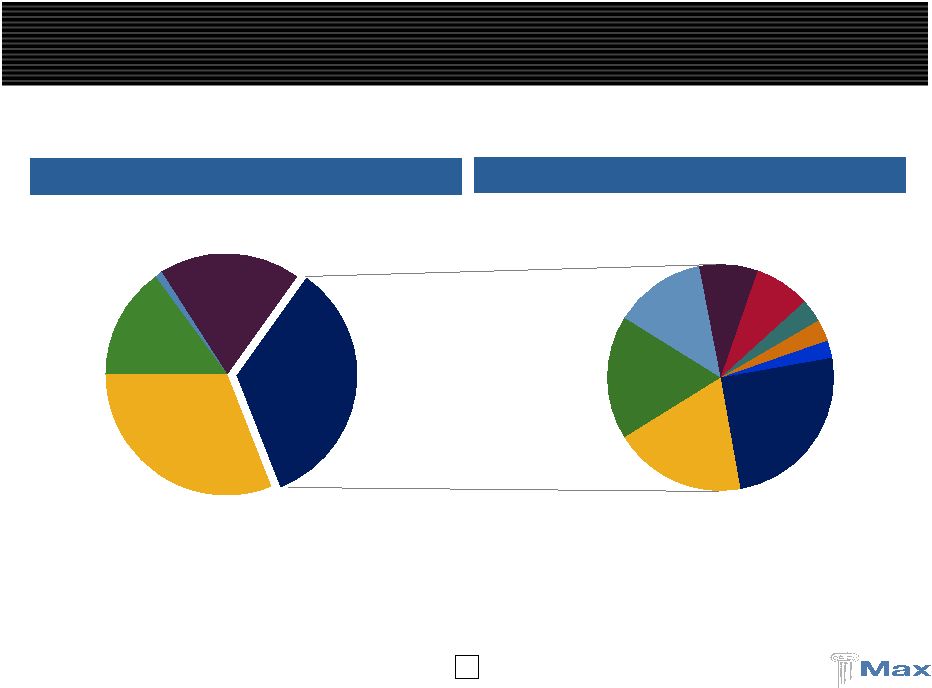
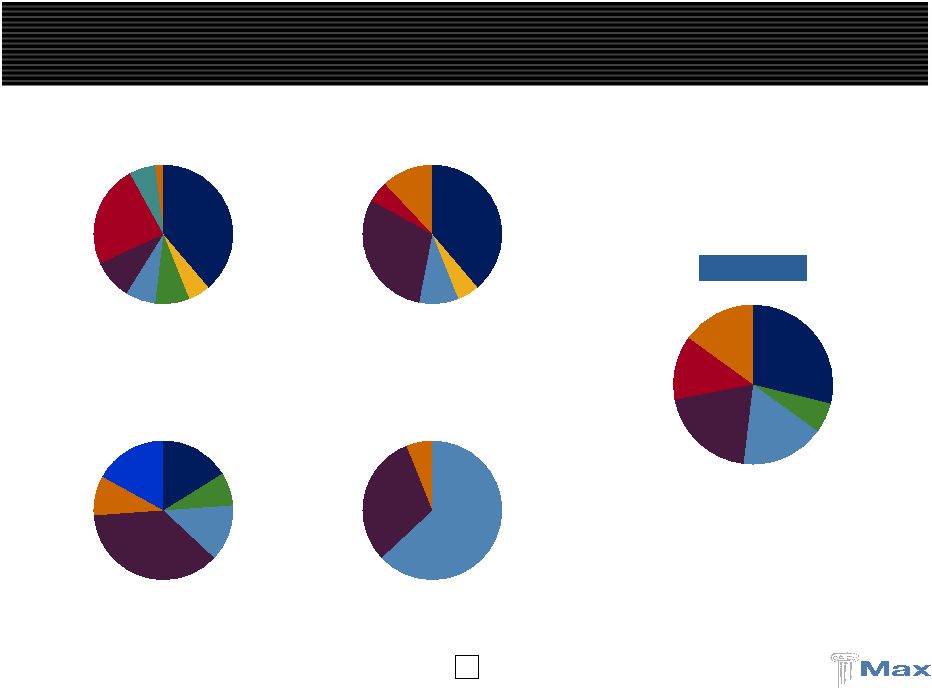
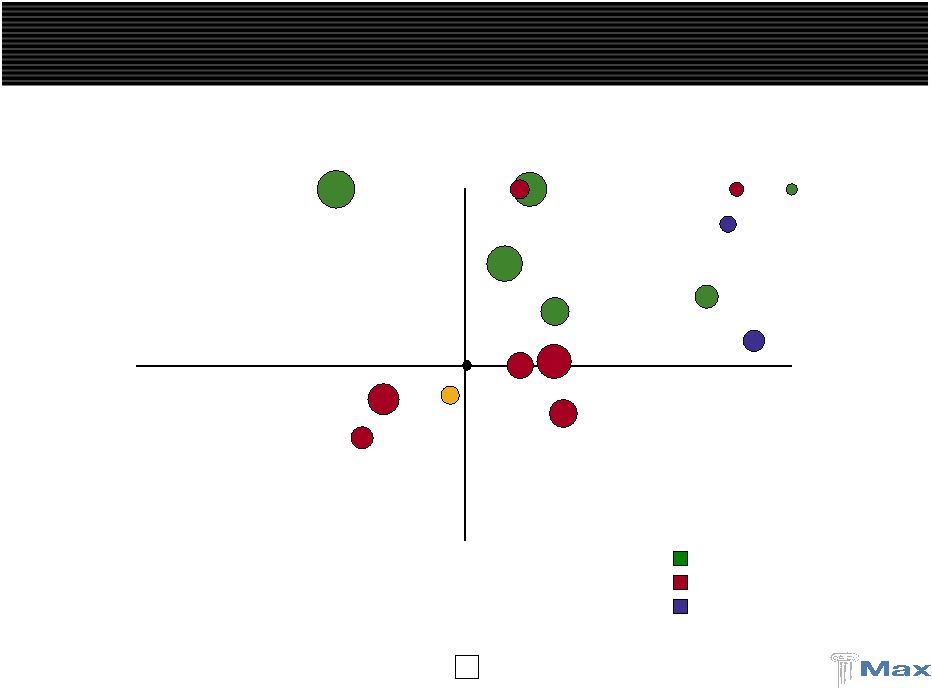 8 8 Diversified Premium Mix: A Key Differentiator Property Casualty Insurance Incumbent (Re) Insurers Class of 2001 Class of 2005 ____________________ Source: Merrill Lynch Note: Based on full year 2008 property and casualty gross premiums written. Certain allocations have been estimated. Reinsurance RE TRH PRE ORH AXS ACGL ENH AHL RNR AWH PTP MXGL MRH VR IPCR FSR |
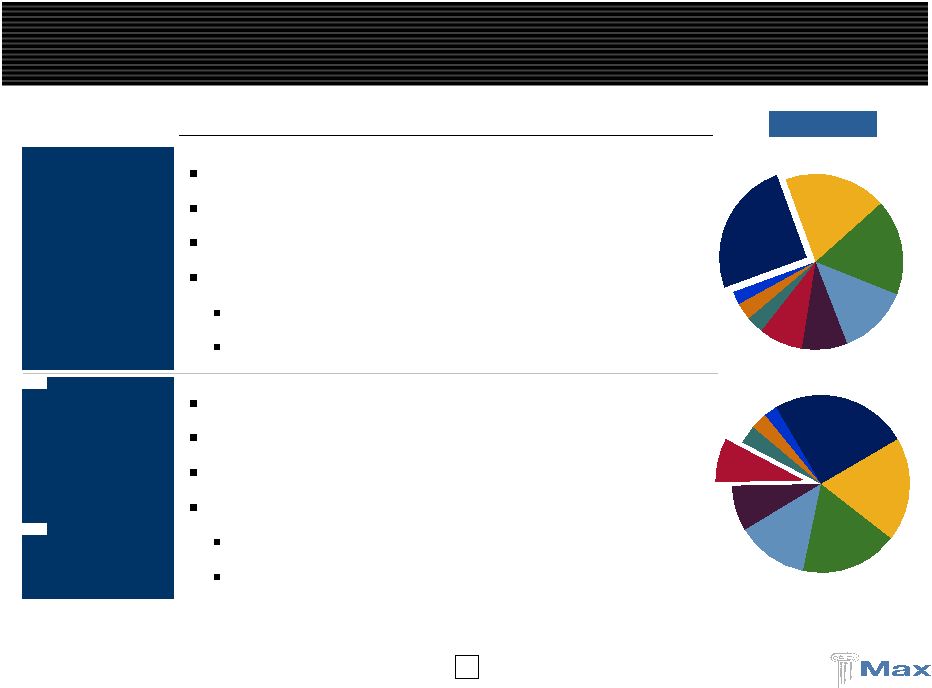
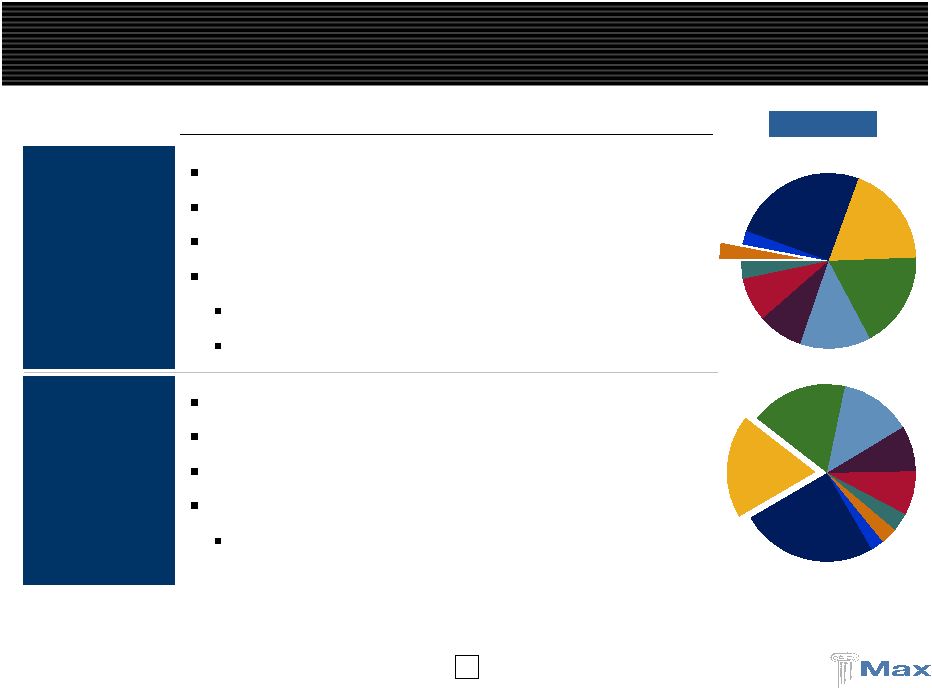
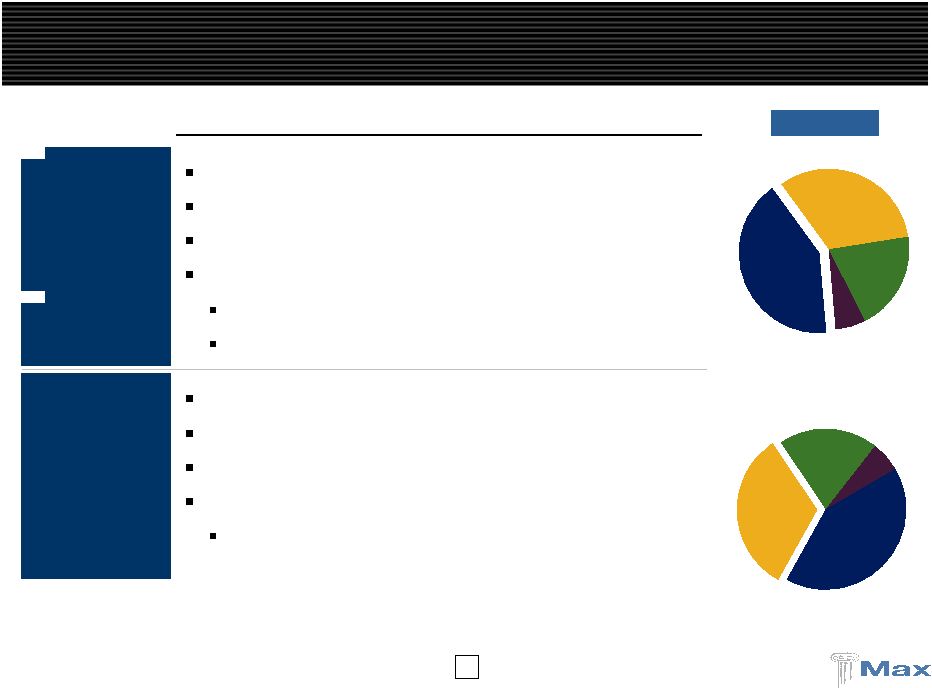
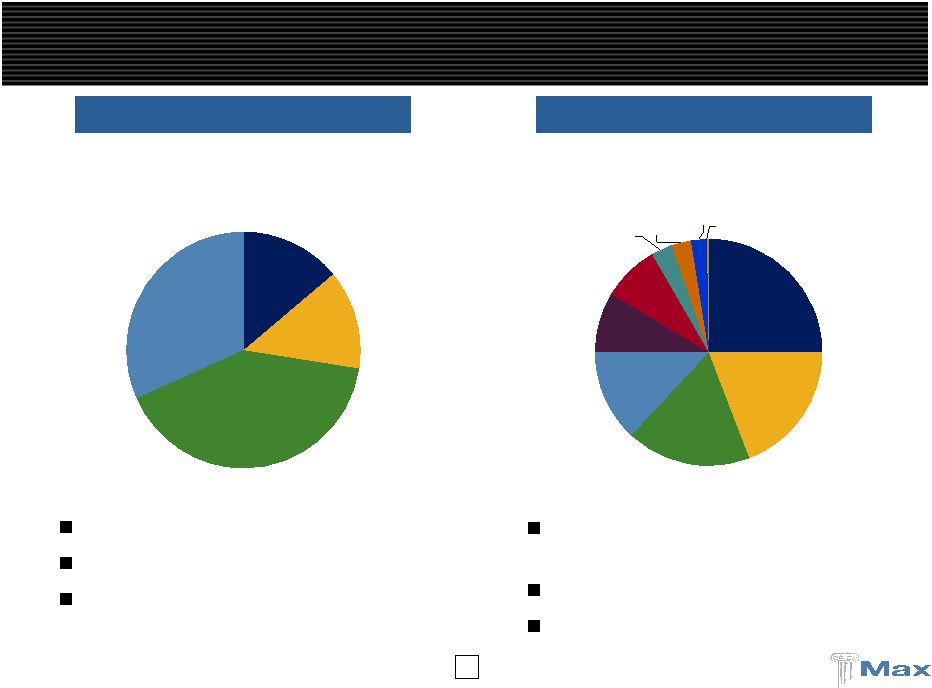 9 Max Has a Strong Market Position in Specialty Classes … Working layer excess business Focus on Fortune 1000 customers 2008 combined ratio = 88% 2008 GPW - $389 million 2008 GPW - $420 million Bermuda / Dublin Insurance Bermuda / Dublin Reinsurance Working layer excess / quota share business Cross class capability 2008 combined ratio = 87% Excess Liability Professional Liability Aviation Property 14% 14% 41% 32% Other General Liability Marine & Energy Whole Account Aviation Prof. Liabliity Workers Comp Med. Mal. Agriculture Property 25% 19% 18% 13% 9% 8% 3% 3% |
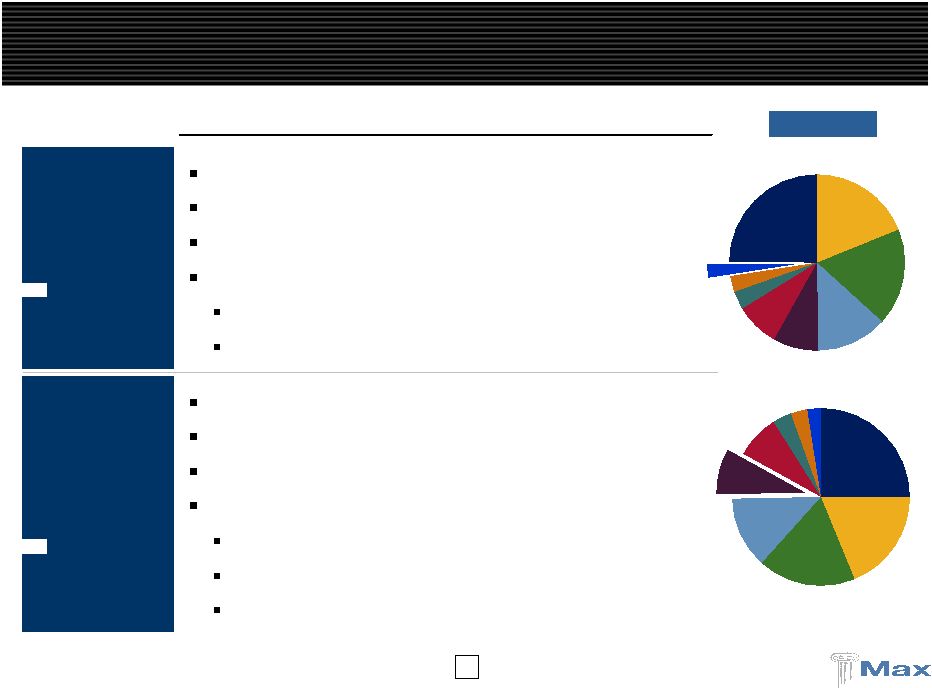
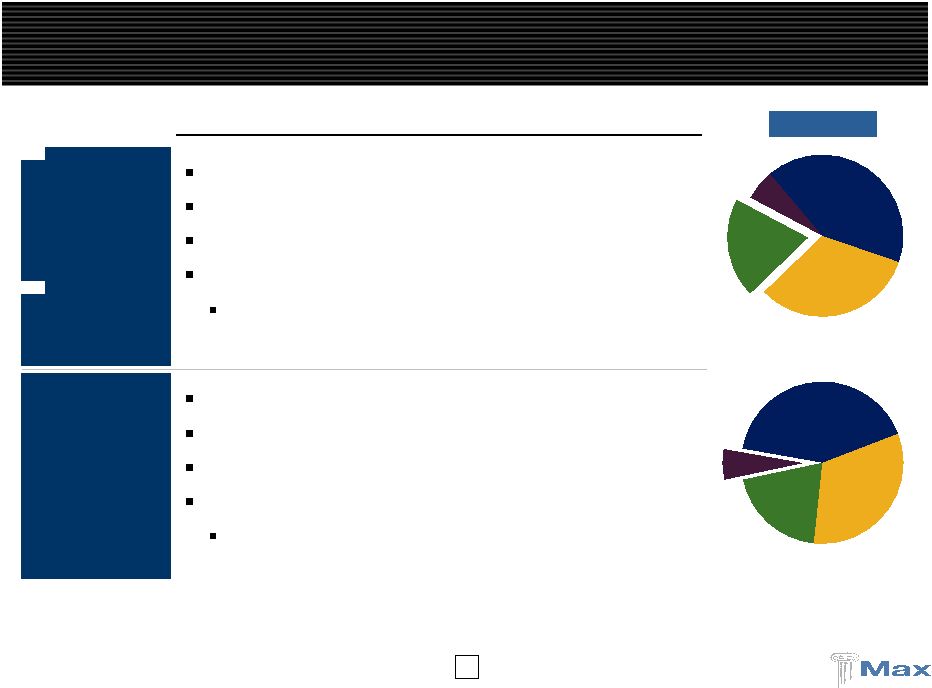
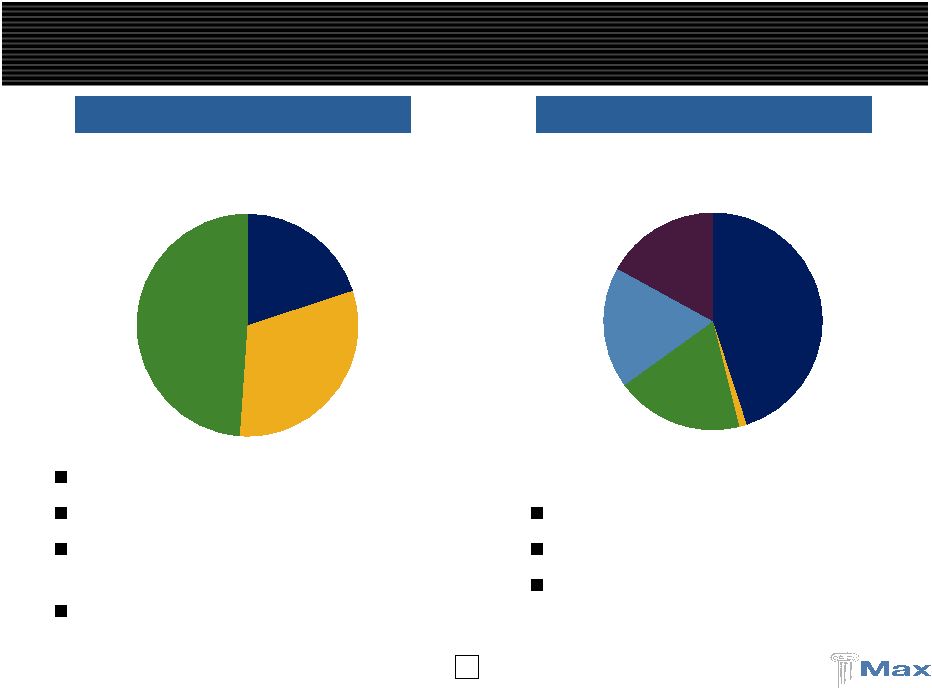 10 … With an Attractive Position in the U.S. Market and Lloyd’s Launched in 2007 Nationwide niche E&S underwriter Growing into expense base – target combined ratio of 85% to 90% Expected GPW of $250 million in 2009 2008 GPW - $194 million 2008 GPW - £65 million (1) U.S. Insurance Max at Lloyd’s Acquired in November 2008 Direct and reinsurance Expected GPW of $150 million in 2009 ____________________ (1) GPW reflects full year of business, which includes periods prior to the acquisition by Max. Marine General Casualty Property 20% 31% 49% Accident & Health Fin. Institutions Prof. Indemnity / Med. Mal. Employers' Public Liability Property Treaty 45% 1% 19% 18% 17% |
 11 As % of Total Investments Max Investment Portfolio Highlights ____________________ (1) Peers include : IPCR, PRE, ORH, ACGL, RE, RNR, MRH, ENH, TRH, AXS, AWH, PTP, VR, AHL, FSR, and GLRE. Peer average represents 3/31/09 allocation of preferred / equities and “other investments” as % of total investments. Hedge fund allocation is decreasing Market neutral / absolute return focus Max alternatives in line with Bermuda peers Max hedge funds target = 5%-7% Peer group (1) (average) = 10% 5%-7% 8.5% 29% 0% 5% 10% 15% 20% 25% 30% 35% Max 12/31/05 Max 6/30/09 Target Long / Short funds 33.5% Opportunistic 0.6% Distressed Securities 16.5% Arbitrage strategies 28.5% Emerging / Global Markets 20.9% Hedge funds 8.5% Cash 19.7% Fixed income 71.8% |
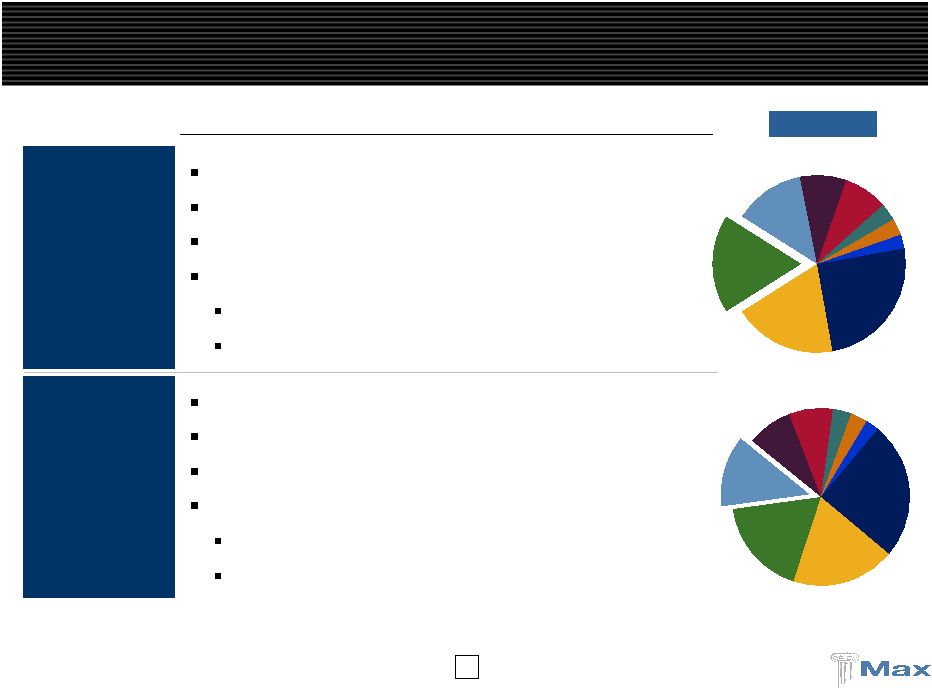
 12 U.S. Specialty 15% Max at Lloyd's (1) 1% Bermuda/Dublin Insurance 31% Life & Annuity Reinsurance 19% Bermuda/Dublin Reinsurance 34% Bermuda/Dublin P&C Insurance: A Consistently Profitable Performer Bermuda / Dublin Insurance 2008 GPW Max Capital 2008 GPW Total = $1,254 million Total = $389 million 2009E Total = $405 million ____________________ (1) Max at Lloyd’s acquired in November 2008 and includes partial year GPW. Excess Liability Professional Liability Aviation Property 14% 14% 41% 32% |
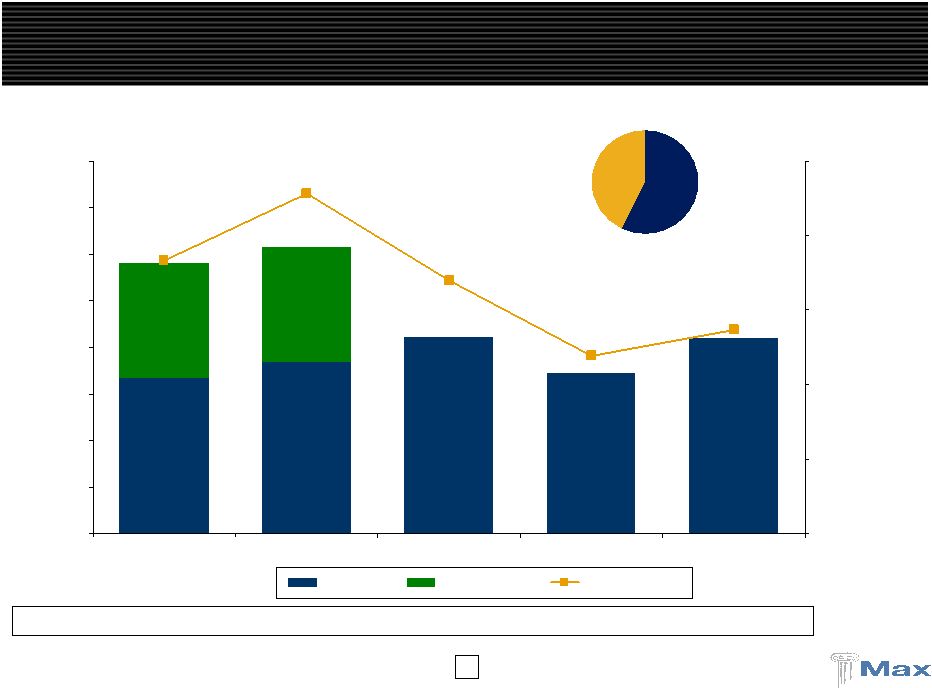
 13 $163.2 $355.3 $396.6 $389.4 $248.1 $382.9 107.3% 80.5% 92.8% 70.6% 86.2% 88.2% $0 $100 $200 $300 $400 $500 $600 2003 2004 2005 2006 2007 2008 60.0% 70.0% 80.0% 90.0% 100.0% 110.0% Bermuda/Dublin P&C Insurance: Historical Results GPW ($MM) Combined Ratio Loss Ratio 75.4% 101.5% 62.8% 77.1% 78.1% 73.0% (78.4% excluding KRW) Casualty Property / Short- Tail 27% 73% 2008 GPW |
 14 Bermuda/Dublin P&C Insurance: Solid Casualty Results GWP ($MM) Policy Year Loss Ratio Max has demonstrated profitable underwriting and risk selection Max entered in 2002 / 2003 Strong underwriting teams Quantitative models “Tougher”, better priced classes Predominately claims made 2003 to 2006 were extremely profitable Profitable booked loss ratios High amounts of IBNR remain Rates are currently flat year over year Overall IBNR is 70% - 75% of current casualty reserves $163.2 $245.9 $321.0 $313.7 $289.0 $282.6 74.1% 63.7% 76.2% 78.2% 82.7% $100 $200 $300 $400 $500 $600 $700 2003 2004 2005 2006 2007 2008 40.0% 50.0% 60.0% 70.0% 80.0% 90.0% 100.0% 110.0% |
  15 Highlights Excess Liability Expected 2009 GPW of $125mm Average premium of approximately $1mm per policy Major classes – healthcare, pharma, railroad, industrial Market conditions – Q1 09 rates stable Professional Liability Expected 2009 GPW of $160mm Average premium of approximately $400,000 per policy Major classes – E&O (lawyers), EPLI, & D&O Market conditions E&O – Stable to up 10% D&O – Slightly up to substantially up on FI EPLI – Stable Bermuda/Dublin: Casualty Insurance 2008 GPW Excess Liability Professional Liability Aviation 32% Excess Liability Professional Liability Aviation Property 41% |
   16 Bermuda/Dublin: Specialty Insurance 2008 GPW Property 14% Aviation 14% Highlights Property Insurance Expected 2009 GPW of $60mm Average premium of approximately $250,000 per policy Major classes – commercial, industrial, & energy Market conditions Up 10% to 15% on accounts with no losses Significantly higher on loss effected accounts Aviation Insurance Expected 2009 GPW of $60mm Average premium of approximately $85,000 per policy Major classes – airlines, aerospace, and general aviation Market conditions Rates up 10% to 15% on airlines Stable on aerospace and general aviation |
 17 Excess Liability Marine & Energy Other Aviation Prof. Liabliity Workers Comp Med. Mal. Agriculture Property 25% 19% 18% 13% 9% 8% 4% 3% 2% Bermuda / Dublin Reinsurance 2008 GPW Max Capital 2008 GPW Total = $1,254 million Total = $420 million 2009E Total = $415 million ____________________ (1) Max at Lloyd’s acquired in November 2008 and includes partial year GPW. Bermuda/Dublin: P&C Reinsurance Premium Contribution U.S. Specialty 15% Max at Lloyd's (1) 1% Bermuda/Dublin Insurance 31% Life & Annuity Reinsurance 19% Bermuda/Dublin Reinsurance 34% |
 18 Bermuda/Dublin P&C Reinsurance: Historical Results GPW ($MM) Combined Ratio Loss Ratio 74.9% 91.1% 70.0% 55.4% 64.0% $248.6 $246.1 $419.5 $345.2 $423.6 $369.6 $334.6 87.4% 83.9% 93.9% 105.7% 96.7% $0 $100 $200 $300 $400 $500 $600 $700 $800 2004 2005 2006 2007 2008 60.0% 70.0% 80.0% 90.0% 100.0% 110.0% Traditional Non-traditional Combined Ratio $583.2 $615.7 Casualty 57% 43% Property / Short-Tail |
   19 Bermuda/Dublin: Specialty Reinsurance Excess Liability Marine & Energy Other Aviation Prof. Liabliity Workers Comp Agriculture 25% Excess Liability Marine & Energy Other Aviation Prof. Liabliity Med. Mal. Agric Property 8% Property Aviation 2008 GPW Highlights Property Reinsurance Expected 2009 GPW of $100mm Average premium of approximately $700,000 per treaty US nationwide, super regional, Japan, Europe Market conditions Nationwide up 15%, regional & super regional up 5%-10% Europewide up 5% to 15%, other international flat to up 5% Aviation & Space Expected 2009 GPW of $30mm Average premium of approximately $1.2mm per treaty Airlines, satellite, and general aviation Market conditions Signs of hardening on airline insurance, GA is stable Satellite up 10% to 15% |
 20 Bermuda/Dublin: Specialty Reinsurance (cont’d) Agricult Workers Comp Prof. Liabliity Aviation Other Energy Excess Liability 3% Excess Liability Marine & Energy Other Aviat Prof. Med. Mal. Agriculture 19% Marine & Energy Agriculture 2008 GPW Highlights Marine & Energy Expected 2009 GPW of $20mm Average premium of approximately $1.0mm per treaty Onshore and offshore energy Market conditions Gulf market is seeking 60% to 75% rate increases Onshore rates are up 5% to 10% Agriculture Expected 2009 GPW of $75mm Average premium of approximately $8.0mm per treaty Multi peril crop, some crop/hail and named peril Market conditions Flat on an exposure adjusted basis |
   21 Bermuda/Dublin: Casualty Reinsurance Property Agriculture Me Workers Comp Prof. Liabliity Aviation Other Marine & Energy Excess Liability 2% 2% Excess Liability Marine & Energy Other Aviation Workers Comp Med. Mal. Agricult Property 9% Prof. Liability 2008 GPW Highlights Excess Liability Expected 2009 GPW of $25mm Average premium of approximately $2mm per treaty General liability, auto liability, public entity business Market conditions Primary rates flat to increasing, reinsurance rates up National writers looking for support Professional Liability Expected 2009 GPW of $15mm Average premium of approximately $400,000 per treaty D&O, E&O, & E&O – lawyers Market conditions E&O – Stable to up 10% D&O – Slightly up to substantially up on FI EPLI – Stable |
 22 Exces Liabilit Marine Energ Other Aviation Prof. Liabliity Workers Comp Med. Mal. Agriculture Property 18% Excess Liability Marine & Energy Other Aviation Prof. Liabliity Workers Comp Med. Mal. Agriculture Prop 13% 2008 GPW Bermuda/Dublin: Casualty Reinsurance (cont’d) Highlights Medical Malpractice Expected 2009 GPW of $60mm Average premium of approximately $2.0mm per treaty Physicians & surgeons, hospitals, surgery centers Market conditions Physician & primary HPL stable Excess HPL rates not as attractive Workers Compensation Expected 2009 GPW of $55mm Average premium of approximately $1.7mm per treaty Small regional, single state funds, national writers on cat Market conditions Primary rates flat to down, reinsurance rates mixed Looking to exploit XOL/QS pricing differentials |
 23 Max at Lloyd’s: Max’s Newest Platform Manage £125.0 million of 100% owned capacity in Syndicate 1400. Also manage two partially owned third party syndicates Offices in London, Copenhagen, and Tokyo - total staff of 85 Syndicates under management Syndicate 1400 - 2008 stamp capacity of £125.0mm – 100% provided by Max Writes property reinsurance, accident & health reinsurance and financial institutions insurance Broad geographic spread, including the US, UK, Caribbean and Asia Syndicate 2525 - 2008 stamp capacity of £42.0mm – 2% provided by Max Writes employers’ and third party / product liability lines, both on primary and excess of loss bases Concentrates on the UK, with only small overseas exposures and no US-domiciled insureds Syndicate 2526 - 2008 stamp capacity of £31.8mm – 36% provided by Max Writes professional indemnity and medical malpractice Primarily UK-domiciled insureds with some European and Australian accounts |
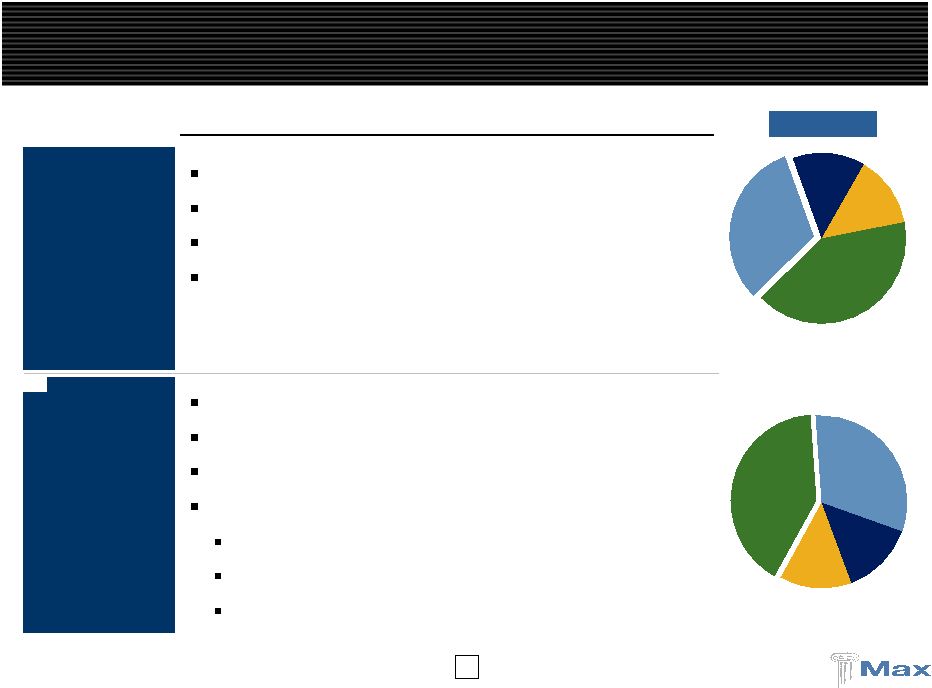
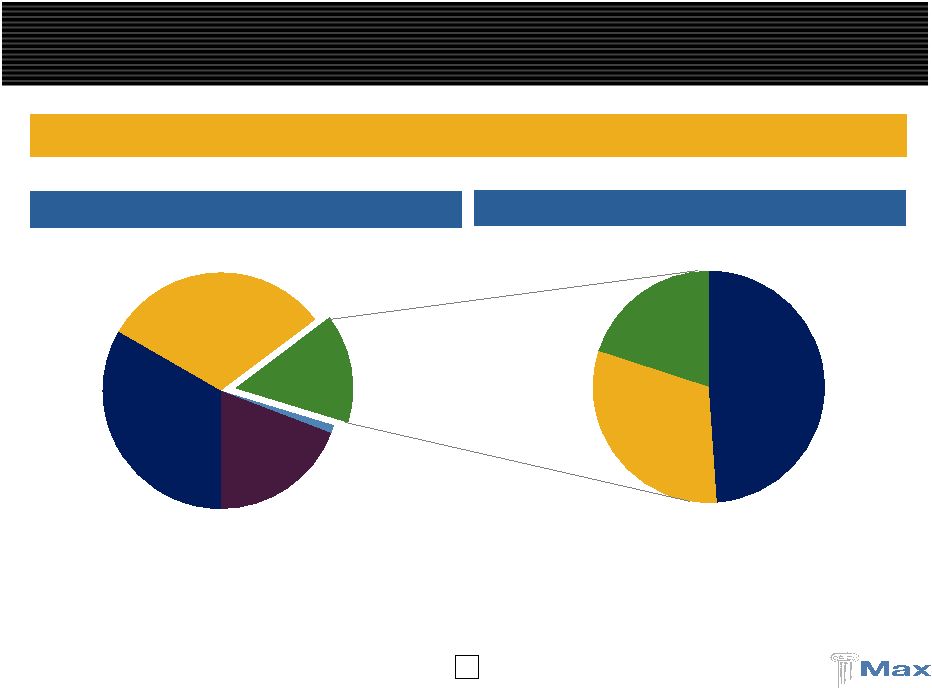
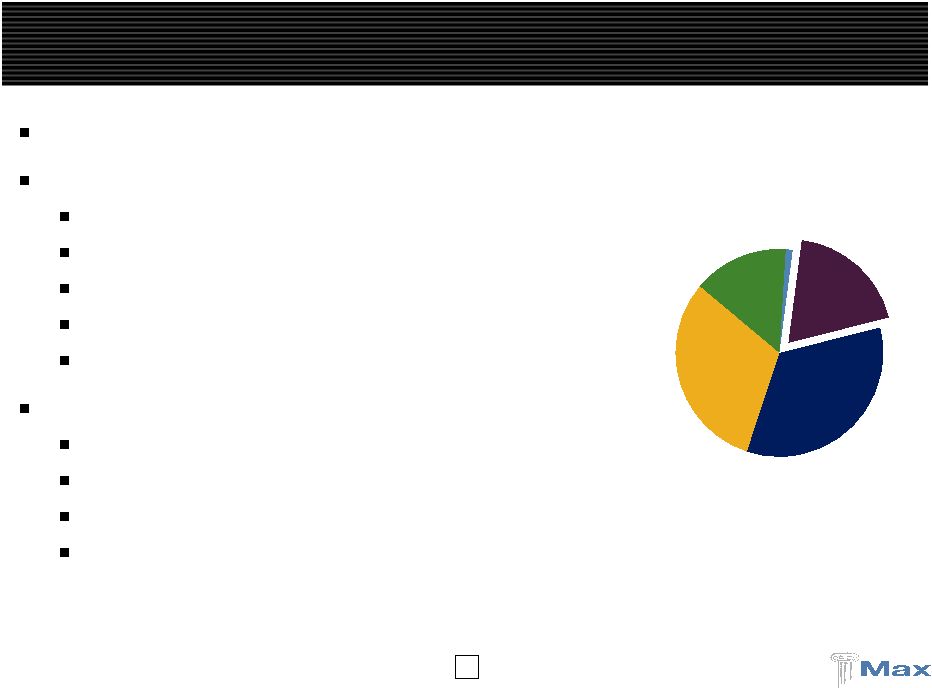
 24 Accident & Health 25% Property Treaty 75% Accident & Health 16% Other 2% Professional Indemnity 15% Financial Institutions 17% Property Treaty 50% 24 Max at Lloyd’s: 2009E Gross Premiums Written Total = $150 million Max At Lloyd’s 2009E GPW ____________________ Note: 2009 gross premiums written represent Max at Lloyd’s syndicate interests only. Reinsurance: $99 million PL/EL 5% Professional Indemnity 44% Financial Institutions 50% Insurance: $51 million |
 25 USA 29% Japan 13% Europe 20% UK/Eire 17% Caribbean 6% Other 15% Europe 31% UK/Eire 63% Other 6% USA 16% Caribbean 8% UK/Eire 13% Europe 37% Latin America 17% Other 9% USA 39% Canada 5% Europe 30% Japan 5% UK/Eire 9% Other 12% Max at Lloyd’s: Geographic Reach USA 39% Canada 5% Japan 24% Europe 9% UK/Eire 7% Caribbean 8% Australasia 6% Other 2% Property Professional Indemnity Financial Institutions Accident & Health Total |
 26 Enhancing Max at Lloyds in 2009 Maintain and strengthen our existing Lloyd’s underwriting resources Continuing emphasis on robust pricing process and superior risk selection Market conditions improving – but slowly Strategy of diversification to add further experienced underwriting teams, to further leverage the Lloyd’s franchise: PA insurance Casualty treaty reinsurance Marine Others Hired 4 new underwriters thus far in 2009: Clive Hatto in accident & health; Hugh Sprowson in financial institutions; Graeme Scott and Stuart Hawes in international casualty treaty reinsurance Improved capital efficiency, reduced expense ratio and improved ROEs |
 27 Property General Casualty Marine 49% 31% 20% Max Specialty: An Important and Growing Business for Max Life & Annuity Reinsurance Max at Lloyd's U.S. Specialty Bermuda/Dublin Insurance Bermuda/Dublin Reinsurance 34% 31% 15% 1% 19% Product diversification allows resources to be reallocated as market cycles change Max Specialty 2008 GPW Max Capital 2008 GPW Total = $1,254 million Total = $194 million 2009E Total = $250 million ____________________ (1) Max at Lloyd’s acquired in November 2008 and includes partial year GPW. (1) |
 28 Max Specialty – Leading E&S Writer Max Specialty contributes to Max Capital’s diversified niche orientation by adding profitable business in both property and casualty throughout the market cycle Nationwide excess and surplus lines writer of property, casualty and marine Three distinct divisions: Brokerage, Marine and Contract Binding Six strategically placed offices in the US Strong financial strength and technical expertise Significant product diversification and strong distribution relationships Start-up in 2007 with experienced teams from Essex/Markel and other E&S platforms Expected to write $250 million of GWP in 2009 Internal structure in place and start-up expenses have stabilized Strong relationships with our brokers and agents Licensed in 49 states on a non-admitted basis and 50 states on an admitted basis Have the people and the platforms to write a diversified book anywhere in the U.S. Use of third party reinsurance to minimize exposure in early years Strong sponsorship by the reinsurance community Placed with favorable terms and conditions Target combined ratio of 85% to 90% Loss ratio on target; expense ratio decreasing as book continues to grow |
   29 Max Specialty Segment Review 2008 GPW Contract Bindi Max Managers Marin Brokerage 41% Contract Binding Max Man Marine 33% Highlights Brokerage Division Expected 2009 GPW of $90mm Average premium of approximately $45,000 per policy Apartments, offices, mixed use, hotels, shopping centers Market conditions Loss effected layers up 25% to 30%, others up 10% Non cat exposed layer pricing remains soft Contract Binding Expected 2009 GPW of $86mm Average premium of approximately $2,000 per policy Mostly casualty – contractors, habitational, retail, and service Market conditions Casualty pricing mixed |
   30 Max Specialty Segment Review (cont’d) 2008 GPW Max Managers Marine 6% Marine 20% Highlights Marine Expected 2009 GPW of $53mm Average premium of approximately $30,000 per policy Contractors equipment, builders risk, motor truck cargo Market conditions Primary rates flat with meaningful increases on loss affected accounts Max Managers Expected 2009 GPW of $21mm Average premium of approximately $2mm per treaty Nursing homes, hospital, other medical and industrial Market conditions Rates mixed |
 31 Overview of Life Reinsurance Spread management business, comparable to basic full Loss Portfolio Transfer Purchase blocks of existing policy or claim reserves (reserve buy outs) All originated transactions – winner takes all Known data files – no unreported exposures, minimal IBNR Access to historic experience data Only products with highly predictable and non-volatile cash flows Full asset transfer – the economic value of the liabilities It is NOT … Risk premium reinsurance (mainstream life reinsurance) Automatic reinsurance of new business (treaty business) Mega-sized transactions Variable or deferred annuities, XXX, term insurance, life settlements, COLI/BOLI U.S. Specialty 15% Max at Lloyd's (1) 1% Bermuda/Dublin Insurance 31% Life & Annuity Reinsurance 19% Bermuda/Dublin Reinsurance 34% ____________________ (1) Max at Lloyd’s acquired in November 2008 and includes partial year GPW. |
 32 Overview of Life Reinsurance Business targets 3 or 4 deals per year - $150+ million new business Remain expense efficient Price and realize ROE of 15%+ Sales: 2000 to 2008 in excess of $1.75 billion 27 transactions; 15 counterparties; 3 deals per year on average Reserves Under Management - $1.4 billion European pension annuities in payment Disabled life claim reserves, both disability income and mortality Small face amount life insurance, mostly paid-up Structured settlements Liability performance virtually exactly on target with pricing; no policy performance impact of recession or natural disasters Cost-efficiency: expenses lower than priced for Gross Premiums Written ($MM) $212.3 $275.0 $45.0 $302.0 $242.2 $0.0 $50.0 $100.0 $150.0 $200.0 $250.0 $300.0 $350.0 2004 2005 2006 2007 2008 |
 33 Max Bermuda and Dublin (Insurance/Reinsurance) Rates rising in short-tail property cat and energy Long-tail lines have stabilized and stopped declining Max at Lloyd’s Provides access to global specialty business, high credit ratings, worldwide licenses Experienced team underwriting a seasoned book of business Building out the platform recruiting new teams with recent additions International casualty reinsurance Marine and personal accident insurance Max Specialty Strong distribution relationships continue to generate a high flow of business Market dislocations provide the opportunity to add teams and new products Benefiting from improving property rates Profitability improving as the business matures and can retain more business Life Reinsurance Only writes “closed” blocks of business with no variable annuity exposure Provides surplus relief which will be in high demand as many life insurers are capital constrained Max is Strongly Positioned in 2009 |
 34 Property and Casualty GPW growth target of 20% to 22% driven by: Max at Lloyd’s Max Specialty Bermuda/Dublin Insurance and Casualty Reinsurance relatively flat Expected combined ratio of 88% to 90% Assumes a cat load of 4-6 points Improved profitability at Max Specialty as earned premiums offset higher expenses to build-out the platform Investment allocations 93%-95% fixed income 5%-7% hedge funds Target ROE is 15%** *Issued Feb 2009 **Over the course of the cycle 2009 Guidance* |
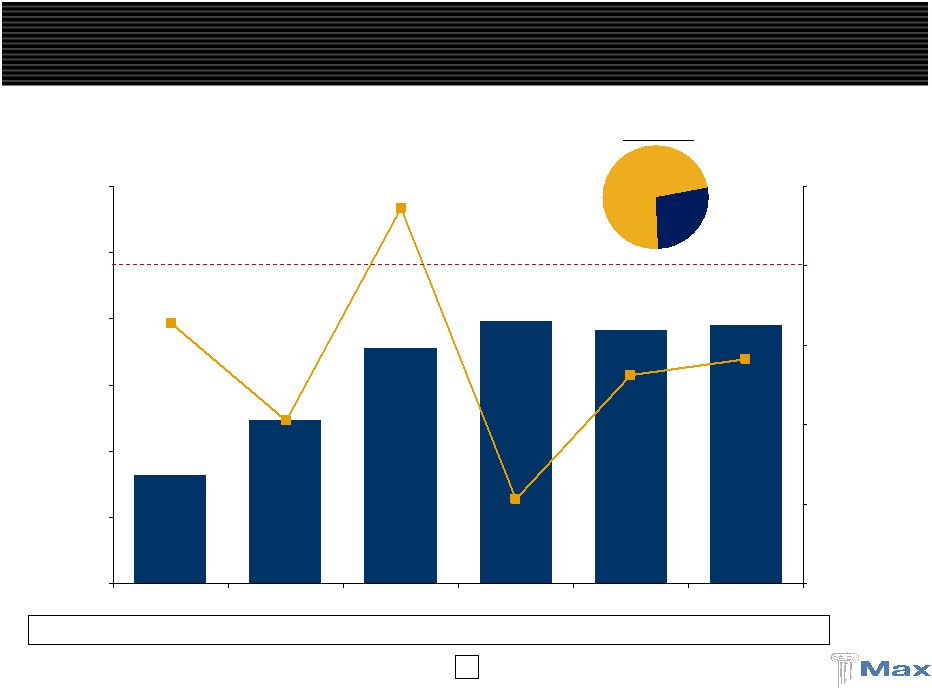
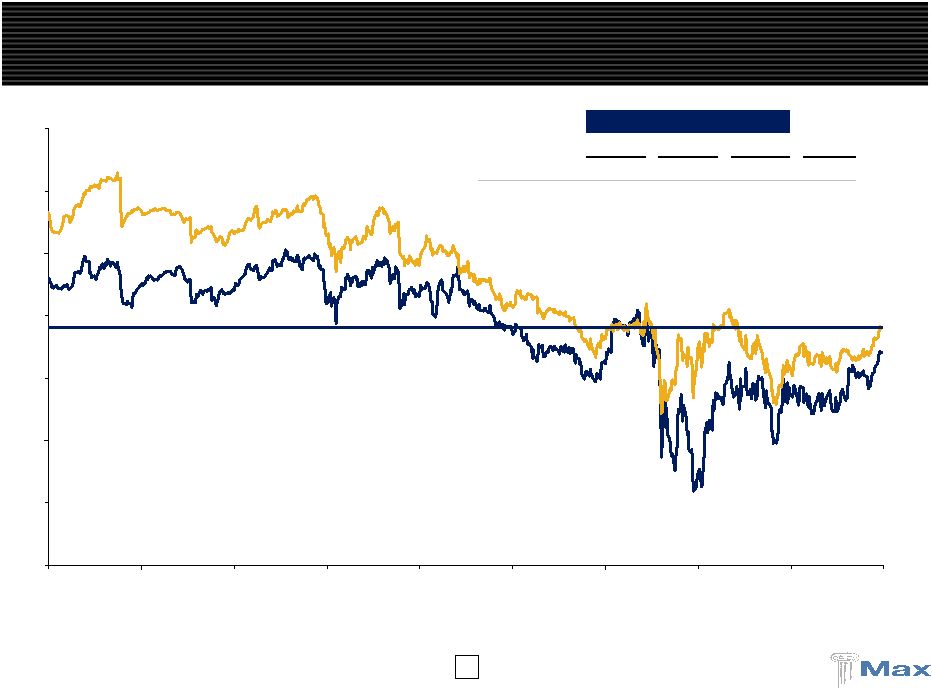 35 Max Average ____________________ Source : FactSet, SNL and company filings. Note : Based on primary book value per share. (1) Diversified peers include RE, AXS, ACGL, TRH, PRE, ORH, AWH, ENH, AHL, and PTP. Stock Valuation Is Lagging Underwriting Performance 0.20x 0.40x 0.60x 0.80x 1.00x 1.20x 1.40x 1.60x 7/28/06 11/26/06 3/28/07 7/28/07 11/27/07 3/27/08 7/27/08 11/26/08 3/28/09 7/28/09 Average Price / Book Value 3-Year 2-Year 1-Year Current Max 0.96x 0.88x 0.76x 0.88x Diversified 1.11 1.01 0.89 0.96 |
 36 36 Strongly positioned to capitalize on market dislocations Diversified portfolio with four robust underwriting platforms Significant reduction in hedge fund exposure Bringing hedge funds down to 5-7% of total investments Meaningful investment opportunity to redeploy significant cash position Demonstrated commitment to enhancing shareholder value Well capitalized liquid balance sheet with financial flexibility Valuation at a significant discount to “specialty insurance” peers 36 Investment Opportunity in Max Today |
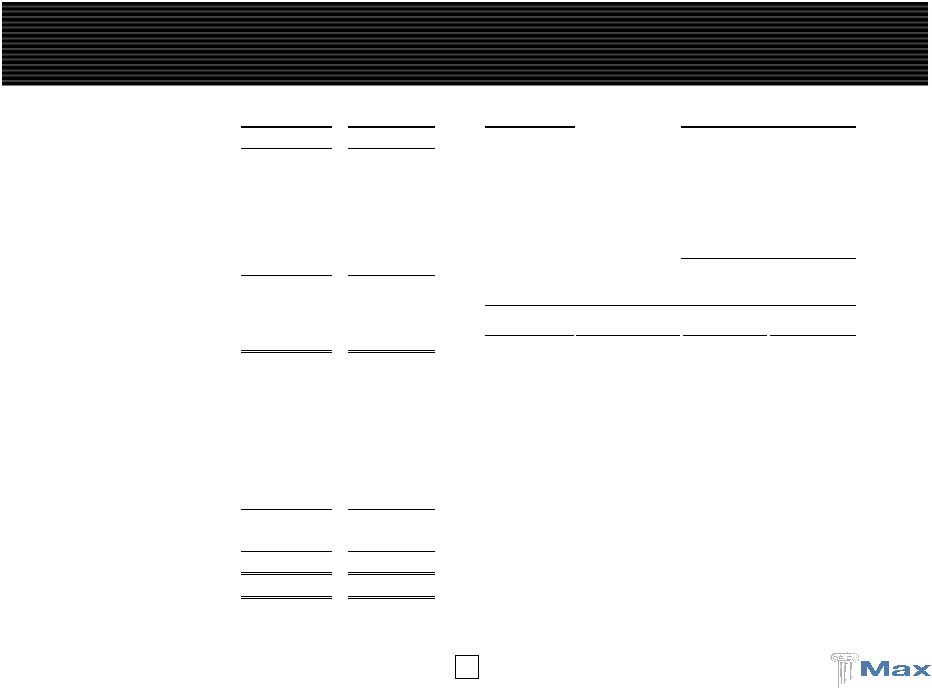
 37 ($ in millions) Strong Balance Sheet June 30, December 31, 2009 2008 Cash & Fixed Maturities $4,687 $4,603 Other Investments 437 754 Premium Receivables 670 555 Losses Recoverable 930 847 Other Assets 568 493 Total Assets $7,292 $7,252 Property & Casualty Losses $3,058 $2,938 Life & Annuity Benefits 1,389 1,367 Deposit Liabilities 153 219 Funds Withheld 141 164 Unearned Premium 746 574 Bank Loan 105 375 Senior Notes 91 91 Other Liabilities 246 244 Total Liabilites $5,929 $5,972 Shareholders' Equity 1,363 1,280 $7,292 $7,252 |
 38 ($ in millions) Quarterly Results Comparison 2009 2008 Gross Premiums Written $397 $369 Net Premiums Earned 229 235 Net Investment Income 42 43 Net Gains on Other Investments 21 39 Net Realized Losses on Fixed Maturities (2) (2) Other Income 1 - Total Revenues 291 315 Total Losses, Expenses & Taxes 245 241 Net Income $46 $74 Property & Casualty Underwriting Loss Ratio 65% 55% Expense Ratio 26% 24% Combined Ratio 91% 79% Three months ended June 30, |
 39 Three months ended June 30, 2009 ($ in millions) Diversified Operating Platform Life & Property & Casualty Annuity Corporate Consolidated Bermuda / Dublin Max at Insurance Reinsurance U.S. Specialty Lloyd's Total Reinsurance Gross premiums written $133.9 $95.2 $81.0 $45.4 $355.5 $41.0 $0.0 $396.5 Reinsurance premiums ceded (49.3) (18.1) (51.7) (10.6) (129.6) (0.0) 0.0 (129.7) Net premiums written $84.7 $77.1 $29.4 $34.7 $225.8 $41.0 $0.0 $266.8 Earned premiums 101.6 112.6 63.1 36.4 313.6 41.0 0.0 354.6 Earned premiums ceded (50.7) (22.8) (41.7) (10.6) (125.8) 0.0 0.0 (125.8) Net premiums earned 50.8 89.7 21.4 25.8 187.8 41.0 0.0 228.8 Net investment income 5.7 10.0 1.5 0.6 17.8 12.9 11.0 41.8 Net gains on other investments 1.0 2.4 0.0 0.0 3.4 9.3 8.7 21.4 Net realized gains (losses) on fixed maturities 0.0 0.0 0.0 0.7 0.7 0.0 (2.7) (1.9) Other income 0.0 0.0 0.4 0.4 0.8 0.0 0.2 1.0 Total revenues $57.5 $102.1 $23.3 $27.6 $210.6 $63.3 $17.2 $291.0 Net losses and loss expenses 37.8 57.8 13.1 13.5 122.2 0.0 0.0 122.2 Claims and policy benefits 0.0 0.0 0.0 0.0 0.0 55.4 0.0 55.4 Acquisition costs (0.5) 15.7 2.7 6.4 24.4 0.7 0.0 25.1 Interest expense 0.0 1.2 0.0 0.0 1.2 0.8 2.7 4.7 Foreign exchange (gains) losses 0.0 0.0 0.0 (1.7) (1.7) 0.0 (1.7) (3.4) Merger and acquisition expenses 0.0 0.0 0.0 0.0 0.0 0.0 4.8 4.8 General and administrative expenses 5.4 7.2 5.6 5.7 24.0 0.7 11.5 36.1 Total losses and expenses 42.8 82.0 21.5 23.9 170.1 57.6 17.2 244.9 Income (loss) before taxes $14.8 $20.1 $1.8 $3.7 $40.4 $5.7 $0.0 $46.0 Loss Ratio 74.4% 64.4% 61.4% 52.1% 65.1% Combined Ratio 84.1% 90.0% 100.4% 99.0% 90.8% |
 40 P&C Combined Ratio Operating ROE Gross Premiums Written Operating Earnings Per Share (Diluted) Life, $212 Life, $275 Life, $45 Life, $302 Life, $242 $1,254 $1,078 $865 $1,246 $1,044 $0 $250 $500 $750 $1,000 $1,250 $1,500 2004 2005 2006 2007 2008 $2.70 $3.52 $4.81 $0.19 ($2.59) ($3) $0 $3 $6 2004 2005 2006 2007 2008 15.8% 1.0% 17.3% 20.7% (10.2%) (10%) (5%) 0% 5% 10% 15% 20% 25% 2004 2005 2006 2007 2008 Profitable Underwriting Trends 94% 106% 86% 88% 92% 75% 100% 125% 2004 2005 2006 2007 2008 |
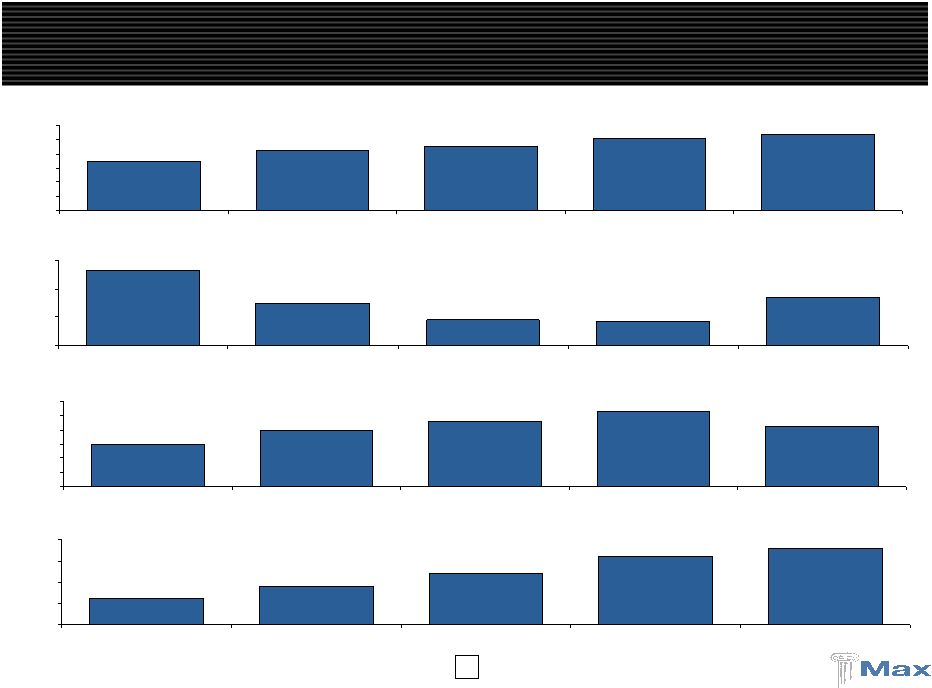 41 Invested Assets (Ratio to Shareholders’ Equity) Shareholders’ Equity (Book Value Per Share) Dividends Operating Cash Flow $3,515 $4,223 $4,536 $5,123 $5,357 $0 $1,000 $2,000 $3,000 $4,000 $5,000 $6,000 2004 2005 2006 2007 2008 $799 $447 $273 $252 $508 $0 $300 $600 $900 2004 2005 2006 2007 2008 $903 $1,186 $1,390 $1,584 $1,280 $0 $300 $600 $900 $1,200 $1,500 $1,800 2004 2005 2006 2007 2008 $0.12 $0.18 $0.24 $0.32 $0.36 $0.00 $0.10 $0.20 $0.30 $0.40 2004 2005 2006 2007 2008 (3.9:1) (3.6:1) (3.3:1) (3.2:1) (3.9:1) ($19.70) ($20.16) ($23.06) ($27.54) ($22.77) ($ in millions) A Growing, Global Insurance / Reinsurance Company |
 42 Average quality of AA 70%+ of fixed income securities rated Aa or better Less than 7% rated Baa or below Approximately 42% of portfolio is Cash, Governments, Agencies, and Agency MBS Cash balance is approximately $1,008 million or 22% of the portfolio U.S. and G7 governments approximately $805 million or 17% of the portfolio U.S. Agencies approximately $238 million or 5% of the portfolio U.S. Agency MBS approximately $571 million or 12% of the portfolio Corporate Holdings are well diversified Approximately 32% of the portfolio Approximately 200 different corporate issuers Largest “Aa” issuer is less than 1.1% of the portfolio Largest “A” issuer is less than 1.0% of the portfolio No CDO’s, CLO’s, SIV’s or other highly structured securities Remaining portfolio is high quality ABS, RMBS and CMBS Holdings Almost all RMBS holdings are rated AAA, with substantial portion being agency CMO’s Almost all CMBS holdings are rated AAA Principal losses, if any, are expected to be minimal based upon cash flow and stress testing ABS holdings are largely comprised of plain vanilla auto and credit cards Home equity ABS holdings amount to approximately $38 million (all Subprime and Alt – A) Subprime and Alt – A exposures are approximately $68 million book value 2.8 year weighted average life Significant and growing over-collateralization No principal losses are expected based upon cash flow and stress testing Unrealized loss of approximately $20 million High Quality Cash and Fixed Income Portfolio |
 43 Supplemental Investment Data ____________________ (1) Included within U.S. Governments and Agencies are Agency Mortgage-Backed Securities with a fair value of $571,399 Note: Past performance should not be considered to be a reliable indicator of future performance. Fair Investment Credit Fair Ratings ($ thousands) Value Distribution Rating Value Distribution Cash and Cash Equivalents $1,008,178 19.7% U.S. Government and Agencies (1) $964,246 26.2% U.S. Government and Agencies 392,847 7.7% AAA 1,335,687 36.3% Non-U.S. Government 650,456 12.7% AA 371,494 10.1% Corporate Securities 1,517,071 29.6% A 768,592 20.9% Municipal Securities 40,712 0.8% BBB 147,497 4.0% Asset-Backed Securities 155,351 3.0% BB 27,761 0.8% Residential Mortgage-Backed Securities 650,545 12.7% B or lower 63,938 1.7% Commercial Mortgage-Backed Securities 272,233 5.3% $3,679,215 100.0% Fixed Maturities $3,679,215 71.8% Annualized Periodic Rate of Return Last Year Last Last 3 Months to Date 12 months 60 months Cash and Fixed Maturities $4,687,393 91.5% 1.30% 0.88% 5.08% 4.44% Convertible Arbitrage - 0.0% 0.00% 16.99% 2.72% (0.18%) Distressed Securities 71,680 1.4% 4.71% 4.44% (17.45%) 7.48% Diversified Arbitrage 38,177 0.7% 3.03% 3.29% (29.35%) (3.31%) Emerging Markets 41,613 0.8% 19.76% 19.98% (19.19%) 7.50% Event-Driven Arbitrage 60,291 1.2% 8.42% 11.66% (29.96%) 6.05% Fixed Income Arbitrage 25,177 0.5% 2.36% 12.24% 17.36% 10.59% Global Macro 48,911 1.0% 6.69% 6.52% (4.59%) 5.57% Long / Short Credit 14,169 0.3% 7.07% 10.27% (5.97%) 5.96% Long / Short Equity 131,205 2.5% 1.47% 5.58% (8.59%) 4.23% Opportunistic 2,926 0.1% (26.34%) (28.86%) (55.57%) (1.74%) Hedge Funds 434,149 8.5% 3.14% 5.21% (16.10%) 3.29% Reinsurance Private Equity 2,454 0.0% (4.20%) 7.61% 2.92% 8.77% Other Investments $436,603 8.5% 3.11% 5.23% (16.02%) 2.68% Total Investments $5,123,996 100.0% 1.53% 1.62% (2.59%) 4.30% |