Exhibit 99.1

Investor Presentation August 30, 2019 Bancorp

2 Bancorp 2 Bancorp 2 Section 1 About 1 st Constitution Bancorp
Bancorp 3 Forward - Looking Statement and Safe Harbor This presentation contains forward - looking statements within the meaning of Section 27A of the Securities Act of 1933, as amende d, and Section 21E of the Securities Exchange Act of 1934, as amended (the “Exchange Act”). The Private Securities Litigatio n Reform Act of 1995 provides a “safe harbor” for forward - looking statements. When used in this and in future filings by 1st Cons titution Bancorp (the “Company”) with the Securities and Exchange Commission (the “SEC”), in the Company’s press releases and in oral statements made with the approval of an authorized executive officer of the Company, the words or phrases “will,” “w ill likely result,” “could,” “anticipates,” “believes,” “continues,” “expects,” “plans,” “will continue,” “is anticipated,” “ est imated,” “project” or “outlook” or similar expressions (including confirmations by an authorized executive officer of the Company of a ny such expressions made by a third party with respect to the Company) are intended to identify forward - looking statements. Readers should not place undue reliance on these forward - looking statements, which are based upon the current beliefs and expectations of the management of the Company. These forward - looking statements are subject to risks and uncertainties and actual results might differ materially from those discussed in, or implied by, the forward - looking statements. Factors that may cause actual results to differ from those results expressed or implied, include, but are not limited to, tho se listed under “Business”, “Risk Factors” and “Management’s Discussion and Analysis of Financial Condition and Results of Operations” in the Company’s Annual Report on Form 10 - K for the year ended December 31, 2018 filed with the SEC on March 15, 201 9, and in other filings made by the Company with the SEC, such as the overall economy and the interest rate environment; the ability of customers to repay their obligations; the adequacy of the allowance for loan losses; competition; si gnificant changes in accounting, tax or regulatory practices and requirements; certain interest rate risks; risks associated wit h investments in mortgage - backed securities; risks associated with speculative construction lending; risks associated with safegua rding information technology systems; the risk of the failure to close the merger of Shore Community Bank (“Shore”) with and int o 1st Constitution Bank (the “Bank”) for any reason, including the failure to obtain Shore shareholder approval; the risk that exp ected cost savings and synergies from the merger may not be realized; risks associated with the diversion of Company management’s time from ongoing business operations due to issues relating to the merger; and the risk that the Company may be un able to retain certain Shore customers and employees . Although management has taken certain steps to mitigate any negative effect of the aforementioned items, significant unfavorable changes could severely impact the assumptions used and c oul d have an adverse effect on profitability. The Company undertakes no obligation to update, alter, or otherwise revise any for war d - looking statements, whether written or oral, that may be made from time to time, whether as the result of new information, fu tur e events, or otherwise . On June 23, 2019, the Company and the Bank entered into an Agreement and Plan of Merger (the “Merger Agreement”) with Shore, pro vid ing for the merger of Shore with and into the Bank, with the Bank as the surviving entity (the “Merger”). The material terms of the Merger Agreement and the Merger were disclosed on a Current Report on Form 8 - K filed with the SEC on June 25, 2019. This communication shall not constitute an offer to sell or the solicitation of an offer to buy any securities or a solicitat ion of any vote or approval, nor shall there be any sale of securities in any jurisdiction in which such offer, solicitation or s al e would be unlawful prior to the registration or qualification under the securities laws of any such jurisdiction. No offer of securities shall b e m ade except by means of a prospectus meeting the requirements of Section 10 of the Securities Act of 1933, as amended. In connection with the Merger, the Company filed a registration statement on Form S - 4 with the SEC. The Company’s registration sta tement was declared effective by the SEC on August 26, 2019. The Company may file other documents with the SEC regarding the Merger. A definitive proxy statement/prospectus has been mailed to the shareholders of Shore. INVESTORS AND SEC URI TY HOLDERS ARE ADVISED TO READ THE PROXY STATEMENT/PROSPECTUS AND ANY OTHER RELEVANT DOCUMENTS FILED WITH THE SEC, AS WELL AS ANY AMENDMENTS OR SUPPLEMENTS TO SUCH DOCUMENTS, BECAUSE THEY CONTAIN IMPOR TAN T INFORMATION. Investors and security holders may obtain a free copy of the registration statement, including the proxy statement/prospectus, and other documents containing in for mation about the Company at the SEC’s website at www.sec.gov. Copies of these documents may also be obtained from the Company by directing a request to Robert F. Mangano, President and Chief Executive Officer, 1ST Constitution Bancorp, at 2650 Ro ute 130 North, P.O. Box 634, Cranbury, New Jersey 08512, telephone (609) 655 - 4500. This communication is not a solicitation of a proxy from any security holder of Shore. However, the Company, Shore, their res pec tive directors and executive officers, and other persons, may be deemed to be participants in the solicitation of proxies from Shore shareholders in respect of the Merger. Information regarding the directors and executive officers of the C omp any may be found in its definitive proxy statement relating to its 2019 Annual Meeting of Shareholders, which was filed with the SEC on April 19, 2019 and can be obtained free of charge from the SEC’s website at www.sec.gov or from the Co mpany by directing a request to Robert F. Mangano, President and Chief Executive Officer, 1STConstitution Bancorp, at 2650 Route 130 North, P.O. Box 634, Cranbury, New Jersey 08512, telephone (609) 655 - 4500. Information regarding the directors and executive officers of Shore may be found in its proxy statement relating to its 2019 Annual Meeting of Shareholders, which can be obtained free of charge from Robert T. English, President and Chief Executive Officer, Sho re Community Bank, 1012 Hooper Avenue, Toms River, New Jersey 08753, telephone (732) 240 - 5800. Other information regarding the participants in the proxy solicitation and a description of their direct and indirect interests, by se curity holdings or otherwise, is contained in the proxy statement/prospectus and other relevant materials filed with the SEC.
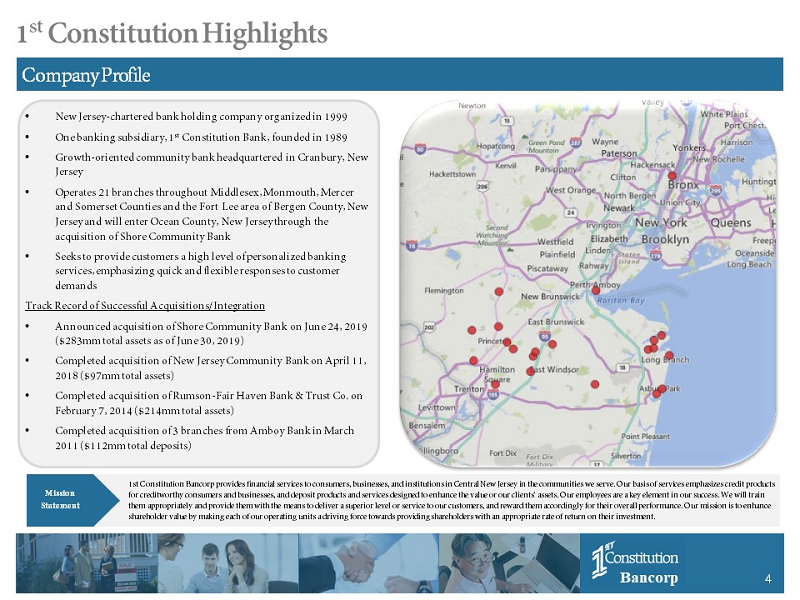
Bancorp 4 1 st Constitution Highlights Company Profile • New Jersey - chartered bank holding company organized in 1999 • One banking subsidiary, 1 st Constitution Bank, founded in 1989 • Growth - oriented community bank headquartered in Cranbury, New Jersey • Operates 21 branches throughout Middlesex , Monmouth, Mercer and Somerset Counties and the Fort Lee area of Bergen County, New Jersey and will enter Ocean County, New Jersey through the acquisition of Shore Community Bank • Seeks to provide customers a high level of personalized banking services, emphasizing quick and flexible responses to customer demands Track Record of Successful Acquisitions/Integration • Announced acquisition of Shore Community Bank on June 24, 2019 ($283mm total assets as of June 30, 2019) • Completed acquisition of New Jersey Community Bank on April 11, 2018 ($97mm total assets ) • Completed acquisition of Rumson - Fair Haven Bank & Trust Co. on February 7, 2014 ($214mm total assets) • Completed acquisition of 3 branches from Amboy Bank in March 2011 ($112mm total deposits ) Mission Statement 1st Constitution Bancorp provides financial services to consumers, businesses, and institutions in Central New Jersey in the com munities we serve. Our basis of services emphasizes credit products for creditworthy consumers and businesses, and deposit products and services designed to enhance the value or our clients' as set s . Our employees are a key element in our success. We will train them appropriately and provide them with the means to deliver a superior level or service to our customers, and reward them a cco rdingly for their overall performance . Our mission is to enhance shareholder value by making each of our operating units a driving force towards providing shareholders with an appropriate ra te of return on their investment.

Bancorp 5 Acquisition of Shore Community Bank Transaction Highlights Transaction Overview • Price / Tangible Book Value: 162% (1) • Price / LTM Earnings : 13.3x (1) • Price / 2020 Pro Forma Net Income: 10.0x (2) • $ 0.28 per share or 17.6% accretive to 2020E EPS (2) • $0.35 per share or 21.1% accretive to 2021E EPS (2) • TBV Impact : 13.1% dilution with crossover earn back of 4.7 years (2) • Anticipated Cost Savings: $2.8 million or 42.3%, pre tax (2) • Projected IRR over 18% (2) • Expected to close in the 4 th quarter of 2019 Transaction Rationale • Opportunity to acquire a high performing community bank operating in an attractive and stable market • Strategic acquisition that improves franchise value of FCCY’s strong footprint in central New Jersey • Compelling projected pro forma financial effects of the merger on 1 st Constitution • Provides significant loan and deposit growth opportunities and revenue expansion opportunities • SHRC has a 2018 ROAA of 1.45% and a 2018 ROAE of 13.62% • Builds upon FCCY’s 2014 acquisition of Rumson - Fair Haven Bank & Trust Company and FCCY’s 2018 acquisition of New Jersey Community Bank in Monmouth County (FCCY) 1 st Constitution Bancorp (SHRC) Shore Community Bank US Branches: Current US Branches: Current (1) Information obtained from the Form S - 4/A filed by 1st Constitution with the SEC on August 23, 2019 (2) Information obtained from the Investor Presentation dated June 24, 2019 and furnished as an exhibit to a Form 8 - K filed with the SEC on June 24, 2019
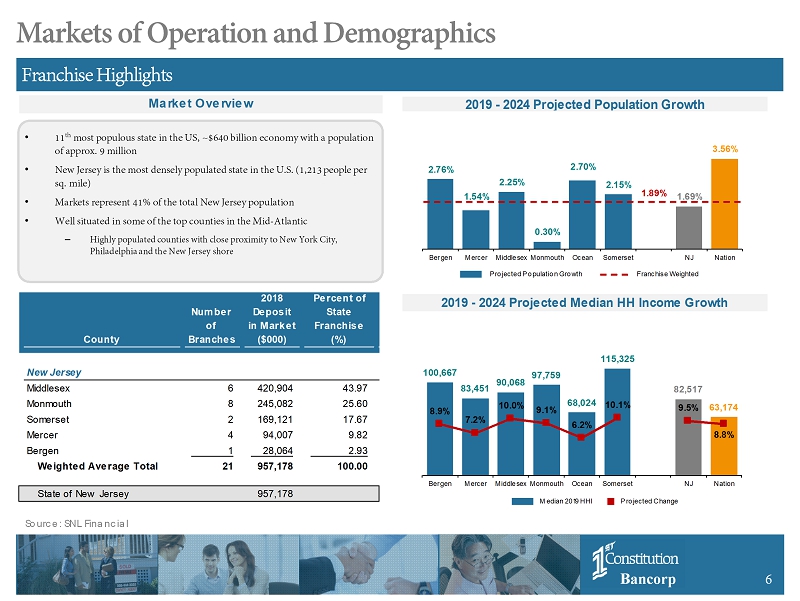
6 Bancorp 6 Median 2019 HHI Projected Change 63,174 82,517 115,325 68,024 97,759 90,068 83,451 100,667 8.8% 9.5% 10.1% 6.2% 9.1% 10.0% 7.2% 8.9% Nation NJ Somerset Ocean Monmouth Middlesex Mercer Bergen 2019 - 2024 Projected Population Growth 2019 - 2024 Projected Median HH Income Growth Markets of Operation and Demographics Franchise Highlights Source: SNL Financial • 11 th most populous state in the US, ~$640 billion economy with a population of approx. 9 million • New Jersey is the most densely populated state in the U.S. (1,213 people per sq. mile) • Markets represent 41% of the total New Jersey population • Well situated in some of the top counties in the Mid - Atlantic – Highly populated counties with close proximity to New York City, Philadelphia and the New Jersey shore 1.89% Projected Population Growth Franchise Weighted 3.56% 1.69% 2.15% 2.70% 0.30% 2.25% 1.54% 2.76% Nation NJ Somerset Ocean Monmouth Middlesex Mercer Bergen Market Overview 2018 Percent of Number Deposit State of in Market Franchise County Branches ($000) (%) New Jersey Middlesex 6 420,904 43.97 Monmouth 8 245,082 25.60 Somerset 2 169,121 17.67 Mercer 4 94,007 9.82 Bergen 1 28,064 2.93 Weighted Average Total 21 957,178 100.00 State of New Jersey 957,178
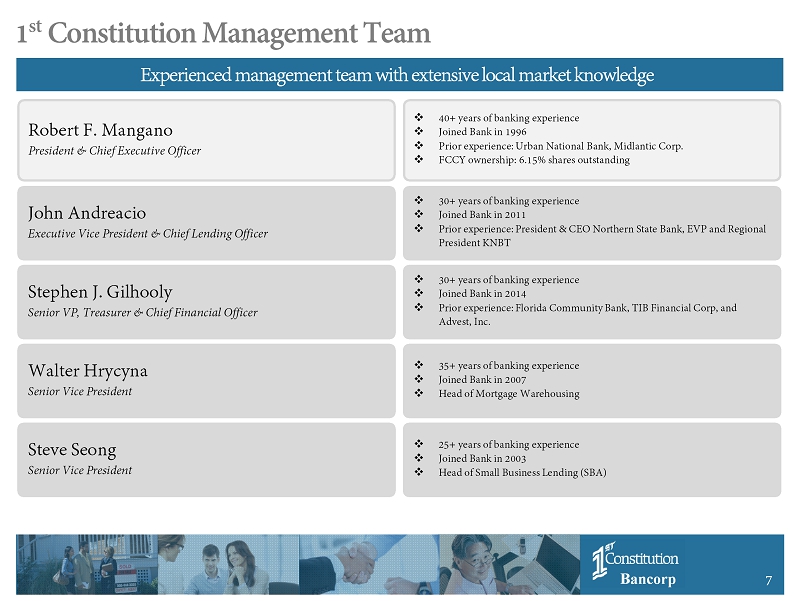
7 Bancorp 7 1 st Constitution Management Team Experienced management team with extensive local market knowledge Robert F. Mangano President & Chief Executive Officer □ 40+ years of banking experience □ Joined Bank in 1996 □ Prior experience: Urban National Bank, Midlantic Corp. □ FCCY ownership: 6.15% shares outstanding Stephen J. Gilhooly Senior VP, Treasurer & Chief Financial Officer □ 30+ years of banking experience □ Joined Bank in 2014 □ Prior experience: Florida Community Bank, TIB Financial Corp, and Advest, Inc. Walter Hrycyna Senior Vice President □ 35+ years of banking experience □ Joined Bank in 2007 □ Head of Mortgage Warehousing Steve Seong Senior Vice President □ 25+ years of banking experience □ Joined Bank in 2003 □ Head of Small Business Lending (SBA) John Andreacio Executive Vice President & Chief Lending Officer □ 30+ years of banking experience □ Joined Bank in 2011 □ Prior experience: President & CEO Northern State Bank, EVP and Regional President KNBT

8 Bancorp 8 1 st Constitution Management Team (Continued) Experienced management team with extensive local market knowledge Andrea Pagiazitis Senior Vice President □ 25+ years of banking experience □ Joined Bank in 1998 □ Head of Retail Banking Christina Barbaro Senior Vice President □ 25+ years of banking experience □ Joined Bank in 2010 □ Head of Deposit Operations Carol Strang Senior Vice President □ 2 5 + years of banking experience □ Joined Bank in 2016 □ Senior Credit Officer Dorine Nicol Senior Vice President □ 35 + years of banking experience □ Joined Bank in 2003 □ Director of Human Resources Donna Foster Senior Vice President □ 25+ years of banking experience □ Joined Bank in 2015 □ Chief Compliance Officer

9 Bancorp 9 Bancorp 9 Section 2 1 st Constitution Financial Summary
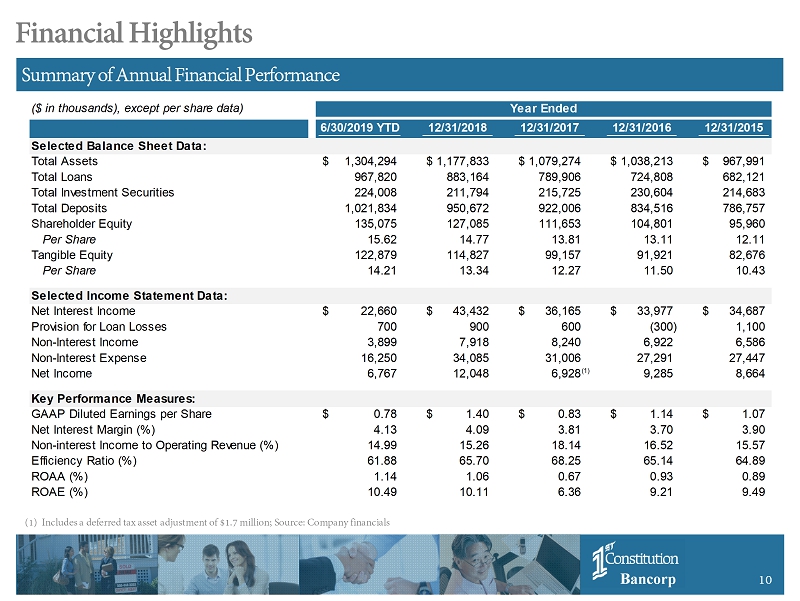
10 Bancorp 10 Financial Highlights (1) Includes a deferred tax asset adjustment of $1.7 million; Source: Company financials Summary of Annual Financial Performance ($ in thousands), except per share data) Year Ended 6/30/2019 YTD 12/31/2018 12/31/2017 12/31/2016 12/31/2015 Selected Balance Sheet Data: Total Assets 1,304,294$ 1,177,833$ 1,079,274$ 1,038,213$ 967,991$ Total Loans 967,820 883,164 789,906 724,808 682,121 Total Investment Securities 224,008 211,794 215,725 230,604 214,683 Total Deposits 1,021,834 950,672 922,006 834,516 786,757 Shareholder Equity 135,075 127,085 111,653 104,801 95,960 Per Share 15.62 14.77 13.81 13.11 12.11 Tangible Equity 122,879 114,827 99,157 91,921 82,676 Per Share 14.21 13.34 12.27 11.50 10.43 Selected Income Statement Data: Net Interest Income 22,660$ 43,432$ 36,165$ 33,977$ 34,687$ Provision for Loan Losses 700 900 600 (300) 1,100 Non-Interest Income 3,899 7,918 8,240 6,922 6,586 Non-Interest Expense 16,250 34,085 31,006 27,291 27,447 Net Income 6,767 12,048 6,928 9,285 8,664 Key Performance Measures: GAAP Diluted Earnings per Share 0.78$ 1.40$ 0.83$ 1.14$ 1.07$ Net Interest Margin (%) 4.13 4.09 3.81 3.70 3.90 Non-interest Income to Operating Revenue (%) 14.99 15.26 18.14 16.52 15.57 Efficiency Ratio (%) 61.88 65.70 68.25 65.14 64.89 ROAA (%) 1.14 1.06 0.67 0.93 0.89 ROAE (%) 10.49 10.11 6.36 9.21 9.49 (1)

11 Bancorp 11 ($ in thousands), except per share data) 6/30/2019 3/31/2019 6/30/2018 Linked Q ∆ YOY ∆ Selected Balance Sheet Data: Total Assets 1,304,294$ 1,191,477$ 1,229,512$ 9.5% 6.1% Total Loans 967,820 874,333 899,912 10.7% 7.5% Total Investment Securities 224,008 225,063 225,397 -0.5% -0.6% Total Deposits 1,021,834 995,205 956,787 2.7% 6.8% Shareholder Equity 135,075 131,207 120,348 2.9% 12.2% Per Share 15.62 15.24 14.36 2.5% 8.7% Tangible Equity 122,879 118,981 107,961 3.3% 13.8% Per Share 14.21 13.82 12.88 2.8% 10.3% Selected Income Statement Data: Net Interest Income 11,433$ 11,227$ 11,018$ 1.8% 3.8% Provision for Loan Losses 400 300 225 33.3% 77.8% Non-Interest Income 2,170 1,866 2,043 16.3% 6.2% Non-Interest Expense 8,566 8,094 10,251 5.8% -16.4% Net Income 3,370 3,397 1,871 -0.8% 80.1% Key Performance Measures: GAAP Diluted Earnings per Share 0.39$ 0.39$ 0.22$ -$ 0.17$ Net Interest Margin (%) 4.06 4.21 4.13 -15 bps -7 bps Non-interest Income to Operating Revenue (%) 15.82 14.13 15.48 169 bps 34 bps Efficiency Ratio (%) 62.46 61.27 77.68 119 bps -1522 bps ROAA (%) 1.10 1.16 0.65 -6 bps 45 bps ROAE (%) 10.22 10.60 6.36 -38 bps 386 bps Quarter Ended Financial Highlights Source: Company financials Summary of Quarterly Financial Performance

12 Bancorp 12 -20.0 0.0 20.0 40.0 60.0 80.0 100.0 120.0 140.0 160.0 180.0 8/28/14 8/28/15 8/28/16 8/28/17 8/28/18 8/28/19 Valuation Impact 3 - Year Total Shareholder Return -10.0 0.0 10.0 20.0 30.0 40.0 50.0 60.0 70.0 80.0 90.0 8/26/16 1/26/17 6/26/17 11/26/17 4/26/18 9/26/18 2/26/19 7/26/19 8/28/2019 8/28/2018 8/28/2014 Price: 16.98$ 21.30$ 8.95$ Market Cap ($M): 146.9$ 178.5$ 70.2$ 52-week Avg. Daily Volume: 10,072 13,589 4,592 Price/LTM EPS: 10.5x 22.9x 19.4x Price/Book Value: 108.7% 148.3% 86.0% Price/Tangible Book Value: 120.5% 166.5% 103.2% Dividend Yield 1.77% 1.10% 0.00% Shareholder Returns Summary Stockholder Information Source: SNL Financial; market data as of 8/28/2019 (1) Except 2013 & 2014; Declared a 6% stock dividend in 2006 & 2007 (2) Includes all major exchange (NYSE, NYSE American, NASDAQ) banks in SNL's coverage universe with $1B to $5B in total assets • Publicly traded on the NASDAQ (“FCCY”) • Ownership: – Fully Diluted Insider Ownership: 14.3% – Institutional Ownership: 36.1% (includes 10.6% mutual fund ownership) • Has declared a 5% stock dividend annually from 1999 - 2015 (1) • Declared first cash dividend of $0.05 in the 3 rd quarter of 2016 and later raised it to $0.06 in the 4 th quarter of 2017 and to $0.075 in the 3 rd quarter of 2018 FCCY 35.9% 0.0% SNL U.S. Bank $1B-$5B (2) 30.2% FCCY 97.4% 0.0% SNL U.S. Bank $1B-$5B (2) 69.3% 5 - Year Total Shareholder Return

13 Bancorp 13 Total Assets ($000) Total Loans ($000) Loan Portfolio Growth ($000) Total Deposits ($000) Total Equity ($000) $1,304,294 $1,177,833 $1,079,274 $1,038,213 $967,991 6/30/2019 2018 2017 2016 2015 YTD Year Ended $967,820 $883,164 $789,906 $724,808 $682,121 6/30/2019 2018 2017 2016 2015 YTD Year Ended $1,021,834 $950,672 $922,006 $834,516 $786,757 6/30/2019 2018 2017 2016 2015 YTD Year Ended $135,075 $127,085 $111,653 $104,801 $95,960 6/30/2019 2018 2017 2016 2015 YTD Year Ended Balance Sheet Trends Financial Highlights Source: SNL Financial

14 Bancorp 14 Yield on Loans (%) Noninterest-bearing Deposits / Deposits (%) 5.69% 5.38% 4.96% 4.77% 4.90% 6/30/2019 2018 2017 2016 2015 YTD Year Ended ($ in 000s) % of Loan Composition Balance Total Comm. RE 410,721 42.5% Mortgage Warehouse Lines 204,204 21.1% Cons. Loans 154,162 15.9% Comm. Business 118,481 12.2% Res. RE 58,241 6.0% Loans to Ind. 21,463 2.2% Other Loans 158 0.0% Total Gross Loans 967,430 Deferred Loan Costs, Net 390 Total Loans 967,820 Comm. RE 43% Mortgage Warehouse Lines 21 % Cons. Loans 16 % Comm. Business 12 % Res. RE 6 % Loans to Ind. 2 % Source: Company financials Conservative Loan Portfolio with Commercial Focus Balanced Loan Portfolio Loan Composition (%)
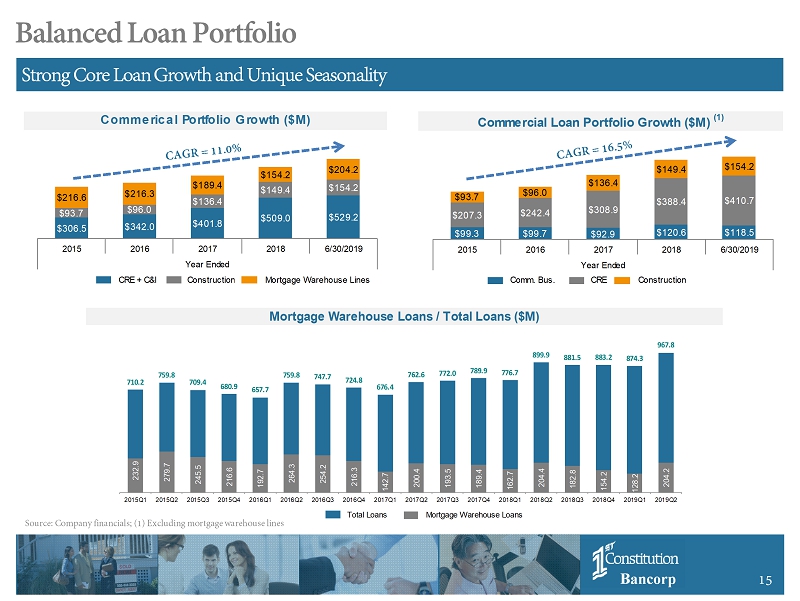
15 Bancorp 15 Comm. Bus. CRE Construction $99.3 $99.7 $92.9 $120.6 $118.5 $207.3 $242.4 $308.9 $388.4 $410.7 $93.7 $96.0 $136.4 $149.4 $154.2 2015 2016 2017 2018 6/30/2019 Year Ended CRE + C&I Construction Mortgage Warehouse Lines $306.5 $342.0 $401.8 $509.0 $529.2 $93.7 $96.0 $136.4 $149.4 $154.2 $216.6 $216.3 $189.4 $154.2 $204.2 2015 2016 2017 2018 6/30/2019 Year Ended Source: Company financials; (1) Excluding mortgage warehouse lines Strong Core Loan Growth and Unique Seasonality Balanced Loan Portfolio Commerical Portfolio Growth ($M) Total Loans Mortgage Warehouse Loans 232.9 279.7 245.5 216.6 192.7 264.3 254.2 216.3 142.7 200.4 193.5 189.4 162.7 204.4 182.8 154.2 128.2 204.2 710.2 759.8 709.4 680.9 657.7 759.8 747.7 724.8 676.4 762.6 772.0 789.9 776.7 899.9 881.5 883.2 874.3 967.8 2015Q1 2015Q2 2015Q3 2015Q4 2016Q1 2016Q2 2016Q3 2016Q4 2017Q1 2017Q2 2017Q3 2017Q4 2018Q1 2018Q2 2018Q3 2018Q4 2019Q1 2019Q2 Mortgage Warehouse Loans / Total Loans ($M) Commercial Loan Portfolio Growth ($M) (1)

16 Bancorp 16 Source: SNL Financial • Commercial real estate – Primarily owner occupied and income properties • Commercial business and SBA – Provide a variety of commercial loan services, including term loans, lines of credit, and loans secured by equipment and receivables – Purpose of the loans include working capital (inventory and receivables), business expansion (including acquisition and development of real estate and improvements) and the purchase of equipment and machinery – SBA – preferred lender designation • Construction – Principally residential single family and multi family • Mortgage Warehouse – Provides a revolving line of credit that is available to licensed mortgage banking companies – Originates one - to - four family residential mortgage loans that are pre - sold to the secondary mortgage market – On average, loans remain outstanding for a period of less than 30 days, with repayment coming directly from the sale of the l oan into the secondary mortgage market • Residential mortgage banking – Originate and sell into secondary market Summary of Lending Focus Loan Portfolio Overview
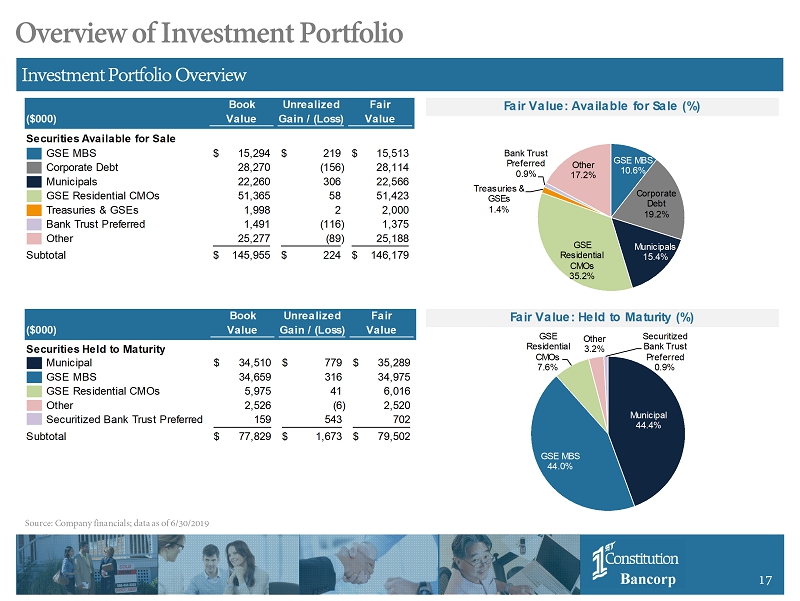
17 Bancorp 17 Book Unrealized Fair ($000) Value Gain / (Loss) Value Securities Held to Maturity Municipal 34,510$ 779$ 35,289$ GSE MBS 34,659 316 34,975 GSE Residential CMOs 5,975 41 6,016 Other 2,526 (6) 2,520 Securitized Bank Trust Preferred 159 543 702 Subtotal 77,829$ 1,673$ 79,502$ Book Unrealized Fair ($000) Value Gain / (Loss) Value Securities Available for Sale GSE MBS 15,294$ 219$ 15,513$ Corporate Debt 28,270 (156) 28,114 Municipals 22,260 306 22,566 GSE Residential CMOs 51,365 58 51,423 Treasuries & GSEs 1,998 2 2,000 Bank Trust Preferred 1,491 (116) 1,375 Other 25,277 (89) 25,188 Subtotal 145,955$ 224$ 146,179$ Overview of Investment Portfolio Source: Company financials; data as of 6/30/2019 Investment Portfolio Overview Fair Value: Available for Sale (%) Fair Value: Held to Maturity (%) GSE MBS 10.6% Corporate Debt 19.2% Municipals 15.4% GSE Residential CMOs 35.2% Treasuries & GSEs 1.4% Bank Trust Preferred 0.9% Other 17.2% Municipal 44.4% GSE MBS 44.0% GSE Residential CMOs 7.6% Other 3.2% Securitized Bank Trust Preferred 0.9%

18 Bancorp 18 Nonaccrual Loans / Total Loans (%) 0.88% 0.72% 0.90% 0.74% 0.41% 2015 2016 2017 2018 6/30/2019 Year Ended Valuation Impact Commerical Portfolio Growth ($M) Loan Composition (%) Market Overview 2019 - 2024 Projected Population Growth 2019 - 2024 Projected Median HH Income Growth Nonaccrual Oreo NCOs / Average Loans (%) NPAs Excl Restructured / Assets (%) Asset Quality 0.07% (0.03%) 0.01% 0.06% 0.10% 0.72% 0.52% 0.66% 0.77% 0.42% 2015 2016 2017 2018 6/30/2019 Year Ended $6.0 $5.2 $7.1 $6.5 $4.0 $1.0 $0.2 $2.5 $1.5 2015 2016 2017 2018 6/30/2019 Year Ended Asset Quality Asset Quality Source: SNL Financial $7.0 $5.4 $7.1 $9.0 $5.5 Conservative Credit Culture NPAs by Type ($M) Nonaccrual Loans / Total Loans
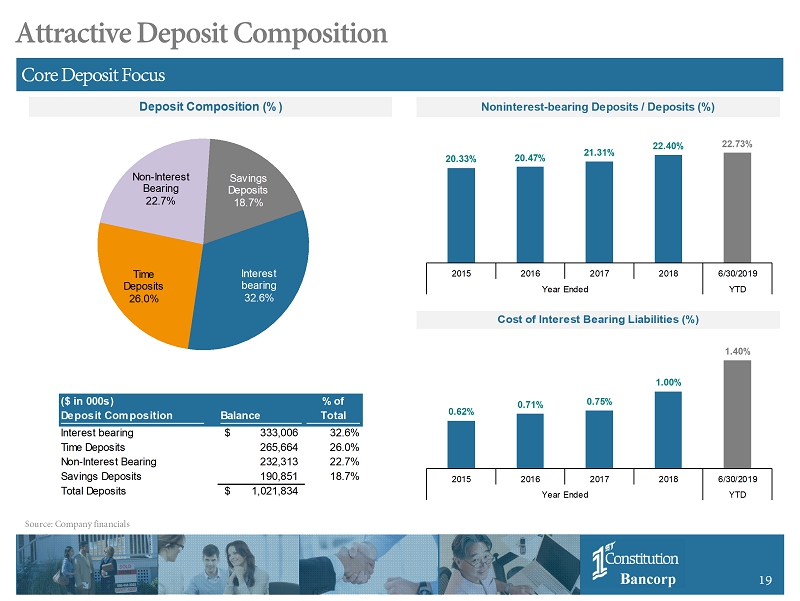
19 Bancorp 19 Cost of Interest Bearing Liabilities (%) Deposit Composition (%) Noninterest-bearing Deposits / Deposits (%) ($ in 000s) % of Deposit Composition Balance Total Interest bearing 333,006$ 32.6% Time Deposits 265,664 26.0% Non-Interest Bearing 232,313 22.7% Savings Deposits 190,851 18.7% Total Deposits 1,021,834$ Interest bearing 32.6% Time Deposits 26.0% Non - Interest Bearing 22.7% Savings Deposits 18.7% 22.73% 22.40% 21.31% 20.47% 20.33% 6/30/2019 2018 2017 2016 2015 YTD Year Ended Source: Company financials Core Deposit Focus Attractive Deposit Composition 1.40% 1.00% 0.75% 0.71% 0.62% 6/30/2019 2018 2017 2016 2015 YTD Year Ended
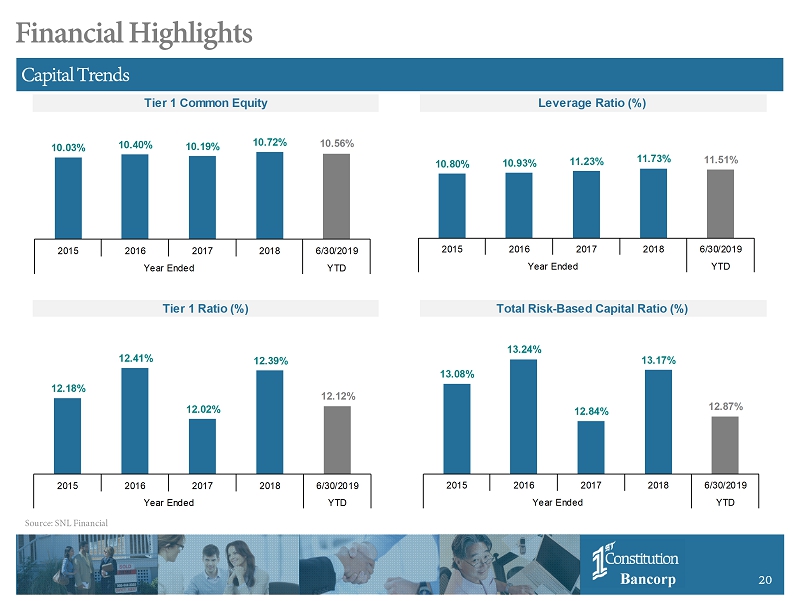
20 Bancorp 20 Tier 1 Common Equity Leverage Ratio (%) Tier 1 Ratio (%) Total Risk-Based Capital Ratio (%) 10.56% 10.72% 10.19% 10.40% 10.03% 6/30/2019 2018 2017 2016 2015 YTD Year Ended 11.51% 11.73% 11.23% 10.93% 10.80% 6/30/2019 2018 2017 2016 2015 YTD Year Ended 12.12% 12.39% 12.02% 12.41% 12.18% 6/30/2019 2018 2017 2016 2015 YTD Year Ended 12.87% 13.17% 12.84% 13.24% 13.08% 6/30/2019 2018 2017 2016 2015 YTD Year Ended Financial Highlights Source: SNL Financial Capital Trends

21 Bancorp 21 Net Interest Income ($000) Noninterest Expense ($000) Noninterest Income ($000) Net Income ($000) 32,439 31,944 30,741 27,291 27,447 273 2,141 265 6/30/2019 2018 2017 2016 2015 LTM Year Ended 8,240 6,922 6,586 6/30/2019 2018 2017 2016 2015 LTM Year Ended 14,091 12,048 6,928 9,285 8,664 191 1,573 188 (28) 1,712 6/30/2019 2018 2017 2016 2015 LTM Year Ended 45,395 43,432 36,165 33,977 34,687 6/30/2019 2018 2017 2016 2015 LTM Year Ended 7,918 14,236 8,828 32,712 31,006 34,085 13,363 7,889 (230) (46) (230) (46) Source: SNL Financial Income Statement Trends Financial Highlights Adjusted for Merger Expense Deferred Tax Asset Revaluation Gain on Bargain Purchase
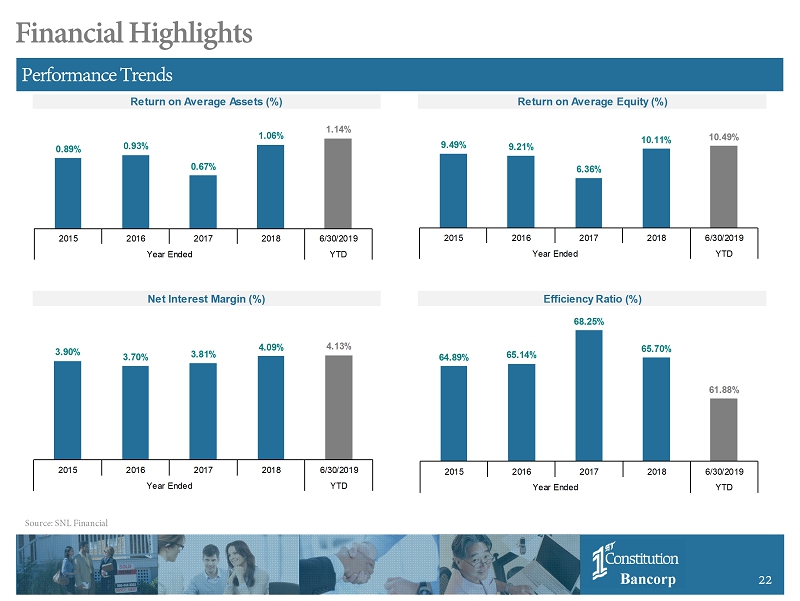
22 Bancorp 22 Return on Average Assets (%) Return on Average Equity (%) Net Interest Margin (%) Efficiency Ratio (%) 1.14% 1.06% 0.67% 0.93% 0.89% 6/30/2019 2018 2017 2016 2015 YTD Year Ended 10.49% 10.11% 6.36% 9.21% 9.49% 6/30/2019 2018 2017 2016 2015 YTD Year Ended 4.13% 4.09% 3.81% 3.70% 3.90% 6/30/2019 2018 2017 2016 2015 YTD Year Ended 61.88% 65.70% 68.25% 65.14% 64.89% 6/30/2019 2018 2017 2016 2015 YTD Year Ended Source: SNL Financial Performance Trends Financial Highlights

23 Bancorp 23 Full Suite of Online Banking and Mobile Delivery Systems Focus on Technology Consumer Online Banking Services Business Online Banking Consumer Mobile Banking Business Mobile Banking • Bill payments • Account alerts • E - statements • Transfer funds • Review account activity • Open new account • Zelle • Real Time Alerts – Advises of any changes in account activity by instantly sending a message via text, email, or to the customer’s Online Banking message center • 1stconstitution.com – main website • 1stconstitutiondirect.com – internet bank • m omentummortgage.com – residential mortgage • Offers full online banking functionality to customers from their mobile devices • Can be accessed by downloading the 1st Constitution mobile app on a mobile device or tablet • Deposit checks from mobile device • Mobile Wallet – Pay with your debit card from mobile device • Card Valet – manage your debit card by setting spending limits or block your card if lost or stolen • Zelle • Real Time Alerts – Advises of any changes in account activity by instantly sending a message via text, email, or to the customer’s Online Banking message center • Text Fraud Alerts – Monitors suspicious activity of the customer’s debit card • Online Cash Management – Originate wire transfers and ACH, place stop payments and view account activity • EZ Deposit (remote deposit capture) • Bill Payment (pay bills online) • Positive Pay (fraud detection) by matching checks issued by a customer against checks presented for payment • Offers all of the functionalities of business online banking to business customers from their mobile devices • Can be accessed by downloading the Cash Manager app on a mobile device or tablet • Deposit checks from mobile device

Bancorp 24 24

25 Bancorp 25 Summary • Experienced management team with extensive in - market experience • Significant insider ownership by management and directors • Each line of business managed by experienced and trained professionals who have been at the Company for an average of 10 years • Internal audit, compliance, BSA, and loan review functions overseen in - house by trained and experienced, full - time employees • Focus on credit quality • Attractive market demographics and growth opportunities • Low cost, core deposit franchise • Diversified loan portfolio • Strong historical record of profitability • High return to shareholders through increasing dividends • Shareholder and customer focus • Successful acquirer/integrator of banks/branches

26 Bancorp 26 Bancorp 26 Appendix
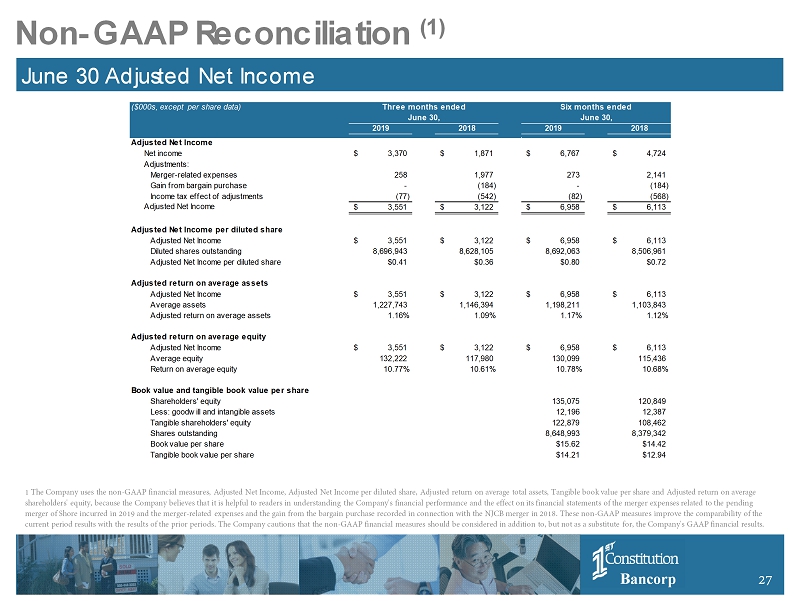
27 Bancorp 27 Non - GAAP Reconciliation (1) June 30 Adjusted Net Income ($000s, except per share data) 2019 2018 2019 2018 Adjusted Net Income Net income 3,370$ 1,871$ 6,767$ 4,724$ Adjustments: Merger-related expenses 258 1,977 273 2,141 Gain from bargain purchase - (184) - (184) Income tax effect of adjustments (77) (542) (82) (568) Adjusted Net Income 3,551$ 3,122$ 6,958$ 6,113$ Adjusted Net Income per diluted share Adjusted Net Income 3,551$ 3,122$ 6,958$ 6,113$ Diluted shares outstanding 8,696,943 8,628,105 8,692,063 8,506,961 Adjusted Net Income per diluted share $0.41 $0.36 $0.80 $0.72 Adjusted return on average assets Adjusted Net Income 3,551$ 3,122$ 6,958$ 6,113$ Average assets 1,227,743 1,146,394 1,198,211 1,103,843 Adjusted return on average assets 1.16% 1.09% 1.17% 1.12% Adjusted return on average equity Adjusted Net Income 3,551$ 3,122$ 6,958$ 6,113$ Average equity 132,222 117,980 130,099 115,436 Return on average equity 10.77% 10.61% 10.78% 10.68% Book value and tangible book value per share Shareholders' equity 135,075 120,849 Less: goodwill and intangible assets 12,196 12,387 Tangible shareholders' equity 122,879 108,462 Shares outstanding 8,648,993 8,379,342 Book value per share $15.62 $14.42 Tangible book value per share $14.21 $12.94 June 30, June 30, Three months ended Six months ended 1 The Company uses the non - GAAP financial measures, Adjusted Net Income, Adjusted Net Income per diluted share, Adjusted return on average total assets, Tangible book value per share and Adjusted return on average shareholders' equity, because the Company believes that it is helpful to readers in understanding the Company's financial per for mance and the effect on its financial statements of the merger expenses related to the pending merger of Shore incurred in 2019 and the merger - related expenses and the gain from the bargain purchase recorded in connection with the NJCB merger in 2018. These non - GAAP measures improve the comparability of the current period results with the results of the prior periods. The Company cautions that the non - GAAP financial measures should b e considered in addition to, but not as a substitute for, the Company's GAAP financial results.
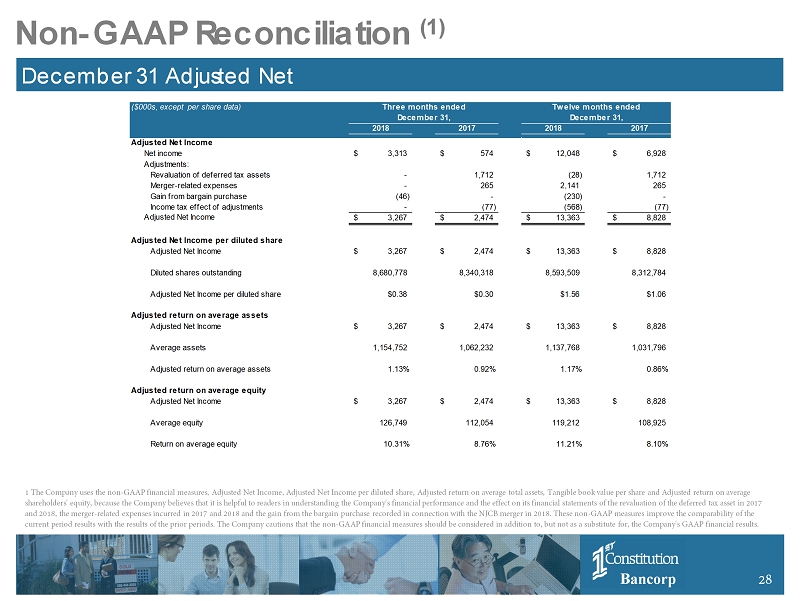
28 Bancorp 28 ($000s, except per share data) 2018 2017 2018 2017 Adjusted Net Income Net income 3,313$ 574$ 12,048$ 6,928$ Adjustments: Revaluation of deferred tax assets - 1,712 (28) 1,712 Merger-related expenses - 265 2,141 265 Gain from bargain purchase (46) - (230) - Income tax effect of adjustments - (77) (568) (77) Adjusted Net Income 3,267$ 2,474$ 13,363$ 8,828$ Adjusted Net Income per diluted share Adjusted Net Income 3,267$ 2,474$ 13,363$ 8,828$ Diluted shares outstanding 8,680,778 8,340,318 8,593,509 8,312,784 Adjusted Net Income per diluted share $0.38 $0.30 $1.56 $1.06 Adjusted return on average assets Adjusted Net Income 3,267$ 2,474$ 13,363$ 8,828$ Average assets 1,154,752 1,062,232 1,137,768 1,031,796 Adjusted return on average assets 1.13% 0.92% 1.17% 0.86% Adjusted return on average equity Adjusted Net Income 3,267$ 2,474$ 13,363$ 8,828$ Average equity 126,749 112,054 119,212 108,925 Return on average equity 10.31% 8.76% 11.21% 8.10% December 31, December 31, Three months ended Twelve months ended Non - GAAP Reconciliation (1) December 31 Adjusted Net Income 1 The Company uses the non - GAAP financial measures, Adjusted Net Income, Adjusted Net Income per diluted share, Adjusted return on average total assets, Tangible book value per share and Adjusted return on average shareholders' equity, because the Company believes that it is helpful to readers in understanding the Company's financial performance and the effect on its financial statements of the revaluation of the deferred tax asset in 2017 and 2018, the merger - related expenses incurred in 2017 and 2018 and the gain from the bargain purchase recorded in connection with the NJCB merger in 2018. These non - GAAP measures improve the comparability of the current period results with the results of the prior periods. The Company cautions that the non - GAAP financial measures should be considered in additio n to, but not as a substitute for, the Company's GAAP financial results.