UNITED STATES
SECURITIES AND EXCHANGE COMMISSION
Washington, D.C. 20549
SECURITIES AND EXCHANGE COMMISSION
Washington, D.C. 20549
FORM N-CSR
CERTIFIED SHAREHOLDER REPORT OF REGISTERED
MANAGEMENT INVESTMENT COMPANIES
Investment Company Act file number 811-10401
Trust for Professional Managers
(Exact name of registrant as specified in charter)
(Exact name of registrant as specified in charter)
615 East Michigan Street
Milwaukee, WI 53202
(Address of principal executive offices) (Zip code)
(Address of principal executive offices) (Zip code)
Jay Fitton
U.S. Bancorp Fund Services, LLC
615 East Michigan Street
Milwaukee, WI 53202
(Name and address of agent for service)
(Name and address of agent for service)
(513) 629-8104
Registrant's telephone number, including area code
Date of fiscal year end: May 31, 2020
Date of reporting period: November 30, 2019
Item 1. Reports to Stockholders.

BARRETT GROWTH FUND
Semi-Annual Report
November 30, 2019
BARRETT
GROWTH FUND
| Letter to | Dear Shareholders: |
| Shareholders | |
| November 30, 2019 | The Six Month Period in Review |
| As soon as the fall season began, the stock market changed direction and headed south with a particularly sharp decline in October. Since the market had not experienced a monthly decline of that size since late 2011, it seemed to startle investors. Although it is always difficult to pinpoint the reason for the market’s change in direction, we think it is centered on global issues such as trade disagreements with China and slowing growth in Europe. Since the market has been increasing since 2009 with only sporadic bouts of small decline, investors are currently reassessing global growth risks. | |
Investment Outlook | |
| We continue to expect stocks to outpace bonds and cash over the longer term, particularly since the yield on bonds and cash remain relatively low. As we have written in the past, the short and intermediate term outlook for stocks is always trickier to predict. | |
| As we said in our annual report for the year ended in May, short term concerns will revolve around rising U.S. interest rates and trade issues. Up until a few weeks ago, financial markets were convinced that the Federal Reserve (“Fed”) would follow through with additional increases in short rates in 2019. However, with the economic weakness in Europe and China and some signs of weakness in the U.S. housing market, investors now believe the Fed will hike rates once more, but then reevaluate their 2019 projections. The trade issues have not only made investors nervous but corporations as well. It appears that some companies are putting selective capital spending programs on hold until they have more clarity on tariffs and other trade restrictions. The tariffs that have been enacted and others that are set to be enacted are sure to increase inflation and slow global trade. It remains unclear how severe these trade issues will prove to be, but the underlying global tensions of heightened nationalistic pressures are negatively affecting investor sentiment. | |
| The intermediate term outlook, through 2019 and into 2020, is more focused on whether global economic growth will simply slow or contract. The U.S. is in a mature cyclical recovery, but the new tax bill and additional fiscal spending remain catalysts for a continuation of this very slow but prolonged economic recovery. Europe has slowed recently and the political headwinds in the U.K. and France are worsening. We do not expect a contraction in 2019, but a return to more sluggish global growth during both years. | |
| The market is likely to continue weighing positive corporate earnings and dividend increases against bond yields. One benefit to slowing economic growth is that bond yields may not rise to the levels previously expected. In fact, the 10 year U.S. Treasury bond yield has fallen recently as growth expectations have moderated. The trend in earnings will be most important as 2019 ends, and here again the outlook is mixed as labor costs continue to rise. As a result, we expect stock returns to be positive over the next year, but most likely in the single digit range. | |
The Portfolio | |
| The Barrett Growth Fund (the “Fund”) remains diversified by economic sector and industry. Relative to the S&P 500 Index, the Fund is most overweighted in Technology |
1
BARRETT
GROWTH FUND
| and Health Care, and most underweighted in Financials, Energy and Consumer Staples. The primary reason for the relative weighting differences is that the Fund focuses on companies with the most open ended growth opportunities, which are most evident in the Technology and Medical Technology areas. |
| Top Ten Holdings (Percent of Net Assets)* | Sector Weightings (Percent of Total Investments)* | |||||||
| 1. | Microsoft Corp. | 5.84 | % | 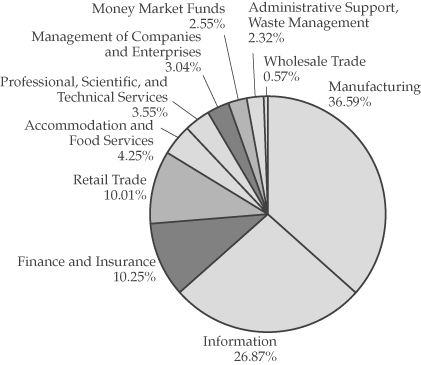 | ||||
| 2. | Visa, Inc. – Class A | 4.95 | % | |||||
| 3. | Apple, Inc. | 4.48 | % | |||||
| 4. | Amazon.com, Inc. | 4.23 | % | |||||
| 5. | Tetra Tech, Inc. | 3.55 | % | |||||
| 6. | PayPal Holdings, Inc. | 3.26 | % | |||||
| 7. | Thermo Fisher Scientific, Inc. | 3.16 | % | |||||
| 8. | JPMorgan Chase & Co. | 3.09 | % | |||||
| 9. | The Walt Disney Co. | 3.05 | % | |||||
| 10. | Accenture PLC – Class A | 3.04 | % | |||||
| * | Portfolio characteristics are as of November 30, 2019, and are subject to change at any time. |
| We are enthusiastic about the prospects of the companies in the Fund. We expect most of the holdings to increase their dividends at healthy rates going forward. Most of the companies in the Fund have strong balance sheets, which allow the companies to expand operations, increase dividends and opportunistically repurchase stock. | |
Performance | |
| The Fund gained +13.31% during the six-month period ended November 30, 2019. The Lipper Large-Cap Growth Funds Index gained +14.02% during this period, and the S&P 500 Index posted a total return of +15.26%. The best performing sectors in the S&P 500 Index were Health Care, Consumer Staples and Utilities. The weakest performing sectors were Energy, Materials and Information Technology. The Fund was overweighted in Health Care but underweighted in Consumer Staples and Utilities. The Fund was also overweighted in Technology, but underweighted in Energy. As a result the sector weightings tended to balance one another off. | |
| In the Fund, Health Care companies that contributed positively to performance included Thermo Fisher Scientific Inc., Zoetis Inc., Danaher Corp., and Johnson & Johnson. Although the Consumer Staples sector was underweighted, Costco Wholesale Corp. helped with a gain of 17% in the quarter. Other positive contributors to performance were Starbucks Corp., Dunkin Brands Group Inc., Verisk Analytics Inc., TJX Companies Inc., Ecolab Inc., Visa Inc., Walt Disney Co., and Microsoft Corp. On the negative side, Alibaba Group Holding Ltd., BlackRock Inc., ICU Medical Inc., Facebook, John Bean Technologies Corp., Blackbaud Inc., and TransUnion declined in value. |
2
BARRETT
GROWTH FUND
| Thank you for choosing the Barrett Growth Fund. |
 |  | |
Robert J. Milnamow | E. Wells Beck, CFA | |
Lead Portfolio Manager | Portfolio Manager |
| Past performance is not a guarantee of future results. | |
The outlook, views, and opinions presented are those of the Adviser as of November 30, 2019. These are not intended to be a forecast of future events, a guarantee of future results, or investment advice. | |
| Diversification does not assure a profit nor protect against loss in a declining market. | |
| Earnings growth is not representative of the Fund’s future performance. | |
| Must be preceded or accompanied by a prospectus. | |
| Mutual fund investing involves risk. Principal loss is possible. Foreign investments are subject to special risks not ordinarily associated with U.S. securities including currency fluctuations and social, economic and political uncertainties, which could increase volatility. These risks are magnified in emerging markets. The Fund may also invest in smaller and mid-capitalization companies, which involve a higher degree of risk and volatility than investments in larger, more established companies. The Fund may also invest in derivatives, such as options and futures, which can be illiquid, may disproportionately increase losses, and have a potentially large impact on Fund performance. | |
The S&P 500 Index is a capitalization-weighted index of five hundred large capitalization stocks, which is designed to measure broad domestic securities markets. The performance of the S&P 500 Index reflects the reinvestment of dividends and capital gains, but does not reflect the deduction of any investment advisory fees. | |
The Lipper Large-Cap Growth Funds Index is an equally-weighted performance index, adjusted for capital gains distributions and income dividends, of the 30 largest mutual funds within the Growth Funds category as reported by Lipper. | |
An index is unmanaged. Investors cannot invest directly in an index. | |
Fund holdings and sector allocations are subject to change and should not be considered a recommendation to buy or sell any security. For a complete list of portfolio holdings, please refer to the Schedule of Investments provided in this report. | |
The Barrett Growth Fund is distributed by Quasar Distributors, LLC. |
3
BARRETT
GROWTH FUND
Expense Example – November 30, 2019 (Unaudited)
As a shareholder of the Fund, you incur ongoing costs, including: investment advisory fees; distribution and service (12b-1) fees; and other Fund expenses. This example is intended to help you understand your ongoing costs (in dollars) of investing in the Fund and to compare these costs with the ongoing costs of investing in other mutual funds.
The example is based on an investment of $1,000 invested at the beginning of the period and held for the entire six-month period (June 1, 2019 – November 30, 2019).
Actual Expenses
The first line of the table below provides information about actual account values and actual expenses. However, the table does not include shareholder specific fees such as the $15.00 fee charged for wire redemptions. The table also does not include portfolio trading commissions and related trading costs, which are included in the Fund’s net asset value. You may use the information in this line, together with the amount you invested, to estimate the expenses that you paid over the period. Simply divide your account value by $1,000 (for example, an $8,600 account value divided by $1,000 = 8.6), then multiply the result by the number in the first line under the heading entitled “Expenses Paid During the Period” to estimate the expenses you paid on your account during this period.
Hypothetical Example for Comparison Purposes
The second line of the table below provides information about hypothetical account values and hypothetical expenses based on the Fund’s actual net expense ratio and an assumed rate of return of 5% per year before expenses, which is not the Fund’s actual return. The hypothetical account values and expenses may not be used to estimate the actual ending account balance or expenses you paid for the period. You may use this information to compare the ongoing costs of investing in the Fund with other funds. To do so, compare this 5% hypothetical example with the 5% hypothetical examples that appear in the shareholder reports of the other funds.
Please note that the expenses shown in the table are meant to highlight your ongoing costs only and do not reflect any transactional costs, such as sales charges (loads), redemption fees, or exchange fees, which, although not charged by the Fund, may be charged by other funds. Therefore, the second line of the table is useful in comparing ongoing costs only, and will not help you determine the relative costs of owning different funds.
| Expenses Paid | |||
| Beginning | Ending | During the Period* | |
| Account Value | Account Value | June 1, 2019 to | |
June 1, 2019 | November 30, 2019 | November 30, 2019 | |
Actual | $1,000.00 | $1,133.10 | $6.67 |
Hypothetical | |||
(5% return before expenses) | $1,000.00 | $1,018.75 | $6.31 |
* | Expenses are equal to the Fund’s annualized expense ratio of 1.25% (which reflects the effect of the Adviser’s fee waiver and expense limitation agreement), multiplied by the average account value over the period, multiplied by 183/366 (to reflect the one-half year period). |
4
BARRETT
GROWTH FUND
(Unaudited)
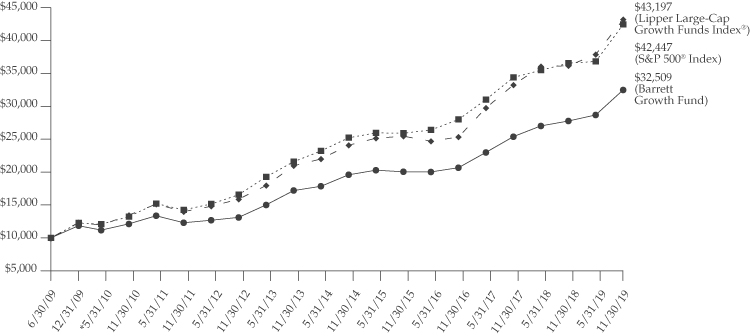
* On March 30, 2010, the Fund changed its fiscal year end from June 30th to May 31st. |
This chart assumes an initial gross investment of $10,000 made on 6/30/2009. |
The S&P 500® Index is a capitalization-weighted index of five hundred large capitalization stocks, which is designed to measure broad domestic securities markets. |
The Lipper Large-Cap Growth Funds Index® is an equally-weighted performance index, adjusted for capital gains distributions and income dividends, of the 30 largest mutual funds within the Growth Funds category, as reported by Lipper. |
| Average Annual Total Returns as of November 30, 2019 | |||||||
One Year | Three Year | Five Year | Ten Year | ||||
–●– | Barrett Growth Fund | 17.07% | 16.28% | 10.66% | 11.00% | ||
--■-- | S&P 500® Index | 16.11% | 14.88% | 10.98% | 13.44% | ||
| –◆– | Lipper Large-Cap | ||||||
Growth Funds Index® | 19.46% | 19.46% | 12.39% | 13.72% | |||
RETURNS SHOWN INCLUDE THE REINVESTMENT OF ALL DIVIDENDS AND DISTRIBUTIONS. RETURNS SHOWN DO NOT REFLECT THE DEDUCTION OF TAXES THAT A SHAREHOLDER WOULD PAY ON FUND DISTRIBUTIONS OR THE REDEMPTION OF FUND SHARES. IN THE ABSENCE OF FEE WAIVERS AND REIMBURSEMENTS, TOTAL RETURN WOULD BE REDUCED. PAST PERFORMANCE IS NOT PREDICTIVE OF FUTURE PERFORMANCE. INVESTMENT RETURN AND PRINCIPAL VALUE WILL FLUCTUATE, SO THAT YOUR SHARES, WHEN REDEEMED, MAY BE WORTH MORE OR LESS THAN THEIR ORIGINAL COST. |
5
BARRETT
GROWTH FUND
Schedule of Investments
November 30, 2019 (Unaudited)
| Shares | Value | ||||||
| COMMON STOCKS - 97.46% | |||||||
| Administrative and | |||||||
| Support Services - 5.58% | |||||||
8,000 | TransUnion | $ | 690,480 | ||||
9,000 | PayPal Holdings, Inc. (a) | 972,090 | |||||
1,662,570 | |||||||
| Amusement, Gambling, | |||||||
| and Recreation | |||||||
| Industries - 3.05% | |||||||
6,000 | The Walt Disney Co. | 909,480 | |||||
| Beverage and | |||||||
| Tobacco Product | |||||||
| Manufacturing - 1.40% | |||||||
1,500 | PepsiCo, Inc. | 203,745 | |||||
4,000 | The Coca-Cola Co. | 213,600 | |||||
417,345 | |||||||
| Chemical | |||||||
| Manufacturing - 10.19% | |||||||
4,000 | Ecolab, Inc. | 746,680 | |||||
4,000 | Johnson & Johnson | 549,960 | |||||
6,000 | Merck & Co., Inc. | 523,080 | |||||
1,500 | Regeneron | ||||||
Pharmaceuticals, Inc. (a) | 553,500 | ||||||
5,500 | Zoetis, Inc. | 662,860 | |||||
3,036,080 | |||||||
| Clothing and Clothing | |||||||
| Accessories Stores - 2.77% | |||||||
13,500 | The TJX Companies, Inc. | 825,255 | |||||
| Computer and | |||||||
| Electronic Product | |||||||
| Manufacturing - 16.83% | |||||||
600 | Alphabet, Inc. - Class A (a) | 782,454 | |||||
551 | Alphabet, Inc. - Class C (a) | 719,033 | |||||
5,000 | Apple, Inc. | 1,336,250 | |||||
5,500 | Danaher Corp. | 802,890 | |||||
2,000 | NVIDIA Corp. | 433,480 | |||||
3,000 | Thermo Fisher Scientific, Inc. | 941,850 | |||||
5,015,957 | |||||||
| Credit Intermediation and | |||||||
| Related Activities - 9.70% | |||||||
4,500 | First Republic Bank | 494,550 | |||||
7,000 | JPMorgan Chase & Co. | 922,320 | |||||
8,000 | Visa, Inc. - Class A | 1,476,080 | |||||
2,892,950 | |||||||
| Data Processing, Hosting | |||||||
| and Related Services - 4.76% | |||||||
6,000 | Fidelity National Information | ||||||
Services, Inc. | 828,900 | ||||||
4,000 | Verisk Analytics, Inc. | 589,920 | |||||
1,418,820 | |||||||
| Electrical Equipment, | |||||||
| Appliance, and Component | |||||||
| Manufacturing - 1.53% | |||||||
6,500 | EnerSys, Inc. | 456,105 | |||||
| Food Services and | |||||||
| Drinking Places - 6.56% | |||||||
9,000 | Dunkin’ Brands Group, Inc. | 688,950 | |||||
3,000 | McDonald’s Corp. | 583,440 | |||||
8,000 | Starbucks Corp. | 683,440 | |||||
1,955,830 | |||||||
The accompanying notes are an integral part of these financial statements.
6
BARRETT
GROWTH FUND
Schedule of Investments (Cont’d)
November 30, 2019 (Unaudited)
| Shares | Value | ||||||
| General Merchandise | |||||||
| Stores - 3.02% | |||||||
3,000 | Costco Wholesale Corp. | $ | 899,430 | ||||
| Insurance Carriers and | |||||||
| Related Activities - 3.50% | |||||||
2,750 | Berkshire Hathaway, Inc. - | ||||||
Class B (a) | 605,825 | ||||||
6,000 | Progressive Corp. | 438,300 | |||||
1,044,125 | |||||||
| Merchant Wholesalers, | |||||||
| Durable Goods - 0.57% | |||||||
1,000 | 3M Co. | 169,770 | |||||
| Miscellaneous | |||||||
| Manufacturing - 2.06% | |||||||
3,000 | Stryker Corp. | 614,580 | |||||
| Nonstore Retailers - 4.23% | |||||||
700 | Amazon.com, Inc. (a) | 1,260,560 | |||||
| Other Information | |||||||
| Services - 4.04% | |||||||
4,000 | Alibaba Group Holding Ltd. - | ||||||
ADR (a) | 800,000 | ||||||
2,000 | Facebook, Inc. - Class A (a) | 403,280 | |||||
1,203,280 | |||||||
| Petroleum and Coal Products | |||||||
| Manufacturing - 0.79% | |||||||
2,000 | Chevron Corp. | 234,260 | |||||
| Professional, Scientific, and | |||||||
| Technical Services - 8.08% | |||||||
4,500 | Accenture PLC - Class A (b) | 905,220 | |||||
12,000 | Tetra Tech, Inc. | 1,059,480 | |||||
2,000 | Waters Corp. (a) | 444,140 | |||||
2,408,840 | |||||||
| Publishing Industries | |||||||
| (except Internet) - 6.81% | |||||||
3,500 | Blackbaud, Inc. | 290,080 | |||||
11,500 | Microsoft Corp. | 1,740,870 | |||||
2,030,950 | |||||||
| Securities, Commodity | |||||||
| Contracts, and Other | |||||||
| Financial Investments and | |||||||
| Related Activities - 1.99% | |||||||
1,200 | BlackRock, Inc. | 593,892 | |||||
Total Common Stocks | |||||||
(Cost $13,464,482) | 29,050,079 | ||||||
| SHORT-TERM INVESTMENTS - 2.55% | |||||||
| Money Market Funds - 2.55% | |||||||
759,896 | Fidelity Investments | ||||||
Government Portfolio - | |||||||
Class I, 1.530% (c) | 759,896 | ||||||
Total Short-Term Investments | |||||||
(Cost $759,896) | 759,896 | ||||||
| Total Investments | |||||||
| (Cost $14,224,378) - 100.01% | 29,809,975 | ||||||
| Liabilities in Excess | |||||||
| of Other Assets - (0.01)% | (2,926 | ) | |||||
| Total Net Assets - 100.00% | $ | 29,807,049 | |||||
ADR | American Depository Receipt |
PLC | Public Limited Company |
| (a) | Non-income producing security. |
| (b) | Foreign issued security. |
| (c) | Seven day yield as of November 30, 2019. |
The accompanying notes are an integral part of these financial statements.
7
BARRETT
GROWTH FUND
Statement of Assets and Liabilities
November 30, 2019 (Unaudited)
| ASSETS | ||||
| Investments, at value (cost $14,224,378) | $ | 29,809,975 | ||
| Dividends and interest receivable | 33,138 | |||
| Other assets | 12,713 | |||
| Total assets | 29,855,826 | |||
| LIABILITIES | ||||
| Payable for distribution fees | 4,844 | |||
| Payable to affiliates | 14,538 | |||
| Payable to Adviser | 9,854 | |||
| Accrued expenses and other liabilities | 19,541 | |||
| Total liabilities | 48,777 | |||
| NET ASSETS | $ | 29,807,049 | ||
| NET ASSETS CONSIST OF: | ||||
| Paid-in capital | $ | 13,605,185 | ||
| Total distributable earnings | 16,201,864 | |||
| Net Assets | $ | 29,807,049 | ||
| Shares of beneficial interest outstanding | ||||
| (unlimited number of shares authorized, $0.001 par value) | 1,263,873 | |||
Net asset value, redemption price and offering price per share | $ | 23.58 | ||
The accompanying notes are an integral part of these financial statements.
8
BARRETT
GROWTH FUND
Statement of Operations
For the Six Months Ended November 30, 2019 (Unaudited)
| INVESTMENT INCOME | ||||
| Dividend income | $ | 133,759 | ||
| Interest income | 14,598 | |||
| Total investment income | 148,357 | |||
| EXPENSES | ||||
| Advisory fees | 142,374 | |||
| Administration fees | 19,836 | |||
| Fund accounting fees | 14,050 | |||
| Distribution fees | 13,645 | |||
| Federal and state registration fees | 12,158 | |||
| Transfer agent fees and expenses | 10,863 | |||
| Legal fees | 10,575 | |||
| Audit and tax fees | 8,592 | |||
| Chief Compliance Officer fees and expenses | 6,877 | |||
| Trustees’ fees and related expenses | 4,473 | |||
| Reports to shareholders | 3,843 | |||
| Custody fees | 2,562 | |||
| Other expenses | 2,812 | |||
| Total expenses | 252,660 | |||
| Less waivers and reimbursement by Adviser (Note 4) | (74,693 | ) | ||
| Net expenses | 177,967 | |||
Net investment loss | (29,610 | ) | ||
| REALIZED AND UNREALIZED GAIN ON INVESTMENTS | ||||
| Net realized loss from investments | (62,351 | ) | ||
| Change in net unrealized appreciation on investments | 3,586,749 | |||
| Net realized and unrealized gain on investments | 3,524,398 | |||
| Net increase in net assets from operations | $ | 3,494,788 | ||
The accompanying notes are an integral part of these financial statements.
9
BARRETT
GROWTH FUND
Statements of Changes in Net Assets
| Six Months Ended | ||||||||
| November 30, 2019 | Year Ended | |||||||
| (Unaudited) | May 31, 2019 | |||||||
| FROM OPERATIONS | ||||||||
| Net investment loss | $ | (29,610 | ) | $ | (21,937 | ) | ||
| Net realized gain (loss) on investments | (62,351 | ) | 1,413,288 | |||||
| Net change in unrealized appreciation on investments | 3,586,749 | 164,618 | ||||||
| Net increase in net assets from operations | 3,494,788 | 1,555,969 | ||||||
| FROM DISTRIBUTIONS | ||||||||
| Net dividends and distributions | — | (803,257 | ) | |||||
| Net decrease in net assets resulting from distributions paid | — | (803,257 | ) | |||||
| FROM CAPITAL SHARE TRANSACTIONS | ||||||||
| Proceeds from shares sold | 420,708 | 341,073 | ||||||
| Net asset value of shares issued to shareholders | ||||||||
| in payment of distributions declared | — | 803,154 | ||||||
| Cost of shares redeemed | (287,400 | ) | (1,471,214 | ) | ||||
| Net increase in net assets resulting | ||||||||
| from capital share transactions | 133,308 | (326,987 | ) | |||||
| TOTAL INCREASE IN NET ASSETS | 3,628,096 | 425,725 | ||||||
| NET ASSETS | ||||||||
| Beginning of period | 26,178,953 | 25,753,228 | ||||||
| End of period | $ | 29,807,049 | $ | 26,178,953 | ||||
The accompanying notes are an integral part of these financial statements.
10
BARRETT
GROWTH FUND
Financial Highlights
Per share data for a share of capital stock outstanding for the entire period and selected information for each period are as follows:
| Six Months | ||||||||||||||||||||||||
| Ended | ||||||||||||||||||||||||
| November 30, | ||||||||||||||||||||||||
| 2019 | Years Ended May 31, | |||||||||||||||||||||||
| (Unaudited) | 2019 | 2018 | 2017 | 2016 | 2015 | |||||||||||||||||||
| NET ASSET VALUE | ||||||||||||||||||||||||
| Beginning of period | $ | 20.81 | $ | 20.30 | $ | 18.10 | $ | 15.78 | $ | 16.01 | $ | 14.11 | ||||||||||||
| OPERATIONS | ||||||||||||||||||||||||
Net investment income (loss)1 | (0.02 | ) | (0.02 | ) | (0.01 | ) | 0.05 | 0.01 | 0.02 | |||||||||||||||
| Net realized and unrealized | ||||||||||||||||||||||||
| gains (losses) on securities | 2.79 | 1.17 | 3.12 | 2.29 | (0.22 | ) | 1.91 | |||||||||||||||||
| Total from investment operations | 2.77 | 1.15 | 3.11 | 2.34 | (0.21 | ) | 1.93 | |||||||||||||||||
| LESS DISTRIBUTIONS | ||||||||||||||||||||||||
| Distributions from | ||||||||||||||||||||||||
| net investment income | — | — | (0.05 | ) | (0.02 | ) | (0.02 | ) | (0.03 | ) | ||||||||||||||
| Distributions from net | ||||||||||||||||||||||||
| realized gains on investments | — | (0.64 | ) | (0.86 | ) | — | — | — | ||||||||||||||||
| Total distributions paid | — | (0.64 | ) | (0.91 | ) | (0.02 | ) | (0.02 | ) | (0.03 | ) | |||||||||||||
| NET ASSET VALUE | ||||||||||||||||||||||||
| End of period | $ | 23.58 | $ | 20.81 | $ | 20.30 | $ | 18.10 | $ | 15.78 | $ | 16.01 | ||||||||||||
Total return2 | 13.31 | % | 6.17 | % | 17.51 | % | 14.82 | % | -1.28 | % | 13.70 | % | ||||||||||||
Net assets at end of period | ||||||||||||||||||||||||
(000s omitted) | $ | 29,807 | $ | 26,179 | $ | 25,753 | $ | 21,826 | $ | 19,528 | $ | 19,530 | ||||||||||||
| RATIO OF EXPENSES TO | ||||||||||||||||||||||||
| AVERAGE NET ASSETS | ||||||||||||||||||||||||
Before expense reimbursement3 | 1.77 | % | 1.81 | % | 1.90 | % | 2.00 | % | 2.00 | % | 2.02 | % | ||||||||||||
After expense reimbursement3 | 1.25 | % | 1.25 | % | 1.25 | % | 1.25 | % | 1.25 | % | 1.25 | % | ||||||||||||
| RATIO OF NET INVESTMENT | ||||||||||||||||||||||||
| INCOME (LOSS) TO | ||||||||||||||||||||||||
| AVERAGE NET ASSETS | ||||||||||||||||||||||||
Before expense reimbursement3 | (0.73 | )% | (0.64 | )% | (0.71 | )% | (0.45 | )% | (0.67 | )% | (0.65 | )% | ||||||||||||
After expense reimbursement3 | (0.21 | )% | (0.08 | )% | (0.06 | )% | 0.30 | % | 0.08 | % | 0.12 | % | ||||||||||||
Portfolio turnover rate2 | 6 | % | 16 | % | 20 | % | 39 | % | 34 | % | 37 | % | ||||||||||||
1 | Net investment income (loss) per share represents net investment income (loss) divided by the daily average shares of beneficial interest outstanding throughout each period. |
2 | Not annualized for periods less than one year. |
3 | Annualized for periods less than one year. |
The accompanying notes are an integral part of these financial statements.
11
BARRETT
GROWTH FUND
Notes to the Financial Statements
November 30, 2019 (Unaudited)
| 1. | Organization | Trust for Professional Managers (the “Trust”) was organized as a Delaware statutory trust under a Declaration of Trust dated May 29, 2001. The Trust is registered under the Investment Company Act of 1940, as amended (the “1940 Act”), as an open-end, management investment company. The Barrett Growth Fund (the “Fund”) represents a distinct diversified series with its own investment objective and policies within the Trust. The investment objective of the Fund is to achieve long-term capital appreciation and to maximize after-tax returns. The Trust may issue an unlimited number of shares of beneficial interest at $0.001 par value. The assets of the Fund are segregated, and a shareholder’s interest is limited to the fund in which shares are held. The Fund commenced operations on December 29, 1998 as a series of The Barrett Funds. On March 30, 2010, the Fund reorganized as a series of the Trust and changed its fiscal year end from June 30th to May 31st. Effective April 29, 2011, Barrett Asset Management, LLC (the “Adviser”) began serving as the investment adviser to the Fund. Prior to April 29, 2011, Barrett Associates, Inc., a wholly-owned subsidiary of Legg Mason, Inc., a financial services holding company, served as the investment adviser to the Fund. |
The Fund is an investment company and accordingly follows the investment company accounting and reporting guidance of the Financial Accounting Standards Board (“FASB”) Accounting Standards Codification Topic 946 “Financial Services — Investment Companies”. | ||
| 2. | Significant | The following is a summary of significant accounting policies consistently followed by the Fund in the preparation of the financial |
| Accounting | statements. These policies are in conformity with generally accepted accounting principles in the United States of America (“GAAP”). | |
| Policies | ||
a) Investment Valuation | ||
Each security owned by the Fund that is listed on a securities exchange, except for securities listed on the NASDAQ Stock Market LLC (“NASDAQ”), is valued at its last sale price on the exchange on the date as of which assets are valued. When the security is listed on more than one exchange, the Fund will use the price of the exchange that the Fund generally considers to be the principal exchange on which the stock is traded. | ||
Fund securities listed on NASDAQ will be valued at the NASDAQ Official Closing Price (“NOCP”), which may not necessarily represent the last sale price. If the NOCP is not available, such securities shall be valued at the last sale price on the day of valuation. If there has been no sale on such exchange or on NASDAQ on such day, the security is valued at (i) the mean between the most recent quoted bid and asked prices at the close of the exchange on such day or (ii) the latest sales price on the Composite Market for the day such security is |
12
BARRETT
GROWTH FUND
being valued. “Composite Market” means a consolidation of the trade information provided by national securities and foreign exchanges and over-the-counter markets as published by a pricing service. When market quotations are not readily available, any security or other asset is valued at its fair value as determined under procedures approved by the Trust’s Board of Trustees. These fair value procedures will also be used to price a security when corporate events, events in the securities market or world events cause the Adviser to believe that a security’s last sale price may not reflect its actual fair market value. The intended effect of using fair value pricing procedures is to ensure that the Fund is accurately priced. The Board of Trustees will regularly evaluate whether the Fund’s fair value pricing procedures continue to be appropriate in light of the specific circumstances of the Fund and the quality of prices obtained through their application by the Trust’s valuation committee. | ||
In the case of foreign securities, the occurrence of certain events after the close of foreign markets, but prior to the time the Fund’s net asset value (“NAV”) is calculated (such as a significant surge or decline in the U.S. or other markets) often will result in an adjustment to the trading prices of foreign securities when foreign markets open on the following business day. If such events occur, the Fund will value foreign securities at fair value, taking into account such events, in calculating the NAV. In such cases, use of fair valuation can reduce an investor’s ability to seek to profit by estimating the Fund’s NAV in advance of the time the NAV is calculated. | ||
Exchange traded options are valued at the composite price, using the National Best Bid and Offer quotes (“NBBO”). NBBO consists of the highest bid price and lowest ask price across any of the exchanges on which an option is quoted, thus providing a view across the entire U.S. options marketplace. Specifically, composite pricing looks at the last trades on the exchanges where the options are traded. If there are no trades for the option on a given business day, composite option pricing calculates the mean of the highest bid price and lowest ask price across the exchanges where the option is traded. Option contracts on securities, currencies and other financial instruments traded in the OTC market with less than 180 days remaining until their expiration are valued at the evaluated price provided by the broker-dealer with which the option was traded. Option contracts on securities, currencies and other financial instruments traded in the OTC market with 180 days or more remaining until their expiration are valued at the prices provided by a recognized independent broker-dealer. | ||
Redeemable securities issued by open-end, registered investment companies are valued at the NAVs of such companies for purchase and/or redemption orders placed on that day. If, on a particular day, a share of an investment company is not listed on NASDAQ, such security’s fair value will be determined. Money market mutual funds are valued at cost. If cost does not represent current market value the securities will be priced at fair value. |
13
BARRETT
GROWTH FUND
FASB Accounting Standards Codification, “Fair Value Measurements and Disclosures” Topic 820 (“ASC 820”), establishes an authoritative definition of fair value and sets out a hierarchy for measuring fair value. ASC 820 requires an entity to evaluate certain factors to determine whether there has been a significant decrease in volume and level of activity for the security such that recent transactions and quoted prices may not be determinative of fair value and further analysis and adjustment may be necessary to estimate fair value. ASC 820 also requires enhanced disclosure regarding the inputs and valuation techniques used to measure fair value in those instances as well as expanded disclosure of valuation levels for each class of investments. These inputs are summarized in the three broad levels listed below: |
Level 1 – | Quoted prices in active markets for identical securities. | ||
Level 2 – | Other significant observable inputs (including quoted prices for similar securities, interest rates, prepayment speeds, credit risk, etc.). | ||
Level 3 – | Significant unobservable inputs (including the Fund’s own assumptions in determining the fair value of investments). |
The inputs or methodology used for valuing securities are not necessarily an indication of the risk associated with investing in those securities. The following is a summary of the inputs used to value the Fund’s investments carried at fair value as of November 30, 2019: |
| Level 1 | Level 2 | Level 3 | Total | |||||||||||||||
| Assets: | ||||||||||||||||||
| Equity | ||||||||||||||||||
Common Stocks(1) | $ | 29,050,079 | $ | — | $ | — | $ | 29,050,079 | ||||||||||
| Total Equity | 29,050,079 | — | — | 29,050,079 | ||||||||||||||
| Short-Term Investments | 759,896 | — | — | 759,896 | ||||||||||||||
| Total Investments in Securities | $ | 29,809,975 | $ | — | $ | — | $ | 29,809,975 | ||||||||||
(1) See the Schedule of Investments for industry classifications. | ||||||||||||||||||
The Fund measures Level 3 activity as of the end of the period. For the period ended November 30, 2019, the Fund did not have any significant unobservable inputs (Level 3 securities) used in determining fair value. Therefore, a reconciliation of assets in which significant unobservable inputs (Level 3) were used in determining fair value is not applicable. | ||
b) Federal Income Taxes | ||
The Fund intends to comply with the requirements of Subchapter M of the Internal Revenue Code of 1986, as amended, necessary to qualify as a regulated investment company and to make the requisite distributions of income and capital gains to its shareholders sufficient to relieve it from all or substantially all federal income taxes. Therefore, no federal income tax provision has been provided. |
14
BARRETT
GROWTH FUND
As of and during the year ended May 31, 2019, the Fund did not have a liability for any unrecognized tax benefits. The Fund recognizes interest and penalties, if any, related to uncertain tax benefits as income tax expense in the Statement of Operations. During the fiscal year, the Fund did not incur any interest or penalties. The Fund is not subject to examination by U.S. taxing authorities for tax periods prior to the year ended May 31, 2016. | ||
c) Distributions to Shareholders | ||
The Fund will distribute any net investment income and any net realized long- or short-term capital gains, if any, at least annually. Distributions from net realized gains for book purposes may include short-term capital gains. All short-term capital gains are included in ordinary income for tax purposes. Distributions to shareholders are recorded on the ex-dividend date. The Fund may also pay a special distribution at the end of the calendar year to comply with federal tax requirements. The Fund may make additional distributions if it deems it desirable at another time during the year. | ||
d) Use of Estimates | ||
The preparation of financial statements in conformity with GAAP requires management to make estimates and assumptions that affect the reported amounts of assets and liabilities and disclosure of contingent assets and liabilities at the date of the financial statements and the reported amounts of revenues and expenses during the reporting period. Actual results could differ from those estimates. | ||
e) Share Valuation | ||
The NAV per share of the Fund is calculated by dividing the sum of the value of the securities held by the Fund, plus cash or other assets, minus all liabilities (including estimated accrued expenses) by the total number of shares outstanding for the Fund, rounded to the nearest cent. The Fund’s shares will not be priced on the days on which the New York Stock Exchange (“NYSE”) is closed for trading. | ||
f) Expenses | ||
Expenses associated with a specific fund in the Trust are charged to that fund. Common expenses are typically allocated evenly between the funds of the Trust, or by other equitable means. | ||
g) Other | ||
Investment transactions are recorded on the trade date. The Fund determines the gain or loss from investment transactions on the identified cost basis by comparing the cost of the security lot sold with the net sales proceeds. Dividend income, less foreign withholding tax, is recognized on the ex-dividend date and interest income is recognized on an accrual basis. Withholding taxes on foreign dividends and interest, net of any reclaims, have been provided for in accordance with the Fund’s understanding of the applicable country’s tax rules and rates. |
15
BARRETT
GROWTH FUND
| 3. | Federal Tax | The tax character of distributions paid during the years ended May 31, 2019 and May 31, 2018 was as follows: |
| Matters |
| May 31, 2019 | May 31, 2018 | |||||||||
Ordinary Income | $ | — | $ | 66,266 | ||||||
Long-Term Capital Gain | $ | 803,257 | $ | 1,036,600 | ||||||
The components of accumulated earnings (losses) on a tax basis as of May 31, 2019 were as follows: |
Cost basis of investments for federal | ||||||
income tax purposes | $ | 14,210,634 | ||||
Gross tax unrealized appreciation | $ | 12,248,445 | ||||
Gross tax unrealized depreciation | (264,039 | ) | ||||
Net tax unrealized appreciation | 11,984,406 | |||||
Undistributed ordinary income | — | |||||
Undistributed long-term capital gain | 727,024 | |||||
Distributable earnings | 727,024 | |||||
Other accumulated losses | (4,354 | ) | ||||
Total distributable earnings | $ | 12,707,076 | ||||
The differences between book-basis and tax-basis unrealized appreciation and depreciation is primarily attributable to the tax deferral of losses on wash sales. | ||
At May 31, 2019, the Barrett Growth Fund deferred, on a tax basis, late year losses of $4,354. | ||
GAAP requires that certain components of net assets relating to permanent differences be reclassified between financial and tax reporting. These reclassifications have no effect on net assets or NAV per share. For the year ended May 31, 2019, the following reclassifications were made for permanent tax differences on the Statement of Assets and Liabilities: |
Total Distributable Earnings | $ | 17,583 | ||||
Paid-In Capital | $ | (17,583 | ) |
| 4. | Investment | The Trust has an Investment Advisory Agreement (the “Agreement”) with the Adviser to furnish investment advisory services to the Fund. |
| Adviser | Under the terms of the Agreement, the Trust, on behalf of the Fund, compensates the Adviser for its management services at the | |
annual rate of 1.00% of the Fund’s average daily net assets. | ||
The Adviser has contractually agreed to waive its management fee and/or reimburse the Fund’s other expenses at least through September 28, 2020, at the discretion of the Adviser and the Board of Trustees, to the extent necessary to ensure that the Fund’s total operating expenses (exclusive of front-end or contingent deferred sales loads, taxes, leverage (i.e., any expenses incurred in connection with borrowings made by the Fund), interest, brokerage commissions, expenses incurred in connection with any merger or |
16
BARRETT
GROWTH FUND
reorganization, dividends or interest on short positions, acquired fund fees and expenses and extraordinary expenses such as litigation) do not exceed 1.25% (the “Expense Limitation Cap”) of the Fund’s average daily net assets. For the six months ended November 30, 2019, the Fund waived expenses of $74,693 which were reimbursed by the Adviser. Any such waiver or reimbursement is subject to later adjustment to allow the Adviser to recoup amounts waived or reimbursed; provided, however, that the Adviser shall only be entitled to recoup such amounts for three years from the date such fees and expenses were waived or reimbursed, if such recoupment will not cause the Fund to exceed the lesser of: (1) the Expense Limitation Cap in place at the time of the waiver and/or expense payment; or (2) the Expense Limitation Cap in place at the time of the recoupment. During the six months ended November 30, 2019, $74,049 of previously waived expenses subject to recovery expired. | ||
The following table shows the remaining waived or reimbursed expenses subject to potential recovery expiring during the fiscal year ending: |
May 31, 2020 | $ | 77,485 | ||||
May 31, 2021 | $ | 153,043 | ||||
May 31, 2022 | $ | 145,867 | ||||
November 30, 2022 | $ | 74,693 |
| 5. | Distribution | The Trust adopted a plan pursuant to Rule 12b-1 (the “12b-1 Plan”), on behalf of the Fund, which authorizes it to pay Quasar |
| Plan | Distributors, LLC (the “Distributor”) a distribution fee of up to 0.25% of the Fund’s average daily net assets for services | |
to prospective Fund shareholders and distribution of Fund shares. During the six months ended November 30, 2019, the Fund incurred expenses of $13,645 pursuant to the 12b-1 Plan. As of November 30, 2019, the Fund owed the Distributor $4,844 in fees. | ||
| 6. | Related Party | U.S. Bancorp Fund Services, LLC, doing business as U.S. Bank Global Fund Services (“Fund Services” or the “Administrator”), acts as |
| Transactions | the Fund’s administrator under an Administration Agreement. The Administrator prepares various federal and state regulatory filings, reports and returns for the Fund; prepares reports and materials to be supplied to the Trustees; monitors the activities of the Fund’s custodian, transfer agent and fund accountant; coordinates the preparation and payment of the Fund’s expenses; and reviews the Fund’s expense accruals. Fund Services also serves as the fund accountant and transfer agent to the Fund. U.S. Bank National Association (“US Bank”), an affiliate of Fund Services, serves as the Fund’s custodian. Fees and expenses incurred for the six months ended November 30, 2019, and owed as of November 30, 2019 are as follows: |
| Incurred | Owed | |||||||||
Administration | $ | 19,836 | $ | 3,133 | ||||||
Fund accounting | $ | 14,050 | $ | 4,676 | ||||||
Transfer agency | $ | 10,863 | $ | 3,524 | ||||||
Custody | $ | 2,562 | $ | 825 | ||||||
17
BARRETT
GROWTH FUND
The Distributor acts as the Fund’s principal underwriter in a continuous public offering of the Fund’s shares. The Distributor is an affiliate of Fund Services and US Bank. | ||
Certain officers of the Fund are also employees of Fund Services. A Trustee of the Trust is affiliated with Fund Services and US Bank. This same Trustee is an interested person of the Distributor. | ||
The Trust’s Chief Compliance Officer is also an employee of Fund Services. For the six months ended November 30, 2019, the Fund was allocated $6,877 of the Trust’s Chief Compliance Officer fee. At November 30, 2019, the Fund owed fees of $2,380 for the Chief Compliance Officer’s services. |
| 7. | Capital Share | Transactions in shares of the Fund were as follows: | ||||||||
| Transactions | Six Months Ended | |||||||||
| November 30, 2019 | Year Ended | |||||||||
| (Unaudited) | May 31, 2019 | |||||||||
| Shares Sold | 18,759 | 16,536 | ||||||||
| Shares Reinvested | — | 44,769 | ||||||||
| Shares Redeemed | (12,777 | ) | (71,833 | ) | ||||||
| Net Increase/(Decrease) | 5,982 | (10,528 | ) | |||||||
| 8. | Investment | The aggregate purchases and sales of securities, excluding short-term investments, for the Fund for the six months ended November |
| Transactions | 30, 2019, were $2,862,187 and $1,751,928, respectively. For the six months ended November 30, 2019, there were no purchases or sales of U.S. government securities for the Fund. | |
| 9. | Subsequent | On December 20, 2019, the Fund declared and paid distributions to shareholders of record as of December 19, 2019, as follows: |
| Event |
| Ordinary | Short-Term | Long-Term | |||
Income | Capital Gains | Capital Gains | |||
| $ — | $ — | $727,034 |
In preparing these financial statements, the Fund has evaluated events and transactions for potential recognition or disclosure through the date the financial statements were issued. On November 25, 2019, U.S. Bancorp, the parent company of Quasar Distributors, LLC (“Quasar”), the Fund’s distributor, announced that it had signed a purchase agreement to sell Quasar to Foreside Financial Group, LLC (“Foreside”) such that Quasar will become a wholly-owned broker-dealer subsidiary of Foreside. The transaction is expected to close by the end of March 2020. Quasar will remain the Fund’s distributor at the close of the transaction, subject to Board approval. |
18
BARRETT
GROWTH FUND
BASIS FOR TRUSTEES’ APPROVAL OF INVESTMENT ADVISORY AGREEMENT
The Board of Trustees (the “Trustees”) of Trust for Professional Managers (the “Trust”) met on July 22, 2019 to consider the renewal of the Investment Advisory Agreement (the “Agreement”) between the Trust, on behalf of the Barrett Growth Fund (the “Fund”), a series of the Trust, and Barrett Asset Management, LLC, the Fund’s investment adviser (the “Adviser”). The Trustees also met at a prior meeting held on June 13, 2019 (the “June 13, 2019 Meeting”) to review materials related to the renewal of the Agreement. Prior to these meetings, the Trustees requested and received materials to assist them in considering the renewal of the Agreement. The materials provided contained information with respect to the factors enumerated below, including a copy of the Agreement, a memorandum prepared by the Trust’s outside legal counsel discussing in detail the Trustees’ fiduciary obligations and the factors they should assess in considering the renewal of the Agreement, detailed comparative information relating to the Fund’s performance, as well as the management fees and other expenses of the Fund, due diligence materials relating to the Adviser (including a due diligence questionnaire completed on behalf of the Fund by the Adviser, the Adviser’s Form ADV, select financial statements of the Adviser, bibliographic information of the Adviser’s key management and compliance personnel, comparative fee information for the Fund and the Adviser’s other separately-managed accounts and a summary detailing key provisions of the Adviser’s written compliance program, including its code of ethics) and other pertinent information. The Trustees also received information periodically throughout the year that was relevant to the Agreement renewal process, including performance, management fee and other expense information. Based on their evaluation of the information provided by the Adviser, in conjunction with the Fund’s other service providers, the Trustees, by a unanimous vote (including a separate vote of the Trustees who are not “interested persons,” as that term is defined in the Investment Company Act of 1940, as amended (the “Independent Trustees”)), approved the continuation of the Agreement for an additional one-year term ending August 31, 2020.
DISCUSSION OF FACTORS CONSIDERED
In considering the renewal of the Agreement and reaching their conclusions, the Trustees reviewed and analyzed various factors that they determined were relevant, including the factors enumerated below.
| 1. | NATURE, EXTENT AND QUALITY OF SERVICES PROVIDED TO THE FUND |
The Trustees considered the nature, extent and quality of services provided by the Adviser to the Fund and the amount of time devoted to the Fund’s affairs by the Adviser’s staff. The Trustees considered the Adviser’s specific responsibilities in all aspects of day-to-day management of the Fund, as well as the qualifications, experience and responsibilities of Robert J. Milnamow, E. Wells Beck and Owen W. Gilmore, the Fund’s portfolio managers, and other key personnel at the Adviser involved in the day-to-day activities of the Fund. The Trustees reviewed the information provided by the Adviser in a due diligence summary, including the structure of the Adviser’s compliance program and discussed the Adviser’s marketing activity and its continuing commitment to the Fund. The Trustees noted that during the course of the prior year they had met with the Adviser in person to discuss various performance, marketing and compliance issues. The Trustees also noted any services that extended beyond portfolio management, and they considered the brokerage practices of the Adviser. The Trustees discussed in detail the Adviser’s handling of compliance matters, including the reports of the Trust’s chief compliance officer to the Trustees on the effectiveness of the Adviser’s compliance program. The
19
BARRETT
GROWTH FUND
Trustees concluded that the Adviser had sufficient quality and depth of personnel, resources, investment methods and compliance policies and procedures essential to performing its duties under the Agreement and that the nature, overall quality and extent of the management services provided to the Fund, as well as the Adviser’s compliance program, were satisfactory and reliable.
| 2. | INVESTMENT PERFORMANCE OF THE FUND AND THE ADVISER |
The Trustees discussed the performance of the Fund for the year-to-date, one-year, three-year, five-year and ten-year periods ended April 30, 2019. In assessing the quality of the portfolio management services delivered by the Adviser, the Trustees also compared the short-term and longer-term performance of the Fund on both an absolute basis and in comparison to the Fund’s benchmark index, the S&P 500® Index, and in comparison to a peer group of U.S. open-end large growth funds in the Fund’s current Morningstar category as constructed by data presented by Morningstar Direct (the “Morningstar Peer Group”). The Trustees also reviewed information on the historical performance of a composite of other separately-managed equity only accounts of the Adviser that are similar to the Fund in terms of investment strategy.
The Trustees noted the Fund’s performance for the five-year period ended April 30, 2019 was above the Morningstar Peer Group median, and that the Fund’s performance for the one-year period ended April 30, 2019 was equal to the Morningstar Peer Group median. The Trustees also noted the Fund’s performance for each of the year-to-date, three-year and ten-year periods ended April 30, 2019 was below the Morningstar Peer Group median. The Trustees also reviewed the Fund’s performance for the quarter, one-year, three-year, five-year, ten-year and since inception periods ended March 31, 2019. The Trustees noted the Fund outperformed the S&P 500® Index for the quarter and one-year periods ended March 31, 2019, but that the Fund’s performance lagged the S&P 500® Index for the three-year, five-year, ten-year and since inception periods ended March 31, 2019. The Trustees reviewed the Fund’s performance relative to the Adviser’s composite of other separately-managed equity only accounts managed with investment strategies substantially similar to the Fund and noted the Adviser attributed any differences in performance for the periods reviewed to the Fund’s more growth-oriented investment strategy, specific stock selection and higher concentration of holdings in the Fund’s portfolio.
After considering all of the information, the Trustees concluded that the performance obtained by the Adviser for the Fund was satisfactory under current market conditions. Although past performance is not a guarantee or indication of future results, the Trustees determined that the Fund and its shareholders were likely to benefit from the Adviser’s continued management.
| 3. | COSTS OF SERVICES PROVIDED AND PROFITS REALIZED BY THE ADVISER |
The Trustees considered the cost of services and the structure of the Adviser’s fees, including a review of the expense analyses and other pertinent material with respect to the Fund. The Trustees reviewed the related statistical information and other materials provided, including the comparative expenses, expense components and peer group selections. The Trustees considered the cost structure of the Fund relative to the Morningstar Peer Group, as well as the fee waivers and expense reimbursements provided by the Adviser.
The Trustees also considered the overall profitability of the Adviser, reviewing the Adviser’s financial information and noted that the Adviser has subsidized the Fund’s operations since the Fund’s inception. The Trustees also examined the level of profits that could be expected to accrue to the Adviser from the fees payable under the Agreement, as well as the Fund’s brokerage practices and use of soft dollars by
20
BARRETT
GROWTH FUND
the Adviser. These considerations were based on materials requested by the Trustees and the Fund’s administrator specifically for the June 13, 2019 meeting and the July 22, 2019 meeting at which the Agreement was formally considered, as well as the presentations made by the Adviser over the course of the year.
The Trustees noted that the Fund’s contractual management fee of 1.00% ranked above the Morningstar Peer Group average of 0.76%. The Trustees observed that the Fund’s total expense ratio (net of fee waivers and expense reimbursements and excluding the Fund’s Rule 12b-1 fee) of 1.00% fell below the Morningstar Peer Group average of 1.06% (which excludes Rule 12b-1 fees). The Trustees also compared the fees paid by the Fund to the fees paid by other separately-managed accounts and another registered mutual fund managed by the Adviser.
The Trustees concluded that the Fund’s expenses and the management fees paid to the Adviser were fair and reasonable in light of the comparative performance, expense and management fee information. The Trustees noted, based on a profitability analysis prepared by the Adviser, that the Adviser’s profit from sponsoring the Fund had not been, and currently was not, excessive, and the Trustees further concluded that the Adviser had maintained adequate profit levels to support its services to the Fund from the revenues of its overall investment advisory business, despite subsidizing the Fund’s operations.
| 4. | EXTENT OF ECONOMIES OF SCALE AS THE FUND GROWS |
The Trustees compared the Fund’s expenses relative to the Morningstar Peer Group and discussed realized and potential economies of scale. The Trustees also reviewed the structure of the Fund’s management fee and whether the Fund was large enough to generate economies of scale for shareholders or whether economies of scale would be expected to be realized as Fund assets grow (and if so, how those economies of scale were being or would be shared with shareholders). The Trustees reviewed all fee waivers and expense reimbursements by the Adviser with respect to the Fund. The Trustees noted that the Fund’s management fee structure did not contain any breakpoint reductions as the Fund’s assets grow in size, but the feasibility of incorporating breakpoints would continue to be reviewed on a regular basis. With respect to the Adviser’s fee structure and any applicable expense waivers, the Trustees concluded that the current fee structure was reasonable and reflects a sharing of economies of scale between the Adviser and the Fund at the Fund’s current asset level.
| 5. | BENEFITS DERIVED FROM THE RELATIONSHIP WITH THE FUND |
The Trustees considered the direct and indirect benefits that could be realized by the Adviser from its association with the Fund. The Trustees examined the brokerage practices of the Adviser with respect to the Fund. The Trustees concluded that the benefits the Adviser may receive, such as greater name recognition and increased ability to obtain research or brokerage services, appear to be reasonable, and in many cases may benefit the Fund.
CONCLUSIONS
The Trustees considered all of the foregoing factors. In considering the renewal of the Agreement, the Trustees did not identify any one factor as all-important, but rather considered these factors collectively in light of the Fund’s surrounding circumstances. Based on this review, the Trustees, including a majority of the Independent Trustees, approved the continuation of the Agreement for an additional term ending August 31, 2020 as being in the best interests of the Fund and its shareholders.
21
BARRETT
GROWTH FUND
NOTICE OF PRIVACY POLICY & PRACTICES
We collect non-public personal information about you from the following sources:
• | information we receive about you on applications or other forms; | |
• | information you give us orally; and | |
• | information about your transactions with us or others. |
We do not disclose any non-public personal information about our shareholders or former shareholders without the shareholder’s authorization, except as permitted by law or in response to inquiries from governmental authorities. We may share information with affiliated parties and unaffiliated third parties with whom we have contracts for servicing the Fund. We will provide unaffiliated third parties with only the information necessary to carry out their assigned responsibility. All shareholder records will be disposed of in accordance with applicable law. We maintain physical, electronic and procedural safeguards to protect your non-public personal information and require third parties to treat your non-public personal information with the same high degree of confidentiality.
In the event that you hold shares of the Fund through a financial intermediary, including, but not limited to, a broker-dealer, bank or trust company, the privacy policy of your financial intermediary would govern how your non-public personal information would be shared with unaffiliated third parties.
22
BARRETT
GROWTH FUND
Additional Information
(Unaudited)
TAX INFORMATION
The Fund designated 0.00% of its ordinary income distribution for the year ended May 31, 2019, as qualified dividend income under the Jobs and Growth Tax Relief Reconciliation Act of 2003.
For the year ended May 31, 2019, 0.00% of dividends paid from net ordinary income qualified for the dividends received deduction available to corporate shareholders.
The percentage of taxable ordinary income distributions that are designated as short-term capital gain distributions under Internal Revenue Code Section 871(k)(2)(C) for the Fund was 0.00%.
INDEMNIFICATIONS
Under the Trust’s organizational documents, its officers and Trustees are indemnified against certain liabilities arising out of the performance of their duties to the Fund. In addition, in the normal course of business, the Fund enters into contracts that provide general indemnifications to other parties. The Fund’s maximum exposure under these arrangements is unknown as this would involve future claims that may be made against the Fund that have not yet occurred. However, the Fund has not had prior claims or losses pursuant to these contracts and expects the risk of loss to be remote.
INFORMATION ABOUT TRUSTEES
The business and affairs of the Trust are managed under the direction of the Board of Trustees. Information pertaining to the Trustees of the Trust is set forth below. The Statement of Additional Information includes additional information about the Trustees and is available, without charge, upon request by calling 1-877-363-6333.
| Number of | Other | ||||
| Term of | Portfolios | Principal | Directorships | ||
| Name, | Position(s) | Office and | in Trust | Occupation(s) | Held by Trustee |
| Address and | Held with | Length of | Overseen | During the Past | During the Past |
Year of Birth | the Trust | Time Served | by Trustee | Five Years | Five Years |
| INDEPENDENT TRUSTEES | |||||
Michael D. Akers, Ph.D. | Trustee | Indefinite | 26 | Professor Emeritus, | Independent |
615 E. Michigan St. | Term; Since | Department of Accounting | Trustee, USA | ||
Milwaukee, WI 53202 | August 22, | (June 2019–present), | MUTUALS | ||
Year of Birth: 1955 | 2001 | Professor, Department | (an open-end | ||
of Accounting | investment | ||||
(2004–May 2019), Chair, | company with | ||||
Department of | two portfolios). | ||||
Accounting (2004–2017), | |||||
Marquette University. | |||||
Gary A. Drska | Trustee | Indefinite | 26 | Pilot, Frontier/Midwest | Independent |
615 E. Michigan St. | Term; Since | Airlines, Inc. (airline | Trustee, USA | ||
Milwaukee, WI 53202 | August 22, | company) (1986–present). | MUTUALS | ||
Year of Birth: 1956 | 2001 | (an open-end | |||
investment | |||||
company with | |||||
two portfolios). | |||||
23
BARRETT
GROWTH FUND
| Number of | Other | ||||
| Term of | Portfolios | Principal | Directorships | ||
| Name, | Position(s) | Office and | in Trust | Occupation(s) | Held by Trustee |
| Address and | Held with | Length of | Overseen | During the Past | During the Past |
Year of Birth | the Trust | Time Served | by Trustee | Five Years | Five Years |
| INDEPENDENT TRUSTEES (Continued) | |||||
Jonas B. Siegel | Trustee | Indefinite | 26 | Retired (2011–present); | Independent |
615 E. Michigan St. | Term; Since | Managing Director, Chief | Trustee, Gottex | ||
Milwaukee, WI 53202 | October 23, | Administrative Officer | Trust (an open- | ||
Year of Birth: 1943 | 2009 | (“CAO”) and Chief | end investment | ||
Compliance Officer | company | ||||
(“CCO”), Granite Capital | (2010–2016); | ||||
International Group, L.P. | Independent | ||||
(an investment management | Manager, Ramius | ||||
firm) (1994–2011). | IDF fund | ||||
complex (two | |||||
closed-end | |||||
investment | |||||
companies) | |||||
(2010–2015); | |||||
Independent | |||||
Trustee, Gottex | |||||
Multi-Asset | |||||
Endowment fund | |||||
complex (three | |||||
closed-end | |||||
investment | |||||
companies) | |||||
(2010–2015); | |||||
Independent | |||||
Trustee, Gottex | |||||
Multi- | |||||
Alternatives | |||||
fund complex | |||||
(three closed-end | |||||
investment | |||||
companies) | |||||
(2010–2015). | |||||
24
BARRETT
GROWTH FUND
| Number of | Other | ||||
| Term of | Portfolios | Principal | Directorships | ||
| Name, | Position(s) | Office and | in Trust | Occupation(s) | Held by Trustee |
| Address and | Held with | Length of | Overseen | During the Past | During the Past |
Year of Birth | the Trust | Time Served | by Trustee | Five Years | Five Years |
| INTERESTED TRUSTEE AND OFFICERS | |||||
Joseph C. Neuberger* | Chairperson | Indefinite | 26 | President (2017–present), | Trustee, USA |
615 E. Michigan St. | and | Term; Since | Chief Operating Officer | MUTUALS | |
Milwaukee, WI 53202 | Trustee | August 22, | (2016–present), | (an open-end | |
Year of Birth: 1962 | 2001 | Executive Vice President | investment | ||
(1994–2017), U.S. Bancorp | company) | ||||
Fund Services, LLC. | (2001–2018); | ||||
Trustee, Buffalo | |||||
Funds (an open- | |||||
end investment | |||||
company) | |||||
(2003–2017). | |||||
John P. Buckel | President | Indefinite | N/A | Vice President, U.S. Bancorp | N/A |
615 E. Michigan St. | and | Term; Since | Fund Services, LLC | ||
Milwaukee, WI 53202 | Principal | January 24, | (2004–present). | ||
Year of Birth: 1957 | Executive | 2013 | |||
Officer | |||||
Jennifer A. Lima | Vice | Indefinite | N/A | Vice President, U.S. Bancorp | N/A |
615 E. Michigan St. | President, | Term; Since | Fund Services, LLC | ||
Milwaukee, WI 53202 | Treasurer | January 24, | (2002–present). | ||
Year of Birth: 1974 | and Principal | 2013 | |||
Financial and | |||||
Accounting | |||||
Officer | |||||
Elizabeth B. Scalf | Chief | Indefinite | N/A | Senior Vice President, U.S. | N/A |
615 E. Michigan St. | Compliance | Term; | Bancorp Fund Services, LLC | ||
Milwaukee, WI 53202 | Officer, | Since | (February 2017–present); Vice | ||
Year of Birth: 1985 | Vice | July 1, | President and Assistant CCO, | ||
President and | 2017 | Heartland Advisors, Inc. | |||
Anti-Money | (December 2016–January 2017); | ||||
Laundering | Vice President and CCO, | ||||
Officer | Heartland Group, Inc. | ||||
(May 2016–November 2016); | |||||
Vice President, CCO and | |||||
Senior Legal Counsel | |||||
(May 2016–November 2016), | |||||
Assistant CCO and Senior Legal | |||||
Counsel (January 2016–April 2016), | |||||
Senior Legal and Compliance | |||||
Counsel (2013–2015), Heartland | |||||
Advisors, Inc. | |||||
25
BARRETT
GROWTH FUND
| Number of | Other | ||||
| Term of | Portfolios | Principal | Directorships | ||
| Name, | Position(s) | Office and | in Trust | Occupation(s) | Held by Trustee |
| Address and | Held with | Length of | Overseen | During the Past | During the Past |
Year of Birth | the Trust | Time Served | by Trustee | Five Years | Five Years |
| INTERESTED TRUSTEE AND OFFICERS (Continued) | |||||
Jay S. Fitton | Secretary | Indefinite | N/A | Assistant Vice | N/A |
615 E. Michigan St. | Term; Since | President, U.S. | |||
Milwaukee, WI 53202 | July 22, | Bancorp Fund | |||
Year of Birth: 1970 | 2019 | Services, LLC | |||
(2019–present); | |||||
Partner, Practus, | |||||
LLP (2018–2019); | |||||
Counsel, Drinker | |||||
Biddle & Reath | |||||
LLP (2016–2018); | |||||
Counsel, | |||||
Huntington | |||||
Bancshares, Inc. | |||||
(2011–2015). | |||||
Kelly A. Burns | Assistant | Indefinite | N/A | Assistant Vice President, | N/A |
615 E. Michigan St. | Treasurer | Term; Since | U.S. Bancorp Fund | ||
Milwaukee, WI 53202 | April 23, | Services, LLC | |||
Year of Birth: 1987 | 2015 | (2011–present). | |||
Melissa Aguinaga | Assistant | Indefinite | N/A | Assistant Vice President, | N/A |
615 E. Michigan St. | Treasurer | Term; Since | U.S. Bancorp Fund | ||
Milwaukee, WI 53202 | July 1, | Services, LLC | |||
Year of Birth: 1987 | 2015 | (2010–present). | |||
Laura A. Caroll | Assistant | Indefinite | N/A | Assistant Vice President, | N/A |
615 E. Michigan St. | Treasurer | Term; Since | U.S. Bancorp Fund | ||
Milwaukee, WI 53202 | August 20, | Services, LLC | |||
Year of Birth: 1985 | 2018 | (2007–present). | |||
________
* | Mr. Neuberger is an “interested person” of the Trust as defined by the 1940 Act by virtue of the fact that he is a board member and an interested person of Quasar Distributors, LLC (the “Distributor”), the Fund’s principal underwriter. |
26
BARRETT
GROWTH FUND
A NOTE ON FORWARD LOOKING STATEMENTS (Unaudited)
Except for historical information contained in this report for the Fund, the matters discussed in this report may constitute forward-looking statements made pursuant to the safe-harbor provisions of the Securities Litigation Reform Act of 1995. These include any adviser or portfolio manager predictions, assessments, analyses or outlooks for individual securities, industries, market sectors and/or markets. These statements involve risks and uncertainties. In addition to the general risks described for the Fund in the current Prospectus, other factors bearing on this report include the accuracy of the Adviser’s or portfolio managers’ forecasts and predictions, and the appropriateness of the investment programs designed by the Adviser or portfolio managers to implement their strategies efficiently and effectively. Any one or more of these factors, as well as other risks affecting the securities markets and investment instruments generally, could cause the actual results of the Fund to differ materially as compared to benchmarks associated with the Fund.
ADDITIONAL INFORMATION (Unaudited)
The Fund has adopted proxy voting policies and procedures that delegate to the Adviser the authority to vote proxies. A description of the Fund’s proxy voting policies and procedures is available without charge, upon request, by calling the Fund toll free at 1-877-363-6333. A description of these policies and procedures is also included in the Fund’s Statement of Additional Information, which is available on the SEC’s website at http://www.sec.gov.
The Fund’s proxy voting record for the most recent 12-month period ended June 30, is available without charge, either upon request by calling the Fund toll free at 1-877-363-6333 or by accessing the SEC’s website at http://www.sec.gov.
The Fund files a complete schedule of its portfolio holdings with the SEC for the first and third quarter of each fiscal year on Form N-Q (through the quarter ended February 29, 2020) or Part F of Form N-PORT (beginning with filings thereafter). Shareholders may view the Fund’s Form N-Q or Part F of Form N-PORT, as applicable, on the SEC’s website at http://www.sec.gov.
HOUSEHOLDING (Unaudited)
In an effort to decrease costs, the Fund intends to reduce the number of duplicate prospectuses and annual and semi-annual reports you receive by sending only one copy of each to those addresses shared by two or more accounts and to shareholders the Fund reasonably believes are from the same family or household. Once implemented, if you would like to discontinue householding for your accounts, please call toll-free at 1-877-363-6333 to request individual copies of these documents. Once the Fund receives notice to stop householding, the Fund will begin sending individual copies 30 days after receiving your request. This policy does not apply to account statements.
27
(This Page Intentionally Left Blank.)
BARRETT GROWTH FUND
c/o U.S. Bank Global Fund Services
615 East Michigan Street
Milwaukee, Wisconsin 53202
INVESTMENT ADVISER
Barrett Asset Management, LLC
90 Park Avenue, 34th Floor
New York, New York 10016
DISTRIBUTOR
Quasar Distributors, LLC
777 East Wisconsin Avenue
Milwaukee, Wisconsin 53202
ADMINISTRATOR, FUND ACCOUNTANT
& TRANSFER AGENT
U.S. Bancorp Fund Services, LLC
615 East Michigan Street
Milwaukee, Wisconsin 53202
CUSTODIAN
U.S. Bank National Association
Custody Operations
1555 North RiverCenter Drive, Suite 302
Milwaukee, Wisconsin 53212
LEGAL COUNSEL
Godfrey & Kahn, S.C.
833 East Michigan Street, Suite 1800
Milwaukee, Wisconsin 53202
INDEPENDENT REGISTERED PUBLIC ACCOUNTING FIRM
Cohen & Company, Ltd.
1350 Euclid Avenue, Suite 800
Cleveland, Ohio 44115
This report is intended for shareholders of the Fund and may not be used as sales literature unless preceded or accompanied by a current prospectus.
Item 2. Code of Ethics.
Not applicable for semi-annual reports.
Item 3. Audit Committee Financial Expert.
Not applicable for semi-annual reports.
Item 4. Principal Accountant Fees and Services.
Not applicable for semi-annual reports.
Item 5. Audit Committee of Listed Registrants.
Not applicable to registrants who are not listed issuers (as defined in Rule 10A-3 under the Securities Exchange Act of 1934).
Item 6. Investments.
(a) | Schedule of Investments is included as part of the report to shareholders filed under Item 1 of this Form. |
(b) | Not Applicable. |
Item 7. Disclosure of Proxy Voting Policies and Procedures for Closed-End Management Investment Companies.
Not applicable to open-end investment companies.
Item 8. Portfolio Managers of Closed-End Management Investment Companies.
Not applicable to open-end investment companies.
Item 9. Purchases of Equity Securities by Closed‑End Management Investment Company and Affiliated Purchasers.
Not applicable to open-end investment companies.
Item 10. Submission of Matters to a Vote of Security Holders.
There have been no material changes to the procedures by which shareholders may recommend nominees to the registrant’s board of trustees.
Item 11. Controls and Procedures.
(a) | The Registrant’s President and Treasurer have reviewed the Registrant's disclosure controls and procedures (as defined in Rule 30a-3(c) under the Investment Company Act of 1940 (the “Act”)) as of a date within 90 days of the filing of this report, as required by Rule 30a-3(b) under the Act and Rules 13a-15(b) or 15d‑15(b) under the Securities Exchange Act of 1934. Based on their review, such officers have concluded that the disclosure controls and procedures are effective in ensuring that information required to be disclosed in this report is appropriately recorded, processed, summarized and reported and made known to them by others within the Registrant and by the Registrant’s service provider. |
(b) | There were no changes in the Registrant's internal control over financial reporting (as defined in Rule 30a-3(d) under the Act) that occurred during the last fiscal half-year covered by this report that has materially affected, or is reasonably likely to materially affect, the Registrant's internal control over financial reporting. |
Item 12. Disclosure of Securities Lending Activities for Closed-End Management Investment Companies
Not applicable to open-end investment companies.
Item 13. Exhibits.
| (a) | (1) Any code of ethics or amendment thereto, that is the subject of the disclosure required by Item 2, to the extent that the registrant intends to satisfy Item 2 requirements through filing an exhibit. Not Applicable. |
(2) A separate certification for each principal executive and principal financial officer pursuant to Section 302 of the Sarbanes-Oxley Act of 2002. Filed herewith.
(3) Any written solicitation to purchase securities under Rule 23c‑1 under the Act sent or given during the period covered by the report by or on behalf of the registrant to 10 or more persons. Not applicable to open-end investment companies.
(4) Change in the registrant’s independent public accountant. There was no change in the registrant’s independent public accountant for the period covered by this report.
| (b) | Certifications pursuant to Section 906 of the Sarbanes‑Oxley Act of 2002. Furnished herewith. |
SIGNATURES
Pursuant to the requirements of the Securities Exchange Act of 1934 and the Investment Company Act of 1940, the registrant has duly caused this report to be signed on its behalf by the undersigned, thereunto duly authorized.
(Registrant) Trust for Professional Managers
By (Signature and Title)* /s/ John Buckel
John Buckel, President
Date 1/28/2020
Pursuant to the requirements of the Securities Exchange Act of 1934 and the Investment Company Act of 1940, this report has been signed below by the following persons on behalf of the registrant and in the capacities and on the dates indicated.
By (Signature and Title)* /s/ John Buckel
John Buckel, President
Date 1/28/2020
By (Signature and Title)* /s/ Jennifer Lima
Jennifer Lima, Treasurer
Date 1/28/2020
* Print the name and title of each signing officer under his or her signature.