UNITED STATES
SECURITIES AND EXCHANGE COMMISSION
Washington, D.C. 20549
FORM N-CSR
CERTIFIED SHAREHOLDER REPORT OF REGISTERED
MANAGEMENT INVESTMENT COMPANIES
Investment Company Act file number 811-10401
Trust for Professional Managers
(Exact name of registrant as specified in charter)
615 East Michigan Street
Milwaukee, WI 53202
(Address of principal executive offices) (Zip code)
Jay S. Fitton
U.S. Bancorp Fund Services, LLC
615 East Michigan Street
Milwaukee, WI 53202
(Name and address of agent for service)
(513) 629-8104
Registrant's telephone number, including area code
Date of fiscal year end:May 31, 2020
Date of reporting period:November 30, 2019
Item 1. Reports to Stockholders.
Beginning on January 1, 2021, as permitted by regulations adopted by the SEC, paper copies of the Fund’s shareholder reports will no longer be sent by mail, unless you specifically request paper copies of the reports from the Fund (defined herein) or from your financial intermediary, such as a broker-dealer or bank. Instead, the reports will be made available on the Fund’s website (www.jenseninvestment.com), and you will be notified by mail each time a report is posted and provided with a website link to access the report.
If you already elected to receive shareholder reports electronically, you will not be affected by this change and you need not take any action. You may elect to receive shareholder reports and other communications from the Fund electronically by contacting your financial intermediary or, if you are a direct investor, by calling 1-800-992-4144 or by sending an e-mail request to funds@jenseninvestment.com.
You may elect to receive all future reports in paper free of charge. If you invest through a financial intermediary, you can contact your financial intermediary to request that you continue to receive paper copies of your shareholder reports. If you invest directly with the Fund, you can call 1-800-992-4144 or send an e-mail request to funds@jenseninvestment.com to let the Fund know you wish to continue receiving paper copies of your shareholder reports. Your election to receive reports in paper will apply to all funds held in your account if you invest through your financial intermediary.
Letter from the Investment Adviser
Dear Fellow Shareholders,
The Jensen Quality Value Fund (the “Fund”)—Class J Shares—posted a return of 11.09% for the six months ended November 30, 2019, compared to a return of 12.37% for the Russell 2500 Total Return Index (the “Index”). Please see pages 4 through 5 of this report for complete standardized performance information for the Fund.
Market Perspective
During the six months ended November 30, 2019, the U.S. economy continued to enjoy solid economic growth accompanied by low unemployment and moderate inflation. Markets reacted positively to expectations of an improving trade relationship between the U.S. and China and interest rate cuts from the U.S. Federal Reserve. During this period of strong positive market returns, the Fund captured 90% of the market upswing despite its historically lower volatility than the Index.
Overall, we continue to be impressed by the underlying business performance of the companies in the Fund. The Fund seeks to hold high-quality businesses at reasonable prices. We believe that attention to valuation is critical and that investors in high quality, reasonably priced businesses should be rewarded over the long term.
Commentary on Results
For the six months ended November 30, 2019, the Fund’s performance relative to the Index was aided by an underweight position in the Energy and Utilities sectors and an overweight to the Information Technology sector. Specific companies in the Consumer Staples, Real Estate, and Communications sectors also contributed positively to performance.
Relative to the Index, the Fund’s cash position and its overweight position in the Consumer Staples sector detracted from performance. At the company level, the Fund’s performance was negatively impacted by specific companies in the Information Technology, Industrial, and Health Care sectors. As of November 30, 2019, the Fund held 38 companies.
The top contributor to Fund performance for the six months ended November 30, 2019 wasCrown Holdings, a manufacturer of packaging products including aluminum, steel, and glass containers for food, beverage, and household goods. During the period, Crown Holdings announced earnings results that exceeded the expectations of many investors, primarily due to demand for aluminum cans outpacing supply.
Crown Holdings was selected for the Fund because of its compelling valuation at the time of purchase and its positive fundamental attributes, including high barriers to entry, stable demand, and recent share gains versus competitors as customers shifted toward aluminum and steel containers in lieu of plastic. Other notable companies that contributed positively to portfolio performance wereCBRE Group, a commercial real estate services company,Encompass Health, a provider of post-acute healthcare services,Best Buy, a retailer of electronics and appliances, andWestern Union, a consumer financial services company.
| Semi-Annual Report | Jensen Quality Value Fund | 1 |
The largest negative contributor to Fund performance for the six months ended November 30, 2019 wasTeradata Corporation, a provider of software and hardware products for enterprise data analytics. Despite strong growth in its backlog and subscription service revenues, Teradata’s stock underperformed due to concerns over declines in business spending on hardware and the board’s unexpected termination of the CEO due to a lack of strategic execution.
Teradata was selected for the Fund for its attractive valuation at the time of purchase and its compelling fundamental attributes, which include steep barriers to entry, high customer switching costs, and strong customer retention, as well as a rapidly growing industry and its ongoing mix-shift to a recurring-revenue subscription model. Other notable companies that weighed on relative performance wereOwens-Illinois, a manufacturer of food and beverage containers,Middleby, a producer of kitchen equipment for restaurants,Tractor Supply, a retailer for suburban and rural lifestyles, andLennox, a manufacturer of heating, ventilation, air conditioning, and refrigeration systems.
The Jensen Outlook
Positive market sentiment in 2019 appears to have been largely based on the premise that proactive Federal Reserve rate cuts and expectations of further policy accommodation will allow for an economic “soft landing.” This type of environment, in which stock prices are more sensitive to future implications of policy actions rather than changes in business fundamentals, does not always play to the strengths of the Fund. We cannot predict the resolution of this trend, but we were active in taking advantage of perceived market dislocations during the six-month period ended November 30, 2019, predominantly by trimming portfolio holdings when valuations are elevated and redeploying the proceeds into companies that we considered undervalued.
Longer term, we have doubts about the sustainability of U.S. equity market advances. Our concern is primarily a function of an aging bull market, slowing global growth, and domestic manufacturing weakness. Ongoing U.S./China trade tension creates another layer of uncertainty. Status quo tariff escalation adds an incremental headwind to growth, whereas a favorable resolution could be a positive catalyst. As a result, we believe risk management, at both the portfolio and asset allocation levels, is likely to play an increasingly important role in shaping investor returns.
At Jensen, we prefer to focus on those companies which we believe can produce strong underlying business results, and we attempt to use short-term volatility as an opportunity to take advantage of pricing disconnects in the stocks of these companies. We believe companies with strong fundamentals, durable competitive advantages, and a history of growing free cash flow can “chart their own paths” and have the potential to outperform lower-quality businesses over time.
We invite you to seek additional information about the Fund at www.jenseninvestment.com where additional content, including updated holdings and performance information, is available. We take our investment responsibilities seriously and appreciate the trust you have placed in us. As always, we welcome your feedback.
Cordially,
The Jensen Quality Value Investment Team
| 2 | Jensen Quality Value Fund | Semi-Annual Report |
This discussion and analysis of the Fund is as of November 30, 2019 and is subject to change, and any forecasts made cannot be guaranteed and should not be considered investment advice. Past performance is no guarantee of future results.Fund holdings and sector weightings are subject to change and are not recommendations to buy or sell any security. For more complete information regarding performance and holdings, please refer to the financial statements and schedule of investments headings of this report. Mutual fund investing involves risk, and principal loss is possible. The Fund invests in mid- and smaller capitalization companies, which involve additional risks such as limited liquidity and greater volatility. Growth stocks typically are more volatile than value stocks; however, value stocks have a lower expected growth rate in earnings and sales. The Russell 2500 Total Return Index is a market capitalization weighted index that includes the smallest 2,500 companies covered in the Russell 3000 universe of United States-based listed equities. The index is unmanaged, and you cannot invest directly in an index. Free Cash Flow:Is equal to the after-tax net income of a company plus depreciation and amortization less capital expenditures. Must be preceded or accompanied by a prospectus for the Jensen Quality Value Fund. The Jensen Quality Value Fund is distributed by Quasar Distributors, LLC. |
| Semi-Annual Report | Jensen Quality Value Fund | 3 |
Jensen Quality Value Fund - Class J (Unaudited)
Total Returns vs. Russell 2500®Total Return Index
| Average Annual Total Returns – | 1 year | 3 years | 5 years | Since Inception |
| For periods ended November 30, 2019 (Unaudited) | (3/31/2010) | |||
| Jensen Quality Value Fund - Class J | 11.76% | 9.50% | 6.26% | 9.64% |
| Russell 2500®Total Return Index | 11.41% | 10.27% | 8.77% | 11.77% |
The Russell 2500®Total Return Index is a market capitalization weighted index that includes the smallest 2,500 companies covered in the Russell 3000®universe of United States-based listed equities.
The chart at the top of the page assumes an initial gross investment of $10,000 made on March 31, 2010, the inception date for Class J shares. Returns shown include the reinvestment of all Fund distributions. Returns shown do not reflect the deduction of taxes that a shareholder would pay on Fund distributions or the redemption of Fund shares.
Investment performance reflects fee waivers in effect. In the absence of such waivers, total returns would be reduced.
Performance data shown represents past performance. Past performance does not guarantee future results. The investment return and principal value of an investment will fluctuate so that an investor’s shares, when redeemed, may be worth more or less than their original cost. Current performance of the Fund may be lower or higher than the performance shown. Performance data current to the most recent month-end may be obtained by calling 800-992-4144 or by visiting www.jenseninvestment.com.
| 4 | Jensen Quality Value Fund | Semi-Annual Report |
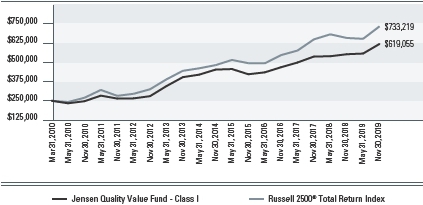
Jensen Quality Value Fund - Class I (Unaudited)
Total Returns vs. Russell 2500® Total Return Index
| Average Annual Total Returns – | 1 year | 3 years | 5 years | Since Inception |
| For periods ended November 30, 2019 (Unaudited) | (3/31/2010) | |||
| Jensen Quality Value Fund - Class I | 12.08% | 9.76% | 6.46% | 9.83% |
| Russell 2500®Total Return Index | 11.41% | 10.27% | 8.77% | 11.77% |
The Russell 2500®Total Return Index is a market capitalization weighted index that includes the smallest 2,500 companies covered in the Russell 3000®universe of United States-based listed equities.
The chart at the top of the page assumes an initial gross investment of $250,000 made on March 31, 2010, the inception date for Class I shares. Returns shown include the reinvestment of all Fund distributions. Returns shown do not reflect the deduction of taxes that a shareholder would pay on Fund distributions or the redemption of Fund shares.
Investment performance reflects fee waivers in effect. In the absence of such waivers, total returns would be reduced.
Performance data shown represents past performance. Past performance does not guarantee future results. The investment return and principal value of an investment will fluctuate so that an investor’s shares, when redeemed, may be worth more or less than their original cost. Current performance of the Fund may be lower or higher than the performance shown. Performance data current to the most recent month-end may be obtained by calling 800-992-4144 or by visiting www.jenseninvestment.com.
| Semi-Annual Report | Jensen Quality Value Fund | 5 |
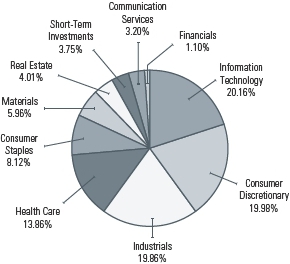
Investments by Sector as of November 30, 2019
(as a Percentage of Total Investments) (Unaudited)
| 6 | Jensen Quality Value Fund | Semi-Annual Report |
Statement of Assets & Liabilities
November 30, 2019 (Unaudited)
| Assets: | ||
| Investments, at value (cost $38,805,467) | $43,801,557 | |
| Income receivable | 51,607 | |
| Receivable for capital stock issued | 1,313 | |
| Other Assets | 13,880 | |
| Total Assets | 43,868,357 | |
| Liabilities: | ||
| Payable for capital stock redeemed | 716 | |
| Payable for 12b-1 fees - Class J | 935 | |
| Payable to Adviser | 8,205 | |
| Payable to Custodian | 1,733 | |
| Payable to affiliates | 19,625 | |
| Accrued expenses and other liabilities | 12,842 | |
| Total Liabilities | 44,056 | |
| Net Assets | $43,824,301 | |
| Net Assets Consist of: | ||
| Capital stock | 37,347,741 | |
| Total distributable earnings | 6,476,560 | |
| Total Net Assets | $43,824,301 | |
| Net Assets Consist of: | ||
| Class J Shares: | ||
| Net Assets | $4,485,392 | |
| Shares of beneficial interest outstanding | 330,725 | |
| Net Asset Value, Offering Price and Redemption Price Per | ||
| Share (unlimited number of shares authorized, $.001 par value) | $13.56 | |
| Class I Shares: | ||
| Net Assets | $39,338,909 | |
| Shares of beneficial interest outstanding | 2,916,388 | |
| Net Asset Value, Offering Price and Redemption Price Per Share | ||
| (unlimited number of shares authorized, $.001 par value) | $13.49 | |
The accompanying notes are an integral part of these financial statements.
| Semi-Annual Report | Jensen Quality Value Fund | 7 |
Schedule of Investments
November 30, 2019 (Unaudited)
Common Stocks - 96.20%
| shares | Air Freight & Logistics - 2.76% | value |
| 16,150 | Expeditors International of Washington, Inc. | $1,207,374 |
| shares | Building Products - 2.17% | value |
| 3,710 | Lennox International, Inc. | $949,204 |
| shares | Capital Markets - 1.10% | value |
| 5,630 | Affiliated Managers Group, Inc. | $480,633 |
| shares | Chemicals - 2.32% | value |
| 10,060 | Scotts Miracle-Gro Co. | $1,016,865 |
| shares | Commercial Services & Supplies - 1.84% | value |
| 16,840 | Herman Miller, Inc. | $804,615 |
| shares | Communications Equipment - 1.50% | value |
| 4,520 | F5 Networks, Inc. (a) | $658,609 |
| shares | Containers & Packaging - 3.64% | value |
| 21,020 | Crown Holdings, Inc. (a) | $1,595,418 |
| shares | Distributors - 3.16% | value |
| 13,250 | Genuine Parts Co. | $1,382,903 |
| shares | Electrical Equipment - 1.77% | value |
| 3,950 | Rockwell Automation, Inc. | $773,568 |
| shares | Electronic Equipment, Instruments & Components - 1.65% | value |
| 6,940 | Amphenol Corp. - Class A | $721,760 |
| shares | Food & Staples Retailing - 2.37% | value |
| 37,990 | Kroger Co. | $1,038,647 |
The accompanying notes are an integral part of these financial statements.
| 8 | Jensen Quality Value Fund | Semi-Annual Report |
Schedule of Investmentscontinued
November 30, 2019 (Unaudited)
| shares | Food Products - 5.74% | value |
| 20,650 | Campbell Soup Co. | $961,671 |
| 29,160 | General Mills, Inc. | $1,554,810 |
| $2,516,481 | ||
| shares | Health Care Equipment & Supplies - 3.49% | value |
| 11,440 | Varian Medical Systems, Inc. (a) | $1,529,871 |
| shares | Health Care Providers & Services - 7.34% | value |
| 25,330 | Encompass Health Corp. | $1,791,085 |
| 8,280 | Laboratory Corporation of America Holdings (a) | $1,426,561 |
| $3,217,646 | ||
| shares | Hotels, Restaurants & Leisure - 3.80% | value |
| 9,520 | Choice Hotels International, Inc. | $925,820 |
| 4,810 | Cracker Barrel Old Country Store, Inc. | $739,489 |
| $1,665,309 | ||
| shares | IT Services - 8.62% | value |
| 14,100 | Broadridge Financial Solutions, Inc. | $1,744,312 |
| 15,140 | Paychex, Inc. | $1,303,857 |
| 26,980 | Western Union Co. | $725,222 |
| $3,773,391 | ||
| shares | Leisure Products - 2.36% | value |
| 10,180 | Hasbro, Inc. | $1,035,306 |
| shares | Life Sciences Tools & Services - 3.02% | value |
| 5,960 | Waters Corp. (a) | $1,323,537 |
The accompanying notes are an integral part of these financial statements.
| Semi-Annual Report | Jensen Quality Value Fund | 9 |
Schedule of Investmentscontinued
November 30, 2019 (Unaudited)
| shares | Machinery - 3.43% | value |
| 8,250 | Donaldson Company, Inc. | $462,660 |
| 9,030 | Middleby Corp. (a) | $1,045,312 |
| $1,507,972 | ||
| shares | Media - 3.20% | value |
| 17,650 | Omnicom Group, Inc. | $1,402,822 |
| shares | Professional Services - 2.53% | value |
| 7,940 | Equifax, Inc. | $1,108,742 |
| shares | Real Estate Management & Development - 4.00% | value |
| 30,780 | CBRE Group, Inc. - Class A (a) | $1,755,076 |
| shares | Road & Rail - 2.78% | |
| 10,950 | Landstar System, Inc. | $1,219,940 |
| shares | Semiconductors & Semiconductor Equipment - 3.22% | value |
| 65,811 | ON Semiconductor Corp. (a) | $1,412,962 |
| shares | Software - 3.39% | value |
| 7,040 | Citrix Systems, Inc. | $794,182 |
| 26,000 | Teradata Corp. (a) | $690,560 |
| $1,484,742 | ||
| shares | Specialty Retail - 6.38% | value |
| 18,030 | Best Buy Company, Inc. | $1,453,939 |
| 14,200 | Tractor Supply Co. | $1,341,048 |
| $2,794,987 | ||
| shares | Technology Hardware, Storage & Peripherals - 1.78% | value |
| 12,870 | NetApp, Inc. | $779,793 |
The accompanying notes are an integral part of these financial statements.
| 10 | Jensen Quality Value Fund | Semi-Annual Report |
Schedule of Investmentscontinued
November 30, 2019 (Unaudited)
| shares | Textiles, Apparel & Luxury Goods - 4.27% | |
| 12,070 | Carter’s, Inc. | $1,246,952 |
| 41,420 | Hanesbrands, Inc. | $624,199 |
| $1,871,151 | ||
| shares | Trading Companies & Distributors - 2.57% | value |
| 3,560 | WW Grainger, Inc. | $1,128,342 |
| Total Common Stocks | value | |
| (Cost $37,161,576) | $42,157,666 | |
| Short-Term Investments - 3.75% | ||
| shares | value | |
| First American Treasury Obligations Fund - | ||
| 1,643,891 | Class X - 1.584% (b) | $1,643,891 |
| Total Short-Term Investments | ||
| (Cost $1,643,891) | $1,643,891 | |
| Total Investments | ||
| (Cost $38,805,467) - 99.95% | $43,801,557 | |
| Other Assets in Excess of Liabilities - 0.05% | $22,744 | |
| TOTAL NET ASSETS - 100.00% | $43,824,301 | |
Percentages are stated as a percent of net assets.
| (a) | Non-income producing security. |
| (b) | Seven day yield as of November 30, 2019. |
The accompanying notes are an integral part of these financial statements.
| Semi-Annual Report | Jensen Quality Value Fund | 11 |
Statement of Operations
For the Six Months Ended November 30, 2019 (Unaudited)
| Investment Income: | |||
| Dividend income | $331,509 | ||
| Interest income | 19,706 | ||
| Total Investment Income | 351,215 | ||
| Expenses: | |||
| Investment management fees | 130,010 | ||
| Administration fees | 26,040 | ||
| Federal and state registration fees | 16,755 | ||
| Fund accounting fees | 12,877 | ||
| Transfer agent fees | 10,361 | ||
| Legal fees | 9,806 | ||
| Audit and tax fees | 8,506 | ||
| Chief Compliance Officer fees | 6,961 | ||
| Reports to shareholders | 6,039 | ||
| 12b-1 fees - Class J | 4,678 | ||
| Trustees’ fees | 4,327 | ||
| Custody fees | 4,237 | ||
| Shareholder servicing fees - Class I | 3,626 | ||
| Transfer agent expenses | 2,479 | ||
| Other | 3,218 | ||
| Total expenses | 249,920 | ||
| Less waivers and reimbursements by Adviser (Note 4) | (81,604 | ) | |
| Net expenses | 168,316 | ||
| Net Investment Income | 182,899 | ||
| Realized and Unrealized Gain on Investments: | |||
| Net realized gain on investment transactions | 435,214 | ||
| Change in unrealized appreciation on investments | 3,526,047 | ||
| Net realized and unrealized gain on investments | 3,961,261 | ||
| Net Increase in Net Assets Resulting from Operations | 4,144,160 |
The accompanying notes are an integral part of these financial statements.
| 12 | Jensen Quality Value Fund | Semi-Annual Report |
Statements of Changes in Net Assets
| six months ended | year ended | |
| November 30, 2019 | May 31, 2019 | |
| Operations: | (Unaudited) | |
| Net investment income | $182,899 | $377,932 |
| Net realized gain on investment transactions | 435,214 | 2,295,137 |
| Change in unrealized appreciation (depreciation) on investments | 3,526,047 | (1,606,452) |
| Net increase in net assets resulting from operations | 4,144,160 | 1,066,617 |
| six months ended | year ended | |
| November 30, 2019 | May 31, 2019 | |
| Capital Share Transactions: | (Unaudited) | |
| Shares Sold - Class J | 2,237,661 | 1,632,567 |
| Shares Sold - Class I | 2,418,660 | 1,619,991 |
| Shares issued to holders in reinvestment | ||
| of dividends - Class J | 7,628 | 91,507 |
| Shares issued to holders in reinvestment | ||
| of dividends - Class I | 133,323 | 1,862,054 |
| Shares redeemed - Class J | (535,740) | (1,703,845) |
| Shares redeemed - Class I | (353,624) | (1,738,543) |
| Net increase in net assets from capital share transactions | 3,907,908 | 1,763,731 |
| six months ended | year ended | |
| November 30, 2019 | May 31, 2019 | |
| Dividends and Distributions to Shareholders: | (Unaudited) | |
| Net dividends and distributions to shareholders - Class J | (7,661) | (92,204) |
| Net dividends and distributions to shareholders - Class I | (133,324) | (1,862,054) |
| Total dividends and distributions | (140,985) | (1,954,258) |
| Increase in Net Assets | 7,911,083 | 876,090 |
| six months ended | year ended | |
| November 30, 2019 | May 31, 2019 | |
| Net Assets: | (Unaudited) | |
| Beginning of period | $35,913,218 | $35,037,128 |
| End of period | $43,824,301 | $35,913,218 |
The accompanying notes are an integral part of these financial statements.
| Semi-Annual Report | Jensen Quality Value Fund | 13 |
Financial Highlights
Class J
| six months | year | year | year | year | year | |
| ended | ended | ended | ended | ended | ended | |
| November | May 31, | May 31, | May 31, | May 31, | May 31, | |
| 30, 2019 | 2019 | 2018 | 2017 | 2016 | 2015 | |
| Per Share Data: | (Unaudited) | |||||
| Net asset value, beginning of period | $12.24 | $12.59 | $12.14 | $10.74 | $13.29 | $13.99 |
| Income from investment operations: | ||||||
| Net investment income(1) | 0.04 | 0.10 | 0.11 | 0.15 | 0.12 | 0.11 |
| Net realized and unrealized gain (loss) | ||||||
| on investments | 1.31 | 0.22 | 0.86 | 1.40 | (0.89) | 1.05 |
| Total from investment operations | 1.35 | 0.32 | 0.97 | 1.55 | (0.77) | 1.16 |
| Less distributions: | ||||||
| Dividends from net | ||||||
| investment income | (0.03) | (0.10) | (0.08) | (0.15) | (0.11) | (0.09) |
| Distributions from net realized gain | ||||||
| on investments | — | (0.57) | (0.44) | — | (1.67) | (1.77) |
| Total distributions | (0.03) | (0.67) | (0.52) | (0.15) | (1.78) | (1.86) |
| Net asset value, end of period | $13.56 | $12.24 | $12.59 | $12.14 | $10.74 | $13.29 |
| Total return(2) | 11.09% | 2.89% | 7.98% | 14.52% | -4.86% | 8.49% |
| Supplemental data and ratios: | ||||||
| Net assets, end of period (000’s) | $4,485 | $2,444 | $2,482 | $2,598 | $3,172 | $22,885 |
| Ratio of expenses to average | ||||||
| net assets | ||||||
| Before waivers and | ||||||
| reimbursements of expenses(3) | 1.46% | 1.50% | 1.51% | 1.68% | 1.63% | 1.65% |
| After waivers and | ||||||
| reimbursements of expenses(3) | 1.05% | 1.05% | 1.11%(4) | 1.25% | 1.25% | 1.25% |
| Ratio of net investment income to | ||||||
| average net assets | ||||||
| Before waivers and reimbursements | ||||||
| of expenses(3) | 0.28% | 0.39% | 0.50% | 0.88% | 0.60% | 0.39% |
| After waivers and reimbursements | ||||||
| of expenses(3) | 0.69% | 0.84% | 0.90%(4) | 1.31% | 0.98% | 0.79% |
| Portfolio turnover rate(2) | 16.69% | 42.51% | 44.29% | 71.33% | 92.94% | 119.76% |
| (1) | Per share amounts are calculated using the average shares outstanding method. |
| (2) | Not annualized for periods less than one year. |
| (3) | Annualized for periods less than one year. |
| (4) | Effective September 30, 2017, the expense cap for Class J shares was decreased from 1.00% to 0.80% excluding Rule 12b-1 fees of 0.25%. |
The accompanying notes are an integral part of these financial statements.
| 14 | Jensen Quality Value Fund | Semi-Annual Report |
Financial Highlights
Class l
| six months | year | year | year | year | year | |
| ended | ended | ended | ended | ended | ended | |
| November | May 31, | May 31, | May 31, | May 31, | May 31, | |
| 30, 2019 | 2019 | 2018 | 2017 | 2016 | 2015 | |
| Per Share Data: | (Unaudited) | |||||
| Net asset value, beginning of period | $12.18 | $12.52 | $12.08 | $10.69 | $13.26 | $13.97 |
| Income from investment operations: | ||||||
| Net investment income(1) | 0.06 | 0.13 | 0.14 | 0.16 | 0.13 | 0.13 |
| Net realized and unrealized gain (loss) | ||||||
| on investments | 1.30 | 0.23 | 0.85 | 1.40 | (0.88) | 1.05 |
| Total from investment operations | 1.36 | 0.36 | 0.99 | 1.56 | (0.75) | 1.18 |
| Less distributions: | ||||||
| Dividends from net | ||||||
| investment income | (0.05) | (0.13) | (0.11) | (0.17) | (0.15) | (0.12) |
| Distributions from net realized | ||||||
| gain on investments | — | (0.57) | (0.44) | — | (1.67) | (1.77) |
| Total distributions | (0.05) | (0.70) | (0.55) | (0.17) | (1.82) | (1.89) |
| Net asset value, end of period | $13.49 | $12.18 | $12.52 | $12.08 | $10.69 | $13.26 |
| Total return(2) | 11.17% | 3.25% | 8.15% | 14.73% | -4.71% | 8.67% |
| Supplemental data and ratios: | ||||||
| Net assets, end of period (000’s) | $39,339 | $33,470 | $32,555 | $30,550 | $25,761 | $11,037 |
| Ratio of expenses to average net assets | ||||||
| Before waivers and reimbursements | ||||||
| of expenses(3) | 1.23% | 1.27% | 1.28% | 1.46% | 1.48% | 1.42% |
| After waivers and reimbursements | ||||||
| of expenses(3) | 0.82% | 0.82% | 0.91%(4) | 1.10% | 1.10% | 1.10% |
| Ratio of net investment income | ||||||
| to average net assets | ||||||
| Before waivers and reimbursements | ||||||
| of expenses(3) | 0.53% | 0.62% | 0.73% | 1.05% | 0.81% | 0.65% |
| After waivers and reimbursements | ||||||
| of expenses(3) | 0.94% | 1.07% | 1.10%(4) | 1.41% | 1.19% | 0.97% |
| Portfolio turnover rate(2) | 16.69% | 42.51% | 44.29% | 71.33% | 92.94% | 119.76% |
| (1) | Per share amounts are calculated using the average shares outstanding method. |
| (2) | Not annualized for periods less than one year. |
| (3) | Annualized for periods less than one year. |
| (4) | Effective September 30, 2017, the expense cap for Class I shares was decreased from 1.00% to 0.80% excluding shareholder servicing fees of 0.10%. |
The accompanying notes are an integral part of these financial statements.
| Semi-Annual Report | Jensen Quality Value Fund | 15 |
Notes to Financial Statements
November 30, 2019 (Unaudited)
1. Organization
Trust for Professional Managers (the “Trust”) was organized as a Delaware statutory trust under a Declaration of Trust dated May 29, 2001. The Trust is registered under the Investment Company Act of 1940, as amended (the “1940 Act”), as an open-end management investment company. The Jensen Quality Value Fund (the “Fund”), formerly known as the Jensen Value Fund, represents a distinct diversified series with its own investment objective and policies within the Trust. The investment objective of the Fund is long-term capital appreciation. The Trust may issue an unlimited number of shares of beneficial interest at $0.001 par value. The assets of the Fund are segregated, and a shareholder’s interest is limited to the fund in which shares are held. The Fund became effective and commenced operations on March 31, 2010. The Fund currently offers Class J and Class I shares. Class J shares are subject to a 0.25% distribution (Rule 12b-1) and shareholder servicing fee and Class I shares are subject to a shareholder servicing fee of up to 0.10%. Each class of shares has identical rights and privileges except with respect to the distribution (Rule 12b-1) and shareholder servicing fees, and voting rights on matters affecting a single share class. Costs incurred by the Fund in connection with the organization, registration and the initial public offering of shares were paid by Jensen Investment Management, Inc. (the “Adviser”), the Fund’s investment adviser.
The Fund is an investment company and accordingly follows the investment company accounting and reporting guidance of the Financial Accounting Standards Board (“FASB”) Accounting Standard Codification Topic 946 “Financial Services–Investment Companies”.
2. Significant Accounting Policies
The following is a summary of significant accounting policies consistently followed by the Fund in the preparation of the financial statements. These policies are in conformity with generally accepted accounting principles in the United States of America (“GAAP”).
(a) Investment Valuation– Each equity security owned by the Fund that is listed on a securities exchange, except those listed on the NASDAQ Stock Market LLC (“NASDAQ”), is valued at its last sale price on that exchange on the date as of which assets are valued. If a security is listed on more than one exchange, the Fund will use the price of the exchange that the Fund generally considers to be the principal exchange on which the stock is traded.
Fund securities listed on NASDAQ will be valued at the NASDAQ Official Closing Price, which may not necessarily represent the last sale price. If there has been no sale on such exchange or on NASDAQ on such day, the security is valued at (i) the mean between the most recent quoted bid and asked prices at the close of the exchange or (ii) the latest sales price on the Composite Market for the day such security is being valued. “Composite Market“ means a consolidation of the trade information provided by national securities and foreign exchanges and over-the-counter markets, as published by an approved independent pricing service (“Pricing Service”).
| 16 | Jensen Quality Value Fund | Semi-Annual Report |
Debt securities, including short-term debt instruments having a maturity of 60 days or less, are valued at the mean in accordance with prices supplied by a Pricing Service. Pricing Services may use various valuation methodologies such as the mean between the bid and the asked prices, matrix pricing and other analytical pricing models as well as market transactions and dealer quotations. If a price is not available from a Pricing Service, the most recent quotation obtained from one or more broker-dealers known to follow the issue will be obtained. Quotations will be valued at the mean between the bid and the offer. In the absence of available quotations, the securities will be priced at fair value, as described below. Any discount or premium is accreted or amortized using the constant yield method until maturity.
Redeemable securities issued by open-end, registered investment companies are valued at the net asset value (“NAV”) of such companies for purchase and/or redemption orders placed on that day. If, on a particular day, a share of an investment company is not listed on NASDAQ, such security’s fair value will be determined. Money market mutual funds are valued at cost. If cost does not represent current market value the securities will be priced at fair value.
When market quotations are not readily available, any security or other financial instrument is valued at its fair value as determined under procedures approved by the Trust’s Board of Trustees. These fair value procedures will also be used to price a security when corporate events, events in the securities market or world events cause the Adviser to believe that a security’s last sale price may not reflect its actual fair value. The intended effect of using fair value pricing procedures is to ensure that the Fund is accurately priced.
FASB Accounting Standards Codification, “Fair Value Measurements and Disclosures” Topic 820 (“ASC 820”), establishes an authoritative definition of fair value and sets out a hierarchy for measuring fair value. ASC 820 requires an entity to evaluate certain factors to determine whether there has been a significant decrease in volume and level of activity for the security such that recent transactions and quoted prices may not be determinative of fair value and further analysis and adjustment may be necessary to estimate fair value. ASC 820 also requires enhanced disclosure regarding the inputs and valuation techniques used to measure fair value in those instances as well as expanded disclosure of valuation levels for each class of investments. These inputs are summarized in the three broad levels listed below:
| ● | Level 1 – | Quoted prices in active markets for identical securities. |
| ● | Level 2 – | Other significant observable inputs (including quoted prices for similar securities, interest rates, prepayment speeds, credit risk, etc.). |
| ● | Level 3 – | Significant unobservable inputs (including the Fund’s own assumptions in determining the fair value of investments). |
| Semi-Annual Report | Jensen Quality Value Fund | 17 |
The inputs or methodology used for valuing securities are not necessarily an indication of the risk associated with investing in those securities. The following is a summary of the inputs used to value the Fund’s investments carried at fair value as of November 30, 2019:
| Level 1 | Level 2 | Level 3 | Total | ||||||||
| Common Stock(1) | $42,157,666 | $— | $— | $42,157,666 | |||||||
| Short-Term Investments | $1,643,891 | — | — | $1,643,891 | |||||||
| Total Investments | $43,801,557 | $— | $— | $43,801,557 | |||||||
| (1) | See the Schedule of Investments for industry classifications. |
The Fund did not hold any investments during the six months ended November 30, 2019 with significant unobservable inputs which would be classified as Level 3. The Fund did not hold financial derivative instruments during the six months ended November 30, 2019.
(b) Federal Income Taxes– The Fund intends to comply with the requirements of Subchapter M of the Internal Revenue Code necessary to qualify as a regulated investment company and to make the requisite distributions of income and capital gains to its shareholders sufficient to relieve it from all or substantially all federal income taxes. Therefore, no federal income tax provision has been provided.
As of and during the six months ended November 30, 2019, the Fund did not have a liability for any unrecognized tax benefits. The Fund recognizes interest and penalties, if any, related to uncertain tax benefits as income tax expense in the Statement of Operations. During the six months ended November 30, 2019, the Fund did not incur any interest or penalties. The Fund has no examination in progress. The Fund is also not aware of any tax provisions for which it is reasonably possible that the total amounts of unrecognized tax benefits will significantly change in the next twelve months.
(c) Distributions to Shareholders– The Fund will declare and distribute any net investment income quarterly. The Fund will distribute any net realized long- or short-term capital gains at least annually. Distributions from net realized gains for book purposes may include short-term capital gains. All short-term capital gains are included in ordinary income for tax purposes. Distributions to shareholders are recorded on the ex-dividend date. The Fund may also pay a special distribution at the end of the calendar year to comply with federal tax requirements. The Fund may utilize earnings and profits distributed to shareholders on redemption of shares as part of the dividend paid deduction.
(d) Use of Estimates– The preparation of financial statements in conformity with GAAP requires management to make estimates and assumptions that affect the reported amounts of assets and liabilities and disclosure of contingent assets and liabilities at the date of the financial statements and the reported amounts of revenues and expenses during the reporting period. Actual results could differ from those estimates.
| 18 | Jensen Quality Value Fund | Semi-Annual Report |
(e) Share Valuation– The NAV per share of the Fund is calculated by dividing the sum of the value of the securities held by the Fund, plus cash or other assets, minus all liabilities (including estimated accrued expenses) by the total number of shares outstanding for the Fund, rounded to the nearest cent. The Fund’s shares will not be priced on the days on which the New York Stock Exchange (“NYSE”) is closed for trading.
(f) Allocation of Income, Expenses and Gains/Losses– Income, expenses (other than those deemed attributable to a specific share class), and gains and losses of the Fund are allocated daily to each class of shares based upon the ratio of net assets represented by each class as a percentage of the net assets of the Fund. Expenses deemed directly attributable to a class of shares are recorded by the specific class. Most Fund expenses are allocated by class based on relative net assets. Distribution (12b-1) and shareholder servicing fees are expensed at 0.25% of average daily net assets of Class J shares. Shareholder servicing fees are expensed at up to 0.10% of the average daily net assets of Class I shares. Expenses associated with a specific fund in the Trust are charged to that fund. Common Trust expenses are typically allocated evenly between the funds of the Trust, or by other equitable means.
(g) Other– Investment transactions are recorded on the trade date. The Fund determines the gain or loss from investment transactions using the specific identification method by comparing the original cost of the security lot sold with the net sale proceeds. Dividend income is recognized on the ex-dividend date and interest income is recognized on an accrual basis.
3. Federal Tax Matters
The tax character of distributions paid during the years ended May 31, 2019 and May 31, 2018 were as follows:
| May 31, 2019 | May 31, 2018 | |||||
| Ordinary Income | $913,744 | $975,318 | ||||
| Long-Term Capital Gain | $1,040,514 | $552,694 | ||||
| Short-Term Capital Gain | $— | $— | ||||
The components of accumulated earnings on a tax basis as of May 31, 2019 were as follows:
| Cost basis of investments for federal income tax purposes | $34,823,181 | |
| Gross tax unrealized appreciation | 3,847,190 | |
| Gross tax unrealized depreciation | (2,420,337 | ) |
| Net tax unrealized appreciation | $1,426,853 | |
| Undistributed ordinary income | 22,998 | |
| Undistributed long-term capital gain | 1,023,534 | |
| Distributable earnings | $1,046,532 | |
| Other accumulated losses | — | |
| Total distributable earnings | $2,473,385 |
| Semi-Annual Report | Jensen Quality Value Fund | 19 |
The difference between book basis and tax basis of investments is primarily attributable to the deferral of losses on wash sales.
On June 14, 2019, the Fund declared and paid a distribution from ordinary income of $6,530 and $106,808 for Class J and Class I shares, respectively, to shareholders of record as of June 13, 2019.
Additionally, GAAP requires that certain components of net assets relating to permanent differences be reclassified between financial and tax reporting. These reclassifications have no effect on net assets or NAV per share.
On the Statement of Assets and Liabilities, the following adjustments were made for permanent tax adjustments:
| Accumulated Earnings | $— | |
| Paid-in Capital | $— |
4. Investment Adviser
The Trust has an Investment Advisory Agreement (the “Agreement”) with the Adviser to furnish investment advisory services to the Fund. Under the terms of the Agreement, the Fund compensates the Adviser for its management services at the annual rate of 0.65% of the Fund’s average daily net assets.
The Adviser has contractually agreed to waive its management fee and/or reimburse the Fund’s other expenses at least through January 15, 2021, to the extent necessary to ensure that the Fund’s total operating expenses (exclusive of front-end or contingent deferred sales loads, Rule 12b-1 plan fees, shareholder servicing plan fees, taxes, leverage (i.e., any expenses incurred in connection with borrowings made by the Fund), interest (including interest incurred in connection with bank and custody overdrafts), brokerage commissions and other transactional expenses, expenses incurred in connection with any merger or reorganization, dividends or interest expenses on short positions, acquired fund fees and expenses and extraordinary expenses such as litigation) do not exceed 0.80% (the “Expense Limitation Cap”) of the Fund’s average daily net assets. For the six months ended November 30, 2019, expenses of $7,607 and $73,997 were waived or reimbursed by the Adviser for Class J and Class I shares, respectively. Any such waiver or reimbursement is subject to later adjustment to allow the Adviser to recoup amounts waived or reimbursed to the extent actual fees and expenses for a fiscal period do not exceed the lesser of: (1) the Expense Limitation Cap in place at the time of waiver or reimbursement or (2) the Expense Limitation Cap in place at the time of the recoupment; provided, however, that the Adviser shall only be entitled to recoup such amounts over the following three year period from the date of the waiver or reimbursement.
| 20 | Jensen Quality Value Fund | Semi-Annual Report |
The following table shows the remaining waived or reimbursed expenses subject to potential recovery expiring during the fiscal period ending:
| May 31, 2020 | $65,690 | |
| May 31, 2021 | $131,227 | |
| May 31, 2022 | $162,498 | |
| November 30, 2022 | $81,604 |
5. Distribution and Shareholder Servicing Plan
The Trust adopted a distribution and shareholder servicing plan pursuant to Rule 12b-1 (the “12b-1 Plan”), on behalf of the Fund, which authorizes it to pay Quasar Distributors, LLC (the “Distributor” or “Quasar”), the Fund’s distributor and principal underwriter, a distribution fee of 0.25% of the Fund’s average daily net assets attributable to Class J shares for services to Class J shareholders and distribution of Class J shares. The Trust adopted a shareholder servicing plan (the “Shareholder Servicing Plan”), on behalf of the Fund, which authorizes it to pay up to 0.10% of the Fund’s average daily net assets attributable to Class I shares to other financial institutions for shareholder servicing and maintenance of Class I shareholder accounts. During the six months ended November 30, 2019, the Fund accrued expenses of $4,678 pursuant to the 12b-1 Plan for distribution fees relating to Class J shares and $3,626 pursuant to the Shareholder Servicing Plan for shareholder servicing fees relating to Class I shares. As of November 30, 2019, the Distributor was owed fees of $935 for 12b-1 fees relating to Class J shares and $1,714 for shareholder servicing fees relating to Class I shares which are included within accrued expenses and other liabilities on the Statement of Assets and Liabilities.
6. Related Party Transactions
U.S. Bancorp Fund Services, LLC, doing business as U.S. Bank Global Fund Services (“Fund Services” or the “Administrator”), acts as the Fund’s Administrator under an Administration Agreement. The Administrator prepares various federal and state regulatory filings, reports and returns for the Fund; prepares reports and materials to be supplied to the Trustees; monitors the activities of the Fund’s custodian, transfer agent and fund accountant; coordinates the preparation and payment of the Fund’s expenses and reviews the Fund’s expense accruals. For the six months ended November 30, 2019, the Fund incurred $26,040 in administration fees. At November 30, 2019, the Administrator was owed fees of $7,413.
Fund Services also serves as the fund accountant and transfer agent to the Fund. U.S. Bank National Association (“US Bank”), an affiliate of Fund Services, serves as the Fund’s custodian. For the six months ended November 30, 2019, the Fund incurred $12,877, $12,840 and $4,237 in fund accounting, transfer agency, and custody fees, respectively. At November 30, 2019, fees of $4,110, $3,986, and $1,665 were owed for fund accounting, transfer agency, and custody fees, respectively.
The Fund has a line of credit with US Bank (see Note 10).
The Distributor acts as the Fund’s principal underwriter in a continuous public offering of the Fund’s shares. The Distributor is an affiliate of Fund Services and US Bank.
| Semi-Annual Report | Jensen Quality Value Fund | 21 |
Certain officers of the Fund are also employees of Fund Services. A Trustee of the Trust is affiliated with Fund Services and US Bank. This same Trustee is a board member and an interested person of the Distributor.
The Trust’s Chief Compliance Officer is also an employee of Fund Services. For the six months ended November 30, 2019, the Fund was allocated $6,961 of the Trust’s Chief Compliance Officer fee. At November 30, 2019, fees of $2,451 were owed by the Fund for the Chief Compliance Officer’s services.
7. Capital Share Transactions
Transactions in shares of the Fund were as follows:
| Class J | six months ended November 30, 2019 (Unaudited) | year ended May 31, 2019 | ||||||
| Shares sold | 171,756 | 126,127 | ||||||
| Shares issued in reinvestment of dividends | 592 | 7,823 | ||||||
| Shares redeemed | (41,191 | ) | (131,558 | ) | ||||
| Net increase | 131,157 | 2,392 | ||||||
| Class J | six months ended November 30, 2019 (Unaudited) | year ended May 31, 2019 | ||||||
| Shares sold | 184,730 | 130,270 | ||||||
| Shares issued in reinvestment of dividends | 10,395 | 160,022 | ||||||
| Shares redeemed | (27,493 | ) | (141,443 | ) | ||||
| Net increase | 167,632 | 148,849 | ||||||
8. Investment Transactions
The aggregate purchases and sales of securities, excluding short-term investments, for the Fund for the six months ended November 30, 2019, were $10,553,875 and $6,362,646, respectively. For the six months ended November 30, 2019, there were no purchases or sales of U.S. government securities for the Fund.
9. Beneficial Ownership
The beneficial ownership, either directly or indirectly, of more than 25% of the voting securities of a fund creates a presumption of control of the fund under Section 2(a)(9) of the 1940 Act. At November 30, 2019, Charles Schwab & Co. Inc., and Wells Fargo Clearing Services, LLC, for the benefit of its customers, held 39.61% and 29.30%, respectively, of the outstanding shares of the Class J share class. At November 30, 2019, Pershing, LLC, for the benefit of its customers, held 91.98% of the outstanding shares of the Class I share class.
| 22 | Jensen Quality Value Fund | Semi-Annual Report |
10. Line of Credit
At November 30, 2019, the Fund had a line of credit in the amount of the lesser of $3,000,000 or 33.33% of the fair value of unencumbered assets of the Fund, which matures on August 8, 2020. This unsecured line of credit is intended to provide short-term financing, if necessary, subject to certain restrictions, in connection with shareholder redemptions. The interest rate on outstanding principal amounts is equal to the prime rate (4.75% as of November 30, 2019). The credit facility is with the Fund’s custodian, US Bank. During the six months ended November 30, 2019, the Fund did not utilize the line of credit.
11. Subsequent Events
In preparing these financial statements, the Fund has evaluated events and transactions for potential recognition or disclosure through the date the financial statements were issued. On November 25, 2019, U.S. Bancorp, the parent company of Quasar, the Fund’s distributor, announced that it had signed a purchase agreement to sell Quasar to Foreside Financial Group, LLC (“Foreside”) such that Quasar will become a wholly-owned broker-dealer subsidiary of Foreside. The transaction is expected to close by the end of March 2020. Quasar will remain the Fund’s distributor at the close of the transaction, subject to Board approval received on January 17, 2020.
On December 18, 2019, the Fund declared and paid a distribution from ordinary income of $7,704 and $94,904 for Class J and Class I shares, respectively, to shareholders of record as of December 17, 2019.
On December 18, 2019, the Fund declared and paid a distribution from long-term capital gains of $158,339 and $1,414,666 for Class J and Class I shares, respectively, to shareholders of record as of December 17, 2019.
Effective January 15, 2020, the Fund issued a new class of shares, Class Y shares, which commenced operations January 15, 2020.
| Semi-Annual Report | Jensen Quality Value Fund | 23 |
Expense Example – November 30, 2019 (Unaudited)
As a shareholder of the Fund, you incur ongoing costs, including investment management fees, distribution (12b-1) fees (Class J only) and shareholder servicing fees (Class I only), and other Fund expenses, which are indirectly paid by shareholders. This example is intended to help you understand your ongoing costs (in dollars) of investing in the Fund and to compare these costs with the ongoing costs of investing in other mutual funds.
The Example is based on an investment of $1,000 invested at the beginning of the period and held for the entire period (June 1, 2019 - November 30, 2019).
Actual Expenses
The first lines of the tables below for each share class of the Fund provide information about actual account values and actual expenses. However, the table does not include shareholder specific fees, such as the $15.00 fee charged to IRA accounts or the $15.00 fee charged for wire redemptions. The table also does not include portfolio trading commissions and related trading costs. You may use the information in these lines, together with the amount you invested, to estimate the expenses that you paid over the period. Simply divide your account value by $1,000 (for example, an $8,600 account value divided by $1,000 = 8.6), then multiply the result by the number in the first line under the heading titled “Expenses Paid During Period” to estimate the expenses you paid on your account during this period.
Hypothetical Example for Comparison Purposes
The second lines of the tables below for each share class of the Fund provide information about hypothetical account values and hypothetical expenses based on the actual expense ratios for each share class of the Fund and an assumed rate of return of 5% per year before expenses, which is not the Fund’s actual return. The hypothetical account values and expenses may not be used to estimate the actual ending account balance or expenses you paid for the period. You may use this information to compare the ongoing costs of investing in the Fund and other funds. To do so, compare this 5% hypothetical example with the 5% hypothetical examples that appear in the shareholder reports of the other funds.
Please note that the expenses shown in the table are meant to highlight your ongoing costs only and do not reflect any transactional costs, such as sales charges (loads), redemption fees, or exchange fees which, although not charged by the Fund, may be charged by other funds. Therefore, the second lines of the tables are useful in comparing ongoing costs only, and will not help you determine the relative total costs of owning different funds.
| 24 | Jensen Quality Value Fund | Semi-Annual Report |
Expense Example Tables (Unaudited)
| Ending | Expenses Paid | ||||||||
| Beginning | Account Value | During Period* | |||||||
| Account Value | November 30, | June 1, 2019 – | |||||||
| Jensen Quality Value Fund – Class J | June 1, 2019 | 2019 | November 30, 2019 | ||||||
| Actual | $1,000.00 | $1,110.90 | $5.54 | ||||||
| Hypothetical (5% return before expenses) | 1,000.00 | $1,019.75 | $5.30 | ||||||
| * | Expenses are equal to Class J’s annualized expense ratio of 1.05%, multiplied by the average account value over the period, multiplied by 183/366 to reflect the one-half year period. |
| Ending | Expenses Paid | ||||||||
| Beginning | Account Value | During Period* | |||||||
| Account Value | November 30, | June 1, 2019 – | |||||||
| Jensen Quality Value Fund – Class I | June 1, 2019 | 2019 | November 30, 2019 | ||||||
| Actual | $1,000.00 | $1,111.70 | $4.33 | ||||||
| Hypothetical (5% return before expenses) | 1,000.00 | $1,020.90 | $4.14 | ||||||
| * | Expenses are equal to Class I’s annualized expense ratio of 0.82%, multiplied by the average account value over the period, multiplied by 183/366 to reflect the one-half year period. |
1. Shareholder Notification of Federal Tax Status
The Fund designated 77.44% of dividends declared during the fiscal year ended May 31, 2019 as dividends qualifying for the dividends received deduction available to corporate shareholders.
The Fund designated 77.44% of dividends declared from net investment income during the fiscal year ended May 31, 2019 as qualified dividend income under the Jobs and Growth Tax Relief Reconciliation Act of 2003.
The Fund designated 52.46% of taxable ordinary income distributions as short-term capital gain distributions under Internal Revenue Code Section 871(k)(2)(c) for the year ended May 31, 2019.
Additional Information Applicable to Foreign Shareholders Only:
The Fund designated 0.00% of ordinary income distributions as interest-related dividends under Internal Revenue Code Section 871(k)(1)(c).
2. Availability of Proxy Voting Information
The Fund has adopted proxy voting policies and procedures that delegate to the Adviser the authority to vote proxies. A description of the Fund’s proxy voting policies and procedures is available without charge, upon request, by calling the Fund toll free at 800-992-4144. A description of these policies and procedures is also included in the Fund’s Statement of Additional Information, which is available on the SEC’s website at http://www.sec.gov.
| Semi-Annual Report | Jensen Quality Value Fund | 25 |
The Fund’s proxy voting record for the most recent 12-month period ended June 30 is available without charge, upon request, by calling toll free, 800-992-4144, or by accessing the SEC’s website at http://www.sec.gov.
3. Portfolio Holdings
The Fund files its complete schedule of portfolio holdings with the SEC for the first and third quarters of each fiscal year on Part F of Form N-PORT. Shareholders may view the Fund’s Form N-PORT reports on the SEC’s website at http://www.sec.gov.
4. Householding
In an effort to decrease costs, the Fund intends to reduce the number of duplicate prospectuses and annual and semi-annual reports you receive by sending only one copy of each to those addresses shared by two or more accounts and to shareholders the Fund reasonably believes are from the same family or household. Once implemented, if you would like to discontinue householding for your accounts, please call the Fund toll-free at 800-992-4144 to request individual copies of these documents. Once the Fund receives notice to stop householding, the Fund will begin sending individual copies 30 days after receiving your request. This policy does not apply to account statements.
| 26 | Jensen Quality Value Fund | Semi-Annual Report |
Basis for Trustees’ Approval of Investment Advisory Agreement
The Board of Trustees (the “Trustees”) of Trust for Professional Managers (the “Trust”) met on July 22, 2019 to consider the renewal of the Investment Advisory Agreement (the “Agreement”) between the Trust, on behalf of the Jensen Quality Value Fund (the “Fund”), a series of the Trust, and Jensen Investment Management, Inc., the Fund’s investment adviser (the “Adviser”). The Trustees also met at a prior meeting held on June 13, 2019 (the “June 13, 2019 Meeting”) to review materials related to the renewal of the Agreement. Prior to these meetings, the Trustees requested and received materials to assist them in considering the renewal of the Agreement. The materials provided contained information with respect to the factors enumerated below, including a copy of the Agreement, a memorandum prepared by the Trust’s outside legal counsel discussing in detail the Trustees’ fiduciary obligations and the factors they should assess in considering the renewal of the Agreement, detailed comparative information relating to the Fund’s performance, as well as the management fees and operating expenses of the Fund, due diligence materials relating to the Adviser (including a due diligence questionnaire completed on behalf of the Fund by the Adviser, the Adviser’s Form ADV, select financial statements of the Adviser, bibliographic information of the Adviser’s key management and compliance personnel, comparative fee information for the Fund and a summary detailing key provisions of the Adviser’s written compliance program, including its code of ethics) and other pertinent information. The Trustees also received information periodically throughout the year that was relevant to the Agreement renewal process, including performance, management fee and other expense information. Based on their evaluation of the information provided by the Adviser, in conjunction with the Fund’s other service providers, the Trustees, by a unanimous vote (including a separate vote of the Trustees who are not “interested persons,” as that term is defined in the Investment Company Act of 1940, as amended (the “Independent Trustees”)), approved the continuation of the Agreement for an additional one-year term ending August 31, 2020.
Discussion of Factors Considered
In considering the renewal of the Agreement and reaching their conclusions, the Trustees reviewed and analyzed various factors that they determined were relevant, including the factors enumerated below.
1. Nature, Extent and Quality of Services Provided to the Fund
The Trustees considered the nature, extent and quality of services provided by the Adviser to the Fund and the amount of time devoted by the Adviser’s staff to the Fund’s operations. The Trustees considered the Adviser’s specific responsibilities in all aspects of day-to-day management of the Fund, as well as the qualifications, experience and responsibilities of Eric H. Schoenstein, Kurt M. Havnaer, Allen T. Bond, Kevin J. Walkush and Adam D. Calamar, the Fund’s portfolio managers, and other key personnel at the Adviser involved in the day-to-day activities of the Fund. The Trustees reviewed information provided by the Adviser in a due diligence summary, including the structure of the Adviser’s compliance program and discussed the Adviser’s marketing activities
| Semi-Annual Report | Jensen Quality Value Fund | 27 |
and its continuing commitment to the Fund. The Trustees noted that during the course of the prior year they had met via teleconference with the Adviser during a Board meeting to discuss various performance, marketing and compliance issues. The Trustees also noted any services that extended beyond portfolio management, and they considered the brokerage practices of the Adviser. The Trustees discussed in detail the Adviser’s handling of compliance matters, including the reports of the Trust’s chief compliance officer to the Trustees on the effectiveness of the Adviser’s compliance program. The Trustees concluded that the Adviser had sufficient quality and depth of personnel, resources, investment methods and compliance policies and procedures essential to performing its duties under the Agreement and that the nature, overall quality and extent of the management services provided to the Fund, as well as the Adviser’s compliance program, were satisfactory and reliable.
2. Investment Performance of the Fund and the Adviser
The Trustees discussed the performance of the Fund’s Class I shares for the year-to-date, one-year, three-year and five-year periods ended April 30, 2019. In assessing the quality of the portfolio management services provided by the Adviser, the Trustees also compared the short-term and longer-term performance of the Class I shares of the Fund on both an absolute basis and in comparison to a benchmark index, the Russell 2500®Total Return Index, and in comparison to a peer group of U.S. open-end mid-cap value funds in the Fund’s current Morningstar category as constructed by data presented by Morningstar Direct (the “Morningstar Peer Group”). The Trustees noted the Adviser did not manage any other accounts with the same or similar investment strategies as the Fund.
The Trustees noted that for the year-to-date, one-year, three-year and five-year periods ended April 30, 2019, the Fund’s performance for Class I shares ranked above the Morningstar Peer Group median, and, for the one-year period, was the best performing fund in the Morningstar Peer Group. The Trustees also noted that for the year-to-date, three-year, five-year and since inception periods ended March 31, 2019, the Fund’s Class I shares had underperformed the Russell 2500®Total Return Index, but that for the one-year period ended March 31, 2019, the Fund’s Class I shares had outperformed the Russell 2500®Total Return Index.
After considering all of the information, the Trustees concluded that the performance obtained by the Adviser for the Fund was satisfactory under current market conditions. Although past performance is not a guarantee or indication of future results, the Trustees determined that the Fund and its shareholders were likely to benefit from the Adviser’s continued management.
3. Costs of Services Provided and Profits Realized by the Adviser
The Trustees considered the cost of services and the structure of the Adviser’s fees, including a review of the expense analyses and other pertinent material with respect to the Fund. The Trustees reviewed the related statistical information and other materials provided, including the comparative expenses, expense components and peer group selection. The Trustees also considered the cost structure of the Fund relative to the Morningstar Peer Group.
| 28 | Jensen Quality Value Fund | Semi-Annual Report |
The Trustees also considered the overall profitability of the Adviser, reviewing the Adviser’s financial information and noted that the Adviser had subsidized the Fund’s operations since the Fund’s inception, and had not yet recouped those subsidies. The Trustees also examined the level of profits realized by the Adviser from the fees payable under the Agreement, as well as the Fund’s brokerage practices. These considerations were based on materials requested by the Trustees and the Fund’s administrator specifically for the June 13, 2019 meeting and the July 22, 2019 meeting at which the Agreement was formally considered, as well as the reports made by the Adviser over the course of the year.
The Trustees noted that the Fund’s contractual management fee of 0.65% was below its Morningstar Peer Group average of 0.76%. The Trustees observed that the Fund’s total expense ratio of 0.82% (net of fee waivers and expense reimbursements and which includes shareholder servicing fees of 0.02%) for Class I shares was below the Morningstar Peer Group average (which excludes Rule 12b-1 fees) of 0.97%.
The Trustees concluded that the Fund’s expenses and the management fees paid to the Adviser were fair and reasonable in light of the comparative performance, expense and management fee information. The Trustees further concluded, based on a profitability analysis prepared by the Adviser, that the Fund was not profitable to the Adviser, but the Adviser maintained adequate profit levels to support its services to the Fund from the revenues of its overall investment advisory business, despite its subsidies to support the Fund’s operations.
4. Extent of Economies of Scale as the Fund Grows
The Trustees compared the Fund’s expenses relative to its peer group and discussed realized and potential economies of scale. The Trustees also reviewed the structure of the Fund’s management fee and whether the Fund was large enough to generate economies of scale for shareholders or whether economies of scale would be expected to be realized as Fund assets grow (and if so, how those economies of scale were being or would be shared with shareholders). The Trustees reviewed fee waivers and expense reimbursements by the Adviser with respect to the Fund. The Trustees noted that the Fund’s management fee structure did not contain any breakpoint reductions as the Fund’s assets grow in size, but that the feasibility of incorporating breakpoints would continue to be reviewed on a regular basis. With respect to the Adviser’s fee structure, the Trustees concluded that the current fee structure was reasonable and reflected a sharing of economies of scale between the Adviser and the Fund at the Fund’s current asset level.
5. Benefits Derived from the Relationship with the Fund
The Trustees considered the direct and indirect benefits that could be realized by the Adviser from its association with the Fund. The Trustees concluded that the benefits the Adviser may receive, such as greater name recognition or the ability to attract additional investor assets appear to be reasonable, and in many cases may benefit the Fund.
| Semi-Annual Report | Jensen Quality Value Fund | 29 |
Conclusions
The Trustees considered all of the foregoing factors. In considering the renewal of the Advisory Agreement, the Trustees did not identify any one factor as all-important, but rather considered these factors collectively in light of the Fund’s surrounding circumstances. Based on this review, the Trustees, including a majority of the Independent Trustees, approved the continuation of the Advisory Agreement for an additional term ending August 31, 2020 as being in the best interests of the Fund and its shareholders.
| 30 | Jensen Quality Value Fund | Semi-Annual Report |
Notice of Privacy Policy & Practices
We collect non-public personal information about you from the following sources:
| ● | information we receive about you on applications or other forms; |
| ● | information you give us orally; and |
| ● | information about your transactions with us or others. |
We do not disclose any non-public personal information about our shareholders or former shareholders without the shareholder’s authorization, except as permitted by law or in response to inquiries from governmental authorities. We may share information with affiliated parties and unaffiliated third parties with whom we have contracts for servicing the Fund. We will provide unaffiliated third parties with only the information necessary to carry out their assigned responsibility. All shareholder records will be disposed of in accordance with applicable law. We maintain physical, electronic and procedural safeguards to protect your non-public personal information and require third parties to treat your non-public personal information with the same high degree of confidentiality.
In the event that you hold shares of the Fund through a financial intermediary, including, but not limited to, a broker-dealer, bank or trust company, the privacy policy of your financial intermediary would govern how your non-public personal information would be shared with unaffiliated third parties.
Indemnifications
Under the Trust’s organizational documents, its officers and Trustees are indemnified against certain liabilities arising out of the performance of their duties to the Fund. In addition, in the normal course of business, the Fund enters into contracts that provide general indemnifications to other parties. The Fund’s maximum exposure under these arrangements is unknown as this would involve future claims that may be made against the Fund that have not yet occurred. However, the Fund has not had prior claims or losses pursuant to these contracts and expects the risk of loss to be remote.
Information About Trustees
The business and affairs of the Trust are managed under the direction of the Trust’s Board of Trustees. Information pertaining to the Trustees of the Trust is set forth below. The Statement of Additional Information includes additional information about the Trustees and is available, without charge, upon request by calling 800-992-4144.
| Semi-Annual Report | Jensen Quality Value Fund | 31 |
Independent Trustees (Unaudited)
| Number of | |||||
| Portfolios | Other Directorships | ||||
| Position(s) | Term of Office | in Trust | Held by Trustee | ||
| Name, Address and | Held with | and Length of | Overseen | Principal Occupation(s) | During the Past Five |
| Year of Birth | the Trust | Time Served | by Trustee | During the Past Five Years | Years |
| Michael D. Akers, Ph.D. 615 E. Michigan St. Milwaukee, WI 53202 Year of Birth: 1955 | Trustee | Indefinite Term; | 26 | Professor Emeritus, Department of Accounting (June 2019-present), Professor, Department of Accounting (2004-2019), Chair, Department of Accounting (2004-2017), Marquette University. | Independent Trustee, USA MUTUALS (an open-end investment company with two portfolios). |
| Gary A. Drska 615 E. Michigan St. Milwaukee, WI 53202 Year of Birth: 1956 | Trustee | Indefinite Term; Since August 22, 2001 | 26 | Pilot, Frontier/ Midwest Airlines, Inc. (airline company) (1986-present). | Independent Trustee, USA MUTUALS (an open-end investment company with two portfolios). |
| Jonas B. Siegel 615 E. Michigan St. Milwaukee, WI 53202 Year of Birth: 1943 | Trustee | Indefinite Term; Since October 23, 2009 | 26 | Retired (2011-present); Managing Director, Chief Administrative Officer (“CAO”) and Chief Compliance Officer (“CCO”), Granite Capital International Group, L.P. (an investment management firm) (1994-2011). | Independent Trustee, Gottex Trust (an open-end investment company) (2010-2016); Independent Manager, Ramius IDF fund complex (two closed-end investment companies) (2010-2015); Independent Trustee, Gottex Multi-Asset Endowment fund complex (three closed-end investment companies) (2010-2015); Independent Trustee, Gottex Multi- Alternatives fund complex (three closed-end investment companies) (2010-2015). |
| Joseph C. Neuberger* 615 E. Michigan St. Milwaukee, WI 53202 Year of Birth: 1962 | Chairperson and Trustee | Indefinite Term; Since August 22, 2001 | 26 | President (2017-present), Chief Operating Officer (2016-present), Executive Vice President (1994-2017), U.S. Bancorp Fund Services, LLC. | Trustee; USA Mutuals (an open-end investment company) (2001-2018); Trustee, Buffalo Funds (an open-end investment company) (2003-2017). |
| 32 | Jensen Quality Value Fund | Semi-Annual Report |
Interested Trustee and Officers (Unaudited)
| Number of | |||||
| Portfolios | Other Directorships | ||||
| Position(s) | Term of Office | in Trust | Held by Trustee | ||
| Name, Address and | Held with | and Length of | Overseen | Principal Occupation(s) | During the Past Five |
| Year of Birth | the Trust | Time Served | by Trustee | During the Past Five Years | Years |
| John P. Buckel 615 E. Michigan St. Milwaukee, WI 53202 Year of Birth: 1957 | President and Principal Executive Officer | Indefinite Term; Since January 24, 2013 | N/A | Vice President, U.S. Bancorp Fund Services, LLC (2004-present). | N/A |
| Jennifer A. Lima 615 E. Michigan St. Milwaukee, WI 53202 Year of Birth: 1974 | Vice President, Treasurer and Principal Financial and Accounting Officer | Indefinite Term; Since January 24, 2013 | N/A | Vice President, U.S. Bancorp Fund Services, LLC (2002-present). | N/A |
| Elizabeth B. Scalf 615 E. Michigan St. Milwaukee, WI 53202 Year of Birth: 1985 | Chief Compliance Officer, Vice President and Anti- Money Laundering Officer | Indefinite Term; Since July 1, 2017 | N/A | Senior Vice President, U.S. Bancorp Fund Services, LLC (February 2017-present); Vice President and Assistant CCO, Heartland Advisors, Inc. (December 2016-January 2017); Vice President and CCO, Heartland Group, Inc. (May 2016-November 2016); Vice President, CCO and Senior Legal Counsel (May 2016-November 2016), Assistant CCO and Senior Legal Counsel (January 2016-April 2016), Senior Legal and Compliance Counsel (2013-2015), Heartland Advisors, Inc. | N/A |
| Jay S. Fitton 615 E. Michigan St. Milwaukee, WI 53202 Year of Birth: 1970 | Secretary | Indefinite Term; Since July 22, 2019 | N/A | Assistant Vice President, U.S. Bancorp Fund Services, LLC (2019-present); Partner, Practus, LLP (2018- 2019); Counsel, Drinker Biddle & Reath LLP (2016-2018); Counsel, Huntington Bancshares, Inc. (2011-2015). | N/A |
| Kelly A. Burns 615 E. Michigan St. Milwaukee, WI 53202 Year of Birth: 1987 | Assistant Treasurer | Indefinite Term; Since April 23, 2015 | N/A | Assistant Vice President, U.S. Bancorp Fund Services, LLC (2011-present). | N/A |
| Semi-Annual Report | Jensen Quality Value Fund | 33 |
| Number of | |||||
| Portfolios | Other Directorships | ||||
| Position(s) | Term of Office | in Trust | Held by Trustee | ||
| Name, Address and | Held with | and Length of | Overseen | Principal Occupation(s) | During the Past Five |
| Year of Birth | the Trust | Time Served | by Trustee | During the Past Five Years | Years |
| Melissa Aguinaga 615 E. Michigan St. Milwaukee, WI 53202 Year of Birth: 1987 | Assistant Treasurer | Indefinite Term; Since July 1, 2015 | N/A | Assistant Vice President, U.S. Bancorp Fund Services, LLC (2010-present). | N/A |
| Laura A. Carroll 615 E. Michigan St. Milwaukee, WI 53202 Year of Birth: 1985 | Assistant Treasurer | Indefinite Term; Since August 20, 2018 | N/A | Assistant Vice President, U.S. Bancorp Fund Services, LLC (2007-present). | N/A |
| * | Mr. Neuberger is an “interested person” of the Trust as defined by the 1940 Act by virtue of the fact that he is a board member and an interested person of Quasar Distributors, LLC the Fund’s principal underwriter. |
| 34 | Jensen Quality Value Fund | Semi-Annual Report |

JN-SEMIANNUALQV
| Jensen Quality Value Fund | |||
| Class J Shares | Class I Shares | ||
Fund Administrator, Transfer Agent, Custodian Legal Counsel Independent Registered Public Accounting Firm Distributor
| |||
This report has been prepared for shareholders and may be distributed to others only if preceded or accompanied by a current prospectus | |||
Item 2. Code of Ethics.
Not applicable for semi-annual reports.
Item 3. Audit Committee Financial Expert.
Not applicable for semi-annual reports.
Item 4. Principal Accountant Fees and Services.
Not applicable for semi-annual reports.
Item 5. Audit Committee of Listed Registrants.
Not applicable to registrants who are not listed issuers (as defined in Rule 10A-3 under the Securities Exchange Act of 1934).
Item 6. Investments.
| (a) Schedule of Investments is included as part of the report to shareholders filed under Item 1 of this Form. |
| (b) Not Applicable. |
Item 7. Disclosure of Proxy Voting Policies and Procedures for Closed-End Management Investment Companies.
Not applicable to open-end investment companies.
Item 8. Portfolio Managers of Closed-End Management Investment Companies.
Not applicable to open-end investment companies.
Item 9. Purchases of Equity Securities by Closed-End Management Investment Company and Affiliated Purchasers.
Not applicable to open-end investment companies.
Item 10. Submission of Matters to a Vote of Security Holders.
There have been no material changes to the procedures by which shareholders may recommend nominees to the registrant’s board of trustees.
1
Item 11. Controls and Procedures.
| (a) | The Registrant’s President and Treasurer have reviewed the Registrant's disclosure controls and procedures (as defined in Rule 30a-3(c) under the Investment Company Act of 1940 (the “Act”)) as of a date within 90 days of the filing of this report, as required by Rule 30a-3(b) under the Act and Rules 13a-15(b) or 15d-15(b) under the Securities Exchange Act of 1934. Based on their review, such officers have concluded that the disclosure controls and procedures are effective in ensuring that information required to be disclosed in this report is appropriately recorded, processed, summarized and reported and made known to them by others within the Registrant and by the Registrant’s service provider. |
| (b) | There were no changes in the Registrant's internal control over financial reporting (as defined in Rule 30a-3(d) under the Act) that occurred during the period covered by this report that has materially affected, or is reasonably likely to materially affect, the Registrant's internal control over financial reporting. |
Item 12. Disclosure of Securities Lending Activities for Closed-End Management Investment Companies
Not applicable to open-end investment companies.
Item 13. Exhibits.
| (a) | (1)Any code of ethics or amendment thereto, that is the subject of the disclosure required by Item 2, to the extent that the registrant intends to satisfy Item 2 requirements through filing an exhibit. Incorporated by reference to previous Form N-CSR filed August 6, 2010. |
| (2)A separate certification for each principal executive officer and principal financial officer pursuant to Section 302 of the Sarbanes-Oxley Act of 2002. Filed herewith. | |
| (3)Any written solicitation to purchase securities under Rule 23c-1 under the Act sent or given during the period covered by the report by or on behalf of the registrant to 10 or more persons. Not applicable to open-end investment companies. | |
| (4)Change in the registrant’s independent public accountant.There was no change in the registrant’s independent public accountant for the period covered by this report. | |
| (b) | Certifications pursuant to Section 906 of the Sarbanes-Oxley Act of 2002.Furnished herewith. |
2
SIGNATURES
Pursuant to the requirements of the Securities Exchange Act of 1934 and the Investment Company Act of 1940, the registrant has duly caused this report to be signed on its behalf by the undersigned, thereunto duly authorized.
| (Registrant) | Trust for Professional Managers |
| By (Signature and Title)* | /s/ John Buckel |
| John Buckel, President |
| Date | 2/5/2020 |
Pursuant to the requirements of the Securities Exchange Act of 1934 and the Investment Company Act of 1940, this report has been signed below by the following persons on behalf of the registrant and in the capacities and on the dates indicated.
| By (Signature and Title)* | /s/ John Buckel |
| John Buckel, President |
| Date | 2/5/2020 |
| By (Signature and Title)* | /s/ Jennifer Lima |
| Jennifer Lima, Treasurer |
| Date | 2/5/2020 |
* Print the name and title of each signing officer under his or her signature.
3