UNITED STATES
SECURITIES AND EXCHANGE COMMISSION
Washington, D.C. 20549
SECURITIES AND EXCHANGE COMMISSION
Washington, D.C. 20549
FORM N-CSR
CERTIFIED SHAREHOLDER REPORT OF REGISTERED
MANAGEMENT INVESTMENT COMPANIES
Investment Company Act file number 811-10401
Trust for Professional Managers
(Exact name of registrant as specified in charter)
(Exact name of registrant as specified in charter)
615 East Michigan Street
Milwaukee, WI 53202
(Address of principal executive offices) (Zip code)
(Address of principal executive offices) (Zip code)
Jay S. Fitton
U.S. Bancorp Fund Services, LLC
615 East Michigan Street
Milwaukee, WI 53202
(Name and address of agent for service)
(Name and address of agent for service)
(513) 629-8104
Registrant's telephone number, including area code
Date of fiscal year end: August 31, 2020
Date of reporting period: February 29, 2020
Item 1. Reports to Stockholders.

Semi-Annual Report | February 29, 2020
Performance Trust Strategic Bond
Fund (Symbols: PTIAX, PTAOX, PTCOX) and
Performance Trust Municipal Bond
Fund (Symbols: PTIMX, PTRMX)
© 2020 PT Asset Management, LLC. All Rights Reserved.
Beginning on January 1, 2021, as permitted by regulations adopted by the U.S. Securities and Exchange Commission, paper copies of the Funds’ annual and semi-annual shareholder reports will no longer be sent by mail, unless you specifically request paper copies of the reports from the Funds or from your financial intermediary (such as a broker-dealer or bank). Instead, the reports will be made available on a website, and you will be notified by mail each time a report is posted and provided with a website link to access the report.
If you already elected to receive shareholder reports electronically, you will not be affected by this change and you need not take any action. You may elect to receive shareholder reports and other communications from the Funds electronically by contacting your financial intermediary or, if you are a direct investor, by calling the Funds at 1-877-738-9095.
You may elect to receive all future reports in paper free of charge. If you invest through a financial intermediary,
you can contact your financial intermediary to request that you continue to receive paper copies of your shareholder reports; if you invest directly with the Funds, you can call the Funds at 1-877-738-9095 to request that you continue to receive paper copies of your shareholder reports.
Your election to receive reports in paper form will apply to all funds held in your account with your financial intermediary or, if you invest directly, to all Performance Trust Funds you hold.
LETTER FROM THE INVESTMENT ADVISER
Dear Fellow Shareholders:
Institutional Class of Performance Trust Strategic Bond Fund (PTIAX)
Semi-Annual Management Discussion and Analysis: 9/1/2019 – 2/29/2020
For the six-month period ended February 29, 2020, the Institutional Class of Performance Trust Strategic Bond Fund (“PTIAX” or the “Fund”) posted a return of 3.23%, assuming all dividends were reinvested into the Fund. The Bloomberg Barclays U.S. Aggregate Bond Index (“Index”) returned 3.39% over the same time period, and the Morningstar Multisector US Bond category returned 2.04%.
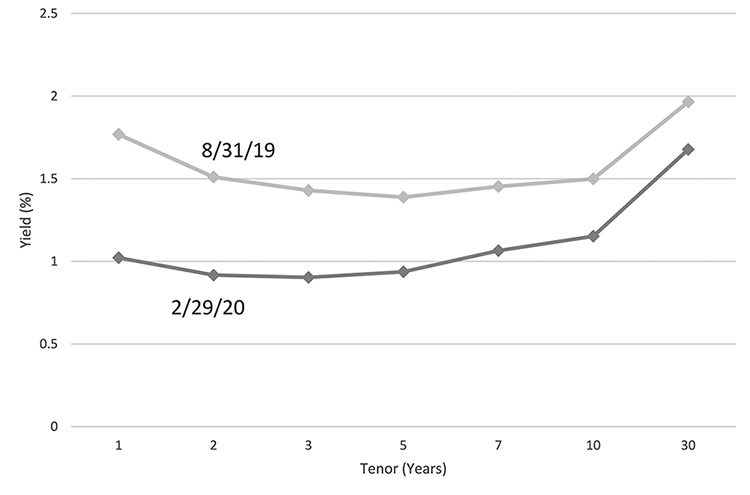
Interest rates fluctuated up and down for most of the period before a steep drop in the last two weeks of February. This left 5-year Treasuries down 45 basis points (0.45%) and 10-year Treasuries down 35 basis points (0.35%) for the period. The drop in interest rates at the end of the period coincided with a sharp decline in the equity markets; the S&P 500 Index dropped by more than 12% during the last two weeks of February. This volatility was likely due to concerns over the uncertainty of how the rapidly growing coronavirus disease would impact the U.S. economy. These concerns led investors to seek safe haven assets causing Treasuries to rally. The overall shape of the Treasury yield curve did not change significantly with a slight inversion evident throughout the entire period. However, the curve became less inverted over the period with the 1-year Treasury falling by 28 basis points (0.28%) more than the 5-year as the market began to price in the possibility of a Federal Reserve (the “Fed”) interest rate cut sometime in the very near future. The graph below shows the Treasury yield curve at the beginning of the period (orange line) and the end (blue line).
Breaking down the performance within the Fund, our best performing asset classes were Corporate, Tax-Exempt, and Taxable Municipal Bonds, which all produced returns in excess of 4.5%. The outperformance of these three asset classes is largely due to the decline in interest rates over the period. The Fund’s municipal and corporate bonds have longer durations than the other asset classes in the portfolio and are therefore more sensitive to changes in interest rates.
The primary reason for the Fund’s slight underperformance of the Index was the performance of our structured credit sectors, including Non-Agency Residential Mortgage Backed Securities (RMBS), Commercial Mortgage Backed Securities (CMBS), Asset Backed Securities (ABS), and Collateralized Loan Obligations (CLOs). Our structured credit bonds tend to have shorter durations, or in some cases, floating rate coupons, which did not benefit as much from the decline in interest rates. These sectors produced returns over the period that somewhat lagged the Index.
The Fund’s allocation to structured credit remained relatively flat over the period, decreasing by about 1.5%. The allocation to RMBS decreased the most compared to other structured credit products (by over 5%) due to both the natural amortization of the securities and relatively attractive opportunities in other sectors. Increased allocation to CLOs in the Fund came from attractive buying opportunities that appeared during a short-lived weakening in the asset class that occurred primarily during the fall of 2019. An increase in CMBS allocations resulted from healthy new issue supply
PAGE 3
LETTER FROM THE INVESTMENT ADVISER
along with our favorable view on the product. We did not increase allocations to ABS during the period because of the dramatic reduction in short-term interest rates. Because ABS tend to price off the very front end of the yield curve, over this period the sector became less attractive compared to other asset classes. We continued the Fund’s shift away from Tax-Exempt Municipal Bonds into Taxable Municipal Bonds as the former continued to become more expensive relative to taxable alternatives. Heavy supply of Taxable Municipals at the end of 2019 also led to what we considered to be attractive entry levels.
8/31/2019 | 2/29/2020 | ||||
| Non-Agency RMBS | 25.26% | 19.87% | |||
| CLOs | 4.53% | 6.59% | |||
| CMBS | 23.96% | 26.09% | |||
| ABS | 5.87% | 5.61% | |||
| Sub-total Structured Credit | 59.62% | 58.16% | |||
| Cash | 2.84% | 0.79% | |||
| Treasuries | 4.07% | 6.82% | |||
| Corporate Bonds | 7.23% | 7.49% | |||
| Taxable Municipal Bonds | 20.50% | 22.61% | |||
| Tax-Exempt Municipal Bonds | 5.65% | 4.10% | |||
| Other | 0.07% | 0.03% |
Looking Forward
In the current market environment with a relatively flat Treasury yield curve and interest rates across most of the curve hovering around 1%, it is difficult to take efficient interest rate risk. As a result, we have maintained a fairly defensive posture as it relates to interest rates with increases to sectors such as Treasury Bills, CLOs, and interest-only CMBS. However, we do not attempt to predict interest rates and maintain a longer duration component to our portfolio. Within this part of the portfolio, which we consider “interest rate offense”, we are currently positioned primarily in Taxable Municipal, Tax-Exempt Municipal, AAA-rated CMBS, and Investment Grade Corporate Bonds.
Institutional Class of Performance Trust Municipal Bond Fund (PTIMX)
Semi-Annual Management Discussion and Analysis: 9/1/2019 – 2/29/2020
For the six-month period ended February 29, 2020, the Institutional Class of Performance Trust Municipal Bond (“PTIMX” or the “Fund”) returned 3.67%, assuming dividends were reinvested, outperforming the Bloomberg Barclays Municipal Bond Index’s return of 3.04%. Municipal 10-year rates fell by 28 basis points (0.28%) over the period, while longer maturities fell by as much as 32 basis points (0.32%), leading to a flatter municipal bond yield curve. PTIMX’s higher sensitivity to interest rates bolstered its relative performance. Further, the majority of PTIMX’s positions have maturities greater than 10 years, allowing the Fund to benefit from a flattening yield curve. PTIMX performance was somewhat constrained by its allocation to shorter bonds, which decreased interest rate sensitivity in a falling rate environment, and its limited allocation to high yield bonds, which continued to perform well for the period.
Technical factors in the municipal market over the months of January and February helped keep the ratio of municipal yields to Treasury yields in the 70% to 80% range, near record low levels. Municipal bond supply and demand was distorted over the period by $120 billion of inflows over a 61-week period, which was driving up demand, while issuers turned to taxable markets to advance refund their tax exempt bonds, limiting the availability of tax exempt supply. Further, municipal rates fell in sympathy with Treasury rates, which were driven down by 3 “insurance” cuts by the Federal Reserve to keep the economy on track and by the rapid spread of a virus that originated in China, known as COVID-19. While some geopolitical risks were ameliorated by the cease fire in the tariff war with China (phase one deal) and a decisive vote in favor of the Brexit campaign (although individual trade deals still need to be negotiated), the net effect over the last six months was a flight-to-quality primarily related to COVID-19.
Fund flows into PTIMX have been strong, with assets growing by 30% in the six months ended February 29, 2020. New cash has been used to: 1) increase the size of existing positions in order to manage our research burden; 2) hold higher levels of cash to decrease our interest rate exposure as interest rates fall (as opposed to selling securities, which would increase the Fund’s realized capital gains tax burden); and 3) continue buying higher quality bonds in the most attractive portion of the yield curve. Spreads continued to remain at historically low levels for the period. We do not believe that these spreads compensate investors to take incremental credit risk. As a result, nearly three-quarters of PTIMX was in cash or AA credit (or higher) as of February 29, 2020. Additionally, less than 10% of below investment grade and non-rated securities were concentrated in shorter duration securities, which could soften the impact of a credit event. While municipal market technical factors have been supportive as of late, we are quickly approaching tax season, which historically has brought a reversal of technicals in the form of selling municipal securities to meet tax liabilities and higher new issue supply. Therefore, we intend to continue our conservative positioning, absent widening credit spreads.
PAGE 4
LETTER FROM THE INVESTMENT ADVISER
Risk Management for the Funds
The Portfolio Management team employs Shape Management® as a key component of our investment process. Shape Management® is a proprietary means of applying total return scenario analysis to both individual bonds and portfolios of bonds. Total return scenario analysis applies various interest rate shifts, yield curve slope analysis, reinvestment rate assumptions and probability analysis to determine a municipal bond’s “shape”, or how we believe that bond will perform in various interest rate environments.
We measure the risk of the portfolio on both an individual bond and portfolio level. Interest rate and credit spread volatility effects are measured by evaluating portfolio performance in fluctuating yield environments. Idiosyncratic risks are evaluated and diversified across coupon, credit quality, maturity, credit sector, duration, position size, and state. Liquidity is managed through a line of credit, cash balance, allocation limits to individual issuers, and allocation limits to the sectors. Management regularly reviews the risks of the portfolio in order to appropriately position its holdings based on the continuously changing uncertainties associated with the various markets in which we participate.
For the RMBS allocation, Management regularly stresses the bonds for various credit scenarios incorporating decreases in home prices and increases in unemployment akin to those experienced in the credit crises. We combine these stress scenarios with various movements in credit spreads to monitor the risks inherent in the RMBS allocation of the portfolio.
Past performance is not indicative of future returns. There can be no guarantee that any strategy (risk management or otherwise) will be successful. All investing involves risk, including potential loss of principal. The views in this report were those of the Funds’ Managers as of February 29, 2020 and may not reflect the views of the Funds’ Managers on the date this Report is first published or anytime thereafter. These views are intended to assist shareholders of the Funds in understanding their investments in the Funds and do not constitute investment advice.
PAGE 5
GROWTH OF PERFORMANCE TRUST STRATEGIC BOND FUND (PTIAX)
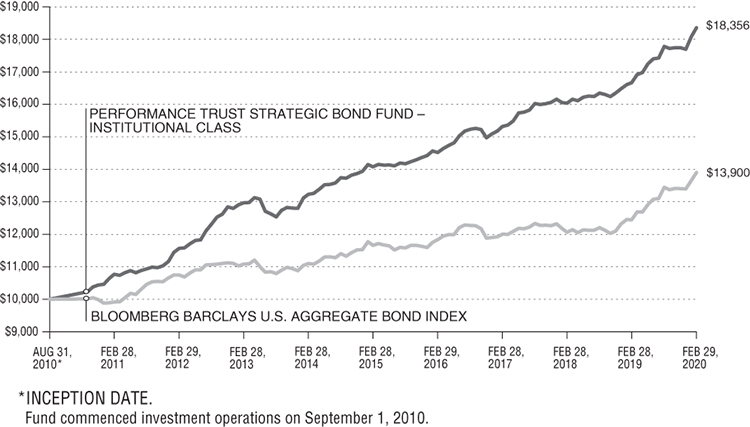
Performance Trust Strategic Bond Fund – Institutional Class (Unaudited)
Total Return vs. Bloomberg Barclays U.S. Aggregate Bond Index
Average Annual Returns—For the Periods Ended February 29, 2020 (Unaudited)
| ANNUALIZED | ||||
| ONE | THREE | FIVE | SINCE INCEPTION | |
| YEAR | YEAR | YEAR | (AUGUST 31, 2010)(1) | |
| Performance Trust Strategic Bond Fund – Institutional Class | 10.15% | 6.22% | 5.45% | 6.61% |
| Bloomberg Barclays U.S. Aggregate Bond Index | 11.68% | 5.01% | 3.58% | 3.53% |
(1) | The Performance Trust Strategic Bond Fund (the “Fund”) commenced investment operations on September 1, 2010. |
The Bloomberg Barclays U.S. Aggregate Bond Index is a broad-based benchmark that measures the investment grade, Barclays Capital dollar denominated, fixed-rate taxable bond market, including Treasuries, government-related and corporate securities, Mortgage-Backed Securities (agency fixed-rate and hybrid Adjustable-Rate Mortgage Passthroughs), Asset-Backed Securities, and Commercial Mortgage-Backed Securities. The Bloomberg Barclays U.S. Aggregate Bond Index was created in 1986, with index history backfilled to January 1, 1976. The chart at the top of the page assumes an initial gross investment of $10,000 made on August 31, 2010, the inception date for Institutional Class shares of the Performance Trust Strategic Bond Fund (the “Fund”).
Returns shown do not reflect the deduction of taxes that a shareholder would pay on Fund distributions or the redemption of Fund shares. Returns shown include the reinvestment of all Fund distributions. Investment performance reflects fee waivers in effect. In the absence of such waivers, total returns would be reduced.
For a period of time following the Fund’s inception when the Fund’s asset levels were lower than current asset levels, the Fund’s investments in certain fixed-income instruments purchased in odd lot-sized transactions contributed positively to the Fund’s performance. As Fund asset levels increased, similar odd lot-sized transactions, if any, did not have the same relative impact on the Fund’s performance and are not anticipated to have the same relative impact on the Fund’s future performance.
Performance data shown represents past performance. Past performance does not guarantee future results. The investment return and principal value of an investment will fluctuate so that an investor’s shares, when redeemed, may be worth more or less than their original cost. Current performance of the Fund may be lower or higher than the performance shown. Performance data current to the most recent month end may be obtained by calling 1 (877) 738-9095 or by visiting www.PTAM.com.
The expense ratio for Institutional Class shares is 0.81% per the prospectus dated December 29, 2019.
PAGE 6
GROWTH OF PERFORMANCE TRUST STRATEGIC BOND FUND (PTAOX)
Performance Trust Strategic Bond Fund – Class A (Unaudited)
Total Return vs. Bloomberg Barclays U.S. Aggregate Bond Index
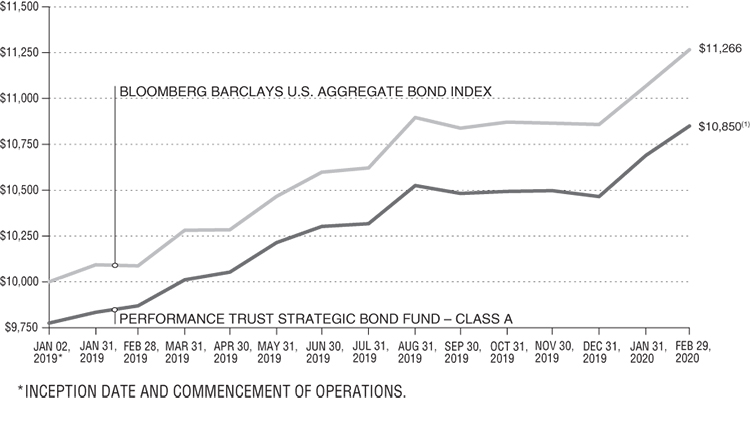
(1) | Reflects 2.25% initial sales load. |
Average Annual Returns—For the Periods Ended February 29, 2020 (Unaudited)
| ANNUALIZED | ||
| ONE | SINCE INCEPTION | |
| YEAR | (JANUARY 2, 2019) | |
| Performance Trust Strategic Bond Fund – Class A (with sales charge) | 7.47% | 7.31% |
| Performance Trust Strategic Bond Fund – Class A (without sales charge) | 9.93% | 9.44% |
| Bloomberg Barclays U.S. Aggregate Bond Index | 11.68% | 10.86% |
The Bloomberg Barclays U.S. Aggregate Bond Index is a broad-based benchmark that measures the investment grade, Barclays Capital dollar denominated, fixed-rate taxable bond market, including Treasuries, government-related and corporate securities, Mortgage-Backed Securities (agency fixed-rate and hybrid Adjustable-Rate Mortgage Passthroughs), Asset-Backed Securities, and Commercial Mortgage-Backed Securities. The Bloomberg Barclays U.S. Aggregate Bond Index was created in 1986, with index history backfilled to January 1, 1976. The chart at the top of the page assumes an initial gross investment of $10,000 made on January 2, 2019, the inception date for Class A shares of the Performance Trust Strategic Bond Fund (the “Fund”).
Returns shown do not reflect the deduction of taxes that a shareholder would pay on Fund distributions or the redemption of Fund shares. Returns shown include the reinvestment of all Fund distributions. Investment performance reflects fee waivers in effect. In the absence of such waivers, total returns would be reduced.
For a period of time following the Fund’s inception when the Fund’s asset levels were lower than current asset levels, the Fund’s investments in certain fixed-income instruments purchased in odd lot-sized transactions contributed positively to the Fund’s performance. As Fund asset levels increased, similar odd lot-sized transactions, if any, did not have the same relative impact on the Fund’s performance and are not anticipated to have the same relative impact on the Fund’s future performance.
Performance data shown represents past performance. Past performance does not guarantee future results. The investment return and principal value of an investment will fluctuate so that an investor’s shares, when redeemed, may be worth more or less than their original cost. Current performance of the Fund may be lower or higher than the performance shown. Performance data current to the most recent month end may be obtained by calling 1 (877) 738-9095 or by visiting www.PTAM.com.
The expense ratio for Class A shares is 1.06% per the prospectus dated December 29, 2019.
PAGE 7
GROWTH OF PERFORMANCE TRUST STRATEGIC BOND FUND (PTCOX)
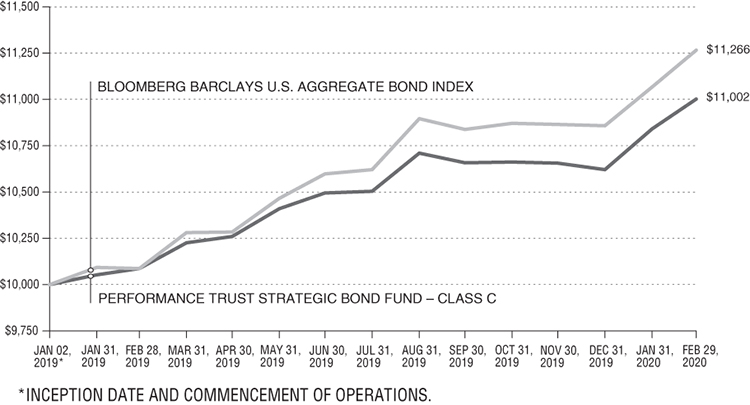
Performance Trust Strategic Bond Fund – Class C (Unaudited)
Total Return vs. Bloomberg Barclays U.S. Aggregate Bond Index
Average Annual Returns—For the Periods Ended February 29, 2020 (Unaudited)
| ANNUALIZED | ||
| ONE | SINCE INCEPTION | |
| YEAR | (JANUARY 2, 2019) | |
| Performance Trust Strategic Bond Fund – Class C | 9.07% | 8.61% |
| Bloomberg Barclays U.S. Aggregate Bond Index | 11.68% | 10.86% |
The Bloomberg Barclays U.S. Aggregate Bond Index is a broad-based benchmark that measures the investment grade, Barclays Capital dollar denominated, fixed-rate taxable bond market, including Treasuries, government-related and corporate securities, Mortgage-Backed Securities (agency fixed-rate and hybrid Adjustable-Rate Mortgage Passthroughs), Asset-Backed Securities, and Commercial Mortgage-Backed Securities. The Bloomberg Barclays U.S. Aggregate Bond Index was created in 1986, with index history backfilled to January 1, 1976. The chart at the top of the page assumes an initial gross investment of $10,000 made on January 2, 2019, the inception date for Class C shares of the Performance Trust Strategic Bond Fund (the “Fund”).
Returns shown do not reflect the deduction of taxes that a shareholder would pay on Fund distributions or the redemption of Fund shares. Returns shown include the reinvestment of all Fund distributions. Investment performance reflects fee waivers in effect. In the absence of such waivers, total returns would be reduced.
For a period of time following the Fund’s inception when the Fund’s asset levels were lower than current asset levels, the Fund’s investments in certain fixed-income instruments purchased in odd lot-sized transactions contributed positively to the Fund’s performance. As Fund asset levels increased, similar odd lot-sized transactions, if any, did not have the same relative impact on the Fund’s performance and are not anticipated to have the same relative impact on the Fund’s future performance.
Performance data shown represents past performance. Past performance does not guarantee future results. The investment return and principal value of an investment will fluctuate so that an investor’s shares, when redeemed, may be worth more or less than their original cost. Current performance of the Fund may be lower or higher than the performance shown. Performance data current to the most recent month end may be obtained by calling 1 (877) 738-9095 or by visiting www.PTAM.com.
The expense ratio for Class C shares is 1.81% per the prospectus dated December 29, 2019.
PAGE 8
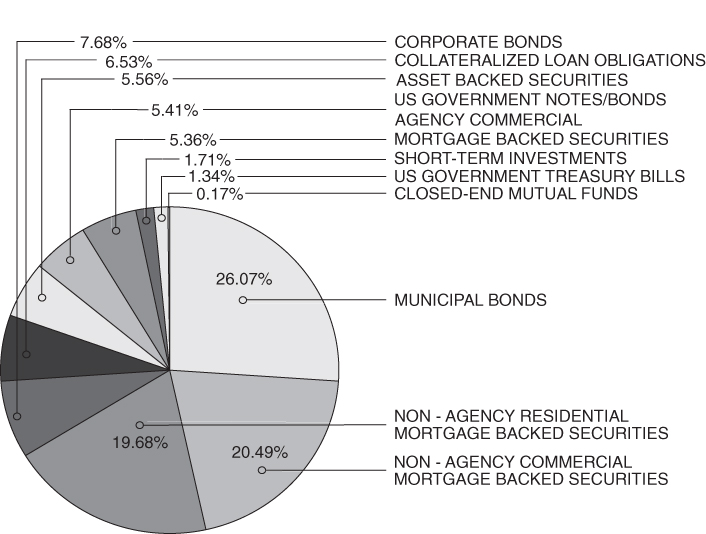
PERFORMANCE TRUST STRATEGIC BOND FUND (PTIAX, PTAOX, PTCOX)
Allocation of Portfolio Holdings (% of Investments) (Unaudited)
As of February 29, 2020
PAGE 9
GROWTH OF PERFORMANCE TRUST MUNICIPAL BOND FUND (PTIMX)
Performance Trust Municipal Bond Fund – Institutional Class (Unaudited)
Total Return vs. Bloomberg Barclays Municipal Bond Index

Average Annual Returns—For the Periods Ended February 29, 2020 (Unaudited)
| ANNUALIZED | ||||
| ONE | THREE | FIVE | SINCE INCEPTION | |
| YEAR | YEAR | YEAR | (JUNE 30, 2011) | |
| Performance Trust Municipal Bond Fund – Institutional Class | 11.46% | 6.39% | 4.84% | 6.23% |
| Bloomberg Barclays Municipal Bond Index | 9.46% | 5.32% | 4.01% | 4.59% |
The Bloomberg Barclays Municipal Bond Index is a rules based, market-value-weighted index engineered for the long-term tax-exempt bond market. The index tracks general obligation bonds, revenue bonds, insured bonds, and pre-refunded bonds rated Baa3/ BBB or higher by at least two of the ratings agencies: Moody’s, S&P and Fitch. The Bloomberg Barclays Municipal Bond Index was created in 1986, with index history backfilled to January 1, 1976. The chart at the top of the page assumes an initial gross investment of $10,000 made on June 30, 2011, the inception date for the Institutional Class shares of the Performance Trust Municipal Bond Fund (the “Fund”).
Returns shown do not reflect the deduction of taxes that a shareholder would pay on Fund distributions or the redemption of Fund shares. Returns shown include the reinvestment of all Fund distributions. Investment performance reflects fee waivers in effect. In the absence of such waivers, total returns would be reduced.
For a period of time following the Fund’s inception when the Fund’s asset levels were lower than current asset levels, the Fund’s investments in certain fixed-income instruments purchased in odd lot-sized transactions contributed positively to the Fund’s performance. As Fund asset levels increased, similar odd lot-sized transactions, if any, did not have the same relative impact on the Fund’s performance and are not anticipated to have the same relative impact on the Fund’s future performance.
Performance data shown represents past performance. Past performance does not guarantee future results. The investment return and principal value of an investment will fluctuate so that an investor’s shares, when redeemed, may be worth more or less than their original cost. Current performance of the Fund may be lower or higher than the performance shown. Performance data current to the most recent month end may be obtained by calling 1 (877) 738-9095 or by visiting www.PTAM.com.
The Fund’s investment adviser, PT Asset Management, LLC, has contractually agreed to waive its fees and/or pay for operating expenses of the Fund to ensure that total annual fund operating expenses (excluding any front-end or contingent deferred loads, Rule 12b-1 plan fees, shareholder servicing plan fees, taxes, leverage, interest, brokerage commissions and other transactional expenses, expenses incurred in connection with any merger or reorganization, dividends or interest on short positions, acquired fund fees and expenses or extraordinary expenses such as litigation expenses) do not exceed 0.55% of the average daily net assets of the Fund. This agreement is effective at least through December 29, 2020. Net Expense Ratio (Institutional Class): 0.55%. Gross Expense Ratio (Institutional Class): 0.57%.
PAGE 10
GROWTH OF PERFORMANCE TRUST MUNICIPAL BOND FUND (PTRMX)
Performance Trust Municipal Bond Fund – Class A (Unaudited)
Total Return vs. Bloomberg Barclays Municipal Bond Index
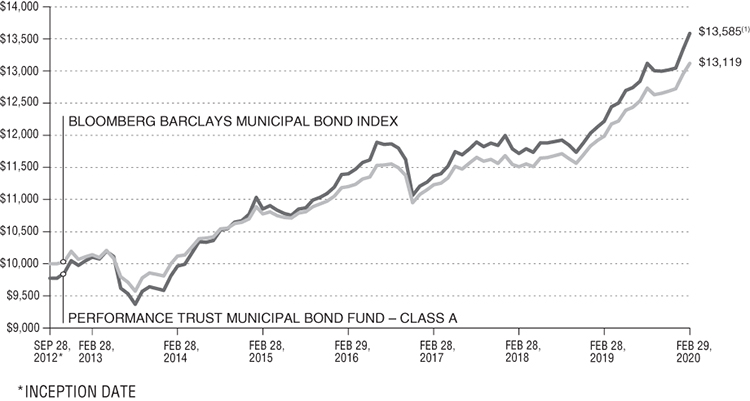
(1) | Reflects 2.25% initial sales load. |
Average Annual Returns—For the Periods Ended February 29, 2020 (Unaudited)
| ANNUALIZED | ||||
| ONE | THREE | FIVE | SINCE INCEPTION | |
| YEAR | YEAR | YEAR | (SEPTEMBER 28, 2012) | |
| Performance Trust Municipal Bond Fund – Class A | ||||
| (with sales charge) | 8.71% | 5.32% | 4.12% | 4.22% |
| Performance Trust Municipal Bond Fund – Class A | ||||
| (without sales charge) | 11.19% | 6.12% | 4.59% | 4.54% |
| Bloomberg Barclays Municipal Bond Index | 9.46% | 5.32% | 4.01% | 3.73% |
The Bloomberg Barclays Municipal Bond Index is a rules based, market-value-weighted index engineered for the long-term tax-exempt bond market. The index tracks general obligation bonds, revenue bonds, insured bonds, and pre-refunded bonds rated Baa3/ BBB or higher by at least two of the ratings agencies: Moody’s, S&P and Fitch. The Bloomberg Barclays Municipal Bond Index was created in 1986, with index history backfilled to January 1, 1976. The chart at the top of the page assumes an initial gross investment of $10,000 made on September 28, 2012, the inception date for the Class A shares of the Performance Trust Municipal Bond Fund (the “Fund”).
Returns shown do not reflect the deduction of taxes that a shareholder would pay on Fund distributions or the redemption of Fund shares. Returns shown include the reinvestment of all Fund distributions. Investment performance reflects fee waivers in effect. In the absence of such waivers, total returns would be reduced.
Performance data shown represents past performance. Past performance does not guarantee future results. The investment return and principal value of an investment will fluctuate so that an investor’s shares, when redeemed, may be worth more or less than their original cost. Current performance of the Fund may be lower or higher than the performance shown. Performance data current to the most recent month end may be obtained by calling 1 (877) 738-9095 or by visiting www.PTAM.com.
The Fund’s investment adviser, PT Asset Management, LLC, has contractually agreed to waive its fees and/or pay for operating expenses of the Fund to ensure that total annual fund operating expenses (excluding any front-end or contingent deferred loads, Rule 12b-1 plan fees, shareholder servicing plan fees, taxes, leverage, interest, brokerage commissions and other transactional expenses, expenses incurred in connection with any merger or reorganization, dividends or interest on short positions, acquired fund fees and expenses or extraordinary expenses such as litigation expenses) do not exceed 0.55% of the average daily net assets of the Fund. This agreement is effective at least through December 29, 2020. Net Expense Ratio (Class A): 0.80%. Gross Expense Ratio (Class A): 0.82%.
PAGE 11
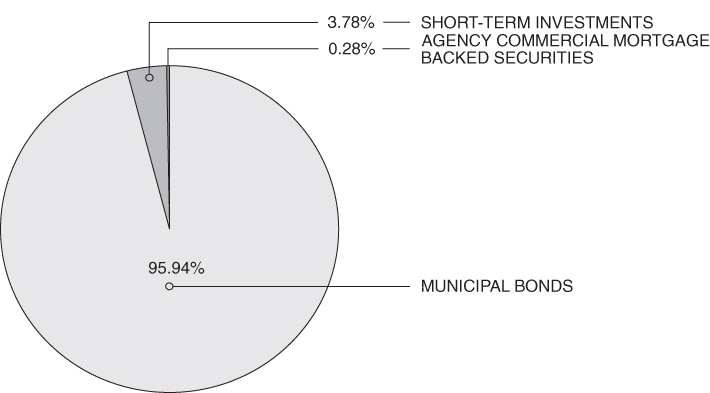
PERFORMANCE TRUST MUNICIPAL BOND FUND (PTIMX, PTRMX)
Allocation of Portfolio Holdings (% of Investments) (Unaudited)
As of February 29, 2020
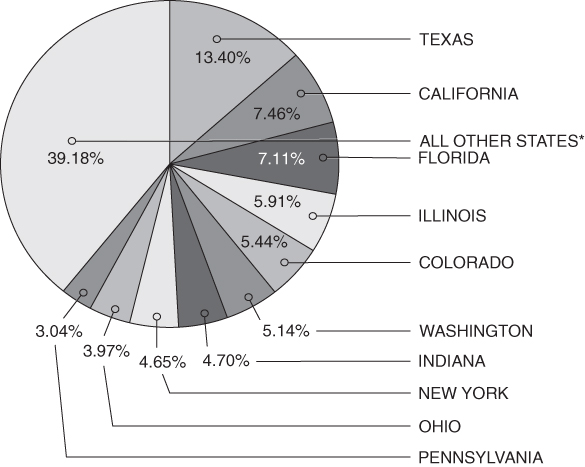
| * | For additional details on allocation of portfolio holdings by state, please see the Schedule of Investments. |
PAGE 12
STATEMENTS OF ASSETS AND LIABILITIES
February 29, 2020 (Unaudited)
| Performance Trust | Performance Trust | |||||||
| Strategic | Municipal | |||||||
| Bond Fund | Bond Fund | |||||||
| Assets | ||||||||
| Investments, at value (cost $3,574,351,935 | ||||||||
| and $399,894,742, respectively) | $ | 3,712,541,019 | $ | 429,204,713 | ||||
| Dividend and interest receivable | 24,115,881 | 3,824,042 | ||||||
| Receivable for investments sold | 3,313,921 | 3,412,050 | ||||||
| Receivable for Fund shares sold | 28,370,252 | 2,532,449 | ||||||
| Other assets | 107,081 | 26,891 | ||||||
| Total Assets | 3,768,448,154 | 439,000,145 | ||||||
| Liabilities | ||||||||
| Payable for investments purchased | 37,663,007 | 7,835,583 | ||||||
| Payable for Fund shares redeemed | 9,808,674 | 813,160 | ||||||
| Payable to Adviser | 1,245,814 | 96,479 | ||||||
| Payable to affiliates | 428,644 | 65,147 | ||||||
| Payable for distribution fees | 13,910 | 4,994 | ||||||
| Payable for shareholder servicing fees | 6,272 | — | ||||||
| Accrued expenses and other liabilities | 415,099 | 16,337 | ||||||
| Total Liabilities | 49,581,420 | 8,831,700 | ||||||
| Net Assets | $ | 3,718,866,734 | $ | 430,168,445 | ||||
| Net Assets Consist Of: | ||||||||
| Paid-in capital | $ | 3,585,749,105 | $ | 399,499,886 | ||||
| Total distributable earnings | 133,117,629 | 30,668,559 | ||||||
| Net Assets | $ | 3,718,866,734 | $ | 430,168,445 | ||||
| Strategic Bond Fund and Municipal Bond Fund Shares – | ||||||||
| Institutional Class | ||||||||
| Net assets | $ | 3,683,705,534 | $ | 404,389,405 | ||||
| Shares of beneficial interest outstanding (unlimited | ||||||||
| number of shares authorized, $0.001 par value) | 156,685,345 | 15,542,940 | ||||||
| Net asset value, redemption and offering price per share | $ | 23.51 | $ | 26.02 | ||||
| Strategic Bond Fund and Municipal Bond Fund Shares – Class A | ||||||||
| Net assets | $ | 15,195,953 | $ | 25,779,040 | ||||
| Shares of beneficial interest outstanding (unlimited | ||||||||
| number of shares authorized, $0.001 par value) | 646,269 | 990,054 | ||||||
| Net asset value, redemption and offering price per share | $ | 23.51 | $ | 26.04 | ||||
| Maximum offering price per share | ||||||||
(Net asset value per share divided by 0.9775)(1) | $ | 24.05 | $ | 26.64 | ||||
| Strategic Bond Fund Shares – Class C | ||||||||
| Net assets | $ | 19,965,247 | $ | — | ||||
| Shares of beneficial interest outstanding (unlimited | ||||||||
| number of shares authorized, $0.001 par value) | 851,539 | — | ||||||
| Net asset value, redemption and offering price per share | $ | 23.45 | $ | — | ||||
| (1) | Reflects a maximum sales charge of 2.25%. |
The accompanying notes are an integral part of these financial statements.
PAGE 13
PERFORMANCE TRUST STRATEGIC BOND FUND — SCHEDULE OF INVESTMENTS
February 29, 2020 (Unaudited)
| PRINCIPAL | ||||||||
| AMOUNT | VALUE | |||||||
| ASSET BACKED SECURITIES – 5.55% | ||||||||
| American Credit Acceptance | ||||||||
| Receivables Trust | ||||||||
| 2018-4, 3.380%, 12/13/2021 (a) | $ | 67,233 | $ | 67,271 | ||||
| 2019-2, 2.850%, 07/12/2022 (a) | 1,804,510 | 1,808,620 | ||||||
| 2019-3, 2.440%, 12/12/2022 (a) | 1,827,322 | 1,833,404 | ||||||
| 2020-1, 1.890%, 04/13/2023 (a) | 3,500,000 | 3,512,072 | ||||||
| Americredit Automobile | ||||||||
| Receivables Trust | ||||||||
| 2019-2, 2.430%, 09/19/2022 | 16,480,807 | 16,544,617 | ||||||
| Carmax Auto Owner Trust | ||||||||
| 2019-2, 2.690%, 07/15/2022 | 4,095,967 | 4,127,257 | ||||||
| 2019-1, 3.020%, 07/15/2022 | 4,336,940 | 4,359,874 | ||||||
| CPS Auto Receivables Trust | ||||||||
| 2019-C, 2.550%, 09/15/2022 (a) | 3,064,783 | 3,078,976 | ||||||
| Drive Auto Receivables Trust | ||||||||
| 2019-4, 2.320%, 06/15/2022 | 4,248,366 | 4,256,041 | ||||||
2019-3, 2.038% (1 Month LIBOR USD + 0.380%), | ||||||||
| 09/15/2022 (b) | 4,059,341 | 4,061,664 | ||||||
| Exeter Automobile | ||||||||
| Receivables Trust | ||||||||
| 2016-1A, 5.520%, 10/15/2021 (a) | 100,675 | 100,849 | ||||||
| 2019-3A, 2.590%, 09/15/2022 (a) | 5,332,380 | 5,349,845 | ||||||
| 2019-4A, 2.180%, 01/17/2023 (a) | 5,211,077 | 5,232,148 | ||||||
| 2018-1A, 3.030%, 01/17/2023 (a) | 1,506,000 | 1,516,040 | ||||||
| 2020-1A, 2.050%, 06/15/2023 (a) | 5,843,752 | 5,861,818 | ||||||
| Fifth Third Auto Trust | ||||||||
| 2019-1, 2.660%, 05/16/2022 | 3,758,452 | 3,781,608 | ||||||
| First Investors Auto Owner Trust | ||||||||
| 2019-2A, 2.210%, 09/16/2024 (a) | 3,226,425 | 3,251,064 | ||||||
| Flagship Credit Auto Trust | ||||||||
| 2017-1, 2.830%, 03/15/2023 (a) | 176,930 | 177,040 | ||||||
| Ford Credit Auto Owner Trust | ||||||||
| 2019-A, 2.780%, 02/15/2022 | 8,366,748 | 8,404,867 | ||||||
| 2016-C, 1.930%, 04/15/2023 | 2,700,000 | 2,703,792 | ||||||
| GLS Auto Receivables Issuer Trust | ||||||||
| 2019-3A, 2.580%, 07/17/2023 (a) | 7,302,796 | 7,364,886 | ||||||
| 2019-4A, 2.470%, 11/15/2023 (a) | 8,116,553 | 8,179,350 | ||||||
| 2020-1A, 2.170%, 02/15/2024 (a) | 10,000,000 | 10,036,990 | ||||||
| GM Financial Consumer | ||||||||
| Automobile Receivables Trust | ||||||||
| 2019-2, 2.660%, 06/16/2022 | 8,062,338 | 8,096,796 | ||||||
| Hyundai Auto Receivables Trust | ||||||||
| 2016-A, 1.730%, 05/16/2022 | 114,397 | 114,404 | ||||||
| Navient Student Loan Trust | ||||||||
2019-2A, 2.627% (1 Month LIBOR USD + 1.000%), | ||||||||
| 02/27/2068 (a)(b) | 6,930,000 | 6,990,680 | ||||||
| Nelnet Student Loan Trust | ||||||||
2006-1, 2.133% (3 Month LIBOR USD + 0.450%), | ||||||||
| 08/23/2036 (a)(b) | 10,000,000 | 9,891,361 | ||||||
| Santander Drive Auto | ||||||||
| Receivables Trust | ||||||||
| 2019-3, 2.280%, 02/15/2022 | 6,957,916 | 6,968,670 | ||||||
| 2019-2, 2.630%, 07/15/2022 | 5,088,843 | 5,106,673 | ||||||
| 2017-2, 2.790%, 08/15/2022 | 686,538 | 688,212 | ||||||
| 2016-3, 4.290%, 02/15/2024 | 10,000,000 | 10,227,372 | ||||||
| SoFi Consumer Loan | ||||||||
| Program Trust | ||||||||
| 2019-3, 2.900%, 05/25/2028 (a) | 2,588,435 | 2,616,135 | ||||||
| 2020-1, 2.020%, 01/25/2029 (a) | 3,000,000 | 3,022,041 | ||||||
| Westlake Automobile | ||||||||
| Receivables Trust | ||||||||
| 2019-3A, 2.150%, 02/15/2023 (a) | 10,000,000 | 10,087,989 | ||||||
| 2018-2A, 3.200%, 01/16/2024 (a) | 8,205,000 | 8,231,163 | ||||||
| 2018-2A, 3.500%, 01/16/2024 (a) | 1,225,000 | 1,240,113 | ||||||
| World Omni Auto | ||||||||
| Receivables Trust | ||||||||
| 2019-B, 2.630%, 06/15/2022 | 6,374,697 | 6,406,448 | ||||||
| 2017-A, 1.930%, 09/15/2022 | 8,130,346 | 8,140,833 | ||||||
| 2019-A, 2.060%, 08/15/2023 | 10,000,000 | 10,064,446 | ||||||
| World Omni Automobile Lease | ||||||||
| Securitization Trust | ||||||||
| 2019-A, 2.890%, 11/15/2021 | 2,744,437 | 2,762,116 | ||||||
| TOTAL ASSET BACKED | ||||||||
| SECURITIES | ||||||||
| (Cost $205,290,028) | 206,265,545 | |||||||
| COLLATERALIZED LOAN | ||||||||
| OBLIGATIONS – 6.52% | ||||||||
| ALM Ltd. | ||||||||
2020-8A, 0.000% (3 Month LIBOR USD + 0.450%), | ||||||||
| 04/15/2033 (a)(b)(c)(e)(i) | 2,000,000 | 2,000,000 | ||||||
| AMMC CLO 22 Ltd. | ||||||||
2018-22A, 3.244% (3 Month LIBOR USD + 1.450%), | ||||||||
| 04/25/2031 (a)(b)(c) | 9,750,000 | 9,556,950 | ||||||
| Apidos CLO XV | ||||||||
2013-15A, 3.669% (3 Month LIBOR USD + 1.850%), | ||||||||
| 04/20/2031 (a)(b)(c) | 5,000,000 | 4,860,500 | ||||||
| Apidos CLO XX | ||||||||
2015-20A, 3.393% (3 Month LIBOR USD + 1.550%), | ||||||||
| 07/16/2031 (a)(b)(c) | 10,000,000 | 9,881,000 | ||||||
Percentages are stated as a percent of net assets.
The accompanying notes are an integral part of these financial statements.
PAGE 14
PERFORMANCE TRUST STRATEGIC BOND FUND — SCHEDULE OF INVESTMENTS (CONT.)
February 29, 2020 (Unaudited)
| PRINCIPAL | ||||||||
| AMOUNT | VALUE | |||||||
| Apidos CLO XXIII | ||||||||
2015-23A, 0.000% (3 Month LIBOR USD + 1.600%), | ||||||||
| 01/15/2033 (a)(b)(c) | $ | 6,500,000 | $ | 6,500,000 | ||||
| Apidos CLO XXIX | ||||||||
2018-29A, 3.344% (3 Month LIBOR USD + 1.550%), | ||||||||
| 07/25/2030 (a)(b)(c) | 3,000,000 | 2,964,000 | ||||||
2018-29A, 3.694% (3 Month LIBOR USD + 1.900%), | ||||||||
| 07/25/2030 (a)(b)(c) | 7,600,000 | 7,406,960 | ||||||
2018-29A, 4.544% (3 Month LIBOR USD + 2.750%), | ||||||||
| 07/25/2030 (a)(b)(c) | 6,250,000 | 6,027,500 | ||||||
| Apidos CLO XXX | ||||||||
XXXA, 3.819% (3 Month LIBOR USD + 2.000%), | ||||||||
| 10/18/2031 (a)(b)(c) | 2,000,000 | 1,961,000 | ||||||
| Ares XLVI CLO Ltd. | ||||||||
2017-46A, 3.570%, 01/15/2030 (a)(c) | ||||||||
| 3,600,000 | 3,601,080 | |||||||
| Ares XLVIII CLO Ltd. | ||||||||
2018-48A, 3.119% (3 Month LIBOR USD + 1.300%), | ||||||||
| 07/20/2030 (a)(b)(c) | 7,000,000 | 6,885,900 | ||||||
| Ares XXVII CLO Ltd. | ||||||||
2013-2A, 4.195% (3 Month LIBOR USD + 2.400%), | ||||||||
| 07/28/2029 (a)(b)(c) | 1,750,000 | 1,751,925 | ||||||
| Ares XXXIR CLO Ltd. | ||||||||
2014-31RA, 2.983% (3 Month LIBOR USD + 1.300%), | ||||||||
| 05/24/2030 (a)(b)(c) | 5,000,000 | 4,918,000 | ||||||
| Bean Creek CLO Ltd. | ||||||||
2015-1A, 2.839% (3 Month LIBOR USD + 1.020%), | ||||||||
| 04/20/2031 (a)(b)(c) | 5,500,000 | 5,457,100 | ||||||
2015-1A, 3.269% (3 Month LIBOR USD + 1.450%), | ||||||||
| 04/20/2031 (a)(b)(c) | 3,200,000 | 3,134,080 | ||||||
| BlueMountain CLO Ltd. | ||||||||
2015-1A, 5.598% (3 Month LIBOR USD + 3.750%), | ||||||||
| 04/13/2027 (a)(b)(c) | 2,000,000 | 2,007,000 | ||||||
2018-1A, 3.470% (3 Month LIBOR USD + 1.700%), | ||||||||
| 07/30/2030 (a)(b)(c) | 6,996,770 | 6,954,090 | ||||||
2014-2A, 3.569% (3 Month LIBOR USD + 1.750%), | ||||||||
| 10/20/2030 (a)(b)(c) | 5,000,000 | 4,984,500 | ||||||
2013-2A, 3.402% (3 Month LIBOR USD + 1.600%), | ||||||||
| 10/22/2030 (a)(b)(c) | 2,750,000 | 2,734,600 | ||||||
2018-2A, 3.392% (3 Month LIBOR USD + 1.700%), | ||||||||
| 08/15/2031 (a)(b)(c) | 5,500,000 | 5,467,000 | ||||||
| BlueMountain Fuji US CLO III Ltd. | ||||||||
2017-3A, 3.206% (3 Month LIBOR USD + 1.375%), | ||||||||
| 01/15/2030 (a)(b)(c) | 6,800,000 | 6,638,160 | ||||||
| Chenango Park CLO Ltd. | ||||||||
2018-1A, 3.381% (3 Month LIBOR USD + 1.550%), | ||||||||
| 04/15/2030 (a)(b)(c) | 7,000,000 | 6,918,800 | ||||||
2018-1A, 3.681% (3 Month LIBOR USD + 1.850%), | ||||||||
| 04/15/2030 (a)(b)(c) | 5,500,000 | 5,348,750 | ||||||
| CIFC Funding Ltd. | ||||||||
2017-3A, 3.619% (3 Month LIBOR USD + 1.800%), | ||||||||
| 07/20/2030 (a)(b)(c) | 2,100,000 | 2,100,210 | ||||||
2013-3RA, 2.781% (3 Month LIBOR USD + 0.980%), | ||||||||
| 04/24/2031 (a)(b)(c) | 2,000,000 | 1,980,600 | ||||||
| Goldentree Loan Management | ||||||||
| US CLO 3 Ltd. | ||||||||
2018-3A, 3.369% (3 Month LIBOR USD + 1.550%), | ||||||||
| 04/20/2030 (a)(b)(c) | 5,250,000 | 5,190,150 | ||||||
2018-3A, 4.430%, 04/20/2030 (a)(c) | ||||||||
| 2,500,000 | 2,503,000 | |||||||
| Goldentree Loan | ||||||||
| Opportunities X Ltd. | ||||||||
2015-10A, 3.269% (3 Month LIBOR USD + 1.450%), | ||||||||
| 07/20/2031 (a)(b)(c) | 3,250,000 | 3,224,325 | ||||||
| Goldentree Loan | ||||||||
| Opportunities XII Ltd. | ||||||||
2016-12A, 4.375%, 07/21/2030 (a)(c) | ||||||||
| 3,750,000 | 3,763,125 | |||||||
| Golub Capital Part CLO Ltd. | ||||||||
2020-47A, 0.000%, 05/05/2032 (c)(e) | ||||||||
| 15,000,000 | 15,000,000 | |||||||
| Grippen Park CLO Ltd. | ||||||||
2017-1A, 3.469% (3 Month LIBOR USD + 1.650%), | ||||||||
| 01/20/2030 (a)(b)(c) | 3,000,000 | 3,000,000 | ||||||
| LCM 26 Ltd. | ||||||||
26A, 2.889% (3 Month LIBOR USD + 1.070%), | ||||||||
| 01/20/2031 (a)(b)(c) | 11,163,000 | 11,141,232 | ||||||
Percentages are stated as a percent of net assets.
The accompanying notes are an integral part of these financial statements.
PAGE 15
PERFORMANCE TRUST STRATEGIC BOND FUND — SCHEDULE OF INVESTMENTS (CONT.)
February 29, 2020 (Unaudited)
| PRINCIPAL | ||||||||
| AMOUNT | VALUE | |||||||
| LCM 26 Ltd. (Cont.) | ||||||||
26A, 3.219% (3 Month LIBOR USD + 1.400%), | ||||||||
| 01/20/2031 (a)(b)(c) | $ | 7,900,000 | $ | 7,745,950 | ||||
| LCM Loan Income Fund I | ||||||||
| Income Note Issuer Ltd. | ||||||||
27A, 3.793% (3 Month LIBOR USD + 1.950%), | ||||||||
| 07/16/2031 (a)(b)(c) | 2,700,000 | 2,660,580 | ||||||
| LCM XIV LP | ||||||||
14A, 3.399% (3 Month LIBOR USD + 1.580%), | ||||||||
| 07/20/2031 (a)(b)(c) | 10,000,000 | 9,899,000 | ||||||
14A, 3.669% (3 Month LIBOR USD + 1.850%), | ||||||||
| 07/20/2031 (a)(b)(c) | 6,000,000 | 5,830,200 | ||||||
| LCM XV LP | ||||||||
15A, 5.519% (3 Month LIBOR USD + 3.700%), | ||||||||
| 07/20/2030 (a)(b)(c) | 3,000,000 | 3,001,800 | ||||||
| LCM XVI LP | ||||||||
16A, 3.581% (3 Month LIBOR USD + 1.750%), | ||||||||
| 10/15/2031 (a)(b)(c) | 4,000,000 | 4,000,000 | ||||||
16A, 3.981% (3 Month LIBOR USD + 2.150%), | ||||||||
| 10/15/2031 (a)(b)(c) | 5,100,000 | 5,050,020 | ||||||
| LCM XXIV Ltd. | ||||||||
24A, 4.069% (3 Month LIBOR USD + 2.250%), | ||||||||
| 03/20/2030 (a)(b)(c) | 2,750,000 | 2,725,250 | ||||||
| Long Point Park CLO Ltd. | ||||||||
2017-1A, 3.211% (3 Month LIBOR USD + 1.375%), | ||||||||
| 01/17/2030 (a)(b)(c) | 11,750,000 | 11,503,250 | ||||||
2017-1A, 4.236% (3 Month LIBOR USD + 2.400%), | ||||||||
| 01/17/2030 (a)(b)(c) | 4,000,000 | 3,780,400 | ||||||
| Magnetite VIII Ltd. | ||||||||
2014-8A, 4.731% (3 Month LIBOR USD + 2.900%), | ||||||||
| 04/15/2031 (a)(b)(c) | 2,400,000 | 2,351,760 | ||||||
| Mountain View Clo XV Ltd. | ||||||||
2019-2A, 3.701% (3 Month LIBOR USD + 1.900%), | ||||||||
| 01/15/2033 (a)(b)(c) | 3,000,000 | 3,000,000 | ||||||
| Octagon Investment | ||||||||
| Partners 26 Ltd. | ||||||||
2016-1A, 3.631% (3 Month LIBOR USD + 1.800%), | ||||||||
| 07/15/2030 (a)(b)(c) | 6,220,000 | 6,045,840 | ||||||
| OZLM XXIV Ltd. | ||||||||
2019-24A, 2.869% (3 Month LIBOR USD + 1.050%), | ||||||||
| 07/20/2032 (a)(b)(c) | 4,000,000 | 4,000,000 | ||||||
| Webster Park CLO Ltd. | ||||||||
2015-1A, 3.619% (3 Month LIBOR USD + 1.800%), | ||||||||
| 07/20/2030 (a)(b)(c) | 1,300,000 | 1,258,790 | ||||||
2015-1A, 4.719% (3 Month LIBOR USD + 2.900%), | ||||||||
| 07/20/2030 (a)(b)(c) | 3,800,000 | 3,701,200 | ||||||
| TOTAL COLLATERALIZED LOAN | ||||||||
| OBLIGATIONS (Cost $241,466,852) | 242,415,577 | |||||||
| CORPORATE BONDS – 7.67% | ||||||||
| Administrative and | ||||||||
| Support Services – 0.03% | ||||||||
| Northwell Healthcare, Inc. | ||||||||
| 3.391%, 11/01/2027 | 1,000,000 | 1,083,220 | ||||||
| Ambulatory Health | ||||||||
| Care Services – 0.27% | ||||||||
| Toledo Hospital | ||||||||
| 6.015%, 11/15/2048 | 6,980,000 | 9,878,472 | ||||||
| Beverage and Tobacco | ||||||||
| Product Manufacturing – 0.20% | ||||||||
| Keurig Dr. Pepper, Inc. | ||||||||
| 7.450%, 05/01/2038 | 5,000,000 | 7,540,060 | ||||||
| Broadcasting | ||||||||
| (except Internet) – 0.32% | ||||||||
| Walt Disney Co. | ||||||||
| 6.200%, 12/15/2034 | 8,170,000 | 12,070,479 | ||||||
| Chemical Manufacturing – 0.11% | ||||||||
| Bristol-Myers Squibb Co. | ||||||||
| 6.125%, 05/01/2038 | 1,000,000 | 1,418,529 | ||||||
| Wyeth LLC | ||||||||
| 5.950%, 04/01/2037 | 1,808,000 | 2,654,154 | ||||||
| Computer and Electronic | ||||||||
| Product Manufacturing – 0.29% | ||||||||
| Cisco Systems, Inc. | ||||||||
| 5.500%, 01/15/2040 | 7,517,000 | 10,950,471 | ||||||
| Couriers and Messengers – 0.11% | ||||||||
| United Parcel Service | ||||||||
| of America, Inc. | ||||||||
| 8.375%, 04/01/2030 | 2,731,000 | 4,018,601 | ||||||
| Credit Intermediation | ||||||||
| and Related Activities – 2.50% | ||||||||
| Allegiance Bancshares, Inc. | ||||||||
| 4.700% to 10/01/2024 then | ||||||||
| 3 Month LIBOR USD + 3.130%, | ||||||||
| 10/01/2029 (b) | 2,500,000 | 2,608,526 | ||||||
Percentages are stated as a percent of net assets.
The accompanying notes are an integral part of these financial statements.
PAGE 16
PERFORMANCE TRUST STRATEGIC BOND FUND — SCHEDULE OF INVESTMENTS (CONT.)
February 29, 2020 (Unaudited)
| PRINCIPAL | ||||||||
| AMOUNT | VALUE | |||||||
| Ameris Bancorp | ||||||||
| 4.250% to 12/15/2024 then | ||||||||
| SOFR + 2.940%, 12/15/2029 | $ | 7,000,000 | $ | 7,266,936 | ||||
| Bank of New York Mellon Corp. | ||||||||
| 3.442% to 02/07/2027 then | ||||||||
| 3 Month LIBOR USD + 1.069%, | ||||||||
| 02/07/2028 (b) | 7,000,000 | 7,696,622 | ||||||
| Bank of NT Butterfield & Son Ltd. | ||||||||
| 5.250% to 06/01/2023 then | ||||||||
| 3 Month LIBOR USD + 2.255%, | ||||||||
| 06/01/2028 (b)(c) | 3,000,000 | 3,138,108 | ||||||
| BlueHub Loan Fund, Inc. | ||||||||
| 3.099%, 01/01/2030 | 3,000,000 | 3,141,036 | ||||||
| Cadence BanCorp. | ||||||||
| 4.750% to 06/30/2024 then | ||||||||
| 3 Month LIBOR USD + 3.030%, | ||||||||
| 06/30/2029 (b) | 3,000,000 | 3,116,707 | ||||||
| First Citizens Bancshares Inc. | ||||||||
| 3.375%, 03/15/2030 | 7,500,000 | 7,500,000 | ||||||
| First Commonwealth Bank | ||||||||
| 4.875% to 06/21/2023 then | ||||||||
| 3 Month LIBOR USD + 1.845%, | ||||||||
| 06/01/2028 (b) | 1,000,000 | 1,041,523 | ||||||
| Heritage Commerce Corp. | ||||||||
| 5.250% to 06/01/2022 then | ||||||||
| (3 Month LIBOR USD + 3.365%), | ||||||||
| 06/01/2027 (b) | 3,935,000 | 4,062,411 | ||||||
| JP Morgan Chase & Co. | ||||||||
| 4.452% to 12/05/2028 then | ||||||||
| 3 Month LIBOR USD + 1.330%, | ||||||||
| 12/05/2029 (b) | 5,000,000 | 5,837,449 | ||||||
| MB Financial Bank, NA | ||||||||
| 4.000% to 12/01/2022 then | ||||||||
| 3 Month LIBOR USD + 1.873%, | ||||||||
| 12/01/2027 (b) | 3,000,000 | 3,123,551 | ||||||
| Midland States Bancorp, Inc. | ||||||||
| 5.000% to 9/30/2024 then | ||||||||
| SOFR + 3.610%, 09/30/2029 | 3,500,000 | 3,644,704 | ||||||
| Pacific Premier Bancorp, Inc. | ||||||||
| 4.875% to 05/15/2024 then | ||||||||
| 3 Month LIBOR USD + 2.500%, | ||||||||
| 05/15/2029 (b) | 4,000,000 | 4,188,345 | ||||||
| Pinnacle Financial Partners, Inc. | ||||||||
| 4.125% to 09/15/2024 then | ||||||||
| 3 Month LIBOR USD + 2.775%, | ||||||||
| 09/15/2029 (b) | 6,000,000 | 6,303,265 | ||||||
| Preferred Bank | ||||||||
| 6.000% to 06/15/2021 then | ||||||||
| 3 Month LIBOR USD + 4.673%, | ||||||||
| 06/15/2026 (b) | 2,500,000 | 2,571,361 | ||||||
| Revere Bank | ||||||||
| 5.625% to 09/30/2021 then | ||||||||
| 3 Month LIBOR USD + 4.409%, | ||||||||
| 09/30/2026 (b) | 3,700,000 | 3,820,390 | ||||||
| Sandy Spring Bancorp, Inc. | ||||||||
| 4.250% to 11/15/2024 then | ||||||||
| 3 Month LIBOR USD + 2.620%, | ||||||||
| 11/15/2029 (b) | 4,000,000 | 4,187,170 | ||||||
| Signature Bank | ||||||||
| 4.125% to 11/01/2024 then | ||||||||
| 3 Month LIBOR USD + 2.559%, | ||||||||
| 11/01/2029 (b) | 5,000,000 | 5,186,854 | ||||||
| Sterling Bancorp. | ||||||||
| 3.500%, 06/08/2020 | 2,250,000 | 2,255,667 | ||||||
| 4.000% (SOFR + 2.530%), | ||||||||
| 12/30/2029 (b) | 5,000,000 | 5,108,539 | ||||||
| Towne Bank | ||||||||
| 4.500% to 07/30/2022 then | ||||||||
| 3 Month LIBOR USD + 2.550%, | ||||||||
| 07/30/2027 (b) | 4,000,000 | 4,126,176 | ||||||
| Triumph Bancorp, Inc. | ||||||||
| 4.875% to 11/27/2024 then | ||||||||
| 3 Month LIBOR USD + 3.330%, | ||||||||
| 11/27/2029 (b) | 3,000,000 | 3,148,004 | ||||||
| Educational Services – 0.44% | ||||||||
| Liberty University, Inc. | ||||||||
| 3.338%, 03/01/2034 | 15,000,000 | 16,325,953 | ||||||
| Hospitals – 1.51% | ||||||||
| Advocate Health & Hospitals Corp. | ||||||||
| 3.829%, 08/15/2028 | 1,000,000 | 1,150,602 | ||||||
| Baptist Health South Florida, Inc. | ||||||||
| 4.590%, 08/15/2021 | 645,000 | 675,052 | ||||||
| CHRISTUS Health | ||||||||
| 4.341%, 07/01/2028 | 8,375,000 | 9,793,785 | ||||||
| CommonSpirit Health | ||||||||
| 3.347%, 10/01/2029 | 2,235,000 | 2,376,060 | ||||||
| 3.817%, 10/01/2049 | 2,150,000 | 2,317,277 | ||||||
| Cottage Health Obligated Group | ||||||||
| 3.304%, 11/01/2049 | 3,250,000 | 3,523,923 | ||||||
| Memorial Health Services | ||||||||
| 3.496%, 05/01/2022 | 575,000 | 593,594 | ||||||
| 3.447%, 11/01/2049 | 9,820,000 | 11,114,043 | ||||||
| Providence St. Joseph Health | ||||||||
| Obligated Group | ||||||||
| 2.532%, 10/01/2029 | 5,000,000 | 5,179,184 | ||||||
| SSM Health Care Corp. | ||||||||
| 3.823%, 06/01/2027 | 6,225,000 | 6,915,189 | ||||||
| Sutter Health | ||||||||
| 3.695%, 08/15/2028 | 11,000,000 | 12,360,603 | ||||||
Percentages are stated as a percent of net assets.
The accompanying notes are an integral part of these financial statements.
PAGE 17
PERFORMANCE TRUST STRATEGIC BOND FUND — SCHEDULE OF INVESTMENTS (CONT.)
February 29, 2020 (Unaudited)
| PRINCIPAL | ||||||||
| AMOUNT | VALUE | |||||||
| Management of Companies | ||||||||
| and Enterprises – 0.18% | ||||||||
| Bryn Mawr Bank Corp. | ||||||||
| 4.250% to 12/15/2022 then | ||||||||
| 3 Month LIBOR USD + 2.050%, | ||||||||
| 12/15/2027 (b) | $ | 3,500,000 | $ | 3,589,418 | ||||
| First National of Nebraska, Inc. | ||||||||
| 4.375% to 04/01/2023 then | ||||||||
| 3 Month LIBOR USD + 1.600%, | ||||||||
| 04/01/2028 (a)(b) | 3,000,000 | 3,097,549 | ||||||
| Merchant Wholesalers, | ||||||||
| Durable Goods – 0.15% | ||||||||
| Honeywell International, Inc. | ||||||||
| 5.700%, 03/15/2036 | 1,635,000 | 2,376,586 | ||||||
| 5.700%, 03/15/2037 | 2,075,000 | 3,060,860 | ||||||
| Nursing and Residential | ||||||||
| Care Facilities – 0.18% | ||||||||
| HumanGood California | ||||||||
| Obligated Group | ||||||||
| 3.000%, 10/01/2028 | 6,500,000 | 6,734,185 | ||||||
| Publishing Industries | ||||||||
| (except Internet) – 0.09% | ||||||||
| Oracle Corp. | ||||||||
| 3.850%, 07/15/2036 | 2,825,000 | 3,276,123 | ||||||
| Real Estate – 0.53% | ||||||||
| Arbor Realty Trust, Inc. | ||||||||
| 4.750%, 10/15/2024 (a) | 4,000,000 | 4,133,695 | ||||||
| 4.500%, 03/15/2027 (a) | 5,000,000 | 5,000,000 | ||||||
| Enterprise Community | ||||||||
| Loan Fund, Inc. | ||||||||
| 3.685%, 11/01/2023 | 5,000,000 | 5,274,671 | ||||||
| 4.152%, 11/01/2028 | 5,000,000 | 5,504,311 | ||||||
| Religious, Grantmaking, Civic, | ||||||||
| Professional, and Similar | ||||||||
| Organizations – 0.11% | ||||||||
| Penn State Health | ||||||||
| 3.806%, 11/01/2049 | 3,500,000 | 4,074,968 | ||||||
| Rental and Leasing | ||||||||
| Services – 0.24% | ||||||||
| ERAC USA Finance, LLC | ||||||||
| 7.000%, 10/15/2037 (a) | 5,963,000 | 9,003,155 | ||||||
| Securities, Commodity Contracts, | ||||||||
| and Other Financial Investments | ||||||||
| and Related Activities – 0.21% | ||||||||
| Charles Schwab Corp. | ||||||||
| 3.250%, 05/22/2029 | 7,000,000 | 7,715,738 | ||||||
| Utilities – 0.20% | ||||||||
| Oglethorpe Power Corp. | ||||||||
| 6.191%, 01/01/2031 (a) | 6,000,000 | 7,338,687 | ||||||
| TOTAL CORPORATE BONDS | ||||||||
| (Cost $266,513,912) | 285,192,541 | |||||||
| NON-AGENCY RESIDENTIAL | ||||||||
| MORTGAGE BACKED SECURITIES – 19.65% | ||||||||
| ACE Securities Corp. Home Equity | ||||||||
| Loan Trust | ||||||||
| 2006-ASP4, 1.787% | ||||||||
| (1 Month LIBOR USD + 0.160%), | ||||||||
| 08/25/2036 (b) | 662,573 | 662,988 | ||||||
| Adjustable Rate Mortgage Trust | ||||||||
| 2005-3, 3.948%, 07/25/2035 (d) | 712,252 | 689,951 | ||||||
| 2006-2, 4.524%, 05/25/2036 (d) | 1,497,370 | 1,492,811 | ||||||
| Alternative Loan Trust | ||||||||
| 2004-28CB, 5.000%, 01/25/2021 | 127,195 | 126,588 | ||||||
| 2006-J3, 5.750%, 05/25/2026 | 611,823 | 556,893 | ||||||
| 2004-27CB, 6.000%, 12/25/2034 | 348,821 | 352,063 | ||||||
| 2004-28CB, 6.000%, 01/25/2035 | 590,579 | 610,985 | ||||||
| 2005-6CB, 5.750%, 04/25/2035 | 3,271,672 | 3,339,874 | ||||||
| 2005-6CB, 7.500%, 04/25/2035 | 383,636 | 397,871 | ||||||
| 2005-9CB, 2.127% | ||||||||
| (1 Month LIBOR USD + 0.500%), | ||||||||
| 05/25/2035 (b) | 3,756,716 | 3,473,322 | ||||||
| 2005-21CB, 5.250%, 06/25/2035 | 4,573,758 | 4,480,156 | ||||||
| 2005-21CB, 6.000%, 06/25/2035 | 2,760,169 | 2,795,589 | ||||||
| 2005-20CB, 5.500%, 07/25/2035 | 1,992,458 | 1,937,263 | ||||||
| 2005-43, 4.494%, 09/25/2035 (d) | 349,321 | 336,108 | ||||||
| 2005-63, 3.676%, 11/25/2035 (d) | 1,390,755 | 1,354,093 | ||||||
| 2005-54CB, 5.500%, 11/25/2035 | 927,905 | 801,014 | ||||||
| 2005-J13, 5.500%, 11/25/2035 | 531,206 | 487,177 | ||||||
| 2005-65CB, 0.000%, | ||||||||
| 12/25/2035 (e) | 1,194,939 | 754,486 | ||||||
| 2005-65CB, 5.500%, 01/25/2036 | 180,804 | 167,585 | ||||||
| 2005-75CB, 5.500%, 01/25/2036 | 2,317,577 | 2,159,777 | ||||||
| 2005-73CB, 5.750%, 01/25/2036 | 517,358 | 413,002 | ||||||
| 2005-86CB, 5.500%, 02/25/2036 | 1,435,030 | 1,284,681 | ||||||
| 2005-86CB, 5.500%, 02/25/2036 | 199,306 | 177,879 | ||||||
| 2006-6CB, 5.500%, 05/25/2036 | 166,660 | 166,416 | ||||||
| 2006-12CB, 5.750% | ||||||||
| (1 Month LIBOR USD + 5.750%), | ||||||||
| 05/25/2036 (b) | 743,072 | 593,958 | ||||||
| 2006-16CB, 6.000%, 06/25/2036 | 517,576 | 441,938 | ||||||
| 2006-19CB, 2.027% | ||||||||
| (1 Month LIBOR USD + 0.400%), | ||||||||
| 08/25/2036 (b) | 986,481 | 632,012 | ||||||
| 2006-24CB, 5.750%, 08/25/2036 | 368,009 | 323,551 | ||||||
| 2006-19CB, 6.000% | ||||||||
| (1 Month LIBOR USD + 1.000%), | ||||||||
| 08/25/2036 (b) | 1,482,883 | 1,316,101 | ||||||
Percentages are stated as a percent of net assets.
The accompanying notes are an integral part of these financial statements.
PAGE 18
PERFORMANCE TRUST STRATEGIC BOND FUND — SCHEDULE OF INVESTMENTS (CONT.)
February 29, 2020 (Unaudited)
| PRINCIPAL | ||||||||
| AMOUNT | VALUE | |||||||
| Alternative Loan Trust (Cont.) | ||||||||
2006-19CB, 6.000%, 08/25/2036 | ||||||||
| $ | 206,435 | $ | 182,666 | |||||
2006-19CB, 6.000% (1 Month LIBOR USD + 1.000%), | ||||||||
| 08/25/2036 (b) | 3,761,381 | 3,340,681 | ||||||
| 2006-23CB, 6.000%, 08/25/2036 | 1,132,872 | 1,169,164 | ||||||
| 2006-26CB, 6.250%, 09/25/2036 | 6,815,236 | 5,370,631 | ||||||
| 2006-32CB, 5.500%, 11/25/2036 | 241,720 | 199,167 | ||||||
| 2006-31CB, 6.000%, 11/25/2036 | 143,346 | 123,350 | ||||||
| 2006-32CB, 6.000%, 11/25/2036 | 3,684,128 | 3,177,243 | ||||||
| 2006-32CB, 6.000%, 11/25/2036 | 1,225,476 | 1,056,867 | ||||||
| 2006-32CB, 6.000%, 11/25/2036 | 3,738,611 | 3,224,230 | ||||||
| 2006-39CB, 6.000%, 01/25/2037 | 4,008,130 | 4,157,647 | ||||||
| 2006-41CB, 6.000%, 01/25/2037 | 736,588 | 631,209 | ||||||
| 2006-43CB, 6.000%, 02/25/2037 | 4,409,731 | 3,675,813 | ||||||
| 2007-4CB, 5.750%, 04/25/2037 | 2,078,059 | 2,096,752 | ||||||
| 2007-8CB, 6.000%, 05/25/2037 | 1,006,700 | 863,735 | ||||||
| 2008-2R, 6.000%, 08/25/2037 (d) | 9,291,186 | 7,589,913 | ||||||
| American Home Mortgage | ||||||||
| Investment Trust | ||||||||
| 2006-2, 6.750%, 06/25/2036 (f) | 2,858,721 | 963,153 | ||||||
| Banc of America Alternative | ||||||||
| Loan Trust | ||||||||
| 2005-5, 5.500%, 06/25/2035 | 224,157 | 227,836 | ||||||
| 2005-5, 6.000%, 06/25/2035 | 962,847 | 981,438 | ||||||
| 2005-11, 5.750%, 12/25/2035 | 1,218,759 | 1,155,674 | ||||||
| 2005-11, 5.750%, 12/25/2035 | 225,799 | 214,112 | ||||||
| 2005-12, 5.750%, 01/25/2036 | 511,923 | 527,321 | ||||||
| 2006-1, 6.500%, 02/25/2036 | 2,765,123 | 2,803,327 | ||||||
| 2006-3, 6.000%, 04/25/2036 | 4,396,437 | 4,480,234 | ||||||
| 2006-3, 6.000%, 04/25/2036 | 139,356 | 139,915 | ||||||
2006-9, 2.027% (1 Month LIBOR USD + 0.400%), | ||||||||
| 01/25/2037 (b) | 1,515,588 | 1,233,221 | ||||||
| 2006-9, 6.000%, 01/25/2037 | 331,433 | 334,497 | ||||||
| 2006-4, 6.500%, 05/25/2046 | 1,513,516 | 1,583,121 | ||||||
| 2006-4, 6.500%, 05/25/2046 | 1,501,207 | 1,559,243 | ||||||
| 2006-5, 6.000%, 06/25/2046 | 486,304 | 490,381 | ||||||
| 2006-6, 6.000%, 07/25/2046 | 1,827,445 | 1,854,419 | ||||||
| Banc of America Funding Trust | ||||||||
| 2003-3, 5.500%, 10/25/2033 | 338,890 | 355,093 | ||||||
| 2004-1, 6.000%, 02/25/2034 | 1,105,870 | 1,232,779 | ||||||
| 2004-1, 6.000%, 03/25/2034 | 6,511,683 | 7,330,994 | ||||||
| 2004-B, 3.624%, 11/20/2034 (d) | 1,739,260 | 1,785,583 | ||||||
| 2007-4, 5.500%, 11/25/2034 | 777,253 | 789,425 | ||||||
| 2005-3, 5.500%, 06/25/2035 | 173,510 | 188,302 | ||||||
2014-R3, 4.137%, 06/26/2035 (a)(d) | ||||||||
| 1,615,478 | 1,621,293 | |||||||
2014-R3, 4.717%, 06/26/2035 (a)(d) | ||||||||
| 3,424,684 | 3,473,065 | |||||||
| 2005-4, 5.500%, 08/25/2035 | 64,758 | 69,785 | ||||||
| 2005-5, 5.500%, 09/25/2035 | 431,741 | 460,359 | ||||||
| 2005-5, 5.500%, 09/25/2035 | 3,557,644 | 3,993,443 | ||||||
| 2005-7, 5.500%, 11/25/2035 | 6,547,646 | 6,747,708 | ||||||
| 2005-7, 5.750%, 11/25/2035 | 46,337 | 49,145 | ||||||
| 2005-7, 6.000%, 11/25/2035 | 230,492 | 240,974 | ||||||
| 2005-8, 5.750%, 01/25/2036 | 6,054,868 | 6,073,355 | ||||||
| 2006-B, 3.616%, 03/20/2036 (d) | 1,274,375 | 1,217,252 | ||||||
| 2006-5, 5.750%, 09/25/2036 | 748,245 | 786,114 | ||||||
| 2006-7, 6.000%, 09/25/2036 | 1,061,214 | 1,064,201 | ||||||
| 2006-1, 3.920%, 12/20/2036 (d) | 6,245,149 | 6,533,685 | ||||||
| 2006-1, 3.920%, 12/20/2036 (d) | 1,086,314 | 1,115,043 | ||||||
| 2006-1, 4.074%, 12/20/2036 (d) | 1,257,502 | 1,285,201 | ||||||
| 2007-1, 6.189%, 01/25/2037 (f) | 1,179,794 | 1,211,226 | ||||||
2007-2, 0.050% (1 Month LIBOR USD + 0.060%), | ||||||||
| 03/25/2037 (b) | 741,845 | 601,939 | ||||||
2007-3, 2.057% (1 Month LIBOR USD + 0.430%), | ||||||||
| 04/25/2037 (b) | 1,482,856 | 1,372,269 | ||||||
2007-6, 1.907% (1 Month LIBOR USD + 0.280%), | ||||||||
| 07/25/2037 (b) | 7,597,396 | 7,310,659 | ||||||
| 2007-5, 5.500%, 07/25/2037 | 2,385,062 | 2,336,095 | ||||||
| 2006-J, 4.184%, 01/20/2047 (d) | 239,633 | 234,567 | ||||||
| Banc of America Mortgage Trust | ||||||||
| 2005-A, 3.682%, 02/25/2035 (d) | 3,100,510 | 3,160,420 | ||||||
| 2005-F, 4.388%, 07/25/2035 (d) | 1,929,071 | 1,929,313 | ||||||
| 2007-1, 6.000%, 03/25/2037 | 3,253,678 | 3,282,656 | ||||||
| 2006-B, 3.829%, 10/20/2046 (d) | 1,296,584 | 1,264,069 | ||||||
| BCAP LLC Trust | ||||||||
| 2007-AA2, 7.500%, 04/25/2037 (g) | 405,355 | 352,834 | ||||||
| Bear Stearns ALT-A Trust | ||||||||
| 2006-6, 3.950%, 11/25/2036 (d) | 627,335 | 569,239 | ||||||
| Bear Stearns ARM Trust | ||||||||
| 2004-12, 3.357%, 02/25/2035 (d) | 153,123 | 149,558 | ||||||
| Bear Stearns Asset Backed | ||||||||
| Securities I Trust | ||||||||
2005-AC5, 2.627% (1 Month LIBOR USD + 1.000%), | ||||||||
| 08/25/2035 (b) | 769,127 | 627,915 | ||||||
2006-AC4, 1.877% (1 Month LIBOR USD + 0.250%), | ||||||||
| 07/25/2036 (b) | 5,645,221 | 5,006,400 | ||||||
2006-AC4, 26.534% (1 Month LIBOR USD + 33.583%), | ||||||||
| 07/25/2036 (b)(g)(i) | 1,303,116 | 1,902,430 | ||||||
| Chase Funding Trust | ||||||||
2004-1, 2.377% (1 Month LIBOR USD + 0.750%), | ||||||||
| 09/25/2033 (b) | 1,010,074 | 1,002,973 | ||||||
Percentages are stated as a percent of net assets.
The accompanying notes are an integral part of these financial statements.
PAGE 19
PERFORMANCE TRUST STRATEGIC BOND FUND — SCHEDULE OF INVESTMENTS (CONT.)
February 29, 2020 (Unaudited)
| PRINCIPAL | ||||||||
| AMOUNT | VALUE | |||||||
| Chase Mortgage Finance Trust | ||||||||
| 2005-S3, 5.500%, 11/25/2035 | $ | 10,088,891 | $ | 9,859,556 | ||||
| 2005-A1, 3.794%, 12/25/2035 (d) | 1,440,206 | 1,443,887 | ||||||
| 2005-A1, 3.794%, 12/25/2035 (d) | 1,409,287 | 1,412,888 | ||||||
| 2006-S3, 6.000%, 11/25/2036 | 8,481,504 | 6,358,752 | ||||||
| 2006-S4, 6.000%, 12/25/2036 | 1,058,626 | 799,589 | ||||||
| 2006-S4, 6.000%, 12/25/2036 | 1,008,281 | 761,562 | ||||||
| 2007-S1, 6.000%, 02/25/2037 | 5,348,740 | 3,729,959 | ||||||
| 2007-S3, 5.750%, 05/25/2037 | 885,955 | 662,347 | ||||||
| 2007-S3, 6.000%, 05/25/2037 | 2,008,143 | 1,540,813 | ||||||
| Chaseflex Trust | ||||||||
| 2005-1, 5.500%, 02/25/2035 | 583,031 | 558,306 | ||||||
| 2006-2, 4.575%, 09/25/2036 (d) | 4,017,434 | 4,135,875 | ||||||
| CHL Mortgage Pass-Through Trust | ||||||||
| 2005-20, 5.250%, 12/25/2027 | 38,666 | 35,826 | ||||||
| 2003-42, 3.862%, 10/25/2033 (d) | 1,858,266 | 1,892,726 | ||||||
| 2003-44, 5.000%, 10/25/2033 | 541,000 | 549,497 | ||||||
| 2004-4, 5.500%, 05/25/2034 | 886,712 | 916,740 | ||||||
| 2004-21, 4.000%, 11/25/2034 | 1,272,294 | 1,315,788 | ||||||
| 2004-24, 5.500%, 12/25/2034 | 2,100,377 | 2,165,725 | ||||||
| 2004-J9, 5.500%, 01/25/2035 | 843,647 | 864,030 | ||||||
| 2004-HYB5, 3.864%, | ||||||||
| 04/20/2035 (d) | 986,933 | 1,008,116 | ||||||
| 2005-HYB2, 3.996%, | ||||||||
| 05/20/2035 (d) | 1,295,222 | 1,339,670 | ||||||
| 2005-J3, 5.500%, 09/25/2035 | 154,206 | 155,136 | ||||||
| 2005-27, 5.500%, 12/25/2035 | 589,075 | 460,354 | ||||||
| 2005-31, 3.576%, 01/25/2036 (d) | 2,295,324 | 2,181,753 | ||||||
| 2005-30, 5.500%, 01/25/2036 | 114,310 | 104,547 | ||||||
| 2005-HY10, 3.478%, | ||||||||
| 02/20/2036 (d) | 2,408,281 | 2,311,406 | ||||||
| 2005-HY10, 3.501%, | ||||||||
| 02/20/2036 (d) | 118,143 | 103,946 | ||||||
| 2005-HY10, 4.142%, | ||||||||
| 02/20/2036 (d) | 342,774 | 323,797 | ||||||
| 2006-6, 6.000%, 04/25/2036 | 926,981 | 749,401 | ||||||
| 2006-J4, 6.250%, 09/25/2036 | 150,707 | 112,103 | ||||||
| 2006-16, 6.500%, 11/25/2036 | 767,651 | 521,048 | ||||||
| 2006-18, 6.000%, 12/25/2036 | 192,624 | 172,653 | ||||||
| 2006-21, 6.000%, 02/25/2037 | 996,057 | 863,903 | ||||||
| 2007-1, 6.000%, 03/25/2037 | 2,500,930 | 2,110,952 | ||||||
| 2007-5, 5.500%, 05/25/2037 | 1,253,928 | 1,057,831 | ||||||
| 2007-5, 5.750%, 05/25/2037 | 8,550,599 | 7,364,335 | ||||||
| 2007-5, 5.750%, 05/25/2037 | 926,817 | 798,235 | ||||||
| 2007-5, 5.750%, 05/25/2037 | 876,679 | 755,053 | ||||||
| 2007-10, 6.000%, 07/25/2037 | 2,732,782 | 2,251,032 | ||||||
| 2007-J2, 6.000%, 07/25/2037 | 250,565 | 167,217 | ||||||
| 2007-HY5, 3.754%, | ||||||||
| 09/25/2037 (d) | 1,806,771 | 1,747,220 | ||||||
| 2007-HY6, 3.829%, | ||||||||
| 11/25/2037 (d) | 571,911 | 522,969 | ||||||
| 2007-HY5, 4.243%, | ||||||||
| 09/25/2047 (d) | 9,553,386 | 9,145,398 | ||||||
| Citicorp Mortgage Securities Trust | ||||||||
| 2006-3, 5.500%, 06/25/2021 | 86,723 | 78,656 | ||||||
| 2007-4, 5.500%, 05/25/2022 | 19,025 | 19,159 | ||||||
| 2006-1, 6.000%, 02/25/2036 | 233,272 | 241,811 | ||||||
| 2006-3, 5.750%, 06/25/2036 | 629,820 | 643,651 | ||||||
| 2007-3, 5.500%, 04/25/2037 | 313,660 | 329,651 | ||||||
| 2007-3, 6.000%, 04/25/2037 | 1,121,882 | 1,157,092 | ||||||
| Citigroup Mortgage Loan Trust | ||||||||
| 2004-2, 9.250%, 08/25/2033 (a) | 60,393 | 63,102 | ||||||
| 2004-HY3, 4.176%, | ||||||||
| 09/25/2034 (d) | 1,129,970 | 1,135,241 | ||||||
| 2005-WF1, 5.830%, | ||||||||
| 11/25/2034 (f) | 2,742,380 | 2,858,968 | ||||||
| 2005-1, 3.335%, 04/25/2035 (d) | 731,320 | 727,707 | ||||||
| 2005-2, 4.123%, 05/25/2035 (d) | 785,027 | 787,882 | ||||||
| 2005-5, 6.000%, 08/25/2035 | 3,043,837 | 3,146,106 | ||||||
| 2005-7, 3.794%, 09/25/2035 (d) | 818,970 | 771,032 | ||||||
| 2005-10, 3.908%, 12/25/2035 (d) | 1,801,760 | 1,521,293 | ||||||
| 2006-WF1, 4.863%, 03/25/2036 (f) | 545,276 | 382,740 | ||||||
| 2006-WF1, 5.248%, | ||||||||
| 03/25/2036 (f) | 35,525,944 | 26,208,960 | ||||||
| 2006-AR7, 4.064%, | ||||||||
| 11/25/2036 (d) | 2,572,926 | 2,472,861 | ||||||
| 2007-6, 3.313%, 10/25/2046 (d) | 555,583 | 517,859 | ||||||
| CitiMortgage Alternative Loan Trust | ||||||||
| 2007-A4, 5.500%, 04/25/2022 | 18,414 | 18,589 | ||||||
2006-A2, 2.227% (1 Month LIBOR USD + 0.600%), | ||||||||
| 05/25/2036 (b) | 716,980 | 639,285 | ||||||
| 2006-A4, 6.000%, 09/25/2036 | 1,578,615 | 1,607,400 | ||||||
| 2007-A1, 6.000%, 01/25/2037 | 2,396,753 | 2,444,837 | ||||||
| 2007-A1, 6.000%, 01/25/2037 | 4,091,062 | 4,173,139 | ||||||
| Credit Suisse First Boston | ||||||||
| Mortgage Securities Corp. | ||||||||
| 2005-8, 7.000%, 09/25/2035 | 3,208,575 | 2,480,455 | ||||||
| CSFB Mortgage-Backed | ||||||||
| Pass-Through Certificates | ||||||||
| 2004-8, 5.500%, 12/25/2034 | 607,932 | 597,099 | ||||||
| 2005-3, 5.500%, 07/25/2035 | 963,532 | 982,701 | ||||||
| 2005-9, 5.500%, 10/25/2035 | 1,112,145 | 955,379 | ||||||
| 2005-10, 5.500%, 11/25/2035 | 613,844 | 589,512 | ||||||
| 2005-10, 5.500%, 11/25/2035 | 2,636,744 | 2,532,229 | ||||||
| 2005-10, 6.000%, 11/25/2035 | 886,281 | 436,086 | ||||||
| CSMC Mortgage-Backed Trust | ||||||||
| 2006-CF1, 5.000%, | ||||||||
| 11/25/2035 (a)(f) | 2,565,000 | 2,677,312 | ||||||
| 2006-1, 5.500%, 02/25/2036 | 596,276 | 603,507 | ||||||
| 2006-1, 5.500%, 02/25/2036 | 78,096 | 81,797 | ||||||
| 2011-13R, 3.727%, | ||||||||
| 02/27/2036 (a)(d) | 4,646,312 | 4,454,220 | ||||||
| 2006-2, 5.750%, 03/25/2036 | 991,722 | 918,269 | ||||||
Percentages are stated as a percent of net assets.
The accompanying notes are an integral part of these financial statements.
PAGE 20
PERFORMANCE TRUST STRATEGIC BOND FUND — SCHEDULE OF INVESTMENTS (CONT.)
February 29, 2020 (Unaudited)
| PRINCIPAL | ||||||||
| AMOUNT | VALUE | |||||||
| CSMC Mortgage-Backed Trust (Cont.) | ||||||||
| 2006-2, 6.000%, 03/25/2036 | $ | 5,246,878 | $ | 3,893,408 | ||||
| 2006-4, 6.000%, 05/25/2036 | 721,607 | 608,878 | ||||||
| 2006-4, 7.000%, 05/25/2036 | 566,671 | 219,179 | ||||||
2011-12R, 3.820%, 07/27/2036 (a)(d) | ||||||||
| 2,000,000 | 2,021,242 | |||||||
| 2006-7, 6.000%, 08/25/2036 | 1,141,802 | 1,146,023 | ||||||
| 2007-2, 5.500%, 03/25/2037 | 2,190,146 | 1,882,582 | ||||||
| 2007-2, 5.750%, 03/25/2037 | 233,909 | 194,882 | ||||||
| 2007-3, 5.500%, 04/25/2037 | 699,278 | 714,103 | ||||||
| 2007-3, 5.500%, 04/25/2037 | 978,299 | 999,040 | ||||||
2013-2R, 3.747%, 05/27/2037 (a)(d) | ||||||||
| 2,741,942 | 2,186,908 | |||||||
2013-IVR4, 2.500%, 07/25/2043 (a)(d) | ||||||||
| 2,943,768 | 2,944,522 | |||||||
| Deutsche Alt-A Securities, Inc. | ||||||||
| Mortgage Loan Trust | ||||||||
2005-1, 2.127% (1 Month LIBOR USD + 0.500%), | ||||||||
| 02/25/2035 (b) | 3,337,735 | 3,282,560 | ||||||
2005-3, 2.127% (1 Month LIBOR USD + 0.500%), | ||||||||
| 05/25/2035 (b) | 2,131,101 | 1,999,532 | ||||||
| 2005-6, 5.500%, 12/25/2035 | 2,397,980 | 2,419,187 | ||||||
| Deutsche Alt-B Securities, Inc. | ||||||||
| Mortgage Loan Trust | ||||||||
2006-AB4, 1.727% (1 Month LIBOR USD + 0.100%), | ||||||||
| 10/25/2036 (b) | 765,565 | 590,388 | ||||||
| DFC HEL Trust | ||||||||
2001-1, 3.308% (1 Month LIBOR USD + 1.650%), | ||||||||
| 08/15/2031 (b) | 1,911,994 | 1,959,593 | ||||||
| Equity One Mortgage | ||||||||
| Pass-Through Trust | ||||||||
| 2003-1, 4.860%, 08/25/2033 (d) | 1,433,472 | 1,480,042 | ||||||
| 2003-3, 4.868%, 12/25/2033 (d) | 1,318,929 | 1,380,545 | ||||||
| Fannie Mae Connecticut | ||||||||
| Avenue Securities | ||||||||
2016-C01, 8.577% (1 Month LIBOR USD + 6.950%), | ||||||||
| 08/25/2028 (b) | 3,610,733 | 3,918,493 | ||||||
2016-C05, 6.077% (1 Month LIBOR USD + 4.450%), | ||||||||
| 01/25/2029 (b) | 3,909,501 | 4,120,427 | ||||||
2016-C07, 5.977% (1 Month LIBOR USD + 4.350%), | ||||||||
| 05/25/2029 (b) | 4,266,480 | 4,470,570 | ||||||
| First Horizon Alternative | ||||||||
| Mortgage Securities Trust | ||||||||
| 2005-FA11, 5.250%, 02/25/2021 | 11,984 | 11,433 | ||||||
| 2006-FA6, 5.750%, 11/25/2021 | 8,282 | 8,145 | ||||||
| 2004-AA6, 3.448%, 01/25/2035 (d) | 480,442 | 490,559 | ||||||
| 2005-AA5, 3.787%, 07/25/2035 (d) | 3,015,827 | 2,997,728 | ||||||
| 2005-AA7, 3.582%, 09/25/2035 (d) | 2,291,413 | 2,233,373 | ||||||
| 2005-FA8, 5.500%, 11/25/2035 | 1,990,253 | 1,707,364 | ||||||
| 2006-FA1, 5.750%, 04/25/2036 | 2,547,461 | 1,873,037 | ||||||
| 2006-FA1, 6.000%, 04/25/2036 | 589,619 | 444,010 | ||||||
| 2006-FA2, 6.000%, 05/25/2036 | 2,522,356 | 1,917,661 | ||||||
| 2006-FA2, 6.000%, 05/25/2036 | 2,269,111 | 1,725,127 | ||||||
| 2006-FA3, 6.000%, 07/25/2036 | 9,095,187 | 6,983,405 | ||||||
| 2006-FA3, 6.000%, 07/25/2036 | 1,312,603 | 1,007,834 | ||||||
| 2006-FA6, 6.000%, 11/25/2036 | 1,324,083 | 860,375 | ||||||
| 2006-FA6, 6.250%, 11/25/2036 | 1,678,356 | 1,124,532 | ||||||
| 2006-FA6, 6.250%, 11/25/2036 | 8,421,669 | 6,293,439 | ||||||
| 2007-FA4, 6.250%, 08/25/2037 (d) | 2,610,994 | 1,978,828 | ||||||
| First Horizon Mortgage | ||||||||
| Pass-Through Trust | ||||||||
| 2006-AR4, 3.989%, 01/25/2037 (d) | 617,764 | 534,254 | ||||||
| 2006-4, 5.750%, 02/25/2037 | 2,133,110 | 1,646,748 | ||||||
| 2006-4, 6.000%, 02/25/2037 | 1,291,674 | 1,018,792 | ||||||
| 2007-AR1, 4.413%, 05/25/2037 (d) | 856,433 | 623,205 | ||||||
| 2007-AR2, 4.814%, 08/25/2037 (d) | 4,753,216 | 3,389,939 | ||||||
| Freddie Mac Structured Agency | ||||||||
| Credit Risk Debt Notes | ||||||||
2016-DNA4, 5.427% (1 Month LIBOR USD + 3.800%), | ||||||||
| 03/25/2029 (b) | 5,000,000 | 5,310,530 | ||||||
| GMACM Mortgage Loan Trust | ||||||||
| 2004-J2, 5.500%, 06/25/2034 | 58,816 | 60,424 | ||||||
| 2005-AR6, 3.882%, 11/19/2035 (d) | 606,297 | 590,563 | ||||||
| GSAA Home Equity Trust | ||||||||
| 2005-1, 5.760%, 11/25/2034 (f) | 2,000,000 | 2,065,746 | ||||||
| 2006-15, 6.192%, 09/25/2036 (f) | 2,480,915 | 1,138,511 | ||||||
| 2006-18, 5.682%, 11/25/2036 (f) | 2,055,338 | 951,125 | ||||||
2007-7, 1.807% (1 Month LIBOR USD + 0.180%), | ||||||||
| 07/25/2037 (b) | 2,569,394 | 2,513,011 | ||||||
| GSR Mortgage Loan Trust | ||||||||
| 2005-4F, 6.500%, 04/25/2020 | 50,100 | 50,137 | ||||||
| 2003-5F, 3.000%, 08/25/2032 | 1,756,748 | 1,749,887 | ||||||
| 2004-15F, 6.000%, 12/25/2034 | 2,364,300 | 2,508,337 | ||||||
| 2005-1F, 6.000%, 01/25/2035 | 22,952 | 24,126 | ||||||
| 2005-AR4, 4.633%, 07/25/2035 (d) | 497,273 | 478,372 | ||||||
| 2005-6F, 5.250%, 07/25/2035 | 235,244 | 249,697 | ||||||
| 2005-7F, 6.000%, 09/25/2035 | 38,653 | 41,457 | ||||||
| 2005-AR5, 4.605%, 10/25/2035 (d) | 578,867 | 594,250 | ||||||
| 2005-AR7, 4.128%, 11/25/2035 (d) | 558,640 | 561,710 | ||||||
| 2006-2F, 5.750%, 02/25/2036 | 778,269 | 775,404 | ||||||
Percentages are stated as a percent of net assets.
The accompanying notes are an integral part of these financial statements.
PAGE 21
PERFORMANCE TRUST STRATEGIC BOND FUND — SCHEDULE OF INVESTMENTS (CONT.)
February 29, 2020 (Unaudited)
| PRINCIPAL | ||||||||
| AMOUNT | VALUE | |||||||
| HarborView Mortgage Loan Trust | ||||||||
| 2006-6, 4.125%, 08/19/2036 (d) | $ | 716,271 | $ | 680,863 | ||||
| Home Partners of America Trust | ||||||||
| 2019-1, 2.908%, 09/17/2039 (a) | 2,949,809 | 3,101,093 | ||||||
| 2019-2, 2.703%, 10/19/2039 (a) | 3,902,366 | 3,966,371 | ||||||
| HomeBanc Mortgage Trust | ||||||||
| 2006-1, 3.591%, 04/25/2037 (d) | 262,313 | 252,427 | ||||||
| Impac CMB Trust | ||||||||
2005-5, 2.127% (1 Month LIBOR USD + 0.500%), | ||||||||
| 08/25/2035 (b) | 929,540 | 929,515 | ||||||
| Impac Secured Assets | ||||||||
| CMN Owner Trust | ||||||||
| 2002-2, 6.500%, 04/25/2033 | 1,657,840 | 1,595,091 | ||||||
| 2004-2, 4.145%, 08/25/2034 (f) | 852,675 | 870,085 | ||||||
| IndyMac IMSC Mortgage Loan Trust | ||||||||
| 2007-AR1, 3.595%, 06/25/2037 (d) | 509,027 | 434,178 | ||||||
| IndyMac INDA Mortgage Loan Trust | ||||||||
| 2007-AR1, 3.812%, 03/25/2037 (d) | 529,693 | 510,512 | ||||||
| IndyMac INDX Mortgage Loan Trust | ||||||||
2004-AR11, 3.384%, 12/25/2034 (d) | ||||||||
| 1,722,890 | 1,720,096 | |||||||
| 2005-AR3, 3.444%, 04/25/2035 (d) | 1,086,702 | 1,070,517 | ||||||
| 2005-AR9, 4.386%, 07/25/2035 (d) | 4,192,238 | 3,501,912 | ||||||
2005-AR23, 3.241%, 11/25/2035 (d) | ||||||||
| 1,148,811 | 1,107,192 | |||||||
2005-AR23, 3.647%, 11/25/2035 (d) | ||||||||
| 1,534,557 | 1,468,865 | |||||||
2005-AR25, 3.595%, 12/25/2035 (d) | ||||||||
| 2,779,990 | 2,447,933 | |||||||
| 2005-AR35, 3.383%, | ||||||||
| 02/25/2036 (d) | 1,660,038 | 1,588,591 | ||||||
| 2006-AR3, 3.644%, 03/25/2036 (d) | 8,162,479 | 7,565,920 | ||||||
| 2006-AR9, 3.623%, 06/25/2036 (d) | 2,304,899 | 2,304,969 | ||||||
2006-AR25, 3.478%, 09/25/2036 (d) | ||||||||
| 2,213,339 | 2,129,920 | |||||||
2006-AR25, 3.868%, 09/25/2036 (d) | ||||||||
| 2,781,345 | 2,406,763 | |||||||
2006-AR31, 3.689%, 11/25/2036 (d) | ||||||||
| 5,494,214 | 5,484,349 | |||||||
| Jefferies Resecuritization Trust | ||||||||
2009-R1, 4.141%, 11/26/2035 (a)(d) | ||||||||
| 1,355,989 | 1,390,492 | |||||||
| JP Morgan Alternative Loan Trust | ||||||||
| 2006-S2, 6.050%, 05/25/2036 (f) | 4,436 | 4,345 | ||||||
| 2006-A5, 3.570%, 10/25/2036 (d) | 1,145,542 | 1,419,250 | ||||||
| 2006-S4, 5.960%, 12/25/2036 (f) | 1,314,794 | 1,318,470 | ||||||
| 2008-R4, 6.000%, 12/27/2036 (a) | 4,555,594 | 3,714,310 | ||||||
| JP Morgan Acquisition Trust | ||||||||
| 2007-CH1, 4.880%, 11/25/2036 (f) | 6,916,318 | 7,065,567 | ||||||
| JP Morgan Mortgage Trust | ||||||||
2004-A6, 3.568%, 12/25/2034 (d) | ||||||||
| 285,702 | 281,969 | |||||||
| 2005-S3, 5.750%, 01/25/2036 | 64,839 | 50,583 | ||||||
| 2007-A3, 4.151%, 05/25/2037 (d) | 4,917,191 | 4,751,929 | ||||||
| JP Morgan Resecuritization Trust | ||||||||
| 2009-7, 5.444%, 07/27/2037 (a)(d) | 416,742 | 421,176 | ||||||
| Lehman Mortgage Trust | ||||||||
| 2005-2, 5.500%, 12/25/2035 | 2,105,142 | 1,714,621 | ||||||
| 2005-2, 5.750%, 12/25/2035 | 853,330 | 712,138 | ||||||
2005-3, 2.127% (1 Month LIBOR USD + 0.500%), | ||||||||
| 01/25/2036 (b) | 1,203,465 | 782,702 | ||||||
2005-3, 3.123% (1 Month LIBOR USD + 4.750%), | ||||||||
| 01/25/2036 (b)(g)(h)(i) | 1,203,465 | 214,890 | ||||||
| 2005-3, 5.500%, 01/25/2036 | 302,486 | 254,077 | ||||||
| 2006-1, 5.500%, 02/25/2036 | 537,460 | 444,622 | ||||||
| 2007-4, 5.750%, 05/25/2037 | 1,352,463 | 1,093,751 | ||||||
| 2007-4, 5.750%, 05/25/2037 | 2,955,132 | 2,389,847 | ||||||
| 2007-5, 5.750%, 06/25/2037 | 2,565,971 | 2,601,880 | ||||||
| 2007-5, 6.000%, 06/25/2037 | 2,966,291 | 1,638,312 | ||||||
| 2007-5, 6.000%, 06/25/2037 | 8,101,830 | 4,474,723 | ||||||
| MASTR Adjustable Rate | ||||||||
| Mortgages Trust | ||||||||
| 2004-4, 4.360%, 05/25/2034 (d) | 104,660 | 103,094 | ||||||
2004-14, 3.127% (1 Month LIBOR USD + 1.500%), | ||||||||
| 01/25/2035 (b) | 201,968 | 203,688 | ||||||
| 2005-1, 3.615%, 02/25/2035 (d) | 194,281 | 195,422 | ||||||
| MASTR Alternative Loan Trust | ||||||||
| 2003-5, 5.933%, 08/25/2033 (d) | 1,113,036 | 1,169,728 | ||||||
| 2003-7, 6.250%, 11/25/2033 | 398,301 | 414,043 | ||||||
| 2004-6, 5.500%, 07/25/2034 | 264,026 | 271,908 | ||||||
| 2004-6, 6.000%, 07/25/2034 | 286,002 | 299,860 | ||||||
| 2004-11, 6.500%, 10/25/2034 | 1,086,832 | 1,203,471 | ||||||
| 2005-2, 5.500%, 03/25/2035 | 2,000,000 | 2,302,550 | ||||||
| 2005-6, 5.500%, 12/25/2035 | 547,307 | 526,937 | ||||||
| 2006-3, 6.500%, 07/25/2036 | 1,234,236 | 767,666 | ||||||
| MASTR Asset Securitization Trust | ||||||||
2002-NC1, 4.777% (1 Month LIBOR USD + 3.150%), | ||||||||
| 10/25/2032 (b) | 273,222 | 282,197 | ||||||
2006-1, 2.077% (1 Month LIBOR USD + 0.450%), | ||||||||
| 05/25/2036 (b) | 819,539 | 310,085 | ||||||
2006-2, 6.000% (1 Month LIBOR USD + 6.000%), | ||||||||
| 06/25/2036 (b) | 2,471,742 | 2,368,022 | ||||||
Percentages are stated as a percent of net assets.
The accompanying notes are an integral part of these financial statements.
PAGE 22
PERFORMANCE TRUST STRATEGIC BOND FUND — SCHEDULE OF INVESTMENTS (CONT.)
February 29, 2020 (Unaudited)
| PRINCIPAL | ||||||||
| AMOUNT | VALUE | |||||||
| Merrill Lynch Mortgage | ||||||||
| Investors Trust MLCC | ||||||||
2004-D, 2.395% (6 Month LIBOR USD + 0.720%), | ||||||||
| 09/25/2029 (b) | $ | 1,091,693 | $ | 1,073,081 | ||||
| 2006-3, 3.881%, 10/25/2036 (d) | 832,718 | 848,312 | ||||||
| Merrill Lynch Mortgage | ||||||||
| Investors Trust MLMI | ||||||||
| 2005-A5, 4.300%, 06/25/2035 (d) | 625,616 | 635,039 | ||||||
| 2005-A7, 4.250%, 09/25/2035 (d) | 8,043,500 | 7,564,835 | ||||||
| Morgan Stanley Mortgage | ||||||||
| Loan Trust | ||||||||
| 2005-7, 5.500%, 11/25/2035 | 1,840,434 | 1,881,757 | ||||||
| 2005-7, 5.500%, 11/25/2035 | 562,921 | 568,567 | ||||||
| 2006-2, 5.629%, 02/25/2036 (d) | 1,056,952 | 903,104 | ||||||
| 2006-2, 6.500%, 02/25/2036 | 1,137,452 | 889,238 | ||||||
| 2006-11, 6.000%, 08/25/2036 | 2,706,520 | 2,147,883 | ||||||
| 2006-11, 6.000%, 08/25/2036 | 2,116,958 | 2,016,390 | ||||||
| 2007-8XS, 6.000%, 04/25/2037 (d) | 1,621,217 | 885,551 | ||||||
| 2007-3XS, 5.763%, 01/25/2047 (f) | 7,821,901 | 3,932,563 | ||||||
| Morgan Stanley Reremic Trust | ||||||||
2012-R3, 3.271%, 11/26/2036 (a)(d) | ||||||||
| 1,571,971 | 1,524,795 | |||||||
| MortgageIT Trust | ||||||||
2005-3, 2.227% (1 Month LIBOR USD + 0.600%), | ||||||||
| 08/25/2035 (b) | 10,857,333 | 10,816,526 | ||||||
| Nomura Asset Acceptance Corp. | ||||||||
| Alternative Loan Trust | ||||||||
| 2005-WF1, 5.159%, 03/25/2035 (f) | 163,990 | 175,138 | ||||||
| 2005-AR3, 5.688%, 07/25/2035 (d) | 935,647 | 946,720 | ||||||
| 2007-1, 5.669%, 03/25/2047 (f) | 1,293,795 | 1,318,988 | ||||||
| 2007-1, 5.995%, 03/25/2047 (f) | 2,379,056 | 2,424,976 | ||||||
| Nomura Resecuritization Trust | ||||||||
2011-4RA, 2.768%, 12/26/2036 (a)(d) | ||||||||
| 9,623,674 | 9,514,252 | |||||||
| Opteum Mortgage Acceptance | ||||||||
| Corp. Asset Backed | ||||||||
| Pass-Through Certificates | ||||||||
| 2005-5, 5.850%, 12/25/2035 (d) | 572,844 | 590,391 | ||||||
| Ownit Mortgage Loan Trust | ||||||||
2005-1, 2.722% (1 Month LIBOR USD + 1.095%), | ||||||||
| 09/25/2035 (b) | 3,453,893 | 3,474,129 | ||||||
| 2006-2, 5.633%, 01/25/2037 (f) | 683,355 | 695,714 | ||||||
| RAAC Trust | ||||||||
| 2005-SP1, 6.000%, 09/25/2034 | 5,064 | 5,055 | ||||||
| RALI Trust | ||||||||
| 2006-QA1, 5.498%, 01/25/2036 (d) | 643,306 | 567,263 | ||||||
| 2006-QS1, 5.750%, 01/25/2036 | 363,607 | 367,648 | ||||||
| 2006-QS6, 6.000%, 06/25/2036 | 1,443,895 | 1,399,679 | ||||||
| 2006-QS6, 6.000%, 06/25/2036 | 741,635 | 718,924 | ||||||
2006-QS9, 2.327% (1 Month LIBOR USD + 0.700%), | ||||||||
| 07/25/2036 (b) | 2,551,599 | 1,891,167 | ||||||
| 2006-QS13, 6.000%, 09/25/2036 | 4,024,688 | 3,696,111 | ||||||
2006-QS17, 1.977% (1 Month LIBOR USD + 0.350%), | ||||||||
| 12/25/2036 (b) | 1,507,847 | 1,190,615 | ||||||
| 2006-QS17, 6.000%, 12/25/2036 | 598,083 | 574,129 | ||||||
| 2007-QS1, 5.750%, 01/25/2037 | 630,086 | 586,379 | ||||||
| 2007-QS1, 6.000%, 01/25/2037 | 1,955,333 | 1,846,783 | ||||||
| 2007-QS6, 6.000%, 04/25/2037 | 4,749,171 | 4,580,320 | ||||||
| 2007-QS9, 6.500%, 07/25/2037 | 4,940,204 | 4,895,819 | ||||||
| 2007-QS10, 6.500%, 09/25/2037 | 508,012 | 503,290 | ||||||
| RBSGC Mortgage Loan Trust | ||||||||
| 2005-A, 5.750%, 04/25/2035 | 1,029,169 | 1,031,498 | ||||||
| RBSSP Resecuritization Trust | ||||||||
| 2009-7, 6.000%, 03/26/2036 (a) | 6,044,235 | 4,800,143 | ||||||
| Renaissance Home | ||||||||
| Equity Loan Trust | ||||||||
| 2005-1, 5.016%, 05/25/2035 (f) | 519,534 | 535,072 | ||||||
| Resecuritization | ||||||||
| Pass-Through Trust | ||||||||
| 2005-8R, 6.000%, 10/25/2034 | 3,685,596 | 3,826,218 | ||||||
| Residential Asset | ||||||||
| Securitization Trust | ||||||||
| 2003-A9, 4.000%, 08/25/2033 | 1,349,771 | 1,380,964 | ||||||
| 2004-R2, 5.500%, 08/25/2034 | 2,782,773 | 2,848,722 | ||||||
| 2005-A5, 5.500%, 05/25/2035 | 1,517,592 | 1,447,920 | ||||||
| 2005-A11, 4.850%, 10/25/2035 | 4,122,976 | 2,741,351 | ||||||
| 2005-A11, 5.500%, 10/25/2035 | 380,203 | 357,177 | ||||||
| 2005-A11, 6.000%, 10/25/2035 | 469,489 | 362,192 | ||||||
| 2006-A5CB, 6.000%, 06/25/2036 | 2,612,017 | 1,782,726 | ||||||
2006-A10, 2.277% (1 Month LIBOR USD + 0.650%), | ||||||||
| 09/25/2036 (b) | 12,162,499 | 4,467,492 | ||||||
2006-A10, 4.223% (1 Month LIBOR USD + 5.850%), | ||||||||
| 09/25/2036 (b)(g)(h)(i) | 12,162,499 | 3,942,040 | ||||||
2006-A15, 2.227% (1 Month LIBOR USD + 0.600%), | ||||||||
| 01/25/2037 (b) | 18,661,123 | 6,536,402 | ||||||
2006-A15, 4.023% (1 Month LIBOR USD + 5.650%), | ||||||||
| 01/25/2037 (b)(g)(h)(i) | 18,661,123 | 5,765,182 | ||||||
| RFMSI Trust | ||||||||
| 2005-SA4, 4.283%, 09/25/2035 (d) | 2,452,404 | 2,075,939 | ||||||
| 2005-SA4, 4.433%, 09/25/2035 (d) | 2,563,816 | 2,254,028 | ||||||
| 2005-SA4, 4.522%, 09/25/2035 (d) | 1,444,062 | 1,445,156 | ||||||
| 2006-S3, 5.500%, 03/25/2036 | 4,081,087 | 4,002,507 | ||||||
Percentages are stated as a percent of net assets.
The accompanying notes are an integral part of these financial statements.
PAGE 23
PERFORMANCE TRUST STRATEGIC BOND FUND — SCHEDULE OF INVESTMENTS (CONT.)
February 29, 2020 (Unaudited)
| PRINCIPAL | ||||||||
| AMOUNT | VALUE | |||||||
| RFMSI Trust (Cont.) | ||||||||
| 2006-S4, 6.000%, 04/25/2036 | $ | 3,538,004 | $ | 3,545,727 | ||||
| 2006-S5, 6.000%, 06/25/2036 | 359,469 | 358,382 | ||||||
| 2006-S5, 6.000%, 06/25/2036 | 739,985 | 737,747 | ||||||
| 2006-S5, 6.000%, 06/25/2036 | 3,101,110 | 3,091,727 | ||||||
| 2006-S5, 6.000%, 06/25/2036 | 385,413 | 384,247 | ||||||
| 2006-S6, 6.000%, 07/25/2036 | 248,592 | 250,806 | ||||||
| 2006-S6, 6.000%, 07/25/2036 | 1,279,807 | 1,291,204 | ||||||
| 2006-S7, 6.250%, 08/25/2036 | 2,093,305 | 2,043,556 | ||||||
| 2006-S7, 6.500%, 08/25/2036 | 1,251,506 | 1,232,866 | ||||||
| 2006-S9, 5.750%, 09/25/2036 | 2,497,045 | 2,418,864 | ||||||
| 2007-S1, 6.000%, 01/25/2037 | 923,450 | 913,880 | ||||||
| 2007-S7, 6.000%, 07/25/2037 | 2,780,787 | 2,755,399 | ||||||
| Sequoia Mortgage Trust | ||||||||
| 2013-4, 1.550%, 04/25/2043 (d) | 2,988,822 | 2,937,835 | ||||||
| Specialty Underwriting | ||||||||
| & Residential Finance Trust | ||||||||
| 2006-BC2, 4.053%, 02/25/2037 (f) | 977,669 | 542,295 | ||||||
| STARM Mortgage Loan Trust | ||||||||
| 2007-S1, 4.569%, 01/25/2037 (d) | 704,340 | 657,309 | ||||||
| 2007-1, 3.956%, 02/25/2037 (d) | 9,436,688 | 9,047,916 | ||||||
| 2007-2, 4.342%, 04/25/2037 (d) | 709,399 | 492,482 | ||||||
| Structured Adjustable | ||||||||
| Rate Mortgage Loan Trust | ||||||||
| 2004-18, 3.835%, 12/25/2034 (d) | 839,714 | 840,205 | ||||||
| 2005-12, 4.201%, 06/25/2035 (d) | 942,446 | 858,234 | ||||||
| 2005-21, 3.625%, 11/25/2035 (d) | 489,705 | 474,260 | ||||||
| 2005-21, 4.031%, 11/25/2035 (d) | 4,230,104 | 3,599,522 | ||||||
| 2006-1, 3.765%, 02/25/2036 (d) | 1,730,403 | 1,625,922 | ||||||
| 2006-1, 3.776%, 02/25/2036 (d) | 707,306 | 687,162 | ||||||
| 2006-4, 3.865%, 05/25/2036 (d) | 983,282 | 855,291 | ||||||
| 2006-12, 4.028%, 01/25/2037 (d) | 915,516 | 867,839 | ||||||
2007-9, 3.263% (6 Month LIBOR USD + 1.500%), | ||||||||
| 10/25/2037 (b) | 1,316,863 | 1,316,219 | ||||||
| Structured Asset | ||||||||
| Securities Corp. Trust | ||||||||
| 2004-18H, 4.750%, 10/25/2034 | 567,676 | 608,804 | ||||||
| Suntrust Alternative Loan Trust | ||||||||
| 2005-1F, 5.750%, 12/25/2035 | 1,819,122 | 1,834,820 | ||||||
| 2005-1F, 6.000%, 12/25/2035 | 4,200,747 | 4,279,411 | ||||||
| 2005-1F, 6.500%, 12/25/2035 | 4,192,290 | 4,364,741 | ||||||
| TBW Mortgage-Backed Trust | ||||||||
| 2006-2, 5.500%, 07/25/2036 | 128,785 | 66,481 | ||||||
| WaMu Mortgage | ||||||||
| Pass-Through Certificates Trust | ||||||||
| 2003-S4, 5.643%, 06/25/2033 (d) | 2,338,440 | 2,420,468 | ||||||
| 2004-S2, 6.000%, 06/25/2034 | 95,223 | 98,735 | ||||||
| 2006-AR10, 3.827%, | ||||||||
| 09/25/2036 (d) | 1,065,760 | 1,032,083 | ||||||
| 2006-AR16, 3.349%, | ||||||||
| 12/25/2036 (d) | 1,606,016 | 1,563,094 | ||||||
| 2007-HY5, 3.900%, | ||||||||
| 05/25/2037 (d) | 2,539,403 | 2,515,325 | ||||||
| 2007-HY7, 3.743%, | ||||||||
| 07/25/2037 (d) | 395,429 | 341,151 | ||||||
| Washington Mutual Mortgage | ||||||||
| Pass-Through Certificates | ||||||||
| WMALT Trust | ||||||||
| 2005-4, 5.500%, 06/25/2035 | 1,686,479 | 1,712,242 | ||||||
| 2005-6, 5.500%, 08/25/2035 | 5,376,594 | 5,357,246 | ||||||
| 2005-6, 5.500%, 08/25/2035 | 1,175,394 | 1,171,164 | ||||||
| 2005-6, 6.500%, 08/25/2035 | 486,733 | 491,911 | ||||||
| 2005-9, 5.500%, 11/25/2035 | 700,948 | 695,182 | ||||||
| 2006-8, 4.306%, 10/25/2036 (f) | 2,817,326 | 1,643,944 | ||||||
| 2007-HY2, 3.858%, 04/25/2037 (d) | 1,878,085 | 1,342,520 | ||||||
| 2007-OC2, 1.937% | ||||||||
| (1 Month LIBOR USD + 0.310%), | ||||||||
| 06/25/2037 (b) | 4,802,934 | 4,655,848 | ||||||
| Wells Fargo Alternative | ||||||||
| Loan Trust | ||||||||
| 2005-1, 5.500%, 02/25/2035 | 1,424,944 | 1,440,014 | ||||||
| 2005-1, 5.500%, 02/25/2035 | 1,057,666 | 1,081,661 | ||||||
| 2007-PA1, 6.000%, 03/25/2037 | 1,266,151 | 1,280,717 | ||||||
| 2007-PA6, 4.483%, 12/28/2037 (d) | 8,355,706 | 8,362,362 | ||||||
| Wells Fargo Mortgage | ||||||||
| Backed Securities Trust | ||||||||
| 2006-AR1, 4.294%, 03/25/2036 (d) | 3,255,236 | 3,224,719 | ||||||
| 2007-AR3, 4.886%, 04/25/2037 (d) | 1,623,568 | 1,591,096 | ||||||
| TOTAL NON-AGENCY RESIDENTIAL | ||||||||
| MORTGAGE BACKED SECURITIES | ||||||||
| (Cost $738,661,737) | 730,565,142 | |||||||
| NON-AGENCY COMMERCIAL | ||||||||
| MORTGAGE BACKED SECURITIES – 20.46% | ||||||||
| Aventura Mall Trust | ||||||||
| 2018-AVM, 4.112%, | ||||||||
| 07/05/2040 (a)(d) | 10,000,000 | 11,678,405 | ||||||
| BAMLL Commercial Mortgage | ||||||||
| Securities Trust | ||||||||
| 2020-BOC, 3.032%, | ||||||||
| 01/15/2032 (a) | 7,000,000 | 7,413,559 | ||||||
| BANK | ||||||||
| 2017-BNK8, 0.742%, | ||||||||
| 11/15/2050 (d)(h) | 37,436,708 | 1,844,364 | ||||||
| 2019-BNK16, 0.966%, | ||||||||
| 02/15/2052 (d)(h) | 81,078,495 | 5,822,920 | ||||||
| 2019-BNK17, 0.568%, | ||||||||
| 04/15/2052 (d)(h) | 123,653,000 | 6,244,291 | ||||||
| 2019-BNK21, 2.808%, | ||||||||
| 10/17/2052 | 11,582,000 | 12,374,159 | ||||||
Percentages are stated as a percent of net assets.
The accompanying notes are an integral part of these financial statements.
PAGE 24
PERFORMANCE TRUST STRATEGIC BOND FUND — SCHEDULE OF INVESTMENTS (CONT.)
February 29, 2020 (Unaudited)
| PRINCIPAL | ||||||||
| AMOUNT | VALUE | |||||||
| BANK (Cont.) | ||||||||
| 2019-BNK23, 0.177%, | ||||||||
| 12/15/2052 (d)(h) | $ | 238,421,000 | $ | 4,363,247 | ||||
| 2018-BNK14, 0.521%, | ||||||||
| 09/15/2060 (d)(h) | 96,074,948 | 3,367,907 | ||||||
| 2018-BNK14, 4.185%, | ||||||||
| 09/15/2060 | 6,500,000 | 7,394,751 | ||||||
| 2018-BNK13, 4.193%, | ||||||||
| 08/15/2061 (d) | 5,500,000 | 6,180,204 | ||||||
| 2018-BNK15, 4.285%, | ||||||||
| 11/15/2061 (d) | 5,000,000 | 5,718,323 | ||||||
| 2019-BNK20, 2.933%, | ||||||||
| 09/15/2062 | 2,100,000 | 2,260,614 | ||||||
| 2019-BNK24, 0.303%, | ||||||||
| 11/15/2062 (d)(h) | 174,693,000 | 3,613,944 | ||||||
| 2020-BNK25, 0.888%, | ||||||||
| 01/15/2063 (d)(h) | 94,552,403 | 7,149,561 | ||||||
| Barclays Commercial | ||||||||
| Mortgage Trust | ||||||||
2019-C3, 0.776%, 05/15/2052 (d)(h) | ||||||||
| 56,340,000 | 3,865,110 | |||||||
2019-C4, 1.149%, 08/15/2052 (d)(h) | ||||||||
| 43,170,000 | 4,207,348 | |||||||
2019-C4, 1.601%, 08/15/2052 (d)(h) | ||||||||
| 32,295,877 | 3,914,428 | |||||||
2019-C5, 0.372%, 11/15/2052 (d)(h) | ||||||||
| 174,774,000 | 5,607,187 | |||||||
| BBCMS Mortgage Trust | ||||||||
2020-C6, 0.679%, 02/15/2053 (d)(h) | ||||||||
| 59,000,000 | 3,817,660 | |||||||
2020-C6, 1.060%, 02/15/2053 (d)(h) | ||||||||
| 59,000,000 | 5,070,631 | |||||||
| BENCHMARK Mortgage Trust | ||||||||
| 2018-B4, 4.059%, 07/15/2051 (d) | 5,315,000 | 6,006,244 | ||||||
2018-B2, 0.423%, 02/15/2051 (d)(h) | ||||||||
| 171,062,964 | 4,382,804 | |||||||
2018-B6, 0.441%, 10/10/2051 (d)(h) | ||||||||
| 78,448,049 | 2,205,088 | |||||||
2019-B9, 1.047%, 03/15/2052 (d)(h) | ||||||||
| 29,995,464 | 2,413,456 | |||||||
| 2019-B9, 4.267%, 03/15/2052 (d) | 1,500,000 | 1,746,078 | ||||||
2019-B12, 0.417%, 08/15/2052 (a)(d)(h) | ||||||||
| 93,260,000 | 3,504,291 | |||||||
2020-B16, 0.240%, 02/15/2053 (a)(d)(h) | ||||||||
| 70,467,000 | 1,560,978 | |||||||
2020-B16, 0.928%, 02/15/2053 (d)(h) | ||||||||
| 44,842,000 | 3,569,329 | |||||||
2018-B7, 0.446%, 05/15/2053 (d)(h) | ||||||||
| 115,333,485 | 3,643,962 | |||||||
2019-B13, 0.539%, 08/15/2057 (a)(d)(h) | ||||||||
| 82,774,000 | 3,043,228 | |||||||
2019-B13, 1.640%, 08/15/2057 (a)(d)(h) | ||||||||
| 12,071,000 | 1,542,009 | |||||||
2019-B14, 0.791%, 12/15/2062 (d)(h) | ||||||||
| 79,715,903 | 4,540,179 | |||||||
| Braemar Hotels & Resorts Trust | ||||||||
2018-PRME, 2.709% (1 Month LIBOR USD + 1.050%), | ||||||||
| 06/15/2035 (a)(b) | 6,170,000 | 6,148,104 | ||||||
2018-PRME, 2.909% (1 Month LIBOR USD + 1.250%), | ||||||||
| 06/15/2035 (a)(b) | 3,000,000 | 2,994,360 | ||||||
| Cantor Commercial | ||||||||
| Real Estate Lending | ||||||||
2019-CF2, 0.769%, 11/18/2052 (d)(h) | ||||||||
| 134,736,000 | 7,564,861 | |||||||
| CCUBS Commercial | ||||||||
| Mortgage Trust | ||||||||
2017-C1, 0.290%, 11/15/2050 (d)(h) | ||||||||
| 40,062,667 | 931,881 | |||||||
2017-C1, 1.012%, 11/15/2050 (d)(h) | ||||||||
| 31,295,348 | 1,778,665 | |||||||
| CD Mortgage Trust | ||||||||
2017-CD3, 0.576%, 02/10/2050 (d)(h) | ||||||||
| 61,857,000 | 2,494,179 | |||||||
| 2017-CD5, 3.220%, 08/15/2050 | 5,000,000 | 5,357,291 | ||||||
| 2018-C7, 4.213%, 08/15/2051 | 3,236,000 | 3,696,508 | ||||||
| CGMS Commercial | ||||||||
| Mortgage Trust | ||||||||
2017-B1, 0.210%, 08/15/2050 (d)(h) | ||||||||
| 38,016,000 | 597,581 | |||||||
| Citigroup Commercial | ||||||||
| Mortgage Trust | ||||||||
2013-GC17, 5.110%, 11/10/2046 (d) | ||||||||
| 5,000,000 | 5,492,073 | |||||||
2014-GC19, 4.805%, 03/10/2047 (d) | ||||||||
| 3,030,000 | 3,352,730 | |||||||
2014-GC19, 5.092%, 03/10/2047 (d) | ||||||||
| 2,757,579 | 3,072,086 | |||||||
| 2017-GC37, 3.576%, 04/10/2049 | 5,250,000 | 5,738,112 | ||||||
| 2016-C1, 4.117%, 05/10/2049 | 3,000,000 | 3,334,254 | ||||||
| 2016-C1, 4.951%, 05/10/2049 (d) | 6,840,000 | 7,665,580 | ||||||
| 2016-P6, 4.241%, 12/10/2049 (d) | 6,835,000 | 7,589,602 | ||||||
2017-P7, 0.533%, 04/14/2050 (d)(h) | ||||||||
| 45,124,000 | 1,834,593 | |||||||
2017-C4, 0.301%, 10/12/2050 (d)(h) | ||||||||
| 42,746,500 | 926,569 | |||||||
2017-C4, 1.107%, 10/12/2050 (d)(h) | ||||||||
| 21,363,757 | 1,360,395 | |||||||
| 2017-C4, 3.297%, 10/12/2050 | 4,500,000 | 4,852,993 | ||||||
2018-B2, 0.393%, v03/10/2051 (d)(h) | ||||||||
| 49,202,000 | 1,572,668 | |||||||
2018-C5, 0.213%, 06/10/2051 (a)(d)(h) | ||||||||
| 28,400,000 | 779,765 | |||||||
Percentages are stated as a percent of net assets.
The accompanying notes are an integral part of these financial statements.
PAGE 25
PERFORMANCE TRUST STRATEGIC BOND FUND — SCHEDULE OF INVESTMENTS (CONT.)
February 29, 2020 (Unaudited)
| PRINCIPAL | ||||||||
| AMOUNT | VALUE | |||||||
| Citigroup Commercial | ||||||||
| Mortgage Trust (Cont.) | ||||||||
2018-C5, 0.599%, 06/10/2051 (d)(h) | ||||||||
| $ | 107,143,257 | $ | 5,272,230 | |||||
| 2018-C5, 4.148%, 06/10/2051 (d) | 4,000,000 | 4,528,491 | ||||||
2018-C6, 0.786%, 11/10/2051 (d)(h) | ||||||||
| 22,512,333 | 1,347,879 | |||||||
| 2018-C6, 4.343%, 11/10/2051 | 5,000,000 | 5,762,736 | ||||||
| 2020-GC46, 0.310%, | ||||||||
| 01/15/2053 (a)(d)(h) | 92,457,000 | 3,007,349 | ||||||
| 2020-GC46, 0.980%, | ||||||||
| 01/15/2053 (d)(h) | 90,000,000 | 7,334,361 | ||||||
| 2019-GC41, 1.190%, | ||||||||
| 08/10/2056 (d)(h) | 49,954,277 | 3,988,250 | ||||||
2019-C7, 0.286%, 12/15/2072 (a)(d)(h) | ||||||||
| 50,711,000 | 1,428,007 | |||||||
2019-C7, 0.882%, 12/15/2072 (d)(h) | ||||||||
| 76,857,804 | 5,558,364 | |||||||
2019-C7, 1.203%, 12/15/2072 (a)(d)(h) | ||||||||
| 15,760,000 | 1,672,650 | |||||||
| 2019-C7, 3.667%, 12/15/2072 (d) | 4,000,000 | 4,380,081 | ||||||
| COMM Mortgage Trust | ||||||||
2013-CR13, 4.889%, 11/10/2046 (d) | ||||||||
| 2,500,000 | 2,762,034 | |||||||
2014-CR15, 4.746%, 02/10/2047 (d) | ||||||||
| 5,500,000 | 6,036,658 | |||||||
| 2014-CR16, 4.582%, 04/10/2047 | 5,164,000 | 5,622,684 | ||||||
2014-CR18, 4.456%, 07/15/2047 (d) | ||||||||
| 4,550,700 | 4,948,394 | |||||||
2013-CR11, 0.928%, 08/10/2050 (d)(h) | ||||||||
| 51,393,083 | 1,529,294 | |||||||
2019-GC44, 1.029%, 08/15/2057 (a)(d)(h) | ||||||||
| 10,478,000 | 961,432 | |||||||
| CSAIL Commercial | ||||||||
| Mortgage Trust | ||||||||
2016-C5, 1.000%, 11/15/2048 (a)(d)(h) | ||||||||
| 46,821,000 | 2,387,829 | |||||||
2015-C1, 0.500%, 04/15/2050 (a)(d)(h) | ||||||||
| 62,192,000 | 1,353,236 | |||||||
2017-C8, 0.377%, 06/15/2050 (d)(h) | ||||||||
| 74,773,000 | 1,943,582 | |||||||
2018-C14, 4.359%, 11/15/2051 (d) | ||||||||
| 8,000,000 | 9,119,867 | |||||||
2019-C16, 0.751%, 06/15/2052 (d)(h) | ||||||||
| 66,938,000 | 4,396,160 | |||||||
2019-C17, 1.369%, 09/15/2052 (d)(h) | ||||||||
| 86,176,155 | 8,987,518 | |||||||
2019-C18, 1.086%, 12/15/2052 (d)(h) | ||||||||
| 64,338,200 | 5,092,092 | |||||||
| FREMF Mortgage Trust | ||||||||
2019-K735, 4.020%, 05/25/2026 (a)(d) | ||||||||
| 6,000,000 | 6,522,110 | |||||||
2011-K12, 4.345%, 01/25/2046 (a)(d) | ||||||||
| 14,075,000 | 14,344,190 | |||||||
2015-K43, 3.733%, 02/25/2048 (a)(d) | ||||||||
| 3,446,743 | 3,707,555 | |||||||
2015-K45, 3.590%, 04/25/2048 (a)(d) | ||||||||
| 3,100,000 | 3,298,861 | |||||||
2019-K734, 4.052%, 02/25/2051 (a)(d) | ||||||||
| 5,000,000 | 5,430,045 | |||||||
2019-K101, 3.527%, 10/25/2052 (a)(d) | ||||||||
| 10,000,000 | 10,618,407 | |||||||
| GS Mortgage Securities Corp. II | ||||||||
2012-BWTR, 3.255%, 11/05/2034 (a) | ||||||||
| 6,608,000 | 6,795,538 | |||||||
| GS Mortgage Securities Trust | ||||||||
2017-FARM, 3.541%, 01/10/2043 (a)(d) | ||||||||
| 9,135,000 | 10,229,711 | |||||||
2011-GC3, 4.753%, 03/10/2044 (a) | ||||||||
| 8,085,609 | 8,208,085 | |||||||
| 2012-GC6, 3.314%, 01/10/2045 | 1,583,977 | 1,600,051 | ||||||
2015-GC32, 4.417%, 07/10/2048 (d) | ||||||||
| 5,100,000 | 5,680,143 | |||||||
2016-GS3, 3.395%, 10/10/2049 (d) | ||||||||
| 10,417,000 | 11,153,418 | |||||||
2015-GC30, 4.008%, 05/10/2050 (d) | ||||||||
| 2,750,000 | 2,981,129 | |||||||
2017-GS8, 0.384%, 11/10/2050 (d)(h) | ||||||||
| 44,642,000 | 1,326,506 | |||||||
2019-GC38, 1.836%, 02/10/2052 (a)(d)(h) | ||||||||
| 20,916,000 | 3,159,569 | |||||||
2019-GC39, 0.639%, 05/10/2052 (d)(h) | ||||||||
| 69,588,000 | 3,894,618 | |||||||
2019-GC39, 1.626%, 05/10/2052 (a)(d)(h) | ||||||||
| 8,215,000 | 1,086,898 | |||||||
2019-GC40, 1.161%, 07/10/2052 (a)(d)(h) | ||||||||
| 5,920,000 | 593,675 | |||||||
2019-GSA1, 0.835%, 11/10/2052 (d)(h) | ||||||||
| 73,189,437 | 5,083,680 | |||||||
| JP Morgan Chase Commercial | ||||||||
| Mortgage Securities Trust | ||||||||
2016-NINE, 2.854%, 09/06/2038 (a)(d) | ||||||||
| 7,000,000 | 7,298,592 | |||||||
2012-CBX, 5.132%, 06/15/2045 (d) | ||||||||
| 6,680,000 | 7,007,846 | |||||||
| 2015-JP1, 4.735%, 01/15/2049 (d) | 4,285,000 | 4,684,901 | ||||||
2007-CB20, 0.000%, 02/12/2051 (a)(d)(e)(h)(i) | ||||||||
| 11,168,220 | 112 | |||||||
| JPMBB Commercial | ||||||||
| Mortgage Securities Trust | ||||||||
| 2015-C28, 3.532%, 10/15/2048 | 5,000,000 | 5,346,769 | ||||||
2015-C32, 0.500%, 11/15/2048 (a)(d)(h) | ||||||||
| 23,066,000 | 576,375 | |||||||
| 2015-C33, 3.562%, 12/15/2048 | 5,561,000 | 5,917,829 | ||||||
Percentages are stated as a percent of net assets.
The accompanying notes are an integral part of these financial statements.
PAGE 26
PERFORMANCE TRUST STRATEGIC BOND FUND — SCHEDULE OF INVESTMENTS (CONT.)
February 29, 2020 (Unaudited)
| PRINCIPAL | ||||||||
| AMOUNT | VALUE | |||||||
| JPMCC Commercial | ||||||||
| Mortgage Securities Trust | ||||||||
| 2017-JP6, 0.658%, | ||||||||
| 07/15/2050 (d)(h) | $ | 68,830,000 | $ | 3,081,581 | ||||
| JPMDB Commercial | ||||||||
| Mortgage Securities Trust | ||||||||
| 2016-C4, 3.638%, 12/15/2049 (d) | 5,500,000 | 5,930,251 | ||||||
| Morgan Stanley Bank | ||||||||
| of America Merrill Lynch Trust | ||||||||
| 2013-C12, 4.482%, 10/15/2046 (d) | 5,000,000 | 5,466,267 | ||||||
| 2014-C16, 3.592%, 06/15/2047 | 5,793,064 | 5,877,253 | ||||||
| 2015-C27, 4.526%, 12/15/2047 (d) | 3,000,000 | 3,361,535 | ||||||
| 2015-C25, 4.527%, 10/15/2048 (d) | 5,000,000 | 5,529,886 | ||||||
2016-C31, 1.313%, 11/15/2049 (a)(d)(h) | ||||||||
| 21,212,500 | 1,679,652 | |||||||
| 2015-C23, 4.155%, 07/15/2050 (d) | 3,595,000 | 3,938,196 | ||||||
| Morgan Stanley Capital I Trust | ||||||||
| 2016-BNK2, 0.545%, | ||||||||
| 11/15/2049 (d)(h) | 42,650,000 | 1,530,696 | ||||||
2018-H3, 0.358%, 07/15/2051 (d)(h) | ||||||||
| 135,712,000 | 4,122,103 | |||||||
| 2018-H3, 4.120%, 07/15/2051 | 5,000,000 | 5,684,582 | ||||||
2019-L2, 0.626%, 03/15/2052 (d)(h) | ||||||||
| 127,093,000 | 7,115,581 | |||||||
2019-H7, 0.663%, 07/15/2052 (d)(h) | ||||||||
| 130,723,000 | 7,627,007 | |||||||
| UBS Commercial Mortgage Trust | ||||||||
2017-C1, 0.892%, 06/15/2050 (d)(h) | ||||||||
| 13,000,000 | 803,492 | |||||||
2017-C6, 0.364%, 12/15/2050 (d)(h) | ||||||||
| 63,420,500 | 2,236,150 | |||||||
2017-C7, 0.364%, 12/15/2050 (d)(h) | ||||||||
| 170,396,000 | 4,758,751 | |||||||
2018-C10, 0.956%, 05/15/2051 (d)(h) | ||||||||
| 48,454,505 | 3,093,752 | |||||||
| 2018-C11, 4.118%, 06/15/2051 | 5,000,000 | 5,617,273 | ||||||
2018-C12, 0.230%, 08/15/2051 (d)(h) | ||||||||
| 139,858,000 | 3,614,322 | |||||||
2018-C12, 0.827%, 08/15/2051 (d)(h) | ||||||||
| 49,539,051 | 2,921,996 | |||||||
| 2018-C12, 4.195%, 08/15/2051 | 5,000,000 | 5,634,990 | ||||||
2018-C13, 0.253%, 10/15/2051 (d)(h) | ||||||||
| 128,678,000 | 3,578,278 | |||||||
| 2018-C13, 4.241%, 10/15/2051 | 3,000,000 | 3,436,918 | ||||||
2018-C14, 0.303%, 12/15/2051 (d)(h) | ||||||||
| 114,392,000 | 3,497,696 | |||||||
2019-C17, 0.996%, 10/15/2052 (d)(h) | ||||||||
| 128,213,000 | 9,666,286 | |||||||
| 2019-C18, 2.987%, 12/15/2052 | 4,500,000 | 4,866,381 | ||||||
| 2019-C18, 3.378%, 12/15/2052 | 4,000,000 | 4,349,266 | ||||||
| UBS-Barclays Commercial | ||||||||
| Mortgage Trust | ||||||||
2012-C3, 4.365%, 08/10/2049 (a)(d) | ||||||||
| 6,000,000 | 6,351,319 | |||||||
| Wells Fargo Commercial | ||||||||
| Mortgage Trust | ||||||||
2017-SMP, 2.409% (1 Month LIBOR USD + 0.750%), | ||||||||
| 12/15/2034 (a)(b) | 1,875,000 | 1,874,369 | ||||||
2015-NXS1, 3.658%, 05/15/2048 (d) | ||||||||
| 1,320,000 | 1,408,419 | |||||||
2016-LC24, 1.012%, 10/15/2049 (d)(h) | ||||||||
| 36,969,489 | 2,258,699 | |||||||
2017-RB1, 0.714%, 03/15/2050 (d)(h) | ||||||||
| 38,474,561 | 1,971,563 | |||||||
2017-C42, 0.327%, 12/15/2050 (d)(h) | ||||||||
| 116,750,000 | 3,130,441 | |||||||
2018-C44, 0.755%, 05/15/2051 (d)(h) | ||||||||
| 95,469,690 | 4,932,833 | |||||||
| 2018-C45, 4.147%, 06/15/2051 | 5,388,000 | 6,085,105 | ||||||
2018-C46, 0.944%, 08/15/2051 (d)(h) | ||||||||
| 52,778,123 | 3,018,054 | |||||||
| 2018-C46, 4.086%, 08/15/2051 | 5,040,000 | 5,705,770 | ||||||
2018-C48, 0.243%, 01/15/2052 (d)(h) | ||||||||
| 138,642,000 | 3,368,751 | |||||||
2018-C48, 0.952%, 01/15/2052 (d)(h) | ||||||||
| 48,051,485 | 3,406,346 | |||||||
| 2018-C48, 4.245%, 01/15/2052 | 7,000,000 | 7,994,475 | ||||||
2019-C49, 0.604%, 03/15/2052 (d)(h) | ||||||||
| 125,812,000 | 6,699,703 | |||||||
| 2019-C49, 3.933%, 03/15/2052 | 5,000,000 | 5,655,623 | ||||||
| 2019-C49, 4.546%, 03/15/2052 | 4,647,000 | 5,377,512 | ||||||
2019-C50, 0.871%, 05/15/2052 (d)(h) | ||||||||
| 36,427,311 | 2,791,210 | |||||||
| 2019-C50, 3.635%, 05/15/2052 | 5,000,000 | 5,569,866 | ||||||
2019-C51, 0.689%, 06/15/2052 (d)(h) | ||||||||
| 130,394,000 | 7,694,407 | |||||||
2019-C52, 1.095%, 08/15/2052 (d)(h) | ||||||||
| 43,270,854 | 4,098,256 | |||||||
2019-C52, 1.623%, 08/15/2052 (d)(h) | ||||||||
| 61,370,626 | 7,404,120 | |||||||
2019-C53, 0.456%, 10/15/2052 (d)(h) | ||||||||
| 105,325,000 | 4,731,989 | |||||||
| 2019-C53, 2.964%, 10/15/2052 | 7,381,000 | 7,922,255 | ||||||
| 2019-C53, 3.514%, 10/15/2052 (d) | 5,000,000 | 5,396,298 | ||||||
2019-C54, 0.843%, 12/15/2052 (d)(h) | ||||||||
| 39,183,349 | 2,752,556 | |||||||
| 2019-C54, 3.063%, 12/15/2052 | 5,000,000 | 5,411,759 | ||||||
2020-C55, 0.818%, 02/15/2053 (d)(h) | ||||||||
| 58,030,370 | 4,320,709 | |||||||
2020-C55, 1.314%, 02/15/2053 (d)(h) | ||||||||
| 30,586,491 | 3,274,293 | |||||||
Percentages are stated as a percent of net assets.
The accompanying notes are an integral part of these financial statements.
PAGE 27
PERFORMANCE TRUST STRATEGIC BOND FUND — SCHEDULE OF INVESTMENTS (CONT.)
February 29, 2020 (Unaudited)
| PRINCIPAL | ||||||||
| AMOUNT | VALUE | |||||||
| Wells Fargo Commercial | ||||||||
| Mortgage Trust (Cont.) | ||||||||
| 2020-C55, 3.542%, 02/15/2053 | $ | 5,691,000 | $ | 6,021,987 | ||||
2015-C30, 4.067%, 09/15/2058 (d) | ||||||||
| 10,000,000 | 11,083,617 | |||||||
2015-C30, 4.400%, 09/15/2058 (d) | ||||||||
| 5,100,000 | 5,643,516 | |||||||
2018-C47, 0.158%, 09/15/2061 (d)(h) | ||||||||
| 164,144,000 | 2,590,488 | |||||||
| 2018-C47, 4.365%, 09/15/2061 | 5,625,000 | 6,469,397 | ||||||
| WFRBS Commercial | ||||||||
| Mortgage Trust | ||||||||
2011-C5, 5.661%, 11/15/2044 (a)(d) | ||||||||
| 5,695,000 | 6,000,945 | |||||||
2013-UBS1, 4.738%, 03/15/2046 (d) | ||||||||
| 7,500,000 | 8,326,872 | |||||||
| TOTAL NON-AGENCY | ||||||||
| COMMERCIAL MORTGAGE | ||||||||
| BACKED SECURITIES | ||||||||
| (Cost $730,050,510) | 760,932,563 | |||||||
| AGENCY COMMERCIAL | ||||||||
| MORTGAGE BACKED SECURITIES – 5.35% | ||||||||
| Freddie Mac Multifamily | ||||||||
| ML Certificates | ||||||||
| 2019-ML06, 1.132%, | ||||||||
| 06/25/2037 (a) | 10,228,223 | 1,193,058 | ||||||
| Freddie Mac Multifamily Structured | ||||||||
| Pass Through Certificates | ||||||||
| K014, 1.149%, 04/25/2021 (d)(h) | 90,844,901 | 915,480 | ||||||
| K018, 1.300%, 01/25/2022 (d)(h) | 59,058,247 | 1,097,763 | ||||||
| K019, 1.591%, 03/25/2022 (d)(h) | 87,803,335 | 2,464,455 | ||||||
| K021, 1.422%, 06/25/2022 (d)(h) | 71,894,737 | 1,970,419 | ||||||
| K723, 0.951%, 08/25/2023 (d)(h) | 73,825,072 | 2,017,241 | ||||||
| K723, 0.855%, 09/25/2023 (d)(h) | 61,645,000 | 1,763,818 | ||||||
| K728, 0.414%, 08/25/2024 (d)(h) | 64,583,984 | 1,037,832 | ||||||
| K729, 0.364%, 10/25/2024 (d)(h) | 53,368,654 | 775,436 | ||||||
| K042, 1.045%, 12/25/2024 (d)(h) | 80,425,917 | 3,498,712 | ||||||
| K734, 0.648%, 02/25/2026 (d)(h) | 65,238,783 | 2,238,493 | ||||||
| K735, 0.965%, 05/25/2026 (d)(h) | 62,716,114 | 3,394,020 | ||||||
| K735, 1.365%, 05/25/2026 (d)(h) | 70,547,000 | 5,714,730 | ||||||
| K737, 1.004%, 10/25/2026 (d)(h) | 20,050,000 | 1,279,453 | ||||||
| K061, 0.045%, 11/25/2026 (d)(h) | 72,512,000 | 452,047 | ||||||
| K062, 0.170%, 12/25/2026 (d)(h) | 79,423,000 | 1,102,836 | ||||||
| K063, 0.290%, 01/25/2027 (d)(h) | 102,768,434 | 1,902,305 | ||||||
| K064, 0.607%, 03/25/2027 (d)(h) | 98,866,159 | 3,812,042 | ||||||
| K065, 0.547%, 05/25/2027 (d)(h) | 57,193,000 | 2,250,493 | ||||||
| K066, 0.751%, 06/25/2027 (d)(h) | 31,856,665 | 1,551,423 | ||||||
| KW03, 0.843%, 06/25/2027 (d)(h) | 16,261,463 | 780,658 | ||||||
| K067, 0.578%, 07/25/2027 (d)(h) | 40,830,581 | 1,604,564 | ||||||
| K068, 0.435%, 08/25/2027 (d)(h) | 25,516,120 | 759,533 | ||||||
| K069, 0.365%, 09/25/2027 (d)(h) | 30,382,766 | 795,026 | ||||||
| K070, 0.326%, 11/25/2027 (d)(h) | 280,102,654 | 6,763,835 | ||||||
| K072, 0.369%, 12/25/2027 (d)(h) | 61,526,235 | 1,651,715 | ||||||
| K073, 0.203%, 01/25/2028 (d) | 54,203,000 | 991,514 | ||||||
| K074, 0.291%, 01/25/2028 (d)(h) | 207,910,240 | 4,885,704 | ||||||
| K073, 0.303%, 01/25/2028 (d)(h) | 156,955,936 | 3,772,436 | ||||||
| KW06, 0.093%, 06/25/2028 (d)(h) | 597,513,159 | 6,328,620 | ||||||
| K080, 0.120%, 07/25/2028 (d)(h) | 431,779,380 | 5,344,349 | ||||||
| K081, 0.069%, 08/25/2028 (d)(h) | 156,316,742 | 1,399,160 | ||||||
| K084, 0.203%, 10/25/2028 (d)(h) | 339,719,056 | 6,193,656 | ||||||
| K089, 0.453%, 01/25/2029 (d)(h) | 53,965,000 | 2,193,801 | ||||||
| K088, 0.507%, 01/25/2029 (d)(h) | 149,899,284 | 6,426,962 | ||||||
| K090, 0.705%, 02/25/2029 (d)(h) | 77,955,804 | 4,581,868 | ||||||
| K091, 0.486%, 03/25/2029 (d)(h) | 53,659,000 | 2,365,299 | ||||||
| KW09, 0.802%, 05/25/2029 (d)(h) | 47,500,000 | 2,946,235 | ||||||
| K093, 0.952%, 05/25/2029 (d)(h) | 54,738,893 | 4,244,339 | ||||||
| K094, 0.881%, 06/25/2029 (d)(h) | 101,555,206 | 7,386,110 | ||||||
| K097, 1.090%, 07/25/2029 (d)(h) | 72,990,298 | 6,637,811 | ||||||
| KG02, 1.018%, 08/25/2029 (d)(h) | 33,000,000 | 2,659,757 | ||||||
| K098, 1.146%, 08/25/2029 (d)(h) | 62,351,178 | 5,904,114 | ||||||
| KW10, 0.650%, 09/25/2029 (d)(h) | 74,100,000 | 4,085,363 | ||||||
| K099, 0.886%, 09/25/2029 (d)(h) | 66,963,938 | 4,963,508 | ||||||
| K100, 0.910%, 09/25/2029 (d)(h) | 62,086,000 | 5,049,765 | ||||||
| K102, 0.947%, 10/25/2029 (d)(h) | 101,501,699 | 7,090,594 | ||||||
| K101, 1.093%, 10/25/2029 (d)(h) | 65,686,000 | 6,393,054 | ||||||
| K103, 0.757%, 11/25/2029 (d)(h) | 125,500,000 | 6,917,372 | ||||||
| K104, 1.127%, 01/25/2030 (d)(h) | 75,140,000 | 7,218,256 | ||||||
| K152, 0.956%, 01/25/2031 (d)(h) | 31,045,832 | 2,548,503 | ||||||
| K155, 0.114%, 04/25/2033 (d)(h) | 247,516,998 | 4,236,550 | ||||||
| K1511, 0.778%, 03/25/2034 (d)(h) | 43,120,721 | 3,633,585 | ||||||
| K1512, 0.912%, 04/25/2034 (d)(h) | 47,755,111 | 4,562,370 | ||||||
| K1513, 0.865%, 08/25/2034 (d)(h) | 76,978,460 | 7,129,691 | ||||||
| K1514, 0.703%, 10/25/2034 (d)(h) | 77,000,000 | 5,344,316 | ||||||
| K090, 0.621%, 02/25/2052 (d)(h) | 50,517,000 | 2,741,194 | ||||||
| TOTAL AGENCY COMMERCIAL | ||||||||
| MORTGAGE BACKED SECURITIES | ||||||||
| (Cost $184,926,593) | 198,963,243 | |||||||
| MUNICIPAL BONDS – 26.02% | ||||||||
| Arizona – 0.43% | ||||||||
| Arizona Department of Transportation | ||||||||
| State Highway Fund Revenue | ||||||||
| 2.462%, 07/01/2030 | 6,875,000 | 7,346,006 | ||||||
| City of Phoenix Civic | ||||||||
| Improvement Corp. | ||||||||
| 5.500%, 07/01/2042 | 4,000,000 | 6,571,720 | ||||||
| Tempe Industrial | ||||||||
| Development Authority | ||||||||
| 4.000%, 10/01/2023 (a) | 2,000,000 | 2,019,380 | ||||||
| 15,937,106 | ||||||||
Percentages are stated as a percent of net assets.
The accompanying notes are an integral part of these financial statements.
PAGE 28
PERFORMANCE TRUST STRATEGIC BOND FUND — SCHEDULE OF INVESTMENTS (CONT.)
February 29, 2020 (Unaudited)
| PRINCIPAL | ||||||||
| AMOUNT | VALUE | |||||||
| California – 5.01% | ||||||||
| Alvord Unified School District | ||||||||
| 0.000%, 08/01/2046 (e) | $ | 1,720,000 | $ | 2,167,183 | ||||
| California School | ||||||||
| Finance Authority | ||||||||
| 4.000%, 07/15/2020 (a)(i) | 5,000,000 | 5,012,350 | ||||||
| City of Industry, CA | ||||||||
| 4.000%, 01/01/2028 | 2,885,000 | 3,254,107 | ||||||
| City of Los Angeles | ||||||||
| Department of Airports | ||||||||
| 6.582%, 05/15/2039 | 5,070,000 | 7,171,464 | ||||||
| City of Los Angeles, CA | ||||||||
| 3.550%, 09/01/2031 | 3,000,000 | 3,375,360 | ||||||
| City of Oakland, CA | ||||||||
| 3.000%, 01/15/2027 | 3,100,000 | 3,435,885 | ||||||
| City of Sacramento, CA Transient | ||||||||
| Occupancy Tax Revenue | ||||||||
| 3.858%, 06/01/2025 | 3,320,000 | 3,662,093 | ||||||
| City of San Diego Tobacco | ||||||||
| Settlement Revenue Funding Corp. | ||||||||
| 3.435%, 06/01/2023 | 2,155,000 | 2,289,903 | ||||||
| City of South Lake Tahoe, CA | ||||||||
| 4.000%, 06/01/2027 | 1,600,000 | 1,783,088 | ||||||
| City of Union City, CA | ||||||||
| 0.000%, 07/01/2025 (e) | 2,105,000 | 1,872,861 | ||||||
| Coachella Valley Unified | ||||||||
| School District | ||||||||
| 0.000%, 08/01/2034 (e) | 1,100,000 | 824,439 | ||||||
| County of Marin, CA | ||||||||
| 5.410%, 08/01/2026 | 9,495,000 | 11,277,306 | ||||||
| County of San Diego, CA | ||||||||
| 6.029%, 08/15/2026 | 765,000 | 915,782 | ||||||
| County of Sonoma, CA | ||||||||
| 6.000%, 12/01/2029 | 9,685,000 | 11,985,284 | ||||||
| Fresno Unified School District | ||||||||
| 0.000%, 08/01/2029 (e) | 2,500,000 | 2,035,400 | ||||||
| Fullerton Public | ||||||||
| Financing Authority | ||||||||
| 7.750%, 05/01/2031 | 1,490,000 | 1,988,092 | ||||||
| Garden Grove Unified | ||||||||
| School District | ||||||||
| 2.380%, 08/01/2028 | 2,000,000 | 2,087,980 | ||||||
| Los Angeles County Metropolitan | ||||||||
| Transportation Authority | ||||||||
| 5.735%, 06/01/2039 | 12,775,000 | 18,032,168 | ||||||
| Los Angeles Unified | ||||||||
| School District | ||||||||
| 5.981%, 05/01/2027 | 12,375,000 | 15,973,402 | ||||||
| Metropolitan Water District | ||||||||
| of Southern California | ||||||||
| 6.947%, 07/01/2040 | 15,000,000 | 15,282,450 | ||||||
| Monrovia School Facilities | ||||||||
| Grant Financing Authority | ||||||||
| 7.000%, 06/01/2027 | 2,410,000 | 3,090,970 | ||||||
| M-S-R Energy Authority | ||||||||
| 7.000%, 11/01/2034 | 3,500,000 | 5,656,175 | ||||||
| Northern California Power Agency | ||||||||
| 5.679%, 06/01/2035 | 7,900,000 | 10,164,140 | ||||||
| Norwalk-La Mirada Unified | ||||||||
| School District | ||||||||
| 0.000%, 08/01/2038 (e) | 4,200,000 | 2,567,460 | ||||||
| Palmdale Elementary | ||||||||
| School District | ||||||||
| 0.000%, 08/01/2029 (e) | 540,000 | 457,364 | ||||||
| Pasadena Unified School District | ||||||||
| 2.568%, 05/01/2031 | 2,395,000 | 2,532,617 | ||||||
| Peralta Community | ||||||||
| College District | ||||||||
| 0.000%, 08/05/2031 (e) | 4,450,000 | 3,972,025 | ||||||
| Placentia-Yorba Linda | ||||||||
| Unified School District | ||||||||
| 0.000%, 08/01/2035 (e) | 7,600,000 | 5,741,648 | ||||||
| Pomona Redevelopment Agency | ||||||||
| Successor Agency | ||||||||
| 3.930%, 02/01/2026 | 7,020,000 | 7,988,479 | ||||||
| Poway Unified School District | ||||||||
| 0.000%, 08/01/2034 (e) | 5,360,000 | 4,151,320 | ||||||
| San Diego Unified School District | ||||||||
| 0.000%, 07/01/2036 (e) | 7,895,000 | 5,764,534 | ||||||
| San Francisco City & County | ||||||||
| Redevelopment Financing Authority | ||||||||
| 0.000%, 08/01/2036 (e) | 5,185,000 | 3,359,465 | ||||||
| University of California | ||||||||
| 4.601%, 05/15/2031 | 9,980,000 | 12,085,980 | ||||||
| Yosemite Community | ||||||||
| College District | ||||||||
| 0.000%, 08/01/2038 (e) | 6,110,000 | 4,246,328 | ||||||
| 186,205,102 | ||||||||
| Colorado – 1.05% | ||||||||
| Board of Governors of Colorado | ||||||||
| State University System | ||||||||
| 2.594%, 03/01/2033 | 4,560,000 | 4,824,845 | ||||||
| 2.644%, 03/01/2034 | 6,275,000 | 6,637,444 | ||||||
| City & County of Denver, CO | ||||||||
| Airport System Revenue | ||||||||
| 5.000%, 12/01/2036 | 10,750,000 | 15,495,157 | ||||||
Percentages are stated as a percent of net assets.
The accompanying notes are an integral part of these financial statements.
PAGE 29
PERFORMANCE TRUST STRATEGIC BOND FUND — SCHEDULE OF INVESTMENTS (CONT.)
February 29, 2020 (Unaudited)
| PRINCIPAL | ||||||||
| AMOUNT | VALUE | |||||||
| Colorado – 1.05% (Cont.) | ||||||||
| City of Fort Collins, CO Electric | ||||||||
| Utility Enterprise Revenue | ||||||||
| 3.859%, 12/01/2030 | $ | 1,500,000 | $ | 1,793,550 | ||||
| 3.909%, 12/01/2031 | 4,775,000 | 5,756,167 | ||||||
| City of Fruita, CO | ||||||||
| Healthcare Revenue | ||||||||
| 5.000%, 01/01/2028 | 3,375,000 | 3,444,458 | ||||||
| Colorado Educational & | ||||||||
| Cultural Facilities Authority | ||||||||
| 3.285%, 03/01/2028 | 1,000,000 | 1,099,070 | ||||||
| 39,050,691 | ||||||||
| Connecticut – 0.03% | ||||||||
| Harbor Point Infrastructure | ||||||||
| Improvement District | ||||||||
| 12.500%, 04/01/2039 | 1,275,000 | 1,285,825 | ||||||
| District of Columbia – 0.49% | ||||||||
| Metropolitan Washington | ||||||||
| Airports Authority Dulles | ||||||||
| Toll Road Revenue | ||||||||
| 8.000%, 10/01/2047 | 10,120,000 | 18,337,541 | ||||||
| Florida – 0.59% | ||||||||
| City of Gainesville, FL | ||||||||
| 0.000%, 10/01/2027 (e) | 4,610,000 | 3,956,947 | ||||||
| 0.000%, 10/01/2028 (e) | 1,300,000 | 1,082,302 | ||||||
| County of Miami-Dade, FL | ||||||||
| 6.875%, 10/01/2034 | 1,345,000 | 2,020,499 | ||||||
| County of Miami-Dade, FL | ||||||||
| Aviation Revenue | ||||||||
| 3.175%, 10/01/2028 | 5,100,000 | 5,592,048 | ||||||
| 3.275%, 10/01/2029 | 1,700,000 | 1,886,507 | ||||||
| County of Miami-Dade, FL | ||||||||
| Water & Sewer System Revenue | ||||||||
| 2.551%, 10/01/2028 | 2,000,000 | 2,145,540 | ||||||
| 2.601%, 10/01/2029 | 3,395,000 | 3,658,079 | ||||||
| Reedy Creek Improvement District | ||||||||
| 2.731%, 06/01/2038 | 1,500,000 | 1,611,795 | ||||||
| 21,953,717 | ||||||||
| Georgia – 0.32% | ||||||||
| Medical Center Hospital Authority | ||||||||
| 4.875%, 08/01/2022 | 7,020,000 | 7,478,195 | ||||||
| Valdosta & Lowndes County | ||||||||
| Hospital Authority | ||||||||
| 2.604%, 10/01/2030 | 2,000,000 | 2,133,700 | ||||||
| 3.000%, 10/01/2029 | 2,000,000 | 2,221,440 | ||||||
| 11,833,335 | ||||||||
| Illinois – 0.35% | ||||||||
| City of Chicago, IL | ||||||||
| Waterworks Revenue | ||||||||
| 5.750%, 11/01/2030 | 2,485,000 | 3,232,737 | ||||||
| Illinois Finance Authority | ||||||||
| 3.548%, 08/15/2029 | 1,800,000 | 2,008,044 | ||||||
| Metropolitan Water Reclamation | ||||||||
| District of Greater Chicago | ||||||||
| 5.000%, 12/01/2041 | 2,570,000 | 3,139,126 | ||||||
| Southwestern Illinois | ||||||||
| Development Authority | ||||||||
| 7.030%, 04/15/2032 | 675,000 | 679,509 | ||||||
| State of Illinois | ||||||||
| 5.750%, 01/01/2037 | 3,000,000 | 3,853,470 | ||||||
| 12,912,886 | ||||||||
| Indiana – 0.37% | ||||||||
| City of Fishers, IN | ||||||||
| 4.000%, 08/01/2028 | 1,525,000 | 1,747,558 | ||||||
| Indiana Finance Authority | ||||||||
| 4.807%, 07/15/2035 | 3,000,000 | 3,914,250 | ||||||
| Indianapolis Board of | ||||||||
| School Commissioners | ||||||||
| 3.800%, 07/15/2030 | 5,000,000 | 5,834,750 | ||||||
| Indianapolis Local Public | ||||||||
| Improvement Bond Bank | ||||||||
| 5.854%, 01/15/2030 | 1,810,000 | 2,242,409 | ||||||
| 13,738,967 | ||||||||
| Kansas – 0.25% | ||||||||
| Kansas Development | ||||||||
| Finance Authority | ||||||||
| 5.371%, 05/01/2026 | 8,210,000 | 9,233,130 | ||||||
| Kentucky – 0.17% | ||||||||
| County of Warren, KY | ||||||||
| 3.921%, 12/01/2031 | 825,000 | 970,901 | ||||||
| 4.397%, 12/01/2038 | 1,540,000 | 1,951,735 | ||||||
| Kentucky Higher Education | ||||||||
| Student Loan Corp. | ||||||||
| 3.860%, 06/01/2025 | 2,000,000 | 2,220,060 | ||||||
| Kentucky State Property & | ||||||||
| Building Commission | ||||||||
| 5.000%, 02/01/2032 | 1,150,000 | 1,381,943 | ||||||
| 6,524,639 | ||||||||
| Louisiana – 0.52% | ||||||||
| State of Louisiana | ||||||||
| 5.000%, 03/01/2039 | 15,000,000 | 19,324,350 | ||||||
Percentages are stated as a percent of net assets.
The accompanying notes are an integral part of these financial statements.
PAGE 30
PERFORMANCE TRUST STRATEGIC BOND FUND — SCHEDULE OF INVESTMENTS (CONT.)
February 29, 2020 (Unaudited)
| PRINCIPAL | ||||||||
| AMOUNT | VALUE | |||||||
| Massachusetts – 1.01% | ||||||||
| Commonwealth of Massachusetts | ||||||||
| 2.663%, 09/01/2039 | $ | 10,000,000 | $ | 10,437,300 | ||||
| 4.910%, 05/01/2029 | 3,115,000 | 3,926,676 | ||||||
| Commonwealth of Massachusetts | ||||||||
| Transportation Fund Revenue | ||||||||
| 5.631%, 06/01/2030 | 1,050,000 | 1,336,083 | ||||||
| Massachusetts Educational | ||||||||
| Financing Authority | ||||||||
| 3.455%, 07/01/2028 | 2,000,000 | 2,249,740 | ||||||
| 3.831%, 07/01/2024 | 4,215,000 | 4,580,145 | ||||||
| Massachusetts State College | ||||||||
| Building Authority | ||||||||
| 2.439%, 05/01/2028 | 10,375,000 | 11,041,386 | ||||||
| 2.499%, 05/01/2029 | 3,000,000 | 3,217,950 | ||||||
| 5.932%, 05/01/2040 | 550,000 | 787,947 | ||||||
| 37,577,227 | ||||||||
| Michigan – 1.27% | ||||||||
| Chippewa Valley Schools | ||||||||
| 5.000%, 05/01/2039 | 3,800,000 | 4,878,782 | ||||||
| 5.000%, 05/01/2040 | 3,975,000 | 5,083,787 | ||||||
| Detroit City School District | ||||||||
| 7.747%, 05/01/2039 | 8,560,000 | 13,459,744 | ||||||
| Michigan Finance Authority | ||||||||
| 2.610%, 11/01/2025 | 2,180,000 | 2,285,795 | ||||||
| 2.710%, 11/01/2026 | 7,145,000 | 7,546,335 | ||||||
| 3.084%, 12/01/2034 | 5,000,000 | 5,477,700 | ||||||
| 3.610%, 11/01/2032 | 3,000,000 | 3,391,680 | ||||||
| University of Michigan | ||||||||
| 5.513%, 04/01/2030 | 4,000,000 | 5,119,520 | ||||||
| 47,243,343 | ||||||||
| Mississippi – 0.47% | ||||||||
| Mississippi Development Bank | ||||||||
| 5.460%, 10/01/2036 | 5,955,000 | 7,555,109 | ||||||
| State of Mississippi | ||||||||
| 5.000%, 10/15/2037 | 7,925,000 | 10,103,424 | ||||||
| 17,658,533 | ||||||||
| Missouri – 0.38% | ||||||||
| Kansas City Land Clearance | ||||||||
| Redevelopment Authority | ||||||||
| 6.400%, 10/15/2040 (a) | 8,000,000 | 8,868,560 | ||||||
| St. Louis School District | ||||||||
| 6.450%, 04/01/2028 | 3,800,000 | 5,114,762 | ||||||
| 13,983,322 | ||||||||
| Nebraska – 0.45% | ||||||||
| Central Plains Energy Project | ||||||||
| 5.000%, 09/01/2034 | 5,700,000 | 7,831,116 | ||||||
| University of Nebraska | ||||||||
| Facilities Corp. | ||||||||
| 2.365%, 10/01/2029 | 8,520,000 | 9,007,770 | ||||||
| 16,838,886 | ||||||||
| Nevada – 0.39% | ||||||||
| City of North Las Vegas, NV | ||||||||
| 6.572%, 06/01/2040 | 5,880,000 | 8,321,494 | ||||||
| Clark County School District | ||||||||
| 5.510%, 06/15/2024 | 5,495,000 | 6,076,261 | ||||||
| 14,397,755 | ||||||||
| New Jersey – 1.28% | ||||||||
| Mercer County | ||||||||
| Improvement Authority | ||||||||
| 8.270%, 12/01/2034 | 5,000,000 | 7,526,750 | ||||||
| New Jersey Economic | ||||||||
| Development Authority | ||||||||
| 0.000%, 02/15/2025 (e) | 18,806,000 | 17,249,051 | ||||||
| 7.425%, 02/15/2029 | 10,000,000 | 13,064,900 | ||||||
| New Jersey Educational | ||||||||
| Facilities Authority | ||||||||
| 2.504%, 07/01/2023 | 1,355,000 | 1,389,986 | ||||||
| New Jersey Institute of Technology | ||||||||
| 3.323%, 07/01/2024 | 2,270,000 | 2,364,909 | ||||||
| 3.415%, 07/01/2042 | 3,500,000 | 3,805,410 | ||||||
| Rutgers The State University | ||||||||
| of New Jersey | ||||||||
| 3.270%, 05/01/2043 | 2,000,000 | 2,217,920 | ||||||
| 47,618,926 | ||||||||
| New York – 2.55% | ||||||||
| Dutchess County Local | ||||||||
| Development Corp. | ||||||||
| 4.550%, 07/01/2022 | 1,055,000 | 1,112,128 | ||||||
| Fiscal Year 2005 | ||||||||
| Securitization Corp. | ||||||||
| 4.930%, 04/01/2020 | 100,000 | 100,268 | ||||||
| New York City Transitional Finance | ||||||||
| Authority Building Aid Revenue | ||||||||
| 4.800%, 07/15/2026 | 4,000,000 | 4,704,840 | ||||||
| New York City Transitional | ||||||||
| Finance Authority Future | ||||||||
| Tax Secured Revenue | ||||||||
| 3.500%, 08/01/2027 | 12,000,000 | 13,534,440 | ||||||
| 3.590%, 08/01/2027 | 7,000,000 | 7,938,840 | ||||||
| 5.932%, 11/01/2036 | 3,215,000 | 3,309,875 | ||||||
| New York City Water | ||||||||
| & Sewer System | ||||||||
| 6.124%, 06/15/2042 | 7,490,000 | 7,589,842 | ||||||
| 6.124%, 06/15/2042 | 4,250,000 | 4,309,500 | ||||||
Percentages are stated as a percent of net assets.
The accompanying notes are an integral part of these financial statements.
PAGE 31
PERFORMANCE TRUST STRATEGIC BOND FUND — SCHEDULE OF INVESTMENTS (CONT.)
February 29, 2020 (Unaudited)
| PRINCIPAL | ||||||||
| AMOUNT | VALUE | |||||||
| New York – 2.55% (Cont.) | ||||||||
| New York State | ||||||||
| Dormitory Authority | ||||||||
| 2.746%, 07/01/2030 | $ | 19,730,000 | $ | 21,337,601 | ||||
| 2.826%, 07/01/2031 | 15,015,000 | 16,370,404 | ||||||
| 2.957%, 02/15/2032 | 5,975,000 | 6,682,619 | ||||||
| 5.096%, 08/01/2034 | 3,125,000 | 3,956,156 | ||||||
| New York State Urban | ||||||||
| Development Corp. | ||||||||
| 3.420%, 03/15/2028 | 3,580,000 | 3,991,413 | ||||||
| 94,937,926 | ||||||||
| Ohio – 1.21% | ||||||||
| Buckeye Tobacco Settlement | ||||||||
| Financing Authority | ||||||||
| 1.850%, 06/01/2029 | 4,000,000 | 4,056,840 | ||||||
| County of Hamilton, OH | ||||||||
| 3.756%, 06/01/2042 | 8,000,000 | 9,030,800 | ||||||
| JobsOhio Beverage System | ||||||||
| 4.532%, 01/01/2035 | 13,885,000 | 17,526,202 | ||||||
| South-Western City | ||||||||
| School District | ||||||||
| 0.000%, 12/01/2028 (e) | 2,735,000 | 2,293,763 | ||||||
| State of Ohio | ||||||||
| 3.276%, 01/01/2042 | 10,000,000 | 11,132,400 | ||||||
| Sycamore Community | ||||||||
| City School District | ||||||||
| 5.850%, 12/01/2028 | 605,000 | 791,999 | ||||||
| 44,832,004 | ||||||||
| Oklahoma – 0.36% | ||||||||
| Oklahoma County Metro | ||||||||
| Technology Centers | ||||||||
| School District No. 22 | ||||||||
| 3.050%, 06/01/2028 | 9,000,000 | 9,902,520 | ||||||
| Oklahoma Development | ||||||||
| Finance Authority | ||||||||
| 5.450%, 08/15/2028 | 3,015,000 | 3,572,353 | ||||||
| 13,474,873 | ||||||||
| Oregon – 0.43% | ||||||||
| Benton & Linn Counties | ||||||||
| Consolidated School District | ||||||||
| No. 509J & 509A | ||||||||
| 0.000%, 06/15/2038 (e) | 2,000,000 | 2,523,660 | ||||||
| Oregon Health & | ||||||||
| Science University | ||||||||
| 2.850%, 07/01/2030 | 1,000,000 | 1,097,110 | ||||||
| Oregon School | ||||||||
| Boards Association | ||||||||
| 5.680%, 06/30/2028 | 10,000,000 | 12,555,500 | ||||||
| 16,176,270 | ||||||||
| Pennsylvania – 1.09% | ||||||||
| Berks County Industrial | ||||||||
| Development Authority | ||||||||
| 3.950%, 05/15/2024 | 720,000 | 754,690 | ||||||
| 4.450%, 05/15/2027 | 800,000 | 867,336 | ||||||
| Carbon County Hospital Authority | ||||||||
| 3.377%, 11/15/2023 | 1,000,000 | 1,064,840 | ||||||
| 3.677%, 11/15/2025 | 1,000,000 | 1,108,700 | ||||||
| Commonwealth | ||||||||
| Financing Authority | ||||||||
| 2.758%, 06/01/2030 | 4,500,000 | 4,852,260 | ||||||
| 2.758%, 06/01/2030 | 1,040,000 | 1,121,411 | ||||||
| 3.657%, 06/01/2038 | 5,000,000 | 5,959,750 | ||||||
| 3.807%, 06/01/2041 | 30,000 | 36,738 | ||||||
| 4.014%, 06/01/2033 | 2,130,000 | 2,531,185 | ||||||
| Pennsylvania Economic | ||||||||
| Development Financing Authority | ||||||||
| 5.000%, 12/31/2030 | 1,000,000 | 1,205,850 | ||||||
| 5.201%, 06/15/2020 | 1,290,000 | 1,301,468 | ||||||
| Pennsylvania | ||||||||
| Turnpike Commission | ||||||||
| 5.000%, 06/01/2042 | 5,000,000 | 6,049,400 | ||||||
| 6.375%, 12/01/2038 | 3,850,000 | 5,215,364 | ||||||
| Philadelphia Authority for | ||||||||
| Industrial Development | ||||||||
| 0.000%, 04/15/2022 (e) | 6,447,000 | 6,243,791 | ||||||
| Union County Hospital Authority | ||||||||
| 3.800%, 08/01/2023 | 1,100,000 | 1,141,712 | ||||||
| 4.400%, 08/01/2028 | 1,060,000 | 1,180,564 | ||||||
| 40,635,059 | ||||||||
| Puerto Rico – 0.21% | ||||||||
| Children’s Trust Fund | ||||||||
| 5.375%, 05/15/2033 | 4,750,000 | 4,880,720 | ||||||
| Puerto Rico Sales Tax Financing | ||||||||
| Corp. Sales Tax Revenue | ||||||||
| 0.000%, 07/01/2027 (e) | 3,237,000 | 2,768,995 | ||||||
| 7,649,715 | ||||||||
| South Carolina – 0.08% | ||||||||
| Commission of Public Works, | ||||||||
| City of Greer | ||||||||
| 5.500%, 09/01/2032 | 2,000,000 | 2,837,320 | ||||||
| Tennessee – 0.14% | ||||||||
| Memphis-Shelby County | ||||||||
| Industrial Development Board | ||||||||
| 4.700%, 07/01/2027 | 230,000 | 251,930 | ||||||
| State of Tennessee | ||||||||
| 4.182%, 08/01/2031 | 4,000,000 | 4,803,600 | ||||||
| 5,055,530 | ||||||||
Percentages are stated as a percent of net assets.
The accompanying notes are an integral part of these financial statements.
PAGE 32
PERFORMANCE TRUST STRATEGIC BOND FUND — SCHEDULE OF INVESTMENTS (CONT.)
February 29, 2020 (Unaudited)
| PRINCIPAL | ||||||||
| AMOUNT | VALUE | |||||||
| Texas – 3.79% | ||||||||
| City of Austin, TX Electric | ||||||||
| Utility Revenue | ||||||||
| 2.987%, 11/15/2029 | $ | 4,985,000 | $ | 5,541,176 | ||||
| 3.037%, 11/15/2030 | 1,000,000 | 1,117,620 | ||||||
| City of Dallas, TX | ||||||||
| 0.000%, 02/15/2026 (e) | 2,565,000 | 2,330,739 | ||||||
| 0.000%, 02/15/2031 (e) | 10,000,000 | 7,923,400 | ||||||
| 0.000%, 02/15/2032 (e) | 15,000,000 | 11,551,650 | ||||||
| City of El Paso, TX | ||||||||
| 6.018%, 08/15/2035 | 3,000,000 | 4,276,860 | ||||||
| City of Houston, TX | ||||||||
| 5.508%, 03/01/2036 | 4,900,000 | 6,914,145 | ||||||
| 6.290%, 03/01/2032 | 4,885,000 | 6,144,939 | ||||||
| 6.290%, 03/01/2032 | 1,000,000 | 1,265,250 | ||||||
| 6.290%, 03/01/2032 | 5,580,000 | 7,102,336 | ||||||
| City of Houston, TX | ||||||||
| Airport System Revenue | ||||||||
| 6.880%, 01/01/2028 | 1,500,000 | 1,856,205 | ||||||
| City of Irving, TX | ||||||||
| 7.375%, 08/15/2044 | 3,500,000 | 3,964,695 | ||||||
| Colony Economic | ||||||||
| Development Corp. | ||||||||
| 7.250%, 10/01/2042 | 5,000,000 | 5,711,500 | ||||||
| County of Galveston, TX | ||||||||
| 5.905%, 02/01/2029 | 4,630,000 | 5,574,983 | ||||||
| Fort Worth International Airport | ||||||||
| 2.994%, 11/01/2038 | 15,000,000 | 16,398,900 | ||||||
| El Paso Independent | ||||||||
| School District | ||||||||
| 1.550%, 08/15/2025 | 6,175,000 | 6,164,317 | ||||||
| Metropolitan Transit | ||||||||
| Authority of Harris County | ||||||||
| Sales & Use Tax Revenue | ||||||||
| 2.599%, 11/01/2037 | 7,015,000 | 7,523,517 | ||||||
| Midland County Fresh | ||||||||
| Water Supply District No. 1 | ||||||||
| 2.690%, 09/15/2030 | 6,670,000 | 7,098,281 | ||||||
| New Hope Cultural | ||||||||
| Education Facilities Corp. | ||||||||
| 4.000%, 08/01/2020 (i) | 220,000 | 118,822 | ||||||
| North Texas Tollway Authority | ||||||||
| 0.000%, 01/01/2031 (e) | 7,500,000 | 6,258,525 | ||||||
| 8.410%, 02/01/2030 | 5,090,000 | 7,049,039 | ||||||
| Port Arthur Independent | ||||||||
| School District | ||||||||
| 5.000%, 02/15/2027 | 1,310,000 | 1,591,532 | ||||||
| 5.000%, 02/15/2028 | 1,740,000 | 2,149,283 | ||||||
| Texas A&M University | ||||||||
| 3.531%, 05/15/2032 | 1,750,000 | 2,040,133 | ||||||
| Texas Public Finance Authority | ||||||||
| 8.250%, 07/01/2024 | 9,695,000 | 9,938,441 | ||||||
| Texas State University System | ||||||||
| 2.588%, 03/15/2029 | 3,000,000 | 3,212,130 | ||||||
| 140,818,418 | ||||||||
| Utah – 0.14% | ||||||||
| County of Salt Lake, UT | ||||||||
| Convention Hotel Revenue | ||||||||
| 5.750%, 10/01/2047 (a) | 5,000,000 | 5,205,300 | ||||||
| Virginia – 0.40% | ||||||||
| Virginia Commonwealth | ||||||||
| Transportation Board | ||||||||
| 5.350%, 05/15/2035 | 3,610,000 | 4,686,935 | ||||||
| Virginia Public Building Authority | ||||||||
| 5.900%, 08/01/2030 | 7,675,000 | 10,196,468 | ||||||
| 14,883,403 | ||||||||
| Washington – 0.13% | ||||||||
| Washington State Housing | ||||||||
| Finance Commission | ||||||||
| 3.000%, 01/01/2025 (a) | 5,000,000 | 5,033,650 | ||||||
| West Virginia – 0.20% | ||||||||
| Tobacco Settlement | ||||||||
| Finance Authority | ||||||||
| 7.467%, 06/01/2047 | 6,740,000 | 7,492,858 | ||||||
| Wisconsin – 0.46% | ||||||||
| Public Finance Authority | ||||||||
| 3.930%, 12/15/2025 | 1,960,000 | 2,214,173 | ||||||
| 4.153%, 05/15/2031 | 3,635,000 | 4,202,315 | ||||||
| 5.000%, 05/15/2032 (a) | 1,275,000 | 1,456,598 | ||||||
| 7.625%, 12/01/2048 (a) | 5,000,000 | 5,210,950 | ||||||
| 9.000%, 06/01/2029 (a)(i) | 4,000,000 | 4,054,840 | ||||||
| 17,138,876 | ||||||||
| TOTAL MUNICIPAL BONDS | ||||||||
| (Cost $887,722,298) | 967,826,483 | |||||||
| US GOVERNMENT NOTES/BONDS – 5.40% | ||||||||
| United States Treasury Notes/Bonds | ||||||||
| 2.500%, 06/30/2020 | 50,000,000 | 50,193,360 | ||||||
| 1.500%, 07/15/2020 | 50,000,000 | 50,037,109 | ||||||
| 2.625%, 08/31/2020 | 50,000,000 | 50,318,833 | ||||||
| 2.500%, 12/31/2020 | 25,000,000 | 25,281,738 | ||||||
| 1.250%, 03/31/2021 | 25,000,000 | 25,052,735 | ||||||
| TOTAL US GOVERNMENT | ||||||||
| NOTES/BONDS | ||||||||
| (Cost $200,486,992) | 200,883,775 | |||||||
Percentages are stated as a percent of net assets.
The accompanying notes are an integral part of these financial statements.
PAGE 33
PERFORMANCE TRUST STRATEGIC BOND FUND — SCHEDULE OF INVESTMENTS (CONT.)
February 29, 2020 (Unaudited)
| PRINCIPAL | ||||||||
| AMOUNT | VALUE | |||||||
| US TREASURY BILLS – 1.34% | ||||||||
| United States Treasury Bills | ||||||||
| 1.602%, 04/14/2020 | $ | 50,000,000 | $ | 49,917,718 | ||||
| TOTAL US TREASURY BILLS | ||||||||
| (Cost $49,904,300) | 49,917,718 | |||||||
| CLOSED-END MUTUAL FUNDS – 0.17% | ||||||||
| BlackRock Investment Quality | ||||||||
| Municipal Trust, Inc. | 24,400 | 380,396 | ||||||
| Invesco High Income Trust II | 71,475 | 967,057 | ||||||
| Invesco Municipal Opportunity Trust | 172,200 | 2,161,110 | ||||||
| Nuveen Quality Municipal | ||||||||
| Income Fund | 183,527 | 2,727,211 | ||||||
| TOTAL CLOSED-END | ||||||||
| MUTUAL FUNDS | ||||||||
| (Cost $5,986,055) | 6,235,774 | |||||||
| SHORT-TERM INVESTMENTS – 1.70% | ||||||||
| First American Government | ||||||||
| Obligations Fund – | ||||||||
| Class X, 1.493% (j) | 63,342,658 | 63,342,658 | ||||||
| TOTAL SHORT-TERM INVESTMENTS | ||||||||
| (Cost $63,342,658) | 63,342,658 | |||||||
| Total Investments | ||||||||
| (Cost $3,574,351,935) – 99.83% | 3,712,541,019 | |||||||
| Other Assets in Excess | ||||||||
| of Liabilities – 0.17% | 6,325,715 | |||||||
| TOTAL NET ASSETS – 100.00% | $ | 3,718,866,734 | ||||||
Percentages are stated as a percent of net assets.
| (a) | Securities issued pursuant to Rule 144A under the Securities Act of 1933. |
| (b) | Variable rate security; the rate shown represents the rate at February 29, 2020. |
| (c) | Foreign issued security. |
| (d) | Variable rate security; the rate shown represents the rate at February 29, 2020. The coupon is based on an underlying pool of loans. |
| (e) | Represents a principal-only security that entitles holders to receive only principal payments on underlying mortgages. |
| (f) | Step-up bond; the rate shown represents the rate at February 29, 2020. |
| (g) | Inverse floating rate security whose interest rate moves in opposite direction of reference interest rates. Reference interest rates are typically based on a negative multiplier slope. |
| (h) | Represents an interest-only security that entitles holders to receive only interest payments on underlying mortgages. |
| (i) | Represents an illiquid security. The total market value of these securities was $23,010,666, representing 0.62% of net assets. |
| (j) | Seven day yield at February 29, 2020. |
The accompanying notes are an integral part of these financial statements.
PAGE 34
PERFORMANCE TRUST MUNICIPAL BOND FUND — SCHEDULE OF INVESTMENTS
February 29, 2020 (Unaudited)
| PRINCIPAL | ||||||||
| AMOUNT | VALUE | |||||||
| AGENCY COMMERCIAL MORTGAGE | ||||||||
| BACKED SECURITIES – 0.28% | ||||||||
| Freddie Mac Multifamily ML Certificates | ||||||||
| 2019-ML06, 1.132%, | ||||||||
| 06/25/2037 (a) | $ | 10,227,226 | $ | 1,192,942 | ||||
| TOTAL AGENCY COMMERCIAL | ||||||||
| MORTGAGE BACKED SECURITIES | ||||||||
| (Cost $1,087,316) | 1,192,942 | |||||||
| MUNICIPAL BONDS – 95.73% | ||||||||
| Alabama – 0.99% | ||||||||
| Alabama Economic | ||||||||
| Settlement Authority | ||||||||
| 3.163%, 09/15/2025 | 1,625,000 | 1,699,636 | ||||||
| City of Homewood, AL | ||||||||
| 5.000%, 09/01/2033 | 1,000,000 | 1,236,920 | ||||||
| Lower Alabama Gas District | ||||||||
| 5.000%, 09/01/2031 | 1,005,000 | 1,325,404 | ||||||
| 4,261,960 | ||||||||
| Alaska – 0.82% | ||||||||
| Alaska Housing Finance Corp. | ||||||||
| 5.000%, 12/01/2031 | 1,145,000 | 1,473,581 | ||||||
| CIVIC Ventures, AK | ||||||||
| 5.000%, 09/01/2033 | 1,750,000 | 2,062,025 | ||||||
| 3,535,606 | ||||||||
| Arizona – 1.88% | ||||||||
| City of Phoenix Civic | ||||||||
| Improvement Corp. | ||||||||
| 5.500%, 07/01/2038 | 2,000,000 | 3,170,000 | ||||||
| 5.500%, 07/01/2042 | 1,545,000 | 2,538,327 | ||||||
| Florence Town, Inc. Industrial | ||||||||
| Development Authority | ||||||||
| 5.000%, 07/01/2023 | 325,000 | 341,367 | ||||||
| Industrial Development | ||||||||
| Authority of the City of Phoenix | ||||||||
| 5.000%, 06/01/2027 | 500,000 | 541,490 | ||||||
| Tempe Industrial | ||||||||
| Development Authority | ||||||||
| 4.000%, 10/01/2023 (a) | 1,500,000 | 1,514,535 | ||||||
| 8,105,719 | ||||||||
| Arkansas – 0.35% | ||||||||
| County of Saline, AR | ||||||||
| 3.550%, 06/01/2042 | 1,410,000 | 1,496,743 | ||||||
| California – 7.14% | ||||||||
| California School Finance Authority | ||||||||
| 3.000%, 07/15/2020 (a)(b) | 2,120,000 | 2,123,774 | ||||||
| California Statewide Communities | ||||||||
| Development Authority | ||||||||
| 6.400%, 06/01/2039 | 2,420,000 | 3,442,450 | ||||||
| City of Los Angeles, CA | ||||||||
| Department of Airports | ||||||||
| 5.000%, 05/15/2033 | 1,000,000 | 1,221,740 | ||||||
| City of San Diego Tobacco | ||||||||
| Settlement Revenue Funding Corp. | ||||||||
| 4.000%, 06/01/2032 | 895,000 | 986,720 | ||||||
| Clovis Unified School District | ||||||||
| 0.000%, 08/01/2028 (c) | 2,000,000 | 1,781,240 | ||||||
| El Camino Healthcare District | ||||||||
| 0.000%, 08/01/2028 (c) | 1,435,000 | 1,262,140 | ||||||
| Encinitas Union School District | ||||||||
| 0.000%, 08/01/2035 (c) | 500,000 | 695,055 | ||||||
| Low Income Investment Fund | ||||||||
| 3.711%, 07/01/2029 | 1,000,000 | 1,084,605 | ||||||
| Manteca Redevelopment Agency | ||||||||
| Successor Agency | ||||||||
| 2.393%, 10/01/2030 | 500,000 | 524,410 | ||||||
| M-S-R Energy Authority | ||||||||
| 7.000%, 11/01/2034 | 1,160,000 | 1,874,618 | ||||||
| Palmdale Elementary School District | ||||||||
| 0.000%, 08/01/2028 (c) | 500,000 | 434,300 | ||||||
| Ravenswood City School District | ||||||||
| 5.000%, 08/01/2038 | 1,260,000 | 1,554,046 | ||||||
| Rialto Redevelopment Agency | ||||||||
| 5.000%, 09/01/2037 | 1,000,000 | 1,285,550 | ||||||
| San Diego Unified School District | ||||||||
| 0.000%, 07/01/2041 (c) | 2,000,000 | 2,305,060 | ||||||
| San Joaquin Hills Transportation | ||||||||
| Corridor Agency | ||||||||
| 5.000%, 01/15/2029 | 550,000 | 650,776 | ||||||
| San Mateo Foster City Public | ||||||||
| Financing Authority | ||||||||
| 5.000%, 08/01/2049 | 2,000,000 | 2,604,160 | ||||||
| St. Helena Unified School District | ||||||||
| 0.000%, 06/01/2036 (c) | 2,805,000 | 3,610,287 | ||||||
| University of California | ||||||||
| 4.601%, 05/15/2031 | 2,700,000 | 3,269,754 | ||||||
| 30,710,685 | ||||||||
| Colorado – 5.21% | ||||||||
| City & County of Denver, CO Airport | ||||||||
| System Revenue | ||||||||
| 5.000%, 12/01/2034 | 2,500,000 | 3,528,325 | ||||||
| City of Fruita, CO Healthcare Revenue | ||||||||
| 5.000%, 01/01/2028 | 1,000,000 | 1,020,580 | ||||||
Percentages are stated as a percent of net assets.
The accompanying notes are an integral part of these financial statements.
PAGE 35
PERFORMANCE TRUST MUNICIPAL BOND FUND — SCHEDULE OF INVESTMENTS (CONT.)
February 29, 2020 (Unaudited)
| PRINCIPAL | ||||||||
| AMOUNT | VALUE | |||||||
| Colorado – 5.21% (Cont.) | ||||||||
| Colorado Health Facilities Authority | ||||||||
| 3.125%, 05/15/2027 | $ | 1,250,000 | $ | 1,252,500 | ||||
| 5.000%, 08/01/2044 | 910,000 | 1,132,950 | ||||||
| CommonSpirit Health | ||||||||
| 2.950%, 11/01/2022 | 1,725,000 | 1,776,132 | ||||||
| El Paso County School | ||||||||
| District No. 49 | ||||||||
| 5.000%, 12/15/2031 | 1,500,000 | 1,811,340 | ||||||
| Public Authority for | ||||||||
| Colorado Energy | ||||||||
| 6.500%, 11/15/2038 | 1,570,000 | 2,556,243 | ||||||
| Pueblo City Schools | ||||||||
| 5.000%, 12/15/2039 | 2,000,000 | 2,637,420 | ||||||
| Vauxmont Metropolitan District | ||||||||
| 5.000%, 12/15/2021 | 100,000 | 106,273 | ||||||
| 5.000%, 12/01/2021 | 300,000 | 312,234 | ||||||
| 5.000%, 12/01/2050 | 1,950,000 | 2,357,004 | ||||||
| Weld County School | ||||||||
| District No. RE-2 | ||||||||
| 5.000%, 12/01/2044 | 3,000,000 | 3,903,450 | ||||||
| 22,394,451 | ||||||||
| Delaware – 1.10% | ||||||||
| University of Delaware | ||||||||
| 5.000%, 11/01/2038 | 1,595,000 | 2,416,058 | ||||||
| 5.000%, 11/01/2039 | 1,510,000 | 2,312,444 | ||||||
| 4,728,502 | ||||||||
| District of Columbia – 0.43% | ||||||||
| Metropolitan Washington | ||||||||
| Airports Authority | ||||||||
| 5.000%, 10/01/2032 | 1,500,000 | 1,840,290 | ||||||
| Florida – 6.81% | ||||||||
| City of Belle Isle, FL | ||||||||
| 5.500%, 10/01/2022 | 330,000 | 346,362 | ||||||
| City of Orlando, FL | ||||||||
| 5.000%, 11/01/2038 | 1,000,000 | 1,239,860 | ||||||
| County of Miami-Dade, FL | ||||||||
| 5.000%, 07/01/2043 | 1,500,000 | 1,816,155 | ||||||
| 5.000%, 07/01/2043 | 3,500,000 | 4,507,580 | ||||||
| County of Miami-Dade, FL | ||||||||
| Aviation Revenue | ||||||||
| 5.000%, 10/01/2038 | 2,225,000 | 2,613,040 | ||||||
| County of Miami-Dade, FL | ||||||||
| Seaport Revenue | ||||||||
| 5.750%, 10/01/2028 | 545,000 | 633,900 | ||||||
| County of Sarasota, FL Utility | ||||||||
| System Revenue | ||||||||
| 5.000%, 10/01/2039 | 2,000,000 | 2,587,860 | ||||||
| Dade County, FL Professional Sports | ||||||||
| Franchise Facilities Tax Revenue | ||||||||
| 5.250%, 10/01/2030 | 1,030,000 | 1,410,595 | ||||||
| Florida Development Finance Corp. | ||||||||
| 1.900%, 01/01/2049 | 2,505,000 | 2,505,852 | ||||||
| 6.500%, 01/01/2049 (a) | 3,250,000 | 3,358,355 | ||||||
| Greater Orlando Aviation Authority | ||||||||
| 5.000%, 10/01/2046 | 1,500,000 | 1,795,140 | ||||||
| School Board of Miami-Dade County | ||||||||
| 5.000%, 03/15/2039 | 2,645,000 | 3,191,589 | ||||||
| School District of Broward County | ||||||||
| 5.000%, 07/01/2040 | 2,500,000 | 3,179,350 | ||||||
| Venetian Community | ||||||||
| Development District | ||||||||
| 5.000%, 05/01/2023 | 100,000 | 103,899 | ||||||
| 29,289,537 | ||||||||
| Georgia – 1.28% | ||||||||
| Americus & Sumter County | ||||||||
| Hospital Authority | ||||||||
| 5.125%, 05/15/2023 | 325,000 | 346,655 | ||||||
| Brookhaven Development Authority | ||||||||
| 5.000%, 07/01/2039 | 770,000 | 997,281 | ||||||
| City of Atlanta, GA Water & | ||||||||
| Wastewater Revenue | ||||||||
| 5.500%, 11/01/2027 | 1,550,000 | 1,944,444 | ||||||
| Georgia Municipal Association, Inc. | ||||||||
| 5.000%, 12/01/2037 | 500,000 | 631,580 | ||||||
| Main Street Natural Gas, Inc. | ||||||||
| 5.000%, 05/15/2029 | 1,250,000 | 1,601,225 | ||||||
| 5,521,185 | ||||||||
| Hawaii – 0.88% | ||||||||
| City & County of Honolulu, HI | ||||||||
| 5.000%, 10/01/2030 | 1,000,000 | 1,390,380 | ||||||
| State of Hawaii | ||||||||
| 5.000%, 01/01/2038 | 1,885,000 | 2,399,888 | ||||||
| 3,790,268 | ||||||||
| Illinois – 5.66% | ||||||||
| Boone & Winnebago | ||||||||
| Counties Community Unit | ||||||||
| School District No. 200 | ||||||||
| 0.000%, 01/01/2024 (c) | 815,000 | 767,877 | ||||||
| Boone Mchenry & Dekalb | ||||||||
| Counties Community Unit | ||||||||
| School District No. 100 | ||||||||
| 0.000%, 12/01/2023 (c) | 1,135,000 | 1,088,431 | ||||||
| 0.000%, 12/01/2024 (c) | 520,000 | 490,786 | ||||||
Percentages are stated as a percent of net assets.
The accompanying notes are an integral part of these financial statements.
PAGE 36
PERFORMANCE TRUST MUNICIPAL BOND FUND — SCHEDULE OF INVESTMENTS (CONT.)
February 29, 2020 (Unaudited)
| PRINCIPAL | ||||||||
| AMOUNT | VALUE | |||||||
| Illinois – 5.66% (Cont.) | ||||||||
| Chicago Board of Education | ||||||||
| 0.000%, 12/01/2022 (c) | $ | 840,000 | $ | 817,093 | ||||
| Chicago O’Hare | ||||||||
| International Airport | ||||||||
| 5.000%, 01/01/2037 | 2,000,000 | 2,425,120 | ||||||
| Chicago Transit Authority | ||||||||
| 5.000%, 06/01/2024 | 750,000 | 867,502 | ||||||
| 5.250%, 12/01/2036 | 1,500,000 | 1,610,820 | ||||||
| Cook County School | ||||||||
| District No. 103 | ||||||||
| 0.000%, 12/01/2022 (c) | 850,000 | 820,531 | ||||||
| Illinois Finance Authority | ||||||||
| 5.000%, 01/01/2034 | 500,000 | 601,405 | ||||||
| 5.000%, 07/01/2037 | 2,010,000 | 2,617,844 | ||||||
| Metropolitan Pier & | ||||||||
| Exposition Authority | ||||||||
| 0.000%, 06/15/2026 (c) | 2,380,000 | 2,175,344 | ||||||
| Metropolitan Water Reclamation | ||||||||
| District of Greater Chicago | ||||||||
| 5.000%, 12/01/2041 | 3,500,000 | 4,275,075 | ||||||
| Railsplitter Tobacco | ||||||||
| Settlement Authority | ||||||||
| 5.000%, 06/01/2027 | 1,000,000 | 1,231,130 | ||||||
| Sales Tax Securitization Corp. | ||||||||
| 5.000%, 01/01/2027 | 1,700,000 | 2,118,778 | ||||||
| State of Illinois | ||||||||
| 6.000%, 06/15/2026 | 1,575,000 | 2,015,528 | ||||||
| Will County Community Unit | ||||||||
| School District No. 201 | ||||||||
| 0.000%, 11/01/2020 (c) | 430,000 | 426,865 | ||||||
| 24,350,129 | ||||||||
| Indiana – 4.50% | ||||||||
| City of Valparaiso, IN | ||||||||
| 6.750%, 01/01/2034 | 500,000 | 586,070 | ||||||
| Hammond Multi-School | ||||||||
| Building Corp. | ||||||||
| 5.000%, 07/15/2034 | 2,000,000 | 2,499,040 | ||||||
| Indiana Finance Authority | ||||||||
| 5.000%, 09/01/2036 | 1,000,000 | 1,206,850 | ||||||
| 5.500%, 11/15/2026 | 1,155,000 | 1,233,136 | ||||||
| Indiana Health Facility | ||||||||
| Financing Authority | ||||||||
| 5.000%, 11/15/2034 | 1,010,000 | 1,222,807 | ||||||
| Indiana Municipal Power Agency | ||||||||
| 5.000%, 01/01/2042 | 2,500,000 | 3,022,250 | ||||||
| Indianapolis Local Public | ||||||||
| Improvement Bond Bank | ||||||||
| 5.000%, 01/01/2038 | 1,715,000 | 2,206,914 | ||||||
| 5.000%, 01/01/2039 | 2,500,000 | 3,188,075 | ||||||
| 5.250%, 02/01/2039 | 2,120,000 | 2,788,881 | ||||||
| Northern Indiana Commuter | ||||||||
| Transportation District | ||||||||
| 5.000%, 07/01/2033 | 1,130,000 | 1,389,120 | ||||||
| 19,343,143 | ||||||||
| Iowa – 0.30% | ||||||||
| Iowa Finance Authority | ||||||||
| 2.875%, 05/15/2049 | 1,250,000 | 1,268,063 | ||||||
| Kentucky – 2.03% | ||||||||
| Grant County School District | ||||||||
| Finance Corp. | ||||||||
| 1.400%, 08/01/2022 | 240,000 | 240,408 | ||||||
| Kentucky Bond Development Corp. | ||||||||
| 5.000%, 09/01/2049 | 3,000,000 | 3,820,470 | ||||||
| Kentucky Economic | ||||||||
| Development Finance Authority | ||||||||
| 5.000%, 05/15/2026 | 1,000,000 | 1,105,780 | ||||||
| Kentucky Public Energy Authority | ||||||||
| 4.000%, 02/01/2050 | 3,000,000 | 3,564,840 | ||||||
| 8,731,498 | ||||||||
| Louisiana – 1.78% | ||||||||
| East Baton Rouge | ||||||||
| Sewerage Commission | ||||||||
| 5.000%, 02/01/2039 | 2,000,000 | 2,361,300 | ||||||
| Louisiana Energy & Power Authority | ||||||||
| 5.250%, 06/01/2028 | 410,000 | 464,005 | ||||||
| Louisiana Local Government | ||||||||
| Environmental Facilities & | ||||||||
| Community Development Authority | ||||||||
| 5.000%, 11/01/2032 | 1,200,000 | 1,453,020 | ||||||
| 5.000%, 12/01/2037 | 1,685,000 | 2,156,750 | ||||||
| Tobacco Settlement Financing Corp. | ||||||||
| 5.000%, 05/15/2022 | 400,000 | 434,100 | ||||||
| 5.250%, 05/15/2033 | 740,000 | 799,570 | ||||||
| 7,668,745 | ||||||||
| Maine – 0.61% | ||||||||
| Maine Governmental | ||||||||
| Facilities Authority | ||||||||
| 5.000%, 10/01/2038 | 2,000,000 | 2,609,640 | ||||||
| Maryland – 0.36% | �� | |||||||
| City of Rockville, MD | ||||||||
| 2.500%, 11/01/2024 | 1,560,000 | 1,560,577 | ||||||
Percentages are stated as a percent of net assets.
The accompanying notes are an integral part of these financial statements.
PAGE 37
PERFORMANCE TRUST MUNICIPAL BOND FUND — SCHEDULE OF INVESTMENTS (CONT.)
February 29, 2020 (Unaudited)
| PRINCIPAL | ||||||||
| AMOUNT | VALUE | |||||||
| Massachusetts – 1.29% | ||||||||
| Commonwealth of Massachusetts | ||||||||
| 5.250%, 09/01/2043 | $ | 2,000,000 | $ | 2,594,020 | ||||
| Massachusetts Educational | ||||||||
| Financing Authority | ||||||||
| 4.500%, 07/01/2024 | 85,000 | 90,222 | ||||||
| 5.000%, 07/01/2028 | 2,250,000 | 2,866,635 | ||||||
| 5,550,877 | ||||||||
| Michigan – 2.01% | ||||||||
| Battle Creek School District | ||||||||
| 5.000%, 05/01/2037 | 775,000 | 938,951 | ||||||
| Bedford Public School District | ||||||||
| 5.000%, 05/01/2037 | 1,150,000 | 1,479,280 | ||||||
| Charter Township of Commerce, MI | ||||||||
| 5.000%, 12/01/2038 | 1,000,000 | 1,205,010 | ||||||
| Detroit City School District | ||||||||
| 5.250%, 05/01/2027 | 715,000 | 912,669 | ||||||
| Grand Rapids Public Schools | ||||||||
| 5.000%, 11/01/2040 | 1,000,000 | 1,281,280 | ||||||
| Michigan Finance Authority | ||||||||
| 3.875%, 10/01/2023 | 250,000 | 268,330 | ||||||
| 5.000%, 12/01/2041 | 1,950,000 | 2,553,915 | ||||||
| 8,639,435 | ||||||||
| Minnesota – 1.75% | ||||||||
| City of Minneapolis, MN | ||||||||
| 3.750%, 11/01/2021 | 1,000,000 | 1,000,440 | ||||||
| 5.000%, 03/01/2029 | 450,000 | 479,016 | ||||||
| City of St. Anthony, MN | ||||||||
| 6.000%, 12/01/2030 | 1,000,000 | 1,103,870 | ||||||
| Dakota County Community | ||||||||
| Development Agency | ||||||||
| 3.800%, 07/01/2022 | 2,000,000 | 2,007,160 | ||||||
| Housing & Redevelopment | ||||||||
| Authority of the City of St. Paul, MN | ||||||||
| 3.750%, 09/01/2021 | 1,000,000 | 1,000,500 | ||||||
| 3.750%, 03/01/2021 | 1,000,000 | 1,000,000 | ||||||
| Minneapolis-St. Paul Metropolitan | ||||||||
| Airports Commission | ||||||||
| 5.000%, 01/01/2041 | 750,000 | 924,097 | ||||||
| 7,515,083 | ||||||||
| Missouri – 1.72% | ||||||||
| Jackson County School District | ||||||||
| 5.500%, 03/01/2035 | 1,015,000 | 1,387,627 | ||||||
| 5.500%, 03/01/2037 | 990,000 | 1,351,399 | ||||||
| Kansas City Land Clearance | ||||||||
| Redevelopment Authority | ||||||||
| 4.375%, 02/01/2031 (a) | 1,000,000 | 1,127,690 | ||||||
| Maryland Heights Industrial | ||||||||
| Development Authority | ||||||||
| 5.000%, 03/15/2039 | 1,000,000 | 1,119,090 | ||||||
| Missouri Joint Municipal Electric | ||||||||
| Utility Commission | ||||||||
| 5.000%, 12/01/2040 | 2,000,000 | 2,404,160 | ||||||
| 7,389,966 | ||||||||
| Nebraska – 0.64% | ||||||||
| Central Plains Energy Project | ||||||||
| 5.000%, 09/01/2034 | 2,000,000 | 2,747,760 | ||||||
| Nevada – 2.25% | ||||||||
| City of Las Vegas, NV | ||||||||
| 5.000%, 09/01/2031 | 1,150,000 | 1,413,281 | ||||||
| County of Clark | ||||||||
| Department of Aviation | ||||||||
| 5.000%, 07/01/2041 | 2,500,000 | 3,239,525 | ||||||
| County of Washoe, NV | ||||||||
| 5.000%, 02/01/2042 | 2,000,000 | 2,549,860 | ||||||
| Las Vegas Convention & | ||||||||
| Visitors Authority | ||||||||
| 5.000%, 07/01/2043 | 2,000,000 | 2,483,040 | ||||||
| 9,685,706 | ||||||||
| New Jersey – 2.04% | ||||||||
| Garden State Preservation Trust | ||||||||
| 5.750%, 11/01/2028 | 965,000 | 1,236,078 | ||||||
| New Jersey Economic | ||||||||
| Development Authority | ||||||||
| 3.375%, 07/01/2030 | 1,000,000 | 1,070,930 | ||||||
| 5.500%, 01/01/2027 | 300,000 | 349,233 | ||||||
| 6.425%, 12/15/2035 | 1,805,000 | 1,830,523 | ||||||
| New Jersey Higher Education | ||||||||
| Student Assistance Authority | ||||||||
| 5.000%, 12/01/2027 | 750,000 | 944,302 | ||||||
| New Jersey Transportation | ||||||||
| Trust Fund Authority | ||||||||
| 0.000%, 12/15/2027 (c) | 2,150,000 | 1,898,730 | ||||||
| 0.000%, 12/15/2030 (c) | 1,780,000 | 1,455,417 | ||||||
| 8,785,213 | ||||||||
| New Mexico – 0.16% | ||||||||
| City of Santa Fe, NM | ||||||||
| 2.250%, 05/15/2024 | 700,000 | 704,655 | ||||||
| New York – 4.45% | ||||||||
| City of New York, NY | ||||||||
| 5.000%, 12/01/2037 | 2,000,000 | 2,586,420 | ||||||
| 6.246%, 06/01/2035 | 2,000,000 | 2,023,080 | ||||||
Percentages are stated as a percent of net assets.
The accompanying notes are an integral part of these financial statements.
PAGE 38
PERFORMANCE TRUST MUNICIPAL BOND FUND — SCHEDULE OF INVESTMENTS (CONT.)
February 29, 2020 (Unaudited)
| PRINCIPAL | ||||||||
| AMOUNT | VALUE | |||||||
| New York – 4.45% (Cont.) | ||||||||
| New York City Transitional | ||||||||
| Finance Authority Future | ||||||||
| Tax Secured Revenue | ||||||||
| 5.000%, 08/01/2040 | $ | 5,000,000 | $ | 6,361,250 | ||||
| New York City Water & | ||||||||
| Sewer System | ||||||||
| 5.000%, 06/15/2040 | 2,005,000 | 2,554,510 | ||||||
| New York Liberty | ||||||||
| Development Corp. | ||||||||
| 5.250%, 10/01/2035 | 875,000 | 1,265,259 | ||||||
| New York State | ||||||||
| Dormitory Authority | ||||||||
| 5.000%, 03/15/2041 | 2,000,000 | 2,572,200 | ||||||
| Port Authority of | ||||||||
| New York & New Jersey | ||||||||
| 5.000%, 09/01/2032 | 1,525,000 | 1,783,823 | ||||||
| 19,146,542 | ||||||||
| North Carolina – 0.23% | ||||||||
| North Carolina Medical | ||||||||
| Care Commission | ||||||||
| 3.550%, 10/01/2024 | 1,000,000 | 1,000,890 | ||||||
| North Dakota – 0.87% | ||||||||
| City of Horace, ND | ||||||||
| 2.500%, 08/01/2021 | 2,000,000 | 2,010,280 | ||||||
| City of Mandan, ND | ||||||||
| 2.750%, 09/01/2041 | 915,000 | 932,961 | ||||||
| County of Burleigh, ND | ||||||||
| 3.000%, 11/01/2021 | 800,000 | 800,064 | ||||||
| 3,743,305 | ||||||||
| Ohio – 3.80% | ||||||||
| Buckeye Tobacco Settlement | ||||||||
| Financing Authority | ||||||||
| 1.850%, 06/01/2029 | 2,000,000 | 2,028,420 | ||||||
| County of Cuyahoga, OH | ||||||||
| 5.500%, 02/15/2052 | 1,300,000 | 1,563,549 | ||||||
| County of Hamilton, OH | ||||||||
| 3.374%, 06/01/2034 | 3,000,000 | 3,334,230 | ||||||
| Dayton City School District | ||||||||
| 5.000%, 11/01/2031 | 1,000,000 | 1,373,980 | ||||||
| Franklin County Convention | ||||||||
| Facilities Authority | ||||||||
| 5.000%, 12/01/2046 | 3,000,000 | 3,828,060 | ||||||
| Highland Local School District | ||||||||
| 5.250%, 12/01/2054 | 1,500,000 | 1,713,855 | ||||||
| Licking Heights Local | ||||||||
| School District | ||||||||
| 5.000%, 10/01/2042 | 1,000,000 | 1,238,880 | ||||||
| State of Ohio | ||||||||
| 5.000%, 01/01/2033 | 1,000,000 | 1,276,380 | ||||||
| 16,357,354 | ||||||||
| Oregon – 0.82% | ||||||||
| Benton & Linn Counties | ||||||||
| Consolidated School | ||||||||
| District No. 509J & 509A | ||||||||
| 0.000%, 06/15/2038 (c) | 1,455,000 | 1,835,963 | ||||||
| Medford Hospital Facilities Authority | ||||||||
| 5.000%, 10/01/2024 | 450,000 | 507,978 | ||||||
| Port of Portland, OR | ||||||||
| Airport Revenue | ||||||||
| 5.000%, 07/01/2042 | 1,000,000 | 1,201,960 | ||||||
| 3,545,901 | ||||||||
| Pennsylvania – 2.91% | ||||||||
| Berks County Industrial | ||||||||
| Development Authority | ||||||||
| 3.200%, 05/15/2021 | 565,000 | 568,480 | ||||||
| Commonwealth Financing Authority | ||||||||
| 5.000%, 06/01/2034 | 1,000,000 | 1,258,340 | ||||||
| 5.000%, 06/01/2035 | 500,000 | 627,175 | ||||||
| Delaware Valley Regional | ||||||||
| Finance Authority | ||||||||
| 1.990%, 09/01/2048 | 1,000,000 | 1,004,510 | ||||||
| Hopewell Area School District | ||||||||
| 0.000%, 09/01/2026 (c) | 900,000 | 815,400 | ||||||
| Montour School District | ||||||||
| 5.000%, 04/01/2035 | 1,825,000 | 2,176,586 | ||||||
| Pennsylvania Economic | ||||||||
| Development Financing Authority | ||||||||
| 5.000%, 06/30/2028 | 750,000 | 911,430 | ||||||
| Pennsylvania Turnpike Commission | ||||||||
| 6.000%, 12/01/2030 | 625,000 | 829,713 | ||||||
| 6.375%, 12/01/2038 | 2,000,000 | 2,709,280 | ||||||
| Philadelphia Authority for | ||||||||
| Industrial Development | ||||||||
| 0.000%, 04/15/2021 (c) | 1,025,000 | 1,006,222 | ||||||
| Scranton School District | ||||||||
| 5.000%, 12/01/2035 | 500,000 | 619,320 | ||||||
| 12,526,456 | ||||||||
| Puerto Rico – 1.51% | ||||||||
| Children’s Trust Fund | ||||||||
| 5.375%, 05/15/2033 | 1,590,000 | 1,633,757 | ||||||
| Puerto Rico Convention | ||||||||
| Center District Authority | ||||||||
| 4.500%, 07/01/2036 | 1,900,000 | 1,904,294 | ||||||
Percentages are stated as a percent of net assets.
The accompanying notes are an integral part of these financial statements.
PAGE 39
PERFORMANCE TRUST MUNICIPAL BOND FUND — SCHEDULE OF INVESTMENTS (CONT.)
February 29, 2020 (Unaudited)
| PRINCIPAL | ||||||||
| AMOUNT | VALUE | |||||||
| Puerto Rico – 1.51% (Cont.) | ||||||||
| Puerto Rico Sales Tax Financing | ||||||||
| Corp. Sales Tax Revenue | ||||||||
| 0.000%, 07/01/2024 (c) | $ | 2,034,000 | $ | 1,861,150 | ||||
| 0.000%, 07/01/2029 (c) | 1,331,000 | 1,079,827 | ||||||
| 6,479,028 | ||||||||
| Rhode Island – 1.02% | ||||||||
| City of Cranston, RI | ||||||||
| 5.000%, 08/01/2039 | 1,950,000 | 2,539,777 | ||||||
| Rhode Island Student Loan Authority | ||||||||
| 5.000%, 12/01/2023 | 905,000 | 1,030,822 | ||||||
| 5.000%, 12/01/2025 | 525,000 | 632,174 | ||||||
| Tobacco Settlement Financing Corp. | ||||||||
| 2.250%, 06/01/2041 | 175,000 | 175,445 | ||||||
| 4,378,218 | ||||||||
| South Carolina – 1.73% | ||||||||
| Commission of Public Works, | ||||||||
| City of Greer | ||||||||
| 5.500%, 09/01/2032 | 1,000,000 | 1,418,660 | ||||||
| Spartanburg County School | ||||||||
| District No. 7 | ||||||||
| 5.000%, 03/01/2039 | 4,635,000 | 6,020,911 | ||||||
| 7,439,571 | ||||||||
| Tennessee – 0.45% | ||||||||
| Metropolitan Nashville | ||||||||
| Airport Authority | ||||||||
| 5.000%, 07/01/2044 | 1,500,000 | 1,930,380 | ||||||
| Texas – 12.83% | ||||||||
| Alamo Regional Mobility Authority | ||||||||
| 5.000%, 06/15/2039 | 1,335,000 | 1,576,501 | ||||||
| Alvin Texas Independent | ||||||||
| School District | ||||||||
| 5.000%, 02/15/2038 | 2,095,000 | 2,605,007 | ||||||
| Arlington Higher Education | ||||||||
| Finance Corp. | ||||||||
| 2.550%, 12/01/2029 | 1,850,000 | 1,938,153 | ||||||
| 5.000%, 02/15/2030 | 1,000,000 | 1,182,740 | ||||||
| Bexar County Hospital District | ||||||||
| 5.000%, 02/15/2038 | 2,135,000 | 2,703,593 | ||||||
| City of Austin, TX | ||||||||
| 5.000%, 09/01/2039 | 2,345,000 | 3,061,913 | ||||||
| City of Fort Worth, TX | ||||||||
| 5.250%, 03/01/2036 | 1,800,000 | 2,124,468 | ||||||
| City of San Antonio, TX | ||||||||
| 5.000%, 08/01/2037 | 5,015,000 | 6,467,795 | ||||||
| City of San Antonio, TX Electric & | ||||||||
| Gas Systems Revenue | ||||||||
| 5.000%, 02/01/2044 | 1,000,000 | 1,281,950 | ||||||
| Colony Economic | ||||||||
| Development Corp. | ||||||||
| 7.250%, 10/01/2042 | 1,500,000 | 1,713,450 | ||||||
| Colony Local Development Corp. | ||||||||
| 7.250%, 10/01/2033 | 600,000 | 690,324 | ||||||
| County of Bexar, TX | ||||||||
| 5.000%, 06/15/2039 | 1,265,000 | 1,572,129 | ||||||
| County of Harris, TX | ||||||||
| 1.803%, 08/15/2035 | 1,020,000 | 979,557 | ||||||
| 5.000%, 08/15/2034 | 1,000,000 | 1,242,040 | ||||||
| Dallas Area Rapid Transit | ||||||||
| 5.250%, 12/01/2031 | 800,000 | 1,145,776 | ||||||
| El Paso Independent | ||||||||
| School District | ||||||||
| 5.000%, 08/15/2037 | 1,250,000 | 1,545,925 | ||||||
| Grand Parkway Transportation Corp. | ||||||||
| 5.000%, 10/01/2038 | 2,000,000 | 2,535,680 | ||||||
| Harris County-Houston | ||||||||
| Sports Authority | ||||||||
| 5.000%, 11/15/2027 | 500,000 | 578,910 | ||||||
| North East Independent | ||||||||
| School District | ||||||||
| 5.250%, 02/01/2030 | 1,025,000 | 1,419,338 | ||||||
| 5.250%, 02/01/2035 | 1,000,000 | 1,529,840 | ||||||
| North Texas Tollway Authority | ||||||||
| 5.000%, 01/01/2043 | 1,965,000 | 2,455,995 | ||||||
| San Antonio Water System | ||||||||
| 5.000%, 05/15/2050 | 3,000,000 | 3,904,980 | ||||||
| Socorro Independent | ||||||||
| School District | ||||||||
| 5.000%, 08/15/2039 | 2,000,000 | 2,478,640 | ||||||
| State of Texas | ||||||||
| 5.500%, 08/01/2033 | 1,000,000 | 1,257,180 | ||||||
| Tarrant County Cultural | ||||||||
| Education Facilities Finance Corp. | ||||||||
| 5.000%, 07/01/2036 | 1,500,000 | 1,911,825 | ||||||
| Texas Municipal Gas | ||||||||
| Acquisition & Supply Corp. I | ||||||||
| 6.250%, 12/15/2026 | 1,690,000 | 2,012,182 | ||||||
| United Independent School District | ||||||||
| 5.000%, 08/15/2037 | 2,580,000 | 3,258,308 | ||||||
| 55,174,199 | ||||||||
| Utah – 2.35% | ||||||||
| County of Utah, UT | ||||||||
| 5.000%, 05/15/2041 | 1,500,000 | 1,815,345 | ||||||
| Salt Lake City Corp. Airport Revenue | ||||||||
| 5.000%, 07/01/2042 | 3,000,000 | 3,656,550 | ||||||
Percentages are stated as a percent of net assets.
The accompanying notes are an integral part of these financial statements.
PAGE 40
PERFORMANCE TRUST MUNICIPAL BOND FUND — SCHEDULE OF INVESTMENTS (CONT.)
February 29, 2020 (Unaudited)
| PRINCIPAL | ||||||||
| AMOUNT | VALUE | |||||||
| Utah – 2.35% (Cont.) | ||||||||
| Utah Associated Municipal | ||||||||
| Power Systems | ||||||||
| 5.000%, 09/01/2037 | $ | 2,005,000 | $ | 2,509,578 | ||||
| Utah Charter School | ||||||||
| Finance Authority | ||||||||
| 5.000%, 10/15/2035 | 1,500,000 | 1,776,945 | ||||||
| 6.300%, 07/15/2032 | 335,000 | 360,273 | ||||||
| 10,118,691 | ||||||||
| Vermont – 0.07% | ||||||||
| Vermont Economic | ||||||||
| Development Authority | ||||||||
| 5.000%, 05/01/2021 | 300,000 | 309,360 | ||||||
| Washington – 4.92% | ||||||||
| Chelan County Public | ||||||||
| Utility District No. 1 | ||||||||
| 0.000%, 06/01/2026 (c) | 450,000 | 417,753 | ||||||
| City of Seattle, WA Municipal | ||||||||
| Light & Power Revenue | ||||||||
| 5.000%, 04/01/2042 | 3,000,000 | 3,866,820 | ||||||
| Port of Seattle, WA | ||||||||
| 5.000%, 04/01/2034 | 1,500,000 | 1,734,060 | ||||||
| Spokane County School | ||||||||
| District No. 81 | ||||||||
| 5.000%, 12/01/2036 | 2,000,000 | 2,626,760 | ||||||
| State of Washington | ||||||||
| 5.000%, 08/01/2039 | 5,000,000 | 6,407,100 | ||||||
| Washington Health Care | ||||||||
| Facilities Authority | ||||||||
| 5.000%, 10/01/2038 | 1,535,000 | 1,799,081 | ||||||
| Washington State Convention | ||||||||
| Center Public Facilities District | ||||||||
| 5.000%, 07/01/2048 | 2,000,000 | 2,487,920 | ||||||
| Washington State Housing | ||||||||
| Finance Commission | ||||||||
| 2.375%, 01/01/2026 (a) | 1,250,000 | 1,257,400 | ||||||
| 5.000%, 01/01/2055 (a) | 500,000 | 572,470 | ||||||
| 21,169,364 | ||||||||
| West Virginia – 1.83% | ||||||||
| Roane County Building Commission | ||||||||
| 2.550%, 11/01/2021 | 2,000,000 | 2,012,700 | ||||||
| State of West Virginia | ||||||||
| 5.000%, 06/01/2041 | 2,500,000 | 3,251,575 | ||||||
| 5.000%, 12/01/2043 | 2,000,000 | 2,586,420 | ||||||
| 7,850,695 | ||||||||
| Wisconsin – 1.95% | ||||||||
| County of Milwaukee, WI | ||||||||
| Airport Revenue | ||||||||
| 5.000%, 12/01/2028 | 1,000,000 | 1,238,490 | ||||||
| Plateville Redevelopment Authority | ||||||||
| 5.000%, 07/01/2022 | 450,000 | 471,803 | ||||||
| Public Finance Authority | ||||||||
| 5.000%, 10/01/2044 | 1,000,000 | 1,248,950 | ||||||
| 5.000%, 07/01/2038 | 2,000,000 | 2,499,220 | ||||||
| 5.250%, 05/15/2037 (a) | 500,000 | 572,515 | ||||||
| 9.000%, 12/01/2029 (a)(b) | 1,000,000 | 1,013,710 | ||||||
| Wisconsin Health & Educational | ||||||||
| Facilities Authority | ||||||||
| 5.000%, 08/15/2034 | 1,100,000 | 1,364,110 | ||||||
| 8,408,798 | ||||||||
| TOTAL MUNICIPAL BONDS | ||||||||
| (Cost $382,599,843) | 411,804,188 | |||||||
| SHORT-TERM INVESTMENTS – 3.77% | ||||||||
| First American Government | ||||||||
| Obligations Fund – | ||||||||
| Class X, 1.493% (d) | 16,207,583 | 16,207,583 | ||||||
| TOTAL SHORT-TERM INVESTMENTS | ||||||||
| (Cost $16,207,583) | 16,207,583 | |||||||
| Total Investments | ||||||||
| (Cost $399,894,742) – 99.78% | 429,204,713 | |||||||
| Other Assets in Excess | ||||||||
| of Liabilities – 0.22% | 963,732 | |||||||
| TOTAL NET ASSETS – 100.00% | $ | 430,168,445 | ||||||
Percentages are stated as a percent of net assets.
| (a) | Securities issued pursuant to Rule 144A under the Securities Act of 1933. |
| (b) | Represents an illiquid security. The total market value of these securities was $3,137,484, representing 0.73% of net assets. |
| (c) | Represents a principal-only security that entitles holders to receive only principal payments on underlying mortgages. |
| (d) | Seven day yield at February 29, 2020. |
The accompanying notes are an integral part of these financial statements.
PAGE 41
STATEMENTS OF OPERATIONS
For the Six Months Ended February 29, 2020 (Unaudited)
| Performance Trust | Performance Trust | |||||||
| Strategic | Municipal | |||||||
| Bond Fund | Bond Fund | |||||||
| Investment Income | ||||||||
| Interest income | $ | 72,858,830 | $ | 6,149,446 | ||||
| Dividend income | 180,635 | — | ||||||
| Total Investment Income | 73,039,465 | 6,149,446 | ||||||
| Expenses | ||||||||
| Advisory fees | 9,535,599 | 726,404 | ||||||
| Transfer agent fees and expenses | 1,692,308 | 41,638 | ||||||
| Administration and accounting fees | 808,880 | 127,179 | ||||||
| Federal and state registration fees | 179,864 | 34,062 | ||||||
| Reports to shareholders | 126,762 | 11,229 | ||||||
| Custody fees | 90,348 | 9,609 | ||||||
| Distribution fees – Class C | 53,433 | — | ||||||
| Legal fees | 21,022 | 6,512 | ||||||
| Shareholder servicing fees – Class C | 17,811 | — | ||||||
| Distribution fees – Class A | 14,584 | 28,735 | ||||||
| Audit and tax fees | 11,388 | 9,268 | ||||||
| Chief Compliance Officer fees | 6,188 | 6,188 | ||||||
| Trustees’ fees | 5,018 | 5,116 | ||||||
| Other expenses | 17,470 | 5,200 | ||||||
| Total Expenses | 12,580,675 | 1,011,140 | ||||||
| Expense Recoupment by Adviser (Note 4) | — | 16,401 | ||||||
| Net Expenses | 12,580,675 | 1,027,541 | ||||||
| Net Investment Income | 60,458,790 | 5,121,905 | ||||||
| Realized and Unrealized Gain on Investments | ||||||||
| Net realized gain from: | ||||||||
| Investments | 12,477,118 | 816,658 | ||||||
| Change in net unrealized appreciation from investments | 41,457,894 | 9,194,397 | ||||||
| Net Realized and Unrealized Gain on Investments | 53,935,012 | 10,011,055 | ||||||
| Net Increase in Net Assets from Operations | $ | 114,393,802 | $ | 15,132,960 | ||||
The accompanying notes are an integral part of these financial statements.
PAGE 42
STATEMENTS OF CHANGES IN NET ASSETS
Performance Trust Strategic Bond Fund
| Six Months Ended | ||||||||
| February 29, 2020 | Year Ended | |||||||
| (Unaudited) | August 31, 2019 | |||||||
| From Operations | ||||||||
| Net investment income | $ | 60,458,790 | $ | 77,555,479 | ||||
| Net realized gain from investments | 12,477,118 | 15,519,285 | ||||||
| Change in net unrealized appreciation from investments | 41,457,894 | 104,022,848 | ||||||
| Net increase in net assets from operations | 114,393,802 | 197,097,612 | ||||||
| From Distributions | ||||||||
| Net dividends and distributions – Institutional Class | (62,125,636 | ) | (85,755,546 | ) | ||||
Net dividends and distributions – Class A(1) | (226,300 | ) | (77,697 | ) | ||||
Net dividends and distributions – Class C(2) | (228,912 | ) | (70,290 | ) | ||||
| Net decrease in net assets resulting from distributions paid | (62,580,848 | ) | (85,903,533 | ) | ||||
| From Capital Share Transactions | ||||||||
| Proceeds from shares sold – Institutional Class | 1,076,946,469 | 1,561,491,883 | ||||||
Proceeds from shares sold – Class A(1) | 8,091,762 | 8,700,779 | ||||||
Proceeds from shares sold – Class C(2) | 13,986,405 | 7,252,512 | ||||||
| Shares issued in reinvestment of distributions declared – | ||||||||
| Institutional Class | 53,956,123 | 70,780,541 | ||||||
Shares issued in reinvestment of distributions declared – Class A(1) | 225,787 | 69,711 | ||||||
Shares issued in reinvestment of distributions declared – Class C(2) | 228,309 | 61,611 | ||||||
Cost for shares redeemed – Institutional Class(3) | (335,304,504 | ) | (466,038,145 | ) | ||||
Cost for shares redeemed – Class A(1)(4) | (909,103 | ) | (1,372,813 | ) | ||||
Cost for shares redeemed – Class C(2)(5) | (1,989,406 | ) | (55,176 | ) | ||||
| Net increase in net assets from capital share transactions | 815,231,842 | 1,180,890,903 | ||||||
| Total Increase in Net Assets | 867,044,796 | 1,292,084,982 | ||||||
| Net Assets | ||||||||
| Beginning of period | 2,851,821,938 | 1,559,736,956 | ||||||
| End of period | $ | 3,718,866,734 | $ | 2,851,821,938 | ||||
| (1) | Class A Shares commenced operations on January 2, 2019. |
| (2) | Class C Shares commenced operations on January 2, 2019. |
| (3) | Net of redemption fees of $62,120 and $213,584 for the six months ended February 29, 2020 and the year ended August 31, 2019, respectively. |
| (4) | Net of redemption fees of $2 and $1,068 for the six months ended February 29, 2020 and the year ended August 31, 2019, respectively. |
| (5) | Net of redemption fees of $1,762 and $432 for the six months ended February 29, 2020 and the year ended August 31, 2019, respectively. |
The accompanying notes are an integral part of these financial statements.
PAGE 43
STATEMENTS OF CHANGES IN NET ASSETS
Performance Trust Municipal Bond Fund
| Six Months Ended | ||||||||
| February 29, 2020 | Year Ended | |||||||
| (Unaudited) | August 31, 2019 | |||||||
| From Operations | ||||||||
| Net investment income | $ | 5,121,905 | $ | 7,848,552 | ||||
| Net realized gain from investments | 816,658 | 1,413,953 | ||||||
| Change in net unrealized appreciation from investments | 9,194,397 | 18,485,408 | ||||||
| Net increase in net assets from operations | 15,132,960 | 27,747,913 | ||||||
| From Distributions | ||||||||
| Net dividends and distributions – Institutional Class | (5,343,663 | ) | (7,251,756 | ) | ||||
| Net dividends and distributions – Class A | (331,193 | ) | (564,372 | ) | ||||
| Net decrease in net assets resulting from distributions paid | (5,674,856 | ) | (7,816,128 | ) | ||||
| From Capital Share Transactions | ||||||||
| Proceeds from shares sold – Institutional Class | 103,083,339 | 133,246,607 | ||||||
| Proceeds from shares sold – Class A | 4,388,519 | 3,689,376 | ||||||
| Shares issued in reinvestment of distributions declared – Institutional Class | 4,465,802 | 5,653,643 | ||||||
| Shares issued in reinvestment of distributions declared – Class A | 266,711 | 468,848 | ||||||
Cost for shares redeemed – Institutional Class(1) | (19,455,507 | ) | (58,351,076 | ) | ||||
Cost for shares redeemed – Class A(2) | (1,562,947 | ) | (6,246,615 | ) | ||||
| Net increase in net assets from capital share transactions | 91,185,917 | 78,460,783 | ||||||
| Total Increase in Net Assets | 100,644,021 | 98,392,568 | ||||||
| Net Assets | ||||||||
| Beginning of period | 329,524,424 | 231,131,856 | ||||||
| End of period | $ | 430,168,445 | $ | 329,524,424 | ||||
| (1) | Net of redemption fees of $1,093 and $1,191 for the six months ended February 29, 2020 and the year ended August 31, 2019, respectively. |
| (2) | Net of redemption fees of $462 and $122 for the six months ended February 29, 2020 and the year ended August 31, 2019, respectively. |
The accompanying notes are an integral part of these financial statements.
PAGE 44
PERFORMANCE TRUST STRATEGIC BOND FUND — FINANCIAL HIGHLIGHTS
Per Share Data for a Share Outstanding Throughout Each Period
| Six Months | Year | Year | Year | Year | Year | |||||||||||||||||||
| Ended | Ended | Ended | Ended | Ended | Ended | |||||||||||||||||||
| February 29, 2020 | August 31, | August 31, | August 31, | August 31, | August 31, | |||||||||||||||||||
| (Unaudited) | 2019 | 2018 | 2017 | 2016 | 2015 | |||||||||||||||||||
| Institutional Class Shares | ||||||||||||||||||||||||
| Net Asset Value, | ||||||||||||||||||||||||
| Beginning of Period | $ | 23.22 | $ | 22.21 | $ | 22.84 | $ | 22.98 | $ | 22.53 | $ | 22.91 | ||||||||||||
| Income/(loss) from | ||||||||||||||||||||||||
| investment operations: | ||||||||||||||||||||||||
Net investment income(1) | 0.44 | 0.83 | 0.94 | 1.09 | 1.17 | 0.98 | ||||||||||||||||||
| Net realized and unrealized | ||||||||||||||||||||||||
gain/(loss) on investments(2) | 0.30 | 1.07 | (0.50 | ) | 0.05 | 0.46 | (0.28 | ) | ||||||||||||||||
| Total from investment operations | 0.74 | 1.90 | 0.44 | 1.14 | 1.63 | 0.70 | ||||||||||||||||||
| Less distributions paid: | ||||||||||||||||||||||||
| From net investment income | (0.45 | ) | (0.89 | ) | (1.07 | ) | (1.28 | ) | (1.19 | ) | (1.08 | ) | ||||||||||||
| From net realized gain on investments | — | — | — | — | — | — | ||||||||||||||||||
| Total distributions paid | (0.45 | ) | (0.89 | ) | (1.07 | ) | (1.28 | ) | (1.19 | ) | (1.08 | ) | ||||||||||||
| Paid-in capital from | ||||||||||||||||||||||||
| redemption fees (Note 2) | 0.00 | (3) | 0.00 | (3) | 0.00 | (3) | 0.00 | (3) | 0.01 | 0.00 | (3) | |||||||||||||
| Net Asset Value, End of Period | $ | 23.51 | $ | 23.22 | $ | 22.21 | $ | 22.84 | $ | 22.98 | $ | 22.53 | ||||||||||||
Total Return(4) | 3.23 | % | 8.79 | % | 2.00 | % | 5.20 | % | 7.48 | % | 3.13 | % | ||||||||||||
| Supplemental Data and Ratios: | ||||||||||||||||||||||||
| Net assets at end of Period (000’s) | $ | 3,683,706 | $ | 2,836,855 | $ | 1,559,737 | $ | 1,057,374 | $ | 688,597 | $ | 164,375 | ||||||||||||
| Ratio of expenses to | ||||||||||||||||||||||||
average net assets(5) | 0.79 | % | 0.80 | % | 0.81 | % | 0.76 | % | 0.79 | % | 0.84 | % | ||||||||||||
| Ratio of net investment income | ||||||||||||||||||||||||
to average net assets(5) | 3.81 | % | 3.68 | % | 4.19 | % | 4.83 | % | 5.14 | % | 4.31 | % | ||||||||||||
Portfolio turnover rate(4) | 17.32 | % | 40.59 | % | 37.99 | % | 78.53 | % | 45.58 | % | 80.49 | % | ||||||||||||
| (1) | Per share net investment income was calculated using the average shares outstanding method. |
| (2) | Realized gains and losses per share in the caption are balancing amounts necessary to reconcile the change in net asset value per share for the period, and may not reconcile with the aggregate gains and losses in the Statement of Operations due to share transactions for the period. |
| (3) | Rounds to less than 0.5 cent per share. |
| (4) | Not annualized for periods less than one year. |
| (5) | Annualized for periods less than one year. |
The accompanying notes are an integral part of these financial statements.
PAGE 45
PERFORMANCE TRUST STRATEGIC BOND FUND — FINANCIAL HIGHLIGHTS
Per Share Data for a Share Outstanding Throughout Each Period
| Six Months | Period | |||||||
| Ended | Ended | |||||||
| February 29, 2020 | August 31, | |||||||
| (Unaudited) | 2019(1) | |||||||
| Class A Shares | ||||||||
| Net Asset Value, Beginning of Period | $ | 23.23 | $ | 22.13 | ||||
| Income from investment operations: | ||||||||
Net investment income(2) | 0.41 | 0.58 | ||||||
Net realized and unrealized gain on investments(3) | 0.30 | 1.08 | ||||||
| Total from investment operations | 0.71 | 1.66 | ||||||
| Less distributions paid: | ||||||||
| From net investment income | (0.43 | ) | (0.57 | ) | ||||
| From net realized gain on investments | — | — | ||||||
| Total distributions paid | (0.43 | ) | (0.57 | ) | ||||
| Paid-in capital from redemption fees (Note 2) | 0.00 | (4) | 0.01 | |||||
| Net Asset Value, End of Period | $ | 23.51 | $ | 23.23 | ||||
Total Return(5)(6) | 3.09 | % | 7.67 | % | ||||
| Supplemental Data and Ratios: | ||||||||
| Net assets at end of Period (000’s) | $ | 15,196 | $ | 7,549 | ||||
Ratio of expenses to average net assets(7) | 1.04 | % | 1.05 | % | ||||
Ratio of net investment income to average net assets(7) | 3.57 | % | 3.80 | % | ||||
Portfolio turnover rate(6)(8) | 17.32 | % | 40.59 | % | ||||
| (1) | The Class A shares commenced operations on January 2, 2019. |
| (2) | Per share net investment income was calculated using the average shares outstanding method. |
| (3) | Realized gains and losses per share in the caption are balancing amounts necessary to reconcile the change in net asset value per share for the period, and may not reconcile with the aggregate gains and losses in the Statement of Operations due to share transactions for the period. |
| (4) | Rounds to less than 0.5 cent per share. |
| (5) | Based on net asset value, which does not reflect sales charge. |
| (6) | Not annualized for periods less than one year. |
| (7) | Annualized for periods less than one year. |
| (8) | Portfolio turnover rates are calculated at the Fund level (not by individual share class). |
The accompanying notes are an integral part of these financial statements.
PAGE 46
PERFORMANCE TRUST STRATEGIC BOND FUND — FINANCIAL HIGHLIGHTS
Per Share Data for a Share Outstanding Throughout Each Period
| Six Months | Period | |||||||
| Ended | Ended | |||||||
| February 29, 2020 | August 31, | |||||||
| (Unaudited) | 2019(1) | |||||||
| Class C Shares | ||||||||
| Net Asset Value, Beginning of Period | $ | 23.18 | $ | 22.13 | ||||
| Income from investment operations: | ||||||||
Net investment income(2) | 0.32 | 0.46 | ||||||
Net realized and unrealized gain on investments(3) | 0.30 | 1.09 | ||||||
| Total from investment operations | 0.62 | 1.55 | ||||||
| Less distributions paid: | ||||||||
| From net investment income | (0.35 | ) | (0.50 | ) | ||||
| From net realized gain on investments | — | — | ||||||
| Total distributions paid | (0.35 | ) | (0.50 | ) | ||||
| Paid-in capital from redemption fees (Note 2) | 0.00 | (4) | 0.00 | (4) | ||||
| Net Asset Value, End of Period | $ | 23.45 | $ | 23.18 | ||||
Total Return(5) | 2.72 | % | 7.10 | % | ||||
| Supplemental Data and Ratios: | ||||||||
| Net assets at end of Period (000’s) | $ | 19,965 | $ | 7,418 | ||||
Ratio of expenses to average net assets(6) | 1.79 | % | 1.80 | % | ||||
Ratio of net investment income to average net assets(6) | 2.83 | % | 3.04 | % | ||||
Portfolio turnover rate(5)(7) | 17.32 | % | 40.59 | % | ||||
| (1) | The Class C shares commenced operations on January 2, 2019. |
| (2) | Per share net investment income was calculated using the average shares outstanding method. |
| (3) | Realized gains and losses per share in the caption are balancing amounts necessary to reconcile the change in net asset value per share for the period, and may not reconcile with the aggregate gains and losses in the Statement of Operations due to share transactions for the period. |
| (4) | Rounds to less than 0.5 cent per share. |
| (5) | Not annualized for periods less than one year. |
| (6) | Annualized for periods less than one year. |
| (7) | Portfolio turnover rates are calculated at the Fund level (not by individual share class). |
The accompanying notes are an integral part of these financial statements.
PAGE 47
PERFORMANCE TRUST MUNICIPAL BOND FUND — FINANCIAL HIGHLIGHTS
Per Share Data for a Share Outstanding Throughout Each Period
| Six Months | Year | Year | Year | Year | Year | |||||||||||||||||||
| Ended | Ended | Ended | Ended | Ended | Ended | |||||||||||||||||||
| February 29, 2020 | August 31, | August 31, | August 31, | August 31, | August 31, | |||||||||||||||||||
| (Unaudited) | 2019 | 2018 | 2017 | 2016 | 2015 | |||||||||||||||||||
| Institutional Class Shares | ||||||||||||||||||||||||
| Net Asset Value, | ||||||||||||||||||||||||
| Beginning of Period | $ | 25.49 | $ | 23.79 | $ | 24.34 | $ | 24.87 | $ | 23.26 | $ | 23.07 | ||||||||||||
| Income/(loss) from | ||||||||||||||||||||||||
| investment operations: | ||||||||||||||||||||||||
Net investment income(1) | 0.36 | 0.72 | 0.67 | 0.62 | 0.57 | 0.61 | ||||||||||||||||||
| Net realized and unrealized | ||||||||||||||||||||||||
| gain/(loss) on investments | 0.56 | 1.69 | (0.55 | ) | (0.53 | ) | 1.59 | 0.18 | ||||||||||||||||
| Total from investment operations | 0.92 | 2.41 | 0.12 | 0.09 | 2.16 | 0.79 | ||||||||||||||||||
| Less distributions paid: | ||||||||||||||||||||||||
| From net investment income | (0.32 | ) | (0.71 | ) | (0.67 | ) | (0.61 | ) | (0.55 | ) | (0.60 | ) | ||||||||||||
| From net realized gain on investments | (0.07 | ) | — | — | (0.01 | ) | — | — | ||||||||||||||||
| Total distributions paid | (0.39 | ) | (0.71 | ) | (0.67 | ) | (0.62 | ) | (0.55 | ) | (0.60 | ) | ||||||||||||
| Paid-in capital from | ||||||||||||||||||||||||
redemption fees (Note 2)(2) | 0.00 | 0.00 | 0.00 | 0.00 | 0.00 | 0.00 | ||||||||||||||||||
| Net Asset Value, End of Period | $ | 26.02 | $ | 25.49 | $ | 23.79 | $ | 24.34 | $ | 24.87 | $ | 23.26 | ||||||||||||
Total Return(3) | 3.67 | % | 10.31 | % | 0.46 | % | 0.50 | % | 9.43 | % | 3.41 | % | ||||||||||||
| Supplemental Data and Ratios: | ||||||||||||||||||||||||
| Net assets at end of Period (000’s) | $ | 404,389 | $ | 307,384 | $ | 208,325 | $ | 172,201 | $ | 129,466 | $ | 63,257 | ||||||||||||
| Ratio of expenses to | ||||||||||||||||||||||||
| average net assets: | ||||||||||||||||||||||||
| Before waiver, expense | ||||||||||||||||||||||||
reimbursements and recoupments(4) | 0.54 | % | 0.57 | % | 0.60 | % | 0.66 | % | 0.73 | % | 0.86 | % | ||||||||||||
| After waiver, expense | ||||||||||||||||||||||||
reimbursements and recoupments(4) | 0.55 | % | 0.55 | % | 0.55 | % | 0.55 | % | 0.55 | % | 0.55 | % | ||||||||||||
| Ratio of net investment income | ||||||||||||||||||||||||
| to average net assets: | ||||||||||||||||||||||||
| Before waiver, expense | ||||||||||||||||||||||||
reimbursements and recoupments(4) | 2.85 | % | 2.94 | % | 2.76 | % | 2.50 | % | 2.16 | % | 2.30 | % | ||||||||||||
| After waiver, expense | ||||||||||||||||||||||||
reimbursements and recoupments(4) | 2.84 | % | 2.96 | % | 2.81 | % | 2.61 | % | 2.34 | % | 2.61 | % | ||||||||||||
Portfolio turnover rate(3) | 10.22 | % | 35.29 | % | 28.49 | % | 42.53 | % | 13.66 | % | 31.83 | % | ||||||||||||
| (1) | Per share net investment income was calculated using the average shares outstanding method. |
| (2) | Rounds to less than 0.5 cent per share. |
| (3) | Not annualized for periods less than one year. |
| (4) | Annualized for periods less than one year. |
The accompanying notes are an integral part of these financial statements.
PAGE 48
PERFORMANCE TRUST MUNICIPAL BOND FUND — FINANCIAL HIGHLIGHTS
Per Share Data for a Share Outstanding Throughout Each Period
| Six Months | Year | Ended | Year | Year | Year | |||||||||||||||||||
| Ended | Ended | Ended | Ended | Ended | Ended | |||||||||||||||||||
| February 29, 2020 | August 31, | August 31, | August 31, | August 31, | August 31, | |||||||||||||||||||
| (Unaudited) | 2019 | 2018 | 2017 | 2016 | 2015 | |||||||||||||||||||
| Class A Shares | ||||||||||||||||||||||||
| Net Asset Value, | ||||||||||||||||||||||||
| Beginning of Period | $ | 25.51 | $ | 23.81 | $ | 24.36 | $ | 24.91 | $ | 23.30 | $ | 23.09 | ||||||||||||
| Income/(loss) from | ||||||||||||||||||||||||
| investment operations: | ||||||||||||||||||||||||
Net investment income(1) | 0.33 | 0.66 | 0.61 | 0.56 | 0.50 | 0.55 | ||||||||||||||||||
| Net realized and unrealized | ||||||||||||||||||||||||
| gain/(loss) on investments | 0.56 | 1.69 | (0.55 | ) | (0.53 | ) | 1.60 | 0.17 | ||||||||||||||||
| Total from investment operations | 0.89 | 2.35 | 0.06 | 0.03 | 2.10 | 0.72 | ||||||||||||||||||
| Less distributions paid: | ||||||||||||||||||||||||
| From net investment income | (0.29 | ) | (0.65 | ) | (0.61 | ) | (0.57 | ) | (0.51 | ) | (0.54 | ) | ||||||||||||
| From net realized gain on investments | (0.07 | ) | — | — | (0.01 | ) | — | — | ||||||||||||||||
| Total distributions paid | (0.36 | ) | (0.65 | ) | (0.61 | ) | (0.58 | ) | (0.51 | ) | (0.54 | ) | ||||||||||||
| Paid-in capital from | ||||||||||||||||||||||||
| redemption fees (Note 2) | 0.00 | (2) | 0.00 | (2) | 0.00 | (2) | 0.00 | (2) | 0.02 | 0.03 | ||||||||||||||
| Net Asset Value, End of Period | $ | 26.04 | $ | 25.51 | $ | 23.81 | $ | 24.36 | $ | 24.91 | $ | 23.30 | ||||||||||||
Total Return(3)(4) | 3.55 | % | 10.02 | % | 0.25 | % | 0.24 | % | 9.20 | % | 3.29 | % | ||||||||||||
| Supplemental Data and Ratios: | ||||||||||||||||||||||||
| Net assets at end of Period (000’s) | $ | 25,779 | $ | 22,141 | $ | 22,807 | $ | 25,495 | $ | 31,744 | $ | 10,476 | ||||||||||||
| Ratio of expenses to | ||||||||||||||||||||||||
| average net assets: | ||||||||||||||||||||||||
| Before waiver, expense | ||||||||||||||||||||||||
reimbursements and recoupments(5) | 0.79 | % | 0.82 | % | 0.85 | % | 0.80 | % | 0.85 | % | 1.10 | % | ||||||||||||
| After waiver, expense | ||||||||||||||||||||||||
reimbursements and recoupments(5) | 0.80 | % | 0.80 | % | 0.80 | % | 0.80 | % | 0.80 | % | 0.80 | % | ||||||||||||
| Ratio of net investment income | ||||||||||||||||||||||||
| to average net assets: | ||||||||||||||||||||||||
| Before waiver, expense | ||||||||||||||||||||||||
reimbursements and recoupments(5) | 2.59 | % | 2.69 | % | 2.50 | % | 2.34 | % | 2.02 | % | 2.05 | % | ||||||||||||
| After waiver, expense | ||||||||||||||||||||||||
reimbursements and recoupments(5) | 2.58 | % | 2.71 | % | 2.55 | % | 2.34 | % | 2.07 | % | 2.35 | % | ||||||||||||
Portfolio turnover rate(4) | 10.22 | % | 35.29 | % | 28.49 | % | 42.53 | % | 13.66 | % | 31.83 | % | ||||||||||||
| (1) | Per share net investment income was calculated using the average shares outstanding method. |
| (2) | Rounds to less than 0.5 cent per share. |
| (3) | Based on net asset value, which does not reflect sales charge. |
| (4) | Not annualized for periods less than one year. |
| (5) | Annualized for periods less than one year. |
The accompanying notes are an integral part of these financial statements.
PAGE 49
PERFORMANCE TRUST MUTUAL FUNDS – NOTES TO FINANCIAL STATEMENTS
February 29, 2020 (Unaudited)
| 1. | Organization |
Trust for Professional Managers (the “Trust”) was organized as a Delaware statutory trust under a Declaration of Trust dated May 29, 2001. The Trust is registered under the Investment Company Act of 1940, as amended (the “1940 Act”), as an open-end management investment company. The Performance Trust Mutual Funds (the “Funds”) are comprised of the Performance Trust Strategic Bond Fund (the “Strategic Bond Fund”), and the Performance Trust Municipal Bond Fund (the “Municipal Bond Fund”), each representing a distinct diversified series with its own investment objective and policies within the Trust. The investment objective of the Strategic Bond Fund is to purchase undervalued fixed-income assets and achieve investment returns through interest income and potential capital appreciation. The investment objective of the Municipal Bond Fund is to provide a high level of current interest income that is substantially exempt from regular federal income taxes and is consistent with preservation of capital. The Trust may issue an unlimited number of shares of beneficial interest at $0.001 par value. The assets of the Funds are segregated, and a shareholder’s interest is limited to the Fund in which shares are held. The Institutional Class shares of the Strategic Bond Fund commenced investment operations on September 1, 2010. The Class A and Class C shares of the Strategic Bond Fund commenced investment operations on January 2, 2019. The Municipal Bond Fund commenced investment operations on June 30, 2011 and September 28, 2012 for the Institutional Class and Class A shares, respectively. Effective January 2, 2019, the Retail Class shares of the Municipal Bond Fund were redesignated as Class A shares. Class A shares are subject to an initial maximum sales charge of 2.25% imposed at the time of purchase. The sales charge declines as the amount purchased increases in accordance with the Funds’ prospectus. Class A shares are subject to a 0.25% Rule 12b-1 distribution and service fee. Class C shares are subject to a 1.00% Rule 12b-1 distribution and service fee. Each class of shares has identical rights and privileges except with respect to distribution fees, and voting rights on matters affecting a single class of shares. Costs incurred by the Funds in connection with the organization and the initial public offering of shares were paid by PT Asset Management, LLC (the “Adviser”), the Funds’ investment adviser. The Funds are investment companies and accordingly follow the investment company accounting and reporting guidance of the Financial Accounting Standards Board (“FASB”) Accounting Standard Codification Topic 946 Financial Services—Investment Companies. | |
| 2. | Significant Accounting Policies |
| The following is a summary of significant accounting policies consistently followed by the Funds in the preparation of the financial statements. These policies are in conformity with generally accepted accounting principles in the United States of America (“GAAP”). | |
| a. | Investment Valuation |
| Each equity security owned by a Fund that is listed on a securities exchange, except securities listed on the NASDAQ Stock Market, LLC (“NASDAQ”), is valued at its last sale price at the close of that exchange on the date as of which assets are valued. If the security is listed on more than one exchange, a Fund will use the price of the exchange that the Fund generally considers to be the principal exchange on which the security is traded. Portfolio securities listed on NASDAQ will be valued at the NASDAQ Official Closing Price, which may not necessarily represent the last sale price. If there has been no sale on such exchange or on NASDAQ on such day, the security is valued at the mean between the most recent quoted bid and asked prices on such day or the security shall be valued at the latest sales price on the “composite market” for the day such security is being valued. The composite market is defined as a consolidation of the trade information provided by national securities and foreign exchanges and over-the-counter markets as published by an approved independent pricing service (a “Pricing Service”). | |
| Debt securities, such as U.S. government securities, corporate securities, municipal securities and asset-backed and mortgage-backed securities, including short-term debt instruments having a maturity of 60 days or less, are valued at the mean in accordance with prices supplied by a Pricing Service. Pricing Services may use various valuation methodologies such as the mean between the bid and the asked prices, matrix pricing and other analytical pricing models as well as market transactions and dealer quotations. If a price is not available from a Pricing Service, the most recent quotation obtained from one or more broker-dealers known to follow the issue will be obtained. Quotations will be valued at the mean between the bid and the offer. In the absence of available quotations, the securities will be priced at fair value. Any discount or premium is accreted or amortized over the expected life of the respective security using the constant yield to maturity method. Pricing Services generally value debt securities assuming orderly transactions of an institutional round lot size, but such securities may be held or transactions may be conducted in such securities in smaller, odd lot sizes. Odd lots often trade at lower prices than institutional round lots. | |
| Money market funds, demand notes and repurchase agreements are valued at cost. If cost does not represent current market value the securities will be priced at fair value. | |
| Redeemable securities issued by open-end, registered investment companies are valued at the net asset value (“NAV”) of such companies for purchase and/or redemption orders placed on that day. If, on a particular day, a share of an investment company is not listed on NASDAQ, such security’s fair value will be determined. All exchange-traded funds are valued at the last reported sale price on the exchange on which the security is principally traded. In the event market quotations are not readily available, such security will be valued at its fair value. | |
| If market quotations are not readily available, a security or other asset will be valued at its fair value as determined under fair value pricing procedures approved by the Board of Trustees. These fair value pricing procedures will also be used to price a security when corporate events, events in the securities market and/or world events cause the Adviser to believe that a security’s last sale price may not reflect its actual market value. The intended effect of using fair value pricing procedures is to ensure that the Funds are accurately priced. The Board of Trustees will regularly evaluate whether the Funds’ fair value pricing procedures continue to be appropriate in light of the specific circumstances of the Funds and the quality of prices obtained through the application of such procedures by the Trust’s valuation committee. | |
FASB Accounting Standards Codification, Fair Value Measurements and Disclosures Topic 820 (“ASC 820”), establishes an authoritative definition of fair value and sets out a hierarchy for measuring fair value. ASC 820 requires an entity to evaluate certain factors to determine whether there has been a significant decrease in volume and level of activity for the security such that recent transactions and quoted prices may not be determinative of fair value and further analysis and adjustment may be necessary to estimate fair value. ASC 820 also requires enhanced disclosure regarding the inputs and valuation techniques used to measure fair value as well as expanded disclosure of valuation levels for |
PAGE 50
PERFORMANCE TRUST MUTUAL FUNDS – NOTES TO FINANCIAL STATEMENTS (CONT.)
February 29, 2020 (Unaudited)
| each class of investments. These inputs are summarized in the three broad levels listed below: |
| » | Level 1: Quoted prices in active markets for identical securities. | |
| » | Level 2: Other significant observable inputs (including quoted prices for similar securities, interest rates, prepayment speeds, credit risk, etc.). | |
| » | Level 3: Significant unobservable inputs (including a Fund’s own assumptions in determining the fair value of investments). |
| The inputs or methodology used for valuing securities are not necessarily an indication of the risk associated with investing in those securities. The following is a summary of the inputs used to value the Funds’ investments carried at fair value as of February 29, 2020: | |
| Performance Trust Strategic Bond Fund |
| Level 1 | Level 2 | Level 3 | Total | ||||||||||||||
| Fixed Income: | |||||||||||||||||
| Asset Backed | |||||||||||||||||
| Securities | $ | — | $ | 206,265,545 | $ | — | $ | 206,265,545 | |||||||||
| Collateralized | |||||||||||||||||
| Loan | |||||||||||||||||
| Obligations | — | 242,415,577 | — | 242,415,577 | |||||||||||||
| Corporate | |||||||||||||||||
| Bonds | — | 285,192,541 | — | 285,192,541 | |||||||||||||
| Non – Agency | |||||||||||||||||
| Residential | |||||||||||||||||
| Mortgage | |||||||||||||||||
| Backed | |||||||||||||||||
| Securities | — | 730,565,142 | — | 730,565,142 | |||||||||||||
| Non – Agency | |||||||||||||||||
| Commercial | |||||||||||||||||
| Mortgage | |||||||||||||||||
| Backed | |||||||||||||||||
| Securities | — | 760,932,563 | — | 760,932,563 | |||||||||||||
| Agency | |||||||||||||||||
| Commercial | |||||||||||||||||
| Mortgage | |||||||||||||||||
| Backed | |||||||||||||||||
| Securities | — | 198,963,243 | — | 198,963,243 | |||||||||||||
| Municipal | |||||||||||||||||
| Bonds | — | 967,826,483 | — | 967,826,483 | |||||||||||||
| US | |||||||||||||||||
| Government | |||||||||||||||||
| Notes/Bonds | — | 200,883,775 | — | 200,883,775 | |||||||||||||
| US | |||||||||||||||||
| Treasury Bills | — | 49,917,718 | — | 49,917,718 | |||||||||||||
| Total Fixed | |||||||||||||||||
| Income: | — | 3,642,962,587 | — | 3,642,962,587 | |||||||||||||
| Equity | |||||||||||||||||
| Closed-End | |||||||||||||||||
| Mutual | |||||||||||||||||
| Funds | 6,235,774 | — | — | 6,235,774 | |||||||||||||
| Total Equity | 6,235,774 | — | — | 6,235,774 | |||||||||||||
| Short-Term | |||||||||||||||||
| Investments | 63,342,658 | — | — | 63,342,658 | |||||||||||||
| Total | |||||||||||||||||
| Investments | |||||||||||||||||
| in Securities | $ | 69,578,432 | $ | 3,642,962,587 | $ | — | $ | 3,712,541,019 | |||||||||
| Performance Trust Municipal Bond Fund |
| Level 1 | Level 2 | Level 3 | Total | ||||||||||||||
| Fixed Income: | |||||||||||||||||
| Agency | |||||||||||||||||
| Commercial | |||||||||||||||||
| Mortgage | |||||||||||||||||
| Backed | |||||||||||||||||
| Securities | $ | — | $ | 1,192,942 | $ | — | $ | 1,192,942 | |||||||||
| Municipal | |||||||||||||||||
| Bonds | — | 411,804,188 | — | 411,804,188 | |||||||||||||
| Total Fixed | |||||||||||||||||
| Income | — | 412,997,130 | — | 412,997,130 | |||||||||||||
| Short-Term | |||||||||||||||||
| Investments | 16,207,583 | — | — | 16,207,583 | |||||||||||||
| Total | |||||||||||||||||
| Investments | |||||||||||||||||
| in Securities | $ | 16,207,583 | $ | 412,997,130 | $ | — | $ | 429,204,713 | |||||||||
| The Funds did not hold any Level 3 securities during the six months ended February 29, 2020. | |
| The Funds did not hold any financial derivative instruments during the six months ended February 29, 2020. | |
| b. | Short Positions |
| The Funds may sell a security they do not own in anticipation of a decline in the fair value of that security. When a Fund sells a security short, it must borrow the security sold short and deliver it to the broker-dealer through which it made the short sale. A gain, limited to the price at which a Fund sold the security short, or a loss, unlimited in size, will be recognized upon the termination of a short sale. The Funds are liable for any dividends or interest payable on securities while those securities are in a short position. Such amounts are recorded on the ex-dividend date as a dividend expense. As collateral for its short positions, the Funds are required under the 1940 Act to maintain segregated assets consisting of cash, cash equivalents or liquid securities. The segregated assets are valued consistent with Note 2a above. The amount of segregated assets are required to be adjusted daily to reflect changes in the fair value of the securities sold short. As of February 29, 2020, the Funds did not have any open short positions and accordingly did not have securities or cash held as collateral. | |
| c. | Federal Income Taxes |
| The Funds intend to comply with the requirements of Subchapter M of the Internal Revenue Code necessary to qualify as a regulated investment company and to make the requisite distributions of income and capital gains to their shareholders sufficient to relieve them from all or substantially all federal income taxes. Therefore, no federal income tax provision has been provided. | |
| As of and during the six months ended February 29, 2020, the Funds did not have a liability for any unrecognized tax benefits. The Funds recognize interest and penalties, if any, related to uncertain tax benefits as income tax expense in the Statements of Operations. During the six months ended February 29, 2020, the Funds did not incur any interest or penalties. The Funds are not subject to examination by U.S. taxing authorities for the tax periods prior to the year ended August 31, 2016. | |
| d. | Distributions to Shareholders |
| The Funds will distribute any net investment income monthly. The Funds will distribute any net realized long- or short-term capital gains at least annually. Distributions from net realized gains for book purposes may include short-term capital gains. All short-term capital gains are included in ordinary income for |
PAGE 51
PERFORMANCE TRUST MUTUAL FUNDS – NOTES TO FINANCIAL STATEMENTS (CONT.)
February 29, 2020 (Unaudited)
| tax purposes. Distributions to shareholders are recorded on the ex-dividend date. The Funds may also pay a special distribution at the end of the calendar year to comply with federal tax requirements. Income and capital gain distributions may differ from GAAP, primarily due to timing differences in the recognition of income, gains and losses by the Funds. To the extent that these differences are attributable to permanent book and tax accounting differences, the components of net assets have been adjusted. | |
| e. | Use of Estimates |
| The preparation of financial statements in conformity with GAAP requires management to make estimates and assumptions that affect the reported amounts of assets and liabilities and disclosure of contingent assets and liabilities at the date of the financial statements and the reported amounts of revenues and expenses during the reporting period. Actual results could differ from those estimates. | |
| f. | Share Valuation |
| The NAV per share of a Fund is calculated by dividing the sum of the value of the securities held by the Fund, plus cash or other assets, minus all liabilities (including estimated accrued expenses) by the total number of shares outstanding for the Fund, rounded to the nearest cent. The Funds’ shares will not be priced on the days on which the New York Stock Exchange (“NYSE”) is closed for trading. The Funds charged a 2.00% redemption fee on shares redeemed within sixty days of purchase through December 28, 2019. These fees are deducted from the redemption proceeds otherwise payable to the shareholder. Effective December 29, 2019, the Funds eliminated the redemption fees. The Funds will retain the fee charged as an increase in paid-in capital and such fees become part of a Fund’s daily NAV calculation. For the six months ended February 29, 2020, redemption fees of $63,884 and $1,555 were collected for the Strategic Bond Fund and Municipal Bond Fund, respectively. | |
| g. | Allocation of Income, Expenses and Gains/Losses |
| Income, expenses (other than those deemed attributable to a specific share class), and gains and losses of each Fund are allocated daily to each class of shares based upon the ratio of net assets represented by each class as a percentage of the net assets of the Fund. Expenses deemed directly attributable to a class of shares are recorded by the specific class. Most expenses are allocated by class based on relative net assets. Distribution and service (Rule 12b-1) fees are expensed at 0.25% of average daily net assets of the Class A shares of the Funds and 0.75% of average daily net assets of the Class C shares of the Strategic Bond Fund. Shareholder servicing fees are expensed at 0.25% of average daily net assets of Class C shares of the Strategic Bond Fund. Expenses associated with a specific fund in the Trust are charged to that fund. Common expenses of the Trust are typically allocated evenly between the funds of the Trust, or by other equitable means. | |
| h. | Other |
| Investment transactions are recorded on the trade date. The Funds determine the gain or loss from investment transactions on the basis of identified cost basis by comparing the original cost of the security lot sold with the net sale proceeds. Dividend income, less foreign withholding tax, is recognized on the ex-dividend date and interest income is recognized on an accrual basis. Discounts, premiums and interest only strips are accreted or amortized over the expected life of the respective securities using the constant yield method. Gains and losses on principal payments and short-falls of mortgage backed securities (paydown gains and losses) are included as an adjustment to interest income in the Statements of Operations. | |
| 3. | Federal Tax Matters |
| The tax character of distributions paid during the years ended August 31, 2019 and August 31, 2018 was as follows: | |
| PERFORMANCE TRUST STRATEGIC BOND FUND |
| YEAR ENDED | YEAR ENDED | ||||||
| AUGUST 31, 2019 | AUGUST 31, 2018 | ||||||
| Ordinary Income | $85,903,533 | $62,058,773 | |||||
| Tax-Exempt Income | — | — | |||||
| Long-Term Capital Gain | — | — |
| PERFORMANCE TRUST MUNICIPAL BOND FUND |
| YEAR ENDED | YEAR ENDED | ||||||
| AUGUST 31, 2019 | AUGUST 31, 2018 | ||||||
| Ordinary Income | $ 349,527 | $ 6,020 | |||||
| Tax-Exempt Income | 7,466,601 | 5,985,900 | |||||
| Long-Term Capital Gain | — | — |
| As of August 31, 2019, the components of accumulated earnings (losses) on a tax basis were as follows: | |
| PERFORMANCE TRUST STRATEGIC BOND FUND |
| Cost basis of investments for federal | |||||
| income tax purposes | $ | 2,752,628,622 | |||
| Gross tax unrealized appreciation | $ | 126,039,683 | |||
| Gross tax unrealized depreciation | (29,299,838 | ) | |||
| Net tax unrealized appreciation | 96,739,845 | ||||
| Undistributed ordinary income | 2,537,641 | ||||
| Undistributed long-term capital gain | — | ||||
| Total distributable earnings | 2,537,641 | ||||
| Other accumulated losses | (17,972,811 | ) | |||
| Total accumulated gains | $ | 81,304,675 | |||
| PERFORMANCE TRUST MUNICIPAL BOND FUND | |||||
| Cost basis of investments for federal | |||||
| income tax purposes | $ | 308,850,677 | |||
| Gross tax unrealized appreciation | $ | 20,382,499 | |||
| Gross tax unrealized depreciation | (266,925 | ) | |||
| Net tax unrealized appreciation | 20,115,574 | ||||
| Undistributed tax-exempt income | 45,541 | ||||
| Undistributed long-term capital gain | 1,049,340 | ||||
| Total distributable earnings | 1,094,881 | ||||
| Other accumulated losses | — | ||||
| Total accumulated gains | $ | 21,210,455 | |||
| The difference between book-basis and tax-basis unrealized appreciation (depreciation) is attributable primarily to the tax deferral of losses on wash sale adjustments and non-REIT return of capital. | |
| At August 31, 2019, the Strategic Bond Fund had short-term capital loss carryovers of $17,971,713. These losses will be carried forward indefinitely to offset future realized capital gains. To the extent the Strategic Bond Fund realizes future net capital gains, taxable distributions to shareholders will be offset by any unused capital loss carryovers. During the year ended August 31, 2019, short-term capital loss carryovers of $4,267,003 and $364,613 were utilized by the Strategic Bond Fund and Municipal Bond Fund, respectively. During the year |
PAGE 52
PERFORMANCE TRUST MUTUAL FUNDS – NOTES TO FINANCIAL STATEMENTS (CONT.)
February 29, 2020 (Unaudited)
| ended August 31, 2019, long-term capital loss carryovers of $536,307 were utilized by the Strategic Bond Fund. | |
| GAAP requires that certain components of net assets relating to permanent differences be reclassified between financial and tax reporting. These reclassifications have no effect on net assets or NAV per share. For the year ended August 31, 2019, the following reclassifications were made for permanent tax differences on the Statements of Assets and Liabilities: |
| STRATEGIC | MUNICIPAL | ||||||||
| BOND FUND | BOND FUND | ||||||||
| Total distributable | |||||||||
| earnings | $ | — | $ | — | |||||
| Paid in capital | $ | — | $ | — | |||||
| 4. | Investment Adviser |
| The Trust has an Investment Advisory Agreement (the “Agreement”) with the Adviser to furnish investment advisory services to the Funds. Under the terms of the Agreement, the Funds compensate the Adviser for its management services at the annual rate of 0.60% for the Strategic Bond Fund and 0.40% for the Municipal Bond Fund of the respective Fund’s average daily net assets. | |
| The Adviser has contractually agreed to waive its management fee and/or reimburse Fund expenses at least through December 29, 2020 at the discretion of the Adviser and the Board of Trustees, to the extent necessary to ensure that the total annual Fund operating expenses (exclusive of front-end or contingent deferred sales loads, Rule 12b-1 plan fees, shareholder servicing plan fees, taxes, leverage (i.e., any expenses incurred in connection with borrowings made by a Fund), interest (including interest incurred in connection with bank and custody overdrafts), brokerage commissions and other transactional expenses, expenses incurred in connection with any merger or reorganization, dividends or interest expense on short positions, acquired fund fees and expenses and extraordinary expenses such as litigation) do not exceed 0.95% and 0.55% (the “Expense Limitation Cap”) of the average daily net assets of the Strategic Bond Fund and Municipal Bond Fund, respectively. Prior to December 29, 2017, the Adviser had agreed to waive its management fees and/or reimburse expenses of the Fund to ensure that Total Annual Fund Operating Expenses exclusive of interest, acquired fund fees and expenses, leverage (i.e., any expenses incurred in connection with borrowings made by the Fund), tax expenses, dividends and interest on short positions, brokerage commissions, and extraordinary expenses), did not exceed 0.95%, 0.55% and 0.80% of the average daily net assets of the Strategic Bond Fund and Municipal Bond Fund – Institutional Class and Class A shares, respectively. Any such waiver or reimbursement is subject to later adjustment to allow the Adviser to recover amounts waived or reimbursed to the extent actual fees and expenses for a fiscal period do not exceed the lesser of: (1) the Expense Limitation Cap in place at the time of the waiver and/or reimbursement; or (2) the Expense Limitation Cap in place at the time of recovery; provided, however, that the Adviser shall only be entitled to recover such amounts for a period of up to three years from the date such amount was waived or reimbursed. During the six months ended February 29, 2020, expenses of $15,382 for the Municipal Bond Fund – Institutional Class, and $1,019 for the Municipal Bond Fund – Class A were recouped by the Adviser. |
| The following table shows the remaining waived or reimbursed expenses subject to potential recovery expiring during the fiscal year ending: |
| STRATEGIC | MUNICIPAL | ||||||||
| BOND FUND | BOND FUND | ||||||||
| August 31, 2020 | $ | — | $ | 85,581 | |||||
| August 31, 2021 | $ | — | $ | 100,645 | |||||
| August 31, 2022 | $ | — | $ | 49,664 | |||||
| 5. | Distribution and Shareholder Servicing Plan |
| The Trust has adopted a plan pursuant to Rule 12b-1 under the 1940 Act (the “12b-1 Plan”) on behalf of the Funds, which authorize the Funds to pay Foreside Fund Services, LLC (the “Distributor”) a distribution fee of 0.25% of each Fund’s average daily net assets of Class A shares and 0.75% of the Strategic Bond Fund’s average daily net assets for Class C shares, for services to prospective Fund shareholders and distribution of Fund shares, and 0.25% of the Strategic Bond Fund’s average daily net assets of Class C shares for shareholder servicing, as applicable. During the six months ended February 29, 2020, the Funds accrued expenses pursuant to the 12b-1 Plan as follows: |
| Shareholder | |||||||
| 12b-1 Fees | Servicing Fees | ||||||
| Strategic Bond Fund | |||||||
| Class A | $14,584 | N/A | |||||
| Class C | $53,433 | $17,811 | |||||
| Municipal Bond Fund | |||||||
| Class A | $28,735 | N/A |
| 6. | Related Party Transactions |
| U.S. Bancorp Fund Services, LLC (doing business as U.S. Bank Global Fund Services (“Fund Services”)) acts as the Funds’ Administrator and Fund Accountant under an Administration Agreement. Fund Services performs various administrative and accounting services including: preparing various federal and state regulatory filings, reports and returns for the Funds; preparing reports and materials to be supplied to the Trustees; monitoring the activities of the Funds’ custodian, transfer agent and accountants; coordinating the preparation and payment of the Funds’ expenses; and reviewing the Funds’ expense accruals. Fund Services also serves as the transfer agent to the Funds. U.S. Bank, N.A. (“US Bank”), an affiliate of Fund Services, serves as each Fund’s custodian. Fees incurred for the six months ended February 29, 2020, and owed as of February 29, 2020, are as follows: |
| Administration | |||||||||
| and Accounting | Incurred | Owed | |||||||
| Strategic Bond Fund | $ | 808,880 | $ | 291,387 | |||||
| Municipal Bond Fund | $ | 127,179 | $ | 43,990 | |||||
| Transfer Agency | Incurred | Owed | |||||||
| Strategic Bond Fund | $ | 291,998 | (1) | $ | 103,091 | (1) | |||
| Municipal Bond Fund | $ | 41,638 | $ | 15,622 | |||||
(1) This amount does not include sub-transfer agency fees. |
| Custody | Incurred | Owed | |||||||
| Strategic Bond Fund | $ | 90,348 | $ | 32,093 | |||||
| Municipal Bond Fund | $ | 9,609 | $ | 3,521 | |||||
| The Funds each have a line of credit with US Bank (see Note 10). | |
| Certain officers of the Funds are also employees of Fund Services. A Trustee of the Trust is affiliated with Fund Services and US Bank. |
PAGE 53
PERFORMANCE TRUST MUTUAL FUNDS – NOTES TO FINANCIAL STATEMENTS (CONT.)
February 29, 2020 (Unaudited)
| The Trust’s Chief Compliance Officer is also an employee of Fund Services. Each Fund’s allocation of the Trust’s Chief Compliance Officer fee incurred for the six months ended February 29, 2020, and owed as of February 29, 2020, are as follows: |
| Incurred | Owed | ||||||||
| Strategic Bond Fund | $ | 6,188 | $ | 2,073 | |||||
| Municipal Bond Fund | $ | 6,188 | $ | 2,014 | |||||
| 7. | Capital Share Transactions |
| Transactions in shares of the Funds were as follows: | |
| STRATEGIC BOND FUND – INSTITUTIONAL CLASS |
| SIX MONTHS ENDED | YEAR ENDED | ||||||||
| February 29, 2020 | AUGUST 31, 2019 | ||||||||
| Shares sold | 46,723,038 | 69,620,617 | |||||||
| Shares issued | |||||||||
| to holders in | |||||||||
| reinvestment | |||||||||
| of distributions | 2,349,594 | 3,148,637 | |||||||
| Shares redeemed | (14,547,581 | ) | (20,820,292 | ) | |||||
| Net increase | 34,525,051 | 51,948,962 | |||||||
| STRATEGIC BOND FUND – CLASS A | |||||||||
| SIX MONTHS ENDED | PERIOD ENDED | ||||||||
| February 29, 2020 | AUGUST 31, 2019(1) | ||||||||
| Shares sold | 351,086 | 381,918 | |||||||
| Shares issued | |||||||||
| to holders in | |||||||||
| reinvestment | |||||||||
| of distributions | 9,830 | 3,049 | |||||||
| Shares redeemed | (39,582 | ) | (60,032 | ) | |||||
| Net increase | 321,334 | 324,935 | |||||||
(1) The Class A shares commenced operations on January 2, 2019. | |
| STRATEGIC BOND FUND – CLASS C |
| SIX MONTHS ENDED | PERIOD ENDED | ||||||||
| February 29, 2020 | AUGUST 31, 2019(1) | ||||||||
| Shares sold | 608,074 | 319,782 | |||||||
| Shares issued | |||||||||
| to holders in | |||||||||
| reinvestment | |||||||||
| of distributions | 9,966 | 2,701 | |||||||
| Shares redeemed | (86,553 | ) | (2,431 | ) | |||||
| Net increase | 531,487 | 320,052 | |||||||
(1) The Class C shares commenced operations on January 2, 2019. | |
| MUNICIPAL BOND FUND – INSTITUTIONAL CLASS |
| SIX MONTHS ENDED | YEAR ENDED | ||||||||
| February 29, 2020 | AUGUST 31, 2019 | ||||||||
| Shares sold | 4,075,309 | 5,494,023 | |||||||
| Shares issued | |||||||||
| to holders in | |||||||||
| reinvestment of | |||||||||
| distributions | 177,412 | 232,279 | |||||||
| Shares redeemed | (768,683 | ) | (2,422,921 | ) | |||||
| Net increase | 3,484,038 | 3,303,381 | |||||||
| MUNICIPAL BOND FUND – CLASS A |
| SIX MONTHS ENDED | YEAR ENDED | ||||||||
| February 29, 2020 | AUGUST 31, 2019 | ||||||||
| Shares sold | 173,338 | 151,464 | |||||||
| Shares issued | |||||||||
| to holders in | |||||||||
| reinvestment of | |||||||||
| distributions | 10,588 | 19,320 | |||||||
| Shares redeemed | (61,745 | ) | (260,682 | ) | |||||
| Net increase (decrease) | 122,181 | (89,898 | ) | ||||||
| 8. | Investment Transactions |
| The aggregate purchases and sales of securities, excluding short-term investments, for the Funds for the six months ended February 29, 2020, are summarized below. |
| STRATEGIC | MUNICIPAL | ||||||||
| BOND FUND | BOND FUND | ||||||||
| Purchases | |||||||||
| U.S. Government | $ | 350,752,490 | $ | — | |||||
| Other | 925,733,889 | 117,741,140 | |||||||
| Sales | |||||||||
| U.S. Government | $ | 108,897,740 | $ | — | |||||
| Other | 420,740,482 | 36,108,949 | |||||||
| 9. | Beneficial Ownership |
| The beneficial ownership, either directly or indirectly, of more than 25% of the voting securities of a fund creates a presumption of control of a fund, under Section 2(a)(9) of the 1940 Act. At February 29, 2020, Raymond James, for the benefit of its customers, held 40.24% of the Strategic Bond Fund’s outstanding Class A shares. At February 29, 2020, Raymond James and Morgan Stanley Smith Barney, LLC, for the benefit of its customers, held 38.82% and 38.51%, respectively, of the Strategic Bond Fund's outstanding Class C shares. At February 29, 2020, National Financial Services Corp. and Charles Schwab & Company, Inc., for the benefit of its customers, held 27.21% and 26.17%, respectively, of the Municipal Bond Fund’s outstanding Institutional Class shares. At February 29, 2020, National Financial Services Corp. for the benefit of its customers, held 52.70% of the Municipal Bond Fund’s outstanding Class A shares. | |
| 10. | Line of Credit |
| At February 29, 2020, the Strategic Bond Fund and the Municipal Bond Fund each had a line of credit which matures on August 8, 2020 with a maximum borrowing equal to the lesser of $200,000,000 and $30,000,000, respectively, or 20% and 33.33%, respectively, of the fair value of unencumbered assets of each Fund. These secured lines of credit are intended to provide short-term financing, if necessary, subject to certain restrictions, in connection with shareholder redemptions. The Funds’ securities serve as collateral for the lines of credit. The credit facility is with the Funds’ custodian, US Bank. Interest will be accrued at the prime rate (4.75% as of February 29, 2020). The Funds did not utilize their lines of credit during the six months ended February 29, 2020. | |
| The Funds did not have any outstanding balances on the lines of credit at February 29, 2020. |
PAGE 54
PERFORMANCE TRUST MUTUAL FUNDS – NOTES TO FINANCIAL STATEMENTS (CONT.)
February 29, 2020 (Unaudited)
| 11. | New Accounting Pronouncement |
In March 2017, the FASB issued Accounting Standards Update (ASU) No. 2017-08, Receivables—Nonrefundable Fees and Other Costs (Subtopic 310-20): Premium Amortization on Purchased Callable Debt Securities. The amendments in the ASU shorten the amortization period for certain callable debt securities, held at a premium, to be amortized to the earliest call date. The ASU does not require an accounting change for securities held at a discount; which continues to be amortized to maturity. The ASU is effective for fiscal years and interim periods within those fiscal years beginning after December 15, 2018. Management is currently evaluating the impact, if any, of applying this provision. | |
| 12. | Subsequent Events |
| On March 16, 2020, the Funds declared and paid distributions from ordinary income to shareholders of record as of March 13, 2020, as follows: |
| Ordinary | |||||
| Income | |||||
| Strategic Bond Fund | |||||
| Institutional Class | $ | 10,441,448 | |||
| Class A | $ | 40,119 | |||
| Class C | $ | 42,889 | |||
| Municipal Bond Fund | |||||
| Institutional Class | $ | 889,540 | |||
| Class A | $ | 55,833 | |||
| Recent Market Events Risk. U.S. and international markets have experienced significant periods of volatility in recent years due to a number of economic, political and global macro factors including the impact of the coronavirus as a global pandemic and related public health issues, growth concerns in the U.S. and overseas, uncertainties regarding interest rates, trade tensions and the threat of tariffs imposed by the U.S. and other countries. These developments as well as other events, such as the upcoming U.S. presidential election, could result in further market volatility and negatively affect financial asset prices, the liquidity of certain securities and the normal operations of securities exchanges and other markets. As a result, the risk environment remains elevated. The Adviser will monitor developments and seek to manage each Fund in a manner consistent with achieving the Fund’s investment objective, but there can be no assurance that it will be successful in doing so. |
PAGE 55
NOTICE OF PRIVACY POLICY & PRACTICES
We collect non-public personal information about you from the following sources:
» information we receive about you on applications or other forms;
» information you give us orally; and
» information about your transactions with us or others.
We do not disclose any non-public personal information about our shareholders or former shareholders without the shareholder’s authorization, except as permitted by law or in response to inquiries from governmental authorities. We may share information with affiliated parties and unaffiliated third parties with whom we have contracts for servicing the Funds. We will provide unaffiliated third parties with only the information necessary to carry out their assigned responsibility. All shareholder records will be disposed of in accordance with applicable law. We maintain physical, electronic and procedural safeguards to protect your non-public personal information and require third parties to treat your nonpublic personal information with the same high degree of confidentiality.
In the event that you hold shares of the Funds through a financial intermediary, including, but not limited to, a broker-dealer, bank or trust company, the privacy policy of your financial intermediary would govern how your non-public personal information would be shared with unaffiliated third parties.
PAGE 56
EXPENSE EXAMPLE
Period Ended February 29, 2020 (Unaudited)
As a shareholder of the Funds, you incur two types of costs: (1) transaction costs, including sales charge (loads) on purchase payments (Class A shares only) and (2) ongoing costs, including management fees, distribution 12b-1 and service fees (Class A and Class C shares only) and other Fund expenses. This example is intended to help you understand your ongoing costs (in dollars) of investing in the Funds and to compare these costs with the ongoing costs of investing in other mutual funds.
The Example is based on an investment of $1,000 invested at the beginning of the period and held for the entire period (9/1/19 – 2/29/20).
Actual Expenses
The first line of the following tables provides information about actual account values and actual expenses for each Fund. If you purchase Class A shares of a Fund you will pay an initial sales charge of 2.25% when you invest. The tables do not include shareholder specific fees, such as the $15.00 fee charged to IRA accounts, or the $15.00 fee charged for wire redemptions. The tables also do not include portfolio trading commissions and related trading costs. You may use the information in this line, together with the amount you invested, to estimate the expenses that you paid over the period. Simply divide your account value by $1,000 (for example, an $8,600 account value divided by $1,000 = 8.6), then multiply the result by the number in the first line under the heading entitled “Expenses Paid During Period” to estimate the expenses you paid on your account during this period.
Hypothetical Example for Comparison Purposes
The second line of the following tables provides information about hypothetical account values and hypothetical expenses based on the actual expense ratios for each Fund and an assumed rate of return of 5% per year before expenses, which is not the Fund’s actual return. The hypothetical account values and expenses may not be used to estimate the actual ending account balance or expenses you paid for the period. You may use this information to compare the ongoing costs of investing in the Funds and other funds. To do so, compare this 5% hypothetical example with the 5% hypothetical examples that appear in the shareholder reports of the other funds.
Please note that the expenses shown in the tables are meant to highlight your ongoing costs only and do not reflect any transactional costs, such as sales charges (loads), redemption fees, or exchange fees. Therefore, the second line of each of the tables is useful in comparing ongoing costs only, and will not help you determine the relative total cost of owning different funds. In addition, if these transactional costs were included, your costs would have been higher.
| EXPENSES PAID | |||
| PERFORMANCE TRUST | DURING PERIOD | ||
| STRATEGIC BOND FUND – | BEGINNING ACCOUNT VALUE | ENDING ACCOUNT VALUE | SEPTEMBER 1, 2019 – |
| INSTITUTIONAL CLASS | SEPTEMBER 1, 2019 | FEBRUARY 29, 2020 | FEBRUARY 29, 2020* |
| Actual | $1,000.00 | $1,032.30 | $3.99 |
| Hypothetical | |||
| (5% annual return before expenses) | $1,000.00 | $1,020.93 | $3.97 |
| * | Expenses are equal to the Fund’s annualized expense ratio of 0.79%, multiplied by the average account value over the period, multiplied by 182/366 to reflect the one-half year period. |
| EXPENSES PAID | |||
| PERFORMANCE TRUST | DURING PERIOD | ||
| STRATEGIC BOND FUND – | BEGINNING ACCOUNT VALUE | ENDING ACCOUNT VALUE | SEPTEMBER 1, 2019 – |
| CLASS A | SEPTEMBER 1, 2019 | FEBRUARY 29, 2020 | FEBRUARY 29, 2020* |
| Actual | $1,000.00 | $1,030.90 | $5.25 |
| Hypothetical | |||
| (5% annual return before expenses) | $1,000.00 | $1,019.69 | $5.22 |
| * | Expenses are equal to the Fund’s annualized expense ratio of 1.04%, multiplied by the average account value over the period, multiplied by 182/366 to reflect the one-half year period. |
| EXPENSES PAID | |||
| PERFORMANCE TRUST | DURING PERIOD | ||
| STRATEGIC BOND FUND – | BEGINNING ACCOUNT VALUE | ENDING ACCOUNT VALUE | SEPTEMBER 1, 2019 – |
| CLASS C | SEPTEMBER 1, 2019 | FEBRUARY 29, 2020 | FEBRUARY 29, 2020* |
| Actual | $1,000.00 | $1,027.20 | $9.02 |
| Hypothetical | |||
| (5% annual return before expenses) | $1,000.00 | $1,015.96 | $8.97 |
| * | Expenses are equal to the Fund’s annualized expense ratio of 1.79%, multiplied by the average account value over the period, multiplied by 182/366 to reflect the one-half year period. |
PAGE 57
EXPENSE EXAMPLE (CONT.)
Period Ended February 29, 2020 (Unaudited)
| EXPENSES PAID | |||
| PERFORMANCE TRUST | DURING PERIOD | ||
| MUNICIPAL BOND FUND – | BEGINNING ACCOUNT VALUE | ENDING ACCOUNT VALUE | SEPTEMBER 1, 2019 – |
| INSTITUTIONAL CLASS | SEPTEMBER 1, 2019 | FEBRUARY 29, 2020 | FEBRUARY 29, 2020* |
| Actual | $1,000.00 | $1,036.70 | $2.79 |
| Hypothetical | |||
| (5% annual return before expenses) | $1,000.00 | $1,022.13 | $2.77 |
| * | Expenses are equal to the Fund’s annualized expense ratio of 0.55%, multiplied by the average account value over the period, multiplied by 182/366 to reflect the one-half year period. |
| EXPENSES PAID | |||
| PERFORMANCE TRUST | DURING PERIOD | ||
| MUNICIPAL BOND FUND – | BEGINNING ACCOUNT VALUE | ENDING ACCOUNT VALUE | SEPTEMBER 1, 2019 – |
| CLASS A | SEPTEMBER 1, 2019 | FEBRUARY 29, 2020 | FEBRUARY 29, 2020* |
| Actual | $1,000.00 | $1,035.50 | $4.05 |
| Hypothetical | |||
| (5% annual return before expenses) | $1,000.00 | $1,020.89 | $4.02 |
| * | Expenses are equal to the Fund’s annualized expense ratio of 0.80%, multiplied by the average account value over the period, multiplied by 182/366 to reflect the one-half year period. |
PAGE 58
ADDITIONAL INFORMATION
(Unaudited)
Availability of Proxy Voting Information
The Funds have adopted proxy voting policies and procedures that delegate to the Adviser the authority to vote proxies. A description of the Funds’ proxy voting policies and procedures is available without charge, upon request, by calling the Funds toll free at 1 (877) 738-9095. A description of these policies and procedures is also included in the Funds’ Statement of Additional Information, which is available on the SEC’s website at http://www.sec.gov.
The Funds’ proxy voting record for the most recent 12-month period ended June 30 is available without charge, upon request, by calling toll free, 1 (877) 738-9095, or by accessing the SEC’s website at http://www.sec.gov.
Portfolio Holdings
The Funds file a complete schedule of portfolio holdings with the U.S. Securities and Exchange Commission (the “SEC”) for the first and third quarters of each fiscal year on Part F of Form N-PORT. The Funds’ filings on Part F of Form N-PORT are available on the SEC’s website at www.sec.gov.
Householding
In an effort to decrease costs, the Funds intend to reduce the number of duplicate prospectuses and annual and semi-annual reports you receive by sending only one copy of each to those addresses shared by two or more accounts and to shareholders the Funds reasonably believe are from the same family or household. Once implemented, if you would like to discontinue householding for your accounts, please call toll-free at 1-877-738-9095 to request individual copies of these documents. Once the Funds receive notice to stop householding, the Funds will begin sending individual copies 30 days after receiving your request. This policy does not apply to account statements.
Forward Looking Statements
Except for historical information contained in this report for the Funds, the matters discussed in this report may constitute forward-looking statements made pursuant to the safe-harbor provisions of the Private Securities Litigation Reform Act of 1995. These include any Adviser or portfolio manager predictions, assessments, analyses or outlooks for individual securities, industries, market sectors and/or markets. These statements involve risks and uncertainties. In addition to the general risks described for the Funds in the most recent prospectus, other factors bearing on this report include the accuracy of the Adviser’s or portfolio manager’s data, forecasts and predictions, and the appropriateness of the investment programs designed by the Adviser or portfolio manager to implement their strategies efficiently and effectively. Any one or more of these factors, as well as other risks affecting the securities markets and investment instruments generally, could cause the actual results of the Funds to differ materially as compared to benchmarks associated with the Funds.
Indemnification
Under the Trust’s organizational documents, its officers and Trustees are indemnified against certain liabilities arising out of the performance of their duties to the Funds. In addition, in the normal course of business, the Funds enter into contracts that provide general indemnification to other parties. The Funds’ maximum exposure under these arrangements is unknown as this would involve future claims that may be made against the Funds that have not yet occurred. However, the Funds have not had prior claims or losses pursuant to these contracts and expect the risk of loss to be remote.
Information About Trustees
The business and affairs of the Trust are managed under the direction of the Trust’s Board of Trustees. Information pertaining to the Trustees of the Trust is set forth below. The Funds’ Statement of Additional Information includes additional information about the Trustees and is available, without charge, upon request by calling 1 (877) 738-9095.
PAGE 59
INDEPENDENT TRUSTEES
(Unaudited)
| NUMBER OF | OTHER | ||||
| PORTFOLIOS | PRINCIPAL | DIRECTORSHIPS | |||
| NAME, | POSITION(S) | TERM OF OFFICE | IN THE TRUST | OCCUPATION(S) | HELD BY TRUSTEE |
| ADDRESS, AND | HELD WITH | AND LENGTH OF | OVERSEEN BY | DURING THE | DURING THE PAST |
| YEAR OF BIRTH | THE TRUST | TIME SERVED | THE TRUSTEE | PAST FIVE YEARS | FIVE YEARS |
| Independent Trustees | |||||
| Michael D. | Trustee | Indefinite Term; | 19 | Professor Emeritus, | Independent |
| Akers, Ph.D. | Since August 22, | Department of Accounting | Trustee, USA | ||
| 615 E. Michigan St. | 2001 | (June 2019-present), | MUTUALS | ||
| Milwaukee, WI | Professor, Department of | (an open-end | |||
| 53202 | Accounting (2004-2019), | investment | |||
| Year of Birth: 1955 | Chair, Department of | company with | |||
| Accounting (2004-2017), | two portfolios). | ||||
| Marquette University. | |||||
| Gary A. Drska | Trustee | Indefinite Term; | 19 | Pilot, Frontier/Midwest | Independent |
| 615 E. Michigan St. | Since August 22, | Airlines, Inc. (airline company) | Trustee, USA | ||
| Milwaukee, WI | 2001 | (1986-present). | MUTUALS | ||
| 53202 | (an open-end | ||||
| Year of Birth: 1956 | investment | ||||
| company with | |||||
| two portfolios). | |||||
| Jonas B. Siegel | Trustee | Indefinite Term; | 19 | Retired (2011-present); | Independent |
| 615 E. Michigan St. | Since October 23, | Managing Director, Chief | Trustee, Gottex | ||
| Milwaukee, WI | 2009 | Administrative Officer (“CAO”) | Trust (an open- | ||
| 53202 | and Chief Compliance Officer | end investment | |||
| Year of Birth: 1943 | (“CCO”), Granite Capital | company) | |||
| International Group, L.P. | (2010-2016); | ||||
| (an investment management | Independent | ||||
| firm) (1994-2011). | Manager, Ramius | ||||
| IDF fund complex | |||||
| (two closed-end | |||||
| investment | |||||
| companies) (2010- | |||||
| 2015); Independent | |||||
| Trustee, Gottex | |||||
| Multi-Asset | |||||
| Endowment fund | |||||
| complex (three | |||||
| closed-end | |||||
| investment | |||||
| companies) (2010- | |||||
| 2015); Independent | |||||
| Trustee, Gottex | |||||
| Multi-Alternatives | |||||
| fund complex | |||||
| (three closed-end | |||||
| investment | |||||
| companies) | |||||
| (2010-2015). |
PAGE 60
INTERESTED TRUSTEE AND OFFICERS
(Unaudited)
| NUMBER OF | OTHER | ||||
| PORTFOLIOS | PRINCIPAL | DIRECTORSHIPS | |||
| NAME, | POSITION(S) | TERM OF OFFICE | IN THE TRUST | OCCUPATION(S) | HELD BY TRUSTEE |
| ADDRESS, AND | HELD WITH | AND LENGTH OF | OVERSEEN BY | DURING THE | DURING THE PAST |
| YEAR OF BIRTH | THE TRUST | TIME SERVED | THE TRUSTEE | PAST FIVE YEARS | FIVE YEARS |
| Interested Trustee and Officers | |||||
| Joseph C. | Chairperson | Indefinite Term; | 19 | President (2017-present), | Trustee, Buffalo |
| Neuberger* | and Trustee | Since August 22, | Chief Operating Officer | Funds (an open-end | |
| 615 E. Michigan St. | 2001 | (2016-present), Executive | investment | ||
| Milwaukee, WI | Vice President (1994-2017), | company) (2003- | |||
| 53202 | U.S. Bancorp Fund | 2017); Trustee, | |||
| Year of Birth: 1962 | Services, LLC. | USA MUTUALS | |||
| (an open-end | |||||
| investment | |||||
| company) | |||||
| (2001-2018). | |||||
| John P. Buckel | President | Indefinite Term; | N/A | Vice President,U.S. Bancorp | N/A |
| 615 E. Michigan St. | and Principal | Since January 24, | Fund Services, LLC | ||
| Milwaukee, WI | Executive | 2013 | (2004-present). | ||
| 53202 | Officer | ||||
| Year of Birth: 1957 | |||||
| Jennifer A. Lima | Vice | Indefinite Term; | N/A | Vice President, U.S. Bancorp | N/A |
| 615 E. Michigan St. | President, | Since January 24, | Fund Services, LLC | ||
| Milwaukee, WI | Treasurer | 2013 | (2002-present). | ||
| 53202 | and Principal | ||||
| Year of Birth: 1974 | Financial and | ||||
| Accounting | |||||
| Officer | |||||
| Elizabeth B. Scalf | Chief | Indefinite Term; | N/A | Senior Vice President, | N/A |
| 615 E. Michigan St. | Compliance | Since July 1, | U.S. Bancorp Fund | ||
| Milwaukee, WI | Officer, Vice | 2017 | Services, LLC | ||
| 53202 | President and | (February 2017-present); | |||
| Year of Birth: 1985 | Anti-Money | Vice President and | |||
| Laundering | Assistant CCO, Heartland | ||||
| Officer | Advisors, Inc. (December | ||||
| 2016-January 2017); | |||||
| Vice President and CCO, | |||||
| Heartland Group, Inc. | |||||
| (May 2016-November 2016); | |||||
| Vice President, CCO and | |||||
| Senior Legal Counsel | |||||
| (May 2016-November 2016), | |||||
| Assistant CCO and Senior | |||||
| Legal Counsel (January | |||||
| 2016-April 2016), Senior | |||||
| Legal and Compliance | |||||
| Counsel (2013-2015), | |||||
| Heartland Advisors, Inc. | |||||
| Jay S. Fitton | Secretary | Indefinite Term; | N/A | Assistant Vice President, | N/A |
| 615 E. Michigan St. | Since July 22, | U.S. Bancorp Fund | |||
| Milwaukee, WI | 2019 | Services, LLC | |||
| 53202 | (2019-present); Partner, | ||||
| Year of Birth: 1970 | Practus, LLP (2018-2019); | ||||
| Counsel, Drinker Biddle & | |||||
| Reath (2016-2018); Counsel, | |||||
| Huntington Bancshares Inc. | |||||
| (2011-2015). | |||||
| * | Mr. Neuberger is deemed to be an “interested person” of the Trust as defined by the 1940 Act due to his position and material business relationship with the Trust. |
PAGE 61
INTERESTED TRUSTEE AND OFFICERS
(Unaudited)
| NUMBER OF | OTHER | ||||
| PORTFOLIOS | PRINCIPAL | DIRECTORSHIPS | |||
| NAME, | POSITION(S) | TERM OF OFFICE | IN THE TRUST | OCCUPATION(S) | HELD BY TRUSTEE |
| ADDRESS, AND | HELD WITH | AND LENGTH OF | OVERSEEN BY | DURING THE | DURING THE PAST |
| YEAR OF BIRTH | THE TRUST | TIME SERVED | THE TRUSTEE | PAST FIVE YEARS | FIVE YEARS |
| Officers | |||||
| Kelly A. Burns | Assistant | Indefinite Term; | N/A | Assistant Vice President, | N/A |
| 615 E. Michigan St. | Treasurer | Since April 23, | U.S. Bancorp Fund | ||
| Milwaukee, WI | 2015 | Services, LLC | |||
| 53202 | (2011-present). | ||||
| Year of Birth: 1987 | |||||
| Melissa Aguinaga | Assistant | Indefinite Term; | N/A | Assistant Vice President, | N/A |
| 615 E. Michigan St. | Treasurer | Since July 1, | U.S. Bancorp Fund | ||
| Milwaukee, WI | 2015 | Services, LLC | |||
| 53202 | (2010-present). | ||||
| Year of Birth: 1987 | |||||
| Laura A. Carroll | Assistant | Indefinite Term; | N/A | Assistant Vice President, | N/A |
| 615 E. Michigan St. | Treasurer | Since August 20, | U.S. Bancorp Fund | ||
| Milwaukee, WI | 2018 | Services, LLC | |||
| 53202 | (2007-present). | ||||
| Year of Birth: 1985 |
PAGE 62
(This Page Intentionally Left Blank.)
Investment Adviser
PT Asset Management, LLC
500 W. Madison, Suite 470
Chicago, IL 60661
888.282.3220
www.PTAM.com
Fund Administrator, Transfer Agent,
and Fund Accountant
U.S. Bancorp Fund Services, LLC
615 East Michigan Street
Milwaukee, WI 53202
Custodian
U.S. Bank, N.A.
Custody Operations
1555 N. RiverCenter Drive, Suite 302
Milwaukee, WI 53212
Legal Counsel
Godfrey & Kahn, S.C.
833 East Michigan Street, Suite 1800
Milwaukee, WI 53202
Independent Registered
Public Accounting Firm
Cohen & Company, Ltd.
1350 Euclid Avenue, Suite 800
Cleveland, OH 44115
Distributor
Foreside Fund Services, LLC
3 Canal Plaza, Suite 100
Portland, ME 04101
This report has been prepared for shareholders
and may be distributed to others only if preceded
or accompanied by a current prospectus.
The Performance Trust Mutual Funds are distributed
by Foreside Fund Services, LLC
Item 2. Code of Ethics.
Not applicable for semi-annual reports.
Item 3. Audit Committee Financial Expert.
Not applicable for semi-annual reports.
Item 4. Principal Accountant Fees and Services.
Not applicable for semi-annual reports.
Item 5. Audit Committee of Listed Registrants.
Not applicable to registrants who are not listed issuers (as defined in Rule 10A-3 under the Securities Exchange Act of 1934).
Item 6. Investments.
(a) | Schedule of Investments is included as part of the report to shareholders filed under Item 1 of this Form. |
(b) | Not Applicable. |
Item 7. Disclosure of Proxy Voting Policies and Procedures for Closed-End Management Investment Companies.
Not applicable to open-end investment companies.
Item 8. Portfolio Managers of Closed-End Management Investment Companies.
Not applicable to open-end investment companies.
Item 9. Purchases of Equity Securities by Closed‑End Management Investment Company and Affiliated Purchasers.
Not applicable to open-end investment companies.
Item 10. Submission of Matters to a Vote of Security Holders.
There have been no material changes to the procedures by which shareholders may recommend nominees to the registrant’s board of trustees.
Item 11. Controls and Procedures.
(a) | The Registrant’s President and Treasurer have reviewed the Registrant's disclosure controls and procedures (as defined in Rule 30a-3(c) under the Investment Company Act of 1940 (the “Act”)) as of a date within 90 days of the filing of this report, as required by Rule 30a-3(b) under the Act and Rules 13a-15(b) or 15d‑15(b) under the Securities Exchange Act of 1934. Based on their review, such officers have concluded that the disclosure controls and procedures are effective in ensuring that information required to be disclosed in this report is appropriately recorded, processed, summarized and reported and made known to them by others within the Registrant and by the Registrant’s service provider. |
(b) | There were no changes in the Registrant's internal control over financial reporting (as defined in Rule 30a-3(d) under the Act) that occurred during the last fiscal half-year of the period covered by this report that has materially affected, or is reasonably likely to materially affect, the Registrant's internal control over financial reporting. |
Item 12. Disclosure of Securities Lending Activities for Closed-End Management Investment Companies
Not applicable to open-end investment companies.
Item 13. Exhibits.
(a) | (1) Any code of ethics or amendment thereto, that is the subject of the disclosure required by Item 2, to the extent that the registrant intends to satisfy Item 2 requirements through filing an exhibit. Not Applicable. |
(3) Any written solicitation to purchase securities under Rule 23c‑1 under the Act sent or given during the period covered by the report by or on behalf of the registrant to 10 or more persons. Not applicable to open-end investment companies.
(4) Change in the registrant’s independent public accountant. There was no change in the registrant’s independent public accountant for the period covered by this report.
SIGNATURES
Pursuant to the requirements of the Securities Exchange Act of 1934 and the Investment Company Act of 1940, the registrant has duly caused this report to be signed on its behalf by the undersigned, thereunto duly authorized.
(Registrant) Trust for Professional Managers
By (Signature and Title)* /s/ John Buckel
John Buckel, President
Date: 4/29/2020
Pursuant to the requirements of the Securities Exchange Act of 1934 and the Investment Company Act of 1940, this report has been signed below by the following persons on behalf of the registrant and in the capacities and on the dates indicated.
By (Signature and Title)* /s/ John Buckel
John Buckel, President
Date: 4/29/2020
By (Signature and Title)* /s/ Jennifer Lima
Jennifer Lima, Treasurer
Date: 4/29/2020
* Print the name and title of each signing officer under his or her signature.