UNITED STATES
SECURITIES AND EXCHANGE COMMISSION
Washington, D.C. 20549
FORM N-CSR
CERTIFIED SHAREHOLDER REPORT OF REGISTERED
MANAGEMENT INVESTMENT COMPANIES
Investment Company Act file number 811-10401
Trust for Professional Managers
(Exact name of registrant as specified in charter)
615 East Michigan Street
Milwaukee, WI 53202
(Address of principal executive offices) (Zip code)
Jay S. Fitton
U.S. Bancorp Fund Services, LLC
615 East Michigan Street
Milwaukee, WI 53202
(Name and address of agent for service)
(513) 629-8104
Registrant's telephone number, including area code
Date of fiscal year end: September 30, 2021
Date of reporting period: September 30, 2021
Item 1. Reports to Stockholders.
(a)
Annual Report
September 30, 2021
CrossingBridge Low Duration High Yield Fund
Institutional Class
(CBLDX)
CrossingBridge Responsible Credit Fund
Institutional Class
(CBRDX)
CrossingBridge Ultra-Short Duration Fund
Institutional Class
(CBUDX)
CrossingBridge Pre-Merger SPAC ETF
(SPC)
Investment Adviser
CrossingBridge Advisors, LLC
427 Bedford Road
Suite 230
Pleasantville, New York 10570
Phone: 1-888-898-2780
Table of Contents
MANAGEMENT’S DISCUSSION OF | | |
FUND PERFORMANCE AND ANALYSIS | | | 3 |
| | | | |
EXPENSE EXAMPLE | | | 14 |
| | | | |
INVESTMENT HIGHLIGHTS | | | 16 |
| | | | |
SCHEDULES OF INVESTMENTS | | | 24 |
| | | | |
STATEMENTS OF ASSETS AND LIABILITIES | | | 47 |
| | | | |
STATEMENTS OF OPERATIONS | | | 49 |
| | | | |
STATEMENTS OF CHANGES IN NET ASSETS | | | 51 |
| | | | |
FINANCIAL HIGHLIGHTS | | | 54 |
| | | | |
NOTES TO FINANCIAL STATEMENTS | | | 59 |
| | | | |
REPORT OF INDEPENDENT REGISTERED | | | |
PUBLIC ACCOUNTING FIRM | | | 78 |
| | | | |
BASIS FOR TRUSTEES’ APPROVAL OF | | | |
INVESTMENT ADVISORY AGREEMENTS | | | 80 |
| | | | |
REVIEW OF LIQUIDITY RISK MANAGEMENT PROGRAM | | | 91 |
| | | | |
ADDITIONAL INFORMATION | | | 92 |
Management’s Discussion of Fund Performance and Analysis
CrossingBridge Low Duration High Yield Fund
(Unaudited)
The 2021 fiscal year for the CrossingBridge Low Duration High Yield Fund (CBLDX; the “Fund”) covers the twelve-month period of October 1, 2020 through September 30, 2021. During this period, the Fund gained 9.13% on its Institutional Class shares while the ICE BofA 0-3 Year U.S. High Yield Excluding Financials Index gained 10.85%, the ICE BofA 1-3 Year U.S. Corporate Bond Index gained 1.28% and the ICE BofA 0-3 Year U.S. Treasury Index gained 0.06%.
Monthly investment results for the fiscal year ranged from -0.42% in October 2020 to 1.69% in January 2021. The Fund generated positive returns for eleven out of the twelve months during the fiscal year. The median monthly return for the period was 0.49% with an annualized standard deviation of 2.46%.
The Fund had positive contributions from interest income and had realized and unrealized gains during the period. 100% of the income was distributed for a 1-year dividend yield of 3.90%. The Fund’s subsidized 30 day SEC yield was 2.23% and unsubsidized 30 day SEC yield was 2.24%. The total return for the period was higher as the NAV increased from $9.86 on September 30, 2020 to $10.36 on September 30, 2021.
We believe the opportunity set for the CrossingBridge Low Duration High Yield Fund was very attractive during the fiscal year:
| • | The strong mergers and acquisitions environment led to various event-driven opportunities |
| | |
| • | Special purpose acquisition companies offered one of the most attractive risk/reward opportunities in today’s market and our exposure continues to grow |
| | |
| • | Core buy & hold and cushion bonds positions performed well |
High Yield Spread Per Unit of Leverage (SPL) and
% of High Yield Bonds that are Trading to Call
High Yield Credit Chartbook, Bank of America, July 1, 2021 and 1Q21 High Yield and Loan Fundamentals, Morgan Stanley, July 6, 2021
The historically low interest rate policy (sometimes referred to as “the Fed put”) and the highly anticipated rebound in the economy have driven asset prices to new heights as investors fear missing out. As illustrated above, the portion of the high yield market trading at a yield-to-call rate is at a 20+ year high as capital markets are wide open and any CFO who can refinance debt at a lower rate is taking advantage of the market. Concurrently, investors have become more complacent in their required compensation for credit risk. As shown above, the high yield spread per unit of leverage has fallen to match the lows seen over the last 20 years. In such an environment, it is as important as ever to be a “bottom up” credit-specific investor. The good news is that the universe of investment candidates is growing as turbocharged investment bankers feed the market with refinancings, mergers & acquisitions and market access for first-time debt issuers. Moreover, the series of massive government stimulus packages and the policies of the Federal Reserve have permitted the U.S. economy to rebound rapidly, producing economic growth not seen since the 1950’s. Looking forward, we believe the opportunity set remains very favorable for the Fund and we believe we are well-positioned to capitalize on it.
The Fund purchases below investment grade debt as part of its core strategy. Deemed speculative in nature by credit rating agencies because of elevated balance sheet leverage, the asset class has a greater potential for defaults and credit losses than government and investment grade debt. However, we believe our “bottom-up” research approach significantly mitigates this risk.
Opinions expressed are subject to change at any time, are not guaranteed and should not be considered investment advice.
Past performance does not guarantee future results.
Diversification does not assure a profit nor protect against risk in a declining market.
Fund holdings and sector allocation are subject to change at any time and should not be considered a recommendation to buy or sell any security. Please see the Schedule of Investments for complete Fund holdings.
*Definitions: The ICE BofA 0-3 Year U.S. High Yield Excluding Financials Index (HSNF) tracks the performance of short maturity U.S. dollar denominated below investment grade rating (based on an average of Moody’s, S&P, and Fitch), at least 18 months to final maturity at the time of issuance, at least one month but less than three years remaining term to final maturity as of the rebalancing date, a fixed coupon schedule and minimum amount outstanding of $250 million. The ICE BofA 1-3 Year U.S. Corporate Bond Index (C1A0) is a subset of the ICE BofA U.S. Corporate Bond Index including all securities with a remaining term to final maturity less than three years. The ICE BofA 0-3 Year U.S. Treasury Index (G1QA) tracks the performance of U.S. dollar denominated sovereign debt publicly issued by the U.S. government in its domestic market with maturities less than three years. Standard Deviation is a statistical measure that is used to quantify the amount of variation or dispersion of a set of data values. Duration is the weighted average of the present value of the cash flows and is used as a measure of a bond price’s response to changes in yield. Rising interest rates mean falling bond prices, while declining interest rates mean rising bond prices. Dividend Yield expresses a percentage of a current share price. SEC yield is a standard yield calculation developed by the U.S. Securities and Exchange Commission (SEC) that allows for fairer comparisons of bond funds. It is based on the most recent 30-day period covered by the fund’s filings with the SEC. The yield figure reflects the dividends and interest earned during the period after the deduction of the fund’s expenses. It is also referred to as the “standardized yield.” Basis Point is one hundredth of one percent.
It is not possible to invest directly in an index.
Mutual fund investing involves risk. Principal loss is possible. Investments in foreign securities involve greater volatility and political, economic and currency risks and differences
in accounting methods. Investments in debt securities typically decrease in value when interest rates rise. This risk is usually greater for longer-term debt securities. Investment in lower-rated and non-rated securities presents a greater risk of loss to principal and interest than higher-rated securities. The Fund may make short sales of securities, which involves the risk that losses may exceed the original amount invested. The Fund may invest in exchange-traded funds (“ETFs”) and exchange-traded notes (“ETNs”), which are subject to additional risks that do not apply to conventional mutual funds, including the risks that the market price of an ETF’s and ETN’s shares may trade at a discount to its net asset value (“NAV”), an active secondary trading market may not develop or be maintained, or trading may be halted by the exchange in which they trade, which may impact the Fund’s ability to sell the shares. The value of ETNs may be influenced by the level of supply and demand for the ETN, volatility and lack of liquidity. The Fund may invest in derivative securities, which derive their performance from the performance of an underlying asset, index, interest rate or currency exchange rate. Derivatives can be volatile and involve various types and degrees of risks, and, depending upon the characteristics of a particular derivative, suddenly can become illiquid. Investments in asset-backed, mortgage-backed, and collateralized mortgage-backed securities include additional risks that investors should be aware of such as credit risk, prepayment risk, possible illiquidity and default, as well as increased susceptibility to adverse economic developments. The Fund invests in equity securities and warrants of special purpose acquisition companies (“SPACs”). Pre-combination SPACs have no operating history or ongoing business other than seeking a merger, share exchange, asset acquisition, share purchase negotiation or similar business combination (a “Combination”), and the value of their securities is particularly dependent on the ability of the entity’s management to identify and complete a profitable Combination. There is no guarantee that the SPACs in which the Fund invests will complete a Combination or that any Combination that is completed will be profitable. Unless and until a Combination is completed, a SPAC generally invests its assets in U.S. government securities, money market securities, and cash. Public stockholders of SPACs may not be afforded a meaningful opportunity to vote on a proposed initial Combination because certain stockholders, including stockholders affiliated with the management of the SPAC, may have sufficient voting power, and a financial incentive, to approve such a transaction without support from public stockholders. As a result, a SPAC may complete a Combination even though a majority of its public stockholders do not support such a Combination. Some SPACs may pursue Combinations only within certain industries or regions, which may increase the volatility of their prices. The Fund may invest in SPACs domiciled or listed outside of the U.S., including, but not limited to, Canada, the Cayman Islands, Bermuda and the Virgin Islands. Investments in SPACs domiciled or listed outside of the U.S. may involve risks not generally associated with investments in the securities of U.S. SPACs, such as risks relating to political, social, and economic developments abroad and differences between U.S. and foreign regulatory requirements and market practices. Further, tax treatment may differ from U.S. SPACs and securities may be subject of foreign withholding taxes. Smaller capitalization SPACs will have a more limited pool of companies with which they can pursue a business combination relative to larger capitalization companies. That may make it more difficult for a small capitalization SPAC to consummate a business combination.
Must be preceded or accompanied by a prospectus.
Distributor: Quasar Distributors, LLC.
Management’s Discussion of Fund Performance and Analysis
CrossingBridge Responsible Credit Fund
(Unaudited)
The 2021 fiscal period for the CrossingBridge Responsible Credit Fund (CBRDX; the “Fund”) covers the three-month period of June 30, 2021 (commencement of investment operations) through September 30, 2021. During this period, the Fund gained 0.57% on its Institutional Class shares while the ICE BofA U.S. High Yield Index gained 0.94%, the ICE BofA U.S. Corporate Index lost 0.06% and the ICE BofA 3-7 Year U.S. Treasury Index lost 0.16%.
Monthly investment results for the fiscal period ranged from -0.20% in July 2021 to 0.54% in August 2021. The Fund generated positive returns for two out of the three months during the fiscal period. The median monthly return for the period was 0.23%.
The Fund had positive contributions from interest income and had realized capital losses and unrealized gains during the period. The total return for the period was higher as the NAV increased from $10.00 on June 30, 2021 to $10.01 on September 30, 2021.
According to J.P. Morgan, European corporate debt issuers actively pursuing environmental, social and governance (ESG) principals are often rewarded with a lower cost of capital whereas the same phenomenon is not yet prevalent in the U.S. This appears, to us, to be another market mis-pricing and future opportunity.
Industrial BBB Credit Spreads vs. ESG Scores
Oceans Apart – Assessing the ESG Cost of Debt in Global Credit, J.P. Morgan, June 9, 2021
The graph above illustrates the difference in the pricing of ESG-sensitive credit in Europe versus the U.S. credit spreads. BBB1 quality European credits with higher ESG scores tend to have lower credit spreads. This sharply contrasts with the U.S. where the credit spreads of BBB credits do not appear to be correlated to the ESG score, and counterintuitively, the credits with the best ESG scores in the U.S. yield 14 basis points more than those with lower scores. Although we respect the objectives of ESG-mindful companies and the discipline required to execute these elements, credit quality must also be taken into account when determining the appropriate spread.
1 | Ratings given by a rating agency such as S&P or Moody’s. |
Many consider the Nordic financial markets as leaders in adopting ESG principles and standardization as well as a model to observe investor behavior. As one of the largest U.S. investors in the Nordic corporate credit market, we have witnessed firsthand the tightening in credit spreads for ESG-friendly companies when investors emphasized adherence to ESG standards.
ESG Global HY Issuance
The Sustainable Finance Movement, Deutsche Bank, June 7, 2021
Globally, ESG equity funds have grown from $299 billion at the end of 2017 to approximately $1.6 trillion in August 2021, a cumulative annual growth rate of approximately 67%. However, the global fixed income market has been slower to adopt ESG strategies with assets growing from approximately $350 billion in early 2018 to an estimated $500 billion in early 2021 for a cumulative average growth rate of less than 13%. As shown above, growth of global high yield issuance of ESG bonds has been robust over the last two years, although the issuance amount has been quite small relative to the whole high yield market. Generally, the U.S. has lagged Europe in ESG adoption, and the ESG-friendly high yield debt market is even further behind and in the early stages. We are hopeful that ESG standardization and independent scoring will encourage broader mindfulness among corporate issuers rather than simply be a catalyst for one-off “green” projects. Then, we believe the market should boom.
Opinions expressed are subject to change at any time, are not guaranteed and should not be considered investment advice.
Past performance does not guarantee future results.
The Fund is non-diversified under the 1940 act, therefore allowing the Fund to be more concentrated than a diversified fund. Because the Fund is non-diversified it may invest a greater percentage of its assets in the securities of a single issuer or a smaller number of issuers than if it were a diversified fund. As a result, a decline in the value of an investment in a single issuer could cause the Fund’s overall value to decline to a greater degree than if the Fund held a more diversified portfolio. Current fund statistics may not be indicative of future positioning.
Fund holdings and sector allocation are subject to change at any time and should not be considered a recommendation to buy or sell any security. Please see the Schedule of Investments for complete Fund holdings.
Definitions: The ICE BofA U.S. High Yield Index (H0A0) tracks the performance of U.S. dollar denominated below investment grade corporate debt publicly issued in the U.S. domestic market. The ICE BofA U.S. Corporate Index (C0A0) tracks the performance of U.S. dollar denominated investment grade corporate debt publicly issued in the U.S. domestic market. The ICE BofA 3-7 Year U.S. Treasury Index (G30C) is a subset of ICE BofA U.S. Treasury Index including all securities with a remaining term to final maturity greater than or equal to 3 years and less than 7 years. Basis Point is one hundredth of one percent.
It is not possible to invest directly in an index.
Mutual fund investing involves risk. Principal loss is possible. Investments in foreign securities involve greater volatility and political, economic and currency risks and differences in accounting methods. Investments in debt securities typically decrease in value when interest rates rise. This risk is usually greater for longer-term debt securities. Investment in lower-rated and non-rated securities presents a greater risk of loss to principal and interest than higher-rated securities. The Fund may make short sales of securities, which involves the risk that losses may exceed the original amount invested. The Fund’s focus on sustainability considerations (ESG criteria) may limit the number of investment opportunities available to the Fund, and as a result, at times, the Fund may underperform funds that are not subject to similar investment considerations. The Fund invests in equity securities of special purpose acquisition companies (“SPACs”), which raise assets to seek potential business combination opportunities. Unless and until a business combination is completed, a SPAC generally invests its assets in U.S. government securities, money market securities, and cash. Because SPACs have no operating history or ongoing business other than seeking a business combination, the value of their securities is particularly dependent on the ability of the entity’s management to identify and complete a profitable business combination. There is no guarantee that the SPACs in which the Fund invests will complete a business combination or that any business combination that is completed will be profitable. The Fund is non-diversified meaning it may concentrate its assets in fewer individual holdings than a diversified fund. The Fund invests in equity securities and warrants of SPACs. Pre-combination SPACs have no operating history or ongoing business other than seeking a merger, share exchange, asset acquisition, share purchase negotiation or similar business combination (a “Combination”), and the value of their securities is particularly dependent on the ability of the entity’s management to identify and complete a profitable Combination. There is no guarantee that the SPACs in which the Fund invests will complete a Combination or that any Combination that is completed will be profitable. Unless and until a Combination is completed, a SPAC generally invests its assets in U.S. government securities, money market securities, and cash. Public stockholders of SPACs may not be afforded a meaningful opportunity to vote on a proposed initial Combination because certain stockholders, including stockholders affiliated with the management of the SPAC, may have sufficient voting power, and a financial incentive, to approve such a transaction without support from public stockholders. As a result, a SPAC may complete a Combination even though a majority of its public stockholders do not support such a Combination. Some SPACs may pursue Combinations only within certain industries or regions, which may increase the volatility of their prices. The Fund may invest in SPACs domiciled or listed outside of the U.S., including, but not limited to, Canada, the Cayman Islands, Bermuda and the Virgin Islands. Investments in SPACs domiciled or listed outside of the U.S. may involve risks not generally associated with investments in the securities of U.S. SPACs, such as risks relating to political, social, and economic developments abroad and differences between U.S. and foreign regulatory requirements and market practices. Further, tax treatment may differ from U.S. SPACs and securities may be subject of foreign withholding taxes. Smaller capitalization SPACs will have a more limited pool of companies with which they can pursue a business combination relative to larger capitalization companies. That may make it more difficult for a small capitalization SPAC to consummate a business combination.
Must be preceded or accompanied by a prospectus.
Distributor: Quasar Distributors, LLC.
Management’s Discussion of Fund Performance and Analysis
CrossingBridge Ultra-Short Duration Fund
(Unaudited)
The 2021 fiscal period for the CrossingBridge Ultra-Short Duration Fund (CBUDX; the “Fund”) covers the three-month period of June 30, 2021 (commencement of investment operations) through September 30, 2021. During this period, the Fund gained 0.07% on its Institutional Class shares while the ICE BofA 0-1 Year U.S. Corporate Index gained 0.09%, the ICE BofA 0-1 Year U.S. Treasury Index gained 0.03% and the ICE BofA 0-3 Year U.S. Fixed Rate Asset Backed Securities Index gained 0.12%.
Monthly investment results for the fiscal period ranged from -0.09% in August 2021 to 0.11% in September 2021. The Fund generated positive returns for two out of the three months during the fiscal period. The median monthly return for the period was 0.05%.
The Fund had positive contributions from interest income and had realized and unrealized gains during the period. The total return for the period was higher as the NAV increased from $10.00 on June 30, 2021 to $10.01 on September 30, 2021.
We launched the CrossingBridge Ultra-Short Duration Fund on June 30, 2021 to offer a solution for investors seeking ultra-short term fixed income allocations at “rock bottom” interest rates, while stressing preservation of capital. The Fund was designed to compete in the Morningstar Ultra-Short Bond category which requires a minimum of 65% of the Fund be in investment grade bonds.
Opinions expressed are subject to change at any time, are not guaranteed and should not be considered investment advice.
Past performance does not guarantee future results.
Diversification does not assure a profit nor protect against risk in a declining market.
Fund holdings and sector allocation are subject to change at any time and should not be considered a recommendation to buy or sell any security. Please see the Schedule of Investments for complete Fund holdings.
*Definitions: The ICE BofA 0-1 Year U.S. Corporate Index (H540) tracks the performance of short-maturity U.S. dollar denominated investment grade corporate debt publicly issued in the U.S. domestic market. The ICE BofA 0-1 Year U.S. Treasury Index (G0QA) tracks the performance of U.S. dollar denominated sovereign debt publicly issued by the U.S. government in its domestic market with maturities less than a year. The ICE BofA 0-3 Year U.S. Fixed Rate Asset Backed Securities Index (R1A0) is a subset of ICE BofA U.S. Fixed Rate Asset Backed Securities Index including all securities with an average life less than 3 years. Duration is the weighted average of the present value of the cash flows and is used as a measure of a bond price’s response to changes in yield. Rising interest rates mean falling bond prices, while declining interest rates mean rising bond prices.
It is not possible to invest directly in an index.
Mutual fund investing involves risk. Principal loss is possible. Investments in foreign securities involve greater volatility and political, economic and currency risks and differences in accounting methods. Investments in debt securities typically decrease in value when interest rates rise. This risk is usually greater for longer-term debt securities. Investment in lower-rated and non-rated securities presents a greater risk of loss to principal and interest than higher-rated securities. The fund may make short sales of securities, which involves the risk that losses may exceed the original amount invested. The Fund invests in equity securities and warrants of special purpose acquisition companies (“SPACs”). Pre-combination
SPACs have no operating history or ongoing business other than seeking a merger, share exchange, asset acquisition, share purchase negotiation or similar business combination (a “Combination”), and the value of their securities is particularly dependent on the ability of the entity’s management to identify and complete a profitable Combination. There is no guarantee that the SPACs in which the Fund invests will complete a Combination or that any Combination that is completed will be profitable. Unless and until a Combination is completed, a SPAC generally invests its assets in U.S. government securities, money market securities, and cash. Public stockholders of SPACs may not be afforded a meaningful opportunity to vote on a proposed initial Combination because certain stockholders, including stockholders affiliated with the management of the SPAC, may have sufficient voting power, and a financial incentive, to approve such a transaction without support from public stockholders. As a result, a SPAC may complete a Combination even though a majority of its public stockholders do not support such a Combination. Some SPACs may pursue Combinations only within certain industries or regions, which may increase the volatility of their prices. The Fund may invest in SPACs domiciled or listed outside of the U.S., including, but not limited to, Canada, the Cayman Islands, Bermuda and the Virgin Islands. Investments in SPACs domiciled or listed outside of the U.S. may involve risks not generally associated with investments in the securities of U.S. SPACs, such as risks relating to political, social, and economic developments abroad and differences between U.S. and foreign regulatory requirements and market practices. Further, tax treatment may differ from U.S. SPACs and securities may be subject of foreign withholding taxes. Smaller capitalization SPACs will have a more limited pool of companies with which they can pursue a business combination relative to larger capitalization companies. That may make it more difficult for a small capitalization SPAC to consummate a business combination.
Must be preceded or accompanied by a prospectus.
Distributor: Quasar Distributors, LLC.
Management’s Discussion of Fund Performance and Analysis
CrossingBridge Pre-Merger SPAC ETF
(Unaudited)
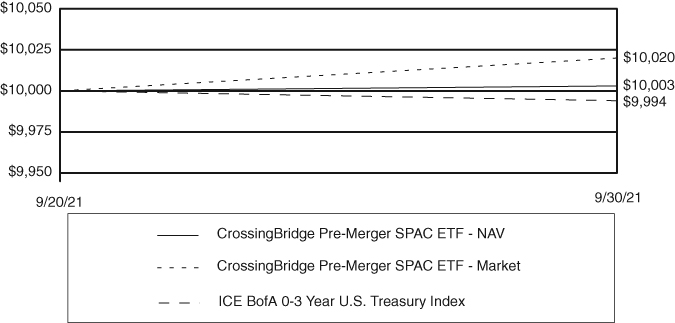
The 2021 fiscal period for the CrossingBridge Pre-Merger SPAC ETF (SPC; the “Fund”) covers the ten-day period of September 20, 2021 (commencement of investment operations) through September 30, 2021. During this period, the Fund had a NAV return of 0.03% and a market return of 0.20% while the ICE BofA 0-3 Year U.S. Treasury Index lost 0.06%. The Fund had realized gains and unrealized losses during the period. The total return for the period was higher as the share price increased from $20.00 on September 20, 2021 to $20.04 on September 30, 2021 while the NAV increased from $20.00 to $20.01 for the period.
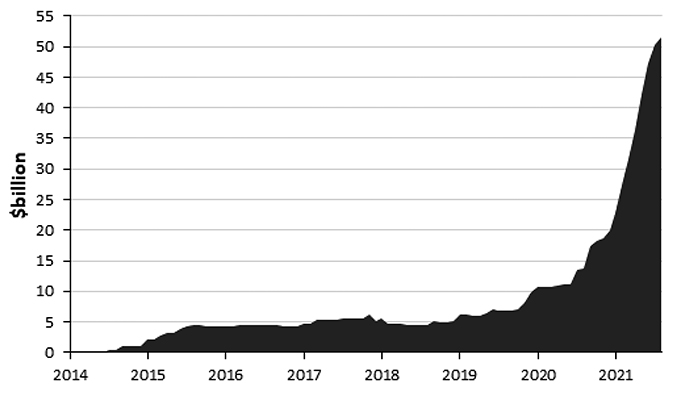
During the COVID-19 pandemic, Special Purpose Acquisition Companies (SPACs) have evolved from a backwater niche to a bona fide stand-alone asset class1. We contend that SPACs purchased below trust value with the intent to hold them to liquidation or redeem upon a business combination (whichever happens sooner) are an attractive alternative to short-term fixed income allocations. Please see the end of the letter for a brief primer on SPACs.
According to SPACinformer.com2, there are 461 SPACS with $134 billion of trust value seeking merger partners and 120 SPACs with $35 billion of capital with pending transactions at quarter-end.
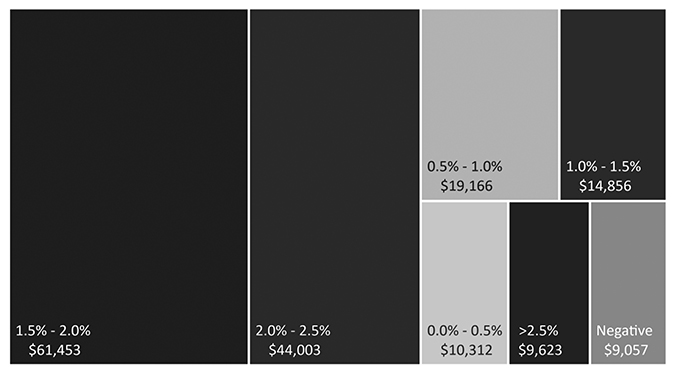
Special Purpose Acquisition Companies (SPACs) Trust Value ($millions) and Yield to Liquidation Date (%) – October 1, 20213
The subset of SPACS with a yield to liquidation greater than 2.0%, referenced in the chart above, is comprised of 229 companies with $53.6 billion of trust value. As a group these SPACS had a 2.4% yield to liquidation and time to liquidation of 1.1 years, which represents a 227-basis point spread to a comparable-maturity U.S. Treasury bond.4
________________
1 | The SPAC market has grown from 59 SPACs raising $14.0 billion in 2019 to a cumulative 670 SPACs raising over $200 billion in 2020 and 2021 (year-to-date). |
2 | SPACinformer.com is an affiliate of CrossingBridge Advisors, LLC. |
3 | Per SPACinformer.com, as of 10/1/2021. |
4 | Computation is based on weighted average capital in trust. |
Should a SPAC consummate a transaction substantially sooner than its liquidation date, the realized return will be significantly greater for investors that exercise the redemption right. For example, if all SPACs currently seeking targets closed transactions within the next six months, the yield to redemption date will be in excess of 4.0%. Additional upside may occur should the market become enthusiastic about an announced deal and drive the stock price above the trust value, allowing an exit through the sale of shares instead of redemption.
SPAC Primer
A special purpose acquisition company (SPAC) is a company with no commercial operations that raises money from investors through an IPO for the sole purpose of acquiring an existing private operating business within a specific period of time (generally up to two years). SPACs are sometimes called “blank check companies” because, at the time of the IPO, investors do not know the business in which the sponsor will choose to invest, although the sponsor’s track record of investment in certain industries or stated areas of interest may provide an indication. IPO proceeds are placed in a trust account, typically invested in U.S. government securities, money markets, and cash. This trust account is held for the benefit of the SPAC’s common shareholders until it is used to fund a successful business combination, or until it is returned to investors once the SPAC is liquidated because it failed to consummate a merger. A unique feature of SPACs is that SPAC common shareholders have the option to redeem their shares for their pro rata interest in the trust should the investor choose not to participate in the newly formed company. In many cases, the SPAC sponsor may overcollateralize the trust at the time of the IPO, meaning that there is more money in the trust than the IPO proceeds raised with the excess cash held for the benefit of SPAC common shareholders in the event of redemption or liquidation. If SPAC common shares are purchased at or below trust value, we believe the opportunity exists to earn an attractive yield to liquidation with minimal principal risk. As a result of the shareholder-friendly redemption feature of SPACs, should a SPAC successfully pursue a business combination, an investor’s realized rate of return will likely be higher due to the shortened maturity of the security. Furthermore, the market’s positive reaction to a SPAC’s announcement of a business combination may result in equity upside above the trust value.
SPACs are commonly issued at $10 per unit with a unit consisting of one share and a warrant or fraction of a warrant. The warrant allows its holder to purchase a specified amount of common stock at a specified price for a specified time; typically, the exercise price is $11.50 and the warrant has 5 years until expiration. On average, 55-60 days following the IPO, SPAC unit holders may elect to separate their units into shares and warrants that will trade as standalone securities. Some investors may sell the warrants to reduce their initial cost, thereby enhancing the yield to liquidation or yield to redemption. Other investors may choose to sell their SPAC common shares while keeping the warrants, in essence creating a portfolio of long-term, out-of-the-money options of future business combinations. Some investors may simply choose to keep the units, or the combination of SPAC common shares and warrants, to replicate the characteristics of a convertible bond.
Opinions expressed are subject to change at any time, are not guaranteed and should not be considered investment advice.
Past performance does not guarantee future results.
Diversification does not assure a profit nor protect against risk in a declining market.
Fund holdings and sector allocation are subject to change at any time and should not be considered a recommendation to buy or sell any security. Please see the Schedule of Investments for complete Fund holdings.
*Definitions: The ICE BofA 0-3 Year U.S. Treasury Index tracks the performance of U.S. dollar denominated sovereign debt publicly issued by the U.S. government in its domestic market with maturities less than three years. Yield to Liquidation is similar to a bond’s Yield to Maturity, SPACs have a Yield to Liquidation/Redemption, which can be calculated using the Gross Spread and Time to Liquidation. Basis Point is one hundredth of one percent. Out-of-the-money is if the underlying option price is trading below the strike price of the call, or a put options underlying’s price is above the put’s strike price.
It is not possible to invest directly in an index.
Investing involves risk; Principal loss is possible. The Fund invests in equity securities and warrants of SPACs. Pre-combination SPACs have no operating history or ongoing business other than seeking a merger, share exchange, asset acquisition, share purchase negotiation or similar business combination (a “Combination”), and the value of their securities is particularly dependent on the ability of the entity's management to identify and complete a profitable Combination. There is no guarantee that the SPACs in which the Fund invests will complete a Combination or that any Combination that is completed will be profitable. Unless and until a Combination is completed, a SPAC generally invests its assets in U.S. government securities, money market securities, and cash. Public stockholders of SPACs may not be afforded a meaningful opportunity to vote on a proposed initial Combination because certain stockholders, including stockholders affiliated with the management of the SPAC, may have sufficient voting power, and a financial incentive, to approve such a transaction without support from public stockholders. As a result, a SPAC may complete a Combination even though a majority of its public stockholders do not support such a Combination. Some SPACs may pursue Combinations only within certain industries or regions, which may increase the volatility of their prices. The Fund may invest in SPACs domiciled or listed outside of the U.S., including, but not limited to, Canada, the Cayman Islands, Bermuda and the Virgin Islands. Investments in SPACs domiciled or listed outside of the U.S. may involve risks not generally associated with investments in the securities of U.S. SPACs, such as risks relating to political, social, and economic developments abroad and differences between U.S. and foreign regulatory requirements and market practices. Further, tax treatment may differ from U.S. SPACs and securities may be subject of foreign withholding taxes. Smaller capitalization SPACs will have a more limited pool of companies with which they can pursue a business combination relative to larger capitalization companies. That may make it more difficult for a small capitalization SPAC to consummate a business combination. Because the Fund is non-diversified it may invest a greater percentage of its assets in the securities of a single issuer or a smaller number of issuers than if it were a diversified fund. As a result, a decline in the value of an investment in a single issuer could cause the Fund’s overall value to decline to a greater degree than if the Fund held a more diversified portfolio.
Must be preceded or accompanied by a prospectus.
Distributor: Foreside Fund Services, LLC.
CROSSINGBRIDGE FUNDS
Expense Example
(Unaudited)
As a shareholder of the CrossingBridge Low Duration High Yield Fund, CrossingBridge Responsible Credit Fund and CrossingBridge Ultra-Short Duration Fund, you incur two types of costs: (1) transaction costs and (2) ongoing costs, including management fees, shareholder servicing plan fees and other Fund expenses. As a shareholder of the CrossingBridge Pre-Merger SPAC ETF, you incur two types of costs: (1) transaction costs, including brokerage commissions paid on purchases and sales of the Fund’s shares, and (2) ongoing costs, including management fees of the Fund. The Example is intended to help you understand your ongoing costs (in dollars) of investing in the Funds and to compare these costs with the ongoing costs of investing in other funds. The Example is based on an investment of $1,000 invested at the beginning of the respective period disclosed in the following table and held for the entire respective period disclosed in the following table.
Actual Expenses
The first line under each Fund in the following table provides information about actual account values and actual expenses for each Fund. You may use the information in this line, together with the amount you invested, to estimate the expenses that you paid over the period. Simply divide your account value by $1,000 (for example, an $8,600 account value divided by $1,000 = 8.6), then multiply the result by the number in the first line under the heading entitled “Expenses Paid During Period” to estimate the expenses you paid on your account during this period.
Hypothetical Example for Comparison Purposes
The second line under each Fund in the following table provides information about hypothetical account values and hypothetical expenses based on each Fund’s actual expense ratio and an assumed rate of return of 5% per year before expenses, which is not the Fund’s actual return. The hypothetical account values and expenses may not be used to estimate the actual ending account balance or expenses you paid for the period. You may use this information to compare the ongoing costs of investing in the Funds and other funds. To do so, compare this 5% hypothetical example with the 5% hypothetical examples that appear in the shareholder reports of other funds. Please note that the expenses shown in the table are meant to highlight your ongoing costs only and do not reflect any transactional costs, such as sales charges (loads), redemption fees or exchange fees. Therefore, the second line of the table is useful in comparing ongoing costs only, and will not help you determine the relative total costs of owning different funds. In addition, if these transactional costs were included, your costs would have been higher.
CROSSINGBRIDGE FUNDS
Expense Example (Continued)
(Unaudited)
| | | Beginning | Ending | |
| | Annualized | Account Value | Account Value | Expenses |
| | Expense | April 1, | September 30, | Paid During |
| | Ratio | 2021 | 2021 | Period(1) |
| CrossingBridge Low | | | | |
| Duration High Yield Fund | | | | |
Based on actual return | 0.86% | $1,000.00 | $1,031.70 | $4.38 |
Based on hypothetical return | | | | |
| (5% return before expenses) | 0.86% | 1,000.00 | 1,020.76 | 4.36 |
| (1) | Expenses are calculated using the Fund’s annualized expense ratio, multiplied by the average account value over the period, multiplied by the number of days in the period (183 days), divided by 365 days to reflect the six month period ended September 30, 2021. |
| | | Beginning | Ending | |
| | Annualized | Account Value | Account Value | Expenses |
| | Expense | June 30, | September 30, | Paid During |
| | Ratio | 2021(1) | 2021 | Period(2) |
| CrossingBridge | | | | |
| Responsible Credit Fund | | | | |
Based on actual return | 0.91% | 1,000.00 | 1,005.70 | 2.30 |
Based on hypothetical return | | | | |
| (5% return before expenses) | 0.91% | 1,000.00 | 1,010.42 | 2.33 |
| | | | | |
| CrossingBridge | | | | |
| Ultra-Short Duration Fund | | | | |
Based on actual return | 0.90% | 1,000.00 | 1,000.70 | 2.27 |
Based on hypothetical return | | | | |
| (5% return before expenses) | 0.90% | 1,000.00 | 1,010.45 | 2.31 |
| (1) | Commencement of operations. |
| (2) | Expenses are calculated using the Fund’s annualized expense ratio, multiplied by the average account value over the period, multiplied by the number of days in the period (93 days), divided by 365 days to reflect the period of June 30, 2021 through September 30, 2021. |
| | | Beginning | Ending | |
| | Annualized | Account Value | Account Value | Expenses |
| | Expense | September 20, | September 30, | Paid During |
| | Ratio | 2021(1) | 2021 | Period(2) |
| CrossingBridge | | | | |
| Pre-Merger SPAC ETF | | | | |
Based on actual return | 0.80% | 1,000.00 | 1,000.30 | 0.22 |
Based on hypothetical return | | | | |
| (5% return before expenses) | 0.80% | 1,000.00 | 1,001.27 | 0.24 |
| (1) | Commencement of operations. |
| (2) | Expenses are calculated using the Fund’s annualized expense ratio, multiplied by the average account value over the period, multiplied by the number of days in the period (11 days), divided by 365 days to reflect the period of September 20, 2021 through September 30, 2021. |
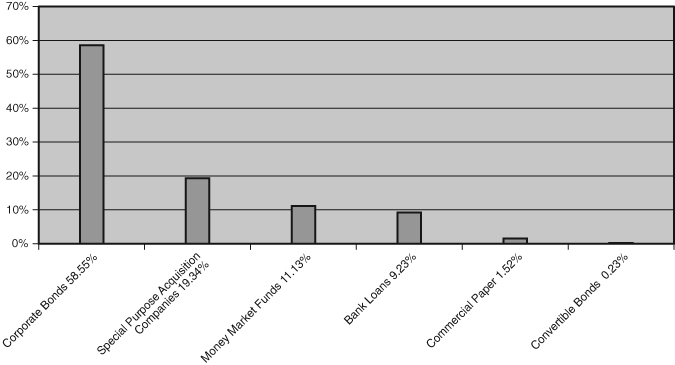
CROSSINGBRIDGE LOW DURATION HIGH YIELD FUND
Investment Highlights
(Unaudited)
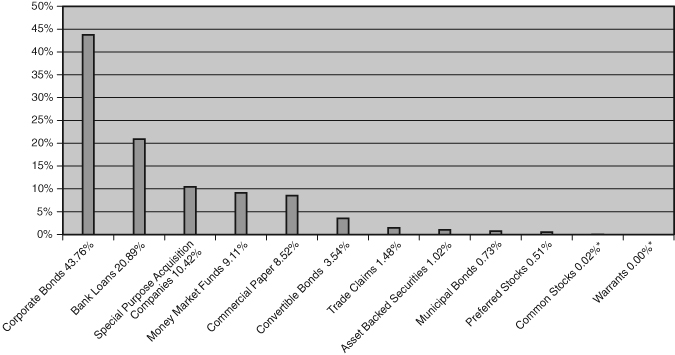
The Fund seeks high current income and capital appreciation consistent with the preservation of capital using a low duration mandate. The allocation of portfolio holdings as of September 30, 2021 is as follows:
Allocation of Portfolio Holdings
(% of Investments)
Average Annual Total Returns as of September 30, 2021
| | One | Three | Since |
| | Year | Years | February 1, 20181 |
| Institutional Class Shares | 9.13% | 4.52% | 4.24% |
| ICE BofA 0-3 Year U.S. High Yield | | | |
| Excluding Financials Index | 10.85% | 4.58% | 4.75% |
| ICE BofA 0-3 Year U.S. Treasury Index | 0.06% | 2.27% | 2.07% |
| ICE BofA 1-3 Year U.S. Corporate Bond Index | 1.28% | 3.63% | 3.24% |
1 | Commencement of investment operations. |
Performance data quoted represents past performance and does not guarantee future results. The investment return and principal value of an investment will fluctuate so that an investor’s shares, when redeemed, may be worth more or less than their original cost. Current performance of the Fund may be lower or higher than the performance quoted. Performance data current to the most recent month-end may be obtained by calling 1-888-898-2780.
Investment performance reflects fee waivers in effect. In the absence of such waivers, total returns would be reduced.
CROSSINGBRIDGE LOW DURATION HIGH YIELD FUND
Investment Highlights (Continued)
(Unaudited)
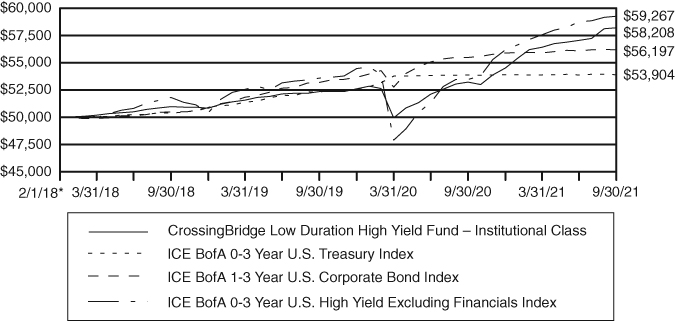
The returns shown assume reinvestment of Fund distributions and do not reflect the deduction of taxes that a shareholder would pay on Fund distributions or the redemption of Fund shares. The following graph illustrates performance of a hypothetical investment made in the Fund and the Fund’s primary benchmark index, the ICE BofA 0-3 Year U.S. High Yield Excluding Financials Index, as well as other broad-based securities indices on the Fund’s inception date. The graph does not reflect any future performance. ICE BofA 0-3 Year U.S. High Yield Excluding Financials Index is a subset of ICE BofA 0-3 Year U.S. High Yield Index excluding sector level 2 Financial issuers. ICE BofA 0-3 Year U.S. Treasury Index tracks the performance of U.S. dollar denominated sovereign debt publicly issued by the U.S. government in its domestic market with maturities less than three years. Qualifying securities must have at least 18 months to maturity at point of issuance, at least one month and less than three years remaining term to final maturity, a fixed coupon schedule and minimum amount outstanding of $1 billion. ICE BofA 1-3 Year U.S. Corporate Bond Index is a subset of ICE BofA U.S. Corporate Bond Index including all securities with a remaining term to final maturity less than 3 years. It is not possible to invest directly in an index.
Growth of $50,000 Investment
| * | Commencement of investment operations. |
CROSSINGBRIDGE RESPONSIBLE CREDIT FUND
Investment Highlights
(Unaudited)
The Fund seeks high current income and capital appreciation consistent with the preservation of capital by investing in fixed income securities that meet the responsible investing criteria of the Fund’s investment adviser. The allocation of portfolio holdings as of September 30, 2021 is as follows:
Allocation of Portfolio Holdings
(% of Investments)
Total Returns as of September 30, 2021
| | Since |
| | June 30, 20211 |
| Institutional Class Shares | 0.57% |
| ICE BofA U.S. High Yield Index | 0.94% |
| ICE BofA 3-7 Year U.S. Treasury Index | -0.16% |
| ICE BofA U.S. Corporate Index | -0.06% |
1 | Commencement of investment operations. |
Performance data quoted represents past performance and does not guarantee future results. The investment return and principal value of an investment will fluctuate so that an investor’s shares, when redeemed, may be worth more or less than their original cost. Current performance of the Fund may be lower or higher than the performance quoted. Performance data current to the most recent month end may be obtained by calling 1-888-898-2780.
Investment performance reflects fee waivers in effect. In the absence of such waivers, total returns would be reduced.
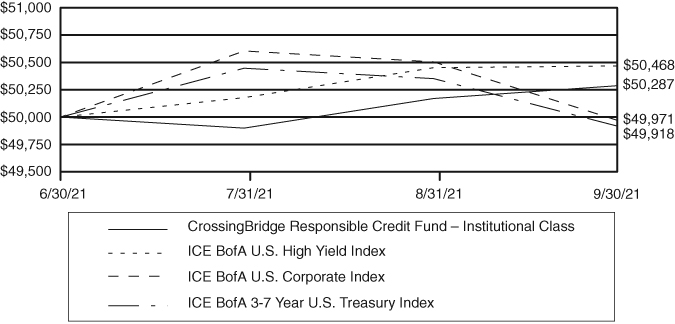
CROSSINGBRIDGE RESPONSIBLE CREDIT FUND
Investment Highlights (Continued)
(Unaudited)
The returns shown assume reinvestment of Fund distributions and do not reflect the deduction of taxes that a shareholder would pay on Fund distributions or the redemption of Fund shares. The following graph illustrates performance of a hypothetical investment made in the Fund and the Fund’s primary benchmark index, the ICE BofA U.S. High Yield Index, as well as other broad-based securities indices on the Fund’s inception date. ICE BofA 3-7 Year U.S. Treasury Index measures the performance of public obligations of the U.S. Treasury that have a remaining maturity of greater than 3 years and less than or equal to 7 years. ICE BofA U.S. Corporate Index is an unmanaged index comprised of U.S. dollar denominated investment grade, fixed rate corporate debt securities publicly issued in the U.S. domestic market with at least one year remaining term to final maturity and at least $250 million outstanding. ICE BofA U.S. High Yield Index is an unmanaged index that tracks the performance of U.S. dollar denominated, below investment-grade rated corporate debt publicly issued in the U.S. domestic market. It is not possible to invest directly in an index.
Growth of $50,000 Investment
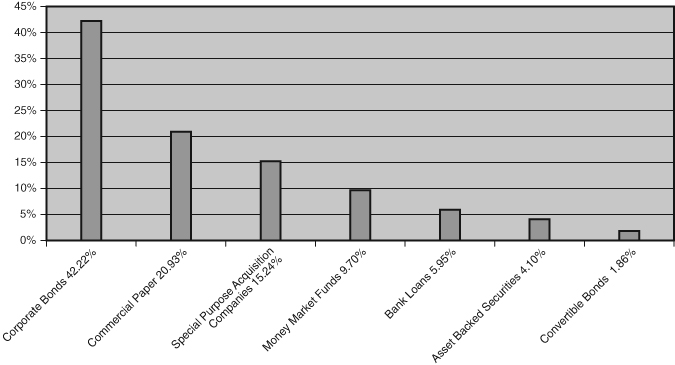
CROSSINGBRIDGE ULTRA-SHORT DURATION FUND
Investment Highlights
(Unaudited)
The Fund seeks to offer a higher yield than cash instruments while maintaining a low duration. The allocation of portfolio holdings as of September 30, 2021 is as follows:
Allocation of Portfolio Holdings
(% of Investments)
Total Returns as of September 30, 2021
| | Since |
| | June 30, 20211 |
| Institutional Class Shares | 0.07% |
| ICE BofA 0-1 Year U.S. Corporate Index | 0.09% |
| ICE BofA 0-1 Year U.S. Treasury Index | 0.03% |
| ICE BofA 0-3 Year U.S. Fixed Rate | |
| Asset Backed Securities Index | 0.12% |
1 | Commencement of investment operations. |
Performance data quoted represents past performance and does not guarantee future results. The investment return and principal value of an investment will fluctuate so that an investor’s shares, when redeemed, may be worth more or less than their original cost. Current performance of the Fund may be lower or higher than the performance quoted. Performance data current to the most recent month end may be obtained by calling 1-888-898-2780.
Investment performance reflects fee waivers in effect. In the absence of such waivers, total returns would be reduced.
CROSSINGBRIDGE ULTRA-SHORT DURATION FUND
Investment Highlights (Continued)
(Unaudited)
The returns shown assume reinvestment of Fund distributions and do not reflect the deduction of taxes that a shareholder would pay on Fund distributions or the redemption of Fund shares. The following graph illustrates performance of a hypothetical investment made in the Fund and the Fund’s primary benchmark index, ICE BofA 0-1 Year U.S. Corporate Index, as well as other broad-based securities indices on the Fund’s inception date. ICE BofA 0-1 Year U.S. Corporate Index is a subset of ICE BofA U.S. Corporate Bond Index including all securities with a remaining term to final maturity less than 1 year. ICE BofA 0-1 Year U.S. Treasury Index tracks the performance of U.S. dollar denominated sovereign debt publicly issued by the U.S. government in its domestic market with maturities less than one year. ICE BofA 0-3 Year U.S. Fixed Rate Asset Backed Securities Index is a subset of ICE BofA U.S. Fixed Rate Asset Backed Securities Index including all securities with a remaining term to final maturity less than three years. It is not possible to invest directly in an index.
Growth of $50,000 Investment
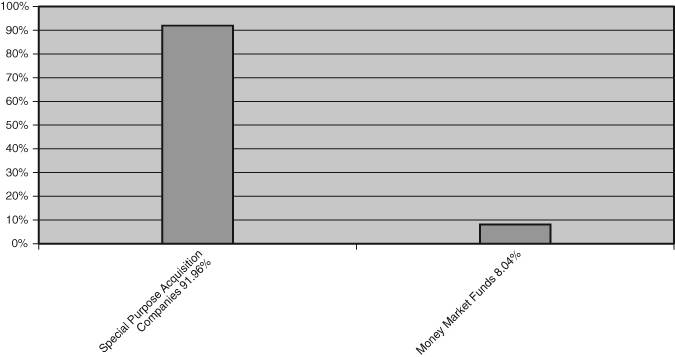
CROSSINGBRIDGE PRE-MERGER SPAC ETF
Investment Highlights
(Unaudited)
The Fund seeks to provide total returns consistent with the preservation of capital. The allocation of portfolio holdings as of September 30, 2021 is as follows:
Allocation of Portfolio Holdings
(% of Investments)
Total Returns as of September 30, 2021
| | Since |
| | September 20, 20211 |
Net Asset Value | 0.03% |
Market Value | 0.20% |
| ICE BofA 0-3 Year U.S. Treasury Index | -0.06% |
1 | Commencement of investment operations. |
Performance data quoted represents past performance and does not guarantee future results. The investment return and principal value of an investment will fluctuate so that an investor’s shares, when redeemed, may be worth more or less than their original cost. Current performance of the Fund may be lower or higher than the performance quoted. Performance data current to the most recent month end may be obtained by calling 1-888-898-2780.
The returns shown assume reinvestment of Fund distributions and do not reflect the deduction of taxes that a shareholder would pay on Fund distributions or the redemption of Fund shares. The following graph illustrates performance of a hypothetical investment made in the Fund and broad-based securities indices on the Fund’s inception date. The graph does not reflect any future performance. ICE BofA 0-3 Year U.S. Treasury Index tracks the performance of U.S. dollar denominated sovereign debt publicly issued by the
CROSSINGBRIDGE PRE-MERGER SPAC ETF
Investment Highlights (Continued)
(Unaudited)
U.S. government in its domestic market with maturities less than three years. Qualifying securities must have at least 18 months to maturity at point of issuance, at least one month and less than three years remaining term to final maturity, a fixed coupon schedule and minimum amount outstanding of $1 billion. It is not possible to invest directly in an index.
Growth of $10,000 Investment
CROSSINGBRIDGE LOW DURATION HIGH YIELD FUND
September 30, 2021
| | | Face | | | | |
| | | Amount† | | | Value | |
| | | | | | | |
| ASSET BACKED SECURITIES – 1.02% | | | | | | |
| | | | | | | |
| Finance and Insurance – 0.30% | | | | | | |
HTS Fund I LLC | | | | | | |
2021-1, 1.410%, 08/25/2036 (a) | | | 1,000,000 | | | $ | 999,961 | |
| | | | | | | | | |
| Transportation and Warehousing – 0.72% | | | | | | | | |
Hawaiian Airlines 2013-1 Class B Pass Through Certificates | | | | | | | | |
2013-1, 4.950%, 07/15/2023 | | | 2,341,761 | | | | 2,339,766 | |
| TOTAL ASSET BACKED SECURITIES (Cost $3,194,943) | | | | | | | 3,339,727 | |
| | | | | | | | | |
| BANK LOANS – 20.95% | | | | | | | | |
| | | | | | | | | |
| Arts, Entertainment, and Recreation – 0.63% | | | | | | | | |
Golden Nugget | | | | | | | | |
13.000% (3 Month LIBOR + 12.000%), 10/04/2023 (b) | | | 1,884,938 | | | | 2,064,007 | |
| | | | | | | | | |
| Construction – 0.25% | | | | | | | | |
Lealand Finance (McDermott) | | | | | | | | |
3.084% (1 Month Base Rate + 3.000%), 06/30/2024 (b)(d) | | | 1,337,668 | | | | 802,601 | |
| | | | | | | | | |
| Finance and Insurance – 1.32% | | | | | | | | |
JZ Capital Partners Ltd. | | | | | | | | |
16.000% (3 Month LIBOR + 11.000% + | | | | | | | | |
4.000% PIK), 06/12/2022 (b)(d)(j)(k) | | | 4,293,369 | | | | 4,293,369 | |
| | | | | | | | | |
| Health Care and Social Assistance – 0.77% | | | | | | | | |
Change Healthcare Holdings LLC | | | | | | | | |
3.500% (1 Month LIBOR + 2.500%), 03/01/2024 (b) | | | 2,514,089 | | | | 2,514,214 | |
| | | | | | | | | |
| Information – 5.18% | | | | | | | | |
Gray Television, Inc. | | | | | | | | |
0.000%, 08/03/2022 (l)(m) | | | 6,233,000 | | | | 6,233,000 | |
Intelsat Jackson Holdings SA | | | | | | | | |
8.000% (3 Month LIBOR + 3.750%), 11/27/2023 (b)(d) | | | 825,000 | | | | 837,375 | |
8.625%, 01/02/2024 (d) | | | 3,301,000 | | | | 3,362,894 | |
8.750% (3 Month LIBOR + 4.500%), 01/02/2024 (b)(d) | | | 2,131,000 | | | | 2,171,627 | |
Meredith Corp. | | | | | | | | |
2.584% (1 Month LIBOR + 2.500%), 01/31/2025 (b) | | | 4,318,000 | | | | 4,313,056 | |
| | | | | | | | 16,917,952 | |
| | | | | | | | | |
| Manufacturing – 8.38% | | | | | | | | |
Forterra Finance LLC | | | | | | | | |
4.000% (1 Month LIBOR + 3.000%), 10/25/2023 (b) | | | 4,185,492 | | | | 4,188,108 | |
The accompanying notes are an integral part of these financial statements.
CROSSINGBRIDGE LOW DURATION HIGH YIELD FUND
| Schedule of Investments (Continued) |
September 30, 2021
| | | Face | | | | |
| | | Amount† | | | Value | |
| | | | | | | |
| BANK LOANS – 20.95% (CONTINUED) | | | | | | |
| | | | | | | |
| Manufacturing – 8.38% (Continued) | | | | | | |
K&N Parent, Inc. | | | | | | |
5.750% (3 Month LIBOR + 4.750%), 10/20/2023 (b) | | | 4,401,072 | | | $ | 4,228,704 | |
LABL, Inc. | | | | | | | | |
4.084% (1 Month LIBOR + 4.000%), 07/02/2026 (b) | | | 4,407,756 | | | | 4,408,307 | |
Mallinckrodt International | | | | | | | | |
4.382% (3 Month LIBOR + 2.250%), 02/28/2022 (b) | | | 12,524,560 | | | | 12,322,601 | |
Pixelle Specialty Solutions | | | | | | | | |
7.500% (1 Month LIBOR + 6.500%), 10/31/2024 (b) | | | 2,199,000 | | | | 2,201,749 | |
| | | | | | | | 27,349,469 | |
| | | | | | | | | |
| Mining, Quarrying, and Oil and Gas Extraction – 1.36% | | | | | | | | |
Quarternorth Energy Holding, Inc. | | | | | | | | |
9.000% (Base Rate + 8.000%), 08/27/2026 (b) | | | 4,419,985 | | | | 4,447,610 | |
| | | | | | | | | |
| Professional, Scientific, and Technical Services – 1.58% | | | | | | | | |
Parexel International Corp. | | | | | | | | |
2.834% (1 Month LIBOR + 2.750%), 09/27/2024 (b) | | | 5,169,268 | | | | 5,170,716 | |
| | | | | | | | | |
| Transportation and Warehousing – 1.48% | | | | | | | | |
Syncreon Group BV | | | | | | | | |
7.000% (1 Month LIBOR + 6.000%), 04/01/2025 (b)(d) | | | 4,824,000 | | | | 4,878,270 | |
| TOTAL BANK LOANS (Cost $68,776,517) | | | | | | | 68,438,208 | |
| | | | | | | | | |
| | | | | | | | | |
| COMMERCIAL PAPER – 8.55% | | | | | | | | |
| | | | | | | | | |
| Manufacturing – 8.55% | | | | | | | | |
Conagra Brands, Inc. | | | | | | | | |
0.251%, 12/22/2021 (c) | | | 5,418,000 | | | | 5,414,153 | |
Constellation Brands, Inc. | | | | | | | | |
0.170%, 10/08/2021 (c) | | | 3,370,000 | | | | 3,369,768 | |
General Motors Financial Co, Inc. | | | | | | | | |
0.271%, 10/06/2021 (c) | | | 4,136,000 | | | | 4,135,825 | |
0.320%, 11/22/2021 (c) | | | 4,141,000 | | | | 4,138,939 | |
ITT, Inc. | | | | | | | | |
0.170%, 11/30/2021 (c) | | | 2,096,000 | | | | 2,094,629 | |
Viatris, Inc. | | | | | | | | |
0.323%, 10/25/2021 (c) | | | 3,870,000 | | | | 3,869,038 | |
0.365%, 11/19/2021 (c) | | | 4,879,000 | | | | 4,876,391 | |
| TOTAL COMMERCIAL PAPER (Cost $27,900,753) | | | | | | | 27,898,743 | |
The accompanying notes are an integral part of these financial statements.
CROSSINGBRIDGE LOW DURATION HIGH YIELD FUND
| Schedule of Investments (Continued) |
September 30, 2021
| | | Number | | | | |
| | | of Shares | | | Value | |
| COMMON STOCKS – 0.02% | | | | | | |
| | | | | | | |
| Mining, Quarrying, and Oil and Gas Extraction – 0.02% | | | | | | |
Superior Energy Services, Inc. | | | 1,616 | | | $ | 69,488 | |
| TOTAL COMMON STOCKS (Cost $2,117) | | | | | | | 69,488 | |
| | | | | | | | | |
| | | Face | | | | | |
| | | Amount† | | | | | |
| | | | | | | | | |
| CONVERTIBLE BONDS – 3.56% | | | | | | | | |
| | | | | | | | | |
| Information – 2.58% | | | | | | | | |
Buzzfeed, Inc. | | | | | | | | |
7.000%, 09/30/2026 (n) | | | 4,900,000 | | | | — | |
DISH Network Corp. | | | | | | | | |
2.375%, 03/15/2024 | | | 5,229,000 | | | | 5,114,616 | |
UpHealth, Inc. | | | | | | | | |
6.250%, 06/15/2026 (a) | | | 4,136,000 | | | | 3,314,094 | |
| | | | | | | | 8,428,710 | |
| | | | | | | | | |
| Transportation and Warehousing – 0.98% | | | | | | | | |
Ship Finance International Ltd. | | | | | | | | |
5.750%, 10/15/2021 (d) | | | 3,150,000 | | | | 3,177,720 | |
| TOTAL CONVERTIBLE BONDS (Cost $12,352,483) | | | | | | | 11,606,430 | |
| | | | | | | | | |
| | | | | | | | | |
| CORPORATE BONDS – 43.91% | | | | | | | | |
| | | | | | | | | |
| Accommodation and Food Services – 0.56% | | | | | | | | |
Nathan’s Famous, Inc. | | | | | | | | |
6.625%, 11/01/2025 (a) | | | 1,803,000 | | | | 1,844,505 | |
| | | | | | | | | |
| Administrative and Support and Waste | | | | | | | | |
| Management and Remediation Services – 0.12% | | | | | | | | |
Lakers Holding AB | | | | | | | | |
5.960% (3 Month NIBOR + 5.500%), 06/09/2025 (b)(d)(e) | | NOK 3,400,000 | | | | 399,634 | |
| | | | | | | | | |
| Arts, Entertainment, and Recreation – 0.13% | | | | | | | | |
Gaming Innovation Group PLC | | | | | | | | |
8.500% (3 Month STIBOR + 8.500%), 06/11/2024 (b)(d)(f) | | SEK 3,500,000 | | | | 411,184 | |
| | | | | | | | | |
| Educational Services – 0.14% | | | | | | | | |
Hercules Achievement Inc / Varsity Brands Holding Co, Inc. | | | | | | | | |
9.000% (3 Month LIBOR + 8.000%), 12/22/2024 (a)(b) | | | 473,000 | | | | 473,816 | |
The accompanying notes are an integral part of these financial statements.
CROSSINGBRIDGE LOW DURATION HIGH YIELD FUND
| Schedule of Investments (Continued) |
September 30, 2021
| | | Face | | | | |
| | | Amount† | | | Value | |
| | | | | | | |
| CORPORATE BONDS – 43.91% (CONTINUED) | | | | | | |
| | | | | | | |
| Finance and Insurance – 3.53% | | | | | | |
Icahn Enterprises LP / Icahn Enterprises Finance Corp. | | | | | | |
6.750%, 02/01/2024 | | | 3,162,000 | | | $ | 3,205,477 | |
Nordic Capital Partners II AS | | | | | | | | |
6.800% (3 Month NIBOR + 6.250%), 06/30/2024 (b)(d)(e) | | NOK 10,200,000 | | | | 1,187,455 | |
Stockwik Forvaltning AB | | | | | | | | |
7.000% (3 Month STIBOR + 7.000%), 09/03/2023 (b)(d)(f) | | SEK 7,500,000 | | | | 878,135 | |
StoneX Group, Inc. | | | | | | | | |
8.625%, 06/15/2025 (a) | | | 5,486,000 | | | | 5,904,308 | |
VNV Global Ltd. | | | | | | | | |
5.750%, 10/04/2022 (d)(f) | | SEK 2,960,000 | | | | 349,104 | |
| | | | | | | | 11,524,479 | |
| | | | | | | | | |
| Health Care and Social Assistance – 0.65% | | | | | | | | |
ADDvise Group AB | | | | | | | | |
7.250% (3 Month STIBOR + 7.250%), 05/21/2024 (b)(d)(f) | | SEK 5,470,000 | | | | 640,459 | |
Surgery Center Holdings, Inc. | | | | | | | | |
6.750%, 07/01/2025 (a) | | | 1,452,000 | | | | 1,479,225 | |
| | | | | | | | 2,119,684 | |
| | | | | | | | | |
| Information – 16.91% | | | | | | | | |
Azerion Holding BV | | | | | | | | |
7.250%, 04/28/2024 (d)(g) | | EUR 2,571,000 | | | | 3,102,279 | |
CCO Holdings LLC / CCO Holdings Capital Corp. | | | | | | | | |
4.000%, 03/01/2023 (a) | | | 3,617,000 | | | | 3,638,449 | |
Cengage Learning, Inc. | | | | | | | | |
9.500%, 06/15/2024 (a) | | | 4,959,000 | | | | 5,082,479 | |
CentralNic Group PLC | | | | | | | | |
7.000% (3 Month EURIBOR + 7.000%), 07/03/2023 (b)(d)(g) | | EUR 943,000 | | | | 1,133,282 | |
Cogent Communications Group, Inc. | | | | | | | | |
5.375%, 03/01/2022 (a) | | | 425,000 | | | | 427,656 | |
CSC Holdings LLC | | | | | | | | |
6.750%, 11/15/2021 | | | 11,540,000 | | | | 11,583,275 | |
INNOVATE Corp. | | | | | | | | |
8.500%, 02/01/2026 (a) | | | 6,774,000 | | | | 6,748,801 | |
Linkem S.p.A. | | | | | | | | |
6.000% (3 Month EURIBOR + 6.000%), 08/09/2022 (a)(b)(d)(g) | | EUR 5,917,000 | | | | 6,853,933 | |
Lumen Technologies, Inc. | | | | | | | | |
5.800%, 03/15/2022 | | | 6,076,000 | | | | 6,199,039 | |
Meredith Corp. | | | | | | | | |
6.500%, 07/01/2025 | | | 2,224,000 | | | | 2,383,505 | |
The accompanying notes are an integral part of these financial statements.
CROSSINGBRIDGE LOW DURATION HIGH YIELD FUND
| Schedule of Investments (Continued) |
September 30, 2021
| | | Face | | | | |
| | | Amount† | | | Value | |
| | | | | | | |
| CORPORATE BONDS – 43.91% (CONTINUED) | | | | | | |
| | | | | | | |
| Information – 16.91% (Continued) | | | | | | |
Nielsen Co. | | | | | | |
5.000%, 02/01/2025 (a)(d) | | | 3,796,000 | | | $ | 3,890,900 | |
NortonLifeLock, Inc. | | | | | | | | |
5.000%, 04/15/2025 (a) | | | 391,000 | | | | 397,721 | |
Sprint Communications, Inc. | | | | | | | | |
11.500%, 11/15/2021 | | | 3,709,000 | | | | 3,755,363 | |
| | | | | | | | 55,196,682 | |
| | | | | | | | | |
| Manufacturing – 9.64% | | | | | | | | |
Chobani LLC / Chobani Finance Corp, Inc. | | | | | | | | |
7.500%, 04/15/2025 (a) | | | 5,194,000 | | | | 5,410,849 | |
Dell International LLC / EMC Corp. | | | | | | | | |
7.125%, 06/15/2024 (a) | | | 9,013,000 | | | | 9,229,312 | |
EnPro Industries, Inc. | | | | | | | | |
5.750%, 10/15/2026 | | | 2,607,000 | | | | 2,730,507 | |
Fiven ASA | | | | | | | | |
6.850% (3 Month EURIBOR + 6.850%), 06/21/2024 (b)(d)(g) | | EUR 3,160,000 | | | | 3,784,606 | |
Ford Motor Credit Co LLC | | | | | | | | |
0.999% (3 Month LIBOR + 0.880%), 10/12/2021 (b) | | | 979,000 | | | | 979,007 | |
3.813%, 10/12/2021 | | | 6,653,000 | | | | 6,664,643 | |
LR Global Holding GmbH | | | | | | | | |
7.250% (3 Month EURIBOR + 7.250%), 02/03/2025 (b)(d)(g) | | EUR 2,198,000 | | | | 2,670,164 | |
| | | | | | | | 31,469,088 | |
| | | | | | | | | |
| Mining, Quarrying, and Oil and Gas Extraction – 1.51% | | | | | | | | |
Copper Mountain Mining Corp. | | | | | | | | |
8.000%, 04/09/2026 (d) | | | 4,700,000 | | | | 4,935,000 | |
| | | | | | | | | |
| Professional, Scientific, and Technical Services – 3.90% | | | | | | | | |
C3 Nano, Inc. | | | | | | | | |
6.500%, 02/15/2024 (a) | | | 630,000 | | | | 636,407 | |
Desenio Holding AB | | | | | | | | |
5.500% (3 Month STIBOR + 5.500%), 12/16/2024 (b)(d)(f) | | SEK 2,500,000 | | | | 292,139 | |
Diebold Nixdorf, Inc. | | | | | | | | |
8.500%, 04/15/2024 | | | 3,448,000 | | | | 3,527,252 | |
Jaguar Holding Co II / PPD Development LP | | | | | | | | |
4.625%, 06/15/2025 (a) | | | 7,969,000 | | | | 8,287,760 | |
| | | | | | | | 12,743,558 | |
| | | | | | | | | |
| Retail Trade – 2.71% | | | | | | | | |
The Fresh Market, Inc. | | | | | | | | |
9.750%, 05/01/2023 (a) | | | 8,579,000 | | | | 8,847,094 | |
The accompanying notes are an integral part of these financial statements.
CROSSINGBRIDGE LOW DURATION HIGH YIELD FUND
| Schedule of Investments (Continued) |
September 30, 2021
| | | Face | | | | |
| | | Amount† | | | Value | |
| | | | | | | |
| CORPORATE BONDS – 43.91% (CONTINUED) | | | | | | |
| | | | | | | |
| Transportation and Warehousing – 3.27% | | | | | | |
Altera Shuttle Tankers LLC | | | | | | |
7.125%, 08/15/2022 (d) | | | 1,600,000 | | | $ | 1,610,000 | |
PBF Logistics LP / PBF Logistics Finance Corp. | | | | | | | | |
6.875%, 05/15/2023 | | | 2,468,000 | | | | 2,409,385 | |
Rockpoint Gas Storage Canada Ltd. | | | | | | | | |
7.000%, 03/31/2023 (a)(d) | | | 6,538,000 | | | | 6,644,243 | |
| | | | | | | | 10,663,628 | |
| | | | | | | | | |
| Wholesale Trade – 0.84% | | | | | | | | |
Martin Midstream Partners LP / Martin Midstream Finance Corp. | | | | | | | | |
10.000%, 02/29/2024 (a) | | | 2,656,079 | | | | 2,740,689 | |
| TOTAL CORPORATE BONDS (Cost $142,614,867) | | | | | | | 143,369,041 | |
| | | | | | | | | |
| | | | | | | | | |
| MUNICIPAL BONDS – 0.73% | | | | | | | | |
| | | | | | | | | |
| Construction – 0.73% | | | | | | | | |
Puerto Rico Highway & Transportation Authority | | | | | | | | |
7.215%, 07/01/2022 (c) | | | 1,055,000 | | | | 991,787 | |
7.312%, 07/01/2023 (c) | | | 1,570,000 | | | | 1,387,580 | |
| TOTAL MUNICIPAL BONDS (Cost $2,389,515) | | | | | | | 2,379,367 | |
| | | | | | | | | |
| | | Number of | | | | | |
| | | Shares | | | | | |
| | | | | | | | | |
| PREFERRED STOCKS – 0.51% | | | | | | | | |
| | | | | | | | | |
| Real Estate and Rental and Leasing – 0.51% | | | | | | | | |
Gladstone Land Corp. Series D | | | | | | | | |
Cumulative Term Preferred 5.000%, 01/31/2026 | | | 63,987 | | | | 1,665,901 | |
| TOTAL PREFERRED STOCKS (Cost $1,599,675) | | | | | | | 1,665,901 | |
| | | | | | | | | |
| | | | | | | | | |
| SPECIAL PURPOSE ACQUISITION COMPANIES – 10.45% | | | | | | | | |
890 5th Avenue Partners, Inc. (h) | | | 193,405 | | | | 1,916,644 | |
Adit EdTech Acquisition Corp. (h) | | | 12,435 | | | | 121,117 | |
Alkuri Global Acquisition Corp. (h) | | | 12,435 | | | | 123,977 | |
Argus Capital Corp. (h) | | | 45,287 | | | | 457,399 | |
Aries I Acquisition Corp. (d)(h) | | | 1,018 | | | | 10,160 | |
Athena Technology Acquisition Corp. (h) | | | 30,481 | | | | 302,536 | |
Athlon Acquisition Corp. (h) | | | 12,435 | | | | 121,614 | |
Atlantic Avenue Acquisition Corp. (h) | | | 90,259 | | | | 884,538 | |
Authentic Equity Acquisition Corp. (d)(h) | | | 12,435 | | | | 120,619 | |
AxonPrime Infrastructure | | | | | | | | |
Acquisition Corp. Founder Shares (h)(j)(k) | | | 5,000 | | | | — | |
Alpha Partners Technology Merger Corp. Founder Shares (h)(j)(k) | | | 9,341 | | | | — | |
The accompanying notes are an integral part of these financial statements.
CROSSINGBRIDGE LOW DURATION HIGH YIELD FUND
| Schedule of Investments (Continued) |
September 30, 2021
| | | Number of | | | | |
| | | Shares | | | Value | |
| SPECIAL PURPOSE ACQUISITION | | | | | | |
| COMPANIES – 10.45% (CONTINUED) | | | | | | |
Benessere Capital Acquisition Corp. (h) | | | 52 | | | $ | 524 | |
Berenson Acquisition Corp. I (h) | | | 252,107 | | | | 2,485,775 | |
Berenson Acquisition Corp. Founder Shares (h)(j)(k) | | | 19,099 | | | | — | |
BGP Acquisition Corp. (d)(h) | | | 61,619 | | | | 582,300 | |
Bite Acquisition Corp. (h) | | | 15,849 | | | | 154,211 | |
Bull Horn Holdings Corp. (d)(h) | | | 150,000 | | | | 1,492,500 | |
Carney Technology Acquisition Corp. II (h) | | | 186,545 | | | | 1,822,545 | |
Cartesian Growth Corp. (d)(h) | | | 38,645 | | | | 381,426 | |
Cascade Acquisition Corp. (h) | | | 19,565 | | | | 195,063 | |
Cerberus Telecom Acquisition Corp. (d)(h) | | | 62,107 | | | | 621,070 | |
CF Acquisition Corp. IV (h) | | | 21,247 | | | | 206,733 | |
CF Acquisition Corp. VI (h) | | | 23,923 | | | | 232,292 | |
Chavant Capital Acquisition Corp. (d)(h) | | | 157,965 | | | | 1,559,115 | |
Clarim Acquisition Corp. (h) | | | 19,291 | | | | 189,631 | |
Cohn Robbins Holdings Corp. (d)(h) | | | 14,295 | | | | 140,377 | |
COVA Acquisition Corp. (d)(h) | | | 12,435 | | | | 120,744 | |
DHB Capital Corp. (h) | | | 4,520 | | | | 43,844 | |
Disruptive Acquisition Corp. I (d)(h) | | | 34,905 | | | | 338,928 | |
Duddell Street Acquisition Corp. (d)(h) | | | 6,717 | | | | 65,625 | |
EJF Acquisition Corp. (d)(h) | | | 26,496 | | | | 261,251 | |
Empowerment & Inclusion Capital I Corp. (h) | | | 21,858 | | | | 213,771 | |
EQ Health Acquisition Corp. (h) | | | 12,435 | | | | 121,490 | |
Equity Distribution Acquisition Corp. (h) | | | 27,989 | | | | 274,852 | |
Executive Network Partnering Corp. (h) | | | 42,321 | | | | 415,592 | |
Fintech Evolution Acquisition Group (d)(h) | | | 12,435 | | | | 120,495 | |
Forum Merger IV Corp. (h) | | | 30,394 | | | | 296,645 | |
G&P Acquisition Corp. (h) | | | 56,448 | | | | 557,142 | |
G3 VRM Acquisition Corp. (h) | | | 104,604 | | | | 1,046,040 | |
GigCapital4, Inc. (h) | | | 43,710 | | | | 430,981 | |
Global Consumer Acquisition Corp. (h) | | | 100,022 | | | | 988,217 | |
Global Partner Acquisition Corp. II (d)(h) | | | 12,977 | | | | 125,877 | |
Global SPAC Partners Co. (d)(h) | | | 134,584 | | | | 1,344,494 | |
Golden Falcon Acquisition Corp. (h) | | | 46,683 | | | | 455,159 | |
Growth Capital Acquisition Corp. (h) | | | 99,658 | | | | 984,621 | |
Hamilton Lane Alliance Holdings I, Inc. (h) | | | 24,449 | | | | 237,155 | |
Healthcare Services Acquisition Corp. (h) | | | 12,435 | | | | 120,993 | |
HPX Corp. (d)(h) | | | 2,751 | | | | 27,070 | |
Ignyte Acquisition Corp. (h) | | | 12,435 | | | | 121,739 | |
Isleworth Healthcare Acquisition Corp. (h) | | | 26,494 | | | | 260,436 | |
Itiquira Acquisition Corp. (d)(h) | | | 12,435 | | | | 121,241 | |
Jack Creek Investment Corp. (d)(h) | | | 12,435 | | | | 121,241 | |
Malacca Straits Acquisition Co Ltd. (d)(h) | | | 69,784 | | | | 693,653 | |
Maquia Capital Acquisition Corp. (h) | | | 53,783 | | | | 537,830 | |
The accompanying notes are an integral part of these financial statements.
CROSSINGBRIDGE LOW DURATION HIGH YIELD FUND
| Schedule of Investments (Continued) |
September 30, 2021
| | | Number of | | | | |
| | | Shares | | | Value | |
| SPECIAL PURPOSE ACQUISITION | | | | | | |
| COMPANIES – 10.45% (CONTINUED) | | | | | | |
Mason Industrial Technology, Inc. (h) | | | 206,515 | | | $ | 2,011,456 | |
North Atlantic Acquisition Corp. (d)(h) | | | 12,435 | | | | 121,366 | |
Oaktree Acquisition Corp. II (d)(h) | | | 26,901 | | | | 263,630 | |
Omnichannel Acquisition Corp. (h) | | | 63,103 | | | | 624,720 | |
One Equity Partners Open Water I Corp. (h) | | | 19,319 | | | | 187,974 | |
OTR Acquisition Corp. (h) | | | 33,414 | | | | 336,813 | |
Oyster Enterprises Acquisition Corp. (h) | | | 12,435 | | | | 121,241 | |
Peridot Acquisition Corp. II (d)(h) | | | 20,358 | | | | 197,676 | |
Pontem Corp. (d)(h) | | | 2,927 | | | | 28,421 | |
PWP Forward Acquisition Corp. I (h) | | | 6,639 | | | | 63,867 | |
RMG Acquisition Corp. III (d)(h) | | | 31,887 | | | | 310,261 | |
Seaport Global Acquisition Corp. (h) | | | 29,044 | | | | 292,473 | |
Seven Oaks Acquisition Corp. (h) | | | 19,916 | | | | 197,766 | |
Silver Crest Acquisition Corp. (d)(h) | | | 12,435 | | | | 122,236 | |
Tailwind International Acquisition Corp. (d)(h) | | | 30,005 | | | | 291,048 | |
Tailwind Two Acquisition Corp. (d)(h) | | | 33,081 | | | | 321,878 | |
Tech and Energy Transition Corp. (h) | | | 13,307 | | | | 130,009 | |
Tekkorp Digital Acquisition Corp. (d)(h) | | | 59,086 | | | | 580,225 | |
Thimble Point Acquisition Corp. (h) | | | 17,560 | | | | 174,546 | |
Tishman Speyer Innovation Corp. II (h) | | | 44,553 | | | | 436,619 | |
Trebia Acquisition Corp. (d)(h) | | | 69,535 | | | | 689,092 | |
Vector Acquisition Corp. II (d)(h) | | | 166,059 | | | | 1,619,075 | |
Vistas Media Acquisition Co., Inc. (h) | | | 29,979 | | | | 302,188 | |
Zanite Acquisition Corp. (h) | | | 13,073 | | | | 132,168 | |
| TOTAL SPECIAL PURPOSE ACQUISITION VEHICLES | | | | | | | | |
| (Cost $33,989,083) | | | | | | | 34,126,040 | |
| | | | | | | | | |
| TRADE CLAIMS – 1.49% | | | | | | | | |
| | | | | | | | | |
| Utilities – 1.49% | | | | | | | | |
Brazos Electric Power Cooperative, Inc. | | | 5,397,407 | | | | 4,857,667 | |
| TOTAL TRADE CLAIMS (Cost $4,891,400) | | | | | | | 4,857,667 | |
| | | | | | | | | |
| | | | | | | | | |
| WARRANTS – 0.01% | | | | | | | | |
Clarim Acquisition Corp. (h) | | | | | | | | |
Expiration: 12/31/2027, Exercise Price: $11.50 | | | 6,430 | | | | 3,987 | |
DHB Capital Corp. (h) | | | | | | | | |
Expiration: 03/15/2028, Exercise Price: $11.50 | | | 1,507 | | | | 979 | |
Empowerment & Inclusion Capital I Corp. (h) | | | | | | | | |
Expiration: 12/31/2027, Exercise Price: $11.50 | | | 4,712 | | | | 3,534 | |
PWP Forward Acquisition Corp. I (h) | | | | | | | | |
Expiration: 03/29/2026, Exercise Price: $11.50 | | | 877 | | | | 719 | |
The accompanying notes are an integral part of these financial statements.
CROSSINGBRIDGE LOW DURATION HIGH YIELD FUND
| Schedule of Investments (Continued) |
September 30, 2021
| | | Number of | | | | |
| | | Shares | | | Value | |
| WARRANTS – 0.01% (CONTINUED) | | | | | | |
Tailwind International Acquisition Corp. (d)(h) | | | | | | |
Expiration: 03/01/2028, Exercise Price: $11.50 | | | 10,002 | | | $ | 6,201 | |
Thaihot Investment Company (h) | | | | | | | | |
Expiration: 11/30/2021, Exercise Price: $0.01 | | | 29 | | | | — | |
| TOTAL WARRANTS (Cost $15,441) | | | | | | | 15,420 | |
| | | | | | | | | |
| MONEY MARKET FUNDS – 9.14% | | | | | | | | |
First American Government Obligations | | | | | | | | |
Fund – Class X, 0.026% (i) | | | 14,921,919 | | | | 14,921,919 | |
First American Treasury Obligations Fund – Class X, 0.013% (i) | | | 14,921,919 | | | | 14,921,919 | |
| TOTAL MONEY MARKET FUNDS (Cost $29,843,838) | | | | | | | 29,843,838 | |
Total Investments (Cost $327,570,632) – 100.34% | | | | | | | 327,609,870 | |
Liabilities in Excess of Other Assets – (0.34)% | | | | | | | (1,126,236 | ) |
| Total Net Assets – 100.00% | | | | | | $ | 326,483,634 | |
Percentages are stated as a percent of net assets.
| † | Face amount in U.S. Dollar unless otherwise indicated. |
| (a) | Securities issued pursuant to Rule 144A under the Securities Act of 1933 and Regulation S under the Securities Act of 1933. Aggregate value of these securities is $82,852,201 or 25.38% of Fund’s net assets. |
| (b) | Variable rate security. The rate shown represents the rate at September 30, 2021. |
| (c) | The rate shown is the effective yield. |
| (d) | Foreign issued security. |
| (e) | Principal amount denominated in Norwegian Krone. |
| (f) | Principal amount denominated in Swedish Krona. |
| (g) | Principal amount denominated in Euros. |
| (h) | Non-income producing security. |
| (i) | Seven day yield as of September 30, 2021. |
| (j) | Illiquid security. |
| (k) | Security valued using unobservable inputs. |
| (l) | Zero coupon security. |
| (m) | Entire position is unsettled as of September 30, 2021. |
| (n) | Unfunded commitment. The total of unfunded commitments as of September 30, 2021 was $0. |
Definitions:
EURIBOR – Euro-Interbank Offer Rate is a reference rate expressing the average interest rate at which eurozone banks offer unsecured short-term lending on the interbank market.
LIBOR – London Interbank Offer Rate is a benchmark rate at which banks offer to lend funds to one another in the international interbank market for short-term loans.
NIBOR – Norwegian Interbank Offer Rate is a collective term for Norwegian money market rates at different maturities. It is intended to reflect the interest rate level a bank require for unsecured money market lending in Norwegian Krone to another bank.
STIBOR – Stockholm Interbank Offer Rate is a reference rate that shows the average interest rate at which a number of active banks on the Swedish money market are willing to lend to one another, without collateral, at different maturities.
The accompanying notes are an integral part of these financial statements.
CROSSINGBRIDGE LOW DURATION HIGH YIELD FUND
| Schedule of Investments (Continued) |
| Forward Currency Exchange Contracts | September 30, 2021 |
| | |
|
| | | | USD Value at | | Currency | | | | | Unrealized | |
| Settlement | | Counter- | | to be | | September 30, | | to be | | September 30, | | | Appreciation/ | |
| Date | | party | | Delivered | | | 2021 | | Received | | | 2021 | | | (Depreciation) | |
| 10/15/21 | | U.S. Bank | | 15,280,000 EUR | | $ | 17,704,799 | | 18,097,938 USD | | $ | 18,097,938 | | | $ | 393,139 | |
| 10/15/21 | | U.S. Bank | | 13,820,000 NOK | | | 1,580,735 | | 1,602,077 USD | | | 1,602,077 | | | | 21,342 | |
| 10/15/21 | | U.S. Bank | | 22,453,000 SEK | | | 2,565,059 | | 2,609,297 USD | | | 2,609,297 | | | | 44,238 | |
| | | | | | | | $ | 21,850,593 | | | | $ | 22,309,312 | | | $ | 458,719 | |
EUR – Euro
NOK – Norwegian Krone
SEK – Swedish Krona
USD – U.S. Dollars
The accompanying notes are an integral part of these financial statements.
CROSSINGBRIDGE RESPONSIBLE CREDIT FUND
September 30, 2021
| | | Face | | | | |
| | | Amount† | | | Value | |
| | | | | | | |
| BANK LOANS – 9.10% | | | | | | |
| | | | | | | |
| Information – 2.23% | | | | | | |
Gray Television, Inc. | | | | | | |
0.000%, 08/03/2022 (k)(l) | | | 376,000 | | | $ | 376,000 | |
| | | | | | | | | |
| Retail Trade – 2.98% | | | | | | | | |
West Marine, Inc. | | | | | | | | |
9.000% (1 Month LIBOR + 8.250%), 06/01/2029 (a) | | | 500,000 | | | | 503,750 | |
| | | | | | | | | |
| Transportation and Warehousing – 3.89% | | | | | | | | |
Syncreon Group BV | | | | | | | | |
7.000% (1 Month LIBOR + 6.000%), 04/01/2025 (a)(d) | | | 650,000 | | | | 657,312 | |
| TOTAL BANK LOANS (Cost $1,528,275) | | | | | | | 1,537,062 | |
| | | | | | | | | |
| | | | | | | | | |
| COMMERCIAL PAPER – 1.50% | | | | | | | | |
| | | | | | | | | |
| Manufacturing – 1.50% | | | | | | | | |
Viatris, Inc. | | | | | | | | |
0.365%, 11/19/2021 (b) | | | 253,000 | | | | 252,865 | |
| TOTAL COMMERCIAL PAPER (Cost $252,869) | | | | | | | 252,865 | |
| | | | | | | | | |
| | | | | | | | | |
| CONVERTIBLE BONDS – 0.23% | | | | | | | | |
| | | | | | | | | |
| Information – 0.23% | | | | | | | | |
Kaleyra, Inc. | | | | | | | | |
6.125%, 06/01/2026 (c) | | | 37,000 | | | | 38,776 | |
| TOTAL CONVERTIBLE BONDS (Cost $36,642) | | | | | | | 38,776 | |
| | | | | | | | | |
| CORPORATE BONDS – 57.72% | | | | | | | | |
| | | | | | | | | |
| Finance and Insurance – 4.13% | | | | | | | | |
StoneX Group, Inc. | | | | | | | | |
8.625%, 06/15/2025 (c) | | | 648,000 | | | | 697,410 | |
| | | | | | | | | |
| Information – 18.16% | | | | | | | | |
Cengage Learning, Inc. | | | | | | | | |
9.500%, 06/15/2024 (c) | | | 274,000 | | | | 280,822 | |
Elastic NV | | | | | | | | |
4.125%, 07/15/2029 (c)(d) | | | 3,000 | | | | 3,019 | |
INNOVATE Corp. | | | | | | | | |
8.500%, 02/01/2026 (c) | | | 460,000 | | | | 458,289 | |
The accompanying notes are an integral part of these financial statements.
CROSSINGBRIDGE RESPONSIBLE CREDIT FUND
| Schedule of Investments (Continued) |
September 30, 2021
| | | Face | | | | |
| | | Amount† | | | Value | |
| | | | | | | |
| CORPORATE BONDS – 57.72% (CONTINUED) | | | | | | |
| | | | | | | |
| Information – 18.16% (Continued) | | | | | | |
Linkem S.p.A. | | | | | | |
6.000% (3 Month EURIBOR + 6.000%), 08/09/2022 (a)(c)(d)(e) | | EUR 1,250,000 | | | $ | 1,447,932 | |
MicroStrategy, Inc. | | | | | | | |
6.125%, 06/15/2028 (c) | | | 364,000 | | | | 368,146 | |
NortonLifeLock, Inc. | | | | | | | | |
5.000%, 04/15/2025 (c) | | | 500,000 | | | | 508,595 | |
| | | | | | | | 3,066,803 | |
| | | | | | | | | |
| Manufacturing – 8.37% | | | | | | | | |
Chobani LLC / Chobani Finance Corp, Inc. | | | | | | | | |
7.500%, 04/15/2025 (c) | | | 550,000 | | | | 572,962 | |
Dell International LLC / EMC Corp. | | | | | | | | |
7.125%, 06/15/2024 (c) | | | 466,000 | | | | 477,184 | |
LR Global Holding GmbH | | | | | | | | |
7.250% (3 Month EURIBOR + 7.250%), 02/03/2025 (a)(d)(e) | | EUR 300,000 | | | | 364,445 | |
| | | | | | | | 1,414,591 | |
| | | | | | | | | |
| Mining, Quarrying, and Oil and Gas Extraction – 2.16% | | | | | | | | |
Copper Mountain Mining Corp. | | | | | | | | |
8.000%, 04/09/2026 (d) | | | 347,000 | | | | 364,350 | |
| | | | | | | | | |
| Professional, Scientific, and Technical Services – 7.28% | | | | | | | | |
Diebold Nixdorf, Inc. | | | | | | | | |
8.500%, 04/15/2024 | | | 577,000 | | | | 590,262 | |
Getty Images, Inc. | | | | | | | | |
9.750%, 03/01/2027 (c) | | | 600,000 | | | | 639,750 | |
| | | | | | | | 1,230,012 | |
| | | | | | | | | |
| Retail Trade – 5.94% | | | | | | | | |
Ambience Merger Sub, Inc. | | | | | | | | |
4.875%, 07/15/2028 (c) | | | 549,000 | | | | 549,694 | |
The Fresh Market, Inc. | | | | | | | | |
9.750%, 05/01/2023 (c) | | | 440,000 | | | | 453,750 | |
| | | | | | | | 1,003,444 | |
| | | | | | | | | |
| Transportation and Warehousing – 3.91% | | | | | | | | |
Rockpoint Gas Storage Canada Ltd. | | | | | | | | |
7.000%, 03/31/2023 (c)(d) | | | 650,000 | | | | 660,563 | |
The accompanying notes are an integral part of these financial statements.
CROSSINGBRIDGE RESPONSIBLE CREDIT FUND
| Schedule of Investments (Continued) |
September 30, 2021
| | | Face | | | | |
| | | Amount† | | | Value | |
| | | | | | | |
| CORPORATE BONDS – 57.72% (CONTINUED) | | | | | | |
| | | | | | | |
| Utilities – 6.44% | | | | | | |
IEA Energy Services LLC | | | | | | |
6.625%, 08/15/2029 (c) | | | 1,100,000 | | | $ | 1,087,515 | |
| | | | | | | | | |
| Wholesale Trade – 1.33% | | | | | | | | |
Leroy Seafood Group ASA | | | | | | | | |
3.350%, 09/17/2031 (d)(f) | | NOK 2,000,000 | | | | 224,317 | |
| TOTAL CORPORATE BONDS (Cost $9,761,523) | | | | | | | 9,749,005 | |
| | | | | | | | | |
| | | Number of | | | | | |
| | | Shares | | | | | |
| | | | | | | | | |
| SPECIAL PURPOSE ACQUISITION COMPANIES – 19.06% | | | | | | | | |
890 5th Avenue Partners, Inc. (g) | | | 34,998 | | | | 346,830 | |
ACE Convergence Acquisition Corp. (d)(g) | | | 30,000 | | | | 297,300 | |
Athlon Acquisition Corp. (g) | | | 31,000 | | | | 303,180 | |
Atlantic Avenue Acquisition Corp. (g) | | | 26,630 | | | | 260,974 | |
Authentic Equity Acquisition Corp. (d)(g) | | | 31,000 | | | | 300,700 | |
AxonPrime Infrastructure | | | | | | | | |
Acquisition Corp. Founder Shares (g)(j)(k) | | | 1,000 | | | | — | |
Carney Technology Acquisition Corp. II (g) | | | 6,389 | | | | 62,421 | |
Cohn Robbins Holdings Corp. (d)(g) | | | 7,200 | | | | 70,704 | |
COVA Acquisition Corp. (d)(g) | | | 16,671 | | | | 161,875 | |
Empowerment & Inclusion Capital I Corp. (g) | | | 22,322 | | | | 218,309 | |
Executive Network Partnering Corp. (g) | | | 2,044 | | | | 20,072 | |
Global Consumer Acquisition Corp. (g) | | | 3,687 | | | | 36,428 | |
Healthcare Services Acquisition Corp. (g) | | | 31,000 | | | | 301,630 | |
Ignyte Acquisition Corp. (g) | | | 22,737 | | | | 222,595 | |
North Atlantic Acquisition Corp. (d)(g) | | | 31,000 | | | | 302,560 | |
Omnichannel Acquisition Corp. (g) | | | 30,000 | | | | 297,000 | |
Thimble Point Acquisition Corp. (g) | | | 1,000 | | | | 9,940 | |
Trebia Acquisition Corp. (d)(g) | | | 669 | | | | 6,630 | |
| TOTAL SPECIAL PURPOSE ACQUISITION VEHICLES | | | | | | | | |
| (Cost $3,209,686) | | | | | | | 3,219,148 | |
The accompanying notes are an integral part of these financial statements.
CROSSINGBRIDGE RESPONSIBLE CREDIT FUND
| Schedule of Investments (Continued) |
September 30, 2021
| | | Number of | | | | |
| | | Shares | | | Value | |
| | | | | | | |
| MONEY MARKET FUNDS – 10.97% | | | | | | |
First American Government Obligations | | | | | | |
Fund – Class X, 0.026% (h) | | | 925,808 | | | $ | 925,808 | |
First American Treasury Obligations Fund – Class X, 0.013% (h) | | | 926,781 | | | | 926,781 | |
| TOTAL MONEY MARKET FUNDS (Cost $1,852,589) | | | | | | | 1,852,589 | |
Total Investments (Cost $16,641,584) – 98.58% | | | | | | | 16,649,445 | |
Other Assets in Excess of Liabilities – 1.42% | | | | | | | 239,978 | |
| Total Net Assets – 100.00% | | | | | | $ | 16,889,423 | |
Percentages are stated as a percent of net assets.
| † | Face amount in U.S. Dollar unless otherwise indicated. |
| (a) | Variable rate security. The rate shown represents the rate at September 30, 2021. |
| (b) | The rate shown is the effective yield. |
| (c) | Securities issued pursuant to Rule 144A under the Securities Act of 1933 and Regulation S under the Securities Act of 1933. Aggregate value of these securities is $8,244,407 or 48.81% of Fund’s net assets. |
| (d) | Foreign issued security. |
| (e) | Principal amount denominated in Euros. |
| (f) | Principal amount denominated in Norwegian Krone. |
| (g) | Non-income producing security. |
| (h) | Seven day yield as of September 30, 2021. |
| (i) | Illiquid security. |
| (j) | Security valued using unobservable inputs. |
| (k) | Zero coupon security. |
| (l) | Entire position is unsettled as of September 30, 2021. |
Definitions:
EURIBOR – Euro-Interbank Offer Rate is a reference rate expressing the average interest rate at which eurozone banks offer unsecured short-term lending on the interbank market.
LIBOR – London Interbank Offer Rate is a benchmark rate at which banks offer to lend funds to one another in the international interbank market for short-term loans.
The accompanying notes are an integral part of these financial statements.
CROSSINGBRIDGE RESPONSIBLE CREDIT FUND
| Schedule of Investments (Continued) |
| Forward Currency Exchange Contracts | September 30, 2021 |
| | |
| | | Currency | | USD Value at | | Currency | | USD Value at | | | Unrealized | |
| Settlement | | Counter- | | to be | | September 30, | | to be | | September 30, | | | Appreciation/ | |
| Date | | party | | Delivered | | | 2021 | | Received | | | 2021 | | | (Depreciation) | |
| 10/15/21 | | U.S. Bank | | 1,580,000 EUR | | $ | 1,830,732 | | 1,871,384 USD | | $ | 1,871,384 | | | $ | 40,652 | |
| 10/15/21 | | U.S. Bank | | 2,000,000 NOK | | | 228,761 | | 232,845 USD | | | 232,845 | | | | 4,084 | |
| | | | | | | | $ | 2,059,493 | | | | $ | 2,104,229 | | | $ | 44,736 | |
EUR – Euro
NOK – Norwegian Krone
USD – U.S. Dollars
The accompanying notes are an integral part of these financial statements.
CROSSINGBRIDGE ULTRA-SHORT DURATION FUND
September 30, 2021
| | | Face | | | | |
| | | Amount† | | | Value | |
| | | | | | | |
| ASSET BACKED SECURITIES – 4.51% | | | | | | |
| | | | | | | |
| Finance and Insurance – 2.14% | | | | | | |
LendingPoint 2021-A Asset Securitization Trust | | | | | | |
1.000%, 12/15/2028 (a) | | | 44,532 | | | $ | 44,671 | |
LendingPoint 2021-B Asset Securitization Trust | | | | | | | | |
1.110%, 02/15/2029 | | | 750,000 | | | | 749,943 | |
| | | | | | | | 794,614 | |
| | | | | | | | | |
| Information – 0.33% | | | | | | | | |
SBA Tower Trust | | | | | | | | |
2018-1, 3.448%, 03/15/2048 (a) | | | 120,000 | | | | 121,618 | |
| | | | | | | | | |
| Transportation and Warehousing – 2.04% | | | | | | | | |
Continental Airlines 2007-1 Class A Pass Through Trust | | | | | | | | |
2007-1, 5.983%, 10/19/2023 | | | 662,142 | | | | 670,854 | |
Southwest Airlines Co 2007-1 Pass Through Trust | | | | | | | | |
2007-1, 6.650%, 08/01/2022 | | | 84,394 | | | | 85,357 | |
| | | | | | | | 756,211 | |
| TOTAL ASSET BACKED SECURITIES (Cost $1,675,576) | | | | | | | 1,672,443 | |
| | | | | | | | | |
| BANK LOANS – 6.55% | | | | | | | | |
| | | | | | | | | |
| Information – 2.75% | | | | | | | | |
Intelsat Jackson Holdings SA | | | | | | | | |
8.750% (3 Month LIBOR + 4.500%), 01/02/2024 (b)(d) | | | 1,000,000 | | | | 1,019,065 | |
| | | | | | | | | |
| Manufacturing – 3.80% | | | | | | | | |
Mallinckrodt International | | | | | | | | |
4.382% (3 Month LIBOR + 2.250%), 02/28/2022 (b) | | | 1,431,606 | | | | 1,408,521 | |
| TOTAL BANK LOANS (Cost $2,438,040) | | | | | | | 2,427,586 | |
| | | | | | | | | |
| | | | | | | | | |
| COMMERCIAL PAPER – 23.03% | | | | | | | | |
| | | | | | | | | |
| Finance and Insurance – 3.24% | | | | | | | | |
Cigna Corp. | | | | | | | | |
0.152%, 10/13/2021 (c) | | | 600,000 | | | | 599,973 | |
Humana, Inc. | | | | | | | | |
0.193%, 10/26/2021 (c) | | | 600,000 | | | | 599,875 | |
| | | | | | | | 1,199,848 | |
| | | | | | | | | |
| Information – 2.02% | | | | | | | | |
AT&T, Inc. | | | | | | | | |
0.139%, 10/19/2021 (c) | | | 250,000 | | | | 249,983 | |
The accompanying notes are an integral part of these financial statements.
CROSSINGBRIDGE ULTRA-SHORT DURATION FUND
| Schedule of Investments (Continued) |
September 30, 2021
| | | Face | | | | |
| | | Amount† | | | Value | |
| | | | | | | |
| COMMERCIAL PAPER – 23.03% (CONTINUED) | | | | | | |
| | | | | | | |
| Information – 2.02% (Continued) | | | | | | |
Rogers Communications, Inc. | | | | | | |
0.141%, 10/07/2021 (c) | | | 250,000 | | | $ | 249,994 | |
0.248%, 01/13/2022 (c) | | | 250,000 | | | | 249,854 | |
| | | | | | | | 749,831 | |
| | | | | | | | | |
| Manufacturing – 12.74% | | | | | | | | |
Amphenol Corp. | | | | | | | | |
0.107%, 10/22/2021 (c) | | | 700,000 | | | | 699,955 | |
Conagra Brands, Inc. | | | | | | | | |
0.251%, 12/22/2021 (c) | | | 619,000 | | | | 618,560 | |
Constellation Brands, Inc. | | | | | | | | |
0.170%, 10/08/2021 (c) | | | 328,000 | | | | 327,977 | |
0.172%, 10/15/2021 (c) | | | 587,000 | | | | 586,916 | |
General Motors Financial Co., Inc. | | | | | | | | |
0.271%, 10/06/2021 (c) | | | 396,000 | | | | 395,983 | |
0.320%, 10/22/2021 (c) | | | 400,000 | | | | 399,926 | |
ITT, Inc. | | | | | | | | |
0.170%, 11/30/2021 (c) | | | 250,000 | | | | 249,837 | |
Leggett & Platt, Inc. | | | | | | | | |
0.244%, 10/27/2021 (c) | | | 250,000 | | | | 249,955 | |
Sherwin Williams Company | | | | | | | | |
0.107%, 10/25/2021 (c) | | | 750,000 | | | | 749,910 | |
Viatris, Inc. | | | | | | | | |
0.323%, 10/25/2021 (c) | | | 442,000 | | | | 441,890 | |
| | | | | | | | 4,720,909 | |
| | | | | | | | | |
| Retail Trade – 5.03% | | | | | | | | |
Dollarama, Inc. | | | | | | | | |
0.145%, 10/19/2021 (c) | | | 783,000 | | | | 782,946 | |
Walgreens Boots Alliance, Inc. | | | | | | | | |
0.151%, 10/08/2021 (c) | | | 300,000 | | | | 299,990 | |
0.177%, 11/03/2021 (c) | | | 783,000 | | | | 782,868 | |
| | | | | | | | 1,865,804 | |
| TOTAL COMMERCIAL PAPER (Cost $8,536,674) | | | | | | | 8,536,392 | |
| | | | | | | | | |
| | | | | | | | | |
| CONVERTIBLE BONDS – 2.05% | | | | | | | | |
| | | | | | | | | |
| Finance and Insurance – 2.05% | | | | | | | | |
Goldman Sachs BDC, Inc. | | | | | | | | |
4.500%, 04/01/2022 | | | 743,000 | | | | 757,846 | |
| TOTAL CONVERTIBLE BONDS (Cost $757,240) | | | | | | | 757,846 | |
The accompanying notes are an integral part of these financial statements.
CROSSINGBRIDGE ULTRA-SHORT DURATION FUND
| Schedule of Investments (Continued) |
September 30, 2021
| | | Face | | | | |
| | | Amount† | | | Value | |
| | | | | | | |
| CORPORATE BONDS – 46.46% | | | | | | |
| | | | | | | |
| Agriculture, Forestry, Fishing and Hunting – 1.41% | | | | | | |
Land O’ Lakes, Inc. | | | | | | |
6.000%, 11/15/2022 (a) | | | 500,000 | | | $ | 522,506 | |
| | | | | | | | | |
| Construction – 1.62% | | | | | | | | |
Lennar Corp. | | | | | | | | |
4.125%, 01/15/2022 | | | 600,000 | | | | 600,750 | |
| | | | | | | | | |
| Finance and Insurance – 2.04% | | | | | | | | |
Main Street Capital Corp. | | | | | | | | |
4.500%, 12/01/2022 | | | 725,000 | | | | 754,957 | |
| | | | | | | | | |
| Health Care and Social Assistance – 0.93% | | | | | | | | |
Fresenius Medical Care US Finance II, Inc. | | | | | | | | |
5.875%, 01/31/2022 (a) | | | 340,000 | | | | 345,947 | |
| | | | | | | | | |
| Information – 9.60% | | | | | | | | |
CSC Holdings LLC | | | | | | | | |
6.750%, 11/15/2021 | | | 1,104,000 | | | | 1,108,140 | |
IHS Markit Ltd. | | | | | | | | |
5.000%, 11/01/2022 (a)(d) | | | 900,000 | | | | 934,353 | |
Sprint Communications, Inc. | | | | | | | | |
11.500%, 11/15/2021 | | | 424,000 | | | | 429,300 | |
Verisk Analytics, Inc. | | | | | | | | |
4.125%, 09/12/2022 | | | 1,050,000 | | | | 1,087,371 | |
| | | | | | | | 3,559,164 | |
| | | | | | | | | |
| Manufacturing – 15.50% | | | | | | | | |
AbbVie, Inc. | | | | | | | | |
3.450%, 03/15/2022 | | | 1,200,000 | | | | 1,210,736 | |
Bayer US Finance LLC | | | | | | | | |
3.000%, 10/08/2021 (a) | | | 750,000 | | | | 750,216 | |
Cintas Corp. No 2 | | | | | | | | |
3.250%, 06/01/2022 | | | 500,000 | | | | 506,017 | |
Cooke Omega Investments Inc / Alpha VesselCo Holdings, Inc. | | | | | | | | |
8.500%, 12/15/2022 (a)(d) | | | 446,000 | | | | 455,505 | |
General Electric Co. | | | | | | | | |
4.650%, 10/17/2021 | | | 245,000 | | | | 245,375 | |
General Mills, Inc. | | | | | | | | |
3.150%, 12/15/2021 | | | 35,000 | | | | 35,028 | |
Leggett & Platt, Inc. | | | | | | | | |
3.400%, 08/15/2022 | | | 750,000 | | | | 763,872 | |
The accompanying notes are an integral part of these financial statements.
CROSSINGBRIDGE ULTRA-SHORT DURATION FUND
| Schedule of Investments (Continued) |
September 30, 2021
| | | Face | | | | |
| | | Amount† | | | Value | |
| | | | | | | |
| CORPORATE BONDS – 46.46% (CONTINUED) | | | | | | |
| | | | | | | |
| Manufacturing – 15.50% (Continued) | | | | | | |
Sherwin-Williams Company | | | | | | |
4.200%, 01/15/2022 | | | 50,000 | | | $ | 50,061 | |
The J.M. Smucker Co. | | | | | | | | |
3.500%, 10/15/2021 | | | 1,174,000 | | | | 1,175,178 | |
Viatris, Inc. | | | | | | | | |
1.125%, 06/22/2022 (a) | | | 550,000 | | | | 552,986 | |
| | | | | | | | 5,744,974 | |
| | | | | | | | | |
| Mining, Quarrying, and Oil and Gas Extraction – 2.25% | | | | | | | | |
Glencore Finance Canada Ltd. | | | | | | | | |
4.950%, 11/15/2021 (a)(d) | | | 830,000 | | | | 833,461 | |
| | | | | | | | | |
| Retail Trade – 6.96% | | | | | | | | |
AutoZone, Inc. | | | | | | | | |
3.700%, 04/15/2022 | | | 752,000 | | | | 759,326 | |
Foot Locker, Inc. | | | | | | | | |
8.500%, 01/15/2022 | | | 362,000 | | | | 371,374 | |
Kroger Co. | | | | | | | | |
2.950%, 11/01/2021 | | | 600,000 | | | | 601,203 | |
The Fresh Market, Inc. | | | | | | | | |
9.750%, 05/01/2023 (a) | | | 821,000 | | | | 846,656 | |
| | | | | | | | 2,578,559 | |
| | | | | | | | | |
| Transportation and Warehousing – 3.56% | | | | | | | | |
Canadian Pacific Railway Co. | | | | | | | | |
4.500%, 01/15/2022 (d) | | | 589,000 | | | | 595,933 | |
Delta Air Lines, Inc. | | | | | | | | |
7.000%, 05/01/2025 (a) | | | 30,000 | | | | 34,997 | |
El Paso Natural Gas Co LLC | | | | | | | | |
8.625%, 01/15/2022 | | | 50,000 | | | | 51,177 | |
Rockpoint Gas Storage Canada Ltd. | | | | | | | | |
7.000%, 03/31/2023 (a)(d) | | | 625,000 | | | | 635,156 | |
| | | | | | | | 1,317,263 | |
| | | | | | | | | |
| Utilities – 0.14% | | | | | | | | |
Pacific Gas and Electric Co. | | | | | | | | |
1.500% (3 Month LIBOR + 1.375%), 11/15/2021 (b) | | | 50,000 | | | | 50,025 | |
The accompanying notes are an integral part of these financial statements.
CROSSINGBRIDGE ULTRA-SHORT DURATION FUND
| Schedule of Investments (Continued) |
September 30, 2021
| | | Face | | | | |
| | | Amount† | | | Value | |
| | | | | | | |
| CORPORATE BONDS – 46.46% (CONTINUED) | | | | | | |
| | | | | | | |
| Wholesale Trade – 2.45% | | | | | | |
Arrow Electronics, Inc. | | | | | | |
3.500%, 04/01/2022 | | | 900,000 | | | $ | 909,060 | |
| TOTAL CORPORATE BONDS (Cost $17,219,584) | | | | | | | 17,216,666 | |
| | | | | | | | | |
| | | Number of | | | | | |
| | | Shares | | | | | |
| | | | | | | | | |
| SPECIAL PURPOSE ACQUISITION COMPANIES – 16.76% | | | | | | | | |
890 5th Avenue Partners, Inc. (e) | | | 5,000 | | | | 49,550 | |
ACE Convergence Acquisition Corp. (d)(e) | | | 25,000 | | | | 247,750 | |
Argus Capital Corp. (e) | | | 15,680 | | | | 158,368 | |
Aries I Acquisition Corp. (d)(e) | | | 38,546 | | | | 384,689 | |
Athlon Acquisition Corp. (e) | | | 1,000 | | | | 9,780 | |
Atlantic Avenue Acquisition Corp. (e) | | | 1,000 | | | | 9,800 | |
Authentic Equity Acquisition Corp. (d)(e) | | | 1,000 | | | | 9,700 | |
Benessere Capital Acquisition Corp. (e) | | | 1,954 | | | | 19,697 | |
Berenson Acquisition Corp. I (e) | | | 24,118 | | | | 237,804 | |
Berenson Acquisition Corp. Founder Shares (e)(g)(h) | | | 1,827 | | | | — | |
Better World Acquisition Corp. (e) | | | 29,575 | | | | 297,968 | |
Bull Horn Holdings Corp. (d)(e) | | | 60,000 | | | | 597,000 | |
Carney Technology Acquisition Corp. II (e) | | | 1,000 | | | | 9,770 | |
Chavant Capital Acquisition Corp. (d)(e) | | | 85,000 | | | | 838,950 | |
CITIC Capital Acquisition Corp. (d) (e) | | | 4,260 | | | | 42,472 | |
Cohn Robbins Holdings Corp. (d)(e) | | | 1,000 | | | | 9,820 | |
COVA Acquisition Corp. (d)(e) | | | 1,000 | | | | 9,710 | |
Empowerment & Inclusion Capital I Corp. (e) | | | 800 | | | | 7,824 | |
G3 VRM Acquisition Corp. (e) | | | 30,000 | | | | 300,000 | |
Global Consumer Acquisition Corp. (e) | | | 65,000 | | | | 642,200 | |
Global SPAC Partners Co. (d)(e) | | | 12,875 | | | | 128,621 | |
Healthcare Services Acquisition Corp. (e) | | | 1,000 | | | | 9,730 | |
Ignyte Acquisition Corp. (e) | | | 1,000 | | | | 9,790 | |
Malacca Straits Acquisition Co Ltd. (d)(e) | | | 13,497 | | | | 134,160 | |
Maquia Capital Acquisition Corp. (e) | | | 30,000 | | | | 300,000 | |
North Atlantic Acquisition Corp. (d)(e) | | | 1,000 | | | | 9,760 | |
Thimble Point Acquisition Corp. (e) | | | 1,000 | | | | 9,940 | |
Trebia Acquisition Corp. (d)(e) | | | 668 | | | | 6,620 | |
Vistas Media Acquisition Co, Inc. (e) | | | 77,877 | | | | 785,000 | |
Zanite Acquisition Corp. (e) | | | 92,647 | | | | 936,661 | |
| TOTAL SPECIAL PURPOSE ACQUISITION VEHICLES | | | | | | | | |
| (Cost $6,169,110) | | | | | | | 6,213,134 | |
The accompanying notes are an integral part of these financial statements.
CROSSINGBRIDGE ULTRA-SHORT DURATION FUND
| Schedule of Investments (Continued) |
September 30, 2021
| | | Number of | | | | |
| | | Shares | | | Value | |
| | | | | | | |
| MONEY MARKET FUNDS – 10.67% | | | | | | |
First American Government Obligations | | | | | | |
Fund – Class X, 0.026% (f) | | | 1,976,584 | | | $ | 1,976,584 | |
First American Treasury Obligations Fund – Class X, 0.013% (f) | | | 1,976,583 | | | | 1,976,583 | |
| TOTAL MONEY MARKET FUNDS (Cost $3,953,167) | | | | | | | 3,953,167 | |
Total Investments (Cost $40,749,391) – 110.03% | | | | | | | 40,777,234 | |
Liabilities in Excess of Other Assets – (10.03)% | | | | | | | (3,716,497 | ) |
| Total Net Assets – 100.00% | | | | | | $ | 37,060,737 | |
Percentages are stated as a percent of net assets.
| † | Face amount in U.S. Dollar unless otherwise indicated. |
| (a) | Securities issued pursuant to Rule 144A under the Securities Act of 1933 and Regulation S under the Securities Act of 1933. Aggregate value of these securities is $6,078,073 or 16.40% of Fund’s net assets. |
| (b) | Variable rate security. The rate shown represents the rate at September 30, 2021. |
| (c) | The rate shown is the effective yield. |
| (d) | Foreign issued security. |
| (e) | Non-income producing security. |
| (f) | Seven day yield as of September 30, 2021. |
| (g) | Illiquid security. |
| (h) | Security valued using unobservable inputs. |
The accompanying notes are an integral part of these financial statements.
CROSSINGBRIDGE PRE-MERGER SPAC ETF
September 30, 2021
| | | Number of | | | | |
| | | Shares | | | Value | |
| | | | | | | |
| SPECIAL PURPOSE ACQUISITION COMPANIES – 85.42% | | | | | | |
26 Capital Acquisition Corp. (a) | | | 9,840 | | | $ | 95,645 | |
ACE Convergence Acquisition Corp. (a)(b) | | | 9,840 | | | | 97,514 | |
Acropolis Infrastructure Acquisition Corp. (a) | | | 4,610 | | | | 44,740 | |
Alkuri Global Acquisition Corp. (a) | | | 10,290 | | | | 102,591 | |
Apollo Strategic Growth Capital (a)(b) | | | 8,210 | | | | 80,130 | |
ArcLight Clean Transition Corp. II (a)(b) | | | 7,760 | | | | 75,738 | |
Argus Capital Corp. (a) | | | 6,000 | | | | 60,600 | |
Austerlitz Acquisition Corp. I (a)(b) | | | 9,840 | | | | 97,810 | |
B. Riley Principal 250 Merger Corp. (a) | | | 5,060 | | | | 49,082 | |
Berenson Acquisition Corp I (a) | | | 12,175 | | | | 120,045 | |
Berenson Acquisition Corp. Founder Shares (a) | | | 922 | | | | — | |
Bridgetown Holdings Ltd. (a)(b) | | | 8,660 | | | | 84,955 | |
Cartesian Growth Corp. (a)(b) | | | 4,500 | | | | 44,415 | |
CC Neuberger Principal Holdings II (a)(b) | | | 8,210 | | | | 80,622 | |
CITIC Capital Acquisition Corp. (a)(b) | | | 9,840 | | | | 98,105 | |
Colicity, Inc. (a) | | | 7,760 | | | | 75,815 | |
Compute Health Acquisition Corp. (a) | | | 8,210 | | | | 80,212 | |
Digital World Acquisition Corp. (a) | | | 7,760 | | | | 78,609 | |
FTAC Hera Acquisition Corp. (a)(b) | | | 5,060 | | | | 49,284 | |
FTAC Parnassus Acquisition Corp. (a) | | | 5,060 | | | | 49,335 | |
G Squared Ascend I, Inc. (a)(b) | | | 13,680 | | | | 134,953 | |
GigCapital4, Inc. (a) | | | 7,590 | | | | 74,837 | |
GigInternational1, Inc. (a) | | | 5,510 | | | | 54,384 | |
Global Consumer Acquisition Corp. (a) | | | 7,590 | | | | 74,989 | |
Goal Acquisitions Corp. (a) | | | 6,690 | | | | 65,027 | |
Health Assurance Acquisition Corp. (a) | | | 8,210 | | | | 80,294 | |
Healthcare Capital Corp. (a) | | | 10,515 | | | | 103,678 | |
HealthCor Catalio Acquisition Corp. (a)(b) | | | 7,760 | | | | 76,824 | |
Horizon Acquisition Corp. II (a)(b) | | | 7,760 | | | | 76,048 | |
Hudson Executive Investment Corp. III (a) | | | 7,760 | | | | 75,505 | |
Independence Holdings Corp. (a)(b) | | | 4,610 | | | | 45,040 | |
International Media Acquisition Corp. (a) | | | 8,210 | | | | 80,458 | |
Isos Acquisition Corp. (a)(b) | | | 4,610 | | | | 46,008 | |
ITHAX Acquisition Corp. (a)(b) | | | 5,060 | | | | 49,335 | |
Itiquira Acquisition Corp. (a)(b) | | | 6,690 | | | | 65,228 | |
KKR Acquisition Holdings I Corp. (a) | | | 7,760 | | | | 75,660 | |
Levere Holdings Corp. (a)(b) | | | 5,510 | | | | 53,778 | |
LightJump Acquisition Corp. (a) | | | 6,690 | | | | 65,896 | |
M3-Brigade Acquisition II Corp. (a) | | | 9,840 | | | | 97,514 | |
Macondray Capital Acquisition Corp. I (a)(b) | | | 8,210 | | | | 80,786 | |
Magnum Opus Acquisition Ltd. (a)(b) | | | 7,590 | | | | 75,065 | |
Maquia Capital Acquisition Corp. (a) | | | 7,140 | | | | 71,400 | |
Motive Capital Corp. (a)(b) | | | 9,840 | | | | 97,416 | |
The accompanying notes are an integral part of these financial statements.
CROSSINGBRIDGE PRE-MERGER SPAC ETF
| Schedule of Investments (Continued) |
September 30, 2021
| | | Number of | | | | |
| | | Shares | | | Value | |
| | | | | | | |
| SPECIAL PURPOSE ACQUISITION | | | | | | |
| COMPANIES – 85.42% (CONTINUED) | | | | | | |
Mudrick Capital Acquisition Corp. II (a) | | | 8,660 | | | $ | 86,167 | |
NightDragon Acquisition Corp. (a) | | | 5,510 | | | | 53,833 | |
North Atlantic Acquisition Corp. (a)(b) | | | 10,740 | | | | 104,822 | |
Novus Capital Corp. II (a) | | | 9,840 | | | | 97,416 | |
Parabellum Acquisition Corp. (a) | | | 42,165 | | | | 420,385 | |
Parabellum Acquisition Corp. Founder Shares (a)(d)(e) | | | 1,874 | | | | — | |
Pathfinder Acquisition Corp. (a)(b) | | | 5,060 | | | | 49,993 | |
Pershing Square Tontine Holdings Ltd. (a) | | | 8,040 | | | | 158,388 | |
Pioneer Merger Corp. (a)(b) | | | 9,840 | | | | 97,711 | |
Primavera Capital Acquisition Corp. (a)(b) | | | 8,210 | | | | 80,048 | |
Provident Acquisition Corp. (a)(b) | | | 5,060 | | | | 49,335 | |
ScION Tech Growth I (a)(b) | | | 5,510 | | | | 53,612 | |
Silver Crest Acquisition Corp. (a)(b) | | | 9,840 | | | | 96,727 | |
Silver Spike Acquisition Corp. II (a)(b) | | | 5,510 | | | | 53,998 | |
StoneBridge Acquisition Corp. (a)(b) | | | 10,290 | | | | 103,723 | |
Tailwind International Acquisition Corp. (a)(b) | | | 6,690 | | | | 64,893 | |
Tio Tech A (a)(b) | | | 4,610 | | | | 44,671 | |
Viveon Health Acquisition Corp. (a) | | | 5,510 | | | | 55,045 | |
Zanite Acquisition Corp. (a) | | | 9,840 | | | | 99,482 | |
| TOTAL SPECIAL PURPOSE ACQUISITION VEHICLES | | | | | | | | |
| (Cost $4,957,412) | | | | | | | 4,955,619 | |
| | | | | | | | | |
| MONEY MARKET FUNDS – 7.46% | | | | | | | | |
First American Government Obligations | | | | | | | | |
Fund – Class X, 0.026% (c) | | | 216,511 | | | | 216,511 | |
First American Treasury Obligations Fund – Class X, 0.013% (c) | | | 216,510 | | | | 216,510 | |
| TOTAL MONEY MARKET FUNDS (Cost $433,021) | | | | | | | 433,021 | |
Total Investments (Cost $5,390,433) – 92.88% | | | | | | | 5,388,640 | |
Other Assets in Excess of Liabilities – 7.12% | | | | | | | 413,143 | |
| Total Net Assets – 100.00% | | | | | | $ | 5,801,783 | |
Percentages are stated as a percent of net assets.
| (a) | Non-income producing security. |
| (b) | Foreign issued security. |
| (c) | Seven day yield as of September 30, 2021. |
| (d) | Illiquid security. |
| (e) | Security valued using unobservable inputs. |
The accompanying notes are an integral part of these financial statements.
CROSSINGBRIDGE FUNDS
| Statements of Assets and Liabilities |
September 30, 2021
| | | CrossingBridge | | | CrossingBridge | |
| | | Low Duration High | | | Responsible | |
| | | Yield Fund | | | Credit Fund | |
| ASSETS | | | | | | |
| Investments, at value | | | | | | |
| (cost $327,570,632 and $16,641,584) | | $ | 327,609,870 | | | $ | 16,649,445 | |
| Cash | | | 20,958,248 | | | | 457,068 | |
| Cash held in foreign currency, at value | | | | | | | | |
| (cost $96,980 and $16,442 ) | | | 97,002 | | | | 16,429 | |
| Receivable for investment securities sold | | | 4,461,998 | | | | — | |
| Dividends and interest receivable | | | 3,241,979 | | | | 162,533 | |
| Receivable for Fund shares sold | | | 2,080,604 | | | | — | |
| Unrealized appreciation of forward currency | | | | | | | | |
| exchange contracts | | | 458,719 | | | | 44,736 | |
| Prepaid expenses and other assets | | | 34,763 | | | | 23,248 | |
| Receivable from Adviser | | | — | | | | 5,577 | |
| TOTAL ASSETS | | | 358,943,183 | | | | 17,359,036 | |
| LIABILITIES | | | | | | | | |
| Payable for investments purchased | | | 32,058,844 | | | | 376,000 | |
| Payable to Adviser | | | 174,742 | | | | — | |
| Payable for Fund shares redeemed | | | 99,878 | | | | 39,614 | |
| Payable to affiliates | | | 62,696 | | | | 27,222 | |
| Accrued expenses and other liabilities | | | 42,491 | | | | 25,313 | |
| Shareholder servicing fees payable | | | 20,898 | | | | 1,464 | |
| TOTAL LIABILITIES | | | 32,459,549 | | | | 469,613 | |
| NET ASSETS | | $ | 326,483,634 | | | $ | 16,889,423 | |
| Net assets consist of: | | | | | | | | |
| Paid-in capital | | $ | 319,914,647 | | | $ | 16,838,736 | |
| Total distributable earnings | | | 6,568,987 | | | | 50,687 | |
| NET ASSETS | | $ | 326,483,634 | | | $ | 16,889,423 | |
| | | | | | | | | |
| INSTITUTIONAL CLASS | | | | | | | | |
| Shares of beneficial interest outstanding (unlimited | | | | | | | | |
| number of shares authorized, $0.001 par value) | | | 31,501,489 | | | | 1,686,806 | |
| Net asset value, offering, and | | | | | | | | |
| redemption price per share | | $ | 10.36 | | | $ | 10.01 | |
The accompanying notes are an integral part of these financial statements.
CROSSINGBRIDGE FUNDS
| Statements of Assets and Liabilities (Continued) |
September 30, 2021
| | | CrossingBridge | | | CrossingBridge | |
| | | Ultra-Short | | | Pre-Merger | |
| | | Duration Fund | | | SPAC ETF | |
| ASSETS | | | | | | |
| Investments, at value | | | | | | |
| (cost $40,749,391 and $5,390,433) | | $ | 40,777,234 | | | $ | 5,388,640 | |
| Cash | | | 294,253 | | | | 43,186 | |
| Receivable for investment securities sold | | | 814,880 | | | | 45,600 | |
| Dividends and interest receivable | | | 292,119 | | | | 2 | |
| Receivable for Fund shares sold | | | 76,875 | | | | 1,603,648 | |
| Prepaid expenses and other assets | | | 24,412 | | | | — | |
| Receivable from Adviser | | | 607 | | | | — | |
| TOTAL ASSETS | | | 42,280,380 | | | | 7,081,076 | |
| LIABILITIES | | | | | | | | |
| Payable for investments purchased | | | 5,163,773 | | | | 1,278,384 | |
| Accrued expenses and other liabilities | | | 27,229 | | | | — | |
| Payable to affiliates | | | 25,946 | | | | — | |
| Shareholder servicing fees payable | | | 2,676 | | | | — | |
| Payable for Fund shares redeemed | | | 19 | | | | — | |
| Payable to Adviser | | | — | | | | 909 | |
| TOTAL LIABILITIES | | | 5,219,643 | | | | 1,279,293 | |
| NET ASSETS | | $ | 37,060,737 | | | $ | 5,801,783 | |
| Net assets consist of: | | | | | | | | |
| Paid-in capital | | $ | 37,029,790 | | | $ | 5,803,792 | |
| Total distributable earnings/(accumulated losses) | | | 30,947 | | | | (2,009 | ) |
| NET ASSETS | | $ | 37,060,737 | | | $ | 5,801,783 | |
| | | | | | | | | |
| INSTITUTIONAL CLASS | | | | | | | | |
| Shares of beneficial interest outstanding (unlimited | | | | | | | | |
| number of shares authorized, $0.001 par value) | | | 3,703,463 | | | | | |
| Net asset value, offering, and | | | | | | | | |
| redemption price per share | | $ | 10.01 | | | | | |
| | | | | | | | | |
| FUND | | | | | | | | |
| Shares of beneficial interest outstanding (unlimited | | | | | | | | |
| number of shares authorized, $0.001 par value) | | | | | | | 290,000 | |
| Net asset value, offering, and | | | | | | | | |
| redemption price per share | | | | | | $ | 20.01 | |
The accompanying notes are an integral part of these financial statements.
CROSSINGBRIDGE FUNDS
For the Year/Period Ended September 30, 2021
| | | CrossingBridge | | | CrossingBridge | |
| | | Low Duration High | | | Responsible | |
| | | Yield Fund | | | Credit Fund(1) | |
| INVESTMENT INCOME | | | | | | |
Interest income (net of $74,188 and $5,936 | | | | | | |
foreign withholding tax, respectively) | | $ | 8,207,425 | | | $ | 102,175 | |
Dividend income | | | 55,775 | | | | — | |
| TOTAL INVESTMENT INCOME | | | 8,263,200 | | | | 102,175 | |
| EXPENSES | | | | | | | | |
Management fees (Note 4) | | | 1,262,622 | | | | 20,335 | |
Shareholder servicing fees – Institutional Class (Note 5) | | | 146,366 | | | | 3,128 | |
Administration and accounting fees (Note 6) | | | 126,127 | | | | 17,585 | |
Transfer agent fees and expenses (Note 6) | | | 52,855 | | | | 6,290 | |
Federal and state registration fees | | | 41,648 | | | | 5,720 | |
Legal fees | | | 31,923 | | | | 3,513 | |
Custody fees (Note 6) | | | 28,053 | | | | 3,810 | |
Audit and tax fees | | | 19,155 | | | | 16,741 | |
Pricing fees (Note 6) | | | 16,299 | | | | 1,999 | |
Trustees’ fees | | | 15,588 | | | | — | |
Chief Compliance Officer fees (Note 6) | | | 13,694 | | | | 2,917 | |
Reports to shareholders | | | 9,953 | | | | 3,425 | |
Expense recoupment by Adviser (Note 4) | | | 4,619 | | | | — | |
Other expenses | | | 4,576 | | | | 904 | |
Insurance fees | | | 3,621 | | | | 210 | |
| TOTAL EXPENSES | | | 1,777,099 | | | | 86,577 | |
| Less waivers and reimbursement by Adviser (Note 4) | | | (75,455 | ) | | | (58,237 | ) |
| NET EXPENSES | | | 1,701,644 | | | | 28,340 | |
| NET INVESTMENT INCOME | | | 6,561,556 | | | | 73,835 | |
| REALIZED AND UNREALIZED | | | | | | | | |
| GAIN (LOSS) ON INVESTMENTS | | | | | | | | |
Net realized gain (loss) on: | | | | | | | | |
| Investments | | | 7,132,312 | | | | 1,480 | |
| Foreign currency exchange contracts | | | 274,815 | | | | (8,861 | ) |
| Written options contracts | | | 57,400 | | | | — | |
| Foreign currency transactions | | | 12,907 | | | | 3,209 | |
| | | | 7,477,434 | | | | (4,172 | ) |
Net change in unrealized appreciation (depreciation) on: | | | | | | | | |
| Investments | | | 2,551,056 | | | | 7,861 | |
| Foreign currency exchange contracts | | | 307,539 | | | | 44,736 | |
| Foreign currency translation | | | (1,282 | ) | | | (53 | ) |
| | | | 2,857,313 | | | | 52,544 | |
| NET REALIZED AND UNREALIZED | | | | | | | | |
| GAIN ON INVESTMENTS | | | 10,334,747 | | | | 48,372 | |
| NET INCREASE IN NET ASSETS FROM OPERATIONS | | $ | 16,896,303 | | | $ | 122,207 | |
(1) | Represents period from June 30, 2021 (commencement of operations) through September 30, 2021 |
The accompanying notes are an integral part of these financial statements.
CROSSINGBRIDGE FUNDS
| Statements of Operations (Continued) |
For the Period Ended September 30, 2021
| | | CrossingBridge | | | CrossingBridge | |
| | | Ultra-Short | | | Pre-Merger | |
| | | Duration Fund(1) | | | SPAC ETF(2) | |
| INVESTMENT INCOME | | | | | | |
Interest income | | $ | 20,370 | | | $ | 2 | |
| TOTAL INVESTMENT INCOME | | | 20,370 | | | | 2 | |
| EXPENSES | | | | | | | | |
Management fees (Note 4) | | | 21,476 | | | | 909 | |
Administration and accounting fees (Note 6) | | | 17,585 | | | | — | |
Audit and tax fees | | | 16,500 | | | | — | |
Federal and state registration fees | | | 7,090 | | | | — | |
Transfer agent fees and expenses (Note 6) | | | 6,309 | | | | — | |
Legal fees | | | 4,372 | | | | — | |
Reports to shareholders | | | 3,425 | | | | — | |
Shareholder servicing fees – Institutional Class (Note 5) | | | 3,303 | | | | — | |
Chief Compliance Officer fees (Note 6) | | | 2,917 | | | | — | |
Custody fees (Note 6) | | | 2,576 | | | | — | |
Pricing fees (Note 6) | | | 1,919 | | | | — | |
Insurance fees | | | 210 | | | | — | |
Other expenses | | | 743 | | | | — | |
| TOTAL EXPENSES | | | 88,425 | | | | 909 | |
| Less waivers and reimbursement by Adviser (Note 4) | | | (58,690 | ) | | | — | |
| NET EXPENSES | | | 29,735 | | | | 909 | |
| NET INVESTMENT LOSS | | | (9,365 | ) | | | (907 | ) |
| REALIZED AND UNREALIZED | | | | | | | | |
| GAIN (LOSS) ON INVESTMENTS | | | | | | | | |
Net realized gain (loss) on: | | | | | | | | |
| Investments | | | 5,227 | | | | 691 | |
| Foreign currency transactions | | | 7,242 | | | | — | |
| | | | 12,469 | | | | 691 | |
Net change in unrealized appreciation (depreciation) on: | | | | | | | | |
| Investments | | | 27,843 | | | | (1,793 | ) |
| | | | 27,843 | | | | (1,793 | ) |
| NET REALIZED AND UNREALIZED | | | | | | | | |
| GAIN (LOSS) ON INVESTMENTS | | | 40,312 | | | | (1,102 | ) |
| NET INCREASE (DECREASE) IN | | | | | | | | |
| NET ASSETS FROM OPERATIONS | | $ | 30,947 | | | $ | (2,009 | ) |
(1) | Represents period from June 30, 2021 (commencement of operations) through September 30, 2021. |
(2) | Represents period from September 20, 2021 (commencement of operations) through September 30, 2021. |
The accompanying notes are an integral part of these financial statements.
CROSSINGBRIDGE FUNDS
| Statements of Changes in Net Assets |
| | | CROSSINGBRIDGE LOW DURATION | |
| | | HIGH YIELD FUND | |
| | | Year Ended | | | Year Ended | |
| | | September 30, 2021 | | | | |
| FROM OPERATIONS | | | | | | |
| Net investment income | | $ | 6,561,556 | | | $ | 4,843,248 | |
| Net realized gain (loss) on: | | | | | | | | |
| Investments | | | | | | | (537,671 | ) |
| Forward currency exchange contracts | | | | | | | — | |
| Written options contracts | | | 57,400 | | | | — | |
| Foreign currency transactions | | | 12,907 | | | | 63,938 | |
| Net change in unrealized | | | | | | | | |
| appreciation (depreciation) on: | | | | | | | | |
| Investments | | | | | | | | |
| Forward currency exchange contracts | | | | | | | 151,180 | |
| Foreign currency translation | | | | | | | (181 | ) |
| Net increase in net assets from operations | | | 16,896,303 | | | | 2,049,026 | |
| | | | | | | | | |
| FROM DISTRIBUTIONS | | | | | | | | |
| Distributions to shareholders | | | (7,308,862 | ) | | | (5,081,642 | ) |
| Net decrease in net assets | | | | | | | | |
| resulting from distributions paid | | | (7,308,862 | ) | | | (5,081,642 | ) |
| | | | | | | | | |
| FROM CAPITAL SHARE TRANSACTIONS | | | | | | | | |
| Proceeds from sales of shares – | | | | | | | | |
| Institutional Class | | | 257,858,317 | | | | 68,152,381 | |
| Net asset value of shares issued to shareholders | | | | | | | | |
| in payment of distributions declared – | | | | | | | | |
| Institutional Class | | | 5,795,404 | | | | 4,149,819 | |
| Payments for shares redeemed – | | | | | | | | |
| Institutional Class | | | (90,881,724 | ) | | | (54,164,236 | ) |
| Net increase in net assets | | | | | | | | |
| from capital share transactions | | | 172,771,997 | | | | 18,137,964 | |
| TOTAL INCREASE IN NET ASSETS | | | 182,359,438 | | | | 15,105,348 | |
| | | | | | | | | |
| NET ASSETS: | | | | | | | | |
| Beginning of Year | | | 144,124,196 | | | | 129,018,848 | |
| End of Year | | $ | 326,483,634 | | | $ | 144,124,196 | |
| | | | | | | | | |
The accompanying notes are an integral part of these financial statements.
CROSSINGBRIDGE FUNDS
| Statements of Changes in Net Assets (Continued) |
| | | CROSSINGBRIDGE | | | CROSSINGBRIDGE | |
| | | RESPONSIBLE | | | ULTRA-SHORT | |
| | | CREDIT FUND | | | DURATION FUND | |
| | | Period from | | | Period from | |
| | | June 30, 2021(1) | | | June 30, 2021(1) | |
| | | through | | | through | |
| | | September 30, 2021 | | | September 30, 2021 | |
| FROM OPERATIONS | | | | | | |
| Net investment income (loss) | | $ | 73,835 | | | $ | (9,365 | ) |
| Net realized gain (loss) on: | | | | | | | | |
| Investments | | | 1,480 | | | | 5,227 | |
| Forward currency exchange contracts | | | (8,861 | ) | | | — | |
| Foreign currency transactions | | | 3,209 | | | | 7,242 | |
| Net change in unrealized | | | | | | | | |
| appreciation (depreciation) on: | | | | | | | | |
| Investments | | | 7,861 | | | | 27,843 | |
| Forward currency exchange contracts | | | 44,736 | | | | — | |
| Foreign currency translation | | | (53 | ) | | | — | |
| Net increase in net assets from operations | | | 122,207 | | | | 30,947 | |
| | | | | | | | | |
| FROM DISTRIBUTIONS | | | | | | | | |
| Distributions to shareholders | | | (71,520 | ) | | | — | |
| Net decrease in net assets | | | | | | | | |
| resulting from distributions paid | | | (71,520 | ) | | | — | |
| | | | | | | | | |
| FROM CAPITAL SHARE TRANSACTIONS | | | | | | | | |
| Proceeds from sales of shares – | | | | | | | | |
| Institutional Class | | | 17,033,340 | | | | 37,029,820 | |
| Net asset value of shares issued to shareholders | | | | | | | | |
| in payment of distributions declared – | | | | | | | | |
| Institutional Class | | | 71,520 | | | | — | |
| Payments for shares redeemed – | | | | | | | | |
| Institutional Class | | | (266,124 | ) | | | (30 | ) |
| Net increase in net assets | | | | | | | | |
| from capital share transactions | | | 16,838,736 | | | | 37,029,790 | |
| TOTAL INCREASE IN NET ASSETS | | | 16,889,423 | | | | 37,060,737 | |
| | | | | | | | | |
| NET ASSETS: | | | | | | | | |
| Beginning of Period | | | — | | | | — | |
| End of Period | | $ | 16,889,423 | | | $ | 37,060,737 | |
(1) | Commencement of operations. |
The accompanying notes are an integral part of these financial statements.
CROSSINGBRIDGE FUNDS
| Statements of Changes in Net Assets (Continued) |
| | | CROSSINGBRIDGE | |
| | | PRE-MERGER SPAC ETF | |
| | | Period from | |
| | | September 20, 2021(1) | |
| | | through | |
| | | September 30, 2021 | |
| FROM OPERATIONS | | | |
| Net investment loss | | $ | (907 | ) |
| Net realized gain (loss) on: | | | | |
| Investments | | | 691 | |
| Net change in unrealized appreciation (depreciation) on: | | | | |
| Investments | | | (1,793 | ) |
| Net decrease in net assets from operations | | | (2,009 | ) |
| | | | | |
| FROM DISTRIBUTIONS | | | | |
| Net decrease in net assets resulting from distributions paid | | | — | |
| | | | | |
| FROM CAPITAL SHARE TRANSACTIONS | | | | |
| Proceeds from sales of shares | | | 5,803,792 | |
| Net asset value of shares issued to shareholders | | | | |
| in payment of distributions declared | | | — | |
| Payments for shares redeemed | | | — | |
| Net increase in net assets from capital share transactions | | | 5,803,792 | |
| TOTAL INCREASE IN NET ASSETS | | | 5,801,783 | |
| | | | | |
| NET ASSETS: | | | | |
| Beginning of Period | | | — | |
| End of Period | | $ | 5,801,783 | |
(1) | Commencement of operations. |
The accompanying notes are an integral part of these financial statements.
CROSSINGBRIDGE LOW DURATION HIGH YIELD FUND
Institutional Class
| | | Year Ended | |
| | | September 30, | |
| | | 2021 | |
| Net Asset Value, Beginning of Year/Period | | $ | 9.86 | |
| | | | | |
| Income from investment operations: | | | | |
Net investment income(2) | | | 0.34 | |
Net realized and unrealized gain (loss) on investments(3) | | | 0.54 | |
Total from investment operations | | | 0.88 | |
| | | | | |
| Less distributions paid: | | | | |
| From net investment income | | | (0.38 | ) |
| From net realized gains | | | — | |
Total distributions paid | | | (0.38 | ) |
| | | | | |
| Net Asset Value, End of Year/Period | | $ | 10.36 | |
Total return(5) | | | 9.13 | % |
| | | | | |
| Supplemental Data and Ratios: | | | | |
Net assets, end of year/period (000’s) | | $ | 326,484 | |
| | | | | |
Ratio of expenses to average net assets: | | | | |
Before waivers and reimbursements of expenses(6)(7) | | | 0.91 | % |
After waivers and reimbursement of expenses(6)(7) | | | 0.88 | % |
Ratio of net investment income to average net assets: | | | | |
Before waivers and reimbursements of expenses(6) | | | 3.34 | % |
After waivers and reimbursements of expenses(6) | | | 3.37 | % |
Portfolio turnover rate(8) | | | 169.73 | % |
(1) | Commencement of investment operations. |
(2) | Per share net investment income was calculated using average shares outstanding method. |
(3) | Net realized and unrealized gain (loss) per share in the caption are balancing amounts necessary to reconcile the change in net asset value per share for the period and may not reconcile with the aggregate gains and losses in the Statements of Operations. |
(4) | Less than $0.005 per share. |
(5) | Total return represents the rate that investor would have earned or lost on an investment in the Fund, assuming reinvestment of dividends. Total return for a period of less than one year is not annualized. |
(6) | Annualized for periods less than one year. |
(7) | This ratio includes previous expense reimbursements recouped by the Adviser. If this recoupment was excluded, this ratio would be unchanged. |
(8) | Portfolio turnover not annualized for periods less than one year. Short-term securities with maturities less than or equal to 365 days are excluded from the portfolio turnover calculation. |
The accompanying notes are an integral part of these financial statements.
CROSSINGBRIDGE LOW DURATION HIGH YIELD FUND
| Financial Highlights (Continued) |
Per Share Data for a Share Outstanding Throughout Each Period/Year
| | | | | | | Period from | |
| | | | | | | February 1, 2018(1) | |
| Year Ended | | | Year Ended | | | through | |
| September 30, 2020 | | | September 30, 2019 | | | September 31, 2018 | |
$ | 10.04 | | | $ | 10.06 | | | $ | 10.00 | |
| | | | | | | | | | | |
| | | | | | | | | | | |
| | 0.35 | | | | 0.29 | | | | 0.17 | |
| | (0.18 | ) | | | (0.02 | ) | | | 0.02 | |
| | 0.17 | | | | 0.27 | | | | 0.19 | |
| | | | | | | | | | | |
| | | | | | | | | | | |
| | (0.35 | ) | | | (0.29 | ) | | | (0.13 | ) |
| | — | | | | (0.00 | )(4) | | | — | |
| | (0.35 | ) | | | (0.29 | ) | | | (0.13 | ) |
| | | | | | | | | | | |
$ | 9.86 | | | $ | 10.04 | | | $ | 10.06 | |
| | 1.80 | % | | | 2.71 | % | | | 1.95 | % |
| | | | | | | | | | | |
| | | | | | | | | | | |
$ | 144,124 | | | $ | 129,019 | | | $ | 45,827 | |
| | | | | | | | | | | |
| | | | | | | | | | | |
| | 0.96 | % | | | 1.08 | % | | | 1.90 | % |
| | 0.90 | % | | | 0.96 | % | | | 1.00 | % |
| | | | | | | | | | | |
| | 3.35 | % | | | 2.83 | % | | | 1.64 | % |
| | 3.41 | % | | | 2.95 | % | | | 2.54 | % |
| | 224.86 | % | | | 198.63 | % | | | 76.70 | % |
The accompanying notes are an integral part of these financial statements.
CROSSINGBRIDGE RESPONSIBLE CREDIT FUND
Per Share Data for a Share Outstanding Throughout Each Period
| Institutional Class | | | |
| | | Period from | |
| | | June 30, 2021(1) | |
| | | through | |
| | | September 30, | |
| | | 2021 | |
| Net Asset Value, Beginning of Period | | $ | 10.00 | |
| | | | | |
| Income from investment operations: | | | | |
Net investment income(2) | | | 0.06 | |
Net realized and unrealized loss on investments(3) | | | (0.01 | ) |
Total from investment operations | | | 0.05 | |
| | | | | |
| Less distributions paid: | | | | |
| From net investment income | | | (0.04 | ) |
| From net realized gains | | | — | |
Total distributions paid | | | (0.04 | ) |
| | | | | |
| Net Asset Value, End of Period | | $ | 10.01 | |
Total return(4) | | | 0.57 | % |
| | | | | |
| Supplemental Data and Ratios: | | | | |
Net assets, end of period (000’s) | | $ | 16,889 | |
| | | | | |
Ratio of expenses to average net assets: | | | | |
Before waivers and reimbursements of expenses(5) | | | 2.77 | % |
After waivers and reimbursement of expenses(5)(6) | | | 0.91 | % |
Ratio of net investment income to average net assets: | | | | |
Before waivers and reimbursements of expenses(5) | | | 0.50 | % |
After waivers and reimbursements of expenses(5) | | | 2.36 | % |
Portfolio turnover rate(7) | | | 39.47 | % |
(1) | Commencement of investment operations. |
(2) | Per share net investment income was calculated using average shares outstanding method. |
(3) | Net realized and unrealized loss per share in the caption are balancing amounts necessary to reconcile the change in net asset value per share for the period and may not reconcile with the aggregate gains and losses in the Statements of Operations. |
(4) | Total return represents the rate that investor would have earned or lost on an investment in the Fund, assuming reinvestment of dividends. Total return for a period of less than one year is not annualized. |
(5) | Annualized for periods less than one year. |
(6) | The ratio of expenses to average net assets after waivers and reimbursement of expenses includes bank loan service charges. Excluding these charges, the ratio was 0.90%. |
(7) | Portfolio turnover not annualized for periods less than one year. Short-term securities with maturities less than or equal to 365 days are excluded from the portfolio turnover calculation. |
The accompanying notes are an integral part of these financial statements.
CROSSINGBRIDGE ULTRA-SHORT DURATION FUND
Per Share Data for a Share Outstanding Throughout Each Period
| Institutional Class | | | |
| | | Period from | |
| | | June 30, 2021(1) | |
| | | through | |
| | | September 30, | |
| | | 2021 | |
| Net Asset Value, Beginning of Period | | $ | 10.00 | |
| | | | | |
| Income from investment operations: | | | | |
Net investment loss(1) | | | (0.01 | ) |
Net realized and unrealized gain on investments(2) | | | 0.02 | |
Total from investment operations | | | 0.01 | |
| | | | | |
| Less distributions paid: | | | | |
| From net investment income | | | — | |
| From net realized gains | | | — | |
Total distributions paid | | | — | |
| | | | | |
| Net Asset Value, End of Period | | $ | 10.01 | |
Total return(4) | | | 0.07 | % |
| | | | | |
| Supplemental Data and Ratios: | | | | |
Net assets, end of period (000’s) | | $ | 37,061 | |
| | | | | |
Ratio of expenses to average net assets: | | | | |
Before waivers and reimbursements of expenses(5) | | | 2.68 | % |
After waivers and reimbursement of expenses(5) | | | 0.90 | % |
Ratio of net investment loss to average net assets: | | | | |
Before waivers and reimbursements of expenses(5) | | | (2.06 | %) |
After waivers and reimbursements of expenses(5) | | | (0.28 | %) |
Portfolio turnover rate(6) | | | 41.74 | % |
(1) | Commencement of investment operations. |
(2) | Per share net investment loss was calculated using average shares outstanding method. |
(3) | Net realized and unrealized gain per share in the caption are balancing amounts necessary to reconcile the change in net asset value per share for the period and may not reconcile with the aggregate gains and losses in the Statements of Operations. |
(4) | Total return represents the rate that investor would have earned or lost on an investment in the Fund, assuming reinvestment of dividends. Total return for a period of less than one year is not annualized. |
(5) | Annualized for periods less than one year. |
(6) | Portfolio turnover not annualized for periods less than one year. Short-term securities with maturities less than or equal to 365 days are excluded from the portfolio turnover calculation. |
The accompanying notes are an integral part of these financial statements.
CROSSINGBRIDGE PRE-MERGER SPAC ETF
Per Share Data for a Share Outstanding Throughout Each Period
| NAV | | | |
| | | Period from | |
| | | September 20, | |
| | | 2021(1) | |
| | | through | |
| | | September 30, | |
| | | 2021 | |
| Net Asset Value, Beginning of Period | | $ | 20.00 | |
| | | | | |
| Income from investment operations: | | | | |
Net investment loss(2) | | | (0.00 | )(3) |
Net realized and unrealized gain on investments(4) | | | 0.01 | |
Total from investment operations | | | 0.01 | |
| | | | | |
| Less distributions paid: | | | | |
| From net investment income | | | — | |
| From net realized gains | | | — | |
Total distributions paid | | | — | |
| | | | | |
| Net Asset Value, End of Period | | $ | 20.01 | |
Total return(5) | | | 0.03 | % |
| | | | | |
| Supplemental Data and Ratios: | | | | |
Net assets, end of period (000’s) | | $ | 5,802 | |
| | | | | |
Ratio of expenses to average net assets(6) | | | 0.80 | % |
Ratio of net investment loss to average net assets(6) | | | (0.80 | %) |
Portfolio turnover rate(7)(8) | | | 4.29 | % |
(1) | Commencement of investment operations. |
(2) | Per share net investment loss was calculated using average shares outstanding method. |
(3) | Amount between $(0.005) and $0.00 per share. |
(4) | Net realized and unrealized gain per share in the caption are balancing amounts necessary to reconcile the change in net asset value per share for the period and may not reconcile with the aggregate gains and losses in the Statements of Operations. |
(5) | Total return represents the rate that investor would have earned or lost on an investment in the Fund, assuming reinvestment of dividends. Total return for a period of less than one year is not annualized. Total return presented is total return of Net Asset Value. Total return of the Market Value is 0.20%. |
(6) | Annualized for periods less than one year. |
(7) | Portfolio turnover not annualized for periods less than one year. Short-term securities with maturities less than or equal to 365 days are excluded from the portfolio turnover calculation. |
(8) | Excludes in-kind transactions associated with creations and redemptions of the Fund. |
The accompanying notes are an integral part of these financial statements.
CROSSINGBRIDGE FUNDS
Notes to Financial Statements
September 30, 2021
| (1) | Organization |
| | |
| | Trust for Professional Managers (the “Trust”) was organized as a Delaware statutory trust under a Declaration of Trust dated May 29, 2001. The Trust is registered under the Investment Company Act of 1940, as amended (the “1940 Act”), as an open-end management investment company. The CrossingBridge Funds (the “Funds”) are comprised of the CrossingBridge Low Duration High Yield Fund, the CrossingBridge Responsible Credit Fund, the CrossingBridge Ultra-Short Duration Fund (collectively, the “Mutual Funds”) and the CrossingBridge Pre-Merger SPAC ETF (the “ETF”), each representing a distinct diversified series with its own investment objective and policies within the Trust. |
| | |
| | The investment objective of the CrossingBridge Low Duration High Yield Fund is to seek high current income and capital appreciation consistent with the preservation of capital. The investment objective of the CrossingBridge Responsible Credit Fund is to seek high current income and capital appreciation consistent with the preservation of capital. The investment objective of the CrossingBridge Ultra-Short Duration Fund is to offer a higher yield than cash instruments while maintaining a low duration. |
| | |
| | The CrossingBridge Low Duration High Yield Fund commenced investment operations on February 1, 2018. The Fund has registered both an Investor Class and Institutional Class of shares. During the fiscal year ended September 30, 2021, only the Institutional Class was operational. Both the CrossingBridge Responsible Credit Fund and CrossingBridge Ultra-Short Duration Fund commenced investment operations on June 30, 2021. Both Funds registered only an Institutional Class of shares. |
| | |
| | The investment objective of the CrossingBridge Pre-Merger SPAC ETF is to provide total returns consistent with the preservation of capital. The ETF commenced investment operations on September 20, 2021. |
| | |
| | Costs incurred by the Funds in connection with the organization, registration and the initial public offering of shares were paid by CrossingBridge Advisors, LLC (“the Adviser”), the Funds’ investment adviser. The Trust may issue an unlimited number of shares of beneficial interest at $0.001 par value. The Funds are investment companies and accordingly follow the investment company accounting and reporting guidance of the Financial Accounting Standards Board (“FASB”) Accounting Standards Codification Topic 946 “Financial Services – Investment Companies.” |
| | |
| (2) | Significant Accounting Policies |
| | |
| | The following is a summary of significant accounting policies consistently followed by the Funds in the preparation of the financial statements. These policies are in conformity with generally accepted accounting principles in the United States of America (“GAAP”). |
| | |
| | (a) Investment Valuation |
| | |
| | Each security owned by a Fund that is listed on a securities exchange, including Special Purpose Acquisition Companies (“SPACs”), is valued at its last sale price on that exchange on the date as of which assets are valued. Bank loans are valued at prices supplied by an approved independent pricing service (“Pricing Service”), if available, and otherwise will be valued at the most recent bid quotations or evaluated prices, as applicable, based on quotations or prices obtained from one or more broker-dealers known to follow the issue. |
CROSSINGBRIDGE FUNDS
Notes to Financial Statements (Continued)
September 30, 2021
| | If the security is listed on more than one exchange, a Fund will use the price of the exchange that the Fund generally considers to be the principal exchange on which the security is traded. Portfolio securities listed on NASDAQ will be valued at the NASDAQ Official Closing Price, which may not necessarily represent the last sale price. If there has been no sale on such exchange or on NASDAQ on such day, the security is valued at the mean between the most recent bid and asked prices on such day or the security shall be valued at the latest sales price on the “composite market” for the day such security is being valued. The composite market is defined as a consolidation of the trade information provided by national securities and foreign exchanges and over-the-counter markets as published by a Pricing Service. |
| | |
| | Foreign securities will be priced in their local currencies as of the close of their primary exchange or market or as of the time a Fund calculates its NAV, whichever is earlier. Foreign securities, currencies and other assets denominated in foreign currencies are then translated into U.S. dollars at the exchange rate of such currencies against the U.S. dollar, as provided by an approved Pricing Service or reporting agency. All assets denominated in foreign currencies will be converted into U.S. dollars using the applicable currency exchange rates as of the close of the New York Stock Exchange (“NYSE”), generally 4:00 p.m. Eastern Time. |
| | |
| | Debt securities, including corporate bonds, bank loans, commercial paper, and short-term debt instruments having a maturity of 60 days or less, are valued at the mean in accordance with prices supplied by an approved Pricing Service. Pricing Services may use various valuation methodologies such as the mean between the bid and the asked prices, matrix pricing and other analytical pricing models as well as market transactions and dealer quotations. If a price is not available from a Pricing Service, the most recent quotation obtained from one or more broker-dealers known to follow the issue will be obtained. Quotations will be valued at the mean between the bid and the offer. Any discount or premium is accreted or amortized using the constant yield method until maturity. |
| | |
| | Money market funds are valued at cost. If cost does not represent current market value, the securities will be priced at fair value. |
| | |
| | Redeemable securities issued by open-end, registered investment companies are valued at the NAVs of such companies for purchase and/or redemption orders placed on that day. All exchange-traded funds are valued at the last reported sale price on the exchange on which the security is principally traded. |
| | |
| | If market quotations are not readily available, a security or other asset will be valued at its fair value as determined under fair value pricing procedures approved by the Board of Trustees. These fair value pricing procedures will also be used to price a security when corporate events, events in the securities market and/or world events cause the Adviser to believe that a security’s last sale price may not reflect its actual fair market value. The intended effect of using fair value pricing procedures is to ensure that a Fund is accurately priced. The Board of Trustees will regularly evaluate whether the Funds’ fair value pricing procedures continue to be appropriate in light of the specific circumstances of the Funds and the quality of prices obtained through the application of such procedures by the Trust’s valuation committee. |
CROSSINGBRIDGE FUNDS
Notes to Financial Statements (Continued)
September 30, 2021
| | FASB Accounting Standards Codification, “Fair Value Measurements and Disclosures” Topic 820 (“ASC 820”), establishes an authoritative definition of fair value and sets out a hierarchy for measuring fair value. ASC 820 requires an entity to evaluate certain factors to determine whether there has been a significant decrease in volume and level of activity for the security such that recent transactions and quoted prices may not be determinative of fair value and further analysis and adjustment may be necessary to estimate fair value. ASC 820 also requires enhanced disclosure regarding the inputs and valuation techniques used to measure fair value in those instances as well as expanded disclosure of valuation levels for major security types. These inputs are summarized in the three broad levels listed below: |
| | Level 1 – | Unadjusted quoted prices in active markets for identical securities. |
| | | |
| | Level 2 – | Other significant observable inputs (including quoted prices for similar securities, interest rates, prepayment speeds, credit risk, etc.). |
| | | |
| | Level 3 – | Significant unobservable inputs (including the Funds’ own assumptions in determining the fair value of investments). |
| | The inputs or methodology used for valuing securities are not necessarily an indication of the risk associated with investing in those securities. The following is a summary of the inputs used to value the Funds’ investments carried at fair value as of September 30, 2021: |
| | CrossingBridge Low Duration High Yield Fund | | | | | | | | | | | | |
| | | | Level 1 | | | Level 2 | | | Level 3 | | | Total | |
| | Investments(1): | | | | | | | | | | | | |
| | Asset Backed Securities | | $ | — | | | $ | 3,339,727 | | | $ | — | | | $ | 3,339,727 | |
| | Bank Loans | | | — | | | | 64,144,839 | | | | 4,293,369 | | | | 68,438,208 | |
| | Commercial Paper | | | — | | | | 27,898,743 | | | | — | | | | 27,898,743 | |
| | Common Stocks | | | — | | | | 69,488 | | | | — | | | | 69,488 | |
| | Convertible Bonds | | | — | | | | 11,606,430 | | | | — | | | | 11,606,430 | |
| | Corporate Bonds | | | — | | | | 143,369,041 | | | | — | | | | 143,369,041 | |
| | Municipal Bonds | | | — | | | | 2,379,367 | | | | — | | | | 2,379,367 | |
| | Preferred Stocks | | | — | | | | 1,665,901 | | | | — | | | | 1,665,901 | |
| | Special Purpose | | | | | | | | | | | | | | | | |
| | Acquisition Companies | | | 32,973,094 | | | | 1,152,946 | | | | 0 | | | | 34,126,040 | |
| | Trade Claims | | | — | | | | 4,857,667 | | | | — | | | | 4,857,667 | |
| | Warrants | | | 15,420 | | | | — | | | | 0 | | | | 15,420 | |
| | Money Market Funds | | | 29,843,838 | | | | — | | | | — | | | | 29,843,838 | |
| | Total Investments | | $ | 62,832,352 | | | $ | 260,484,149 | | | $ | 4,293,369 | | | $ | 327,609,870 | |
| | Other Financial Instruments(2) | | | | | | | | | | | | | | | | |
| | Forward Currency | | | | | | | | | | | | | | | | |
| | Exchange Contracts | | $ | — | | | $ | 458,719 | | | $ | — | | | $ | 458,719 | |
| | Total Other | | | | | | | | | | | | | | | | |
| | Financial Instruments | | $ | — | | | $ | 458,719 | | | $ | — | | | $ | 458,719 | |
| | (1) | See the Schedule of Investments for industry classifications. |
| | (2) | Other financial instruments are forward currency exchange contracts not included in the Schedule of Investments, which are reflected at the net unrealized appreciation (depreciation) on the instrument. |
CROSSINGBRIDGE FUNDS
Notes to Financial Statements (Continued)
September 30, 2021
| | CrossingBridge Responsible Credit Fund | | | | | | | | | | | | |
| | | | Level 1 | | | Level 2 | | | Level 3 | | | Total | |
| | Investments(1): | | | | | | | | | | | | |
| | Bank Loans | | $ | — | | | $ | 1,537,062 | | | $ | — | | | $ | 1,537,062 | |
| | Commercial Paper | | | — | | | | 252,865 | | | | — | | | | 252,865 | |
| | Convertible Bonds | | | — | | | | 38,776 | | | | — | | | | 38,776 | |
| | Corporate Bonds | | | — | | | | 9,749,005 | | | | — | | | | 9,749,005 | |
| | Special Purpose | | | | | | | | | | | | | | | | |
| | Acquisition Companies | | | 3,219,148 | | | | — | | | | 0 | | | | 3,219,148 | |
| | Money Market Funds | | | 1,852,589 | | | | — | | | | — | | | | 1,852,589 | |
| | Total Investments | | $ | 5,071,737 | | | $ | 11,577,708 | | | $ | 0 | | | $ | 16,649,445 | |
| | Other Financial Instruments(2) | | | | | | | | | | | | | | | | |
| | Forward Currency | | | | | | | | | | | | | | | | |
| | Exchange Contracts | | $ | — | | | $ | 44,736 | | | $ | — | | | $ | 44,736 | |
| | Total Other | | | | | | | | | | | | | | | | |
| | Financial Instruments | | $ | — | | | $ | 44,736 | | | $ | — | | | $ | 44,736 | |
| | (1) | See the Schedule of Investments for industry classifications. |
| | (2) | Other financial instruments are forward currency exchange contracts not included in the Schedule of Investments, which are reflected at the net unrealized appreciation (depreciation) on the instrument. |
| | CrossingBridge Ultra-Short Duration Fund | | | | | | | | | | | | |
| | | | Level 1 | | | Level 2 | | | Level 3 | | | Total | |
| | Investments(1): | | | | | | | | | | | | |
| | Asset Backed Securities | | $ | — | | | $ | 1,672,443 | | | $ | — | | | $ | 1,672,443 | |
| | Bank Loans | | | — | | | | 2,427,586 | | | | — | | | | 2,427,586 | |
| | Commercial Paper | | | — | | | | 8,536,392 | | | | — | | | | 8,536,392 | |
| | Convertible Bonds | | | — | | | | 757,846 | | | | — | | | | 757,846 | |
| | Corporate Bonds | | | — | | | | 17,216,666 | | | | — | | | | 17,216,666 | |
| | Special Purpose | | | | | | | | | | | | | | | | |
| | Acquisition Companies | | | 6,213,134 | | | | — | | | | 0 | | | | 6,213,134 | |
| | Money Market Funds | | | 3,953,167 | | | | — | | | | — | | | | 3,953,167 | |
| | Total Investments | | $ | 10,166,301 | | | $ | 30,610,933 | | | $ | 0 | | | $ | 40,777,234 | |
| | (1) | See the Schedule of Investments for industry classifications. |
| | CrossingBridge Pre-Merger SPAC ETF | | | | | | | | | | | | |
| | | | Level 1 | | | Level 2 | | | Level 3 | | | Total | |
| | Investments(1): | | | | | | | | | | | | |
| | Special Purpose | | | | | | | | | | | | |
| | Acquisition Companies | | $ | 4,910,879 | | | $ | 44,740 | | | $ | 0 | | | $ | 4,955,619 | |
| | Money Market Funds | | | 433,021 | | | | — | | | | — | | | | 433,021 | |
| | Total Investments | | $ | 5,343,900 | | | $ | 44,740 | | | $ | 0 | | | $ | 5,388,640 | |
| | (1) | See the Schedule of Investments for industry classifications. |
CROSSINGBRIDGE FUNDS
Notes to Financial Statements (Continued)
September 30, 2021
| | Each Fund held investments in SPACs whose value was deemed immaterial for the tables listed below. |
| | |
| | The following is a reconciliation of Level 3 assets in the Funds for which significant unobservable inputs were used to determine fair value: |
| | CrossingBridge Low Duration High Yield Fund | | | |
| | | | Bank Loans | |
| | Beginning Balance – October 1, 2020 | | $ | — | |
| | Purchases | | | 5,540,269 | |
| | Sales | | | (1,244,821 | ) |
| | Realized gains | | | — | |
| | Realized losses | | | (2,079 | ) |
| | Change in unrealized appreciation (depreciation) | | | — | |
| | Transfer in/(out) of Level 3 | | | — | |
| | Ending Balance – September 30, 2021 | | $ | 4,293,369 | |
| | The following table represents additional information about valuation methodologies and inputs used for investments that are measured at fair value and categorized within Level 3 as of September 30, 2021: |
| | CrossingBridge Low Duration High Yield Fund |
| | | | | | Range/Weighted |
| | | Fair Value | | | Average |
| | | September 30, | Valuation | Unobservable | Unobservable |
| | Description | 2021 | Methodologies | Input | Input* |
| | Bank Loans* | $4,293,369 | Company-specific | Market | $100.00 |
| |
|
| information | assessment |
|
| | * | Table presents information for one security, which has been valued at $100.00 throughout the period. |
| | (b) | Foreign Securities and Currency Transactions |
| | Investment securities and other assets and liabilities denominated in foreign currencies are translated into U.S. dollar amounts at the date of valuation. Purchases and sales of investment securities and income and expense items denominated in foreign currencies are translated into U.S. dollar amounts on the respective dates of such transactions. |
| | |
| | The Funds do not isolate the portion of the results of operations from changes in foreign exchange rates on investments from the fluctuations arising from changes in market prices of securities held. Realized foreign exchange gains or losses arising from sales of portfolio securities and sales and maturities of short-term securities are reported within realized gain (loss) on investments. Net unrealized foreign exchange gains and losses arising from changes in the values of investments in securities from fluctuations in exchange rates are reported within unrealized gain (loss) on investments. |
CROSSINGBRIDGE FUNDS
Notes to Financial Statements (Continued)
September 30, 2021
| | Investments in foreign securities entail certain risks. There may be a possibility of nationalization or expropriation of assets, confiscatory taxation, political or financial instability, and diplomatic developments that could affect the value of a Fund’s investments in certain foreign countries. Since foreign securities normally are denominated and traded in foreign currencies, the value of a Fund’s assets may be affected favorably or unfavorably by currency exchange rates, currency exchange control regulations, foreign withholding taxes, and restrictions or prohibitions on the repatriation of foreign currencies. There may be less information publicly available about a foreign issuer than about a U.S. issuer, and foreign issuers are not generally subject to accounting, auditing, and financial reporting standards and practices comparable to those in the United States. The securities of some foreign issuers are less liquid and at times more volatile than securities of comparable U.S. issuers. |
| | |
| | (c) Federal Income Taxes |
| | |
| | The Funds intend to comply with the requirements of Subchapter M of the Internal Revenue Code of 1986, as amended, necessary to qualify as a regulated investment company and to make the requisite distributions of income and capital gains to its shareholders sufficient to relieve it from all or substantially all federal income taxes. Therefore, no federal income tax provision has been provided. |
| | |
| | As of and during the fiscal year or period ended September 30, 2021, the Funds did not have liabilities for any unrecognized tax benefits. The Funds recognize interest and penalties, if any, related to unrecognized tax benefits as income tax expense in the Statements of Operations. During the fiscal year or period ended September 30, 2021, the Funds did not incur any interest or penalties. The Funds are subject to examination by U.S. taxing authorities for the tax periods since the commencement of operations. |
| | |
| | (d) Distributions to Shareholders |
| | |
| | In general, the Mutual Funds will distribute any net investment income monthly and any net realized capital gains at least annually. The ETF will distribute any net investment income annually and any net realized capital gains at least annually. The Funds may make additional distributions if deemed to be desirable during the year. Distributions from net realized gains for book purposes may include short-term capital gains. All short-term capital gains are included in ordinary income for tax purposes. Distributions to shareholders are recorded on the ex-dividend date. The Funds may also pay a special distribution at the end of the calendar year to comply with federal tax requirements. |
| | |
| | Treatment of income and capital gain distributions for federal income tax purposes may differ from GAAP, primarily due to timing differences in the recognition of income and gains and losses by the Funds. To the extent that these differences are attributable to permanent book and tax accounting differences, they are reclassified in the components of net assets. |
CROSSINGBRIDGE FUNDS
Notes to Financial Statements (Continued)
September 30, 2021
| | (e) Use of Estimates |
| | |
| | The preparation of financial statements in conformity with GAAP requires management to make estimates and assumptions that affect the reported amounts of assets and liabilities and disclosure of contingent assets and liabilities at the date of the financial statements and the reported amounts of revenues and expenses during the reporting period. Actual results could differ from those estimates. |
| | |
| | (f) Share Valuation |
| | |
| | The NAV per share of a Fund is calculated by dividing the sum of the value of the securities held by the Fund, plus cash or other assets, minus all liabilities (including estimated accrued expenses) by the total number of shares outstanding for the Fund, rounded to the nearest cent. The Funds’ shares will not be priced on the days on which the NYSE is closed for trading. |
| | |
| | (g) Allocation of Income, Expenses and Gains/Losses |
| | |
| | Income, expenses (other than those deemed attributable to a specific share class), and gains and losses of a Fund are allocated daily to each class of shares based upon the ratio of net assets represented by each class as a percentage of the net assets of the Fund. Expenses deemed directly attributable to a class of shares are recorded by the specific class. Most Fund expenses are allocated by class based on relative net assets. Shareholder servicing fees are currently expensed up to 0.10% of average daily net assets of each Mutual Fund’s Institutional Class shares. Expenses associated with a specific fund in the Trust are charged to that fund. Common Trust expenses are typically allocated evenly between the Mutual Funds of the Trust, or by other equitable means. |
| | |
| | (h) Other |
| | |
| | Investment transactions are recorded on the trade date. The Funds determine the gain or loss from investment transactions using the specific identification method for the best tax relief order by comparing the original cost of the security lot sold with the net sale proceeds. Interest income is recognized on an accrual basis. Withholding taxes on foreign interest, net of any reclaims, have been provided for in accordance with the Funds’ understanding of the applicable country’s tax rules and rates. Any discount or premium on securities purchased are accreted or amortized over the expected life of the respective securities using the constant yield method. |
| | |
| | (i) Loan Participation |
| | |
| | When purchasing participation interests in a loan, a Fund generally has no right to enforce compliance with the terms of the loan agreement with the borrower. As a result, a Fund may be subject to the credit risk of both the borrower and the lender that is selling the loan agreement. A Fund may enter into unfunded loan commitments, which are contractual obligations for future funding. Unfunded loan commitments represent a future obligation in full, even though a percentage of the notional loan amounts may not be utilized by the borrower. When investing in a loan participation agreement, a Fund has the right to receive payments of principal, |
CROSSINGBRIDGE FUNDS
Notes to Financial Statements (Continued)
September 30, 2021
| | interest and any fees to which it is entitled only from the lender selling the loan agreement and only upon receipt of payments by the lender from the borrower. A Fund may receive a commitment fee based on the undrawn portion of the underlying line of credit portion of a floating rate loan. In certain circumstances, a Fund may receive a penalty fee upon the prepayment of a floating rate loan by a borrower. Fees earned are recorded as a component of interest income or interest expense, respectively, on the Statements of Operations. |
| | |
| | (j) Derivatives |
| | |
| | The Funds may utilize derivative instruments such as options, swaps, futures, forward contracts and other instruments with similar characteristics to the extent that they are consistent with the Funds’ investment objectives and limitations. The use of derivatives may involve additional investment risks, including counterparty credit risk, i.e., the risk that a Fund may experience delay in obtaining financial recovery in the event a counterparty experiences financial difficulty. To mitigate this risk, the Adviser will seek to effect derivative transactions with only counterparties that they believe are creditworthy. |
| | |
| | The Funds have adopted authoritative standards regarding disclosure about derivatives and hedging activities and how they affect the Funds’ Statements of Assets and Liabilities and Statements of Operations. For the fiscal year or period ended September 30, 2021, the monthly average quantity and notional value of derivatives are described below: |
| | CrossingBridge Low Duration High Yield Fund |
| | | | | | | | |
| | | | Monthly Average | | | Monthly Average | |
| | | | Contracts | | | Notional Value | |
| | Forward Currency Exchange Contracts | | | 4 | | | $ | 16,575,405 | |
| | Warrants | | | 69,513 | | | | 104,167 | |
| | Written Options Contracts | | | 37 | | | | 367,947 | |
| | CrossingBridge Responsible Credit Fund | | | | | | |
| | | | | | | | |
| | | | Monthly Average | | | Monthly Average | |
| | | | Contracts | | | Notional Value | |
| | Forward Currency Exchange Contracts | | | 1 | | | $ | 1,359,550 | |
| Statements of Assets and Liabilities |
| |
| Fair value of derivative instruments as of September 30, 2021 are described below: |
| | |
| | CrossingBridge Low Duration High Yield Fund |
| | |
| Asset Derivatives | |
| | | | Statements of Assets | | | |
| | | | and Liabilities Location | | Fair Value | |
| | Forward Currency Exchange Contracts | | Unrealized Appreciation | | $ | 458,719 | |
| | Warrants | | Investments, at value | | | 15,420 | |
CROSSINGBRIDGE FUNDS
Notes to Financial Statements (Continued)
September 30, 2021
| | CrossingBridge Responsible Credit Fund | |
| | | |
| |
| Asset Derivatives |
| | | Statements of Assets | |
| | | and Liabilities Location | Fair Value |
| | Forward Currency Exchange Contracts | Unrealized Appreciation | $44,736 |
| | | | |
| | Statements of Operations | | |
| | | | |
| | The effect of derivative instruments on the Statements of Operations for the fiscal year or period ended September 30, 2021 are described below: |
| | CrossingBridge Low Duration High Yield Fund | | | |
| | | | Amount of Realized | |
| | | | Gain (Loss) on Derivatives | |
| | Forward Currency Exchange Contracts | | $ | 274,815 | |
| | Written options contracts | | | 57,400 | |
| | Warrants | | | 3,980,741 | |
| | | | | | |
| | | | Change in Unrealized Appreciation | |
| | | | (Depreciation) on Derivatives | |
| | Forward Currency Exchange Contracts | | $ | 307,539 | |
| | Warrants | | | (21 | ) |
| | | | | | |
| | CrossingBridge Responsible Credit Fund | | | | |
| | | | Amount of Realized | |
| | | | Gain (Loss) on Derivatives | |
| | Forward Currency Exchange Contracts | | $ | (8,861 | ) |
| | | | | | |
| | | | Change in Unrealized Appreciation | |
| | | | (Depreciation) on Derivatives | |
| | Forward Currency Exchange Contracts | | $ | 44,736 | |
| | The CrossingBridge Ultra-Short Duration Fund and CrossingBridge Pre-Merger SPAC ETF did not invest in derivatives during the fiscal period ended September 30, 2021. |
| | |
| | (k) LIBOR |
| | |
| | The London Interbank Offered Rate (“LIBOR”) is an interest-rate average calculated from estimates submitted by the leading banks in London. LIBOR represents the rate which banks may obtain short-term borrowings from each other. It is the primary interest rate benchmark for short-term interest rates around the world. On March 5, 2021, the United Kingdom's Financial Conduct Authority, which regulates LIBOR and the LIBOR administrator, ICE Benchmark Association, announced that most LIBOR reference rates will no longer be published after December 31, 2021 and a majority of U.S. reference dollar reference rates will no longer be published after June 30, 2023. Industry initiatives are underway to identify alternative reference rates; however, there is no assurance that the composition or characteristics of any such alternative reference rate will be similar to or produce the same value or economic equivalence as LIBOR. |
CROSSINGBRIDGE FUNDS
Notes to Financial Statements (Continued)
September 30, 2021
| | The expected discontinuation of LIBOR could have a significant impact on the financial markets, and may present a risk for certain market participants, including the risk that the transition from LIBOR to alternative interest rate benchmarks will not be orderly, will occur over various time periods or will have unintended consequences. |
| | |
| (3) | Federal Tax Matters |
| | |
| | The tax character of distributions paid during the fiscal years or periods ended September 30, 2021 and September 30, 2020 were as follows: |
| | CrossingBridge Low Duration High Yield Fund | | |
| | | Year Ended | Year Ended |
| | | September 30, 2021 | September 30, 2020 |
| | Ordinary Income | $7,308,862 | $5,081,642 |
| | Long Term Capital Gain | — | — |
| | | | |
| | CrossingBridge Responsible Credit Fund(1) | | |
| | | Period Ended | |
| | | September 30, 2021 | |
| | Ordinary Income | $71,520 | |
| | Long Term Capital Gain | — | |
| | (1) | Fund commenced investment operations on June 30, 2021. |
| | The CrossingBridge Ultra-Short Duration Fund and CrossingBridge Pre-Merger SPAC ETF did not make any distributions to shareholders during the fiscal period ended September 30, 2021. |
| | |
| | The Funds designated as long-term capital gain dividend, pursuant to Internal Revenue Code Section 852(b)(3), the amount necessary to reduce the earnings and profits of the Fund related to net capital gain to zero for the tax year ended September 30, 2021. |
| | |
| | As of September 30, 2021, the components of accumulated earnings on a tax basis were as follows: |
| | | | CrossingBridge | | | CrossingBridge | |
| | | | Low Duration | | | Responsible | |
| | | | High Yield Fund | | | Credit Fund | |
| | Cost basis of investments for | | | | | | |
| | federal income tax purposes | | $ | 327,804,846 | | | $ | 16,659,846 | |
| | Gross tax unrealized appreciation | | $ | 2,269,336 | | | $ | 96,388 | |
| | Gross tax unrealized depreciation | | | (1,910,129 | ) | | | (45,664 | ) |
| | Total net tax unrealized appreciation | | | | | | | | |
| | (depreciation) on investments | | | 359,207 | | | | 50,724 | |
| | Undistributed ordinary income | | | 6,668,499 | | | | 23,174 | |
| | Undistributed long-term capital gain | | | — | | | | 21,525 | |
| | Other accumulated earnings (losses) | | | (458,719 | ) | | | (44,736 | ) |
| | Total distributable earnings (accumulated losses) | | $ | 6,568,987 | | | $ | 50,687 | |
CROSSINGBRIDGE FUNDS
Notes to Financial Statements (Continued)
September 30, 2021
| | | | CrossingBridge | | | CrossingBridge | |
| | | | Ultra-Short | | | Pre-Merger | |
| | | | Duration Fund | | | SPAC ETF | |
| | Cost basis of investments for | | | | | | |
| | federal income tax purposes | | $ | 40,774,290 | | | $ | 5,394,535 | |
| | Gross tax unrealized appreciation | | $ | 57,293 | | | $ | 6,955 | |
| | Gross tax unrealized depreciation | | | (54,349 | ) | | | (12,850 | ) |
| | Total net tax unrealized appreciation | | | | | | | | |
| | (depreciation) on investments | | | 2,944 | | | | (5,895 | ) |
| | Undistributed ordinary income | | | 28,003 | | | | 3,886 | |
| | Undistributed long-term capital gain | | | — | | | | — | |
| | Other accumulated earnings (losses) | | | — | | | | — | |
| | Total distributable earnings (accumulated losses) | | $ | 30,947 | | | $ | (2,009 | ) |
| | The difference between book-basis and tax-basis unrealized appreciation (depreciation) is attributable primarily to the tax deferral of losses on wash sale adjustments and tax treatment of Passive Foreign Investment Companies. |
| | |
| | At September 30, 2021, the Funds had no capital loss carryovers to be carried forward to offset future realized capital gains. |
| | |
| | GAAP requires that certain components of net assets relating to permanent differences be reclassified between financial and tax reporting. These reclassifications have no effect on net assets or net asset value per share. For the year or period ended September 30, 2021, no reclassifications were made for permanent tax differences on the Statements of Assets and Liabilities. |
| | |
| (4) | Investment Adviser |
| | |
| | The Trust has an investment advisory agreement with the Adviser to furnish investment advisory services to the Mutual Funds. Under the terms of this agreement, the Trust, on behalf of the Mutual Funds, compensates the Adviser for its investment advisory services at the annual rate of 0.65% of each Mutual Fund’s respective average daily net assets. |
| | |
| | In addition, pursuant to a separate investment advisory agreement between the Trust, on behalf of the ETF, and the Adviser, the Adviser is responsible for managing the ETF in accordance with its investment objectives. For the services it provides the ETF, the ETF pays the Adviser a unified management fee, which is calculated daily and paid monthly, at an annual rate of 0.80% of the ETF’s average daily net assets. Under this agreement, the Adviser has agreed to pay all expenses of the ETF except interest charges on any borrowings, dividends, and other expenses on securities sold short, taxes, brokerage commissions and other expenses incurred in placing orders for the purchase and sale of securities and other investment instruments, acquired fund fees and expenses, accrued deferred tax liability, extraordinary expenses, distribution fees and expenses paid by the ETF under any distribution plan adopted pursuant to Rule 12b-1 under the 1940 Act, and the unified management fee payable to the Adviser. |
CROSSINGBRIDGE FUNDS
Notes to Financial Statements (Continued)
September 30, 2021
| | With respect to the Mutual Funds, the Adviser has contractually agreed to waive its management fee and/or reimburse a Fund’s other expenses at least through June 30, 2023 (August 31, 2022 for the CrossingBridge Low Duration High Yield Fund) to the extent necessary to ensure that a Fund’s total operating expenses (exclusive of front-end or contingent deferred sales loads, distribution (12b-1) fees, shareholder servicing plan fees, taxes, leverage (i.e., any expense incurred in connection with borrowings made by a Fund), interest, brokerage commissions, expenses incurred in connection with any merger or reorganization, dividends or interest expenses on short positions, acquired fund fees and expenses and extraordinary items) (the “Expense Limitation Cap”) does not exceed 0.80% of each Mutual Fund’s respective average daily net assets. |
| | |
| | Any such waiver or reimbursement is subject to later adjustment to allow the Adviser to recoup amounts waived or reimbursed within three years from the date such amount was waived or reimbursed, subject to the operating expense limitation agreement, if such reimbursement will not cause a Mutual Fund’s expense ratio, after recoupment has been taken into account, to exceed the lesser of: (1) the Expense Limitation Cap in place at the time of the waiver and/or expense payment; or (2) the Expense Limitation Cap in place at the time of the recoupment. During the fiscal year ended September 30, 2021, the Adviser recouped $4,619 of previously waived expenses in the CrossingBridge Low Duration High Yield Fund. The following table shows the remaining waiver or reimbursed expenses for the Mutual Funds subject to potential recovery expiring: |
| | | | Expiring: | |
| | | | 9/30/22 | | | 9/30/23 | | | 9/30/24 | |
| | CrossingBridge Low Duration High Yield Fund | | $ | 96,889 | | | $ | 97,442 | | | $ | 75,455 | |
| | CrossingBridge Responsible Credit Fund | | | — | | | | — | | | | 58,237 | |
| | CrossingBridge Ultra-Short Duration Fund | | | — | | | | — | | | | 58,690 | |
| (5) | Distribution and Shareholder Servicing Plans |
| | |
| | The Trust has adopted a plan pursuant to Rule 12b-1 under the 1940 Act (the “12b-1 Plan”), on behalf of the CrossingBridge Low Duration High Yield Fund, which authorizes the Fund to pay Quasar Distributors, LLC (the “Distributor”) a distribution fee of 0.25% of the Fund’s average daily net assets of the Fund’s Investor Class shares for services to prospective Fund shareholders and distribution of Fund shares. The Fund incurred no fees pursuant to the 12b-1 Plan during the year ended September 30, 2021 as the Investor Class was not operational during the year. |
| | |
| | The Mutual Funds have adopted a Shareholder Servicing Plan to pay for shareholder support services from the applicable Fund’s assets pursuant to a Shareholder Servicing Agreement in an amount not to exceed 0.15% of the applicable Fund’s average daily net assets. Currently, the shareholder servicing fee authorized for each Mutual Fund is up to 0.10%; however, the fee may be increased up to 0.15% of a Fund’s daily net assets, at any time. Each Mutual Fund is responsible for paying a portion of shareholder servicing fees to each of the shareholder servicing agents who have written shareholder servicing agreements with the Fund, and perform shareholder |
CROSSINGBRIDGE FUNDS
Notes to Financial Statements (Continued)
September 30, 2021
| | servicing functions and maintenance of shareholder accounts on behalf of shareholders. The following table details the fees incurred for Institutional Class shares for the Mutual Funds pursuant to the Shareholder Servicing Plan during the year or period September 30, 2021, as well as the fees owed as of September 30, 2021. |
| | | | Fees incurred | | | Fees owed | |
| | CrossingBridge Low Duration High Yield Fund | | $ | 146,366 | | | $ | 20,898 | |
| | CrossingBridge Responsible Credit Fund | | | 3,128 | | | | 1,464 | |
| | CrossingBridge Ultra-Short Duration Fund | | | 3,303 | | | | 2,676 | |
| (6) | Related Party Transactions |
| | |
| | U.S. Bancorp Fund Services, LLC, doing business as U.S. Bank Global Fund Services (“Fund Services” or “Administrator”), acts as the Funds’ Administrator under an Administration Agreement. The Administrator prepares various federal and state regulatory filings, reports and returns for the Funds; prepares reports and materials to be supplied to the Trustees; monitors the activities of the Funds’ custodian, transfer agent and accountants; coordinates the preparation and payment of the Funds’ expenses and reviews the Funds’ expense accruals. Fund Services also serves as the transfer agent to the Funds and provides pricing services to the Funds. U.S. Bank, N.A. (“U.S. Bank”), an affiliate of Fund Services, serves as the Funds’ custodian. Fees incurred for the fiscal year or period ended September 30, 2021, and owed as of September 30, 2021, are as follows: |
| | Fund Administration, Accounting and Pricing | | Fees incurred | | | Fees owed | |
| | CrossingBridge Low Duration High Yield Fund | | $ | 142,426 | | | $ | 41,085 | |
| | CrossingBridge Responsible Credit Fund | | | 19,584 | | | | 15,706 | |
| | CrossingBridge Ultra-Short Duration Fund | | | 19,504 | | | | 15,644 | |
| | | | | | | | | | |
| | Transfer Agency | | Fees incurred | | | Fees owed | |
| | CrossingBridge Low Duration High Yield Fund | | $ | 52,855 | | | $ | 13,835 | |
| | CrossingBridge Responsible Credit Fund | | | 6,290 | | | | 4,789 | |
| | CrossingBridge Ultra-Short Duration Fund | | | 6,309 | | | | 4,809 | |
| | | | | | | | | | |
| | Custody | | Fees incurred | | | Fees owed | |
| | CrossingBridge Low Duration High Yield Fund | | $ | 28,053 | | | $ | 4,860 | |
| | CrossingBridge Responsible Credit Fund | | | 3,810 | | | | 3,810 | |
| | CrossingBridge Ultra-Short Duration Fund | | | 2,576 | | | | 2,576 | |
| | Under the terms of a Fund Servicing Agreement, the Adviser pays the Fund Administration and Accounting, Transfer Agency and Custody fees for the ETF. |
| | |
| | Certain officers of the Funds are also employees of Fund Services. A Trustee of the Trust is affiliated with Fund Services and U.S. Bank. |
CROSSINGBRIDGE FUNDS
Notes to Financial Statements (Continued)
September 30, 2021
| | The Trust’s Chief Compliance Officer is also an employee of Fund Services. The Mutual Funds’ allocation of the Trust’s Chief Compliance Officer fees incurred for the fiscal year or period ended September 30, 2021, and owed as of September 30, 2021, is as follows: |
| | | | Fees incurred | | | Fees owed | |
| | CrossingBridge Low Duration High Yield Fund | | $ | 13,694 | | | $ | 2,916 | |
| | CrossingBridge Responsible Credit Fund | | | 2,917 | | | | 2,917 | |
| | CrossingBridge Ultra-Short Duration Fund | | | 2,917 | | | | 2,917 | |
| | Under the terms of a Fund Servicing Agreement, the Adviser pays the Chief Compliance Officer fees for the ETF. |
| | |
| | The CrossingBridge Low Duration High Yield Fund also has a line of credit with U.S. Bank (See Note 11). |
| | |
| (7) | Capital Share Transactions |
| | |
| | Transactions in shares of the Funds were as follows: |
| | CrossingBridge Low Duration High Yield Fund | | | | | | |
| | | | Year ended | | | Year ended | |
| | | | September 30, 2021 | | | September 30, 2020 | |
| | Shares sold | | | 25,189,279 | | | | 6,883,162 | |
| | Shares reinvested | | | 571,682 | | | | 423,496 | |
| | Shares redeemed | | | (8,883,494 | ) | | | (5,538,037 | ) |
| | Net Increase | | | 16,877,467 | | | | 1,768,621 | |
| | | | | | | | | | |
| | CrossingBridge Responsible Credit Fund | | | | | | | | |
| | | | Period from | | | | | |
| | | | June 30, 2021(1) | | | | | |
| | | | through | | | | | |
| | | | September 30, 2021 | | | | | |
| | Shares sold | | | 1,706,239 | | | | | |
| | Shares reinvested | | | 7,151 | | | | | |
| | Shares redeemed | | | (26,584 | ) | | | | |
| | Net Increase | | | 1,686,806 | | | | | |
| | | | | | | | | | |
| | CrossingBridge Ultra-Short Duration Fund | | | | | | | | |
| | | | Period from | | | | | |
| | | | June 30, 2021(1) | | | | | |
| | | | through | | | | | |
| | | | September 30, 2021 | | | | | |
| | Shares sold | | | 3,703,466 | | | | | |
| | Shares reinvested | | | — | | | | | |
| | Shares redeemed | | | (3 | ) | | | | |
| | Net Increase | | | 3,703,463 | | | | | |
CROSSINGBRIDGE FUNDS
Notes to Financial Statements (Continued)
September 30, 2021
| | CrossingBridge Pre-Merger SPAC ETF | | | |
| | | | Period from | |
| | | | September 20, 2021(1) | |
| | | | through | |
| | | | September 30, 2021 | |
| | Shares sold | | | 290,000 | |
| | Shares reinvested | | | — | |
| | Shares redeemed | | | — | |
| | Net Increase | | | 290,000 | |
| | (1) | Commencement of operations. |
| (8) | Creation and Redemption Transactions |
| | |
| | Shares of the CrossingBridge Pre-Merger SPAC ETF are listed and traded on the NASDAQ Stock Market, LLC (the “Exchange”). The ETF issues and redeems shares on a continuous basis at NAV only in large blocks of shares called “Creation Units.” Creation Units are to be issued and redeemed principally in kind for a basket of securities and a balancing cash amount. Shares generally will trade in the secondary market in amounts less than a Creation Unit at market prices that change throughout the day. Market prices for the shares may be different from their NAV. The NAV is determined as of the close of trading (generally, 4:00 p.m. Eastern Time) on each day the NYSE is open for trading. The NAV of the shares of the Fund will be equal to the ETF’s total assets minus the ETF’s total liabilities divided by the total number of shares outstanding. The NAV that is published will be rounded to the nearest cent; however, for purposes of determining the price of Creation Units, the NAV will be calculated to five decimal places. |
| | |
| | Only “Authorized Participants” may purchase or redeem shares directly from the ETF. An Authorized Participant is either (i) a broker-dealer or other participant in the clearing process through the Continuous Net Settlement System of National Securities Clearing Corporation or (ii) a DTC participant and, in each case, must have executed a Participant Agreement with the Distributor. Most retail investors will not qualify as Authorized Participants or have the resources to buy and sell whole Creation Units. Therefore, they will be unable to purchase or redeem the shares directly from the ETF. Rather, most retail investors will purchase shares in the secondary market with the assistance of a broker and will be subject to customary brokerage commissions or fees. Securities received or delivered in connection with in-kind creates and redeems are valued as of the close of business on the effective date of the creation or redemption. |
| | |
| | Creation Unit Transaction Fee |
| | |
| | Authorized Participants will be required to pay to the Custodian a fixed transaction fee (the “Creation Transaction Fee”) in connection with the issuance of Creation Units. The standard Creation Transaction Fee will be the same regardless of the number of Creation Units purchased by an investor on the applicable Business Day. The Creation Transaction Fee for the ETF is $250. |
CROSSINGBRIDGE FUNDS
Notes to Financial Statements (Continued)
September 30, 2021
| | An additional variable fee of up to a maximum of 2% of the value of the Creation Units subject to the transaction may be imposed for cash purchases, nonstandard orders, or partial purchase of Creation Units. For orders comprised entirely of cash, a variable fee of 0.03% of the value of the order will be charged by the ETF. The variable charge is primarily designed to cover additional costs (e.g., brokerage, taxes) involved with buying the securities with cash. The ETF may determine to not charge a variable fee on certain orders when the Adviser has determined that doing so is in the best interests of ETF shareholders. |
| | |
| | A creation unit will generally not be issued until the transfer of good title of the deposit securities to the ETF and the payment of any cash amounts have been completed. To the extent contemplated by the applicable participant agreement, Creation Units of the ETF will be issued to such authorized participant notwithstanding the fact that the ETF’s deposits have not been received in part or in whole, in reliance on the undertaking of the authorized participant to deliver the missing deposit securities as soon as possible. If the ETF or its agents do not receive all of the deposit securities, or the required cash amounts, by such time, then the order may be deemed rejected and the authorized participant shall be liable to the ETF for losses, if any. |
| | |
| (9) | Investment Transactions |
| | |
| | The aggregate purchases and sales of securities, excluding short-term investments, for the fiscal year or period ended September 30, 2021 are summarized below: |
| | | | Purchases | | | Sales | |
| | CrossingBridge Low Duration High Yield Fund | | $ | 361,043,006 | | | $ | 258,947,893 | |
| | CrossingBridge Responsible Credit Fund | | | 17,510,096 | | | | 3,321,118 | |
| | CrossingBridge Ultra-Short Duration Fund | | | 14,693,421 | | | | 1,731,623 | |
| | CrossingBridge Pre-Merger SPAC ETF | | | 862,322 | | | | 106,200 | |
| | The above purchases and sales exclude any in-kind transactions associated with creations and redemptions. During the period ended September 30, 2021, the CrossingBridge Pre-Merger SPAC had $4,200,598 of creations in-kind and $0 of redemptions in-kind. |
| | |
| | There were no purchases or sales of U.S. government securities in the Funds. |
| | |
| (10) | Beneficial Ownership |
| | |
| | The beneficial ownership, either directly or indirectly, of more than 25% of the voting securities of a fund creates a presumption of control of the fund, under Section 2(a)(9) of the 1940 Act. At September 30, 2021, Charles Schwab & Co., Inc. held 27.61% and 85.19% of the CrossingBridge Low Duration High Yield Fund and CrossingBridge Responsible Credit Fund, respectively. National Financial Services LLC held 94.67% of the CrossingBridge Ultra-Short Duration Fund at September 30, 2021. There were no beneficial shareholders in the CrossingBridge Pre-Merger SPAC ETF at September 30, 2021. |
CROSSINGBRIDGE FUNDS
Notes to Financial Statements (Continued)
September 30, 2021
| (11) | Line of Credit |
| | |
| | At September 30, 2021, the CrossingBridge Low Duration High Yield Fund had a line of credit in the amount of the lesser of $15,000,000 or 33 1/3% of the fair value of unencumbered assets of the Fund, as defined, which matures on August 6, 2022. The unsecured line of credit is intended to provide short-term financing, if necessary, subject to certain restrictions, in connection with shareholder redemptions. The credit facility is with the Fund’s custodian, U.S. Bank, N.A. Interest will be accrued at the prime rate (3.25% as of September 30, 2021). During the fiscal year ended September 30, 2021, the Fund did not utilize the line of credit. |
| | |
| (12) | Subsequent Events |
| | |
| | In preparing these financial statements, the Funds have evaluated events and transactions for potential recognition or disclosure through the date the financial statements were issued. |
| | |
| | On June 30, 2021, Foreside Financial Group, LLC (“FFG”), the parent company of Quasar Distributors, LLC (“Quasar”), the Mutual Funds’ distributor, and Foreside Fund Services, LLC (“Foreside”), the ETF’s distributor, and Lovell Minnick Partners, LLC (“LMP”) entered into a definitive purchase and sale agreement with Genstar Capital (“Genstar”), a private equity firm specializing in financial and related business services companies. Genstar will acquire a majority stake in FFG, and LMP will exit its investment in FFG. The transaction closed September 30, 2021. The Board has approved Quasar and Foreside to remain the Mutual Funds’ and ETF’s distributor, respectively, after the close of the transaction. |
CROSSINGBRIDGE FUNDS
Notes to Financial Statements (Continued)
September 30, 2021
| On October 20, 2021, the Board of Trustees approved the appointment of Deanna B. Marotz as the Trust’s Chief Compliance Officer effective October 21, 2021. Ms. Marotz replaced Elizabeth A. Scalf. The information about Ms. Scalf in the Officers table located in the Additional Information section of this report will be replaced with the below: |
| | | | | | | Other |
| | | | | | | Directorships |
| | | | Term of | Number of | | Held by |
| | | | Office and | Portfolios | Principal | Trustee |
| | Name, | Position(s) | Length of | in the Trust | Occupation(s) | During |
| | Address and | Held with | Time | Overseen | During the Past | the Past |
| | Year of Birth | the Trust | Served | by Trustee | Five Years | Five Years |
| | Deanna B. Marotz | Chief | Indefinite | N/A | Senior Business | N/A |
| | 615 E. Michigan St. | Compliance | Term; Since | | Line Regulatory | |
| | Milwaukee, WI | Officer, | October 21, | | Review Manager, | |
| | 53202 | Vice | 2021 | | US Bancorp Fund | |
| | Year of Birth: 1965 | President, | | | Services, LLC | |
| | | and Anti- | | | (2021-present); | |
| | | Money | | | Chief Compliance | |
| | | Laundering | | | Officer of Keeley- | |
| | | Officer | | | Teton Advisors, LLC | |
| | | | | | and Teton Advisors, | |
| | | | | | Inc. (since 2017); | |
| | | | | | Chief Compliance | |
| | | | | | Officer of Keeley | |
| | | | | | Asset Management | |
| | | | | | Corp. (2015-2017); | |
| | | | | | Chief Compliance | |
| | | | | | Officer of Invesco | |
| | | | | | PowerShares | |
| | | | | | Capital Management | |
| | | | | | LLC (2008-2015). | |
| On October 28, 2021, the CrossingBridge Low Duration High Yield Fund and CrossingBridge Responsible Credit Fund declared and paid an income distribution of $768,329 and $30,900, respectively, to their Institutional Class shareholders of record on October 27, 2021. |
| | |
| | On November 29, 2021, the CrossingBridge Low Duration High Yield Fund, CrossingBridge Responsible Credit Fund and CrossingBridge Ultra-Short Duration Fund declared and paid an income distribution of $1,283,729, $36,968 and $25,287, respectively, to their Institutional Class shareholders of record on November 26, 2021. The CrossingBridge Low Duration High Yield Fund, CrossingBridge Responsible Credit Fund and CrossingBridge Ultra-Short Duration Fund declared and paid a short term capital gain distribution of $5,563,806, $18,301 and $45,223, respectively, to their Institutional Class shareholders of record on November 26, 2021. The CrossingBridge Responsible Credit Fund declared and paid a long term capital gain distribution of $21,525 to its Institutional Class shareholders of record on November 26, 2021. |
CROSSINGBRIDGE FUNDS
Notes to Financial Statements (Continued)
September 30, 2021
| (13) | Recent Market Events |
| | |
| | U.S. and international markets have experienced volatility in recent months and years due to a number of economic, political and global macro factors, including the impact of the coronavirus (COVID-19) global pandemic, which resulted in a public health crisis, business interruptions, growth concerns in the U.S. and overseas, travel restrictions, changed social behaviors, rising inflation and reduced consumer spending. While several countries, including the U.S., have begun to lift public health restrictions in efforts to reopen their respective economies, the outbreak of the Delta variant has led to the renewal of health mandates by local governments and businesses, reduced hiring efforts by employers, event cancellations and additional travel restrictions, supply chain shortages, cessation of return-to-office plans and an overall economic slowdown. While U.S. and global economies are recovering from the effects of COVID-19, the recovery is proceeding at slower than expected rates and may last for a prolonged period of time. Uncertainties regarding interest rates, political events, rising government debt in the U.S. and trade tensions have also contributed to market volatility. Global economies and financial markets are increasingly interconnected, which increases the possibility that conditions in one country or region might adversely impact issuers in a different country or region. In particular, a rise in protectionist trade policies, slowing global economic growth, risks associated with epidemic and pandemic diseases, risks associated with the United Kingdom’s departure from the European Union, the risk of trade disputes, and the possibility of changes to some international trade agreements, could affect the economies of many nations, including the United States, in ways that cannot necessarily be foreseen at the present time. Continuing market volatility as a result of recent market conditions or other events may have adverse effects on your account. |
CROSSINGBRIDGE FUNDS
Report of Independent Registered Public Accounting Firm
To the Shareholders of CrossingBridge Funds and
Board of Trustees of Trust for Professional Managers
Opinion on the Financial Statements
We have audited the accompanying statements of assets and liabilities, including the schedules of investments, of CrossingBridge Funds comprising the funds listed below (the “Funds”), each a series of Trust for Professional Managers, as of September 30, 2021, the related statements of operations, the statements of changes in net assets, the related notes, and the financial highlights for each of the periods indicated below (collectively referred to as the “financial statements”). In our opinion, the financial statements present fairly, in all material respects, the financial position of each of the Funds as of September 30, 2021, the results of their operations, the changes in net assets, and the financial highlights for each of the periods indicated below in conformity with accounting principles generally accepted in the United States of America.
| | | Statements of | |
| | Statements of | Changes in | Financial |
| Fund Name | Operations | Net Assets | Highlights |
CrossingBridge Low | For the year ended | For the years ended | For the years ended |
Duration High Yield Fund | September 30, 2021 | September 30, 2021 | September 30, 2021, |
| | | and 2020 | 2020, and 2019, and |
| | | | for the period from |
| | | | February 1, 2018 |
| | | | (commencement of |
| | | | operations) through |
| | | | September 30, 2018 |
CrossingBridge Responsible | For the period from June 30, 2021 (commencement of operations) |
Credit Fund and CrossingBridge | through September 30, 2021 |
Ultra-Short Duration Fund | | | |
CrossingBridge | For the period from September 20, 2021 (commencement of |
Pre-Merger SPAC ETF | operations) through September 30, 2021 |
Basis for Opinion
These financial statements are the responsibility of the Funds’ management. Our responsibility is to express an opinion on the Funds’ financial statements based on our audits. We are a public accounting firm registered with the Public Company Accounting Oversight Board (United States) (“PCAOB”) and are required to be independent with respect to the Funds in accordance with the U.S. federal securities laws and the applicable rules and regulations of the Securities and Exchange Commission and the PCAOB.
We conducted our audits in accordance with the standards of the PCAOB. Those standards require that we plan and perform the audit to obtain reasonable assurance about whether the financial statements are free of material misstatement whether due to error or fraud.
Our audits included performing procedures to assess the risks of material misstatement of the financial statements, whether due to error or fraud, and performing procedures that respond to those risks. Such procedures included examining, on a test basis, evidence regarding the amounts and disclosures in the financial statements. Our procedures included confirmation of securities owned as of September 30, 2021, by correspondence with the custodian, agent banks, and brokers; when replies were not received from
CROSSINGBRIDGE FUNDS
Report of Independent Registered Public Accounting Firm
(Continued)
brokers or agent banks, we performed other auditing procedures. Our audits also included evaluating the accounting principles used and significant estimates made by management, as well as evaluating the overall presentation of the financial statements. We believe that our audits provide a reasonable basis for our opinion.
We have served as the auditor of one or more Funds advised by CrossingBridge Advisors, LLC since 2015.

COHEN & COMPANY, LTD.
Milwaukee, Wisconsin
November 29, 2021
CROSSINGBRIDGE LOW DURATION HIGH YIELD FUND
Basis for Trustees’ Approval of Investment Advisory Agreement
(Unaudited)
The Board of Trustees (the “Trustees”) of Trust for Professional Managers (the “Trust”) met on August 4, 2021 to consider the renewal of the Investment Advisory Agreement (the “Agreement”) between the Trust, on behalf of the CrossingBridge Low Duration High Yield Fund (the “Fund”), a series of the Trust, and CrossingBridge Advisors, LLC (“CrossingBridge”), the Fund’s investment adviser. The Trustees also met at a prior meeting held on June 23, 2021 (the “June 23, 2021 Meeting”) to review materials related to the renewal of the Agreement. Prior to these meetings, the Trustees requested and received materials to assist them in considering the renewal of the Agreement. The materials provided contained information with respect to the factors enumerated below, including a copy of the Agreement, a memorandum prepared by the Trust’s outside legal counsel discussing in detail the Trustees’ fiduciary obligations and the factors they should assess in considering the renewal of the Agreement, detailed comparative information relating to the Fund’s performance, as well as the management fees and other expenses of the Fund, due diligence materials relating to the Adviser (including a due diligence questionnaire completed on behalf of the Fund by the Adviser, the Adviser’s Form ADV, select financial statements of the Adviser, bibliographic information of the Adviser’s key management and compliance personnel, comparative fee information for the Fund and the Adviser’s other separately-managed accounts and a summary detailing key provisions of the Adviser’s written compliance program) and other pertinent information. The Trustees also received information periodically throughout the year that was relevant to the Agreement renewal process, including performance, management fee and other expense information. Based on their evaluation of the information provided by the Adviser, in conjunction with the Fund’s other service providers, the Trustees, by a unanimous vote (including a separate vote of the Trustees who are not “interested persons,” as that term is defined in the Investment Company Act of 1940, as amended (the “Independent Trustees”)), approved the continuation of the Agreement for an additional one-year term ending August 31, 2022.
DISCUSSION OF FACTORS CONSIDERED
In considering the renewal of the Agreement and reaching their conclusions, the Trustees reviewed and analyzed various factors that they determined were relevant, including the factors enumerated below.
| 1. | NATURE, EXTENT AND QUALITY OF SERVICES PROVIDED TO THE FUND |
| | |
| | The Trustees considered the nature, extent and quality of services provided by the Adviser to the Fund and the amount of time devoted by the Adviser’s staff to the Fund’s operations. The Trustees considered the Adviser’s specific responsibilities in all aspects of day-to-day management of the Fund, as well as the qualifications, experience and responsibilities of David K. Sherman and Michael De Kler, the Fund’s portfolio managers and other key personnel at the Adviser involved in the day-to-day activities of the Fund. The Trustees reviewed information provided by the Adviser in a due diligence questionnaire, including the structure of the Adviser’s compliance program and discussed the Adviser’s marketing activities and its continuing commitment to the Fund. The Trustees noted that during the course of the prior year the Adviser had participated in a Trust board meeting to discuss various performance, |
CROSSINGBRIDGE LOW DURATION HIGH YIELD FUND
Basis for Trustees’ Approval of Investment Advisory Agreement
(Unaudited) (Continued)
| | marketing and compliance issues. The Trustees also noted any services that extended beyond portfolio management, and they considered the brokerage practices of the Adviser. The Trustees discussed the Adviser’s handling of compliance matters, including the reports of the Trust’s chief compliance officer to the Trustees on the effectiveness of the Adviser’s compliance program. The Trustees also considered the Adviser’s overall financial condition, as well as the implementation and operational effectiveness of the Adviser’s business continuity plan in response to the novel coronavirus (COVID-19) pandemic and challenges to day-to-day operations. The Trustees concluded that the Adviser had sufficient quality and depth of personnel, resources, investment methods and compliance policies and procedures essential to performing its duties under the Advisory Agreement and that the nature, overall quality and extent of the management services provided to the Fund, as well as the Adviser’s compliance program, were satisfactory and reliable. |
| | |
| 2. | INVESTMENT PERFORMANCE OF THE FUND AND THE ADVISER |
| | |
| | The Trustees discussed the performance of the Institutional Class shares of the Fund for the quarter, one-year, three-year and since inception periods ended March 31, 2021. In assessing the quality of the portfolio management services delivered by the Adviser, the Trustees also compared the short-term and longer-term performance of the Institutional Class shares of the Fund on both an absolute basis and in comparison to a benchmark index, the BofA 0-3 Year US HY Index ex Financials, and in comparison to a peer group of U.S. high yield bond funds in the Fund’s current Morningstar category as constructed by data presented by Morningstar Direct (the “Morningstar Peer Group”). The Trustees also reviewed the performance of the Institutional Class shares of the Fund in comparison to a peer group of five funds selected by the Adviser (the “Adviser Peer Group”), constructed using data presented by Morningstar Direct for the period ended March 31, 2021. The Trustees also noted that the Adviser sub-advises a mutual fund and manages its segment of the mutual fund’s portfolio with an investment strategy similar to that of the Fund. |
| | |
| | The Trustees noted the performance for the Institutional Class shares of the Fund for the quarter period ended March 31, 2021 was above the Morningstar Peer Group median. The Trustees noted the performance for the Institutional Class shares of the Fund for each of the one-year and three-year periods ended March 31, 2021 was below the Morningstar Peer Group median. The Trustees noted the performance for the Institutional Class shares of the Fund for the quarter period ended March 31, 2021 was above the Adviser Peer Group median. The Trustees noted the performance for the Institutional Class shares of the Fund for each of the one-year and three-year periods ended March 31, 2021 was equal to the Adviser Peer Group median. The Trustees noted that for the quarter ended March 31, 2021, the Institutional Class shares of the Fund had outperformed the BofA 0-3 Year US HY Index ex Financials. The Trustees also noted the performance of the Fund was in-line with the performance of the segment of the separate comparable mutual fund sub-advised by the Adviser. |
CROSSINGBRIDGE LOW DURATION HIGH YIELD FUND
Basis for Trustees’ Approval of Investment Advisory Agreement
(Unaudited) (Continued)
| | After considering all of the information, the Trustees concluded that the performance obtained by the Adviser for the Fund was satisfactory under current market conditions. Although past performance is not a guarantee or indication of future results, the Trustees determined that the Fund and its shareholders could benefit from the Adviser’s continued management. |
| | |
| 3. | COSTS OF SERVICES PROVIDED AND PROFITS REALIZED BY THE ADVISER |
| | |
| | The Trustees considered the cost of services and the structure of the Adviser’s fees, including a review of the expense analyses and other pertinent material with respect to the Fund. The Trustees reviewed the related statistical information and other materials provided, including the comparative expenses, expense components and peer group selection. The Trustees considered the cost structure of the Fund relative to its Morningstar Peer Group and the Adviser Peer Group, as well as any fee waivers and expense reimbursement of the Adviser. |
| | |
| | The Trustees also considered the overall profitability of the Adviser, reviewing the Adviser’s financial information and noting that the Adviser had provided substantial subsidies for the Fund’s operations since its inception and has not yet recouped those subsidies. The Trustees also examined the level of profits that could be expected to accrue to the Adviser from the fees payable under the Advisory Agreement and the expense subsidization undertaken by the Adviser with respect to the Fund, as well as the Fund’s brokerage practices, noting the Adviser makes no effort to seek soft dollar arrangements. These considerations were based on materials requested by the Trustees and the Fund’s administrator specifically for the June 23, 2021 meeting and the August 4, 2021 meeting at which the Advisory Agreement was formally considered, as well as the reports prepared by the Adviser over the course of the year. |
| | |
| | The Trustees noted that the Fund’s contractual management fee of 0.65% was above the Morningstar Peer Group average of 0.58%, but equal to the Adviser Peer Group average of 0.65%. The Trustees observed that the Fund’s total expense ratio of 0.90% for Institutional Class shares (net of fee waivers and expense reimbursements and which includes a 0.10% shareholder servicing plan fee) was above the Morningstar Peer Group and Adviser Peer Group averages (each of which exclude Rule 12b-1 fees) of 0.74% and 0.85%, respectively. |
| | |
| | The Trustees concluded that the Fund’s expenses and the management fees paid to the Adviser were fair and reasonable in light of the comparative performance, expense and management fee information. The Trustees noted, based on a profitability analysis prepared by the Adviser, that the Adviser’s profit from sponsoring the Fund was not excessive and that the Adviser maintained adequate profit levels to support its services to the Fund. |
| | |
| 4. | EXTENT OF ECONOMIES OF SCALE AS THE FUND GROWS |
| | |
| | The Trustees compared the Fund’s expenses relative to its peer groups and discussed realized and potential economies of scale. The Trustees also reviewed the structure of the Fund’s management fee and whether the Fund was large enough to generate economies of scale for shareholders or whether economies of scale would |
CROSSINGBRIDGE LOW DURATION HIGH YIELD FUND
Basis for Trustees’ Approval of Investment Advisory Agreement
(Unaudited) (Continued)
| | be expected to be realized as Fund assets grow (and if so, how those economies of scale were being or would be shared with shareholders). The Trustees reviewed all fee waivers, expense reimbursements and potential recoupments by the Adviser with respect to the Fund. The Trustees noted that the Fund’s management fee structure did not contain any breakpoint reductions as the Fund’s assets grow in size, but that the feasibility of incorporating breakpoints would continue to be reviewed on a regular basis. With respect to the Adviser’s fee structure, the Trustees concluded that the current fee structure was reasonable and reflected a sharing of economies of scale between the Adviser and the Fund at the Fund’s current asset level. |
| | |
| 5. | BENEFITS DERIVED FROM THE RELATIONSHIP WITH THE FUND |
| | |
| | The Trustees considered the direct and indirect benefits that could be realized by the Adviser from its association with the Fund. The Trustees examined the brokerage practices of the Adviser with respect to the Fund, noting that the Adviser receives no soft dollar benefits from its relationship with the Fund. The Trustees concluded that the benefits the Adviser may receive, such as greater name recognition or ability to attract additional investor assets, appear to be reasonable, and in many cases may benefit the Fund. |
CONCLUSIONS
The Trustees considered all of the foregoing factors. In considering the renewal of the Advisory Agreement, the Trustees did not identify any one factor as all-important, but rather considered these factors collectively in light of the Fund’s surrounding circumstances. Based on this review, the Trustees, including a majority of the Independent Trustees, approved the continuation of the Advisory Agreement for an additional term ending August 31, 2022 as being in the best interests of the Fund and its shareholders.
CROSSINGBRIDGE RESPONSIBLE CREDIT FUND
CROSSINGBRIDGE ULTRA-SHORT DURATION FUND
Basis for Trustees’ Approval of Investment Advisory Agreement
(Unaudited)
The Board of Trustees (the “Trustees”) of Trust for Professional Managers (the “Trust”) met on February 19, 2021 to consider the initial approval of the Investment Advisory Agreement (the “CrossingBridge Advisory Agreement”) between the Trust, on behalf of the CrossingBridge Responsible Credit Fund and the CrossingBridge Ultra-Short Duration Fund (each, a “Fund”, and collectively, the “Funds”), two series of the Trust, and CrossingBridge Advisors, LLC, the Funds’ investment adviser (the “Adviser”). In advance of the meeting, the Trustees requested and received materials to assist them in considering the approval of the Agreement, including a memorandum provided by the Funds’ legal counsel, which outlined the Trustees’ responsibilities in considering the Agreement. The materials provided contained information with respect to the factors enumerated below, including a copy of the Agreement, detailed comparative information relating to the Funds’ management fees and other expenses of the Funds, due diligence materials relating to the Adviser (including a due diligence questionnaire completed on behalf of the Funds by the Adviser, the Adviser’s Form ADV, select financial statements of the Adviser, bibliographic information of the Adviser’s key management and compliance personnel and comparative fee information for the Funds and the Adviser’s other separately-managed accounts and other pertinent information.
Based on their evaluation of the information provided by the Adviser, in conjunction with the Funds’ other service providers, the Trustees, by a unanimous vote (including a separate vote of the Trustees who are not “interested persons,” as that term is defined in the Investment Company Act of 1940, as amended (the “Independent Trustees”)), approved the CrossingBridge Advisory Agreement for an initial term ending two years following the Funds’ commencement of operations pursuant to an effective registration statement.
DISCUSSION OF FACTORS CONSIDERED
In considering the approval of the CrossingBridge Advisory Agreement and reaching their conclusions, the Trustees reviewed and analyzed various factors that they determined were relevant, including the factors enumerated below.
| 1. | NATURE, EXTENT AND QUALITY OF SERVICES TO BE PROVIDED TO THE FUNDS |
| | |
| | The Trustees considered the nature, extent and quality of services that would be provided by the Adviser to the Funds and the amount of time to be devoted by the Adviser’s staff to the Funds’ operations. The Trustees considered the Adviser’s specific responsibilities in all aspects of day-to-day management of the Funds, as well as the qualifications, experience and responsibilities of David K. Sherman and T. Kirk Whitney, who will serve as the Responsible Credit Fund’s portfolio managers, Michael De Kler, who along with Mr. Sherman will serve as the Ultra-Short Duration Fund’s portfolio managers, and other key personnel at the Adviser who would be involved in the day-to-day activities of the Funds. The Trustees reviewed information provided by the Adviser in a due diligence questionnaire, including the structure of the Adviser’s compliance program and discussed the Adviser’s marketing activities and its commitment to the growth of each Fund’s assets. The Trustees also noted any |
CROSSINGBRIDGE RESPONSIBLE CREDIT FUND
CROSSINGBRIDGE ULTRA-SHORT DURATION FUND
Basis for Trustees’ Approval of Investment Advisory Agreement
(Unaudited) (Continued)
| | services that extended beyond portfolio management, and they considered the overall capability of the Adviser. The Trustees noted that the Trust’s chief compliance officer concluded that the Adviser’s written compliance policies and procedures, as required by Rule 206(4)-7 under the Investment Advisers Act of 1940, as amended, are reasonably designed to prevent violations of federal securities laws. They noted that the Trust’s chief compliance officer further concluded that the Adviser’s compliance program appears to adequately address the major areas of risk associated with its current advisory business. The Trustees also considered the Adviser’s overall financial condition, as well as the implementation and operational effectiveness of the Adviser’s business continuity plan in response to the novel coronavirus (COVID-19) pandemic and challenges to day-to-day operations in a predominately work-from-home environment. The Trustees concluded that the Adviser had sufficient quality and depth of personnel, resources, investment methods and compliance policies and procedures essential to performing its duties under the CrossingBridge Advisory Agreement and that the nature, overall quality and extent of the management services to be provided to the Funds, as well as the Adviser’s compliance program, were satisfactory and reliable. |
| | |
| 2. | INVESTMENT PERFORMANCE OF THE FUNDS AND THE ADVISER |
| | |
| | The Trustees noted that the Funds had not yet commenced operations and, therefore, the performance of the Funds was not a relevant factor for consideration. In assessing the portfolio management services to be provided by the Adviser, the Trustees considered the investment management experience of Messrs. Sherman, Whitney and De Kler, who will serve as the Funds’ portfolio managers, as applicable. The Trustees noted the performance of other accounts managed by the Adviser with similar investment strategies as each of the Funds. |
| | |
| | After considering all of the information, the Trustees determined that the Funds and its shareholders were likely to benefit from the Adviser’s management. |
| | |
| 3. | COSTS OF SERVICES PROVIDED AND PROFITS TO BE REALIZED BY THE ADVISER |
| | |
| | The Trustees considered the cost of services and the structure of the Adviser’s proposed management fees, including a review of the expense analyses and other pertinent material with respect to the Funds. The Trustees reviewed the related statistical information and other materials provided, including the comparative expenses, expense components and peer group selection. The Trustees also considered the cost structure of the Funds relative to a peer group of U.S. high yield bond funds as constructed by data presented by Morningstar Direct (the “Morningstar Peer Group”) and other accounts managed by the Adviser with similar investment strategies as each of the Funds. |
| | |
| | The Trustees noted that the Ultra-Short Duration Fund’s proposed contractual management fee of 0.65% was above the Morningstar Peer Group average of 0.61%. The Trustees further noted that the Adviser had agreed to waive its management fee |
CROSSINGBRIDGE RESPONSIBLE CREDIT FUND
CROSSINGBRIDGE ULTRA-SHORT DURATION FUND
Basis for Trustees’ Approval of Investment Advisory Agreement
(Unaudited) (Continued)
| | and/or reimburse fund expenses for at least a two-year period, so that the Ultra-Short Duration Fund’s total annual fund operating expenses do not exceed 0.90% of the Fund’s average daily net assets, which was above the Morningstar Peer Group average of 0.79%. The Trustees then compared the fees to be paid by the Ultra-Short Duration Fund to fees paid by other accounts managed by the Adviser with similar strategies. |
| | |
| | The Trustees noted that the Responsible Credit Fund’s proposed contractual management fee of 0.65% was above the Morningstar Peer Group average of 0.61%. The Trustees further noted that the Adviser had agreed to waive its management fee and/or reimburse fund expenses for at least a two-year period, so that the Responsible Credit Fund’s total annual fund operating expenses do not exceed 0.90% of the Fund’s average daily net assets, which was above the Morningstar Peer Group average of 0.79%. The Trustees then compared the fees to be paid by the Responsible Credit Fund to fees paid by other accounts managed by the Adviser with similar strategies. |
| | |
| | The Trustees also considered the overall profitability that may result from the Adviser’s management of each of the Funds and reviewed the Adviser’s financial information. The Trustees also examined the level of profits that could be realized by the Adviser from the fees payable under the CrossingBridge Advisory Agreement anticipated by the Adviser. |
| | |
| | The Trustees concluded that each Fund’s estimated expenses and the proposed management fee to be paid to the Adviser were fair and reasonable in light of the comparative expense information and the investment management services to be provided to each Fund by the Adviser. The Trustees further concluded, based on a pro forma profitability analysis prepared by the Adviser, that while each Fund would not be profitable to the Adviser in the short-term after accounting for marketing and distribution expenses, the Adviser had adequate financial resources to support its services to each Fund, despite the anticipated subsidization of each Fund’s operations. |
| | |
| 4. | EXTENT OF ECONOMIES OF SCALE AS THE FUNDS GROW |
| | |
| | The Trustees compared each Fund’s estimated expenses relative to its Morningstar Peer Group and discussed economies of scale. The Trustees noted that each Fund’s management fee structure did not contain any breakpoint reductions as Fund assets grow in size, but that the feasibility of incorporating breakpoints would be reviewed on a regular basis. With respect to the Adviser’s fee structure, the Trustees concluded that the potential economies of scale with respect to each Fund were acceptable. |
| | |
| 5. | BENEFITS TO BE DERIVED FROM THE RELATIONSHIP WITH THE FUNDS |
| | |
| | The Trustees considered the direct and indirect benefits that could be realized by the Adviser from its association with the Funds. The Trustees concluded that the benefits the Adviser may receive, such as greater name recognition or the ability to attract additional investor assets, appear to be reasonable, and in many cases may benefit the Funds. |
CROSSINGBRIDGE RESPONSIBLE CREDIT FUND
CROSSINGBRIDGE ULTRA-SHORT DURATION FUND
Basis for Trustees’ Approval of Investment Advisory Agreement
(Unaudited) (Continued)
CONCLUSIONS
The Trustees considered all of the foregoing factors. In considering the approval of the CrossingBridge Advisory Agreement, the Trustees did not identify any one factor as all-important, but rather considered these factors collectively in light of the Funds’ surrounding circumstances. Based on this review, the Trustees, including a majority of the Independent Trustees, approved the proposed CrossingBridge Advisory Agreement for an initial two-year term as being in the best interests of each Fund and its shareholders.
CROSSINGBRIDGE PRE-MERGER SPAC ETF
Basis for Trustees’ Approval of Investment Advisory Agreement
(Unaudited)
The Board of Trustees (the “Trustees”) of Trust for Professional Managers (the “Trust”) met on August 4, 2021 to consider the initial approval of the Investment Advisory Agreement (the “CrossingBridge Advisory Agreement”) between the Trust, on behalf of the CrossingBridge Pre-Merger SPAC ETF (the “Fund”), a series of the Trust, and CrossingBridge Advisors, LLC, the Fund’s investment adviser (the “Adviser”). In advance of the meeting, the Trustees requested and received materials to assist them in considering the approval of the CrossingBridge Advisory Agreement, including a memorandum provided by the Fund’s legal counsel, which outlined the Trustees’ responsibilities in considering the CrossingBridge Advisory Agreement. The materials provided contained information with respect to the factors enumerated below, including a copy of the CrossingBridge Advisory Agreement, detailed comparative information relating to the Fund’s management fees and other expenses of the Fund, due diligence materials relating to the Adviser (including a due diligence questionnaire completed on behalf of the Fund by the Adviser, the Adviser’s Form ADV, select financial statements of the Adviser, bibliographic information of the Adviser’s key management and compliance personnel and comparative fee information for the Fund and the Adviser’s other separately-managed accounts and other pertinent information.
Based on their evaluation of the information provided by the Adviser, in conjunction with the Fund’s other service providers, the Trustees, by a unanimous vote (including a separate vote of the Trustees who are not “interested persons,” as that term is defined in the Investment Company Act of 1940, as amended (the “Independent Trustees”)), approved the CrossingBridge Advisory Agreement for an initial term ending two years following the Fund’s commencement of operations pursuant to an effective registration statement.
In considering the approval of the CrossingBridge Advisory Agreement and reaching their conclusions, the Trustees reviewed and analyzed various factors that they determined were relevant, including the factors enumerated below.
| 1. | NATURE, EXTENT AND QUALITY OF SERVICES TO BE PROVIDED TO THE FUND |
| | |
| | The Trustees considered the nature, extent and quality of services provided by the Adviser to the Fund and the amount of time devoted by the Adviser’s staff to the Fund’s operations. The Trustees considered the Adviser’s specific responsibilities in all aspects of day-to-day management of the Fund, as well as the qualifications, experience and responsibilities of David K. Sherman and T. Kirk Whitney, the Fund’s portfolio managers and other key personnel at the Adviser involved in the day-to-day activities of the Fund. The Trustees reviewed information provided by the Adviser in a due diligence questionnaire, including the structure of the Adviser’s compliance program and discussed the Adviser’s marketing activities and its commitment to the growth of the Fund’s assets. The Trustees also noted any services that extended beyond portfolio management, and they considered the overall capability of the Adviser. The Trustees noted that the Trust’s chief compliance officer concluded that the Adviser’s written compliance policies and procedures, as required by Rule 206(4)-7 under the Investment Advisers Act of 1940, as amended, are reasonably designed to prevent violations of federal securities laws. The Trustees also noted that the Trust’s chief compliance officer further concluded that the Adviser’s compliance program |
CROSSINGBRIDGE PRE-MERGER SPAC ETF
Basis for Trustees’ Approval of Investment Advisory Agreement
(Unaudited) (Continued)
| | appears to adequately address the major areas of risk associated with its current advisory business. The Trustees also considered the Adviser’s overall financial condition, as well as the implementation and operational effectiveness of the Adviser’s business continuity plan in response to the novel coronavirus (COVID-19) pandemic and challenges to day-to-day operations in a predominately work-from-home environment. The Trustees concluded that the Adviser had sufficient quality and depth of personnel, resources, investment methods and compliance policies and procedures essential to performing its duties under the CrossingBridge Advisory Agreement and that the nature, overall quality and extent of the management services provided to the Fund, as well as the Adviser’s compliance program, were satisfactory and reliable. |
| | |
| 2. | INVESTMENT PERFORMANCE OF THE FUND AND THE ADVISER |
| | |
| | The Trustees noted that the Fund had not yet commenced operations and, therefore, that performance of the Fund was not a relevant factor for consideration. In assessing the portfolio management services to be provided by the Adviser, the Trustees considered the investment management experience of Messrs. Sherman and Whitney, who will serve as the Fund’s portfolio managers. The Trustees noted that the Adviser did not manage any other accounts with the same or similar investment strategies as the Fund. After considering all of the information, the Trustees determined that the Fund and its shareholders were likely to benefit from the Adviser’s management. |
| | |
| 3. | COSTS OF SERVICES PROVIDED AND PROFITS TO BE REALIZED BY THE ADVISER |
| | |
| | The Trustees considered the cost of services and the structure of the Adviser’s proposed management fee, including a review of the expense analyses and other pertinent material with respect to the Fund. The Trustees took into consideration that the management fee was a “unitary management fee” whereby the Adviser agrees to pay all expenses incurred by the Fund, except the unitary management fee payable to the Adviser and certain other costs of the Fund, specifically interest charges on any borrowings, dividends and other expenses on securities sold short, taxes, brokerage commissions and other expenses incurred in placing orders for the purchase and sale of securities and other investment instruments, acquired fund fees and expenses, accrued deferred tax liability, extraordinary expenses and any Rule 12b-1 plan fees. The Trustees reviewed the related statistical information and other materials provided, including the comparative expenses and expense components. The Trustees considered the cost structure of the Fund relative to a peer group of U.S. open-end small growth funds in the Fund’s proposed Morningstar category as constructed by data presented by Morningstar Direct (the “Morningstar Peer Group”). |
| | |
| | The Trustees noted that the Fund’s proposed contractual management fee of 0.80% was below the Morningstar Peer Group average of 0.84%. The Trustees further noted that the Fund’s proposed unitary fee structure will limit the Fund’s total annual fund operating expenses to 0.80% of the Fund’s average annual assets and was below the Morningstar Peer Group (which excludes Rule 12b-1 fees) of 1.13%. |
| | |
| | The Trustees also considered the overall profitability that may result from the Adviser’s management of the Fund and reviewed the Adviser’s financial information. |
CROSSINGBRIDGE PRE-MERGER SPAC ETF
Basis for Trustees’ Approval of Investment Advisory Agreement
(Unaudited) (Continued)
| | The Trustees also examined the level of profits that could be expected to accrue to the Adviser from the fees payable under the CrossingBridge Advisory Agreement anticipated by the Adviser. |
| | |
| | The Trustees concluded that the Fund’s estimated expenses and the proposed management fees paid to the Adviser were fair and reasonable in light of the comparative performance, expense and management fee information and the investment management services to be provided to the Fund by the Adviser. The Trustees noted, based on a pro forma profitability analysis prepared by the Adviser, that the Adviser’s anticipated profit from sponsoring the Fund would not be excessive and that the Adviser maintained adequate profit levels to support its services to the Fund. |
| | |
| 4. | EXTENT OF ECONOMIES OF SCALE AS THE FUND GROWS |
| | |
| | The Trustees compared the Fund’s estimated expenses relative to its Morningstar Peer Group and discussed economies of scale. The Trustees noted that the Fund’s proposed management fee structure did not contain any breakpoint reductions as the Fund’s assets grow in size, but that the feasibility of incorporating breakpoints would be reviewed on a regular basis. With respect to the Adviser’s fee structure, the Trustees concluded that the potential economies of scale with respect to the Fund were acceptable. |
| | |
| 5. | BENEFITS TO BE DERIVED FROM THE RELATIONSHIP WITH THE FUND |
| | |
| | The Trustees considered the direct and indirect benefits that could be realized by the Adviser from its association with the Fund. The Trustees concluded that the benefits the Adviser may receive, such as greater name recognition or the ability to attract additional investor assets, appear to be reasonable, and in many cases may benefit the Fund. |
CONCLUSIONS
The Trustees considered all of the foregoing factors. In considering the approval of the CrossingBridge Advisory Agreement, the Trustees did not identify any one factor as all-important, but rather considered these factors collectively in light of the Fund’s surrounding circumstances. Based on this review, the Trustees, including a majority of the Independent Trustees, approved the proposed CrossingBridge Advisory Agreement for an initial two-year term as being in the best interests of the Fund and its shareholders.
CROSSINGBRIDGE LOW DURATION HIGH YIELD FUND
Review of Liquidity Risk Management Program
(Unaudited)
In accordance with Rule 22e-4 under the Investment Company Act of 1940, as amended, Trust for Professional Managers (the “Trust”) has adopted and implemented a liquidity risk management program (the “Trust Program”). As required under the Trust Program, CrossingBridge Advisors, LLC (“CrossingBridge”), the investment adviser to the CrossingBridge Low Duration High Yield Fund (the “Fund”), a series of the Trust, adopted and implemented a liquidity risk management program tailored specifically to the Fund (the “Adviser Program”). The Adviser Program seeks to promote effective liquidity risk management for the Fund and to protect Fund shareholders from dilution of their interests. The Board of Trustees (the “Board”) of the Trust has approved CrossingBridge as the administrator for the Adviser Program (the “Program Administrator”). The Program Administrator has further delegated administration of the Adviser Program to its Liquidity Risk Management Committee. The Program Administrator is required to provide a written annual report to the Board and the Trust’s chief compliance officer regarding the adequacy and effectiveness of the Adviser Program, including the operation of each Fund’s highly liquid investment minimum, if applicable, and any material changes to the Adviser Program.
On April 15, 2021, the Board reviewed the Program Administrator’s written annual report for the period July 1, 2020 through December 31, 2020 (the “Report”). The Report provided an assessment of the Fund’s liquidity risk: the risk that the Fund could not meet requests to redeem shares issued by the Fund without significant dilution of the remaining investors’ interests in the Fund. The Adviser Program assesses liquidity risk under both normal and reasonably foreseeable stressed market conditions. The Program Administrator has retained ICE Data Services, Inc., a third party vendor, to provide portfolio investment classification services, and the Report noted that the Fund primarily held investments that were classified as highly liquid during the review period. The Report noted that the Fund’s portfolio is expected to continue to primarily hold highly liquid investments and the determination that the Fund be designated as a “primarily highly liquid fund” (as defined in Rule 22e-4) remains appropriate and the Fund can therefore continue to rely on the exclusion in Rule 22e-4 from the requirements to determine and review a highly liquid investment minimum for the Fund and to adopt policies and procedures for responding to a highly liquid investment minimum shortfall. The Report noted that there were no breaches of the Fund’s restriction on holding illiquid investments exceeding 15% of its net assets during the review period. The Report confirmed that the Fund’s investment strategy was appropriate for an open-end management investment company. The Report also indicated that no material changes had been made to the Adviser Program during the review period.
The Program Administrator determined that the Fund is reasonably likely to be able to meet redemption requests without adversely affecting non-redeeming Fund shareholders through significant dilution. The Program Administrator concluded that the Adviser Program was adequately designed and effectively implemented during the review period.
CROSSINGBRIDGE FUNDS
Additional Information
(Unaudited)
Tax Information
For the fiscal year or period ended September 30, 2021, 0% of the Funds’ taxable ordinary income distributions were designated as short-term capital gain distributions under the Internal Revenue Code Section 871(k).
For the fiscal year or period ended September 30, 2021, certain dividends paid by the Funds may be subject to a maximum tax rate of 20%, as provided for by the Jobs and Growth Tax Relief Reconciliation Act of 2003. The percentage of dividends declared from ordinary income designated as qualified dividend income was 0.38% for the CrossingBridge Low Duration High Yield Fund and 0% for the other Funds.
For corporate shareholders, the percent of ordinary income distributions qualifying for the corporate dividends received deduction for the fiscal year or period ended September 30, 2021, was 0.38% for the CrossingBridge Low Duration High Yield Fund and 0% for the other Funds.
Indemnifications
Under the Trust’s organizational documents, its Officers and Trustees are indemnified against certain liabilities arising out of the performance of their duties to the Funds. In addition, in the normal course of business, the Funds enter into contracts that provide general indemnifications to other parties. A Fund’s maximum exposure under these arrangements is unknown as this would involve future claims that may be made against the Funds that have not yet occurred. However, the Funds have not had prior claims or losses pursuant to these contracts and expects the risk of loss to be remote.
CROSSINGBRIDGE FUNDS
Additional Information (Continued)
(Unaudited)
Information about Trustees
The business and affairs of the Trust are managed under the direction of the Board of Trustees. Information pertaining to the Trustees of the Trust is set forth below. The Statement of Additional Information includes additional information about the Trustees and is available, without charge, upon request by calling 1-888-898-2780.
| | | | | | Other |
| | | | | | Directorships |
| | | | Number of | | Held by |
| | | Term of | Portfolios | Principal | Trustee |
| Name, | Position(s) | Office and | in the Trust | Occupation(s) | During |
Address and | Held with | Length of | Overseen | During the Past | the Past |
| | | | | | |
| Independent Trustees | | | | | |
| | | | | | |
Michael D. | Trustee | Indefinite | 26 | Professor | Independent |
Akers, Ph.D. | | Term; Since | | Emeritus, | Trustee, USA |
615 E. Michigan St. | | August 22, | | Department of | MUTUALS |
Milwaukee, WI 53202 | | 2001 | | Accounting | (an open-end |
Year of Birth: 1955 | | | | (June 2019- | investment |
| | | | | present); | company |
| | | | | Professor, | (2001-2021). |
| | | | | Department of | |
| | | | | Accounting | |
| | | | | (2004-2019); | |
| | | | | Chair, | |
| | | | | Department | |
| | | | | of Accounting | |
| | | | | (2004-2017), | |
| | | | | Marquette | |
| | | | | University. | |
| | | | | | |
Gary A. Drska | Trustee | Indefinite | 26 | Pilot, | Independent |
615 E. Michigan St. | | Term; Since | | Frontier/Midwest | Trustee, USA |
Milwaukee, WI 53202 | | August 22, | | Airlines, Inc. | MUTUALS |
Year of Birth: 1956 | | 2001 | | (airline company) | (an open-end |
| | | | | (1986–present). | investment |
| | | | | | company |
| | | | | | (2001-2021). |
CROSSINGBRIDGE FUNDS
Additional Information (Continued)
(Unaudited)
| | | | | | Other |
| | | | | | Directorships |
| | | | Number of | | Held by |
| | | Term of | Portfolios | Principal | Trustee |
| Name, | Position(s) | Office and | in the Trust | Occupation(s) | During |
| Address and | Held with | Length of | Overseen | During the Past | the Past |
Year of Birth | the Trust | Time Served | by Trustee | Five Years | Five Years |
| | | | | | |
| Interested Trustee and Officers | | | | | |
| | | | | | |
Joseph C. Neuberger* | Chairperson | Indefinite | 26 | President | Trustee, Buffalo |
615 E. Michigan St. | and | Term; Since | | (2017–present), | Funds (an |
Milwaukee, WI 53202 | Trustee | August 22, | | Chief | open-end |
Year of Birth: 1962 | | 2001 | | Operating | investment |
| | | | | Officer | company) |
| | | | | (2016–2020), | (2003-2017); |
| | | | | Executive Vice | Trustee, USA |
| | | | | President | MUTUALS |
| | | | | (1994–2017), | (an open-end |
| | | | | U.S. Bancorp | investment |
| | | | | Fund Services, | company) |
| | | | | LLC. | (2001-2018). |
| | | | | | |
John P. Buckel | President | Indefinite | N/A | Vice President, | N/A |
615 E. Michigan St. | and | Term; Since | | U.S. Bancorp | |
Milwaukee, WI 53202 | Principal | January 24, | | Fund Services, | |
Year of Birth: 1957 | Executive | 2013 | | LLC (2004– | |
| | Officer | | | present). | |
| | | | | | |
Jennifer A. Lima | Vice | Indefinite | N/A | Vice President, | N/A |
615 E. Michigan St. | President, | Term; Since | | U.S. Bancorp | |
Milwaukee, WI 53202 | Treasurer | January 24, | | Fund Services, | |
Year of Birth: 1974 | and | 2013 | | LLC (2002– | |
| | Principal | |
| present). | |
| | Financial | | | | |
| | and | | | | |
| | Accounting | | | | |
| | Officer | | | | |
* | Mr. Neuberger is deemed to be an “interested person” of the Trust as defined by the 1940 Act due to his position and material business relationship with the Trust. |
CROSSINGBRIDGE FUNDS
Additional Information (Continued)
(Unaudited)
| | | | | | Other |
| | | | | | Directorships |
| | | | Number of | | Held by |
| | | Term of | Portfolios | Principal | Trustee |
| Name, | Position(s) | Office and | in the Trust | Occupation(s) | During |
| Address and | Held with | Length of | Overseen | During the Past | the Past |
Year of Birth | the Trust | Time Served | by Trustee | Five Years | Five Years |
| | | | | | |
Elizabeth B. Scalf | Chief | Indefinite | N/A | Senior Vice | N/A |
615 E. Michigan St. | Compliance | Term; Since | | President, U.S. | |
Milwaukee, WI 53202 | Officer, | July 1, | | Bancorp Fund | |
Year of Birth: 1985 | Vice | 2017 | | Services, LLC | |
| | President | | | (February 2017– | |
| | and Anti- | | | present); Vice | |
| | Money | | | President and | |
| | Laundering | | | Assistant CCO, | |
| | Officer | | | Heartland Advisors, | |
| | | | | Inc. (December | |
| | | | | 2016–January | |
| | | | | 2017); Vice | |
| | | | | President and CCO, | |
| | | | | Heartland Group, | |
| | | | | Inc. (May 2016– | |
| | | | | November 2016); | |
| | | | | Vice President, | |
| | | | | CCO and Senior | |
| | | | | Legal Counsel | |
| | | | | (May 2016– | |
| | | | | November 2016), | |
| | | | | Heartland | |
| | | | | Advisors, Inc. | |
| | | | | | |
Jay S. Fitton | Secretary | Indefinite | N/A | Assistant Vice | N/A |
615 E. Michigan St. | | Term; Since | | President, U.S. | |
Milwaukee, WI 53202 | | July 22, | | Bancorp Fund | |
Year of Birth: 1970 | | 2019 | | Services, LLC | |
| | | | | (2019-present); | |
| | | | | Partner, Practus, | |
| | | | | LLP (2018-2019); | |
| | | | | Counsel, Drinker | |
| | | | | Biddle & Reath LLP | |
| | | | | (2016-2018). | |
CROSSINGBRIDGE FUNDS
Additional Information (Continued)
(Unaudited)
| | | | | | Other |
| | | | | | Directorships |
| | | | Number of | | Held by |
| | | Term of | Portfolios | Principal | Trustee |
| Name, | Position(s) | Office and | in the Trust | Occupation(s) | During |
| Address and | Held with | Length of | Overseen | During the Past | the Past |
Year of Birth | the Trust | Time Served | by Trustee | Five Years | Five Years |
| | | | | | |
Kelly A. Burns | Assistant | Indefinite | N/A | Assistant Vice | N/A |
615 E. Michigan St. | Treasurer | Term; Since | | President, U.S. | |
Milwaukee, WI 53202 | | April 23, | | Bancorp Fund | |
Year of Birth: 1987 | | 2015 | | Services, LLC | |
| | | | | (2011–present). | |
| | | | | | |
Melissa Aguinaga | Assistant | Indefinite | N/A | Assistant Vice | N/A |
615 E. Michigan St. | Treasurer | Term; Since | | President, U.S. | |
Milwaukee, WI 53202 | | July 1, | | Bancorp Fund | |
Year of Birth: 1987 | | 2015 | | Services, LLC | |
| | | | | (2010–present). | |
| | | | | | |
Laura Carroll | Assistant | Indefinite | N/A | Assistant Vice | N/A |
615 E. Michigan St. | Treasurer | Term; Since | | President, U.S. | |
Milwaukee, WI 53202 | | August 20, | | Bancorp Fund | |
Year of Birth: 1985 | | 2018 | | Services, LLC | |
| | | | | (2007–present). | |
(This Page Intentionally Left Blank.)
A NOTE ON FORWARD LOOKING STATEMENTS (Unaudited)
Except for historical information contained in this report for the Funds, the matters discussed in this report may constitute forward-looking statements made pursuant to the safe-harbor provisions of the Private Securities Litigation Reform Act of 1995. These include any adviser or portfolio manager predictions, assessments, analyses or outlooks for individual securities, industries, market sectors and/or markets. These statements involve risks and uncertainties. In addition to the general risks described for the Funds in the current Prospectus, other factors bearing on this report include the accuracy of the adviser’s or portfolio managers’ forecasts and predictions, and the appropriateness of the investment programs designed by the adviser or portfolio managers to implement their strategies efficiently and effectively. Any one or more of these factors, as well as other risks affecting the securities markets and investment instruments generally, could cause the actual results of a Fund to differ materially as compared to benchmarks associated with the Fund.
ADDITIONAL INFORMATION (Unaudited)
The Funds have adopted proxy voting policies and procedures that delegate to the Adviser the authority to vote proxies. A description of the Funds’ proxy voting policies and procedures is available without charge, upon request, by calling the Funds’ toll free at 1-888-898-2780. A description of these policies and procedures is also included in a Fund’s Statement of Additional Information, which is available on the SEC’s website at http://www.sec.gov.
A Fund’s proxy voting record for the most recent 12-month period ended June 30 (as applicable) is available without charge, upon request, by calling, toll free, 1-888-898-2780, or by accessing the SEC’s website at http://www.sec.gov.
The Funds file their complete schedules of portfolio holdings with the SEC for the first and third quarters of each fiscal year on Part F of Form N-PORT. Shareholders may view a Fund’s filings (as applicable) on the SEC’s website at www.sec.gov.
HOUSEHOLDING (Unaudited)
In an effort to decrease costs, the Funds intend to reduce the number of duplicate prospectuses and certain other shareholder documents you receive by sending only one copy of each to those addresses shared by two or more accounts and to shareholders the Funds reasonably believes are from the same family or household. Once implemented, if you would like to discontinue householding for your accounts, please call toll-free at 1-888-898-2780 to request individual copies of these documents. Once a Fund receives notice to stop householding, the Fund will begin sending individual copies 30 days after receiving your request. This policy does not apply to account statements.
FREQUENCY DISTRIBUTION OF PREMIUMS AND DISCOUNTS (Unaudited)
Information regarding how often shares of the CrossingBridge Pre-Merger SPAC ETF trade on an exchange at a price above (i.e., at a premium) or below (i.e., at a discount) the NAV of the ETF is available without charge, on the ETF’s website at www.crossingbridgefunds.com.
CROSSINGBRIDGE FUNDS
| Investment Adviser | CrossingBridge Advisors, LLC |
| | 427 Bedford Road |
| | Suite 230 |
| | Pleasantville, New York 10570 |
| | |
| Legal Counsel | Godfrey & Kahn, S.C. |
| | 833 East Michigan Street, Suite 1800 |
| | Milwaukee, Wisconsin 53202 |
| | |
| Independent Registered Public | Cohen & Company, Ltd. |
| Accounting Firm | 342 North Water Street, Suite 830 |
| | Milwaukee, Wisconsin 53202 |
| | |
| Transfer Agent, Fund Accountant and | U.S. Bancorp Fund Services, LLC |
| Fund Administrator | 615 East Michigan Street |
| | Milwaukee, Wisconsin 53202 |
| | |
| Custodian | U.S. Bank, N.A. |
| | Custody Operations |
| | 1555 North River Center Drive |
| | Milwaukee, Wisconsin 53212 |
| | |
| Distributors | Quasar Distributors, LLC |
| | 111 East Kilbourn Avenue, Suite 1250 |
| | Milwaukee, Wisconsin 53202 |
| | |
| | Foreside Fund Services, LLC |
| | Three Canal Plaza, Suite 100 |
| | Portland, Maine 04101 |
This report is intended for shareholders of the Funds and may not be used as sales literature unless preceded or accompanied by a current prospectus.
(b) Not applicable.
Item 2. Code of Ethics.
The registrant has adopted a code of ethics that applies to the registrant’s principal executive officer and principal financial officer. The registrant has not made any amendments to its code of ethics during the period covered by this report. The registrant has not granted any waivers from any provisions of the code of ethics during the period covered by this report. A copy of the registrant’s Code of Ethics is incorporated by reference to the Registrant’s Form N-CSR filed on December 10, 2018.
Item 3. Audit Committee Financial Expert.
The registrant’s board of trustees has determined that there is at least one audit committee financial expert serving on its audit committee. Dr. Michael Akers is the “audit committee financial expert” and is considered to be “independent” as each term is defined in Item 3 of Form N‑CSR. Dr. Akers holds a Ph.D. in accountancy and is a professor Emeritus of accounting at Marquette University in Milwaukee, Wisconsin.
Item 4. Principal Accountant Fees and Services.
The registrant has engaged its principal accountant to perform audit services, audit-related services, tax services and other services during the past two fiscal years. “Audit services” refer to performing an audit of the registrant's annual financial statements or services that are normally provided by the accountant in connection with statutory and regulatory filings or engagements for those fiscal years. “Audit-related services” refer to the assurance and related services by the principal accountant that are reasonably related to the performance of the audit. “Tax services” refer to professional services rendered by the principal accountant for tax compliance, tax advice, and tax planning. The following table details the aggregate fees billed or expected to be billed for each of the last two fiscal years for audit fees, audit-related fees, tax fees and other fees by the principal accountant.
| | FYE 9/30/2021 | FYE 9/30/2020 |
(a) Audit Fees | $54,500 | $18,000 |
(b) Audit-Related Fees | 0 | 0 |
(c) Tax Fees | 11,500 | 3,500 |
(d) All Other Fees | 0 | 0 |
(e)(1) The audit committee has adopted pre-approval policies and procedures that require the audit committee to pre‑approve all audit and non‑audit services of the registrant, including services provided to any entity affiliated with the registrant.
(e)(2) The percentage of fees billed by Cohen & Company, Ltd. applicable to non-audit services pursuant to waiver of pre-approval requirement were as follows:
| | FYE 9/30/2021 | FYE 9/30/2020 |
Audit-Related Fees | 0% | 0% |
Tax Fees | 0% | 0% |
All Other Fees | 0% | 0% |
(f) All of the principal accountant’s hours spent on auditing the registrant’s financial statements were attributed to work performed by full‑time permanent employees of the principal accountant.
(g) The following table indicates the non-audit fees billed or expected to be billed by the registrant’s accountant for services to the registrant and to the registrant’s investment adviser (and any other controlling entity, etc.—not sub-adviser) for the last two years.
Non-Audit Related Fees | FYE 9/30/2021 | FYE 9/30/2020 |
Registrant | $0 | $0 |
Registrant’s Investment Adviser | $0 | $0 |
(h) The audit committee of the board of trustees has considered whether the provision of non-audit services that were rendered to the registrant's investment adviser is compatible with maintaining the principal accountant's independence and has concluded that the provision of such non-audit services by the accountant has not compromised the accountant’s independence.
(i) Not applicable.
(j) Not applicable.
Item 5. Audit Committee of Listed Registrants.
Not applicable to registrants who are not listed issuers (as defined in Rule 10A-3 under the Securities Exchange Act of 1934).
Item 6. Investments.
(a) | Schedule of Investments is included as part of the report to shareholders filed under Item 1 of this Form. |
Item 7. Disclosure of Proxy Voting Policies and Procedures for Closed-End Management Investment Companies.
Not applicable to open-end investment companies.
Item 8. Portfolio Managers of Closed-End Management Investment Companies.
Not applicable to open-end investment companies.
Item 9. Purchases of Equity Securities by Closed‑End Management Investment Company and Affiliated Purchasers.
Not applicable to open-end investment companies.
Item 10. Submission of Matters to a Vote of Security Holders.
There have been no material changes to the procedures by which shareholders may recommend nominees to the registrant’s board of trustees.
Item 11. Controls and Procedures.
(a) | The Registrant’s President and Treasurer have reviewed the Registrant's disclosure controls and procedures (as defined in Rule 30a-3(c) under the Investment Company Act of 1940 (the “Act”)) as of a date within 90 days of the filing of this report, as required by Rule 30a-3(b) under the Act and Rules 13a-15(b) or 15d‑15(b) under the Securities Exchange Act of 1934. Based on their review, such officers have concluded that the disclosure controls and procedures are effective in ensuring that information required to be disclosed in this report is appropriately recorded, processed, summarized and reported and made known to them by others within the Registrant and by the Registrant’s service provider. |
(b) | There were no changes in the Registrant's internal control over financial reporting (as defined in Rule 30a-3(d) under the Act) that occurred during the last fiscal half-year of the period covered by this report that has materially affected, or is reasonably likely to materially affect, the Registrant's internal control over financial reporting. |
Item 12. Disclosure of Securities Lending Activities for Closed-End Management Investment Companies
Not applicable to open-end investment companies.
Item 13. Exhibits.
(3) Any written solicitation to purchase securities under Rule 23c‑1 under the Act sent or given during the period covered by the report by or on behalf of the registrant to 10 or more persons. Not applicable to open-end investment companies.
(4) Change in the registrant’s independent public accountant. There was no change in the registrant’s independent public accountant for the period covered by this report.
SIGNATURES
Pursuant to the requirements of the Securities Exchange Act of 1934 and the Investment Company Act of 1940, the registrant has duly caused this report to be signed on its behalf by the undersigned, thereunto duly authorized.
(Registrant) Trust for Professional Managers
By (Signature and Title)* /s/ John Buckel
Date: 12/1/2021
Pursuant to the requirements of the Securities Exchange Act of 1934 and the Investment Company Act of 1940, this report has been signed below by the following persons on behalf of the registrant and in the capacities and on the dates indicated.
By (Signature and Title)* /s/ John Buckel
John Buckel, President
Date: 12/1/2021
By (Signature and Title)* /s/ Jennifer Lima
Jennifer Lima, Treasurer
Date: 12/1/2021
* Print the name and title of each signing officer under his or her signature.