Rockefeller Climate Solutions Fund
Rockefeller Equity Allocation Fund
Rockefeller Core Taxable Bond Fund
Rockefeller Intermediate Tax Exempt
National Bond Fund
Rockefeller Intermediate Tax Exempt
New York Bond Fund
Annual Report
November 30, 2021
Investment Adviser
Rockefeller & Co. LLC
45 Rockefeller Plaza, 5th Floor
New York, New York 10111
Table of Contents
| LETTER TO SHAREHOLDERS | 3 |
| EXPENSE EXAMPLES | 7 |
| INVESTMENT HIGHLIGHTS | 10 |
| SCHEDULES OF INVESTMENTS | 22 |
| STATEMENTS OF ASSETS AND LIABILITIES | 42 |
| STATEMENTS OF OPERATIONS | 44 |
| STATEMENTS OF CHANGES IN NET ASSETS | 46 |
| FINANCIAL HIGHLIGHTS | 52 |
| NOTES TO FINANCIAL STATEMENTS | 62 |
| REPORT OF INDEPENDENT | |
| REGISTERED PUBLIC ACCOUNTING FIRM | 75 |
| BASIS FOR TRUSTEES’ APPROVAL | |
| OF INVESTMENT ADVISORY AGREEMENT | 77 |
| NOTICE OF PRIVACY POLICY & PRACTICES | 85 |
| ADDITIONAL INFORMATION | 86 |
Dear Shareholder:
The year 2021 continued to produce significant gains in equity markets, in large part driven by robust earnings growth. With the continued successful rollout of vaccinations, Europe and the U.S. were largely reopened, while Asian economies lagged in vaccination and reopening efforts, a divergence that was also reflected in equity market returns for their respective geographies. Inflation continued to be heightened due to tight labor conditions as well as supply chain issues. An emboldened consumer thanks to pent up savings and generous fiscal outlays, resulted in demand outstripping supply for many goods and services.
Despite the surge in inflation, interest rates remained at subdued levels suggesting that bond investors still believe the price increases are transitory and will fade with the pandemic. By historic norms, central banks seemed to be behind the ball here, with the Central Bank of Norway as the first major central bank to embark on a rate rise to counteract these globally inflationary pressures. By the end of November, the Bank of England and the US Federal Reserve had yet to tighten. If labor shortages and supply chain challenges persist, we could see a big change of tone and policies.
The year finished with a surge of volatility as fears around the global impact of Omicron variant led to a knee-jerk risk-off reaction by investors. Early trends suggest no material step up in mortality or hospitalization rates so far and it seems proliferation of testing and policy from governments to counteract the spread will post the biggest headwinds to economic growth related to the virus.
Global Economy
Economic growth was relatively strong during the period, as economies rebounded from the lows of the pandemic induced shutdowns. It seemed the biggest problem facing economies was increases in raw material costs, supply chain issues, and labor shortages across multiple industries creating headwinds to keep up with demand. This all culminated in inflationary pressures globally, with central banks largely brushing off these pressures as ‘transitory’ in nature. The recent conclusion of the 2021 United Nations Climate Change Conference (COP26) speaks to some of the ambitious de-carbonization plans for countries globally, and the long-term growth opportunity for renewable energy.
Federal Reserve Policy and the Bond Market:
The U.S. economy was extremely volatile in 2021. Economic growth surged following robust fiscal and monetary policy support as well as positive public health developments in the deployment and efficacy of vaccines. The labor market has rebounded and averaged nearly a half a million new jobs per month.
Meanwhile while wage growth has accelerated, labor supply remains challenged and consumer and producer inflation has risen to multi decade highs. In response, the US Federal Reserve began tapering its asset purchases in November and doubled the pace in December along with indicating an earlier liftoff to rate hikes than previously expected as recently as a few months ago. Bond markets are now fully priced for multiple fed fund rate hikes over the course of 2022. Despite this backdrop, the 10-year U.S. Treasury yield remains historically low at approximately 1.50%. It is now crystal clear to market participants that the multi decade high in inflation will likely not be met with significantly higher long-term Treasury yields.
While the outlook for the economy at this moment is encouraging, we believe it is too early in the cycle for an up-in-quality bias and continue to think pockets of value still exist. Next year is likely to be another challenging one particularly navigating fed tapering, rate hikes, and higher rate volatility. There could be a new wave of infections which could be
heightened by the recently discovered Omicron variant. Science proved to be a saving grace when vaccines were quickly rolled out at the beginning of 2021. We are confident active fixed income portfolio management should benefit next year in what we believe will be a volatile one.
Rockefeller Core Taxable Bond Fund:
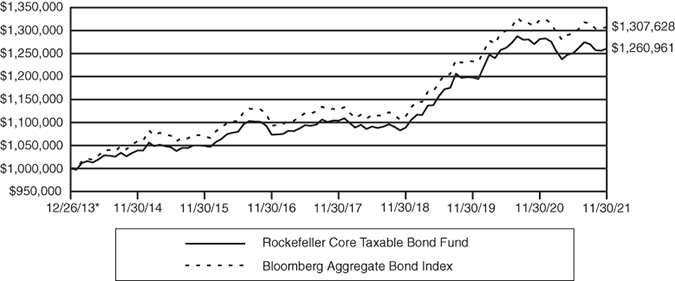
For the fiscal year ended November 30, 2021, the Institutional Class shares of the Rockefeller Core Taxable Bond Fund had a return of -1.59% (net), underperforming the Bloomberg Aggregate Bond Index benchmark (formerly known as Bloomberg Barclays Aggregate Bond Index), which returned -1.15%. The Fund’s sector overweight to taxable municipals positively contributed to relative performance in addition to an underweight to US Treasuries. However, modest duration overweight detracted from relative performance. Duration is a commonly used measure of the potential volatility of the price of a debt security, or the aggregate market value of a portfolio of debt securities, prior to maturity. Securities with a longer duration generally have more volatile prices than securities of comparable quality with a shorter duration.
Rockefeller Intermediate Tax-Exempt National Bond Fund:
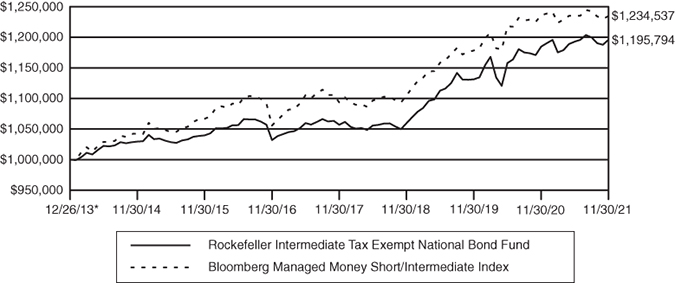
For the fiscal year ended November 30, 2021, the Institutional Class shares of the Rockefeller Intermediate Tax-Exempt National Bond Fund had a return of +0.94% (net), while the Bloomberg Managed Money Short/Intermediate Municipal Index (formerly known as Bloomberg Barclays Managed Money Short/Intermediate Municipal Index) returned -0.11%. A longer maturity profile and duration was a positive contributor as the longer end of the curve outperformed. Additionally, the Fund’s overweight exposure to lower rated credits helped relative performance as lower credit quality outperformed.
Rockefeller Intermediate Tax-Exempt New York Bond Fund:
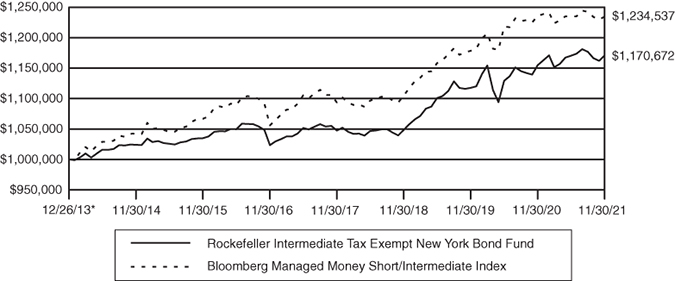
For fiscal year ended November 30, 2021, the Institutional Class shares of the Rockefeller Intermediate Tax-Exempt New York Bond Fund had a return of +1.37% (net), while the Bloomberg Managed Money Short/Intermediate Municipal Index returned -0.11%. A longer maturity profile and duration was a positive contributor as the longer end of the curve outperformed. The Fund’s overweight exposure to lower rated credits helped relative performance as lower credit quality outperformed. Additionally, the Fund’s geographical overweight to New York also contributed as municipal bonds from this region outperformed during the period.
Rockefeller Equity Allocation Fund:
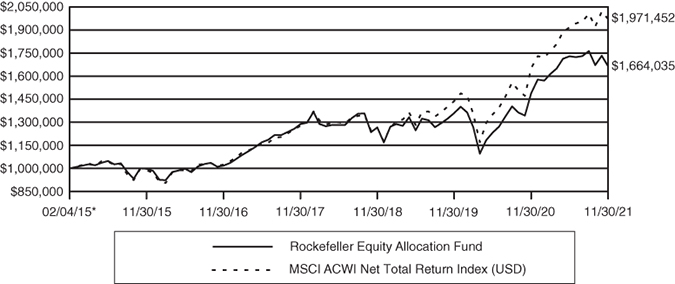
For the fiscal year ended November 30, 2021, the Institutional Class shares of the Rockefeller Equity Allocation Fund returned 11.74% (net), while the MSCI All-Country World Index (Net Dividends) had a return of 19.27%. The Fund is invested in a blend of value and growth securities on a global basis. Information Technology was the largest detracting sector to performance for the period, as our underweight in the sector, particularly on the mega cap side, negatively impacted performance. Alibaba, with shares negatively impacted by headlines around the regulation of many industries in China, was the largest detracting stock during the period, though we do not think there will be a protracted effect on our holding as there could be with other industries in scope. We view the sell-off in Alibaba as overdone and with the stock selling at 15x expected earnings, consider the political and regulatory risk as already priced into the valuation. On the positive side, strong stock selection in Industrials had the greatest positive impact to performance during the period, as a number of our companies should be beneficiaries of infrastructure initiatives globally, in addition to experiencing strong demand during the year. Applied Materials was the largest contributing stock for the period, as capital expenditures in the semiconductor industry was strong, which benefitted the company.
Rockefeller Climate Solutions Fund:
For the period from Fund launch on July 21, 2021 to November 30, 2021, the strategy underperformed the benchmark. This was in large part due to the structural over/underweights the strategy has given the focus on investing in companies providing climate adaptation, or mitigation solutions. As such, the strategy was underweight to financials, energy, and large cap information technology, all areas of the market that significantly outperformed. Bakkafrost was the largest detracting stock. The company suffered biological challenges (compromised gill health etc.) that led to a high level of salmon mortalities at several of its farming sites, with some of the measures to counteract this resulting in higher costs in the short run. However, these mitigation actions are expected to aid in control of biological risks and enhance operational efficiency over the long run, and we continue to hold the shares. Thermo Fisher was the largest contributing stock during the period, as shares rallied following better than expected 2021 earnings guidance.
Looking Forward
New variants can create uncertainty in both the response of policy makers as well as consumers. At the same time, central bankers need to thread the needle in terms of battling heightened inflation but not rattling equity markets that have been buoyed by multiple expansion and low interest rates. We remain generally pro-cyclical in the portfolio positioning as we believe Omicron may merely delay the emergence of normal economic activity that has been distorted since early 2020 from the pandemic. We are positioned in stocks that should benefit from modestly higher rates and have pricing power should inflation persist. We are invested in companies that are geared towards new infrastructure initiatives, especially those required to transition to a lower carbon economy. With U.S. equity market gains so concentrated amongst the largest companies getting larger, we are positioned for a broadening of equity returns and have been decreasing the average capitalization within the portfolio.
Sincerely,
David P. Harris, CFA
Chief Investment Officer
Rockefeller Asset Management
Opinions expressed are those of Rockefeller Asset Management and are subject to change, are not guaranteed and should not be considered investment advice. Rockefeller Asset Management is a division of Rockefeller & Co. LLC, the investment adviser to the Rockefeller Funds.
Must be preceded or accompanied by a current prospectus.
Past performance is no guarantee of future results.
Mutual fund investing involves risk. Principal loss is possible. The Funds are susceptible to adverse economic, political, tax, or regulatory changes which may magnify other risks. Income from tax-exempt funds may become subject to state and local taxes and a portion of income may be subject to the federal alternative minimum tax for certain investors. Investments in debt securities typically decrease in value when interest rates rise. This risk is usually greater for longer-term debt securities. Investment by the Funds in lower-rated and non-rated securities presents a greater risk of loss to principal and interest than higher-rated securities. Investing in
the municipal securities market is volatile and can be significantly affected by adverse tax, legislative or political changes and the financial condition of the issuers of municipal securities. Investments in asset-backed and mortgage-backed securities include additional risks that investors should be aware of such as credit risk, prepayment risk, possible illiquidity and default, as well as increased susceptibility to adverse economic development. The Funds may invest in restricted securities or “private placement” transactions. Private placement securities are not registered under the Securities Act of 1933, as amended, and are subject to restrictions on resale. As such they are often both difficult to sell and to value. The Funds may invest in exchange traded funds (“ETFs”) which are subject to additional risks, including the risks that the market price of an ETF’s shares may trade at a discount to its net asset value ("NAV"), an active secondary trading market may not develop or be maintained, or trading may be halted by the exchange in which they trade, which may impact a Fund’s ability to sell its shares. The Rockefeller Intermediate Tax-Exempt New York Bond Fund is non-diversified, meaning it concentrates its assets in fewer individual holdings than a diversified fund, specifically in the State of New York issues. The Rockefeller Equity Allocation Fund is subject to small- and medium-capitalization company risks, which tend to have limited liquidity and greater price volatility than large-capitalization companies. The Rockefeller Equity Allocation Fund also invests in foreign securities which involve greater volatility and political, economic and currency risks and differences in accounting methods. These risks are greater in emerging markets. Investing in commodities may subject the Fund to greater risks and volatility as commodity prices may be influenced by a variety of factors including unfavorable weather, environmental factors, and changes in government regulations. Master limited partnerships (“MLPs”) in which the Rockefeller Equity Allocation Fund may invest are subject to certain risks inherent in the structure of MLPs, including complex tax structure risks, the limited ability for election or removal of management, limited voting rights, potential dependence on parent companies or sponsors for revenues to satisfy obligations, and potential conflicts of interest between partners, members and affiliates. Earnings growth is not representative of the Fund’s future performance.
The Bloomberg Aggregate Bond Index is an unmanaged index which is widely regarded as a standard for measuring U.S. investment grade bond market performance.
The Bloomberg Managed Money Short/Intermediate (1-10 Years) Index is the 1-10 year component of the Barclays Managed Money Index, which is a rules-based, market-value-weighted index engineered for the tax-exempt municipal bond market.
The MSCI All Country World Index (Net Dividends) (“MSCI ACWI”) is a free float-adjusted market capitalization weighted index that measures the equity performance of global developed and emerging markets. The MSCI ACWI total return indices reinvest dividends after the deduction of withholding taxes, using (for international indices) a tax rate applicable to non-resident institutional investors who do not benefit from double taxation treaties.
One cannot invest directly in an index.
Manufacturing Purchasing Managers’ Indices are indicators of business activity in the manufacturing sectors. They are survey-based measures that ask respondents about changes in their perception of some key business variable from the prior month. A figure above 50 denotes an expansion in business activity. A figure below 50 denotes a contraction in business activity.
Fund holdings and sector allocations are subject to change and are not recommendations to buy or sell any security.
The Rockefeller Funds are distributed by Quasar Distributors, LLC.
Rockefeller Funds
Expense Examples
(Unaudited)
As a shareholder of the Funds, you incur two types of costs: (1) transaction costs, and (2) ongoing costs, including management fees, distribution and service (12b-1) fees and other Fund expenses. These Examples are intended to help you understand your ongoing costs (in dollars) of investing in the Funds, and to compare these costs with the ongoing costs of investing in other mutual funds. The Examples are based on an investment of $1,000 invested at the beginning of the period and held for the entire period (6/1/21 – 11/30/21).
Actual Expenses
The first line of each of the following tables provides information about actual account values and actual expenses. Although the Funds charge no sales load, you will be assessed fees for outgoing wire transfers, returned checks and stop payment orders at prevailing rates charged by U.S. Bancorp Fund Services, LLC, the Funds’ transfer agent. If you request that a redemption be made by wire transfer, currently a $15.00 fee is charged by the Funds’ transfer agent. Individual Retirement Accounts will be charged a $15.00 annual maintenance fee. To the extent the Funds invest in shares of exchange-traded funds or other investment companies as part of their investment strategies, you will indirectly bear your proportionate share of any fees and expenses charged by the underlying funds in which the Funds invest in addition to the expenses of the Funds. Actual expenses of the underlying funds are expected to vary among the various underlying funds. These expenses are not included in the Examples. The Examples include, but are not limited to, management fees, fund administration fees and accounting, custody and transfer agent fees. You may use the information in this line, together with the amount you invested, to estimate the expenses that you paid over the period. Simply divide your account value by $1,000 (for example, an $8,600 account value divided by $1,000 = 8.6), then multiply the result by the number in the first line under the heading entitled “Expenses Paid During Period” to estimate the expenses you paid on your account during this period.
Hypothetical Example for Comparison Purposes
The second line of each of the following tables provides information about hypothetical account values and hypothetical expenses based on the Funds’ actual expense ratios and an assumed rate of return of 5% per year before expenses, which is not the Funds’ actual return. The hypothetical account values and expenses may not be used to estimate the actual ending account balance or expenses you paid for the period. You may use this information to compare the ongoing costs of investing in the Funds and other funds. To do so, compare this 5% hypothetical example with the 5% hypothetical examples that appear in the shareholder reports of other funds. Please note that the expenses shown in the tables are meant to highlight your ongoing costs only and do not reflect any transactional costs, such as sales charges (loads), redemption fees or exchange fees. Therefore, the second line of the table is useful in comparing ongoing costs only, and will not help you determine the relative total costs of owning different funds. In addition, if these transactional costs were included, your costs would have been higher.
Rockefeller Funds
Expense Examples (Continued)
(Unaudited)
Rockefeller Climate Solutions Fund – Institutional Class
| | Beginning | Ending | Expenses Paid |
| | Account Value | Account Value | During Period |
| | 7/21/21 | 11/30/21 | 7/22/21 – 11/30/21* |
| Actual | $1,000.00 | $1,005.80 | $3.56 |
| Hypothetical (5% return | | | |
| before expenses) | $1,000.00 | $1,014.39 | $3.58 |
| * | Expenses are equal to the Fund’s annualized expense ratio of 0.99%, multiplied by the average account value over the period, multiplied by 131/365 (to reflect the period). |
Rockefeller Climate Solutions Fund – Class A
| | Beginning | Ending | Expenses Paid |
| | Account Value | Account Value | During Period |
| | 7/21/21 | 11/30/21 | 7/22/21 – 11/30/21* |
| Actual | $1,000.00 | $1,005.00 | $4.46 |
| Hypothetical (5% return | | | |
| before expenses) | $1,000.00 | $1,013.49 | $4.48 |
| * | Expenses are equal to the Fund’s annualized expense ratio of 1.24%, multiplied by the average account value over the period, multiplied by 131/365 (to reflect the period). |
Rockefeller Equity Allocation Fund
| | Beginning | Ending | Expenses Paid |
| | Account Value | Account Value | During Period |
| | 6/1/21 | 11/30/21 | 6/1/21 – 11/30/21* |
| Actual | $1,000.00 | $962.40 | $6.05 |
| Hypothetical (5% return | | | |
| before expenses) | $1,000.00 | $1,018.90 | $6.23 |
| * | Expenses are equal to the Fund’s annualized expense ratio of 1.23%, multiplied by the average account value over the period, multiplied by 183/365 (to reflect the one-half year period). |
Rockefeller Core Taxable Bond Fund
| | Beginning | Ending | Expenses Paid |
| | Account Value | Account Value | During Period |
| | 6/1/21 | 11/30/21 | 6/1/21 – 11/30/21* |
| Actual | $1,000.00 | $1,008.20 | $3.47 |
| Hypothetical (5% return | | | |
| before expenses) | $1,000.00 | $1,021.61 | $3.50 |
| * | Expenses are equal to the Fund’s annualized expense ratio of 0.69%, multiplied by the average account value over the period, multiplied by 183/365 (to reflect the one-half year period). |
Rockefeller Funds
Expense Examples (Continued)
(Unaudited)
Rockefeller Intermediate Tax Exempt National Bond Fund
| | Beginning | Ending | Expenses Paid |
| | Account Value | Account Value | During Period |
| | 6/1/21 | 11/30/21 | 6/1/21 – 11/30/21* |
| Actual | $1,000.00 | $1,002.50 | $3.21 |
| Hypothetical (5% return | | | |
| before expenses) | $1,000.00 | $1,021.86 | $3.24 |
| * | Expenses are equal to the Fund’s annualized expense ratio of 0.64%, multiplied by the average account value over the period, multiplied by 183/365 (to reflect the one-half year period). |
Rockefeller Intermediate Tax Exempt New York Bond Fund
| | Beginning | Ending | Expenses Paid |
| | Account Value | Account Value | During Period |
| | 6/1/21 | 11/30/21 | 6/1/21 – 11/30/21* |
| Actual | $1,000.00 | $1,000.20 | $3.96 |
| Hypothetical (5% return | | | |
| before expenses) | $1,000.00 | $1,021.11 | $4.00 |
| * | Expenses are equal to the Fund’s annualized expense ratio of 0.79%, multiplied by the average account value over the period, multiplied by 183/365 (to reflect the one-half year period). |
Rockefeller Climate Solutions Fund
Investment Highlights
(Unaudited)
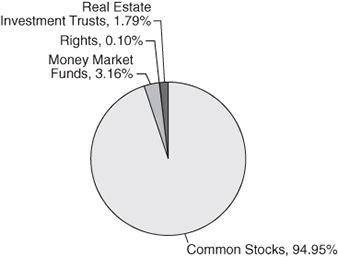
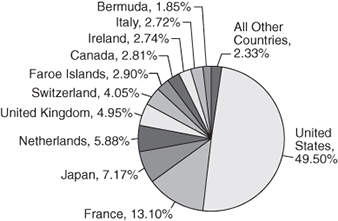
The Fund seeks long-term growth of capital principally through equity investments in global companies across the market capitalization spectrum offering on climate change mitigation or adaptation products and services. The Adviser typically considers a company to be focused on climate mitigation or adaptation solutions where it generates revenue by delivering products or services related to water infrastructure and technologies, waste management and technologies, energy efficiency, food, agriculture and forestry, renewable and alternative energy, healthcare, pollution control, and/or climate support systems (“Climate Solution Activities”). While the Fund may invest in companies operating in any industry or sector, due to its focus on Climate Solutions Activities, the Fund is expected to have more meaningful exposure to companies operating in the Industrials sector, and to a lesser extent, to companies operating in the Consumer Discretionary, Communication Services, traditional Energy, and Financials sectors. Rockefeller & Co., LLC (the “Adviser”) believes that companies positioned alongside environmental sectors have the potential to significantly outperform the broader equity market over the long-term.
Allocation of Portfolio Holdings as of November 30, 2021
(% of Investments)
Average Annual Returns as of November 30, 2021
| | | | MSCI All Country |
| | Rockefeller Climate Solutions Fund | World Index |
| | Institutional Class(1) | Class A | (Net Dividends) |
| 1 Year | 9.83% | — | 19.27% |
| 5 Year | 15.79% | — | 13.99% |
| Since Inception | 12.26% | 0.50% | 11.97%(2) |
(1) | The Institutional Class Shares of the Fund commenced operations on July 21, 2021, after the conversion of a private fund (the “Private Fund”) into Institutional Class shares of the Fund. The performance prior to July 21, 2021 is for the Private Fund, which commenced operations on June 1, 2012. |
(2) | As of June 1, 2012. |
Continued
Rockefeller Climate Solutions Fund
Investment Highlights (Continued)
(Unaudited)
Performance data quoted represents past performance and does not guarantee future results. The investment return and principal value of an investment will fluctuate so that an investor’s shares, when redeemed, may be worth more or less than their original cost. Current performance of the Fund may be lower or higher than the performance quoted. Performance data current to the most recent month-end may be obtained by calling 855-369-6209.
Short-term performance, in particular, is not a good indication of the Fund’s future performance, and an investment should not be made based solely on historical returns.
Investment performance reflects fee waivers in effect. In the absence of such waivers, total return would be reduced.
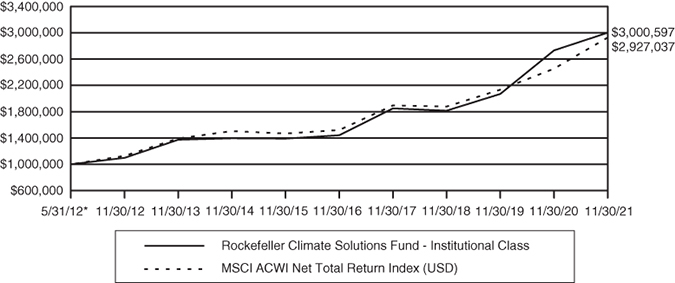
The returns shown assume reinvestment of Fund distributions and do not reflect the deduction of taxes that a shareholder would pay on Fund distributions or the redemption of Fund shares. The following chart illustrates performance of a hypothetical investment made in the Fund and a broad-based securities index on the Fund’s inception date. The graph does not reflect any future performance.
The MSCI All Country World Index (Net Dividends) (“MSCI ACWI”) is a free float-adjusted market capitalization weighted index that measures the equity performance of global developed and emerging markets. The MSCI ACWI total return indices reflect the reinvestment of dividends after the deduction of withholding taxes, using (for international indices) a tax rate applicable to non-resident institutional investors who do not benefit from double taxation treaties.
Continued
Rockefeller Climate Solutions Fund
Investment Highlights (Continued)
(Unaudited)
Growth of $1,000,000 Investment
Growth of $10,000 Investment
* Inception Date
Rockefeller Equity Allocation Fund
Investment Highlights
(Unaudited)
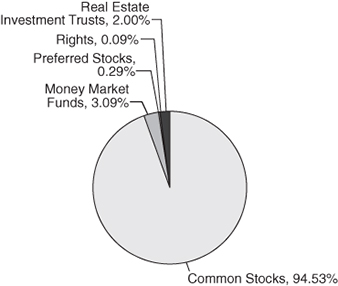
The Fund seeks to achieve its investment objective of long-term total return from capital appreciation and income by investing its assets globally in a range of equity asset classes and, to a lesser extent, in fixed-income securities, real estate and commodity linked equities (such as real estate investment trusts and master limited partnerships), and currencies. The Adviser will allocate the Fund’s assets across asset classes taking into consideration both the Adviser’s longer-term strategic outlook as well as tactical views as to potential near-term opportunities. The Adviser considers a number of factors when making allocation decisions, including relative attractiveness among equity market capitalizations and geographic regions, inflation risks and factors that influence commodity prices.
Allocation of Portfolio Holdings as of November 30, 2021*
(% of Investments)
| * | For additional details on allocation of portfolio holdings by industry, please see the Schedule of Investments. |
Average Annual Returns as of November 30, 2021
| | Rockefeller | MSCI All Country |
| | Equity Allocation | World Index |
| | Fund | (Net Dividends) |
| 1 Year | 11.74% | 19.27% |
| 5 Year | 10.33% | 13.99% |
| Since Inception (2/4/15) | 7.75% | 10.47% |
Performance data quoted represents past performance and does not guarantee future results. The investment return and principal value of an investment will fluctuate so that an investor’s shares, when redeemed, may be worth more or less than their original cost. Current performance of the Fund may be lower or higher than the performance quoted. Performance data current to the most recent month-end may be obtained by calling 855-369-6209.
Continued
Rockefeller Equity Allocation Fund
Investment Highlights (Continued)
(Unaudited)
Short-term performance, in particular, is not a good indication of the Fund’s future performance, and an investment should not be made based solely on historical returns.
Investment performance reflects fee waivers in effect. In the absence of such waivers, total return would be reduced.
The returns shown assume reinvestment of Fund distributions and do not reflect the deduction of taxes that a shareholder would pay on Fund distributions or the redemption of Fund shares. The following chart illustrates performance of a hypothetical investment made in the Fund and a broad-based securities index on the Fund’s inception date. The graph does not reflect any future performance.
The MSCI All Country World Index (Net Dividends) (“MSCI ACWI”) is a free float-adjusted market capitalization weighted index that measures the equity performance of global developed and emerging markets. The MSCI ACWI total return indices reflect the reinvestment of dividends after the deduction of withholding taxes, using (for international indices) a tax rate applicable to non-resident institutional investors who do not benefit from double taxation treaties.
Growth of $1,000,000 Investment
* Inception Date
Rockefeller Core Taxable Bond Fund
Investment Highlights
(Unaudited)
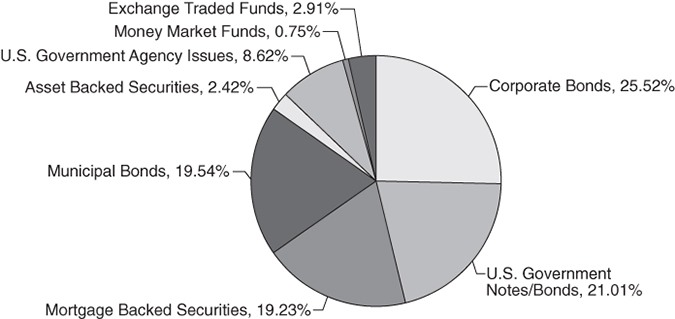
The Fund seeks to achieve its investment objective to generate current income consistent with the preservation of capital by investing under normal market conditions at least 80% of its net assets (plus any borrowings for investment purposes) in taxable fixed-income securities. “Fixed-income securities” include corporate, government and municipal bonds, asset-backed and mortgage-backed securities, other investment companies and ETFs that will invest in fixed-income securities, and other fixed-income instruments. The Fund invests primarily in investment grade fixed-income securities. Investment grade securities are fixed-income securities rated in the top four ratings categories by independent rating organizations such as Standard & Poor’s Ratings Group (“S&P”) and Moody’s Investors Service, Inc. (“Moody’s”) or another nationally recognized statistical rating organization (“NRSRO”), or deemed by the Adviser to be of comparable quality. The Adviser anticipates the Fund’s weighted average duration will be more than three years but less than ten years.
Allocation of Portfolio Holdings as of November 30, 2021
(% of Investments)
Average Annual Returns as of November 30, 2021
| | Rockefeller | Bloomberg |
| | Core Taxable | Aggregate |
| | Bond Fund | Bond Index |
| 1 Year | -1.59%
| -1.15%
|
| 5 Year | 3.27% | 3.65% |
| Since Inception (12/26/13) | 2.97% | 3.44% |
Performance data quoted represents past performance and does not guarantee future results. The investment return and principal value of an investment will fluctuate so that an investor’s shares, when redeemed, may be worth more or less than their original cost. Current performance of the Fund may be lower or higher than the performance quoted. Performance data current to the most recent month-end may be obtained by calling 855-369-6209.
Continued
Rockefeller Core Taxable Bond Fund
Investment Highlights (Continued)
(Unaudited)
Short-term performance, in particular, is not a good indication of the Fund’s future performance, and an investment should not be made based solely on historical returns.
Investment performance reflects fee waivers in effect. In the absence of such waivers, total return would be reduced.
The returns shown assume reinvestment of Fund distributions and do not reflect the deduction of taxes that a shareholder would pay on Fund distributions or the redemption of Fund shares. The following chart illustrates performance of a hypothetical investment made in the Fund and a broad-based securities index on the Fund’s inception date. The graph does not reflect any future performance.
The Bloomberg Aggregate Bond Index is an unmanaged index which is widely regarded as a standard for measuring U.S. investment grade bond market performance. An index is unmanaged and cannot be invested in directly.
Growth of $1,000,000 Investment
* Inception Date
Rockefeller Intermediate Tax Exempt National Bond Fund
Investment Highlights
(Unaudited)
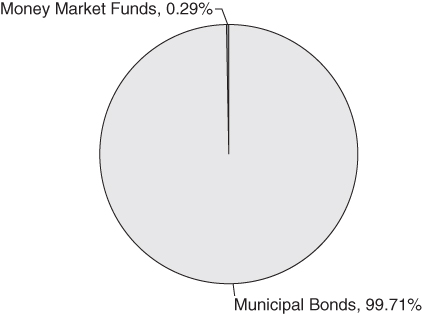
The Fund seeks to achieve its investment objective to generate current income that is exempt from federal personal income tax consistent with the preservation of capital by investing under normal market conditions at least 80% of its net assets (plus any borrowings for investment purposes) in municipal bonds and other fixed-income securities that generate income exempt from regular federal income tax, including the federal alternative minimum tax (“AMT”). The Fund may invest in all types of municipal bonds, including, but not limited to, general obligation bonds and industrial development bonds. The Fund may also invest in asset-backed and mortgage-backed securities, other investment companies, ETFs and the obligations of other issuers that pay interest that is exempt from regular federal income taxes. While the Fund will invest primarily in tax exempt securities, it is possible that up to 20% of the Fund’s total assets may be invested in fixed-income securities that generate income that is not exempt from regular federal income tax, including the federal AMT. The Fund invests primarily in investment grade municipal bonds and other types of fixed-income securities. Investment grade securities are fixed-income securities rated in the top four ratings categories by independent rating organizations such as S&P and Moody’s or another NRSRO, or, if unrated, deemed by the Adviser to be of comparable quality. While the Fund may invest in securities of any duration, the Adviser anticipates the weighted average duration of the Fund’s portfolio will be more than three years but less than ten years.
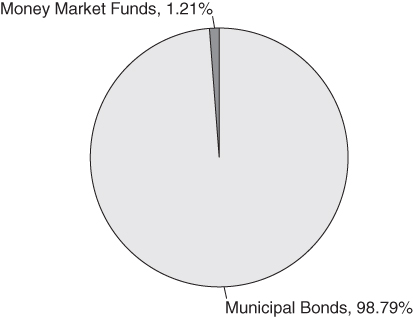
Allocation of Portfolio Holdings as of November 30, 2021
(% of Investments)
Continued
Rockefeller Intermediate Tax Exempt National Bond Fund
Investment Highlights (Continued)
(Unaudited)
Average Annual Returns as of November 30, 2021
| | Rockefeller | Bloomberg |
| | Intermediate Tax | Managed |
| | Exempt National | Money Short/ |
| | Bond Fund | Intermediate Index |
| 1 Year | 0.94% | -0.11%
|
| 5 Year | 2.99% | 3.18% |
| Since Inception (12/26/13) | 2.28% | 2.69% |
Performance data quoted represents past performance and does not guarantee future results. The investment return and principal value of an investment will fluctuate so that an investor’s shares, when redeemed, may be worth more or less than their original cost. Current performance of the Fund may be lower or higher than the performance quoted. Performance data current to the most recent month end may be obtained by calling 855-369-6209.
Short-term performance, in particular, is not a good indication of the Fund’s future performance, and an investment should not be made based solely on historical returns.
Investment performance reflects fee waivers in effect. In the absence of such waivers, total return would be reduced.
The returns shown assume reinvestment of Fund distributions and do not reflect the deduction of taxes that a shareholder would pay on Fund distributions or the redemption of Fund shares. The following chart illustrates performance of a hypothetical investment made in the Fund and a broad-based securities index on the Fund’s inception date. The graph does not reflect any future performance.
The Bloomberg Managed Money Short/Intermediate Index is the 1-10 year component of the Barclays Managed Money Index, which is a rules-based, market-value-weighted index engineered for the tax-exempt municipal bond market.
Growth of $1,000,000 Investment
* Inception Date
Rockefeller Intermediate Tax Exempt New York Bond Fund
Investment Highlights
(Unaudited)
The Fund seeks to achieve its investment objective to generate current income that is exempt from federal, New York State and New York City personal income tax consistent with the preservation of capital by investing under normal market conditions at least 80% of its net assets (plus any borrowings for investment purposes) in municipal bonds and other fixed-income securities that generate income exempt from regular federal, New York State and New York City personal income tax, including the federal AMT. The Fund may invest in all types of municipal bonds, including, but not limited to, general obligation bonds, industrial development bonds, and other obligations issued by the State of New York, its subdivisions, authorities, instrumentalities and corporations. The Fund may also invest in asset-backed and mortgage-backed securities, other investment companies, ETFs and the obligations of other issuers that pay interest that is exempt from regular federal and New York State and New York City personal income tax. While the Fund will invest primarily in tax exempt securities, it is possible that up to 20% of the Fund’s total assets may be invested in fixed-income securities that generate income that is not exempt from regular federal income tax, New York State and New York City personal income tax, including the federal AMT. The Fund invests primarily in investment grade fixed-income securities rated in the top four ratings categories by independent rating organizations such as S&P and Moody’s or another NRSRO, or deemed by the Adviser to be of comparable quality. While the Fund may invest in securities of any duration, the Adviser anticipates the weighted average duration of the Fund’s portfolio will be more than three years but less than ten years. The Fund is non-diversified.
Allocation of Portfolio Holdings as of November 30, 2021
(% of Investments)
Continued
Rockefeller Intermediate Tax Exempt New York Bond Fund
Investment Highlights (Continued)
(Unaudited)
Average Annual Returns as of November 30, 2021
| | Rockefeller | Bloomberg |
| | Intermediate Tax | Managed |
| | Exempt New York | Money Short/ |
| | Bond Fund | Intermediate Index |
| 1 Year | 1.37% | -0.11%
|
| 5 Year | 2.73% | 3.18% |
| Since Inception (12/26/13) | 2.01% | 2.69% |
Performance data quoted represents past performance and does not guarantee future results. The investment return and principal value of an investment will fluctuate so that an investor’s shares, when redeemed, may be worth more or less than their original cost. Current performance of the Fund may be lower or higher than the performance quoted. Performance data current to the most recent month-end may be obtained by calling 855-369-6209.
Short-term performance, in particular, is not a good indication of the Fund’s future performance, and an investment should not be made based solely on historical returns.
Investment performance reflects fee waivers in effect. In the absence of such waivers, total return would be reduced.
The returns shown assume reinvestment of Fund distributions and do not reflect the deduction of taxes that a shareholder would pay on Fund distributions or the redemption of Fund shares. The following chart illustrates performance of a hypothetical investment made in the Fund and a broad-based securities index on the Fund’s inception date. The graph does not reflect any future performance.
The Bloomberg Managed Money Short/Intermediate Index is the 1-10 year component of the Barclays Managed Money Index, which is a rules-based, market-value-weighted index engineered for the tax-exempt municipal bond market.
Continued
Rockefeller Intermediate Tax Exempt New York Bond Fund
Investment Highlights (Continued)
(Unaudited)
Growth of $1,000,000 Investment
* Inception Date
Rockefeller Climate Solutions Fund
November 30, 2021
| | | Shares | | | Value | |
| Common Stocks – 94.98% | | | | | | |
| Aerospace & Defense – 3.12% | | | | | | |
| Maxar Technologies, Inc. | | | 76,839 | | | $ | 2,115,378 | |
| Teledyne Technologies, Inc. (a) | | | 3,473 | | | | 1,442,302 | |
| | | | | | | | 3,557,680 | |
| Building Products – 5.54% | | | | | | | | |
| A. O. Smith Corp. | | | 28,396 | | | | 2,244,704 | |
| Cie de Saint-Gobain (b) | | | 33,970 | | | | 2,154,698 | |
| Geberit AG (b) | | | 2,520 | | | | 1,924,049 | |
| | | | | | | | 6,323,451 | |
| Chemicals – 2.60% | | | | | | | | |
| Danimer Scientific, Inc. (a) | | | 15,003 | | | | 200,140 | |
| Koninklijke DSM NV (b) | | | 12,866 | | | | 2,769,221 | |
| | | | | | | | 2,969,361 | |
| Commercial Services & Supplies – 3.93% | | | | | | | | |
| Stericycle, Inc. (a) | | | 33,210 | | | | 1,876,365 | |
| Tetra Tech, Inc. | | | 14,122 | | | | 2,608,051 | |
| | | | | | | | 4,484,416 | |
| Construction & Engineering – 6.23% | | | | | | | | |
| Arcadis NV (b) | | | 78,783 | | | | 3,503,222 | |
| MasTec, Inc. (a) | | | 39,082 | | | | 3,602,188 | |
| | | | | | | | 7,105,410 | |
| Diversified Telecommunication Services – 1.65% | | | | | | | | |
| Iridium Communications, Inc. (a) | | | 49,057 | | | | 1,886,242 | |
| | | | | | | | | |
| Electric Utilities – 4.94% | | | | | | | | |
| Enel S.p.A. (b) | | | 382,522 | | | | 2,898,495 | |
| SSE Plc (b) | | | 133,492 | | | | 2,744,439 | |
| | | | | | | | 5,642,934 | |
| Electrical Equipment – 5.57% | | | | | | | | |
| Array Technologies, Inc. (a) | | | 41,433 | | | | 746,416 | |
| Schneider Electric SE (b) | | | 28,190 | | | | 5,002,970 | |
| Vestas Wind Systems A/S (b) | | | 17,978 | | | | 603,643 | |
| | | | | | | | 6,353,029 | |
| Electronic Equipment, Instruments & Components – 11.96% | | | | | | | | |
| Badger Meter, Inc. | | | 24,037 | | | | 2,460,427 | |
| Halma Plc (b) | | | 63,794 | | | | 2,542,866 | |
| Hitachi Ltd. (b) | | | 29,900 | | | | 1,751,487 | |
| Itron, Inc. (a) | | | 10,952 | | | | 678,038 | |
| TE Connectivity Ltd. – ADR | | | 15,608 | | | | 2,402,539 | |
| Trimble, Inc. (a) | | | 44,522 | | | | 3,823,105 | |
| | | | | | | | 13,658,462 | |
The accompanying notes are an integral part of these financial statements.
Rockefeller Climate Solutions Fund
| Schedule of Investments (Continued) |
November 30, 2021
| | | Shares | | | Value | |
| Food Products – 4.59% | | | | | | |
| Bakkafrost P/F (b) | | | 47,146 | | | $ | 3,096,340 | |
| Darling Ingredients, Inc. (a) | | | 31,802 | | | | 2,147,271 | |
| | | | | | | | 5,243,611 | |
| Health Care Equipment & Supplies – 5.09% | | | | | | | | |
| Danaher Corp. | | | 18,045 | | | | 5,803,994 | |
| | | | | | | | | |
| Hotels, Restaurants & Leisure – 1.41% | | | | | | | | |
| Sweetgreen, Inc. (a) | | | 42,090 | | | | 1,606,996 | |
| | | | | | | | | |
| Independent Power and Renewable Electricity Producers – 2.32% | | | | | | | | |
| Brookfield Renewable Corp. – ADR | | | 18,215 | | | | 674,501 | |
| Brookfield Renewable Partners LP | | | 54,214 | | | | 1,967,969 | |
| | | | | | | | 2,642,470 | |
| Industrial Conglomerates – 1.20% | | | | | | | | |
| Roper Technologies, Inc. | | | 2,961 | | | | 1,374,348 | |
| | | | | | | | | |
| Life Sciences Tools & Services – 5.25% | | | | | | | | |
| Thermo Fisher Scientific, Inc. | | | 9,473 | | | | 5,994,798 | |
| | | | | | | | | |
| Machinery – 17.03% | | | | | | | | |
| Alstom SA (b) | | | 56,838 | | | | 2,025,802 | |
| Kubota Corp. (b) | | | 180,800 | | | | 3,762,086 | |
| METAWATER Co. Ltd. (b) | | | 124,400 | | | | 2,137,823 | |
| Mueller Industries, Inc. | | | 56,029 | | | | 3,100,085 | |
| Mueller Water Products, Inc. | | | 113,717 | | | | 1,551,100 | |
| Pentair PLC – ADR | | | 39,633 | | | | 2,920,556 | |
| The Timken Co. | | | 23,627 | | | | 1,555,365 | |
| Xylem Inc. | | | 19,563 | | | | 2,369,275 | |
| | | | | | | | 19,422,092 | |
| Professional Services – 9.15% | | | | | | | | |
| Bureau Veritas SA (b) | | | 151,484 | | | | 4,797,528 | |
| Stantec, Inc. (a)(b) | | | 42,999 | | | | 2,327,927 | |
| Verisk Analytics, Inc. | | | 14,744 | | | | 3,315,483 | |
| | | | | | | | 10,440,938 | |
| Real Estate Management & Development – 1.55% | | | | | | | | |
| Vonovia SE (b) | | | 31,880 | | | | 1,769,205 | |
| | | | | | | | | |
| Semiconductors & Semiconductor Equipment – 0.65% | | | | | | | | |
| First Solar, Inc. (a) | | | 7,162 | | | | 741,983 | |
The accompanying notes are an integral part of these financial statements.
Rockefeller Climate Solutions Fund
| Schedule of Investments (Continued) |
November 30, 2021
| | | Shares | | | Value | |
| Water Utilities – 1.20% | | | | | | |
| American Water Works Co., Inc. | | | 8,119 | | | $ | 1,368,620 | |
| Total Common Stocks (Cost $107,707,199) | | | | | | | 108,390,040 | |
| | | | | | | | | |
| Real Estate Investment Trusts – 1.79% | | | | | | | | |
| Mortgage Real Estate Investment Trusts (REITs) – 1.79% | | | | | | | | |
| Hannon Armstrong Sustainable Infrastructure Capital, Inc. | | | 35,989 | | | | 2,047,054 | |
| Total Real Estate Investment Trusts (Cost $2,064,991) | | | | | | | 2,047,054 | |
| | | | | | | | | |
| Rights – 0.10% | | | | | | | | |
| Vonovia SE (Expiration: December 10, 2021) (a)(b) | | | 31,880 | | | | 112,442 | |
| Total Rights (Cost $135,448) | | | | | | | 112,442 | |
| | | | | | | | | |
| Money Market Funds – 3.16% | | | | | | | | |
| Morgan Stanley Institutional Liquidity Funds – | | | | | | | | |
| Treasury Portfolio – Institutional Class, 0.010% (c) | | | 3,603,121 | | | | 3,603,121 | |
| Total Money Market Funds (Cost $3,603,121) | | | | | | | 3,603,121 | |
| Total Investments (Cost $113,510,759) – 100.03% | | | | | | | 114,152,657 | |
| Liabilities in Excess of Other Assets – (0.03)% | | | | | | | (30,568 | ) |
| Total Net Assets – 100.00% | | | | | | $ | 114,122,089 | |
Percentages are stated as a percent of net assets.
ADR American Depository Receipt.
REIT Real Estate Investment Trust.
| (a) | Non-income producing security. |
| (b) | Foreign issued security. |
| (c) | The rate shown represents the seven day yield as of November 30, 2021. |
The Global Industry Classification Standard (GICS®) was developed by and/or is the exclusive property of MSCI, Inc. (“MSCI”) and Standard & Poor’s Financial Services LLC (“S&P”). GICS is a service mark of MSCI and S&P and has been licensed for use by U.S. Bancorp Fund Services, LLC.
The accompanying notes are an integral part of these financial statements.
Rockefeller Equity Allocation Fund
November 30, 2021
| | | Shares | | | Value | |
| Common Stocks – 94.76% | | | | | | |
| Air Freight & Logistics – 1.74% | | | | | | |
| Deutsche Post AG (a) | | | 21,568 | | | $ | 1,273,834 | |
| | | | | | | | | |
| Application Software – 0.06% | | | | | | | | |
| Outset Medical, Inc. (b) | | | 865 | | | | 41,001 | |
| | | | | | | | | |
| Auto Components – 2.83% | | | | | | | | |
| Continental AG (a)(b) | | | 6,660 | | | | 712,314 | |
| Denso Corp. (a) | | | 13,800 | | | | 1,009,542 | |
| Gentherm, Inc. (b) | | | 1,716 | | | | 144,916 | |
| Hankook Tire & Technology Co. Ltd. (a) | | | 4,590 | | | | 148,822 | |
| Standard Motor Products, Inc. | | | 1,003 | | | | 50,190 | |
| | | | | | | | 2,065,784 | |
| Banks – 10.28% | | | | | | | | |
| Comerica, Inc. | | | 1,410 | | | | 116,367 | |
| First Horizon National Corp. | | | 58,195 | | | | 938,685 | |
| ICICI Bank Ltd. – ADR | | | 70,771 | | | | 1,306,432 | |
| KB Financial Group, Inc. – ADR | | | 5,052 | | | | 224,208 | |
| KB Financial Group, Inc. (a) | | | 17,336 | | | | 770,462 | |
| Lloyds Banking Group PLC (a) | | | 1,828,205 | | | | 1,135,210 | |
| Oversea-Chinese Banking Corp Ltd. (a) | | | 104,900 | | | | 840,690 | |
| Svenska Handelsbanken AB (a) | | | 106,513 | | | | 1,126,904 | |
| Swedbank AB (a) | | | 52,091 | | | | 1,048,842 | |
| | | | | | | | 7,507,800 | |
| Biotechnology – 1.90% | | | | | | | | |
| Alnylam Pharmaceuticals, Inc. (b) | | | 2,546 | | | | 467,955 | |
| BioMarin Pharmaceutical, Inc. (b) | | | 7,386 | | | | 637,338 | |
| Bridgebio Pharma, Inc. (b) | | | 5,338 | | | | 216,189 | |
| Ionis Pharmaceuticals, Inc. (b) | | | 2,576 | | | | 68,264 | |
| | | | | | | | 1,389,746 | |
| Building Products – 3.27% | | | | | | | | |
| AAON, Inc. | | | 1,251 | | | | 97,578 | |
| Carrier Global Corp. | | | 16,092 | | | | 870,899 | |
| Cie de Saint-Gobain (a) | | | 18,594 | | | | 1,179,406 | |
| Lennox International, Inc. | | | 187 | | | | 57,787 | |
| Simpson Manufacturing Co., Inc. | | | 1,581 | | | | 182,384 | |
| | | | | | | | 2,388,054 | |
| Chemicals – 1.09% | | | | | | | | |
| Air Liquide SA (a) | | | 4,526 | | | | 747,432 | |
| Axalta Coating Systems Ltd. – ADR(b) | | | 1,559 | | | | 47,269 | |
| | | | | | | | 794,701 | |
The accompanying notes are an integral part of these financial statements.
Rockefeller Equity Allocation Fund
| Schedule of Investments (Continued) |
November 30, 2021
| | | Shares | | | Value | |
| Commercial Services & Supplies – 0.50% | | | | | | |
| Healthcare Services Group, Inc. | | | 2,577 | | | $ | 45,098 | |
| Stericycle, Inc. (b) | | | 1,641 | | | | 92,717 | |
| Tetra Tech, Inc. | | | 1,227 | | | | 226,601 | |
| | | | | | | | 364,416 | |
| Construction & Engineering – 0.27% | | | | | | | | |
| Quanta Services, Inc. | | | 862 | | | | 98,078 | |
| WillScot Mobile Mini Holdings Corp. (b) | | | 2,596 | | | | 98,882 | |
| | | | | | | | 196,960 | |
| Construction Materials – 2.74% | | | | | | | | |
| HeidelbergCement AG (a) | | | 16,092 | | | | 1,070,620 | |
| Martin Marietta Materials, Inc. | | | 2,298 | | | | 927,266 | |
| | | | | | | | 1,997,886 | |
| Consumer Finance – 2.88% | | | | | | | | |
| Discover Financial Services | | | 14,365 | | | | 1,549,265 | |
| FirstCash, Inc. | | | 1,034 | | | | 66,011 | |
| OneMain Holdings, Inc. | | | 7,775 | | | | 387,117 | |
| SLM Corp. | | | 5,683 | | | | 101,044 | |
| | | | | | | | 2,103,437 | |
| Diversified Consumer Services – 0.06% | | | | | | | | |
| Mister Car Wash, Inc. (b) | | | 2,567 | | | | 41,226 | |
| | | | | | | | | |
| Diversified Financial Services – 0.20% | | | | | | | | |
| FactSet Research Systems, Inc. | | | 314 | | | | 147,131 | |
| Industrivarden AB (a) | | | 2 | | | | 55 | |
| | | | | | | | 147,186 | |
| Diversified Telecommunication Services – 0.38% | | | | | | | | |
| KT Corp. – ADR | | | 16,922 | | | | 214,740 | |
| KT Corp. (a) | | | 2,555 | | | | 65,042 | |
| | | | | | | | 279,782 | |
| Electric Utilities – 1.68% | | | | | | | | |
| Enel S.p.A. (a) | | | 161,955 | | | | 1,227,187 | |
| | | | | | | | | |
| Electrical Equipment – 2.52% | | | | | | | | |
| ABB Ltd. – ADR | | | 4,022 | | | | 138,960 | |
| Array Technologies, Inc. (b) | | | 3,071 | | | | 55,324 | |
| Schneider Electric SE (a) | | | 7,274 | | | | 1,290,940 | |
| TPI Composites, Inc. (b) | | | 1,996 | | | | 35,589 | |
| Vestas Wind Systems A/S (a) | | | 9,400 | | | | 315,622 | |
| | | | | | | | 1,836,435 | |
The accompanying notes are an integral part of these financial statements.
Rockefeller Equity Allocation Fund
| Schedule of Investments (Continued) |
November 30, 2021
| | | Shares | | | Value | |
| Electronic Equipment, Instruments & Components – 5.56% | | | | | | |
| Badger Meter, Inc. | | | 1,197 | | | $ | 122,525 | |
| Hitachi Ltd. (a) | | | 18,000 | | | | 1,054,407 | |
| II-VI, Inc. (b) | | | 8,539 | | | | 533,944 | |
| IPG Photonics Corp. (b) | | | 1,051 | | | | 172,564 | |
| Keysight Technologies, Inc. (b) | | | 3,784 | | | | 735,912 | |
| Littelfuse, Inc. | | | 750 | | | | 223,860 | |
| Samsung SDI Co. Ltd. (a) | | | 115 | | | | 66,447 | |
| TE Connectivity Ltd. – ADR | | | 5,977 | | | | 920,040 | |
| Trimble, Inc. (b) | | | 2,689 | | | | 230,904 | |
| | | | | | | | 4,060,603 | |
| Entertainment – 1.39% | | | | | | | | |
| Nintendo Co. Ltd. (a) | | | 2,300 | | | | 1,014,341 | |
| | | | | | | | | |
| Food & Staples Retailing – 0.58% | | | | | | | �� | |
| E-MART, Inc. (a) | | | 3,523 | | | | 422,945 | |
| | | | | | | | | |
| Food Products – 0.15% | | | | | | | | |
| Utz Brands, Inc. | | | 7,833 | | | | 110,524 | |
| | | | | | | | | |
| Health Care Equipment & Supplies – 4.99% | | | | | | | | |
| ABIOMED, Inc. (b) | | | 511 | | | | 160,853 | |
| Alcon, Inc. – ADR | | | 1 | | | | 78 | |
| Becton Dickinson & Co. | | | 4,316 | | | | 1,023,496 | |
| Edwards Lifesciences Corp. (b) | | | 983 | | | | 105,486 | |
| Inogen, Inc. (b) | | | 1,293 | | | | 39,501 | |
| Insulet Corp. (b) | | | 709 | | | | 204,504 | |
| Integer Holdings Corp. (b) | | | 1,073 | | | | 85,561 | |
| Koninklijke Philips NV (a) | | | 25,739 | | | | 907,048 | |
| Masimo Corp. (b) | | | 482 | | | | 134,054 | |
| Medtronic PLC – ADR | | | 5,899 | | | | 629,423 | |
| Merit Medical Systems, Inc. (b) | | | 2,945 | | | | 185,123 | |
| ResMed, Inc. | | | 680 | | | | 173,298 | |
| | | | | | | | 3,648,425 | |
| Health Care Providers & Services – 1.45% | | | | | | | | |
| Centene Corp. (b) | | | 10,926 | | | | 780,225 | |
| Chemed Corp. | | | 382 | | | | 177,817 | |
| Guardant Health, Inc. (b) | | | 374 | | | | 39,315 | |
| Molina Healthcare, Inc. (b) | | | 203 | | | | 57,892 | |
| | | | | | | | 1,055,249 | |
The accompanying notes are an integral part of these financial statements.
Rockefeller Equity Allocation Fund
| Schedule of Investments (Continued) |
November 30, 2021
| | | Shares | | | Value | |
| Health Care Technology – 0.62% | | | | | | |
| Omnicell, Inc. (b) | | | 1,624 | | | $ | 287,448 | |
| Vocera Communications, Inc. (b) | | | 2,773 | | | | 161,777 | |
| | | | | | | | 449,225 | |
| Hotels, Restaurants & Leisure – 0.14% | | | | | | | | |
| Compass Group PLC (a) | | | 1 | | | | 20 | |
| Wyndham Hotels & Resorts, Inc. | | | 1,277 | | | | 101,495 | |
| | | | | | | | 101,515 | |
| Household Durables – 3.41% | | | | | | | | |
| Panasonic Corp. (a) | | | 82,300 | | | | 897,278 | |
| Sony Corp. (a) | | | 13,000 | | | | 1,586,114 | |
| | | | | | | | 2,483,392 | |
| Industrial Conglomerates – 1.03% | | | | | | | | |
| LG Corp. (a) | | | 11,409 | | | | 755,011 | |
| | | | | | | | | |
| Insurance – 6.48% | | | | | | | | |
| Arch Capital Group Ltd. – ADR(b) | | | 20,808 | | | | 840,227 | |
| BRP Group, Inc. (b) | | | 2,522 | | | | 93,415 | |
| Globe Life, Inc. | | | 11,006 | | | | 952,459 | |
| Intact Financial Corp. (a)(b) | | | 1,634 | | | | 202,765 | |
| Reinsurance Group of America, Inc. | | | 13,128 | | | | 1,245,978 | |
| SCOR SE (a) | | | 7,599 | | | | 238,522 | |
| Willis Towers Watson Plc – ADR | | | 5,121 | | | | 1,156,527 | |
| | | | | | | | 4,729,893 | |
| Interactive Media & Services – 1.46% | | | | | | | | |
| Tencent Holdings Ltd. (a) | | | 18,300 | | | | 1,067,239 | |
| | | | | | | | | |
| Internet & Catalog Retail – 0.74% | | | | | | | | |
| Amazon.com, Inc. (b) | | | 155 | | | | 543,596 | |
| | | | | | | | | |
| Internet & Direct Marketing Retail – 0.21% | | | | | | | | |
| Trip.com Group Ltd. – ADR(b) | | | 5,679 | | | | 156,173 | |
| | | | | | | | | |
| Internet Software & Services – 4.19% | | | | | | | | |
| Alibaba Group Holding, Ltd. – ADR(b) | | | 7,696 | | | | 981,471 | |
| Facebook, Inc. – Class A (b) | | | 6,404 | | | | 2,077,842 | |
| | | | | | | | 3,059,313 | |
| IT Services – 3.00% | | | | | | | | |
| Fidelity National Information Services, Inc. | | | 7,733 | | | | 808,098 | |
| Visa, Inc. – Class A | | | 3,684 | | | | 713,849 | |
| WEX, Inc. (b) | | | 5,291 | | | | 668,888 | |
| | | | | | | | 2,190,835 | |
The accompanying notes are an integral part of these financial statements.
Rockefeller Equity Allocation Fund
| Schedule of Investments (Continued) |
November 30, 2021
| | | Shares | | | Value | |
| Machinery – 2.24% | | | | | | |
| Deere & Co. | | | 3,169 | | | $ | 1,095,017 | |
| Doosan Bobcat, Inc. (a)(b) | | | 5,043 | | | | 153,517 | |
| Epiroc AB (a) | | | 8,041 | | | | 194,670 | |
| Kubota Corp. (a) | | | 4,400 | | | | 91,555 | |
| Mueller Industries, Inc. | | | 916 | | | | 50,682 | |
| The Timken Co. | | | 707 | | | | 46,542 | |
| | | | | | | | 1,631,983 | |
| Metals & Mining – 0.35% | | | | | | | | |
| Grupo Mexico SAB de CV (a) | | | 22,593 | | | | 94,102 | |
| Vale Indonesia Tbk PT (a) | | | 236,200 | | | | 79,095 | |
| Vale SA – ADR | | | 6,788 | | | | 83,968 | |
| | | | | | | | 257,165 | |
| Pharmaceuticals – 4.32% | | | | | | | | |
| Elanco Animal Health, Inc. (b) | | | 25,469 | | | | 731,979 | |
| Eli Lilly and Co. | | | 4,115 | | | | 1,020,685 | |
| Novo Nordisk A/S – ADR | | | 1,530 | | | | 163,450 | |
| Roche Holdings AG (a) | | | 3,177 | | | | 1,240,333 | |
| | | | | | | | 3,156,447 | |
| Professional Services – 1.23% | | | | | | | | |
| Mistras Group, Inc. (b) | | | 3,444 | | | | 27,449 | |
| RELX Plc (a) | | | 28,089 | | | | 871,336 | |
| | | | | | | | 898,785 | |
| Real Estate Management & Development – 1.43% | | | | | | | | |
| Vonovia SE (a) | | | 18,811 | | | | 1,043,931 | |
| | | | | | | | | |
| Semiconductors & Semiconductor Equipment – 5.67% | | | | | | | | |
| Applied Materials, Inc. | | | 7,451 | | | | 1,096,713 | |
| First Solar, Inc. (b) | | | 3,827 | | | | 396,477 | |
| Samsung Electronics Co. Ltd. (a) | | | 31,573 | | | | 1,895,207 | |
| Taiwan Semiconductor Manufacturing Co. Ltd. – ADR | | | 4,550 | | | | 533,033 | |
| Teradyne, Inc. | | | 710 | | | | 108,538 | |
| Tokyo Electron Ltd. (a) | | | 200 | | | | 105,094 | |
| | | | | | | | 4,135,062 | |
| Software – 5.85% | | | | | | | | |
| Everbridge, Inc. (b) | | | 1,334 | | | | 151,302 | |
| Microsoft Corp. | | | 10,218 | | | | 3,377,968 | |
| New Relic, Inc. (b) | | | 5,063 | | | | 561,132 | |
| PROS Holdings, Inc. (b) | | | 1,668 | | | | 60,582 | |
| Varonis Systems, Inc. (b) | | | 2,191 | | | | 113,516 | |
| | | | | | | | 4,264,500 | |
The accompanying notes are an integral part of these financial statements.
Rockefeller Equity Allocation Fund
| Schedule of Investments (Continued) |
November 30, 2021
| | | Shares | | | Value | |
| Specialty Retail – 0.06% | | | | | | |
| Torrid Holdings, Inc. (b) | | | 2,761 | | | $ | 44,921 | |
| | | | | | | | | |
| Technology Hardware, Storage & Peripherals – 1.77% | | | | | | | | |
| Apple, Inc. | | | 7,436 | | | | 1,229,171 | |
| Stratasys Ltd. – ADR(b) | | | 2,474 | | | | 66,773 | |
| | | | | | | | 1,295,944 | |
| Textiles, Apparel & Luxury Goods – 1.12% | | | | | | | | |
| Carter’s, Inc. | | | 1,469 | | | | 148,413 | |
| Deckers Outdoor Corp. (b) | | | 121 | | | | 49,053 | |
| Ralph Lauren Corp. | | | 4,734 | | | | 549,334 | |
| Shenzhou International Group Holdings Ltd. (a) | | | 3,700 | | | | 69,478 | |
| | | | | | | | 816,278 | |
| Trading Companies & Distributors – 1.09% | | | | | | | | |
| Ashtead Group Plc (a) | | | 2,047 | | | | 164,677 | |
| Herc Holdings, Inc. | | | 770 | | | | 131,247 | |
| United Rentals, Inc. (b) | | | 1,468 | | | | 497,270 | |
| | | | | | | | 793,194 | |
| Transportation Infrastructure – 0.80% | | | | | | | | |
| Airports of Thailand PCL (a) | | | 329,500 | | | | 583,564 | |
| | | | | | | | | |
| Wireless Telecommunication Services – 1.03% | | | | | | | | |
| Tele2 AB (a) | | | 52,867 | | | | 754,446 | |
| Total Common Stocks (Cost $49,802,299) | | | | | | | 69,179,934 | |
| | | | | | | | | |
| Rights – 0.09% | | | | | | | | |
| Vonovia SE (Expiration: December 10, 2021) (a)(b) | | | 18,811 | | | | 66,347 | |
| Total Rights (Cost $45,038) | | | | | | | 66,347 | |
| | | | | | | | | |
| Preferred Stocks – 0.29% | | | | | | | | |
| Banks – 0.06% | | | | | | | | |
| Itau Unibanco Holding SA (a)(c), 4.42% (d) | | | 11,095 | | | | 43,492 | |
| | | | | | | | | |
| Semiconductors & Semiconductor Equipment – 0.23% | | | | | | | | |
| Samsung Electronics Co. Ltd. (a)(c), 4.72% (d) | | | 3,140 | | | | 169,328 | |
| Total Preferred Stocks (Cost $166,422) | | | | | | | 212,820 | |
| | | | | | | | | |
| Real Estate Investment Trusts – 2.00% | | | | | | | | |
| Residential REITs – 0.06% | | | | | | | | |
| American Campus Communities, Inc. | | | 885 | | | | 45,790 | |
The accompanying notes are an integral part of these financial statements.
Rockefeller Equity Allocation Fund
| Schedule of Investments (Continued) |
November 30, 2021
| | | Shares | | | Value | |
| Retails REITs – 1.22% | | | | | | |
| CapitaLand Mall Trust (a) | | | 578,300 | | | $ | 891,424 | |
| | | | | | | | | |
| Specialized REITs – 0.11% | | | | | | | | |
| Iron Mountain, Inc. | | | 1,757 | | | | 79,838 | |
| | | | | | | | | |
| Healthcare REITs – 0.61% | | | | | | | | |
| Medical Properties Trust, Inc. | | | 20,869 | | | | 444,301 | |
| Total Real Estate Investment Trusts (Cost $1,308,557) | | | | | | | 1,461,353 | |
| | | | | | | | | |
| Money Market Funds – 3.10% | | | | | | | | |
| Morgan Stanley Institutional Liquidity Funds – | | | | | | | | |
| Treasury Portfolio – Institutional Class, 0.010% (e) | | | 2,263,622 | | | | 2,263,622 | |
| Total Money Market Funds (Cost $2,263,622) | | | | | | | 2,263,622 | |
| Total Investments (Cost $53,585,938) – 100.24% | | | | | | | 73,184,076 | |
| Liabilities in Excess of Other Assets – (0.24)% | | | | | | | (171,870 | ) |
| Total Net Assets – 100.00% | | | | | | $ | 73,012,206 | |
Percentages are stated as a percent of net assets.
ADR American Depository Receipt.
REIT Real Estate Investment Trust.
| (a) | Foreign issued security. |
| (b) | Non-income producing security. |
| (c) | Perpetual preferred stock with no stated maturity. |
| (d) | Dividend yield; the rate shown represents the rate at November 30, 2021. |
| (e) | The rate shown represents the seven day yield as of November 30, 2021. |
The Global Industry Classification Standard (GICS®) was developed by and/or is the exclusive property of MSCI, Inc. (“MSCI”) and Standard & Poor’s Financial Services LLC (“S&P”). GICS is a service mark of MSCI and S&P and has been licensed for use by U.S. Bancorp Fund Services, LLC.
The accompanying notes are an integral part of these financial statements.
Rockefeller Core Taxable Bond Fund
November 30, 2021
| | | Principal | | | | |
| | | Amount | | | Value | |
| Asset Backed Securities – 2.42% | | | | | | |
| GM Financial Consumer Automobile Receivables Trust 2019-3 | | | | | | |
| A-3, 2.180%, 04/16/2024 | | $ | 330,603 | | | $ | 333,062 | |
| Verizon Owner Trust | | | | | | | | |
| 2019-B, 2.330%, 12/20/2023 | | | 1,280,155 | | | | 1,289,713 | |
| Total Asset Backed Securities (Cost $1,613,171) | | | | | | | 1,622,775 | |
| | | | | | | | | |
| Corporate Bonds – 25.53% | | | | | | | | |
| Aerospace & Defense – 1.05% | | | | | | | | |
| The Boeing Co. | | | | | | | | |
| 2.196%, 02/04/2026 | | | 705,000 | | | | 704,096 | |
| | | | | | | | | |
| Diversified Banks – 6.03% | | | | | | | | |
| Bank of America Corp. | | | | | | | | |
| 4.244% (3 Month LIBOR USD + 1.814%), 04/24/2038 (a) | | | 790,000 | | | | 930,005 | |
| Citigroup, Inc. | | | | | | | | |
| 3.980% (3 Month LIBOR USD + 1.338%), 03/20/2030 (a) | | | 1,154,000 | | | | 1,279,285 | |
| JPMorgan Chase & Co. | | | | | | | | |
| 4.493% (SOFR + 3.790%), 03/24/2031 (a) | | | 1,587,000 | | | | 1,832,748 | |
| | | | | | | | 4,042,038 | |
| Health Care Services – 1.49% | | | | | | | | |
| CVS Health Corp. | | | | | | | | |
| 3.250%, 08/15/2029 | | | 940,000 | | | | 1,000,603 | |
| | | | | | | | | |
| Home Improvement Retail – 2.97% | | | | | | | | |
| The Home Depot, Inc. | | | | | | | | |
| 5.875%, 12/16/2036 | | | 1,402,000 | | | | 1,990,633 | |
| | | | | | | | | |
| Integrated Telecommunication Services – 4.29% | | | | | | | | |
| AT&T, Inc. | | | | | | | | |
| 1.700%, 03/25/2026 | | | 1,425,000 | | | | 1,423,972 | |
| Verizon Communications, Inc. | | | | | | | | |
| 5.250%, 03/16/2037 | | | 1,107,000 | | | | 1,455,888 | |
| | | | | | | | 2,879,860 | |
| Investment Banking & Brokerage – 2.82% | | | | | | | | |
| Morgan Stanley | | | | | | | | |
| 3.217% (SOFR + 1.485%), 04/22/2042 (a) | | | 926,000 | | | | 977,823 | |
| The Goldman Sachs Group, Inc. | | | | | | | | |
| 4.223% (3 Month LIBOR USD + 1.301%), 05/01/2029 (a) | | | 818,000 | | | | 910,177 | |
| | | | | | | | 1,888,000 | |
The accompanying notes are an integral part of these financial statements.
Rockefeller Core Taxable Bond Fund
| Schedule of Investments (Continued) |
November 30, 2021
| | | Principal | | | | |
| | | Amount | | | Value | |
| Mortgage and Nonmortgage Loan Brokers – 1.50% | | | | | | |
| AerCap Ireland Capital DAC / AerCap Global Aviation Trust | | | | | | |
| 3.000%, 10/29/2028 | | $ | 1,002,000 | | | $ | 1,009,194 | |
| | | | | | | | | |
| Regional Banks – 3.24% | | | | | | | | |
| BB&T Corp. | | | | | | | | |
| 3.750%, 12/06/2023 | | | 2,058,000 | | | | 2,175,385 | |
| | | | | | | | | |
| Systems Software – 2.14% | | | | | | | | |
| Microsoft Corp. | | | | | | | | |
| 3.500%, 02/12/2035 | | | 1,250,000 | | | | 1,436,014 | |
| Total Corporate Bonds (Cost $16,460,482) | | | | | | | 17,125,823 | |
| | | | | | | | | |
| Mortgage Backed Securities – 19.23% | | | | | | | | |
| Fannie Mae Pool | | | | | | | | |
| 2.500%, 07/01/2023 | | | 40,466 | | | | 41,948 | |
| 3.000%, 04/01/2032 | | | 647,198 | | | | 678,863 | |
| 2.000%, 12/01/2035 | | | 480,958 | | | | 495,735 | |
| 2.000%, 07/01/2036 | | | 1,171,171 | | | | 1,202,376 | |
| 2.500%, 08/01/2041 | | | 981,261 | | | | 1,018,247 | |
| 4.000%, 10/01/2048 | | | 1,180,161 | | | | 1,285,985 | |
| 4.500%, 07/01/2049 | | | 685,329 | | | | 740,127 | |
| 2.500%, 01/01/2050 | | | 81,095 | | | | 83,236 | |
| 2.000%, 09/01/2050 | | | 1,493,377 | | | | 1,499,297 | |
| 2.500%, 11/01/2050 | | | 280,222 | | | | 287,694 | |
| 3.000%, 04/01/2051 | | | 718,540 | | | | 752,101 | |
| 2.000%, 05/01/2051 | | | 506,019 | | | | 507,702 | |
| 3.000%, 05/01/2051 | | | 494,849 | | | | 517,219 | |
| 2.500%, 07/01/2051 | | | 1,824,897 | | | | 1,873,065 | |
| 3.000%, 09/01/2051 | | | 638,138 | | | | 666,874 | |
| Freddie Mac Pool | | | | | | | | |
| 2.500%, 10/01/2032 | | | 543,850 | | | | 568,615 | |
| 2.500%, 10/01/2040 | | | 379,664 | | | | 392,935 | |
| 3.500%, 08/01/2049 | | | 271,373 | | | | 288,605 | |
| Total Mortgage Backed Securities (Cost $12,862,253) | | | | | | | 12,900,624 | |
| | | | | | | | | |
| Municipal Bonds – 19.55% | | | | | | | | |
| California – 1.56% | | | | | | | | |
| Contra Costa Community College District | | | | | | | | |
| 6.504%, 08/01/2034 | | | 750,000 | | | | 1,047,642 | |
The accompanying notes are an integral part of these financial statements.
Rockefeller Core Taxable Bond Fund
| Schedule of Investments (Continued) |
November 30, 2021
| | | Principal | | | | |
| | | Amount | | | Value | |
| Colorado – 0.73% | | | | | | |
| Regional Transportation District Sales Tax Revenue | | | | | | |
| 2.337%, 11/01/2036 | | $ | 500,000 | | | $ | 490,522 | |
| | | | | | | | | |
| Hawaii – 1.53% | | | | | | | | |
| State of Hawaii | | | | | | | | |
| 2.065%, 08/01/2035 | | | 1,045,000 | | | | 1,027,457 | |
| | | | | | | | | |
| Iowa – 0.31% | | | | | | | | |
| Iowa Finance Authority | | | | | | | | |
| 1.980%, 07/01/2022 | | | 205,000 | | | | 206,768 | |
| | | | | | | | | |
| Maryland – 1.64% | | | | | | | | |
| City of Baltimore MD | | | | | | | | |
| 2.814%, 07/01/2040 | | | 1,070,000 | | | | 1,097,426 | |
| | | | | | | | | |
| New York – 3.49% | | | | | | | | |
| Metropolitan Transportation Authority | | | | | | | | |
| 6.734%, 11/15/2030 | | | 870,000 | | | | 1,108,080 | |
| New York State Dormitory Authority | | | | | | | | |
| 4.850%, 07/01/2048 | | | 1,065,000 | | | | 1,233,407 | |
| | | | | | | | 2,341,487 | |
| North Carolina – 2.13% | | | | | | | | |
| University of North Carolina at Chapel Hill | | | | | | | | |
| 3.327%, 12/01/2036 | | | 1,240,000 | | | | 1,428,133 | |
| | | | | | | | | |
| Ohio – 0.51% | | | | | | | | |
| Ohio Housing Finance Agency | | | | | | | | |
| 2.650%, 11/01/2041 | | | 333,000 | | | | 339,073 | |
| | | | | | | | | |
| Oregon – 1.56% | | | | | | | | |
| State of Oregon | | | | | | | | |
| 3.975%, 05/01/2038 | | | 950,000 | | | | 1,046,317 | |
| | | | | | | | | |
| Texas – 6.09% | | | | | | | | |
| North Texas Tollway Authority | | | | | | | | |
| 3.011%, 01/01/2043 | | | 575,000 | | | | 592,775 | |
| Permanent University Fund – Texas A&M University System | | | | | | | | |
| 3.660%, 07/01/2047 | | | 2,500,000 | | | | 2,732,351 | |
| Texas Transportation Commission | | | | | | | | |
| 2.562%, 04/01/2042 | | | 750,000 | | | | 760,826 | |
| | | | | | | | 4,085,952 | |
| Total Municipal Bonds (Cost $12,483,830) | | | | | | | 13,110,777 | |
The accompanying notes are an integral part of these financial statements.
Rockefeller Core Taxable Bond Fund
| Schedule of Investments (Continued) |
November 30, 2021
| | | Principal | | | | |
| | | Amount | | | Value | |
| U.S. Government Agency Issues – 8.63% | | | | | | |
| Federal Farm Credit Banks Funding Corp. | | | | | | |
| 0.870%, 04/15/2026 | | $ | 725,000 | | | $ | 717,985 | |
| Federal Home Loan Banks | | | | | | | | |
| 0.625%, 11/27/2024 | | | 2,110,000 | | | | 2,089,800 | |
| 1.020%, 05/19/2026 | | | 1,440,000 | | | | 1,425,095 | |
| Ginnie Mae II Pool | | | | | | | | |
| 3.000%, 08/20/2045 | | | 542,676 | | | | 567,644 | |
| 3.500%, 03/20/2047 | | | 593,784 | | | | 626,575 | |
| 4.000%, 12/20/2047 | | | 335,472 | | | | 358,801 | |
| Total U.S. Government Agency Issues (Cost $5,746,794) | | | | | | | 5,785,900 | |
| | | | | | | | | |
| U.S. Government Notes/Bonds – 21.02% | | | | | | | | |
| United States Treasury Note/Bond | | | | | | | | |
| 0.250%, 06/15/2024 | | | 523,000 | | | | 517,014 | |
| 2.625%, 03/31/2025 | | | 2,535,000 | | | | 2,678,089 | |
| 1.625%, 09/30/2026 | | | 4,466,000 | | | | 4,572,068 | |
| 2.750%, 02/15/2028 | | | 2,771,000 | | | | 3,014,220 | |
| 2.500%, 02/15/2045 | | | 1,638,000 | | | | 1,837,567 | |
| 1.250%, 05/15/2050 | | | 1,689,000 | | | | 1,479,393 | |
| Total U.S. Government Notes/Bonds (Cost $13,447,195) | | | | | | | 14,098,351 | |
| | | | | | | | | |
| | | Shares | | | | | |
| Exchange Traded Funds – 2.91% | | | | | | | | |
| Vanguard Mortgage-Backed Securities ETF | | | 36,798 | | | | 1,951,766 | |
| Total Exchange Traded Funds (Cost $1,982,191) | | | | | | | 1,951,766 | |
| | | | | | | | | |
| Money Market Funds – 0.75% | | | | | | | | |
| Morgan Stanley Institutional Liquidity Funds – | | | | | | | | |
| Treasury Portfolio – Institutional Class, 0.010% (b) | | | 505,278 | | | | 505,278 | |
| Total Money Market Funds (Cost $505,278) | | | | | | | 505,278 | |
| Total Investments (Cost $65,101,194) – 100.04% | | | | | | | 67,101,294 | |
| Liabilities in Excess of Other Assets – (0.04)% | | | | | | | (29,340 | ) |
| Total Net Assets – 100.00% | | | | | | $ | 67,071,954 | |
Percentages are stated as a percent of net assets.
| (a) | Variable rate security; the rate shown represents the rate at November 30, 2021. |
| (b) | The rate shown represents the seven day yield at November 30, 2021. |
The Global Industry Classification Standard (GICS®) was developed by and/or is the exclusive property of MSCI, Inc. (“MSCI”) and Standard & Poor’s Financial Services LLC (“S&P”). GICS is a service mark of MSCI and S&P and has been licensed for use by U.S. Bancorp Fund Services, LLC.
The accompanying notes are an integral part of these financial statements.
Rockefeller Intermediate Tax Exempt National Bond Fund
November 30, 2021
| | | Principal | | | | |
| | | Amount | | | Value | |
| Municipal Bonds – 98.67% | | | | | | |
| Alabama – 2.76% | | | | | | |
| Southeast Energy Authority A Cooperative District | | | | | | |
| 4.000%, 11/01/2051 (a) | | $ | 2,000,000 | | | $ | 2,345,693 | |
| | | | | | | | | |
| Alaska – 3.76% | | | | | | | | |
| Alaska Housing Finance Corp. | | | | | | | | |
| 5.000%, 12/01/2033 | | | 2,590,000 | | | | 3,196,875 | |
| | | | | | | | | |
| Arizona – 2.37% | | | | | | | | |
| Salt River Project Agricultural Improvement & Power District | | | | | | | | |
| 5.000%, 01/01/2032 | | | 625,000 | | | | 776,347 | |
| 5.000%, 01/01/2036 | | | 1,000,000 | | | | 1,234,583 | |
| | | | | | | | 2,010,930 | |
| Colorado – 2.57% | | | | | | | | |
| Colorado Educational & Cultural Facilities Authority | | | | | | | | |
| 5.000%, 03/01/2035 | | | 1,610,000 | | | | 2,185,930 | |
| | | | | | | | | |
| Connecticut – 0.57% | | | | | | | | |
| Connecticut Housing Finance Authority | | | | | | | | |
| 2.850%, 11/15/2026 | | | 465,000 | | | | 481,296 | |
| | | | | | | | | |
| Florida – 2.52% | | | | | | | | |
| Florida Housing Finance Corp. | | | | | | | | |
| 3.200%, 07/01/2030 | | | 460,000 | | | | 472,167 | |
| Florida’s Turnpike Enterprise | | | | | | | | |
| 4.000%, 07/01/2033 | | | 1,500,000 | | | | 1,674,357 | |
| | | | | | | | 2,146,524 | |
| Illinois – 10.27% | | | | | | | | |
| Chicago O’Hare International Airport | | | | | | | | |
| 5.000%, 01/01/2036 | | | 2,000,000 | | | | 2,392,874 | |
| 5.000%, 01/01/2036 | | | 750,000 | | | | 874,819 | |
| Illinois Finance Authority | | | | | | | | |
| 5.000%, 07/01/2036 | | | 1,300,000 | | | | 1,664,259 | |
| Illinois Finance Authority – Ascension Health Credit Group | | | | | | | | |
| 4.000%, 02/15/2033 | | | 2,550,000 | | | | 2,914,818 | |
| State of Illinois | | | | | | | | |
| 4.000%, 03/01/2022 | | | 875,000 | | | | 883,281 | |
| | | | | | | | 8,730,051 | |
| Kansas – 1.75% | | | | | | | | |
| State of Kansas Department of Transportation | | | | | | | | |
| 5.000%, 09/01/2030 | | | 1,210,000 | | | | 1,490,752 | |
The accompanying notes are an integral part of these financial statements.
Rockefeller Intermediate Tax Exempt National Bond Fund
| Schedule of Investments (Continued) |
November 30, 2021
| | | Principal | | | | |
| | | Amount | | | Value | |
| Massachusetts – 7.55% | | | | | | |
| Commonwealth of Massachusetts | | | | | | |
| 4.000%, 11/01/2035 | | $ | 2,000,000 | | | $ | 2,460,530 | |
| Massachusetts Development Finance Agency | | | | | | | | |
| 5.000%, 07/01/2050 (a) | | | 750,000 | | | | 971,042 | |
| Massachusetts Development Finance Agency – | | | | | | | | |
| Dana-Farber Cancer Obligation | | | | | | | | |
| 5.000%, 12/01/2032 | | | 430,000 | | | | 513,934 | |
| Massachusetts Development Finance Agency – | | | | | | | | |
| Partners HealthCare System | | | | | | | | |
| 5.000%, 07/01/2030 | | | 2,000,000 | | | | 2,470,578 | |
| | | | | | | | 6,416,084 | |
| Minnesota – 2.05% | | | | | | | | |
| Minneapolis-St. Paul Metropolitan Airports Commission | | | | | | | | |
| 5.000%, 01/01/2026 | | | 550,000 | | | | 602,350 | |
| 5.000%, 01/01/2030 | | | 1,040,000 | | | | 1,136,256 | |
| | | | | | | | 1,738,606 | |
| Nebraska – 0.91% | | | | | | | | |
| Nebraska Investment Finance Authority | | | | | | | | |
| 3.350%, 09/01/2028 | | | 765,000 | | | | 775,912 | |
| | | | | | | | | |
| Nevada – 5.84% | | | | | | | | |
| Clark County Water Reclamation District | | | | | | | | |
| 4.000%, 07/01/2034 | | | 1,175,000 | | | | 1,327,364 | |
| County of Clark Department of Aviation | | | | | | | | |
| 5.000%, 07/01/2033 | | | 1,770,000 | | | | 1,968,966 | |
| Las Vegas Valley Water District | | | | | | | | |
| 5.000%, 06/01/2030 | | | 1,405,000 | | | | 1,666,484 | |
| | | | | | | | 4,962,814 | |
| New York – 14.56% | | | | | | | | |
| City of New York, NY | | | | | | | | |
| 5.000%, 12/01/2034 | | | 705,000 | | | | 888,338 | |
| Metropolitan Transportation Authority | | | | | | | | |
| 5.000%, 11/15/2027 | | | 1,795,000 | | | | 2,084,651 | |
| 4.000%, 11/15/2035 | | | 1,000,000 | | | | 1,132,803 | |
| New York City Transitional Finance Authority | | | | | | | | |
| Future Tax Secured Revenue | | | | | | | | |
| 5.000%, 02/01/2036 | | | 1,695,000 | | | | 2,215,972 | |
| New York State Dormitory Authority | | | | | | | | |
| 5.000%, 02/15/2033 | | | 1,090,000 | | | | 1,237,254 | |
| Port Authority of New York & New Jersey | | | | | | | | |
| 5.000%, 11/15/2033 | | | 1,490,000 | | | | 1,837,971 | |
The accompanying notes are an integral part of these financial statements.
Rockefeller Intermediate Tax Exempt National Bond Fund
| Schedule of Investments (Continued) |
November 30, 2021
| | | Principal | | | | |
| | | Amount | | | Value | |
| New York – 14.56% (Continued) | | | | | | |
| State of New York Mortgage Agency | | | | | | |
| 2.750%, 10/01/2028 | | $ | 400,000 | | | $ | 425,121 | |
| 3.125%, 10/01/2032 | | | 970,000 | | | | 1,028,310 | |
| Triborough Bridge & Tunnel Authority | | | | | | | | |
| 5.000%, 11/15/2030 | | | 1,255,000 | | | | 1,527,478 | |
| | | | | | | | 12,377,898 | |
| Ohio – 3.68% | | | | | | | | |
| Ohio Water Development Authority | | | | | | | | |
| 5.000%, 06/01/2028 | | | 750,000 | | | | 910,687 | |
| 5.000%, 12/01/2030 | | | 1,835,000 | | | | 2,216,087 | |
| | | | | | | | 3,126,774 | |
| Pennsylvania – 10.15% | | | | | | | | |
| Commonwealth of Pennsylvania | | | | | | | | |
| 3.250%, 08/15/2026 | | | 1,560,000 | | | | 1,705,505 | |
| Pennsylvania Economic Development Financing Authority | | | | | | | | |
| 5.000%, 02/01/2033 | | | 1,130,000 | | | | 1,258,637 | |
| 4.000%, 11/15/2035 | | | 1,480,000 | | | | 1,704,386 | |
| Pennsylvania Housing Finance Agency | | | | | | | | |
| 2.375%, 10/01/2027 | | | 510,000 | | | | 532,486 | |
| 3.200%, 10/01/2031 | | | 2,065,000 | | | | 2,162,174 | |
| Pennsylvania Turnpike Commission | | | | | | | | |
| 5.000%, 12/01/2035 | | | 1,040,000 | | | | 1,269,226 | |
| | | | | | | | 8,632,414 | |
| Texas – 15.69% | | | | | | | | |
| Aldine Independent School District | | | | | | | | |
| 5.000%, 02/15/2028 | | | 1,000,000 | | | | 1,138,512 | |
| Arlington Higher Education Finance Corp. – | | | | | | | | |
| A.W. Brown Fellowship Leader | | | | | | | | |
| 5.000%, 08/15/2024 | | | 315,000 | | | | 349,283 | |
| City of Houston, TX Combined Utility System Revenue | | | | | | | | |
| 5.000%, 11/15/2033 | | | 825,000 | | | | 1,093,251 | |
| Clifton Higher Education Finance Corp. | | | | | | | | |
| 4.000%, 08/15/2032 | | | 1,000,000 | | | | 1,198,440 | |
| Dallas Independent School District | | | | | | | | |
| 5.000%, 02/15/2036 (a) | | | 5,000 | | | | 5,049 | |
| North Texas Tollway Authority | | | | | | | | |
| 3.990%, 09/01/2037 (b) | | | 2,035,000 | | | | 1,152,467 | |
| San Antonio Independent School District/TX | | | | | | | | |
| 4.000%, 08/15/2035 | | | 500,000 | | | | 614,566 | |
| State of Texas | | | | | | | | |
| 5.000%, 10/01/2034 | | | 1,250,000 | | | | 1,539,658 | |
The accompanying notes are an integral part of these financial statements.
Rockefeller Intermediate Tax Exempt National Bond Fund
| Schedule of Investments (Continued) |
November 30, 2021
| | | Principal | | | | |
| | | Amount | | | Value | |
| Texas – 15.69% (Continued) | | | | | | |
| Tarrant Regional Water District | | | | | | |
| 5.000%, 03/01/2029 | | $ | 2,050,000 | | | $ | 2,339,640 | |
| Tarrant Regional Water District Water Supply System Revenue | | | | | | | | |
| 5.000%, 03/01/2032 | | | 350,000 | | | | 409,785 | |
| Texas Municipal Gas Acquisition and Supply Corp I | | | | | | | | |
| 6.250%, 12/15/2026 | | | 3,030,000 | | | | 3,495,675 | |
| | | | | | | | 13,336,326 | |
| Virginia – 1.83% | | | | | | | | |
| FHLMC Multifamily VRD Certificates | | | | | | | | |
| 2.550%, 06/15/2035 | | | 1,465,000 | | | | 1,559,895 | |
| | | | | | | | | |
| Washington – 5.65% | | | | | | | | |
| Central Puget Sound Regional Transit Authority | | | | | | | | |
| 5.000%, 11/01/2030 | | | 750,000 | | | | 900,371 | |
| State of Washington | | | | | | | | |
| 5.000%, 07/01/2029 | | | 1,545,000 | | | | 1,813,603 | |
| 5.000%, 06/01/2032 | | | 550,000 | | | | 705,780 | |
| Washington State Housing Finance Commission | | | | | | | | |
| 3.000%, 12/01/2031 | | | 1,325,000 | | | | 1,383,637 | |
| | | | | | | | 4,803,391 | |
| Wisconsin – 4.19% | | | | | | | | |
| State of Wisconsin | | | | | | | | |
| 5.000%, 05/01/2032 | | | 1,015,000 | | | | 1,127,899 | |
| 5.000%, 11/01/2032 | | | 1,000,000 | | | | 1,221,414 | |
| Wisconsin Department of Transportation | | | | | | | | |
| 5.000%, 07/01/2028 | | | 1,085,000 | | | | 1,214,398 | |
| | | | | | | | 3,563,711 | |
| Total Municipal Bonds (Cost $80,218,855) | | | | | | | 83,881,876 | |
| | | | | | | | | |
| | | Shares | | | | | |
| Money Market Funds – 0.29% | | | | | | | | |
| Morgan Stanley Institutional Liquidity Funds – | | | | | | | | |
| Treasury Portfolio – Institutional Class, 0.010% (c) | | | 243,627 | | | | 243,627 | |
| Total Money Market Funds (Cost $243,627) | | | | | | | 243,627 | |
| Total Investments (Cost $80,462,482) – 98.96% | | | | | | | 84,125,503 | |
| Other Assets in Excess of Liabilities – 1.04% | | | | | | | 882,686 | |
| Total Net Assets – 100.00% | | | | | | $ | 85,008,189 | |
Percentages are stated as a percent of net assets.
| (a) | Adjustable rate security; the rate is determined by a remarketing agreement. |
| (b) | Zero coupon bond; effective yield is shown. |
| (c) | The rate shown represents the seven day yield as of November 30, 2021. |
The accompanying notes are an integral part of these financial statements.
Rockefeller Intermediate Tax Exempt New York Bond Fund
November 30, 2021
| | | Principal | | | | |
| | | Amount | | | Value | |
| Municipal Bonds – 97.96% | | | | | | |
| Georgia – 3.51% | | | | | | |
| City of Atlanta GA Airport Passenger Facility Charge | | | | | | |
| 5.000%, 07/01/2035 | | $ | 1,130,000 | | | $ | 1,435,094 | |
| | | | | | | | | |
| Illinois – 1.59% | | | | | | | | |
| State of Illinois | | | | | | | | |
| 4.000%, 03/01/2024 | | | 605,000 | | | | 651,457 | |
| | | | | | | | | |
| New York – 88.58% | | | | | | | | |
| City of New York, NY | | | | | | | | |
| 4.000%, 08/01/2034 | | | 740,000 | | | | 842,169 | |
| 5.000%, 12/01/2035 | | | 1,230,000 | | | | 1,549,179 | |
| City of Yonkers, NY | | | | | | | | |
| 4.000%, 05/01/2035 | | | 750,000 | | | | 882,558 | |
| County of Dutchess, NY | | | | | | | | |
| 4.000%, 03/01/2032 | | | 500,000 | | | | 575,016 | |
| County of Westchester, NY | | | | | | | | |
| 4.000%, 12/01/2029 | | | 650,000 | | | | 755,225 | |
| Metropolitan Transportation Authority | | | | | | | | |
| 5.000%, 11/15/2026 | | | 1,190,000 | | | | 1,242,801 | |
| 5.000%, 11/15/2028 | | | 355,000 | | | | 433,861 | |
| 4.000%, 11/15/2032 | | | 1,000,000 | | | | 1,141,964 | |
| 4.000%, 11/15/2035 | | | 750,000 | | | | 849,602 | |
| Nassau County Interim Finance Authority | | | | | | | | |
| 4.000%, 11/15/2034 | | | 1,275,000 | | | | 1,584,929 | |
| New York City Housing Development Corp. | | | | | | | | |
| 1.850%, 05/01/2026 | | | 250,000 | | | | 260,021 | |
| 2.850%, 11/01/2031 | | | 1,130,000 | | | | 1,188,932 | |
| New York City Transitional Finance Authority Building Aid Revenue | | | | | | | | |
| 5.000%, 07/15/2030 | | | 965,000 | | | | 1,119,557 | |
| New York City Transitional Finance Authority | | | | | | | | |
| Future Tax Secured Revenue | | | | | | | | |
| 5.000%, 02/01/2034 | | | 500,000 | | | | 603,468 | |
| 5.000%, 02/01/2036 | | | 1,000,000 | | | | 1,307,358 | |
| New York City Water & Sewer System | | | | | | | | |
| 5.000%, 06/15/2031 | | | 500,000 | | | | 609,065 | |
| 4.000%, 06/15/2036 | | | 1,190,000 | | | | 1,414,087 | |
| New York State Dormitory Authority | | | | | | | | |
| 5.000%, 10/01/2032 | | | 1,000,000 | | | | 1,198,178 | |
| 5.000%, 03/15/2033 | | | 135,000 | | | | 170,443 | |
| 4.000%, 03/15/2034 | | | 2,000,000 | | | | 2,422,160 | |
| 5.000%, 07/01/2034 | | | 1,000,000 | | | | 1,153,258 | |
| 5.000%, 03/15/2035 | | | 500,000 | | | | 579,217 | |
| New York State Dormitory Authority – New York University | | | | | | | | |
| 5.000%, 07/01/2033 | | | 1,090,000 | | | | 1,258,309 | |
The accompanying notes are an integral part of these financial statements.
Rockefeller Intermediate Tax Exempt New York Bond Fund
| Schedule of Investments (Continued) |
November 30, 2021
| | | Principal | | | | |
| | | Amount | | | Value | |
| New York – 88.58% (Continued) | | | | | | |
| New York State Dormitory Authority – State University of New York | | | | | | |
| 5.000%, 07/01/2031 | | $ | 1,105,000 | | | $ | 1,347,118 | |
| New York State Housing Finance Agency | | | | | | | | |
| 2.125%, 11/01/2023 | | | 400,000 | | | | 400,957 | |
| 2.900%, 11/01/2025 | | | 190,000 | | | | 198,757 | |
| 3.050%, 11/01/2027 | | | 1,000,000 | | | | 1,009,296 | |
| New York State Thruway Authority | | | | | | | | |
| 5.000%, 01/01/2032 | | | 1,020,000 | | | | 1,150,471 | |
| 5.000%, 01/01/2035 | | | 1,000,000 | | | | 1,168,880 | |
| New York State Thruway Authority Highway & Bridge Trust Fund | | | | | | | | |
| 5.000%, 04/01/2032 | | | 750,000 | | | | 761,869 | |
| Port Authority of New York & New Jersey | | | | | | | | |
| 5.000%, 10/15/2033 | | | 1,250,000 | | | | 1,454,406 | |
| 5.000%, 11/15/2033 | | | 700,000 | | | | 863,476 | |
| Sales Tax Asset Receivable Corp. | | | | | | | | |
| 5.000%, 10/15/2029 | | | 195,000 | | | | 220,960 | |
| State of New York Mortgage Agency | | | | | | | | |
| 2.300%, 10/01/2027 | | | 700,000 | | | | 724,041 | |
| 2.650%, 04/01/2029 | | | 500,000 | | | | 524,993 | |
| Triborough Bridge & Tunnel Authority | | | | | | | | |
| 2.795%, 11/15/2032 (a) | | | 865,000 | | | | 693,145 | |
| 5.000%, 11/15/2034 | | | 1,000,000 | | | | 1,257,790 | |
| Utility Debt Securitization Authority | | | | | | | | |
| 5.000%, 12/15/2034 | | | 1,125,000 | | | | 1,330,371 | |
| | | | | | | | 36,247,887 | |
| Texas – 4.28% | | | | | | | | |
| Texas Municipal Gas Acquisition and Supply Corp I | | | | | | | | |
| 6.250%, 12/15/2026 | | | 1,520,000 | | | | 1,753,606 | |
| Total Municipal Bonds (Cost $38,485,517) | | | | | | | 40,088,044 | |
| | | | | | | | | |
| | | Shares | | | | | |
| Money Market Funds – 1.20% | | | | | | | | |
| Morgan Stanley Institutional Liquidity Funds – | | | | | | | | |
| Treasury Portfolio – Institutional Class, 0.010% (b) | | | 490,897 | | | | 490,897 | |
| Total Money Market Funds (Cost $490,897) | | | | | | | 490,897 | |
| Total Investments (Cost $38,976,414) – 99.16% | | | | | | | 40,578,941 | |
| Other Assets in Excess of Liabilities – 0.84% | | | | | | | 341,968 | |
| Total Net Assets – 100.00% | | | | | | $ | 40,920,909 | |
Percentages are stated as a percent of net assets.
| (a) | Zero coupon bond; effective yield is shown. |
| (b) | The rate shown represents the seven day yield as of November 30, 2021. |
The accompanying notes are an integral part of these financial statements.
Rockefeller Funds
| Statements of Assets and Liabilities |
Assets
Investments, at value (cost $113,510,759, $53,585,938, $65,101,194,
$80,462,482, and $38,976,414, respectively)
Foreign currencies (Cost $—, $61,969, $—, $— and $—, respectively)
Dividends and interest receivable
Receivable for capital shares sold
Receivable for investment securities sold
Other assets
Total Assets
Liabilities
Payable to Adviser
Due to custodian
Payable to affiliates
Payable for fund shares redeemed
Payable for 12b-1 fees – Class A
Accrued expenses and other liabilities
Total Liabilities
Net Assets
Net Assets Consist of:
Paid-in capital
Total distributable earnings
Net Assets
Institutional
Net Assets
Shares of beneficial interest outstanding (unlimited
number of shares authorized, $0.001 par value)
Net asset value, redemption price and offering price per share
Class A
Net Assets
Shares of beneficial interest outstanding (unlimited
number of shares authorized, $0.001 par value)
Net asset value, redemption price and offering price per share
The accompanying notes are an integral part of these financial statements.
November 30, 2021
| | | | | | | | | | Rockefeller | | | Rockefeller | |
| Rockefeller | | | Rockefeller | | | | | | Intermediate | | | Intermediate | |
| Climate | | | Equity | | | Rockefeller | | | Tax Exempt | | | Tax Exempt | |
| Solutions | | | Allocation | | | Core Taxable | | | National | | | New York | |
| Fund | | | Fund | | | Bond Fund | | | Bond Fund | | | Bond Fund | |
| | | | | | | | | | | | | | |
| | | | | | | | | | | | | | |
| $ | 114,152,657 | | | $ | 73,184,076 | | | $ | 67,101,294 | | | $ | 84,125,503 | | | $ | 40,578,941 | |
| | — | | | | 60,205 | | | | — | | | | — | | | | — | |
| | 70,343 | | | | 167,085 | | | | 384,161 | | | | 1,001,000 | | | | 417,472 | |
| | 44,182 | | | | 9,000 | | | | — | | | | — | | | | — | |
| | — | | | | 69,414 | | | | — | | | | — | | | | — | |
| | 14,552 | | | | 5,176 | | | | 7,215 | | | | 11,385 | | | | 5,114 | |
| | 114,281,734 | | | | 73,494,956 | | | | 67,492,670 | | | | 85,137,888 | | | | 41,001,527 | |
| | | | | | | | | | | | | | | | | | | |
| | | | | | | | | | | | | | | | | | | |
| | | | | | | | | | | | | | | | | | | |
| | 46,797 | | | | 66,571 | | | | 19,311 | | | | 24,708 | | | | 12,990 | |
| | 27,280 | | | | — | | | | — | | | | — | | | | — | |
| | 36,051 | | | | 36,865 | | | | 24,144 | | | | 29,962 | | | | 18,588 | |
| | 211 | | | | 339,240 | | | | 335,917 | | | | 34,000 | | | | 8,000 | |
| | 340 | | | | — | | | | — | | | | — | | | | — | |
| | 48,966 | | | | 40,074 | | | | 41,344 | | | | 41,029 | | | | 41,040 | |
| | 159,645 | | | | 482,750 | | | | 420,716 | | | | 129,699 | | | | 80,618 | |
| | | | | | | | | | | | | | | | | | | |
| $ | 114,122,089 | | | $ | 73,012,206 | | | $ | 67,071,954 | | | $ | 85,008,189 | | | $ | 40,920,909 | |
| | | | | | | | | | | | | | | | | | | |
| | | | | | | | | | | | | | | | | | | |
| $ | 88,368,242 | | | $ | 42,979,761 | | | $ | 63,766,311 | | | $ | 79,492,602 | | | $ | 38,587,249 | |
| | 25,753,847 | | | | 30,032,445 | | | | 3,305,643 | | | | 5,515,587 | | | | 2,333,660 | |
| $ | 114,122,089 | | | $ | 73,012,206 | | | $ | 67,071,954 | | | $ | 85,008,189 | | | $ | 40,920,909 | |
| | | | | | | | | | | | | | | | | | | |
| | | | | | | | | | | | | | | | | | | |
| $ | 113,234,659 | | | $ | 73,012,206 | | | $ | 67,071,954 | | | $ | 85,008,189 | | | $ | 40,920,909 | |
| | | | | | | | | | | | | | | | | | | |
| | 11,258,469 | | | | 5,258,390 | | | | 6,374,993 | | | | 8,016,328 | | | | 3,889,927 | |
| $ | 10.06 | | | $ | 13.88 | | | $ | 10.52 | | | $ | 10.60 | | | $ | 10.52 | |
| | | | | | | | | | | | | | | | | | | |
| | | | | | | | | | | | | | | | | | | |
| $ | 887,430 | | | | | | | | | | | | | | | | | |
| | | | | | | | | | | | | | | | | | | |
| | 88,305 | | | | | | | | | | | | | | | | | |
| $ | 10.05 | | | | | | | | | | | | | | | | | |
The accompanying notes are an integral part of these financial statements.
Rockefeller Funds
Investment Income
Dividend income
Interest income
Total Investment Income
Expenses
Management fees
Administration and accounting fees
Audit and tax fees
Federal & state registration fees
Transfer agent fees & expenses
Custody fees
Chief Compliance Officer fees
Legal fees
Pricing Fees
Reports to shareholders
Trustees’ fees
12b-1 fees – Class A
Insurance expense
Other expense
Total expenses before recoupment or waivers
Expense waiver by Adviser (Note 4)
Net expenses
Net Investment Income/(Loss)
Realized and Unrealized Gain (Loss) on Investments
Net realized gain/(loss) from:
Investments
Foreign currency
Change in net unrealized appreciation/(depreciation) on:
Investments
Foreign currency
Net Realized and Unrealized Gain/(Loss) on Investments
Net Increase/(Decrease) in Net Assets from Operations
(1) | The Fund commenced operations on July 21, 2021. |
(2) | Net of $9,530 and $114,969 withholding taxes and issuance fees for each fund respectively. |
The accompanying notes are an integral part of these financial statements.
For the Period Ended November 30, 2021
| | | | | | | | | | Rockefeller | | | Rockefeller | |
| Rockefeller | | | Rockefeller | | | | | | Intermediate | | | Intermediate | |
| Climate | | | Equity | | | Rockefeller | | | Tax Exempt | | | Tax Exempt | |
| Solutions | | | Allocation | | | Core Taxable | | | National | | | New York | |
Fund(1) | | | Fund | | | Bond Fund | | | Bond Fund | | | Bond Fund | |
| | | | | | | | | | | | | | |
| $ | 213,112 | (2) | | $ | 1,536,317 | (2) | | $ | 26,702 | | | $ | — | | | $ | — | |
| | 153 | | | | 178 | | | | 1,428,192 | | | | 1,933,169 | | | | 927,428 | |
| | 213,265 | | | | 1,536,495 | | | | 1,454,894 | | | | 1,933,169 | | | | 927,428 | |
| | | | | | | | | | | | | | | | | | | |
| | | | | | | | | | | | | | | | | | | |
| | 324,966 | | | | 713,179 | | | | 247,192 | | | | 332,136 | | | | 164,029 | |
| | 54,786 | | | | 132,532 | | | | 119,336 | | | | 156,483 | | | | 85,298 | |
| | 34,202 | | | | 34,413 | | | | 36,839 | | | | 35,452 | | | | 36,982 | |
| | 23,188 | | | �� | 10,842 | | | | 7,806 | | | | 11,924 | | | | 5,223 | |
| | 18,648 | | | | 19,600 | | | | 18,859 | | | | 20,519 | | | | 17,454 | |
| | 9,204 | | | | 55,589 | | | | 5,395 | | | | 5,066 | | | | 4,232 | |
| | 3,974 | | | | 11,139 | | | | 11,153 | | | | 11,139 | | | | 11,139 | |
| | 3,636 | | | | 19,306 | | | | 19,019 | | | | 20,898 | | | | 16,962 | |
| | 2,466 | | | | 17,403 | | | | 8,414 | | | | 13,187 | | | | 8,901 | |
| | 2,242 | | | | 3,274 | | | | 2,522 | | | | 3,546 | | | | 1,855 | |
| | 774 | | | | 10,516 | | | | 10,516 | | | | 10,516 | | | | 10,530 | |
| | 485 | | | | — | | | | — | | | | — | | | | — | |
| | 154 | | | | 3,749 | | | | 3,297 | | | | 2,477 | | | | 2,291 | |
| | 566 | | | | 2,924 | | | | 2,414 | | | | 2,628 | | | | 2,376 | |
| | 479,291 | | | | 1,034,466 | | | | 492,762 | | | | 625,971 | | | | 367,272 | |
| | (100,316 | ) | | | — | | | | — | | | | — | | | | — | |
| | 378,975 | | | | 1,034,466 | | | | 492,762 | | | | 625,971 | | | | 367,272 | |
| | | | | | | | | | | | | | | | | | | |
| | (165,710 | ) | | | 502,029 | | | | 962,132 | | | | 1,307,198 | | | | 560,156 | |
| | | | | | | | | | | | | | | | | | | |
| | | | | | | | | | | | | | | | | | | |
| | | | | | | | | | | | | | | | | | | |
| | (322,499 | ) | | | 11,033,708 | | | | 1,361,743 | | | | 1,597,513 | | | | 627,977 | |
| | (7,674 | ) | | | (29,809 | ) | | | — | | | | — | | | | — | |
| | | | | | | | | | | | | | | | | | | |
| | 642,491 | | | | (1,589,208 | ) | | | (3,512,432 | ) | | | (2,010,630 | ) | | | (486,481 | ) |
| | (325 | ) | | | (8,408 | ) | | | — | | | | — | | | | — | |
| | 311,993 | | | | 9,406,283 | | | | (2,150,689 | ) | | | (413,117 | ) | | | 141,496 | |
| $ | 146,283 | | | $ | 9,908,312 | | | $ | (1,188,557 | ) | | $ | 894,081 | | | $ | 701,652 | |
The accompanying notes are an integral part of these financial statements.
Rockefeller Climate Solutions Fund
| Statement of Changes in Net Assets |
| | | Period From | |
| | | July 21, 2021(1) to | |
| | November 30, 2021 |
| From Operations | | | |
| Net investment loss | | $ | (165,710 | ) |
| Net realized gain/(loss) from investments | | | | |
| and foreign currency translation | | | (330,173 | ) |
| Net change in unrealized appreciation on | | | | |
| investments and foreign currency translation | | | 642,166 | |
| Net increase in net assets from operations | | | 146,283 | |
| | | | | |
| From Capital Share Transactions | | | | |
| Proceeds from shares sold – Institutional Class | | | 23,389,127 | |
| Proceeds from shares issued from transfers in-kind – Institutional Class | | | 91,552,365 | |
| Proceeds from shares sold – Class A | | | 910,655 | |
| Proceeds from shares issued from transfers in-kind – Class A | | | 10,000 | |
| Costs of shares redeemed – Institutional Class | | | (1,875,956 | ) |
| Costs of shares redeemed – Class A | | | (10,385 | ) |
| Net increase in net assets from capital share transactions | | | 113,975,806 | |
| | | | | |
| Total Increase in Net Assets | | | 114,122,089 | |
| | | | | |
| Net Assets | | | | |
| Beginning of period | | | — | |
| End of period | | $ | 114,122,089 | |
(1) | The Fund commenced operations on July 21, 2021. |
The accompanying notes are an integral part of these financial statements.
Rockefeller Equity Allocation Fund
| Statements of Changes in Net Assets |
| | | Year Ended | | | Year Ended | |
| | | November 30, 2021 | | | November 30, 2020 | |
| From Operations | | | | | | |
| Net investment income | | $ | 502,029 | | | $ | 620,712 | |
| Net realized gain from investments | | | | | | | | |
| and foreign currency translation | | | 11,003,899 | | | | 3,346,752 | |
| Net change in unrealized | | | | | | | | |
| appreciation/(depreciation) on | | | | | | | | |
| investments and foreign currency translation | | | (1,597,616 | ) | | | 2,435,298 | |
| Net increase in net assets from operations | | | 9,908,312 | | | | 6,402,762 | |
| | | | | | | | | |
| From Distributions | | | | | | | | |
| Net dividends and distributions | | | (3,559,042 | ) | | | (3,384,004 | ) |
| Net decrease in net assets resulting | | | | | | | | |
| from distributions paid | | | (3,559,042 | ) | | | (3,384,004 | ) |
| | | | | | | | | |
| From Capital Share Transactions | | | | | | | | |
| Proceeds from shares sold | | | 3,230,471 | | | | 10,288,993 | |
| Net asset value of shares issued | | | | | | | | |
| to distributions declared | | | 1,248,078 | | | | 1,376,299 | |
| Costs of shares redeemed | | | (22,258,128 | ) | | | (40,043,474 | ) |
| Net decrease in net assets | | | | | | | | |
| from capital share transactions | | | (17,779,579 | ) | | | (28,378,182 | ) |
| �� | | | | | | | | |
| Total Decrease in Net Assets | | | (11,430,309 | ) | | | (25,359,422 | ) |
| | | | | | | | | |
| Net Assets | | | | | | | | |
| Beginning of year | | | 84,442,515 | | | | 109,801,937 | |
| End of year | | $ | 73,012,206 | | | $ | 84,442,515 | |
The accompanying notes are an integral part of these financial statements.
Rockefeller Core Taxable Bond Fund
| Statements of Changes in Net Assets |
| | | Year Ended | | | Year Ended | |
| | | November 30, 2021 | | | November 30, 2020 | |
| From Operations | | | | | | |
| Net investment income | | $ | 962,132 | | | $ | 1,304,258 | |
| Net realized gain from investments | | | 1,361,743 | | | | 1,044,294 | |
| Net change in unrealized | | | | | | | | |
| appreciation/(depreciation) on investments | | | (3,512,432 | ) | | | 2,547,530 | |
| Net increase/(decrease) in net | | | | | | | | |
| assets from operations | | | (1,188,557 | ) | | | 4,896,082 | |
| | | | | | | | | |
| From Distributions | | | | | | | | |
| Net dividends and distributions | | | (1,142,166 | ) | | | (1,552,674 | ) |
| Net decrease in net assets resulting | | | | | | | | |
| from distributions paid | | | (1,142,166 | ) | | | (1,552,674 | ) |
| | | | | | | | | |
| From Capital Share Transactions | | | | | | | | |
| Proceeds from shares sold | | | 3,043,978 | | | | 5,299,190 | |
| Net asset value of shares issued | | | | | | | | |
| to distributions declared | | | 556,326 | | | | 755,159 | |
| Costs of shares redeemed | | | (8,175,086 | ) | | | (8,022,807 | ) |
| Net decrease in net assets from | | | | | | | | |
| capital share transactions | | | (4,574,782 | ) | | | (1,968,458 | ) |
| | | | | | | | | |
| Total Increase/(Decrease) in Net Assets | | | (6,905,505 | ) | | | 1,374,950 | |
| | | | | | | | | |
| Net Assets | | | | | | | | |
| Beginning of year | | | 73,977,459 | | | | 72,602,509 | |
| End of year | | $ | 67,071,954 | | | $ | 73,977,459 | |
The accompanying notes are an integral part of these financial statements.
Rockefeller Intermediate Tax Exempt National Bond Fund
| Statements of Changes in Net Assets |
| | | Year Ended | | | Year Ended | |
| | | November 30, 2021 | | | November 30, 2020 | |
| From Operations | | | | | | |
| Net investment income | | $ | 1,307,198 | | | $ | 1,514,317 | |
| Net realized gain from investments | | | 1,597,513 | | | | 663,049 | |
| Net change in unrealized | | | | | | | | |
| appreciation/(depreciation) on investments | | | (2,010,630 | ) | | | 2,499,535 | |
| Net increase in net assets from operations | | | 894,081 | | | | 4,676,901 | |
| | | | | | | | | |
| From Distributions | | | | | | | | |
| Net dividends and distributions | | | (2,007,249 | ) | | | (2,155,642 | ) |
| Net decrease in net assets | | | | | | | | |
| resulting from distributions paid | | | (2,007,249 | ) | | | (2,155,642 | ) |
| | | | | | | | | |
| From Capital Share Transactions | | | | | | | | |
| Proceeds from shares sold | | | 6,550,934 | | | | 9,537,000 | |
| Net asset value of shares issued | | | | | | | | |
| to distributions declared | | | 642,578 | | | | 647,160 | |
| Costs of shares redeemed | | | (26,059,399 | ) | | | (8,928,956 | ) |
| Net increase/(decrease) in net assets | | | | | | | | |
| from capital share transactions | | | (18,865,887 | ) | | | 1,255,204 | |
| | | | | | | | | |
| Total Increase/(Decrease) in Net Assets | | | (19,979,055 | ) | | | 3,776,463 | |
| | | | | | | | | |
| Net Assets | | | | | | | | |
| Beginning of year | | | 104,987,244 | | | | 101,210,781 | |
| End of year | | $ | 85,008,189 | | | $ | 104,987,244 | |
The accompanying notes are an integral part of these financial statements.
Rockefeller Intermediate Tax Exempt New York Bond Fund
| Statements of Changes in Net Assets |
| | | Year Ended | | | Year Ended | |
| | | November 30, 2021 | | | November 30, 2020 | |
| From Operations | | | | | | |
| Net investment income | | $ | 560,156 | | | $ | 678,526 | |
| Net realized gain from investments | | | 627,977 | | | | 248,708 | |
| Net change in unrealized | | | | | | | | |
| appreciation/(depreciation) on investments | | | (486,481 | ) | | | 678,586 | |
| Net increase in net assets from operations | | | 701,652 | | | | 1,605,820 | |
| | | | | | | | | |
| From Distributions | | | | | | | | |
| Net dividends and distributions | | | (830,870 | ) | | | (891,326 | ) |
| Net decrease in net assets | | | | | | | | |
| resulting from distributions paid | | | (830,870 | ) | | | (891,326 | ) |
| | | | | | | | | |
| From Capital Share Transactions | | | | | | | | |
| Proceeds from shares sold | | | 2,544,775 | | | | 4,536,800 | |
| Net asset value of shares issued | | | | | | | | |
| to distributions declared | | | 363,824 | | | | 375,457 | |
| Costs of shares redeemed | | | (10,798,248 | ) | | | (6,740,410 | ) |
| Net decrease in net assets | | | | | | | | |
| from capital share transactions | | | (7,889,649 | ) | | | (1,828,153 | ) |
| | | | | | | | | |
| Total Decrease in Net Assets | | | (8,018,867 | ) | | | (1,113,659 | ) |
| | | | | | | | | |
| Net Assets | | | | | | | | |
| Beginning of year | | | 48,939,776 | | | | 50,053,435 | |
| End of year | | $ | 40,920,909 | | | $ | 48,939,776 | |
The accompanying notes are an integral part of these financial statements.
(This Page Intentionally Left Blank.)
Rockefeller Climate Solutions Fund – Institutional Class
Per Share Data for a Share Outstanding Throughout the Period
| | | Period Ended | |
| | | November 30, | |
| | | 2021(1) | |
| Net Asset Value, Beginning of Period | | $ | 10.00 | |
| | | | | |
| Income from investment operations: | | | | |
Net investment loss(2) | | | (0.01 | ) |
| Net realized and unrealized gain/(loss) on investments | | | 0.07 | |
| Total from investment operations | | | 0.06 | |
| | | | | |
| Net Asset Value, End of Period | | $ | 10.06 | |
| | | | | |
Total Return(3) | | | 0.58 | % |
| | | | | |
| Supplemental Data and Ratios: | | | | |
| Net assets at end of period (000’s) | | $ | 113,235 | |
| Ratio of expenses to average net assets: | | | | |
Before waiver, expense recoupment(4) | | | 1.25 | % |
After waiver, expense recoupment(4) | | | 0.99 | % |
| Ratio of net investment income/(loss) to average net assets: | | | | |
Before waiver, expense recoupment(4) | | | (0.69 | )% |
After waiver, expense recoupment(4) | | | (0.43 | )% |
Portfolio turnover rate(5) | | | 13.14 | % |
(1) | Fund commenced operations on July 21, 2021. |
(2) | Per share net investment income has been calculated using the daily average share method. |
(3) | Not annualized. |
(4) | Annualized. |
(5) | Portfolio turnover rate is not annualized and excludes the value of portfolio securities received as a result of in-kind subscriptions. |
The accompanying notes are an integral part of these financial statements.
Rockefeller Climate Solutions Fund – Class A
Per Share Data for a Share Outstanding Throughout the Period
| | | Period Ended | |
| | | November 30, | |
| | | 2021(1) | |
| Net Asset Value, Beginning of Period | | $ | 10.00 | |
| | | | | |
| Income from investment operations: | | | | |
Net investment loss(2) | | | (0.03 | ) |
| Net realized and unrealized gain/(loss) on investments | | | 0.08 | |
| Total from investment operations | | | 0.05 | |
| | | | | |
| Net Asset Value, End of Period | | $ | 10.05 | |
| | | | | |
Total Return(3) | | | 0.50 | % |
| | | | | |
| Supplemental Data and Ratios: | | | | |
| Net assets at end of period (000’s) | | $ | 887 | |
| Ratio of expenses to average net assets: | | | | |
Before waiver, expense recoupment(4) | | | 1.56 | % |
After waiver, expense recoupment(4) | | | 1.24 | % |
| Ratio of net investment income/(loss) to average net assets: | | | | |
Before waiver, expense recoupment(4) | | | (1.21 | )% |
After waiver, expense recoupment(4) | | | (0.89 | )% |
Portfolio turnover rate(5) | | | 13.14 | % |
(1) | Fund commenced operations on July 21, 2021. |
(2) | Per share net investment income has been calculated using the daily average share method. |
(3) | Not annualized. |
(4) | Annualized. |
(5) | Portfolio turnover rate is not annualized and excludes the value of portfolio securities received as a result of in-kind subscriptions. |
The accompanying notes are an integral part of these financial statements.
Rockefeller Equity Allocation Fund
Net Asset Value, Beginning of Year
Income from investment operations:
Net investment income(1)
Net realized and unrealized gain (loss) on investments
Total from investment operations
Less distributions paid:
From net investment income
From net realized gain on investments
Total distributions paid
Net Asset Value, End of Year
Total Return
Supplemental Data and Ratios:
Net assets at end of year (000’s)
Ratio of expenses to average net assets:
Before waiver, expense recoupment
After waiver, expense recoupment
Ratio of net investment income to average net assets:
Before waiver, expense recoupment
After waiver, expense recoupment
Portfolio turnover rate
(1) | Per share net investment income has been calculated using the daily average share method. |
The accompanying notes are an integral part of these financial statements.
Per Share Data for a Share Outstanding Throughout each Year
| Year Ended | | | Year Ended | | | Year Ended | | | Year Ended | | | Year Ended | |
| November 30, | | | November 30, | | | November 30, | | | November 30, | | | November 30, | |
| 2021 | | | 2020 | | | 2019 | | | 2018 | | | 2017 | |
| $ | 12.96 | | | $ | 12.20 | | | $ | 12.11 | | | $ | 12.61 | | | $ | 10.05 | |
| | | | | | | | | | | | | | | | | | | |
| | | | | | | | | | | | | | | | | | | |
| | 0.09 | | | | 0.08 | | | | 0.11 | | | | 0.07 | | | | 0.09 | |
| | 1.40 | | | | 1.05 | | | | 0.68 | | | | (0.28 | ) | | | 2.57 | |
| | 1.49 | | | | 1.13 | | | | 0.79 | | | | (0.21 | ) | | | 2.66 | |
| | | | | | | | | | | | | | | | | | | |
| | | | | | | | | | | | | | | | | | | |
| | (0.08 | ) | | | (0.10 | ) | | | (0.11 | ) | | | (0.24 | ) | | | (0.10 | ) |
| | (0.49 | ) | | | (0.27 | ) | | | (0.59 | ) | | | (0.05 | ) | | | — | |
| | (0.57 | ) | | | (0.37 | ) | | | (0.70 | ) | | | (0.29 | ) | | | (0.10 | ) |
| | | | | | | | | | | | | | | | | | | |
| $ | 13.88 | | | $ | 12.96 | | | $ | 12.20 | | | $ | 12.11 | | | $ | 12.61 | |
| | | | | | | | | | | | | | | | | | | |
| | 11.74 | % | | | 9.54 | % | | | 7.38 | % | | | -1.69 | % | | | 26.54 | % |
| | | | | | | | | | | | | | | | | | | |
| | | | | | | | | | | | | | | | | | | |
| $ | 73,012 | | | $ | 84,443 | | | $ | 109,802 | | | $ | 112,228 | | | $ | 118,260 | |
| | | | | | | | | | | | | | | | | | | |
| | 1.23 | % | | | 1.22 | % | | | 1.15 | % | | | 1.15 | % | | | 1.18 | % |
| | 1.23 | % | | | 1.22 | % | | | 1.15 | % | | | 1.15 | % | | | 1.22 | % |
| | | | | | | | | | | | | | | | | | | |
| | 0.60 | % | | | 0.67 | % | | | 0.94 | % | | | 0.57 | % | | | 0.84 | % |
| | 0.60 | % | | | 0.67 | % | | | 0.94 | % | | | 0.57 | % | | | 0.80 | % |
| | 40.55 | % | | | 77.50 | % | | | 37.01 | % | | | 32.22 | % | | | 35.98 | % |
The accompanying notes are an integral part of these financial statements.
Rockefeller Core Taxable Bond Fund
Net Asset Value, Beginning of Year
Income from investment operations:
Net investment income(1)
Net realized and unrealized gain (loss) on investments
Total from investment operations
Less distributions paid:
From net investment income
From net realized gain on investments
Total distributions paid
Net Asset Value, End of Year
Total Return
Supplemental Data and Ratios:
Net assets at end of year (000’s)
Ratio of expenses to average net assets:
Before waiver, expense recoupment
After waiver, expense recoupment
Ratio of net investment income to average net assets:
Before waiver, expense recoupment
After waiver, expense recoupment
Portfolio turnover rate
(1) | Per share net investment income has been calculated using the daily average share method. |
The accompanying notes are an integral part of these financial statements.
Per Share Data for a Share Outstanding Throughout each Year
| Year Ended | | | Year Ended | | | Year Ended | | | Year Ended | | | Year Ended | |
| November 30, | | | November 30, | | | November 30, | | | November 30, | | | November 30, | |
| 2021 | | | 2020 | | | 2019 | | | 2018 | | | 2017 | |
| $ | 10.86 | | | $ | 10.38 | | | $ | 9.69 | | | $ | 10.08 | | | $ | 10.08 | |
| | | | | | | | | | | | | | | | | | | |
| | | | | | | | | | | | | | | | | | | |
| | 0.14 | | | | 0.19 | | | | 0.26 | | | | 0.26 | | | | 0.21 | |
| | (0.31 | ) | | | 0.52 | | | | 0.70 | | | | (0.40 | ) | | | 0.08 | |
| | (0.17 | ) | | | 0.71 | | | | 0.96 | | | | (0.14 | ) | | | 0.29 | |
| | | | | | | | | | | | | | | | | | | |
| | | | | | | | | | | | | | | | | | | |
| | (0.17 | ) | | | (0.23 | ) | | | (0.27 | ) | | | (0.25 | ) | | | (0.20 | ) |
| | — | | | | — | | | | — | | | | — | | | | (0.09 | ) |
| | (0.17 | ) | | | (0.23 | ) | | | (0.27 | ) | | | (0.25 | ) | | | (0.29 | ) |
| | | | | | | | | | | | | | | | | | | |
| $ | 10.52 | | | $ | 10.86 | | | $ | 10.38 | | | $ | 9.69 | | | $ | 10.08 | |
| | | | | | | | | | | | | | | | | | | |
| | -1.59 | % | | | 6.95 | % | | | 10.05 | % | | | -1.37 | % | | | 2.85 | % |
| | | | | | | | | | | | | | | | | | | |
| | | | | | | | | | | | | | | | | | | |
| $ | 67,072 | | | $ | 73,977 | | | $ | 72,603 | | | $ | 71,360 | | | $ | 76,066 | |
| | | | | | | | | | | | | | | | | | | |
| | 0.70 | % | | | 0.69 | % | | | 0.66 | % | | | 0.64 | % | | | 0.65 | % |
| | 0.70 | % | | | 0.69 | % | | | 0.66 | % | | | 0.64 | % | | | 0.65 | % |
| | | | | | | | | | | | | | | | | | | |
| | 1.36 | % | | | 1.78 | % | | | 2.57 | % | | | 2.61 | % | | | 2.14 | % |
| | 1.36 | % | | | 1.78 | % | | | 2.57 | % | | | 2.61 | % | | | 2.14 | % |
| | 50.01 | % | | | 46.39 | % | | | 98.69 | % | | | 42.37 | % | | | 50.92 | % |
The accompanying notes are an integral part of these financial statements.
Rockefeller Intermediate Tax Exempt National Bond Fund
Net Asset Value, Beginning of Year
Income from investment operations:
Net investment income(1)
Net realized and unrealized gain (loss) on investments
Total from investment operations
Less distributions paid:
From net investment income
From net realized gain on investments
Total distributions paid
Net Asset Value, End of Year
Total Return
Supplemental Data and Ratios:
Net assets at end of year (000’s)
Ratio of expenses to average net assets:
Before waiver, expense recoupment
After waiver, expense recoupment
Ratio of net investment income to average net assets:
Before waiver, expense recoupment
After waiver, expense recoupment
Portfolio turnover rate
(1) | Per share net investment income has been calculated using the daily average share method. |
(2) | Amount is less than $0.005. |
The accompanying notes are an integral part of these financial statements.
Per Share Data for a Share Outstanding Throughout each Year
| Year Ended | | | Year Ended | | | Year Ended | | | Year Ended | | | Year Ended | |
| November 30, | | | November 30, | | | November 30, | | | November 30, | | | November 30, | |
| 2021 | | | 2020 | | | 2019 | | | 2018 | | | 2017 | |
| $ | 10.72 | | | $ | 10.46 | | | $ | 9.95 | | | $ | 10.04 | | | $ | 9.96 | |
| | | | | | | | | | | | | | | | | | | |
| | | | | | | | | | | | | | | | | | | |
| | 0.15 | | | | 0.15 | | | | 0.17 | | | | 0.12 | | | | 0.09 | |
| | (0.05 | ) | | | 0.33 | | | | 0.50 | | | | (0.10 | ) | | | 0.15 | |
| | 0.10 | | | | 0.48 | | | | 0.67 | | | | 0.02 | | | | 0.24 | |
| | | | | | | | | | | | | | | | | | | |
| | | | | | | | | | | | | | | | | | | |
| | (0.15 | ) | | | (0.16 | ) | | | (0.16 | ) | | | (0.11 | ) | | | (0.09 | ) |
| | (0.07 | ) | | | (0.06 | ) | | | — | | | | 0.00 | (2) | | | (0.07 | ) |
| | (0.22 | ) | | | (0.22 | ) | | | (0.16 | ) | | | (0.11 | ) | | | (0.16 | ) |
| | | | | | | | | | | | | | | | | | | |
| $ | 10.60 | | | $ | 10.72 | | | $ | 10.46 | | | $ | 9.95 | | | $ | 10.04 | |
| | | | | | | | | | | | | | | | | | | |
| | 0.94 | % | | | 4.73 | % | | | 6.77 | % | | | 0.24 | % | | | 2.43 | % |
| | | | | | | | | | | | | | | | | | | |
| | | | | | | | | | | | | | | | | | | |
| $ | 85,008 | | | $ | 104,987 | | | $ | 101,211 | | | $ | 102,245 | | | $ | 94,759 | |
| | | | | | | | | | | | | | | | | | | |
| | 0.66 | % | | | 0.65 | % | | | 0.63 | % | | | 0.63 | % | | | 0.66 | % |
| | 0.66 | % | | | 0.65 | % | | | 0.63 | % | | | 0.63 | % | | | 0.66 | % |
| | | | | | | | | | | | | | | | | | | |
| | 1.38 | % | | | 1.46 | % | | | 1.61 | % | | | 1.23 | % | | | 0.91 | % |
| | 1.38 | % | | | 1.46 | % | | | 1.61 | % | | | 1.23 | % | | | 0.91 | % |
| | 17.32 | % | | | 23.45 | % | | | 64.26 | % | | | 41.52 | % | | | 37.63 | % |
The accompanying notes are an integral part of these financial statements.
Rockefeller Intermediate Tax Exempt New York Bond Fund
Net Asset Value, Beginning of Year
Income from investment operations:
Net investment income(1)
Net realized and unrealized gain (loss) on investments
Total from investment operations
Less distributions paid:
From net investment income
From net realized gain on investments
Total distributions paid
Net Asset Value, End of Year
Total Return
Supplemental Data and Ratios:
Net assets at end of year (000’s)
Ratio of expenses to average net assets:
Before waiver, expense recoupment
After waiver, expense recoupment
Ratio of net investment income to average net assets:
Before waiver, expense recoupment
After waiver, expense recoupment
Portfolio turnover rate
(1) | Per share net investment income has been calculated using the daily average share method. |
The accompanying notes are an integral part of these financial statements.
Per Share Data for a Share Outstanding Throughout each Year
| Year Ended | | | Year Ended | | | Year Ended | | | Year Ended | | | Year Ended | |
| November 30, | | | November 30, | | | November 30, | | | November 30, | | | November 30, | |
| 2021 | | | 2020 | | | 2019 | | | 2018 | | | 2017 | |
| $ | 10.56 | | | $ | 10.40 | | | $ | 9.89 | | | $ | 9.98 | | | $ | 9.94 | |
| | | | | | | | | | | | | | | | | | | |
| | | | | | | | | | | | | | | | | | | |
| | 0.13 | | | | 0.14 | | | | 0.15 | | | | 0.11 | | | | 0.07 | |
| | 0.01 | | | | 0.20 | | | | 0.50 | | | | (0.10 | ) | | | 0.16 | |
| | 0.14 | | | | 0.34 | | | | 0.65 | | | | 0.01 | | | | 0.23 | |
| | | | | | | | | | | | | | | | | | | |
| | | | | | | | | | | | | | | | | | | |
| | (0.13 | ) | | | (0.14 | ) | | | (0.14 | ) | | | (0.10 | ) | | | (0.07 | ) |
| | (0.05 | ) | | | (0.04 | ) | | | — | | | | — | | | | (0.12 | ) |
| | (0.18 | ) | | | (0.18 | ) | | | (0.14 | ) | | | (0.10 | ) | | | (0.19 | ) |
| | | | | | | | | | | | | | | | | | | |
| $ | 10.52 | | | $ | 10.56 | | | $ | 10.40 | | | $ | 9.89 | | | $ | 9.98 | |
| | | | | | | | | | | | | | | | | | | |
| | 1.37 | % | | | 3.34 | % | | | 6.59 | % | | | 0.10 | % | | | 2.35 | % |
| | | | | | | | | | | | | | | | | | | |
| | | | | | | | | | | | | | | | | | | |
| $ | 40,921 | | | $ | 48,940 | | | $ | 50,053 | | | $ | 45,068 | | | $ | 37,044 | |
| | | | | | | | | | | | | | | | | | | |
| | 0.78 | % | | | 0.77 | % | | | 0.73 | % | | | 0.76 | % | | | 0.82 | % |
| | 0.78 | % | | | 0.77 | % | | | 0.73 | % | | | 0.76 | % | | | 0.85 | % |
| | | | | | | | | | | | | | | | | | | |
| | 1.20 | % | | | 1.35 | % | | | 1.41 | % | | | 1.07 | % | | | 0.78 | % |
| | 1.20 | % | | | 1.35 | % | | | 1.41 | % | | | 1.07 | % | | | 0.75 | % |
| | 22.56 | % | | | 18.47 | % | | | 69.23 | % | | | 36.05 | % | | | 34.50 | % |
The accompanying notes are an integral part of these financial statements.
Rockefeller Funds
Notes to Financial Statements
November 30, 2021
| (1) | Organization |
| | |
| | Trust for Professional Managers (the “Trust”) was organized as a Delaware statutory trust under a Declaration of Trust dated May 29, 2001. The Trust is registered under the Investment Company Act of 1940, as amended (the “1940 Act”), as an open-end management investment company. The Rockefeller Funds (the “Funds”) are comprised of the Rockefeller Climate Solutions Fund, Rockefeller Equity Allocation Fund, Rockefeller Core Taxable Bond Fund, Rockefeller Intermediate Tax Exempt National Bond Fund, and the Rockefeller Intermediate Tax Exempt New York Bond Fund. Each represents a distinct series with its own investment objective and policies within the Trust. With the exception of the Rockefeller Tax Exempt New York Bond Fund which is a non-diversified series of the Trust, each Fund is a diversified series of the Trust.The investment objective of the Rockefeller Climate Solutions Fund is to seek long-term growth of capital principally through equity investments in public companies across the market capitalization spectrum offering climate change mitigation or adaptation products and services. The investment objective of the Rockefeller Equity Allocation Fund is to seek long-term total return from capital appreciation and income. The investment objective of the Rockefeller Core Taxable Bond Fund is to generate current income consistent with the preservation of capital. The investment objective of the Rockefeller Intermediate Tax Exempt National Bond Fund is to generate current income that is exempt from federal personal income tax consistent with the preservation of capital. The investment objective of the Rockefeller Intermediate Tax Exempt New York Bond Fund is to generate current income that is exempt from federal, New York State and New York City personal income tax consistent with the preservation of capital. The Trust may issue an unlimited number of shares of beneficial interest at $0.001 par value. The Rockefeller Core Taxable Bond Fund, Rockefeller Intermediate Tax Exempt National Bond Fund and Rockefeller Intermediate Tax Exempt New York Bond Fund commenced operations on December 26, 2013. The Rockefeller Equity Allocation Fund commenced operations on February 4, 2015. The Rockefeller Climate Solutions Fund commenced operations on July 21, 2021. Adviser Class shares of the Rockefeller Equity Allocation Fund, Rockefeller Core Taxable Bond Fund, Rockefeller Intermediate Tax Exempt National Bond Fund and Rockefeller Intermediate Tax Exempt New York Bond Fund, are authorized but are currently not offered for purchase. Costs incurred by the Funds in connection with the organization, registration and initial public offering of shares were borne by the Adviser. |
| | |
| (2) | Significant Accounting Policies |
| | |
| | The following is a summary of significant accounting policies consistently followed by the Funds in the preparation of the financial statements. These policies are in conformity with accounting principles generally accepted in the United States of America (“GAAP”). |
| | |
| | The Funds are investment companies and accordingly follow the investment company accounting reporting guidance of the Financial Accounting Standards Board (FASB) Accounting Standard Codification Topic 946 “Financial Services-Investment Companies”. |
Rockefeller Funds
Notes to Financial Statements (Continued)
November 30, 2021
| | (a) Investment Valuation |
| | |
| | Each equity security owned by the Funds that is listed on a securities exchange, except for securities listed on the NASDAQ Stock Market LLC (“NASDAQ”), is valued at its last sale price at the close of that exchange on the date as of which assets are valued. If a security is listed on more than one exchange, the Funds will use the price on the exchange that the Funds generally consider to be the principal exchange on which the security is traded. |
| | |
| | Fund securities, including common stocks, preferred stocks and exchange traded funds, listed on NASDAQ will be valued at the NASDAQ Official Closing Price, which may not necessarily represent the last sale price. If, on a particular day, an exchange-listed or NASDAQ security does not trade, then: (i) the security is valued at the mean between the most recent quoted bid and asked prices at the close of the exchange on such day; or (ii) the security is valued at the latest sales price on the Composite Market for the day such security is being valued. “Composite Market” means a consolidation of the trade information provided by national securities and foreign exchanges and the over-the-counter markets as published by an approved independent pricing service (“Pricing Service”). |
| | |
| | Foreign securities will be priced in their local currencies as of the close of their primary exchange or market or as of the time the Fund calculates its NAV, whichever is earlier. Foreign securities, currencies and other assets denominated in foreign currencies are then translated into U.S. dollars at the exchange rate of such currencies against the U.S. dollar using the applicable currency exchange rates as of the close of the New York Stock Exchange (“NYSE”), generally 4:00 p.m. Eastern Time. |
| | |
| | Foreign securities are traded on foreign exchanges which typically close before the close of business on each day on which the NYSE is open. Each security trading on these exchanges may be valued utilizing a systematic fair valuation model provided by a pricing service. The valuation of each security that meets certain criteria in relation to the valuation model is systematically adjusted to reflect the impact of movement in the U.S. market after the foreign markets close and are classified as Level 2 securities. Securities that do not meet the criteria, or that are principally traded in other foreign markets, are valued as of the last reported sale price at the time the respective Fund determines its NAV, or when reliable market prices or quotations are not readily available, at the mean between the most recent bid and asked quotations as of the close of the appropriate exchange or other designated time. |
| | |
| | Debt securities, including short-term debt instruments having a maturity of 60 days or less, are generally valued at the mean in accordance with prices provided by a Pricing Service. Pricing Services may use various valuation methodologies such as the mean between the bid and the asked prices, matrix pricing and other analytical pricing models as well as market transactions and dealer quotations. If a price is not available from a Pricing Service, the most recent quotation obtained from one or more broker-dealers known to follow the issue will be obtained. Quotations will be valued at the mean between the bid and the offer. In the absence of available quotations, the securities will be priced at fair value in accordance with the procedures approved by the Board of Trustees. |
Rockefeller Funds
Notes to Financial Statements (Continued)
November 30, 2021
| | Municipal bonds are priced by a Pricing Service. A discounted cash flow methodology is employed using a benchmark yield and estimated cash flows for each bond, as well as an estimated discount for liquidity. Additional inputs such as calls of bond principal by the issuer are considered in the estimate of fair value. To the extent the inputs are based on observable inputs, municipal bonds would be categorized in Level 2 of the fair value hierarchy; otherwise, they would be generally categorized as Level 3. |
| | |
| | U.S. government notes/bonds are normally valued by a Pricing Service using a model that incorporates market observable data such as reported sales of similar securities, broker quotes, yields, bids, offers, and reference data. Certain securities are valued principally using dealer quotations. U.S. government notes/bonds are typically categorized in Level 2 of the fair value hierarchy. |
| | |
| | When market quotations are not readily available, any security or other financial instrument is valued at its fair value as determined under procedures approved by the Trust’s Board of Trustees. These fair value procedures will also be used to price a security when corporate events, events in the securities market and/or world events cause the Adviser to believe that a security’s last sale price may not reflect its actual fair market value. The intended effect of using fair value pricing procedures is to ensure that the Funds are accurately priced. The Board of Trustees will regularly evaluate whether the Funds’ fair value pricing procedures continue to be appropriate in light of the specific circumstances of the Funds and the quality of prices obtained by the Trust’s Valuation Committee. |
| | |
| | The Funds have adopted Statement of Financial Accounting Standards, “Fair Value Measurements and Disclosures,” which requires the Funds to classify their securities based on a valuation method. These inputs are summarized in the three broad levels listed below: |
| | Level 1— | Quoted prices in active markets for identical securities. |
| | | |
| | Level 2— | Other significant observable inputs (including quoted prices for similar securities, interest rates, prepayment speeds, credit risk, etc.). |
| | | |
| | Level 3— | Significant unobservable inputs (including the Funds’ own assumptions in determining the fair value of investments). |
| | The inputs or methodology used for valuing securities are not necessarily an indication of the risk associated with investing in those securities. The following is a summary of the inputs used to value the Funds’ investments carried at fair value as of November 30, 2021: |
| | Climate Solutions Fund | | | | | | | | | | | | |
| | | | Level 1 | | | Level 2 | | | Level 3 | | | Total | |
| | Assets(1): | | | | | | | | | | | | |
| | Equities: | | | | | | | | | | | | |
| | Common Stock | | $ | 64,906,166 | | | $ | 43,483,874 | | | $ | — | | | $ | 108,390,040 | |
| | Real Estate Investment Trusts | | | 2,047,054 | | | | — | | | | — | | | | 2,047,054 | |
| | Rights | | | 112,442 | | | | — | | | | — | | | | 112,442 | |
| | Total Equity Securities | | | 67,065,662 | | | | 43,483,874 | | | | — | | | | 110,549,536 | |
| | Money Market Funds | | | 3,603,121 | | | | — | | | | — | | | | 3,603,121 | |
| | Total Investments in Securities | | $ | 70,668,783 | | | $ | 43,483,874 | | | $ | — | | | $ | 114,152,657 | |
Rockefeller Funds
Notes to Financial Statements (Continued)
November 30, 2021
| | Equity Allocation Fund | | | | | | | | | | | | |
| | | | Level 1 | | | Level 2 | | | Level 3 | | | Total | |
| | Assets(1): | | | | | | | | | | | | |
| | Equities: | | | | | | | | | | | | |
| | Common Stock | | $ | 39,960,735 | | | $ | 29,219,199 | | | $ | — | | | $ | 69,179,934 | |
| | Preferred Stock | | | 43,492 | | | | 169,328 | | | | — | | | | 212,820 | |
| | Real Estate Investment Trusts | | | 569,929 | | | | 891,424 | | | | — | | | | 1,461,353 | |
| | Rights | | | 66,347 | | | | — | | | | — | | | | 66,347 | |
| | Total Equity Securities | | | 40,640,503 | | | | 30,279,951 | | | | — | | | | 70,920,454 | |
| | Money Market Funds | | | 2,263,622 | | | | — | | | | — | | | | 2,263,622 | |
| | Total Investments in Securities | | $ | 42,904,125 | | | $ | 30,279,951 | | | $ | — | | | $ | 73,184,076 | |
| | | | | | | | | | | | | | | | | | |
| | Core Taxable Bond Fund | | | | | | | | | | | | | | | | |
| | | | Level 1 | | | Level 2 | | | Level 3 | | | Total | |
| | Assets: | | | | | | | | | | | | | | | | |
| | Fixed Income Securities: | | | | | | | | | | | | | | | | |
| | Asset Backed Securities | | $ | — | | | $ | 1,622,775 | | | $ | — | | | $ | 1,622,775 | |
| | Corporate Bonds | | | — | | | | 17,125,823 | | | | — | | | | 17,125,823 | |
| | Mortgage Backed Securities | | | — | | | | 12,900,624 | | | | — | | | | 12,900,624 | |
| | Municipal Bonds | | | — | | | | 13,110,777 | | | | — | | | | 13,110,777 | |
| | U.S. Government Agency Issues | | | — | | | | 5,785,900 | | | | — | | | | 5,785,900 | |
| | U.S. Government Notes/Bonds | | | — | | | | 14,098,351 | | | | — | | | | 14,098,351 | |
| | Total Fixed Income Securities | | | — | | | | 64,644,250 | | | | — | | | | 64,644,250 | |
| | Exchange-Traded Funds | | | 1,951,766 | | | | — | | | | — | | | | 1,951,766 | |
| | Money Market Funds | | | 505,278 | | | | — | | | | — | | | | 505,278 | |
| | Total Investments in Securities | | $ | 2,457,044 | | | $ | 64,644,250 | | | $ | — | | | $ | 67,101,294 | |
| | | | | | | | | | | | | | | | | | |
| | Intermediate Tax Exempt National Bond Fund | | | | | | | | | | | | | | | | |
| | | | Level 1 | | | Level 2 | | | Level 3 | | | Total | |
| | Assets: | | | | | | | | | | | | | | | | |
| | Fixed Income Securities: | | | | | | | | | | | | | | | | |
| | Municipal Bonds | | $ | — | | | $ | 83,881,876 | | | $ | — | | | $ | 83,881,876 | |
| | Total Fixed Income Securities | | | — | | | | 83,881,876 | | | | — | | | | 83,881,876 | |
| | Money Market Funds | | | 243,627 | | | | — | | | | — | | | | 243,627 | |
| | Total Investments in Securities | | $ | 243,627 | | | $ | 83,881,876 | | | $ | — | | | $ | 84,125,503 | |
| | | | | | | | | | | | | | | | | | |
| | Intermediate Tax Exempt New York Bond Fund | | | | | | | | | | | | | | | | |
| | | | Level 1 | | | Level 2 | | | Level 3 | | | Total | |
| | Assets: | | | | | | | | | | | | | | | | |
| | Fixed Income Securities: | | | | | | | | | | | | | | | | |
| | Municipal Bonds | | $ | — | | | $ | 40,088,044 | | | $ | — | | | $ | 40,088,044 | |
| | Total Fixed Income Securities | | | — | | | | 40,088,044 | | | | — | | | | 40,088,044 | |
| | Money Market Funds | | | 490,897 | | | | — | | | | — | | | | 490,897 | |
| | Total Investments in Securities | | $ | 490,897 | | | $ | 40,088,044 | | | $ | — | | | $ | 40,578,941 | |
| | (1) See the Schedule of Investments for industry classifications. |
| | |
| | The Funds held no Level 3 securities during the periods ended November 30, 2021. |
| | |
| | The Funds did not invest in derivative securities or engage in hedging activities during the periods ended November 30, 2021. |
Rockefeller Funds
Notes to Financial Statements (Continued)
November 30, 2021
| | (b) Federal Income Taxes |
| | |
| | The Funds comply with the requirements of Subchapter M of the Internal Revenue Code of 1986, as amended the (“Code”), necessary to qualify as regulated investment companies and make the requisite distributions of income and capital gains to their shareholders sufficient to relieve them from all or substantially all federal income taxes. Therefore, no federal income tax provision has been provided. |
| | |
| | (c) Distributions to Shareholders |
| | |
| | The Rockefeller Climate Solutions Fund will distribute net investment income (less operation expenses) and net capital gains annually and the Fund made distributions in December 2021. The Rockefeller Equity Allocation Fund, Rockefeller Core Taxable Bond Fund, Rockefeller Intermediate Tax Exempt National Bond Fund and Rockefeller Intermediate Tax Exempt New York Bond Fund will distribute net investment income at least quarterly, and net capital gains at least annually. Distributions from net realized gains for book purposes may include short-term capital gains. All short-term capital gains are included in ordinary income for tax purposes. Distributions to shareholders are recorded on the ex-dividend date. The Funds may also pay a special distribution at the end of the calendar year to comply with federal tax requirements. |
| | |
| | The amounts of dividends from net investment income and distributions from net realized gains are determined in accordance with federal income tax regulations, which may differ from GAAP. These differences are either temporary or permanent in nature. To the extent these differences are permanent in nature, such amounts are reclassified within the composition of net assets based on their federal tax-basis treatment. |
| | |
| | (d) Use of Estimates |
| | |
| | The preparation of financial statements in conformity with GAAP requires management to make estimates and assumptions that affect the reported amounts of assets and liabilities and disclosure of contingent assets and liabilities at the date of the financial statements and the reported amounts of revenues and expenses during the reporting period. Actual results could differ from those estimates. |
| | |
| | (e) Share Valuation |
| | |
| | The NAV per share of each Fund is calculated by dividing the sum of the value of the securities held by each Fund, plus cash or other assets, minus all liabilities (including estimated accrued expenses) by the total number of shares outstanding for each Fund, rounded to the nearest cent. The Funds’ shares will not be priced on the days on which the NYSE is closed for trading. The offering and redemption price per share for each Fund is equal to each Fund’s NAV per share. |
| | |
| | (f) Expenses |
| | |
| | Expenses associated with a specific fund in the Trust are charged to that fund. Expenses are recognized on an accrual basis. Common expenses are typically allocated evenly between the series of the Trust, or by other equitable means. |
| | |
| | (g) Other |
| | |
| | Investment transactions are recorded on the trade date. The Funds determine the gain or loss from investment transactions on a high amortized cost basis. Dividend |
Rockefeller Funds
Notes to Financial Statements (Continued)
November 30, 2021
| | income is recognized on the ex-dividend date and interest income is recognized on an accrual basis. Distributions received from the Funds’ investments in REITs are comprised of ordinary income, capital gains and return of capital, as applicable. For financial statement purposes, the Funds use estimates to characterize these distributions received as return of capital, capital gain or ordinary income. Such estimates are based on historical information available from each REIT and other industry sources. These estimates may subsequently be revised based on information received for the security after the tax reporting periods are concluded, as the actual character of these distributions is not known until after the fiscal year end of the Funds. Changes to estimates will be recorded in the period they are known. The distributions received from REIT securities that have been classified as income and capital gains are included in dividend income and net realized gain on investments, respectively, on the Statement of Operations. The distributions received that are classified as return of capital reduced the cost of investments on the Statement of Assets and Liabilities. Any discount or premium is accreted or amortized using the constant yield method until maturity, or where applicable, the first call date of the security. Constant yield amortization takes into account the income that is produced on a debt security. This accretion/amortization type utilizes the discount rate used in computing the present value of all future principal and interest payments made by a debt instrument and produces an amount equal to the cost of the debt instrument. |
| | |
| (3) | Federal Tax Matters |
| | |
| | The tax character of distributions paid during the year ended November 30, 2021 was as follows: |
| | | | | | | | | | | | | Rockefeller | | | Rockefeller | |
| | | | Rockefeller | | | Rockefeller | | | | | | Intermediate | | | Intermediate | |
| | | | Climate | | | Equity | | | Rockefeller | | | Tax Exempt | | | Tax Exempt | |
| | | | Solutions | | | Allocation | | | Core Taxable | | | National | | | New York | |
| | Distributions paid from: | | Fund | | | Fund | | | Bond Fund | | | Bond Fund | | | Bond Fund | |
| | Ordinary Income | | $ | — | | | $ | 460,606 | | | $ | 1,142,166 | | | $ | 78,676 | | | $ | 84,412 | |
| | Tax-Exempt Income | | | — | | | | — | | | | — | | | | 1,343,395 | | | | 582,085 | |
| | Long Term Capital Gain | | | — | | | | 3,098,436 | �� | | | — | | | | 585,178 | | | | 164,373 | |
| | Total Distributions Paid | | $ | — | | | $ | 3,559,042 | | | $ | 1,142,166 | | | $ | 2,007,249 | | | $ | 830,870 | |
Rockefeller Funds
Notes to Financial Statements (Continued)
November 30, 2021
| | As of November 30, 2021, the components of accumulated earnings (losses) for income tax purposes were as follows: |
| | | | | | | | | | | | | Rockefeller | | | Rockefeller | |
| | | | Rockefeller | | | Rockefeller | | | | | | Intermediate | | | Intermediate | |
| | | | Climate | | | Equity | | | Rockefeller | | | Tax Exempt | | | Tax Exempt | |
| | | | Solutions | | | Allocation | | | Core Taxable | | | National | | | New York | |
| | | | Fund | | | Fund | | | Bond Fund | | | Bond Fund | | | Bond Fund | |
| | Cost basis of investments | | | | | | | | | | | | | | | |
| | for federal income | | | | | | | | | | | | | | | |
| | tax purposes | | $ | 88,733,001 | | | $ | 54,036,168 | | | $ | 65,104,674 | | | $ | 80,462,482 | | | $ | 38,976,414 | |
| | Gross tax unrealized | | | | | | | | | | | | | | | | | | | | |
| | appreciation | | | 31,369,639 | | | | 22,506,624 | | | | 2,626,890 | | | | 3,700,647 | | | | 1,641,138 | |
| | Gross tax unrealized | | | | | | | | | | | | | | | | | | | | |
| | depreciation | | | (5,949,715 | ) | | | (3,361,295 | ) | | | (630,270 | ) | | | (37,626 | ) | | | (38,611 | ) |
| | Net tax unrealized | | | | | | | | | | | | | | | | | | | | |
| | appreciation | | | 25,419,924 | | | | 19,145,329 | | | | 1,996,620 | | | | 3,663,021 | | | | 1,602,527 | |
| | Undistributed | | | | | | | | | | | | | | | | | | | | |
| | ordinary income | | | — | | | | 2,068,233 | | | | 200,816 | | | | 20,235 | | | | — | |
| | Undistributed tax-exempt | | | | | | | | | | | | | | | | | | | | |
| | ordinary income | | | — | | | | — | | | | — | | | | 255,124 | | | | 103,228 | |
| | Undistributed | | | | | | | | | | | | | | | | | | | | |
| | long-term gains | | | 502,577 | | | | 8,818,883 | | | | 1,108,207 | | | | 1,577,207 | | | | 627,905 | |
| | Total accumulated gains | | | 502,577 | | | | 10,887,116 | | | | 1,309,023 | | | | 1,852,566 | | | | 731,133 | |
| | Total other | | | | | | | | | | | | | | | | | | | | |
| | accumulated loss | | | (168,654 | ) | | | — | | | | — | | | | — | | | | — | |
| | Total distributable earnings | | $ | 25,753,847 | | | $ | 30,032,445 | | | $ | 3,305,643 | | | $ | 5,515,587 | | | $ | 2,333,660 | |
| | The difference between cost amounts for financial statement and federal income tax purposes is due to Passive Foreign Investment Company adjustments and timing differences in recognizing certain gains and losses in security transactions, including differences in the cost basis as a result of the transfer-in-kind for the Climate Solutions Fund. |
| | |
| | During the 2021 fiscal year, Rockefeller Core Taxable Bond Fund utilized $114,498 of long-term capital loss carryover. |
| | |
| | Rockefeller Climate Solutions Fund had Late Year Ordinary Loss of $168,654 as of November 30, 2021, which the Fund has elected to defer to the first day of its next tax year. Also, the Funds recognized no interest and penalties related to uncertain tax benefits in the fiscal year 2021. As of November 30, 2021, the tax year 2021 remains open to examination for Rockefeller Climate Solutions Fund and the tax years 2018, 2019, 2020 and 2021 remain open to examination for the Rockefeller Equity Allocation Fund, Rockefeller Core Taxable Bond Fund, Rockefeller Intermediate Tax Exempt National Bond Fund and Rockefeller Intermediate Tax Exempt New York Bond Fund. The Funds are also not aware of any tax positions for which it is reasonably possible that the total amounts of unrecognized tax benefits will significantly change in the next year. The Funds recognize interest and penalties, if any, related to unrecognized tax benefits as income tax expense in the Statement of Operations. During the year, the Funds did not incur any interest or penalties, nor were any accrued as of November 30, 2021. |
Rockefeller Funds
Notes to Financial Statements (Continued)
November 30, 2021
| | GAAP requires that certain components of net assets relating to permanent differences be reclassified between financial and tax reporting. These reclassifications have no effect on net assets or NAV per share. For the year ended November 30, 2021, the following reclassifications were made for permanent tax differences on the Statement of Assets and Liabilities. |
| | | | | | | | | | | | | Rockefeller | | | Rockefeller | |
| | | | Rockefeller | | | Rockefeller | | | | | | Intermediate | | | Intermediate | |
| | | | Climate | | | Equity | | | Rockefeller | | | Tax Exempt | | | Tax Exempt | |
| | | | Solutions | | | Allocation | | | Core Taxable | | | National | | | New York | |
| | | | Fund | | | Fund | | | Bond Fund | | | Bond Fund | | | Bond Fund | |
| | Total Distributable | | | | | | | | | | | | | | | |
| | Earnings/(Losses) | | $ | 25,607,564 | | | $ | — | | | $ | — | | | $ | — | | | $ | — | |
| | Paid-In Capital | | | (25,607,564 | ) | | | — | | | | — | | | | — | | | | — | |
| (4) | Investment Adviser |
| | |
| | The Trust has an Investment Advisory Agreement (the “Agreement”) with the Adviser to furnish investment advisory services to the Funds. Under the terms of the Agreement, the Funds compensate the Adviser for its management services at the annual rates of 0.85%, 0.85%, 0.35%, 0.35% and 0.35% of the average daily net assets of the Rockefeller Climate Solutions Fund, Rockefeller Equity Allocation Fund, Rockefeller Core Taxable Bond Fund, Rockefeller Intermediate Tax Exempt National Bond Fund and Rockefeller Intermediate Tax Exempt New York Bond Fund, respectively. |
| | |
| | The Adviser has contractually agreed to waive its management fee and/or reimburse each Fund’s other expenses through the expiration date listed below to the extent necessary to ensure that each Fund’s total annual operating expenses do not exceed each Fund’s Expense Limitation Cap, listed below, of the Fund’s average daily net assets. |
| | | Expense | Expiration |
| | | Limitation Cap | Date |
| | Rockefeller Climate Solutions Fund | 0.99% | July 20, 2023 |
| | Rockefeller Equity Allocation Fund | 1.25% | March 30, 2023 |
| | Rockefeller Core Taxable Bond Fund | 0.85% | March 30, 2023 |
| | Rockefeller Intermediate Tax Exempt National Bond Fund | 0.85% | March 30, 2023 |
| | Rockefeller Intermediate Tax Exempt New York Bond Fund | 0.85% | March 30, 2023 |
| | Any such waiver or reimbursement is subject to later adjustment to allow the Adviser to recover amounts waived or reimbursed to the extent actual fees and expenses for a fiscal period do not exceed the lesser of: (1) the Expense Limitation Cap in place at the time of the waiver and/or reimbursement; or (2) the Expense Limitation Cap in place at the time of recovery; provided, however, that the Adviser shall only be entitled to recover such amounts for a period of up to three years from the date such amount was waived or reimbursed. For the period ended November 30, 2021, the Rockefeller Climate Solutions Fund waived $100,316 in expenses which are eligible for recoupment through November 30, 2024. |
| | |
| (5) | Related Party Transactions |
| | |
| | U.S. Bancorp Fund Services, LLC, doing business as U.S. Bank Global Fund Services (“Fund Services” or the “Administrator”), acts as the Funds’ Administrator |
Rockefeller Funds
Notes to Financial Statements (Continued)
November 30, 2021
| | under an Administration Agreement. The Administrator prepares various federal and state regulatory filings, reports and returns for the Funds; prepares reports and materials to be supplied to the Trustees; monitors the activities of the Funds’ custodian, transfer agent and accountants; coordinates the preparation and payment of the Funds’ expenses; and reviews the Funds’ expense accruals. Fund Services also serves as the fund accountant and transfer agent to the Funds. U.S. Bank National Association (“US Bank”), an affiliate of Fund Services, serves as each Fund’s custodian. The Trust’s Chief Compliance Officer is also an employee of Fund Services. Fees and expenses incurred for the periods ended November 30, 2021, and owed as of November 30, 2021, are as follows: |
| | Administration and Accounting | | Incurred | | | Owed | |
| | Rockefeller Climate Solutions Fund | | $ | 54,786 | | | $ | 23,260 | |
| | Rockefeller Equity Allocation Fund | | $ | 132,532 | | | $ | 20,518 | |
| | Rockefeller Core Taxable Bond Fund | | $ | 119,336 | | | $ | 16,826 | |
| | Rockefeller Intermediate Tax Exempt National Bond Fund | | $ | 156,483 | | | $ | 21,831 | |
| | Rockefeller Intermediate Tax Exempt New York Bond Fund | | $ | 85,298 | | | $ | 11,713 | |
| | | | | | | | | | |
| | Pricing | | Incurred | | | Owed | |
| | Rockefeller Climate Solutions Fund | | $ | 2,466 | | | $ | 1,152 | |
| | Rockefeller Equity Allocation Fund | | $ | 17,403 | | | $ | 3,034 | |
| | Rockefeller Core Taxable Bond Fund | | $ | 8,414 | | | $ | 1,517 | |
| | Rockefeller Intermediate Tax Exempt National Bond Fund | | $ | 13,187 | | | $ | 2,195 | |
| | Rockefeller Intermediate Tax Exempt New York Bond Fund | | $ | 8,901 | | | $ | 1,438 | |
| | | | | | | | | | |
| | Transfer Agency | | Incurred | | | Owed | |
| | Rockefeller Climate Solutions Fund | | $ | 18,648 | | | $ | 5,717 | |
| | Rockefeller Equity Allocation Fund | | $ | 19,600 | | | $ | 3,167 | |
| | Rockefeller Core Taxable Bond Fund | | $ | 18,859 | | | $ | 3,043 | |
| | Rockefeller Intermediate Tax Exempt National Bond Fund | | $ | 20,519 | | | $ | 3,315 | |
| | Rockefeller Intermediate Tax Exempt New York Bond Fund | | $ | 17,454 | | | $ | 2,925 | |
| | | | | | | | | | |
| | Custody | | Incurred | | | Owed | |
| | Rockefeller Climate Solutions Fund | | $ | 9,204 | | | $ | 4,087 | |
| | Rockefeller Equity Allocation Fund | | $ | 55,589 | | | $ | 8,317 | |
| | Rockefeller Core Taxable Bond Fund | | $ | 5,395 | | | $ | 918 | |
| | Rockefeller Intermediate Tax Exempt National Bond Fund | | $ | 5,066 | | | $ | 794 | |
| | Rockefeller Intermediate Tax Exempt New York Bond Fund | | $ | 4,232 | | | $ | 685 | |
| | | | | | | | | | |
| | Chief Compliance Officer | | Incurred | | | Owed | |
| | Rockefeller Climate Solutions Fund | | $ | 3,974 | | | $ | 1,835 | |
| | Rockefeller Equity Allocation Fund | | $ | 11,139 | | | $ | 1,829 | |
| | Rockefeller Core Taxable Bond Fund | | $ | 11,153 | | | $ | 1,840 | |
| | Rockefeller Intermediate Tax Exempt National Bond Fund | | $ | 11,139 | | | $ | 1,827 | |
| | Rockefeller Intermediate Tax Exempt New York Bond Fund | | $ | 11,139 | | | $ | 1,827 | |
| | The Rockefeller Equity Allocation Fund, Rockefeller Core Taxable Bond Fund, Rockefeller Tax Exempt National Bond Fund and Rockefeller Intermediate Tax Exempt New York Bond Fund each have a line of credit with US Bank (see Note 9). |
| | |
| | Certain officers of the Funds are also employees of Fund Services. A Trustee of the Trust is affiliated with Fund Services and US Bank. |
Rockefeller Funds
Notes to Financial Statements (Continued)
November 30, 2021
| (6) | Distribution Plan |
| | |
| | The Trust has adopted a Distribution Plan pursuant to Rule 12b-1 under the 1940 Act (the “12b-1 Plan”), on behalf of the Class A shares of the Rockefeller Climate Solutions Fund, which authorizes the Trust to pay Quasar Distributors, LLC (the “Distributor”), the Funds’ principal distributor, a distribution fee of 0.25% of each Fund’s average daily net assets of Rockefeller Climate Solutions Fund Class A shares. During the period ended November 30, 2021, the Rockefeller Climate Solutions Fund Class A shares incurred fees pursuant to the 12b-1 Plan of $485. |
| | |
| (7) | Capital Share Transactions |
| | |
| | Transactions in the shares of the Funds were as follows: |
| | Rockefeller Climate Solutions Fund | | | | | | |
| | | | Period Ended | | | | |
| | Institutional Class | | November 30, 2021 | | | | |
| | Shares Sold | | | 2,286,459 | | | | |
| | Shares issued from transfer-in-kind | | | 9,155,236 | | | | |
| | Shares Redeemed | | | (183,226 | ) | | | |
| | Net Increase | | | 11,258,469 | | | | |
| | | | | | | | | |
| | | | Period Ended | | | | |
| | Class A | | November 30, 2021 | | | | |
| | Shares Sold | | | 88,305 | | | | |
| | Shares issued from transfer-in-kind | | | 1,000 | | | | |
| | Shares Redeemed | | | (1,000 | ) | | | |
| | Net Increase | | | 88,305 | | | | |
| | | | | | | | | |
| | Rockefeller Equity Allocation Fund | | | | | | | |
| | | | Year Ended | | | Year Ended | |
| | | | November 30, 2021 | | | November 30, 2020 | |
| | Shares Sold | | | 227,462 | | | | 906,492 | |
| | Shares Reinvested | | | 94,118 | | | | 114,116 | |
| | Shares Redeemed | | | (1,580,330 | ) | | | (3,505,732 | ) |
| | Net Decrease | | | (1,258,750 | ) | | | (2,485,124 | ) |
| | | | | | | | | | |
| | Rockefeller Core Taxable Bond Fund | | | | | | | | |
| | | | Year Ended | | | Year Ended | |
| | | | November 30, 2021 | | | November 30, 2020 | |
| | Shares Sold | | | 285,581 | | | | 497,016 | |
| | Shares Reinvested | | | 52,388 | | | | 71,524 | |
| | Shares Redeemed | | | (771,781 | ) | | | (755,902 | ) |
| | Net Decrease | | | (433,812 | ) | | | (187,362 | ) |
Rockefeller Funds
Notes to Financial Statements (Continued)
November 30, 2021
| | Rockefeller Intermediate Tax Exempt National Bond Fund | | | | | | |
| | | | Year Ended | | | Year Ended | |
| | | | November 30, 2021 | | | November 30, 2020 | |
| | Shares Sold | | | 615,564 | | | | 902,642 | |
| | Shares Reinvested | | | 60,389 | | | | 62,548 | |
| | Shares Redeemed | | | (2,449,334 | ) | | | (853,484 | ) |
| | Net Increase/(Decrease) | | | (1,773,381 | ) | | | 111,706 | |
| | | | | | | | | | |
| | Rockefeller Intermediate Tax Exempt New York Bond Fund | | | | | | | | |
| | | | Year Ended | | | Year Ended | |
| | | | November 30, 2021 | | | November 30, 2020 | |
| | Shares Sold | | | 241,275 | | | | 434,051 | |
| | Shares Reinvested | | | 34,539 | | | | 36,553 | |
| | Shares Redeemed | | | (1,021,459 | ) | | | (646,933 | ) |
| | Net Decrease | | | (745,645 | ) | | | (176,329 | ) |
| (8) | Investment Transactions |
| | |
| | The aggregate securities transactions, excluding short-term investments and amounts transferred in-kind noted below, for the Funds for the year ended November 30, 2021 are listed below. |
| | | | | | | | | | U.S. | | | U.S. | |
| | | | | | | | | | Government | | | Government | |
| | | | | | | | | | Securities | | | Securities | |
| | | | Purchases | | | Sales | | | Purchases | | | Sales | |
| | Rockefeller Climate | | | | | | | | | | | | |
| | Solutions Fund | | $ | 33,119,882 | | | $ | 11,140,985 | | | $ | — | | | $ | — | |
| | Rockefeller Equity | | | | | | | | | | | | | | | | |
| | Allocation Fund | | $ | 32,589,252 | | | $ | 54,343,368 | | | $ | — | | | $ | — | |
| | Rockefeller Core | | | | | | | | | | | | | | | | |
| | Taxable Bond Fund | | $ | 25,091,054 | | | $ | 29,140,737 | | | $ | 9,517,659 | | | $ | 8,677,339 | |
| | Rockefeller Intermediate Tax | | | | | | | | | | | | | | | | |
| | Exempt National Bond Fund | | $ | 15,897,940 | | | $ | 33,915,657 | | | $ | — | | | $ | — | |
| | Rockefeller Intermediate Tax | | | | | | | | | | | | | | | | |
| | Exempt New York Bond Fund | | $ | 10,361,230 | | | $ | 17,971,087 | | | $ | — | | | $ | — | |
| | During the period ended November 30, 2021, the Rockefeller Climate Solutions Fund accepted securities, from an affiliated fund of the investment adviser, eligible for investment by the Fund as consideration for Institutional Class shares issued at a fair value of $88,297,880. |
| | |
| (9) | Line of Credit |
| | |
| | As of November 30, 2021, the Rockefeller Equity Allocation Fund, Rockefeller Core Taxable Bond Fund, Rockefeller Intermediate Tax Exempt National Bond Fund, and Rockefeller Intermediate Tax Exempt New York Bond Fund each had a line of credit in the amount of $10,000,000, $8,000,000, $8,500,000, and $4,000,000, respectively, which all mature on August 6, 2022. These secured lines of credit are intended to |
Rockefeller Funds
Notes to Financial Statements (Continued)
November 30, 2021
| | provide short-term financing, if necessary, and subject to certain restrictions, in connection with shareholder redemptions. The credit facility is with the Funds’ custodian, US Bank. Interest was accrued at the prime rate of 3.25%. The following table summarizes the line of credit activity for the Rockefeller Equity Allocation Fund and Rockefeller Intermediate Tax Exempt New York Bond Fund during the year ended November 30, 2021. The Rockefeller Core Taxable Bond Fund and Rockefeller Intermediate Tax Exempt National Bond Fund did not utilize its line of credit during the year ended November 30, 2021. The Funds did not have any loans outstanding as of November 30, 2021. |
| | | | | | | Average | | | | | | Maximum | | Date of |
| | | | Days | | | Amount of | | | Interest | | | Amount of | | Maximum |
| | | | Utilized | | | Borrowing | | | Expense* | | | Borrowing | | Borrowing |
| | Rockefeller Intermediate | | | | | | | | | | | | | |
| | Tax Exempt New York | | | | | | | | | | | | | |
| | Bond Fund | | 1 | | | $ | 1,251,000 | | | $ | 113 | | | $ | 1,251,000 | | 12/8/2020 |
| | Rockefeller Equity | | | | | | | | | | | | | | | | |
| | Allocation Fund | | 1 | | | $ | 263,000 | | | $ | 24 | | | $ | 263,000 | | 12/30/2020 |
| | * Interest Expense is included with “Other expenses” on the Statements of Operations. |
| (10) | Recent Market Events |
| | |
| | U.S. and international markets have experienced volatility in recent months and years due to a number of economic, political and global macro factors, including the impact of the coronavirus (COVID-19) global pandemic, which resulted in a public health crisis, business interruptions, growth concerns in the U.S. and overseas, travel restrictions, changed social behaviors, rising inflation and reduced consumer spending. While several countries, including the U.S., have begun to lift public health restrictions in efforts to reopen their respective economies, the outbreak of new variants has led to the renewal of health mandates by local governments and businesses, reduced hiring efforts by employers, event cancellations and additional travel restrictions, supply chain shortages, cessation of return-to-office plans and an overall economic slowdown. While U.S. and global economies are recovering from the effects of COVID-19, the recovery is proceeding at slower than expected rates and may last for a prolonged period of time. Uncertainties regarding inflation, interest rates, political events, rising government debt in the U.S. and trade tensions have also contributed to market volatility. Global economies and financial markets are increasingly interconnected, which increases the possibility that conditions in one country or region might adversely impact issuers in a different country or region. In particular, a rise in protectionist trade policies, slowing global economic growth, risks associated with epidemic and pandemic diseases, risks associated with the United Kingdom’s departure from the European Union, the risk of trade disputes, and the possibility of changes to some international trade agreements, could affect the economies of many nations, including the United States, in ways that cannot necessarily be foreseen at the present time. Continuing market volatility as a result of recent market conditions or other events may have adverse effects on the Funds. |
Rockefeller Funds
Notes to Financial Statements (Continued)
November 30, 2021
| (11) | LIBOR |
| | |
| | The London Interbank Offered Rate (“LIBOR”) is an interest-rate average calculated from estimates submitted by the leading banks in London. LIBOR represents the rate which banks may obtain short-term borrowings from each other. It is the primary interest rate benchmark for short-term interest rates around the world. The regulator of the LIBOR administrator who publishes the rate has announced most LIBOR reference rates will no longer be published after December 31, 2021 and a majority of U.S. dollar reference rates will no longer be published after June 30, 2023. Because the usefulness of LIBOR as a reference rate could deteriorate during the transition from LIBOR to an alternative reference rate, these effects could occur prior to the discontinuation of LIBOR. The expected discontinuation of LIBOR could have a significant impact on the financial markets, and may present a risk for certain market participants, including the risk that the transition from LIBOR to an alternative interest rate will not be orderly, will occur over various time periods or will have unintended consequences. |
| | |
| (12) | Subsequent Events |
| | |
| | The Funds have evaluated events and transactions that have occurred subsequent to November 30, 2021 and determined there were no subsequent events that would require recognition or disclosure within the financial statements other than as described below. |
| | |
| | On December 28, 2021, the Funds declared and paid distributions from ordinary income to shareholders of record as of December 27, 2021, as follows: |
| | | | Ordinary | | | Short-Term | | | Long-Term | |
| | | | Income | | | Capital Gains | | | Capital Gains | |
| | Rockefeller Climate Solutions Fund – | | | | | | | | | |
| | Institutional Class | | $ | — | | | $ | — | | | $ | 487,399 | |
| | Rockefeller Climate Solutions Fund – | | | | | | | | | | | | |
| | Class A | | | — | | | | — | | | | 3,903 | |
| | Rockefeller Equity Allocation Fund | | | 208,260 | | | | 1,896,472 | | | | 8,818,920 | |
| | Rockefeller Core Taxable Bond Fund | | | 286,711 | | | | — | | | | 1,108,255 | |
| | Rockefeller Intermediate Tax Exempt | | | | | | | | | | | | |
| | National Bond Fund | | | 354,091 | | | | 20,293 | | | | 1,577,219 | |
| | Rockefeller Intermediate Tax Exempt | | | | | | | | | | | | |
| | New York Bond Fund | | | 146,972 | | | | — | | | | 627,923 | |
Rockefeller Funds
Report of Independent Registered Public Accounting Firm
To the Shareholders of the Rockefeller Funds and the
Board of Trustees of Trust for Professional Managers:
Opinion on the Financial Statements and Financial Highlights
We have audited the accompanying statements of assets and liabilities, including the schedules of investments, of the Rockefeller Funds, comprising Rockefeller Climate Solutions Fund, Rockefeller Equity Allocation Fund, Rockefeller Core Taxable Bond Fund, Rockefeller Intermediate Tax Exempt National Bond Fund, and Rockefeller Intermediate Tax Exempt New York Bond Fund, (the “Funds”), each a portfolio of the diversified series constituting Trust for Professional Managers, as of November 30, 2021, the related statements of operations, the statements of changes in net assets and the financial highlights for the periods indicated in the table below, and the related notes. In our opinion, the financial statements and financial highlights present fairly, in all material respects, the financial position of each of the portfolios constituting the Funds as of November 30, 2021, and the results of their operations, the changes in their net assets, and the financial highlights for the periods indicated in the table below, in conformity with accounting principles generally accepted in the United States of America.
| Individual Funds | | Statements of | |
| Comprising the | Statements of | Changes in | Financial |
Rockefeller Funds | Operations | Net Assets | Highlights |
| Rockefeller Climate | For the period from July 21, 2021 (commencement date) to |
| Solutions Fund | November 30, 2021 | | |
| | | | |
| Rockefeller Equity | For the year ended | For the two years | For the five years |
| Allocation Fund | November 30, 2021 | in the period ended | in the period ended |
| | | November 30, 2021 | November 30, 2021 |
| | | | |
| Rockefeller Core | For the year ended | For the two years | For the five years |
| Taxable Bond Fund | November 30, 2021 | in the period ended | in the period ended |
| | | November 30, 2021 | November 30, 2021 |
| | | | |
| Rockefeller Intermediate | For the year ended | For the two years | For the five years |
| Tax Exempt National | November 30, 2021 | in the period ended | in the period ended |
| Bond Fund | | November 30, 2021 | November 30, 2021 |
| | | | |
| Rockefeller Intermediate | For the year ended | For the two years | For the five years |
| Tax Exempt New York | November 30, 2021 | in the period ended | in the period ended |
| Bond Fund | | November 30, 2021 | November 30, 2021 |
Basis for Opinion
These financial statements and financial highlights are the responsibility of the Funds’ management. Our responsibility is to express an opinion on the Funds’ financial statements and financial highlights based on our audits. We are a public accounting firm registered with the Public Company Accounting Oversight Board (United States) (PCAOB) and are required to be independent with respect to the Funds in accordance with the U.S. federal securities laws and the applicable rules and regulations of the Securities and Exchange Commission and the PCAOB.
Rockefeller Funds
Report of Independent Registered Public Accounting Firm
(Continued)
We conducted our audits in accordance with the standards of the PCAOB. Those standards require that we plan and perform the audits to obtain reasonable assurance about whether the financial statements and financial highlights are free of material misstatement, whether due to error or fraud. The Funds are not required to have, nor were we engaged to perform, an audit of their internal control over financial reporting. As part of our audits we are required to obtain an understanding of internal control over financial reporting but not for the purpose of expressing an opinion on the effectiveness of the Funds’ internal control over financial reporting. Accordingly, we express no such opinion.
Our audits included performing procedures to assess the risks of material misstatement of the financial statements and financial highlights, whether due to error or fraud, and performing procedures that respond to those risks. Such procedures included examining, on a test basis, evidence regarding the amounts and disclosures in the financial statements and financial highlights. Our audits also included evaluating the accounting principles used and significant estimates made by management, as well as evaluating the overall presentation of the financial statements and financial highlights. Our procedures included confirmation of securities owned as of November 30, 2021, by correspondence with the custodian and brokers; when replies were not received from brokers, we performed other auditing procedures. We believe that our audits provide a reasonable basis for our opinion.
/s/ Deloitte & Touche LLP
Chicago, Illinois
January 28, 2022
We have served as the auditor of one or more Trust for Professional Managers’ investment companies since 2002.
Rockefeller Climate Solutions Fund
Basis for Trustees’ Approval of Investment Advisory Agreement
(Unaudited)
The Board of Trustees (the “Trustees”) of Trust for Professional Managers (the “Trust”) met on April 15, 2021 to consider the initial approval of the Investment Advisory Agreement (the “Agreement”) between the Trust, on behalf of the Rockefeller Climate Solutions Fund (the “Fund”), a series of the Trust, and Rockefeller & Co. LLC, the Fund’s investment adviser (the “Adviser”). In advance of the meeting, the Trustees requested and received materials to assist them in considering the approval of the Agreement, including a memorandum provided by the Fund’s legal counsel, which outlined the Trustees’ responsibilities in considering the Agreement. The materials provided contained information with respect to the factors enumerated below, including a copy of the Agreement, detailed comparative information relating to the Fund’s performance, as well as the management fees and other expenses of the Fund, due diligence materials relating to the Adviser (including a due diligence questionnaire completed on behalf of the Fund by the Adviser, the Adviser’s Form ADV, select financial statements of the Adviser, bibliographic information of the Adviser’s key management and compliance personnel, comparative fee information for the Fund and the Adviser’s other separately-managed accounts and a summary detailing key provisions of the Adviser’s written compliance program, including its code of ethics) and other pertinent information. In considering approval of the Agreement, the Trustees also reviewed the Trust’s post effective amendment to its Form N-1A registration statement, including the prospectus and statement of additional information included therein, relating to the initial registration of the Fund.
In reviewing the Rockefeller Advisory Agreement, the Board considered certain matters, including, but not limited to, the following: (1) the nature, extent and quality of services to be provided to the Fund by the Adviser; (2) the investment performance of the Fund and the Adviser; (3) the cost of services provided and profits realized by the Adviser from its management of the Fund; (4) the extent to which economies of scale would be realized as the Fund grows and whether the proposed management fees for the Fund reflect these economies of scale for the Fund’s benefit; and (5) other financial benefits to the Adviser resulting from services rendered to the Fund.
Based on its evaluation of information provided by the Adviser, in conjunction with the Fund’s other service providers, the Trustees, by a unanimous vote (including a separate vote of the Trustees who are not “interested persons,” as that term is defined in the Investment Company Act of 1940, as amended (the “Independent Trustees”)), approved the Agreement for an initial term ending two years following the Fund’s commencement of operations pursuant to an effective registration statement.
1. NATURE, EXTENT AND QUALITY OF SERVICES TO BE PROVIDED TO THE FUND
The Trustees considered the nature, extent and quality of services that would be provided by the Adviser to the Fund and the amount of time to be devoted by the Adviser’s staff to the Fund’s operations. The Trustees considered the Adviser’s specific responsibilities in all aspects of day-to-day management of the Fund, as well as the qualifications, experience and responsibilities of Casey C. Clark and Rolando F. Morillo, who will serve as the Fund’s portfolio managers, and other key personnel at the Adviser who would be involved in the day-to-day activities of the Fund. The Trustees reviewed information provided by the Adviser in a due diligence questionnaire, including the structure of the Adviser’s compliance
Rockefeller Climate Solutions Fund
Basis for Trustees’ Approval of Investment Advisory Agreement
(Unaudited) (Continued)
program and discussed the Adviser’s marketing activities and its commitment to the growth of the Fund’s assets. The Trustees also noted any services that extended beyond portfolio management, and they considered the overall capability of the Adviser. The Trustees noted that the Trust’s chief compliance officer concluded that the Adviser’s written compliance policies and procedures, as required by Rule 206(4)-7 under the Investment Advisers Act of 1940, as amended, are reasonably designed to prevent violations of federal securities laws. They noted that the Trust’s chief compliance officer further concluded that the Adviser’s compliance program appears to adequately address the major areas of risk associated with its current advisory business. The Trustees also considered the Adviser’s overall financial condition, as well as the implementation and operational effectiveness of the Adviser’s business continuity plan in response to the novel coronavirus (COVID-19) pandemic and challenges to day-to-day operations in a predominately work-from-home environment. The Trustees concluded that the Adviser had sufficient quality and depth of personnel, resources, investment methods and compliance policies and procedures essential to performing its duties under the Agreement and that the nature, overall quality and extent of the management services to be provided to the Fund, as well as the Adviser’s compliance program, were satisfactory and reliable.
2. INVESTMENT PERFORMANCE OF THE FUND AND THE ADVISER
In assessing the portfolio management services to be provided by the Adviser, the Trustees considered the investment management experience of Messrs. Clark and Morillo, who will serve as the Fund’s portfolio managers. Because the Fund had not yet commenced operations and did not have its own performance history, the Trustees considered the historical performance of the Rockefeller Climate Solutions Fund, L.P. (the “Private Fund”), a Delaware limited partnership managed by Messrs. Clark and Morillo in the same material respects as they will manage the Fund. The Trustees noted that the Fund will not commence operations until after the closing of the conversion of the Private Fund with and into the Fund, at which time the Fund will adopt the performance history of the Private Fund. The Trustees compared the performance of the Private Fund to the MSCI All Country World Index for the year-to-date, one-year, three-year, five-year, and since inception periods ended February 28, 2021. The Trustees noted that the Private Fund’s performance underperformed the Index in the short term for the year-to-date period ended February 28, 2021, but outperformed the Index in the longer term for the one-year, three-year, five-year, and since inception periods ended February 28, 2021. The Trustees also noted the performance of other accounts managed by the Adviser with the same or similar investment strategies as the Private Fund.
After considering all of the information and noting that past performance is not a guarantee or indication of future results, the Trustees determined that the Fund and its shareholders were likely to benefit from the Adviser’s management.
3. COSTS OF SERVICES PROVIDED AND PROFITS TO BE REALIZED BY THE ADVISER
The Trustees considered the cost of services and the structure of the Adviser’s proposed management fee, including a review of the expense analyses and other pertinent material with respect to the Fund. The Trustees reviewed the related statistical information and other materials provided, including the comparative expenses, expense components and peer group selection. The Trustees also considered the cost structure of the Fund relative
Rockefeller Climate Solutions Fund
Basis for Trustees’ Approval of Investment Advisory Agreement
(Unaudited) (Continued)
to a peer group of U.S. world small/mid stock funds as constructed by data presented by Morningstar Direct (the “Morningstar Peer Group”) and other accounts managed by the Adviser with similar investment strategies as the Fund, including the Private Fund.
The Trustees noted that the Fund’s proposed contractual management fee of 0.85% was below the Morningstar Peer Group average of 0.88%. The Trustees further noted that the Adviser had agreed to waive its management fee and/or reimburse fund expenses for at least a two-year period, so that the Fund’s total annual fund operating expenses do not exceed 0.99% of the Fund’s average daily net assets, which was below the Morningstar Peer Group average of 1.10%. The Trustees then compared the fees to be paid by the Fund to fees paid by other accounts managed by the Adviser with similar investment strategies as the Fund, including the Private Fund.
The Trustees also considered the overall profitability that may result from the Adviser’s management of the Fund and reviewed the Adviser’s financial information. The Trustees also examined the level of profits that could be realized by the Adviser from the fees payable under the Agreement anticipated by the Adviser.
The Trustees concluded that the Fund’s estimated expenses and the proposed management fee to be paid to the Adviser were fair and reasonable in light of the comparative expense information and the investment management services to be provided to the Fund by the Adviser. The Trustees further concluded, based on a pro forma profitability analysis prepared by the Adviser, that the Adviser’s anticipated profit from sponsoring the Fund will not be excessive, and the Trustees further concluded that the Adviser had adequate financial resources to support its services to the Fund, despite the anticipated subsidization of the Fund’s operations.
4. EXTENT OF ECONOMIES OF SCALE AS THE FUND GROWS
The Trustees compared the Fund’s estimated expenses relative to its Morningstar Peer Group and discussed economies of scale. The Trustees noted that the Fund’s management fee structure did not contain any breakpoint reductions as Fund assets grow in size, but that the feasibility of incorporating breakpoints would be reviewed on a regular basis. With respect to the Adviser’s fee structure, the Trustees concluded that the potential economies of scale with respect to the Fund were acceptable.
5. BENEFITS TO BE DERIVED FROM THE RELATIONSHIP WITH THE FUND
The Trustees considered the direct and indirect benefits that could be realized by the Adviser from its association with the Fund. The Trustees concluded that the benefits the Adviser may receive, such as greater name recognition or the ability to attract additional investor assets, appear to be reasonable, and in many cases may benefit the Fund.
CONCLUSIONS
The Trustees considered all of the foregoing factors. In considering the approval of the Agreement, the Trustees did not identify any one factor as all-important, but rather considered these factors collectively in light of the Fund’s surrounding circumstances. Based on this review, the Trustees, including a majority of the Independent Trustees, approved the proposed Agreement for an initial two-year term as being in the best interests of the Fund and its shareholders.
Rockefeller Funds
Basis for Trustees’ Approval of Investment Advisory Agreement
(Unaudited)
The Board of Trustees (the “Trustees”) of Trust for Professional Managers (the “Trust”) met on August 4, 2021 to consider the renewal of the Investment Advisory Agreement (the “Agreement”) between the Trust, on behalf of the Rockefeller Equity Allocation Fund (the “Equity Allocation Fund”), Rockefeller Core Taxable Bond Fund (the “Core Taxable Bond Fund”), Rockefeller Intermediate Tax Exempt National Bond Fund (the “Intermediate Tax Exempt National Bond Fund”) and Rockefeller Intermediate Tax Exempt New York Bond Fund (the “Intermediate Tax Exempt New York Bond Fund”) (each, a “Fund,” and together, the “Funds”), each a series of the Trust, and Rockefeller & Co. LLC, the Funds’ investment adviser (the “Adviser”). The Trustees also met at a prior meeting held on June 23, 2021 (the “June 23, 2021 Meeting”) to review materials related to the renewal of the Agreement. Prior to these meetings, the Trustees requested and received materials to assist them in considering the renewal of the Agreement. The materials provided contained information with respect to the factors enumerated below, including a copy of the Agreement, a memorandum prepared by the Trust’s outside legal counsel discussing in detail the Trustees’ fiduciary obligations and the factors they should assess in considering the renewal of the Agreement, detailed comparative information relating to the Funds’ performance, as well as the management fees and other expenses of the Funds, due diligence materials relating to the Adviser (including a due diligence questionnaire completed on behalf of the Funds by the Adviser, the Adviser’s Form ADV, select financial statements of the Adviser, bibliographic information of the Adviser’s key management and compliance personnel, comparative fee information for the Funds and a summary detailing key provisions of the Adviser’s written compliance program, including its code of ethics) and other pertinent information. The Trustees also received information periodically throughout the year that was relevant to the Agreement renewal process, including performance, management fee and other expense information. Based on their evaluation of the information provided by the Adviser, in conjunction with the Funds’ other service providers, the Trustees, by a unanimous vote (including a separate vote of the Trustees who are not “interested persons,” as that term is defined in the Investment Company Act of 1940, as amended (the “Independent Trustees”)), approved the continuation of the Agreement for an additional one-year term ending August 31, 2022.
DISCUSSION OF FACTORS CONSIDERED
In considering the renewal of the Agreement and reaching their conclusions, the Trustees reviewed and analyzed various factors that they determined were relevant, including the factors enumerated below.
1. NATURE, EXTENT AND QUALITY OF SERVICES PROVIDED TO THE FUNDS
The Trustees considered the nature, extent and quality of services provided by the Adviser to the Funds and the amount of time devoted by the Adviser’s staff to the Funds’ operations. The Trustees considered the Adviser’s specific responsibilities in all aspects of day-to-day management of the Funds, as well as the qualifications, experience and responsibilities of David P. Harris, who serves as a portfolio manager for the Equity Allocation Fund, Stefan Langer, who serves as a portfolio manager for the Intermediate Tax Exempt National Bond Fund and Intermediate Tax Exempt New York Bond Fund, Michael Seo, who serves as a portfolio manager for the Equity Allocation Fund, Andrew M. Kello, who serves as a portfolio manager for the Core Taxable Bond Fund, Intermediate Tax Exempt National Bond Fund
Rockefeller Funds
Basis for Trustees’ Approval of Investment Advisory Agreement
(Unaudited) (Continued)
and Intermediate Tax Exempt New York Bond Fund, and Albert (Trey) Sindall, who serves as a portfolio manager for the Core Taxable Bond Fund, as well as other key personnel at the Adviser involved in the day-to-day activities of the Funds. The Trustees reviewed information provided by the Adviser in a due diligence questionnaire, including the structure of the Adviser’s compliance program and discussed the Adviser’s marketing activities and its continuing commitment to the Funds. The Trustees noted that during the course of the prior year the Adviser had participated in a Trust board meeting to discuss various performance, marketing and compliance issues. The Trustees also noted any services that extended beyond portfolio management, and they considered the brokerage practices of the Adviser. The Trustees discussed the Adviser’s handling of compliance matters, including the reports of the Trust’s chief compliance officer to the Trustees on the effectiveness of the Adviser’s compliance program. The Trustees also considered the Adviser’s overall financial condition, as well as the implementation and operational effectiveness of the Adviser’s business continuity plan in response to the novel coronavirus (COVID-19) pandemic and challenges to day-to-day operations. The Trustees concluded that the Adviser had sufficient quality and depth of personnel, resources, investment methods and compliance policies and procedures essential to performing its duties under the Agreement and that the nature, overall quality and extent of the management services to be provided to the Funds, as well as the Adviser’s compliance program, were satisfactory and reliable.
2. INVESTMENT PERFORMANCE OF THE FUNDS AND THE ADVISER
The Trustees discussed the performance of the Institutional Class shares of the Equity Allocation Fund, the Core Taxable Bond Fund, the Intermediate Tax Exempt National Bond Fund, and the Intermediate Tax Exempt New York Bond Fund for the year-to-date, one-year, three-year, five-year and since inception periods ended February 28, 2021 and March 31, 2021. In assessing the quality of the portfolio management services delivered by the Adviser, the Trustees compared the short-term and longer-term performance for the Institutional Class shares of the Funds on both an absolute basis and in comparison to benchmark indices (the MSCI All Country World Index Net for the Equity Allocation Fund, the Bloomberg U.S. Aggregate Bond Index for the Core Taxable Bond Fund, and the Bloomberg Managed Money Short/Intermediate Index for each of the Intermediate Tax Exempt National Bond Fund and the Intermediate Tax Exempt New York Bond Fund), and in comparison to a peer group of funds in each Fund’s current Morningstar category as constructed by data presented by Morningstar Direct (a peer group of U.S. world large stock funds for the Equity Allocation Fund, a peer group of U.S. open-end intermediate core bond funds for the Core Taxable Bond Fund, a peer group of U.S. open-end municipal national intermediate funds for the Intermediate Tax Exempt National Bond Fund, and a peer group of U.S. open-end municipal New York intermediate funds for the Intermediate Tax Exempt New York Bond Fund). The Trustees also reviewed information on the historical performance of other separately-managed accounts that were similar to the Core Taxable Bond Fund, the Intermediate Tax Exempt National Bond Fund and the Intermediate Tax Exempt New York Bond Fund in terms of investment strategies. The Trustees noted that the Adviser did not manage any other accounts with the same or similar investment strategies as the Equity Allocation Fund.
Rockefeller Funds
Basis for Trustees’ Approval of Investment Advisory Agreement
(Unaudited) (Continued)
The Trustees noted the Equity Allocation Fund’s performance for its Institutional Class shares for the quarter ended March 31, 2021 was above the Morningstar Peer Group median. The Trustees noted the Equity Allocation Fund’s performance for its Institutional Class shares for each of the one-year, three-year and five-year periods ended March 31, 2021 was below the Morningstar Peer Group median. The Trustees noted for the year-to-date period ended February 28, 2021, the Equity Allocation Fund outperformed the MSCI All Country World Index Net. The Trustees also noted for the one-year, three-year, five-year and since inception periods ended February 28, 2021, the Equity Allocation Fund underperformed the MSCI All Country World Index Net.
The Trustees noted the Core Taxable Bond Fund’s performance for its Institutional Class shares for the five-year period ended March 31, 2021 was above the Morningstar Peer Group median. The Trustees also noted the Core Taxable Bond Fund’s performance for its Institutional Class shares for the quarter, one-year and three-year periods ended March 31, 2021 was below the Morningstar Peer Group median. The Trustees further noted for the year-to-date, one-year, three-year, five-year and since inception periods ended February 28, 2021, the Core Taxable Bond Fund underperformed the Bloomberg U.S. Aggregate Bond Index. The Trustees noted the Fund’s performance was generally in-line with the performance of the comparable separately-managed account composite for all periods reviewed and the Adviser considered any performance dispersion to be de minimis.
The Trustees noted that the performance of the Intermediate Tax Exempt National Bond Fund for its Institutional Class shares for each of the quarter, one-year, three-year and five-year periods ended March 31, 2021 was below the Morningstar Peer Group median. The Trustees also noted that for the year-to-date, one-year, three-year, five-year and since inception periods ended February 28, 2021, the Intermediate Tax Exempt National Bond Fund underperformed the Bloomberg Managed Money Short/Intermediate Index. The Trustees noted the Fund’s performance was generally in-line with the performance of the comparable separately-managed account composite for all periods reviewed and the Adviser considered any performance dispersion to be de minimis.
The Trustees noted that the performance of the Intermediate Tax Exempt New York Bond Fund for its Institutional Class shares for the quarter, one-year, three-year and five-year periods ended March 31, 2021 was below the Morningstar Peer Group median. The Trustees noted that for the one-year, three-year, five-year and since inception periods ended February 28, 2021, the Intermediate Tax Exempt New York Bond Fund underperformed the Bloomberg Managed Money Short/Intermediate Index, and that for the year-to-date period ended February 28, 2021, the Intermediate Tax Exempt New York Bond Fund outperformed the Bloomberg Managed Money Short/Intermediate Index. The Trustees noted the Fund’s performance was generally in-line with the performance of the comparable separately-managed account composite for all periods reviewed and the Adviser considered any performance dispersion to be de minimis.
After considering all of the information, the Trustees concluded that the performance obtained by the Adviser for each Fund was satisfactory under current market conditions. Although past performance is not a guarantee or indication of future results, the Trustees determined that, despite comparative underperformance for certain periods reviewed, each Fund and its shareholders could benefit from the Adviser’s continued management.
Rockefeller Funds
Basis for Trustees’ Approval of Investment Advisory Agreement
(Unaudited) (Continued)
3. COSTS OF SERVICES PROVIDED AND PROFITS REALIZED BY THE ADVISER
The Trustees considered the cost of services and the structure of the Adviser’s fees, including a review of the expense analyses and other pertinent material with respect to the Funds. The Trustees reviewed the related statistical information and other materials provided, including the comparative expenses, expense components and peer group selections. The Trustees considered the cost structure of each Fund relative to its Morningstar Peer Group, and the Adviser’s separately-managed accounts, as applicable.
The Trustees also considered the overall profitability of the Adviser, reviewing the Adviser’s financial information and noted that the Adviser had previously provided subsidies for each Fund’s operations following each Fund’s inception and had fully recouped those subsidies. The Trustees also examined the level of profits realized by the Adviser from the fees payable under the Agreement, as well as the Funds’ brokerage practices. These considerations were based on materials requested by the Trustees and the Funds’ administrator specifically for the June 23, 2021 meeting and the August 4, 2021 meeting at which the Agreement was formally considered, as well as the reports prepared by the Adviser over the course of the year.
The Trustees noted that the Equity Allocation Fund’s contractual management fee of 0.85% was above the Morningstar Peer Group average of 0.78%. The Trustees observed that the Equity Allocation Fund was operating below its expense cap of 1.25% for Institutional Class shares. The Trustees observed that the Equity Allocation Fund’s total expense ratio of 1.23% for Institutional Class shares was above the Morningstar Peer Group average (which excludes Rule 12b-1 fees) of 1.00%.
The Trustees noted that the Core Taxable Bond Fund’s contractual management fee of 0.35% was below the Morningstar Peer Group average of 0.39%. The Trustees observed that the Core Taxable Bond Fund was operating below its expense cap of 0.85% for Institutional Class shares. The Trustees observed that the Core Taxable Bond Fund’s total expense ratio of 0.71% for Institutional Class shares was above the Morningstar Peer Group average (which excludes Rule 12b-1 fees) of 0.57%. The Trustees also compared the fees paid by the Core Taxable Bond Fund to the fees paid by other separately-managed accounts of the Adviser.
The Trustees noted that the Intermediate Tax Exempt National Bond Fund’s contractual management fee of 0.35% was below the Morningstar Peer Group average of 0.41%. The Trustees observed that the Intermediate Tax Exempt National Bond Fund was operating below its expense cap of 0.85% for Institutional Class shares. The Trustees observed that the Intermediate Tax Exempt National Bond Fund’s total expense ratio of 0.68% for Institutional Class shares was above the Morningstar Peer Group average (which excludes Rule 12b-1 fees) of 0.50%. The Trustees also compared the fees paid by the Intermediate Tax Exempt National Bond Fund to the fees paid by separately-managed accounts of the Adviser.
The Trustees noted that the Intermediate Tax Exempt New York Bond Fund’s contractual management fee of 0.35% was below the Morningstar Peer Group average of 0.46%. The Trustees observed that the Intermediate Tax Exempt New York Bond Fund was operating below its expense cap of 0.85% for Institutional Class shares. The Trustees observed that the Intermediate Tax Exempt New York Bond Fund’s total expense ratio of 0.78% for Institutional
Rockefeller Funds
Basis for Trustees’ Approval of Investment Advisory Agreement
(Unaudited) (Continued)
Class shares was above the Morningstar Peer Group average (which excludes Rule 12b-1 fees) of 0.66%. The Trustees also compared the fees paid by the Intermediate Tax Exempt New York Bond Fund to the fees paid by separately-managed accounts of the Adviser.
The Trustees concluded that the Funds’ expenses and the management fees paid to the Adviser were fair and reasonable in light of the comparative performance, expense and management fee information. The Trustees further concluded, based on a profitability analysis prepared by the Adviser, that the Adviser’s profit from sponsoring each of the Funds had not been, and currently was not, excessive, and that the Adviser maintained adequate profit levels to support its services to the Funds from the revenues of its overall investment advisory business.
4. EXTENT OF ECONOMIES OF SCALE AS THE FUNDS GROW
The Trustees compared the Funds’ expenses relative to their respective peer groups and discussed realized and potential economies of scale. The Trustees also reviewed the structure of each Fund’s management fee and whether a Fund was large enough to generate economies of scale for shareholders or whether economies of scale would be expected to be realized as Fund assets grow (and if so, how those economies of scale were being or would be shared with shareholders). The Trustees noted that each Fund’s management fee structure did not contain any breakpoint reductions as a Fund’s assets grow in size, but the feasibility of incorporating breakpoints would continue to be reviewed on a regular basis. With respect to the Adviser’s fee structure, the Trustees concluded that the current fee structure was reasonable and reflected a sharing of economies of scale between the Adviser and each Fund at the Fund’s current asset level.
5. BENEFITS DERIVED FROM THE RELATIONSHIP WITH THE FUNDS
The Trustees considered the direct and indirect benefits that could be realized by the Adviser from its association with the Funds. The Trustees examined the brokerage practices of the Adviser with respect to the Funds. The Trustees concluded that the benefits the Adviser may receive, such as greater name recognition or increased ability to obtain research or brokerage services or attract additional investor assets, appear to be reasonable, and in many cases may benefit the Funds.
CONCLUSIONS
The Trustees considered all of the foregoing factors. In considering the renewal of the Agreement, the Trustees did not identify any one factor as all-important, but rather considered these factors collectively in light of each Fund’s surrounding circumstances. Based on this review, the Trustees, including a majority of the Independent Trustees, approved the continuation of the Agreement for an additional term ending August 31, 2022 as being in the best interests of each Fund and its shareholders.
Rockefeller Funds
Notice of Privacy Policy & Practices
We collect non-public personal information about you from the following sources:
• information we receive about you on applications or other forms;
• information you give us orally; and
• information about your transactions with us or others.
We do not disclose any non-public personal information about our shareholders or former shareholders without the shareholder’s authorization, except as permitted by law or in response to inquiries from governmental authorities. We may share information with affiliated parties and unaffiliated third parties with whom we have contracts for servicing the Funds. We will provide unaffiliated third parties with only the information necessary to carry out their assigned responsibility. All shareholder records will be disposed of in accordance with applicable law. We maintain physical, electronic and procedural safeguards to protect your non-public personal information and require third parties to treat your non-public personal information with the same high degree of confidentiality.
In the event that you hold shares of the Funds through a financial intermediary, including, but not limited to, a broker-dealer, bank or trust company, the privacy policy of your financial intermediary would govern how your non-public personal information would be shared with unaffiliated third parties.
Rockefeller Funds
Additional Information
(Unaudited)
Tax Information
For the year ended November 30, 2021, certain dividends paid by the Funds may be subject to a maximum tax rate of 23.8%, as provided for by the Jobs and Growth Tax Relief Reconciliation Act of 2003. The percentage of dividends declared from ordinary income designated as qualified dividend income was as follows:
| Rockefeller Climate Solutions Fund | 0.00% |
| Rockefeller Equity Allocation Fund | 56.79% |
| Rockefeller Core Taxable Bond Fund | 0.00% |
| Rockefeller Intermediate Tax Exempt National Bond Fund | 0.00% |
| Rockefeller Intermediate Tax Exempt New York Bond Fund | 0.00% |
For corporate shareholders, the percent of ordinary income distributions qualifying for the corporate dividends received deduction for the fiscal year ended November 30, 2021, was as follows:
| Rockefeller Climate Solutions Fund | 0.00% |
| Rockefeller Equity Allocation Fund | 14.14% |
| Rockefeller Core Taxable Bond Fund | 0.00% |
| Rockefeller Intermediate Tax Exempt National Bond Fund | 0.00% |
| Rockefeller Intermediate Tax Exempt New York Bond Fund | 0.00% |
For the year ended November 30, 2021, the percentage of taxable ordinary income distributions designated as short-term capital gain distributions under Section 871(k)(2)(c) of the Code for the Funds was as follows:
| Rockefeller Climate Solutions Fund | 0.00% |
| Rockefeller Equity Allocation Fund | 0.00% |
| Rockefeller Core Taxable Bond Fund | 0.00% |
| Rockefeller Intermediate Tax Exempt National Bond Fund | 98.97% |
| Rockefeller Intermediate Tax Exempt New York Bond Fund | 99.96% |
Foreign Tax Credit Pass Through
Pursuant to Section 853 of the Code, the Rockefeller Equity Allocation Fund designated the following amounts as foreign taxes paid for the year ended November 30, 2021. Foreign taxes paid for purposes of Section 853 may be less than actual foreign taxes paid for financial statement purposes.
| | | | Distribution Derived |
| | Creditable Foreign | Per Share | From Foreign |
| | Tax Credit Paid | Amount | Sourced Income |
| Rockefeller Equity Allocation | 106,573 | 0.02026729 | 74.73% |
Foreign taxes paid or withheld should be included in taxable income with an offsetting deduction from gross income or as a credit for taxes paid to foreign governments.
Above figures may differ from those cited elsewhere in this report due to differences in the calculation of income and gains for GAAP purposes and Internal Revenue Service purposes.
Shareholders are strongly advised to consult their own tax advisers with respect to the tax consequences of their investments in the Funds.
Rockefeller Funds
Additional Information (Continued)
(Unaudited)
Indemnifications
Under the Trust’s organizational documents, its officers and Trustees are indemnified against certain liabilities arising out of the performance of their duties to the Funds. In addition, in the normal course of business, the Funds enter into contracts that provide general indemnifications to other parties. The Funds’ maximum exposure under these arrangements is unknown as this would involve future claims that may be made against the Funds that have not yet occurred. However, the Funds have not had prior claims or losses pursuant to these contracts and expect the risk of loss to be remote.
Information about Trustees
The business and affairs of the Trust are managed under the direction of the Board of Trustees. Information pertaining to the Trustees of the Trust is set forth below. The Statement of Additional Information includes additional information about the Trustees and is available, without charge, upon request by calling 855-369-6209.
| | | | | | Other |
| | | | | | Directorships |
| | | Term of | Number of | Principal | Held by |
| | | Office and | Portfolios | Occupation(s) | Trustee |
| | Position(s) | Length | in Trust | During the | During the |
| Name, Address | Held with | of Time | Overseen | Past Five | Past Five |
and Year of Birth | the Trust | Served | by Trustee | Years | Years |
| Independent Trustees | | | | | |
| | | | | | |
| Michael D. Akers, Ph.D. | Trustee | Indefinite | 24 | Professor Emeritus | Independent |
| 615 E. Michigan St. | | Term; Since | | Department of | Trustee, USA |
| Milwaukee, WI 53202 | | August 22, | | Accounting | MUTUALS |
| Year of Birth: 1955 | | 2001 | | (June 2019– | (an open-end |
| | | | | present), Professor, | investment |
| | | | | Department of | company with |
| | | | | Accounting | two portfolios). |
| | | | | (2004–May 2019), | |
| | | | | Chair, Department | |
| | | | | of Accounting | |
| | | | | (2004–2017), | |
| | | | | Marquette University. | |
| | | | | | |
| Gary A. Drska | Trustee | Indefinite | 24 | Pilot, | Independent |
| 615 E. Michigan St. | | Term; Since | | Frontier/Midwest | Trustee, USA |
| Milwaukee, WI 53202 | | August 22, | | Airlines, Inc. | MUTUALS |
| Year of Birth: 1956 | | 2001 | | (airline company) | (an open-end |
| | | | | (1986–present). | investment |
| | | | | | company with |
| | | | | | two portfolios). |
Rockefeller Funds
Additional Information (Continued)
(Unaudited)
| | | | | | Other |
| | | | | | Directorships |
| | | Term of | Number of | Principal | Held by |
| | | Office and | Portfolios | Occupation(s) | Trustee |
| | Position(s) | Length | in Trust | During the | During the |
| Name, Address | Held with | of Time | Overseen | Past Five | Past Five |
and Year of Birth | the Trust | Served | by Trustee | Years | Years |
| Interested Trustee and Officers | | | | | |
| | | | | | |
| Joseph C. Neuberger* | Chairperson | Indefinite | 24 | President | Trustee, USA |
| 615 E. Michigan St. | and | Term; Since | | (2017–present), | MUTUALS |
| Milwaukee, WI 53202 | Trustee | August 22, | | Chief Operating | (an open-end |
| Year of Birth: 1962 | | 2001 | | Officer (2016– | investment |
| | | | | 2020), Executive | company) |
| | | | | Vice President, | (2001–2018); |
| | | | | (1994–2017), | Trustee, Buffalo |
| | | | | U.S. Bancorp | Funds (an |
| | | | | Fund Services, | open-end |
| | | | | LLC. | investment |
| | | | | | company) |
| | | | | | (2003–2017). |
| | | | | | |
| John P. Buckel | President | Indefinite | N/A | Vice President, | N/A |
| 615 E. Michigan St. | and | Term; Since | | U.S. Bancorp Fund | |
| Milwaukee, WI 53202 | Principal | January 24, | | Services, LLC | |
| Year of Birth: 1957 | Executive | 2013 | | (2004–present). | |
| | Officer | | | | |
| | | | | | |
| Jennifer A. Lima | Vice | Indefinite | N/A | Vice President, | N/A |
| 615 E. Michigan St. | President, | Term; Since | | U.S. Bancorp Fund | |
| Milwaukee, WI 53202 | Treasurer | January 24, | | Services, LLC | |
| Year of Birth: 1974 | and | 2013 | | (2002–present). | |
| | Principal | | | | |
| | Financial | | | | |
| | and | | | | |
| | Accounting | | | | |
| | Officer | | | | |
| | | | | | |
| Deanna B. Marotz | Chief | Indefinite | N/A | Senior Vice President | N/A |
| 615 E. Michigan St. | Compliance | Term; | | U.S. Bancorp Fund | |
| Milwaukee, WI 53202 | Officer, | Since | | Services, LLC | |
| Year of Birth: 1965 | Vice | October 21, | | (2021–present); | |
| | President | 2021 | | Chief Compliance | |
| | and | | | Officer of Keeley- | |
| | Anti-Money | | | Teton Advisors, LLC | |
| | Laundering | | | and Teton | |
| | Officer | | | Advisors, Inc; | |
| | | | | (2017–present); Chief | |
| | | | | Compliance Officer | |
| | | | | of Keeley Asset | |
| | | | | Management Corp. | |
| | | | | (2015–2017). | |
Rockefeller Funds
Additional Information (Continued)
(Unaudited)
| | | | | | Other |
| | | | | | Directorships |
| | | Term of | Number of | Principal | Held by |
| | | Office and | Portfolios | Occupation(s) | Trustee |
| | Position(s) | Length | in Trust | During the | During the |
| Name, Address | Held with | of Time | Overseen | Past Five | Past Five |
and Year of Birth | the Trust | Served | by Trustee | Years | Years |
| Jay S. Fitton | Secretary | Indefinite | N/A | Assistant Vice | N/A |
| 615 E. Michigan St. | | Term; Since | | President, | |
| Milwaukee, WI 53202 | | July 22, | | U.S. Bancorp Fund | |
| Year of Birth: 1970 | | 2019 | | Services, LLC | |
| | | | | (2019–present); | |
| | | | | Partner, Practus, LLP | |
| | | | | (2018–2019); | |
| | | | | Counsel, Drinker | |
| | | | | Biddle & Reath LLP | |
| | | | | (2016–2018). | |
| | | | | | |
| Kelly A. Burns | Assistant | Indefinite | N/A | Assistant Vice | N/A |
| 615 E. Michigan St. | Treasurer | Term; Since | | President, U.S. | |
| Milwaukee, WI 53202 | | April 23, | | Bancorp Fund | |
| Year of Birth: 1987 | | 2015 | | Services, LLC | |
| | | | | (2011–present). | |
| | | | | | |
| Melissa Aguinaga | Assistant | Indefinite | N/A | Assistant Vice | N/A |
| 615 E. Michigan St. | Treasurer | Term; Since | | President, U.S. | |
| Milwaukee, WI 53202 | | July 1, | | Bancorp Fund | |
| Year of Birth: 1987 | | 2015 | | Services, LLC | |
| | | | | (2010–present). | |
| | | | | | |
| Laura A. Caroll | Assistant | Indefinite | N/A | Assistant Vice | N/A |
| 615 E. Michigan St. | Treasurer | Term; Since | | President, U.S. | |
| Milwaukee, WI 53202 | | August 20, | | Bancorp Fund | |
| Year of Birth: 1985 | | 2018 | | Services, LLC | |
| | | | | (2007–present). | |
| * | Mr. Neuberger is deemed to be an “interested person” of the Trust as defined by the 1940 Act due to his position and material business relationship with the Trust. |
(This Page Intentionally Left Blank.)
A NOTE ON FORWARD LOOKING STATEMENTS (Unaudited)
Except for historical information contained in this report for the Funds, the matters discussed in this report may constitute forward-looking statements made pursuant to the safe-harbor provisions of the Private Securities Litigation Reform Act of 1995. These include any adviser or portfolio manager predictions, assessments, analyses or outlooks for individual securities, industries, market sectors and/or markets. These statements involve risks and uncertainties. In addition to the general risks described for the Funds in the current Prospectus, other factors bearing on this report include the accuracy of the Adviser’s or portfolio managers’ forecasts and predictions, and the appropriateness of the investment programs designed by the Adviser or portfolio managers to implement their strategies efficiently and effectively. Any one or more of these factors, as well as other risks affecting the securities markets and investment instruments generally, could cause the actual results of the Funds to differ materially as compared to benchmarks associated with the Funds.
ADDITIONAL INFORMATION (Unaudited)
The Funds have adopted proxy voting policies and procedures that delegate to the Adviser the authority to vote proxies. A description of the Funds’ proxy voting policies and procedures is available without charge, upon request, by calling the Funds toll free at 855-369-6209. A description of these policies and procedures is also included in the Funds’ Statement of Additional Information, which is available on the SEC’s website at http://www.sec.gov.
The Funds’ proxy voting records for the most recent 12-month period ended June 30 are available without charge, either upon request by calling the Funds toll free at 855-369-6209 or by accessing the SEC’s website at http://www.sec.gov.
The Funds file their complete schedule of portfolio holdings with the SEC for the first and third quarters of each fiscal year on Part F of Form N-PORT. Shareholders may view the Part F of Form N-PORT reports, on the SEC’s website at http://www.sec.gov.
HOUSEHOLDING (Unaudited)
In an effort to decrease costs, the Funds intend to reduce the number of duplicate prospectuses and certain other shareholder documents you receive by sending only one copy of each to those addresses shared by two or more accounts and to shareholders the Funds reasonably believe are from the same family or household. Once implemented, if you would like to discontinue householding for your accounts, please call toll-free at 855-369-6209 to request individual copies of these documents. Once the Funds receive notice to stop householding, the Funds will begin sending individual copies 30 days after receiving your request. This policy does not apply to account statements.
ROCKEFELLER FUNDS
| Investment Adviser | Rockefeller & Co. LLC |
| | 45 Rockefeller Plaza, 5th Floor |
| | New York, New York 10111 |
| | |
| Legal Counsel | Godfrey & Kahn, S.C. |
| | 833 East Michigan Street |
| | Suite 1800 |
| | Milwaukee, Wisconsin 53202 |
| | |
| Independent Registered Public | Deloitte & Touche LLP |
| Accounting Firm | 111 South Wacker Drive |
| | Chicago, Illinois 60606 |
| | |
| Transfer Agent, Fund Accountant and | U.S. Bancorp Fund Services, LLC |
| Fund Administrator | 615 East Michigan Street |
| | Milwaukee, Wisconsin 53202 |
| | |
| Custodian | U.S. Bank National Association |
| | Custody Operations |
| | 1555 North River Center Drive |
| | Suite 302 |
| | Milwaukee, Wisconsin 53212 |
| | |
| Distributor | Quasar Distributors, LLC |
| | 111 East Kilbourn Avenue |
| | Suite 2200 |
| | Milwaukee, Wisconsin 53202 |
This report is intended for shareholders of the Funds and may not be used as sales literature unless preceded or accompanied by a current prospectus.
Item 2. Code of Ethics.
The registrant has adopted a code of ethics that applies to the registrant’s principal executive officer and principal financial officer. The registrant has not made any amendments to its code of ethics during the period covered by this report. The registrant has not granted any waivers from any provisions of the code of ethics during the period covered by this report. Incorporated by reference to the Registrant’s Form N-CSR filed on February 6, 2019.
Item 3. Audit Committee Financial Expert.
The registrant’s board of trustees has determined that there is at least one audit committee financial expert serving on its audit committee. Dr. Michael Akers is the “audit committee financial expert” and is considered to be “independent” as each term is defined in Item 3 of Form N‑CSR. Dr. Akers holds a Ph.D. in accountancy and is a professor of accounting at Marquette University in Milwaukee, Wisconsin.
Item 4. Principal Accountant Fees and Services.
The registrant has engaged its principal accountant to perform audit services, audit-related services, tax services and other services during the past two fiscal years. “Audit services” refer to performing an audit of the registrant's annual financial statements or services that are normally provided by the accountant in connection with statutory and regulatory filings or engagements for those fiscal years. “Audit-related services” refer to the assurance and related services by the principal accountant that are reasonably related to the performance of the audit. “Tax services” refer to professional services rendered by the principal accountant for tax compliance, tax advice, and tax planning. The following table details the aggregate fees billed or expected to be billed for each of the last two fiscal years for audit fees, audit-related fees, tax fees and other fees by the principal accountant.
| | FYE 11/30/2021 | FYE 11/30/2020 |
Audit Fees | $147,900 | $116,400 |
Audit-Related Fees | 0 | 0 |
Tax Fees | $27,900 | $21,050 |
All Other Fees | 0 | 0 |
The audit committee has adopted pre-approval policies and procedures that require the audit committee to pre‑approve all audit and non‑audit services of the registrant, including services provided to any entity affiliated with the registrant.
The percentage of fees billed by Deloitte & Touche LLP applicable to non-audit services pursuant to waiver of pre-approval requirement were as follows:
| | FYE 11/30/2021 | FYE 11/30/2020 |
Audit-Related Fees | 0% | 0% |
Tax Fees | 0% | 0% |
All Other Fees | 0% | 0% |
All of the principal accountant’s hours spent on auditing the registrant’s financial statements were attributed to work performed by full‑time permanent employees of the principal accountant.
The following table indicates the non-audit fees billed or expected to be billed by the registrant’s accountant for services to the registrant and to the registrant’s investment adviser (and any other controlling entity, etc.—not sub-adviser) for the last two years. The audit committee of the board of trustees/directors has considered whether the provision of non-audit services that were rendered to the registrant's investment adviser is compatible with maintaining the principal accountant's independence and has concluded that the provision of such non-audit services by the accountant has not compromised the accountant’s independence.
Non-Audit Related Fees | FYE 11/30/2021 | FYE 11/30/2020 |
Registrant | $0
| $0
|
Registrant’s Investment Adviser | $613,700 | $575,700 |
The registrant has not been identified by the U.S. Securities and Exchange Commission as having filed an annual report issued by a registered public accounting firm branch or office that is located in a foreign jurisdiction where the Public Company Accounting Oversight Board is unable to inspect or completely investigate because of a position taken by an authority in that jurisdiction.
The registrant is not a foreign issuer.
Item 5. Audit Committee of Listed Registrants.
Not applicable to registrants who are not listed issuers (as defined in Rule 10A-3 under the Securities Exchange Act of 1934).
Item 6. Investments.
(a) | Schedule of Investments is included as part of the report to shareholders filed under Item 1 of this Form. |
Item 7. Disclosure of Proxy Voting Policies and Procedures for Closed-End Management Investment Companies.
Not applicable to open-end investment companies.
Item 8. Portfolio Managers of Closed-End Management Investment Companies.
Not applicable to open-end investment companies.
Item 9. Purchases of Equity Securities by Closed‑End Management Investment Company and Affiliated Purchasers.
Not applicable to open-end investment companies.
Item 10. Submission of Matters to a Vote of Security Holders.
There have been no material changes to the procedures by which shareholders may recommend nominees to the registrant’s board of trustees.
Item 11. Controls and Procedures.
(a) | The Registrant’s President and Treasurer have reviewed the Registrant's disclosure controls and procedures (as defined in Rule 30a-3(c) under the Investment Company Act of 1940 (the “Act”)) as of a date within 90 days of the filing of this report, as required by Rule 30a-3(b) under the Act and Rules 13a-15(b) or 15d‑15(b) under the Securities Exchange Act of 1934. Based on their review, such officers have concluded that the disclosure controls and procedures are effective in ensuring that information required to be disclosed in this report is appropriately recorded, processed, summarized and reported and made known to them by others within the Registrant and by the Registrant’s service provider. |
(b) | There were no changes in the Registrant's internal control over financial reporting (as defined in Rule 30a-3(d) under the Act) that occurred during the last fiscal half-year of the period covered by this report that has materially affected, or is reasonably likely to materially affect, the Registrant's internal control over financial reporting. |
Item 12. Disclosure of Securities Lending Activities for Closed-End Management Investment Companies
Not applicable to open-end investment companies.
Item 13. Exhibits.
| (3) Any written solicitation to purchase securities under Rule 23c‑1 under the Act sent or given during the period covered by the report by or on behalf of the registrant to 10 or more persons. Not applicable to open-end investment companies. |
| (4) Change in the registrant’s independent public accountant. There was no change in the registrant’s independent public accountant for the period covered by this report. |
SIGNATURES
Pursuant to the requirements of the Securities Exchange Act of 1934 and the Investment Company Act of 1940, the registrant has duly caused this report to be signed on its behalf by the undersigned, thereunto duly authorized.
(Registrant) Trust for Professional Managers
By (Signature and Title /s/John Buckel
John Buckel, President
Date February 2, 2022
Pursuant to the requirements of the Securities Exchange Act of 1934 and the Investment Company Act of 1940, this report has been signed below by the following persons on behalf of the registrant and in the capacities and on the dates indicated.
By (Signature and Title)* /s/John Buckel
John Buckel, President
Date February 2, 2022
By (Signature and Title)* /s/Jennifer Lima
Jennifer Lima, Treasurer
Date February 2, 2022
* Print the name and title of each signing officer under his or her signature.